of the commonwealth - Controller's Office
74
UNIVERSITY OF PITTSBURGH – OF THE COMMONWEALTH SYSTEM OF HIGHER EDUCATION Consolidated Financial Statements and Independent Auditors’ Reports Required by Title 2 U.S. Code of Federal Regulations Part 200, Uniform Administrative Requirements, Cost Principles, and Audit Requirements for Federal Awards, and Related Information Year ended June 30, 2020
-
Upload
khangminh22 -
Category
Documents
-
view
0 -
download
0
Transcript of of the commonwealth - Controller's Office

UNIVERSITY OF PITTSBURGH – OF THE COMMONWEALTH SYSTEM OF HIGHER EDUCATION
Consolidated Financial Statements and Independent Auditors’ Reports Required by Title 2 U.S. Code of Federal Regulations Part 200, Uniform
Administrative Requirements, Cost Principles, and Audit Requirements for Federal Awards, and Related Information
Year ended June 30, 2020

UNIVERSITY OF PITTSBURGH – OF THE
COMMONWEALTH SYSTEM OF HIGHER EDUCATION
June 30, 2020
Table of Contents
Page
Independent Auditors’ Report
Consolidated Balance Sheets 1
Consolidated Statement of Activities 2
Consolidated Statements of Cash Flows 4
Notes to Consolidated Financial Statements 5
Schedule of Expenditures of Federal Awards 36
Notes to Schedule of Expenditures of Federal Awards 62
Independent Auditors’ Report on Internal Control Over Financial Reporting and on Compliance
and Other Matters Based on an Audit of Financial Statements Performed in Accordance
With Government Auditing Standards 65
Independent Auditors’ Report on Compliance for Each Major Federal Program; Report on
Internal Control Over Compliance; and Report on Schedule of Expenditures of Federal
Awards Required by the Uniform Guidance 67
Schedule of Findings and Questioned Costs 69
Independent Auditors’ Report
The Board of Trustees
The University of Pittsburgh – Of the Commonwealth
System of Higher Education:
Report on the Consolidated Financial Statements
We have audited the accompanying consolidated financial statements of The University of Pittsburgh – Of the
Commonwealth System of Higher Education (the University), which comprise the consolidated balance sheets
as of June 30, 2020 and 2019, the related consolidated statements of activities and cash flows for the years
then ended, and the related notes to the consolidated financial statements.
Management’s Responsibility for the Consolidated Financial Statements
Management is responsible for the preparation and fair presentation of these consolidated financial statements
in accordance with U.S. generally accepted accounting principles; this includes the design, implementation, and
maintenance of internal control relevant to the preparation and fair presentation of consolidated financial
statements that are free from material misstatement, whether due to fraud or error.
Auditors’ Responsibility
Our responsibility is to express an opinion on these consolidated financial statements based on our audits. We
conducted our audits in accordance with auditing standards generally accepted in the United States of America
and the standards applicable to financial audits contained in Government Auditing Standards, issued by the
Comptroller General of the United States. Those standards require that we plan and perform the audit to obtain
reasonable assurance about whether the consolidated financial statements are free from material
misstatement.
An audit involves performing procedures to obtain audit evidence about the amounts and disclosures in the
consolidated financial statements. The procedures selected depend on the auditors’ judgment, including the
assessment of the risks of material misstatement of the consolidated financial statements, whether due to fraud
or error. In making those risk assessments, the auditor considers internal control relevant to the entity’s
preparation and fair presentation of the consolidated financial statements in order to design audit procedures
that are appropriate in the circumstances, but not for the purpose of expressing an opinion on the effectiveness
of the entity’s internal control. Accordingly, we express no such opinion. An audit also includes evaluating the
appropriateness of accounting policies used and the reasonableness of significant accounting estimates made
by management, as well as evaluating the overall presentation of the consolidated financial statements.
We believe that the audit evidence we have obtained is sufficient and appropriate to provide a basis for our
audit opinion.
Opinion
In our opinion, the consolidated financial statements referred to above present fairly, in all material respects,
the financial position of The University of Pittsburgh – Of the Commonwealth System of Higher Education as of
June 30, 2020 and 2019, and the changes in its net assets and its cash flows for the years then ended, in
accordance with U.S. generally accepted accounting principles.
KPMG LLPBNY Mellon CenterSuite 3400500 Grant StreetPittsburgh, PA 15219-2598
KPMG LLP, a Delaware limited liability partnership and a member firm of the KPMG global organization of independent member firms affiliated with KPMG International Limited, a private English company limited by guarantee.

2
Emphasis of Matter
As discussed in note 1 to the consolidated financial statements, in 2020, the University adopted Accounting
Standards Update No. 2016-02, Leases (Topic 842), as amended. Our opinion is not modified with respect to
this matter.
Other Reporting Required by Government Auditing Standards
In accordance with Government Auditing Standards, we have also issued our report dated October 20, 2020 on
our consideration of the University’s internal control over financial reporting and on our tests of its compliance
with certain provisions of laws, regulations, contracts, and grant agreements and other matters. The purpose of
that report is solely to describe the scope of our testing of internal control over financial reporting and
compliance and the results of that testing, and not to provide an opinion on the effectiveness of the University’s
internal control over financial reporting or on compliance. That report is an integral part of an audit performed in
accordance with Government Auditing Standards in considering the University’s internal control over financial
reporting and compliance.
Pittsburgh, Pennsylvania
October 20, 2020

1
Fiscal Year 2020 Financial Report
CONSOLIDATED BALANCE SHEETS
JUNE 30, 2020 AND 2019 (in thousands of dollars)
2020 2019
ASSETS: Cash and cash equivalents (Notes 1, 2 and 6) $ 117,648 $ 10,521 Operating investments (Notes 1, 2, 5 and 6) 1,037,526 469,630 Inventories and deferred charges 26,161 35,656 Accounts and notes receivable, net (Notes 2 and 3) 232,318 266,984 Contributions receivable, net (Notes 1 and 4) 56,526 55,663 Student loans receivable, net 32,300 36,811 Foundation assets (Note 1) 35,615 30,903 Endowment investments (Notes 5 and 6) 4,203,474 4,342,563 Endowed funds held by third parties (Note 6) 22,865 23,677 Operating lease right-of-use assets, net (Note 7) 268,368 - Property, plant, and equipment, net (Note 8) 1,979,055 1,929,919
TOTAL ASSETS $ 8,011,856 $ 7,202,327
LIABILITIES: Accounts payable and accrued expenses $ 104,839 $ 106,235 Accrued payroll and related liabilities 105,219 81,987
Deferred student and other revenue (Note 1) 41,609 48,101
Advanced receipt of grant funds (Note 1) 84,961 73,708
Refundable U.S. government student loans 26,000 32,978
Other liabilities (Notes 6 and 10) 144,857 138,004
Pension and postretirement obligations (Note 11) 721,088 622,845
Conditional asset remediation obligation (Note 8) 28,940 30,022 Right-of-use lease liabilities (Note 7) 300,765 -
Bonds and notes payable (Note 9) 1,452,894 899,687
TOTAL LIABILITIES 3,011,172 2,033,567
NET ASSETS:
Without donor restrictions (Notes 1 and 12)
Endowment designated for financial aid 1,556,934 1,704,446
Other designated endowments 1,010,788 947,923
Net invested in plant and other 698,087 763,467
Total without donor restrictions 3,265,809 3,415,836
With donor restrictions (Notes 1 and 12)
Endowments 1,618,332 1,663,466
Other 116,543 89,458
Total with donor restrictions 1,734,875 1,752,924
TOTAL NET ASSETS 5,000,684 5,168,760
TOTAL LIABILITIES AND NET ASSETS $ 8,011,856 $ 7,202,327
The accompanying notes are an integral part of these consolidated financial statements.

2
Fiscal Year 2020 Financial Report
CONSOLIDATED STATEMENT OF ACTIVITIES FOR THE YEAR ENDED JUNE 30, 2020 COMPARED TO SUMMARY INFORMATION FOR THE YEAR ENDED JUNE 30, 2019 (in thousands of dollars)
The accompanying notes are an integral part of these consolidated financial statements.
2020
OPERATING REVENUES:
Without Donor
Restrictions
With Donor
Restrictions
Total
2019 Tuition and fees (net of tuition discounts of $240.1 million and $206.0 million) $ 632,622 $ - $ 632,622 $ 639,561 Commonwealth appropriation 183,146 - 183,146 174,675 Commonwealth construction grants 1,838 25,833 27,671 8,781 Research grants and contracts 894,888 - 894,888 859,690 Contributions for operations 41,798 14,305 56,103 51,047 Endowment distributions and investment income 174,968 - 174,968 157,031 Sales and services, educational and other 135,139 - 135,139 138,947 Sales and services, auxiliary 127,317 - 127,317 151,020 UPMC academic support (Note 15) 270,135 - 270,135 172,218 Net assets released from restrictions 16,989 (16,989) - - Total operating revenues 2,478,840 23,149 2,501,989 2,352,970 OPERATING EXPENSES: Salaries and wages 1,164,657 - 1,164,657 1,055,046 Fringe benefits 333,071 - 333,071 300,091 Total compensation 1,497,728 - 1,497,728 1,355,137 Supplies 115,591 - 115,591 122,669 Business and professional 348,940 - 348,940 374,303 Facilities 99,600 - 99,600 103,357 Depreciation 194,369 - 194,369 184,835 Interest 42,676 - 42,676 30,137 Rent 61,077 - 61,077 52,507 Other 56,826 - 56,826 42,301 Total operating expenses (Note 14) 2,416,807 - 2,416,807 2,265,246 Change in net assets from operating activities 62,033 23,149 85,182 87,724 OTHER ACTIVITIES: Investment (losses) gains, net of endowment distributions for operations (71,936) (65,130) (137,066) 71,575 Contributions for endowment - 23,932 23,932 31,025 Change in fair value of interest rate swaps (Note 10) (35,300) - (35,300) (20,765) Deferred tax (expense) benefit (Note 1) (11,355) - (11,355) 11,355 Other components of net periodic benefit cost (Note 11) (23,586) - (23,586) (22,241) Nonperiodic changes in benefit plans (Note 11) (69,883) - (69,883) (46,707) Total other activities (212,060) (41,198) (253,258) 24,242
CHANGE IN NET ASSETS (150,027) (18,049) (168,076) 111,966
NET ASSETS, BEGINNING OF YEAR 3,415,836 1,752,924 5,168,760 5,056,794
NET ASSETS, END OF YEAR $ 3,265,809 $ 1,734,875 $ 5,000,684 $ 5,168,760

3
Fiscal Year 2020 Financial Report
CONSOLIDATED STATEMENT OF ACTIVITIES
FOR THE YEAR ENDED JUNE 30, 2019 (in thousands of dollars)
The accompanying notes are an integral part of these consolidated financial statements.
2019
OPERATING REVENUES:
Without Donor
Restrictions
With Donor
Restrictions
Total Tuition and fees (net of tuition discounts of $206.0 million)
$ 639,561 $ - $ 639,561
Commonwealth appropriation 174,675 - 174,675 Commonwealth construction grants - 8,781 8,781 Research grants and contracts 859,690 - 859,690 Contributions for operations 33,216 17,831 51,047 Endowment distributions and investment income 157,031 - 157,031 Sales and services, educational and other 138,947 - 138,947 Sales and services, auxiliary 151,020 - 151,020 UPMC academic support (Note 15) 172,218 - 172,218 Net assets released from restrictions 42,037 (42,037) - Total operating revenues 2,368,395 (15,425) 2,352,970 OPERATING EXPENSES: Salaries and wages 1,055,046 - 1,055,046 Fringe benefits 300,091 - 300,091 Total compensation 1,355,137 - 1,355,137 Supplies 122,669 - 122,669 Business and professional 374,303 - 374,303 Facilities 103,357 - 103,357 Depreciation 184,835 - 184,835 Interest 30,137 - 30,137 Rent 52,507 - 52,507 Other 42,301 - 42,301 Total operating expenses (Note 14) 2,265,246 - 2,265,246 Change in net assets from operating activities 103,149 (15,425) 87,724 OTHER ACTIVITIES: Investment gains, net of endowment distributions for operations
44,111 27,464 71,575
Contributions for endowment - 31,025 31,025 Change in fair value of interest rate swaps (Note 10) (20,765) - (20,765) Deferred tax benefit (Note 1) 11,355 - 11,355 Other components of net periodic benefit cost (Note 11) (22,241) - (22,241) Nonperiodic changes in benefit plans (Note 11) (46,707) - (46,707) Total other activities (34,247) 58,489 24,242
CHANGE IN NET ASSETS 68,902 43,064 111,966
NET ASSETS, BEGINNING OF YEAR 3,346,934 1,709,860 5,056,794
NET ASSETS, END OF YEAR $ 3,415,836 $ 1,752,924 $ 5,168,760
4
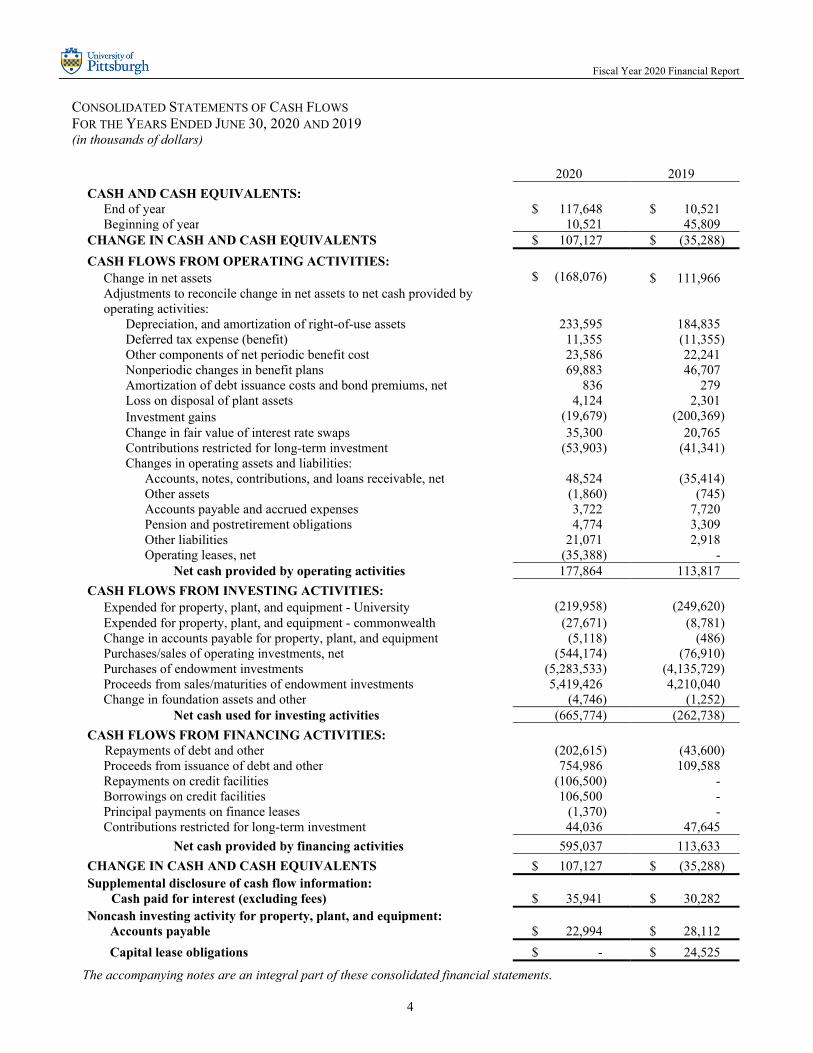
Fiscal Year 2020 Financial Report
CONSOLIDATED STATEMENTS OF CASH FLOWS
FOR THE YEARS ENDED JUNE 30, 2020 AND 2019 (in thousands of dollars)
The accompanying notes are an integral part of these consolidated financial statements.
2020 2019
CASH AND CASH EQUIVALENTS: End of year $ 117,648 $ 10,521 Beginning of year 10,521 45,809 CHANGE IN CASH AND CASH EQUIVALENTS $ 107,127 $ (35,288)
CASH FLOWS FROM OPERATING ACTIVITIES: Change in net assets $ (168,076) $ 111,966 Adjustments to reconcile change in net assets to net cash provided by operating activities: Depreciation, and amortization of right-of-use assets 233,595 184,835 Deferred tax expense (benefit) 11,355 (11,355) Other components of net periodic benefit cost 23,586 22,241 Nonperiodic changes in benefit plans 69,883 46,707 Amortization of debt issuance costs and bond premiums, net 836 279 Loss on disposal of plant assets 4,124 2,301 Investment gains (19,679) (200,369) Change in fair value of interest rate swaps 35,300 20,765 Contributions restricted for long-term investment (53,903) (41,341) Changes in operating assets and liabilities: Accounts, notes, contributions, and loans receivable, net 48,524 (35,414) Other assets (1,860) (745) Accounts payable and accrued expenses 3,722 7,720 Pension and postretirement obligations 4,774 3,309 Other liabilities 21,071 2,918 Operating leases, net (35,388) - Net cash provided by operating activities 177,864 113,817
CASH FLOWS FROM INVESTING ACTIVITIES: Expended for property, plant, and equipment - University (219,958) (249,620) Expended for property, plant, and equipment - commonwealth (27,671) (8,781) Change in accounts payable for property, plant, and equipment (5,118) (486) Purchases/sales of operating investments, net (544,174) (76,910) Purchases of endowment investments (5,283,533) (4,135,729) Proceeds from sales/maturities of endowment investments 5,419,426 4,210,040 Change in foundation assets and other (4,746) (1,252) Net cash used for investing activities (665,774) (262,738)
CASH FLOWS FROM FINANCING ACTIVITIES: Repayments of debt and other (202,615) (43,600) Proceeds from issuance of debt and other 754,986 109,588 Repayments on credit facilities (106,500) - Borrowings on credit facilities 106,500 - Principal payments on finance leases (1,370) - Contributions restricted for long-term investment 44,036 47,645
Net cash provided by financing activities 595,037 113,633
CHANGE IN CASH AND CASH EQUIVALENTS $ 107,127 $ (35,288) Supplemental disclosure of cash flow information: Cash paid for interest (excluding fees) $ 35,941 $ 30,282 Noncash investing activity for property, plant, and equipment: Accounts payable $ 22,994 $ 28,112
Capital lease obligations $ - $ 24,525

5
Fiscal Year 2020 Financial Report
NOTE 1: SUMMARY OF SIGNIFICANT ACCOUNTING AND REPORTING PRACTICES Organization Founded in 1787, the University of Pittsburgh (the University) is one of the oldest institutions of higher education in the United States. The University’s mission is to provide high-quality undergraduate and graduate programs in the arts and sciences and professional fields; engage in research, artistic, and scholarly activities that advance learning through the extension of the frontiers of knowledge and creative endeavor; cooperate with industrial and governmental institutions to transfer knowledge in science, technology, and health care; offer continuing educational programs adapted to the personal enrichment, professional upgrading, and career advancement interests and needs of adult Pennsylvanians; and make available to local communities and public agencies the expertise of the University in ways that are consistent with the primary teaching and research functions and contribute to social, intellectual, and economic development in the commonwealth, the nation, and the world.
The University’s main campus in the City of Pittsburgh comprises 16 schools and several academic centers educating approximately 28,400 students in various undergraduate, graduate, and doctorate-professional programs. Four regional campuses with a total enrollment approximating 5,400 students are located throughout western Pennsylvania.
Relationship with the Commonwealth of Pennsylvania The University derives its corporate existence under the laws of the Commonwealth of Pennsylvania (the commonwealth) by reason of the act of the General Assembly of the commonwealth establishing an “Academy or Public School in the town of Pittsburgh” on February 28, 1787 and from the act of February 18, 1819 incorporating the “Western University of Pennsylvania.” In 1908, the University’s name was changed to the “University of Pittsburgh” by order of the Court of Common Pleas of Allegheny County. In 1966, the Pennsylvania State Legislature enacted the “University of Pittsburgh- Commonwealth Act,” which changed the name of the University to the “University of Pittsburgh – of the Commonwealth System of Higher Education” and established the University as an instrumentality of the commonwealth to serve as a state- related institution in the Commonwealth System of Higher Education. The University is a Pennsylvania nonprofit corporation subject to the Nonprofit Corporation Law of 1988.
The entire management, control, and conduct of the instructional, administrative, and financial affairs of the University are vested with the Board of Trustees. The Board of Trustees is comprised of fifty-two members (thirty-six voting members), including twelve commonwealth trustees and sixteen special trustees elected by the board. Special trustees may attend all meetings of the board and are entitled to and exercise all rights, responsibilities, and privileges of trusteeship, except the right to vote at board meetings.
Funding from the Commonwealth of Pennsylvania As a state-related institution, the University receives an annual appropriation from the commonwealth. There is no assurance that such appropriation will continue to be made at current levels or at levels requested by the University. In addition, the commonwealth funds certain capital projects in support of the University’s mission, as well as support for sponsored research grants and contracts, as presented in the following table:
2020 2019 Commonwealth appropriation: (in thousands of dollars) General support $ 151,507 $ 148,536 Rural Education Outreach 3,346 2,846 Supplemental funds – Academic Medical Centers and general support
28,293 23,293 Total commonwealth appropriation 183,146 174,675 Commonwealth construction grants 27,671 8,781 Commonwealth research grants and contracts 13,712 13,918 Total $ 224,529 $ 197,374
6
Fiscal Year 2020 Financial Report
Basis of Presentation The consolidated financial statements include the accounts of the University, which do not include the net assets or activities of the University of Pittsburgh Medical Center (UPMC) or the University of Pittsburgh Physicians (UPP) clinical practice plans, as they are separate legal entities affiliated with but not controlled by the University. The University has the right to designate one-third of the members of the UPMC Board of Directors and any Executive Committee thereof.
The other activities section of the Consolidated Statements of Activities includes investment gains (losses), net of endowment distributions for operations; contributions for endowment; change in fair value of interest rate swaps; deferred tax expense/benefit; other components of net periodic benefit cost; and nonperiodic changes in pension and postretirement benefit plans. Endowment distributions for operations represent those distributions not reinvested in the endowment (see Note 13).
Basis of Accounting The consolidated financial statements have been prepared on the accrual basis of accounting in conformity with U.S. generally accepted accounting principles (GAAP) as promulgated by the Financial Accounting Standards Board (FASB) Accounting Standards Codification (ASC) 958, Not-for-Profit Entities.
The University’s net assets have been classified in accordance with the presence or absence of donor-imposed restrictions and are reported as follows:
Net assets without donor restrictions - Includes revenues, gains, and losses, which are free from donor restrictions and are available for the general operating purposes of the University. All University expenses are reported as a reduction in net assets without donor restrictions. This class of net assets includes contributions and endowment distributions whose donor-imposed restrictions have been met within the fiscal year as well as endowment funds designated by the University’s Board of Trustees or management, as delegated by the board. Restrictions are considered to be released if unrestricted resources are used for a purpose for which restricted resources are available. Contributions for capital construction or acquisition are reported as net assets without donor restrictions once the asset is placed into service.
Net assets with donor restrictions - Includes donor-imposed restrictions that may be met by the University through
the passage of time or through the use of such funds in accordance with the donor’s wishes. These funds include endowed contributions and pledges requiring that the original corpus be maintained in perpetuity. The distributions generated by these contributions may be either expended or reinvested in the endowment in accordance with donor restrictions and endowment contribution and spending policies. This net asset category also includes donor restricted funds to be used as revolving student loan funds in perpetuity.
Donor restricted contributions are reported as increases in net assets with donor restrictions. When a restriction expires, net assets are reclassified from net assets with donor restrictions to net assets without donor restrictions in the Consolidated Statements of Activities.
Estimates Preparation of the consolidated financial statements requires management to make estimates and assumptions that affect the reported amounts of assets and liabilities, disclosure of contingent assets and liabilities at the date of the consolidated financial statements, and the reported amounts of revenues and expenses during the reporting period. Actual results could differ materially from those estimates.
Revenue Recognition – Contracts with Customers and Accounts Receivable In May 2014, FASB issued Accounting Standards Update (ASU) No. 2014-09, Revenue from Contracts with Customers (Topic 606). The core principle of Topic 606 is that an entity should recognize revenue to depict the transfer of promised goods or services to customers in an amount that reflects the consideration it expects to be entitled in exchange. In addition, Topic 606 requires disclosures about the nature, amount, timing, and uncertainty of revenue and cash flows arising from contracts with customers. Topic 606 also requires that tuition, fees, and auxiliary student revenues be presented in the Consolidated Statements of Activities at the transaction price, net of student aid (tuition discounts).
7
Fiscal Year 2020 Financial Report
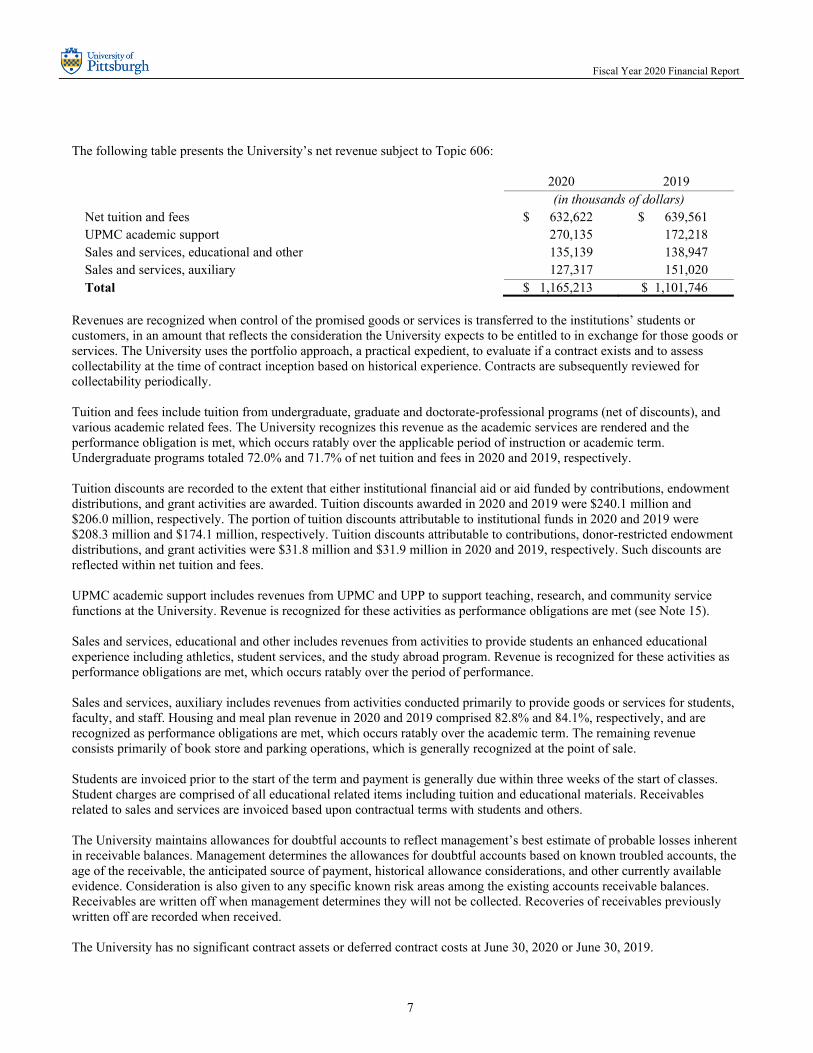
The following table presents the University’s net revenue subject to Topic 606:
2020 2019 (in thousands of dollars) Net tuition and fees $ 632,622 $ 639,561 UPMC academic support 270,135 172,218 Sales and services, educational and other 135,139 138,947 Sales and services, auxiliary 127,317 151,020 Total $ 1,165,213 $ 1,101,746
Revenues are recognized when control of the promised goods or services is transferred to the institutions’ students or customers, in an amount that reflects the consideration the University expects to be entitled to in exchange for those goods or services. The University uses the portfolio approach, a practical expedient, to evaluate if a contract exists and to assess collectability at the time of contract inception based on historical experience. Contracts are subsequently reviewed for collectability periodically. Tuition and fees include tuition from undergraduate, graduate and doctorate-professional programs (net of discounts), and various academic related fees. The University recognizes this revenue as the academic services are rendered and the performance obligation is met, which occurs ratably over the applicable period of instruction or academic term. Undergraduate programs totaled 72.0% and 71.7% of net tuition and fees in 2020 and 2019, respectively.
Tuition discounts are recorded to the extent that either institutional financial aid or aid funded by contributions, endowment distributions, and grant activities are awarded. Tuition discounts awarded in 2020 and 2019 were $240.1 million and $206.0 million, respectively. The portion of tuition discounts attributable to institutional funds in 2020 and 2019 were $208.3 million and $174.1 million, respectively. Tuition discounts attributable to contributions, donor-restricted endowment distributions, and grant activities were $31.8 million and $31.9 million in 2020 and 2019, respectively. Such discounts are reflected within net tuition and fees.
UPMC academic support includes revenues from UPMC and UPP to support teaching, research, and community service functions at the University. Revenue is recognized for these activities as performance obligations are met (see Note 15). Sales and services, educational and other includes revenues from activities to provide students an enhanced educational experience including athletics, student services, and the study abroad program. Revenue is recognized for these activities as performance obligations are met, which occurs ratably over the period of performance.
Sales and services, auxiliary includes revenues from activities conducted primarily to provide goods or services for students, faculty, and staff. Housing and meal plan revenue in 2020 and 2019 comprised 82.8% and 84.1%, respectively, and are recognized as performance obligations are met, which occurs ratably over the academic term. The remaining revenue consists primarily of book store and parking operations, which is generally recognized at the point of sale.
Students are invoiced prior to the start of the term and payment is generally due within three weeks of the start of classes. Student charges are comprised of all educational related items including tuition and educational materials. Receivables related to sales and services are invoiced based upon contractual terms with students and others.
The University maintains allowances for doubtful accounts to reflect management’s best estimate of probable losses inherent in receivable balances. Management determines the allowances for doubtful accounts based on known troubled accounts, the age of the receivable, the anticipated source of payment, historical allowance considerations, and other currently available evidence. Consideration is also given to any specific known risk areas among the existing accounts receivable balances. Receivables are written off when management determines they will not be collected. Recoveries of receivables previously written off are recorded when received.
The University has no significant contract assets or deferred contract costs at June 30, 2020 or June 30, 2019.

8
Fiscal Year 2020 Financial Report
The University recognizes a contract liability, or deferred revenue, for payments received in advance of providing services under certain contracts. Contract liabilities include advanced receipt of student tuition and fees, athletic ticket sales, and housing and food service revenue. These contract liabilities are recorded in deferred student and other revenue on the Consolidated Balance Sheets. Revenue recognized related to prior period contract liabilities in 2020 and 2019 was $39.2 million and $43.2 million, respectively. Revenue Recognition - Contributions In June 2018, FASB issued ASU No. 2018-08, Not-for-Profit Entities (Topic 958), Clarifying the Scope and Accounting Guidance for Contributions Received and Contributions Made. The FASB issued this ASU to reduce diversity in reporting by clarifying (1) whether transactions should be accounted for as contributions within the scope of Topic 958 or as exchange transactions subject to other guidance and (2) whether a contribution is conditional.
Commonwealth appropriation revenue is provided by the commonwealth to support the general operations of the University and allows for a reduction in tuition rates for Pennsylvania resident students. The reduction in rates in 2020 and 2019 amounted to $288.3 million and $273.9 million, respectively. Funds are to be spent in accordance with applicable laws and revenue is recognized ratably over the fiscal year as qualified expenses are incurred.
Commonwealth construction grants are provided by the commonwealth to fund certain capital projects in support of the University’s mission. This revenue is classified as with donor restrictions until the capital project is completed and placed in service, at which time the net assets are released from restrictions.
The University conducts sponsored program activity with various sponsors, including agencies and departments of the federal government, the commonwealth, local government entities, companies, and foundations. Sponsored activity in 2020 and 2019 was $894.9 million and $859.7 million, respectively, with approximately 64% of the funding awarded through the National Institutes of Health. Most University sponsored activity is conducted on a cost-reimbursable basis with the University recognizing revenue as qualifying expenses are incurred. Certain sponsors, however, provide funding in advance of related expenses, and such funding is recorded as advanced receipt of grant funds on the Consolidated Balance Sheets. There is no assurance that sponsored awards will continue to be made at current levels.
The University initially records at fair value unconditional pledges (which are agreements with donors involving non- reciprocal transfers of cash or other assets) as net assets with donor restrictions or without donor restrictions depending on the nature of the donor-imposed restrictions. Contributions whose restrictions are met in the same fiscal year in which they are received are reported with net assets without donor restrictions. Contributions receivable are discounted at a risk-adjusted rate commensurate with the donor’s payment plan.
Conditional pledges of cash or other assets are recognized as contribution revenues and receivables when the conditions surrounding the pledge are substantially met.
Cash and Cash Equivalents and Operating Investments Cash equivalents consist of operating investments with original maturities of 90 days or less. Operating investments include U.S. Treasury instruments and other high-quality, liquid securities that at the time of purchase are rated A3/P-1 or better by Moody’s Investors Service or A-/A-1 or better by Standard & Poor’s Ratings Services. Operating investments, together with cash and cash equivalents, are utilized to fund the University’s short-term operating needs and are invested with the expectation that such securities can be liquidated at their current value in a short time frame. Cash equivalents that are part of endowment investments are shown therewith, as such funds are utilized for endowment purposes rather than University operating needs and therefore are not included in cash and cash equivalents for purposes of the statement of cash flows.
Foundation Assets The University’s foundation assets represent the University’s interest in the Bradford Educational Foundation (BEF). The BEF is a 509(a)(3) Type III supporting organization whose sole purpose is to receive, administer, and distribute property for the benefit of the University of Pittsburgh Bradford campus. The BEF is governed by an independent board of directors, with the majority of members being non-University members. Although the University does not exercise control of the BEF, all assets held by the BEF are held for the financial benefit of the University. As such, the consolidated financial statements include the net assets and annual change in net assets of the BEF.
9
Fiscal Year 2020 Financial Report
Endowment Investments The University’s endowment investments are reported at fair value. The fair value of direct University holdings in publicly traded securities and exchange traded funds are based upon quoted or published market prices. The fair value of all other investments, which consist of indirect holdings in both privately and publicly traded assets, is determined using net asset value (NAV) per share or unit of interest. Used as a practical expedient for the estimated fair value, NAV per share or its equivalent is provided by the fund managers and reviewed by the University. Indirect holdings of private assets primarily consist of University interests in funds investing in non-marketable alternatives, real assets, and/or distressed securities, whereas indirect holdings of publicly traded assets primarily consist of University interests in marketable alternatives or other commingled funds. Non-marketable alternatives are private equity or equity-like holdings, such as mezzanine and subordinated debt interests, in venture capital, buyout, or recapitalized companies or properties. Real assets are physical assets, or financial assets associated with such physical assets, whose income streams and/or fair values tend to rise with inflation; they include real estate, natural resources, commodities, and other hard assets. Marketable alternatives consist of absolute return-oriented strategies, distressed debt, long/short equity, and other hedging strategies. In the case of indirect holdings, changes in market conditions, economic environment, regulatory environment, currency exchange rates, interest rates, and commodity prices may significantly impact the NAV of the funds holding the investments and, consequently, the fair value of the University’s interest in such funds and could materially affect the amounts reported in the consolidated financial statements. Although a secondary market exists for these investments, it is not active, and individual transactions are typically not observable. When transactions do occur in this limited secondary market, they may occur at discounts to the reported NAV. It is therefore possible that if the University were to sell these investments in the secondary market, a buyer may require a discount to the reported NAV, and the discount could be significant. The University attempts to manage these risks through diversification, ongoing due diligence of fund managers, maintaining adequate liquidity, and continuously monitoring economic and market conditions. Dividend income is recognized net of applicable withholding taxes on the ex-dividend date. Noncash dividends are recorded at the fair value of the securities received. Interest income and expenses are recorded net of management fees and applicable withholding taxes on the accrual basis of accounting.
Government Loan Funds U.S. government student loans are recorded as liabilities because these funds are refundable to the federal government under certain conditions. Student loan funds donated by private groups, organizations, or individuals are recorded as net assets with donor restrictions since such funds operate on a revolving fund basis with principal and interest payments remaining in the fund for future lending.
Derivative Financial Instruments The University records derivatives at fair value on the Consolidated Balance Sheets with changes in fair value reflected in the Consolidated Statements of Activities (see Note 10).
Split-Interest Agreements These agreements with donors consist primarily of charitable gift annuities, pooled income funds, and irrevocable charitable remainder trusts for which the University serves as trustee. Assets are invested and payments are made to donors and/or other beneficiaries in accordance with the respective agreements. Endowment investments include $31.1 million and $31.2 million at June 30, 2020 and 2019, respectively, and other liabilities include $15.6 million at both June 30, 2020 and 2019, respectively, for split-interest agreements.
The University maintains separate and distinct reserve funds adequate to meet future payments of all outstanding charitable gift annuities administered by the University. The University complies with applicable state annuity reserve requirements.

10
Fiscal Year 2020 Financial Report
Property, Plant, and Equipment, Net Property, plant, and equipment is recorded at cost, or if acquired by contribution, at fair value as of the date of the contribution. Depreciation is calculated using the straight-line method. Useful lives generally range from 15 to 40 years for buildings and improvements and 5 to 10 years for furnishings and equipment. As assets are retired, sold, or otherwise disposed, the cost and related accumulated depreciation are removed from the accounts, and gains or losses are recognized in the Consolidated Statements of Activities. Costs associated with the construction of new facilities and renovation and expansion of existing facilities are capitalized within construction in progress until such projects are placed in service. The University capitalizes software and certain implementation costs and generally depreciates such assets over 5 to 10 years. Works of art, historical treasures, and similar assets include a variety of paintings, sculptures, photographs, antiques, and furnishings, as well as scholarly papers and archives. These assets are used for public exhibition, the preservation of artifacts and antiques for future generations, and scholarly research. Due to their nature, these assets are not depreciated. Library books, which include hard copy publications, periodicals, and electronic publications with rights to archival content, are depreciated over a period of 7 years. Maintenance and repairs are expensed as incurred.
Insurance Liabilities The University is self-insured through an agreement with UPMC to provide medical coverage for its employees. A liability for estimated incurred but unreported claims of $9.0 million and $8.2 million has been recorded at June 30, 2020 and 2019, respectively, based upon management’s analysis of claims history. This liability is reflected in accrued payroll and related liabilities on the Consolidated Balance Sheets.
The University is also self-insured for other activities, including workers’ compensation, unemployment compensation, and certain litigation claims. Liabilities have been established for these programs generally based on third-party administrators’ estimates using the University’s historical loss experience. The self-insurance accrual is subject to periodic adjustment by the University based on actual loss experience factors. Liabilities for these other self-insured obligations aggregated $10.7 million and $6.0 million at June 30, 2020 and 2019, respectively, and are included in accrued payroll and related liabilities on the Consolidated Balance Sheets.
Recent Accounting Pronouncements In February 2016, FASB issued ASU No. 2016-02, Leases (Topic 842), as amended. The ASU is effective for fiscal year 2021 and requires lessees to report most leases as assets and liabilities on the balance sheet, while lessor accounting remains substantially unchanged. The ASU aims to increase transparency and comparability among organizations by recognizing lease assets and lease liabilities on the balance sheet and disclosing key information about leasing arrangements. The University early adopted this standard on July 1, 2019, using a modified retrospective basis and elected the package of practical expedients permitted under the transition guidance with Topic 842, which allows the University to carry forward its identification of contracts that are or contain leases, its historical classification of existing leases, and its accounting for initial direct costs for existing leases. Upon adoption, the University recorded operating right-of-use (ROU) assets and liabilities of $193.9 million, as of July 1, 2019, primarily related to real estate leases. No change to beginning net assets was required. See Note 7 for additional lease disclosures.
Tax-Exempt Status The University is exempt from federal income tax under Section 501(c)(3) of the United States Internal Revenue Code. Accordingly, it is not subject to income taxes except to the extent it has taxable income from activities that are not related to its exempt purpose. The University annually reviews its tax positions and has determined that there are no material uncertain tax positions that require recognition in the consolidated financial statements. No provision for income taxes was required for 2020 or 2019.

11
Fiscal Year 2020 Financial Report
In 2019, the University recorded an $11.4 million deferred tax benefit (included in inventories and deferred charges on the Consolidated Balance Sheets) as management believed it was more likely than not that unrelated business income from parking operations would generate sufficient taxable income in future periods so federal net operating loss carryforwards would be utilized. On December 20, 2019, the Taxpayer Certainty and Disaster Tax Relief Act of 2019 was signed into law, which retroactively repeals the "parking tax" for tax exempt organizations. As a result, the University removed the deferred tax benefit recorded in 2019 and a full valuation allowance was recorded at June 30, 2020. Reclassifications Certain 2019 operating revenue line items include reclassifications related to the presentation of a separate UPMC academic support line item on the Consolidated Statements of Activities to conform with the 2020 presentation. There was no change in total operating revenues.

12
Fiscal Year 2020 Financial Report
NOTE 2: LIQUIDITY AND AVAILABILITY OF FINANCIAL ASSETS As of June 30, the following financial assets could be made available within one year of the balance sheet date to meet general expenditures:
2020 2019 (in thousands of dollars) Cash and cash equivalents $ 117,648 $ 10,521 Operating investments 1,015,898 448,012 Accounts and notes receivable, net 232,318 266,984 Payout on designated endowment – financial aid 75,976 66,629 Payout on endowments - other 82,732 79,385 Financial assets available within one year $ 1,524,572 $ 871,531
The University regularly monitors liquidity required to meet all general and capital expenditures, liabilities, and contractual obligations, while striving to maximize the investment of its available funds. For purposes of analyzing resources available to meet general operating needs over a twelve-month period, the University considers all expenditures related to its ongoing activities of teaching, research, and public service mission. This includes operating expenses, principal and interest payments on debt, and capital-related expenditures. Resources not available to meet general expenditures within one year may include those with external limitations imposed by donors, laws, or contracts or internal limitations imposed by management restrictions.
The University has various sources of liquidity, including cash and cash equivalents, operating investments, and lines of credit. Operating investments consist of high-quality securities which are utilized to fund the University's short-term operating needs and are invested with the expectation that such securities can be liquidated at their current value in a short time frame.
Accounts and notes receivable consist of amounts due from students; sponsors of research, instruction, and public service initiatives; UPMC; the commonwealth; and various other entities. All amounts are expected to be converted to cash within twelve months. Student loans receivable are not included, as principal and interest on these loans are used solely to make new loans and are, therefore, not available to meet current operating needs.
The University maintains a management designated endowment fund, the payout from which is used to support student financial aid. Payout on other endowments represents distributions on endowments which are expected to be available for use in the next twelve months. These funds are primarily available to the academic units in which the endowments were directed and are used to support scholarships, chairs and other initiatives.
To help manage unanticipated liquidity needs, the University has four general unsecured credit facilities aggregating $100.0 million at June 30, 2020. No draws were made against the facilities during 2020. Termination dates on the lines of credit available at June 30, 2020 range from January 2023 to January 2025. It is management’s intention to extend each credit facility. The University also maintains two unsecured credit facilities aggregating $150.0 million at June 30, 2020 to manage the cash flow requirements of the University’s endowment. The University made draws of $106.5 million against the facilities during 2020 and there are no outstanding balances at June 30, 2020. The $50.0 million credit facility terminates in January 2023 and the $100.0 million credit facility terminates in January 2025.

13
Fiscal Year 2020 Financial Report
NOTE 3: ACCOUNTS AND NOTES RECEIVABLE, NET
NOTE 4: CONTRIBUTIONS RECEIVABLE, NET
Contributions receivable, net, at June 30 consists of the following: 2020 2019 Amounts due in: (in thousands of dollars) Less than one year $ 20,051 $ 17,890 One to five years 31,299 32,026 Greater than five years 7,527 10,816 Gross contributions receivable 58,877 60,732 Less: Allowance for uncollectible pledges (1,650) (1,392) Unamortized discounts (701) (3,677) Total contributions receivable, net $ 56,526 $ 55,663
At June 30, 2020 and 2019, the five largest outstanding pledge balances represented 49% and 55%, respectively, of the University’s net contributions receivable.
The University has been named a beneficiary in the wills of numerous donors or has received conditional pledges totaling $298.0 million and $283.5 million at June 30, 2020 and 2019, respectively. These bequests are considered intentions to give and do not fall within the definition of an unconditional pledge, and hence, are not recognized in the consolidated financial statements.
Accounts and notes receivable, net, at June 30 consists of the following:
2020 2019 (in thousands of dollars)
Sponsored grant receivables, net $ 147,453 $ 134,557 Hospitals and affiliated organizations receivables, net 37,386 33,278 Other receivables, net 22,119 16,320 Plant construction receivables due from commonwealth 18,692 11,833 Student receivables, net 6,668 7,496 Commonwealth appropriation receivable - 63,500 Total accounts and notes receivable, net $ 232,318 $ 266,984
14
Fiscal Year 2020 Financial Report
NOTE 5: ENDOWMENT AND OPERATING INVESTMENTS
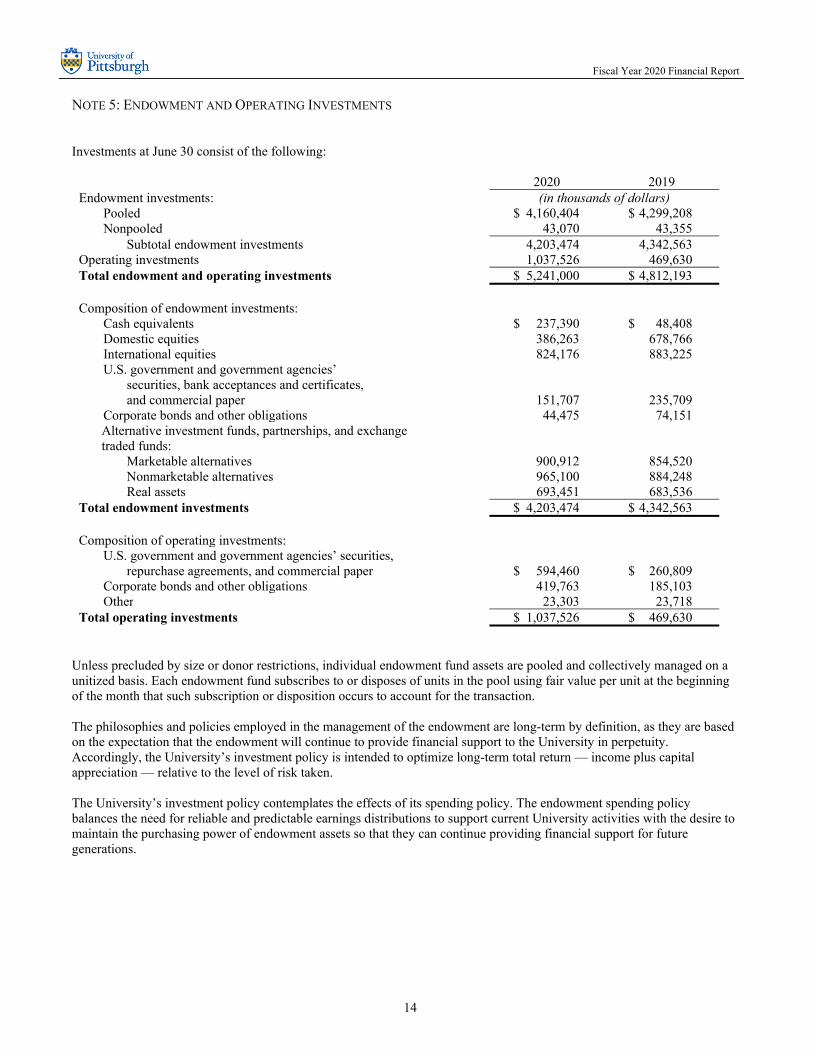
Investments at June 30 consist of the following:
2020 2019 Endowment investments: (in thousands of dollars) Pooled $ 4,160,404 $ 4,299,208 Nonpooled 43,070 43,355 Subtotal endowment investments 4,203,474 4,342,563 Operating investments 1,037,526 469,630 Total endowment and operating investments $ 5,241,000 $ 4,812,193 Composition of endowment investments: Cash equivalents $ 237,390 $ 48,408 Domestic equities 386,263 678,766 International equities 824,176 883,225 U.S. government and government agencies’ securities, bank acceptances and certificates, and commercial paper 151,707 235,709 Corporate bonds and other obligations 44,475 74,151 Alternative investment funds, partnerships, and exchange traded funds: Marketable alternatives 900,912 854,520 Nonmarketable alternatives 965,100 884,248 Real assets 693,451 683,536 Total endowment investments $ 4,203,474 $ 4,342,563 Composition of operating investments: U.S. government and government agencies’ securities, repurchase agreements, and commercial paper $ 594,460 $ 260,809 Corporate bonds and other obligations 419,763 185,103 Other 23,303 23,718 Total operating investments $ 1,037,526 $ 469,630
Unless precluded by size or donor restrictions, individual endowment fund assets are pooled and collectively managed on a unitized basis. Each endowment fund subscribes to or disposes of units in the pool using fair value per unit at the beginning of the month that such subscription or disposition occurs to account for the transaction.
The philosophies and policies employed in the management of the endowment are long-term by definition, as they are based on the expectation that the endowment will continue to provide financial support to the University in perpetuity. Accordingly, the University’s investment policy is intended to optimize long-term total return — income plus capital appreciation — relative to the level of risk taken.
The University’s investment policy contemplates the effects of its spending policy. The endowment spending policy balances the need for reliable and predictable earnings distributions to support current University activities with the desire to maintain the purchasing power of endowment assets so that they can continue providing financial support for future generations.
15
Fiscal Year 2020 Financial Report
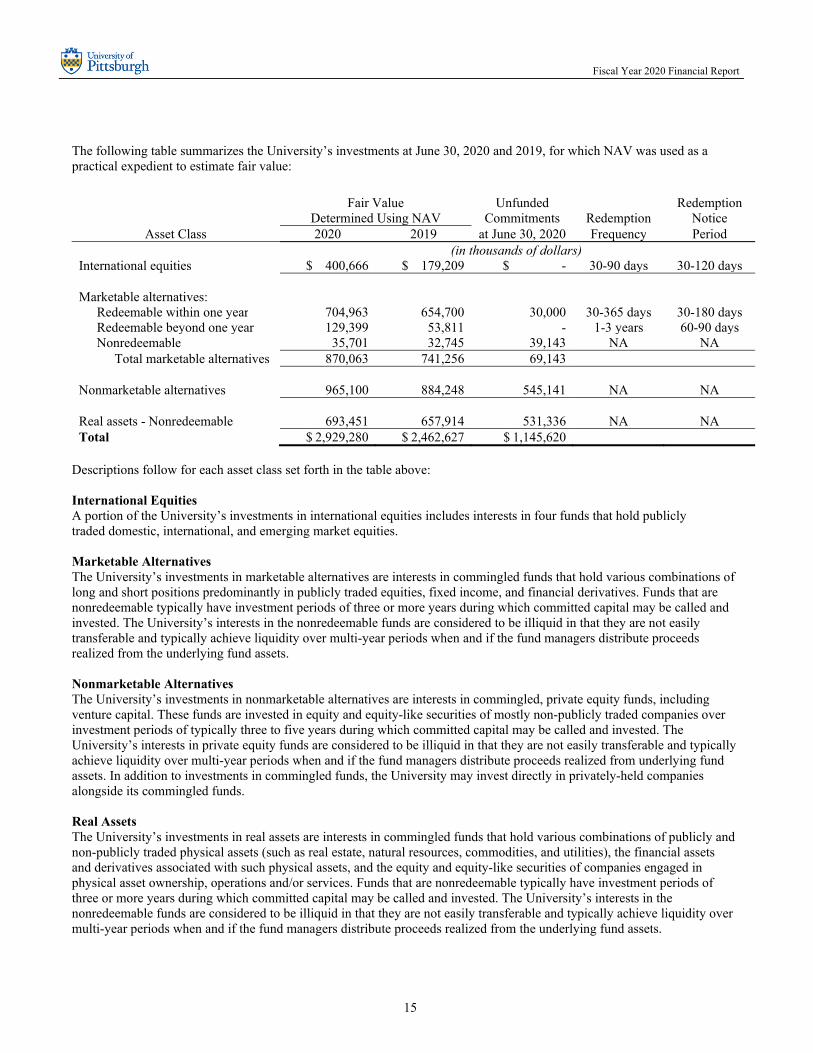
The following table summarizes the University’s investments at June 30, 2020 and 2019, for which NAV was used as a practical expedient to estimate fair value:
Fair Value
Determined Using NAV Unfunded
Commitments Redemption Redemption
Notice Asset Class 2020 2019 at June 30, 2020 Frequency Period
(in thousands of dollars) International equities $ 400,666 $ 179,209 $ - 30-90 days 30-120 days Marketable alternatives: Redeemable within one year 704,963 654,700 30,000 30-365 days 30-180 days Redeemable beyond one year 129,399 53,811 - 1-3 years 60-90 days Nonredeemable 35,701 32,745 39,143 NA NA Total marketable alternatives 870,063 741,256 69,143 Nonmarketable alternatives 965,100 884,248 545,141 NA NA Real assets - Nonredeemable 693,451 657,914 531,336 NA NA Total $ 2,929,280 $ 2,462,627 $ 1,145,620
Descriptions follow for each asset class set forth in the table above: International Equities A portion of the University’s investments in international equities includes interests in four funds that hold publicly traded domestic, international, and emerging market equities.
Marketable Alternatives The University’s investments in marketable alternatives are interests in commingled funds that hold various combinations of long and short positions predominantly in publicly traded equities, fixed income, and financial derivatives. Funds that are nonredeemable typically have investment periods of three or more years during which committed capital may be called and invested. The University’s interests in the nonredeemable funds are considered to be illiquid in that they are not easily transferable and typically achieve liquidity over multi-year periods when and if the fund managers distribute proceeds realized from the underlying fund assets.
Nonmarketable Alternatives The University’s investments in nonmarketable alternatives are interests in commingled, private equity funds, including venture capital. These funds are invested in equity and equity-like securities of mostly non-publicly traded companies over investment periods of typically three to five years during which committed capital may be called and invested. The University’s interests in private equity funds are considered to be illiquid in that they are not easily transferable and typically achieve liquidity over multi-year periods when and if the fund managers distribute proceeds realized from underlying fund assets. In addition to investments in commingled funds, the University may invest directly in privately-held companies alongside its commingled funds.
Real Assets The University’s investments in real assets are interests in commingled funds that hold various combinations of publicly and non-publicly traded physical assets (such as real estate, natural resources, commodities, and utilities), the financial assets and derivatives associated with such physical assets, and the equity and equity-like securities of companies engaged in physical asset ownership, operations and/or services. Funds that are nonredeemable typically have investment periods of three or more years during which committed capital may be called and invested. The University’s interests in the nonredeemable funds are considered to be illiquid in that they are not easily transferable and typically achieve liquidity over multi-year periods when and if the fund managers distribute proceeds realized from the underlying fund assets.
16
Fiscal Year 2020 Financial Report
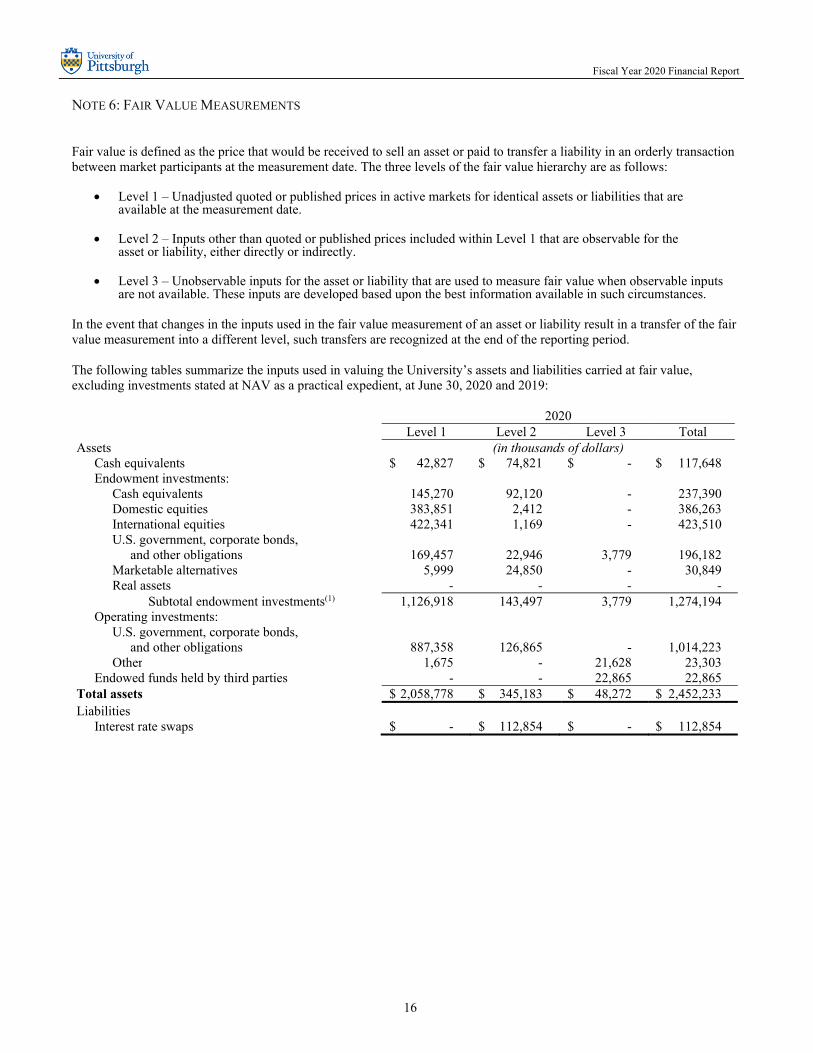
NOTE 6: FAIR VALUE MEASUREMENTS
Fair value is defined as the price that would be received to sell an asset or paid to transfer a liability in an orderly transaction between market participants at the measurement date. The three levels of the fair value hierarchy are as follows:
Level 1 – Unadjusted quoted or published prices in active markets for identical assets or liabilities that are
available at the measurement date. Level 2 – Inputs other than quoted or published prices included within Level 1 that are observable for the
asset or liability, either directly or indirectly. Level 3 – Unobservable inputs for the asset or liability that are used to measure fair value when observable inputs
are not available. These inputs are developed based upon the best information available in such circumstances.
In the event that changes in the inputs used in the fair value measurement of an asset or liability result in a transfer of the fair value measurement into a different level, such transfers are recognized at the end of the reporting period.
The following tables summarize the inputs used in valuing the University’s assets and liabilities carried at fair value, excluding investments stated at NAV as a practical expedient, at June 30, 2020 and 2019: 2020 Level 1 Level 2 Level 3 Total Assets (in thousands of dollars) Cash equivalents $ 42,827 $ 74,821 $ - $ 117,648 Endowment investments: Cash equivalents 145,270 92,120 - 237,390 Domestic equities 383,851 2,412 - 386,263 International equities 422,341 1,169 - 423,510 U.S. government, corporate bonds, and other obligations 169,457 22,946 3,779 196,182 Marketable alternatives 5,999 24,850 - 30,849 Real assets - - - - Subtotal endowment investments(1) 1,126,918 143,497 3,779 1,274,194 Operating investments: U.S. government, corporate bonds, and other obligations 887,358 126,865 -
1,014,223
Other 1,675 - 21,628 23,303 Endowed funds held by third parties - - 22,865 22,865 Total assets $ 2,058,778 $ 345,183 $ 48,272 $ 2,452,233 Liabilities Interest rate swaps $ - $ 112,854 $ - $ 112,854

17
Fiscal Year 2020 Financial Report
2019 Level 1 Level 2 Level 3 Total Assets (in thousands of dollars) Cash equivalents $ 9,485 $ 1,036 $ - $ 10,521 Endowment investments: Cash equivalents 39,175 9,233 - 48,408 Domestic equities 678,766 - - 678,766 International equities 696,058 5,417 2,541 704,016 U.S. government, corporate bonds, and other obligations 268,449 29,850 11,561 309,860 Marketable alternatives 23,270 89,994 - 113,264 Real assets 25,622 - - 25,622 Subtotal endowment investments(1) 1,731,340 134,494 14,102 1,879,936 Operating investments: U.S. government, corporate bonds, and other obligations
378,037
67,875
-
445,912
Other 2,100 - 21,618 23,718 Endowed funds held by third parties - - 23,677 23,677 Total assets $ 2,120,962 $ 203,405 $ 59,397 $ 2,383,764 Liabilities Interest rate swaps $ - $ 77,554 $ - $ 77,554
(1) The subtotals of endowment investments within the fair value tables above exclude investments of $2,929,280 and $2,462,627 as of June 30, 2020 and 2019, respectively, which are measured at NAV as a practical expedient and are not classified in the fair value hierarchy (see Note 5).
The following table summarizes the change in the Level 3 activity for the years ended June 30, 2020 and 2019:
U.S. Government Other Operating and International Equities
Corporate and Other
Endowed Funds Held by Third Parties Total
(in thousands of dollars) Fair Value - June 30, 2018 $ 2,887 $ 10,750 $ 45,575 $ 59,212 Capital calls/purchases - 1,300 1,070 2,370 Distributions/sales (448) (800) (982) (2,230) Realized gains 107 65 - 172 Unrealized (losses) gains (5) 246 (368) ( 127) Fair Value - June 30, 2019 $ 2,541 $ 11,561 $ 45,295 $ 59,397 Capital calls/purchases - - 1,138 1,138 Distributions/sales (1,851) (7,829) (1,032) (10,712) Realized gains 451 709 - 1,160 Unrealized losses (1,141) (662) (908) (2,711) Fair Value - June 30, 2020 $ - $ 3,779 $ 44,493 $ 48,272
18
Fiscal Year 2020 Financial Report
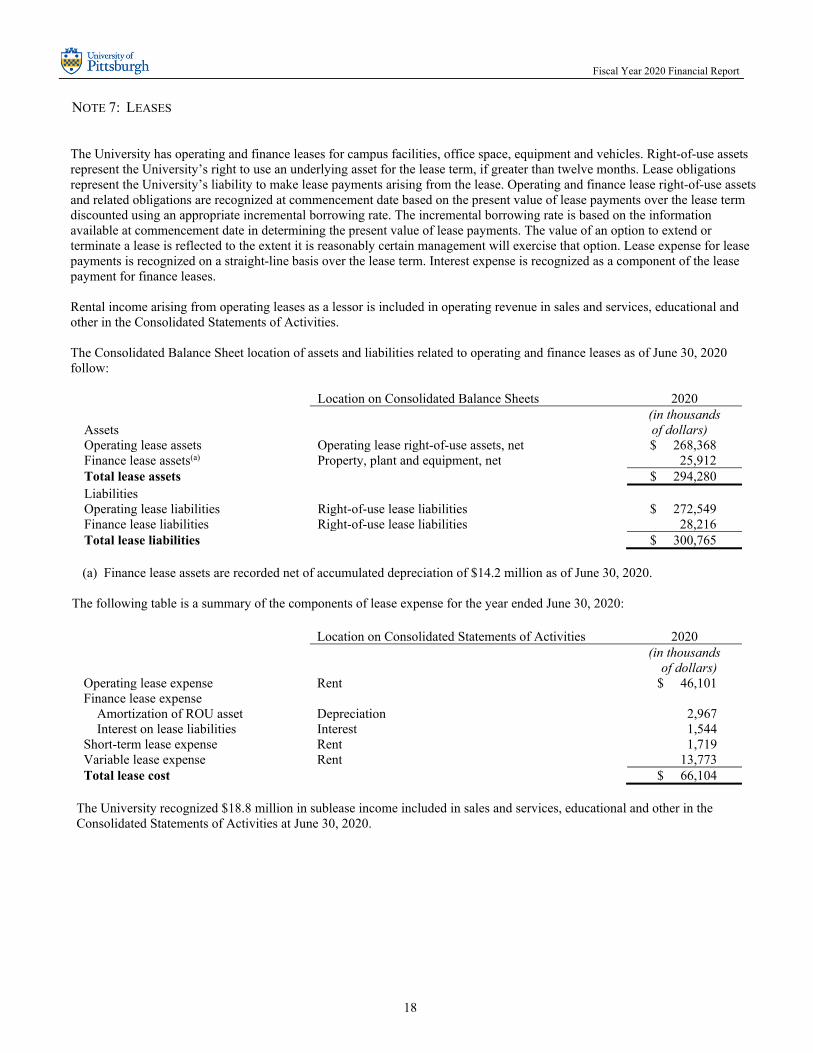
NOTE 7: LEASES The University has operating and finance leases for campus facilities, office space, equipment and vehicles. Right-of-use assets represent the University’s right to use an underlying asset for the lease term, if greater than twelve months. Lease obligations represent the University’s liability to make lease payments arising from the lease. Operating and finance lease right-of-use assets and related obligations are recognized at commencement date based on the present value of lease payments over the lease term discounted using an appropriate incremental borrowing rate. The incremental borrowing rate is based on the information available at commencement date in determining the present value of lease payments. The value of an option to extend or terminate a lease is reflected to the extent it is reasonably certain management will exercise that option. Lease expense for lease payments is recognized on a straight-line basis over the lease term. Interest expense is recognized as a component of the lease payment for finance leases. Rental income arising from operating leases as a lessor is included in operating revenue in sales and services, educational and other in the Consolidated Statements of Activities. The Consolidated Balance Sheet location of assets and liabilities related to operating and finance leases as of June 30, 2020 follow:
Location on Consolidated Balance Sheets 2020
(in thousands Assets of dollars) Operating lease assets Operating lease right-of-use assets, net $ 268,368 Finance lease assets(a) Property, plant and equipment, net 25,912 Total lease assets $ 294,280 Liabilities Operating lease liabilities Right-of-use lease liabilities $ 272,549 Finance lease liabilities Right-of-use lease liabilities 28,216 Total lease liabilities $ 300,765
(a) Finance lease assets are recorded net of accumulated depreciation of $14.2 million as of June 30, 2020.
The following table is a summary of the components of lease expense for the year ended June 30, 2020:
Location on Consolidated Statements of Activities 2020
(in thousands of dollars) Operating lease expense Rent $ 46,101 Finance lease expense Amortization of ROU asset Depreciation 2,967 Interest on lease liabilities Interest 1,544 Short-term lease expense Rent 1,719 Variable lease expense Rent 13,773 Total lease cost $ 66,104
The University recognized $18.8 million in sublease income included in sales and services, educational and other in the Consolidated Statements of Activities at June 30, 2020.

19
Fiscal Year 2020 Financial Report
When the rate implicit in the contract is not readily determinable, a collateralized incremental borrowing rate as the discount rate for the present value of lease payments is used. Lease terms and discount rates follow: Weighted average remaining lease term (years): 2020 Operating leases 8.19 Finance leases 13.66
Weighted average discount rate: Operating leases 2.69% Finance leases 4.43%
Supplemental cash flow information related to leases as of and for the year ended June 30, 2020 is as follows:
2020
Cash paid for amounts included in the measurement of lease liabilities: (in thousands
of dollars) Operating cash flows paid for operating leases $ 45,269 Operating cash flows paid for interest portion of finance leases $ 1,544 Financing cash flows paid for principal portion of finance leases $ 1,370 Right-of-use assets obtained in exchange for new operating lease liabilities $ 113,681 Right-of-use assets obtained in exchange for new finance lease liabilities $ -
The approximate future minimum lease payments under operating and financing leases as of June 30, 2020 are as follows:
Operating Leases Finance Leases (in thousands of dollars)
2021 $ 46,183 $ 2,860 2022 40,301 2,883 2023 38,089 2,907 2024 35,709 2,974 2025 29,460 2,898 Thereafter 114,494 26,581 Total lease payments 304,236 41,103 Less: imputed interest (31,687) (12,887) Present value of lease liabilities $ 272,549 $ 28,216
As previously disclosed in the fiscal year 2019 Financial Report and under the previous lease accounting standard, future minimum lease payments under operating leases that have initial or remaining noncancelable lease terms or expected variable lease commitments for the years ended June 30 are as follows:
Operating Leases (in thousands
of dollars) 2021 $ 43,378 2022 37,678 2023 32,291 2024 30,054 2025 28,602 Thereafter 108,266 Total $ 280,269

20
Fiscal Year 2020 Financial Report
Approximate minimum future rental revenue under operating leases that have initial or remaining noncancelable lease terms for the years ended June 30 are as follows:
Lessor Rental Revenue
(in thousands of dollars)
2021 $ 17,422 2022 14,286 2023 12,307 2024 10,280 2025 2,010 Thereafter 6,294 Total $ 62,599
NOTE 8: PROPERTY, PLANT, AND EQUIPMENT, NET
Property, plant, and equipment, net, at June 30 is summarized below:
2020 2019 (in thousands of dollars) Land $ 77,429 $ 75,658 Buildings and improvements 3,563,075 3,465,813 Equipment 843,148 804,690 Library books 320,146 308,705 Works of art, historical treasures, and similar assets 22,739 21,690 Construction in progress 220,345 151,790 Subtotal 5,046,882 4,828,346 Less: Accumulated depreciation (3,067,827) (2,898,427) Total property, plant, and equipment, net $ 1,979,055 $ 1,929,919
The amount capitalized in property, plant, and equipment related to expenditures funded by the commonwealth on behalf of the University totaled $781.1 million and $779.9 million at June 30, 2020 and 2019, respectively. The net book value of these items was $304.8 million and $330.1 million at June 30, 2020 and 2019, respectively.
The University has recognized a liability for conditional asset retirement obligations and through an analysis of such obligations, determined that asbestos remediation costs represented the primary source of the liability. The University reviewed facilities on all campuses and estimated the timing, method, and cost of remediation. The resulting liability for conditional asset remediation obligations recognized at June 30, 2020 and 2019 was $28.9 million and $30.0 million, respectively.

21
Fiscal Year 2020 Financial Report
NOTE 9: BONDS AND NOTES PAYABLE
Bonds and notes payable at June 30 are reported based upon outstanding principal and consists of the following:
The principal payments of bonds and notes payable for the next five years ending June 30 in millions of dollars are:
2021 $ 41.8 2022 $ 151.2 2023 $ 39.4 2024 $ 240.8 2025 $ 39.7
The foregoing principal payments do not include $46.0 million of variable-rate demand bonds (VRDBs) in commercial paper (CP) mode, all of which have maturity dates between 2025 and 2035. These bonds bear short-term rates that are fixed over staggered periods of approximately 90 days each and are remarketed at the expiration of their respective rate periods.
Liquidity support for the $46.0 million of outstanding VRDBs in CP mode is provided by the University. In the event that the University receives notice of an optional tender on its VRDBs in CP mode, the tendered bonds will be purchased with remarketing proceeds. If the remarketing proceeds are insufficient to purchase all tendered bonds, the University would have a current obligation to meet the shortfall. Since the University commenced providing self-liquidity in October 2009, there have been no failed remarketings.
In November 2019, the University issued $400.0 million Taxable University Bonds (Series 2019-A). These bonds are fixed rate and issued as a century bond with the principal due in 100 years (September 2119) from the issuance date. The proceeds of the 2019-A Bonds will be used to finance various capital projects of the University.
Range of Years Outstanding Principal Remaining 2020 Effective (in thousands of dollars) to Maturity Interest Rates 2020 2019 Variable-rate bonds and notes: Series 2017-C1, taxable - 1.73%-2.48% $ - $ 55,000 Series 2017-C2, taxable - 1.65%-2.48% - 55,000 Series 2017-C3, taxable - 1.83%-2.50% - 50,000 Series 2014-B1/B2, tax-exempt 5-15 0.40%-1.70% 46,000 46,000
Series 2018 PANTHERTM Notes, due September 15, 2021 0.36%-3.10% 110,000 110,000 Series 2019 PANTHERTM Notes, due February 15, 2024 0.48%-3.22% 200,000 -
Total variable-rate bonds and notes 356,000 316,000 Fixed-rate bonds:
Series 2017-A, taxable 3 mos.-16 1.83%-3.65% 393,300 434,900 Series 2017-B, taxable 3 mos.-10 1.72%-3.60% 101,320 102,335 Series 2014-A, tax-exempt 16-24 3.51%-3.65% 49,000 49,000 Series 2017-C, taxable 11-21 2.53%-3.01% 160,000 - Series 2019-A, taxable 99 3.56% 400,000 - Noninterest-bearing promissory note 171 171
Total fixed-rate bonds 1,103,791 586,406 Unamortized net premium 1,213 1,274 Debt issuance costs (8,110) (3,993) Total bonds and notes payable $1,452,894 $ 899,687
22
Fiscal Year 2020 Financial Report
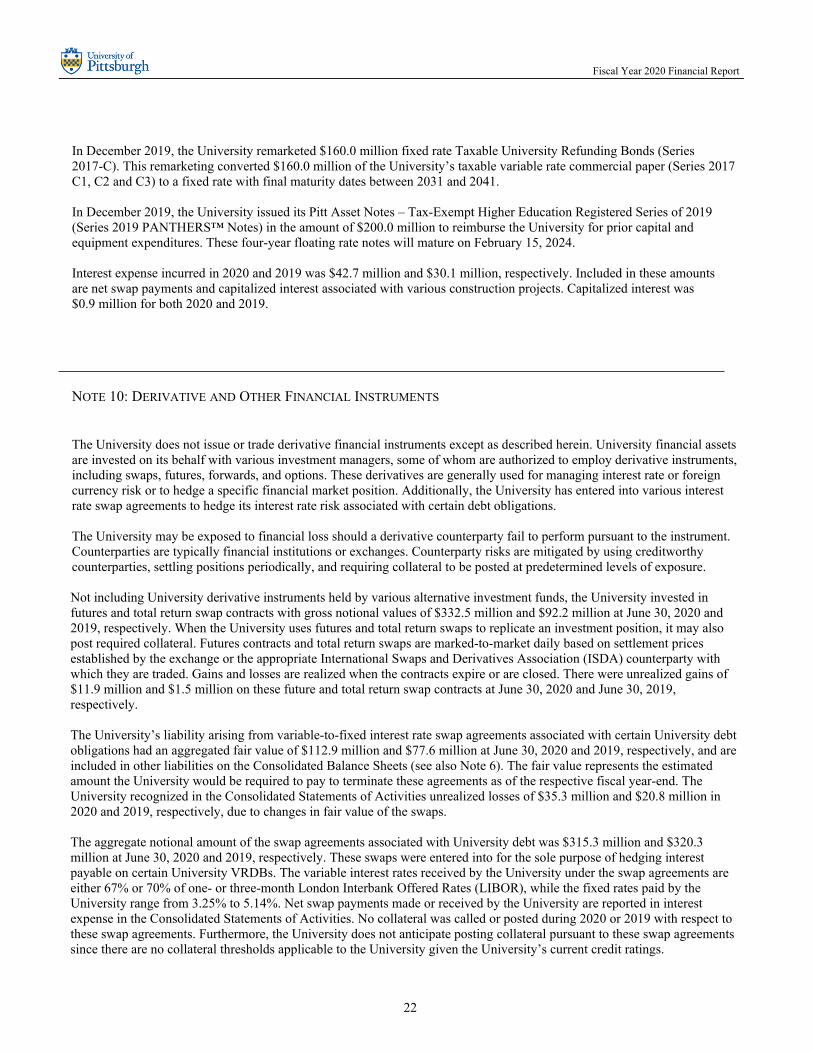
In December 2019, the University remarketed $160.0 million fixed rate Taxable University Refunding Bonds (Series 2017-C). This remarketing converted $160.0 million of the University’s taxable variable rate commercial paper (Series 2017 C1, C2 and C3) to a fixed rate with final maturity dates between 2031 and 2041. In December 2019, the University issued its Pitt Asset Notes – Tax-Exempt Higher Education Registered Series of 2019 (Series 2019 PANTHERS™ Notes) in the amount of $200.0 million to reimburse the University for prior capital and equipment expenditures. These four-year floating rate notes will mature on February 15, 2024. Interest expense incurred in 2020 and 2019 was $42.7 million and $30.1 million, respectively. Included in these amounts are net swap payments and capitalized interest associated with various construction projects. Capitalized interest was $0.9 million for both 2020 and 2019.
NOTE 10: DERIVATIVE AND OTHER FINANCIAL INSTRUMENTS
The University does not issue or trade derivative financial instruments except as described herein. University financial assets are invested on its behalf with various investment managers, some of whom are authorized to employ derivative instruments, including swaps, futures, forwards, and options. These derivatives are generally used for managing interest rate or foreign currency risk or to hedge a specific financial market position. Additionally, the University has entered into various interest rate swap agreements to hedge its interest rate risk associated with certain debt obligations.
The University may be exposed to financial loss should a derivative counterparty fail to perform pursuant to the instrument. Counterparties are typically financial institutions or exchanges. Counterparty risks are mitigated by using creditworthy counterparties, settling positions periodically, and requiring collateral to be posted at predetermined levels of exposure.
Not including University derivative instruments held by various alternative investment funds, the University invested in futures and total return swap contracts with gross notional values of $332.5 million and $92.2 million at June 30, 2020 and 2019, respectively. When the University uses futures and total return swaps to replicate an investment position, it may also post required collateral. Futures contracts and total return swaps are marked-to-market daily based on settlement prices established by the exchange or the appropriate International Swaps and Derivatives Association (ISDA) counterparty with which they are traded. Gains and losses are realized when the contracts expire or are closed. There were unrealized gains of $11.9 million and $1.5 million on these future and total return swap contracts at June 30, 2020 and June 30, 2019, respectively. The University’s liability arising from variable-to-fixed interest rate swap agreements associated with certain University debt obligations had an aggregated fair value of $112.9 million and $77.6 million at June 30, 2020 and 2019, respectively, and are included in other liabilities on the Consolidated Balance Sheets (see also Note 6). The fair value represents the estimated amount the University would be required to pay to terminate these agreements as of the respective fiscal year-end. The University recognized in the Consolidated Statements of Activities unrealized losses of $35.3 million and $20.8 million in 2020 and 2019, respectively, due to changes in fair value of the swaps. The aggregate notional amount of the swap agreements associated with University debt was $315.3 million and $320.3 million at June 30, 2020 and 2019, respectively. These swaps were entered into for the sole purpose of hedging interest payable on certain University VRDBs. The variable interest rates received by the University under the swap agreements are either 67% or 70% of one- or three-month London Interbank Offered Rates (LIBOR), while the fixed rates paid by the University range from 3.25% to 5.14%. Net swap payments made or received by the University are reported in interest expense in the Consolidated Statements of Activities. No collateral was called or posted during 2020 or 2019 with respect to these swap agreements. Furthermore, the University does not anticipate posting collateral pursuant to these swap agreements since there are no collateral thresholds applicable to the University given the University’s current credit ratings.
23
Fiscal Year 2020 Financial Report
NOTE 11: PENSION AND POSTRETIREMENT OBLIGATIONS
Pension The University provides retirement benefits under contributory or noncontributory plans to substantially all employees. The University’s contributory plan provides for participant directed investment in certain investments managed by the Teachers Insurance and Annuity Association (TIAA) and College Retirement Equities Fund (CREF) and in certain investment funds of the Vanguard Group. The plan requires three years of service for vesting of the University contribution. Employees hired before January 1, 1995 were immediately vested. University contributions to this plan in 2020 and 2019 were $90.5 million and $86.3 million, respectively.
The noncontributory plan is a defined-benefit pension plan that covers employees who do not participate in the contributory plan. The plan was amended to freeze new entrants effective November 3, 2015. The plan provides for vesting after five years with pension benefits accruing at 2.1% of base salary or the Social Security wage base, whichever is lower. Pension benefits are payable upon normal retirement at age 65 or early retirement at age 55, in accordance with the conditions and pension eligibility criteria described in the plan. University contributions to this plan in 2020 and 2019 were $6.7 million and $4.9 million, respectively.
Postretirement The University also provides postretirement medical and life insurance benefits to eligible employees and their spouses upon retirement through a contributory benefit plan.
Though funding is not required, the University has elected to fund its postretirement liability via a Board designated endowment fund, which is managed within the University’s pooled endowment investments (see Notes 5 and 13). The fair value of this fund at June 30, 2020 and 2019 was $479.1 million and $479.5 million, respectively, and is included in endowment investments on the Consolidated Balance Sheets. Although the University has established this endowment for the postretirement plan, payments to beneficiaries of this plan are currently made through non-endowed operating funds.
Under the Medicare Prescription Drug, Improvement, and Modernization Act of 2003, the federal government provides a subsidy to employers equal to 28% of the employer’s qualifying prescription drug costs for retirees if the plan offered by the employer is at least actuarially equivalent to Medicare Part D. The University is qualified for and receives the subsidy via a reduction in premiums charged by its provider.
24
Fiscal Year 2020 Financial Report
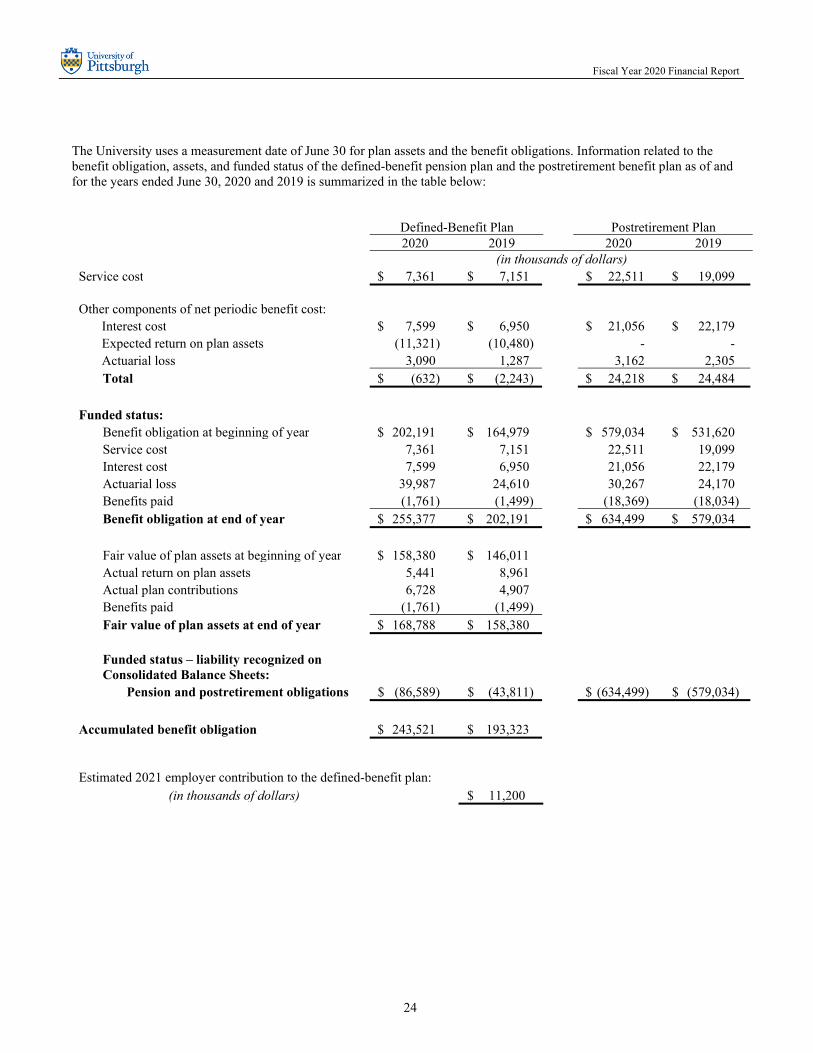
The University uses a measurement date of June 30 for plan assets and the benefit obligations. Information related to the benefit obligation, assets, and funded status of the defined-benefit pension plan and the postretirement benefit plan as of and for the years ended June 30, 2020 and 2019 is summarized in the table below:
Defined-Benefit Plan Postretirement Plan 2020 2019 2020 2019 (in thousands of dollars) Service cost $ 7,361 $ 7,151 $ 22,511 $ 19,099 Other components of net periodic benefit cost: Interest cost $ 7,599 $ 6,950 $ 21,056 $ 22,179 Expected return on plan assets (11,321) (10,480) - - Actuarial loss 3,090 1,287 3,162 2,305 Total $ (632) $ (2,243) $ 24,218 $ 24,484
Funded status: Benefit obligation at beginning of year $ 202,191 $ 164,979 $ 579,034 $ 531,620 Service cost 7,361 7,151 22,511 19,099 Interest cost 7,599 6,950 21,056 22,179 Actuarial loss 39,987 24,610 30,267 24,170 Benefits paid (1,761) (1,499) (18,369) (18,034) Benefit obligation at end of year $ 255,377 $ 202,191 $ 634,499 $ 579,034
Fair value of plan assets at beginning of year $ 158,380 $ 146,011 Actual return on plan assets 5,441 8,961 Actual plan contributions 6,728 4,907 Benefits paid (1,761) (1,499) Fair value of plan assets at end of year $ 168,788 $ 158,380
Funded status – liability recognized on Consolidated Balance Sheets: Pension and postretirement obligations $ (86,589) $ (43,811) $ (634,499) $ (579,034)
Accumulated benefit obligation $ 243,521 $ 193,323 Estimated 2021 employer contribution to the defined-benefit plan: (in thousands of dollars) $ 11,200
25
Fiscal Year 2020 Financial Report
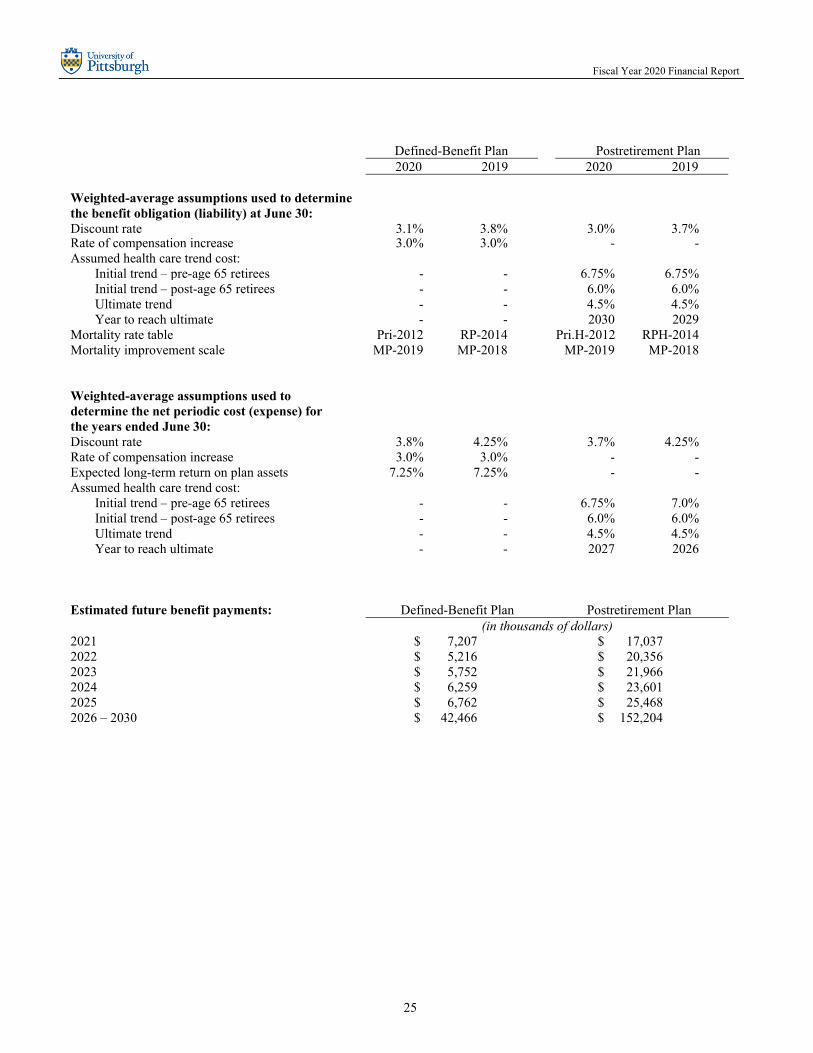
Defined-Benefit Plan Postretirement Plan 2020 2019 2020 2019 Weighted-average assumptions used to determine the benefit obligation (liability) at June 30: Discount rate 3.1% 3.8% 3.0% 3.7% Rate of compensation increase 3.0% 3.0% - - Assumed health care trend cost: Initial trend – pre-age 65 retirees - - 6.75% 6.75% Initial trend – post-age 65 retirees - - 6.0% 6.0% Ultimate trend - - 4.5% 4.5% Year to reach ultimate - - 2030 2029 Mortality rate table Pri-2012 RP-2014 Pri.H-2012 RPH-2014 Mortality improvement scale MP-2019 MP-2018 MP-2019 MP-2018 Weighted-average assumptions used to determine the net periodic cost (expense) for the years ended June 30: Discount rate 3.8% 4.25% 3.7% 4.25% Rate of compensation increase 3.0% 3.0% - - Expected long-term return on plan assets 7.25% 7.25% - - Assumed health care trend cost: Initial trend – pre-age 65 retirees - - 6.75% 7.0% Initial trend – post-age 65 retirees - - 6.0% 6.0% Ultimate trend - - 4.5% 4.5% Year to reach ultimate - - 2027 2026
Estimated future benefit payments: Defined-Benefit Plan Postretirement Plan (in thousands of dollars) 2021 $ 7,207 $ 17,037 2022 $ 5,216 $ 20,356 2023 $ 5,752 $ 21,966 2024 $ 6,259 $ 23,601 2025 $ 6,762 $ 25,468 2026 – 2030 $ 42,466 $ 152,204

26
Fiscal Year 2020 Financial Report
Pension Assets Assets related to the University’s defined-benefit pension plan are segregated in a trust managed by a third-party investment manager. The fair value of these assets at June 30, 2020 and 2019 was $168.8 million and $158.4 million, respectively. The fund is invested through common collective trust funds in domestic and international equities and fixed-income securities using the S&P 500 Index as a benchmark for domestic equities, the MSCI EAFE Index for international equities, and the Barclays Intermediate Government/Credit Bond Index for the fixed-income securities. Common collective trust funds are similar to mutual funds; however, they are generally not registered with the U.S. Securities and Exchange Commission and participation is not open to the public but limited to institutional investors. The specific investment objective is to meet or exceed the investment policy benchmark over the long term. Plan investment valuations are determined using NAV per share available at the measurement date, as published by the fund manager. The plan has no unfunded commitments. Pension plan assets are Level 1 in the fair value hierarchy.
The long-term investment strategy for pension plan assets is to meet present and future benefit obligations to all participants and beneficiaries; cover reasonable expenses incurred to provide such benefits, including expenses incurred in the administration of the trust and the plan; provide sufficient liquidity to meet benefit and expense payment requirements on a timely basis; and provide a total return that, over the long term, maximizes the ratio of trust assets to liabilities by maximizing investment return, at an appropriate level of risk. The expected return on plan assets is based on a weighted average of the individual expected return for each asset category in the plan’s portfolio. Expected return comprises inflation plus the real rate of return for each asset class.
Over the long term, asset allocation is believed to be the single greatest determinant of risk and return. Asset allocation will deviate from the target percentages due to market movement, cash flows, and investment manager performance. Material deviations from the asset allocation target can alter the expected return and risk of the trust. However, frequent rebalancing to the asset allocation targets may result in significant transaction costs, which can impair the trust’s ability to meet its investment objective. The target allocation for both fiscal years and the fair value of the University’s pension plan assets at June 30, by asset category, were as follows:
Target
Allocation 2020 2019 Asset class: (in thousands of dollars) Equity securities: Stock index and small cap 35% $ 58,918 $ 55,096 International 35% 58,573 55,525 Debt securities 30% 50,762 47,475 Cash and cash equivalents - 535 284 Total pension plan assets $ 168,788 $ 158,380
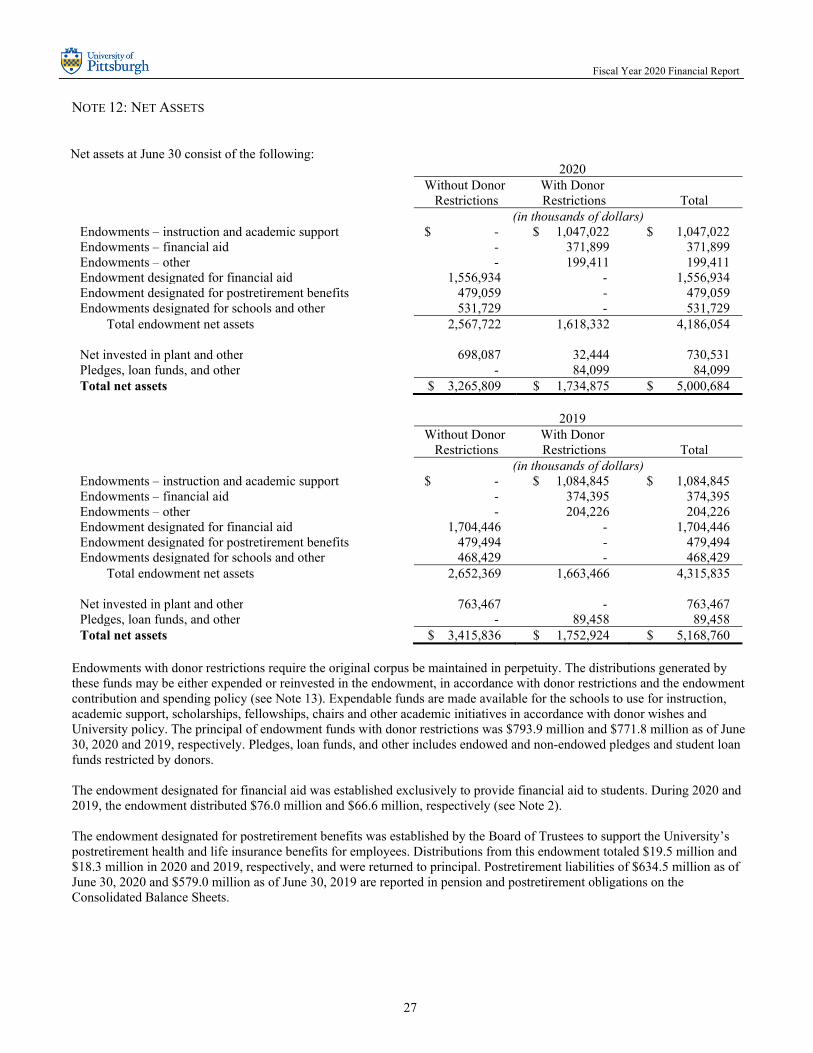
27
Fiscal Year 2020 Financial Report
NOTE 12: NET ASSETS
Net assets at June 30 consist of the following: 2020 Without Donor
Restrictions With Donor Restrictions
Total
(in thousands of dollars) Endowments – instruction and academic support $ - $ 1,047,022 $ 1,047,022 Endowments – financial aid - 371,899 371,899 Endowments – other - 199,411 199,411 Endowment designated for financial aid 1,556,934 - 1,556,934 Endowment designated for postretirement benefits 479,059 - 479,059 Endowments designated for schools and other 531,729 - 531,729 Total endowment net assets 2,567,722 1,618,332 4,186,054 Net invested in plant and other 698,087 32,444 730,531 Pledges, loan funds, and other - 84,099 84,099 Total net assets $ 3,265,809 $ 1,734,875 $ 5,000,684
2019 Without Donor
Restrictions With Donor Restrictions
Total
(in thousands of dollars) Endowments – instruction and academic support $ - $ 1,084,845 $ 1,084,845 Endowments – financial aid - 374,395 374,395 Endowments – other - 204,226 204,226 Endowment designated for financial aid 1,704,446 - 1,704,446 Endowment designated for postretirement benefits 479,494 - 479,494 Endowments designated for schools and other 468,429 - 468,429 Total endowment net assets 2,652,369 1,663,466 4,315,835 Net invested in plant and other 763,467 - 763,467 Pledges, loan funds, and other - 89,458 89,458 Total net assets $ 3,415,836 $ 1,752,924 $ 5,168,760
Endowments with donor restrictions require the original corpus be maintained in perpetuity. The distributions generated by these funds may be either expended or reinvested in the endowment, in accordance with donor restrictions and the endowment contribution and spending policy (see Note 13). Expendable funds are made available for the schools to use for instruction, academic support, scholarships, fellowships, chairs and other academic initiatives in accordance with donor wishes and University policy. The principal of endowment funds with donor restrictions was $793.9 million and $771.8 million as of June 30, 2020 and 2019, respectively. Pledges, loan funds, and other includes endowed and non-endowed pledges and student loan funds restricted by donors.
The endowment designated for financial aid was established exclusively to provide financial aid to students. During 2020 and 2019, the endowment distributed $76.0 million and $66.6 million, respectively (see Note 2).
The endowment designated for postretirement benefits was established by the Board of Trustees to support the University’s postretirement health and life insurance benefits for employees. Distributions from this endowment totaled $19.5 million and $18.3 million in 2020 and 2019, respectively, and were returned to principal. Postretirement liabilities of $634.5 million as of June 30, 2020 and $579.0 million as of June 30, 2019 are reported in pension and postretirement obligations on the Consolidated Balance Sheets.

28
Fiscal Year 2020 Financial Report
Endowments designated for schools and other include both Board and management designated endowments. Endowments designated to the schools support scholarships, fellowships, chairs, and other academic initiatives. Endowments designated by management support self-insurance liabilities and other general purposes. Cash not yet invested in the consolidated endowment pool as of June 30 is included in endowments designated for schools and other.
Invested in plant and other primarily includes the value of University property net of debt and other capital-related liabilities. Other capital-related liabilities include the valuation of the University’s interest rate swap agreements and the conditional asset retirement obligation (see Note 8).
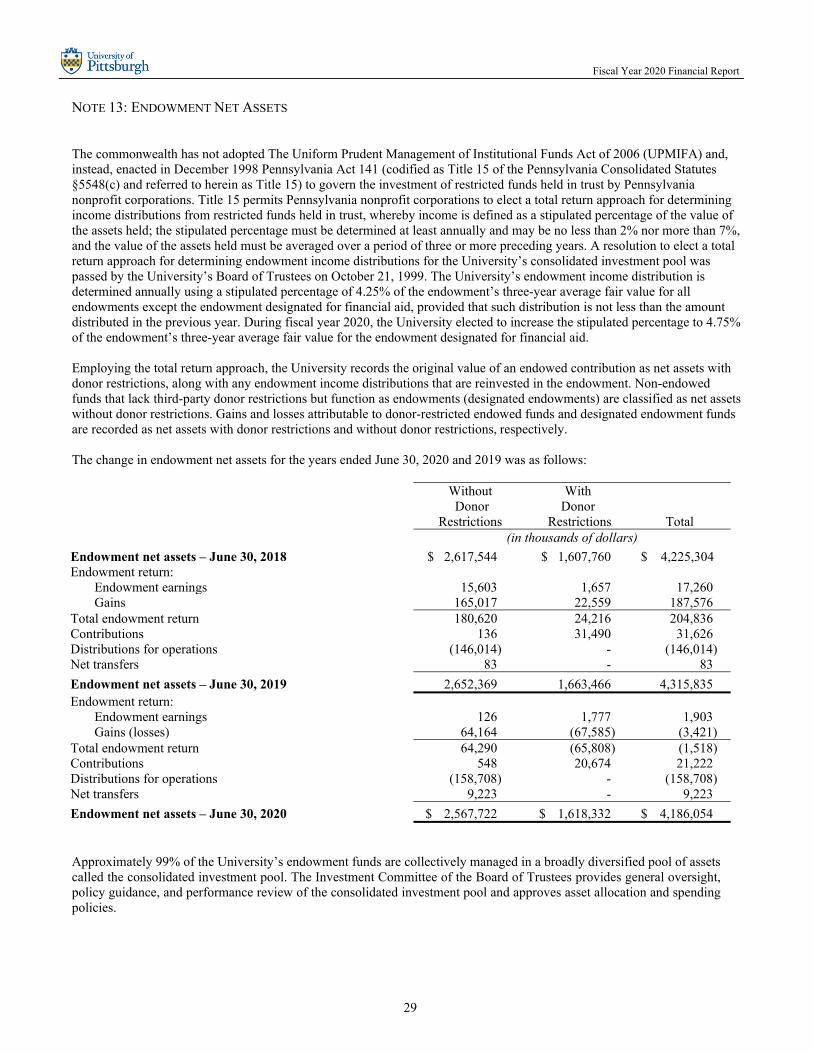
29
Fiscal Year 2020 Financial Report
NOTE 13: ENDOWMENT NET ASSETS
The commonwealth has not adopted The Uniform Prudent Management of Institutional Funds Act of 2006 (UPMIFA) and, instead, enacted in December 1998 Pennsylvania Act 141 (codified as Title 15 of the Pennsylvania Consolidated Statutes §5548(c) and referred to herein as Title 15) to govern the investment of restricted funds held in trust by Pennsylvania nonprofit corporations. Title 15 permits Pennsylvania nonprofit corporations to elect a total return approach for determining income distributions from restricted funds held in trust, whereby income is defined as a stipulated percentage of the value of the assets held; the stipulated percentage must be determined at least annually and may be no less than 2% nor more than 7%, and the value of the assets held must be averaged over a period of three or more preceding years. A resolution to elect a total return approach for determining endowment income distributions for the University’s consolidated investment pool was passed by the University’s Board of Trustees on October 21, 1999. The University’s endowment income distribution is determined annually using a stipulated percentage of 4.25% of the endowment’s three-year average fair value for all endowments except the endowment designated for financial aid, provided that such distribution is not less than the amount distributed in the previous year. During fiscal year 2020, the University elected to increase the stipulated percentage to 4.75% of the endowment’s three-year average fair value for the endowment designated for financial aid.
Employing the total return approach, the University records the original value of an endowed contribution as net assets with donor restrictions, along with any endowment income distributions that are reinvested in the endowment. Non-endowed funds that lack third-party donor restrictions but function as endowments (designated endowments) are classified as net assets without donor restrictions. Gains and losses attributable to donor-restricted endowed funds and designated endowment funds are recorded as net assets with donor restrictions and without donor restrictions, respectively.
The change in endowment net assets for the years ended June 30, 2020 and 2019 was as follows:
Without Donor
Restrictions
With Donor
Restrictions
Total (in thousands of dollars)
Endowment net assets – June 30, 2018 $ 2,617,544 $ 1,607,760 $ 4,225,304 Endowment return: Endowment earnings 15,603 1,657 17,260 Gains 165,017 22,559 187,576 Total endowment return 180,620 24,216 204,836 Contributions 136 31,490 31,626 Distributions for operations (146,014) - (146,014) Net transfers 83 - 83
Endowment net assets – June 30, 2019 2,652,369 1,663,466 4,315,835 Endowment return: Endowment earnings 126 1,777 1,903 Gains (losses) 64,164 (67,585) (3,421) Total endowment return 64,290 (65,808) (1,518) Contributions 548 20,674 21,222 Distributions for operations (158,708) - (158,708) Net transfers 9,223 - 9,223
Endowment net assets – June 30, 2020 $ 2,567,722 $ 1,618,332 $ 4,186,054
Approximately 99% of the University’s endowment funds are collectively managed in a broadly diversified pool of assets called the consolidated investment pool. The Investment Committee of the Board of Trustees provides general oversight, policy guidance, and performance review of the consolidated investment pool and approves asset allocation and spending policies.

30
Fiscal Year 2020 Financial Report
NOTE 14: FUNCTIONAL EXPENSES
The University accounts for expenses according to major classes of program services or functions. Functional expenses for the years ended June 30 consist of the following:
2020 Program Services
Academics
Research and Related
Student Services
Auxiliary Enterprises
Support Services
Total
(in thousands of dollars) Salaries and wages $ 509,937 $ 462,085 $ 80,123 $ 21,114 $ 91,398 $ 1,164,657 Fringe benefits 142,647 129,628 26,432 7,439 26,925 333,071 Total compensation 652,584 591,713 106,555 28,553 118,323 1,497,728 Supplies 31,037 67,645 9,678 2,829 4,402 115,591 Business and professional 48,703 179,593 37,377 38,997 44,270 348,940 Facilities 42,868 23,188 8,248 18,587 6,709 99,600 Depreciation 80,393 51,801 19,140 27,387 15,648 194,369 Interest 16,792 10,913 3,996 7,701 3,274 42,676 Rent 21,352 27,058 2,476 4,361 5,830 61,077 Other 9,671 4,331 14,498 23,298 5,028 56,826 Total operating expenses 903,400 956,242 201,968 151,713 203,484 2,416,807 Other components of net periodic benefit cost 10,327 9,358 1,623 427 1,851 23,586 Total $ 913,727 $ 965,600 $ 203,591 $ 152,140 $ 205,335 $ 2,440,393
2019 Program Services
Academics
Research and Related
Student Services
Auxiliary Enterprises
Support Services
Total
(in thousands of dollars) Salaries and wages $ 495,462 $ 373,335 $ 76,385 $ 20,881 $ 88,983 $ 1,055,046 Fringe benefits 136,459 105,269 24,981 7,359 26,023 300,091 Total compensation 631,921 478,604 101,366 28,240 115,006 1,355,137 Supplies 33,995 71,021 9,109 2,750 5,794 122,669 Business and professional 60,505 187,642 40,909 45,106 40,141 374,303 Facilities 45,541 22,463 8,526 19,608 7,219 103,357 Depreciation 79,570 46,784 16,793 26,445 15,243 184,835 Interest 12,032 7,126 2,535 6,067 2,377 30,137 Rent 19,110 26,451 2,851 1,104 2,991 52,507 Other 1,570 19,157 4,421 23,340 (6,187) 42,301 Total operating expenses 884,244 859,248 186,510 152,660 182,584 2,265,246 Other components of net periodic benefit cost 10,445 7,871 1,610 440 1,875 22,241 Total $ 894,689 $ 867,119 $ 188,120 $ 153,100 $ 184,459 $ 2,287,487
Costs related to the operation and maintenance of property, including depreciation of property and equipment and interest on related debt, are allocated to program services and support services based upon salary effort.
Academics includes instructional, academic support, and library costs. Research and related includes sponsored programs related to research and development as well as public service activity such as clinical trials. Student services represents expenses supporting the well-being and development of students outside of direct instruction, including student admissions, registration, counseling and advising, as well as intercollegiate athletics. Auxiliary enterprises consists of costs to provide services to students, faculty, and staff, such as student housing, meal plans, parking, and book store activity. Support services consists of institution-wide administrative functions in support of the University’s academic, research, and public service mission.

31
Fiscal Year 2020 Financial Report
NOTE 15: RELATED PARTIES
The University has relationships and affiliation agreements with separately incorporated entities including UPMC and affiliated hospitals and UPP. These relationships include a common paymaster arrangement for certain University School of Medicine (SOM) faculty with academic and clinical responsibilities; contractual obligations for UPMC and UPP to support certain educational and research functions at the University; and property rental agreements. There is no guarantee these agreements will be renewed in future periods. Transactions with all related entities are conducted in the ordinary course of business and are discussed below.
The following summarizes the significant related party transactions between the University and UPMC for the years ended June 30, 2020 and 2019:
(a) Certain University SOM faculty and staff provide clinical services through their University appointments to UPMC,
UPP, and affiliated hospitals. The University invoices these entities monthly for reimbursement of the clinical portion of the associated compensation costs. SOM faculty members, having both a University academic appointment and a separate, external appointment for clinical responsibilities, participate in the common paymaster arrangement for purposes of determining appropriate FICA taxation. In addition to the reimbursable compensation costs, the University also engages in other transactions with these entities, which include providing certain facilities-related services, telephone, mailing, printing, and various other services, which are reimbursed at cost.
Service Agreement Location on the Consolidated
Financial Statements 2020 2019 (in thousands of dollars) Common paymaster arrangement(a),(c) Net on balance sheet $ 33,450 $ 119,196 Facilities-related services, mail, telephone, printing, and other services(a) Net on balance sheet 17,442 16,491
Net balance sheet transactions with UPMC $ 50,892 $ 135,687 UPMC dean’s tax, Children’s Hospital of Pittsburgh, and other academic support(b) UPMC academic support $ 118,834 $ 104,178 UPMC dual faculty support(c) UPMC academic support 82,310 - UPMC academic affiliation agreement(d) UPMC academic support 31,500 31,000 UPMC Hillman Cancer Center research support payments(e) UPMC academic support 16,876 17,237 UPMC grant revenue(f) Research grants and contracts 15,447 13,072 Rental revenue(g) UPMC academic support 10,496 10,209 Health Sciences Library System(h) UPMC academic support 5,189 4,057 Cost sharing for Medical and Health Sciences Foundation(i) UPMC academic support 3,635 3,657 UPMC Enterprises Contributions for operations 455 2,250 Institute for Personalized Medicine UPMC academic support 1,295 1,880
Revenues from UPMC $ 286,037 $ 187,540
Health insurance coverage for University employees(j) Fringe benefits $ 135,650 $ 130,608 WPIC and UPMC Hillman Cancer Center research services(k) Primarily compensation 26,558 27,007 Rental expense paid to UPMC(g) Rent 24,161 23,999
Expenses paid to UPMC $ 186,369 $ 181,614
32
Fiscal Year 2020 Financial Report
(b) UPMC provides support to the SOM for the school’s general academic mission, research, new programs, and faculty recruitment; and to augment operating budgets for certain departments that do not generate sufficient revenues to meet their academic and research costs. Additionally, UPMC provides financial support to the SOM through the Children’s Hospital of Pittsburgh of UPMC (CHP), which supports pediatric research programs.
(c) Beginning in fiscal year 2020, UPP and the University entered into a funding arrangement to broadly support the SOM and its missions. The funding arrangement specifies monthly remittances which can be used for operations. Previously, UPP would reimburse the University for faculty compensation, which was recognized on a net basis (see (a) above).
(d) The University signed an agreement with UPMC that included financial commitments designed to further the two
entities’ commitment to their interrelated teaching, research, clinical care, and community service missions. As part of the agreement, UPMC provides annual funding for the SOM.
(e) UPMC provides support payments to the UPMC Hillman Cancer Center (UHCC) for various subsidies, research
initiatives, and general support. (f) A portion of the University’s sponsored program activity is provided by UPMC. (g) The University is involved in certain rental arrangements in which the University acts as both lessor or lessee with
UPMC and its affiliates.
(h) UPMC provides support for their use of the University’s Health Sciences Library System. (i) In 2003, the University and UPMC created the Medical and Health Sciences Foundation (MHSF), a separate
501(c)(3) organization. The MHSF serves as a unified fundraising organization for the University’s schools of the health sciences and UPMC. The arrangement calls for the cost of MHSF to be split between the University and UPMC.
(j) UPMC serves as the provider of health insurance coverage to all eligible University employees who enroll in the
plan. The University is self-insured for these costs and reimburses UPMC for actual claims cost. (k) The University has an arrangement with UPMC whereby certain research-related costs incurred by UPMC
(primarily staff compensation) in relation to the Western Psychiatric Institute and Clinic (WPIC) and UHCC research awards are charged to such awards via an electronic billing and reimbursed to UPMC each month.
A lease arrangement exists between the University and the commonwealth for WPIC. Since 1949, the University has managed WPIC under an agreement between the University and the commonwealth whereby the University rents for a consideration of $1 per year the land, building, equipment, and other items that are used by WPIC. The agreement provides for continuing terms of 10 years each; however, this agreement is cancelable by either party on one year’s written notice. In 1992, the University subleased to UPMC the land, building, equipment, and other items subject to the current lease arrangement between the commonwealth and the University. This sublease arrangement continued to be in effect during 2020 and 2019. Included in property, plant, and equipment is $183.3 million and $181.4 million at June 30, 2020 and 2019, respectively, related to the land, buildings, and equipment used by WPIC. Accumulated depreciation related to these assets totaled $160.8 million and $156.9 million at June 30, 2020 and 2019, respectively.

33
Fiscal Year 2020 Financial Report
NOTE 16: COMMITMENTS AND CONTINGENCIES In March 2020, the World Health Organization declared the novel coronavirus (COVID-19) a pandemic. The outbreak of the disease has affected travel, commerce and financial markets globally. Commencing March 18, 2020, undergraduate and graduate course instruction was conducted virtually and most students vacated the campus. The University granted refunds of $18.1 million in 2020 for housing and dining services not provided after March 18, 2020. Students continued to meet their academic requirements for the remainder of the 2020 academic year. The University granted student emergency grants under the Higher Education Emergency Relief Act (HEERF) of approximately $10.6 million. In addition, another $10.6 million was received through HEERF to offset the University’s institutional costs related to the pandemic. Total revenue of $16.6 million is recognized as research grants and contracts in the Consolidated Statement of Activities in 2020. While the start of the 2021 academic year will begin with a modified return to campus plan for students, many faculty and staff remain working in a remote environment. Given the uncertainty over the progression of the virus and governmental emergency directives, there is no timetable for when instruction and campus operations will return to normal. The COVID-19 pandemic has negatively affected national, state, and local economies and global financial markets, and the higher education landscape in general. While the financial impact on the University is being monitored at this time, the pandemic may continue to adversely affect operations and financial condition, including, among other things, the ability of the Universtiy to conduct its operations and/or the cost of operations; governmental and non-governmental funding; and financial markets impacting investments valuation and interest rates. The University continues to monitor the pandemic and is prepared to take additional measures to protect the health of the University community and promote the continuity of its academic and research missions. At June 30, 2020 and 2019, the University had outstanding contractual commitments of $265.8 million and $141.8 million, respectively, for property, plant, and equipment expenditures. In May 2019, the University entered into a transaction with a third-party developer and its affiliates to develop a mixed-use facility consisting of commercial, laboratory, parking, and office space at 5051 Centre Avenue in Pittsburgh. The transaction calls for the University to lease portions of the property to the developer with the University leasing back a portion of the space for research and academic purposes once the development is completed.
The University is a defendant in a number of legal actions seeking damages and other relief from the University. While the final outcome of each action cannot be determined at this time, legal counsel and University management are of the opinion that the liability, if any, in these legal actions will not have a material adverse effect on the University’s consolidated financial statements. The University receives significant financial assistance from the federal government including the sponsorship of federal research projects. Research grants and contracts normally provide for the recovery of direct and indirect costs. Recovery of indirect costs is recorded at predetermined rates negotiated with the federal government. Indirect cost recovery rates from nonfederal sources may vary. Entitlement to these resources for the recovery of the applicable direct and related indirect costs is generally conditioned upon compliance with the terms and conditions of the grant or contract agreements and applicable federal regulations, including the expenditure of the resources for eligible purposes. Substantially all grants and contracts, and the University’s indirect cost rate, are subject to financial and compliance reviews and audits by the grantors. Funds received through federal sources are subject to audit each year in accordance with the Office of Management and Budget’s Uniform Guidance. In management’s opinion, the likelihood of a material adverse outcome on the University’s financial position from those reviews and audits is remote.
As part of ongoing operations, the University enters into utility contracts to secure electric and natural gas rates. These contracts are with various utility suppliers and some of the contracts cover multiple years. The University monitors the energy markets on an ongoing basis and will make commitments on new rates if deemed in the best interest of the University.
34
Fiscal Year 2020 Financial Report
The University conducts a review of contracts and agreements that may contain guarantees, including loan guarantees such as standby letters of credit and indemnifications. In certain contracts, the University agrees to indemnify a third-party service provider under certain circumstances. Pursuant to its bylaws, the University provides indemnification to directors, officers, and, in some cases, employees and agents against certain liabilities incurred as a result of service provided on behalf of or at the request of the University. The terms of indemnity vary from agreement to agreement, and the amount of indemnification, if any, cannot be reasonably determined. NOTE 17: SUBSEQUENT EVENTS
The University has evaluated subsequent events through October 20, 2020, the date on which the consolidated financial statements were issued and determined that there were no subsequent events requiring additional disclosure or adjustment to the consolidated financial statements.
35
Fiscal Year 2020 Financial Report
MEMBERSHIP OF THE BOARD OF TRUSTEES FISCAL YEAR 2020
M E M B E R S
E X O F F I C I O ( N O N V O T I N G )
Tom W. Wolf, Governor
of the Commonwealth of Pennsylvania
Pedro A. Rivera, Secretary of Education of the Commonwealth of Pennsylvania Rich Fitzgerald, Allegheny County Executive William Peduto, Mayor of the City of Pittsburgh
2019 – 2023 Douglas M. Browning Louis R. Cestello David C. Chavern Deborah J. Gillotti
2020 – 2024
John A. Barbour Edward J. Grefenstette Patricia D. Horoho John H. Pelusi Jr. Marna Cupp Whittington
A L U M N I T R U S T E E S
2017 – 2021
Larry J. Merlo
2018 – 2022
Jane Bilewicz Allred Gary T. Brownlee
2019 – 2023
Michael G. Wells
2020 – 2024
S. Jeffrey Kondis Lisa A. Golden
E M E R I T U S T R U S T E E S
J. David Barnes Thomas G. Bigley Suzanne W. Broadhurst John G. Conomikes George A. Davidson Jr. Catherine D. DeAngelis Herbert P. Douglas Jr. D. Michael Fisher E. Jeanne Gleason J. Roger Glunt Earl F. Hord Paul E. Lego George L. Miles Jr. Frank E. Mosier Alfred L. Moyé Thomas H. O’Brien Anthony J. F. O’Reilly Robert A. Paul Robert P. Randall James C. Roddey Farrell Rubenstein Richard P. Simmons Charles M. Steiner John A. Swanson Burton M. Tansky Dick Thornburgh Thomas J. Usher Sam S. Zacharias
M E M B E R E X O F F I C I O
( V O T I N G )
Patrick Gallagher, Chancellor and Chief Executive Officer
S P E C I A L T R U S T E E S
2017 – 2021 SaLisa L. Berrien Tamara M. Haddad Adam C. Walker Herbert S. Shear
2018 – 2022 Eva Tansky Blum Sundaa Bridgett-Jones Wen-Ta Chiu David J. Morehouse
2019 – 2023
Robert O. Agbede G. Nicholas Beckwith III Emil Spadafore A. David Tilstone
2020 – 2024
John P. Gismondi Marlee S. Myers Arthur J. Rooney II Vacant
C O M M O N W E A L T H
T R U S T E E S
G: Governor appointment H: House appointment S: Senate appointment
2016 – 2020 Bradley J. Franc (G) Thomas O. Johnson II (H) Jay Costa Jr. (S)
2017 – 2021 Sy Holzer (G) Thomas VanKirk (H) William K. Lieberman (S)
2018 – 2022 Vacant (G) John A. Maher III (H) John J. Verbanac (S)
2019 – 2023 Jake Wheatley Jr. (G) Diane P. Holder (H) Peter C. Varischetti (S)
T E R M T R U S T E E S
2017 – 2021 Ira J. Gumberg Dawne S. Hickton Roberta A. Luxbacher Thomas E. Richards
2018 – 2022
Mary Ellen Callahan Vaughn S. Clagette James P. Covert Keith E. Schaefer
The consolidated financial statements have been reviewed and approved by the University’s Audit Committee. The Audit Committee is comprised of outside directors having requisite financial expertise and meets regularly with University management and both internal and external auditors to review internal accounting controls, audit issues, and financial reporting matters. The Committee meets with the external auditors in private sessions and is also responsible for approving the independent auditing firm retained each year. Nonvoting representatives on the Committee include members of the University’s administration as well as student, faculty, and staff representatives.
SCHEDULE OF EXPENDITURES OF FEDERAL AWARDS AND AUDITORS’ REPORT AS REQUIRED BY TITLE 2 U.S. CODE OF
FEDERAL REGULATIONS PART 200

UNIVERSITY OF PITTSBURGH – OF THECOMMONWEALTH SYSTEM OF HIGHER EDUCATION
Schedule of Expenditures of Federal Awards
Year ended June 30, 2020
PassedCFDA Direct award or pass-through through to Federal
Federal grantor/pass through grantor/program title number entity identifying number subrecipients expendituresI. RESEARCH & DEVELOPMENT CLUSTER:
Department of Health and Human Services:Administration for Children and Families:
Westat, Inc. 93.RD 6469-02-S001 $ — (30)
Total Administration for Children and Families — (30)
Administration for Community Living:Paralysis Resource Center 93.325 Direct 55,983 85,204
ACL National Institute on Disability, Independent Living, andRehabilitation Research 93.433 Direct 178,958 4,318,852
Craig Hospital 93.433 UP001 — 3,677 Gallaudet University 93.433 0000023621 — (7,035) University of Michigan 93.433 3004739336 — 20,326 University of Michigan 93.433 SUBK00012505 12,194 66,495 University of Oklahoma 93.433 RS20181718-01 — 27,436
Subtotal 93.433 191,152 4,429,751
Administration for Community Living 93.RD Direct — 28,211
Total Administration for Community Living 247,135 4,543,166
Research on Healthcare Costs, Quality and Outcomes:National Research Service Awards Health Services Research
Training 93.225 Direct — 84,590
Research on Healthcare Costs, Quality and Outcomes 93.226 Direct 157,102 1,540,386 Columbia University 93.226 2(GG014652-02) — 45,651 Commonwealth of Pennsylvania 93.226 OUD RURAL PA 37,668 623,089 Magee-Womens Research Institute & Foundation 93.226 4039 — 129,230 Tufts University 93.226 HH5422 — 54,517 University of Arizona 93.226 455834 — 40,320 University of Illinois 93.226 16661 — 428 University of Illinois 93.226 16661-02 — 481 University of North Carolina 93.226 5111271 — 16,648 University of Utah 93.226 10055538 — 102,186 University of Utah 93.226 10055388-02 — 112,850 Vanderbilt University Medical Center 93.226 VUMC 67801 — 9,736 Vanderbilt University Medical Center 93.226 VUMC67801 — 30,958
Subtotal 93.226 194,770 2,706,480
Total Research on Healthcare Costs, Quality and Outcomes 194,770 2,791,070
Centers for Disease Control and Prevention:Innovations in Applied Public Health Research 93.061 Direct 63,515 607,198 Gaia Medical Institute 93.061 SALIVA BIOMARKERS — 36,060 MOSAIX Software, Inc. 93.061 JRDA000276-01 — 52,076
Subtotal 93.061 63,515 695,334
University of Rwanda 93.067 EMR IMPACT — (9,553) Prevention of Disease, Disability, and Death through
Immunization and Control of Respiratory and Related Diseases 93.083 Direct — 875,745 Centers for Research and Demonstration for Health
Promotion and Disease Prevention 93.135 Direct — 246,424
Injury Prevention and Control Research and Stateand Community Based Programs 93.136 Direct 5,012 341,906
Allegheny County 93.136 239092 — 85,168 Allegheny County 93.136 240645 — 124,901 Commonwealth of Pennsylvania 93.136 4300651914 — 138,721 Commonwealth of Pennsylvania 93.136 4300654631 — 118,232 Medical College of Wisconsin 93.136 1U01 CE002944-01 — 101,527 Medical College of Wisconsin 93.136 5U01 CE002944-02 — 167,948
Subtotal 93.136 5,012 1,078,403
Immunization Research, Demonstration, Public Information andEducation Training and Clinical Skills Improvement Projects 93.185 Direct — 2,977,468
Carnegie Mellon University 93.185 1090610-425287 — 7,592
Subtotal 93.185 — 2,985,060
Occupational Safety and Health Program 93.262 Direct 173,804 1,577,032 CPWR The Center for Construction Research and Training 93.262 3001-817-01 NIOSH 42,490 45,908 Mount Sinai School of Medicine 93.262 0254-5766-4609 — 5,366 Mount Sinai School of Medicine 93.262 0254-5767-4609 — 24,701 Texas A&M Engineering Experiment Station 93.262 28-M1803757 — (38,029)
Subtotal 93.262 216,294 1,614,978
(Continued)36
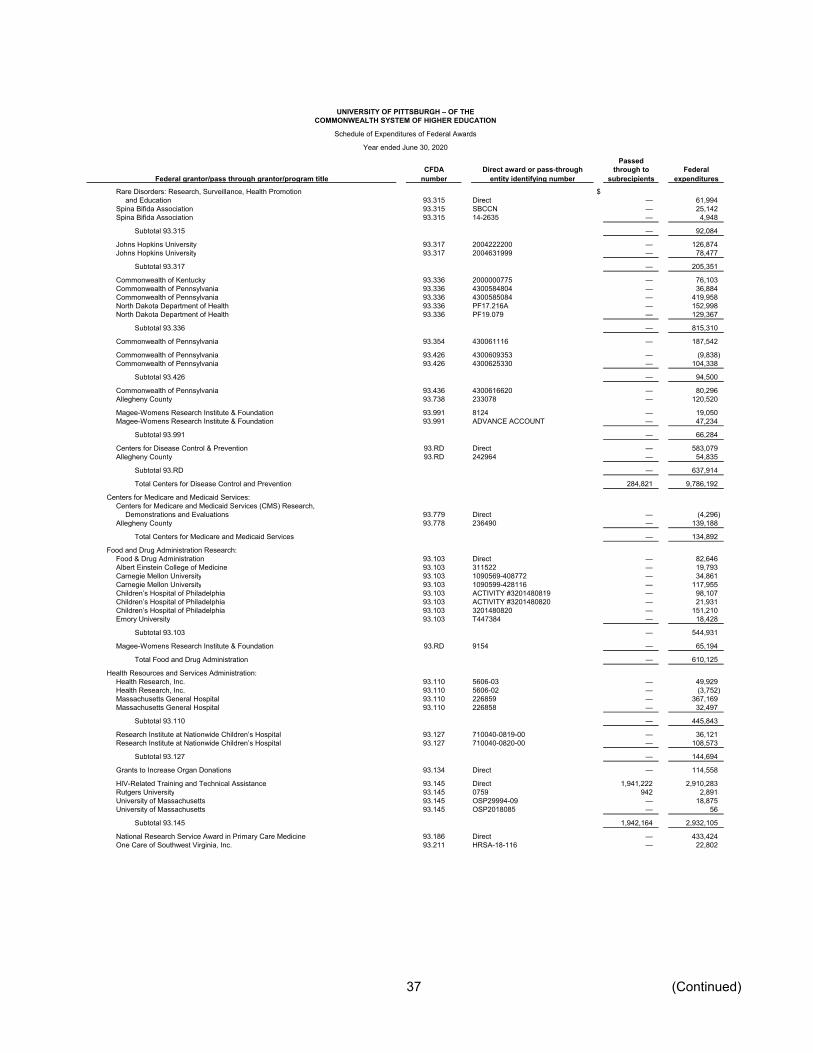
UNIVERSITY OF PITTSBURGH – OF THECOMMONWEALTH SYSTEM OF HIGHER EDUCATION
Schedule of Expenditures of Federal Awards
Year ended June 30, 2020
PassedCFDA Direct award or pass-through through to Federal
Federal grantor/pass through grantor/program title number entity identifying number subrecipients expendituresRare Disorders: Research, Surveillance, Health Promotion $
and Education 93.315 Direct — 61,994 Spina Bifida Association 93.315 SBCCN — 25,142 Spina Bifida Association 93.315 14-2635 — 4,948
Subtotal 93.315 — 92,084
Johns Hopkins University 93.317 2004222200 — 126,874 Johns Hopkins University 93.317 2004631999 — 78,477
Subtotal 93.317 — 205,351
Commonwealth of Kentucky 93.336 2000000775 — 76,103 Commonwealth of Pennsylvania 93.336 4300584804 — 36,884 Commonwealth of Pennsylvania 93.336 4300585084 — 419,958 North Dakota Department of Health 93.336 PF17.216A — 152,998 North Dakota Department of Health 93.336 PF19.079 — 129,367
Subtotal 93.336 — 815,310
Commonwealth of Pennsylvania 93.354 430061116 — 187,542
Commonwealth of Pennsylvania 93.426 4300609353 — (9,838) Commonwealth of Pennsylvania 93.426 4300625330 — 104,338
Subtotal 93.426 — 94,500
Commonwealth of Pennsylvania 93.436 4300616620 — 80,296 Allegheny County 93.738 233078 — 120,520
Magee-Womens Research Institute & Foundation 93.991 8124 — 19,050 Magee-Womens Research Institute & Foundation 93.991 ADVANCE ACCOUNT — 47,234
Subtotal 93.991 — 66,284
Centers for Disease Control & Prevention 93.RD Direct — 583,079 Allegheny County 93.RD 242964 — 54,835
Subtotal 93.RD — 637,914
Total Centers for Disease Control and Prevention 284,821 9,786,192
Centers for Medicare and Medicaid Services:Centers for Medicare and Medicaid Services (CMS) Research,
Demonstrations and Evaluations 93.779 Direct — (4,296) Allegheny County 93.778 236490 — 139,188
Total Centers for Medicare and Medicaid Services — 134,892
Food and Drug Administration Research:Food & Drug Administration 93.103 Direct — 82,646 Albert Einstein College of Medicine 93.103 311522 — 19,793 Carnegie Mellon University 93.103 1090569-408772 — 34,861 Carnegie Mellon University 93.103 1090599-428116 — 117,955 Children’s Hospital of Philadelphia 93.103 ACTIVITY #3201480819 — 98,107 Children’s Hospital of Philadelphia 93.103 ACTIVITY #3201480820 — 21,931 Children’s Hospital of Philadelphia 93.103 3201480820 — 151,210 Emory University 93.103 T447384 — 18,428
Subtotal 93.103 — 544,931
Magee-Womens Research Institute & Foundation 93.RD 9154 — 65,194
Total Food and Drug Administration — 610,125
Health Resources and Services Administration:Health Research, Inc. 93.110 5606-03 — 49,929 Health Research, Inc. 93.110 5606-02 — (3,752) Massachusetts General Hospital 93.110 226859 — 367,169 Massachusetts General Hospital 93.110 226858 — 32,497
Subtotal 93.110 — 445,843
Research Institute at Nationwide Children’s Hospital 93.127 710040-0819-00 — 36,121 Research Institute at Nationwide Children’s Hospital 93.127 710040-0820-00 — 108,573
Subtotal 93.127 — 144,694
Grants to Increase Organ Donations 93.134 Direct — 114,558
HIV-Related Training and Technical Assistance 93.145 Direct 1,941,222 2,910,283 Rutgers University 93.145 0759 942 2,891 University of Massachusetts 93.145 OSP29994-09 — 18,875 University of Massachusetts 93.145 OSP2018085 — 56
Subtotal 93.145 1,942,164 2,932,105
National Research Service Award in Primary Care Medicine 93.186 Direct — 433,424 One Care of Southwest Virginia, Inc. 93.211 HRSA-18-116 — 22,802
(Continued)37
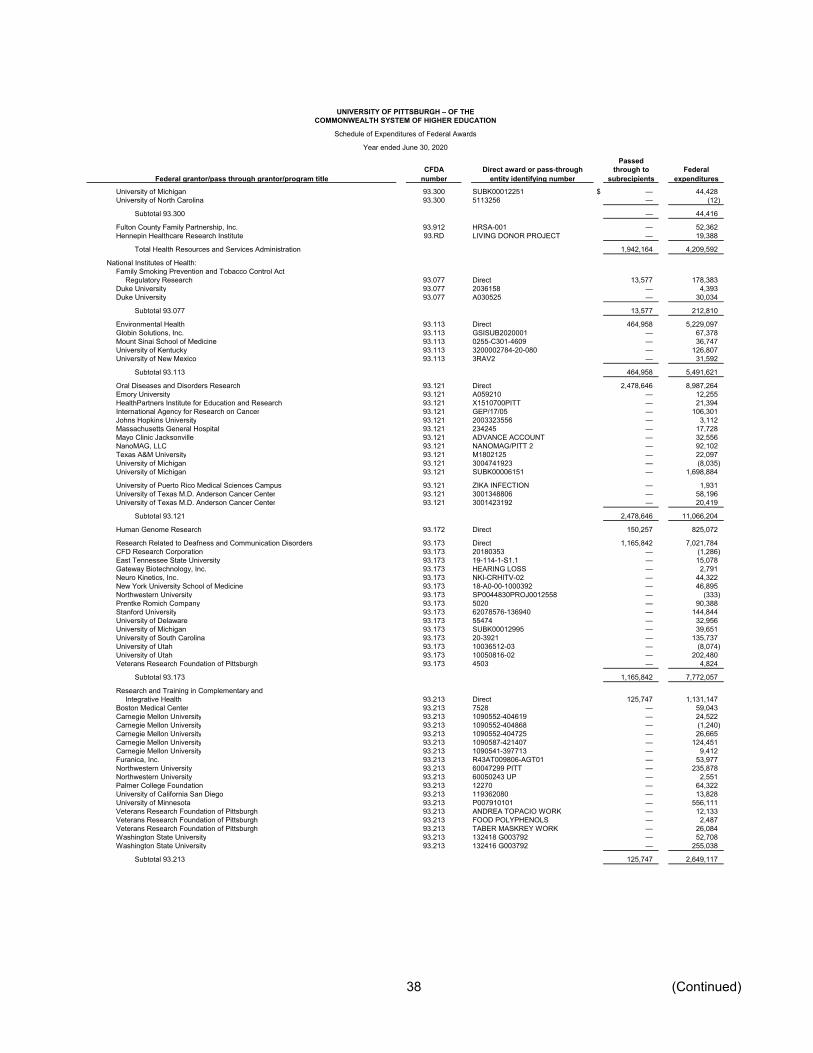
UNIVERSITY OF PITTSBURGH – OF THECOMMONWEALTH SYSTEM OF HIGHER EDUCATION
Schedule of Expenditures of Federal Awards
Year ended June 30, 2020
PassedCFDA Direct award or pass-through through to Federal
Federal grantor/pass through grantor/program title number entity identifying number subrecipients expendituresUniversity of Michigan 93.300 SUBK00012251 $ — 44,428 University of North Carolina 93.300 5113256 — (12)
Subtotal 93.300 — 44,416
Fulton County Family Partnership, Inc. 93.912 HRSA-001 — 52,362 Hennepin Healthcare Research Institute 93.RD LIVING DONOR PROJECT — 19,388
Total Health Resources and Services Administration 1,942,164 4,209,592
National Institutes of Health:Family Smoking Prevention and Tobacco Control Act
Regulatory Research 93.077 Direct 13,577 178,383 Duke University 93.077 2036158 — 4,393 Duke University 93.077 A030525 — 30,034
Subtotal 93.077 13,577 212,810
Environmental Health 93.113 Direct 464,958 5,229,097 Globin Solutions, Inc. 93.113 GSISUB2020001 — 67,378 Mount Sinai School of Medicine 93.113 0255-C301-4609 — 36,747 University of Kentucky 93.113 3200002784-20-080 — 126,807 University of New Mexico 93.113 3RAV2 — 31,592
Subtotal 93.113 464,958 5,491,621
Oral Diseases and Disorders Research 93.121 Direct 2,478,646 8,987,264 Emory University 93.121 A059210 — 12,255 HealthPartners Institute for Education and Research 93.121 X1510700PITT — 21,394 International Agency for Research on Cancer 93.121 GEP/17/05 — 106,301 Johns Hopkins University 93.121 2003323556 — 3,112 Massachusetts General Hospital 93.121 234245 — 17,728 Mayo Clinic Jacksonville 93.121 ADVANCE ACCOUNT — 32,556 NanoMAG, LLC 93.121 NANOMAG/PITT 2 — 92,102 Texas A&M University 93.121 M1802125 — 22,097 University of Michigan 93.121 3004741923 — (8,035) University of Michigan 93.121 SUBK00006151 — 1,698,884
University of Puerto Rico Medical Sciences Campus 93.121 ZIKA INFECTION — 1,931 University of Texas M.D. Anderson Cancer Center 93.121 3001348806 — 58,196 University of Texas M.D. Anderson Cancer Center 93.121 3001423192 — 20,419
Subtotal 93.121 2,478,646 11,066,204
Human Genome Research 93.172 Direct 150,257 825,072
Research Related to Deafness and Communication Disorders 93.173 Direct 1,165,842 7,021,784 CFD Research Corporation 93.173 20180353 — (1,286) East Tennessee State University 93.173 19-114-1-S1.1 — 15,078 Gateway Biotechnology, Inc. 93.173 HEARING LOSS — 2,791 Neuro Kinetics, Inc. 93.173 NKI-CRHITV-02 — 44,322 New York University School of Medicine 93.173 18-A0-00-1000392 — 46,895 Northwestern University 93.173 SP0044830PROJ0012558 — (333) Prentke Romich Company 93.173 5020 — 90,388 Stanford University 93.173 62078576-136940 — 144,844 University of Delaware 93.173 55474 — 32,956 University of Michigan 93.173 SUBK00012995 — 39,651 University of South Carolina 93.173 20-3921 — 135,737 University of Utah 93.173 10036512-03 — (8,074) University of Utah 93.173 10050816-02 — 202,480 Veterans Research Foundation of Pittsburgh 93.173 4503 — 4,824
Subtotal 93.173 1,165,842 7,772,057
Research and Training in Complementary andIntegrative Health 93.213 Direct 125,747 1,131,147
Boston Medical Center 93.213 7528 — 59,043 Carnegie Mellon University 93.213 1090552-404619 — 24,522 Carnegie Mellon University 93.213 1090552-404868 — (1,240) Carnegie Mellon University 93.213 1090552-404725 — 26,665 Carnegie Mellon University 93.213 1090587-421407 — 124,451 Carnegie Mellon University 93.213 1090541-397713 — 9,412 Furanica, Inc. 93.213 R43AT009806-AGT01 — 53,977 Northwestern University 93.213 60047299 PITT — 235,878 Northwestern University 93.213 60050243 UP — 2,551 Palmer College Foundation 93.213 12270 — 64,322 University of California San Diego 93.213 119362080 — 13,828 University of Minnesota 93.213 P007910101 — 556,111 Veterans Research Foundation of Pittsburgh 93.213 ANDREA TOPACIO WORK — 12,133 Veterans Research Foundation of Pittsburgh 93.213 FOOD POLYPHENOLS — 2,487 Veterans Research Foundation of Pittsburgh 93.213 TABER MASKREY WORK — 26,084 Washington State University 93.213 132418 G003792 — 52,708 Washington State University 93.213 132416 G003792 — 255,038
Subtotal 93.213 125,747 2,649,117
(Continued)38
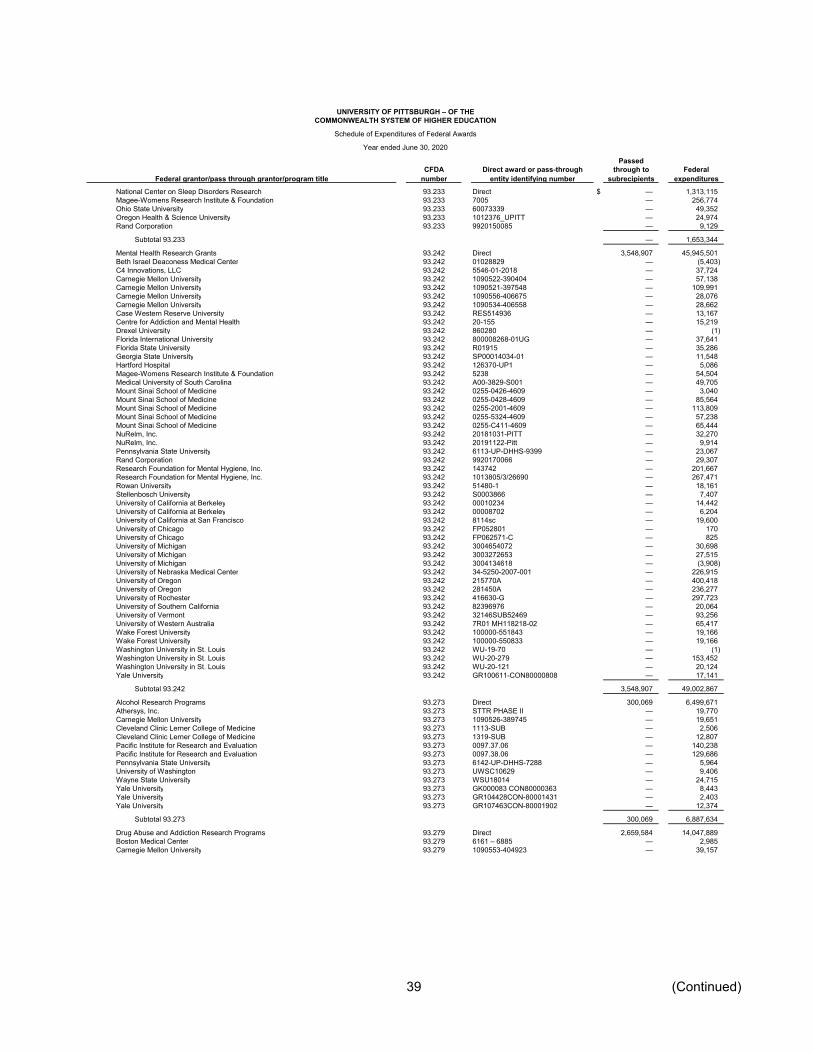
UNIVERSITY OF PITTSBURGH – OF THECOMMONWEALTH SYSTEM OF HIGHER EDUCATION
Schedule of Expenditures of Federal Awards
Year ended June 30, 2020
PassedCFDA Direct award or pass-through through to Federal
Federal grantor/pass through grantor/program title number entity identifying number subrecipients expendituresNational Center on Sleep Disorders Research 93.233 Direct $ — 1,313,115 Magee-Womens Research Institute & Foundation 93.233 7005 — 256,774 Ohio State University 93.233 60073339 — 49,352 Oregon Health & Science University 93.233 1012376_UPITT — 24,974 Rand Corporation 93.233 9920150085 — 9,129
Subtotal 93.233 — 1,653,344
Mental Health Research Grants 93.242 Direct 3,548,907 45,945,501 Beth Israel Deaconess Medical Center 93.242 01028829 — (5,403) C4 Innovations, LLC 93.242 5546-01-2018 — 37,724 Carnegie Mellon University 93.242 1090522-390404 — 57,138 Carnegie Mellon University 93.242 1090521-397548 — 109,991 Carnegie Mellon University 93.242 1090556-406675 — 28,076 Carnegie Mellon University 93.242 1090534-406558 — 28,662 Case Western Reserve University 93.242 RES514936 — 13,167 Centre for Addiction and Mental Health 93.242 20-155 — 15,219 Drexel University 93.242 860280 — (1) Florida International University 93.242 800008268-01UG — 37,641 Florida State University 93.242 R01915 — 35,286 Georgia State University 93.242 SP00014034-01 — 11,548 Hartford Hospital 93.242 126370-UP1 — 5,086 Magee-Womens Research Institute & Foundation 93.242 5238 — 54,504 Medical University of South Carolina 93.242 A00-3829-S001 — 49,705 Mount Sinai School of Medicine 93.242 0255-0426-4609 — 3,040 Mount Sinai School of Medicine 93.242 0255-0428-4609 — 85,564 Mount Sinai School of Medicine 93.242 0255-2001-4609 — 113,809 Mount Sinai School of Medicine 93.242 0255-5324-4609 — 57,238 Mount Sinai School of Medicine 93.242 0255-C411-4609 — 65,444 NuRelm, Inc. 93.242 20181031-PITT — 32,270 NuRelm, Inc. 93.242 20191122-Pitt — 9,914 Pennsylvania State University 93.242 6113-UP-DHHS-9399 — 23,067 Rand Corporation 93.242 9920170066 — 29,307 Research Foundation for Mental Hygiene, Inc. 93.242 143742 — 201,667 Research Foundation for Mental Hygiene, Inc. 93.242 1013805/3/26690 — 267,471 Rowan University 93.242 51480-1 — 18,161 Stellenbosch University 93.242 S0003866 — 7,407 University of California at Berkeley 93.242 00010234 — 14,442 University of California at Berkeley 93.242 00008702 — 6,204 University of California at San Francisco 93.242 8114sc — 19,600 University of Chicago 93.242 FP052801 — 170 University of Chicago 93.242 FP062571-C — 825 University of Michigan 93.242 3004654072 — 30,698 University of Michigan 93.242 3003272653 — 27,515 University of Michigan 93.242 3004134618 — (3,908) University of Nebraska Medical Center 93.242 34-5250-2007-001 — 226,915 University of Oregon 93.242 215770A — 400,418 University of Oregon 93.242 281450A — 236,277 University of Rochester 93.242 416630-G — 297,723 University of Southern California 93.242 82396976 — 20,064 University of Vermont 93.242 32146SUB52469 — 93,256 University of Western Australia 93.242 7R01 MH118218-02 — 65,417 Wake Forest University 93.242 100000-551843 — 19,166 Wake Forest University 93.242 100000-550833 — 19,166 Washington University in St. Louis 93.242 WU-19-70 — (1) Washington University in St. Louis 93.242 WU-20-279 — 153,452 Washington University in St. Louis 93.242 WU-20-121 — 20,124 Yale University 93.242 GR100611-CON80000808 — 17,141
Subtotal 93.242 3,548,907 49,002,867
Alcohol Research Programs 93.273 Direct 300,069 6,499,671 Athersys, Inc. 93.273 STTR PHASE II — 19,770 Carnegie Mellon University 93.273 1090526-389745 — 19,651 Cleveland Clinic Lerner College of Medicine 93.273 1113-SUB — 2,506 Cleveland Clinic Lerner College of Medicine 93.273 1319-SUB — 12,807 Pacific Institute for Research and Evaluation 93.273 0097.37.06 — 140,238 Pacific Institute for Research and Evaluation 93.273 0097.38.06 — 129,686 Pennsylvania State University 93.273 6142-UP-DHHS-7288 — 5,964 University of Washington 93.273 UWSC10629 — 9,406 Wayne State University 93.273 WSU18014 — 24,715 Yale University 93.273 GK000083 CON80000363 — 8,443 Yale University 93.273 GR104428CON-80001431 — 2,403 Yale University 93.273 GR107463CON-80001902 — 12,374
Subtotal 93.273 300,069 6,887,634
Drug Abuse and Addiction Research Programs 93.279 Direct 2,659,584 14,047,889 Boston Medical Center 93.279 6161 – 6885 — 2,985 Carnegie Mellon University 93.279 1090553-404923 — 39,157
(Continued)39

UNIVERSITY OF PITTSBURGH – OF THECOMMONWEALTH SYSTEM OF HIGHER EDUCATION
Schedule of Expenditures of Federal Awards
Year ended June 30, 2020
PassedCFDA Direct award or pass-through through to Federal
Federal grantor/pass through grantor/program title number entity identifying number subrecipients expendituresCarnegie Mellon University 93.279 1090602-424175 $ — 39,629 Duke University 93.279 2034171 — 596 Duke University 93.279 2037242 — (901) Hennepin Healthcare Research Institute 93.279 15159-4-Pitt — 12,623 Jackson Laboratory 93.279 210247-0419-09 — 159,522 Magee-Womens Research Institute & Foundation 93.279 7421 — 4,788 Magee-Womens Research Institute & Foundation 93.279 6590 — 165,889 McLean Hospital 93.279 401655 — 56,951 McLean Hospital 93.279 401108 — 36,128 Northwestern University 93.279 60050859 PITT — 15,021 Oregon Health & Science University 93.279 1006667_UPITT — 12 RTI International 93.279 888-11-16-02 — 62,358 SRI International 93.279 PO27396 — 43,921 Tamade, LLC 93.279 01 PITT — 49,136 University of California San Diego 93.279 113950787 — 22,041 University of California San Diego 93.279 117780914/S9002323 — 4,926 University of Massachusetts 93.279 WA00458201OSP2017020 — 248,266 University of Nebraska Medical Center 93.279 34-5250-2009-001 — 258,036 Virginia Commonwealth University 93.279 FP00000224_SA005 — 44,884 Yale University 93.279 GR104009-CON80001376 — 6,514
Subtotal 93.279 2,659,584 15,320,371
Discovery and Applied Research for TechnologicalInnovations to Improve Human Health 93.286 Direct 492,223 3,877,269
Carnegie Mellon University 93.286 1090530-395680 — 16,306 Carnegie Mellon University 93.286 1090550-405293 — 7,610 Case Western Reserve University 93.286 RES513611 — (5,176) Case Western Reserve University 93.286 RES514740 — 69,294 Children’s Hospital of Los Angeles 93.286 RGF010339-B — 114,112 Illinois Institute of Technology 93.286 A19-0016-S001 — 15,917 Massachusetts General Hospital 93.286 233327 — 193,007 Sheehan Medical LLC 93.286 ULTRASOUND TRAINING — (21) University of North Carolina 93.286 5108992 — 49,774 University of Utah 93.286 10049378-UPITT — 111,566 University of Wisconsin 93.286 0000000358 — 140,609
Subtotal 93.286 492,223 4,590,267
Minority Health and Health Disparities Research 93.307 Direct 618,355 3,007,393 Columbia University 93.307 2(GG012238) — 71,555 Mayo Clinic Rochester 93.307 UNI-259664/PO #66958 — 8,495 University of Arizona 93.307 462673 — 31,565 University of Chicago 93.307 FP064671-01 5,839 7,063 University of Iowa 93.307 1001859514 — 2,754 University of Mississippi Medical Center 93.307 66106330216UP — 7,182 University of North Carolina 93.307 5115736 — 40,894 University of Puerto Rico Medical Sciences Campus 93.307 PRENATAL STRESSORS — 16,131 Virginia Commonwealth University 93.307 FP00000731_SA001 — 30,617
Subtotal 93.307 624,194 3,223,649
Trans-NIH Research Support 93.310 Direct 1,728,564 20,527,614 Carnegie Mellon University 93.310 1090565-407039 — (1,050) Carnegie Mellon University 93.310 1090580-423516 — 719,126 Carnegie Mellon University 93.310 1090580-423515 — 30,170 Case Western Reserve University 93.310 RES512402 — 44,849 Case Western Reserve University 93.310 RES514373 — 35,646 GE Global Research 93.310 401134920 — 71,255 Massachusetts General Hospital 93.310 233284 — 22,735 Medical College of Wisconsin 93.310 5U24 HG010423-02 — 23,239 Micro-Leads, Inc. 93.310 3OT2OD024908PITT4908 — 2,985 Micro-Leads, Inc. 93.310 3OT2OD024908-01S1 — 126,054 Mount Sinai School of Medicine 93.310 0255-2443-4609 — 3,917 Mount Sinai School of Medicine 93.310 0255-2446-4609 — 37,674 Pacific Northwest National Laboratory 93.310 503935 — 7,531 University of California at Los Angeles 93.310 1553 G VC502 — (1,730) University of Melbourne 93.310 3OT2OD023872TA102211 — 84,101 University of Rochester 93.310 417410GURFAOGR510838 — 27,324 University of Rochester 93.310 417410G/UR FAO GR510 — 127,212 University of Toledo 93.310 F-2018-25 — 157,425 University of Wisconsin 93.310 830K631 — 17,083 University of Wisconsin 93.310 0000000207 — 103,990 Vanderbilt University Medical Center 93.310 VUMC71992 — 24,266
Subtotal 93.310 1,728,564 22,191,416
National Center for Advancing Translational Sciences 93.350 Direct 5,523,124 21,943,625 Children’s Hospital of Boston 93.350 GENFD0001706508 — 41,727 Duke University 93.350 203-7853 — 33,245 Tufts Medical Center 93.350 5016899-SERV — 15,185
(Continued)40

UNIVERSITY OF PITTSBURGH – OF THECOMMONWEALTH SYSTEM OF HIGHER EDUCATION
Schedule of Expenditures of Federal Awards
Year ended June 30, 2020
PassedCFDA Direct award or pass-through through to Federal
Federal grantor/pass through grantor/program title number entity identifying number subrecipients expendituresTufts Medical Center 93.350 5017092-SERV $ — 40,284 University of Texas Health Science Center at San Antonio 93.350 165615/165608 — 143,494
University of Utah 93.350 10046258-04 — 6,919 Vanderbilt University 93.350 UNIV60378 — 511,269 Washington University in St. Louis 93.350 WU-18-404-MOD-1 — (7,758)
Subtotal 93.350 5,523,124 22,727,990
Research Infrastructure Programs 93.351 Direct 341,252 1,401,175 Carnegie Mellon University 93.351 1090520-394508 — 70,667 Case Western Reserve University 93.351 RES512402 — 267,299 Magee-Womens Research Institute & Foundation 93.351 2667 — 58,606 University of Michigan 93.351 3004884630 — 70,794
Subtotal 93.351 341,252 1,868,541
Fred Hutchinson Cancer Research Center 93.353 00009963491 — 6,978 Fred Hutchinson Cancer Research Center 93.353 0001003173 — 3,250 Magee-Womens Research Institute & Foundation 93.353 6800 — 221,226 Roswell Park Cancer Institute 93.353 378-01 — 209,043
Subtotal 93.353 — 440,497
Nursing Research 93.361 Direct 477,426 3,829,289 Cornell University 93.361 84286-11030 — 157,616 Duke University 93.361 205859 — 2,947 Magee-Womens Research Institute & Foundation 93.361 7015 — 148,884 University of California at San Francisco 93.361 11808sc — 13,870 University of Colorado 93.361 FY20.1011.001 — 16,031 University of North Carolina 93.361 5112455 — 12,845 University of North Carolina 93.361 5106245 — 107,371 University of Tennessee 93.361 20-0108-PITT — 30,133
Subtotal 93.361 477,426 4,318,986
Cancer Cause and Prevention Research 93.393 Direct 522,209 7,489,369 Carnegie Mellon University 93.393 1090617-429056 — 4,598 Carnegie Mellon University 93.393 1090617-429439 — 25,144 Children’s Hospital of Boston 93.393 GENFD0001693799 — 63,347 Fred Hutchinson Cancer Research Center 93.393 0000956670 — 3,010 International Agency for Research on Cancer 93.393 CRA/GEP/2018/1 — 69,301 Johns Hopkins University 93.393 2003599606 — 57,158 Mayo Clinic Rochester 93.393 UNI-256642 — 28,808 Northwestern University 93.393 60037274 UP — 13,088 Northwestern University 93.393 60047262 PITT — 1,806 Rand Corporation 93.393 9920190020 — 87,090 University of Colorado 93.393 FY20.788.001 — 35,634 University of Pennsylvania 93.393 568654 — 22,575 University of Southern California 93.393 87299989 — 4,152 University of Southern California 93.393 112322259 — 22,556 University of Texas M.D. Anderson Cancer Center 93.393 3000991391 — 2,612 University of Texas M.D. Anderson Cancer Center 93.393 3001065589 — 8,821 University of Texas M.D. Anderson Cancer Center 93.393 3001463099 — 40,779 University of Virginia 93.393 GB10208 150461 — 13,679 Vanderbilt University Medical Center 93.393 VUMC74743 — 15,580 Washington State University 93.393 130544-G003975 — 42,912
Subtotal 93.393 522,209 8,052,019
Cancer Detection and Diagnosis Research 93.394 Direct 891,884 4,833,002 Boston University 93.394 4500002272 — 86,713 Brigham & Women’s Hospital 93.394 115580 — 148,890 Cernostics, Inc. 93.394 R44CA192416SA — (181) Duquesne University 93.394 G1400051 — 46,200 Fred Hutchinson Cancer Research Center 93.394 0000989339 — 12,125 Fred Hutchinson Cancer Research Center 93.394 ADVANCE ACCOUNT — 4,042 Johns Hopkins University 93.394 JHU_BRAND YR4 — 45,057 Magee-Womens Research Institute & Foundation 93.394 5105 — 44,729 Massachusetts General Hospital 93.394 226786 — 45,328 NRG Oncology Foundation, Inc. 93.394 NRG BSB-PITT YR 1 946 946 NRG Oncology Foundation, Inc. 93.394 NRG BSB 29,912 49,357 Ohio State University 93.394 60070453 — 111,693 University of Chicago 93.394 AWD042423-03-PR 92,364 2,952,032 University of Chicago 93.394 ADVANCE ACCOUNT — 1,407,871 University of Texas M.D. Anderson Cancer Center 93.394 3001529471 — 34,224 University of Washington 93.394 UWSC10500 — 7,232 Van Andel Institute 93.394 V313-R1-2 — 120,058 Van Andel Institute 93.394 V544-CR1-2 — 71,279 Vanderbilt University Medical Center 93.394 VUMC79758 — 9,710
Subtotal 93.394 1,015,106 10,030,307
Cancer Treatment Research 93.395 Direct 733,030 13,208,870 Brigham & Women’s Hospital 93.395 120624 18,561 461,682
(Continued)41

UNIVERSITY OF PITTSBURGH – OF THECOMMONWEALTH SYSTEM OF HIGHER EDUCATION
Schedule of Expenditures of Federal Awards
Year ended June 30, 2020
PassedCFDA Direct award or pass-through through to Federal
Federal grantor/pass through grantor/program title number entity identifying number subrecipients expendituresBrigham & Women’s Hospital 93.395 120627 $ — 173,509 Cancer Targeted Technology, LLC 93.395 CTT-PITT09192018 — 64,907 Cedars-Sinai Medical Center 93.395 1524466 — 45,611 Cedars-Sinai Medical Center 93.395 1620971 — 34,653 Children’s Hospital of Philadelphia 93.395 3208130624 — 65,740 Children’s Hospital of Philadelphia 93.395 9500120719-04C — 7,184 Children’s Hospital of Philadelphia 93.395 FP00017458_SUB52_01 — 8,374 Children’s Hospital of Philadelphia 93.395 FP00021561_SUB04_01 — 4,569 Children’s Hospital of Philadelphia 93.395 FP00025505_SUB26_01 — 93,997 Children’s Hospital of Philadelphia 93.395 FP00025505_SUB79_01 — 6,342 Children’s Hospital of Philadelphia 93.395 FP00026529_SUB208_01 — 73,928 Children’s Hospital of Philadelphia 93.395 FP25505_SUB75_01 — 6,820 Children’s Hospital of Philadelphia 93.395 SUB31 01 — 60,752 Children’s Research Institute 93.395 30004166-04 — 16,997 Ecog-Acrin Medical Research Foundation, Inc. 93.395 IND FED — (7,784) Ecog-Acrin Medical Research Foundation, Inc. 93.395 NCORP AGREEMENT — 822 Ecog-Acrin Medical Research Foundation, Inc. 93.395 NCTN AGREEMENT — 9,341 Ecog-Acrin Medical Research Foundation, Inc. 93.395 U10CA180820-06PITT1C — 6,305 Ecog-Acrin Medical Research Foundation, Inc. 93.395 UG1CA189828-06-PITT1 — 12,866 Fred Hutchinson Cancer Research Center 93.395 0000990735 — 13,872 Johns Hopkins University 93.395 ABTC 1401 — 5,746 Johns Hopkins University 93.395 ABTC 1601 — 4,333 Johns Hopkins University 93.395 ABTC 1603 — 7,512 Johns Hopkins University 93.395 ABTC 1604 — 999 Johns Hopkins University 93.395 ABTC 1801 — 2,230 Johns Hopkins University 93.395 ABTC1501BMSCA209-596 — 24,269 Magee-Womens Research Institute & Foundation 93.395 6804 — 86,763 Mayo Clinic Rochester 93.395 ALLIANCE — 3,947 NRG Oncology Foundation, Inc. 93.395 FORTE01-SCHOEN — 483 NRG Oncology Foundation, Inc. 93.395 NRG FED — 8,114 NRG Oncology Foundation, Inc. 93.395 PITT SDMC-NCORP-01 416,965 548,747 NSABP Foundation, Inc. 93.395 NRG-Rastogi-GY6 — (2,522) NSABP Foundation, Inc. 93.395 NSABP-Rastogi-GY6 — 196,771 NSABP Foundation, Inc. 93.395 WASHU GY5 – NSABP — 1,226 Oncovir, Inc. 93.395 16-028 ONC2014-001 — (2,992) Seattle Children’s Hospital 93.395 12198SUB — 40,239 St. Jude Children’s Research Hospital 93.395 110068201-7815261 — 37,142 St. Jude Children’s Research Hospital 93.395 110068200-7815261 — 2 St. Jude Children’s Research Hospital 93.395 PBTC-051 — 1,134 Texas State University 93.395 19022-83187-1 — 12,920 University of California at San Francisco 93.395 8985SC — 17,665 University of Illinois 93.395 16349 — 89,768 University of Michigan 93.395 3004687808 — 207,081 University of South Alabama 93.395 A17-0064-S003 — 30,131 University of Virginia 93.395 GI15368 — 588 Washington University in St. Louis 93.395 WU-17-437 — 25,131
Subtotal 93.395 1,168,556 15,716,784
Cancer Biology Research 93.396 Direct 149,250 5,851,965 Aethlon Medical, Inc. 93.396 0001 — 35,476 Fred Hutchinson Cancer Research Center 93.396 0000979569/215475 — 27,187 Johns Hopkins University 93.396 2004525404 — 1,724 Love Research Foundation 93.396 PITT-CA189966 — 20,358 Magee-Womens Research Institute & Foundation 93.396 6807 — 128,452 Magee-Womens Research Institute & Foundation 93.396 6810 — 225,505 Ohio State University 93.396 60072259 — 20,823 Texas A&M University 93.396 M1901199 — 8,716 University of Pennsylvania 93.396 568432 — 99,886 University of Texas M.D. Anderson Cancer Center 93.396 3001122307 — 10,985 University of Texas Southwestern Medical Center 93.396 GMO 201209 — 4,598 Wistar Institute 93.396 29016-02-324 — 116,763
Subtotal 93.396 149,250 6,552,438
Cancer Centers Support Grants 93.397 Direct 245,568 7,792,374 Mayo Clinic Rochester 93.397 UNI-245908 — 18,781 Roswell Park Cancer Institute 93.397 122-06 — 9,684
Subtotal 93.397 245,568 7,820,839
Cancer Research Manpower 93.398 Direct — 2,159,311 Magee-Womens Research Institute & Foundation 93.398 6592 — 24,639 Magee-Womens Research Institute & Foundation 93.398 6593 — 115,579 University of Rochester 93.398 417346 — (5,861) University of Rochester 93.398 417575 — 88,552
Subtotal 93.398 — 2,382,220
Cardiovascular Diseases Research 93.837 Direct 3,044,950 33,114,624 All Children’s Research Institute, Inc. 93.837 ACRI 13-001 — 2,595 Beth Israel Deaconess Medical Center 93.837 01028492 — 687 BloodCenter of Wisconsin, Inc. 93.837 1001023-Pitt — 3,426
(Continued)42

UNIVERSITY OF PITTSBURGH – OF THECOMMONWEALTH SYSTEM OF HIGHER EDUCATION
Schedule of Expenditures of Federal Awards
Year ended June 30, 2020
PassedCFDA Direct award or pass-through through to Federal
Federal grantor/pass through grantor/program title number entity identifying number subrecipients expendituresBrigham & Women’s Hospital 93.837 INVESTED $ — 2,565 Brown University 93.837 00000954 — 197,981 Brown University 93.837 00000960 — 201,867 Brown University 93.837 00001214 — 47,294 Children’s Hospital of Philadelphia 93.837 962896RSUB3200170321 — 1,976 Cleveland Clinic Lerner College of Medicine 93.837 1226-SUB — 40,775 Cornell University 93.837 84545-11080 — 19,973 Duke University 93.837 2037350 — (9,521) Duke University 93.837 2037894 — 3,192 Duke University 93.837 A031560 — 119,508 Emory University 93.837 A202925 — 68,747 Emory University 93.837 T805573 — 12,373 Emory University 93.837 T962650 — 28,721 Feinstein Institute for Medical Research 93.837 500736UOP — 79,999 Florida International University 93.837 800006875-01UG — (353) Henry M. Jackson Foundation 93.837 3735 — 428 Indiana University 93.837 IN-4688372-PIT — 1,479 Kaiser Foundation Research Institute 93.837 OOS030150_UoP — 15,933 Kaiser Foundation Research Institute 93.837 RNG209939-01 — 16,417 Magee-Womens Research Institute & Foundation 93.837 2226 — 30,142 Magee-Womens Research Institute & Foundation 93.837 5260 — 4,960 Magee-Womens Research Institute & Foundation 93.837 5270 — 27,200 Magee-Womens Research Institute & Foundation 93.837 5275 — 2,210 Massachusetts General Hospital 93.837 225709 — 30,393 Massachusetts General Hospital 93.837 226586 — 35,190 Massachusetts General Hospital 93.837 230547 — 254,466 Medical College of Wisconsin 93.837 5R01 HL119747-05 — (1,982) Mount Sinai School of Medicine 93.837 0255-A341-4605 — (4) New England Research Institutes 93.837 BEST-CLI — 42,496 New England Research Institutes 93.837 HEART NETWORK — 110,372 New England Research Institutes 93.837 HEART NETWORK SUBAWD — 8,656 New York University 93.837 15-A1-00-003412-01 — 18,101 Ohio State University 93.837 60059059 — 23,752 Oregon Health & Science University 93.837 1011985_UPITT — 22,374 Rand Corporation 93.837 9920180116 — 100,073 Rand Corporation 93.837 9920190079 — 21,227 Rand Corporation 93.837 SCON-00000023 — 77,602 Research Foundation – State University of New York 93.837 100-1091654-83591 — 10,789 University of Alabama 93.837 000518176-004 A05 — 367
University of California at Los Angeles 93.837 1520 G WC256 — 47,352 University of California at San Francisco 93.837 10893SC — 45,486 University of California at San Francisco 93.837 11668sc — 283 University of Chicago 93.837 FP064434-B — 299,944 University of Delaware 93.837 45433 28,529 226,154 University of Minnesota 93.837 N005339702 — 4,763 University of Minnesota 93.837 N006187439 — 2,877 University of Nebraska Medical Center 93.837 ADVANCE ACCOUNT — 16,247 University of Pennsylvania 93.837 569052 — (468) University of Rochester 93.837 417044GURFAOGR500479 — 3,795 University of Washington 93.837 UWSC8676 — (643) University of Washington 93.837 UWSC9052 — 62,809 University of Washington 93.837 UWSC9200 — 39,713 Yale University 93.837 GR103769-CON80001340 — 571 Yale University 93.837 GR107265-CON80001869 — 65,715 Yale University 93.837 SNP6462264 — 1,131
Subtotal 93.837 3,073,479 35,604,799
Lung Diseases Research 93.838 Direct 4,727,709 29,554,357 Allegheny Health Network 93.838 49708209 — 2,814 Brigham & Women’s Hospital 93.838 122869 — 53,360 COPD Foundation, Inc. 93.838 003 — 8,982 Indiana University 93.838 IN4687826UP — 12,352 Johns Hopkins University 93.838 2003090748 — 21,656 Massachusetts General Hospital 93.838 229960 – PETAL 75,666 179,374 National Jewish Medical and Research Center 93.838 20072410 — 70,998 Ohio State University 93.838 60070682 — 303,532 Ohio State University 93.838 60070683 — 173,649 Ohio State University 93.838 60070684 23,546 372,597 Ohio State University 93.838 60070685 — 428,964 Ohio State University 93.838 60070686 — 347,044 Ohio State University 93.838 60076004 — 1,883 Pennsylvania State University 93.838 PITSCHL109086 — (4,565) Rhode Island Hospital 93.838 701-7137369 — 17,202 Scripps Research Institute 93.838 5-27245 — 100,328 University of Alabama 93.838 000507361-009 A03 — 32,064 University of Alabama 93.838 000521782-SC001 — 27,541 University of Alabama 93.838 000513913-001 — 8,254 University of Michigan 93.838 3004174082 — 267,122 University of Minnesota 93.838 N006919401 — 15,842 University of North Carolina 93.838 5114474-H3PITTSBUR — 74,116
(Continued)43
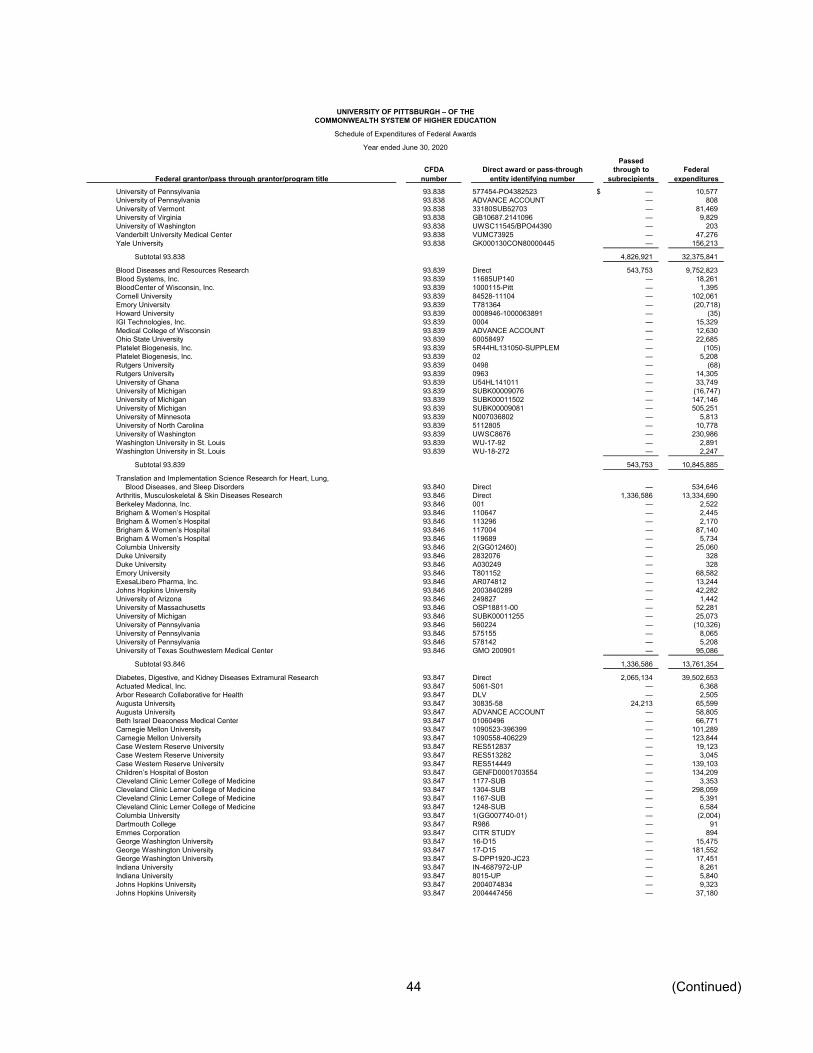
UNIVERSITY OF PITTSBURGH – OF THECOMMONWEALTH SYSTEM OF HIGHER EDUCATION
Schedule of Expenditures of Federal Awards
Year ended June 30, 2020
PassedCFDA Direct award or pass-through through to Federal
Federal grantor/pass through grantor/program title number entity identifying number subrecipients expendituresUniversity of Pennsylvania 93.838 577454-PO4382523 $ — 10,577 University of Pennsylvania 93.838 ADVANCE ACCOUNT — 808 University of Vermont 93.838 33180SUB52703 — 81,469 University of Virginia 93.838 GB10687.2141096 — 9,829 University of Washington 93.838 UWSC11545/BPO44390 — 203 Vanderbilt University Medical Center 93.838 VUMC73925 — 47,276 Yale University 93.838 GK000130CON80000445 — 156,213
Subtotal 93.838 4,826,921 32,375,841
Blood Diseases and Resources Research 93.839 Direct 543,753 9,752,823 Blood Systems, Inc. 93.839 11685UP140 — 18,261 BloodCenter of Wisconsin, Inc. 93.839 1000115-Pitt — 1,395 Cornell University 93.839 84528-11104 — 102,061 Emory University 93.839 T781364 — (20,718) Howard University 93.839 0008946-1000063891 — (35) IGI Technologies, Inc. 93.839 0004 — 15,329 Medical College of Wisconsin 93.839 ADVANCE ACCOUNT — 12,630 Ohio State University 93.839 60058497 — 22,685 Platelet Biogenesis, Inc. 93.839 5R44HL131050-SUPPLEM — (105) Platelet Biogenesis, Inc. 93.839 02 — 5,208 Rutgers University 93.839 0498 — (68) Rutgers University 93.839 0963 — 14,305 University of Ghana 93.839 U54HL141011 — 33,749 University of Michigan 93.839 SUBK00009076 — (16,747) University of Michigan 93.839 SUBK00011502 — 147,146 University of Michigan 93.839 SUBK00009081 — 505,251 University of Minnesota 93.839 N007036802 — 5,813 University of North Carolina 93.839 5112805 — 10,778 University of Washington 93.839 UWSC8676 — 230,986 Washington University in St. Louis 93.839 WU-17-92 — 2,891 Washington University in St. Louis 93.839 WU-18-272 — 2,247
Subtotal 93.839 543,753 10,845,885
Translation and Implementation Science Research for Heart, Lung,Blood Diseases, and Sleep Disorders 93.840 Direct — 534,646
Arthritis, Musculoskeletal & Skin Diseases Research 93.846 Direct 1,336,586 13,334,690 Berkeley Madonna, Inc. 93.846 001 — 2,522 Brigham & Women’s Hospital 93.846 110647 — 2,445 Brigham & Women’s Hospital 93.846 113296 — 2,170 Brigham & Women’s Hospital 93.846 117004 — 87,140 Brigham & Women’s Hospital 93.846 119689 — 5,734 Columbia University 93.846 2(GG012460) — 25,060 Duke University 93.846 2832076 — 328 Duke University 93.846 A030249 — 328 Emory University 93.846 T801152 — 68,582 ExesaLibero Pharma, Inc. 93.846 AR074812 — 13,244 Johns Hopkins University 93.846 2003840289 — 42,282 University of Arizona 93.846 249827 — 1,442 University of Massachusetts 93.846 OSP18811-00 — 52,281 University of Michigan 93.846 SUBK00011255 — 25,073 University of Pennsylvania 93.846 560224 — (10,326) University of Pennsylvania 93.846 575155 — 8,065 University of Pennsylvania 93.846 578142 — 5,208 University of Texas Southwestern Medical Center 93.846 GMO 200901 — 95,086
Subtotal 93.846 1,336,586 13,761,354
Diabetes, Digestive, and Kidney Diseases Extramural Research 93.847 Direct 2,065,134 39,502,653 Actuated Medical, Inc. 93.847 5061-S01 — 6,368 Arbor Research Collaborative for Health 93.847 DLV — 2,505 Augusta University 93.847 30835-58 24,213 65,599 Augusta University 93.847 ADVANCE ACCOUNT — 58,805 Beth Israel Deaconess Medical Center 93.847 01060496 — 66,771 Carnegie Mellon University 93.847 1090523-396399 — 101,289 Carnegie Mellon University 93.847 1090558-406229 — 123,844 Case Western Reserve University 93.847 RES512837 — 19,123 Case Western Reserve University 93.847 RES513282 — 3,045 Case Western Reserve University 93.847 RES514449 — 139,103 Children’s Hospital of Boston 93.847 GENFD0001703554 — 134,209 Cleveland Clinic Lerner College of Medicine 93.847 1177-SUB — 3,353 Cleveland Clinic Lerner College of Medicine 93.847 1304-SUB — 298,059 Cleveland Clinic Lerner College of Medicine 93.847 1167-SUB — 5,391 Cleveland Clinic Lerner College of Medicine 93.847 1248-SUB — 6,584 Columbia University 93.847 1(GG007740-01) — (2,004) Dartmouth College 93.847 R986 — 91 Emmes Corporation 93.847 CITR STUDY — 894 George Washington University 93.847 16-D15 — 15,475 George Washington University 93.847 17-D15 — 181,552 George Washington University 93.847 S-DPP1920-JC23 — 17,451 Indiana University 93.847 IN-4687972-UP — 8,261 Indiana University 93.847 8015-UP — 5,840 Johns Hopkins University 93.847 2004074834 — 9,323 Johns Hopkins University 93.847 2004447456 — 37,180
(Continued)44
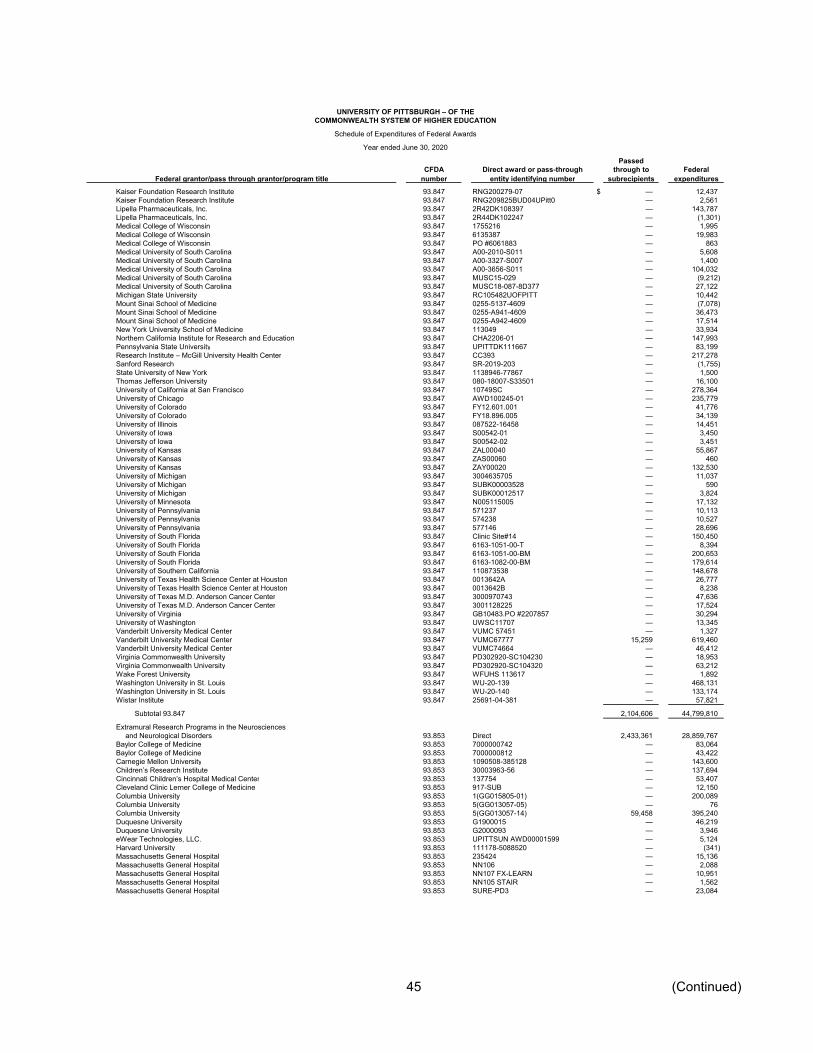
UNIVERSITY OF PITTSBURGH – OF THECOMMONWEALTH SYSTEM OF HIGHER EDUCATION
Schedule of Expenditures of Federal Awards
Year ended June 30, 2020
PassedCFDA Direct award or pass-through through to Federal
Federal grantor/pass through grantor/program title number entity identifying number subrecipients expendituresKaiser Foundation Research Institute 93.847 RNG200279-07 $ — 12,437 Kaiser Foundation Research Institute 93.847 RNG209825BUD04UPitt0 — 2,561 Lipella Pharmaceuticals, Inc. 93.847 2R42DK108397 — 143,787 Lipella Pharmaceuticals, Inc. 93.847 2R44DK102247 — (1,301) Medical College of Wisconsin 93.847 1755216 — 1,995 Medical College of Wisconsin 93.847 6135387 — 19,983 Medical College of Wisconsin 93.847 PO #6061883 — 863 Medical University of South Carolina 93.847 A00-2010-S011 — 5,608 Medical University of South Carolina 93.847 A00-3327-S007 — 1,400 Medical University of South Carolina 93.847 A00-3656-S011 — 104,032 Medical University of South Carolina 93.847 MUSC15-029 — (9,212) Medical University of South Carolina 93.847 MUSC18-087-8D377 — 27,122 Michigan State University 93.847 RC105482UOFPITT — 10,442 Mount Sinai School of Medicine 93.847 0255-5137-4609 — (7,078) Mount Sinai School of Medicine 93.847 0255-A941-4609 — 36,473 Mount Sinai School of Medicine 93.847 0255-A942-4609 — 17,514 New York University School of Medicine 93.847 113049 — 33,934 Northern California Institute for Research and Education 93.847 CHA2206-01 — 147,993 Pennsylvania State University 93.847 UPITTDK111667 — 83,199 Research Institute – McGill University Health Center 93.847 CC393 — 217,278 Sanford Research 93.847 SR-2019-203 — (1,755) State University of New York 93.847 1138946-77867 — 1,500 Thomas Jefferson University 93.847 080-18007-S33501 — 16,100 University of California at San Francisco 93.847 10749SC — 278,364 University of Chicago 93.847 AWD100245-01 — 235,779 University of Colorado 93.847 FY12.601.001 — 41,776 University of Colorado 93.847 FY18.896.005 — 34,139 University of Illinois 93.847 087522-16458 — 14,451 University of Iowa 93.847 S00542-01 — 3,450 University of Iowa 93.847 S00542-02 — 3,451 University of Kansas 93.847 ZAL00040 — 55,867 University of Kansas 93.847 ZAS00060 — 460 University of Kansas 93.847 ZAY00020 — 132,530 University of Michigan 93.847 3004635705 — 11,037 University of Michigan 93.847 SUBK00003528 — 590 University of Michigan 93.847 SUBK00012517 — 3,824 University of Minnesota 93.847 N005115005 — 17,132 University of Pennsylvania 93.847 571237 — 10,113 University of Pennsylvania 93.847 574238 — 10,527 University of Pennsylvania 93.847 577146 — 28,696 University of South Florida 93.847 Clinic Site#14 — 150,450 University of South Florida 93.847 6163-1051-00-T — 8,394 University of South Florida 93.847 6163-1051-00-BM — 200,653 University of South Florida 93.847 6163-1082-00-BM — 179,614 University of Southern California 93.847 110873538 — 148,678 University of Texas Health Science Center at Houston 93.847 0013642A — 26,777 University of Texas Health Science Center at Houston 93.847 0013642B — 8,238 University of Texas M.D. Anderson Cancer Center 93.847 3000970743 — 47,636 University of Texas M.D. Anderson Cancer Center 93.847 3001128225 — 17,524 University of Virginia 93.847 GB10483.PO #2207857 — 30,294 University of Washington 93.847 UWSC11707 — 13,345 Vanderbilt University Medical Center 93.847 VUMC 57451 — 1,327 Vanderbilt University Medical Center 93.847 VUMC67777 15,259 619,460 Vanderbilt University Medical Center 93.847 VUMC74664 — 46,412 Virginia Commonwealth University 93.847 PD302920-SC104230 — 18,953 Virginia Commonwealth University 93.847 PD302920-SC104320 — 63,212 Wake Forest University 93.847 WFUHS 113617 — 1,892 Washington University in St. Louis 93.847 WU-20-139 — 468,131 Washington University in St. Louis 93.847 WU-20-140 — 133,174 Wistar Institute 93.847 25691-04-381 — 57,821
Subtotal 93.847 2,104,606 44,799,810
Extramural Research Programs in the Neurosciencesand Neurological Disorders 93.853 Direct 2,433,361 28,859,767
Baylor College of Medicine 93.853 7000000742 — 83,064 Baylor College of Medicine 93.853 7000000812 — 43,422 Carnegie Mellon University 93.853 1090508-385128 — 143,600 Children’s Research Institute 93.853 30003963-56 — 137,694 Cincinnati Children’s Hospital Medical Center 93.853 137754 — 53,407 Cleveland Clinic Lerner College of Medicine 93.853 917-SUB — 12,150 Columbia University 93.853 1(GG015805-01) — 200,089 Columbia University 93.853 5(GG013057-05) — 76 Columbia University 93.853 5(GG013057-14) 59,458 395,240 Duquesne University 93.853 G1900015 — 46,219 Duquesne University 93.853 G2000093 — 3,946 eWear Technologies, LLC. 93.853 UPITTSUN AWD00001599 — 5,124 Harvard University 93.853 111178-5088520 — (341) Massachusetts General Hospital 93.853 235424 — 15,136 Massachusetts General Hospital 93.853 NN106 — 2,088 Massachusetts General Hospital 93.853 NN107 FX-LEARN — 10,951 Massachusetts General Hospital 93.853 NN105 STAIR — 1,562 Massachusetts General Hospital 93.853 SURE-PD3 — 23,084
(Continued)45
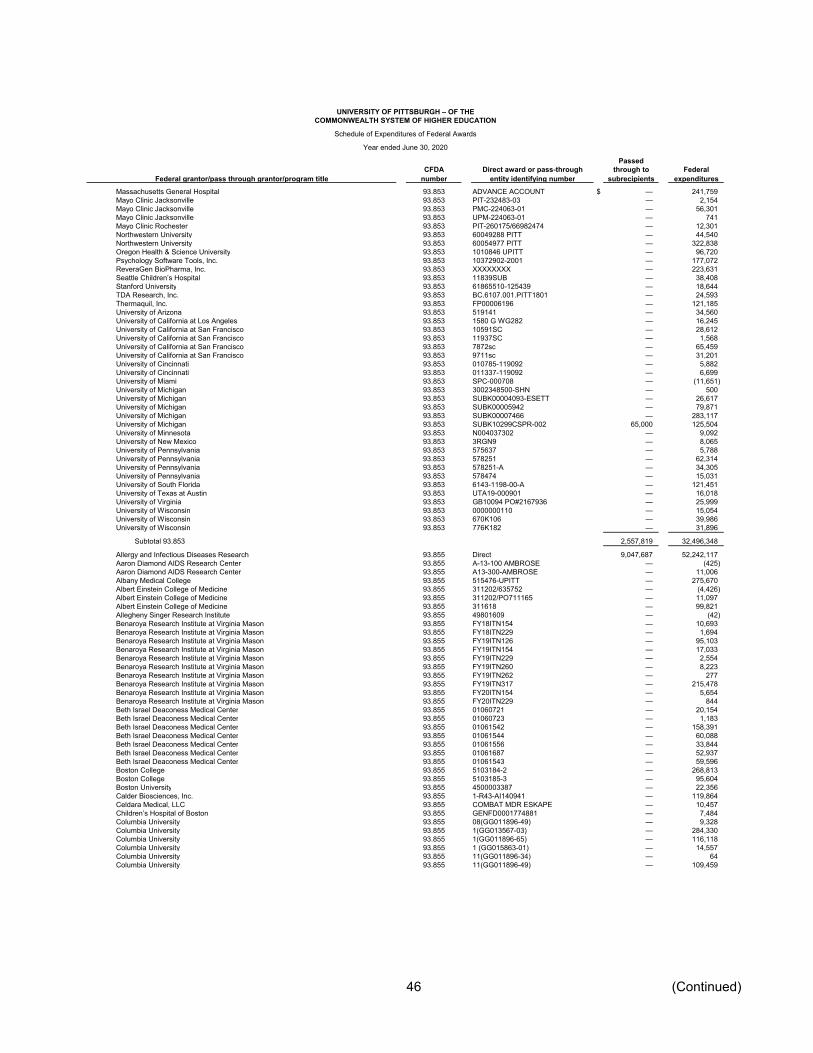
UNIVERSITY OF PITTSBURGH – OF THECOMMONWEALTH SYSTEM OF HIGHER EDUCATION
Schedule of Expenditures of Federal Awards
Year ended June 30, 2020
PassedCFDA Direct award or pass-through through to Federal
Federal grantor/pass through grantor/program title number entity identifying number subrecipients expendituresMassachusetts General Hospital 93.853 ADVANCE ACCOUNT $ — 241,759 Mayo Clinic Jacksonville 93.853 PIT-232483-03 — 2,154 Mayo Clinic Jacksonville 93.853 PMC-224063-01 — 56,301 Mayo Clinic Jacksonville 93.853 UPM-224063-01 — 741 Mayo Clinic Rochester 93.853 PIT-260175/66982474 — 12,301 Northwestern University 93.853 60049288 PITT — 44,540 Northwestern University 93.853 60054977 PITT — 322,838 Oregon Health & Science University 93.853 1010846 UPITT — 96,720 Psychology Software Tools, Inc. 93.853 10372902-2001 — 177,072 ReveraGen BioPharma, Inc. 93.853 XXXXXXXX — 223,631 Seattle Children’s Hospital 93.853 11839SUB — 38,408 Stanford University 93.853 61865510-125439 — 18,644 TDA Research, Inc. 93.853 BC.6107.001.PITT1801 — 24,593 Thermaquil, Inc. 93.853 FP00006196 — 121,185 University of Arizona 93.853 519141 — 34,560 University of California at Los Angeles 93.853 1580 G WG282 — 16,245 University of California at San Francisco 93.853 10591SC — 28,612 University of California at San Francisco 93.853 11937SC — 1,568 University of California at San Francisco 93.853 7872sc — 65,459 University of California at San Francisco 93.853 9711sc — 31,201 University of Cincinnati 93.853 010785-119092 — 5,882 University of Cincinnati 93.853 011337-119092 — 6,699 University of Miami 93.853 SPC-000708 — (11,651) University of Michigan 93.853 3002348500-SHN — 500 University of Michigan 93.853 SUBK00004093-ESETT — 26,617 University of Michigan 93.853 SUBK00005942 — 79,871 University of Michigan 93.853 SUBK00007466 — 283,117 University of Michigan 93.853 SUBK10299CSPR-002 65,000 125,504 University of Minnesota 93.853 N004037302 — 9,092 University of New Mexico 93.853 3RGN9 — 8,065 University of Pennsylvania 93.853 575637 — 5,788 University of Pennsylvania 93.853 578251 — 62,314 University of Pennsylvania 93.853 578251-A — 34,305 University of Pennsylvania 93.853 578474 — 15,031 University of South Florida 93.853 6143-1198-00-A — 121,451 University of Texas at Austin 93.853 UTA19-000901 — 16,018 University of Virginia 93.853 GB10094 PO#2167936 — 25,999 University of Wisconsin 93.853 0000000110 — 15,054 University of Wisconsin 93.853 670K106 — 39,986 University of Wisconsin 93.853 776K182 — 31,896
Subtotal 93.853 2,557,819 32,496,348
Allergy and Infectious Diseases Research 93.855 Direct 9,047,687 52,242,117 Aaron Diamond AIDS Research Center 93.855 A-13-100 AMBROSE — (425) Aaron Diamond AIDS Research Center 93.855 A13-300-AMBROSE — 11,006 Albany Medical College 93.855 515476-UPITT — 275,670 Albert Einstein College of Medicine 93.855 311202/635752 — (4,426) Albert Einstein College of Medicine 93.855 311202/PO711165 — 11,097 Albert Einstein College of Medicine 93.855 311618 — 99,821 Allegheny Singer Research Institute 93.855 49801609 — (42) Benaroya Research Institute at Virginia Mason 93.855 FY18ITN154 — 10,693 Benaroya Research Institute at Virginia Mason 93.855 FY18ITN229 — 1,694 Benaroya Research Institute at Virginia Mason 93.855 FY19ITN126 — 95,103 Benaroya Research Institute at Virginia Mason 93.855 FY19ITN154 — 17,033 Benaroya Research Institute at Virginia Mason 93.855 FY19ITN229 — 2,554 Benaroya Research Institute at Virginia Mason 93.855 FY19ITN260 — 8,223 Benaroya Research Institute at Virginia Mason 93.855 FY19ITN262 — 277 Benaroya Research Institute at Virginia Mason 93.855 FY19ITN317 — 215,478 Benaroya Research Institute at Virginia Mason 93.855 FY20ITN154 — 5,654 Benaroya Research Institute at Virginia Mason 93.855 FY20ITN229 — 844 Beth Israel Deaconess Medical Center 93.855 01060721 — 20,154 Beth Israel Deaconess Medical Center 93.855 01060723 — 1,183 Beth Israel Deaconess Medical Center 93.855 01061542 — 158,391 Beth Israel Deaconess Medical Center 93.855 01061544 — 60,088 Beth Israel Deaconess Medical Center 93.855 01061556 — 33,844 Beth Israel Deaconess Medical Center 93.855 01061687 — 52,937 Beth Israel Deaconess Medical Center 93.855 01061543 — 59,596 Boston College 93.855 5103184-2 — 268,813 Boston College 93.855 5103185-3 — 95,604 Boston University 93.855 4500003387 — 22,356 Calder Biosciences, Inc. 93.855 1-R43-AI140941 — 119,864 Celdara Medical, LLC 93.855 COMBAT MDR ESKAPE — 10,457 Children’s Hospital of Boston 93.855 GENFD0001774881 — 7,484 Columbia University 93.855 08(GG011896-49) — 9,328 Columbia University 93.855 1(GG013567-03) — 284,330 Columbia University 93.855 1(GG011896-65) — 116,118 Columbia University 93.855 1 (GG015863-01) — 14,557 Columbia University 93.855 11(GG011896-34) — 64 Columbia University 93.855 11(GG011896-49) — 109,459
(Continued)46
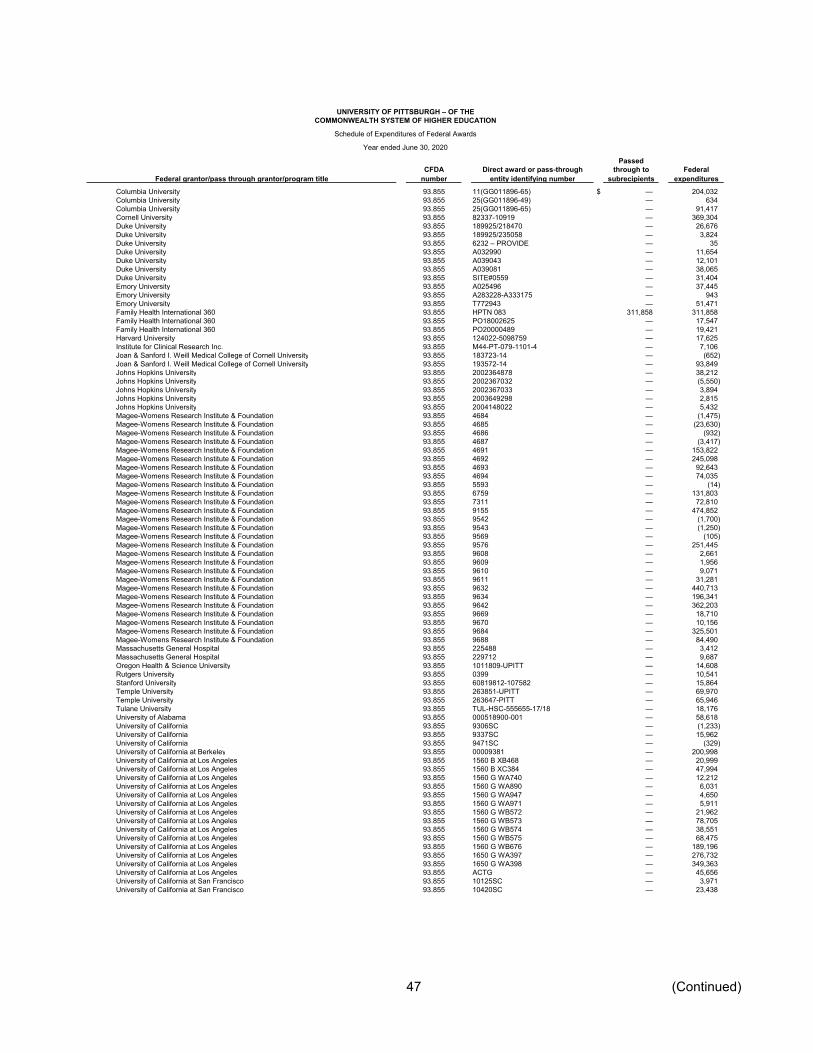
UNIVERSITY OF PITTSBURGH – OF THECOMMONWEALTH SYSTEM OF HIGHER EDUCATION
Schedule of Expenditures of Federal Awards
Year ended June 30, 2020
PassedCFDA Direct award or pass-through through to Federal
Federal grantor/pass through grantor/program title number entity identifying number subrecipients expendituresColumbia University 93.855 11(GG011896-65) $ — 204,032 Columbia University 93.855 25(GG011896-49) — 634 Columbia University 93.855 25(GG011896-65) — 91,417 Cornell University 93.855 82337-10919 — 369,304 Duke University 93.855 189925/218470 — 26,676 Duke University 93.855 189925/235058 — 3,824 Duke University 93.855 6232 – PROVIDE — 35 Duke University 93.855 A032990 — 11,654 Duke University 93.855 A039043 — 12,101 Duke University 93.855 A039081 — 38,065 Duke University 93.855 SITE#0559 — 31,404 Emory University 93.855 A025496 — 37,445 Emory University 93.855 A283228-A333175 — 943 Emory University 93.855 T772943 — 51,471 Family Health International 360 93.855 HPTN 083 311,858 311,858 Family Health International 360 93.855 PO18002625 — 17,547 Family Health International 360 93.855 PO20000489 — 19,421 Harvard University 93.855 124022-5098759 — 17,625 Institute for Clinical Research Inc. 93.855 M44-PT-079-1101-4 — 7,106 Joan & Sanford I. Weill Medical College of Cornell University 93.855 183723-14 — (652) Joan & Sanford I. Weill Medical College of Cornell University 93.855 193572-14 — 93,849 Johns Hopkins University 93.855 2002364878 — 38,212 Johns Hopkins University 93.855 2002367032 — (5,550) Johns Hopkins University 93.855 2002367033 — 3,894 Johns Hopkins University 93.855 2003649298 — 2,815 Johns Hopkins University 93.855 2004148022 — 5,432 Magee-Womens Research Institute & Foundation 93.855 4684 — (1,475) Magee-Womens Research Institute & Foundation 93.855 4685 — (23,630) Magee-Womens Research Institute & Foundation 93.855 4686 — (932) Magee-Womens Research Institute & Foundation 93.855 4687 — (3,417) Magee-Womens Research Institute & Foundation 93.855 4691 — 153,822 Magee-Womens Research Institute & Foundation 93.855 4692 — 245,098 Magee-Womens Research Institute & Foundation 93.855 4693 — 92,643 Magee-Womens Research Institute & Foundation 93.855 4694 — 74,035 Magee-Womens Research Institute & Foundation 93.855 5593 — (14) Magee-Womens Research Institute & Foundation 93.855 6759 — 131,803 Magee-Womens Research Institute & Foundation 93.855 7311 — 72,810 Magee-Womens Research Institute & Foundation 93.855 9155 — 474,852 Magee-Womens Research Institute & Foundation 93.855 9542 — (1,700) Magee-Womens Research Institute & Foundation 93.855 9543 — (1,250) Magee-Womens Research Institute & Foundation 93.855 9569 — (105) Magee-Womens Research Institute & Foundation 93.855 9576 — 251,445 Magee-Womens Research Institute & Foundation 93.855 9608 — 2,661 Magee-Womens Research Institute & Foundation 93.855 9609 — 1,956 Magee-Womens Research Institute & Foundation 93.855 9610 — 9,071 Magee-Womens Research Institute & Foundation 93.855 9611 — 31,281 Magee-Womens Research Institute & Foundation 93.855 9632 — 440,713 Magee-Womens Research Institute & Foundation 93.855 9634 — 196,341 Magee-Womens Research Institute & Foundation 93.855 9642 — 362,203 Magee-Womens Research Institute & Foundation 93.855 9669 — 18,710 Magee-Womens Research Institute & Foundation 93.855 9670 — 10,156 Magee-Womens Research Institute & Foundation 93.855 9684 — 325,501 Magee-Womens Research Institute & Foundation 93.855 9688 — 84,490 Massachusetts General Hospital 93.855 225488 — 3,412 Massachusetts General Hospital 93.855 229712 — 9,687 Oregon Health & Science University 93.855 1011809-UPITT — 14,608 Rutgers University 93.855 0399 — 10,541 Stanford University 93.855 60819812-107582 — 15,864 Temple University 93.855 263851-UPITT — 69,970 Temple University 93.855 263647-PITT — 65,946 Tulane University 93.855 TUL-HSC-555655-17/18 — 18,176 University of Alabama 93.855 000518900-001 — 58,618 University of California 93.855 9306SC — (1,233) University of California 93.855 9337SC — 15,962 University of California 93.855 9471SC — (329) University of California at Berkeley 93.855 00009381 — 200,998 University of California at Los Angeles 93.855 1560 B XB468 — 20,999 University of California at Los Angeles 93.855 1560 B XC384 — 47,994 University of California at Los Angeles 93.855 1560 G WA740 — 12,212 University of California at Los Angeles 93.855 1560 G WA890 — 6,031 University of California at Los Angeles 93.855 1560 G WA947 — 4,650 University of California at Los Angeles 93.855 1560 G WA971 — 5,911 University of California at Los Angeles 93.855 1560 G WB572 — 21,962 University of California at Los Angeles 93.855 1560 G WB573 — 78,705 University of California at Los Angeles 93.855 1560 G WB574 — 38,551 University of California at Los Angeles 93.855 1560 G WB575 — 68,475 University of California at Los Angeles 93.855 1560 G WB676 — 189,196 University of California at Los Angeles 93.855 1650 G WA397 — 276,732 University of California at Los Angeles 93.855 1650 G WA398 — 349,363 University of California at Los Angeles 93.855 ACTG — 45,656 University of California at San Francisco 93.855 10125SC — 3,971 University of California at San Francisco 93.855 10420SC — 23,438
(Continued)47
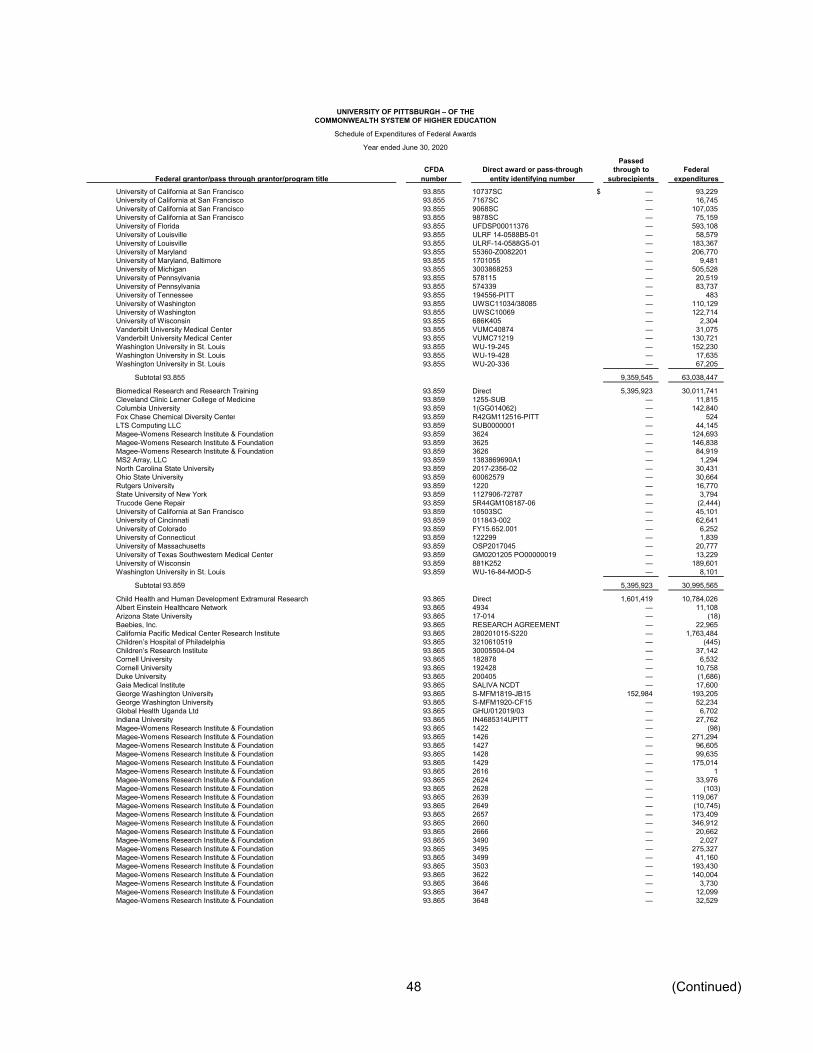
UNIVERSITY OF PITTSBURGH – OF THECOMMONWEALTH SYSTEM OF HIGHER EDUCATION
Schedule of Expenditures of Federal Awards
Year ended June 30, 2020
PassedCFDA Direct award or pass-through through to Federal
Federal grantor/pass through grantor/program title number entity identifying number subrecipients expendituresUniversity of California at San Francisco 93.855 10737SC $ — 93,229 University of California at San Francisco 93.855 7167SC — 16,745 University of California at San Francisco 93.855 9068SC — 107,035 University of California at San Francisco 93.855 9878SC — 75,159 University of Florida 93.855 UFDSP00011376 — 593,108 University of Louisville 93.855 ULRF 14-0588B5-01 — 58,579 University of Louisville 93.855 ULRF-14-0588G5-01 — 183,367 University of Maryland 93.855 55360-Z0082201 — 206,770 University of Maryland, Baltimore 93.855 1701055 — 9,481 University of Michigan 93.855 3003868253 — 505,528 University of Pennsylvania 93.855 578115 — 20,519 University of Pennsylvania 93.855 574339 — 83,737 University of Tennessee 93.855 194556-PITT — 483 University of Washington 93.855 UWSC11034/38085 — 110,129 University of Washington 93.855 UWSC10069 — 122,714 University of Wisconsin 93.855 686K405 — 2,304 Vanderbilt University Medical Center 93.855 VUMC40874 — 31,075 Vanderbilt University Medical Center 93.855 VUMC71219 — 130,721 Washington University in St. Louis 93.855 WU-19-245 — 152,230 Washington University in St. Louis 93.855 WU-19-428 — 17,635 Washington University in St. Louis 93.855 WU-20-336 — 67,205
Subtotal 93.855 9,359,545 63,038,447
Biomedical Research and Research Training 93.859 Direct 5,395,923 30,011,741 Cleveland Clinic Lerner College of Medicine 93.859 1255-SUB — 11,815 Columbia University 93.859 1(GG014062) — 142,840 Fox Chase Chemical Diversity Center 93.859 R42GM112516-PITT — 524 LTS Computing LLC 93.859 SUB0000001 — 44,145 Magee-Womens Research Institute & Foundation 93.859 3624 — 124,693 Magee-Womens Research Institute & Foundation 93.859 3625 — 146,838 Magee-Womens Research Institute & Foundation 93.859 3626 — 84,919 MS2 Array, LLC 93.859 1383869690A1 — 1,294 North Carolina State University 93.859 2017-2356-02 — 30,431 Ohio State University 93.859 60062579 — 30,664 Rutgers University 93.859 1220 — 16,770 State University of New York 93.859 1127906-72787 — 3,794 Trucode Gene Repair 93.859 5R44GM108187-06 — (2,444) University of California at San Francisco 93.859 10503SC — 45,101 University of Cincinnati 93.859 011843-002 — 62,641 University of Colorado 93.859 FY15.652.001 — 6,252 University of Connecticut 93.859 122299 — 1,839 University of Massachusetts 93.859 OSP2017045 — 20,777 University of Texas Southwestern Medical Center 93.859 GM0201205 PO00000019 — 13,229 University of Wisconsin 93.859 881K252 — 189,601 Washington University in St. Louis 93.859 WU-16-84-MOD-5 — 8,101
Subtotal 93.859 5,395,923 30,995,565
Child Health and Human Development Extramural Research 93.865 Direct 1,601,419 10,784,026 Albert Einstein Healthcare Network 93.865 4934 — 11,108 Arizona State University 93.865 17-014 — (18) Baebies, Inc. 93.865 RESEARCH AGREEMENT — 22,965 California Pacific Medical Center Research Institute 93.865 280201015-S220 — 1,763,484 Children’s Hospital of Philadelphia 93.865 3210610519 — (445) Children’s Research Institute 93.865 30005504-04 — 37,142 Cornell University 93.865 182878 — 6,532 Cornell University 93.865 192428 — 10,758 Duke University 93.865 200405 — (1,686) Gaia Medical Institute 93.865 SALIVA NCDT — 17,600 George Washington University 93.865 S-MFM1819-JB15 152,984 193,205 George Washington University 93.865 S-MFM1920-CF15 — 52,234 Global Health Uganda Ltd 93.865 GHU/012019/03 — 6,702 Indiana University 93.865 IN4685314UPITT — 27,762 Magee-Womens Research Institute & Foundation 93.865 1422 — (98) Magee-Womens Research Institute & Foundation 93.865 1426 — 271,294 Magee-Womens Research Institute & Foundation 93.865 1427 — 96,605 Magee-Womens Research Institute & Foundation 93.865 1428 — 99,635 Magee-Womens Research Institute & Foundation 93.865 1429 — 175,014 Magee-Womens Research Institute & Foundation 93.865 2616 — 1 Magee-Womens Research Institute & Foundation 93.865 2624 — 33,976 Magee-Womens Research Institute & Foundation 93.865 2628 — (103) Magee-Womens Research Institute & Foundation 93.865 2639 — 119,067 Magee-Womens Research Institute & Foundation 93.865 2649 — (10,745) Magee-Womens Research Institute & Foundation 93.865 2657 — 173,409 Magee-Womens Research Institute & Foundation 93.865 2660 — 346,912 Magee-Womens Research Institute & Foundation 93.865 2666 — 20,662 Magee-Womens Research Institute & Foundation 93.865 3490 — 2,027 Magee-Womens Research Institute & Foundation 93.865 3495 — 275,327 Magee-Womens Research Institute & Foundation 93.865 3499 — 41,160 Magee-Womens Research Institute & Foundation 93.865 3503 — 193,430 Magee-Womens Research Institute & Foundation 93.865 3622 — 140,004 Magee-Womens Research Institute & Foundation 93.865 3646 — 3,730 Magee-Womens Research Institute & Foundation 93.865 3647 — 12,099 Magee-Womens Research Institute & Foundation 93.865 3648 — 32,529
(Continued)48
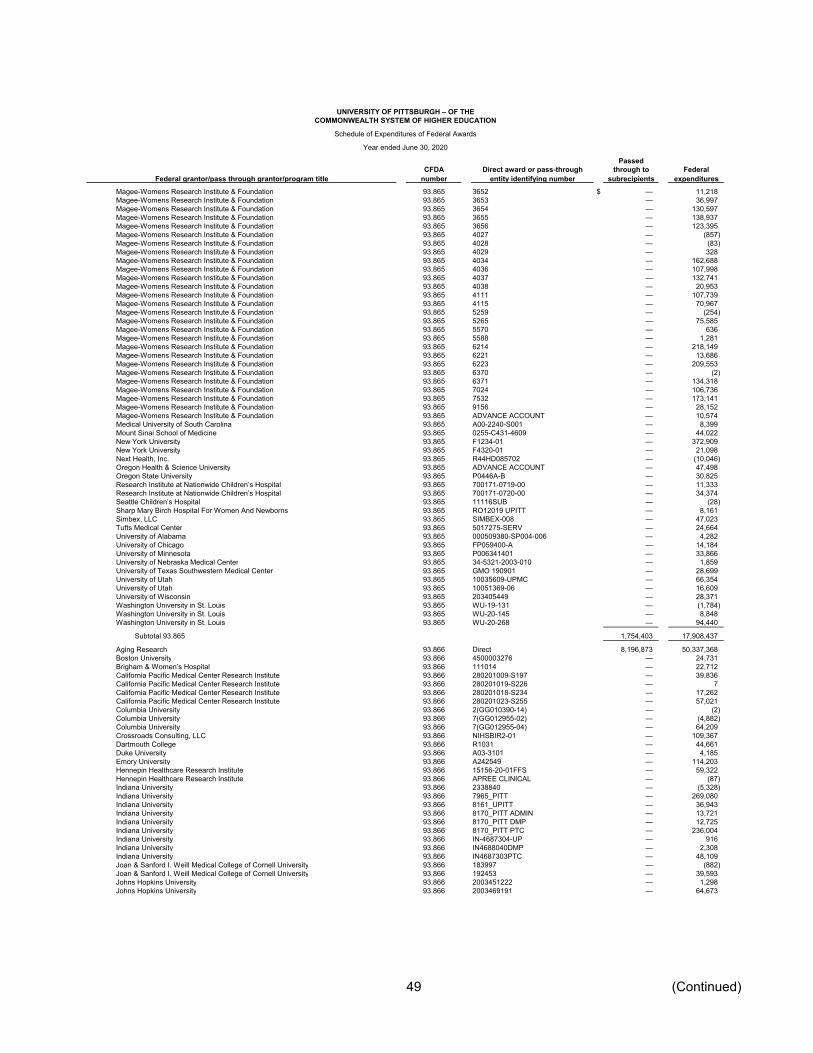
UNIVERSITY OF PITTSBURGH – OF THECOMMONWEALTH SYSTEM OF HIGHER EDUCATION
Schedule of Expenditures of Federal Awards
Year ended June 30, 2020
PassedCFDA Direct award or pass-through through to Federal
Federal grantor/pass through grantor/program title number entity identifying number subrecipients expendituresMagee-Womens Research Institute & Foundation 93.865 3652 $ — 11,218 Magee-Womens Research Institute & Foundation 93.865 3653 — 36,997 Magee-Womens Research Institute & Foundation 93.865 3654 — 130,597 Magee-Womens Research Institute & Foundation 93.865 3655 — 138,937 Magee-Womens Research Institute & Foundation 93.865 3656 — 123,395 Magee-Womens Research Institute & Foundation 93.865 4027 — (857) Magee-Womens Research Institute & Foundation 93.865 4028 — (83) Magee-Womens Research Institute & Foundation 93.865 4029 — 328 Magee-Womens Research Institute & Foundation 93.865 4034 — 162,688 Magee-Womens Research Institute & Foundation 93.865 4036 — 107,998 Magee-Womens Research Institute & Foundation 93.865 4037 — 132,741 Magee-Womens Research Institute & Foundation 93.865 4038 — 20,953 Magee-Womens Research Institute & Foundation 93.865 4111 — 107,739 Magee-Womens Research Institute & Foundation 93.865 4115 — 70,967 Magee-Womens Research Institute & Foundation 93.865 5259 — (254) Magee-Womens Research Institute & Foundation 93.865 5265 — 75,585 Magee-Womens Research Institute & Foundation 93.865 5570 — 636 Magee-Womens Research Institute & Foundation 93.865 5588 — 1,281 Magee-Womens Research Institute & Foundation 93.865 6214 — 218,149 Magee-Womens Research Institute & Foundation 93.865 6221 — 13,686 Magee-Womens Research Institute & Foundation 93.865 6223 — 209,553 Magee-Womens Research Institute & Foundation 93.865 6370 — (2) Magee-Womens Research Institute & Foundation 93.865 6371 — 134,318 Magee-Womens Research Institute & Foundation 93.865 7024 — 106,736 Magee-Womens Research Institute & Foundation 93.865 7532 — 173,141 Magee-Womens Research Institute & Foundation 93.865 9156 — 28,152 Magee-Womens Research Institute & Foundation 93.865 ADVANCE ACCOUNT — 10,574 Medical University of South Carolina 93.865 A00-2240-S001 — 8,399 Mount Sinai School of Medicine 93.865 0255-C431-4609 — 44,022 New York University 93.865 F1234-01 — 372,909 New York University 93.865 F4320-01 — 21,098 Next Health, Inc. 93.865 R44HD085702 — (10,046) Oregon Health & Science University 93.865 ADVANCE ACCOUNT — 47,498 Oregon State University 93.865 P0446A-B — 30,825 Research Institute at Nationwide Children’s Hospital 93.865 700171-0719-00 — 11,333 Research Institute at Nationwide Children’s Hospital 93.865 700171-0720-00 — 34,374 Seattle Children’s Hospital 93.865 11116SUB — (28) Sharp Mary Birch Hospital For Women And Newborns 93.865 RO12019 UPITT — 8,161 Simbex, LLC 93.865 SIMBEX-008 — 47,023 Tufts Medical Center 93.865 5017275-SERV — 24,664 University of Alabama 93.865 000509380-SP004-006 — 4,282 University of Chicago 93.865 FP059400-A — 14,184 University of Minnesota 93.865 P006341401 — 33,866 University of Nebraska Medical Center 93.865 34-5321-2003-010 — 1,859 University of Texas Southwestern Medical Center 93.865 GMO 190901 — 28,699 University of Utah 93.865 10035609-UPMC — 66,354 University of Utah 93.865 10051369-06 — 16,609 University of Wisconsin 93.865 203405449 — 28,371 Washington University in St. Louis 93.865 WU-19-131 — (1,784) Washington University in St. Louis 93.865 WU-20-145 — 8,848 Washington University in St. Louis 93.865 WU-20-268 — 94,440
Subtotal 93.865 1,754,403 17,908,437
Aging Research 93.866 Direct 8,196,873 50,337,368 Boston University 93.866 4500003276 — 24,731 Brigham & Women’s Hospital 93.866 111014 — 22,712 California Pacific Medical Center Research Institute 93.866 280201009-S197 — 39,836 California Pacific Medical Center Research Institute 93.866 280201019-S226 — 7 California Pacific Medical Center Research Institute 93.866 280201018-S234 — 17,262 California Pacific Medical Center Research Institute 93.866 280201023-S255 — 57,021 Columbia University 93.866 2(GG010390-14) — (2) Columbia University 93.866 7(GG012955-02) — (4,882) Columbia University 93.866 7(GG012955-04) — 64,209 Crossroads Consulting, LLC 93.866 NIHSBIR2-01 — 109,367 Dartmouth College 93.866 R1031 — 44,661 Duke University 93.866 A03-3101 — 4,185 Emory University 93.866 A242549 — 114,203 Hennepin Healthcare Research Institute 93.866 15156-20-01FFS — 59,322 Hennepin Healthcare Research Institute 93.866 APREE CLINICAL — (87) Indiana University 93.866 2338840 — (5,328) Indiana University 93.866 7965_PITT — 269,080 Indiana University 93.866 8161_UPITT — 36,943 Indiana University 93.866 8170_PITT ADMIN — 13,721 Indiana University 93.866 8170_PITT DMP — 12,725 Indiana University 93.866 8170_PITT PTC — 236,004 Indiana University 93.866 IN-4687304-UP — 916 Indiana University 93.866 IN4688040DMP — 2,308 Indiana University 93.866 IN4687303PTC — 48,109 Joan & Sanford I. Weill Medical College of Cornell University 93.866 183997 — (882) Joan & Sanford I. Weill Medical College of Cornell University 93.866 192453 — 39,593 Johns Hopkins University 93.866 2003451222 — 1,298 Johns Hopkins University 93.866 2003469191 — 64,673
(Continued)49
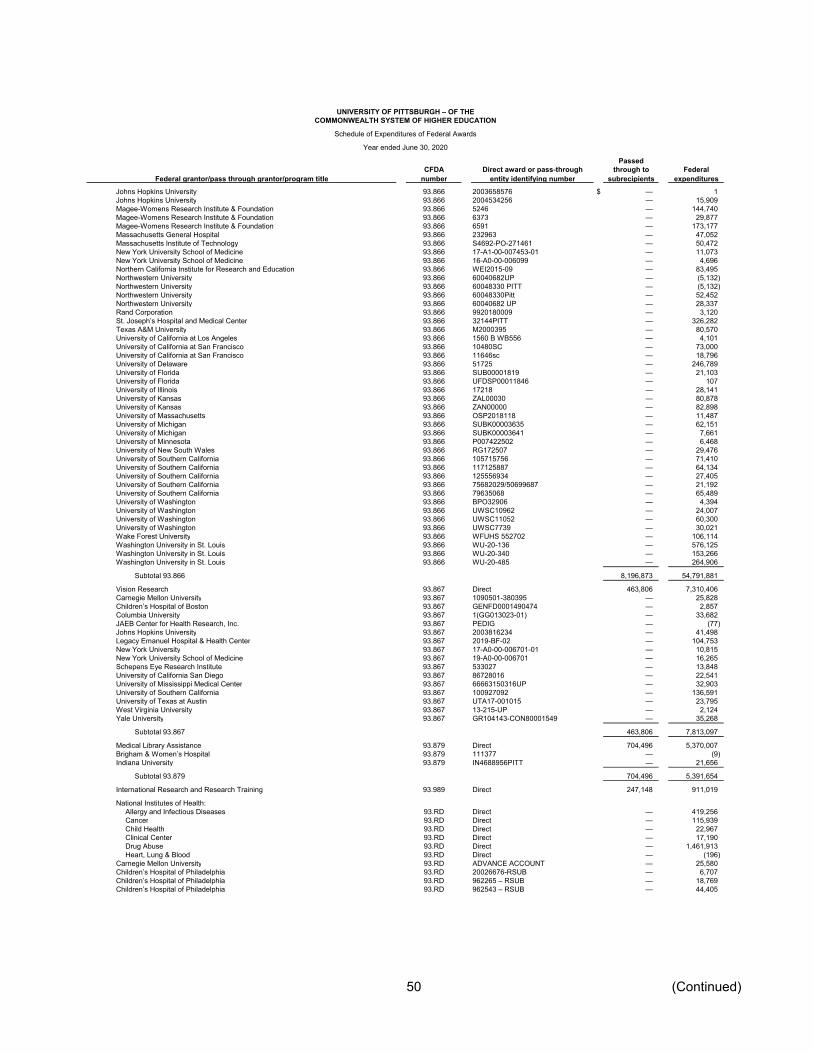
UNIVERSITY OF PITTSBURGH – OF THECOMMONWEALTH SYSTEM OF HIGHER EDUCATION
Schedule of Expenditures of Federal Awards
Year ended June 30, 2020
PassedCFDA Direct award or pass-through through to Federal
Federal grantor/pass through grantor/program title number entity identifying number subrecipients expendituresJohns Hopkins University 93.866 2003658576 $ — 1 Johns Hopkins University 93.866 2004534256 — 15,909 Magee-Womens Research Institute & Foundation 93.866 5246 — 144,740 Magee-Womens Research Institute & Foundation 93.866 6373 — 29,877 Magee-Womens Research Institute & Foundation 93.866 6591 — 173,177 Massachusetts General Hospital 93.866 232963 — 47,052 Massachusetts Institute of Technology 93.866 S4692-PO-271461 — 50,472 New York University School of Medicine 93.866 17-A1-00-007453-01 — 11,073 New York University School of Medicine 93.866 16-A0-00-006099 — 4,696 Northern California Institute for Research and Education 93.866 WEI2015-09 — 83,495 Northwestern University 93.866 60040682UP — (5,132) Northwestern University 93.866 60048330 PITT — (5,132) Northwestern University 93.866 60048330Pitt — 52,452 Northwestern University 93.866 60040682 UP — 28,337 Rand Corporation 93.866 9920180009 — 3,120 St. Joseph’s Hospital and Medical Center 93.866 32144PITT — 326,282 Texas A&M University 93.866 M2000395 — 80,570 University of California at Los Angeles 93.866 1560 B WB556 — 4,101 University of California at San Francisco 93.866 10480SC — 73,000 University of California at San Francisco 93.866 11646sc — 18,796 University of Delaware 93.866 51725 — 246,789 University of Florida 93.866 SUB00001819 — 21,103 University of Florida 93.866 UFDSP00011846 — 107 University of Illinois 93.866 17218 — 28,141 University of Kansas 93.866 ZAL00030 — 80,878 University of Kansas 93.866 ZAN00000 — 82,898 University of Massachusetts 93.866 OSP2018118 — 11,487 University of Michigan 93.866 SUBK00003635 — 62,151 University of Michigan 93.866 SUBK00003641 — 7,661 University of Minnesota 93.866 P007422502 — 6,468 University of New South Wales 93.866 RG172507 — 29,476 University of Southern California 93.866 105715756 — 71,410 University of Southern California 93.866 117125887 — 64,134 University of Southern California 93.866 125556934 — 27,405 University of Southern California 93.866 75682029/50699687 — 21,192 University of Southern California 93.866 79635068 — 65,489 University of Washington 93.866 BPO32906 — 4,394 University of Washington 93.866 UWSC10962 — 24,007 University of Washington 93.866 UWSC11052 — 60,300 University of Washington 93.866 UWSC7739 — 30,021 Wake Forest University 93.866 WFUHS 552702 — 106,114 Washington University in St. Louis 93.866 WU-20-136 — 576,125 Washington University in St. Louis 93.866 WU-20-340 — 153,266 Washington University in St. Louis 93.866 WU-20-485 — 264,906
Subtotal 93.866 8,196,873 54,791,881
Vision Research 93.867 Direct 463,806 7,310,406 Carnegie Mellon University 93.867 1090501-380395 — 25,828 Children’s Hospital of Boston 93.867 GENFD0001490474 — 2,857 Columbia University 93.867 1(GG013023-01) — 33,682 JAEB Center for Health Research, Inc. 93.867 PEDIG — (77) Johns Hopkins University 93.867 2003816234 — 41,498 Legacy Emanuel Hospital & Health Center 93.867 2019-BF-02 — 104,753 New York University 93.867 17-A0-00-006701-01 — 10,815 New York University School of Medicine 93.867 19-A0-00-006701 — 16,265 Schepens Eye Research Institute 93.867 533027 — 13,848 University of California San Diego 93.867 86728016 — 22,541 University of Mississippi Medical Center 93.867 66663150316UP — 32,903 University of Southern California 93.867 100927092 — 136,591 University of Texas at Austin 93.867 UTA17-001015 — 23,795 West Virginia University 93.867 13-215-UP — 2,124 Yale University 93.867 GR104143-CON80001549 — 35,268
Subtotal 93.867 463,806 7,813,097
Medical Library Assistance 93.879 Direct 704,496 5,370,007 Brigham & Women’s Hospital 93.879 111377 — (9) Indiana University 93.879 IN4688956PITT — 21,656
Subtotal 93.879 704,496 5,391,654
International Research and Research Training 93.989 Direct 247,148 911,019
National Institutes of Health:Allergy and Infectious Diseases 93.RD Direct — 419,256 Cancer 93.RD Direct — 115,939 Child Health 93.RD Direct — 22,967 Clinical Center 93.RD Direct — 17,190 Drug Abuse 93.RD Direct — 1,461,913 Heart, Lung & Blood 93.RD Direct — (196)
Carnegie Mellon University 93.RD ADVANCE ACCOUNT — 25,580 Children’s Hospital of Philadelphia 93.RD 20026676-RSUB — 6,707 Children’s Hospital of Philadelphia 93.RD 962265 – RSUB — 18,769 Children’s Hospital of Philadelphia 93.RD 962543 – RSUB — 44,405
(Continued)50
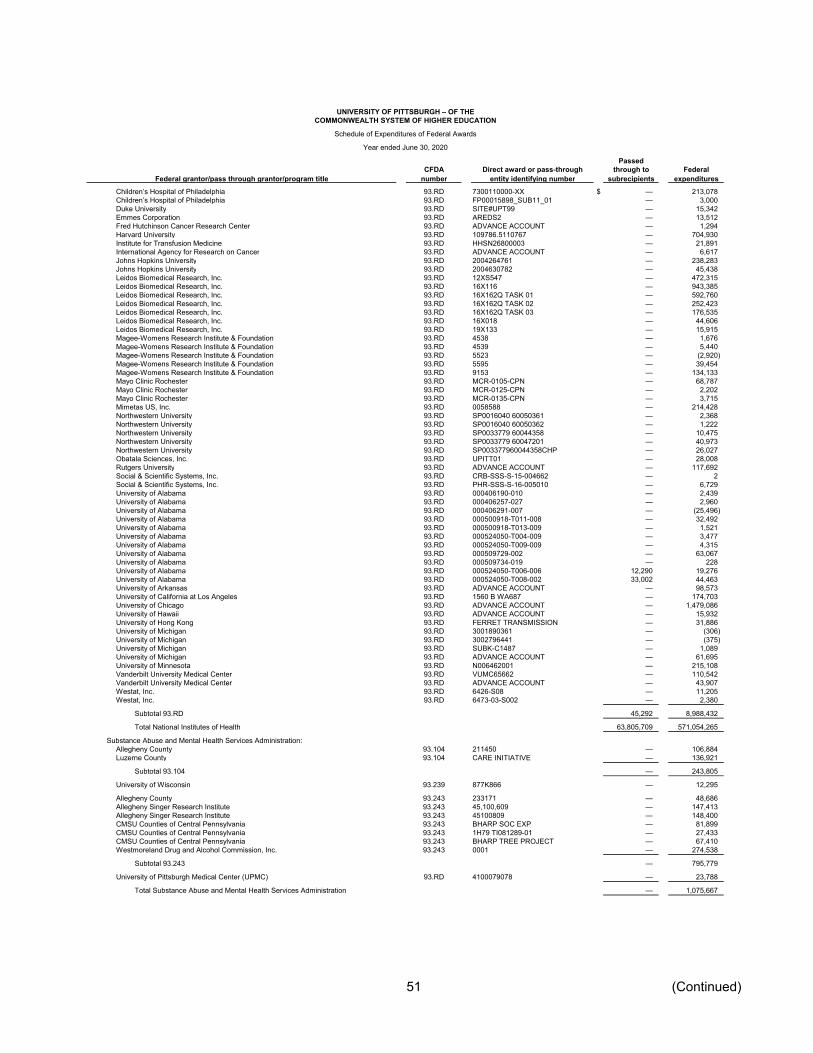
UNIVERSITY OF PITTSBURGH – OF THECOMMONWEALTH SYSTEM OF HIGHER EDUCATION
Schedule of Expenditures of Federal Awards
Year ended June 30, 2020
PassedCFDA Direct award or pass-through through to Federal
Federal grantor/pass through grantor/program title number entity identifying number subrecipients expendituresChildren’s Hospital of Philadelphia 93.RD 7300110000-XX $ — 213,078 Children’s Hospital of Philadelphia 93.RD FP00015898_SUB11_01 — 3,000 Duke University 93.RD SITE#UPT99 — 15,342 Emmes Corporation 93.RD AREDS2 — 13,512 Fred Hutchinson Cancer Research Center 93.RD ADVANCE ACCOUNT — 1,294 Harvard University 93.RD 109786.5110767 — 704,930 Institute for Transfusion Medicine 93.RD HHSN26800003 — 21,891 International Agency for Research on Cancer 93.RD ADVANCE ACCOUNT — 6,617 Johns Hopkins University 93.RD 2004264761 — 238,283 Johns Hopkins University 93.RD 2004630782 — 45,438 Leidos Biomedical Research, Inc. 93.RD 12XS547 — 472,315 Leidos Biomedical Research, Inc. 93.RD 16X116 — 943,385 Leidos Biomedical Research, Inc. 93.RD 16X162Q TASK 01 — 592,760 Leidos Biomedical Research, Inc. 93.RD 16X162Q TASK 02 — 252,423 Leidos Biomedical Research, Inc. 93.RD 16X162Q TASK 03 — 176,535 Leidos Biomedical Research, Inc. 93.RD 16X018 — 44,606 Leidos Biomedical Research, Inc. 93.RD 19X133 — 15,915 Magee-Womens Research Institute & Foundation 93.RD 4538 — 1,676 Magee-Womens Research Institute & Foundation 93.RD 4539 — 5,440 Magee-Womens Research Institute & Foundation 93.RD 5523 — (2,920) Magee-Womens Research Institute & Foundation 93.RD 5595 — 39,454 Magee-Womens Research Institute & Foundation 93.RD 9153 — 134,133 Mayo Clinic Rochester 93.RD MCR-0105-CPN — 68,787 Mayo Clinic Rochester 93.RD MCR-0125-CPN — 2,202 Mayo Clinic Rochester 93.RD MCR-0135-CPN — 3,715 Mimetas US, Inc. 93.RD 0058588 — 214,428 Northwestern University 93.RD SP0016040 60050361 — 2,368 Northwestern University 93.RD SP0016040 60050362 — 1,222 Northwestern University 93.RD SP0033779 60044358 — 10,475 Northwestern University 93.RD SP0033779 60047201 — 40,973 Northwestern University 93.RD SP003377960044358CHP — 26,027 Obatala Sciences, Inc. 93.RD UPITT01 — 28,008 Rutgers University 93.RD ADVANCE ACCOUNT — 117,692 Social & Scientific Systems, Inc. 93.RD CRB-SSS-S-15-004662 — 2 Social & Scientific Systems, Inc. 93.RD PHR-SSS-S-16-005010 — 6,729 University of Alabama 93.RD 000406190-010 — 2,439 University of Alabama 93.RD 000406257-027 — 2,960 University of Alabama 93.RD 000406291-007 — (25,496) University of Alabama 93.RD 000500918-T011-008 — 32,492 University of Alabama 93.RD 000500918-T013-009 — 1,521 University of Alabama 93.RD 000524050-T004-009 — 3,477 University of Alabama 93.RD 000524050-T009-009 — 4,315 University of Alabama 93.RD 000509729-002 — 63,067 University of Alabama 93.RD 000509734-019 — 228 University of Alabama 93.RD 000524050-T006-006 12,290 19,276 University of Alabama 93.RD 000524050-T008-002 33,002 44,463 University of Arkansas 93.RD ADVANCE ACCOUNT — 98,573 University of California at Los Angeles 93.RD 1560 B WA687 — 174,703 University of Chicago 93.RD ADVANCE ACCOUNT — 1,479,086 University of Hawaii 93.RD ADVANCE ACCOUNT — 15,932 University of Hong Kong 93.RD FERRET TRANSMISSION — 31,886 University of Michigan 93.RD 3001890361 — (306) University of Michigan 93.RD 3002796441 — (375) University of Michigan 93.RD SUBK-C1487 — 1,089 University of Michigan 93.RD ADVANCE ACCOUNT — 61,695 University of Minnesota 93.RD N006462001 — 215,108 Vanderbilt University Medical Center 93.RD VUMC65662 — 110,542 Vanderbilt University Medical Center 93.RD ADVANCE ACCOUNT — 43,907 Westat, Inc. 93.RD 6426-S08 — 11,205 Westat, Inc. 93.RD 6473-03-S002 — 2,380
Subtotal 93.RD 45,292 8,988,432
Total National Institutes of Health 63,805,709 571,054,265
Substance Abuse and Mental Health Services Administration:Allegheny County 93.104 211450 — 106,884 Luzerne County 93.104 CARE INITIATIVE — 136,921
Subtotal 93.104 — 243,805
University of Wisconsin 93.239 877K866 — 12,295
Allegheny County 93.243 233171 — 48,686 Allegheny Singer Research Institute 93.243 45,100,609 — 147,413 Allegheny Singer Research Institute 93.243 45100809 — 148,400 CMSU Counties of Central Pennsylvania 93.243 BHARP SOC EXP — 81,899 CMSU Counties of Central Pennsylvania 93.243 1H79 TI081289-01 — 27,433 CMSU Counties of Central Pennsylvania 93.243 BHARP TREE PROJECT — 67,410 Westmoreland Drug and Alcohol Commission, Inc. 93.243 0001 — 274,538
Subtotal 93.243 — 795,779
University of Pittsburgh Medical Center (UPMC) 93.RD 4100079078 — 23,788
Total Substance Abuse and Mental Health Services Administration — 1,075,667
(Continued)51
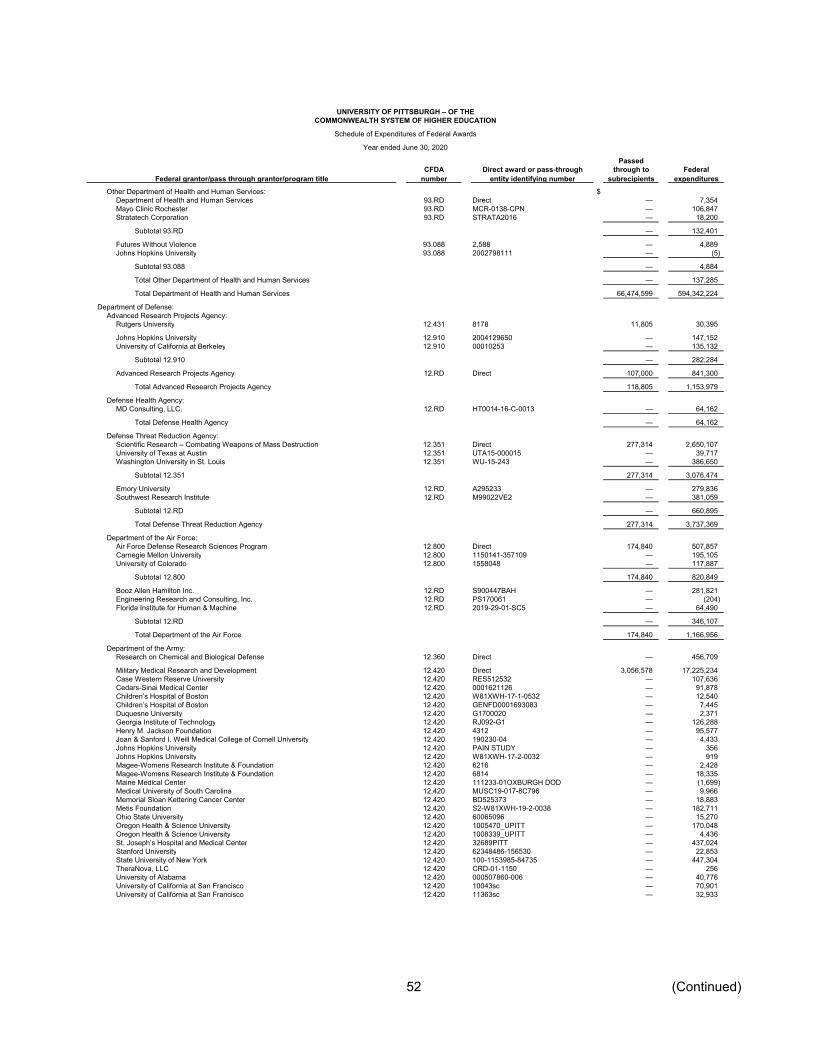
UNIVERSITY OF PITTSBURGH – OF THECOMMONWEALTH SYSTEM OF HIGHER EDUCATION
Schedule of Expenditures of Federal Awards
Year ended June 30, 2020
PassedCFDA Direct award or pass-through through to Federal
Federal grantor/pass through grantor/program title number entity identifying number subrecipients expendituresOther Department of Health and Human Services: $
Department of Health and Human Services 93.RD Direct — 7,354 Mayo Clinic Rochester 93.RD MCR-0138-CPN — 106,847 Stratatech Corporation 93.RD STRATA2016 — 18,200
Subtotal 93.RD — 132,401
Futures Without Violence 93.088 2,588 — 4,889 Johns Hopkins University 93.088 2002798111 — (5)
Subtotal 93.088 — 4,884
Total Other Department of Health and Human Services — 137,285
Total Department of Health and Human Services 66,474,599 594,342,224
Department of Defense:Advanced Research Projects Agency:
Rutgers University 12.431 8178 11,805 30,395
Johns Hopkins University 12.910 2004129650 — 147,152 University of California at Berkeley 12.910 00010253 — 135,132
Subtotal 12.910 — 282,284
Advanced Research Projects Agency 12.RD Direct 107,000 841,300
Total Advanced Research Projects Agency 118,805 1,153,979
Defense Health Agency:MD Consulting, LLC. 12.RD HT0014-16-C-0013 — 64,162
Total Defense Health Agency — 64,162
Defense Threat Reduction Agency:Scientific Research – Combating Weapons of Mass Destruction 12.351 Direct 277,314 2,650,107 University of Texas at Austin 12.351 UTA15-000015 — 39,717 Washington University in St. Louis 12.351 WU-15-243 — 386,650
Subtotal 12.351 277,314 3,076,474
Emory University 12.RD A295233 — 279,836 Southwest Research Institute 12.RD M99022VE2 — 381,059
Subtotal 12.RD — 660,895
Total Defense Threat Reduction Agency 277,314 3,737,369
Department of the Air Force:Air Force Defense Research Sciences Program 12.800 Direct 174,840 507,857 Carnegie Mellon University 12.800 1150141-357109 — 195,105 University of Colorado 12.800 1558048 — 117,887
Subtotal 12.800 174,840 820,849
Booz Allen Hamilton Inc. 12.RD S900447BAH — 281,821 Engineering Research and Consulting, Inc. 12.RD PS170061 — (204) Florida Institute for Human & Machine 12.RD 2019-29-01-SC5 — 64,490
Subtotal 12.RD — 346,107
Total Department of the Air Force 174,840 1,166,956
Department of the Army:Research on Chemical and Biological Defense 12.360 Direct — 456,709
Military Medical Research and Development 12.420 Direct 3,056,578 17,225,234 Case Western Reserve University 12.420 RES512532 — 107,636 Cedars-Sinai Medical Center 12.420 0001621126 — 91,878 Children’s Hospital of Boston 12.420 W81XWH-17-1-0532 — 12,540 Children’s Hospital of Boston 12.420 GENFD0001693083 — 7,445 Duquesne University 12.420 G1700020 — 2,371 Georgia Institute of Technology 12.420 RJ092-G1 — 126,288 Henry M. Jackson Foundation 12.420 4312 — 95,577 Joan & Sanford I. Weill Medical College of Cornell University 12.420 190230-04 — 4,433 Johns Hopkins University 12.420 PAIN STUDY — 356 Johns Hopkins University 12.420 W81XWH-17-2-0032 — 919 Magee-Womens Research Institute & Foundation 12.420 6216 — 2,428 Magee-Womens Research Institute & Foundation 12.420 6814 — 18,335 Maine Medical Center 12.420 111233-01OXBURGH DOD — (1,699) Medical University of South Carolina 12.420 MUSC19-017-8C796 — 9,966 Memorial Sloan Kettering Cancer Center 12.420 BD525373 — 18,883 Metis Foundation 12.420 S2-W81XWH-19-2-0038 — 182,711 Ohio State University 12.420 60065096 — 15,270 Oregon Health & Science University 12.420 1005470_UPITT — 170,048 Oregon Health & Science University 12.420 1008339_UPITT — 4,436 St. Joseph’s Hospital and Medical Center 12.420 32689PITT — 437,024 Stanford University 12.420 62348486-156530 — 22,853 State University of New York 12.420 100-1153985-84735 — 447,304 TheraNova, LLC 12.420 CRD-01-1150 — 256 University of Alabama 12.420 000507860-006 — 40,776 University of California at San Francisco 12.420 10043sc — 70,901 University of California at San Francisco 12.420 11363sc — 32,933
(Continued)52

UNIVERSITY OF PITTSBURGH – OF THECOMMONWEALTH SYSTEM OF HIGHER EDUCATION
Schedule of Expenditures of Federal Awards
Year ended June 30, 2020
PassedCFDA Direct award or pass-through through to Federal
Federal grantor/pass through grantor/program title number entity identifying number subrecipients expendituresUniversity of Cincinnati 12.420 010376-002 $ — 10,610 University of Colorado 12.420 FY18.576.003 — 11,679 University of Miami 12.420 SPC-001243 — 60,814 University of Michigan 12.420 3003179986 — (858) University of Michigan 12.420 3005327478 — 4,256 University of Michigan 12.420 SUBK00003004 — 106,913 University of New Mexico 12.420 3RDE3 — 73,792 University of Pennsylvania 12.420 578105 — 9,882 University of Virginia 12.420 GG12134.159875 — 126,625 Wake Forest University 12.420 WFUHS 440271 (1,453) — Wake Forest University 12.420 WFUHS 441000B GU-00 — 206,100 Wake Forest University 12.420 WFUHS 441022 SR-12 — 48,255 Wake Forest University 12.420 WFUHS 441037 CTA-07 31,103 52,008 Wake Forest University 12.420 WFUHS 441053 ER-03 — 48,517 Wake Forest University 12.420 WFUHS 441055 ER-05 — 48,021 Wake Forest University 12.420 WFUHS 441056 ER-06 — 61,446 Wake Forest University 12.420 WFUHS 441063 ER-13 — 5,170 Wake Forest University 12.420 WFUHS 441075 CF-05 64,363 66,392 Wake Forest University 12.420 WFUHS 441077 CF-07 — 29,472 Wake Forest University 12.420 WFUHS 441079 CF-09 36,190 62,400 Wake Forest University 12.420 WFUHS 441083 CF-13 — 13,462 Washington University in St. Louis 12.420 WU-20-434 — 7,386
Subtotal 12.420 3,186,781 20,199,444
Basic Scientific Research 12.431 Direct 1,579,109 2,350,816 Carnegie Mellon University 12.431 1130208-378915 — 69,912 Carnegie Mellon University 12.431 1130220-399314 — 33,185 Princeton University 12.431 SUB0000081 — 121,773 University of California at Santa Barbara 12.431 KK1714 — 242,818 University of Massachusetts 12.431 20-015174-A00 — 28,566 University of Michigan 12.431 3004628718 — 186,981
Subtotal 12.431 1,579,109 3,034,051
Carnegie Mellon University 12.630 1130247-418715 — 65,104 Research and Technology Development 12.910 Direct 398,645 2,493,101
Department of the Army 12.RD Direct 4,892,119 9,615,809 Advanced Technology International 12.RD 2019-447-001 — 400,269 Advanced Technology International 12.RD 2019-447-002 91,696 282,768 Arsenal Medical, Inc. 12.RD REVIVE — 62,247 BAE Systems 12.RD 1001524 — 167,561 Brigham & Women’s Hospital 12.RD 120070 — 75,824 Carnegie Mellon University 12.RD 1990586-418139 — 184,371 Chromologic LLC 12.RD MSA-162000 — 1,442 Guild Associates, Inc. 12.RD 40800619 — 188,028 Intelligent Automation, Inc. 12.RD 2375-1 — 12,999 Intelligent Automation, Inc. 12.RD 2423-3 — 13,440 Johns Hopkins University 12.RD 2004207953 — 145,055 Lynntech, Inc. 12.RD ARM-080 — 41,562 Materials Sciences Corporation 12.RD 12530-SD45 — 225,908 Materials Sciences Corporation 12.RD 14243-GG15-001 — 20,821 Rehat LLC 12.RD 2019-406-001 — 9,526 Synedgen, Inc. 12.RD AWD00002229 — 21,569 University of California at San Francisco 12.RD 11291SC — 305,052 University of California at Santa Barbara 12.RD KK1815 — 50,141 University of Cincinnati 12.RD 010580-002 — 34,645 Vivonics, Inc. 12.RD 2128-S008 — 2,980
Subtotal 12.RD 4,983,815 11,862,017
Total Department of the Army 10,148,350 38,110,426
Department of the Navy:Basic and Applied Scientific Research 12.300 Direct 6,421 2,537,951 Carnegie Mellon University 12.300 1141300-422095 — 57,435 Carnegie Mellon University 12.300 1141302-385701 — 28,045 Lehigh University 12.300 543974-78001 — 57,248 University of Virginia 12.300 GG11737 146385 — (70)
Subtotal 12.300 6,421 2,680,609
Department of the Navy 12.RD Direct — 551,363 Carnegie Mellon University 12.RD 1990581-417720 — 93,087 Concurrent Technologies Corporation 12.RD 181000117S — 25,652 Directed Vapor Technologies International, Inc. 12.RD D0149-02 — 13,042 Materials Sciences Corporation 12.RD 12985-AR01 — (4,130) Mount Sinai School of Medicine 12.RD 0258-A061-4609 — 140,167
Subtotal 12.RD — 819,181
Total Department of the Navy 6,421 3,499,790
(Continued)53
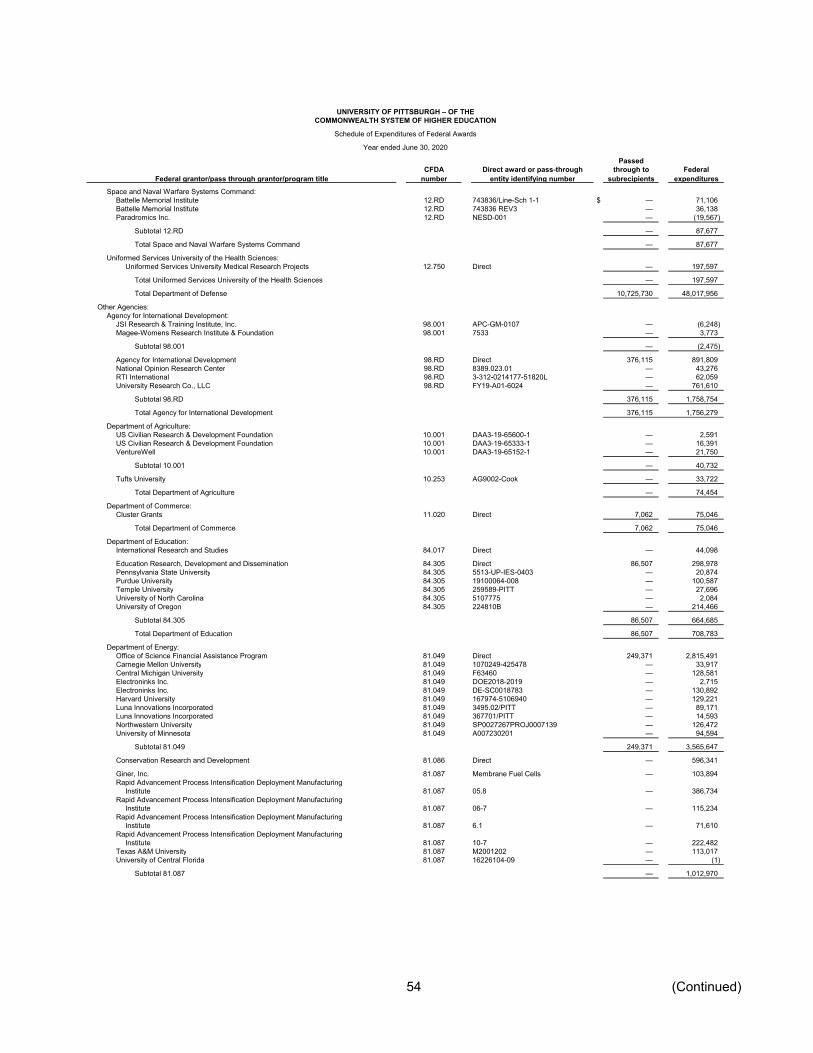
UNIVERSITY OF PITTSBURGH – OF THECOMMONWEALTH SYSTEM OF HIGHER EDUCATION
Schedule of Expenditures of Federal Awards
Year ended June 30, 2020
PassedCFDA Direct award or pass-through through to Federal
Federal grantor/pass through grantor/program title number entity identifying number subrecipients expendituresSpace and Naval Warfare Systems Command:
Battelle Memorial Institute 12.RD 743836/Line-Sch 1-1 $ — 71,106 Battelle Memorial Institute 12.RD 743836 REV3 — 36,138 Paradromics Inc. 12.RD NESD-001 — (19,567)
Subtotal 12.RD — 87,677
Total Space and Naval Warfare Systems Command — 87,677
Uniformed Services University of the Health Sciences:Uniformed Services University Medical Research Projects 12.750 Direct — 197,597
Total Uniformed Services University of the Health Sciences — 197,597
Total Department of Defense 10,725,730 48,017,956
Other Agencies:Agency for International Development:
JSI Research & Training Institute, Inc. 98.001 APC-GM-0107 — (6,248) Magee-Womens Research Institute & Foundation 98.001 7533 — 3,773
Subtotal 98.001 — (2,475)
Agency for International Development 98.RD Direct 376,115 891,809 National Opinion Research Center 98.RD 8389.023.01 — 43,276 RTI International 98.RD 3-312-0214177-51820L — 62,059 University Research Co., LLC 98.RD FY19-A01-6024 — 761,610
Subtotal 98.RD 376,115 1,758,754
Total Agency for International Development 376,115 1,756,279
Department of Agriculture:US Civilian Research & Development Foundation 10.001 DAA3-19-65600-1 — 2,591 US Civilian Research & Development Foundation 10.001 DAA3-19-65333-1 — 16,391 VentureWell 10.001 DAA3-19-65152-1 — 21,750
Subtotal 10.001 — 40,732
Tufts University 10.253 AG9002-Cook — 33,722
Total Department of Agriculture — 74,454
Department of Commerce:Cluster Grants 11.020 Direct 7,062 75,046
Total Department of Commerce 7,062 75,046
Department of Education:International Research and Studies 84.017 Direct — 44,098
Education Research, Development and Dissemination 84.305 Direct 86,507 298,978 Pennsylvania State University 84.305 5513-UP-IES-0403 — 20,874 Purdue University 84.305 19100064-008 — 100,587 Temple University 84.305 259589-PITT — 27,696 University of North Carolina 84.305 5107775 — 2,084 University of Oregon 84.305 224810B — 214,466
Subtotal 84.305 86,507 664,685
Total Department of Education 86,507 708,783
Department of Energy:Office of Science Financial Assistance Program 81.049 Direct 249,371 2,815,491 Carnegie Mellon University 81.049 1070249-425478 — 33,917 Central Michigan University 81.049 F63460 — 128,581 Electroninks Inc. 81.049 DOE2018-2019 — 2,715 Electroninks Inc. 81.049 DE-SC0018783 — 130,892 Harvard University 81.049 167974-5106940 — 129,221 Luna Innovations Incorporated 81.049 3495.02/PITT — 89,171 Luna Innovations Incorporated 81.049 367701/PITT — 14,593 Northwestern University 81.049 SP0027267PROJ0007139 — 126,472 University of Minnesota 81.049 A007230201 — 94,594
Subtotal 81.049 249,371 3,565,647
Conservation Research and Development 81.086 Direct — 596,341
Giner, Inc. 81.087 Membrane Fuel Cells — 103,894 Rapid Advancement Process Intensification Deployment Manufacturing
Institute 81.087 05.8 — 386,734 Rapid Advancement Process Intensification Deployment Manufacturing
Institute 81.087 06-7 — 115,234 Rapid Advancement Process Intensification Deployment Manufacturing
Institute 81.087 6.1 — 71,610 Rapid Advancement Process Intensification Deployment Manufacturing
Institute 81.087 10-7 — 222,482 Texas A&M University 81.087 M2001202 — 113,017 University of Central Florida 81.087 16226104-09 — (1)
Subtotal 81.087 — 1,012,970
(Continued)54

UNIVERSITY OF PITTSBURGH – OF THECOMMONWEALTH SYSTEM OF HIGHER EDUCATION
Schedule of Expenditures of Federal Awards
Year ended June 30, 2020
PassedCFDA Direct award or pass-through through to Federal
Federal grantor/pass through grantor/program title number entity identifying number subrecipients expendituresFossil Energy Research and Development 81.089 Direct $ 131,489 1,067,585 Gas Technology Institute 81.089 AGREEMENT NO. S876 — 246,082 Oklahoma State University 81.089 1-578930-PITT — 44,484 Pennsylvania State University 81.089 5955-UP-DOE-6825 — 138,234 Pennsylvania State University 81.089 5957-UP-DOE-6825 — 120,101 Pennsylvania State University 81.089 5987-UP-DOE-6825 — 88,886 West Virginia University 81.089 18-971-UP — 72,489
Subtotal 81.089 131,489 1,777,861
Nuclear Energy Research, Development and Demonstration 81.121 Direct 158,779 733,474 University of Houston 81.121 R-19-0010 — 79,354 Utah State University 81.121 200658-604 — 391,357
Subtotal 81.121 158,779 1,204,185
Clarkson University 81.122 100906-1 — 39,609 Westinghouse Electric Company, LLC 81.135 4500784107 — 115,907
Department of Energy 81.RD Direct — 2,110 AECOM Energy and Construction, Incorporated 81.RD TASK RELEASE NO 214 — (2,333) Battelle Energy Alliance, LLC 81.RD 0207637 106,161 237,933 Battelle Energy Alliance, LLC 81.RD 191828 — 6,306 Battelle Energy Alliance, LLC 81.RD 206932 — 145,690 Battelle Energy Alliance, LLC 81.RD 211001 — 70,264 Battelle Energy Alliance, LLC 81.RD 213209 — 103,915 Battelle Energy Alliance, LLC 81.RD 215245 — 49,659 Battelle Energy Alliance, LLC 81.RD 218149 — 59,093 Battelle Energy Alliance, LLC 81.RD 226706 — 73,315 Battelle Energy Alliance, LLC 81.RD 229773 — 69,473 Battelle Memorial Institute 81.RD 455499 — 52,228 Battelle Memorial Institute 81.RD 734574 — 102,176 Brookhaven Science Associates, LLC 81.RD 359437 — 123,716 Brookhaven Science Associates, LLC 81.RD 382354 — 2,249 Fluor Marine Propulsion, LLC 81.RD 128753 — 125,423 Fluor Marine Propulsion, LLC 81.RD 134229 — 4,860 KeyLogic Systems, Inc. 81.RD 5000-017 — 18,299 Leidos Biomedical Research, Inc. 81.RD P010220918 TASK 1 — 93,463 Leidos Biomedical Research, Inc. 81.RD P010220918 TASK 10 — 42,446 Leidos Biomedical Research, Inc. 81.RD P010220918 TASK 11 — 10,204 Leidos Biomedical Research, Inc. 81.RD P010220918 TASK 12 — 142,203 Leidos Biomedical Research, Inc. 81.RD P010220918 TASK 14 — (6) Leidos Biomedical Research, Inc. 81.RD P010220918 TASK 16 — 4,464 Leidos Biomedical Research, Inc. 81.RD P010220918 TASK 17 — 13,853 Leidos Biomedical Research, Inc. 81.RD P010220918 TASK 18 — 34,016 Leidos Biomedical Research, Inc. 81.RD P010220918 TASK 19 — 1,923 Leidos Biomedical Research, Inc. 81.RD P010220918 TASK 20 — 47,514 Leidos Biomedical Research, Inc. 81.RD P010220918 TASK 21 — 118,474 Leidos Biomedical Research, Inc. 81.RD P010220918 TASK 22 — 4,835 Leidos Biomedical Research, Inc. 81.RD P010220918 TASK 23 — 1,654 Leidos Biomedical Research, Inc. 81.RD P010220918 TASK 3 — 18,108 Leidos Biomedical Research, Inc. 81.RD P010220918 TASK 4 — 3,117 Leidos Biomedical Research, Inc. 81.RD P010220918 TASK 5 — 36,347 Leidos Biomedical Research, Inc. 81.RD P010220918 TASK 6 — 22,496 Leidos Biomedical Research, Inc. 81.RD P010220918 TASK 7 — (5) Leidos Biomedical Research, Inc. 81.RD P010220918 TASK 8 — 108,289 REMADE Institute 81.RD SA-19-05 28,914 55,005 Sandia Corporation, a subsidiary of Lockheed Martin 81.RD 1967875 — 44,000 Sandia Corporation, a subsidiary of Lockheed Martin 81.RD 2084579 — 73,941 Stanford University 81.RD 199859 — 24,473 Triad National Security, LLC 81.RD 439301 — 111,921 UChicago Argonne, LLC 81.RD 9F-60178 — 118,962 UChicago Argonne, LLC 81.RD 9F-60287 — 53,096 University of California 81.RD 7374238 — (3) University of New Mexico 81.RD 327093-874E — 39,595
Subtotal 81.RD 135,075 2,468,761
Total Department of Energy 674,714 10,781,281
Department of Housing and Urban Development:Municipality of Penn Hills 14.218 PH STABILIZATION — (29)
Total Department of Housing and Urban Development — (29)
Department of the Interior:Commonwealth of Pennsylvania 15.250 4400011482 31,610 75,014 U.S. Geological Survey Research and Data Collection 15.808 Direct — 1,530
Total Department of the Interior 31,610 76,544
Department of Justice:National Institute of Justice Research, Evaluation, and
Development Project Grants 16.560 Direct 946,123 1,617,104 Pennsylvania Commission on Crime and Deliquency 16.738 2014/16-JG98/SS28121 — 34,559 Pennsylvania Commission on Crime and Deliquency 16.812 SR/DP-04/ST-27520 — 24,580 Pennsylvania Commission on Crime and Deliquency 16.RD ADVANCE ACCOUNT — 43,153
Total Department of Justice 946,123 1,719,396
(Continued)55
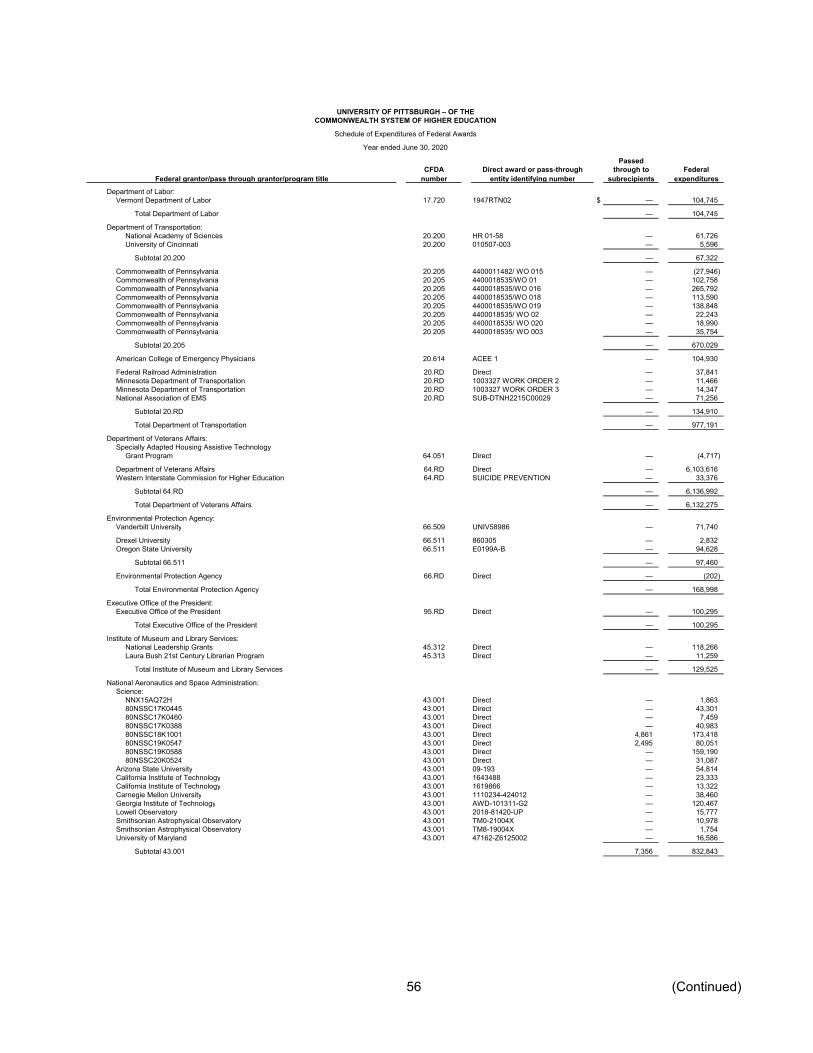
UNIVERSITY OF PITTSBURGH – OF THECOMMONWEALTH SYSTEM OF HIGHER EDUCATION
Schedule of Expenditures of Federal Awards
Year ended June 30, 2020
PassedCFDA Direct award or pass-through through to Federal
Federal grantor/pass through grantor/program title number entity identifying number subrecipients expendituresDepartment of Labor:
Vermont Department of Labor 17.720 1947RTN02 $ — 104,745
Total Department of Labor — 104,745
Department of Transportation:National Academy of Sciences 20.200 HR 01-58 — 61,726 University of Cincinnati 20.200 010507-003 — 5,596
Subtotal 20.200 — 67,322
Commonwealth of Pennsylvania 20.205 4400011482/ WO 015 — (27,946) Commonwealth of Pennsylvania 20.205 4400018535/WO 01 — 102,758 Commonwealth of Pennsylvania 20.205 4400018535/WO 016 — 265,792 Commonwealth of Pennsylvania 20.205 4400018535/WO 018 — 113,590 Commonwealth of Pennsylvania 20.205 4400018535/WO 019 — 138,848 Commonwealth of Pennsylvania 20.205 4400018535/ WO 02 — 22,243 Commonwealth of Pennsylvania 20.205 4400018535/ WO 020 — 18,990 Commonwealth of Pennsylvania 20.205 4400018535/ WO 003 — 35,754
Subtotal 20.205 — 670,029
American College of Emergency Physicians 20.614 ACEE 1 — 104,930
Federal Railroad Administration 20.RD Direct — 37,841 Minnesota Department of Transportation 20.RD 1003327 WORK ORDER 2 — 11,466 Minnesota Department of Transportation 20.RD 1003327 WORK ORDER 3 — 14,347 National Association of EMS 20.RD SUB-DTNH2215C00029 — 71,256
Subtotal 20.RD — 134,910
Total Department of Transportation — 977,191
Department of Veterans Affairs:Specially Adapted Housing Assistive Technology
Grant Program 64.051 Direct — (4,717)
Department of Veterans Affairs 64.RD Direct — 6,103,616 Western Interstate Commission for Higher Education 64.RD SUICIDE PREVENTION — 33,376
Subtotal 64.RD — 6,136,992
Total Department of Veterans Affairs — 6,132,275
Environmental Protection Agency:Vanderbilt University 66.509 UNIV58986 — 71,740
Drexel University 66.511 860305 — 2,832 Oregon State University 66.511 E0199A-B — 94,628
Subtotal 66.511 — 97,460
Environmental Protection Agency 66.RD Direct — (202)
Total Environmental Protection Agency — 168,998
Executive Office of the President:Executive Office of the President 95.RD Direct — 100,295
Total Executive Office of the President — 100,295
Institute of Museum and Library Services:National Leadership Grants 45.312 Direct — 118,266 Laura Bush 21st Century Librarian Program 45.313 Direct — 11,259
Total Institute of Museum and Library Services — 129,525
National Aeronautics and Space Administration:Science:
NNX15AQ72H 43.001 Direct — 1,863 80NSSC17K0445 43.001 Direct — 43,301 80NSSC17K0460 43.001 Direct — 7,459 80NSSC17K0388 43.001 Direct — 40,983 80NSSC18K1001 43.001 Direct 4,861 173,418 80NSSC19K0547 43.001 Direct 2,495 80,051 80NSSC19K0588 43.001 Direct — 159,190 80NSSC20K0524 43.001 Direct — 31,087
Arizona State University 43.001 09-193 — 54,814 California Institute of Technology 43.001 1643488 — 23,333 California Institute of Technology 43.001 1619866 — 13,322 Carnegie Mellon University 43.001 1110234-424012 — 38,460 Georgia Institute of Technology 43.001 AWD-101311-G2 — 120,467 Lowell Observatory 43.001 2018-81420-UP — 15,777 Smithsonian Astrophysical Observatory 43.001 TM0-21004X — 10,978 Smithsonian Astrophysical Observatory 43.001 TM8-19004X — 1,754 University of Maryland 43.001 47162-Z6125002 — 16,586
Subtotal 43.001 7,356 832,843
(Continued)56

UNIVERSITY OF PITTSBURGH – OF THECOMMONWEALTH SYSTEM OF HIGHER EDUCATION
Schedule of Expenditures of Federal Awards
Year ended June 30, 2020
PassedCFDA Direct award or pass-through through to Federal
Federal grantor/pass through grantor/program title number entity identifying number subrecipients expendituresAeronautics 43.002 Direct $ — 261,778 Vanderbilt University 43.012 UNIV61194 — 8,758 University of Arizona 43.007 545020 — 26,963
Pennsylvania State University 43.008 5240-UP-NASA-K06H — 23,906 Pennsylvania State University 43.008 5497-UP-NASA-K06H — 2,494
Subtotal 43.008 — 26,400
Space Technology 43.012 Direct — 213,984
Association of Universities for Research in Astronomy, Inc. 43.RD HST-GO-14683.002-A — 11,263 Association of Universities for Research in Astronomy, Inc. 43.RD HST-GO-15957.001-A — 74,666 Center for the Advancement of Science in Space 43.RD GA-2016-236 311 1,380 Center for the Advancement of Science in Space 43.RD GA-2019-906 — 136,818 Emergent Space Technologies, Inc. 43.RD UNPIT001 — 118,982 Georgia Institute of Technology 43.RD AWD101311G2/RH809-G2 — 117,532 QuesTek Innovations LLC 43.RD 1918 — 221,197 Space Telescope Science Institute 43.RD HST-AR-14568.001-A — (4) Space Telescope Science Institute 43.RD HST-GO-14476.002-A — (21) Wyle Laboratories, Inc. 43.RD T804051 — 64,768
Subtotal 43.RD 311 746,581
Total National Aeronautics and Space Administration 7,667 2,117,307
National Endowment for the Humanities:Promotion of the Humanities Division of Preservation and Access 45.149 Direct — 117,245
Total National Endowment for the Humanities — 117,245
National Science Foundation:Engineering 47.041 Direct 193,227 5,550,205 AnkyrBio LLC 47.041 PITT-001 — 15,721 Carnegie Mellon University 47.041 1123333-407865 — 5,217 North Carolina A & T State University 47.041 260116A — 271,709 Northwestern University 47.041 60053758 PBH — 99,133 SpIntellx, Inc. 47.041 UPITT-NSF1843825 — 39,406 Thermaquil, Inc. 47.041 1913403 — 85,031 University of Tennessee 47.041 A17-1367-S001 — 7,136 Virginia Tech University 47.041 479852-19442 — 103,156
Subtotal 47.041 193,227 6,176,714
Mathematical and Physical Sciences 47.049 Direct 633,652 5,738,598 Associated Universities, Inc. 47.049 SOSPA5-010 — (1) Association of Universities for Research in Astronomy, Inc. 47.049 N72572C — 7,679 Carnegie Mellon University 47.049 1122343-351111 — 25,810 Florida Gulf Coast University 47.049 20028-UP-001 — 43,955 Research Foundation – State University of New York 47.049 76749/1136652/2 — 216,607 University of California at Irvine 47.049 2014-3124 — 98,076 University of California at Santa Barbara 47.049 KK2025 — 44,444
Subtotal 47.049 633,652 6,175,168
Geosciences 47.050 Direct 97,529 574,661 University of Arizona 47.050 125166 — (44)
Subtotal 47.050 97,529 574,617
Computer and Information Science and Engineering 47.070 Direct 285,921 4,971,676 Carnegie Mellon University 47.070 1122353-399022 — 10,543 Carnegie Mellon University 47.070 1122586-417119 — 19,426 Rensselaer Polytechnic Institute 47.070 A14-0011-S008 — 20,164 Research Foundation – State University of New York 47.070 R1146532 — 25,329 University of Tennessee 47.070 A16-1316-S001-A01 — 136,592 University of Utah 47.070 10047390-UPITT — 34,606
Subtotal 47.070 285,921 5,218,336
Biological Sciences 47.074 Direct 35,922 2,344,907 Baylor University 47.074 32050279-01 — 33,609 Carnegie Mellon University 47.074 1122469-369793 — 23,751 University of Dayton 47.074 RSC16079 — 67,054 University of Florida 47.074 SUB00002000 — 122,556
Subtotal 47.074 35,922 2,591,877
Social, Behavioral, and Economic Sciences 47.075 Direct — 967,198 Carnegie Mellon University 47.075 1122300-352752 — 47,408 National Bureau of Economic Research 47.075 36353.00.00.00.7700 — 11,290 University of California 47.075 KK1708 — 5,792
Subtotal 47.075 — 1,031,688
Education and Human Resources 47.076 Direct 344,983 4,801,112 Colorado School of Mines 47.076 401516-5802 — 22,957 Community College of Allegheny County 47.076 1400575-Pitt — 7,494 University of Michigan 47.076 SUBK00010602 — 35,230 University of Montana 47.076 G196-19-W7292 — 9,378 University of South Florida 47.076 2015-1126-00-A — 11,379 University of Wisconsin 47.076 847K383 — 27,297
Subtotal 47.076 344,983 4,914,847
(Continued)57
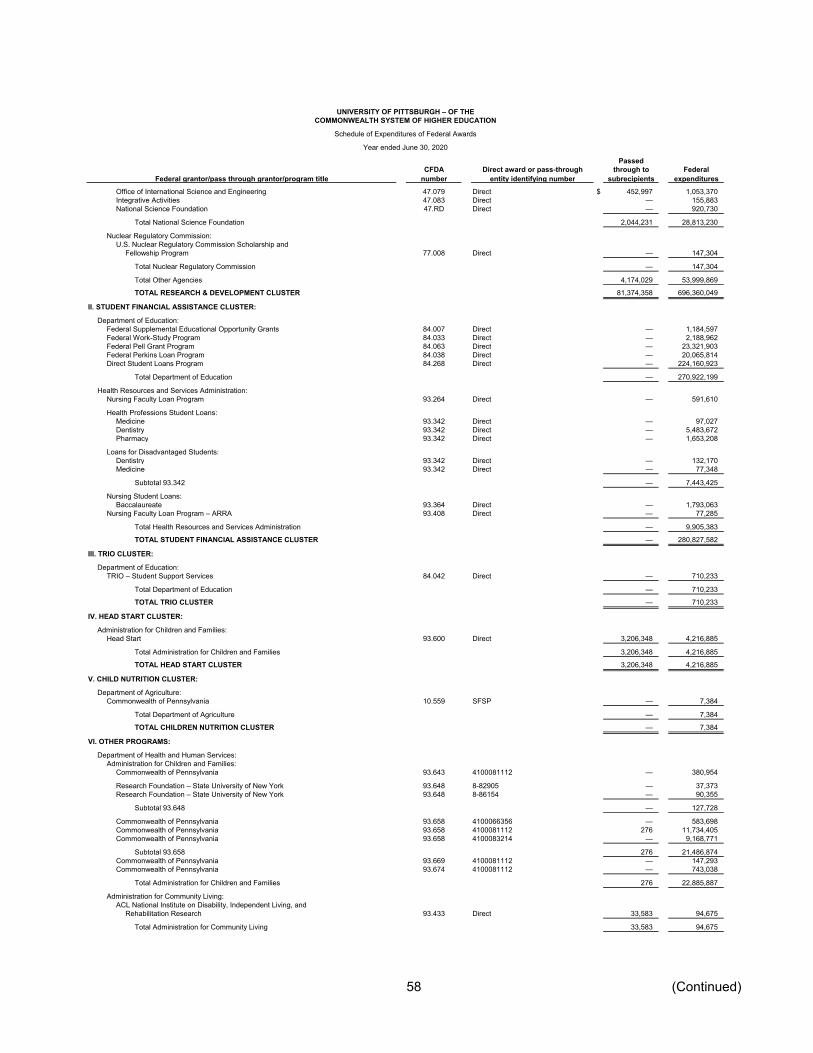
UNIVERSITY OF PITTSBURGH – OF THECOMMONWEALTH SYSTEM OF HIGHER EDUCATION
Schedule of Expenditures of Federal Awards
Year ended June 30, 2020
PassedCFDA Direct award or pass-through through to Federal
Federal grantor/pass through grantor/program title number entity identifying number subrecipients expendituresOffice of International Science and Engineering 47.079 Direct $ 452,997 1,053,370 Integrative Activities 47.083 Direct — 155,883 National Science Foundation 47.RD Direct — 920,730
Total National Science Foundation 2,044,231 28,813,230
Nuclear Regulatory Commission:U.S. Nuclear Regulatory Commission Scholarship and
Fellowship Program 77.008 Direct — 147,304
Total Nuclear Regulatory Commission — 147,304
Total Other Agencies 4,174,029 53,999,869
TOTAL RESEARCH & DEVELOPMENT CLUSTER 81,374,358 696,360,049
II. STUDENT FINANCIAL ASSISTANCE CLUSTER:
Department of Education:Federal Supplemental Educational Opportunity Grants 84.007 Direct — 1,184,597 Federal Work-Study Program 84.033 Direct — 2,188,962 Federal Pell Grant Program 84.063 Direct — 23,321,903 Federal Perkins Loan Program 84.038 Direct — 20,065,814 Direct Student Loans Program 84.268 Direct — 224,160,923
Total Department of Education — 270,922,199
Health Resources and Services Administration:Nursing Faculty Loan Program 93.264 Direct — 591,610
Health Professions Student Loans:Medicine 93.342 Direct — 97,027 Dentistry 93.342 Direct — 5,483,672 Pharmacy 93.342 Direct — 1,653,208
Loans for Disadvantaged Students:Dentistry 93.342 Direct — 132,170 Medicine 93.342 Direct — 77,348
Subtotal 93.342 — 7,443,425
Nursing Student Loans:Baccalaureate 93.364 Direct — 1,793,063
Nursing Faculty Loan Program – ARRA 93.408 Direct — 77,285
Total Health Resources and Services Administration — 9,905,383
TOTAL STUDENT FINANCIAL ASSISTANCE CLUSTER — 280,827,582
III. TRIO CLUSTER:
Department of Education:TRIO – Student Support Services 84.042 Direct — 710,233
Total Department of Education — 710,233
TOTAL TRIO CLUSTER — 710,233
IV. HEAD START CLUSTER:
Administration for Children and Families:Head Start 93.600 Direct 3,206,348 4,216,885
Total Administration for Children and Families 3,206,348 4,216,885
TOTAL HEAD START CLUSTER 3,206,348 4,216,885
V. CHILD NUTRITION CLUSTER:
Department of Agriculture:Commonwealth of Pennsylvania 10.559 SFSP — 7,384
Total Department of Agriculture — 7,384
TOTAL CHILDREN NUTRITION CLUSTER — 7,384
VI. OTHER PROGRAMS:
Department of Health and Human Services:Administration for Children and Families:
Commonwealth of Pennsylvania 93.643 4100081112 — 380,954
Research Foundation – State University of New York 93.648 8-82905 — 37,373 Research Foundation – State University of New York 93.648 8-86154 — 90,355
Subtotal 93.648 — 127,728
Commonwealth of Pennsylvania 93.658 4100066356 — 583,698 Commonwealth of Pennsylvania 93.658 4100081112 276 11,734,405 Commonwealth of Pennsylvania 93.658 4100083214 — 9,168,771
Subtotal 93.658 276 21,486,874 Commonwealth of Pennsylvania 93.669 4100081112 — 147,293 Commonwealth of Pennsylvania 93.674 4100081112 — 743,038
Total Administration for Children and Families 276 22,885,887
Administration for Community Living:ACL National Institute on Disability, Independent Living, and
Rehabilitation Research 93.433 Direct 33,583 94,675
Total Administration for Community Living 33,583 94,675
(Continued)58

UNIVERSITY OF PITTSBURGH – OF THECOMMONWEALTH SYSTEM OF HIGHER EDUCATION
Schedule of Expenditures of Federal Awards
Year ended June 30, 2020
PassedCFDA Direct award or pass-through through to Federal
Federal grantor/pass through grantor/program title number entity identifying number subrecipients expendituresCenters for Disease Control and Prevention:
Birth Defects and Developmental Disabilities – Preventionand Surveillance 93.073 Direct $ — 6,416
Injury Prevention and Control Research and State and CommunityBased Programs 93.136 Direct — 505,684
Gateway Health Plan 93.136 1001 — 41,436 University of Pittsburgh Medical Center (UPMC) 93.136 01 — 19,027
Subtotal 93.136 — 566,147
Oregon Health Authority 93.354 159701 — 12,001 ChangeLab Solutions 93.421 CDC7055-0-0109-1 — 10,614 Pennsylvania Pharmacists Association 93.426 4100082224-1815 — 45,340 Commonwealth of Pennsylvania 93.758 4100081647 96,080 256,503 Commonwealth of Pennsylvania 93.940 4100081987 — 158,708
Commonwealth of Pennsylvania 93.977 4300587825 — 807,225 Commonwealth of Pennsylvania 93.977 4300645528 — 671,315
Subtotal 93.977 — 1,478,540
Commonwealth of Pennsylvania 93.991 4100081647 37,800 44,704
Total Centers for Disease Control and Prevention 133,880 2,578,973
Health Resources and Services Administration:Training in General, Pediatric, and Public Health Dentistry 93.059 Direct — 515,286 Eastcentral Pennsylvania Area Health Education Center 93.107 EC UP6111 — 9,501 Maternal & Child Health Federal Consolidated Programs 93.110 Direct — 588,804 Nurse Anesthetist Traineeships 93.124 Direct — 45,408 Public Health Training Centers Program 93.516 Direct 256,041 893,308
Mental and Behavioral Health Education and Training Grants 93.732 Direct — 486,003 Chatham University 93.732 02 — 17,603 Chatham University 93.732 BHWET 01 — 9,358
Subtotal 93.732 — 512,964
Grants for Primary Care Training and Enhancement 93.884 Direct — 243,235 Rural Health Care Services Outreach, Rural Health Network Development and
Small Health Care Provider Quality Improvement 93.912 Direct — 123,428 PPHF Geriatric Education Centers 93.969 Direct 84,786 172,579
Total Health Resources and Services Administration 340,827 3,104,513
Substance Abuse and Mental Health Services Administration:CMSU Counties of Central Pennsylvania 93.104 6U79 SM062468-04M001 — 22,634 Commonwealth of Pennsylvania 93.104 4100078411 — 823,836
Subtotal 93.104 — 846,470
Substance Abuse and Mental Health Services Projects ofRegional and National Significance 93.243 Direct 108,387 1,484,955
Allegheny County 93.243 174565 — 93,607 Allegheny County 93.243 211641 — 1 Allegheny County 93.243 236665 — 8,000 Allegheny Singer Research Institute 93.243 49247909 — 11,501 Allegheny Singer Research Institute 93.243 49248309 — 28,369 Blair County Drug and Alcohol Program, Inc. 93.243 1001 — 103,322 Chatham University 93.243 1 — 4,371 Commonwealth of Pennsylvania 93.243 4300600269 — 102,183 Commonwealth of Pennsylvania 93.243 4300637503 — 200,978 Commonwealth of Pennsylvania 93.243 SAP 4100068678 — 92,442 Community Human Services Corporation 93.243 2525304 — 39,404 University of the Sciences in Philadelphia 93.243 121-129102801 — 8,910 University of Utah 93.243 10041723-PITT — 29,119 Ursuline College 93.243 1001 — 59,024
Subtotal 93.243 108,387 2,266,186
Pennsylvania State University 93.788 6007-UP-SAMHSA-1889 — 9,172 Cambria County 93.959 SBIRT — 22,151
Total Substance Abuse and Mental Health Services Administration 108,387 3,143,979
Other Department of Health and Human Services:District of Columbia 93.817 CW61684 — 53,713
Total Other Department of Health and Human Services — 53,713
Total Department of Health and Human Services 616,953 31,861,740
Department of Defense:Defense Health Agency 12.UNK Direct — 69,662
Total Defense Health Agency — 69,662
Department of the Air Force 12.UNK Direct — 582,022
Total Department of the Air Force — 582,022
Department of the Army 12.UNK Direct — 538,307
Total Department of the Army — 538,307
Department of the Navy:University of California at Los Angeles 12.UNK 2000 P UG248 — 63,590
Total Department of the Navy — 63,590
(Continued)59

UNIVERSITY OF PITTSBURGH – OF THECOMMONWEALTH SYSTEM OF HIGHER EDUCATION
Schedule of Expenditures of Federal Awards
Year ended June 30, 2020
PassedCFDA Direct award or pass-through through to Federal
Federal grantor/pass through grantor/program title number entity identifying number subrecipients expendituresNational Security Agency:
Language Grant Program 12.900 Direct $ — 120,586
Total National Security Agency — 120,586
Other Department of Defense:Institute of International Education 12.357 1801PITT20PGO051PO1 — 48,983 Institute of International Education 12.357 PGO1801PITT20PGO051P — 340,579
Subtotal 12.537 — 389,562
Total Other Department of Defense — 389,562
Total Department of Defense — 1,763,729
Other Agencies:Appalachian Regional Commission:
Innovation Works 23.002 ARC POWER — 162,253
Total Appalachian Regional Commission — 162,253
Corporation for National and Community Services:Jumpstart for Young Children, Inc. 94.006 JS-SITE #09 — 37,626 Jumpstart for Young Children, Inc. 94.006 JS-SITE #291 — 175,525
Subtotal 94.006 — 213,151
National Service and Civic Engagement Research Competition 94.026 Direct 10,170 79,796
Total Corporation for National and Community Services 10,170 292,947
Department of Agriculture:Commonwealth of Pennsylvania 10.558 300-02-961-3 — 13,390
Total Department of Agriculture — 13,390
Department of Commerce:Catalyst Connection 11.307 PO00003070 — 55,394
Total Department of Commerce — 55,394
Department of Education:
National Resource Centers Program for Foreign Language andand Area Studies or Foreign Language and InternationalStudies Program and Foreign Language and Area StudiesFellowship Program 84.015A Direct — 603,008
National Resource Centers Program for Foreign Language andand Area Studies or Foreign Language and InternationalStudies Program and Foreign Language and Area StudiesFellowship Program 84.015B Direct — 624,704
Subtotal 84.015 — 1,227,712
Undergraduate International Studies and Foreign Language Programs 84.016 Direct — 28,438 Overseas Programs – Group Projects Abroad 84.021 Direct — 2,296 Higher Education Institutional Aid 84.031 Direct — 513,156
Commonwealth of Pennsylvania 84.126 4000007735 — 919,256 Commonwealth of Pennsylvania 84.126 FC4000007735 — (164,472)
Subtotal 84.126 — 754,784
Graduate Assistance in Areas of National Need 84.200 Direct — 97,297 Homewood Children’s Village 84.215 HCV/PACS — 8,165 Pennsylvania State University 84.229 6023-UP-USDE-0009 — 23,534 Special Education – Personnel Development to Improve
Services and Results for Children with Disabilities 84.325D Direct — 212,955 Special Education – Personnel Development to Improve
Services and Results for Children with Disabilities 84.325K Direct — 267,259 Salus University 84.325H PITT 88404A 1819 — 1,999 Salus University 84.325H PITT 86405 19-20 — 64,560
Subtotal 84.325 — 546,773
National Writing Project 84.367 92-PA09-2019SEED-AI — 4,644 National Writing Project 84.367 92-PA09-SEED2019 — 7,352
Subtotal 84.367 — 11,996
COVID-19 Education Stabilization Fund 84.425E Direct — 10,632,670 COVID-19 Education Stabilization Fund 84.425F Direct — 6,000,000
Subtotal 84.425 — 16,632,670
Total Department of Education — 19,846,821
(Continued)60
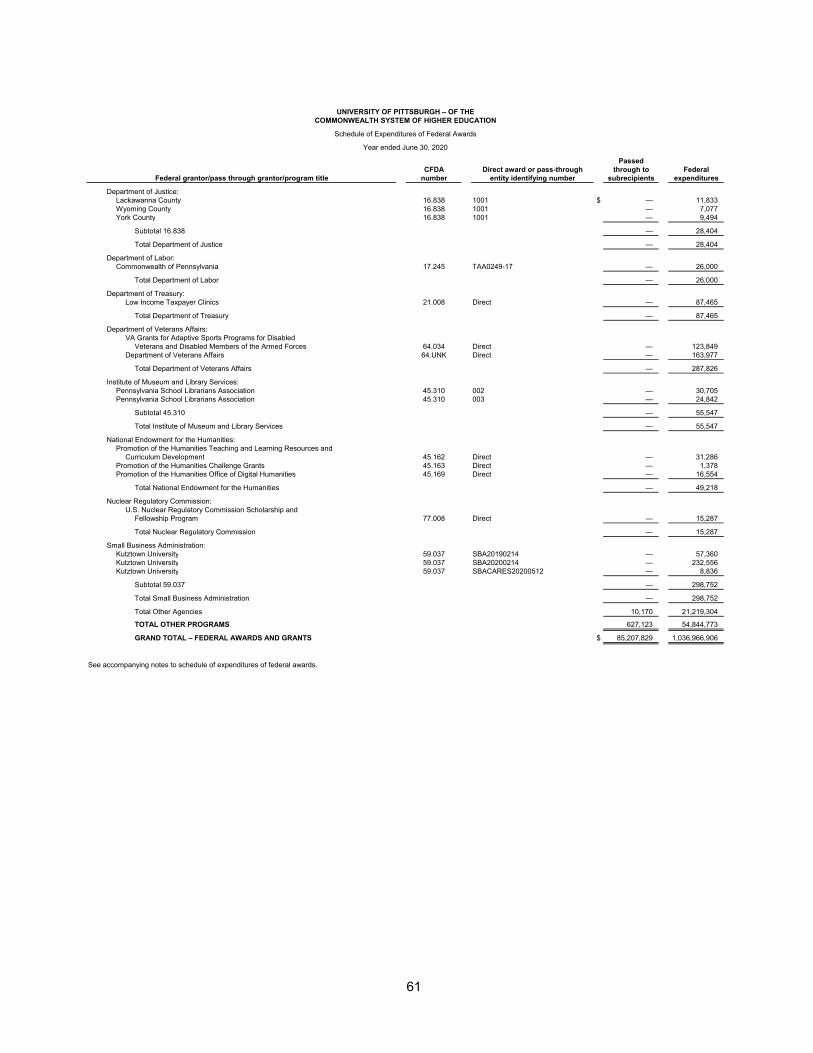
UNIVERSITY OF PITTSBURGH – OF THECOMMONWEALTH SYSTEM OF HIGHER EDUCATION
Schedule of Expenditures of Federal Awards
Year ended June 30, 2020
PassedCFDA Direct award or pass-through through to Federal
Federal grantor/pass through grantor/program title number entity identifying number subrecipients expenditures
Department of Justice:Lackawanna County 16.838 1001 $ — 11,833 Wyoming County 16.838 1001 — 7,077 York County 16.838 1001 — 9,494
Subtotal 16.838 — 28,404
Total Department of Justice — 28,404
Department of Labor:Commonwealth of Pennsylvania 17.245 TAA0249-17 — 26,000
Total Department of Labor — 26,000
Department of Treasury:Low Income Taxpayer Clinics 21.008 Direct — 87,465
Total Department of Treasury — 87,465
Department of Veterans Affairs:VA Grants for Adaptive Sports Programs for Disabled
Veterans and Disabled Members of the Armed Forces 64.034 Direct — 123,849 Department of Veterans Affairs 64.UNK Direct — 163,977
Total Department of Veterans Affairs — 287,826
Institute of Museum and Library Services:Pennsylvania School Librarians Association 45.310 002 — 30,705 Pennsylvania School Librarians Association 45.310 003 — 24,842
Subtotal 45.310 — 55,547
Total Institute of Museum and Library Services — 55,547
National Endowment for the Humanities:Promotion of the Humanities Teaching and Learning Resources and
Curriculum Development 45.162 Direct — 31,286 Promotion of the Humanities Challenge Grants 45.163 Direct — 1,378 Promotion of the Humanities Office of Digital Humanities 45.169 Direct — 16,554
Total National Endowment for the Humanities — 49,218
Nuclear Regulatory Commission:U.S. Nuclear Regulatory Commission Scholarship and
Fellowship Program 77.008 Direct — 15,287
Total Nuclear Regulatory Commission — 15,287
Small Business Administration:Kutztown University 59.037 SBA20190214 — 57,360 Kutztown University 59.037 SBA20200214 — 232,556 Kutztown University 59.037 SBACARES20200512 — 8,836
Subtotal 59.037 — 298,752
Total Small Business Administration — 298,752
Total Other Agencies 10,170 21,219,304
TOTAL OTHER PROGRAMS 627,123 54,844,773
GRAND TOTAL – FEDERAL AWARDS AND GRANTS $ 85,207,829 1,036,966,906
See accompanying notes to schedule of expenditures of federal awards.
61

UNIVERSITY OF PITTSBURGH – OF THE
COMMONWEALTH SYSTEM OF HIGHER EDUCATION
Notes to Schedule of Expenditures of Federal Awards
Year ended June 30, 2020
62 (Continued)
(1) Basis of Presentation and Significant Accounting Policies
The accompanying schedule of expenditures of federal awards (the Schedule) includes all grants,
contracts, and similar agreements of the University of Pittsburgh – Of the Commonwealth System of Higher
Education(the University), which has been financed by the U.S. federal government for the year ended
June 30, 2020. The federal award information is presented in accordance with the requirements of Title 2
U.S. Code of Federal Regulations Part 200, Uniform Administrative Requirements, Cost Principals, and
Audit Requirements for Federal Awards (Uniform Guidance).
For the purposes of the Schedule, federal awards have been classified in two types:
• Direct federal awards, and
• Pass through funds received from nonfederal organizations made under federally sponsored programs
conducted by those organizations.
The Schedule also presents expenditures passed through from the University to other nonfederal
subrecipient organizations. Since the Schedule presents only a selected portion of the activities of the
University, it is not intended to and does not present either the financial position, changes in net assets, or
cash flows of the University. The Schedule is prepared on the accrual basis of accounting. Negative
expenditures detailed in the Schedule result from current year adjustments to prior year award amounts.
Expenditures for federal awards (excluding student financial assistance) are determined using cost
accounting principles and procedures set forth in OMB Circular A-21, Cost Principles for Educational
Institutions, and the uniform administrative requirements as set forth in OMB Circular A-110, Uniform
Administrative Requirements for Grants and Agreements with Institutions of Higher Education, Hospitals,
and Other Non-Profit Organizations or the administrative and cost principles contained in the Uniform
Guidance, as applicable. Under these costs principles and administrative requirements, certain
expenditures are not allowable or are limited as to reimbursement.
Expenditures for student financial assistance are recognized as incurred and include the federal share of
students’ Federal Supplemental Educational Opportunity Grants program and Federal Work-Study program
earnings, Pell grants, loan disbursements and administrative cost allowances, where applicable.
(2) Reimbursement of Facilities and Administrative Costs
Sponsored grants and contracts normally provide for the recovery of direct and facilities and administrative
costs (F&A costs). Recovery of the related F&A costs is generally recorded at predetermined rates
negotiated with the federal government. Entitlement to these resources for the recovery of the applicable
direct and related F&A costs is generally conditioned upon compliance with the terms and conditions of the
grant agreements and applicable federal regulations, including the expenditure of the resources for eligible
purposes. Substantially all grants and the University’s F&A cost rate are subject to financial and
compliance reviews and audits by the grantors. In management’s opinion, the likelihood of an adverse
material outcome upon the University’s financial position from those reviews and audits is remote. On
November 19, 2019, the Department of Health and Human Services approved F&A cost recovery rates
effective from July 1, 2019 through June 30, 2023. The University has elected not to use the 10-percent de
minimis indirect cost rate as allowed under the Uniform Guidance.

UNIVERSITY OF PITTSBURGH – OF THE
COMMONWEALTH SYSTEM OF HIGHER EDUCATION
Notes to Schedule of Expenditures of Federal Awards
Year ended June 30, 2020
63 (Continued)
(3) Federal Loan Programs
The University administers the following federal loan programs with an outstanding loan balance at
June 30, 2020:
Federal
CFDA Outstanding
Federal Grant and Program Title number loan balance
Department of Education – Federal Perkins Loan Program 84.038 $ 15,617,392
Department of Health and Human Services – Public Service:
Health Professions Student Loan Program:
Medicine 93.342 $ 84,989
Dentistry 93.342 4,672,898
Pharmacy 93.342 1,380,202
Nursing Student Loan Program – Baccalaureate 93.364 1,464,590
Nursing Faculty Loan Program:
Nursing Faculty Loan ARRA 93.408 55,727
Nursing Faculty Loan 93.264 488,032
Disadvantaged Student Loan Program:
Medicine 93.342 72,709
Dentistry 93.342 80,728
The Perkins and Department of Health and Human Services Public Service Loan Programs are
administered directly by the University, and balances and transactions relating to these programs are
included in the University’s consolidated financial statements. The amounts included in the Schedule of
Expenditures under the Perkins and Department of Health and Human Services Public Service Loan
Programs include the balance of the respective loan program as of June 30, 2019 and new loans issued
during fiscal 2020.
(4) Department of Education Loan Programs
The University is responsible only for the performance of certain administrative duties with respect to the
Direct Loans; accordingly, these loans are not included in the University’s consolidated financial statements
and it is not practical to determine the balance of loans outstanding to students and former students of the
University under these programs.
(5) Student Financial Assistance Program
For the year ended June 30, 2020, administrative costs on the Student Financial Assistance Program were
claimed under the Federal Work Study Program in the amount of $188,464.
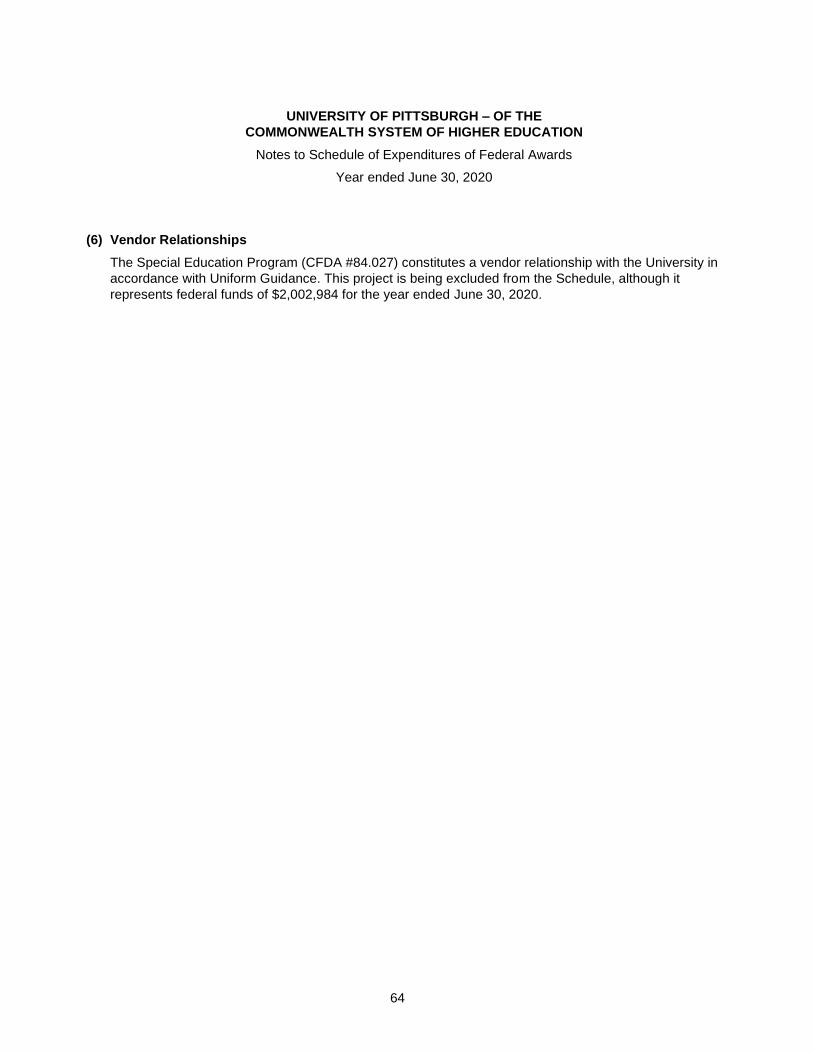
UNIVERSITY OF PITTSBURGH – OF THE
COMMONWEALTH SYSTEM OF HIGHER EDUCATION
Notes to Schedule of Expenditures of Federal Awards
Year ended June 30, 2020
64
(6) Vendor Relationships
The Special Education Program (CFDA #84.027) constitutes a vendor relationship with the University in
accordance with Uniform Guidance. This project is being excluded from the Schedule, although it
represents federal funds of $2,002,984 for the year ended June 30, 2020.

Independent Auditors’ Report on Internal Control Over Financial Reporting and on Compliance and
Other Matters Based on an Audit of Financial Statements Performed in Accordance With Government
Auditing Standards
The Board of Trustees
The University of Pittsburgh – Of the Commonwealth
System of Higher Education:
We have audited, in accordance with the auditing standards generally accepted in the United States of America
and the standards applicable to financial audits contained in Government Auditing Standards, issued by the
Comptroller General of the United States, the consolidated financial statements of The University of
Pittsburgh – Of the Commonwealth System of Higher Education (the University), which comprise the
consolidated balance sheet as of June 30, 2020, the related consolidated statements of activities and cash
flows for the year then ended, and the related notes to the consolidated financial statements, and have issued
our report thereon dated October 20, 2020. Our report contains an emphasis of matter paragraph referring to
the University’s adoption, in 2020, of Accounting Standards Update No. 2016-02, Leases (Topic 842), as
amended.
Internal Control Over Financial Reporting
In planning and performing our audit of the consolidated financial statements, we considered the University’s
internal control over financial reporting (internal control) as a basis for designing audit procedures that are
appropriate in the circumstances for the purpose of expressing our opinion on the consolidated financial
statements, but not for the purpose of expressing an opinion on the effectiveness of the University’s internal
control. Accordingly, we do not express an opinion on the effectiveness of the University’s internal control.
A deficiency in internal control exists when the design or operation of a control does not allow management or
employees, in the normal course of performing their assigned functions, to prevent, or detect and correct,
misstatements on a timely basis. A material weakness is a deficiency, or a combination of deficiencies, in
internal control, such that there is a reasonable possibility that a material misstatement of the entity’s
consolidated financial statements will not be prevented or detected and corrected on a timely basis. A
significant deficiency is a deficiency, or a combination of deficiencies, in internal control that is less severe than
a material weakness, yet important enough to merit attention by those charged with governance.
Our consideration of internal control was for the limited purpose described in the first paragraph of this section
and was not designed to identify all deficiencies in internal control that might be material weaknesses or
significant deficiencies. Given these limitations, during our audit we did not identify any deficiencies in internal
control that we consider to be material weaknesses. However, material weaknesses may exist that have not
been identified.
Compliance and Other Matters
As part of obtaining reasonable assurance about whether the University’s consolidated financial statements are
free from material misstatement, we performed tests of its compliance with certain provisions of laws,
regulations, contracts, and grant agreements, noncompliance with which could have a direct and material effect
on the consolidated financial statements. However, providing an opinion on compliance with those provisions
was not an objective of our audit, and accordingly, we do not express such an opinion. The results of our tests
disclosed no instances of noncompliance or other matters that are required to be reported under Government
Auditing Standards.
KPMG LLPBNY Mellon CenterSuite 3400500 Grant StreetPittsburgh, PA 15219-2598
KPMG LLP, a Delaware limited liability partnership and a member firm of the KPMG global organization of independent member firms affiliated with KPMG International Limited, a private English company limited by guarantee.
66
Purpose of this Report
The purpose of this report is solely to describe the scope of our testing of internal control and compliance and
the results of that testing, and not to provide an opinion on the effectiveness of the University’s internal control
or on compliance. This report is an integral part of an audit performed in accordance with Government Auditing
Standards in considering the University’s internal control and compliance. Accordingly, this communication is
not suitable for any other purpose.
Pittsburgh, Pennsylvania
October 20, 2020

Independent Auditors’ Report on Compliance for Each Major Federal Program;
Report on Internal Control Over Compliance; and Report on Schedule of Expenditures of Federal
Awards Required by the Uniform Guidance
The Board of Trustees of the
University of Pittsburgh – Of the Commonwealth
System of Higher Education:
Report on Compliance for Each Major Federal Program
We have audited the University of Pittsburgh – Of the Commonwealth System of Higher Education’s
(the University) compliance with the types of compliance requirements described in the OMB Compliance
Supplement that could have a direct and material effect on each of the University’s major federal programs for
the year ended June 30, 2020. The University’s major federal programs are identified in the summary of
auditors’ results section of the accompanying schedule of findings and questioned costs.
Management’s Responsibility
Management is responsible for compliance with federal statutes, regulations, and the terms and conditions of
its federal awards applicable to its federal programs.
Auditors’ Responsibility
Our responsibility is to express an opinion on compliance for each of the University’s major federal programs
based on our audit of the types of compliance requirements referred to above. We conducted our audit of
compliance in accordance with auditing standards generally accepted in the United States of America; the
standards applicable to financial audits contained in Government Auditing Standards, issued by the Comptroller
General of the United States; and the audit requirements of Title 2 U.S. Code of Federal Regulations Part 200,
Uniform Administrative Requirements, Cost Principles, and Audit Requirements for Federal Awards (Uniform
Guidance). Those standards and the Uniform Guidance require that we plan and perform the audit to obtain
reasonable assurance about whether noncompliance with the types of compliance requirements referred to
above that could have a direct and material effect on a major federal program occurred. An audit includes
examining, on a test basis, evidence about the University’s compliance with those requirements and performing
such other procedures as we considered necessary in the circumstances.
We believe that our audit provides a reasonable basis for our opinion on compliance for each major federal
program. However, our audit does not provide a legal determination of the University’s compliance.
Opinion on Each Major Federal Program
In our opinion, the University complied, in all material respects, with the types of compliance requirements
referred to above that could have a direct and material effect on each of its major federal programs for the year
ended June 30, 2020.
Report on Internal Control Over Compliance
Management of the University is responsible for establishing and maintaining effective internal control over
compliance with the types of compliance requirements referred to above. In planning and performing our audit
of compliance, we considered the University’s internal control over compliance with the types of requirements
that could have a direct and material effect on each major federal program to determine the auditing
procedures that are appropriate in the circumstances for the purpose of expressing an opinion on compliance
KPMG LLPBNY Mellon CenterSuite 3400500 Grant StreetPittsburgh, PA 15219-2598
KPMG LLP, a Delaware limited liability partnership and a member firm of the KPMG global organization of independent member firms affiliated with KPMG International Limited, a private English company limited by guarantee.

68
for each major federal program and to test and report on internal control over compliance in accordance with
the Uniform Guidance, but not for the purpose of expressing an opinion on the effectiveness of internal control
over compliance. Accordingly, we do not express an opinion on the effectiveness of the University’s internal
control over compliance.
A deficiency in internal control over compliance exists when the design or operation of a control over
compliance does not allow management or employees, in the normal course of performing their assigned
functions, to prevent, or detect and correct, noncompliance with a type of compliance requirement of a federal
program on a timely basis. A material weakness in internal control over compliance is a deficiency, or a
combination of deficiencies, in internal control over compliance, such that there is a reasonable possibility that
material noncompliance with a type of compliance requirement of a federal program will not be prevented, or
detected and corrected, on a timely basis. A significant deficiency in internal control over compliance is a
deficiency, or a combination of deficiencies, in internal control over compliance with a type of compliance
requirement of a federal program that is less severe than a material weakness in internal control over
compliance, yet important enough to merit attention by those charged with governance.
Our consideration of internal control over compliance was for the limited purpose described in the first
paragraph of this section and was not designed to identify all deficiencies in internal control over compliance
that might be material weaknesses or significant deficiencies. We did not identify any deficiencies in internal
control over compliance that we consider to be material weaknesses. However, material weaknesses may exist
that have not been identified.
The purpose of this report on internal control over compliance is solely to describe the scope of our testing of
internal control over compliance and the results of that testing based on the requirements of the Uniform
Guidance. Accordingly, this report is not suitable for any other purpose.
Report on Schedule of Expenditures of Federal Awards Required by the Uniform Guidance
We have audited the consolidated financial statements of the University as of and for the year ended June 30,
2020, and have issued our report thereon dated October 20, 2020, which included an emphasis of matter
paragraph for the adoption of Accounting Standards Update No. 2016-02, Leases (Topic 842), as amended,
which contained an unmodified opinion on those consolidated financial statements. Our audit was conducted
for the purpose of forming an opinion on the consolidated financial statements as a whole. The accompanying
schedule of expenditures of federal awards is presented for purposes of additional analysis as required by the
Uniform Guidance and is not a required part of the consolidated financial statements. Such information is the
responsibility of management and was derived from and relates directly to the underlying accounting and other
records used to prepare the consolidated financial statements. The information has been subjected to the
auditing procedures applied in the audit of the consolidated financial statements and certain additional
procedures, including comparing and reconciling such information directly to the underlying accounting and
other records used to prepare the consolidated financial statements or to the consolidated financial statements
themselves, and other additional procedures in accordance with auditing standards generally accepted in the
United States of America. In our opinion, the schedule of expenditures of federal awards is fairly stated in all
material respects in relation to the consolidated financial statements as a whole.
Pittsburgh, Pennsylvania
September 24, 2021

UNIVERSITY OF PITTSBURGH – OF THE
COMMONWEALTH SYSTEM OF HIGHER EDUCATION
Schedule of Findings and Questioned Costs
Year ended June 30, 2020
69
(1) Summary of Auditors’ Results
(a) Type of report issued on whether the consolidated financial statements were prepared in accordance
with generally accepted accounting principles: Unmodified
(b) Internal control deficiencies over financial reporting disclosed by the audit of the consolidated financial
statements:
• Material weaknesses: No
• Significant deficiencies: None reported
(c) Noncompliance material to the financial statements: No
(d) Internal control deficiencies over major programs disclosed by the audit:
• Material weaknesses: No
• Significant deficiencies: None reported
(e) Type of report issued on compliance for major programs: Unmodified
(f) Audit findings that are required to be reported in accordance with 2 CFR 200.516(a): No
(g) Major programs:
• Research and Development Cluster – various CFDA numbers
• Head Start Cluster – various CFDA numbers
• Education Stabilization Fund – CFDA #84.425
(h) Dollar threshold used to distinguish between Type A and Type B programs: $3,110,901
(i) Auditee qualified as a low-risk auditee: Yes
(2) Findings Relating to the Financial Statements Reported in Accordance with Government Auditing
Standards
None
(3) Findings and Questioned Costs Relating to Federal Awards
None