FortiSIEM 5.3.1 Online Help (PDF) - AWS
505
User Guide Version 5.3.1
-
Upload
khangminh22 -
Category
Documents
-
view
1 -
download
0
Transcript of FortiSIEM 5.3.1 Online Help (PDF) - AWS

User Guide
Version 5.3.1

FORTINET DOCUMENT LIBRARY
http://docs.fortinet.com
FORTINET VIDEO GUIDE
http://video.fortinet.com
FORTINET BLOG
https://blog.fortinet.com
CUSTOMER SERVICE & SUPPORT
https://support.fortinet.com
FORTINET TRAINING & CERTIFICATION PROGRAM
https://www.fortinet.com/support-and-training/training.html
NSE INSTITUTE
https://training.fortinet.com
FORTIGUARD CENTER
https://fortiguard.com/
END USER LICENSE AGREEMENT
http://www.fortinet.com/doc/legal/EULA.pdf
FEEDBACK
Email: [email protected]
6/2/2020FortiSIEM - User's Guide

TABLE OF CONTENTS
Overview 14Scale-Out Architecture 14Multi-tenancy 14Infrastructure Discovery and Automated CMDB 15High Performance Log Collection and Flexible Parsing 15Performance and AvailabilityMonitoring 15Network Configuration and File IntegrityMonitoring 15CustomDevice and Application Support 16User Identity and Location Tracking 16External Threat Intelligence Integration 16Distributed Event Correlation and Threat Detection – the Rule Engine 16Device and User Risk Scoring 17Incident Response andMitigation 17Search, Threat Hunting, Compliance Reports and Dashboards 17Internal Ticketing System and Two-way Third-party Ticketing Integration 18Business Service Analytics 18
What’s New 19What's New in 5.3.1 19
Pre-upgrade Notes 19Bug Fixes and Enhancements 19
What's New in 5.3.0 21Pre-upgrade Notes 22New Features 22Key Enhancements 25New Device Support 28Existing Device Support Bug Fixes and Enhancements 28Other Bug Fixes and Enhancements 31New Reports 36New/Modified Rules 38Vulnerabilities Fixed 39
What's New in 5.2.8 39What's New in 5.2.7 40
Upgrade Notes 40What's New in 5.2.6 40

Pre-upgrade notes 41New Features 41Key Enhancements 42New Device Support 43Important Bug and Data Fixes 43Vulnerabilities Fixed 48
What's New in 5.2.5 49Pre-deployment Notes 49New Features 50Key Enhancements 53New Device Support 53Device Support Extensions 54New andModified Rules and Reports 55Important Bug Fixes 59Known Issues in Release 5.2.5 62
What's New in 5.2.4 63Features 63Enhancements 65Bug Fixes 66
What's New in 5.2.2 67Support for new 3500Gmodel 67
What’s New in 5.2.1 67New Features 67Enhancements 68New Device Support 68Device Support Enhancements 69Resolved issues 76
What’s New in 5.1.3 81Ability to run in Cluster mode 81
What’s New in 5.1.2 81What’s New in 5.1.1 82What’s New in 5.1.0 85
New Features 85Enhancements 85New Device Support 88Device Support Enhancements 88Resolved Issues 89
What’s New in 5.0.1 92New Features 93Enhancements 93
What’s New in 5.0.0 94New Features 95

KeyEnhancements 95New Device Support 96
Key Concepts 102Clustering Architecture 102Licensing 103Multi-tenancy andOrganizations 104Role-based AccessControl 105Discovery and CMDB 105Windows and Linux Agents 106Business Services 107Parsers andMonitors 107Entity Risk Score 107User Identity and Location 107Searches, Reports and Compliance 108Rules and Incidents 108Incident Notification Policy 109Remediation Library 109External Ticketing System Integration 110Dashboards 110
Getting Started 112Advanced Operations 121
Discovering Users 122Creating FortiSIEMUsers 123Setting External Authentication 123Setting 2-factor Authentication 124Assigning FortiSIEMRoles to Users 124Creating Business Services 124Creating Dynamic CMDBGroups and Business Services 125Setting Device Geo-Location 125Creating CMDB Reports 126Searching Incidents 126Tuning Incidents via Exceptions 126Tuning Incidents via Modifying Rules 126Tuning Incidents via Drop Rules 127Tuning Incidents by Adjusting Thresholds 127Clearing Incidents 127Adding Comments or Remediation Advice to an Incident 128Remediating an Incident 128Notifying an Incident via Email 130For Policy based Notification 130Creating New Rules 131Creating a FortiSIEMTicket 131

Creating a Ticket in External Ticketing System 132Checking DeviceMonitoring Status and Health 132Setting DevicesUnder Maintenance 133Creating CustomMonitors 133Setting Important Interfaces and Processes 134Modifying SystemParsers 134Creating CustomParsers 135HandlingMulti-line Syslog 135Creating Synthetic TransactionMonitors 135Mapping Events to Organizations 136AddingWindowsAgents 136Adding Linux Agents 136Forwarding Events to External Systems 137Creating New Rules 137Creating New Reports 137Scheduling Reports 137Customizing Built-in Dashboards 137Creating CustomDashboards 138Creating Business Service Dashboards 138Monitoring SystemHealth 138Monitoring Collector Health 138Monitoring Elasticsearch Health 139SystemErrors 139Monitoring User Activity 139
Administration 140Setup 140
Configuring Storage 140Setting Organizations and Collectors (Service Provider) 151Setting Collectors (Enterprise) 153Setting Credentials 154Discovering Devices 156Editing Event Pulling 160Editing PerformanceMonitors 161Configuring Synthetic TransactionMonitoring 162ConfiguringMaintenance Calendars 169ConfiguringWindowsAgent 171Configuring Linux Agent 190
Device support 200Working with Devices or Applications 200Working with Event Attributes 201Working with Event Types 202Working with Parsers 203

Working with CustomPerformanceMonitors 222Working with CustomProperties 253Analyzing custom log files 253Creating SNMP SystemObject Identifiers for devices 254
Health 254Viewing Cloud Health 254Viewing Collector Health 262Viewing Elasticsearch Health 264
License 264Viewing License Information 264Viewing License Usage 265Adding Nodes 265
Settings 266SystemSettings 267Analytics Settings 274Discovery Settings 279Monitoring Settings 283Event Handling Settings 286Event Database Settings 289General Settings 299Role Settings 326
Managing Tasks 331Requesting a de-anonymization request 331Approving a de-anonymization request 331
Managing CMDB 333Devices 333
Viewing Device Information 333Working with Device Groups 334Creating and Editing Devices 336PerformingOperations on Devices and Device Groups 336Associating Parsers to a Device 337Searching for Devices 338
Applications 338Viewing Application Information 338Editing Applications 339Working with Application Groups 339
Users 340Adding Users 340Editing User Information 341Working with User Groups 342
Business Services 342Viewing Business Services 343

Creating Business Services 343Working with Business Service Groups 344
CMDB Reports 344Creating CMDB Reports 347Scheduling a CMDB Report 349Running a CMDB Report 350Adding CMDB Report to Dashboard 351
Managing Resources 352Reports 352
Viewing SystemReports 352WorkingWith Report Templates 353Creating New Reports 357Running SystemReports 358Scheduling Reports 358Importing and Exporting Reports 361
Rules 362Viewing Rules 362Creating Rules 363Activating and Deactivating a Rule 370Testing a Rule 371Exporting and Importing Rule Definitions 372
Network 372Adding a Network 373Modifying a Network 373Deleting a Network 373
Watch list 374System-definedWatch list 374Creating aWatch List 382Modifying aWatch List 383Using aWatch list 383Exporting and ImportingWatch Lists 384
Protocols 384Adding a Protocol 384Modifying a Protocol 385Deleting a protocol 385
Event types 385Adding an event type 385Modifying an Event Type 386Deleting an Event Type 386
Working with FortiGuard IOCs 386Working with FortiGuardMalware Domains 386Working with FortiGuardMalware IPs 387

Working with FortiGuardMalware URLs 387Working with ThreatConnect IOCs 387
Download ThreatConnect Malware Domains 387DownloadOther ThreatConnect IOCs 388Specifying a schedule 388
Malware Domains 389Adding aMalware Domain 389Modifying aMalware Domain 389Deleting aMalware Domain 390
Malware IPs 390Adding aMalware IP 390Modifying aMalware IP 391Deleting aMalware IP 391ImportingMalware IPs 391
Malware URLs 394Adding aMalware URL 394Modifying aMalware URL 395Deleting aMalware URL 395ImportingMalware URLs 395
Malware Processes 398Creating aMalware ProcessGroup 398Adding aMalware Process 398Modifying aMalware Process 399Deleting aMalware Process 399
CountryGroups 399Creating a CountryGroup 399Adding a CountryGroup 400Modifying a CountryGroup 400Deleting a CountryGroup 400Creating a Country 400Deleting a Country 400
Malware Hash 401Adding aMalware Hash 401Modifying aMalware Hash 401Updating user-definedMalware Hash 401
Default Password 405Adding a Default Password 405Modifying a Default Password 405Importing and Exporting a Default Password 405
Anonymity network 406Adding Anonymity Networks 406Modifying Anonymity Networks 407

Updating Anonymity Networks 407User Agents 410
Adding User Agents 410Modifying User Agents 410Importing and Exporting User Agents 410
Remediations 411Adding Remediations 411Modifying Remediations 412Deleting Remediations 412
Working with Cases 413Creating a Ticket 413
Creating a ticket fromCase tab 413Creating a ticket from Incidents tab 414Creating a ticket via Incident Notification policy 414
Editing a Ticket 415Managing Cases 415
Viewing a Ticket 415Searching a Ticket 418Escalating a Ticket 419Exporting a Ticket 419
Working with Incidents 421List View 421
Viewing Incidents 421Acting on Incidents 425
Attack View 430Using the Attack View 431Filtering in the Incident Attack View 431Getting Detailed Information on an Incident 431Displaying Triggering Events for an Incident 432
Overview View 432Risk View 434Explorer View 434
Using the Incident Explorer View 437Filtering in the Incident Explorer View 437
Lookups Via ExternalWebsites (e.g. VirusTotal) 437Prerequisites 437Performing an External Lookup on VirusTotal and/or RiskIQ 438
CVE-Based IPS False Positive Analysis 439Working with Analytics 441
Running a Built-in Search 441Understanding Search Components 442
Specifying Search Filters 442

Specifying Search TimeWindow 443Specifying Aggregations and Display Fields 443Specifying Organizations for a Service Provider Deployment 445Examples of Operators in Expressions 445
Viewing Historical Search Results 446Using search result tabs 446Zooming-in on a specific time window 447Viewing parsed raw events 447Adding an attribute to the filter criteria in the search 447Adding an attribute to the search display 447
Viewing Real-time Search Results 447Viewing Parsed Raw Events 448Zooming-in on a Specific TimeWindow 448
Using NestedQueries 448Outer CMDBQuery, Inner Event Query 449Outer Event Query, Inner Event Query 450Outer Event Query, Inner CMDB Event Query 451
Saving Search Results 451Viewing Saved Search Results 452Exporting Search Results 452Emailing Search Results 452Creating a Rule fromSearch 453
Working with Dashboards 455General Operations 455
Viewing built-in dashboard folders 455Displaying only dashboard folders of interest 460Setting a home dashboard folder 460Creating a new dashboard folder 460Creating a new dashboard under a folder 460Sharing dashboard folders 461Deleting a dashboard 462Deleting a dashboard folder 462Starting dashboard slideshow 463
Widget Dashboard 463Creating aWidget Dashboard 463Data source 463Populating aWidget Dashboard 463ModifyingWidget Dashboard layout 464Modifying widget information display 464Searching in aWidget Dashboard 464Drill-down into a widget 465ExportingWidget Dashboard definition 465

Importing aWidget Dashboard 465Forcing a refresh 465
SummaryDashboard 465Creating a SummaryDashboard 466Data Source 466Managing devices in a SummaryDashboard 466Changing display columns 466Changing refresh interval 467Forcing a refresh 467Searching a SummaryDashboard 467
Business Service Dashboard 467Creating a Business Service Dashboard 467Data source 467Adding/Removing Business Services to the Dashboard 468Summary view 468Drilldown view 468Filtering Summary view 469Filtering Drilldown view 469Changing refresh interval 469Forcing a refresh 469
Identity and Location Dashboard 469Data source 469Adding to the Data source 470Viewing Identity and Location Dashboard 471Searching for specific information 471
Using the Interface Dashboard 471Data source 472Adding/Removing devices and interfaces to the dashboard 474Viewing device level metrics 474Viewing interface level metrics 474Viewing Application Usage 475ViewingQoS Statistics 475Drill-down fromwidgets 475Modifying widget information display 475Changing refresh interval 475Forcing a refresh 475
PCI Logging Status Dashboard 475Setting up data source 475Creating a Dashboard 479Analyzing Dashboard data 479Searching Dashboard data 479
Managing Tasks 480

Requesting a de-anonymization request 480Approving a de-anonymization request 480
Appendix 482Flash to HTML5GUI mapping 482
Dashboard 482Analytics 485Incidents 486CMDB 486Admin 487
FortiSIEMDeployment Scenarios 489Enterprise deployment 489Service Provider deployment 490
FortiSIEMEvent Attribute to CEF KeyMapping 493Differences in Analytics Semantics between EventDB and Elasticsearch 496
Issues 497Example 1 - Matching Event Types 497Example 2 - Matching Raw Messsages 498Elasticsearch Support for Regex 498
FortiSIEMEvent Categories and Handling 499FortiSIEMCharts and Views 500Configuring FortiSIEMApplication Server for ProxyConnectivity 504

Scale-Out Architecture Overview
Overview
FortiSIEM is an advanced Security Information and Event Management (SIEM) solution that combines advancedlog and traffic analysis with performance/availability monitoring, change analysis and accurate knowledge of theinfrastructure to provide accurate threat detection, remediation, incident response and compliance reporting.
FortiSIEM can be deployed as a hardware appliance, a virtual appliance or as a cluster of virtual appliances toscale-out to large infrastructure deployments.
Scale-Out Architecture
FortiSIEM scales seamlessly from small enterprises to large and geographically distributed enterprises andservice providers.
For smaller deployments, FortiSIEM can be deployed a single all-in-one hardware or virtual appliance thatcontains full functionality of the product. The virtual appliance can run on most common hypervisors includingVMware ESX, Microsoft Hyper-V, and RedHat KVM and can be deployed on premise or in Amazon AWSCloud.For larger environments needing greater event handling throughput and storage, FortiSIEM can be deployed incluster mode. There are three types of FortiSIEM nodes – Collector, Worker and Supervisor
Collectors are used to scale data collection from various geo-separated network environments potentially behinda firewall. Collectors communicate to the devices, collect the data, parse the data and then send to the Workernodes over a compressed secure HTTP(S) channel. Supervisor and Worker nodes reside inside the data centerand perform data analysis functions using distributed co-operative algorithms. For scalable event storage,FortiSIEM provides two solutions – FortiSIEM NoSQL event database with data residing on a NFS Server andElasticsearch.
As the compute or storage needs grow, you can add Collector nodes, Worker nodes, disks on the NFS server andElasticsearch Data Nodes.
FortiSIEM also providesWindows Agents that enable log collection from a large number of Windows Servers.Windows Agents can be configured to send events to Collectors in a highly available load balanced manner.
Multi-tenancy
FortiSIEM allows you to manage multiple groups of devices and users (Organizations) within a single FortiSIEMinstallation. Devices and IP addresses can overlap between Organizations. FortiSIEM provides strict logicalseparation between organizations at an application layer. Users of one Organization cannot see anotherOrganization’s data including devices, users and logs. But users belonging to Manage Service ProviderOrganization can only see all Organizations.
14 User GuideFortinet Technologies Inc.

Overview Infrastructure Discovery and Automated CMDB
Infrastructure Discovery and Automated CMDB
For complete situational awareness, user needs to know the network and server infrastructure in depth.FortiSIEM’s inbuilt discovery engine can explore an IT infrastructure (on premise and cloud, physical and virtual),discover and categorize network devices, servers, users and applications in depth. A wide range of information isdiscovered including hardware information, serial numbers and licenses, installed software, running applicationsand services, and device configurations. Some special topological relationships can be discovered, for example -WLAN Access Points to WLAN Controllers, VMware guests to physical hosts. This rich information populates anintegrated configuration management database (CMDB), which is kept up to date through scheduled re-discoveries.
A novel aspect of FortiSIEM discovery is that the system automatically discovers what can be monitored andwhich log can be pulled using the provided credentials. This approach reduces human error, since FortiSIEMlearns the true network configuration state.
High Performance Log Collection and Flexible Parsing
FortiSIEM has flexible distributed log collection and parsing architecture. For logs pushed to FortiSIEM (such asSyslog), the devices can load balance the logs across variousWorkers or Collectors. For logs pulled by FortiSIEM(such asWindowsWMI or Cloud services via REST API), the pulling functionality is automatically load balancedacrossWorkers and Collectors. Logs are immediately parsed at the point at which they are received – thisdistributed processing speeds up log collection and analysis.
FortiSIEM has a patented XML based log parsing language that is both flexible and computationally efficient.Flexibility comes from the fact that users can easily write their own parsers (XML files) or edit system providedones using the FortiSIEM GUI. The parser XML files are compiled at run-time and executed as an efficient code –this makes log parsing very efficient almost as efficient as writing code in native programming languages.
Performance and Availability Monitoring
Zero-day malware can create performance issues on a server - a malware can take up large memory, aransomware scanning and encrypting files can slow the performance of other applications. By shutting downcertain services and creating excessive network traffic, a malware can cause availability issues. To properlydetect and remediate security issues, an investigator needs to know the performance and availability trends ofcritical infrastructure services. Powered by its discovery capabilities, FortiSIEM can seamlessly collect a richvariety of performance and availability metrics to help the investigator hunt for threats. FortiSIEM can also alertwhen the metrics are outside of normal profile and can correlate such violations with security issues to create highfidelity alerts.
Network Configuration and File Integrity Monitoring
Unauthorized or inadvertent changes to key system configuration files (such as httpd.conf) or router/firewallconfiguration can lead to security issues. Malware can modify key system files. Bad actors (for example, insider
User GuideFortinet Technologies Inc.
15

Custom Device and Application Support Overview
threats) can steal forbidden files. It is important to maintain control of key files and directories.
FortiSIEM provides mechanisms for tracking and detecting key file changes. It can monitor start-up and runningconfiguration of network devices via SSH. It can monitor configuration files on servers. FortiSIEM agents canefficiently monitor large server infrastructures. An alert is created when the file changes from one version toanother or deviates from a blessed hardened configuration.
Custom Device and Application Support
While FortiSIEM provides turnkey support for a large number of devices and applications, users can build theirown full-fledged support from the GUI. System log parsers, performance monitors and configuration changedetectors can be modified. New device and application types can be defined and new log parsers; performancemonitors and configuration change detectors can be defined.
User Identity and Location Tracking
By combining DHCP logs, VPN logs, WLAN logs, Domain Controller logon events, FortiSIEM is able to maintainan audit trail for IP address to user and geo-location mappings over time. While IP address to User mapping isimportant for look-up purposes by its own right, this feature enables FortiSIEM to detect stolen credentials asthey tend to get used from distant locations over a short period of time.
External Threat Intelligence Integration
External websites can provide cyber threat information in terms of:
l Malware IPl Malware Domainl Malware hashl Malware URLl Anonymity Networks
FortiSIEM has a flexible framework to connect to a wide variety of threat sources (both free and paid), efficientlydownload this information and find matches in real-time in the environment it is running. Some threat sources canhave a large number (millions) of bad IPs and URLs. FortiSIEM’s distributed search and rule engines findsmatches with such large sets of data at a very high event rate.
Distributed Event Correlation and Threat Detection – the Rule Engine
FortiSIEM has a distributed event correlation engine that can detect complex threats in near real-time. Threatsare users or machine behavioral anomalies and can be specified in terms of event patterns sequenced over time.A threat can be alternatively looked at as a SQL query evaluated in a streaming mode. FortiSIEM has an inbuiltprofiling engine that can handle threats defined using statistical thresholds - mean and standard deviation.
16 User GuideFortinet Technologies Inc.

Overview Device and User Risk Scoring
What makes FortiSIEM rule engine powerful is (a) the ability to include any data in a rule, for example:performance and change metrics along with security logs, (b) distributed in-memory computation (patent-pending) involving Supervisor and Worker nodes for near real-time performance with high event rates, (c) theability for the rule to generate a dynamic watch list which can be use recursively in a new rule to create a nestedrule hierarchy, (d) use of CMDBObjects in Rule definition, and (e) unified XML based language for rules andreports which makes it easy to convert a report into a rule and vice-versa.
Several machine learning based UEBAmodels are part of FortiSIEM inbuilt rule library – (a) detect simultaneouslogins from two different countries, (b) detect simultaneous logins from two improbable geo-locations, (c) loginbehavior anomaly – log on to servers and at times that one does not typically log on etc., (d) detecting traffic todynamically generated domains.
FortiSIEM has a large number of in-built behavioral anomaly rules that work out of the box but can be adapted bythe user to their own environment. A framework is provided where the user can write new rules via GUI, test themwith real events and then deploy in the system.
Device and User Risk Scoring
By combining with asset criticality, user role and importance, incident severity, frequency of occurrence andvulnerabilities found, FortiSIEM assigns a risk score to users and machines. This score is displayed in adashboard with drill-down capabilities to identify the underlying factors.
Incident Response and Mitigation
FortiSIEM provides a number of mitigation scripts that can run an action when an incident happens. The scriptscan be invoked automatically when an incident happens or can be invoked on-demand. Some examples areblocking an IP or a MAC, deactivating a user from active directory, removing an infected file, putting a user into awatch list, restarting a process or rebooting a server and so on. You can also write own mitigation scripts anddeploy on a running system.
Search, Threat Hunting, Compliance Reports and Dashboards
FortiSIEM provides a flexible and unified search framework. User can search data based on keywords or in astructured way using FortiSIEM parsed attributes. In real-time mode, the matched data streaming in from devicesis displayed. In Historical mode, events in event database are searched. Supervisor and Worker nodes performsearch in a distributed manner.
A large number of inbuilt reports (search templates) are provided, based on the device type, and functionalitysuch as availability, performance, change and security.
Two novel aspects of FortiSIEM search are event unification and drill-down or threat hunting capabilities. Withevent unification, all data is analyzed and presented the same way, whether it is presentation aspects (real-timesearch, reports, rules) or context (performance and availability metrics, change events or security logs). Usingdrill-down, you can start from a specific context, such as Top Authentication Failed Users, and select attributes tofurther analyze data and iteratively, get to the root cause of a problem. As an example, the investigation of 'Top
User GuideFortinet Technologies Inc.
17

Internal Ticketing System and Two-way Third-party Ticketing Integration Overview
Authentication Failed users' could be followed by picking a specific user from the list and selecting Destination IP,Ports to see which machines the user communicated with, followed by selecting the raw logs for real evidence.
FortiSIEM contains a wide selection of compliance reports out of the box – PCI, COBIT, SOX, ISO, ISO 27001,HIPAA, GLBA, FISMA, NERC, GPG13, SANSCritical Control, NIST800-53, NIST800-171.
FortiSIEM provides a wide variety of dashboards for user to visualize the data it collects and the incidents thathave triggered - Summary dashboards, Widget dashboards, Business Service dashboard, Incident dashboard,Identity and Location dashboard.
Internal Ticketing System and Two-way Third-party Ticketing Integration
FortiSIEM has a built-in ticketing system for managing incidents via tickets. It supports the full ticket life cycle ofopening, escalating, closing, reopening and creating cases with attachments for evidence.
FortiSIEM can also integrates with third-party ticketing systems. When an incident occurs in FortiSIEM, a ticketcan be created in the external ticketing system and linked to an existing device or a new device can be created inthe external system. You can customize various FortiSIEM incident fields to external ticketing system field. Whenthe ticket is closed in the external ticketing system, the ticket is closed in FortiSIEM.
Several third-party external ticketing systems are supported out of the box, for example, ServiceNow, Salesforce,ConnectWise and Remedy. An API is provided so that other integrations can be built.
Business Service Analytics
A Business Service enables you to prioritize incidents and view performance/availability metrics and from abusiness service perspective. A business service is defined within FortiSIEM as a smart container of relevantdevices and applications serving a common business purpose. Once defined, all monitoring and analysis arepresented from a business service perspective.
FortiSIEM enables you to easily define and maintain a business service. Since FortiSIEM automatically discoversthe applications running on the servers as well as the network connectivity and the traffic flow, you can easilychoose the applications and respective servers and be intelligently guided to choose the rest of components ofthe business service.
18 User GuideFortinet Technologies Inc.

What’s New What's New in 5.3.1
What’s New
The following sections provide release specific information about new features, enhancements, and resolvedissues:
What's New in 5.3.1What's New in 5.3.0What's New in 5.2.8What's New in 5.2.7What's New in 5.2.6What's New in 5.2.5What's New in 5.2.4What's New in 5.2.2What’s New in 5.2.1What’s New in 5.1.3What’s New in 5.1.2What’s New in 5.1.1What’s New in 5.1.0What’s New in 5.0.1What’s New in 5.0.0
What's New in 5.3.1
This document describes pre-upgrade instructions, bug fixes, and enhancements for the FortiSIEM 5.3.1 release.
l Pre-upgrade Notesl Bug Fixes and Enhancements
Pre-upgrade NotesIf you are upgrading from FortiSIEM release 5.2.x or earlier to 5.3.1, then read the FortiSIEM 5.3.0 Pre-upgradeNotes.
Bug Fixes and EnhancementsThis release includes the following bug fixes and enhancements:
ID Severity Module Description
631433 Major Upgrade App Server has an exception that caused the Redis cache to beincompletely populated during App Server start up.
633552 Major Upgrade 5.3.0 upgrade fails often, resulting in inconsistent databasepasswords.
User GuideFortinet Technologies Inc.
19

What's New in 5.3.1 What’s New
ID Severity Module Description
633142 Major Upgrade phRuleMaster and phIpIdentityWorker are down after upgrading theSuper to 5.3.0.1658.
603845 Major AppServer
Risk score calculation storage saves excessive disk space inPostGreSQL
636430 Minor AppServer
Number of user sessions grow if REST API is invoked frequently.
636933 Minor AppServer
Excessive emails are sent out when a Ticket escalation policy isviolated.
634518 Minor AppServer
The Cleared/Resolved incident count is incremented instead ofcreating new incidents.
628730 Minor AppServer
The Supervisor is using too many connections for the ServiceNowdevice integration.
629681 Minor AppServer
After an upgrade to 5.0, the user is unable to login if two users havethe same user name in the same organization.
627395 Minor AppServer
A PH_DEV_MON_PERFMON_DEVICE_DELAY_HIGH event isgenerated unnecessarily because of disabled monitors.
632282 Minor AppServer
FortiSIEM User accounts could not be locked again once they wereunlocked.
633120 Minor AppServer
The Super/Global Identity and Location / Summary dashboards donot work if they have different display columns.
630561 Minor AppServer
The Incident Search by Id fails when a Rule is deleted.
572484 Minor Data Differences between the Country Names in GUI and the GeoDatabase cause rules/reports using country names to fail to trigger.The workaround is to use the Country Code instead of the CountryName. This release fixes the issue.
632838 Minor Data Windows Agent logs for French OS are not parsed correctly becauseof an extra space in French keywords.
459789 Minor Data Cannot parse one of the log segments for the Imperva device.
628778 Minor Discovery The firmware version of the FortiGate hardware devices are notpolled correctly beginning with FortiGate version 6.0.5.
612331 Minor GUI Dashboard slideshow times out after 1 day.
611534 Minor GUI Cases display an Overdue state when they were closed before thedue date.
630762 Minor GUI Enhanced Widgets for the Interface Usage Dashboard for Netflowand QoS.
632925 Minor GUI The Attack dashboard and the Incident > List > Category do notdisplay when there is a rule with a missing Category or Subcategory.
20 User GuideFortinet Technologies Inc.

What’s New What's New in 5.3.0
ID Severity Module Description
633037 Minor GUI The Admin password change does not work for a first time login fromthe Storage setup page.
613018 Minor Parser Failed DNS lookups may cause a Collector to drop logs in high EPSscenarios.
629988 Minor Parser DNS name resolution does not work for Netflow events.
629517 Minor Parser Clear the Checkpoint certificates and configurations cached bybackend.
635027 Minor Query The NFSOnline Query is slow when Archive is also defined. It alsohas slower disks compared to Online.
631496 Enhancement Data Added a parser for the Broadcom SSLv Load-Balancer.
633775 Enhancement Data Enhanced Windows security log parsing for ID 4624, because logsdiffered between Windows Server 2012 and 2016.
629479 Enhancement Data The event type SophosXG-Event-SSLVPNAuthentication-Authentication needs additions for success and failure.
622987 Enhancement Data The Palo Alto Network Firewall configuration pull displays differencesthat were caused by dynamic certificates in the configuration.
63173 Enhancement Data Parse more fields in the Checkpoint CEF log.
628104 Enhancement Data Error message "PHBoxparser Failed to execute node:collectAndSetAttrBySymbol".
627760 Enhancement Data The Palo Alto Firewall has more logs that are not parsed.
629261 Enhancement Data Improvement to the Azure Event Hub Parser.
635481 Enhancement Parser FortiSIEM does not set Owning Organizations for IP during Geo tablelookups.
What's New in 5.3.0
This document describes new and enhanced features for the FortiSIEM 5.3.0 release.
l Pre-upgrade Notesl New Featuresl Key Enhancementsl New Device Supportl Existing Device Support Bug Fixes and Enhancementsl Other Bug Fixes and Enhancementsl New Reportsl New/Modified Rulesl Vulnerabilities Fixed
User GuideFortinet Technologies Inc.
21

What's New in 5.3.0 What’s New
Pre-upgrade Notesl The GUI settings for Archive are lost during the upgrade to 5.3.0. In earlier releases, the user mounted the archive
and defined the local mount point in FortiSIEM. In this release, however, the user provides the archive host andexported directory and FortiSIEM performs the mount operation. This action unifies both the online and archivedatabase mounting operations. If you were archiving in version 5.2.8 or earlier, then complete the following steps torecover the archive settings.
a. Upgrade the Super and all Workers to FortiSIEM version 5.3.0.b. Unmount the archive.c. Delete the /etc/fstab entry of archive setting.d. Define the archive in ADMIN > Setup > Storage > Archive . Make sure that the Archive host and
exported directories are identical to the settings before the archive.e. Click Test and Save. FortiSIEM will now archive new events to the same location as before the upgrade.f. Delete all of the Workers in Admin > License > Nodes.g. Re-add all of the Workers in Admin > License > Nodes.
l To remediate a vulnerability in an external module, Flex login via LDAP is disabled.
l Because of changes to the Geo database from release 5.2.x to 5.3.0, some State/Province and City names mightnot match if they were set for CMDBDevices. For example, the French Province Auvergne in the 5.2.x Geodatabase changed to Auvergne-Rhone-Alpes in 5.3.0. If you set a device location to Auvergne in 5.2.x, then youmust re-edit the location and set it to Auvergne-Rhone-Alpes.
New Featuresl Search With Display Conditionsl Nested Searchl Use Fortinet GeoIP Databasel Incident Title Using Attributesl Searchable Archive and Support for HDFSl Ability to Collect Specific Windows Logs via WMIl Rule and Scheduled Report Activation Workflowl Customizable Entity Risk Score for User Selected Rules
Search With Display Conditions
Currently, when you run an aggregated search in FortiSIEM, there is no way to limit the search results. Forexample, suppose you want to display hosts with an average CPU utilization more than 90%, or users with morethan 10 login failures in 1 hour. This release enables you to define display conditions using Boolean logic to limitthe search results, just like the HAVING in SQL. This feature works for all supported event databases: FortiSIEMEventDB, Elasticsearch, and HDFS.
For details, see Specifying Search Conditions for Aggregated Search.
22 User GuideFortinet Technologies Inc.

What’s New What's New in 5.3.0
Nested Search
This release allows you to use the results of one search in another search using IN or NOT IN operators, just likethe SQL Subquery functionality. Suppose you want to show all Servers belonging to a specific Business Servicethat did not report any login event in last 1 hour - a very useful feature for compliance. To do this, you first definea search that reports all Servers belong to a specific Business Service that sent at least 1 event in last 1 hour.Then, define another CMDB search to exclude the devices in the result of the first search. Another example is toreport newWindows/Linux processes for today that were not seen in the last 2 days - a very useful query for threathunting scenarios.
To accomplish this, this release unifies CMDB and Event searches to be run from the ANALYTICS tab. When youdefine the filter condition in the outer search, you can specify an attribute IN/ NOT IN the results of the innersearch.
Three scenarios are supported:
OuterQuery
InnerQuery
Use Case
CMDB Event Show all servers that did not report any event in the last 1 hour.
Event Event Show all successful logins for excessive failed login users. Show newWindows/Linuxprocesses for today that were not seen in the last 2 days
Event CMDB Show all failed logins from externally authenticated FortiSIEM admins.
Both FortiSIEM EventDB and Elasticsearch are supported for nested searches. Since Elasticsearch does notnatively support nested search functionality, FortiSIEM has built its own nested search functionality on top ofElasticsearch. Nested searches can be run in adhoc mode from the GUI or can be scheduled. Currently HDFSdoes not support nested search.
For details on how to set up and run a nested search, see Using Nested Queries.
Use Fortinet GeoIP Database
This releases replaces the existing GeoIP database with Fortinet GeoIP database. All of the Geo IP features workin the same way with the new database.
Incident Title Using Attributes
For each rule, you can now define a title containing the incident attributes, for example: “Brute force login from10.1.1.1 user Bob to Finance Server”. This enables you to quickly summarize an incident without looking intovarious fields such as Incident Source, Incident Target, and Incident Details. For built-in rules, titles are pre-defined. For custom rules, you must define them after installation. Incident Titles can be used as an Incidentattribute in any part of the GUI where an Incident is displayed.
For details on how to define an Incident Title, see Defining an Incident Title.
Searchable Archive and Support for HDFS
When the online event database reaches capacity, events are either purged or archived to make room for newevents. The current archive solution has the limitation that one must restore the data from the archive into theonline event database—this process is tedious and can consume precious online event database storage. Thisrelease enables searching the Archive database from the GUI and also provides two new Archive options forElasticsearch - FortiSIEM EventDB on NFS and HDFS.
User GuideFortinet Technologies Inc.
23

What's New in 5.3.0 What’s New
In this release, the following scenarios are supported:
24 User GuideFortinet Technologies Inc.

What’s New What's New in 5.3.0
Event DB Retention Historical Search Rulesand RealTimeSearch
Online Archive Online Archive Online Archive
FortiSIEMEventDB(local orNFS)
NFS Policy-basedand Space-
based
Policy-basedand Space-
based
Super andWorkers
Super andWorkers
Superand
Workers
Elasticsearch FortiSIEMEventDB(NFS)
Space-based Policy-basedand Space-
based
Super andElasticsearch
Super andWorkers
Superand
Workers
Elasticsearch HDFS Space-based Space-based Super andElasticsearch
Super andSparkCluster
Superand
Workers
The user can set up Archive options from the GUI. For details, see Configuring Storage.
The user can search the Archive event database directly from the FortiSIEM GUI, in the same way as the Onlineevent database. Except for the EventDB scenario, the user can simply choose the event source to be archived inthe Filter Dialog.
Ability to Collect Specific Windows Logs via WMI
This release enables you to choose specific Windows (Security, System, and Application) events to be collectedvia WMI. Choosing only the needed event types enables you to save processing and storage space.
For details on how to collect specific Windows logs via WMI, see WindowsWMI Filter.
Rule and Scheduled Report Activation Workflow
Currently any user that has access to the Resources and Analytics tabs can activate a Rule or schedule a Report.A loosely written rule or report can consume serious system resources. This release introduces an auditmechanism in this process via RBAC. The capability to activate a Rule and schedule a report is now part of a Roledefinition. A user that does not have this capability must request approval and can execute only if approved.
l For details on setting Report scheduling and Rule activation capabilities as part of a Role, see Adding a New Role.l For details on Report scheduling using workflows, see Scheduling Reports Using a Workflow,l For details on Rule activation using workflow, see Activating a Rule Using a Workflow.
Customizable Entity Risk Score for User Selected Rules
This release enables you to choose the rules for the calculation of Entity Risk score. Currently, risk score is basedon rules.
For details, see Setting Risk Filters.
Key EnhancementsThe 5.3.0 release provides these key enhancements:
User GuideFortinet Technologies Inc.
25

What's New in 5.3.0 What’s New
l CASE Enhancementsl Agent Based FIM Extensionsl Faster Analytics Using CMDBObjectsl Query Only Workersl Ability for a Super/Global User to Share DashboardsWith Any Organizationl Show Agent License Usagel Automated CVE-Based Checks for IPS Eventsl Incident Dashboard Enhancementsl Widget Dashboard Enhancementsl Custom PDF Enhancements
CASE Enhancements
This release contains several CASE enhancements:
l A timeline view to capture activities on a Case and on related incidents.l A separate Evidence tab is created to capture the attachments and the triggering events.l Mean Time to Resolution (MTTR) metric for Closed Cases.l Enhanced search functionality similar to CMDB and Incidents.l Bi-directional one-click drill down from Incidents to Cases and vice versa.
Agent Based FIM Extensions
This release includes several enhancements for File Integrity Monitoring (FIM) when using Windows and LinuxAgents:
l Detect File Permission and Ownership changes.l Ability to push monitored files from agents to the FortiSIEM Supervisor where an audit trail of file changes are kept
in SVN. The user can then examine the differences between the files.l Ability to detect file changes from a baseline.
For Windows Agents, see the table of FIM settings in Adding Windows Agent Monitor Templates.
For Linux Agents, see the table of FIM settings in Adding Linux Agent Monitor Templates.
Faster Analytics Using CMDB Objects
In the current architecture, when a search is performed using a CMDBObject, each Worker gets the CMDBObject values from the Supervisor node. The Worker nodes cache the values. When there is a change (forexample, caused by discovery or user change), Workers again get the values from the App Server. For a largeFortiSIEM cluster with manyWorker nodes and large CMDBObjects, the Supervisor’s performance may beimpacted, preventing GUI users from logging in.
In this release, Redis distributed database technology is introduced to improve the above performance issue. TheSupervisor runs as the Redis Master, while each Worker runs as a Redis Slave. The Supervisor only publisheschanges to the Redis Master. Redis rapidly synchronizes CMDBObjects within the FortiSIEM Cluster. TheWorker node processes (Rule and Report Workers, etc.) retrieve CMDBObjects from the local Redis, therebyrelieving the Supervisor node from providing CMDBObjects from PostGreSQL.
26 User GuideFortinet Technologies Inc.

What’s New What's New in 5.3.0
Query Only Workers
This release enables users to have Workers that will only handle Query requests. There are now two types ofWorker nodes:
l QueryWorker - these worker only handle query requests, adhoc queries from the GUI, and scheduled reports.l Event Worker - these workers handle all other event processing jobs, including receiving events from Collectors or
devices, and storing them into the event database, rule, inline query, real time query, etc.
Reserving Worker nodes for queries allows more system resources to be dedicated to queries and make them runfaster.
l For more information on configuring an Event Worker, see Event Worker Settings.l For more information on configuring a QueryWorker, see QueryWorker Settings.
Ability for a Super/Global User to Share Dashboards With Any Organization
Currently, a user can share a dashboard only with users belonging to the same organization. Thus, aSuper/Global user cannot create shared dashboards with specific Organization users. This release removes thisrestriction. When Super/Global user shares a dashboard with users of various organizations, FortiSIEM willpopulate the dashboard with data belonging to specific organizations. Thus, users of a specific Organization willsee their own data.
Show Agent License Usage
Users can now see Windows and Linux Agent usage by navigating to ADMIN > License > Agent Usage.
Automated CVE-Based Checks for IPS Events
In this release, automated CVE-based checks are performed to detect IPS false positives. If the IPS Events haveassociated CVEs, but Scanner reports do not show that the target host is not vulnerable to those CVEs, then theIncident severity is downgraded. However, if scanner reports indeed show that the target host is vulnerable to anyof those CVEs, then severity is increased and a Case is created.
For more information, see Performing CVE-Based IPS False Positive Analysis.
Incident Dashboard Enhancements
There are several enhancements for INCIDENTS tab:
l Ability to save Incident List View Search filters and then load them on demand from a drop down. See SearchingIncidents.
l Two additional Incident List Views: List by Device and List by Incidents to facilitate incident investigation. SeeViewing Incidents.
l Performance improvement: All the queries under INCIDENTS tab, except the Attack View Trend Graph andTrigger event queries, now use data in PostGreSQL database and run faster.
Widget Dashboard Enhancements
There are several enhancements for Widget dashboards in the DASHBOARD tab.
l Ability to select all relevant fields in the filterl Display Bar trend graphs for integer valuesl Ability to save column widths for the Table View
User GuideFortinet Technologies Inc.
27

What's New in 5.3.0 What’s New
l Improved representation in the Donut chartl Ability to show up to 10K entries in the Table Viewl Ability to maximize a widget inlinel Ability to revert color settings for a single line view
Custom PDF Enhancements
l The user can choose to create the PDF in Landscape mode. This provides better readability for table-formattedreports with many columns.
l When a Table is split across more than one page, each page has its own table header for better readability.
New Device SupportThe current release includes support for the following devices:
l FortiTesterl Cisco Viptelal MobileIronl Duol Indegy Industrial Cybersecurity Suitel Netwrixl Darktrace DCIPl Hirschmann SCADA Firewalls and Switches
Existing Device Support Bug Fixes and EnhancementsThe current release includes these enhancements for existing devices:
ID Severity Summary
616714 Minor All Account Lockout Rules do not consistently update the Watch List.
611209 Minor MITRE ATT&CKCategories of a couple of rules are incorrect.
611208 Minor Phishing attack found but not remediated refers to an incorrect Event Type Group.
610287 Minor Malware found in a mail rule does not map incident parameters correctly.
605005 Minor Incident Target is not set for Malware hash match rule.
601979 Minor FortiGate configuration change events appears under the wrong category.
599966 Minor JunOS Events appear in the wrong Event Type Group.
598477 Minor Duplicate Sysmon Event Types appear in the CMDB.
592949 Minor Windows Application Audit log cleared has incorrect logic.
582647 Minor Update Snort Signatures.
480266 Minor No phEventCategory attribute is defined for the PH_SYSTEM_DEVICE_NO_EVENTS event type.
616600 Minor Enhance Multiple FortiGate Web Filter Log URL Parsing Issues.
28 User GuideFortinet Technologies Inc.

What’s New What's New in 5.3.0
ID Severity Summary
611928 Minor High Severity IPS Exploit rule is triggering on denied events instead of permitevents.
599406 Minor Spelling error in Event Type: Win-System-Service-Control-Manager-7045description in CMDB.
616625 Minor WinOSWmiParser does not parse DNS Server events coming in throughFortiSIEM Windows Agent.
611660 Minor Sophos XG Firewalls Parser needs enhancement.
610178 Minor Ironportweb parser needs enhancement to handle new log format.
609981 Minor SecurityOnionBroParser parser needs updates.
604691 Minor FortiGate - infoURL is incorrectly parsed.
603930 Minor Enhance CheckPoint Parser to recognize anti-malware events.
601471 Minor Fortigate Azure Events are not parsed correctly.
599203 Minor Meraki Parser does not parse "pattern" for deny or allow.
598691 Minor Enhance Windows Defender ATP support must be extended to include eventtypes.
598657 Minor FortiGate VPN/NAT Event has incorrect Event Categories.
598590 Minor Parse geo location information enhancement from F5 syslog.
598586 Minor FortiGate Parser enhancement for interface hostname.
597526 Minor Windows DNS Auditing: there are incorrect and missing Event Types.
596694 Minor Event Type PAN-IDP-31914 classified as a log on failure, but the vendor does notclassify this as a failure.
596569 Minor SonicOS firewall parser has been fixed to add additional parsing.
596030 Minor Rule Definition - Event Dropped by License - Value uses peak event drop. It willnever stop triggering incidents once started.
595830 Minor FortiGate parser statically parses "LCD" as a user.
595707 Minor Watchguard Parser does not parse configuration change event.
594262 Minor Netscaler Event does not parse the user name and client IP.
594239 Minor Meraki FW parser does not parse IDS Events.
590452 Minor Parser incorrectly parses the domain name from FortiSIEM generated hostnames.
585663 Minor HuaweiVRPParser -does not parse IP/Port attributes.
580810 Minor Add Zyxel USG60 FW Event Support.
580645 Minor When receiving syslog over TLS, the parser does not handle chained certs.
578200 Minor Some ASA-106010 events are not parsed correctly.
User GuideFortinet Technologies Inc.
29

What's New in 5.3.0 What’s New
ID Severity Summary
576849 Minor Certain Palo Alto Networks Firewall Event attributes are not parsed.
576099 Minor Certain Unix logs are not parsed correctly.
575859 Minor Enhance PulseSecure Parser to handle all syslog headers.
575319 Minor Windows Correlog parser needs to be extended.
574843 Minor Windows Detailed DNS Agent Log - destination IP not parsed.
574280 Minor Need to update WinOSWmiParser.
566111 Minor SFLOW parser does not pick up all elements in the flow sample.
561293 Minor JunOS parser sets an incorrect eventAction attribute for RT_FLOW_SESSION_DENY events.
553480 Minor WinOSWmi parser does not parse MS-SQL login events from an external client.
551497 Minor RSA Authentication Server draft parser and log samples.
551006 Minor Cisco ASA parser does not parse duration field if time is past 1 day.
548960 Minor Enhance MS_OFFICE365_AlertTriggered_Succeeded event to include user andrule.
544277 Minor Add Support for Symantec Security Analytics Platform.
541957 Minor Cisco WLC2 parser does not parse user name, SSID , or AP.
521472 Minor Add support for MikroTik Firewall events.
505270 Minor Enhance translation for Windows es-CO language.
502441 Minor Need to parse CLIENT field for MSSQL Events.
493496 Minor Enhance Bind DNS log parser to include named-sdb.
603560 Minor Box.com parser does not parse the field ip_address as Source IP.
603129 Minor JunOS Parser does not parse the user for event type JUNOS_SSHD_LOGIN_FAILED.
592942 Minor Enhance Windows Sysmon parsing to include more event types.
589900 Minor Add parser for Azure Event Hub Events.
561431 Minor Enhance McAfee EPO syslog parser.
555569 Minor Add CEF syslog format for Trend Micro Apex Central (office scan).
535868 Minor Add support for Cisco Firepower and NGIPS.
609086 Enhancement Windows Event parser needs enhancements to parse additional attributes fromlogs.
607029 Enhancement Watchguard parser needs enhancement to parse the user from firewall events.
601327 Enhancement Need ESET Parser to handle JSON formatted events.
597523 Enhancement SophosWebFilter Parser needs an extension to handle the new event format.
30 User GuideFortinet Technologies Inc.

What’s New What's New in 5.3.0
ID Severity Summary
597149 Enhancement Extend FortiGate Parser to parse more event types.
594189 Enhancement Office 365 Parser needs some validations for parsing some attributes.
579907 Enhancement Rename winOSParser to an appropriate name like winSyslogParser.
577988 Enhancement Need to enhance SentinelOne Parser to support for syslog relays.
575277 Enhancement Enhance Juniper new event type RT_IDP variant.
550100 Enhancement Enhance Symantec Endpoint Protection parsing.
610632 Enhancement Enhance IPS rules to include McAfee Stonesoft IPS.
596053 Enhancement Get OKTA Events with new System Log API.
586639 Enhancement GitLab Integration: support token authentication.
531794 Enhancement Need to support Tenable SecurityCenter without Tenable IO.
580253 Enhancement Cisco IOSXE 5760 WLC cannot discover Access Points.
575002 Enhancement Support Windows 2019 discovery and performance monitoring.
540965 Enhancement Oracle Weblogic 12c monitoring fails as it requires the Java client to usewlthint3client.jar.
Other Bug Fixes and EnhancementsThe current release includes the following bug fixes and enhancements.
l Bug Fixesl Other Enhancements
Bug Fixes
The current release includes fixes for these bugs.
ID Severity Module Summary
612884 Major Analytics Rule Worker and QueryWorker can consume large resident memoryunder some situations.
616680 Major Data Purger Archive Purge may remove more data than necessary because policycheck and low disk check run in parallel.
599845 Major GUI Online retention policy cannot be saved for Enterprise clients.
617150 Minor App Server CMDBDevice Update Method becomes MANUAL if the user changesthe Device Status from Pending to Approved or vice-versa.
610780 Minor App Server The event PH_DEV_MON_LOG_DEVICE_DELAY_HIGH is notgenerated for LOG only discovered devices.
604530 Minor App Server Do not allow REST API to fetch FortiSIEM System Config.
User GuideFortinet Technologies Inc.
31

What's New in 5.3.0 What’s New
ID Severity Module Summary
599093 Minor App Server Windows Performance Monitoring via WMI/SNMPmay not work ifFortiSIEM Agent is not installed first and reports a new device type thatis not recognized by the system.
595355 Minor App Server Analytic search queries are not working for certain languages like Koreanor Russian.
593726 Minor App Server Discovery Modifies "Last Successful" Timer for performance monitoringjobs.
588826 Minor App Server Update monitoring through the API is not working.
587796 Minor App Server Certificates covering many domains will cause Java SSL connection tothrow an error on "hostname does not match".
587458 Minor App Server Reports cannot be emailed out to more than 1 CMDBUser.
581924 Minor App Server Duplicate device is created if the device is first discovered byWMI orSNMP and then the FortiSIEM Windows Agent is added.
571793 Minor App Server PH_SYS_COLLECTOR_TRAIL table in postGreSQL becomes too large- need to truncate the table and perform space management.
571480 Minor App Server DUO 2FA creates extra users when creating an account forauthentication.
555268 Minor App Server REST API: Enhancement: Discovery status needs to return the progresspercentage.
552712 Minor App Server If the agent is installed on top of an approved device, the agent willchange the device status to unmanaged --> pending but never back toapproved after the template association.
552111 Minor App Server An empty report is emailed, even if "Do Not Send Scheduled Email ifReport is empty" is checked.
548378 Minor App Server AD Group Mapping: if you disable Check Certificate first, then re- enableit, then you need to restart the app server for it to take effect.
524274 Minor App Server Scheduled PDF reports emails no longer contain a record count perreport.
459758 Minor App Server PH_MAX_DEVICES_EXCEEDED reports license is exceeded when thetotal usage equals but has not yet exceeded the total number oflicensed device.
513033 Minor App Server Original Device Discovery does not merge the device type afterrediscovery because of the lack of a Cisco Generic device type.
613131 Minor DataManager
If index_per_customer flag is false, the phDataManager still writesevents to different organization's index in Elasticsearch, instead ofwriting to one index.
608304 Minor DataManager
Data purger may consume large amounts of memory even if build_event_statistics=false.
32 User GuideFortinet Technologies Inc.

What’s New What's New in 5.3.0
ID Severity Module Summary
594711 Minor Discovery LDAPDiscovery cannot discover users or groups when DN is configuredto lowest level.
593163 Minor Discovery For FortiGate via SSH, prompts containing [ ] are not handled.
612698 Minor EventPulling
Pulling vulnerability scan reports from Qualys take a long time if thereare large number of reports.
612305 Minor EventPulling
Crowdstrike API log pulling uses a fixed endpointfirehose.crowdstrike.com even when credential definition points to adifferent API endpoint.
611979 Minor EventPulling
FortiGuard IOC update via proxy fails when the Supervisor cannotresolve the FortiGuard endpoint.
610179 Minor EventPulling
Tenable Security Center can support only one account.
605231 Minor EventPulling
Any device credential without a user name, password or apiToken cancause some back end modules to crash.
603118 Minor EventPulling
Incorrect FireSight Error message, "unable to get certificate", displaysfor possible password failures.
571470 Minor EventPulling
FortiSIEM suddenly stops collecting events from CheckPointSmartCenter.
497122 Minor EventPulling
Missing memory Name attribute for PH_DEV_MON_SYS_MEM_UTILevent.
616673 Minor GUI Browser memory grows very fast when running Dashboard Slideshow.
612256 Minor GUI User is allowed to query events with Equal operator and multiple values.
610750 Minor GUI If you click run for 37+ organizations in the Dashboard widget, theconfiguration will not save.
609498 Minor GUI Pressing ENTER key in the Rule or Report Description will result in aSPACE and not a line return.
606710 Minor GUI Auto refresh on Incident Overview tab is not working in Fortisiem 5.2.5and 5.2.6.
606092 Minor GUI CMDBReport does not report the Last Domain Logon and PasswordLast Set Values correctly.
600202 Minor GUI User cannot add user created business service groups to Settings >Discovery > CMDBGroups.
596814 Minor GUI Enabled parsers may not be distributed to workers.
595760 Minor GUI Event Type Search for PH_DEV_MON_NET_ shows NETAPP events.
595401 Minor GUI Malware hash IOC import via the CSV file requires the botnet name --the hash should be enough
595214 Minor GUI Enterprise /online retention policy saved as "all organizations". There isno option to change.
User GuideFortinet Technologies Inc.
33

What's New in 5.3.0 What’s New
ID Severity Module Summary
595186 Minor GUI If the user disables Online Retention Policy, then the information is notsaved in the database.
594437 Minor GUI New Resources > Default Password for SNMP requires a User Name.
593644 Minor GUI Incident Display Column changes are applied "per org" instead of "peruser".
591648 Minor GUI Parser test does not show message value in HTML5 but shows in Flex.
589908 Minor GUI User sees "No Write Permission" when editing their own password, butpassword changes anyway.
588863 Minor GUI Windows Agent CMDBDisplay Inconsistencies - Method column doesnot display AGENT if the server has also been discovered byWMI;Status column behavior is incorrect when the agent is disabled then re-enabled.
588846 Minor GUI The "Run as Query" button does not populate filter conditions in theanalytics page if the rule has more than seven filter conditions.
587919 Minor GUI If you set the Target of a CMDBReport to "Report", it displays the RuleCategory field.
587346 Minor GUI User cannot choose Scatter plot "Size" attribute to be anything otherthan the X or Y attribute. A third attribute is the main use case.
587092 Minor GUI Super/Local Licensed Count shows unallocated device count.
582511 Minor GUI Unable to add networks to an organization if "Include IP/IP Range" isspecified under Org setup.
575582 Minor GUI Organization Name does not display in a Report unless the OrganizationID is also in the Report.
572878 Minor GUI Install Patches "installed time" does not display in HTML5, but isavailable and reflected in flex for the same device.
572867 Minor GUI GUI does not render with readable columns under CMDB > Devices >Quick Info.
563711 Minor GUI When viewing the page on a larger, external monitor, the UI does notdisplay the data in the last column.
552721 Minor GUI Pull Events / Discovery tabs display "Discovered by supervisor". It isactually a list of all enterprise devices only.
498942 Minor GUI If Built in Admin User from an organization is removed, FortiSIEM picksup a random full admin to be organization administrator. The usershould never be able to delete the Built in Admin User.
479356 Minor GUI Users should not be able to choose themselves as the manager on H5.
475953 Minor GUI External Lookup for Domain is grayed out.
609243 Minor GUI RegEx filtering with "\" produces an Extra "\" after the expression issaved.
34 User GuideFortinet Technologies Inc.

What’s New What's New in 5.3.0
ID Severity Module Summary
587670 Minor GUI In the cloned parser XML, two spaces are changed to one in some xmlfunctions.
599215 Minor Identitylocation
In certain cases with multi- tenant collectors, Identity and LocationReport for one organization may display data for another organization.
541960 Minor PerformanceMonitoring
Large disks are not monitored correctly for utilization using SNMP.
498682 Minor PerformanceMonitoring
River Bed Peer monitoring fails.
540487 Minor PerformanceMonitoring
ASR 9k large memory capacity router reports 100%memory usage.
604928 Minor Query Operators HourOfDay and DayOfWeek are not working when usingElasticsearch.
582062 Minor Query Elasticsearch query does not work with network groups with low and highvalues.
620383 Minor Query Elasticsearch scrolled queries cause the Elasticsearch node to run out ofmemory.
620428 Minor Query The Elasticsearch index sends fail messages because the utf8characters in events are not escaped the first time.
626036 Minor Query The ElasticSearch precision_threshold causes the Elasticsearch node torun out of memory on COUNT DISTINCT queries.
563753 Minor VULN FortiSIEM should force users to change default password on first timeGUI/CLI login.
557076 Minor VULN jQuery 1 has a new CVE, CVE-2019-11358 disclosed on 2019-04-19.
Other Enhancements
The current release includes these additional enhancements:
ID Severity Module Summary
609317 Enhancement App Server Setting PHOENIX_MERGE_BY_HOSTNAME_ONLY attribute inphoenix_config.txt to true results in duplicate devices.
600891 Enhancement App Server Allow super global user to share a dashboard with any user.
579895 Enhancement App Server Merging message is misleading when not merging based on IP.
544876 Enhancement App Server Long tables spanning multiple pages in PDF Report Export needto be broken up into multiple tables with their own headers.
509857 Enhancement App Server Landscape mode is needed to print tables with many columns inPDF report.
477152 Enhancement App Server Add Audit logs for FortiSIEM user role change.
434850 Enhancement App Server Use Vulnerabilities reported against devices with IPS Events todetermine attack success.
User GuideFortinet Technologies Inc.
35

What's New in 5.3.0 What’s New
ID Severity Module Summary
616057 Enhancement Data Purger Separate thresholds for online and archive.
591511 Enhancement EventPulling
FortiSIEM needs to use "show running-config view full" commandover SSH to collect configuration.
609828 Enhancement GUI Need to allowIP ranges when setting up Virtual IPs used for CMDBDevice merging.
601457 Enhancement GUI Show the root cause of the Sudden Login Distribution Change rulewith a visual chart.
582246 Enhancement GUI User cannot create a new object easily without pointing to a groupfirst.
573534 Enhancement GUI FortiSIEM GUI sends the login name and password in plain textinside HTTP(S). GUI needs to hash the password.
559179 Enhancement GUI Ability to assign an Incident to "In Progress".
552984 Enhancement GUI PDF export does not have columns sized correctly when there aretoo many columns.
497502 Enhancement GUI Tunnel pop up vanishes too quickly, needs to have confirmationbutton.
609469 Enhancement H5_Admin Event Org Mapping with Reporting IP as the event attribute doesnot allow a comma separated IP list.
609166 Enhancement PerformanceMonitoring
Restore Job stat logs in DEBUG mode.
617283 Enhancement System Tune Linux socket buffers and socket listen queue to higher valuesto accommodate both large and small customers.
608249 Enhancement System Add "Query Only"Worker List to only perform Queries.
New ReportsThe following reports are new for this release:
l FIM Reportsl Audit Reports
FIM Reports
l Agent FIM: Windows File/Directory Created/Deleted/Renamedl Agent FIM: Windows File/Directory Ownership Changesl Agent FIM: Windows File/Directory Permission Changesl Agent FIM: Windows File/Directory Archive Bit Changesl Agent FIM: Windows File Content Modified in SVNl Agent FIM: Windows File Content Modifiedl Agent FIM: Windows File Change from Baselinel Agent FIM: Linux File/Directory Creation/Deletion/Movement/Unmount Activityl Agent FIM: Linux File/Directory Ownership or Permission Changes
36 User GuideFortinet Technologies Inc.

What’s New What's New in 5.3.0
l Agent FIM: Linux ASCII File Content Modificationl Agent FIM: Linux File Content Modifiedl Agent FIM: Linux File Change from Baselinel Agent FIM: Linux File Content Modified in SVN
Audit Reports
l FortiSIEM CMDBDevice Addition via Discoveryl FortiSIEM CMDBDevice Addition/Deletion By Userl FortiSIEM CMDBDevice Modification via Discoveryl FortiSIEM Device Modificationsl FortiSIEM CMDBDevice Discovery Merge Historyl FortiSIEM Scheduled Malware IOC Update Historyl FortiSIEM Admin User Addedl FortiSIEM Admin User Deletedl FortiSIEM Admin User Password Modifiedl FortiSIEM User Default Role Changedl FortiSIEM User Organization Role Enabled/Disabled/Changedl FortiSIEM Role Created/Deletedl FortiSIEM SSH Tunnel Open/Close Historyl FortiSIEM User Initiated Performance Monitoring Job Status Changesl FortiSIEM Discovery Removed/Not-scheduled Performance Monitoring Jobsl FortiSIEM Performance Monitoring Job Execution Failuresl FortiSIEM CMDBDevice Status Changesl FortiSIEM Device License exceeded - Device Set to Unmanagedl FortiSIEM Rule Activation Approval Activityl FortiSIEM Rule Deactivation Approval Activityl FortiSIEM Report Schedule Approval Activityl FortiSIEM CMDBDevice Added or Deletedl FortiSIEM CMDBDevice Status Changel FortiSIEM Rule Added/Deletedl FortiSIEM Rule Modifiedl FortiSIEM Report Added/Deletedl FortiSIEM Report Modifiedl FortiSIEM Rule Activated/Deactivatedl FortiSIEM Reports Completedl FortiSIEM Reports Scheduledl FortiSIEM Reports Stoppedl Slowest FortiSIEM Event Reportsl FortiSIEM Dashboard Folder Added/Deletedl FortiSIEM Dashboard Folder Sharedl FortiSIEM Incident Notification Policy Added/Deletedl FortiSIEM Incident Notification Policy Executed
User GuideFortinet Technologies Inc.
37

What's New in 5.3.0 What’s New
l FortiSIEM CMDBDiscovery Executionl FortiSIEM On-demand Remediation Executedl FortiSIEM Case Created/Updated/Closedl FortiSIEM Incident Cleared By Userl FortiSIEM Incident Cleared By Systeml Successful Online Event Database Archive Actionsl Successful Online Event Database Purge Actionsl Successful Archive Event Database Purge Actionsl Successful Archive EventDB Policy-based-Purge Actionsl Successful Archive EventDB Low-Space-Purge Actionsl Failed Event Database Archive or Purge Actions
New/Modified RulesThe following rules are new or have been modified for this release:
l Lateral Movement Detectedl Agent FIM - Linux File Content Modifiedl Agentless FIM - Audited file or directory createdl Agentless FIM - Audited file or directory deletedl Agentless FIM - Audited file or directory ownership or permission changedl Audited file or directory content modified in SVNl Agentless FIM - Audited target file content modifiedl Agent FIM - Linux File Ownership or Permission Changedl Agent FIM - Linux Directory Ownership or Permission Changedl Agent FIM - Windows File or Directory Createdl Agent FIM - Windows File or Directory Deletedl Agent FIM - Linux File or Directory Createdl Agent FIM - Linux File or Directory Deletedl Agent FIM - Windows File Content Modifiedl Agent FIM - Windows File Permission Changedl Agent FIM - Windows File Ownership Changedl Agent FIM - Windows File or Directory Archive Bit Changedl Agent FIM - Windows File Changed From Baselinel Agent FIM - Linux File Changed From Baselinel FortiSIEM Online Event Database Archiving Failedl FortiSIEM Archive Directory Unavailablel FortiSIEM Online Event Database Archiving Completedl FortiSIEM Online Event Database Successfully Purgedl Low Available System Archive Spacel FortiSIEM Archive Event Database Purging Startedl FortiSIEM Archive Purging Completedl FortiSIEM Archive Purging Failed
38 User GuideFortinet Technologies Inc.

What’s New What's New in 5.2.8
Vulnerabilities FixedFortiSIEM 5.3.0 is no longer vulnerable to the following CVE-Reference:
l CVE-2015-0279
What's New in 5.2.8
This release fixes the following issues:
Bug ID Severity Module Summary
607041 Minor API Incident detail does notreturn values for Incidentqueries run via RESTAPI.
608164 Minor App Server Windows agent cannotbe installed in two ormore servers with thesameWindows GUID.
607154 Minor DataManagement
phDataPurger modulemay hit a deadlockduring archiving.
600897 Minor DataManagement
DataPurger can consumelarge memory on largeMSPs with high eventrates.
607893 Minor Event Pulling Rapid 7 VulnerabilityScan – Duplicatevulnerability events maybe generated from earlierscans.
605231 Minor Event Pulling 3 modules - phParser,phAgentManager, andphCheckpoint may crashwhen some othercredentials (e.g. CiscoFireAMP) are set.
User GuideFortinet Technologies Inc.
39

What's New in 5.2.7 What’s New
Bug ID Severity Module Summary
605589 Minor Event Pulling Rapid 7 VulnerabilityScan – Event pulling mayfail and/or take a longtime when there aremany devices withvulnerabilities.
607545 Minor GUI Online Retention Policyenable/disable checkboxnot saved.
561378 Minor System Collectors cannotcommunicate toSupervisor/Worker viaProxy.
606828 Enhancement API Allow Incident Severity tobe set via REST API.
596053 Enhancement Event Pulling Use newer System LogAPI for Okta eventpulling.
What's New in 5.2.7
This release fixes the following vulnerability:
FortiSIEM installations have a hardcoded SSH key for a specific user (name: tunneluser) that allows anyone toauthenticate as tunneluser to the Supervisor over SSH ports 22 and 19999.
Upgrade Notes1. This release ONLY provides an upgrade for all platforms.2. If you want to install FortiSIEM 5.2.7, then follow these steps
a. Install 5.2.6 or earlier.b. Choose the final event database storage: local disk, FortiSIEM EventDB on NFS or Elasticsearch.c. Upgrade to 5.2.7.
What's New in 5.2.6
This document describes new and enhanced features for the FortiSIEM 5.2.6 release.
l Pre-upgrade Notesl New Featuresl Key Enhancementsl New Device Support
40 User GuideFortinet Technologies Inc.
What’s New What's New in 5.2.6
l Important Bug and Data Fixesl Vulnerabilities Fixed
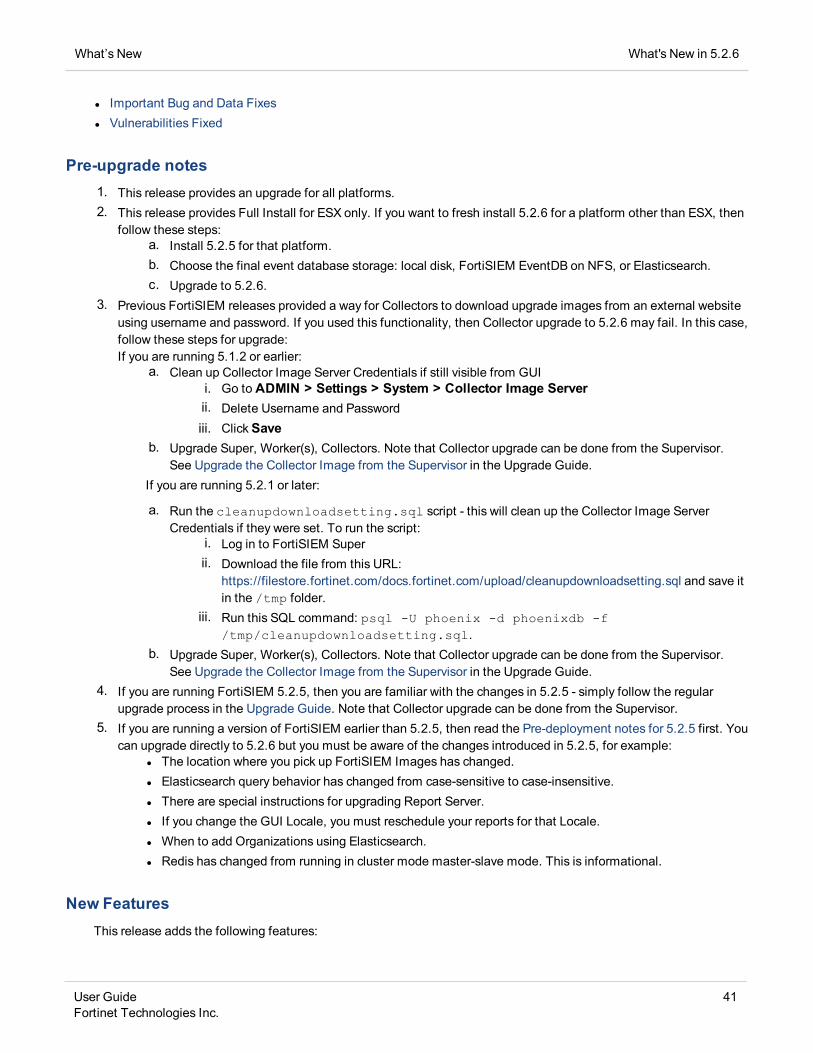
Pre-upgrade notes1. This release provides an upgrade for all platforms.2. This release provides Full Install for ESX only. If you want to fresh install 5.2.6 for a platform other than ESX, then
follow these steps:a. Install 5.2.5 for that platform.b. Choose the final event database storage: local disk, FortiSIEM EventDB on NFS, or Elasticsearch.c. Upgrade to 5.2.6.
3. Previous FortiSIEM releases provided a way for Collectors to download upgrade images from an external websiteusing username and password. If you used this functionality, then Collector upgrade to 5.2.6 may fail. In this case,follow these steps for upgrade:If you are running 5.1.2 or earlier:
a. Clean up Collector Image Server Credentials if still visible from GUIi. Go to ADMIN > Settings > System > Collector Image Serverii. Delete Username and Passwordiii. ClickSave
b. Upgrade Super, Worker(s), Collectors. Note that Collector upgrade can be done from the Supervisor.See Upgrade the Collector Image from the Supervisor in the Upgrade Guide.
If you are running 5.2.1 or later:
a. Run the cleanupdownloadsetting.sql script - this will clean up the Collector Image ServerCredentials if they were set. To run the script:
i. Log in to FortiSIEM Superii. Download the file from this URL:
https://filestore.fortinet.com/docs.fortinet.com/upload/cleanupdownloadsetting.sql and save itin the /tmp folder.
iii. Run this SQL command: psql -U phoenix -d phoenixdb -f/tmp/cleanupdownloadsetting.sql.
b. Upgrade Super, Worker(s), Collectors. Note that Collector upgrade can be done from the Supervisor.See Upgrade the Collector Image from the Supervisor in the Upgrade Guide.
4. If you are running FortiSIEM 5.2.5, then you are familiar with the changes in 5.2.5 - simply follow the regularupgrade process in the Upgrade Guide. Note that Collector upgrade can be done from the Supervisor.
5. If you are running a version of FortiSIEM earlier than 5.2.5, then read the Pre-deployment notes for 5.2.5 first. Youcan upgrade directly to 5.2.6 but you must be aware of the changes introduced in 5.2.5, for example:
l The location where you pick up FortiSIEM Images has changed.l Elasticsearch query behavior has changed from case-sensitive to case-insensitive.l There are special instructions for upgrading Report Server.l If you change the GUI Locale, you must reschedule your reports for that Locale.l When to add Organizations using Elasticsearch.l Redis has changed from running in cluster mode master-slave mode. This is informational.
New FeaturesThis release adds the following features:
User GuideFortinet Technologies Inc.
41

What's New in 5.2.6 What’s New
Attack Dashboard
MITRE has provided a taxonomy of Security Attack kill chains (https://attack.mitre.org/matrices/enterprise/). Inthe FortiSIEM 5.2.5 release, MITRE ATT&CK categories were added as FortiSIEM Incident Securitysubcategories, and FortiSIEM Security Rules were associated with MITRE ATT&CK categories. This releaseprovides a specific Security Incident dashboard, called the Attack Dashboard, that clearly shows the MITREATT&CK categories associated with each host based on the triggered incidents. This dashboard enables SecurityAnalysts to quickly focus on hosts that have advanced further in the Attack Kill Chain and mitigate the issues. SeeAttack View.
Run on Amazon Elasticsearch Service
This release allows FortiSIEM users to enable AWS-managed Elasticsearch(https://aws.amazon.com/elasticsearch-service/). The supported Elasticsearch version is 6.8. See Setting EventStorage.
Collector Upgrade from Supervisor
In FortiSIEM 5.2.5, the user is required to install their own webserver to distribute upgrade images to theCollector nodes. This release simplifies the process by enabling the Supervisor as the webserver. Collectors candownload upgrade images from the Supervisor. See Upgrade the Collector Image From the Supervisor in theUpgrade Guide.
Key EnhancementsThe following are the key enhancements to the current release:
Show User Roles for AD Group Mappings
Release 5.2.5 allowed FortiSIEM administrators to map Active Directory Groups to FortiSIEM roles. If the userbelongs to multiple LDAP groups, then the user is assigned the union of all mapped FortiSIEM roles. A compositeFortiSIEM role is not always easy to understand. This release explicitly shows the user's permissions in CMDB >User > Access Control. See Viewing User Roles for AD Group Mappings.
Ability to Filter on Any Attribute in Widget Dashboard Search
In FortiSIEM 5.2.5, the user is allowed search for the following attributes in the Widget Dashboard: Host, IP,User, and Device/App Properties. This restriction is relaxed in this release. Now the user can search on any fieldthat appears in at least one widget on a widget dashboard. See Searching in a Widget Dashboard.
Ability to Calculate Much Larger COUNT DISTINCT
In FortiSIEM 5.2.5 and earlier, COUNT DISTINCT queries returned a maximum of 16K. This release extends thenumber to much higher numbers, using the HyperLogLog algorithm. We have tested up to 1 million with 3% errorrate. Higher counts are possible at the expense of higher error rates. See the tables in Creating Rules.
Ability to Download FortiGuard IOC via Proxy
This release allows FortiSIEM to download FortiGuard IOC via a Proxy server (such as Squid) using tunnel mode.See Working With FortiGuard IOCs.
42 User GuideFortinet Technologies Inc.

What’s New What's New in 5.2.6
Optimize CASES Tab User Experience
In this release, the CASES tab is displayed in multiple pages, with only one page loading at a time. This makesthe CASES page much faster to display. Search is also rendered more efficiently.
New Device SupportThe current release includes support for the following devices:
l Cyberoam Firewalll EPIC EMR/EHR Systeml FortiEDR (enSilo)l FortiNACl Microsoft Network Policy Server (RAS VPN)l Trend Micro Deep Discovery
Important Bug and Data FixesAll issues listed in Known Issues in Release 5.2.5 have been fixed in 5.3.1.
The current release includes the following bug and data fixes.
l Bug Fixesl Data Fixesl Vulnerabilities Fixed
Bug Fixes
The current release includes fixes for these bugs.
ID Severity Module Summary
583870 Minor App Server Action history not readable when updating incidentattributes through API
529612 Minor App Server Users need Admin access to email scheduled reports
545405 Minor App Server Malware Domain import from CSV file unnecessarilyrequires IP address
572905 Minor App Server Collector Registration cannot handle "&" or [space] inpassword
548701 Minor App Server Dynamic-reports folder builds up and need to be purged
592278 Minor App Server Super attempts outbound connectivity to old images-cdn.fortisiem.fortinet.com site to get updates
592325 Minor App Server Only users with Admin privileges can change UI Settings
550599 Minor App Server Old Device Maintenance schedules causing high AppServer CPU
User GuideFortinet Technologies Inc.
43

What's New in 5.2.6 What’s New
ID Severity Module Summary
552111 Minor App Server Scheduled report email is sent even if "Do Not SendScheduled Email if Report is empty" is checked
552712 Minor App Server Windows Agent changes device status if alreadydiscovered
577845 Minor App Server User is not allowed interface if interface mask isdiscovered as 255.255.255.255
581697 Minor App Server Full Admin cannot edit credentials defined by an user
585859 Minor App Server REST API: FortiSIEM Agent Status not correct -Disconnected returned as Running Inactive
581924 Minor App Server Duplicate device is created if device first discovered byWMI or SNMP and then an Agent is added
584853 Minor App Server Sometimes unable to run reports caused by databasetable ph_drq_report_inst not getting cleaned up
584644 Minor App Server Agent availability events(Installed/Running/Stopped/Started/Uninstalled/Non-responsive) not being generated
587252 Enhancement App Server Integer based attributes do not display the user friendlydescriptions in bundle reports
586662 Enhancement App Server PH_REPORT_ACTION_STATUS log shows EMAILdatabase id instead of user name
572872 Minor GUI Malware Hash Update from file does not work
470730 Minor GUI Rule Exception for Org CMDB report will expose customerinformation across orgs
575354 Minor GUI Dashboard CMDBwidget does not map the integer valuefor "Storage Type" to the corresponding String Value
542982 Minor GUI Rule Editor does not properly save expressions inaggregate condition editor after user edits the expression
526824 Minor GUI Kafka info is lost after an event forwarding rule via kafka isenabled
568068 Minor GUI Analytic Reporting Only shows top 5 results on Trendcharts, no matter what rows are checked in the table
513726 Minor GUI Storage setup - Testing shows errors if disk is mounted orformatted
582511 Minor GUI Unable to add networks to organization if "Include IP/IPRange" is specified Under Org setup
544787 Minor GUI Case created due date follows desktop time
576921 Minor GUI Windows Agent Host to Template association Rank resetsto first page when moving items up the list
44 User GuideFortinet Technologies Inc.

What’s New What's New in 5.2.6
ID Severity Module Summary
512274 Minor GUI Event Type Table column headers in Device Support andResources tabs do not match Analytics Query results
588865 Minor GUI Dashboard >Widget Dashboard > Choropleth widget drilldown does not show right logs
572875 Minor GUI Notification Policy Time Zone Change Reverts back todefault when reoccurance has no end date
588712 Minor GUI An Org user appears to be able to apply Rule Exceptionsto all organizations
544011 Minor GUI GUI shows large TCP/UDP port numbers as estimatedvalues
583966 Minor GUI External Lookup does not pickup IPs from the externallookup request unless you specify <IP> in the URL.
536763 Minor GUI Some logged in user on User Activity tab do not showusername and role
586077 Minor GUI Dashboard drill down does not work correctly for IP Portand Protocol
586546 Minor GUI Unable to create ticket from multiple incidents
586640 Minor GUI Default Time Range (10 days) on Incident ExplorerDashboard is too long and cannot be modified
582603 Minor GUI Widget dashboard > Filters do not appear in some cases
588879 Minor GUI Incident > Explorer view pivot on triggering event IP fails
587670 Minor GUI Parser clone function sometimes changes two spaces toone space in the parser XML
587473 Minor GUI GUI incorrectly showing the subcategory of another rule
593144 Minor GUI If there is a rule with undefined sub-category, thenIncidents > List View > Search > Categories does not showvalues
580784 Enhancement GUI Make LDAPGroup to Role more transparent
586736 Enhancement GUI Analytics tab - SAVE and LOAD of Filter/Display tabs aremore intuitive
583411 Enhancement GUI Content of last column in Tables wraps under the firstcolumn
588669 Enhancement GUI Not possible to choose Incident Subcategory and IncidentResolution in Custom Email template.
491770 Enhancement GUI Login Page lists CUST/ORG ID as part of the login, buttakes only Name
585060 Enhancement GUI Case management page times out when there are largenumber of Cases
User GuideFortinet Technologies Inc.
45

What's New in 5.2.6 What’s New
ID Severity Module Summary
589991 Enhancement Linux Agent Linux Agent to Support CentOS 8+
592736 Enhancement Linux Agent FIM does not capture file/directory permission andownership changes
524355 Minor Log Pulling Azure Audit - Stops pulling events but no errors inphoenix.log
491789 Minor Parser/Code phParser gets stuck against bad CMR records or CDRrecords -- cannot bypass causing files to back up
575519 Minor Parser/Code FortiSIEM does not resolve IP of Fortigates whenFortigate hostname is changed
580645 Minor Parser/Code phParser does not support the ability to connect againstcertificates that have chain certs
597921 Minor Parser Windows Defender ATP does not have correct ReportingIP
524276 Minor PerformanceMonitoring
Excessive logging: PH_DEV_MON_SYS_STATUS fromMeraki
562841 Minor PerformanceMonitoring
Fortisiem SSH into fortigate every 3minute though themonitors are disabled
582062 Minor Query Engine Elasticsearch queries do not work with network groups withlow and high IP addresses specified
582282 Minor Query Engine Elasticsearch queries do not work if disable/delete anMalware IP entry from GUI
582145 Minor Query Engine Elasticsearch queries do not work for URL IN a singleMalware URL item (group works however)
543218 Minor Query Engine ReportMaster does not always clean up inline report files
593636 Minor Query Engine Queriues containing "Reporting IP IN Biz Service" is notworking for Event DB
598441 Major System Supervisor Upgrade to 5.2.5 fails when upgrade isperformed in the month of December
585536 Minor System Swap partition is not created for Super, Worker, andCollector.
586951 Minor System RedisCluster_6669 is down after upgrade from 521 to 525in Elasticsearch based deployments
582939 Enhancement System FortiGuard IOC integration is not working via Proxy Server
569343 Minor System FortiSIEM Collector doesn't validate Supervisor/WorkerHTTPS certificate
519974 Minor WindowsAgent
Not receiving username and domain details for FileIntegrity monitoring events via Windows Agent. Only fixedfor Italian.
46 User GuideFortinet Technologies Inc.

What’s New What's New in 5.2.6
Data Fixes
The current release includes fixes for these data and parser/data bugs.
ID Severity Module Summary
528749 Minor Data Malware found by Firewall but not remediated referenceswrong event type group
528725 Enhancement Data Additional Office 365 User login succeeded report
535710 Minor Parser/Data Wrong user name parseing in FortiGate log causeincorrect Identity and Location dashboard
580973 Enhancement Parser/Data AWSVPC doesn't work without accountName
487754 Enhancement Parser/Data PAN OSEvents parser needs to be enhanced to parsemore event types
551006 Enhancement Parser/Data Cisco ASA Parser does not parse duration field if time ispast 1 day
480346 Enhancement Parser/Data Juniper JunOS logs are not parsed because vendorintroduced a new format
495878 Enhancement Parser/Data Symantec AV - new events are being parsed as symantecav generic
492246 Enhancement Parser/Data PAN OSCORRELATION Event not able to be parsed
537118 Enhancement Parser/Data FortiGate Parser parse right event type information forLogID(0000000020)
575143 Enhancement Parser/Data Meraki Events not parsing all the way -- due to new eventtypes
496607 Enhancement Parser/Data FortiMail - not parsing client IP value
492448 Enhancement Parser/Data Barracuda Web Filter Parser format change
529083 Enhancement Parser/Data Update SymantecAVParser to include log description inevent
492489 Enhancement Parser/Data SonicOS sonicwall parser needs to be enhanced to parsemore event types
493500 Enhancement Parser/Data Cisco ASA Parser bug to provide port on pre and postnatted events
542444 Enhancement Parser/Data Fortisiem not detecting the "lsass" service logsfrom Ubuntu
576088 Enhancement Parser/Data SonicOS parser needd to be updated to include webcategory
592870 Enhancement Parser/Data CloudTrail Parser does not parse account information toan event attribute
549320 Enhancement Parser/Data Fortigate Parser Apprisk is not utilizing the correct case
User GuideFortinet Technologies Inc.
47

What's New in 5.2.6 What’s New
ID Severity Module Summary
556324 Enhancement Parser/Data WinOSWmiParser fails to extract attributes correctly onEventCode 4624
557631 Enhancement Parser/Data Mysql DB parser does not parse message field completely,due to comma separated values
582689 Enhancement Parser/Data If FGT IPS event is denied, dropped, blocked - set eventseverity to medium
590121 Enhancement Parser/Data PulseSecure parser does not handle priority field in syslogheader
577186 Enhancement Parser/Data BUG - Tipping Point Parser update request
577082 Enhancement Parser/Data FortiWeb 6.1.1 Parser Enhancements
576860 Enhancement Parser/Data FortiMail parser enhancement, several event attributesnot parsed
582975 Enhancement Parser/Data SymantecSAPParser need to be extended
575859 Enhancement Parser/Data PulseSecure parser needs to be extended
574890 Enhancement Parser/Data FortiGate IPS Event Severity needs to be fixed to addressfirewall action
590127 Enhancement Parser/Data FortiOSGTP logs not sufficiently parsed
573605 Enhancement Parser/Data Verify FGT Parser is collecting all attributes and update asneeded.
573569 Enhancement Parser/Data FortiADC logs parser needs to be extended
572910 Enhancement Parser/Data PAN firewall parser to support USERID and HIPMATCHevents
590451 Enhancement Parser/Data Fortigate Parser does not parse Objectpath, Object name,Configuration
570577 Enhancement Parser/Data Windows parser to handle escape character when parsingaccount names
592163 Enhancement Parser/Data Office365 Parser does not parse target user field fromevent
587917 Enhancement Parser/Data Incorrect parsing logic in WinOSWmiParser
583269 Enhancement Parser/Data User information in GitLab-Authentication-Failure notparsed
582231 Enhancement Parser/Data Elasticsearch query does not work with netflow group forFortiGate-NetFlow
Vulnerabilities FixedFortiSIEM 5.2.6 is no longer vulnerable to the following CVE-References:
l CVE-2019-17653l CVE-2019-16153
48 User GuideFortinet Technologies Inc.

What’s New What's New in 5.2.5
l CVE-2019-17651
What's New in 5.2.5
This document describes the requirements for the FortiSIEM 5.2.5 release.
Note that this release includes 5.2.4 release features. For more information on 5.2.4 features, look here.
l Pre-deployment Notesl New Featuresl Key Enhancementsl New Device Supportl Device Support Extensionsl New and Modified Rules and Reportsl Important Bug Fixesl Known Issues in Release 5.2.5
Pre-deployment NotesThe location where you pick up FortiSIEM Images has changed—the website https://images-cdn.fortisiem.fortinet.com/ is no longer available. You must obtain FortiSIEM Images from theFortinet support site: https://support.fortinet.com/.
1. Follow the instructions in Downloading FortiSIEM Products to get the FortiSIEM images.2. Follow the fresh install instructions in Getting Started.3. Follow the upgrade instructions in the Upgrade Guide.Elasticsearch and upgrades to 5.2.5:
In 5.2.5, Elasticsearch query behavior changed from case-sensitive to case-insensitive, to enable users to searchlog data without knowing the case. To support this enhancement, Elasticsearch event data format has changed in5.2.5. After the 5.2.5 upgrade, data will be written in the new format starting new day UTC time. FortiSIEM canonly query data in the new format, so event queries will not work with older data until they are re-indexed. Fordetails, see "Migrating Elasticsearch data from 5.2.1 or earlier to 5.2.5" in the Upgrade Guide.
Report Server upgrade to 5.2.5 is not working. If you are running Report Server, then follow thesesteps to upgrade to 5.2.5:
1. Upgrade Super, Worker, Collector, and Report Server as described in the Upgrade Guide.2. Archive the Report Server event database. Run this command:
/opt/phoenix/deployment/reportdb_archiver.sh
3. The report db backup is under /data/archive/reportdb/reportdb_2019-09-09T14-33-26.4. Delete the Report Server from Super.5. Add the Report Server back to Super.6. Restore Report Server event database from Archive. Run this command:
/opt/phoenix/deployment/reportdb_restore.sh/data/archive/reportdb/reportdb_2019-09-09T14-33-26.
Rescheduling Reports After Changing GUI Locale
User GuideFortinet Technologies Inc.
49

What's New in 5.2.5 What’s New
If you change the GUI Locale after upgrading to 5.2.5, then you must reschedule all of your scheduled reports forthe new Locale.
Adding Organizations Using Elasticsearch
Dynamic Shard management becomes active on a new day in the Coordinated Universal Time (UTC) timezone.This affects the 5.2.5 upgrade and the addition of new customers in Managed Service Provider (MSP)environments. This means that if you are in the Pacific Standard Timezone (PST):
l It is better to upgrade to 5.2.5 slightly after 4 PM, which is the beginning of a new day (4 PM PST = 0 AM UTC).l If you are adding an Organization to the system, it is better to add the customer slightly after 4 PM local time.
Swap not set up on fresh install
To add back the swap partition, run the following command on Super, Worker, Report Server and Collectornodes:
mv -f /etc/fstab /etc/fstab.bak.525; (cat /etc/fstab.bak.525 | grep -Ev'^UUID=.*\sswap'; blkid | grep swap | sed -E 's/.*UUID="(\S+)" TYPE.*/UUID=\1swap swap defaults 0 0/') > /etc/fstab; swapon -a; free –h
Redis running in master-slave mode
Starting with release 5.2.5, Redis mode has changed from cluster to master-slave to better suit FortiSIEM'sneeds
New Featuresl New Chart Types for Data Visualizationl Incident Explorer Viewl Enhanced CMDBSearchl Dynamic CMDBGroup from Custom Propertiesl Support for Dependent Properties in CMDB Importl User Interfacel Elasticsearch Support Featuresl Linux/Windows Agent Featuresl Cluster Upgrade Script
New Chart Types for Data Visualization
This release adds more visualization charts in the widget dashboard and analytics: Choropleth Map (RegionMap), Sankey Diagram, Chord Diagram, Clustered Bubble Chart and Sunburst Diagram. These charts areavailable from the Widget Dashboard and Analytics. See FortiSIEM Charts and Views.
Incident Explorer View
This release adds a dynamic Incident dashboard that helps users to correlate actors (IP, Host, User) acrossmultiple incidents, without creating multiple reports in separate tabs. The Incident Explorer View displays incidenttrends, actor, and incident details on the same page. The user can choose an actor and see all of the incidentsconcerning the actor. The user can then select a time range to narrow down the number of incidents. Timeranges, actors, and incidents can be chosen in any order. Each time a selection is made, the rest of thedashboard updates to reflect that selection. See Incident Explorer View.
50 User GuideFortinet Technologies Inc.

What’s New What's New in 5.2.5
Enhanced CMDB Search
In previous releases, the user could search the CMDB by entering a string to match the contents of a set of fields.In this release, the user can search on a field-by-field basis and on multiple fields at once. The possible values areshown so that the user can select them. Custom device attributes are included in search fields as well. SeeSearching for Devices.
Dynamic CMDB Group from Custom Properties
Dynamic CMDBGroups can now be created from device properties. See Grouping Devices by CustomProperties.
Support for Dependent Properties in CMDB Import
This release enables users to model an external CMDB inside the FortiSIEM CMDB by adding the concepts ofSite and Application to Device. Conceptually:
l an Application runs on one or more Sites andl a Site contains many Devices
To model this in the FortiSIEM CMDB, users must create the following items (in ADMIN > Device Support >Custom Property):
l a set of Site properties with one Site property being a Keyl a set of App properties with one App property being a Key
The user must then create a CMDB file containing Device, Site, and App Properties and import it via DeviceInbound Integration in ADMIN > Settings > Integration.
The user can use these Device, Site, and App properties in Analytics, Rules, CMDBReports, and Dashboards.
User Interface
In addition to English, the FortiSIEM GUI is localized to the following languages:
l Chinese - Simplifiedl Chinese - Taiwanl Chinese - Hong Kongl Frenchl Italianl Japanesel Koreanl Portuguesel Spanishl Russianl Romanian
The user can specify the language for the GUI in the UI Settings tab of the User Profile dialog box. For moreinformation, see "Language" in the table beneath UI Settings here.
User GuideFortinet Technologies Inc.
51

What's New in 5.2.5 What’s New
Elasticsearch Support Features
This release contains the following Elasticsearch enhancements:
l Elasticsearch 6.8 Supportl Dynamic Shard managementl REST client Supportl Ability to view and stop long running queries
Elasticsearch 6.8 support enables customers to use HTTP(S) REST clients under basic license, frozen indices,and others.
Prior releases used a fixed number of shards per index, per day. If EPS is very high, then the index may becomevery large. On the other hand, for the MSSP case using one index per customer, a large number of customers cancreate too many shards. Both cases can cause Elasticsearch performance to degrade.
This release adds dynamic shard management to maintain optimal Elasticsearch performance.
This is based on the following checks: (a) Size of a shard is less than 40GB, (b) total number of Shards is lessthan the total number of Hot Nodes times the number of vCPU per node, (c) Index is half full. By usingElasticsearch aliasing techniques when each of these conditions are violated, FortiSIEM keeps the number ofshards under operational limits. Additionally, when the number of segments is more than twice the number ofshards, then FortiSIEM forces a segment merge to reduce Elasticsearch memory usage.
In addition to Transport Client, Elasticsearch Queries can now use REST-based HTTP(S). This can be configuredduring Elasticsearch setup.
Long running Elasticsearch queries can now be stopped from the FortiSIEM GUI.
For more information on HTTP(S) REST and shards, see Configuring Storage.
Linux/Windows Agent Features
l Signed Agent binaries: Both Linux and Windows Agent binaries are now cryptographically signed by Fortinet.l Ability to specify host name: The user can specify a host name during Agent installation. The Agent will register
to the Supervisor with that host name. CMDBwill show that host name. See "Installing Windows Agent" in theWindows Agent 3.1.2 Installation Guide and "Installing Linux Agent" in the Linux Agent Installation Guide.
l Virtual Collector Support: Agents can send events to a Virtual Collector (such as an F5 Load balancer) locatedbetween Agents and Collectors. Virtual Collectors can be defined in the Agent definition on the Supervisor.
l Linux Agent – detects process creation similar to the Windows Sysmon agent: FortiSIEM Linux Agent isextended to detect processes being created on a host along with parent process and file hash. The event type isLINUX_PROCESS_EXEC.
l Linux Agent – adds time zone information so that times in logs are normalized correctly.l Linux Agent syslog definition section automatically selects logs of higher severity when a specificseverity is chosen. This avoids unnecessary mouse clicks.
Cluster upgrades
Current upgrade procedure is complex for a large Super, Worker cluster:
1. Stop Workers2. Stop Super3. Upgrade Super
52 User GuideFortinet Technologies Inc.

What’s New What's New in 5.2.5
4. Bring up Super5. Upgrade and bring up Workers one by oneFortiSIEM provides one script to upgrade the Super and another script to upgrade the Workers.
The scripts are available only in releases after 5.2.5.
See "Upgrading a FortiSIEM Cluster Deployment" in the Upgrade Guide.
Key Enhancementsl In the GUI, we explicitly show the specific report design template that will be used to create the PDF. See here.l FortiSIEM automatically adds a default template when the user adds a new report to a Report Bundle with an
existing design templatel On the Entity Risk score page, the user can choose the time duration for Risk Trends and Associated Incidentsl For the Nessus6 scanner, the user can discover and pull log names by host namel ARedis cluster is introduced for Super and Worker nodes to share large objects such as device properties. This
reduces the load on the App Server.l In the Custom Parser definition, search is improved to show all matched values more clearlyl The ability to search for a specific job in the Jobs page has been addedl Improved performance for C++ XML parsing of large XMLs received from App Serverl Custom Jobs are now discoverable without SNMP/WMI credentialsl A system error is created when many in-line report files accumulate at a Worker node. This indicates that the
Worker is falling behind in merging in-line reports. You should add a Worker or reduce the number of in-line reports.l Jira incident outbound integration can now map FortiSIEM Incident attributes to custom Issue Typesl REST APIs have been added to:
l update certain Incident attributesl get Agent Status for a specific hostl get Triggering Event IDs for one or more incidentsFor more information see the FortiSIEM - Integration API Guide.
l Optimize Malware IP/Domain/URL import performance via CSV filesl Multi-line log parsing support for logs read from a directoryl Identity and Location data processing is optimized to run fasterl ConnectWise is deprecating SOAP-based integration and recommending REST APIs. For REST API-based
ConnectWise integration, Client ID is now required.
New Device SupportDevices are described in the External Systems Configuration Guide.
Support for the following devices are added in this release:
l Alert Logic IPS IRIS V2.0 API - Log collection via APIl AWSKinesis stream - Log collection via APIl AWSSecurity Hub - Log collection via APIl Bro Parser - New log parserl Cisco AMP endpoint V1 streaming API - Log collection via APIl CoSoSys Endpoint Protector - New log parser
User GuideFortinet Technologies Inc.
53

What's New in 5.2.5 What’s New
l Forcepoint - New log parserl FortiADC - New log parserl Fortinet FortiInsight – Alert collection via APIl GitLab - Log collection via Git CLIl Microsoft Azure Event Hub - Log collection via APIl OneIdentity Balabit - New log parserl Sophos XG Firewalls - New log parser
Device Support Extensionsl BIND - Enhanced syslog parsing and new Event Typesl Cisco ASA - Enhanced syslog parsingl Cisco ASA - Enhanced syslog parsing and support Threat Defensel Cisco ISE - Enhanced syslog parsingl Crowdstrike Falcon Data Replicator - EnhancedLog collection via API, parse more attributesl FireEye - Enhanced syslog parsingl Forcepoint - Enhanced syslog parsingl Forescout ACT - Enhanced syslog parsingl FortiAuthenticator – parse logs received via FortiAnalyzerl FortiGate - parse firewall action - Enhanced syslog parsingl FortiMail support alternative date format - Enhanced syslog parsingl FortiOS add support for FOS 6.2 - Enhanced syslog parsingl FortiSandbox 2.5.1 - Enhanced syslog parsingl FortiSwitch – Discovery, CPU and Memory usage monitoringl FortiWeb - Enhanced syslog parsingl French Windows Security Logs parsing update - Enhancement to parserl Gitlab - Enhanced parsingl IPFIX – Parse pre-NAT Source IP fieldl Juniper SRX300 JUNOS-15 support - Enhanced syslog parsingl Linux/Unix - Enhanced syslog parsingl Mcafee web gateway - Enhanced syslog parsingl Microsoft Windows Security events - Enhancement to parserl Nozomi - Enhanced syslog parsingl Office 365 - Enhanced parsingl PacketFence - Enhanced syslog parsingl Palo Alto Firewall - Enhanced syslog parsingl Postfix - Enhanced syslog parsing and new Event Typesl SentinelOne - Enhanced syslog parsingl Snort parser to support Security Onion - Enhanced syslog parsingl STIX OTX Integration – extended to cover STIX 2.0l SymantecWebIsolation - Enhanced syslog parsingl Websense Web security - Enhanced syslog parsing and new Event Types
54 User GuideFortinet Technologies Inc.

What’s New What's New in 5.2.5
l Windows - Update WinOSParser (logs received via Snare) to match WinOSWMIParser and WinOSPullParserparsing
l Windows Security events – update parsing and categorization for event Ids - 4625, 4768, 4771, 4772, 4769l Windows Security logs – translations updated for French
New and Modified Rules and Reportsl New Rulesl New Reportsl Modified Reportsl Deleted Reports
New Rules
The following new rules have been defined for the 5.2.5 release:
l AI: File Creation Anomalyl AI: File Deletion Anomalyl AI: File Reading Anomalyl AI: File Writing Anomalyl AI: Process Started Anomalyl AI: Process Stopped Anomalyl AlertLogic Incidentl AWSSecHub: Host Vulnerability Detectedl AWSSecHub: Software and Configuration Violationl AWSSecHub: Tactics: Collection Detectedl AWSSecHub: Tactics: Command_and_Control Detectedl AWSSecHub: Tactics: Credential Access Detectedl AWSSecHub: Tactics: Defense Evasion Detectedl AWSSecHub: Tactics: Discovery Detectedl AWSSecHub: Tactics: Execution Detectedl AWSSecHub: Tactics: Impact: Data Destruction Detectedl AWSSecHub: Tactics: Impact: Data Exfiltration Detectedl AWSSecHub: Tactics: Impact: Data Exposure Detectedl AWSSecHub: Tactics: Impact: Denial of Service Detectedl AWSSecHub: Tactics: Initial Access Detectedl AWSSecHub: Tactics: Lateral Movement Detectedl AWSSecHub: Tactics: Persistence Detectedl AWSSecHub: Tactics: Privilege Escalation Detectedl AWSSecHub: Unusal Data Behavior Detectedl AWSSecHub: Unusal Database Behavior Detectedl AWSSecHub: Unusal Network Flow Behavior Detectedl AWSSecHub: Unusal Process Behavior Detectedl AWSSecHub: Unusal Serverless Behavior Detectedl AWSSecHub: Unusual Application Behavior Detected
User GuideFortinet Technologies Inc.
55
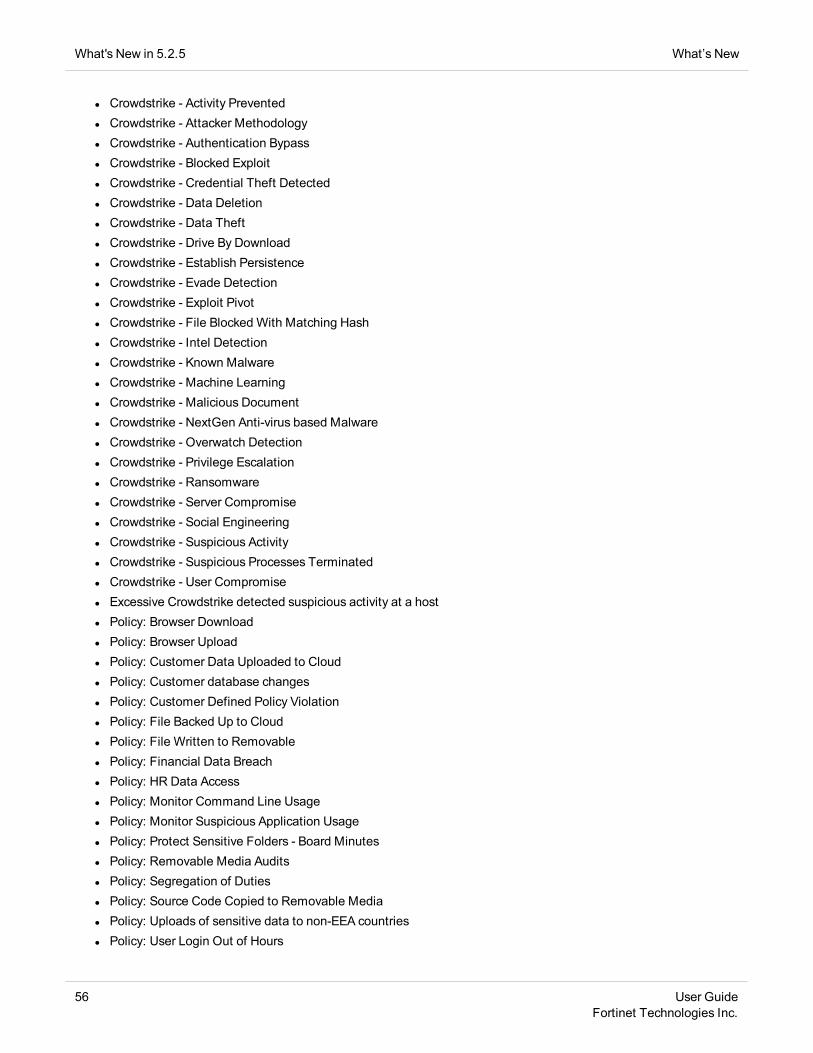
What's New in 5.2.5 What’s New
l Crowdstrike - Activity Preventedl Crowdstrike - Attacker Methodologyl Crowdstrike - Authentication Bypassl Crowdstrike - Blocked Exploitl Crowdstrike - Credential Theft Detectedl Crowdstrike - Data Deletionl Crowdstrike - Data Theftl Crowdstrike - Drive By Downloadl Crowdstrike - Establish Persistencel Crowdstrike - Evade Detectionl Crowdstrike - Exploit Pivotl Crowdstrike - File Blocked With Matching Hashl Crowdstrike - Intel Detectionl Crowdstrike - Known Malwarel Crowdstrike - Machine Learningl Crowdstrike - Malicious Documentl Crowdstrike - NextGen Anti-virus based Malwarel Crowdstrike - Overwatch Detectionl Crowdstrike - Privilege Escalationl Crowdstrike - Ransomwarel Crowdstrike - Server Compromisel Crowdstrike - Social Engineeringl Crowdstrike - Suspicious Activityl Crowdstrike - Suspicious Processes Terminatedl Crowdstrike - User Compromisel Excessive Crowdstrike detected suspicious activity at a hostl Policy: Browser Downloadl Policy: Browser Uploadl Policy: Customer Data Uploaded to Cloudl Policy: Customer database changesl Policy: Customer Defined Policy Violationl Policy: File Backed Up to Cloudl Policy: File Written to Removablel Policy: Financial Data Breachl Policy: HR Data Accessl Policy: Monitor Command Line Usagel Policy: Monitor Suspicious Application Usagel Policy: Protect Sensitive Folders - Board Minutesl Policy: Removable Media Auditsl Policy: Segregation of Dutiesl Policy: Source Code Copied to Removable Medial Policy: Uploads of sensitive data to non-EEA countriesl Policy: User Login Out of Hours
56 User GuideFortinet Technologies Inc.

What’s New What's New in 5.2.5
l Policy: VPN Usage
New Reports
The following new reports have been defined for the 5.2.5 release:
l All AWSSecurity Hub Eventsl All AWSSecurity Hub Threat Sourcesl All Crowdstrike Authentication Audit Activity Eventsl All Crowdstrike Detection Eventsl DNSRequests to .ru and .cnl Linux bash history accessl Linux file stagingl Linux file timestomping via touchl Linux internal reconnl Linux Successful and Failed sudol Malware activity - AfraidGatel Malware activity - Anglerl Malware activity - InPage - Domain matchl Malware activity - Sage 2.0 - Domain matchl Malware activity - Sage 2.0 Ransomware - IP and Port matchl Malware activity - Sage 2.0 Ransomware - Process matchl Top AWSSecurity Events and Hostsl Top AWSSecurity Hub Eventsl Top Crowdstrike Detection Eventsl Top DNSDestination domainsl Top HostsWith AWSSecurity Hub Eventsl Top Linux Process File Hashes (from Crowdstrike Data Replicator)l Top Linux Process File Hashes (from FSM Agent)l Top Non-USWeb Connectionsl Top outbound non-http connections by destination city, countryl Top Unique DNSRequesters (From Crowdstrike Data Replicator logs)l Top Unique DNSRequesters (From FSM Agent)l Top Windows Process File Hashes (from Crowdstrike Data Replicator)l Top Windows Process File Hashes (from sysmon)l Top Windows SystemsWith Unique Loginsl Windows Active Directory Controller Database file modificationl Windows BITSAdmin downloadl Windows Certutil Decode in AppDatal Windows Code Execution in Non Executable Folderl Windows Code Execution in Webserver Root Folderl Windows Command With Suspicious URL and AppData Stringl Windows DHCPCallout DLL installationl Windows External IP in Command Line (From Crowdstrike data Replicator)
User GuideFortinet Technologies Inc.
57

What's New in 5.2.5 What’s New
l Windows External IP in Command Line (From FSM Agent)l Windows Java running with remote debuggingl Windows Logons By Logon typel Windows LSASS Process Accessl Windowsmachines running MSWORDl Windowsmalicious HTML Applications Spawning Windows Shelll Windows Net.exe command auditl Windows Network Connection from Suspicious Program Locationsl Windows Permission check command auditl Windows Powershell command hidingl Windows Powershell command usage auditl Windows Powershell opening external connectionsl Windows Registry Changesl Windows regsvr32 command usage auditl Windows Remote Desktop connectionsl Windows Remote Thread in LSASSl Windows Routing table modificationl Windows SSH/telnet connections to outsidel Windows Suspicious Control Panel DLL Loadl Windows suspicious driver load from Temp directoryl Windows whoami command usage auditl Windows wmic command usage auditl Windows wmic suspicious information retrieval
Modified Reports
The following existing reports have been modified for the 5.2.5 release.
l AppFlow: Top Applications By Bytes (Detailed)l AppFlow: Top Applications By Bytesl AppFlow: Top Conversations By Bytes (Detailed)l AppFlow: Top Sources By Bytesl AppFlow: Top Conversations By Bytesl Windows Servers By Last Authentication Event Receive Timel Windows Servers By Last Change Event Receive Timel Windows Servers By Last FIM Event Receive Timel Linux Servers By Last Authentication Event Receive Timel Linux Servers By Last Change Event Receive Timel Linux Servers By Last FIM Event Receive Timel Routers/Switches By Last Authentication Event Receive Timel Routers/Switches By Last Change Event Receive Timel Firewalls By Last Authentication Event Receive Timel Firewalls By Last Change Event Receive Timel Hypervisors By Last Authentication Event Receive Time
58 User GuideFortinet Technologies Inc.

What’s New What's New in 5.2.5
l All PCI Systems By Last Event Receive Timel FortiGate Top Botnetsl FortiGate Top Botnetsl FortiSandbox Top Source Country By Malwarel FortiSandbox Top Destination Country By Malwarel FortiSandbox Total Analysis Jobsl FortiSandbox Zero Day Suspicious URLsl FortiSandbox Zero Day Malicious URLsl FortiSandbox Zero Day Malicious Filesl FortiGate Top Applications by Bandwidthl FortiGate Top Websites by Connectionsl FortiGate Top IPS detected Attacksl FortiGate Top MaliciousWebsitesl FortiGate Top Phishing Websitesl FortiGate Top Proxy Avoidance Attemptsl FortiGate Top Protocols By Bandwidthl GLBA 1.6.1: Top Reporting Modules Ranked By Event Ratel ISO 27001 A.12.4.1: Top Reporting Modules By Event Rate (Per Sec)
Deleted Reports
The following report has been deleted for the 5.2.5 release:
l Carbon Black Functionality Stopped
Important Bug Fixes
Bug ID Severity Module Description
564336 Minor AppServer
CSVReport Export Reportwith Calculations fail
570934 Enhancement SystemRemove Hail a Taxii fromExternal Threat Intelligencesource - no longer updating
561449 Minor GUI Non Built in admin usershave session timeoutsregardless of configuration
567553 Minor QueryCOUNT DISTINCT Eventqueries do not work onElasticsearch
559488 Minor AppServer
Email Notification withTLS1.2 does not work
User GuideFortinet Technologies Inc.
59

What's New in 5.2.5 What’s New
Bug ID Severity Module Description
580713 Minor AppServer
Remediation scriptexecution failed whenevents triggered in org level
566959 Minor LogCollection
Azure Expect scriptcredentials need to beobfuscated
564252 Minor Parser
Incident Event Forwardingnot working when eventgroup is chosen in filterconditions
524946 Minor AppServer
FortiSIEM incidentnotification unnecessarilyadds Identity And Locationinformation to incident_detail
570780 Minor DataManager
Events are not cached oncollector when ElasticSearchis down
524275 Minor GUI Quick Info and IdentityLocation Dashboard >SenderBase Reputation haswrong URL
556271 Normal GUIIncident risk entity is notshowing up if user set it ashome landing page
428993 Minor AppServer
PostGreSQL Incident tabledoes not sync with time zonechanges
561378 Normal GUI Collector fails to registercollector through proxy
573744 Minor AppServer
When Organization isrenamed, offline retentionpolicy still refers to the oldname
60 User GuideFortinet Technologies Inc.

What’s New What's New in 5.2.5
Bug ID Severity Module Description
573922 Minor DataManager
Excessive phDataPurgerloading agent info into cachelog fills up disk over time
556271 Minor GUI Incident > Risk View doesnot display if user set it ashome landing page.Information shows if youchange tabs and come back
556525 Minor LogCollection
Custom JDBC job: Oracleservice name is not saved
564804 Minor AppServer
Incident XML export shows anegative value for RepeatCount
559241 Minor Parser
Excessive logging duringSophos Central logcollection causes disk to befull
572591 Minor DataManager
Incorrectly parsed binaryeven type attributes causesdata corruption
574694 Minor AppServer
Saved search results atOrganization level cannot beviewed
476419 Enhancement GUI User session should nottimeout during testconnectivity, discovery anddashboards
552531 Minor LogCollection
Sophos Central Eventpulling do not work
570234 Minor RuleEngine
Rule does not trigger with INcondition when there arenore than 2 elements in theSET
569235 Normal LogCollection
Used EPS information doesnot correctly account netflowlogs
User GuideFortinet Technologies Inc.
61

What's New in 5.2.5 What’s New
Bug ID Severity Module Description
574901 Minor Parser Correctly set FortiGate IPSSeverity based on severityfield
550234 Minor RuleEngine
Incident attributes notshowing non-Englishcharacters - Non-ASCIIcharacters displayed as '_' inincident
572800 Minor GUI GUI memory leak when useris switching between tabs
Known Issues in Release 5.2.5l Search - Unable to get more than 16.38K entries in COUNT DISTINCT operations. No workaround is
possible.l Search – Many files may accumulate in the dynamic-reports folder for canceled report exports. The folder
path is /opt/phoenix/config/dynamicreports/customize-export. The workaround is toperiodically delete the files.
l FortiSIEM Collector doesn't validate the Supervisor/Worker HTTPS public certificate. No workaround ispossible.
l The Default Time Range (10 days) on the Incident Explorer dashboard is too long and the user cannotchange this default setting. The workaround is to change the setting to fewer days and make sure there issufficient disk I/O to the event database for this query to return results.
l External Lookup does not pickup IPs from the external lookup request unless you specify <IP> in the URL.The workaround is to put “<IP>” in the URL.
l The Elasticsearch NOT IN query does not work with network groups with low and high. No workaround ispossible, other than trying to rewrite the query.
l The Widget Dashboard drill down gives incorrect results when the report contains Protocol and Port. Theworkaround is to add the specific Protocol and Port conditions in the drill down query.
l FortiSIEM is unable to create a ticket from multiple incidents. No workaround is possible.l The rule "Multiple Distinct IPS Events From Same Src" is firing on FGT non-IPS events. The workaround
is to modify the rule definition by modifying the rule filter condition to ”Event Type CONTAIN FortiGate-ips-“.
l Swap partition is not created for Super, Worker, and Collector. The workaround is as follows:l Run the blkid /dev/sda2 executable.l Take this UUID and replace the UUID for the swap partition in the /etc/fstab folder.
l No FortiSIEM user can delete or modify a device credential other than the user who created it. Theworkaround is to delete the credential from the database. It is advisable to contact ForiSIEM technicalsupport for this operation.
l If there are lots of Cases created in FortiSIEM, then the CASES tab may take a long time to load. Theworkaround is to delete some old cases from the database. It is advisable to contact ForiSIEM technicalsupport for this operation.
62 User GuideFortinet Technologies Inc.
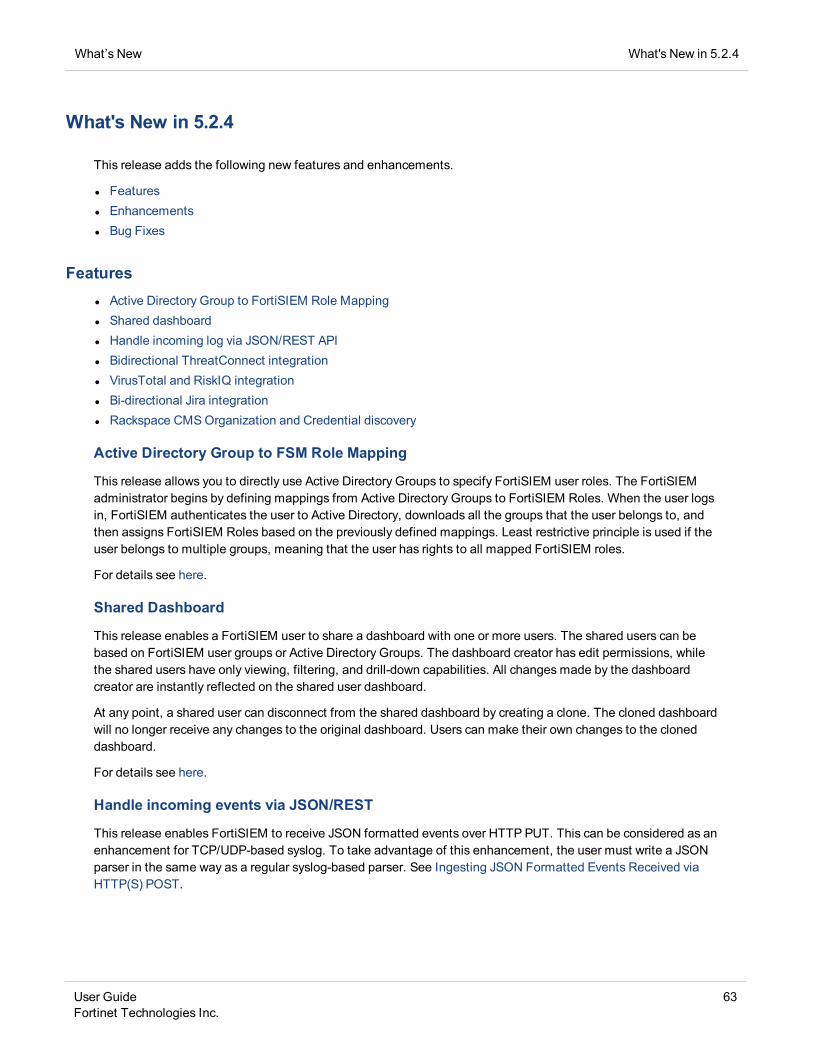
What’s New What's New in 5.2.4
What's New in 5.2.4
This release adds the following new features and enhancements.
l Featuresl Enhancementsl Bug Fixes
Featuresl Active Directory Group to FortiSIEM Role Mappingl Shared dashboardl Handle incoming log via JSON/REST APIl Bidirectional ThreatConnect integrationl VirusTotal and RiskIQ integrationl Bi-directional Jira integrationl Rackspace CMSOrganization and Credential discovery
Active Directory Group to FSM Role Mapping
This release allows you to directly use Active Directory Groups to specify FortiSIEM user roles. The FortiSIEMadministrator begins by defining mappings from Active Directory Groups to FortiSIEM Roles. When the user logsin, FortiSIEM authenticates the user to Active Directory, downloads all the groups that the user belongs to, andthen assigns FortiSIEM Roles based on the previously defined mappings. Least restrictive principle is used if theuser belongs to multiple groups, meaning that the user has rights to all mapped FortiSIEM roles.
For details see here.
Shared Dashboard
This release enables a FortiSIEM user to share a dashboard with one or more users. The shared users can bebased on FortiSIEM user groups or Active Directory Groups. The dashboard creator has edit permissions, whilethe shared users have only viewing, filtering, and drill-down capabilities. All changes made by the dashboardcreator are instantly reflected on the shared user dashboard.
At any point, a shared user can disconnect from the shared dashboard by creating a clone. The cloned dashboardwill no longer receive any changes to the original dashboard. Users can make their own changes to the cloneddashboard.
For details see here.
Handle incoming events via JSON/REST
This release enables FortiSIEM to receive JSON formatted events over HTTP PUT. This can be considered as anenhancement for TCP/UDP-based syslog. To take advantage of this enhancement, the user must write a JSONparser in the same way as a regular syslog-based parser. See Ingesting JSON Formatted Events Received viaHTTP(S) POST.
User GuideFortinet Technologies Inc.
63

What's New in 5.2.4 What’s New
Bi-directional ThreatConnect integration
ThreatConnect is a source of external threat intelligence, e.g. Indicators of Compromise (IOCs) includingmalware domain, IP, URL, and hash.
In FortiSIEM 5.2.4, users can download IOCs from ThreatConnect and receive alerts on matches in logs. SinceThreatConnect aggregates threat feeds from multiple sources, large numbers of automatically downloaded IOCscan cause false positives, increase processing needs and filling storage.
To circumvent this issue, FortiSIEM 5.2.4 release enables the user to control the downloaded IOCs by specifyingIOC download policies. Only the IOCs that match policy definitions would be downloaded.
This release also enables the user to mark a ThreatConnect IOC as a False positive. This action can be takenwhen an incident triggers matching a ThreatConnect IOC, and the user determines that it is a false positive
For details on setting up ThreatConnect integration, see Working with ThreatConnect IOCs. For details onmarking a ThreatConnect IOC as a False positive, see here.
VirusTotal and RiskIQ integration
VirusTotal and Risk IQ websites provide reputation for IP addresses, domains, URLs, and file hashes. They alsoprovide APIs which allow the user to programmatically consume data.
In this release, a FortiSIEM user can run checks against these websites when an appropriate security incidenttriggers. This check can be run either on demand seeing an incident trigger or in the background via a notificationpolicy. In on-demand mode, FortiSIEM will display the reputation results on screen and the user can take variousfollow-up actions such as, updating Incident comments, resolving the incident as a true or false positive, openinga ticket in FortiSIEM or an external ticketing system, taking a remediation action. When run in background mode,incident comments will be automatically updated with the findings from the websites.
For details on VirusTotal and RiskIQ integration, see here.
Bi-directional Jira integration
This release supports Jira as an external ticketing system. A ticket can be created in Jira either on-demand whenan incident triggers, or in the background via a notification policy. Extensive mappings between Jira fields andFortiSIEM incident fields are provided to enable a Jira ticket to have sufficient information. When a Jira ticket isclosed, the corresponding ticket is closed in FortiSIEM.
For details on Jira integration, see here.
Rackspace Customer Organization and Credential discovery
This release enables FortiSIEM to discover Rackspace customers and cloud credentials from Rackspace Janus,MSCloud and CMSSystems. This discovery-based methodology eliminates administrators need to entercredentials twice since they already exist in Rackspace internal systems. Additionally, it is easy to update – whencustomers get added or credentials get added or updated, a simple rediscovery enables FortiSIEM to have thenew information.
The user must provide credentials for Rackspace Janus, MSCloud and CMSSystems in FortiSIEM and then run aRackspace Org Credential discovery. FortiSIEM will do the following
l Discover Rackspace customers and automatically create organizations in FortiSIEMl Discover AWS and Azure cloud credentials associated with each customer
64 User GuideFortinet Technologies Inc.

What’s New What's New in 5.2.4
l Discover Cloud application credentials e.g. Cloud Passage Halo, Crowdstrike and AlertLogic.l Start pulling events logs Cloud applications
Enhancementsl PCI Logging Dashboard Enhancementsl Elasticsearch queries are now case-insensitivel Generic GUI Enhancementsl Allow the user to change the severity of an Incidentl Windows Agent (3.1.1) Enhancements
PCI Logging Dashboard Enhancements
1. Drill down is permitted on all metrics2. Search allows the user to select values from a drop-down menu
Elasticsearch queries are now case-insensitive
This release changes Elasticsearch query behavior from case-sensitive to case-sensitive. This increases thestorage by about 10% as Elasticsearch has to store the original version for display and a lower-case version forsearch.
For existing customers that are already running elastic search, older data has to be re-indexed for searches towork after upgrading to 5.2.4. Exact steps are as follows
1. Upgrade FortiSIEM to 5.2.42. Go to Admin > Setup > Storage. Click Test and Save.3. Wait for GMT new day (current day's index will still be with old style).4. Re-index all old indices.5. Delete old indices.6. Create alias.
Re-indexing:
curl -X POST "X.X.X.X:9200/_reindex" -H 'Content-Type: application/json' -d'{"source": {"index": "fortisiem-event-2019.04.22"},"dest": {"index": "fortisiem-event-upgrade-2019.04.22"}}'
Delete old index:
curl -XDELETE http://X.X.X.X:9200/fortisiem-event-2019.04.22
User GuideFortinet Technologies Inc.
65

What's New in 5.2.4 What’s New
Creating Alias :
curl -X POST "X.X.X.X:9200/_aliases" -H 'Content-Type: application/json' -d'{"actions" : [{ "add" : { "index" : "fortisiem-event-upgrade-2019.04.22", "alias" : "fortisiem-event-2019.04.22" } }]}'
Generic GUI Enhancements
1. In CMDB, Incident List View and Dashboard Table View, a horizontal slide bar is added when the userchooses to display a large number of columns.
2. Incident Details panel is re-organized:a. Separate incident attributes, incident comments, and Incident Action historyb. Newly added Incident Action history records every (modification) action taken by the user or the system
on that incident3. For faster display, the following views are paginated:
a. Admin > Organization View – especially when there are large numbers of organizationsb. Widget Dashboard > Table View
Allow the user to change the severity of an Incident
In prior releases, Incident severities are set by Rule severity. Now the user can change the Incident severityindependently of Rule severity.
Windows Agent (3.1.1) Enhancements
1. Ability to install and run with SYSTEM privilege2. Support for Italian locale for File Integrity Monitoring User name detection
Bug Fixes
Bug Id Module Description
553127 GUI Two issues - CMDB > Auto-expand option is not saved. In Analytics result, row highlightdisappears after viewing event details.
553283 App Server Duo@ Factor Authentication is broken after App Server security hardening.
553230 App Server Random GUI login failures when Active Directory Group to FortiSIEM Role Mapping is used.
553122 App Server Event pulling jobs like Alertlogic and Cloudpassage should be distributed to multi-tenantcollectors.
552912 WindowsAgent
Windows Agent doesn't support Virtual Collector
66 User GuideFortinet Technologies Inc.

What’s New What's New in 5.2.2
Bug Id Module Description
550826 Java QueryServer COUNT (DISTINCT ) not working for Elasticsearch ad hoc queries
549634 System Linux agent log fortisiem-linux-agent.log file has world writable permissions
548677 Rule Engine Rule with Event Type IN more than 2 non-group entries fails to trigger
548646 App Server Device names with a single quote will break SQL grammar
548229 Java MSSQLAgent MSSQL JDBCMonitor does not handle dates found in Spanish locale
What's New in 5.2.2
This release is for hardware appliances only.
It contains the following new feature.
Support for new 3500GmodelIn addition to FSM 2000F and FSM 500F appliances, this release supports the new FSM 3500G appliance, areplacement for FSM 3500F. This model is more powerful than FSM3500F, with 24 cores, 48 vCPU, 128 GBRAM and 48 TB (12x4TB) storage.
The release contains the following bug fix.
Bug 549856: “diagnose system disk info” command output does not show the correct physical disk slots
What’s New in 5.2.1
FortiSIEM 5.2.1 release includes the following:l New Featuresl Enhancementsl New Device Supportl Device Support Enhancementsl Resolved Issues
New FeaturesFortiSIEM 5.2.1 release includes the following features:
User GuideFortinet Technologies Inc.
67

What’s New in 5.2.1 What’s New
l Automated Failover and Disaster Recoveryl Multi-tenant Collectorsl Data Anonymization supportl Windows Agent without Windows Agent Managerl Linux Agentl Custom Log File Analysisl PCI Logging Status Dashboardl Packet Capture (PCAP) File analysisl Ability to forward any event in FortiSIEM to an external server via CEFl Azure Platform Support
EnhancementsFortiSIEM 5.2.1 release includes the following enhancements:
l Elasticsearch deployment and performance enhancementsl Windows Agent enhancementsl HTML GUI enhancementsl Ability to rate limit collectorsl Rule Worker Performance optimizationl Incident Reporting statusl Case Management enhancementsl Custom Device Property support in Analyticsl System Security Hardening
New Device Support
l AWSCloud Passage Halo - log collection via APIl Tenable.io - log collection via APIl GitLab - log collection via APIl Rapid7 InsightVM - log collection via APIl Crowdstrike - log collection via Streaming API, Data Replicatorl Sophos Central - log collection via APIl Windows Defender ATP - log collection via APIl Tanium Connect - log parserl OneIdentity - log parserl Cyxtera AppGate - log parserl PacketFence - log parserl Cimcor CimTrak - log parserl Watchguard Firebox - discovery and performance monitoringl TruStar - Threat Intelligence integration via APIl ThreatConnect - Threat Intelligence integration via API
68 User GuideFortinet Technologies Inc.

What’s New What’s New in 5.2.1
Device Support Enhancements
l Microsoft Office365 - new event typesl ForeScout CounterACT - enhanced log parserl AlertLogic - enhanced log parserl Cisco ISE - enhanced log parserl Box - API - log collectionl Nessus Pro v7 and v8l McAfee EPO - enhanced log parsingl FortiManager - enhanced syslog parsingl PulseSecure - enhanced syslog parsingl Digital Guardian DLP - enhanced syslog parsingl HPComWare - enhanced syslog parsingl F5 LTM - enhanced syslog parsingl Office 365 - enhanced management activity log parsingl Checkpoint Firewall 1 - CEF and syslog event parsingl Windows - French language - enhanced security event parsingl FireAMP/eStreamer - new agent
Automated Failover and Disaster RecoveryThis release enables native FortiSIEM Failover and Disaster Recovery. The feature works with all FortiSIEMdeployments – hardware appliance, all-in-one Virtual Appliance and Super/Worker Cluster using NFS basedEvent Database (Event DB) or Elasticsearch.
This feature enables customers to have two FortiSIEM systems – one Primary FortiSIEM for full Read/Writeoperations and a Secondary FortiSIEM for Read only operations. Logs are sent to the Primary Site. Discovery andPerformance monitoring happens on the Primary Site. Users normally login to the Primary Site. Alerts andnotifications trigger on the Primary Site. The full state - CMDB (PostGreSQL DB), Config (SVN), Profile data(SQLite DB) and Event DB (NFS based Event DB or Elasticsearch) are synched from Primary to Secondary – aresynched from the Primary to the Secondary. Users can login to the Secondary FortiSIEM and run searches – theresults are available after a slight delay.
After disaster, the Secondary FortiSIEM can become the Primary and users and events can be diverted to thenew Primary using DNSmechanisms.
This feature requires a separate FortiSIEM license with exactly same parameters as the original. FortiSIEM hasto be set up in two sites in an identical fashion, implying identical number of Super, Workers and identical EventDB (NFS or Elasticsearch) at the two sites. To handle CMDB replication, the embedded PostgresSQL databasewill be automatically upgraded to 9.4-BDR as part of 5.2.1 upgrade.
For details about setting up Failover and Disaster Recovery, see here.
Multi-tenant CollectorsACollector is an important component in a multi-tenant FortiSIEM deployment. By associating one or moreCollectors to an Organization, devices and logs can be easily associated to that Organization.
Prior to 5.2.1, Collectors can be deployed in one of two ways:
User GuideFortinet Technologies Inc.
69

What’s New in 5.2.1 What’s New
l Many-to-One deployment: Collectors can be associated to an Organization in many-to-one fashion. Logscollected and devices monitored by a Collector belong to the corresponding Organization.
l Special One-to-Many deployment: To handle multi-tenant log sources (for example, FortiGate firewall withVDOM), a Collector can be associated to the special Super/Local FortiSIEM Organization. You can define EventOrganization Mapping Rules to map the Organizations in multi-tenant devices to FortiSIEM Organizations. TheCollector uses the Event Organization Mapping Rules to associate devices and logs to the correct FortiSIEMOrganization.
A Collector belonging to the Super/Local Organization is a multi-tenant Collector, since it can handle multipleOrganizations. In this release, the multi-tenant Collector concept is enhanced further:
l Multi-tenant Agents: FortiSIEM Windows Agent 3.1 and Linux Agents 5.2.1 belonging to any Organization cansend logs to a multi-tenant Collector. Using the Organization Id information in log, a multi-tenant Collector canassociate the Agents and the logs to the correct Organization.
l Multi-tenant Event Pulling: When events need to be collected via an API (for example, AWSAudit trail), the usercan now associate a FortiSIEM Organization to a credential. The event collection job is assigned to a multi-tenantCollector and it associates events to the correct Organization.
l Multi-tenant Collector Pool: For scalability, multiple multi-tenant Collectors can be defined for the Super/LocalOrganization. Windows and Linux Agents send to the multi-tenant Collector pool in a round-robin fashion. APIbased event pulling jobs are distributed by the Application Server to a collector from the multi-tenant collector pool.If one Collector goes offline or is deleted, the job is automatically re-distributed to another multi-tenant Collector.
For details about various deployment scenarios, see here.For details about setting upmulti-tenant collectors, see here.
Data Anonymization SupportStarting this release, FortiSIEM can anonymize any parsed log field containing Personally IdentifiableInformation (PII), including IP addresses, host names, user names, MAC addresses and email addresses. Usercan choose any attribute including custom-defined attributes for anonymization. This enables Organizations tocomply with data privacy regulations such as General Data Protection Regulation (GDPR).
Anonymization is done for externally received logs, internally generated logs, incidents and CMDB records,search results, notifications. FortiSIEM is able to store the event database on both NFS and Elasticsearchdeployments. Encryption can be used where the underlying storage is encrypted by the external storage system ina way that is transparent to FortiSIEM. If the user mounts the hard disk at a different location, a password isrequired to access the internal data.
Data Anonymization is role-based. You need to define a new role, specify the attributes to be anonymized for thatrole and map users to that role. FortiSIEM includes a de-anonymization workflow. You need to define a de-anonymization approver user for approving de-anonymization requests. A user may create a de-anonymizationrequest. Once the request is approved for a specific time duration, the data is de-anonymized for the specific userand duration. After the de-anonymization duration expires, the date is re-anonymized using a different key.
Currently, a user belonging to the anonymized role has the following restrictions:
l User cannot see any part of the raw events – they are completely hidden.l User cannot perform search on anonymized event attributes.l User cannot run CSV exports on search results.l If an integer event field is anonymized, the GUI may not show those fields. Normally, integer fields are not
anonymized.
For details about setting up data anonymization support, see here.
70 User GuideFortinet Technologies Inc.

What’s New What’s New in 5.2.1
Windows Agent without Agent ManagersWindows Agents (version 3.1 onwards) can now be centrally configured and managed from the FortiSIEM GUI.Windows Agent Manager is not required.
Note: Collectors are required to collect logs from Windows Agents.
The new Agent configuration process is similar to earlier releases, except that it is done from FortiSIEM GUI andcan be applied globally to Agents belonging to multiple Organizations in Service Provider deployments.
a. Define WindowsMonitoring Templates in GUIb. Associate Windows hosts to Monitoring Templates and a list of Collectors.c. Deploy the Agents.Agents register to Supervisor and obtain the respective monitoring templates and the list of Collectors to forwardevents. Agents collect logs according to the monitoring template and send to one of the available Collectors. Ifany change is made to the template or the Collector list, the changes are propagated to the Agents. Agents cansend logs to a different Collector from the list, if one is busy.
The new centralized Agent configuration approach simplifies Agent management and eliminates the need tohave an Agent Manager. In addition to providing the same functionality as earlier 2.x versions, new Agentsinclude additional features as described in the Windows Agent Enhancements.
For details about setting upWindows 3.1 agents, see here.
Linux AgentsThis release introduces Linux Agents (Version 5.2.1) with the following functionalities:
l Collect any logs sent to the syslog facilityl Monitor Custom log filesl File Integrity Monitoring
Note: Collectors are required to collect logs from Windows Agents.
Linux Agents configuration is done from FortiSIEM GUI and can be applied globally to Agents belonging tomultiple Organizations in Service Provider deployments.
a. Define Linux Monitoring Templates.b. Associate Linux hosts to Monitoring Templates and a list of Collectors.c. Deploy the Agents.Agents register to Supervisor and obtain the respective monitoring templates and the list of Collectors to forwardevents to. Agents collect logs according to the monitoring template and send to one of the available Collectors. Ifany change is made to the template or the Collector list, the changes are propagated to the Agents. Agents cansend logs to a different Collector from the list, if one is busy.
Linux agents need to be licensed in the same way asWindows Agents. FortiSIEM enforces the total number ofWindows or Linux Agents deployed within the system.
For details about setting up Linux 5.2.1 agents, see here.
Custom CSV File AnalysisThis release allows the ability to load a custom CSV file from the GUI. User can define a mapping from CSV filecolumns to event attributes. FortiSIEM will generate events – one for every line in the log file. The events can besearched like an externally received event.
For details about setting up a custom CSV file for analysis, see here.
User GuideFortinet Technologies Inc.
71

What’s New in 5.2.1 What’s New
PCI Logging Status DashboardThis release provides a dashboard that provides a status of PCI devices that are logging/not logging at all orlogging correctly. Logging correctness is defined on a device group basis by associating a Report to a devicegroup in Report > Compliance folder.
For details about setting up PCI Logging Status Dashboard, see here.
Azure Platform supportFortiSIEM can now be deployed in Azure Clouds.
Formore information about FortiSIEM Azure Collector installation, see here.
PCAP File AnalysisThis release allows user to parse PCAP files. IP, TCP/UDP and HTTP attributes. PCAP files can be moved to thislocation on any node defined in phoenix_config.txt.
Ability to forward any event to an external server via CEFThis release enables FortiSIEM to forward logs to an external system using Common Event Format (CEF) formatover UDP or TCP.
For details about setting up event forwarding via CEF, see here.
FortiSIEM parsed event attribute to CEF attribute mapping is defined here.
Elasticsearch deployment and performance enhancementsFortiSIEM can be configured to use Elasticsearch as its event database – this enables FortiSIEM to scale outevent storage and search capabilities using Elasticsearch distributed architecture. This release adds the followingElasticsearch related enhancements:
l Elasticsearch 6.4.2 version support.l Multiple Coordinator node support for fail-over: Enter multiple coordinator nodes using a comma
separated manner in Admin >Setup >Storage.
72 User GuideFortinet Technologies Inc.

What’s New What’s New in 5.2.1
l Ability to store events on per-customer basis in Service Provide deploymentsFor multi-tenant deployments, you can optionally store logs for each Organization in a separateElasticsearch index. This enables you to easily delete the logs for an Organization if needed, withoutaffecting the performance of the system.
To do this set index_per_customer = true in the Elasticsearch section of/opt/config/phoenix_config.txt for Super and each Worker nodes.
[BEGIN Elasticsearch]enable=false...index_per_customer=false...
[END]
By default, index_per_customer = false
It is highly recommended to set this at the beginning of the install before events are stored inElasticsearch. Once the setting is changed, Supervisor andWorker nodes need to be restarted for themodules to read the change. If the change is done after Elasticsearch has been running for a while,then the queries around the time of changemay not work properly. But queries for time window beforeor after the time change will work correctly.
Note: You will likely need more data nodes if you decide to separate customer data. Refer to theElasticsearch capacity planning guide.
l Elasticsearch log storage capacity improvementsa. Use 'best compression'.b. FortiSIEM event attribute types mapped to the smallest (in size) Elasticsearch data type.c. FortiSIEM profile data and per-Worker-5minute-inline-report data not stored in Elasticsearch.d. Option to not store inline report data in Elasticsearch. Inline reports speed up Dashboard
display. There are now three options to choose from:i. Disable inline computation – when the user visits a Dashboard, the GUI will query
directly raw events in Elasticsearch – this does not consume Elasticsearch storage.ii. Inline computation via files – inline computation is still done but the results are
stored in files on Supervisor node - this does not consume Elasticsearch storage. Thisapproach is the same as FortiSIEM NFS based Event Database.
iii. Inline computation via Elasticsearch (default) – Inline computation results will bestored in Elasticsearch. It consumes Elasticsearch storage and dashboard will loadfaster. However, compared to earlier releases, per Worker results are not stored andmerging is done outside of Elasticsearch – so Dashboard queries will be equally fastbut consume less space.
l Support of tiered Elasticsearch Hot/Warm storageUser can configure certain Elasticsearch Data Nodes (typically with SSD) as Hot Nodes, andremaining Data Nodes (typically with magnetic disks) asWarm Nodes. In this configuration,read/writes involving recent logs go to the Elasticsearch hot nodes. When the hot nodesbecome close to full, then logs are migrated to Warm nodes. When the Warm nodes becomefull, logs are either Archived (if an archive destination is defined) or purged. FortiSIEMmanages the Hot >Warm > Archive data movement based on user defined storage utilizationthresholds. User can search events from Hot and Warm nodes in a transparent manner –
User GuideFortinet Technologies Inc.
73

What’s New in 5.2.1 What’s New
specific knowledge of data residence is not needed. Currently, restore from Archived node toElasticsearch Warm nodes is not supported.
l Support of CMDBDeviceToAttributeMap functionality in Elasticsearch searchesOften there is a need to 'join' log data with device properties from CMDB. TheCMDBDeviceToAttributeMap function provides this functionality with custom device properties.These searches now work for Elasticsearch.
Windows Agent EnhancementsThis release contains the following Windows Agent specific enhancements, in addition to the ability to workwithout Agent Manager functionality described earlier.
l Support for Windows Event ForwardingWindows can forward logs using Windowsmechanisms to a Central Windows Server. AFortiSIEM agent on the central server can then bring all the events from the various windowsservers to FortiSIEM. This is an alternative to running FortiSIEM agent on everyWindowsserver. The disadvantage of this approach is that Windows (Security, application and system)event logs can be collected in this way, while FortiSIEM agent can collect other informationsuch as FIM, Custom log, Sysmon etc. This release is able to parse the forwarded Windowsevents so that actual reporting Windows server is captured and all the attributes are parsed assent by native agents.
l Support of Windows FIPS enabled modeIn earlier releases, the agent did not work properly if FIPSmode was turned on. This issue isaddressed in this release.
l File hash for File Integrity Monitoring computed using SHA256The file hash value for file/folder monitoring is now reported using SHA256 algorithm instead ofMD5. This enables direct match with external threat intelligence malware file hashes.
For enabling Windows Event Forwarding on Windows Servers, see here.
For enabling FIPS on Windows Servers, see here.
HTML GUI EnhancementsThis release adds the following important GUI enhancements:
l Light theme is now added for FortiSIEM GUI. This can be configured on a per user basis underADMIN >Settings >System >UI.
l User state is saved while the user navigates from one tab to another during a login session. When theuser goes back to a tab, the last user view is shown.
l The following items are added from Flash GUI:l Dashboard slide showl Interface Usage Dashboardl Event Database Management – works both for NFS based Event Database and Elasticsearchl Port Mapping tablel Application Health table
l Keyword-based search is added in Analytics.
74 User GuideFortinet Technologies Inc.

What’s New What’s New in 5.2.1
l User can save the Analytics Filters and Time Range attributes and then choose the Saved Filters inSearch later.
l Dashboard search filter GUI is redesigned to be similar to Incident Search.l When user creates a Dashboard Search, queries are run on-demand to capture all data.l SNMPSysObject Ids can be defined from GUI. This enables custom device discovery.l New Dashboard view with counts of important types in CMDB and Case tabs.l Newmain 'TASK' tab for managing de-anonymization approval and requests.
For setting light theme, see here.
For creating Dashboard slide show, see here.
For creating Interface Usage Dashboard, see here.
For details about Event Database Management, see here.
For Keyword based search, see here.
For saving and displaying Analytics Filters and Display attributes, see here.
For creating SNMPSysObject Ids, see here.
For details about de-anonymization, see here.
Ability to Rate Limit CollectorsThis release allows user to limit the rate at which Collectors can send events to Workers.
FortiSIEM, being a real-time event correlation system, requires Collectors to push events as quickly as possible tothe Workers. However, if Collectors are offline for a long period of time or Internet bandwidth is scarce, then theCollector to Worker link can get overwhelmed. By defining an upper limit on a Collector bandwidth, the user canforce the Collector to limit Collector to Worker bandwidth usage. Note that the drawback of rate limiting is thatevents may be delayed and correlation rules may not trigger for the delayed events. Also, events may get lost ifCollector disk gets full if Collector is receiving events at a higher rate than it is allowed to send.
For setting an upper limit on a Collector bandwidth, see here.
Rule Worker Performance OptimizationIn this release, the Rule Worker CPU performance is improved by keeping a cache of event type to Rulemappings – this eliminates the requirement to check every rule for event type match.
Incident Reporting StatusThis release adds the incident reporting device status flag (Approved or Pending) to every incident. This enablesusers to quickly identify the incidents triggered by Approved devices and assign them higher priority.
Case Management EnhancementsThis release adds several enhancements to the in-built Case management system:
l Ability to search cases using Incident Id.l Ability to drill down from Case to Incident List view page with the incidents pre-selected.l Display the triggered events directly in a Case.
For more information about Case Management, see here.
User GuideFortinet Technologies Inc.
75

What’s New in 5.2.1 What’s New
Custom Device Property Support in AnalyticsThis release allows users to define custom device properties and then display them under CMDB for use inAnalytics searches and incidents.
System Security Hardening
In this release, FortiSIEM Super, Worker and Collector system is configured to be more secure. Following are theSecurity Hardening enhancements in various ports:
Port 443 hardeningl Removed Apache default installation/welcome page.l Disabled HTTPOPTIONSmethod.l Allows only TLS 1.2 and good ciphers: AES128-SHA, ECDHE-RSA-AES128-SHA, ECDHE-RSA-AES256-
GCM-SHA384, ECDHE-ECDSA-AES256-GCM-SHA384.
Port 21 hardeningl Allows only TLS 1.2 and good ciphers: AES128-SHA, ECDHE-RSA-AES128-SHA, ECDHE-RSA-AES256-
GCM-SHA384, ECDHE-ECDSA-AES256-GCM-SHA384.l Disallows non-SSL FTP.
General system hardeningl Google Chrome packages are removed - so Selenium based Synthetic Transaction Monitoring will not
work out of the box.l ICMP redirection is disabled.l Only root partition allows device files (Partition mounting weakness).l TCP timestamp response is disabled.l Tightened permission for user nfsnobody (used for nfs mounting).l Removed Ghostscript package.l Changed permission of some files from world writable to world readable.l All path entries are made absolute paths.
Port 5480 hardeningl Disabled light httpd port 5480 on Collector. Collectors need to be registered by running this script:phProvisionCollector --add <user> <password> <super IP or host><organization> <collectorName>
Resolved issues
Id Severity Module Summary
429644 Minor GUI User Activity Windowdoes not properly showfull name for users.
76 User GuideFortinet Technologies Inc.

What’s New What’s New in 5.2.1
Id Severity Module Summary
432791 Minor GUI
Increase passwordlength limit from 32characters to 64characters.
465797 Minor Discovery Test connectivity taskfor OKTAwith largenumber of users mayfail.
502929 Minor App ServerSmart Scan discoverydoes not ignore devicesalready in the CMDB.
505759 Minor GUI Incidents are nottriggering for failedSTM.
507368 Minor App Server
CMDBRule Exceptionreport shows exceptionsfrom otherOrganizations.
511230 Minor GUI User full name is notdisplayed in the usertraffic report.
517223 Minor Agent
Windows AgentInstallation error onWindows Server runningPowerShell 5.1.
520294 Minor Agent Windows DNS parserwith collection via Agentdoes not work ifDetailed Debug DNS isNOT enabled.
521194 Minor GUI
The Due Date in CreateTicket via NotificationPolicy should BeRelative Time.
522672 Minor App Server Exporting PDF reportsfails after host upgradefrom 5.0.0.
User GuideFortinet Technologies Inc.
77

What’s New in 5.2.1 What’s New
Id Severity Module Summary
522810 Minor System
CURL problemsresulting undefinedbehavior includingdeadlock.
522824 Minor App Server Scheduled Reports runstwice on Execution.
522857 Minor App Server
ThedeviceInfo/PerfMonitorREST API may takelong time to load.
523287 Minor App Server HTML RoleManagement may takea long time to load.
523654 Minor App Server Large Active Directorydiscovery may be slow.
524273 Minor App Server String Longitude valuein Identity LocationIdentity XML causesinvalid XML
525052 Minor DataManager
Excessive "eventwithout host attribute"error logs for summarydashboard.
525333 Minor App Server Last Login Dateconversion in CMDBReport is not correct.
526306 Minor App ServerCMDBReport loadingcan be slow whenCMDB is large.
528698 Minor Data Purger Log integrity signatureupdate to PostGress DBcan be slow.
529008 Minor App ServerCMDBDevice deletecan be slow whenCMDB is very large.
78 User GuideFortinet Technologies Inc.

What’s New What’s New in 5.2.1
Id Severity Module Summary
529205 Minor GUI CSVReport export hasdata in exponentialformat.
529300 Minor GUIFortiSIEM LDAP serverpassword reflected inGUI.
529795 Minor App Server Scheduled report mayrun as inline report andnot get data.
530642 Minor Parser
Collector EPSmay be alarge number whenevent dropping rules arein action.
531851 Minor App Server CSV Export eventshows receive time anddevice time to be 1 hourahead of current time.
532784 Minor QueryEngine
Excessive PH_REPORT_VALUE_TYPE_UNSUPPORTEDerrors reported byphReportMaster.
532800 Minor GUI HTML Role definitionshows Flash GUIelements.
533985 Minor PerformanceMonitoring
Fortinet QoS statisticsfor bytes and packetdrops not being pulled.
534857 Enhancement Parser Vulnerability uploadfrom Parser to AppSvrcontains unnecessaryinformation, causesprocessing delay on AppServer.
User GuideFortinet Technologies Inc.
79

What’s New in 5.2.1 What’s New
Id Severity Module Summary
535344 Minor PerformanceMonitoring
Fortinet Link usagedashboard does notshow Jitter/Latency/PktLoss.
535926 Minor PerformanceMonitoring
Monitor inbound andoutbound QoS forFortiGate InterfaceUsage Monitoring.
500588 Enhancement App Server
Allow users to configuremultiple SNMP Trap /SMTP servers fornotifications.
510555 Enhancement GUI Enhance the time axisin Bar trend and linetrend chart based onlength of time window.
519377 Enhancement System
Add flexibility forFortiSIEM to havebetter event databasecompression (at lowEPS).
519870 Enhancement System Need to enable HTTPSand PowerShell forWindows Remediation(WinRM protocol).
534857 Enhancement Parser
Vulnerability uploadfrom Parser to AppServer containsunnecessaryinformation, causesprocessing delay on AppServer.
Common Vulnerabilities and Exposures
80 User GuideFortinet Technologies Inc.

What’s New What’s New in 5.1.3
Bug ID CVE References
529300 FortiSIEM 5.2.1 is no longervulnerable to the following. CVEReference:
l CVE-2018-13378
What’s New in 5.1.3
This release is for FortiSIEM hardware appliances 2000F and 3500F models only. It has the followingenhancement.
Ability to run in Cluster modeEarlier releases allowed FortiSIEM hardware appliances 2000F and 3500F to run only in standalone (or all-in-one)mode without the ability to add external storage. This release removes this restriction. See Setting Event Storagefor configuration information.
When you set up the appliance, you must choose between Supervisor and Worker mode. If you chose Supervisormode, then select one of the following event data storage options:
l Local disk (previous standalone mode)l External storage - FortiSIEM EventDB on NFSl External storage - Elasticsearch
To set up a cluster, follow these steps:
1. First set up external storage.2. Install Supervisor appliance (2000F or 3500F) and configure event storage as external.3. Install Worker appliances (2000F or 3500F) and add them to the cluster using the Supervisor GUI.To run as standalone mode:
1. Install the Supervisor appliance (2000F or 3500F) and configure the event storage as local disk.
What’s New in 5.1.2
FortiSIEM 5.1.2 release resolves the following issues.
Resolved issues
Id Severity Module Summary
522824 Major App Server Scheduled Reports may run twice onexecution.
User GuideFortinet Technologies Inc.
81

What’s New in 5.1.1 What’s New
Id Severity Module Summary
523653 Major System Some SSH based inbuilt remediationscripts do not work.
524273 Minor IdentityLocation
Misformatted 'Longitude' field in IdentityLocation message creates and sendsinvalid XML to the App Server.
523791 Minor ParserLarge number of Device Vulnerabilitiesreported by scanners may cause the AppServer to slow down.
523654 Minor App Server Large Active Directory user discovery cancause unnecessary change sets to begenerated, slowing down log collectionand performance monitoring.
523287 Minor App ServerRole Management page loads slowly inHTML GUI when there are large numberof users with different roles.
522672 Minor App Server Custom PDF Report export may notwork after upgrading from FortiSIEM5.0.0.
520515 Minor App ServerCustom PDF Report export may notwork if Trend Bar chart contains nullvalues in data.
519643 Minor App Server Exporting a Saved Report Result mayfail, requiring users to re-run the reporton Analytics page.
What’s New in 5.1.1
FortiSIEM 5.1.1 release includes the following resolved issues and enhancements.
Resolved issues and Enhancements
Id Severity Module Summary
515799 Major AppServer
Scheduled Custom PDF Report alwaysproduces data only for the last one hour.
82 User GuideFortinet Technologies Inc.

What’s New What’s New in 5.1.1
Id Severity Module Summary
515642 Major AppServer
Scheduled Custom PDF Report mayhave data leak across customers.
515135 Major QueryEngine
Analytics results differ for the samequery when run from Super and Org.
514354 Major QueryEngine
Incident > Triggering events may notshow when there are more than threeevents in an Incident.
512797 Major AppServer
Custom PDF may allow tenants to viewother tenant's devices when CMDBreport contains 'Customer Name'attribute.
518437 Minor SystemInitial install may fail when user specifiesFQDN in vami_config_net.Subsequent installs often succeed.
518301 Minor AppServer
Global defined report template may belost after the template is modified andsaved in Organization level.
516240 Minor AppServer
Java error: 'Comparison method violatesits general contract' found in logs cancause 'Identity and location' module tonot work correctly sometimes.
515926 Minor AppServer
Role Based Access Control (RBAC) doesnot apply on Incident Overview - Usercan see Incidents of otherOrganizations.
515907 Minor AppServer
Incident Notification fails when therecipient is a FortiSIEM LDAP user.
519844 Minor GUI The 'Edit Organization' window does notopen the selected Organization.
518405 Minor GUI
The unit of 'Max Avg Response Time'setting for PING protocol should bereplaced with 'millisecond' instead of'second' in the GUI.
User GuideFortinet Technologies Inc.
83

What’s New in 5.1.1 What’s New
Id Severity Module Summary
517958 Minor GUI If the mouse is hovered over the secondhalf of the 'Collector Health' page, thepointer does not move.
517957 Minor GUI CMDB groups from page 2 onwardscannot be modified from the GUI.
517749 Minor GUI User has to save Report Design manytimes while adding a few sections to theReport Design.
517552 Minor GUIRapid7 Nexpose API credentials are notsaved or incorrect when configuring fromthe HTML GUI.
517352 Minor Parser Buffer timeout for Cisco ASA buildupand teardown session is too short (2minutes) - preventing matching up buildand teardown syslog.
516006 Minor ParserFor certain parsers, phParserTestercoredumps upon testing causing parsertest to fail.
515444 Minor QueryEngine
Widget dashboard (more than 5minutes) is empty for non-admin useronly.
518501 Enhancement GUI Time Axis is crowded in Custom PDF formonthly reports.
513090 Enhancement AppServer
CMDBDeviceInfo/devices REST API isslow when number of devices is verylarge.
472895 Enhancement Parser Excessive parser errors of the same typeare reported in log.
515807 Enhancement Data FortiMail parser is incomplete and notaccurate for many event types.
515805 Enhancement Data FortiWeb parser is not parsing eventaction for FortiWeb event 20000008.
514775 Enhancement Data Need to utilize UTM Action as the finalFirewall action for FortiGate.
84 User GuideFortinet Technologies Inc.

What’s New What’s New in 5.1.0
Id Severity Module Summary
512227 Enhancement Data Missing FortiSwitch SysObject ID tosystemSnmpSysObjId.csv.
510934 Enhancement Data Russian translation file parser need toupdate for Windows logs.
432617 Enhancement Data Parse log from gtmd module for F5.
What’s New in 5.1.0
FortiSIEM 5.1.0 release includes the following new features, enhancements and device support.
New Featuresl IPv6 Supportl Custom PDF Reportsl Incident Subcategoryl Incident Resolutionl Analyze log files from a directory on FortiSIEM nodes
Enhancementsl Custom time zone support in PDF reportsl Ability to associate specific parsers to a devicel Ability to drop specific parsed event attributesl Windows Agent 2.3
IPv6 Support
This release enables FortiSIEM deployment in IPv6 networks including the following features:
l FortiSIEM components - Supervisor, Worker, Collector, Report Server can be installed in IPv6 networks.l Receive, parse and analyze IPv6 syslog, Netflow.l Discovery of IPv6 devices via Simple Network Management Protocol (SNMP).l Discovery of configuration from IPv6 devices via Secure Shell (SSH).l GUI, Search, Report and Correlation functions with both IPv6 and IPv4 formatted addresses. You can enter
addresses in various IPv6 formats in the GUI. FortiSIEM displays the addresses in standard IPv6 notation.l FortiSIEM supports both Mixed and Dual IPv4 and IPv6 environments.
Currently, the following features do NOT work with IPv6 systems:
l Log collection and monitoring via Protocols other than Syslog, SNMP, SSH, and Netflowl Windows Agent and Windows Agent Manager (These can only run in IPv4 networks.)l Geo-location look-up for IPv6 addresses
User GuideFortinet Technologies Inc.
85

What’s New in 5.1.0 What’s New
Custom PDF Report
In earlier releases, FortiSIEM supported a fixed PDF Report format. This release enables you to format a PDFReport and Report Bundle by adding:
l Cover Page with custom imagel Table of Contentsl Sections and Subsections with Titlesl Custom content in each section including notes, charts, tables and imagesl One or more CMDB reports along with Event reports
You can customize both scheduled and ad hoc reports. The PDF Report templates can be defined at folder levelin RESOURCES >Reports to avoid defining the format for each and every Report in the folder.
Formore information about customizing a PDF Report Output, see here.
l FortiSIEM Flash GUI does not support the 'Custom PDF Report' feature.To customize PDF reports and export, use the HTML GUI.
l After upgrading to FortiSIEM 5.1.0, you must reimport all the ReportBundle reports because the report template has to be created. Otherwise,the Report Bundles may fail.
Incident Subcategory
FortiSIEM Incidents are grouped into different categories – Availability, Change, Performance, Security andOther. A Category is assigned to every Rule and you can search any Incidents using these Categories.
This release extends this concept to include Subcategories. A Subcategory is defined for every system-definedrule. You can add a Subcategory for custom rules and also create new Subcategories. Incidents can be searchedusing both Categories and Subcategories.
Formore information about creating Subcategories, see the section 'Setting Rule Subcategory' here.
Incident Resolution
This release adds Incident Resolution attribute for Incidents. Incident Resolution can be set to 'True Positive','False Positive' or 'Open'. Incidents can be searched using the Incident Resolution values.
For more information about Incident Resolution settings, see the desciption for 'Resolution' in the table here.
Ability to analyze log files from a directory on FortiSIEM nodes
Currently, FortiSIEM handles logs either (a) sent to it via Protocols such as Syslog, SNMP trap and so on or (b)pulled from devices via Protocols such asWMI, Checkpoint LEA and so on.
In this release, FortiSIEM can process log files copied to a directory on one of the FortiSIEM nodes:
l Copy the files to a specific directory named by the reporting device IP. For Service Provider installations, create thisdirectory on the Collector of the Organization to which these log files belong. The attribute event_sftp_directory in phoenix_config.txt defines the path. For example, to handle logs from a device with IP:1.2.3.4, create log files in <event_sftp_directory>/1.2.3.4. A typical example isopt/phoenix/cache/syslog/1.2.3.4.
86 User GuideFortinet Technologies Inc.

What’s New What’s New in 5.1.0
l Each log in the files should be formatted exactly in the same way as sent by the device. If this is a new log source, anew parser may need to be defined.
l Each file should have a distinct time stamp to prevent files from being overwritten.l Set event_eps_limit_controls in phoenix_config.txt to control the EPS burst.
l If event_eps_limit_controls is set to '10', FortiSIEM will process 30 events from this file in 3seconds.
l If event_eps_limit_controls is set to '0', FortiSIEM will process as many log files as possible andthis may inhibit the overall EPS license usage.
l If you change a phoenix_config.txt parameter, then reload the parser on that node.
Note the following:
l The log file is deleted once it has been read. Keep a separate backup if required.l The system requires write access to the log file directory in order to delete the log file once read. This is important
because if the log file cannot be deleted, it is repeatedly read and consumed by FortiSIEM resulting in manyduplicate events and extra EPS consumption.
Custom time zone support in PDF reports
In earlier releases, the time zone of Supervisor was used to report event receive time. Now, you can choose therequired time zone. If the devices are in a different time zone from the Supervisor, you can choose the time zoneof the devices while configuring the PDF report.
For more information about adding custom time zone in reports, see Step #6 here.
Ability to associate specific parsers to a device
Currently, upon receiving an event, the system tries the list of parsers in a specific order looking for Event FormatRecognizer match defined in each parser. Syslog from some devices are too generic and do not have a properEvent Format Recognizer and causes parsing issues.
To overcome this issue, this release enables you to attach a list of parsers to a device in CMDB. This overridesthe default parser selection mechanism based on Event Format Recognizer. When a device with a list of attachedparsers sends a log, the specified parsers are attempted first.
Formore information about associating a set of parsers to a device, see here.
Ability to drop specific parsed event attributes
FortiSIEM adds many meta data to events such as geo-location for every IP field, user name, user full name.FortiSIEM also adds a message for its self-generated events. This can contribute to storage costs especially forfrequently occurring events.
This release allows you to not store such meta data if you want to minimize storage costs.
Formore information about dropping specific parsed event attributes, see 'Event Dropping' - Step #8 here.
Windows Agent 2.3
This release includesWindows Agent 2.3 with the following enhancements:
l Ability to install Windows Agent and Windows Agent Manager where only TLS 1.2 is enabled for Security reasons(Mantis id: 0441466)
l Extended Date and Time format parsing for Windows DNS logs (Mantis id: 0470398)
User GuideFortinet Technologies Inc.
87

What’s New in 5.1.0 What’s New
Formore information about working withWindows Agent, see here.
New Device SupportThis release includes support for the following devices:
l Azure Identity Protectionl Azure Advanced Threat Protection (ATP) via Syslog (CEF)l Azure Logs - Data Plane logs, Processed event via Syslog (CEF)l Cisco Stealthwatch log parserl Microsoft Cloud App Security via Syslog (CEF)
Device Support EnhancementsThis release includes the following device support enhancements:
MantisId Summary
430995 Huawei Firewall log parser extension
433018 ESXi log parsing extension
433100 F5 log parser extension
433308 Dell S-Series Switch performance monitoring via SNMP
447872 Aruba OS log parser extension
449028 Huawei Router/Switch log parser extension
469708 Cisco ISE performance monitoring extension
471431 FortiDDoS performance monitoring extension
472384 FortiSandbox discovery and performance monitoring extension
473490 FireEye Email Malware Protection System (MPS) log parser extensions
475500 Cisco IronPort Mail parser extension
493483 FortiGate Syslog action field parsing
494321 Private external threat intelligence for Threat Stream
494445 Barracuda Spam Firewall log parser extensions
88 User GuideFortinet Technologies Inc.

What’s New What’s New in 5.1.0
MantisId Summary
496052 SNMPSys Object Ids to cover discovery and performance monitoring formore HP Switch models
501370 FortiClient Parser enhancement to Include Vulnerability Scanning fixand Risk Score Integration
503933 FortiAuthenticator performance monitoring extension
503935 FortiMail discovery and performance monitoring extension
Resolved IssuesThis release includes the following resolved issues:
MantisId Severity Keyword Summary
494980 Major App Server Scheduled Report Bundle PDF Reportsmay not contain data for all reports ifone query takes a long time tocomplete.
481042 Major RuleEngine
Rule Engine may crash when there aretoo many active Incidents in theCMDB.
474074 Minor App Server FortiSIEM LDAP user is not discoveredfor Korean language Active Directory.
494457 Minor App ServerThe Last received Syslog time updatesmay lag in CMDB > Devices > Monitortab.
496946 Minor App Server Remove Session id from App Serverlog.
496953 Minor App ServerIncident Overview page sometimes faildue to the lack of information fromPostgreSQL queries.
497363 Minor App Server New Organization creation may show'Null Pointer Exception' againstBusiness Services.
User GuideFortinet Technologies Inc.
89

What’s New in 5.1.0 What’s New
MantisId Severity Keyword Summary
501040 Minor App ServerCMDBDevice Risk calculationconsumes lots of resources when thenumber of CMDB devices is large.
504259 Minor App Server ConnectWise Integration - unable toclose tickets outside of time ConstraintWindow.
505476 Minor App Server
App Server looks for expiration timebeing updated when it's not necessary.This happens only when there is aReport Server installed and the loginuser has a role which doesn't have writepermission on License page.
505528 Minor App Server Too many 'No Entity found for query'exception is shown in the log.
506947 Minor App ServerMonitoring Event pulling Status Updateis slow and cannot keep with a verylarge number of devices and jobs.
498600 Minor Discovery CMDBDevice Filter does not considerAWS Log Discovery and Netflow LogDiscovery.
488388 Minor GUI HTML GUI does not create and saveCheckPoint Certificates.
490587 Minor GUI Baseline reporting for the interfacedoes not show data in HTML GUI.
491271 Minor GUI Watch List Device Health pop-up doesnot show data.
498876 Minor GUI GUI does not correctly save CyberArkcredential configurations.
501707 Minor GUI Changes to the Watch List is savedeven if the user clicks 'Cancel' button.
501719 Minor GUI CSV file import fails underRESOURCES > User Agent.
90 User GuideFortinet Technologies Inc.

What’s New What’s New in 5.1.0
MantisId Severity Keyword Summary
503941 Minor GUICMDB > Network Device >Router/Switch Group under Systemfolder cannot be modified.
504584 Minor GUI Business Service Dashboard does notshow full device name as it appears inCMDB.
504593 Minor GUI Ticket status name is inconsistentbetween CASE and INCIDENT tab.
505745 Minor GUI Organization list is empty if userselects an Organization with Collectorunder Business Services and switch toCMDB > Devices.
458679 Minor AnalyticsAnalytics page does not show EventDetails for events without raw event log(such as Netflow).
462749 Minor Parser Log discovery increases the load onApp Server causing discoveries to bemissed.
501370 Minor ParserFortiClient Vulnerability Scanning logsdo not contribute to Risk Scores inCMDB.
504518 Minor Parser Parser generates excessive logs whenit's log discovery cache is full.
489792 Enhancement App Server Add an alert message to confirm beforedeleting Organization or Collector.
490788 Enhancement App Server Incident Remediation is not supportedfor groups of devices.
494321 Enhancement App Server ThreatStream Private Collectioncannot be collected.
497768 Enhancement App Server FortiSIEM Super and Worker canbecome Unmanaged devices whenLicense limit is reached - preventingrules from being triggered.
User GuideFortinet Technologies Inc.
91

What’s New in 5.0.1 What’s New
MantisId Severity Keyword Summary
506508 Enhancement App Server
Monitor and truncate App Serverdiscovery files so that it does not grow.A large number of discovery files maycause future discoveries to fail.
472999 Enhancement GUI HTML GUI does not provide the abilityto search 'Sync only' reports.
490089 Enhancement GUI Incident List View is missing ExternalIntegration.
490405 Enhancement GUI Some Incident Detail attributes are notcorrectly formatted.
491073 Enhancement GUI WindowsWMI installed softwaredescription shows 'null'.
501689 Enhancement GUI In Elasticsearch environment, ReportExport in CSV format shows infinity formissing numerical fields.
501693 Enhancement GUIWhile adding a network interface for adevice in CMDB, the GUI does not alertfor missing network mask.
502806 Enhancement GUI In Incident PDF Export, 'Incident TicketStatus' shows '6' (meaning null) whenno ticket exists for Incident.
493483 Enhancement ParserFortiGate Parser does not parse thedropped attack field and rules triggerunnecessarily.
505461 Enhancement Rule Enhance IPS rules to exclude blockedattacks from outside.
506512 Enhancement System Limit the size of Analytics phoenix_log files.
What’s New in 5.0.1
FortiSIEM 5.0.1 release includes the New Features and Enhancements described below.
If you are upgrading from FortiSIEM 4.1.0, refer to 'What's New in 5.0.0' for more information about the featuresin 5.0.0.
92 User GuideFortinet Technologies Inc.

What’s New What’s New in 5.0.1
New Featuresl Windows Agent 2.2l ServiceNow Event Management Integration
Windows Agent 2.2
Windows Agent 2.2 feature includes the following changes:
a. Additional parsing of Windows DNS logs to include Source IP, Destination Name, Destination IP,Destination Canonical Name and Received Bytes.
l Source IP – name resolution requestorl Destination Name and IP – resolved name and IPl Destination Canonical Name – CNAME of the resolved entityl Received Bytes – bytes in the DNS response
b. Avoid Agent Configuration loss at Windows Agent Manager during Agent upgrade.c. Automatic clean-up of .SVC files when it reaches a certain size.d. Do not erase log file after Agent restart.e. Monitor encrypted USB disks.f. Agent to perform SSL certificate checks.g. Flush log files during file rotation of a monitored file.
ServiceNow Event Management Integration
FortiSIEM Incidents can now be pushed to ServiceNow Event Management tables via the FortiSIEM integrationframework. For more details about ServiceNow Event Management, see here.
EnhancementsFortiSIEM 5.0.1 release includes the following enhancements:
l The phoenix_config.txt merge upgrade process is improved - The phoenix_config.txt file onSupervisor and Worker stores system level configurations. In earlier releases, during the upgrade process, user isasked to merge the phoenix_config.txt file from the new release with the phoenix_config.txt fileexisting on the system. In this release, this process is simplified as follows:
l User is never asked to merge phoenix_config.txt files.l The existing phoenix_config.txt file is backed up to:/opt/phoenix/config/phoenix_config.txt.<ver>For example: /opt/phoenix/config/phoenix_config.txt 5.0.0.1201
l Selected entries from the existing phoenix_config.txt file are picked up to create the phoenix_config.txt file used by the system and stored in /opt/phoenix/config/phoenix_config.txt
l User can examine the difference between the phoenix_config.txt files and modify the systemphoenix_config.txt file if needed.
The following sections are merged from the existing phoenix_config.txt file:
User GuideFortinet Technologies Inc.
93

What’s New in 5.0.0 What’s New
Global l cainfol agent_keyl agent_certl ccm_ftp_directoryl avaya_sftp_directory
phParser
l airline_sls_directoryl airline_sls_directory_highl airline_threadl incoming_log_cfg
phEventForwarder l tls_certificate_filel tls_key_filel tls_certificate_filel tls_key_file
phQueryWorkerl max_num_thread_per_taskl phReportMaster sectionl num_merge_threads
Kafka l thread_num
Elasticsearch l Entire Elasticsearch section, ifconfigured.
l Incident > Remediation – Enforce On and Run On fields are automatically populated based on Incident ReportingDevice and Incident Target. Remediation Scripts are scoped down based on the Enforced On device type.Remediation results are shown on the Remediation page.
l Flex GUI is now disabled by default. You can turn on the Flex GUI by setting Enable_Flex_UI = true inphoenix_config.txt on Supervisor.
What’s New in 5.0.0
Read Before Installing or Upgrading to FortiSIEM Release 5.0.01. Starting FortiSIEM 5.0.0 release, FortiSIEM all-in-one hardware appliances (FSM 3500F/FSM 2000F)
will run on bare metal, bypassing the OpenStack Hypervisor layer. This will simplify installation andmaintenance and improve performance. The user has two options:(a) Stay on OpenStack and simply upgrade FortiSIEM application to 5.0.0. In this case, follow the stepsin the 'Upgrading FortiSIEM' section of Hardware Configuration Guide (FSM 3500F/FSM 2000F) here.(b) Recommended - Migrate the current data on your appliance and move to new FSM 3500F/FSM2000F OS - basically run on bare metal but retain the old data. Follow the steps in theMigration Guide(FSM 3500F/FSM 2000F) here.
2. Starting this release, you have to explicitly choose Event Database Storage for fresh software basedinstalls. If you upgrade to 5.0.0, then the existing database will be maintained. If you plan to switch toanother database, then the data will not be migrated.
94 User GuideFortinet Technologies Inc.

What’s New What’s New in 5.0.0
3. Upgrade notes:- Customers in releases prior to 4.10.0 must first upgrade to 4.10.0 before upgrading to 5.0.0.Customers in 4.10.0 can upgrade to 5.0.0 - this is because of license changes in 4.9.0 and 4.10.0.- Make sure that Super, Worker, Collector and Report Server can connect to FortiSIEM hosted CentOSrepo on https port 443 under the URLs below. Otherwise, some packages may not install and 5.0.0binaries will not run.- https://os-pkgs-cdn.fortisiem.fortinet.com/centos6/- https://os-pkgs.fortisiem.fortinet.com/centos6/
4. AWSCustomers only - After upgrading to 5.0.0, customers' needs to apply the new license using EC2instance Hardware ID.
5. Kafka and Event Forwarding Settings are not compatible with release 4.0. Once you upgrade to 5.0.0,the configuration in 4.10 will be lost. You have to redo the Kafka and Event Forwarding definitions afteryou have upgraded to 5.0.0
6. Export and Import on these tabs only support user-defined entries:- Admin > Device Support > Device/App- Admin > Device Support > Event Attribute- Admin > Device Support > Event Type- Admin > Device Support > Dashboard Column
7. Kafka based Event Forwarding is now Rule-based and done from Collectors.8. FortiSIEM 5.0.0 release supports receiving logs via Kafka into FortiSIEM. Kafka based log pulling can
only support 10K events per pull. If more than 10K events are suddenly generated, it may take morethan one pull to consume all the events.
9. If Elasticsearch is chosen as the Event Database, the Supervisor needs an additional 8 GBRAM - in thiscase, the minimum requirement of the Supervisor is 32 GBRAM.
10. Since the GUI layout is different in Flash and HTML5, FortiSIEM User Roles defined in Flash GUI in4.10.0 will not work in HTML5 GUI. The user needs to define new roles for use in HTML5 GUI.
11. Since the Dashboard layout is different in Flash and HTML5, user-created Dashboards in Flash GUI in4.10.0 or earlier will not be shown in the HTML5 GUI. However, you can export from the Flash GUI andimport into the Dashboard of your choice in HTML5 GUI.
FortiSIEM 5.0.0 is a significant milestone release including the following features and functionality.
New FeaturesFortiSIEM 5.0.0 release includes the following new features:
l New HTML5 Based GUI with Online help Documentationl Elasticsearch Event Database Optionl User Entity Behavior Anomaly Detectionl User Risk Scoringl Incident Mitigation Framework and Library
Key EnhancementsFortiSIEM 5.0.0 release includes the following key enhancements:
User GuideFortinet Technologies Inc.
95

What’s New in 5.0.0 What’s New
l Event Insertion Performance Improvementl Hardware Appliance Directly On Hardware without OpenStackl Event Forwarding Enhancementsl Ability to Handle IPFIX Based Network Flowl Ability to Handle EC2 VPC Logsl Ability to Receive Logs via Kafkal Policy-Based FortiSIEM Ticket Escalationl Multiple Language Support in Reportsl ConnectWise Integration via REST APIl Ability to Add More User Context into Events in Real-timel Ability to Handle AWS Terminated Instances in CMDBl Ability to Include Multiple Incidents to a FortiSIEM Ticketl NIST 800-171 Compliance Supportl Full Catalog of FortiSIEM System Errors Using Distinct Event Types
New Device Supportl FortiAuthenticator – discovery and log analysisl Palo Alto Traps – log analysisl EMC Isilon – log analysisl Radware Network IPS – log analysisl HyTrust CloudControl – log analysisl Vormetric Data Security Manager – log analysisl Cisco ASA Firepower SFR module – log analysisl Checkpoint GAIA – log analysisl CodeGreen DLP – log analysisl TrendMicro Interscan Web Filterl Language support for Windows security logs – Korean, German, Russianl Microsoft Exchange Tracking – log analysis
HTML5 based GUI with Online Help Documentation
This release provides a fresh HTML5 based GUI that combines the best ideas from the current Adobe Flashbased GUI with advances in JavaScript technology.
The following table provides a high level overview of the changes in the HTML5 GUI. For a complete mapping ofFlash GUI to HTML5 GUI, see Appendix A.
96 User GuideFortinet Technologies Inc.

What’s New What’s New in 5.0.0
Area Enhancements
Overall l Bigger font for ease in readabilityl Dark theme for ease of readability (light theme in a future release)l Clean, airy look with consolidated buttonsl Right-click rolled into button action, considering mobile devicesl Dynamically adjusting table column width for maximum readability
CMDB
l Simplified CMDB navigation tree to contain Devices, Applications, Users,Business Service and CMDBReports. The rest have been moved toResources.
l Action button consolidates all Flash right-click operations on a devicel Consolidated device health pop-upl Ability to choose device property columns
Analytics l Combines Real-time and Historical Searchl Combines Display and Group Byl Validity checks in Display Columns
Dashboard
l Two-layer dashboard hierarchy – dashboard folders with each containingmultiple dashboards. Each dashboard can be any one of Summarydashboard, Widget dashboard, Business Service dashboard and Identitylocation dashboard. This provides a good way to mix and match variouspresentation techniques in one dashboard folder.
l Ability for users to customize the dashboards they want to see and also thehome dashboard.
l Ability to dynamically update Widget dashboard via search.l ANew Business service dashboard with high level incident counts and
impacted devices.
Incidents l Two new Incident views – Overview and Risk View to complement List View,with drill downs from each view.
l An intuitive way to search incidents in List View.l Action button consolidates all Flash right click operations on one incident or
multiple incidents.
Resourcesl Consolidates all CMDBHelper Objects and Rules/Reportsl Incident Remediation library
Admin l Allows user to specify event database storage options - local disk, NFS orElasticsearch.
l Consolidated navigation tree folders including License and Health folders.
The following items are not available in the current HTML5 GUI release. Some of them may be added in futurereleases:
User GuideFortinet Technologies Inc.
97

What’s New in 5.0.0 What’s New
l Topology Viewl Specific Incident dashboards - Fishbone View, Calendar Viewl VM Viewl IPS Vulnerability Mapl Incident > Add Rule exception Via Patchesl CMDB > Link Usage Viewl Analytics > Auditl Analytics > Display Column Sets, Filter Criteria Setsl Event Database Managementl Dashboard Slideshow viewl Simple keyword based search
Elasticsearch Event Database Option
This release provides the Elasticsearch database option for storing events. Existing customers can continue usingthe FortiSIEM EventDB and decide to switch at some point. Data Migration procedures from FortiSIEM EventDBto Elasticsearch is not available. New customers can choose Elasticsearch.
Elasticsearch is a distributed database that provides linearly scalable event insertion speed and query responsetime improvement. However, you must deploy more nodes and use more storage. The higher storage capacityapplies to local disks on Elasticsearch nodes, which are relatively inexpensive. For details, see FortiSIEM -Sizing Guide here.
In earlier FortiSIEM releases, event database option (local disk or external NFS) was chosen during installation.Starting with release 5.0.0, user needs to choose event database option from the GUI – the additionalElasticsearch option is provided along with local disk and external NFS options.
In FortiSIEM 5.0.0, Elasticsearch will be a drop-in replacement – the system works seamlessly for NFS, local diskand Elasticsearch, with the following exceptions:
l Policy based data retention is currently not supported on Elasticsearch – FortiSIEM will just purge fromElasticsearch when a limit (10 GB by default and configurable) is reached.
l Percent Change aggregation function and CMDBDeviceToAttr look-up functions are currently notsupported.
l Aggregation queries with multiple Group By conditions are interpreted differently – current eventdatabase considers multiple Group By as a tuple while Elasticsearch treats them as nested. So the sortedresults are displayed differently in Elasticsearch. Consider a query with Group By A, B and display count indescending order. In current FortiSIEM event database, each row will be sorted descending by count.Elasticsearch will show the results sorted first by A and then by B. This is how Elasticsearch currentlyworks, although there are plans to extend to tuple sorting in their later Elasticsearch releases.
For details about how FortiSIEM works with Elasticsearch, see Key Concepts.
User Entity Behavior Anomaly Detection
FortiSIEM already tracks IP addresses to user and geo-location in its User Identity and Location database. Thisinformation is now used as the foundation for machine learning techniques for the following two use cases:
l Login location anomaly detection – FortiSIEM will detect if the same user is simultaneously logging fromtwo different locations at times that are not physically possible because of geographical distance andtravel speed limitations. This covers various login scenarios:
l Logging into a serverl VPN into corporate network
98 User GuideFortinet Technologies Inc.

What’s New What’s New in 5.0.0
l Logging into a Cloud SSO platform such as OKTAl Logging onto a Cloud Service such as Google Apps, Office365, Salesforce
l Login pattern anomaly detection – FortiSIEM profiles user login behavior: users logging on toinfrastructure devices using specific computers on specific hours of day and detect the followinganomalies:
l User logging in to a server during times that he typically never logs onl User logging in to a server that he typically never logs onl Excessive user login to a server over the whole day
User Risk Scoring
FortiSIEM 4.10 provides a machine risk score by combining asset criticality, un-patched vulnerabilities andincident severity. This concept is now extended to users. Users may use multiple machines (mobile phone, tablet,laptops, workstations) and may trigger incidents on infrastructure devices. A user risk score is calculated bycombining the associated user machine risk scores and users own risk scores. User and machine scores are nowpresented in a unified Entity Risk dashboard.
Incident Mitigation Framework and Library
In FortiSIEM 4.10, users could write their own remediation scripts and attach them as an Incident action. Thatrequired users to hard code credentials in the script even if FortiSIEM had the credentials in its CMDB. In thisrelease, incident mitigation concept is formalized by eliminating that shortcoming.
l AREST API is provided to pull credentials from FortiSIEM CMDBl Amitigation library is provided with 29 built-in mitigation actions that show the use of the API. Users can
write their own mitigation scripts and include in the library from the GUI.l Amitigation action can be taken on demand when an incident triggers or as part of a notification policy
action.
FortiSIEM’s inbuilt multi-vendor and multi-function incident mitigation library includes:l Blocking an IP on FortiGate, Palo Alto and Cisco ASA firewalls and FortiWebl Block a MAC on all FortiSwitches managed by FortiGate firewalll Block a MAC on Cisco IOS router/switch devicel Quarantine end points via Fortinet EMS and FortiClientl Disable an interface on Windows and Linux Serversl Disable a port on Cisco IOS devicel Add an IP for fine-grained control to FortiADC and FortiCachel Add source email address to FortiMail Session Profilel Block a web domain on Infoblox and Microsoft Windows DNSl De-authenticate a user on FortWLC, Cisco and Aruba WLAN Controllersl De-authenticate a user on FortiAuthenticator, Linux Server and Microsoft Active Directoryl Delete a file with specific checksums on Windows and Linux Serversl Delete a file by name on Linux Serversl Restart a service on Windows and Linux Serversl Reboot a Windows or Linux server
Event Insertion Performance Improvement
FortiSIEM event indexing and insertion performance is improved significantly (approximately 25-50%):
User GuideFortinet Technologies Inc.
99

What’s New in 5.0.0 What’s New
l FSM-2000F hardware appliance can now handle 15K EPSwithout loss.l FSM-3500F hardware appliance can now handle 30K EPSwithout loss.l A Single Supervisor and a Single Worker performance is also improved as follows:
l A node with 8 vCPU can handle 10K EPSwithout loss.l A node with 16 vCPU can handle 15K EPSwithout loss.
These benchmarks were done with specific data set and the performance in your environment may differ. Fordetails, see FortiSIEM - Sizing Guide here.
Hardware Appliance Directly On Hardware without OpenStack
FortiSIEM Hardware Appliances (FSM-2000F and FSM-3500F) now run directly on bare metal hardware withoutOpenStack. It is easier to install, configure and manage and gives better performance since OpenStack resourcescan now be used by FortiSIEM.
Existing customers have two options:
l Choose to stay on OpenStack and simply upgrade FortiSIEM guest from 4.10.0 to 5.0.0.See the 'Upgrading FortiSIEM' section of the Hardware Configuration Guides by selecting themodels here.
l Migrate to 5.0.0 without losing their data.See theMigration Guides for 2000F and 3500F.
Event Forwarding Enhancements
FortiSIEM can forward events to third-party systems. In this release, this feature is enhanced in the followingways:
l Event forwarding is now more robust by buffering events in files just like Collector to Worker event forwarding. If aforwarding destination is not temporarily reachable, events are stored locally and then attempted later forforwarding.
l Event forwarding criteria is now more fine grained including Reporting IP, Event Type, Source and Destination IPand Event payload.
l More event forwarding protocols are included:l Syslog – UDP, TCP, TCP/SSLl Netflowl Kafka
l Kafka based event forwarding can now be controlled by filtering criteria.l All event forwarding now happens from the FortiSIEM node that first receives the event from 3rd party system
(typically a FortiSIEM Collector). In earlier releases, Kafka based event forwarding happened from Super/Workernodes.
Ability to Handle IPFIX
FortiSIEM can handle high volume network flow data from firewalls and other network devices in the form ofNetflow Version 5, Version 9, SFlow, JFlow, and Cisco AVC. This release enhances this support to include IPFIX.
Ability to Handle AWS EC2 VPC Traffic Log
In this release, FortiSIEM is able to receive, parse and analyze AWSEC2 VPC traffic like any other traffic log.
100 User GuideFortinet Technologies Inc.

What’s New What’s New in 5.0.0
Ability to Receive Logs via Kafka
FortiSIEM can forward logs to an external system via Kafka. In this release, FortiSIEM can receive logs via Kafka.This allows FortiSIEM to have robust 2-way log exchange with 3rd party systems.
Policy-Based FortiSIEM Ticket Escalation
Administrators can now define ticket escalation policies for FortiSIEM internal ticketing system. After defining aticket due date, user can define policies to escalate to the manager of the assignee when the ticket is not yetresolved and current time is 'close' to the due date.
Multiple Language Support in Event Report
Log data may contain certain log attribute values (for example, user name) in various languages. This releaseenables PDF and CSV reports to properly show these log values in various languages. Currently, out-of-the-boxsupported languages are English, Korean, Russian, Japanese and Chinese. User can add a language of theirchoice.
ConnectWise Ticketing System Integration via REST API
FortiSIEM has a built-in integration with ConnectWise ticketing system via a SOAP API. Since the SOAP API isbeing deprecated, FortiSIEM 5.0 release can now do the same functionality via the new REST API.
Ability to Add More User Context into Events in Real-time
FortiSIEM can discover users from Active Directory and OpenLDAP and add user context to events in real time.For example, when the user name matches in an event, FortiSIEM adds the full user name to the event to makethe user identifiable. In this release, more user attributes such as employee serial number and membershipgroups are added to events in real time.
Ability to Handle AWS Terminated Instances in CMDB
FortiSIEM can discover server instances in AWS and populate it's CMDB. Until this release, the deletion fromCMDB used to be a manual audit worthy event, since it is difficult to tell for sure, whether the server has beenterminated or it is a network connectivity issue. In AWS, where instances are brought up and torn down quickly,stale server instances in CMDB causes license exhaustion. In this release, FortiSIEM is able to analyze the AWSCloudTrail log and delete the terminated devices from CMDB.
Ability to Include Multiple Incidents to a Ticket in FortiSIEM Internal Ticketing System
You can now add more than one (related) incident to a ticket in the FortiSIEM internal ticketing system.
NIST 800-171 Compliance Support
This release adds reports for NIST 800-171 Compliance.
Full Catalog of FortiSIEM System Errors Using Distinct Event Types
Stating this release, FortiSIEM internal errors are generated with proper event types and severity so they can bequeried easily from FortiSIEM.
User GuideFortinet Technologies Inc.
101

Clustering Architecture Key Concepts
Key Concepts
This section describes several key concepts used in FortiSIEM.
l Clustering Architecturel Licensingl Multi-tenancy and Organizationsl Role-based Access Controll Discovery and CMDBl Windows and Linux Agentsl Business Servicesl Parsers and Monitorsl Entity Risk Scorel User Identity and Locationl Searches, Reports and Compliancel Rules and Incidentsl Incident Notification Policyl Remediation Libraryl External Ticketing Systems Integrationl Dashboard
Clustering Architecture
FortiSIEM scales seamlessly from small enterprises to large and geographically distributed enterprises andservice providers.
l For smaller deployments, FortiSIEM can be deployed a single all-in-one hardware or virtual appliance that containsfull functionality of the product.
l For larger environments that need greater event handling throughput, FortiSIEM can be deployed in a cluster ofSupervisor and Worker Virtual Appliances.
There are three types of FortiSIEM nodes – Collector, Worker, and Supervisor. Collectors are used to scale datacollection from various geographically separated network environments potentially behind firewalls. Collectorscommunicate to the devices, collect, parse and compress the data and then send to the Worker nodes over asecure HTTP(S) channel in a load balanced manner. Supervisor and Worker nodes reside inside the data centerand perform data analysis functions using distributed co-operative algorithms.
There are five primary data analysis tasks:
1. Indexing the data and storing in an event database2. Searching the data3. Correlating the data in a streaming mode to trigger rules (behavioral anomalies)4. Creating a user identity and location database for adding context to data5. Creating baselines for anomaly detection
102 User GuideFortinet Technologies Inc.

Key Concepts Licensing
For scalability, each of these tasks is divided into a heavyweight Worker component executed by the Workernodes and a lightweight Master component executed by the Supervisor node. The Supervisor nodes also the GUIusing a self-contained three-tier model – GUI, Application Server containing the business logic and a relationaldatabase for holding the FortiSIEM application state.
For scalable event storage, FortiSIEM provides three options:
l Local diskl FortiSIEM NoSQL event database with data residing on an NFS Serverl Elasticsearch distributed database
Hardware appliance and All-in-one virtual appliance solutions use the Local disk option while the NoSQL orElasticsearch options can be exploited by a FortiSIEM cluster of Supervisor and Workers.
The NoSQL event database option is a purpose built FortiSIEM proprietary solution. The Supervisor and Workernodes create and maintain the database indices. To scale event insertion and search performance in this moderequires (a) a fast communication network between the Supervisor/Worker nodes and the NFS Server and (b)high NFS IOPS that can be achieved using fast RAID disk or tiered SSD and magnetic disks.
Elasticsearch provides a true distributed, redundant columnar database option for scale-out databaseperformance at the expense of higher storage needs. In this option, FortiSIEM Worker nodes push the data inreal time to Elasticsearch cluster, which maintains the event database. FortiSIEM has developed an intermediateadaptation layer, so that the same GUI can run seamlessly on both Elasticsearch and FortiSIEM NoSQL eventdatabase.
Licensing
FortiSIEM is licensed based on the following:
l Number of devices FortiSIEM monitors or receives logs froml Number of Windows Agents and Linux Agentsl Aggregate Events per Second (EPS) it receives
Note that FortiSIEM licensing is not based on storage - you can store and query the data as needed for yourcompliance needs without any concern regarding licensing. The license parameters can be perpetual orsubscription based. Maintenance and FortiGuard Threat Intelligence are subscription based.
You can have unlimited devices in CMDB. However, the total number of devices that send logs to FortiSIEM or ismonitored by FortiSIEM cannot exceed the device license. The devices under license are called 'Managed' whilethe remaining devices are called 'Unmanaged'. If you do a discovery and the number of newly discovered devicescombined with Managed CMDB devices exceed the license, then the extra devices are tagged in CMDB as'Unmanaged'. You can either buy more device license or exchange an Unmanaged device with a Manageddevice.
FortiSIEM calculates Events per Second (EPS) over a 3-minute period as the total number of events received overa 3-minute period divided by 180. FortiSIEM is a distributed system where events can be received at any node -Collector, Worker, or Supervisor. The EPS licensing is enforced as follows:
At the end of every 3-minute interval, Incoming EPS is calculated at each event entry node (Collector, Worker, orSupervisor) and the value is sent to the central decision-making engine on the Supervisor node.
1. The Supervisor node takes all Incoming EPS values and based on the Licensed EPS, computes the Allocated EPSfor the next 3-minute interval for every node and communicates those values to every node.
User GuideFortinet Technologies Inc.
103

Multi-tenancy and Organizations Key Concepts
2. For the next 3-minute interval, each node accepts up to (Allocated EPS * 180) events. It also reports IncomingEPS for the current interval to the Supervisor node.
3. The continuous EPS reallocation process continues.FortiSIEM includes some additional refinements to EPS enforcement as follows:
l Each Collector has a Guaranteed EPS and Allocated EPS for this Collector is always greater than Allocated EPS.l FortiSIEM keeps track of Unused EPS as the sum of positive differences of Allocated EPS and Incoming EPS over
all nodes. At the beginning of the day (12:00 am), Unused EPS is set to 50% of previous day’s Unused EPS andthen Unused EPS accumulates throughout the day before maxing out at five times Licensed EPS. Unused EPS canbe used for bursting during attacks or other event surge periods, beyond Licensed EPS.
Multi-tenancy and Organizations
Multi-tenancy enables you to manage multiple groups of devices (Organizations) within a single installation.FortiSIEM provides logical separation between Organizations at an application layer. The users of oneOrganization cannot see another Organization’s data including devices, users and logs.
You have to choose the Service Provider Installation type when you first install FortiSIEM. Organizations can bedefined in two ways:
l By adding a Collector to anOrganization – all devices sending logs to a Collector or all devices monitored by aCollector are automatically assigned to the Organization. To which the Collector belongs. Device Names and IPAddresses can overlap between two Organizations. This situation can be used to model is Remote ManagedService Providers.
l By assigning IP ranges to Organizations – there are no Collectors and devices will be discovered from Supervisornode and send logs to Supervisor or Worker nodes. If the IP addresses of ALL interfaces of a device are whollyincluded within the IP range for an Organization, then the device is assigned to that Organization. Else, the deviceis assigned to the Super/Local Organization (see below).
In addition to user-defined Organizations, FortiSIEM creates two Organizations for ease of management:
l Super/Local Organization – this can be used to model Service Provider’s own network.l For Organizations with Collectors, if a device sends log directly to Supervisor or Worker nodes or is
discovered from the Supervisor node, then it belongs to the Super/Local Organizationl For Organizations without Collectors, if the all IP addresses of a device (being discovered or sending logs)
are not wholly included within the IP range for any Organization, then that device is assigned to theSuper/Local Organization.
l Super/Global Organization – this is a virtual Organization that can 'see' all the other Organizations. This is usefulfor Service Provider administrative users.
FortiSIEM Multi-tenancy principles are as follows:
1. Users belonging to Super/Global Organization can see other organizations and their data.2. Users belonging to Super/Local Organization and user-defined Organizations can only see its own Organization.3. Devices and events are automatically tagged by FortiSIEM with the Organization Id and Name.4. Rules can be written at a Global level or for a specific Organization. Incidents trigger when rule conditions are met
and they trigger independently for each organization. Each Incident is labeled with Customer Id and Name.5. Searches/Reports can be executed from Super/Global Organization for any combinations of Organizations.6. From a specific user-defined Organization or Super/Local Organization, Searches/Reports can run on that
104 User GuideFortinet Technologies Inc.

Key Concepts Role-based Access Control
Organization.7. Viewing Incidents is simply a specific Search and follows the same principles as specified in 5 and 6.
Role-based Access Control
After installation, FortiSIEM automatically creates an admin user with Full Admin rights for Super/Global andSuper/Local Organization. When the user creates a new Organization, FortiSIEM creates an admin user for thatOrganization. These are accounts with Full Admin rights. FortiSIEM users with Full Admin rights can create Rolesand then create users and assign them a role.
A FortiSIEM role is based on the following aspects:
l What the user can see:l Restrict GUI visibility by hiding parts of the GUIl Restrict some Organizations for Service Provider installationsl Restrict data by writing filters on device type, event type and any parsed event attribute
l What the user can do:l Restrict or even hide Admin tab where most of the configuration takes placel Restrict any other GUI tabl Restrict write capability on certain parts of the GUI
FortiSIEM has a few built-in roles that the users can customize to meet their own needs.
Discovery and CMDB
Discovery is a key differentiator for FortiSIEM as it enables users to seamlessly discover their infrastructure (the'truth') and auto-populate the CMDB, which can then be used to facilitate analytics.
Discovery can be of two types:
l Simple LOG discovery – FortiSIEM has mappings for device type to log parser for all its in-built log parsers.When it sees a log that matches a parser, it associates the corresponding device type to that device and creates aCMDB entry.
l Detailed device discovery – LOG discovery is very basic since only the Vendor and Model can be guessed (forexample: Cisco IOS, Fortinet FortiGate, Microsoft Windows, Generic Linux). It is not possible to deduce moredetails about the device, for example: Operating System version, hardware model, installed patches, installedsoftware, running processes, network device configurations, interfaces, monitor-able performance metrics, etc. Inaddition to discovering all of the above, FortiSIEM can also discover certain inter-device relationships, for example,Virtualization Guest to Host mappings, WLAN AP to Controller mappings, Multi-context device to physical devicemappings, network topology etc. Devices in the AWSCloud and MS Azure Cloud can be discovered as well.
Discovered information is used to automatically populate a CMDB. As new devices get added or deleted from theinfrastructure, scheduled re-discoveries can keep FortiSIEM CMDB up to date. User can also define some rules tomap certain groups of devices to certain CMDB device groups.
The key advantages of FortiSIEM Discovery and CMDB are as follows:
1. The customer has an accurate picture of the infrastructure and its relationships from a simple discovery. If a newrogue device is added to the network, FortiSIEM re-discovery learns immediately and could alert to this potentialsecurity issue. If an inadvertent configuration change to a key file is made, FortiSIEM re-discovery or configuration
User GuideFortinet Technologies Inc.
105

Windows and Linux Agents Key Concepts
monitoring also detects and alerts.2. Performance and availability monitoring is automated since FortiSIEM simply learns what can be monitored and
starts monitoring immediately. This approach eliminates human errors.3. Certain key CMDB Objects such as Business Services can remain up to date against infrastructure changes
as they can be auto-populated by discovery.4. CMDB Objects makes rules and reports easy to create. First, this makes rules and reports very simple to write
without a long explicit list of IP addresses or host names. Second, the rules do not need to be rewritten as devicesget added or deleted.
5. Discovery enables configuration change detection both day-to-day changes and changes to golden versions.
Windows and Linux Agents
Some logs and performance metrics can be collected remotely from Windows servers via WMI and by running theWinexe command. Some key performance metrics and file monitoring on Linux servers can be done via SSH.However, the following limitations exist:
For Windows Servers:
l Not all metrics can be collected from a FortiSIEM Linux platform via WMI (for example: Sysmon, Generic EventLogs in the Event Log navigation tree, Registry changes). WMI can be used to collect only Windows Event logs.
l File Integrity Monitoring Data collected viaWindows Security logs is very verbose (~8 logs per file operation) andcreates unnecessary noise in FortiSIEM.
l Remotely running some programs suchWinexe starts services on the servers – this may trigger security alerts incertain environments.
l A domain account is required to collect certain logs. The regular account does not provide all logs.l WMI Service often creates CPU load on the servers when a large number of logs are pulled via WMI.l Collecting logs via polling from thousands of servers is not efficient. If a server is not responsive or slow, you have
to wait for the connection to timeout and this wastes resources.
Linux Servers send log via syslog. However, if you want to collect File Integrity Monitoring Data, then certainconfiguration is required to be done remotely.
Agents provide a clean and efficient way to collect exactly the data that we need. FortiSIEM Agents are verylightweight and do not consume more than 5% of system CPU and memory. FortiSIEM Windows Agents have thefollowing functionality:
l Collect anyWindows Event log including Security, Application and Performance event logs, DHCP/DNS logs,Sysmon logs etc.
l Collect Custom log filesl Detect registry changesl Detect File read, write and edits (FIM) with added user contextl Run any PowerShell command and send the output as logs – this allows users to capture any data at periodic
intervals and send to FortiSIEM.l Detect removable media insertion, deletion, read and write
FortiSIEM Windows Agent Manager can manage a large number of FortiSIEM Windows Agents usingconfiguration templates. The user needs to create a template and associate it with many servers. WindowsAgents can be configured to send logs to FortiSIEM collectors in a round robin fashion. If one collector is not
106 User GuideFortinet Technologies Inc.

Key Concepts Business Services
available, then the Agent can send it to the next Collector in the list. This provides a robust and scalable way tocollect logs from a large number of servers.
Linux Agents can be used to detect file reads, writes, and edits (FIM functionality) with added user context.
Business Services
A Business Service provides a collection of devices and applications serving a common business purpose. Youcan define a Business Service in FortiSIEM either manually or by the Dynamic CMDBGroup framework that addsit to the Business Service once a device matching certain criteria appears in CMDB.
The primary objective of a Business Service is to assist in incident triage. Once a Business Service is defined,every incident is tagged with the impacted Business Services. A Business Service dashboard provides a top-levelIncident-centric view of Business Services. The user can take care of incidents for critical Business services andensure that they stay up.
Parsers and Monitors
The ability to parse any log to any depth is a key SIEM functionality. FortiSIEM comes inbuilt with over 2500event attributes, 175,000 event types and 250 parsers for various device types and applications. In addition, ithas a flexible GUI based framework for customers to enhance existing log parsers, and create completely newdevice types, event attributes, event types and log parsers. User can test parser changes on a live system andapply them to become effective immediately on all nodes – so changes take effect without any downtime.Parsers can also be exported out of one system and imported into another system. In Service Providerenvironments, a parser change can be created at a global level and deployed to all organizations.
FortiSIEM also comes with a number of built-in performance monitors and configuration pulling scripts for devicetypes and applications. Discovery automatically enables the applicable monitors and the user can adjust someparameters, such as polling intervals. Similar to log parsers, the user can create and test performance monitorson a live system and apply them to become effective immediately on all nodes – so changes take effect withoutany downtime. Performance Monitors can also be exported out of one system and imported into another system.
FortiSIEM tracks changes to installed software and network device configuration. If a new configuration file needsto be monitored and can be obtained via a script, then the user can add them to the system. FortiSIEM monitorschanges from current to the previous version, deviation from a blessed file, changes between running config andstartup config for certain devices.
Entity Risk Score
User Identity and Location
FortiSIEM creates an Audit trail of User Identity and Location data in real time by associating a network identity(for example: an IP address, or MAC address) to user identity (for example: a user name, computer name, ordomain or Cloud logon) and tying that to a location (like a wired switch port, a wireless LAN controller, or VPN
User GuideFortinet Technologies Inc.
107

Searches, Reports and Compliance Key Concepts
gateway or geo-location for VPN logins). The associations are generated by piecing together various pieces ofinformation from Windows Active Directory events, DHCP events, WLAN and VPN logon events and variousCloud service logon events, with discovery results.
FortiSIEM Supervisor and Worker nodes collaborate in a distributed manner to create User Identity and Locationrecords. The IdentityWorker module on Worker nodes keep a partial User Identity and Location in-memorydatabase based on the events that they see. Whenever IdentityWorker module on specific Worker sees newinformation, for example: a new IP address to User association, then it updates the database and communicatesto the IdentityMaster module on Supervisor node. The global User Identity and Location database is created byIdentityMaster module on Supervisor node by combining information from all IdentityWorker modules. Wheneverthe IdentityMaster module sees new information, it sends a signal to parser modules in all nodes, which then getsthe latest updates from the Supervisor node. The parser module injects IP to User meta-data into events in realtime so that this information can be searched without complicated database join operations.
Searches, Reports and Compliance
FortiSIEM provides a unified way to search the data it collects from various devices. All data whether it is systemlogs, performance metrics, or configuration changes, is converted to an event with parsed event attributes – thismakes it easy to search.
Search can be done for real-time data or historical data. In real time mode, the search occurs in a streaming nodeon incoming data without touching the event database. In historical mode, the user specifies a time period anddata residing in event database is searched for that time period. Searches can be specified on raw logs or parsedattributes. A rich variety of grouping and aggregation constructs are supported to display data at variousgranularity.
FortiSIEM comes pre-built with a large number of reports that can be used as starting points. User can customizethem and save as their own reports for later use. Reports can be scheduled to run at specified times and deliveredin PDF or CSV format via email. FortiSIEM provides a large number of compliance reports, each with reference tospecific compliance mandates. To run these reports, user simply needs to add devices to the specific compliancedevice group (Business Service) and then run the report.
All searches run in a distributed fashion in FortiSIEM. For deployments with FortiSIEM NoSQL database,Supervisor node distributes each search query to Worker nodes and summarizes the partial results sent back fromWorker nodes. Assuming you have sufficient NFS IOPS, Searches can be made faster up by adding Workernodes. Worker nodes can be added to a live system. Since event data is centrally stored in NFS, the newly addedWorker can participate in queries.
For deployments with Elasticsearch, Supervisor node sends each search query to Elasticsearch Coordinatingnode, which then distributes each search query to Elasticsearch Data Node and summarizes the partial resultssent back from Data Node to the Supervisor node. Adding Elasticsearch Data Nodes can make up searchesfaster. Since each Data Node has its own storage, it takes some time for data to be distributed to the newlyadded Data Node. However, since data is stored locally on each Data Node, this solution scales horizontally.
Rules and Incidents
Rules detect bad behavioral anomalies for machines and users in real time. FortiSIEM has developed SQL-likeXML based rule specification language. The user creates a rule from GUI, tests it using real events and thendeploys the rule. The XML language is quite powerful and uses CMDBObjects (e.g. Device, Network and
108 User GuideFortinet Technologies Inc.

Key Concepts Incident Notification Policy
Application Groups, Event Type Groups, Malware Objects, Country groups, Watch Lists) to keep the rulesconcise.
A Rule specification involves multiple sub-patterns of events connected by temporal operators (AND, OR, ANDNOT, FOLLOWED BY, and NOT FOLLOWED BY). Each sub-pattern is like a SQL Query with filters, group byattributes and thresholds on aggregates. The thresholds can be static or dynamically specified based onstatistics. A rule can be nested – meaning a rule can be set to trigger another rule. A rule can also create a watchlist that, like a CMDBObject, can be used in another rule.
Rule computation happens in a streaming mode using distributed in-memory computation involving Super andWorker nodes. Latest Rule definitions are distributed to Super and Worker nodes. Worker nodes evaluate eachRule based on the events it sees and periodically sends partial Rule results to the Supervisor node. Supervisornode keeps the global rule state machine and creates an incident when the Rule conditions are met. When a ruleinvolves a statistical attribute (for example: mean or standard deviation), a baseline report is created whichcomputes the statistics and updates the rule conditions. The baseline report also runs in a streaming mode usingin-line distributed computation. When a CMDBObject changes, an App Server module on the Supervisor nodesends a change signal to the Worker nodes, which then download the changes. This distributed in-memorycomputation enables FortiSIEM to scale to near real time performance with high EPS and large number of rules.
Since FortiSIEM analyzes all data including logs, performance and availability metrics, flows and configurationchanges, the rule engine can detect suspicious behavior. This ability to cross correlate across different functionalIT domains is what makes FortiSIEM rule framework powerful.
Incident Notification Policy
Once an incident trigger, the user may want to take an action, for example: send an email, create a ticket orinitiate a remediation action. Rather than attaching an action to an incident, which does not scale, FortiSIEMtakes a policy-based approach. You can write Incident Notification policies involving Time Of Day, IncidentSeverity, Affected Items, and Affected Organization and attach actions to policies. This allows you to createcorporate wide policies on who works on what and on which times of the day. Affected Items are specified usingCMDBGroups and Assigned Users can be specified using CMDBUsers – this makes incident notification policieseasy to specify and maintain.
Remediation Library
You may want to remediate an Incident by running a script. In FortiSIEM, this amounts to creating an IncidentNotification Policy and attaching the Remediation Script as an Action to the Notification Policy. The remediationscript may run on the Supervisor node or on the Collectors since the enforced devices may be behind a firewall.
When an Incident triggers and a Remediation Action has to be taken, App Server sends a signal to the involvedenforcement points (Supervisor and Collectors). The enforcement point first retrieves necessary information(such as enforced on device IP or Host name, enforced on device credentials and Incident details) from theSupervisor node and passes that information to the Remediation Script. After the script executes, theRemediation results are attached to the Incident.
FortiSIEM provides a wide collection of inbuilt Remediation Scripts. The user can create new Remediation Scriptsin FortiSIEM.
User GuideFortinet Technologies Inc.
109

External Ticketing System Integration Key Concepts
External Ticketing System Integration
This feature allows you to manage a FortiSIEM Incident in an external ticketing system. Several API based built-in integrations are available – ServiceNow, Salesforce and ConnectWise. A Java based framework is available foruser to create integrations to other ticketing systems.
There can be four types of integrations – Device or Incident and Inbound or Outbound.
l Incident Outbound Integration is used to create a ticket in an external ticketing system.l Incident Inbound Integration is used to update the external ticket status in FortiSIEM of a ticket opened previously
using Incident Outbound Integration. If a ticket is closed in external ticketing system, then the ticket status is alsoupdated in FortiSIEM.
l Device Outbound Integration is used to update CMDB in an external ticketing system from FortiSIEM CMDB. Everyticketing system needs a CMDB.
l Device Inbound Integration is used to update FortiSIEM device attributes from an external CMDB.
To use built-in Incident Outbound and Device Outbound Integrations, define an appropriate Integration andattach it as an Action to an Incident Notification Policy. You can use extensive field mappings to customize howthe ticket will appear in the external ticketing system. Incident Inbound and Device Inbound integrations have tobe scheduled to run at periodic intervals.
Dashboards
FortiSIEM offers various types of dashboards for the user to understand the data it collects and the incidents thatare triggering in the system:
l Summary Dashboardsl Widget Dashboardsl Business Service Dashboardsl Identity and Location Dashboardsl Incident Dashboardsl Interface Usage Dashboardsl PCI Logging Dashboards
Summary Dashboards
Summary dashboards show a near real time view of health, up-time, incidents and other key performance metricsof many devices in a single spreadsheet format – each row is a device and each column is a metric. Cells arecolor-coded (Red, Yellow, Green) to highlight the values when they cross certain customizable limits. Theadvantage of this type dashboard is that user can simultaneously compare many metrics of many devices from asingle view and instantaneously spot issues. User can customize the groups of devices and the correspondingmetrics. The user can build multiple Summary dashboards. FortiSIEM has developed an in-memory databasethat powers this dashboard – continuous querying event database does not scale. For more information, seeSummary Dashboards.
110 User GuideFortinet Technologies Inc.

Key Concepts Dashboards
Widget Dashboards
Widget dashboards offer the more traditional Top N dashboard view – one chart for one metric. A wide variety ofchart types are available and are described in FortiSIEM Charts and Views.
Any FortiSIEM Report – whether it is reported on Events or on CMDB – can be added to a Widget dashboard.FortiSIEM Widget Dashboards have these distinct advantages.
l Color Coding – Items in each widget can be color coding based on thresholds – this can quickly help the user to spotproblems
l Dynamic Search – The user can filter the entire dashboard by Host Name or IP Address and quicklyl Streaming Computation – The reports in the widget dashboard are computed in a streaming mode without making
repeated queries to the event database. This makes the dashboards fast to load.
For more information, see Widget Dashboards.
Business Service Dashboards
Business Service Dashboards provide a top-down view of Business Service health. User can see the incidentsrelated to each Business Service and then drill down on the impacted devices and incidents. For moreinformation, see Business Service Dashboards.
Identity and Location Dashboards
Identity and Location dashboards provide a tabular view of network identity to user identity mappings. For moreinformation, see Identity and Incident Dashboards.
Incident Dashboards
FortiSIEM provides two Incident Dashboards – Overview and Risk View.
l Overview dashboard shows a top-down view into Incidents By Category, Top Incidents and where they aretriggering, Top Impacted Devices and what Incidents they are triggering.
l Risk View dashboard organizes devices and users by Risk.
For more information, see Overview and Risk View.
Interface Usage Dashboards
This dashboard provides an overview of the usage of individual interfaces of Router and Firewall devices. You canobtain metrics at three levels:
device level, interface level and application level. For more information, see Interface Usage Dashboards.
PCI Logging Dashboards
A PCI Logging Status dashboard provides an overview of which devices in PCI are logging . The devices aredisplayed by CMDBDevice Groups (for example Windows, Linux, Firewalls and so on) and by Business Units. Formore information, see PCI Logging Dashboards.
User GuideFortinet Technologies Inc.
111

Dashboards Getting Started
Getting Started
Following are the basic steps for getting started with FortiSIEM:
l Step 0 - Pre-Install Considerationsl Step 1 - Install the Virtual or Hardware Appliancel Step 2 - Install Licensel Step 3 - Specify Event Database Storagel Step 4 - Check System Health and Licensel Step 5 - (Optional) Create Organizations for Service Provider deploymentsl Step 6 - (Optional) Check Full Admin Organization Users for Service Provider deploymentsl Step 7 - Add Email Gatewayl Step 8 - (Optional) Add Collectorl Step 9 - (Optional) Set Event Upload Destination for the Collector(s)l Step 10 - (Optional) Check Collector Healthl Step 11 - Receive Syslog and Netflowl Step 12 - Check CMDBDevices and Run Searches for received eventsl Step 13 - Discover Devicesl Step 14 - Check CMDB and Performance Monitors for discovered devicesl Step 15 - Check Monitored Device healthl Step 16 - Check Incidentsl Step 17 - Notify an Incident via emaill Step 18 - Create a Ticket in FortiSIEMl Step 19 - View System Dashboardsl Step 20 - (Optional) Add Workerl Step 21 - (Optional) CheckWorker Healthl Step 22 - Check License Usagel Step 23 - Set Home Page and Complete Your User Profilel Step 24 - Log on to the Console and Check Statusl Step 25 - Change Default Passwords
Step 0 - Pre-Install ConsiderationsFortiSIEM can run in the following modes:
l Single node all in one Virtual Appliance (Supervisor node) running on a wide variety of Hypervisors with local eventdatabase storage
l Virtual Appliance Cluster – Supervisor and Worker nodes - external event database storagel Dedicated hardware appliances – single node with local event database storage or cluster with external event
database storage
Before starting the installation process, make the following decisions:
112 User GuideFortinet Technologies Inc.

Getting Started Dashboards
l Installation type: Hardware appliance or Virtual appliancel If Virtual Appliance, then decide:
l Hypervisor type – ESX, KVM, HyperV, AWS, Azurel Enterprise version or Service Provider versionl Single node (All-in-one Supervisor) or a Cluster (single Supervisor and multiple Workers)l Local event database or External storage (cluster requires external storage)l External storage type - FortiSIEM event database or Elasticsearchl Whether Collectors are needed
l If hardware appliance, then decide:l Enterprise version or Service Provider versionl Single node (All-in-one Supervisor Appliance) or a Cluster (single Supervisor Appliance e.g. 3500F and
multiple Workers e.g. 2000F)l Local event database or External storage (cluster requires external storagel External storage type - FortiSIEM event database or Elasticsearchl Whether Collectors are needed
Step 1 - Install the Virtual or Hardware ApplianceYou can choose to use all-in-one FortiSIEM Hardware Appliance or a Virtual Appliance based solution.
To install FortiSIEM Hardware Appliance (FSM-2000F, FSM-3500F, FSM-500F), see here.
To install a FortiSIEM Virtual Appliance based solution:
l Select the hypervisor (VMWare ESX, AWS, HyperV, KVM) on which FortiSIEM is going to runl Select event database storage – local or NFS or Elasticsearchl Set up external storage if needed: NFS and Elasticsearch
See NFS StorageGuide and Elasticsearch Storage Guidel Install FortiSIEM Virtual Appliance (see the installation guides here.)
Step 2 - Install LicenseApply the license provided by Fortinet. Note that for Virtual appliance install, the UUID of the Supervisor nodemust match the license while for hardware appliance, the hardware serial numbers must match the license.
After applying the license, the system will reboot and provide a login page.
Login with the following default values:
l USER ID - adminl PASSWORD - admin*1l CUST/ORG ID - superl DOMAIN - LOCAL
For more information about FortiSIEM Licensing, see the Licensing Guide here.
Step 3 - Specify Event Database StorageIf you chose Virtual Appliances, then specify storage option (see here – ADMIN >Setup >Storage).
Hardware appliances only support local disk event database storage.
User GuideFortinet Technologies Inc.
113

Dashboards Getting Started
Step 4 - Check System Health and LicenseEnsure that:
l All the system components are up and in good health (ADMIN >Health >Cloud Health – see here)l The license matches your purchase by visiting the ADMIN > License > License page – see here
Step 5 - (Optional) Create Organizations for Service Provider deploymentsA Service Provider would consist of multiple Organizations.
These Organizations can be defined in two ways:l Case 1 - By associating one or more collectors to an Organization – any log received by those Collectors
or any devices discovered by those collectors will belong to that Organization. This typically makes sensefor remote management scenarios.
l Case 2 - By associating an IP range to an Organization – this typically makes sense for hosted scenarios
In both cases, create organizations by visiting ADMIN >Setup >Organizations (see here).
The system will create default system users with Full Admin functionality for each created organization.
Step 6 - (Optional) Check Full Admin Organization Users for Service Provider deploymentsFortiSIEM will automatically create a Super-global Full Admin user and one Full Admin user for eachOrganization. Ensure that you are able to log in to:
l each Organization using the system created Full Admin usersl Super-Global mode using Super-global Full Admin user and then switch to any Organization
Step 7 - Add Email GatewayFortiSIEM will send notifications for incidents via email. Setup the email gateway by visiting ADMIN >Settings >System >Email (see here for details).
Step 8 - (Optional) Add CollectorIf your monitored devices are behind a firewall or in a distant location across the Internet, then you will need aCollector to collector to collect logs and performance metrics from that location.
FortiSIEM Collectors can be Hardware Appliances or Virtual Appliances. Hardware Appliances are easiest toinstall.
l For FSM-500F
See 500F Collector Configuration Guide for the installation above.
Install the FortiSIEM Collector Virtual appliance based on the Hypervisor of your choice:l VMWare ESXl AWSl KVMl Microsoft Hyper-V
See the specific Installation Guides here for the installations above.
114 User GuideFortinet Technologies Inc.

Getting Started Dashboards
Register the Collector to the FortiSIEM Supervisor node.
See the section Registering Collectors for the registration process.
Step 9 - (Optional) Set Event Upload Destination for the Collector(s)You must specify the FortiSIEM nodes where the Collector will upload events to, in ADMIN >Settings >System>Worker Upload (see here). There are three options:
l In a simple setup with one Supervisor node, specify the Supervisor node. This is not recommended inlarger setups as this will make the Supervisor node busy
l You may want to specify one or more Worker nodes, listed byWorker IP addresses. The Collectors willload balance across the specified Worker nodes. In this manner, streaming analytics like inline reportsand rule are distributed over Worker nodes.
l You may specify a load balancer name that sits in front of the Worker nodes. Note that in this case, youhave to carefully tune the load balancing configuration to get optimum performance.
The second option works the best in most cases.
Step 10 - (Optional) Check Collector HealthYou want to make sure that Collectors are up and running properly. Go to ADMIN >Health >Collector Healthto check (see here for details).
At this point, the system is ready to receive events or perform discovery.
Step 11 - Receive Syslog and NetflowFirst check the list of supported devices whose logs are parsed by FortiSIEM out of the box. The list isADMIN >Device Support >Parser. See also the external device support document for further details (see here). If yourdevice is in that list, then FortiSIEM will likely parse your logs out of the box.
Note that with every new version, vendors add new log types or sometimes, even change the log format in a non-backward compatible manner. In that case, the built-in parser may need to be adjusted (this topic will be coveredin Advanced Operations). If your device is not on the list of built-in parsed devices, then a custom parser needs tobe written. This topic will be covered in Advanced Operations.
Configure your device to send logs to FortiSIEM. If your device is behind a Collector, then the logs will be sent tothe Collector. Otherwise, logs can be sent to Supervisor or Worker node. For devices with high event rates, it isrecommended to add a Worker node (Step 19) and send logs directly to Worker node. Most vendors havestraightforward methods to send syslog to external systems – see here but be aware that the information may bea little out of date. Consider your vendor's manual in that case.
FortiSIEM automatically receives Netflow variations of well-defined ports.
Step 12 – Check CMDB Devices and Run Searches for Received EventsIf the logs in Step 11 are received correctly in FortiSIEM, then you should see the sending devices in the correctCMDB device and application group.
You can also search for the logs and see how they are parsed. Go to ANALYTICS >Shortcuts from the folderdrop-down and run 'Raw Messages', 'Top Reporting Devices' or 'Top Event Types' queries (see here for details).
User GuideFortinet Technologies Inc.
115

Dashboards Getting Started
Step 13 - Discover DevicesSome systems (for example, Linux based servers) have generic log patterns – so logs cannot precisely identifythe Operating system. If you want to get accurate information from such systems, then you must discover themvia protocols such as SNMP, SSH. For Windows servers, if you want to collect logs via WMI, then you mustdiscover them via WMI only or SNMP and WMI.
To perform discovery first go to ADMIN >Setup >Credentials and set up credentials and then go to ADMIN >Setup >Discovery and run discoveries. For Service Provider deployments with collectors, do the discoveriesfrom each organization because IP addresses and names can be overlapping.
You can run the discovery in the foreground or in the background. If you run in the foreground, then you will knowwhen it finishes. If you run in the background, then you must go to Tasks section to see the discovery completionpercentages and status. Note that ill-defined discoveries can take a long time to complete – see here forguidelines.
To see the benefits of discovery, see the External Systems Configuration Guide here and search your devicetype.
Step 14 - Check CMDB and Performance Monitors for Discovered DevicesAfter discovery is complete, you will see the CMDB populated with the discovered devices in the correct device,application and network segment folders.
Note the following:l If the number of devices is within your license limits, then the discovered devices will be in managed and
Pending state. Otherwise, a set of (randomly chosen) devices exceeding license limit will be in theUnmanaged state. FortiSIEM will not receive logs from unmanaged devices, nor they can be monitored.You can flip a device from Unmanaged to Managed and vice-versa. You can also buy additional licensesto rectify this situation.
l If devices have overlapping IP addresses, then they will be merged. Check for this incident “PH_RULE_DEVICE_MERGED_OVERLAP_IP” to look for merged devices. To correct this situation, you have twochoices:
l Change the overlapping IP address on the device, delete the device from CMDB and rediscover.l If the overlapping IP is a Virtual IP (VIP), then add this IP to the VIP list in ADMIN >Settings >Discovery. Delete the device from CMDB and re-discover.
After you have corrected the situation, make sure that devices are not merged and appear correctly in CMDB.
Note that in the enterprise mode, discoveries are done by the Supervisor node. In the Service Provider version,there are two possibilities, depending on how organizations are defined (see Step 5)
l For Organizations defined by IP addresses, discoveries are done by the Supervisor node. After discovery,the devices should belong to the correct organization.
l If all interfaces of a device belong to the specified Organization IP range, then the device belongsto that Organization.
l On the other hand, if at least one IP does not belong to specified Organization IP range, then thedevice belongs to the Super/local Organization (representing the Hosting Service ProviderOrganization).
l For Organizations with Collectors, discoveries are done by the associated Collector node. CheckCMDBto see that the devices are marked with the correct Organization and Collector.
116 User GuideFortinet Technologies Inc.

Getting Started Dashboards
As part of discovery, FortiSIEM also discovers which performance metrics it can collect and which logs it can pull.See ADMIN >Setup >Pull Events and ADMIN >Setup >Monitor Performance tabs (see here for details).You can turn off log/performance metric collection or tune the polling intervals.
Performance monitoring and log collection is a continuous process. If you tested the credentials before runningdiscoveries (ADMIN >Setup >Credentials > Test Connectivity) and fixed the errors showing up in Discoveryerror tab, then the metric/log collection should not have errors. After running for some time, there can be errors –some reasons being (a) network connectivity issues from FortiSIEM to the devices, (b) someone changed thecredentials or access policies on the device, (c) the device can have performance issues. Please check for errorsin the ADMIN >Setup >Pull Events and ADMIN >Setup >Monitor Performance tabs (see here for details)and fix them. If credentials have changed, then you must change the credentials in ADMIN >Setup >Credentials and rediscover the corresponding devices.
Step 15 - Check Monitored Device healthYou can watch the current health of a device in CMDB by selecting the device and choosing the Device healthoption from the menu. To see the performance metrics in real time, select the device in CMDB and choose theReal time performance option from the menu.
Step 16 - Check IncidentsFortiSIEM provides a large number of built-in machine and user behavior anomalies in the form of rules. Theserules are active by default and will trigger incidents. See here on how to navigate incidents. Advanced Operationsdescribes how to tune these rules for your environment.
Step 17 – Notify an Incident via EmailYou may want to notify users via email when an incident trigger. This is achieved in one of two ways.
l Create an Incident Notification Policy and specify the incident matching criteria and the receiver emailaddress. See here for details.
l Select an incident from INCIDENT > List view, go to Action and select Notify via Email. See here fordetails.
Note that many other advanced actions are possible such as:
l Customizing the email templatel Remediating the incident by running a scriptl Opening a ticket in an external ticketing system and so on.
See Advanced Operations for details.
Step 18 – Create a Ticket in FortiSIEMYou can use FortiSIEM built-in ticketing system to handle tickets. Currently, this is handled outside of thenotification policy concept (Step 17).
To create a FortiSIEM ticket, select one or more incidents from INCIDENT > List view, go to Action and selectCreate Ticket.
User GuideFortinet Technologies Inc.
117
Dashboards Getting Started
Step 19 - View System DashboardsFortiSIEM provides several built-in dashboards:
l Incident Dashboard – Overview and Risk Viewl Incident Location View - (see here for details)l Incident and Location Dashboard – select DASHBOARD > Incident and Location Dashboard (this
requires you to collect DHCP, Active Directory logon events – see here for details
Go to DASHBOARD and select the dashboard of your choice.
Step 20 - (Optional) Add WorkerFor larger software based deployments that involve multiple collectors or large number of monitored devices ordevices with high event rates, it is highly recommended to deploy one or more Workers to distribute theSupervisor node’s workload. Note that Workers cannot be added to Hardware-based appliances.
Workers can be added by visiting ADMIN > License >Nodes - see here for details.
After adding the Worker(s), remember to add the workers to the collect event upload destination list (ADMIN >Settings >System >Worker Upload - see here for details).
Step 21 - (Optional) Check Worker HealthCheck the health of the Workers by visiting ADMIN >Health >Cloud Health.
l The health of all nodes should be Normal, load average should be within bounds (typically less than thenumber of cores), CPU should not be pegged at 99%, and little swap should be used.
l Click on any node and check the health of individual processes running on that node in the bottom pane.Status should be Up with large Up times and reasonable CPU and memory usage.
Step 22 - Check License UsageCheck whether the system is operating within licensed parameters (Monitored device count and EPS) by visitingADMIN > License >Usage (see here for details).
Step 23 - Set Home Page and Complete Your User Profile
Click the Edit User Profile icon ( ) in the upper right corner of the UI. The dialog box contains three tabs:
Basic - Use the Basic tab to change your password into the system.
Contact - Use the Contact tab to enter your contact information.
UI Settings - Use the UI Settings tab to set the following:
Settings Guidelines
Home Select the tab which opens when you log in to the FortiSIEM UI.
Incident Home Select the Overview, List, Risk, or Explorer display for the INCIDENT tab.
118 User GuideFortinet Technologies Inc.

Getting Started Dashboards
Settings Guidelines
Dashboard Home Select the Dashboard to open by default under the DASHBOARD tab from this drop-down list.
Dashboard Settings Select the type of dashboards to be visible/hidden using the left/right arrows. Theup/down arrows can be used to sort the Dashboards.
Language Specify which language will be used for the UI display. Many UI items have beentranslated into the languages in the drop-down list, including buttons, labels, top-levelheadings, and breadcrumbs. Items that are data-driven are not translated.
Theme Select Dark or Light theme for FortiSIEM UI. Save and refresh the browser to view thechange.
Step 24 – Log on to the console and check statusIn rare situations when the GUI is not responding, you may need to SSH in to the system console of Supervisor,Worker and Collector nodes and issue some commands. The list of node IP addresses are available in ADMIN >License >Nodes, ADMIN >Health >Cloud Health and ADMIN >Health >Collector Health.
Log on to each of them using the default password as below. Step 25 describes how to change the defaultpassword.
FortiSIEM provides two SSH user accounts:l User: 'root' and password: ProspectHillsl User: 'admin' and password: admin*1
The following commands are available:l Run phstatus from the admin account – shows the status of all FortiSIEM processesl Run phstatus –a from the root account – shows the detailed status of all FortiSIEM processes along
with events per second and local I/O rates
The following Linux commands can be useful:l Run top from the admin account – shows the CPU, memory usage of all Linux processesl Run iostat –x 2 to check the I/O statistics for local diskl Run nfsiostat –x 2 to check the NFS I/O statistics for Supervisor and Worker for NFS based
deploymentsl Run tail -300f /opt/phoenix/log/phoenix.log to see the C++module log
Step 25 – Change default passwordsFortiSIEM provides these default passwords. Please change them before running the system for production.
On Supervisor, Workers, Collectors and Report Server:l User: root and password: ProspectHillsl User: admin and password: admin*1
User GuideFortinet Technologies Inc.
119

Dashboards Getting Started
On GUI:l Enterprise deployment – User: admin and password: admin*1 with full Admin User rightsl Service Provider deployment – One user for Super/Global, Super/Local and each user created
organizations - user: admin and password: admin*1
The GUI accounts can be changed from the GUI by clicking the Edit User Profile icon on top right corner andopening the Basic tab. Linux passwords can be changed by issuing the passwd command as a logged in user.
120 User GuideFortinet Technologies Inc.

Advanced Operations Dashboards
Advanced Operations
FortiSIEM enables you to perform the following advanced operations:
l CMDBl Discovering Usersl Creating FortiSIEM Usersl Setting External Authenticationl Setting 2-factor Authenticationl Assigning FortiSIEM Roles to Usersl Creating Business Servicesl Creating Dynamic CMDBGroupsl Setting Device Geo-locationl Creating CMDBReports
l Incidents and Casesl Searching Incidentsl Tuning Incidents via Exceptionsl Tuning Incidents via Modifying Rulesl Tuning Incidents via Drop Rulesl Tuning Incidents by Adjusting Thresholdsl Clearing Incidentsl Adding Comments or Remediation advice to an Incidentl Remediating an Incidentl Notifying an Incident via Emaill Creating New Rulesl Creating a FortiSIEM Ticketl Creating a Ticket in External Ticketing System
l Device Supportl Checking Device Monitoring Status and Healthl Setting Devices Under Maintenancel Creating Custom Monitorsl Setting Important Interfaces and Processesl Modifying System Parsersl Creating Custom Parsersl Handling Multi-line Syslogl Creating Synthetic Transaction Monitorsl Mapping events to Organizationsl Adding Windows Agentsl Adding Linux Agentsl Forwarding Events to External Systems
User GuideFortinet Technologies Inc.
121

Discovering Users Advanced Operations
l Rules, Reports and Dashboardsl Creating New Rulesl Creating New Reportsl Scheduling Reportsl Customizing Built-in Dashboardsl Creating custom Dashboardsl Customizing Business Service Dashboards
l Advanced System Healthl Monitoring System Healthl Monitoring Collector Healthl Monitoring Elasticsearch Healthl System Errorsl Monitoring User Activity
Discovering Users
Users can be discovered via LDAP, OpenLDAP, or they can be added manually. Discovering users via OpenLDAPor OKTA are similar.
To discover users in Windows Active Directory, discover the Windows Domain Controller:
1. Go to ADMIN >Setup >Credentials.2. ClickNew to create an LDAP discovery credential by entering the following in the Access Method Definition dialog
box:a. Name for the credentialb. Device Type as "Microsoft Windows Server 2012 R2"c. Access Protocol as "LDAP"d. Used For as "Microsoft Active Directory"e. Enter the Base DN and NetBios Domain
3. Test the LDAPCredentials.4. Run discovery.5. Go to CMDB >Users.6. Click the "Refresh" icon on left panel and see the users displayed on the right panel.To add users manually:
1. Go to CMDB >Users.2. ClickNew and add the user information.
For details about Discovering Users, see here (Refer to the table by searching: Credentials for Microsoft WindowsServer)
For details about Adding Users, see here.
122 User GuideFortinet Technologies Inc.

Advanced Operations Creating FortiSIEM Users
Creating FortiSIEM Users
To create users that access FortiSIEM:1. Login as a user with "Full Admin" rights.2. Create the user in CMDB.3. Set a password – after logging in, the user can set a new password.4. Select the user and clickEdit.5. Select System Admin and enter the following:
a. Authentication Mode - "Local" or "External"b. Enterprise case - select the Rolec. Service Provide Case - select the Role for each Organization
For details about creating users, see here.
To change the password:1. Login as the user.2. Click the "User Profile" icon on the top-right corner.3. ClickSave.
Setting External Authentication
FortiSIEM users can be authenticated in two ways:
l Local authentication – user credentials are stored in FortiSIEMl External authentication – user credentials are stored in an external database (AAA Server or Active Directory) and
FortiSIEM communicates with the external database to authenticate the user
Step 1: Set up an Authentication Profile
1. Login as a user with Full Admin rights.2. Create an authentication profile by visiting ADMIN >Settings >General >Authentication.3. ClickNew.4. Provide the following information in the External Authentication Profile dialog box:
a. Enter a Name for the profileb. Select anOrganization from the drop-down listc. Set Protocol appropriately (for example, LDAP, LDAPS, or LDAPTLS for Active Directory)d. Enter the IP/Host and Port number
5. Make sure the credentials are defined in ADMIN >Setup >Credentials.6. Select the entry and click Test to ensure it works correctly.Step 2: Attach the Authentication Profile to the user
1. Select the user underCMDB >User and clickEdit.2. Select System Admin and click the edit icon.3. Set Mode to "External" and set the Authentication Profile created.For details about Setting up Authentication Profiles, see here.
For details about Editing Users, see here.
User GuideFortinet Technologies Inc.
123

Setting 2-factor Authentication Advanced Operations
Setting 2-factor Authentication
FortiSIEM supports Duo as 2-factor authentication for FortiSIEM users:
Step 1: Set up an Authentication Profile
1. Login as a user with Full Admin rights.2. Create an authentication profile by visiting ADMIN >Settings >General >Authentication:
a. Set Protocol to "Duo"b. Make sure the credentials are defined in ADMIN >Setup >Credentialsc. Select the entry and click Test to make sure it works correctly
Step 2: Attach the Authentication Profile to the user
l Select the userCMDB >Users and clickEditl Select System Admin and click the edit iconl Set Mode to "External" and set the Authentication Profile created
For details about Setting up Authentication Profiles, see here.
For details about Editing Users, see here.
Assigning FortiSIEM Roles to Users
FortiSIEM allows the admin user to create Roles based on what data the user can see what the user can do withthe data. To set up Roles:
Step 1: Create a Role of your choice
1. Login as a user with Full Admin rights.2. Go to ADMIN >Settings >Role >Role.3. Make sure there is a Role that suits your needs. If not, then create a new one by clicking New and entering the
required information. You can also Clone an existing Role and make the changes.Step 2: Attach the Role to the user
1. Select the userCMDB >Users and clickEdit2. Select System Admin and click the edit icon.3. Set Default Role:
a. Enterprise case – select the Roleb. Service Provide Case – select Role for each Organization
For details about Setting up Roles, see here.
For details about Editing Users,see here.
Creating Business Services
Business Service is a smart grouping of devices. Once created, incidents are tagged with the impacted BusinessService(s) and you can see business service health in a custom Business Service dashboard.
124 User GuideFortinet Technologies Inc.

Advanced Operations Creating Dynamic CMDBGroups and Business Services
For details about creating a Business Service, see here.
For details about setting up Dynamic Business Service, see here.
For details about viewing Business Service health, see here.
Creating Dynamic CMDB Groups and Business Services
CMDBGroups are a key concept in FortiSIEM. Rules and Reports make extensive use of CMDBGroups. Whileinbuilt CMDBGroups are auto-populated by Discovery, user-defined ones and Business Services are not. You canuse the Dynamic CMDBGroup feature to make mass changes to user-defined CMDBGroups and BusinessServices.
To create Dynamic CMDB Group Assignment Rules:
1. Login as a user with ADMIN tab modification rights.2. Go to ADMIN >Settings >Discovery >CMDB Group.3. ClickNew.4. Enter CMDBMembership Criteria based on Vendor, Model, Host Name and IP Range.5. Select the CMDB group (Groups) or Business Services (Biz Services) to which the Device would belong if the
criteria in Step 3 is met.6. ClickSave.You can now clickApply to immediately move the Devices to the desired CMDBGroups and Business Services.Discovery will also honor those rules – so newly discovered devices would belong to the desired CMDBGroupsand Business Services.
For details about Setting up Dynamic CMDBGroups and Business Services, see here.
Setting Device Geo-Location
FortiSIEM has location information for public IP addresses. For private address space, you can define thelocations as follows:
1. Login as a user with ADMIN tab modification rights.2. Go to ADMIN >Settings >Discovery > Location.3. ClickNew.4. Enter IP/IP Range.5. Specify the Corresponding Location for the IP address Range.6. Select Update Manual Devices if you want already discovered device locations to be updated.7. ClickSave.
You can now clickApply to set the geo-locations for all devices matching the IP ranges.For details about Setting Device Location, see here.
User GuideFortinet Technologies Inc.
125

Creating CMDBReports Advanced Operations
Creating CMDB Reports
If you want to extract data from FortiSIEM CMDB and produce a report, FortiSIEM can run a CMDBReport anddisplay the values on the screen and allows you to export the data into a PDF or CSV file.
For details about Creating CMDBReports, see here.
Searching Incidents
If you want to search for specific incidents, go to INCIDENT > List >Action >Search. A Search Windowsappears on left. First, select the Time Window of interest. Then by clicking on any of the criteria, you can see thecurrent values. You can select values to see matches incidents in the right pane.
For details about Searching Incidents, see here.
Tuning Incidents via Exceptions
If you do not want a rule to trigger for a specific Incident Attribute, then you can create an exception.1. Go to INCIDENT > List view.2. Search the Incident (Action > Search) or make sure that Incident shows in the right pane.3. Highlight the Incident.4. ClickAction >Edit Rule Exception.5. Enter the exception criteria – attribute based or time-based.
For details about Tuning Incidents via Exceptions, see here.
Tuning Incidents via Modifying Rules
Sometimes modifying the rule is a better idea than creating exceptions. For example, if you do not want a rule totrigger for DNS Servers, simply modify the rule condition by stating something like “Source IP NOT CONTAINDNS Server”. To do this:
1. Go to INCIDENT > List view.2. Search the Incident (Action > Search) or make sure that Incident shows in the right pane.3. Highlight the Incident4. ClickAction >Edit Rule5. Edit the Rule.
If it is a System Rule, then you must save it as a User Rule. Deactivate the old System Rule and activatethe new User Rule.
For details, see here.
126 User GuideFortinet Technologies Inc.

Advanced Operations Tuning Incidents via Drop Rules
Tuning Incidents via Drop Rules
Sometimes the rule can be prevented from triggering by dropping the event from rule considerations. There aretwo choices - (a) store the event in database but not trigger the rule or (b) drop the event completely.
To do this:1. Go to INCIDENT > List view.2. Search the Incident (Action > Search) or make sure that Incident shows in the right pane.3. Highlight the Incident.4. ClickAction >Create Event Dropping Rule.5. Specify event drop criteria and action. Events can be dropped on certain parsed fields (like
Reporting/Source/Destination IP and Regex filter on the content).
For details, see here.
Tuning Incidents by Adjusting Thresholds
Some performance rules are written using global thresholds, for example - the Rule “High Process CPU: Server”uses the global threshold “Process CPU Util Critical Threshold” defined in ADMIN >Device Support >CustomProperty.
You have two choices – (a) modify the global threshold or (b) modify the threshold for a specific device or a groupof devices. If you change the global threshold, then the threshold will change for all devices.
To modify the global threshold, follow these steps:
1. Go ADMIN >Device Support >Custom Property.2. Select the property and clickEdit.3. Enter the new value and clickSave.
For details, see here.
To modify the threshold for one device, follow these steps:
1. Go to CMDB.2. Select the device and clickEdit.3. In the Properties tab, enter the new value and clickSave.To modify the threshold for a group of devices, repeat the above step for all devices.
Clearing Incidents
In some cases, the Incident may not be happening anymore as the exception condition was corrected.
To clear one or more Incidents:1. Go to INCIDENT > List view.2. Search the Incident (Action > Search) or make sure that Incidents show in the right pane.3. Highlight the Incidents.
User GuideFortinet Technologies Inc.
127

Adding Comments or Remediation Advice to an Incident Advanced Operations
4. ClickAction >Clear Incident5. EnterReason and clickOK.
For details, see here.
Adding Comments or Remediation Advice to an Incident
To add a comment to an Incident:1. Go to INCIDENT > List view.2. Search the Incident or make sure that Incidents show in the right pane.3. Highlight the Incidents.4. ClickAction >Edit Comment5. Enter the Comment and clickOK.
For details, see here.
Sometimes, it is necessary to add Remediation advice for the recipient of an Incident, so he can take some actionto remediate the Incident. This has to be done by editing the Rule.
1. Go to RESOURCES >Rules2. Select a Rule and clickEdit.3. EnterRemediation Note text and clickSave.
For details, see here.
The Remediation text can be added to the Incident Notification email template.
For details, see here.
Remediating an Incident
You can use the following commands to enable Windows Remote Management (WinRM) and set authenticationon the target Windows Servers. See Remediations for information on adding, editing, and deleting aremeditation from the FortiSIEM UI.
In the remediation script:
1. When you initiate the WinRM session, set transport parameter to ssl.2. Set the server_cert_validation option accordingly. If you do not need to validate the certificate, set to
ignore. For example:session = winrm.Session(enforceOn, auth = (user, password),transport="ssl", server_cert_validation = "ignore")
In the target Windows server:
Note: You might need to disable Windows Firewall before running remediation.
1. Create the self-signed certificate in the certificate store, for example:New-SelfSignedCertificate -CertStoreLocation Cert:\LocalMachine\My -DnsName "mySubjectName.lan"
128 User GuideFortinet Technologies Inc.

Advanced Operations Remediating an Incident
where Cert:\LocalMachine\My is the location of the certificate store and mySubjectName.lanis the subject alternate name extension of the certificate.
2. Create an HTTPS listener, for example:winrm create winrm/config/Listener?Address=*+Transport=HTTPS '@{Port="5986";Hostname="{your host name}"; CertificateThumbprint="{CertificateThumbprint}"}'
3. Start the WinRM service and set the service startup type to auto-start. The quickconfig commandalso configures a listener for the ports that send and receive WS-Management protocol messages using eitherHTTP or HTTPS on any IP address.
winrm quickconfig -transport:https
4. Validate the WinRM service configuration and Listener.a. Check whether basic authentication is allowed, for example:
winrm get winrm/config/service
b. Check whether a listener is running, and verify the default ports, for example:winrm get winrm/config/listener
Remediation can be done either on an ad hoc basis (for example, user selects an Incident that has alreadyoccurred to Remediate) or using a Notification Policy where the system takes the Remediation action whenIncident happens. First, make sure the Remediation script for your scenario is defined. Check the existingRemediation scripts in ADMIN >Settings >General >Notification > Remediation settings. If your device is notin the list, add the needed Remediation script.
To set ad hoc remediation:
1. Go to INCIDENT > List view.2. Search the Incident (Action > Search) or make sure that Incidents show in the right pane.3. Highlight the Incident you want to remediate (you can remediate only one Incident at a time)..4. ClickAction >Remediate Incident.5. In the Run Remediation dialog box:
a. Select the script in the Remediation drop-down list that you want to run.b. Select the role that the script will run on from the Run On drop-down list.c. Open the Enforce On drop-down list to choose which devices the remediation script will run on. In the
Run Remediation dialog box, open the Device tree. Select individual devices and shuttle them to theSelections column. (You can choose only individual devices; you cannot choose device groups.)
6. ClickRun in the Run Remediation dialog box.For details, see here.
To set policy-based remediation:
1. Go to ADMIN >Settings >General >Notification2. ClickNew.3. UnderAction, click the edit icon next to Run Remediation/Script.4. In the Notification Policy - Define Script\Remediation dialog box click New.5. In the dialog box tha topens click either Legacy Script orRemediation:
l Legacy Script: l Enter the name and path to the script in the Script field.l Select the role the script will run on from the Run On drop-down list.
User GuideFortinet Technologies Inc.
129

Notifying an Incident via Email Advanced Operations
l Remediation:l Select a remediation script from the Script drop-down list.l Select the role that the script will run on from the Run On drop-down list.l Open the Enforce On drop-down list to choose which devices the remediation script will run on. In
theNotification Policy - Define Script\Remediation - Enforce On dialog box, open theDevice tree. Select individual devices and shuttle them to the Selections column. (You canchoose only individual devices; you cannot choose device groups.)
6. ClickSave.For details, see here.
To see the Notification history of an Incident:
1. Go to INCIDENT > List view.2. Search the Incident (Action > Search) or make sure that Incidents show in the right pane.3. Highlight the Incidents.4. ClickAction >Show Notification HistoryFor details, see here.
Notifying an Incident via Email
Notifying an Incident can be done either on ad hoc basis (for example - user selects an Incident that has alreadyoccurred to notify) or using a Notification Policy where the system takes the notification action when Incidenthappens.
First, make sure that Email Server has been properly defined in ADMIN >Settings >Email >Email Settings.
FortiSIEM has a built-in Incident Notification Email template. If you want a different one, please define it underADMIN >Settings >Email > Incident Email Template.
For details, see here.
To set ad hoc notifications:
1. Go to INCIDENT > List view.2. Search the Incident (Action > Search) or make sure that Incidents show in the right pane.3. Highlight the Incidents.4. ClickAction >Notify via Email.5. Choose Receive Email Address and Email Template.6. ClickSend.For details, see here.
For Policy based Notification
To send policy-based notifications:1. Go to ADMIN >Settings >General >Notification.2. ClickNew.
130 User GuideFortinet Technologies Inc.

Advanced Operations Creating New Rules
3. Specify the Incident Filter Conditions (Severity, Rules, Time Range, Affected Items, AffectedOrganizations) carefully to avoid excessive emails.
4. UnderAction, clickSend Email/SMS to Target Users.5. Enter Email Address or Users from CMDB.6. Click Save.
For details, see here.
To see the Notification history of an Incident:
l Go to INCIDENT > List view.l Search the Incident (Action > Search) or make sure that Incidents show in the right pane.l Highlight the Incidents.l ClickAction >Show Notification History
For details, see here.
Creating New Rules
Sometime, you may want to create a new rule from scratch.
For details, see here.
Creating a FortiSIEM Ticket
First make sure that:
l Ticket’s assigned user is in CMDBl Assigned user’s Manager that is going to handle escalation is in CMDBl A Ticket Escalation Policy is defined
For adding users see Advanced Operations > Creating System users.
For defining ticket escalation policy, see here.
To create a FortiSIEM ticket:
l Go to INCIDENT > List view.l Search the Incident (Action > Search) or make sure that Incidents show in the right pane.l Highlight the Incidents.l ClickAction >Create Ticket.l ClickSave
Note that you can put multiple Incidents on one ticket or add an Incident to an existing ticket.
For details, see here.
User GuideFortinet Technologies Inc.
131

Creating a Ticket in External Ticketing System Advanced Operations
Creating a Ticket in External Ticketing System
First, define an Incident Outbound Integration Policy by visiting ADMIN >Settings >General > Integration.
For details, see here.
Then set the Incident Outbound Integration Policy in Notification Policy Action:
1. Go to ADMIN >Settings >General >Notification.2. ClickNew.3. Specify the Incident Filter Conditions (Severity, Rules, Time Range, Affected Items, Affected
Organizations) carefully to avoid excessive emails.4. UnderAction, click Invoke an Integration Policy.5. Choose the Integration Policy.6. ClickSave.For details, see here.
To update external ticket state in FortiSIEM:
1. Define an Incident Inbound Integration Policy by visiting ADMIN >Settings >General > Integration.2. Select the Policy and clickSchedule to run the Incident Inbound Integration Policy.For details, see here.
Checking Device Monitoring Status and Health
For Performance Monitoring scenarios, you would like to know:
l Is FortiSIEM is able to monitor the devices on time? Is FortiSIEM falling behind?l Are there monitoring errors?l What is the current health of monitored devices?
To check whether FortiSIEM is able to collect monitoring data on time:
1. Go to CMDB.2. Search for the device and by typing in a string in the search window.3. Check theMonitor Status column.4. If Monitor StatusWarning or Critical, then select the Device and check the Monitor sub-tab in the bottom pane to
find out the reason.FortiSIEM is an optimized multi-threaded solution. If one node is given too many devices to monitor, each devicewith many metrics, then it may not be able to keep up. If FortiSIEM is not able to keep up (e.g. polling interval is 1minute and last poll was 3 minutes ago), then you can do one of the following:
1. Check the Monitored Device resources (CPU, memory) and the network between FortiSIEM and the MonitoredDevice. Many monitoring protocols such as SNMP, WMI will not operate under WAN type latencies (greater than10 msec).
2. Increase the polling intervals by visiting ADMIN >Setup >Monitor Performance >More >Edit Intervals.Note: If you increase polling intervals, some performance monitoring rules that require a certain number of polls in
132 User GuideFortinet Technologies Inc.

Advanced Operations Setting Devices Under Maintenance
a time window may not trigger. Please adjust those rules either by reducing the number of polls or increasing thetime window. For example, if a rule needs 3 events (polls) for a 10 min time window with original polling interval as3 min, the rule will not trigger if polling interval is changed to 4 min or higher. To make the rule trigger again, eitherreduce the number of events needed (for example, from 3 to 2) or increase the time window (for example, from 10min to 15 min).
3. Turn off some other jobs by visiting ADMIN >Setup >Monitor Performance >More >Edit Intervals.4. Deploy Collectors close to the Monitored Devices or deploy more Collectors and distribute performance
monitoring jobs to Collectors by doing re-discovery.To check for Monitoring errors:
l Go to ADMIN >Setup >Monitor Performance >More >Errors.
For details see here.
To see current health of a monitored device:
1. Go to CMDB.2. Search for the device and by typing in a string in search window.3. Choose Action >Device Health.For details, see here.
Setting Devices Under Maintenance
If a device will undergo maintenance and you do not want to trigger performance and availability rules while thedevice is in maintenance, then
1. Go to ADMIN >Setup >Maintenance2. Select the Maintenance Schedule.3. Select the Group of Devices or Synthetic Transaction Monitors (STM) for maintenance.4. Make sure theGenerate Incidents for Devices under Maintenance is checked.For details, see here
Creating Custom Monitors
Although FortiSIEM provides out of the box monitoring for many devices and applications, user can addmonitoring for custom device types or add monitoring for supported device types.
1. Go to ADMIN >Device Support >Monitoring2. ClickEnter Performance Object >New and enter the specification of the Performance Object.3. Select the Performance Object and click Test.4. ClickEnter Device Type to Performance Object Association >New and choose a set of Device Types and
associated Performance Objects.5. Go to ADMIN >Setup >Credentials and enter the Device Credentials for a set of device types specified in Step
4.6. Go to ADMIN >Setup >Discovery and discover these devices.7. FortiSIEM will pick the customer monitors defined in Step 2 if the Tests in Step 3 succeeded.
User GuideFortinet Technologies Inc.
133

Setting Important Interfaces and Processes Advanced Operations
8. Go to ADMIN >Setup >Monitor Performance and see the monitorsFrom the same tab, Select one or more devices and ClickMore >Report and check whether the monitoringevents are generated correctly.
Steps 1-4 are described here.
Steps 5 is described here.
Steps 6 is described here.
Step 8-9 are here.
Setting Important Interfaces and Processes
A network may have hundreds of interfaces and you have may have hundreds of network devices. Not allinterfaces may not be interesting for up/down and utilization monitoring. For example, you may only want tomonitor WAN links and trunk ports and leave out Access Ports. This saves you lots of CPU and storage. Similarlogic applies to critical processes on servers.
Since FortiSIEM discovers interfaces and processes, it is easy to select Critical Interfaces and Processes forMonitoring.
1. Go to ADMIN >Settings >Monitoring2. Click Important Interfaces>Enable >New and select the Interfaces.3. Click Important Processes>Enable>New and select the Processes.Note that once you select Important Interfaces and Processes, only these Interfaces and Processes will bemonitored for availability and performance.
For details, see here.
Modifying System Parsers
If you want to modify a built-in log parser, then do the following steps:
1. Go to ADMIN >Device Support >Parser.2. Select a Parser and clickDisable since you have two parsers for the same device.3. Select the same Parser and clickClone.4. Make the required modifications to the parser.5. ClickValidate to check the modified Parser syntax.6. Click Test to check the semantics of the modified Parser.7. If both Validate and Test pass, then clickEnable and then Save.
The modified Parser should show Enabled8. ClickApply to deploy the modified Parser to all the nodes.For details, see here.
134 User GuideFortinet Technologies Inc.

Advanced Operations Creating Custom Parsers
Creating Custom Parsers
If you want to create a completely new log parser, then do the following steps:
1. Go to ADMIN >Device Support >Parser.2. Parsers are evaluated serially from top to bottom in the list. Select the parser just before the current custom parser
and clickNew.3. Fill in the parser details – Name, Device Type, test Events and the parser itself.4. ClickValidate to check the syntax5. Click Test to check the semantics of the modified parser.6. If all passes, then clickEnable and then clickSave.
The newly added parser should show Enabled.7. ClickApply to deploy the change to all the nodes.For details, see here.
Handling Multi-line Syslog
When devices send the same log in multiple log messages, you can combine them into one log in FortiSIEM tofacilitate analysis and correlation.
1. Go to ADMIN >Settings >Event Handling >Multiline Syslog2. Click New to begin a multi-line syslog handling rule.3. Enter a Protocol – TCP or UDP.4. Enter a Begin Pattern and End Pattern regular expressions.
All the logs matching a begin pattern and an end pattern are combined into a single log5. ClickSave.For details, see here.
Creating Synthetic Transaction Monitors
You can define a Synthetic Transaction Monitor to monitor the health an application or a web service. To do this:
1. Go to ADMIN >Setup >STM.2. Step 1: Create a monitoring definition, clickNew and enter the required fields. When the protocol is HTTP,
then a Selenium script can be input. Specify the timeout values for detecting STM failures.3. Step 2: Apply the monitoring definition to a host4. Step 3: Make sure it is working correctly - clickMonitor Status.For details, see here.
User GuideFortinet Technologies Inc.
135

Mapping Events to Organizations Advanced Operations
Mapping Events to Organizations
In most cases, the events received by a Collector is tagged with the Organization to which the Collector belongs.In some cases, events for multiple Organizations are aggregated by an upstream device and then forwarded toFortiSIEM. In this case, FortiSIEM needs to map events to organizations based on some parsed event attribute.An example is the FortiGate VDOM attribute.
This is accomplished as follows:
1. Go to ADMIN >Settings >Event Handling >Event Org Mapping.2. ClickNew to create an Event Org mapping definition.3. Select a Device Type from the drop-down list.4. Specify the Event Attribute that contains the Organization information.5. Specify the Collector that will do this Event Org Mapping.6. Specify an IP or IP Range.7. Specify the mapping rules by clicking the edit icon next toOrg mapping. In the Event Organization Mapping
dialog box, map Event Attribute values to Organizations.For details, see here.
Adding Windows Agents
FortiSIEM Windows Agents provides a scalable way to collect performance metrics, logs and other auditviolations from a large number of Windows servers. Windows Agents (version 3.1 onwards) can be configured andmanaged from the FortiSIEM GUI. Windows Agent Manager is not required. As long as license is available, youcan install Windows Agents and register to the FortiSIEM Supervisor node.
For details about Installing Windows Agents, see Windows Agent 3.2.0 Installation Guide.
For details about Configuring Windows Agent in FortiSIEM, see here.
Adding Linux Agents
Starting release 5.2.1, Linux Agent requires a license. Install a Linux Agent and register to the FortiSIEMSupervisor node. As long as the license is available, you can install Linux Agent and register to the FortiSIEMSupervisor node. Linux Agents can be configured and managed from the FortiSIEM GUI.
For details about Installing Linux Agents, see Linux Agent Installation Guide.
For details about Configuring Linux Agent in FortiSIEM, see here.
136 User GuideFortinet Technologies Inc.

Advanced Operations Forwarding Events to External Systems
Forwarding Events to External Systems
Events received by FortiSIEM can be forwarded to external systems. FortiSIEM provides a flexible way to defineforwarding criteria and forwarding mechanism such as syslog, Kafka and Netflow.
For details, see here.
Creating New Rules
To create new Rules, go to RESOURCES >Rules, choose a folder and clickNew. Remember to test andactivate the rule.
For details, see here.
Rules can also be created from ANALYTICS tab. Once you have run a search, create a rule from it by clickingAction >Create Rule.
For details, see here.
Creating New Reports
New Reports can be created from RESOURCES >Reports > Choose a Folder > ClickNew.
For details, see here.
Reports can also be created from ANALYTICS tab. Once you have run a search, you can save it as a Report byclicking Action >Save Result.
For details, see here.
Scheduling Reports
Reports can be scheduled to run at later time and contain data for a specific period of time. Go to RESOURCES>Reports > Choose a Report >More >Schedule.
For details, see here.
Customizing Built-in Dashboards
FortiSIEM Built-in Dashboards are organized in Folders with multiple Dashboards in each Folder. You can adddashboards to any Folder or modify the dashboards in any built-in folder. Dashboard modification can include –modifying chart layout, chart settings or even adding new widgets for widget dashboards.
For details, see here.
User GuideFortinet Technologies Inc.
137

Creating Custom Dashboards Advanced Operations
You can also choose to display only a set of Dashboard Folders by visiting ADMIN >Settings >System >UI >Dashboard Settings.
Creating Custom Dashboards
You can either create a new Dashboard Folder and move dashboards in it or add dashboards to an existing folder.
To create a new Dashboard folder:
1. ClickDASHBOARD2. Open the Dashboard Folder drop-down list.3. ClickNew.To create a new Dashboard for the folder:
1. Select the Dashboard Folder from the drop-down list.2. Click + to the right of the selected folder.3. Enter a Name and Dashboard Type from the drop-down list in the Create New Dashboard dialog box.4. If you created a Widget Dashboard, click + beneath the folder name to add Widgets to the Dashboard.For details, see here.
Creating Business Service Dashboards
After creating a new Dashboard, choose Type = Business Service Dashboard. Then select the Business ServiceSelector on the top right to add Business Services to the Dashboard.
For details, see here.
Monitoring System Health
To see the system level health of every FortiSIEM Supervisor/Worker node, go to ADMIN >Health >CloudHealth. The top pane shows the overall health of various nodes – Supervisor and Workers. Click any one nodeand the bottom pane shows the health of the various processes in that node.
For details, see here.
Monitoring Collector Health
To see the system level health of every FortiSIEM Collector node, go to ADMIN >Health >Collector Health.
For details, see here.
138 User GuideFortinet Technologies Inc.

Advanced Operations Monitoring Elasticsearch Health
Monitoring Elasticsearch Health
To see the Elasticsearch health information, go to ADMIN >Health >Elasticsearch Health.
For details, see here.
System Errors
To see the system errors, click the Jobs/Errors icon on the top-right corner of FortiSIEM GUI and select theError tab. You can also run a report in ANALYTICS > click the Folders icon >Shortcuts > Top FortiSIEMOperational Errors.
Monitoring User Activity
To see FortiSIEM User Activity, click the "User Activity" icon on the top-right corner of FortiSIEM GUI. You cansee Logged in Users and what Queries they are doing and Locked out users. You can also forcefully log outspecific users.
User GuideFortinet Technologies Inc.
139

Setup Administration
Administration
TheADMIN tab provides the tools required to setup andmonitor FortiSIEM.
The following tools are available:
SetupDevice supportHealthLicenseSettings
Setup
Before initiating discovery and monitoring of your IT infrastructure, configure the following settings:
Configuring StorageSetting Organizations and Collectors (Service Provider)Setting Collectors (Enterprise)Setting CredentialsDiscovering DevicesEditing Event PullingEditing Performance MonitorsConfiguring Synthetic Transaction MonitoringConfiguring Maintenance CalendarsConfiguring Windows AgentConfiguring Linux Agent
Configuring Storagel Overviewl Configuring Online Event Database on Local Diskl Configuring Online Event Database on NFSl Configuring Online Event Database on Elasticsearchl Configuring Archive Event Database on NFSl Configuring Archive Event Database on HDFSl Changing Event Storage Options
Overview
FortiSIEM provides a wide array of event storage options. Upon arrival in FortiSIEM, events are stored in theOnline event database. The user can define retention policies for this database. When the Online event databasebecomes full, FortiSIEM will move the events to the Archive Event database. Similarly, the user can defineretention policies for the Archive Event database. When the Archive becomes full, events are discarded.
The Online event database can be one of the following:
140 User GuideFortinet Technologies Inc.

Administration Setup
l FortiSIEM EventDBl On local disk for All-in-one installationl On NFS for cluster installation
l Elasticsearchl Native installationl AWSElasticsearch
The Archive event database can be one of the following:
l FortiSIEM EventDB on NFSl HDFS
Note the various installation documents for 3rd party databases, for example.
l Elasticsearch Storage Guidel NFS Storage Guide
In this release, the following combinations are supported:
Event DB Retention
Online Archive Online Archive
FortiSIEM EventDB(local or NFS)
FortiSIEM EventDB(NFS)
Policy-based andSpace-based
Policy-based andSpace-based
Elasticsearch FortiSIEM EventDB(NFS)
Space-based Policy-based andSpace-based
Elasticsearch HDFS Space-based Space-based
Configuring Online Event Database on Local Disk
l Setting Up the Databasel Setting Up Retentionl Viewing Online Data
This section describes how to configure the Online Event database on local disk. Use this option when you havean all-in-one system, with only the Supervisor and no Worker nodes deployed.
Setting Up the Database
1. Go to ADMIN > Setup > Storage.2. ClickOnline > Local Disk.
User GuideFortinet Technologies Inc.
141

Setup Administration
3. Enter the following parameters :
Settings Guidelines
DiskName
[Required] Local disk name.During FortiSIEM installation, you can add a'Local' data disk of appropriate size as the 4thdisk. Use the command fdisk -l to find thedisk name.
If you want to configure Local Disk for thephysical 2000F or 3500F appliances, enter"hardware" in this field. This prompts a scriptto run that will configure local storage.
4. Click Test.5. If the test succeeds, clickSave.
Setting Up Retention
When Online database becomes full, then events have to be deleted to make room for new events. This can beSpace-based or Policy-based.
l Setting Up Space-Based Retentionl Setting Up Policy-Based Retentionl How Space- and Policy-Based Retention Work Together
Setting Up Space-Based Retention
Space-based retention is based on two thresholds defined in the phoenix_config.txt file on the Supervisornode.
[BEGIN phDataPurger]online_low_space_action_threshold_GB=10online_low_space_warning_threshold_GB=20[END]
When the Online Event database size in GB falls below the value of online_low_space_action_threshold_GB, events are deleted until the available size in GB goes slightly above the online_low_space_action_threshold_GB value. If Archive is defined, then the events are archived. Otherwise, theyare purged.
If you want to change these values, then change them on the Supervisor and restart phDataManager andphDataPurger modules.
Setting Up Policy-Based Retention
Policies can be used to enforce which types of event data remains in the Online event database.
For information on how to create policies, see Creating Online Event Retention Policy. Note: This is a CPU, I/O,and memory-intensive operation. For best performance, try to write as few retention policies as possible.
142 User GuideFortinet Technologies Inc.

Administration Setup
How Space- and Policy-Based Retention Work Together
1. First, Policy-based retention policies are applied.2. If the available space is still below the value of online_low_space_action_threshold_GB, then Space-
based policies are enforced.
Viewing Online Data
For more information, see Viewing Online Event Data Usage.
Configuring Online Event Database on NFS
The following sections describe how to configure the Online database on NFS.
l Setting Up the Databasel Setting Up Retentionl Viewing Online Data
Setting Up the Database
You must choose this option when you have multiple Workers deployed and you plan to use FortiSIEM EventDB.
1. Go to ADMIN > Setup > Storage.2. ClickOnline > NFS3. Enter the following parameters :
Settings Guidelines
ServerIP/Host
[Required] the IP address/Host name of theNFS server
ExportedDirectory
[Required] the file path on the NFS Serverwhich will be mounted
4. Click Test.5. If the test succeeds, clickSave.
Setting Up Retention
When the Online database becomes full, then events must be deleted to make room for new events. This can beSpace-based or Policy-based.
l Setting Up Space-Based Retentionl Setting Up Policy-Based Retentionl How Space- and Policy-Based Retention Work Together
Setting Up Space-Based Retention
Space-based retention is based on two thresholds defined in the phoenix_config.txt file on the Supervisornode.
[BEGIN phDataPurger]online_low_space_action_threshold_GB=10
User GuideFortinet Technologies Inc.
143

Setup Administration
online_low_space_warning_threshold_GB=20[END]
When the Online Event database size in GB falls below the value of online_low_space_action_threshold_GB, events are deleted until the available size in GB goes slightly above the online_low_space_action_threshold_GB value. If Archive is defined, then the events are archived. Otherwise, theyare purged.
If you want to change these values, then change them on the Supervisor and restart the phDataManager andphDataPurger modules.
Setting Up Policy-Based Retention
Policies can be used to enforce which types of event data stays in the Online event database.
For information on how to create policies, see Creating Online Event Retention Policy. Note: This is a CPU, I/O,and memory-intensive operation. For best performance, try to write as few retention policies as possible.
How Space- and Policy-Based Retention Work Together
1. First, Policy-based retention policies are applied.2. If the available space is still below the online_low_space_action_threshold_GB, then Space-based
policies are enforced.
Viewing Online Data
For more information, see Viewing Online Event Data Usage.
Configuring Online Event Database on Elasticsearch
The following sections describe how to set up the Online database on Elasticsearch:
l Setting Up the Databasel Setting Up Space-Based Retentionl Viewing Online Data
Setting Up the Database
There are three options for setting up the database:
l Elasticsearch Using REST APIl Elasticsearch Using Java Transport Clientl AWSElasticsearch Using REST API
Elasticsearch Using REST API
Use this option when you want FortiSIEM to use the REST API Client to communicate with Elasticsearch.
1. Go to ADMIN > Setup > Storage.2. ClickOnline > Elasticsearch and choose Client as Rest API and AWS = No.
144 User GuideFortinet Technologies Inc.

Administration Setup
3. Enter the following parameters:
Settings Guidelines
URL [Required] IP address or DNS name of theElasticsearch cluster Coordinating node.The IP/Hostmust contain https.
Port [Required] The port number
User Name [Optional] User name
Password [Optional] Password associated with theuser
ShardAllocation
l Fixed -Enter the number ofShards and Replicas
l Dynamic-Dynamically shardsdata using the Elasticsearchrollover API
PerOrganizationIndex
Select to create an index for eachorganization
4. Click Test5. If the test succeeds, clickSave
Elasticsearch Using Java Transport Client
Use this option when you want FortiSIEM to use Java Transport Client to communicate with Elasticsearch. This isan outdated option.
1. Go to ADMIN > Setup > Storage.2. ClickOnline > Elasticsearch and choose Client as Java Transport.3. Enter the following parameters:
Settings Guidelines
ClusterName
[Required] Name of the ElasticsearchCluster
ClusterIP/Host
[Required] IP address or DNS name of theElasticsearch cluster Coordinating node.The IP/Hostmust contain http.
HTTP Port [Required] HTTP port number
Java Port [Required] Java port number
User GuideFortinet Technologies Inc.
145

Setup Administration
Settings Guidelines
User Name [Optional] User name
Password [Optional] Password associated with theuser
ShardAllocation
l Fixed - Enter the number ofShards and Replicas
l Dynamic - Dynamically shardsdata using the Elasticsearchrollover API
PerOrganizationIndex
Select to create an index for eachorganization
4. Click Test.5. If the test succeeds, clickSave.
AWS Elasticsearch Using REST API
Use this option when you have FortiSIEM deployed in AWSCloud and you want to use AWSElasticsearch.
1. Go to ADMIN > Setup > Storage2. ClickOnline > Elasticsearch and choose Client asREST API and AWS = Yes.3. Enter the following parameters:
Settings Guidelines
URL [Required] IP address or DNS name of theElasticsearch cluster Coordinating node.The IP/Hostmust contain https.
Port [Required] The port number
User Name [Optional] User name
Password [Optional] Password associated with theuser
ShardAllocation
l Fixed -Enter the number ofShards and Replicas
l Dynamic-Dynamically shardsdata using the Elasticsearchrollover API
146 User GuideFortinet Technologies Inc.

Administration Setup
Settings Guidelines
PerOrganizationIndex
Select to create an index for eachorganization
4. Click Test.5. If the test succeeds, clickSave.
Setting Up Space-Based Retention
Elasticsearch is installed using Hot (required) and Warm (optional) nodes. The space is managed by Hot andWarm node thresholds defined in Setting Elasticsearch Retention Threshold.
l When the Hot node cluster storage capacity falls below the lower threshold, then:l if Warm nodes are defined, the events are moved to Warm nodes,l else, if Archive is defined then they are archived,l otherwise, events are purgedThis is done until storage capacity exceeds the upper threshold.
l If Warm nodes are defined and the Warm node cluster storage capacity falls below lower threshold, then:l if Archive is defined, then they are archived,l otherwise, events are purgedThis is done until storage capacity exceeds the upper threshold
Viewing Online Data
For more information, see Viewing Online Event Data Usage.
Configuring Archive Event Database on NFS
The following sections describe how to set up the Archive database on NFS:
l Setting Up the Databasel Setting Up Retentionl Viewing Archive Data
Setting Up the Database
You must choose this option when you have multiple Workers deployed and you plan to use FortiSIEM EventDB.
1. Go to ADMIN > Setup > Storage,2. ClickArchive > NFS,3. Enter the following parameters:
Settings Guidelines
ServerIP/Host
[Required] the IP address/Host name of theNFS server
User GuideFortinet Technologies Inc.
147

Setup Administration
Settings Guidelines
ExportedDirectory
[Required] the file path on the NFS Serverwhich will be mounted
4. Click Test.5. If the test succeeds, clickSave.
Setting Up Retention
When the Archive database becomes full, then events must be deleted to make room for new events. This can beSpace-based or Policy-based.
l Space-Based Retentionl Policy-Based Retentionl How Space- and Policy-Based Retention Work Together
Space-Based Retention
Space-based retention is based on two thresholds defined in phoenix_config.txt file on the Supervisornode.
[BEGIN phDataPurger]archive_low_space_action_threshold_GB=10archive_low_space_warning_threshold_GB=20[END]
When the Archive Event database size in GB falls below the value of archive_low_space_action_threshold_GB, events are purged until the available size in GB goes slightly above the value set forarchive_low_space_action_threshold_GB.
If you want to change these values, then change them on the Supervisor and restart the phDataManager andphDataPurger modules.
Policy-Based Retention
Policies can be used to enforce which types of event data remain in the Archive event database.
For information on how to create policies, see Creating Offline (Archive) Retention Policy. Note - This is a CPU,I/O, and memory-intensive operation. For best performance, try to write as few retention policies as possible.
How Space- and Policy-Based Retention Work Together
1. First, Policy-based retention policies are applied.2. If the available space is still below archive_low_space_action_threshold_GB, then Space-based
policies are enforced.
Viewing Archive Data
For more information, see Viewing Archive Data.
Configuring Archive Event Database on HDFS
The following sections describe how to set up the Archive database on HDFS:
148 User GuideFortinet Technologies Inc.

Administration Setup
l Setting Up the Databasel Setting Up Space-Based Retentionl Viewing Archive Data
Setting Up the Database
HDFS provides a more scalable event archive option - both in terms of performance and storage.
1. Go to ADMIN > Setup > Storage.2. ClickArchive > HDFS.3. Enter the following parameters:
Settings Guidelines
Spark Master Node
IP/Host IP or Host name of the Spark cluster Masternode.
Port TCP port number for FortiSIEM tocommunicate to Spark Master node.
HDFS Name Node
IP/Host IP or Host name of HDFSName node. This isthe machine which stores the HDFSmetadata:the directory tree of all files in the file system,and tracks the files across the cluster.
Port TCP port number for FortiSIEM tocommunicate to HDFSName node.
4. Click Test.5. If the test succeeds, clickSave.
Setting Up Space-Based Retention
When the HDFS database becomes full, events have to be deleted to make room for new events.
This is set by Archive Thresholds defined in the GUI. Go to ADMIN > Settings > Database > Archive Data.Change the Low and High settings, as needed.
When the HDFS database size in GB rises above the value of archive_low_space_action_threshold_GB, events are purged until the available size in GB goes slightly above the value set for archive_low_space_action_threshold_GB.
Viewing Archive Data
For more information, see Viewing Archive Data.
User GuideFortinet Technologies Inc.
149

Setup Administration
Changing Event Storage Options
It is highly recommended to chose a specific event storage option and retain it. However, it is possible to switch toa different storage type.
Note: In all cases of changing storage type, the old event data is not migrated to the new storage. ContactFortiSIEM Support if this is needed - some special cases may be supported.
For the following three cases, simply choose the new storage type from ADMIN >Setup >Storage.
l Local to Elasticsearchl NFS to Elasticsearchl Elasticsearch to Local
The following four storage change cases need special considerations:
l Elasticsearch to NFSl Local to NFSl NFS to Locall NFS to Elasticsearch to NFS
Elasticsearch to NFS
1. Log in to FortiSIEM GUI.2. Select and delete the existing Workers from ADMIN > License >Nodes >Delete.3. Go to ADMIN >Setup >Storage and update the Storage type asNFS server4. Go to ADMIN > License >Nodes and Add the recently deleted Workers in step #2.
Local to NFS
1. SSH to the Supervisor and stop FortiSIEM processes by running:phtools --stop all
2. Unmount /data by running:umount /data
3. Validate that /data is unmounted by running:df –h
4. Edit /etc/fstab and remove /datamount location.5. Log in to FortiSIEM GUI, go to ADMIN >Setup >Storage and update the Storage type asNFS server.
NFS to Local
1. SSH to the Supervisor and stop FortiSIEM processes by running:phtools --stop all
2. Unmount /data by running:umount /data
3. Validate that /data is unmounted by running:df –h
4. Edit /etc/fstab and remove /datamount location.5. Connect the new disk to Supervisor VM.6. Log in to FortiSIEM GUI, go to ADMIN >Setup >Storage and update the Storage type as Local Disk.
150 User GuideFortinet Technologies Inc.

Administration Setup
NFS to Elasticsearch to NFS
1. SSH to the Supervisor and stop FortiSIEM processes by running:phtools --stop all
2. Unmount /data by running:umount /data
3. Validate that /data is unmounted by running:df –h
4. Edit /etc/fstab and remove /data mount location.5. Repeat steps #1 to #4 on all Workers.6. Log in to FortiSIEM GUI, select and delete all the existing Workers from ADMIN > License >Nodes >Delete.7. Go to ADMIN >Setup >Storage and update the Storage type as appropriate.8. Go to ADMIN > License >Nodes and add all recently deleted Workers in step #6.
Setting Organizations and Collectors (Service Provider)FortiSIEM supports multi-tenancy via Organizations in a Service Provider deployment. The devices and logsbelonging to two Organizations are kept separate. Incidents trigger separately for Organizations.
A Collector enables FortiSIEM to collect logs and performance metrics from geographically disparate networks.Data collection protocols such as SNMP and WMI are often chatty and the devices may only be reachable fromthe Supervisor node via Internet and behind a firewall. Syslog protocol specially over UDP is unreliable andinsecure. A Collector can be deployed behind the firewall to solve these issues. The Collector registers withFortiSIEM Supervisor node and then receives commands from the Supervisor regarding discovery and datacollection. The Collector parses the logs and forwards the compressed logs to Supervisor/Worker nodes over anencrypted HTTPS channel. The Collector also buffers the logs locally for a period of time if the networkconnection to the Super/Worker is not available.
Organizations can be defined in one of two ways:
l Associating one or more Collectors to an Organization – the devices monitored by the Collector or the events sentto the Collector automatically belong to the associated Organization.
l Defining an IP range for an Organization – if the sending IP of a device belongs to the IP range, then the device andlogs belong to that Organization.
This section provides the procedures to configure an Organization for a multi-tenant FortiSIEM deployment.l Creating an Organizationl Installing a Collectorl Registering a Collector
Make sure the Worker Upload has been configured prior to defining the Collectors.
Creating an Organization
Complete these steps to add an Organization:
1. Go to ADMIN > Setup > Organizations tab.2. Click New. 3. In theOrganization Definition dialog box, enter the information below.
User GuideFortinet Technologies Inc.
151

Setup Administration
Settings Guidelines
Organization [Required] Name of the Organization
Full Name Full name of the Organization
Admin User [Required] User name that will be used two purposes: (a) Users logging in toFortiSIEM Supervisor GUI for that Organization and (b) Collector registration toSupervisor. This user has 'Full Admin' role.
Admin Password/ConfirmAdmin Password [Required] Password of the Admin user.
Admin Email [Required] Email id of the Admin user for the Organization.
Phone Contact number for the Organization
Include IP/IP Range IP range for the Organization in case the Organization is defined by IP addresses.Allowed format is comma-separated individual IPs or IP range 10.10.10.1-10.10.10.8
Exclude IP/IP Range IP range to be excluded for the Organization. Allowed format is comma-separatedindividual IPs or IP range 10.10.10.1-10.10.10.8
Agent User User name used by FortiSIEM Windows and Linux Agents to register to FortiSIEMSupervisor.
Agent Password/ConfirmAgent Password Password of Agent User.
Max Devices Maximum number of monitored CMDB devices for the Organization
Address Contact address for the Organization
4. If your Organization uses Collectors, click New underCollectors and enter the information below.
Settings Guidelines
Name [Required] Name of the Collector
Guaranteed EPS
[Required] Events from this Collector are always accepted when its eventrate is below this Guaranteed EPS. FortiSIEM will re-allocate excess EPS(license minus the sum of Guaranteed EPS over all the collectors) based onneed but the allocation will never go below the Guaranteed EPS.
Upload Rate Limit (Kbps) Maximum rate limit (in Kbps) at which a Collector can send events to allWorkers.
152 User GuideFortinet Technologies Inc.

Administration Setup
Settings Guidelines
Start Time [Required] Select a specific start date or check 'Unlimited'. Collectors willnot work outside of start and end dates if specific dates are chosen.
End Time [Required] Select a specific end date or check 'Unlimited'. Collectors willnot work outside of start and end dates if specific dates are chosen.
5. Enter theDescription about the Organization.6. Click Save.
Installing a Collector
For installing Collectors, see the "Install Collector" sections in the specific Installation Guides. See also theUpgrade Guide and the Sizing Guide.
Registering a Collector
Once a Collector has been created in the GUI, the Collector needs to be installed and registered.
For registering a Collector, follow these steps:
1. SSH to the Collector.2. Run the following command:
phProvisionCollector --add <user> <password> <super IP or host> <organization><collectorName>Refer to the tables in steps 3 and 4 here for more information about these settings:<user>, <password>, <organization>and <collectorName>
Setting Collectors (Enterprise)ACollector enables FortiSIEM to collect logs and performance metrics from geographically disparate networks.Data collection protocols such as SNMP and WMI are often chatty and the devices may only be reachable fromthe Supervisor node via Internet and behind a firewall. Syslog protocol, especially over UDP, is unreliable andinsecure. A Collector can be deployed behind the firewall to solve these issues. The Collector registers withFortiSIEM Supervisor node and then receives commands from the Supervisor regarding discovery and datacollection. The Collector parses the logs and forwards the compressed logs to Supervisor/Worker nodes over anencrypted HTTPS channel. The Collector also buffers the logs locally for a period of time if the networkconnection to the Super/Worker is not available.
This section provides the procedures to configure a Collector in Enterprise deployment.l Adding a Collectorl Installing a Collectorl Registering a Collector
Make sure the Worker Upload has been configured prior to defining the Collectors.
Adding a Collector
Complete these steps to add an Collector:
1. Go to ADMIN > Setup > Collector tab.2. Click New.
User GuideFortinet Technologies Inc.
153

Setup Administration
3. In theEvent Collector Definition dialog box, enter the information below.
Settings Guidelines
Name [Required] Collector name
Guaranteed EPS
[Required] Events from this Collector are always accepted when its event rate isbelow this Guaranteed EPS. FortiSIEM will re-allocate excess EPS (license minusthe sum of Guaranteed EPS over all the collectors) based on need but theallocation will never go below the Guaranteed EPS.
Upload Rate Limit (Kbps) Maximum rate limit (in Kbps) at which a Collector can send events to all Workers.
Start Time [Required] Select a specific start date or check 'Unlimited'. Collectors will not workoutside of start and end dates if specific dates are chosen.
End Time [Required] Select a specific end date or check 'Unlimited'. Collectors will not workoutside of start and end dates if specific dates are chosen.
4. Click Save.
Installing a Collector
For installing Collectors, see the "Install Collector" sections in the specific Installation Guides. See also theUpgrade and Sizing Guides here.
Registering a Collector
Once a Collector has been created in the GUI, the Collector needs to be installed and registered.
For registering a Collector, follow these steps:
1. SSH to the Collector.2. Run the following command:
phProvisionCollector --add <user> <password> <super IP or host> <organization><collectorName>Refer to the tables in steps 3 and 4 here for more information about these settings:<user>, <password>, <organization>and <collectorName>
Setting CredentialsFortiSIEM communicates with various systems to collect operating system/hardware/software information, logs,and performance metrics. This section provides the procedures to set up a device credential and associate themto an IP or IP range.
l Creating a Credentiall Associating a Credential to IP Ranges or Hostsl Testing Credentials and API Event Collectionl Modifying Device Credential
154 User GuideFortinet Technologies Inc.

Administration Setup
l Modifying a Credential Associationl Credentials Based on Access Protocol
Creating a Credential
Complete these steps to create a login credential:
1. Go to ADMIN >Setup > Credentials tab.2. Under Step 1: Enter Credentials section, clickNew.3. In the Access Method Definition dialog box, enter the information below.
Settings Guidelines
Name [Required] Name of the credential that will be used for reference purpose.
Device Type Type of device from the drop-down.
Access Protocol Type of access protocol from the drop-down. Note that this list depends on theselected device type.
Port TCP/UDP Port number for communicating to the device for the access protocol.
Password config ChooseManual orCyberArk.-Manual: The credentials will be defined and stored in FortiSIEM. See the tablebelow for the corresponding device type configuration settings.-CyberArk: FortiSIEM will get credentials from CyberArk password Vault. See"CyberArk Password Configuration" in the External Systems ConfigurationGuide for configuration settings.
4. Enter the options in the remaining fields that appear based on the Device Type selection.5. ClickSave.
Associating a Credential to IP Ranges or Hosts
The association is on a per-Collector basis.
1. Under Step 2: Enter IP Range to Credential Associations section, clickNew.2. In the Device Credential Mapping Definition dialog box, enter the information below.
Settings Guidelines
IP/Host Name [Required] Host name, IP address or IP range to associate with a credential. Allowed IPrange syntax is single IP, single range, single CIDR or a list separated by comma – e.g.10.1.1.1, 10.1.1.2,20.1.1.0/24, 30.1.1.1-30.1.1.10. Host names are only allowed for aspecific set of credentials see below.
Credentials Select one or more credentials by name. Use + to add more.
3. ClickSave.
User GuideFortinet Technologies Inc.
155

Setup Administration
Testing Credentials and API Event Collection
Credentials can be tested to ensure that they are working correctly and do not perform a full discovery, andtherefore provide results more quickly.
Test Connectivity also has a special function for certain Device API integrations. Instead of performing separateDiscovery to integrate FortiSIEM with a Device API, clicking Test Connectivitywill test the credential and startcollecting event from the API. The External System Configuration Guide details Device integrations that requireonly this step to collect events.
1. Select an association.2. Click Test after choosing:
l Test Connectivity – the device will be pinged first and then the credential will be attempted. Thisshortens the test connectivity process in case the device with specified IP is not present or reachable.
l Test Connectivity without Ping – the credential will be attempted without pinging first.3. Check the test connectivity result in the pop up display.
Modifying Device Credentials
Complete these steps to modify device credentials:
1. Select an association from the list and click the required option.l Edit - to modify any credential settings.l Delete - to delete a credential.l Clone - to duplicate a credential.
2. ClickSave.
Modifying a Credential Association
Complete these steps to modify a credential association:
1. Select the credential association from the list and click the required option under Step 2: Enter IP Range toCredential Associations:
l Edit - to edit an associated IP/IP rangel Delete - to delete any association
2. ClickSave.
Credentials Based on Access Protocol
For information on the credential configuration settings for selected devices, see the External SystemsConfiguration Guide.
Discovering DevicesFortiSIEM automatically discovers devices, applications, and users in your IT infrastructure and start monitoringthem. You can initiate device discovery by providing the credentials that are needed to access the infrastructurecomponent, and from there FortiSIEM will discover information about your component such as the host name,operating system, hardware information such as CPU and memory, software information such as runningprocesses and services, and configuration information. Once discovered, FortiSIEM will also begin monitoringyour component on an ongoing basis.
156 User GuideFortinet Technologies Inc.

Administration Setup
This section provides the procedures for discovering devices.
l Creating a discovery entryl Discovering on demandl Scheduling a discoveryl Searching previous discovery resultsl Editing a discoveryl Exporting discovery results
Creating a discovery entry
Complete these steps to create a discovery:
1. Go to ADMIN >Setup > Discovery tab.2. ClickNew.3. In the Range Definition dialog box, enter the information below.
Settings Guidelines
Name [Required] Name of the discovery entry that will be used for reference.
Discovery Type
Select the type of discovery:l Range Scan - FortiSIEM will sequentially discover each device in one or more
IP ranges and CIDR subnets.l Smart Scan - FortiSIEM will first discover the Root IP, which will provide a list
of devices that it knows about. Then FortiSIEM will discover each of thedevices learnt from the Root IP device. Each of these devices will provide a listof devices they know about, which FortiSIEM will then discover. This processcontinues until the list of known devices is exhausted.
l AWS Scan - FortiSIEM will discover the devices in Amazon Web Services(AWS) Cloud learnt via AWSSDK. For AWSScan to succeed, there needs tobe an AWSCredential mapped to aws.com or amazon.com in the IP toCredential mapping.
l L2 Scan - FortiSIEM will discover only the Layer 2 connectivity of the devices.l Azure Scan - FortiSIEM will discover the devices in Azure Cloud learnt via
Azure SDK. For Azure Scan to succeed, there needs to be a Credentialmapped to azure.com in the IP to Credential mapping.
Root IPs IP address of the Starting device for Smart Scan. See Smart scan definition above.
Include[Required] A list of IP addresses that will be included for discovery. Allowed IP rangesyntax is single IP, single range, single CIDR or a list separated by comma – e.g.10.1.1.1, 10.1.1.2,20.1.1.0/24, 30.1.1.1-30.1.1.10.
Exclude A list of IP addresses that will be excluded for discovery. Allowed IP range syntax issingle IP, single range, single CIDR or a list separated by comma – e.g. 10.1.1.1,10.1.1.2,20.1.1.0/24, 30.1.1.1-30.1.1.10.
User GuideFortinet Technologies Inc.
157

Setup Administration
Settings Guidelines
Include Types A list of device Types that will be included for discovery. Click the edit icon to configurethe Range Definition and Save.
Exclude Types A list of device Types that will be excluded for discovery. Click the edit icon toconfigure the Range Definition and Save.
Name resolution
Host names can learn from DNS look up or SNMP/WMI. If these do not match, thenchoose which discovery method with higher priority. For example, if DNS is chosenthen FortiSIEM will get host names from DNS. If DNS lookup fails for an IP, the hostnames will be obtained from SNMP/WMI.
Options Select the options for this discovery:-Do not ping before discovery: Device will not be pinged before attempting thecredentials.- Ping before discovery: Device will be pinged before attempting the credentials. Asuccessful ping can shorten discovery times; since FortiSIEM may have to wait for aprotocol timeout in case of failed credentials.-Winexe based discovery - for windows servers, we discover HyperVmetrics andother AD replication metrics via Winexe. However, winexe installs a service anduninstalls the service after it finishes for certain old OS. This setting enables to controlthis behavior.-Only discover devices not in CMDB-Discover Routes: Routes help to discover neighboring devices for Smart Scan but“show route” can be expensive for BGP routers. This selection provides a way tocontrol this behavior.- Include powered off VMs: This allows the administrator to control whetherpowered off VMs will be discovered during VCenter discovery- Include VM templates: This allows the administrator to control whether VMtemplates will be discovered during VCenter discovery.- Set discovered devices as unmanaged: This allows the administrator to set thediscovered devices as unmanaged.
4. ClickSave.
Discovering on demand
1. Go to ADMIN > Setup > Discovery.2. Select the required discovery from the table.3. ClickDiscover.4. ClickResults to view the discovery result.5. ClickErrors to check for any errors found during discovery.
Use the Run in Background to run discovery in background while performing other operations.6. After successful discovery, Discovery Completed. message is displayed with the discovery results.
158 User GuideFortinet Technologies Inc.

Administration Setup
Scheduling a discovery
Discovery can be a long-running process when performed on a large network, or over a large IP range, and so youmay want to schedule it to occur when there is less load on your network or during off hours. You may also want toset up a schedule for the process to run and discover new devices on a regular basis.
1. Go to ADMIN > Setup > Discovery.2. ClickScheduled.3. UnderDiscovery Schedule dialog box, clickNew.4. Select from the available ranges.
You can select multiple ranges and set the order in which discovery will run on them using the up and downarrows.
5. Set the time at which you want discovery to run. l For a one-time scheduled discovery, select the Start Time.l For recurring discoveries, select how often (hourly, daily, weekly, monthly), you want discovery to run, and
then enter other scheduling options. 6. ClickSave.
Searching previous discovery results
Complete these steps to search previously discovered results:
1. Go to ADMIN > Setup > Discovery.2. Select a discovery result.3. ClickHistory.4. In the Discovery History dialog box, clickView Results, View Errors or View Changes to see the related
information.
Editing a discovery
Complete these steps to modify discovery settings:
1. Select the required option from the table below.l Edit - to edit any scheduled discovery settings.l Delete - to delete any scheduled discovery.
2. ClickOK.
Exporting discovery results
Complete these steps to export discovery history:
1. ClickHistory.2. In the Discovery History dialog box, select the discovery type.3. Based on the type of information required, select the required option:
- View Results - to see the discovery results- View Errors - to see the errors during discovery- View Changes - to see the changes in discovery
4. ClickExport based on your selection in step#3.5. Optional - Enter the User Notes.6. Select theOutput Format asPDF orCSV.
User GuideFortinet Technologies Inc.
159
Setup Administration
7. ClickGenerate.'Export successful message' is displayed under Export Report dialog box.
8. ClickView to see the discovery results.
Editing Event PullingAfter discovery is complete, FortiSIEM starts pulling events from devices with correct credentials. Examplesinclude Windows Servers via WMI, VMWare VCenter via VMWare SDK, AWSCloudTrail via AWSSDK, etc.
The following section describes the procedures to see the status of these event pulling jobs and turn them on/off.
l Viewing event pulling jobsl Modifying event pulling jobsl Checking status of event pulling jobsl Exporting event pulling jobs into a reportl Viewing event pulling reports
Viewing event pulling
Complete these steps to enable event pulling:
1. Go to ADMIN >Setup > Pull Events tab.2. See the listed jobs:
l Enabled – the job is enabled at a device level.l Device name – name of the device in CMDB.l Access IP – IP address with which FortiSIEM accesses this device.l Device Type – the device type in CMDB.l Organization – the organization to which this device belongs (for a multi-tenant FortiSIEM install).l Method – the event pulling method – format - credential name (Access Protocol).l Maintenance – indicates if this device is in maintenance or not.
3. See Enabled option to view the enabled device.4. Select Errors to view the list of errors, if any.
Modifying event pulling jobs
Complete these steps to enable/disable event pulling at all device level (all jobs will be enabled/disabled).
1. Go to ADMIN >Setup > Pull Events tab.2. Select the device from the list.3. Select All check-box to enable all jobs or deselect to disable.4. ClickApply.Complete these steps to enable/disable a specific event pulling job for a device:
1. Go to ADMIN >Setup >Pull Events tab.2. Select the device from the list.3. ClickEdit.4. Check the specific job to enable/disable.5. ClickApply.
160 User GuideFortinet Technologies Inc.

Administration Setup
Checking status of event pulling jobs
Complete these steps to the status of event pulling jobs:
1. Go to ADMIN >Setup >Pull Events tab.2. Select the device from the list.3. Hover over the method column – the tool tip shows the Execution Status.4. To see the events generated from the event pulling job, clickReport.
A report is run for all the events generated by this event pulling job in the last 10 minutes.
Exporting event pulling jobs into a report
Complete these steps to export an event pulling job report:
1. Go to ADMIN >Setup >Pull Events tab.2. ClickExport.3. Optional - Enter the User Notes.4. Select the output format to PDF orCSV and clickGenerate.5. ClickView to download and view the report.
Viewing event pulling reports
1. Go to ADMIN >Setup >Pull Events tab.2. Select Super/Local orOrg with collector or use the Search field to view any related jobs.
Editing Performance MonitorsAfter the discovery is complete, FortiSIEM starts monitoring successfully discovered devices for performance,availability and change. The following section describes the procedure to see the status of these performancemonitoring jobs and edit them.
l Viewing performance monitoring jobsl Enabling/Disabling performance monitoring jobsl Modifying performance monitoring jobs
Viewing performance monitoring jobs
1. Go to ADMIN >Setup > Monitor Performance tab.2. To check the Device Health details, select the device from the list and click the drop-down near the device name.3. To check the errors during the monitoring job, select the device and clickMore >Errors.4. To export a Performance Monitor, select the device and clickMore >Export Monitors.5. To generate a Performance Monitoring report for any device(s), select the device and clickMore >Report.
Enabling/Disabling performance monitoring jobs
Complete these steps to enable/disable performance monitoring at a device level – all jobs will beenabled/disabled:
1. Go to ADMIN >Setup >Monitor Performance tab.2. Select the device from the list.
User GuideFortinet Technologies Inc.
161

Setup Administration
3. Select Enabled check-box to enable and select again to disable.4. ClickApply.
Modifying performance monitoring jobs
Complete these steps to enable/disable a specific performance monitoring job for a device:
1. Change the Scope to Local and go to ADMIN >Setup >Monitor Performance tab.2. Select the device from the list.3. ClickMore and select the required option:
l Edit System Monitors to select the Protocols and clickSave.l Edit App Monitors to select the Protocols and clickSave.
4. ClickSave.5. ClickApply.Another way to enable/disable a specific job or tune monitoring intervals for specific jobs for all devices:
1. Go to ADMIN >Setup >Monitor Performance tab.2. ClickMore >Edit Intervals.3. In the Set Intervals pop-up:
l Choose the Monitor on the left panel.l Choose the device on the middle panel.l Click >> to move the chosen jobs on the chosen devices to the right panel.l Choose the new polling interval or choose Disabled.l ClickSave.
4. ClickApply.
Configuring Synthetic Transaction MonitoringA Synthetic Transaction Monitoring (STM) test lets you test whether a service is up or down, and measure theresponse time. An STM test can range from something as simple as pinging a service, to complex as sending andreceiving an email or a nested Web transaction.
This section provides the procedures to set up Synthetic Transaction Monitoring tests.
l Create monitoring definitionl Create STM testl Edit monitoring definitionl Protocol settings for STM tests
Creating monitoring definition
Complete these steps to create monitor definitions:
1. Go to ADMIN >Setup > STM tab.2. Under Step 1: Edit Monitoring Definitions, clickNew.3. In the Add Monitor Definition dialog box, enter the information below.
a. Name – enter a name that will be used for reference.b. Description – enter a description.c. Frequency – how often the STM test will be performed.
162 User GuideFortinet Technologies Inc.

Administration Setup
d. Protocol - See 'Protocol Settings for STM Tests' for more information about the settings and test resultsfor specific protocols.
e. Timeout – when the STM test will give up when it fails.f. Probe Settings - enter the timeout period in seconds.
4. ClickSave.
Creating an STM test
Complete these steps to create an STM test:
1. Go to ADMIN >Setup > STM tab.2. Under Step 2: Create synthetic transaction monitoring entry by associating host name to monitoring
definitions, select New.3. ClickNew and enter the following information:
a. Monitoring Definition – enter the name of the Monitor (previous step).b. Host name or IP/IP Range – enter a host name or IP or IP range on which the test will be performed.c. Service Ports – click the Port(s) on which the test will be performed. To add/delete Ports, click +/-.d. CheckSSL option to enable SSL for encryption.e. Click Test and Save to test and save the changes.f. ClickApply.
Editing monitoring definition
Complete these steps to modify monitor definition settings:
1. In the Step 1: Edit Monitoring Definitions dialog box, click the tab based on the required action.
Tab Description
Edit To modify the Monitoring Definitions.
Delete To delete the selected Monitoring Definition.
Clone To duplicate the selected Monitoring Definition.
2. ClickSave.
Protocol settings for STM tests
This table describes the settings associated with the various protocols used for Creating monitoring definition.
User GuideFortinet Technologies Inc.
163

Setup Administration
Protocol Description Settings Notes
Ping Checks packet lossand round trip time.
Maximum Packet Loss PCT: tolerablepacket loss.
Maximum Average Round Trip Time:tolerable round trip time (seconds) fromFortiSIEM to the destination and back.
If either of these two thresholds areexceeded, then the test is considered asfailed.
Make sure the device isaccessible from theFortiSIEM node from whichthis test is going to beperformed.
LOOPEmail
This test sends anemail to anoutbound SMTPserver and thenattempts to receivethe same emailfrom a mailbox viaIMAP or POP. Italso records theend-to-end time.
Timeout: the time limit by which the endto end LOOPEMAIL test must complete.
Outgoing Settings: these specify theoutgoing SMTP server account for sendingthe email.
l SMTP Server: name ofthe SMTP server.
l User Name: user accounton the SMTP server.
l Email Subject: content ofthe subject line in the testemail.
Incoming Settings: These specify theinbound IMAP or POP server account forfetching the email.
l Protocol Type: chooseIMAP or POP.
l Server: name of the IMAPor POP server.
l User Name: user accounton the IMAP or POPserver.
l Email Subject: content ofthe subject line in the testemail.
Before you set up the testyou must have set upaccess credentials for anoutbound SMTP accountfor sending email, and aninbound POP/IMAPaccount for receiving email.
164 User GuideFortinet Technologies Inc.

Administration Setup
Protocol Description Settings Notes
HTTP(S) -SeleniumScript
This test uses aSelenium script toplay back a series ofwebsite actions inFortiSIEM.
Upload: select the java file you exportedfrom Selenium.Total Timeout: the script must completeby this time or the test will be consideredfailed.Step Timeout: each step must completeby this time.
How to export:l Make sure
Selenium IDE isinstalled withinFirefox browser.
l Open Firefox.l Launch Tools >
Selenium IDE.From now on,Selenium isrecording useractions.
l Visit websites.l Once done, stop
recording.l Click File > Export
Test case as > Java/ Junit 4/WebDriver.
l Save the file as.java in yourdesktop. This filehas to be inputtedin FortiSIEM.
HTTP(S) -Simple
This test connectsto a URI over HTTP(s) and checks theresponse time andexpected results.
URL: the URI to connect to.Authentication: any authenticationmethod to use when connecting to thisURI.Timeout: this is the primary successcriterion - if there is no response within thetime specified here, then the test fails.Contains: an expected string in the testresults.Does Not Contain: a string that shouldnot be contained in the test results.Response Code: an expected HTTP(S)response code in the test results. Thedefault is set to 200 - 204.
User GuideFortinet Technologies Inc.
165

Setup Administration
Protocol Description Settings Notes
HTTP(S) -Advanced
This test uses HTTPrequests to connectto a URI over HTTP(s), and checks theresponse time andexpected results.
Click + to add an HTTP request to runagainst a URI.
URI: the URI to run the test against.SSL: Whether or not to use SSL whenconnecting to the URI, and the port toconnect on.Authentication: the type ofauthentication use when connecting to theURI.Timeout: this is the primary successcriterion - if there is no response within thetime specified here, then the test fails.Method Type: the type of HTTP requestto use.Send Parameters: click + or the Pencilicon to add or edit any parameters for therequest.Contains: an expected string in the testresults.Does Not Contain: a string that shouldnot be contained in the test results.Response Code : an expected HTTP(S)response code in the test results. Thedefault is set to 200 - 204.Store Variables as Response Data forLater Use: click + or the Pencil icon toadd or edit any variable patterns thatshould be used as data for later tests.
TCP
This test attemptsto connect to thespecified port usingTCP.
Timeout: this is the single successcriterion. If there is no response within thetime specified here, then the test fails.
DNS Checks responsetime and expectedIP address.
Query: the domain name that needs to beresolved.Record Type: the type of record to testagainst.Result: specify the expected IP addressthat should be associated with the DNSentry.Timeout: this is the primary successcriterion - if there is no response within thetime specified here, then the test fails.
166 User GuideFortinet Technologies Inc.

Administration Setup
Protocol Description Settings Notes
SSH
This test issues acommand to theremote server overSSH, and checksthe response timeand expectedresults.
Remote Command: the command to runafter logging on to the system Timeout: this is the primary successcriterion - if there is no response within thetime specified here, then the test fails.
Contains: an expected string in the testresults.
You must set up an SSHcredential on the targetserver before setting up thistest. As an example test,you could set RawCommand to ls, and thenset Contains to the nameof a file that should bereturned when thatcommand executes on thetarget server and directory.
LDAP This test connectsto the LDAP server,and checks theresponse time andexpected results.
Base DN: an LDAP base DNyou want to run the test against.Filter: any filter criteria for theBase DN.Scope: any scope for the test.Timeout: this is the primarysuccess criterion - if there is noresponse within the timespecified here, then the testfails.Number of Rows: theexpected number of rows in thetest results.Contains: an expected string inthe test results.Does Not Contain: a stringthat should not be contained inthe test results.
You must set up an accesscredential for the LDAPserver before you can setup this test
IMAPThis tests checksconnectivity to theIMAP service.
Timeout: this is the single successcriterion - if there is no response within thetime specified here, then the test fails.
POP This test checksconnectivity to theIMAP service.
Timeout: this is the single successcriterion - if there is no response within thetime specified here, then the test fails.
SMTPThis test checksconnectivity to theSMTP service.
Timeout: this is the single successcriterion - if there is no response within thetime specified here, then the test fails.
User GuideFortinet Technologies Inc.
167

Setup Administration
Protocol Description Settings Notes
JDBC This test issues aSQL command overJDBC to a targetdatabase, andchecks the responsetime and expectedresults.
JDBC Type: the type of database toconnect to.Database Name: the name of the targetdatabase.SQL: the SQL command to run againstthe target database.Timeout: this is the primary successcriterion - if there is no response within thetime specified here, then the test fails.Number of Rows: the expected numberof rows in the test results.Contains: an expected string in the testresults.Does Not Contain: a string that shouldnot be contained in the test results.
FTP
This test issues aFTP command tothe server andchecks expectedresults.
Anonymous Login: choose whether touse anonymous login to connect to theFTP directory.Remote Directory: the remote directoryto connect to.Timeout: this is the primary successcriterion - if there is no response within thetime specified here, then the test fails.
168 User GuideFortinet Technologies Inc.

Administration Setup
Protocol Description Settings Notes
TRACEROUTE
This test issues atrace routecommand to thedestination andparses the results tocreate PH_DEV_MON_TRACEROUTEevents, one for eachhop.
Timeout: If there is no response from thesystem within the time specified here, thenthe test fails. Protocol Type: Specifies the IP protocolover which trace route packets are send -current options are UDP, TCP and ICMP.Max TTL: Max time to live (hop) valueused in outgoing trace route probepackets.Wait Time: Max time in seconds to waitfor a trace route probe response.
For the trace route from AOto destination D via hopsH1, H2, H3, FortiSIEMgenerates 3 hop by hopPH_DEV_MON_TRACEROUTE events.First event: Source AO,destination H1,Min/Max/Avg RTT, PacketLoss for this hop.Second event: Source H1,destination H2,Min/Max/Avg RTT, PacketLoss for this hop.Third event: Source H2,destination H3,Min/Max/Avg RTT, PacketLoss for this hop.Fourth event: Source H3,destination D,Min/Max/Avg RTT, PacketLoss for this hopFourth event: Source H3,destination D,Min/Max/Avg RTT, PacketLoss for this hop.
When an STM test fails, three system rules are triggered, and you can receive an email notification of that failureby creating a notification policy for these rules:
l Service Degraded - Slow Response to STM: Detects that the response time of an end-user monitored serviceis greater than a defined threshold (average over 3 samples in 15 minutes is more than 5 seconds).
l Service Down - No Response to STM:Detects a service suddenly went down from the up state and is no longerresponding to synthetic transaction monitoring probes.
l Service Staying Down - No Response to STM: Detects a service staying down, meaning that it went from up todown and did not come up, and is no longer responding to end user monitoring probes.
Configuring Maintenance CalendarsAMaintenance Calendar displays when a device is undergoing maintenance (likely due to hardware and softwareupgrades). When a device is in maintenance, it is not monitored for performance, availability and change and thecorresponding rules do not trigger.
This section provides the procedures to set up maintenance calendars.l Create a maintenance calendar
l Specifying a schedulel Specifying the devices under maintenance
User GuideFortinet Technologies Inc.
169

Setup Administration
l Viewing existing maintenance calendarsl Modifying existing maintenance calendars
Create a maintenance calendar
Complete these steps to schedule maintenance:
1. Go to ADMIN >Setup > Maintenance tab.2. ClickNew and specify the following:
Settings Guidelines
Name [Required] Name of the Calendar. This will be displayed on the Calendar.
Description Description or details about this schedule.
Schedule [Required] Specify the times during which devices will be in maintenance.
Groups/Devices Specify the groups/devices and Synthetic Transaction Monitoring (STM) tasksthat will be in maintenance.
3. Optional - To generate incidents during maintenance, enableGenerate Incidents for Devices underMaintenance.
4. ClickSave.
Specifying a schedule
1. Click the Schedule drop-down list in the Device Maintenancewindow.2. Enter values for the following options:
l Time Range specifies start time (within the day) and the duration of the maintenance window.l Recurrence Pattern specifies if and how the maintenance window will repeat.
l If the maintenance window is one time:a. Select Once forRecurrence Pattern.b. Select the specific date on the Recurrence Range.
l If the maintenance window should repeat on certain days of the week:a. Select Recurring Days and select the Repeat Days and Repeat months.b. Select the start and end dates for Recurrence Range.
l If the maintenance window should repeat on certain months of the year:a. Select Recurring Months and select the Repeat Months.b. Select the Start From/End By dates for Recurrence Range or select No end date to
continue the recurrance forever.3. ClickSave to apply the changes.
Specifying the devices under maintenance
1. Click theGroups/Devices drop-down list in the Device Maintenance dialog box.2. From the Folders on the left pane, select either the Devices folder or the STM folder of all the STM jobs defined
so far.
170 User GuideFortinet Technologies Inc.

Administration Setup
3. From the devices/STM jobs shown in the middle pane, select the appropriate ones and click > for them to appearin the right Selections pane.
4. To select all devices in a folder, select the folder on the left windows and click >> to move the folder into the rightwindow.
5. ClickSave.
Viewing existing maintenance calendars
The existing maintenance calendars can be displayed in various time windows. These options are available onthe top-right:
l Monthly view - clickMonth.l Weekly view - clickWeek or List (Week).l Day view - clickDay.
You can navigate to a specific month on the Calendar, click the < and > buttons on the top-left of the Calendar.To view the current Maintenance, clickCurrent.
Modifying existing maintenance calendars
Complete these steps to modify a maintenance schedule:
1. Select the schedule from the Calendar.2. Click the tab based on the required action:
l Edit - to edit the scheduled maintenance settings.l Delete - to delete the scheduled maintenance.
3. ClickSave.
Configuring Windows AgentStarting with version 3.0, Windows Agents can be configured and managed from the FortiSIEM Supervisor node.Windows Agent Manager is not required.
Before proceeding, follow the instructions in the Windows Agent 3.2.0 Installation Guide to complete these steps:
1. Install the Windows Agent using the correct installation file.2. Make sure the Agent appears in the CMDB page of the FortiSIEM GUI, using the host name defined in the
installation file.3. Configure the Windows Server to receive the types logs of interest (see Configuring Windows Servers for
FortiSIEM Agents in the Windows Agent 3.2.0 Installation Guide).To receive logs from Windows Agent, you must complete the following steps:
1. Define Windows Agent Monitor Templates2. Associate Windows Agents to TemplatesOnce these steps are completed, the Supervisor node will distribute monitoring policies to the Agents and you willbe able to see events in FortiSIEM.
This section also covers these topics:
l Viewing Agent Statusl Enabling or Disabling an Agentl Viewing Files in FortiSIEM
User GuideFortinet Technologies Inc.
171

Setup Administration
l Verifying Events in FortiSIEMl Sample Windows Agent Logs
Define the Windows Agent Monitor Templates
AWindowsMonitoring Template consists of:
l Log Settings: Windows Event Logs and Log Filesl Change Settings: File Integrity Monitoring, Registry Changes, Installed Software Changes, Removable medial Script Settings: WMI Classes and PowerShell Scripts
Complete these steps to add a Windows Agent Monitor Template:
1. Go to ADMIN > Setup >Windows Agent tab.2. Click New under the sectionWindows Agent Monitor Templates.3. In theWindows Agent Monitor Template dialog box, enter the information under each tab with reference to
the tables below.
a. Configure theGeneric settings with reference to the table below:
Generic settings Guidelines
Name Enter the name of the Windows Agent Monitor Template. This name is used asa reference in Template associations.
Description Enter a description of the Windows Agent Monitor Template.
b. Configure theEvent settings with reference to the table below. Make sure you have completed thesesteps from theWindows Agent 3.2.0 Installation Guide:
l To enable DNS logging, follow the steps in Configuring Windows DNS.l To enable DHCP logging, follow the steps in Configuring Windows DHCP.l To enable IIS logging, follow the steps in Configuring Windows IIS.l To get sysmon events, follow the steps in Configuring Windows Sysmon.
172 User GuideFortinet Technologies Inc.

Administration Setup
Event settings Guidelines
Event Log To configure Event log settings:
a. Select the Type of log from the drop-down:l Application— Events that are logged byWindows
Application. Select All, Exchange Server or SQL Server asSource.
l Security— Log that contains records of login/logout activityor other security-related events specified by the system's auditpolicy.
l System— Events that are logged by the operating systemcomponents.
l DFS— Logs to identify the users who accessed theDistributed File System.
l DNS— DNSDebug logs and Name Resolution Activity logs.l Hardware Events— Events related to hardware.l Key Management Service— Events related to creation and
control of keys used to encrypt your data.l Setup— Log files for all actions that occur during installation.l Windows PowerShell— Logs related to Windows
PowerShell.l Other— Any other log type (specify the name under EventName setting.)
b. Enter the events to be included under Include Event and the ones toexclude under Exclude Event.
c. Configure theUser Log settings with reference to the table below:
User Log settings Guidelines
User Log ClickNew to add the custom log files that must be monitored:
l File/Directory—Path to the file/directory.l Log Prefix—Any prefix to the identify events from this file/directory for
better accessibility.
d. Configure the FIM settings with reference to the table below. Make sure you have completed thesesteps from theWindows Agent 3.2.0 Installation Guide:
l To enable logging appropriately, follow the steps in Configure Security Audit Logging Policy.l To get user meta data in the file auditing logs, follow the steps in Configure File Auditing Policy.l To enable change events for permission and/or ownership changes to files and/or directories,
follow the steps in Configure Audit File System Policy.
User GuideFortinet Technologies Inc.
173

Setup Administration
FIM settings Guidelines
FIM To include the file directory details:
a. ClickNew to add the file directory details:l File/Directory— Enter the full path of the file directory:l Include Subfolder(s)— Select if you must include the
directory sub-folders.l Exclude Subfolder(s)— Enter any sub-folders to exclude, if
any.l Include File Type— Enter the file types to include separated
by a semi-colon.l Exclude File Type— Enter the file types to exclude, if any,
separated by a semi-colon.l On Modify:
l Push Files—Select this if you want Windows Agent topush files to FortiSIEM whenever there is a change.The files are stored in SVN and are accessible from theSupervisor. These files are displayed in CMDB >Device > File. Send only important files, as this can fillup disk space.
l Compare Baseline—Select this if you want to bealerted when the file changes from a baseline. This iscommon for configuration files that rarely change. Ifyou choose this option, you will be asked to provide acopy of the baseline file. ClickChoose File and uploadthe file from your workstation. The Supervisor willcompute the MD5 checksum and distribute thechecksum to the agents for comparison.
b. ClickSave.Use the Edit/Delete buttons to modify/remove any file directoryinformation.
e. Configure theChange settings with reference to the table below:
174 User GuideFortinet Technologies Inc.

Administration Setup
Change settings Guidelines
Registry Change Select the required key(s) to monitor:
l HKEY_CLASSES_ROOT—key that contains file extensionassociation information, as well as a programmatic identifier, Class ID,and Interface ID data.
l HKEY_CURRENT_USER—key that contains configurationinformation for Windows and software specific to the currently logged inuser.
l HKEY_LOCAL_MACHINE—hive that contains the majority of theconfiguration information for the software you have installed, as well asfor the Windows Operating System.
l HKEY_USERS—key that contains user-specific configurationinformation of all currently active users on the computer.
l HKEY_CURRENT_CONFIG—key that acts as a shortcut to a registrykey which keeps information about the hardware profile currently used.
Check Every Set the time period to check the Registry Change in Minute(s) or Hour(s).
Installed SoftwareChange
Select to enable monitoring of any installed software change.
Removable Drive
Select the removable drive to track:
l USB drive(s)l CD-DVD drive(s)
f. Configure theScript settings with reference to the table below:
Script settings Guidelines
WMI Classes To include a WMI Class:
a. ClickNew to add a newWMI Class. Select the Name,WMI Class,and Attributes from the drop-down lists (Use ';' as the separator).
b. Set the time period to monitor in Minute(s) or Hour(s) underCheckEvery setting.
Use the Edit/Delete buttons to modify/remove anyWMI Classes.
PowerShell Script To include a PowerShell Script:
ClickNew to add a new PowerShell Script and enter the Name andScript.
Use the Edit/Delete buttons to modify/remove any PowerShellScript.
User GuideFortinet Technologies Inc.
175

Setup Administration
4. Click Save.Use theEdit button tomodify any template orDelete button to remove any Windows Agent Monitor template.
Associate Windows Agents to Templates
After defining the monitoring templates, you must associate hosts to templates. To scale to a large number ofhosts, this is done via Policies. A Policy is a mapping from Organization and Host to Templates and Collectors.Policies are evaluated in order (lower order or rank is higher priority) and the policy that matches first is selected.Therefore, define the exceptions first followed by broad policies. Hosts are defined in terms of CMDBDeviceGroups or Business Services. Multiple templates can be used in one Policy and the system detects conflicts, ifany.
Complete these steps to associate a Host to Template:
1. Click New under the sectionHost To Template Associations.2. In theHost To Template Associations dialog box, enter the information below.
Settings Guidelines
Name Name of the Host to Template Association.
Organization Select the organization.
Host Use the drop-down list to browse the folders and select the Devices or/and BusinessServices to monitor and clickSave.
Template Select one or more monitoring templates from the list or select All Templates toinclude all. You can also use the search bar to find any specific template.
Collector Select the Collector from the list or select All Collectors to include all. Agents forwardevents to Collectors via HTTP(S). A Collector is chosen at random and if that Collector isnot available or non-responsive, then another Collector in the list is chosen.
3. ClickSave and Apply.ARank is automatically assigned to the association.
You can use the Edit button to modify orDelete button to remove any template association.
Viewing Agent Status
Complete these steps to view the Windows Agent status for any specific device:
1. Go to CMDB > Devices and select the device.The following fields display the information related to the Agent:
l Agent Status: status of the Agent on the devicel Agent Policy: agent policy namel Monitor Status: status of monitoring
TheAgent Status indicates the following:
176 User GuideFortinet Technologies Inc.

Administration Setup
Status Description
Registered Agent has completed registration but has not received the monitoring template.
Running Active Agent has received a monitoring template and it is performing properly.
Running Inactive Agent is running but does not have a monitoring template – the reasons can be (a) nolicense or (b) incomplete definition - no Collector or Template is defined for that host.
Stopped Agent is stopped on the Linux Server.
Disconnected Supervisor did not receive any status from the Agent for the last 10 minutes.
Enabling or Disabling an Agent
Complete these steps to enable or disable Agent for a specific device:
1. Go to CMDB > Devices and select the required device.2. Select theAction drop-downmenu and click Enable Agent to enable orDisable Agent to disable Agent
monitoring for the selected device.
Viewing Files in FortiSIEM
If the FortiSIEM Agent is running on a Server and a FIM policy is enabled with Push Files On Modify, then theFortiSIEM Agent will send the files to FortiSIEM when a change is detected. FortiSIEM stores the files in SVN onthe Supervisor.
1. Go to the CMDB page. Make sure that AGENT is one of theMethods.2. Search for the device in CMDB by name.
Use the host name that you used in the InstallSettings.xml file to install the Windows Agent.
3. Click File beneath the device table.You will see all of the files that were changed since the monitoring template was applied.
4. Select a file.If you need to search for a file, set the From and To dates. The files which changed between thosedates will be displayed.
5. Click the file name on the left and its contents will be displayed in the right hand window.Each file has a header containing file meta data followed by the actual file content.
l FILEPATH: The full file name, including the path.
l ARCHIVE: Set to true if ArchiveBit is set; set to false if it is not.
l HASHCODE: The file hash.
l HASHALGO: The algorithm used to compute file hash.
l OWNER: The file owner.
l USER, PERMIT, DENY: Permissions are specified as a (User, Permit, Deny) triple. Thisdescribes the actions that the user is allowed to perform.
l MODIFIED_TIME: The time when the file was last modified.
6. To see the differences between two files, select two files on left and clickDiff.
User GuideFortinet Technologies Inc.
177

Setup Administration
Verifying Events in FortiSIEM
Follow the steps below to verify the events in FortiSIEM:
1. Go to ANALYTICS tab.2. Click the Filters field.3. Create the following condition: Attribute=Raw Event Log, Operator = CONTAIN, Value = AccelOps-WUA and
clickSave & Run.Note: All event types for all Windows Server generated logs are prefixed byAccelOps-WUA.
4. Select the followingGroup By:a. Reporting Device Nameb. Reporting IP
5. Select the following Display Fields:a. Reporting Device Nameb. Reporting IPc. COUNT(Matched Events)
6. Run the query for the last 15 minutes.The query will return all hosts that reported events in the last 15 minutes.
Sample Windows Agent Logs
FortiSIEM Windows Agent Manager generatesWindows logs in an easy way to analyze "attribute=value" stylewithout losing any information.
l System Logsl Application Logsl Security Logsl DNS Logsl DHCP Logsl IIS Logsl DFS Logsl File Content Monitoring Logsl File Integrity Monitoring Logsl Installed Software Logsl Registry change Logsl WMI Logs
System Logs
#Win-System-Service-Control-Manager-7036Thu May 07 02:13:42 2015 WIN-2008-LAW-agent 10.1.2.242 AccelOps-WUA-WinLog [mon-itorStatus]="Success" [eventName]="System"[eventSource]="Service Control Manager" [eventId]="7036" [eventType]="Information"[domain]="" [computer]="WIN-2008-LAW-agent"[user]="" [userSID]="" [userSIDAcctType]="" [eventTime]="May 07 2015 10:13:41" [deviceTime]-]="May 07 2015 10:13:41"[msg]="The Skype Updater service entered the running state."
Thu May 07 02:13:48 2015 WIN-2008-LAW-agent 10.1.2.242 AccelOps-WUA-WinLog [mon-itorStatus]="Success" [eventName]="System"
178 User GuideFortinet Technologies Inc.

Administration Setup
[eventSource]="Service Control Manager" [eventId]="7036" [eventType]="Information"[domain]="" [computer]="WIN-2008-LAW-agent"[user]="" [userSID]="" [userSIDAcctType]="" [eventTime]="May 07 2015 10:13:47" [deviceTime]-]="May 07 2015 10:13:47"[msg]="The Skype Updater service entered the stopped state."
Application Logs
#Win-App-MSExchangeServiceHost-2001Thu May 07 03:05:42 2015 WIN-2008-249.ersijiu.com 10.1.2.249 AccelOps-WUA-WinLog [mon-itorStatus]="Success" [eventName]="Application" [eventSource]="MSExchangeServiceHost"[eventId]="2001" [eventType]="Information" [domain]="" [computer]="WIN-2008-249.ersijiu.com"[user]="" [userSID]="" [userSIDAcctType]="" [eventTime]="May 07 2015 11:05:42" [deviceTime]-]="May 07 2015 11:05:42"[msg]="Loading servicelet module Microsoft.Exchange.OABMaintenanceServicelet.dll"
#MSSQL#Win-App-MSSQLSERVER-17137Thu May 07 03:10:16 2015 WIN-2008-249.ersijiu.com 10.1.2.249 AccelOps-WUA-WinLog [mon-itorStatus]="Success" [eventName]="Application"[eventSource]="MSSQLSERVER" [eventId]="17137" [eventType]="Information" [domain]="" [com-puter]="WIN-2008-249.ersijiu.com" [user]=""[userSID]="" [userSIDAcctType]="" [eventTime]="May 07 2015 11:10:16" [deviceTime]="May 072015 11:10:16"[msg]="Starting up database 'model'."
Security Logs
#Win-Security-4624(Windows logon success)Thu May 07 02:23:58 2015 WIN-2008-249.ersijiu.com 10.1.2.249 AccelOps-WUA-WinLog[monitorStatus]="Success" [eventName]="Security"[eventSource]="Microsoft-Windows-Security-Auditing" [eventId]="4624" [eventType]-]="Audit Success" [domain]=""[computer]="WIN-2008-249.ersijiu.com" [user]="" [userSID]="" [userSIDAcctType]=""[eventTime]="May 07 2015 10:23:56"[deviceTime]="May 07 2015 10:23:56" [msg]="An account was successfully logged on."[[Subject]][Security ID]="S-1-0-0" [Account Name]=""[Account Domain]="" [Logon ID]="0x0" [Logon Type]="3" [[New Logon]][Security ID]-]="S-1-5-21-3459063063-1203930890-2363081030-500"[Account Name]="Administrator" [Account Domain]="ERSIJIU" [Logon ID]="0xb9bd3"[Logon GUID]="{00000000-0000-0000-0000-000000000000}"[[Process Information]][Process ID]="0x0" [Process Name]="" [[Network Inform-ation]][Workstation Name]="SP171" [Source Network Address]="10.1.2.171"[Source Port]="52409" [[Detailed Authentication Information]][Logon Pro-cess]="NtLmSsp" [Authentication Package]="NTLM" [Transited Services]=""[Package Name (NTLM only)]="NTLM V2" [Key Length]="128" [details]=""
DNS Logs
#DNS Debug Logs#AccelOps-WUA-DNS-StartedThu May 07 02:35:43 2015 WIN-2008-LAW-agent 10.1.2.242 AccelOps-WUA-DNS [mon-
User GuideFortinet Technologies Inc.
179

Setup Administration
itorStatus]="Success"[msg]="5/7/2015 10:34:05 AM 20BC EVENT The DNS server has started."
#AccelOps-WUA-DNS-ZoneDownloadCompleteThu May 07 02:35:43 2015 WIN-2008-LAW-agent 10.1.2.242 AccelOps-WUA-DNS [mon-itorStatus]="Success" [msg]="5/7/2015 10:34:05 AM 20BC EVENTThe DNS server has finished the background loading of zones. All zones are now available forDNS updates and zonetransfers, as allowed by their individual zone configuration."
#AccelOps-WUA-DNS-A-Query-SuccessThu May 07 02:48:25 2015 WIN-2008-LAW-agent 10.1.2.242 AccelOps-WUA-DNS [mon-itorStatus]="Success" [msg]="5/7/201510:47:13 AM 5D58 PACKET 0000000002B74600 UDP Rcv 10.1.20.232 0002 Q [0001 D NOERROR]A (8)testyjyj(4)yjyj(3)com(0)"Thu May 07 02:48:25 2015 WIN-2008-LAW-agent 10.1.2.242AccelOps-WUA-DNS [monitorStatus]="Success" [msg]="5/7/201510:47:13 AM 5D58 PACKET 0000000002B74600 UDP Snd 10.1.20.232 0002 R Q [8085 A DRNOERROR] A (8)testyjyj(4)yjyj(3)com(0)"
#AccelOps-WUA-DNS-PTR-Query-SuccessThu May 07 02:48:25 2015 WIN-2008-LAW-agent 10.1.2.242 AccelOps-WUA-DNS [mon-itorStatus]="Success" [msg]="5/7/201510:47:22 AM 5D58 PACKET 00000000028AB4B0 UDP Rcv 10.1.20.232 0002 Q [0001 D NOERROR]PTR(3)223(3)102(3)102(3)102(7)in-addr(4)arpa(0)"
Thu May 07 02:48:25 2015 WIN-2008-LAW-agent 10.1.2.242 AccelOps-WUA-DNS [mon-itorStatus]="Success" [msg]="5/7/201510:47:22 AM 5D58 PACKET 00000000028AB4B0 UDP Snd 10.1.20.232 0002 R Q [8085 A DRNOERROR] PTR(3)223(3)102(3)102(3)102(7)in-addr(4)arpa(0)"
#DNS System Logs#Win-App-DNS-2(DNS Server started)Thu May 07 02:39:17 2015 WIN-2008-LAW-agent 10.1.2.242 AccelOps-WUA-WinLog [mon-itorStatus]="Success"[eventName]="DNS Server" [eventSource]="DNS" [eventId]="2" [eventType]="Information"[domain]="" [computer]="WIN-2008-LAW-agent"[user]="" [userSID]="" [userSIDAcctType]="" [eventTime]="May 07 2015 10:39:17" [deviceTime]-]="May 07 2015 10:39:17"[msg]="The DNS server has started."
#Win-App-DNS-3(DNS Server shutdown)Thu May 07 02:39:16 2015 WIN-2008-LAW-agent 10.1.2.242 AccelOps-WUA-WinLog [mon-itorStatus]="Success" [eventName]="DNS Server"[eventSource]="DNS" [eventId]="3" [eventType]="Information" [domain]="" [computer]="WIN-2008-LAW-agent" [user]="" [userSID]=""[userSIDAcctType]="" [eventTime]="May 07 2015 10:39:16" [deviceTime]="May 07 2015 10:39:16"[msg]="The DNS server has shut down.
180 User GuideFortinet Technologies Inc.

Administration Setup
DHCP Logs
AccelOps-WUA-DHCP-GenericThu May 07 05:44:44 2015 WIN-2008-LAW-agent 10.1.2.242 AccelOps-WUA-DHCP [mon-itorStatus]="Success" [ID]="00" [Date]="05/07/15"[Time]="13:44:08" [Description]="Started" [IP Address]="" [Host Name]="" [MAC Address]=""[User Name]="" [ TransactionID]="0"[ QResult]="6" [Probationtime]="" [ CorrelationID]="" [Dhcid.]=""
#AccelOps-WUA-DHCP-IP-ASSIGNThu May 07 05:56:41 2015 WIN-2008-LAW-agent 10.1.2.242 AccelOps-WUA-DHCP [mon-itorStatus]="Success" [ID]="10" [Date]="05/07/15"[Time]="13:56:37" [Description]="Assign" [IP Address]="10.1.2.124" [Host Name]="Agent-247.yj"[MAC Address]="000C2922118E"[User Name]="" [ TransactionID]="2987030242" [ QResult]="0" [Probationtime]="" [ Cor-relationID]="" [Dhcid.]=""
#AccelOps-WUA-DHCP-Generic(Release)Thu May 07 05:56:41 2015 WIN-2008-LAW-agent 10.1.2.242 AccelOps-WUA-DHCP [mon-itorStatus]="Success" [ID]="12" [Date]="05/07/15"[Time]="13:56:33" [Description]="Release" [IP Address]="10.1.2.124" [Host Name]="Agent-247.yj" [MAC Address]="000C2922118E"[User Name]="" [ TransactionID]="2179405838" [ QResult]="0" [Probationtime]="" [ Cor-relationID]="" [Dhcid.]=""
#AccelOps-WUA-DHCP-IP-LEASE-RENEWWed Feb 25 02:53:28 2015 WIN-2008-LAW-agent 10.1.2.242 AccelOps-WUA-DHCP [mon-itorStatus]="Success" [ID]="11" [Date]="02/25/15"[Time]="10:53:19" [Description]="Renew" [IP Address]="10.1.2.123" [Host Name]="WIN-2008-249.yj" [MAC Address]="0050568F1B5D"[User Name]="" [ TransactionID]="1136957584" [ QResult]="0" [Probationtime]="" [ Cor-relationID]="" [Dhcid.]=""
IIS Logs
#AccelOps-WUA-IIS-Web-Request-SuccessThu May 07 03:49:23 2015 WIN-2008-LAW-agent 10.1.2.242 AccelOps-WUA-IIS [mon-itorStatus]="Success" [date]="2015-05-07"[time]="03:44:28" [s-sitename]="W3SVC1" [s-computername]="WIN-2008-LAW-AG" [s-ip]-]="10.1.2.242" [cs-method]="GET"[cs-uri-stem]="/welcome.png" [cs-uri-query]="-" [s-port]="80" [cs-username]="-" [c-ip]-]="10.1.20.232" [cs-version]="HTTP/1.1"[cs(User-Agent)]="Mozilla/5.0+(Windows+NT+6.1;+WOW64)+AppleWebKit/537.36+(KHTML,+-like+Gecko)+Chrome/42.0.2311.135+Safari/537.36"[cs(Cookie)]="-" [cs(Referer)]="http://10.1.2.242/" [cs-host]="10.1.2.242" [sc-status]="200"[sc-substatus]="0" [sc-win32-status]="0"[sc-bytes]="185173" [cs-bytes]="324" [time-taken]="78" [site]="Default Web Site" [form-at]="W3C"
#AccelOps-WUA-IIS-Web-Client-ErrorThu May 07 03:49:23 2015 WIN-2008-LAW-agent 10.1.2.242 AccelOps-WUA-IIS
User GuideFortinet Technologies Inc.
181

Setup Administration
[monitorStatus]="Success" [date]="2015-05-07" [time]="03:44:37"[s-sitename]="W3SVC1" [s-computername]="WIN-2008-LAW-AG" [s-ip]="10.1.2.242" [cs-meth-od]="GET" [cs-uri-stem]="/wrongpage" [cs-uri-query]="-"[s-port]="80" [cs-username]="-" [c-ip]="10.1.20.232" [cs-version]="HTTP/1.1" [cs(User-Agent)]-]="Mozilla/5.0+(Windows+NT+6.1;+WOW64)+AppleWebKit/537.36+(KHTML,+-like+Gecko)+Chrome/42.0.2311.135+Safari/537.36" [cs(Cookie)]="-" [cs(Referer)]="-" [cs-host]="10.1.2.242" [sc-status]="404"[sc-substatus]="0" [sc-win32-status]="2" [sc-bytes]="1382" [cs-bytes]="347" [time-taken]="0"[site]="Default Web Site" [format]="W3C"
#AccelOps-WUA-IIS-Web-Forbidden-Access-DeniedThu May 07 03:30:39 2015 WIN-2008-249.ersijiu.com 10.1.2.249 AccelOps-WUA-IIS [mon-itorStatus]="Success" [date]="2015-05-07" [time]="03:30:15" [s-ip]="10.1.2.249" [cs-meth-od]="POST" [cs-uri-stem]="/AOCACWS/AOCACWS.svc" [cs-uri-query]="-" [s-port]="80" [cs-username]="-"[c-ip]="10.1.2.42" [cs(User-Agent)]="-" [sc-status]="403" [sc-substatus]="4" [sc-win32-status]="5" [time-taken]="1" [site]="Default Web Site"[format]="W3C"
DFS Logs
#Win-App-DFSR-1002Thu May 07 03:01:12 2015 WIN-2008-LAW-agent 10.1.2.242 AccelOps-WUA-WinLog [mon-itorStatus]="Success" [eventName]="DFS Replication"[eventSource]="DFSR" [eventId]="1002" [eventType]="Information" [domain]="" [computer]="WIN-2008-LAW-agent" [user]="" [userSID]=""[userSIDAcctType]="" [eventTime]="May 07 2015 11:01:12" [deviceTime]="May 07 2015 11:01:12"[msg]="The DFS Replication service is starting."
#Win-App-DFSR-1004Thu May 07 03:01:12 2015 WIN-2008-LAW-agent 10.1.2.242 AccelOps-WUA-WinLog [mon-itorStatus]="Success" [eventName]="DFS Replication"[eventSource]="DFSR" [eventId]="1004" [eventType]="Information" [domain]="" [computer]="WIN-2008-LAW-agent" [user]="" [userSID]=""[userSIDAcctType]="" [eventTime]="May 07 2015 11:01:12" [deviceTime]="May 07 2015 11:01:12"[msg]="The DFS Replication service has started."
#Win-App-DFSR-1006Thu May 07 03:01:10 2015 WIN-2008-LAW-agent 10.1.2.242 AccelOps-WUA-WinLog [mon-itorStatus]="Success" [eventName]="DFS Replication"[eventSource]="DFSR" [eventId]="1006" [eventType]="Information" [domain]="" [computer]="WIN-2008-LAW-agent" [user]="" [userSID]=""[userSIDAcctType]="" [eventTime]="May 07 2015 11:01:10" [deviceTime]="May 07 2015 11:01:10"[msg]="The DFS Replication service is stopping."
#Win-App-DFSR-1008Thu May 07 03:01:11 2015 WIN-2008-LAW-agent 10.1.2.242 AccelOps-WUA-WinLog [mon-itorStatus]="Success" [eventName]="DFS Replication"[eventSource]="DFSR" [eventId]="1008" [eventType]="Information" [domain]="" [computer]="WIN-2008-LAW-agent" [user]="" [userSID]=""
182 User GuideFortinet Technologies Inc.

Administration Setup
[userSIDAcctType]="" [eventTime]="May 07 2015 11:01:11" [deviceTime]="May 07 2015 11:01:11"[msg]="The DFS Replication service has stopped."
File Content Monitoring Logs
#AccelOps-WUA-UserFileThu May 07 05:40:08 2015 WIN-2008-LAW-agent 10.1.2.242 AccelOps-WUA-UserFile [mon-itorStatus]="Success" [fileName]="C:\test\i.txt"[msg]="another newline adddedddddd"
File Integrity Monitoring Logs
The following sections describe various use cases that can be detected by File Integrity Monitoring Logs.
l Use Case 1: File or Directory Createdl Use Case 2: File or Directory Deletedl Use Case 3: File Content Modifiedl Use Case 4: File Content Modified and Upload is Selectedl Use Case 5: File Renamedl Use Case 6: File Permission Changedl Use Case 7: File Ownership Changedl Use Case 8: File Archive Bit Changedl Use Case 9: File Baseline Changed
Use Case 1: File or Directory Created
Event Type
AO-WUA-FileMon-Added
Important Event Attributes
l userId: The ID of the user who added the file.l domain: The user’s domain for a Domain computer.l osObjType- Can be either File or Directory.l fileName: The name of the file or directory that was added.l hashCode, hashAlgo: The file hash obtained by using the specified algorithm.l procName: The name of the Windows process that was used to create the file.l fileOwner: The owner of the file.l targetUserType, targetUser: The user or group to whom the permission applies.l targetFilePermit: The permitted file operations.l targetFileDeny: The denied file operations.l archiveSet: Is true if the Archive bit is set for this file; false otherwise.
Reports
Agent FIM: Windows File/Directory Created/Deleted/Renamed
Rules
Agent FIM - Windows File or Directory Created
User GuideFortinet Technologies Inc.
183

Setup Administration
Sample Log
2020-03-25T07:30:50Z Win-167 10.30.2.167 AccelOps-WUA-FileMon [phCustId]="2000" [cus-tomer]="org1" [monitorStatus]="Success" [Locale]="en-US" [MachineGuid]="e892a6e4-bbfa-4ba6-bc8c-00d2c31812b4" [timeZone]="+0800" [userId]="jdoe" [domain]="ACME" [eventTime]="Mar 252020 07:30:48" [fileName]="C:\\test\\New Text Document.txt" [osObjAction]="Added"[objectType]="File" [hashCode]-]="e3b0c44298fc1c149afbf4c8996fb92427ae41e4649b934ca495991b7852b855" [hashAlgo]="SHA256"[procName]="C:\\Windows\\explorer.exe" [msg]="" [archiveSet]="true" [fileOwner]=""
Use Case 2: File or Directory Deleted
Event Type
AO-WUA-FileMon-Removed
Important Event Attributes
l userId: The ID of the user who removed the file.l domain: The user’s domain for a Domain computer.l fileName: The name of the file that was removed.l procName: The Windows process that was used to remove the file.
Report
Agent FIM: Windows File/Directory Creation/Deletion/Rename
Rule
Agent FIM - Windows File or Directory Deleted
Sample Log
2020-03-25T07:43:24Z Win-167 10.30.2.167 AccelOps-WUA-FileMon [phCustId]="2000"[customer]="org1" [monitorStatus]="Success" [Locale]="en-US" [MachineGuid]-]="e892a6e4-bbfa-4ba6-bc8c-00d2c31812b4" [timeZone]="+0800" [userId]="jdoe"[domain]="ACME" [eventTime]="Mar 25 2020 07:43:21" [fileName]-]="C:\\test\\test1.txt" [osObjAction]="Removed" [objectType]="Unknown"[hashCode]="" [hashAlgo]="SHA256" [procName]="C:\\Windows\\explorer.exe" [msg]=""[archiveSet]="false" [fileOwner]=""
Use Case 3: File Content Modified
Event Type
AO-WUA-FileMon-Modified
Important Event Attributes
l userId: The user who modified the file.l domain: The user’s domain for a Domain computer.l fileName: The name of the file that was modified.l procName: The Windows process that was used to modify the file.l hashCode, hashAlgo: The file hash after modification and the algorithm used to calculate the hash.
184 User GuideFortinet Technologies Inc.

Administration Setup
Report
Agent FIM: Windows File Content Modified
Rule
Agent FIM - Windows File Content Modified
Sample Log
2020-03-25T10:50:40Z WIN-167.fortinet.wulei.com 10.30.2.167 AccelOps-WUA-FileMon[phCustId]="2000" [customer]="org1" [monitorStatus]="Success" [Locale]="en-US"[MachineGuid]="e892a6e4-bbfa-4ba6-bc8c-00d2c31812b4" [timeZone]="+0800" [user-Id]="jdoe" [domain]="ACME" [eventTime]="Mar 25 2020 10:50:37" [fileName]-]="C:\\test\\test.txt" [osObjAction]="Modified" [objectType]="File"[hashCode]="6396e3c19b155770f3ae25afa5f29832d6f35b315407ed88820339b705fd2bcc"[hashAlgo]="SHA256" [procName]="C:\\Windows\\System32\<br/>otepad.exe" [msg]=""[archiveSet]="true" [fileOwner]=""
Use Case 4: File Content Modified and Upload is Selected
Event Type
PH_DEV_MON_FILE_CONTENT_CHANGE
Important Event Attributes
l userId: The ID of the user who modified the file.l domain: The user’s domain for a Domain computer.l fileName: The name of the file that was modified.l procName: The Windows process that was used to modify the file.l hashCode, hashAlgo: The file hash after modification and the algorithm used to calculate the hash.l oldSVNVersion: The SVN revision number of file before the change.l newSVNVersion: The SVN revision number of file after the change.l addedItem: The lines that were added to the file.l deletedItem: The lines that were removed from the file.
Report
Agent FIM: Windows File Content Modified in SVN
Rule
Audited file or directory content modified in SVN
Sample Log
<14>Mar 25 20:30:44 sp3 phPerfMonitor[17521]: [PH_DEV_MON_FILE_CONTENT_CHANGE]:[eventSeverity]=PHL_INFO,[procName]=phPerfMonitor,[fileName]=phSvnUpdate.cpp,[lineNumber]=306,[phCustId]=2000,[hostName]=Win-169,[hostIpAddr]=10.30.3.169,[fileName]=/C:/test/test.txt,[hashCode]=08998b2cce90ee6695bd8dae82d43137,[oldSVNVersion]=50,[newSVNVersion]=51,[deletedItem]=(none),[addedItem]=333;,[user-]=Administrator,[hashAlgo]=SHA256,[phLogDetail]=
User GuideFortinet Technologies Inc.
185

Setup Administration
Use Case 5: File Renamed
Event Type
AO-WUA-FileMon-Renamed-New-Name
Important Event Attributes
l userId: The ID of the user who renamed the file.l domain: The user’s domain for a Domain computer.l fileName: The new name of the file.l procName: The Windows process that was used to rename the file.l hashCode, hashAlgo: The new file hash using the specified algorithm.
Report
Agent FIM: Windows File/Directory Creation/Deletion/Rename
Rule
None
Sample Log
2020-03-25T09:59:34Z WIN-167.fortinet.wulei.com 10.30.2.167 AccelOps-WUA-FileMon[phCustId]="2000" [customer]="org1" [monitorStatus]="Success" [Locale]="en-US"[MachineGuid]="e892a6e4-bbfa-4ba6-bc8c-00d2c31812b4" [timeZone]="+0800" [user-Id]="jdoe" [domain]="ACME" [eventTime]="Mar 25 2020 09:59:32" [fileName]-]="C:\\test\\test5.txt" [osObjAction]="Renamed [New Name]" [objectType]="File"[hashCode]="2b64c6d9afd8a34ed0dbf35f7de171a8825a50d9f42f05e98fe2b1addf00ab44"[hashAlgo]="SHA256" [procName]="C:\\Windows\\explorer.exe" [msg]="" [archiveSet]-]="true" [fileOwner]=""
Event Type
AO-WUA-FileMon-Renamed-Old-Name
Important Event Attributes
userId: The ID of the user who modified the file.
domain: The user’s domain for a Domain computer.
fileName: The old name of the file before renaming.
procName: The Windows process that was used to remove the file.
Report
Agent FIM: Windows File/Directory Creation/Deletion/Rename
Rule
None
Sample Log
None
186 User GuideFortinet Technologies Inc.

Administration Setup
Use Case 6: File Permission Changed
Event Type
AO-WUA-FileMon-PermissionChange
Important Event Attributes
l userId: The ID of the user who modified the file permission.l domain: The user’s domain for a Domain computer.l objectType: The type of object. Can be File or Directory.l fileName: The name of the file or directory whose permission was changed.l procName: The Windows process that was used to change the permission.l hashCode, hashAlgo: The file hash using the specified algorithm.l fileOwner: The name of the owner of the file.l targetUserType, targetUser: The name of the user or group to whom the permission below applies.l targetFilePermit: The permitted file operations after change.l targetFileDeny: The denied file operations after change.l archiveSet: Is true if the Archive bit is set for this file; false otherwise.
Report
Agent FIM: Windows File/Directory Permission Changes
Rule
Agent FIM - Windows File Permission Changed
Sample Log
2020-03-25T10:21:00Z WIN-167.fortinet.wulei.com 10.30.2.167 AccelOps-WUA-FileMon[phCustId]="2000" [customer]="org1" [monitorStatus]="Success" [Locale]="en-US"[MachineGuid]="e892a6e4-bbfa-4ba6-bc8c-00d2c31812b4" [timeZone]="+0800" [user-Id]="jdoe" [domain]="ACME" [eventTime]="Mar 25 2020 10:20:58" [fileName]-]="C:\\test\\test.txt" [osObjAction]="PermissionChange" [objectType]="File"[hashCode]="7936d255ef43706a93fdd15f4bbfde45e3b2d2b9a0d4cc7c39184cf745ab78c5"[hashAlgo]="SHA256" [procName]="C:\\Windows\\System32\\dllhost.exe" [msg]=""[archiveSet]="true" [fileOwner]=“Joe” [targetUserType]="USER" [tar-getUser]="BUILTIN\Administrators" [targetFilePermit]="ALL" [tar-getFileDeny]="WRITE"
Use Case 7: File Ownership Changed
Event Type
AO-WUA-FileMon-OwnershipChange
Important Event Attributes
l userId: The ID of the user who modified the file ownership.l domain: The user’s domain for a Domain computer.l objectType: The type of object whose ownership was changed: File or Directory.l fileName: The name of the file or directory whose ownership was changed.
User GuideFortinet Technologies Inc.
187

Setup Administration
l procName: The Windows process that was used to change ownership.l hashCode, hashAlgo: The file hash using the specified algorithm.l fileOwner: The name of the new file owner.l archiveSet: Is true if the Archive bit is set for this file; false otherwise.
Report
Agent FIM: Windows File/Directory Ownership Changes
Rule
Agent FIM - Windows File Ownership Changed
Sample Log
2020-03-06T07:08:56Z Win-167 10.30.2.167 AccelOps-WUA-FileMon [phCustId]="1" [cus-tomer]="super" [monitorStatus]="Success" [Locale]="en-US" [MachineGuid]="e892a6e4-bbfa-4ba6-bc8c-00d2c31812b4" [timeZone]="+0800" [userId]="Administrator" [domain]-]="WIN-167" [eventTime]="Mar 06 2020 07:08:53" [fileName]="C:\\test\\test1.txt"[osObjAction]="OwnershipChange" [objectType]="File" [hashCode]-]="d17f25ecfbcc7857f7bebea469308be0b2580943e96d13a3ad98a13675c4bfc2" [hashAl-go]="SHA256" [procName]="C:\\Windows\\System32\\dllhost.exe" [msg]=""[archiveSet]="true" [fileOwner]=“Joe”
Use Case 8: File Archive Bit Changed
Event Type
AO-WUA-FileMon-ArchivedBitChange
Important Event Attributes
l userId: The ID of the user who modified the file.l domain: The user’s domain for a Domain computer.l objectType: The type of object whose Archive bit was changed: File or Directory.l fileName: The name of the file whose archive bit was changed.l procName: The Windows process that was used to change archive bit.l hashCode, hashAlgo: The file hash using the specified algorithm.l archiveSet: Is true if the Archive bit is set for this file; false otherwise.
Report
Agent FIM: Windows File/Directory Archive Bit Changes
Rule
Agent FIM - Windows File/Directory Archive Bit Changed
Sample Log
2020-03-25T10:02:38Z WIN-167.fortinet.wulei.com 10.30.2.167 AccelOps-WUA-FileMon[phCustId]="2000" [customer]="org1" [monitorStatus]="Success" [Locale]="en-US"[MachineGuid]="e892a6e4-bbfa-4ba6-bc8c-00d2c31812b4" [timeZone]="+0800" [user-Id]="jdoe" [domain]="ACME" [eventTime]="Mar 25 2020 10:02:35" [fileName]-]="C:\\test\\test.txt" [osObjAction]="ArchivedBitChange" [objectType]="File"
188 User GuideFortinet Technologies Inc.

Administration Setup
[hashCode]="7936d255ef43706a93fdd15f4bbfde45e3b2d2b9a0d4cc7c39184cf745ab78c5"[hashAlgo]="SHA256" [procName]="C:\\Windows\\System32\\attrib.exe" [msg]=""[archiveSet]="false" [fileOwner]=""
Use Case 9: File Baseline Changed
Event Type
AO-WUA-FileMon-BaselineChange
Important Event Attributes
l userId: The ID of the user who modified the file.l domain: The user’s domain for a Domain computer.l fileName: The name of the file that was changed.l procName: The Windows process that was used to remove the file.l hashCode, hashAlgo: The file hash using the specified algorithm.l targetHashCode: The hash of the target file (defined in the GUI).
Report
Agent FIM: Windows File Change from Baseline
Rule
Agent FIM - Windows File Changed From Baseline
Sample Log
2020-03-25T12:52:42Z Win-169 10.30.3.169 AccelOps-WUA-FileMon [phCustId]="2000" [cus-tomer]="org1" [monitorStatus]="Success" [Locale]="en-US" [MachineGuid]="5c83ec12-73fd-4e06-a396-1f128564f09e" [timeZone]="+0800" [userId]="Administrator" [domain]="WINSRV2012-169"[fileName]="C:\\test\\test.txt" [osObjAction]="BaselineChange" [hashCode]-]="c1f79ea2bbfb77bf30446a4c9be762eb" [hashAlgo]="MD5" [tar-getHashCode]="74DE7651DFC55294CC59240AE514A676" [msg]="
Installed Software Logs
#AccelOps-WUA-InstSw-AddedThu May 07 05:28:17 2015 WIN-2008-LAW-agent 10.1.2.242 AccelOps-WUA-InstSw [mon-itorStatus]="Success" [osObjAction]="Added"[appName]="7-Zip 9.20 (x64 edition)" [vendor]="Igor Pavlov" [appVersion]="9.20.00.0"
#AccelOps-WUA-InstSw-RemovedThu May 07 05:28:30 2015 WIN-2008-LAW-agent 10.1.2.242 AccelOps-WUA-InstSw [mon-itorStatus]="Success" [osObjAction]="Removed"[appName]="7-Zip 9.20 (x64 edition)" [vendor]="Igor Pavlov" [appVersion]="9.20.00.0"
Registry Change Logs
#AccelOps-WUA-Registry-ModifiedThu May 07 04:01:58 2015 WIN-2008-249.ersijiu.com 10.1.2.249 AccelOps-WUA-Registry [mon-itorStatus]="Success"
User GuideFortinet Technologies Inc.
189

Setup Administration
[regKeyPath]="HKLM\\SOFTWARE\\Microsoft\\ExchangeServer\\v14\\ContentIndex\\CatalogHealth\\{0d2a342a-0b15-4995-93db-d18c3df5860d}" [regValueName]="TimeStamp" [regValueType]="1" [osOb-jAction]="Modified" [oldRegValue]="MgAwADEANQAtADAANQAtADAANwAgADAAMwA6ADQAOQA6ADQANwBaAAAA"[newRegValue]="MgAwADEANQAtADAANQAtADAANwAgADAANAA6ADAAMQA6ADQAOABaAAAA"
#AccelOps-WUA-Registry-RemovedThu May 07 05:25:09 2015 WIN-2008-LAW-agent 10.1.2.242 AccelOps-WUA-Registry [mon-itorStatus]="Success"[regKeyPath]="HKLM\\SOFTWARE\\RegisteredApplications" [regValueName]="Skype" [regValueType]-]="1" [osObjAction]="Removed" [oldRegValue]-="UwBPAEYAVABXAEEAUgBFAFwAQwBsAGkAZQBuAHQAcwBcAEkAbgB0AGUAcgBuAGUAdAAgAEMAYQBsAGwAXABTAGsAeQ-BwAGUAXABDAGEAcABhAGIAaQBsAGkAdABpAGUAcwBkAGgAZABoAGQAaABkAGgAZABoAGQAAAA=" [newRegValue]=""
WMI logs
#AccelOps-WUA-WMI-Win32_ProcessorThu May 07 03:53:33 2015 WIN-2008-LAW-agent 10.1.2.242 AccelOps-WUA-WMI [mon-itorStatus]="Success" [__CLASS]="Win32_Processor"[AddressWidth]="64" [Architecture]="9" [Availability]="3" [Caption]="Intel64 Fam-ily 6 Model 26 Stepping 5" [ConfigManagerErrorCode]="" [Con-figManagerUserConfig]="" [CpuStatus]="1" [CreationClassName]="Win32_Processor"[CurrentClockSpeed]="2266" [CurrentVoltage]="33"[DataWidth]="64" [Description]="Intel64 Family 6 Model 26 Stepping 5" [DeviceID]-]="CPU0" [ErrorCleared]="" [ErrorDescription]=""[ExtClock]="" [Family]="12" [InstallDate]="" [L2CacheSize]="0" [L2CacheSpeed]=""[L3CacheSize]="0" [L3CacheSpeed]="0"[LastErrorCode]="" [Level]="6" [LoadPercentage]="8" [Manufacturer]="GenuineIntel"[MaxClockSpeed]="2266"[Name]="Intel(R) Xeon(R) CPU E5520 @ 2.27GHz" [NumberOfCores]="1" [Num-berOfLogicalProcessors]="1"[OtherFamilyDescription]="" [PNPDeviceID]="" [PowerManagementCapabilities]=""[PowerManagementSupported]="0"[ProcessorId]="0FEBFBFF000106A5" [ProcessorType]="3" [Revision]="6661" [Role]-]="CPU" [SocketDesignation]="CPU socket #0"[Status]="OK" [StatusInfo]="3" [Stepping]="" [SystemCreationClassName]="Win32_Com-puterSystem" [SystemName]="WIN-2008-LAW-AG"UniqueId]="" [UpgradeMethod]="4" [Version]="" [VoltageCaps]="2"
Configuring Linux AgentLinux Agents can be configured and managed from the FortiSIEM Supervisor node.
Before proceeding, install the Linux Agent following the instructions in the Linux Agent Installation Guide.
To receive logs from the Linux Agent, you must complete the following steps
1. Define the Linux Agent Monitoring Templates.2. Associate Linux Agents to Templates.Once these steps are completed, the Supervisor node will distribute monitoring policies to the Linux Agents andyou will be able to see events in FortiSIEM.
Note: FortiSIEM Linux Agent will perform file integrity monitoring on the /root directory.
This section also covers these topics.
190 User GuideFortinet Technologies Inc.

Administration Setup
l Viewing Agent Statusl Enabling or Disabling an Agentl Viewing Files in FortiSIEMl File Integrity Monitoring Logs
Define the Linux Agent Monitor Templates
Complete these steps to add a Linux Agent Monitor Template:
1. Go to ADMIN > Setup > Linux Agent tab.2. Click New under the section Linux Agent Monitor Templates.3. In the Linux Agent Monitor Template dialog box, enter the information below.
Generic tab:
Configure the Generic settings with reference to the table below:
Generic Settings Guidelines
Name [Required] Enter the name of the FortiSIEM Linux Agent. This name is used as areference in Template associations.
Description [Required] Enter the description about the FortiSIEM Linux Agent.
Syslog tab:
Configure the Syslog settings with reference to the table below:
Syslog Settings Guidelines
Syslog Select the Facility with the corresponding Syslog levels:
l Emergencyl Alertl Criticall Errorl Warningl Noticel Infol Debug
Log File tab:
Configure the Log File settings with reference to the table below:
User GuideFortinet Technologies Inc.
191

Setup Administration
Log File Settings Guidelines
Log Files Click New to add the custom log files to monitor:
l File/Directory—Path to the file or directory.l Log Prefix—Any prefix to the identify events from this file or directory for better
accessibility.
FIM tab:
Configure the FIM settings with reference to the table below:
FIM Settings Guidelines
FIM Click New to add the files to monitor:
l Include File/Directory—Enter the file or directory to monitor.l Exclude File/Directory—Enter the file or directory to exclude from monitoring using a
semi-colon (;) as a separator.l Action—Select the actions to monitor when there is an event in the included file or
directory:l All—All of the following actions will be monitored.l Open—One or more of the monitored files or directories has been opened.l Close—One or more of the monitored files or directories has been closed.l Create—A file or directory has been created in one or more of the monitored
files or directories.l Modify—One or more of the monitored files or directories has been edited.l Delete—One or more of the monitored files or directories has been deleted.l Attribute Change—An attribute belonging to one or more of the monitored
files or directories has been changed.l On Modify (appears only if All or Modify is selected):
l Push Files—Select this if you want Linux Agent to push files to FortiSIEMwhenever there is a change. The files are stored in SVN and are accessible fromthe Supervisor. These files are displayed in CMDB > Device > File. Send onlyimportant files, as this can fill up disk space.
l Compare Baseline—–Select this if you want to be alerted when the filechanges from a baseline. This is common for configuration files that rarelychange. If you choose this option, you will be asked to provide a copy of thebaseline file. ClickChoose File and upload the file from your workstation. TheSupervisor will compute the MD5 checksum and distribute the checksum to theagents for comparison.
4. Click Save
192 User GuideFortinet Technologies Inc.

Administration Setup
Associate Linux Agents to Templates
After defining the monitoring templates, associate the hosts to templates. To scale to large number of Hosts, thisis done via Policies. A Policy is a mapping from Organization and Host to Templates and Collectors. Policies areevaluated in order (lower order or rank is higher priority) and the policy that matches first is selected. Therefore,define the exceptions first followed by broad policies. Hosts can be defined in terms of CMDBDevice Groups orBusiness Services. Multiple templates can be used in one Policy and the system detects conflicts, if any.
Complete these steps to associate a Host to Template:
1. Click New under the sectionHost To Template Associations.2. In theHost To Template Associations dialog box, enter the information below.
Settings Guidelines
Name Name of the Host to Template Association.
Organization Select the organization.
Host Use the drop-down list to browse the folders and select the items.
Template Select one or more monitoring templates from the list or select All Templates to selectall. You can also use the search bar to find a specific template.
Collector Select the Collector from the list or select All Collectors to select all. Agents forwardevents to Collectors via HTTP(S). A Collector is chosen at random and if that Collector isnot available or non-responsive, then another Collector in the list is chosen.
3. ClickSave and Apply.ARank number is automatically assigned to the association.
You can use the Edit button to modify orDelete button to remove any template association.
Viewing Agent Status
Complete these steps to view the Agent status for any specific device:
1. Go to CMDB > Devices and select the device.The following fields displays the information related to the Agent:
l Agent Status: status of the Agent running on the device.l Agent Policy: agent policy.l Monitor Status: status of monitoring.
TheAgent Status indicates the following:
Status Description
Registered Agent has completed registration but has not received the monitoring template.
Running Active Agent has received a monitoring template and it is performing properly.
User GuideFortinet Technologies Inc.
193

Setup Administration
Status Description
Running Inactive Agent is running but does not have a monitoring template – the reasons can be (a) nolicense or (b) incomplete definition - no Collector or Template is defined for that host.
Stopped Agent is stopped on the Linux Server.
Disconnected Supervisor did not receive any status from the Agent for the last 10 minutes.
Enabling or Disabling an Agent
Complete these steps to enable or disable Linux Agent for a specific device:
1. Go to CMDB > Devices and select the required device.2. Select theAction drop-downmenu and click Enable Agent to enable orDisable Agent to disable Agent
monitoring for the selected device.
Viewing Files in FortiSIEM
If the FortiSIEM Agent is running on a Server and a FIM policy is enabled with Push Files On Modify, then theFortiSIEM Agent will send the files to FortiSIEM when a change is detected. FortiSIEM stores the files in SVN onthe Supervisor.
1. Go to the CMDB page. Make sure that AGENT is one of theMethods.2. Search for the device in CMDB by name.
Use the host name that you used to install the Linux Agent.
3. Click File beneath the device table.You will see all of the files that were changed since the monitoring template was applied.
4. Select a file.If you need to search for a file, set the From and To dates. The files which changed between thosedates will be displayed.
5. Click the file name on the left and its contents will be displayed in the right hand window.Each file has a header containing file meta data followed by the actual file content.
l OWNER: The name of the file ownerl GROUP: User group for specifying file permissions.l PERMISSION=USER: “OWNER”, PERMIT: "...": The file owner’s permissions.l PERMISSION=GROUP: “MEMBER”, PERMIT: "...":: The group member’s file permissions.l PERMISSION=GROUP: “OTHER”, PERMIT: "...":: Other group file permissions.l FILEPATH: The full file name, including the path.l HASHCODE: The file hash.l HASHALGO: The algorithm used to compute file hash.l MODIFIED_TIME: The time when the file was last modified.
6. To see the differences between two files, select two files on left and clickDiff.
File Integrity Monitoring Logs
The following sections describe various use cases that can be detected by File Integrity Monitoring Logs.
194 User GuideFortinet Technologies Inc.

Administration Setup
l Use Case 1: File Createdl Use Case 2: File Deletedl Use Case 3: File Attributes Changedl Use Case 4: File Modifiedl Use Case 5: File Modified and Upload is Selectedl Use Case 6: File Baseline Changedl Use Case 7: File Renamedl Use Case 8: File Accessedl Use Case 9: File Openedl Use Case 10: File Closed
Use Case 1: File Created
Event Type
FSM_LINUX_FILE_CREATE
Important Event Attributes
l targetOsObjType: The type of object that was created: File or Directory.l targetOsObjName: The name of the file or directory.l user: The name of the user who made the change.l hashCode: The hash code of the file.l hashAlgo: The algorithm used to create the file.
Reports
Agent FIM: Linux File/Directory Creation/Deletion/Movement/Unmount Activity
Rules
Agent FIM - Linux File or Directory Created
Sample Log
Fri Mar 27 09:39:25 2020 centos7: [FSM_LINUX_FILE_CREATE]: [objectType]=Directory,[objectName]=/mlm,[objectAction]=CREATE,[targetObjType]=File,[tar-getObjName]="/mlm/a.log",[hashCode]="d41d8cd98f00b204e9800998ecf8427e",[hashAl-go]="MD5",[user]=root
Use Case 2: File Deleted
Event Type
FSM_LINUX_FILE_DELETE
Important Event Attributes
l targetOsObjType: The type of object that was created: File or Directory.l targetOsObjName: The name of the file or directory.l user: The name of the user who made the change.
Reports
User GuideFortinet Technologies Inc.
195

Setup Administration
Agent FIM: Linux File/Directory Creation/Deletion/Movement/Unmount Activity
Rules
Agent FIM - Linux File or Directory Deleted
Sample Log
Fri Mar 27 09:43:11 2020 centos7: [FSM_LINUX_FILE_DELETE]: [objectType]=Directory,[objectName]=/mlm,[objectAction]=DELETE,[targetObjType]=File,[tar-getObjName]="/mlm/k.log",[user]=root
Use Case 3: File Attributes Changed
Event Type
FSM_LINUX_FILE_ATTRIB_CHANGE
Important Event Attributes
l targetOsObjType: The type of object: File or Directory.l targetOsObjName: The name of the file or directory.l user: The name of the user who made the change.l fileOwner: The name of the owner of the file or directory.l userGrp: The name of the user group for the file or directory.l userPerm: The permission granted to the owner.l groupPerm: The permission granted to the user group.l otherPerm: Other permissions.
Reports
Agent FIM: Linux File/Directory Ownership or Permission Changes
Rules
l Agent FIM - Linux Directory Ownership or Permission changed
l Agent FIM - Linux File Ownership or Permission Changed
Sample Log
Fri Mar 27 09:45:27 2020 centos7: [FSM_LINUX_FILE_ATTRIB_CHANGE]: [objectType]-]=Directory,[objectName]=/mlm,[objectAction]=ATTRIBUTE_CHANGE,[tar-getObjType]=File,[targetObjName]="/mlm/mlm.txt",[fileOwner]="root",[groupName]="mlm",[userPerm]="READ,WRITE,EXEC",[groupPerm]="READ,EXEC",[oth-erPerm]="READ,EXEC",[user]=root
Use Case 4: File Modified
Event Type
FSM_LINUX_FILE_MODIFY
Important Event Attributes
196 User GuideFortinet Technologies Inc.

Administration Setup
l targetOsObjName: The name of the file.l user: The name of the user who made the change.l hashCode: The hash code of the file.l hashAlgo: The algorithm used to create the file.
Reports
Agent FIM: Linux File Content Modified
Rules
Agent FIM - Linux File Content Modified
Sample Log
Fri Mar 27 09:47:06 2020 centos7: [FSM_LINUX_FILE_MODIFY]: [objectType]=Directory,[objectName]=/mlm,[objectAction]=MODIFY,[targetObjType]=File,[tar-getObjName]="/mlm/mlm.txt",[hashCode]=5d71f074cf9a75e0324f210160d4b9cb,[hashAl-go]=md5,[user]=root
Use Case 5: File Modified and Upload is Selected
Event Type
PH_DEV_MON_FILE_CONTENT_CHANGE
Important Event Attributes
l userId: The ID of the user who modified the file.l domain: The user’s domain for a Domain computer.l fileName: The name of the file that was modified.l procName: The Windows process that was used to modify the file.l hashCode, hashAlgo: The file hash after modification and the algorithm used to calculate the hash.l oldSVNVersion: The SVN revision number of the file before change.l newSVNVersion: The SVN revision number of the file after change.l addedItem: The lines that were added to the file.l deletedItem: The lines that were removed from the file.
Reports
Agent FIM: Linux File Content Modified in SVN
Rules
Audited file or directory content modified in SVN
Sample Log
<14>Mar 27 09:51:30 sp3 phPerfMonitor[6340]: [PH_DEV_MON_FILE_CONTENT_CHANGE]:[eventSeverity]=PHL_INFO,[procName]=phPerfMonitor,[fileName]=phSvnUpdate.cpp,[lineNumber]=306,[phCustId]=2000,[hostName]=centos7,[hostIpAddr]=10.30.3.39,[fileName]=/mlm/mlm.txt,[hashCode]=ac399331afa9d1f13618c9eff36ed51c,[oldSVNVer-sion]=53,[newSVNVersion]=54,[deletedItem]=(none),[addedItem]=retest;,[user]=root,[hashAlgo]=MD5,[phLogDetail]=
User GuideFortinet Technologies Inc.
197

Setup Administration
Use Case 6: File Baseline Changed
Event Type
FSM_LINUX_FILE_CHANGE_BASELINE
Important Event Attributes
l targetOsObjName: The name of the baseline file.l user: The name of the user who made the change.l hashCode: The hash code of the file after modification.l hashAlgo: The algorithm used to create the file hash.l targetHashCode: The hash code of the baseline file.
Reports
Agent FIM: Linux File Change from Baseline
Rules
Agent FIM - Linux File Changed From Baseline
Sample Log
Fri Mar 27 09:51:23 2020 centos7: [FSM_LINUX_FILE_CHANGE_BASELINE]: [fileName]-]=/mlm/mlm.txt,[targetHashCode]="aa63e826654915e0e2e1da385e6d14f8",[hashCode]-]="ac399331afa9d1f13618c9eff36ed51c",[hashAlgo]="MD5",[user]=root
Use Case 7: File Renamed
Event Types
l FSM_LINUX_FILE_MOVED_TO
l FSM_LINUX_FILE_MOVED_FROM
Important Event Attributes
l targetOsObjType: The file type: File or Directory.l targetOsObjName: The file or directory name.l user: The name of the user who renamed the file.
Reports
Agent FIM: Linux File/Directory Creation/Deletion/Movement/Unmount Activity
Rules
None
Sample Logs
Fri Mar 27 09:57:42 2020 centos7: [FSM_LINUX_FILE_MOVED_FROM]: [objectType]-]=Directory,[objectName]=/mlm,[objectAction]=MOVED_FROM,[targetObjType]=File,[tar-getObjName]="/mlm/bb.log",[user]=root
198 User GuideFortinet Technologies Inc.

Administration Setup
Fri Mar 27 09:57:42 2020 centos7: [FSM_LINUX_FILE_MOVED_TO]: [objectType]-]=Directory,[objectName]=/mlm,[objectAction]=MOVED_TO,[targetObjType]=File,[tar-getObjName]="/mlm/cc.log",[user]=root
Use Case 8: File Accessed
Event Type
FSM_LINUX_FILE_ACCESS
Important Event Attributes
l targetOsObjType: The file type: File or Directory.l targetOsObjName: The file or directory name.l user: The name of the user who accessed the file.
Reports
None
Rules
None
Sample Log
Fri Mar 27 10:05:28 2020 centos7: [FSM_LINUX_FILE_ACCESS]: [objectType]=Directory,[objectName]=/mlm,[objectAction]=ACCESS,[targetObjType]=File,[tar-getObjName]="/mlm/mlm.txt",[user]=root
Use Case 9: File Opened
Event Type
FSM_LINUX_FILE_OPEN
Important Event Attributes
l targetOsObjType: The file type: File or Directory.l targetOsObjName: The file or directory name.l user: The name of the user who opened the file.
Reports
None
Rules
None
Sample Log
Fri Mar 27 09:57:40 2020 centos7: [FSM_LINUX_FILE_OPEN]: [objectType]=Directory,[objectName]=/mlm,[objectAction]=OPEN,[targetObjType]=Directory,[tar-getObjName]="/mlm",[user]=root
User GuideFortinet Technologies Inc.
199

Device support Administration
Use Case 10: File Closed
Event Types
l FSM_LINUX_FILE_CLOSE_WRITE
l FSM_LINUX_FILE_CLOSE_NOWRITE
Important Event Attributes
l targetOsObjType: The file type: File or Directory.l targetOsObjName: The file or directory name.l user: The name of the user who closed the file.
Reports
None
Rules
None
Sample Logs
Fri Mar 27 09:57:36 2020 centos7: [FSM_LINUX_FILE_CLOSE_WRITE]: [objectType]-]=Directory,[objectName]=/mlm,[objectAction]=CLOSE_WRITE,[targetObjType]=File,[tar-getObjName]="/mlm/bb.log",[user]=root
Fri Mar 27 10:05:28 2020 centos7: [FSM_LINUX_FILE_CLOSE_NOWRITE]: [objectType]-]=Directory,[objectName]=/mlm,[objectAction]=CLOSE_NOWRITE,[targetObjType]=File,[targetObjName]="/mlm/mlm.txt",[user]=root
Device support
The following sections provide procedures to configure device support:
Working with Devices or ApplicationsWorking with Event AttributesWorking with Event TypesWorking with ParsersWorking with Custom Performance MonitorsWorking with Custom PropertiesAnalyzing custom log filesCreating SNMPSystem Object Identifiers for devices
Working with Devices or ApplicationsYou can create a device/application if it is not available in the list for creating a parser or monitoring underADMIN >Device Support >Device/App.
This section provides the procedure to configure devices or applications.l Adding a device/applicationl Modifying a device/application
200 User GuideFortinet Technologies Inc.

Administration Device support
Adding a device or application
Complete these steps to add a new device or application:
1. Go to ADMIN >Device Support >Device/App tab.2. Click New. 3. In the Device/Application Type Definition dialog box, enter the information below.
Settings Guidelines
Category [Required] Select the Device orApplication from the drop-down list.
Vendor [Required] Vendor of the device or application.
Model [Required] Device or application model.
Version [Required] Version number of the device or application.
Device/App Group [Required] Select the group where you want to add this new device/application
Biz Service Group Select the Biz Service group.
Access Protocol Select the Access Protocol from the drop-down.
App Package Group This setting is applicable only for 'Application' category. Enter the app packagegroup here.
Description Description about the device or application.
4. ClickSave.The new device(s)/application(s) appears in the list.
5. Select the device(s)/application(s) from the list and clickApply.You can clone an existing device/application by clicking Clone and modify as necessary.
Modifying a device/application
Complete these steps to modify a device or application:
1. Select one or more device(s)/application(s) to edit from the list.2. Click the required option:
l Edit to modify any device/application setting.l Delete to remove any device /application.
3. ClickSave.
Working with Event AttributesEvent attributes are used to capture parsed information from events. Create a new attribute if the one you want touse for your custom parser or monitor is not listed in ADMIN >Device Support >Event Attribute.
User GuideFortinet Technologies Inc.
201

Device support Administration
This section provides the procedure to create event attributes.l Adding an event attributel Modifying an event attribute
Adding an event attribute
Complete these steps to add a new event attribute:1. Go to ADMIN >Device Support >Event Attribute tab.2. Click New. 3. In the Add Event Attribute Type Definition dialog box, enter the information below.
Settings Guidelines
Name [Required] Event attribute name
Display Name [Required] Display name of the event attribute
Value Type [Required] Select the value type from the drop-down to associate withthe event attribute type.
Display Format Units in which the event attribute has to be displayed
Description Description of the event attribute
4. ClickSave.The new event attribute appears in the list.
5. Select the event attribute(s) from the list and clickApply.You can clone an existing event attribute type to use as the basis for a new one. Select the eventattribute type you want to use, clickClone and modify as necessary.
Modifying an event attribute
Complete these steps to modify an event attribute setting:1. Select one or more event attribute(s) to edit from the list.2. Click the required option:
l Edit to modify the settings of an event attribute(s).l Delete to remove an event attribute(s).
3. ClickSave.
Working with Event TypesAfter parsing an event or log, FortiSIEM assigns a unique event type to that event/log. When you create a newcustom parser for device logs, you have to add a new event type to FortiSIEM so the log events can be identified.
This section provides the procedure to create event types.
l Adding an event typel Modifying an event type
202 User GuideFortinet Technologies Inc.

Administration Device support
Adding an event type
Complete these steps to add an event:1. Go to ADMIN >Device Support>Event tab.2. Click New. 3. In the Event Definition dialog box, enter the information below.
Settings Guidelines
Name [Required] Event type name - must begin with PH_DEV_MON_CUST_.
Device Type [Required] Select a device from the drop-down list.
Event Type Group [Required] Select the type of group for the event.
Severity [Required] Severity (0 - lowest) to 10 (highest).
Description Description of the event type.
4. ClickSave.The new event appears in the table.
5. Select the event(s) from the list and clickApply.You can also use the Clone option to duplicate and modify an existing event type.
Modifying an event type
Complete these steps to modify an event type:
1. Select one or more event attribute(s) to edit from the list.2. Click the required option from the following table.
l Edit - To modify the settings of a selected event(s).l Delete - To delete an event type.
3. ClickSave.
Working with ParsersCreating a custom parser for device logs involves writing an XML specification for the parser and using a testevent to make sure the logs are parsed correctly.
Prerequisites
You should have:
l examples of the logs that you want to parse.l created any new device/application types, event attribute types, or event types that you want to use in your XML
specification.l already written the XML specification for your parser.l prepared a test event that you can use to validate the parser.
User GuideFortinet Technologies Inc.
203

Device support Administration
Parsers are applied in the order they are listed in ADMIN > Device Support > Parser, so it is important to addyour custom parser to the list in relation to any other parsers that may be applied to your device logs. If you clickFix Order, this will arrange the parsers with system-defined parsers at the top of the list in their original order,and user-defined parsers at the bottom. Be sure to clickApply to ensure the change in order is picked up by theback-end module.
The following sections provide information about working with parsers:
l Event Parser XML Specificationl Creating a Custom Parserl Deleting or Disabling a Parserl Ingesting JSON Formatted Events Received via HTTP(S) POSTl Parser Examples
Event Parser Specification
FortiSIEM uses an XML-based parser framework to parse events. These topics describe the parser syntax andinclude examples of XML parser specifications.
l Custom Parser XML Specification Templatel Parser Name Specificationl Device or Application Type Specificationl Format Recognizer Specificationl Pattern Definition Specificationl Parsing Instructions Specification
Custom Parser XML Specification Template
The basic template for a custom parser XML specification includes five sections. Click the name of any section formore information.
Section Description
Name Name of the parser file.
Device Type The type of device or application associated with the parser.
Format RecognizerSpecification
Patterns that determine whether an event will be parsed by this parser.
Pattern DefinitionSpecification Defines the parsing patterns that are iterated over by the parsing instructions.
Parsing InstructionsSpecification
Instructions on how to parse events that match the format recognizer patterns.
Custom Parser XML Specification Template
<eventParser name="xxx"><deviceType> </deviceType><eventFormatRecognizer> </eventFormatRecognizer>
204 User GuideFortinet Technologies Inc.

Administration Device support
<patternDefinitions> </patternDefinitions><parsingInstructions> </parsingInstructions>
</eventParser>
Parser Name Specification
This section specifies the name of the parser, which is used only for readability and identifying the device typeassociated with the parser.
<eventParser name="CiscoIOSParser"></eventParser>
Device or Application Type Specification
This section specifies the device or the application to which this parser applies. The device and applicationdefinitions enable FortiSIEM to detect the device and application type for a host from the received events. This iscalled log-based discovery in FortiSIEM. Once a received event is successfully parsed by this file, a CMDBentry is created with the device and application set from this file. FortiSIEM discovery may further refine thedevice.
There are two separate subsections for device and application. In each section, vendor, model and version can bespecified, but version is not typically needed.
Set Version to Any
In the examples in this topic, <Version> is set to ANY because events are generally not tied to a particularversion of a device or software. You could of course set this to a specific version number if you only wanted thisparser to apply to a specific version of an application or device.
Vendor and Model Must Match the FortiSIEM Version
<Vendor> and <Model> entries must match the spelling and capitalization in the CMDB.
Examples of Specifications for Types of Device and Applications
Hardware Appliances
In this case, the type of event being parsed specifies the device type, for example Cisco IOS, Cisco ASA, etc.
<deviceType><Vendor>Cisco</Vendor><Model>IOS</Model><Version>ANY</Version>
</deviceType>
Software Operating Systems that Specify the Device Type
In this case, the type of events being parsed specifies the device type, for example Microsoft Windows etc. In thiscase the device type section looks like:
<deviceType><Vendor>Microsoft</Vendor><Model>Windows</Model><Version>ANY</Version>
</deviceType>
User GuideFortinet Technologies Inc.
205

Device support Administration
Applications that Specify Both Device Type and Application
In this case, the events being parsed specify the device and application types because Microsoft SQL Server canonly run on Microsoft Windows OS.
<deviceType><Vendor>Microsoft</Vendor><Model>Windows</Model><Version>ANY</Version>
</deviceType><appType>
<Vendor>Microsoft</Vendor><Model>SQL Server</Model><Version>ANY</Version><Name> Microsoft SQL Server</Name>
</appType>
Applications that Specify the Application Type but Not the Device Type
Consider the example of an Oracle database server, which can run on both Windows and Linux operatingsystems. In this case, the device type is set toGeneric but the application is specific. FortiSIEM depends ondiscovery to identify the device type.
<deviceType><Vendor>Generic</Vendor><Model>Generic</Model><Version>ANY</Version>
</deviceType><appType>
<Vendor>Oracle</Vendor><Model>Database Server</Model><Version>ANY</Version><Name>Oracle Database Server</Name>
</appType>
Format Recognizer Specification
In many cases, events associated with a device or application will contain a unique pattern. You can enter aregular expression in the Format Recognizer section of the parser XML file to search for this pattern, which iffound, will then parse the events according to the parser instructions. After the first match, the event source IP toparser file map is cached, and only that parser file is used for all events from that source IP. A notable exceptionis when events from disparate sources are received via a syslog server, but that case is handled differently.
While not a required part of the parser specification, a format recognizer can speed up event parsing, especiallywhen one parsing pattern file among many pattern files must be chosen. Only one pattern check can determinewhether the parsing file must be used or not. The other less efficient option would be to examine patterns in everyfile. At the same time, the format recognizer must be carefully chosen so that it is not so broad to misclassifyevents into wrong files, and at the same time, not so narrow that it fails at classifying the right file.
Order in Which Parsers are Used
FortiSIEM parser processes the files in the specific order listed in the file parserOrder.csv.
206 User GuideFortinet Technologies Inc.

Administration Device support
Format Recognizer Syntax
The specification for the format recognizer section is:
<eventFormatRecognizer><![CDATA[regexpattern]]></eventFormatRecognizer>
In the regexpattern block, a pattern can be directly specified using regex or a previously defined pattern (inthe pattern definition section in this file or in the GeneralPatternDefinitions.xml file) can bereferenced.
Example Format Recognizers
Cisco IOS
All Cisco IOS events have a %module name pattern.
<patternDefinitions><pattern name="patCiscoIOSMod" list="begin"><![CDATA[FW|SEC|SEC_
LOGIN|SYS|SNMP|]]></pattern><pattern name="patCiscoIOSMod" list="continue"><![CDATA
[LINK|SPANTREE|LINEPROTO|DTP|PARSER|]]></pattern><pattern name="patCiscoIOSMod" list="end"><![CDATA[CDP|DHCPD|CONTROLLER|PORT_
SECURITY-SP]]></pattern></patternDefinitions><eventFormatRecognizer><![CDATA[:%<:patCiscoIOSMod>-<:gPatInt>-<:patStrEndCo-lon>:]]></eventFormatRecognizer>
Cisco ASA
All Cisco ASA events have the pattern ASA-severity-id pattern, for example ASA-5-12345.
<eventFormatRecognizer><![CDATA[ASA-\d-\d+]]></eventFormatRecognizer>
Palo Alto Networks Log Parser
In this case, there is no unique keyword, so the entire message structure from the beginning to a specific point inthe log must be considered.
Event<14>May 6 15:51:04 1,2010/05/0615:51:04,0006C101167,TRAFFIC,start,1,2010/05/0615:50:58,192.168.28.21,172.16.255.78,::172.16.255.78,172.16.255.78,rule3,,,icmp,vsys1,untrust,untrust,ethernet1/1,ethernet1/1,syslog-172.16.20.152,2010/05/0615:51:04,600,2,0,0,0,0,0x40,icmp,allow,196,196,196,2,2010/05/0615:50:58,0,any,0
<eventFormatRecognizer><![CDATA[<:gPatTime>,\w+,(?:TRAFFIC|THREAT|CONFIG|SYSTEM)]]></eventFormatRecognizer>
User GuideFortinet Technologies Inc.
207

Device support Administration
Pattern Definition Specification
In this section of the parser XML specification, you set the regular expression patterns that that FortiSIEM williterate through to parse the device logs.
Reusing Pattern Definitions in Multiple Parser Specifications
If you want to use a pattern definition in multiple parser specifications, you must define it in theGeneralPatternDefinitions.xml file. The patterns in the file must have a g prefix, and can bereferenced as shown in this example:
<generalPatternDefinitions><pattern name="gPatSyslogPRI"><![CDATA[<\d+>]]></pattern>
<pattern name="gPatMesgBody"><![CDATA[.*]]></pattern><pattern name="gPatMonNum"><![CDATA[\d{1,2}]]></pattern><pattern name="gPatDay"><![CDATA[\d{1,2}]]></pattern><pattern name="gPatTime"><![CDATA[\d{1,2}:\d{1,2}:\d{1,2}]]></pattern><pattern name="gPatYear"><![CDATA[\d{2,4}]]></pattern>
</generalPatternDefinitions>
Each pattern has a name and the regular expression pattern within the CDATA section. This the basic syntax:
<pattern name="patternName"><![CDATA[pattern]]></pattern>
This is an example of a pattern definition:
<patternDefinitions><pattern name="patIpV4Dot"><![CDATA[\d{1,3}.\d{1,3}.\d{1,3}.\d{1,3}]]></pat-
tern><pattern name="patComm"><![CDATA[[^,]+]]></pattern><pattern name="patUpDown"><![CDATA[up|down]]></pattern><pattern name="patStrEndColon"><![CDATA[[^:]*]]></pattern>
</patternDefinitions>
You can also write a long pattern definition in multiple lines and indicate their order as shown in this example. Thevalue of the list attribute should be begin in first line and end in last line. If there are more than two lines, theattribute should be set to continue for the other lines.
<pattern name="patSolarisMod" list="begin"><![CDATA[sshd|login|]]></pattern><pattern name="patSolarisMod" list="continue"><![CDATA[inetd|lpstat|]]></pattern><pattern name="patSolarisMod" list="end"><![CDATA[su|sudo]]></pattern>
Parsing Instructions Specification
This section is the heart of the parser, which attempts to recognize patterns in a log message and populateparsed event attributes.
In most cases, parsing involves applying a regular expression to the log, picking up values, and setting them toevent attributes. Sometimes the processing is more involved, for example when attributes must be stored as localvariables and compared before populating the event attributes. There are three key components that are used inparsing instructions: Event attributes and variables, inbuilt functions that perform operations on event attributesand variables, and switch and choose branching constructs for logical operations. Values can be collectedfrom both unstructured and structured strings in log messages.
l Event Attributes and Variablesl Inbuilt Functions
208 User GuideFortinet Technologies Inc.

Administration Device support
l Branching Constructsl Collecting Values from Unstructured Stringsl Collecting Fields from Structured Strings
Event Attributes and Variables
The dictionary of event attributes are defined in FortiSIEM database and any member not belonging to that list isconsidered a local variable. For readability, local variables should begin with an underscore (_), although this isnot enforced.
Setting an Event Attribute to a Constant
<setEventAttribute attr="eventSeverity">1</setEventAttribute>
Setting an Event Attribute from Another Variable
The $ symbol is used to specify the content of a variable. In the example below, attribute hostMACAddr getsthe value stored in the local variable _mac.
<setEventAttribute attr="hostMACAddr">$_mac</setEventAttribute>
Inbuilt Functions
Combining Two or More Strings to Produce a Final String
Use the combineMsgId function to do this. Here _evIdPrefix is the prefix, _evIdSuffix is the suffix, andthe output will be string1-_evIdPrefix-_evIdSuffix.
<setEventAttribute attr="eventType">combineMsgId("string1",$_evIdPrefix, "-", $_evIdSuffix)</setEventAttribute>
Normalize MAC Address
Use the normalizeMAC function to do this. The output will be six groups of two nibbles separated by a colon,for example AA:BB:CC:DD:EE:FF.
<setEventAttributeattr="hostMACAddr">normalizeMAC($_mac)</setEventAttribute>
Compare Interface Security Level
Use the compIntfSecVal function to do this. This primarily applies to Cisco ASA and PIX firewalls. The resultsreturned are:
l LESS if srcIntf has strictly lower security level than destIntfl GREATER if srcIntf has strictly higher security level than destIntfl EQUAL if srcIntf and destIntf have identical security levels
<setEventAttribute attr="_result">compIntfSecVal($srcIntf, $destInt-f)</setEventAttribute>
Convert Hex Number to Decimal Number
Use the convertHexStrToInt function to do this.
User GuideFortinet Technologies Inc.
209
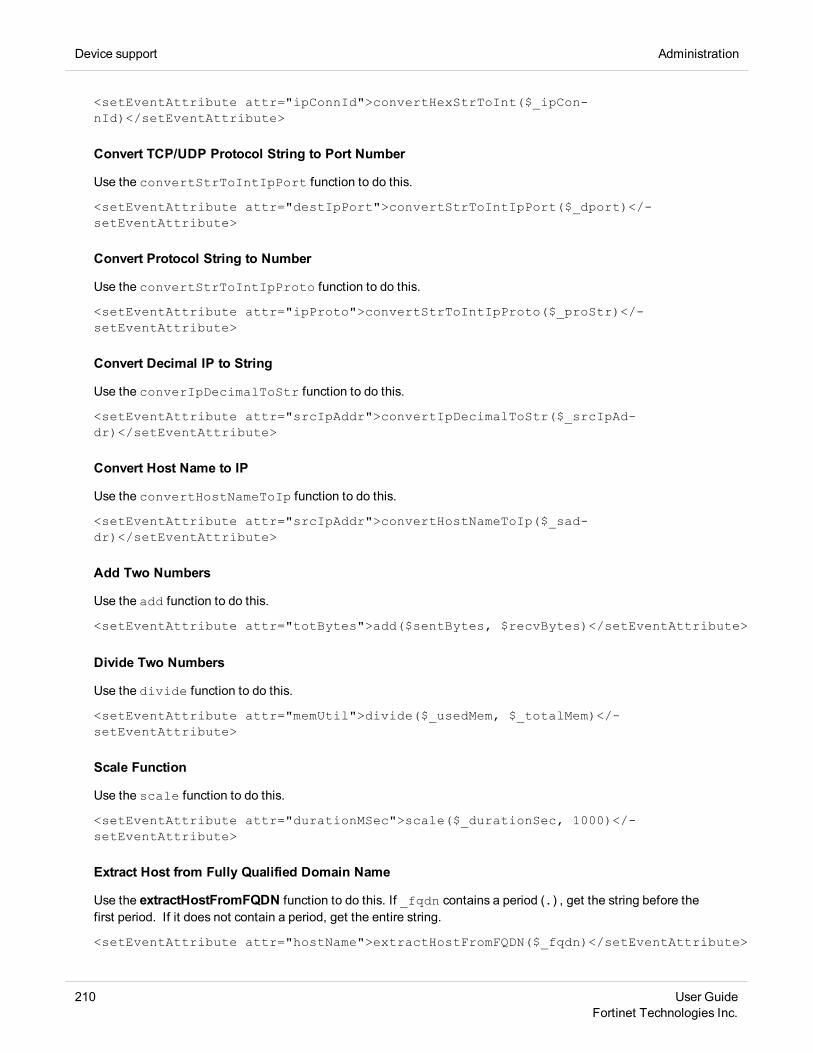
Device support Administration
<setEventAttribute attr="ipConnId">convertHexStrToInt($_ipCon-nId)</setEventAttribute>
Convert TCP/UDP Protocol String to Port Number
Use the convertStrToIntIpPort function to do this.
<setEventAttribute attr="destIpPort">convertStrToIntIpPort($_dport)</-setEventAttribute>
Convert Protocol String to Number
Use the convertStrToIntIpProto function to do this.
<setEventAttribute attr="ipProto">convertStrToIntIpProto($_proStr)</-setEventAttribute>
Convert Decimal IP to String
Use the converIpDecimalToStr function to do this.
<setEventAttribute attr="srcIpAddr">convertIpDecimalToStr($_srcIpAd-dr)</setEventAttribute>
Convert Host Name to IP
Use the convertHostNameToIp function to do this.
<setEventAttribute attr="srcIpAddr">convertHostNameToIp($_sad-dr)</setEventAttribute>
Add Two Numbers
Use the add function to do this.
<setEventAttribute attr="totBytes">add($sentBytes, $recvBytes)</setEventAttribute>
Divide Two Numbers
Use the divide function to do this.
<setEventAttribute attr="memUtil">divide($_usedMem, $_totalMem)</-setEventAttribute>
Scale Function
Use the scale function to do this.
<setEventAttribute attr="durationMSec">scale($_durationSec, 1000)</-setEventAttribute>
Extract Host from Fully Qualified Domain Name
Use the extractHostFromFQDN function to do this. If _fqdn contains a period (.) , get the string before thefirst period. If it does not contain a period, get the entire string.
<setEventAttribute attr="hostName">extractHostFromFQDN($_fqdn)</setEventAttribute>
210 User GuideFortinet Technologies Inc.

Administration Device support
Replace a String Using a Regular Expression
Use the replaceStringByRegex function to do this.
<setEventAttribute attr="eventType">replaceStringByRegex($_eventType, "\s+", "_")</setEventAttribute>e.g. _eventType: "Event Type"; eventType: "Event_Type"
Replace String in String
Use the replaceStrInStr function to do this.
<setEventAttribute attr="computer">replaceStrInStr($_computer, "\\", "")</-setEventAttribute>
Resolve DNS Name
Use the resolveDNSName function to do this. This function converts the DNS name to an IP address.
<setEventAttribute attr="destIpAddr">resolveDNSName($destName)</setEventAttribute>
Convert to UNIX Time
Use the toDateTime function to do this.
<setEventAttribute attr="deviceTime">toDateTime($_mon, $_day, $_year, $_time)</-setEventAttribute><setEventAttribute attr="deviceTime">toDateTime($_mon, $_day, $_time)</setEventAttribute>
Trim Attribute
Use the trimAttribute function to do this. In this example, it is used to trim the leading and trailing dots indestName.
<setEventAttribute attr="destName">trimAttribute($destName, ".")</-setEventAttribute>
Branching Constructs
l ChooseThe format is:
<choose><when test='$AttributeOrVariable1 operator Value1'>
...</when><when test='$AttributeOrVariable2 operator Value2'>
...</when><otherwise>
...</otherwise>
</choose>
l SwitchThe format is:
User GuideFortinet Technologies Inc.
211

Device support Administration
<switch><case>...
</case><case>...
</case></switch>
Collecting Values from Unstructured Strings
From a string input source, a regex match is applied and variables are set. The variables can be event attributesor local variables. The input will be a local variable or the default raw message variable. The syntax is:
<collectAndSetAttrByRegex src="$inputString "><regex><![CDATA[regexpattern]]></regex>
</collectAndSetAttrByRegex>
The regexpattern is specified by a list of variables and sub-patterns embedded within a larger pattern. Eachvariable and sub-pattern pair are enclosed within angle brackets (<>).
Consider an example in which the local variable _body is set to list 130 permitted eigrp172.16.34.4(Serial1 ) > 172.16.34.3, 1 packet. From this string we must set the values to localvariables and event attributes.
Value Set To Type
130 _aclName Local Variable
permitted _action Local Variable
eigrp _proto Local Variable
172.16.34.4 srcIpAddr Event Attribute
Serial1 srcIntfName Event Attribute
172.16.34.3 destIpAddr Event Attribute
1 totPkts Event Attribute
This is achieved by using this XML. Note that you can use both the collectAndSetAttrByRegex andcollectFieldsByRegex functions to collect values from fields.
<collectAndSetAttrByRegex src="$_body"><regex><![CDATA[list <_aclName:gPatStr> <_action:gPatWord>
<_proto:gPatWord> <srcIpAddr:gPatIpV4Dot>(<:srcIntfName:gPatWord>) -><destIpAddr:gPatIpV4Dot>, <totPkts:gPatInt> <:gPatMesgBody>]]></regex></collectAndSetAttrByRegex>
Collecting Fields from Structured Strings
There are usually two types of structured strings in device logs:
212 User GuideFortinet Technologies Inc.

Administration Device support
l Key=value structuredl Value list structured
In each case, two simpler specialized parsing constructs are provided.
Key=Value Structured Data
Certain logs, such as SNMP traps, are structured as Key1 = value1 <separator> Key2 = value2,....These can be parsed using the collectAndSetAttrByKeyValuePair XML attribute tag with this syntax.
<collectAndSetAttrByKeyValuePair sep='separatorString'src="$inputString"><attrKeyMap attr="variableOrEventAttribute1" key="key1"/><attrKeyMap attr="variableOrEventAttribute2" key="key2"/>
</collectAndSetAttrByKeyValuePair>
When a key1 match is found, the entire string following key1 up to the separatorString is parsed out andstored in the attribute variableOrEventAttribute1.
For example, consider this log fragment:
_body =SNMPv2-SMI::enterprises.14823.2.3.1.11.1.1.60 = Hex-STRING: 07 D8 06 0B13 15 00 00 2D 07 00 SNMPv2-SMI::enterprises.14823.2.3.1.11.1.1.11.0= Hex-STRING: 00 16 B6 DB 12 22SNMPv2-SMI::enterprises.14823.2.3.1.11.1.1.12.0 = Hex-STRING: 00 21 554D 66 B0 SNMPv2-SMI::enterprises.14823.2.3.1.11.1.1.13.0 = INTEGER: 36SNMPv2-SMI::enterprises.14823.2.3.1.11.1.1.1.0 = Hex-STRING: 00 1A 1E C060 7A SNMPv2-SMI::enterprises.14823.2.3.1.11.1.1.56.0 = INTEGER: 2SNMPv2-SMI::enterprises.14823.2.3.1.11.1.1.17.0 = STRING:"00:1a:1e:c0:60:7a"
The corresponding parser fragment is:
<collectAndSetAttrByKeyValuePair sep='\t\\| SNMP' src="$_body"><attrKeyMap attr="srcMACAddr"
key="SNMPv2-SMI::enterprises.14823.2.3.1.11.1.1.11.0 = Hex-STRING: "/><attrKeyMap attr="_destMACAddr"
key="SNMPv2-SMI::enterprises.14823.2.3.1.11.1.1.12.0 = Hex-STRING: "/><attrKeyMap attr="wlanSSID"
key="SNMPv2-SMI::enterprises.14823.2.3.1.11.1.1.6.0 = STRING: "/><attrKeyMap attr="wlanRadioId"
key="SNMPv2-SMI::enterprises.14823.2.3.1.11.1.1.56.0 = INTEGER: "/><attrKeyMap attr="apMac"
key="SNMPv2-SMI::enterprises.14823.2.3.1.11.1.1.17.0 = STRING: "/></collectAndSetAttrByKeyValuePair>
After parsing, the attribute values are set:
Value Attribute
00 16 B6 DB 12 22 srcMACAddr
00 21 55 4D 66 B0 destMacAddr
User GuideFortinet Technologies Inc.
213

Device support Administration
Value Attribute
2 wlanRadioId
00:1a:1e:c0:60:7a apMac
Value List Structured Data
Certain application logs, such as those from Microsoft IIS, are structured as a list of values with a separator.These can be parsed using the collectAndSetAttrByPos XML attribute tag following this syntax.
<collectAndSetAttrByPos sep='separatorString' src="$inputString"><attrPosMap attr="variableOrEventAttribute1" pos='offset1'/><attrPosMap attr="variableOrEventAttribute2" pos='offset2'/>
</collectAndSetAttrByPos>
When the position offset1 is encountered, the subsequent values up to the separatorString is stored invariableOrEventAttribute1.
For example, consider this log fragment:
_body =W3SVC1 ADS-PRI 192.168.0.10 GET /Document/ACE/index.htm - 80 -192.168.20.55 HTTP/1.1Mozilla/5.0+(Windows;+U;+Windows+NT+5.1;+en-US;+rv:1.8.1.11)+Gecko/20071127+Firefox/2.0.0.11 [http://wwwin/Document/] wwwin 200 0 0 5750 445 15
The parser fragment is:
<collectAndSetAttrByPos src="$_body" sep=' '><attrPosMap attr="srvInstName" pos='1'/><attrPosMap attr="destName" pos='2'/><attrPosMap attr="relayDevIpAddr" pos='2'><attrPosMap attr="destIpAddr" pos='3'/><attrPosMap attr="httpMethod" pos='4'/><attrPosMap attr="uriStem" pos='5'/><attrPosMap attr="uriQuery" pos='6'/><attrPosMap attr="destIpPort" pos='7'/><attrPosMap attr="user" pos='8'/><attrPosMap attr="srcIpAddr" pos='9'/><attrPosMap attr="httpVersion" pos='10'/><attrPosMap attr="httpUserAgent" pos='11'/><attrPosMap attr="httpReferrer" pos='13'/><attrPosMap attr="httpStatusCode" pos='15'/><attrPosMap attr="httpSubStatusCode" pos='16'/><attrPosMap attr="httpWin32Status" pos='17'/><attrPosMap attr="recvBytes" pos='18'/><attrPosMap attr="sentBytes" pos='19'/><attrPosMap attr="durationMSec" pos='20'/>
</collectAndSetAttrByPos>
For structured strings, techniques in this section are more efficient than in the previous section because theexpression is simpler and ONE tag can be used to parse regardless of the order in which the keys or valuesappear in the string.
214 User GuideFortinet Technologies Inc.

Administration Device support
Creating a Custom Parser
You should have:
l examples of the logs that you want to parse.l created any new device/application types, event attribute types, or event types that you want to use in your XML
specification.l already written the XML specification for your parser.l prepared a test event that you can use to validate the parser.
Parsers are applied in the order they are listed in ADMIN > Device Support > Parser, so it is important to addyour custom parser to the list in relation to any other parsers that may be applied to your device logs. If you clickFix Order, this will arrange the parsers with system-defined parsers at the top of the list in their original order,and user-defined parsers at the bottom. Be sure to clickApply to ensure the change in order is picked up by theback-end module.
Note:Custom parsers can be created only from the Super/Global account in Service Provider FortiSIEMdeployments.
1. Go to ADMIN > Device Support > Parser.2. Select a parser that is above the location in the list where you want to add your parser, and clickNew.3. Enter a Name for the parser. 4. Select a Device Type from the drop-down list to which the parser should apply.
If the device type doesn't appear in the menu, you should create a new device type.5. Enter a Test containing an example of an event that you want to use to validate the parser.6. Enter the Parser XML.7. ClickValidate.
This will validate the XML.8. Click Test.
This will send the test event to the parser to make sure it is parsed correctly, and will also test the parsers aboveand below yours in the list to make sure they continue to parse logs correctly.
9. If the XML for your parser validates and the test event is correctly parsed, select Enable.If you must continue working on your parser, you can Save it without selecting Enable.
10. Add a Description of the Parser.11. ClickSave.12. ClickApply to have the back-end module pick up your parser and begin applying it to device logs.
You should now validate that events are being parsed by creating some activity that will cause a log to begenerated, and then run a query against the new device IP address and validate the parsed results.
Cloning New Parsers
You can clone an existing parser and then use it as the basis for creating a new one. Select the parser you want toclone, and then clickClone. Modify the parser as necessary, and then make sure you use the Up and Downbuttons to place it in the list of parsers at the point at which is should be applied.
Ingesting JSON Formatted Events Received via HTTP(S) POST
FortiSIEM can receive, parse, and store JSON formatted events received via HTTP(S) POST. Follow these stepsto implement this.
User GuideFortinet Technologies Inc.
215

Device support Administration
1. Configure the FortiSIEM node with the HTTPS credential for receiving the HTTP(S) POST event.a. Identity the FortiSIEM node receiving the events. Most likely, this will be the Collector.b. SSH to the Collector and run the command: htpasswd -b /etc/httpd/accounts/passwds
<user> <password>
2. Modify the built-in JSON parser to parse event attributes and set the Event Type.a. Login to the Supervisor.
b. Go to ADMIN > Device Support > Parser.
c. Clone PHCustomJSONParser.xml and make the changes so that additional event attributes areparsed.
d. Validate, Test, and Save the parser.e. ClickApply All to deploy the parser changes.
3. Make sure the events are being pushed to the FSM node using the credentials in Step 1 via this REST API:https://<FSMNodeName>/rawupload?vendor=<vendor>&model=<model>&reptIp=<reptIp>&reptName=<reptHost>
where FSNNodeName is the resolvable host name or FQDN in Step 1. The parameters ReportingVendor (vendor), Reporting Model (model), Reporting Device (reptHost), and Reporting IP(reptIP) are needed to create a CMDB entry and populate events.
4. Query the events by using the Reporting Device Name or IP in Step 3 and Event Type in Step 2c.
Deleting or Disabling a Parser
l Deleting Parsersl Disabling Parsers
Deleting Parsers
You can only delete user-defined parsers.
1. Go to ADMIN > Device Support > Parser.2. Select the parser you want to delete.3. ClickDelete.4. ClickYes to confirm.
Disabling Parsers
You can disable both system and user-defined parsers.
1. Go to ADMIN > Device Support > Parser.2. Select the parser and deselect the tick mark below Enabled column.3. ClickYes to confirm.
Parser Examples
The followng example is based on Cisco IOS Syslog Parser. The objective is to parse this syslog message:
<190>91809: Jan 9 02:38:47.872: %SEC-6-IPACCESSLOGP: list testlog permitted tcp192.168.20.33(3438) -> 69.147.86.184(80), 1 packet
Complete these steps to create an appropriate parser.
216 User GuideFortinet Technologies Inc.

Administration Device support
l Add Device Typel Create the Parser Specification and Add Local Patternsl Define the Format Recognizerl Parse the Syslog Headerl Parse the Syslog Bodyl Final Parserl Parsed Output
Add Device Type
Create a CiscoIOSParser.xml file with this content:
<eventParser name="CiscoIOSParser"><deviceType>
<Vendor>Cisco</Vendor><Model>IOS</Model><Version>ANY</Version>
</deviceType></eventParser>
Create the Parser Specification and Add Local Patterns
Create the parser XML file with this content, and add the pattern definition patCiscoIOSMod for detecting IOSmodules such as SEC.
<eventParser name="CiscoIOSParser"><deviceType>
<Vendor>Cisco</Vendor><Model>IOS</Model><Version>ANY</Version>
</deviceType><patternDefinitions>
<pattern name="patCiscoIOSMod" list="begin"> <![CDATA[FW|SEC|SEC_LOGIN|SYS|SNMP|]]></pattern>
<pattern name="patCiscoIOSMod" list="continue"><![CDATA[LINK|SPANTREE|LINEPROTO|DTP|PARSER|]]></pattern>
<pattern name="patCiscoIOSMod" list="end"><![CDATA[CDP|DHCPD|CONTROLLER|PORT_SECURITY-SP]]></pattern>
<pattern name="patStrEndColon"><![CDATA[[^:]*]]></pattern><pattern name="patComm"><![CDATA[[^,]+]]></pattern>
</patternDefinitions></eventParser>
Define the Format Recognizer
Add this format recognizer for detecting %SEC-6-IPACCESSLOGP, which is a signature of Cisco IOS syslogmessages.
<eventParser name="CiscoIOSParser"><deviceType>
<Vendor>Cisco</Vendor><Model>IOS</Model>
User GuideFortinet Technologies Inc.
217

Device support Administration
<Version>ANY</Version></deviceType><patternDefinitions>
<pattern name="patCiscoIOSMod" list="begin"> <![CDATA[FW|SEC|SEC_LOGIN|SYS|SNMP|]]></pattern>
<pattern name="patCiscoIOSMod" list="continue"><![CDATA[LINK|SPANTREE|LINEPROTO|DTP|PARSER|]]></pattern>
<pattern name="patCiscoIOSMod" list="end"><![CDATA[CDP|DHCPD|CONTROLLER|PORT_SECURITY-SP]]></pattern>
<pattern name="patStrEndColon"><![CDATA[[^:]*]]></pattern><pattern name="patComm"><![CDATA[[^,]+]]></pattern>
</patternDefinitions><eventFormatRecognizer>
<![CDATA[: %<:patCiscoIOSMod>-<:gPatInt>-<:patStrEndColon>:]]></eventFormatRecognizer>
</eventParser>
Parse the Syslog Header
A syslog message consists of a syslog header and a body. For better organization, first parse the syslog headerand event type. Subsequent code will include event type specific parsing, which is why event type is extracted inthis step. In this example, the header is in boldface.
<190>91809: Jan 9 02:38:47.872: %SEC-6-IPACCESSLOGP: list testlog permittedtcp 192.168.20.33(3438) -> 69.147.86.184(80), 1 packet
The XML code for parsing the header does the following:
1. Matches the pattern <190>91809: Jan 9 02:38:47.872: %SEC-6-IPACCESSLOGP:
2. Sets the eventType attribute to IOS-SEC- IPACCESSLOGP.3. Sets deviceTime.4. Sets event severity (1-7 scale in Cisco IOS, 1=>most severe, to normalized 1-10 scale in FortiSIEM where
10=>most severe)5. Saves the event list testlog permitted tcp 192.168.20.33(3438) -> 69.147.86.184
(80), 1 packet in a temporary variable _body.Note that the patterns gPatSyslogPRI, gPatMon, gPatDay, gPatTime, gPatInt, and gPatmesgBodyare global patterns that are defined in the GeneralPatternDefinitions.xml file:
<generalPatternDefinitions><pattern name="gPatSyslogPRI"><![CDATA[<\d+>]]></pattern><pattern name="gPatMesgBody"><![CDATA[.*]]></pattern><pattern name="gPatMon"> <![CDATA[Jan|Fe-
b|Mar|Apr|May|Jun|Jul|Aug|Sep|Oct|Nov|Dec|\d{1,2}]]></pattern><pattern name="gPatDay"><![CDATA[\d{1,2}]]></pattern><pattern name="gPatTime"><![CDATA[\d{1,2}:\d{1,2}:\d{1,2}]]></pattern><pattern name="gPatInt"><![CDATA[\d+]]></pattern>
</generalPatternDefinitions>
This parser file XML fragment for parsing the example syslog message looks like this:
<parsingInstructions><collectFieldsByRegex src="$_rawmsg"><regex><
Administration Device support
Colon>: <_body:gPatMesgBody>]]></regex></collectFieldsByRegex><setEventAttribute attr="eventType">combineMsgId("IOS-",$_evIdPrefix, "-", $_
evIdSuffix)</setEventAttribute><choose>
<when test='$_severity IN "6, 7"'><setEventAttribute attr="eventSeverity">1</setEventAttribute>
</when><when test='$_severity = "1"'>
<setEventAttribute attr="eventSeverity">10</setEventAttribute></when><when test='$_severity = "2"'>
<setEventAttribute attr="eventSeverity">8</setEventAttribute></when><when test='$_severity IN "3, 4"'>
<setEventAttribute attr="eventSeverity">5</setEventAttribute></when><when test='$_severity = "5"'>
<setEventAttribute attr="eventSeverity">2</setEventAttribute></when>
</choose><parsingInstructions>
Parse the Syslog Body
The parsing is done on an eventType by eventType basis, because the formats are eventType-specific.Parsing the syslog body involves three steps:
1. Parsing the action string. Based on the action staring value (permit or denied), modify the eventType byappending the action string value at the end, and also modify the eventSeverity values.
2. Parsing the protocol, source, and destination IP, port, and totalPackets.3. Converting the protocol string to a protocol integer.
<choose><when test='$eventType IN "IOS-SEC-IPACCESSLOGP,IOS-SEC-IPACCESSLOGDP, IOS-SEC-
IPACCESSLOGRP"'><collectAndSetAttrByRegex src="$_body"><regex><![CDATA[list <_aclName:gPatStr>\s+<_action:gPatWord>\s+<_pro-
to:gPatWord>\s+<srcIpAddr:gPatIpV4Dot>\(<srcIpPort:gPatInt>\)<:gPatMesgBody>->\s+<destIpAddr:gPatIpV4Dot>\(<destIpPort:gPatInt>\),\s+<totPkts:gPatInt> <:gPatMesgBody>]]>
</regex></collectAndSetAttrByRegex><choose>
<when test='$_action = "permitted"'><setEventAttribute attr="eventType">combineMsgId("IOS-",$_evIdPre-
fix, "-", $_evIdSuffix, "-PERMITTED")</setEventAttribute><setEventAttribute attr="eventSeverity">1</setEventAttribute>
</when><when test='$_action = "denied"'>
<setEventAttribute attr="eventType">combineMsgId("IOS-",$_evIdPre-fix, "-", $_evIdSuffix, "-DENIED")</setEventAttribute>
<setEventAttribute attr="eventSeverity">3</setEventAttribute>
User GuideFortinet Technologies Inc.
219

Device support Administration
</when></choose><setEventAttribute attr="ipProto">convertStrToIntIpProto($_pro-
to)</setEventAttribute></when>
</choose>
Final Parser
<eventParser name="CiscoIOSParser"><deviceType>
<Vendor>Cisco</Vendor><Model>IOS</Model><Version>ANY</Version>
</deviceType><patternDefinitions>
<pattern name="patCiscoIOSMod" list="begin"> <![CDATA[FW|SEC|SEC_LOGIN|SYS|SNMP|]]></pattern>
<pattern name="patCiscoIOSMod" list="continue"> <![CDATA[LINK|SPANTREE|LINEPROTO|DTP|PARSER|]]></pattern>
<pattern name="patCiscoIOSMod" list="end"><![CDATA[CDP|DHCPD|CONTROLLER|PORT_SECURITY-SP]]></pattern>
<pattern name="patStrEndColon"><![CDATA[[^:]*]]></pattern><pattern name="patComm"><![CDATA[[^,]+]]></pattern>
</patternDefinitions><parsingInstructions><!—parse header --><collectFieldsByRegex src="$_rawmsg"><regex><![CDATA[<:gPatSys-
logPRI>?<:gPatMon>\s+<:gPatDay>\s+<:gPatTime>%<_evIdPrefix:patCiscoIOSMod>-<_severity:gPatInt>-<_evIdSuffix:patStrEndColon>: <_body:gPatMesgBody>]]></regex>
</collectFieldsByRegex><setEventAttribute attr="eventType">combineMsgId("IOS-",$_evIdPrefix, "-", $_
evIdSuffix)</setEventAttribute><choose>
<when test='$_severity IN "6, 7"'><setEventAttribute attr="eventSeverity">1</setEventAttribute>
</when><when test='$_severity = "1"'>
<setEventAttribute attr="eventSeverity">10</setEventAttribute></when><when test='$_severity = "2"'>
<setEventAttribute attr="eventSeverity">8</setEventAttribute></when><when test='$_severity IN "3, 4"'>
<setEventAttribute attr="eventSeverity">5</setEventAttribute></when><when test='$_severity = "5"'>
<setEventAttribute attr="eventSeverity">2</setEventAttribute></when>
</choose><!—parse body -->
220 User GuideFortinet Technologies Inc.

Administration Device support
<choose><when test='$eventType IN "IOS-SEC-IPACCESSLOGP,IOS-SEC-IPACCESSLOGDP, IOS-
SEC-IPACCESSLOGRP"'><collectAndSetAttrByRegex src="$_body">
<regex><![CDATA[list<_aclName:gPatStr>\s+<_action:gPatWord>\s+<_proto:gPatWord>\s+<srcIpAddr:gPatIpV4Dot>\(<srcIpPort:gPatInt>\)<:gPatMesgBody>->\s+<destIpAddr:gPatIpV4Dot>\(<destIpPort:gPatInt>\),\s+<totPkts:gPatInt> <:gPatMesgBody>]]>
</regex></collectAndSetAttrByRegex><choose>
<when test='$_action = "permitted"'><setEventAttribute attr="eventType">combineMsgId("IOS-", $_
evIdPrefix, "-", $_evIdSuffix,"-PERMITTED")</setEventAttribute>
<setEventAttribute attr="eventSeverity">1</setEventAttribute></when><when test='$_action = "denied"'>
<setEventAttributeattr="eventType">combineMsgId("IOS-", $_evIdPre-fix, "-", $_evIdSuffix,"-DENIED")</setEventAttribute>
<setEventAttribute attr="eventSeverity">3</setEventAttribute></when>
</choose><setEventAttribute attr="ipProto">convertStrToIntIpProto($_pro-
to)</setEventAttribute>
</when></choose>
<parsingInstructions>
Parsed Output
Input syslog:
<190>91809: Jan 9 02:38:47.872: %SEC-6-IPACCESSLOGP: list testlog permittedtcp 192.168.20.33(3438) -> 69.147.86.184(80), 1 packet
Parsed fields:
1. phRecvTime: the time at which the event was received by FortiSIEM2. phDeviceTime: Jan 9 02:38:47 20103. eventType: SEC-IPACCESSLOGP-PERMITTED4. eventSeverity: 35. eventSeverityCategory: LOW6. aclName: testlog7. ipProto: 68. srcIpAddr: 192.168.20.339. destIpAddr: 69.147.86.18410. srcIpPort: 3438
User GuideFortinet Technologies Inc.
221

Device support Administration
11. destIpPort: 8012. totPkts: 1
Working with Custom Performance MonitorsCreating a custom performance monitor involves creating a performance object that specifies the monitoringaccess protocol to use, maps event attributes available for that protocol to FortiSIEM event attribute types, andthen associates those attributes to an event type. You can use system or user-defined device types, eventattribute types, and event types when creating the performance object. The following sections provideinformation about working with Performance Monitors:
l Creating a Custom Performance Monitorl Monitoring Protocol Configuration Settingsl Mapping Monitoring Protocol Objects to Event Attributesl Managing Monitoring of System and Application Metrics for Devicesl Examples of Custom Performance Monitors
Creating a Custom Performance Monitor
You can create Custom Performance Monitors by defining the performance object that you want to monitor,including the relationship between the performance object and FortiSIEM events and event attributes, and thenassociating the performance object to a device type.
In Service Provider FortiSIEM deployments, custom performance performance have to be created by theSuper/Global account, and apply to all organizations. In enterprise deployments, custom performance monitorscan be created by any user who has access to the ADMIN tab.
Prerequisites
l You should review the configuration settings for the monitoring protocols that you will use in your monitor, and beready to provide the appropriate OIDs, classes, or database table attributes for the access protocol.
l You should have created any new device/application types, event attributes, or event types that you want to use inyour Performance Monitor.
l You should have the IP address and access credentials for a device that you can use to test the monitor.
Creating the Performance Object and Applying it to a Device
1. Go to ADMIN > Device Support > Monitoring.2. ClickNew.3. Enter a Name for the Performance Monitor.4. For Type, select either System orApplication.5. ForMethod, select the monitoring protocol for the performance monitor.
See the topics under Monitoring Protocol Configuration Settings for more information about the configurationsettings for each type of monitoring protocol.
6. ClickNew next to List of Attributes, and create the mapping between the performance object and FortiSIEMevent attributes. Note that the Method you select will determine the name of this mapping and the configuration options that areavailable. See Mapping Monitoring Protocol Objects to Event Attributes for more information.
7. Select the Event Type that will be monitored.
222 User GuideFortinet Technologies Inc.

Administration Device support
8. Enter the Polling Frequency for the monitor.9. Enter a Description. 10. ClickSave.11. Under Enter Device Type to Performance Object Association section, clickNew. 12. Enter a Name for the mapping. 13. Select the Device Type from the drop-down for which you want to apply the monitor.
Whenever a device belonging to the selected device type is discovered, FortiSIEM will attempt to apply theperformance monitor to it.
14. ClickPerf Objects drop-down to select or search the Performance Objects.15. ClickSave.
Testing the Performance Monitor
1. Go to ADMIN > Device Support > Monitoring.2. Select the Performance Monitor.3. Click Test.4. For IP, enter the IP address of the device that you want to use to test the monitor.
Testing for Multi-Tenant Deployments: If you have a Service Provider FortiSIEM, select the Supervisor orCollector where the device is monitored.
5. Click Test.If the test succeeds, click Close, and then click Apply to register the new monitor with the back-endmodule.
After you have successfully tested and applied the performance monitor, you should initiate discovery of thedevice that it will monitor, and then make sure that the new monitor is enabled as described in ManagingMonitoring of System and Application Metrics for Devices.
Monitoring Protocol Configuration Settings
These topics describe the configuration settings for monitoring Protocols such as SNMP, WMI, and JDBC that areused for creating custom Performance Monitors.
l JDBC Configuration Settingsl JMXConfiguration Settingsl SNMPConfiguration Settings for Custom Performance Monitorsl WMI Configuration Settings for Custom Performance Monitorsl Login Configuration Settings for Custom Performance Monitors
JDBC Configuration Settings
Use these settings when configuring JDBC as the access protocol for a custom performance monitor. You mightwant to review the topic Custom JDBC Performance Monitor for a Custom Table as an example of how to set upa custom performance monitor using JDBC.
Field Setting/Notes
Method JDBC
User GuideFortinet Technologies Inc.
223

Device support Administration
Field Setting/Notes
Database Type Select the type of database to connect to
SQL Query The SQL Query to execute when connecting
List of ColumnsThis creates the mapping between columns in the database and FortiSIEM eventattributes. See Mapping Monitoring Protocol Objects to Event Attributes for moreinformation.
Where Clause This indicates whether the database table being queried has a fixed set of rows, orwhether it is growing over time. An example of this would be a table containing logs,in which case FortiSIEM would keep track of the last entry and only pull the newones. There are three options here:
1. There is a fixed set of rows and all rows are needed.Leave all options cleared.
2. There is a fixed set of rows and a fixed number of rows are needed.Select Fixed records and enter the number of required rows.
3. The table is growing and only new values are needed.Select Retrieve all new values since last retrieve time of column,and enter the name of the column that represents time in the database.FortiSIEM will keep track of the largest value in this column and only pullentries greater than that value during the next polling interval.
Event Type
Select the Event Type from the drop-down for which you want to applythe monitor. Whenever a event belonging to the selected method is discovered,FortiSIEM will attempt to apply the performance monitor to it.
Polling Frequency Enter the Polling Frequency for the monitor.
JMX Configuration Settings
When configuring JMX as the monitoring protocol for a custom performance monitor, use these settings. Youmay also want to review the topic Custom JMXMonitor for IBM Websphere as an example of creating a customJMX performance monitor.
Field Setting/Notes
Method JMX
MBean
Enter the MBean interface that you want to monitor, or click the downward arrow tobrowse the JMX tree and select it. Note that the option you select here will determinethe objects that are available when you select anObject Attribute for the List ofAttributes. See the next section in this topic for information on how to find MBeans
224 User GuideFortinet Technologies Inc.

Administration Device support
Field Setting/Notes
Event Type Select the Event Type from the drop-down for which you want to apply themonitor. Whenever a event belonging to the selected method is discovered,FortiSIEM will attempt to apply the performance monitor to it.
Polling Frequency Enter the Polling Frequency for the monitor.
Identifying MBean Names and Attributes for Custom Applications
This section discusses how to get MBean names and attributes for custom J2EE based applications.
1. Launch JConsole on your workstation and connect to the application.2. Select theMBeans tab.3. Browse to the application you want to monitor, and select it.4. In the right pane, you will see the MBeanInfo. Note the ObjectName, while the attributes for the application
will be listed in the tree view.
SNMP Configuration Settings for Custom Performance Monitors
When configuring SNMP as the access protocol for a custom performance monitor, use these settings. You mayalso want to review the topics Custom SNMPMonitor for D-Link Interface Network Statistics and Custom SNMPMonitor for D-Link HostName and SysUpTime as example of how to set up a custom performance monitor usingSNMP.
Field Settings/Notes
Method SNMP
Parent OID
The parent Object Identifier (OID) is used to optimize the number of SNMPGETsrequired for pulling the various individual OIDs. You can enter this directly, or click thedownward arrow to select it from an MIB file. Several different MIB files are available toselect from, see Importing OID Definitions from a MIB File for more information.
Parent ID istable
Select is table if the OIDs you want to monitor are in a table with at least one row. Anexample would be interface metrics, such as ifInOctets and ifOutOctets, sincethere is an interface metric for each interface.
List of OIDsThe OIDs you want to monitor mapped to FortiSIEM event attributes. The selection youmake for Parent OID determines the options available in theOID menu when you selectNew.
Importing OID Definitions from a MIB File
Many devices include MIB files that you can then use to create a custom performance monitor for the device. Thisinvolves creating a configuration file based on information in the MIB file, using that file as input for the mib2xmlexecutable, and then placing the resulting output file in the /data/mibXml directory of your Supervisor. Once
User GuideFortinet Technologies Inc.
225

Device support Administration
placed in this directory, you can select the file from theMIB File Listmenu to select the parent OID, which willthen also affect which OIDs you can select for the OID to event attribute mapping.
Procedure
1. Collect the device OID files you want to use and place them in a directory where the mib2XML resides. 2. Create the input config file with these fields, and name it with the .cfg file extension.
See the attached alcatel.cfg file for an example. (Note: the link is available only in the HTML version of the UserGuide.)
Field Description
group This is the number of MIB file group. MIB files must be analyzed as a group because ofcross-references within them. The group attribute specifies an ID for each group andneeds to be unique for every group.
mibFileThe name of the MIB file being analyzed. There can be multiple entries. Be sure tospecify the path to the MIB files.
vendor The name of the device vendor for the MIB file.
model The model name or number for the device.
evtPrefix As SNMP trap notification definitions in the MIB file are parsed, an event file is generatedfor each SNMP trap. This field specifies the event type prefix.
enterpriseIdThe enterprise ID number for this vendor, which is used for generating the SNMP trapparser.
3. Run mib2XML <filename>.cfg.4. Move the resulting .mib.xml file to the /data/mibXml directory of your Supervisor.
Example
In this example, a set of MIB files from an Alcatel 7x50 device are used to generate the XML output file. (Note:the following links are available only in the HTML version of the User Guide.)
1. Sample MIB files:TIMETRA-CHASSIS-MIB.mibTIMETRA-GLOBAL-MIB.mibTIMETRA-SYSTEM-MIB.mibTIMETRA-TC-MIB.mib
2. Information in these files, and the paths to them, are then used to create this config file. alcatel.cfg
3. Running mib2xml alcatel.cfg generates both an output and an mib2XML file. alcatel.outTIMETRA-TC-MIB.mib.xml
226 User GuideFortinet Technologies Inc.

Administration Device support
WMI Configuration Settings for Custom Performance Monitors
When configuring WMI as the monitoring protocol for a custom performance monitor, use these settings. Youmay also want to review the topic Custom WMI Monitor for Windows Domain and Physical Registry as exampleof how to set up a custom performance monitor using WMI.
Field Settings
Method WMI
Parent ClassWMI metrics are defined in the form of a parent class having multiple attributes. Forexample, the parent class Win32_ComputerSystem has the attributes Domain andTotalPhysicalMemory.
Is Table If the parent WMI class is a table with one or more rows, select this option.
LOGIN Configuration Settings for Custom Performance Monitors
From the Used For drop-down list, choose File Monitor, Target File, Command Output Monitoring, orConfiguration Monitoring.
Used For: File Monitor
Field Settings
File Path This setting is pre-populated with the Parent OID/Class/File Path value.
Used For: Target File
Field Settings
File Path This setting is pre-populated with the Parent OID/Class/File Path value.
Upload TargetFile ClickUpload and browse to the file you want to upload.
Used For: Command Output Monitoring
Field Settings
Command
RegularExpression Enter a regex expression.
User GuideFortinet Technologies Inc.
227

Device support Administration
Field Settings
MatchedAttributeCount
Apply RegularExpression to Select Single Line or Multiple Lines.
List ofAttributes
ClickEdit to edit an existing attribute orNew to create a new attribute. SeeAdding Attributes for Command Output Monitoring.
Used For : Configuration Monitoring
Field Settings
Upload Expect Script ClickUpload to browse for the script you want to use.
Adding Attributes for Command Output Monitoring
ClickNew to add a new attribute or Edit to modify an existing attribute.
Field Settings
Matched Position
Format Select either INTEGER, DOUBLE, or STRING from the drop-down list.
Type Select Counter orRaw Value from the drop-down list.
Event Attribute Click the drop-down list and select an event attribute from the table.
Transform For information on adding transforms, see Creating Transforms.
Mapping Monitoring Protocol Objects to Event Attributes
When you select a monitoring protocol for your custom performance monitor, you must also establish therelationship between the objects used by that protocol and event attributes in FortiSIEM. For example, creating aperformance monitor that uses SNMP to monitor a device requires that you create a mapping between the SNMPOIDs that you want to monitor, and set of event attributes. This topic describes the configuration settings that youwill use to create these object-to-event attribute relationships.
1. When creating your custom performance monitor, after you have selected theMethod, clickNew next to List ofAttributes.Depending on the monitoring protocol that you select, this table may be named List of Oids (SNMP), or List of
228 User GuideFortinet Technologies Inc.

Administration Device support
Columns (JDBC). 2. In the first field, enter or select the monitoring protocol object that you want to map to FortiSIEM event attribute.
Your options depend on the monitoring protocol you selected for Method.
MonitoringProtocol Field name Settings/Notes
SNMP OID Select an MIB file from theMIB File List, and then select the OID that youwant to create the mapping for.You must enter an Event Type and aPolling Frequency.
WMI Attributes Enter an attribute of the WMI class you entered for Parent Class. Youmust enter an Event Type and a Polling Frequency.
JMX ObjectAttribute
TheMBean you select determines the attributes you can select. You mustenter an Event Type and a Polling Frequency. You will also have toenter a Name and Private Key for the MBean attribute.
JDBC Column Name Select the Database Type, the SQL Query and specify the list ofcolumns. You must enter an Event Type and a Polling Frequency.
WINEXE MatchedPosition
Enter the Matched Position. You must enter an Event Type and a PollingFrequency.
LOGIN Used For Select File Monitor, Target File, Command Output Monitoring, orConfiguration Monitoring from the drop-down list.
3. Select the Format for the object attribute.Your options will depend on the monitoring protocol you selected for Method.
4. For Type, select Raw Value or Counter. 5. For Event Attribute, select the FortiSIEM event attribute that the monitoring protocol object should map to.
If you must create a new event attribute, see Adding an Event Attribute.6. Create any Transforms of the values returned for the monitoring protocol object.
See the next section for more information how to configure transforms.7. ClickSavewhen you are done creating the mappings, and complete the configuration of your custom
performance monitor.
Creating Transforms
You can use a transform to convert the value returned for your monitoring project object into a more physicallymeaningful or usable metric. You an create multiple transforms, and they will be evaluated in the order shown inthe table. Multiple transforms can be selected – they are evaluated in sequential order as shown in the displaytable.
1. Next to Transforms, clickNew.2. For Type, select system or custom. 3. For Formula, either select a system-defined transformation formula from the menu if you selected System for
Type, or enter a formula if you selected custom. 4. ClickSave. You can use the Edit, Delete orClone buttons to modify, remove or clone a Transform respectively.
User GuideFortinet Technologies Inc.
229

Device support Administration
Managing Monitoring of System and Application Metrics for Devices
When FortiSIEM discovers devices, it also discovers the system and application metics that can be monitored foreach device, and displays these in theMonitor Performance tab of ADMIN >Setup. Here you can also disablethe monitoring of specific metrics for devices, disable devices from being monitored, and change the pollinginterval for specific metrics. See Checking status of event pulling jobs for checking the status.
1. Go to ADMIN > Setup > Monitor Performance.2. ClickRefresh icon to make sure you have the latest list of devices.3. To disable monitoring for a device, clear the Enable option for it.4. To enable or disable monitoring of a specific metrics for a device, click a device to select it, then clickMore and
select Edit System Monitors or Edit App Monitorsto view the list of metrics associated with that monitor anddevice. You can also enable or disable the metrics for a device's monitor type by clicking on the Edit SystemMonitoring or Edit Application Monitoring section for the device.
5. To change the polling interval for a metric, in theMoremenu, select Edit Intervals. Select theMonitor Typeand Device, and then set the interval.
6. When you are done making changes, clickSave.
Examples of Custom Performance Monitors
l Custom JDBC Performance Monitor for a Custom Tablel Custom SNMPMonitor for D-Link Interface Network Statisticsl Custom JMXMonitor for IBM Webspherel Custom SNMPMonitor for D-Link HostName and SysUpTimel Custom WMI Monitor for Windows Domain and Physical Registry
Custom JDBC Performance Monitor for a Custom Table
l Planningl Adding New JDBC Performance Objectsl Associating Device Types to Performance Objectsl Testing the Performance Monitorl Enabling the Performance Monitorl Writing Queries for the Performance Metrics
Planning
Examining the Table Structure
For this example, consider two custom Oracle tables that you want to monitor.
1. A table called HEALTH_STATIC_DEMO that does not have time stamp as a column. The table does not grow withtime, and the HEALTH column is updated by the application.
create table HEALTH_STATIC_DEMO{
ID VARCHAR2 (200) not null,HOST_NAME NVARCHAR2 (200) not null,HEALTH NVARCHAR2 (50)
}
230 User GuideFortinet Technologies Inc.

Administration Device support
2. A table called HEALTH_DYNAMIC_DEMO that has a time-stamp in the column create_time. Only records witha more recent time-stamp than previous ones have to be pulled in, and every time a new record is written, itincludes a time stamp.
create table HEALTH_DYNAMIC_DEMO{
ID VARCHAR2 (200) not null,HOST_NAME NVARCHAR2 (200) not null,HEALTH NVARCHAR2 (50),CREATE_TIME DATE not null
}
Creating New Device Types, Event Attribute Types, and Event Types
To create these items, go to Admin > Device Support.
In this case, you only need to create two new event types to handle the contents of the two tables.
Naming Custom Event Types
All custom event types must begin with the prefix P H_DEV_MON_CUST_ .
Event Types
Name Device Type Priority
PH_DEV_MON_CUST_JDBC_PERFORMANCE_STATIC Generic Low
PH_DEV_MON_CUST_JDBC_PERFORMANCE_DYNAMIC Generic Low
Adding New JDBC Performance Objects
Each table requires its own performance object for monitoring.
Performance Object Configuration for Static Table HEALTH_STATIC_DEMO
Field Setting
Name jdbc_static_perfObj
Type Application
Method JDBC
Database Type Oracle Database Server
SQL Query select * from health_static_demo
User GuideFortinet Technologies Inc.
231

Device support Administration
Field Setting
List of Columns
Column Name Name Format Event Attribute
host_name STRING hostName
health STRING health
Where Clauses Not applicable, since the table doesn't grow over time
Event Type PH_DEV_MON_CUST_JDBC_PERFORMANCE_STATIC
Polling Frequency 180 seconds
Performance Object Configuration for Dynamic Table HEALTH_DYNAMIC_DEMO
Field Setting
Name jdbc_dynamic_perfObj
Type Application
Method JDBC
Database Type Oracle Database Server
SQL Query select * from health_dynamic_demo
List of Columns
Column Name Name Format Event Attribute
host_name STRING hostName
cpu_util DOUBLE cpuUtil
mem_util DOUBLE memUtil
create_time STRING createTime
Where Clauses retrieve all new values since last retrieve time of column create_time
Event Type PH_DEV_MON_CUST_JDBC_PERFORMANCE_STATIC
Polling Frequency 180 seconds
Associating Device Types to Performance Objects
In this example, the Oracle database runs on Microsoft Windows, so you must associate Microsoft Windowsdevice types to the two performance objects. Because the discovered device type has to exactly match one of
232 User GuideFortinet Technologies Inc.

Administration Device support
device types in this association for the discovery module to initiate monitoring, you must add other device types,such as Linux, if you also want to monitor Oracle databases over JDBC on those devices.
Edit Device to Performance Object
Field Settings
Name windows_oracle_perf_association
Device Types
l Microsoft Windowsl Microsoft Windows 7l Microsoft Windows 98l Microsoft WindowsMEl Microsoft Windows NTl Microsoft Windows Server 2000l Microsoft Windows Server 2003l Microsoft Windows Server 2008l Microsoft Windows Vistal Microsoft Windows XP
Perf Objects l jdbc_static_perfObj(JDBC) - Default Interval:3minsl jdbc_dynamic_perfObj(JDBC) - Default Interval:3mins
Testing the Performance Monitor
Before testing the monitor, make sure you have defined the access credentials for the database server, createdthe IP address to credentials mapping, and tested connectivity to the server.
1. Go to ADMIN > Device Support > Monitoring.2. Select one of the performance monitors you created, and then click Test. 3. For IP, enter the address of the Oracle database server, and select either the Supervisor or Collector node that will
retrieve the information for this monitor. 4. Click Test .
You should see succeed underResult , and a parsed event attributes in the test result pane. 5. When the test succeeds, click Close, and then click Apply to register the new monitor with the back-end module.
Enabling the Performance Monitor
1. Discover or re-discover the device you want to monitor. 2. Once the device is successfully discovered, make sure that the monitor is enabled and pulling metrics.
Writing Queries for the Performance Metrics
You can now use a simple query to make sure that that the metrics are pulled correctly. The search results shoulddisplay the metrics for the event attributes you defined.
1. Create a structured historical search, and in the Filter Criteria, enter Event Type = "PH_DEV_MON_CUST_JDBC_PERFORMANCE_STATIC"; Group by: [None]This should show the entries in the HEALTH_STATIC_DEMO table
User GuideFortinet Technologies Inc.
233

Device support Administration
2. Create a structured historical search, and in the Filter Criteria, enter Event Type = "PH_DEV_MON_CUST_JDBC_PERFORMANCE_SDynamic"; Group by: [None]This should show the entries in the HEALTH_DYNAMIC_DEMO table .
Custom SNMP Monitor for D-Link Interface Network Statistics
This example shows how to create a custom performance monitor for network interface statistics for D-linkswitches. In this case, the result is a table, with one set of metrics for each interface.
l Planningl Adding the D-Link SNMPPerformance Objectl Associating Device Types to Performance Objectsl Testing the Performance Monitorl Enabling the Performance Monitorl Writing Queries for the Performance Metrics
Planning
Matching SNMP OIDs to FortiSIEM Event Attribute Types
If you run the command snmpwalk -v 1 -c <community> <ip> .1.3.6.1.2.1.2.2.1 against theD-Link switch, you should see an output similar to this:
IF-MIB::ifIndex.1 = INTEGER: 1IF-MIB::ifIndex.2 = INTEGER: 2IF-MIB::ifIndex.3 = INTEGER: 3IF-MIB::ifIndex.4 = INTEGER: 4IF-MIB::ifIndex.5 = INTEGER: 5...
To get the interface index, you would run snmpwalk -v 1 -c <community> <ip>.1.3.6.1.2.1.2.2.1.1:
IF-MIB::ifIndex.1 = INTEGER: 1IF-MIB::ifIndex.2 = INTEGER: 2IF-MIB::ifIndex.3 = INTEGER: 3IF-MIB::ifIndex.4 = INTEGER: 4IF-MIB::ifIndex.5 = INTEGER: 5...
To get interface queue length (the outQLen event attribute in FortiSIEM), you would run snmpwalk -v 1 -c<community> <ip> .1.3.6.1.2.1.2.2.1.21:
IF-MIB::ifOutQLen.1 = Gauge32: 0IF-MIB::ifOutQLen.2 = Gauge32: 0IF-MIB::ifOutQLen.3 = Gauge32: 0IF-MIB::ifOutQLen.4 = Gauge32: 0IF-MIB::ifOutQLen.5 = Gauge32: 0...
To get interface speed, you would run snmpwalk -v 1 -c <community> <ip>.1.3.6.1.2.1.2.2.1.5:
234 User GuideFortinet Technologies Inc.

Administration Device support
IF-MIB::ifSpeed.1 = Gauge32: 1000000000IF-MIB::ifSpeed.2 = Gauge32: 1000000000IF-MIB::ifSpeed.3 = Gauge32: 1000000000IF-MIB::ifSpeed.4 = Gauge32: 1000000000IF-MIB::ifSpeed.5 = Gauge32: 1000000000...
To get received bytes (the recvBitsPerSec event attribute in FortiSIEM), you would run snmpwalk -v 1 -c <community> <ip> .1.3.6.1.2.1.2.2.1.10:
IF-MIB::ifInOctets.1 = Counter32: 0IF-MIB::ifInOctets.2 = Counter32: 1247940872IF-MIB::ifInOctets.3 = Counter32: 0IF-MIB::ifInOctets.4 = Counter32: 0IF-MIB::ifInOctets.5 = Counter32: 0...
Finall,y to get sent bytes (the sentBitsPerSec event attribute in FortiSIEM ), you would run snmpwalk -v1 -c <community> <ip> .1.3.6.1.2.1.2.2.1.16:
IF-MIB::ifOutOctets.1 = Counter32: 0IF-MIB::ifOutOctets.2 = Counter32: 1271371281IF-MIB::ifOutOctets.3 = Counter32: 0IF-MIB::ifOutOctets.4 = Counter32: 0IF-MIB::ifOutOctets.5 = Counter32: 0...
From these outputs you can see that if you want to create a performance monitor for D-Link switch uptime, youmust:
1. Create a new device type, since D-Link switches are not supported in this release.2. Create an event type, PH_DEV_MON_CUST_DLINK_INTF_STAT, that will contain the event attribute types
outQLen , recvBitsPerSec, and sentBitsPerSec, which are already part of the FortiSIEM eventattribute library, and hostNameSnmpIndx and intfSpeed, which you must create.
3. Create the mapping between the SNMPOIDs and the event attributes:1. OID .1.3.6.1.2.1.2.2.1.1 and hostNameSnmpIndx2. OID .1.3.6.1.2.1.2.2.1.5 and intfSpeed3. OID .1.3.6.1.2.1.2.2.1.21 and outQLen4. OID .1.3.6.1.2.1.2.2.1.10 and recvBitsPerSec5. OID .1.3.6.1.2.1.2.2.1.16 and sentBitsPerSec
Creating New Device Types, Event Attributes, and Event Types
To create these items, go to Admin > Device Support.
Device Type
Create a new device type with these attributes:
Field Setting
Vendor D-Link
User GuideFortinet Technologies Inc.
235

Device support Administration
Field Setting
Model DGS
Version Any
Device/App Group Devices > Network Devices > Router Switch
Biz Service Group <no selection>
Description D-Link Switch
Event Attribute Types
Create these event attribute types:
Name Display Name Value Type Display Format Type
hostSnmpIndex Host Interface SNMP Index INT64 <left blank>
intfSpeed Interface Speed in bits/sec INT64 <left blank>
Event Types
Naming Custom Event Types: All custom event types must begin with the prefix PH_DEV_MON_CUST_ .
Create this event type:
Name Device Type Severity
PH_DEV_MON_CUST_INTF_STAT D-Link DGS Low
Adding the D-Link SNMP Performance Object
In this case, you will create one performance object that will map the SNMPOIDs to the FortiSIEM eventattribute types, and then associate them with the PH_DEV_MON_CUST_INTF_STAT event type. When youcreate the recvBitsPerSec and sentBitsPerSec mapping you will also add a sequentialtransform to convert the cumulative metric to a rate, and then convert bytes per second to bits per second. .
Performance Object Configuration for Event Type PH_DEV_MON_CUST_INTF_STAT
Field Setting
Name D-LinkIntStat
Type System
Method SNMP
236 User GuideFortinet Technologies Inc.

Administration Device support
Field Setting
ParentOID .1.3.6.1.2.1.2.2.1
ParentOID isTable
Selected
List ofOIDs
Object Attribute Name Format Type EventAttribute
.1.3.6.1.1.2.1.2.2.1.1 IntfIndex INTEG
ERRawValue
hostSnmpIndex
.1.3.6.1.1.2.1.1.2.1.5 intfSpeed Gauge3
2RawValue
intfSpeed
.1.3.6.1.1.2.1.1.2.1.10
recvBitsPerSec
Counter32 Counter recvBitsPerSec
.1.3.6.1.1.2.1.1.2.1.16
sentBitsPerSect Counter
32
Counter sentBitsPerSect
.1.3.6.1.1.2.1.1.2.1.21
outInftQ Gauge32
RawValue
OutQLen
EventType
PH_DEV_MON_CUST_INTF_STAT
PollingFrequency
60 seconds
Transform Formula for recvBitsPerSec and sentBitsPerSec Event Attributes
Type Formula
system toRate
system BytesPerSecToBitsPerSec
Associating Device Types to Performance Objects
In this case you would only need to make one association with the D-Link DGS device you created.
User GuideFortinet Technologies Inc.
237

Device support Administration
Field Settings
Name D-LinkPerfObj
Device Types l D-Link DGS
Perf Objects l D-LinkIntfStat(SNMP) - Default Interval:1mins
Testing the Performance Monitor
Before testing the monitor, make sure you have defined the access credentials for the D-Link device, created theIP address to credentials mapping, and tested connectivity.
1. Go to ADMIN > Device Support > Monitoring.2. Select the performance monitor you created, and then click Test. 3. For IP, enter the address of the device, and select either the Supervisor or Collector node that will retrieve the
information for this monitor. 4. Click Test.
You should see succeed under Result, and the parsed event attributes in the test result pane. 5. When the test succeeds, click Close, and then click Apply to register the new monitor with the back-end module.
Enabling the Performance Monitor
1. Discover or re-discover the device you want to monitor. 2. Once the device is successfully discovered, make sure that the monitor is enabled and pulling metrics.
Writing Queries for the Performance Metrics
You can now use a simple query to make sure that that the metrics are pulled correctly. The search results shoulddisplay the metrics for the event attributes you defined.
Create a structured historical search with these settings:
Filter Criteria Display Columns Time ForOrganizations
StructuredReporting IP IN <IP Range> ANDEvent Type =" PH_DEV_MON_CUST_INTF_STAT"; Group by: HostName, Host Interface
Host Name,Host Interface SNMPIndex,MAX(Out Intf Queue), AVG(Intf Speed), AVG(Sent Bit Rate),AVG(Received Bit Rate)
Last 10Minutes
All
Custom JMX Monitor for IBM Websphere
l Planningl Adding New IBM WebSphere Performance Objectsl Associating Device Types to Performance Objectsl Testing the Performance Monitor
238 User GuideFortinet Technologies Inc.

Administration Device support
l Enabling the Performance Monitorl Writing Queries for the Performance Metrics
This example illustrates how to write a custom performance monitor for retrieving IBM Websphere thread, heapmemory, and non-heap memory metrics.
Planning
Creating New Device Types, Event Attribute Types, and Event Types
To create these items, go to Admin > Device Support.
In this case, the IBM Websphere device type is already supported by FortiSIEM, but you must create new eventattributes and event types for the metrics you want to retrieve.
Event Attribute Types
Name Display Name ValueType
DisplayFormat Type
websphere_heapPCT WebSphere HeapPct INT64
websphere_numThreads WebSphere NumThreads INT64
websphere_maxThreads WebSphere MaxThreads INT64
websphere_threadPct WebSphere ThreadPct INT64
websphere_numClass WebSphere NumClass INT64
websphere_heapUsed WebSphere HeapUsed INT64 Bytes
websphere_heapMax WebSphere HeapMax INT64 Bytes
websphere_heapCommitted WebSphere HeapCommitted INT64 Bytes
websphere_nonHeapUsed WebSphere NonHeapUsed INT64 Bytes
websphere_nonHeapMax WebSphere NonHeapMax INT64 Bytes
websphere_nonHeapCommitted WebSphereNonHeapCommitted
INT64 Bytes
Event Types
Naming Custom Event Types: All custom event types must begin with the prefix PH_DEV_MON_CUST_ .
User GuideFortinet Technologies Inc.
239

Device support Administration
Name Device Type Severity
PH_DEV_MON_CUST_WEBSPHERE_HEAPMEMORY IBM WebSphere App Server Low
PH_DEV_MON_CUST_WEBSPHERE_NON_HEAPMEMORY IBM WebSphere App Server Low
PH_DEV_MON_CUST_WEBSPHERE_THREAD IBM WebSphere App Server Low
Adding New IBM WebSphere Performance Objects
Each of the event types requires creating a performance object for monitoring.
Performance Object Configuration for Event Type PH_DEV_MON_CUST_WEBSPHERE_HEAPMEMORY
Field Setting
Name websphere_heapMemory_perfObj
Type Application
Method JMX
MBean java.lang:type=Memory
List ofAttributes Object
AttributePrivateKey Name Form
atEventAttribute
HeapMemoryUsage
committed
committed Long
websphere_heapCommitted
HeapMemoryUsage
used used Longwebsphere_heapUsed
HeapMemoryUsage
max max Longwebsphere_heapMax
Longwebsphere_heapPCT
Event Type PH_DEV_MON_CUST_WEBSPHERE_HEAPMEMORY
PollingFrequency
180 seconds
240 User GuideFortinet Technologies Inc.

Administration Device support
Performance Object Configuration for Event Type PH_DEV_MON_CUST_WEBSPHERE_THREAD
For the webSphere_threadPctEvent Attribute, you will enter a transform as shown in the second table.
Field Setting
Name websphere_thread_perfObj
Type Application
Method JMX
MBean java.lang:type=Threading
List ofAttributes Object
AttributePrivate Key Name Form
atEventAttribute
ThreadCount ThreadCount Long
websphere_numThreads
PeakThreadCount
PeakThreadCount Long
websphere_maxThreads
Longwebsphere_threadPCT
Event Type PH_DEV_MON_CUST_WEBSPHERE_THREAD
PollingFrequency
180 seconds
Transform Formula for websphere_threadPCT Event Attribute
ClickNew next to Transforms in the dialog to enter the formula.
Field Settings
Object Attribute <blank>
User GuideFortinet Technologies Inc.
241

Device support Administration
Field Settings
Name <blank>
Private Key <blank>
Format Long
Event Attribute websphere_threadPct
Transforms Type Formula
custom ThreadCount*100/PeakThreadcount
Performance Object Configuration for Event Type PH_DEV_MON_CUST_WEBSPHERE_NON_HEAPMEMORY
Field Setting
Name websphere_nonHeapMemory_perfObj
Type Application
Method JMX
MBean java.lang:type=Memory
List ofAttributes
Object Attribute PrivateKey
Name
Format Event Attribute
NonHeapMemoryUsage used Long
websphere_nonHeapUsed
NonHeapMemoryUsage
committed Long
websphere_nonHeapCommitted
NonHeapMemoryUsage max Long
websphere_nonHeapMax
EventType PH_DEV_MON_CUST_WEBSPHERE_NON_HEAPMEMORY
PollingFrequency
180 seconds
242 User GuideFortinet Technologies Inc.

Administration Device support
Associating Device Types to Performance Objects
In this example, IBM WebSphere runs on Microsoft Windows, so you must associate Microsoft Windows devicetypes to the three performance objects. Because the discovered device type has to exactly match one of devicetypes in this association for the discovery module to initiate these monitors, you must add other device types,such as Linux, if you also wanted to monitor IBM Websphere over JMX on those devices.
Edit Device to Performance Object
Field Settings
Name windows_oracle_perf_association
Device Types
l Microsoft Windowsl Microsoft Windows 7l Microsoft Windows 98l Microsoft WindowsMEl Microsoft Windows NTl Microsoft Windows Server 2000l Microsoft Windows Server 2003l Microsoft Windows Server 2008l Microsoft Windows Vistal Microsoft Windows XP
Perf Objects l websphere_thread_perfObj(JMX) - Default Interval:3minsl websphere_thread_perfObj(JMX) - Default Interval:3minsl websphere_nonHeapMemory_perfObj (JMX) - Default Interval:3mins
Testing the Performance Monitor
Before testing the monitor, make sure you have defined the access credentials for the server, created the IPaddress to credentials mapping, and tested connectivity.
1. Go to ADMIN > Device Support > Monitoring.2. Select one of the performance monitors you created, and then click Test. 3. For IP, enter the address of the Oracle database server, and select either the Supervisor or Collector node that will
retrieve the information for this monitor. 4. Click Test .
You should see succeed under Result , and the parsed event attributes in the test result pane. 5. When the test succeeds, click Close, and then click Apply to register the new monitor with the back-end module.
Enabling the Performance Monitor
1. Discover or re-discover the device you want to monitor. 2. Once the device is successfully discovered, make sure that the monitor is enabled and pulling metrics.
User GuideFortinet Technologies Inc.
243

Device support Administration
Writing Queries for the Performance Metrics
You can now use a simple query to make sure that that the metrics are pulled correctly. The search results shoulddisplay the metrics for the event attributes you defined.
Create a structured historical search with these settings:
Filter Criteria Display Columns Time ForOrganizations
StructuredReporting IP IN <IP Range> AND EventType CONTAIN "ph_dev_mon_cust_web";Group by: [None]
Event ReceiveTime,Reporting IP,Event
Last 60Minutes
All
Custom SNMP Monitor for D-Link HostName and SysUpTime
Although D-link switches and routers are not supported in this release of FortiSIEM, you can still use the custommonitor feature to create a system uptime event that will collect basic performance metrics like hostName andSysUpTime.
l Planningl Adding New IBM WebSphere Performance Objectsl Associating Device Types to Performance Objectsl Testing the Performance Monitorl Enabling the Performance Monitorl Writing Queries for the Performance Metrics
Planning
Mapping SNMP OIDs to FortiSIEM Event Attribute Types
If you run the command snmpwalk -v 1 -c <community> <ip> .1.3.6.1.2.1.1 against the D-Linkswitch, you should see an output similar to this:
SNMPv2-MIB::sysDescr.0 = STRING: DGS-1210-48 2.00.011SNMPv2-MIB::sysObjectID.0 = OID: SNMPv2-SMI::enterprises.171.10.76.11DISMAN-EVENT-MIB::sysUpTimeInstance = Timeticks: (157556100) 18 days, 5:39:21.00SNMPv2-MIB::sysContact.0 = STRING:SNMPv2-MIB::sysName.0 = STRING: SJ-Test-Lab-D-LinkSNMPv2-MIB::sysLocation.0 = STRING: San JoseSNMPv2-MIB::sysServices.0 = INTEGER: 72SNMPv2-MIB::sysORLastChange.0 = Timeticks: (157555949) 18 days, 5:39:19.49
To get sysUptime, you would run snmpwalk -v 1 -c <community> <ip> .1.3.6.1.2.1.1.3:
DISMAN-EVENT-MIB::sysUpTimeInstance = Timeticks: (157577770) 18 days, 5:42:57.70
To get hostname, you run snmpwalk -v 1 -c <community> <ip> .1.3.6.1.2.1.1.5:
SNMPv2-MIB::sysName.0 = STRING: SJ-Test-Lab-D-Link
From these outputs you can see that if you want to create a performance monitor for D-Link switch uptime, youmust:
244 User GuideFortinet Technologies Inc.

Administration Device support
1. Create a new device type, since D-Link switches are not supported in this release2. Create an event type, PH_DEV_MON_CUST_DLINK_UPTIME, that will contain the event attribute
types hostName and SysUpTime, which are already part of the FortiSIEM event attribute type library. 3. Create the mapping between the SNMPOIDs and the event attributes:
l OID .1.3.6.1.2.1.1.5 and hostName.l OID .1.3.6.1.2.1.1.5 and SysUpTime.
Creating New Device Types, Event Attribute Types, and Event Types
To create these items, go to Admin > Device Support.
Device Type:
Create a new device type with these attributes:
Field Setting
Vendor D-Link
Model DGS
Version Any
Device/App Group Devices > Network Devices > Router Switch
Biz Service Group <no selection>
Description D-Link Switch
Event Attribute Types and Event Types
Both sysUptime and hostName are included in the Event Attribute Types, so you only need to create a newevent type, PH_DEV_MON_CUST_DLINK_UPTIME, that will contain them.
Naming Custom Event Types
All custom event types must begin with the prefix PH_DEV_MON_CUST_ .
Name Device Type Severity Description
PH_DEV_MON_CUST_DLINK_UPTIME D-Link DGS 0 - Low D-Link Uptime
Adding the D-Link SNMP Performance Object
In this case, you will create one performance object that will map the SNMPOIDs to the FortiSIEM eventattribute types hostName and SysUptime, and then associate them with the PH_DEV_MON_CUST_DLINK_UPTIME event type. When you create the SysUpTime mapping you will also add a transform to convert systemtime to centiseconds to seconds as shown in the second table.
User GuideFortinet Technologies Inc.
245

Device support Administration
Performance Object Configuration for Event Type PH_DEV_MON_CUST_DLINK_UPTIME
Field Setting
Name D-LinkUptime
Type System
Method SNMP
Parent OID .1.3.6.1.1.2.1.1
Parent OID is Table <left cleared>
List of OIDs
ObjectAttribute Name Format Type Event
Attribute
.1.3.6.1.1.2.1.1
.5
HostName String RawValu
ehostName
.1.3.6.1.1.2.1.1
.3
Uptime
Timeticks RawValu
e
SysUpTime
Event Type PH_DEV_MON_CUST_DLINK_UPTIME
Polling Frequency 10 seconds
Transform Formula for SysUptime Event Attribute
Type Formula
custom uptime/100
Associating Device Types to Performance Objects
In this case you would only need to make one association with the D-Link DGS device you created.
Field Settings
Name D-LinkPerfObj
Device Types D-Link DGS
Perf Objects D-LinkUptime(SNMP) - Default Interval:0.17mins
246 User GuideFortinet Technologies Inc.

Administration Device support
Testing the Performance Monitor
Before testing the monitor, make sure you have defined the access credentials for the D-Link device, created theIP address to credentials mapping, and tested connectivity.
1. Go to ADMIN > Device Support > Performance Monitoring.2. Select the performance monitor you created, and then click Test. 3. For IP, enter the address of the device, and select either the Supervisor or Collector node that will retrieve the
information for this monitor. 4. Click Test.
You should see succeed under Result, and the parsed event attributes in the test result pane. 5. When the test succeeds, click Close, and then click Apply to register the new monitor with the back-end module.
Enabling the Performance Monitor
1. Discover or re-discover the device you want to monitor. 2. Once the device is successfully discovered, make sure that the monitor is enabled and pulling metrics.
Writing Queries for the Performance Metrics
You can now use a simple query to make sure that that the metrics are pulled correctly. The search results shoulddisplay the metrics for the event attributes you defined.
Create a structured historical search with these settings:
Filter Criteria DisplayColumns Time For
Organizations
StructuredReporting IP IN <IP Range> AND Event Type ="PH_DEV_MON_CUST_DLINK_UPTIME"; Group by:[None]
Event Last 10Minutes
All
Custom WMI Monitor for Windows Domain and Physical Registry
l Planningl Adding New IBM WebSphere Performance Objectsl Associating Device Types to Performance Objectsl Testing the Performance Monitorl Enabling the Performance Monitorl Writing Queries for the Performance Metrics
Planning
Mapping Windows WMI Classes to FortiSIEM Event Attribute Types
If you run the command wmic -U <domain>/<user>%<pwd> //<ip> "select * from Win32_ComputerSystem against a Windows server, you will see an output similar to this:
CLASS: Win32_ComputerSystem
User GuideFortinet Technologies Inc.
247

Device support Administration
AdminPass-wordStatus::SEP::Auto-mat-icMan-agedPage-file::SEP::Auto-mat-icRe-setBootOp-tion::SEP::Auto-mat-icRe-setCap-abil-ity::SEP::BootOp-tionOnLim-it::SEP::BootOp-tionOnWatchDo-g::SEP::BootROMSup-por-ted::SEP::BootupState::SEP::Cap-tion::SEP::ChassisBootupState::SEP::CreationClassName::SEP::Cur-rentTimeZone::SEP::Day-lightInEf-fect::SEP::De-scrip-tion::SEP::DNSHostName::SEP::Do-main::SEP::Do-mainRole::SEP::En-ableDay-lightSav-ing-sTime::SEP::FrontPanelRe-setStatus::SEP::In-fraredSup-por-ted::SEP::Ini-tialLoadIn-fo::SEP::In-stallDate::SEP::Key-boardPass-wordStatus::SEP::LastLoadIn-fo::SEP::Man-ufac-turer-::SEP::Model::SEP::Name::SEP::NameFormat::SEP::Net-workServer-ModeEn-abled::SEP::Num-ber-OfLo-
248 User GuideFortinet Technologies Inc.

Administration Device support
gic-alPro-cessor-s::SEP::Num-ber-OfPro-cessor-s::SEP::OEMLo-goBit-map::SEP::OEMStringAr-ray::SEP::PartOfDo-main::SEP::PauseAfter-Reset::SEP::PCSys-temType::SEP::Power-Man-age-mentCap-abil-ities::SEP::Power-Man-age-mentSup-por-ted::SEP::Power-OnPass-wordStatus::SEP::Power-State::SEP::Power-Sup-plyState::SEP::PrimaryOwn-erContact::SEP::PrimaryOwn-erName::SEP::Re-setCap-abil-ity::SEP::Re-setCoun-t::SEP::Re-setLim-it::SEP::Roles::SEP::Status::SEP::Sup-portContactDe-scrip-tion::SEP::Sys-temStar-tupDelay::SEP::Sys-temStar-tupOp-tion-s::SEP::Sys-temStar-tupSet-ting::SEP::Sys-temType::SEP::ThermalState::SEP::TotalPhys-icalMemory::SEP::UserName::SEP::WakeUpType::SEP::Workgroup
User GuideFortinet Technologies Inc.
249

Device support Administration
1::SEP::True::SEP::True::SEP::True::SEP::3::SEP::3::SEP::True::SEP::Normalboot::SEP::WIN2008-ADS::SEP::3::SEP::Win32_ComputerSystem::SEP::-420::SEP::True::SEP::AT/AT COMPATIBLE::SEP::WIN2008-ADS::SEP::FortiSIEM.net::SEP::5::SEP::True::SEP::3::SEP::False::SEP::NULL::SEP::(null)::SEP::3::SEP::(null)::SEP::VMware, Inc.::SEP::VMware Virtual Plat-form::SEP::WIN2008-ADS::SEP::(null)::SEP::True::SEP::1::SEP::1::SEP::NULL::SEP::([MS_VM_CERT/SHA1/27d66596a61c48dd3dc7216fd715126e33f59ae7],Welcome to the VirtualMachine)::SEP::True::SEP::3932100000::SEP::0::SEP::NULL::SEP::False::SEP::0::SEP:-:0::SEP::3::SEP::(null)::SEP::Windows User::SEP::1::SEP::-1::SEP::-1::SEP::(LM_Workstation,LM_Server,Primary_Domain_Con-troller-,Timesource,NT,DFS)::SEP::OK::SEP::NULL::SEP::0::SEP::NULL::SEP::0::SEP::X86-basedPC::SEP::3::SEP::4293496832::SEP::FortiSIEM\Administrator::SEP::6::SEP::(null)
From this output you can see that the Win32_ComputerSystemWMI class has two attributes:
l Domain
l TotalPhysicalMemory
From these outputs you can see that if you want to create a performance monitor for Windows Domain andPhysical Registry, you must:
1. Create an event type, PH_DEV_MON_CUST_WIN_MEM, that will contain the event attribute types Domain andmemTotalMB, both of which are already contained in the FortiSIEM event attribute types library.
2. Create the mapping between the WMI class attributes and the FortiSIEM event attribute types:l WMI class attribute Domain and Domain.l WMI class attribute TotalPhysicalMemory (Bytes) and memTotalMB (type INT64). BecauseTotalPhysicalMemory returns in bytes, and memTotalMB is in INT64, a transform will be requiredto convert the metrics.
Creating New Device Types, Event Attributes, and Event Types
To create these items, go to Admin > Device Support.
l Device TypeSince Microsoft Windows is supported by FortiSIEM, you don't need to create a new device type.
l Event Attribute Types and Event TypesBoth Domain and memTotalMB are included in the FortiSIEM event attribute type library, so you onlyneed to create a new event type, PH_DEV_MON_CUST_WIN_MEM, that will contain them.
l Naming Custom Event TypesAll custom event types must begin with the prefix PH_DEV_MON_CUST_ .
Name Device Type Severity Description
PH_DEV_MON_CUST_WIN_MEM Microsoft Windows 0 - Low Windows Domain and Memory
Adding the Microsoft Windows WMI Performance Object
In this case, you will create one performance object that will map the WMI Class attributes to the FortiSIEM eventattribute types Domain and memTotalMB, and then associate them with the PH_DEV_MON_CUST_WIN_
250 User GuideFortinet Technologies Inc.

Administration Device support
MEM event type. When you create the memTotalMB mapping you will also add a transform to convert bytes toINT64 as shown in the second table.
Performance Object Configuration for Event Type PH_DEV_MON_CUST_DLINK_UPTIME
Field Setting
Name WinMem
Type System
Method WMI
Parent Class Win32_ComputerSystem
Parent Class is Table <left cleared>
List of Attributes
Attribute Format Type EventAttribute
Domain String RawValue domain
TotalPhysicalMemory Integer RawValue memTotalMB
Event Type PH_DEV_MON_CUST_WIN_MEM
Polling Frequency 20 seconds
Transform Formula for TotalPhysicalMemory Event Attribute Type
Type Formula
custom TotalPhysicalMemory/1024/1024
Associating Device Types to Performance Objects
In this example, you must associate Microsoft Windows device types to the performance object.
Edit Device to Performance Object
Field Settings
Name WinMisc
User GuideFortinet Technologies Inc.
251

Device support Administration
Field Settings
Device Types
l Microsoft Windowsl Microsoft Windows NTl Microsoft Windows Server 2000l Microsoft Windows Server 2003l Microsoft Windows Server 2008l Microsoft Windows Vistal Microsoft Windows XP
Perf Objects l WinMem(WMI) - DefaultInterval:0.33mins
Testing the Performance Monitor
Before testing the monitor, make sure you have defined the access credentials for the server, created the IPaddress to credentials mapping, and tested connectivity.
1. Go to ADMIN > Device Support > Monitoring.2. Select one of the performance monitors you created, and then click Test. 3. For IP, enter the address of the Microsoft Windows server, and select either the Supervisor or Collector node that
will retrieve the information for this monitor. 4. Click Test.
You should see succeed under Result, and the parsed event attributes in the test result pane. 5. When the test succeeds, click Close, and then click Apply to register the new monitor with the back-end module.
Enabling the Performance Monitor
1. Discover or re-discover the device you want to monitor. 2. Once the device is successfully discovered, make sure that the monitor is enabled and pulling metrics.
Writing Queries for the Performance Metrics
You can now use a simple query to make sure that that the metrics are pulled correctly. The search results shoulddisplay the metrics for the event attributes you defined.
Create a structured historical search with these settings:
Filter Criteria Display Columns Time ForOrganizations
Host IP = <IP> AND Event Type =" PH_DEV_MON_CUST_WIN_MEM";Groupby:[None]
Event Receive Time,ReportingIP,Domain,Total Memory (MB)
Last 10Minutes
All
252 User GuideFortinet Technologies Inc.

Administration Device support
Working with Custom PropertiesFortiSIEM includes over 30+ pre-defined global threshold properties that you can edit and use in rules, but youcan also create custom threshold properties.
This section provides the procedure to configure Custom Properties.
l Adding a Custom Propertyl Modifying a Custom Property
Adding a Custom Property
Complete these steps to add a custom property:
1. Go to ADMIN > Device Support > Custom Property.2. ClickNew.3. Enter a Name and Display Name for the new property. 4. Enter the Default Value for the threshold. 5. Select the Value Type of threshold value.
For most global threshold values, select Double. ForMap thresholds, which apply to disks and interfaces, selectthe Item Type for the threshold value, and select the Component Type to which it applies.
6. ClickSave.
Modifying a Custom Property
Complete these steps to modify a custom property:
1. Select one or more property from the list.2. Click the required option:
l Edit to modify a property setting.l Delete to remove a property.
3. ClickSave.
Analyzing custom log filesCustom CSV formatted log files can be uploaded from the FortiSIEM GUI for detailed analysis. For this, amapping has to be defined from the CSV file columns to the event attributes. This generates a FortiSIEM eventthat can be searched, similar to an externally received event.
Complete these steps to upload a custom log file for analysis:
1. Set up a Parsing template:a. Go to ADMIN > Device Support > Upload Files.b. ClickNew.c. Upload the log file under Step 1: CSV file:
i. Browse to select the Sample File to upload.ii. Enter the Separator used in the CSV file.iii. To include the header, select Header.iv. ClickNext.
User GuideFortinet Technologies Inc.
253

Health Administration
d. Map the CSV file columns to the event attributes under Step 2: Attribute Mapping:i. Select the event attributes to map to the CSV file columns.ii. ClickNext.
e. Set the template details under Step 3: Template Details:i. Enter a Name for the Template.ii. The Event Type is automatically updated based on the name.iii. Enter anyDescription about the Template.iv. ClickSave.
2. Upload the file.3. Run Reports.
Creating SNMP System Object Identifiers for devicesIf a new device has to be identified using SNMPSystem Object Identifiers (OIDs) during discovery, you cancreate a device type and add the SNMPSystem OID or this device from the FortiSIEM UI.
Complete these steps to create SNMPObject Identifiers for device discovery:
1. Go to ADMIN > Device Support > SNMP SysObjectId.2. ClickNew.3. Select the Device Type from the drop-down which lists all the devices added in the system under Device
Support > Device/App.4. Enter the Hardware Model of the device.5. Enter an SNMP SysObjectId for the device.6. ClickSave.
Health
The following sections provide procedures to view health information:
Viewing Cloud HealthViewing Collector HealthViewing Elasticsearch Health
Viewing Cloud HealthThe ADMIN >Health >Cloud Health page displays the status of the nodes in your deployment and theprocesses running on them. The top frame displays all of the available clouds and the lower frame providesinformation about the applications that are contained in the cloud selected in the main frame.
Complete these steps to view the information about Cloud health:
1. Go to ADMIN >Health >Cloud Health tab.2. Click any node in the first frame to view its process details in the second frame.
See the FortiSIEM Back-End Processes table for more information about the system role played by each process.
254 User GuideFortinet Technologies Inc.

Administration Health
First frame
Settings Description
Name Name of the available clouds
IP Address IP address of the available clouds
Module Role Module role, for example, 'Supervisor'
Health Current health of the cloud
Version Current version of the cloud
Upgrade Version Upgrade version number
Build Date Date when the cloud was created
Cores Number of cores
Load Average Average load of the cloud
CPU Percentage CPU used
Swap Size Swap size
Swap Used Swap used
Memory Size Maximum memory size
Memory Used Memory used
Up Time Total time that the cloud was in 'Up' status
Last Report Sync Time when the report was synched previously
Second frame
Settings Description
Process Name Name of the process
Status Status of the process
User GuideFortinet Technologies Inc.
255

Health Administration
Settings Description
Up Time Total up time of the process
CPU Measure of the CPU that the process is using
Event Rate Events used each second by the process
Physical Memory Amount of physical memory used by the process
Virtual Memory Amount of virtual memory used by the process
SharedStore ID and SharedStorePosition SharedStore ID and position information
FortiSIEM Back-End Processes
Process
Function Present inSupervisor
Present inWorker
PresentinCollector
Apache Webserver forfront-endinghttp(s)requests toAppSvr orotherFortiSIEMnodes
x x x
AppSvr Middleware forhandling GUIrequests,storing andmanagingPostgreSQLdatabase andserving RESTAPI requestsfromFortiSIEMnodes
x
256 User GuideFortinet Technologies Inc.

Administration Health
Process
Function Present inSupervisor
Present inWorker
PresentinCollector
DBSvr PostgreSQLDatabase forstoringinformationdisplayed inFortiSIEM GUIother thanevents
x
Node.js-charting
Message
Node.js-pm2
phAgentManager
Collects logsand metricsfrom devicesor serversusing protocolsother thanSNMP andWMI.
x x x
phCheckpoint Collects logsfromCheckpointfirewalls viaLEA
phDataManager
Stores theparsed eventsto event store(FortiSIEMEventDB orElasticsearch)
x x
User GuideFortinet Technologies Inc.
257

Health Administration
Process
Function Present inSupervisor
Present inWorker
PresentinCollector
phDataPurger Archives onlineevent store(FortiSIEMEventDB orElasticsearch).Implementsevent retentionpolicy forFortiSIEMEventDB - bothonlineFortiSIEMEventDB andarchive.
x
phDiscover Discoversdevices usingvariousprotocols suchas SNMP,WMI and SSH
x x
phEventForwarder
Forwardsevents fromFortiSIEM toexternalSystems
x x x
phIpIdentityMaster
MergesIdentity andlocation audittrails frommultiplephIpIdentityWorker modulesto produce thefinal Identityand locationaudit trail.Stores the trailin PostgreSQLDatabase.
258 User GuideFortinet Technologies Inc.
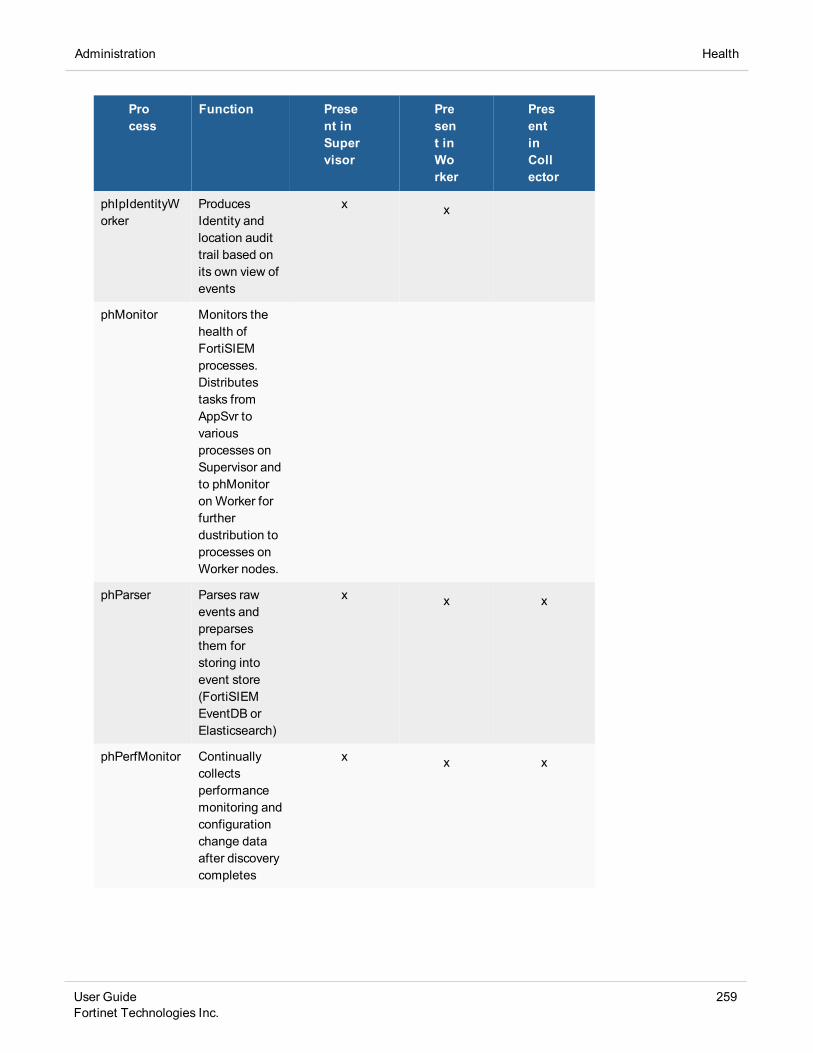
Administration Health
Process
Function Present inSupervisor
Present inWorker
PresentinCollector
phIpIdentityWorker
ProducesIdentity andlocation audittrail based onits own view ofevents
x x
phMonitor Monitors thehealth ofFortiSIEMprocesses.Distributestasks fromAppSvr tovariousprocesses onSupervisor andto phMonitoron Worker forfurtherdustribution toprocesses onWorker nodes.
phParser Parses rawevents andpreparsesthem forstoring intoevent store(FortiSIEMEventDB orElasticsearch)
x x x
phPerfMonitor Continuallycollectsperformancemonitoring andconfigurationchange dataafter discoverycompletes
x x x
User GuideFortinet Technologies Inc.
259

Health Administration
Process
Function Present inSupervisor
Present inWorker
PresentinCollector
phQueryMaster
Handles Adhocqueries fromGUI forFortiSIEMEventDB.Paralellizesqueries bysending themtophQueryWorkers andmergesindividualresults toproduce thefinal result.
x
phQueryWorker
HandlesindividualFortiSIEMEventDBqueries fromphQueryMaster
x x
phReportLoader
Loads Reportdata intoReport Server.
x
phReportMaster
HandlesindividualFortiSIEMEventDB inlinereports.Producesresults every 5minutes.
x
260 User GuideFortinet Technologies Inc.

Administration Health
Process
Function Present inSupervisor
Present inWorker
PresentinCollector
phReportWorker
Handles inlineevent reportsFortiSIEMEventDB.Merges individualinline reportresultsmultiplephReportMaster modules toproduce thefinal result.Rolls upresults from 5minuteintervals to 15minuteintervals andthen to 60minuteintervals.
x
phRuleMaster Triggers a rulein real time byevaluating rulesummariesfrom individualphRuleWorkermodules
x
phRuleWorker Evaluates arule in realtime based onevents seen bythe worker andsends asummary tothephRuleMastermodule
x x
User GuideFortinet Technologies Inc.
261

Health Administration
Process
Function Present inSupervisor
Present inWorker
PresentinCollector
Redis In-memorydistributeddatabase forholding resultsreturned byElasticsearchand fordistributingCMDB objectsbetweenSupervisor andWorker nodes.
x x
Viewing Collector HealthIf your FortiSIEM deployment includes Collectors, you can monitor the status of the Collectors in the ADMIN >Health > Collector Health page. You can also upgrade Collectors from this page. Select a Collector and clickShow Processes to see the processes running on that Collector. Refer to the 'FortiSIEM Back-End Processes' table below for information about the processes that run onCollectors.
The Actionmenu provides the operations you can perform on a Collector:
l Start - to start the Collector.l Stop - to start the Collector.l Download Image - to download a Collector image.l Install Image - to install a Collector image.l Download Update - to download a Collector image update.l Install Update - to install a Collector image update.
Properties associated with Collector Health
Collector Property Description
Organization Name of the organization to which the Collector belongs.
Name Name of the Collector.
IP Address IP address of the Collector.
Status Status of the Collector as eitherUp orDown.
262 User GuideFortinet Technologies Inc.

Administration Health
Collector Property Description
Health Health of the Collector based on the health of the modules running on it. If Health isCritical, it means that one of the modules is not running on the Collector.
Up Time Total time that the Collector has been up.
Last Status Updated The time when the collector last reported its status to the cloud.
Last Event Time The time when the collector last reported events to the cloud.
Last File Received The time when the collector last reported its performance status to the cloud.
CPU Overall CPU utilization of the Collector.
Memory Overall memory utilization of the Collector.
Allocated EPS The number of events per second (EPS) dynamically allocated by the system to thiscollector.
Incoming EPS The EPS that the Collector is currently seeing.
Upgrade Version If the Collector has been upgraded, the new version.
Build Date Date on which the version of FortiSIEM the Collector is running on was built.
Install Status If you upgrade the Collector, the status of the upgrade is shown here as either Success orFailed.
Download Status If an image was downloaded to the Collector, the status of the download is shown here asSuccess or Failed.
Version Version of FortiSIEM the Collector is running on.
FortiSIEM Back-End Processes
Process Function Used by Super-visor
Used byWorker
Used by Col-lector
phAgentManager Execute event pulling job X X X
phCheckpoint Execute checkpoint monitoring X X X
phDiscover Pulling basic data from target X X
User GuideFortinet Technologies Inc.
263

License Administration
Process Function Used by Super-visor
Used byWorker
Used by Col-lector
phEventForwarderResponsible for forwarding eventsand incidents from FortiSIEM toexternal systems
X X X
phEventPackage Uploading event/SVN file toSupervisor/Worker
X
phMonitorAgent Monitoring other processes X X X
phParser Parsing event to shared store (SS) X X X
phPerfMonitor Execute performance job X X X
rsyslogd Responsible for forwarding locallygenerated logs to FortiSIEM
X X X
Viewing Elasticsearch HealthThe Elasticsearch Health page displays two frames of information.
Complete these steps to view Elasticsearch health details:
1. Go to ADMIN >Health >Elasticsearch Health tab.2. ClickColumns tab under both frames to select the required information to display.
License
The following sections provide procedures to view License information:
Viewing License InformationViewing License UsageAdding Nodes
Viewing License InformationThe License displays information associated with your current FortiSIEM license underADMIN > License >License tab.
l Total EPSl Maintenance and Supportl IOC Servicel Endpoint Devicesl Devicesl Agentsl Basic Windows Agent
264 User GuideFortinet Technologies Inc.

Administration License
l Advanced Windows Agentl Additional EPS
You can use the Upload button on the top-right to upload a new License. For more information, refer toFortiSIEM Licensing Guide.
Viewing License UsageThe License Usage tab displays the information your license. Select the desired time period from the top-rightdrop-down to Last 1 Hour, Last 1 Day, or Last 1 Week.
The current License information is displayed under various tab:l Device Usage - Organization, Licensed, and Used devicesl Agent Usage - Organization, Windows Agents, Linux Agents, and total agents used for an organizationl EPS Usage - Total Licensed EPS, Used EPS and Unused Eventsl EPS Usage by Node - EPSUsage based on each Nodel EPS Usage by Organization - EPSUsage based on each Organization
To print the monthly usage report, click the Print Monthly Usage Report button on the top-right corner.
Adding NodesThis tab allows you to add nodes.
l Adding a Workerl Adding a Report Server
Adding a Worker
Complete these steps to add a Worker:
1. Go to ADMIN > License> Nodes tab.2. ClickAdd to add a newWorker.3. Select the Type and enter theWorker IP Address.4. ClickOK.
Adding a Report Server
Complete these steps to add a Report Server:
1. Go to ADMIN > License> Nodes tab.2. ClickAdd to add a new Report Server.3. Select the Type as 'Report Server' and enter the Report Server IP Address.4. Enter the Database Username and Database Password.5. ClickOK.
User GuideFortinet Technologies Inc.
265

Settings Administration
Settings
This section contains information on monitoring the health of your FortiSIEM deployment, general systemsettings such as language, date format, and system logos, and how to add devices to a maintenance calendar.
l System Settingsl UI Settingsl Email settingsl Collector Image Server settingsl Event Worker Settingsl QueryWorker Settingsl Data Update Server settingsl Lookup settingsl Kafka settingsl Dashboard Slideshow settings
l Analytics Settingsl Scheduling Report Alertsl Setting Incident SNMP Trapsl Setting Incident HTTPNotificationl Setting Remedy Notificationl Scheduling Report Copyl Setting a Subcategoryl Setting Risk Filters
l Discovery Settingsl Generic Settingsl Setting CMDBDevice Filterl Setting Application Filterl Setting Locationl Setting CMDBGroup
l Monitoring Settingsl Important Processesl Important Portsl Important Interfacesl Excluded Disksl WindowsWMI Pulling Template
l Event Handling Settingsl Event Droppingl Event Forwardingl Event Organization Mappingl Multiline Syslog
l Event Database Settingsl Configuring Database Replicationl Creating Retention Policy
266 User GuideFortinet Technologies Inc.

Administration Settings
l Viewing Online Event Datal Viewing Archive Event Datal Setting Elasticsearch Retention Thresholdl Setting HDFSRetention Thresholdl Validating Event Log Integrity
l General Settingsl External Authentication Settingsl Incident Notification Settingsl External System Integration Settingsl Escalation Settings
l Role Settingsl Mapping AD Groups to Roles
System SettingsThe following section describes the procedures for system settings:
l UI settingsl Email settingsl Collector Image Server settingsl Event Worker settingsl QueryWorker settingsl Data Update Server settingsl Lookup settingsl Kafka settingsl Dashboard Slideshow settings
UI settings
There are two locations where you can change UI settings in FortiSIEM. One location is in the user profile. Theother is in the administrator settings.
l User Profile UI Settingsl Administrator UI Settings
User Profile UI Settings
The initial view of FortiSIEM UI after login can be configured using the UI settings including dashboard, logos,and theme.
Click the Edit User Profile icon ( ) in the upper right corner of the UI. The dialog box contains three tabs:
Basic - Use the Basic tab to change your password into the system.
Contact - Use the Contact tab to enter your contact information.
UI Settings - Use the UI Settings tab to set the following:
User GuideFortinet Technologies Inc.
267

Settings Administration
Settings Guidelines
Home Select the tab which opens when you log in to the FortiSIEM UI.
Incident Home Select the Overview, List, Risk, or Explorer display for the INCIDENT tab.
Dashboard Home Select the Dashboard to open by default under the DASHBOARD tab from this drop-down list.
Dashboard Settings Select the type of dashboards to be visible/hidden using the left/right arrows. Theup/down arrows can be used to sort the Dashboards.
Language Specify which language will be used for the UI display. Many UI items have beentranslated into the languages in the drop-down list, including buttons, labels, top-levelheadings, and breadcrumbs. Items that are data-driven are not translated.
Theme Select Dark or Light theme for FortiSIEM UI. Save and refresh the browser to view thechange.
Note: All of the above settings will take effect when you log in again or when you refresh the browser in the samelogin session.
Administrator UI Settings
ClickADMIN > Settings > System > UI to access the administrator UI settings.
Settings Guidelines
UI Logo Click the edit icon to enter the path to the image file for the logo that will be used in theUI.
Report Logo Click the edit icon to enter the path to the image file for the logo that will be used inreports.
Google Maps API Key Click the edit icon to enter the API key to access Google Maps.
Email settings
The system can be configured to send email as an incident notification action or send scheduled reports. Usethese fields to specify outbound email server settings.
Complete these steps to customize email settings:
1. Go to ADMIN >Settings > System > Email tab.2. Enter the following information under Email Settings:
268 User GuideFortinet Technologies Inc.

Administration Settings
Settings Guidelines
Email Gateway Server [Required] Holds the gateway server used for email.
Server Account ID [Required] The account name for the gateway.
Account password [Required] The password for the account.
Server Port Port used by the gateway server.
Secure Connection (TLS) Protocol used by the gateway server. This can be Exchange or SMTP.
Admin Email Ids Email addresses for all of the admins.
Default Email Sender Default email address of the sender.
3. Click Test Email button to test the new email settings.4. ClickSave.
Customizing the Incident Email Template
Use the following procedure to customize the incident email template.
1. ClickNew under the section Incident Email Template.2. Enter the Name of the template.3. Select theOrganization from the list.4. Enter the Email Subject. You can also choose the incident attribute variables from Insert Content drop-down as
part of Email Subject.5. Enter the Email Body by selecting the attribute variables from Insert Content drop-down into your template,
rather than typing. If required, enable Support HTML for HTML content support.Incident Attribute Description
Organization Organization to which this Incident belongs.
Status Incident Status – Active (0), Auto Cleared (1), ManuallyCleared (2), System Cleared (3)
Host Name Host Name from Incident Target. If not found then gatheredfrom Incident Source
Incident IDIncident ID – assigned by FortiSIEM and is unique – thisattribute has an URL which takes user to this incident afterlogin
Incident ID Without Link Incident ID – assigned by FortiSIEM and is unique – thisattribute does not have an URL
User GuideFortinet Technologies Inc.
269

Settings Administration
Incident Attribute Description
First Seen Time First time the incident occurred
Last Seen Time Last time the incident occurred
Incident Category Security, Performance, Availability or Change
Incident Severity A number from 0-10
Incident Severity Category HIGH (9-10), MEDIUM (5-8) and LOW (1-4)
Incident Count Number of times the same incident has happened with thesame group by parameters
Rule Name Rule Name
Rule Remediation Note Remediation note defined for each rule
Rule Description Rule Description
Incident Source Source IP, Source Name in an Incident
Incident Target Destination IP, Destination Host Name, Host IP, HostName, User in an Incident
Incident Detail Any group by attribute in an Incident other than those inIncident Source and Incident Target
Affected Business ServiceComma separated list of all business services to whichIncident Source, Incident Target or Reporting Devicebelongs
Identity Identity and Location for Incident Source
Notify Policy ID Notification Policy ID that triggered this email notification
Triggering Attributes List of attributes that trigger a rule – found in Rule > Subpattern > Aggregate
Raw Events Triggering events in raw format as sent by the device (up to10)
Incident Cleared Reason Value set by user when clearing a rule
Device Annotation Annotation for the device in Incident Target – set in CMDB
Device Description Description for the device in Incident Target – set in CMDB
270 User GuideFortinet Technologies Inc.

Administration Settings
Incident Attribute Description
Device Location Location for the device in Incident Target – set in CMDB
Incident Subcategory Specific for each category – as set in the Rule definition
Incident Resolution None, True Positive, False Positive
6. ClickPreview to preview the email template.7. ClickSave to apply the changes.To set an email template as default, select the template in the list, and then clickSet as Default. When you arecreating a notification policy and must select an email template, if you leave the option blank, the defaulttemplate will be used. For Service Provider deployments, to select a template as default for an Organization, firstselect the Organization, then set the default email template for that organization.
Collector Image Server settings
ClickAdmin > Settings > System > Collector Image Server to display the location of the image updates.The Image Download URL field cannot be edited.
To update the image, see Upgrade the Collector Image From the Supervisor in the Upgrade Guide for moreinformation.
If the Image Download URL field is empty, then no image updates have been performed.
Event Worker settings
Collectors upload events and configurations to Worker nodes. Use this field to specify the Worker host names orIP addresses.
There are three cases:
l Explicit list of Worker IP addresses or host names - Collector forwards to this list in a round robin manner.l If you are not using Workers and using only a Supervisor and Collector(s) – specify the Supervisor IP
addresses or host name. The Collectors will upload directly to the Supervisor node.
l Host name of a load balancer - Collector forwards this to the load balancer which must be configured to distributeevents to the workers.
Any Hostnames specified in the Worker Upload must be resolvable by the Collector and similarly, any specified IPaddresses must have connectivity from the Collector.
Complete these steps to configure Worker upload settings:
1. Go to ADMIN >Settings > System2. ClickEvent Worker.3. Enter the IP address of the event worker underWorker Address.
You can click '+' or '-' to add or remove addresses.4. ClickSave.
User GuideFortinet Technologies Inc.
271

Settings Administration
Query Worker Settings
Release 5.3 introduces the concept of a QueryWorker to handle only query requests, adhoc queries from GUI,and scheduled reports. This allows more system resources to be dedicated to queries and make them run faster.
By default, all Workers are also QueryWorkers. If you want only a subset of Workers to be QueryWorkers, thencomplete these steps:
1. Go to ADMIN > Settings > System.2. ClickQuery Worker.3. Select the Workers you want to use from the list.
Note:Workers will be removed automatically from the QueryWorker Settings if they are explicitly listedthere. If you used a load balancer or DNS name, then you must manually remove the QueryWorkerfrom those configurations.
Data Update Server settings
Data Update Server settings are used to specify the location of the data update images and the credentialsneeded to access them.
Prerequisites
l Contact FortiSIEM support and make sure that your license includes Data Update Service.l Make sure you have the Data Update URL which is typically https://images.FortiSIEM.net/upgrade/ds- contact
FortiSIEM to make sure that this information has not changed.l Make sure you have license credentials.
Complete these steps to configure Data Update server settings:
1. Go to ADMIN >Settings > System >Data Update Server tab.2. Enter the following information:
l Data Update URLl Server Username and Server Password - these are the license credentials.l Notify Email - you will receive an email notification when new data updates are available.
3. ClickSave.
Lookup settings
Lookup setting can be used to find any IP or domain by providing the link.
Complete these steps for lookup:
1. Go to ADMIN >Settings > System > Lookup tab.2. Enter the Name.3. Select the Client Type to IP orDomain.4. Enter the Link for look-up.
You must enter "<ip>” in the link. FortiSIEM will replace "<ip>” with a proper IP duringlookup.
For example, to lookup the following URL:
http://whois.domaintools.com/8.8.8.8
Enter the following link in FortiSIEM:
272 User GuideFortinet Technologies Inc.

Administration Settings
http://whois.domaintools.com/<ip>
5. ClickSave.
Kafka settings
FortiSIEM events found in system event database can be exported to an external system via Kafka message bus.
FortiSIEM supports both forwarding events to an external system via Kafka message bus as a 'Producer' andreceiving events from a third-party system to FortiSIEM via Kafka message bus as a 'Consumer'.
As a Producer:
l Make sure you have set up a Kafka Cloud (here) with a specific Topic for FortiSIEM events.l Make sure you have identified a set of Kafka brokers that FortiSIEM is going to send events to.l Make sure you have configured Kafka receivers which can parse FortiSIEM events and store in a database. An
example would be Logstash receiver (see here) that can store in an Elastic Search database.l Supported Kafka version: 0.8
As a Consumer:
l Make sure you have set up a Kafka Cloud (here) with a specific Topic, Consumer Group and a Consumer forsending third party events to FortiSIEM.
l Make sure you have identified a set of Kafka brokers that FortiSIEM will receive events from.l Supported Kafka version: 0.8
Complete these steps for configuring Kafka settings in FortiSIEM:
1. Go to ADMIN >Settings > System >Kafka tab.2. ClickNew.3. Enter the Name and Topic.4. Select or search theOrganization from the drop-down.5. Add Brokers by clicking + icon.
a. Enter IP address or Host name of the broker.b. Enter Broker port (default 9092).
6. ClickSave.7. Select the Client Type to Producer or Consumer.8. If the Consumer is selected in step 7, enter the Consumer Name andGroup Name fields.9. ClickSave.
Dashboard Slideshow settings
Dashboard Slideshow settings are used to select a set of dashboards and display them in a slideshow mode onbig monitors to cover the entire display. This is useful for Network and Security Operation Centers.
Complete these steps to create a Dashboard Slideshow:
1. Go to ADMIN >Settings > System >Dashboard Slideshow tab.2. ClickNew to create a slideshow.3. Enter a Name for the slideshow.4. Select the Interval for switching between dashboards.5. Select the Dashboards from the list and move to the Selected list.
User GuideFortinet Technologies Inc.
273
Settings Administration
These dashboards will be displayed in a slideshow mode.6. ClickSave.For all the above System settings, use the Edit button to modify orDelete button to remove any setting from thelist.
Analytics SettingsThe following section describes the procedures for Analytics settings:
l Scheduling Report Alertsl Setting Incident SNMP Trapsl Setting Incident Http Notificationl Setting Remedy Notificationl Scheduling Report Copyl Setting a Subcategoryl Setting Risk Filters
Scheduling Report Alerts
You can schedule reports to run and send email notifications to specific individuals. This setting is for defaultemail notifications that will be sent when any scheduled report is generated.
1. Go to ADMIN >Settings >Analytics tab.2. Select the required action under Scheduled Report Alerts section.
l Do not send scheduled emails if report is empty - Sometimes a report may be empty because thereare no matching events. If you don't want to send empty reports to users, select this option. If you arerunning a multi-tenant deployment, and you select this option while in the Super/Global view, this willapply only to Super/Global reports. If you want to suppress delivery of empty reports to individualOrganizations, configure this option in the Organizational view.
3. Enter the email address in Deliver notification via filed. Click + to add more than one email address, if needed.4. ClickSave.5. To receive email notifications, go to Admin >Settings >System >Email and configure your mail server.
Setting Incident SNMP Traps
You can define SNMP traps that will be notified when an event triggers an incident.
1. Go to ADMIN >Settings >Analytics tab.2. Enter the following information under Incident SNMP Traps section.
a. SNMP Trap IP Addressb. SNMP Community String - to authorize sending the trap to the SNMP trap IP address.
3. Select the SNMP Trap Type and SNMP Trap Protocol options.4. Click Test to check the connection.5. ClickSave.
Setting Incident HTTP Notification
You can configure FortiSIEM to send an XML message over HTTP(s) when an incident is triggered by a rule.
274 User GuideFortinet Technologies Inc.

Administration Settings
1. Go to ADMIN >Settings >Analytics tab.2. Enter the following information under Incident Http Notification section.3. ForHTTP(S) Server URL, enter the URL of the remote host where the message should be sent.4. Enter the User Name and Password to use when logging in to the remote host, and enterConfirm Password
to reconfirm the password.5. Click Test to check the connection.6. ClickSave.
Setting Remedy Notification
You can set up Remedy to accept notifications from FortiSIEM and generate tickets from those notifications.
Configuring Remedy to Accept Tickets from FortiSIEM Incident Notifications
Before configuring Remedy to accept tickets, make sure you have configured the Remedy Notifications inFortiSIEM.
1. In Remedy, create a new form, FortiSIEM_Incident_Interface, with the incident attributes listed in the table atthe end of this topic as the form fields.
2. When you have defined the fields in the form, right-click the field and select the Data Type that corresponds tothe incident attribute.
3. After setting the form field data type, click in the form field again to set the Label for the field.4. When you are done creating the form, go to Servers > localhost >Web Service in Remedy, and select New
Web Service5. ForBase Form, enter FortiSIEM_Incident_Interface.6. Click theWSDL tab.7. For theWSDL Handler URL, enter http://<midtier_
server>/arsys/WSDL/public/<servername>/FortiSIEM_Incident_Interface.8. Click the Permissions tab and select Public.9. Click Save.You can test the configuration by opening a browser window and entering the WSDL handler URL from step 7above, substituting the Remedy Server IP address for <midtier_server> and localhost for<servername>. If you see an XML page, your configuration was successful.
Incident Attributes for Defining Remedy Forms
Incident Attribute Data type Description
biz_service text Name of the business services affected by this incident
cleared_events text Events which cleared the incident
cleared_reason text Reason for clearing the incident if it was cleared
cleared_time bigint Time at which the incident was cleared
User GuideFortinet Technologies Inc.
275

Settings Administration
Incident Attribute Data type Description
cleared_user character varying(255)
User who cleared the incident
comments text Comments
cust_org_id bigint Organization id to which the incident belongs
first_seen_time bigint Time when the incident occurred for the first time
last_seen_time bigint Time when the incident occurred for the last time
incident_count integer Number of times the incident triggered between the first andlast seen times
incident_detail text Incident Detail attributes that are not included in incident_srcand incident_target
incident_et text Incident Event type
incident_id bigint Incident Id
incident_src text Incident Source
incident_status integer Incident Status
incident_target text Incident Target
notif_recipients text Incident Notification recipients
notification_action_status text Incident Notification Status
orig_device_ip text Originating/Reporting device IP
ph_incident_category
character varying(255)
FortiSIEM defined category to which the incident belongs:Network, Application, Server, Storage, Environmental,Virtualization, Internal, Other
rule_id bigint Rule id
severity integer Incident Severity 0 (lowest) - 10 (highest)
severity_cat character varying(255)
LOW (0-4), MEDIUM (5-8), HIGH (9-10)
ticket_id character varying(2048) Id of the ticket created in FortiSIEM
276 User GuideFortinet Technologies Inc.

Administration Settings
Incident Attribute Data type Description
ticket_status integer Status of ticket created in FortiSIEM
ticket_user character varying(1024)
Name of the user to which the ticket is assigned to inFortiSIEM
view_status integer View status
view_users text View users
Complete these steps to set up the routing to your Remedy server.
1. Go to ADMIN >Settings >Analytics tab.2. Enter the following information underRemedy Notification section.3. ForWSDL, enter the URL of the Remedy Server.4. Enter the User Name and Password associated with your Remedy server, and enterConfirm Password to
reconfirm the password.5. Click Test to check the connection.6. ClickSave.
Scheduling Report Copy
Reports can be copied to a remote location when the scheduler runs any report. Note that this setting onlysupports copy to Linux remote directory.
1. Go to ADMIN >Settings >Analytics tab.2. Enter the following information under Scheduled Report Copy section.3. Enter the Host - IP address or name.4. Enter the Path - absolute path, such as /abc/def.5. Enter the User Name and Password, and enterConfirm Password to reconfirm the password.6. Click Test to check the connection.7. ClickSave.Note: For all of the above configurations, use the Edit button to modify any setting orDelete to remove anysetting.
Setting a Subcategory
FortiSIEM Incidents are grouped into different categories – Availability, Change, Performance, Security andOther. A Category is assigned to every Rule and you can search any Incidents using these Categories. FortiSIEMextends this concept to include Subcategories. A Subcategory is defined for every system-defined rule. You canadd a Subcategory for custom rules and also create new Subcategories. Incidents can be searched using bothCategories and Subcategories.
Creating a Subcategory
1. Go to ADMIN > Settings > Analytics > Subcategory.2. Select the Category from the left-hand panel where you want to create a Subcategory.
User GuideFortinet Technologies Inc.
277

Settings Administration
3. ClickAdd in the right-hand panel.4. Enter a name for the new Subcategory.5. Click the checkmark icon or clickSave All.
Modifying a Subcategory
You can modify only user-defined Subcategories. You cannot modify system-defined Subcategories.
1. Select the Subcategory you want to modify.2. Click the edit icon.3. Modify the name in the Subcategory field.4. Click the checkmark icon or Save All.
Deleting a Subcategory
You can delete only user-defined Subcategories. You cannot delete system-defined Subcategories.
1. Select the Subcategory you want to delete.2. Click the - icon.3. ClickSave All.
Setting Risk Filters
ARisk Filter allows you to include or exclude certain rules from the Risk Score calculation. For more informationon Risk Scores, see Risk View. (Note we also have an Entity Risk Score topic which is empty)
In the SPmodel, you can create a global Risk Filter or filters for individual organizations. A global Risk Filter caninclude only system rules, and is available to all organizations. You can create only one Risk Filter for anorganization. Multiple filters are not allowed. This Risk Filter includes the filter defined for the organization itselfand the global filter if one exists.
The VAmodel allows only one filter.
The Risk Filter view contains a table with three columns. The Scope column lists the organization the filterbelongs to. The Included Rules column lists the rules that will be included in the calculation of the risk score.The Excluded Rules columns lists the rules that will not be included in the calculation of the Risk Score.
Creating a Risk Filter
Follow these steps to create a Risk Filter.
1. Go to ADMIN > Settings > Analytics > Risk Filter to open the Risk Filter view.2. ClickNew.3. In the New Risk Filter dialog box, select Super/Local or the name of an organization from the Add filter for
drop-down list.4. ClickNext.5. In the next dialog box, Include is selected by default. Open the Rules tree underGroups and shuttle the rules
you want to include in the filter from the Rules column to the Selection column.6. Select Exclude and repeat the process described in the previous step to exclude rules from the filter.7. ClickSave. Your rule selections will appear in the Included Rules and Excluded Rules columns of the table.
278 User GuideFortinet Technologies Inc.

Administration Settings
Editing a Risk Filter
Follow these steps to edit a Risk Filter.
1. Go to ADMIN > Settings > Analytics > Risk Filter to open the Risk Filter view.2. ClickEdit.3. In the dialog box, Include is selected by default. Shuttle the rules you do not want to be included in the Risk Score
from the Selection column to the Rules column.4. Select Exclude and repeat the process described in the previous step to exclude rules from the filter.5. ClickSave.
Deleting a Risk Filter
Follow these steps to delete a Risk Filter.
1. Go to ADMIN > Settings > Analytics > Risk Filter to open the Risk Filter view.2. Select the row in the table containing the filter you want to delete.3. ClickDelete.
Viewing Risk Filter Results
To see the impact of the filters you defined, go to INCIDENTS. Click the Risk icon to open the Risk View.For a description of the Risk View, see Risk View.
Discovery SettingsThe following section describes the procedures for Discovery settings:
l Generic Settingsl Setting CMDBDevice Filterl Setting Application Filterl Setting Locationl Setting CMDBGroup
Generic Settings
Before you initiate discovery, you should configure the Discovery Settings in your Supervisor as required for yourdeployment.
1. Go to ADMIN >Settings >Discovery >Generic tab.2. Enter the following information underGeneric Settings section. In a SP deployment, you must define all these
settings for each Organization by logging in to the Organization directly.
User GuideFortinet Technologies Inc.
279

Settings Administration
Setting Description
Virtual IPs Often a common virtual IP address will exist in multiple machines forload balancing and fail-over purposes. When you discover devices, youmust have these virtual IP addresses defined within your discoverysettings for two reasons:
l Listing the virtual IP addresses ensures that two or moredevices with the same virtual IP will not be merged into onedevice during device discovery, so each of the load-balanceddevices will maintain their separate identity in the CMDB
l The virtual IP will not be used as an access IP during discovery,since the identity of the device when accessed via the virtual IPis unpredictable
Enter the Virtual IP and click + to add more, if required.
Excluded Shared DeviceIPs
An enterprise often has servers that share credentials, for examplemail servers, web proxies, and source code control servers, and a largenumber of users will authenticate to these servers to access theirservices. Providing a list of the IP addresses for these servers allowsFortiSIEM to exclude these servers from user identity and locationcalculations in the Analytics > IdentityandLocation report.For example, suppose user A logs on to server B to retrieve his mail,and server B authenticates user A via Active Directory. If server B is notexcluded, the Analytics > Identity and Location Reportwill containtwo entries for user A: one for the workstation that A logs into, and alsoone for server B. You can eliminate this behavior by adding server B tothe list of Server IPs with shared credentials.
Enter the Excluded Shared Device IPs and click + to add more, ifrequired.
Virtual Device HardwareSerial Numbers
If two or more devices have identical hardware serial number, specifythem here. In general, hardware serial number is used to uniquelyidentify a device and therefore two devices with identical hardwareserial number is merged into a single device in CMDB. If a hardwareserial number is present in the Virtual Hardware Serial Numbers list,then it is excluded for merging purposes.
Enter the Virtual Device Hardware Serial Numbers and click + toadd more, if required.
280 User GuideFortinet Technologies Inc.

Administration Settings
Setting Description
Allow Incident Firing on
This setting allows you to control incident firings based on approveddevice status.If the Approved Devices Only option is selected, the following logicis used:(a) If at least one Source, Destination or Host IP is approved, theincident triggers.(b) Else if at least one incident reporting device is approved, theincident triggers.(c) Else the incident does not trigger.Note: System devices (Super, Worker, and Collectors) will always beconsidered to be approved devices. In other words, incidents will firefor these system devices even if Approved Devices Only option isselected.
Select All Devices orApproved Devices Only accordingly.
3. ClickSave.
Setting CMDB Device Filter
This setting allows you to limit the set of devices that the system automatically learns from logs and Netflows.After receiving a log from a device, the system automatically learns that device and adds it to CMDB. When aTCP/UDP service is detected running on a server from Netflow analysis, the server along with the open ports areadded to CMDB.
Sometimes, you may not want to add all of these devices to CMDB. You can create filters to exclude a specificset of devices from being added to CMDB. Each filter consists of a required Excluded IP Range field and anoptional Except field.
1. Go to ADMIN >Settings >Discovery >CMDB Device Filter tab.2. ClickNew.3. In the Range Definition dialog box, enter the following information:
a. Excluded IP Ranges - A device will not be added to CMDB if it falls in the range defined in theExcluded IP Range field. For example, if you wanted to exclude the 172.16.20.0/24 network fromCMDB, add a filter with 172.16.20.0-172.16.20.255 in itsExcluded IP Range field.
b. Except - This field allows you to specify some exceptions in the excluded range. For example, if youwanted to exclude the 172.16.20.0/24 network without excluding the 172.16.20.0/26 network,add a filter with 172.16.20.0-172.16.20.255 in the Excluded IP Range field, and172.16.20.192-172.16.20.255 in the Except field.
You can add multiple values for these fields by clicking the + icon or remove an entry by clicking the - icon.4. ClickSave.
Setting Application Filter
This setting allows you to limit the set of applications/processes that the system automatically learns fromdiscovery. You may be more interested in discovering and monitoring server processes/daemons, rather thanclient processes, that run on a server. To exclude client processes from being discovered and listed in the CMDB,
User GuideFortinet Technologies Inc.
281

Settings Administration
enter these applications here. An application/process will not be added to CMDB if it matches one of the entriesdefined in this table.
1. Go to ADMIN >Settings >Discovery >Application Filter tab.2. ClickNew.3. In the Process Definition dialog box, enter the Process Name and anyParameters for that process that you
want to filter.Matching is exact and case-insensitive based on Process Name and Parameter. If Parameter is empty, then onlyProcess Name is matched.
4. Select theOrganization from the drop-down list.5. ClickSave.
Setting Location
This setting allows you to set location information for devices in CMDB. Location information can be defined for aset of IP addresses. When applied, this information will overwrite the existing Location information in the CMDB.Future discoveries will not overwrite this information. Use this method to update locations of multiple devices withprivate IP addresses only. It is not necessary to update locations for public address space in this manner, becausethis information can also be obtained from a separate built-in database location.
1. Go to ADMIN >Settings >Discovery > Location tab.2. ClickNew.3. In the Location Definition dialog box, select or enter the following information:
l Organization Typel IP/IP Rangel Locationl Update Manual Devices (This enables the system to overwrite the location information for manually
defined devices in CMDB.) 4. ClickSave.5. Select the new location from the list and clickApply.
Setting CMDB Group
This setting allows you to write rules to add devices in CMDBDevice Group and Business Service Groups of yourchoice. When a device is discovered, the policies defined here are applied and the device is assigned to the group(s) defined in the matching policies. This device grouping does not overwrite the CMDBDevice group assignedduring discovery. The grouping defined here is in addition to the discovery defined CMDB group.
1. Go to ADMIN >Settings >Discovery >CMDB Group tab.2. ClickNew.3. In the CMDB Group Definition dialog box, select or enter the following information:
l Organization - the organization which this rule applies tol Vendor - the matching device vendorl Model - the matching device modell Host Name - matching device host name via regular expression matchl IP Range - matching device access IP - format is single IP, IP range, CIDRl Custom Properties - see Grouping Devices by Custom Propertiesl Groups - specify the groups which the matching devices will be added tol Biz Services- specify the business services which the matching devices will be added to
282 User GuideFortinet Technologies Inc.

Administration Settings
4. ClickSave.5. Select the new CMDB group from the list and clickApply.Conditions are matched in ANDed manner: Both the actions are taken, that is, if both a Group and aBusiness Service is specified, then the device will be added to both the specified Group and Business Service.
To apply one or more CMDB Group policies:
1. Select one or more policies and clickApply or clickApply All to apply all policies.2. Once a policy is saved, then next discovery will apply these policies. That means, discovered devices will belong to
the groups and business services defined in the policies.Note: For all the above configurations, use the Edit button to modify any setting orDelete to remove any setting.
Grouping Devices by Custom Properties
FortiSIEM allows you to define device groups based on IP address, host name, or device type. You can alsogroup devices based on custom properties. These steps assume that you have already defined the customproperties you are interested in. See Working with Custom Properties.
To group devices by custom properties:
1. In the CMDB Group Definition dialog box, click the edit icon next to Custom Properties.2. Click + to add a new group definition based on the custom property.3. Select a custom property from the Property drop-down list.4. Enter a Value for the property. You can add multiple values by clicking the + button.5. ClickSave, then clickSave again to return to the CMDB Group Definition dialog box.6. In the Add To section of the dialog box, select the group to which the CMDBGroup will be added from the
Groups drop-down list.
Monitoring SettingsThe following sections describe the procedures for Monitoring settings:
l Important Processesl Important Portsl Important Interfacesl Excluded Disksl WindowsWMI Filter
Important Processes
This setting allows you to always get process resource utilization reports and UP/DOWN alerts on a set ofimportant processes across all device types.
1. Go to ADMIN >Settings >Monitoring > Important Processes tab.2. ClickEnable.
This will stop monitoring all processes.3. ClickNew.4. Enter a Process Name, Parameter, and select anOrganization from the drop-down.5. ClickSave.6. Select the processes from the table and clickApply.
User GuideFortinet Technologies Inc.
283

Settings Administration
FortiSIEM will start monitoring only the selected processes in this tab.7. If you want to disable this and return to ALL process monitoring, then clickDisable.
Important Ports
This setting allows you to get TCP/UDP port UP/DOWN status only for a set of important critical ports. Alwaysreporting UP/DOWN status for every TCP/UDP port on every server can consume a significant amount ofresources. A port's UP/DOWN status is reported only if the port belongs to this list defined here.
Matching is exact based on port number and IP protocol.
1. Go to ADMIN >Settings >Monitoring > Important Ports tab.2. ClickNew.3. Enter the Port Number and select the Port Type andOrganization from the drop-down.4. ClickSave.5. Select the new ports from the list and clickApply.
Important Interfaces
This setting allows you to always get interface utilization reports on a set of important network interfaces acrossall device types.
1. Create a list of all Important interfaces.2. Go to ADMIN >Settings >Monitoring > Important Interfaces tab.3. ClickEnable.
This will stop monitoring all interfaces.4. Click the icon left to search field to select either Show Device Table or Show Interface only.5. ClickSelect to add the selected interface to the list. The Critical andMonitor columns will be automatically
checked.6. Check the WAN box if applicable. If checked, the interface utilization events will have the isWAN = "yes"
attribute.You can use this to run a report for all WAN interfaces.
7. Select the interfaces from the table and clickApply.FortiSIEM will start monitoring only the selected interfaces in this tab.
8. If you want to disable this and return to ALL process monitoring, clickDisable.By default, this feature is disabled regardless of whether it is upgraded or newly installed. If this feature isdisabled, FortiSIEM monitors all interface util and up/down events. The isHostIntfCritical attribute willbe set to false for all interfaces. Only non-critical interface staying down rule may trigger. Critical interface stayingdown rule will have no chance to trigger. If this feature is enabled, there are two check boxes - monitor andcritical. If critical is checked, monitor will be checked automatically. Monitor controls whether we must generateinterface util event. We monitor interface utils events for interface whose monitor check box is selected. Criticalcontrols whether we must generate interface up/down events. FortiSIEM monitors interface up/down events foran interface whose critical check box is selected. If one interface is marked as critical, we set the attribute ofisHostIntfCritical to true in the generated interface util and up/down events. The Rule “critical interfacestaying down” will trigger on interfaces whose isHostIntfCritical is true. Non-critical interface stayingdown rule will have no chance to trigger.
284 User GuideFortinet Technologies Inc.

Administration Settings
Excluded Disks
This setting allows you to exclude disks from disk capacity utilization monitoring. Disk capacity utilization eventswill not be generated for devices matching device name, access IP and disk name. Incidents will not trigger forthese events, and the disks will not show up in summary dashboards. Use this list to exclude read only diskvolumes or partitions that do not grow in size and are close to full.
1. Go to ADMIN >Settings >Monitoring >Excluded Disks tab.2. ClickNew.3. From the Choose Disk dialog box, select the device from the device group.4. ClickSelect.5. Select the device from the table and clickApply.
Windows WMI Filter
Windows can produce a very high number of system, application, and security logs. The system provides adefault filter, Get All Logs, which returns all of the Windows logs detected. By defining a filter, you can obtainonly the logs you need.
Step 1: Create the Windows WMI Filter
1. Go to ADMIN >Settings >Monitoring >Windows WMI Filter tab.2. ClickNew.3. Enter a name and an optional description for the filter in the NewWMI Filter dialog box.4. ClickNew to define a filter for the template:
a. From the Type drop-down list, select Application, Security, or System.b. In the Include and Exclude fields, enter a comma-separated list of the event codes which should be
included or excluded from the filter.c. ClickSave.
5. ClickSave again to save the WindowsWMI filter.
Step 2: Apply the Filter in a Credential
1. Go to ADMIN > Setup > Credentials.2. ClickNew in Step 1: Enter Credentials.
a. In the Access Method Definition dialog box, select one of the Microsoft devices from the Device Typedrop-down list.
b. From the Access Protocol drop-down list, selectWMI.c. From theWMI Filter drop-down list, select the filter created in Step 1: Create the WindowsWMI Filter.d. Enter any other required information for the credential. For more information, see Setting Credentials.e. ClickSave.
3. ClickNew in Step 2: Enter the IP Range for Credential.a. In the Device Credential Mapping Definition dialog box, enter an IP or IP range.b. From the Credentials drop-down list, select the filter created in Step 1: Create the WindowsWMI Filter.
For more information, see Associating a credential to IP ranges or hosts.
c. ClickSave.
User GuideFortinet Technologies Inc.
285

Settings Administration
Step 3: Discover using the WMI credential in Step 2
AnyWindows Server discovery that uses that a WMI credential will only pull the logs specified in the Filter in Step1.
Event Handling SettingsThis section provides the procedures to configure Event Handling.
l Event Droppingl Event Forwardingl Event Organization Mappingl Multiline Syslog
Event Dropping
Some devices and applications generate a significant number of logs, which may be very verbose, contain littlevaluable information, and consume storage resources. You can configure Event Dropping rules that will dropevents just after they have been received by FortiSIEM, preventing these event logs from being collected andprocessed. Implementing these rules may require some thought to accurately set the event type, reportingdevice, and event regular expression match, for example. However, dropped events do not count towardslicensed Events per Second (EPS), and are not stored in the Event database. Dropped events also do not appearin reports, and do not trigger rules. You can also specify that events should be dropped but stored, so eventinformation will be available for searches and reports, but will not trigger rules. An example of an event type thatyou might want to store but not have trigger any rules would be an IPS event that is a false positive.
1. Go to ADMIN >Settings >Event Handling >Dropping tab.2. ClickNew.3. Deselect All and click the drop-down next to Reporting Device and browse the folders to select the device group
or individual devices for which you must create a rule.4. ClickSave.5. Deselect All and click the drop-down next to Event Type and browse the folders to find the group of event types,
or a specific event type for which you must create a rule.6. ClickSave.7. Enter Source IP orDestination IP that you want to filter. The value can be IP range.8. Select the Action that should be taken when the event dropping rule is triggered from the available options.
l Drop eventl Store event:
n Do not trigger rulesn Drop attributes - to select the drop attributes, use the edit icon.
9. ForRegex Filter, enter any regular expressions you want to use to filter the log files. If any matches are made against your regular expression, then the event will be dropped.
10. Enter anyDescription for the rule. 11. ClickSave.Notes:
l All matching rules are implemented by FortiSIEM, and inter-rule order is not important. If you create a duplicate ofan event dropping rule, the first rule is in effect.
286 User GuideFortinet Technologies Inc.

Administration Settings
l If you leave a rule definition field blank, then that field is not evaluated. For example, leaving Event Type blank isthe same as selecting All Event Types.
l FortiSIEM drops the event at the first entry point. If your deployment uses Collectors, events are dropped by theCollectors. If your deployment doesn't use Collectors, then the event will be dropped by the Worker or Supervisorwhere the event is received.
l You can use the report System Event Processing Statistics to view the statistics for dropped events. Whenyou run the report, select AVG(Policy Dropped Event Rate (/sec) as one of the dimensions for Chart to see eventsthat have been dropped to this policy.
Event Forwarding
In systemsmanagement, many servers may need access to forward logs, traps and Netflows from networkdevices and servers, but it is often resource intensive for network devices and servers to forward logs, traps andNetflows to multiple destinations. For example, most Cisco routers can forward Netflow to two locations at most.However, FortiSIEM can forward/relay specific logs, traps and Netflows to one or more destinations. A Super,Worker or Collector can forward events - the one which receives and parses the event forwards it. If you want tosend a log to multiple destinations, you can send it to FortiSIEM, which will use an event forwarding rule to send itto the desired locations.
1. Go to ADMIN >Settings >Event Handling > Forwarding tab.2. ClickNew.3. Select theOrganization for which the rule will apply.4. Click the drop-down next to Reporting Device and browse the folders to find the group of devices, or a specific
device for which you must create a rule.5. Click the drop-down next to Event Type and browse the folders to find the group of event types, or a specific
event type for which you must create a rule.6. ClickSave.7. Select the Traffic Type to which the rule should apply.8. For Source IP, enter the IP address of the device that will be sending the logs.9. ForDestination IP, enter the IP address of the device to which the logs are sent.10. For Severity, select an operator and enter a severity level that must match for the log to be forwarded.11. ForRegex Filter, enter any regular expressions you want to use to filter the log files.
If any matches are made against your regular expression, then the event will be forwarded.12. Select the forwarding Protocol from the drop-down.
l UDP - If you use this protocol, events may be lost.l TCP - This method ensures reliability.l TCP over SSL - This method ensures reliability and security. See Note 3 below.
13. Based on your selection of Traffic Type, enter the following information:a. Enter the IP address in Forward to > IP.b. Select the Port number in Forward to > Port field.c. Select a Forward to >Protocol from the drop-down list.d. Select the Forward to > Format:
l Incoming - outgoing format is same as incoming.l CEF - outgoing events are CEF formatted. See here for details on CEF formatted logs.
14. ClickSave.Notes:
User GuideFortinet Technologies Inc.
287

Settings Administration
1. If you want the same sender IP to forward events to multiple destinations, create a rule for each destination.2. FortiSIEM will implement all rules that you create and enable, so if you create a duplicate of an event forwarding
rule, two copies of the same log will be sent to the destination IP. 3. If you want to use public CA certificates for TCP over SSL communication, then note the following:
l FortiSIEM's SSL library can validate an external system’s certificate if it is signed by a public CA.
l If the external system wants to verify the FortiSIEM node's certificate, then you need to add thefollowing certificate and key to the phoenix_config.txt file of the FortiSIEM nodesforwarding the event.
[BEGIN phEventForwarder]tls_certificate_file= #/opt/phoenix/bin/.ssh/my_cert.crt…tls_key_file= #/opt/phoenix/bin/.ssh/my_cert.key[END]
Event Organization Mapping
FortiSIEM can handle multi-tenant reporting devices that already have Organization names in the events theysend, for example, VDOM attribute in FortiGate. This section shows how to map Organization names in externalevents to those in FortiSIEM. FortiSIEM will create a separate reporting device in each Organization andassociate the events to the reporting device in the corresponding FortiSIEM Organization.
This feature requires that:
l One or more (multi-tenant) Collectors are created under Super-Local Organization.l Multi-tenant devices send logs to the multi-tenant Collectors under Super-Local Organization.
Follow the steps below:
1. Go to ADMIN >Settings >Event Handling >Event Org Mapping tab.2. ClickNew.3. Select or search the Device Type of the sender from the drop-down.
This has to be a device that FortiSIEM understands and able to parse events.4. Select or search the Event Attribute that contains the external organization name from the drop-down.
FortiSIEM will map the value in this field to the FortiSIEM Organization.5. Select or search the multi-tenant Collectors under Super-Local Organization that will receive the events from the
drop-down.To include all Collectors, select All Collectors.
6. Specify the IP/IP Range of the multi-tenant devices that are sending events.Only a single IP or an IP Range is allowed, for example, 10.1.1.1 or 10.1.1.1-10.1.1.2. Comma-separated values,such as 10.1.1.1,10.1.1.2, are not allowed.
7. Click the edit icon next toOrg Mapping to map an organization to an event.l Click on anyEvent Organization cell in the Event Organization Mapping dialog box to edit. ClickSave.
8. ClickSave.Note: Do not define overlapping rules - make sure there are no overlaps in (Collector, Reporting IP/Range, EventAttribute) between multiple rules.
288 User GuideFortinet Technologies Inc.

Administration Settings
Multiline Syslog
Often applications generate a single syslog in multiple lines. For analysis purposes, the multiple lines must be puttogether into a single log. This feature enables you to do that. User can write multiple multiline syslog combiningrules based on reporting IP and begin and ending patterns. All matching syslog within the begin and endingpattern are combined into a single log.
1. Go to ADMIN >Settings >Event Handling >Event Multiline Syslog tab.2. ClickNew.3. Enter or select the following information:
a. Organization - syslog from devices belonging to this Organization will be combined to one line.b. Sender IP - the source of the syslog. Format is a single IP, IP range, CIDR and a combination of the
above separated by comma.c. Protocol - TCP or UDP since syslog can come via either of these protocols.d. Begin Pattern - combining syslog starts when the regular expression specified here is encountered.e. End Pattern - combining syslog stops when the regular expression specified here is encountered.
4. ClickSave.Note: For all the above configurations, use the Edit button to modify any setting orDelete to remove any setting.
The current conception is only for UDP, which is different from TCP. If a single event is sent by multiple UDPpackets, you need a multiline rule to combine them. Otherwise, FortiSIEM treats them as multiple events. If acontinuous TCP stream contains multiple events, you need a multiline rule to separate them. Otherwise,FortiSIEM treats LF (new line character \n) as the separator.
Event Database SettingsThe following sections provide more information about the Event Database settings:
Configuring Event Database Replication
FortiSIEM enables Database Replication by setting up two identical sites (identical number of Super, Workersand identical Event Database - NFS/Elasticsearch) using separate licenses.
The Active site is called 'Primary' while the Passive (disaster recovery) site is called the 'Secondary'. The Passivesite receives data from Primary and the system will be ready for use but not usable while the Primary is running.Once the setup is complete, CMDB (PostGreSQL DB), Config (SVN), Profile data (SQLite DB) and Event DB(NFS based Event DB or Elasticsearch) are synched from the Primary to the Secondary site. Synching can becontrolled via an update interval.
The following sections provide more information about configuring Database Replication:
l Replication settings for Local/NFS storagel Replication settings for Elasticsearch storagel Exporting Database Replication settingsl Importing Database Replication settingsl Disabling Disaster Recovery
For the operational details about setting up and managing FortiSIEM disaster recovery and failover, see:
l Operationalizing Disaster Recovery and Failover
User GuideFortinet Technologies Inc.
289

Settings Administration
Replication settings for Local/NFS storage
Settings Description
Host Info
Role
Choose the site as:- 'Primary' for the main active site.- 'Secondary' for the disaster recovery site which will receive data from thePrimary and the system will be ready for use only when the Primary site isdown.
Host Host name of the Primary/Secondary site.
IP Public IP of Primary/Secondary Supervisor to communicate with eachother.
UUID Universal Unique Identifier (UUID) for Supervisors to identify the Primaryand Secondary site.
CMDB Replication
Mount Point CMDBReplication Mount point where the CMDB directory has to bemounted on Primary for writing and for a Write Mount Point on Secondaryfor reading.
Configuration and Profile Replication
SSH Public Key SSH Public Key is used for rsynch based data movements (for profiledatabase, SVN and Local/NFS Event Database).
SSH Private Key Path Path to the SSH Private Key.
Replication Frequency
Value Frequency (in minutes/hours) at which the Primary and Secondary sitesdata are synchronized.
EventDB Replication Allows Event Database replication from the Primary to Secondary site.
Replication settings for Elasticsearch storage
Settings Description
Host Info
290 User GuideFortinet Technologies Inc.

Administration Settings
Settings Description
Role
Choose the site as:- Primary for the main active site.- Secondary for the disaster recovery site which will receive data from thePrimary and the system will be ready for use when the Primary site is down.
Host Host name of the Primary /Secondary site.
IP Public IP of Primary/Secondary Supervisor to communicate with eachother.
UUID Universal Unique Identifier (UUID) for Supervisors to identify the Primaryand Secondary site.
CMDBReplication Mount Point
CMDBReplication Mount Point is used during PostGreSQL replication.CMDBReplication Mount point is where the CMDB directory has to bemounted on Primary for writing and for a Write Mount Point on Secondaryfor reading.
SSH Public Key SSH Public Key is used for rsynch based data movements (for profiledatabase, SVN and Local/NFS Event Database).
Elasticsearch Snapshot
Write Mount Point Write Mount Point is used during Elasticsearch Snapshot. ElasticsearchData Directory is mounted to a Write Mount Point on Primary for writingand for a Write Mount Point on Secondary for reading.
Read Mount Point Read Mount Point for Elasticsearch Restore operation.
Write Repository Elasticsearch writes snapshots into Write repositories.
Read Repository Elasticsearch reads snapshots from Read repositories.
Frequency Frequency (in minutes/hours) at which the Primary and Secondary sitesdata are synchronized.
Exporting Database Replication settings
Database Replication settings can be exported to a JSON file for use in the Secondary site during setup. You canimport the same settings in the Secondary site to avoid manual entry at the Secondary site.
Complete these steps to export an existing Database Replication setting:
1. Go to ADMIN > Settings > Database > Replicate.2. Once the Database Replication settings are defined, clickExport.3. Save the JSON file to your local system for future use.
User GuideFortinet Technologies Inc.
291

Settings Administration
Importing Database Replication settings
To set up the Primary and Secondary sites for Disaster Recovery, you can import the Database Replicationsettings exported earlier into these sites.
Complete these steps to import Database Replication settings:
1. Go to ADMIN > Settings > Database > Replicate.2. Click Import to upload the Database Replication settings from a previously saved JSON file.3. ClickSave to update the Replication settings to the Primary and Secondary sites.
Operationalizing Disaster Recovery and Failover
This section provides details about setting up and managing FortiSIEM disaster recovery and failover.
l Prerequisitesl Setup Disaster Recovery and Failoverl Handling Disasterl Handling Recoveryl Disabling Disaster Recovery
Prerequisites
It is recommended to use DNS names for Supervisor to support this operation.
Note: You need two separate FortiSIEM licenses - one for each site.
1. Create DNSNames for the Supervisor nodes at the two sites, for example:l Site1.fortisiem.acme.coml Site2.fortisiem.acme.com
2. Install FortiSIEM on both sites (version 5.2.1 and later).3. The FortiSIEM setup at the two sites must be identical. (Note: Collectors are not part of replication as they
are deployed close to the devices.)a. Number of Workersb. Storage typec. Archiving setupd. Report Server setupe. Hardware resources (CPU, Memory, Disk) of various FortiSIEM nodes
4. Make sure the users and Collector nodes can access both Supervisor nodes by DNS names.5. Make sure that the two sites can communicate with each other using HTTPS, SSH and PostgreSQL.6. Log in to the Supervisor, go to ADMIN >Settings >Database >Replicate and make sure you have the required
information for the two sites.
Set up Disaster Recovery and Failover
Before setting up Disaster Recovery, determine which of the two sites will be the Primary site to start with.
292 User GuideFortinet Technologies Inc.

Administration Settings
1. Log in to the current Primary Supervisor node:a. Go to ADMIN >Settings >Database >Replicate.b. Enter the required information based on the event storage type:
l Local/NFSl Elasticsearch
c. ClickSave.The Replication process starts and runs in the background. A Job will be created – the status can be seenin the Job window.
d. Go back to ADMIN >Settings >Database >Replicate page.e. ClickExport and Save the Replication Configuration file on your local system.
2. Log in to the current Secondary Supervisor node:a. Go to ADMIN >Settings >Database >Replicate.b. Select the exported Replication file from the current Primary site stored in your local computer. Click
Import.c. The Replicate page opens. Make sure the information is correct. ClickSave.
This will continue the Replication process that started with the current Primary. A Job will also be createdon the current Secondary – the status can be seen in the Job window.
The Replication process works as follows:
1. The CMDB of the current Primary will be replicated to current Secondary.2. Once step 1 is complete, you will see that the two jobs created in Primary and Secondary will show complete in the
Job window.3. Other replication will begin and continue until replication status changes:
a. SVN replication – Secondary will pull in replication files from Primaryb. Profile DB replicationc. Local or NFS based replicationd. Elasticsearch replication
Operating FortiSIEM in Replication mode
1. Make sure DNS points to current Primary:a. DNS: fortisiem.acme.com (Site1.fortisiem.acme.com)b. Users log in to fortisiem.acme.com (Site1.fortisiem.acme.com)c. Collectors register to fortisiem.acme.com. This will cause the Worker Configuration at
Site1.fortisiem.acme.com to be pushed to Collectors.2. Events and configurations will be sent to the Primary and replicated to Secondary.3. Profile Database and Incidents will be computed in the Primary and replicated to Secondary.4. Inline Reports and scheduled reports are not copied over from Primary to Secondary. Incident Notification and
Scheduled Report delivery happens on Primary only.5. Incidents trigger on Primary and replicates to Secondary.6. Archiving and Report Server synching occur independently on the two sites.7. All processes will be up on Primary. However, on the Secondary node, only the processes required for user login
(App Server, PostGreSQL, Query Master/Worker, Java Query Server) and replication (Data Purger) will be up.8. The Secondary site can be operated like a Primary except the events are delayed because of replication (see
ADMIN >Settings >Database >Replicate >Replication Frequency).9. CMDB is set in a multi-master mode – so any changes on Secondary are replicated over to Primary. It is
recommended to do all edits on the Primary site.
User GuideFortinet Technologies Inc.
293

Settings Administration
Handling Disaster
Assuming that disaster happens at the current Primary Site, make sure DNS points to current Secondary, that is,fortisiem.acme.com points to Site2.fortisiem.acme.com. Users log in to fortisiem.acme.com (nowSite2.fortisiem.acme.com).
Log in to the current Secondary Supervisor node (Site2.fortisiem.acme.com) and:
1. Go to ADMIN >Settings >Database >Replicate.2. Switch the roles – set Site2.fortisiem.acme.com as the Primary site.3. ClickSave.
A Replication Change will be created in the Secondary and it will finish (Progress 100%). All processes will comeup on Supervisor and all Worker nodes.
Collectors will send to the new Primary (Site2.fortisiem.acme.com) as follows:
1. Collectors will first fail to send to old Workers (part of Site1.fortisiem.acme.com).2. Collectors will request a newWorker list from Super (now Site2.fortisiem.acme.com because of DNS change).3. Collectors a new list of Workers from Site2.fortisiem.acme.com4. Collectors will start sending events to the new Primary FortiSIEM cluster
Handling Recovery
Once the old Primary (Site1.fortisiem.acme.com) recovers, you may want to switch back to that site.
First, make the old Primary (Site1.fortisiem.acme.com) a Secondary.
1. Log on to Site1.fortisiem.acme.com and make it Secondary and follow these steps:a. Go to ADMIN >Settings >Database >Replicate.b. Make sure Site1.fortisiem.acme.com is Secondary and Site2.fortisiem.acme.com is Primary. This will
happen because the CMDB replication will bring back changes from Site2 (Current Primary) to Site 1(Current Secondary).
c. ClickSave.A Replication Change will be created in the Secondary and it will finish (Progress 100%).
d. Only the processes required for user login (App Server, PostGreSQL, Query Master/Worker, Java QueryServer) and replication (Data Purger) will be up.
e. Replication will continue – all missing data during disaster will flow back in from Site2 to Site1.Once Site1.fortisiem.acme.com has come up, make it Primary.
1. Log in to Site1.fortisiem.acme.com and make it Primary:
a. Go to ADMIN >Settings >Database >Replicate.b. Switch Roles.c. ClickSave.
2. Log in to Site2.fortisiem.acme.com and make it Secondary:
a. Go to ADMIN >Settings >Database >Replicate.b. Verify Roles (verify since the changes in Site1 will be replicated).c. ClickSave.
Disabling Disaster Recovery
If you do not want to enable the Disaster Recovery feature, you can turn off this.
294 User GuideFortinet Technologies Inc.

Administration Settings
Log in to the current Primary (note that this has to be done first):
1. Go to ADMIN >Settings >Database >Replicate.2. UncheckEnable Replication to disable Replication.3. ClickSave and make sure Replication setting task is completed.
A Replication Job will be created. Make sure that the Job is finished from the Jobs and Errors window.Log in to the current Secondary site:
1. Go to ADMIN >Settings >Database >Replicate.2. Make sure Replication is disabled.3. ClickSave.
A Replication Job will be created. Make sure that the Job is finished from the Jobs and Errors window.
Creating Retention Policy
The life cycle of an event in FortiSIEM begins in the online event database, before moving to the Archive datastore. You can set up retention policies to specify which events are retained, and for how long, in the online eventdatabase and the archive.
l Creating Online Event Retention Policyl Creating Offline (Archive) Retention Policy
Creating Online Event Retention Policy
Online event retention policies specify which events are retained, and for how long, in the online event database.Currently, these policies can be defined when the online event database type is local disk or NFS. Elasticsearch isnot supported. Recall that events in the online event database can be directly queried from the GUI (see Workingwith Analytics). In contrast, events in the archive must be restored to the online event database before they canbe queried.
Note: This is applicable only for NFS and Local Storage.
1. Go to ADMIN > Settings > Database > Retention.2. UnderOnline Retention Policy, clickNew.3. Select Enabled if the policy has to be enforced immediately.4. Choose theOrganizations for which the policy must be applied (for service provider installations). Select All if it
should apply to all organizations. 5. Choose the Reporting Devices to apply this policy using the edit icon and clickSave. 6. Choose the Event Type or event type groups to apply this policy and clickSave.7. Enter or select the Time Period in days that the event data specified by the conditions (Organizations, Reporting
Devices and Event Type) should be held in the online storage before it is moved to archive or purged.8. Enter anyDescription related to the policy.9. ClickSave.Consider the following when implementing online event retention policies:
l Implementing an online event policy requires selectively deleting specific events from the database and then re-indexing the database for the affected days. This is expensive in terms of time and performance. Therefore, do notdefine excessively fine-grained retention policies, because this will affect database performance.
User GuideFortinet Technologies Inc.
295

Settings Administration
l Policies are enforced only at the end of day – this means that events are deleted and re-indexed only at the end ofthe day. This minimizes the impact on database performance, because the database usage should be low at thattime.
l Policies are enforced only from the day the policy is first created. It can be expensive to automatically applyretention policies on potentially large amount of historical events. It is advisable to manually enforce the retentionpolicies by running the command: EnforceRetentionpolicy <DATES>, where DATES is a comma-separated list of dates or date-range on which to enforce the policy. DATES is specified as the number of dayssince the UNIX epoch began: 1970-01-01. A date-range is the range specified by two dates inclusively separated by"-". For example, run the command EnforceRetentionpolicy 16230,16233-16235 to imply "enforceretention policies" on the online event database on these dates: 6/8/2014 and from 6/11/2014 to 6/13/2014.
l FortiSIEM will attempt to retain the events in the online event database according to the policies. However, if thelow storage threshold is hit (20GB, by default), then the events from the earliest day are moved to archive.
l If an event has remained in the online event database for the time period in the event retention policy, then theevent is moved to the archive at the end of the day.
l If an event does not match any online event retention policy, then it remains in the online event database until thelow storage threshold (20GB, by default) is reached. The event is then moved to the archive.
l If the archive mount point is defined, then ALL events are moved from online to archive. Nothing is purged.l If the archive is not reachable after multiple retries, then FortiSIEM is forced to purge the event because there is
nowhere to store the event.
Creating Offline (Archive) Retention Policy
These policies specify which events are retained, and for how long, in the archive. Currently, events in the archivecannot be queried directly but have to be restored to the online event database and then queried.
1. Go to ADMIN > Settings > Database > Retention.2. UnderOffline Retention Policy, clickNew to create a new policy.3. Select theOrganization this policy applies to.4. Enter the Time Period in days for archive retention.5. ClickSave.Consider the following when implementing offline (archive) event retention policies:
l Policies are enforced only at the end of the day.l FortiSIEM will attempt to retain the events in the archive according to the policies. However, if the low storage
threshold is hit (20GB, by default), then the events which occurred earliest in the day are purged.l Policies are enforced only from the day the policy is written. It can be expensive to automatically apply retention
policies on potentially large amounts of historical events. It is advisable to manually enforce the retention policiesby running the command: TestDiskUChecker purge <archive mount point> <orgId><StartPurgeDateEpoch> where archive mount point is the full path to the location where data isstores, orgID is the ID of the organization and StartPurgeEpoch is the number of days since the UNIX epochbegan.
l If an event has remained in the archive for the time period in the event retention policy, then the event is purged atthe end of the day.
l If an event does not match any archive retention policies, then it stays in the archive until the low storage threshold(20GB, by default) is reached. It is then purged.
296 User GuideFortinet Technologies Inc.

Administration Settings
Viewing Online Event Data Usage
Online Event Data Usage enables you to see a summarized view of online event data usage. This view enableyou to manage storage more effectively by writing appropriate event dropping policies or online event retentionpolicies.
The Online Event Data Usage is displayed in tree view underADMIN > Settings > Database > Online Datagrouped by the year and dates for NFS/Local storage. For Elasticsearch-based deployments, if the storage is setper Organization, the usage is displayed specific to each Organization grouped by year and dates. You can drill-down from the year to view the usage for any specific date.
Viewing Archive Event Data
The event database archived data is displayed in tree view grouped by Organization and archive dates.
Complete these steps to view archived data:
1. Go toADMIN > Settings > Database > Archive.2. Search the Archived Data by Organization in the search box and drill-down to find the specific data by specific
dates from the tree view.
Setting Elasticsearch Retention Threshold
Complete these steps to configure the Elasticsearch retention threshold:
1. Go to ADMIN > Settings > Database > Archive Data.2. Select the low and high percentage thresholds under:
a. Hot Threshold - When the Hot node cluster disk utilization falls below Low value, then events aremoved to Warm nodes until the Hot node cluster utilization reachesHigh value. If Warm nodes are notdefined, but Archive is defined, then events are archived. If neither Warm nodes nor Archive are defined,then events are purged.
b. Warm Threshold - When the Warm node cluster disk utilization reaches Low value, then:l If Archive is defined, then events are archived until Warm node cluster disk utilization reachesHigh value
l If Archive is not defined then events are purged until the Warm node cluster disk utilizationreachesHigh value
c. Archive Threshold - Snapshots are archived. When Archive Mount Point disk utilization reachesLow value, then snapshots are purged until disk utilization reachesHigh value.
3. ClickSave.
Setting HDFS Retention Threshold
Complete these steps to configure the HDFS retention threshold:
1. Go to ADMIN > Settings > Database > Archive Data.2. Select the low and high percentage thresholds underArchive Threshold. If HDFS disk utilization falls below
Low value, then events are purged until disk utilization reachesHigh value.
Validating Event Log Integrity
Security auditors can validate that archived event data has not been tampered using the Event Integrity functionof event database management.
Note: This setting is not available for Elasticsearch.
User GuideFortinet Technologies Inc.
297

Settings Administration
Viewing Event Log Integrity Status
1. Go to ADMIN >Settings >Database >Event Integrity.2. Use the following filters to view the event log integrity:
a. For a specific time using the From and To fields.b. Based on the status of event integrity using the Status drop-down:
l Not Validated - the event integrity has not been validated yet.l Successful - the event integrity has been validated and the return was success. This means that
the logs in this file were not altered.l Failed - the event integrity has been validated and the return was failed. This means that the
logs in this file were altered.l Archived - the events in this file were archived to offline storage.l Purged - the log event is removed from the log.l Restored - the event is restored to the log file.
The event log integrity table is automatically updated with the applied filters.
Columns Description
Start Time The earliest time of the messages in thisfile. The file does not contain messagesthat were received by FortiSIEM beforethis time.
End TimeThe latest time of the messages in this file.The file does not contain messages thatwere received by FortiSIEM after this time.
Category l Internal: these messages weregenerated by FortiSIEM for its ownuse. This includes FortiSIEMsystem logs and monitoring eventssuch as the ones that begin withPH_DEV_MON.
l External: these messages werereceived by FortiSIEM from anexternal system.
l Incident: these corresponds toincidents generated by FortiSIEM.
File Name Name of the log file.
Events Number of events in the file.
Algorithm Checksum algorithm used for computingmessage integrity.
Checksum Value of the checksum.
298 User GuideFortinet Technologies Inc.

Administration Settings
Columns Description
Status Event log integrity validation status.
File Location File location:l Local: Local to Supervisor node.l External: means external to
Supervisor node, for example, onNFS storage.
Validating Event Log Integrity
1. Go to ADMIN >Settings >Database >Event Integrity.2. To validate the event log integrity of:
a. Single event log - select the event log and clickValidate.b. Multiple event logs - use Ctrl/Command keys to select the event logs and clickValidate.c. All logs at a time - clickValidate All.
The validation Status of the event log(s) will be updated in the list. The Validation History of any selected eventlog can be viewed underAction >Validation History.
Exporting Event Log Integrity Status
1. Go to ADMIN >Settings >Database >Event Integrity.2. To generate and download the file in PDF or CSV format, select the event log from the list and clickExport. Use
Ctrl/Command keys to select multiple event logs.
General Settingsl External Authentication Settingsl Incident Notification Settingsl External System Integration Settingsl Escalation Settingsl Mapping AD Groups to Roles
External Authentication Settings
This screen allows you to define servers for external user authentication. Once one or more authentication serverprofiles have been defined, users of the system can be configured to be authenticated locally, or by one or moreof these external authentication servers. To configure a user for external authentication, select that user from theCMDB > Users screen, and select External as the authentication mode. If more than one authentication profileis associated with a user, then the servers will be contacted one by one until a connection to one of them issuccessful. Once a server has been contacted, if the authentication fails, the process ends, and the user isnotified that the authentication failed.
The following section describes the procedure to configure External Authentication Settings:
l Adding External Authentication settingsl Modifying External Authentication settings
User GuideFortinet Technologies Inc.
299

Settings Administration
Adding External Authentication settings
Prerequisites
The following sections provide prerequisites steps before setting up external authentication in FortiSIEM.
Note: RADIUS and Okta follow the same authentication set up process.
l Adding Users from Active Directory via LDAPl Adding Users from Oktal Adding 2-factor Authentication via Duo Securityl Authenticating users against FortiAuthenticator (FAC) via RADIUS
Adding Users from Active Directory via LDAP
If you want to add users to your FortiSIEM deployment from an Active Directory server over LDAP, you must firstadd the login credentials for your server and associate them to an IP range, and then run the discovery process onthe Active Directory server. If the server is discovered successfully, then all the users in that directory will beadded to your deployment. You then must set up an authentication profile, which will become an option you canassociate with users as described in Adding Users.
l Creating Login Credentials and Associate with an IP Addressl Discovering the Active Directory Server and Users
Creating Login Credentials and Associating with an IP Address
1. Log in to your Supervisor node.2. Go to ADMIN> Setup > Credentials.3. ClickNew.4. Enter a Name.5. ForDevice Type, select Microsoft Windows.6. Select yourAccess Protocol.
FortiSIEM supports these LDAP protocols:
Protocol Settings
LDAP [Required] IP Host - Access IP for LDAPPort - Non-secure version on port 389
LDAPS [Required] IP Host - Access IP for LDAPSPort - Secure version on port 636
LDAP Start TLS [Required] IP Host - Access IP for LDAP Start TLSPort - Secure version on port 389
7. ForUsed For, select Microsoft Active Directory. 8. ForBase DN, enter the root of the LDAP user tree. 9. Enter the NetBIOS/Domain for your LDAP directory.10. Enter the User Name for your LDAP directory.
For user discovery from OpenLDAP, specify the full DN as the user name. For Active Directory, use your serverlogin name.
300 User GuideFortinet Technologies Inc.

Administration Settings
11. Enter and confirm the Password for yourUser Name. 12. ClickSave.
Your LDAP credentials will be added to the list of Credentials.13. Under Enter IP Range to Credential Associations, clickAdd. 14. Select your LDAP credentials from the list of Credentials. Click + to add more.15. Enter the IP/IP Range or host name for your Active Directory server.16. ClickSave.
Your LDAP credentials will appear in the list of credential/IP address associations.17. Click Test > Test Connectivity to make sure you can connect to the Active Directory server.
Discovering the Active Directory Server and Users
1. Go to ADMIN> Discovery.2. ClickAdd.3. ForName, enterActive Directory.4. For Include Range, enter the IP address or host name for your Active Directory server. 5. Leave all the default settings, but clear the Discover Routes underOptions. 6. ClickOK.
Active Directory will be added to the list of discoverable devices.7. Select the Active Directory device and clickDiscover. 8. After discovery completes, go to CMDB > Users to view the discovered users.
You may need to clickRefresh for the user tree hierarchy to load.
Adding Users from Okta
Follow the procedures below to add users from Otka.
Configuring Okta Authentication
To use Okta authentication for your FortiSIEM deployment, you must set up a SAML 2.0 Application in Okta, andthen use the certificate associated with that application when you configure external authentication.
1. Log into Okta.2. In the Applications tab, create a new application using Template SAML 2.0 App. 3. Under Settings, configure the settings similar to the table below:
Post Back URL Post Back URL
Application label FortiSIEM Demo
Force Authentication Enable
Post Back URL https://<FortiSIEMIP>/phoenix/okta
Name ID Format EmailAddress
Recipient FortiSIEM
User GuideFortinet Technologies Inc.
301

Settings Administration
Post Back URL Post Back URL
Audience Restriction Super
authnContextClassRef PasswordProtectedTransport
Response Signed
Assertion Signed
Request Uncompressed
Destination https://<FortiSIEMIP>/phoenix/okta
4. ClickSave.5. In the Sign On tab, click View Setup Instructions.6. ClickDownload Certificate. 7. Follow the instructions above and enter the downloaded certificate for Okta authentication.
Creating an Okta API Token
1. Log in to Okta using your Okta credentials. 2. Got to Administration > Security > API Tokens.3. ClickCreate Token.
You will use this token when you set up the Okta login credentials in the next section. Note that this token will havethe same permissions as the person who generated it.
Creating Login Credentials and Associating Them with an IP Address
1. Log in to your Supervisor node.2. Go to ADMIN> Setup > Credentials.3. ClickNew.4. Enter a Name.5. For Device Type, select OKTA.com OKTA.6. ForAccess Protocol, select OKTA API.7. Enter the Pull Interval in minutes.8. Enter the Domain associated with your Okta account.
For example, FortiSIEM.okta.com. 9. Enter and reconfirm the Security Token you created.10. Enter any related information in Description.11. Click Save.
Your Okta credentials will be added to the list of Credentials.12. Under Enter IP Range to Credential Associations, click New. 13. Enter the IP/IP range or host name for your Okta account.14. Select your Okta credentials from the list of Credentials. Click + to add more.15. Click Save.
302 User GuideFortinet Technologies Inc.

Administration Settings
Your Okta credentials will appear in the list of credential/IP address associations.16. Click Test > Test Connectivity to make sure you can connect to the Okta server.
Discovering Okta Users
If the number of users is less than 200, then Test Connectivity will discover all the users. Okta API has somerestrictions that do not allow FortiSIEM to pull more than 200 users. In this case, follow these steps:
1. Log in toOkta.2. Download user list CSV file (OktaPasswordHealth.csv) by visiting Admin >Reports >Okta Password
Health.3. Rename the CSV file to all_user_list_%s.csv. (%s is the placeholder of token obtained in Create an Okta
API Token - Step 3, e.g. all_user_list_00UbCrgrU9b1Uab0cHCuup-5h-6Hi9ItokVDH8nRRT.csv).4. Log in to FortiSIEM Supervisor node:
a. Upload CSV file all_user_list_%s.csv to this directory /opt/phoenix/config/okta/b. Make sure the permissions are admin and admin (Run chown -R admin:admin
/opt/phoenix/config/okta/)c. Go to ADMIN > Setup > Credentials > Enter IP Range to Credential Associations.d. Select the Okta entry and run Test > Test connectivity to import all users.
Adding 2-factor Authentication via Duo Security
Obtain keys for FortiSIEM to communicate with Duo Security
1. Sign up for a Duo Security account: signup.This will be admin account for Duo Security.
2. Log in to Duo Security Admin Panel and navigate to Applications.3. ClickProtect an Application. LocateWeb SDK in the applications.4. Get API Host Name, Integration key, Secret key from the page.
You will need it when you configure FortiSIEM.5. Generate Application key as a long string.
This is a password that Duo Security will not know. You can choose any 40 character long string or generate it asfollows using python
import os, hashlib
print hashlib.sha1(os.urandom(32)).hexdigest()
Create and Manage FortiSIEM users in Duo Security
This determines how the 2-factor authentication response page will look like in FortiSIEM and how the user willrespond to the second-factor authentication challenge:
1. Log in to Duo Security as admin user.2. Choose the Logo which will be shown to users as they log on.3. Choose the super set of 2-factorAuthentication Methods.4. Optional - you can create the specific users that will logon via FortiSIEM. If the users are not pre-created here,
then user accounts will be created automatically when they attempt 2-factor authentication for the first time.
Setup External Authentication Profiles
Add LDAP, LDAPS, and LDAPTLS authentication profile as follows:
User GuideFortinet Technologies Inc.
303

Settings Administration
1. Go to ADMIN >Settings >General >Authentication.2. ClickNew.3. EnterName.4. Select Organization.5. Set Protocol as LDAP or LDAPS or LDAPTLS.6. Set IP/Host of LDAP server.7. Change the port if it is different than default port.8. CheckSet DN Pattern if needed by filling in the DN Pattern field.
Setting the DN pattern manually is not necessary if the user is discovered via LDAP. However, this feature allowsyou to manually override the discovered pattern, or enter it for a user that is being manually created. Enter %s torepresent the user's name (CN/uid), for example:CN=%s,CN=Users,DC=accelops,DC=com
9. ClickSaveAdd RADIUS authentication profile as follows:
1. Go to ADMIN>Settings >General >Authentication.2. ClickNew.3. EnterName.4. Select Organization.5. Set Protocol as RADIUS.6. Set IP/Host of RADIUS server.7. Change and set Authen Port if the port is different from default.8. Enter Shared Secret.9. Click on CHAP if Radius server uses Challenge Handshake Authentication Protocol.10. ClickSave.Add Okta authentication profile as follows:
1. Go to ADMIN>Settings >General >Authentication.2. ClickNew.3. EnterName.4. Select Organization5. Set Protocol as "Okta".6. Copy and paste the certificate you downloaded in Configuring Okta Authentication - step 6 to Certificate.7. ClickSave.
Add 2-factor authentication option for FortiSIEM users
1. Create a 2-factor authentication profile:a. Go to ADMIN> Settings >General >Authentication.b. Click New.
a. Enter Name.b. Select the organization from theOrganization drop-downc. Set the Protocol as 'Duo'.d. Set the IP/Host from API hostname in Step 4 above.e. Set the Integration key, Secret keyfrom Step 4 above.
304 User GuideFortinet Technologies Inc.

Administration Settings
f. Set the Application key from Step 5 above.g. ClickSave.
2. Add the 2-factor authentication profile to an user:a. Go to CMDB >Users >Ungrouped.b. ClickNew to create a new use or Edit to modify a selected user.c. Select System Admin checkbox and click the edit icon.d. In the Edit User dialog box, enter and confirm a password for a new user.e. Select the Second Factor check-box.f. Select the 2-factor authentication profile created in Step 1 above.g. Select a Default Role from the drop-down list.h. ClickSave.
Log in to FortiSIEM using 2-factor authentication
Before logging in to FortiSIEM with 2-factor authentication, make sure that these steps are completed.
1. Obtain keys for FortiSIEM to communicate with Duo Security.2. Create and Manage FortiSIEM users in Duo Security.3. Add 2-factor authentication option for FortiSIEM users.Follow these steps:
1. Log on to FortiSIEM normally (first factor) using the credential defined in FortiSIEM - local or external in LDAP.2. If the 2-factor authentication is enabled, the user will now be redirected to the 2-factor step.
a. If the user is not created in the Duo system (by the Duo admin), a setup wizard will let you set some basicinformation like phone number and ask you to download the Duo app.
b. If the user already exists in FortiSIEM, then follow the authentication method and click Log in.The user will be able to log in to FortiSIEM.
Authenticating users against FortiAuthenticator (FAC)
FortiSIEM authenticates users against FortiAuthenticator (FAC) via RADIUS. User credentials are either stored inthe FAC local database, or in an external credential store such as Active Directory (AD), accessed via LDAP. FACoptionally applies 2-factor authentication to users with the FortiToken.
The following sections provide information about the configurations and steps to log in and troubleshoot:
a. Configure AD usersb. Configure FortiAuthenticatorc. Configure FortiSIEM
Configure AD users
1. Install AD Domain Services following the steps here.2. Configure the test domain users:
a. Server Manager > Tools >Active Directory Users and Computers.b. Expand the Domain, right-clickUsers, select New >User.
Configure FortiAuthenticator
1. Perform the basic FAC setup following the steps in the FortiAuthenticator Administration Guide: Section:FortiAuthenticator-VM image installation and initial setup here.
User GuideFortinet Technologies Inc.
305

Settings Administration
a. Use the default credentials:l user name: adminl password: <blank>
b. At the CLI prompt enter the following commands:l set port1-ip 192.168.1.99/24
l set default-gw 192.168.1.2Note that the CLI syntax has changed in FAC 5.x. Refer to FAC 6.x documentation for details.
c. Log in to the FAC GUI (default credentials user name / password: admin / <blank>).d. Set the time zone under System >Dashboard >Status >System Information >System Time.e. Change the GUI idle timeout for ease of use during configuration, if desired: System Administration >
GUI Access > Idle Timeout.2. Configure the DC as a remote LDAP server underAuthentication >Remote Authentication Servers > LDAP.
Follow the instructions in the FortiAuthenticator - FSSO Authentication User Guide.Note that the user must haveappropriate privileges. The Domain Admin account can be used for testing in a lab environment. The ‘RemoteLDAPUsers’ section will be blank at this stage, users are imported later.
3. Configure an external Realm to reference the LDAP store:a. Select Authentication >User Management >Realms >Create New.b. Choose the LDAP source from the drop-down and clickOK.
4. Configure the FortiSIEM as a RADIUSClient:a. Select Authentication >RADIUS Service >Clients >Create New.b. Enter the IP address of FortiSIEM and a shared secret.c. Choose the realms as required.d. Click 'add a realm' to include multiple realms.
Note the FAC evaluation license only supports 2 realms.e. ClickSave.
5. Import users from LDAP to FortiSIEM to allow FortiToken to be used:a. Select Authentication >User Management >Remote Users.b. Select the Import button.c. Choose and import the test users configured in AD. Note that the FAC Evaluation license is limited to 5
users.6. (Optional) Configure local users in the FAC database for local authentication underAuthentication >User
Management > Local Users.7. Provision the FortiToken:
a. Select and edit the user in Authentication >User Management >Remote Users (or Local Users asappropriate).
b. Select the Token Based Authentication check box, and assign an available FortiToken Mobile.FAC evaluation includes 2 demo FortiTokens.
c. Choose Email delivery method and enter an email address in user information.The email address doesn’t have to be valid for basic testing, the provisioning code is visible in the FAClogs.
d. ClickOK.8. Configure the FortiToken iPhone app:
a. Install the FortiToken app from the app store.b. Open the app and select the + icon in the top right corner.c. Choose enter manually from the bottom of the screen.
306 User GuideFortinet Technologies Inc.

Administration Settings
d. Select and edit the user in Authentication >User Management >Remote Users (or Local Users asappropriate).
e. Select the Token Based Authnetication check box, and assign an avaialble FortiToken Mobile. FACeval includes 2 demo FortiTokens.
f. Choose Email delivery method and enter an email address in user information. The email addressdoesn’t have to be valid for basic testing, the provisioning code is visible in the FAC logs.
g. ClickOK.
Configure FortiSIEM
Step 1: Configure an External Authentication Source
1. Go to ADMIN>Settings >General >Authentication.2. ClickNew.3. Enter the following settings:
l Organization - Systeml Protocol - RADIUSl IP/Host - IP of FortiAuthenticatorl Shared Secret - Secret configured when setting RADIUSClient in FAC
4. ClickSave.5. Click Test to test the authentication settings.
Step 2: Configure users in FortiSIEM database
1. Go to CMDB >Users and clickNew.2. Enter the user name to match the user configured in FSM/AD. (Use the format: [email protected])3. Select the System Admin checkbox.4. Select theMode asExternal.5. Select the RADIUS profile previously configured from Authentication Profiles.6. Select the Default Role from the list.7. ClickSave.
Logging In
The User Namemust be entered in the format [email protected]. For 2-factor authentication, the passwordand FortiToken value must be concatenated and entered directly into the Password field.
For example:
l Username: [email protected] Password : testpass123456; where 123456 is the current FortiToken value
Troubleshooting
FortiAuthenticator logs are accessible by opening the Logging tab. Select a log entry to see more details.
Modifying External Authentication settings
Complete these steps to modify External Authentication settings:
User GuideFortinet Technologies Inc.
307

Settings Administration
1. Use the following buttons to modify External Authentication settings:l Edit - to modify an External Authentication setting.l Delete - to delete an External Authentication setting.
2. ClickSave.
Incident Notification Settings
Notification Policies handles the sending of notifications when an incident occurs. Instead of setting notificationsfor each rule, you can create a policy and apply it to multiple rules.
The following section describes the procedures to enable Incident Notification settings:
l Adding Incident Notification settingsl Modifying Incident Notification settings
Adding Incident Notification settings
1. Go to ADMIN >Settings >General >Notification tab.2. ClickNew.3. Select the Severity.4. ForRules, click the drop-down and select the rule or rules you want to trigger this notification from the folders. 5. Set a Time Range during which this notification will be in effect.
Notifications will be sent only if an incident occurs during the time range you set here.6. ForAffected Items, click the drop-down and select the devices or applications from the Select Devices drop-
down list for which this policy should apply. Instead of individual devices or groups, you can apply the notification policy to an IP address or range by clickingAdd IP/Range. You can also select a group, and move to the (NOT) Selections column to explicitly exclude thatgroup of applications or devices from the notification policy.
7. For Service Provider deployments, select the Affected Orgs to which the notification policy should apply.Notifications will be sent only if the triggering incidents affect the selected organization.
8. Select the Action to take when the notification is triggered. l Send Email/SMS to the target users. See here.l Run Remediation/Script. See here.l Invoke integration Policy. Run:no policyl Send SNMPmessage to the destination set in ADMIN > Settings > Analytics.l Send XML file over HTTP(S) to the destination set in ADMIN> Settings > Analytics.l Open Remedy ticket using the configuration set in ADMIN > Settings > Analytics.
9. Select the Settings to enable the exceptions for notification trigger. l Do not notify when an incident is cleared automatically.l Do not notify when an incident is cleared manually.l Do not notify when an incident is cleared by system.
10. Enter anyComments about the policy.11. ClickSave.You can also create a duplicate notification by selecting a notification from the table and clicking Clone.
Modifying Incident Notification settings
Complete these steps to modify an Incident Notification setting.
308 User GuideFortinet Technologies Inc.

Administration Settings
1. Go to ADMIN >Settings >General >Notification tab.2. Use the following buttons to modify Incident Notification settings:
l Edit - To edit an Incident Notification settingl Delete - To delete an Incident Notification setting
3. ClickSave.
System Integration Settings
This tab allows you to integrate devices and incidents with external CMDB and helpdesk/workflow systems. Youcan also write your own plugins to support other systems.
This section provides the procedures to configure External Systems Integration.
l Proxy Settingsl Setting up External System Integrationl Modifying an External System Integration
Proxy Settings
If you want the communication between the FortiSIEM Supervisor and the external system to go through a proxy,then complete the following steps
1. Login to Supervisor as admin.2. Go to the glassfish configuration directory: /opt/glassfish/domains/domain1/config.3. Add proxy server information to the domain.xml file:
<jvm-options>-Dhttp.proxyHost=172.30.57.100</jvm-options><jvm-options>-Dhttp.proxyPort=3128</jvm-options><jvm-options>-Dhttp.proxyUser=foo</jvm-options><jvm-options>-Dhttp.proxyPassword=password</jvm-options>
4. Restart glassfish.
Setting up External System Integration
FortiSIEM integration helps to create a two-way linkage between external ticketing/work flow systems likeServiceNow, ConnectWise and Salesforce. The integration can be for Incidents and CMDB.
This involves two steps:
1. Create an integration.2. Attach the integration to an Incident Notification Policy or run the integration on a schedule.Four types of integrations are supported:
l Incident Outbound Integration: This creates a ticket in an external ticketing system from FortiSIEM incidents.l Incident Inbound Integration: This updates FortiSIEM incident ticket state from external system ticket states.
Specifically, when a ticket is closed in the external ticketing system, the incident is cleared in FortiSIEM and theticket status is marked closed to synchronize with the external ticketing system.
l CMDB Outbound Integration: This populates an external CMDB from FortiSIEM CMDB.l CMDB Inbound Integration: This populates FortiSIEM CMDB from an external CMDB.
FortiSIEM provides a Java-based API that can be used to integrate with ticketing systems. Out of the boxintegration is available for ServiceNow, ConnectWise, Salesforce, RiskIQ, VirusTotal, and Jira. Integration withother systems can be built using the API. Contact Fortinet support for assistance.
User GuideFortinet Technologies Inc.
309
Settings Administration
See the following sections to set up External Systems Integration:
l ConnectWise Integrationl ServiceNow Integrationl Salesforce Integrationl RiskIQ Integrationl VirusTotal Integrationl Jira Integrationl CMDB Inbound Integration
ConnectWise Integration
l Configuring ConnectWise for FortiSIEM Integrationl ConnectWise Incident Outbound Integrationl ConnectWise Incident Inbound Integrationl ConnectWise CMDBOutbound Integration
Configuring ConnectWise for FortiSIEM Integration
1. Log in to ConnectWise MANAGE.2. Go to Setup Tables > Integrator Login List.3. Create a new Integrator Login for FortiSIEM:
a. EnterUsername.b. Enter Password.c. Set Access Level to Records created by integrator.d. Enable Service Ticket API for Incident Integration.e. Enable Configure API for CMDB Integration.
4. For Service Provider Configurations, create Companies by creating:a. Company Nameb. Company ID
ConnectWise Incident Outbound Integration
1. Log into your Supervisor node with administrator credentials. 2. Go to ADMIN >Settings >General > Integration. 3. Click New.4. For Type, select Incident. 5. For Direction, select Outbound. 6. For Vendor, select the vendor of the system you want to connect to. ConnectWise is supported out of the box.
When you select the Vendor:a. An Instance is created - this is the unique name for this policy. For example if you had two ConnectWise
installations, each would have different Instance names.b. Choose whether the Plugin Type is SOAP orREST.c. A default Plugin Name is populated - this is the Java code that implements the integration including
connecting to the external help desk systems and synching the CMDB elements. The plugin isautomatically populated for ConnectWise. For other vendors, you must create your own plugin and enterthe plugin name here.
310 User GuideFortinet Technologies Inc.

Administration Settings
7. For Host/URL, enter the host name or URL of the external system. For ConnectWise, enter the login URL.8. If you chose SOAP asPlugin Type, enter a User Name, Password, and Client ID that the system can use to
authenticate with the external system. For ConnectWise, select the credentials created in ConfiguringConnectWise for FortiSIEM Integration, Step 3. If you chose REST, enter the Public Key and the Private Key inaddition to the User Name, Password, and Client ID.
9. For Incidents Comments Template, specify the formatting of the incident fields.10. For Organization Mapping, click Edit to create mappings between the organizations in your FortiSIEM
deployment and the names of the organization in the external system. For ConnectWise, enter the Companynames in Configuring ConnectWise for FortiSIEM Integration, Step 4.
11. ForRun For, choose the organizations for whom tickets will be created.12. Enter theMax Incidents to be recorded.13. Click Save.Next, link the integration to one or more incident notification policies.
ConnectWise Incident Inbound Integration
This updates the FortiSIEM incident state and clears the incident when the incident is cleared in the external helpdesk system. Built-in integrations are available for ConnectWise.
The steps are:
1. Create an Incident Inbound integration schedule.2. Create a schedule for automatically running the Incident Inbound integration.This will update the FortiSIEM incident inbound integration schedule and clears the incident when the incident iscleared in the external help desk system.
Step 1: Create an Incident Inbound integration
1. Log into your Supervisor node with administrator credentials. 2. Go to ADMIN >Settings >General > Integration. 3. Click New.4. For Type, select Incident. 5. For Direction, select Inbound. 6. For Vendor, select the vendor of the system you want to connect to. ConnectWise is supported out of the box.
When you select the Vendor:a. An Instance is created - this is the unique name for this policy. For example if you had two ConnectWise
installations, each would have different Instance names.b. Choose whether the Plugin Type is SOAP orREST.c. A default Plugin Name is populated. This is the Java code that implements the integration including
connecting to the external help desk systems and synching the CMDB elements. The plugin isautomatically populated for ConnectWise. For other vendors, you must create your own plugin and enterthe plugin name here.
7. For Host/URL, enter the host name or URL of the external system (see section Configuring external helpdesksystems). For ConnectWise, select the login URL.
8. If you chose SOAP asPlugin Type, enter a User Name, Password, and Client ID that the system can use toauthenticate with the external system. For ConnectWise, select the credentials created in ConfiguringConnectWise for FortiSIEM Integration, Step 3. If you chose REST, enter the Public Key and the Private Key inaddition to the User Name, Password, and Client ID.
User GuideFortinet Technologies Inc.
311

Settings Administration
9. For Time Window, select the number of hours for which incident states will be synched. For example, if timewindows is set to 10 hours, the states of incidents that occurred in the last 10 hours will be synched.
10. Click Save.Step 2: Create an Incident Inbound integration schedule
This will update FortiSIEM following incident fields when ticket state is updated in the external ticketing system.
l External Ticket Statel Ticket Statel External Cleared Timel External Resolve Time
Follow these steps:
1. Log into your FortiSIEM Supervisor with administrator credentials.2. Go to ADMIN >Settings >General > Integration.3. ClickSchedule and then click +.
a. Select the integration policy.b. Select a schedule.
ConnectWise CMDB Outbound Integration
CMDBOutbound Integration populates an external CMDB from FortiSIEM’s own CMDB. Built in integrations areavailable for ServiceNow, ConnectWise and Salesforce.
Step 1: Create a CMDB Outbound integration
1. Log into your Supervisor node with administrator credentials. 2. Go to ADMIN >Settings >General > Integration. 3. Click New.4. For Type, select Device. 5. For Direction, select Outbound. 6. For Vendor, select the vendor of the system you want to connect to. ConnectWise is supported out of the box.
When you select the Vendor:a. An Instance is created - this is the unique name for this policy. For example if you had two ConnectWise
installations, each would have different Instance names.b. Choose whether the Plugin Type is SOAP orREST.c. A default Plugin Name is populated - this is the Java code that implements the integration including
connecting to the external help desk systems and synching the CMDB elements. The plugin isautomatically populated for ConnectWise. For other vendors, you have to create your own plugin andtype in the plugin name here.
7. For Host/URL, enter the host name or URL of the external system. For ConnectWise, select the login URL.8. If you chose SOAP asPlugin Type, enter a User Name, Password, and Client ID that the system can use to
authenticate with the external system. For ConnectWise, select the credentials created in ConfiguringConnectWise for FortiSIEM Integration, Step 3. If you chose REST, enter the Public Key and the Private Key inaddition to the User Name, Password, and Client ID.
9. For Organization Mapping, click Edit to create mappings between the organizations in your FortiSIEMdeployment and the names of the organization in the external system. For ConnectWise, select the Companyname in Configuring ConnectWise for FortiSIEM Integration, Step 4.
10. ForRun For, choose the organizations for whom tickets will be created.
312 User GuideFortinet Technologies Inc.

Administration Settings
11. For ConnectWise, it is possible to define a Content Mapping.a. EnterColumn Mapping values:
i. To add a new mapping, click the + button.ii. Choose FortiSIEM CMDB attribute as the Source Column.iii. Enter external (ConnectWise) attribute as the Destination Column.iv. Specify Default Mapped Value as the value assigned to the Destination Column if the Source
Column is not found in Data Mapping definitions.v. Select Put to a Question is the Destination Column is a custom column in ConnectWise.
b. EnterData Mapping values:i. Choose the (Destination) Column Name.ii. Enter From as the value in FortiSIEM.iii. Enter To as the value in ConnectWise.
12. ForGroups, select the FortiSIEM CMDBGroups whose member devices would be synched to external CMDB.13. Select Run after Discovery if you want this export to take place after you have run discovery in your system. This
is the only way to push automatic changes from FortiSIEM to the external system.14. Enter theMax Devices: the number of devices to send to the external system.15. Click Save.
Step 2: Create a CMDB Outbound integration schedule
Updating external CMDB automatically after FortiSIEM discovery:
1. Create an integration policy.2. Make sure Run after Discovery is checked.3. ClickSave.Updating external CMDB on a schedule:
1. Log into your FortiSIEM Supervisor with administrator credentials.2. Go to ADMIN > Settings > General > Integration.3. ClickSchedule and then click +.
a. Select the integration policies.b. Select a schedule.
Updating external CMDB on-demand (one-time):
1. Log into your FortiSIEM Supervisor with administrator credentials.2. Go to ADMIN > Settings > General > Integration.3. Select a specific integration policy and clickRun.
ServiceNow Integration
l Configuring ServiceNow for FortiSIEM Integrationl ServiceNow Incident Outbound Integrationl ServiceNow Incident Inbound Integrationl ServiceNow CMDBOutbound Integration
User GuideFortinet Technologies Inc.
313

Settings Administration
Configuring ServiceNow for FortiSIEM Integration
1. Log in to ServiceNow.2. For Service Provider Configurations, create Companies by creating Company Name.
ServiceNow Incident Outbound Integration
1. Log into your Supervisor node with administrator credentials. 2. Go to ADMIN >Settings >General > Integration. 3. Click New.4. For Type, select Incident. 5. For Direction, select Outbound. 6. For Vendor, select the vendor of the system you want to connect to. ServiceNow is supported out of the box.
When you select the Vendor:a. An Instance is created - this is the unique name for this policy. For example if you had two ServiceNow
installations, each would have different Instance names.b. Select whether Plugin Type is Ticket or Event Management.c. A default Plugin Name is populated - this is the Java code that implements the integration including
connecting to the external help desk systems and synching the CMDB elements. The plugin isautomatically populated for ServiceNow. For other vendors, you must create your own plugin and enterthe plugin name here.
7. For Host/URL, enter the host name or URL of the external system. For ServiceNow, enter the login URL.8. For User Name and Password, enter a user name and password that the system can use to authenticate with
the external system. For ServiceNow, enter the login credentials.9. If your Plugin Type is Ticket, specify the formatting of the incident fields in the Incidents Comments
Template. If your Plugin Type is Event Management, specify the mapping of attributes to resources in theAttribute Mapping table.
10. For Organization Mapping, click Edit to create mappings between the organizations in your FortiSIEMdeployment and the names of the organization in the external system. For ServiceNow, enter the Companynames as in Configuring ServiceNow for FortiSIEM Integration, Step 2.
11. ForRun For, choose the organizations for whom tickets will be created.12. Enter the maximum number of incidents you want to record inMax Incidents.13. Click Save.Next, link the integration to one or more incident notification policies.
ServiceNow Incident Inbound Integration
This updates the FortiSIEM incident state and clears the incident when the incident is cleared in the external helpdesk system. Built-in integrations are available for ServiceNow.
The steps are:
1. Create an Incident Inbound integration schedule.2. Create a schedule for automatically running the Incident Inbound integration.This will update the FortiSIEM incident inbound integration schedule and clears the incident when the incident iscleared in the external help desk system.
Step 1: Create an Incident Inbound integration
314 User GuideFortinet Technologies Inc.
Administration Settings
1. Log into your Supervisor node with administrator credentials. 2. Go to ADMIN >Settings >General > Integration. 3. Click New.4. For Type, select Incident. 5. For Direction, select Inbound. 6. For Vendor, select the vendor of the system you want to connect to. ServiceNow is supported out of the box.
When you select the Vendor:a. An Instance is created - this is the unique name for this policy. For example if you had two ServiceNow
installations, each would have different Instance names.b. A default Plugin Name is populated. This is the Java code that implements the integration including
connecting to the external help desk systems and synching the CMDB elements. The plugin isautomatically populated for ServiceNow. For other vendors, you must create your own plugin and enterthe plugin name here.
7. For Host/URL, enter the host name or URL of the external system (see section Configuring external helpdesksystems). For ServiceNow, select the login URL.
8. For User Name and Password, enter a user name and password that the system can use to authenticate withthe external system. For ServiceNow, select the login credentials.
9. In Attribute Mapping, specify the mapping of attributes to resources.10. For Time Window, select the number of hours for which incident states will be synched. For example, if time
windows is set to 10 hours, the states of incidents that occurred in the last 10 hours will be synched.11. Click Save.
Step 2: Create an Incident Inbound integration schedule
This will update FortiSIEM following incident fields when ticket state is updated in the external ticketing system.
l External Ticket Statel Ticket Statel External Cleared Timel External Resolve Time
Follow these steps:
1. Log into your FortiSIEM Supervisor with administrator credentials.2. Go to ADMIN >Settings >General > Integration.3. ClickSchedule and then click +.
a. Select the integration policy.b. Select a schedule.
ServiceNow CMDB Outbound Integration
CMDBOutbound Integration populates an external CMDB from FortiSIEM’s own CMDB. Built in integrations areavailable for ServiceNow.
Step 1: Create a CMDB Outbound integration
1. Log into your Supervisor node with administrator credentials. 2. Go to ADMIN > Settings > General > Integration. 3. Click New.
User GuideFortinet Technologies Inc.
315

Settings Administration
4. For Type, select Device. 5. For Direction, select Outbound. 6. For Vendor, select the vendor of the system you want to connect to. ServiceNow is supported out of the box.
When you select the Vendor:a. An Instance is created - this is the unique name for this policy. For example if you had 2 ServiceNow
installations, each would have different Instance names.b. A default Plugin Name is populated - this is the Java code that implements the integration including
connecting to the external help desk systems and synching the CMDB elements. The plugin isautomatically populated for ServiceNow. For other vendors, you have to create your own plugin and typein the plugin name here.
7. For Host/URL, enter the host name or URL of the external system. For ServiceNow, select the login URL8. For User Name and Password, enter a user name and password that the system can use to authenticate with
the external system. For ServiceNow, select the login credentials.9. In Attribute Mapping, specify the mapping of attributes to resources.10. For Organization Mapping, click Edit to create mappings between the organizations in your FortiSIEM
deployment and the names of the organization in the external system. For ServiceNow, select the Companynames as iin Configuring ServiceNow for FortiSIEM Integration, Step 2.
11. ForRun For, choose the organizations for whom tickets will be created.12. ForGroups, select the FortiSIEM CMDBGroups whose member devices would be synched to external CMDB.13. Select Run after Discovery if you want this export to take place after you have run discovery in your system. This
is the only way to push automatic changes from FortiSIEM to the external system.14. Enter theMaximum number of devices to send to the external system.15. Click Save.Step 2: Create a CMDB Outbound integration schedule
Updating external CMDB automatically after FortiSIEM discovery:
1. Create an integration policy.2. Make sure Run after Discovery is checked.3. ClickSave.Updating external CMDB on a schedule:
1. Log into your FortiSIEM Supervisor with administrator credentials.2. Go to ADMIN > Settings > General > Integration.3. ClickSchedule and then click +.
a. Select the integration policies.b. Select a schedule.
Updating external CMDB on-demand (one-time):
1. Log into your FortiSIEM Supervisor with administrator credentials.2. Go to ADMIN > Settings > General > Integration.3. Select a specific integration policy and clickRun.
Salesforce Integration
l Configuring Salesforce for FortiSIEM Integrationl Salesforce Incident Outbound Integration
316 User GuideFortinet Technologies Inc.

Administration Settings
l Salesforce Incident Inbound Integrationl Salesforce CMDBOutbound Integration
Configuring Salesforce for FortiSIEM Integration
1. Log in to Salesforce.2. Create a custom domain.3. For Service Provider Configurations, create Service App >Accounts.
FortiSIEM will use the Account Name.
Salesforce Incident Outbound Integration
1. Log into your Supervisor node with administrator credentials. 2. Go to ADMIN > Settings > General > Integration. 3. Click New.4. For Type, select Incident. 5. For Direction, select Outbound. 6. For Vendor, select the vendor of the system you want to connect to. Salesforce is supported out of the box.
When you select the Vendor:a. An Instance is created - this is the unique name for this policy. For example if you had two Salesforce
installations, each would have different Instance names.b. A default Plugin Name is populated - this is the Java code that implements the integration including
connecting to the external help desk systems and synching the CMDB elements. The plugin isautomatically populated for Salesforce. For other vendors, you must create your own plugin and enterthe plugin name here.
7. For Host/URL, enter the host name or URL of the external system. For Salesforce:a. Log in to Salesforce.b. Go to Setup >Settings.c. Use the Custom URL underMy Domain, typically it is xyz.my.salesforce.com
8. For User Name and Password, enter a user name and password that the system can use to authenticate withthe external system.
a. For Salesforce, enter the login credentials.9. For Incidents Comments Template, specify the formatting of the incident fields.10. For Organization Mapping, click Edit to create mappings between the organizations in your FortiSIEM
deployment and the names of the organization in the external system. For Salesforce:a. Go to Service App >Accounts.
b. Use Account Name.11. ForRun For, choose the organizations for whom tickets will be created.12. Select Run after Discovery if you want this export to take place after you have run discovery in your system. This
is the only way to push automatic changes from FortiSIEM to the external system13. Click Save.Next, link the integration to one or more incident notification policies.
User GuideFortinet Technologies Inc.
317

Settings Administration
Salesforce Incident Inbound Integration
This updates the FortiSIEM incident state and clears the incident when the incident is cleared in the external helpdesk system. Built-in integrations are available for Salesforce.
The steps are:
1. Create an Incident Inbound integration schedule.2. Create a schedule for automatically running the Incident Inbound integration.This will update the FortiSIEM incident inbound integration schedule and clears the incident when the incident iscleared in the external help desk system.
Step 1: Create an Incident Inbound integration
1. Log into your Supervisor node with administrator credentials. 2. Go to ADMIN > Settings > General > Integration. 3. Click New.4. For Type, select Incident. 5. For Direction, select Inbound. 6. For Vendor, select the vendor of the system you want to connect to. Salesforce is supported out of the box.
When you select the Vendor:a. An Instance is created - this is the unique name for this policy. For example if you had two Salesforce
installations, each would have different Instance names.b. A default Plugin Name is populated. This is the Java code that implements the integration including
connecting to the external help desk systems and synching the CMDB elements. The plugin isautomatically populated for Salesforce. For other vendors, you must create your own plugin and enterthe plugin name here.
7. For Host/URL, enter the host name or URL of the external system. For Salesforce:a. Log in to Salesforce.
b. Go to Setup > Settings.c. Use the custom URL underMy Domain – typically it is xyz.my.salesforce.com.
8. For User Name and Password, enter a user name and password that the system can use to authenticate withthe external system. For Salesforce, select the login credentials.
9. For Time Window, select the number of hours for which incident states will be synched. For example, if timewindows is set to 10 hours, the states of incidents that occurred in the last 10 hours will be synched.
10. Click Save.
Step 2: Create an Incident Inbound integration schedule
This will update FortiSIEM following incident fields when ticket state is updated in the external ticketing system.
l External Ticket Statel Ticket Statel External Cleared Timel External Resolve Time
Follow these steps:
318 User GuideFortinet Technologies Inc.

Administration Settings
1. Log into your FortiSIEM Supervisor with administrator credentials.2. Go to ADMIN >Settings >General > Integration.3. ClickSchedule and then click +.
a. Select the integration policy.b. Select a schedule.
Salesforce CMDB Outbound Integration
CMDBOutbound Integration populates an external CMDB from FortiSIEM’s own CMDB. Built in integrations areavailable for Salesforce.
Step 1: Create a CMDB Outbound integration
1. Log into your Supervisor node with administrator credentials. 2. Go to ADMIN > Settings > General > Integration. 3. Click New.4. For Type, select Device. 5. For Direction, select Outbound. 6. For Vendor, select the vendor of the system you want to connect to. Salesforce is supported out of the box.
When you select the Vendor:a. An Instance is created - this is the unique name for this policy. For example if you had 2 Salesforce
installations, each would have different Instance names.b. A default Plugin Name is populated - this is the Java code that implements the integration including
connecting to the external help desk systems and synching the CMDB elements. The plugin isautomatically populated for Salesforce . For other vendors, you have to create your own plugin and typein the plugin name here.
7. For Host/URL, enter the host name or URL of the external system. For Salesforce:a. Log in to Salesforce.b. Go to Setup >Settings.c. Use the Custom URL underMy Domain, typically it is xyz.my.salesforce.com.
8. For User Name and Password, enter a user name and password that the system can use to authenticate withthe external system. For Salesforce, select the login credentials.
9. Enter theMaximum number of devices to send to the external system.10. For Organization Mapping, click Edit to create mappings between the organizations in your FortiSIEM
deployment and the names of the organization in the external system. For Salesforce:a. Go to Service App >Accounts.
b. Use Account Name.11. ForRun For, choose the organizations for whom tickets will be created.12. ForGroups, select the FortiSIEM CMDBGroups whose member devices would be synched to external CMDB.13. Select Run after Discovery if you want this export to take place after you have run discovery in your system. This
is the only way to push automatic changes from FortiSIEM to the external system.14. Click Save.
Step 2: Create a CMDB Outbound integration schedule
Updating external CMDB automatically after FortiSIEM discovery:
User GuideFortinet Technologies Inc.
319

Settings Administration
1. Create an integration policy.2. Make sure Run after Discovery is checked.3. ClickSave.Updating external CMDB on a schedule:
1. Log into your FortiSIEM Supervisor with administrator credentials.2. Go to ADMIN > Settings > General > Integration.3. ClickSchedule and then click +.
a. Select the integration policies.b. Select a schedule.
Updating external CMDB on-demand (one-time):
1. Log into your FortiSIEM Supervisor with administrator credentials.2. Go to ADMIN > Settings > General > Integration.3. Select a specific integration policy and clickRun.
RiskIQ Integration
l Configuring RiskIQ for FortiSIEM Integrationl RiskIQ Incident Outbound Integration
Configuring RiskIQ for FortiSIEM Integration
Register at the RiskIQ website to obtain a user name, password, and the API keys. For more information, seehttps://api.riskiq.net/api/concepts.html.
RiskIQ Incident Outbound Integration
To create an outbound integration, follow these steps:
1. Go to Admin > Settings > General > Integration.2. ClickNew to create a new integration or Edit to modify an existing integration.3. In the Integration Policy dialog box, provide the following values:
l Type: select Incident.l Direction: select Outbound.l Vendor: select RiskIQ.l Instance: enter an instance name or accept the default.l Plugin Name: is pre-populated with the name of the integration class:com.accelops.phoenix.jira.JiraTicketIntegration.
l Username and Password, enter your RiskIQ user name and the API key as the password.4. Enter an optional Description of the integration.5. Click the edit icon next to Attribute Mapping.
a. In the Incident Comments Template dialog box, select content from the Insert Content drop-downlist.
b. ClickSave when you are finished.6. Click the edit icon next to theOrganization Mapping to map attributes to resources.7. Click the edit icon next to the Run for.
320 User GuideFortinet Technologies Inc.

Administration Settings
a. In the Run for dialog box, select the organizations for which the integrations will be run.b. ClickSave when you are finished.
8. Enter the maximum number of incidents you want recorded in theMax Incidents field.9. ClickSave.
VirusTotal Integration
l Configuring VirusTotal for FortiSIEM Integrationl VirusTotal Incident Outbound Integration
Configuring VirusTotal for FortiSIEM Integration
Register at the VirusTotal website to obtain a user name, password, and the API key. For more information, seehttps://developers.virustotal.com/reference?gclid=Cj0KCQjw4-XlBRDuARIsAK96p3AvLlJSGdBtBWpE1Tm0_KJkWci7U0aAxBVcoOgoZKfd3qjDMG2jJ9IaArVuEALw_wcB#getting-started.
VirusTotal Incident Outbound Integration
To create an outbound integration, follow these steps:
1. Go to Admin > Settings > General > Integration.2. ClickNew to create a new integration or Edit to modify an existing integration.3. In the Integration Policy dialog box, provide the following values:
l Type: select Incident.l Direction: select Outbound.l Vendor: select VirusTotal.l Instance: enter an instance name or accept the default.l Plugin Name: is pre-populated with the name of the integration class:com.accelops.service.integration.impl.VirusTotalIntegrationServiceImpl.
l Password: enter your API key in the password field.4. Enter an optional Description of the integration.5. Click the edit icon next to the Incident Comments template.
a. In the Incident Comments Template dialog box, select content from the Insert Content drop-downlist.
b. ClickSave when you are finished.6. Click the edit icon next to theOrganization Mapping.
a. In theOrg Mapping dialog box, click beneath External Company ID to enter the ID of the companyyou want to map to organizations.
b. ClickSave when you are finished.7. Click the edit icon next to the Run for.
a. In the Run for dialog box, select the organizations for which the integrations will be run.b. ClickSave when you are finished.
8. Enter the maximum number of incidents you want recorded in theMax Incidents field.9. ClickSave.
User GuideFortinet Technologies Inc.
321

Settings Administration
Jira Integration
l Configuring Jira for FortiSIEM Integrationl Jira Incident Outbound Integrationl Jira Incident Inbound Integration
Configuring Jira for FortiSIEM Integration
Before configuring Jira, you must log in to your Jira account and create an API Key. Follow these steps:
1. Log in to your Jira account.2. Create an API Key.3. Use the GUI user name and API Key in FortiSIEM.
Jira Incident Outbound Integration
Jira outbound integration allows a user to map FortiSIEM fields to Jira ticket fields and to create incidents in Jira.When the integration runs, FortiSIEM looks for incidents that match the mappings and creates a ticket in the Jirasystem.
To create an outbound integration, follow these steps:
Step 1: Provide Configuration Information
1. Go to Admin > Settings > General > Integration.2. ClickNew to create a new integration or Edit to modify an existing integration.3. In the Integration Policy dialog box, provide the following values:
l Type: select Incident.l Direction: select Outbound.l Vendor: select Jira.l Instance: enter an instance name or accept the default.l Plugin Name: is pre-populated with the name of the Jira integration class:com.accelops.phoenix.jira.JiraTicketIntegration.
l Host/URL, enter the URL of the Jira provider, for example, https://rackspace.atlassian.net.l Username and Password, enter your Jira user name and password.
Step 2: Specify the FortiSIEM to Jira Field Mapping
1. Click the edit icon next to Field Mapping.2. In the Field Mapping dialog box, provide the following values:
l Project: enter a name for the project.l Issue Type: select Event.l The Summary: field is pre-populated with the Incident Rule Name ($ruleName).l ForDescription: click the edit icon to build the expression for the Jira issue description. The drop-down
list contains FortiSIEM fields that can be mapped to.l The Priority: field is pre-populated with Incident Severity Category ($incident_severityCat).
322 User GuideFortinet Technologies Inc.

Administration Settings
3. Create mappings between Jira fields and FortiSIEM fields by clicking New.Select Jira fields from the upper drop-down list and match them with corresponding FortiSIEM fields inthe lower drop-down list.
4. ClickSavewhen you are finished mapping fileds. The mappings are reflected in the table in the Field Mappingdialog box.
5. ClickSave to dismiss theMapping Fields dialog box.
Step 3: Run the Jira Integration
Select the Jira instance and clickRun. FortiSIEM looks for incidents that match the mappings and creates aticket in the Jira system.
Jira Incident Inbound Integration
Jira inbound integration allows a user to close a ticket in FortiSIEM if the ticket is closed in Jira.
To create an inbound integration, follow these steps:
Step 1: Provide Configuration Information
1. Go to Admin > Settings > General > Integration.2. ClickNew to create a new integration or Edit to modify an existing integration.3. In the Integration Policy dialog box, provide the following values:
l Type: select Incident.l Direction: select Inbound.l Vendor: select Jira.l Instance: enter an instance name or accept the default.l Plugin Name: is pre-populated with the name of the Jira integration class:com.accelops.phoenix.jira.JiraTicketIntegration.
l Host/URL, enter the URL of the Jira provider, for example, https://rackspace.atlassian.net.l Username and Password, enter your Jira user name and password.l Description: enter an optional description of the integration.l Time Window: enter the number of hours for which incident states will be synched. For example, if time
windows is set to 10 hours, the states of incidents that occurred in the last 10 hours will be synched.
Step 2: Specify the FortiSIEM to Jira Field Mapping
1. Click the edit icon next to Field Mapping.2. In the Field Mapping dialog box, provide the following values:
l Project: enter a name for the project.l Issue Type: select Event.l The Summary: field is pre-populated with the Incident Rule Name ($ruleName).l ForDescription: click the edit icon to build the expression for the Jira issue description. The drop-down
list contains FortiSIEM fields that can be mapped to.l The Priority: field is pre-populated with Incident Severity Category ($incident_severityCat).
User GuideFortinet Technologies Inc.
323
Settings Administration
3. Create mappings between Jira fields and FortiSIEM fields by clicking New.Select Jira fields from the upper drop-down list and match them with corresponding FortiSIEM fields inthe lower drop-down list.
4. ClickSavewhen you are finished mapping fileds. The mappings are reflected in the table in the Field Mappingdialog box.
5. ClickSave to dismiss theMapping Fields dialog box.
Step 3: Run the Jira Integration
Select the Jira instance and clickRun. FortiSIEM looks for incidents which are closed in the Jira system andcloses them if they also appear in FortiSIEM.
Link the Integration to One or More Incident Notification Policies (for Incident Outbound)
1. Complete the incident outbound integration steps for your system.2. Go to Admin >Settings >General >Notifications.3. ClickNew to create a new policy or Edit to edit an existing policy.4. In the Notification Settings dialog box, select Action > Invoke an Integration Policy, then select the edit
icon.5. Choose a specific integration from the drop-down list.6. ClickSave.
CMDB Inbound Integration
CMDB Inbound Integration populates FortiSIEM CMDB from an external CMDB.
Step 1: Create a CMDB Inbound integration
You must create a CSV file for mapping the contents of the external database to a location on your FortiSIEMSupervisor, which will be periodically updated based on the schedule you set.
1. Log into your Supervisor node with administrator credentials. 2. Go to ADMIN > Settings > General > Integration.3. ClickNew.4. For Type, select Device. 5. ForDirection, select Inbound. 6. Enter the File Path to the CSV file. 7. ForContent Mapping, click the edit icon.
a. ForColumn Mapping, click + and enter the mapping between columns in the SourceCSV file and theDestination CMDB.
I. Enter Source CSV column Name for Source ColumnII. CheckCreate Property if it Does not Exist to create the new attribute in FortiSIEM if it does
not existi. Enter a name for the Destination Column of the property from the drop-down list.ii. Select Overwrite Existing Value if the property exists in the CMDB, but you want to
overwrite it's current value.III. If the property exists in the CMDB, select FortiSIEM CMDB attribute forDestination Column.IV. Select Overwrite Existing Value if the property exists in the CMDB, but you want to overwrite
324 User GuideFortinet Technologies Inc.

Administration Settings
its current value.V. ClickOK.
b. ForData Mapping, click + and enter the mapping between data values in the external system and thedestination CMDB.For example, if you wanted to change all instances of California in the entries for the State attribute inthe external system to CA in the destination CMDB, you would select the State attribute, enterCalifornia for From. and CA for To.
8. In Attribute Mapping, map attributes to resources.9. ClickOK.10. ClickSave.Step 2: Create a CMDB Inbound integration schedule
Updating FortiSIEM CMDB on a schedule:
1. Log into your FortiSIEM Supervisor with administrator credentials.2. Go to ADMIN > Settings > General > Integration.3. ClickSchedule and then click +.
a. Select the integration policies.b. Select a schedule.
Updating FortiSIEM CMDB on-demand (one-time):
1. Log into your FortiSIEM Supervisor with administrator credentials.2. Go to ADMIN > Settings > General > Integration.3. Select a specific integration policy and clickRun.
Modifying an External System Integration
Complete these steps to modify an External System Integration.
1. Use the below options to modify an External System Integration setting.
Settings Guidelines
Edit To edit an External System Integration setting.
Delete To delete an External System Integration setting.
2. ClickSave.
Escalation Settings
Escalation settings allow you to define escalation policies for incident tickets and then use it as an escalationpolicy when creating a ticket using FortiSIEM Case system.
Follow the below procedures to enable Escalation Settings:l Adding an escalation policyl Modifying an escalation policy
User GuideFortinet Technologies Inc.
325

Settings Administration
Adding an escalation policy
Complete these steps to create an escalation ticket and then use it as an escalation policy while creating a ticket,using FortiSIEM Case system.
1. Go to ADMIN >Settings >General >Escalation tab.2. ClickNew.3. In the Escalation Policy dialog box, enter or select the following information:
Settings Guidelines
Name [Required] Name of the escalation policy.
Remaining Time Expiration Time of the policy either relative or absolute time.
Email To Email the policy to the Assignee or Assignee's Manager.
4. ClickSave.
Modifying an escalation policy
Complete these steps to create an escalation ticket:
1. Go to ADMIN >Settings >General >Escalation tab.2. Select one or more ticket(s).3. Use the options below to edit an escalation ticket.
l Edit - to edit an escalation ticket.l Delete - to delete an escalation ticket.
4. ClickSave.
Role SettingsFortiSIEM provides performance, availability, and environmental alerts, as well as change and securitymonitoring for network devices, servers and applications. It is difficult for one admin to monitor across the entirespectrum of available information. In addition, devices may be in widely distributed geographical andadministratively disjointed locations. Role-based access control provides a way to partition the FortiSIEMadministrative responsibilities across multiple admins.
A role defines two aspects of a user's interaction with the FortiSIEM platform:l Which user interface elements a user can see and the ability to use the associated Read/Write/Execute
permissions. As an example, the built-in Executive role can see only the dashboard, while the ServerAdmin role cannot see network devices. Role permissions can be defined to the attribute level in which,for example, a Tier1 Network Admin role can see network devices but not their configurations.
l What data can the user see. For example, consider a Windows Admin role and a Unix Admin role. Theyboth can run the same reports, but the Windows admins sees only logs from Windows devices. Thisdefinition can also be fine-grained, for example one Windows admin sub-role can be defined to seeWindows performance metrics, while another Windows admin sub-role can see Windows authenticationlogs. The roles described in the following table are default roles.
326 User GuideFortinet Technologies Inc.

Administration Settings
Role Permissions
DBAdmin Full access to the database servers part of the GUI and full access to logsfrom those devices.
Executive View access to the Business Service dashboard and personalized MyDashboard tabs, but reports can be populated by logs from any device.
Full Admin Full access to the GUI and full access to the data. Only this role can defineroles, create users and map users to roles.
Help Desk Access to the Admin, CMDB, and Dashboard tabs, with view and runpermissions for the Analytics and Incidents tabs.
Network Admin Full access to the network device portion of the GUI and full access to logsfrom network devices.
Read OnlyAdmin View access to all tabs and permission to run reports.
Security Admin Full access to Security aspects of all devices.
Server Admin Full access to the Server part of the GUI and full access to logs from thosedevices.
Storage Admin Full access to the Storage device part of the GUI and full access to logs fromthose devices.
System Admin Full access to the Server/Workstation/Storage part of the GUI and full accessto logs from those devices.
Unix ServerAdmin
Full access to the Unix Server part of the GUI and full access to logs fromthose devices.
WindowsServer Admin
Full access to the Windows Server part of the GUI and full access to logs fromthose devices.
The following sections describe the procedures to create custom roles and privileges:
l Adding a New Rolel Modifying a Rolel Viewing User Roles for AD Group Mappings
Adding a New Role
You can create a new role or use an existing role by selecting an existing role and clicking the Clone button.
1. Go to ADMIN > Settings > Role > Role Management.2. ClickNew.3. Enter a Role Name and Description.
User GuideFortinet Technologies Inc.
327

Settings Administration
4. Enter the Data Conditions for this role. This restricts access to the event/log data that is available to the user, and will be appended to any query that issubmitted by users with this role. This applies to both Real-Time and Historical searches, as well as Report andDashboard information.
5. Enter the CMDB Report Conditions for this role. Choose a type from the drop-down list.This restricts access to the reports for devices, users, monitors, rule, report, task, identity, incident, audit that areavailable to the user with this role.
6. Select the appropriate Approver capability:l Select De-Obfuscation if this role can approve De-Obfuscation requests.l Select Report Schedule if this role can approve Report Schedule Activation requests.
l Select Rule Activation/Deactivation if this role can approve Rule Activation/Deactivation requests,7. Select the appropriate Activation capability:
l Select Report Schedule if this role needs approval for Report Schedule Activation.l Select Rule Activation/Deactivation if this role needs approval for Rule Activation/Deactivation.
8. Select the Data Obfuscation options for this role:l System Event/CMDB Attribtues to anonymize IP, User and Email or Host Name in the events.l Custom Event Attributes to anonymize custom event attributes. Search or click + to include multiple
attributes.
Note: If Data Obfuscation is turned on for a FortiSIEM user:l Raw events are completely obfuscated - user cannot see any part of the raw message.l Cannot perform search on obfuscated event attributes.l CSVExport feature is disabled.l If an integer event attribute is obfuscated, then the GUI may not show those obfuscated fields.
Normally, integer fields are not obfuscated.
9. Select the UI Access conditions for this role.This defines the user interface elements that can be accessed by users with this role. By default, the child nodes inthe tree inherit the permissions of their immediate parent, however you can override those default permissions byexplicitly editing the permission of the child node. The options for these settings are in the All Nodes drop-downlist:
l Full - No access restrictions.l Edit - The role can make changes to the UI element.l Run - The role can execute processes for the UI element.l View - The role can only view the UI element. l Hide - The UI element is hidden from the role.
10. ClickSave.
Hiding Network Segments
If a Network Segment is marked as hidden for a user role, users with that role will not be able to see any of thedevices whose IP addresses fall within that network segment, even if the CMDB folder(s) containing thosedevices have not been hidden.
Modifying a role
Complete these steps to modify a cloned or user defined role. (You cannot directly modify a system defined role):
328 User GuideFortinet Technologies Inc.

Administration Settings
1. Select the role from the table.2. Click the required option:
a. Edit to modify any role setting.b. Delete to remove a role.c. Clone to duplicate a role.
3. ClickSave.
Viewing User Roles for AD Group Mappings
To see the AD groups that the user is a member of, go to CMDB > Users > Member Of.
The User Roles are explicitly shown in CMDB > Users > Access Control.
Mapping AD Groups to Roles
FortiSIEM provides the ability to map Microsoft Active Directory (AD) Groups to Roles. A user mapped to morethan one Role has permissions for all roles following the Least Restrictive Role principle described below.
Follow these steps to map an AD Group to a Role:
Step 1: Setup or Edit an Authentication Profile
1. Log in to the FortiSIEM system.2. Follow the instructions in Adding External Authentication Settings to setup a new profile or edit an existing profile.
Currently, only LDAPS and LDAPTLS are supported for mapping AD Groups. The new or edited entry appears inthe list of authenticated organizations.
Step 2: Create a Role to be Mapped to the AD Group
Follow the instructions in Adding a New Role to add a role that is to be mapped to an AD Group.
Step 3: Assign an AD Group
1. ClickAdmin > Settings > Role > AD Group Role.2. ClickNew to create a new AD Group mapping or select a row and clickEdit to edit an existing mapping.3. Provide the following information in the Add AD Group Role popup:
l Organization - Set to System (all organizations can use the information), Super/Local (onlySuper/Local can use the information).
l AD Group DN - The AD Group domain name. Currently, the server must be either LDAPS orLDAPTLS.
l Mapped Role - Scroll down the list for the role you want to map to. You can find descriptions ofthe predefined roles in Role Settings.
l Comment - Enter an optional comment describing the mapping.
Step 4: Test Your Mappings
Test your mappings by logging out of the FortiSIEM session then logging back in as the LDAPS/LDAPTLS user.
You can use either the CN or the SamAccountName as the Username in FortiSIEM.
The following example account illustrates the options:
User GuideFortinet Technologies Inc.
329

Settings Administration
PS C:\Users\Administrator> Get-ADUser -Identity jdoe
DistinguishedName : CN=J Doe,OU=department1,DC=fortisiem,DC=labEnabled : TrueGivenName : JName : J DoeObjectClass : userObjectGUID : 2386c3e6-d2c0-47b8-85d0-334585e959fSamAccountName : jdoeSID : S-1-5-21-87403157-1919951427-186658781-1620Surname : DoeUserPrincipalName : [email protected]
l Using the CN as the Username, for example:User: J DoePassword: ********Domain: local
l Using the SamAccountName as the Username, for example:User: fortisiem\jdoePassword: ********Domain: local
Principle of Least Restrictive Role
If a user belongs to two FortiSIEM Roles, then the user will have the rights of BOTH Roles.
l Case 1 - A node is explicitly defined in both role definitions. Then a user belonging to BOTH roles have the union ofall permissions for that node. Explicit definitions mean that the node appears in the bottom Restrictions areawhen you view the Role in Settings > Role. Some examples:
One Role has READ permission on the Resources tab, while the other Role hasWRITE and EXECUTEpermissions on Resources tab. Then, a user belonging to BOTH roles has READ, WRITE, EXECUTE onResources tab.
One Role has READ permission on the Resources tab, while the Resources tab is hidden in the otherRole. Then, a user belonging to BOTH roles has READ permission on Resources tab.
l Case 2 - A node is not explicitly defined in one Role but explicitly defined in the other role. Then the user belongingto BOTH roles have the explicit permission defined in the second role. For example, a Full Admin role has nothingexplicitly defined, because it has full permission on ALL nodes. If the user belongs to both Full Admin role andanother role that can only READ the CMDB tab, then the user has only READ permission on the CMDB tab.
l Case 3 - A node is not explicitly defined in two Roles. Then the user belonging to BOTH roles has full permission onthat node.
330 User GuideFortinet Technologies Inc.

Managing Tasks Requesting a de-anonymization request
Managing Tasks
FortiSIEM supports Data Anonymization to hide Personally Identifiable Information including IP addresses, hostnames, user names and email addresses in external and internal logs, Incidents, and CMDB records based onthe user role for a specific period of time.
After assigning the user to anonymize a role and creating a Data Anonymization approver, the work-flow is asfollows:
a. The user creates a de-anonymization request and sends to the approver.b. The approver receives an email notification.c. The approver then verifies and accepts the request for a specific period by setting a validity date. (An approver
may also reject a request specifying a valid reason.)d. If approved, the user can see the de-anonymized data until the validity period.e. After the validity period, the data is hidden again. To de-anonymize the data, create a new request.The following procedures describe how a user can submit a task request and the Data Anonymization approverapproves or rejects.
l Requesting a de-anonymization requestl Approving a de-anonymization request
Requesting a de-anonymization request
You can send a de-anonymization request with justification, to a Data Anonymization approver, to de-anonymizethe requested data for a specific period of time.
1. Go to TASK>Request tab.2. ClickNew to create a de-anonymization request.3. Select the Approver from the drop-down to send this request.4. Select the Type of de-anonymization request.5. Enter the Justification for viewing the data.6. ClickSave to send the request to the Data Anonymization approver.
Approving a de-anonymization request
When a user sends a de-anonymization request, the Data Anonymization approver receives an email notification.The approver can see the list of de-anonymization requests under the Approval tab on login. The approver thenverifies the justification and provides approval.
1. Go to TASK>Approval tab.2. Select the request from the list or search using the search bar and choose the following options from the drop-
down list on the right:
l Approve to allow de-anonymization for a specific time period under Valid Till or For the date and timelisted in the time stamp field. You can click the time stamp field to choose a different date and time.
User GuideFortinet Technologies Inc.
331

Approving a de-anonymization request Managing Tasks
l Reject to reject the de-anonymization request specifying a valid Reason.3. ClickOK to send the approval/rejection.
The user can see the Status of this request under the Request tab on login.
332 User GuideFortinet Technologies Inc.

Managing CMDB Devices
Managing CMDB
FortiSIEM Configuration Management Database (CMDB) contains the following:l Discovery information about your IT infrastructure such as devices, applications, and users.l Information derived from your discovered infrastructure, including inter-device relationships such as the
relationship of WLAN Access Points to Controller, and Virtual Machines to ESXHosts.l Information about system objects such as business services and CMDB reports.
The following topics provide more information about managing CMDB:
DevicesApplicationsUsersBusiness ServicesCMDBReports
Devices
You can add devices to the CMDB through the Discovering Infrastructure process. However, there may besituations in which you want to add devices to the CMDBmanually. For example, you may not have accesscredentials for a device but still want to include network information about it so that logs received by FortiSIEMcan be parsed properly.
These topics describe those situations and provide instructions for adding a device to the CMDB:
Viewing Device InformationWorking with Device GroupsCreating and Editing DevicesPerforming Operations on Devices and Device GroupsAssociating Parsers to a DeviceSearching for Devices
Viewing Device InformationTo view device information, open the CMDB page and clickDevices in the left panel. Expand Devices to see allof the subgroups belonging to it. ClickDevices, or on one of its subgroups, to see the devices in the tableassociated with that group. The icons above the panel allow you to add, edit, and delete subgroups. System-defined subgroups cannot be deleted, but they can be edited. For more information on managing device groups,see Working with Device Groups.
The headings and numbers at the top of the page, such as above Routers, Firewall,Windows, and so on,represent the number of devices of that type that are active in FortiSIEM. Click the heading to see the devicesassociated with that device type.
The table on the right of the page displays a list of all of the devices known to FortiSIEM. The table containscolumns such as the Device Name, IP address, Device Type, Status, and so on.
On the CMDB page you can do the following:
User GuideFortinet Technologies Inc.
333

Devices Managing CMDB
l Choose which columns to display by clicking the Choose columns icon. For more information, see ChangingDisplay Columns.
l Create, edit, and delete devices by clicking the New, Edit, and Delete buttons. See Creating and Editing Devicesfor more information.
l Filter the list of devices by organization by opening the drop-down list to the right of the Delete button.l Perform a variety of operations on a selected device by making a selection from the Action drop-down list. For
more information on the operations you can perform, see Performing Operations on Devices.l Get more information about a device by clicking a device name and then clicking one of the buttons beneath the
table: Summary, Properties, Monitor, Software, Hardware, Configuration, Relationships, and File. Theinformation returned is described in the following table.
Selection Description
Summary ClickSummary to return general information about the device such as the Name, DeviceType, Importance, IP address, and so on. It also displays information regarding the device'shealth, what group it is a member of, and various statistics (such asCreated, LastDiscovered, Last Updated, and so on.
Properties
Monitor ClickMonitor to return tables describing the Event Received Status andMonitor Status.
Software ClickSoftware and make a selection from the drop-down list: Installed Software, RunningApplications,Windows Services, or Installed Patches.
Hardware ClickHardware and make a selection from the drop-down list: Interfaces, Processes,Storage, SAN Storage, System BIOS, Components, or SAN Ports.
Configuration
Relationships ClickRelationships to return the device'sNode Name, Access IP, Version, Device Type,and Description.
File
Working with Device GroupsThis section provides the procedures to set up Device Groups.
l Adding Device Groupsl Modifying Device Groupsl Performing Operations on Device Groupsl Changing Display Columns
Adding Device Groups
Complete these steps to add device groups:1. Go to CMDB and clickDevices folder on the left panel.2. Click + above the list of CMDB groups list.3. In the Create New Device Group dialog box, enter/select the information below:
334 User GuideFortinet Technologies Inc.

Managing CMDB Devices
Settings Guidelines
Organization Select the organization from the drop-down list.
Group [Required] Enter a name for the group.
Description Enter a description of the device group.
Folders Choose a folder underDeviceswhere you want to create the new group.
Items Displays the devices in the selected folder. Use the |<, <, > and >| buttons topage through the list of devices. Select the devices you want to include in thenew group.
Selections Click > to shuttle the selected devices into the Selections column. Thesedevices will be the members of the new group.
4. ClickSave.The new device group appears on the left panel.
Modifying Device Groups
Complete these steps to modify a Device Group:
1. ClickDevices from the left panel and navigate to the device group.2. Select the required change from the table below:
Settings Guidelines
Edit To modify any Device Group.
Delete To delete any Device Group.
3. ClickSave.
Performing Operations on Device Groups
You can perform a number of operations on devices or device groups by selecting the Action drop-down list. Formore information on these actions, see Performing Operations on Devices and Device Groups.
Changing Display Columns
Complete these steps to choose which columns appear in the device table.
1. Click the Choose columns icon.2. In the Select Columns dialog box, select the columns you want to display from Available Columns and use the
> button to shuttle them to Selected Columns. Likewise, you can remove columns from the display by selectingcolumns in Selected Columns and using the < button to shuttle them to Available Columns.
3. ClickSave.The table will display your chosen columns.
User GuideFortinet Technologies Inc.
335

Devices Managing CMDB
Creating and Editing DevicesComplete these steps to add a new device.1. Click CMDB and select the device group underDevices on the left panel.2. Click New. 3. In the Add New Device dialog box, enter the information under Summary, Contact, Interfaces, and
Properties tabs.4. ClickSave.
The new device appears in the list.5. Click on the device from the list.
A second pane opens below with information under various tabs.Complete these steps to edit a device:
1. Go to CMDB tab.2. From the left panel, select the device type underDevices folder.3. Select the Device from the list displayed on the table and clickEdit.4. In the Edit Device dialog box, modify the settings under Summary, Contact, Interfaces, Properties and
Parser tabs.5. ClickSave.
Performing Operations on Devices and Device GroupsYou can perform various operations on individual devices or device groups by selecting the device or device groupand clicking the Action drop-down list. The following table descries the operations you can perform.
Action Settings Function description
Quick Info Displays the a summary of information about the device. The information can include the DeviceName, Access IP, Device Type , Version, and so on.
Device HealthDisplays Availability Status, Performance Status, and a variety of health reports for the device,such as Monitor Status, Incident Status, and so on. Click the < and > buttons to shuttle throughadditional health information.
Vulnerabilities By default, displays the top 10 vulnerabilities of the past week. You can also choose a timeinterval of 15 minutes, 1 hour, one day, or 30 days.
Incidents Displays the summary of incidents associated with the device. Click an incident and open theAction drop-down list to drill down on the incident for more information.
Real Time Events Opens a Real Time Search window for events for the selected device. For more information, seeViewing Real-time Search Results.
Historical EventsDisplays the historical events underANALYTICS tab. Use Action tab on top-left corner toemail, export, copy to a new tab or save results. For more information, see Viewing HistoricalSearch Results.
336 User GuideFortinet Technologies Inc.

Managing CMDB Devices
Action Settings Function description
Real-timePerformance
Displays the real-time Performance Metrics of the selected device. You can choose aMonitor,and Collector from the drop-down lists, and set the polling Frequency and the number ofRuns.
Impacted BusinessServices Displays the Business services that contain the selected device.
Change Status Changes the status of the device to Approved orUnmanaged. The devices under license arecalled 'Managed' while the remaining devices are called "Unmanaged".
Edit Location Changes the device location address: Country, State, City, Latitude, Longitude, Region,Building and Floor.
Change Organization Changes the organization in the New Organization drop-down list.
ImpactedOrganization Select the Impacted Orgs from the drop-down list.
Decommission Decommissions the selected device. Enter a reason in the Decommission Device dialog box.
Recommission Recommissions the selected device.
Connect To Connects to a specific Protocol or Port. Select a Protocol from the drop-down list and enter aPort number and User name. A Secure Shell plugin is required.
Re-discover Specify the Range Definition information to rediscover the device. For a description of theoptions in the Discovery Definition dialog box, see the table in Creating a discovery entry.
Add to Watchlist Add the device to Watchlist. In the Add to Watch List dialog, select the Attribute,Organization, and Expires on time. Make selections from the list using the > button.
All Event Group Displays all event groups underANALYTICS tab. Use the Action tab on top-left corner toemail, export, copy to a new tab or save results.
Enable Agent Enables Agent monitoring for the selected device.
Disable Agent Disables Agent monitoring for the selected device.
Associating Parsers to a DeviceYou can attach a set of parsers to a device in CMDB. This overrides the default parser selection mechanismbased on the Event Format Recognizer. When a device with a list of attached parsers sends a log, the specifiedparsers are attempted first.
1. Go to CMDB tab.2. From the left panel, select the device(s) underDevices folder.3. ClickEdit and select the Parser tab.
User GuideFortinet Technologies Inc.
337

Applications Managing CMDB
4. Select the parsers from the Available Parsers list and move to the Selected Parsers list using the right arrow.You can use the up and down arrows to re-arrange the order of the parsers. Note that the parsers will beattempted in order.
5. ClickSave to confirm the parser selection.The selected parsers are now associated to the device.
Searching for DevicesFortiSIEM allows you to search for CMDB devices based on system device properties and custom deviceproperties.
Note: For custom properties to appear in the search list, you must first select them in ADMIN > DeviceSupport > Custom Property. To select and define custom properties, see Working with Custom Properties.
1. Go to CMDB > Devices.2. Click the Search icon.3. Select the value(s) you want to search for:
l In the drop-down list, click a device attribute (for example, Device Type). All possible values of theselected attribute (for example, Cent OS, VMware, Cisco, and so on) are displayed with a count next to it.You can select multiple attributes and values in the drop-down list. The results will be ANDed together.
l If you need to search for a column or an attribute value, enter it in the Search field.4. ClickSearch at the top of the drop-down list.
The top 5 items are returned. ClickShow All to display all of the returned items.
5. The CMDB device list updates based on your search criteria.6. To refine your search, click the Search icon again and select other CMDB device attributes or clickX to cancel a
selection.
Applications
Applications in the CMDB are grouped at the highest level by Infrastructure and User apps, with further sub-categorization in each of those two categories.
Viewing Application InformationEditing ApplicationsWorking with Application Groups
Viewing Application InformationComplete these steps to add and view application information:1. Click CMDB and select the application group underApplications on the left panel.2. Click New. 3. In the Add New Application dialog box, enter the information related to the Application.4. To add an IP to the Application, click the edit icon nearRunning on.
a. ClickAdd by IP and enter the IP in the search box.b. Click the tick mark.
5. ClickSave.The new application appears in the list.
338 User GuideFortinet Technologies Inc.

Managing CMDB Applications
6. Click on the application from the list.A second pane opens below with information under various tabs.
Editing ApplicationsComplete these steps to edit an application:
1. From the left panel tree, select the application group underApplications.2. Select the Application from the list and clickEdit.3. In the Edit Application dialog box, modify the settings.4. To modify an IP, click the edit icon nearRunning on and select the IP.
l ClickAdd by IP to add a new IP.l ClickDelete to delete the IP.
5. ClickSave.
Working with Application GroupsThis section provides the procedures to set up Application Groups.
l Adding Application Groupsl Modifying Application Groups
Adding Application Groups
Complete these steps to add Application groups:1. Go to CMDB and clickApplications folder on the left panel.2. Click + above the list of CMDB groups list.3. In the Create New application Group dialog box, enter/select the information below:
Settings Guidelines
Organization Select the Organization.
Group [Required] Group name.
Description Description about the application group.
Folders Folder underApplicationswhere the group has to be created.
Items Items to add under the application group.
Selections Click > to confirm the selections from Folders and Items.
4. ClickSave.The new application group appears on the left panel.
Modifying Application Groups
Complete these steps to modify an Application Group:
User GuideFortinet Technologies Inc.
339

Users Managing CMDB
1. ClickApplications from the left panel and navigate to the Application group.2. Use the delete, edit or move icon above the application groups list for the required modification.3. ClickSave.
Users
FortiSIEM CMDBUsers page contains information about the users of your system.
Adding UsersEditing User InformationWorking with User Groups
Adding UsersComplete these steps to add Users:1. Click CMDB and select Users folder on the left panel.2. Click New to create a new user.3. In the New User dialog box, enter the detailed information about this User:
a. Add the user profile information including User Name, Full Name, Job Title and Company.b. Click the drop-down to select the Importance of this user - "Important", "Critical" or "Mission Critical".c. Enable Active if this is an active user.d. Enter the user'sDomain.e. Enter the user's Distinguished Name DN.f. ForUser Lockout, enter the number of minutes the user will be unable to log into the system after three
successive authentication failures.g. For Password Reset, enter the number of days after which a user’s current password for logging in to
the system will automatically expire. If left blank, the user's password will never expire. h. For Session Timeout, enter the number of minutes after which an inactive user will be logged out. i. Enter the Employee ID of the user.j. Select theManager to which this user belongs.k. For System Admin, select Yes.
i. ForMode, select Local or External.If you select Local, enter and then reconfirm the user password. For External,see Authentication Settings for more information about using external authentication.Note: If more than one authentication profile is associated with a user, then the servers will becontacted one-by-one until a connection to one of them is successful. Once a server has beencontacted, if the authentication fails, the process ends, and the user is notified that theauthentication failed.
ii. Select a Default Role for the user.See the topic Role Settings for a list of default roles and permission. You can also create newroles, which will be available in this menu after you create them.
l. If this System Admin user should be allowed to approve de-anonymization requests, enable De-obfuscation Approver.
m. ClickContact Info to enter your personal contact information.n. Enter anyDescription about the user.
340 User GuideFortinet Technologies Inc.

Managing CMDB Users
4. ClickSave.The new user details appear in the list.
Notes:
l When viewing this user list as a Super global user, you may see repetitions of a fewUser Names, where thosenames exist in multiple Organizations. This can be determined by checking the contents of theOrganizationcolumn.
l Repetition of User Namesmay also occur if an LDAP server has moved from one Organization to another anddiscovery of that LDAP server introduces users from the previous organization who may share the same user name.In this case, the administrator may wish to remove users that are no longer applicable.
Editing User InformationComplete these steps to edit a CMDB user:
1. From the left panel folders, select a User from the Users folder.2. ClickEdit.3. In the Edit User dialog box:
a. Add the User Name and user profile information including User Name, Full Name, Job Title, andCompany.
b. Click the drop-down to select the Importance - "Important", "Critical" or "Mission Critical".c. Select a Default Role for the user.
See Role Settings for a list of default roles and permission. You can also create new roles, which will beavailable in this menu after you create them.
d. For Session Timeout, enter the number of minutes after which an inactive user will be logged out. e. ForUser Lockout, enter the number of minutes the user will be unable to log into the system after three
successive authentication failures.f. For Password Reset, enter the number of days after which a user’s current password for logging in to
the system will automatically expire.If left blank, the user's password will never expire.
g. Enter the Employee ID of the user.h. Select theManager to which this user belongs.i. For System Administrator, select Yes.j. If this System Admin user should be allowed to approve de-anonymization requests, enable De-
obfuscation Approver.k. For Password, select Local or External.
If you select Local, enter and then reconfirm the user password. See Authentication Settings for moreinformation about using external authentication.Note: If more than one authentication profile is associated with a user, then the servers will be contactedone-by-one until a connection to one of them is successful. Once a server has been contacted, if theauthentication fails, the process ends, and the user is notified that the authentication failed.
4. ClickSave.You can also use the following functions on the Action menu:
l Unlock - to unlock a user, select the user from the list and clickAction >Unlock.l Add to Watchlist- select the user from the list and clickAction >Add to Watchlist. In the Add to Watch List
dialog, select theOrganization and Expires on time. Make the selections from the list using the > button andsave.
User GuideFortinet Technologies Inc.
341

Business Services Managing CMDB
Working with User GroupsThis section provides the procedures to set up User Groups.
l Adding User Groupsl Modifying User Groups
Adding User Groups
Complete these steps to add User groups:1. Go to CMDB and click the Users folder on the left panel.2. Click + above the list of CMDB groups.3. In the Create New User Group dialog box, provide the following information:
Settings Guidelines
Organization Select the Organization.
Group [Required] Group name.
Description Description about the User group.
Folders Folder underUserswhere the group has to be created.
Items Items to add under the User group.
Selections Click > to confirm the selections from Folders and Items.
4. ClickSave.The new User group appears on the left panel.
Modifying User Groups
Complete these steps to modify a User Group:
1. ClickUsers from the left panel and navigate to the User group.2. Use the delete, edit or move icon above the User groups list for the required modification.3. ClickSave.
Business Services
A business service lets you view FortiSIEM metrics and prioritize alerts from a business service perspective. Abusiness service is defined within FortiSIEM as a smart container of relevant devices and applications serving abusiness purpose. Once defined, all monitoring and analysis can be presented from a business serviceperspective. It is possible to track service level metrics, efficiently respond to incidents on a prioritized basis,record business impact, and provide business intelligence on IT best practices, compliance reporting, and ITservice improvement. What is also novel about FortiSIEM is how easily a business service can be defined andmaintained. Because FortiSIEM automatically discovers the applications running on the servers as well as the
342 User GuideFortinet Technologies Inc.

Managing CMDB Business Services
network connectivity and the traffic flow, you can simply choose the applications and respective servers and beintelligently guided to choose the rest of components of the business service. This business service discovery anddefinition capability in FortiSIEM completely automates a process that would normally take many people andconsiderable effort to complete and maintain.
Defining an IT or Business Service can create a logical grouping of devices and IT components which can bemonitored together.
Viewing Business ServicesCreating Business ServicesWorking with Business Service Groups
Viewing Business ServicesComplete these steps to view Business Services:
1. Go toCMDB and select a service underBusiness Services in the left panel.The services are: IT Srvc, Biz Srvc, Compliance, or Ungrouped.
2. Select the service from the list.The lower panel displays the information about the service including the following details:Type, Name, Running on, Access IP, Details, andMaintenance.
Creating Business ServicesComplete these steps to create a Business Service:
1. Go toCMDB and select a service underBusiness Services in the left panel.2. Click New. 3. In theNew Business Service dialog box, enter the following information.
Settings Guidelines
Name Name of the Business Service group.
Description Description about the Business Service group.
Filter Click this field to add the Filter.
DevicesBrowse this folder to select or search the devices and also the adjacent networkdevices. Click > to move the device selections to the Selected Devices/Appstable.
Applications Browse this folder to select or search the applications, instancerunning on and adjacent network devices. Click > to move theapplication selections to the Selected Devices/Apps table.
4. Click Save to save the selections orApply Filter and Save to proceed with adding the service.You can use the links in the drilldown menu on the Business Services summary dashboard to find out moreinformation about incidents, device availability, device and application performance, interface and event status,and real-time and historical search for a selected business service.
User GuideFortinet Technologies Inc.
343

CMDBReports Managing CMDB
Working with Business Service GroupsThis section provides the procedures to set up Business Service Groups.
l Adding Business Service Groupsl Modifying Business Service Groups
Adding Business Service Groups
Complete these steps to add Business Service groups:1. Go to CMDB and clickBusiness Services folder on the left panel.2. Click + above the list of CMDB groups list.3. In the Create New Business Service Group dialog box, enter/select the information below:
Settings Guidelines
Organization Select the Organization.
Group [Required] Group name.
Description Description about the Business Service group.
Folders Folder underBusiness Servicewhere the group has to be created.
Items Items to add under the Business Service group.
Selections Click > to confirm the selections from Folders and Items.
4. ClickSave.The new Business Service group appears on the left panel.
Modifying Business Service Groups
Complete these steps to modify a Business Service Group:
1. ClickBusiness Services from the left panel and select a Business Service group.2. Click the required option:
l Edit to modify the settings of a Business Service.l Delete to remove a Business Service.
3. ClickSave.
CMDB Reports
You can find all system-defined reports underCMDB >CMDB Reports. The reports are organized into foldersas shown on the left tree. Click a report to view Summary and Schedule information. the report conditions, andthe columns included in the report.
344 User GuideFortinet Technologies Inc.

Managing CMDB CMDBReports
CMDB ReportFolder Object to Report On Report Name
Overall Device Approval Status l Approved Devicesl Not Approved Devices
Users
l Discovered Usersl Externally Authenticated FortiSIEM
Usersl Locally Authenticated FortiSIEM Usersl Manually Defined Users
Rules l Active Rulesl Rules with Exceptions
Reports l Scheduled Reports
Performance Monitors l Active Performance Monitors
Task l All Existing Tasks
Business Service l Business Service Membership
Network
Inventory
l Network Device Components withSerial Number
l Network Interface Reportl Router/Switch Inventoryl Router/Switch Image Distribution
Ports l Network Open Ports
Relationship l WLAN-APRelationship
User GuideFortinet Technologies Inc.
345

CMDBReports Managing CMDB
CMDB ReportFolder Object to Report On Report Name
Server Inventory l Server Inventoryl Server OSDistributionl Server Hardware: Processorl Server Hardware: Memory and
Storage
Ports l Server Open Ports
Running Services l Windows Auto Running Servicesl Windows Auto Stopped Servicesl Windows Exchange Running Servicesl Windows IIS Running Servicesl WindowsManual Running Servicesl WindowsManual Stopped Servicesl Windows SNMPRunning Servicesl Windows VNC Running Servicesl WindowsWMI Running Services
Installed Software /Patches
l Windows Installed Softwarel Windows Installed Patchesl Windows Installed Software
Distribution
Virtualization Relationship l VM-ESXRelationship
Beaconing
l CMDBDevice Typesl CMDBNetwork Device Countl CMDBServer Countl CMDBStorage Device Countl PING Monitored Device Countl Performance Monitor Status
346 User GuideFortinet Technologies Inc.

Managing CMDB CMDBReports
CMDB ReportFolder Object to Report On Report Name
FortiCare l FortiCare 360 Device Inventory Reportl FortiCare 360 Software License
Reportl FortiCare 360 Software Update Reportl Top FortiCare 360 Customers By
Devices Monitoredl Top FortiCare 360 Customers and
Hardware Models By Countl Top FortiCare 360 Customers and OS
Versions By Count
Ungrouped user-defined user-defined
The following topics provides information about using CMDB reports.
Creating CMDBReportsScheduling a CMDBReportRunning a CMDBReportAdding CMDBReport to Dashboard
Creating CMDB ReportsThere are two ways you can create new CMDB reports:
l Create a new report from scratch.l Clone and modify an existing system or user-defined report by selecting a report and clicking Clone.
Follow these procedures to create or modify a CMDBReport.l Creating a CMDB reportl Cloning and Modifying a CMDB reportl Exporting a CMDBReportl Importing and Exporting CMDBReport Definitions
Creating a CMDB report
1. Go toCMDB and select the CMDB report folder where you want to create the report.2. Click New. 3. In theNew CMDB Report dialog box, enter the following information.
Settings Guidelines
Report Name Name of the CMDB report.
Description Any information related to the new report.
User GuideFortinet Technologies Inc.
347

CMDBReports Managing CMDB
Settings Guidelines
Target Select the target type.
ConditionsSet the filter conditions by selecting (Attributes, Operator and Value) togetherwith Next Operators. Parenthesis can be added by clicking + to give higherprecedence to any evaluation conditions.
Display Columns The columns in the report result. The order can be changed by selecting acolumn and clicking the Up or Down icons. You can specify theOrder as ASC orDESC.
4. Click Save.You can also import a report under CMDB by clicking Import to browse and choose.
Cloning and Modifying a CMDB report
You can modify user-defined reports by selecting the report and clicking Edit. However, you cannot directly edit asystem-defined report. Instead, you have to clone it, then save it as a new report and modify.
1. Go to CMDB > CMDB Reports.2. Select the system-defined report you want to modify, and clickClone.3. Enter a name for the new report, and clickSave.
The cloned report will be added to the folder of the original report. 4. Select the new report, and then clickEdit.5. Modify the report, and clickSave.
Exporting a CMDB Report
1. Go to CMDB > CMDB Reports.2. Select the CMDBReport folder from where the report will be exported.3. ClickExport to download and save the report.
Importing and Exporting CMDB Report Definitions
Instead of using the user interface to define a report, you can import report definitions, or you can export adefinition, modify it, and import it back into your FortiSIEM virtual appliance. Report definitions follow an XMLschema.
Importing a CMDB Report Definition
1. Go to CMDB > CMDB Reports.2. Select the CMDBReport folder to where the report will be imported.3. Click Import. The report will appear in the selected folder.
Exporting a Report Definition
1. Go to CMDB > CMDB Reports.2. Select the CMDB report to be imported.3. ClickExport. The report will appear in the selected folder.
348 User GuideFortinet Technologies Inc.

Managing CMDB CMDBReports
4. Paste the report definition into a text editor, modify it, and then follow the instructions for importing it back intoyour virtual appliance.
XML Schema for Report Definitions
The XML schema for the report definition is:
<cmdbReports><cmdbReport><name></name><naturalid></naturalid><description></description><selectClause></selectClause><orderByClause></orderByClause><whereClause></whereClause></cmdbReport></cmdbReports>
This is an example for the Active Rules report:
<cmdbReports><cmdbReport><name>Active Rules</name><naturalId>PH_CMDB_Report_Overall_8</naturalId><target>com.ph.phoenix.model.query.Rule</target><description>This report captures active rules on a per organizationbasis</description><selectClause>ph_drq_rule.ph_incident_category,ph_drq_rule.name,ph_sys_domain.name</selectClause><orderByClause>ph_drq_rule.ph_incident_category ASC</orderByClause><whereClause>ph_drq_rule.active = true</whereClause></cmdbReport></cmdbReports>
Scheduling a CMDB ReportComplete these steps to schedule a CMDB report to run at a later time:
1. Go toCMDB and browse to select the report underCMDB Reports on the left tree.2. Select the report from the list.3. Click Schedule. 4. In theSchedule dialog box, select the required information.
User GuideFortinet Technologies Inc.
349

CMDBReports Managing CMDB
Settings Guidelines
Organization Organization type.
Select whether to Run this report for or Schedulethis report for the remaining settings.
l Choose Run this report for if you would like to run thereport for only Global administrators. This choice willcombine event data from all selected Organizationswithin one PDF or CSV report and sent to the GlobalAdministrators added in the notification settings whilescheduling report alerts.
l Choose Schedule this report for if you would like to runthis report for each selected Organization seperatelysame as your login to each of these Organizations andschedule this report there. In this case, each selectedOrganization will receive its own copy of PDF or CSVreport containing the event data for its own Organizationbased on the notification settings added while schedulingreport alerts.
Schedule Time Range Enter the Time range to run the report.
Schedule Recurrence Pattern Recurrence pattern: once, hourly, daily, weekly ormonthly. Enter the start date in the Start From field.
Notification
Use the options as required:
l Default Notification - to send notification to newrecipients by adding them using the + icon.
l Custom Notification - to send the notification to thespecific email addresses added under ADMIN > Settings> System.
l Copy to a remote location - To copy the report to aremote directory, first define the remote location inADMIN > Settings > Analytics > Report to be copied tothis remote location when scheduler runs any report andthen select this option.
5. Click OK.You can also schedule a CMDB report by selecting the report from the list and clicking +underSchedule tab inthe lower pane.
Running a CMDB ReportComplete these steps to run a CMDBReport.
1. Go toCMDB > CMDB Reports and select the report you want to run from the folder.2. Click Run.
350 User GuideFortinet Technologies Inc.

Managing CMDB CMDBReports
3. In theRun CMDB for dialog box, select the Organization and click Run.Reports are saved only for the duration of your login session. You can view saved reports by clickingResults.You can use theExport button to export any report in PDF or CSV format.
Adding CMDB Report to DashboardComplete these steps to add CMDB reports to Dashboard:
1. Select the dashboard to which you want to add a CMDB report.2. Click + to the right of the dashboard.3. In the Create New Dashboard dialog box, enter a name for the Dashboard and select the Widget Dashboard
from the drop-down list. For more information, refer to Dashboard.4. Click + below the Dashboard drop-down list.5. Select a report from the CMDB Reports folder, then click >. The report will be added to the dashboard.
User GuideFortinet Technologies Inc.
351

Reports Managing Resources
Managing Resources
The following sections provide the procedures for managing Resources:
ReportsRulesNetworkWatch listProtocolsEvent typesWorking with FortiGuard IOCsWorking with ThreatConnect IOCsMalware DomainsMalware IPsMalware URLsMalware ProcessesCountry GroupsMalware HashDefault PasswordAnonymity networkUser AgentsRemediations
Reports
Reports as similar to pre-defined versions of searches that you can load and run at any time. FortiSIEM includesover 2000 pre-defined reports that you can access in RESOURCES > Reports.
Viewing System ReportsWorking With Report TemplatesCreating New ReportsRunning System ReportsScheduling ReportsImporting and Exporting Reports
Viewing System ReportsComplete these steps to view system-defined Reports:
1. Go to RESOURCES >Reports.2. Select theOrganization for which you want to view the available reports. 3. Expand the Reports folder on the left panel and select the sub-category of report to view.4. Select the report you want to view information about.
The reports display the information below under various tabs in the lower pane:
352 User GuideFortinet Technologies Inc.

Managing Resources Reports
l Summary - Includes the Condition andGroup By conditions for the report, and the report'sDisplayattributes.
l Schedule - Information about when the report is scheduled to run. See Scheduling a Report for moreinformation. Click the + icon to set a schedule for the report to run.
l Results - The results from any scheduled runs of the report, or results you have saved by running thereport.
Note: If Data Obfuscation is turned on for a FortiSIEM user:l Raw events are completely obfuscated - user cannot see any part of the raw message.l Cannot perform search on obfuscated event attributes.l CSVExport feature is disabled.l If an integer event attribute is obfuscated, then the GUI may not show those obfuscated fields. Normally,
integer fields are not obfuscated.
Working With Report TemplatesFortiSIEM gives you the flexibility of designing custom templates for each of your reports. When you selectRESOURCES > Reports, notice that the table of reports includes a Report Design Template column. Thiscolumn identifies the template to be used when generating and exporting a report. By default, all reports areassigned the same template. The default template name has the format organization_name scopeReportsTemplate. For example, Global System Reports Template would be a report for the Global organization withSystem scope.
The Global System Reports Template cannot be edited unless you log in as Super/Global. In this case, an Editicon will appear next to Global System Reports Template.
A Template can be created at various levels:l For each Report in RESOURCES > Reportsl For each Report folder in RESOURCES > Reportsl For each Report Bundle defined in RESOURCES > Reports > Report Bundles
When you run a report underRESOURCES > Reports, FortiSIEM will choose the appropriate PDF ReportTemplate in the following order:
1. If a specific template is defined for the selected report, then that template will be chosen.2. If a template in the previous step is not found, then the template for the folder to which the Report
belongs will be chosen.3. If no matching template is found in Steps 1 and 2, then the system-defined template for the root folder
RESOURCES > Reportswill be chosen. System-defined templates cannot be edited.
If you load and run a report in RESOURCES > Reports from the ANALYTICS page and then manually exportthe Report in PDF format:
l If you choose the Defined option, then FortiSIEM will use the rules above to find the matching template.l If you choose the New option, then you can define a new Report format for this report instance only.
Note:
l For Service Provider deployments, the PDF Report templates can only be defined at the Super/Global level andapplies for all customers.
l If a report is part of two folders and each folder has its own template defined, then the template of the current folderbeing viewed will be used.
The following sections provide information about:
User GuideFortinet Technologies Inc.
353

Reports Managing Resources
l Creating a PDF report templatel Designing a PDF report template
Creating a PDF Report template
A PDF Report template can be created as follows:
1. Go to Resources > Reports and select one of the subcategories from the left pane.2. Select the desired row from the table.3. (Optional) Select the Sync checkbox in the row to synchronize the report with the Report Server.4. Open theMore drop-down list and select Report Design. The Report Design page opens.5. Notice that the Name given to the report template is in the form organization_name scope report_name
Template. You can edit this name if you want.6. Follow the instructions in Designing a PDF report template to design the cover page and add sections,
subsections, attachments, and so on, to the report.7. ClickSave.
The name of the new template will be displayed in the Report Design Template column of the table.Notice that an edit icon appears next to the name of the template.
Creating report templates for a Report folder or Resource Bundle
To create a report template for a Resource folder, choose any Report folder from the left pane. The steps tocreate the template are similar to Creating a PDF Report template.
To create a report template for a Report Bundle, complete these steps:
1. Select any system-defined or user-defined report bundle in this group.2. Select all of the reports in the table.3. ClickMore >Report Design.Notice that the Name of the template for a Report Bundle cannot be edited.
Modifying an existing report template
1. Click the edit icon next to the name of the existing report design template. The Report Design page opens.2. Make the desired changes to the template design.3. ClickSave.
Designing a PDF report template
You can design or modify the following template sections using the settings underReport Design:l Cover Pagel Table of Contents - Sections and Subsections
Cover Page
The default Cover Page template includes the current Organization, Start Time, End Time, Generated Time, andDevice Time Zone as Default Text. These settings can be deleted or rearranged but not modified. You can alsoadd text content and attachments to the Cover Page.
354 User GuideFortinet Technologies Inc.
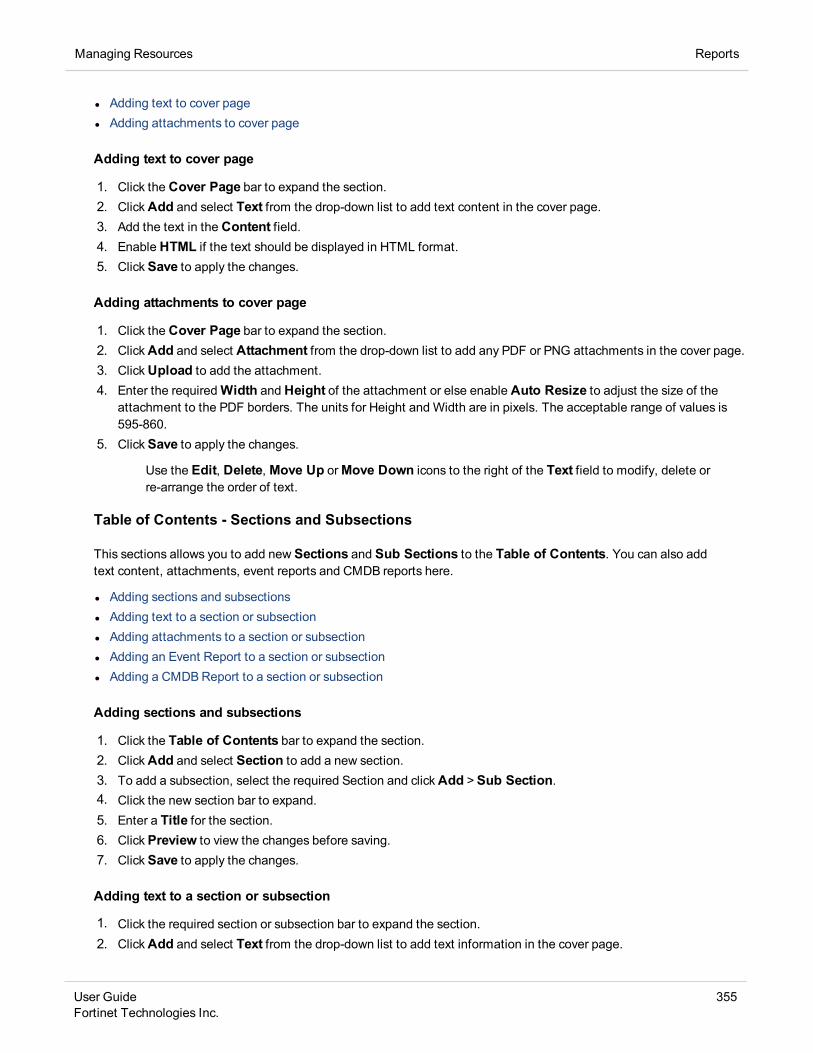
Managing Resources Reports
l Adding text to cover pagel Adding attachments to cover page
Adding text to cover page
1. Click the Cover Page bar to expand the section.2. ClickAdd and select Text from the drop-down list to add text content in the cover page.3. Add the text in the Content field.4. Enable HTML if the text should be displayed in HTML format.5. ClickSave to apply the changes.
Adding attachments to cover page
1. Click the Cover Page bar to expand the section.2. ClickAdd and select Attachment from the drop-down list to add any PDF or PNG attachments in the cover page.3. ClickUpload to add the attachment.4. Enter the requiredWidth and Height of the attachment or else enable Auto Resize to adjust the size of the
attachment to the PDF borders. The units for Height and Width are in pixels. The acceptable range of values is595-860.
5. ClickSave to apply the changes.
Use the Edit, Delete, Move Up orMove Down icons to the right of the Text field to modify, delete orre-arrange the order of text.
Table of Contents - Sections and Subsections
This sections allows you to add new Sections and Sub Sections to the Table of Contents. You can also addtext content, attachments, event reports and CMDB reports here.
l Adding sections and subsectionsl Adding text to a section or subsectionl Adding attachments to a section or subsectionl Adding an Event Report to a section or subsectionl Adding a CMDBReport to a section or subsection
Adding sections and subsections
1. Click the Table of Contents bar to expand the section.2. ClickAdd and select Section to add a new section.3. To add a subsection, select the required Section and clickAdd >Sub Section.4. Click the new section bar to expand.5. Enter a Title for the section.6. ClickPreview to view the changes before saving.7. ClickSave to apply the changes.
Adding text to a section or subsection
1. Click the required section or subsection bar to expand the section.2. ClickAdd and select Text from the drop-down list to add text information in the cover page.
User GuideFortinet Technologies Inc.
355

Reports Managing Resources
3. Add the text in the Content field.4. Enable HTML if the text should be displayed in HTML format.5. ClickSave to apply the changes.
Adding attachments to a section or subsection
1. Click on the required section or subsection bar to expand the section.2. ClickAdd and select Attachment from the drop-down list to add any PDF or PNG attachments.3. ClickUpload to add the attachment.4. Enter the requiredWidth and Height of the attachment or else enable Auto Resize to adjust the size of the
attachment to the PDF borders.5. ClickSave to apply the changes.
Adding an Event Report to a section or subsection
1. Click on the required section or subsection bar to expand the section.2. ClickAdd and select Event Report from the drop-down list.3. Select the Event Report from the drop-down.4. To display the event type, enable Show Event Type.5. When you define a custom template forReport Bundles (excluding the root group), you can select any Event
Reports from the Select Event Report drop-down list.Note the following:- For Report folders (including the root group), the Select Event Report setting is not available.- For a single Report, the Event Report is automatically selected under Select Event Report setting and youcannot modify this.
6. Configure the display format:a. Select the report Format from the drop-down list. The list displays the available charts.b. Select the Attribute.c. Enter the Title for the chart.d. Select or enter the number of Items to display.e. Enter the Height of the chart or table.f. To add more formats, click + underRow and use theMove arrows to re-order the list.g. ClickSave.
7. ClickSave to apply the changes.
Adding a CMDB Report to a section or subsection
Note: You can add CMDB Reports only to a Report Bundle template.
1. Click on the required section or subsection bar to expand the section.2. ClickAdd and select CMDB Report from the drop-down.3. Click the Edit icon to select the CMDB Report from the drop-down. You can also use the search bar to find a
specific CMDB report.4. ClickSelect to confirm the selection.5. Select the number of Items to display.6. ClickSave to apply the changes.
356 User GuideFortinet Technologies Inc.

Managing Resources Reports
Creating New Reportsl Creating a Reportl Creating a Report Bundlel Editing a Report Bundle
Creating a Report
Creating a report or baseline report is like creating a structured historical search, because you set the ConditionsandGroup By attributes that will be used to process the report data, and specifyDisplay Columns to use inthe report summary. You can clone an existing report to use as the basis for a new report by selecting the existingreport, and clicking Clone.
Complete these steps to create a report:
1. Go to RESOURCES > Reports.2. Select the report type from the Reports folder on the left panel.3. ClickNew.4. Enter a Report Name and Description.5. For baseline reports, select Anomaly Detection Baseline.6. Enter the Conditions to use in your report.7. Set the Display Columns to use in your search results. 8. ClickSave.9. Optional - If you want to create a new PDF report template for this report, follow the steps in Working With Report
Templates or else the system-defined template will be used.Your report will be saved into the selected category, and you can run it or schedule it to run later.
Creating a Report Bundle
Complete these steps to create a report bundle:
1. Go to the RESOURCES tab and select a Report Bundle from the left panel.2. ClickNew.3. Enter a Report Name and Description.4. For baseline reports, select Anomaly Detection Baseline.5. Enter the Conditions to use in your report.6. Set the Display Columns to use in your search results. 7. ClickSave.8. Optional - If you want to create a new PDF report template for this report, follow the steps here or else the system-
defined template will be used.Your report will be saved into the selected category, and you can run it or schedule it to run later.
Editing a Report Bundle
Complete these steps to edit a user-defined resource bundle:
1. Go to the RESOURCES tab and select a Report Bundle from the left panel.
2. Click the Edit icon ( ) above the left panel. The Edit Report Group dialog box opens.3. Edit the Report Group Name and Description, if needed.
User GuideFortinet Technologies Inc.
357

Reports Managing Resources
4. From the Folders column select the report subcategory.5. In the Items column, select the desired report(s) to add to the report bundle.6. Select Update Template if you want to add the selected reports to the previously defined Report Bundle
template. See Creating a PDF report template.7. ClickSave.
Running System ReportsFortiSIEM includes a number of baseline reports for common data center analytics, as well as over 300 reportsrelating to IT infrastructure. You can also create your own reports.
Complete these steps to run a system-generated or user-defined baseline report:
1. Go to RESOURCES tab and select the desired report group from the Reports folder.2. Select the report(s) from the table.3. ClickRun to run the report(s) immediately, or select More and clickSchedule to schedule the report. 4. If you have a multi-tenant deployment, select theOrganization for which you want to run the report.5. Select one of the Report Time Range options:
l Relative: Select the last number of hours from which report has to be generated.l Absolute: Select the range of start and end date and time.
6. ClickOK.The report will run and the results will be displayed.
Scheduling ReportsYou can schedule reports/report bundles to run once or for recurring periods in the future. When you schedule areports/report bundle, you can specify notifications that can be sent for the report. In addition, you should makesure that the default settings for notifications for all scheduled reports/report bundles have been set up.
l Scheduling a Reportl Scheduling a Report Bundlel Scheduling Reports Using a Workflow
Scheduling a Report
Complete these steps to schedule a report:
1. Go to RESOURCES tab and select the report underReports folder from the left pane.2. Select the report(s) to schedule from the list on the right pane.3. ClickMore >Schedule.
Note: You can also schedule a report from the lower pane - select the Schedule tab after selecting the report.Use the + icon to enter the Schedule settings.
4. In Super/Global scope, underOrganization section, you can choose eitherRun this report for or Schedulethis report for with selected organizations:
358 User GuideFortinet Technologies Inc.

Managing Resources Reports
l Choose Run this report for if you would like to run the report for only Global administrators. This choicewill combine event data from all selected Organizations within one PDF or CSV report and sent to theGlobal Administrators added in the Notification settings while scheduling reports.
l Choose Schedule this report for if you would like to run this report for each selected Organizationseparately same as your login to each of these Organizations and schedule this report there. In this case,each selected organization will receive its own copy of the PDF or CSV report containing the event data forits own Organization based on the Notification settings added while scheduling reports.
5. ClickNext.6. Use the Schedule Time Range option if the run time has to be scheduled for a later period and a specific place.7. Schedule the Schedule Recurrence Pattern for the report to run once, hourly, daily, weekly, or monthly or set
the range under Schedule Recurrence Range.8. ClickNext.9. Select theOutput Format asPDF orCSV.
For PDF output, the default template configured underRESOURCES >Reports is used. You can customize thereport templates following the steps under Designing a PDF Report Template.
10. Specify the Notification that should be sent when the report runs from the available options:
l Default Notifications - to send default notifications. Click the edit icon to add more Recipients.l Custom Notifications - to send notifications to specific email addresses. Use the edit icon to add moreRecipients
l Copy to a remote directory - to copy the report to a remote directory.
11. Specify the time that the report should be retained after it has run using the Retention setting in hours or numberof days.
12. ClickOK.The report will run at the time you scheduled.
Scheduling a Report Bundle
Complete these steps to schedule a report bundle:
1. Go to RESOURCES > Reports tab and select a report bundle underReport Bundles folder from the left pane.
2. Select the clock icon ( ) above the left panel folders to open the scheduler settings.3. In Super/Global scope, underOrganization section, you can choose eitherRun this report for or Schedule
this report for with selected organizations:
l Choose Run this report for if you would like to run the report for only Global administrators. This choicewill combine event data from all selected Organizations within one PDF or CSV report and sent to theGlobal Administrators added in the Notification settings while scheduling reports.
l Choose Schedule this report for if you would like to run this report for each selected Organizationseparately same as your login to each of these Organizations and schedule this report there. In this case,each selected Organization will receive its own copy of PDF or CSV report containing the event data for itsown Organization based on the Notification settings added while scheduling reports.
4. Select the Report Time Range:
l Select the Time Zone.l Select Relative to enter the last number of hours from which report has to be generated orAbsolute to
enter the range of start and end date and time.
5. ClickNext.
User GuideFortinet Technologies Inc.
359

Reports Managing Resources
6. Use the Schedule Time Range if the run time has to be scheduled for a later period and a specific place.7. ClickNext.8. Select theOutput Format asPDF orCSV.
For PDF output, the default template configured underRESOURCES >Reports is used. You can customize thereport templates following the steps under Designing a PDF Report Template
9. Schedule the Schedule Recurrence Pattern for the report bundle to run once, hourly, daily, weekly, or monthlyor set the range under Schedule Recurrence Range.
10. Specify the Notification that should be sent when the report bundle runs from the available options:
l Default Notifications - to send default notifications. Click + to add more Recipients.l Custom Notifications - to send notifications to specific email addresses. Use the edit icon to add moreRecipients.
l Copy to a remote directory - to copy the report bundle to a remote directory.
11. Specify the Event/CMDBAttribute, Operator, and Value. Click + to add more, if required.12. ClickOK.
The report bundle will run at the time you scheduled.
Scheduling Reports Using a Workflow
Follow these steps to schedule a report by using a workflow.
l Step 1 - Create Appropriate Roles for Usersl Step 2 - Map Users to Appropriate Rolesl Step 3 - Request the Report to be Scheduledl Step 4 - Approve the Report Scheduling Requestl Step 5 - View the Report Scheduling Request Status
Step 1 - Create Appropriate Roles for Users
Complete these steps to create a role that will require report scheduling approval.
1. Go to ADMIN > Settings > Role > Role Management.2. ClickNew to create a new role or edit an existing role by selecting a role from the table and clicking Edit.3. Make sure the Approver > Report Schedule option is not checked.4. Make sure the Activation > Report Schedule option is not checked.5. Save the role definition.
Complete these steps to create a role that can approve report scheduling requests.
1. Go to ADMIN > Settings > Role > Role Management2. ClickNew to create a new role or edit an existing role by selecting a role from the table and clicking Edit.3. Make sure the Approver > Report Schedule option is checked.4. Make sure the Activation > Report Schedule option is not checked.5. Save the role definition.
360 User GuideFortinet Technologies Inc.

Managing Resources Reports
Step 2 - Map Users to Appropriate Roles
1. Go to CMDB > Users.2. Select a user from the table and clickEdit.3. In the Edit User dialog box, select the System Admin option, and click the Edit icon.4. Select the Requestor orApprover role as appropriate.
Step 3 - Request Report to be Scheduled
1. Go to RESOURCES > Reports.2. Select a report, then select More > Schedule. The Create New Request dialog box opens.3. If the role requires approval, select an approver from the Approver drop-down list.4. ClickSubmit.5. The approver will receive an email with a link to log back in to FortiSIEM and approve the request.
Step 4 - Approve the Report Scheduling Request
1. Login to FortiSIEM using a role that can approve a report being scheduled .2. ClickApproval. The table in the TASKS page lists pending requests.3. To process the requests, scroll to the right-hand end of the row.4. From the drop-down list, select Approve orReject.
l If you select Approve, the Approve Request dialog box opens. You can choose whether the request isvalid Until or For the date and time listed in the time stamp field. You can click the time stamp fieldto choose a different date and time.
l If you choose Reject, the Reject Request dialog box opens where you can enter a reason for the rejection.5. If you choose Approve, the report will now be scheduled.
Step 5 - View Report Scheduling Request Status
Complete this step to see the status of your report schedule activation requests.
1. Login to FortiSIEM using the same account as in Step 3.2. ClickRequest. The table in the TASKS page shows the status of requests.
Importing and Exporting Reports
Importing a Report
1. Go to RESOURCE>Reports and select the folder where you want to import the report.2. Open theMore drop-down list and select Import.3. ClickChoose File and browse to the report file to import.4. Click Import.
Exporting a Report
Complete these steps to export Reports in PDF or CSV format:
User GuideFortinet Technologies Inc.
361

Rules Managing Resources
1. Go to RESOURCES tab and select the report underReports folder from the left panel.2. Select the reports and clickRun to view the results underANALYTICS tab.3. Go to Action and select Export Result.4. Optional - Enter anyUser Notes about this report.5. Select theOutput Format for the report as CSV or PDF.6. Select the Time Zone for which the report is to be generated. If the devices are in a different Timezone from the
Supervisor, then you can choose the time zone of the devices while configuring the PDF report.7. Select the Template if PDF format is selected:
l Defined - to use the default template defined for this report defined underRESOURCES >Reports.l New - to create a new custom report template for one-time use. The Report Design settings appear on
choosing this option. Note that this template will not replace the template defined underRESOURCES >Reports. See Designing a PDF Report Template for the steps to customize the report template.
8. ClickGenerate to create the report.9. ClickView to open and save the report.Note: If Data Obfuscation is turned on for a FortiSIEM user:
l Raw events are completely obfuscated - the user cannot see any part of the raw message.l Cannot perform search on obfuscated event attributes.l CSVExport feature is disabled.l If an integer event attribute is obfuscated, then the GUI may not show those obfuscated fields. Normally,
integer fields are not obfuscated.
Rules
FortiSIEM continuously monitors your IT infrastructure and provides information to analyze performance,availability, and security. There may also be situations in which you want to receive alerts when exceptional,suspicious, or potential failure conditions arise. You can accomplish this using rules that define the conditions towatch out for, and which trigger an incident when those conditions arise. You can configure a notification policythat will send email and SNMP alerts that the incident has occurred. FortiSIEM includes over 500 system-definedrules, which you can see in RESOURCES > Rules, but you can also create your own rules as described in thetopics in this section.
Viewing RulesCreating RulesActivating and Deactivating a RuleTesting a RuleExporting and Importing Rule Definitions
Viewing RulesFortiSIEM includes a large set of rules for Availability, Performance, Change, Security, and Beaconing groups inaddition to the rules that you can define for your system.
Complete these steps to view all system and user-defined rules:
1. Go to RESOURCES > Rules.2. Use the System drop-down menu of the Rules list pane to filter rules by Organization.3. Select any rule in the Rules list to view related information in the lower pane.
362 User GuideFortinet Technologies Inc.

Managing Resources Rules
All rules have two information tabs:
Tabs Description
Summary This tab provides an overview of the rule logic, its status, and notification settings.
Test ResultsIf you are testing a rule, you can view the results here.
Note: Active rules cannot be tested. You must deactivate a rule beforetesting.
Creating RulesCreating a new rule involves defining the attributes of the incident that is triggered by the rule, as well as thetriggering conditions and any exceptions or clear conditions. You can also create a rule by cloning an existing ruleusing the Clone button and editing it.
Note: Do not use certain keywords in sub-pattern names - regexp.
l Creating a Rulel Defining Rule Conditionsl Defining the Incident Generated by a Rulel Defining Rule Exceptionsl Defining Clear Conditionsl Defining an Incident Title
Creating a Rule
Complete these steps to create a rule:
1. Go to RESOURCES > Rules.2. Select the group where you want to add the new rule.3. ClickNew to create a new rule.
Settings Guidelines
Step 1: General
Rule Name Enter a name for the new Rule.
Description Enter a description of the new Rule.
Event Type The name you enter in the Rule Type field is replicated in the Event Type field.
Remediation Note Enter the Remediation script. Make sure that the Remediation script for your scenario isdefined. Check the existing Remediation scripts underADMIN >Settings >Notification>Action column. If your device is not in the list, add the needed Remediation script.
User GuideFortinet Technologies Inc.
363

Rules Managing Resources
Settings Guidelines
Step 2: Define Conditions
Conditions ClickCondition to create the rule conditions. See Defining Rule Conditions.
Step 3: Define Actions
Severity Select a Severity to associate with the incident triggered by the rule.
Category Select the Category of incidents to be triggered by the rule.
Subcategory Select the Subcategory from the available list based on the selected incident Category.To add custom subcategories, follow the steps under Setting Rule Subcategory.
ActionClick the edit icon to define the incident (Incident Attributes and Triggered Attributes) thatwill be generated by this rule. You must have at least one incident defined before you cansave your rule.
Exception Click the edit icon to define any Exceptions for the rule. See Defining Rule Exceptions.
Dashboard Select Dashboard to add this report underDASHBOARD tab.
Notification Enter a Notification frequency for how often you want notifications to be sent when anincident is triggered by this rule.
Impacts Select the Impacts of the incident triggered by this rule from the drop-down.
Watch Lists Click the edit icon to add the rule you want to add to the watch list.
Note: The Type that you set for the watch list must match the Incident Attribute Types forthe rule. For example, if your watch list Type is IP, and the Incident Attribute Type for therule is string, you will not be able to associate the watch list to the rule.
Clear Click the edit icon to define anyClear conditions for the rule. See Defining ClearConditions.
4. ClickSave.Your new rule will be saved to the group you selected in an inactive state. Before you activate the rule, you shouldtest it.
Defining Rule Conditions
Rule conditions define the event attributes and thresholds that will trigger an incident. Rule conditions are builtfrom sub-patterns of event attribute filters and aggregation functions. You can specify more than one subpatternand the relationships and constraints between them.
364 User GuideFortinet Technologies Inc.

Managing Resources Rules
Specifying a Subpattern
A subpattern defines the characteristics of events that will cause a rule to trigger an incident. A subpatterninvolves defining event attributes that will be monitored, and then defining the threshold values for aggregationsof event attributes that will trigger an incident.
Event Filters
Event filter criteria determine which event attributes and values will be monitored by the rule, and are set in a waythat is similar to the way you set event attributes for structured historical searches and real time searches.
Event Aggregation
While you could have a rule that triggers an incident on a single instance of a particular event, it is more likely thatyou will want your rule to trigger an incident when some number of events have been found that meet your eventfilter criteria.
Group By Attributes
This determines which event attributes will be used to group the events before the group constraints are applied,in a way that is similar to the way the Group By attribute is used to aggregate the results of structured searches.
Aggregate Conditions
The group aggregation conditions set the threshold at which some aggregation of events will trigger a rule tocreate an incident. You create an aggregation condition by using the Expression Builder to set a function, andthen enter theOperator and Value for the aggregation condition. Examples of Group By and AggregateConditions Settings are shown below:
Scenario Group By Attributes AggregateConditions
10 or more events none COUNT(Matchedevents) >= 10
Connections to 100 or more distinctdestination IPs from the same source IP Source IP
COUNT (DISTINCTDestination IP) >=100
Connections to 100 or more distinctdestination IPs from the same source IP onthe same destination port
Source IP,Destination Port COUNT (DISTINCTdestination IP) >=100
Average CPU Utilization on the same server >95% over 3 samples Host IP
COUNT (MatchedEvents) >= 3 ANDAVG(CPU Util) > 95
Logins from the same source workstation to 5or more accounts on the same target server
Source IP, Destination IP COUNT(DISTINCTuser) >= 5
User GuideFortinet Technologies Inc.
365

Rules Managing Resources
Setting the Relationship between Subpatterns
If you have more than one sub-pattern, you must specify the relationship between them with these operators.
Operator Meaning
AND Sub-pattern P1 AND Sub-pattern P2means both sub-patterns P1 and P2have to occur
OR Sub-pattern P1 OR Sub-pattern P2means either P1 or P2 have to occur
FOLLOWED-BY Sub-pattern P1 FOLLOWED-BY Sub-pattern P2means P1 has to befollowed by P2 in time
AND-NOT Sub-pattern P1 AND-NOT Sub-pattern P2means P1 must occur while P2must not; the time order between P1 and P2 is not important
NOT-FOLLOWED-BY Sub-pattern P1 NOT-FOLLOWED-BY P2means P1 must occur and P2must not occur after P1
Setting Inter-subpattern Constraints
You may want to relate attributes of a sub-pattern to the corresponding attributes of another sub-pattern, in a waythat is similar to a JOIN operation in an SQL, by using the relationship operators <, >, <=, >=, =, !=.
366 User GuideFortinet Technologies Inc.

Managing Resources Rules
Examples of inter-subpattern relationships and constraints
Scenario
Sub-pattern P1 -filter
P1 -Group-byattributeset
P1Groupconstraint
Sub-patternP2 filter
P2-group-byattribute
P2groupconstraint
Inter-P1-P2relationships
Inter-P1-P2constraints
5 loginfailuresfrom thesamesource toa servernotfollowedby asuccessfullogonfrom thesamesource tothe sameserver
Eventtype =LoginSuccess
SourceIP,Destination IP
COUNT(MatchedEvent)>= 5
Eventtype =Loginfailure
SourceIP,Destination IP
COUNT(Matched Event)> 0
P1 NOT_FOLLOWED_BY P2
P1'sSourceIP = P2'sSourceIP
Ansecurityattack to aserverfollowedby theserverscanningthenetwork,that is,attempting tocommunicate to100distinctdestination IPaddressesin 5minutetimewindows
Eventtype =Attack
Destination IP
COUNT(MatchedEvent)> 0
EventType =ConnectionAttempted
SourceIP
COUNT(DISTINCTDestination IP) >100
P1FOLLOWED_BY P2
P1'sDestination IP =P2'sSourceIP
User GuideFortinet Technologies Inc.
367

Rules Managing Resources
Scenario
Sub-pattern P1 -filter
P1 -Group-byattributeset
P1Groupconstraint
Sub-patternP2 filter
P2-group-byattribute
P2groupconstraint
Inter-P1-P2relationships
Inter-P1-P2constraints
AverageCPU >95% over3 sampleon aserverAND Pingloss >75%
EventType=CPU_Stat
Host IPCOUNT(MatchedEvent)>= 3ANDAVG(cpuUtil) > 95
EventType =PINGStat
Host IPpingLossPct > 75
P1 ANDP2
P1'sHost IP= P2'sHost IP
Defining the Incident Generated by a Rule
Defining an incident involves setting attributes for the incident based on the subpatterns you created asconditions for the rule, and then setting attributes for the incident that will be used in analytics and reports.
Note: You must have at least one incident defined before you can save your rule.
1. Select the rule you want to define an incident for.2. ClickEditand go to Step 2: Define Condition.3. Select a Subpattern from the drop-down list and click the edit icon to define the conditions for the rule. See
Defining Rule Conditions.Define attributes for the incident based on the Filter, Aggregate, andGroup By attributes you set foryour subpatterns. Typically, you will set the Incident attributes to be the same as the Group By attributesin the subpattern:
a. Select the Attribute you want to add to Incident.b. Select a Subpattern. c. This will populate values from theGroup By attributes in the subpattern to the Filter menu. d. In the Filtermenu, select the attribute you want to set as equivalent to the Event Attribute.
4. In Step 3: Define Action, provide values for the Severity, Category, Subcategory, Dashboard, Notification,Impacts, andWatch List fields as described in Creating a Rule. For information on exceptions, see DefiningRule Exceptions.
5. Click the Action edit icon to define the incident events and triggered attributes in theGenerate Incident fordialog box. This dialog box is is pre-populated with typical attributes you would want included in an incident report.
6. Under Triggered Attributes, select the attributes from the triggering events that you want to include inDashboards and Analytics for this event.
7. ClickSave.
Defining Rule Exceptions
Once you activate a rule, it continuously monitors your IT infrastructure for conditions that would trigger an event.However, you may also want to define exceptions to those conditions. For example, you may know that a server
368 User GuideFortinet Technologies Inc.

Managing Resources Rules
will be going down for maintenance during a specific time period and you don't want your Server Down - NoPing Response rule to trigger an incident for it.
1. In RESOURCES >Rules, select the rule you want to add the exception to, and clickEdit. 2. Select Step 3: Define Action.3. Next to Exceptions, clickEdit.4. Select an Attribute andOperator, and enter a Value, for the conditions that will prevent an incident from being
generated. The values in the Attribute menu are from the Event Attributes associated with the incident definition.
5. Click the + icon to set an effective time period for the exception.You can set effective time periods for single and recurring events, and for durations of time from hours to days.
6. Enter anyNotes about the exception. 7. ClickSave.
Defining Clear Conditions
Clear conditions specify conditions in which incidents will have their status changed from Active to Cleared. Youcan set the time period that must elapse for the clear condition to occur, and then set the conditions based on thetriggering of the original rule, or on a sub pattern based on the Incident Attributes.
1. In RESOURCES >Rules, select the rule you want to add the clear condition to, and click Edit. 2. Select Step 3: Define Action.3. Next to Clear Condition, clickEdit.4. Set the Time Period that should elapse for the clear condition to go into effect.5. If you want the clear condition to go into effect based on the firing of the original rule, select the Original Rule
Does Not Trigger.For example, if you wanted the clear condition to change the status of Active incidents to Cleared after theoriginal rule had not been triggered for ten minutes, you would set Cleared Within to 10 Minutes and select thisoption.
6. If you want to base the clear condition on a sub-pattern of the incident attributes, select the followingconditions are met.The incident attributes from your rule will load and the clear condition attributes will be set to match.
7. Define the pattern to use by clicking the Edit icon next to the clear sub pattern.8. ClickSave.
Defining an Incident Title
Defining an incident title makes it convenient to identify an incident without having to search on incident source,target, and details. You can define titles for both user-defined rules and system rules.
These steps assume you have already created a rule or are editing a system rule.
1. In RESOURCES >Rules, select the rule you want to add a title to, and clickEdit. 2. Select Step 3: Define Action.3. You can either enter text for the title or build the title using incident attributes defined for the rule.
To use the incident attributes to build the title, follow these steps:
a. Open the drop-down list next to Insert Attribute.Notice that the list contains all of the attributes defined in the Incident Attributes field.
User GuideFortinet Technologies Inc.
369

Rules Managing Resources
b. Select an attribute and click the + symbol to the right of the Insert Attribute list.The attribute appears in the Incident Title field prefixed by a "$" symbol, for example,$user.
c. Repeat the previous step for all of the attributes you want to appear in the title.d. You can add text to the Incident Title field to make it more meaningful to you, for example: $user
created $fileName on $hostName.4. ClickSavewhen you have finished your edits.Once the title is defined in a rule definition, FortiSIEM will populate Incident Title field for all new instances of theIncidents.
To Display the Incident Title Field
Follow these steps to display the Incident Title column in the list of incidents table.
1. Go to INCIDENTS > List by Time view.2. Open the Action drop-down list and select Change Display Columns.3. Select Incident Title from the list.4. ClickClose.The Incident Title column appears in the incidents table.
Activating and Deactivating a Rulel Activating a Rule Without a Workflowl Activating a Rule Using a Workflow
Activating a Rule Without a Workflow
If you have permission to activate a rule, follow these steps: You may also want to deactivate a rule, for exampleto test it, instead of deleting it from the system.
1. Go to RESOURCES > Rules.2. Browse or search to find the rule that you want to activate or deactivate.3. Select Active in the Active column to activate the rule, or clear the Active option to deactivate the rule.
Activating a Rule Using a Workflow
Follow these steps to activate a rule by using a workflow.
l Step 1 - Create Appropriate Roles for Usersl Step 2 - Map Users to Appropriate Rolesl Step 3 - Rule to be Activated/Deactivatedl Step 4 - Approve the Rule Activation/Deactivation Requestl Step 5 - View the Rule Activation/Deactivation Request Status
Step 1 - Create Appropriate Roles for Users
Complete these steps to create a role that will require approval for rule activation/deactivation requests.
1. Go to ADMIN > Settings > Role > Role Management.2. ClickNew to create a new role or edit an existing role by selecting a role from the table and clicking Edit.
370 User GuideFortinet Technologies Inc.

Managing Resources Rules
3. Make sure the Approver > Rule Activation/Deactivation option is not checked.4. Save the role definition.
Complete these steps to create a role that can approve rule activation/deactivation requests.
1. Go to ADMIN > Settings > Role > Role Management2. ClickNew to create a new role or edit an existing role by selecting a role from the table and clicking Edit.3. Make sure the Approver > Rule Activation/Deactivation option is checked.4. Save the role definition.
Step 2 - Map Users to Appropriate Roles
1. Go to CMDB > Users.2. Select a user from the table and clickEdit.3. In the Edit User dialog box, select the System Admin option, and click the Edit icon.4. Select the Requestor orApprover role as appropriate.
Step 3 - Request Rule to be Activated/Deactivated
1. Go to RESOURCES > Rules.2. Select a rule, then check or uncheck the active column status as needed. The Create New Request dialog box
opens.3. If the role requires approval, select an approver from the Approver drop-down list.4. ClickSubmit.5. The approver will receive an email with a link to log back in to FortiSIEM and approve the request.
Step 4 - Approve the Rule Activation/Deactivation Requests
1. Login to FortiSIEM using a role that can approve rule activation/deactivation requests.2. ClickApproval. The table in the TASKS page lists pending requests.3. To process the requests, scroll to the right-hand end of the row.4. From the drop-down list, select Approve orReject.
l If you select Approve, the Approve Request dialog box opens. You can choose whether the request isvalid Until or For the date and time listed in the time stamp field. You can click the time stamp fieldto choose a different date and time.
l If you choose Reject, the Reject Request dialog box opens where you can enter a reason for the rejection.5. If you choose Approve, the rule will be enabled or disabled.
Step 5 - View the Rule Activation/Deactivation Request Status
Complete this step to see the status of your rule activation/deactivation requests.
1. Login to FortiSIEM using the same account as in Step 3.2. ClickRequest. The table in the TASKS page shows the status of requests.
Testing a RuleAfter creating or editing a rule, you should test it to see if it works as expected, before activating.
User GuideFortinet Technologies Inc.
371

Network Managing Resources
Note: You can perform rule testing only on the super global organization and not within the local organization.
Complete these steps to test a rule:
1. Go to RESOURCES > Rules, and deactivate the rule to test.Note: If you cannot deactivate a rule for testing, you can clone an inactive version of it.
2. In the Set Activation Scope dialog box, deselect the Activation Status for New Org and all of theorganizations underActivation Status for This Rule.
3. ClickSave to close the Set Activation Scope dialog box.4. Select the rule, and click Test.
This opens the Rule Debug Events dialog box.5. Enter a Reporting IP where the synthetic event should originate from.
If the rule you're testing specifies that the Reporting IP should be a member of a group, you should make surethat the Reporting IP you enter here is in that group.
6. UnderRaw Event, enter the raw event log text that contains the triggering conditions for the rule. 7. Under Pause, enter the number of seconds before the next test event will be sent, and click + underAction to
enter additional test events.Create as many events as necessary to trigger the rule conditions.
8. Click Test Rule.If the test succeeds you are now ready to activate the rule.
Exporting and Importing Rule DefinitionsInstead of using the user interface to define a rule, you can import rule definitions, or you can export a definition,modify it, and import it back into your FortiSIEM virtual appliance. Rule definitions follow an XML schema.
l Exporting a Rule Definitionl Importing a Rule Definition
Exporting a Rule Definition
Complete these steps to export a Rule Definition:
1. Go to RESOURCES > Rule.2. Select the Rule Definition(s) to export from the table.3. ClickExport to download and save the Rule Definition.
Importing a Rule Definition
Complete these steps to import a Rule Definition:
1. Go to RESOURCES > Rule.2. Select the Rule Definition(s) to import in XML format.3. Click Import to import the Rule Definition.
Network
The Networks page lists the defined networks in your IT infrastructure.
Adding a Network
372 User GuideFortinet Technologies Inc.

Managing Resources Network
Modifying a NetworkDeleting a Network
Adding a NetworkComplete these steps to add a network:
1. Go to RESOURCES > Networks.2. Select a group where you want to add the Network group, or create a new one by clicking + above the
RESOURCES groups. 3. Click New.4. Enter the following information:
l Name - name of the networkl Low - lower IP address of the network IP rangel High - higher IP address of the network IP rangel Mask - Subnet mask
5. Click Save.
Modifying a NetworkComplete these steps to modify a network:
1. Go to RESOURCES > Networks.2. Select the network to modify from the table.3. Click Edit.4. Modify the required information:
l Name - name of the networkl Low - lower IP address of the network IP rangel High - higher IP address of the network IP rangel Mask - Subnet mask
5. Click Save.
Deleting a NetworkComplete these steps to delete a network:
1. Go to RESOURCES > Networks.2. Select the network to modify from the table.3. ClickDelete.4. Click Yes to delete the network orRemove only from group to just remove the network from the group.
User GuideFortinet Technologies Inc.
373

Watch list Managing Resources
Watch list
AWatch List is a smart container of similar items such as host names, IP addresses, or user names, that are ofsignificant interest to an administrator and must be watched. Examples of watch lists that are already set up inFortiSIEM are:
l Frequent Account Lockouts - users who are frequently locked outl Host Scanners - IP addresses that scan other devicesl Disk space issues - hosts with disks that are running out of capacityl Denied countries - countries with an excessive number of access denials at the firewalll Blacklisted WLAN endpoints - Endpoints that have been blacklisted byWireless IPS systems
Items are added to a watch list dynamically when a rule is triggered, but you can also add items to a watch listmanually. When you define a rule, you can also choose a watch list that will be populated with a specific incidentattribute, and you can use watch lists as conditions while creating reports, as described in Using a WatchList. You can also define when an entry leaves a watch list - this is time based. For example, if the rule does nottrigger for that attribute for defined time-period, then the entry is removed from the watch list. Watch lists are alsomulti-tenant aware, with organization IDs tracked in relation to watch list items.
The following section provides the procedures to use Watch Lists:
System-defined Watch listCreating a Watch ListModifying a Watch ListUsing a Watch listExporting and Importing Watch Lists
System-defined Watch listFortiSIEM includes several pre-defined watch lists that are populated by system-defined rules.
Watch list DescriptionAttributeType
Triggering Rules
AccountsLocked
Domainaccounts thatare locked outfrequently
User(STRING)
Account Locked: Domain
374 User GuideFortinet Technologies Inc.

Managing Resources Watch list
Watch list DescriptionAttributeType
Triggering Rules
ApplicationIssues
Applicationsexhibitingissues
Host Name(STRING)
IIS Virtual Memory CriticalSQL Server Low Buffer Cache Hit RatioSQL Server Low Log Cache Hit RatioSQL Server Excessive DeadlockSQL Server Excessive Page Read/WriteSQL Server Low Free Pages In Buffer PoolSQL Server Excessive BlockingDatabase Server Disk Latency CriticalSQL Server Excessive Full ScanSQL Server scheduled job failedHigh Oracle Table Scan UsageHigh Oracle Non-System Table Space UsageOracle database not backed up for 1 dayExchange Server SMTPQueue HighExchange Server Mailbox Queue HighExchange Server RPC Request HighExchange Server RPC Latency HighOracle DB Low Buffer Cache Hit RatioOracle DB Low Library Cache Hit RatioOracle DB Low Row Cache Hit RatioOracle DB Low Memory Sorts RatioOracle DB Alert Log ErrorExcessively Slow Oracle DBQueryExcessively Slow SQL Server DBQueryExcessively Slow MySQL DBQuery
User GuideFortinet Technologies Inc.
375

Watch list Managing Resources
Watch list DescriptionAttributeType
Triggering Rules
AvailabilityIssues
Servers,networks orstoragedevices orApplicationsthat areexhibitingavailabilityissues
Host Name(STRING)
Network Device Degraded - Lossy Ping ResponseNetwork Device Down - No Ping ResponseServer Degraded - Lossy Ping ResponseServer Down - No Ping ResponseServer Network Interface Staying DownNetwork Device Interface FlappingServer Network Interface FlappingImportant Process Staying DownImportant Process DownAuto Service StoppedCritical network Interface Staying DownEC2 Instance DownStorage Port DownOracle Database Instance DownOracle Listener Port DownMySQL Database Instance DownSQL Server Instance DownService Staying Down - Slow Response To STMService Down - No Response to STMService Staying Down - No Response to STM
DNSViolators
Sources thatsendexcessive DNStraffic or sendtraffic tounauthorizedDNS gateways
Source IP
Excessive End User DNSQueries to UnauthorizedDNS serversExcessive End User DNSQueriesExcessive Denied End User DNSQueriesExcessive Malware Domain Name QueriesExcessive uncommon DNSQueriesExcessive Repeated DNSQueries To The SameDomain
DeniedCountries
Countries thatare seeing ahigh volume ofdenials on thefirewall
DestinationCountry(STRING)
Excessive Denied Connections From An ExternalCountry
376 User GuideFortinet Technologies Inc.

Managing Resources Watch list
Watch list DescriptionAttributeType
Triggering Rules
Denied Ports
Ports that areseeing a highvolume ofdenies on thefirewall
DestinationPort (INT)
Excessive Denied Connection To A Port
EnvironmentalIssues
EnvironmentalDevices thatare exhibitingissues
Host name(String)
UPS Battery Metrics CriticalUPS Battery Status CriticalHVAC Temp HighHVAC Temp LowHVAC Humidity HighHVAC Humidity LowFPC Voltage THD HighFPC Voltage THD LowFPC Current THD HighFPC ground current highNetBoz Module Door OpenNetBotz Camera Motion DetectedWarning APC TrapCritical APC Trap
HardwareIssues
Servers,networks orstoragedevices thatare exhibitinghardwareissues
Host Name(String)
Network Device Hardware WarningNetwork Device Hardware CriticalServer Hardware WarningServer Hardware CriticalStorage Hardware WarningStorage Hardware CriticalWarning NetApp TrapCritical Network Trap
Host Scanners Hosts thatscan otherhosts
Source IP Heavy Half-open TCPHost ScanHeavy Half-open TCPHost Scan On Fixed PortHeavy TCPHost ScanHeavy TCPHost Scan On Fixed PortHeavy UDPHost ScanHeavy UDPHost Scan On Fixed PortHeavy ICMPPing SweepMultiple IPS Scans From The Same Src
User GuideFortinet Technologies Inc.
377

Watch list Managing Resources
Watch list DescriptionAttributeType
Triggering Rules
Mail Violators
End nodesthat send toomuch mail orsend mail tounauthorizedgateways
Excessive End User Mail to UnauthorizedGatewaysExcessive End User Mail
MalwareFound
Hosts wheremalware foundby Host IPS/AV basedsystems andthe malware isnotremediated
Host Name(String)
Virus found but not remediatedMalware found but not remediatedPhishing attack found but not remediatedRootkit foundAdware process found
MalwareLikely
Hosts that arelikely to havemalware -detected bynetworkdevices andthedeterminationis not ascertain as hostbaseddetection
Source IPorDestinationIP
Excessive Denied Connections From Same SrcSuspicious BotNet Like End host DNS BehaviorPermitted Blacklisted SourceDenied Blacklisted SourcePermitted Blacklisted DestinationDenied Blacklisted DestinationSpam/malicious Mail Attachment found but notremediatedSpyware found but not remediatedDNS Traffic to Malware DomainsTraffic to Emerging Threat Shadow server listTraffic to Emerging Threat RBN listTraffic to Emerging Threat Spamhaus listTraffic to Emerging Threat Dshield listTraffic to Zeus Blocked IP listPermitted traffic from Emerging Threat Shadowserver listPermitted traffic from Emerging Threat RBN listPermitted traffic from Emerging ThreatSpamhaus listPermitted traffic from Emerging Threat DshieldlistPermitted traffic from Zeus Blocked IP list
378 User GuideFortinet Technologies Inc.

Managing Resources Watch list
Watch list DescriptionAttributeType
Triggering Rules
Port Scanners Hosts thatscan ports ona machine
Source IP Heavy Half-open TCP Port Scan: SingleDestinationHeavy Half-open TCP Port Scan: MultipleDestinationsHeavy TCP Port Scan: Single DestinationHeavy TCP Port Scan: Multiple DestinationsHeavy UDP Port Scan: Single DestinationHeavy UDP Port Scan: Multiple Destinations
PolicyViolators
End nodesexhibitingbehavior thatis notacceptable intypicalCorporatenetworks
Source IP
P2P Traffic detectedIRC Traffic detectedP2P Traffic consuming high network bandwidthTunneled Traffic detectedInappropriate website accessInappropriate website access - multiplecategoriesInappropriate website access - high volumeInbound clear text password usageOutbound clear text password usageRemote desktop from InternetVNC From InternetLong lasting VPN sessionHigh throughput VPN sessionOutbound Traffic to Public DNS Servers
User GuideFortinet Technologies Inc.
379

Watch list Managing Resources
Watch list DescriptionAttributeType
Triggering Rules
ResourceIssues
Servers,networks orstoragedevices thatare exhibitingresourceissues: CPU,memory, diskspace, diskI/O, networkI/O,virtualizationresources -either at thesystem level orapplicationlevel
Host Name(STRING)
High Process CPU: ServerHigh Process CPU: NetworkHigh Process Memory: ServerHigh Process Memory: NetworkServer CPUWarningServer CPU CriticalNetwork CPUWarningNetwork CPU CriticalServer MemoryWarningServer Memory CriticalNetwork MemoryWarningNetwork Memory CriticalServer Swap Memory CriticalServer Disk space WarningServer Disk space CriticalServer Disk LatencyWarningServer Disk Latency CriticalServer Intf Util WarningServer Intf Util CriticalNetwork Intf Util WarningNetwork Intf Util CriticalNetwork IPS Intf Util WarningNetwork IPS Intf Util CriticalNetwork Intf Error WarningNetwork Intf Error CriticalServer Intf Error WarningServer Intf Error Critical
380 User GuideFortinet Technologies Inc.

Managing Resources Watch list
Watch list DescriptionAttributeType
Triggering Rules
Virtual Machine CPUWarningVirtual Machine CPU CriticalVirtual Machine Memory Swapping WarningVirtual Machine Memory Swapping CriticalESXCPUWarningESXCPU CriticalESXMemoryWarningESXMemory CriticalESXDisk I/O WarningESXDisk I/O CriticalESXNetwork I/O WarningESXNetwork I/O CriticalStorage CPUWarningStorage CPU CriticalNFS Disk space WarningNFSDisk space Critical
NetApp NFSRead/Write LatencyWarningNetApp NFSRead/Write Latency CriticalNetApp CIFS Read/Write LatencyWarningNetApp CIFS Read/Write Latency CriticalNetApp ISCSI Read/Write LatencyWarningNetApp ISCSI Read/Write Latency CriticalNetApp FCPRead/Write LatencyWarningNetApp FCPRead/Write Latency CriticalNetApp Volume Read/Write LatencyWarning
NetApp Volume Read/Write Latency CriticalEqualLogic Connection Read/Write LatencyWarningEqualLogic Connection Read/Write LatencyCriticalIsilon Protocol LatencyWarning
RoutingIssues
Networkdevicesexhibitingrouting relatedissues
Host Name(STRING)
OSPF Neighbor DownEIGRPNeighbor downOSPF Neighbor Down
User GuideFortinet Technologies Inc.
381

Watch list Managing Resources
Watch list DescriptionAttributeType
Triggering Rules
ScannedHosts
Hosts that arescanned
DestinationIP
Half-open TCPDDOSAttackTCPDDOSAttackExcessive Denied Connections to SameDestination
VulnerableSystems
Systems thathave highseverityvulnerabilitiesfrom scanners
Host Name(STRING)
Scanner found severe vulnerability
Wireless LANIssues
Wirelessnodestriggeringviolations
MACAddress(String)
Rogue or Unsecure AP detectedWireless Host BlacklistedExcessive WLAN ExploitsExcessive WLAN Exploits: Same Source
Creating a Watch ListComplete these steps to create a Watch List:
1. Go to RESOURCES >Watch Lists.2. Select an existing group underWatch Lists folder or create a newWatch List group.To create a new Watch List group:
a. SelectWatch Lists folder from the left panel and click + above the RESOURCES groups. b. In the Create New Watch List dialog box, select theOrganization type.c. Enter the information below:
l Group - name of the Watch List groupl Description - description about the Watch List groupl Type - Watch List type - String, Number, IP, or Datel Case Sensitive - Select if the group name is case-sensitivel Expired in - time period in which the items will expire from the watch if there is no activity for that time
To create a new Watch List:
a. Select a Watch List and clickNew.In the Add New Entry dialog box, theWatch List and Type values are pre-populated based on the Watch Listselection.
b. Enter the information below:l Active - select whether the Watch List will be active when it is createdl Value - a value for the Watch Listl Description - a description of the Watch Listl Expires - time period in which the items will expire from the watch if there is no activity for that time
c. Click Save.
382 User GuideFortinet Technologies Inc.

Managing Resources Watch list
Modifying a Watch ListComplete these steps to modify a Watch List:
1. Go to RESOURCES >Watch Lists.2. Select the Watch List to modify from the table.3. Click Edit and make the required changes.4. Click Save.Use the Delete button to select and delete anyWatch List(s) from the table.
Using a Watch listl Adding Watch List to a Rulel Using Watch Lists as Conditions in Rules and Reports
Adding Watch List to a Rule
You can now add your new watch list to a rule, so that when the rule is triggered, items will be added to the watchlist.
1. Go to RESOURCES > Rules.2. Select the rule where you want to add the watch list, and click Edit.3. Go to the Step 3: Define Action page.4. Click the edit icon for theWatch List.5. For Incident Attribute, select the incident information you want to add to the watch list.
Note:Watch List Attribute Type Must Match Incident Attribute- The Type that you set for the watch listmust match the Incident Attribute Types for the rule. For example, if your watch list Type is IP, and the IncidentAttribute Type for the rule is string, you will not be able to associate the watch list to the rule.
6. Move the watch list you want to add from Available to Selected list using the right arrow.7. ClickSave.
TheWatch Lists field value displays "Defined".
Using Watch Lists as Conditions in Rules and Reports
If you want to create a rule that refers to the attributes in a watch list, for example if you want to create a conditionin which a Source IP listed in yourDNS Violators watch list will trigger an incident.
1. Go to RESOURCES >Reports orRules and select the rule or report where you want to use the watch list.2. ClickEdit.3. Go to the Step 2: Define Condition page.4. UnderConditions for the report in your rule sub-pattern, enter the watch list attribute you want to filter for in the
Attribute field.For example, Source IP.
5. ForOperator, select IN.6. Click ... Select from CMDB under Value, and browse the folders to select the watch list using the right arrow.
For example, DNS Violators.7. ClickOK and continue creating your search criteria or rule sub pattern.
User GuideFortinet Technologies Inc.
383

Protocols Managing Resources
Exporting and Importing Watch Listsl Exporting Watch Listsl Importing Watch Lists
Exporting a Watch List
Complete these steps to export a Watch List:
1. Go to RESOURCES >Watch Lists.2. Select the Watch List(s) to export from the table.3. ClickExport.4. Select the file format asPDF orCSV and clickGenerate.
"Export successful" message is displayed.5. ClickOpen Report File to save the file.
Importing a Watch List
Complete these steps to import a Watch List:
1. Go to RESOURCES >Watch Lists.2. Select the Watch List to modify from the table.3. Click Import.4. Select the file to import in CSV format and click Import.
Protocols
The Protocols page lists the protocols used by applications and devices to communicate with the FortiSIEMvirtual appliance.
Adding a ProtocolModifying a ProtocolDeleting a protocol
Adding a ProtocolComplete these steps to add a Protocol:
1. Go to RESOURCES > Protocols.2. Select a group where you want to add the Network group, or create a new one by clicking + above the
RESOURCES groups. 3. Click New.4. Enter the following information:
a. Name - name of the protocol.b. Description - description about the protocol.c. Protocol/Port(s) - select the Protocol and Port from the drop-down.d. Apps Group - enter the group to associate with the Protocol.
384 User GuideFortinet Technologies Inc.

Managing Resources Event types
5. Click Save.
Modifying a ProtocolComplete these steps to modify a Protocol:
1. Go to RESOURCES > Protocols.2. Select the Protocol to modify from the table.3. Click Edit.4. Modify the required information:
l Name - name of the protocol.l Description - description about the protocol.l Protocol/Port(s) - Protocol and Port from the drop-down.l Apps Group - group to associate with the Protocol.
5. Click Save.
Deleting a protocolComplete these steps to delete a Protocol:
1. Go to RESOURCES > Protocols.2. Select the Protocol to delete from the table.3. Click Delete.4. ClickYes to confirm.
Event types
The Event Types page lists the types of events that are collected for supported devices.
Adding an event typeModifying an Event TypeDeleting an Event Type
Adding an event typeComplete these steps to add an event type:
1. Go to RESOURCES > Event Types.2. Select a group to add the new event to, or create a new one. 3. ClickNew.4. Enter a Name, and Description for the event type. 5. Select the Device Type from the drop-down list to associate with this event type. 6. Select the level of Severity associated with this event type.7. ForCVE IDs, enter links to any vulnerabilities associated with this event type as cataloged by the National
Vulnerability Database.8. ClickSave.
User GuideFortinet Technologies Inc.
385

Working with FortiGuard IOCs Managing Resources
Modifying an Event TypeComplete these steps to modify an Event Type:
1. Go to RESOURCES > Event Types.2. Select the Event Type to modify from the table.3. Click Edit to modify any settings.4. Click Save.
Deleting an Event TypeComplete these steps to delete an Event Type:
1. Go to RESOURCE> Event Types.2. Select the Event Type group from the folder structure on the left panel.3. Select the Event Type from the table and clickDelete to delete.4. Confirm whether to Remove only from group or to remove completely by clicking Yes.
Working with FortiGuard IOCs
The following sections describe how to work with FortiGuard malware domains, IPs, and URLs.
l Working with FortiGuard Malware Domainsl Working with FortiGuard Malware IPsl Working with FortiGuard Malware URLs
Working with FortiGuard Malware DomainsThe following sections describe how to enable, disable, and setup a proxy for the FortiGuard Malware domain.
l Enabling the FortiGuard IOC Servicel Disabling the FortiGuard IOC Servicel Using a Proxy for the FortiGuard IOC Service
Enabling the FortiGuard IOC Service
To start the FortiGuard IOC service, follow these steps:
1. Go to Resources > Malware Domains and select the FortiGuard Malware Domain folder.2. Select an inactive domain from the table.3. ClickMore > Update. In the Update FortiGuard IOC Service dialog box, select Enable IOC Service.4. (Optional) Schedule the starting of the service. See Specifying a schedule.5. ClickSave.
Disabling the FortiGuard IOC Service
To stop the FortiGuard IOC service, follow these steps:
386 User GuideFortinet Technologies Inc.

Managing Resources Working with ThreatConnect IOCs
1. Go to Resources > Malware Domains and select the FortiGuard Malware Domain folder.2. Select an active domain from the table.3. ClickMore > Update. In the Update FortiGuard IOC Service dialog box, select Disable IOC Service.4. ClickSave.
Using a Proxy for the FortiGuard IOC Service
Follow these steps to use a proxy for the FortiGuard IOC service:
1. Go to Resources > Malware Domains and select the FortiGuard Malware Domain folder.2. Select a domain from the table.3. ClickMore > Update. In the Update FortiGuard IOC Service dialog box, select Use Proxy.4. TheModewill be Proxy. Provide the following information:
a. IP/Hostb. Portc. User Named. Password
5. ClickSave.
Working with FortiGuard Malware IPsFor FortiGuard Malware IPs, go to Resources > Malware IPs, select the FortiGuard Malware IP folder, andrepeat the same steps as for FortiGuard Malware Domains.
Working with FortiGuard Malware URLsFor FortiGuard Malware URLs, go to Resources > Malware URLs, select the FortiGuard Malware URLfolder, and repeat the same steps as for FortiGuard Malware Domains.
Working with ThreatConnect IOCs
ThreatConnect can provide malware IPs, domains, hashes, or URLs which FortiSIEM can use to match in logdata The steps are as follows: for each IOC (IP, domain, hash, URL).
1. Discover Collections2. Create Collection Policy3. Schedule IOC DownloadSince an Organization may subscribe to many Collections (an intelligence source), downloading every IOC for allCollections may result in too much data. Therefore, specifying a Collection Policy is essential.
Download ThreatConnect Malware Domains1. Go to Resources > Malware Domains and select the ThreatConnect Malware Domain folder.2. ClickMore > Update. In the Update Malware dialog box, then select Update via API.3. Use your ThreatConnect credentials to complete the URL, User name, and Password fields.4. Plugin Class is provided by default.5. Select a Data Format. In this release, onlySTIX-TAXII is supported.
User GuideFortinet Technologies Inc.
387

Working with ThreatConnect IOCs Managing Resources
6. Enter anOrganization name that is defined in your ThreatConnect account.7. Define a Collection.8. ClickDiscover Collections to expose all of the collections you are eligible to use.9. Select a collection policy in the table and clickEdit.10. Edit any of the following values in the Edit Collection Policy dialog box:
l Enabled: select whether the collection policy is enabledl Collection: edit the collection namel Tag: enter an optional user-defined tag for the collectionl Max False Positive Count: enter a number where the frequency of an attack produces a false positive
on your network.l Min Rating: enter a value between 0 and 5.l Confidence: enter a value between 1 and 100.
11. ClickSave.12. Schedule the download. See Specifying a schedule.13. Check the folder 5 minutes after the scheduled time. Downloaded results should be displayed – organized by each
collection.Note that FortiSIEM does not provide system rules and reports because ThreatConnect folders are dynamic. Theuser must create them using the Collection folders.
Download Other ThreatConnect IOCsFor ThreatConnect Malware IP, go to Resources > Malware IP, select the ThreatConnect Malware IP folder,and repeat the same steps as forMalware Domains.
For ThreatConnect Malware URL, go to Resources > Malware URLs, select the ThreatConnect MalwareURL folder, and repeat the same steps as forMalware Domains.
For ThreatConnect Malware hash, go to Resources > Malware Hash , select the ThreatConnect MalwareHash folder and repeat the same steps as forMalware Domains.
Specifying a schedule1. Click the + icon next to Schedule.2. Enter values for the following options:
l Time Range specifies start time (within the day) and the duration of the scheduling window. Select aUTC time and a corresponding location from the drop-down lists.
l Recurrence Pattern specifies if and how the window will repeat.l If you are scheduling for one time only:
a. Select Once forRecurrence Pattern.b. Select the specific date in Start From.
l If you are scheduling for hourly:a. Enter the hourly interval.b. Select the Start From date forRecurrence Range, then either End after the number
of occurrences, and End by date, orNo end date to continue the recurrence forever.l If you are scheduling forDaily:
a. Select the interval of days or Every weekday.b. Select the Start From date forRecurrence Range, then either End after the number
of occurrences, and End by date, orNo end date to continue the recurrence forever.
388 User GuideFortinet Technologies Inc.

Managing Resources Malware Domains
l If you are scheduling forWeekly:a. Select the interval of weeks or select particular days of the week.b. Select the Start From date forRecurrence Range, then either End after the number
of occurrences, and End by date, orNo end date to continue the recurrence forever.l If you are scheduling forMonthly:
a. Select the days and months from the drop-down lists.b. Select the Start From date forRecurrence Range, then either End after the number
of occurrences, and End by date, orNo end date to continue the recurrence forever.3. ClickSave to apply the changes.
Malware Domains
The Malware Domains page lists domains that are known to generate spam, host botnets, create DDoS attacks,and generally contain malware. The default groups included in your FortiSIEM deployment, MalwareDomainList,Zeus Domains, and SANSDomains, contain malware domains that are derived from the websitesmalwaredomainlist.com and isc.sans.edu. Since Malware Domains are constantly changing, FortiSIEMrecommends maintaining a dynamically generated list of IP addresses provided by services such as these that isupdated on a regular schedule, but you can also add or remove blocked IP addresses from these system-definedgroups, and create your own groups based on manual entry of IP addresses or file upload.
The following sections describe Malware Domains:
Adding a Malware DomainModifying a Malware DomainDeleting a Malware Domain
Adding a Malware DomainComplete these steps to add a Malware domain:
1. Go to RESOURCES > Malware Domains.2. Select a group where you want to add the Malware Domains, or create a new one by clicking + above
the RESOURCES groups. To create a new Malware Domain group:a. Select Malware Domain folder and click + above the RESOURCES groups.b. Enter theGroup name and Description of the Malware Domain.
3. Select the Malware Domain group (existing or new) and clickNew.4. Select the Domain Name and Description of the Malware domain.5. ClickSave.To configure a ThreatConnect Malware Domain, see Working with ThreatConnect IOCs.
To configure a FortiGuard Malware Domain, see Working with FortiGuard Malware Domains.
Modifying a Malware DomainComplete these steps to edit a Malware Domain:
1. Go to RESOURCES> Malware Domain.2. Select the Malware Domain group on the left panel.
User GuideFortinet Technologies Inc.
389

Malware IPs Managing Resources
3. Select the Malware Domain from the table and clickEdit to modify the settings.4. Click Save.To configure a ThreatConnect Malware Domain, see Working with ThreatConnect IOCs.
To configure a FortiGuard Malware Domain, see Working with FortiGuard Malware Domains.
Deleting a Malware DomainComplete these steps to delete a Malware Domain:
1. Go to RESOURCES >Malware Domain.2. Select the Malware Domain on the left panel.3. Select the Malware Domain from the table and clickDelete.4. ClickYes.
Malware IPs
The Malware IP Addresses page lists IP addresses that are known to generate spam, host botnets, create DDoSattacks, and generally contain malware. The two default groups included in your FortiSIEM deployment,Emerging Threats and Zeus, contain IP addresses that are derived from the websites rules.emergingthreats.netand zeustracker.abuse.ch. Because malware IP addresses are constantly changing, FortiSIEM recommendsmaintaining a dynamically generated list of IP addresses provided by services such as these that is updated on aregular schedule, but you can also add or remove blocked IP addresses from these system-defined groups, andcreate your own groups based on manual entry of IP addresses or file upload.
The following sections describe Malware IPs:
Adding a Malware IPModifying a Malware IPDeleting a Malware IPImporting Malware IPs
Adding a Malware IPComplete these steps to add a Malware IPs:
1. Go to RESOURCES > Malware IPs.2. Select a group where you want to add the Malware IPs, or create a new one by clicking + above the
RESOURCES groups. 3. ClickNew.4. Enter the details of the Malware IP.5. ClickSave.To configure a ThreatConnect Malware IP, see Working with ThreatConnect.
To configure a FortiGuard Malware IP, see Working with FortiGuard Malware IPs.
390 User GuideFortinet Technologies Inc.

Managing Resources Malware IPs
Modifying a Malware IPComplete these steps to edit a Malware IP:
1. Go to RESOURCE> Malware IP.2. Select the Malware IP group in the left panel.3. Select the Malware IP from the table and clickEdit to modify the settings.4. Click Save.
To configure a ThreatConnect Malware IP, see Working with ThreatConnect IOCs.
To configure a FortiGuard Malware IP, see Working with FortiGuard Malware IPs.
You can use the Delete button to select and remove any Malware IP from the list.
Deleting a Malware IPComplete these steps to delete a Malware IP:
1. Go to RESOURCE> Malware IPs.2. Select the Malware IP group from the folder structure on the left panel.3. Select the Malware IP from the table and clickDelete to delete.4. ClickYes to confirm.
Importing Malware IPsYou can import Malware IP information into FortiSIEM from external threat feed websites.
l Prerequisitesl Websites with built-in supportl Custom threat feed websites - CSV data - one-time manual importl Custom threat feed websites - CSV data - programmatic importl Custom threat feed websites - non-CSV data - programmatic importl Custom threat feed websites - STIX formatted data and TAXII import
Prerequisites
Before proceeding, gather the following information about a threat feed web site:
l Website URLl Credentials required to access the website (optional).l If the website is not supported by FortiSIEM, you may need to understand the format of the data returned by the
URL.l If the data is in the comma-separated value format (the separator need not be a comma but could be any
separator), then a simple integration is possible.l If the data is any other format, for example, XML, then some code must be written for integration using the
framework provided by FortiSIEM.
Websites with built in support
The following websites are supported:
User GuideFortinet Technologies Inc.
391

Malware IPs Managing Resources
l Emerging threat (http://rules.emergingthreats.net)l Threat Stream Malware IP (https://api.threatstream.com)l Hail-A-TAXII Malware IP (http://hailataxii.com/)
For Threat Stream Malware IP, the following Malware types are imported:
l Bot IPl Actor IPl APT Emaill APT IPl Bruteforce IPl Compromised IPl Malware IPl DDoS IPl Phishing email IPl Phish URL IPl Scan IPl Spam IP
To import data from these websites, follow these steps:
1. In the RESOURCES > Malware IPs, find the website you must import data from. 2. Select the folder.3. ClickMore >Update.4. Select Update via API. The link will show in the edit box.5. Enter a Schedule by clicking the + icon.6. Enter the schedule parameters - when to start and how often to import. FortiSIEM recommends no more frequent
than hourly.7. Select the type of template you want to create.
Custom threat feed websites - CSV data - one-time manual import
This requires that the data to be imported is already in a file in comma-separated value format. The requiredformat is:
Name, Low IP, High IP, Malware Type, Confidence, Severity, ASN, Org, Country ,De-scription,Data Found(MM/DD/YYYY),Last Seen(MM/DD/YYYY)
Although many fields are possible, only Low IP is required. If High IP is not provided, then it is set to Low IP.
1. Select RESOURCE>Malware IPs.2. Click the + button on the left navigation tree to open the Create New Malware IP Group dialog box.3. Enter aGroup name and add a Description.4. ClickSave to create the folder underMalware IPs.5. Select the folder just created.6. Select More > Update.7. ClickChoose File.8. Browse to the file you want to import and clickSave.
The imported data will appear in the right pane.
392 User GuideFortinet Technologies Inc.

Managing Resources Malware IPs
Custom threat feed websites - CSV data - programmatic import
This requires that the web site data is:
l a file in comma-separated value format (separator can be any special character such as space, tab, hash, dollaretc.).
l one entry is in one line.
Although many fields are possible, only Low IP is required. If High IP is not provided, then it is set to Low IP.
Follow these steps:
1. Select RESOURCES >Malware IPs.2. Click the + button on the left navigation tree to open the Create New Malware IP Group dialog.3. EnterGroup and add Description. ClickSave to create the folder underMalware IPs.4. Select the folder just created.5. Select More >Update >Update via API.6. Click the edit icon next to URL and provide the following information:
a. Enter the URL of the website.b. EnterUser Name and Password (optional).c. For Plugin Class, the default class
com.accelops.service.threatfeed.impl.ThreatFeedWithMappingPolicyService is displayed.Note: Do not modify this in any case.
d. Enter the correct Field Separator (by default, it is a comma).e. Select CSV as the Data Format.f. Enter the Data Mapping by choosing the mapped field and the corresponding position in the website
data. For example, if the IP is in third position, then choose 3 in the Position column.7. ClickSave.8. Select an import schedule by clicking + on the Schedule. Select when to start the import and how often to import
to get new data from the website.The imported data will show on the right pane after some time.
Custom threat feed websites - non-CSV data - programmatic import
This is the most general case where the website data format does not satisfy the previous conditions. In thiscase, write a Java plugin class by modifying the default system provided one.
After the class has been written and fully tested for correctness, follow these steps.
1. Select RESOURCES >Malware IPs.2. Click on the "+" button on the left navigation tree to bring up the Create New Malware IP Group dialog.3. EnterGroup and add Description.4. ClickSave to create the folder underMalware IPs.5. Select the folder just created.6. Select More >Update >Update via API.7. Click the edit icon and:
a. Enter the URL of the website.b. EnterUser Name and Password (optional).c. For Plugin Class, the custom Java class for this case.
User GuideFortinet Technologies Inc.
393

Malware URLs Managing Resources
d. Select 'Custom' as the Data Format.e. ClickSave.
8. Select an import schedule by clicking + on the Schedule. Select when to start the import and how often to importto get new data from the website.The imported data will display on the right pane after some time.
Custom threat feed websites - STIX formatted data and TAXII import
In this case, the threat feed data is available formatted as STIX and follows the TAXII protocol.
1. Select RESOURCES >Malware IPs.2. Click on the "+" button on the left navigation tree to bring up the Create New Malware IP Group dialog.3. EnterGroup and add Description. ClickSave to create the folder underMalware IPs.4. Select the folder just created.5. Select More >Update >Update via API.6. Click the edit icon and:
a. Enter the URL of the website.b. EnterUser Name and Password (optional).c. Select 'STIX-TAXII' as the Data Format.d. For Plugin Class, choose com.accelops.service.threatfeed.impl.StixMalwareIPUpdateService
and Full.e. ClickSave.
7. Select a import schedule by clicking + on the Schedule. Select when to start the import and how often to importto get new data from the website.The imported data will show on the right pane after some time.
Malware URLs
The Malware URLs page lists URLs that are known to host malware. The Threat Stream Blocked URL group isincluded in your FortiSIEM deployment.
The following sections describe Malware URLs:
Adding a Malware URLModifying a Malware URLDeleting a Malware URLImporting Malware URLs
Adding a Malware URLComplete these steps to add a Malware URL:
1. Go to RESOURCES > Malware URLs.2. Select a group where you want to add the Malware URL, or create a new one by clicking + above the
RESOURCES groups. 3. ClickNew.
394 User GuideFortinet Technologies Inc.

Managing Resources Malware URLs
4. Enter the following information about the Malware URL:l URLl Malware Typel Confidencel Descriptionl Last Seen
5. ClickSave.To configure a ThreatConnect Malware Domain, see Working with ThreatConnect IOCs.
To configure a FortiGuard Malware URL, see Working with FortiGuard Malware URLs.
Modifying a Malware URLComplete these steps to edit a Malware URL:
1. Go to RESOURCE> Malware URL.2. Select the Malware URL group from the folder structure on the left panel.3. Select the Malware URL from the table and clickEdit to modify the settings.4. Click Save.
To configure a ThreatConnect Malware URL, see Working with ThreatConnect IOCs.
To configure a FortiGuard Malware URL, see Working with FortiGuard Malware URLs.
You can use the Delete button to select and remove any Malware URL from the list.
Deleting a Malware URLComplete these steps to delete a Malware URL:
1. Go to RESOURCES > Malware URLs.2. Select the Malware URL group from the folder structure on the left panel.3. Select the Malware URL from the table and clickDelete to delete.4. ClickYes to confirm.
Importing Malware URLsThis section describes how to import Malware URL information into FortiSIEM from external threat feedwebsites.
l Prerequisitesl Threat feed websites with built in supportl Custom threat feed websites - CSV data - one-time manual importl Custom threat feed websites - CSV data - GUI importl Custom threat feed websites - non-CSV data - programmatic importl Custom threat feed websites - STIX formatted data and TAXII import
Prerequisites
Before proceeding, gather the following information about a threat feed web site:
User GuideFortinet Technologies Inc.
395

Malware URLs Managing Resources
l Website URL.l Credentials required to access the website (optional).l If the website is not supported by FortiSIEM, you may need to understand the format of the data returned by the
URL.l If the data is in comma-separated value (CSV) format, then a simple integration is possible. Note that the
separator need not be a comma but could be any separator.l If the data is any other format, for example, XML, then some code must be written for integration using the
framework provided by FortiSIEM.
Threat feed websites with built in support
The following websites are supported:
l Threat Stream Malware URL (https://api.threatstream.com)l FortiSandbox Malware URLl Hail-A-TAXII Malware IP (http://hailataxii.com/)
To import data from these websites, follow these steps:
1. In the RESOURCES > Malware URLs, find the website you must import data from. 2. Select the folder.3. ClickMore >Update.4. Select Update via API. The link will show in the edit box.5. Enter a Schedule by clicking the + icon.6. Enter the schedule parameters: when to start and how often to import. FortiSIEM recommends no more frequent
than hourly.
Custom threat feed websites - CSV data - one-time manual import
This requires that the data to be imported is already in a file in comma-separated value format. The requiredformat is:
URL, Malware Type, Confidence, Description,Last Seen(MM/DD/YYYY)
1. Select RESOURCES >Malware URLs.2. Click the + button on the left navigation tree to open the Create New Malware URL Group dialog.3. EnterGroup and add Description. ClickSave to create the folder underMalware URLs.4. Select the folder just created.5. Select Import from a CSV file.6. ClickChoose File; enter the file name and clickUpload.
The imported data will show on the right pane.
Custom threat feed websites - CSV data - GUI import
This requires that the web site data has the following structure:
l The file is in a comma-separated value format (the separator can be any special character such as space, tab, hash,dollar sign, etc.).
l One line has only one entry.
Follow these steps:
396 User GuideFortinet Technologies Inc.

Managing Resources Malware URLs
1. Select RESOURCES >Malware URLs.2. Click the + button on the left navigation tree to open the Create New Malware URL Group dialog box.3. EnterGroup and add Description. ClickSave to create the folder underMalware URLs.4. Select the folder just created.5. Select More >Update >Update via API.6. Click the edit icon next to URL and:
a. Enter the URL of the website.b. EnterUser Name and Password (optional).c. For Plugin Class, the default class
com.accelops.service.threatfeed.impl.ThreatstreamMalwareUrlUpdateService is shown. Do notmodify this value for this case.
d. Enter the correct Field Separator (by default it is a comma).e. Set Data Format to CSV.f. Select Data Update as Full to overwrite the existing data or Incremental to retain the existing data.g. Enter the Data Mapping by choosing the mapped field and the corresponding position in the website
data. For example if the URL is in third position, then choose 3 in the Position column.h. ClickSave.
7. Select an import schedule by clicking + on the Schedule. Select when to start the import and how often to importnew data from the website.The imported data will show on the right pane.
Custom threat feed websites - non-CSV data - programmatic import
This is the most general case where the website data format is not CSV. In this case, write a Java plugin bymodifying the default class provided by the system.
After the class has been written and fully tested for correctness, follow these steps:
1. Select RESOURCES >Malware URLs.2. Click the + button on the left navigation tree to open the Create New Malware URL Group dialog.3. Enter theGroup name and add a Description. ClickSave to create the folder underMalware URLs.4. Select the folder just created.5. Select More >Update >Update via API.6. Click the edit icon and:
a. Enter the URL of the website.b. EnterUser Name and Password (optional).c. For Plugin Class, enter the name of the custom Java plugin class.d. Select Custom as the Data Format.e. Select Data Update as Full to overwrite the existing data or Incremental to retain the existing data.f. ClickSave.
7. Select an import schedule by clicking + on the Schedule. Select when to start the import and how often to importnew data from the website.The imported data will show on the right pane.
Custom threat feed websites - STIX formatted data and TAXII import
In this case, the threat feed data is available formatted as STIX and follows the TAXII protocol.
User GuideFortinet Technologies Inc.
397

Malware Processes Managing Resources
1. Select RESOURCES >Malware URLs.2. Click the + button on the left navigation tree to open the Create New Malware URL Group dialog box.3. EnterGroup and add Description. ClickSave to create the folder underMalware URLs.4. Select the folder just created.5. Select More >Update >Update via API.6. Click the edit icon and:
a. Enter the URL of the website.b. EnterUser Name and Password (optional).c. Do not edit the name of the Plugin Class.d. Select STIX-TAXII as the Data Format.e. Enter the name of the STIX-TAXII Collection.f. Select Full as the Data Update value. Existing data will be overwritten.g. ClickSave.
7. Select an import schedule by clicking + on the Schedule. Select when to start the import and how often to importnew data from the website.The imported data will display on the right pane.
Malware Processes
The following sections describe Malware Processes:
Creating a Malware Process GroupAdding a Malware ProcessModifying a Malware ProcessDeleting a Malware Process
Creating a Malware Process GroupComplete these steps to add a Malware Process group:
1. Go to RESOURCES and select Malware Processes.2. Click + above the RESOURCES groups.3. Enter a group Name and Description in the Create New Malware Process Group dialog box.4. Choose processes to include by expanding the tree in the Folders panel.5. Select processes from the Items panel and move them to the Selections panel.6. ClickSave.
Adding a Malware ProcessComplete these steps to add a Malware Processes:
1. Go to RESOURCES > Malware Processes.2. Select a group where you want to add the Malware Processes. 3. ClickNew.4. Enter the Process Name and Description of the Malware Process.5. ClickSave.
398 User GuideFortinet Technologies Inc.

Managing Resources Country Groups
Complete these steps to import Malware processes from a CSV file:
1. Go to RESOURCES > Malware Processes. 2. ClickMore >Update > Import from a CSV file.3. ClickChoose File to select the CSV file.4. Click Import.
Modifying a Malware ProcessComplete these steps to edit a Malware Process:
1. Go to RESOURCE> Malware Process.2. Select the Malware Process group from the folder structure on the left panel.3. Select the Malware Process from the table and clickEdit to modify the settings.4. Click Save.
Deleting a Malware ProcessComplete these steps to delete a Malware Process:
1. Go to RESOURCE> Malware Processes.2. Select the Malware Process group from the folder structure on the left panel.3. Select the Malware Process from the table and clickDelete to delete.4. Confirm whether to Remove only from group by clicking Yes orNo.
Country Groups
The Country Groups page contains a list of all of the country names in the FortiSIEM geolocation database. Youcan also create folders that represent different organizations of countries for use in analytics.
Creating a Country GroupAdding a Country GroupModifying a Country GroupDeleting a Country GroupCreating a CountryDeleting a Country
Creating a Country GroupComplete these steps to add a Country Group:
1. Go to RESOURCES > Country Group.2. Click + above the RESOURCES groups. 3. Enter a group Name and Description in the Create New Country Group dialog box.4. Choose countries to include by expanding the tree in the Folders panel, selecting countries from the
Items panel, and moving them to the Selections panel.5. ClickSave.
User GuideFortinet Technologies Inc.
399

Country Groups Managing Resources
Adding a Country GroupComplete these steps to add a Country Group:
1. Go to RESOURCES > Country Group.2. Select a group where you want to add the Country Group, or create a new one by clicking + above the
RESOURCES groups. 3. ClickNew.4. Enter the Country Name and Description of the Country Group.5. ClickSave.
Modifying a Country GroupComplete these steps to edit a Country Group:
1. Go to RESOURCE> Country Group.2. Select a Country Group from the left panel.3. Select the Country Group from the table and clickEdit to modify the settings.4. Click Save.
Deleting a Country GroupComplete these steps to delete a Country Group:
1. Go to RESOURCE> Country Group.2. Select a Country Group from the left panel.3. Select - above the Resource groups.4. Confirm whether to Remove only from group or to remove the group completely by clicking Yes.
Creating a CountryComplete these steps to add a Country to a Country Group:
1. Go to RESOURCES > Country Group.2. Click the Country Group where you want to create a country.3. ClickNew.4. Enter a countryName and Description in the Add New Geo Country dialog box.5. ClickSave.
Deleting a CountryComplete these steps to delete a Country from a Country Group:
1. Go to RESOURCE> Country Group.2. Select a Country Group from the left panel.3. Select a country from the table and clickDelete.4. Confirm whether to Remove only from group only or to remove the country completely.
400 User GuideFortinet Technologies Inc.

Managing Resources Malware Hash
Malware Hash
Use theMalware Hash page to define a list of malware files and their hash functions. When FortiSIEM monitorsa directory, it generates these directory events:
Directory Event Generated by This Action
PH_DEV_MON_CUST_FILE_CREATE New file creation
PH_DEV_MON_CUST_FILE_SCAN Directory is scanned
PH_DEV_MON_CUST_FILE_CHANGE_CONTENT Changes in file content
When FortiSIEM scans a file and collects its hash, it uses the system rule Malware Hash Check to check thelist of malware hashes. FortiSIEM will then trigger an alert if a match is found.
The following sections describe Malware Hashes:
Adding a Malware HashModifying a Malware HashUpdating user-defined Malware Hash
Adding a Malware HashComplete these steps to add a Malware Hash:
1. Go to RESOURCES >Malware Hash.2. Select a group where you want to add the Malware Hash, or create a new group by clicking + above the
RESOURCES groups. 3. ClickNew and add the information related to the Malware Hash.4. ClickSave.To add a ThreatConnect Malware Hash, see Working with ThreatConnect.
Modifying a Malware HashComplete these steps to edit a Malware Hash:
1. Go to RESOURCE> Malware Hash.2. Select the Malware Hash group from the folder structure on the left panel.3. Select the Malware Hash from the table and clickEdit to modify the settings.4. Click Save.To modify a ThreatConnect Malware Hash, see Working with ThreatConnect.
You can use the Delete button to select and remove any Malware Hash from the list.
Updating user-defined Malware HashSystem defined groups are updated by its own service:
User GuideFortinet Technologies Inc.
401

Malware Hash Managing Resources
l Threat Stream Malware Hashl FortiSandbox Malware Hash
You can update the Malware Hash using the following options:
l Import from a CSV filel Update via API
Prerequisites:
Before proceeding, gather the following information about a threat feed web site.l Website URL.l Credentials required to access the website (optional).l If the website is not supported by FortiSIEM, you must understand the format of the data returned by the
URL.l If the data is in the comma-separated value format (the separator need not be a comma but could
be any separator, then a simple integration is possible.)l If the data is any other format, for example, XML, then some code must be written for integration
using the framework provided by FortiSIEM.
Import from a CSV file
Custom websites - CSV data - one-time manual import
Instead of manually adding Malware Hashes to a group individually, you can upload a CSV file with multipleentries. This requires that the data to be imported is already in a file in a comma-separated value format.
Botnet Name, Algorithm, Hash Code, Controller IP, Malware Type, Confidence,Severity, Asn, Org, Country, Description, Data Found(MM/DD/YYYY), Last Seen(MM/DD/YYYY), High IP,Malware Type, Confidence, Severity, ASN, Org, Country,Description,Data Found (MM/DD/YYYY),Last Seen(MM/DD/YYYY)
Note: Although many fields are possible, only Botnet Name and Hash Code are required.1. Go to RESOURCES >Malware Hash.2. Select the group from the left panel or create a new group by clicking the + icon above the list of
RESOURCES groups.3. Select More >Update.4. Select Import from a CSV file and choose the file to import.5. Click Import.
Update via API
This section describes how to import Malware Hash information into FortiSIEM from external threat feedwebsites. Malware Hashes are used by malware to hide their own identity.
Updating System Defined Malware Hash Group
The following websites are supported:
l Threat Stream Open Proxy (https://api.threatstream.com)l Threat Stream TOR Node (https://api.threatstream.com)
Complete these steps to import data from these websites:
402 User GuideFortinet Technologies Inc.
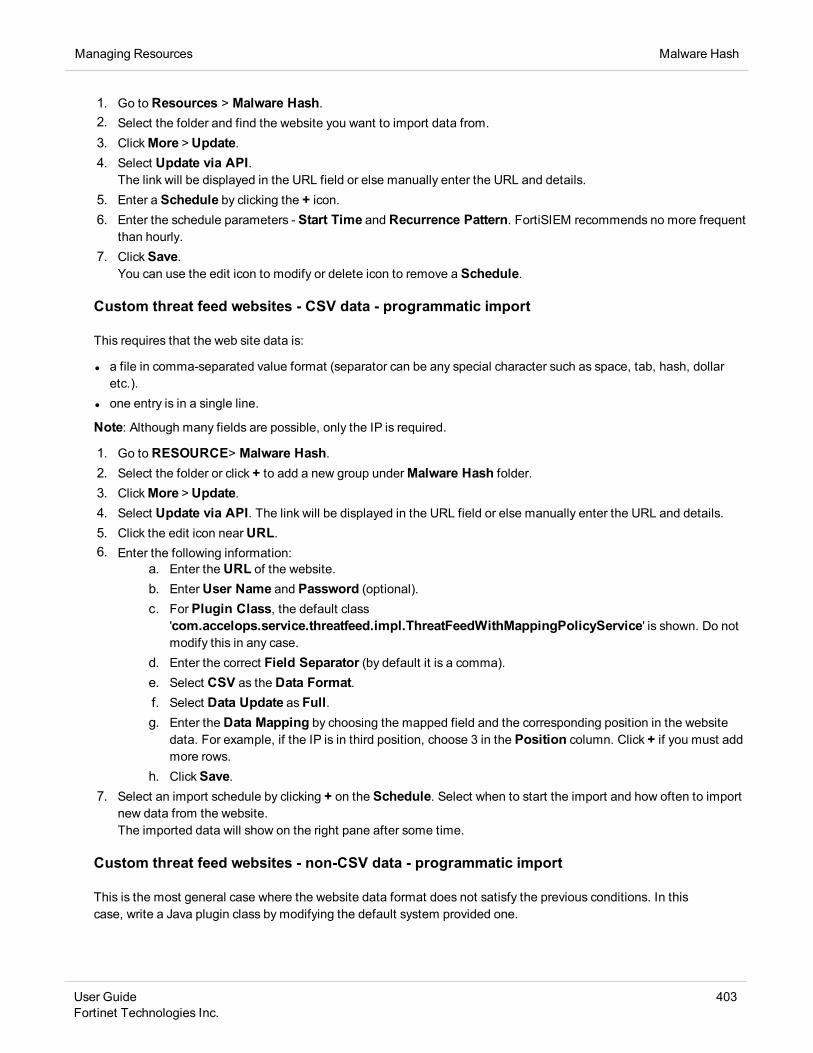
Managing Resources Malware Hash
1. Go to Resources > Malware Hash.2. Select the folder and find the website you want to import data from. 3. ClickMore >Update.4. Select Update via API.
The link will be displayed in the URL field or else manually enter the URL and details.5. Enter a Schedule by clicking the + icon.6. Enter the schedule parameters - Start Time and Recurrence Pattern. FortiSIEM recommends no more frequent
than hourly.7. ClickSave.
You can use the edit icon to modify or delete icon to remove a Schedule.
Custom threat feed websites - CSV data - programmatic import
This requires that the web site data is:
l a file in comma-separated value format (separator can be any special character such as space, tab, hash, dollaretc.).
l one entry is in a single line.
Note: Although many fields are possible, only the IP is required.
1. Go to RESOURCE> Malware Hash.2. Select the folder or click + to add a new group underMalware Hash folder.3. ClickMore >Update.4. Select Update via API. The link will be displayed in the URL field or else manually enter the URL and details.5. Click the edit icon nearURL.6. Enter the following information:
a. Enter the URL of the website.b. EnterUser Name and Password (optional).c. For Plugin Class, the default class
'com.accelops.service.threatfeed.impl.ThreatFeedWithMappingPolicyService' is shown. Do notmodify this in any case.
d. Enter the correct Field Separator (by default it is a comma).e. Select CSV as the Data Format.f. Select Data Update as Full.g. Enter the Data Mapping by choosing the mapped field and the corresponding position in the website
data. For example, if the IP is in third position, choose 3 in the Position column. Click + if you must addmore rows.
h. ClickSave.7. Select an import schedule by clicking + on the Schedule. Select when to start the import and how often to import
new data from the website.The imported data will show on the right pane after some time.
Custom threat feed websites - non-CSV data - programmatic import
This is the most general case where the website data format does not satisfy the previous conditions. In thiscase, write a Java plugin class by modifying the default system provided one.
User GuideFortinet Technologies Inc.
403

Malware Hash Managing Resources
1. Go to RESOURCE> Malware Hash.2. Select the folder or click + to add a new group underMalware Hash folder.3. ClickMore >Update.4. Select Update via API.5. Click the edit icon nearURL.6. Enter the following information:
a. Enter the URL of the website.
b. EnterUser Name and Password (optional).
c. For Plugin Class, the custom Java class in this case.
d. Select Custom as the Data Format.
l Enter the Data Mapping by choosing the mapped field and the corresponding position in thewebsite data. For example, if the IP is in third position, choose 3 in the Position column. Click +if you must add more rows.
l Select Full as the Data Update value. Existing data will be overwritten. Select Incremental topreserve the existing data.
For STIX-TAXII:
l Enter the name of the STIX-TAXII Collection.l Select Full as the Data Update value. Existing data will be overwritten.
e. ClickSave.
7. Select an import schedule by clicking + on the Schedule. Select when to start the import and how often to importnew data from the website.The imported data will display in the table after some time.
Custom threat feed websites - non-CSV data -STIX formatted data and TAXII import
In this case, the threat feed data is available formatted as STIX and follows the TAXII protocol.
1. Go to RESOURCE> Malware Hash.2. Select the folder or click + to add a new group underMalware Hash folder.3. ClickMore >Update.4. Select Update via API.5. Click the edit icon nearURL.6. Enter the following information:
a. Enter the URL of the website.b. EnterUser Name and Password (optional).c. For Plugin Class, the custom Java class in this case.d. Enter the name of the STIX-TAXII Collection.e. Select STIX-TAXII as the Data Format.f. Select Data Update as Full.g. ClickSave.
7. Select an import schedule by clicking + on the Schedule. Select when to start the import and how often to importnew data from the website.The imported data will display in the table after some time.
404 User GuideFortinet Technologies Inc.

Managing Resources Default Password
Default Password
The Default Password page contains a list of default vendor credentials. These well-known credentials shouldnever be used in production. During device discovery FortiSIEM checks if the device credentials are still set todefault, The system rule Default Password Detected by System triggers an incident if they are.
This is a sample raw event log for a default password incident:
<174>Oct 20 22:50:03 [PH_AUDIT_DEFAULT_PWD_MATCH]:[phEventCategory]=2,[appTransportProto]=SNMP,[reptModel]=Firewall-1 SPLAT,[srcIpAddr]=192.168.19.195,[phCustId]=1,[sessionId]=0f8bdee2b6a265c4bd075fc777ed,[procName]=AppServer,[reptVendor]=Checkpoint,[hostIpAddr]=172.16.0.1,[hostName]=SJ-QA-F-Lnx-CHK,[eventSeverity]=PHL_INFO,[user]=,[phLogDetail]=Default password matches for thesame composite key (Vendor, Model, Access method, User Name, Password)
The following sections describe Default Passwords:
Adding a Default PasswordModifying a Default PasswordImporting and Exporting a Default Password
Adding a Default PasswordComplete these steps to add a default password:
1. Go to RESOURCES > Default Password.2. Select a group where you want to add the default password, or create a new group by clicking + above
the RESOURCE groups. 3. ClickNew.4. Select the Vendor andModel of the device for which you want to enter a default password.5. Select the Access Protocol that is used to connect to the device from the drop-down.6. Enter the default User Name and Password for the device. 7. ClickSave.
Modifying a Default PasswordComplete these steps to edit a default password:
1. Go to RESOURCES> Default Password.2. Select the default password group from the folder structure on the left panel.3. Select the default password from the table and clickEdit to modify the settings.4. Click Save.Use the Delete button to select and remove any default password(s) from the list.
Importing and Exporting a Default PasswordThe procedures below describe how to import and export a Default Password.
User GuideFortinet Technologies Inc.
405

Anonymity network Managing Resources
Importing Default Password
Instead of manually adding default passwords to a user-defined or system group individually, you can upload aCSV file with multiple entries into a group.
You must format the file with these fields: Vendor,Model,Access Protocol,User Name,Password
For example: Microsoft,Windows,WMI,Administrator,Administrator
1. Go to RESOURCES >Default Password.2. Select the Default Password group where you want to import the new password from the folder
structure.3. Click Import and select the CSV file.4. Click Import.
Exporting Default Password
Complete these steps to export a default password from a Group to a CSV File.1. Go to RESOURCES >Default Password.2. Select the Default Password group from where you want to export the Default Password from the folder
structure.3. Select the Default Password from the table and clickExport.4. ClickGenerate.
'Export successful' message is displayed.5. ClickOpen Report File and save the report.
Anonymity network
An anonymity network is used to hide one's network identity, and is typically used by malware to hide itsoriginating IP address. Enterprise network traffic should not be originating from or destined to Anonymity network.
When FortiSIEM discovers traffic destined to or originating from anonymity networks, it triggers these rules:
l Inbound Traffic from Tor Networkl Outbound Traffic to Tor Networkl Inbound Traffic from Open Proxiesl Outbound Traffic to Open Proxies
Adding Anonymity NetworksModifying Anonymity NetworksUpdating Anonymity Networks
Adding Anonymity NetworksFortiSIEM provides two default (system-defined) groups for Anonymity Networks:
l Open Proxies: A set of open proxies in the internet. This is a static group.l Tor Nodes: This group is dynamically updated from https://check.torproject.org/exit-addresses. To schedule
regular updates for this group, click the group name, then click Update and provide updated schedulinginformation.
406 User GuideFortinet Technologies Inc.

Managing Resources Anonymity network
Complete these steps to add Anonymity Networks:
1. Go to RESOURCE> Anonymity Network folder on the left panel. 2. Select Open Proxies or Tor Nodes folder or click + to add a new group.3. Click New.4. Enter IP, Port, and Country information about the anonymity network. 5. Click the Calendar icon to select the Date Found and Last Seen.6. Click Save.
Adding Anonymity Networks to Watch Lists
You can easily add an anonymity network IP address to your watch lists. Hover your mouse cursor over theanonymity network IP address until the icon for theOptionsmenu appears, and then select Add to Watchlist.
Modifying Anonymity NetworksComplete these steps to edit an Anonymity Network:
1. Go to RESOURCE> Anonymity Network.2. Select the Anonymity Network group from the folder structure on the left panel.3. Select the Anonymity Network from the table and clickEdit to modify the settings.4. Click Save.You can use the Delete button to select and remove any Anonymity Network from the list.
Updating Anonymity NetworksThis section describes how to update Anonymity Network information in FortiSIEM from external threat feedwebsites.
You can update the Anonymity Network information in the following ways:
l Import from a CSV filel Update via API
Prerequisites:
Before proceeding, gather the following information about a threat feed web site.l Website URL.l Credentials required to access the website (optional).l If the website is not supported by FortiSIEM, you must understand the format of the data returned by the
URL.l If the data is in the comma-separated value format (the separator need not be a comma but could
be any separator, then a simple integration is possible.)l If the data is any other format, for example, XML, then some code needs to be written for
integration using the FortiSIEM provided framework.
User GuideFortinet Technologies Inc.
407

Anonymity network Managing Resources
Import from a CSV file
Custom websites - CSV data - one-time manual import
Instead of manually adding anonymity networks to a group individually, you can upload a CSV file with multipleentries. This requires that the data to be imported is already in a file in comma-separated value format.
IP, Port, Malware Type, Confidence, Severity, Asn, Org, Country, Description, DataFound(MM/DD/YYYY), Last Seen(MM/DD/YYYY)
Note: Although many fields are possible, only the IP is required.1. Go to RESOURCES >Anonymity Network.2. Select the group from the left panel or create a new group by clicking the + icon above the list of
RESOURCES groups.3. Select More >Update.4. Select Import from a CSV file and choose the file to import.5. Click Import.
Update via API
This section describes how to import anonymity networks information into FortiSIEM from external threat feedwebsites. Anonymity networks are used by malware to hide their own identity.
Websites with built in support
The following websites are supported:
l Threat Stream Open Proxy (https://api.threatstream.com)l Threat Stream TOR Node (https://api.threatstream.com)
Complete these steps to import data from these websites:
1. Go to Resources > Anonymity Network.2. Select the folder and find the website you must import data from. 3. ClickMore >Update.4. Select Update via API. The link will be displayed in the URL field or else manually enter the URL and
details.5. Enter a Schedule by clicking the + icon.6. Enter the schedule parameters - Start Time and Recurrence Pattern. FortiSIEM recommends no
more frequent than hourly.7. ClickSave.
You can use the edit icon to modify or delete icon to remove a Schedule.
Custom websites - CSV data - programmatic import
This requires that the web site data is:
l a file in comma-separated value format (separator can be any special character such as space, tab, hash,dollar etc.).
l one entry is in a single line.
408 User GuideFortinet Technologies Inc.

Managing Resources Anonymity network
Note: Although many fields are possible, only the IP is required.
1. Go to RESOURCE> Anonymity Network.2. Select the folder or click + to add a new group underAnonymity Network folder.3. ClickMore >Update.4. Select Update via API. The link will be displayed in the URL field or else manually enter the URL and
details.5. Click the edit icon nearURL.6. Enter the following information:
a. Enter the URL of the website.b. EnterUser Name and Password (optional).c. For Plugin Class, the default class
com.accelops.service.threatfeed.impl.ThreatFeedWithMappingPolicyService is shown. Do not modify this in this case.
d. Enter the correct Field Separator (by default it is a comma).e. Select CSV as the Data Format.f. Select Data Update as Full to overwrite the existing data or Incremental to retain the
existing data.g. Enter the Data Mapping by choosing the mapped field and the corresponding position in the
website data. For example, if the IP is in third position, choose 3 in the Position column. Click+ if you must add more rows.
h. ClickSave.7. Select an import schedule by clicking + on the Schedule Summary. Select when to start the import
and how often to import new data from the website.The imported data will show on the right pane after some time.
NewWebsites - non-CSV data - programmatic import
This is the most general case where the website data format does not satisfy the previous conditions.In this case, you have to write a Java plugin class by modifying the default system provided one. Afterthe class has been written and fully tested for correctness, follow these steps.
1. Go to RESOURCE> Anonymity Network.2. Select the folder or click + to add a new group underAnonymity Network folder.3. ClickMore >Update.4. Select Update via API.5. Click the edit icon nearURL.6. Enter the following information:
a. Enter the URL of the website.b. EnterUser Name and Password (optional).c. For Plugin Class, the custom Java class in this case.d. Enter the correct Field Separator (by default it is a comma).e. Select Custom or STIX-TAXII as the Data Format.
l STIX-TAXII - provide the name of the Collection. Select Data Update as Full tooverwrite the existing data or Incremental to retain the existing data.
l Custom - select Data Update as Full to overwrite the existing data or Incrementalto retain the existing data.
User GuideFortinet Technologies Inc.
409

User Agents Managing Resources
f. ClickSave.7. Select an import schedule by clicking + on the Schedule Summary. Select when to start the import
and how often to import new data from the website.The imported data will display in the table after some time.
User Agents
The User Agent page lists common and uncommon user agents in HTTP communications. The traditional usecase for a user agent is to detect browser types so the server can return an optimized page. However, user agentsare often misused by malware, and are used to communicate the identity of the client to the BotNet controllerover HTTP(S). FortiSIEM monitors HTTP(S) logs and the system rule Blacklist User Agent Match uses regularexpression matching to detect blacklisted user agents.
Adding User AgentsModifying User AgentsImporting and Exporting User Agents
Adding User AgentsComplete these steps to add a User Agent:
1. Go to RESOURCE> User Agents.2. Select the User Agent group where you want to add the new user agent from the folder structure on the left
panel. To create a new User Agent group, click + above the Resources tree.3. Click New.4. Enter the User Agent using regular expression notation.5. Click Save.
Modifying User AgentsComplete these steps to edit a User Agent:
1. Go to RESOURCE> User Agents.2. Select the User Agent group from the folder structure on the left panel.3. Select the User Agent from the table and clickEdit to modify the settings.4. Click Save.
You can use the Delete button to select and remove any User Agent from the list.
Importing and Exporting User AgentsThe procedures below describe how to import and export User Agents.
Importing User Agents
Instead of manually adding User Agents to a user-defined or system group individually, you can upload a CSV filewith multiple entries into a group.
410 User GuideFortinet Technologies Inc.

Managing Resources Remediations
Note: You must format the User Agent password with regular expression notation: User Agent (regularexpression)
Complete these steps to import User Agents to a Group from a CSV File.1. Go to RESOURCES >User Agents.2. Select the User Agent group where you want to import the new User Agents from the folder structure.3. Click Import and select the CSV file.4. Click Import.
Exporting User Agents
Complete these steps to export User Agents from a Group to a CSV File.1. Go to RESOURCES >User Agents.2. Select the User Agent group from where you want to export the User Agents from the folder structure.3. Select the User Agent from the table and clickExport.4. ClickGenerate.
If the export is successful, an "Export successful" message is displayed.5. ClickOpen Report File and save the report.
Remediations
Remediation can be performed either on an ad hoc basis or by using a Notification Policy. A Notification Policydirects the system to take a Remediation action when an Incident occurs. To invoke a Remediation, do thefollowing:
l Make sure the Remediation script for your scenario is defined.l Check the existing Remediation scripts. Go to ADMIN >Settings >General >Notification, then choose RunRemediation/Script in the Action section of the Notification Policy dialog box. See Adding Incident Notificationsettings.
l If your device is not in the list, add the needed Remediation script.
The system-defined and custom Remediations are listed underRESOURCES >Remediations. The followingsections describe how to create and manage custom Remediations.
l Adding Remediationsl Modifying Remediationsl Deleting Remediations
Adding RemediationsComplete these steps to create a new custom Remediation. You can also select any existing Remediation toClone and customize.
1. Go to RESOURCES > Remediations.2. ClickNew.3. Enter the Name of the Remediation.4. Select the Device Type to which this Remediation will be applied.5. Select the Protocol as SSH, HTTP, HTTPS or MS_WMI for the device type.6. Enter the Remediation Script Name.
User GuideFortinet Technologies Inc.
411

Remediations Managing Resources
7. Enter the Remediation Script Content.8. Add anyDescription related to this Remediation.9. Click Save.
The Remediation will be available in the list along with the system-defined Remediations.
Modifying RemediationsNote that you cannot modify any system-defined Remediations.
Complete these steps to modify a custom Remediation:
1. Go to RESOURCE> Remediations.2. Select a custom Remediation from the list.3. ClickEdit and modify the remediation settings.4. Click Save.
The updated Remediation will be available in the list along with the system-defined Remediations.
Deleting RemediationsNote that you cannot remove any system-defined Remediations.
Complete these steps to delete a custom Remediation(s).
1. Go to RESOURCES > Remediations.2. Select the custom Remediation to delete from the list.3. ClickDelete.4. Click Yes to confirm.
These Remediation(s) will be deleted from the list.
412 User GuideFortinet Technologies Inc.

Working with Cases Creating a Ticket
Working with Cases
FortiSIEM allows you to create and assign cases for IT infrastructure tasks, and create tickets. You can see alltickets that have been created under the CASES tab and use filter controls to view tickets by assignees,organization, priority, and other attributes.
The following topics provide instructions for ticket related operations:
Creating a TicketEditing a TicketManaging Cases
Creating a Ticket
FortiSIEM has a built-in ticketing system. A ticket can be created from the following:
l Case tabl Incidents tabl Via Incident Notification policy
Creating a ticket from Case tabTo create a ticket from Case tab:
1. Go to CASE.2. ClickNew.3. In the New Ticket dialog box, enter the following information:
Settings Guidelines
Summary [Required] Summary information about theticket.
StateState is automatically created by the systemonce the ticket is created. This can be modifiedfrom New to other values later.
Assignee Click the edit icon to select a user from the listof Users.
Escalation Escalation policy.
Priority [Required] Priority of the ticket - High, Medium,or Low.
User GuideFortinet Technologies Inc.
413

Creating a Ticket Working with Cases
Settings Guidelines
Due Date Due date for the ticket.
Attachment Click the edit icon to select and upload ordelete any files related to the ticket.
CC Email IDs to copy the ticket details to.
Notes Any description of the ticket.
4. ClickSave.A unique ID is automatically assigned to the ticket.
5. Select the ticket from the list to display tabs for the Detail, Action History, and Evidence information in thelower pane.
Creating a ticket from Incidents tabTo create a ticket from any specific Incident:
1. Go to INCIDENT > List View.2. Select the incident and click the Action drop-down menu to select Create Case.
The Incident details are automatically pulled to the new ticket creation window.3. Enter the following information for the new ticket:
Settings Guidelines
Assignee Click the edit icon to select a user from the listof Users.
Priority [Required] Priority of the ticket - High, Medium,or Low.
Due Date Due date for the ticket.
Attachment Click the edit icon to select and upload ordelete any files related to the ticket.
CC Email IDs of the users who will receive copiesof the ticket details.
4. ClickSave.
Creating a ticket via Incident Notification policyTo create a ticket automatically when an Incident triggers:
1. Go to ADMIN >Settings >General >Notification.2. ClickNew and select Create Case when an incident is created.
414 User GuideFortinet Technologies Inc.

Working with Cases Editing a Ticket
3. Click the edit icon for this setting and add the following details:
Settings Guidelines
Escalation Select an escalation policy from thedrop-down list. See EscalationSettings.
Expires in Time after which the ticket expires.
Priority [Required] Priority of the ticket - High, Medium,or Low.
AssigneeClick the edit icon and assign this ticket to auser in the Users group. The user can belongto any Organization.
4. ClickSave.
Editing a Ticket
The Edit option underCASE allows you to edit any ticket settings except the Ticket ID.
Complete these steps to edit an existing ticket:1. Go to CASE and select the ticket to edit.2. ClickEdit.3. In the Edit Ticket dialog box, modify the ticket information.4. ClickSave.
The modified ticket appears in the table.
Managing Cases
You can perform the following operations from Cases tab:
l Viewing a Ticketl Searching a Ticketl Escalating a Ticketl Exporting a Ticket
Viewing a TicketThe Ticket Dashboard displays the total number of:
l New - tickets in New state.l Assigned - tickets that are Assigned.l High - tickets in high priority state.
User GuideFortinet Technologies Inc.
415

Managing Cases Working with Cases
l Overdue - tickets that crossed the Due Date.l Late - tickets that elapsed more than half of the Due Date but not yet overdue.l Closed - tickets that are closedl MTTR - mean time to repair
Understanding ticket settings
The CASES tab displays all of the tickets raised in the system in a tabular format with the following information:
Settings Description
Elapsed Percentage of time elapsed since the ticket was created. If the timeis beyond Due Date, this field displays the "Overdue" status.
State Current status of the ticket.
Priority Priority of the ticket - High, Medium or Low.
Ticket ID Unique ID assigned to the ticket automatically by the system duringcreation.
Organization Organization of the reporting device.
Summary Summary information about the ticket.
IncidentID
Unique ID of the incident in the incident database.
Assignee User assigned to the ticket.
Creator User who created the ticket.
Resolution Time The time to resolve the incident in the external ticketing system.
Due Date The date by which the ticket should be resolved.
Creation Date Date when the ticket was created.
For any selected ticket, the Incident and event details are displayed in the Detail and Action History sections.
Settings Description
Detail
Assignee The user to whom the ticket is assigned.
416 User GuideFortinet Technologies Inc.

Working with Cases Managing Cases
Settings Description
Close code The reason for closing the ticket. Choose one of the following fromthe drop-down list: Solved (Workaround), Solved (Permanent),Not Solved (Not Reproducible), Not Solved (Expensive),Closed (Resolved by Caller)
Closed date The date when the ticket was closed
Creator User who created the ticket.
Escalation Policies Escalation policy for the incident tickets.
Priority The priority assigned tothe ticket: LOW, MEDIUM, or HIGH.
State Current status of the ticket.
Ticket ID Unique ID assigned to the ticket automatically by the systemduring creation.
CC Email address(es) of the users who will receive a copy of the ticketdetails.
Close Note Any description you want to enter when closing the ticket.
Creation Date Date when the ticket was created.
Elapsed Percentage of time elapsed since the ticket was created. If thetime is beyond Due Date, this field displays the "Overdue" status.
Incident ID Unique ID of the incident in the incident database.
Resolution Time The time when the ticket was resolved in the ticketing system.
Summary Summary information about the ticket.
Time Zone The time zone in which the ticket was created.
Action History
Incident Name Name of the rule that triggered the incident.
Incident Target IP or host name where the incident occurred.
Incident Detail Event attributes that triggered the incident.
User GuideFortinet Technologies Inc.
417

Managing Cases Working with Cases
Settings Description
Incident ID To find the events that triggered the incident for the Case, clickTriggering Events.
Evidence
Attachments List of files related to the ticket.
TriggeringEvent
List of events that triggered the incident for the Case.
Viewing Incident details
To see the incident details related to a ticket:
1. Go to the CASES tab.2. Select the ticket from the list. You can find the Incident ID from the Detail section and the Incident name, target
and details from the Action History section.3. Click the Incident ID underDetail section to open the details under the INCIDENT tab.
Viewing events that triggered the incident
To see the events that triggered the Incident for a ticket:
1. Go to the CASES tab.2. Select the ticket from the list.3. ClickAction History-List. The events appear in the Case action section. Or you can clickEvidence >
Triggering Event to view the event details.
Creating a ticket escalation policy
To create a ticket escalation policy, follow the steps here.
Searching a TicketYou can use various attributes mentioned in the table below from the search filter to find more information aboutany ticket.
Complete these steps to search a ticket:
1. Go to CASES tab.2. Click the Add Filter search field to select any known filter from the drop-down with reference to the table below.
418 User GuideFortinet Technologies Inc.

Working with Cases Managing Cases
3. Based on the selection, new fields appear including the condition and value fields.
Settings Guidelines
Time Range Search any ticket created during a specific time range. Use LASTto find the tickets from the last number of days, hours and/orminutes or FROM to choose a range of dates and time from theCalendar.
State Select the state of the ticket from the drop-down list: New,Assigned, Closed, In Progress, or Reopened.
Elapsed Search using the time elapsed since the ticket was created.
Assignee Search any ticket by entering the assignee of the ticket.
Creator Search any ticket using the creator of the ticket.
Priority Search any ticket by entering the priority: High, Medium, or Low.
Organization Search any ticket by entering the Organization to which the ticketapplies.
Ticket ID Search any ticket using the Ticket ID auto-generated by thesystem.
Incident ID Search any ticket using the Incident ID associated with the ticket.
Summary Search any ticket using any known information included in theTicket Summary.
4. Select the check mark to display the results.The results are displayed in the table. Select any Ticket to display the Detail and Action History in thelower pane.
Escalating a TicketComplete these steps to escalate a ticket:
1. Go to CASES tab.2. Click the Add Filter search field to select and open a ticket using filters.
The table displays the tickets matching the filter criteria.
3. ClickEdit button to open the ticket settings.4. Select the Escalation type from the drop-down and clickSave.Refer to Ticket Escalation Settings for more information about related settings.
Exporting a TicketYou can export all or selected tickets using filters to a PDF or CSV report.
Complete these steps to export a ticket:
User GuideFortinet Technologies Inc.
419

Managing Cases Working with Cases
1. Go to CASES.2. ClickAdd Filter search field to search any ticket using filters.
The table displays the tickets matching the filter criteria.
3. Select one or more tickets from the list and click the Export button.4. In the Export Report dialog box, select the following:
a. Report Option: Select Summary for all tickets orDetailed report for selected tickets.b. User Notes (optional): Description related to the exported document.c. Output Format: PDF or CSV.
5. ClickGenerate."Export Successful" message is displayed.
6. ClickView to download and save the report.
420 User GuideFortinet Technologies Inc.

Working with Incidents List View
Working with Incidents
When a correlation rule triggers, an incident is created in FortiSIEM. This section describes how to view andmanage Incidents in FortiSIEM. There are three views:
l List View: This tabular view enables the user to search incidents and take actions.l Attack ViewThis view classifies security events detected by FortiSIEM into MITRE ATT&CK categories.l Overview: This view provides a "top down" view of the various types of Incidents and impacted hosts.l Risk View: This view organizes impacted entities (Devices, Users) by Risk based on the triggered incidents.l Incident Explorer View: This view helps users to correlate Actors (IP, Host, User) across multiple incidents,
without creating multiple reports in separate tabs.
FortiSIEM can cross-correlate incident data and perform lookups on selected external ticketing/work flowsystems. See Filtering in the Incident Explorer View and Lookups Via External Websites.
FortiSIEM can also be configured to collect this host vulnerability data to preform CVE-Based IPS False PositiveAnalysis.
List View
This tabular view enables the user to search incidents and take actions.l Viewing Incidentsl Acting on Incidents
Viewing IncidentsTo see this view, click INCIDENTSin the FortiSIEM header. By default, the List by Time view opens. TheINCIDENTS view also allows you to filter data by device and by incident.
You can set INCIDENTS as the default view by selecting User Profile > UI Settings then choosing Incidentsfrom the Home drop-down list. You can filter the INCIDENTS view further by choosing List – by Time, List –by Device, or List – by Incident from the Incident Home drop down list.
The following sections describe the three views that are available through the INCIDENTS view:
l List by Time Viewl List by Device Viewl List by Incident View
List by Time View
The List by Time view displays a table of the incidents which have been active in the last 2 hours. The LastOccurred column contains the incidents sorted by time, with the most recent first. By default, the view refreshesautomatically every minute. The refresh menu on the top bar allows the user to disable automatic refresh orchoose a different refresh interval.
Unique to the List by Time view is a list of five time range buttons ( ) which appear above thepaginator. They allow you to filter data by the last 15 minutes, 1 hour, 1 day, 7 days, or 30 days.
User GuideFortinet Technologies Inc.
421

List View Working with Incidents
The following attributes are shown for each incident:
l Severity - High (Red), MEDIUM (Yellow), or LOW (Green).l Last Occurred - last time this incident occurred.l Incident - name of the incident.l Reporting - set of devices that is reporting the incident.l Source - source of the incident (host name or IP address).l Target - target of the incident (host name or IP address or user).l Detail - other incident details, for example, Counts, Average CPU utilization, file name, and so on.
To see the incident details, click the incident. A bottom panel appears that shows more details about the incident:
l Details - includes the full list of incident attributes that are not shown in the top pane.
Column Description
Biz Service Impacted biz services to which either the incident source or target belongs.
Category Category of incidents triggered.
Cleared Reason For manually cleared incidents, this displays the reason the incident was cleared.
Cleared Time Time when the incident was cleared.
Cleared User User who cleared the incident.
Count Number of times this incident has occurred with the same incident source and targetcriteria.
Detail Event attributes that triggered the incident.
Event Type Event type associated with this incident. All incidents with the same name have the sameIncident Type.
External ClearedTime
Time when the incident was resolved in an external ticketing system.
External ResolveTime Resolution time in an external ticketing system.
External Ticket ID ID of a ticket in an external ticketing system such as ServiceNow, ConnectWise, etc.
External TicketState State of a ticket in an external ticketing system.
External Ticket Type Type of the external ticketing system (ServiceNow, ConnectWise, Salesforce, Remedy).
External User External user assigned to a ticket in an external ticketing system.
422 User GuideFortinet Technologies Inc.

Working with Incidents List View
Column Description
First Occurred The first time that the incident was triggered.
Incident Name of the rule that triggered the incident. Use the drop-down list near the Incident ifyou must add this incident to filter.
Incident Comments Comments added by the user.
Incident ID Unique ID of the incident in the Incident database.
Incident Status Incident can be in one of these states:l Active: an ongoing incidentl Cleared: cleared manually by a userl System Cleared: cleared by the system – rule clearance logic can be set in the
rule definitionl External Cleared: cleared in the external ticketing system
Incident Title A system default title or a user-defined title for an incident.
Last Occurred The last time when the incident was triggered.
NotificationRecipient User who was notified about the incident.
Notification Status Status of the Notification: Success or Fail.
Organization Organization of the reporting device (for Service Provider installations).
Reporting Reporting device.
Reporting IP IP addresses of the devices reporting the incident.
Reporting Status Status of the device: Approved or Pending. You must approve devices for the incidents totrigger, but they will still be monitored.
User GuideFortinet Technologies Inc.
423

List View Working with Incidents
Column Description
Resolution
Incident Resolution Status:Open (not defined or not known whether the incident is True Positive or False Positive),True Positive, False Positive, or In Progress.
To change the resolution, open the drop-down list near the Resolution column or go toAction > Resolve Incidents and select the required option. Set the Resolution to:
l Open - not defined or not known whether the incident is True Positive or FalsePositive.
l True Positive - either the Source orDestination is vulnerable. A case is opened.l Clear and set Resolution to False Positive - the incident is determined not to be a
vulnerability. The incident is cleared and a case is not opened.l In Progress - the incident alert is currently being worked on. This setting helps to
prevent doubled work a single incident. A case is not opened.To clear an incident, go to Action and select Clear Incident. Note the following beforeclearing:
l If you are changing the Resolution to False Positive, you must clear the incidentat the same time.
l Cleared incidents can be changed to "True Positive" or "False Positive" but notback to "Open".
Severity Incident Severity is an integer in the range 0-10 (0-4 is set as Low, 5-8 as Medium, and 9-10 as High).
Severity Category Incident Severity Category: High, Medium or Low.
Source Source IP or host name that triggered the incident.
Subcategory Subcategory of the triggered incident. To add custom subcategories to an incidentcategory, see here.
Target IP or host name where the incident occurred.
Ticket ID ID of the ticket if created in FortiSIEM.
Ticket Status Status of any tickets associated with the incident.
Ticket User User assigned to a ticket if created in FortiSIEM.
View Status Whether the Incident has been Read or Not.
l Events - this displays the set of events that triggered the incident. If an incident involves multiple sub-patterns,select the sub-pattern to see the events belonging to that sub-pattern. ForRaw Event Log column, clickShowDetails from the drop-down to see the parsed fields for that event.
l Rule - this displays the Definition of Rule that Triggered the Incident and the Triggered Event Attributes.
To close the incident details pane, click the highlighted incident.
424 User GuideFortinet Technologies Inc.

Working with Incidents List View
List by Device View
The upper pane of the List by Device view lists the devices that are experiencing incidents. In the list, the devicecan be identified by either an IP or a host name. The name of the device is followed by the number of incidents inparentheses. Click the device name to see the incidents associated with the device. The lower portion of the viewcontains the same features and functionality as the List by Time view.
List by Incident View
The upper pane of the List by Incident view lists the incidents detected by FortiSIEM. The name of the incidentis followed by the number of incidents in parentheses. Click the incident name to see the incidents associatedwith the device. The lower portion of the view contains the same features and functionality as the List by Timeview.
Acting on IncidentsThe Actionmenu provides a list of actions that can be taken on incidents. To see a Location View of theincidents, select Locations from the Actionmenu. FortiSIEM has a built in database of locations of public IPaddresses. Private IP address locations can be defined in ADMIN >Settings >Discovery > Location.
To change the incident attribute display columns in the List View, select Display from the Actionmenu, selectthe desired attributes and clickClose.
You can perform the following operations using the Actionmenu:
l Changing the Severity of an Incidentl Searching Incidentsl Searching for MITRE ATT&CK Incidentsl Clearing one or more Incidentsl Clearing All Incidents from the Incident Viewl Disabling one or more rulesl Adding or editing comments for one or more incidentsl Exporting one or more incidents into a PDF or CSV filel Fine tuning a rule triggering an Incidentl Creating an exception for the Rulel Creating Event Dropping Rulesl Creating a Ticketl Emailing Incidentsl Creating a Remediation actionl Show Ticket History
Changing the Severity of an Incident
1. Select the incident.2. Select Change Severity from the Actionmenu.3. Select Change to HIGH, MEDIUM, or LOW.
User GuideFortinet Technologies Inc.
425

List View Working with Incidents
Searching Incidents
1. Select Search from the Actionmenu.2. In the left pane, click an Incident attribute (for example, Function). All possible values of the selected
attribute with a count next to it is shown (for example, Security, Availability and Performance forFunction).
3. Select any value (for example, Performance) and the right pane updates with the relevant incidents.4. Click and select other Incident Attributes to refine the Search or clickX to cancel the selection.Changing the Time Range for the Search
1. Select Search from the Actionmenu.2. Near the top of the left panel, click the time value.3. ClickRelative orAbsolute:
l If you clickRelative, adjust the time value in the Last field.l If you clickAbsolute enter a time range. If you select Always Prior, enter a time period prior
to the current time.Saving the Search Criteria
Once you have performed your search, follow these steps to save the search criteria:
1. Click the Save icon which appears above the list of incident attributes.2. In the Save Search Filter under by Time as dialog box, enter a name for the filter or accept the
default. The default will be a time stamp value such as Search Filters - 12/17/201917:04:59.
The filter will appear in the Search drop-down list, for example:
l When saving a filter based on the List by Time View, it displays in the Search drop-down list.l When saving a filter based on the List by Device View, it displays in the Search drop-down list.l When saving a filter based on the List by Incident View, it displays in the Search drop-down list.
Searching for MITRE ATT&CK Incidents
To find incidents that fall into any of the 12 MITRE ATT&CK categories, follow these steps:
1. Select Search from the Action menu.2. ClickCategory in the left pane.
The total number of security incidents will appear under Security. The tree under Securitydisplays the MITRE ATT&CK categories (among others) that have associated securityincidents.
3. Select one or more checkboxs next to the categories of interest.The incidents associated with the categories are displayed.
For more information on the Attack View and MITRE ATT&CK categories, see Attack View.
Clearing one or more incidents
1. Search for specific incidents and move them into the right pane.2. Select the first incident.
426 User GuideFortinet Technologies Inc.

Working with Incidents List View
3. Press and hold the Shift key and select the last incident – all incidents between the first and the last arehighlighted.
4. Select Clear Incident from the Actionmenu.5. Select whether the Resolution is True Positive or False Positive.6. Enter a Reason for clearing.7. ClickOK.
Clearing All Incidents from the Incident View
You can remove all occurrences of selected incidents from the Incident View. This action canpotentially span multiple pages.
1. Search for specific incidents and move them into the right pane.2. Select Clear All Incidents in View from the Action menu.3. Select whether the Resolution is True Positive or False Positive.4. Enter a Reason for clearing.5. ClickOK.
Disabling one or more rules
1. Search for specific incidents and move them into the right pane.2. Select the first incident.3. Press and hold the Shift key and select the last incident – all incidents between the first and the last are
highlighted.4. Select Disable Rule from the Actionmenu.5. For Service Provider installations, select the Organizations for which to disable the rule.6. ClickOK.
Adding or editing comments for one or more incidents
1. Search for specific incidents and move them into the right pane.2. Select the first incident.3. Press and hold the Shift key and select the last incident – all incidents between the first and the last are
highlighted.4. Select Edit Comment from the Actionmenu.5. Enter or edit the comment in the edit box.6. ClickOK.
Exporting one or more incidents into a PDF or CSV file
1. Search for specific incidents and move them into the right pane.2. Select the first incident.3. Press and hold the Shift key and select the last incident – all incidents between the first and the last are
highlighted.4. Select Export from the Actionmenu.5. Enter or edit the comment in the edit box.6. Select theOutput Format andMaximum Rows.
User GuideFortinet Technologies Inc.
427

List View Working with Incidents
7. ClickGenerate.A file will be downloaded in your browser.
Fine tuning a rule triggering an Incident
1. Select an incident.2. Select Edit Rule from the Actionmenu.3. In the Edit Rule dialog box, make the required changes.4. ClickOK.
Creating an exception for the rule
1. Select an incident.2. Select Edit Rule Exception from the Actionmenu.3. In the Edit Rule Exception dialog box, make the required changes:
a. For Service provider deployments, select the Organizations for which the exception will apply.b. Select the exception criteria:
i. For incident attribute based exceptions, select the incident attributes for which rulewill not trigger.
ii. For time based exceptions, select the time for which rule will not trigger.iii. Select AND/OR between the two criteria.iv. Add Notes.
c. ClickSave.
Creating Event Dropping Rules
Event Dropping Rules may need to be created to prevent an incident from triggering. To create such a rule:1. Select an incident.2. Select Event Dropping Rule from the Actionmenu.3. In the Event Dropping Rule dialog box, enter the event dropping criteria:
a. Organization - For Service provider deployments, select the organizations for which theexception will apply.
b. Reporting Device - Select the device whose reported events will be dropped.c. Event Type - Select the matching event types.d. Source IP - Select the matching source IP address in the event.e. Destination IP - Select the matching destination IP address in the event.f. Action - Choose to drop the events completely or store them in the event database. If you
store events, you can select the following actions:l Do not trigger rulesl Drop attributes (Click the edit icon to open the selection window and select the
attributes to drop)g. Regex filter - Select a regex filter to match the raw event log.h. Description - Add a description for the drop rule.
4. ClickSave.The Rule will be appear in ADMIN >Settings >Event Handling >Dropping.
428 User GuideFortinet Technologies Inc.

Working with Incidents List View
Creating a Ticket
See Creating a ticket from Incidents tab.
Emailing incidents
Incidents can be emailed to one or more recipients. Make sure that Email settings are defined in ADMIN >Settings >System >Email. Note that email notification from the Incident page is somewhat ad hoc and mustbe manually setup by the user after the incident has triggered. To define an automatic notification, create anIncident Notification Policy in ADMIN >Settings >Notification. To email one or more incidents on demand:
1. Search for specific incidents and move them into the right pane.2. Select the first incident.3. Press and hold Shift key and select the last incident – all incidents between the first and the last are
highlighted.4. Select Notify via Email from the Actionmenu and enter the following information:
a. Send To – a list of receiver email addresses, separated by commas.b. Email template – Choose an email template. You can use the default email template, or
create your own in ADMIN >Settings >System >Email > Incident Email Template.
Creating a Remediation action
Incidents can be mitigated by deploying a mitigation script, for example, blocking an IP in a firewall or disabling auser in Active Directory. Note that this type of incident mitigation from the Incident page is somewhat ad hoc andmust be manually setup by the user after the incident has triggered.
To define an automatic remediation, create an Incident Notification Policy in ADMIN > Settings > General >Notification. ClickNew, and in the Notification Policy dialog box, select Run Remediation/Script in theAction section. To create a remediation action:
1. Select an incident.2. Select Remediate Incident from the Actionmenu.3. Choose the Enforce On devices – the script will run on those devices. Make sure that FortiSIEM has
working credentials for these devices defined in ADMIN >Setup >Credentials.4. Choose the Remediation script from the drop-down menu.5. Choose the node on which the remediation will Run On from the drop-down list.
Show Ticket History
1. Select an incident.2. Select Show Ticket History from the Actionmenu.3. The Ticket History dialog box opens and displays the following information:
Field Description
Detail:
Incident ID The unique ID of the incident in the incident database.
Due Date The date by which the ticket should be resolved.
User GuideFortinet Technologies Inc.
429

Attack View Working with Incidents
Field Description
Escalation Policy The escalation policy defined for the incident.
Attachment The list of files related to the incident.
Action History:
Created at The time when the incident was created.
Incident Name The name of the rule that triggered the incident.
Incident Target The IP or host name where the incident occurred.
Incident Detail The event attributes that triggered the incident.
Incident ID The unique ID of the incident in the incident database.
Attack View
The INCIDENTS Attack View maps security incidents detected by FortiSEIM into attack categories defined byMITRECorporation (MITRE ATT&K). Go to INCIDENT >Attack to see this view. Attack can set as the defaultview by selecting User Profile > UI Settings then choosing Incidents from the Home drop-down list andAttack from the Incident Home drop-down list.
The following table briefly describes the attack categories. See https://attack.mitre.org/matrices/enterprise/ formore detailed information.
Category Description
Initial Access The adversary is trying to get into your network.
Execution The adversary is trying to run malicious code.
Persistence The adversary is trying to maintain their foothold.
PrivilegeEscalation The adversary is trying to gain higher-level permissions.
Defense Evasion The adversary is trying to avoid being detected.
Credential Access The adversary is trying to steal account names and passwords.
Discovery The adversary is trying to figure out your environment.
430 User GuideFortinet Technologies Inc.

Working with Incidents Attack View
Category Description
LateralMovement The adversary is trying to move through your environment.
Collection The adversary is trying to gather data of interest to their goal.
Command andControl
The adversary is trying to communicate with compromised systems tocontrol them.
Exfiltration The adversary is trying to steal data.
Impact The adversary is trying to manipulate, interrupt, or destroy your systemsand data.
Using the Attack ViewTo open the Incident Attack View, click the Attack icon ( ) on the INCIDENTS tab. The table
at the top of the Incident Attack View displays the devices experiencing the security incidents and the MITREATT&CK categories into which the incidents fall. The circles in the table indicate:
l Number - The number in the middle of the circle indicates the number of incidents in that category. Click thenumber to get more detail on the incidents. See Getting Detailed Information on an Incident.
l Size - The size of the circle is relative to the number of incidents.l Color - The color of the circle indicates the severity of the incident: Red=HIGH severity, Yellow=MEDIUM severity,
and Green=LOW severity.
Filtering in the Incident Attack ViewYou can filter the incident data by attack category, whether the incident is active or cleared, and the time rangewhen the incident occurred.
l The Subcategory drop–down list allows you to filter on one or more of the attack categories. You can also displayAll of the categories.
l The Status drop-down list allows you to filter on Active and/orCleared incidents.l The Time Range dialog box allows you to choose a relative or absolute time range. For relative times, enter a
numerical value and then eitherMinutes, Hours, orDays from the drop-down list. For absolute times, use thecalendar dialog to specify From and To dates.
Getting Detailed Information on an IncidentThe lower pane of the Incident Attack View provides a table with more detailed information about a securityincident. You can populate the table in any of these ways:
l Click a device to see all of the incidents associated with the device.l Open the Subcategory drop-down list and choose one of the attack categories. All of the incidents associated with
the selected category or categories are displayed. You can also choose to displayAll of the categories.
User GuideFortinet Technologies Inc.
431

Overview View Working with Incidents
l Click the heading in the table of the attack category you are interested in (for example, Execution, Persistence,Collection, and so on). All of the incidents associated with the selected category are displayed.
l Click the number in the middle of the circle. All of the incidents associated with the selected device and category aredisplayed.
l Click an incident and all of the actions in the Action drop-down list that you can perform on the event becomeavailable. See Acting on Incidents.
For more information on the column headings that appear in the lower pane of the Attack View, see ViewingIncidents.
Displaying Triggering Events for an IncidentClick an incident in the lower table to display its triggering events. Another pane opens below the Incident table. Itdisplays information related to the event that triggered the incident, such asHost Name, Host IP, and so on.
Overview View
The Overview view provides a "top down" view of various types of Incidents and impacted hosts. Go toINCIDENT >Overview to see this view. Overview can set as the default view by selecting User Profile > UISettings then choosing Incidents from the Home drop-down list andOverview from the Incident Home drop-down list.
The panel is divided into three sections:l Incidents By Category – displays Incident Counts By Function and Severity.l Top Incidents – displays the Top Incidents sorted first by Severity and then Count.l Top Impacted Hosts – displays Top impacted hosts by Severity or Risk Score.
To change the incident time range, choose the Time Range option on the top right. For Service providerinstallations, choose the appropriate Organizations on top right. By default, the data combined for allOrganizations and the Organization is shown next to each host. This view will automatically refresh every minuteby default. The refresh menu on top bar allows the user to disable the automatic refresh or choose a differentrefresh interval.
Incidents By Category
This pane shows the number of unique Security, Performance, Availability, and Change incidents that havetriggered in the specified time range.
To drill into a specific category, click the number and the matching incidents are displayed in a separate IncidentList View. To return to the main view, click the < button. From this View, you can initiate the same actions asdescribed in Incidents List View.
Top Incidents
This pane shows the Top Incidents, first by Severity and then by Count.l Each box represents an Incident.l The color of the box title reflects the Incident Severity.l The number reflects the unique incidents that has triggered in the chosen time window.
432 User GuideFortinet Technologies Inc.

Working with Incidents Overview View
l The entries inside the box represent the IP address and host names appearing in either the IncidentSource or Incident Target.
l Boxes are ordered left to right by Incident Severity and then unique incident count. That means that Redcolored boxes (High Severity) appear first, then Yellow (Medium Severity), and finally Green (LowSeverity). Within boxes of the same color, boxes with a higher number of Incident counts appear first. Youcan scroll to the right.
To drill down, click the number in the left side bar or each host and the matching incidents are displayed in aseparate Incident List View. To return to the main view, click the < button. From this View, you can initiate thesame actions as described in Incidents List View.
Top Impacted Hosts By Severity
This pane shows the Top Impacted Hosts, first by Severity and then by Count.l Each box represents an impacted host (where an Incident has occurred during the specified time
window).l The color of the box title reflects the maximum of Severity over all Incidents.l The number on the left of the box reflects the unique incidents that have triggered on the host in the
chosen time window.l The entries inside the box represent the incidents that have triggered for that host.l Boxes are ordered left to right by Incident Severity and then unique incident count. That means that the
Red colored boxes (High Severity) appear first, then Yellow (Medium Severity), and finally Green (LowSeverity). Within boxes of the same color, boxes with a higher number of Incident counts appear first. Youcan scroll to the right.
To drill down, click the number in the left side bar or each incident and the matching incidents are displayed in aseparate Incident List View. To return to the main view, click the < button. From this View, you can initiate thesame actions as described in Incidents List View.
Top Impacted Hosts By Risk Score
This pane shows the Top Impacted Hosts, first by Risk Score.l Each Box represents an impacted host (where an Incident has occurred during the specified time
window).l The color of the box title reflects the Risk Score (80 and above is Red, 50-79 is Yellow, and less than 50 is
Green).l The number on the left of the box reflects the risk score.l The entries inside the box represent the incidents that have triggered for that host.l Boxes are ordered left to right by Risk Score. That means that Red colored boxes (High Risk) appear first,
then Yellow colored boxes (Medium Risk), and Green colored boxes (Low Risk).l You can scroll to the right.
To drill down, click the number in the left side bar or each incident and the matching incidents are displayed in aseparate Incident List View. To return to the main view, click the < button. From this View, you can initiate thesame actions as described in Incidents List View.
User GuideFortinet Technologies Inc.
433

Risk View Working with Incidents
Risk View
Risk view displays the Devices and Users ordered by Risk. Risk is calculated based on the triggering incidentsusing a proprietary algorithm that incorporates asset criticality, incident severity, frequency of incidentoccurrence, and vulnerabilities found. Risk is only computed for devices in CMDB, private IP addresses, andusers found in logs or discovered via LDAP.
Go to INCIDENT >Risk to see this view. Risk can set as the default view by selecting User Profile > UISettings then choosing Incidents from the Home drop-down list and Risk from the Incident Home drop-downlist.
Devices and Users are categorized by Risk as follows:
l Devices - number of devices with Riskl Users - number of users with Riskl High Risk - number of devices and users with high riskl Medium Risk - number of devices and users with medium riskl Low Risk - number of devices and users with low risk
To see only the above categories of devices and users in the Risk View, click any of the five categories above.
The Risk View displays the following:
l Device or User namel Current Risk - Current value, up or down versus the same periodl 24 Hour Risk Trendl Incidents in Last 24 hours
To drill down, click one row and the incidents that led to this risk are shown in a time line format. You can selectan incident, and select any action from the Actionmenu. The actions are similar to those described for the Listview.
Explorer View
The Incident Explorer view allows you to correlate Actors (IP, Host, User) across multiple incidents, withoutcreating multiple reports in separate tabs. Incident trends, Actor and Incident detail are displayed on the samepage. You can choose an actor and see all the incidents that actor is part of. You can then choose a time rangeand narrow down the incidents. Time ranges, Actors, and Incidents can be chosen in any order. Each time aselection is made, the rest of the dashboard updates to reflect that selection.
To open the Incident Explorer view, click INCIDENTS, then click the Explorer icon . Explorercan set as the default view by selecting User Profile > UI Settings then choosing Incidents from the Homedrop-down list and Explorer from the Incident Home drop-down list.
The Incident Explorer view is divided into three layers:
l The top layer displays the Incident Trend graph. The graph displays the incident counts over time,organized by severity, then by count.
434 User GuideFortinet Technologies Inc.

Working with Incidents Explorer View
Each bar in the graph represents the number of incidents at a given time. The colors used in the barsreflects the Incident Severity. Red colored boxes (High Severity) appear first then Yellow (MediumSeverity), and finally Green (Low Severity). The numbers in the bars reflect the number of uniqueincidents that triggered in the chosen time window.
l The middle layer displays panels for Incidents, Hosts, IPs, and Users. You can filter the items in thepanels by Category, Status, and Time Range. See “Filtering in the Incident Explorer” for moreinformation.
l The bottom layer displays the Incidents Table with these headings: Severity, Last Occurred, Incident,Reporting, Source, Target, Detail, Incident Status, and Resolution. Click an incident row to get moredetail.
Drill down is available from the Reporting, Target, Detail, Resolution columns.
The following tables describe the drill down options available for each column.
Reporting Options
Option Description
QuickInfo
Displays the quick information about the device.
DeviceHealth Availability, Performance, and Security health reports for the device.
RelatedIncidents
Switches to List view and displays related incidents.
Add toFilter
Switches to List view. Open the drop-down list next to the Reporting column for thedesired incident and select Add to Filter. Add to Filter modifies the search on thecurrent tab by including this constraint.
Target Options
Option Description
Quick Info Displays the quick information about the device.
ExternalLookup
Looks up external threat intelligence websites about likely malicious Indicators ofCompromise (IOCs).
DeviceHealth
Availability, Performance, and Security health reports for the device.
User GuideFortinet Technologies Inc.
435

Explorer View Working with Incidents
Option Description
RelatedIncidents Switches to List view and displays related incidents.
RelatedReal TimeEvents
Switches to the ANALYTICS tab and displays related real time events.
RelatedHistoricalEvents
Switches to the ANALYTICS tab and displays related historical events.
Add toFilter
Switches to List view. Open the drop-down list next to the Reporting column for thedesired incident and select Add to Filter. Add to Filtermodifies the search on thecurrent tab by including this constraint.
Add toApplicationGroup
Opens the IP Application Group Mapping Definition dialog box where you can choosethe group where you want to add the incident.
Detail Options
Displays other incident details, such as Counts, Average CPU utilization, file name, and so on.
Resolution Options
Option Description
SetResolutionto Open
Sets the resolution status to Open (not defined or not known whether the incident isTrue Positive or False Positive).
SetResolutionto TruePositive
Sets the incident resolution status to True Positive.
SetResolutionto FalsePositive
Sets the incident resolution status to False Positive. If you are changing the Resolutionto False Positive, you must clear the incident at the same time.
To leave the Incident Explorer View, click the List icon or select Action > Show in Incident List View.
436 User GuideFortinet Technologies Inc.

Working with Incidents Lookups Via External Websites (e.g. VirusTotal)
Using the Incident Explorer ViewClick any of the bars in the Incident Trend graph. The corresponding Incidents, IP addresses, Hosts and Usersare displayed in the panels. The corresponding incidents are also displayed in the Incident Table.
Click any of the items in the Incident, IP, Host, or User panels. The corresponding bar is displayed in the IncidentTrend graph and corresponding incidents are displayed in the Incident Table.
Click multiple items in the Incident Trend graph and in the panels. Your selections will be ANDed together andthe results displayed in the Incident Table.
Click any incident in the Incident Table. Details on the event that triggered the incident will open beneath theIncident Table.
Filtering in the Incident Explorer ViewYou can filter the incident data by incident category, whether the incident is active or cleared, and the time rangewhen the incident occurred.
l The Category drop–down list allows you to filter on unique Security, Performance, Availability, and Changeincidents that have triggered in the specified time range.
l The Status drop-down list allows you to filter on Active and/orCleared incidents.l The Time Range dialog box allows you to choose a relative or absolute time range. ForRelative, enter a
numerical value and then eitherMinutes, Hours, orDays from the drop-down list. ForAbsolute, use the calendardialog to specify From and To dates.
Lookups Via External Websites (e.g. VirusTotal)
Indicators of Compromise (IOC) can be transmitted via external IPs, domain names, URLs, and file hashes.
When a security incident is triggered due to a potentially malicious IOC, you may want to consult an externalthreat intelligence website to get more information about the IOC. If the website can confidently say that the IOCis malware, then you can take corrective action, such as blocking the IOC. On the other hand, if the website saysthat the IOC is safe, then you can mark the IOC as a false positive.
There are two types of external lookups:
l Some websites accept an IOC as a parameter in the URLand the website will respond with information about theIOC. In many of these cases, the IOC information in the web page cannot be parsed programmatically, and usermust manually determine whether the IOC is malware. For example, seehttps://www.talosintelligence.com/reputation_center/lookup?search=8.8.8.8.
l Other websites, such as VirusTotal and RiskIQ, have APIs. FortiSIEM can analyze the data from these websitesand present the results in an easily understandable format for user. Note: VirusTotal supports domain, URL, andfile hash lookups. RiskIQ supports IP and domain lookups.
FortiSIEM supports both types of lookups. External Website lookups can be performed only from the IncidentList View.
PrerequisitesComplete these steps before performing external lookups:
User GuideFortinet Technologies Inc.
437

Lookups Via External Websites (e.g. VirusTotal) Working with Incidents
1. External lookups that accept an IOC in the URL must be defined in Admin > Settings > System > Lookup.See Lookup Settings for more information.
2. VirusTotal and RiskIQ integrations must be defined in Admin > Settings > General > Integration. Thisinvolves setting credentials.
See VirusTotal Integration and RiskIQ Integration for more information.
Performing an External Lookup on VirusTotal and/or RiskIQFollow these steps to perform an external lookup on VirusTotal and/or RiskIQ.
1. Go to INCIDENTS and click the List view.2. Select an incident from the table.3. Drill down on either the Source, Target, orDetail columns and choose External Lookup. FortiSIEM will identify
IP, Domain, URL and file hash fields for lookup.4. Choose one of the following and click Check.
a. An External website that accepts IP in the URLb. VirusTotal and/orRiskIQ
5. For the first case (4a), the page opens in a different tab in the browser. 6. For the second case (4b), FortiSIEM collects information about the IOC from the websites using the API, makes a
conclusion as to whether it is Safe/Malware/Not Sure, and presents the data.7. Based on the information about the IOC, you can take any of the following actions.
a. Update Comment: You can update Incident comment based on the website findings. Enter an optionalcomment about the incident and clickAdd Summary, then Apply. The comment will appear in theIncident Comment panel in the Details tab when you select the incident in the List view.
b. Resolve Incident: You can resolve the incident. ChooseOpen, True Positive, or False Positive.ClickApply.
l If you choose False Positive, you have the option of providing a reason for your choice. Youalso have the option to Create a False Positive in ThreatConnect. Clicking this option willrespond with a message describing whether the creation was successful. This option assumesthat you have created a malware configuration for ThreatConnect. You can configure IPs,domains, hash, or URLs for ThreatConnect. See Working with ThreatConnect IOCs.
c. Create Rule Exception: If it is a false positive, then you can create a rule exception. Click the edit iconto create an exception to the rule. For more information on using the Edit Rule Exception dialog box,see Creating an exception for the rule.
d. Set Incident Severity: You can change the incident severity. Open the drop-down list and chooseChange to LOW, Change to MEDIUM, orChange to HIGH.
e. Remediate Incident: You can remediate the Incident, e.g. block the malware domain. Click the editicon to remediate the incident. For more information on using the Run Remediation feature, seeCreating a Remediation action.
f. Run External Integration: You can create a ticket in an external ticketing system. Click the edit icon tochoose an integration policy from the drop-down list. ClickOK.
8. ClickClose.
438 User GuideFortinet Technologies Inc.

Working with Incidents CVE-Based IPS False Positive Analysis
CVE-Based IPS False Positive Analysis
Network Intrusion Prevention Sensors (IPS) trigger alerts based on network traffic. When an IPS sees trafficmatching an attack signature, it generates an alert. Some of these attacks correspond to host vulnerabilities andhave an associated CVE number. Most organizations run vulnerability scanning tools to scan their servers forvulnerabilities. If FortiSIEM is configured to collect this host vulnerability data, it can combine the IPS signature toCVEmapping, and Host to CVEmapping to detect if an IPS Alert is false positive.
l Requirementsl False Positive Detection Logicl Running an IPS False Positive Testl Consequences of Running the IPS False Positive Test
Requirements
l Currently, FortiSIEM applies this logic on Incidents but not events. All important IPS events trigger some rule inFortiSIEM.
l FortiSIEM IPS rules must be written with a Signature Id and Event Type in the group by conditions. All built-inrules have been enhanced with this requirement starting with release 5.3.0.
l The primary source of IPS Signature to CVEmapping is FortiSIEM CMDB. These mappings are part of theFortiSIEM knowledge base and upgraded with every release. For FortiGate IPS signatures, FortiSIEM can also pullthis information from FortiGuard Services via an API. The FortiGuard IOC license must be enabled in FortiSIEM.
l The source of Host to CVEmapping is Vulnerability scanners. FortiSIEM currently supports Qualys, Rapid7, Nessusand Tenable scanners. Make sure FortiSIEM is configured to collect this data at least once a day.
False Positive Detection Logic
Recall that for this detection logic to work, IPS-related incidents must have Signature Id and ComponentEvent Type configured (for example, see the built-in High Severity Outbound Permitted IPS Exploit rule).The test is performed separately for both internal (for example, RFC-1918 address space) Incident Source andIncident Target IPs, as it does not make sense to perform tests for Internet addresses.
After the incident triggers, the associated CVEs for the Incident Event Type are first looked up. The primarysource is the CMDB. If the CMDB does not have this information, then external websites are looked up. In thecurrent release, only Fortinet IPS signatures are looked up using Signature Id in the FortiGuard database.
If associated CVEs are found, then another CMDB lookup is performed to see if the Host (in Incident Source orTarget) is vulnerable to the CVEs. CMDB collects Host Vulnerability information from vulnerability scan data.
There are four detection outcomes:
l Vulnerable - this can result if ALL the following are true:a. IP is internal and,b. Event type to CVEmapping is found and,c. Host has been scanned for vulnerabilities in the last 2 weeks and,d. At least one CVE in (b) is found in the list of current vulnerabilities in (c).
l Not Vulnerable - this can result if ALL the following are true:a. IP is internal and,b. Event type to CVEmapping is found and,
User GuideFortinet Technologies Inc.
439

CVE-Based IPS False Positive Analysis Working with Incidents
c. Host has been scanned for vulnerabilities in the last 2 weeks and,d. None of the CVEs in (b) are found in the list of current vulnerabilities in (c).
l Insufficient Information - this can result any of these cases:a. Even type to CVEmapping is not found or,b. Host has not been scanned in the last 2 weeks.
l Not Needed - this case is true if the IP is external.
An Incident is False positive if either of the following cases is true
l Source Detection Status is not Not Needed and Destination isNot Vulnerable or vice-versal Both Source and Target are Not Vulnerable
An Incident is True positive when either Source orDestination is Vulnerable.
Running an IPS False Positive Test
This test can be run on-demand or automatically when an Incident triggers. First you need to set up anIntegration.
1. Go to ADMIN > Settings > Integration.2. ClickNew.3. Set Type = Incident, Direction = Outbound, Vendor = “FortiSIEM Attach CVE Check".4. ClickSave.
To Run the IPS False Positive Test On-Demand on an IPS Incident
1. Go to INCIDENTS > List By Time.2. Select one incident. Make sure that the Signature Id and Component Event Type are configured in the
Incident Detail.3. ClickAction and select Run External Integration.4. Select the specific integration and clickOK.The IPS False positive test can be automated so that it runs automatically when the Incident triggers for the firsttime. To do this, create an Incident Notification Policy. The IPS Attack CVECheck will run as an IncidentAction.
1. Go to ADMIN > Settings > Notification.2. Select an existing notification policy to edit, or clickNew to create one.3. In the Action section, select Invoke an Integration policy, then select the policy.4. Save the policy.
Consequences of Running the IPS False Positive Test
When you run the integration policy, the following results can occur:
l The Incident Comment is updated with the detection status.l The Incident Status is determined based on the following cases:
a. False Positive Case: the Incident Severity is set to Low and the Incident is cleared.b. True Positive Case: the Incident Severity is set to High and a Case is opened.c. In all other cases, the Incident Status remains unchanged.
440 User GuideFortinet Technologies Inc.

Working with Analytics Running a Built-in Search
Working with Analytics
FortiSIEM search functionality includes real time and historical search of information that has been collected fromyour IT infrastructure. With real time search, you can see events as they happen, while historical search is basedon information stored in the event database. Both types of search include simple keyword searching, andstructured searches that let you search based on specific event attributes and values, and then group the resultsby attributes.
Note: If Data Obfuscation is turned on for a FortiSIEM user:l Raw events are completely obfuscated - the user cannot see any part of the raw message.l Cannot perform search on obfuscated event attributes.l CSVExport feature is disabled.l If an integer event attribute is obfuscated, then the GUI may not show those obfuscated fields. Normally,
integer fields are not obfuscated.
The following section provides the information about the operations under ANALYTICS tab:
Running a Built-in SearchUnderstanding Search ComponentsViewing Historical Search ResultsViewing Real-time Search ResultsUsing Nested QueriesSaving Search ResultsViewing Saved Search ResultsExporting Search ResultsEmailing Search ResultsCreating a Rule from Search
Running a Built-in Search
FortiSIEM provides a number of built-in reports.
Complete these steps to run an built-in report:1. Go to ANALYTICS tab.2. From the folder drop-down list on the left, select Shortcuts or the Reports folder.
l Shortcuts folder contains a few quick reports.l Reports folder contains the entire collection of built-in reports.
You can search for a specific report in both of these collections by entering keywords in theSearch box.
3. Select a specific report and click >.4. If you are generating the report from Shortcuts, select whether you want to run the report in the
currently selected tab or a new tab.Note: Running search in the currently selected tab discards the existing results displayed on that tab.The query will run and display the results.Note: You can also run the reports from RESOURCE >Reports folder. See here.
User GuideFortinet Technologies Inc.
441

Understanding Search Components Working with Analytics
Search can be performed in two modes:l Real time mode – from current time onwards. This mode runs only built-in searches that have no
aggregation (for example, Shortcuts >Raw Messages). Note that every time you re-run this query, thedisplayed results will change.
l Historical mode – for previous time periods. Any query can be run in this mode. Note that the displayedsearch results will not change if you re-run this query for Absolute time range.
To run a historical search:1. Click the Edit Filters and Time Range edit box.
The filter conditions are displayed for the selected built-in query.2. For Time, select Relative orAbsolute option.
a. ForRelative option, the query will run for a duration in the past, starting from current time.Select the value and time scale in (Minutes/Hours/Days).
b. ForAbsolute option, the query will run for a specific time window in the past. There are twoways to specify this:
i. Using two explicitly defined time epochs.ii. Using Always prior option to define time-periods like last 1 week or last 2 months. If
you are interested in re-running the same report on a daily basis, then you do nothave to change the time period.
3. ClickApply & Run.
Understanding Search Components
To perform a well-defined search, see the following sections:
l Specifying Search Filters – this specifies which data will be included in the Search.l Specifying Search Time Window – only events that have been received by FortiSIEM within this time window will be
part of the search.l Specifying Aggregations and Display fields – this specifies how the data will be grouped and which fields will be
displayed in the search result.l Specifying Organizations for a Service Provider deployment – only events belonging to this organization will be
included in the Search.l Examples of Operators in Expressions
Specifying Search FiltersComplete these steps to specify search filters:
1. Click the Edit Filters and Time Range edit box.2. Specify a filter condition:
a. Event Keyword - Enter any related keyword for search.b. Event Attribute - Choose an event attribute from the drop-down list or build an expression using the
expression builder. Only those event attributes based on the event type will be displayed.i. Operator - Choose the operator from the drop-down list.ii. Value - Enter a value in the edit box, or choose from CMDB, or build an expression using the
expression builder, or select from Report.c. CMDB Attribute - Select a Target from the drop-down list. In the table, enter the CMDB attributes you
want to search on.
442 User GuideFortinet Technologies Inc.

Working with Analytics Understanding Search Components
a. Select the Attribute.
b. Select theOperator--the most common operators are IN and NOT IN.c. Click in the Value field and select Select from Report or Select from CMDB.
3. If more than one filter condition is needed, then click + underRow.a. Specify the AND/OR operator underNext.b. Specify the next filter condition. When you click in the Attribute field, FortiSIEM will display only those
attributes that can be used with the previous attribute.c. Apply parenthesis if needed to prioritize filter evaluation by clicking + on the Paren icon.
Note that the rows can be deleted by clicking the - under Row and the parenthesis can be deleted byclicking - under Paren.
Specifying Search Time WindowComplete these steps to specify search filters and time window:
1. Click the Edit Filters and Time Range edit box.2. Specify the time window:
a. Real time mode – only from the current time onwards.b. Historical mode – for previous time periods that have already occurred. Select Relative orAbsolute
option.l For the Relative option, the query will run for a duration in the past, starting from current time.
Choose the time scale (Minutes/Hours/Days) and the quantity.l For the Absolute option, the query will run for a specific time window in the past. There are two
ways to specify this:l Using two explicitly defined time epochs.l Using Always prior option to define time-periods such as the previous week or the
previous two months. If you are interested in re-running the same report on a daily basis,then you do not have to change the time period.
The ANALYTICS view also provides a list of five time range buttons ( ) which appear to the left ofthe paginator. They allow you to filter data by the last 15 minutes, 1 hour, 1 day, 7 days, or 30 days.
Specifying Aggregations and Display FieldsThe following sections describe how to aggregate data using Group By fields and how to apply display conditions.
l Specifying Group By and Display Fieldsl Specifying Display Conditions for Aggregated Searchl Saving Group By and Display Fields and Display Conditionsl Loading Group By and Display Fields and Display Conditions
Specifying Group By and Display Fields
If you want to specify an non-aggregated search (without Group By fields), then complete these steps:
1. Click the Change Display Fields drop-down list icon to create a display column.2. Under theGroup By and Display Fields section, enter an attribute:
a. For a non-aggregated search, choose the event attribute from the drop-down list. If the attribute is not onthe list, then enter a part of the attribute name to see some matches (for example, entering “IP” will
User GuideFortinet Technologies Inc.
443

Understanding Search Components Working with Analytics
display “Source IP” which is not on the list).3. Optionally, select theOrder of display asASC (ascending) orDESC (descending) if the search result needs to
show the results ordered by this column. Choose this order carefully. If multiple columns haveOrder specified,then the system will order the column that appears first and then go on to the other columns in order ofappearance in the Display Column page.
4. If you want a column heading to display differently than the attribute, choose the desired name asDisplay As.5. The search results are displayed in the order of the columns. You can alter the position of a column by clicking the
Move up and down arrows.
If you want to specify an aggregated search (with Group By fields), then complete these steps:
1. Click the Change Display Fields drop-down list icon to create a display column.2. Under theGroup By and Display Fields section, enter an attribute:
a. For aggregated search, enter an event attribute or create an expression using the Expression Builder,described below.
3. Optionally, select theOrder of display asASC (ascending) orDESC (descending) if the search result needs toshow the results ordered by this column. Choose this order carefully. If multiple columns haveOrder specified,then the system will order the column that appears first and then go on to the other columns in order ofappearance in the Display Column page.
4. If you want a column heading to display differently than the attribute, choose the desired name asDisplay As.5. The search results are displayed in the order of the columns. You can alter the position of a column by clicking the
Move up and down arrows.
Specifying Display Conditions for Aggregated Search
If you specified an aggregate search with Group By fields, then you can specify certain conditions. Only theevents that match these display conditions will be displayed.
In the Display Conditions section of theGroup By and Display Fields dialog box :
1. Choose an Attribute from the drop-down list.2. Choose anOperator from the drop-down list.3. Enter a Value for the operator.4. If you require additional conditions, choose a value from the Next drop-down list and click the + icon underRow.5. Click the + or - icons under Paren as needed, to add or remove parentheses on a row.
Saving Group By and Display Fields and Display Conditions
To save Group By and Display Fields and Display conditions, complete these steps:
1. ClickSave in theGroup By and Display Fields dialog box to save your configuration as a template.2. Choose a Scope from the drop-down list in the Save Group By and Display Fields as: dialog box and enter a
name for the template.
Loading Group By and Display Fields and Display Conditions
To load Group By and Display Fields and Display conditions, complete these steps:
1. Click Load in theGroup By and Display Fields dialog box if you want to see a list of display fields that can beadded to the template. The list can contain system- and user-defined display fields.
444 User GuideFortinet Technologies Inc.

Working with Analytics Understanding Search Components
2. Click an item in the list, then click Load. TheGroup By and Display Fields dialog box closes and you will seethe selected item in the list of Attributes in theGroup By and Display Fields section.
Specifying Organizations for a Service Provider Deployment
To specify Organizations in a Service Provider deployment, select the organizations from the drop-down.
Examples of Operators in Expressions
Operator Argument Example
COUNT Matched Events COUNT (Matched Events)
COUNT DISTINCT Any non-numerical attributethat is not unique COUNT DISTINCT (Host Name)
AVG, MAX, MIN, SUM,Pctile95, PctChange
Numerical attribute AVG (CPU Util), MAX (CPU Util), MIN(CPU Util)
LAST, FIRST Numerical attribute LAST (System Uptime), FIRST (SystemUptime)
HourOfDay, DayOfWeek Time attribute HourOfDay(Event Receive Time),DayOfWeek (Event Receive Time)
DeviceToCMDBAttr Host name/IP DeviceToCMDBAttr (Reporting IP :County/Region )
Examples of Expressions
Operators with arguments can be combined with +, -, / and * with parenthesis to form an expression. For a goodexample, see the built in report “Top Devices By System Uptime Pct” which computes the System Uptimepercentage using the expression
100 – (100*SUM(System Down Time)/SUM(Polling Interval)).
Examples of various searches
l Non-aggregate search – see Shortcut >Raw Messages.l Aggregate search:
a. Basic – one attribute and one counting expression - Shortcut > Top Event Types.b. Intermediate – three attributes and one counting expression - Shortcut > Top Reporting
Devices and Event Typesc. Advanced – multiple attributes and complex expressions including Device to CMDB attributes:
i. Reports > Function >Performance > Top Network Interfaces By Utilii. Reports > Function >Availability > Top Devices By Business Hours Network
User GuideFortinet Technologies Inc.
445
Viewing Historical Search Results Working with Analytics
Ping Uptime Pctiii. Reports > Incidents By Location and Category
Viewing Historical Search Results
Historical Search results are displayed in two panes:
l Bottom pane displays the results in tabular view following the definitions in the Display Fields.l Top pane displays the trends over time:
l For non-aggregated searches, the trend is for event occurrence and is displayed in a trending bar graph.Each bar captures the number of entries in the table during a particular time window.
l For aggregated searches, the trend is for any of the (numerical) columns with aggregations. Trends aredisplayed for the Top 5 entries in the table. For integer values, such as COUNT (Matched Events), you willsee a trend bar graph, while for continuous values such as AVG(CPU Utilization), you will see a line chart.
Both the bar and line charts show trends in a stacked manner, one for each row in the table. To see the trend for aspecific row, disable all the other entries by deselecting the check box in the first column. To view the trend for aset of entries, you can select the check box corresponding to those entries.
For continuous values, you can toggle between a stacked view and a non-stacked view:
l To show the stacked view, click
l To show the line chart view, click
If there are multiple aggregate columns:l Select a specific column in the Chart for in top right to see the Chart for that column.l Select one column forChart for and another column for Lower Chart to see the two charts at the same
time – one on +ve Y-axis and one on –ve Y-axis. This generally makes sense when the values are of thesame order. For example, AVG(CPU Utilization) and AVG(Memory Utilization) or AVG(Sent Bytes) andAVG(Recv Bytes).
You can visualize the results in other charts by clicking the drop-down. See FortiSIEM Charts andViews for descriptions of the available charts.
Events in FortiSIEM have an Event Type (like an unique ID) and an Event Name, a short description. When youchoose to display Event Type, the Event Name is automatically displayed but Event type is hidden to make roomto show other fields. To see the Event Types, click the Show Event Type check-box.
Raw events often take many lines to display in a search result. By default, Raw events are truncated anddisplayed in one line so that user can see many search results in one page. To see the full raw event, click theWrap Raw Event check-box.
Using search result tabsA search result typically shows many rows. To drill down into a specific value for a specific column, hover over thespecific cell and choose Add to Filter orAdd to Tab. Add to Filtermodifies the search on the current tab byincluding this constraint. Add to Tab on the other hand, gives you the option to keep the current tab intact andadd the constraint to a new tab or to a tab of your choice. This enables you to see multiple search results side by
446 User GuideFortinet Technologies Inc.

Working with Analytics Viewing Real-time Search Results
side. ClickAdd to Tab and select the tab where the constraint needs to be added. The filter conditions anddisplay columns are copied over to the new tab.
Zooming-in on a specific time windowIf you see an unusual pattern (for example, a spike) in the trend chart and want to drill down without providing anexact time range, do one of the following:
l Click the bar – a new search tab is created by duplicating the original search and adding the right timewindow as seen by hovering on the bar.
l Press and hold the Shift key and drag the mouse over a time window. This modifies the time window inthe current tab. ClickApply & Run to see the results.
Viewing parsed raw eventsHover over a Raw Event Log cell and clickShow Details. The display shows how FortiSIEM parsed that event.
Adding an attribute to the filter criteria in the searchComplete these steps to add an attribute to the filter criteria in the search:
1. Check the Filter column.2. ClickOK.
The Attribute is added to the filter condition.3. Re-run the query to get the new results.
Adding an attribute to the search displayComplete these steps to add an attribute to the search display:
1. Check the Display column.2. ClickOK.
The Attribute is added to the display condition.3. Re-run the query to get the new results.
Viewing Real-time Search Results
Real-time Search results display matching events that occur from the current time onwards.
The search results are displayed in two panes:l Bottom pane displays the results in tabular form following the definitions in the Display Fields.
Note that aggregations are not permitted in real-time search. Since results are coming in continuously,the results scroll and the latest events are displayed at the top.
l Top pane displays the counts of matched events over time.
The following actions are possible while viewing Real-time Search results:l To pause the search, clickPause.l To restart the real-time search from the point you left off, clickResume after Pause.l To fast forward to the current time, click Fast forward.
User GuideFortinet Technologies Inc.
447

Using Nested Queries Working with Analytics
l To clear the result table, clickClear.l To restart the search all over again from the current time, clickStop and then Run.
In real-time search, only Event Type (like a unique ID) is displayed. Enable Show Event Typewhile running areal-time query. Note that Event Names are not displayed.
Raw events often take many lines to display in a search result. By default, Raw events are truncated and shown inone line so that user can see many search results in one page. To see the full raw event, click theWrap RawEvent check-box.
Viewing Parsed Raw EventsHover over a Raw Event Log cell and clickShow Details. The display shows how FortiSIEM parses the event.
Adding an attribute to the filter criteria in the search
Complete these steps to add an attribute to the filter criteria in the search:
1. Check the Filter column.2. ClickOK.
The Attribute is added to the filter condition.3. Re-run the query to get the new results
Adding an attribute to the search display
Complete these steps to add an attribute to the search display:
1. Check the Display column.2. ClickOK.
The Attribute is added to the display condition.
3. Re-run the query to get the new results.
Zooming-in on a Specific Time WindowIf you see an unusual pattern (for example, a spike) in the trend chart and want to drill down without entering theexact time range, do one of the following:
l Click the bar – a new search tab is created by duplicating the original search and adding the right time window asseen by hovering on the bar
l Press and hold Shift key and drag the mouse over a time window – this modifies the time window in the current tab.ClickApply & Run to see the results.
l When you run the Real-time search, a pop-up will appear asking if you want to stop the Real-time search beforeproceeding to the Historical Search.
Using Nested Queries
Nested Query functionality enables one query to refer to results from another query. This section describes howto set up and use nested queries for the three supported scenarios:
448 User GuideFortinet Technologies Inc.

Working with Analytics Using Nested Queries
l Outer CMDBQuery, Inner Event Queryl Outer Event Query, Inner Event Queryl Outer Event Query, Inner CMDBQuery
Outer CMDB Query, Inner Event QueryThe following generalized steps describe how to create a nested query where the outer query targets CMDB andthe inner event query targets events.
If you want to reuse an existing query, then skip Step 1 and go to Step 2. Note that for a nested query to workcorrectly, the data type of the filter attribute in the outer query must "match up" with the data type of one certaindisplay column in the inner query.
Step 1: Construct the Inner Event Query
1. Go to the ANALYTICS page.2. Construct the query and make sure it produces the desired results.
a. Click the Edit Filter and Time Range field and select Event Attribute in the query tab.b. Set the Time Range. For example, you can set it to the last 1 hour. This time period is not important if
you use this query as an inner query.c. If it has the Event Source, then you can set it as Online.d. ClickApply to save your changes.e. Click the Change Display Fields icon and enter the attributes you want to display.f. ClickApply & Run.
3. ClickAction > Save as Report.4. Ensure Save Definition is checked.
Step 2: Construct the Outer CMDB Query by Referring to the Query in Step 1
1. Go to the ANALYTICS page.2. Click in the Search bar--it will open the Filter dialog box.3. Select CMDB Attribute.4. Select the appropriate target from the drop-down list.5. Set the query condition.
a. Select the Attribute.b. Select theOperator--the most common operators are IN and NOT IN.c. Click in the Value field and select Select from Report.d. Select the Report name, saved in Step 1, Substep 4.e. Open the Attribute drop-down list and choose the attribute that matches the attribute in Step 2, Substep
5a.f. ClickOK.
6. Choose the Nested Time Range: the inner report will be run for this time range.
7. Click the Change Display Fields icon and choose the attributes you want to display.8. ClickApply & Run.9. To save the report, clickAction > Save as Report. Enter the name of the nested query.
User GuideFortinet Technologies Inc.
449

Using Nested Queries Working with Analytics
Outer Event Query, Inner Event QueryThe following generalized steps describe how to set up and use nested queries for an outer event query and aninner event query.
Step 1: Construct the Inner Event Query
1. Go to the ANALYTICS page.2. Click the Edit Filter and Time Range field.
a. Select Event Attribute and create the Filter Condition.b. Set the Time Range.
For example, you can set it to the last 1 hour. This time period is only useful to check if thisquery produces the desired results. If used as an inner query, time range would be setseparately in Step 2 below.
c. If it has the Event Source, then you can set it as Online.d. ClickApply to save your changes.e. Click the Change Display Fields icon and enter the attributes you want to display. This query needs to
be an aggregate query to be used as an inner query. One of the Group By attributes must match(meaning compatible value sets) an attribute chosen in the outer query in Step 2, Substep 2.d.ii
f. ClickApply & Run.3. If you are happy with the result, then clickAction > Save as Report. Ensure Save Definition is checked.
Step 2: Construct the Outer Event Query
1. Go to the ANALYTICS page.2. Click the Edit Filter and Time Range field.
a. Select Event Attribute in the query tab.b. Choose an Attribute.c. Choose anOperator. The most common operators are IN and NOT IN.d. Click the Value field and select Select from Reports.
i. Select the Report name, saved in Step 1, Substep 3.ii. Open the Attribute drop-down list and choose the attribute that matches the attribute in Step
1, Substep 2e.iii. ClickOK.
3. Choose the time ranges.
a. Choose the time range for outer query.b. Choose Nested Time Range for the inner query.c. If it has the Event Source, then you can set it as Online.
4. ClickApply to save your changes.5. Click the Change Display Fields icon and enter the attributes you want to display.6. ClickApply & Run.7. You can save the results by clicking Action > Save as Report. Ensure Save Definition is checked.
450 User GuideFortinet Technologies Inc.

Working with Analytics Saving Search Results
Outer Event Query, Inner CMDB Event QueryThe following generalized steps describe how to set up and use nested queries for an outer event query and aninner CMDB query.
Step 1: Construct the Inner CMDB Query
1. Go to the ANALYTICS page.2. Click the Edit Filter and Time Range field and select CMDB Attribute in the query tab.
a. Select the appropriate Target from the drop-down list.b. Set the query condition.
i. Select the Attribute.ii. Select theOperatoriii. Click in the Value field. Do not select Select from Report.
c. ClickApply to save your changes.3. Click the Change Display Fields icon and enter the attributes you want to display.4. ClickApply & Run.5. If you are happy with the result, then clickAction > Save as Report. Ensure Save Definition is checked.
Step 2: Construct the Outer Event Query
1. Go to the ANALYTICS page.2. Click the Edit Filter and Time Range field and select Event Attribute in the query tab.
a. Choose an Attribute.b. Choose anOperator - the most common operators are IN and NOT IN.c. Click in the Value field and select Select from Report.
i. Select the Report name, saved in Step 1 Substep 5.ii. Open the Attribute drop-down list and choose the attribute that matches the attribute in Step 1
Substep3.iii. ClickOK.
3. Choose the Time Range for outer query.4. If it has the Event Source, then you can set it as Online.5. ClickApply to save your changes.6. Click the Change Display Fields icon and enter the attributes you want to display.7. ClickApply & Run.8. You can save the results by clicking Action > Save as Report. Ensure Save Definition is checked.
Saving Search Results
Sometimes you must save a search and/or the search results for later use. With the search result displayed inANALYTICS, complete these steps:
1. From the Action drop-down list, select Save as Report.2. Specify the Report Name.3. Specify whether the Report Definition must be saved. This will allow you to re-run the query at a later time. If you
respond "yes", then:
User GuideFortinet Technologies Inc.
451

Viewing Saved Search Results Working with Analytics
a. CheckSave Definition.b. Select the report folder in Save To where the new report should be saved.
4. Enable Save Results if the Report results should be saved and then select the time duration.If this option is enabled, the results will be stored under the Saved Results folder under the Folders icon.
5. Enable Save Template if you want to apply a template to your results. Follow the instructions in Designing a PDFreport template to design the cover page and add sections, subsections, attachments, and so on, to the report.
Viewing Saved Search Results
Complete these steps to view previously saved search results:
1. Go to the Saved Results folder under2. Select the specific entry.3. Hover over the Name cell and choose View Result from the drop-down list. (To delete a saved search result, you
can choose Delete.)The results will be displayed.
Exporting Search Results
With the search results displayed underANALYTICS, complete these steps to export:
1. From the Action drop-down list, select Export Result.2. Enter the User Notes (optional).3. Specify theOutput Format asPDF orCSV.
Files with a large number of rows should be exported in CSV format.4. Select the Time Zone of the data from the drop-down list.5. Select the Report Template if you select PDF format:
l Defined - to use the template defined for this report defined underRESOURCES >Reports or use thesystem default template for Analytics export.
l New - to create a new custom report template for one-time use. The Report Design settings appearwhen you choose this option. Note that this template will not replace the template defined underRESOURCES >Reports.Refer to Designing a PDF Report Template for the steps to design the Cover Page and Table ofContents.
6. ClickGenerate to generate the report.7. ClickView to download the report to the local disk.
Emailing Search Results
You must first configure email settings underADMIN >Settings >System >Email. With the search resultdisplayed in ANALYTICS tab, complete these steps to email search results:
452 User GuideFortinet Technologies Inc.

Working with Analytics Creating a Rule from Search
1. Go to the Action drop-down list and select Email Result.2. Enter the receiver email address in the To field.3. Enter the Subject of the email.4. Enter anyDescription about the email.5. Enter anyUser Notes about the search results (optional).6. Choose theOutput Format asPDF orCSV.7. Select the Time Zone of the data from the drop-down list.8. Select the Report Template if you select PDF format:
l Defined - to use the template defined for this report defined underRESOURCES >Reports or use thesystem default template for Analytics export.
l New - to create a new custom report template for one-time use. The Report Design settings appearwhen you choose this option. Note that this template will not replace the template defined underRESOURCES >Reports.Refer to Designing a PDF Report Template for the steps to design the Cover Page and Table ofContents.
9. ClickSend.
Creating a Rule from Search
With the search result displayed in Analytics, follow the steps below to create a rule:1. From the Action drop-down list, select Create Rule.2. A rule template is automatically created by copying over important Search parameters:
a. Rule Sub-pattern Filters contain Search Filter conditionsb. Rule Sub-pattern Group By contain Search Display conditionsc. Rule Aggregate Conditions are set to COUNT(Matched Events) >= 1
3. To complete the rule creation, configure the settings under the Create Rulewindow with reference tothe following table:
Settings Guidelines
Rule Name Enter a name for the new Rule.
Description Enter a description about the new Rule.
Remediation Enter the Remediation script. Make sure that the Remediation script for yourscenario is defined. Check the existing Remediation scripts underADMIN >Settings >Notification >Action column. If your device is not in the list, addthe needed Remediation script.
Condition ClickCondition to create the rule conditions. See Defining Rule Conditions.
Severity Select a Severity to associate with the incident triggered by the rule.
Category Select the Category of incidents to be triggered by the rule.
User GuideFortinet Technologies Inc.
453

Creating a Rule from Search Working with Analytics
Settings Guidelines
Subcategory Select the Subcategory from the available list based on the selected incidentCategory. To add custom subcategories, follow the steps under Setting RuleSubcategory.
ActionsClick the edit icon to define the incident (Incident Attributes and TriggeredAttributes) that will be generated by this rule. You must have at least oneincident defined before you can save your rule.
Exception Click the edit icon to define any Exceptions for the rule. See Defining RuleExceptions.
Dashboard Select Dashboard to add this report underDASHBOARD tab.
Notification Select a Notification frequency for how often you want notifications to besent when an incident is triggered by this rule.
Impacts Select the Impacts of the incident triggered by this rule from the drop-down.
Watch Lists Click the edit icon to add the rule you want to add to the watch list.
Note: The Type that you set for the watch list must match theIncident Attribute Types for the rule. For example, if your watch listType is IP, and the Incident Attribute Type for the rule is string, youwill not be able to associate the watch list to the rule.
Clear Click the edit icon to define anyClear conditions for the rule. See DefiningClear Conditions.
4. ClickSave.Your new rule will be saved to the group you selected in an inactive state. Before you activatethe rule, you should test it.
454 User GuideFortinet Technologies Inc.

Working with Dashboards General Operations
Working with Dashboards
FortiSIEM collects logs and performance metrics and create Incidents by event correlation and other means. Thisdata can be summarized in Reports. A Dashboard provides a graphical view of these reports. FortiSIEMDashboards are organized into a two-level hierarchy: Dashboard folders with each folder containing multipleDashboards.
You can perform various operations from FortiSIEM Dashboards:
l General Operations
A Dashboard can be one of the following six built-in dashboard types:
l Widget Dashboardl Summary Dashboardl Business Service Dashboardl Identity and Location Dashboardl Interface Usage Dashboardl PCI Logging Status Dashboard
General Operations
FortiSIEM Dashboard can be used to perform various operations:
l Viewing built-in dashboard foldersl Displaying only dashboard folders of interestl Setting a home dashboard folderl Creating a new dashboard folderl Creating a new dashboard under a folderl Sharing dashboard foldersl Deleting a dashboardl Deleting a dashboard folderl Starting dashboard slideshow
Viewing built-in dashboard foldersFortiSIEM provides several built-in dashboard folders:
Folder Dashboard Type Description
Amazon WebServicesDashboard
Summary SummaryDashboard
User GuideFortinet Technologies Inc.
455

General Operations Working with Dashboards
Folder Dashboard Type Description
Performance WidgetDashboard
Login WidgetDashboard
Cloud Trail WidgetDashboard
ApplicationServerDashboard
JBoss WidgetDashboard
WebSphere WidgetDashboard
WebLogic WidgetDashboard
Tomcat WidgetDashboard
GlassFish WidgetDashboard
DatabaseDashboard Logon Widget
Dashboard
System Perf WidgetDashboard
Oracle Performance WidgetDashboard
SQL ServerPerformance
WidgetDashboard
MySQL Performance WidgetDashboard
FortiSIEMDashboard
Event WidgetDashboard
Audit WidgetDashboard
Incidents WidgetDashboard
456 User GuideFortinet Technologies Inc.

Working with Dashboards General Operations
Folder Dashboard Type Description
Fortinet SecurityFabric FortiSandbox Widget
Dashboard
FortiGate Threat WidgetDashboard
FortiGate Traffic WidgetDashboard
FortiMail WidgetDashboard
FortiClient WidgetDashboard
FortiCare 360 WidgetDashboard
Google AppsDashboard Logon Widget
Dashboard
Audit WidgetDashboard
Identity andLocationDashboard
Identity and Location SummaryDashboard
NetAppDashboard
Overall WidgetDashboard
NFS Perf WidgetDashboard
CISF Perf WidgetDashboard
ISCSI Perf WidgetDashboard
NetworkDashboard
Summary SummaryDashboard
Hardware SummaryDashboard
Availability WidgetDashboard
User GuideFortinet Technologies Inc.
457

General Operations Working with Dashboards
Folder Dashboard Type Description
Performance WidgetDashboard
Login/Change WidgetDashboard
Netflow WidgetDashboard
IPSLA WidgetDashboard
VoIP WidgetDashboard
CBQoS WidgetDashboard
Office365Dashboard Logon Widget
Dashboard
Audit WidgetDashboard
SalesforceDashboard Login Widget
Dashboard
Activity WidgetDashboard
Performance WidgetDashboard
SecurityDashboard
Perimeter WidgetDashboard
Access WidgetDashboard
Malware WidgetDashboard
Vulnerability WidgetDashboard
Exploits WidgetDashboard
458 User GuideFortinet Technologies Inc.

Working with Dashboards General Operations
Folder Dashboard Type Description
Policy Violation WidgetDashboard
ServerDashboard
Summary SummaryDashboard
Hardware SummaryDashboard
Availability WidgetDashboard
Performance WidgetDashboard
Login WidgetDashboard
VMWareDashboard VM Widget
Dashboard
ESX WidgetDashboard
Cluster WidgetDashboard
Resource Pool WidgetDashboard
Datastore WidgetDashboard
Environment WidgetDashboard
Events WidgetDashboard
VNXDashboard Processor WidgetDashboard
Ports WidgetDashboard
LUNs WidgetDashboard
User GuideFortinet Technologies Inc.
459

General Operations Working with Dashboards
Folder Dashboard Type Description
Storage Pool WidgetDashboard
Web ServerDashboard
System Performance WidgetDashboard
IIS Performance WidgetDashboard
Apache Performance WidgetDashboard
Access WidgetDashboard
Displaying only dashboard folders of interestComplete these steps to see only the dashboards folders that are of interest to you:
1. Click the Edit User Profile icon ( ) in the upper right corner of the UI.2. Click the UI Settings tab.3. Select the currentlyVisible Dashboards that you want to hide and click <.4. ClickSave.The dashboard folder drop-down list under the DASHBOARD tab will display only the selected dashboardfolders.
Setting a home dashboard folderComplete these steps to see a specific dashboard folder when you navigate to the DASHBOARD tab:
1. Click the Edit User Profile icon ( ) in the upper right corner of the UI.2. Click the UI Settings tab.3. Select a Dashboard Home from the drop-down list.4. ClickSave. Refresh the Web page if it doesn’t reload automatically.
Creating a new dashboard folderComplete these steps to create a new dashboard folder:
1. Go to DASHBOARD and select New from the Dashboard drop-down list.2. Enter a dashboard Name.3. Select whether you want to share the dashboard.4. ClickSave.
Creating a new dashboard under a folderNote: You can add a dashboard to a built-in dashboard folder.
460 User GuideFortinet Technologies Inc.

Working with Dashboards General Operations
To create a new dashboard under a dashboard folder:
1. Go to DASHBOARD tab.2. Select the dashboard from the folder drop-down list. The dashboards belonging to the folder will display on the top
menu.3. Click + to the right.4. Enter a dashboard Name, select a dashboard Type, and add any related Description about this dashboard.5. ClickSave.
Sharing dashboard foldersWhen you create a new dashboard folder, FortiSIEM gives you the option of sharing the folder, and all of thedashboards in it, with other users.
Note the following rules and restrictions on shared dashboards:
Rules for creating and using shared dashboard folders:
l A user can share only with other users in the same organization.l A Super user can share only with other Super users, even if that Super user is in Global mode.l Org users can share only with (the same) Org users.
l If a Global/Super user shares a dashboard with another user, the other user can see only this dashboard inGlobal/Super mode.
l If a Local/Super user shares a dashboard with another user, the other user can see only this dashboard inLocal/Super mode.
l If you share with all users in the current Org, then above rules also apply.
Restrictions on shared dashboards:
l Only the user who created the dashboard hasWrite permission to it, including setting the list of shareable users.The users with whom the dashboards are shared have only Read permission.
l Shared users can view the reports and perform Search and drill down operations on them. If shared users try tochange the dashboard in any way, they will be asked to clone the dashboard with a new name. Cloning thedashboard breaks the link with the original dashboard. If the user wants access to the original dashboard, then theuser who created the dashboard must share it again.
l For shared dashboards, run the report once, so that all users see the same data.l A shared dashboard cannot be hidden from view.
Advantages of a shared dashboard folder:
l The dashboard owner can seamlessly propagate changes to the users with whom the dashboard is shared.l An organization can quickly standardize on a set of dashboards created by experts.l The report to populate the dashboard is run once if the report is run in inline mode. This uses less system resources
Creating a Shared Dashboard
Complete these steps to create a shared dashboard folder:
1. Go to DASHBOARD and clickNew to create a dashboard folder.2. In the Create Dashboard Folder dialog box, enter a Name for the dashboard folder.3. Select the Everyone in current org checkbox to share the dashboard folder with everyone in the current
organization.
User GuideFortinet Technologies Inc.
461

General Operations Working with Dashboards
a. To share with selected users/groups, click the edit icon. Select Users (CMDBUsers) and/orAD Groupsfrom the left column, then select individual users from the middle column and shuttle them to theSelections column.
b. ClickContinue. The selected users and groups will be able to access the shared dashboard and itscontents.
4. Click the edit icon next to Exclude to exclude sharing with selected users.a. Select Users (CMDBUsers) and/orAD Groups from the left column, then select individual users from
the middle column and shuttle them to the Selections column.b. ClickContinue. The excluded users will not be able to see or access the shared dashboard folder.
5. ClickSave. The dashboard folder will have a icon – this indicates that it is a shared folder.6. At this point, you can create dashboards for the shared dashboard folder. See Creating a new dashboard under a
folder.
Cloning a Shared Dashboard Folder
In shared dashboard, you can perform the refresh, drill down, and search operations. If you want to make anyother changes, such as add a dashboard, change display settings, or delete the dashboard, then you must clonethe shared dashboard folder. Once cloned, the link between the original shared dashboard and the cloneddashboard will be broken. This means that changes to the original shared dashboard will not be reflected in thecloned dashboard.
Complete these steps to clone a dashboard folder.
1. Log in to FortiSIEM.2. Go to Dashboard and select the dashboard folder that has been shared with you from the drop-down list.3. Any changes you attempt to make, such as add a dashboard, change display settings, or delete the dashboard,
will open the Clone Dashboard Folder dialog box.4. Enter a new Folder Name in the Clone Dashboard Folder dialog box.5. ClickSave.You can now make your own changes to the dashboards in the cloned dashboard folder.
Deleting a dashboardNote: Built-in dashboards cannot be deleted.
Complete these steps to delete a user-created dashboard:
1. Go to DASHBOARD tab.2. Select the dashboard folder drop-down list. The dashboards belonging to that folder will display.3. Select the dashboard to delete from the top menu and click the x.
Deleting a dashboard folderNote: Built-in dashboard folders cannot be deleted.
Complete these steps to delete a user-created dashboard folder:
1. Go to DASHBOARD tab.2. Select the dashboard folder from the folder drop-down list and click the x.
462 User GuideFortinet Technologies Inc.

Working with Dashboards Widget Dashboard
Starting dashboard slideshowMake sure that you have created the slideshow templates before starting a slideshow. See Dashboard Slideshowsettings.
Complete these steps to start a dashboard slideshow:
1. Go to DASHBOARD tab.2. Click the dashboard folder drop-down list and clickStart Slideshow to select the configured slideshow.
The slideshow starts in full screen mode. To exit full screen mode, click the Exit Full Screen (Esc) button.3. To return to the dashboard page, click button on the top-right.
Widget Dashboard
AWidget Dashboard displays a graphical view of FortiSIEM reports. The reports can be from CMDB data or Eventdata. The reports can be Top N type aggregated reports or non-aggregated reports, likely displaying rawmessages. Aggregated reports can be displayed in various forms: gadgets, bar, donuts, tables, line, stacked line,scatter plot, heat maps, tree maps, and geo-maps.
l Creating a Widget Dashboardl Data Sourcel Populating a Widget Dashboardl Modifying Widget Dashboard layoutl Modifying widget information displayl Searching in a Widget Dashboardl Drill-down into a widgetl Exporting Widget Dashboard definitionl Importing Widget Dashboardl Forcing a refresh
Creating a Widget DashboardWhen you create a new dashboard, choose Widget Dashboard as the Type.
Data sourceAll Event data and CMDBData can be used to populate a Widget Dashboard.
Populating a Widget DashboardYou can add up to a maximum of 20 event reports or CMDB reports to a Widget Dashboard. Complete thesesteps to add a report to a Widget Dashboard:
1. Make sure the report of your choice exists. CMDBReports can be found in CMDB >CMDB Reports. EventReports can be found in RESOURCES >Reports.
l If the report exists, then run the report to make sure that data is accurate and the fields you want to seeare present. Do not choose too many columns in a dashboard view, as may clutter the dashboard.
User GuideFortinet Technologies Inc.
463

Widget Dashboard Working with Dashboards
l If the report does not exist, then create the report and Save it. You can save it in a folder for easynavigation.
2. Go to DASHBOARD tab. Select the dashboard folder from the drop-down list.3. Click + below the dashboard folder drop-down list. Select the report from the menu and click > to display it on the
dashboard.The report will run and the results will be displayed in the Widget Dashboard.
Modifying Widget Dashboard layoutYou can select one of two Widget Dashboard layouts from the Layout drop-down list on top-right menu ofdashboard:
l Tile view - widgets can be of non-uniform size and can be dragged around the dashboard space.l Column view - widgets are arranged in a fixed number of columns (1, 2 or 4) in the dashboard space.
Modifying widget information display1. Click the tools icon on the top-right of the widget to open the Settings page.
a. To change the title, enter a new Title.b. To change the chart format, choose a newDisplay from the available choices, only if it is relevant for
the report. FortiSIEM Charts and Views describes the available charts.c. To change the time duration of the report, choose a different Time.d. To modify the size of the widget, choose a differentWidth and Height. Widgets displayed in tabular
formats typically take more width and height compared to Single Line view.e. To display more or fewer entries, choose the appropriate Result Limit. Note that a larger result limit
may require more width and height.f. For a Service Provider installed in a Super/Global view, choose theOrganizations to run the report for.
This option is available if you run reports from the Super/Global view.g. To change the chart refresh interval, select the appropriate Refresh Interval. Reports will be re-run
periodically at specified refresh intervals.h. Select Display Settings for the specificDisplay chosen before. FortiSIEM Charts and Views describes
the required settings for each of the charts.2. ClickSave.
Searching in a Widget DashboardYou can search data for specific event attributes simultaneously in all the widgets in a dashboard. To do this, clickthe Filter button on left and select the values. You can search on any field that appears in at least one widget on adashboard.
For example, if you choose to Filter on IP = 10.1.1.1, then only the entries for Source IP or Destination IP or HostIP = 10.1.1.1 are shown on all the widgets.
Note the following:
l The values you can search are pre-populated by searching through the data in various widgets. You can only searchfor a value if it is present in any widget on the dashboard.
464 User GuideFortinet Technologies Inc.

Working with Dashboards Summary Dashboard
l Without filters, a dashboard shows pre-computed results – so they load quickly. However, when you search, all thereports in the Widget Dashboard are run in an ad hoc mode. Subsequently, search results may return relativelyslowly.
Drill-down into a widgetTo analyze the results shown in a widget further, click the magnifying glass icon on the top-right of the widget.This will take you to the ANALYTICS tab. The same query will be re-run slightly differently:
l Time conditions are maintainedl Filter conditions are maintainedl Aggregation conditions are removed and the field values and the raw messages are shown directly
This enables users to better understand the widget results. For example, if a column like AVG(CPU) is high over atime duration, then drill down shows all the individual CPU values over the time duration so that you can quicklygo to the time when CPU spiked.
Exporting Widget Dashboard definitionIf you want to create the same dashboard in another FortiSIEM, or share with another user, or create the samedashboard for another Organization in a Service Provider FortiSIEM instance, use the export/import feature.
To export the dashboard definition, click the export button on top-right. The definition will be saved in a file, whichthen can be imported into another FortiSIEM Widget Dashboard.
Importing a Widget DashboardTo import a dashboard widget, click the import button on top-right and select the file. The imported file must beexported from another FortiSIEM Widget Dashboard.
Forcing a refreshEach widget refreshes according to the Refresh Interval specified within the widget. To update the wholedashboard, click the refresh icon on top-right.
Summary Dashboard
A Summary Dashboard displays the metrics for many devices in a spreadsheet format. Unlike the widgetdashboard that shows a few metrics in one widget, a Summary Dashboard can simultaneously show many moremetrics. This often allows rapid diagnostics. FortiSIEM calculates and maintains these metrics in an in-memorydatabase inside Query Master module.
Note: RBAC for Summary dashboard is controlled by hiding by Device Group and not by Data Condition. If youwant to hide a group of devices in Summary dashboard for a role, hide the Device Group in the role. The usershould not be able to choose the devices from the Device Group.
l Creating a Summary Dashboardl Data sourcel Managing devices in a Summary Dashboard
User GuideFortinet Technologies Inc.
465

Summary Dashboard Working with Dashboards
l Changing display columnsl Changing refresh intervall Forcing a refreshl Searching a Summary Dashboard
Creating a Summary DashboardWhen you create a new dashboard, choose Summary Dashboard as Type.
Data SourceThe source of data in a Summary Dashboard is the performance and availability monitoring metrics andincidents. To see the metrics that can be displayed, click the column icon. The left table shows the event typesand the middle table shows the available metrics for the selected event type. These metrics can be displayed in aSummary Dashboard. Custom attributes from custom monitoring may also be displayed after they are defined.
In addition to metrics, the following are shown:
l Performance, Availability and Security incident countsl Performance, Availability and Security Status each derived from respective incident severities
Managing devices in a Summary DashboardWhen you create a Summary Dashboard for the first time, no devices are displayed.
Complete these steps to add devices to the dashboard:1. Click the device icon.2. Choose devices to display from the Available Devices list and click the right arrow button.3. ClickOK.
If the devices do not display in the dashboard, check the pre-defined filters for Severity. You may want to setSeverity to All Severities to see the device recently added. When there are a large number of devices beingmonitored, you may want to show only the devices with Critical + Warning severity, as they would needattention.
Complete these steps to remove a device from the dashboard:1. Click the device icon.2. Choose devices to display from the Selected Devices list and click the left arrow button.3. ClickOK.
Changing display columnsComplete these steps to change the pre-defined set of display columns in the Summary Dashboard:
1. Click the columns icon.2. To remove a column, choose the column from the Selected Columns list and click the left arrow button.3. To add a new column:
a. Select an Event Types on the left-most tabb. Choose the Columns from the middle tab corresponding to the selected Event Types.c. Click right arrow.
4. ClickOK.
466 User GuideFortinet Technologies Inc.

Working with Dashboards Business Service Dashboard
Changing refresh intervalSelect the refresh interval from the drop-down menu on the top-right menu.
Forcing a refreshTo update the whole dashboard click the refresh icon on top-right menu.
Searching a Summary DashboardYou can search for specific devices by entering values in the search field.
1. Select the fields to search by clicking the search icon.2. Enter the search string in the search field.You can also filter from the three pre-defined drop-down lists:
l Severityl Organizationsl Locations
You can set the location property for devices from ADMIN >Settings >Discovery > Location.
Business Service Dashboard
In FortiSIEM, you can define a Business Service as a container of Devices (Go to CMDB >Business Services,then clickNew). A Business Service Dashboard provides an overview of the health of the business service byshowing the related Incidents and impacted devices.
l Creating a Business Service Dashboardl Data sourcel Adding/Removing Business Service to the Dashboardl Summary viewl Drilldown viewl Filtering Summary viewl Filtering Drilldown viewl Changing refresh intervall Forcing a refresh
Creating a Business Service DashboardWhen you create a new dashboard, choose Business Service Dashboard as Type.
Data sourceThe only source of data for this dashboard is incidents triggering for the devices belonging to a Business Service.
User GuideFortinet Technologies Inc.
467

Business Service Dashboard Working with Dashboards
Adding/Removing Business Services to the DashboardWhen you create a Business Service Dashboard for the first time, no Business Services are shown.
Complete these steps to add a Business Service to the dashboard:
1. Click the devices icon.2. Select the Business Services from the Available Services Business Service list.3. Click right arrow to move them to the Selected Services list.4. ClickSave.Complete these steps to remove a Business Service from the dashboard:
1. Click the devices icon.2. Select the Business Services to remove from the Selected Services list.3. Click left arrow to move them back to the Available Services list.4. ClickSave.
Summary viewBusiness Service Dashboard has two views: Summary view and Drilldown view. The Summary view is the defaultview when you access the Dashboard.
The first level Summary view displays:
l Incident Counts By Severity and Top Impacted Devices across all Business Services.l High and Medium Severity Incident Counts for each Business Service.
Click a specific Business Service in the first level to see the second level Summary view. This displays:
l Devices belonging to the Business Service that has triggered incidents.l For each device:
l Device Namel Device Typel Availability Statusl Incidents and counts – you can click an Incident to see more details in a pop up. From there, you can take
action on an incident (for example, drill down the incident on Incident page).
Drilldown viewClick the Drilldown button to display the Drilldown view of Business Services.
The first level Drilldown view displays the Incidents of each Business Service.
Click a specific Business Service in the first level to display the second level Drilldown view. It displays theSummary dashboard view of each device belonging to the selected Business Service.
Click theOverview button to get back to the Summary view.
468 User GuideFortinet Technologies Inc.

Working with Dashboards Identity and Location Dashboard
Filtering Summary viewIn the first level Summary view, you can filter the information displayed by Incident Severity and Organizations(for Service Provider deployments). Choose the values from the respective drop-down lists.
In the second level Summary view, you can filter the information by Device name and type.
Filtering Drilldown viewIn the first level Drilldown view, you can filter the information by Organizations (for Service Providerdeployments). Simply choose the values from the drop-down list.
In the second level Drilldown view, you can filter the information by Device name and type.
Changing refresh intervalSelect the refresh interval from the drop-down menu on top-right.
Forcing a refreshTo update the whole dashboard, select Refresh Now on top-right.
Identity and Location Dashboard
In many situations, you would like to know which user is using an IP address and where the user connected from.The Identity and Location Dashboard provides you an audit trail of this information by providing the linkagebetween:
l Network Identity - IP address, or MAC addressl User identity - user name, host name, or domainl Location - a wired switch port, a wireless LAN controller, or VPN gateway
The following sections provide more information about Identity and Location Dashboard:
l Data sourcel Adding to the Data sourcel Viewing Identity and Location Dashboardl Searching for specific information
Data sourceThis association is built over time by combining information from the following events:
l Active Directory logon events – such asWin-Security-540 and Win-Security-4624 that provide IP Address, User,and Domain information
User GuideFortinet Technologies Inc.
469

Identity and Location Dashboard Working with Dashboards
l DHCP events – these provide IP, MAC address, and sometimes host name information. Events include:l WIN-DHCP-IP-LEASE-RENEWl WIN-DHCP-IP-ASSIGNl FortiGate-event-DHCP-response-Requestl FortiGate-event-DHCP-response-Ackl AO-WUA-DHCP-IP-LEASE-RENEWl AO-WUA-DHCP-IP-ASSIGNl Linux_DHCPACKl Generic_DHCPACKl Cradlepoint-dhcp-updated
l VPN logon events – these provide IP and user information. Events include:l ASA-713228l Juniper-SecureAccess-Session-Startl Cisco-VPN3K-IKE/25l ASA-722022l ASA-713049-Client-VPN-Logon-successl FortiGate-ssl-vpn-session-tunnel-upl ASA-113019
l WLAN logon events – these provide IP and user information. Events include:l Aruba-1014-wlsxNUserEntryCreated,l FortiGate-Wireless-Client-IP-Assignedl Cisco-WLC-53-bsnDot11StationAssociate
l Cloud Service logon events – these provide IP and user information. Events include:l AWS-CloudTrail-SIGNIN-ConsoleLogin-Successl Google_Apps_login_login_successl Salesforce_Login_Successl OKTA-USER-AUTH-LOGIN-SUCCESSl MS_OFFICE365_UserLoggedIn_Succeeded
l AAA Authentication events - these provide IP and user information. Events include:l Win-IAS-PassedAuthl CisACS_01_PassedAuth
l FortiSIEM Discovery events – these provide IP, user, and location information. Events include:l PH_DISCOV_HOST_LOCATIONl PH_DISCOV_CISCO_WLAN_HOST_LOCATIONl PH_DISCOV_ARUBA_WLAN_HOST_LOCATIONl PH_DISCOV_GEN_WLAN_HOST_LOCATION
Adding to the Data sourceYou can modify the file /opt/phoenix/config/identityDef.xml file to add new events. Remember torestart the phIdentityMaster and phIdentityWorkermodules on all nodes after the changes are done.
470 User GuideFortinet Technologies Inc.

Working with Dashboards Using the Interface Dashboard
Viewing Identity and Location DashboardIdentity and Location Dashboard is a spreadsheed style tabular dashboard that displays the followinginformation:
l IP Address - IP address of a host whose identity and location is recorded in this result. You can view IP addresseswith country flags in a map by clicking Locations.
l MAC Address - MAC address of the hostl User Name - User associated with this IP Address. Obtained from one of these event types in the Data Source
section.l Host Name - Host Name from which IP Address was used. Obtained from one of these event types in the Data
Source section.l Domain - Provides context for the User. The Information displayed here depends on the logon event type it was
obtained from:l Windows Domain Logon: Domain namel VPN Logon: reporting IP address of the VPN gatewayl WLAN Logon: reporting IP address of the WLAN controllerl AAA Logon: reporting IP of the AAA server
l VLAN ID- For hosts directly attached to a switch, this is the VLAN ID of the switch port,l Connected to - For hosts attached to a switch port, this is the switch name, reporting IP address, and interface
name,l First Seen - The time at which this entry was first created in the AccelOps Identity and Location database,l Last Seen - The time at which some attribute of this entry was last updated. If there is a conflict, for example, a
host acquiring a new IP address because of DHCP, then the original entry is closed and a new entry is created. Aclosed entry will never be updated.
l Organization - Displays the Organization to which the IP address belongs for Service Provider installations in aSuper/Global View.
Searching for specific informationYou can search in two ways:
l Search single field - use the search box.l For Time Range, choose the time ranges in the time range field on the top rightl For other fields, select the fields in the Search area and enter the value to be searched
l Search multiple fields at the same time – use the Filter areal Select the field, enter the searched value and clickOK. The condition will diaplay on the topl Select another field and so on.l You can clear a condition by clicking the x button.
Using the Interface Dashboard
This dashboard provides an overview of the usage of individual interfaces of Router and Firewall devices. Thedashboard has three levels:
User GuideFortinet Technologies Inc.
471

Using the Interface Dashboard Working with Dashboards
l The Top view displays device level metrics in a tabular form.l Once you select a device in the Top view, the middle table shows the basic interface level metrics such as received
and sent bytes.l You can drill-down and get Application level usage and QoSmetrics for a specific device interface. To do this, select
a device in the Top view and a specific interface in the middle view.
The following sections provide more information about the Interface Usage Dashboard:
l Data sourcel Adding/Removing Devices and Interfaces to the Dashboardl Viewing device level metricsl Viewing interface level metricsl Viewing Application Usagel Viewing QoS Statisticsl Drill-down from widgetsl Modifying widget information displayl Changing refresh intervall Forcing a refresh
Data sourceThis dashboard applies to network devices: Routers/Switches and Firewalls.
l Top View - Device level metrics are sourced from Ping monitoring and SNMP.l Middle View – Basic interface level metrics are also sourced from SNMP.
l The sent and receive metrics are available for all network devices implementing MIB2 (RFC 1213).l Latency, Jitter, and Loss are available for FortiGate Firewalls/UTM devices via SNMP – see FORTINET-
FORTIGATE-MIB: fgSystem.fgLinkMonitor (see note below on configuration restriction).l Bottom View
l Application Usage is available from Netflowl QoS values are available for FortiGate Firewalls/UTM devices via SNMP – see FORTINET-FORTIGATE-
MIB: fgIntf.fgIntfBcs.fgIntfBcInTable.fgIntfBcInEntry for ingress andfgIntf.fgIntfBcs.fgIntfBcTable.fgIntfBcEntry for egress.
Configuring Latency, Jitter and Loss
FortiGate SNMPmetrics report Latency, Jitter. and Loss by link ID, which is different from SNMP interface ID.FortiSIEM requires that the user configures the link ID to be identical to SNMP interface ID.
SNMP interface IDs are available by running the SNMPwalk command: snmpwalk –v2c –c<cred> <ip>ifName. In the output, the integer after ifName is the interface ID.
#snmpwalk –v2c –cpwd 10.1.1.1 ifNameIF-MIB::ifName.1 = STRING: port1IF-MIB::ifName.2 = STRING: port2IF-MIB::ifName.3 = STRING: port3
Here the SNMP interface ID of port1 is 1, SNMP interface ID of port2 is 2 and so on.
Use the SNMP interface ID in the config system virtual-wan-link command – see the examplesbelow:
472 User GuideFortinet Technologies Inc.

Working with Dashboards Using the Interface Dashboard
This is a basic example where the port, health check members and SNMP index can align naturally,however this is not likely to be the case with all configurations.
#config system virtual-wan-linkset status enableconfig members
edit 1set interface port1
nextedit 2
set interface port2next
end
#config health-checkedit "HC_Backoffice"
set server "8.8.8.8"set update-static-route disableset members 1 2
next
Asmentioned, to ensure that the Interface SNMP Index ID corresponds to that of the virtual WAN link and thehealth check, it is required that SNMP index must align. This example and description shows how to configure aFortiGate for SDWANmonitoring with FortiSIEM.
1. The interface should specify the SNMP index, for example, 105 (set snmp-index 105) :config system interface
edit "port4"set vdom "root"set ip 10.1.31.10 255.255.255.240set allowaccess ping https sshset type physicalset netflow-sampler bothset inbandwidth 50192set outbandwidth 50192set ingress-shaping-profile "test_Internal"set egress-shaping-profile "test_Internal"set alias "MPLS"set snmp-index 105set preserve-session-route enable
nextend
2. The member ID in the virtual WAN link must be same as the SNMP index associated with the Interface, forexample, 105.
config system virtual-wan-linkset status enable
config membersedit 105
set interface "ha"set gateway 10.1.31.1set comment "MPLS"next……
User GuideFortinet Technologies Inc.
473

Using the Interface Dashboard Working with Dashboards
……end
end
3. The member ID should be added to a health check, again in this example it is 105.config health-check
edit "TEST_Backoffice"set server "10.10.33.240" "10.10.1.240"set interval 5set update-cascade-interface disableset update-static-route disableset members 1 2 105
nextend
4. When monitoring Latency, Jitter and Loss via SNMP it is now possible to identify the Interface it is associated withthe health check.
[snmpwalk -v2c -c {password} {HostIp} 1.3.6.1.4.1.12356.101.4.9.2.1SNMPv2-SMI::enterprises.12356.101.4.9.2.1.3.7 = Gauge32: 105SNMPv2-SMI::enterprises.12356.101.4.9.2.1.5.7 = STRING: "20.078" (latency)SNMPv2-SMI::enterprises.12356.101.4.9.2.1.6.7 = STRING: "0.736" (Jitter)SNMPv2-SMI::enterprises.12356.101.4.9.2.1.9.7 = STRING: "0.000" (Loss)
Adding/Removing devices and interfaces to the dashboardWhen you create an Interface Usage Dashboard for the first time, no devices are displayed.
Complete these steps to add a device to the dashboard:
1. Click the devices icon.2. Select the Organization and then click the Firewall orRouter Switch folder.3. Select a device and its interface of interest.4. Click the right arrow.5. ClickSave.Complete these steps to remove a device from the dashboard:
1. Click the devices icon.2. Select the Device/Interface pair from the selected list.3. Click the left arrow.4. ClickSave.This dashboard is data driven. That means the dashboard will be populated only if the metrics are present. First,create a Summary dashboard and see if the devices are present in that dashboard and display values. Then, youwill see them in this dashboard.
Viewing device level metricsThe Top view displays Device level metrics. The metrics are averaged over three minute intervals. To see thetrend, click the trend icon next to the numbers.
Viewing interface level metricsOnce you select a device in the Top view, the middle table displays the interface level metrics for that device. Themetrics are averaged over three minute intervals. To see the trend, click the trend icon next to the numbers.
474 User GuideFortinet Technologies Inc.

Working with Dashboards PCI Logging Status Dashboard
Viewing Application UsageComplete these steps to see the Application Usage for an interface:
1. Select a device in the Top view.2. Select an interface in the Middle view.3. Click the Application Usage tab.
Viewing QoS StatisticsComplete these steps to see the QoS Statistics for an interface:
1. Select a device in the Top view.2. Select an interface for the selected device in the Middle view.3. Click theQoS Statistics tab.
Drill-down from widgetsClick the magnifying glass icon on a widget. This will take you to the ANALYTICS tab with the values populated.From there, you can analyze the data in more depth.
Modifying widget information displayFollow the steps in Widget Dashboard > Modifying widget information display.
Changing refresh intervalSelect the refresh interval from the drop-down menu on top-right.
Forcing a refreshTo update the whole dashboard, select the refresh icon on the top-right menu.
PCI Logging Status Dashboard
A PCI Logging Status dashboard provides an overview of which devices in PCI are logging and logging correctly.The devices are displayed by CMDBDevice Groups (for example Windows, Linux, Firewalls, and so on) and byBusiness Units.
l Setting up data sourcel Creating a Dashboardl Analyzing Dashboard datal Searching Dashboard data
Setting up data sourceData source setup includes the following steps:
User GuideFortinet Technologies Inc.
475

PCI Logging Status Dashboard Working with Dashboards
1. Creating CMDBDevices2. Assigning devices to Business Units3. Assigning devices to PCI Business Service4. Specifying the criteria for logging correctly5. Specifying the violation time limits
Creating CMDB Devices
The devices must be available in CMDB for displaying in the dashboard. This can be done in any of the followingways:
l Manually:a. Go to CMDB > select the Device Group > clickNew.
l Discovery:a. Create the credentials in ADMIN >Setup >Credentials.b. Discover in ADMIN >Setup >Discovery.
l Device Import:a. Go to ADMIN >Settings >General > Integration.b. ClickNew and choose Type as "Device" and Direction as "Inbound".c. Choose the File Path on the Supervisor node and place the CSV file there.d. ForContent Mapping, click the edit icon.
I. ForColumn Mapping, click + and enter the mapping between columns in the SourceCSV fileand the Destination CMDB.
i. Enter Source CSV column Name for Source Column.ii. CheckCreate Property if it Does not Exist to create the new attribute in FortiSIEM
if it does not exist.A. Enter a name for the Destination Column of the property from the drop-
down list.B. Select Overwrite Existing Value if the property exists in the CMDB, but you
want to overwrite it's current value.iii. If the property exists in the CMDB, select FortiSIEM CMDB attribute forDestination
Column.iv. Select Overwrite Existing Value if the property exists in the CMDB, but you want to
overwrite its current value.v. ClickOK.
II. ForData Mapping, click + and enter the mapping between data values in the external systemand the destination CMDB.
e. ClickSave.f. Select the Instance and clickRun.
Assigning Devices to Business Units
For the PCI Logging dashboard to display the devices logging and logging correctly by business units, theBusiness Unit property needs to be set for a device. This can be done in any of the following ways:
l Manually:a. Go to CMDB > select one or more devices > clickEdit and set the Business Unit.b. ClickSave.
476 User GuideFortinet Technologies Inc.

Working with Dashboards PCI Logging Status Dashboard
l Device Import:a. Prepare a CSV file containing Device Host Names and Business Unit as two columns. Note that the
Device host names must match the host names in CMDB, if they are present.b. Go to ADMIN >Settings >General > Integration.c. ClickNew and choose Type as "Device" and Direction as "Inbound".d. Choose the File Path on the Supervisor node and place the CSV file there.e. ForContent Mapping, click the edit icon.
I. ForColumn Mapping, click + and enter the mapping between columns in the SourceCSV fileand the Destination CMDB.
i. Enter Source CSV column Name for Source Columnii. CheckCreate Property if it Does not Exist to create the new attribute in FortiSIEM
if it does not existA. Enter a name for the Destination Column of the property from the drop-
down list.B. Select Overwrite Existing Value if the property exists in the CMDB, but you
want to overwrite it's current value.iii. If the property exists in the CMDB, select FortiSIEM CMDB attribute forDestination
Column.iv. Select Overwrite Existing Value if the property exists in the CMDB, but you want to
overwrite its current value.v. ClickOK.
II. ForData Mapping, click + and enter the mapping between data values in the external systemand the destination CMDB.
f. ClickSave.g. Select the instance and clickRun.
Assigning Devices to PCI Service
Devices in the PCI Logging Status Dashboard belong to the PCI Business Service. Assigning Devices to the PCIService can be done in any of the following ways:
l Manually:a. Go to CMDB >Business Services >Compliance > select the PCI Service > clickEdit and add
Devices.b. ClickSave.
l Device Import:a. Prepare a CSV file containing Device Host Names and isPCI property. Host names must match the host
names in CMDB. The isPCI Device Property takes TRUE or FALSE values.b. Go to ADMIN >Settings >General > Integration.c. ClickNew and choose Type as "Device" and Direction as "Inbound".d. Choose the File Path on the Supervisor node and place the CSV file there.e. ForContent Mapping, click the edit icon.
I. ForColumn Mapping, click + and enter the mapping between columns in the SourceCSV fileand the Destination CMDB.
i. Enter Source CSV column Name for Source Columnii. CheckCreate Property if it Does not Exist to create the new attribute in FortiSIEM
if it does not exist
User GuideFortinet Technologies Inc.
477

PCI Logging Status Dashboard Working with Dashboards
A. Enter a name for the Destination Column of the property from the drop-down list.
B. Select Overwrite Existing Value if the property exists in the CMDB, but youwant to overwrite it's current value.
iii. If the property exists in the CMDB, select FortiSIEM CMDB attribute forDestinationColumn.
iv. Select Overwrite Existing Value if the property exists in the CMDB, but you want tooverwrite its current value.
v. ClickOK.II. ForData Mapping, click + and enter the mapping between data values in the external system
and the destination CMDB.f. ClickSave.g. Select the instance and clickRun.
Note: Device Import options in Assigning Devices to Business Units and Assigning Devices to PCI Service can becombined. So it is possible to have a single file with three columns: Host Name, Business Unit, and isPCI.
Specifying criteria for logging correctly
To specify a criteria for logging correctly, define the following:
l Correctly Logging Reports – these specify the criteria for devices in a device group to be correctly loggingAuthentication, FIM, and Change events. Reports must be defined separately for each CMDB device group andeach functional category: Authentication, FIM, and Change. Several Correctly Logging Reports are pre-defined inRESOURCES >Reports > Function >Compliance >Compliance Logging Policy.
l PCI Logging Policy – these specify whether a CMDBDevice Group needs to correctly send logs in the variousfunctional categories: Authentication, FIM, and Change. Currently, these three functional categories are fixed. PCILogging Policies can be specified in ADMIN >Settings >Compliance >PCI. Several PCI Logging Policies arepre-defined.
Complete these steps to customize correctly logging criteria:
1. Define a report in RESOURCES >Reports > Function >Compliance >Compliance Logging Policy.2. Create a PCI Logging Policy in ADMIN >Settings >Compliance >PCI and specify the new report.If you create your own correctly logging report, then it must have the following well-defined structure:
l Group By Criteriamust have Customer ID and Reporting Device Name.l Select Clausemust have Customer ID, Reporting Device Name, and Last Event Receive Time.l Filtering Criteriamust be specific to the CMDBDevice Group (for example: Firewalls, Routers, Windows Server,
and so on) and functional logging category (for example: Authentication, FIM, and Change).
Note: It is highly recommended to clone an existing correctly logging report and modify the FilteringCriteria.
Specifying violation time limits
Specify the time duration after which a device is reported to be not logging or not logging correctly. Fourproperties are defined in ADMIN >Device Support >Custom UI Properties:
478 User GuideFortinet Technologies Inc.

Working with Dashboards PCI Logging Status Dashboard
l lastAuthTimeLimit - time limit for authentication logs (default 1 day)l lastFIMTimeLimit - time limit for FIM logs (default 1 day)l lastChangeTimeLimit - time limit for authentication log (default 1 day)l lastLogTimeLimit - time limit for sending any log (default 1 day)
Similar to any other device property, you can change the global defaults and set them on a per-device basis.
Creating a DashboardOnce you setup the data sources following the steps described in Setting up data source, the dashboard must becreated manually.
The dashboard is updated nightly at 12:00 am (Supervisor time). At that time, the Supervisor:
l Runs the reports specified in ADMIN >Settings >Compliance >PCI .l Updates the last reporting times.l Calculates violations using the thresholds defined in ADMIN >Device Support >Custom Properties.
When you open the PCI Logging Status dashboard, the results are displayed from the daily run of previous night.
Analyzing Dashboard dataThe PCI Logging Status Dashboard displays:
l Logging - Percentage of PCI devices logging within the time period lastLogTimeLimit (default 1 day).l Logging Correctly - Percentage of PCI devices logging correctly.l Logging By Group - Percentage of PCI devices logging correctly broken down by Device Group.l Logging Correctly By Group - Percentage of PCI devices logging correctly broken down by Device Group.l Logging Correctly By Business Unit, Group - Percentage of PCI devices logging correctly broken down by
Device Group.
The displays are color coded as Red, Yellow, and Green according to the tunable thresholds defined inDashboard > Threshold Setting. By default:
l Red – less than 50%l Yellow – between 50% and 80%l Green – higher than 80%
If you click the entries, the devices in violation are shown in a tabular format along with the last time they reportedevents in each category.
Searching Dashboard dataThe Dashboard data can be searched by any Device Property, for example a Business Unit defined in ADMIN >Device Support >Custom Propertieswith Search (check-box) enabled. Click the search field under a specificcategory and enter the property values. Matches are exact and case sensitive.
User GuideFortinet Technologies Inc.
479

Requesting a de-anonymization request Managing Tasks
Managing Tasks
FortiSIEM supports Data Anonymization to hide Personally Identifiable Information including IP addresses, hostnames, user names and email addresses in external and internal logs, Incidents, and CMDB records based onthe user role for a specific period of time.
After assigning the user to anonymize a role and creating a Data Anonymization approver, the work-flow is asfollows:
a. The user creates a de-anonymization request and sends to the approver.b. The approver receives an email notification.c. The approver then verifies and accepts the request for a specific period by setting a validity date. (An approver
may also reject a request specifying a valid reason.)d. If approved, the user can see the de-anonymized data until the validity period.e. After the validity period, the data is hidden again. To de-anonymize the data, create a new request.The following procedures describe how a user can submit a task request and the Data Anonymization approverapproves or rejects.
l Requesting a de-anonymization requestl Approving a de-anonymization request
Requesting a de-anonymization request
You can send a de-anonymization request with justification, to a Data Anonymization approver, to de-anonymizethe requested data for a specific period of time.
1. Go to TASK>Request tab.2. ClickNew to create a de-anonymization request.3. Select the Approver from the drop-down to send this request.4. Select the Type of de-anonymization request.5. Enter the Justification for viewing the data.6. ClickSave to send the request to the Data Anonymization approver.
Approving a de-anonymization request
When a user sends a de-anonymization request, the Data Anonymization approver receives an email notification.The approver can see the list of de-anonymization requests under the Approval tab on login. The approver thenverifies the justification and provides approval.
1. Go to TASK>Approval tab.2. Select the request from the list or search using the search bar and choose the following options from the drop-
down list on the right:
l Approve to allow de-anonymization for a specific time period under Valid Till or For the date and timelisted in the time stamp field. You can click the time stamp field to choose a different date and time.
480 User GuideFortinet Technologies Inc.

Managing Tasks Approving a de-anonymization request
l Reject to reject the de-anonymization request specifying a valid Reason.3. ClickOK to send the approval/rejection.
The user can see the Status of this request under the Request tab on login.
User GuideFortinet Technologies Inc.
481

Flash to HTML5 GUI mapping Appendix
Appendix
Flash to HTML5 GUI mappingFortiSIEM Deployment ScenariosFortiSIEM Event Attribute to CEF Key MappingDifferences in Analytics Semantics between EventDB and ElasticsearchFortiSIEM Event Categories and HandlingFortiSIEM Charts and ViewsConfiguring FortiSIEM Application Server for Proxy Connectivity
Flash to HTML5 GUI mapping
This section describes the mapping between FortiSIEM Flash-based GUI (available for all AccelOps andFortiSIEM versions up to 5.0.0) and FortiSIEM HTML5-based GUI (available from FortiSIEM version 5.0.0). Thismapping enables you to familiarize with AccelOps/FortiSIEM Flash-based GUI to quickly find the correspondingfunctions in FortiSIEM HTML5-based GUI.
FortiSIEM HTML5-based GUI is similar to the earlier Flash-based GUI. In addition to the Dashboard, Analytics,Incidents, CMDB and Admin tabs from Flash-based GUI, the HTML5-based GUI adds two new tabs - CASES andRESOURCES.
The following tables show the mapping for each tab.
Dashboard
Flash Element HTML5 Element
Executive Summary DASHBOARD > Network Dashboard > SummaryDASHBOARD > Server Dashboard > SummaryDASHBOARD > Storage Dashboard > Summary
Incident Dashboard > Table View INCIDENT > List View
Incident Dashboard > Fishbone View Currently not available
Incident Dashboard > Topological View Currently not available
Incident Dashboard > Calendar View Currently not available
Incident Dashboard > Location View INCIDENT > List View > Action > Locations
My Dashboard DASHBOARD > New Dashboard (can be imported)
482 User GuideFortinet Technologies Inc.

Appendix Flash to HTML5 GUI mapping
Flash Element HTML5 Element
Summary Dashboard > Biz ServiceSummary
DASHBOARD > Click + to add new Dashboard andchoose Type as 'Business Service Dashboard'.
Summary Dashboard > All Device DASHBOARD > Network Dashboard > SummaryDASHBOARD > Server Dashboard > SummaryDASHBOARD > Storage Dashboard > Summary
Summary Dashboard > Network Device DASHBOARD > Network Dashboard > Summary
Summary Dashboard > Servers DASHBOARD > Server Dashboard > Summary
Summary Dashboard > EC2 Systems DASHBOARD > Amazon Web Services Dashboard >Summary
Summary Dashboard > Azure Systems Currently not available as built-in (user can create theirown)
Summary Dashboard > All VMs DASHBOARD > VMWare Dashboard > VMDASHBOARD > VMWare Dashboard > ESX
Summary Dashboard > My Devices DASHBOARD > Any customized summary dashboardcan be used to manage devices.
Availability / Performance > HardwareSummary
DASHBOARD > Network Dashboard > HardwareDASHBOARD > Server Dashboard > Hardware
Storage DASHBOARD > NetApp DashboardDASHBOARD > VNXDashboard
Top Monitored Processes Currently not available
Apache Servers DASHBOARD >Web Server Dashboard
Exchange Servers Currently not available as built-in (user can create theirown)
Windows DHCP Currently not available as built-in (user can create theirown)
Windows DNS Currently not available as built-in (user can create theirown)
IIS Servers DASHBOARD >Web Server Dashboard
ASP.NET Servers Currently not available
User GuideFortinet Technologies Inc.
483

Flash to HTML5 GUI mapping Appendix
Flash Element HTML5 Element
MSActive Directory Servers Currently not available
MSSQL Servers DASHBOARD > Database Dashboard
Oracle DB Servers DASHBOARD > Database Dashboard
MySQL Servers DASHBOARD > Database Dashboard
VoIP Summary Currently not available as built-in (user can create theirown)
IPSLA Summary Currently not available as built-in (user can create theirown)
STM Summary Currently not available as built-in (user can create theirown)
Environmental Dashboard Currently not available as built-in (user can create theirown)
Dashboard By Function > Network >Generic
DASHBOARD > Network Dashboard > AvailabilityDASHBOARD > Network Dashboard > PerformanceDASHBOARD > Network Dashboard > Login/ChangeDASHBOARD > Network Dashboard > Change
Dashboard By Function > Network >Netflow DASHBOARD > Network Dashboard > Netflow
Dashboard By Function > Network >VoIP
DASHBOARD > Network Dashboard > VoIP
Dashboard By Function > Network >IPSLA DASHBOARD > Network Dashboard > IPSLA
Dashboard By Function > Server DASHBOARD > Server Dashboard
Dashboard By Function > Virtualization DASHBOARD > VMWare Dashboard
Dashboard By Function > Application >Generic
DASHBOARD > Server Dashboard > AvailabilityDASHBOARD > Server Dashboard > Performance
Dashboard By Function > Application >Mail
Currently not available as built-in (user can create theirown)
Dashboard By Function > Application >Database
Currently not available as built-in (user can create theirown)
484 User GuideFortinet Technologies Inc.

Appendix Flash to HTML5 GUI mapping
Flash Element HTML5 Element
Dashboard By Function > Application >Web DASHBOARD >Web Server Dashboard
Dashboard By Function > Storage DASHBOARD > NetApp DashboardDASHBOARD > VNXDashboard
Dashboard By Function > Environment Currently not available as built-in (user can create theirown)
Dashboard By Function > Event/LogMgmt
DASHBOARD > FortiSIEM Dashboard
Dashboard By Function > FortinetSecurity Fabric DASHBOARD > Fortinet Security Fabric
Analytics
Flash Element HTML5 Element
Real Time Search ANALYTICS
Historical Search ANALYTICS
Reports RESOURCES > Reports
Generated Reports ANALYTICS >
Identity and Location Report DASHBOARD > Click + to add new Dashboard andchoose Type as 'Identity and Location Dashboard'.
Rules RESOURCES > Rules
Audit Currently not available
Incident Notification Policy ADMIN > Settings > General > Notification
Remediations RESOURCES > Remediations
Display Column Sets Currently not available
Filter Column Sets Currently not available
User GuideFortinet Technologies Inc.
485

Flash to HTML5 GUI mapping Appendix
Incidents
Flash Element HTML5 Element
Incidents INCIDENT > List View
Tickets CASE
IPS Vulnerability Map Currently not available
CMDB
Flash Element HTML5 Element
Topology Currently not available
Devices CMDB > Devices
Applications CMDB > Applications
Users CMDB > Users
Business Services CMDB > Business Services
Networks RESOURCES > Networks
Watch Lists RESOURCES >Watch Lists
Protocols RESOURCES > Protocols
Event Types RESOURCES > Event Types
Malware Domains RESOURCES >Malware Domains
Malware IP RESOURCES >Malware IPs
Malware URLs RESOURCES >Malware URLs
Malware Processes RESOURCES >Malware Processes
CMDBReports CMDB > CMDBReports
Country Groups RESOURCES > Country Groups
Malware Hash RESOURCES >Malware Hash
486 User GuideFortinet Technologies Inc.

Appendix Flash to HTML5 GUI mapping
Flash Element HTML5 Element
Default Password RESOURCES > Default Password
Anonymity Networks RESOURCES > Anonymity Networks
User Agents RESOURCES > User Agents
Admin
Flash Element HTML5 Element
Admin > Startup Not available
Admin > Setup Wizard > Organizations ADMIN > Setup > Organizations
Admin > Setup Wizard >Windows Agents ADMIN > Setup >Windows Agents
Admin > Setup Wizard > Credentials ADMIN > Setup > Credentials
Admin > Setup Wizard > Discovery ADMIN > Setup > Discovery
Admin > Setup Wizard > Pull Events ADMIN > Setup > Pull Events
Admin > Setup Wizard > MonitorChange/Performance
ADMIN > Setup >Monitor Performance
Admin > Setup Wizard > Synthetic TransactionMonitoring ADMIN > Setup > STM
Admin > Device Support > Device/App Types ADMIN > Device Support > Device/App
Admin > Device Support > Event Attribute Types ADMIN > Device Support > Event Attribute
Admin > Device Support > Event Types ADMIN > Device Support > Event
Admin > Device Support > Parsers ADMIN > Device Support > Parser
Admin > Device Support > PerformanceMonitoring
ADMIN > Device Support > Monitoring
Admin > Device Support > Custom Properties ADMIN > Device Support > Custom Property
Admin > Device Support > Dashboard Columns Currently not available
Admin > Collector Health ADMIN > Health > Collector Health
User GuideFortinet Technologies Inc.
487

Flash to HTML5 GUI mapping Appendix
Flash Element HTML5 Element
Admin > Cloud Health ADMIN > Health > Cloud Health
Admin > Elasticsearch health ADMIN > Health > Elasticsearch health
Admin > General Settings > System ADMIN > Settings > System
Admin > General Settings > Analytics ADMIN > Settings > Analytics
Admin > General Settings > Discovery ADMIN > Settings > Discovery
Admin > General Settings > Monitoring ADMIN > Settings > Monitoring
Admin > General Settings > UI ADMIN > Settings > System > UI
Admin > General Settings > Email Template ADMIN > Settings > System > Email
Admin > General Settings > Event Handling ADMIN > Settings > Event Handling
Admin > General Settings > Kafka Config ADMIN > Settings >System > Kafka
Admin > General Settings > ExternalAuthentication
ADMIN > Settings > General > Authentication
Admin > General Settings > Integration ADMIN > Settings > General > Integration
Admin > General Settings > External Lookup ADMIN > Settings > System > Lookup
Admin > General Settings > Escalation Policy ADMIN > Settings > General > Escalation
Admin > Discovery Results ADMIN > Setup > Discovery > History
Admin > License Management ADMIN > License > License
Admin > Usage Information ADMIN > License > Usage
Admin > Role Management ADMIN > Settings > Role
Admin >Maintenance Calendar ADMIN > Setup >Maintenance
Admin > Event DBManagement Currently not available
Admin > Data Update ADMIN > Data Update
488 User GuideFortinet Technologies Inc.

Appendix FortiSIEM Deployment Scenarios
FortiSIEM Deployment Scenarios
FortiSIEM can be deployed in Enterprise and Service Provider environments in a highly scale-out fashion.
l Enterprise deploymentl Service Provider deployment
Enterprise deployment
Enterprise deployments with Supervisor and no Collector
Enterprise deployment without Collector (Supervisor only) is the simplest setup where:
l Logs are sent to the Supervisor.l Test Connectivity, Discovery performance monitoring, and Event pulling, (for example: Cloud Services, WMI based
Windows log Collection, etc.) are all done from the Supervisor – Go to ADMIN >Setup >Credential and ADMIN>Setup >Discovery.
This setup has the following drawbacks:
l Does not scale up when a large number of devices must be monitored or high EPS needs to be handled. This canbe solved by deploying Workers – see here.
l Logs cannot be collected efficiently from devices across the Internet. Devices cannot be monitored across theInternet. This is because of latency and security issues over Wide Area Networks. This can be solved by deployingCollectors – see here.
l FortiSIEM Agents cannot be used as they need Collectors – see here.
Enterprise deployment with Supervisor and Worker but no Collector
The scalability issue above can be resolved by deploying Worker nodes. To add a Worker node:
1. Install a Worker node.2. Add the Worker to the Supervisor from ADMIN > License >Nodes >Add.In this case:
l Logs can be sent to the Supervisor or Workers. Sending to Workers is recommended since you can load balanceacross multiple Workers.
l Test Connectivity and Discovery is always done from Super.l However, Performance monitoring and Event pulling jobs (for example: Cloud Services, WMI based Windows log
Collection and so on) are done by the Worker nodes in addition to the Supervisor nodes. After Test connectivity andDiscovery, Supervisor node distributes the jobs to the Workers. When a newWorker is added to the FortiSIEMCluster, jobs are re-distributed to the Workers.
Although it provides scalable event handling, this system has the following shortcomings:
l Logs cannot be collected efficiently from devices across the Internet. Devices cannot be monitored across theInternet. This is because of latency and security issues over Wide Area networks. This can be solved by deployingCollectors – see here.
l FortiSIEM Agents cannot be used, because they need Collectors – see here.
User GuideFortinet Technologies Inc.
489

FortiSIEM Deployment Scenarios Appendix
Enterprise deployments with Supervisor, Worker and Collector
This solution provides the flexibility of log collection and performance across the Internet and behind firewalls. Italso provides even more scalability because the Collectors, instead of the Workers, parse events.
To add a Collector node:
1. Go to ADMIN >Setup >Collector and create a Collector in the Supervisor.2. If you have Workers, define the Workers that the Collectors will upload to (Go to ADMIN > Settings > System >
Worker Upload).3. If you are not using Workers you should define the Supervisor IP or DNS name of the Supervisor (Go to
ADMIN > Settings > System > Worker Upload).
4. Install a Collector.5. Register the Collector to the Supervisor using any FortiSIEM user credential with Admin privileges (see CMDB >
User). The built-in admin credential will work. During registration, the Collector will get the Workers to uploadevents to.
In this case:
l Logs can be sent to Collectors (preferred). However, they can be sent to Workers or Super as well. Collectors willupload parsed logs to the Workers in a load-balanced fashion.
l For Test Connectivity and Discovery, choose the Collector for the job. Collectors will collect events and send themWorkers in a load-balanced fashion.
In this configuration, you can add FortiSIEM Windows and Linux Agents:
1. Go to CMDB >User >Add and create an Agent User for Agents to register to the Supervisor node.2. Install the Agents and register them to the Supervisor using the Agent user credential created in the previous step.3. Define the Agent Monitoring templates.4. Assign templates to the Agents and choose Collectors from the set created earlier.Agents will send logs to the Collectors in a load-balanced manner. Collectors can then send to Workers in a load-balanced manner. This enables log collection in a geographically distributed and scalable manner.
Service Provider deploymentIn a Service Provider deployment, there can be one or more Organizations. Devices and logs are kept logicallyseparated for two Organizations.
Note: It is very important to assign devices and logs to the correct Organization in FortiSIEM.
A FortiSIEM Service Provider deployment consists of:
l Supervisor nodel Worker nodes for scalabilityl Collector nodes for remote data collectionl Windows/Linux Agents for richer data collection without remote admin credentials
While Supervisor, Workers, and Agents are shared infrastructure across Organizations, Collectors may be presentand may be dedicated or shared.
This section provides details on how various infrastructure components are deployed, with an eye towardsassigning devices and logs to the right Organization.
490 User GuideFortinet Technologies Inc.

Appendix FortiSIEM Deployment Scenarios
l Organizations with dedicated Collectorl Organizations with shared Collector
Service Provider deployment - Organizations with dedicated Collector
In this case, Organization has one of more Collectors that belong to that Organization only. This is suited forlarge Organizations.
Setup
1. Create Organizations as follows:a. Log in to Super-Global Organization.b. Go to ADMIN >Setup >Organization and create an Organization.c. Define Admin credentials (for Collector registration) and Agent credentials (for FortiSIEM Agent
registration).d. Add Collectors to that Organization.
2. Install the Collectors and register them to Supervisor. Use any Organization Admin credentials defined in ADMIN>Setup >Organization, to register the Collector.
Operations
Collecting logs via Agents
1. Install Agents and register them to the Supervisor. Use the Agent credentials for the Organization that the Agentsbelong to.
2. Define the Agent Monitoring templates. Assign the templates to agents and designate Collectors belonging to thespecific Organization.
Agents will send logs to Collectors in a load-balanced fashion. Since Agents are configured with the OrganizationID, they include the Organization in every log. This information is used by Collectors to assign devices and logs tothe correct Organization.
Collecting logs without Agents
Configure devices to send logs to the Organization’s Collectors. Since these collectors belong to oneorganization, it assigns received devices and logs to that Organization.
Discovery and Performance monitoring by IP Address range
Log in to the specific Organization and:
1. Define the credential.2. Do Test Connectivity and Discovery using a specific Collector.
Event Pulling for Cloud Services
Log in to the specific Organization and:
1. Define the credential.2. Do Test Connectivity and Discovery using a specific Collector.
User GuideFortinet Technologies Inc.
491

FortiSIEM Deployment Scenarios Appendix
Service Provider deployment - Organizations with shared multi-tenant Collector
It may not be economically viable for smaller Organizations to deploy their own collectors. But Collectors may beneeded to deploy Agents and to scale out data collection across many smaller Organizations managed under thesame FortiSIEM.
Setup
In this setup, special multi-tenant Collectors must be defined under the Super/Local Organization as follows:
1. Log in to the Super-Local Organization. This is a built-in organization meant for the Service Provider’s use only .2. Go to ADMIN >Setup >Collector and add Collectors to that Organization. These are called multi-tenant
Collectors as they handle devices and logs from multiple Organizations.3. Install the Collectors and register them to the Supervisor. Use any Full Admin user in CMDB >User to register
the Collector.Then create Organizations as follows:
1. Log in to Super-Global Organization.2. Go to ADMIN >Setup >Organization and create an Organization.3. Add Agent credentials for Agent registration.4. Define the Include/Exclude IP Address ranges if devices belonging to various Organizations are going to send logs
to multi-tenant Collectors.
Operations
Collecting logs via Agents
1. Install Agents and register them to the Supervisor. Use the Agent credentials for the Organization that the Agentsbelong to.
2. Define Agent Monitoring templates. Assign templates to Agents and designate multi-tenant collectors belongingto the Super-local Organization.
FortiSIEM Agents will send logs to multi-tenant Collectors in a load-balanced fashion. Since Agents areconfigured with the Organization ID, they include the Organization in every log. This information is used by multi-tenant Collectors to assign devices and logs to the correct Organization.
Collecting logs without Agents
Configure devices to send logs to the multi-tenant Collectors. Make sure the reporting device IPmatches theInclude/Exclude IP ranges defined for that Organization in ADMIN >Setup >Organization. A multi-tenantCollector uses the reporting device IP to assign devices and logs to the correct Organization.
Discovery and Performance monitoring by IP Address range
This is possible so long as the IP Address range matches the Include/Exclude IP ranges defined for thatOrganization in ADMIN >Setup >Organization.
This can be done in two ways:
1. (Recommended) From Super/Global Organization:a. Define the credential.b. Do Test Connectivity and Discovery. We will automatically choose a multi-tenant collector
492 User GuideFortinet Technologies Inc.

Appendix FortiSIEM Event Attribute to CEF Key Mapping
2. Alternatively, log in to the Super/Local Organization and:a. Define the credential.b. Do Test Connectivity and Discovery using a specific multi-tenant Collector.
Approach #1 is recommended because the Collector is automatically chosen.
Event Pulling for Cloud Services
From Super/Global Organization:
1. Define the credential. Specify the Organization in the credential.2. Perform Test Connectivity and Discovery.
FortiSIEM will automatically choose a multi-tenant Collector.
Collecting logs from multi-tenant devices
A shared Collector also enables you to collect logs from multi-tenant devices such as FortiGate with VirtualDomains (VDOM). This assumes that the logs contain an attribute (such as FortiGate VDOM) that enablesFortiSIEM to classify logs from multi-tenant devices to different Organizations.
From a Super/Global Organization:
1. Go to ADMIN >Settings >Event Handling >Event Org Mapping.2. ClickNew and enter the Organization mappings for the discriminating log attribute (such as VDOM).3. ClickSave.
FortiSIEM Event Attribute to CEF Key Mapping
FortiSIEM forwards externally received logs and internally generated events/incidents to an external system viaCEF formatted syslog.
FortiSIEM Event Attribute to CEF Key Mappings
FortiSIEM event attributes CEF key Notes
appCategory cat
appTransportProto app
count cnt
destAction act
destDomain destinationDnsDomain
destIntfName deviceOutboundInterface
destIpAddr destinationTranslated Address
destIpAddr dst
User GuideFortinet Technologies Inc.
493

FortiSIEM Event Attribute to CEF Key Mapping Appendix
FortiSIEM event attributes CEF key Notes
destIpPort destinationTranslatedPort
destIpPort dpt
destMACAddr dmac
destName dhost
destServiceName destinationServiceName
destUser duser
destUserId duid
destUserPriv dpriv
deviceIdentification deviceExternalId
deviceTime rt
domain deviceDnsDomain
endTime end
errReason reason
extEventId externalId
fileAccess filePermission
fileId fileId
fileModificationTime fileModificationTime
fileName fname
filePath filePath
fileSize fsize
fileType fileType
hashCode fileHash
hostIpAddr dvc
hostMACAddr dvcmac
494 User GuideFortinet Technologies Inc.

Appendix FortiSIEM Event Attribute to CEF Key Mapping
FortiSIEM event attributes CEF key Notes
hostName dvchost
httpCookie requestCookies
httpMethod requestMethod
httpReferrer requestContext
httpUserAgent requestClientApplication
infoURL request
ipProto proto
msg msg
postNATHostIpAddr deviceTranslatedAddress
postNATSrcIpAddr sourceTranslatedAddress
postNATSrcIpPort sourceTranslatedPort
procId dvcpid
procName deviceProcessName
recvBytes in
sentBytes out
serviceName sourceServiceName
srcDomain sourceDnsDomain
srcIntfName deviceInboundInterface
intfName deviceInboundInterface
srcIpAddr src
srcIpPort spt
srcMACAddr smac
srcName shost
srcUser suser
User GuideFortinet Technologies Inc.
495

Differences in Analytics Semantics between EventDB and Elasticsearch Appendix
FortiSIEM event attributes CEF key Notes
srcUserPriv spriv
startTime start
targetProcId dpid
targetProcName dproc
Mapping to CEF Custom Attributes
FortiSIEM event attributes CEF key Notes
supervisorName cs1Label =SupervisorHostName
customer cs2Label = CustomerName
incidentDetail cs3Label=IncidentDetail
ruleName cs4Label=RuleName
inIncidentEventIdList cs5Label=IncidentEventIDList
phCustId cn1Label=CustomerID
incidentId cn2Label=IncidentID
type 0 = base event; 2 = incident
Differences in Analytics Semantics between EventDB and Elasticsearch
FortiSIEM can run on EventDB, its own proprietary NoSQL database, or Elasticsearch. To make analytics workcorrectly in both environments, it is important to understand the differences. Analytics includes real-time search,historical search, and rule correlation.
FortiSIEM rule correlation and real-time search work identically in both environments, because computation isdone in-memory. The database is not used.
However, for historical search, results are obtained from the database and the following differences exist in thearea of string comparisons, primarily because of the way Elasticsearch, a third-party product, works.
l Issuesl Example 1 - Matching Event Typesl Example 2 - Matching Raw Messsagesl Elasticsearch Support for Regex
496 User GuideFortinet Technologies Inc.

Appendix Differences in Analytics Semantics between EventDB and Elasticsearch
Issues1. EventDB is a sub-string match while Elasticsearch is a word-based match with white space as a delimiter between
words. This means that the EventDB will find a match anywhere in the string. For Elasticsearch, you mustexplicitly include wildcard characters. This affects string operations involving the following operators: =, IN,CONTAIN, REGEXP and their inverse versions: !=, NOT IN, NOT CONTAIN and NOT REGEXP.
2. For Elasticsearch query, if an expression is defined as a display parameter and the expression includes aggregatefunctions, then the aggregates must be separately added as display parameters. For example, if a user wants todisplay an expression such as 100 - (100.0 * SUM(System Downtime))/SUM(Polling Interval), then the user mustalso add SUM(System Downtime) and SUM(Polling Interval) to the list of display parameters.
3. Sorting does not work forl LAST and FIRST operators when the operand is a non-Date type.l HourOfDay and DayOfWeek operators
4. When sorting is used for multiple key values, e.g. Group By Source IP, Destination IP, COUNT(*) DESC, then theresults are presented by the last attribute (e.g. Destination IP). FortiSIEM EventDB sorts by all the fields taken asa tuple, e.g. (Source IP, Destination IP). See
https://www.elastic.co/guide/en/elasticsearch/reference/current/search-aggregations-bucket-terms-aggregation.htmlSee also Example 1 - Matching Event Types and Example 2 - Matching Raw Messsages
5. Elasticsearch (and lucene) do not support full Perl-compatible regex syntax.https://www.elastic.co/guide/en/elasticsearch/reference/current/regexp-syntax.htmlThe table in Elasticsearch Support for Regex lists what is supported and workaround suggestions.
Example 1 - Matching Event TypesSuppose you are trying to match PH_DEV_MON for Event Type:
l In EventDB, you can write any of the following:l EventType CONTAIN PH_DEV_MONl EventType CONTAIN _DEV_MONl EventType CONTAIN ph_dev_MONl EventType CONTAIN _DEV_mon
l In Elasticsearch, you can write any of the following. Note that since event types do not end with PH_DEV_MON,you have to add the wildcard “.*” at the end.
l EventType CONTAIN PH_DEV_MON.*l EventType CONTAIN .*_DEV_MON.*
Suppose you are trying to exactly match PH_DEV_MON_INTF_UTIL for Event Type:
l In EventDB, you can write any of the following:l EventType = PH_DEV_MON_INTF_UTILl EventType = ph_dev_mon_intf_utill EventType = ph_dev_MON_INTF_UTIL
l In Elasticsearch, you must write:l EventType = PH_DEV_MON_INTF_UTIL
User GuideFortinet Technologies Inc.
497

Differences in Analytics Semantics between EventDB and Elasticsearch Appendix
Example 2 - Matching RawMesssagesSuppose the raw message is:
l XYZ info=”ABB123CCC”
To match this raw message:
l In EventDB, you can write any of the following:l Raw Message REGEX bb[0-9]*c*X?l RawMessage REGEXAbb[0-9]*c*X?"$
l In Elasticsearch, you can write any of the following:l Raw Message REGEX BB[0-9]*c*X?l Raw Message REGEX .*BB[0-9]*c*X?
Elasticsearch Support for Regex
Regex syntax Elasticsearchsupport Workaround (if any)
. ? + * | Yes
?? +? *? No Not possible
() Yes
(?:) No Use () instead. Replace (?:com|net|org)with (com|net|org)
[] Yes
[^] Yes
{} Yes
{}? No Not possible
^ $ No Elasticsearch requires full match. Add .*for partial match.
498 User GuideFortinet Technologies Inc.

Appendix FortiSIEM Event Categories and Handling
Regex syntax Elasticsearchsupport Workaround (if any)
\d \D \w \W \s \S No
Replace \d with [0-9]
Replace \D with [^0-9]
Replace \w with [a-zA-Z0-9_]
Replace \W with [^a-zA-Z0-9_]
Replace \s with [ \t \n \r]
Replace \S with [^ \t \n \r]
\b \A \Z No Not possible
(?i:) No Not possible
\1 \2 No Not possible
(?=) No Not possible
(?!) No Not possible
(?#) No Not possible
Case sensitive match onkeyword attributes
No If an attribute is not a keyword, it will bestored as lower case in Elasticsearch. Useabc or [aA][bB][cC]
Entire raw message search No
Elasticsearch tokenizes string attributesusing space as tokens. So, it is notpossible to search the whole string. UseCONTAIN operator.
FortiSIEM Event Categories and Handling
This topic provides a brief description of various types of event categories in FortiSIEM.
System EventCategory Description Counted in
EPS Licensephstatus -aoutout
Stored inDB?
0 External events and not flow events (e.g.syslog, SNMP Trap, Event pulling)
Yes EPS Yes
1 Incidents (events that begin with PH_RULE) No EPS INTERNAL Yes
User GuideFortinet Technologies Inc.
499

FortiSIEM Charts and Views Appendix
System EventCategory Description Counted in
EPS Licensephstatus -aoutout
Stored inDB?
2 FortiSIEM Audit Events (events that beginwith PH_AUDIT)
No EPS INTERNAL Yes
3 FortiSIEM Internal system logs, free format No EPS INTERNAL Yes
4 External flow events (Netflow, Sflow) Yes EPS Yes
5 FortiSIEM Internal health events for summarydashboards No EPS INTERNAL Yes
6 FortiSIEM Performance Monitoring events(events that begin with PH_DEV_MON)
Yes EPS PERF Yes
7 AO Beaconing events No EPS INTERNAL Yes
8 FortiSIEM Real Time Performance ProbeEvents
No EPS INTERNAL No
99 FortiSIEM Internal Rule Engine No EPS INTERNAL No
FortiSIEM Charts and Views
FortiSIEM provides a variety of charts and maps to better help you understand and analyze your incident data.You can access these charts and views from the widget dashboard settings (see Modifying widget information
display) or by clicking the drop-down icon in the ANALYTICS page (see Viewing Historical SearchResults).
Chart/View Description Display Settings Requirements
Aggregation(Bar) View
Displays data similar to abar chart.
Select theAggregate Field(Column) todisplay and theircolors. You canalso reverse thecolor map.
At least onenumericcolumn isrequired.
500 User GuideFortinet Technologies Inc.

Appendix FortiSIEM Charts and Views
Chart/View Description Display Settings Requirements
Aggregations(Donut) View Displays data similar to a
pie chart.
Select theAggregate Field(Column) todisplay since thereport may havemultipleAggregate Fields.
At least onenumericcolumn isrequired.
ChoroplethMap (RegionMap)
A thematic map in whichareas are shaded orpatterned in proportion tothe measurement of thestatistical variable beingdisplayed on the map.
Select theLocation andValue from thedrop-down lists.
At least onelocationcolumn isrequired.ConfigureGoogleMaps APIKey inADMIN >Settings >System > UISee UISettings.
Chord View
A graphical method ofdisplaying the inter-relationships betweendata in a matrix. The datais arranged radially arounda circle with therelationships between thedata points typically drawnas arcs connecting thedata.
Select theincident Source,Target, andValue from thedrop-down lists.
At least twokey columnsand onenumericcolumn arerequired.
ClusteredBubble Chart
You can use a bubblechart instead of a scatterchart if your data hasthree data series thateach contain a set ofvalues. The sizes of thebubbles are determinedby the values in the thirddata series.
Select theColumn from thedrop-down list.
At least onenumericcolumn isrequired.
ColumnTrend View
Displays positive ornegative trends in thedata.
None None
User GuideFortinet Technologies Inc.
501

FortiSIEM Charts and Views Appendix
Chart/View Description Display Settings Requirements
Combo View Displays an aggregatefield and a line chart.
Select theAggregate Field(Column) todisplay and thecolors. You canalso reverse thecolor map and setcolor thresholds.
One GROUPBY columnand oneaggregationcolumn isrequired.
Geo Map(Map View)
Displays the IP addressesin a geographic map.
Public or privateIP addresses withlocation defined inADMIN >Settings >Discovery >Location. SeeSetting Location.
At least onenumericcolumn isrequired.
Heat Map Displays two eventattributes and a numericalaggregate value.
Select the Heatmap coordinatesX and Y, and anassociated Value.
At least twokey columnsand onenumericcolumn arerequired.
Line View Data displays as a line(Line Chart).
Select theColumn todisplay from thedrop-down list.You can choose todisplay the dataas a StackedArea or a LineView (non-stacked).
One GROUPBY columnand oneaggregationcolumn isrequired.
Map View See Geo Map.
Pivot TableView
A table of statistics thatsummarizes the data of amore extensive table.
Select the KeyColumn andValue Columnfrom the drop-down lists.
At least twoGROUPBYcolumns andone numericcolumn arerequired.
502 User GuideFortinet Technologies Inc.

Appendix FortiSIEM Charts and Views
Chart/View Description Display Settings Requirements
SankeyDiagram
A specific type of flowdiagram, in which thewidth of the arrows isshown proportionally tothe flow quantity.
Select theSource, Target,and Value fromthe drop-downlists.
At least twoGROUPBYcolumns andone numericcolumn arerequired.
Scatter Plot Plots two aggregatefields.
Select twoaggregate fields,X and Y. Selectthe Size of thesample.
At least twonumericcolumns arerequired.
Single Line Displays a single value. Select the Text orGauge view andthe Column andRow. ForGauge,you can alsoselect a color-coded Range.
At least onenumericcolumn isrequired.
SunburstChart
Visualizes hierarchicaldata, depicted byconcentric circles. Thecircle in the centerrepresents the root node,with the hierarchy movingoutward from the center.
Select the Rank1,Rank2, andCount from thedrop-down lists.
Only onecolumn can beused in onerank.
Table View Displays data in a tabularformat.
You can choose todisplay the barchart (ShowBar), the eventtype (ShowEvent Type), andthe count(Count). Set thecolors for the barchart or reversethe color map.
None
Tree Map Displays columns in aTree Map.
Select the TreeMap Ranks andthe Countattributes fromthe drop-downlists.
Only onecolumn can beused in onerank.
User GuideFortinet Technologies Inc.
503

Configuring FortiSIEM Application Server for Proxy Connectivity Appendix
Configuring FortiSIEM Application Server for Proxy Connectivity
Follow these steps to configure the FortiSIEM application server to support proxy connectivity for Integrations (forexample, Incidents, CMDB, Indicators of Compromise).
1. Edit the Glassfish configuration file using your favorite text editor:/opt/glassfish/domains/domain1/config/domain.xml.
2. Replace the 172.30.57.100 host value in the sample configuration to the Proxy Server IP, port and/orusername and password in the environment.
3. If no user name and password is required, then remove the Dhttp.proxyUser and Dhttp.proxyPasswordlines from the configuration file..
4. If a proxy exclusion for certain destination hosts is required, then add the http.nonProxyHosts configurationoption to exclude the proxy server. If this is not required, then delete the line.
5. If the proxy server allows only HTTPS, then add ’s’ to http. For example, change http.proxyHost tohttps.proxyHost.
The following is a sample configuration:
<jvm-options>-Dhttp.proxyHost=172.30.57.100</jvm-options><jvm-options>-Dhttp.proxyPort=3128</jvm-options><jvm-options>-Dhttp.proxyUser=foobar</jvm-options><jvm-options>-Dhttp.proxyPassword=password</jvm-options><jvm-options>-Dhttp.nonProxyHosts=172.30.59.130|localhost|update.fortiguard.com</jvm-
options>
504 User GuideFortinet Technologies Inc.

Copyright© 2020 Fortinet, Inc. All rights reserved. Fortinet®, FortiGate®, FortiCare® and FortiGuard®, and certain other marks are registered trademarks of Fortinet,Inc., in the U.S. and other jurisdictions, and other Fortinet names herein may also be registered and/or common law trademarks of Fortinet. All other product or companynames may be trademarks of their respective owners. Performance and other metrics contained herein were attained in internal lab tests under ideal conditions, andactual performance and other results may vary. Network variables, different network environments and other conditions may affect performance results. Nothing hereinrepresents any binding commitment by Fortinet, and Fortinet disclaims all warranties, whether express or implied, except to the extent Fortinet enters a binding writtencontract, signed by Fortinet’s General Counsel, with a purchaser that expressly warrants that the identified product will perform according to certain expressly-identifiedperformancemetrics and, in such event, only the specific performancemetrics expressly identified in such binding written contract shall be binding on Fortinet. Forabsolute clarity, any such warranty will be limited to performance in the same ideal conditions as in Fortinet’s internal lab tests. In no event does Fortinet make anycommitment related to future deliverables, features, or development, and circumstances may change such that any forward-looking statements herein are not accurate.Fortinet disclaims in full any covenants, representations,and guarantees pursuant hereto, whether express or implied. Fortinet reserves the right to change, modify,transfer, or otherwise revise this publication without notice, and themost current version of the publication shall be applicable.