Forstverein Steiermark - QGIS User Guide
623
QGIS User Guide Release 3.4 QGIS Project 05.08.2019
-
Upload
khangminh22 -
Category
Documents
-
view
1 -
download
0
Transcript of Forstverein Steiermark - QGIS User Guide

QGIS User GuideRelease 3.4
QGIS Project
05.08.2019


Contents
1 Präambel 1
2 Vorwort 3
3 Gebrauch der Dokumentation 53.1 GUI Schreibstile . . . . . . . . . . . . . . . . . . . . . . . . . . . . . . . . . . . . . . . . . . . 53.2 Text oder Tastatur Schreibstile . . . . . . . . . . . . . . . . . . . . . . . . . . . . . . . . . . . . 63.3 Betriebssystemspezifische Anweisungen . . . . . . . . . . . . . . . . . . . . . . . . . . . . . . 6
4 Funktionalitäten 74.1 Daten visualisieren . . . . . . . . . . . . . . . . . . . . . . . . . . . . . . . . . . . . . . . . . . 74.2 Daten erkunden, abfragen und Karten layouten . . . . . . . . . . . . . . . . . . . . . . . . . . . 74.3 Daten erstellen, editieren, verwalten und exportieren . . . . . . . . . . . . . . . . . . . . . . . . 84.4 Daten analysieren . . . . . . . . . . . . . . . . . . . . . . . . . . . . . . . . . . . . . . . . . . 84.5 Karten im Internet veröffentlichen . . . . . . . . . . . . . . . . . . . . . . . . . . . . . . . . . . 84.6 Erweiterte QGIS Funktionalität durch Erweiterungen . . . . . . . . . . . . . . . . . . . . . . . . 94.7 Python-Konsole . . . . . . . . . . . . . . . . . . . . . . . . . . . . . . . . . . . . . . . . . . . 94.8 Bekannte Probleme . . . . . . . . . . . . . . . . . . . . . . . . . . . . . . . . . . . . . . . . . . 9
5 Was ist neu in QGIS 3.4 11
6 Der erste Einstieg 136.1 Installing QGIS . . . . . . . . . . . . . . . . . . . . . . . . . . . . . . . . . . . . . . . . . . . . 136.2 Starting and stopping QGIS . . . . . . . . . . . . . . . . . . . . . . . . . . . . . . . . . . . . . 146.3 Sample Session: Loading raster and vector layers . . . . . . . . . . . . . . . . . . . . . . . . . . 15
7 Working with Project Files 177.1 Introducing QGIS projects . . . . . . . . . . . . . . . . . . . . . . . . . . . . . . . . . . . . . . 177.2 Generating output . . . . . . . . . . . . . . . . . . . . . . . . . . . . . . . . . . . . . . . . . . 19
8 QGIS GUI 218.1 Menüleiste . . . . . . . . . . . . . . . . . . . . . . . . . . . . . . . . . . . . . . . . . . . . . . 228.2 Bedienfelder und Werkzeugkästen . . . . . . . . . . . . . . . . . . . . . . . . . . . . . . . . . . 318.3 Kartenfenster . . . . . . . . . . . . . . . . . . . . . . . . . . . . . . . . . . . . . . . . . . . . . 338.4 3D Map View . . . . . . . . . . . . . . . . . . . . . . . . . . . . . . . . . . . . . . . . . . . . . 338.5 Statusleiste . . . . . . . . . . . . . . . . . . . . . . . . . . . . . . . . . . . . . . . . . . . . . . 35
9 QGIS Anpassung 379.1 Optionen . . . . . . . . . . . . . . . . . . . . . . . . . . . . . . . . . . . . . . . . . . . . . . . 379.2 Working with User Profiles . . . . . . . . . . . . . . . . . . . . . . . . . . . . . . . . . . . . . 599.3 Projekteigenschaften . . . . . . . . . . . . . . . . . . . . . . . . . . . . . . . . . . . . . . . . . 599.4 Anpassung . . . . . . . . . . . . . . . . . . . . . . . . . . . . . . . . . . . . . . . . . . . . . . 64
i

9.5 Keyboard shortcuts . . . . . . . . . . . . . . . . . . . . . . . . . . . . . . . . . . . . . . . . . . 669.6 Running QGIS with advanced settings . . . . . . . . . . . . . . . . . . . . . . . . . . . . . . . . 67
10 Arbeiten mit Projektionen 7310.1 Überblick zur Projektionsunterstützung . . . . . . . . . . . . . . . . . . . . . . . . . . . . . . . 7310.2 Layer Coordinate Reference Systems . . . . . . . . . . . . . . . . . . . . . . . . . . . . . . . . 7310.3 Project Coordinate Reference Systems . . . . . . . . . . . . . . . . . . . . . . . . . . . . . . . 7410.4 CRS Settings . . . . . . . . . . . . . . . . . . . . . . . . . . . . . . . . . . . . . . . . . . . . . 7510.5 On The Fly (OTF) CRS Transformation . . . . . . . . . . . . . . . . . . . . . . . . . . . . . . . 7610.6 Coordinate Reference System Selector . . . . . . . . . . . . . . . . . . . . . . . . . . . . . . . 7610.7 Eigenes Koordinatenbezugssystem definieren . . . . . . . . . . . . . . . . . . . . . . . . . . . . 7610.8 Datum Transformations . . . . . . . . . . . . . . . . . . . . . . . . . . . . . . . . . . . . . . . 78
11 Allgemeine Werkzeuge 8111.1 Hilfe . . . . . . . . . . . . . . . . . . . . . . . . . . . . . . . . . . . . . . . . . . . . . . . . . 8111.2 Bedienfelder . . . . . . . . . . . . . . . . . . . . . . . . . . . . . . . . . . . . . . . . . . . . . 8111.3 Layer/Gruppen einbinden . . . . . . . . . . . . . . . . . . . . . . . . . . . . . . . . . . . . . . 9011.4 Working with the map canvas . . . . . . . . . . . . . . . . . . . . . . . . . . . . . . . . . . . . 9111.5 Interacting with features . . . . . . . . . . . . . . . . . . . . . . . . . . . . . . . . . . . . . . . 10111.6 Save and Share Layer Properties . . . . . . . . . . . . . . . . . . . . . . . . . . . . . . . . . . . 10711.7 Storing values in Variables . . . . . . . . . . . . . . . . . . . . . . . . . . . . . . . . . . . . . . 11011.8 Authentifizierung . . . . . . . . . . . . . . . . . . . . . . . . . . . . . . . . . . . . . . . . . . . 11011.9 Common widgets . . . . . . . . . . . . . . . . . . . . . . . . . . . . . . . . . . . . . . . . . . . 112
12 Verwaltung von Datenquellen 11912.1 Opening Data . . . . . . . . . . . . . . . . . . . . . . . . . . . . . . . . . . . . . . . . . . . . . 11912.2 Creating Layers . . . . . . . . . . . . . . . . . . . . . . . . . . . . . . . . . . . . . . . . . . . 13712.3 Exploring Data Formats and Fields . . . . . . . . . . . . . . . . . . . . . . . . . . . . . . . . . 149
13 Arbeiten mit Vektordaten 15713.1 Die Symbolbibliothek . . . . . . . . . . . . . . . . . . . . . . . . . . . . . . . . . . . . . . . . 15713.2 Vektorlayereigenschaften . . . . . . . . . . . . . . . . . . . . . . . . . . . . . . . . . . . . . . 16913.3 Ausdrücke . . . . . . . . . . . . . . . . . . . . . . . . . . . . . . . . . . . . . . . . . . . . . . 24013.4 Mit Attributtabelle arbeiten . . . . . . . . . . . . . . . . . . . . . . . . . . . . . . . . . . . . . 26013.5 Editierfunktionen . . . . . . . . . . . . . . . . . . . . . . . . . . . . . . . . . . . . . . . . . . . 280
14 Arbeiten mit Rasterdaten 30914.1 Dialogfenster Rasterlayereigenschaften . . . . . . . . . . . . . . . . . . . . . . . . . . . . . . . 30914.2 Rasteranalyse . . . . . . . . . . . . . . . . . . . . . . . . . . . . . . . . . . . . . . . . . . . . . 321
15 Working with Mesh Data 32715.1 Working with Mesh Data . . . . . . . . . . . . . . . . . . . . . . . . . . . . . . . . . . . . . . . 327
16 Kartenlayout 33716.1 Überblick über das Drucklayout . . . . . . . . . . . . . . . . . . . . . . . . . . . . . . . . . . . 33716.2 Layout Items . . . . . . . . . . . . . . . . . . . . . . . . . . . . . . . . . . . . . . . . . . . . . 35216.3 Eine Ausgabe erzeugen . . . . . . . . . . . . . . . . . . . . . . . . . . . . . . . . . . . . . . . 38816.4 Creating a Report . . . . . . . . . . . . . . . . . . . . . . . . . . . . . . . . . . . . . . . . . . . 395
17 Arbeiten mit OGC Daten 41317.1 QGIS als OGC Datenclient . . . . . . . . . . . . . . . . . . . . . . . . . . . . . . . . . . . . . 41317.2 QGIS as OGC Data Server . . . . . . . . . . . . . . . . . . . . . . . . . . . . . . . . . . . . . . 424
18 Arbeiten mit GPS Daten 46518.1 GPS Plugin . . . . . . . . . . . . . . . . . . . . . . . . . . . . . . . . . . . . . . . . . . . . . . 46518.2 Live GPS tracking . . . . . . . . . . . . . . . . . . . . . . . . . . . . . . . . . . . . . . . . . . 469
19 Authentifizierungssystem 47519.1 Authentifizierungssystem Übersicht . . . . . . . . . . . . . . . . . . . . . . . . . . . . . . . . . 47519.2 Benutzerauthentifizierung Workflows . . . . . . . . . . . . . . . . . . . . . . . . . . . . . . . . 487
ii

19.3 Sicherheitsüberprüfung . . . . . . . . . . . . . . . . . . . . . . . . . . . . . . . . . . . . . . . . 497
20 GRASS GIS Integration 50120.1 Beispieldatensatz . . . . . . . . . . . . . . . . . . . . . . . . . . . . . . . . . . . . . . . . . . . 50120.2 GRASS Layer visualisieren . . . . . . . . . . . . . . . . . . . . . . . . . . . . . . . . . . . . . 50120.3 Daten in eine GRASS LOCATION importieren via drag and drop . . . . . . . . . . . . . . . . . 50220.4 Managing GRASS data in QGIS Browser . . . . . . . . . . . . . . . . . . . . . . . . . . . . . . 50220.5 GRASS Optionen . . . . . . . . . . . . . . . . . . . . . . . . . . . . . . . . . . . . . . . . . . 50220.6 GRASS Plugin starten . . . . . . . . . . . . . . . . . . . . . . . . . . . . . . . . . . . . . . . . 50220.7 GRASS Mapset öffnen . . . . . . . . . . . . . . . . . . . . . . . . . . . . . . . . . . . . . . . . 50320.8 Information zur GRASS-Datenbank . . . . . . . . . . . . . . . . . . . . . . . . . . . . . . . . . 50320.9 Daten in eine GRASS LOCATION importieren . . . . . . . . . . . . . . . . . . . . . . . . . . . 50420.10 Das GRASS Vektormodell . . . . . . . . . . . . . . . . . . . . . . . . . . . . . . . . . . . . . . 50620.11 Einen neuen GRASS Vektorlayer erstellen . . . . . . . . . . . . . . . . . . . . . . . . . . . . . 50720.12 Digitalisieren und Editieren eines GRASS Vektorlayers . . . . . . . . . . . . . . . . . . . . . . 50720.13 Einstellung der GRASS Region . . . . . . . . . . . . . . . . . . . . . . . . . . . . . . . . . . . 50920.14 Die GRASS Werkzeugkiste . . . . . . . . . . . . . . . . . . . . . . . . . . . . . . . . . . . . . 510
21 QGIS Verarbeitung Umgebung 51921.1 Einführung . . . . . . . . . . . . . . . . . . . . . . . . . . . . . . . . . . . . . . . . . . . . . . 51921.2 Configuring the Processing Framework . . . . . . . . . . . . . . . . . . . . . . . . . . . . . . . 51921.3 The Toolbox . . . . . . . . . . . . . . . . . . . . . . . . . . . . . . . . . . . . . . . . . . . . . 52221.4 Das Protokoll . . . . . . . . . . . . . . . . . . . . . . . . . . . . . . . . . . . . . . . . . . . . . 53021.5 Die Grafische Modellierung . . . . . . . . . . . . . . . . . . . . . . . . . . . . . . . . . . . . . 53121.6 Die Batch Processing Schnittstelle . . . . . . . . . . . . . . . . . . . . . . . . . . . . . . . . . . 53721.7 Verarbeitung Algorithmen von der Konsole aus verwenden . . . . . . . . . . . . . . . . . . . . . 54021.8 Writing new Processing algorithms as Python scripts . . . . . . . . . . . . . . . . . . . . . . . . 54821.9 Konfiguration externer Anwendungen . . . . . . . . . . . . . . . . . . . . . . . . . . . . . . . . 553
22 Plugins 55922.1 QGIS Plugins . . . . . . . . . . . . . . . . . . . . . . . . . . . . . . . . . . . . . . . . . . . . . 55922.2 Using QGIS Core Plugins . . . . . . . . . . . . . . . . . . . . . . . . . . . . . . . . . . . . . . 56322.3 QGIS Python Konsole . . . . . . . . . . . . . . . . . . . . . . . . . . . . . . . . . . . . . . . . 593
23 Hilfe und Support 59723.1 Mailinglisten . . . . . . . . . . . . . . . . . . . . . . . . . . . . . . . . . . . . . . . . . . . . . 59723.2 IRC . . . . . . . . . . . . . . . . . . . . . . . . . . . . . . . . . . . . . . . . . . . . . . . . . . 59823.3 BugTracker . . . . . . . . . . . . . . . . . . . . . . . . . . . . . . . . . . . . . . . . . . . . . . 59823.4 Blog . . . . . . . . . . . . . . . . . . . . . . . . . . . . . . . . . . . . . . . . . . . . . . . . . 59823.5 Plugins . . . . . . . . . . . . . . . . . . . . . . . . . . . . . . . . . . . . . . . . . . . . . . . . 59923.6 Wiki . . . . . . . . . . . . . . . . . . . . . . . . . . . . . . . . . . . . . . . . . . . . . . . . . 599
24 Contributors 60124.1 Authors . . . . . . . . . . . . . . . . . . . . . . . . . . . . . . . . . . . . . . . . . . . . . . . . 60124.2 Translators . . . . . . . . . . . . . . . . . . . . . . . . . . . . . . . . . . . . . . . . . . . . . . 602
25 Anhang 60525.1 GNU General Public License . . . . . . . . . . . . . . . . . . . . . . . . . . . . . . . . . . . . 60525.2 GNU Free Documentation License . . . . . . . . . . . . . . . . . . . . . . . . . . . . . . . . . 609
26 Literatur und Internetreferenzen 617
iii

iv

CHAPTER 1
Präambel
This document is the original user guide of the described software QGIS. The software and hardware describedin this document are in most cases registered trademarks and are therefore subject to legal requirements. QGIS issubject to the GNU General Public License. Find more information on the QGIS homepage, https://www.qgis.org.
Die in diesem Werk enthaltenen Angaben, Daten, Ergebnisse usw. wurden von den Autoren nach bestem Wissenerstellt und mit Sorgfalt überprüft. Dennoch sind inhaltliche Fehler nicht völlig auszuschließen.
Daher erfolgen alle Angaben ohne jegliche Verpflichtung oder Garantie. Die Autoren und Herausgeberübernehmen aus diesem Grund auch keinerlei Verantwortung oder Haftung für Fehler und deren Folgen.Hinweiseauf eventuelle Irrtümer werden gerne entgegengenommen.
This document has been typeset with reStructuredText. It is available as reST source code via github and onlineas HTML and PDF via https://www.qgis.org/en/docs/. Translated versions of this document can be downloaded inseveral formats via the documentation area of the QGIS project as well. For more information about contributingto this document and about translating it, please visit https://qgis.org/en/site/getinvolved/index.html.
Verweise in diesem Dokument
Das Dokument enthält interne und externe Verweise. Wenn Sie auf einen internen Verweis klicken dann springenSie innerhalb des Dokuments währeddessen sich wenn Sie auf einen externen Verweis klicken eine Internetadresseöffnet. Im PDF sind interne Verweise blau und externe Verweise grün dargestellt. Klicken Sie auf einen grünenVerweis dann wird mit Ihrem Webbrowser eine Seite im Internet geöffnet. In der HTML Version sind die Farbender Verweise identisch.
Autoren des englischsprachigen User Guides:
The list of the persons who contribute on writing, reviewing and translating the following documentation is avail-able at Contributors.
Copyright (c) 2004 - 2017 QGIS Development Team
Internet: https://www.qgis.org
Lizenz des Dokuments
Es wird die Erlaubnis gewährt, dieses Dokument zu kopieren, zu verteilen und/oder zu modifizieren, unter denBestimmungen der GNU Free Documentation License, Version 1.3 oder jeder späteren Version, veröffentlicht vonder Free Software Foundation; ohne unveränderliche Abschnitte, ohne vordere Umschlagtexte und ohne hintereUmschlagtexte. Eine Kopie der Lizenz wird im Kapitel GNU Free Documentation License bereitgestellt.
1

QGIS User Guide, Release 3.4
2 Chapter 1. Präambel

CHAPTER 2
Vorwort
Willkommen in der wunderbaren Welt der Geographischen Informationssysteme (GIS)!
QGIS is an Open Source Geographic Information System. The project was born in May of 2002 and was estab-lished as a project on SourceForge in June of the same year. We’ve worked hard to make GIS software (whichis traditionally expensive proprietary software) a viable prospect for anyone with basic access to a personal com-puter. QGIS currently runs on most Unix platforms, Windows, and macOS. QGIS is developed using the Qt toolkit(https://www.qt.io) and C++. This means that QGIS feels snappy and has a pleasing, easy-to-use graphical userinterface (GUI).
QGIS soll ein einfach zu benutzendes GIS sein und grundlegende GIS-Funktionalitäten bieten. Das anfänglicheZiel bestand darin, einen einfachen Geo-Datenviewer zu entwickeln. Dieses Ziel wurde bereits mehr als erreicht,so dass QGIS mittlerweile von vielen Anwendern für ihre tägliche Arbeit eingesetzt wird. QGIS unterstützteine Vielzahl von Raster- und Vektorformaten. Mit Hilfe der Plugin-Architektur können weitere Funktionalitäteneinfach ergänzt werden.
QGIS wird unter der GNU Public License (GPL) herausgegeben. Für die Entwicklung des Programms bedeutetdies das Recht, den Quellcode einzusehen und entsprechend der Lizenz verändern zu dürfen. Für die Anwendungder Software ist damit garantiert, dass GIS kostenfrei aus dem Internet heruntergeladen, genutzt und weitergegebenwerden kann. Eine vollständige Kopie der Lizenz ist dem Programm beigefügt und kann auch im Appendix GNUGeneral Public License eingesehen werden.
Tipp: Aktuellste Dokumentation
The latest version of this document can always be found in the documentation area of the QGIS website at https://www.qgis.org/en/docs/.
3

QGIS User Guide, Release 3.4
4 Chapter 2. Vorwort

CHAPTER 3
Gebrauch der Dokumentation
Dieser Abschnitt beschreibt die in diesem Handbuch benutzten einheitlichen Schreibstile.
3.1 GUI Schreibstile
Die GUI Schreibstile der sollen das Erscheinungsbild der Grafischen Benutzeroberfläche nachahmen. Im Allge-meinen gibt ein Stil das einfache Erscheinungsbild wieder, so dass der Benutzer die GUI nach etwas das wie dieInstruktionen im Handbuch aussieht absuchen kann.
• Menü Optionen: Layer → Rasterlayer hinzufügen oder Einstellungen → Werkzeugkasten → Digitalisierung
• Werkzeug: Rasterlayer hinzufügen
• Button : Save as Default
• Titel einer Dialogbox: Layereigenschaften
• Reiter: Allgemein
• Kontrollkästchen: Darstellen
• Radiobutton: Postgis SRID EPSG ID
• Wähle eine Zahl:
• Wähle ein Wort:
• Browse for a file: . . .
• Wähle eine Farbe:
• Schieberegler:
• Eingabetext:
Ein Schatten zeigt, dass dieses GUI Element mit der Maus anwählbar ist.
5

QGIS User Guide, Release 3.4
3.2 Text oder Tastatur Schreibstile
Dieses Handbuch enthält auch Stile die sich auf Texte, Tastaturbefehle und Codes beziehen um verschiedeneEinheiten, wie Klassen und Methoden anzuzeigen. Diese Stile entsprechen nicht dem tatsächlichen Aussehen vonTexten oder Codezeilen innerhalb von QGIS.
• Hyperlinks: https://qgis.org
• Tastenkombinationen: Drücken Sie Strg+B, was heisst dass Sie doe Strg-Taste drücken und halten sollenund dann die B-Taste drücken sollen.
• Name einer Datei: lakes.shp
• Name einer Klasse:New Layer
• Methode: classFactory
• Server: myhost.de
• User Text: qgis --help
Kodezeilen werden durch eine Schriftart mit festgelegter Breite angezeigt:
PROJCS["NAD_1927_Albers",GEOGCS["GCS_North_American_1927",
3.3 Betriebssystemspezifische Anweisungen
GUI sequences and small amounts of text may be formatted inline: Click File QGIS → Quit to closeQGIS. This indicates that on Linux, Unix and Windows platforms, you should click the File menu first, then Quit,while on macOS platforms, you should click the QGIS menu first, then Quit.
Größere Texte können als Liste formatiert werden:
• Mache dies
• Mache das
• Or do that
oder als Paragraph
Mache dies und dies und dies. Dann mache dies und dies und dies, und dies und dies und dies, und dies unddies und dies.
Do that. Then do that and that and that, and that and that and that, and that and that and that, and that and that.
Abbildungen innerhalb der Dokumentation können unter verschiedenen Betriebssystemen erstellt worden sein.Das jeweilige Betriebssystem wird dabei am Ende der Abbildungsüberschrift mit einem Icon angezeigt.
6 Chapter 3. Gebrauch der Dokumentation

CHAPTER 4
Funktionalitäten
QGIS offers many common GIS functions provided by core features and plugins. A short summary of six generalcategories of features and plugins is presented below, followed by first insights into the integrated Python console.
4.1 Daten visualisieren
You can view combinations of vector and raster data (in 2D or 3D) in different formats and projections withoutconversion to an internal or common format. Supported formats include:
• Spatially-enabled tables and views using PostGIS, SpatiaLite and MS SQL Spatial, Oracle Spatial, vectorformats supported by the installed OGR library, including GeoPackage, ESRI Shapefile, MapInfo, SDTS,GML and many more. See section Arbeiten mit Vektordaten.
• Raster- und Bilddatenformate die von der installierten GDAL (Geospatial Data Abstraction Library) Bib-liothek unterstützt werden wiie z.B. GeoTIFF, ERDAS IMG, ArcInfo ASCII GRID, JPEG, PNG und vielemehr. Siehe Kapitel Arbeiten mit Rasterdaten.
• GRASS Raster- und Vektordaten aus GRASS Datenbanken (Location/Mapset). Siehe Kapitel GRASS GISIntegration.
• Online Geodaten welche als OGC Webdienst, darunter WMS, WMTS, WCS, WFS und WFS-T, bereit-gestellt werden. Siehe Kapitel Arbeiten mit OGC Daten.
4.2 Daten erkunden, abfragen und Karten layouten
Sie können Karten zusammenstellen und interaktiv räumliche Daten mit einer benutzerfreundlichen GUI erkun-den. Die vielen in der GUI erhältlichen hilfreichen Werkzeuge beinhalten:
• QGIS Browser
• Spontanreprojektion
• DB Manager
• Print layout
• Kartenübersichtsfenster
• Räumliche Bookmarks
7

QGIS User Guide, Release 3.4
• Beschriftungswerkzeuge
• Identifizieren/Selektieren von Objekten
• Editieren/Visualisieren/Suchen von Attributdaten
• Data-defined feature labeling
• Datendefinierte Vektor- und Rastersymbolisierungswerkzeuge
• Atlas Kartenzusammenstellung mit Gradnetz-Layern
• North arrow, scale bar and copyright label for maps
• Unterstützung für das Speichern und Wiederherstellen von Projekten
4.3 Daten erstellen, editieren, verwalten und exportieren
Sie können Vektor- und Rasterlayer erstellen, bearbeiten und in zahlreiche Formate exportieren. QGIS bietet diefolgenden an:
• Digitalisierwerkzeuge für OGR-unterstützte Formate und GRASS Vektorlayer
• Ability to create and edit multiple file formats and GRASS vector layers
• Georeferenzierungsplugin um Bilder zu geocodieren
• GPS tools to import and export GPX format, and convert other GPS formats to GPX or down/upload directlyto a GPS unit (on Linux, usb: has been added to list of GPS devices)
• Unterstützung für das Darstellen und Bearbeiten von OpenStreetMap Daten
• Ability to create spatial database tables from files with the DB Manager plugin
• Verbesserte Handhabung von räumlichen Datenbanktabellen
• Werkzeuge um Vektorattributtabellen zu verwalten
• Möglichkeit Screenshots als georeferenzierte Bilder zu speichern
• DXF - Export-Tool mit erweiterten Funktionen um Stile und Plugins zu exportieren und CAD-ähnlicheFunktionen auszuführen
4.4 Daten analysieren
You can perform spatial data analysis on spatial databases and other OGR-supported formats. QGIS currentlyoffers vector analysis, sampling, geoprocessing, geometry and database management tools. You can also use theintegrated GRASS tools, which include the complete GRASS functionality of more than 400 modules. (See sec-tion GRASS GIS Integration.) Or, you can work with the Processing Plugin, which provides a powerful geospatialanalysis framework to call native and third-party algorithms from QGIS, such as GDAL, SAGA, GRASS andmore. (See section Einführung.)
4.5 Karten im Internet veröffentlichen
QGIS kann als WMS, WMTS, WMS-C oder WFS und WFS-T Client und als WMS, WCS oder WFS Serverbenutzt werden. (Siehe Kapitel Arbeiten mit OGC Daten.) Zusätzlich können Sie Ihre Daten im Internet veröf-fentlichen in dem Sie einen mit UMN MapServer oder GeoServer installierten Webserver verwenden.
8 Chapter 4. Funktionalitäten

QGIS User Guide, Release 3.4
4.6 Erweiterte QGIS Funktionalität durch Erweiterungen
QGIS kann an Ihre speziellen Bedürfnisse mit seiner erweiterbaren Pluginarchitektur und Bibliotheken die zumerstellen von Plugins benutzt werden können angepasst werden. Sie können sogar neue Anwendungen mit C++oder Python erstellen!
4.6.1 Kern Plugins
Kernplugins sind:
1. Coordinate Capture (capture mouse coordinates in different CRSs)
2. DB Manager (exchange, edit and view layers and tables from/to databases; execute SQL queries)
3. eVIS (visualize events)
4. Geometry Checker (check geometries for errors)
5. Georeferencer GDAL (add projection information to rasters using GDAL)
6. GPS Tools (load and import GPS data)
7. GRASS 7 (integrate GRASS GIS)
8. MetaSearch Catalogue Client (interacting with metadata catalog services supporting the OGC Catalog Ser-vice for the Web (CSW) standard)
9. Offline Editing (allow offline editing and synchronizing with databases)
10. Processing (the spatial data processing framework for QGIS)
11. Topology Checker (find topological errors in vector layers)
4.6.2 Externe Python Plugins
QGIS bietet eine steigende Anzahl von externen Python Plugins, die von der Community bereitgestellt werden,an. Diese Plugins werden in dem offiziellen Plugins Repository vorgehalten und können auf einfache Art undWeise mit der Python Plugin Installation installiert werden. Siehe Kapitel Der Erweiterungen Dialog.
4.7 Python-Konsole
For scripting, it is possible to take advantage of an integrated Python console, which can be opened with: Plugins→ Python Console. The console opens as a non-modal utility window. For interaction with the QGIS environment,there is the qgis.utils.iface variable, which is an instance of QgisInterface. This interface providesaccess to the map canvas, menus, toolbars and other parts of the QGIS application. You can create a script, thendrag and drop it into the QGIS window and it will be executed automatically.
For further information about working with the Python console and programming QGIS plugins and applications,please refer to QGIS Python Konsole and PyQGIS-Developer-Cookbook.
4.8 Bekannte Probleme
4.8.1 Begrenzung der Anzahl von geöffneten Dateien
Wenn Sie ein großes QGIS Projekt öffnen und Sie sicher sind dass alle Layer gültig sind aber einige Layer alsschlecht markiert sind stehen Sie wahrscheinlich vor diesem Problem. Linux (und auch andere Bs) hat eineprozessbezogene Begrenzung von geöffneten Dateien. Ressourcengrenzen beziehen sich auf einen Prozess und
4.6. Erweiterte QGIS Funktionalität durch Erweiterungen 9

QGIS User Guide, Release 3.4
werden vererbt. Der ulimit Befehl, den die Shell zur Verfügung stellt, verändert die Begrenzung nur für denaktuellen Shell-Prozess; die neue Begrenzung wird von allen untergeordneten Prozessen geerbt.
You can see all current ulimit info by typing:
$ ulimit -aS
You can see the current allowed number of opened files per process with the following command on a console:
$ ulimit -Sn
To change the limits for an existing session, you may be able to use something like:
$ ulimit -Sn #number_of_allowed_open_files$ ulimit -Sn$ qgis
Um es für immer zu beheben
Unter den meisten Linux Systemen werden die Ressourcenbegrenzungen beim Login durch das pam_limitsModul gemäß den Einstellungen in etc/security/limits.conf oder /etc/security/limits.d/*.conf eingestellt. Sie müssten in der Lage sein die Dateien zu editieren wenn Sie Root-Rechte haben (auchüber sudo), die Änderungen jedoch werden erst wirksam wenn Sie sich erneut anmelden.
Mehr Informationen:
https://www.cyberciti.biz/faq/linux-increase-the-maximum-number-of-open-files/ https://linuxaria.com/article/open-files-in-linux
10 Chapter 4. Funktionalitäten

CHAPTER 5
Was ist neu in QGIS 3.4
Diese Version enthält neue Features und erweitert die Programmierschnittstelle vorhergehender Versionen. Wirempfehlen dass Sie diese Version statt der vorherigen Veröffentlichungen benutzen.
Diese Version enthält hunderte Fehlerkorrekturen und viele neue Funktionen und Verbesserungen gegenüber QGIS2.18 die in diesem Handbuch beschrieben werden. Sie können sich dazu auch den visuellen Changelog unterhttps://qgis.org/en/site/forusers/visualchangelogs.html ansehen.
11

QGIS User Guide, Release 3.4
12 Chapter 5. Was ist neu in QGIS 3.4

CHAPTER 6
Der erste Einstieg
This chapter provides a quick overview of installing QGIS, downloading QGIS sample data, and running a firstsimple session visualizing raster and vector data.
6.1 Installing QGIS
QGIS project provides different ways to install QGIS depending on your platform.
6.1.1 Installing from binaries
Standard installers are available for MS Windows and macOS. Binary packages (rpm and deb) or software
repositories are provided for many flavors of GNU/Linux .
For more information and instructions for your operating system check https://download.qgis.org.
6.1.2 Installing from source
If you need to build QGIS from source, please refer to the installation instructions. They are distributed with theQGIS source code in a file called INSTALL. You can also find them online at https://htmlpreview.github.io/?https://raw.github.com/qgis/QGIS/master/doc/INSTALL.html.
If you want to build a particular release and not the version in development, you should replace master withthe release branch (commonly in the release-X_Y form) in the above-mentioned link (installation instructionsmay differ).
6.1.3 Installing on external media
It is possible to install QGIS (with all plugins and settings) on a flash drive. This is achieved by defining a–profiles-path option that overrides the default user profile path and forces QSettings to use this directory, too.See section System Settings for additional information.
13

QGIS User Guide, Release 3.4
6.1.4 Downloading sample data
This user guide contains examples based on the QGIS sample dataset (also called the Alaska dataset).
The Windows installer has an option to download the QGIS sample dataset. If checked, the data will bedownloaded to your Documents folder and placed in a folder called GIS Database. You may use WindowsExplorer to move this folder to any convenient location. If you did not select the checkbox to install the sampledataset during the initial QGIS installation, you may do one of the following:
• bereits auf Ihrem Rechner vorhandene GIS Daten verwenden
• Download sample data from https://qgis.org/downloads/data/qgis_sample_data.zip
• QGIS deinstallieren, wieder neu installieren und dabei die entsprechende Option auswählen, wenn die obenangesprochenen Optionen nicht funktionieren.
For GNU/Linux and macOS, there are no dataset installation packages available as rpm, deb or dmg. To usethe sample dataset, download it from https://qgis.org/downloads/data/qgis_sample_data.zip and unzip the archiveon any convenient location on your system.
The Alaska dataset includes all GIS data that are used for the examples and screenshots in this user guide; it alsoincludes a small GRASS database. The projection for the QGIS sample datasets is Alaska Albers Equal Area withunits feet. The EPSG code is 2964.
PROJCS["Albers Equal Area",GEOGCS["NAD27",DATUM["North_American_Datum_1927",SPHEROID["Clarke 1866",6378206.4,294.978698213898,AUTHORITY["EPSG","7008"]],TOWGS84[-3,142,183,0,0,0,0],AUTHORITY["EPSG","6267"]],PRIMEM["Greenwich",0,AUTHORITY["EPSG","8901"]],UNIT["degree",0.0174532925199433,AUTHORITY["EPSG","9108"]],AUTHORITY["EPSG","4267"]],PROJECTION["Albers_Conic_Equal_Area"],PARAMETER["standard_parallel_1",55],PARAMETER["standard_parallel_2",65],PARAMETER["latitude_of_center",50],PARAMETER["longitude_of_center",-154],PARAMETER["false_easting",0],PARAMETER["false_northing",0],UNIT["us_survey_feet",0.3048006096012192]]
If you intend to use QGIS as a graphical front end for GRASS, you can find a selection of sample locations (e.g.,Spearfish or South Dakota) at the official GRASS GIS website, https://grass.osgeo.org/download/sample-data/.
6.2 Starting and stopping QGIS
QGIS can be started like any other application on your computer. This means that you can launch QGIS by:
• using the Applications menu, the Start menu, or the Dock
• Doppelklicken Sie das QGIS Icon oder die Desktop Verknüpfung
• double clicking an existing QGIS project file (with .qgz or .qgs extension). Note that this will also openthe project.
• typing qgis in a command prompt (assuming that QGIS is added to your PATH or you are in its installationfolder)
To stop QGIS, use:
14 Chapter 6. Der erste Einstieg

QGIS User Guide, Release 3.4
• die Menüoptionen Projekt → QGIS beenden oder benutzen Sie das Tastenkürzel Strg+Q
• QGIS → QGIS beenden, oder benutzen Sie das Tastenkürzel Ctrl+Q
• or use the red cross at the top-right corner of the main interface of the application.
6.3 Sample Session: Loading raster and vector layers
Now that you have QGIS installed and a sample dataset available, we will demonstrate a first sample session. Inthis example, we will visualize a raster and a vector layer. We will use:
• the landcover raster layer (qgis_sample_data/raster/landcover.img)
• and the lakes vector layer (qgis_sample_data/gml/lakes.gml)
Where qgis_sample_data represents the path to the unzipped dataset.
1. Start QGIS as seen in Starting and stopping QGIS.
2. To load the files in QGIS:
(a) Click on the Open Data Source Manager icon. The Data Source Manager should open in Browser mode.
(b) Browse to the folder qgis_sample_data/raster/
(c) Select the ERDAS IMG file landcover.img and double-click it. The landcover layer is added inthe background while the Data Source Manager window remains open.
(d) To load the lakes data, browse to the folder qgis_sample_data/gml/, and double-click thelakes.gml file to open it.
(e) A Coordinate Reference System Selector dialog opens with NAD27 / Alaska Alberts selected, clickOK.
(f) Close the Data Source Manager window
You now have the two layers available in your project in some random colours. Let’s do some customization onthe lakes layer.
1. Select the Zoom In tool on the Navigation toolbar
2. Zoom to an area with some lakes
3. Double-click the lakes layer in the map legend to open the Properties dialog
4. To change the lakes color:
(a) Click on the Symbology tab
(b) Select blue as fill color.
(c) Press Apply. Lakes are now displayed in blue in the map canvas.
5. To display the name of the lakes:
(a) Click on the Labels tab
(b) Select Single labels in the drop-down menu to enable labeling.
(c) From the Label with list, choose the NAMES field.
(d) Press Apply. Names will now load over the boundaries.
6. You can improve readability of the labels by adding a white buffer around them:
(a) Click the Buffer tab in the list on the left
(b) Check Draw text buffer
6.3. Sample Session: Loading raster and vector layers 15

QGIS User Guide, Release 3.4
(c) Choose 3 as buffer size
(d) Click Apply
(e) Check if the result looks good, and update the value if needed.
(f) Finally click OK to close the guilabel:Layer Properties dialog and apply the changes.
Let’s now add some decorations in order to shape the map and export it out of QGIS:
1. Select View → Decorations → Scale Bar menu
2. In the dialog that opens, check Enable Scale Bar option
3. Customize the options of the dialog as you want
4. Press Apply
5. Likewise, from the decorations menu, add more items (north arrow, copyright. . . ) to the map canvas withcustom properties.
6. Click Project → Import/Export → Export Map to Image. . .
7. Press Save in the opened dialog
8. Select a file location, a format and confirm by pressing Save again.
9. Press Project → Save. . . to store your changes as a .qgz project file.
That’s it! You can see how easy it is to visualize raster and vector layers in QGIS, configure them and generateyour map in an image format you can use in other softwares. Let’s move on to learn more about the availablefunctionality, features and settings, and how to use them.
16 Chapter 6. Der erste Einstieg

CHAPTER 7
Working with Project Files
7.1 Introducing QGIS projects
The state of your QGIS session is called a project. QGIS works on one project at a time. Any settings can beproject-specific or an application-wide default for new projects (see section Optionen). QGIS can save the state of
your workspace into a project file using the menu options Project → Save or Project → Save As. . . .
Bemerkung: If the project you loaded has been modified in the meantime, by default, QGIS will ask you if
you want to overwrite the changes. This behavior is controlled by the Prompt to save project and data sourcechanges when required setting under Settings → Options → General menu.
You can load existing projects into QGIS using Project → Open. . . , Project → New from template or Project→ Open Recent →.
At startup, a list of recently opened projects is displayed, including screenshots, names and file paths (for up toten projects). This is a handy quick way to access recently used projects. Double-click an entry in this list to openthe corresponding project. If you instead want to create a new project, just add any layer and the list disappears,giving way to the map canvas.
If you want to clear your session and start fresh, go to Project → New. This will prompt you to save theexisting project if changes have been made since it was opened or last saved.
The information saved in a project file includes:
• Layers added
• Which layers can be queried
• Layer properties, including symbolization and styles
• Projection for the map view
• Last viewed extent
• Print layouts
• Print layout elements with settings
• Print layout atlas settings
17

QGIS User Guide, Release 3.4
Figure 7.1: Starting a new project in QGIS
• Digitizing settings
• Table Relations
• Project Macros
• Project default styles
• Plugins settings
• QGIS Server settings from the OWS settings tab in the Project properties
• Queries stored in the DB Manager
The project file is saved in XML format. This means that it is possible to edit the file outside of QGIS if you knowwhat you are doing. The file format has been updated several times compared with earlier QGIS versions. Projectfiles from older QGIS versions may not work properly any more.
Bemerkung: By default, QGIS will warn you of version differences. This behavior is controlled in Settings →Options. On the General tab, you should tick Warn when opening a project file saved with an older version ofQGIS.
Whenever you save a .qgs project in QGIS, a backup of the project file is created with the extension .qgs~ andstored in the same directory as the project file.
The extension for QGIS projects is .qgs but when saving from QGIS, the default is to save using a compressedformat with the .qgz extension. The .qgs file is embedded in the .qgz file (a zip archive), together with itsassociated sqlite database (.qgd) for auxiliary data. You can get to these files by unzipping.
Bemerkung: A zipped project may be particularly useful with the Auxiliary Storage Properties mechanism inorder to embed the underlying database.
Projects can also be saved/loaded to/from a PostgreSQL database using the following Project menu items:
• Project → Open from
18 Chapter 7. Working with Project Files

QGIS User Guide, Release 3.4
• Project → Save to
Both menu items have a sub-menu with a list of extra project storage implementations (currently just PostgreSQL).Clicking the action will open a dialog to pick a PostgreSQL connection name, schema name and project.
Projects stored in PostgreSQL can be also loaded from the QGIS browser panel (the entries are located within theschema they are stored in), either by double-clicking them or by dragging them to the map canvas.
7.2 Generating output
There are several ways to generate output from your QGIS session. We have already discussed saving as a projectfile in Introducing QGIS projects. Other ways to produce output files are:
• Creating images: Project → Import/Export → Export Map to Image. . . opens a file dialog where youselect the name, path and type of image (PNG, JPG and many other formats). This will also create a worldfile (with extension PNGW or JPGW) that is saved in the same folder as your image. This world file is usedto georeference the image.
• Exporting to DXF files: Project → Import/Export → Export Project to DXF. . . opens a dialog where youcan define the ‚Symbology mode‘, the ‚Symbology scale‘ and vector layers you want to export to DXF.Through the ‚Symbology mode‘ symbols from the original QGIS Symbology can be exported with highfidelity (see section Creating new DXF files).
• Designing print maps: Project → New Print Layout. . . opens a dialog where you can layout and printthe current map canvas (see section Kartenlayout).
7.2. Generating output 19

QGIS User Guide, Release 3.4
20 Chapter 7. Working with Project Files

CHAPTER 8
QGIS GUI
When QGIS starts, a GUI displays as shown in the figure below (the numbers 1 through 5 in yellow circles arediscussed below).
Figure 8.1: QGIS GUI mit Alaskabeispieldatensatz
Bemerkung: Das Aussehen einzelner Bereiche (Titelleiste, etc.) kann in Abhängigkeit vom Betriebssystem unddem Fenstermanager abweichen.
The QGIS GUI is divided into five components:
1. Menüleiste
21

QGIS User Guide, Release 3.4
2. Werkzeugkästen
3. Bedienfelder
4. Kartenfenster
5. Statusleiste
Scroll down for detailed explanations of these features.
8.1 Menüleiste
The Menu bar provides access to various QGIS functions using a standard hierarchical menu. The Menus, theiroptions, associated icons and keyboard shortcuts are outlined below. These keyboard shortcuts are the defaultsettings, but they can be reconfigured using the Keyboard Shortcuts via the Settings → menu.
Most Menu options have a corresponding tool and vice-versa. However, the Menus are not organized exactly likethe toolbars. The locations of menu options in the toolbars are indicated below in the table. Plugins may add newoptions to Menus. For more information about tools and toolbars, see Werkzeugkästen.
Bemerkung: QGIS is a cross-platform application - while the same tools are available on all platforms, they maybe placed in different menus on different operating systems. The lists below show the most common locationsincluding known variations.
8.1.1 Projekt
The Project menu provides access and exit points of the project file. It provides you with tools to:
• Create a New file from scratch or using another project file as a template (see Project files options fortemplate configuration)
• Open. . . a project file from either a file browser or PostgreSQL database
• Close a project or revert it to its last saved state
• Save a project in .qgs or .qgz file format, either as a file or within a PostgreSQL database
• Export the map canvas to different formats or use a print layout for more complex output
• Set the project properties and the snapping options when editing layers.
22 Chapter 8. QGIS GUI

QGIS User Guide, Release 3.4
Menüleiste Tastenkürzel Werkzeu-gleiste
Referenz
Neu Ctrl+N Projekt Introducing QGIS projectsNeu aus Vorlage → Introducing QGIS projects
Open. . . Strg+O Projekt Introducing QGIS projectsOpen from → PostgreSQL Introducing QGIS projectsZuletzt verwendetes → Introducing QGIS projectsClose Introducing QGIS projects
Speichern Strg+S Projekt Introducing QGIS projects
Speichern als. . . Strg+Shift+S Projekt Introducing QGIS projectsSave to → PostgreSQL Introducing QGIS projectsRevert. . .Eigenschaften. . . Strg+Shift+P ProjekteigenschaftenFangoptionen. . . Einstellen der Fangtoleranz und des
SuchradiusImport/Export →
Export Map to Image. . . Generating output
Export Map to PDF. . . Generating outputExport Project to DXF. . . Generating outputImport Layers fromDWG/DXF. . .
Importing a DXF or DWG file
New Print Layout. . . Strg+P Projekt Kartenlayout
New Report. . . Kartenlayout
Layout Manager. . . Projekt KartenlayoutLayouts → Kartenlayout
QGIS beenden Strg+Q
Under macOS, the Exit QGIS command corresponds to QGIS → Quit QGIS (Cmd+Q).
8.1.2 Bearbeiten
The Edit menu provides most of the native tools needed to edit layer attributes or geometry (see Editierfunktionenfor details).
Menüleiste Tastenkürzel Werkzeugleiste Referenz
Rückgängig Strg+Z Digitalisierung Rückgängig und Wiederholen
Wiederholen Strg+Shift+Z Digitalisierung Rückgängig und Wiederholen
Ausgewählte Objekte ausschneiden Strg+X Digitalisierung Objekte ausschneiden, kopieren und einfügen
Objekte kopieren Strg+C Digitalisierung Objekte ausschneiden, kopieren und einfügen
Objekte einfügen Strg+V Digitalisierung Objekte ausschneiden, kopieren und einfügenPaste Features as → Mit Attributtabelle arbeiten
Continued on next page
8.1. Menüleiste 23

QGIS User Guide, Release 3.4
Table 8.1 – continued from previous pageMenüleiste Tastenkürzel Werkzeugleiste ReferenzAuswahl → Attribute Selecting features
Add Record Strg+. Digitalisierung
Add Point Feature Strg+. Digitalisierung Objekte digitalisieren
Add Line Feature Strg+. Digitalisierung Objekte digitalisieren
Add Polygon Feature Strg+. Digitalisierung Objekte digitalisieren
Add Circular String Shape Digitizing Kreisbogen hinzufügen
Add Circular String by Radius Shape Digitizing Kreisbogen hinzufügenAdd Circle → Shape DigitizingAdd Rectangle → Shape DigitizingAdd Regular Polygon → Shape DigitizingAdd Ellipse → Shape Digitizing
Objekte verschieben Erweiterte Digitalisierung Objekt(e) verschieben
Copy and Move Feature(s) Erweiterte Digitalisierung Objekt(e) verschieben
Ausgewähltes löschen Digitalisierung Ausgewählte Objekte löschen
Modify Attributes of Selected Features Digitalisierung Editiere Attributwerte
Objekte verschieben Erweiterte Digitalisierung Objekt(e) drehen
Objekt vereinfachen Erweiterte Digitalisierung Objekt vereinfachen
Ring hinzufügen Erweiterte Digitalisierung Ring hinzufügen
Teil hinzufügen Erweiterte Digitalisierung Teil hinzufügen
Ring füllen Erweiterte Digitalisierung Ring füllen
Ring löschen Erweiterte Digitalisierung Ring löschen
Teil löschen Erweiterte Digitalisierung Teil löschen
Objekte überarbeiten Erweiterte Digitalisierung Objekte überarbeiten
Linie versetzen Erweiterte Digitalisierung Linie versetzen
Objekte trennen Erweiterte Digitalisierung Objekte trennen
Teile zerlegen Erweiterte Digitalisierung Teile zerlegen
Gewählte Objekte verschmelzen Erweiterte Digitalisierung Gewählte Objekte verschmelzen
Merge Attributes of Selected Features Erweiterte Digitalisierung Attribute gewählter Objekte vereinen
Vertex Tool (All Layers) Digitalisierung Knotenwerkzeug
Vertex Tool (Current Layer) Digitalisierung Knotenwerkzeug
Punktsymbole drehen Erweiterte Digitalisierung Punktsymbole drehen
Offset Point Symbols Erweiterte Digitalisierung Punktsymbolversatz
Reverse Line Erweiterte Digitalisierung
24 Chapter 8. QGIS GUI

QGIS User Guide, Release 3.4
Tools dependent on the selected layer geometry type i.e. point, polyline or polygon, are activated accordingly:
Menüleiste Point Polyline Polygon
Move Feature(s)
Copy and Move Feature(s)
8.1.3 Ansicht
The map is rendered in map views. You can interact with these views using the View tools (see Working with themap canvas for more information). For example, you can:
• Create new 2D or 3D map views next to the main map canvas
• Zoom or pan to any place
• Query displayed features‘ attributes or geometry
• Enhance the map view with preview modes, annotations or decorations
• Access any panel or toolbar
The menu also allows you to reorganize the QGIS interface itself using actions like:
• Toggle Full Screen Mode: covers the whole screen while hiding the title bar
• Toggle Panel Visibility: shows or hides enabled panels - useful when digitizing features (for maximumcanvas visibility) as well as for (projected/recorded) presentations using QGIS‘ main canvas
• Toggle Map Only: hides panels, toolbars, menus and status bar and only shows the map canvas. Combinedwith the full screen option, it makes your screen display only the map
Menüleiste Tastenkürzel Werkzeugleiste Referenz
New Map View Ctrl+M Kartennavigation
New 3D Map View Ctrl+Shift+M 3D Map View
Karte verschieben Kartennavigation Zoomen und Karte verschieben
Karte zur Auswahl verschieben Kartennavigation
Hineinzoomen Ctrl+Alt++ Kartennavigation Zoomen und Karte verschieben
Herauszoomen Ctrl+Alt+- Kartennavigation Zoomen und Karte verschieben
Objekte abfragen Strg+Shift+I Attribute Identifying FeaturesMessen → Attribute Messen
Statistische Zusammenfassung Attribute Statistical Summary Panel
Volle Ausdehnung Strg+Shift+F Kartennavigation
Auf den Layer zoomen Kartennavigation
Zur Auswahl zoomen Strg+J Kartennavigation
Zoom zurück Kartennavigation
Zoom vor Kartennavigation
Zoom To Native Resolution (100%) KartennavigationDekorationen → DekorationenVorschaumodus →
Show Map Tips Attribute Display PropertiesContinued on next page
8.1. Menüleiste 25

QGIS User Guide, Release 3.4
Table 8.2 – continued from previous pageMenüleiste Tastenkürzel Werkzeugleiste Referenz
New Bookmark. . . Strg+B Kartennavigation Räumliche Lesezeichen
Lesezeichen anzeigen Strg+Shift+B Kartennavigation Räumliche Lesezeichen
Aktualisieren F5 Kartennavigation
Alle Layer anzeigen Strg+Shift+U Layers Panel
Alle Layer ausblenden Strg+Shift+H Layers Panel
Show Selected Layers Layers Panel
Hide Selected Layers Layers Panel
Hide Deselected Layers Layers PanelBedienfelder → Bedienfelder und WerkzeugkästenWerkzeugkästen → Bedienfelder und WerkzeugkästenVolle Ausdehnung F11Toggle Panel Visibility Ctrl+TabToggle Map Only Ctrl+Shift+Tab
Under Linux KDE, Panels →, Toolbars → and Toggle Full Screen Mode are in the Settings menu.
8.1.4 Layer
The Layer menu provides a large set of tools to create new data sources, add them to a project or save modificationsto them. Using the same data sources, you can also:
• Duplicate a layer, generating a copy you can modify within the same project
• Copy and Paste layers or groups from one project to another as a new instance whose features and propertiesyou can modify independently of the original
• or Embed Layers and Groups. . . from another project, as read-only copies which you cannot modify (seeLayer/Gruppen einbinden)
The Layer menu also contains tools to configure, copy or paste layer properties (style, scale, CRS. . . ).
26 Chapter 8. QGIS GUI

QGIS User Guide, Release 3.4
Menüleiste Tastenkürzel Werkzeugleiste Referenz
Data Source Manager Ctrl+L Data Source Man-ager
Opening Data
Layer erzeugen → Data Source Man-ager
Creating new vector layers
Layer hinzufügen → Data Source Man-ager
Opening Data
Eingebettete Layer und Grup-pen. . .
Layer/Gruppen einbinden
Aus Layerdefinitionsdateihinzufügen. . .
Layer definition file
Copy Style Save and Share Layer Properties
Paste Style Save and Share Layer Properties
Copy Layer
Paste Layer/Group
Attributtabelle öffnen F6 Attribute Mit Attributtabelle arbeiten
Bearbeitungsstatus um-schalten
Digitalisierung Einen vorhandenen Layer edi-tieren
Layeränderungen speichern Digitalisierung Änderungen speichern
Aktuelle Änderungen → Digitalisierung Änderungen speichernSave As. . . Creating new layers from an exist-
ing layerSave As Layer Definition File. . . Layer definition file
Layer/Gruppe löschen Strg+D
Duplicate Layer(s)Set Scale Visibility of Layer(s)KBS von Layer(n) setzen Strg+Shift+CSet Project CRS from LayerLayer Properties. . . VektorlayereigenschaftenFilter. . . Ctrl+F Abfrageeditor
Beschriftung Labels Properties
Show in Overview Overview PanelShow All in Overview Overview Panel
Hide All from Overview Overview Panel
8.1.5 Einstellungen
Menüleiste ReferenzUser Profiles → Working with User Profiles
Style Manager. . . Die Stilverwaltung
Custom Projections. . . Eigenes Koordinatenbezugssystem definieren
Keyboard Shortcuts. . . Keyboard shortcuts
Interface Customization. . . AnpassungOptionen. . . Optionen
8.1. Menüleiste 27

QGIS User Guide, Release 3.4
Under Linux KDE, you’ll find more tools in the Settings menu such as Panels →, Toolbars → and ToggleFull Screen Mode.
8.1.6 Erweiterungen
Menüleiste Tastenkürzel Werkzeu-gleiste
Referenz
Erweiterungen verwalten und instal-lieren. . .
Der Erweiterungen Dia-log
Python Console Strg+Alt+P Plugins QGIS Python Konsole
Wenn Sie QGIS das erste Mal starten werden nicht alle Erweiterungen geladen.
8.1.7 Vektor
This is what the Vector menu looks like if all core plugins are enabled.
Menüleiste Tastenkürzel Werkzeugleiste Referenz
Coordinate Capture Vector Coordinate Capture Plugin
Check Geometries. . . Vector Geometry Checker Plugin
GPS Tools Vector GPS Plugin
Topology Checker Vector Topology Checker PluginGeoprocessing Tools → Alt+O + G Configuring the Processing FrameworkGeometry Tools → Alt+O + E Configuring the Processing FrameworkAnalysis Tools → Alt+O + A Configuring the Processing FrameworkData Management Tools → Alt+O + D Configuring the Processing FrameworkResearch Tools → Alt+O + R Configuring the Processing Framework
By default, QGIS adds Processing algorithms to the Vector menu, grouped by sub-menus. This provides shortcutsfor many common vector-based GIS tasks from different providers. If not all these sub-menus are available, enablethe Processing plugin in Plugins → Manage and Install Plugins. . . .
Note that the list of the Vector menu tools can be extended with any Processing algorithms or some externalplugins.
8.1.8 Raster
This is what the Raster menu looks like if all core plugins are enabled.
28 Chapter 8. QGIS GUI

QGIS User Guide, Release 3.4
Menüleiste Werkzeugleiste Referenz
Raster calculator. . . RasterrechnerRaster ausrichten. . . Raster AusrichtungAnalysis → Configuring the Processing FrameworkProjection → Configuring the Processing FrameworkMiscellaneous → Configuring the Processing FrameworkExtraction → Configuring the Processing FrameworkConversion → Configuring the Processing Framework
Georeferencer Raster Georeferencer Plugin
By default, QGIS adds Processing algorithms to the Raster menu, grouped by sub-menus. This provides a shortcutfor many common raster-based GIS tasks from different providers. If not all these sub-menus are available, enablethe Processing plugin in Plugins → Manage and Install Plugins. . . .
Note that the list of the Raster menu tools can be extended with any Processing algorithms or some externalplugins.
8.1.9 Datenbank
This is what the Database menu looks like if all the core plugins are enabled. If no database plugins are enabled,there will be no Database menu.
Menüleiste Werkzeugleiste Referenz
DB Manager Datenbank DB Manager PlugineVis → Datenbank eVis PluginOffline Editing → Datenbank Offline Editing Plugin
Wenn Sie QGIS das erste Mal starten werden nicht alle Erweiterungen geladen.
8.1.10 Web
This is what the Web menu looks like if all the core plugins are enabled. If no web plugins are enabled, there willbe no guilabel:Web menu.
Menüleiste Werkzeugleiste Referenz
MetaSearch Web MetaSearch Catalog Client
Wenn Sie QGIS das erste Mal starten werden nicht alle Erweiterungen geladen.
8.1. Menüleiste 29

QGIS User Guide, Release 3.4
8.1.11 Verarbeitung
Menüleiste Tastenkürzel Referenz
Toolbox Ctrl+Alt+T The Toolbox
Grafische Model-lierung. . .
Strg+Alt+M Die Grafische Modellierung
History. . . Ctrl+Alt+H Das Protokoll
Results Viewer Ctrl+Alt+R Konfiguration externer Anwendungen
Edit Features In-Place Mit Verarbeitung Objekte innerhalb eines Layers verän-dern
Wenn Sie QGIS das erste Mal starten werden nicht alle Erweiterungen geladen.
8.1.12 Hilfe
Menüleiste Tastenkürzel Werkzeugleiste
Hilfe-Übersicht F1 DirekthilfeAPI DokumentationEin Problem meldenBrauchen Sie professionelle Unterstützung?
QGIS-Homepage Strg+HCheck QGIS Version
About
QGIS-Sponsoren
8.1.13 QGIS
This menu is only available under macOS and contains some OS related commands.
Menüleiste Tastenkürzel ReferenzPreferencesÜber QGISQGIS verbergenShow AllAndere verbergenQGIS beenden Cmd+Q
Präferenzen und Über QGIS sind die selben Befehle wie Einstellungen → Optionen und Hilfe → Über. QGISbeenden deckt sich mit Projekt → QGIS schließen unter der anderen Plattform.
30 Chapter 8. QGIS GUI

QGIS User Guide, Release 3.4
8.2 Bedienfelder und Werkzeugkästen
From the View menu (or Settings), you can switch QGIS widgets (Panels →) and toolbars (Toolbars →) onand off. To (de)activate any of them, right-click the menu bar or toolbar and choose the item you want. Each panelor toolbar can be moved and placed wherever you feel comfortable within the QGIS interface. The list can alsobe extended with the activation of Core or external plugins.
8.2.1 Werkzeugkästen
The toolbar provides access to most of the same functions as the menus, plus additional tools for interacting withthe map. Each toolbar item has pop-up help available. Hover your mouse over the item and a short description ofthe tool’s purpose will be displayed.
Jede Werkzeugleiste kann nach eigenen Wünschen verschoben werden und kann auch an bzw. ausgeschaltetwerden, indem Sie mit der Maus in einen freien Bereich der Werkzeugleiste fahren und auf den rechten Mausknopfdrücken.
Figure 8.2: Das Werkzeugkästen Menü
Tipp: Werkzeugleiste wiederherstellen
If you have accidentally hidden a toolbar, you can get it back by choosing menu option View → Toolbars →
(or Settings → Toolbars →). If for some reason a toolbar (or any other widget) totally disappears from theinterface, you’ll find tips to get it back at restoring initial GUI.
8.2. Bedienfelder und Werkzeugkästen 31
QGIS User Guide, Release 3.4
8.2.2 Bedienfelder
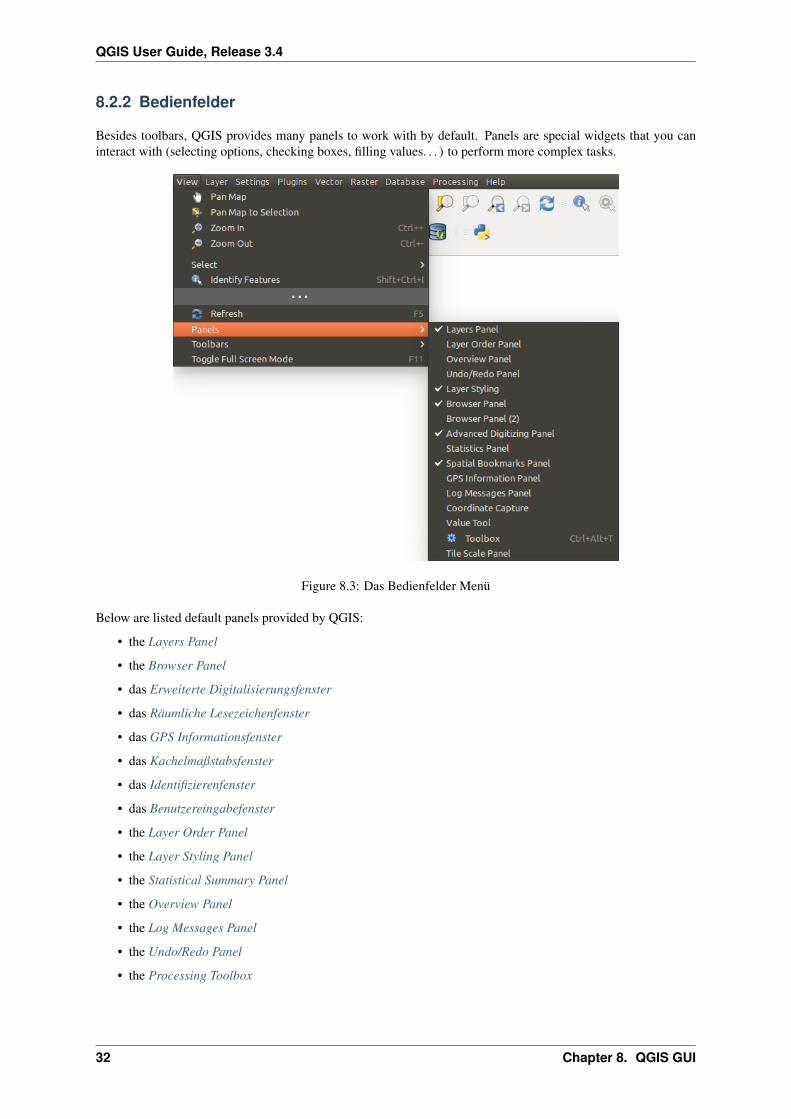
Besides toolbars, QGIS provides many panels to work with by default. Panels are special widgets that you caninteract with (selecting options, checking boxes, filling values. . . ) to perform more complex tasks.
Figure 8.3: Das Bedienfelder Menü
Below are listed default panels provided by QGIS:
• the Layers Panel
• the Browser Panel
• das Erweiterte Digitalisierungsfenster
• das Räumliche Lesezeichenfenster
• das GPS Informationsfenster
• das Kachelmaßstabsfenster
• das Identifizierenfenster
• das Benutzereingabefenster
• the Layer Order Panel
• the Layer Styling Panel
• the Statistical Summary Panel
• the Overview Panel
• the Log Messages Panel
• the Undo/Redo Panel
• the Processing Toolbox
32 Chapter 8. QGIS GUI

QGIS User Guide, Release 3.4
8.3 Kartenfenster
Also called Map canvas, this is the „business end“ of QGIS — maps are displayed in this area. The map displayedin this window will depend on the vector and raster layers you have chosen to load.
When you add a layer (see e.g. Opening Data), QGIS automatically looks for its Coordinate Reference System(CRS) and zooms to its extent if you start with a blank QGIS project. The layer’s CRS is then applied to theproject. If there are already layers in the project, and if the new layer has the same CRS as the project, its featuresfalling in the current map canvas extent will be visualized. If the new layer is in a different CRS from the project’s,you must Enable on-the-fly CRS transformation from the Project → Properties. . . → CRS (see On The Fly (OTF)CRS Transformation). The added layer should now be visible if data are available in the current view extent.
The map view can be panned, shifting the display to another region of the map, and it can be zoomed in and out.Various other operations can be performed on the map as described in the Werkzeugkästen section. The map viewand the legend are tightly bound to each other — the maps in the view reflect changes you make in the legendarea.
Tipp: Mit dem Mausrad in der Karte zoomen
Sie können das Mausrad benutzen, um im Kartenfenster in Layer hinein- bzw. hinauszuzoomen. Platzieren Siedazu den Mauszeiger im Kartenfenster und drehen Sie das Mausrad nach vorne (Hinauszoomen) oder nach hintenzum Hineinzoomen. Der Mauszeiger bildet dabei das Zentrum. Sie können das Verhalten des Mausrades in derMenüleiste Einstellungen →Optionen unter dem Menü Kartenwerkzeuge einstellen.
Tipp: Den Kartenausschnitt mit den Pfeiltasten und der Leertaste verschieben
You can use the arrow keys to pan the map. Place the mouse cursor inside the map area and click on the arrowkeys to pan left, right, up and down. You can also pan the map by moving the mouse while holding down thespace bar or the middle mouse button (or holding down the mouse wheel).
8.4 3D Map View
3D visualization support is offered through the 3D map view.
Bemerkung: 3D visualization in QGIS requires a recent version of the QT library (5.8 or later).
You create and open a 3D map view via View → New 3D Map View. A floating QGIS panel will appear. Thepanel can be docked.
To begin with, the 3D map view has the same extent and view as the 2D canvas. There is no dedicated toolbar fornavigation in the 3D canvas. You zoom in/out and pan in the same way as in the main 2D canvas. You can alsozoom in and out by dragging the mouse down/up with the right mouse button pressed.
Navigation options for exploring the map in 3D:
• Tilt and rotate
– To tilt the terrain (rotating it around a horizontal axis that goes through the center of the window):
* Drag the mouse forward/backward with the middle mouse button pressed
* Press Shift and drag the mouse forward/backward with the left mouse button pressed
* Press Shift and use the up/down keys
– To rotate the terrain (around a vertical axis that goes through the center of the window):
* Drag the mouse right/left with the middle mouse button pressed
8.3. Kartenfenster 33

QGIS User Guide, Release 3.4
* Press Shift and drag the mouse right/left with the left mouse button pressed
* Press Shift and use the left/right keys
• Change the camera angle
– Pressing Ctrl and dragging the mouse with the left mouse button pressed changes the camera anglecorresponding to directions of dragging
– Pressing Ctrl and using the arrow keys turns the camera up, down, left and right
• Move the camera up/down
– Pressing the Page Up/Page Down keys moves the terrain up and down, respectively
• Zoom in and out
– Dragging the mouse with the right mouse button pressed will zoom in (drag down) and out (drag up)
• Move the terrain around
– Dragging the mouse with the left mouse button pressed moves the terrain around
– Using the up/down/left/right keys moves the terrain closer, away, right and left, respectively
To reset the camera view, click the Zoom Full button on the top of the 3D canvas panel.
8.4.1 Terrain Configuration
A terrain raster provides the elevation. This raster layer must contain a band that represents elevation. To selectthe terrain raster:
1. Click the Configure. . . button at the top of the 3D canvas panel to open the 3D configuration window
2. Choose the terrain raster layer in the Elevation pull-down menu
In the 3D Configuration window there are various other options to fine-tune the 3D scene. Before diving into thedetails, it is worth noting that terrain in a 3D view is represented by a hierarchy of terrain tiles and as the cameramoves closer to the terrain, existing tiles that do not have sufficient detail are replaced by smaller tiles with moredetails. Each tile has mesh geometry derived from the elevation raster layer and texture from 2D map layers.
Configuration options and their meaning:
• Elevation: Raster to be used for generation of terrain.
• Vertical scale: Scale factor for vertical axis. Increasing the scale will exaggerate the terrain.
• Tile resolution: How many samples from the terrain raster layer to use for each tile. A value of 16px meansthat the geometry of each tile will be built from 16x16 elevation samples. Higher numbers create moredetailed terrain tiles at the expense of increased rendering complexity.
• Skirt height: Sometimes it is possible to see small cracks between tiles of the terrain. Raising this value willadd vertical walls („skirts“) around terrain tiles to hide the cracks.
• Map tile resolution: Width and height of the 2D map images used as textures for the terrain tiles. 256pxmeans that each tile will be rendered into an image of 256x256 pixels. Higher numbers create more detailedterrain tiles at the expense of increased rendering complexity.
• Max. screen error: Determines the threshold for swapping terrain tiles with more detailed ones (and viceversa) - i.e. how soon the 3D view will use higher quality tiles. Lower numbers mean more details in thescene at the expense of increased rendering complexity.
• Max. ground error: The resolution of the terrain tiles at which dividing tiles into more detailed ones will stop(splitting them would not introduce any extra detail anyway). This value limits the depth of the hierarchy oftiles: lower values make the hierarchy deep, increasing rendering complexity.
• Zoom labels: Shows the number of zoom levels (depends on the map tile resolution and max. ground error).
• Show labels: Toggles map labels on/off
34 Chapter 8. QGIS GUI

QGIS User Guide, Release 3.4
• Show map tile info: Include border and tile numbers for the terrain tiles (useful for troubleshootingterrain issues)
• Show bounding boxes: Show 3D bounding boxes of the terrain tiles (useful for troubleshooting terrainissues)
• Show camera’s view center
8.4.2 3D vector layers
A vector layer with elevation values can be shown in the 3D map view by checking Enable 3D Renderer in the3D View section of the vector layer properties. A number of options are available for controlling the rendering ofthe 3D vector layer.
8.5 Statusleiste
The status bar provides you with general information about the map view and processed or available actions, andoffers you tools to manage the map view. On the left side of the status bar, the locator bar, a quick search widget,helps you find and run any feature or options in QGIS. Simply type text associated with the item you are lookingfor (name, tag, keyword. . . ) and you get a list that updates as you write. You can also limit the search scope using
locator filters. Click the button to select any of them and press the Configure entry for global settings.
In the area next to the locator bar, a summary of actions you’ve carried out will be shown when needed (such asselecting features in a layer, removing layer) or a long description of the tool you are hovering over (not availablefor all tools).
In case of lengthy operations, such as gathering of statistics in raster layers, executing Processing algorithms orrendering several layers in the map view, a progress bar is displayed in the status bar.
The Coordinate option shows the current position of the mouse, following it while moving across the mapview. You can set the units (and precision) in the Project → Properties. . . → General tab. Click on the small
button at the left of the textbox to toggle between the Coordinate option and the Extents option that displaysthe coordinates of the current bottom-left and top-right corners of the map view in map units.
Next to the coordinate display you will find the Scale display. It shows the scale of the map view. There is a scaleselector, which allows you to choose between predefined and custom scales.
On the right side of the scale display, press the button to lock the scale to use the magnifier to zoom in orout. The magnifier allows you to zoom in to a map without altering the map scale, making it easier to tweak thepositions of labels and symbols accurately. The magnification level is expressed as a percentage. If the Magnifierhas a level of 100%, then the current map is not magnified. Additionally, a default magnification value can bedefined within Settings → Options → Rendering → Rendering behavior, which is very useful for high-resolutionscreens to enlarge small symbols.
To the right of the magnifier tool you can define a current clockwise rotation for your map view in degrees.
On the right side of the status bar, there is a small checkbox which can be used temporarily to prevent layers beingrendered to the map view (see section Layeranzeige kontrollieren).
To the right of the render functions, you find the EPSG:code button showing the current project CRS. Clickingon this opens the Project Properties dialog and lets you apply another CRS to the map view.
The Messages button next to it opens the Log Messages Panel which has information on underlying processes(QGIS startup, plugins loading, processing tools. . . )
Depending on the Plugin Manager settings, the status bar can sometimes show icons to the right to inform you
about availability of new or upgradeable plugins. Click the icon to open the Plugin Manager dialog.
8.5. Statusleiste 35

QGIS User Guide, Release 3.4
Tipp: Die richtige Maßstabseinheit im Kartenfenster einstellen
When you start QGIS, the default CRS is WGS 84 (EPSG 4326) and units are degrees. This means that QGISwill interpret any coordinate in your layer as specified in degrees. To get correct scale values, you can eithermanually change this setting in the General tab under Project → Properties. . . (e.g. to meters), or you can use
the EPSG:code icon seen above. In the latter case, the units are set to what the project projection specifies (e.g.,+units=us-ft).
Beachten Sie, dass die KBS Wahl beim Start unter Einstellungen → Optionen → KBS eingestellt werden kann.
36 Chapter 8. QGIS GUI

CHAPTER 9
QGIS Anpassung
QGIS is highly configurable. Through the Settings menu, it provides different tools to:
• Options. . . : set global options to apply in different areas of the software. These preferences are savedin the active User profile settings and applied by default whenever you open a new project with this profile.Also, they can be overridden during each QGIS session by the project properties (accessible under Projectmenu).
• Interface Customization. . . : configure the application interface, hiding dialogs or tools you may notneed.
• Keyboard Shortcuts. . . : define your own set of keyboard shortcuts.
• Style Manager. . . : create and manage symbols and color ramps.
• Custom Projections. . . : create your own coordinate reference systems.
9.1 Optionen
Some basic options for QGIS can be selected using the Options dialog. Select the menu option Settings →Options. You can modify the options according to your needs. Some of the changes may require a restart of QGISbefore they will be effective.
The tabs where you can customize your options are described below.
Bemerkung: Plugins can embed their settings within the Options dialog
While only Core settings are presented below, note that this list can be extended by installed plugins implementingtheir own options into the standard Options dialog. This avoids each plugin having their own config dialog withextra menu items just for them. . .
9.1.1 General Settings
Locale Settings
37

QGIS User Guide, Release 3.4
• Check Override system locale if you want to use a language different from your system’s and pick thereplacement in Locale to use instead combobox.
• Information about active system locale are provided.
Anwendung
• Select the Style (QGIS restart required) and choose between ‚Oxygen‘, ‚Windows‘, ‚Motif‘, ‚CDE‘,‚Plastique‘ and ‚Cleanlooks‘;
• Define the UI theme . It can be ‚default‘ or ‚Night Mapping‘;
• Define the Icon size ;
• Define the Font and its Size. The font can be Qt default or a user-defined one;
• Change the Timeout for timed messages or dialogs ;
• Hide splash screen at startup;
• Check QGIS version at startup to keep you informed if a newer version is released;
• Modeless data source manager dialog to keep the data source manager dialog opened and allow inter-action with QGIS interface while adding layers to project;
• Use native color chooser dialogs (see Farbauswahl).
Projektdateien
• Open project on launch (choose between ‚New‘, ‚Most recent‘, ‚Welcome Page‘, and ‚Specific‘).When choosing ‚Specific‘ use the . . . button to define the project to use by default. The ‚Welcome Page‘displays a list of recent projects with screenshot.
• Neues Projekt aus Vorgabeprojekt erstellen. Sie haben die Möglichkeit auf Aktuelles Projekt als Vorgabespeichern oder Vorgabe zurücksetzen zu drücken. Sie können durch Ihre Dateien gehen und ein Verzeichnisdefinieren in dem Sie ihre benutzerdefinierten Projektvorlagen festlegen. Diese werden dann dem Menü
Projekt → Neu aus Vorlage hinzugefügt wenn Sie erst Neues Projekt aus Vorgabeprojekt erstellenaktivieren und dann ein Projekt in den Projektvorlagenordner speichern.
• Prompt to save project and data source changes when required to avoid losing changes you made.
• Prompt for confirmation when a layer is to be removed
• Warn when opening a project file saved with an older version of QGIS. You can always open projectscreated with older version of QGIS but once the project is saved, trying to open with older release may failbecause of features not available in that version.
• Makros aktivieren . Diese Option wurde erstellt um Makros zu handhaben die geschrieben wurdenum eine Aktion auf Projektereignisse auszuführen. Sie können zwischen ‚Nie‘, ‚Fragen‘, ‚Nur in dieserSitzung‘ und ‚Immer (nicht empfohlen)‘ wählen.
9.1.2 System Settings
SVG paths
Add or Remove Path(s) to search for Scalable Vector Graphic (SVG) symbols. These SVG files are then availableto symbolize features or decorate your map composition.
Erweiterungspfade
Add or Remove Path(s) to search for additional C++ plugin libraries.
Documentation paths
38 Chapter 9. QGIS Anpassung

QGIS User Guide, Release 3.4
Add or Remove Documentation Path(s) to use for QGIS help. By default, a link to the official online User Manualcorresponding to the version being used is added. You can however add other links and prioritize them from topto bottom: each time you click on a Help button in a dialog, the topmost link is checked and if no correspondingpage is found, the next one is tried, and so on.
Bemerkung: Documentation is versioned and translated only for QGIS Long Term Releases (LTR), meaning thatif you are running a regular release (eg, QGIS 3.0), the help button will by default open the next LTR manual page(ie. 3.4 LTR), which may contain description of features in newer releases (3.2 and 3.4). If no LTR documentationis available then the testing doc, with features from newer and development versions, is used.
QSettings
It helps you Reset user interface to default settings (restart required) if you made any customization.
Umgebung
Systemumgebungsvariablen können nun eingesehen werden und viele von ihnen konfiguriert in der UmgebungGruppe (siehe figure_environment_variables). Dies ist für Betriebssysteme wie Mac nützlich da dort eine GUIAnwendung nicht notwendigerweise die Shellumgebung des Benutzers übernimmt. Sie ist auch nützlich umUmgebungsvariablen für externe Werkzeuge die von der Verarbeitungs-Toolbox (z.B. SAGA, GRASS) kontrolliertwerden zu setzen und zu visualisieren und um die Debug-Ausgabe für bestimmte Abschnitte des Quellcodesanzuschalten.
• Use custom variables (restart required - include separators). You can Add and Remove variables.Already-defined environment variables are displayed in Current environment variables, and it’s possible to
filter them by activating Show only QGIS-specific variables.
Figure 9.1: Systemumgebungsvariablen in QGIS
9.1. Optionen 39

QGIS User Guide, Release 3.4
9.1.3 CRS Settings
Default CRS for new projects
There is an option to automatically set new project’s CRS:
• Use CRS from first layer added: the CRS of the project is turned to match the CRS of the first layerloaded into it
• Use a default CRS: a preselected CRS is applied by default to any new project and is left unchangedwhen adding layers to the project.
The choice will be saved for use in subsequent QGIS sessions and in any case, the Coordinate Reference Systemof the project can still be overridden from the Project → Project properties → CRS tab.
KBS für neue Layer
Der zweite Bereich ermöglicht es, Voreinstellungen vorzunehmen, wenn ein neuer Layer erzeugt wird oder einLayer geladen wird, der keine KBS Information besitzt.
• Prompt for CRS
• Use project CRS
• Use a default CRS
Datumtransformationsvorgaben
In this group, you can control whether reprojecting layers to another CRS should be:
• automatically processed using QGIS default transformations settings;
• and/or more controlled by you with custom preferences such as:
– Ask for datum transformation if several are available
– a predefined list of datum transformations to apply by default. See Datum Transformations for moredetails.
Bemerkung: For more information on how QGIS handles layers projection, please read the dedicated section atArbeiten mit Projektionen.
9.1.4 Data Sources Settings
Objektattribute und -tabelle
• Open attribute table in a dock window
• Copy features as ‚Plain text, no geometry‘, ‚Plain text, WKT geometry‘, or ‚GeoJSON‘ when pasting fea-tures in other applications.
• Attribute table behavior : set filter on the attribute table at the opening. There are three possibilities:‚Show all features‘, ‚Show selected features‘ and ‚Show features visible on map‘.
• Default view: define the view mode of the attribute table at every opening. It can be ‚Remember last view‘,‚Table view‘ or ‚Form view‘.
• Attributtabellenzeilencache . Dieser Zeilencache erlaubt es, die N zuletzt geladenen Attributzeilenim Cache zu speichern. Dadurch wird das Arbeiten mit der Attributtabelle schneller. Der Cache wird wiedergelöscht, wenn man die Attributtabelle schliesst.
• Repräsentation für NULL-Werte. Hier können Sie einen Wert für Datenfelder die einen NULL-Wert enthal-ten festlegen.
40 Chapter 9. QGIS Anpassung

QGIS User Guide, Release 3.4
Figure 9.2: CRS Settings in QGIS
9.1. Optionen 41

QGIS User Guide, Release 3.4
Tipp: Improve opening of big data attribute table
When working with layers with big amount of records, opening the attribute table may be slow as the dialogrequest all the rows in the layer. Setting the Attribute table behavior to Show features visible on map will makeQGIS request only the features in the current map canvas when opening the table, allowing a quick data loading.
Note that data in this attribute table instance will be always tied to the canvas extent it was opened with, meaningthat selecting Show All Features within such a table will not display new features. You can however update theset of displayed features by changing the canvas extent and selecting Show Features Visible On Map option inthe attribute table.
Datenquellenbehandlung
• Nach gültigen Element im Browser suchen . Sie können zwischen ‚Erweiterung prüfen‘ und ‚Datei-inhalt prüfen‘ wählen.
• Scan for contents of compressed files (.zip) in browser dock defines how detailed is the widget infor-mation at the bottom of the Browser panel when querying such files. ‚No‘, ‚Basic scan‘ and ‚Full scan‘ arepossible options.
• Beim Öffnen nach Rasterunterlayern fragen. Einige Rasterformate unterstützen Unterlayer - sie werdenSubdataset in GDAL genannt. Ein Beispiel sind netCDF-Dateien - wenn es viele netCDF-Variablen gibtinterpretiert GDAL jede Variable als Subdataset. Die Option ermöglicht es Ihnen zu steuern wie mitUnterlayern umgegangen wird wenn eine Datei mit Unterlayern geöffnet wird. Sie haben die folgendenWahlmöglichkeiten:
– ‚Immer‘: Immer fragen (ob es Unterlayer gibt)
– ‚Wenn nötig‘: Fragen ob Layer keine Bänder aber Unterlayer hat
– ‚Nie‘: Nie fragen, lädt dann nichts
– ‚Alle laden‘: Nie auffordern aber alle Unterlayer laden
• Shapefile-Kodierungsangabe ignorieren. Wenn eine Shapedatei Kodierungsinformationen enthält wirddieses von QGIS ignoriert.
• PostGIS-Layer per Doppelklick hinzufügen und zur Auswahl den erweiterten Modus verwenden
• Oracle-Layer mit Doppelklick hinzufügen und zur Auswahl den erweiterten Modus verwenden
• Ausdrücke wenn möglich serverseitig ausführen
• Evaluate default values defines whether default values from database provider should be calculatedwhen digitizing the new feature (checked status) or when saving the changes.
Ausgeblendeter Browserpfad
This widget lists all the folders you chose to hide from the Browser panel. Removing a folder from the list willmake it available in the Browser panel.
9.1.5 Rendering Settings
Zeichenverhalten
• By default new layers added to the map should be displayed: unchecking this option can be handy whenloading multiple layers to avoid each new layer being rendered in the canvas and slow down the process
• Wo möglich den Darstellungscache benutzen, um das Neuzeichnen zu beschleunigen
• Layer mit vielen CPU-Kernen parallel zeichnen
42 Chapter 9. QGIS Anpassung

QGIS User Guide, Release 3.4
Figure 9.3: Data Sources Settings in QGIS
9.1. Optionen 43

QGIS User Guide, Release 3.4
Figure 9.4: Rendering tab of Project Properties dialog
• Max. zu benutzende Kerne
• Kartenaktualisierungsintervall
• Geometrievereinfachung für neue Layer voreinstellen
• Vereinfachungsschwelle
• Simplification algorithm: This option performs a local „on-the-fly“ simplification on feature’s and speedsup geometry rendering. It doesn’t change the geometry fetched from the data providers. This is importantwhen you have expressions that use the feature geometry (e.g. calculation of area) - it ensures that thesecalculations are done on the original geometry, not on the simplified one. For this purpose, QGIS providesthree algorithms: ‚Distance‘ (default), ‚SnapToGrid‘ and ‚Visvalingam‘.
• Simplify on provider side if possible: the geometries are simplified by the provider (PostGIS, Oracle. . . )and unlike the local-side simplification, geometry-based calculations may be affected
• Größter Maßstab bis zu dem der Layer vereinfacht werden soll
• Magnification level (see the magnifier)
Bemerkung: Besides the global setting, feature simplification can be set for any specific layer from its Layerproperties → Rendering menu.
Zeichenqualität
• Linie auf Kosten der Zeichengeschwindigkeit weniger gezackt zeichnen
Curve segmentation
44 Chapter 9. QGIS Anpassung

QGIS User Guide, Release 3.4
• Segmentation tolerance: this setting controls the way circular arcs are rendered. The smaller maximum an-gle (between the two consecutive vertices and the curve center, in degrees) or maximum difference (distancebetween the segment of the two vertices and the curve line, in map units), the more straight line segmentswill be used during rendering.
• Tolerance type: it can be Maximum angle or Maximum difference between approximation and curve.
Raster
• Mit RGB Kanalauswahl können Sie Nummer für den Roten Kanal, Grünen Kanal und Blauen Kanal festle-gen.
Kontrasverbesserung
Contrast enhancement options can be applied to Single band gray, Multi band color (byte/band) or Multi bandcolor (>byte/band). For each, you can set:
• the Algorithm to use, whose values can be ‚No stretch‘, ‚Stretch to MinMax‘, ‚Stretch and Clip to MinMax‘or ‚Clip to MinMax‘
• the Limits (minimum/maximum) to apply, with values such as ‚Cumulative pixel count cut‘, ‚Mini-mum/Maximum‘, ‚Mean +/- standard deviation‘.
For rasters rendering, you can also define the following options:
• Kommulative Pixelanzahl-Schnittgrenzen
• Standardabweichungsfaktor
Fehlersuche
• Map canvas refresh to debug rendering duration in the Log Messages panel.
9.1.6 Canvas and Legend Settings
Figure 9.5: Canvas and Legend Settings
These properties let you set:
• the Default map appearance (overridden by project properties): the Selection color and Backgroundcolor.
• Layer legend interaction:
– Double click action in legend . You can either ‚Open layer properties‘, ‚Open attribute table‘ or‚Open layer styling dock‘ with the double click.
– Display classification attribute names in the Layers panel, e.g. when applying a categorized orrule-based renderer (see Symbology Properties for more information).
9.1. Optionen 45

QGIS User Guide, Release 3.4
– the WMS getLegendGraphic Resolution
• the Delay in milliseconds of layers map tips display
9.1.7 Map tools Settings
This tab offers some options regarding the behavior of the Identify tool.
• Search radius for identifying features and displaying map tips is a tolerance distance within which theidentify tool will depict results as long as you click within this tolerance.
• Highlight color allows you to choose with which color should features being identified be highlighted.
• Puffer, legt eine Pufferdistanz, die durch die Umrisslinie der Hervorhebung dargestellt wird, fest.
• Minimalbreite, legt fest wie dick die Umrisslinie eines hervorgehobenen Objektes sein soll.
Messwerkzeug
• Definieren Sie Gummibandfarbe für das Meßwerkzeug
• Definieren Sie Dezimalstellen
• Keep base unit nicht automatisch große Zahle umzuwandeln (z. B. Meter zu Kilometer)
• Preferred distance units (‚Meters‘, ‚Kilometers‘, ‚Feet‘, ‚Yards‘, ‚Miles‘, ‚Nautical Miles‘, ‚Degrees‘or ‚Map Units‘ )
• Preferred area units (‚Square meters‘, ‚Square kilometers‘, ‚Square feet‘, ‚Square yards‘, ‚Squaremiles‘, ‚Hectares‘, ‚Acres‘, ‚Square nautical miles‘, ‚Square degrees‘ or ‚Map Units‘)
• Preferred angle units (‚Degrees‘, ‚Radians‘, ‚Gon/gradians‘, ‚Minutes of arc‘, ‚Seconds of arc‘ or‚Turns/revolutions‘)
Verschieben und Zoomen
• Define a Zoom factor for zoom tools or wheel mouse
Vordefinierte Maßstäbe
Hier können Sie eine Liste von vordefinierten Skalen finden. Mit dem und Knopf fügen Sie personalisiertehinzu oder löschen diese. Sie können auch Skalen aus/zu einer .XML Datei exportieren/importieren. BeachtenSie, dass Sie immer noch die Möglichkeit haben, um die Änderungen zu entfernen und auf die vordefinierte Listezurückzusetzen.
9.1.8 Colors Settings
This menu allows you to create or update palettes of colors used throughout the application in the color selectorwidget. You can choose from:
• Recent colors showing recently used colors
• Standard colors, the default palette of colors
• Project colors, a set of colors specific to the current project (see Default Styles Properties for more details)
• New layer colors, a set of colors to use by default when new layers are added to QGIS
• or custom palette(s) you can create or import using the . . . button next to the palette combobox.
By default, Recent colors, Standard colors and Project colors palettes can not be removed and are set to appear inthe color button drop-down. Custom palettes can also be added to this widget thanks to the Show in Color Buttonsoption.
For any of the palettes, you can manage the list of colors using the set of tools next to the frame, ie:
46 Chapter 9. QGIS Anpassung
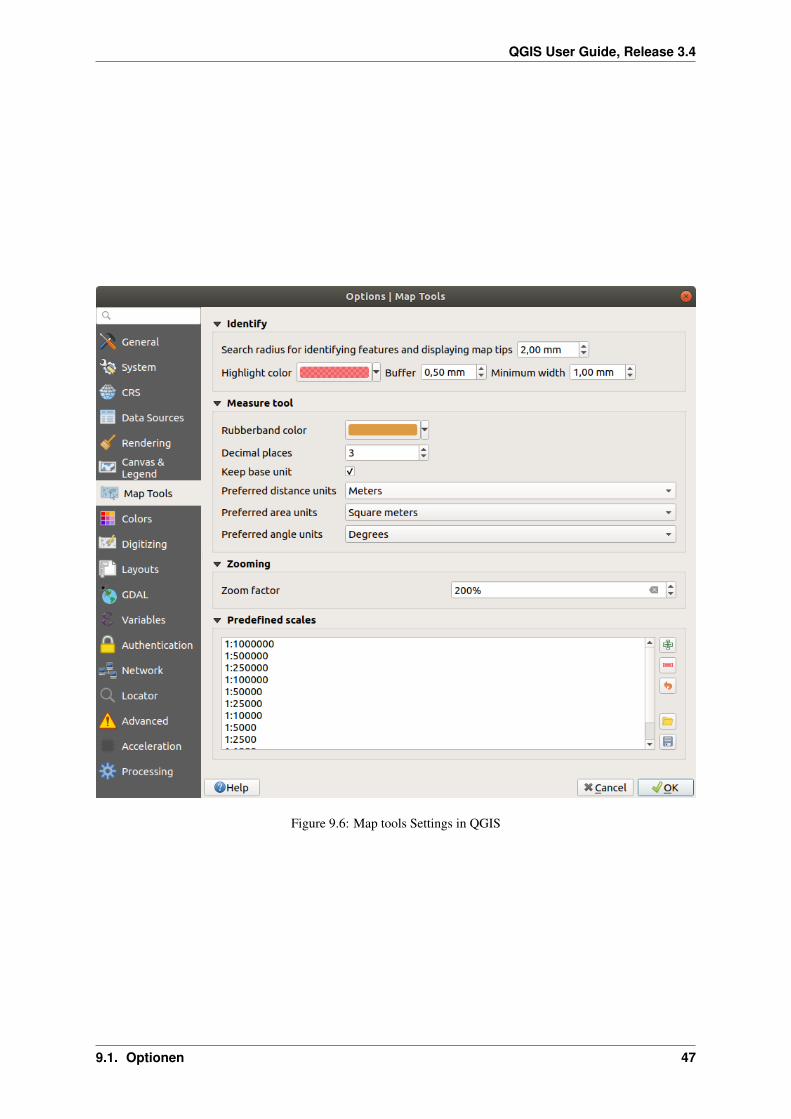
QGIS User Guide, Release 3.4
Figure 9.6: Map tools Settings in QGIS
9.1. Optionen 47

QGIS User Guide, Release 3.4
• Add or Remove color
• Copy or Paste color
• Import or Export the set of colors from/to .gpl file.
Double-click a color in the list to tweak or replace it in the Color Selector dialog. You can also rename it bydouble-clicking in the Label column.
Figure 9.7: Colors Settings
9.1.9 Digitizing Settings
This tab helps you configure general settings when editing vector layer (attributes and geometry).
Objekterzeugung
• Suppress attribute form pop-up after feature creation: this choice can be overridden in each layer prop-erties dialog.
• Reuse last entered attribute values.
• Geometrien prüfen. Das Bearbeiten komplexer Linien/Polygone mit vielen Stützpunkten kann zu einer er-heblichen Verlangsamung der Darstellung führen. Das liegt an den Standard-Validierungsverfahren, die vielZeit benötigen. Um die Darstellung zu beschleunigen ist es möglich die Geometrieüberprüfung von GEOS(von GEOS 3.3.an) zu wählen oder die Validierung ganz auszuschalten. Die GEOS Geometrieüberprüfungist viel schneller, aber der Nachteil ist dass nur das erste Geometrieproblem gemeldet wird.
• Default Z value to use when creating new 3D features.
Gummiband
• Define Rubberband Line width, Line color and Fill color.
• Don’t update rubberband during vertex editing.
Objektfang
• Enable snapping by default
• Define Default snap mode (‚Vertex‘, ‚Vertex and segment‘, ‚Segment‘)
• Definieren Sie die Voreingestellte Fangtoleranz in Karteneinheiten oder Pixeln
48 Chapter 9. QGIS Anpassung

QGIS User Guide, Release 3.4
• Definieren Sie den Suchradius für die Stützpunktbearbeitung in Karteneinheiten oder Pixeln.
• Display main dialog as (restart required): set whether the Advanced Snapping dialog should be shown as‚Dialog‘ or ‚Dock‘.
• Snapping marker color
• Show snapping tooltips such as name of the layer whose feature you are about to snap. Helpful whenmultiple features overlap.
• Enable snapping on invisible features
Stützpunktmarken
• Markierungen nur für gewählte Objekte anzeigen
• Legen Sie für die Stützpunktmarken den Markierungsstil (‚Kreuz‘ (standard), ‚TeiltransparenterKreis‘ oder ‚Keine‘) fest
• Definieren Sie die Markierungsgröße für die Stützpunktmarken
Werkzeug zum Linien versetzen
Die nächsten 3 Optionen beziehen sich auf das Linie versetzen Werkzeug in Erweiterte Digitalisierung. Durch dieverschiedenen Einstellungen ist es möglich die Form des Linienversatzes zu beeinflussen. Diese Optionen sindvon GEOS 3.3 an möglich.
• Join style: ‚Round‘, ‚Mitre‘ or ‚Bevel‘
• Quadrantensegmente
• Eckengrenze
9.1.10 Layouts Settings
Zusammenstellungsvoreinstellungen
You can define the Default font used within the print layout.
Gitterdarstellung
• Definieren Sie den Gitterstil (‚Ausgefüllt‘, ‚Punkte‘, ‚Kreuze‘)
• Definieren Sie Gitterfarbe
Gitter- und Führungsvoreinstellungen
• Definieren Sie Zwischenräume
• Define the Grid offset for X and Y
• Legen Sie die Fangtoleranz fest
Layout Paths
• Define Path(s) to search for extra print templates: a list of folders with custom layout templates to use whilecreating new one.
9.1.11 GDAL Settings
GDAL is a data exchange library for vector and raster files. It provides drivers to read and or write data in differentformats. The GDAL tab currently exposes the drivers for raster formats with their capabilities.
9.1. Optionen 49

QGIS User Guide, Release 3.4
Figure 9.8: Digitizing Settings in QGIS
50 Chapter 9. QGIS Anpassung

QGIS User Guide, Release 3.4
Figure 9.9: Layouts Settings in QGIS
GDAL driver options
This frame provides ways to customize the behavior of drivers that support read and write access:
• Edit create options: allows you to edit or add different profiles of file transformation, i.e. a set of predefinedcombinations of parameters (type and level of compression, blocks size, overview, colorimetry, alpha. . . ) touse when outputting raster files. The parameters depend on the driver.
Figure 9.10: Sample of create options profile (for GeoTiff)
The upper part of the dialog lists the current profile(s) and allows you to add new ones or remove any ofthem. You can also reset the profile to its default parameters if you have changed them. Some drivers (eg,GeoTiff) have some sample of profiles you can work with.
At the bottom of the dialog:
– The button lets you add rows to fill with the parameter name and value
– The button deletes the selected parameter
9.1. Optionen 51

QGIS User Guide, Release 3.4
– Click the Validate button to check that the creation options entered for the given format are valid
– Use the Help button to find the parameters to use, or refer to the GDAL raster drivers documentation.
• Edit Pyramids Options
Figure 9.11: Sample of Pyramids profile
GDAL drivers
In this frame, you can define which GDAL driver is to use to read and/or write files, as in some cases more thanone GDAL driver is available.
Tipp: Double-click a driver that allows read and write access (rw+(v)) opens the Edit Create options dialog forcustomization.
9.1.12 Variables Settings
The Variables tab lists all the variables available at the global-level.
It also allows the user to manage global-level variables. Click the button to add a new custom global-level
variable. Likewise, select a custom global-level variable from the list and click the button to remove it.
More information about variables in the Storing values in Variables section.
9.1.13 Authentication Settings
In dem Authentifikation Reiter können Sie Authentifikationskonfigurationen vornehmen und PKI Zertifikate ver-walten. Für mehr Details siehe Authentifizierungssystem.
9.1.14 Network Settings
Allgemein
• WMS Suchadresse - Standard ist http://geopole.org/wms/search?search=%1&type=rss
• Definieren Sie Zeitüberschreitung für Netzwerkanfragen (ms) - Standard ist 60000
• Define Default expiration period for WMS Capabilities (hours) - default is 24
• Definieren Sie Verfallszeitraumvorgabe für WMS-C/WMTS Kacheln (Stunden) - Standard ist 24
52 Chapter 9. QGIS Anpassung

QGIS User Guide, Release 3.4
Figure 9.12: GDAL Settings in QGIS
Figure 9.13: Variables Settings in QGIS
9.1. Optionen 53

QGIS User Guide, Release 3.4
Figure 9.14: Authentication Settings in QGIS
54 Chapter 9. QGIS Anpassung

QGIS User Guide, Release 3.4
• Define Max retry in case of tile or feature request errors
• Definieren Sie User-Agent
Figure 9.15: Proxy-Einstellungen in QGIS
Cache-Einstellungen
Defines the Directory and a Size for the cache. Also offers tools to automatically clear the connection authentica-tion cache on SSL errors (recommanded).
Proxy for web access
• Use proxy for web access
• Set the Proxy type according to your needs and define ‚Host‘ and ‚Port‘. Available proxy types are:
– Default Proxy: Proxy is determined based on system’s proxy
– Socks5Proxy →: Proxy für jede Art von Verbindung. Unterstützt TCP, UDP, Bindung an einen Port(eingehende Verbindungen) und Authentifizierung.
– HttpProxy →: Umgesetzt mit dem „CONNECT“-Befehl, unterstützt nur ausgehende TCP-Verbindungen und Authentifizierung.
– HttpCachingProxy:Umgesetzt mit normalen HTTP Befehlen ist dies nur im Zusammenhang mit HTTPBefehlen sinnvoll einzusetzen.
9.1. Optionen 55

QGIS User Guide, Release 3.4
– FtpCachingProxy: Mit einem FTP-Proxy umgesetzt ist dies nur sinnvoll im Zusammenhang mit FTP-Anforderungen anzuwenden
Credentials of proxy are set using the authentication widget.
Das Ausschließen von URLs kann in das Textfenster unter den Proxyeinstellungen eingetragen werden (sieheFigure_Network_Tab).
If you need more detailed information about the different proxy settings, please refer to the manual of the under-lying QT library documentation at https://doc.qt.io/qt-5.9/qnetworkproxy.html#ProxyType-enum
Tipp: Proxy richtig anwenden
Using proxies can sometimes be tricky. It is useful to proceed by ‚trial and error‘ with the above proxy types, tocheck if they succeed in your case.
9.1.15 Locator Settings
The Locator tab allows to configure the Locator bar, a quick search widget available on the status bar thathelps you perform searches anywhere in the application. It provides some default filters (with prefix) to use:
• Project layers (l): finds and selects a layer in the Layers panel.
• Project layouts (pl): finds and opens a print layout.
• Actions (.): finds and executes a QGIS action; actions can be any tool or menu in QGIS, opening a panel. . .
• Active layer features (f): searches for matching attributes in any field from the current active layer andzooms to the selected feature.
• Features in all layers (af): searches for matching attributes in the display name of each searchable layersand zooms to the selected feature.
• Calculator (=): allows evaluation of any QGIS expression and, if valid, gives an option to copy the result tothe clipboard.
• Spatial bookmarks (b): finds and zooms to the bookmark extent.
• Settings (set): browses and opens project and application-wide properties dialogs.
• Processing (a): searches and opens a Processing algorithm dialog.
• Edit selected features (ef): gives quick access and runs a compatible modify-in-place Processing algorithmon the active layer.
For each filter, you can customize the filter, set whether it is enabled by default or not. The set of default locatorfilters can be extended by plugins, eg for OSM nominatim searches, direct database searching, layer catalogsearches.
The locator search bar can be activated pressing Ctrl+K. Type your text to perform a search. By default, resultsare returned for all enabled locator filters but you can limit the search to a certain filter by prefixing your text withthe locator filter prefix, ie. typing l cad will return only the layers whose name contains cad. Click on theresult to execute the corresponding action, depending on the type of item.
Searching is handled using threads, so that results always become available as quickly as possible, regardless ofwhether any slow search filters may be installed. They also appear as soon as each result is encountered by eachfilter, which means that e.g. a file search filter will show results one by one as the file tree is scanned. This ensuresthat the UI is always responsive even if a very slow search filter is present (e.g. one which uses an online service).
Tipp: Quick access to the locator’s configurations
56 Chapter 9. QGIS Anpassung

QGIS User Guide, Release 3.4
Click on the icon inside the locator widget on the status bar to display the list of filters you can use and aConfigure entry that opens the Locator tab of the Settings → Options. . . menu.
Figure 9.16: Locator Settings in QGIS
9.1.16 Advanced Settings
Depending on your OS, all the settings related to QGIS (UI, tools, data providers, default values, plugins op-tions. . . ) are saved:
• in a text file: $HOME/.config/QGIS/QGIS2.conf
• in the properties list file: $HOME/Library/Preferences/org.qgis.qgis.plist
• in the registry under: HKEY\CURRENT_USER\Software\QGIS\qgis
The Advanced tab offers you in a single place, regardless your OS, means to manage these settings through theAdvanced Settings Editor. After you promise to be careful, the widget is populated with a tree of all QGIS settings,which you can directly edit.
Warnung: Avoid using the Advanced tab settings blindly
Be careful while modifying items in this dialog given that changes are automatically applied. Doing changeswithout knowledge can break your QGIS installation in various ways.
9.1.17 Processing Settings
The Processing tab provides you with general settings of tools and data providers that are used in the QGISProcessing framework. More information at QGIS Verarbeitung Umgebung.
9.1. Optionen 57

QGIS User Guide, Release 3.4
Figure 9.17: Advanced Settings tab in QGIS
Figure 9.18: Processing Settings tab in QGIS
58 Chapter 9. QGIS Anpassung

QGIS User Guide, Release 3.4
9.2 Working with User Profiles
The Settings → User Profiles menu provides functions to set and access user profiles. A user profile is a unifiedapplication configuration that allows to store in a single folder:
• all the global settings, including locale, projections‘, authentication settings, color palettes, shortcuts. . .
• GUI configurations and customization
• installed plugins and their configurations
• project templates and history of saved project with their image preview
• processing settings, logs, scripts, models.
By default, a QGIS installation contains a single user profile named default. But you can create as many userprofiles as you want:
1. Click the New profile. . . entry.
2. You’ll be prompted to provide a profile name, creating a folder of the same name under ~/<UserProfiles>/ where:
• ~ represents the HOME directory, which on Windows is usually something likeC:\Users\(user).
• and <UserProfiles> represents the main profiles folder, i.e.:
– .local/share/QGIS/QGIS3/profiles/
– AppData\Roaming\QGIS\QGIS3\profiles\
– Library/Application Support/QGIS/QGIS3/profiles/
The user profile folder can be opened from within QGIS using the Open Active Profile Folder.
3. A new instance of QGIS is started, using a clean configuration. You can then set your custom configurations.
As each user profile contains isolated settings, plugins and history they can be great for different workflows,demos, users of the same machine, or testing settings, etc. And you can switch from one to the other by selectingthem in the Settings → User Profiles menu. You can also run QGIS with a specific user profile from the commandline.
Unless changed, the profile of the last closed QGIS session will be used in the following QGIS sessions.
Tipp: Run QGIS under a new user profile to check for bug persistence
When you encounter weird behavior with some functions in QGIS, create a new user profile and run the commandsagain. Sometimes, bugs are related to some leftovers in the current user profile and creating a new one may fixthem as it restarts QGIS with the new (clean) profile.
9.3 Projekteigenschaften
In the properties window for the project under Project → Project Properties, you can set project-specific options.The project-specific options overwrite their equivalent in the Options dialog described above.
9.3.1 General Properties
In the General tab, the General settings let you:
• see the location of the project file
9.2. Working with User Profiles 59

QGIS User Guide, Release 3.4
• set the folder for the project home (available in the Project Home item in the browser). The path can berelative to the folder of the project file (type it in) or absolute. The project home can be used for storing dataand other content that is useful for the project.
• einen Titel für das Projekt hinter dem Projektpfad vergeben
• die Farbe auswählen, die markierte Objekte haben, wenn sie ausgewählt sind
• die Hintergrundfarbe wählen: die Farbe für den Kartenhintergrund
• einstellen, ob der Pfad zu den Layern des Projekts als absolute (voll) oder als relative zu der Projektdateigespeichert werden soll. Sie bevorzugen wahrscheinlich relative Pfade, wenn Layer und Projektdatei bewegtwerden oder geteilt oder wenn Sie von Computern auf verschiedenen Plattformen auf das Projekt zugreifenwollen.
• wählen Sie Artefakte bei der Darstellung von Kartenkacheln vermeiden. Beachten Sie, dass diese Optionzu Leistungseinbußen führen kann.
Calculating areas and distances is a common need in GIS. However, these values are really tied to the underlyingprojection settings. The Measurements frame lets you control these parameters. You can indeed choose:
• the Ellipsoid, on which distance and area calculations are entirely based; it can be:
– None/Planimetric: returned values are in this case cartesian measurements.
– a Custom one: you’ll need to set values of the semi-major and semi-minor axes.
– or an existing one from a predefined list (Clarke 1866, Clarke 1880 IGN, New International 1967,WGS 84. . . ).
• Die Einheiten für Entfernungsmessung für Länge und Umfang und die Einheiten für Flächenmessung. DieseEinstellungen, die standardmäßig über die festgelegten Einheiten in den QGIS Optionen definiert sind,werden dann aber überschrieben für das aktuelle Projekt, werden eingesetzt in:
– Attributtabellen Feld mit Aktualisierungsleiste
– Feldrechner Berechnungen
– Abfragewerkzeug abgeleitet von Länge, Umfang und Flächenwerten
– Standardeinheiten gezeigt im Messen Dialog
The Coordinate display allows you to choose and customize the format of units to use to display the mousecoordinate in the status bar and the derived coordinates shown via the identify tool.
Finally, you can set a Project predefined scales list, which overrides the global predefined scales.
9.3.2 Metadata Properties
The Metadata tab allows detailed metadata to be defined, including (among the others): author, creation date,language, abstracts, categories, keywords, contact details, links, history. There is also a validation functionalitythat checks if specific fields were filled, anyway this is not enforced. See vector layer metadata properties forsome details.
9.3.3 CRS Properties
The CRS tab helps you set the coordinate reference system to use in this project. It can be:
• No projection (or unknown/non-Earth projection): this setting can be used to guess a layer CRS or whenusing QGIS for non earth uses like role-playing game maps, building mapping or microscopic stuff. In thiscase:
– No reprojection is done while rendering the layers: features are just drawn using their raw coordinates.
– The ellipsoid is locked out and forced to None/Planimetric.
60 Chapter 9. QGIS Anpassung

QGIS User Guide, Release 3.4
Figure 9.19: Allgemein-Reiter des Projekteigenschaften Dialogs
9.3. Projekteigenschaften 61

QGIS User Guide, Release 3.4
– The distance and area units, and the coordinate display are locked out and forced to „unknown units“;all measurements are done in unknown map units, and no conversion is possible.
• or an existing coordinate reference system that can be geographic, projected or user-defined. A preview ofthe CRS extent on earth is displayed to help you select the appropriate one. Layers added to the projectare on-the-fly translated to this CRS in order to overlay them regardless their original CRS. Use of units,ellipsoid setting are available and make sense and you can perform calculations accordingly.
The CRS tab also helps you control the layers reprojection settings by configuring the datum transformationpreferences to apply in the current project. As usual, these override any corresponding global settings. See DatumTransformations for more details.
9.3.4 Default Styles Properties
The Default Styles tab lets you control how new layers will be drawn in the project when they do not have anexisting .qml style defined. You can:
• Set default symbols (Marker, Line, Fill) to apply depending on the layer geometry type as well as a defaultColor Ramp
• Apply a default Opacity to new layers
• Assign random colors to symbols, modifying the symbols fill colors, hence avoiding same rendering forall layers.
Figure 9.20: Default Styles tab
Using the Style Manager button, you can also quickly access the Style Manager dialog and configure symbolsand color ramps.
There is also an additional section where you can define specific colors for the running project. Like the globalcolors, you can:
62 Chapter 9. QGIS Anpassung

QGIS User Guide, Release 3.4
• Add or Remove color
• Copy or Paste color
• Import or Export the set of colors from/to .gpl file.
Double-click a color in the list to tweak or replace it in the Color Selector dialog. You can also rename it bydouble-clicking in the Label column.
These colors are identified as Project colors and listed as part of color widgets.
Tipp: Use project colors to quickly assign and update color widgets
Project colors can be refered to using their label and the color widgets they are used in are bound to them. Thismeans that instead of repeatedly setting the same color for many properties and, to avoid a cumbersome updateyou can:
1. Define the color as a project color
2. Apply it using the project_color('color_label') expression in color data defined override wid-get
3. Update the color once in a Project colors list
4. And the change is reflected EVERYWHERE.
9.3.5 Data Sources Properties
In the Data Sources tab, you can:
• Automatically create transaction groups where possible: When this mode is turned on, all (postgres)layers from the same database are synchronised in their edit state, i.e. when one layer is put into edit state,all are, when one layer is committed or one layer is rolled back, so are the others. Also, instead of bufferingedit changes locally, they are directly sent to a transaction in the database which gets committed when theuser clicks save layer. Note that you can (de)activate this option only if no layer is being edited in theproject.
• Evaluate default values on provider side: When adding new features in a PostgreSQL table, fields withdefault value constraint are evaluated and populated at the form opening, and not at the commit moment.This means that instead of an expression like nextval('serial'), the field in the Add Feature formwill display expected value (e.g., 25).
• Trust project when data source has no metadata: To speed up project loading by skipping data checks.Useful in QGIS Server context or in projects with huge database views/materialized views. The extent oflayers will be read from the QGIS project file (instead of data sources) and when using the PostgreSQLprovider the primary key unicity will not be checked for views and materialized views.
• Configure the Layers Capabilities, i.e.:
– Set (or disable) which layers are identifiable, i.e. will respond to the identify tool. By default,layers are set queryable.
– Set whether a layer should appear as read-only, meaning that it can not be edited by the user,regardless of the data provider’s capabilities. Although this is a weak protection, it remains a quickand handy configuration to avoid end-users modifying data when working with file-based layers.
– Define which layers are searchable, i.e. could be queried using the locator widget. By default,layers are set searchable.
– Define which layers are defined as required. Checked layers in this list are protected from inadver-tent removal from the project.
The Layers Capabilities table provides some convenient tools to:
9.3. Projekteigenschaften 63

QGIS User Guide, Release 3.4
– Select multiple cells and press Toggle Selection to have them change their checkbox state;
– Show spatial layers only, filtering out non-spatial layers from the layers list;
– Filter layers. . . and quickly find a particular layer to configure.
9.3.6 Relations Properties
The Relations tab is used to define 1:n relations. The relations are defined in the project properties dialog. Oncerelations exist for a layer, a new user interface element in the form view (e.g. when identifying a feature andopening its form) will list the related entities. This provides a powerful way to express e.g. the inspection historyon a length of pipeline or road segment. You can find out more about 1:n relations support in Section Creatingone or many to many relations.
9.3.7 Variables Properties
The Variables tab lists all the variables available at the project’s level (which includes all global variables). Be-
sides, it also allows the user to manage project-level variables. Click the button to add a new custom project-
level variable. Likewise, select a custom project-level variable from the list and click the button to remove it.More information on variables usage in the General Tools Storing values in Variables section.
9.3.8 Macros Properties
The Macros tab is used to edit Python macros for projects. Currently, only three macros are available:openProject(), saveProject() and closeProject().
9.3.9 QGIS Server Properties
The tab QGIS Server allows you to configure your project in order to publish it online. Here you can defineinformation about the QGIS Server WMS and WFS capabilities, extent and CRS restrictions. More informationavailable in section Configure your project and subsequent.
9.4 Anpassung
The customization dialog lets you (de)activate almost every element in the QGIS user interface. This can be veryuseful if you want to provide your end-users with a ‚light‘ version of QGIS, containing only the icons, menus orpanels they need.
Bemerkung: Bevor Ihre Änderungen übernommen werden, müssen Sie QGIS neu starten.
Die Anpassung aktivieren Checkbox anzuklicken ist der erste Schritt, zur QGIS Anpassung. Dies aktiviert dieWerkzeugleiste und das Widget-Panel, hier können Sie einige QGIS Elemente unsichtbar schalten.
Die konfigurierbaren Elemente können sein:
• ein Menü oder einige ihrer Untermenüs von dem Menüleiste
• das komplette Panel (siehe Bedienfelder und Werkzeugkästen)
• die Statusleiste beschrieben in Statusleiste oder einige ihrer Elemente
• eine Werkzeugleiste: die komplette oder einige ihrer Icons
• oder irgendein Widget aus irgendeinem QGIS Dialog: Beschriftung, Knöpfe, Komboboxen. . .
64 Chapter 9. QGIS Anpassung

QGIS User Guide, Release 3.4
Figure 9.21: Makroeinstellungen in QGIS
Figure 9.22: Der Anpassung Dialog
9.4. Anpassung 65
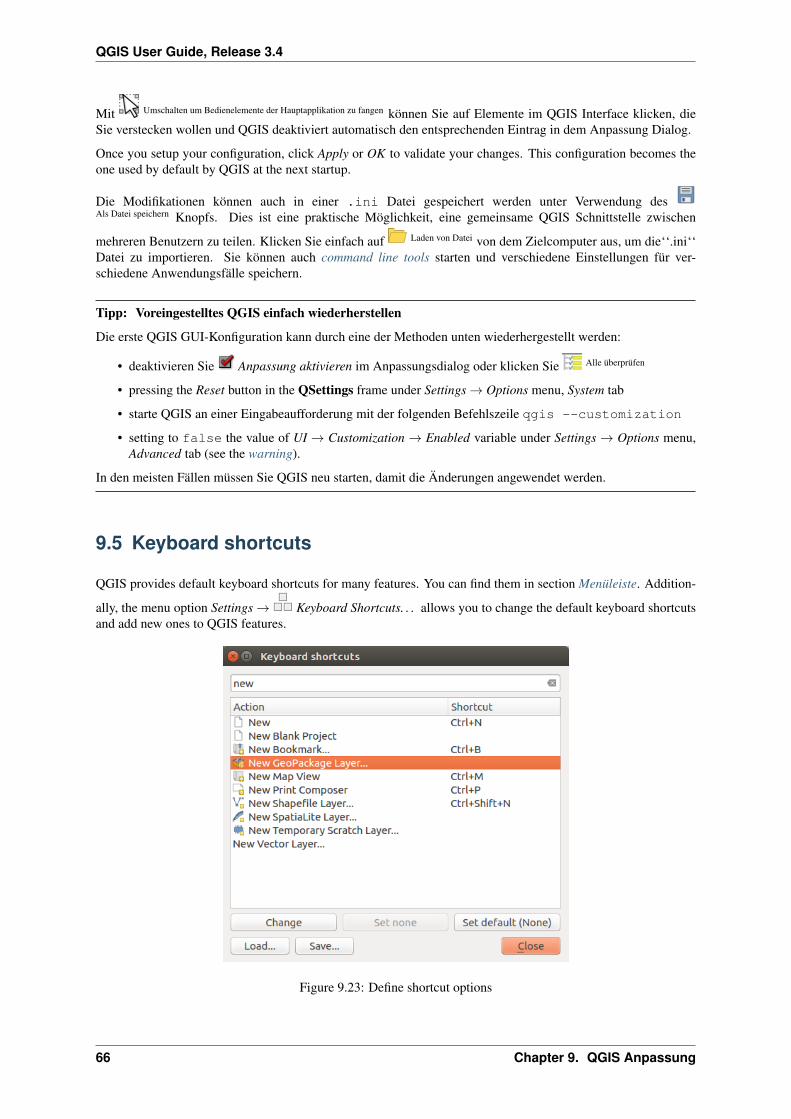
QGIS User Guide, Release 3.4
Mit Umschalten um Bedienelemente der Hauptapplikation zu fangen können Sie auf Elemente im QGIS Interface klicken, dieSie verstecken wollen und QGIS deaktiviert automatisch den entsprechenden Eintrag in dem Anpassung Dialog.
Once you setup your configuration, click Apply or OK to validate your changes. This configuration becomes theone used by default by QGIS at the next startup.
Die Modifikationen können auch in einer .ini Datei gespeichert werden unter Verwendung desAls Datei speichern Knopfs. Dies ist eine praktische Möglichkeit, eine gemeinsame QGIS Schnittstelle zwischen
mehreren Benutzern zu teilen. Klicken Sie einfach auf Laden von Datei von dem Zielcomputer aus, um die‘‘.ini‘‘Datei zu importieren. Sie können auch command line tools starten und verschiedene Einstellungen für ver-schiedene Anwendungsfälle speichern.
Tipp: Voreingestelltes QGIS einfach wiederherstellen
Die erste QGIS GUI-Konfiguration kann durch eine der Methoden unten wiederhergestellt werden:
• deaktivieren Sie Anpassung aktivieren im Anpassungsdialog oder klicken Sie Alle überprüfen
• pressing the Reset button in the QSettings frame under Settings → Options menu, System tab
• starte QGIS an einer Eingabeaufforderung mit der folgenden Befehlszeile qgis --customization
• setting to false the value of UI → Customization → Enabled variable under Settings → Options menu,Advanced tab (see the warning).
In den meisten Fällen müssen Sie QGIS neu starten, damit die Änderungen angewendet werden.
9.5 Keyboard shortcuts
QGIS provides default keyboard shortcuts for many features. You can find them in section Menüleiste. Addition-
ally, the menu option Settings → Keyboard Shortcuts. . . allows you to change the default keyboard shortcutsand add new ones to QGIS features.
Figure 9.23: Define shortcut options
66 Chapter 9. QGIS Anpassung

QGIS User Guide, Release 3.4
Configuration is very simple. Use the search box at the top of the dialog to find a particular action, select it fromthe list and click on :
• Change and press the new combination you want to assign as new shortcut
• Set None to clear any assigned shortcut
• or Set Default to backup the shortcut to its original and default value.
Proceed as above for any other tools you wish to customize. Once you have finished your configuration, simplyClose the dialog to have your changes applied. You can also Save the changes as an .XML file and Load them intoanother QGIS installation.
9.6 Running QGIS with advanced settings
9.6.1 Command line and environment variables
We’ve seen that launching QGIS is done as for any application on your OS. QGIS provides command line optionsfor more advanced use cases (in some cases you can use an environment variable instead of the command lineoption). To get a list of the options, enter qgis --help on the command line, which returns:
QGIS is a user friendly Open Source Geographic Information System.Usage: /usr/bin/qgis.bin [OPTION] [FILE]
OPTION:[--version] display version information and exit[--snapshot filename] emit snapshot of loaded datasets to given file[--width width] width of snapshot to emit[--height height] height of snapshot to emit[--lang language] use language for interface text (changes existing
→˓override)[--project projectfile] load the given QGIS project[--extent xmin,ymin,xmax,ymax] set initial map extent[--nologo] hide splash screen[--noversioncheck] don't check for new version of QGIS at startup[--noplugins] don't restore plugins on startup[--nocustomization] don't apply GUI customization[--customizationfile path] use the given ini file as GUI customization[--globalsettingsfile path] use the given ini file as Global Settings
→˓(defaults)[--authdbdirectory path] use the given directory for authentication
→˓database[--code path] run the given python file on load[--defaultui] start by resetting user ui settings to default[--hide-browser] hide the browser widget[--dxf-export filename.dxf] emit dxf output of loaded datasets to
→˓given file[--dxf-extent xmin,ymin,xmax,ymax] set extent to export to dxf[--dxf-symbology-mode none|symbollayer|feature] symbology mode for dxf
→˓output[--dxf-scale-denom scale] scale for dxf output[--dxf-encoding encoding] encoding to use for dxf output[--dxf-map-theme maptheme] map theme to use for dxf output[--take-screenshots output_path] take screen shots for the user
→˓documentation[--screenshots-categories categories] specify the categories of
→˓screenshot to be used (see QgsAppScreenShots::Categories).[--profile name] load a named profile from the user's profiles
→˓folder.[--profiles-path path] path to store user profile folders. Will create
→˓profiles inside a {path}\profiles folder[--version-migration] force the settings migration from older version if
→˓found
9.6. Running QGIS with advanced settings 67

QGIS User Guide, Release 3.4
[--openclprogramfolder] path to the folder containing the sources→˓for OpenCL programs.
[--help] this text[--] treat all following arguments as FILEs
FILE:Files specified on the command line can include rasters,vectors, and QGIS project files (.qgs and .qgz):1. Rasters - supported formats include GeoTiff, DEM
and others supported by GDAL2. Vectors - supported formats include ESRI Shapefiles
and others supported by OGR and PostgreSQL layers usingthe PostGIS extension
Tipp: Example Using command line arguments
You can start QGIS by specifying one or more data files on the command line. For example, assuming you arein the qgis_sample_data directory, you could start QGIS with a vector layer and a raster file set to load onstartup using the following command: qgis ./raster/landcover.img ./gml/lakes.gml
--version
This option returns QGIS version information.
--snapshot
This option allows you to create a snapshot in PNG format from the current view. This comes in handy when youhave many projects and want to generate snapshots from your data, or when you need to create snapshots of thesame project with updated data.
Currently, it generates a PNG file with 800x600 pixels. The size can be adjusted using the --width and--height arguments. The filename can be added after --snapshot. For example:
qgis --snapshot my_image.png --width 1000 --height 600 --project my_project.qgs
--width
This option returns the width of the snapshot to be emitted (used with --snapshot).
--height
This option returns the height of the snapshot to be emitted (used with --snapshot).
--lang
Based on your locale, QGIS selects the correct localization. If you would like to change your language, you canspecify a language code. For example, qgis --lang it starts QGIS in Italian localization.
--project
Starting QGIS with an existing project file is also possible. Just add the command line option --projectfollowed by your project name and QGIS will open with all layers in the given file loaded.
68 Chapter 9. QGIS Anpassung

QGIS User Guide, Release 3.4
--extent
To start with a specific map extent use this option. You need to add the bounding box of your extent in thefollowing order separated by a comma:
--extent xmin,ymin,xmax,ymax
This option probably makes more sense when paired with the --project option to open a specific project at thedesired extent.
--nologo
This option hides the splash screen when you start QGIS.
--noversioncheck
Skip searching for a new version of QGIS at startup.
--noplugins
If you have trouble at start-up with plugins, you can avoid loading them at start-up with this option. They will stillbe available from the Plugins Manager afterwards.
--nocustomization
Using this option, any existing GUI customization will not be applied at startup. This means that any hiddenbuttons, menu items, toolbars, and so on, will show up on QGIS start up. This is not a permanent change. Thecustomization will be applied again if QGIS is launched without this option.
This option is useful for temporarily allowing access to tools that have been removed by customization.
--customizationfile
Using this option, you can define a UI customization file, that will be used at startup.
--globalsettingsfile
Using this option, you can specify the path for a Global Settings file (.ini), also known as the Default Set-tings. The settings in the specified file replace the original inline default ones, but the user profiles‘ settingswill be set on top of those. The default global settings is located in your_QGIS_PKG_path/resources/qgis_global_settings.ini.
Presently, there’s no way to specify a file to write settings to; therefore, you can create a copy of an originalsettings file, rename, and adapt it.
Setting the qgis_global_setting.ini file path to a network shared folder, allows a system administratorto change global settings and defaults in several machines by only editing one file.
The equivalent environment variable is QGIS_GLOBAL_SETTINGS_FILE.
--authdbdirectory
This option is similar to --globalsettingsfile, but defines the path to the directory where the authentica-tion database will be stored and loaded.
9.6. Running QGIS with advanced settings 69

QGIS User Guide, Release 3.4
--code
This option can be used to run a given python file directly after QGIS has started.
For example, when you have a python file named load_alaska.py with following content:
from qgis.utils import ifaceraster_file = "/home/gisadmin/Documents/qgis_sample_data/raster/landcover.img"layer_name = "Alaska"iface.addRasterLayer(raster_file, layer_name)
Assuming you are in the directory where the file load_alaska.py is located, you can start QGIS, load theraster file landcover.img and give the layer the name ‚Alaska‘ using the following command:
qgis --code load_alaska.py
--defaultui
On load, permanently resets the user interface (UI) to the default settings. This option will restore the panelsand toolbars visibility, position, and size. Unless it’s changed again, the default UI settings will be used in thefollowing sessions.
Notice that this option doesn’t have any effect on GUI customization. Items hidden by GUI customization (e.g.the status bar) will remain hidden even using the --defaultui option. See also the --nocustomizationoption.
--hide-browser
On load, hides the Browser panel from the user interface. The panel can be enabled by right-clicking a space in
the toolbars or using the View → Panels (Settings → Panels in Linux KDE).
Unless it’s enabled again, the Browser panel will remain hidden in the following sessions.
--dxf-*
These options can be used to export a QGIS project into a DXF file. Several options are available:
• –dxf-export: the DXF filename into which to export the layers;
• –dxf-extent: the extent of the final DXF file;
• –dxf-symbology-mode: several values can be used here: none (no symbology), symbollayer (Symbollayer symbology), feature (feature symbology);
• –dxf-scale-denom: the scale denominator of the symbology;
• –dxf-encoding: the file encoding;
• –dxf-map-theme: choose a map theme from the layer tree configuration.
--take-screenshots
Takes screenshots for the user documentation. Can be used together with --screenshots-categoriesto filter which categories/sections of the documentation screenshots should be created (see QgsAppScreen-Shots::Categories).
70 Chapter 9. QGIS Anpassung

QGIS User Guide, Release 3.4
--profile
Loads QGIS using a specific profile from the user’s profile folder. Unless changed, the selected profile will beused in the following QGIS sessions.
--profiles-path
With this option, you can choose a path to load and save the profiles (user settings). It creates profiles inside a{path}\profiles folder, which includes settings, installed plugins, processing models and scripts, and so on.
This option allows you to, for instance, carry all your plugins and settings in a flash drive, or, for example, sharethe settings between different computers using a file sharing service.
The equivalent environment variable is QGIS_CUSTOM_CONFIG_PATH.
--version-migration
If settings from an older version are found (e.g., the .qgis2 folder from QGIS 2.18), this option will import theminto the default QGIS profile.
--openclprogramfolder
Using this option, you can specify an alternative path for your OpenCL programs. This is useful for developerswhile testing new versions of the programs without needing to replace the existing ones.
The equivalent environment variable is QGIS_OPENCL_PROGRAM_FOLDER.
9.6.2 Deploying QGIS within an organization
If you need to deploy QGIS within an organization with a custom configuration file, first you needto copy/paste the content of the default settings file located in your_QGIS_PKG_path/resources/qgis_global_settings.ini. This file already contains some default sections identified by a block startingwith []. We recommend that you keep these defaults values and add your own sections at the bottom of the file.If a section is duplicated in the file, QGIS will take the last one from top to bottom.
You can change allowVersionCheck=false to disable the QGIS version check.
If you do not want to display the migration window after a fresh install, you need the following section:
[migration]fileVersion=2settings=true
If you want to add a custom variable in the global scope:
[variables]organisation="Your organization"
To discover all possibilities of the settings INI file, we suggest that you set the config you would like in QGISDesktop and then search for it in your INI file located in your profile using a text editor. A lot of settings can beset using the INI file such as WMS/WMTS, PostGIS connections, proxy settings, maptips. . .
Finally, you need to set the environment variable QGIS_GLOBAL_SETTINGS_FILE to the path of your cus-tomized file.
In addition, you can also deploy files such as Python macros, color palettes, layout templates, project templates. . .either in the QGIS system directory or in the QGIS user profile.
• Layout templates must be deployed in the composer_templates directory.
9.6. Running QGIS with advanced settings 71

QGIS User Guide, Release 3.4
• Project templates must be deployed in the project_templates directory.
• Custom Python macros must be deployed in the python directory.
72 Chapter 9. QGIS Anpassung

CHAPTER 10
Arbeiten mit Projektionen
A Coordinate Reference System, or CRS, is a method of associating numerical coordinates with a position on thesurface of the Earth. QGIS has support for approximately 7,000 standard CRSs, each with different use cases,pros and cons! Choosing an appropriate reference system for your QGIS projects and data can be a complex task,but fortunately QGIS helps guide you through this choice, and makes working with different CRSs as transparentand accurate as possible.
10.1 Überblick zur Projektionsunterstützung
QGIS has support for approximately 7,000 known CRSs. These standard CRSs are based on those defined bythe European Petroleum Search Group (EPSG) and the Institut Geographique National de France (IGNF), and aremade available in QGIS through the underlying „Proj“ projection library. Commonly, these standard projectionsare identified through use of an authority:code combination, where the authority is an organisation name such as„EPSG“ or „IGNF“, and the code is a unique number associated with a specific CRS. For instance, the commonWGS 84 latitude/longitude CRS is known by the identifier EPSG:4326, and the web mapping standard CRS isEPSG:3857.
Custom, user-created CRSs are stored in a user CRS database. See section Eigenes Koordinatenbezugssystemdefinieren for information on managing your custom coordinate reference systems.
10.2 Layer Coordinate Reference Systems
In order to correctly project data into a specific target CRS, either your data must contain information aboutits coordinate reference system or you will need to manually assign the correct CRS to the layer. For PostGISlayers, QGIS uses the spatial reference identifier that was specified when that PostGIS layer was created. Fordata supported by OGR or GDAL, QGIS relies on the presence of a recognized means of specifying the CRS.For instance, for the Shapefile format this is a file containing the Well-Known Text (WKT) representation of thelayer’s CRS. This projection file has the same base name as the .shp file and a .prj extension. For example,alaska.shp would have a corresponding projection file named alaska.prj.
Whenever a layer is loaded into QGIS, QGIS attempts to automatically determine the correct CRS for that layer. Insome cases this is not possible, e.g. when a layer has been provided without retaining this information. WheneverQGIS cannot automatically determine the correct CRS for a layer, it will prompt you to manually select the CRS.Selecting the correct choice is crucial, as a wrong choice will place your layer in the wrong position on the Earth’s
73

QGIS User Guide, Release 3.4
surface! Sometimes, accompanying metadata will describe the correct CRS for a layer, in other cases you willneed to contact the original author of the data to determine the correct CRS to use.
10.3 Project Coordinate Reference Systems
Every project in QGIS also has an associated Coordinate Reference System. The project CRS determines howdata is projected from its underlying raw coordinates to the flat map rendered within your QGIS map canvas.Behind the scenes, QGIS transparently reprojects all layers contained within your project into the project’s CRS,so that they will all be rendered in the correct position with respect to each other!
It is important to make an appropriate choice of CRS for your QGIS projects. Choosing an inappropriate CRS cancause your maps to look distorted, and poorly reflect the real-world relative sizes and positions of features. Usually,while working in smaller geographic areas, there will be a number of standard CRSs used within a particularcountry or administrative area. It’s important to research which CRSs are appropriate or standard choices for thearea you are mapping, and ensure that your QGIS project follows these standards.
The project CRS can be set through the CRS tab of the Project properties dialog (Project → Properties. . . ). It willalso be shown in the lower-right of the QGIS status bar.
Figure 10.1: Dialog Projekteigenschaften
The CRS tab also has an optional setting for No projection. Checking this setting will disable ALL projectionhandling within the QGIS project, causing all layer and map coordinates to be treated as simple 2D Cartesiancoordinates, with no relation to positions on the Earth’s surface.
Whenever you select a new CRS for your QGIS project, the measurement units will automatically be changedin the General tab of the Project properties dialog (Project → Properties. . . ) to match the selected CRS. Forinstance, some CRSs define their coordinates in feet instead of meters, so setting your QGIS project to one ofthese CRSs will also set your project to measure using feet by default.
74 Chapter 10. Arbeiten mit Projektionen

QGIS User Guide, Release 3.4
10.4 CRS Settings
By default, QGIS starts each new project using a global default projection. This default CRS is EPSG:4326(also known as „WGS 84“), and it is a global latitude/longitude based reference system. This default CRS can bechanged via the CRS for New Projects setting in the CRS tab under Settings → Options. There is an option toautomatically set the project’s CRS to match the CRS of the first layer loaded into a new project, or alternativelyyou can select a different default CRS to use for all newly created projects. This choice will be saved for use insubsequent QGIS sessions.
Figure 10.2: The CRS tab in the QGIS Options Dialog
When you use layers that do not have a CRS, you can define how QGIS responds to these layers. This can be doneglobally in the CRS tab under Settings → Options.
The options shown in figure_projection_options are:
• KBS abfragen
• KBS des Projektes nutzen
• Use a default CRS
If you want to define the Coordinate Reference System for a certain layer without CRS information, you can alsodo that in the Source tab of the raster and vector properties dialog (see Source Properties for rasters and SourceProperties for vectors). If your layer already has a CRS defined, it will be displayed as shown in Source tab invector Layer Properties dialog. Note that changing the CRS in this setting does not alter the underlying datasource in any way, rather it just changes how QGIS interprets the raw coordinates from the layer in the currentQGIS project only.
10.4. CRS Settings 75

QGIS User Guide, Release 3.4
Tipp: CRS in the Layers Panel
Right-clicking on a layer in the Layers Panel (section Layers Panel) provides two CRS shortcuts. Set layer CRStakes you directly to the Coordinate Reference System Selector dialog (see figure_projection_project). Set projectCRS from Layer redefines the project CRS using the layer’s CRS.
10.5 On The Fly (OTF) CRS Transformation
QGIS supports „on the fly“ CRS transformation for both raster and vector data. This means that regardless of theunderlying CRS of particular map layers in your project, they will always be automatically transformed into thecommon CRS defined for your project.
10.6 Coordinate Reference System Selector
This dialog helps you assign a Coordinate Reference System to a project or a layer, provided a set of projectiondatabases. Items in the dialog are:
• Filter: If you know the EPSG code, the identifier, or the name for a Coordinate Reference System, you canuse the search feature to find it. Enter the EPSG code, the identifier or the name.
• Recently used coordinate reference systems: If you have certain CRSs that you frequently use in youreveryday GIS work, these will be displayed in this list. Click on one of these items to select the associatedCRS.
• Coordinate reference systems of the world: This is a list of all CRSs supported by QGIS, includingGeographic, Projected and Custom coordinate reference systems. To define a CRS, select it from the list byexpanding the appropriate node and selecting the CRS. The active CRS is preselected.
• PROJ text: This is the CRS string used by the PROJ projection engine. This text is read-only and providedfor informational purposes.
The CRS selector also shows a rough preview of the geographic area for which a selected CRS is valid for use.Many CRSs are designed only for use in small geographic areas, and you should not use these outside of the areathey were designed for. The preview map shades an approximate area of use whenever a CRS is selected from thelist. In addition, this preview map also shows an indicator of the current main canvas map extent.
10.7 Eigenes Koordinatenbezugssystem definieren
Wenn QGIS nicht das Koordinatenbezugssystem das Sie brauchen zur Verfügung stellt können Sie ein Be-
nutzerdefiniertes Koordinatensystem definieren. Um ein KBS zu definieren wählen Sie Benutzerkoordinaten-bezugssystem . . . aus dem Menü Einstellungen. Benutzerkoordinatenbezugssysteme werden in Ihrer QGIS Be-nutzerdatenbank gespeichert. Zusätzlich zu Ihrem Benutzerkoordinatensystem enthält diese Datenbank auch IhreRäumlichen Lesezeichen und andere Benutzerdaten.
Defining a custom CRS in QGIS requires a good understanding of the PROJ projection library. To begin, refer to„Cartographic Projection Procedures for the UNIX Environment - A User’s Manual“ by Gerald I. Evenden, U.S.Geological Survey Open-File Report 90-284, 1990 (available at ftp://ftp.remotesensing.org/proj/OF90-284.pdf).
This manual describes the use of proj and related command line utilities. The cartographic parameters used withproj are described in the user manual and are the same as those used by QGIS.
Der Dialog Definition eines Benutzerkoordinatensystems braucht nur zwei Einträge, um eine eigene Projektion zudefinieren:
1. Ein beschreibender Name
76 Chapter 10. Arbeiten mit Projektionen

QGIS User Guide, Release 3.4
Figure 10.3: Der Benutzerkoordinatensystem Dialog
10.7. Eigenes Koordinatenbezugssystem definieren 77

QGIS User Guide, Release 3.4
2. The cartographic parameters in PROJ format
Um ein neues KBS zu erstellen klicken Sie Neu Knopf und geben Sie einen aussagekräftigen Namen sowie dieKBS-Parameter ein.
Denken Sie daran, dass die kartographischen Parameter mit einem +proj=-Block beginnen müssen, um denBeginn eines neuen KBS anzuzeigen.
You can test your CRS parameters to see if they give sane results. To do this, enter known WGS 84 latitudeand longitude values in North and East fields, respectively. Click on Calculate, and compare the results with theknown values in your coordinate reference system.
10.7.1 Integrate an NTv2-transformation in QGIS
To integrate an NTv2 transformation file in QGIS you need one more step:
1. Place the NTv2 file (.gsb) in the CRS/Proj folder that QGIS uses (e.g. C:\OSGeo4W64\share\projfor windows users)
2. Add nadgrids (+nadgrids=nameofthefile.gsb) to the Proj definition in the Parameters field ofthe Custom Coordinate Reference System Definition (Settings → Custom Projections. . . ).
Figure 10.4: Setting an NTv2 transformation
10.8 Datum Transformations
In QGIS, ‚on-the-fly‘ CRS transformation is enabled by default, meaning that whenever you use layers withdifferent coordinate systems QGIS transparently reprojects them to the project CRS. For some CRS, there are anumber of possible transforms available to reproject to the project’s CRS! QGIS optionally allows you to define aparticular transformation to use, otherwise QGIS uses a default one.
This customization is done in the Settings → Options –> CRS tab menu under the Default datum transforma-tions group:
• using Ask for datum transformation if several are available: when more than one appropriate datumtransformation exists for a source/destination CRS combination, a dialog will automatically be openedprompting users to choose which of these datum transformations to use for the project;
• or predefining a list of the appropriate default transformations to use when loading layers to projects orreprojecting a layer.
Use the button to open the Select Datum Transformations dialog. Then:
1. Indicate the Source CRS of the layer, using the drop-down menu or the Select CRS widget.
2. Likewise, provide the Destination CRS.
3. Depending on the transform grid files (based on GDAL and PROJ version installed on your system), alist of available transformations from source to destination is built in the table. Clicking a row showsdetails on the settings applied (epsg code, accuracy of the transform, number of stations involved. . . ).
You can choose to only display current valid transformations by checking the Hide deprecatedoption.
4. Find your preferred transformation, select it and click OK.
A new row is added to the table under CRS → Default datum transformations with information about‚Source CRS‘ and ‚Destination CRS‘ as well as ‚Source datum transform‘ and ‚Destination datumtransform‘.
78 Chapter 10. Arbeiten mit Projektionen

QGIS User Guide, Release 3.4
From now, QGIS automatically uses the selected datum transformation for further transformation between
these two CRSs until you remove it from the list or replace it with another one.
Figure 10.5: Selecting a preferred default datum transformation
Datum transformations set in the Settings → Options –> CRS tab will be inherited by all new QGIS projectscreated on the system. Additionally, a particular project may have its own specific set of transformations specifiedvia the CRS tab of the Project properties dialog (Project → Properties. . . ). These settings apply to the currentproject only.
10.8. Datum Transformations 79

QGIS User Guide, Release 3.4
80 Chapter 10. Arbeiten mit Projektionen

CHAPTER 11
Allgemeine Werkzeuge
11.1 Hilfe
Whenever you need help on a specific topic, you can access the corresponding page in the current User Manualvia the Help button available in most dialogs — please note that third-party plugins can point to dedicated webpages.
11.2 Bedienfelder
By default, QGIS provides many panels to work with. Some of these panels are described below while others maybe found in different parts of the document. A complete list of default panels provided by QGIS is available viathe View → Panels → menu and mentioned at Bedienfelder.
11.2.1 Layers Panel
The Layers panel (also called the map legend) lists all the layers in the project and helps you manage theirvisibility. You can show or hide it by pressing Ctrl+1. A layer can be selected and dragged up or down in thelegend to change the Z-ordering. Z-ordering means that layers listed nearer the top of the legend are drawn overlayers listed lower down in the legend.
Bemerkung: The Z-ordering behavior can be overridden by the Layer Order panel.
At the top of the Layers panel, a toolbar allows you to:
• Open the layer styling dock (F7): toggle the layer styling panel on and off.
• Add new group
• Manage Map Themes: control visibility of layers and arrange them in different map themes.
• Filter Legend by Map Content: only the layers that are set visible and whose features intersect the current mapcanvas have their style rendered in the layers panel. Otherwise, a generic NULL symbol is applied to the
81

QGIS User Guide, Release 3.4
layer. Based on the layer symbology, this is a convenient way to identify which kind of features from whichlayers cover your area of interest.
• Filter Legend by Expression: apply an expression to remove styles from the selected layer tree that have nofeature satisfying the condition. This can be used to highlight features that are within a given area/featureof another layer. From the drop-down list, you can edit and clear the expression currently applied.
• Expand All or Collapse All layers and groups in the layers panel.
• Remove Layer/Group currently selected.
Figure 11.1: Layer Toolbar in Layers Panel
Bemerkung: Tools to manage the layers panel are also available for map and legend items in print layouts
Configuring map themes
The Manage Map Themes drop-down button provides access to convenient shortcuts to manipulate visibility of thelayers in the Layers panel:
• Show All Layers
• Hide All Layers
• Show Selected Layers
• Hide Selected Layers
• Hide Deselected Layers
Beyond the simple control of layer visibility, the Manage Map Themes menu allows you to configure Map Themesin the legend and switch from one map theme to another. A map theme is a snapshot of the current map legendthat records:
• the layers set as visible in the Layers panel
• and for each visible layer:
– the reference to the style applied to the layer
– the visible classes of the style, ie the layer checked node items in the Layers panel. This applies tosymbologies other than the single symbol rendering
– the collapsed/expanded state of the layer node(s) and the group(s) it’s placed inside
To create a map theme:
1. Check a layer you want to show
2. Configure the layer properties (symbology, diagram, labels. . . ) as usual
3. Expand the Style → menu at the bottom and click on Add. . . to store the settings as a new style embeddedin the project
82 Chapter 11. Allgemeine Werkzeuge

QGIS User Guide, Release 3.4
Bemerkung: A map theme does not remember the current details of the properties: only a reference to thestyle name is saved, so whenever you apply modifications to the layer while this style is enabled (eg changethe symbology rendering), the map theme is updated with new information.
4. Repeat the previous steps as necessary for the other layers
5. If applicable, expand or collapse groups or visible layer nodes in the Layers panel
6. Click on the Manage Map Themes button on top of the panel, and Add Theme. . .
7. Enter the map theme’s name and click OK
The new theme is listed in the lower part of the drop-down menu.
You can create as many map themes as you need: whenever the current combination in the map legend (visiblelayers, their active style, the map legend nodes) does not match any existing map theme contents as defined above,click on Add Theme. . . to create a new map theme, or use Replace Theme → to update the current map theme.Use the Remove Current Theme button to delete the active theme.
Map themes are helpful to switch quickly between different preconfigured combinations: select a map theme inthe list to restore its combination. All configured themes are also accessible in the print layout, allowing you tocreate different map items based on specific themes and independent of the current main canvas rendering (seeMap item layers).
Overview of the context menu of the Layers panel
At the bottom of the toolbar, the main component of the Layers panel is the frame listing vector or raster layersadded to the project, optionally organized in groups. Depending on the item selected in the panel, a right-clickshows a dedicated set of options presented below.
Option Vector Layer Raster Layer Group
Zoom toLayer/Group
Zoom to Selection
Show in Overview
Show Feature Count
Copy Layer/Group
Rename Layer/Group
Zoom to Native Res-olution (100%)
Stretch Using CurrentExtent
Update SQLLayer. . .
Add Group
Duplicate Layer
RemoveLayer/Group. . .
Move Out of Group
Move to TopContinued on next page
11.2. Bedienfelder 83

QGIS User Guide, Release 3.4
Table 11.1 – continued from previous pageOption Vector Layer Raster Layer Group
Check and all its Parents
Group Selected
Open Attribute Table
Toggle Editing
Current Edits →Filter. . .
Set Layer Scale Visibil-ity. . .
Zoom to Visible Scale
Set CRS →
• Set Layer/GroupCRS. . .
• Set Project CRSfrom Layer
Set Group WMS Data. . .
Mutually ExclusiveGroup
Check and all its children(Ctrl-click)
Uncheck and all its chil-dren (Ctrl-click)
Make Permanent
Export →
• Save As. . .
• Save FeaturesAs. . .
• Save Selected Fea-tures As. . .
• Save As Layer Def-inition File. . .
• Save As QGISLayer Style File. . .
Continued on next page
84 Chapter 11. Allgemeine Werkzeuge

QGIS User Guide, Release 3.4
Table 11.1 – continued from previous pageOption Vector Layer Raster Layer Group
Styles →
• Copy Style
• Paste Style
• Add. . .
• Rename Cur-rent. . .
Properties. . .
Table: Context menu from Layers Panel items
For GRASS vector layers, Toggle editing is not available. See section Digitalisieren und Editieren eines GRASSVektorlayers for information on editing GRASS vector layers.
Interact with groups and layers
Layers in the legend window can be organized into groups. There are two ways to do this:
1. Press the icon to add a new group. Type in a name for the group and press Enter. Now click on anexisting layer and drag it onto the group.
2. Select some layers, right-click in the legend window and choose Group Selected. The selected layers willautomatically be placed in a new group.
To move a layer out of a group, drag it out, or right-click on it and choose Move Out of Group: the layer is movedfrom the group and placed above it. Groups can also be nested inside other groups. If a layer is placed in a nestedgroup, Move Out of Group will move the layer out of all nested groups.
To move a group or layer to the top of the layer panel, either drag it to the top, or choose Move to Top. If you usethis option on a layer nested in a group, the layer is moved to the top in its current group.
The checkbox for a group will show or hide all the layers in the group with one click.
Enabling the Mutually Exclusive Group option means you can make a group have only one layer visible at thesame time. Whenever a layer within the group is set visible the others will be toggled not visible.
It is possible to select more than one layer or group at the same time by holding down the Ctrl key while clickingadditional layers. You can then move all selected layers to a new group at the same time.
You may also delete more than one layer or group at once by selecting several items with the Ctrl key and thenpressing Ctrl+D: all selected layers or groups will be removed from the layers list.
More information on layers and groups using indicator icon
In some circumstances, icons appears next to the layer or group in the Layers panel to give more information aboutthe layer/group. These symbols are:
• to indicate that the layer is in edit mode and you can modify the data
11.2. Bedienfelder 85

QGIS User Guide, Release 3.4
• to indicate that the layer being edited has some unsaved changes
• to indicate a filter applied to the layer. Hover over the icon to see the filter expression and double-clickto update the setting
• to identify an embedded group or layer and the path to their original project file
• to remind you that the layer is a temporary scratch layer and its content will be discarded when youclose this project. To avoid data loss and make the layer permanent, click the icon to store the layer in anyof the OGR vector formats supported by QGIS.
Editing vector layer style
From the Layers panel, you have shortcuts to change the layer rendering quickly and easily. Right-click on avector layer and select Styles → in the list in order to:
• see the styles currently applied to the layer. If you defined many styles for the layer, you can switch fromone to another and your layer rendering will automatically be updated on the map canvas.
• copy the current style, and when applicable, paste a copied style from another layer
• rename the current style, add a new style (which is actually a copy of the current one) or delete the currentstyle (when multiple styles are available).
Bemerkung: The previous options are also available for raster layers.
Whether the features in the vector layer all have the same unique symbol or they are classified (in which case thelayer is displayed in a tree structure with each class as a sub-item), the following options are available at layerlevel or class level:
• Edit Symbol. . . to open the Die Symbolauswahl dialog to change any properties of the layer or featuresymbol (symbol, size, color. . . ). Double-clicking on a feature also opens the Symbol Selector dialog.
• Farbauswahl with a Color Wheel from which you can click a color to update the symbol fill color automat-ically. For convenience, Recent colors are available at the bottom of the color wheel.
• Show All Items and Hide All Items to toggle on or off the visibility of all the classes of features.This avoids (un)checking items one by one.
Tipp: Quickly share a layer style
From the context menu, copy the style of a layer and paste it to a group or a selection of layers: the style is appliedto all the layers that are of the same type (vector/raster) as the original layer and, for vector layers, have the samegeometry type (point, line or polygon).
11.2.2 Layer Styling Panel
The Layer Styling panel (also enabled with Ctrl+3) is a shortcut to some of the functionalities of the LayerProperties dialog. It provides a quick and easy way to define the rendering and the behavior of a layer, and tovisualize its effects without having to open the layer properties dialog.
In addition to avoiding the blocking (or „modal“) layer properties dialog, the layer styling panel also avoidscluttering the screen with dialogs, and contains most style functions (color selector, effects properties, rule edit,label substitution. . . ): e.g., clicking color buttons inside the layer style panel causes the color selector dialog to beopened inside the layer style panel itself rather than as a separate dialog.
From a drop-down list of current layers in the layer panel, select an item and:
86 Chapter 11. Allgemeine Werkzeuge

QGIS User Guide, Release 3.4
• Set raster layer Symbology, Transparency, and Histogram properties. These options are thesame as those in the Dialogfenster Rasterlayereigenschaften.
• Set vector layer Symbology, 3D View and Labels properties. These options are the same asthose in the Vektorlayereigenschaften.
• Manage the associated style(s) in the Style Manager (more details at Managing Custom Styles).
• See the History of changes you applied to the layer style in the current project: you can therefore cancelor restore to any state by selecting it in the list and clicking Apply.
Another powerful feature of this panel is the Live update checkbox. Tick it to render your changes immediatelyon the map canvas: you no longer need to click the Apply button.
Figure 11.2: Defining a layer’s symbology from the layer styling panel
Tipp: Add custom tabs to the Layer Styling panel
11.2. Bedienfelder 87

QGIS User Guide, Release 3.4
Using PyQGIS, you can set new tabs to manage layer properties in the Layer Styling Panel. See https://nathanw.net/2016/06/29/qgis-style-dock-part-2-plugin-panels/ for an example.
11.2.3 Layer Order Panel
By default, layers shown on the QGIS map canvas are drawn following their order in the Layers panel: the highera layer is in the panel, the higher (hence, more visible) it’ll be in the map view.
You can define a drawing order for the layers independent of the order in the layers panel with the Layer Order
panel enabled in View → Panels → menu or with Ctrl+9. Check Control rendering order underneath thelist of layers and reorganize the layers in the panel as you want. This order becomes the one applied to the mapcanvas. For example, in figure_layer_order, you can see that the airports features are displayed over thealaska polygon despite those layers‘ respective placement in the Layers panel.
Unchecking Control rendering order will revert to default behavior.
Figure 11.3: Define a layer order independent of the legend
11.2.4 Overview Panel
The Overview panel (Ctrl+8) displays a map with a full extent view of some of the layers. The Overview map isfilled with layers using the Show in Overview option from the Layer menu or in the layer contextual menu. Withinthe view, a red rectangle shows the current map canvas extent, helping you quickly to determine which area ofthe whole map you are currently viewing. If you click-and-drag the red rectangle in the overview frame, the mainmap view extent will update accordingly.
Note that labels are not rendered to the map overview even if the layers used in the map overview have been setup for labeling.
88 Chapter 11. Allgemeine Werkzeuge

QGIS User Guide, Release 3.4
11.2.5 Log Messages Panel
When loading or processing some operations, you can track and follow messages that appear in different tabs
using the Log Messages Panel. It can be activated using the most right icon in the bottom status bar.
11.2.6 Undo/Redo Panel
For each layer being edited, the Undo/Redo (Ctrl+5) panel shows the list of actions carried out, allowing youquickly to undo a set of actions by selecting the action listed above. More details at Undo and Redo edits.
11.2.7 Statistical Summary Panel
The Statistics panel (Ctrl+6) provides summarized information on any vector layer. This panel allows you toselect:
• the vector layer to compute the statistics on
• the column to use, or an expression
• the statistics to return using the drop-down button at the bottom-right of the dialog. Depending on the field’s(or expression’s values) type, available statistics are:
Statistics String Integer Float Date
Count
Count Distinct Value
Count Missing value
Sum
Mean
Standard Deviation
Standard Deviation on Sample
Minimal value
Maximal value
Range
Minority
Majority
Variety
First Quartile
Third Quartile
Inter Quartile Range
Minimum Length
Maximum Length
Table: Statistics available for each field type
The statistical summary can be:
• returned for the whole layer or selected features only
• recalculated using the button when the underlying data source changes (eg, new or removed fea-tures/fields, attribute modification)
11.2. Bedienfelder 89

QGIS User Guide, Release 3.4
• copied to the clipboard and pasted as a table in another application
Figure 11.4: Show statistics on a field
11.3 Layer/Gruppen einbinden
Sometimes, you’d like to keep some layers in different projects, but with the same style. You can either create adefault style for these layers or embed them from another project to save time and effort.
Embed layers and groups from an existing project has some advantages over styling:
• All types of layers (vector or raster, local or online. . . ) can be added
• Fetching groups and layers, you can keep the same tree structure of the „background“ layers in your differentprojects
• While the embedded layers are editable, you can’t change their properties such as symbology, labels, forms,default values and actions, ensuring consistency across projects
• Modify the items in the original project and changes are propagated to all the other projects
If you want to embed content from other project files into your project, select Layer → Embed Layers and Groups:
1. Click the . . . button to look for a project: you can see the content of the project (see figure_embed_dialog)
2. Hold down Ctrl ( or Cmd) and click on the layers and groups you wish to retrieve
3. Click OK
The selected layers and groups are embedded in the Layers panel and displayed on the map canvas. An iconis added next to their name for recognition and hovering over displays a tooltip with the original project file path.
90 Chapter 11. Allgemeine Werkzeuge

QGIS User Guide, Release 3.4
Figure 11.5: Einzubettende Layer und Gruppen wählen
Like any other layer, an embedded layer can be removed from the project by right-clicking on the layer and
clicking Remove.
Tipp: Change rendering of an embedded layer
It’s not possible to change the rendering of an embedded layer, unless you make the changes in the original projectfile. However, right-clicking on a layer and selecting Duplicate creates a layer which is fully-featured and notdependent on the original project. You can then safely remove the linked layer.
11.4 Working with the map canvas
11.4.1 Layeranzeige kontrollieren
QGIS rendert standardmäßig alle sichtbaren Layer wenn das Kartenfenster aktualisirt werden muss. Die Abläufe,die eine ‚Erneuerung‘ der Wiedergabe verursachen sind:
• adding a layer
• panning or zooming
• resizing the QGIS window
• changing the visibility of a layer or layers
QGIS ermöglicht es, den Wiedergabeprozess auf verschiedene Arten zu kontrollieren.
Maßstabsabhängige Layeranzeige
Scale-dependent rendering allows you to specify the minimum and maximum scales at which a layer (raster orvector) will be visible. To set scale-dependent rendering, open the Properties dialog by double-clicking on the
layer in the legend. On the Rendering tab, tick Scale dependent visibility and enter the Minimum (exclusive)and Maximum (inclusive) scale values.
You can also activate scale dependent visibility on a layer from the Layers panel. Right-click on the layer and inthe context menu, select Set Layer Scale Visibility.
The Set to current canvas scale button allow you to use the current map canvas scale as boundary of the range visibil-ity.
Bemerkung: When a layer is not rendered in the map canvas because the map scale is out of its visibility scalerange, the layer is greyed in the Layers panel and a new option Zoom to Visible Scale appears in the layer contextmenu. Select it and the map is zoomed to the layer’s nearest visibility scale.
11.4. Working with the map canvas 91

QGIS User Guide, Release 3.4
Layeranzeige kontrollieren
Die Kartendarstellung kann wie unten beschrieben auf verschiedene Art und Weise gesteuert werden.
Wiedergabe unterdrücken
To suspend rendering, click the Render checkbox in the bottom-right corner of the status bar. WhenRender is not checked, QGIS does not redraw the canvas in response to any of the events described in the sectionLayeranzeige kontrollieren. Examples of when you might want to suspend rendering include:
• adding many layers and symbolizing them prior to drawing
• adding one or more large layers and setting scale dependency before drawing
• adding one or more large layers and zooming to a specific view before drawing
• any combination of the above
Wenn Sie die Zeichnen aktivieren, findet automatisch eine Erneuerung der Wiedergabe des Kartenfenstersstatt.
Option für Layer hinzufügen
You can set an option to always load new layers without drawing them. This means the layer will be added to themap, but its visibility checkbox in the legend will be unchecked by default. To set this option, choose menu option
Settings → Options and click on the Rendering tab. Uncheck By default new layers added to the map shouldbe displayed. Any layer subsequently added to the map will be off (invisible) by default.
Zeichnen stoppen
To stop the map drawing, press the Esc key. This will halt the refresh of the map canvas and leave the mappartially drawn. It may take a bit of time between pressing Esc for the map drawing to halt.
Bemerkung: Es ist derzeit nicht möglich das Zeichnen zu stoppen - diese Funktion wurde mit der Version qt4ausgeschaltet da es zu Problemen und Abstürzen der Benutzeroberfläche kam.
Die Qualität der Wiedergabe beeinflussen
Um die Wiedergabequalität der Layer zu beeinflussen gibt es drei Möglichkeiten. Öffnen Sie den Reiter Darstel-
lung im Menü Einstellungen →Optionen → und aktivieren bzw. deaktivieren Sie Linien auf Kosten derZeichengeschwindigkeit weniger gezackt zechnen.
Darstellung beschleunigen
Es gibt zwei Einstellungen die es Ihnen ermöglichen die Darstellungsgeschwindigkeit zu erhöhen. Öffnen Sie denQGIS Optionen Dialog indem Sie Einstellungen → Optionen benutzen, gehen Sie zum Darstellung Menü undaktivieren oder deaktivieren Sie die folgenden Kontrollkästchen:
• Use render caching where possible to speed up redraws.
• Layer mit vielen CPU-Kernen parallel zeichnen und legen Sie dann die Max. zu benutzende Kernefest.
92 Chapter 11. Allgemeine Werkzeuge

QGIS User Guide, Release 3.4
• Die Karte rendert im Hintergrund auf einem separaten Bild und jedes Map Update interval, der Inhaltvon diesem (Off-Screen) Bild wird durch die sichtbare Bildschirmdarstellung getroffen werden, um aktuellzu bleiben. Wenn das Rendering jedoch schneller ist, als diese Dauer beendet ist, wird es sofort angezeigt.
• With Enable Feature simplification by default for newly added layers, you simplify features‘ geometry(fewer nodes) and as a result, they display more quickly. Be aware that this can cause rendering inconsis-tencies.
11.4.2 Zoomen und Karte verschieben
QGIS bietet Werkzeuge zum zoomen oder verschieben des Kartenfensters zu einem Ausschnitt Ihrer Wahl.
Apart from using the pan and zoom-in/ zoom-out icons on the toolbar with the mouse, you can also navigatewith the mouse wheel, spacebar and arrow keys. A Zoom factor can be set under the Settings → Options →Map tools menu to define the scale behavior while zooming.
With the mouse wheel
You can press the mouse wheel to pan inside of the main window (on macOS, you may need to hold down thecmd key). You can roll the mouse wheel to zoom in and out on the map; the mouse cursor position will be thecenter of the zoomed area of interest. Holding down Ctrl while rolling the mouse wheel results in a finer zoom.
With the arrow keys
Panning the map is possible with the arrow keys. Place the mouse cursor inside the map area, and click on thearrow keys to pan up, down, left and right.
You can also use the space bar to cause mouse movements temporarily to pan the map. The PgUp and PgDownkeys on your keyboard will cause the map display to zoom in or out following the zoom factor set. PressingCtrl++ or Ctrl+- also performs an immediate zoom in/out on the map canvas.
When certain map tools are active (Identify, Measure. . . ), you can perform a zoom by holding down Shift anddragging a rectangle on the map to zoom to that area. This is not enabled for selection tools (since they use Shiftfor adding to selection) or edit tools.
11.4.3 Räumliche Lesezeichen
Spatial Bookmarks allow you to „bookmark“ a geographic location and return to it later. By default, bookmarksare saved on the computer, meaning that they are available from any project in the same computer. If you wish tostore the bookmark in the project file (.qgs) then you can do this by selecting the In Project checkbox.
Ein Lesezeichen erstellen
Um ein Lesezeichen zu erstellen:
1. Zoomen oder verschieben Sie das Kartenfenster in einen Ausschnitt Ihrer Wahl.
2. Select the menu option View → New Bookmark or press Ctrl+B. The Spatial Bookmarks panel opens withthe newly created bookmark.
3. Geben Sie eine Beschreibung für das Lesezeichen ein (bis zu 255 Zeichen).
4. Check the In Project box if you wish to save the bookmark in the project file.
5. Drücke Sie Enter um ein Lesezeichen hinzuzufügen oder klicken Sie irgendwo hin.
Sie können mehrere Lesezeichen mit demselben Namen erstellen.
11.4. Working with the map canvas 93

QGIS User Guide, Release 3.4
Arbeiten mit Lesezeichen
To use or manage bookmarks, select View → Show Bookmarks or press Ctrl+7. The Spatial Bookmarks panelallows you to:
• Auf ein Lesezeichen zoomen: wählen Sie das gewünschte Lesezeichen aus und klicken Sie dann Auf Leseze-ichen zoomen. Sie können ebenfalls auf ein Lesezeichen zoomen, indem Sie es doppelt anklicken.
• Löschen eines Lesezeichens: Wählen Sie das Lesezeichen aus und klicken Sie Lesezeichen löschen. Bestäti-gen Sie anschließend.
• Import or Export a bookmark: To share or transfer your bookmarks between computers you can use theImport/Export Bookmarks drop-down menu to export all bookmarks to an .xml file or import bookmarksfrom such a file.
You can also zoom to saved bookmarks by typing the bookmark name in the locator.
11.4.4 Dekorationen
Decorations include Grid, Copyright Label, North Arrow, Scale Bar and Layout Extents. They are used to ‚deco-rate‘ the map by adding cartographic elements.
Gitter
Gitter ermöglicht es Ihnen ein Koordinatengitter und Koordinatenbeschriftungen der Karte hinzuzufügen.
1. Select View → Decorations → Grid to open the dialog.
Figure 11.6: Der Gitter Dialog
2. Tick Enable grid and set grid definitions according to the layers loaded in the map canvas.
3. Tick Draw annotations and set annotation definitions according to the layers loaded in the map canvas.
4. Click Apply to verify that it looks as expected or OK if you’re satisfied.
Urheberrechtshinweis
Copyright label adds a copyright label to the map using your choice of text.
1. Select View → Decorations → Copyright Label to open the dialog
94 Chapter 11. Allgemeine Werkzeuge

QGIS User Guide, Release 3.4
Figure 11.7: Der Urheberrechtshinweis-Dialog
2. Make sure Enable Copyright Label is checked.
3. Enter the text you want to place on the map. You can include expressions (using the Insert an Expressionbutton).
4. Choose the font for the label from the Font combo box. Set the font color and opacity by clicking theblack arrow to the right of the font combo box.
5. Wählen Sie die Platzierung der Beschriftung in der Platzierung Kombobox aus.
6. Refine the placement of the item by setting a horizontal and/or vertical Margin from Edge. These values canbe in Millimeters or Pixels or set as a Percentage of the width or height of the map canvas.
7. You can change the color to apply
8. Click Apply to verify that it looks as expected or OK if you’re satisfied.
In the example above, which is the default, QGIS places a copyright symbol followed by the date in the bottom-right corner of the map canvas.
Nordpfeil
North Arrow adds a north arrow on the map canvas, with options for style and placement.
To add a north arrow:
1. Select View → Decorations → North Arrow to open the dialog.
2. Make sure Enable north arrow is checked
3. Optionally change the color and size, or choose a custom SVG.
4. Optionally change the angle or choose Automatic to let QGIS determine the direction
5. Optionally choose the placement from the Placement combo box
6. Optionally refine the placement of the arrow by setting a horizontal and/or vertical Margin from (Canvas)Edge. These values can be in Millimeters or Pixels or set as a Percentage of the width or height of the mapcanvas.
7. Click Apply to verify that it looks as expected and OK if you’re satisfied.
Maßstab
Maßstab fügt einen einfachen Maßstab in das Kartenfenster ein. Sie können Maßstabstil und Platzierung so wiedie Beschriftung des Balkens steuern.
11.4. Working with the map canvas 95

QGIS User Guide, Release 3.4
Figure 11.8: Der Nordpfeil Dialog
QGIS only supports displaying the scale in the same units as your map frame. So, if the units of your project’sCRS are meters, you can’t create a scale bar in feet. Likewise, if you are using decimal degrees, you can’t createa scale bar to display distance in meters.
Das Hinzufügen eines Maßstabbalkens geht folgendermaßen:
1. Select View → Decorations → Scale Bar to open the dialog
Figure 11.9: Der Maßstab Dialog
2. Make sure Enable scale bar is checked
3. Choose a style from the Scale bar style combo box
4. Select the Color of bar by choosing a fill color (default: black) and an outline color(default: white). The scale bar fill and outline can be made opaque by clicking on the down arrow to theright of the color input.
96 Chapter 11. Allgemeine Werkzeuge

QGIS User Guide, Release 3.4
5. Select the font for the scale bar from the Font of bar combo box
6. Set the Size of bar
7. Optionally check Automatically snap to round number on resize to display easy-to-read values
8. Choose the placement from the Placement combo box
9. You can refine the placement of the item by setting a horizontal and/or vertical Margin from (Canvas) Edge.These values can be in Millimeters or Pixels or set as a Percentage of the width or height of the mapcanvas.
10. Click Apply to verify that it looks as expected or OK if you’re satisfied.
Layout Extents
Layout Extents adds the extents of map item(s) in print layout(s) to the canvas. When enabled, the extents of allmap items within all print layouts are shown using a lightly dotted border labeled with the name of the print layoutand map item. You can control the style and labeling of the displayed layout extents. This decoration is usefulwhen you are tweaking the positioning of map elements such as labels, and need to know the actual visible regionof print layouts.
Figure 11.10: Example of layout extents displayed in a QGIS project with two print layouts. The print layoutnamed ‚Sights‘ contains two map items, while the other print layout contains one map item.
To add layout extent(s):
1. Select View → Decorations → Layout Extents to open the dialog
2. Make sure Show layout extents is checked
11.4. Working with the map canvas 97

QGIS User Guide, Release 3.4
Figure 11.11: The Layout Extents Dialog
3. Optionally change the symbol and labeling of the extents
4. Click Apply to verify that it looks as expected and OK if you’re satisfied
Tipp: Decorations Settings
When you save a QGIS project file, any changes you have made to Grid, North Arrow, Scale Bar, Copyright andLayout Extents will be saved in the project and restored the next time you load the project.
11.4.5 Beschriftungstools
Annotations are information added to the map canvas and shown within a balloon. This information can be ofdifferent types and annotations are added using the corresponding tools in the Attributes Toolbar:
• Text Annotation for custom formatted text
• HTML Annotation to place the content of an html file
• SVG Annotation to add an SVG symbol
• Form Annotation: useful to display attributes of a vector layer in a customized ui file (see fig-ure_custom_annotation). This is similar to the custom attribute forms, but displayed in an annotation item.Also see this video https://youtu.be/0pDBuSbQ02o?t=2m25s from Tim Sutton for more information.
To add an annotation, select the corresponding tool and click on the map canvas. An empty balloon is added.Double-click on it and a dialog opens with various options. This dialog is almost the same for all the annotationtypes:
• At the top, a file selector to fill with the path to an html, svg or ui file depending on the type of annotation.For text annotation, you can enter your message in a text box and set its rendering with the normal font tools.
• Fixed map position: when unchecked, the balloon placement is based on a screen position (instead ofthe map), meaning that it’s always shown regardless the map canvas extent.
• Linked layer: associates the annotation with a map layer, making it visible only when that layer is visible.
• Map marker: using QGIS symbols, sets the symbol to display at the balloon anchor position (shown onlywhen Fixed map position is checked).
98 Chapter 11. Allgemeine Werkzeuge

QGIS User Guide, Release 3.4
Figure 11.12: Customized QT Designer annotation form
• Frame style: sets the frame background color, transparency, stroke color or width of the balloon using QGISsymbols.
• Contents margins: sets interior margins of the annotation frame.
Figure 11.13: Anmerkungstext Dialog
Annotations can be selected when an annotation tool is enabled. They can then be moved by map position (by
dragging the map marker) or by moving only the balloon. The Move Annotation tool also allows you to move theballoon on the map canvas.
To delete an annotation, select it and either press the Del or Backspace button, or double-click it and press theDelete button in the properties dialog.
Bemerkung: If you press Ctrl+T while an Annotation tool (move annotation, text annotation, form annotation)is active, the visibility states of the items are inverted.
11.4. Working with the map canvas 99

QGIS User Guide, Release 3.4
Tipp: Layout the map with annotations
You can print or export annotations with your map to various formats using:
• map canvas export tools available in the Project menu
• print layout, in which case you need to check Draw map canvas items in the corresponding map itemproperties
11.4.6 Messen
General information
QGIS bietet vier Mittel zur Geometriemessung:
• interactive measurement tools
• measuring in the Field Calculator
• derived measurements in the Identifying Features tool
• the vector analysis tool: Vector → Geometry Tools → Export/Add Geometry Columns
Das Messen funktioniert innerhalb projizierter Koordinatensystemen (z. B. UTM) und unprojizierten Daten. Dieersten drei Messwerkzeuge verhalten gleich, für globale Projekteinstellungen:
• Unlike most other GIS, the default measurement metric is ellipsoidal, using the ellipsoid defined in Project→ Properties. . . → General. This is true both when geographic and projected coordinate systems aredefined for the project.
• If you want to calculate the projected/planimetric area or distance using cartesian maths, the measurementellipsoid has to be set to „None/Planimetric“ (Project → Properties. . . → CRS). However, with a geographic(ie unprojected) CRS defined for the data and project, area and distance measurement will be ellipsoidal.
However, neither the identify tool nor the field calculator will transform your data to the project CRS beforemeasuring. If you want to achieve this, you have to use the vector analysis tool: Vector → Geometry Tools → AddGeometry Attributes. . . . Here, measurement is planimetric, unless you choose the ellipsoidal measurement.
Measure length, areas and angles interactively
Click the icon in the Attribute toolbar to begin measurements. The down arrow near the icon switches between
length, area or angle. The default unit used in the dialog is the one set in Project → Properties. . . →General menu.
Bemerkung: Configuring the measure tool
While measuring length or area, clicking the Configuration button at the bottom of the widget opens the Settings→ Options → Map Tools menu, where you can select the rubberband color, the precision of the measurementsand the unit behavior. You can also choose your preferred measurement or angle units, but keep in mind that thosevalues are overridden in the current project by the selection made in the Project → Properties. . . → Generalmenu, and by the selection made in the measurement widget.
All measuring modules use the snapping settings from the digitizing module (see section Einstellen der Fangtol-eranz und des Suchradius). So, if you want to measure exactly along a line feature, or around a polygon feature,first set its layer snapping tolerance. Now, when using the measuring tools, each mouse click (within the tolerancesetting) will snap to that layer.
100 Chapter 11. Allgemeine Werkzeuge

QGIS User Guide, Release 3.4
By default, Measure Line measures real distances between given points according to a defined ellipsoid. The toolthen allows you to click points on the map. Each segment length, as well as the total, shows up in the measurewindow. To stop measuring, click the right mouse button.
Note that you can use the drop-down list near the total to change the measurement units interactively while workingwith the measure tool (‚Meters‘, ‚Kilometers‘, ‚Feet‘, ‚Yards‘, ‚Miles‘, ‚Nautical miles‘, ‚Centimeters‘, ‚Millime-ters‘, ‚Degrees‘, ‚Map units‘). This unit is retained for the widget until a new project is created or another projectis opened.
The Info section in the dialog explains how calculations are made according to the CRS settings available.
Figure 11.14: Entfernung messen
Measure Area: Areas can also be measured. In the measure window, the accumulated area size appears. Right-click to stop drawing. The Info section is also available as well as the ability to switch between different area units(‚Square meters‘, ‚Square kilometers‘, ‚Square feet‘, ‚Square yards‘, ‚Square miles‘, ‚Hectares‘, ‚Acres‘, ‚Squarecentimeters‘, ‚Square millimeters‘, ‚Square nautical miles‘, ‚Square degrees‘, ‚Map units‘).
Figure 11.15: Fläche messen
Measure Angle: You can also measure angles. The cursor becomes cross-shaped. Click to draw the first segmentof the angle you wish to measure, then move the cursor to draw the desired angle. The measurement is displayedin a pop-up dialog.
Figure 11.16: Winkel messen
11.5 Interacting with features
11.5.1 Selecting features
QGIS provides several tools to select features on the map canvas. Selection tools are available in the View →Select menu or in the Attributes toolbar.
11.5. Interacting with features 101

QGIS User Guide, Release 3.4
Bemerkung: Selection tools work with the currently active layer.
Selecting manually on the map canvas
To select one or more features with the mouse, you can use one of the following tools:
• Select Features by area or single click
• Objekte durch Polygon wählen
• Objekte freihändig wählen
• Objekte durch Radius wählen
Bemerkung: Other than Select Features by Polygon, these manual selection tools allow you to select feature(s) onthe map canvas with a single click.
Bemerkung: Use the Select Features by Polygon tool to use an existing polygon to select overlapping features.Right-click in the polygon and choose it from the context menu that shows a list of all the polygons that containthe clicked point. All the overlapping features from the active layer are selected.
While using the Select Feature(s) tool, holding Shift or Ctrl toggles whether a feature is selected (ie eitheradds to the current selection or remove from it).
For the other tools, different behaviors can be performed by holding down:
• Shift: add features to the current selection
• Ctrl: substract features from the current selection
• Ctrl+Shift: intersect with current selection, ie only keep overlapping features from the current selection
• Alt: select features that are totally within the selection shape. Combined with Shift or Ctrl keys, youcan add or substract features to/from the current selection.
Automatic selection
The other selection tools, also available from the Attribute table, perform a selection based on a feature’s attributeor its selection state (note that attribute table and map canvas show the same information, so if you select onefeature in the attribute table, it will be selected on the map canvas too):
• Select By Expression. . . select features using expression dialog
• Select Features By Value. . . or press F3
• Deselect Features from All Layers or press Ctrl+Shift+A to deselect all selected features in all layers
• Select All Features or press Ctrl+A to select all features in the current layer
• Invert Feature Selection to invert the selection in the current layer
For example, if you want to find regions that are boroughs from regions.shp of the QGIS sample data, you
can use the Select features using an Expression icon. Then, expand the Fields and Values group and choose the field that
102 Chapter 11. Allgemeine Werkzeuge

QGIS User Guide, Release 3.4
you want to query. Double-click the field ‚TYPE_2‘ and also click All Unique in the panel that shows up. Fromthe list, choose and double-click ‚Borough‘. In the Expression field, write the following query:
"TYPE_2" = 'Borough'
From the expression builder dialog, you can also use Function list → Recent (Selection) to make a selection thatyou have used before. The dialog remembers the last 20 expressions used. See Ausdrücke for more informationand examples.
Tipp: Save your selection into a new file
Users can save selected features into a New Temporary Scratch Layer or a New Vector Layer using Edit →Copy Features and Edit → Paste Features as in the desired format.
Select Features By Value
This selection tool opens the layer’s feature form allowing the user to choose which value to look for for eachfield, whether the search should be case-sensitive, and the operation that should be used. The tool has alsoautocompletes, automatically filling the search box with existing values.
Figure 11.17: Filter/Select features using form dialog
Alongside each field, there is a drop-down list with options to control the search behaviour:
11.5. Interacting with features 103

QGIS User Guide, Release 3.4
Field search option String Numeric Date
Exclude Field from the search
Equal to (=)
Not equal to ()
Greater than (>)
Less than (<)
Greater than or equal to ()
Less than or equal to ()
Between (inclusive)
Not between (inclusive)
Contains
Does not contain
Is missing (null)
Is not missing (not null)
Starts with
Ends with
For string comparisons, it is also possible to use the Case sensitive option.
After setting all search options, click Select features to select the matching features. The drop-down options are:
• Select features
• Add to current selection
• Filter current selection
• Remove from current current selection
You can also clear all search options using the Reset form button.
Once the conditions are set, you can also either:
• Zoom to features on the map canvas without the need of a preselection
• Flash features, highlighting the matching features. This is a handy way to identify a feature without selec-tion or using the Identify tool. Note that the flash does not alter the map canvas extent and would be visibleonly if the feature is within the bounds of the current map canvas.
11.5.2 Identifying Features
The Identify tool allows you to interact with the map canvas and get information on features in a pop-up window.To identify features, use:
• View → Identify Features
• Ctrl+Shift+I (or Cmd+Shift+I),
• Identify Features icon on the Attributes toolbar
104 Chapter 11. Allgemeine Werkzeuge

QGIS User Guide, Release 3.4
Using the Identify Features tool
QGIS offers several ways to identify features with the Identify Features tool:
• left click identifies features according to the selection mode and the selection mask set in the Identify Resultspanel
• right click with Identify Feature(s) as selection mode set in the Identify Results panel fetches all snappedfeatures from all visible layers. This opens a context menu, allowing the user to choose more precisely thefeatures to identify or the action to execute on them.
• right click with Identify Features by Polygon as selection mode in the Identify Results panel identifies thefeatures that overlap with the chosen existing polygon, according to the selection mask set in the IdentifyResults panel
Tipp: Filter the layers to query with the Identify Features tool
Under Layer Capabilities in Project → Properties. . . → Data Sources, uncheck the Identifiable column next to a
layer to avoid it being queried when using the Identify Features tool in a mode other than Current Layer. This isa handy way to return features from only layers that are of interest for you.
If you click on feature(s), the Identify Results dialog will list information about the feature(s) clicked. The defaultview is a tree view in which the first item is the name of the layer and its children are its identified feature(s). Eachfeature is described by the name of a field along with its value. This field is the one set in Layer Properties →Display. All the other information about the feature follows.
Feature information
The Identify Results dialog can be customized to display custom fields, but by default it will display the followinginformation:
• The feature display name;
• Actions: Actions can be added to the identify feature windows. The action is run by clicking on the actionlabel. By default, only one action is added, namely View feature form for editing. You can definemore actions in the layer’s properties dialog (see Actions Properties).
• Derived: This information is calculated or derived from other information. It includes:
– general information about the feature’s geometry:
* depending on the geometry type, the cartesian measurements of length, perimeter or area in thelayer’s CRS units
* depending on the geometry type and if an ellipsoid is set in the project properties dialog forMeasurements, the ellipsoidal values of length, perimeter or area using the specified units
* the count of geometry parts in the feature and the number of the part clicked
* the count of vertices in the feature
– coordinate information, using the project properties Coordinates display settings:
* X and Y coordinate values of the point clicked
* the number of the closest vertex to the point clicked
* X and Y coordinate values of the closest vertex (and Z`/`M if applicable)
* if you click on a curved segment, the radius of that section is also displayed.
• Datenattribute: Dies ist die Liste von Attributfeldern und Werten für das Objekt, welches angeklickt wurde.
11.5. Interacting with features 105

QGIS User Guide, Release 3.4
Bemerkung: Links in the feature’s attributes are clickable from the Identify Results panel and will open in yourdefault web browser.
Figure 11.18: Identify Results dialog
The Identify Results dialog
At the top of the window, you have a handful of tools:
• Open Form of the current feature
• Expand tree
• Collapse tree
• Expand New Results by Default to define whether the next identified feature’s information should be collapsedor expanded
• Ergebnisse leeren
• Copy selected feature to clipboard
• Print selected HTML response
• selection mode to use to fetch features to identify:
– Identify Features by area or single click
– Identify Features by Polygon
– Identify Features by Freehand
– Identify Features by Radius
Bemerkung: When using Identify Features by Polygon, you can right-click any existing polygon and use it toidentify overlapping features in another layer.
At the bottom of the window are the Mode and View comboboxes. Mode defines from which layers features shouldbe identified:
• Current layer: only features from the selected layer are identified. The layer need not be visible in thecanvas.
106 Chapter 11. Allgemeine Werkzeuge

QGIS User Guide, Release 3.4
• Top down, stop at first: only features from the upper visible layer.
• Top down: all features from the visible layers. The results are shown in the panel.
• Layer selection: opens a context menu where the user selects the layer to identify features from, similar toa right-click. Only the chosen features will be shown in the result panel.
The View can be set as Tree, Table or Graph. ‚Table‘ and ‚Graph‘ views can only be set for raster layers.
The identify tool allows you to Auto open form. If checked, each time a single feature is identified, a formopens showing its attributes. This is a handy way to quickly edit a feature’s attributes.
Andere Funktionen können im Kontextmenü des abgefragten Objekts gefunden werden. Im Kontextmenü könnenSie z.B.:
• Das Objektformular anzeigen
• Zum Objekt zoomen
• Objekt kopieren: Kopieren Sie alle Objektgeometrien und -attribute
• Toggle feature selection: Add identified feature to selection
• Attributwert kopieren: Kopieren Sie nur den Wert des Attributes auf das Sie klicken
• Objektattribute kopieren: Kopieren Sie die Attribute des Objekts
• Ergebnisse löschen: Löschen Sie Ergebnisse im Fenster
• Hervorhebungen löschen: Entfernen Sie in der Karte hervorgehobene Objekte
• Alle hervorheben
• Layer hervorheben
• Layer aktivieren: Wählen Sie einen Layer der aktiviert werden soll
• Layereigenschaften . . . : Öffnen Sie das Layereigenschaften Fenster
• Alles ausklappen
• Alles zusammenfalten
11.6 Save and Share Layer Properties
11.6.1 Managing Custom Styles
When a vector layer is added to the map canvas, QGIS by default uses a random symbol/color to render its features.However, you can set a default symbol in Project → Properties. . . → Default styles that will be applied to eachnewly added layer according to its geometry type.
Most of the time, though, you’d rather have a custom and more complex style that can be applied automatically ormanually to the layers (with less effort). You can achieve this by using the Style menu at the bottom of the LayerProperties dialog. This menu provides you with functions to create, load and manage styles.
A style stores any information set in the layer properties dialog to render or interact with the layer (includingsymbology, labeling, fields and form definitions, actions, diagrams. . . ) for vector layers, or the pixels (band orcolor rendering, transparency, pyramids, histogram . . . ) for raster.
By default, the style applied to a loaded layer is named default. Once you have got the ideal and appropriate
rendering for your layer, you can save it by clicking the Style combobox and choosing:
• Rename Current: The active style is renamed and updated with the current options
• Add: A new style is created using the current options. By default, it will be saved in the QGIS project file.See below to save the style in another file or a database
• Remove: Delete unwanted style, in case you have more than one style defined for the layer.
11.6. Save and Share Layer Properties 107

QGIS User Guide, Release 3.4
Figure 11.19: Vector layer style combobox options
At the bottom of the Style drop-down list, you can see the styles set for the layer with the active one checked.
Note that each time you validate the layer properties dialog, the active style is updated with the changes you’vemade.
You can create as many styles as you wish for a layer but only one can be active at a time. In combination withMap Themes, this offers a quick and powerful way to manage complex projects without the need to duplicate anylayer in the map legend.
Bemerkung: Given that whenever you apply modifications to the layer properties, changes are stored in theactive style, always ensure you are editing the right style to avoid mistakenly altering a style used in a map theme.
Tipp: Manage styles from layer context menu
Right-click on the layer in the Layers panel to add, rename or remove layer styles.
11.6.2 Storing Styles in a File or a Database
While styles created from the Style combobox are by default saved inside the project and can be copied and pastedfrom layer to layer in the project, it’s also possible to save them outside the project so that they can be loaded inanother project.
Save as text file
Clicking the Style → Save Style, you can save the style as a:
• QGIS layer style file (.qml)
• SLD file (.sld), only available for vector layers
Used on file-based format layers (.shp, .tab. . . ), Save as Default generates a .qml file for the layer (withthe same name). SLDs can be exported from any type of renderer – single symbol, categorized, graduated orrule-based – but when importing an SLD, either a single symbol or rule-based renderer is created. This means
108 Chapter 11. Allgemeine Werkzeuge

QGIS User Guide, Release 3.4
that categorized or graduated styles are converted to rule-based. If you want to preserve those renderers, you haveto use the QML format. On the other hand, it can be very handy sometimes to have this easy way of convertingstyles to rule-based.
Save in database
Vector layer styles can also be stored in a database if the layer datasource is a database provider. Supportedformats are PostGIS, GeoPackage, SpatiaLite, MSSQL and Oracle. The layer style is saved inside a table (namedlayer_styles) in the database. Click on Save Style. . . → Save in database then fill in the dialog to define astyle name, add a description, a .ui file if applicable and to check if the style should be the default style.
You can save several styles for a single table in the database. However, each table can have only one defaultstyle. Default styles can be saved in the layer database or in the QGIS local database, a SQLite database in the~/.qgis2/ directory (where QGIS stores its local settings).
Figure 11.20: Save Style in database Dialog
Tipp: Sharing style files between databases
You can only save your style in a database if the layer comes from such a database. You can’t mix databases (layerin Oracle and style in MSSQL for instance). Use instead a plain text file if you want the style to be shared amongdatabases.
Bemerkung: You may encounter issues restoring the layer_styles table from a PostgreSQL databasebackup. Follow QGIS layer_style table and database backup to fix that.
Load style
When loading a layer in QGIS, if a default style already exists for this layer, QGIS loads the layer with this style.Also Style → Restore Default looks for and loads that file, replacing the layer’s current style.
Style → Load Style helps you apply any saved style to a layer. While text-file styles (.sld or .qml) can beapplied to any layer whatever its format, loading styles stored in a database is only possible if the layer is from thesame database or the style is stored in the QGIS local database.
The Database Styles Manager dialog displays a list of styles related to the layer found in the database and all theother styles saved in it, with name and description.
Tipp: Quickly share a layer style within the project
You can also share layer styles within a project without importing a file or database style: right-click on the layerin the Layers Panel and, from the Styles combobox , copy the style of a layer and paste it to a group or a selection
11.6. Save and Share Layer Properties 109

QGIS User Guide, Release 3.4
of layers: the style is applied to all the layers that are of the same type (vector vs raster) as the original layer and,in the case of vector layers, have the same geometry type (point, line or polygon).
11.6.3 Layer definition file
Layer definitions can be saved as a Layer Definition File (.qlr) using Export → Save As Layer Def-inition File. . . in the active layers‘ context menu. A layer definition file (.qlr) includes references to the datasource of the layers and their styles. .qlr files are shown in the Browser Panel and can be used to add the layers(with the saved style) to the Layers Panel. You can also drag and drop .qlr files from the system file managerinto the map canvas.
11.7 Storing values in Variables
In QGIS, you can use variables to store useful recurrent values (e.g. the project’s title, or the user’s full name) thatcan be used in expressions. Variables can be defined at the application’s global level, project level, layer level,layout level, and layout item’s level. Just like CSS cascading rules, variables can be overwritten - e.g., a projectlevel variable will overwrite any application global level variables set with the same name. You can use thesevariables to build text strings or other custom expressions using the @ character before the variable name. Forexample in print layout creating a label with this content:
This map was made using QGIS [% @qgis_version %]. The project file for thismap is: [% @project_path %]
Wird diesen Namen wie folgt darstellen:
This map was made using QGIS 3.4.4-Madeira. The project file for this map is:/gis/qgis-user-conference-2019.qgs
Besides the preset read-only variables, you can define your own custom variables for any of the levels mentionedabove. You can manage:
• global variables from the Settings → Options menu
• project variables from the Project Properties dialog (see Projekteigenschaften)
• vector layer variables from the Layer Properties dialog (see Vektorlayereigenschaften);
• layout variables from the Layout panel in the Print layout (see The Layout Panel);
• and layout item variables from the Item Properties panel in the Print layout (see Layout Items CommonOptions).
To differentiate from editable variables, read-only variable names and values are displayed in italic. On the otherhand, higher level variables overwritten by lower level ones are strike through.
Bemerkung: You can read more about variables and find some examples in Nyall Dawson’s Exploring variablesin QGIS 2.12, part 1, part 2 and part 3 blog posts.
11.8 Authentifizierung
QGIS has the facility to store/retrieve authentication credentials in a secure manner. Users can securely savecredentials into authentication configurations, which are stored in a portable database, can be applied to server ordatabase connections, and are safely referenced by their ID tokens in project or settings files. For more informationsee Authentifizierungssystem.
110 Chapter 11. Allgemeine Werkzeuge

QGIS User Guide, Release 3.4
Figure 11.21: Variables editor at the project level
11.8. Authentifizierung 111

QGIS User Guide, Release 3.4
Ein Hauptpasswort muss eingerichtet werden, wenn das Authentifizierungssystem und seine tragbare Datenbankinitialisiert werden sollen.
11.9 Common widgets
In QGIS, there are some options you’ll often have to work with. For convenience, QGIS provides you with specialwidgets that are presented below.
11.9.1 Farbauswahl
The color dialog
The Select Color dialog will appear whenever you click the icon to choose a color. Thefeatures of this dialog depend on the state of the Use native color chooser dialogs parameter checkbox in Settings→ Options. . . → General. When checked, the color dialog used is the native one of the OS on which QGIS isrunning. Otherwise, the QGIS custom color chooser is used.
The custom color chooser dialog has four different tabs which allow you to select colors by Color ramp,Color wheel, Color swatches or Color picker. With the first two tabs, you can browse to all possible color combina-tions and apply your choice to the item.
Figure 11.22: Farbauswahl Verlaufstyp
In the Color swatches tab, you can choose from a list of color palettes (see Colors Settings for details). All but the
Recent colors palette can be modified with the Add current color and Remove selected color buttons at the bottom ofthe frame.
The . . . button next to the palette combobox also offers several options to:
• copy, paste, import or export colors
• create, import or remove color palettes
• add the custom palette to the color selector widget with the Show in Color Buttons item (see fig-ure_color_selector)
112 Chapter 11. Allgemeine Werkzeuge

QGIS User Guide, Release 3.4
Figure 11.23: Color selector swatches tab
Another option is to use the Color picker which allows you to sample a color from under your mouse cursor atany part of the QGIS UI or even from another application: press the space bar while the tab is active, move themouse over the desired color and click on it or press the space bar again. You can also click the Sample Colorbutton to activate the picker.
Whatever method you use, the selected color is always described through color sliders for HSV (Hue, Saturation,Value) and RGB (Red, Green, Blue) values. The color is also identifiable in HTML notation.
Modifying a color is as simple as clicking on the color wheel or ramp or on any of the color parameters sliders.You can adjust such parameters with the spinbox beside or by scrolling the mouse wheel over the correspondingslider. You can also type the color in HTML notation. Finally, there is an Opacity slider to set transparency level.
The dialog also provides a visual comparison between the Old color (applied to object) and the Current one (being
selected). Using drag-and-drop or pressing the Add color to swatch button, any of these colors can be saved in aslot for easy access.
Tipp: Quick color modification
Drag-and-drop a color selector widget onto another one to apply its color.
The color drop-down shortcut
Click the drop-down arrow to the right of the color button to display a widget for quick colorselection. This shortcut provides access to:
• a color wheel to pick a color from
• an alpha slider to change color opacity
• the color palettes previously set to Show in Color Buttons
• copy the current color and paste it into another widget
• pick a color from anywhere on your computer display
• choose a color from the color selector dialog
11.9. Common widgets 113

QGIS User Guide, Release 3.4
Figure 11.24: Schnelle Farbwahl Menü
The color ramp drop-down shortcut
Color ramps are a practical way to apply a set of colors to one or many features. Their creation is described in theFarbverlauf section. As for the colors, pressing the color ramp button opens the correspondingcolor ramp type dialog allowing you to change its properties.
Figure 11.25: Customizing a colorbrewer ramp
The drop-down menu to the right of the button gives quick access to a wider set of color ramps and options:
• Invert Color Ramp
• a preview of the gradient or catalog: cpt-city color ramps flagged as Favorites in the StyleManager dialog
• All Color Ramps to access the compatible color ramps database
• Create New Color Ramp. . . of any supported type that could be used in the current widget (note that thiscolor ramp will not be available elsewhere unless you save it in the library)
• Edit Color Ramp. . . , the same as clicking the whole color ramp button
114 Chapter 11. Allgemeine Werkzeuge

QGIS User Guide, Release 3.4
• Save Color Ramp. . . , to save the current color ramp with its customizations in the style library
Figure 11.26: Quick color ramp selection widget
11.9.2 Mischmodi
QGIS offers different options for special rendering effects with these tools that you may previously only knowfrom graphics programs. Blending modes can be applied on layers and features, and also on print layout items:
• Normal: Dies ist der Standardmischmodus, der den Alphakanal des oben liegenden Pixels mit dem darunterliegenden Pixel vermischt. Die Farben werden nicht vermischt.
• Heller: Dies wählt das Maximum jeder Komponente der Vordergrund- und Hintergrundpixel. Seien Siesich bewusst dass die Ergebnisse zackig und hart aussehen können.
• Screen: Light pixels from the source are painted over the destination, while dark pixels are not. This modeis most useful for mixing the texture of one item with another item (such as using a hillshade to textureanother layer).
• Dodge: Brighten and saturate underlying pixels based on the lightness of the top pixel. Brighter top pixelscause the saturation and brightness of the underlying pixels to increase. This works best if the top pixelsaren’t too bright. Otherwise the effect is too extreme.
• Addition: Adds pixel values of one item to the other. In case of values above the maximum value (in thecase of RGB), white is displayed. This mode is suitable for highlighting features.
• Darken: Retains the lowest values of each component of the foreground and background pixels. Likelighten, the results tend to be jagged and harsh.
• Multiply: Pixel values of the top item are multiplied with the corresponding values for the bottom item.The results are darker.
• Burn: Darker colors in the top item cause the underlying items to darken. Burn can be used to tweak andcolorize underlying layers.
• Overlay: Combines multiply and screen blending modes. Light parts become lighter and dark parts becomedarker.
• Soft light: Very similar to overlay, but instead of using multiply/screen it uses color burn/dodge. This issupposed to emulate shining a soft light onto an image.
• Hartes Licht: Auch Hartes Licht ist dem Überlagerungsmodus sehr ähnlich. Hier soll die Projektion einessehr intensiven Lichts auf ein Bild nachgeahmt werden.
• Difference: Subtracts the top pixel from the bottom pixel, or the other way around, in order always to get apositive value. Blending with black produces no change, as the difference with all colors is zero.
11.9. Common widgets 115

QGIS User Guide, Release 3.4
• Subtract: Subtracts pixel values of one item from the other. In the case of negative values, black is dis-played.
11.9.3 Datendefinierte Übersteuerung Setup
Next to many options in the vector layer properties dialog or settings in the print layout, you will find aData defined override icon. Using expressions based on layer attributes or item settings, prebuilt or custom functionsand variables, this tool allows you to set dynamic values for parameters. When enabled, the value returned by thiswidget is applied to the parameter regardless of its normal value (checkbox, textbox, slider. . . ).
The data defined override widget
Clicking the Data defined override icon shows the following entries:
• Description. . . that indicates if the option is enabled, which input is expected, the valid input type and thecurrent definition. Hovering over the widget also pops up this information.
• Store data in the project: a button allowing the property to be stored using to the Auxiliary Storage Proper-ties mechanism.
• Field type: an entry to select from the layer’s fields that match the valid input type.
• An entry to list the Variable available.
• Edit. . . button to create or edit the expression to apply, using the Expression String Builder dialog. To helpyou correctly fill in the expression, a reminder of the expected output’s format is provided in the dialog.
• Paste and Copy buttons.
• Löschen Knopf, um das Setup zu entfernen.
• For numeric and color properties, Assistant. . . to rescale how the feature data is applied to the property(more details below)
Tipp: Use right-click to (de)activate the data override
When the data-defined override option is set up correctly the icon is yellow or . If it is broken, the icon is
red or .
You can enable or disable a configured data-defined override button by simply clicking the widget with the rightmouse button.
Using the data-defined assistant interface
When the Data-defined override button is associated with a numeric or color parameter, it has an Assistant. . . optionthat allows you to change how the data is applied to the parameter for each feature. The assistant allows you to:
• Define the Input data, ie:
– the attribute to represent, using the Field listbox or the Set column expression function (see Ausdrücke)
– the range of values to represent: you can manually enter the values or use the Fetch value range from layer
button to fill these fields automatically with the minimum and maximum values returned by the chosenattribute or the expression applied to your data
116 Chapter 11. Allgemeine Werkzeuge

QGIS User Guide, Release 3.4
• Apply transform curve: by default, output values (see below for setting) are applied to input featuresfollowing a linear scale. You can override this logic: enable the transform option, click on the graphic toadd break point(s) and drag the point(s) to apply a custom distribution.
• Define the Output values: the options vary according to the parameter to define. You can globally set:
– the minimum and maximum values to apply to the selected property (n case of a color setting, you’llneed to provide a color ramp)
– the Scale method of representation which can be Flannery, Exponential, Surface or Radius
– the Exponent to use for data scaling
– the output value or color to represent features with NULL values
When compatible with the property, a live-update preview is displayed in the right-hand side of the dialog to helpyou control the value scaling.
Figure 11.27: The data-defined size assistant
The values presented in the varying size assistant above will set the size ‚Data-defined override‘ with:
coalesce(scale_exp(Importance, 1, 20, 2, 10, 0.57), 1)
11.9. Common widgets 117

QGIS User Guide, Release 3.4
118 Chapter 11. Allgemeine Werkzeuge

CHAPTER 12
Verwaltung von Datenquellen
12.1 Opening Data
As part of an Open Source Software ecosystem, QGIS is built upon different libraries that, combined with its ownproviders, offer capabilities to read and often write a lot of formats:
• Vector data formats include ESRI formats (Shapefile, Geodatabase. . . ), MapInfo and MicroStation file for-mats, AutoCAD DWG/DXF, GeoPackage, GeoJSON, GRASS, GPX, KML, Comma Separated Values, andmany more. . . Read the complete list of OGR vector supported formats.
• Raster data formats include ArcInfo Binary Grid, ArcInfo ASCII Grid, JPEG, GeoTIFF, ERDAS IMAGINE,MBTiles, R or Idrisi rasters, ASCII Gridded XYZ, GDAL Virtual, SRTM, Sentinel Data, and many more. . .Read the complete list of raster supported formats.
• Database formats include PostgreSQL/PostGIS, SQLite/SpatiaLite, Oracle, DB2 or MSSQL Spatial,MySQL. . .
• Support of web data services (WM(T)S, WFS, WCS, CSW, ArcGIS Servers. . . ) is also handled by QGISproviders (see QGIS als OGC Datenclient).
• You can also read supported files from archived folders and use QGIS native formats such as virtual andmemory layers.
As of the date of this document, more than 80 vector and 140 raster formats are supported by the GDAL/OGR andQGIS native providers.
Bemerkung: Not all of the listed formats may work in QGIS for various reasons. For example, some requireexternal proprietary libraries, or the GDAL/OGR installation of your OS may not have been built to support theformat you want to use. To have a list of available formats, run the command line ogrinfo --formats (forvector) or check settings → Options → GDAL menu (for raster) in QGIS.
In QGIS, depending on the data format, there are different tools to open it, mainly available in the Layer →Add Layer → menu or from the Manage Layers toolbar (enabled through View → Toolbars menu). However, all
these tools point to a unique dialog, the Data Source Manager dialog that you can directly open with theOpen Data Source Manager button available on the Data Source Manager Toolbar or by pressing Ctrl+L. Indeed, theData Source Manager dialog offers a unified interface to open vector or raster file-based data as well as databases
or web services supported by QGIS. It can be set modal or not with the Modeless data source manager dialogin Settings → Options → General menu.
119

QGIS User Guide, Release 3.4
Figure 12.1: QGIS Data Source Manager dialog
120 Chapter 12. Verwaltung von Datenquellen

QGIS User Guide, Release 3.4
Beside this main entry point, you also have the DB Manager plugin that offers advanced capabilities to analyzeand manipulate connected databases. More information on DB Manager capabilities are exposed in DB ManagerPlugin.
There are also many other tools, native or third-party plugins, that help you open dedicated data formats.
This chapter will describe only the tools provided by default in QGIS to load data. It will mainly focus on theData Source Manager dialog but more than describing each tab, it will also explore the tools based on the dataprovider or format specificities.
12.1.1 The Browser Panel
The Browser is one of the main ways to quickly and easily add your data to projects. It’s available as:
• a Data Source Manager tab, enabled pressing the Open Data Source Manager button (Ctrl+L);
• as a QGIS panel you can open from the menu View → Panels (or Settings → Panels) or by pressingCtrl+2.
In both cases, the Browser helps you navigate in your file system and manage geodata, regardless the type of layer(raster, vector, table), or the datasource format (plain or compressed files, database, web services).
To add a layer into a project, using the Browser interface:
1. Enable the Browser as described above. A browser tree with your file system, databases and web services isdisplayed. You may need to connect databases and web services before they appear (see dedicated sections).
2. Find the layer in the list.
3. Double-click its name or drag-and-drop it into the map canvas. Your layer is now added to the Layers paneland can be viewed in the map canvas.
Tipp: Open a QGIS project directly from the browser
You can also open a QGIS project directly from the Browser panel by double-clicking its name or by drag-and-drop into the map canvas.
Once a file is loaded, you can zoom around it using the map navigation tools. To change the style of a layer,open the Layer Properties dialog by double clicking on the layer name or by right-clicking on the name in thelegend and choosing Properties from the context menu. See section Symbology Properties for more informationon setting symbology of vector layers.
At the top of the Browser panel, you find some icons that help you to:
• Add Selected Layers: you can also add data into the map canvas by selecting Add selected layer(s) from thelayer’s context menu;
• Refresh the browser tree;
• Filter Browser to search for specific data. Enter a search word or wildcard and the browser will filter the treeto only show paths to matching DB tables, filenames or folders – other data or folders won’t be displayed.See the Browser Panel(2) example on the figure_browser_panels. The comparison can be case-sensitive ornot. It can also be set to:
– normal: return any item containing the search text;
– using wildcard(s): fine tune the search using ? and/or * characters to specify the position of the searchtext;
– using a regular expression.
• Collapse All the whole tree;
12.1. Opening Data 121

QGIS User Guide, Release 3.4
• Enable/disable properties widget: when toggled on, a new widget is added at the bottom of the panel showing, ifapplicable, metadatas of the selected item.
Right-click an item in the browser tree helps you to:
• in case of file or table, display its metadata or open it in your project. Tables can even be renamed, deletedor truncated;
• in case of folder, bookmark it into your favourites, hide it from the browser tree. Hidden folders can bemanaged from the Settings → Options → Data Sources tab;
• create connection to databases or web servers;
• refresh, rename or delete schema.
You can also import files into databases or copy tables from one schema/database to another one with a simpledrag-and-drop. There is a second browser panel available to avoid long scrolling while dragging. Just select thefile and drag-and-drop from one panel to the other.
Figure 12.2: QGIS Browser panels side-by-side
Tipp: Add layers to QGIS by simple drag-and-drop from your OS file browser
You can also add file(s) to the project by drag-and-dropping them from your operating system file browser to theLayers Panel or the map canvas.
12.1.2 The DB Manager
The DB Manager Plugin is another one of the main and native tools to integrate and manage spatial databaseformats supported by QGIS (PostGIS, SpatiaLite, GeoPackage, Oracle Spatial, MSSQL, DB2, Virtual layers) inone user interface. It can be activated from the Plugins → Manage and Install Plugins. . . menu.
The DB Manager Plugin provides several features:
• connect to databases and display its structure and contents;
• preview tables of databases;
122 Chapter 12. Verwaltung von Datenquellen

QGIS User Guide, Release 3.4
• add layers to map canvas, either by double-click or drag-and-drop;
• add layers to a database from the QGIS Browser or from another database;
• create and add output of SQL queries to the map canvas;
• create virtual layers.
More information on DB Manager capabilities are exposed in DB Manager Plugin.
Figure 12.3: DB Manager dialog
12.1.3 Provider-based loading tools
Beside Browser Panel and DB Manager, the main tools provided by QGIS to add layers regardless the format,you’ll also find tools that are specific to data providers.
Bemerkung: Some external plugins also propose tools to open specific format files in QGIS.
Loading a layer from a file
To load a layer from a file, you can:
• for vector data (like Shapefile, Mapinfo or dxf layer), click on Add Vector Layer toolbar button, select the
Layer → Add Layer → Add Vector Layer menu option or press Ctrl+Shift+V. This will bring up
12.1. Opening Data 123

QGIS User Guide, Release 3.4
a new window (see figure_vector_add) from which you can check File and click on Browse. You canalso specify the encoding for the file if desired.
Figure 12.4: Add Vector Layer Dialog
• for raster layers, click on the Add Raster Layer icon, select the Layer → Add Layer → Add Raster Layermenu option or type Ctrl+Shift+R.
That will bring up a standard open file dialog (see figure_vector_open), which allows you to navigate the file
system and load a shapefile, a geotiff or other supported data source. The selection box Filter allows youto preselect some supported file formats. Only the formats that have been well tested appear in the list. Otheruntested formats can be loaded by selecting All files (*.*).
Figure 12.5: Open an OGR Supported Vector Layer Dialog
Selecting a file from the list and clicking Open loads it into QGIS. More than one layer can be loaded at the sametime by holding down the Ctrl or Shift key and clicking on multiple items in the dialog. Figure_vector_loadedshows QGIS after loading the alaska.shp file.
Bemerkung: Because some formats like MapInfo (e.g., .tab) or Autocad (.dxf) allow mixing different types
124 Chapter 12. Verwaltung von Datenquellen

QGIS User Guide, Release 3.4
Figure 12.6: QGIS with Shapefile of Alaska loaded
12.1. Opening Data 125

QGIS User Guide, Release 3.4
of geometry in a single file, loading such format in QGIS opens a dialog to select geometries to use in order tohave one geometry per layer.
Using the Add Vector Layer tool:
• You can also load specific formats like ArcInfo Binary Coverage, UK. National TransferFormat, as well as the raw TIGER format of the US Census Bureau or OpenfileGDB. To do that,
you’d need to select Directory as Source type. In this case a directory can be selected in the dialog afterpressing Browse.
• With the Database source type you can select an existing database connection or create one tothe selected database type. Available database types are ODBC, OGDI Vectors, Esri PersonalGeodatabase, MySQL as well as PostgreSQL or MSSQL.
Pressing the New button opens the Create a New OGR Database Connection dialog whose parameters areamong the ones you can find in Creating a stored Connection. Pressing Open you can select from theavailable tables for example of the PostGIS enabled database.
• The last source type, Protocol, enables to open data from the web using for example GeoJSON orCouchDB format. After selecting the type you have to fill URI of the source.
Tipp: Load layers and projects from mounted external drives on macOS
On macOS, portable drives that are mounted beside the primary hard drive do not show up as expected under File→ Open. . . . We are working on a more macOS-native open/save dialog to fix this. As a workaround, you cantype /Volumes in the File name box and press Enter. Then you can navigate to external drives and networkmounts.
Importing a delimited text file
Delimited text file (e.g. .csv, .txt) can be loaded in QGIS using the tools described above. However, loadedthis way, it’ll show up like a simple table data. Sometimes, delimited text files can contain geometric data you’d
want to visualize; this is what the Add Delimited Text Layer is designed for.
Click the Open Data Source Manager icon to open the Data Source Manager dialog and enable the DelimitedText tab, as shown in figure_delimited_text.
First, select the file to import (e.g., qgis_sample_data/csv/elevp.csv) by clicking on the Browse but-ton. In the Layer name field, provide the name to use for the layer in the project (e.g., Elevation).
File format
Once the file is selected, QGIS attempts to parse the file with the most recently used delimiter, trying to identifyfields and rows. To enable QGIS to properly parse the file, it is important to select the correct delimiter. You canspecify a delimiter by activating:
• CSV (comma separated values) to use the comma character;
• Custom delimiters, choosing among some predefined delimiters like comma, space, tab,semicolon. . . ;
• or Regular expression delimiter and entering text into the Expression field. For example, to change thedelimiter to tab, use \t (this is a regular expression for the tab character).
126 Chapter 12. Verwaltung von Datenquellen

QGIS User Guide, Release 3.4
Figure 12.7: Delimited Text Dialog
12.1. Opening Data 127

QGIS User Guide, Release 3.4
Records and fields
Other than settings to identify rows and fields in the data, some convenient options can be used to tweak the datarecognition:
• Number of header lines to discard: convenient when you want to avoid some lines to show in the import,either because those are blank lines or with another formatting.
• First records has field names: values in the first row of data are used as field names, otherwise QGISadds a fields row of a type field_1, field_2. . .
• Detect field types: automatically recognizes the field type. If unchecked then all attributes are treated astext fields.
• Decimal separator is comma: if necessary, you can force a comma to be the decimal separator.
• Trim fields: allows you to trim leading and trailing spaces from fields.
• Discard empty fields.
As you set the parser properties, a sample data preview updates at the bottom of the dialog.
Geometry definition
Once the file is parsed, set Geometry definition to
• Point coordinates and provide the X field and Y field if the layer is of point geometry type and contain
such coordinate fields. If the coordinates are defined as degrees/minutes/seconds, activate the DMScoordinates checkbox;
• Well known text (WKT) option if the spatial information is represented by WKT: select the Geometryfield containing the WKT definition and choose the approriate Geometry field or let QGIS auto-detect it;
• If the file contains non-spatial data, activate No geometry (attribute only table) and it will be loaded asan ordinary table.
Besides the features geometry information, you can also set the layer’s Geometry CRS using the Select CRS
widget.
Layer settings
Additionally, you can enable:
• Use spatial index to improve the performance of displaying and spatially selecting features;
• Use subset index to improve performance of subset filters (when defined in the layer properties);
• Watch file to watch for changes to the file by other applications while QGIS is running.
At the end, click OK to add the layer to the map. In our example, a point layer named Elevation is added tothe project and behaves like any other map layer in QGIS. However, this layer is the result of a query on the .csvsource layer (hence, linked to it) and would require to be saved in order to get a spatial layer on disk.
Importing a DXF or DWG file
DXF and DWG files can be added to QGIS by simple drag-and-drop from the common Browser Panel. You’ll beprompted to select the sublayers you’d like to add to the project. Layers are added with random style properties.
128 Chapter 12. Verwaltung von Datenquellen

QGIS User Guide, Release 3.4
Bemerkung: DXF files containing several geometry types (point, line and/or polygon), the name of the layerwill be made from <filename.dxf> entities <geometry type>.
To keep the dxf/dwg file structure and its symbology in QGIS, you may want to use the dedicated Project →Import/Export → Import Layers from DWG/DXF. . . tool which allows you to:
1. import elements from the drawing file into a GeoPackage database.
2. and add to the project any of the imported elements.
In the DWG/DXF Import dialog, to first import the drawing file contents:
1. Input the location of the Target package, i.e. the new GeoPackage file that will store the data. If an existingfile is provided, then it will be overwritten.
2. Specify the coordinate reference system of the data in the drawing file.
3. Check Expand block references to import the blocks in the drawing file as normal elements.
4. Check Use curves to promote the imported layers to a curved geometry type.
5. Use the Import button to select the DWG/DXF file to use (one per geopackage). The GeoPackage databasewill be automatically populated with the drawing file content. Depending on the size of the *CAD file, thiscould take some time.
After the .dwg or .dxf data is imported into the GeoPackage database the frame in the lower half of the dialogis populated with the list of layers from the imported file. There you can select which layers to add to the QGISproject:
1. At the top, set a Group name to group the drawing files in the project.
2. Check layers to show: Each selected layer is added to an ad hoc group which contains vector layers for thepoint, line, label and area features of the drawing layer. The style of each layer is setup so that it resemblesthe look it originally had in *CAD.
3. Check whether layer should be visible at opening.
4. Alternatively using the Merge layers option places all layers in a single group.
5. Press OK to open the layers in QGIS.
Importing OpenStreetMap Vectors
In recent years, the OpenStreetMap project has gained popularity because in many countries no free geodata suchas digital road maps are available. The objective of the OSM project is to create a free editable map of the worldfrom GPS data, aerial photography or local knowledge. To support this objective, QGIS provides support for OSMdata.
Using the Browser Panel, you can load a .osm file to the map canvas, in which case you’ll get a dialog to selectsublayers based on the geometry type. The loaded layers will contain all the data of that geometry type in the fileand keep the osm file data structure.
SpatiaLite Layers
The first time you load data from a SpatiaLite database, begin by:
• clicking on the Add SpatiaLite Layer toolbar button;
• selecting the Add SpatiaLite Layer. . . option from the Layer → Add Layer menu;
• or by typing Ctrl+Shift+L.
12.1. Opening Data 129

QGIS User Guide, Release 3.4
Figure 12.8: Import dialog for DWG/DXF files
130 Chapter 12. Verwaltung von Datenquellen

QGIS User Guide, Release 3.4
This will bring up a window that will allow you either to connect to a SpatiaLite database already known to QGIS,which you can choose from the drop-down menu, or to define a new connection to a new database. To define anew connection, click on New and use the file browser to point to your SpatiaLite database, which is a file with a.sqlite extension.
QGIS also supports editable views in SpatiaLite.
GPS
Loading GPS data in QGIS can be done using the core plugin: GPS Tools. Instructions are described in SectionGPS Plugin.
GRASS
Working with GRASS vector data is described in Section GRASS GIS Integration.
Database related tools
Creating a stored Connection
In order to read and write tables from the many database formats QGIS supports you’ll need to create a connectionto that database. While QGIS Browser Panel is the simplest and recommanded way to connect and use databases,QGIS provides other tools to connect to each of them and load their tables:
• Add PostGIS Layer. . . or by typing Ctrl+Shift+D;
• Add MSSQL Spatial Layer or by typing Ctrl+Shift+M;
• Add Oracle Spatial Layer. . . or by typing Ctrl+Shift+O;
• Add DB2 Spatial Layer. . . or by typing Ctrl+Shift+2.
These tools are accessible either from the Manage Layers Toolbar or the Layer → Add Layer → menu. Connectingto SpatiaLite database is described at SpatiaLite Layers.
Tipp: Create connection to database from the QGIS Browser Panel
Select the corresponding database format in the Browser tree, right-click and choose connect will provide youwith the database connection dialog.
Most of the connection dialogs follow a common basis that will be described below using the PostGreSQLdatabase tool as example. For additional settings specific to other providers, you can find corresponding de-scription at:
• Connecting to MSSQL Spatial;
• Connecting to Oracle Spatial;
• Connecting to DB2 Spatial.
The first time you use a PostGIS data source, you must create a connection to a database that contains the data.Begin by clicking the appropriate button as exposed above, opening an Add PostGIS Table(s) dialog (see fig-ure_add_postgis_tables). To access the connection manager, click on the New button to display the Create a NewPostGIS Connection dialog.
The parameters required for a PostGIS connection are exposed below. For the other database types, see theirdifferences at Particular Connection requirements.
• Name: A name for this connection. It can be the same as Database.
12.1. Opening Data 131

QGIS User Guide, Release 3.4
Figure 12.9: Create a New PostGIS Connection Dialog
• Service: Service parameter to be used alternatively to hostname/port (and potentially database). This can bedefined in pg_service.conf. Check the PostgreSQL Service connection file section for more details.
• Host: Name of the database host. This must be a resolvable host name such as would be used to open aTCP/IP connection or ping the host. If the database is on the same computer as QGIS, simply enter localhosthere.
• Port: Port number the PostgreSQL database server listens on. The default port for PostGIS is 5432.
• Database: Name of the database.
• SSL mode: How the SSL connection will be negotiated with the server. Note that massive speed-ups inPostGIS layer rendering can be achieved by disabling SSL in the connection editor. The following optionsare available:
– Disable: Only try an unencrypted SSL connection;
– Allow: Try a non-SSL connection. If that fails, try an SSL connection;
– Prefer (the default): Try an SSL connection. If that fails, try a non-SSL connection;
– Require: Only try an SSL connection.
• Username: User name used to log in to the database.
• Password: Password used with Username to connect to the database.
You can save any or both of the username and password parameters, in which case they will be used bydefault each time you need to connect to this database. If not saved, you’ll be prompted to fill the missingcredentials to connect to the database in next QGIS sessions; meanwhile the connection parameters youentered are stored in a temporary internal cache and returned whenever a username/password for the samedatabase is requested, until you close the current QGIS process.
132 Chapter 12. Verwaltung von Datenquellen

QGIS User Guide, Release 3.4
Warnung: QGIS User Settings and Security
In the Authentication tab, saving username and password will keep unprotected credentials in theconnection configuration. Those credentials will be visible if, for instance, you shared the projectfile with someone. Therefore, it’s advisable to save your credentials in a Authentication configurationinstead (Configurations tab - See Authentifizierungssystem for more details) or in a service connectionfile (see PostgreSQL Service connection file for example).
Optionally, depending on the type of database, you can activate the following checkboxes:
• Only show layers in the layer registries
• Don’t resolve type of unrestricted columns (GEOMETRY)
• Only look in the ‚public‘ schema
• Also list tables with no geometry
• Use estimated table metadata
• Allow saving/loading QGIS projects in the database: more details here
Tipp: Use estimated table metadata to speed up operations
When initializing layers, various queries may be needed to establish the characteristics of the geometries storedin the database table. When the Use estimated table metadata option is checked, these queries examine only asample of the rows and use the table statistics, rather than the entire table. This can drastically speed up operationson large datasets, but may result in incorrect characterization of layers (eg. the feature count of filtered layerswill not be accurately determined) and may even cause strange behaviour in case columns that are supposed to beunique actually are not.
Once all parameters and options are set, you can test the connection by clicking on the Test Connection button orapply it hitting OK. From the Add PostGIS Table(s), click now on Connect and the dialog is filled with tables fromthe selected database (as shown in figure_add_postgis_tables).
Particular Connection requirements
Because of database type particularities, provided options are all the same for all the databases. Below are exposedthese connection specificities.
PostgreSQL Service connection file
The service connection file allows PostgreSQL connection parameters to be associated with a single service name.That service name can then be specified by a client and the associated settings will be used.
It’s called .pg_service.conf under *nix systems (GNU/Linux, macOS etc.) and pg_service.conf onWindows.
The service file looks like:
[water_service]host=192.168.0.45port=5433dbname=gisdbuser=paulpassword=paulspass
12.1. Opening Data 133

QGIS User Guide, Release 3.4
[wastewater_service]host=dbserver.comdbname=wateruser=waterpass
Bemerkung: There are two services in the above example: water_service and wastewater_service.You can use these to connect from QGIS, pgAdmin etc. by specifying only the name of the service you want toconnect to (without the enclosing brackets). If you want to use the service with psql you need to do somethinglike export PGSERVICE=water_service before doing your psql commands.
You can find all the parameters here
Bemerkung: If you don’t want to save the passwords in the service file you can use the .pg_pass option.
On *nix operating systems (GNU/Linux, macOS etc.) you can save the .pg_service.conf file in the user’shome directory and the PostgreSQL clients will automatically be aware of it. For example, if the logged user isweb, .pg_service.conf should be saved in the /home/web/ directory in order to directly work (withoutspecifying any other environment variables).
You can specify the location of the service file by creating a PGSERVICEFILE environment variable (e.g. runthe export PGSERVICEFILE=/home/web/.pg_service.conf command under your *nix OS to tem-porarily set the PGSERVICEFILE variable)
You can also make the service file available system-wide (all users) either by placing the .pg_service.conffile at pg_config --sysconfdir or by adding the PGSYSCONFDIR environment variable to specify thedirectory containing the service file. If service definitions with the same name exist in the user and the system file,the user file takes precedence.
Warnung: There are some caveats under Windows:
• The service file should be saved as pg_service.conf and not as .pg_service.conf.
• The service file should be saved in Unix format in order to work. One way to do it is to open it withNotepad++ and Edit → EOL Conversion → UNIX Format → File save.
• You can add environmental variables in various ways; a tested one, known to work reliably, is ControlPanel → System and Security → System → Advanced system settings → Environment Variables addingPGSERVICEFILE and the path of the type C:\Users\John\pg_service.conf
• After adding an environment variable you may also need to restart the computer.
Connecting to Oracle Spatial
The spatial features in Oracle Spatial aid users in managing geographic and location data in a native type withinan Oracle database. In addition to some of the options in Creating a stored Connection, the connection dialogproposes:
• Database: SID or SERVICE_NAME of the Oracle instance;
• Port: Port number the Oracle database server listens on. The default port is 1521;
• Workspace: Workspace to switch to.
Optionally, you can activate following checkboxes:
• Only look in metadata table: restricts the displayed tables to those that are in theall_sdo_geom_metadata view. This can speed up the initial display of spatial tables.
134 Chapter 12. Verwaltung von Datenquellen

QGIS User Guide, Release 3.4
• Only look for user’s tables: when searching for spatial tables, restricts the search to tables that are ownedby the user.
• Also list tables with no geometry: indicates that tables without geometry should also be listed by default.
• Use estimated table statistics for the layer metadata: when the layer is set up, various metadata arerequired for the Oracle table. This includes information such as the table row count, geometry type andspatial extents of the data in the geometry column. If the table contains a large number of rows, determiningthis metadata can be time-consuming. By activating this option, the following fast table metadata operationsare done: Row count is determined from all_tables.num_rows. Table extents are always determinedwith the SDO_TUNE.EXTENTS_OF function, even if a layer filter is applied. Table geometry is determinedfrom the first 100 non-null geometry rows in the table.
• Only existing geometry types: only lists the existing geometry types and don’t offer to add others.
• Include additional geometry attributes.
Tipp: Oracle Spatial Layers
Normally, an Oracle Spatial layer is defined by an entry in the USER_SDO_METADATA table.
Connecting to DB2 Spatial
In addition to some of the options described in Creating a stored Connection, the connection to a DB2 database(see DB2 Spatial Layers for more information) can be specified using either a Service/DSN name defined toODBC or using the driver, host and port information.
An ODBC Service/DSN connection requires the service name defined to ODBC.
A driver/host/port connection requires:
• Driver: Name of the DB2 driver. Typically this would be IBM DB2 ODBC DRIVER.
• DB2 Host: Name of the database host. This must be a resolvable host name such as would be used toopen a TCP/IP connection or ping the host. If the database is on the same computer as QGIS, simply enterlocalhost here.
• DB2 Port: Port number the DB2 database server listens on. The default DB2 LUW port is 50000. Thedefault DB2 z/OS port is 446.
Tipp: DB2 Spatial Layers
A DB2 Spatial layer is defined by a row in the DB2GSE.ST_GEOMETRY_COLUMNS view.
Bemerkung: In order to work effectively with DB2 spatial tables in QGIS, it is important that tables have anINTEGER or BIGINT column defined as PRIMARY KEY and if new features are going to be added, this columnshould also have the GENERATED characteristic.
It is also helpful for the spatial column to be registered with a specific spatial reference identifier (most often 4326for WGS84 coordinates). A spatial column can be registered by calling the ST_Register_Spatial_Columnstored procedure.
Connecting to MSSQL Spatial
In addition to some of the options in Creating a stored Connection, creating a new MSSQL connection dialogproposes you to fill a Provider/DSN name. You can also display available databases.
12.1. Opening Data 135

QGIS User Guide, Release 3.4
Loading a Database Layer
Once you have one or more connections defined to a database (see section Creating a stored Connection), youcan load layers from it. Of course, this requires having available data. See e.g. section Importing Data intoPostgreSQL for a discussion on importing data into a PostGIS database.
To load a layer from a database, you can perform the following steps:
1. Open the „Add <database> table(s)“ dialog (see Creating a stored Connection).
2. Choose the connection from the drop-down list and click Connect.
3. Select or unselect Also list tables with no geometry.
4. Optionally, use some Search Options to reduce the list of tables to those matching your search. You canalso set this option before you hit the Connect button, speeding this way the database fetching.
5. Find the layer(s) you wish to add in the list of available layers.
6. Select it by clicking on it. You can select multiple layers by holding down the Shift key while clicking.
7. If applicable, use the Set Filter button (or double-click the layer) to start the Query Builder dialog (Seesection Abfrageeditor) and define which features to load from the selected layer. The filter expressionappears in the sql column. This restriction can be removed or edited in the Layer Properties → General→ Provider Feature Filter frame.
8. The checkbox in the Select at id column that is activated by default gets the features ids without theattributes and speeds in most cases the data loading.
9. Click on the Add button to add the layer to the map.
Figure 12.10: Add PostGIS Table(s) Dialog
Tipp: Use the Browser Panel to speed up loading of database table(s)
Adding DB tables from their ad hoc tab of the Data Source Manager dialog to QGIS may sometimes be timeconsuming as QGIS fetches statistics and properties (e.g. geometry type and field, CRS, number of features) of
136 Chapter 12. Verwaltung von Datenquellen

QGIS User Guide, Release 3.4
each table beforehand. To avoid this, once the connection is set, it’s better to use the Browser Panel or the DBManager to drag and drop the database tables in the map canvas.
12.1.4 QGIS Custom formats
QGIS proposes two custom formats you can load in the application using their own loading tool:
• Temporary Scratch Layer: a memory layer that is bound to the project it’s opened with (see Creating a newTemporary Scratch Layer for more information)
• Virtual Layers: a layer resulting from a query on other layer(s) (see Creating virtual layers for more infor-mation)
12.1.5 Connecting to web services
With QGIS you can have access to different types of OGC web services (WM(T)S, WFS(-T), CSW . . . ). Thanksto QGIS Server, you can also publish these services. Description of these capabilities and how-to are provided inchapter Arbeiten mit OGC Daten.
12.2 Creating Layers
Layers can be created in many ways, including:
• empty layers from scratch;
• layers from existing layers;
• layers from the clipboard;
• layers as a result of an SQL-like query based on one or many layers: the virtual layer.
QGIS also provides tools to import/export different formats.
12.2.1 Creating new vector layers
QGIS allows you to create new Shapefile layers, new SpatiaLite layers, new GPX layers and new TemporaryScratch layers. Creation of a new GRASS layer is supported within the GRASS plugin. (Please refer to sectionEinen neuen GRASS Vektorlayer erstellen for more information on creating GRASS vector layers.)
Creating a new GeoPackage layer
To create a new GeoPackage layer go to Layer → New → New GeoPackage Layer. . . . The New GeoPackageLayer dialog will be displayed as shown in figure_create_geopackage.
The first step is to select an existing GeoPackage or create a new one. This can be done by pressing the ellipses. . . button at the right of the Database field. Then, give a name for the new layer, define the layer type and specifythe coordinate reference system with Specify CRS.
To define an attribute table for the new GeoPackage layer, add the names of the attribute columns you want tocreate with the corresponding column type, and click on the Add to Fields List button. Once you are happy withthe attributes, click OK. QGIS will automatically add the new layer to the legend, and you can edit it in the sameway as described in section Einen vorhandenen Layer editieren.
12.2. Creating Layers 137

QGIS User Guide, Release 3.4
Figure 12.11: Creating a New GeoPackage layer dialog
138 Chapter 12. Verwaltung von Datenquellen

QGIS User Guide, Release 3.4
Creating a new Shapefile layer
To create a new Shapefile layer, choose Create Layer → New Shapefile Layer. . . from the Layer menu orselect it from the Data Source Manager toolbar. The New Shapefile Layer dialog will be displayed as shown infigure_create_shapefile. The first step is to provide a path and name for the Shapefile. QGIS will automatically addthe .shp extension to the name you specify Next, choose the type of layer (point, line or polygon) and optionalZ or M dimensions, as well as the CRS (coordinate reference system).
Figure 12.12: Creating a new Shapefile layer dialog
To complete the creation of the new Shapefile layer, add the desired attributes by specifying a name and typefor each attribute and clicking on the Add to Fields List button. A first ‚id‘ column is added by default but
can be removed, if not wanted. Only Decimal number , Whole number , Text data and Date
attributes are supported. Additionally, depending on the attribute type, you can also define the length andprecision of the new attribute column. Once you are happy with the attributes, click OK. Once the Shapefile hasbeen created, it will be added to the map as a new layer, and you can edit it in the same way as described in sectionEinen vorhandenen Layer editieren.
Creating a new SpatiaLite layer
To create a new SpatiaLite layer for editing, choose Create Layer → New SpatiaLite Layer. . . from the Layermenu or select it from the Data Source Manager toolbar. The New SpatiaLite Layer dialog will be displayed as
12.2. Creating Layers 139

QGIS User Guide, Release 3.4
shown in Figure_create_spatialite.
Figure 12.13: Creating a New SpatiaLite layer dialog
The first step is to select an existing SpatiaLite database or to create a new SpatiaLite database. This can bedone with the . . . button at the right of the database field. Then, add a name for the new layer, define the layer
type, and specify the coordinate reference system with Specify CRS. If desired, you can select Create anautoincrementing primary key.
To define an attribute table for the new SpatiaLite layer, add the names of the attribute columns you want to createwith the corresponding column type, and click on the Add to Fields List button. Once you are happy with theattributes, click OK. QGIS will automatically add the new layer to the legend, and you can edit it in the same wayas described in section Einen vorhandenen Layer editieren.
Further management of SpatiaLite layers can be done with the DB Manager. See DB Manager Plugin.
140 Chapter 12. Verwaltung von Datenquellen

QGIS User Guide, Release 3.4
Creating a new GPX layer
To create a new GPX file, you need to load the GPS plugin first. Plugins → Plugin Manager. . . opens the
Plugin Manager Dialog. Activate the GPS Tools checkbox.
When this plugin is loaded, choose New → Create new GPX Layer. . . from the Layer menu. In the Save newGPX file as dialog, choose where to save the new file and press Save. Three new layers are added to the LayersPanel: waypoints, routes and tracks with predefined structure.
Creating a new Temporary Scratch Layer
Temporary Scratch Layers are in-memory layers, meaning that they are not saved on disk and will be discardedwhen QGIS is closed. They can be handy to store features you temporarily need or as intermediate layers duringgeoprocessing operations.
Empty, editable temporary scratch layers can be defined using Layer → Create Layer → New Temporary
Scratch Layer or New temporary scratch layer button from the Data Source Manager Toolbar. Here you can create a:
• No geometry type layer, served as simple table,
• Point or MultiPoint layer,
• LineString/CompoundCurve or MultiLineString/MultiCurve layer,
• Polygon/CurvePolygon or MultiPolygon/MultiSurface layer.
Figure 12.14: Creating a new Temporary Scratch layer dialog
By default, a new temporary scratch layer is created without any attribute. But you can also create prepopulatedtemporary scratch layers using e.g. the clipboard (see Creating new layers from the clipboard) or as a result of aProcessing algorithm.
Tipp: Permanently store a memory layer on disk
To avoid data loss when closing project with temporary scratch layers, you can save these layers to any vectorformat supported by QGIS:
• clicking the indicator icon next to the layer;
12.2. Creating Layers 141

QGIS User Guide, Release 3.4
• selecting the Make permanent entry in the layer contextual menu;
• or as of any other vector layer, using the Export → entry from the contextual menu or the Layer → SaveAs. . . menu.
Each of these commands prompts the Save Vector Layer as dialog exposed in Creating new layers from an existinglayer section and the saved file replaces the temporary one in the Layers panel.
12.2.2 Creating new layers from an existing layer
Both raster and vector layers can be saved in a different format and/or reprojected to a different coordinate ref-erence system (CRS) using the Layer → Save As. . . menu or right-clicking on the layer in the Layers panel andselecting:
• Export → Save As. . . for raster layer
• Export → Save Features As. . . or Export → Save Selected Features As. . . for vector layer.
• Drag’n drop layer from the layer tree to the PostGIS entry in the Browser Panel. Note that you should havealready a PostGIS connection in the Browser Panel.
Common parameters
The Save Layer as. . . dialog shows several parameters to change the behavior when saving the layer. Among thecommon parameters for raster and vector are:
• File name
• CRS: can be changed to reproject the data
• Add saved file to map: to add the new layer to the canvas
• Extent (possible values are layer, Map view or user-defined extent)
However, some parameters are specific to raster and vector formats:
Raster specific parameters
Depending on the format of export, some of these options may not be available:
• Output mode (it can be raw data or rendered image)
• Format: exports to any raster format GDAL can write to, such as GeoTiff, GeoPackage, MBTiles, GeospatialPDF, SAGA GIS Binary Grid, Intergraph Raster, ESRI .hdr Labelled. . .
• Resolution
• Create Options: use advanced options (file compression, block sizes, colorimetry. . . ) when generating files,either from the predefined create profiles related to the output format or by setting each parameter.
• Pyramids creation
• VRT Tiles in case you opted to Create VRT
• No data values
Vector specific parameters
Depending on the format of export, some of these options are available or not:
• Format: exports to any vector format GDAL can write to, such as GeoPackage, ESRI Shapefile, AutoCADDXF, ESRI FileGDB, Mapinfo TAB or MIF, SpatiaLite, CSV, KML, ODS. . .
142 Chapter 12. Verwaltung von Datenquellen

QGIS User Guide, Release 3.4
Figure 12.15: Saving as a new raster layer
• Layer name depending on the selected format
• Encoding
• Save only selected features
• Select fields to export and their export options. In case you set your fields behavior with some Edit widgets,
e.g. value map, you can keep the displayed values in the layer by checking Replace all selected rawfields values by displayed values.
• Symbology export: can be used mainly for DXF export and for all file formats who manage OGR featurestyles (see note below) as DXF, KML, tab file formats:
– No symbology: default style of the application that reads the data
– Feature symbology: save style with OGR Feature Styles (see note below)
– Symbol Layer symbology: save with OGR Feature Styles (see note below) but export the samegeometry multiple times if there are multiple symbology symbol layers used
– A Scale value can be applied to the latest options.
Bemerkung: OGR Feature Styles are a way to store style directly in the data as a hidden attribute. Only someformats can handle this kind of information. KML, DXF and TAB file formats are such formats. For advancedusers, you can read the OGR Feature Styles specification document.
• Geometry: you can configure the geometry capabilities of the output layer
– geometry type: keeps the original geometry of the features when set to Automatic, otherwise removesor overrides it with any type. You can add an empty geometry column to an attribute table, remove thegeometry column of a spatial layer.
12.2. Creating Layers 143

QGIS User Guide, Release 3.4
– Force multi-type: forces creation of multi-geometry features in the layer.
– Include z-dimension to geometries.
Tipp: Overriding layer geometry type makes it possible to do things like save a geometryless table (e.g. .csvfile) into a shapefile WITH any type of geometry (point, line, polygon), so that geometries can then be manually
added to rows with the Add Part tool.
• Datasources Options, Layer Options or Custom Options which allow you to configure some advanced pa-rameters. See the gdal-ogr driver documentation.
Figure 12.16: Saving as a new vector layer
When saving a vector layer into an existing file, depending on the capabilities of the output format (Geopackage,SpatiaLite, FileGDB. . . ), the user can decide whether to:
• overwrite the whole file
• overwrite only the target layer (the layer name is configurable)
• append features to the existing target layer
• append features, add new fields if there are any.
For formats like ESRI Shapefile, MapInfo .tab, feature append is also available.
144 Chapter 12. Verwaltung von Datenquellen

QGIS User Guide, Release 3.4
12.2.3 Creating new DXF files
Besides the Save As. . . dialog which provides options to export a single layer to another format, including *.DXF, QGIS provides another tool to export multiple layers as a single DXF layers. It’s accessible in the Project→ Import/Export → Export Project to DXF. . . menu.
In the DXF Export dialog:
1. Indicate the destination layer file.
2. Choose the symbology mode and scale (see the OGR Feature Styles note) if applicable.
3. Select the data Encoding.
4. Select the CRS to apply: the selected layers will be reprojected to the given CRS.
5. select the layers to include in the DXF files either by checking each in the table widget or automaticallypick them from an existing map theme. The Select All and Deselect All buttons can also help to quickly setthe data to export.
For each layer, you can also choose whether to export all the features in a single DXF layer or rely on a fieldwhose values are used to split the features in generated destination layers in the DXF output.
Optionally, you can also choose to:
• Use the layer title as name if set instead of the layer name itself;
• Export features intersecting the current map extent;
• Force 2d output (eg. to support polyline width);
• Export label as MTEXT elements or TEXT elements.
Figure 12.17: Exporting a project to DXF dialog
12.2. Creating Layers 145

QGIS User Guide, Release 3.4
12.2.4 Creating new layers from the clipboard
Features that are on the clipboard can be pasted into a new layer. To do this, Select some features, copy them tothe clipboard, and then paste them into a new layer using Edit → Paste Features as → and choosing:
• New Vector Layer. . . : you need to select the layer CRS, poping up the Save vector layer as. . . dialogfrom which you can select any supported data format (see Creating new layers from an existing layer forparameters);
• or Temporary Scratch Layer. . . : you need to select the layer CRS and give a name.
A new layer, filled with selected features and their attributes is created and added to map canvas if asked.
Bemerkung: Creating layers from clipboard is possible with features selected and copied within QGIS as wellas features from another application, as long as they are defined using well-known text (WKT) string.
12.2.5 Creating virtual layers
Virtual layers are a special kind of vector layer. They allow you to define a layer as the result of an SQL query in-volving any number of other vector layers that QGIS is able to open. Virtual layers do not carry data by themselvesand can be seen as views to other layers.
To create a virtual layer, open the virtual layer creation dialog by:
• clicking Add Virtual Layer option in the Layer → Add Layer → menu;
• enabling the Add Virtual Layer tab in the Data Source Manager dialog;
• or using the DB Manager dialog tree item.
The dialog allows you to specify a Layer name and an SQL Query. The query can use the name (or id) of loadedvector layers as tables, as well as their field names as columns.
For example, if you have a layer called airports, you can create a new virtual layer calledpublic_airports with an SQL query like:
SELECT *FROM airportsWHERE USE = "Civilian/Public"
The SQL query will be executed, regardless of the underlying provider of the airports layer, even if thisprovider does not directly support SQL queries.
Joins and complex queries can also be created, for example, to join airports and country information:
SELECT airports.*, country.populationFROM airportsJOIN countryON airports.country = country.name
Bemerkung: It’s also possible to create virtual layers using the SQL window of DB Manager Plugin.
Embedding layers for use in queries
Besides the vector layers available in the map canvas, the user can add layers to the Embedded layers list, whichhe can use in queries without the need to have them showing in the map canvas or Layers panel.
To embed a layer, click Add and provide the Local name, Provider, Encoding and the path to the Source.
146 Chapter 12. Verwaltung von Datenquellen

QGIS User Guide, Release 3.4
Figure 12.18: Create virtual layers dialog
The Import button allows adding layers loaded in the map canvas into the Embedded layers list. This allows tolater remove those layers from the Layers panel without breaking any existent query.
Supported query language
The underlying engine uses SQLite and SpatiaLite to operate.
It means you can use all of the SQL your local installation of SQLite understands.
Functions from SQLite and spatial functions from SpatiaLite can also be used in a virtual layer query. For instance,creating a point layer out of an attribute-only layer can be done with a query similar to:
SELECT id, MakePoint(x, y, 4326) as geometryFROM coordinates
Functions of QGIS expressions can also be used in a virtual layer query.
To refer the geometry column of a layer, use the name geometry.
Contrary to a pure SQL query, all the fields of a virtual layer query must be named. Don’t forget to use the askeyword to name your columns if they are the result of a computation or function call.
Performance issues
With default parameters set, the virtual layer engine will try its best to detect the type of the different columns ofthe query, including the type of the geometry column if one is present.
This is done by introspecting the query when possible or by fetching the first row of the query (LIMIT 1) at lastresort. Fetching the first row of the result just to create the layer may be undesirable for performance reasons.
The creation dialog allows to specify different parameters:
12.2. Creating Layers 147

QGIS User Guide, Release 3.4
• Unique identifier column: this option allows specifying which field of the query represents unique integervalues that QGIS can use as row identifiers. By default, an autoincrementing integer value is used. Defininga unique identifier column allows to speed up the selection of rows by id.
• No geometry: this option forces the virtual layer to ignore any geometry field. The resulting layer is anattribute-only layer.
• Geometry Column: this option allows to specify the name of the column that is to be used as the geometryof the layer.
• Geometry Type: this option allows to specify the type of the geometry of the virtual layer.
• Geometry CRS: this option allows to specify the coordinate reference system of the virtual layer.
Special comments
The virtual layer engine tries to determine the type of each column of the query. If it fails, the first row of thequery is fetched to determine column types.
The type of a particular column can be specified directly in the query by using some special comments.
The syntax is the following: /*:type*/. It has to be placed just after the name of a column. type can be eitherint for integers, real for floating point numbers or text.
For instance:
SELECT id+1 as nid /*:int*/FROM table
The type and coordinate reference system of the geometry column can also be set thanks to special commentswith the following syntax /*:gtype:srid*/ where gtype is the geometry type (point, linestring,polygon, multipoint, multilinestring or multipolygon) and srid an integer representing theEPSG code of a coordinate reference system.
Use of indexes
When requesting a layer through a virtual layer, indexes of this source layer will be used in the following ways:
• if an = predicate is used on the primary key column of the layer, the underlying data provider will be askedfor a particular id (FilterFid)
• for any other predicates (>, <=, !=, etc.) or on a column without a primary key, a request built from anexpression will be used to request the underlying vector data provider. It means indexes may be used ondatabase providers if they exist.
A specific syntax exists to handle spatial predicates in requests and triggers the use of a spatial index: a hiddencolumn named _search_frame_ exists for each virtual layer. This column can be compared for equality to abounding box. Example:
SELECT *FROM vtabWHERE _search_frame_=BuildMbr(-2.10,49.38,-1.3,49.99,4326)
Spatial binary predicates like ST_Intersects are significantly sped up when used in conjunction with thisspatial index syntax.
148 Chapter 12. Verwaltung von Datenquellen
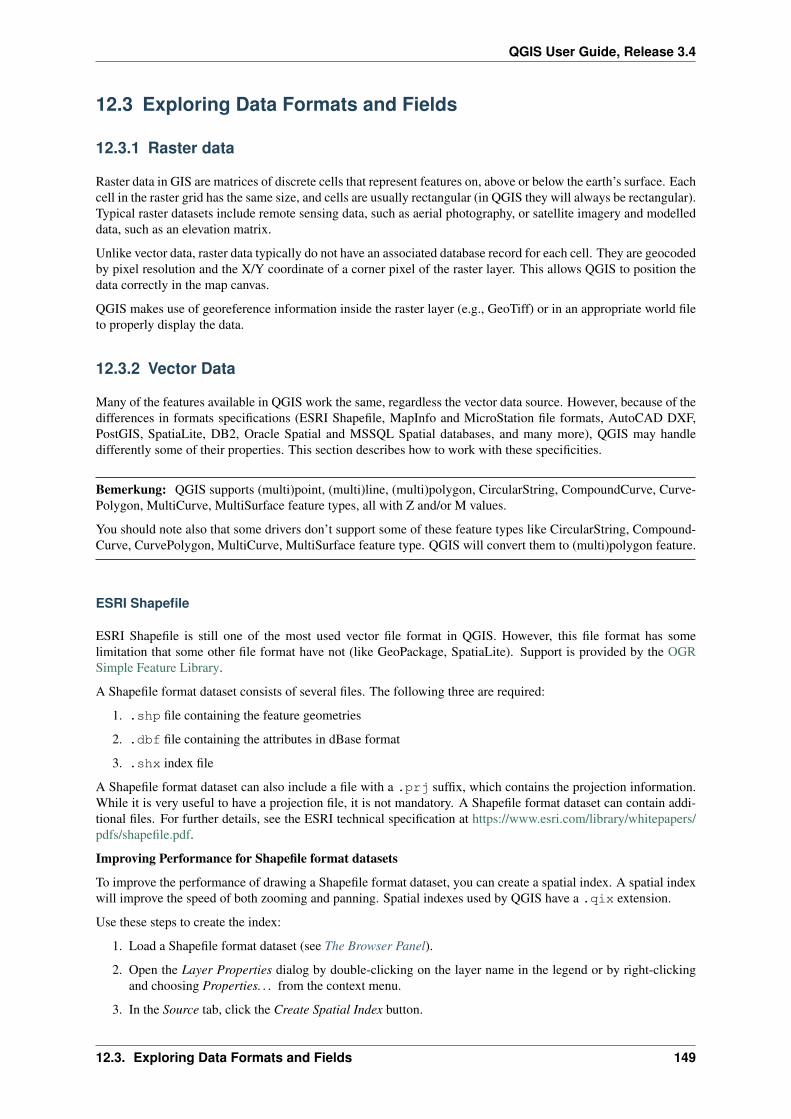
QGIS User Guide, Release 3.4
12.3 Exploring Data Formats and Fields
12.3.1 Raster data
Raster data in GIS are matrices of discrete cells that represent features on, above or below the earth’s surface. Eachcell in the raster grid has the same size, and cells are usually rectangular (in QGIS they will always be rectangular).Typical raster datasets include remote sensing data, such as aerial photography, or satellite imagery and modelleddata, such as an elevation matrix.
Unlike vector data, raster data typically do not have an associated database record for each cell. They are geocodedby pixel resolution and the X/Y coordinate of a corner pixel of the raster layer. This allows QGIS to position thedata correctly in the map canvas.
QGIS makes use of georeference information inside the raster layer (e.g., GeoTiff) or in an appropriate world fileto properly display the data.
12.3.2 Vector Data
Many of the features available in QGIS work the same, regardless the vector data source. However, because of thedifferences in formats specifications (ESRI Shapefile, MapInfo and MicroStation file formats, AutoCAD DXF,PostGIS, SpatiaLite, DB2, Oracle Spatial and MSSQL Spatial databases, and many more), QGIS may handledifferently some of their properties. This section describes how to work with these specificities.
Bemerkung: QGIS supports (multi)point, (multi)line, (multi)polygon, CircularString, CompoundCurve, Curve-Polygon, MultiCurve, MultiSurface feature types, all with Z and/or M values.
You should note also that some drivers don’t support some of these feature types like CircularString, Compound-Curve, CurvePolygon, MultiCurve, MultiSurface feature type. QGIS will convert them to (multi)polygon feature.
ESRI Shapefile
ESRI Shapefile is still one of the most used vector file format in QGIS. However, this file format has somelimitation that some other file format have not (like GeoPackage, SpatiaLite). Support is provided by the OGRSimple Feature Library.
A Shapefile format dataset consists of several files. The following three are required:
1. .shp file containing the feature geometries
2. .dbf file containing the attributes in dBase format
3. .shx index file
A Shapefile format dataset can also include a file with a .prj suffix, which contains the projection information.While it is very useful to have a projection file, it is not mandatory. A Shapefile format dataset can contain addi-tional files. For further details, see the ESRI technical specification at https://www.esri.com/library/whitepapers/pdfs/shapefile.pdf.
Improving Performance for Shapefile format datasets
To improve the performance of drawing a Shapefile format dataset, you can create a spatial index. A spatial indexwill improve the speed of both zooming and panning. Spatial indexes used by QGIS have a .qix extension.
Use these steps to create the index:
1. Load a Shapefile format dataset (see The Browser Panel).
2. Open the Layer Properties dialog by double-clicking on the layer name in the legend or by right-clickingand choosing Properties. . . from the context menu.
3. In the Source tab, click the Create Spatial Index button.
12.3. Exploring Data Formats and Fields 149

QGIS User Guide, Release 3.4
Problem loading a .prj file
If you load a Shapefile format dataset with a .prj file and QGIS is not able to read the coordinate referencesystem from that file, you will need to define the proper projection manually within the Layer Properties →
Source tab of the layer by clicking the Select CRS button. This is due to the fact that .prj files often do notprovide the complete projection parameters as used in QGIS and listed in the CRS dialog.
For the same reason, if you create a new Shapefile format dataset with QGIS, two different projection files are cre-ated: a .prj file with limited projection parameters, compatible with ESRI software, and a .qpj file, providingthe complete parameters of the used CRS. Whenever QGIS finds a .qpj file, it will be used instead of the .prj.
Delimited Text Files
Delimited text file is a very common and widely used format because of its simplicity and readability – data canbe viewed and edited even in a plain text editor. A delimited text file is a tabular data with each column separatedby a defined character and each row separated by a line break. The first row usually contains the column names. Acommon type of delimited text file is a CSV (Comma Separated Values), with each column separated by a comma.Such data files can also contain positional information (see Storing geometry information in delimited text file).
QGIS allows you to load a delimited text file as a layer or ordinal table (see The Browser Panel or Importing adelimited text file). But first check that the file meets the following requirements:
1. The file must have a delimited header row of field names. This must be the first line of the data (ideally thefirst row in the text file).
2. If geometry should be enabled, the header row must contain field(s) with geometry definition. These field(s)can have any name.
3. The X and Y coordinates fields (if geometry is defined by coordinates) must be specified as numbers. Thecoordinate system is not important.
4. If you have any data that is not a string (text) and the file is a CSV file, you must have a CSVT file (seesection Using CSVT file to control field formatting).
As an example of a valid text file, we import the elevation point data file elevp.csv that comes with the QGISsample dataset (see section Downloading sample data):
X;Y;ELEV-300120;7689960;13-654360;7562040;521640;7512840;3[...]
Some items to note about the text file:
1. The example text file uses ; (semicolon) as delimiter. Any character can be used to delimit the fields.
2. The first row is the header row. It contains the fields X, Y and ELEV.
3. No quotes (") are used to delimit text fields.
4. The X coordinates are contained in the X field.
5. The Y coordinates are contained in the Y field.
Storing geometry information in delimited text file
Delimited text files can contain geometry information in two main forms:
• As coordinates in separate columns (eg. Xcol, Ycol. . . ), compatible with point geometry data;
• As well-known text (WKT) representation of geometry in a single column, for any geometry type.
150 Chapter 12. Verwaltung von Datenquellen

QGIS User Guide, Release 3.4
Features with curved geometries (CircularString, CurvePolygon and CompoundCurve) are supported. Here aresome examples of such geometry types as a delimited text with WKT geometries:
Label;WKT_geomLineString;LINESTRING(10.0 20.0, 11.0 21.0, 13.0 25.5)CircularString;CIRCULARSTRING(268 415,227 505,227 406)CurvePolygon;CURVEPOLYGON(CIRCULARSTRING(1 3, 3 5, 4 7, 7 3, 1 3))CompoundCurve;COMPOUNDCURVE((5 3, 5 13), CIRCULARSTRING(5 13, 7 15,
9 13), (9 13, 9 3), CIRCULARSTRING(9 3, 7 1, 5 3))
Delimited Text supports also Z and M coordinates in geometries:
LINESTRINGZ(10.0 20.0 30.0, 11.0 21.0 31.0, 11.0 22.0 30.0)
Using CSVT file to control field formatting
When loading CSV files, the OGR driver assumes all fields are strings (i.e. text) unless it is told otherwise. Youcan create a CSVT file to tell OGR (and QGIS) what data type the different columns are:
Type Name ExampleWhole number Integer 4Decimal number Real 3.456Date Date (YYYY-MM-DD) 2016-07-28Time Time (HH:MM:SS+nn) 18:33:12+00Date & Time DateTime (YYYY-MM-DD HH:MM:SS+nn) 2016-07-28 18:33:12+00
The CSVT file is a ONE line plain text file with the data types in quotes and separated by commas, e.g.:
"Integer","Real","String"
You can even specify width and precision of each column, e.g.:
"Integer(6)","Real(5.5)","String(22)"
This file is saved in the same folder as the .csv file, with the same name, but .csvt as the extension.
You can find more information at GDAL CSV Driver.
PostGIS Layers
PostGIS layers are stored in a PostgreSQL database. The advantages of PostGIS are its spatial indexing, filteringand querying capabilities it provides. Using PostGIS, vector functions such as select and identify work moreaccurately than they do with OGR layers in QGIS.
Tipp: PostGIS Layers
Normally, a PostGIS layer is defined by an entry in the geometry_columns table. QGIS can load layers that donot have an entry in the geometry_columns table. This includes both tables and views. Defining a spatial viewprovides a powerful means to visualize your data. Refer to your PostgreSQL manual for information on creatingviews.
This section contains some details on how QGIS accesses PostgreSQL layers. Most of the time, QGIS shouldsimply provide you with a list of database tables that can be loaded, and it will load them on request. However,if you have trouble loading a PostgreSQL table into QGIS, the information below may help you understand anyQGIS messages and give you direction on changing the PostgreSQL table or view definition to allow QGIS toload it.
12.3. Exploring Data Formats and Fields 151

QGIS User Guide, Release 3.4
Primary key
QGIS requires that PostgreSQL layers contain a column that can be used as a unique key for the layer. For tables,this usually means that the table needs a primary key, or a column with a unique constraint on it. In QGIS, thiscolumn needs to be of type int4 (an integer of size 4 bytes). Alternatively, the ctid column can be used as primarykey. If a table lacks these items, the oid column will be used instead. Performance will be improved if the columnis indexed (note that primary keys are automatically indexed in PostgreSQL).
QGIS offers a checkbox Select at id that is activated by default. This option gets the ids without the attributeswhich is faster in most cases.
View
If the PostgreSQL layer is a view, the same requirement exists, but views do not always have primary keys orcolumns with unique constraints on them. You have to define a primary key field (has to be integer) in the QGISdialog before you can load the view. If a suitable column does not exist in the view, QGIS will not load the layer.If this occurs, the solution is to alter the view so that it does include a suitable column (a type of integer and eithera primary key or with a unique constraint, preferably indexed).
As for table, a checkbox Select at id is activated by default (see above for the meaning of the checkbox). It canmake sense to disable this option when you use expensive views.
QGIS layer_style table and database backup
If you want to make a backup of your PostGIS database using the pg_dump and pg_restore commands, andthe default layer styles as saved by QGIS fail to restore afterwards, you need to set the XML option to DOCUMENTbefore the restore command:
SET XML OPTION DOCUMENT;
Filter database side
QGIS allows to filter features already on server side. Check the Settings → Options → Data Sources →Execute expressions on postgres server-side if possible checkbox to do so. Only supported expressions will be sentto the database. Expressions using unsupported operators or functions will gracefully fallback to local evaluation.
Support of PostgreSQL data types
Most of common data types are supported by the PostgreSQL provider: integer, float, varchar, geometry, times-tamp, array and hstore.
Importing Data into PostgreSQL
Data can be imported into PostgreSQL/PostGIS using several tools, including the DB Manager plugin and thecommand line tools shp2pgsql and ogr2ogr.
DB Manager
QGIS comes with a core plugin named DB Manager. It can be used to load data, and it includes support forschemas. See section DB Manager Plugin for more information.
152 Chapter 12. Verwaltung von Datenquellen
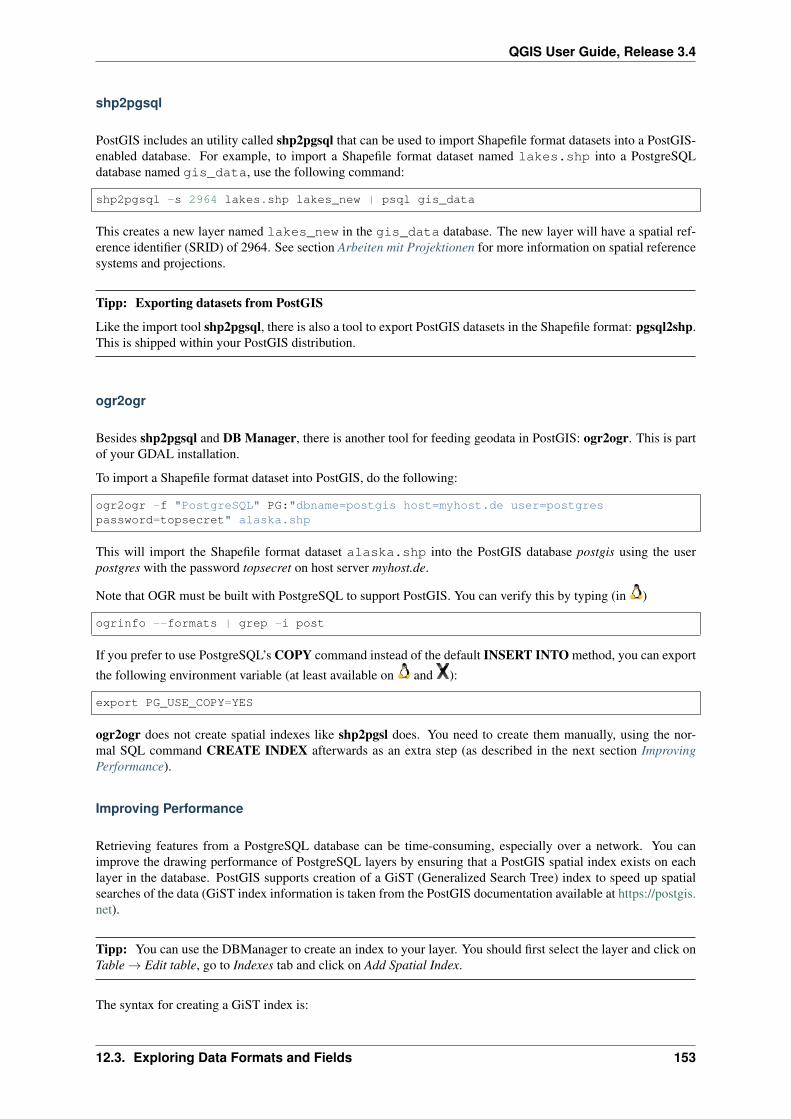
QGIS User Guide, Release 3.4
shp2pgsql
PostGIS includes an utility called shp2pgsql that can be used to import Shapefile format datasets into a PostGIS-enabled database. For example, to import a Shapefile format dataset named lakes.shp into a PostgreSQLdatabase named gis_data, use the following command:
shp2pgsql -s 2964 lakes.shp lakes_new | psql gis_data
This creates a new layer named lakes_new in the gis_data database. The new layer will have a spatial ref-erence identifier (SRID) of 2964. See section Arbeiten mit Projektionen for more information on spatial referencesystems and projections.
Tipp: Exporting datasets from PostGIS
Like the import tool shp2pgsql, there is also a tool to export PostGIS datasets in the Shapefile format: pgsql2shp.This is shipped within your PostGIS distribution.
ogr2ogr
Besides shp2pgsql and DB Manager, there is another tool for feeding geodata in PostGIS: ogr2ogr. This is partof your GDAL installation.
To import a Shapefile format dataset into PostGIS, do the following:
ogr2ogr -f "PostgreSQL" PG:"dbname=postgis host=myhost.de user=postgrespassword=topsecret" alaska.shp
This will import the Shapefile format dataset alaska.shp into the PostGIS database postgis using the userpostgres with the password topsecret on host server myhost.de.
Note that OGR must be built with PostgreSQL to support PostGIS. You can verify this by typing (in )
ogrinfo --formats | grep -i post
If you prefer to use PostgreSQL’s COPY command instead of the default INSERT INTO method, you can export
the following environment variable (at least available on and ):
export PG_USE_COPY=YES
ogr2ogr does not create spatial indexes like shp2pgsl does. You need to create them manually, using the nor-mal SQL command CREATE INDEX afterwards as an extra step (as described in the next section ImprovingPerformance).
Improving Performance
Retrieving features from a PostgreSQL database can be time-consuming, especially over a network. You canimprove the drawing performance of PostgreSQL layers by ensuring that a PostGIS spatial index exists on eachlayer in the database. PostGIS supports creation of a GiST (Generalized Search Tree) index to speed up spatialsearches of the data (GiST index information is taken from the PostGIS documentation available at https://postgis.net).
Tipp: You can use the DBManager to create an index to your layer. You should first select the layer and click onTable → Edit table, go to Indexes tab and click on Add Spatial Index.
The syntax for creating a GiST index is:
12.3. Exploring Data Formats and Fields 153

QGIS User Guide, Release 3.4
CREATE INDEX [indexname] ON [tablename]USING GIST ( [geometryfield] GIST_GEOMETRY_OPS );
Note that for large tables, creating the index can take a long time. Once the index is created, you should performa VACUUM ANALYZE. See the PostGIS documentation (POSTGIS-PROJECT Literatur und Internetreferenzen)for more information.
The following is an example of creating a GiST index:
gsherman@madison:~/current$ psql gis_dataWelcome to psql 8.3.0, the PostgreSQL interactive terminal.
Type: \copyright for distribution terms\h for help with SQL commands\? for help with psql commands\g or terminate with semicolon to execute query\q to quit
gis_data=# CREATE INDEX sidx_alaska_lakes ON alaska_lakesgis_data-# USING GIST (the_geom GIST_GEOMETRY_OPS);CREATE INDEXgis_data=# VACUUM ANALYZE alaska_lakes;VACUUMgis_data=# \qgsherman@madison:~/current$
Vector layers crossing 180° longitude
Many GIS packages don’t wrap vector maps with a geographic reference system (lat/lon) crossing the 180 degreeslongitude line (http://postgis.refractions.net/documentation/manual-2.0/ST_Shift_Longitude.html). As result, ifwe open such a map in QGIS, we will see two far, distinct locations, that should appear near each other. InFigure_vector_crossing, the tiny point on the far left of the map canvas (Chatham Islands) should be within thegrid, to the right of the New Zealand main islands.
Figure 12.19: Map in lat/lon crossing the 180° longitude line
A work-around is to transform the longitude values using PostGIS and the ST_Shift_Longitude function. Thisfunction reads every point/vertex in every component of every feature in a geometry, and if the longitude coor-dinate is < 0°, it adds 360° to it. The result is a 0° - 360° version of the data to be plotted in a 180°-centricmap.
Usage
• Import data into PostGIS (Importing Data into PostgreSQL) using, for example, the DB Manager plugin.
• Use the PostGIS command line interface to issue the following command (in this example,„TABLE“ is the actual name of your PostGIS table): gis_data=# update TABLE setthe_geom=ST_Shift_Longitude(the_geom);
• If everything went well, you should receive a confirmation about the number of features that were updated.Then you’ll be able to load the map and see the difference (Figure_vector_crossing_map).
154 Chapter 12. Verwaltung von Datenquellen

QGIS User Guide, Release 3.4
Figure 12.20: Crossing 180° longitude applying the ST_Shift_Longitude function
SpatiaLite Layers
If you want to save a vector layer to SpatiaLite format, you can do this by right clicking the layer in the legend.Then, click on Save as. . . , define the name of the output file, and select ‚SpatiaLite‘ as format and the CRS. Also,you can select ‚SQLite‘ as format and then add SPATIALITE=YES in the OGR data source creation option field.This tells OGR to create a SpatiaLite database. See also https://www.gdal.org/ogr/drv_sqlite.html.
QGIS also supports editable views in SpatiaLite.
If you want to create a new SpatiaLite layer, please refer to section Creating a new SpatiaLite layer.
Tipp: SpatiaLite data management Plugins
For SpatiaLite data management, you can also use several Python plugins: QSpatiaLite, SpatiaLite Manager orDB Manager (core plugin, recommended). If necessary, they can be downloaded and installed with the PluginInstaller.
GeoJSON specific parameters
When exporting layers to GeoJSON, this format has some specific Layer Options available. These options actuallycome from GDAL which is responsible for the writing of the file:
• COORDINATE_PRECISION the maximum number of digits after the decimal separator to write in coor-dinates. Defaults to 15 (note: for Lat Lon coordinates 6 is considered enough). Truncation will occur toremove trailing zeros.
• WRITE_BBOX set to YES to write a bbox property with the bounding box of the geometries at the featureand feature collection level
DB2 Spatial Layers
IBM DB2 for Linux, Unix and Windows (DB2 LUW), IBM DB2 for z/OS (mainframe) and IBM DashDB productsallow users to store and analyse spatial data in relational table columns. The DB2 provider for QGIS supports thefull range of visualization, analysis and manipulation of spatial data in these databases.
User documentation on these capabilities can be found at the DB2 z/OS KnowledgeCenter, DB2 LUW Knowl-edgeCenter and DB2 DashDB KnowledgeCenter.
For more information about working with the DB2 spatial capabilities, check out the DB2 Spatial Tutorial on IBMDeveloperWorks.
12.3. Exploring Data Formats and Fields 155

QGIS User Guide, Release 3.4
The DB2 provider currently only supports the Windows environment through the Windows ODBC driver.
The client running QGIS needs to have one of the following installed:
• DB2 LUW
• IBM Data Server Driver Package
• IBM Data Server Client
To open a DB2 data in QGIS, you can refer to The Browser Panel or Loading a Database Layer section.
If you are accessing a DB2 LUW database on the same machine or using DB2 LUW as a client, the DB2 executa-bles and supporting files need to be included in the Windows path. This can be done by creating a batch file likethe following with the name db2.bat and including it in the directory %OSGEO4W_ROOT%/etc/ini.
@echo offREM Point the following to where DB2 is installedSET db2path=C:\Program Files (x86)\sqllibREM This should usually be ok - modify if necessarySET gskpath=C:\Program Files (x86)\ibm\gsk8SET Path=%db2path%\BIN;%db2path%\FUNCTION;%gskpath%\lib64;%gskpath%\lib;%path%
156 Chapter 12. Verwaltung von Datenquellen

CHAPTER 13
Arbeiten mit Vektordaten
13.1 Die Symbolbibliothek
13.1.1 Die Stilverwaltung
The Style Manager is the place where users can manage and create generic symbols and color ramps to be used inseveral QGIS projects. You can open that modeless dialog:
• with the Style Manager button of the Project toolbar;
• from the Settings → Style Manager. . . menu;
• or from a vector Layer Properties → Symbology tab (using the Style Manager button in a symbol propertydialog).
The dialog allows you to:
• create, edit and remove symbols and color ramps;
• organize symbols and color ramps in custom groups;
• export and import symbols and color ramps.
Organizing symbols and color ramps
The Style Manager dialog displays in its center a frame with previewed items organized into tabs:
• All for a complete collection of point, linear and surface symbols as the following items allow only to displaya single item group;
• Marker for point symbols;
• Line for linear symbols;
• Fill for surface symbols;
• and Color ramp
157

QGIS User Guide, Release 3.4
Figure 13.1: Die Stilverwaltung
For each family of items, you can organize the elements into different categories, listed in the panel on the left:
• Favorites: displayed by default when configuring an item, it shows a set of default symbols and color rampsyou can extend;
• All: listing all the installed symbols and color ramps;
• Tags: shows a list of labels you can use to identify the items. A symbol or color ramp can be tagged morethan once. Select a tag in the list and you’ll see the items that belong to it for each type of item. To create a
new tag you could later attach to symbols or color ramps, use the Add Tag. . . button or select the AddTag. . . from any tag contextual menu;
• Smart Group: a smart group dynamically fetches its symbols according to conditions set (see eg, fig-ure_smart_group). Click the Add Smart Group. . . button to create smart groups. The dialog box allows youto enter an expression to filter the items to select (has a particular tag, have a string in its name, etc.). Anysymbol or color ramp that satisfies the entered condition(s) is automatically added to the smart group.
Figure 13.2: Eine schlaue Gruppe erstellen
158 Chapter 13. Arbeiten mit Vektordaten

QGIS User Guide, Release 3.4
Tags and smart groups are not mutually exclusive: they are simply two different ways to organize your symbols andcolor ramps. Unlike the smart groups that automatically fetch their belonged items based on the input constraints,tags are filled by the user. To edit any of those categories, you can either:
• select the items, right-click and choose Add to Tag → and then select the tag name or create a new tag;
• select the tag and press Modify group. . . → Attach Selected Tag to Symbols. A checkbox appears neareach item to help you select or deselect it. When selection is finished, press Modify group. . . → FinishTagging.
• select the smart group, press Modify group. . . → Edit smart group. . . and configure a new set of constraintsin the Smart Group Editor dialog. This option is also available in the contextual menu of the smart group.
To remove a tag or a smart group, right-click on it and select the Remove button. Note that this does not deletethe items grouped in the category.
Adding, editing or removing an item
As seen earlier, symbols and color ramps are listed under different tabs whose contents depend on the activecategory (tag, smart group, favorites. . . ). For each type of symbols (Marker , Line or Fill) and color ramp, whenthe tab is enabled, you can:
• Add new items: press the Add item button and configure the item following symbols or color rampsbuilder description.
• Modify an existing item: select an item and press Edit item button and configure as mentioned above.
• Delete existing items: to delete a symbol you no longer need, select it and click Remove item (also availablethrough right-click). The symbol will be deleted from the local symbols database.
Right-clicking over a selection of items also allows you to:
• Add to Favorites;
• Remove from Favorites;
• Add to Tag → and select the appropriate tag or create a new one to use;
• Clear Tags: detaching the symbols from any tag;
• Remove Item(s);
• Edit Item: applies to the item you right-click over;
• Export Selected Symbol(s) as PNG. . . (not available with color ramps);
• Export Selected Symbol(s) as SVG. . . (not available with color ramps);
Sharing symbols and color ramps
The Import/Export tool, at the left bottom of the Style Manager dialog, offers options to easily share symbolsand color ramps with others. These options are also available through right-click over the items.
Exporting items
You can export a set of items to an .XML file:
1. Expand the Import/Export drop-down menu and select Export Item(s). . .
2. Choose the symbols and color ramps you’d like to integrate. Symbol selection can be done with the mouseor using a tag or group previously set.
13.1. Die Symbolbibliothek 159

QGIS User Guide, Release 3.4
3. Press Export when ready. You’ll be prompted to indicate the destination of the saved file. The XML formatgenerates a single file containing all the selected symbols. This file can then be imported in another user’sstyle library.
Figure 13.3: Exporting symbols and color ramps
When symbols are selected, you can also export them to .PNG or .SVG. Exporting to .PNG or .SVG (both notavailable for color ramp symbols) creates a file for each selected symbol in a given folder. The SVG folder can beadded to the SVG paths in Settings → Options → System menu of another user, allowing him direct access to allthese symbols.
Importing items
You can extend your symbols library by importing new symbols:
1. Expand the Import/Export drop-down menu and select Import Item(s) at the left bottom of thedialog.
2. In the new dialog, indicate the source of the symbols (it can be an .xml file on the disk or a url).
3. Set whether to Add to favorites the items to import.
4. Check Do not import embedded tags to avoid the import of tags associated to the items being imported.
5. Give the name of any Additional tag(s) to apply to the new items.
6. Select from the preview the items you want to add to your library.
7. And press Import.
Farbverlauf
The Color ramp tab in the Style Manager dialog helps you preview different color ramps based on the categoryselected in the left panel.
160 Chapter 13. Arbeiten mit Vektordaten

QGIS User Guide, Release 3.4
Figure 13.4: Importing symbols and color ramps
To create a custom color ramp, activate the Color ramp tab and click the Add item button. The button reveals adrop-down list to choose the ramp type:
• Gradient: given a start and end colors, generate a color ramp which can be continuous or discrete. Withdouble-clicking the ramp preview, you can add as many intermediate color stops as you want.
• Color presets: allows to create a color ramp consisting of a list of colors selected by the user;
• Random: creates a random set of colors based on range of values for Hue, Saturation, Value and Opacityand a number of colors (Classes);
• Catalog: ColorBrewer: a set of predefined discrete color gradients you can customize the number of colorsin the ramp;
• or Catalog: cpt-city: an access to a whole catalog of color gradients to locally save as standard gradient.The cpt-city option opens a new dialog with hundreds of themes included ‚out of the box‘.
Tipp: Easily adjust the color stops of the gradient color ramp
Double-clicking the ramp preview or drag-and-drop a color from the color spot onto the ramp preview adds a newcolor stop. Each color stop can be tweaked using the Farbauswahl widgets or by plotting each of its parameters.You can also reposition it using the mouse, the arrow keys (combine with Shift key for a larger move) or theRelative position spinbox. Pressing Delete stop as well as DEL key removes the selected color stop.
13.1.2 Die Symbolauswahl
Symbolauswahl ist der Hauptdialog um ein Symbol zu entwerfen. Sie können Marker, Linie oder Symbole er-stellen oder bearbeiten füllen.
Zwei Hauptkomponenten gliedern den Symbolauswahl-Dialog:
• Der Symbollayerbaum, der einzelne Ebenen zeigt, die später überlagert werden, um ein neues Gesamtsym-bol zu formen
• und Einstellungen, um die ausgewählte Symbolebene im Baum zu konfigurieren.
13.1. Die Symbolbibliothek 161

QGIS User Guide, Release 3.4
Figure 13.5: Beispiel eines benutzerdefinierten Farbverlaufs mit Mehrfachstops
Der Symbollayerbaum
Ein Symbol kann aus mehreren :guilabel:‘Symbol layers‘ bestehen. Der Symbollayerbaum zeigt die Überlagerungdieser Symbollayer, die später kombiniert werden, um ein neues Gesamtsysmbol zu formen. Zudem wird einedynamische Symboldarstellung aktualisiert, so bald sich Symboleigenschaften ändern.
Eine Reihe Werkzeuge ist verfügbar, um die Teile des Symbollayerbaumes zu verwalten. In Abhängigkeit vomausgewählten Layer stehen am unteren Rand des Dialogs verschiedene Werkzeuge zur Verfügung, um:
• Einen neuen Symbollayer hinzufügen: Man kann so viele Symbole stapeln, wie man will
• Gewählten eingebetteten Layer entfernen
• Farben von Symbollayern sperren: eine gesperrte Farbe bleibt unverändert, wenn der Benutzer dieFarbe auf globaler (oder drüber) Symbolebene ändert
• kopiert einen/eine Gruppe von Symbollayer
• Symbollayer nach oben oder unten bewegen
When a symbol layer is selected in the tree, you can also:
• control its visibility with the Enable layer option. Disabled symbol layers are not drawn, but are savedand can be enabled at a later stage. This makes it easier to customize parts of the symbol based on thefeature attributes or to tweak symbol appearance without having to totally delete a symbol layer;
• apply rendering effects using the Draw effects button.
Ein Symbol konfigurieren
in QGIS werden Symbole in zwei Schritten konfiguriert: Das Symbol und dann die Symbolebene.
162 Chapter 13. Arbeiten mit Vektordaten

QGIS User Guide, Release 3.4
Figure 13.6: cpt-city Dialog mit hunderten von Farbverläufen
13.1. Die Symbolbibliothek 163

QGIS User Guide, Release 3.4
Figure 13.7: Designing a Line symbol
164 Chapter 13. Arbeiten mit Vektordaten

QGIS User Guide, Release 3.4
Das Symbol
Auf der obersten Ebene des Baumes hängt die Art des Symbols von der Layergeometrie ab und kann entwederMarkierung, Linie oder Füllung sein. In jedes Symbol können eines oder mehrere Symbole (auch von jedemanderen Typ) oder Symbolebenen eingebettet werden.
You can setup some parameters that apply to the global symbol:
• Unit: it can be Millimeter, Points, Pixels, Meters at Scale, Map unit or Inches
• Transparency
• Color: when this parameter is changed by the user, its value is echoed to all unlocked sub-symbols color
• Size and Rotation for marker symbols
• Width for line symbols
Bemerkung: The Data-defined override button beside the last layer-related parameters is inactive when settingthe symbol from the Style manager dialog. When the symbol is connected to a map layer, this button helps youcreate proportional or multivariate analysis rendering.
The symbols used at this level are items you can pick from the symbols library. Available symbols of the cor-responding type are shown and, through the editable drop-down list just above, can be filtered by free-form text
or by categories. You can also update the list of symbols using the Style Manager button and open the eponymdialog. There, you can use any capabilities as exposed in Die Stilverwaltung section.
The symbols are displayed either:
• in an icon list (with thumbnail, name and associated tags) using the List View button below the frame;
• or as icon preview using the Icon View button.
Press the Save Symbol button to add any symbol being edited to the symbols library. With the Advancedoption, you can:
• set the symbol levels: defining the way symbol layers are connected to each other in the map canvas (seeSymbol levels for more information)
• and for line and fill symbols, clip features to canvas extent.
Tipp: Note that once you have set the size in the lower levels of the Symbol layers dialog, the size of the wholesymbol can be changed with the Size (for marker symbols) or the Width (for line symbols) menu in the first levelagain. The size of the lower levels changes accordingly, while the size ratio is maintained.
The symbol layer
At a lower level of the tree, you can customize the symbol layers. The available symbol layer types depend on the
upper symbol type. You can apply on the symbol layer paint effects to enhance its rendering.
Because describing all the options of all the symbol layer types would not be possible, only particular and signifi-cant ones are mentioned below.
Common parameters
Some common options and widgets are available to build a symbol layer, regardless it’s of marker, line or fillsub-type:
13.1. Die Symbolbibliothek 165

QGIS User Guide, Release 3.4
• the color selector widget to ease color manipulation
• Units: it can be Millimeter, Points, Pixels, Meters at Scale, Map unit or Inches
• the data-defined override widget near almost all options, extending capabilities of customizing each symbol(see Datendefinierte Übersteuerung Setup for more information)
Bemerkung: While the description below assumes that the symbol layer type is bound to the feature geometry,keep in mind that you can embed symbol layers in each others. In that case, the lower level symbol layer parameter(placement, offset. . . ) might be bound to the upper-level symbol, and not to the feature geometry itself.
Markierungssymbole
Appropriate for point geometry features, marker symbols have several Symbol layer types:
• Simple marker (default);
• Ellipse marker: a simple marker symbol layer, with customizable width and height;
• Filled marker: similar to the simple marker symbol layer, except that it uses a fill sub symbol to render themarker. This allows use of all the existing QGIS fill (and stroke) styles for rendering markers, e.g. gradientor shapeburst fills;
• Font marker: use installed fonts as marker symbols;
• Geometry generator (see The Geometry Generator);
• Vector Field marker (see The Vector Field Marker);
• SVG marker: provides you with images from your SVG paths (set in Settings → Options. . . → Systemmenu) to render as marker symbol. Width and height of the symbol can be set independently or using the
Lock aspect ratio. Each SVG file colors and stroke can also be adapted.
Bemerkung: Requirements for a customizable SVG marker symbol
To have the possibility to change the colors of a SVG marker, you have to add the placeholdersparam(fill) for fill color, param(outline) for stroke color and param(outline-width) forstroke width. These placeholders can optionally be followed by a default value, e.g.:
<svg width="100%" height="100%"><rect fill="param(fill) #ff0000" stroke="param(outline) #00ff00" stroke-width=→˓"param(outline-width) 10" width="100" height="100"></rect></svg>
For each marker symbol layer type, you can set some of the following properties:
• Größe
• Fill color using all the capabilities of the Farbauswahl widget, extended by a shortcut to apply a Transparentfill in the drop-down menu;
• Stroke color using all the capabilities of the color selector widget, extended by a shortcut to apply a Trans-parent stroke in the drop-down menu;
• Stroke style
• Stroke width
• Verbindungsstil
• Rotation
166 Chapter 13. Arbeiten mit Vektordaten

QGIS User Guide, Release 3.4
• Offset: You can shift the symbol in the X or Y direction;
• Anchor point.
In most of the marker symbols dialog, you also have a frame with previews of predefined symbols you can choosefrom.
Liniensymbole
Appropriate for line geometry features, line symbols have following symbol layer types:
• Simple line (default): available settings are:
– Color
– Stroke width
– Stroke style
– Verbindungsstil
– Endstil
– Versatz
– Use custom dash pattern: overrides the Stroke style setting with a custom dash.
• Arrow: draws lines as curved (or not) arrows with a single or a double head with configurable width, lengthand thickness. To create a curved arrow the line feature must have at least three vertices. It also uses a fillsymbol such as gradients or shapeburst to render the arrow body. Combined with the geometry generator,this type of layer symbol helps you representing flow maps;
• Geometry generator (see The Geometry Generator);
• Marker line: displays a marker symbol along the line. It can be at a regular distance or based on itsgeometry: first, last or each vertex, on central point or on every curve point. You can set an offset along theline for the marker symbol, or offset the line itself. The Rotate marker option allows you to set whether themarker symbol should follow the line orientation or not.
Fill Symbols
Appropriate for polygon geometry features, fill symbols have also several symbol layer types:
• Simple fill (default): the following settings are available:
– Fill color using all the capabilities of the Farbauswahl widget, extended by a shortcut to apply aTransparent fill
– Füllstil
– Stroke color using all the capabilities of the color selector widget, extended by a shortcut to apply aTransparent stroke
– Stroke width
– Stroke style
– Verbindungsstil
– Offset: You can shift the symbol in the X or Y direction;
• Centroid fill: places a marker symbol at the centroid of the visible feature. The position of the marker mayhowever not be the real centroid of the feature because calculation takes into account the polygon(s) clippedto area visible in map canvas for rendering and ignores holes. Use the geometry generator symbol if youwant the exact centroid.
13.1. Die Symbolbibliothek 167

QGIS User Guide, Release 3.4
The marker can be placed on every part of a multi-part feature or only on its biggest part, and forced to beinside the polygon;
• Geometry generator (see The Geometry Generator);
• Gradient fill: uses a radial, linear or conical gradient, based on either simple two color gradients or apredefined gradient color ramp to fill polygon layers. Gradient can be rotated and applied on a singlefeature basis or across the whole map extent. Also start and end points can be set via coordinates or usingthe centroid (of feature or map);
• Line pattern fill: fills the polygon with a hatching pattern of line symbol layer. You can set the spacingbetween lines and an offset from the feature boundary;
• Point pattern fill: fills the polygon with a hatching pattern of marker symbol layer. You can set the spacingbetween lines and an offset from the feature boundary;
• Raster image fill: you can fill polygons with a tiled raster image. Options include (data defined) file name,opacity, image size (in pixels, mm or map units), coordinate mode (feature or view) and rotation;
• SVG fill: fills the polygon using SVG markers;
• Shapeburst fill: this option buffered a gradient fill, where a gradient is drawn from the boundary of apolygon towards the polygon’s centre. Configurable parameters include distance from the boundary toshade, use of color ramps or simple two color gradients, optional blurring of the fill and offsets;
• Outline: Arrow: uses a line arrow symbol layer to represent the polygon boundary;
• Outline: Marker line: uses a marker line symbol layer to represent the polygon boundary;
• Outline: simple line: uses a simple line symbol layer to represent the polygon boundary. The Draw lineonly inside polygon option helps polygon borders inside the polygon and can be useful to clearly representadjacent polygon boundaries.
Bemerkung: When geometry type is polygon, you can choose to disable the automatic clipping of lines/polygonsto the canvas extent. In some cases this clipping results in unfavourable symbology (e.g. centroid fills where thecentroid must always be the actual feature’s centroid).
The Geometry Generator
Available with all types of symbols, the geometry generator symbol layer allows to use expression syntax togenerate a geometry on the fly during the rendering process. The resulting geometry does not have to match withthe original geometry type and you can add several differently modified symbol layers on top of each other.
Some examples:
-- render the centroid of a featurecentroid( $geometry )
-- visually overlap features within a 100 map units distance from a point-- feature, i.e generate a 100m buffer around the pointbuffer( $geometry, 100 )
-- Given polygon layer1( id1, layer2_id, ...) and layer2( id2, fieldn...)-- render layer1 with a line joining centroids of both where layer2_id = id2make_line( centroid( $geometry ),
centroid( geometry( get_feature( 'layer2', 'id2', attribute($currentfeature, 'layer2_id') ) )
)
168 Chapter 13. Arbeiten mit Vektordaten
QGIS User Guide, Release 3.4
The Vector Field Marker
The vector field marker is used to display vector field data such as earth deformation, tidal flows, and the like.It displays the vectors as lines (preferably arrows) that are scaled and oriented according to selected attributes ofdata points. It can only be used to render point data; line and polygon layers are not drawn by this symbology.
The vector field is defined by attributes in the data, which can represent the field either by:
• cartesian components (x and y components of the field)
• or polar coordinates: in this case, attributes define Length and Angle. The angle may be measured eitherclockwise from north, or Counterclockwise from east, and may be either in degrees or radians.
• or as height only data, which displays a vertical arrow scaled using an attribute of the data. This is appro-priate for displaying the vertical component of deformation, for example.
The magnitude of field can be scaled up or down to an appropriate size for viewing the field.
13.2 Vektorlayereigenschaften
Der Layereigenschaften Dialog für Vektorlayer enthält generelle Einstellungen, um das Aussehen der Layerob-jekte in der Karte (Symbologie, Beschriftung, Diagramme) und die Interaktion mit der Maus (Aktionen, Karten-tipps, form design) zu verwalten. Es bietet auch Informationen über die Layer.
To access the Layer Properties dialog:
• In the Layers panel, double-click the layer or right-click and select Properties. . . from the pop-up menu;
• Go to Layer → Properties. . . menu when the layer is selected.
The vector Layer Properties dialog provides the following sections:
• Information
• Source
• Symbology (also available in the Layer styling panel)
• Labels (also available in the Layer styling panel)
• Diagrams
• 3D View (also available in the Layer styling panel)
• Source Fields
• Attributes Form
• Joins
• Auxiliary Storage
• Actions
• Display
• Rendering
• Variables
• Metadata
13.2. Vektorlayereigenschaften 169

QGIS User Guide, Release 3.4
• Dependencies
• Legend
• QGIS Server
• Digitizing
• and optionally, new tabs added by external plugins you have installed. Those are not presented below.
Tipp: Share full or partial properties of the layer styles
The Style menu at the bottom of the dialog allows you to import or export these or part of these properties from/toseveral destination (file, clipboard, database). See Managing Custom Styles.
Bemerkung: Because properties (symbology, label, actions, default values, forms. . . ) of embedded layers (seeLayer/Gruppen einbinden) are pulled from the original project file and to avoid changes that may break thisbehavior, the layer properties dialog is made unavailable for these layers.
13.2.1 Information Properties
The Information tab is read-only and represents an interesting place to quickly grab summarized informationand metadata on the current layer. Provided information are:
• based on the provider of the layer (format of storage, path, geometry type, data source encoding, extent. . . );
• picked from the filled metadata (access, links, contacts, history. . . );
• or related to its geometry (spatial extent, CRS. . . ) or its attributes (number of fields, characteristics ofeach. . . ).
13.2.2 Source Properties
Use this tab to define general settings for the vector layer.
Other than setting the Layer name to display in the Layers Panel, available options include:
Koordinatenbezugssystem
• Displays the layer’s Coordinate Reference System (CRS) as a PROJ.4 string. You can change the layer’s
CRS, selecting a recently used one in the drop-down list or clicking on Select CRS button (see CoordinateReference System Selector). Use this process only if the CRS applied to the layer is a wrong one or if nonewas applied. If you wish to reproject your data into another CRS, rather use layer reprojection algorithmsfrom Processing or Save it into another layer.
• Create spatial index (only for OGR-supported formats).
• Update extents information for a layer.
Abfrageeditor
The Query Builder dialog is accessible through the eponym button at the bottom of the Source tab in the LayerProperties dialog, under the Provider feature filter group.
170 Chapter 13. Arbeiten mit Vektordaten

QGIS User Guide, Release 3.4
Figure 13.8: Source tab in vector Layer Properties dialog
13.2. Vektorlayereigenschaften 171

QGIS User Guide, Release 3.4
The Query Builder provides an interface that allows you to define a subset of the features in the layer using a SQL-like WHERE clause and to display the result in the main window. As long as the query is active, only the featurescorresponding to its result are available in the project. For example, using the TYPE_2 field of the regionslayer from the QGIS sample data, you could constrain the file to display only regions that are of borough type inthe project (see Figure_vector_querybuilder for such an example). The filter is made at the data provider (OGR,PostgreSQL, MSSQL. . . ) level.
Figure 13.9: Abfrageeditor
You can also open the Query Builder dialog using the Filter. . . option from the Layer menu or the layer contextualmenu. The Fields, Values and Operators sections in the dialog help you to construct the SQL-like query exposedin the Provider specific filter expression box.
The Fields list contains all the fields of the layer. To add an attribute column to the SQL WHERE clause field,double-click its name or just type it into the SQL box.
The Values frame lists the values of the currently selected field. To list all unique values of a field, click the Allbutton. To instead list the first 25 unique values of the column, click the Sample button. To add a value to the SQLWHERE clause field, double click its name in the Values list. You can use the search box at the top of the Valuesframe to easily browse and find attribute values in the list.
The Operators section contains all usable operators. To add an operator to the SQL WHERE clause field, clickthe appropriate button. Relational operators ( = , > , . . . ), string comparison operator (LIKE), and logical operators(AND, OR, . . . ) are available.
The Test button helps you check your query and displays a message box with the number of features satisfying thecurrent query. Use the Clear button to wipe the SQL query and revert the layer to its original state (ie, fully loadall the features).
When a filter is applied, QGIS treats the resulting subset acts as if it were the entire layer. For example if youapplied the filter above for ‚Borough‘ ("TYPE_2" = 'Borough'), you can not display, query, save or edit
172 Chapter 13. Arbeiten mit Vektordaten

QGIS User Guide, Release 3.4
Anchorage, because that is a ‚Municipality‘ and therefore not part of the subset.
Tipp: Filtered layers are indicated in the Layers Panel
In the Layers panel, filtered layer is listed with a Filter icon next to it indicating the query used when the mousehovers over the button. Double-click the icon opens the Query Builder dialog for edit.
13.2.3 Symbology Properties
The Symbology tab provides you with a comprehensive tool for rendering and symbolizing your vector data.You can use tools that are common to all vector data, as well as special symbolizing tools that were designed forthe different kinds of vector data. However all types share the following dialog structure: in the upper part, youhave a widget that helps you prepare the classification and the symbol to use for features and at the bottom theLayerdarstellung widget.
Tipp: Wechseln Sie schnell zwischen verschiedenen Layerdarstellungen
Using the Styles → Add menu at the bottom of the Layer Properties dialog, you can save as many styles asneeded. A style is the combination of all properties of a layer (such as symbology, labeling, diagram, fields form,actions. . . ) as you want. Then, simply switch between styles from the context menu of the layer in Layers Panelto automatically get different representations of your data.
Tipp: Symbologie exportierten
Sie haben die Option die Vektorsymbologie von QGIS nach Google *.kml, *.dxf und MapInfo .*.tab Dateienzu exportieren. Öffnen Sie einfach das Rechte-Maustasten-Menü des Layers und klicken Sie auf Speichernals . . . ‘ um den Namen der Ausgabedatei und ihr Format festzulegen. Verwenden Sie im Dialog das :guil-abel:‘Darstellungsexport Menü um die Symbologie entweder als Objektdarstellung → oder Symbollayerdarstel-lung → zu speichern. Wenn Sie Symbollayer verwendet haben wird empfohlen die zweite Einstellung zu benutzen.
Objekt Darstellung
The renderer is responsible for drawing a feature together with the correct symbol. Regardless layer geometrytype, there are four common types of renderers: single symbol, categorized, graduated and rule-based. For pointlayers, there are a point displacement and a heatmap renderers available while polygon layers can also be renderedwith the inverted polygons and 2.5 D renderers.
Es gibt keinen kontinuirliche Farbe Renderer da es in der Tat einfach ein spezieller Fall des Abgestuft Renderersist. Die Kategorisiert und Abgestuft Renderer können erstellt werden indem ein Symbol und ein Farbverlauffestgelegt werden - Sie werden die Farben für Symbole angemessen einsetzen. Für jeden Datentyp (Punkte, Linienund Polygone) sind Symbollayertypen erhältlich. Abhängig vom ausgesuchten Renderer gibt es verschiedenezusätzliche Bereiche.
Bemerkung: Wenn Sie den Darstellungstyp beim Einstellen des Stils eines Vektorlayers ändern werden dieEinstellungen für das Symbol beibehalten. Beachten Sie dass dieses Vorgehen nur für eine Änderunge funktioniert.Wenn Sie den Darstellungstyp wiederholt ändern gehen die Einstellungen für das Symbol verloren.
13.2. Vektorlayereigenschaften 173

QGIS User Guide, Release 3.4
Einzelsymbol Darstellung
The Single Symbol renderer is used to render all features of the layer using a single user-defined symbol. SeeDie Symbolauswahl for further information about symbol representation.
Figure 13.10: Linieneigenschaften Einzelsymbol
Tipp: Edit symbol directly from layer panel
If in your Layers Panel you have layers with categories defined through categorized, graduated or rule-basedsymbology mode, you can quickly change the fill color of the symbol of the categories by right-clicking on a
category and choose the color you prefer from a color wheel menu. Right-clicking on a category will also giveyou access to the options Hide all items, Show all items and Edit symbol.
No Symbols Renderer
The No Symbols renderer is a special use case of the Single Symbol renderer as it applies the same renderingto all features. Using this renderer, no symbol will be drawn for features, but labeling, diagrams and other non-symbol parts will still be shown.
Selections can still be made on the layer in the canvas and selected features will be rendered with a default symbol.Features being edited will also be shown.
This is intended as a handy shortcut for layers which you only want to show labels or diagrams for, and avoids theneed to render symbols with totally transparent fill/border to achieve this.
Kategorisierte Darstellung
The Categorized renderer is used to render the features of a layer, using a user-defined symbol whose aspectreflects the discrete values of a field or an expression. The Categorized menu allows you to
• select an existing field (using the Column listbox) or
174 Chapter 13. Arbeiten mit Vektordaten

QGIS User Guide, Release 3.4
• type or build an expression using the Set column expression. The expression used to classify features can beof any type; it can for example:
– be a comparison, e.g. myfield >= 100, $id = @atlas_featureid, myfield % 2 = 0,within( $geometry, @atlas_geometry ). In this case, QGIS returns values 1 (True) and0 (False).
– combine different fields, e.g. concat( field1, ' ', field2 ) particularly useful when youwant to process classification on two or more fields simultaneously.
– be a calculation on fields, e.g. myfield % 2, year( myfield ) field_1 + field_2.
– be used to transform linear values in discrete classes, e.g.:
CASE WHEN x > 1000 THEN 'Big' ELSE 'Small' END
– combine several discrete values in one single category, e.g.:
CASEWHEN building IN ('residence', 'mobile home') THEN 'residential'WHEN building IN ('commercial', 'industrial') THEN 'Commercial and→˓Industrial'END
Bemerkung: While you can use any kind of expression to categorize features, for some complex expres-sions it might be simpler to use rule-based rendering.
• the symbol (using the Die Symbolauswahl dialog) which will be used as base symbol for each class;
• the range of colors (using the Color ramp listbox) from which color applied to the symbol is selected.
Then click on Classify button to create classes from the distinct value of the attribute column. Each class can bedisabled unchecking the checkbox at the left of the class name.
Sie können das Symbol, den Wert oder die Beschriftung verändern, klicken Sie einfach auf das Element, das Sieändern wollen.
Ein Rechtsklick zeigt ein Kontextmenü für Kopieren/Einfügen, Farbe ändern, Transparenz ändern, Aus-gabeeinheit ändern, Breite ändern.
The example in figure_categorized_symbology shows the category rendering dialog used for the rivers layer of theQGIS sample dataset.
Tipp: Auswahl und Ändern von Mehrfachsymbolen
Mit der Symbologie können Sie Mehrfachsymbole auswählen und Rechtsklicken um Farbe, Transparenz, Größeoder Breite der ausgewählten Einträge zu ändern.
Tipp: Kategorien Symbolnamen zuordnen
Im Menü [Erweitert] unter den Klassen, können Sie eine der beiden Aktionen wählen, um Symbolnamen aufeinen entsprechenden Kategorienamen in Ihrer Klassifizierung aufeinander abzustimmen. Matched to saved sym-bols Kategorienamen auf einen Symbolnamen aus Ihrem Stilmanager anpassen. Match to symbols from file Kate-gorienamen auf Symbolnamen von einer externen Datei anpassen.
13.2. Vektorlayereigenschaften 175

QGIS User Guide, Release 3.4
Figure 13.11: Kategorisierte Symbolisierungsoptionen
Abgestufte Darstellung
The Graduated renderer is used to render all the features from a layer, using an user-defined symbol whosecolor or size reflects the assignment of a selected feature’s attribute to a class.
Like the Categorized Renderer, the Graduated Renderer allows you to define rotation and size scale from specifiedcolumns.
Genauso können Sie -analog zum Kategorisierten Renderer - im Menü auswählen:
• The attribute (using the Column listbox or the Set column expression function)
• Das Symbol (nutzen des Symbolauswahl Dialogs)
• Die Legendenformatierung und die Genauigkeit
• Die Methode, um das Symbol zu ändern: Farbe oder Größe
• Die Farben (indem man die Farbverlaufsliste verwendet), wenn die Farbmethode ausgewählt ist
• The size (using the size domain and its unit)
Then you can use the Histogram tab which shows an interactive histogram of the values from the assigned field orexpression. Class breaks can be moved or added using the histogram widget.
Bemerkung: Sie können die statistische Zusammenfassung nutzen, um mehr Informationen über Ihren Vektor-layer zu erhalten. Siehe Statistical Summary Panel.
Zurück zu dem Klassen Reiter, Sie können die Anzahl der Klassen und auch den Modus für das Klassifizieren vonObjekten innerhalb der Klassen (indem man die Modus-Liste verwendet) einstellen. Die möglichen Modi sind:
• Equal Interval: each class has the same size (e.g. values from 0 to 16 and 4 classes, each class has a size of4).
• Quantile: each class will have the same number of element inside (the idea of a boxplot).
• Natural Breaks (Jenks): the variance within each class is minimal while the variance between classes ismaximal.
• Standard Deviation: classes are built depending on the standard deviation of the values.
176 Chapter 13. Arbeiten mit Vektordaten

QGIS User Guide, Release 3.4
• Schöne Unterbrechungen: Berechnet eine Sequenz von etwa n+1 mit gleichem Abstand, die den Bereichder Werte in x decken. Die Werte sind so gewählt, dass sie 1, 2 oder 5 mal einer Potenz von 10 sind .(basiertziemlich auf der R statistischen Umgebung http://astrostatistics.psu.edu/datasets/R/html/base/html/pretty.html)
The listbox in the center part of the Symbology tab lists the classes together with their ranges, labels and symbolsthat will be rendered.
Klicken Sie auf den Klassifizieren Knopf um Klassen anhand des ausgewählten Modus zu erstellen. Jede Klassekann anhand des Deaktivierens des Kontrollkästchens links neben dem Klassennamen ausgeschaltet werden.
Sie können das Symbol, den Wert oder die Beschriftung verändern, klicken Sie einfach auf das Element, das Sieändern wollen.
Ein Rechtsklick zeigt ein Kontextmenü für Kopieren/Einfügen, Farbe ändern, Transparenz ändern, Aus-gabeeinheit ändern, Breite ändern.
The example in figure_graduated_symbology shows the graduated rendering dialog for the rivers layer of theQGIS sample dataset.
Figure 13.12: Abgestufte Symbolisierungsoptionen
Tipp: Thematische Karten anhand von Ausdrücken erstellen
Categorized and graduated thematic maps can be created using the result of an expression. In the properties dialog
for vector layers, the attribute chooser is extended with a Set column expression function. So you don’t need to writethe classification attribute to a new column in your attribute table if you want the classification attribute to be acomposite of multiple fields, or a formula of some sort.
Proportionale Symbole und mehrdimensionale Analysen
Proportional Symbol and Multivariate Analysis are not rendering types available from the Symbology render-ing drop-down list. However with the data-defined override options applied over any of the previous renderingoptions, QGIS allows you to display your point and line data with such representation.
13.2. Vektorlayereigenschaften 177

QGIS User Guide, Release 3.4
Proportionale Symbole erstellen
To apply a proportional rendering:
1. First apply to the layer the single symbol renderer.
2. Then set the symbol to apply to the features.
3. Select the item at the upper level of the symbol tree, and use the Data-defined override button next to the Size(for point layer) or Width (for line layer) option.
4. Select a field or enter an expression, and for each feature, QGIS will apply the output value to the propertyand proportionally resize the symbol in the map canvas.
If need be, use the Size assistant. . . option of the menu to apply some transformation (exponential,flannery. . . ) to the symbol size rescaling (see Using the data-defined assistant interface for more details).
You can choose to display the proportional symbols in the Layers panel and the print layout legend item: unfoldthe Advanced drop-down list at the bottom of the main dialog of the Symbology tab and select Data-defined sizelegend. . . to configure the legend items (see Data-defined size legend for details).
Figure 13.13: Scaling airports size based on elevation of the airport
Mehrdimensionale Analyse erzeugen
Eine mehrdimensionale Analyse hilft Ihnen, die Beziehungen zwischen zwei oder mehr Variablen auszuwerten z.B. kann eine als Farbverlauf und die andere als Größe dargestellt werden.
The simplest way to create multivariate analysis in QGIS is to:
1. First apply a categorized or graduated rendering on a layer, using the same type of symbol for all the classes.
2. Then, apply a proportional symbology on the classes:
(a) Click on the Change button above the classification frame: you get the Die Symbolauswahl dialog.
(b) Rescale the size or width of the symbol layer using the data defined override widget as seen above.
178 Chapter 13. Arbeiten mit Vektordaten

QGIS User Guide, Release 3.4
Like the proportional symbol, the scaled symbology can be added to the layer tree, on top of the categorized orgraduated classes symbols using the data defined size legend feature. And both representation are also availablein the print layout legend item.
Figure 13.14: Multivariate example with scaled size legend
Rule-based Renderer
The Rule-based renderer is used to render all the features from a layer, using rule-based symbols whose aspectreflects the assignment of a selected feature’s attribute to a class. The rules are based on SQL statements and canbe nested. The dialog allows rule grouping by filter or scale, and you can decide if you want to enable symbollevels or use only the first-matched rule.
To create a rule:
1. Activate an existing row by double-clicking it (by default, QGIS adds a symbol without a rule when the
rendering mode is enabled) or click the Edit rule or Add rule button.
2. In the Edit Rule dialog that opens, you can define a label to help you identify each rule. This is the label thatwill be displayed in the Layers Panel and also in the print composer legend.
3. Manually enter an expression in the text box next to the Filter option or press the button next to itto open the expression string builder dialog.
4. Use the provided functions and the layer attributes to build an expression to filter the features you’d like toretrieve. Press the Test button to check the result of the query.
5. You can enter a longer label to complete the rule description.
6. You can use the Scale Range option to set scales at which the rule should be applied.
7. Finally, configure the symbol to use for these features.
8. And press OK.
A new row summarizing the rule is added to the Layer Properties dialog. You can create as many rules as necessaryfollowing the steps above or copy pasting an existing rule. Drag-and-drop the rules on top of each other to nestthem and refine the upper rule features in subclasses.
13.2. Vektorlayereigenschaften 179

QGIS User Guide, Release 3.4
Selecting a rule, you can also organize its features in subclasses using the Refine selected rules drop-down menu.Automated rule refinement can be based on:
• scales;
• categories: applying a categorized renderer;
• or ranges: applying a graduated renderer.
Refined classes appear like sub-items of the rule, in a tree hierarchy and like above, you can set symbology ofeach class.
In the Edit rule dialog, you can avoid writing all the rules and make use of the Else option to catch all thefeatures that do not match any of the other rules, at the same level. This can also be achieved by writing Else inthe Rule column of the Layer Properties → Symbology → Rule-based dialog.
The created rules also appear in a tree hierarchy in the map legend. Double-click the rules in the map legend andthe Symbology tab of the layer properties appears showing the rule that is the background for the symbol in thetree.
The example in figure_rule_based_symbology shows the rule-based rendering dialog for the rivers layer of theQGIS sample dataset.
Figure 13.15: Regelbasierte Symbolisierungsoptionen
Point displacement Renderer
The Point Displacement renderer works to visualize all features of a point layer, even if they have the samelocation. To do this, the renderer takes the points falling in a given Distance tolerance from each other and placesthem around their barycenter following different Placement methods:
• Ring: places all the features on a circle whose radius depends on the number of features to display.
• Concentric rings: uses a set of concentric circles to show the features.
• Grid: generates a regular grid with a point symbol at each intersection.
180 Chapter 13. Arbeiten mit Vektordaten

QGIS User Guide, Release 3.4
The Center symbol widget helps you customize the symbol and color of the middle point. For the distributed pointssymbols, you can apply any of the No symbols, Single symbol, Categorized, Graduated or Rule-based rendererusing the Renderer drop-down list and customize them using the Renderer Settings. . . button.
While the minimal spacing of the Displacement lines depends on the point symbol renderer’s, you can still cus-tomize some of its settings such as the Stroke width, Stroke color and Size adjustment (eg, to add more spacingbetween the rendered points).
Use the Labels group options to perform points labeling: the labels are placed near the displaced position of thesymbol, and not at the feature real position. Other than the Label attribute, Label font and Label color, you canset the Minimum map scale to display the labels.
Figure 13.16: Dialog Punktverdrängung
Bemerkung: Point Displacement renderer does not alter feature geometry, meaning that points are not movedfrom their position. They are still located at their initial place. Changes are only visual, for rendering purpose.Use instead the Processing qgispointsdisplacement algorithm if you want to create displaced features.
Point Cluster Renderer
Unlike the Point Displacement renderer which blows up nearest or overlaid point features placement, thePoint Cluster renderer groups nearby points into a single rendered marker symbol. Based on a specified Distance,points that fall within from each others are merged into a single symbol. Points aggregation is made based on theclosest group being formed, rather than just assigning them the first group within the search distance.
From the main dialog, you can:
13.2. Vektorlayereigenschaften 181

QGIS User Guide, Release 3.4
• set the symbol to represent the point cluster in the Cluster symbol; the default rendering displays the numberof aggregated features thanks to the @cluster_size variable on Font marker symbol layer.
• use the Renderer drop-down list to apply any of the other feature rendering types to the layer (single,categorized, rule-based. . . ). Then, push the Renderer Settings. . . button to configure features‘ symbologyas usual. Note that this renderer is only visible on features that are not clustered. Also, when the symbolcolor is the same for all the point features inside a cluster, that color sets the @cluster_color variableof the cluster.
Figure 13.17: Point Cluster dialog
Bemerkung: Point Cluster renderer does not alter feature geometry, meaning that points are not moved fromtheir position. They are still located at their initial place. Changes are only visual, for rendering purpose. Useinstead the Processing qgiskmeansclustering or qgisdbscanclustering algorithm if you want to create cluster-basedfeatures.
Inverted Polygon Renderer
The Inverted Polygon renderer allows user to define a symbol to fill in outside of the layer’s polygons. Asabove you can select subrenderers, namely Single symbol, Graduated, Categorized, Rule-Based or 2.5D renderer.
Heatmap Renderer
With the Heatmap renderer you can create live dynamic heatmaps for (multi)point layers. You can specify theheatmap radius in millimeters, points, pixels, map units or inches, choose and edit a color ramp for the heatmapstyle and use a slider for selecting a trade-off between render speed and quality. You can also define a maximumvalue limit and give a weight to points using a field or an expression. When adding or removing a feature theheatmap renderer updates the heatmap style automatically.
2.5D Renderer
Using the 2.5D renderer it’s possible to create a 2.5D effect on your layer’s features. You start by choosing aHeight value (in map units). For that you can use a fixed value, one of your layer’s fields, or an expression. Youalso need to choose an Angle (in degrees) to recreate the viewer position (0° means west, growing in counter clock
182 Chapter 13. Arbeiten mit Vektordaten

QGIS User Guide, Release 3.4
Figure 13.18: Umgekehrte Polygone Dialog
Figure 13.19: Der Heatmap-Erweiterung Dialog
13.2. Vektorlayereigenschaften 183

QGIS User Guide, Release 3.4
wise). Use advanced configuration options to set the Roof Color and Wall Color. If you would like to simulate
solar radiation on the features walls, make sure to check the Shade walls based on aspect option. You can alsosimulate a shadow by setting a Color and Size (in map units).
Figure 13.20: 2.5D dialog
Tipp: Using 2.5D effect with other renderers
Once you have finished setting the basic style on the 2.5D renderer, you can convert this to another renderer (single,categorized, graduated). The 2.5D effects will be kept and all other renderer specific options will be available foryou to fine tune them (this way you can have for example categorized symbols with a nice 2.5D representationor add some extra styling to your 2.5D symbols). To make sure that the shadow and the „building“ itself do notinterfere with other nearby features, you may need to enable Symbols Levels ( Advanced → Symbol levels. . . ).The 2.5D height and angle values are saved in the layer’s variables, so you can edit it afterwards in the variablestab of the layer’s properties dialog.
Layerdarstellung
From the Symbology tab, you can also set some options that invariably act on all features of the layer:
• Opacity : You can make the underlying layer in the map canvas visible with this tool.Use the slider to adapt the visibility of your vector layer to your needs. You can also make a precisedefinition of the percentage of visibility in the menu beside the slider.
• Blending mode at the Layer and Feature levels: You can achieve special rendering effects with these toolsthat you may previously only know from graphics programs. The pixels of your overlaying and underlayinglayers are mixed through the settings described in Mischmodi.
• Wenden Sie Zeicheneffekte auf alle Layerobjekte an, mit dem Zeicheneffekte Knopf.
• Control feature rendering order allows you, using features attributes, to define the z-order in which they
shall be rendered. Activate the checkbox and click on the button beside. You then get the Define Orderdialog in which you:
1. Choose a field or build an expression to apply to the layer features.
2. Set in which order the fetched features should be sorted, i.e. if you choose Ascending order, thefeatures with lower value are rendered under those with higher value.
184 Chapter 13. Arbeiten mit Vektordaten

QGIS User Guide, Release 3.4
3. Define when features returning NULL value should be rendered: first (bottom) or last (top).
4. Repeat the above steps as many times as rules you wish to use.
The first rule is applied to all the features in the layer, z-ordering them according to their returned value.Then, within each group of features with the same value (including those with NULL value) and thus thesame z-level, the next rule is applied to sort them. And so on. . .
Figure 13.21: Layerdarstellungsoptionen
Andere Einstellungen
Symbol levels
Für Renderer, die Symbollayer gestapelt ermöglichen (nur Heatmap nicht) gibt es eine Option, um die Darstel-lungsreihenfolge der einzelnen Symbolebenen zu steuern.
For most of the renderers, you can access the Symbols levels option by clicking the Advanced button belowthe saved symbols list and choosing Symbol levels. For the Rule-based Renderer the option is directly availablethrough Symbols Levels. . . button, while for Point displacement Renderer renderer the same button is inside theRendering settings dialog.
Um die Symbolebenen zu aktivieren, wählen Sie Symbolebenen aktivieren. Jede Reihe zeigt eine kleineVorschau des kombinierten Symbols, seiner Beschriftung und die individuellen Symbollayer, unterteilt in ver-schiedene Spalten mit einer Nummer. Die Nummern zeigen die Darstellungsreihenfolge, in der die Symbollayergezeichnet werden. Niedrige Werteebenen werden zuerst gezeichnet, liegen ganz unten, während höhere Werteals letztes gezeichnet werden und über den anderen liegen.
Figure 13.22: Symbolebenen Dialog
13.2. Vektorlayereigenschaften 185

QGIS User Guide, Release 3.4
Bemerkung: Wenn Symbolebenen deaktiviert werden, werden alle Symbole entsprechend ihren jeweiligen Ob-jektreihenfolge gezeichnet. Überlappende Symbole werden einfach zu anderen darunter verschleiert. Außerdem„verschmelzen“ ähnliche Symbole nicht mit anderen.
Figure 13.23: Unterschied von aktivierten (A) und deaktivierten (B) Symbolebenen
Data-defined size legend
When a layer is rendered with the proportional symbol or the multivariate rendering or when a scaled size diagramis applied to the layer, you can allow the display of the scaled symbols in both the Layers panel and the print layoutlegend.
To enable the Data-defined Size Legend dialog to render symbology, select the eponym option in the Advancedbutton below the saved symbols list. For diagrams, the option is available under the Legend tab. The dialogprovides the following options to:
• select the type of legend: Legend not enabled, Separated legend items and Collapsed legend.For the latter option, you can select whether the legend items are aligned at the Bottom or at the Center;
• set the symbol to use for legend representation;
• insert the title in the legend;
• resize the classes to use: by default, QGIS provides you with a legend of five classes (based on natural pretty
breaks) but you can apply your own classification using the Manual size classes option. Use the
and buttons to set your custom classes values and labels.
A preview of the legend is displayed in the right panel of the dialog and updated as you set the parameters. Forcollapsed legend, a leader line from the horizontal center of the symbol to the corresponding legend text is drawn.
Bemerkung: Currently, data-defined size legend for layer symbology can only be applied to point layer usingsingle, categorized or graduated symbology.
Zeicheneffekte
Damit die Layerdarstellung verbessert und vermieden (oder zumindest reduziert) wird, dass andere Software aufdie endgültige Darstellung der Karte umsortiert, bietet QGIS eine weitere leistungsfähige Funktionalität: Die
Option Zeicheneffekte, die zur Anpassung Zeicheneffekte für die Visualisierung von Vektorlayern hinzufügt.
186 Chapter 13. Arbeiten mit Vektordaten

QGIS User Guide, Release 3.4
Figure 13.24: Setting size scaled legend
The option is available in the Layer Properties → Symbology dialog, under the Layer rendering group (applyingto the whole layer) or in symbol layer properties (applying to corresponding features). You can combine bothusage.
Paint effects can be activated by checking the Draw effects option and clicking the Customize effects button.That will open the Effect Properties Dialog (see figure_effects_source). The following effect types, with customoptions are available:
• Source: Draws the feature’s original style according to the configuration of the layer’s properties. TheOpacity of its style can be adjusted as well as the Blend mode and Draw mode. These are common propertiesfor all types of effects.
• Blur: Adds a blur effect on the vector layer. The custom options that you can change are the Blur type(Stack blur (fast) or Gaussian blur (quality)) and the Blur strength.
• Colorise: This effect can be used to make a version of the style using one single hue. The base will alwaysbe a grayscale version of the symbol and you can:
– Use the Grayscale to select how to create it: options are ‚By lightness‘, ‚By luminosity‘, ‚Byaverage‘ and ‚Off‘.
– If Colorise is selected, it will be possible to mix another color and choose how strong it should be.
– Control the Brightness, Contrast and Saturation levels of the resulting symbol.
• Drop Shadow: Using this effect adds a shadow on the feature, which looks like adding an extra dimension.This effect can be customized by changing the Offset angle and distance, determining where the shadowshifts towards to and the proximity to the source object. Drop Shadow also has the option to change theBlur radius and the Color of the effect.
• Inner Shadow: This effect is similar to the Drop Shadow effect, but it adds the shadow effect on the insideof the edges of the feature. The available options for customization are the same as the Drop Shadow effect.
• Inner Glow: Adds a glow effect inside the feature. This effect can be customized by adjusting the Spread(width) of the glow, or the Blur radius. The latter specifies the proximity from the edge of the feature whereyou want any blurring to happen. Additionally, there are options to customize the color of the glow using aSingle color or a Color ramp.
13.2. Vektorlayereigenschaften 187

QGIS User Guide, Release 3.4
Figure 13.25: Zeicheneffekte: Dialog Quelle
188 Chapter 13. Arbeiten mit Vektordaten

QGIS User Guide, Release 3.4
Figure 13.26: Zeicheneffekte: Dialog verwischen
13.2. Vektorlayereigenschaften 189

QGIS User Guide, Release 3.4
Figure 13.27: Zeicheneffekte: Dialog einfärben
190 Chapter 13. Arbeiten mit Vektordaten

QGIS User Guide, Release 3.4
Figure 13.28: Zeicheneffekte: Dialog Schattenwurf
13.2. Vektorlayereigenschaften 191

QGIS User Guide, Release 3.4
Figure 13.29: Zeicheneffekte: Dialog Innerer Schatten
192 Chapter 13. Arbeiten mit Vektordaten

QGIS User Guide, Release 3.4
Figure 13.30: Zeicheneffekte: Dialog Inneres Glühen
13.2. Vektorlayereigenschaften 193

QGIS User Guide, Release 3.4
• Outer Glow: This effect is similar to the Inner Glow effect, but it adds the glow effect on the outside of theedges of the feature. The available options for customization are the same as the Inner Glow effect.
Figure 13.31: Zeicheneffekte: Dialog Äußeres Glühen
• Transform: Adds the possibility of transforming the shape of the symbol. The first options availablefor customization are the Reflect horizontal and Reflect vertical, which actually create a reflection on thehorizontal and/or vertical axes. The other options are:
– Shear X,Y: Slants the feature along the X and/or Y axis.
– Scale X,Y: Enlarges or minimizes the feature along the X and/or Y axis by the given percentage.
– Rotation: Turns the feature around its center point.
– and Translate X,Y changes the position of the item based on a distance given on the X and/or Y axis.
One or more effect types can be used at the same time. You (de)activate an effect using its checkbox in the
effects list. You can change the selected effect type by using the Effect type option. You can reorder the
effects using Move up and Move down buttons, and also add/remove effects using the Add new effect andRemove effect buttons.
There are some common options available for all draw effect types. Opacity and Blend mode options work similarto the ones described in Layerdarstellung and can be used in all draw effects except for the transform one. There
is also a Draw mode option available for every effect, and you can choose whether to render and/or modifythe symbol, following some rules:
• Effects render from top to bottom.
• Render only mode means that the effect will be visible.
• Modifier only mode means that the effect will not be visible but the changes that it applies will be passed tothe next effect (the one immediately below).
194 Chapter 13. Arbeiten mit Vektordaten

QGIS User Guide, Release 3.4
Figure 13.32: Zeicheneffekte: Dialog transformieren
13.2. Vektorlayereigenschaften 195

QGIS User Guide, Release 3.4
• The Render and Modify mode will make the effect visible and pass any changes to the next effect. If theeffect is at the top of the effects list or if the immediately above effect is not in modify mode, then it willuse the original source symbol from the layers properties (similar to source).
13.2.4 Labels Properties
The Labels properties provides you with all the needed and appropriate capabilities to configure smart labelingon vector layers. This dialog can also be accessed from the Layer Styling panel, or using the Layer Labeling Options
icon of the Labels toolbar.
The first step is to choose the labeling method from the drop-down list. Available methods are:
• No labels: the default value, showing no labels from the layer
• Single labels, described below
• Rule-based labeling
• and Blocking: allows to set a layer as just an obstacle for other layer’s labels without rendering anylabels of its own.
Setting a label
The next steps assume you select the Single labels option, enabling following tabs that help you configure thelabeling:
• Text
• Formatting
• Buffer
• Background
• Shadow
• Placement
• Rendering
It also enables the Label with drop-down list, from which you can select an attribute column to use. Click ifyou want to define labels based on expressions - See Ausdrucksbasierte Beschriftungen definieren.
The following steps describe simple labeling without using the Data defined override functions, which are situatednext to the drop-down menus - see Datendefinierte Übersteuerung für das Beschriften for a use case.
Text tab
In the Text tab, you can define the Font, Style, and Size of your labels‘ text (see Figure_labels). There areoptions available to set the labels‘ Color and Transparency. Use the Type case option to change the capitalizationstyle of the text. You have the possibility to render the text as ‚All uppercase‘, ‚All lowercase‘ or ‚Capitalizefirst letter‘. In Spacing, you can change the space between words and between individual letters. Finally, use theBlend mode option to determine how your labels will mix with the map features below them (see more about it inMischmodi).
The Apply label text substitutes option gives you ability to specify a list of texts to substitute to texts in featurelabels (e.g., abbreviating street types). Replacement texts are thus used to display labels in the map canvas. Userscan also export and import lists of substitutes to make reuse and sharing easier.
196 Chapter 13. Arbeiten mit Vektordaten

QGIS User Guide, Release 3.4
Figure 13.33: Layer labeling settings - Text tab
Formatting tab
In the Formatting tab, you can define a character for a line break in the labels with the Wrap on characteroption. You can also format the Line Height and the alignment. For the latter, typical values are available (left,right, and center), plus Follow label placement for point layers. When set to this mode, text alignment for labelswill be dependent on the final placement of the label relative to the point. E.g., if the label is placed to the left ofthe point, then the label will be right aligned, while if it is placed to the right, it will be left aligned.
For line vector layers you can include Line directions symbols to help determine the lines directions. They workparticularly well when used with the curved or Parallel placement options from the Placement tab. There areoptions to set the symbols position, and to reverse direction.
Use the Formatted numbers option to format numeric labels. You can set the number of Decimal places. By
default, 3 decimal places will be used. Use the Show plus sign if you want to show the plus sign in positivenumbers.
Buffer tab
To create a buffer around the labels, activate the Draw text buffer checkbox in the Buffer tab. You can
set the buffer’s Size, color, and Transparency. The buffer expands from the label’s outline , so, if the colorbuffer’s fill checkbox is activated, the buffer interior is filled. This may be relevant when using partially transparent
labels or with non-normal blending modes, which will allow seeing behind the label’s text. Deactivating colorbuffer’s fill checkbox (while using totally transparent labels) will allow you to create outlined text labels.
Background tab
In the Background tab, you can define with Size X and Size Y the shape of your background. Use Size typeto insert an additional ‚Buffer‘ into your background. The buffer size is set by default here. The background then
13.2. Vektorlayereigenschaften 197

QGIS User Guide, Release 3.4
consists of the buffer plus the background in Size X and Size Y. You can set a Rotation where you can choosebetween ‚Sync with label‘, ‚Offset of label‘ and ‚Fixed‘. Using ‚Offset of label‘ and ‚Fixed‘, you can rotate thebackground. Define an Offset X,Y with X and Y values, and the background will be shifted. When applyingRadius X,Y, the background gets rounded corners. Again, it is possible to mix the background with the underlyinglayers in the map canvas using the Blend mode (see Mischmodi).
Shadow tab
Use the Shadow tab for a user-defined Draw drop shadow. The drawing of the background is very variable.Choose between ‚Lowest label component‘, ‚Text‘, ‚Buffer‘ and ‚Background‘. The Offset angle depends on the
orientation of the label. If you choose the Use global shadow checkbox, then the zero point of the angle isalways oriented to the north and doesn’t depend on the orientation of the label. You can influence the appearanceof the shadow with the Blur radius. The higher the number, the softer the shadows. The appearance of the dropshadow can also be altered by choosing a blend mode.
Placement tab
Choose the Placement tab for configuring label placement and labeling priority. Note that the placementoptions differ according to the type of vector layer, namely point, line or polygon, and are affected by the globalPAL setting.
Platzierung für Punktlayer
With the Cartographic placement mode, point labels are generated with a better visual relationship with thepoint feature, following ideal cartographic placement rules. Labels can be placed at a set Distance either from thepoint feature itself or from the bounds of the symbol used to represent the feature. The latter option is especiallyuseful when the symbol size isn’t fixed, e.g. if it’s set by a data defined size or when using different symbols in acategorized renderer.
Standardmäßig sind die Platzierungen in dieser Reihenfolge festgelegt:
1. oben rechts
2. oben links
3. unten rechts
4. unten links
5. mitte rechts
6. mitte links
7. oben, leicht rechts
8. unten, leicht rechts
Placement priority can, however, be customized or set for an individual feature using a data defined list of priori-tised positions. This also allows only certain placements to be used, so e.g. for coastal features you can preventlabels being placed over the land.
Die Einstellung Um den Punkt platziert die Beschriftung in einem gleichen Kreisradius (einzustellen in Ab-stand) um das Objekt. Die Platzierung der Beschriftung kann auch eingeschränkt werden, in der Quadrant Option.
With the Offset from point, labels are placed at a fixed offset from the point feature. You can select theQuadrant in which to place your label. You are also able to set the Offset X,Y distances between the points andtheir labels and can alter the angle of the label placement with the Rotation setting. Thus, placement in a selectedquadrant with a defined rotation is possible.
198 Chapter 13. Arbeiten mit Vektordaten

QGIS User Guide, Release 3.4
Platzierung für Linienlayer
Label options for line layers include Parallel, Curved or Horizontal. For the Parallel and
Curved options, you can set the position to Above line, On line and Below line. It’s possible to selectseveral options at once. In that case, QGIS will look for the optimal label position. For Parallel and curved place-ment options, you can also use the line orientation for the position of the label. Additionally, you can define a Max-
imum angle between curved characters when selecting the Curved option (see Figure_labels_placement_line).
Figure 13.34: Label placement examples in lines
For all three placement options, in Repeat, you can set up a minimum distance for repeating labels. The distancecan be in mm or in map units.
Platzierung für Polygonlayer
You can choose one of the following options for placing labels in polygons (see fig-ure_labels_placement_polygon):
• Offset from centroid,
• Horizontal (slow),
• Around centroid,
• Free (slow),
• Using perimeter,
• and Using perimeter (curved).
In the Offset from centroid settings you can specify if the centroid is of the visible polygon or wholepolygon. That means that either the centroid is used for the polygon you can see on the map or the centroid isdetermined for the whole polygon, no matter if you can see the whole feature on the map. You can place yourlabel within a specific quadrant, and define offset and rotation.
The Around centroid setting places the label at a specified distance around the centroid. Again, you can define
visible polygon or whole polygon for the centroid.
With the Horizontal (slow) or Free (slow) options, QGIS places at the best position either a horizontal or a rotatedlabel inside the polygon.
With the Using perimeter option, the label will be drawn next to the polygon boundary. The label will behave like
the parallel option for lines. You can define a position and a distance for the label. For the position, Above
13.2. Vektorlayereigenschaften 199

QGIS User Guide, Release 3.4
line, On line, Below line and Line orientation dependent position are possible. You can specify thedistance between the label and the polygon outline, as well as the repeat interval for the label.
The Using perimeter (curved) option helps you draw the label along the polygon boundary, using a curved labeling.In addition to the parameters available with Using perimeter setting, you can set the Maximum angle betweencurved characters polygon, either inside or outside.
Figure 13.35: Label placement examples in polygons
In the priority section you can define the priority with which labels are rendered for all three vector layer types(point, line, polygon). This placement option interacts with the labels from other vector layers in the map canvas.If there are labels from different layers in the same location, the label with the higher priority will be displayedand the others will be left out.
Rendering tab
In the Rendering tab, you can tune when the labels can be rendered and their interaction with other labels andfeatures.
Unter den Beschriftungsoptionen finden Sie die skalierungsbasierte und die Pixelgrößenbasierte Sichtbarkeitse-instellungen.
Der Beschriftung Z-Index bestimmt, in welcher Reihenfolge, welche Beschriftung dargestellt wird, als auch inwelcher Verbindung mit anderen Objekten in dem Layer (nutzen Sie datendefinierte Übersteuerung), wie mitBeschriftungen anderer Layer. Beschriftungen mit einem hohen Z-Index werden an oberster Stelle dargestellt.
Zusätzlich ist die Logik optimiert worden, so, dass wenn zwei Beschriftungen den selben Z-Index haben, dann:
• wenn sie aus dem selben Layer sind, wird die kleinere Beschriftung über dem größeren gezeichnet
• wenn sie aus verschiedenen Layer sind, werden die Beschriftungen in der selben Reihenfolge gezeichnet,wie die Layer an sich (d. h. unter Berücksichtigung der Reihenfolge in der Kartenlegende).
200 Chapter 13. Arbeiten mit Vektordaten

QGIS User Guide, Release 3.4
Beachten Sie, dass diese Einstellung Beschriftungen nicht unter andere Objekte anderer Layer zeichnet, es kon-trolliert nur die Reihenfolge, in welcher Beschriftungen über allen Layerobjekten gezeichnet werden.
Während der Darstellung der Beschriftungen und um lesbare Beschriftungen anzuzeigen, wertet QGIS automa-tisch die Position der Beschriftungen aus und kann, im Falle einer Kollision, einige von ihnen verstecken. Trotz-
dem können Sie Alle Beschriftungen für diesen layer anzeigen (including colliding labels) wählen und IhreKollisionen manuell beheben.
Mit datendefinierten Ausdrücken in Beschriftungen anzeigen and Immer anzeigen können Sie Feineinstellungenvornehmen, welche Beschriftungen dargestellt werden.
Unter Objektoptionen können Sie Jeden Teil eines Multi-Polygons beschriften und Begrenze die Anzahl der zubeschriftenden Objekte wählen. Sowohl Linien- als auch Polygonlayer bieten die Möglichkeit eine Mindestgrößefür das Beschriften einzustellen, wählen Sie Unterdrücke Beschriftungen für Objekte kleiner als. Für Polygonlayerkönnen Sie auch einen Filter vornehmen, der Beschriftungen anzeigt, wenn sie komplett in dem Polygon liegenoder nicht. Für Linienlayer können Sie wählen Verschmelze verbundene Linien um doppelte Beschriftung zuvermeiden, um eine lebhafte Karte darzustellen in Verbindung mit dem Abstand oder Wiederholen Optionen imReiter Platzierung.
In dem Hindernis Rahmen, können Sie die Abdeckungsbeziehungen zwischen Beschriftungen und Objekten bear-
beiten. Aktivieren Sie die Discourage labels from covering features Option um zu entscheiden, ob Objektedes Layers als Hindernis für Beschriftung wirken soll (inklusive Beschriftungen anderer Objekte des selben Lay-ers). Ein Hindernis ist ein Merkmal, QGIS versucht so weit wie möglich keine Beschriftungen übereinander
zu platzieren. Anstatt des gesamten Layers, können Sie Teilmengen als Hindernis definieren, indem Siedatendefinierte Übersteuerung verwenden.
Der Prioritätsschieberegler für Hindernisse erlaubt es Ihnen Beschriftungen von bestimmtenLayern zum überlappen zu bevorzugen. Eine Geringe Gewichtung einer Hindernispriorität bedeutet, dass Ob-jekte eines Layers weniger als Hindernis gelten und somit eher durch Beschriftungen überlagert werden. DiePriorität kann ebenso datendefiniert sein, so dass innerhalb des selben Layers, bestimmte Objekte wahrschein-licher überdeckt werden als andere.
Für Polygonlayer können Sie dezArt von Hindernisobjekten wählen durch Minimierung der Beschrif-tungsplatzierung sein könnten:
• over the feature’s interior: avoids placing labels over the interior of the polygon (prefers placing labelstotally outside or just slightly inside the polygon)
• or over the feature’s boundary: avoids placing labels over boundary of the polygon (prefers placing labelsoutside or completely inside the polygon). E.g., it can be useful for regional boundary layers, where thefeatures cover an entire area. In this case, it’s impossible to avoid placing labels within these features, andit looks much better to avoid placing them over the boundaries between features.
Setting the automated placement engine
In the top right corner of the Labels tab, you can use the Automated placement settings (applies to all layers) to configure a
global and automated behavior of the labels. Clicking the button provides you with the following options:
• The Search method combobox provides you with different placement methods for finding good placementsolutions for point, line and polygon labeling. More details in this article.
• The Number of candidates controls set how many label placement candidates should be generated for eachfeature type. The more candidates generated, the better the labeling will be - but at a cost of rendering speed.Smaller number of candidates results in less labels placed but faster redraws.
• Draw text as outlines: controls whether text labels are drawn (and exported) as either proper text objectsOR as paths only. If they are exported as text objects then they can be edited in external applications(e.g. Inkscape) as normal text. BUT the side effect is that the rendering quality is decreased, AND there’sissues with rendering when certain text settings like buffers are in place. That’s why drawing as outlines is
13.2. Vektorlayereigenschaften 201

QGIS User Guide, Release 3.4
Figure 13.36: The labels automated placement engine
recommended. Note that when exporting a layout to svg there’s actually an override for this setting - so youcan leave the project rendering as outlines but for a .svg export export the labels as text.
• Show partial labels: controls whether labels which fall partially outside of the map extent should berendered. If checked, these labels will be shown (when there’s no way to place them fully within the visiblearea). If unchecked then partial visible labels will be skipped.
• show all labels for all layers (i.e. including colliding objects). Note that this option can be also set perlayer (see Rendering tab)
• show candidates (for debugging): controls whether boxes should be drawn on the map showing all thecandidates generated for label placement. Like the label says, it’s useful only for debugging and testing theeffect different labeling settings have. This could be handy for a better manual placement with tools fromthe label toolbar.
Regelbasierte Beschriftung
With rule-based labeling multiple label configurations can be defined and applied selectively on the base of ex-pression filters and scale range, as in Rule-based rendering.
To create a rule, select the Rule-based labeling option in the main drop-down list from the Labels tab and
click the button at the bottom of the dialog. Then fill the new dialog with a description and an expression tofilter features. You can also set a scale range in which the label rule should be applied. The other options availablein this dialog are the common settings seen beforehand.
A summary of existing rules is shown in the main dialog (see figure_labels_rule_based). You can add multiple
rules, reorder or imbricate them with a drag-and-drop. You can as well remove them with the button or edit
them with button or a double-click.
Ausdrucksbasierte Beschriftungen definieren
Whether you choose single or rule-based labeling type, QGIS allows using expressions to label features.
Assuming you are using the Single labels method, click the icon near the Label with drop-down list in theLabels tab of the properties dialog.
In figure_labels_expression, you see a sample expression to label the alaska trees layer with tree type andarea, based on the field ‚VEGDESC‘, some descriptive text, and the function $area in combination withformat_number() to make it look nicer.
Expression based labeling is easy to work with. All you have to take care of is that:
202 Chapter 13. Arbeiten mit Vektordaten

QGIS User Guide, Release 3.4
Figure 13.37: Regeleigenschaften
Figure 13.38: Regelbasierte Beschriftung Bedienfelder
13.2. Vektorlayereigenschaften 203

QGIS User Guide, Release 3.4
Figure 13.39: Ausdrücke für das Beschriften verwenden
• You may need to combine all elements (strings, fields, and functions) with a string concatenation functionsuch as concat, + or ||. Be aware that in some situations (when null or numeric value are involved) notall of these tools will fit your need.
• Strings are written in ‚single quotes‘.
• Fields are written in „double quotes“ or without any quote.
Schauen wir uns einige Beispiele an:
1. Label based on two fields ‚name‘ and ‚place‘ with a comma as separator:
"name" || ', ' || "place"
Returns:
John Smith, Paris
2. Label based on two fields ‚name‘ and ‚place‘ with other texts:
'My name is ' + "name" + 'and I live in ' + "place"'My name is ' || "name" || 'and I live in ' || "place"concat('My name is ', name, ' and I live in ', "place")
Returns:
My name is John Smith and I live in Paris
3. Label based on two fields ‚name‘ and ‚place‘ with other texts combining different concatenation functions:
concat('My name is ', name, ' and I live in ' || place)
Returns:
My name is John Smith and I live in Paris
204 Chapter 13. Arbeiten mit Vektordaten

QGIS User Guide, Release 3.4
Or, if the field ‚place‘ is NULL, returns:
My name is John Smith
4. Multi-line label based on two fields ‚name‘ and ‚place‘ with a descriptive text:
concat('My name is ', "name", '\n' , 'I live in ' , "place")
Returns:
My name is John SmithI live in Paris
5. Label based on a field and the $area function to show the place’s name and its rounded area size in aconverted unit:
'The area of ' || "place" || ' has a size of '|| round($area/10000) || ' ha'
Returns:
The area of Paris has a size of 10500 ha
6. Create a CASE ELSE condition. If the population value in field population is <= 50000 it is a town,otherwise it is a city:
concat('This place is a ',CASE WHEN "population" <= 50000 THEN 'town' ELSE 'city' END)
Returns:
This place is a town
7. Display name for the cities and no label for the other features (for the „city“ context, see example above):
CASE WHEN "population" > 50000 THEN "NAME" END
Returns:
Paris
Wie Sie im Ausdruckeditor sehen können stehen Ihnen hunderte von Funktionen zur Verfügung um einfache undsehr komplexe Ausdrücke zumBeschriften Ihrer Daten in QGIS zu erstellen. Siehe das Ausdrücke Kapitel fürweitere Informationen und ein Beispiel zu Ausdrücken.
Datendefinierte Übersteuerung für das Beschriften
With the Data defined override function, the settings for the labeling are overridden by entries in the attribute tableor expressions based on them. This feature can be used to set values for most of the labeling options describedabove.
For example, using the Alaska QGIS sample dataset, let’s label the airports layer with their name, based ontheir militarian USE, i.e. whether the airport is accessible to :
• military people, then display it in gray color, size 8;
• others, then show in blue color, size 10.
To do this, after you enabled the labeling on the NAME field of the layer (see Setting a label):
1. Activate the Text tab.
13.2. Vektorlayereigenschaften 205

QGIS User Guide, Release 3.4
2. Click on the icon next to the Size property.
3. Select Edit. . . and type:
CASEWHEN "USE" like '%Military%' THEN 8 -- because compatible values are
→˓'Military'-- and 'Joint Military/Civilian'
ELSE 10END
4. Press OK to validate. The dialog closes and the button becomes meaning that an rule is being run.
5. Then click the button next to the color property, type the expression below and validate:
CASEWHEN "USE" like '%Military%' THEN '150, 150, 150'ELSE '0, 0, 255'
END
Likewise, you can customize any other property of the label, the way you want. See more details on theData-define override widget’s description and manipulation in Datendefinierte Übersteuerung Setup section.
Figure 13.40: Airports labels are formatted based on their attributes
The Label Toolbar
The Label Toolbar provides some tools to manipulate label or diagram properties, but only if thecorresponding data-defined option is indicated (otherwise, buttons are disabled). Layer might also need to be inedit mode.
206 Chapter 13. Arbeiten mit Vektordaten
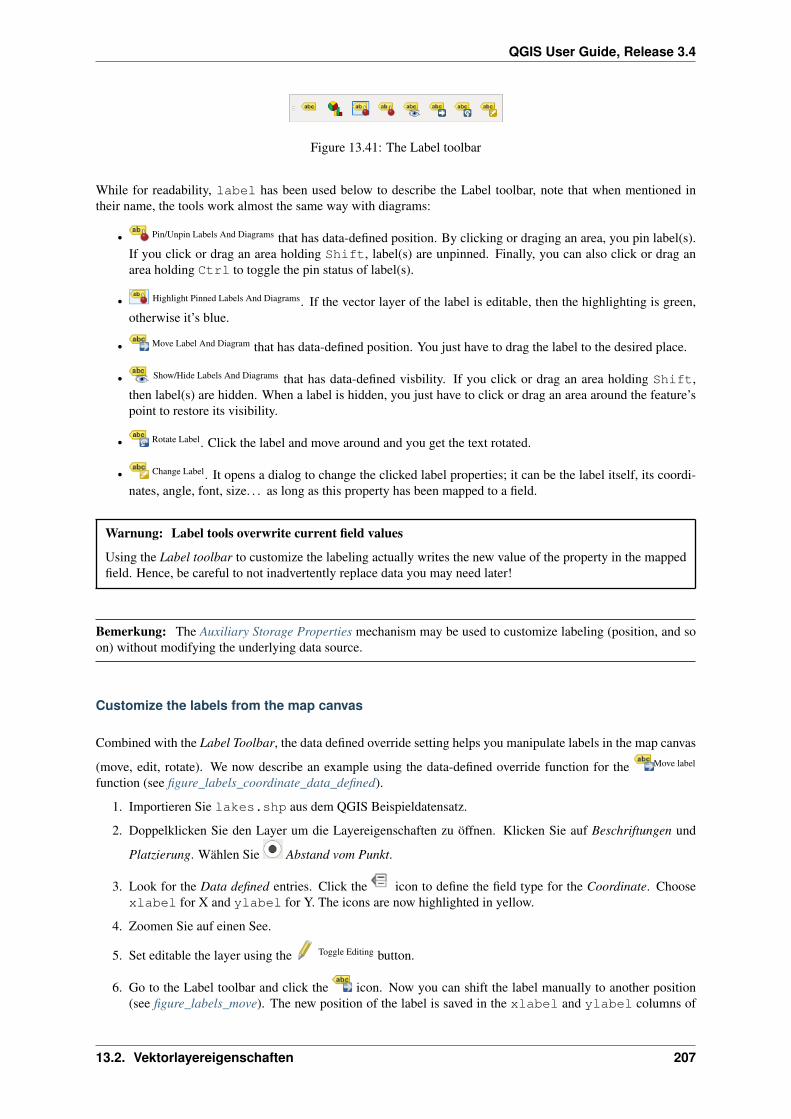
QGIS User Guide, Release 3.4
Figure 13.41: The Label toolbar
While for readability, label has been used below to describe the Label toolbar, note that when mentioned intheir name, the tools work almost the same way with diagrams:
• Pin/Unpin Labels And Diagrams that has data-defined position. By clicking or draging an area, you pin label(s).If you click or drag an area holding Shift, label(s) are unpinned. Finally, you can also click or drag anarea holding Ctrl to toggle the pin status of label(s).
• Highlight Pinned Labels And Diagrams. If the vector layer of the label is editable, then the highlighting is green,otherwise it’s blue.
• Move Label And Diagram that has data-defined position. You just have to drag the label to the desired place.
• Show/Hide Labels And Diagrams that has data-defined visbility. If you click or drag an area holding Shift,then label(s) are hidden. When a label is hidden, you just have to click or drag an area around the feature’spoint to restore its visibility.
• Rotate Label. Click the label and move around and you get the text rotated.
• Change Label. It opens a dialog to change the clicked label properties; it can be the label itself, its coordi-nates, angle, font, size. . . as long as this property has been mapped to a field.
Warnung: Label tools overwrite current field values
Using the Label toolbar to customize the labeling actually writes the new value of the property in the mappedfield. Hence, be careful to not inadvertently replace data you may need later!
Bemerkung: The Auxiliary Storage Properties mechanism may be used to customize labeling (position, and soon) without modifying the underlying data source.
Customize the labels from the map canvas
Combined with the Label Toolbar, the data defined override setting helps you manipulate labels in the map canvas
(move, edit, rotate). We now describe an example using the data-defined override function for the Move label
function (see figure_labels_coordinate_data_defined).
1. Importieren Sie lakes.shp aus dem QGIS Beispieldatensatz.
2. Doppelklicken Sie den Layer um die Layereigenschaften zu öffnen. Klicken Sie auf Beschriftungen und
Platzierung. Wählen Sie Abstand vom Punkt.
3. Look for the Data defined entries. Click the icon to define the field type for the Coordinate. Choosexlabel for X and ylabel for Y. The icons are now highlighted in yellow.
4. Zoomen Sie auf einen See.
5. Set editable the layer using the Toggle Editing button.
6. Go to the Label toolbar and click the icon. Now you can shift the label manually to another position(see figure_labels_move). The new position of the label is saved in the xlabel and ylabel columns of
13.2. Vektorlayereigenschaften 207

QGIS User Guide, Release 3.4
Figure 13.42: Das Beschriften von Polygonlayern mit datendefinierter Übersteuerung
the attribute table.
7. Using The Geometry Generator with the expression below, you can also add a linestring symbol layer toconnect each lake to its moved label:
make_line( centroid( $geometry ), make_point( "xlabel", "ylabel" ) )
Bemerkung: The Auxiliary Storage Properties mechanism may be used with data-defined properties withouthaving an editable data source.
13.2.5 Diagrams Properties
The Diagrams tab allows you to add a graphic overlay to a vector layer (see figure_diagrams_attributes).
Die aktuelle Kernimplementation von Diagrammen bietet Unterstützung von:
• No diagrams: the default value with no diagram displayed over the features;
• Pie charts, a circular statistical graphic divided into slices to illustrate numerical proportion. The arclength of each slice is proportional to the quantity it represents;
• Text diagrams, a horizontaly divided circle showing statistics values inside;
• and Histograms.
In the top right corner of the Diagrams tab, the Automated placement settings (applies to all layers) button provides meansto control diagram labels placement on the map canvas.
Tipp: Switch quickly between types of diagrams
208 Chapter 13. Arbeiten mit Vektordaten

QGIS User Guide, Release 3.4
Figure 13.43: Moved labels
Given that the settings are almost common to the different types of diagram, when designing your diagram, youcan easily change the diagram type and check which one is more appropriate to your data without any loss.
For each type of diagram, the properties are divided into several tabs:
• Attributes
• Rendering
• Size
• Placement
• Options
• Legend
Attribute
Attribute‘definiert, welche Variablen in dem Diagramm gezeigt werden. Nutzen Sie den :sup:‘Objekt hinzufügenKnopf um das gewünschte Feld in das ‚Zugeordnete Attribut‘ Bedienfeld zu schieben. Erzeugte Attribute mit denAusdrücke können auch genutzt werden.
You can move up and down any row with click and drag, sorting how attributes are displayed. You can also changethe label in the ‚Legend‘ column or the attribute color by double-clicking the item.
This label is the default text displayed in the legend of the print layout or of the layer tree.
13.2. Vektorlayereigenschaften 209

QGIS User Guide, Release 3.4
Figure 13.44: Diagram properties - Attributes tab
Rendering
Rendering defines how the diagram looks like. It provides general settings that do not interfere with the statisticvalues such as:
• the graphic’s opacity, its outline width and color;
• and, depending on the type of diagram:
– the width of the bar in case of histogram;
– the circle background color in case of text diagram, and the font used for texts;
– die Ausrichtung der linken Linie von der ersten Scheibe im Tortendiagramm. Beachten Sie, dieScheiben werden im Uhrzeigersinn angezeigt.
In this tab, you can also manage and fine tune the diagram visibility with different options:
• Diagram z-index: controls how diagrams are drawn on top of each other and on top of labels. A diagramwith a high index is drawn over diagrams and labels;
• Show all diagrams: shows all the diagrams even if they overlap each other;
• Show diagram: allows only specific diagrams to be rendered;
• Always Show: selects specific diagrams to always render, even when they overlap other diagrams or maplabels;
• setting the Scale dependent visibility;
• Discourage diagrams and labels from covering features: defines features to use as obstacles, ie QGIS willtry to not place diagrams nor labels over these features.
Größe
Size is the main tab to set how the selected statistics are represented. The diagram size units can be ‚Millimeter‘,‚Points‘, Pixels, ‚Map Units‘ or ‚Inches‘. You can use :
• Feste Größe, eine feste Größe zum Darstellen der Grafik aller Objekte, außer beim Darstellen des His-togramms
• oder Skalierte Größe, basiert auf einem Ausdruck, der Layerattribute benutzt.
210 Chapter 13. Arbeiten mit Vektordaten

QGIS User Guide, Release 3.4
Figure 13.45: Diagram properties - Rendering tab
Figure 13.46: Diagram properties - Size tab
13.2. Vektorlayereigenschaften 211

QGIS User Guide, Release 3.4
Platzierung
Platzierung hilft die Diagramm Position einzustellen. Entsprechend dem Layergeometrietyp, bietet es ver-schiedene Optionen zur Platzierung:
• ‚Over the point‘ or ‚Around the point‘ for point geometry. The latter variable requires a radius to follow.
• ‚Over the line‘ or ‚Around the line‘ for line geometry. Like point feature, the last variable requires a distanceto respect and user can specify the diagram placement relative to the feature (‚above‘, ‚on‘ and/or ‚below‘the line) It’s possible to select several options at once. In that case, QGIS will look for the optimal positionof the diagram. Remember that here you can also use the line orientation for the position of the diagram.
• ‚Über dem Zentrum‘, ‚Um das Zentrum‘ (mit eingestellter Distanz), ‚Umfang‘ und irgendwo ‚Innerhalb desPolygons‘ sind die Optionen für Polygonobjekte.
The diagram can also be placed using feature data to fill the coordinates X and Y fields.
The placement of the diagrams can interact with the labeling, so you can detect and solve position conflictsbetween diagrams and labels by setting the Priority slider value.
Figure 13.47: Vector properties dialog with diagram properties, Placement tab
Optionen
Der Reiter Optionen hat nur Einstellungen im Fall eines Histrogramms. Sie können wählen, ob die Orientierungder Leiste ‚oben‘, ‚unten‘, ‚rechts‘ und ‚links‘ ist.
Legend
From the Legend tab, you can choose to display items of the diagram in the Layers Panel, and in the print layoutlegend, next to the layer symbology:
• check Show legend entries for diagram attributes to display in the legends the Color and Legend prop-erties, as previously assigned in the Attributes tab;
• and, when a scaled size is being used for the diagrams, push the Legend Entries for Diagram Size. . . buttonto configure the diagram symbol aspect in the legends. This opens the Data-defined Size Legend dialogwhose options are described in Data-defined size legend.
212 Chapter 13. Arbeiten mit Vektordaten

QGIS User Guide, Release 3.4
When set, the diagram legend items (attributes with color and diagram size) are also displayed in the print layoutlegend, next to the layer symbology.
Fallstudien
Wir werden ein Beispiel zeigen und dem Alaskagrenzlayer ein Textdiagramm das Temperaturdaten von einemclimate Vektorlayer zeigt überlagern. Beide Vektorlayer sind Teil des QGIS Beispieldatensatzes (siehe AbschnittDownloading sample data).
1. Klicken Sie erst auf das Vektorlayer hinzufügen Icon, browsen Sie zum QGIS Beispieldatensatzordner undladen Sie die beiden Vektorlayer alaska.shp und climate.shp.
2. Doppelklicken Sie auf den climate Layer in der Kartenlegende um den Dialog Layereigenschaften zuöffnen.
3. Click on the Diagrams tab and from the Diagram type combo box, select ‚Text diagram‘.
4. Im Darstellung Reiter wählen wir ein Hellblau als Hintergrundfarbe und im Reiter Größe stellen wir einefeste Größe von 18 mm ein.
5. Im Reiter Position könnte die Platzierung auf ‚Um Punkt‘ eingestellt werden.
6. Im Diagramm wollen wir die Werte der drei Spalten T_F_JAN, T_F_JUL und T_F_MEAN darstellen.Wählen Sie erst T_F_JAN als Attribute´ und klicken Sie den |signPlus| Knopf, dann ‘‘T_F_JUL‘ undschließlich T_F_MEAN.
7. Now click Apply to display the diagram in the QGIS main window.
8. Sie können die Diagrammgröße im Größe Reiter anpassen. Aktivieren Sie Skalierte Größe und stellenSie die Größe des Diagramms auf Basis eines Attributes mit dem Maximalwert und dem Größe Menü
ein. Wenn die Diagramme auf dem Bildschirm zu klein erscheinen können Sie das Kleine Diagrammevergrößern Kontrollkästchen aktivieren und die Minimalgröße des Diagramms definieren.
9. Change the attribute colors by double clicking on the color values in the Assigned attributes field. Fig-ure_diagrams_mapped gives an idea of the result.
10. Finally, click OK.
Figure 13.48: Diagramm aus Temperaturdaten auf einer Karte dargestellt
Behalten Sie im Hinterkopf dass im Reiter Position eine Datendefinierte Position der Diagramme möglich ist. Siekönnen hier Attribute verwenden um die Position des Diagramms zu definieren. Sie können auch eine maßstab-sabhängige Sichtbarkeit im Darstellung Reiter einstellen.
13.2. Vektorlayereigenschaften 213

QGIS User Guide, Release 3.4
The size and the attributes can also be an expression. Use the button to add an expression. See Ausdrückechapter for more information and example.
Using data-defined override
As mentioned above, you can use some custom data-defined to tune the diagrams rendering:
• position in Placement tab by filling X and Y fields
• visibility in Appearance tab by filling the Visibility field
See Datendefinierte Übersteuerung für das Beschriften for more information.
13.2.6 Source Fields Properties
The Source Fields tab provides information on fields related to the layer and helps you organize them.
The layer can be made editable using the Toggle editing mode. At this moment, you can modify its structure using
the New field and Delete field buttons.
You can also rename fields by double-clicking its name. This is only supported for data providers like PostgreSQL,Oracle, Memory layer and some OGR layer depending on the OGR data format and version.
You can define some alias to display human readable fields in the feature form or the attribute table. In this case,you don’t need to switch to editing mode. Alias are saved in project file.
Depending on the data provider, you can associate a comment with a field, for example at its creation. Thisinformation is retrieved and shown in the Comment column and is later displayed when hovering over the fieldlabel in a feature form.
Other than the fields contained in the dataset, virtual fields and Auxiliary Storage included, the Source Fields tabalso lists fields from any joined layers. Depending on the origin of the field, a different background color is appliedto it.
For each listed field, the dialog also lists read-only characteristics such as its type, type name, length andprecision. When serving the layer as WMS or WFS, you can also check here which fields could be retrieved.
13.2.7 Attributes Form Properties
The Attributes Form tab helps you set up the form to display when creating new features or querying existingone. You can define:
• the look and the behavior of each field in the feature form or the attribute table (label, widget, constraints. . . );
• the form’s structure (custom or autogenerated):
• extra logic in Python to handle interaction with the form or field widgets.
At the top right of the dialog, you can set whether the form is opened by default when creating new features. Thiscan be configured per layer or globally with the Suppress attribute form pop-up after feature creation option inthe Settings → Options → Digitizing menu.
Customizing a form for your data
By default, when you click on a feature with the Identify Features tool or switch the attribute table to the formview mode, QGIS displays a basic form with predefined widgets (generally spinboxes and textboxes — each fieldis represented on a dedicated row by its label next to the widget). If relations are set on the layer, fields from thereferencing layers are shown in an embedded frame at the bottom of the form, following the same basic structure.
214 Chapter 13. Arbeiten mit Vektordaten

QGIS User Guide, Release 3.4
Figure 13.49: Source Field properties tab
This rendering is the result of the default Autogenerate value of the Attribute editor layout setting in the Layerproperties → Attributes Form tab. This property holds three different values:
• Autogenerate: keeps the basic structure of „one row - one field“ for the form but allows to customizeeach corresponding widget.
• Drag-and-drop designer: other than widget customization, the form structure can be made morecomplex eg, with widgets embedded in groups and tabs.
• Provide ui file: allows to use a Qt designer file, hence a potentially more complex and fully featuredtemplate, as feature form.
The autogenerated form
When the Autogenerate option is on, the Available widgets panel shows lists of fields (from the layer and itsrelations) that would be shown in the form. Select a field and you can configure its appearance and behavior in theright panel:
• adding custom label and automated checks to the field;
• setting a particular widget to use.
The drag and drop designer
Choose Drag and drop designer from the Attribute editor layout combobox and you enable a Form Lay-out panel next to the Available widgets one. From this panel you can create an editor form with several tabs andnamed groups to present the attribute fields, as shown for example in figure_fields_form.
To create the form, you can drag and drop fields from the Available Widgets panel to the Form Layout one to havefields added to your custom form and drag and drop fields inside the Form Layout to reorder their position.
You can also use categories (tab or group frames) to better structure the form. The first step is to use the iconto create a tab in which fields and groups will be displayed (see figure_fields_layout). You can create as many
categories as you want. Use button to remove any unwanted elements. The next step will be to assign to eachcategory the relevant fields, by simple drag and drop. You can use the same fields many times.
13.2. Vektorlayereigenschaften 215

QGIS User Guide, Release 3.4
Figure 13.50: Das Ergebnis eines integrierten Formulars mit Reitern und benannten Gruppen
Figure 13.51: Dialog Attributeditorzusammenstellung um Kategorien zu erstellen
216 Chapter 13. Arbeiten mit Vektordaten

QGIS User Guide, Release 3.4
You can configure tabs or groups with a double-click. QGIS opens a form in which you can:
• choose to hide or show the item label;
• rename the category;
• set over how many columns the fields under the category should be distributed;
• enter an expression to control the category visibility. The expression will be re-evaluated everytime valuesin the form change and the tab or groupbox shown/hidden accordingly;
• show the category as a group box (only available for tabs).
With a double-click on a field label, you can also specify whether the label of its widget should be visible or notin the form.
In case the layer is involved in one or many to many relations (see Creating one or many to manyrelations), referencing layers are listed in the Relations frame and their form can be embedded in the current layerform by drag-and-drop. Like the other items, double-click the relation label to configure some options:
• choose to hide or show the item label;
• show the link button;
• show the unlink button.
Using custom ui-file
The Provide ui-file option allows you to use complex dialogs made with Qt-Designer. Using a UI-fileallows a great deal of freedom in creating a dialog. Note that, in order to link the graphical objects (textbox,combobox. . . ) to the layer’s fields, you need to give them the same name.
Use the Edit UI to define the path to the file to use.
You’ll find some example in the Creating a new form lesson of the QGIS-training-manual-index-reference. For more advanced information, see https://nathanw.net/2011/09/05/qgis-tips-custom-feature-forms-with-python-logic/.
Enhance your form with custom functions
QGIS forms can have a Python function that is called when the dialog is opened. Use this function to add extralogic to your dialogs. The form code can be specified in three different ways:
• load from the environment: use a function, for example in startup.py or from an installedplugin
• load from an external file: a file chooser will appear in that case to allow you to select a Pythonfile from your filesystem
• provide code in this dialog: a Python editor will appear where you can directly type the func-tion to use.
In all cases you must enter the name of the function that will be called (open in the example below).
Ein Beispiel ist (im Modul MyForms.py):
def open(dialog,layer,feature):geom = feature.geometry()control = dialog.findChild(QWidged,"My line edit")
Reference in Python Init Function like so: open
13.2. Vektorlayereigenschaften 217

QGIS User Guide, Release 3.4
Configure the field behavior
The main part of the Attributes Form tab helps you set the type of widget used to fill or display values of the field,in the attribute table or the feature form: you can define how user interacts with each field and the values or rangeof values that are allowed to be added to each.
Figure 13.52: Dialog um ein Bearbeitungselement für eine Attributspalte auszuwählen
Common settings
Regardless the type of widget applied to the field, there are some common properties you can set to control whetherand how a field can be edited.
General options
• Alias: a human readable name to use for fields. The alias will be displayed in the feature form, the attributetable, or in the Identify results panel. It can also be used as field name replacement in the expression builder,easing expressions understanding and reviews. Aliases are saved in project file.
• Comment: displays the field’s comment as shown in the Source Fields tab, in a read-only state. Thisinformation is shown as tooltip when hovering over the field label in a feature form.
• Editable: uncheck this option to set the field read-only (not manually modifiable) even when the layeris in edit mode. Note that checking this setting doesn’t override any edit limitation from the provider.
• Label on top: places the field name above or beside the widget in the feature form.
Default values
• Default value: for new features, automatically populates by default the field with a predefined value or anexpression-based one. For example, you can:
218 Chapter 13. Arbeiten mit Vektordaten

QGIS User Guide, Release 3.4
– use $x, $length, $area to automatically populate a field with the feature’s X coordinate, length,area or any geometric information at its creation;
– increment a field by 1 for each new feature using maximum("field")+1;
– save the feature creation datetime using now();
– use variables in expressions, making it easier to e.g. insert the operator name (@user_full_name),the project file path (@project_path), . . .
A preview of the resulting default value is displayed at the bottom of the widget.
Bemerkung: The Default value option is not aware of the values in any other field of the featurebeing created so it won’t be possible to use an expression combining any of those values i.e using anexpression like concat(field1, field2) may not work.
• Apply default value on update: whenever the feature attribute or geometry is changed, the default value isrecalculated. This could be handy to save values like last user that modifies data, last time it was changed. . .
Constraints
You can constrain the value to insert in the field. This constraint can be:
• Not null: requires the user to provide a value;
• Unique: guarantee the inserted value to be unique throughout the field;
• based on a custom expression: e.g. regexp_match(col0,'A-Za-z') to ensure that the value of thefield col0 has only alphabetical letter. A short description can be added to help you remember the constraint.
Whenever a value is added or edited in a field, it’s submitted to the existing constraints and:
• if it meets all the requirements, a green check is shown beside the field in the form;
• if it does not meet all the requirements, then a yellow or red cross is displayed near the field. You can hoverover the cross to remind which constraints are applied to the field and fix the value:
– A yellow cross appears when the unmet constraint is an unenforced one and it does not prevent you tosave the changes with the „wrong“ values;
– A red cross can not be ignored and does not allow you to save your modifications until they meet the
constraints. It appears when the Enforce constraint option is checked.
Edit widgets
Based on the field type, QGIS automatically determines and assigns a default widget type to it. You can thenreplace the widget with any other compatible with the field type. The available widgets are:
• Checkbox: Displays a checkbox whose state defines the value to insert.
• Classification: Only available when a categorized symbology is applied to the layer, displays a combo boxwith the values of the classes.
• Color: Displays a color widget allowing to select a color; the color value is stored as a html notation in theattribute table.
• Datum/Zeit: Stellt ein Linienfeld dar, das ein Kalender-Widget zum Öffnen eines Datums, einer Zeit oderbeidem, darstellt. Der Spaltentyp muss Text sein. Sie könnne ein benutzerdefiniertes Format auswählen,einen Pop-up-Kalender, etc.
• Enumeration: Opens a combo box with predefined values fetched from the database. This is currently onlysupported by the PostgreSQL provider, for fields of enum type.
13.2. Vektorlayereigenschaften 219

QGIS User Guide, Release 3.4
• Attachment: Uses a „Open file“ dialog to store file path in a relative or absolute mode. It can also be usedto display a hyperlink (to document path), a picture or a web page.
• Versteckt: Ein verstecktes Attribut ist unsichtbar. Der Anwender kann den Inhalt nicht sehen.
• Key/Value: Displays a two-columns table to store sets of key/value pairs within a single field. This iscurrently supported by the PostgreSQL provider, for fields of hstore type.
• List: Displays a single column table to add different values within a single field. This is currently supportedby the PostgreSQL provider, for fields of array type.
• Bereich: Erlaubt Ihnen numerische Werte eines bestimmten Wertebereichs festzulegen. Das Bearbeitungse-lement kann entweder ein Schieber oder ein Drehfeld sein.
• Relation Reference: This widget lets you embed the feature form of the referenced layer on the featureform of the actual layer. See Creating one or many to many relations.
• Text Edit (default): This opens a text edit field that allows simple text or multiple lines to be used. If youchoose multiple lines you can also choose html content.
• Unique Values: You can select one of the values already used in the attribute table. If ‚Editable‘ is activated,a line edit is shown with autocompletion support, otherwise a combo box is used.
• Uuid Generator: Generates a read-only UUID (Universally Unique Identifiers) field, if empty.
• Value Map: A combo box with predefined items. The value is stored in the attribute, the description isshown in the combo box. You can define values manually or load them from a layer or a CSV file.
• Value Relation: Offers values from a related table in a combobox. You can select layer, key column andvalue column. Several options are available to change the standard behaviors: allow null value, order byvalue, allow multiple selections and use of auto-completer. The forms will display either a drop-down listor a line edit field when completer checkbox is enabled.
Tipp: Relative Path in Attachment widget
If the path which is selected with the file browser is located in the same directory as the .qgs project file or below,paths are converted to relative paths. This increases portability of a .qgs project with multimedia informationattached.
13.2.8 Joins Properties
The Joins tab allows you to join a loaded attribute table to a loaded vector layer. After clicking , theAdd vector join dialog appears. As key columns, you have to define a join layer you want to connect with thetarget vector layer. Then, you have to specify the join field that is common to both the join layer and the target
layer. Now you can also specify a subset of fields from the joined layer based on the checkbox Choose whichfields are joined. As a result of the join, all information from the join layer and the target layer are displayed inthe attribute table of the target layer as joined information. If you specified a subset of fields only these fields aredisplayed in the attribute table of the target layer.
If the target layer is editable, then some icons will be displayed in the attribute table next to fields, in order toinform their status:
• : the join layer is not configured to be editable. If you want to be able to edit join features from the target
attribute table, then you have to check the option Editable join layer.
• : the join layer is well configured to be editable, but its current status is read only.
• : the join layer is editable but synchronization mechanisms are not activated. If you want to automati-cally add a feature in the join layer when a feature is created in the target layer, then you have to check the
220 Chapter 13. Arbeiten mit Vektordaten

QGIS User Guide, Release 3.4
option Upsert on edit. Symmetrically, the option Delete cascade may be activated if you want toautomatically delete join features.
Moreover, the Dynamic form option helps to synchronize join fields on the fly, according to the Target field.This way, constraints for join fields are also correctly updated. Note that it’s deactivated by default because it maybe very time consuming if you have a lot of features or a myriad of joins.
Otherwise, the Cache join layer in virtual memory option allows to cache values in memory (without geome-tries) from the joined layer in order to speed up lookups.
QGIS currently has support for joining non-spatial table formats supported by OGR (e.g., CSV, DBF and Excel),delimited text and the PostgreSQL provider (see figure_joins).
Figure 13.53: Verknüpfe eine Attributtabelle zu einem vorhandenen Vektorlayer
Zusätzlich können Sie mit dem Vektorverknüpfung hinzufügen Dialog:
• Index auf Feld erzeugen
• Verknüpfte Felder wählen
• Erstellen Sie einen :guilabel:‘Benutzerdefinierten Feldnamen Präfix ‘
13.2.9 Auxiliary Storage Properties
The regular way to customize styling and labeling is to use data-defined properties as described in DatendefinierteÜbersteuerung Setup. However, it may not be possible if the underlying data is read only. Moreover, configuringthese data-defined properties may be very time consuming or not desirable! For example, if you want to fully usemap tools coming with The Label Toolbar, then you need to add and configure more than 20 fields in your originaldata source (X and Y positions, rotation angle, font style, color and so on).
13.2. Vektorlayereigenschaften 221

QGIS User Guide, Release 3.4
The Auxiliary Storage mechanism provides the solution to these limitations and awkward configurations. Auxil-iary fields are a roundabout way to automatically manage and store these data-defined properties (labels, diagram,symbology. . . ) in a SQLite database thanks to editable joins. This allows you to store properties for layers thataren’t editable.
A tab is available in vector layer properties dialog to manage auxiliary storage:
Figure 13.54: Auxiliary Storage tab
Labeling
Considering that the data source may be customized thanks to data-defined properties without being editable,labeling map tools described in The Label Toolbar are always available as soon as labeling is activated.
Actually, the auxiliary storage system needs an auxiliary layer to store these properties in a SQLite database (seeAuxiliary storage database). Its creation process is run the first time you click on the map while a labeling maptool is currently activated. Then, a window is displayed, allowing you to select the primary key to use for joining(to ensure that features are uniquely identified):
Figure 13.55: Auxiliary Layer creation dialog
As soon as an auxiliary layer is configured for the current data source, you can retrieve its information in the tab:
222 Chapter 13. Arbeiten mit Vektordaten

QGIS User Guide, Release 3.4
Figure 13.56: Auxiliary Layer key
The auxiliary layer now has these characteristics:
• the primary key is ID,
• there are 0 features using an auxiliary field,
• there are 0 auxiliary fields.
Now that the auxiliary layer is created, you can edit the layer labels. Click on a label while the Change Label
map tool is activated, then you can update styling properties like sizes, colors, and so on. The correspondingdata-defined properties are created and can be retrieved:
As you can see in the figure above, 21 fields are automatically created and configured for labeling. For example,the FontStyle auxiliary field type is a String and is named labeling_fontstyle in the underlyingSQLite database. There is also 1 feature which is currently using these auxiliary fields.
Notice that the icon is displayed in the Labels properties tab indicating that the data-defined override optionsare set correctly:
Otherwise, there’s another way to create an auxiliary field for a specific property thanks to the data-defined override
button. By clicking on Store data in the project, an auxiliary field is automatically created for the Opacity field. Ifyou click on this button whereas the auxiliary layer is not created yet, then the window Auxiliary Layer creationdialog is first displayed to select the primary key to use for joining.
Symbolisierung
Like the method described above for customizing labels, auxiliary fields can also be used to stylize symbols and
diagrams. To do this, click on Data-defined override and select Store data in the project for a specific property. Forexample, the Fill color field:
13.2. Vektorlayereigenschaften 223

QGIS User Guide, Release 3.4
Figure 13.57: Auxiliary Fields
224 Chapter 13. Arbeiten mit Vektordaten

QGIS User Guide, Release 3.4
Figure 13.58: Data-defined properties automatically created
Figure 13.59: Data-defined property menu for symbol
13.2. Vektorlayereigenschaften 225
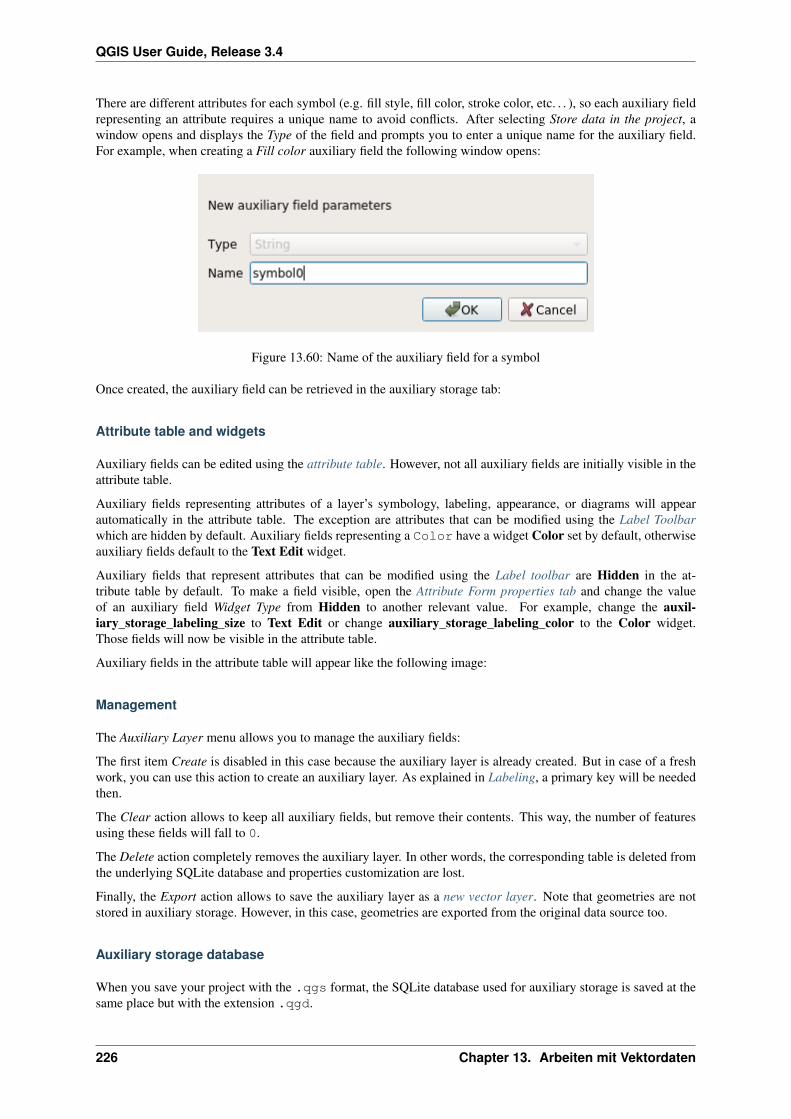
QGIS User Guide, Release 3.4
There are different attributes for each symbol (e.g. fill style, fill color, stroke color, etc. . . ), so each auxiliary fieldrepresenting an attribute requires a unique name to avoid conflicts. After selecting Store data in the project, awindow opens and displays the Type of the field and prompts you to enter a unique name for the auxiliary field.For example, when creating a Fill color auxiliary field the following window opens:
Figure 13.60: Name of the auxiliary field for a symbol
Once created, the auxiliary field can be retrieved in the auxiliary storage tab:
Attribute table and widgets
Auxiliary fields can be edited using the attribute table. However, not all auxiliary fields are initially visible in theattribute table.
Auxiliary fields representing attributes of a layer’s symbology, labeling, appearance, or diagrams will appearautomatically in the attribute table. The exception are attributes that can be modified using the Label Toolbarwhich are hidden by default. Auxiliary fields representing a Color have a widget Color set by default, otherwiseauxiliary fields default to the Text Edit widget.
Auxiliary fields that represent attributes that can be modified using the Label toolbar are Hidden in the at-tribute table by default. To make a field visible, open the Attribute Form properties tab and change the valueof an auxiliary field Widget Type from Hidden to another relevant value. For example, change the auxil-iary_storage_labeling_size to Text Edit or change auxiliary_storage_labeling_color to the Color widget.Those fields will now be visible in the attribute table.
Auxiliary fields in the attribute table will appear like the following image:
Management
The Auxiliary Layer menu allows you to manage the auxiliary fields:
The first item Create is disabled in this case because the auxiliary layer is already created. But in case of a freshwork, you can use this action to create an auxiliary layer. As explained in Labeling, a primary key will be neededthen.
The Clear action allows to keep all auxiliary fields, but remove their contents. This way, the number of featuresusing these fields will fall to 0.
The Delete action completely removes the auxiliary layer. In other words, the corresponding table is deleted fromthe underlying SQLite database and properties customization are lost.
Finally, the Export action allows to save the auxiliary layer as a new vector layer. Note that geometries are notstored in auxiliary storage. However, in this case, geometries are exported from the original data source too.
Auxiliary storage database
When you save your project with the .qgs format, the SQLite database used for auxiliary storage is saved at thesame place but with the extension .qgd.
226 Chapter 13. Arbeiten mit Vektordaten

QGIS User Guide, Release 3.4
Figure 13.61: Auxiliary field symbol
13.2. Vektorlayereigenschaften 227

QGIS User Guide, Release 3.4
Figure 13.62: Form with auxiliary fields
Figure 13.63: Auxiliary layer management
228 Chapter 13. Arbeiten mit Vektordaten

QGIS User Guide, Release 3.4
For convenience, an archive may be used instead thanks to the .qgz format. In this case, .qgd and .qgs filesare both embedded in the archive.
13.2.10 Actions Properties
QGIS bietet die Möglichkeit, Aktionen auf Basis von Attributen einer Ebene durchzuführen. Dies kann füreine Vielzahl von Aktionen genutzt werden, z.B. um ein Programm mit Abfragen aus der Attributdatenbank zufüttern oder um Parameter an ein Web-Reporting-Tool weiterzugeben.
Figure 13.64: Überblick über den Dialog Aktionen mit einigen Beispielaktionen
Aktionen auf Basis von Attributen sind sinnvoll wenn sie häufig eine externe Anwendung starten oder eine Inter-netseite auf Basis von einem oder mehreren Werten in Ihrem Vektorlayer visualisieren wollen. Sie sind in 6 Typenaufgeteilt und können wie folgt verwendet werden:
• Allgemein, Mac, Windows und Unix Aktionen starten einen externen Prozess.
• Python Aktionen führen einen Python-Ausdruck aus.
• Allgemeine und Pythonaktionen sind überall sichtbar.
• Mac, Windows und Unix Aktionen sind nur sichtbar auf der entsprechenden Plattform (z.B. können Siedrei ‚Bearbeiten‘ Aktionen definieren um einen Editor zu öffnen und die Benutzer können nur die eine‚Bearbeiten‘ Aktion für Ihr Betriebssystem sehen und ausführen um den Editor zu starten).
13.2. Vektorlayereigenschaften 229

QGIS User Guide, Release 3.4
There are several examples included in the dialog. You can load them by clicking on Create Default Actions. Toedit any of the examples, double-click its row. One example is performing a search based on an attribute value.This concept is used in the following discussion.
The Show in Attribute Table allows you to display in the attribute table dialog the checked feature-scopedactions, either as Combo Box or as Separate Buttons (see Configuring the columns).
Aktionen definieren
To define an attribute action, open the vector Layer Properties dialog and click on the Actions tab. In the Actions
tab, click the Add a new action to open the Edit Action dialog.
Select the action Type and provide a descriptive name for the action. The action itself must contain the name ofthe application that will be executed when the action is invoked. You can add one or more attribute field values asarguments to the application. When the action is invoked, any set of characters that start with a % followed by thename of a field will be replaced by the value of that field. The special characters %% will be replaced by the valueof the field that was selected from the identify results or attribute table (see using_actions below). Double quotemarks can be used to group text into a single argument to the program, script or command. Double quotes will beignored if preceded by a backslash.
The Action Scopes allows you to define where the action should be available. You have 4 different choices:
1. Feature Scope: action is available when right click in the cell within the attribute table.
2. Field Scope: action is available when right click in the cell within the attribute table, in the feature form andin the default action button of the main toolbar.
3. Layer Scope: action is available in the action button in the attribute table toolbar. Be aware that this type ofaction involves the entire layer and not the single features.
4. Canvas: action is available in the main action button in the toolbar.
Wenn Sie Feldnamen vorfinden die Substrings anderer Feldnamen sind (z.B., col1 und col10) sollten Sie dasangeben indem Sie den Feldnamen (und den % Buchstaben) mit eckigen Klammern umrunden (z.B. [%col10]).Hiermit wird vermieden dass der %col10 Feldname mit de, %col1 Feldnamen mit einem 0 am Ende verwechseltwird. Die Klammern werden von QGS entfernt wenn es im Wert des Feldes ersetzt. Wenn Sie wollen dass das zuersetzende Feld von eckigen Klammern umrandet wird verwenden Sie ein zweites Set wie hier:[[%col10]].
Wenn Sie das Objekte abfragen Werkzeug verwenden, können Sie den Identifikationsergebnis Dialog öffnen. Esenthält eine (Abgeleitet) Item das layertyprelevante Informationen enthält. Die Werte in diesem Element könnenauf ähnliche Weise den anderen Feldern zugeordnet werden indem dem Abgeleitet Feldnamen ein (Derived)vorangeht. Zum Beispiel hat ein Punktlayer ein X und Y Feld und die Werte dieser Felder können in der Aktionmit %(Derived).X und %(Derived).Y verwendet werden. Die Abgeleitet Attribute sind nur in der Objekteabfragen Dialog Box erhältlich, jedoch nicht in der Attributtabelle Dialogbox.
Two example actions are shown below:
• konqueror https://www.google.com/search?q=%nam
• konqueror https://www.google.com/search?q=%%
In the first example, the web browser konqueror is invoked and passed a URL to open. The URL performs aGoogle search on the value of the nam field from our vector layer. Note that the application or script called by theaction must be in the path, or you must provide the full path. To be certain, we could rewrite the first example as:/opt/kde3/bin/konqueror https://www.google.com/search?q=%nam. This will ensure thatthe konqueror application will be executed when the action is invoked.
Das zweite Beispiel nutzt den Ausdruck %%, welcher unabhängig ist von einem speziellen Feld. Beim Ausführendes Befehls wird der Ausdruck %% durch den Wert des jeweils selektierten Feldes aus Objekte abfragen oder derAttributtabelle ersetzt.
230 Chapter 13. Arbeiten mit Vektordaten

QGIS User Guide, Release 3.4
Aktionen anwenden
QGIS offers many ways to execute actions you enabled on a layer. Depending on their settings, they can beavailable:
• in the drop-down menu of Run Feature Action button from the Attributes toolbar or Attribute table dialog;
• when right-clicking a feature with the Identify Features tool (see Identifying Features for more information);
• from the Identify Results panel, under the Actions section;
• as items of an Actions column in the Attribute Table dialog.
Wenn Sie eine Aktion mit %% Notation verwenden, machen Sie einen Rechtsklick auf den Feldwert im Objekteabfragen Dialog oder im Attributtabelle Dialog den Sie der Anwendung oder dem Skript übergeben wollen.
In einem weiteren Beispiel soll gezeigt werden, wie Attributwerte eines Vektorlayers abgefragt und in eine Text-
datei mit Hilfe der Bash und des echo Kommandos geschrieben werden (funktioniert also nur unter und
evtl. ). Der Abfragelayer enthält die Felder Art taxon_name, Latitude lat und Longitude long. Wirmöchten jetzt eine räumliche Selektion von Örtlichkeiten machen und diese Feldwerte in eine Textdatei für denausgewählten Datensatz (in der QGIS Kartenansicht in gelb gezeigt) exportieren. Hier ist die Aktion, um dies zuerreichen:
bash -c "echo \"%taxon_name %lat %long\" >> /tmp/species_localities.txt"
Nachdem ein paar Orte auf dem Bildschirm ausgewählt wurden (diese erscheinen gelb hinterlegt), starten wir dieAktion mit der rechten Maustaste über den Dialog Abfrageergebnisse und können danach in der Textdatei dieErgebnisse ansehen:
Acacia mearnsii -34.0800000000 150.0800000000Acacia mearnsii -34.9000000000 150.1200000000Acacia mearnsii -35.2200000000 149.9300000000Acacia mearnsii -32.2700000000 150.4100000000
As an exercise, we can create an action that does a Google search on the lakes layer. First, we need to determinethe URL required to perform a search on a keyword. This is easily done by just going to Google and doing asimple search, then grabbing the URL from the address bar in your browser. From this little effort, we see that theformat is https://www.google.com//search?q=QGIS, where QGIS is the search term. Armed with this information,we can proceed:
1. Laden Sie den Layer file:lakes.shp.
2. Öffnen Sie den Layereigenschaften Dialog indem Sie einen Doppelklick auf den Layer in der Legendemachen und wählen Sie Eigenschaften aus dem Popup-Menü.
3. Click on the Actions tab.
4. Click Add a new action.
5. Choose the Open action type,
6. Geben Sie einen Namen für die Aktion ein, z.B. Google Search.
7. Additionally you can add a Short Name or even an Icon.
8. Choose the action Scope. See Aktionen definieren for further information. Leave the default settings for thisexample.
9. Für diese Aktion ist es notwendig den Namen des externen Programms anzugeben. In diesem Fall könnenwir Firefox verwenden. Wenn das Programm sich nicht im Pfad befindet müssen Sie den vollständigen Pfadangeben.
10. Following the name of the external application, add the URL used for doing a Google search, up to but notincluding the search term: https://www.google.com//search?q=
11. The text in the Action field should now look like this: https://www.google.com//search?q=
13.2. Vektorlayereigenschaften 231

QGIS User Guide, Release 3.4
12. Click on the drop-down box containing the field names for the lakes layer. It’s located just to the left ofthe Insert button.
13. From the drop-down box, select ‚NAMES‘ and click Insert.
14. Die Aktion sieht nun so aus:
https://www.google.com//search?q=[%NAMES%]
15. To finalize and add the action, click the OK button.
Figure 13.65: Edit action dialog configured with the example
Damit ist die Aktion fertig für den Einsatz. Der gesamte Befehl der Aktion sollte folgendermaßen aussehen:
https://www.google.com//search?q=[%NAMES%]
Damit ist die Aktion fertig für den Einsatz. Schließen Sie den Eigenschaften Dialog und zoomen Sie in einenBereich Ihrer Wahl. Stellen Sie sicher, dass der Layer lakes in der Legende aktiviert ist. Nun identifizieren Sieeinen See. In der Ergebnisanzeige sollte nun die Aktion sichtbar sein:
When we click on the action, it brings up Firefox and navigates to the URL https://www.google.com/search?q=Tustumena. It is also possible to add further attribute fields to the action. Therefore, you can add a + to the end ofthe action text, select another field and click on Insert Field. In this example, there is just no other field availablethat would make sense to search for.
Sie können auch mehrere Aktionen für einen Layer definieren. Sie alle werden dann bei der Abfrage von Objektenim Identifikationsergebnis Dialog angezeigt.
Sie können auch die aus der Attributtabelle aufrufen, indem Sie eine Zeile mit der rechten Maustaste auswählenund dann die Aktion aus dem Pop-up-Menü wählen.
Sie sehen, man kann sich eine Vielzahl interessanter Aktionen ausdenken. Wenn Sie z.B. einen Punktlayer miteinzelnen Punkten haben, an denen Photos geschossen wurden, dann können Sie eine Aktion erstellen, über die
232 Chapter 13. Arbeiten mit Vektordaten

QGIS User Guide, Release 3.4
Figure 13.66: Wählen Sie ein Objekt und eine Aktion aus
Sie dann das entsprechende Foto anzeigen lassen können, wenn Sie auf den Punkt in der Karte klicken. Man kannauch zu bestimmten Attributen webbasierte Information ablegen (z.B. in einer HTML-Datei) und diese dann übereine Aktion anzeigen lassen, etwa so wie in dem Google Beispiel.
Wir können auch komplexere Beispiele erstellen, indem wir z.B. Python Aktionen verwenden.
Usually, when we create an action to open a file with an external application, we can use absolute paths, oreventually relative paths. In the second case, the path is relative to the location of the external program executablefile. But what about if we need to use relative paths, relative to the selected layer (a file-based one, like Shapefileor SpatiaLite)? The following code will do the trick:
command = "firefox"imagerelpath = "images_test/test_image.jpg"layer = qgis.utils.iface.activeLayer()import os.pathlayerpath = layer.source() if layer.providerType() == 'ogr'
else (qgis.core.QgsDataSourceURI(layer.source()).database()if layer.providerType() == 'spatialite' else None)
path = os.path.dirname(str(layerpath))image = os.path.join(path,imagerelpath)import subprocesssubprocess.Popen( [command, image ] )
Wir müssen uns nur ins Gedächtnis rufen dass es sich um eine Python Aktion handelt und dass das Ändern dercommand und imagerelpath Variablen auf unsere Bedürfnisse angepasst wird.
Was aber wenn der relative Pfad relativ zur (gespeicherten) Projektdatei sein muss? Der Code der Python Aktionwürde wie folgt lauten:
command = "firefox"imagerelpath = "images/test_image.jpg"projectpath = qgis.core.QgsProject.instance().fileName()import os.pathpath = os.path.dirname(str(projectpath)) if projectpath != '' else Noneimage = os.path.join(path, imagerelpath)import subprocess
13.2. Vektorlayereigenschaften 233

QGIS User Guide, Release 3.4
subprocess.Popen( [command, image ] )
Ein anderes Python Aktion Beispiel ist das mit wir dem Projekt neue Layer hinzufügen können. Z.B. wird inden folgenden Beispielen dem Projekt ein Vektorlayer beziehungsweise ein Rasterlayer hinzugefügt. Die Namender Dateien, die dem Projekt hinzugefügt werden sollen, und die Namen, die den Layern gegeben werden, sinddatengesteuert (filename und layername sind Spaltennamen der Attributtabelle des Vektorlayers in dem die Aktionerstellt wurde):
qgis.utils.iface.addVectorLayer('/yourpath/[% "filename" %].shp','[% "layername" %]', 'ogr')
Um eine Rasterdatei hinzuzufügen (ein TIF-Bild in diesem Beispiel) wird daraus:
qgis.utils.iface.addRasterLayer('/yourpath/[% "filename" %].tif','[% "layername" %]')
13.2.11 Display Properties
The Display tab helps you configure fields to use for feature identification:
• The Display name: based on a field or an expression. This is:
– the label shown on top of the feature information in the Identify tool results;
– the field used in the locator bar when looking for features in all layers;
– the feature identifier in the attribute table form view;
– the map tip information, i.e. the message displayed in the map canvas when hovering over a feature of
the active layer with the Show Map Tips icon pressed. Applicable when no HTML Map Tip is set.
• The HTML Map Tip is specifically created for the map tips: it’s a more complex and full HTML text mixingfields, expressions and html tags (multiline, fonts, images, hyperlink. . . ).
Figure 13.67: HTML-Code für Kartenhinweis
To activate map tips, select the menu option View → Show Map Tips or click on the Show Map Tips icon of theAttributes Toolbar. Map tip is a cross-session feature meaning that once activated, it stays on and apply to anylayer in any project, even in future QGIS sessions until it’s toggled off.
234 Chapter 13. Arbeiten mit Vektordaten

QGIS User Guide, Release 3.4
Figure 13.68: Kartenhinweis erstellt mit HTML-Code
13.2.12 Rendering Properties
Maßstabsabhängige Sichtbarkeit
You can set the Maximum (inclusive) and Minimum (exclusive) scale, defining a range of scale in which features
will be visible. Out of this range, they are hidden. The Set to current canvas scale button helps you use the currentmap canvas scale as boundary of the range visibility. See Maßstabsabhängige Layeranzeige for more information.
Simplify geometry
QGIS offers support for on-the-fly feature generalisation. This can improve rendering times when drawing many
complex features at small scales. This feature can be enabled or disabled in the layer settings using the Simplifygeometry option. There is also a global setting that enables generalisation by default for newly added layers (seeglobal simplification for more information).
Figure 13.69: Dialog Layergeometrien vereinfachen
Bemerkung: Objektgeneralisierung, kann in einigen Fällen, Artefakte in Ihre gerenderte Ausgabe einführen.
13.2. Vektorlayereigenschaften 235

QGIS User Guide, Release 3.4
Dies können Splitter zwischen Polygonen und ungenau Darstellung bei der Verwendung von Offset-basiertenSymbolayern sein.
While rendering extremely detailed layers (e.g. polygon layers with a huge number of nodes), this can causelayout exports in PDF/SVG format to be huge as all nodes are included in the exported file. This can also makethe resultant file very slow to work with/open in other programs.
Aktivieren von Force layer to render as raster zwingt diese Layer dazu gerastert zu werden, so dass dieexportierten Dateien nicht alle enthaltenen Knoten in diesen Layern enthalten müssen und die Wiedergabe daherbeschleunigt wird.
You can also do this by forcing the layout to export as a raster, but that is an all-or-nothing solution, given that therasterisation is applied to all layers.
Refresh layer at interval (seconds): set a timer to automatically refresh individual layers at a matching interval.Canvas updates are deferred in order to avoid refreshing multiple times if more than one layer has an auto updateinterval set.
Depending on the data provider (e.g. PostgreSQL), notifications can be sent to QGIS when changes are applied to
the data source, out of QGIS. Use the Refresh layer on notification option to trigger an update. You can also
limit the layer refresh to a specific message set in the Only if message is text box.
13.2.13 Variables Properties
The Variables tab lists all the variables available at the layer’s level (which includes all global and project’svariables).
It also allows the user to manage layer-level variables. Click the button to add a new custom layer-level
variable. Likewise, select a custom layer-level variable from the list and click the button to remove it.
More information on variables usage in the General Tools Storing values in Variables section.
13.2.14 Metadata Properties
The Metadata tab provides you with options to create and edit a metadata report on your layer. Information tofill concern:
• the data Identification: basic attribution of the dataset (parent, identifier, title, abstract, language. . . );
• the Categories the data belongs to. Alongside the ISO categories, you can add custom ones;
• the Keywords to retrieve the data and associated concepts following a standard based vocabulary;
• the Access to the dataset (licenses, rights, fees, and constraints);
• the Extent of the dataset, either spatial one (CRS, map extent, altitudes) or temporal;
• the Contact of the owner(s) of the dataset;
• the Links to ancillary resources and related information;
• the History of the dataset.
A summary of the filled information is provided in the Validation tab and helps you identify potential issues relatedto the form. You can then either fix them or ignore them.
Metadata are currently saved in the project file. It can also be saved as an .XML file alongside file based layers orin a local .sqlite database for remote layers (e.g. PostGIS).
236 Chapter 13. Arbeiten mit Vektordaten

QGIS User Guide, Release 3.4
13.2.15 Dependencies Properties
The Dependencies tab allows to declare data dependencies between layers. A data dependency occurs when adata modification in a layer, not by direct user manipulation, may modify data of other layers. This is the case forinstance when geometry of a layer is updated by a database trigger or custom PyQGIS scripting after modificationof another layer’s geometry.
In the Dependencies tab, you can select any layers which may externally alter the data in the current layer. Cor-rectly specifying dependent layers allows QGIS to invalidate caches for this layer when the dependent layers arealtered.
13.2.16 Legend Properties
The Legend properties tab provides you with advanced settings for the Layers panel and/or the print layoutlegend. These options include:
• Text on symbols: In some cases it can be useful to add extra information to the symbols in the legend.With this frame, you can affect to any of the symbols used in the layer symbology a text that is displayedover the symbol, in both Layers panel and print layout legend. This mapping is done by typing each textnext to the symbol in the table widget or filling the table using the Set Labels from Expression button. Textappearance is handled through the font and color selector widgets of the Text Format button.
Figure 13.70: Setting text on symbols (left) and its rendering in the Layers panel (right)
• a list of widgets you can embed within the layer tree in the Layers panel. The idea is to have a way toquickly access some actions that are often used with the layer (setup transparency, filtering, selection, styleor other stuff. . . ).
By default, QGIS provides transparency widget but this can be extended by plugins registering their ownwidgets and assign custom actions to layers they manage.
13.2.17 QGIS Server Properties
The QGIS Server tab consists of Description, Attribution, MetadataURL, and LegendUrl sections.
You can add or edit a title and abstract for the layer in the Description section. It’s also possible to define aKeyword list here. These keyword lists can be used in a metadata catalog. If you want to use a title from an XMLmetadata file, you have to fill in a link in the DataUrl field.
Use Attribution to get attribute data from an XML metadata catalog.
In MetadataUrl, you can define the general path to the XML metadata catalog. This information will be saved inthe QGIS project file for subsequent sessions and will be used for QGIS server.
13.2. Vektorlayereigenschaften 237

QGIS User Guide, Release 3.4
Im Abschnitt LegendenUrl, können Sie der URL eines Legendenbilds in dem URL Feld anbieten. Sie können dasFormat Drop-Down-Menü nutzen, um das entsprechende Format des Bilds anzuwenden. Zur Zeit werden png,jpg und jpeg Formate unterstützt.
Figure 13.71: QGIS Server tab in vector layers properties dialog
13.2.18 Digitizing Properties
The Digitizing tab gives access to options that help to ensure the quality of digitized geometries.
Automatic Fixes
Options in the Automatic Fixes section will directly affect the vertices of any geometry which is added or mod-
ified. If the Remove duplicate nodes option is checked, any two subsequent vertices with exactly the samecoordinates will be removed. If the Geometry precision is set, all vertices will be rounded to the closest multipleof the configured geometry precision. The rounding will happen in the layer coordinate reference system. Z andM values are not rounded. With many map tools, a grid is shown on the canvas while digitizing.
Geometry Checks
In the Geometry checks section, additional validations on a per geometry basis can be activated. Immediately afterany geometry modification, failures in these checks are reported to the user in the geometry validation panel. As
long as a check is failing, it is not possible to save the layer. The Is valid check will run basic validity checkslike self intersection on geometries.
238 Chapter 13. Arbeiten mit Vektordaten
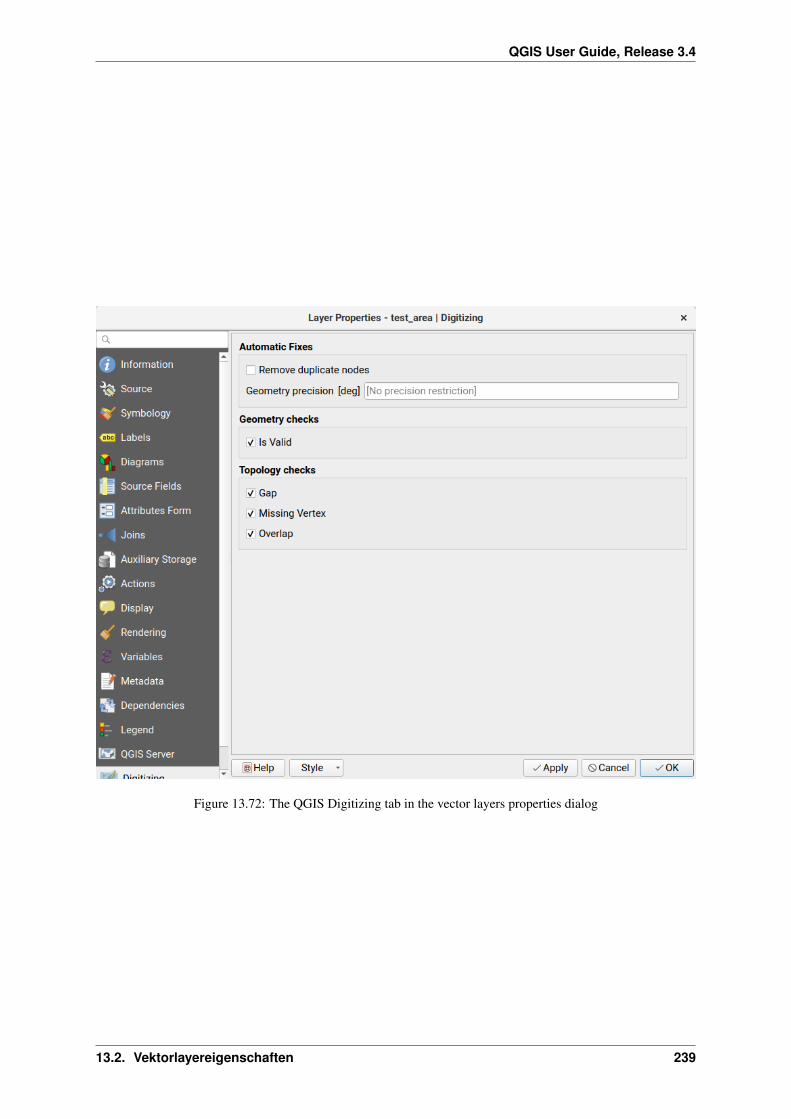
QGIS User Guide, Release 3.4
Figure 13.72: The QGIS Digitizing tab in the vector layers properties dialog
13.2. Vektorlayereigenschaften 239

QGIS User Guide, Release 3.4
Topology Checks
In the Topology checks section, additional topology validation checks can be activated. Topology checks will beexecuted when the user saves the layer. Check errors will be reported in the geometry validation panel. As long asvalidation errors are present, the layer can not be saved. Topology checks are executed in the area of the boundingbox of the modified features. Since other features may be present in the same area, topological errors concerningthese features are reported as well as errors introduced in the current edit session.
Topology check option Illustration
The Gap check will check for gaps between neighbouring polygons.
The Overlap check will check for overlaps between neighbouring polygons.
The Missing vertex check will check for shared boundaries of neighbouring poly-gons where one border misses a vertex which is present on the other one.
13.3 Ausdrücke
Based on layer data and prebuilt or user defined functions, Expressions offer a powerful way to manipulateattribute value, geometry and variables in order to dynamically change the geometry style, the content or positionof the label, the value for diagram, the height of a layout item, select some features, create virtual field . . .
13.3.1 The Expression string builder
Main dialog to build expressions, the Expression string builder is available from many parts in QGIS and, canparticularly be accessed when:
• clicking the button;
• selecting features with the Select By Expression. . . tool;
• editing attributes with e.g. the Field calculator tool;
• manipulating symbology, label or layout item parameters with the Data defined override tool (see Daten-definierte Übersteuerung Setup);
• building a geometry generator symbol layer;
• doing some geoprocessing.
The Expression builder dialog offers access to the:
240 Chapter 13. Arbeiten mit Vektordaten

QGIS User Guide, Release 3.4
• Expression tab which, thanks to a list of predefined functions, helps to write and check the expression touse;
• Function Editor tab which helps to extend the list of functions by creating custom ones.
Some use cases of expressions:
• Aus dem Feldrechner, berechnen Sie ein „pop_density“ Feld, indem Sie die existierenden Felder „total_pop“und „area_km2“ nutzen:
"total_pop" / "area_km2"
• Aktualisieren Sie das Feld „density_level“ mit zugehörigen Kategorien zu den „pop_density“ Werten:
CASE WHEN "pop_density" < 50 THEN 'Low population density'WHEN "pop_density" >= 50 and "pop_density" < 150 THEN 'Medium population
→˓density'WHEN "pop_density" >= 150 THEN 'High population density'
END
• Wenden Sie einen kategorisierten Stil auf alle Objekte an, je nachdem, ob der durchschnittliche Hauspreiskleiner oder größer als 10000C pro Quadratmeter ist:
"price_m2" > 10000
• Mit dem „Durch Ausdruck wählen. . . “ Werkzeug, wählen Sie alle Objekte die eine Fläche mit „Ho-her Bevölkerungsdichte“ und einem durchschnittlichen Hauspreis größer als 10000C pro Quadratmeterdarstellen:
"density_level" = 'High population density' and "price_m2" > 10000
Likewise, the previous expression could also be used to define which features should be labeled or shownin the map.
Using expressions offers you a lot of possibilities.
Tipp: Use named parameters to improve the expression reading
Some functions require many parameters to be set. The expression engine supports the use of named parameters.This means that instead of writing the cryptic expression clamp( 1, 2, 9), you can use clamp( min:=1,value:=2, max:=9). This also allows arguments to be switched, e.g. clamp( value:=2, max:=9,min:=1). Using named parameters helps clarify what the arguments for an expression function refer to, whichis helpful when you are trying to interpret an expression at a later date!
13.3.2 List of functions
The Expression tab provides the main interface to write expressions using functions, layer’s fields and values. Itcontains following widgets:
• An expression editor area to type or paste expressions. Autocompletion is available to speed expressionwriting:
– Corresponding variables, function names and field names to the input text are shown below: use theUp and Down arrows to browse the items and press Tab to insert in the expression or simply click onthe wished item.
– Function parameters are shown while filling them.
QGIS also checks the expression rightness and highlights all the errors using:
– Underline: for unknown functions, wrong or invalid arguments;
– Marker: for every other error (eg, missing parenthesis, unexpected character) at a single location.
13.3. Ausdrücke 241

QGIS User Guide, Release 3.4
Tipp: Document your expression with comments
When using complex expression, it is good practice to add text either as a multiline comment or inlinecomments to help you remember.
/*Labels each region with its highest (in altitude) airport(s)and altitude, eg 'AMBLER : 264m' for the 'Northwest Artic' region
*/with_variable('airport_alti', -- stores the highest altitude of the regionaggregate(
'airports','max',"ELEV", -- the field containing the altitude-- and limit the airports to the region they are withinfilter := within( $geometry, geometry( @parent ) )
),aggregate( -- finds airports at the same altitude in the region
'airports','concatenate',"NAME",filter := within( $geometry, geometry( @parent ) )and "ELEV" = @airport_alti
)|| ' : ' || @airport_alti || 'm'-- using || allows regions without airports to be skipped
)
• Under the expression editor, an Output preview displays the result of the expression evaluated on the firstfeature of the layer. In case of error, it indicates it and you can access details with the provided hyperlink.
• A function selector displays the list of functions, variables, fields. . . organized in groups. A search box isavailable to filter the list and quickly find a particular function or field. Double-clicking an item adds it tothe expression editor.
• A help panel displays help for each selected item in the function selector.
Tipp: Press Ctrl+Click when hovering a function name in an expression to automatically display itshelp in the dialog.
• A field’s values widget shown when a field is selected in the function selector helps to fetch features at-tributes. Double-clicking a value adds it to the expression editor.
Tipp: The right panel, showing functions help or field values, can be collapsed (invisible) in the dialog. Press theShow Values or Show Help button to get it back.
Aggregates Functions
This group contains functions which aggregate values over layers and fields.
242 Chapter 13. Arbeiten mit Vektordaten

QGIS User Guide, Release 3.4
Figure 13.73: Der Ausdruck Reiter
Funktion Beschreibungaggregate Returns an aggregate value calculated using features from another layerarray_agg Returns an array of aggregated values from a field or expressioncollect Returns the multipart geometry of aggregated geometries from an expressionconcatenate Returns the all aggregated strings from a field or expression joined by a delimitercount Returns the count of matching featurescount_distinct Returns the count of distinct valuescount_missing Returns the count of missing (null) valuesiqr Returns the calculated inter quartile range from a field or expressionmajority Returns the aggregate majority of values (most commonly occurring value) from a field or
expressionmax_length Returns the maximum length of strings from a field or expressionmaximum Returns the aggregate maximum value from a field or expressionmean Returns the aggregate mean value from a field or expressionmedian Returns the aggregate median value from a field or expressionmin_length Returns the minimum length of strings from a field or expressionminimum Returns the aggregate minimum value from a field or expressionminority Returns the aggregate minority of values (least commonly occurring value) from a field or
expressionq1 Returns the calculated first quartile from a field or expressionq3 Returns the calculated third quartile from a field or expressionrange Returns the aggregate range of values (maximum - minimum) from a field or expressionrela-tion_aggregate
Returns an aggregate value calculated using all matching child features from a layer relation
stdev Returns the aggregate standard deviation value from a field or expressionsum Returns the aggregate summed value from a field or expression
Examples:
• Return the maximum of the „passengers“ field from features in the layer grouped by „station_class“ field:
13.3. Ausdrücke 243

QGIS User Guide, Release 3.4
maximum("passengers", group_by:="station_class")
• Calculate the total number of passengers for the stations inside the current atlas feature:
aggregate('rail_stations','sum',"passengers",intersects(@atlas_geometry, $geometry))
• Return the mean of the „field_from_related_table“ field for all matching child features using the‚my_relation‘ relation from the layer:
relation_aggregate('my_relation', 'mean', "field_from_related_table")
or:
relation_aggregate(relation:='my_relation', aggregate := 'mean',expression := "field_from_related_table")
Array Functions
This group contains functions to create and manipulate arrays (also known as list data structures). The order ofvalues within the array matters, unlike the ‚map‘ data structure, where the order of key-value pairs is irrelevantand values are identified by their keys.
244 Chapter 13. Arbeiten mit Vektordaten

QGIS User Guide, Release 3.4
Funktion Beschreibungarray Returns an array containing all the values passed as parameterar-ray_append
Returns an array with the given value added at the end
array_cat Returns an array containing all the given arrays concatenatedar-ray_contains
Returns true if an array contains the given value
ar-ray_distinct
Returns an array containing distinct values of the given array
ar-ray_filter
Returns an array with only the items for which an expression evaluates to true
array_find Returns the index (0 for the first one) of a value within an array. Returns -1 if the value is notfound.
array_first Returns the first value of an arrayar-ray_foreach
Returns an array with the given expression evaluated on each item
array_get Returns the Nth value (0 for the first one) of an arrayar-ray_insert
Returns an array with the given value added at the given position
ar-ray_intersect
Returns true if any element of array_1 exists in array_2
array_last Returns the last element of an arrayar-ray_length
Returns the number of elements of an array
ar-ray_prepend
Returns an array with the given value added at the beginning
ar-ray_remove_all
Returns an array with all the entries of the given value removed
ar-ray_remove_at
Returns an array with the given index removed
ar-ray_reverse
Returns the given array with array values in reversed order
array_slice Returns the values of the array from the start_pos argument up to and including the end_posargument
ar-ray_to_string
Concatenates array elements into a string separated by a delimiter and using optional string forempty values
gener-ate_series
Creates an array containing a sequence of numbers
reg-exp_matches
Returns an array of all strings captured by capturing groups, in the order the groups themselvesappear in the supplied regular expression against a string
string_to_arraySplits string into an array using supplied delimiter and optional string for empty values
Farbfunktionen
Diese Gruppe enthält Funktionen zur Farbmanipulation.
13.3. Ausdrücke 245

QGIS User Guide, Release 3.4
Funktion Beschreibungcolor_cmyk Liefert die Zeichenkettendarstellung einer Farbe nach ihrem Cyan-, Magenta-, Gelb- und
Schwarzkomponentencolor_cmyka Liefert die Zeichenkettendarstellung einer Farbe nach ihrem Cyan-, Magenta-, Gelb-,
Schwarz- und Alpha-(Transparenz-)komponentencolor_grayscale_averageApplies a grayscale filter and returns a string representation from a provided colorcolor_hsl Liefert die Zeichenkettendarstellung einer Farbe nach ihrem Farb-, Sättigungs- und Hel-
ligkeitsattributencolor_hsla Liefert die Zeichenkettendarstellung einer Farbe nach ihrem Farb-, Sättigungs-,
Helligkeits- und Alpha-(Transparenz-)Attributencolor_hsv Liefert die Zeichenkettendarstellung einer Farbe nach ihrem Farb-, Sättigungs- und Hel-
ligkeitsattributencolor_hsva Liefert die Zeichenkettendarstellung einer Farbe nach ihrem Farb-, Sättigungs-,
Helligkeits- und Alpha-(Transparenz-)Attributencolor_mix_rgb Returns a string representing a color mixing the red, green, blue, and alpha values of two
provided colors based on a given ratiocolor_part Gibt eine bestimmte Komponente einer Farbzeichenkette zurück, z.B. rote oder Alpha-
Komponentecolor_rgb Liefert die Zeichenkettendarstellung einer Farbe nach ihrem Rot-, Grün- und Blau-
Komponentencolor_rgba Liefert die Zeichenkettendarstellung einer Farbe nach ihrem Rot-, Grün-, Blau- und Alpha-
(Transparenz-)Komponentencreate_ramp Returns a gradient ramp from a map of color strings and stepsdarker Liefert eine dunklere (oder hellere) Farbzeichenkettelighter Liefert eine hellere (oder dunklere) Farbzeichenketteproject_color Liefert eine Farbe aus dem Farbschema des Projektsramp_color Liefert eine Farbe aus einem Verlaufs als Zeichenketteset_color_part Setzt eine bestimmte Komponente einer Farbzeichenkette, z.B. rote oder Alpha-
Komponente
Conditional Functions
Diese Gruppe enthält Funktionen um bedingte Prüfungen in Ausdrücken zu handhaben.
Funktion BeschreibungCASE WHEN . . . THEN. . . END
Wertet einen Ausdruck aus und liefert ein Ergebnis, wenn es wahr ist. Sie könnenmehrere Bedingungen testen
CASE WHEN . . . THEN. . . ELSE . . . END
Wertet einen Ausdruck aus und gibt ein anderes Ergebnis zurück, je nachdem eswahr oder falsch ist. Sie können mehrere Bedingungen testen
coalesce Liefert den ersten Nicht-NULL-Wert aus der Ausdruckslisteif Prüft eine Bedingung und liefert unterschiedliche Ergebnisse je nach deren Aus-
gang
Einige Beispiele:
• Sende einen Wert zurück wenn die erste Bedingung wahr ist, sonst einen anderen Wert:
CASE WHEN "software" LIKE '%QGIS%' THEN 'QGIS' ELSE 'Other' END
246 Chapter 13. Arbeiten mit Vektordaten

QGIS User Guide, Release 3.4
Conversions Functions
Diese Gruppe enthält Funktionen, um einen Datentypen in einen anderen umzuwandeln (z.B. Zeichenketten zuGanzzahlen oder umgekehrt).
Funktion Beschreibungto_date In eine Datumsobjekt umzuwandelnde Zeichenketteto_datetime In eine Zeitpunktobjekt umzuwandelnde Zeichenketteto_dm Converts a coordinate to degree, minuteto_dms Converts coordinate to degree, minute, secondto_int Wandelt eine Zeichenkette in Fließkommazahlento_interval Wandelt eine Zeichenkette in einen Intervalltyp (kann für Tage, Stunden, Monate usw. eines
Datum verwendet werden)to_real Wandelt eine Zeichenkette in Fließkommazahlento_string Wandelte eine Zahl in eine Zeichenketteto_time Wandelt eine Zeichenkette in ein Zeitobjekt
Custom Functions
This group contains functions created by the user. See Funktions Editor for more details.
Datum und Zeit Funktionen
Diese Gruppe enthält Funktionen die auf Datums- und Zeitdaten angewendet werden können.
Funktion Beschreibungage Liefert die Differenz zwischen zwei Terminen oder Terminzeiten als Intervallday Bestimmt den Tag aus einem Datum oder die Anzahl der Tage aus einem Intervall.day_of_week Liefert eine Zahl die dem Tag der Woche entspricht, für ein bestimmtes Datum oder eine Da-
tumzeitepoch Returns the interval in milliseconds between the unix epoch and a given date valuehour Bestimmt den Stundenteil aus einem Datum oder die Stundenzahl aus einem Intervallminute Bestimmt den Minutenteil aus einem Datum oder die Minutenzahl aus einem Intervallmonth Bestimmt den Monat aus einem Datum oder die Anzahl der Monate aus einem Intervallnow Bestimmt das aktuelle Datum und die Zeitsecond Bestimmt den Sekundenteil aus einem Datum oder die Sekundenzahl aus einem Intervallweek Bestimmt die Wochennummer aus einem Datum oder die Anzahl der Wochen aus einem Inter-
vallyear Bestimmt das Jahr aus einem Datum oder die Anzahl der Jahre aus einem Intervall
This group also shares several functions with the Conversions Functions ( to_date, to_time, to_datetime,to_interval) and Zeichenkettenfunktionen (format_date) groups.
Einige Beispiele:
• Get today’s month and year in the „month_number/year“ format:
format_date(now(),'MM/yyyy')-- Returns '03/2017'
Besides these functions, subtracting dates, datetimes or times using the - (minus) operator will return an interval.
13.3. Ausdrücke 247

QGIS User Guide, Release 3.4
Adding or subtracting an interval to dates, datetimes or times, using the + (plus) and - (minus) operators, willreturn a datetime.
• Get the number of days until QGIS 3.0 release:
to_date('2017-09-29') - to_date(now())-- Returns <interval: 203 days>
• The same with time:
to_datetime('2017-09-29 12:00:00') - to_datetime(now())-- Returns <interval: 202.49 days>
• Get the datetime of 100 days from now:
now() + to_interval('100 days')-- Returns <datetime: 2017-06-18 01:00:00>
Bemerkung: Storing date and datetime and intervals on fields
The ability to store date, time and datetime values directly on fields may depend on the data source’s provider (e.g.,Shapefile accepts date format, but not datetime or time format). The following are some suggestions to overcomethis limitation:
• date, Datetime and time can be stored in text type fields after using the to_format() function.
• Intervals can be stored in integer or decimal type fields after using one of the date extraction functions (e.g.,day() to get the interval expressed in days)
Felder und Werte
Enthält eine Liste von Feldern des layers.
Double-click a field name to have it added to your expression. You can also type the field name (preferably insidedouble quotes) or its alias.
To retrieve fields values to use in an expression, select the appropriate field and, in the shown widget, choosebetween 10 Samples and All Unique. Requested values are then displayed and you can use the Search box at thetop of the list to filter the result. Sample values can also be accessed via right-clicking on a field.
To add a value to the expression you are writing, double-click on it in the list. If the value is of a string type, itshould be simple quoted, otherwise no quote is needed.
Unscharfer Vergleich Funktion
Diese Gruppe enthält unscharfe Vergleichsfunktionen zwischen Werten.
Funktion Beschreibungham-ming_distance
Liefert der Anzahl von Zeichen an korrespondieren Positionen innerhalb der Eingabezeichen-ketten an dem die Zeichen unterschiedliche sind.
levensheim Liefert die minimale Anzahl von Zeichenbearbeitungen (Einfügen, Löschen oder Substitutio-nen) die erforderlich, sind um eine Zeichenkette zu einer anderen zu ändern. Misst die Ähn-lichkeit zwischen zwei Zeichenketten
longest_common_substringLiefert die längste gemeinsame Teilzeichenkette zwischen zwei Zeichenkettensoundex Liefert die Soundex Darstellung einer Zeichenkette
248 Chapter 13. Arbeiten mit Vektordaten

QGIS User Guide, Release 3.4
Allgemeine Funktionen
Diese Gruppe enthält allgemeine Funktionen.
Funk-tion
Beschreibung
env Gets an environment variable and returns its content as a string. If the variable is not found, NULLwill be returned.
eval Werte einen Ausdruck aus, der als Zeichenkette übergeben wird. Nützlich um als Kontextvariablenoder Felder übergebene dynamische Parameter zu expandieren.
is_layer_visibleReturns true if a specified layer is visiblelayer_propertyLiefert eine Eigenschaft des Layers oder einen Wert seiner Metadaten. Es kann ein Layername sein,
KBS, Geometrietyp, Objektanzahl. . .var Liefert den Wert, gespeichert innerhalb einer bestimmten Variablen. Siehe Variable Fubktionen
untenwith_variableCreates and sets a variable for any expression code that will be provided as a third argument. Useful
to avoid repetition in expressions where the same value needs to be used more than once.
Geometriefunktionen
Dies Gruppe enthält Funktionen für das Arbeiten mit Geometrieobjekten (z.B. Länge und Flächeninhalt).
Funktion Beschreibung$area Liefert die Fläche des aktuellen Objekts$geometry Liefert die Geometrie des aktuellen Objekts (kann zur Verarbeitung mit anderen Funktionen verwendet werden)$length Liefert die Länge des aktuellen Objekts$perimeter Liefert die Umfanglänge des aktuellen Objekts.$x Returns the X coordinate of the current feature$x_at(n) Returns the X coordinate of the nth node of the current feature’s geometry$y Returns the Y coordinate of the current feature$y_at(n) Returns the Y coordinate of the nth node of the current feature’s geometryangle_at_vertex Returns the bisector angle (average angle) to the geometry for a specified vertex on a linestring geometry. Angles are in degrees clockwise from northarea Liefert die Fläche eines Polygonobjekts. Berechnung erfolgen im Bezugssystem der Geometrieazimuth Returns the north-based azimuth as the angle in radians measured clockwise from the vertical on point_a to point_bboundary Returns the closure of the combinatorial boundary of the geometry (ie the topological boundary of the geometry - see also qgisboundary).bounds Returns a geometry which represents the bounding box of an input geometry. Calculations are in the Spatial Reference System of this geometry (see also qgisboundingboxes)bounds_height Returns the height of the bounding box of a geometry. Calculations are in the Spatial Reference System of this geometrybounds_width Returns the width of the bounding box of a geometry. Calculations are in the Spatial Reference System of this geometrybuffer Returns a geometry that represents all points whose distance from this geometry is less than or equal to distance. Calculations are in the Spatial Reference System of this geometry (see also qgisbuffer)buffer_by_m Creates a buffer along a line geometry where the buffer diameter varies according to the M values at the line vertices (see also qgisbufferbym)centroid Returns the geometric center of a geometry (see also qgiscentroids)closest_point Liefert einen Punkt in einer Geometrie, der der zweiten Geometrie am nächsten liegt.combine Liefert die Kombination von zwei Geometriencontains(a,b) Liefert true dann und nur dann, wenn kein Punkt von b außerhalb von a liegt und mindestens ein Punkt von b in a liegt.convex_hull Returns the convex hull of a geometry (this represents the minimum convex geometry that encloses all geometries within the set) (see also qgisconvexhull)crosses Liefert 1 (wahr), wenn die gelieferte Geometrien einige, aber nicht alle inneren Punkte gemeinsam habendifference(a,b) Returns a geometry that represents that part of geometry a that does not intersect with geometry b (see also qgisdifference)disjoint Liefert 1 (true), wenn die Geometrie keinen Raum teilendistance Returns the minimum distance (based on Spatial Reference System) between two geometries in projected unitsdistance_to_vertex Returns the distance along the geometry to a specified vertexend_point Returns the last node from a geometry (see also qgisextractspecificvertices)extend Extends the start and end of a linestring geometry by a specified amount (see also qgisextendlines)exterior_ring Returns a line string representing the exterior ring of a polygon geometry, or null if the geometry is not a polygonextrude(geom,x,y) Returns an extruded version of the input (Multi-) Curve or (Multi-)Linestring geometry with an extension specified by X and Y
Continued on next page
13.3. Ausdrücke 249

QGIS User Guide, Release 3.4
Table 13.1 – continued from previous pageFunktion Beschreibungflip_coordinates Returns a copy of the geometry with the X and Y coordinates swapped (see also qgisswapxy)geom_from_gml Liefert eine Geometrie erstellt aus einer GML-Darstellung der Geometriegeom_from_wkt Liefert eine Geometrie aus einer Well-Known-Text (WKT)-Darstellunggeom_to_wkt Liefert eine Well-Known-Text (WKT)-Darstellung einer Geometrie ohne SRID-Metadatengeometry Liefert die Geometrie eines Objektsgeometry_n Liefert die nth Geometrie aus einer Geometriecollection oder NULL wenn die Eingabe keine Collection isthausdorff_distance Returns basically a measure of how similar or dissimilar 2 geometries are, with a lower distance indicating more similar geometriesinclination Returns the inclination measured from the zenith (0) to the nadir (180) on point_a to point_binterior_ring_n Liefert die Geometrie des n-ten inneren Rings aus einer Polygongeometrie oder null, wenn die Geometrie kein Polygon istintersection Returns a geometry that represents the shared portion of two geometries (see also qgisintersection)intersects Prüft, ob sich zwei Geometrien schneiden. Liefert 1 (wahr,) wenn sich die Geometrien räumlich schneiden (einen beliebigen gemeinsamen Raum haben) und 0, wenn nicht.intersects_bbox Tests whether a geometry’s bounding box overlaps another geometry’s bounding box. Returns 1 (true) if the geometries spatially intersect (share any portion of space) their bounding box, or 0 if they don’tis_closed Returns true if a line string is closed (start and end points are coincident), false if a line string is not closed, or null if the geometry is not a line stringlength Liefert die Länge eines Liniengeometrie Objekts (oder Länge einer Zeichenkette)line_interpolate_angle Returns the angle parallel to the geometry at a specified distance along a linestring geometry. Angles are in degrees clockwise from north.line_interpolate_point Returns the point interpolated by a specified distance along a linestring geometry. (see also qgisinterpolatepoint)line_locate_point Returns the distance along a linestring corresponding to the closest position the linestring comes to a specified point geometry.line_substring Returns the portion of a line or curve geometry falling betweeen specified start and end distances (measured from the beginning of the line) (see also qgislinesubstring)line_merge Returns a (Multi-)LineString geometry, where any connected LineStrings from the input geometry have been merged into a single linestring.m Returns the M value of a point geometrymake_circle Creates a circular geometry based on center point and radiusmake_ellipse Creates an elliptical geometry based on center point, axes and azimuthmake_line Liefert eine Liniengeometrie aus einer Reihe von Punktgeometrienmake_point(x,y,z,m) Returns a point geometry from X and Y (and optional Z or M) valuesmake_point_m(x,y,m) Returns a point geometry from X and Y coordinates and M valuesmake_polygon Liefert eine Polygongeometrie aus einem äußeren Ring und einer optionalen Liste von inneren Ringenmake_regular_polygon Creates a regular polygonmake_triangle Creates a triangle polygonminimal_circle Returns the minimal enclosing circle of an input geometry (see also qgisminimumenclosingcircle)nodes_to_points Returns a multipoint geometry consisting of every node in the input geometry (see also qgisextractvertices)num_geometries Liefert die Anzahl von Geometrien in Geometrycollections, oder null, wenn die Eingabegeometrie keine Collection istnum_interior_rings Liefert die Anzahl innerer Ringe eines Polygons oder einer Geometrycollection oder null, falls die Geometrie kein Polygon und keine Collection istnum_points Liefert die Anzahl von Stützpunkten einer Geometrienum_rings Liefert die Ringanzahl (ohne äußere Ringe) in einem Polygon oder einer Geometrycollection oder null, wenn die Eingabegeometrie weder Polygon noch Collection istoffset_curve Returns a geometry formed by offsetting a linestring geometry to the side. Distances are in the Spatial Reference System of this geometry. (see also qgisoffsetline)order_parts Sortiert die Teile eine Multigeometrie nach gegebenem Kriteriumoriented_bbox Returns a geometry representing the minimal oriented bounding box of an input geometry (see also qgisorientedminimumboundingbox)overlaps Prüft, ob sich zwei Geometrien überlappen. Liefert wahr, wenn sich die Geometrien Raum teilen, die gleiche Dimension haben, aber nicht komplett ineinander enthalten sindperimeter Liefert den Perimeter eines Polygonobjekts. Berechnung erfolgen im Bezugssystem der Geometriepoint_n Returns a specific node from a geometry (see also qgisextractspecificvertices)point_on_surface Returns a point guaranteed to lie on the surface of a geometry (see also qgispointonsurface)pole_of_inaccessibility Calculates the approximate pole of inaccessibility for a surface, which is the most distant internal point from the boundary of the surface (see also qgispoleofinaccessibility)project Returns a point projected from a start point using a distance and bearing (azimuth) in radians (see also qgisprojectpointcartesian)relate Liefert die Dimensional Extended 9 Intersection Model (DE-9IM) Darstellung der Beziehungen zwischen zwei Geometrienreverse Reverses the direction of a line string by reversing the order of its vertices (see also qgisreverselinedirection)segments_to_lines Returns a multi line geometry consisting of a line for every segment in the input geometry (see also qgisexplodelines)shortest_line Liefert die kürzeste Linie, die zwei Geometrien verbindet. Die resultierende Linie beginnt bei Geometrie 1 und endet bei Geometrie 2simplify Simplifies a geometry by removing nodes using a distance based threshold (see also qgissimplifygeometries)simplify_vw Simplifies a geometry by removing nodes using an area based threshold (see also qgissimplifygeometries)single_sided_buffer Returns a geometry formed by buffering out just one side of a linestring geometry. Distances are in the Spatial Reference System of this geometry (see also qgissinglesidedbuffer)smooth Smooths a geometry by adding extra nodes which round off corners in the geometry (see also qgissmoothgeometry)start_point Returns the first node from a geometry (see also qgisextractspecificvertices)sym_difference Returns a geometry that represents the portions of two geometries that do not intersect (see also qgissymmetricaldifference)
Continued on next page
250 Chapter 13. Arbeiten mit Vektordaten

QGIS User Guide, Release 3.4
Table 13.1 – continued from previous pageFunktion Beschreibungtapered_buffer Creates a buffer along a line geometry where the buffer diameter varies evenly over the length of the line (see also qgistaperedbuffer)touches Prüft, ob sich zwei Geometrien berühren. Liefert 1 (wahr), wenn sich die Geometrien mindestens einen Punkt gemeinsam haben, aber deren Inneres sich nicht überschneidettransform Returns the geometry transformed from the source CRS to the destination CRS (see also qgisreprojectlayer)translate Returns a translated version of a geometry. Calculations are in the Spatial Reference System of the geometry (see also qgistranslategeometry)union Liefert eine Geometrie die alle Punkte der Geometrien umfasstwedge_buffer Returns a wedge shaped buffer originating from a point geometry given an angle and radii (see also qgiswedgebuffers)within (a,b) Prüft, ob eine Geometrie in einer anderen enthalten ist. Liefert 1 (true), wenn die Geometrie komplett innerhalb der Geometrie b liegtx Returns the X coordinate of a point geometry, or the X coordinate of the centroid for a non-point geometryx_min Returns the minimum X coordinate of a geometry. Calculations are in the Spatial Reference System of this geometryx_max Returns the maximum X coordinate of a geometry. Calculations are in the Spatial Reference System of this geometryy Returns the Y coordinate of a point geometry, or the Y coordinate of the centroid for a non-point geometryy_min Returns the minimum Y coordinate of a geometry. Calculations are in the Spatial Reference System of this geometryy_max Returns the maximum Y coordinate of a geometry. Calculations are in the Spatial Reference System of this geometryz Returns the Z coordinate of a point geometry
Einige Beispiele:
• You can manipulate the current geometry with the variable $geometry to create a buffer or get the point onsurface:
buffer( $geometry, 10 )point_on_surface( $geometry )
• Return the X coordinate of the current feature’s centroid:
x( $geometry )
• Sendet einen Wert zur zugehörigen Objektfläche zurück:
CASE WHEN $area > 10 000 THEN 'Larger' ELSE 'Smaller' END
Layout Functions
This group contains functions to manipulate print layout items properties.
Funktion Beschreibungitem_variables Returns a map of variables from a layout item inside this print layout
Einige Beispiele:
• Get the scale of the ‚Map 0‘ in the current print layout:
map_get( item_variables('Map 0'), 'map_scale')
13.3. Ausdrücke 251

QGIS User Guide, Release 3.4
Map Layers
This group contains a list of the available layers in the current project. This offers a convenient way to writeexpressions referring to multiple layers, such as when performing aggregates, attribute or spatial queries.
Maps Functions
This group contains functions to create or manipulate keys and values of map data structures (also known asdictionary objects, key-value pairs, or associative arrays). Unlike the list data structure where values order matters,the order of the key-value pairs in the map object is not relevant and values are identified by their keys.
Funktion Beschreibunghstore_to_mapCreates a map from a hstore-formatted stringjson_to_map Creates a map from a json-formatted stringmap Returns a map containing all the keys and values passed as pair of parametersmap_akeys Returns all the keys of a map as an arraymap_avals Returns all the values of a map as an arraymap_concat Returns a map containing all the entries of the given maps. If two maps contain the same key,
the value of the second map is taken.map_delete Returns a map with the given key and its corresponding value deletedmap_exist Returns true if the given key exists in the mapmap_get Returns the value of a map, given it’s keymap_insert Returns a map with an added key/valuemap_to_hstoreMerges map elements into a hstore-formatted stringmap_to_json Merges map elements into a json-formatted string
Mathematische Funktionen
Diese Gruppe enthält mathematische Funktionen (z.B. sqrt, sin und cos).
252 Chapter 13. Arbeiten mit Vektordaten

QGIS User Guide, Release 3.4
Funk-tion
Beschreibung
abs Liefert den Betrag einer Zahlacos Liefert den inversen Kosinus eines Wert im Bogenmaßasin Liefert den inversen Sinus eines Wert im Bogenmaßatan Returns the inverse tangent of a value in radiansatan2(y,x) Returns the inverse tangent of Y/X by using the signs of the two arguments to determine the
quadrant of the resultaz-imuth(a,b)
Liefert auf Norden bezogenen Azimuth als Winkel im Bogenmaß im Uhrzeigersinn gemessen vonder Vertikalen von punkt a zu punkt b
ceil Rundet eine Zahl aufclamp Beschränke eine Eingabenwert auf einen gegebenen Bereichencos Liefert den inversen Kosinus eines Wert im Bogenmaßdegrees Wandelt Bogenmaß in Grad umexp Liefert den Exponential eines Wertfloor Rundet eine Zahl abinclina-tion
Returns the inclination measured from the zenith (0) to the nadir (180) on point_a to point_b.
ln Liefert den natürlichen Logarithmus des übergebenen Ausdrucklog Liefert den Wert des Logarithmus des gegebenen Werts und der Basislog10 Liefert den 10er-Logarithmus des gegebenen Ausdrucksmax Returns the largest not null value in a set of valuesmin Returns the smallest not null value in a set of valuespi Liefert den Wert von pi für Berechnungenradians Wandelt Grad in Bogenmaß umrand Liefert eine zufällige Zahl aus dem durch Minimum und Maximum festgegelegten Bereichs (inklu-
siv)randf Liefert eine zufällige Fließkommazahl aus einem durch Minimum und Maximum gegebenen Bere-
ichs (inklusiv)round Rundet auf eine bestimmte Stellenzahlscale_exp Wandelt einen bestimmten Wert aus einer Eingangsdomäne zu einem Leistungsbereich einer ex-
ponentielle Kurvescale_linear Wandelt einen gegebenen Wert des Eingabe- mit linearer Interpolation in einen Ausgabebereichsin Liefert den Sinus eines Winkelssqrt Liefert die Quadratwurzel eines Wertstan Liefert den Tangens eines Winkels
Operatoren
Diese Gruppe enthält Operatoren (z. B. ., +, -, *). Beachten Sie, dass für die meisten mathematischen Fubktionenunten gilt, ist eine Eingabe NULL, dann ist das Ergebnis auch NULL.
13.3. Ausdrücke 253

QGIS User Guide, Release 3.4
Funktion Beschreibunga + b Addition von zwei Werten (a plus b)a - b Subtraktion von zwei Werten (a minus b)a * b Multiplikation von zwei Werten (a multipliziert mit b)a / b Division von zwei Werten (a dividiert durch b)a % b Rest der Division von a durch b (beispielsweise 7 % 2 = 1, oder 2 passt in 7 dreimal mit dem
Rest 1)a ^ b Potenz von zwei Werten (zum Beispiel, 2^2=4 oder 2^3=8)a < b Vergleicht zwei Werte und ergibt 1, wenn der linke kleiner dem rechten Wert ist (a ist kleiner
als b)a <= b Compares two values and evaluates to 1 if the left value isless than or equal to the right valuea <> b Vergleicht zwei Werte und ergibt 1 wenn sie nicht gleich sinda = b Vergleicht zwei Werte und ergibt 1 wenn sie gleich sinda != b a und b sind nicht gleicha > b Vergleicht zwei Werte und ergibt 1, wenn der linke größer dem rechten Wert ist (a ist größer
als b)a >= b Vergleicht zwei Werte und ergibt 1, wenn der linke größer oder gleich dem rechten Wert ista ~ b a entspricht dem regulären Ausdruck b|| Verknüpft zwei Werte zusammen zu einer Zeichenkette. Wenn einer der beiden Werte NULL
ist, ist das Ergebnis auch NULL.‚\n‘ Setzt eine neue Linie in einer Zeichenkette einLIKE Liefert 1, wenn der erste Parameter zum gegebenen Muster passtILIKE Liefert 1, wenn der erste Parameter ohne Berücksichtung der Groß-/Kleinschreibung
zum gegebenen Muster passt (ILIKE kann statt LIKE benutzt werden ,damit die Groß-/Kleinschreibung berücksichtigt wird)
a IS b Testet, ob zwei Werte identisch sind. Gibt 1 zurück, wenn a gleich b ista OR b Returns 1 when condition a or condition b is truea AND b Returns 1 when conditions a and b are trueNOT Negiert eine BedingungSpal-tenname„Spal-tenname“
Wert des Feldspaltennamens, achten Sie darauf, es nicht mit einfachen Anführungszeichen zuverwechseln, siehe unten
‚Zeichen-kette‘
einen Zeichenkettenwert, achten Sie darauf, es nicht mit doppelten Anführungszeichen zu ver-wechseln, siehe oben
NULL ein Nullwerta IS NULL a hat keinen Werta IS NOTNULL
a hat einen Wert
a IN(value[,value])
a ist unter den gelistet Werten
a NOT IN(value[,value])
a ist nicht unter den gelisteten Werten
Bemerkung: About fields concatenation
You can concatenate strings using either || or +. The latter also means sum up expression. So if you have aninteger (field or numeric value) this can be error prone. In this case, you should use ||. If you concatenate twostring values, you can use both.
Einige Beispiele:
254 Chapter 13. Arbeiten mit Vektordaten

QGIS User Guide, Release 3.4
• Verbindet eine Zeichenkette und einen Wert von einem Spaltennamen:
'My feature''s id is: ' || "gid"'My feature''s id is: ' + "gid" => triggers an error as gid is an integer"country_name" + '(' + "country_code" + ')'"country_name" || '(' || "country_code" || ')'
• Testen Sie ob das „description“ Attributfeld mit einer ‚Hello‘ Zeichenfolge im Wert startet (beachten Siedie Position des % Zeichens):
"description" LIKE 'Hello%'
Rasters Functions
This group contains functions to operate on raster layer.
Funktion Beschreibungraster_statistic Returns statistics from a raster layerraster_value Returns the raster band value at the provided point
Record and Attributes Functions
Diese Gruppe enthält Funktionen die sich auf datensatzbezeichner beziehen.
Funktion Beschreibung$currentfea-ture
Liefert das aktuellen Objekt. Dies kann mit der Funktion ‚attribute‘ verwendet werde um At-tributwerte des aktuellen Objekts zu bestimmen.
$id Liefert die Objektkennung der aktuellen Zeileattribute Returns the value of a specified attribute from a featureget_feature Returns the first feature of a layer matching a given attribute valueget_feature_by_idReturns the feature of a layer matching the given feature IDis_selected Returns if a feature is selectednum_selected Returns the number of selected features on a given layerrepre-sent_value
Returns the configured representation value for a field value (convenient with some widgettypes)
uuid Generates a Universally Unique Identifier (UUID) for each row. Each UUID is 38 characterslong.
Einige Beispiele:
• Liefert das erste Objekt in Layer „LayerA“ dessen Feld „id“ die selben Werte wie das Feld „name“ desaktuellen Objekts, hat (eine Art Jointure):
get_feature( 'layerA', 'id', attribute( $currentfeature, 'name') )
• Berechnen Sie die Fläche des verbundenen Objekts aus dem vorherigen Beispiel:
area( geometry( get_feature( 'layerA', 'id', attribute( $currentfeature, 'name→˓') ) ) )
13.3. Ausdrücke 255

QGIS User Guide, Release 3.4
Zeichenkettenfunktionen
Diese Gruppe enthält Funktionen für Zeichenketten (z.B. Ersetzen und in Großbuchstaben umwandeln).
Funktion Beschreibungchar Returns the character associated with a unicode codeconcat Verketten mehrerer Zeichenkette zu einemformat Formatiert eine Zeichenkette mit den gegebenen Argumentenfor-mat_date
Formatiert einen Dateityp oder eine Zeichenkette in einen benutzerdefinierten Zeichenketten For-matstyp.
for-mat_number
Liefert eine Zahl formatiert mit den lokalen Tausendertrennern (schneidet die Zahl auch auf dieangegebene Stellenanzahl)
left(string,n)
Liefert einen Teilstring mit den ersten n Zeichen der Zeichenkette
length Liefert die Länge einer Zeichenkette (oder Länge eines Liniengeometrie Objekts)lower wandelt eine Zeichenkette in Kleinbuchstaben umlpad Returns a string padded on the left to the specified width, using the fill characterreg-exp_match
Returns the first matching position matching a regular expression within a string, or 0 if thesubstring is not found
reg-exp_replace
Liefert eine Zeichenkette in der ein regulärer Ausdruck ersetzt wurde
reg-exp_substr
Liefert den Teil der Zeichenkette, die dem gegebenen regulären Ausdrucks entspricht
replace Returns a string with the supplied string, array, or map of strings replaced by a string, an arrayof strings or paired values
right(string,n)
Liefert einen Teilstring mit den ersten n Zeichen der Zeichenkette
rpad Returns a string padded on the right to the specified width, using the fill characterstrpos Returns the first matching position of a substring within another string, or 0 if the substring is
not foundsubstr Liefert eine Teilzeichenkettetitle Wandelt alle Wörter einer Zeilenkette ins Titelformat (alle Wörter in Kleinbuchstaben bis auf die
Anfangsbuchstaben in Großbuchstaben)trim Entfernt Leerzeichen am Anfang und Ende einer Zeichenkette (Leerzeichen, Tabulatoren usw)upper Wandelt eine Zeichenkette in Großbuchstaben.wordwrap Liefert eine auf eine maximale/minimale Zeichenanzahl umgebrochene Zeichenkette
Variable Funktionen
Diese Gruppe enthält dynamische Variablen im Zusammenhang mit der Anwendung, Projektdatei und anderenEinstellungen. Es bedeutet, dass einige Funktionen nicht verfügbar sind, je nach Kontext:
• von dem Objekte über Ausdruck wählen Dialog
• von dem Feldrechner Dialog
• von dem Layereigenschaften Dialog
• from the print layout
Um diese Funktionen in einem Ausdruck zu verwenden, sollte ein @ -Zeichen vorangestellt sein (z.B.@row_number). Betroffen sind:
Funktion Beschreibungalgorithm_id Returns the unique ID of an algorithmatlas_feature Liefert das aktuelle Atlas-Objekt (als Objekt)
Continued on next page
256 Chapter 13. Arbeiten mit Vektordaten
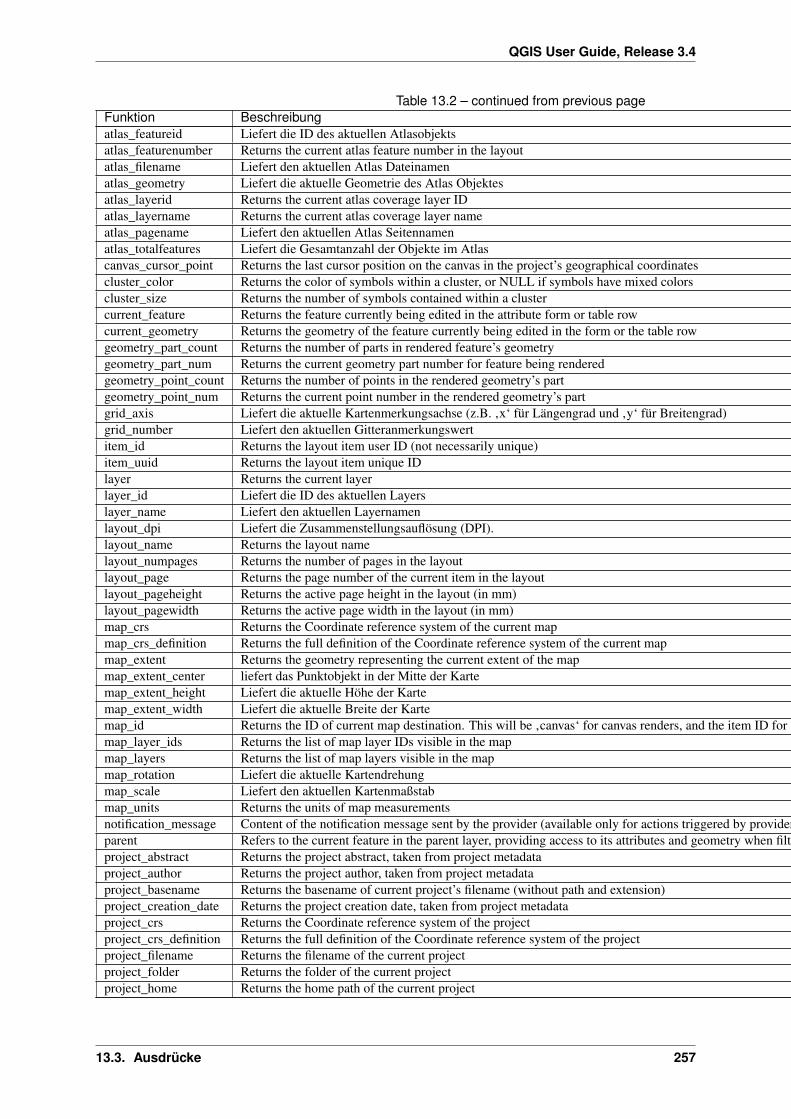
QGIS User Guide, Release 3.4
Table 13.2 – continued from previous pageFunktion Beschreibungatlas_featureid Liefert die ID des aktuellen Atlasobjektsatlas_featurenumber Returns the current atlas feature number in the layoutatlas_filename Liefert den aktuellen Atlas Dateinamenatlas_geometry Liefert die aktuelle Geometrie des Atlas Objektesatlas_layerid Returns the current atlas coverage layer IDatlas_layername Returns the current atlas coverage layer nameatlas_pagename Liefert den aktuellen Atlas Seitennamenatlas_totalfeatures Liefert die Gesamtanzahl der Objekte im Atlascanvas_cursor_point Returns the last cursor position on the canvas in the project’s geographical coordinatescluster_color Returns the color of symbols within a cluster, or NULL if symbols have mixed colorscluster_size Returns the number of symbols contained within a clustercurrent_feature Returns the feature currently being edited in the attribute form or table rowcurrent_geometry Returns the geometry of the feature currently being edited in the form or the table rowgeometry_part_count Returns the number of parts in rendered feature’s geometrygeometry_part_num Returns the current geometry part number for feature being renderedgeometry_point_count Returns the number of points in the rendered geometry’s partgeometry_point_num Returns the current point number in the rendered geometry’s partgrid_axis Liefert die aktuelle Kartenmerkungsachse (z.B. ‚x‘ für Längengrad und ‚y‘ für Breitengrad)grid_number Liefert den aktuellen Gitteranmerkungswertitem_id Returns the layout item user ID (not necessarily unique)item_uuid Returns the layout item unique IDlayer Returns the current layerlayer_id Liefert die ID des aktuellen Layerslayer_name Liefert den aktuellen Layernamenlayout_dpi Liefert die Zusammenstellungsauflösung (DPI).layout_name Returns the layout namelayout_numpages Returns the number of pages in the layoutlayout_page Returns the page number of the current item in the layoutlayout_pageheight Returns the active page height in the layout (in mm)layout_pagewidth Returns the active page width in the layout (in mm)map_crs Returns the Coordinate reference system of the current mapmap_crs_definition Returns the full definition of the Coordinate reference system of the current mapmap_extent Returns the geometry representing the current extent of the mapmap_extent_center liefert das Punktobjekt in der Mitte der Kartemap_extent_height Liefert die aktuelle Höhe der Kartemap_extent_width Liefert die aktuelle Breite der Kartemap_id Returns the ID of current map destination. This will be ‚canvas‘ for canvas renders, and the item ID for layout map rendersmap_layer_ids Returns the list of map layer IDs visible in the mapmap_layers Returns the list of map layers visible in the mapmap_rotation Liefert die aktuelle Kartendrehungmap_scale Liefert den aktuellen Kartenmaßstabmap_units Returns the units of map measurementsnotification_message Content of the notification message sent by the provider (available only for actions triggered by provider notifications).parent Refers to the current feature in the parent layer, providing access to its attributes and geometry when filtering an aggregate functionproject_abstract Returns the project abstract, taken from project metadataproject_author Returns the project author, taken from project metadataproject_basename Returns the basename of current project’s filename (without path and extension)project_creation_date Returns the project creation date, taken from project metadataproject_crs Returns the Coordinate reference system of the projectproject_crs_definition Returns the full definition of the Coordinate reference system of the projectproject_filename Returns the filename of the current projectproject_folder Returns the folder of the current projectproject_home Returns the home path of the current project
Continued on next page
13.3. Ausdrücke 257

QGIS User Guide, Release 3.4
Table 13.2 – continued from previous pageFunktion Beschreibungproject_identifier Returns the project identifier, taken from the project’s metadataproject_keywords Returns the project keywords, taken from the project’s metadataproject_path Returns the full path (including file name) of the current projectproject_title Liefert den Titel des aktuellen Projektsqgis_locale Returns the current language of QGISqgis_os_name Liefert den Betriebssystemnamen, z.B. ‚windows‘, ‚linux‘ oder ‚osx‘qgis_platform Returns QGIS platform, eg ‚desktop‘ or ‚server‘qgis_release_name Returns current QGIS release nameqgis_short_version Returns current QGIS version short stringqgis_version Returns current QGIS version stringqgis_version_no Returns current QGIS version numbersnapping_results Gives access to snapping results while digitizing a feature (only available in add feature)symbol_angle Liefert den Winkel des Symbols zur Objektdarstellung (nur für Markierungssymbole gültig)symbol_color Liefert die Farbe des Symbols zur Objektdarstellunguser_account_name Liefert den Betriebssystemaccountnamen des aktuellen Benutzersuser_full_name Liefert den Betriebssystemkontonamen des aktuellen Benutzersrow_number Speichert die Zahl der aktuellen Reihevalue Returns the current valuewith_variable Allows setting a variable for usage within an expression and avoid recalculating the same value repeatedly
Einige Beispiele:
• Return the X coordinate of a map item center to insert into a label in layout:
x( map_get( item_variables( 'map1'), 'map_extent_center' ) )
• Return for each feature in the current layer the number of overlapping airports features:
aggregate( layer:='airport', aggregate:='count', expression:="code",filter:=intersects( $geometry, geometry( @parent ) ) )
• Get the object_id of the first snapped point of a line:
with_variable('first_snapped_point',array_first( @snapping_results ),attribute(
get_feature_by_id(map_get( @first_snapped_point, 'layer' ),map_get( @first_snapped_point, 'feature_id' )
),'object_id'
))
Kürzlich verwendete Funktionen
This group contains recently used functions. Depending on the context of its usage (feature selection, field calcu-lator, generic), any applied expression is added to the corresponding list (up to ten expressions), sorted from themore recent to the less one. This helps to quickly retrieve and reapply any previously used expression.
258 Chapter 13. Arbeiten mit Vektordaten

QGIS User Guide, Release 3.4
13.3.3 Funktions Editor
With the Function Editor tab, you are able to write your own functions in Python language. This provides a handyand comfortable way to address particular needs that would not be covered by the predefined functions.
Figure 13.74: Der Funktionseditor Reiter
To create a new function:
1. Press the New File button.
2. Enter a name to use in the form that pops up and press OK.
A new item of the name you provide is added in the left panel of the Function Editor tab; this is a Python.py file based on QGIS template file and stored in the /python/expressions folder under the activeuser profile directory.
3. The right panel displays the content of the file: a python script template. Update the code and its helpaccording to your needs.
4. Press the Save and Load Functions button. The function you wrote is added to the functions tree in theExpression tab, by default under the Custom group.
5. Enjoy your new function.
6. If the function requires improvements, enable the Function Editor tab, do the changes and press again the
Save and Load Functions button to make them available in the file, hence in any expression tab.
Custom Python functions are stored under the user profile directory, meaning that at each QGIS startup, it willauto load all the functions defined with the current user profile. Be aware that new functions are only saved in the/python/expressions folder and not in the project file. If you share a project that uses one of your customfunctions you will need to also share the .py file in the /python/expressions folder.
13.3. Ausdrücke 259

QGIS User Guide, Release 3.4
Hier ist ein kurzes Beispiel, wie Sie eine eigene Funktion erzeugen:
from qgis.core import *from qgis.gui import *
@qgsfunction(args='auto', group='Custom')def my_sum(value1, value2, feature, parent):
"""Calculates the sum of the two parameters value1 and value2.<h2>Example usage:</h2><ul>
<li>my_sum(5, 8) -> 13</li><li>my_sum("field1", "field2") -> 42</li>
</ul>"""return value1 + value2
The short example creates a function my_sum that will give you a function with two values. When using theargs='auto' function argument the number of function arguments required will be calculated by the numberof arguments the function has been defined with in Python (minus 2 - feature, and parent).
This function can then be used in expressions:
Figure 13.75: Custom Function added to the Expression tab
Weitere Informationen über das Erstellen von Python-Kodes können in PyQGIS-Developer-Cookbook gefundenwerden.
13.4 Mit Attributtabelle arbeiten
The attribute table displays information on features of a selected layer. Each row in the table represents a feature(with or without geometry), and each column contains a particular piece of information about the feature. Featuresin the table can be searched, selected, moved or even edited.
13.4.1 Foreword: Spatial and non-spatial tables
QGIS allows you to load spatial and non-spatial layers. This currently includes tables supported by OGR anddelimited text, as well as the PostgreSQL, MSSQL, SpatiaLite, DB2 and Oracle provider. All loaded layers arelisted in the Layers panel. Whether a layer is spatially enabled or not determines whether you can interact with iton the map.
260 Chapter 13. Arbeiten mit Vektordaten

QGIS User Guide, Release 3.4
Non-spatial tables can be browsed and edited using the attribute table view. Furthermore, they can be used forfield lookups. For example, you can use columns of a non-spatial table to define attribute values, or a range ofvalues that are allowed, to be added to a specific vector layer during digitizing. Have a closer look at the editwidget in section Attributes Form Properties to find out more.
13.4.2 Introducing the attribute table interface
To open the attribute table for a vector layer, activate the layer by clicking on it in the Layers Panel. Then, from
the main Layer menu, choose Open Attribute Table. It is also possible to right-click on the layer and choose
Open Attribute Table from the drop-down menu, or to click on the Open Attribute Table button in theAttributes toolbar. If you prefer shortcuts, F6 will open the attribute table. Shift+F6 will open the attributetable filtered to selected features and Ctrl+F6 will open the attribute table filtered to visible features.
This will open a new window that displays the feature attributes for the layer (figure_attributes_table). Accordingto the setting in Settings → Options → Data sources menu, the attribute table will open in a docked window ora regular window. The total number of features in the layer and the number of currently selected/filtered featuresare shown in the attribute table title, as well as if the layer is spatially limited.
Figure 13.76: Attributtabelle des regions Layer
Die anderen Knöpfe im Kopf der Attributtabelle stellen die folgenden Funktionalitäten zur Verfügung:
13.4. Mit Attributtabelle arbeiten 261

QGIS User Guide, Release 3.4
Icon Label Purpose Default Shortcut
Toggle editing mode Enable editing functionalities Ctrl+E
Toggle multi edit mode Update multiple fields of many features
Save Edits Save current modifications Ctrl+S
Reload the table
Add feature Add new geometryless feature
Delete selected features Remove selected features from the layer
Cut selected features to clipboard Ctrl+X
Copy selected features to clipboard Ctrl+C
Paste features from clipboard Insert new features from copied ones Ctrl+V
Select features using an Expression
Select All Select all features in the layer Ctrl+A
Invert selection Invert the current selection in the layer Ctrl+R
Deselect all Deselect all features in the current layer Ctrl+Shift+A
Filter/Select features using form Ctrl+F
Move selected to top Move selected rows to the top of the table
Pan map to the selected rows Ctrl+P
Zoom map to the selected rows Ctrl+J
New field Add a new field to the data source Ctrl+W
Delete field Remove a field from the data source Ctrl+L
Open field calculator Update field for many features in a row Ctrl+I
Conditional formatting Enable table formatting
Dock attribute table Allows to dock/undock the attribute table
Actions Lists the actions related to the layer
Table Attribute 1: Available Tools
Bemerkung: Depending on the format of the data and the OGR library built with your QGIS version, some toolsmay not be available.
Below these buttons is the Quick Field Calculation bar (enabled only in edit mode), which allows to quickly apply
calculations to all or part of the features in the layer. This bar uses the same expressions as the Field Calculator
(see Editiere Attributwerte).
Table view vs Form view
QGIS provides two view modes to easily manipulate data in the attribute table:
• The Table view, displays values of multiple features in a tabular mode, each row representing a feature andeach column a field.
262 Chapter 13. Arbeiten mit Vektordaten
QGIS User Guide, Release 3.4
• And the Form view shows feature identifiers in a first panel and displays only the attributes of the clickedidentifier in the second one. Form view uses the layer fields configuration (see Attributes Form Properties).
You can switch from one mode to the other by clicking the corresponding icon at the bottom right of the dialog.
You can also specify the Default view mode at the opening of the attribute table in Settings → Options → DataSources menu. It can be ‚Remember last view‘, ‚Table view‘ or ‚Form view‘.
Configuring the columns
Right-click in a column header when in table view to have access to tools that help you configure what can bedisplayed in the attribute table and how.
Hiding and organizing columns and enabling actions
By right-clicking in a column header, you can choose to hide it from the attribute table. To change several columnsbehavior at once, unhide a column or change the order of the columns, choose Organize columns . . . . In the newdialog, you can:
• check/uncheck columns you want to show or hide
• drag-and-drop items to reorder the columns in the attribute table. Note that this change is for the tablerendering and does not alter the fields order in the layer datasource
• enable a new virtual Actions column that displays in each row a drop-down box or button list of actions foreach row, see Actions Properties for more information about actions.
Resizing columns widths
Columns width can be set through a right-click on the column header and select either:
• Set width. . . to enter the desired value. By default, the current value is displayed in the widget
• Autosize to resize at the best fit the column.
It can also be changed by dragging the boundary on the right of the column heading. The new size of the columnis maintained for the layer, and restored at the next opening of the attribute table.
Sorting columns
The table can be sorted by any column, by clicking on the column header. A small arrow indicates the sortorder (downward pointing means descending values from the top row down, upward pointing means ascendingvalues from the top row down). You can also choose to sort the rows with the sort option of the column headercontext menu and write an expression, e.g. to sort the row using multiple columns you can write concat(col0,col1).
In form view, features identifier can be sorted using the Sort by preview expression option.
Tipp: Sorting based on columns of different types
Trying to sort an attribute table based on columns of string and numeric types may lead to unexpected re-sult because of the concat("USE", "ID") expression returning string values (ie, 'Borough105' <'Borough6'). You can workaround this by using eg concat("USE", lpad("ID", 3, 0)) which re-turns 'Borough105' > 'Borough006'.
13.4. Mit Attributtabelle arbeiten 263

QGIS User Guide, Release 3.4
Figure 13.77: Attribute table in form view (top) vs table view (bottom)
264 Chapter 13. Arbeiten mit Vektordaten

QGIS User Guide, Release 3.4
Formatting of table cells using conditions
Conditional formatting settings can be used to highlight in the attribute table features you may want to put aparticular focus on, using custom conditions on feature’s:
• geometry (e.g., identifying multi-parts features, small area ones or in a defined map extent. . . );
• or field value (e.g., comparing values to a threshold, identifying empty cells. . . ).
You can enable the conditional formatting panel clicking on at the top right of the attributes window in tableview (not available in form view).
The new panel allows user to add new rules to format rendering of Field or Full row. Adding new ruleopens a form to define:
• the name of the rule;
• a condition using any of the expression builder functions;
• the formatting: it can be choosen from a list of predefined formats or created based on properties like:
– background and text colors;
– use of icon;
– bold, italic, underline, or strikeout;
– Schriftart.
Figure 13.78: Bedingte Formatierungsregeln für Attributtabellen
13.4.3 Interacting with features in an attribute table
Selecting features
In table view, each row in the attribute table displays the attributes of a unique feature in the layer. Selecting a rowselects the feature and likewise, selecting a feature in the map canvas (in case of geometry enabled layer) selectsthe row in the attribute table. If the set of features selected in the map canvas (or attribute table) is changed, thenthe selection is also updated in the attribute table (or map canvas) accordingly.
13.4. Mit Attributtabelle arbeiten 265

QGIS User Guide, Release 3.4
Zeilen können ausgewählt werden, indem Sie auf die Zeilennummer links neben der Zeile klicken. MehrereZeilen können ausgewählt werden, indem die Strg Taste während der Auswahl gedrückt wird.Eine kontinuier-liche Auswahl ist möglich, indem Sie bei der Selektion die Umschalt Taste gedrückt halten, während Sie dieZeilennummern auswählen. Alle Zeilen zwischen der aktuell ausgewählten Zeile und der Mauspfeilposition wer-den dadurch selektiert. Bewegt man den Mauszeiger in der Attributtabelle indem man in eine Zelle in der Tabelleklickt ändert die Zeilenauswahl nicht. Verändert man die Auswahl im Kartenfenster bewegt sich der Mauszeigerin der Attributtabelle nicht.
In form view of the attribute table, features are by default identified in the left panel by the value of their displayedfield (see Display Properties). This identifier can be replaced using the drop-down list at the top of the panel,either by selecting an existing field or using a custom expression. You can also choose to sort the list of featuresfrom the drop-down menu.
Click a value in the left panel to display the feature’s attributes in the right one. To select a feature, you need toclick inside the square symbol at the left of the identifier. By default, the symbol turns into yellow. Like in thetable view, you can perform multiple feature selection using the keyboard combinations previously exposed.
Beyond selecting features with the mouse, you can perform automatic selection based on feature’s attribute usingtools available in the attribute table toolbar, such as (see section Automatic selection and following one for moreinformation and use case):
• Select By Expression. . .
• Select Features By Value. . .
• Deselect Features from All Layers
• Select All Features
• Invert Feature Selection.
It is also possible to select features using the Filtering and selecting features using forms.
Filtering features
Once you have selected features in the attribute table, you may want to display only these records in the table.This can be easily done using the Show Selected Features item from the drop-down list at the bottom left of theattribute table dialog. This list offers the following filters:
• Show All Features
• Show Selected Features
• Show Features visible on map
• Show Edited and New Features
• Field Filter - allows the user to filter based on value of a field: choose a column from a list, type a value andpress Enter to filter. Then, only the matching features are shown in the attribute table.
• Advanced filter (Expression) - Opens the expression builder dialog. Within it, you can create complexexpressions to match table rows. For example, you can filter the table using more than one field. Whenapplied, the filter expression will show up at the bottom of the form.
It is also possible to filter features using forms.
Bemerkung: Filtering records out of the attribute table does not filter features out of the layer; they are simplymomentaneously hidden from the table and can be accessed from the map canvas or by removing the filter. Forfilters that do hide features from the layer, use the Query Builder.
Tipp: Update datasource filtering with Show Features Visible on Map
266 Chapter 13. Arbeiten mit Vektordaten

QGIS User Guide, Release 3.4
When for performance reasons, features shown in attribute table are spatially limited to the canvas extent at itsopening (see Data Source Options for a how-to), selecting Show Features Visible on Map on a new canvas extentupdates the spatial restriction.
Filtering and selecting features using forms
Clicking the Filter/Select features using form or pressing Ctrl+F will make the attribute table dialog switch to formview and replace each widget with its search variant.
From this point onwards, this tool functionality is similar to the one described in Select Features By Value, whereyou can find descriptions of all operators and selecting modes.
Figure 13.79: Attribute table filtered by the filter form
When selecting / filtering features from the attribute table, there is a Filter features button that allows definingand refining filters. Its use triggers the Advanced filter (Expression) option and displays the corresponding filterexpression in an editable text widget at the bottom of the form.
If there are already filtered features, you can refine the filter using the drop-down list next to the Filter featuresbutton. The options are:
• Filter within („AND“)
• Extend filter („OR“)
To clear the filter, either select the Show all features option from the bottom left pull-down menu, or clear theexpression and click Apply or press Enter.
13.4.4 Using action on features
Users have several possibilities to manipulate feature with the contextual menu like:
• Select all (Ctrl+A) the features;
• Copy the content of a cell in the clipboard with Copy cell content;
• Zoom to feature without having to select it beforehand;
• Pan to feature without having to select it beforehand;
• Flash feature, to highlight it in the map canvas;
• Open form: it toggles attribute table into form view with a focus on the clicked feature.
13.4. Mit Attributtabelle arbeiten 267

QGIS User Guide, Release 3.4
Figure 13.80: Copy cell content button
If you want to use attribute data in external programs (such as Excel, LibreOffice, QGIS or a custom web applica-
tion), select one or more row(s) and use the Copy selected rows to clipboard button or press Ctrl+C. In Settings →Options → Data Sources menu you can define the format to paste to with Copy features as dropdown list:
• Plain text, no geometry,
• Plain text, WKT geometry,
• GeoJSON
You can also display a list of actions in this contextual menu. This is enabled in the Layer properties → Actionstab. See Actions Properties for more information on actions.
Saving selected features as new layer
The selected features can be saved as any OGR-supported vector format and also transformed into another coordi-nate reference system (CRS). In the contextual menu of the layer, from the Layers panel, click on Export → Saveselected features as. . . to define the name of the output dataset, its format and CRS (see section Creating new
layers from an existing layer). You’ll notice that Save only selected features is checked. It is also possible tospecify OGR creation options within the dialog.
13.4.5 Editiere Attributwerte
Editing attribute values can be done by:
• typing the new value directly in the cell, whether the attribute table is in table or form view. Changes arehence done cell by cell, feature by feature;
• using the field calculator: update in a row a field that may already exist or to be created but for multiplefeatures. It can be used to create virtual fields;
• using the quick field calculation bar: same as above but for only existing field;
268 Chapter 13. Arbeiten mit Vektordaten

QGIS User Guide, Release 3.4
• or using the multi edit mode: update in a row multiple fields for multiple features.
Using the Field Calculator
The Field Calculator button in the attribute table allows you to perform calculations on the basis of existing attributevalues or defined functions, for instance, to calculate length or area of geometry features. The results can be usedto update an existing field, or written to a new field (that can be a virtual one).
The field calculator is available on any layer that supports edit. When you click on the field calculator icon thedialog opens (see figure_field_calculator). If the layer is not in edit mode, a warning is displayed and using thefield calculator will cause the layer to be put in edit mode before the calculation is made.
Based on the Expression Builder dialog, the field calculator dialog offers a complete interface to define an expres-sion and apply it to an existing or a newly created field. To use the field calculator dialog, you must select whetheryou want to:
1. apply calculation on the whole layer or on selected features only
2. create a new field for the calculation or update an existing one.
Figure 13.81: Feldrechner
13.4. Mit Attributtabelle arbeiten 269

QGIS User Guide, Release 3.4
If you choose to add a new field, you need to enter a field name, a field type (integer, real, date or string) and ifneeded, the total field length and the field precision. For example, if you choose a field length of 10 and a fieldprecision of 3, it means you have 7 digits before the dot, and 3 digits for the decimal part.
Ein kurzes Beispiel zeigt wie der Feldrechner arbeitet, wenn Sie den Reiter Ausdruck verwenden. Wir wollen dieLänge des ‚railroads‘ Layers aus dem QGIS Beispieldatensatz in km berechnen:
1. Laden Sie das Shape railroads.shp in QGIS und öffnen Sie die den Dialog Attributtabelle öffnen.
2. Klicken Sie auf Bearbeitungsmodus umschalten und öffnen Sie den Feldrechner Dialog.
3. Wählen Sie das Neues Feld anlegen Kontrollkästchen um die Berechnungen in ein neues Feld zu spe-ichern.
4. Set Output field name to length_km
5. Select Decimal number (real) as Output field type
6. Set the Output field length to 10 and the Precision to 3
7. Double click on $length in the Geometry group to add the length of the geometry into the Field calculatorexpression box.
8. Complete the expression by typing / 1000 in the Field calculator expression box and click OK.
9. You can now find a new length_km field in the attribute table.
Creating a Virtual Field
A virtual field is a field based on an expression calculated on the fly, meaning that its value is automatically updatedas soon as an underlying parameter changes. The expression is set once; you no longer need to recalculate thefield each time underlying values change. For example, you may want to use a virtual field if you need area tobe evaluated as you digitize features or to automatically calculate a duration between dates that may change (e.g.,using now() function).
Bemerkung: Virtuelle Felder benutzen
• Virtuelle Felder sind nicht dauerhaft in den Layerattributen, was bedeutet, dass sie in der Projektdatei gespe-ichert und verfügabr sind, in der sie gespeichert wurden.
• Ein Feld kann nur bei der Erzeugung als virtuell eingestellt werden und der Ausdruck kann später nichtmehr geändert werden: Sie müssen es löschen und ein neues erstellen.
Using the Quick Field Calculation Bar
While Field calculator is always available, the quick field calculation bar on top of the attribute table is only visibleif the layer is in edit mode. Thanks to the expression engine, it offers a quicker access to edit an already existingfield:
1. Select the field to update in the drop-down list.
2. Fill the textbox with a value, an expression you directly write or build using the expression button.
3. Click on Update All, Update Selected or Update Filtered button according to your need.
Editing multiple fields
Unlike the previous tools, multi edit mode allows multiple attributes of different features to be edited simultane-ously. When the layer is toggled to edit, multi edit capabilities are accessible:
270 Chapter 13. Arbeiten mit Vektordaten

QGIS User Guide, Release 3.4
Figure 13.82: Quick Field Calculation Bar
• using the Toggle multi edit mode button from the toolbar inside the attribute table dialog;
• or selecting Edit → Modify attributes of selected features menu.
Bemerkung: Unlike the tool from the attribute table, hitting the Edit → Modify Attributes of Selected Featuresoption provides you with a modal dialog to fill attributes changes. Hence, features selection is required beforeexecution.
In order to edit multiple fields in a row:
1. Select the features you want to edit.
2. From the attribute table toolbar, click the button. This will toggle the dialog to its form view. Featureselection could also be made at this step.
3. At the right side of the attribute table, fields (and values) of selected features are shown. New widgetsappear next to each field allowing for display of the current multi edit state:
• The field contains different values for selected features. It’s shown empty and each feature willkeep its original value. You can reset the value of the field from the drop-down list of the widget.
• All selected features have the same value for this field and the value displayed in the form will bekept.
• The field has been edited and the entered value will be applied to all the selected features. Amessage appears at the top of the dialog, inviting you to either apply or reset your modification.
Clicking any of these widgets allows you to either set the current value for the field or reset to original value,meaning that you can roll back changes on a field-by-field basis.
4. Make the changes to the fields you want.
5. Click on Apply changes in the upper message text or any other feature in the left panel.
Changes will apply to all selected features. If no feature is selected, the whole table is updated with your changes.
Modifications are made as a single edit command. So pressing Undo will rollback the attribute changes for allselected features at once.
Bemerkung: Multi edit mode is only available for auto generated and drag and drop forms (see Customizing aform for your data); it is not supported by custom ui forms.
13.4. Mit Attributtabelle arbeiten 271

QGIS User Guide, Release 3.4
Figure 13.83: Editing fields of multiple features
13.4.6 Creating one or many to many relations
Relations are a technique often used in databases. The concept is that features (rows) of different layers (tables)can belong to each other.
Introducing 1-N relations
Als Beispiel nehmen wir einen Layer mit allen Regionen von Alaska (Polygon) in dem einige Attribute über denNamen und den Regionstyp sowie eine eindeutige ID (die als Primärschlüssel eingesetzt wird) vorhanden sind.
Then you get another point layer or table with information about airports that are located in the regions and youalso want to keep track of these. If you want to add them to the regions layer, you need to create a one to manyrelation using foreign keys, because there are several airports in most regions.
Layers in 1-N relations
QGIS makes no difference between a table and a vector layer. Basically, a vector layer is a table with a geometry.So you can add your table as a vector layer. To demonstrate the 1-n relation, you can load the regions shapefileand the airports shapefile which has a foreign key field (fk_region) to the layer regions. This means, thateach airport belongs to exactly one region while each region can have any number of airports (a typical one tomany relation).
Foreign keys in 1-N relations
In addition to the already existing attributes in the airports attribute table, you’ll need another field fk_regionwhich acts as a foreign key (if you have a database, you will probably want to define a constraint on it).
This field fk_region will always contain an id of a region. It can be seen like a pointer to the region it belongsto. And you can design a custom edit form for editing and QGIS takes care of the setup. It works with different
272 Chapter 13. Arbeiten mit Vektordaten

QGIS User Guide, Release 3.4
Figure 13.84: Die Region Alaska mit Flughäfen
providers (so you can also use it with shape and csv files) and all you have to do is to tell QGIS the relationsbetween your tables.
Defining 1-N relations (Relation Manager)
The first thing we are going to do is to let QGIS know about the relations between the layers. This is done inProject → Project Properties. . . . Open the Relations tab and click on Add Relation.
• Name is going to be used as a title. It should be a human readable string, describing, what the relation isused for. We will just call say Airports in this case.
• Referenced Layer (Parent) also considered as parent layer, is the one with the primary key, pointed to, sohere it is the regions layer
• Referenced Field is the primary key of the referenced layer so it is ID
• Referencing Layer (Child) also considered as child layer, is the one with the foreign key field on it. In ourcase, this is the airports layer
• Referencing Field will say, which field points to the other layer so this is fk_region in this case
• Id will be used for internal purposes and has to be unique. You may need it to build custom forms. If youleave it empty, one will be generated for you but you can assign one yourself to get one that is easier tohandle
• Relationship strength sets the strength of the relation between the parent and the child layer. The defaultAssociation type means that the parent layer is simply linked to the child one while the Composition typeallows you to duplicate also the child features when duplicating the parent ones.
Forms for 1-N relations
Jetzt wo QGIS von der Beziehung weiss wird es dazu benutzt das Formular das es erstellt zu verbessern. Dawir die Standard Formular Methode (autogenerated) nicht verändert haben, wird es Ihrem Formular einfach einneues Bearbeitungselement hinzufügen. Also lassen Sie uns einen Layer ‚region‘ in der Legende auswählen unddas Objekte abfragen Werkzeug benutzen. Abhängig von Ihren Einstellungen öffnet sich das Formular entwederdirekt oder Sie müssen den Identifizieren Dialog unter Aktionen öffnen.
13.4. Mit Attributtabelle arbeiten 273

QGIS User Guide, Release 3.4
Figure 13.85: Relation Manager
Figure 13.86: identifikationsergebnis Dialog von regions mit Beziehung zu airports
274 Chapter 13. Arbeiten mit Vektordaten

QGIS User Guide, Release 3.4
As you can see, the airports assigned to this particular region are all shown in a table. And there are also somebuttons available. Let’s review them shortly:
• Der Knopf ist zum Umschalten des Bearbeitungsmodus da. Seien Sie sich dessen bewusst dass es denBearbeitungsmodus des ‚airport‘ Layers umschaltet, trotzdessen wir uns im Objektformular eines Objektesaus dem ‚region‘ Layer befinden. Die Tabelle jedoch stellt Objekte des ‚aiport‘ Layer dar.
• The button is for saving all the edits.
• The button will add a new record to the airport layer attribute table. And it will assign the new airportto the current region by default.
• The button allows you to copy one or more child features.
• The button will delete the selected airport permanently.
• Das Symbol öffnet einen neuen Dialog in dem Sie jeden vorhandenen ‚airport‘ auswählen können wasdann der aktuellen ‚region‘ zugewiesen wird. Dies kann nützlich sein wenn Sie den ‚airport‘ aus Versehenin der falschen ‚region‘ erstellt haben.
• Das Symbol hebt die Verbindung zwischen dem ausgewählten ‚airport‘ und der aktuellen ‚region‘wieder auf so dass dieser auf wirksame Art und Weise nicht mehr zugewiesen ist (der Fremdschlüssel wirdauf NULL gesetzt).
• With the button you can zoom the map to the selected child features.
• The two buttons and to the right switch between table view and form view where the later let’s youview all the airports in their respective form.
In the above example the referencing layer has geometries (so it isn’t just an alphanumeric table) so the above stepswill create an entry in the layer attribute table that has no corresponding geometric feature. To add the geometry:
1. Choose Open Attribute Table for the referencing layer.
2. Select the record that has been added previously within the feature form of the referenced layer.
3. Use the Add Part digitizing tool to attach a geometry to the selected attributes table record.
If you work on the airport table, the widget Relation Reference is automatically set up for the fk_region field(the one used to create the relation), see Relation Reference widget.
In the airport form you will see the button at the right side of the fk_region field: if you click on the buttonthe form of the region layer will be opened. This widget allows you to easily and quickly open the forms of thelinked parent features.
The Relation Reference widget has also an option to embed the form of the parent layer within the child one. It isavailable in the Properties → Attributes Form menu of the airport layer: select the fk_region field and checkthe Show embedded form option.
Wenn Sie jetzt einen Blick auf den Objektdialog werfen werden Sie sehen dass das Formular der ‚region‘ in das‚airports‘ Formular eingebettet ist und sogar eine Kombobox vorhanden ist mit dem der aktuelle ‚airport‘ zu eineranderen ‚region‘ zugeordnet werden kann.
Moreover if you toggle the editing mode of the airport layer, the fk_region field has also an autocompleterfunction: while typing you will see all the values of the id field of the region layer.
Introducing many-to-many (N-M) relations
N-M relations are many-to-many relations between two tables. For instance, the airports and airlineslayers: an airport receives several airline companies and an airline company flies to several airports.
13.4. Mit Attributtabelle arbeiten 275

QGIS User Guide, Release 3.4
Figure 13.87: Objekte abfragen Dialog von ‚airport‘ mit Beziehung zu ‚regions‘
276 Chapter 13. Arbeiten mit Vektordaten

QGIS User Guide, Release 3.4
This SQL code creates the three tables we need for an N-M relationship in a PostgreSQL/PostGIS schema namedlocations. You can run the code using the Database → DB Manager. . . for PostGIS or external tools such aspgAdmin. The airports table stores the airports layer and the airlines table stores the airlines layer. Inboth tables few fields are used for clarity. The tricky part is the airports_airlines table. We need it to listall airlines for all airports (or vice versa). This kind of table is known as a pivot table. The constraints in this tableforce that an airport can be associated with an airline only if both already exist in their layers.
CREATE SCHEMA locations;
CREATE TABLE locations.airports(
id serial NOT NULL,geom geometry(Point, 4326) NOT NULL,airport_name text NOT NULL,CONSTRAINT airports_pkey PRIMARY KEY (id)
);
CREATE INDEX airports_geom_idx ON locations.airports USING gist (geom);
CREATE TABLE locations.airlines(
id serial NOT NULL,geom geometry(Point, 4326) NOT NULL,airline_name text NOT NULL,CONSTRAINT airlines_pkey PRIMARY KEY (id)
);
CREATE INDEX airlines_geom_idx ON locations.airlines USING gist (geom);
CREATE TABLE locations.airports_airlines(
id serial NOT NULL,airport_fk integer NOT NULL,airline_fk integer NOT NULL,CONSTRAINT airports_airlines_pkey PRIMARY KEY (id),CONSTRAINT airports_airlines_airport_fk_fkey FOREIGN KEY (airport_fk)
REFERENCES locations.airports (id)ON DELETE CASCADEON UPDATE CASCADEDEFERRABLE INITIALLY DEFERRED,
CONSTRAINT airports_airlines_airline_fk_fkey FOREIGN KEY (airline_fk)REFERENCES locations.airlines (id)ON DELETE CASCADEON UPDATE CASCADEDEFERRABLE INITIALLY DEFERRED
);
Instead of PostgreSQL you can also use GeoPackage. In this case, the three tables can be created manually usingthe Database → DB Manager. . . . In GeoPackage there are no schemas so the locations prefix is not needed.
Foreign key constraints in airports_airlines table can´t be created using Table → Create Table. . . or Table→ Edit Table. . . so they should be created using Database → SQL Window. . . . GeoPackage doesn’t support ADDCONSTRAINT statements so the airports_airlines table should be created in two steps:
1. Set up the table only with the id field using Table → Create Table. . .
2. Using Database → SQL Window. . . , type and execute this SQL code:
ALTER TABLE airports_airlinesADD COLUMN airport_fk INTEGERREFERENCES airports (id)ON DELETE CASCADEON UPDATE CASCADEDEFERRABLE INITIALLY DEFERRED;
13.4. Mit Attributtabelle arbeiten 277

QGIS User Guide, Release 3.4
ALTER TABLE airports_airlinesADD COLUMN airline_fk INTEGERREFERENCES airlines (id)ON DELETE CASCADEON UPDATE CASCADEDEFERRABLE INITIALLY DEFERRED;
Then in QGIS, you should set up two one-to-many relations as explained above:
• a relation between airlines table and the pivot table;
• and a second one between airports table and the pivot table.
An easier way to do it (only for PostgreSQL) is using the Discover Relations in Project → Properties → Rela-tions. QGIS will automatically read all relations in your database and you only have to select the two you need.Remember to load the three tables in the QGIS project first.
Figure 13.88: Relations and autodiscover
In case you want to remove an airport or an airline, QGIS won’t remove the associated record(s) inairports_airlines table. This task will be made by the database if we specify the right constraints inthe pivot table creation as in the current example.
Bemerkung: Combining N-M relation with automatic transaction group
You should enable the transaction mode in Project Properties → Data Sources → when working on such context.QGIS should be able to add or update row(s) in all tables (airlines, airports and the pivot tables).
Finally we have to select the right cardinalilty in the Layer Properties → Attributes Form for the airports andairlines layers. For the first one we should choose the airlines (id) option and for the second one the airports(id) option.
Now you can associate an airport with an airline (or an airline with an airport) using Add child feature or Linkexisting child feature in the subforms. A record will automatically be inserted in the airports_airlinestable.
Bemerkung: Using Many to one relation cardinality
278 Chapter 13. Arbeiten mit Vektordaten

QGIS User Guide, Release 3.4
Figure 13.89: Set relationship cardinality
Figure 13.90: N-M relationship between airports and airlines
13.4. Mit Attributtabelle arbeiten 279

QGIS User Guide, Release 3.4
Sometimes hiding the pivot table in an N-M relationship is not desirable. Mainly because there are attributes in therelationship that can only have values when a relationship is established. If your tables are layers (have a geometryfield) it could be interesting to activate the On map identification option (Layer Properties → Attributes Form →Available widgets → Fields) for the foreign key fields in the pivot table.
Bemerkung: Pivot table primary key
Avoid using multiple fields in the primary key in a pivot table. QGIS assumes a single primarykey so a constraint like constraint airports_airlines_pkey primary key (airport_fk,airline_fk) will not work.
13.5 Editierfunktionen
QGIS bietet verschiedene Möglichkeiten um OGR-, SpatiaLite-, PostGIS-, MSSQL Spatial- und Oracle SpatialVektorlayer und -tabellen zu editieren.
Bemerkung: Die Vorgehensweise GRASS Layer zu bearbeiten ist anders - siehe Abschnitt Digitalisieren undEditieren eines GRASS Vektorlayers für Details.
Tipp: Zeitgleiches Editieren
Diese Version von QGIS kontrolliert nicht, ob noch jemand ein Objekt zur gleichen Zeit editiert wie Sie. Diezuletzt schreibende Person gewinnt.
13.5.1 Einstellen der Fangtoleranz und des Suchradius
Für eine optimale und präzise Bearbeitung der Geometrien in Verktorlayern, müssen wir für Objektstützpunkteeinen entsprechenden Wert von Fangtoleranz und den Suchradius einzustellen.
Fangtoleranz
Die Fangtoleranz (Übersetzungshinweis: QGIS benutzt in der deutschen Version den Terminus „Einrasten“,während die Anleitung auch den synonymen Begriff „Fangen“ benutzt) ist der Abstand, den QGIS verwendet,um den nächstgelegenen Stützpunkt und/oder das nächstgelegene Liniensegment zu suchen, mit dem Sie Ihr Ob-jekt verbinden können, wenn sie einen neuen Stützpunkt setzen oder einen bestehenden Stützpunkt verschieben.Wenn Sie sich außerhalb der definierten Fangtoleranz befinden, wird QGIS den Stützpunkt dort lassen wo sich derMauszeiger gerade befindet, anstatt einen bestehenden Stützpunkt oder ein bestehendes Liniensegment zu fangen.Die Fangtoleranzeinstellungen betreffen alle Werkzeuge die mit Toleranz arbeiten.
1. Eine globale, projektweite Fangtoleranz kann definiert werden indem Sie Einstellungen → Optionenauswählen. Im Menü Digitalisierung können Sie zwischen ‚zum Stützpunkt‘, ‚zum Segment‘ oder ‚ZumStützpunkt und Segment‘ als Standard Fangmodus wählen. Sie können auch eine Voreingestellte Fang-toleranz und einen Suchradius für die Stützpunktbearbeitung definieren. Die Toleranz kann entweder inKarteneinheiten oder in Pixeln eingestellt werden. Der Vorteil wenn man Pixel wählt ist dass die Fangtoler-anz sich nicht nach Zoomoperationen verändert. In unserem kleinen Digitalisierprojekt (Arbeiten mit demAlaskadatensatz) definieren wir die Fangeinheiten in Fuß. Ihre Ergebnisse können variieren etwas in derGrößenordnung von 300 ft bei einem Maßstab von 1:10000 sollte eine hinreichende Einstellung sein.
2. Eine layerbezogene Fangtoleranz, die die globalen Fangtoleranzoptionen überschreibt, kann unter Projekt→Einrastoptionen . . . eingestellt werden. Die Einrasteinstellungen ermöglichen es, Fangmodus und -toleranz
280 Chapter 13. Arbeiten mit Vektordaten

QGIS User Guide, Release 3.4
für jeden Layer getrennt einzustellen (Abb. figure_edit_snapping). Der Dialog bietet drei verschiedeneModi, um die zu fangenden Layer auszuwählen:
• Aktueller Layer: nur der aktuelle Layer wird genutzt, eine praktische Möglichkeit die Topologie abzu-sichern, während der Layer bearbeitet wird
• Alle Layer: eine schnelle und einfache Einstellung für alle sichtbaren Layer in dem Projekt, sodass derZeiger alle Ecken und/oder Segmente fängt. In den meisten Fällen reicht es aus, diesen Fangmodus zuverwenden.
• Erweitert: Wenn Sie einen Layer bearbeiten wollen und dass seine Stützpunkte zu einem anderenLayer snappen sollen, dann aktivieren Sie das Fangen nur auf den zu snappenden Layer undverringern Sie die globale Fangtoleranz auf einen kleineren Wert. Darüberhinaus wird das Fangennicht mit einem Layer funktionieren der nicht im Fangoptionen Dialog aktiviert ist, was unabhängigvon der globalen Fangtoleranz funktioniert. Vergewissern Sie sich also dass das Kontrollkästchen fürdie Layer auf die Sie snappen wollen aktiviert ist.
Figure 13.91: Das Bearbeiten von Fangoptionen auf Layerbasis (Fortgeschrittener Modus)
Tipp: Steuern Sie die Liste der zu fangenden Layer
Der Dialog Fangoptionen ist standardmäßig mit Parametern bevölkert (Modus, Toleranz, Einheiten) die in demReiter Digitalisierung einzustellen sind. Um zu vermeiden, dass Layer standardmäßig überprüft werden im Er-weiterten Modus und daher fangbar eingestellt sind, setzen Sie den Standard Fangmodus auf Aus.
Tipp: Einrasten schnell umschalten
Sie können das Einrasten schnell ein- und ausschalten, indem Sie auf das Einrasten einschalten Symbol klicken oderindem Sie die Taste S drücken, während Sie sich in der Kartenansicht befinden.
Die Fangtoleranz kann in Pixeln oder Karteneinheiten (die Einheit der Kartenansicht) eingestellt wer-den. Während dem Erweiterten Layer Auswahlmodus, möglich ist eine Fangtoleranz zu nutzen die sich auf dieLayereinheiten bezieht, die Einheiten des reprojizierten Layers, wenn ‚on-the-fly‘ Transformation aktiviertist.
In der Voreinstellung können nur sichtbare Objekte gefangen werden (d.h. Objekte, deren Stil dargestellt wird,mit Ausnahme von Layern, deren Symbolisierung „Keine Symbole“ ist). Sie können das Fangen unsichtbarer
Objekte durch Anhaken von Einrasten auf verborgene Objekte aktivieren unter Einstellungen→ Optionen→Digitalisierung anschalten
Suchradius
Der Suchradius ist der Abstand, den QGIS verwendet, um nach dem nächsten Stützpunkt zu suchen, den Sieauswählen würden, wenn Sie in die Karte klicken. Wenn Sie sich außerhalb des Suchradius befinden wird QGISkeinen Stützpunkt für das Bearbeiten finden und auswählen. Der Suchradius für Stützpunktbearbeitung kann
13.5. Editierfunktionen 281

QGIS User Guide, Release 3.4
unter Einstellungen → Optionen → Digitalisierung eingestellt werden, an genau der selben Stelle, an der Siedie generelle projektweite Einrasttoleranz einstellen.
Die Fangtoleranz und der Suchradius werden in Karteneinheiten oder Pixeln eingestellt, so dass Sie vielleichtexperimentieren müssen, um Sie passend einzustellen. Wenn Sie eine zu große Toleranz angeben fängt QGIS denfalschen Stützpunkt, besonders wenn Sie es mit einer großen Anzahl von Stützpunkten in kurzer Distanz zu tunhaben. Stellen Sie den Suchradius zu klein ein, wird nichts zum Verschieben gefunden.
13.5.2 Topologisches Editieren
Abgesehen von der Einstellung des layerbasierten Fangmodus können im Menü Einstellungen → Fangoptionen. . .
(oder Datei → Fangoptionen) auch topologische Funktionen aktiviert werden. Hier können Sie Topologische
Bearbeitung an definieren und/oder für Polygonlayer können Sie die Spalte Überschn. verm. aktivieren.
Topologisches Editieren ermöglichen
Die Option Topologische Bearbeitung an dient dem Bearbeiten und Aufrechterhalten von gemeinsamen Gren-zen in Objektmosaiken. QGIS ‚erkennt‘ gemeinsame Grenzen in Objektmosaiken so, dass Sie einfach denStützpunkt einmal verschieben müssen und QGIS dann die Aufgabe übernimmt die benachbarten Objekte zuupdaten.
Überschneidung neuer Polygone vermeiden
Die zweite topologische Option genannt Überschneidungen vermeiden verhindert ein Zeichnen von Objektenüber ein existierendes. Es dient dazu aneinanderhängende Polygone schneller zu digitalisieren. Wenn Sie bereitsein Polygon erstellt haben ist es mit dieser Option möglich das zweite zu digitalisieren, so dass beide sich über-schneiden und QGIS schneidet dann das zweite Polygon gemäß der gemeinsamen Grenze aus. Der Vorteil ist dassSie nicht alle Stützpunkte der gemeinsamen Grenze digitalisieren müssen.
Bemerkung: Wenn die neue Geometrie vollständig durch bestehende abgedeckt ist, wird sie gelöscht und dieneue Funktion wird keine Geometrie haben, wenn vom Anbieter erlaubt, ansonsten werden gespeicherte Änderun-gen eine QGIS Pop-up Fehlermeldung erzeugen.
Warnung: Überschneidungen vermeiden Option Vorsichtig nutzen
Da die Option Geometrien jedes überschneidenden Objekt jedes Polygonlayers schneidet oder löscht,vergessen Sie nicht, diese Option bei Nichtbenutzung zu deaktivieren, andererseits können Sie unerwarteteGeometrien erhalten.
Fang auf Schnittpunkte aktivieren
Ein andere Möglichkeit stellt das Fang auf Schnittpunkte aktivieren dar. Sie können damit auf einenSchnittpunkt von Hintergrundlayern snappen selbst wenn es keinen Stützpunkt auf dem Schnittpunkt gibt.
Geometrieprüfung
Ein Kern-Plugin, dass dem Anwender hilft, Geometrieungültigkeiten zu finden. Weitere Informationen über diesePlugin erhalten Sie unter Geometry Checker Plugin.
282 Chapter 13. Arbeiten mit Vektordaten

QGIS User Guide, Release 3.4
Automatische Spurverfolgung
Wenn Sie Erfassungs-Kartenwerkzeuge (Objekt hinzufügen, Teil hinzufügen, Ring hinzufügen, Objekte über-arbeiten oder Objekte zerteilen) benutzen, müssen Sie normalerweise jeden einzelnen Stützpunkt des Objektsanklicken. Mit der automatischen Spurverfolgung können Sie den Digitalisierprozess beschleunigen, weil sienicht mehr jeden Stützpunkt manuell setzen müssen:
1. Schalten Sie das Werkzeug Spurverfolgung über die Schaltfläche ein oder drücken Sie die Taste T.
2. Snap to Sie einen Stützpunkt oder ein Segment des Objekts, an dessen Grenze entlang Sie digitalisierenwollen.
3. Bewegen Sie die Maus über einen andern Stützpunkt oder ein anderes Segment, das sie fangen möchten.Anstelle der geraden Linie, die Sie überlicherweise erhalten, folgt das Gummiband dem Weg vom letztge-fangenen Punkt bis zur aktuellen Mausposition.
QGIS benutzt die Topologie des zugrundeliegenden Objekts, um den kürzesten Weg zwischen den beidenPunkten zu bestimmen. Die Spurverfolgung erfordert, dass das Einrasten in dem Layer, in dem sich daszu verfolgende Objekte befindet, eingeschaltet ist. Während Sie digitalisieren sollten Sie einen vorhandenStützpunkt oder ein vorhandenes Segment fangen und sicherstellen, dass Anfangs- und Endpunkt durchvorhandene Objektgrenzen topologisch verbunden sind. Ansonsten ist QGIS nicht in der Lage sie zuverbinden und erzeugt eine gerade Verbindungslinie zwischen ihnen.
4. Wenn Sie klicken, plaziert QGIS alle Zwischenstützpunkte entlang des dargestellten Weges.
Klappen Sie die Spurverfolgung einschalten Schaltfläche auf und setzen Sie die Offset-Option, um einen Weg par-allel zu den Objekten zu digitalisieren, anstatt auf ihrer Grenze; ein positiver Wert verschiebt die neue Linie inSpurverfolgungsrichtung nach links und ein negativer Wert nach rechts.
Bemerkung: Justieren Sie den Kartenmaßstab oder die Fangeinstellungen für eine optimale Verfolgung
Wenn zu viele Objekte in der Karte gezeigt werden, ist Verfolgung möglicherweise deaktiviert, um potentiellelangsame Verfolgung und große Speicherzuschläge zu vermeiden. Nach dem hereinzoomen oder dem ausblendeneiniger Layer, ist die Funktion wieder aktiviert.
Bemerkung: Kein topologisches Editieren
Dieses Werkzeug fügt bestehenden Polygonen keine neuen Punkte hinzu, auch wenn Topologisches Editiereneingeschaltet ist. Falls die Geometriegenauigkeit des Bearbeitungslayers gesetzt ist, kann die sich ergebendeGeometrie von der bestehenden abweichen.
Tipp: Schalten Sie die automatische Spurverfolgung schnell an oder aus, indem Sie T drücken
Durch Drücken der T Taste, können Sie die Spurverfolgung jederzeit an- und ausschalten, sogar während Sieein Objekt digitalisieren. Damit ist es möglich, einige Teile eines Objekts mit aktivierter Spurverfolgung zudigitalisieren und andere nicht. Alle Werkzeuge verhalten sich normal, wenn die Spurverfolgung ausgeschaltetist.
13.5.3 Einen vorhandenen Layer editieren
In der Voreinstellung lädt QGIS Vektorlayer im reinen Lesemodus, um ungewolltes Editieren zu verhindern wennSie versehentlich die Maus verrutschen. Ansonsten können Sie aber alle Ebenen editieren, vorausgesetzt der Date-nanbieter unterstützt das (siehe Exploring Data Formats and Fields) und die Datenquelle ist überhaupt schreibbar(d.h. ihre Dateien sind schreibbar).
Tipp: Beschränkung der Editierbarkeit von Layern innerhalb eines Projekts
13.5. Editierfunktionen 283
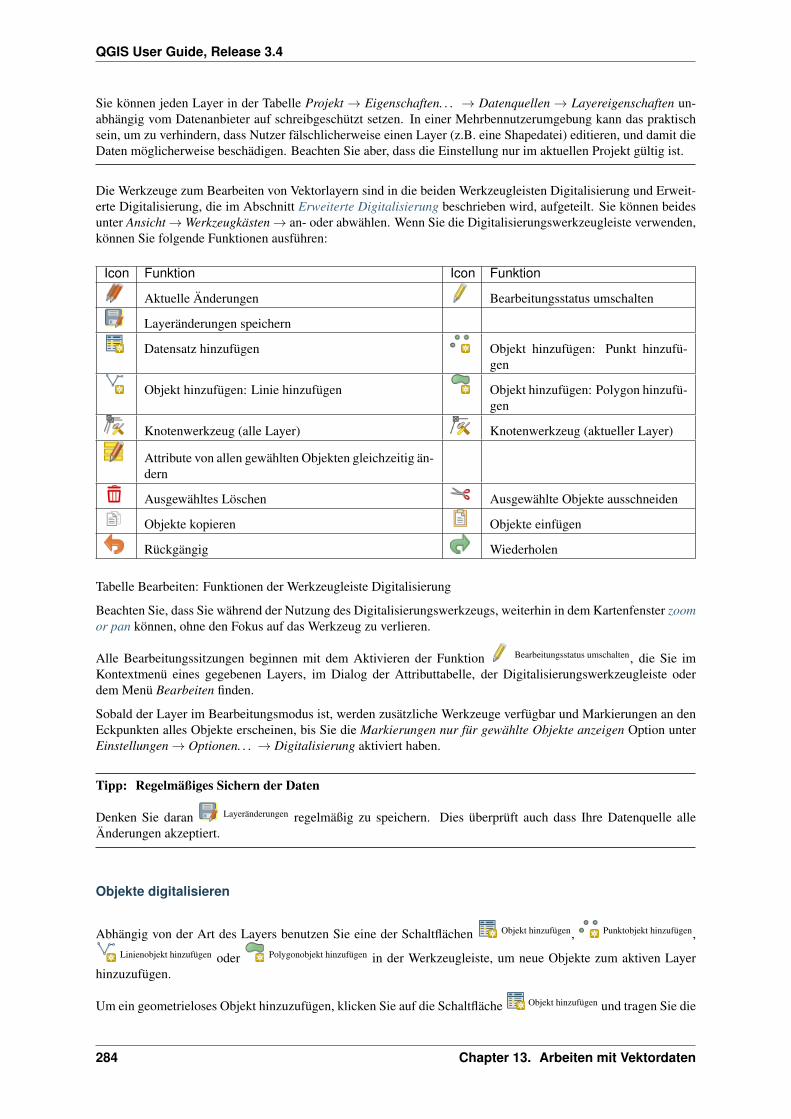
QGIS User Guide, Release 3.4
Sie können jeden Layer in der Tabelle Projekt → Eigenschaften. . . → Datenquellen → Layereigenschaften un-abhängig vom Datenanbieter auf schreibgeschützt setzen. In einer Mehrbennutzerumgebung kann das praktischsein, um zu verhindern, dass Nutzer fälschlicherweise einen Layer (z.B. eine Shapedatei) editieren, und damit dieDaten möglicherweise beschädigen. Beachten Sie aber, dass die Einstellung nur im aktuellen Projekt gültig ist.
Die Werkzeuge zum Bearbeiten von Vektorlayern sind in die beiden Werkzeugleisten Digitalisierung und Erweit-erte Digitalisierung, die im Abschnitt Erweiterte Digitalisierung beschrieben wird, aufgeteilt. Sie können beidesunter Ansicht → Werkzeugkästen → an- oder abwählen. Wenn Sie die Digitalisierungswerkzeugleiste verwenden,können Sie folgende Funktionen ausführen:
Icon Funktion Icon Funktion
Aktuelle Änderungen Bearbeitungsstatus umschalten
Layeränderungen speichern
Datensatz hinzufügen Objekt hinzufügen: Punkt hinzufü-gen
Objekt hinzufügen: Linie hinzufügen Objekt hinzufügen: Polygon hinzufü-gen
Knotenwerkzeug (alle Layer) Knotenwerkzeug (aktueller Layer)
Attribute von allen gewählten Objekten gleichzeitig än-dern
Ausgewähltes Löschen Ausgewählte Objekte ausschneiden
Objekte kopieren Objekte einfügen
Rückgängig Wiederholen
Tabelle Bearbeiten: Funktionen der Werkzeugleiste Digitalisierung
Beachten Sie, dass Sie während der Nutzung des Digitalisierungswerkzeugs, weiterhin in dem Kartenfenster zoomor pan können, ohne den Fokus auf das Werkzeug zu verlieren.
Alle Bearbeitungssitzungen beginnen mit dem Aktivieren der Funktion Bearbeitungsstatus umschalten, die Sie imKontextmenü eines gegebenen Layers, im Dialog der Attributtabelle, der Digitalisierungswerkzeugleiste oderdem Menü Bearbeiten finden.
Sobald der Layer im Bearbeitungsmodus ist, werden zusätzliche Werkzeuge verfügbar und Markierungen an denEckpunkten alles Objekte erscheinen, bis Sie die Markierungen nur für gewählte Objekte anzeigen Option unterEinstellungen → Optionen. . . → Digitalisierung aktiviert haben.
Tipp: Regelmäßiges Sichern der Daten
Denken Sie daran Layeränderungen regelmäßig zu speichern. Dies überprüft auch dass Ihre Datenquelle alleÄnderungen akzeptiert.
Objekte digitalisieren
Abhängig von der Art des Layers benutzen Sie eine der Schaltflächen Objekt hinzufügen, Punktobjekt hinzufügen,Linienobjekt hinzufügen oder Polygonobjekt hinzufügen in der Werkzeugleiste, um neue Objekte zum aktiven Layer
hinzuzufügen.
Um ein geometrieloses Objekt hinzuzufügen, klicken Sie auf die Schaltfläche Objekt hinzufügen und tragen Sie die
284 Chapter 13. Arbeiten mit Vektordaten

QGIS User Guide, Release 3.4
Attribute in das Objektformular ein, das aufgeht. Um Objekte mit den räumlichen Werkzeugen hinzuzufügen, dig-italisieren Sie zunächst die Geometrie und tragen dann die ihre Attribute ein. Das Digitalisieren einer Geometriegeschieht folgendermassen:
1. Left-click on the map area to create the first point of your new feature. For point features, this should beenough and trigger, if required, the feature form to fill in their attributes. Having set the geometry precisionin the layer properties you can use snap to grid here to create features based on a regular distance.
2. Für Linien und Polygone klicken Sie für jeden weiteren Knotenpunkt wieder die linke Maustaste oderbenutzen Sie automatic tracing, um die Digitlisierung zu beschleunigen. Damit erzeugen Sie aufeinander-folgende gerade Linien zwischen den Knotenpunkten, die Sie platzieren.
Bemerkung: Wenn Sie die Entfernen oder Backspace Taste drücken, entfernt das den letzthinzuge-fügten Knoten.
3. Wenn Sie alle Punkte digitalisiert haben, klicken Sie mit der rechten Maustaste auf eine beliebige Stelle, umdie Digitalisierung der Geometrie dieses Objektes abzuschließen.
Bemerkung: Während Sie eine Linie oder ein Polygon digitalisieren, können Sie zwischen den Werkzeu-gen Linienobjekt hinzufügen und circular string tools hin- und herschalten, um zusammengesetzte Geome-trien mit Bögen zu erzeugen.
Tipp: Das Digitalisierungsgummiband anpassen
Während des Erfassens von Polygonen kann das voreingestellte rote Band unterliegende Objekte oder Orteverstecken, um einen Punkt zu erfassen. Dies kann durch Einstellen einer geringeren Opazität (oder Alpha-Kanal) des Bands ausgebessert werden Farbe füllen im Menü Einstellungen → Optionen → Digitalisierung.Sie können auch die Verwendung des Gummibands vermeiden Don’t update rubber band during nodeediting.
4. Das Attributfenster wird erscheinen in dem Sie Informationen für das neue Objekt eingeben können. Fig-ure_edit_2 zeigt die Eingabe von Attributen für einen fiktiven neuen Fluss in Alaska. In dem Menü Digi-talisierung unter Einstellungen → Optionen können Sie auch folgende aktivieren:
• Attributeingabeformular bei der Objekterstellung unterdrücken um das Öffnen des Formulares zuvermeiden
• oder Letzte Attributwerteingaben wiederverwenden um Felder beim Öffnen automatisch gefüllt zuhaben und nur ändernde Werte zu korrigieren.
Figure 13.92: Der Attributwertedialog nach dem Digitalisieren eines neuen Vektorobjekts
Knotenwerkzeug
13.5. Editierfunktionen 285

QGIS User Guide, Release 3.4
Bemerkung: Tiefgreifende Änderungen in QGIS 3
Das Knotenwerkzeug wurde für QGIS 3 komplett überarbeitet und umbenannt. Vorher arbeitete es nach der„klicken und ziehen“-Methode während es jetzt dem Ansatz „klick - klick“ folgt. Das ermöglicht tiefgreifendeVerbesserungen wie die Nutzung des Bedienfelds erweiterte Digitalisierung beim Arbeiten mit dem Knoten-werkzeug während man gleichzeitig Objekte mehrerer Layer digitalsieren bzw. editieren kann.
Das Werkzeug Knotenwerkzeug (aktueller Layer) stellt Bearbeitungsfunktionen für Stützpunkte bereit, ähnlich wie inCAD-Programmen. Es ist einfach möglich, mehrere Stützpunkte gemeinsam auszuwählen und sie zu verschiebenoder zu löschen. Das Knotenwerkzeug arbeitet auch wenn die Spontanreprojektion angeschaltet ist und unterstütztdas topologische Editieren. Das Werkzeug erhält die Objektauswahl; falls eine Operation beendet ist, bleibt dievorhandene Auswahl im Layer bestehen.
Es ist wichtig die Eigenschaften unter menuselection:Einstellungen –> Optionen → Digitalisierung → Suchra-dius: auf eine Zahl größer als Null einzustellen. Andernfalls ist QGIS nicht in der Lage mitzuteilen welcherStützpunkt bearbeitet werden soll und wird einen Warnhinweis zeigen.
Tipp: Stützpunktmarken
Die aktuelle Version von QGIS unterstützt drei Arten von Stützpunktmarkern:‘Teiltransparenter Kreis‘, ‚Kreuz‘und ‚Keine‘. Um den Markierungsstil zu ändern wählen Sie Optionen aus dem Einstellungen Menü, klickenSie auf das Digitalisierung Menü und wählen Sie den entsprechenden Eintrag.
Eine einfache Übung
Aktivieren Sie das Knotenwerkzeug (aktueller Layer). Wenn Sie die Maus über ein Objekt bewegen, werden rote Kreisesichtbar.
• Stützpunkte auswählen: Sie können Stützpunkte auswählen indem Sie nacheinander darauf klickenwährend Sie die Umschalt-Taste gedrückt halten oder indem Sie ein Rechteck um einige Stützpunktedruch klicken und ziehen erzeugen. Wenn ein Stützpunkt ausgewählt ist, ändert sich seine Farbe zu blau.Um der aktuellen Auswahl weitere Stützpunkte hinzuzufügen halten Sie die Umschalt-Taste beim Klickengedrückt. Um Stützpunkte aus der Auswahl zu entfernen, halten Sie Strg gedrückt.
• Stützpunkte im Stapelbetrieb auswählen: Der Stapelbetriebsmodus wird durch drücken vonUmschalt+R aktiviert. Wählen Sie einen ersten Stützpunkt durch einen einzelnen Klick aus und bewegenSie den Mauszeiger ohne zu klicken über einen anderen Stützpunkt. Diese Aktion wählt alle Stützpunktezwischen den beiden aus, wobei (für Polygone) der kürzeste Weg zwischen beiden benutzt wird.
Wenn Sie Strg drücken, wird die Auswahl umgekehrt, so dass der längste Weg entlang der Objektgrenzebenutzt wird. Die Stützpunktauswahl im Stapelbetrieb wird mit einem zweiten Klick abgeschlossen, odermit Esc abgebrochen.
• Stützpunkte hinzufügen: Ein Stützpunkt kann erzeugt werden, indem der virtuelle Knoten, der auf demMittelpunkt eines Segments erscheint, angeklickt wird. Weiterhin kann irgendwo auf einer Grenzlinie miteinem Doppelklick ein neuer Stützpunkt erzeugt werden. Bei Linienobjekten wird ein virtueller Knoten inVerlängerung der Linie an ihren beiden Enden angezeigt, mit dem die Linie verlängert werden kann.
• Stützpunkte löschen: Wählen Sie die Stützpunkte und klicken Sie die Entfernen Taste. Das Löschenaller Stützpunkte erzeugt ein geometrieloses Objekt, sofern das mit der Datenquelle vereinbar ist. BeachtenSie, dass das nicht das gesamte Objekt löscht, sondern nur den Geometrieteil; um ein Objekt in Gänze zu
löschen, müssen Sie das Ausgewähltes löschen Werkzeug benutzen.
• Stützpunkte verschieben: Wählen Sie alle Stützpunkte aus, die verschoben werden sollen und klickenSie auf einen Stützpunkt oder eine Kante; klicken Sie danach auf die gewünschte Zielposition. Alle aus-gewählten Stützpunkte werden zusammen verschoben. Falls Einrasten eingeschaltet ist, kann die ganze
286 Chapter 13. Arbeiten mit Vektordaten

QGIS User Guide, Release 3.4
Figure 13.93: Stützpunkte im Stapelbetrieb mit Umschalt+R auswählen
Figure 13.94: Virtuelle Knoten um Stützpunkte hinzuzufügen
13.5. Editierfunktionen 287

QGIS User Guide, Release 3.4
Auswahl entsprechend springen. Sie können das Bedienfeld Erweiterte Digitalisierung benutzen, um Ab-stand, Winkel oder exakte Koordinaten einzugeben, bevor Sie zum zweiten mal klicken.
Here you can use the snap-to-grid feature. Having set a value for the geometry precision in the layerproperties, a grid appears on a zoom level according to the Geometry precision.
Figure 13.95: Selecting a vertex and moving the vertices to grid
Jede Veränderung die mit dem Stützpunkt gemacht wird, wird als separater Eintrag im Rückgängig Dialog einge-tragen. Beachten Sie dass alle Operationen topologisches Bearbeiten unterstützen, wenn dies eingeschaltet ist.Spontanreprojektion wird auch unterstützt und das Knotenwerkzeug erstellt Tooltips um einen Stützpunkt aus-findig zu machen wenn man mit dem Mauszeiger darübergeht.
Das Bedienfeld Stützpunktbearbeitung
Während Sie das Knotenwerkzeug für ein Objekt benutzen, können Sie mit einem Rechtsklick das BedienfeldStützpunktbearbeitung öffnen, das alle Stützpunkte des Objektes mit ihren x, y (z, m falls zutreffend) Koordinantenund r (für den Radius bei einer bogenförmigen Geometrie) auflistet. Durch Anwählen einer Zeile in der Tabellewird der entsprechende Stützpunkt im Kartenfenster ausgewählt und umgekehrt. Verändern Sie einfach eineKoordinate in der Tabelle, um die Lage des Stützpunkts zu verändern. Sie können auch mehrere Zeilen auswählenund sie zusammen löschen.
Bemerkung: Changed behavior in QGIS 3.4
Right click on a feature will immediately show the vertex editor and lock this feature, thus disabling the editingof any other features. While being locked, a feature is exclusive for editing: Selecting and moving of verticesand segments by clicking or dragging is only possible for this feature. New vertices can only be added to thelocked feature. Also, the vertex editor panel now opens itself automatically upon activating the vertex tool, and itsposition/docked state remembered across uses.
Objekte ausschneiden, kopieren und einfügen
Ausgewählte Objekte können ausgeschnitten, kopiert und an andere Ebenen im aktuellen QGIS-Projekt übergeben(eingefügt) werden, wenn sich der Ziellayer auch im Editiermodus befindet, indem Sie nach Auswahl des Ziellay-
ers auf den Knopf Bearbeitungsstatus umschalten klicken.
288 Chapter 13. Arbeiten mit Vektordaten

QGIS User Guide, Release 3.4
Figure 13.96: Das Bedienfeld Stützpunktbearbeitung mit ausgewählten Knoten
Tipp: Polygone in Linien und umgekehrt transformieren mit copy/paste
Kopieren Sie ein Linienobjekt und fügen Sie ihn in ein Polygonlayer ein: QGIS fügt ihn in den Ziellayer dessenBegrenzung am nächsten der Geometrie des Linienobjekts entspricht. Dies ist ein einfacher Weg, um verschiedeneGeometrien der selben Daten zu erzeugen.
Objekte können an externe Anwendungen als Text übergeben werden. Dabei werden die Objekte im CSV-Formatdargestellt und die Geometriedaten im OGC Well-Know Text (WKT) Format. WKT und GeoJSON–Objekte vonaußerhalb können ebenso in einen Layer innerhalb von QGIS eingefügt werden.
Aber wann macht es Sinn, Objekte zum kopieren, auszuschneiden und einzufügen? Ein Beispiel ist, wenn Sieparallel an mehreren Layern arbeiten und Objekte zwischen den Layern hin- und herkopieren möchten. EinSzenario könnte sein, dass Sie einen neuen Layer erstellen möchten, in dem aber nur einige Objekte aus einembereits existierenden Layer verwendet werden sollen, wie etwa 5 Seen aus der Karte lakes.shp , die insgesamtaber tausende Seen enthält.
Als Beispiel werden wir einige Seen in einen neuen Layer kopieren:
1. Laden Sie den Layer, von dem Sie einige Objekte kopieren wollen (Quelle)
2. Laden oder erstellen Sie einen Layer, in den die kopierten Objekte eingefügt werden sollen (Ziel)
3. Schalten Sie für den Ziel Layer den Bearbeitungsstatus ein
4. Stellen Sie die Quelle aktiv, indem Sie es in der Legende anklicken
5. Objekte über Fläche oder Einzelklick wählen um Objekte aus dessen Quelllayer zu wählen
6. Klicken Sie auf das Icon Objekte kopieren
7. Stellen Sie das ‚Ziel‘ aktiv, indem Sie es in der Legende anklicken
8. Klicken Sie auf das Icon Objekte einfügen
9. Beenden Sie den Bearbeitungsstatus für beide Layer und speichern Sie das Ergebnis ab
13.5. Editierfunktionen 289

QGIS User Guide, Release 3.4
Was passiert, wenn der Quell- und Ziellayer ein unterschiedliches Schema enthält (Spaltennamen und -typenunterscheiden sich)? QGIS verwendet die Einträge, die gleich sind und ignoriert den Rest. Wenn es Ihnen egalist, ob die Attribute korrekt übernommen werden, dann ist es egal, wie Sie die Spaltennamen und -typen derAttributtabelle erstellen. Wenn auch die Attributdaten korrekt übernommen werden sollen, dann stellen Sie sicher,dass auch die Spaltennamen und -typen beider Layer zueinander passen.
Bemerkung: Deckungsgleichheit eingefügter Objekte
Wenn Ihre Quell- und Ziellayer die gleiche Projektion verwenden dann haben die eingefügten Objekte die iden-tische Geometrie wie der Quellayer. Wenn der Ziellayer jedoch eine andere Projektion hat dann kann QGIS nichtgarantieren dass die Geometrie identisch ist. Dies ist einfach aus dem Grund so, dass sich kleine Rundungsfehlerergeben wenn zwischen Projektionen konvertiert wird.
Tipp: Zeichenketten Attribut in ein anderes kopieren
Wenn Sie eine neue Spalte in die Attributtabelle mit dem Typ ‚string‘ erstellt haben und die Werte von eineranderen Attributspalte einfügen, die eine größere Länge als die Länge der Spaltengröße hat, wird diese auf dengleichen Betrag verlängert werden. Dies ist so, weil der GDAL Shapedatei Driver beginnend ab GDAL/OGR 1.10String und Integer Fehler auto-erkennt und die Felder auf die benötigte Länge der eingefügten Daten anpasst.
Ausgewählte Objekte löschen
Wenn Sie ein gesamtes Objekt (Attribut und Geometrie) löschen wollen, können Sie das tun, indem Sie zunächst
die Geometrie der Objekte über Fläche oder Einzelklick wählen auswählen. Die Auswahl kann auch über die Attributtabelleerfolgen. Sobald Sie die Auswahl festgelegt haben, drücken Sie :knd:‘Entfernen‘ oder Rücktaste oder nutzen
Sie Ausgewähltes löschen um Objekte zu löschen. Mehrfachauswahlen können ebenso auf einmal gelöscht werden.
Das Werkzeug Ausgewählte Objekte ausschneiden kann auch benutzt werden, um Objekte zu löschen. Die Objektewerden gelöscht aber zusätzlich noch im ‚spatial clipboard‘ abgelegt. In diesem Fall könnte man dann den letzten
Schritt, falls ein Fehler unterlaufen ist, wieder rückgängig machen, indem wir auf das Werkzeug Objekte einfügen
drücken. Ausschneiden, kopieren und übergeben von Objekten funktioniert mit den gerade ausgewählten Objektenund können nach Bedarf kombiniert verwendet werden.
Rückgängig und Wiederholen
Mit dem Rückgängig und Wiederholen Werkzeug können Sie Vektorbearbeitungsoperationen rückgängigmachen oder wiederholen. Es gibt auch ein andockbares Bedienfeld das alle Operationen im der Rücknahme-/Wiederholungsverlauf zeigt (siehe Figure_edit_undo). Dieses Bedienfeld wird nicht standardmäßig angezeigt; eskann angezeigt werden, indem man mit rechts auf die Werkzeugleiste klickt und das Rücknahme/Wiederholungs-Kontrollkästchen aktiviert. Rücknahme/Wiederholung ist auch dann aktiv wenn das Bedienfeld nicht angezeigtwird.
Wenn Rückgängig oder Strg+z (oder:kbd:Cmd+z) gedrückt wird, wird der Status aller Objekte und Attribute aufden Status zurückgesetzt, den sie vor der zurückgenommenen Aktion hatten. Es kann sein, dass Änderungen diekeine normalen Vektorbearbeitungsoperationen sind (z.B. Änderungen, die durch ein Plugin durchgeführt wurden)nicht rückgängig gemacht werden können. Dies hängt davon ab, wie die Änderungen durchgeführt werden.
Wenn Sie Rücknahme/Wiederholung verwenden wollen klicken Sie einfach auf eine Operation in der History; alleObjekte werden dann auf den Stand vor der ausgewählten Operation zurückgesetzt.
290 Chapter 13. Arbeiten mit Vektordaten

QGIS User Guide, Release 3.4
Figure 13.97: Rückgängig und Wiederholen von Digitalisierschritten
Änderungen speichern
Wenn ein Layer im Bearbeitungsmodus ist behält QGIS alle Änderungen im Speicher. Aus diesem Grund werdendiese nicht umgehend der Datenquelle oder -platte übermittelt. Wenn Sie Bearbeitungen in dem aktuellen Layerspeichern wollen aber mit dem Bearbeiten fortfahren wollen ohne den Bearbeitungsmodus verlassen zu wollen
können Sie den Layeränderungen speichern Knopf klicken. Wenn Sie den Editiermodus mit Bearbeitungsstatus umschalten
aussschalten wollen werden Sie ebenfalls gefragrt ob Sie Ihre Änderungen speichern oder verwerfen wollen.
Wenn die Änderungen nicht gespeichert werden können (z.B. weil die Festplatte voll ist oder Attribute Werteaufweisen, die außerhalb der Wertespanne liegen), bleiben die Änderungen erstmal im QGIS Arbeitsspeicher.Dies ermöglicht es, Änderungen vorzunehmen und dann nochmals die Daten zu speichern.
Tipp: Datenintegrität
Es ist immer gut ein Backup von Ihren Daten zu machen bevor Sie mit dem Bearbeiten starten. Während dieAutoren von QGIS sich bemühen die Integrität Ihrer Daten zu bewahren bieten wir keine Garantie in dieserHinsicht.
Mehrere Layer auf einmal speichern
Mit dieser neuen Funktion können Sie mehrere Layer digitalisieren. Wählen Sie Layeränderungen speichernum alle Änderungen, die Sie in mehreren Layern gemacht haben, zu speichern. Sie haben auch die Möglichkeit
Verwerfen für gewählte Layer zu benutzen so dass die Digitalisierung für alle selektierten Layer rückgängiggemacht werden kann. Wenn Sie das Bearbeiten der selektierten Layer beenden wollen kann man das einfach mit
der Funktion Abbruch für gewählte Layer erreichen.
Die gleichen Funktionen sind für das Bearbeiten aller Layer des Projektes zugängig.
Tipp: Transaktionsgruppen benutzen, um Änderungen in mehreren Layern zu bearbeiten, zu speichernoder zurückzunehmen
Aktivieren Sie Option Wenn möglich automatisch Transaktionsgruppen erstellen im Menü Projekt → Einstellun-gen. . . → Datenquellen beim Arbeiten mit Layern aus der selben PostGreSQL-Datenbank, um ihr Verhalten zusynchronisieren (den Bearbeitungsstatus zusammen umschalten, Änderungen gleichzeitig speichern oder verwer-fen).
13.5. Editierfunktionen 291

QGIS User Guide, Release 3.4
13.5.4 Erweiterte Digitalisierung
Icon Funktion Icon Funktion
Erweiterte Digitalsierungswerkzeuge ein-schalten
Spurverfolgung einschalten
Objekt(e) verschieben Objekt(e) kopieren und ver-schieben
Objekt(e) drehen Objekt vereinfachen
Ring hinzufügen Teil hinzufügen
Ring füllen
Ring löschen Teil löschen
Linie versetzen Objekte überarbeiten
Teile zerlegen Objekte trennen
Attribute gewählter Objekte vereinen Gewählte Objekte verschmelzen
Punktsymbole drehen Punktsymbolversatz
Tabelle Erweiterte Digitalisierung: Werkzeugleiste Erweiterte Digitalisierung für Vektorlayer
Objekt(e) verschieben
Mit dem Objekt(e) verschieben Werkzeug können Sie bestehende Objekte verschieben.
1. Wählen Sie die Objekte aus, die Sie verschieben möchten.
2. Klicken Sie in das Kartenfenster, um den Quellpunkt der Verschiebung zu markieren; Sie können das Ein-rasten benutzen, um einen exakten Punkt auszuwählen.
Sie können auch die Einstellungen im Bedienfeld advanced digitizing constraints benutzen, um die exaktenKoordinaten des Quellpunktes zu setzen. In diesem Falle:
(a) Klicken Sie zunächst auf die Schaltfläche , um das Bedeinfeld zu aktivieren.
(b) Tippen Sie x und tragen Sie den entsprechenden Wert für den Quellpunkt ein, den Sie benutzen wollen.
Drücken Sie dann die Schaltfläche neben der Eingabezeile, um den Wert zu sperren.
(c) Genauso für die y-Koordinate.
(d) Klicken Sie ins Kartenfenster und Ihr Quellpunkt wird an den eingegebenen Koordinaten platziert.
3. Bewegen Sie den Mauszeiger über das Kartenfenster, um den Zielpunkt der Verschiebung zu markieren,wobei Sie weiterhin den Einrastmodus benutzen können oder, wie oben beschrieben, bennutzen Sie dasBedeinfeld Erweiterte Digitalisierung, das Ihnen zusätzliche Abstand- und ‘‘Winkel‘‘einschränkungenanbietet, um den Zielpunkt der Verschiebung zu platzieren.
4. Klicken Sie ins Kartenfenster: Alle Objekte werden an ihren neuen Ort verschoben.
Mit dem Werkzeug Objekt(e) kopieren und verschieben können Sie gleichermaßen eine verschobene Kopie der Objekteerzeugen.
Bemerkung: Wenn kein Objekt ausgewählt ist, während Sie das erste mal mit einem der Werkzeuge Objekt(e)verschieben oder Objekt(e) kopieren und verschieben ins Kartenfenster klicken, wird nur das Objekt unter dem
292 Chapter 13. Arbeiten mit Vektordaten

QGIS User Guide, Release 3.4
Mauszeiger von der Aktion betroffen. Sollten Sie also mehrere Objekte verschieben wollen, sollten sie vorherausgewählt worden sein.
Objekt(e) drehen
Mit dem Werkzeug Objekt drehen können Sie ein oder mehrere Objekte im Kartenfenster drehen.
1. Drücken Sie auf die Schaltfläche Objekt drehen
2. Klicken Sie auf das Objekt, das sie drehen möchten. Der Flächenschwerpunkt des Objekts wird als Drehmit-telpunkt markiert und ein Eingabefeld erscheint, das den aktuellen :guilabel:‘Rotation‘swinkel anzeigt.
3. Klicken Sie ins Kartenfenster, wenn Sie mit der neuen Position zufrieden sind oder geben Sie denDrehwinkel händisch in das Eingabefeld ein. Sie können auch die Eingabe Einrasten auf ° benutzen, umden Winkel einzuschränken.
4. Wollen Sie mehrere Objekte auf einmal drehen, sollten Sie sie zuerst auswählen. Der Drehmittelpunkt istdann der Schwerpunkt ihrer verbundenen Geometrien.
Sie können auch einen anderen Drehmittelpunkt als den Flächenschwerpunkt benutzen: klicken Sie ins Karten-fenster während Sie die Taste Strg drücken und der angeklickte Punkt wird der neue Drehmittelpunkt.
Wenn Sie Shift vor dem Klick auf die Karte halten, wird die Drehung in 45 Grad Schritten erfolgen, wasanschließend in dem Benutzerinterface-Widget bearbeitet werden kann.
Zum Abbrechen der Objektdrehung, drücken Sie die Taste ESC oder klicken Sie auf die SchaltflächeObjekt(e) drehen.
Objekt vereinfachen
Mit dem Werkzeug Objekt vereinfachen können Sie die Form einer Linie oder eines Polygons interaktiv verändern,indem Sie die Anzahl der Stützpunkte verringern oder verdichten, so lange die Geometrie dabei gültig bleibt:
1. Wählen Sie das Werkzeug Objekt vereinfachen.
2. Klicken Sie auf das Objekt oder ziehen Sie ein Rechteck über die Objekte auf.
3. Ein Eingabefeld öffnet sich, in dem Sie die zu verwendende Methode festlegen können, d.h. ob Sie:
• die simplify the geometry wollen, so dass sie weniger Stützpunkte als die Ausgangsgeome-trie enthält. Die zur Verfügung stehenden Methoden sind Nach Abstand vereinfachen,Durch Einrasten auf Gitter vereinfachen oder Durch Fläche vereinfachen(Visvalingam). Dann müssten Sie noch die Toleranz in Layereinheiten, Pixel oderKarteneinheiten angeben, die für die Vereinfachung benutzt werden soll. Je höher die Toler-anz, desto mehr Stützpunkte werden entfernt.
• oder die densify the geometries wollen, indem mit der Option Glatt neue Stützpunkte eingefügt wer-den: für jeden bestehenden Stützpunkt werden zwei Stützpunkte auf jedes von ihm ausgehende Seg-ment gesetzt, und zwar in der mit Versatz definierten Entfernung, wobei der Versatz dem Prozentanteilder Segmentlänge entspricht. Mit Wiederholungen legen Sie fest, wie oft die Platzierung wiederholtwerden soll: je mehr Wiederholungen Sie einstellen, desto mehr Stützpunkte werden eingefügt unddesto regelmäßiger wird das Objekt.
Wenn Sie ein Projekt schließen oder eine Editiersitzung beenden, werden Einstellungen, die Sie benutzthaben, gespeichert. Sie können also die selben Parameter wieder benutzen, wenn Sie das nächste mal einObjekt vereinfachen.
4. Unten im Eingabefenster wird eine Zusammenfassung der Veränderungen angezeigt, die sich ergäben; dabeiwird die Anzahl der Objekte und Stützpunkte aufgelistet (vor und nach der Operation sowie das Verhältnnis
13.5. Editierfunktionen 293

QGIS User Guide, Release 3.4
daraus). Zusätzlich wird im Kartenfenster die zu erwartende Geometrie über die bestehende mithilfe derGummibandfarbe dargestellt.
5. Sobald die zu erwartende Geometrie Ihren Vorstellungen entspricht, klicken Sie OK, um die Änderunganzuwenden. Sollten Sie die Operation abbrechen wollen, klicken Sie auf Abbrechen oder klicken Sie mitrechts in das Kartenfenster.
Bemerkung: im Gegensatz zur Objektvereinfachung im Menü Einstellungen → Optionen → Darstellung,
welches die Geometrie nur zur Darstellung vereinfacht, bearbeitet das Werkzeug Objekt vereinfachen die Geometriein der Datenquelle.
Teil hinzufügen
Sie können zu einem ausgewählten Objekt einen Teil hinzufügen, das erzeugt ein Multipunkt-, Multilinie- oderMultipolygonobjekt. Der neue Teil muss außerhalb des bereits vorhandenen digitalisiert werden, der vorher aus-gewählt werden sollte.
Die Schaltfläche Teil hinzufügen kann ebenfalls benutzt werden, um eine Geometrie zu einem geometrielosenObjekt hinzuzufügen. Zuerst wählen Sie das Objekt in der Attributtabelle, dann digitalisieren Sie eine neue
Geometrie mit dem Werkzeug Teil hinzufügen.
Teil löschen
Mit dem Werkzeug Teil löschen können Teile eines Multiobjekts gelöscht werden (z.B. ein Polygon eines Mul-tipolygonobjekts). Das Werkzeug funktioniert mit allen Multigeometrien: Punkt, Linie und Polygon. Weiterhinkann es dazu verwendet werden, die Geometrie eines Objekts vollständig zu entfernen. Um einen Teil zu löschen,klicken Sie einfach in dieses Teil.
Ring hinzufügen
Sie können Löcher in Polygonen mit dem Werkzeug Ring hinzufügen herstellen. Das bedeutet, dass Sie innerhalbeines bestehenden Polygons weitere Polygone digitalisieren. Diese erscheinen dann als ‚Loch‘, so dass nur derZwischenraum des inneren und des äußeren Polygons als Ringpolygon übrig bleibt.
Ring füllen
Das Werkzeug Ring füllen hilft Ihnen dabei, ein Polygonobjekt zu erzeugen, das komplett innerhalb eines anderenPolygons liegt und so gestaltet ist dass sich beide nirgendwo überlappen; das neue Objekt liegt innerhalb einesLochs im bestehenden Objekt. So gehen Sie vor:
1. Wählen Sie das Werkzeug Ring füllen.
2. Zeichnen Sie ein Polygon über das vorhandene Objekt: QGIS fügt der Geometrie ein neus Loch hinzu (wie
wenn Sie das Werkzeug Ring hinzufügen benutzt hätten) und erzeugt ein neues Objekt, dessen Geometrie
dem Loch entspricht (wie wenn Sie traced über die innere Grenze mit dem Werkzeug Polygonobjekt hinzufügen
angewendet hätten).
3. Falls das Loch im Objekt bereits exisitert, können Sie alternativ den Mauszeiger darüber positionieren undmit links klicken, während Sie die :kbd:‘Umschalt‘taste gedrückt halten: ein neues Objekt, das das Lochausfüllt, wird an dieser Stelle gezeichnet.
294 Chapter 13. Arbeiten mit Vektordaten

QGIS User Guide, Release 3.4
Das Formular Objektattribute des neuen Objekts öffnet sich und ist mit Werten des „Eltern“objekts und/oderfields constraints vorausgefüllt.
Ring löschen
Das Werkzeug Ring löschen ermöglicht es, Löcher innerhalb einer existierenden Fläche zu löschen. DasWerkzeug funktioniert nur mit Polygon- und Multipolygonobjekten. Es findet keine Veränderung statt, wennes auf den äußeren Ring eines Polygons angewendet wird.
Objekte überarbeiten
Mit dem Werkzeug Objekte überarbeiten können Sie Linien- und Polygonobjekte umformen. Bei Linien ersetzt esden Teil der Linie vom ersten bis zum letzen Schnittpunkt mit der ursprünglichen Linie.
Figure 13.98: Eine Linie umformen
Tipp: Liniengeometrien mit dem Werkzeug Objekte überarbeiten verlängern
Benutzen Sie das Werkzeug Objekte überarbeiten, um vorhandene Liniengeometrien zu verlängern: Fangen Sie denersten oder letzten Stützpunkt der Linie und zeichnen sie eine neue. Schließen Sie die Digitalisierung ab und dieneue Objektgeometrie ist die vereinigte Geometrie der beiden Linien.
Bei Polygonen wird die Polygongrenze umgeformt. Damit das funktioniert, muss die Linie des Umformwerkzeugsdie Polygongrenze mindestens zwei mal kreuzen. Um diese Linie zu zeichnen, klicken Sie in das Kartenfen-ster, um ihre Stützpunkte zu erzeugen. Die Zeichnung schließen Sie mit einem Rechtsklick ab. Genauso wiebei Linienobjekten wird nur das Segment zwischen dem ersten und dem letzen Schnittpunkt der Linie mit derPolygongrenze betrachtet. Diejenigen Teile der Linie, die innerhalb des Polygons liegen, schneiden es dort ab,diejenigen, die außerhalb liegen erweitern es.
Bei Polygonen kann das Umformen manchmal zu unerwarteten Ergebnissen führen. Es ist in erster Linie dafürgeeignet, kleinere Teile eines Polygons zu ersetzen und nicht für größere Überarbeitungen, außerdem ist es nichterlaubt, dass die Umformline mehrere Ringe eines Polygons kreuzt, weil das zu einem ungültigen Polygon führenwürde.
Bemerkung: Das Objekte überarbeiten Werkzeug kann die Startposition eines Polygonringes oder einergeschlossenen Linie verändern. Der Punkt, der zweimal abgebildet ist wird also nicht mehr der gleiche sein.
13.5. Editierfunktionen 295

QGIS User Guide, Release 3.4
Figure 13.99: Ein Polygon umformen
Dies mag kein Problem für die meisten Anwendungen sein, sollte aber beachtet werden.
Linie versetzen
Das Linie versetzen Werkzeug erstellt parallele Linien von Linienlayern. Das Werkzeug kann auf den bearbeitetenLayer (die Geometrien werden verändert) und auch auf Hintergrundlayer (in diesem Fall erstellt es Kopien vonLinien/ Ringen und fügt Sie dem bearbeiteten Layer hinzu) angewendet werden. Es ist auf diese Weise idealgeeignet Abstandslinienlayer zu erstellen. Der Benutzereingabe Dialog erscheint und zeigt den Versatz.
Um einen Versatz eines Linienlayers zu erstellen müssen Sie erst in den Bearbeitungsmodus gehen und das
Werkzeug Linie versetzen aktivieren. Klicken Sie dann auf ein Objekt, um es zu verschieben. Bewegen Siedie Maus und klicken Sie, wo Sie es haben wollen oder geben Sie die gewünschte Distanz in der Benutzereingabe
ein. Ihre Änderungen können dann mit dem Werkzeug Layeränderungen speichern gespeichert werden.
Der QGIS Optionen Dialog (Digitalisierung Reiter dann Werkzeug zum Linien versetzen Abschnitt) ermöglichtes Ihnen einige Parameter wie Verbindungsstil,**Quadrantsegmente**, Eckengrenze zu konfigurieren.
Objekte trennen
Mit dem Werkzeug Objekte zerteilen teilen Sie ein Objekt in zwei oder mehr unabhängige Objekte, d.h. jedeGeometrie gehört zu einer neuen Zeile in der Attributtabelle.
So teilen Sie Linien oder Polygonobjekte:
1. Wählen Sie das Werkzeug Objekte zerteilen.
2. Zeichnen Sie eine Linie über das Objekt oder die Objekte, die Sie zerteilen wollen. Gibt es eine aktiveAuswahl, werden nur die ausgewählten Objekte zerteilt. Falls, default values or clauses definiert wurden,werden sie auf die entsprechenden Felder angewendet, andere Attribute des Elternobjekts werden automa-tisch in die neuen Objekte kopiert.
3. Danach können Sie üblicherweise beliebige Attribute der neuen Objekte verändern.
Tipp: Eine Polylinie mit einem Klick in neue Objekte zerteilen
296 Chapter 13. Arbeiten mit Vektordaten

QGIS User Guide, Release 3.4
Fangen und Klicken Sie mit dem Werkzeug Objekte zerteilen auf einen vorhandenen Stützpunkt einer Polylinie,um sie in zwei neue Objekte zu zerteilen.
Teile zerlegen
In QGIS ist es möglich die Teile eines Multi-Part Features zu zerlegen so dass die Anzahl der Teile sich erhöht.
Zeichnen Sie einfach eine Linie über den Teil den Sie zerlegen wollen indem Sie dafür das Teile zerlegen Iconverwenden.
Tipp: Eine Polylinie mit einem Klick in neue Teile zerlegen
Fangen und Klicken Sie mit dem Werkzeug Teile zerlegen auf einen vorhandenen Stützpunkt einer Polylinie, umsie in zwei neue Polylinien zu zelegen, die weiterhin zum selben Objekt gehören.
Gewählte Objekte verschmelzen
Mit dem Werkzeug Gewählte Objekte verschmelzen erzeugen Sie ein neues Objekt durch das verschmelzen vorhan-dener Objekte: Ihre Geometrien werden verschmolzen, um ein neues zu bilden. Wenn die Objekte keine gemein-same Grenze haben, wird ein Multipolygon-/Multipolylinien-/Multipunktobjekt erzeugt.
1. Wählen Sie zunächst die Objekte aus, die Sie verschmelzen wollen.
2. Drücken Sie dann auf die Schaltfläche Gewählte Objekte verschmelzen.
3. Die Zeile the Verschmelzen unten in der Tabelle des sich öffnenden Eingabefensters zeigt die Attribute desneuen Objekts. Sie können jeden dieser Werte folgendermaßen ändern:
• ändern des Wertes in der entsprechenden Zelle;
• eine Zeile in der Tabelle auswählen und auf die Schaltfläche Attribute des gewählten Objektsübernehmen klicken. Damit übernehmen Sie alle Werte dieses Objekts;
• auf die Schaltfläche Alle Felder überspringen klicken, um leere Attribute zu benutzen;
• oder durch öffnen des Aufklappmenüs oben in der Tabelle haben Sie die Möglichkeit jede der genan-nten Optionen nur auf das jeweilige Feld anzuwenden. Sie können auch eine Aggregatfunktion auf dieursprünglichen Objektattribute anwenden (Minimum, Maximum, Median, Summe, Anzahl, Verkn-nüpfung. . . abhängig vom Feldtyp, siehe ref:statistical_summary für eine Auflistung aller Funktio-nen).
Bemerkung: Falls der Layer Standardwerte oder -klauseln für Felder definiert hat, werden diese alsStartwert für das verschmolzene Objekt benutzt.
4. Drücken Sie auf OK um die Änderungen anzuwenden. Ein einzelnes (Multi-)Objekt wird im Layer angelegtund ersetzt die vorher ausgewählten Objekte.
Attribute gewählter Objekte vereinen
Mit dem Werkzeug Attribute gewählter Objekte vereinen können Sie die selben Attribute in Objekte speichern, ohneihre Grenzen zu vereinen. Die Eingabemaske ist die selbe wie beim Werkzeug Gewählte Objekteverschmelzen, außer dass die ausgewählten Objekte mit ihrer Geometrie bestehen bleiben, während einigeihrer Attributwerte identisch werden.
13.5. Editierfunktionen 297

QGIS User Guide, Release 3.4
Punktsymbole drehen
Das Werkzeug Punktsymbole drehen ermöglicht es Ihnen, den Drehwinkel eines Punktsymbols im Kartenfenster zuändern.
1. Zunächst müssen Sie das Symbol eine a data-defined Drehung einstellen:
(a) Im Dialog Layereigenschaften → Symbolisierung gehen Sie zu den Einstellungen für das Symbol.
(b) Klicken Sie auf die Schaltfläche Datendefinierte Übersteuerung neben der Einstellung Drehung(bevorzugt) in der obersten Ebene Markierung der Symbolebenen.
(c) Wählen Sie ein Feld Auswahl Feldtype. Die Werte in diesem Feld werden nun dazu benutzt, jedesSymbol eines Objekts entsprechend zu drehen.
Bemerkung: Stellen Sie sicher, dass in allen Symbolebenen das selbe Feld eingestellt ist
Wenn Sie das datendefinierte Feld für die Drehung in der obersten Ebene der Symbolebenen einstellen, istes automatisch in allen Symbolebenen eingestellt. Das ist die Voraussetzung für die graphische Symbol-drehung mit dem Werkzeug Punktsymbole drehen. Falls auch nur eine Symbolebene nicht das selbe Feldfür die Drehung eingestellt hat, wird das Werkzeug nicht funktionieren.
Figure 13.100: Ein Punktsymbol drehen
2. Klicken Sie mit dem Werkzeug Punktsymbole drehen auf ein Punktobjekt im Kartenfenster und bewegen Sieden Mauszeiger, während Sie die linke Maustaste gedrückt halten. Ein roter Pfeil mit dem Drehwinkel wirdangezeigt (siehe Figure_rotate_point).
3. Sobald Sie die linke Maustaste loslassen, wird das Symbol mit diesem Drehwinkel angezeigt und das beider Drehung eingestellte Feld in der Attributtabelle wird entsprechend aktualisiert.
Tipp: Wenn Sie zusätzlich die Strg-Taste gedrückt halten, findet die Drehung in 15 Grad Schritten statt.
Punktsymbolversatz
Das Werkzeug Punktsymbolversatz ermöglicht es Ihnen, die Darstellungsposition von Punktsymbolen im Karten-
fenster interaktiv zu verändern. Es funktioniert ähnlich wie das Werkzeug Punktsymbole drehen außer dass Sieein Feld für den datendefinierten Versatz (X,Y) des Symbols einstellen müssen. Dieses Feld wird dann mit denVersatzkoordinaten gefüllt, während Sie das Symbol im Kartenfenster hin- und herschieben.
298 Chapter 13. Arbeiten mit Vektordaten

QGIS User Guide, Release 3.4
Bemerkung: Das Werkzeug Punktsymbolversatz verschiebt nicht das Punktobjekt selbst; dafür sollten Sie das
Werkzeug Knotenwerkzeug (aktueller Layer) oder das Werkzeug Objekt verschieben benutzen.
13.5.5 Formen digitalisieren
Die Werzeugleiste für Formen bietet Ihnen Werkzeuge, um regelmäßige Formen und Geometrien mit Bögen zuzeichnen.
Kreisbogen hinzufügen
Mit den Werkzeugen Kreisbogen hinzufügen oder Kreisbogen über Radius hinzufügen können Sie Linien- oder Polygonob-jekte mit bogenförmiger Geometrie hinzufügen.
Das Zeichnen von Objekten mit diesen Werkzeugen folgt der selben Regel wie bei anderen Digitalisierwerkzeu-gen: klicken Sie mit links, um Stützpunkte hinzuzufügen und mit rechts, um die Geometrie abzuschließen.Während Sie die Geometrie zeichnen, können Sie die Werkzeuge wechseln und auch zu den linear geometrytools wechseln, um zusammengesetzte Geometrien zu erzeugen.
Bemerkung: Gebogene Geometrien sind als solche nur in kompatiblen Datenanbieter gespeichert
Obwohl QGIS es ermöglicht, innerhalb jedes editierbaren Datenformats gebogene Geometrien zu digitalisieren,müssen Sie, um gebogene Geometrien zu speichern, einen Datenanbieter verwenden, der gebogene Objekte un-terstützt (z. B. PostGIS, GML oder WFS), ansonsten teilt QGIS die Bögen in Einzelsegmente auf.
13.5.6 Das Bedienfeld Erweiterte Digitalisierung
Wenn Sie neue oder vorhandene Geometrien erfassen, umformen, oder zerteilen, haben Sie auch die Möglichkeit,das Bedienfeld Erweiterte Digitalisierung zu verwenden. Sie können Linien exakt parallel oder rechtwinklig oderin einem bestimmten Winkel digitalisieren oder Linien auf bestimmten Winkeln sperren. Darüber hinaus könnenSie Koordinaten direkt eingeben, so dass Sie eine neue Geometrie genau festlegen können.
Figure 13.101: Das Bedienfeld Erweiterte Digitalisierung
Das Bedienfeld Erweiterete Digitalisierung können Sie mit einem Rechtsklick in die Werkzeugleiste, über dasMenü Ansicht → Bedienfelder→ oder die Tastenkombination Strg+4 öffnen. Sobald das Bedienfeld sichtbar ist,
können Sie die Werkzeuge selbst über die Schaltfläche Erweiterte Digitalisierungswerkzeuge einschalten aktivieren.
13.5. Editierfunktionen 299

QGIS User Guide, Release 3.4
Bemerkung: Die Werkzeuge sind nicht aktiviert, wenn die Kartenansicht geographische Koordinaten zeigt.
Die Idee dahinter
Die Werkzeuge zielen darauf ab, Koordinaten, Längen und Winkel zu sperren, während Sie den Mauszeiger beimDigitalisieren über das Kartenfenster bewegen.
Sie können auch Festsetzungen mit relativer oder absoluter Referenz vornehmen. Relative Referenz bedeutet, dassdie Festsetzungen für den folgenden Stützpunkt relativ zum vorhergehenden Stützpunkt oder Segment sind.
Einrasteinstellungen
Klicken Sie auf die Schaltfläche , um die Einrasteinstellungen der Werkzeuge der Erweiterten Digitalisierungfestzulegen. Sie können festlegen, dass das Werkzeug nur auf gebräuchliche Winkel einrastet. Es gibt folgendeOptionen:
• Nicht auf gemeinsame Winkel einrasten muss heißen: „gebräuchliche“ Winkel
• Auf 30º Winkel einrasten
• Auf 45º Winkel einrasten
• Auf 90º Winkel einrasten
Sie können auch das Einrasten auf Objekte steuern. Hier gibt es folgende Möglichkeiten:
• Do not snap to vertices or segments
• Snap according to project configuration
• Snap to all layers
Tastenkürzel
Um die Arbeit mit dem Bedienfeld Erweiterte Digitalisierung zu beschleunigen, gibt es eine Reihe von Tas-tenkürzeln:
Taste nur Taste Strg+ or Alt+ Umschalt+D Abstand einstellen Abstand beibehaltenA Winkel einstellen Winkel beibehalten Winkel relativ zum letzten Segment an-
/ausschaltenX X-Koordinate ein-
stellenX-Koordinate beibehal-ten
X relativ zum letzten Stützpunkt an-/ausschalten
Y Y-Koordinate ein-stellen
Y-Koordinate beibehal-ten
Y relativ zum letzten Stützpunkt an-/ausschalten
C Konstruktionsmodus an-/ausschaltenP Zwischen senkrechtem und parallelem Modus umschalten
Mit absoluter Referenz digitalsieren
Sobald Sie eine neue Geometrie von Grund auf neu zeichnen, kann es hilfreich sein, den ersten Stützpunkt anfestgelegten Koordinaten zu setzen.
Um beispielsweise ein neues Objekt in einem Polygonlayer zu erzeugen, klicken Sie auf die Schaltfläche . Siekönnen sich für eine die X- und Y-Koordinate entscheiden, an der Sie mit dem Zechnen des Objektes beginnenwollen, dann:
300 Chapter 13. Arbeiten mit Vektordaten

QGIS User Guide, Release 3.4
• klicken Sie auf das Eingabefeld x (oder benutzen das Tastenkürzel X),
• geben Sie die X-Koordinate ein und drücken Sie Eingabe oder klicken Sie auf die Schaltfläche rechtsdavon, um die Mausposition auf der X-Achse im Kartenfenster zu beizubehalten,
• klicken Sie auf das Eingabefeld y (oder benutzen das Tastenkürzel Y),
• geben Sie die Y-Koordinate ein und drücken Sie Eingabe oder klicken Sie auf die Schaltfläche rechtsdavon, um die Mausposition auf der Y-Achse im Kartenfenster zu beizubehalten.
Zwei blaugepunktete Linien und ein grünes Kreuz zeigen genau die Koordinaten an, die Sie eingegeben haben.Beginnen Sie den Digitalisiervorgang, indem Sie in das Kartenfenster klicken; die Position des Mauszeigers wirdam grünen Kreuz beibehalten.
Figure 13.102: Eine Zeichnung mit vorgegebenen Koordinaten beginnen
Sie können nun entweder freihand weiter digitalisieren oder ein neues Koordinatenpaar eingeben oder Sie könnendie Länge (den Abstand) und den Winkel des Segments eingeben.
Falls Sie ein Segment mit einer bestimmten Länge zeichnen wollen, klicken Sie das Eingabefeld d (Abstand) an(Tastenkürzel D), geben Sie den Abstandswert (in Karteneinheiten) ein und drücken Sie Eingabe oder klicken Sie
auf die Schaltfläche rechts davon, um die Mausposition im Kartenfenster mit diesem Abstand beizubehalten.Im Kartenfenster wird um den angeklickten Punkt ein Kreis angezeigt, dessen Radius dem Wert entspricht, denSie als Abstand eingetragen haben.
Figure 13.103: Segment mit einer vorgegebenen Länge
13.5. Editierfunktionen 301

QGIS User Guide, Release 3.4
Sie können auch den Winkel des Segments festlegen. Klicken Sie, wie oben beschrieben, auf die Eingabeflächea (Winkel) (Tastenkürzel A), geben Sie den Winkel (in Grad) ein und drücken Sie Eingabe oder klicken Sie auf
die Schaltfläche rechts davon. Dadurch folgt das Segment dem gewünschten Winkel:
Figure 13.104: Segment mit vorgegebenem Winkel
Mit relativer Referenz digitalsieren
Anstatt absolute Werte für Winkel oder Koordinaten können Sie Werte relativ zum zuletzt eingegebenenStützpunkt oder Segment benutzen.
Bei Winkeln klicken Sie auf die Schaltflläche links der Eingabezeile a (oder drücken Sie Shift+A) umWinkeleingabe relativ zum zuletzt eingegebenen Segment ein- bzw. auszuschalten. Ist diese Option eingeschaltet,werden Winkel zwischen dem zuletzt eingegebenen Segment und der Position des Mauszeigers gemessen.
Zur Koordinateneingabe klicken Sie auf die Schaltflläche links der Eingabezeilen x oder y (oder drücken SieShift+X oder Shift+Y`) um die Koordinateneingabe relativ zum zuletzt eingegebenen Stützpunkt ein- bzw.auszuschalten. Sind diese Optionen eingeschaltet, werden Koordinatenberechnungen so durchgeführt, als wäreder zuletzt eingegebenene Stützpunkt der Koordinatenurspung.
Laufendes Beibehalten
Sie können sowohl beim Digitalisieren mit absoluter als auch mit relativer Referenz Winkel, Abstand sowie die
X- und Y-Festlegungen laufend beibehalten, indem Sie auf die Schaltflächen Laufend beibehalten klicken.Laufendes Beibehalten ermöglicht es Ihnen mehrere Punkte oder Stützpunkte mit den selben Festlegungen zudigitalisieren.
Parallele und senkrechte Linien
Alle oben beschriebenen Werkzeuge können mit den Werkzeugen Senkrecht und Parallel kombiniert werden.Diese beiden Werkzeuge ermöglichen es Ihnen, Segmente exakt senkrecht oder parallel zu einem andern Segmentzu zeichnen.
Um ein senkrechtes Segment zu zeichnen, klicken Sie während des Editierens auf die Schaltfläche senkrecht
(Tastenkürzel P), um das Werkzeug zu aktivieren. Bevor Sie die senkrechte Linie zeichnen, klicken Sie auf dasSegment eines vorhandenen Objekts, zu dem die neue Linie senkrecht sein soll (die Linie des vorhandenen Objektswird hellorange eingefärbt); Sie sollten eine blau gepunktete Linie an der Stelle sehen, an der Ihr Objekt gefangenwird:
302 Chapter 13. Arbeiten mit Vektordaten

QGIS User Guide, Release 3.4
Figure 13.105: Senkrechtes Digitalisieren
Die Schritte, um ein paralleles Objekt zu zeichnen sind die selben: klicken Sie auf die Schaltfläche Parallel
(zweimal Tastenkürzel P), klicken Sie auf das Segment, das Sie als Referenz benutzen wollen und beginnen Siedamit, das Objekt zu zeichen:
Figure 13.106: Paralleles Digitalisieren
Diese beiden Werkzeuge finden genau den richtigen Winkel für senkrechtes und paralleles Zeichnen und behaltenihn während des Editierens bei.
Konstruktionsmodus
Sie können den Konstruktionsmodus ein- und ausschalten, indem Sie auf die Schaltfläche Konstructionsmodus
klicken oder das Tastenkürzel C benutzen. Während der Konstruktionsmodus eingeschaltet ist, fügen Sie mitKlicks im Kartenfenster keine neuen Stützpunkte hinzu, sondern die Klickpositionen werden erfasst, so dass Siesie als Referenzpunkte zur Festlegung von relativem Abstand, Winkel, X- und Y-Kordinaten benutzen können.
Der Konstruktionsmodus kann z.B. benutzt werden, um einen Punkt in einer genau festgelegten Entfernung voneinem bestehenden Punkt zu zeichnen.
13.5. Editierfunktionen 303

QGIS User Guide, Release 3.4
Ist ein Punkt im Kartenfenster vorhanden und der Einrastmodus richtig eingestellt, können Sie ganz einfach weit-
ere Punkte in vorgegebenen Abständen oder Winkeln von ihm zeichnen. Zusätzlich zur Schaltfläche müssen
Sie den Konstruktionsmodus durch Klicken auf die Schaltflläche Konstruktionsmodus oder mit dem Tastenkürzel Ceinschalten .
Klicken Sie in die Nähe des Punktes, von dem aus Sie den Abstand berechnen wollen und klicken Sie auf dieEingabe d (Tastenkürzel D). Geben Sie den gewünschten Abstand ein und drücken Sie Eingabe, um die Maus-position im Kartenfenster beizubehalten:
Figure 13.107: Abstand von einem Punkt
Bevor Sie den neuen Punkt eingeben, drücken Sie C, um den Konstruktionsmodus zu verlassen. Jetzt können Sieins Kartenfenster klicken und der Punkt wird mit dem eingegebenen Abstand platziert.
Sie können die Winkeleinstellung z.B. auch dafür benutzen, einen anderen Punkt mit dem selben Abstand vombestehenden aber in einem bestimmten Winkel zum gerade neu erzeugten Punkt zu erzeugen. Klicken Sie auf
die Schaltfläche Konstruktionsmodus oder Tastenkürzel C um in den Konstruktionsmodus zu wechseln. KlickenSie auf den eben erzeugten Punkt und dann auf den ursprünglich vorhandenen, um eine Richtung zu erhalten.Klicken Sie danach in das Eingabefeld d (Tastenkürzel D), geben Sie den gewünschten Abstand ein und drückenSie Eingabe. Klicken Sie in das Eingabefeld a (Tastenkürzel A), geben Sie den gewünschten Winkel ein unddrücken Sie Eingabe. Die Mausposition im Kartenfenster wird nun sowohl im Abstand als auch im Winkelbeibehalten.
Bevor Sie den neuen Punkt hinzufügen, drücken Sie C, um den Konstruktionsmodus zu verlassen. Jetzt können Siein das Kartenfenster klicken und der Punkt wird in dem eingegebenen Abstand und Winkel erzeugt. Sie könnenden Vorgang wiederholen, um mehrere Punkte zu erzeugen.
13.5.7 Mit Verarbeitung Objekte innerhalb eines Layers verändern
Das Menü Processing menu biete eine große Zahl von Werkzeugen zur Analyse und Erzeugung neuer Objekteauf der Basis der Eigenschaften vorhandener Objekte oder ihrer Bezeihung zu anderen Objekten (innerhalb oderaußerhalb des selben Layers). Während üblicherweise als Ergebnis neue Layer erzeugt werden, erlauben esmanche Algorithmen, den Eingabelayer selbst zu verändern. Das ist praktisch, um mehrfache Objektänderun-gen mittels fortschrittlicher und komplexer Methoden zu automatisieren.
So ändern Sie Objekte insitu:
1. Wählen Sie den Layer, den Sie bearbeiten möchten, im Bedienfeld Layer aus.
2. Wählen Sie die entsprechenden Objekte aus. Diesen Schritt können Sie überspringen, dann werden dieÄnderungen auf den ganzen Layer angewendet.
304 Chapter 13. Arbeiten mit Vektordaten

QGIS User Guide, Release 3.4
Figure 13.108: Abstand von und Winkel zu einem Punkt
Figure 13.109: Punkte in festgelegtem Abstand und Winkel
13.5. Editierfunktionen 305

QGIS User Guide, Release 3.4
3. Drücken Sie die Schaltfläche Objekt insitu ändern oben in Processing toolbox. Die Liste der Algorithmen istgefiltert, es werden nur diejenigen angezeigt, die mit der insitu-Verarbeitung funktionieren, d.h.:
• Sie arbeiten an der Objektquelle und nicht auf Ebene des Layers.
• Sie ändern die Struktur des Layers nicht, z.B. Felder anlegen oder entfernen.
• Sie ändern den Geometrietyp nicht, z.B. von Linie zu Punkt.
Figure 13.110: Verarbeitungswerkzeuge: alle (links) und insitu-Änderung (rechts)
4. Wählen Sie den Algorithmus, den Sie ausführen wollen und doppelklicken Sie darauf.
Bemerkung: Falls der Algorithmus keine weiteren Nutzereingaben erfordert (abgesehen von Eingabelayerund Ausgabelayer), wird er sofort ausgeführt, ohne dass sich das Eingabefenster öffnet.
(a) Falls der Algorithmus andere Nutzereingaben als Ein- und Ausgabelayer erfordert, öffnet sich seinEingabefenster. Geben Sie alle Pflichtangaben ein.
(b) Klicken Sie auf Gewählte Objekte ändern oder Alle Objekte ändern je nachdem, ob des eine aktiveAuswahl gibt.
Die Änderungen werden auf den Layer angewendet und im Editierspeicher festgehalten: tatsächlich wird
der Bearbeitungsstatus des Layers angeschaltet, wie Sie am Symbol neben dem Layernamen erkennenkönnen.
306 Chapter 13. Arbeiten mit Vektordaten

QGIS User Guide, Release 3.4
5. Drücken Sie wie üblich Layeränderungen speichern, um die Änderungen im Layer zu speichern. Sie können
stattdessen auch auf Rückgängig klicken, um alle Änderungen rückgängig zu machen.
13.5. Editierfunktionen 307

QGIS User Guide, Release 3.4
308 Chapter 13. Arbeiten mit Vektordaten

CHAPTER 14
Arbeiten mit Rasterdaten
14.1 Dialogfenster Rasterlayereigenschaften
To view and set the properties for a raster layer, double click on the layer name in the map legend, or right click onthe layer name and choose Properties from the context menu. This will open the Raster Layer Properties dialog.
There are several tabs in the dialog:
• Information
• Source
• Symbology
• Transparency
• Histogram
• Rendering
• Pyramids
• Metadata
• Legend
• QGIS Server
Tipp: Live update rendering
The Layer Styling Panel provides you with some of the common features of the Layer properties dialog and is agood modeless widget that you can use to speed up the configuration of the layer styles and automatically viewyour changes in the map canvas.
Bemerkung: Because properties (symbology, label, actions, default values, forms. . . ) of embedded layers (seeLayer/Gruppen einbinden) are pulled from the original project file and to avoid changes that may break this
309

QGIS User Guide, Release 3.4
behavior, the layer properties dialog is made unavailable for these layers.
14.1.1 Information Properties
The Information tab is read-only and represents an interesting place to quickly grab summarized informationand metadata on the current layer. Provided information are:
• based on the provider of the layer (format of storage, path, data type, extent, width/height, compression,pixel size, statistics on bands, number of columns, rows and no-data values of the raster. . . );
• picked from the filled metadata: access, links, contacts, history. . . as well as data information (CRS, Extent,bands. . . ).
14.1.2 Source Properties
The Source tab displays basic information about the selected raster, including:
• the Layer name to display in the Layers Panel;
• setting the Coordinate Reference System: Displays the layer’s Coordinate Reference System (CRS) as aPROJ.4 string. You can change the layer’s CRS, selecting a recently used one in the drop-down list or
clicking on Select CRS button (see Coordinate Reference System Selector). Use this process only if theCRS applied to the layer is a wrong one or if none was applied. If you wish to reproject your data intoanother CRS, rather use layer reprojection algorithms from Processing or Save it into another layer.
Figure 14.1: Raster Layers - Source Properties Dialog
14.1.3 Symbology Properties
Kanaldarstellung
QGIS bietet vier verschiedene Darstellungsart. Die ausgewählte Darstellungsart hängt vom Datentyp ab.
310 Chapter 14. Arbeiten mit Rasterdaten

QGIS User Guide, Release 3.4
1. Multiband color - if the file comes as a multiband with several bands (e.g., used with a satellite image withseveral bands).
2. Paletted/Unique values - for single band files that come with an indexed palette (e.g., used with a digitaltopographic map) or for general use of palettes for rendering raster layers.
3. Singleband gray - (one band of) the image will be rendered as gray; QGIS will choose this renderer if thefile has neither multibands nor an indexed palette nor a continuous palette (e.g., used with a shaded reliefmap).
4. Singleband pseudocolor - this renderer is possible for files with a continuous palette, or color map (e.g.,used with an elevation map).
5. Hillshade - Creates hillshade from a band.
Multiband color
With the multiband color renderer, three selected bands from the image will be rendered, each band representingthe red, green or blue component that will be used to create a color image. QGIS automatically fetches Min andMax values for each band of the raster and scales the coloring accordingly. You can control the value ranges withthe help of the Min/Max Value Settings section.
A Contrast enhancement method can also be applied to the values: ‚No enhancement‘, ‚Stretch to MinMax‘,‚Stretch and clip to MinMax‘ and ‚Clip to min max‘.
Bemerkung: Kontrastverbesserung
Wenn GRASS Rasterlayer hinzugefügt werden wird die Option Kontrastverbesserung immer automatisch aufStrecken auf MinMax eingestellt, ungeachtet der Einstellungen in den QGIS Optionen.
Tipp: Einen einzelnen Kanal eines Mehrkanal-Rasterlayers anzeigen
If you want to view a single band of a multiband image (for example, Red), you might think you would set theGreen and Blue bands to Not Set. But this is not the correct way. To display the Red band, set the image type toSingleband gray, then select Red as the Gray band to use.
Paletted/Unique values
Dies ist die voreingestellt Darstellungsart für Singleband-Dateien die bereits eine Farbtabelle besitzen, wobeijedem Pixel eine bestimmte Farbe zugewiesen wird. In diesem Fall wird die Palette automatisch dargestellt. WennSie die Farben, die einem bestimmten Wert zugewiesen werden, ändern wollen, Doppelklicken Sie auf die Farbeund der Farbauswahl Dialog erscheint. Seit QGIS 2.2. ist es möglich dem Farbwert eine Beschriftung zuzuweisen.Die Beschriftung erscheint dann in der Legende des Rasterlayers.
This option can be used for rendering all raster bands using a palette, assigning a color to each unique raster value.
Singleband gray
This renderer allows you to render a single band layer with a Color gradient: ‚Black to white‘ or ‚White to black‘.You can define a range of values to color other than the default Min and Max values of the whole raster, thanks tothe Min/Max Value Settings option.
Again, a Contrast enhancement method can be applied to the values: ‚No enhancement‘, ‚Stretch to MinMax‘,‚Stretch and clip to MinMax‘ and ‚Clip to min max‘.
14.1. Dialogfenster Rasterlayereigenschaften 311

QGIS User Guide, Release 3.4
Figure 14.2: Raster Symbology - Multiband color rendering
312 Chapter 14. Arbeiten mit Rasterdaten

QGIS User Guide, Release 3.4
Figure 14.3: Raster Symbology - Paletted unique value rendering
Figure 14.4: Raster Symbology - Singleband gray rendering
14.1. Dialogfenster Rasterlayereigenschaften 313

QGIS User Guide, Release 3.4
Singleband pseudocolor
Dies ist eine Darstellungsoption für Einkanaldateien die eine kontinuierliche Palette enthalten. Sie können hierauch individuelle Karten für die einzelnen Kanäle erstellen.
Figure 14.5: Raster Symbology - Singleband pseudocolor rendering
Using a Band of the layer and a values range, three types of color Interpolation are available:
• Discrete (a <= symbol appears in the value column)
• Linear
• Exact (an equal symbol appears in the Value column)
The Color ramp drop down list lists the color ramp in your QGIS. You can add a new one, edit or save the oneyou changed. The name of the color ramp will be saved in the configuration and in the QML files.
The Label unit suffix is a label added after the value in the legend.
For the classification Mode ‚Equal interval‘, you only need to select the number of classes and press
the button Classify. In the case of the Mode ‚Continuous‘, QGIS creates classes automatically dependingon the Min and Max.
The button Add values manually adds a value to the individual color table. The button Remove selected row deletes a
314 Chapter 14. Arbeiten mit Rasterdaten

QGIS User Guide, Release 3.4
value from the individual color table. Double clicking on the value column lets you insert a specific value. Doubleclicking on the color column opens the dialog Change color, where you can select a color to apply on that value.Further, you can also add labels for each color, but this value won’t be displayed when you use the identify featuretool.
You can use the buttons Load color map from file or Export color map to file to load an existing color table or to savethe defined color table for other sessions.
The Clip out of range values allows QGIS to not render pixel greater than the Max value.
Hillshade
Render a band of the raster layer using hillshading.
Figure 14.6: Raster Symbology - Hillshade rendering
Options:
• Band: The raster band to use.
• Altitude: The elevation angle of the light source (default is 45°).
• Azimuth: The azimuth of the light source (default is 315°).
• Z Factor: Scaling factor for the values of the raster band (default is 1).
• Multidirectional: Specify if multidirectional hillshading is to be used (default is off).
Setting the min and max values
By default, QGIS reports the Min and Max values of the band(s) of the raster. A few very low and/or high valuescan have a negative impact on the rendering of the raster. The Min/Max Value Settings menu helps you control thevalues to render.
Available options are:
• User defined: The default Min and Max values of the band(s) can be overridden
• Cumulative count cut: Removes outliers. The standard range of values is 2% to 98%, but can be adaptedmanually.
14.1. Dialogfenster Rasterlayereigenschaften 315

QGIS User Guide, Release 3.4
Figure 14.7: Raster Symbology - Min and Max Value Settings
• Min/max: Uses the whole range of values in the image band.
• Mean +/- standard deviation x: Creates a color table that only considers values within the standard devi-ation or within multiple standard deviations. This is useful when you have one or two cells with abnormallyhigh values in a raster grid that are having a negative impact on the rendering of the raster.
Calculations of the min and max values of the bands are made based on the:
• Statistics extent: it can be Whole raster, Current canvas or Updated canvas
• and the Accuracy, which can be either Estimate (faster) or Actual (slower).
Bemerkung: For some settings, you may need to press the Apply button of the layer properties dialog in order todisplay the actual min and max values in the widgets.
Farbdarstellung
Für jede Kanaldarstellung ist eine Farbdarstellung möglich.
You can also achieve special rendering effects for your raster file(s) using one of the blending modes (see Mis-chmodi).
Weitere Einstellungen können durch das Verändern der Helligkeit, der Sättigung und des Kontrast gemachtwerden. Sie können auch eine Graustufen Option verwenden bei der Sie zwischen ‚Nach Helligkeit‘, ‚NachLeuchtkraft‘ und ‚Nach Durchschnitt‘ wählen können. Für einen Farbwert in der Farbtabelle können Sie die‚Stärke‘ verändern.
Abtastung
Die Abtastung Option kommt zur Erscheinung wenn Sie in ein Bild herein- oder herauszoomen. Abtastungsmodikönnen die Erscheinung der Karte optimieren. Sie berechnen eine neue Grauwertmatrix anhand einer ge-ometrischen Transformation.
Wenn Sie die ‚Nächster Nachbar‘ Methode anwenden kann die Karte eine pixelige Struktur bein Hineinzoomenhaben. Dieses Erscheinungsbild kann verbessert werden indem man die ‚Bilinear‘ oder ‚Kubisch‘ Methode ver-wendet, die scharfe Objekte verwischt. Der Effekt ist ein weicheres Bild. Diese Methode kann z.B. auf digitaleTopographische Karten angewendet werden.
At the bottom of the Symbology tab, you can see a thumbnail of the layer, its legend symbol, and the palette.
316 Chapter 14. Arbeiten mit Rasterdaten

QGIS User Guide, Release 3.4
Figure 14.8: Raster Symbology - Color rendering and Resampling settings
14.1.4 Transparency Properties
QGIS has the ability to display each raster layer at a different transparency level. Use the transparency slider
to indicate to what extent the underlying layers (if any) should be visible through the currentraster layer. This is very useful if you like to overlay more than one raster layer (e.g., a shaded relief map overlayedby a classified raster map). This will make the look of the map more three dimensional.
Additionally, you can enter a raster value that should be treated as NODATA in the Additional no data value option.
An even more flexible way to customize the transparency can be done in the Custom transparency options section:
• Use Transparency band to apply transparency on an entire band.
• Provide a list of pixels to make transparent with the corresponding level of transparency:
1. Klicken Sie den Werte manuell hinzufügen Knopf. Eine neue Zeile erscheint in der Pixelliste.
2. Enter the Red, Green and Blue values of the pixel and adjust the Percent Transparent to apply.
3. Alternatively, you can directly fetch the pixel values directly from the raster using theAdd values from display button. Then enter the transparency value.
4. Repeat the steps to adjust more values with custom transparency.
5. Press the Apply button and have a look at the map.
Wie Sie sehen können ist es recht einfach die benutzerdefinierte Transparenz einzustellen, aber es kann ganz
schön viel Arbeit sein. Deswegen können Sie den Knopf In Datei exportieren benutzen um Ihre Transparen-
zliste in eine Datei zu speichern. Der Knopf Aus Datei importieren lädt Ihre Transparenzeinstellungen undwendet sie auf den aktuellen Rasterlayer an.
14.1.5 Histogram Properties
The Histogram tab allows you to view the distribution of the bands or colors in your raster. The histogram isgenerated when you press the Compute Histogram button. All existing bands will be displayed together. You can
14.1. Dialogfenster Rasterlayereigenschaften 317

QGIS User Guide, Release 3.4
Figure 14.9: Raster Transparency
save the histogram as an image with the button.
At the bottom of the histogram, you can select a raster band in the drop-down menu and Set min/max style for it.
The Prefs/Actions drop-down menu gives you advanced options to customize the histogram:
• With the Visibility option, you can display histograms of the individual bands. You will need to select the
option Show selected band.
• The Min/max options allow you to ‚Always show min/max markers‘, to ‚Zoom to min/max‘ and to ‚Updatestyle to min/max‘.
• The Actions option allows you to ‚Reset‘ or ‚Recompute histogram‘ after you changed the min or maxvalues of the band(s).
14.1.6 Rendering Properties
In the Rendering tab, it’s possible to:
• apply a Scale dependent visibility to the layer: You can set the Maximum (inclusive) and Minimum (exclu-sive) scale, defining a range of scale in which the layer will be visible. Out of this range, it’s hidden. The
Set to current canvas scale button helps you use the current map canvas scale as boundary of the range visibility.See Maßstabsabhängige Layeranzeige for more information.
• Refresh layer at interval (seconds): set a timer to automatically refresh individual layers at a matchinginterval. Canvas updates are deferred in order to avoid refreshing multiple times if more than one layer hasan auto update interval set.
You can set the Maximum (inclusive) and Minimum (exclusive) scale, defining a range of scale in which the layer
will be visible. Out of this range, it’s hidden. The Set to current canvas scale button helps you use the current mapcanvas scale as boundary of the range visibility. See Maßstabsabhängige Layeranzeige for more information.
318 Chapter 14. Arbeiten mit Rasterdaten

QGIS User Guide, Release 3.4
Figure 14.10: Rasterhistogramm
Figure 14.11: Raster Rendering
14.1. Dialogfenster Rasterlayereigenschaften 319

QGIS User Guide, Release 3.4
14.1.7 Pyramids Properties
Hochaufgelöste Rasterlayer können das Navigieren in QGIS verlangsamen. Indem Sie geringer aufgelöste Kopien(Pyramiden) erstellen, kann die Darstellung optimiert werden. QGIS wählt dann entsprechend des Zoom-Levelsdie passende Auflösung.
Sie brauchen dazu Schreibrecht in dem Ordner, in dem sich sie Originaldaten befinden.
From the Resolutions list, select resolutions for which you want to create pyramid by clicking on them.
If you choose Internal (if possible) from the Overview format drop-down menu, QGIS tries to build pyramidsinternally.
Bemerkung: Bitte beachten Sie dass das Erstellen von Pyramiden die Originaldatei verändern kann und sindsie erstmal erstellt können Sie nicht entfernt werden. Wenn Sie eine ‚nichtpyramidisierte‘ Version Ihres Rasterserhalten wollen, machen Sie eine Backupkopie vor dem Erstellen von Pyramiden.
If you choose External and External (Erdas Imagine) the pyramids will be created in a file next to the originalraster with the same name and a .ovr extension.
Several Resampling methods can be used to calculate the pyramids:
• Nächster Nachbar
• Durchschnitt
• Gauß
• Kubisch
• Cubic Spline
• Laczos
• Modus
• Keine
Finally, click Build Pyramids to start the process.
Figure 14.12: Raster Pyramids
320 Chapter 14. Arbeiten mit Rasterdaten

QGIS User Guide, Release 3.4
14.1.8 Metadata Properties
The Metadata tab provides you with options to create and edit a metadata report on your layer. See vectorlayer metadata properties for more information.
14.1.9 Legend Properties
The Legend tab provides you with a list of widgets you can embed within the layer tree in the Layers panel.The idea is to have a way to quickly access some actions that are often used with the layer (setup transparency,filtering, selection, style or other stuff. . . ).
By default, QGIS provides transparency widget but this can be extended by plugins registering their own widgetsand assign custom actions to layers they manage.
14.1.10 QGIS Server Properties
The QGIS Server tab displays a wealth of information about the raster layer, including statistics about eachband in the current raster layer. From this tab, entries may be made for the Description, Attribution, MetadataUrland Properties. In Properties, statistics are gathered on a ‚need to know‘ basis, so it may well be that a givenlayer’s statistics have not yet been collected.
Figure 14.13: QGIS Server in Raster Properties
14.2 Rasteranalyse
14.2.1 Rasterrechner
The Raster Calculator in the Raster menu allows you to perform calculations on the basis of existing raster pixelvalues (see figure_raster_calculator). The results are written to a new raster layer with a GDAL-supported format.
Die Rasterkanäle Liste enthält alle geladenen Rasterlayer die benutzt werden können. Um einen Rasterlayerdem Rasterrechnerausdruck Feld hinzuzufügen, machen Sie einen Doppelklick auf seinen Namen in der Felder
14.2. Rasteranalyse 321

QGIS User Guide, Release 3.4
Figure 14.14: Rasterrechner
322 Chapter 14. Arbeiten mit Rasterdaten

QGIS User Guide, Release 3.4
Liste. Sie können dann die Operatoren zum konstruieren von Berechnungsausdrücken benutzen oder Sie gebenSie einfach in die Box ein.
Im Abschnitt Ergebnislayer müssen Sie einen Ausgabelayer definieren. Sie können dann den Analysebereichauf Grundlage eines Eingaberasters oder basierend auf Min/Max X und Y-Koordinaten bzw. mittels Spaltenund Zeilen angeben, um die Auflösung des Ausgabelayer festzulegen. Wenn die Eingabelayer eine abweichendeAuflösung besitzen, werden die Werte auf Basis des nearest neighbor Algorithmus resampelt.
The Operators section contains all available operators. To add an operator to the raster calculator expression box,click the appropriate button. Mathematical calculations (+, -, *, . . . ) and trigonometric functions (sin, cos,tan, . . . ) are available. Conditional expressions (=, !=, <, >=, . . . ) return either 0 for false or 1 for true, andtherefore can be used with other operators and functions. Stay tuned for more operators to come!
Mit dem Aktivieren des Kontrollkästchens Ergebnis zum Projekt hinzufügen wird der Ausgabelayer automa-tische der Legende hinzugefügt und kann somit visualisiert werden.
Beispiele
Höhenwerte von Meter zu Fuß konvertieren
Für das Erstellen eines Rasterlayers in Fuß aus einem Rasterlayer in Metern müssen Sie den Konvertierungsfaktorvon Metern zu Fuß benutzen: 3.28. Der Ausdruck lautet:
"elevation@1" * 3.28
Eine Maske verwenden
Wenn Sie Teile des Rasterlayers ausmaskieren wollen, weil Sie nur an Höhenwerten über 0 Metern interessiertsind, können Sie den folgenden Ausdruck zum Erstellen einer Maske und zum gleichzeitigen Anwenden auf denRasterlayer verwenden.
("elevation@1" >= 0) * "elevation@1"
In other words, for every cell greater than or equal to 0 the conditional expression evaluates to 1, which keeps theoriginal value by multiplying it by 1. Otherwise the conditional expression evaluates to 0, which sets the rastervalue to 0. This creates the mask on the fly.
Wenn Sie ein Raster klassifizieren wollen, sagen wir beispielsweise in zwei Höhenklassen, können Sie die folgen-den Ausdrücke verwenden um ein Raster mit zwei Werten 1 und 2 in einem Schritt erstellen.
("elevation@1" < 50) * 1 + ("elevation@1" >= 50) * 2
In anderen Worten stelle den Wert für jede Zelle mit einem Wert kleiner 50 auf 1 ein. Für jede Zelle mit einemWert größer als oder gleich 50 stelle den Wert 2 ein.
14.2.2 Raster Ausrichtung
Dieses Tool ist in der Lage mehrere Raster als Eingabe zu nehmen und sie perfekt auszurichten, das heißt:
• auf gleichem KBS reprojizieren,
• zu derselben Zellengröße resamplen und in dem Gitter versetzen,
• auf ein Interessengebiet schneiden,
• wenn erforderlich, Werte neu skalieren.
Alle Raster werden in anderen Dateien gespeichert.
First, open the tools from Raster → Align Raster. . . and click on the Add new raster button to choose one existingraster in QGIS. Select an output file to save the raster after the alignment, the resampling method and if the toolsneed to Rescale values according to the cell size. The resampling method can be (see figure_raster_align_edit):
14.2. Rasteranalyse 323

QGIS User Guide, Release 3.4
• Nearest Neighbor
• Bilinear (2x2 kernel)
• Cubic (4x4 kernel): Cubic Convolution Approximation
• Cubic B-Spline (4x4 kernel): Cubic B-Spline Approximation
• Lanczos (6x6 kernel): Lanczos windowed sinc interpolation
• Average: computes the average of all non-NODATA contributing pixels
• Mode: selects the value which appears most often of all the sampled points
• Maximum, Minimum, Mediane, First Quartile (Q1) or Third Quartile (Q3) of all non-NODATA con-tributing pixels
Bemerkung: Methods like maximum, minimum, mediane, first and third quartiles are available only if QGIS isbuilt with GDAL >= 2.0.
Figure 14.15: Select Raster Resampling Options
In the main Align raster dialog, you can still Edit file settings or Remove an existing file from the list of raster layers.You can also choose one or more other options (see figure_raster_align):
• Select the Reference Layer,
• Transform into a new CRS,
• Setup a different Cell size,
• Setup a different Grid Offset,
• Clip to Extent: it can be user-defined or based on a layer or the map view
• Output Size,
• Add aligned raster to the map canvas.
324 Chapter 14. Arbeiten mit Rasterdaten

QGIS User Guide, Release 3.4
Figure 14.16: Raster Ausrichtung
14.2. Rasteranalyse 325

QGIS User Guide, Release 3.4
326 Chapter 14. Arbeiten mit Rasterdaten

CHAPTER 15
Working with Mesh Data
15.1 Working with Mesh Data
15.1.1 What’s a mesh?
A mesh is an unstructured grid usually with temporal and other components. The spatial component contains acollection of vertices, edges and faces in 2D or 3D space:
• vertices - XY(Z) points (in the layer’s coordinate reference system)
• edges - connect pairs of vertices
• faces - a face is a set of edges forming a closed shape - typically a triangle or a quadrilateral (quad), rarelypolygons with more vertices
Figure 15.1: Different mesh types
QGIS can currently render mesh data using triangles or regular quads.
327

QGIS User Guide, Release 3.4
Mesh provides information about the spatial structure. In addition, the mesh can have datasets (groups) that assigna value to every vertex. For example, having a triangular mesh with numbered vertices as shown in the imagebelow:
Figure 15.2: Triangular grid with numbered vertices
Each vertex can store different datasets (typically multiple quantities), and those datasets can also have a temporaldimension. Thus, a single file may contain multiple datasets.
The following table gives an idea about the information that can be stored in mesh datasets. Table columnsrepresent indices of mesh vertices, each row represents one dataset. Datasets can have different datatypes. In thiscase, it stores wind velocity at 10m at a particular moments in time (t1, t2, t3).
In a similar way, the mesh dataset can also store vector values for each vertex. For example, wind direction vectorat the given time stamps:
10 metre wind 1 2 3 . . .10 metre speed at time=t1 17251 24918 32858 . . .10 metre speed at time=t2 19168 23001 36418 . . .10 metre speed at time=t3 21085 30668 17251 . . .. . . . . . . . . . . . . . .10m wind direction time=t1 [20,2] [20,3] [20,4.5] . . .10m wind direction time=t2 [21,3] [21,4] [21,5.5] . . .10m wind direction time=t3 [22,4] [22,5] [22,6.5] . . .. . . . . . . . . . . . . . .
We can visualize the data by assigning colors to values (similarly to how it is done with Singleband pseudocolor
328 Chapter 15. Working with Mesh Data

QGIS User Guide, Release 3.4
raster rendering) and interpolating data between vertices according to the mesh topology. It is common that somequantities are 2D vectors rather than being simple scalar values (e.g. wind direction). For such quantities it isdesirable to display arrows indicating the directions.
Figure 15.3: Possible visualisation of mesh data
15.1.2 Supported formats
QGIS accesses mesh data using the MDAL drivers. Hence, the natively supported formats are:
• NetCDF: Generic format for scientific data
• GRIB: Format commonly used in meteorology
• XMDF: As an example, hydraulic outputs from TUFLOW modelling package
• DAT: Outputs of various hydrodynamic modelling packages (e.g. BASEMENT, HYDRO_AS-2D, TU-FLOW)
• 3Di: 3Di modelling package format based on Climate and Forecast Conventions (http://cfconventions.org/)
• Some examples of mesh datasets can be found at https://apps.ecmwf.int/datasets/data/interim-full-daily/levtype=sfc/
15.1.3 Loading a mesh layer
To add a mesh layer to QGIS:
1. Open the Data Source Manager dialog, either by selecting it from the Layer → menu or clicking theOpen Data Source Manager button.
2. Then, enable the Mesh tab on the left panel
3. Press the . . . button to select the file and press Add. The layer will be added using the native mesh rendering.
15.1. Working with Mesh Data 329

QGIS User Guide, Release 3.4
Figure 15.4: Mesh tab in Data Source Manager
330 Chapter 15. Working with Mesh Data

QGIS User Guide, Release 3.4
15.1.4 Mesh Dataset Properties
Information
Figure 15.5: Mesh Layer Properties
The Information tab is read-only and represents an interesting place to quickly grab summarized information andmetadata on the current layer. Provided information are (based on the provider of the layer) uri, vertex count, facecount and dataset groups count.
Source
The Source tab displays basic information about the selected mesh, including:
• the Layer name to display in the Layers panel
• setting the Coordinate Reference System: Displays the layer’s Coordinate Reference System (CRS) as aPROJ.4 string. You can change the layer’s CRS by selecting a recently used one in the drop-down list or
clicking on Select CRS button (see Coordinate Reference System Selector). Use this process only if theCRS applied to the layer is wrong or if none was applied.
Use the Assign Extra Dataset to Mesh button to add more groups to the current mesh layer.
Style
Click the Style button to activate the dialog as shown in the following image:
Style properties are divided in several tabs:
• General
• Contours Symbology
• Vectors Symbology
• Rendering
15.1. Working with Mesh Data 331

QGIS User Guide, Release 3.4
Figure 15.6: Mesh Layer Style
General
The tab presents the following items:
• groups available in the mesh dataset
• dataset in the selected group(s), for example, if the layer has a temporal dimension
• metadata if available
• blending mode available for the selected dataset.
The slider , combo box and buttons allow to explore another dimension of the data,if available. As the slider moves, the metadata is presented accordingly. See the figure Mesh groups below as anexample. The map canvas will display the selected dataset group as well.
Figure 15.7: Dataset in Selected Group(s)
You can apply symbology to each group using the tabs.
332 Chapter 15. Working with Mesh Data

QGIS User Guide, Release 3.4
Contours Symbology
Under Groups, click on to show contours with default visualization parameters.
In the tab you can see and change the current visualization options of contours for the selected group, asshown in the image Styling contours in a mesh below:
Figure 15.8: Styling Contours in a Mesh Layer
Use the slide bar or combo box to set the opacity of the current group.
Use Load to adjust the min and max values of the current group.
The Interpolation list contains three options to render contours: Linear, Discrete and Exact.
The Color ramp widget opens the color ramp drop-down shortcut.
The Label unit suffix is a label added after the value in the legend.
By selecting Continuous in the classification Mode, QGIS creates classes automatically considering the Min andMax values. With ‘Equal interval’, you only need to select the number of classes using the combo box Classesand press the button Classify.
The button Add values manually adds a value to the individual color table. The button Remove selected row deletes a
15.1. Working with Mesh Data 333
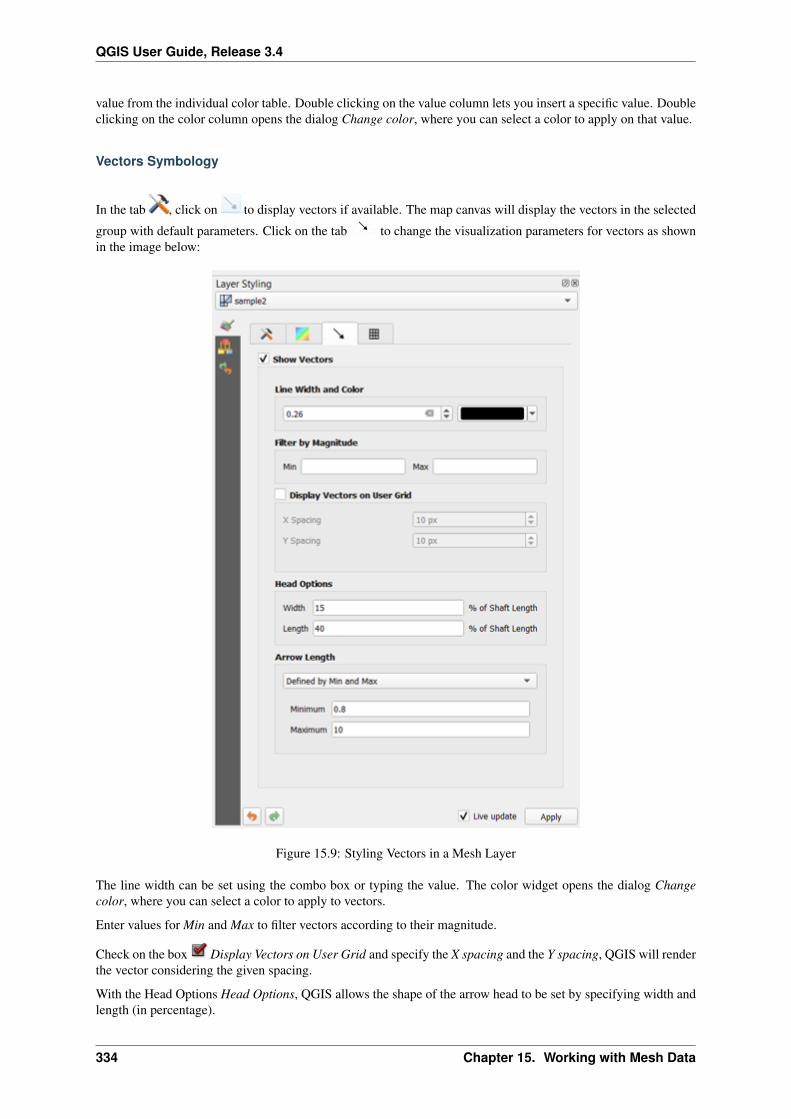
QGIS User Guide, Release 3.4
value from the individual color table. Double clicking on the value column lets you insert a specific value. Doubleclicking on the color column opens the dialog Change color, where you can select a color to apply on that value.
Vectors Symbology
In the tab , click on to display vectors if available. The map canvas will display the vectors in the selected
group with default parameters. Click on the tab to change the visualization parameters for vectors as shownin the image below:
Figure 15.9: Styling Vectors in a Mesh Layer
The line width can be set using the combo box or typing the value. The color widget opens the dialog Changecolor, where you can select a color to apply to vectors.
Enter values for Min and Max to filter vectors according to their magnitude.
Check on the box Display Vectors on User Grid and specify the X spacing and the Y spacing, QGIS will renderthe vector considering the given spacing.
With the Head Options Head Options, QGIS allows the shape of the arrow head to be set by specifying width andlength (in percentage).
334 Chapter 15. Working with Mesh Data

QGIS User Guide, Release 3.4
Vector’s Arrow length can be rendered in QGIS in three different ways:
• Defined by Min and Max: You specify the minimum and maximum length for the vectors, QGIS will adjusttheir visualization accordingly
• Scale to magnitude: You specify the (multiplying) factor to use
• Fixed: all the vectors are shown with the same length
Rendering
In the tab , QGIS offers two possibilities to display the grid, as shown in the image :ref:‘ Mesh rendering<figure_mesh_symbology_grid>‘:
• Native Mesh Rendering that shows quadrants
• Triangular Mesh Rendering that display triangles
Figure 15.10: Mesh Rendering
The line width and color can be changed in this dialog, and both the grid renderings can be turned off.
15.1. Working with Mesh Data 335

QGIS User Guide, Release 3.4
336 Chapter 15. Working with Mesh Data

CHAPTER 16
Kartenlayout
Mit Drucklayouts und Berichten können Sie Karten und Kartenserien (Atlas) erzeugen und sie entweder aus-drucken oder als Bild, PDF- oder SVG-Datei speichern.
16.1 Überblick über das Drucklayout
Das Drucklayout stellt immer mehr Layout- und Druckfunktionen bereit. Es ermöglicht es Ihnen, Elementewie die QGIS Kartenanzeige, Beschriftungen, Legenden, Maßstäbe, Grundformen, Pfeile, Attributtabellen undHTML-Rahmen hinzuzufügen. Sie können bei jedem Element die Größe verändern, es gruppieren, ausrichtenund positionieren als auch die Eigenschaften anpassen um Ihr Layout zu erstellen. Das Layout kann gedrucktoder in Bildformate, PostScript, PDF oder SVG (der Export in SVG funktioniert nicht mit einigen aktuellen Qt4Versionen, Sie sollten dies individuell an Ihrem System ausprobieren) exportiert werden. Sie können das Layoutals Vorlage speichern und es wieder in anderen Sitzungen laden. Schließlich kann das Erstellen mehrerer Kartenbasierend auf einer Vorlage mit der Atlaserzeugung durchgeführt werden. Sie finden eine Liste von Tools intable_composer_1_:
16.1.1 Ein erstes Übungsbeispiel
Bevor Sie mit dem Drucklayout anfangen zu arbeiten, müssen Sie einige Raster- oder Vektorlayer in dasQGIS Kartenfenster laden und deren Eigenschaften Ihren Wünschen anpassen. Wenn alles nach Ihren Wün-schen dargestellt und symbolisiert ist, klicken Sie das auf die Schaltfläche |newComposer| Neues Drucklayout in derWerkzeugleiste oder wählen Sie Projekt → Neues Drucklayout. Sie werden aufgefordert einen Titel für das neueLayout auszuwählen.
Um zu zeigen wie man eine Karte erstellt folgen Sie den nächsten Anweisungen.
1. Wählen Sie den Neue Karte hinzufügen Werkzugleistenknopf aus und zeichnen Sie ein Rechteck auf die Seiteindem Sie die linke Maustaste gedrückt halten. Innerhalb des gezeichneten Rechteckes erscheint die QGISKartenansicht auf der Seite.
2. Wählen Sie die Schaltfläche Neuen Maßstab hinzufügen in der Werkzeugleiste und klicken Sie mit links in dieZeichenfläche der Druckzusammenstellung. Der Zeichenfläche wird ein Maßstab hinzugefügt.
3. Wähllen Sie den Neue Legende hinzufügen Werkzeugleistenknopf und zeichnen Sie ein Rechteck auf die Seiteindem sie die linke Maustaste gedrückt halten. Innerhalb des Rechtecks wird die Legende gezeichnet.
337

QGIS User Guide, Release 3.4
4. Wählen Sie das Den Elementinhalt verschieben Icon um die Karte auszuwählen und verschieben Sie es einbisschen.
5. Während das Kartenelement noch ausgewählt ist, können Sie auch seine Größe verändern. Dazu klicken Siein eins der weißen kleinen Rechtecke in einer der Ecken des Kartenelements, halten Sie die linke Maustastegedrückt und verschieben Sie das Rechteck an einen neuen Ort.
6. Klicken Sie den Reiter Elementeigenschaften im linken unteren Bedienfeld und suchen Sie die Einstellungfür die Kartendrehung. Ändern Sie den Wert der Einstellung Kartendrehung auf ‚15.00°‘. Sie sollten sehen,wie der Drehwinkel des Kartenelements sich ändert.
7. Jetzt können Sie Ihr Drucklayout mit den Exportwerkzeugen im Menü Layout ausdrucken oder in ein Bild-format, nach PDF oder SVG exportieren.
8. Schließlich können Sie Ihr Drucklayout mit der Schaltfläche Projekt speichern innerhalb der Projektdateispeichern.
Sie können dem Drucklayout mehrere Elemente hinzufügen. Es ist auch möglich, dass es mehr als eine Karten-, Legenden- oder Maßstabselement enthält, und das auf einer oder mehreren Seiten. Jedes Element hat seineeigenen Eigenschaften und, im Fall der Karte, seine eigenen Ausmaße. Wenn Sie ein Element aus der Zusammen-stellungsansicht entfernen wollen, können Sie das mit den Tasten Entf oder Rücktaste tun.
16.1.2 Layoutverwaltung
Die Layoutverwaltung ist das Hauptfenster, um Drucklayouts innerhalb des Prohjekts zu verwalten. Sie gibt Ihneneine Übersicht über die vorhandenen Layouts und Berichte im Projekt und bietet folgende Werkzeuge:
• ein neues Drucklayout oder einen neuen Bericht auf der Basis der leeren oder einer bestimmten Vorlageerzeugen oder ein bereits vorhandenes duplizieren;
• eins davon umbenennen oder löschen;
• sie im Projekt zu öffnen.
So öffnen Sie die Maske Layout-Verwaltung:
• Im QGIS-Hauptfenster wählen Sie im Menü Project → Layout-Verwaltung. . . oder klicken Sie auf die
Schaltfläche Layout-Verwaltung in der Projektwerkzeugleiste;
• im Drucklayout oder im Berichtsfenster wählen Sie im Menü Layout → Layout-Verwaltung. . . oder klicken
Sie auf die Schaltfläche Layouverwaltung in der Layout-Werkzeugleiste.
Die Layout-Verwaltung listet im oberen Teil alle im Projekt verfügbaren Drucklayouts oder Berichte auf und bietetfolgende Werkzeuge:
• Anzeigen: Sie können mehrere Drucklayouts und/oder Berichte auswählen und sie mit einem Klick öffnen.Ein Doppelklick auf den Namen öffnet auch;
• das ausgewählte Drucklayout oder den ausgewählten Bericht duplizieren (setzt voraus, dass ein einzelnerEintrag ist ausgewählt ist): erzeugt ein neues Fenster und benutzt das ausgewählte Element als Vorlage. Siewerden dazu aufgefordert, einen neuen Titel für das Layout zu vergeben;
• das ausgewählte Drucklayout oder den ausgewählten Bericht umbenennen (setzt voraus, dass ein einzelnerEintrag ist ausgewählt ist): Sie werden dazu aufgefordert, einen neuen Titel für das Layout zu vergeben;
• das Layout entfernen: das (oder die) ausgewählte(n) Layout(s) wird (werden) aus dem Projekt gelöscht.
Im unteren Teil können Sie neue Drucklayouts oder Berichte erzeugen und dabei eine Vorlage benutzen. Inder Voreinstellung wird QGIS die Vorlagen im Nutzerprofil und den Vorlagenverzeichnissen der Anwendungsuchen (sie sind mit den beiden Schaltflächen unten im Fenster zugänglich) aber auch in jedem Verzeichnis, dasin Einstellungen → Optionen → Layouts als Pfad(e) um nach zusätzlichen Druckvorlagen zu suchen eingetragenwurde. Alle gefundenen Vorlagen werden im Auswahlfeld angezeigt. Wählen Sie eine aus und drücken Sie aufdie Schaltfläche Erzeugen. . . , um einen neuen Bericht oder ein neues Drucklayout zu erzeugen.
338 Chapter 16. Kartenlayout

QGIS User Guide, Release 3.4
Figure 16.1: Die Layout-Verwaltung
Sie können auch Vorlagen aus einem eigenen Verzeichnus benutzen; in diesem Fall wählen Sie Bestimmtes ausdem Auswahlfeld, gehen Sie im Dateisystem zur Vorlage und drücken Sie Erzeugen. . . .
Tipp: So erzeugen Sie Drucklayouts im Bedienfeld Browser aus Vorlagen heraus
Das Einfügen einer Vorlagendatei .qpt per drag and drop aus dem Dateimanager in das Kartenfenster oder einDoppelklick darauf im Bedienfeld Browser erzeugt ein neues Drucklayout aus der Vorlagendatei.
16.1.3 Menüs, Werkzeuge und Bedienfelder des Drucklayouts
Das Öffnen des Drucklayouts bietet Ihnen eine leere Zeichenfläche, die den ausgedruckten Papierbogen darstellt.In der Starteinstellungen finden Sie links neben der Zeichenfläche Schaltflächen, um Elemente des Drucklay-outs hinzuzufügen; die aktuelle QGIS Kartenansicht, Beschriftungen, Bilder, Legenden, Maßstäbe, einfache For-men, Pfeile, Attributtabellen und HTML-Rahmen. In dieser Werkzeugleiste finden Sie auch Schaltflächen zumNavigieren, Zoomen in einen Bereich und zum Verschieben der Ansicht im Layout sowie Schaltflächen, um einElement auszuwählen und den Inhalt des Kartenelements zu verschieben.
figure_layout_overview zeigt die Starteinstellung des Drucklayouts bevor Elemente hinzugefügt wurden.
Rechts von der Zeichenfläche finden Sie zwei Bedienfelder. Das obere enthält die Reiter Elemente und Rücknah-meprotokoll und das untere Bedienfeld enthält die Reiter Layout, Elementeigenschaften und Atlas.
• Der Reiter Elemente enthält eine Liste aller Elemente, die der Zeichenfläche hinzugefügt wurden (siehe TheItems Panel für weitere Informationen).
• Der Reiter Rücknahmeprotokoll Reiter stellt den Verlauf aller Änderungen, die am Drucklayout durchge-führt wurden, dar. Mit einem Mausklick ist es möglich, Layoutschritte vorwärts oder rückwärts bis zu einembestimmten Status rückgängig zu machen oder wiederherzustellen.
• Im Reiter Layout können Sie allgemeine Parameter einstellen, die auf das Layout angewendet werden, wennSie es exportieren oder darin arbeiten (siehe The Layout Panel für eine genauere Beschreibung);
• Der Reiter Elementeigenschaften enthält die Eigenschaften für das ausgewählte Element. Klicken Sie auf
die Schaltfläche Eintrag wählen/verschieben, um ein Element in der Zeichenfläche auszuwählen (z.B. eineLegende, einen Maßstab oder eine Beschriftung). Klicken Sie dann den Reiter Elementeigenschaften an
16.1. Überblick über das Drucklayout 339

QGIS User Guide, Release 3.4
Figure 16.2: Drucklayout
340 Chapter 16. Kartenlayout

QGIS User Guide, Release 3.4
und passen Sie die Einstellungen für das ausgewählte Element an (siehe Layout Items für eine genauereBeschreibung über die Einstellungen jedes Elements).
• Der Reiter Atlas ermöglicht es Ihnen, einen Atlas für das aktuelle Drucklayout zu erzeugen und gibt IhnenZugang zu seinen Einstellungen (siehe Einen Atlas erzeugen für eine genauere Beschreibung der Erzeugungeines Atlas).
Im unteren Teil des Drucklayoutfensters können Sie eine Statusleiste mit der Mausposition, der aktuellen Seite-nanzahl, ein Auswahlfeld zum Einstellen der Zoomstufe, die Anzahl der gewählten Objekte (falls eine Auswahlvorhanden ist) und im Falle einer Atlaserzeugung, die Anzahl der Atlasobjekte, finden.
Im oberen Teil des Drucklayoutfensters finden Sie Menüs und Werkzeugleisten. Alle Werkzeuge des Drucklayoutssind über Menüs und Schaltflächen in der Werkzeugleiste verfügbar.
Die Werkzeugleisten und Reiter können an- und ausgeschaltet werden, indem Sie mit der rechten Maustaste ineine Werkzeugleiste klicken oder über das Menü Ansicht → Werkzeugleiste oder Ansicht→ Bedienfelder.
Menüs und Werkzeuge
Das Menü Layout
Mit den Einträgen im Menü Layout können Sie das Layout verwalten:
• Speichern Sie die Projektdatei direkt aus dem Drucklayout heraus.
• Erzeugen Sie mit dem Eintrag Neues Layout. . . ein neues leeres Drucklayout.
• Layout duplizieren. . . : Erzeugen Sie ein neues Drucklayout als Duplikat des aktuellen.
• Lööschen Sie mit dem Eintrag Layout löschen. . . das aktuelle Layout.
• Öffnen Sie die Layout-Verwaltung mit Layout-Verwaltung. . . .
• Öffnen Sie ein vorhandenes Drucklayout mit Layouts →.
Wenn Sie das Layout fertig gestaltet haben, speichern Sie seinen aktuellen Zustand mit Als Vorlage speichern
in eine .qpt Vorlagendatei und laden Sie seine Elemente mit Elemente zur Vorlage hinzufügen. . . (Über-setzungshinweis: muss richtig heißen „aus Vorlage“) in einer anderen Sitzung/in ein anderes Drucklayout wiederhinein.
Im Menü Layout gibt es auch sehr mächtige Werkzeuge, um geographische Indormationen, die mit QGIS erzeugtwurden, verfügbar zu machen, so dass sie in Berichte eingebunden oder publiziert werden können. Diese
Werkzeug sind Als Bild exportieren. . . , Als PDF exportieren. . . , Als SVGexportieren. . . undDrucken. . . .
Unten ist eine Liste aller verfügbaren Werkzeuge in diesem Menü mit einigen hilfreichen Informationen.
16.1. Überblick über das Drucklayout 341

QGIS User Guide, Release 3.4
Werkzeug Tastenkürzel Werkzeu-gleiste
Referenz
Projekt speichern Strg+S Layout Introducing QGIS projects
Neues Layout Strg+N Layout Layoutverwaltung
Layout duplizieren Layout Layoutverwaltung
Layout löschen
Layout-Verwaltung. . . Layout LayoutverwaltungLayouts →Layouteigenschaften. . . The Layout PanelLayout umbenennen. . .
Seiten hinzufügen. . . Layout Working with the page proper-ties
Elemente aus Vorlage hinzufü-gen
Layout Creating a layout item
Als Vorlage speichern. . . Layout Layoutverwaltung
Als Bild exportieren. . . Layout Speichern als Rasterbild
Als SVG exportieren. . . Layout Als SVG exportieren
Als PDF exportieren. . . Layout Als PDF exportierenSeiteneinstellungen. . . Strg+Umschalt+P
Drucken. . . Strg+P Layout Eine Ausgabe erzeugenSchließen Strg+Q
Menü Bearbeiten
Das Menü Bearbeiten bietet Ihnen Werkzeuge, um Drucklayouts zu bearbeiten. Das beinhaltet gägnige Aufgabenwie Auswahlwerkzeuge, Kopieren/Ausschneiden/Einfügen und die Funktionen Rückgängig/Wiederherstellen(siehe The Undo History Panel: Revert and Restore actions) für Elemente im Layout.
Wenn Sie die Aktion Einfügen benutzen, werden die Elemente an der aktuellen Position des Mauszeigers einge-fügt. Wenn Sie den Menüpunkt Bearbeiten → Durch Einfügen ersetzen (Übersetzungshinweis: muss richtig „Ander Originalposition einfügen“ o.ä. heißen) oder das Tastenkürzel Strg+Umschalt+V drücken, werden dieElemente auf die aktuelle Seite an der Position eingefügt, an der sie auch auf ihrer Originalseite platziert waren.Damit kann sichergestellt werden, dass kopierte Elemente von Seite zu Seite an genau die selbe Stelle eingefügtwerden.
Unten ist eine Liste aller verfügbaren Werkzeuge in diesem Menü mit einigen hilfreichen Informationen.
342 Chapter 16. Kartenlayout
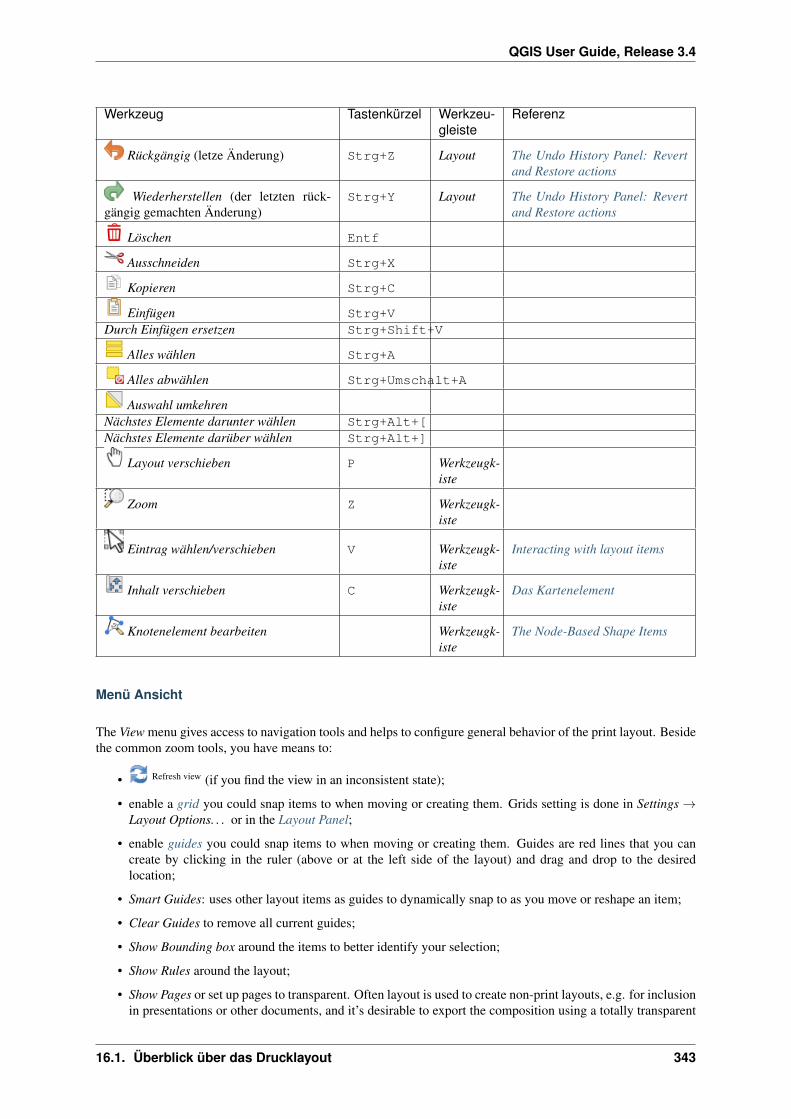
QGIS User Guide, Release 3.4
Werkzeug Tastenkürzel Werkzeu-gleiste
Referenz
Rückgängig (letze Änderung) Strg+Z Layout The Undo History Panel: Revertand Restore actions
Wiederherstellen (der letzten rück-gängig gemachten Änderung)
Strg+Y Layout The Undo History Panel: Revertand Restore actions
Löschen Entf
Ausschneiden Strg+X
Kopieren Strg+C
Einfügen Strg+VDurch Einfügen ersetzen Strg+Shift+V
Alles wählen Strg+A
Alles abwählen Strg+Umschalt+A
Auswahl umkehrenNächstes Elemente darunter wählen Strg+Alt+[Nächstes Elemente darüber wählen Strg+Alt+]
Layout verschieben P Werkzeugk-iste
Zoom Z Werkzeugk-iste
Eintrag wählen/verschieben V Werkzeugk-iste
Interacting with layout items
Inhalt verschieben C Werkzeugk-iste
Das Kartenelement
Knotenelement bearbeiten Werkzeugk-iste
The Node-Based Shape Items
Menü Ansicht
The View menu gives access to navigation tools and helps to configure general behavior of the print layout. Besidethe common zoom tools, you have means to:
• Refresh view (if you find the view in an inconsistent state);
• enable a grid you could snap items to when moving or creating them. Grids setting is done in Settings →Layout Options. . . or in the Layout Panel;
• enable guides you could snap items to when moving or creating them. Guides are red lines that you cancreate by clicking in the ruler (above or at the left side of the layout) and drag and drop to the desiredlocation;
• Smart Guides: uses other layout items as guides to dynamically snap to as you move or reshape an item;
• Clear Guides to remove all current guides;
• Show Bounding box around the items to better identify your selection;
• Show Rules around the layout;
• Show Pages or set up pages to transparent. Often layout is used to create non-print layouts, e.g. for inclusionin presentations or other documents, and it’s desirable to export the composition using a totally transparent
16.1. Überblick über das Drucklayout 343

QGIS User Guide, Release 3.4
background. It’s sometimes referred to as „infinite canvas“ in other editing packages.
In the print layout, you can change the zoom level using the mouse wheel or the slider and combo boxin the status bar. If you need to switch to pan mode while working in the layout area, you can hold theSpacebar or the mouse wheel. With Ctrl+Spacebar, you can temporarily switch to Zoom In mode, andwith Ctrl+Alt+Spacebar, to Zoom Out mode.
Panels and toolbars can be enabled from the View → menu. To maximise the space available to interact with a
composition you can check the View → Toggle Panel Visibility option or press Ctrl+Tab; all panels arehidden and only previously visible panels are restored when unchecked.
It’s also possible to switch to a full screen mode to have more space to interact with by pressing F11 or using
View → Toggle Full Screen.
Werkzeug Tastenkürzel Werkzeugleiste Referenz
Refresh F5 NavigationPreview →
Zoom In Ctrl++ Navigation
Zoom Out Ctrl+- Navigation
Zoom to 100% Ctrl+1 Navigation
Zoom Full Ctrl+0 NavigationZoom to Width
Show Grid Ctrl+' Guides and Grid
Snap to Grid Ctrl+Shift+' Guides and Grid
Show Guides Ctrl+; Guides and Grid
Snap to Guides Ctrl+Shift+; Guides and Grid
Smart Guides Ctrl+Alt+;Manage Guides. . . The Guides PanelClear Guides The Guides Panel
Show Rulers Ctrl+R
Show Bounding Boxes Ctrl+Shift+B
Show PagesToolbars → Bedienfelder und WerkzeugkästenPanels → Bedienfelder und Werkzeugkästen
Toggle Full Screen F11 Ansicht
Toggle Panel Visibility Ctrl+Tab Ansicht
Items menu
The Items helps you configure items‘ position in the layout and the relations between them (see Interacting withlayout items).
344 Chapter 16. Kartenlayout

QGIS User Guide, Release 3.4
Werkzeug Tastenkürzel Werkzeugleiste Referenz
Group Ctrl+G Actions Grouping items
Ungroup Ctrl+Shift+G Actions Grouping items
Raise Ctrl+] Actions Ausrichtung
Lower Ctrl+[ Actions Ausrichtung
Bring to Front Ctrl+Shift+] Actions Ausrichtung
Send to Back Ctrl+Shift+[ Actions Ausrichtung
Lock Selected Items Ctrl+L Actions Locking items
Unlock All Ctrl+Shift+L Actions Locking itemsAlign Items → Actions AusrichtungDistribute Items → Actions Moving and resizing itemsResize → Actions Moving and resizing items
Add Item menu
These are tools to create layout items. Each of them is deeply described in Layout Items chapter.
Werkzeug Werkzeugleiste Referenz
Add Map Werkzeugkiste Das Kartenelement
Add Picture Werkzeugkiste Das Bildelement
Add Label Werkzeugkiste Das Beschriftungselement
Add Legend Werkzeugkiste Das Legendenelement
Add Scale Bar Werkzeugkiste Das Maßstabselement
Add Shape → Werkzeugkiste The Regular Shape Item
Add Arrow Werkzeugkiste The Arrow Item
Add Node Item → Werkzeugkiste The Node-Based Shape Items
Add HTML Werkzeugkiste Das HTML-Rahmen Element
Add Attribute Table Werkzeugkiste Das Attributtabellenelement
16.1. Überblick über das Drucklayout 345

QGIS User Guide, Release 3.4
Atlas menu
Werkzeug Tastenkürzel Werkzeugleiste Referenz
Preview Atlas Ctrl+ALt+/ Atlas Preview and generate an atlas
First Feature Ctrl+< Atlas Preview and generate an atlas
Previous Feature Ctrl+, Atlas Preview and generate an atlas
Next Feature Ctrl+. Atlas Preview and generate an atlas
Last feature Ctrl+> Atlas Preview and generate an atlas
Print Atlas. . . Atlas Preview and generate an atlas
Export Atlas as Images. . . Atlas Preview and generate an atlas
Export Atlas as SVG. . . Atlas Preview and generate an atlas
Export Atlas as PDF. . . Atlas Preview and generate an atlas
Atlas Settings Atlas Einen Atlas erzeugen
Menü Einstellungen
The Settings → Layout Options. . . menu is a shortcut to Settings → Options → Layouts menu of QGIS maincanvas. Here, you can set some options that will be used as default on any new print layout:
• Layout defaults let you specify the default font to use;
• With Grid appearance, you can set the grid style and its color. There are three types of grid: Dots, Solidlines and Crosses;
• Grid and guide defaults defines spacing, offset and tolerance of the grid (see Guides and Grid for moredetails);
• Layout Paths: to manage list of custom paths to search print templates.
Contextual menus
Depending on where you right-click in the print layout dialog, you open a contextual menu with various features:
• Right-click on the menu bar or any toolbar and you get the list of layout panels and toolbars you can enableor disable in one-click.
• Right-click over a ruler and you can Show Guides, Snap to Guides, Manage Guides. . . opening theGuides panel or Clear Guides. It’s also possible to hide the rulers.
• Right-click in the print layout canvas and:
– You’ll be able to Undo and Redo recent changes, or Paste any copied item (only available if no item isselected).
– If you click over a page, you can additionally access the current Page Properties panel or RemovePage.
– If you click on a selected item then you can cut or copy it as well as open the Item Properties panel.
– If more than one item are selected, then you can either group them and/or ungroup if at least one groupis already in the selection.
• Right-click inside a text box or spinbox widget of any layout panel provides edit options to manipulate itscontent.
346 Chapter 16. Kartenlayout

QGIS User Guide, Release 3.4
The Layout Panel
In the Layout panel, you can define the global settings of your print layout.
Figure 16.3: Layout Settings in the Print Layout
General settings
In a print layout, you can use more than one map item. The Reference map selects the map item to be used as thelayout’s master map. The layout will use this map in any properties and variable calculating units or scale. Thisincludes exporting the print layout to georeferenced formats.
Guides and Grid
You can put some reference marks on your paper sheet to help you accurately place some items. These marks canbe:
• simple horizontal or vertical lines (called Guides) put at the position you want (see The Guides Panel forguides creation).
16.1. Überblick über das Drucklayout 347

QGIS User Guide, Release 3.4
• or regular Grid: a network of horizontal and vertical lines superimposed over the layout.
Settings like Grid spacing or Grid offset can be adjusted in this group as well as the Snap tolerance to use foritems. The tolerance is the maximum distance below which the mouse cursor is snapped to a grid or a guide, whilemoving, resizing or creating an item.
Whether grid or guides should be shown is set in View menu. There, you can also decide if they might be used tosnap layout items. When both a grid line and a guide line are within tolerance of a point, guides will always takeprecedence - since they have been manually set (hence, assumption that they have been explicitly placed at highlydesirable snapping locations, and should be selected over the general grid).
Bemerkung: In the Settings → Layout Options menu, you can also set the grid and guides parameters exposedabove. However, these options will only apply as defaults to new print layouts.
Exporteinstellungen
You can define a resolution to use for all exported maps in Export resolution. This setting can then be overriddeneach time you export a map.
Because of some advanced rendering options (blending mode, effects. . . ), a layout item may need rasterizationin order to be exported correctly. QGIS will individually rasterize it without forcing every other item to also berasterized. This allows printing or saving as PostScript or PDF to keep items as much as possible as vectors, e.g.a map item with layer opacity won’t force labels, scale bars, etc to be rasterized too. You can however:
• force all the items to be rasterized checking the Print as raster box;
• or use the opposite option, i.e. Always export as vectors, to force the export to keep items as vectors whenexported to a compatible format. Note that in some cases, this could cause the output to look different tolayout.
Where the format makes it possible (e.g., .TIF, .PDF) exporting a print layout results by default in a georef-erenced file (based on the Reference map item in the General settings group). For other formats, georeferenced
output requires you to generate a world file by checking Save world file. The world file is created besidethe exported map(s), has the name of the page output with the reference map item and contains information togeoreference it easily.
Resize layout to content
Using the Resize page tool in this group, you create a unique page composition whose extent covers the currentcontents of the print layout (with some optional margins around the cropped bounds).
Note that this behavior is different from the crop to content option in that all the items are placed on a real andunique page in replacement of all the existing pages.
Variables
The Variables lists all the variables available at the layout’s level (which includes all global and project’s variables).
It also allows the user to manage layout-level variables. Click the button to add a new custom layout-level
variable. Likewise, select a custom layout-level variable from the list and click the button to remove it.
More information on variables usage in the General Tools section.
348 Chapter 16. Kartenlayout

QGIS User Guide, Release 3.4
Figure 16.4: Variables Editor in the Print Layout
Working with the page properties
A layout can be composed of several pages. For instance, a first page can show a map canvas, and a second pagecan show the attribute table associated with a layer, while a third one shows an HTML frame linking to yourorganization website. Or you can add many types of items on each page.
Adding a new page
Futhermore, a layout can be made using different size and/or orientation of pages. To add a page, select theAdd Pages. . . tool from the Layout menu or Layout Toolbar. The Insert Pages dialog opens and you are asked tofill:
• the number of pages to insert;
• the position of the page(s): before or after a given page or at the end of the print layout;
• The Page size: it could be of a preset format page (A4, B0, Legal, Letter, ANSI A, Arch A and theirderivatives as well as a resolution type, such as 1920x1080 or 1024x768) with associated Orientation(Portrait or Landscape).
The page size can also be of a custom format; In that case, you’d need to enter its Width and Height (withlocked size ratio if needed) and select the unit to use among mm, cm, px, pt, in, ft. . . Conversion ofentered values is automatically applied when switching from one unit to another.
Figure 16.5: Creating a new page in the Print Layout
16.1. Überblick über das Drucklayout 349
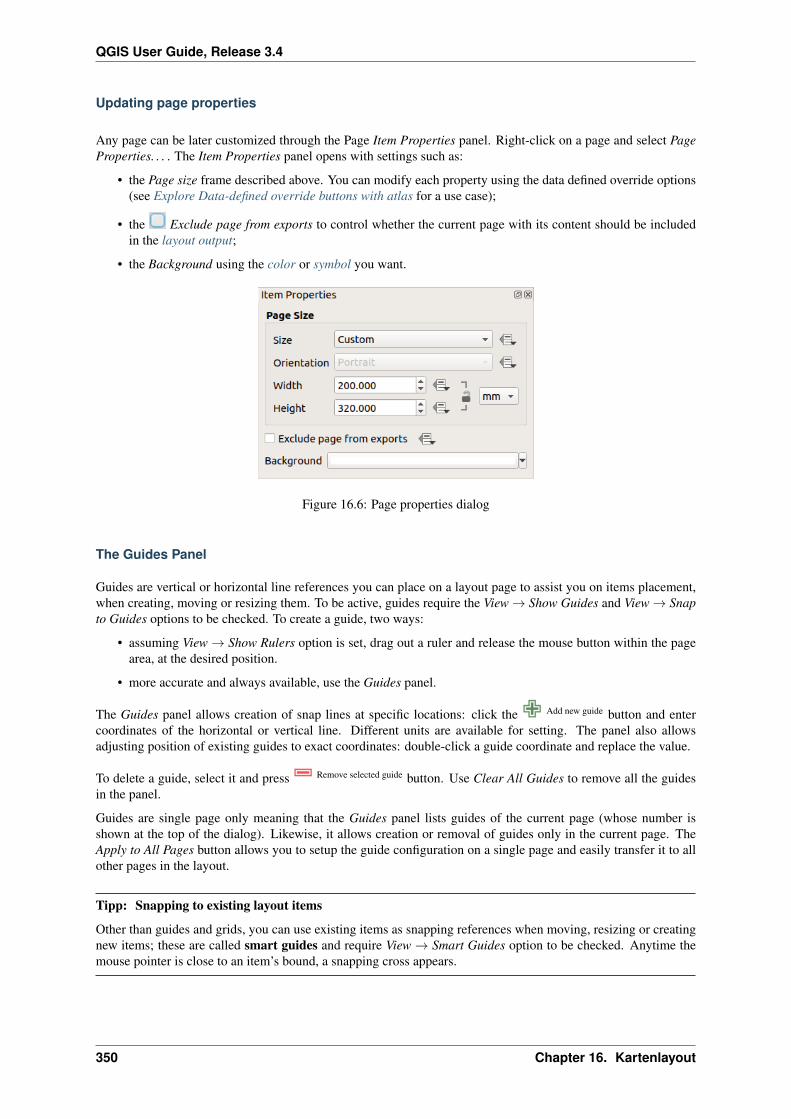
QGIS User Guide, Release 3.4
Updating page properties
Any page can be later customized through the Page Item Properties panel. Right-click on a page and select PageProperties. . . . The Item Properties panel opens with settings such as:
• the Page size frame described above. You can modify each property using the data defined override options(see Explore Data-defined override buttons with atlas for a use case);
• the Exclude page from exports to control whether the current page with its content should be includedin the layout output;
• the Background using the color or symbol you want.
Figure 16.6: Page properties dialog
The Guides Panel
Guides are vertical or horizontal line references you can place on a layout page to assist you on items placement,when creating, moving or resizing them. To be active, guides require the View → Show Guides and View → Snapto Guides options to be checked. To create a guide, two ways:
• assuming View → Show Rulers option is set, drag out a ruler and release the mouse button within the pagearea, at the desired position.
• more accurate and always available, use the Guides panel.
The Guides panel allows creation of snap lines at specific locations: click the Add new guide button and entercoordinates of the horizontal or vertical line. Different units are available for setting. The panel also allowsadjusting position of existing guides to exact coordinates: double-click a guide coordinate and replace the value.
To delete a guide, select it and press Remove selected guide button. Use Clear All Guides to remove all the guidesin the panel.
Guides are single page only meaning that the Guides panel lists guides of the current page (whose number isshown at the top of the dialog). Likewise, it allows creation or removal of guides only in the current page. TheApply to All Pages button allows you to setup the guide configuration on a single page and easily transfer it to allother pages in the layout.
Tipp: Snapping to existing layout items
Other than guides and grids, you can use existing items as snapping references when moving, resizing or creatingnew items; these are called smart guides and require View → Smart Guides option to be checked. Anytime themouse pointer is close to an item’s bound, a snapping cross appears.
350 Chapter 16. Kartenlayout

QGIS User Guide, Release 3.4
Figure 16.7: The Guides panel
The Items Panel
The Items panel offers some options to manage selection and visibility of items. All the items added to the printlayout canvas (including items group) are shown in a list and selecting an item makes the corresponding rowselected in the list as well as selecting a row does select the corresponding item in the print layout canvas. This isthus a handy way to select an item placed behind another one. Note that a selected row is shown as bold.
Für irgendein ausgewähltes Objekt, können Sie:
• set it visible or not;
• lock or unlock its position;
• sort its Z position. You can move up and down each item in the list with a click and drag. The upper itemin the list will be brought to the foreground in the print layout canvas. By default, a newly created item isplaced in the foreground.
• change the item ID by double-clicking the text;
• right-click an item and copy or delete it or open its properties panel.
Once you have found the correct position for an item, you can lock it by ticking the box in column. Lockeditems are not selectable on the canvas. Locked items can be unlocked by selecting the item in the Items panel andunchecking the tickbox or you can use the icons on the toolbar.
The Undo History Panel: Revert and Restore actions
During the layout process, it is possible to revert and restore changes. This can be done with the revert and restoretools available in the Edit menu, the Layout toolbar or the contextual menu any time you right-click in the printlayout area:
• Letzte Änderung zurücknehmen
16.1. Überblick über das Drucklayout 351

QGIS User Guide, Release 3.4
• Letzte Änderung wiederherstellen
This can also be done by mouse click within the Undo history panel (see figure_layout). The History panel liststhe last actions done within the print layout. Just select the point you want to revert to and once you do new actionall the actions done after the selected one will be removed.
Figure 16.8: Undo History in the Print Layout
16.2 Layout Items
16.2.1 Layout Items Common Options
QGIS provides a large set of items to layout a map. They can be of map, legend, scale bar, picture, table, northarrow, image type. . . They however share some common options and behavior that are exposed below.
Creating a layout item
Items can be created using different tools, either from scratch or based on existing items.
To create a layout item from scratch:
1. Select the corresponding tool either from the Add Item menu or the Toolbox bar.
2. Then:
• Click on the page and fill the size and placement information requested in the New Item Propertiesdialog that pops up (for details, see Position and Size);
Figure 16.9: New Item properties dialog
• Or click-and-drag to define the initial size and placement of the item. You can rely on grids and guidessnapping for a better position.
352 Chapter 16. Kartenlayout
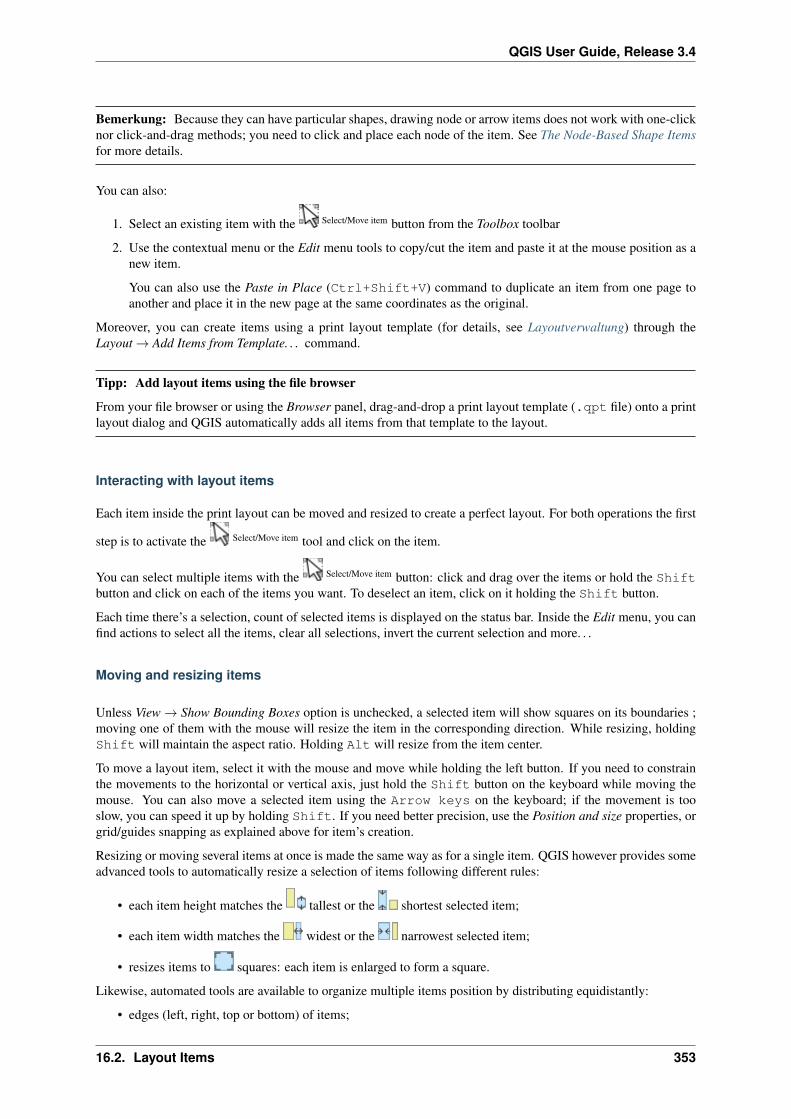
QGIS User Guide, Release 3.4
Bemerkung: Because they can have particular shapes, drawing node or arrow items does not work with one-clicknor click-and-drag methods; you need to click and place each node of the item. See The Node-Based Shape Itemsfor more details.
You can also:
1. Select an existing item with the Select/Move item button from the Toolbox toolbar
2. Use the contextual menu or the Edit menu tools to copy/cut the item and paste it at the mouse position as anew item.
You can also use the Paste in Place (Ctrl+Shift+V) command to duplicate an item from one page toanother and place it in the new page at the same coordinates as the original.
Moreover, you can create items using a print layout template (for details, see Layoutverwaltung) through theLayout → Add Items from Template. . . command.
Tipp: Add layout items using the file browser
From your file browser or using the Browser panel, drag-and-drop a print layout template (.qpt file) onto a printlayout dialog and QGIS automatically adds all items from that template to the layout.
Interacting with layout items
Each item inside the print layout can be moved and resized to create a perfect layout. For both operations the first
step is to activate the Select/Move item tool and click on the item.
You can select multiple items with the Select/Move item button: click and drag over the items or hold the Shiftbutton and click on each of the items you want. To deselect an item, click on it holding the Shift button.
Each time there’s a selection, count of selected items is displayed on the status bar. Inside the Edit menu, you canfind actions to select all the items, clear all selections, invert the current selection and more. . .
Moving and resizing items
Unless View → Show Bounding Boxes option is unchecked, a selected item will show squares on its boundaries ;moving one of them with the mouse will resize the item in the corresponding direction. While resizing, holdingShift will maintain the aspect ratio. Holding Alt will resize from the item center.
To move a layout item, select it with the mouse and move while holding the left button. If you need to constrainthe movements to the horizontal or vertical axis, just hold the Shift button on the keyboard while moving themouse. You can also move a selected item using the Arrow keys on the keyboard; if the movement is tooslow, you can speed it up by holding Shift. If you need better precision, use the Position and size properties, orgrid/guides snapping as explained above for item’s creation.
Resizing or moving several items at once is made the same way as for a single item. QGIS however provides someadvanced tools to automatically resize a selection of items following different rules:
• each item height matches the tallest or the shortest selected item;
• each item width matches the widest or the narrowest selected item;
• resizes items to squares: each item is enlarged to form a square.
Likewise, automated tools are available to organize multiple items position by distributing equidistantly:
• edges (left, right, top or bottom) of items;
16.2. Layout Items 353

QGIS User Guide, Release 3.4
• centers of items either horizontally or vertically.
Grouping items
Grouping items allows you to manipulate a set of items like a single one: you can easily resize, move, delete, copythe items as a whole.
To create a group of items, select more than one and press the Group button on the View menu or the Actionstoolbar or from the right-click menu. A row named Group is added to the Items panel and can be locked or hiddenlike any other Items panel’s object. Grouped items are not individually selectable on the canvas; use the Itemspanel for direct selection and access the item’s properties panel.
Locking items
Once you have found the correct position for an item, you can lock it by using the Lock selected items buttonin the View menu or the Actions toolbar or ticking the box next to the item in the Items panel. Locked items arenot selectable on the canvas.
Locked items can be unlocked by selecting the item in the Items panel and unchecking the tickbox or you can usethe icons on the toolbar.
Ausrichtung
Raising or lowering the visual hierarchy for elements are inside the Raise selected items pull-down menu. Choosean element on the print layout canvas and select the matching functionality to raise or lower the selected elementcompared to the other elements. This order is shown in the Items panel. You can also raise or lower objects in theItems panel by clicking and dragging an object’s label in this list.
Figure 16.10: Alignment helper lines in the print layout
354 Chapter 16. Kartenlayout

QGIS User Guide, Release 3.4
There are several alignment options available within the Align selected items pull-down menu (see fig-ure_layout_common_align). To use an alignment function, you first select the elements and then click on oneof the alignment icons:
• Align Left or Align Right;
• Align Top or Align Bottom;
• Align Center horizontally or Align Center Vertical.
All selected elements will then be aligned to their common bounding box. When moving items on the layoutcanvas, alignment helper lines appear when borders, centers or corners are aligned.
Items Common Properties
Layout items have a set of common properties you will find at the bottom of the Item Properties panel: Positionand size, Rotation, Frame, Background, Item ID, Variables and Rendering (See figure_layout_common).
Bemerkung: The Data defined override icon next to most of the options means that you can associate that propertywith a layer, features attributes, geometry or with any other layout item’s property, using expressions or variables.For more information see Datendefinierte Übersteuerung Setup.
• The Position and size group lets you define the size and position of the frame which contains the item (seePosition and Size for more information).
• Die Drehung stellt die Drehung des Elements (in Grad) ein.
• The Frame shows or hides the frame around the item. Click on the Color and Thickness and Join stylewidgets to adjust those properties.
• Use the Background color menu for setting a background color. Click on the [Color. . . ] button to display adialog where you can pick a color or choose from a custom setting. Transparency can be adjusted throughaltering the alpha field settings.
• Use the Item ID to create a relationship to other print layout items. This is used with QGIS server and otherpotential web clients. You can set an ID on an item (for example, a map or a label), and then the web clientcan send data to set a property (e.g., label text) for that specific item. The GetProjectSettings command willlist the items and IDs which are available in a layout.
• Rendering mode helps you set whether and how the item can be displayed: you can, for instance, applyblending mode, adjust the opacity of the item or Exclude item from exports.
Position and Size
Extending the features of the New Item Properties dialog with data-defined capabilities, this group allows you toplace the items accurately.
• the actual number of the page to place the item on;
• the reference point of the item;
• the X and Y coordinates of the Reference point of the item on the chosen page. The ratio between these
values can be locked by clicking on the button. Changes made to a value using the widget or theSelect/Move item tool will be reflected in both of them;
• the Width and Height of the item bounding box. As for coordinates, the ratio between width and height canbe locked.
16.2. Layout Items 355

QGIS User Guide, Release 3.4
Figure 16.11: Common Item Properties groups
Figure 16.12: New Item properties dialog
356 Chapter 16. Kartenlayout

QGIS User Guide, Release 3.4
Darstellung
QGIS allows advanced rendering for layout items just like vector and raster layers.
Figure 16.13: Darstellung
• Mischmodus: Sie können spezielle Darstellungseffekte mit diesen Tools, die Sie vorher vielleicht nur vonGrafikprogrammen kannten, erzielen. Die Pixel Ihrer oben liegenden und darunterliegenden Elemente wer-den durch den unten beschriebenen Modus gemischt (siehe Mischmodi für Beschreibungen jeden Effekts).
• Transparency : You can make the underlying item in the layout visible with this tool.Use the slider to adapt the visibility of your item to your needs. You can also make a precise definition ofthe percentage of visibility in the menu beside the slider.
• Element aus Export ausnehmen: Sie können sich entschließen ein Element in allen Exporten nichtsichtbar zu machen. Nach dem Aktivieren dieses Kontrollkästchens wird das Element nicht in PDF’s,Drucken etc. enthalten sein
Variables
The Variables lists all the variables available at the layout item’s level (which includes all global, project andcomposition’s variables). Map items also include Map settings variables that provide easy access to values likethe map’s scale, extent, and so on.
In Variables, it’s also possible to manage item-level variables. Click the button to add a new custom variable.
Likewise, select any custom item-level variable from the list and click the button to remove it.
More information on variables usage in the Storing values in Variables section.
16.2.2 Das Kartenelement
The map item is the main frame that displays the map you’ve designed in the map canvas. Use the Add Maptool following items creation instructions to add a new map item that you can later manipulate the same way asexposed in Interacting with layout items.
By default, a new map item shows the current status of the map canvas with its extent and visible layers. Youcan customize it thanks to the Item Properties panel. Other than the items common properties, this feature has thefollowing functionalities:
Haupteigenschaften
In the Main properties group (see figure_layout_map) of the map Item Properties panel, available options are:
• The Update Preview button to refresh the map item rendering if the view in map canvas has been modified.Note that most of the time, the map item refresh is automatically triggered by the changes;
• The Scale to manually set the map item scale;
16.2. Layout Items 357

QGIS User Guide, Release 3.4
Figure 16.14: Map Item Properties Panel
358 Chapter 16. Kartenlayout

QGIS User Guide, Release 3.4
• The Map rotation allows you to rotate the map item content clockwise in degrees. The rotation of the mapcanvas can be imitated here;
• The CRS allows you to display the map item content in any CRS. It defaults to Use project CRS;
• Draw map canvas items lets you show in the print layout annotations that are placed on the main mapcanvas.
Layers
By default, map item appearance is synced with the map canvas rendering meaning that toggling visibility of thelayers or modifying their style in the Layers Panel is automatically applied to the map item. Because, like anyother item, you may want to add multiple map items to a print layout, there’s a need to break this synchronizationin order to allow showing different areas, layer combinations, at different scales. . . The Layers properties group(see figure_layout_map_layers) helps you do that.
Figure 16.15: Map Layers group
If you want to keep the map item consistent with an existing map theme, check Follow map theme and selectthe desired theme in the drop-down list. Any changes applied to the theme in QGIS‘ main window (using thereplace theme function) will automatically affect the map item. If a map theme is selected, the Lock styles forlayers option is disabled because Follow map theme also updates the style (symbology, labels, diagrams) of thelayers.
To lock the layers shown in a map item to the current map canvas visibility, check Lock layers. When thisoption is enabled, any changes on the layers‘ visibility in QGIS‘ main window will not affect the layout’s mapitem. Nevertheless, style and labels of locked layers are still refreshed according to QGIS‘ main window. You canprevent this by using Lock styles for layers.
Instead of using the current map canvas, you can also lock the layers of the map item to those of an existing
map theme: select a map theme from the Set layer list from a map theme drop-down button, and the Lock layers isactivated. The set of visible layers in the map theme is from now on used for the map item until you select another
map theme or uncheck the Lock layers option. You then may need to refresh the view using the Refresh view
button of the Navigation toolbar or the Update Preview button seen above.
Note that, unlike the Follow map theme option, if the Lock layers option is enabled and set to a map theme, thelayers in the map item will not be refreshed even if the map theme is updated (using the replace theme function)in QGIS‘ main window.
Locked layers in the map item can also be data-defined, using the icon beside the option. When used, thisoverrides the selection set in the drop-down list. You need to pass a list of layers separated by | character. Thefollowing example locks the map item to use only layers layer 1 and layer 2:
concat ('layer 1', '|', 'layer 2')
16.2. Layout Items 359

QGIS User Guide, Release 3.4
Ausdehnung
The Extents group of the map item properties panel provides the following functionalities (see fig-ure_layout_map_extents):
Figure 16.16: Map Extents group
The Extents area displays X and Y coordinates of the area shown in the map item. Each of these values canbe manually replaced, modifying the map canvas area displayed and/or map item size. Clicking the Set to MapCanvas Extent button sets the extent of the layout map item to the extent of the main map canvas. The button ViewExtent in Map Canvas does exactly the opposite; it updates the extent of the main map canvas to the extent of thelayout map item.
You can also alter a map item extent using the Move item content tool: click-and-drag within the map item to
modify its current view, keeping the same scale. With the tool enabled, use the mouse wheel to zoom in orout, modifying the scale of the shown map. Combine the movement with Ctrl key pressed to have a smallerzoom.
Controlled by atlas
The Controlled by atlas group properties is available only if an atlas is active in the print layout. Check thisoption if you want the map item being ruled by the atlas; when iterating over the coverage layer, the map itemextent is panned/zoomed to the atlas feature following:
• Margin around features: zooms to the feature at the best scale, keeping around each a margin repre-senting a percentage of the map item width or height. The margin can be the same for all features or setvariable, e.g., depending on map scale;
• Predefined scale (best fit): zooms to the feature at the project predefined scale where the atlas featurebest fits;
• Fixed scale: atlas features are panned from one to another, keeping the same scale of the map item.Ideal when working with features of same size (e.g., a grid) or willing to highlight size differences amongatlas features.
Gitter
With grids, you can add, over your map, information relative to its extent or coordinates, either in the map itemprojection or a different one. The Grids group provides the possibility to add several grids to a map item.
• With the and buttons you can add or remove a selected grid;
360 Chapter 16. Kartenlayout

QGIS User Guide, Release 3.4
• With the and buttons you can move up and down a grid in the list, hence move it on top or bottomof another one, over the map item.
Double-click the added grid to rename it.
Figure 16.17: Kartengitterdialog
After you add a grid, you can activate the checkbox Draw grid to allow overlaying the grid onto the map item.Press the Modify Grid. . . button to access configuration options.
Grid Appearance
As grid type, you can specify to use a:
• Solid: shows a line across the grid frame. The Line style can be customized using color and symbol selectorwidget;
• Cross: displays segment at the grid lines intersection for which you can set the Line style and the Crosswidth;
• Markers: only displays customizable markers symbol at grid lines intersection;
• or Frame and annotations only.
Other than the grid type, you can define:
• the CRS which could not be the same as the map item’s;
• the Interval between two consecutive grid references in X and Y directions;
• the Interval Units to use for the grid references, in Map units, Millimeters or Centimeters;
• an Offset from the map item edges, in X and Y directions;
• and the Blend mode of the grid (see Mischmodi) when compatible.
Grid Frame
There are different options to style the frame that holds the map. Following options are available: NoFrame, Zebra, Interior ticks, Exterior ticks, Interior and Exterior ticks and Lineborder. Also you can choose to set visible or not each side of the grid frame.
When compatible, it’s possible to set the Frame size, Frame line thickness, Frame fill colors. With Latitude/Yonly and Longitude/X only settings in the divisions section you have the possibility to prevent a mix oflatitude/Y and longitude/X coordinates showing on a side when working with rotated maps or reprojected grids.
16.2. Layout Items 361

QGIS User Guide, Release 3.4
Figure 16.18: Gitter zeichnen Dialog
Figure 16.19: Gitterrahmendialog
362 Chapter 16. Kartenlayout

QGIS User Guide, Release 3.4
Coordinates
The Draw coordinates checkbox allows you to add coordinates to the map frame. You can choose the an-notation numeric format, the options range from decimal to degrees, minute and seconds, with or without suffix,aligned or not and a custom format using the expression dialog.
You can choose which annotation to show. The options are: show all, latitude only, longitude only, or dis-able(none). This is useful when the map is rotated. The annotation can be drawn inside or outside the map frame.The annotation direction can be defined as horizontal, vertical ascending or vertical descending.
Finally, you can define the annotation font, font color, distance from the map frame and the precision of the drawncoordinates.
Figure 16.20: Gitter-Koordinaten-Zeichnen-Dialog
Übersichten
Sometimes you may have more than one map in the print layout and would like to locate the study area of one mapitem on another one. This could be for example to help map readers identify the area in relation with its largergeographic context shown in the second map.
The Overviews group of the map panel helps you create the link between two different maps extent and providesthe following functionalities:
16.2. Layout Items 363

QGIS User Guide, Release 3.4
Figure 16.21: Map Overviews group
To create an overview, select the map item on which you want to show the other map item’s extent and expand the
Overviews option in the Item Properties panel. Then press the button to add an overview.
Initially this overview is named ‚Overview 1‘ (see Figure_layout_map_overview). You can:
• Rename it with a double-click;
• With the and buttons, add or remove overviews;
• With the and buttons, move up and down an overview in the list, hence move it on top or bottom ofanother one, over the map item.
Then select the overview item in the list and check the Draw „<name_overview>“ overview to enable theoverview drawing over the selected map frame. You can customize it with:
• Die Übersichtsrahmen Auswahlliste verweist auf das Kartenelement, dessen Ausmaße auf das aktuelleKartenelement gezeichnet werden.
• Der Rahmenstil ermöglicht es Ihnen die Übersichtsrahmenfarbe zu ändern.
• Der Mischmodus ermöglicht verschiedene Transparenzmischmodi einzustellen.
• Übersicht invertieren erstellt eine Maske um die Ausmaße wenn es aktiviert ist: die referenzierte Karte-nausmaße werden deutlich angezeigt, währenddessen alles andere mit einer Rahmenkarte ausgeblendetwird.
• Auf Übersicht zentrieren setzt die Ausmaße des Übersichtsrahmens in die Mitte der Übersichtskarte. Siekönnen nur eine Übersicht zum Zentrieren aktivieren wenn Sie mehrere Übersichten hinzugefügt haben.
16.2.3 Das Beschriftungselement
The Label item is a tool that helps decorate your map with texts that would help to understand it; it can be the title,
author, data sources or any other information. . . You can add a label with the Add Label tool following itemscreation instructions and manipulate it the same way as exposed in Interacting with layout items.
364 Chapter 16. Kartenlayout

QGIS User Guide, Release 3.4
By default, the label item provides a default text that you can customize using its Item Properties panel. Otherthan the items common properties, this feature has the following functionalities (see figure_layout_label):
Figure 16.22: Label Item Properties Panel
Haupteigenschaften
The Main properties group is the place to provide the text (it can be in HTML) or the expression to build the label.Expressions need to be surrounded by [% and %] in order to be interpreted as such.
• Beschriftungen können als HTML-Code interpretiert werden: aktivieren Sie Als HTML darstellen. Siekönnen jetzt eine URL, ein klickbares Bild, das zu einer Webseite führt oder etwas komplexeres eingeben.
• You can also use expressions: click on Insert an expression button, write your formula as usual and whenthe dialog is applied, QGIS automatically adds the surrounding characters.
Bemerkung: Clicking the Insert an Expression button when no selection is made in the textbox will append thenew expression to the existing text. If you want to update an existing text, you need to select it the part of interestbeforehand.
You can combine HTML rendering and expressions, leading to e.g. a text like:
[% '<b>Check out the new logo for ' || '<a href="https://www.qgis.org" title="Nice→˓logo" target="_blank">QGIS ' ||@qgis_short_version || '</a>' || ' : <img src=→˓"https://qgis.org/en/_downloads/qgis-icon128.png" alt="QGIS icon"/>' %]
which will render: Check out the new logo for QGIS 3.0 :
16.2. Layout Items 365

QGIS User Guide, Release 3.4
Darstellung
• Define Font by clicking on the Font. . . button or a Font color by pushing the color widget.
• You can specify different horizontal and vertical margins in mm. This is the margin from the edge of thelayout item. The label can be positioned outside the bounds of the label e.g. to align label items with otheritems. In this case you have to use negative values for the margin.
• Using the text alignment is another way to position your label. It can be:
– Left, Center, Right or Justify for Horizontal alignment
– and Top, Middle, Bottom for Vertical alignment.
Exploring expressions in a label item
Below some examples of expressions you can use to populate the label item with interesting information - re-member that the code, or at least the calculated part, should be surrounded by [% and %] in the Main propertiesframe:
• Display a title with the current atlas feature value in „field1“:
'This is the map for ' || "field1"
or, written in the Main properties section:
This is the map for [% "field1" %]
• Add a pagination for processed atlas features (eg, Page 1/10):
concat( 'Page ', @atlas_featurenumber, '/', @atlas_totalfeatures )
• Return the X coordinate of the bottom left corner of a map canvas:
x_min( map_get( item_variables( 'Map 1' ), 'map_extent' ) )
• Retrieve the name of the layers in the current layout ‚Map 1‘ item, and formats in one name by line:
array_to_string(array_foreach(
map_get( item_variables( 'Map 1' ), 'map_layers' ), -- retrieve the layers→˓list
layer_property( @element, 'name' ) -- retrieve each layer name),'\n' -- converts the list to string separated by breaklines
)
16.2.4 Das Legendenelement
The Legend item is a box or a table that explains the meanings of the symbols used on the map. A legend is
then bound to a map item. You can add a legend item with the Add Legend tool following items creationinstructions and manipulate it the same way as exposed in Interacting with layout items.
By default, the legend item displays all available layers and can be refined using its Item Properties panel. Otherthan the items common properties, this feature has the following functionalities (see figure_layout_legend):
Haupteigenschaften
The Main properties group of the legend Item Properties panel provides the following functionalities (see fig-ure_layout_legend_ppt):
366 Chapter 16. Kartenlayout

QGIS User Guide, Release 3.4
Figure 16.23: Legend Item Properties Panel
Figure 16.24: Legend Main properties group
16.2. Layout Items 367

QGIS User Guide, Release 3.4
In den Haupteigenschaften können Sie:
• change the title of the legend. It can be made dynamic using the data-defined override setting, useful forexample when generating atlas;
• set the Title alignment to Left, Center or Right;
• choose which Map item the current legend will refer to;
• wrap the text of the legend on a given character: each time the character appears, it’s replaced by a linebreak;
• use Resize to fit contents to control whether or not a legend should be automatically resized to fit itscontents. If unchecked, then the legend will never resize and instead just stick to whatever size the user hasset. Any content which doesn’t fit the size is cropped out.
Legendenelemente
The Legend items group of the legend Item Properties panel provides the following functionalities (see fig-ure_layout_legend_items):
Figure 16.25: Legend Items group
• Die Legende wird automatisch geupdatet wenn Automatisch aktualisieren aktiviert ist. Wenn Automa-tisch aktualisieren deaktiviert ist gibt dieses mehr Kontrolle über die Legendenelemente. Die Icons unterden Legendenelementenliste werden aktiviert.
• Das Legendenelementfenster führt alle Legendenelement auf und Sie können die Elementreihenfolge än-dern, Layer gruppieren und Elemente in der Liste wiederherstellen, Namen bearbeiten und einen Filterhinzufügen.
– The item order can be changed using the and buttons or with ‚drag-and-drop‘ functionality.The order can not be changed for WMS legend graphics.
– Use the button to add a legend group.
– Use the button to add layers and button to remove groups, layers or symbol classes.
368 Chapter 16. Kartenlayout

QGIS User Guide, Release 3.4
– The button is used to edit the layer, group name or title. First you need to select the legend item.Double-clicking the item also opens the text box to rename it.
– The button adds a feature count for each class of vector layer.
– With the Filter legend by map content button, only the legend items visible in the map will be listed in the
legend. This tool remains available when Auto-update is active.
– The Filter legend by expression helps you filter which of the legend items of a layer will be displayed, i.e.using a layer that has different legend items (e.g., from a rule-based or categorized symbology), youcan specify a boolean expression to remove from the legend tree, styles that have no feature satisfyinga condition. Note that the features are nevertheless kept and shown in the layout map item.
While the default behavior of the legend item is to mimic the Layers panel tree, displaying the same groups,layers and classes of symbology, right-click any item offers you options to hide layer’s name or raise it as agroup or subgroup. In case you have made some changes to a layer, you can revert them by choosing Resetto defaults from the contextual menu.
After changing the symbology in the QGIS main window, you can click on Update All to adapt the changesin the legend element of the print layout.
• While generating an atlas with polygon features, you can filter out legend items that lie outside the current
atlas feature. To do that, check the Only show items inside current atlas feature option.
Schriftarten, Spalten, Symbol
The Fonts, Columns and Symbol groups of the legend Item Properties panel provide the following functionalities(see figure_layout_legend_fonts):
• You can change the font of the legend title, group, subgroup and item (feature) in the legend item using thefont selector widget;
• You provide the labels with a Color using the color selector widget. The selected color will apply to allfont items in the legend;
• Legend items can be arranged over several columns. Set the number of columns in the Count field.This value can be made dynamic e.g., following atlas features, legend contents, the frame size. . .
– Gleiche Spaltenbreite stellt ein, wie Legendenspalten angepasst werden sollen.
– Die Layer aufteilen Option ermöglicht es eine kategorisierte oder abgestufte Layerlegende in Spal-ten aufzuteilen.
• You can also change the width and height of the legend symbol, set a color and a thickness in case of rasterlayer symbol.
WMS-LegendGraphic und Zwischenräume
The WMS LegendGraphic and Spacing groups of the legend Item Properties panel provide the following function-alities (see figure_layout_legend_wms):
When you have added a WMS layer and you insert a legend item, a request will be sent to the WMS server toprovide a WMS legend. This Legend will only be shown if the WMS server provides the GetLegendGraphiccapability. The WMS legend content will be provided as a raster image.
WMS LegendGraphic wird verwendet um die Legendenbreite und die Legendenhöhe des WMS Lengendenraster-bildes anzupassen.
Spacing around title, group, subgroup, symbol, icon label, box, column or line can be customized through thisdialog.
16.2. Layout Items 369

QGIS User Guide, Release 3.4
Figure 16.26: Legend Fonts, Columns and Symbol groups
Figure 16.27: WMS LegendGraphic and Spacing groups
370 Chapter 16. Kartenlayout

QGIS User Guide, Release 3.4
16.2.5 Das Maßstabselement
Scale bars provide a visual indication of the size of features, and distance between features, on the map item. A
scale bar item requires a map item. Use the Add Scale Bar tool following items creation instructions to add anew scale bar item that you can later manipulate the same way as exposed in Interacting with layout items.
By default, a new scale bar item shows the scale of the most recently added map item. You can customize it thanksto the Item Properties panel. Other than the items common properties, this feature has the following functionalities(see figure_layout_scalebar):
Figure 16.28: Scale Bar Item Properties Panel
Haupteigenschaften
The Main properties group of the scale bar Item Properties panel provides the following functionalities (seefigure_layout_scalebar_ppt):
Figure 16.29: Scale Bar Main properties group
• Wählen Sie zuerst die Karte aus, an der der Maßstab befestigt werden soll.
• Wählen Sie dann den Stil des Maßstabs. Sechs Stile stehen zur Verfügung:
– Single box and Double box styles, which contain one or two lines of boxes alternating colors;
– Middle, Up or Down line ticks;
– Numerisch, wobei das Maßstabsverhältnis gedruckt wird (z.B. 1:50000).
16.2. Layout Items 371

QGIS User Guide, Release 3.4
Einheiten und Segmente
The Units and Segments groups of the scale bar Item Properties panel provide the following functionalities (seefigure_layout_scalebar_units):
Figure 16.30: Scale Bar Units and Segments groups
In these two groups, you can set how the scale bar will be represented.
• Select the units you want to use with Scalebar units. There are many possible choices: Map Units (thedefault one), Meters, Feet, Miles or Nautical Miles. . . which may force unit conversions.
• The Label unit multiplier specifies how many scale bar units per labeled unit. Eg, if your scale bar units areset to „meters“, a multiplier of 1000 will result in the scale bar labels in „kilometers“.
• The Label for units field defines the text used to describe the units of the scale bar, eg m or km. This shouldbe matched to reflect the multiplier above.
• Sie können definieren wie viele Segmente links und rechts vom Maßstab gezeichnet werden.
• You can set how long each segment will be (Fixed width), or limit the scale bar size in mm with Fit segmentwidth option. In the latter case, each time the map scale changes, the scale bar is resized (and its labelupdated) to fit the range set.
• Höhe wird benutzt, um die Höhe der Leiste einzustellen.
Anzeigen
The Display group of the scale bar Item Properties panel provides the following functionalities (see fig-ure_layout_scalebar_display):
Sie können festlegen wie der Maßstab in seinem Rahmen darsgestell wird.
• Rahmenrand: Zwischenraum zwischen Text- und Rahmengrenzen
• Labels margin : space between text and scale bar drawing
• Linienbreite: Linienbreite der Maßstabsdarstellung
372 Chapter 16. Kartenlayout

QGIS User Guide, Release 3.4
Figure 16.31: Scale Bar Display group
• Join style : Corners at the end of scale bar in Bevel, Miter or Round style (only available for Scale bar styleSingle Box & Double Box)
• Endenstil: Das Ende aller Linien im Stil Quadratisch, Rund Flach (nur erhältlich für die MaßstabsstileLinieneinteilung Oben, Unten und Mittig)
• Ausrichtung: Setzt Text auf auf die linke, mittlere oder rechte Seite des Rahmens (funktioniert nur für denMaßsstabsstil Numerisch)
Schriftarten und Farben
The Fonts and colors group of the scale bar Item Properties panel provides the following functionalities (seefigure_layout_scalebar_fonts):
Figure 16.32: Scale Bar Fonts and colors groups
You can define the fonts and colors used for the scale bar.
• Use the Font button to set the font of scale bar label
• Schriftfarbe: setzen Sie die Schriftfarbe
• Füllfarbe: setzen Sie die erste Füllfarbe
• Zweite Füllfarbe: setzen Sie die zweite Füllfarbe
• Line color: set the color of the lines of the Scale Bar
Fill colors are only used for Single Box and Double Box styles.
16.2. Layout Items 373

QGIS User Guide, Release 3.4
16.2.6 Das Attributtabellenelement
Any layer in the project can have its attributes shown in the print layout. You can use this to decorate and explain
your map with information about underlying data. Use the Add Attribute Table tool following items creationinstructions to add a new map item that you can later manipulate the same way as exposed in Interacting withlayout items.
By default, a new attribute table item loads first rows of the first (alphabetically sorted) layer, with all the fields.You can however customize the table thanks to its Item Properties panel. Other than the items common properties,this feature has the following functionalities (see figure_layout_table):
Figure 16.33: Attribute table Item Properties Panel
Haupteigenschaften
The Main properties group of the attribute table provides the following functionalities (see fig-ure_layout_table_ppt):
Figure 16.34: Attribute table Main properties Group
• For Source you can by default only select Layer features allowing you to select a Layer from the vectorlayers loaded in the project.
The data-defined override button near the layer list allows you to dynamically change the layer which is usedto populate the table, e.g. you could fill the attribute table with different layer attributes per atlas page. Note
374 Chapter 16. Kartenlayout

QGIS User Guide, Release 3.4
that the table structure used (column settings) is the one of the layer shown in the Layer drop-down list andit is left intact, meaning that setting a data defined table to a layer with different field(s) will result in emptycolumn(s) in the table.
In case you activate the Generate an atlas option in the Atlas panel (see Einen Atlas erzeugen), there aretwo additional Source possible:
– Current atlas feature (see figure_layout_table_atlas): you won’t see any option to choose the layer,and the table item will only show a row with the attributes from the current feature of the atlas coveragelayer.
– and Relation children (see figure_layout_table_relation): an option with the relation names will showup. This feature can only be used if you have defined a relation using your atlas coverage layer asparent, and the table will show the children rows of the atlas coverage layer’s current feature.
• The button Refresh Table Data can be used to refresh the table when the actual contents of the table haschanged.
Figure 16.35: Attribute table Main properties for ‚Current atlas feature‘
Figure 16.36: Attribute table Main properties for ‚Relation children‘
• The button Attributes. . . starts the Select Attributes dialog, (see figure_layout_table_select) that can be usedto change the visible contents of the table. The upper part of the window shows the list of the attributes todisplay and the lower part helps you sort the data.
Im Spalten Abschnitt können Sie:
– Move attributes up or down the list by selecting the rows and then using the and buttons toshift the rows. Multiple rows can be selected and moved at any one time.
– Add an attribute with the button. This will add an empty row at the bottom of the table where youcan select a field to be the attribute value or create an attribute via a regular expression.
– Remove an attribute with the button. Multiple rows can be selected and removed at any one time.
– Reset the attribute table back to its default state with the Reset button.
– Clear the table using the Clear button. This is useful when you have a large table but only want toshow a small number of attributes. Instead of manually removing each row, it may be quicker to clearthe table and add the rows needed.
– Cell headings can be altered by adding the custom text in the Heading column.
– Cell alignment can be managed with the Alignment column which will dictate the texts position withinthe table cell.
16.2. Layout Items 375

QGIS User Guide, Release 3.4
Figure 16.37: Attribute table Select attributes Dialog
– Cell width can be manually managed by adding custom values to the width column.
Im Sortierung Abschnitt können Sie:
– Add an attribute to sort the table with. Select an attribute and set the sorting order to Ascending or
Descending and press the button. A new line is added to the sort order list.
– select a row in the list and use the and buttons to change the sort priority on attribute level.Selecting a cell in the Sort Order column helps you change the sorting order of the attribute field.
– use the button to remove an attribute from the sort order list.
Objektfiltrierung
The Feature filtering group of the attribute table provides the following functionalities (see fig-ure_layout_table_filter):
Sie können:
• Die Maximalen Zeilen , die dargestellt werden sollen, definieren.
• Doppelte Zeilen aus der Tabelle entfernen aktivieren um nur eindeutige Datensätze zu zeigen.
• Activate Show only visible features within a map and select the corresponding Linked map whose visiblefeatures attributes will be displayed.
• Activate Show only features intersecting Atlas feature is only available when Generate an atlas isactivated. When activated it will show a table with only the features which intersect the current atlas feature.
• Aktivieren Sie Filtern nach und schaffen Sie einen Filter indem Sie eine Eingabezeile eingeben odereinen regulären Ausdruck über den gegebenen Ausdrucksknopf einfügen. Einige Beispiele von Filteran-
376 Chapter 16. Kartenlayout

QGIS User Guide, Release 3.4
Figure 16.38: Attribute table Feature filtering Group
weisungen, die Sie verwenden können wenn Sie den airports Layer aus dem Beispieldatensatz geladenhaben
– ELEV > 500
– NAME = 'ANIAK'
– NAME NOT LIKE 'AN%'
– regexp_match( attribute( $currentfeature, 'USE' ) , '[i]')
Der letzte reguläre Ausdruck wird nur die Flughäfen einfügen die einen Buchstaben ‚i‘ in der Attributspalte‚USE‘ haben.
Darstellung
The Appearance group of the attribute table provides the following functionalities (see fig-ure_layout_table_appearance):
Figure 16.39: Attribute table appearance Group
• Klicken Sie Zeige leere Zeilen um die Attributtabelle mit leeren Zellen zu füllen, diese Option kannauch verwendet werden um zusätzliche leere Zellen zu schaffen, wenn Sie ein Ergebnis anzeigen wollen!
• Mit Zellenränder können Sie die Ränder um den Text in jeder Zelle der Tabelle definieren.
16.2. Layout Items 377

QGIS User Guide, Release 3.4
• Mit Kopf anzeigen können Sie von einer Liste eine der voreingestellten Optionen ‚Im ersten Rahmen‘, ‚Inallen Rahmen‘ oder ‚Kein Kopf‘ auswählen.
• Die Option Leere Tabellen kontrolliert was dargestellt wird wenn die Ergebnisauswahl leer ist.
– Nur Kopf zeichnen zeichnet nur den Kopf ausser Sie haben ‚Kein Kopf‘ bei Kopf anzeigen aus-gewählt.
– Ganze Tabelle ausblenden zeichnet nur den Hintergrund der Tabelle. Sie können Hintergrundnicht anzeigen wenn Rahmen leer ist in Rahmen aktivieren um die Tabelle komplett auszublenden.
– Eingestellte Nachricht anzeigen zeichnet den Kopf und fügt eine Zelle ein, die sich über alle Spaltenerstreckt und eine Nachricht wie ‚Kein Ergebnis‘ kann in der Option Anzuzeigende Nachricht bereit-gestellt werden
• Die Option Anzuzeigende Nachricht ist nur aktiviert wenn Sie Eingestellte Nachricht anzeigen bei LeereTabelle gewählt haben. Die angegebene Nachricht wird in der Tabelle in der ersten Zeile gezeigt wenn dasErgebnis eine leere Tabelle ist.
• With Background color you can set the background color of the table using the color selector widget.The Advanced customization option helps you define different background colors for each cell (see fig-ure_layout_table_background)
Figure 16.40: Attribute table Advanced Background Dialog
• Mit der :gui-Label:‘Wrap Text on‘ Option können Sie ein Zeichen definieren, auf dem der Zellinhalt wirdeingewickelt wird, jedes Mal, wenn er erfüllt ist
• With Oversized text you define the behavior when the width set for a column is smaller than its content’slength. It can be Wrap text or Truncate text.
Gitter anzeigen
The Show grid group of the attribute table provides the following functionalities (see figure_layout_table_grid):
• Activate Show grid when you want to display the grid, the outlines of the table cells. You can also selectto either Draw horizontal lines or Draw vertical lines or both.
378 Chapter 16. Kartenlayout

QGIS User Guide, Release 3.4
Figure 16.41: Attribute table Show grid Group
• Mit Strichbreite können Sie die Dicke der Linien, die im Gitter verwendet werden, festlegen.
• The Color of the grid can be set using the color selection widget.
Schrift- und Textgestaltung
The Fonts and text styling group of the attribute table provides the following functionalities (see fig-ure_layout_table_fonts):
Figure 16.42: Attribute table Fonts and text styling Group
• You can define Font and Color for Table heading and Table contents, using font and color selector widgets.
• For Table heading you can additionally set the Alignment to Follow column alignment or overridethis setting by choosing Left, Center or Right. The column alignment is set using the Select Attributesdialog (see figure_layout_table_select ).
Rahmen
The Frames group of the attribute table properties provides the following functionalities (see fig-ure_layout_table_frames):
• Mit dem Größenmodus können Sie auswählen wie der Inhalt der Attributtabelle gerendert wird:
– Use existing frames displays the result in the first frame and added frames only.
– Extend to next page will create as many frames (and corresponding pages) as necessary todisplay the full selection of attribute table. Each frame can be moved around on the layout. If youresize a frame, the resulting table will be divided up between the other frames. The last frame will betrimmed to fit the table.
– Repeat until finished will also create as many frames as the Extend to next page option,except all frames will have the same size.
16.2. Layout Items 379

QGIS User Guide, Release 3.4
Figure 16.43: Attribute table Frames Group
• Use the Add Frame button to add another frame with the same size as selected frame. The result of thetable that will not fit in the first frame will continue in the next frame when you use the Resize mode Useexisting frames.
• Activate Don’t export page if frame is empty prevents the page to be exported when the table frame hasno contents. This means all other layout items, maps, scalebars, legends etc. will not be visible in the result.
• Das Aktivieren von Hintergrund nicht anzeigen wenn Rahmen leer ist verhindert dass der Hintergrundgezeichnet wird wenn der Rahmen keinen Inhalt hat.
16.2.7 Das Bildelement
Das Element Bild hift Ihnen dabei, Ihre Karte mit Bildern. Logos etc. auszuschmücken. Es ist auch das Element,
das die eingebauten Nordpfeile enthält. Sie können ein Bild mit Bild zum Layout hinzufügen gemäß der Anleitung inEin Layoutelement erzeugen hinzufügen und gemäß der Anleitung in Interacting with layout items bearbeiten.
Zunächst ist das Bildelement ein leerer Rahmen, den Sie über die Elementeigenschaften an Ihre Vorstellungenanpassen können. Abweichend von den allgemeinen Elementeigenschaften, gibt es folgende Funktionen (seefigure_layout_image):
Zunächst müssen Sie das Bild, das Sie darstellen wollen, auswählen. Es gibt mehere Möglichkeiten die Bildquellefestzulegen:
1. In der Gruppe Haupteigenschaften benutzen Sie die Schaltfläche . . . durchsuchen der Bildquelle, um eine Dateiauf Ihrem Computer auszuwählen. Die Suche startet in den SVG-Verzeichnissen, die mit QGIS zusammeninstalliert sind. Außer SVG können Sie auch andere Bildformate wie .png oder .jpg auswählen.
2. Sie können die Qelle direkt in das Eingabefeld Bildquelle eingeben. Sie können sogar die URL-Adresseeines Bildes eingeben.
3. Aus dem Bereich Verzeichnisse durchsuchen können Sie eebnfalls ein Bild als Bildquelle auswählen.Diese Bilder werden per Voreinstellung aus den Verzeichnissen gelesen, die Sie im Menü :menuselec-tion:‘Einstellungen –> Optionen –> System –> SVG Pfade ‘ einstellen.
4. Benutzen Sie die Schaltfläche Datendefinierte Übersteuerung, um die Bildquelle aus einem Objektattribut zulesen oder über einen Ausdruck einzustellen.
Bemerkung: In der Gruppe Verzeichnisse durchsuchen können Sie die Schaltflächen Hinzufügen und Entfernenbenutzen, um die Liste der Verzeichnisse anzupassen, aus dernen Bilder geholt und in der Vorschau angezeigtwerden.
Mit der Einstellung Größenmodus können Sie festlegen, wie das Bld dargestellt wird, wenn sich die Größe desRahmens ändert:
• Zoom: vergröert/verkleinert das Bild passend zum Rahmen, während das Seitenverhältnis des Bildesbeibehalten wird;
• Strecken: dehnt das Bild, so dass es in den Rahmen passt und ignoriert das Seitenverhältnis;
380 Chapter 16. Kartenlayout

QGIS User Guide, Release 3.4
Figure 16.44: Elementeigenschaften für Bilder
16.2. Layout Items 381

QGIS User Guide, Release 3.4
• Zuschneiden: benutzen Sie diese Einstellung ausschließlich für Rasterbilder. Es setzt die Bildgröße aufdie Originalgröße und skaliert das Bild nicht, wobei der Rahmen dazu benutzt wird, das Bild abzuschneiden,so dass nur der Teil des Bildes, der sich im Rahmen befindet, sichtbar ist;
• Rahmen zoomen und Größe anpassen: vergrößert das Bild, so dass es in den Rahmen passt undverändert dann die Größe des Rahmens so, dass er zum sich ergebenden Bild passt;
• Rahmen auf Bildgröße setzen: stellt die Größe des Rahmens so ein, dass sie zur Originalgrößedes Bildes passt.
Abhängig vom ausgewählten Größenmodus, sind die Einstellungen für Platzierung und Bilddrehung inaktiv odernicht. Mit Platzierung können Sie die Lage des Bildes innerhalb seines Rahmens auswählen. Von QGIS zur Ver-fügung gestellte .SVG-Dateien sind anpassbar, was bedeutet, dass Sie einfach eine andere Füllfarbe, Strichfarbe(auch mit Deckkraft) und Strichbreite als im Original auswählen können, indem Sie die entsprechende Einstellungin der Gruppe SVG Parameter benutzen. Diese Eigenschaften können auch datengetrieben übersteuert sein.
Sollten Sie eine .SVG-Datei hinzufügen, die diese Einstellugnen nicht ermöglicht, kann es nötig sein, die folgen-den Tags für z.B. die Deckkraft in die Datei einzufügen:
• fill-opacity=“param(fill-opacity)“
• stroke-opacity=“param(outline-opacity)“
In diesem Blogeintrag finden Sie ein Beispiel.
Bilder können mit dem Bedienfeld Bilddrehung gedreht werden. Wenn Sie das Kontrollkästchen Mit Karteabgleichen anhaken, wird der Drehwinkel des Bildes mit dem auf das ausgewählte Kartenelement angewendetenDrehwinkel synchronisiert; das macht es bequemer für Nordpfeile, die Sie folgendermaßen ausrichten können:
• Gitternorden: Richtung einer Gitterlinie, die parallel zum Zentralmeridian eines nationalen oder lokalenGitternetzes ist;
• oder Geographisch-Nord: Richtung eines Längengrads, der am Nordpol konvergiert.
Sie können der Bilddrehung auch einen Versatz für die Missweisung hinzufügen.
Bemerkung: Vielen Nordpfeilen enthalten kein ‚N‘. Das ist mit Absicht so, für Sprachen die kein ‚N‘ für Nordenverwenden, so dass Sie einen anderen Buchstaben verwenden können.
16.2.8 Das HTML-Rahmen Element
It is possible to add a frame that displays the contents of a website or even create and style your own HTML
page and display it! You can add a picture with the Add HTML following items creation instructions andmanipulate it the same way as exposed in Interacting with layout items.
The HTML item can be customized using its Item Properties panel. Other than the items common properties, thisfeature has the following functionalities (see figure_layout_html):
HTML-Quelle
The HTML Source group of the HTML frame Item Properties panel provides the following functionalities (seefigure_layout_html_ppt):
• In URL you can enter the URL of a webpage you copied from your Internet browser or select an HTML file
using the . . . Browse button. There is also the option to use the Data-defined override button, to provide a URLfrom the contents of an attribute field of a table or using a regular expression.
• Unter Quelle können Sie Text mit einigen HTML-Tags ins Textfenster eingeben oder eine ganze HTML-Seite zur Verfügung zu stellen.
382 Chapter 16. Kartenlayout

QGIS User Guide, Release 3.4
Figure 16.45: Nordpfeile, die von der SVG-Bibliothek zur Verfügung gestellt werden.
Figure 16.46: HTML Frame, the Item Properties Panel
16.2. Layout Items 383

QGIS User Guide, Release 3.4
Figure 16.47: HTML frame, the HTML Source properties
• The Insert an Expression button can be used to insert an expression like [%Year($now)%] in the Sourcetextbox to display the current year. This button is only activated when radiobutton Source is selected. Afterinserting the expression click somewhere in the textbox before refreshing the HTML frame, otherwise youwill lose the expression.
• Aktivieren Sie QGIS-Ausdrücke in HTML-Quelle auswerten um das Ergebnis des Ausdrucks, den Sieeingefügt haben, zu sehen, andernfalls sehen Sie den Ausdruck.
• Use the Refresh HTML button to refresh the HTML frame(s) and see the result of changes.
Rahmen
The Frames group of the HTML frame Item Properties panel provides the following functionalities (see fig-ure_layout_html_frames):
Figure 16.48: HTML frame, the Frames properties
• Mit dem Resize-Modus können Sie auswählen wie der HTMl Inhalt gerendert wird:
– Use existing frames displays the result in the first frame and added frames only.
– Extend to next page will create as many frames (and corresponding pages) as necessary torender the height of the web page. Each frame can be moved around on the layout. If you resize aframe, the webpage will be divided up between the other frames. The last frame will be trimmed to fitthe web page.
– Repeat on every page will repeat the upper left of the web page on every page in frames ofthe same size.
– Repeat until finished will also create as many frames as the Extend to next pageoption, except all frames will have the same size.
• Use the Add Frame button to add another frame with the same size as selected frame. If the HTML pagedoes not fit in the first frame it will continue in the next frame when you use Resize mode or Use existingframes.
384 Chapter 16. Kartenlayout

QGIS User Guide, Release 3.4
• Activate Don’t export page if frame is empty prevents the page from being exported when the frame hasno HTML contents. This means all other layout items, maps, scale bars, legends etc. will not be visible inthe result.
• Das Aktivieren von Hintergrund nicht anzeigen, wenn Rahmen leer ist verhindert, dass der HTML-Rahmen gezeichnet wird wenn der Rahmen leer ist.
Intelligente Seitenumbrüche und Benutzer Stylesheet nutzen
The Use smart page breaks dialog and User style sheet dialog of the HTML frame Item Properties panel providesthe following functionalities (see figure_layout_html_breaks):
Figure 16.49: HTML frame, Use smart page breaks and User style sheet properties
• Aktivieren Sie Intelligente Seitenumbrüche um zu verhindern, dass der HTML-Rahmen inmitten einerTextzeile umbricht so dass er weiter schön und glatt im nächsten Rahmen weitergeht.
• Setzen Sie den erlaubten Maximalabstand wenn ausgerechnet werden soll wo die Seitenumbrüche imHTML platziert werden sollen. Dieser Abstand ist der maximale Größe des leeren Raums am Fuß einesRahmens nachdem der optimale Platz für den Seitenumbruch berechnet wurde. Das Setzen eines größerenWertes resultiert in einer besseren Auswahl des Platzes für den Seitenumbruch, es resultiert aber auch inmehr nicht genutztem Platz am Fuß des Rahmens. Dies wird nur genutzt wenn Intelligenter Seitenumbrüchenutzen aktiviert ist.
• Activate User style sheet to apply HTML styles that often is provided in cascading style sheets. Anexample of style code is provided below to set the color of <h1> header tag to green and set the font andfont size of text included in paragraph tags <p>.
h1 {color: #00ff00;}p {font-family: "Times New Roman", Times, serif;
font-size: 20px;}
• Use the Update HTML button to see the result of the style sheet settings.
16.2.9 The Shape Items
QGIS provides a couple of tools to draw regular or more complex shapes over the print layout.
16.2. Layout Items 385

QGIS User Guide, Release 3.4
Bemerkung: Unlike other print layout items, you can not style the frame nor the background color of the shapesbounding frame (set to transparent by default).
The Regular Shape Item
The Shape item is a tool that helps to decorate your map with regular shapes like triangle, rectangle, ellipse. . .
You can add a regular shape using the Add Shape tool which gives access to particular tools like Add Rectangle,Add Ellipse and Add Triangle. Once you have selected the appropriate tool, you can draw the item following
items creation instructions. Like other layout items, a regular shape can be manipulated the same way as exposedin Interacting with layout items.
Bemerkung: Holding down the Shift key while drawing the basic shape with the click and drag method helpsyou create a perfect square, circle or triangle.
The default shape item can be customized using its Item Properties panel. Other than the items common properties,this feature has the following functionalities (see figure_layout_label):
Figure 16.50: Shape Item Properties Panel
The Main properties group shows and allows you to switch the type of the shape item (Ellipse, Rectangle orTriangle) inside the given frame.
You can set the style of the shape using the advanced symbol and color selector widget. . .
For the rectangle shape, you can set in different units the value of the Corner radius to round of the corners.
The Node-Based Shape Items
While the Add Shape tool provides way to create simple and predefined geometric item, the Add NodeItem tool helps you create a custom and more advanced geometric item. For polylines or polygons, you can drawas many lines or sides as you want and vertices of the items can be independently and directly manipulated using
the Edit Nodes Item. The item itself can be manipulated as exposed in Interacting with layout items.
To add a node-based shape:
1. Click the Add Node Item icon
386 Chapter 16. Kartenlayout

QGIS User Guide, Release 3.4
2. Select either Add Polygon or Add Polyline tool
3. Perform consecutive left clicks to add nodes of your item. If you hold down the Shift key while drawinga segment, it is constrained to follow an orientation multiple of 45°.
4. When you’re done, right-click to terminate the shape.
You can customize the appearance of the shape in the Item Properties panel.
Figure 16.51: Polygon Node Shape Item Properties Panel
In the Main properties, you can set the style of the shape using the advanced symbol and color selector widget. . .
For polyline node items, you can also parameterize the Line markers i.e. add:
• start and/or end markers with options:
– None: draws a simple polyline.
– Arrow: adds a regular triangular arrow head that you can customize.
– SVG marker: uses an SVG file as arrow head of the item.
• customize the arrow head:
– Arrow stroke color: sets the stroke color of the arrow head.
– Arrow fill color: sets the fill color of the arrow head.
– Arrow stroke width: sets the stroke width of the arrow head.
– Arrow head width: sets the size of the arrow head.
SVG images are automatically rotated with the line. Stroke and fill colors of QGIS predefined SVG images canbe changed using the corresponding options. Custom SVG may require some tags following this instruction.
The Arrow Item
The Add Arrow tool is a shortcut to create an arrow-enabled polyline by default and thus has the same propertiesand behavior as a polyline node item.
Actually, the arrow item can be used to add a simple arrow, for example, to show the relation between two differentprint layout items. However, to create a north arrow, the image item should be considered first as it gives access toa set of north arrows in .SVG format that you can sync with a map item so that it rotates automatically with it.
Editing a node item geometry
A specific tool is provided to edit node-based shapes through Edit Nodes Item. Within this mode, you can selecta node by clicking on it (a marker is displayed on the selected node). A selected node can be moved either bydragging it or by using the arrow keys. Moreover, in this mode, you are able to add nodes to an existing shape:
16.2. Layout Items 387

QGIS User Guide, Release 3.4
Figure 16.52: Polyline Node Shape Item Properties Panel
double-click on a segment and a node is added at the place you click. Finally, you can remove the currentlyselected node by hitting the Del key.
16.3 Eine Ausgabe erzeugen
The figure below shows an example of print layout including each type of layout items described in the previoussection.
From the Layout menu or toolbar, you can output the print layout to different file formats, and it is possible tomodify the resolution (print quality) and paper size:
• Das Drucken Icon ermöglicht es Ihnen das Layout in einen angeschlossenen Drucker oder in einePostScipt Datei zu drucken, je nach installierten Druckertreibern.
• The Export as image icon exports the print layout in several image formats such as PNG, BMP, TIF, JPG,and many others. . .
• The Export as SVG icon saves the print layout as an SVG (Scalable Vector Graphic).
• The Export as PDF icon saves the defined print layout directly as a PDF.
16.3.1 Export settings
Whenever you export a print layout, there are a selection of export settings QGIS needs to check in order to returnthe most appropriate output. These configurations are:
388 Chapter 16. Kartenlayout

QGIS User Guide, Release 3.4
Figure 16.53: Print Layout with map view, legend, image, scale bar, coordinates, text and HTML frame added
• the Export settings of the Layout panel, such as Export resolution, Print as raster, Always export as vectorsor Save world file;
• the Exclude page from exports in the page item properties panel;
• the Exclude item from exports in the item properties panel.
16.3.2 Speichern als Rasterbild
Clicking the Export as image icon will ask you to select the image format and enter the filename to use to exportthe print layout: in the case of multi-page composition, each page will be exported to a file with the given nameappended with the page number.
In the next Image Export Options dialog, you can optionally override the print layout resolution and the exportedpage dimensions (set in Layout panel).
By checking Crop to content option, the image output by the layout will include the minimal area enclosingall the items (map, legend, scale bar, shapes, label, image. . . ) of each page of the composition:
• If the composition includes a single page, then the output is resized to include EVERYTHING on thecomposition. The page can then be reduced or extended to all items depending on their position (on, above,below, left or right of the page).
• In case of a multi-page layout, each page will be resized to include items in its area (left and right sidesfor all pages, plus top for the first page and bottom for the last page). Each resized page is exported to aseparate file.
The Crop to content dialog also allows to add some margins around the cropped bounds.
Tipp: Use image formats that support transparency when items extend beyond the paper extent
Since layout items may be placed outside the paper extent, using the Crop to content option while exporting canresult in an image that extends beyond the paper extent. Since the background outside of the paper extent will be
16.3. Eine Ausgabe erzeugen 389

QGIS User Guide, Release 3.4
Figure 16.54: Image Export Options, output is resized to items extent
transparent, for image formats that do not support transparency (eg, .BMP, .JPG) it will be rendered as full black,„corrupting“ the image.
Use transparency-compatible formats like .TIFF or .PNG in such a case.
If you need to export your layout as a georeferenced image (e.g., to share with other projects), check theGenerate world file option and a world file named like the page on which the map reference set in Layout panel isplaced will be created along the export(s). This option can also be checked by default in the layout panel.
When needed, images rendering can also be improved with the Enable antialiasing option.
16.3.3 Als SVG exportieren
With Export as SVG, you also need to fill the filename (used as a basename for all files in case of multi-page
composition) and then can apply Crop to content option.
The SVG export options dialog also allows to override the layout default export and offers other settings:
• Export map layers as SVG groups: may affect label placement.
• Render map labels as outlines: unchecking this will allow you to edit labels as texts in vector illustrationsoftware.
• Always export as vectors: some rendering options require items to be rasterized for a better rendering.Check this option to keep the objects as vectors with the risk that the appearance of the output file may notmatch the print layout preview (for more details, see Exporteinstellungen).
• Export RDF metadata.
Bemerkung: Zur Zeit ist die SVG Ausgabe sehr einfach gehalten. Dies ist kein QGIS Probelm sondern einProblem mit der darunterliegenden Qt Bibliothek. Dies wird hoffentlich in zukünftigen Versionen behoben.
390 Chapter 16. Kartenlayout

QGIS User Guide, Release 3.4
Figure 16.55: SVG Exportoptionen
16.3.4 Als PDF exportieren
The Export as PDF tool exports all the composition pages into a single PDF file you’d need to provide path andname. Unlike the other formats, exporting to .PDF does not provide means to override the layout export settings.So check these settings to ensure they are compatible with your needs.
Figure 16.56: PDF Export Options
Bemerkung: Exporting a print layout to formats like .PDF or .TIFF creates by default a georeferenced output(no world file needed).
16.3.5 Einen Atlas erzeugen
Atlas functions allow you to create map books in an automated way. Atlas uses the features of a vector or tablelayer called coverage layer and creates an output for each atlas feature. The most common usage is to zoom amap item to the current atlas feature. Further use cases include:
• a map item showing, for another layer, only features that share the same attribute as the atlas feature or arewithin its geometry;
• a label or html item whose text is replaced as features are iterated over;
• a table item showing attributes of associated parent or children features of the current atlas feature. . .
16.3. Eine Ausgabe erzeugen 391

QGIS User Guide, Release 3.4
For each feature, an output is processed for all pages and items according to their exports settings.
Tipp: Use variables for more flexibility
QGIS provides a large panel of functions and variables, including atlas related ones, that you can use to manipulatethe layout items but also the layers symbology according to atlas status. Combining these features gives you a lotof flexibility and helps you easily produce advanced mappings.
To enable the generation of an atlas and access atlas parameters, refer to the Atlas panel. This panel contains thefollowing functionalities (see figure_layout_atlas):
Figure 16.57: Atlas Panel
• Generate an atlas, which enables or disables the atlas generation;
• A Coverage layer combo box that allows you to choose the table or vector layer containing thefeatures to iterate over;
• An optional Hidden coverage layer that, if checked, will hide the coverage layer (but not the otherlayers) during the generation;
• An optional Page name combo box to give a more explicit name to each feature page(s) when previewingatlas. You can select a field of the coverage layer or set an expression. If this option is empty, QGIS willuse an internal ID, according to the filter and/or the sort order applied to the layer;
• An optional Filter with text area that allows you to specify an expression for filtering features from thecoverage layer. If the expression is not empty, only features that evaluate to True will be processed;
• An optional Sort by that allows you to sort features of the coverage layer, using a field of the coveragelayer or an expression. The sort order (either ascending or descending) is set by the two-state Sort directionbutton that displays an up or a down arrow.
Sie haben auch die Optionen, die Ausgabe des Atlas‘ einzustellen:
• An Output filename expression textbox that is used to generate a filename for each geometry if needed. It isbased on expressions. This field is meaningful only for rendering to multiple files;
• A Single file export when possible that allows you to force the generation of a single file if this is possiblewith the chosen output format (PDF, for instance). If this field is checked, the value of the Output filenameexpression field is meaningless;
392 Chapter 16. Kartenlayout

QGIS User Guide, Release 3.4
• An Image export format drop-down list to select the output format when using the Export atlas as Images. . .
button.
Control map by atlas
The most common usage of atlas is with the map item, zooming to the current atlas feature, as iteration goes overthe coverage layer. This behavior is set in the Controlled by atlas group properties of the map item. See Controlledby atlas for different settings you can apply on map item.
Customize labels with expression
In order to adapt labels to the feature the atlas iterates over, you can include expressions. What you shouldtake care of is to place expression part (including functions, fields or variables) between [% and %] (see DasBeschriftungselement for more details).
For example, for a city layer with fields CITY_NAME and ZIPCODE, you could insert this:
The area of [% concat( upper(CITY_NAME), ',', ZIPCODE, ' is ',format_number($area/1000000, 2) ) %] km2
oder, andere Kombinationen:
The area of [% upper(CITY_NAME)%],[%ZIPCODE%] is[%format_number($area/1000000,2) %] km2
The information [% concat( upper(CITY_NAME), ',', ZIPCODE, ' is ',format_number($area/1000000, 2) ) %] is an expression used inside the label. Both expres-sions would result in the generated atlas as:
The area of PARIS,75001 is 1.94 km2
Explore Data-defined override buttons with atlas
There are several places where you can use a Data defined override button to override the selected setting. Theseoptions are particularly useful with atlas generation. See Datendefinierte Übersteuerung Setup for more details onthis widget.
For the following examples the Regions layer of the QGIS sample dataset is used and selected as coverage layerfor the atlas generation. We also assume it’s a single page layout containing a map and a label items.
When the height (north-south) of the extents of a region is greater than its width (east-west), you rather want to
use Portrait instead of Landscape orientation to optimize the use of paper. With a Data Defined Override button youcan dynamically set the paper orientation.
Right-click on the page and select Page Properties to open the panel. We want to set the orientation dynamically,
using an expression depending on the region geometry so press the button of field Orientation, select Edit. . .to open the Expression string builder dialog and enter the following expression:
CASE WHEN bounds_width(@atlas_geometry) > bounds_height(@atlas_geometry)THEN 'Landscape' ELSE 'Portrait' END
Now if you preview the atlas, the paper orients itself automatically but items placement may not be ideal. For
each Region you need to reposition the location of the layout items as well. For the map item you can use thebutton of its Width property to set it dynamic using following expression:
16.3. Eine Ausgabe erzeugen 393

QGIS User Guide, Release 3.4
@layout_pagewidth - 20
Likewise, use the button of the Height property to provide following expression and constrain map item size:
@layout_pageheight - 20
To ensure the map item is centered in the page, set its Reference point to the upper left radio button and enter 10for its X and Y positions.
Let’s add a title above the map in the center of the page. Select the label item and set the horizontal alignment to
Center. Next move the label to the right position, activate from Reference point any of the middle buttons,and provide the following expression for field X:
@layout_pagewidth / 2
For all other layout items you can set the position in a similar way so they are correctly positioned when the pageis automatically rotated in portrait or landscape. You can also do more tweaks such as customizing the title withfeature attributes (see Customize labels with expression example), updating images with atlas feature, resizing thelegend columns number according to page orientation. . .
Information provided is an update of the excellent blog (in English and Portuguese) on the Data Defined Overrideoptions Multiple_format_map_series_using_QGIS_2.6 .
This is just one example of how you can use some advanced settings with atlas.
Preview and generate an atlas
Figure 16.58: Atlas-Voransichtwerkzeuge
Once the atlas settings have been configured and layout items (map, table, image. . . ) linked to it, you can create a
preview of all the pages by clicking Atlas → Preview Atlas or Preview Atlas icon. You can then use the arrows inthe same toolbar to navigate through all the features:
• Erstes Objekt
• Vorheriges Objekt
• Nächstes Objekt
• Letztes Objekt
Sie können auch direkt die Kombobox verwenden um eine Vorschau spezifischer Objekte anzuzeigen. Die Kom-bobox zeigt Atlasobjektnamen mit dem zugehörigen Ausdruck, eingestellt in den Atlas Seitenname Optionen.
As for simple compositions, an atlas can be generated in different ways (see Eine Ausgabe erzeugen for moreinformation). Instead of Layout menu, rather use tools from Atlas menu or toolbar.
This means that you can directly print your compositions with Atlas → Print Atlas. You can also create a PDFusing Atlas → Export Atlas as PDF. . . : You will be asked for a directory to save all the generated PDF files, except
if the Single file export when possible has been selected. In that case, you’ll be prompted to give a filename.
With Atlas → Export Atlas as Images. . . or Atlas → Export Atlas as SVG. . . tool, you’re also prompted to selecta folder. Each page of each atlas feature composition is exported to the image file format set in Atlas panel or toSVG file.
Tipp: Drucken eines bestimmten Atlasobjektes
394 Chapter 16. Kartenlayout

QGIS User Guide, Release 3.4
If you want to print or export the composition of only one feature of the atlas, simply start the preview, select thedesired feature in the drop-down list and click on Layout → Print (or Export. . . to any supported file format).
16.4 Creating a Report
16.4.1 What is?
This section will help you set up an automatic report in QGIS. By definition a GIS report is a document containinginformation organized in a narrative, graphic, maps, or tabular form, prepared on ad hoc, periodic, recurring,regular, or as required basis. Reports may refer to specific periods, events, occurrences, or subjects, locations, andmay be communicated or presented in oral or written form. The reports in QGIS will allow the users to outputtheir GIS projects in a simple, quick and structured way.
16.4.2 Get started
Reports menu is an extension of Print Layout. This functionality can be found in Project → New Report or insideof Project → Layout Manager.
In the Layout Manager dialog the report can be created through New from template and select the dropdown optionEmpty Report and hitting Create. . . button.
For this example, we use some administrative boundaries, populated places, ports and airports from dataset ofNatural Earth.
Using the Project → New Report command, we then create a new blank report. Initially, there’s not much to lookat – the dialog which is displayed looks much like the print layout designer, except for the new Report Organizerpanel shown on the left:
16.4. Creating a Report 395

QGIS User Guide, Release 3.4
396 Chapter 16. Kartenlayout

QGIS User Guide, Release 3.4
16.4.3 Layout Report Workspace
QGIS reports can consist of multiple, nested sections. In our new blank report we initially have only the mainreport section. The only options present for this report section is Include report header or Include report footer.If we enable these options, the header will be included as the very first page (or pages. . . — individual parts ofreports can be multi-page if desired) in the report, and the footer would be the last page. Let’s go ahead and enablethe header, and hit the Edit button next to it:
A few things happen as a result. Firstly, an edit pencil is now shown next to the Report section in the ReportOrganizer, indicating that the report section is currently being edited in the designer. We also see a new blankpage shown in the designer itself, with the small Report Header title. In QGIS reports, every component of thereport is made up of individual layouts. They can be created and modified using the exact same tools as areavailable for standard print layouts – so you can use any desired combination of labels, pictures, maps, tables, etc.Let’s add some items to our report header to demonstrate:
We’ll also create a simple footer for the report, by checking the Include report footer option and hitting Edit.
Before proceeding further, let’s export this report and see what we get. Exporting is done from the Report menu– in this case we select Export Report as PDF to render the whole report to a PDF file. Here’s the not-very-impressive result – a two page PDF consisting of our header and footer:
16.4. Creating a Report 397

QGIS User Guide, Release 3.4
398 Chapter 16. Kartenlayout

QGIS User Guide, Release 3.4
16.4. Creating a Report 399
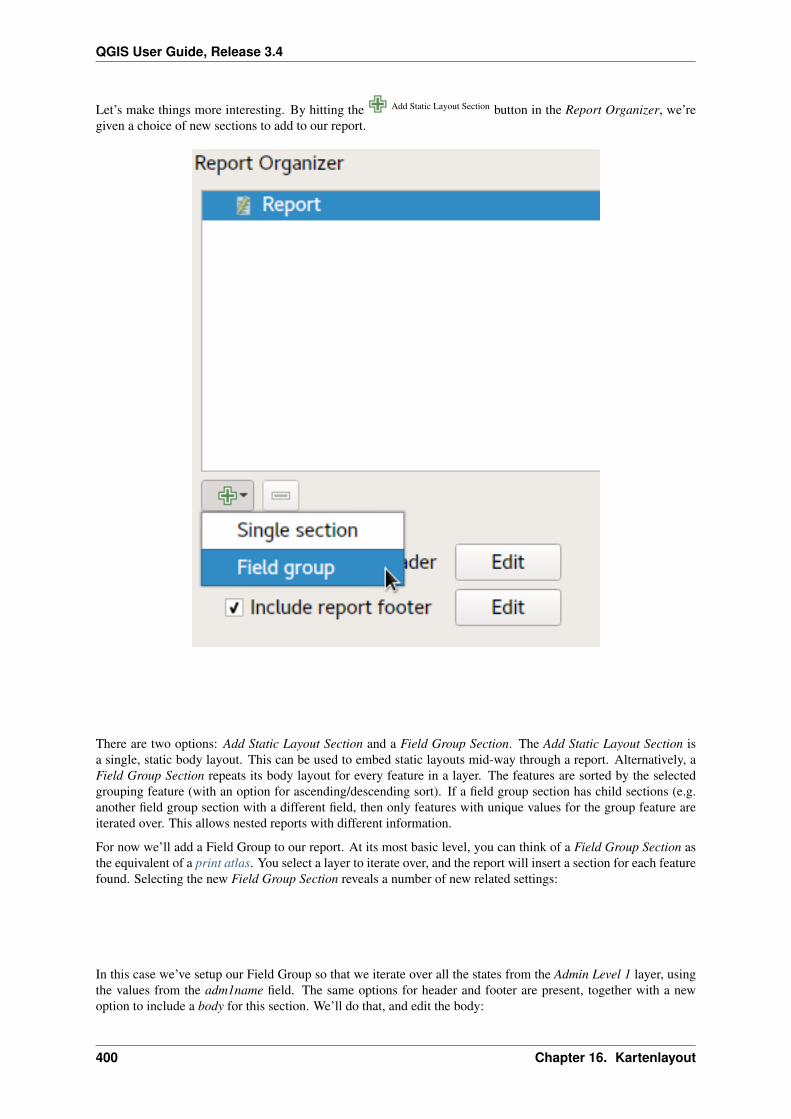
QGIS User Guide, Release 3.4
Let’s make things more interesting. By hitting the Add Static Layout Section button in the Report Organizer, we’regiven a choice of new sections to add to our report.
There are two options: Add Static Layout Section and a Field Group Section. The Add Static Layout Section isa single, static body layout. This can be used to embed static layouts mid-way through a report. Alternatively, aField Group Section repeats its body layout for every feature in a layer. The features are sorted by the selectedgrouping feature (with an option for ascending/descending sort). If a field group section has child sections (e.g.another field group section with a different field, then only features with unique values for the group feature areiterated over. This allows nested reports with different information.
For now we’ll add a Field Group to our report. At its most basic level, you can think of a Field Group Section asthe equivalent of a print atlas. You select a layer to iterate over, and the report will insert a section for each featurefound. Selecting the new Field Group Section reveals a number of new related settings:
In this case we’ve setup our Field Group so that we iterate over all the states from the Admin Level 1 layer, usingthe values from the adm1name field. The same options for header and footer are present, together with a newoption to include a body for this section. We’ll do that, and edit the body:
400 Chapter 16. Kartenlayout

QGIS User Guide, Release 3.4
16.4. Creating a Report 401

QGIS User Guide, Release 3.4
We’ve setup this body with a map (set to follow the current report feature – just like how a map item in an atlascan follow the current atlas feature), and a label showing the state’s name. If we went ahead and exported ourreport now, we’d get something like this:
First, the report header, then a page for each state, and finally the report footer. So more or less an atlas, but with aheader and footer page. Let’s make things more interesting by adding a subsection to our state group. We do this
by first selecting the state field group in the organizer, then hitting the Field Group Section button and adding a newField Group Section:
When a Field Group Section is iterating over its features, it will automatically filter these features to match thefeature attributes from its parent groups. In this case, the subsection we added will iterate over a Populated Placeslayer, including a body section for each place encountered. The magic here is that the Populated Places layer hasan attribute named adm1name, tagging each place with the state it’s contained within (if you’re lucky your datawill already be structured like this – if not, run the Processing Join Attributes by Location algorithm and createyour own field). When we export this report, QGIS will grab the first state from the Admin Level 1 layer, and theniterate over all the Populated Places with a matching adm1name value. Here’s what we get:
Here we created a basic body for the Populated Places group, including a map of the place and a table of someplace attributes. So our report is now a report header, a page for each state followed by a page for every populated
402 Chapter 16. Kartenlayout

QGIS User Guide, Release 3.4
16.4. Creating a Report 403

QGIS User Guide, Release 3.4
404 Chapter 16. Kartenlayout

QGIS User Guide, Release 3.4
place within that state, and finally the report footer. If we were to add a header for the Populated Places group, itwould be included just before listing the populated places for each state:
Similarly, a footer for the Populated Places group would be inserted after the final place for each state is included.
In addition to nested subsections, subsections in a report can also be included consecutively. If we add a secondsubsection to the Admin Level 1 group for Airports, then our report will first list ALL the populated places foreach state, followed by all the airports within that state, before proceeding to the next state. In this case our reportwould be structured like this:
16.4.4 Report Output
The key point here is that our Airports group is a subsection of the Admin Level 1 group – not the Populated Placesgroup. Here’s what our report could look like now:
Combining nested and consecutive sections, together with section headers and footers allows for tons of flexibility.For instance, in the below report we add another field group as a child of the main report for the :guilabel‘Ports‘layer. Now, after listing the states together with their populated places and airports, we’ll get a summary list of allthe ports in the region:
This results in the last part of our report exporting as:
16.4. Creating a Report 405

QGIS User Guide, Release 3.4
406 Chapter 16. Kartenlayout

QGIS User Guide, Release 3.4
16.4. Creating a Report 407

QGIS User Guide, Release 3.4
408 Chapter 16. Kartenlayout

QGIS User Guide, Release 3.4
16.4. Creating a Report 409

QGIS User Guide, Release 3.4
410 Chapter 16. Kartenlayout

QGIS User Guide, Release 3.4
16.4.5 Export settings
Whenever you export a report, there is a selection of export settings QGIS needs to check in order to return themost appropriate output. As you can start to imagine, reports in QGIS are extremely powerful and flexible!
Bemerkung: When you are exporting a report to the available formats please choose the options (Print, SVG,Image, PDF) that have the labels saying Export Report as. . . otherwise you will print the current active map.
The current information was adapted from the blog of North Road, Exploring Reports in QGIS 3.0 - the UltimateGuide!
16.4. Creating a Report 411

QGIS User Guide, Release 3.4
412 Chapter 16. Kartenlayout

CHAPTER 17
Arbeiten mit OGC Daten
17.1 QGIS als OGC Datenclient
Das Open Geospatial Consortium (OGC) ist eine internationale Organisation mit mehr als 300 Mitgliedern auskommerziellen, behördlichen Bereichen, aus der Forschung sowie aus Non-Profit Organisationen Vereinen. DieMitglieder entwickeln und implementieren Standards für den Austausch räumlicher Daten, GIS-Datenprocessingund standardisierte Bereitstellung von Geodaten.
Describing a basic data model for geographic features, an increasing number of specifications are developedby OGC to serve specific needs for interoperable location and geospatial technology, including GIS. Furtherinformation can be found at https://www.opengeospatial.org/.
Wichtige von QGIS unterstützte OGC Spezifikationen sind:
• WMS — Web Map Service (WMS/WMTS Client)
• WMTS — Web Map Tile Service (WMS/WMTS Client)
• WFS — Web Feature Service (WFS und WFS-T Klient)
• WFS-T — Web Feature Service - Transactional (WFS und WFS-T Klient)
• WCS — Web Coverage Service (WCS Client)
• WPS — Web Processing Service
• CSW — Catalog Service for the Web
• SFS — Simple Features for SQL (PostGIS Layers)
• GML — Geography Markup Language
OGC-Dienste werden vermehrt zum Austausch von geographischen Daten zwischen unterschiedlichen GIS-Systemen und -implementierungen verwendet. QGIS unterstützt mittlerweile die oben genannten Spezifikationenals Client in Form von SFS (durch den Postgresql/PostGIS Datenprovider, vgl. PostGIS Layers).
17.1.1 WMS/WMTS Client
413

QGIS User Guide, Release 3.4
Übersicht über die WMS-Unterstützung
Derzeit kann QGIS als WMS-Klient eingesetzt werden. Es unterstützt die Versionen 1.1, 1.1.1 und 1.3 der WMS-Server. Gut getestet wurden die öffentlich verfügbaren Server wie beispielsweise DEMIS.
WMS-Server liefern Daten aufgrund einer Anfrage eines Klienten (hier QGIS) als Rasterbild aus. Dabei spielenAusdehnung, Anzahl der angefragten Layer, Symbolisierungen und Transparenz eine Rolle. Der WMS-Serverholt die benötigten Daten dann aus seiner Datenquelle hervor, rendert diese in eine Rasterkarte und sendet dasfertige Bild zurück zum Klienten. Das für QGIS typische Rasterformat ist in aller Regel JPEG oder PNG.
WMS ist ein komplett auf Übertragung ausgelegter Dienst (REST = Representational State Transfer). Darausresultiert die Tatsache, dass die von QGIS generierte URL für das Bild auch in einem Browser eingesetzt werdenkann. Das Resultat dieser Anfrage sieht in der Regel genauso aus wie in QGIS. Das ist besonders hilfreich, wennes beim Einsatz von WMS Probleme geben sollte. Da es sehr viele unterschiedle WMS-Server-Anbieter am Marktgibt (und alle die WMS-Spezifikation etwas unterschiedlich interpretieren), ist eine Überprüfung im Browser sehrhilfreich.
WMS-Layer können sehr einfach hinzugefügt werden, solange man die URL des Servers kennt, eine Verbindungüber HTTP zu diesem Server besteht und der angefragte Server auch HTTP versteht.
Additionally, QGIS will cache your WMS responses (i.e. images) for 24h as long as the GetCapabilities requestis not triggered. The GetCapabilities request is triggered everytime the Connect button in the Add Layer(s) fromWMS(T) Server dialog is used to retrieve the WMS server capabilities. This is an automatic feature meant tooptimize project loading time. If a project is saved with a WMS layer, the corresponding WMS tiles will beloaded from the cache the next time the project is opened as long as they are no older than 24H.
Überblick über die WMTS Unterstützung
|qg| kann auch als WMTS Client fungieren. WMTS ist ein OGC Standard zum Bereitstellen von Tile Sets vonräumlichen Daten. Dies ist ein schnellerer und effizienterer Weg als die Bereitstellung über einen WMS weil beiWMTS die Tile Sets vorgeneriert werden und der Client nur die Übermittlung von Tiles, nicht Ihre Erstellungabfragt. Ein WMS beinhaltet typischerweise sowohl die Erstellung als auch die Übermittlung der Daten. Einbekanntes Beispiel eines nicht-OGC Standards zum Darstellen von gekachelten räumlichen Daten ist GoogleMaps.
Um die Daten in einer Vielzahl von Maßstäben je nach Anforderung darzustellen werden die WMTS Tile Sets inmehreren verschiedenen Maßstäben erstellt und dem GIS Client zur Abfrage bereitgestellt.
Das Diagramm veranschaulicht das Konzept der Tile Sets:
Figure 17.1: Konzept der WMTS Tile Sets
Dei zwei Typen von WMTS Schnittstellen die QGIS unterstützt sind die über Key-Value-Pairs (KVP) und REST-ful. Diese zwei Schnittstellen sind unterschiedlich und Sie müssen diese für QGIS unterschiedlich spezifizieren.
1. Um einen WMTS KVP Service anzubinden muss ein QGIS Benutzer die WMS/WMTS Schnittstelle öffnenund die folgenden Zeichenkette zu der URL des WMTS Tile Service hinzufügen:
414 Chapter 17. Arbeiten mit OGC Daten

QGIS User Guide, Release 3.4
"?SERVICE=WMTS&REQUEST=GetCapabilities"
Ein Beispiel für diesen Typ von Adresse ist
https://opencache.statkart.no/gatekeeper/gk/gk.open_wmts?\service=WMTS&request=GetCapabilities
Zu Testzwecken funktioniert der topo2 Layer in diesem WMTS gut. Indem man diese Zeichenfolgehinzufügt gibt man an dass ein WMTS Web Service anstatt eines WMS Service benutzt werden soll.
2. Der RESTful WMTS Service erfordert eine andere Form, eine einfache URL. Das von der OGC empfoh-lene Format ist:
{WMTSBaseURL}/1.0.0/WMTSCapabilities.xml
This format helps you to recognize that it is a RESTful address. A RESTful WMTS is accessed in QGIS bysimply adding its address in the WMS setup in the URL field of the form. An example of this type of addressfor the case of an Austrian basemap is https://maps.wien.gv.at/basemap/1.0.0/WMTSCapabilities.xml.
Bemerkung: You can still find some old services called WMS-C. These services are quite similar to WMTS(i.e., same purpose but working a little bit differently). You can manage them the same as you do WMTS services.Just add ?tiled=true at the end of the url. See https://wiki.osgeo.org/wiki/Tile_Map_Service_Specificationfor more information about this specification.
Wenn Sie WMTS lesen können Sie auch an WMS-C denken.
WMS/WMTS Server auswählen
Wenn Sie das WMS Feature das erste Mal in QGIS verwenden sind keine Server definiert.
Fangen Sie an indem Sie den WMS-Layer hinzufügen Knopf in der Werkzeugleiste klicken oder indem Sie Layer →WMS-Layer hinzufügen . . . wählen.
The dialog Add Layer(s) from a Server for adding layers from the WMS server appears. You can add some serversto play with by clicking the Add Default Servers button. This will add two WMS demo servers for you to use: theWMS servers of the DM Solutions Group and Lizardtech. To define a new WMS server in the Layers tab, selectthe New button. Then enter the parameters to connect to your desired WMS server, as listed in table_OGC_wms:
Name Ein Name für diese Verbindung. Dieser Name wird in der Serververbindungs Drop-down Box verwendet und kann diese dann von anderen WMS Servern unterschei-den.
URL URL des Servers der die Daten bereitstellt. Dies muss ein auflösbarer Hostnamesein- das gleiche Format das Sie auch benutzen würden um eine Telnetverbindungzu öffnen oder einen Ping an einen Host zu senden.
Benutzername Benutzername um einen abgesicherten WMS Server anzubinden. Dieser Parameterist optional.
Passwort Passwort für einen durch Authentifizierung abgesicherten WMS Server. Dieser Pa-rameter ist optional.
Gemeldete GetMap-URI aus Diensteigen-schaften ignorieren
Gemeldete GetMap-URI aus Diensteigenschaften ignorieren und benutzestattdessen die angegebene URL aus dem URL-Feld oben.
GemeldeteGetFeatureInfo-URIignorieren
Gemeldete GetFeatureInfo-URI ignorieren. Verwenden Sie die vorgegebeneURI aus dem URL Feld oben.
Tabelle OGC 1: WMS Verbindungs-Parameter
17.1. QGIS als OGC Datenclient 415

QGIS User Guide, Release 3.4
Wenn Sie einen Poxyserver, um WMS Services aus dem Internet empfangen zu können, aufsetzen müssen könnenSie Ihren Proxyserver in den Optionen hinzufügen. Wählen Sie Einstellungen → Optionen und klicken Sie aufdas Menü Netzwerk. Dort können sie Ihre Proxyeinstellungen hinzufügen und diese aktivieren indem Sie das
Kontrollkästchen Proxy für Webzugriff benutzen aktivieren. Vergewissern Sie sich dass Sie den richtigen
Proxytyp aus dem Proxytyp Dropdownmenü ausgewählt haben
Wenn Sie die WMS-Verbindung einmal gesetzt haben, ist sie für zukünftige QGIS Sitzungen gespeichert.
Tipp: WMS-Server-URLs
Vergewissern Sie sich beim Eingeben der WMS Server URL dass Sie nur die einfache URL eingeben. ZumBeispiel sollten keine Fragmente wie request=GetCapabilities oder version=1.0.0 enthalten sein.
Warnung: Entering username and password in the Authentication tab will keep unprotected credentials inthe connection configuration. Those credentials will be visible if, for instance, you shared the project filewith someone. Therefore, it’s advisable to save your credentials in a Authentication configuration instead(configurations tab). See Authentifizierungssystem for more details.
WMS/WMTS Layer laden
Once you have successfully filled in your parameters, you can use the Connect button to retrieve the capabilities ofthe selected server. This includes the image encoding, layers, layer styles and projections. Since this is a networkoperation, the speed of the response depends on the quality of your network connection to the WMS server. Whiledownloading data from the WMS server, the download progress is visualized in the lower left of the WMS dialog.
Your screen should now look a bit like figure_OGC_add_wms, which shows the response provided by the Euro-pean Soil Portal WMS server.
Bildkodierung
Der Bildkodierung Bereich listet die Formate die sowohl vom Client als auch vom Server unterstützt werden auf.Wählen Sie eines abhängig von Ihren Anforderungen an die Bildqualität aus.
Tipp: Bildkodierung
In der Regel bieten WMS-Server JPEG oder PNG als Bildkodierung an. JPEG hat eine bildverschlechterndeKompression, während PNG zumeist die Qualität der ursprünglichen Rasterdaten widerspiegelt.
Verwenden Sie JPEG wenn Sie damit rechnen das die WMS Daten photographischen Charakter haben und/oderSie ein Verlust an Bildqualität nicht stört. Dieser Kompromiss reduziert typischerweise die Datentransferbedin-gungen um das fünffache verglichen mit PNG.
Verwenden Sie PNG wenn Sie eine genaue Wiedergabe der Originaldaten erzielen wollen und die erhöhten Da-tentransferbedingungen Sie nicht stören.
Optionen
Der Optionen Bereich des Dialogs stellt ein Textfeld zur Verfügung in das Sie einen Layernamen für den WMSLayer hinzufügen können. Dieser Name wird nach dem Laden in der Legende erscheinen.
Unter dem Layernamen können Sie wenn Sie den WMS Request in mehrere Requests aufsplitten wollen dieKachelgröße (z.B. 256x256) definieren.
Die Objektbegrenzung für GetFeatureInfo legt fest welche Attributspalten vom Server abgefragt werden.
If you select a WMS from the list, a field with the default projection provided by the mapserver appears. If theChange. . . button is active, you can click on it and change the default projection of the WMS to another CRSprovided by the WMS server.
416 Chapter 17. Arbeiten mit OGC Daten

QGIS User Guide, Release 3.4
Figure 17.2: Dialog zum Hinzufügen eines WMS Servers bei dem die erhältlichen Layer gezeigt werden
17.1. QGIS als OGC Datenclient 417

QGIS User Guide, Release 3.4
Schließlich können Sie Use contextual WMS-Legend aktivieren, wenn der WMS Server diese Funktion un-terstützt. Dann wird nur die entsprechende Legende für Ihre aktuellen Ausmaße der Kartenansicht angezeigt undsomit keine Legendenelemente die Sie nicht in der aktuellen Karte sehen können.
Layerreihenfolge
Der Reiter Layerreihenfolge listet die vom gerade verbundenen WMS Server ausgewählten Layer auf. Sie stellenvielleicht fest dass einige Layer ausklappbar sind. Das bedeutet dass der Layer in einer Auswahl von Bildstilendargestellt werden kann.
Sie können mehrere Layer auf einmal auswählen aber nur einen Bildstil pro Layer. Wenn mehrere Layer aus-gewählt sind werden Sie am WMS Server kombiniert und in einem Rutsch an QGIS weitergegeben.
Tipp: WMS Layer anordnen
Von einem Server dargestellte WMS Layer werden in der Reihenfolge aus dem Abschnitt Layers von oben bisunten überlagert. Wenn Sie die Layerreihenfolge ändern wollen können Sie den Reiter Layerreihenfolge benutzen.
Transparenz
In dieser Version von QGIS ist die Einstellung Globale Transparenz aus dem Menü Layereigenschaften immergemäß den Layereigenschaften eingestellt.
Tipp: Transparenz von WMS-Layern
Die WMS Bildtransparenz steht Ihnen abhänig von der Bildkodierung zur Verfügung: PNG und GIF unterstützenTransparenz währenddessen JPEG keine Untersützung bietet.
Koordinatenbezugsystem
Koordinatenbezugssystem (KBS) ist die Bezeichnung des OGC für eine Projektion in QGIS.
Jeder WMS Layer kann abhängig von den Fähigkeiten des WMS in mehreren KBS dargestellt werden.
To choose a CRS, select Change. . . and a dialog similar to Der Benutzerkoordinatensystem Dialog will appear.The main difference with the WMS version of the dialog is that only those CRSs supported by the WMS serverwill be shown.
Serversuche
Within QGIS, you can search for WMS servers. Figure_OGC_search shows the Server Search tab with the AddLayer(s) from a Server dialog.
As you can see, it is possible to enter a search string in the text field and hit the Search button. After a shortwhile, the search result will be populated into the list below the text field. Browse the result list and inspect yoursearch results within the table. To visualize the results, select a table entry, press the Add Selected Row to WMSList button and change back to the Layers tab. QGIS has automatically updated your server list, and the selectedsearch result is already enabled in the list of saved WMS servers in the Layers tab. You only need to request thelist of layers by clicking the Connect button. This option is quite handy when you want to search maps by specifickeywords.
Diese Suchfunktion ist ein Frontend zur API von http://geopole.org.
Tilesets
Wenn Sie WMTS (gecachte WMS) Dienste verwenden wie
https://opencache.statkart.no/gatekeeper/gk/gk.open_wmts?\service=WMTS&request=GetCapabilities
418 Chapter 17. Arbeiten mit OGC Daten

QGIS User Guide, Release 3.4
Figure 17.3: Dialog zum Suchen von WMS Servern nach einigen Stichwörtern
you are able to browse through the Tilesets tab given by the server. Additional information like tile size, formatsand supported CRS are listed in this table. In combination with this feature, you can use the tile scale slider by
selecting View → Panels ( or Settings → Panels), then choosing Tile Scale Panel. This gives you the availablescales from the tile server with a nice slider docked in.
Das Objekte abfragen Werkzeug
Nachdem Sie einen Layer von einem WMS-Server geladen haben, können Sie die Layer mit dem WerkzeugObjekte Abfragen abfragen, sofern der WMS-Server diese Funktion unterstützt. Ein Klick auf einen Pixel stellt danneine Abfrage an den WMS-Server für diesen Pixel. Das Ergebnis wird in Textform geliefert. Die Formatierunghängt von dem jeweilig verwendeten WMS-Server ab. Formatauswahl
Wenn durch den Server mehrere Formate unterstützt werden wird dem Objekte abfragen Dialog automatisch eineKombobox mit den unterstützten Formaten hinzugefügt und das ausgewählte Format kann im Projekt für denLayer gespeichert werden. GML Formatunterstützung
Das Objekte abfragen Werkzeug unterstützt WMS Server Response (GetFeatureInfo) im GML Format (es wirdFeature in der QGIS GUI in diesem Zusammenhang genannt). Wenn das „Feature“ Format vom Server unterstütztwird und ausgewählt ist, sind die Ergebnisse des Objekte abfragen Werkzeugs Vektorobjekte, wie bei einemnormalen Vektorlayer. Wenn ein einzelnes Objekt im Baum ausgewählt wird wird es in der Karte hervorgehobenund kann in die Zwischenablage kopiert werden und in einen anderen Vektorlayer eingefügt werden. Sehen Siesich für die Unterstüzung von GetFeatureInfo im GML Format das Beispielsetup des UMN Mapservers unten an.
# in layer METADATA add which fields should be included and define geometry→˓(example):
"gml_include_items" "all""ows_geometries" "mygeom""ows_mygeom_type" "polygon"
17.1. QGIS als OGC Datenclient 419

QGIS User Guide, Release 3.4
# Then there are two possibilities/formats available, see a) and b):
# a) basic (output is generated by Mapserver and does not contain XSD)# in WEB METADATA define formats (example):"wms_getfeatureinfo_formatlist" "application/vnd.ogc.gml,text/html"
# b) using OGR (output is generated by OGR, it is send as multipart and contains→˓XSD)# in MAP define OUTPUTFORMAT (example):OUTPUTFORMAT
NAME "OGRGML"MIMETYPE "ogr/gml"DRIVER "OGR/GML"FORMATOPTION "FORM=multipart"
END
# in WEB METADATA define formats (example):"wms_getfeatureinfo_formatlist" "OGRGML,text/html"
Eigenschaften
Nachdem Sie einen WMS Server hinzugefügt haben können Sie sich seine Eigenschaften mit einem Rechtsklickin der Legende und dem Auswählen von Eigenschaften ansehen. Reiter Metadaten
Der Reiter Metadaten im Kontextmenü zeigt eine Vielzahl von Informationen über den WMS-Server. Diese Infossind dem Capabilities-Dokument des Servers entnommen. Viele Definitionen können reduziert werden indemman den WMS Standard liest (siehe OPEN-GEOSPATIAL-CONSORTIUM Literatur und Internetreferenzen),hier sind dazu einige praktische Definitionen:
• Servereigenschaften
– WMS Version– Die WMS-Version, die vom Server unterstützt wird.
– Bildformate — Eine Liste der MIME-Typen mit denen der Server antworten kann. QGIS unterstütztjedes Format, welches die darunterliegende Bibliothek QT unterstützt, mindestens aber image/pngund image/jpeg.
– Abfrageformate — Eine Liste der MIME-Typen mit denen der Server auf Pixel-Abfragen antwortenkann. Derzeit wird von QGIS nur der Typ text-plain unterstützt.
• Layereigenschaften
– Ausgewählt — Gibt an, ob dieser Layer während des Hinzufügens des Server ausgewählt war.
– Sichtbar — Gibt an, ob der Layer in der Legende angezeigt wird oder nicht. (noch nicht verwendetin der aktuellen Version von QGIS.)
– Kann abfragen — Gibt an, ob der Layer auf Abfragen Ergebnisse zurückgibt.
– Kann Transparenz — Gibt an, ob der Layer transparent gezeichnet werden kann. Diese QGIS Ver-sion verwendet ein hardcodiertes Ja, sofern die Bildkodierung Transparenz bietet
– Kann reingezoomt werden —Gibt an, ob dieser Layer gezoomt werden kann. Diese Version vonQGIS verwendet standardmäßig Ja. Daher kann es sein, dass einige Layer komisch aussehen, diediese Funktion nicht unterstützen.
– Kaskadierend — WMS-Server können als Proxy zwischen anderen WMS-Servern agieren, um Ras-terdaten für einen Layer anzufordern. Dieser Eintrag gibt an, wieviele WMS-Server angefragt werdenmüssen, um die Daten zu bekommen.
– Fixierte Höhe, Fixierte Breite —Gibt an, ob der Layer eine feste Pixeldimension hat. Diese Versionvon QGIS nimmt an, dass alle WMS-Layer diesen Wert nicht gesetzt haben. Daher kann es sein, dasseinige Layer komisch aussehen, die diese Funktion nicht unterstützen.
420 Chapter 17. Arbeiten mit OGC Daten

QGIS User Guide, Release 3.4
– WGS 84 Boundingbox —Gibt die Boundingbox eines Layers in WGS84-Koordinaten an. EinigeWMS-Server setzen diese Werte nicht korrekt (z.B. stehen darin manchmal UTM-Koordinaten), so-dass bei solchen Layern in QGIS der Eindruck entsteht, sehr weit herausgezoomt zu sein. Der Web-master des WMS-Servers sollte dann auf dieses Problem aufmerksam gemacht werden. Das WMSXML-Element ist LatLonBoundingBox, EX_GeographicBoundingBox oder die CRS:84BoundingBox.
– Verfügbare Koordinatensysteme — Die Projektionen, in denen dieser Layer dargestellt werdenkann. Diese sind dem Capabilities-Dokument des Servers entnommen.
– Verfügbare Stile — Die Bildstile, in denen dieser Layer dargestellt werden kann.
Show WMS legend graphic in table of contents and layout
The QGIS WMS data provider is able to display a legend graphic in the table of contents‘ layer list and in the printlayout. The WMS legend will be shown only if the WMS server has GetLegendGraphic capability and the layerhas getCapability url specified, so you additionally have to select a styling for the layer.
Wenn eine legendGraphic verfügbar ist, wird diese unter dem Layer angezeigt. Sie ist klein und Sie müssen daraufklicken um Sie in Ihrer tatsächlichen Größe (gemäß den QgsLegendInterface Architekturlimitationen) zu öffnen.Das Klicken auf die Legende des Layers öffnet einen Rahmen mit einer Legende in voller Auflösung.
In the print layout, the legend will be integrated at it’s original (downloaded) dimension. Resolution of the legendgraphic can be set in the item properties under Legend –> WMS LegendGraphic to match your printing require-ments
Die Legende wird Kontextinformationen basiert auf dem aktuellen Maßstab darstellen. Die WMS Legende wirdnur gezeigt wenn der WMS Server eine GetLegendGraphic Capability hat und für dem Layer eine getCapabilityURL angegeben wurde, also müssen Sie einen Stil auswählen.
Einschränkungen des WMS-Klienten
Nicht alle mögliche WMS Client Funktionalitäten sind in diese Version von QGIS| integriert worden. Einige derbemerkenswerteren Ausnahmen folgen noch.
WMS-Layereigenschaften ändern
Nachdem Sie die WMS/WMTS-Layer hinzufügen Prozedur beendet haben gibt es keine Möglichkeit mehr die Einstel-lungen zu ändern. Sie können das Problem umgehen indem Sie den Layer komplett entfernen und neu beginnen.
WMS-Server, die eine Authentifizierung benötigen
Derzeit werden öffentlich zugängliche und gesicherte WMS Services unterstützt. Die gesicherten WMS Serverkönnen mit öffentlicher Authentifizierung angebunden werden. Sie können die (optionalen) Anmeldeinforma-tionen hinzufügen wenn Sie einen WMS Server hinzufügen. Schlagen Sie unter Abschnitt WMS/WMTS Serverauswählen Details nach.
Tipp: Zugriff auf abgesicherte OGC-Layer
If you need to access secured layers with secured methods other than basic authentication, you can use InteProxyas a transparent proxy, which does support several authentication methods. More information can be found in theInteProxy manual at https://inteproxy.wald.intevation.org.
Tipp: QGIS WMS Mapserver
Seit Version 1.7.0 besitzt QGIS seine eigene Implementierung eines WMS 1.3.0 Mapservers. Lesen mehr darüberin Kapitel QGIS as OGC Data Server.
17.1. QGIS als OGC Datenclient 421

QGIS User Guide, Release 3.4
17.1.2 WCS Client
Ein Web Coverage Service (WCS) stellt eine Anbindung zu Rasterdaten in Formaten die nützlich für dieclient-seitige Darstellung, als Input für wissenschaftliche Modelle und für andere Clients zur Verfügung. DerWCS ist vergleichbar zu WFS und WMS. Als WMS und WFS Service Instanz erlaubt der WCS den Clients Teilevon Serverinformationsbeständen basierend auf räumlichen Einschränkungen und Abfragekriterien auszuwählen.
QGIS hat einen nativen WCS Provider und unterstützt sowohl Version 1.0 und 1.1 (welche deutliche Unterschiedeaufweisen), aktuell jedoch wird 1.0 vorgezogen da es mit 1.1 viele Probleme gibt (z.B. implementiert jeder Serveres auf eine andere Art und Weise mit zahlreichen Besonderheiten).
Der native WCS Provider kümmert sich um alle Netzwerkanfragen und verwendet alle voreingestellten QGISNetzwerkanfragen (insbesondere proxy). Es ist auch möglich einen Cache auszuwählen (‚Immer cachen‘, ‚Cachevorziehen‘, ‚Netzwerk vorziehen‘, ‚Immer Netzwerk‘) und der Provider unterstützt ebenfalls das Auswählen derZeitposition wenn Temporal Domain vom Server angeboten wird.
Warnung: Entering username and password in the Authentication tab will keep unprotected credentials inthe connection configuration. Those credentials will be visible if, for instance, you shared the project filewith someone. Therefore, it’s advisable to save your credentials in a Authentication configuration instead(configurations tab). See Authentifizierungssystem for more details.
17.1.3 WFS und WFS-T Klient
In QGIS verhält sich ein WFS-Layer weitestgehend wie ein anderer Vektorlayer. Sie können Objekte abfragen,auswählen und sich die Attributtabelle anschauen. Seit QGIS 1.6 wird das Bearbeiten (WFS-T) unterstützt.
Im Allgemeinen verhält sich das Hinzufügen eines WFS Layers sehr ähnlich wie die Vorgehensweise die beimWMS verwendet wird. Der Unterschied besteht darin dass keine voreingestellten Server definiert sind, alsomüssen wir eigene hinzufügen.
Einen WFS-Layer laden
As an example, we use the Gateway Geomatics WFS server and display a layer. https://demo.gatewaygeomatics.com/cgi-bin/wfs_gateway?REQUEST=GetCapabilities&VERSION=1.0.0&SERVICE=WFS
To be able to load a WFS Layer we create a connection to the WFS server first.
1. Open the Data Source Manager dialog by pressing the Open Data Source Manager button
2. Enable the WFS tab
3. Click on New. . . to open the Create a New WFS Connection dialog
4. Enter Gateway Geomatics as name
5. Enter the URL (see above)
6. In the WFS settings dialog, you can:
• Indicate the WFS version of the server. If unknown, press the Detect button to automatically retrieveit.
• Define the maximum number of features retrieved in a single GetFetFeature request. If empty, no limitis set.
• Invert axis orientation.
• And depending on the WFS version:
– Force to Ignore axis orientation (WFS 1.1/WFS 2.0)
– Enable feature paging and specify the maximum number of features to retrieve with Page size. Ifno limit is defined, then the server default is applied.
422 Chapter 17. Arbeiten mit OGC Daten

QGIS User Guide, Release 3.4
Figure 17.4: Creating a connection to a WFS server
17.1. QGIS als OGC Datenclient 423

QGIS User Guide, Release 3.4
Warnung: Entering username and password in the Authentication tab will keep unprotected cre-dentials in the connection configuration. Those credentials will be visible if, for instance, you sharedthe project file with someone. Therefore, it’s advisable to save your credentials in an Authenticationconfiguration instead (Configurations tab). See Authentifizierungssystem for more details.
7. Press OK to create the connection.
Beachten Sie dass auch jede Proxyeinstellung die Sie in Ihren eingestellt haben berücksichtigt wird.
Now we are ready to load WFS layers from the above connection.
1. Choose ‚Gateway Geomatics‘ from the Server Connections drop-down list.
2. Click Connect
3. Select the Parks layer in the list
4. You can also choose whether to:
• Use title for layer name, showing the layer’s title as defined on the server in the Layers panelinstead of its Name
• Only request features overlapping the view extent
• Change the layer’s CRS
• or Build query to specify particular features to retrieve, by either using the corresponding button ordouble-clicking the target layer.
5. Click Add to add the layer to the map.
You’ll notice the download progress is visualized in the lower left of the QGIS main window. Once the layer isloaded, you can identify and select a couple of features and view the attribute table.
Bemerkung: QGIS supports different versions of the WFS protocol, with background download and progressiverendering, on-disk caching of downloaded features and version autodetection.
Tipp: WFS-Server finden
Sie können weitere WFS Server mit Hilfe von Google oder ihrer bevorzugten Suchmaschine finden. Es gibt eineVielzahl von Listen im Internet, die Links zu öffentlichen Servern bereitstellen.
17.2 QGIS as OGC Data Server
QGIS Server is an open source WMS 1.3, WFS 1.0.0, WFS 1.1.0 and WCS 1.1.1 implementation that, in addition,implements advanced cartographic features for thematic mapping. QGIS Server is a FastCGI/CGI (CommonGateway Interface) application written in C++ that works together with a web server (e.g., Apache, Lighttpd).It has Python plugin support allowing for fast and efficient development and deployment of new features. Theoriginal development of QGIS Server was funded by the EU projects Orchestra, Sany and the city of Uster inSwitzerland.
QGIS Server uses QGIS as back end for the GIS logic and for map rendering. Furthermore, the Qt library isused for graphics and for platform-independent C++ programming. In contrast to other WMS software, the QGISServer uses cartographic rules as a configuration language, both for the server configuration and for the user-defined cartographic rules.
As QGIS desktop and QGIS Server use the same visualization libraries, the maps that are published on the weblook the same as in desktop GIS.
424 Chapter 17. Arbeiten mit OGC Daten

QGIS User Guide, Release 3.4
Figure 17.5: Einen WFS Layer hinzufügen
17.2. QGIS as OGC Data Server 425

QGIS User Guide, Release 3.4
In the following sections, we will provide a sample configuration to set up a QGIS Server on Debian/UbuntuLinux. For more detailed installation instructions on other platforms or distributions and more information onworking with QGIS Server, we recommend reading the QGIS Server Training Manual or server_plugins.
17.2.1 Getting Started
Installation on Debian-based systems
At this point, we will give a short and simple installation how-to for a minimal working configuration on Debianbased systems. However, many other distributions and OSs provide packages for QGIS Server.
Requirements and steps to install QGIS Server on a Debian based system are provided in QGIS installers page.Please refer to that section.
HTTP Server configuration
Apache
Apache and its mod_fcgid module may be used for executing QGIS Server.
Install Apache and mod_fcgid:
sudo apt install apache2 libapache2-mod-fcgid
Here we assume that an Apache VirtualHost is already set up. For example this is what a basicVirtualHost configuration may look like:
<VirtualHost *:80>
ServerAdmin webmaster@localhostDocumentRoot /var/www/html
ErrorLog ${APACHE_LOG_DIR}/error.logCustomLog ${APACHE_LOG_DIR}/access.log combined
</VirtualHost>
Bemerkung: On Debian systems, a default VirtualHost is available in /etc/apache2/sites-available/000-default.conf.
Let’s now add mod_fcgid configuration directives for QGIS Server:
<VirtualHost *:80>
ServerAdmin webmaster@localhostDocumentRoot /var/www/html
ErrorLog ${APACHE_LOG_DIR}/error.logCustomLog ${APACHE_LOG_DIR}/access.log combined
FcgidInitialEnv DISPLAY ":99"FcgidInitialEnv QGIS_SERVER_LOG_LEVEL "0"FcgidInitialEnv QGIS_SERVER_LOG_STDERR "1"
<Location /qgisserver>SetHandler fcgid-scriptFcgidWrapper /usr/lib/cgi-bin/qgis_mapserv.fcgi virtualOptions +ExecCGI -MultiViews +FollowSymLinks
426 Chapter 17. Arbeiten mit OGC Daten

QGIS User Guide, Release 3.4
Require all granted</Location>
</VirtualHost>
See the mod_fcgid documentation for more information on the Fcgid parameters used. And see below tounderstand when and why the DISPLAY environment variable needs to be set.
Now restart Apache for the new configuration to be taken into account:
sudo service apache2 restart
QGIS Server is now available at http://localhost/qgisserver.
NGINX
You can also use QGIS Server with NGINX. Unlike Apache, NGINX does not automatically spawn FastCGIprocesses. The FastCGI processes are to be started by something else.
On Debian-based systems, you may use fcgiwrap or spawn-fcgi to start and manage the QGIS Server processes.Official Debian packages exist for both.
Bemerkung: fcgiwrap is easier to set up than spawn-fcgi, because it’s already wrapped in a Systemd service. Butit also leads to a solution that is much slower than using spawn-fcgi. With fcgiwrap a new QGIS Server process iscreated on each request, meaning that the QGIS Server initialization process, which includes reading and parsingthe QGIS project file, is done on each request. With spawn-fcgi, the QGIS Server process remains alive betweenrequests, resulting in much better performance. For that reason, spawn-fcgi is recommended for production use.
Install NGINX:
sudo apt install nginx
fcgiwrap
If you want to use fcgiwrap to run QGIS Server, you first have to install the corresponding package:
sudo apt install fcgiwrap
Then, introduce the following block in your NGINX server configuration:
1 location /qgisserver {2 gzip off;3 include fastcgi_params;4 fastcgi_pass unix:/var/run/fcgiwrap.socket;5 fastcgi_param SCRIPT_FILENAME /usr/lib/cgi-bin/qgis_mapserv.fcgi;6 }
Finally, restart NGINX and fcgiwrap to take into account the new configuration:
sudo service nginx restartsudo service fcgiwrap restart
QGIS Server is now available at http://localhost/qgisserver.
17.2. QGIS as OGC Data Server 427

QGIS User Guide, Release 3.4
spawn-fcgi
If you prefer to use spawn-fcgi instead of fcgiwrap, the first step is to install the package:
sudo apt install spawn-fcgi
Then, introduce the following block in your NGINX server configuration:
location /qgisserver {gzip off;include fastcgi_params;fastcgi_pass unix:/var/run/qgisserver.socket;
}
And restart NGINX to take into account the new configuration:
sudo service nginx restart
Finally, considering that there is no default service file for spawn-fcgi, you have to manually start QGIS Server inyour terminal:
sudo spawn-fcgi -s /var/run/qgisserver.socket \-U www-data -G www-data -n \/usr/lib/bin/cgi-bin/qgis_mapserv.fcgi
Of course, you may write an init script (like a qgisserver.service file with Systemd) to start QGIS Serverat boot time or whenever you want.
QGIS Server is now available at http://localhost/qgisserver.
Bemerkung: With the above command spawn-fcgi spawns only one QGIS Server process. To use more than oneQGIS Server process you can combine spawn-fcgi with the multiwatch tool, which is also packaged in Debian.
Configuration
The include fastcgi_params; used in previous configuration is important as it adds the parameters from /etc/nginx/fastcgi_params:
fastcgi_param QUERY_STRING $query_string;fastcgi_param REQUEST_METHOD $request_method;fastcgi_param CONTENT_TYPE $content_type;fastcgi_param CONTENT_LENGTH $content_length;
fastcgi_param SCRIPT_NAME $fastcgi_script_name;fastcgi_param REQUEST_URI $request_uri;fastcgi_param DOCUMENT_URI $document_uri;fastcgi_param DOCUMENT_ROOT $document_root;fastcgi_param SERVER_PROTOCOL $server_protocol;fastcgi_param REQUEST_SCHEME $scheme;fastcgi_param HTTPS $https if_not_empty;
fastcgi_param GATEWAY_INTERFACE CGI/1.1;fastcgi_param SERVER_SOFTWARE nginx/$nginx_version;
fastcgi_param REMOTE_ADDR $remote_addr;fastcgi_param REMOTE_PORT $remote_port;fastcgi_param SERVER_ADDR $server_addr;fastcgi_param SERVER_PORT $server_port;fastcgi_param SERVER_NAME $server_name;
428 Chapter 17. Arbeiten mit OGC Daten

QGIS User Guide, Release 3.4
# PHP only, required if PHP was built with --enable-force-cgi-redirectfastcgi_param REDIRECT_STATUS 200;
Of course, you may override these variables in your own configuration. For example:
include fastcgi_params;fastcgi_param SERVER_NAME domain.name.eu;
Moreover, you can use some Environment variables to configure QGIS Server. With NGINX as HTTP Server,you have to use fastcgi_param to define these variables as shown below:
fastcgi_param QGIS_DEBUG 1;fastcgi_param QGIS_SERVER_LOG_FILE /tmp/qgis-000.log;fastcgi_param QGIS_SERVER_LOG_LEVEL 0;
Bemerkung: When using spawn-fcgi, you may directly define environment variables before running the server.For example: export QGIS_SERVER_LOG_FILE=/home/user/qgis.log
Xvfb
QGIS Server needs a running X Server to be fully usable. But if you don’t have one, you may use xvfb to have avirtual X environment.
To install the package:
sudo apt install xvfb
Then, according to your HTTP server, you should configure the DISPLAY parameter or directly use xvfb-run.
For example with NGINX and spawn-fcgi using xvfb-run:
xvfb-run /usr/bin/spawn-fcgi -f /usr/lib/bin/cgi-bin/qgis_mapserv.fcgi \-s /tmp/qgisserver.socket \-G www-data -U www-data -n
The other option is to start a virtual X server environment with a specific display number thanks to Xvfb:
/usr/bin/Xvfb :99 -screen 0 1024x768x24 -ac +extension GLX +render -noreset
Then we just have to set the DISPLAY environment variable in the HTTP server configuration. For example withNGINX:
fastcgi_param DISPLAY ":99";
Or with Apache:
FcgidInitialEnv DISPLAY ":99"
Installation on Windows
QGIS Server can also be installed on Windows systems. While the QGIS Server package is available in the 64 bitversion of the OSGeo4W network installer (https://qgis.org/en/site/forusers/download.html) there is no Apache(or other web server) package available, so this must be installed by other means.
A simple procedure is the following:
17.2. QGIS as OGC Data Server 429

QGIS User Guide, Release 3.4
• Download the XAMPP installer (https://www.apachefriends.org/download.html) for Windows and installApache
• Download the OSGeo4W installer, follow the „Advanced Install“ and install both the QGIS Desktop andQGIS Server packages
• Edit the httpd.conf file (C:\xampp\apache\httpd.conf if the default installation paths have beenused) and make the following changes:
From:
ScriptAlias /cgi-bin/ "C:/xampp/cgi-bin/"
To:
ScriptAlias /cgi-bin/ "c:/OSGeo4W64/apps/qgis/bin/"
From:
<Directory "C:/xampp/cgi-bin">AllowOverride NoneOptions NoneRequire all granted</Directory>
To:
<Directory "c:/OSGeo4W64/apps/qgis/bin">SetHandler cgi-scriptAllowOverride NoneOptions ExecCGIOrder allow,denyAllow from all
430 Chapter 17. Arbeiten mit OGC Daten

QGIS User Guide, Release 3.4
Require all granted</Directory>
From:
AddHandler cgi-script .cgi .pl .asp
To:
AddHandler cgi-script .cgi .pl .asp .exe
Then at the bottom of httpd.conf add:
SetEnv GDAL_DATA "C:\OSGeo4W64\share\gdal"SetEnv QGIS_AUTH_DB_DIR_PATH "C:\OSGeo4W64\apps\qgis\resources"SetEnv PYTHONHOME "C:\OSGeo4W64\apps\Python36"SetEnv PATH "C:\OSGeo4W64\bin;C:\OSGeo4W64\apps\qgis\bin;C:\OSGeo4W64\apps\Qt5\bin;→˓C:\WINDOWS\system32;C:\WINDOWS;C:\WINDOWS\System32\Wbem"SetEnv QGIS_PREFIX_PATH "C:\OSGeo4W64\apps\qgis"SetEnv QT_PLUGIN_PATH "C:\OSGeo4W64\apps\qgis\qtplugins;→˓C:\OSGeo4W64\apps\Qt5\plugins"
Restart the Apache web server from the XAMPP Control Panel and open browser window to testing a GetCapa-bilities request to QGIS Server
http://localhost/cgi-bin/qgis_mapserv.fcgi.exe?SERVICE=WMS&VERSION=1.3.0&REQUEST=GetCapabilities
Serve a project
Now that QGIS Server is installed and running, we just have to use it.
Obviously, we need a QGIS project to work on. Of course, you can fully customize your project by definingcontact information, precise some restrictions on CRS or even exclude some layers. Everything you need to knowabout that is described later in Configure your project.
But for now, we are going to use a simple project already configured. To retrieve the project:
17.2. QGIS as OGC Data Server 431

QGIS User Guide, Release 3.4
cd /home/user/wget https://github.com/qgis/QGIS-Training-Data/archive/QGIS-Training-Data-v2.0.→˓zip -O qgis-server-tutorial.zipunzip qgis-server-tutorial.zipmv QGIS-Training-Data-QGIS-Training-Data-v2.0/training_manual_data/qgis-server-→˓tutorial-data ~
The project file is qgis-server-tutorial-data-master/world.qgs. Of course, you can use yourfavorite GIS software to open this file and take a look on the configuration and available layers.
By opening the project and taking a quick look on layers, we know that 4 layers are currently available:
• airports
• places
• countries
• countries_shapeburst
You don’t have to understand the full request for now but you may retrieve a map with some of the previous layersthanks to QGIS Server by doing something like this in your web browser to retrieve the countries layer:
http://localhost/qgisserver?MAP=/home/user/qgis-server-tutorial-data-master/world.qgs&LAYERS=countries&SERVICE=WMS&REQUEST=GetMap&CRS=EPSG:4326&WIDTH=400&HEIGHT=200
If you obtain the next image, then QGIS Server is running correctly:
Figure 17.6: Server response to a basic GetMap request
Note that you may define PROJECT_FILE environment variable to use a project by default instead of giving aMAP parameter (see Environment variables).
For example with spawn-fcgi:
export PROJECT_FILE=/home/user/qgis-server-tutorial-data-master/world.qgsspawn-fcgi -f /usr/lib/bin/cgi-bin/qgis_mapserv.fcgi \
-s /var/run/qgisserver.socket \-U www-data -G www-data -n
432 Chapter 17. Arbeiten mit OGC Daten

QGIS User Guide, Release 3.4
Configure your project
To provide a new QGIS Server WMS, WFS or WCS, you have to create a QGIS project file with some data or useone of your current project. Define the colors and styles of the layers in QGIS and the project CRS, if not alreadydefined.
Figure 17.7: Definitions for a QGIS Server WMS/WFS/WCS project
Then, go to the QGIS Server menu of the Project → Properties. . . dialog and provide some information aboutthe OWS in the fields under Service Capabilities. This will appear in the GetCapabilities response of the WMS,
WFS or WCS. If you don’t check Service capabilities, QGIS Server will use the information given in thewms_metadata.xml file located in the cgi-bin folder.
WMS capabilities
In the WMS capabilities section, you can define the extent advertised in the WMS GetCapabilities response byentering the minimum and maximum X and Y values in the fields under Advertised extent. Clicking Use Current
Canvas Extent sets these values to the extent currently displayed in the QGIS map canvas. By checking CRSrestrictions, you can restrict in which coordinate reference systems (CRS) QGIS Server will offer to render maps.
17.2. QGIS as OGC Data Server 433

QGIS User Guide, Release 3.4
It is recommended that you restrict the offered CRS as this reduces the size of the WMS GetCapabilities response.
Use the button below to select those CRSs from the Coordinate Reference System Selector, or click Used toadd the CRSs used in the QGIS project to the list.
If you have print layouts defined in your project, they will be listed in the GetProjectSettings response, and theycan be used by the GetPrint request to create prints, using one of the print layout layouts as a template. This isa QGIS-specific extension to the WMS 1.3.0 specification. If you want to exclude any print layout from being
published by the WMS, check Exclude layouts and click the button below. Then, select a print layoutfrom the Select print layout dialog in order to add it to the excluded layouts list.
If you want to exclude any layer or layer group from being published by the WMS, check Exclude Layers
and click the button below. This opens the Select restricted layers and groups dialog, which allows you tochoose the layers and groups that you don’t want to be published. Use the Shift or Ctrl key if you want toselect multiple entries. It is recommended that you exclude from publishing the layers that you don’t need as thisreduces the size of the WMS GetCapabilities response which leads to faster loading times on the client side.
You can receive requested GetFeatureInfo as plain text, XML and GML. Default is XML, text or GML formatdepends the output format chosen for the GetFeatureInfo request.
If you wish, you can check Add geometry to feature response. This will include in the GetFeatureInfo responsethe geometries of the features in a text format.
As many web clients can’t display circular arcs in geometries you have the option to segmentize the geometrybefore sending it to the client in a GetFeatureInfo response. This allows such clients to still display a feature’s
geometry (e.g. for highlighting the feature). You need to check the Segmentize feature info geometry to activatethe option.
You can also use the GetFeatureInfo geometry precision option to set the precision of the GetFeatureInfo geometry.This enables you to save bandwidth when you don’t need the full precision.
If you want QGIS Server to advertise specific request URLs in the WMS GetCapabilities response, enter thecorresponding URL in the Advertised URL field.
Furthermore, you can restrict the maximum size of the maps returned by the GetMap request by entering themaximum width and height into the respective fields under Maximums for GetMap request.
If one of your layers uses the Map Tip display (i.e. to show text using expressions) this will be listed inside theGetFeatureInfo output. If the layer uses a Value Map for one of its attributes, this information will also be shownin the GetFeatureInfo output.
WFS capabilities
In the WFS capabilities area you can select the layers you want to publish as WFS, and specify if they will allowupdate, insert and delete operations. If you enter a URL in the Advertised URL field of the WFS capabilitiessection, QGIS Server will advertise this specific URL in the WFS GetCapabilities response.
WCS capabilities
In the WCS capabilities area, you can select the layers that you want to publish as WCS. If you enter a URL in theAdvertised URL field of the WCS capabilities section, QGIS Server will advertise this specific URL in the WCSGetCapabilities response.
Fine tuning your OWS
For vector layers, the Fields menu of the Layer → Properties dialog allows you to define for each attribute if itwill be published or not. By default, all the attributes are published by your WMS and WFS. If you don’t want aspecific attribute to be published, uncheck the corresponding checkbox in the WMS or WFS column.
434 Chapter 17. Arbeiten mit OGC Daten
QGIS User Guide, Release 3.4
You can overlay watermarks over the maps produced by your WMS by adding text annotations or SVG annotationsto the project file. See the Beschriftungstools section for instructions on creating annotations. For annotations tobe displayed as watermarks on the WMS output, the Fixed map position checkbox in the Annotation text dialogmust be unchecked. This can be accessed by double clicking the annotation while one of the annotation tools isactive. For SVG annotations, you will need either to set the project to save absolute paths (in the General menu ofthe Project → Properties. . . dialog) or to manually modify the path to the SVG image so that it represents a validrelative path.
17.2.2 Services
QGIS Server is able to serve data according to standard protocols as described by the Open Geospatial Consor-tium (OGC):
• WMS 1.1.0 and 1.3.0
• WFS 1.0.0 and 1.1.0
• WCS 1.1.1
• WMTS 1.0.0
Extra vendor parameters and requests are supported in addition to the original standard that greatly enhance thepossibilities of customizing its behavior thanks to the QGIS rendering engine.
Web Map Service (WMS)
The 1.1.0 and 1.3.0 WMS standards implemented in QGIS Server provide a HTTP interface to request map orlegend images generated from a QGIS project. A typical WMS request defines the QGIS project to use, the layersto render as well as the image format to generate. Basic support is also available for the Styled Layer Descriptor(SLD) standard.
Specifications document according to the version number of the service:
• WMS 1.1.0
• WMS 1.3.0
Standard requests provided by QGIS Server:
Request DescriptionGetCapabilities Return XML metadata with information about the serverGetMap Return a mapGetFeatureInfo Retrieves data (geometry and values) for a pixel locationGetLegendGraphics Returns legend symbols
Vendor requests provided by QGIS Server:
Request DescriptionGetPrint Returns a QGIS compositionGetProjectSettings Returns specific information about QGIS Server
GetMap
Standard parameters for the GetMap request according to the OGC WMS 1.1.0 and 1.3.0 specifications:
17.2. QGIS as OGC Data Server 435

QGIS User Guide, Release 3.4
Parameter Required DescriptionSERVICE Yes Name of the service (WMS)VERSION No Version of the serviceREQUEST Yes Name of the request (GetMap)LAYERS No Layers to displaySTYLES No Layers‘ styleSRS / CRS Yes Coordinate reference systemBBOX No Map extentWIDTH Yes Width of the image in pixelsHEIGHT Yes Height of the image in pixelsFORMAT No Image formatTRANSPARENT No Transparent background
In addition to the standard ones, QGIS Server supports the following extra parameters:
Parameter Required DescriptionMAP Yes Specify the QGIS project fileBGCOLOR No Specify the background colorDPI No Specify the output resolutionIMAGE_QUALITY No JPEG compressionOPACITIES No Opacity for layer or groupFILTER No Subset of featuresSELECTION No Highlight featuresFILE_NAME No Only for
FORMAT=application/dxfFile name of the downloaded file
FORMAT_OPTIONS No Only forFORMAT=application/dxfkey:value pairs separated by semi-colon.
• SCALE: to be used forsymbology rules, filters andstyles (not actual scaling ofthe data - data remains in theoriginal scale).
•MODE:NOSYMBOLOGY|FEATURESYMBOLOGY|SYMBOLLAYERSYMBOLOGY:corresponds to the three ex-port options offered in theQGIS Desktop DXF exportdialog.
•LAYERSATTRIBUTES:yourcolumn_with_values_to_be_used_for_dxf_layernamesif not specified, the originalQGIS layer names are used.
•USE_TITLE_AS_LAYERNAME:if enabled, the title of thelayer will be used as layername.
436 Chapter 17. Arbeiten mit OGC Daten

QGIS User Guide, Release 3.4
URL example:
http://localhost/qgis_server?SERVICE=WMS&VERSION=1.3.0&REQUEST=GetMap&MAP=/home/user/project.qgs&LAYERS=mylayer1,mylayer2,mylayer3&STYLES=style1,default,style3&OPACITIES=125,200,125&CRS=EPSG:4326&WIDTH=400&HEIGHT=400&FORMAT=image/png&TRANSPARENT=TRUE&DPI=300
SERVICE
This parameter has to be WMS in case of the GetMap request.
VERSION
This parameter allows to specify the version of the service to use. Available values for the VERSION parameterare:
• 1.1.0
• 1.3.0
If no version is indicated in the request, then 1.3.0 is used by default.
According to the version number, slight differences have to be expected as explained later for the next parameters:
• CRS / SRS
• BBOX
REQUEST
This parameter is GetMap in case of the GetMap request.
LAYERS
This parameter allows to specify the layers to display on the map. Names have to be separated by a comma.
In addition, QGIS Server introduced some options to select layers by:
• a short name
• the layer id
The short name of a layer may be configured through Properties → Metadata in layer menu. If the short name isdefined, then it’s used by default instead of the layer’s name:
17.2. QGIS as OGC Data Server 437

QGIS User Guide, Release 3.4
http://localhost/qgis_server?SERVICE=WMS&REQUEST=GetMap&LAYERS=mynickname1,mynickname2&...
Moreover, there’s a project option allowing to select layers by their id in OWS Server → WMS capabilities menuof the Project → Properties. . . dialog. To activate this option, the checkbox Use layer ids as names has to beselected.
http://localhost/qgis_server?SERVICE=WMS&REQUEST=GetMap&LAYERS=mylayerid1,mylayerid2&...
STYLES
This parameter can be used to specify a layer’s style for the rendering step. Styles have to be separated by acomma. The name of the default style is default.
SRS / CRS
This parameter allows to indicate the map output Spatial Reference System in WMS 1.1.0 and has to be formedlike EPSG:XXXX. Note that CRS is also supported if current version is 1.1.0.
For WMS 1.3.0, CRS parameter is preferable but SRS is also supported.
Note that if both CRS and SRS parameters are indicated in the request, then it’s the current version indicated inVERSION parameter which is decisive.
In the next case, the SRS parameter is kept whatever the VERSION parameter because CRS is not indicated:
http://localhost/qgis_server?SERVICE=WMS&REQUEST=GetMap&VERSION=1.3.0&SRS=EPSG:2854&...
In the next case, the SRS parameter is kept instead of CRS because of the VERSION parameter:
http://localhost/qgis_server?SERVICE=WMS&REQUEST=GetMap&VERSION=1.1.0&CRS=EPSG:4326&SRS=EPSG:2854&...
In the next case, the CRS parameter is kept instead of SRS because of the VERSION parameter:
http://localhost/qgis_server?SERVICE=WMS&REQUEST=GetMap&VERSION=1.3.0&CRS=EPSG:4326&SRS=EPSG:2854&...
438 Chapter 17. Arbeiten mit OGC Daten

QGIS User Guide, Release 3.4
BBOX
This parameter allows to specify the map extent with units according to the current CRS. Coordinates have to beseparated by a comma.
However, a slight difference has to be noticed according to the current VERSION parameter. Actually, in WMS1.1.0, coordinates are formed like minx,miny,maxx,maxy or minlong,minlat,maxlong,maxlat.For example:
http://localhost/qgis_server?SERVICE=WMS&REQUEST=GetMap&VERSION=1.1.0&SRS=epsg:4326&BBOX=-180,-90,180,90&...
But the axis is reversed in WMS 1.3.0, so coordinates are formed like: miny,minx,maxy,maxx or minlat,minlong,maxlat,maxlong. For example:
http://localhost/qgis_server?SERVICE=WMS&REQUEST=GetMap&VERSION=1.3.0&CRS=epsg:4326&BBOX=-90,-180,90,180&...
WIDTH
This parameter allows to specify the width in pixels of the output image.
HEIGHT
This parameter allows to specify the height in pixels of the output image.
FORMAT
This parameter may be used to specify the format of map image. Available values are:
• jpg
• jpeg
• image/jpeg
• image/png
• image/png; mode=1bit
• image/png; mode=8bit
• image/png; mode=16bit
• application/dxfOnly layers that have read access in the WFS service are exported in the DXF format.
URL example:
http://localhost/qgis_server?SERVICE=WMS&VERSION=1.3.0&REQUEST=GetMap
17.2. QGIS as OGC Data Server 439

QGIS User Guide, Release 3.4
&FORMAT=application/dxf&LAYERS=Haltungen,Normschacht,Spezialbauwerke&STYLES=&CRS=EPSG%3A21781&BBOX=696136.28844801,245797.12108743,696318.91114315,245939.→˓25832905&WIDTH=1042&HEIGHT=811&FORMAT_OPTIONS=MODE:SYMBOLLAYERSYMBOLOGY;SCALE:250&FILE_NAME=plan.dxf
TRANSPARENT
This boolean parameter can be used to specify the background transparency. Available values are (not case sensi-tive):
• TRUE
• FALSE
However, this parameter is ignored if the format of the map image indicated with FORMAT is different from PNG.
MAP
This parameter allows to define the QGIS project file to use.
As mentioned in GetMap parameters table, MAP is mandatory because a request needs a QGIS project to actuallywork. However, the QGIS_PROJECT_FILE environment variable may be used to define a default QGIS project.In this specific case, MAP is not longer a required parameter. For further information you may refer to Advancedconfiguration.
BGCOLOR
This parameter allows to indicate a background color for the map image. However it cannot be combined withTRANSPARENT parameter in case of PNG images (transparency takes priority). The colour may be literal or inhexadecimal notation.
URL example with the literal notation:
http://localhost/qgis_server?SERVICE=WMS&REQUEST=GetMap&VERSION=1.3.0&BGCOLOR=green&...
URL example with the hexadecimal notation:
http://localhost/qgis_server?SERVICE=WMS&REQUEST=GetMap&VERSION=1.3.0&BGCOLOR=0x00FF00&...
DPI
This parameter can be used to specify the requested output resolution.
440 Chapter 17. Arbeiten mit OGC Daten

QGIS User Guide, Release 3.4
IMAGE_QUALITY
This parameter is only used for JPEG images. By default, the JPEG compression is -1.
You can change the default per QGIS project in the OWS Server → WMS capabilities menu of the Project →Properties. . . dialog. If you want to override it in a GetMap request you can do it using the IMAGE_QUALITYparameter.
OPACITIES
Opacity can be set on layer or group level. Allowed values range from 0 (fully transparent) to 255 (fully opaque).
FILTER
A subset of layers can be selected with the FILTER parameter. Syntax is basically the same as for the QGISsubset string. However, there are some restrictions to avoid SQL injections into databases via QGIS Server. If adangerous string is found in the parameter, QGIS Server will return the next error:
Indeed, text strings need to be enclosed with quotes (single quotes for strings,→˓double quotes for attributes). A space between each word / special character is→˓mandatory. Allowed Keywords and special characters are 'AND','OR','IN','=','<','>→˓=','>','>=','!=*,'(',')'. Semicolons in string expressions are not allowed
URL example:
http://localhost/qgis_server?SERVICE=WMS&REQUEST=GetMap&LAYERS=mylayer1,mylayer2&FILTER=mylayer1:"OBJECTID" = 3;mylayer2:'text' = 'blabla'&...
Bemerkung: It is possible to make attribute searches via GetFeatureInfo and omit the X/Y parameter if a FILTERis there. QGIS Server then returns info about the matching features and generates a combined bounding box inthe xml output.
SELECTION
The SELECTION parameter can highlight features from one or more layers. Vector features can be selected bypassing comma separated lists with feature ids.
http://localhost/qgis_server?SERVICE=WMS&REQUEST=GetMap&LAYERS=mylayer1,mylayer2&SELECTION=mylayer1:3,6,9;mylayer2:1,5,6&...
The following image presents the response from a GetMap request using the SELECTION option e.g. http://myserver.com/...&SELECTION=countries:171,65.
As those features id’s correspond in the source dataset to France and Romania they’re highlighted in yellow.
17.2. QGIS as OGC Data Server 441

QGIS User Guide, Release 3.4
Figure 17.8: Server response to a GetMap request with SELECTION parameter
442 Chapter 17. Arbeiten mit OGC Daten

QGIS User Guide, Release 3.4
GetFeatureInfo
Standard parameters for the GetFeatureInfo request according to the OGC WMS 1.1.0 and 1.3.0 specifications:
Parameter Required DescriptionSERVICE Yes Name of the service (WMS)VERSION No See GetMapREQUEST Yes See GetMapLAYERS No See GetMapSTYLES No See GetMapSRS / CRS Yes See GetMapBBOX No See GetMapWIDTH Yes See GetMapHEIGHT Yes See GetMapTRANSPARENT No See GetMapINFO_FORMAT No Output formatQUERY_LAYERS Yes Layers to queryFEATURE_COUNT No Maximum number of features to returnI No Pixel column of the point to queryX No Same as I parameter, but in WMS 1.1.0J No Pixel row of the point to queryY No Same as J parameter, but in WMS 1.1.0
In addition to the standard ones, QGIS Server supports the following extra parameters:
Parameter Required DescriptionMAP Yes See GetMapFILTER No See GetMapFI_POINT_TOLERANCE No Tolerance in pixels for point layersFI_LINE_TOLERANCE No Tolerance in pixels for line layersFI_POLYGON_TOLERANCE No Tolerance in pixels for polygon layersFILTER_GEOM No Geometry filteringWITH_MAPTIP No Add map tips to the outputWITH_GEOMETRY No Add geometry to the output
URL example:
http://localhost/qgis_server?SERVICE=WMS&VERSION=1.3.0&REQUEST=GetMap&MAP=/home/user/project.qgs&LAYERS=mylayer1,mylayer2,mylayer3&CRS=EPSG:4326&WIDTH=400&HEIGHT=400&INFO_FORMAT=text/xml&TRANSPARENT=TRUE&QUERY_LAYERS=mylayer1
17.2. QGIS as OGC Data Server 443

QGIS User Guide, Release 3.4
&FEATURE_COUNT=3&I=250&J=250
INFO_FORMAT
This parameter may be used to specify the format of the result. Available values are:
• text/xml
• text/html
• text/plain
• application/vnd.ogc.gml
• application/json
QUERY_LAYERS
This parameter specifies the layers to display on the map. Names are separated by a comma.
In addition, QGIS Server introduces options to select layers by:
• short name
• layer id
See the LAYERS parameter defined in See GetMap for more information.
FEATURE_COUNT
This parameter specifies the maximum number of features per layer to return. For example if QUERY_LAYERSis set to layer1,layer2 and FEATURE_COUNT is set to 3 then a maximum of 3 features from layer1 will bereturned. Likewise a maximun of 3 features from layer2 will be returned.
By default, only 1 feature per layer is returned.
I
This parameter, defined in WMS 1.3.0, allows you to specify the pixel column of the query point.
X
Same parameter as I, but defined in WMS 1.1.0.
J
This parameter, defined in WMS 1.3.0, allows you to specify the pixel row of the query point.
Y
Same parameter as J, but defined in WMS 1.1.0.
444 Chapter 17. Arbeiten mit OGC Daten

QGIS User Guide, Release 3.4
FI_POINT_TOLERANCE
This parameter specifies the tolerance in pixels for point layers.
FI_LINE_TOLERANCE
This parameter specifies the tolerance in pixels for line layers.
FI_POLYGON_TOLERANCE
This parameter specifies the tolerance in pixels for polygon layers.
FILTER_GEOM
This parameter specifies a WKT geometry with which features have to intersect.
WITH_MAPTIP
This parameter specifies whether to add map tips to the output.
Available values are (not case sensitive):
• TRUE
• FALSE
WITH_GEOMETRY
This parameter specifies whether to add geometries to the output.
Available values are (not case sensitive):
• TRUE
• FALSE
GetPrint
QGIS Server has the capability to create print layout output in pdf or pixel format. Print layout windows in thepublished project are used as templates. In the GetPrint request, the client has the possibility to specify parametersof the contained layout maps and labels.
Parameters for the GetPrint request:
17.2. QGIS as OGC Data Server 445

QGIS User Guide, Release 3.4
Parameter Required DescriptionMAP Yes Specify the QGIS project fileSERVICE Yes Name of the service (WMS)VERSION No See GetMapREQUEST Yes Name of the request (GetPrint)LAYERS No See GetMapTEMPLATE Yes Layout template to useSRS / CRS Yes See GetMapFORMAT Yes Output formatSTYLES No See GetMapTRANSPARENT No See GetMapOPACITIES No See GetMapSELECTION No See GetMapmapX:EXTENT No Extent of the map ‚X‘mapX:LAYERS No Layers of the map ‚X‘mapX:STYLES No Layers‘ style of the map ‚X‘mapX:SCALE No Layers‘ scale of the map ‚X‘mapX:ROTATION No Rotation of the map ‚X‘mapX:GRID_INTERVAL_X No Grid interval on x axis of the map ‚X‘mapX:GRID_INTERVAL_Y No Grid interval on y axis of the map ‚X‘
URL example:
http://localhost/qgis_server?SERVICE=WMS&VERSION=1.3.0&REQUEST=GetPrint&MAP=/home/user/project.qgs&CRS=EPSG:4326&FORMAT=png&map0:EXTENT=-180,-90,180,90&map0:LAYERS=mylayer1,mylayer2,mylayer3&map0:OPACITIES=125,200,125&map0:ROTATION=45
Note that the layout template may contain more than one map. In this way, if you want to configure a specificmap, you have to use mapX: parameters where X is a positive number that you can retrieve thanks to the GetPro-jectSettings request.
For example:
<WMS_Capabilities>...<ComposerTemplates xsi:type="wms:_ExtendedCapabilities"><ComposerTemplate width="297" height="210" name="Druckzusammenstellung 1"><ComposerMap width="171" height="133" name="map0"/><ComposerMap width="49" height="46" name="map1"/></ComposerTemplate></ComposerTemplates>...</WMS_Capabilities>
SERVICE
This parameter has to be WMS.
446 Chapter 17. Arbeiten mit OGC Daten

QGIS User Guide, Release 3.4
REQUEST
This parameter has to be GetPrint for the GetPrint request.
TEMPLATE
This parameter can be used to specify the name of a layout template to use for printing.
FORMAT
This parameter specifies the format of map image. Available values are:
• jpg
• jpeg
• image/jpeg
• png
• image/png
• svg
• image/svg
• image/svg+xml
• application/pdf
If the FORMAT parameter is different from one of these values, then an exception is returned.
mapX:EXTENT
This parameter specifies the extent for a layout map item as xmin,ymin,xmax,ymax.
mapX:ROTATION
This parameter specifies the map rotation in degrees.
mapX:GRID_INTERVAL_X
This parameter specifies the grid line density in the X direction.
mapX:GRID_INTERVAL_Y
This parameter specifies the grid line density in the Y direction.
mapX:SCALE
This parameter specifies the map scale for a layout map item. This is useful to ensure scale based visibility oflayers and labels even if client and server may have different algorithms to calculate the scale denominator.
17.2. QGIS as OGC Data Server 447

QGIS User Guide, Release 3.4
mapX:LAYERS
This parameter specifies the layers for a layout map item. See See GetMap for more information on this parameter.
mapX:STYLES
This parameter specifies the layers‘ styles defined in a specific layout map item. See See GetMap for moreinformation on this parameter.
GetLegendGraphics
Several additional parameters are available to change the size of the legend elements:
• BOXSPACE space between legend frame and content (mm)
• LAYERSPACE vertical space between layers (mm)
• LAYERTITLESPACE vertical space between layer title and items following (mm)
• SYMBOLSPACE vertical space between symbol and item following (mm)
• ICONLABELSPACE horizontal space between symbol and label text (mm)
• SYMBOLWIDTH width of the symbol preview (mm)
• SYMBOLHEIGHT height of the symbol preview (mm)
These parameters change the font properties for layer titles and item labels:
• LAYERFONTFAMILY / ITEMFONTFAMILY font family for layer title / item text
• LAYERFONTBOLD / ITEMFONTBOLD TRUE to use a bold font
• LAYERFONTSIZE / ITEMFONTSIZE Font size in point
• LAYERFONTITALIC / ITEMFONTITALIC TRUE to use italic font
• LAYERFONTCOLOR / ITEMFONTCOLOR Hex color code (e.g. #FF0000 for red)
• LAYERTITLE / RULELABEL set them to FALSE to get only the legend graphics without labels
Content based legend. These parameters let the client request a legend showing only the symbols for the featuresfalling into the requested area:
• BBOX the geographical area for which the legend should be built
• CRS / SRS the coordinate reference system adopted to define the BBOX coordinates
• WIDTH / HEIGHT if set these should match those defined for the GetMap request, to let QGIS Serverscale symbols according to the map view image size.
Content based legend features are based on the UMN MapServer implementation:
• SHOWFEATURECOUNT if set to TRUE adds in the legend the feature count of the features like in thefollowing image:
448 Chapter 17. Arbeiten mit OGC Daten

QGIS User Guide, Release 3.4
GetProjectSettings
This request type works similar to GetCapabilities, but it is more specific to QGIS Server and allows a client toread additional information which is not available in the GetCapabilities output:
• initial visibility of layers
• information about vector attributes and their edit types
• information about layer order and drawing order
• list of layers published in WFS
Web Feature Service (WFS)
The 1.0.0 and 1.1.0 WFS standards implemented in QGIS Server provide a HTTP interface to query geographicfeatures from a QGIS project. A typical WFS request defines the QGIS project to use and the layer to query.
Specifications document according to the version number of the service:
• WFS 1.0.0
• WFS 1.1.0
Standard requests provided by QGIS Server:
Request DescriptionGetCapabilities Returns XML metadata with information about the serverGetFeature Returns a selection of featuresDescribeFeatureType Returns a description of feature types and propertiesTransaction Allows features to be inserted, updated or deleted
GetFeature
Standard parameters for the GetFeature request according to the OGC WFS 1.0.0 and 1.1.0 specifications:
Parameter Required DescriptionSERVICE Yes Name of the serviceVERSION No Version of the serviceREQUEST Yes Name of the requestTYPENAME No Name of layersOUTPUTFORMAT No Output FormatRESULTTYPE No Type of the resultPROPERTYNAME No Name of properties to returnMAXFEATURES No Maximum number of features to returnSRSNAME No Coordinate reference systemFEATUREID No Filter the features by idsFILTER No OGC Filter EncodingBBOX No Map ExtentSORTBY No Sort the results
In addition to the standard ones, QGIS Server supports the following extra parameters:
17.2. QGIS as OGC Data Server 449

QGIS User Guide, Release 3.4
Parameter Required DescriptionMAP Yes Specify the QGIS project fileSTARTINDEX No PagingGEOMETRYNAME No Type of geometry to returnEXP_FILTER No Expression filtering
SERVICE
This parameter has to be WFS in case of the GetFeature request.
For example:
http://localhost/qgis_server?SERVICE=WFS&...
VERSION
This parameter allows to specify the version of the service to use. Available values for the VERSION parameterare:
• 1.0.0
• 1.1.0
If no version is indicated in the request, then 1.1.0 is used by default.
URL example:
http://localhost/qgis_server?SERVICE=WFS&VERSION=1.1.0&...
REQUEST
This parameter is GetFeature in case of the GetFeature request.
URL example:
http://localhost/qgis_server?SERVICE=WFS&VERSION=1.1.0&REQUEST=GetFeature&...
RESULTTYPE
This parameter may be used to specify the kind of result to return. Available values are:
• results: the default behavior
• hits: returns only a feature count
URL example:
450 Chapter 17. Arbeiten mit OGC Daten

QGIS User Guide, Release 3.4
http://localhost/qgis_server?SERVICE=WFS&VERSION=1.1.0&REQUEST=GetFeature&RESULTTYPE=hits&...
GEOMETRYNAME
This parameter can be used to specify the kind of geometry to return for features. Available values are:
• extent
• centroid
• none
URL example:
http://localhost/qgis_server?SERVICE=WFS&VERSION=1.1.0&REQUEST=GetFeature&GEOMETRYNAME=centroid&...
STARTINDEX
This parameter is standard in WFS 2.0, but it’s an extension for WFS 1.0.0. Actually, it can be used to skip somefeatures in the result set and in combination with MAXFEATURES, it provides the ability to page through results.
URL example:
http://localhost/qgis_server?SERVICE=WFS&VERSION=1.1.0&REQUEST=GetFeature&STARTINDEX=2&...
Web Map Tile Service (WMTS)
The 1.0.0 WMTS standard implemented in QGIS Server provides a HTTP interface to request tiled map imagesgenerated from a QGIS project. A typical WMTS request defined the QGIS project to use, some WMS parameterslike layers to render, as well as tile parameters.
Specifications document of the service:
• WMTS 1.0.0
Standard requests provided by QGIS Server:
Request DescriptionGetCapabilities Returns XML metadata with information about the serverGetTile Returns a tileGetFeatureInfo Retrieves data (geometry and values) for a pixel location
17.2. QGIS as OGC Data Server 451

QGIS User Guide, Release 3.4
GetCapabilities
Standard parameters for the GetCapabilities request according to the OGC WMTS 1.0.0 specifications:
Parameter Required DescriptionSERVICE Yes Name of the service (WMTS)REQUEST Yes Name of the request (GetCapabilities)
In addition to the standard ones, QGIS Server supports the following extra parameters:
Parameter Required DescriptionMAP Yes Specify the QGIS project file
URL example:
http://localhost/qgis_server?SERVICE=WMTS&REQUEST=GetCapabilities&MAP=/home/user/project.qgs
SERVICE
This parameter has to be WMTS in case of the GetCapabilities request.
REQUEST
This parameter is GetCapabilities in case of the GetCapabilities request.
MAP
This parameter allows to define the QGIS project file to use.
GetTile
Standard parameters for the GetTile request according to the OGC WMTS 1.0.0 specifications:
Parameter Required DescriptionSERVICE Yes Name of the service (WMTS)REQUEST Yes Name of the request (GetTile)LAYER Yes Layer identifierFORMAT Yes Output format of the tileTILEMATRIXSET Yes Name of the pyramidTILEMATRIX Yes MeshingTILEROW Yes Row coordinate in the meshTILECOL Yes Column coordinate in the mesh
452 Chapter 17. Arbeiten mit OGC Daten

QGIS User Guide, Release 3.4
In addition to the standard ones, QGIS Server supports the following extra parameters:
Parameter Required DescriptionMAP Yes Specify the QGIS project file
URL example:
http://localhost/qgis_server?SERVICE=WMTS&REQUEST=GetTile&MAP=/home/user/project.qgs&LAYER=mylayer&FORMAT=image/png&TILEMATRIXSET=EPSG:4326&TILEROW=0&TILECOL=0
SERVICE
This parameter has to be WMTS in case of the GetTile request.
REQUEST
This parameter is GetTile in case of the GetTile request.
LAYER
This parameter allows to specify the layer to display on the tile.
In addition, QGIS Server introduced some options to select a layer by:
• a short name
• the layer id
The short name of a layer may be configured through Properties → Metadata in layer menu. If the short name isdefined, then it’s used by default instead of the layer’s name:
http://localhost/qgis_server?SERVICE=WMTS&REQUEST=GetTile&LAYER=mynickname&...
Moreover, there’s a project option allowing to select layers by their id in OWS Server → WMS capabilities menuof the Project → Project Properties dialog. To activate this option, the checkbox Use layer ids as names has to beselected.
17.2. QGIS as OGC Data Server 453

QGIS User Guide, Release 3.4
http://localhost/qgis_server?SERVICE=WMTS&REQUEST=GetTile&LAYER=mylayerid1&...
FORMAT
This parameter may be used to specify the format of tile image. Available values are:
• jpg
• jpeg
• image/jpeg
• image/png
If the FORMAT parameter is different from one of these values, then the default format PNG is used instead.
TILEMATRIXSET
This parameter allows to define the CRS to use to compute the underlying pyramid and has to be formed likeEPSG:XXXX.
TILEMATRIX
This parameter allows to define the matrix to use for the output tile.
TILEROW
This parameter allows to select the row of the tile to get within the matrix.
TILECOL
This parameter allows to select the column of the tile to get within the matrix.
MAP
This parameter allows to define the QGIS project file to use.
As mentioned in GetMap parameters table, MAP is mandatory because a request needs a QGIS project to actuallywork. However, the QGIS_PROJECT_FILE environment variable may be used to define a default QGIS project.In this specific case, MAP is not longer a required parameter. For further information you may refer to Advancedconfiguration.
GetFeatureInfo
Standard parameters for the GetFeatureInfo request according to the OGC WMTS 1.0.0 specifications:
• WMS 1.1.0
454 Chapter 17. Arbeiten mit OGC Daten

QGIS User Guide, Release 3.4
Parameter Required DescriptionSERVICE Yes Name of the service (WMTS)REQUEST Yes Name of the request (GetFeatureInfo)LAYER Yes Layer identifierINFOFORMAT No Output formatI No X coordinate of a pixelJ No Y coordinate of a pixelTILEMATRIXSET Yes See GetTileTILEMATRIX Yes See GetTileTILEROW Yes See GetTileTILECOL Yes See GetTile
In addition to the standard ones, QGIS Server supports the following extra parameters:
Parameter Required DescriptionMAP Yes Specify the QGIS project file
URL example:
http://localhost/qgis_server?SERVICE=WMTS&REQUEST=GetFeatureInfo&MAP=/home/user/project.qgs&LAYER=mylayer&INFOFORMAT=image/html&I=10&J=5
SERVICE
This parameter has to be WMTS in case of the GetFeatureInfo request.
REQUEST
This parameter is GetFeatureInfo in case of the GetFeatureInfo request.
MAP
This parameter allows to define the QGIS project file to use.
As mentioned in GetMap parameters table, MAP is mandatory because a request needs a QGIS project to actuallywork. However, the QGIS_PROJECT_FILE environment variable may be used to define a default QGIS project.In this specific case, MAP is not longer a required parameter. For further information you may refer to Advancedconfiguration.
17.2. QGIS as OGC Data Server 455

QGIS User Guide, Release 3.4
LAYER
This parameter allows to specify the layer to display on the tile.
In addition, QGIS Server introduced some options to select a layer by:
• a short name
• the layer id
The short name of a layer may be configured through Properties → Metadata in layer menu. If the short name isdefined, then it’s used by default instead of the layer’s name:
http://localhost/qgis_server?SERVICE=WMTS&REQUEST=GetFeatureInfo&LAYER=mynickname&...
Moreover, there’s a project option allowing to select layers by their id in OWS Server → WMS capabilities menuof the Project → Project Properties dialog. To activate this option, the checkbox Use layer ids as names has to beselected.
http://localhost/qgis_server?SERVICE=WMTS&REQUEST=GetFeatureInfo&LAYER=mylayerid1&...
INFOFORMAT
This parameter allows to define the output format of the result. Available values are:
• text/xml
• text/html
• text/plain
• application/vnd.ogc.gml
The default value is text/plain.
I
This parameter allows to define the X coordinate of the pixel for which we want to retrieve underlying information.
J
This parameter allows to define the Y coordinate of the pixel for which we want to retrieve underlying information.
Extra parameters supported by all request types
• FILE_NAME parameter: if set, the server response will be sent to the client as a file attachment with thespecified file name.
• MAP parameter: Similar to MapServer, the MAP parameter can be used to specify the path to the QGISproject file. You can specify an absolute path or a path relative to the location of the server executable(qgis_mapserv.fcgi). If not specified, QGIS Server searches for .qgs files in the directory where theserver executable is located.
456 Chapter 17. Arbeiten mit OGC Daten

QGIS User Guide, Release 3.4
Example:
http://localhost/cgi-bin/qgis_mapserv.fcgi?\REQUEST=GetMap&MAP=/home/qgis/mymap.qgs&...
Bemerkung: You can define a QGIS_PROJECT_FILE as an environment variable to tell the server executablewhere to find the QGIS project file. This variable will be the location where QGIS will look for the project file. Ifnot defined it will use the MAP parameter in the request and finally look at the server executable directory.
REDLINING
This feature is available and can be used with GetMap and GetPrint requests.
The redlining feature can be used to pass geometries and labels in the request which are overlapped by the serverover the standard returned image (map). This permits the user to put emphasis or maybe add some comments(labels) to some areas, locations etc. that are not in the standard map.
The request is in the format:
http://qgisplatform.demo/cgi-bin/qgis_mapserv.fcgi?map=/world.qgs&SERVICE=WMS&→˓VERSION=1.3.0&REQUEST=GetMap...&HIGHLIGHT_GEOM=POLYGON((590000 5647000, 590000 6110620, 2500000 6110620, 2500000→˓5647000, 590000 5647000))&HIGHLIGHT_SYMBOL=<StyledLayerDescriptor><UserStyle><Name>Highlight</Name>→˓<FeatureTypeStyle><Rule><Name>Symbol</Name><LineSymbolizer><Stroke><SvgParameter→˓name="stroke">%23ea1173</SvgParameter><SvgParameter name="stroke-opacity">1</→˓SvgParameter><SvgParameter name="stroke-width">1.6</SvgParameter></Stroke></→˓LineSymbolizer></Rule></FeatureTypeStyle></UserStyle></StyledLayerDescriptor>&HIGHLIGHT_LABELSTRING=Write label here&HIGHLIGHT_LABELSIZE=16&HIGHLIGHT_LABELCOLOR=%23000000&HIGHLIGHT_LABELBUFFERCOLOR=%23FFFFFF&HIGHLIGHT_LABELBUFFERSIZE=1.5
Here is the image outputed by the above request in which a polygon and a label are drawn on top of the normalmap:
You can see there are several parameters in this request:
• HIGHLIGHT_GEOM: You can add POINT, MULTILINESTRING, POLYGON etc. It supports multipartgeometries. Here is an example: HIGHLIGHT_GEOM=MULTILINESTRING((0 0, 0 1, 1 1)).The coordinates should be in the CRS of the GetMap/GetPrint request.
• HIGHLIGHT_SYMBOL: This controls how the geometry is outlined and you can change the stroke width,color and opacity.
• HIGHLIGHT_LABELSTRING: You can pass your labeling text to this parameter.
• HIGHLIGHT_LABELSIZE: This parameter controls the size of the label.
• HIGHLIGHT_LABELCOLOR: This parameter controls the label color.
• HIGHLIGHT_LABELBUFFERCOLOR: This parameter controls the label buffer color.
• HIGHLIGHT_LABELBUFFERSIZE: This parameter controls the label buffer size.
External WMS layers
QGIS Server allows including layers from external WMS servers in WMS GetMap and WMS GetPrint requests.This is especially useful if a web client uses an external background layer in the web map. For performance
17.2. QGIS as OGC Data Server 457

QGIS User Guide, Release 3.4
Figure 17.9: Server response to a GetMap request with redlining parameters
458 Chapter 17. Arbeiten mit OGC Daten

QGIS User Guide, Release 3.4
reasons, such layers should be directly requested by the web client (not cascaded via QGIS server). For printinghowever, these layers should be cascaded via QGIS server in order to appear in the printed map.
External layers can be added to the LAYERS parameter as EXTERNAL_WMS:<layername>. The parameters forthe external WMS layers (e.g. url, format, dpiMode, crs, layers, styles) can later be given as service parameters<layername>:<parameter>. In a GetMap request, this might look like this:
http://localhost/qgis_server?SERVICE=WMS&REQUEST=GetMap...&LAYERS=EXTERNAL_WMS:basemap,layer1,layer2&STYLES=,,&basemap:url=http://externalserver.com/wms.fcgi&basemap:format=image/jpeg&basemap:dpiMode=7&basemap:crs=EPSG:2056&basemap:layers=orthofoto&basemap:styles=default
Similarly, external layers can be used in GetPrint requests:
http://localhost/qgis_server?SERVICE=WMS...&REQUEST=GetPrint&TEMPLATE=A4&map0:layers=EXTERNAL_WMS:basemap,layer1,layer2&map0:EXTENT=<minx,miny,maxx,maxy>&basemap:url=http://externalserver.com/wms.fcgi&basemap:format=image/jpeg&basemap:dpiMode=7&basemap:crs=EPSG:2056&basemap:layers=orthofoto&basemap:styles=default
17.2.3 Plugins
Installation
To install the HelloWorld example plugin for testing the servers, you firstly have to create a directory to hold serverplugins. This will be specified in the virtual host configuration and passed on to the server through an environmentvariable:
sudo mkdir -p /opt/qgis-server/pluginscd /opt/qgis-server/pluginssudo wget https://github.com/elpaso/qgis-helloserver/archive/master.zipIn case unzip was not installed before:sudo apt install unzipsudo unzip master.zipsudo mv qgis-helloserver-master HelloServer
HTTP Server configuration
Apache
To be able to use server plugins, FastCGI needs to know where to look. So, we have to modify the Apacheconfiguration file to indicate the QGIS_PLUGINPATH environment variable to FastCGI:
17.2. QGIS as OGC Data Server 459

QGIS User Guide, Release 3.4
FcgidInitialEnv QGIS_SERVER_LOG_FILE /tmp/qgis-000.logFcgidInitialEnv QGIS_SERVER_LOG_LEVEL 0FcgidInitialEnv QGIS_PLUGINPATH "/opt/qgis-server/plugins"
Moreover, a basic HTTP authorization is necessary to play with the HelloWorld plugin previously introduced. Sowe have to update the Apache configuration file a last time:
# Needed for QGIS HelloServer plugin HTTP BASIC auth<IfModule mod_fcgid.c>
RewriteEngine onRewriteCond %{HTTP:Authorization} .RewriteRule .* - [E=HTTP_AUTHORIZATION:%{HTTP:Authorization}]
</IfModule>
Then, restart Apache:
sudo a2ensite 001-qgis-serversudo service apache2 restart
Tipp: If you work with a feature that has many nodes then modifying and adding a new feature will fail. In thiscase it is possible to insert the following code into the 001-qgis-server.conf file:
<IfModule mod_fcgid.c>FcgidMaxRequestLen 26214400FcgidConnectTimeout 60</IfModule>
How to use a plugin
Test the server with the HelloWorld plugin:
wget -q -O - "http://localhost/cgi-bin/qgis_mapserv.fcgi?SERVICE=HELLO"HelloServer!
You can have a look at the default GetCapabilities of the QGIS server at: http://localhost/cgi-bin/qgis_mapserv.fcgi?SERVICE=WMS&VERSION=1.3.0&REQUEST=GetCapabilities
17.2.4 Advanced configuration
Logging
To log requests sent to the server, you have to set the following environment variables:
• QGIS_SERVER_LOG_LEVEL
• QGIS_SERVER_LOG_FILE
• QGIS_SERVER_LOG_STDERR
Take a look on Environment variables to understand their meanings.
Environment variables
You can configure some aspects of QGIS Server by setting environment variables.
According to the HTTP server and how you run QGIS Server, there are several ways to define these variables.This is fully described in HTTP Server configuration.
460 Chapter 17. Arbeiten mit OGC Daten

QGIS User Guide, Release 3.4
QGIS_OPTIONS_PATH
Specifies the path to the directory with settings. It works the same way as QGIS application --optionspathoption. It is looking for settings file in <QGIS_OPTIONS_PATH>/QGIS/QGIS3.ini.
QUERY_STRING
The query string, normally passed by the web server. This variable can be useful while testing QGIS server binaryfrom the command line.
For example for testing a GetCapabilities request on the command line to a project that also requires a PostgreSQLconnection defined in a pg_service.conf file:
PGSERVICEFILE=/etc/pg_service.conf QUERY_STRING="MAP=/path/to/test.qgs&SERVICE=WMS&→˓REQUEST=GetCapabilities" /path/to/qgis_mapserv.fcgi
The result should be either the content of the GetCapabilities response or, if something is wrong, an error message.
QGIS_PROJECT_FILE
The .qgs or .qgz project file, normally passed as a parameter in the query string (with MAP), you can also setit as an environment variable (for example by using mod_rewrite Apache module).
Note that you may also indicate a project stored in PostgreSQL, e.g. postgresql://localhost:5432?sslmode=disable&dbname=mydb&schema=myschema&project=myproject.
QGIS_SERVER_LOG_FILE
Specify path and filename. Make sure that server has proper permissions for writing to file. File should be createdautomatically, just send some requests to server. If it’s not there, check permissions.
QGIS_SERVER_LOG_FILE is deprecated since QGIS 3.4. File logging support will be removed in QGIS 4.0.
QGIS_SERVER_LOG_STDERR
Activate logging to stderr. It’s disabled by default. This variable has no effect when QGIS_SERVER_LOG_FILEis set.
• 0 or false (case insensitive)
• 1 or true (case insensitive)
MAX_CACHE_LAYERS
Specify the maximum number of cached layers (default: 100).
DISPLAY
This is used to pass (fake) X server display number (needed on Unix-like systems).
QGIS_PLUGINPATH
Useful if you are using Python plugins for the server, this sets the folder that is searched for Python plugins.
17.2. QGIS as OGC Data Server 461

QGIS User Guide, Release 3.4
QGIS_SERVER_LOG_LEVEL
Specify desired log level. Available values are:
• 0 or INFO (log all requests)
• 1 or WARNING
• 2 or CRITICAL (log just critical errors, suitable for production purposes)
QGIS_SERVER_PARALLEL_RENDERING
Activates parallel rendering for WMS GetMap requests. It’s disabled (false) by default. Available values are:
• 0 or false (case insensitive)
• 1 or true (case insensitive)
QGIS_SERVER_MAX_THREADS
Number of threads to use when parallel rendering is activated. Default value is -1 to use the number of processorcores.
QGIS_SERVER_CACHE_DIRECTORY
Specifies the network cache directory on the filesystem. The default directory is named cache and located in theprofile directory.
QGIS_SERVER_CACHE_SIZE
Sets the network cache size in MB. The default value is 50 MB.
Settings summary
When QGIS Server is starting, you have a summary of all configurable parameters thanks to environment variables.Moreover, the value currently used and the origin is also displayed.
For example with spawn-fcgi:
export QGIS_OPTIONS_PATH=/home/user/.local/share/QGIS/QGIS3/profiles/default/export QGIS_SERVER_LOG_FILE=/home/user/qserv.logexport QGIS_SERVER_LOG_LEVEL=2spawn-fcgi -f /usr/lib/cgi-bin/qgis_mapserv.fcgi -s /tmp/qgisserver.sock -U www-→˓data -G www-data -n
QGIS Server Settings:
- QGIS_OPTIONS_PATH / '' (Override the default path for user configuration): '/→˓home/user/.local/share/QGIS/QGIS3/profiles/default/' (read from ENVIRONMENT_→˓VARIABLE)
- QGIS_SERVER_PARALLEL_RENDERING / '/qgis/parallel_rendering' (Activate/→˓Deactivate parallel rendering for WMS getMap request): 'true' (read from INI_→˓FILE)
- QGIS_SERVER_MAX_THREADS / '/qgis/max_threads' (Number of threads to use when→˓parallel rendering is activated): '4' (read from INI_FILE)
462 Chapter 17. Arbeiten mit OGC Daten

QGIS User Guide, Release 3.4
- QGIS_SERVER_LOG_LEVEL / '' (Log level): '2' (read from ENVIRONMENT_VARIABLE)
- QGIS_SERVER_LOG_FILE / '' (Log file): '/tmp/qserv.log' (read from ENVIRONMENT_→˓VARIABLE)
- QGIS_PROJECT_FILE / '' (QGIS project file): '' (read from DEFAULT_VALUE)
- MAX_CACHE_LAYERS / '' (Specify the maximum number of cached layers): '100'→˓(read from DEFAULT_VALUE)
- QGIS_SERVER_CACHE_DIRECTORY / '/cache/directory' (Specify the cache→˓directory): '/root/.local/share/QGIS/QGIS3/profiles/default/cache' (read from→˓DEFAULT_VALUE)
- QGIS_SERVER_CACHE_SIZE / '/cache/size' (Specify the cache size): '52428800'→˓(read from INI_FILE)
Ini file used to initialize settings: /home/user/.local/share/QGIS/QGIS3/profiles/→˓default/QGIS/QGIS3.ini
In this particular case, we know that QGIS_SERVER_MAX_THREADS andQGIS_SERVER_PARALLEL_RENDERING values are read from the ini file found inQGIS_OPTIONS_PATH directory (which is defined through an environment variable). The correspond-ing entries in the ini file are /qgis/max_threads and /qgis/parallel_rendering and their values are true and 4threads.
Short name for layers, groups and project
A number of elements have both a <Name> and a <Title>. The Name is a text string used for machine-to-machine communication while the Title is for the benefit of humans.
For example, a dataset might have the descriptive Title “Maximum Atmospheric Temperature” and be requestedusing the abbreviated Name “ATMAX”. User can already set title for layers, groups and project.
OWS name is based on the name used in layer tree. This name is more a label for humans than a name formachine-to-machine communication.
QGIS Server supports:
• short name line edits to layers properties You can change this by right clicking on a layer, choose Properties→ Metadata tab → Description → Short name.
• WMS data dialog to layer tree group (short name, title, abstract)
By right clicking on a layer group and selecting the Set Group WMS data option you will get:
Figure 17.10: Set group WMS data dialog
• short name line edits to project properties - add a regexp validator "^[A-Za-z][A-Za-z0-9\._-]*"to short name line edit accessible through a static method
17.2. QGIS as OGC Data Server 463

QGIS User Guide, Release 3.4
• add a regexp validator "^[A-Za-z][A-Za-z0-9\._-]*" to short name line edit accessible through astatic method
You can choose a short name for the project root by going to Project properties → OWS Server → Servicecapabilities → Short name.
• add a TreeName element in the fullProjectSettings
If a short name has been set for layers, groups or project it is used by QGIS Sever as the layer name.
Connection to service file
In order to make apache aware of the PostgreSQL service file (see the PostgreSQL Service connection file section)you need to make your *.conf file look like:
SetEnv PGSERVICEFILE /home/web/.pg_service.conf
<Directory "/home/web/apps2/bin/">AllowOverride None
.....
Add fonts to your linux server
Keep in mind that you may use QGIS projects that point to fonts that may not exist by default on other machines.This means that if you share the project, it may look different on other machines (if the fonts don’t exist on thetarget machine).
In order to ensure this does not happen you just need to install the missing fonts on the target machine. Doing thison desktop systems is usually trivial (double clicking the fonts).
For linux, if you don’t have a desktop environment installed (or you prefer the command line) you need to:
• On Debian based systems:
sudo sumkdir -p /usr/local/share/fonts/truetype/myfonts && cd /usr/local/share/fonts/→˓truetype/myfonts
# copy the fonts from their locationcp /fonts_location/* .
chown root *cd .. && fc-cache -f -v
• On Fedora based systems:
sudo sumkdir /usr/share/fonts/myfonts && cd /usr/share/fonts/myfonts
# copy the fonts from their locationcp /fonts_location/* .
chown root *cd .. && fc-cache -f -v
464 Chapter 17. Arbeiten mit OGC Daten

CHAPTER 18
Arbeiten mit GPS Daten
18.1 GPS Plugin
18.1.1 Was ist GPS?
GPS, das Global Positioning System, ist ein satellitenbasiertes System das es jedem mit einem GPS Empfängerermöglicht seine genaue Position überall auf der Welt zu finden. GPS wird als Navigationshilfe in Flugzeu-gen, in Schiffen und von Wanderern benutzt. Der GPS Empfänger verwendet die Signale von den Satelliten umseine Länge, Breite und (manchmal) Höhe zu berechnen. Die meisten Empfänger haben auch die Fähigkeit Orte(bekannt als Wegpunkte), Sequenzen von Wegpunkten, die zusammen eine geplante Route ergeben und Track-logs oder Spuren der zeitlichen Bewegung des Empfängers zu speichern. Wegpunkte, Routen und Spuren sinddie drei Grundtypen in GPS Daten. QGIS stellt Wegpunkte in Punktlayern dar, wohingegen Routen und Spurenin Vektorlinien dargestellt werden.
Bemerkung: QGIS supports also GNSS receivers. But we keep using the term GPS in this documentation.
18.1.2 GPS-Daten aus einer Datei laden
Es gibt viele verschiedene Datenformate zum Speichern von GPS-Daten. Das von QGIS unterstützte Formatist GPX (GPS eXchange format), ein Standardformat, welches Wegpunkte, Routen und Spuren in einer Dateienthalten kann.
Um eine GPX Datei zu laden müssen Sie zuerst das Plugin laden. Erweiterungen → |showPluginManager|:menuselection:‘Erweiterungen verwalten und installieren . . . öffnet den Pluginmanagerdialog. Aktivieren Sie
das GPS Werkzeuge Kontrollkästchen. Wenn dieses Plugin geladen ist erscheint ein Knopf mit einem kleinentragbaren GPS Gerät in der Werkzeugleiste und in:menuselection:Layer –> Layer erstellen –> :
• GPS-Werkzeuge
• Erstelle neuen GPX Layer
Für das Arbeiten mit GPS-Daten stellen wir eine GPX-Beispieldatei im |qg| Beispieldatensatz zur Verfügung:qgis_sample_data/gps/national_monuments.gpx. Siehe Abschnitt Downloading sample data fürweitere Informationen über die Beispieldaten.
465

QGIS User Guide, Release 3.4
1. Select Vector → GPS Tools or click the GPS Tools icon in the toolbar and open the Load GPX file tab (seefigure_GPS).
2. Browse to the folder qgis_sample_data/gps/, select the GPX file national_monuments.gpxand click Open.
Figure 18.1: Das GPS Werkzeuge Dialogfenster
Use the Browse. . . button to select the GPX file, then use the checkboxes to select the feature types you wantto load from that GPX file. Each feature type will be loaded in a separate layer when you click OK. The filenational_monuments.gpx only includes waypoints.
Bemerkung: GPS units allow you to store data in different coordinate systems. When downloading a GPXfile (from your GPS unit or a web site) and then loading it in QGIS, be sure that the data stored in the GPXfile uses WGS 84 (latitude/longitude). QGIS expects this, and it is the official GPX specification. See https://www.topografix.com/GPX/1/1/.
18.1.3 GPSBabel
Since QGIS uses GPX files, you need a way to convert other GPS file formats to GPX. This can be done for manyformats using the free program GPSBabel, which is available at https://www.gpsbabel.org. This program can alsotransfer GPS data between your computer and a GPS device. QGIS uses GPSBabel to do these things, so it isrecommended that you install it. However, if you just want to load GPS data from GPX files you will not need it.Version 1.2.3 of GPSBabel is known to work with QGIS, but you should be able to use later versions without anyproblems.
18.1.4 GPS-Daten importieren
Um GPS-Daten aus einer Datei, die nicht im GPX-Format vorliegt zu importieren, benutzen Sie den ReiterAus anderer Datei importieren. Wählen Sie dann die Datei (und den Dateityp), die importiert werden soll aus,von welchem Datenformat Sie importieren möchten und wo die konvertierte GPX-Datei unter welchem Namenabgelegt werden soll. Beachten Sie, dass nicht für alle Datenformate die drei GPS-Datentypen Wegpunkte, Routenund Spuren unterstützt werden. Manchmal sind es nur ein oder zwei.
466 Chapter 18. Arbeiten mit GPS Daten

QGIS User Guide, Release 3.4
18.1.5 GPS-Daten von einem Empfänger herunterladen
QGIS can use GPSBabel to download data from a GPS device directly as new vector layers. For this we usethe Download from GPS tab of the GPS Tools dialog (see Figure_GPS_download). Here, we select the type ofGPS device, the port that it is connected to (or USB if your GPS supports this), the feature type that you want todownload, the GPX file where the data should be stored, and the name of the new layer.
Figure 18.2: Das Downloadwerkzeug
Durch die Angabe des Typs Ihres GPS-Empfängers legen Sie fest, wie GPSBabel mit dem Gerät kommuniziert.Wenn kein vorhandener Typ mit Ihrem Empfänger funktioniert, können Sie einen eigenen, neuen Gerätetyp er-stellen (vgl. Abschnitt Neues GPS-Gerät definieren).
Der Verbindungsport ist ein Dateiname oder ein anderer Name, den Ihr System als Referenz für den physischenPort benutzt, über den eine Verbindung zum GPS-Empfänger hergestellt wird. Es kann auch einfach USB sein,wenn dies von dem GPS-Gerät unterstützt wird.
• Unter Linux ist dies etwas wie /dev/ttyS0 oder /dev/ttyS1.
• Unter Windows ist dies COM1 oder COM2.
When you click OK, the data will be downloaded from the device and appear as a layer in QGIS.
18.1.6 GPS-Daten auf einen Empfänger hochladen
Sie können auch einen Vektorlayer aus |qg| auf einen GPS-Empfänger hochladen, indem Sie den Reiter Zum GPShochladen verwenden. Der Vektorlayer muss dazu ein GPX-Layer sein. Sie wählen dazu einen entsprechendenLayer aus, den Typ Ihres GPS-Empfängers und den Verbindungsport (oder USB). Genau wie beim Reiter VomGPS herunterladen können Sie bei Bedarf auch einen eigenen, neuen Empfänger-Typ erstellen, wenn Ihr Gerätnicht in der Liste auftaucht.
Dieses Werkzeug ist sehr nützlich, besonders im Zusammenspiel mit den Vektorfunktionen von QGIS. Sie könneneine Karte laden, ein paar Wegpunkte oder Routen digitalisieren und es dann auf Ihren GPS-Empfänger hochladen.
18.1.7 Neues GPS-Gerät definieren
There are lots of different types of GPS devices. The QGIS developers can’t test all of them, so if you have onethat does not work with any of the device types listed in the Download from GPS and Upload to GPS tools, youcan define your own device type for it. You do this by using the GPS device editor, which you start by clickingthe Edit Devices button in the download or the upload tab.
To define a new device, you simply click the New Device button, enter a name, enter download and uploadcommands for your device, and click the Update Device button. The name will be listed in the device menus inthe upload and download windows – it can be any string. The download command is the command that is used todownload data from the device to a GPX file. This will probably be a GPSBabel command, but you can use any
18.1. GPS Plugin 467

QGIS User Guide, Release 3.4
other command line program that can create a GPX file. QGIS will replace the keywords %type, %in, and %outwhen it runs the command.
%type wird ersetzt durch -w, wenn Sie Wegpunkte herunterladen, -r wenn es eine Route ist und -t, wenn essich um Spuren handelt. GPSBabel erfährt dadurch, um welchen GPS-Datentyp es sich handelt.
%in wird ersetzt durch den Namen des Verbindungsports und %out durch den Namen, den Sie für die GPX-Dateigewählt haben. Wenn Sie also einen neuen Gerätetyp mit dem Kommando gpsbabel %type -i garmin-o gpx %in %out (es handelt sich hierbei um das Standard Kommando für einen ‚Garmin Serial‘) definierenund diesen benutzen, um Wegpunkte von Port /dev/ttyS0 in die Datei output.gpx zu schreiben, dannersetzt QGIS die Schlüsselworte und startet das Kommando gpsbabel -w -i garmin -o gpx /dev/ttyS0 output.gpx.
Das Kommando hinaufladen wird benutzt, um die Daten auf Ihren GPS-Empfänger zu transferieren. Es werdendazu die gleichen Schlüsselworte benutzt, nur dass %in durch den Namen der hochzuladenen GPX-Datei und%out durch den Namen des Verbindungsports ersetzt wird.
You can learn more about GPSBabel and its available command line options at https://www.gpsbabel.org.
Wenn Sie einmal einen eigenen Gerätetypen erstellt haben, wird dieser in der Liste der GPS-Geräte dauerhaftangezeigt werden.
18.1.8 Downloaden von Punkten/Spuren von GPS Einheiten
As described in previous sections QGIS uses GPSBabel to download points/tracks directly in the project. QGIScomes out of the box with a pre-defined profile to download from Garmin devices. Unfortunately there is a bug#6318 that does not allow create other profiles, so downloading directly in QGIS using the GPS Tools is at themoment limited to Garmin USB units.
Garmin GPSMAP 60cs
MS Windows
Install the Garmin USB drivers from https://www8.garmin.com/support/download_details.jsp?id=591
Verbinden Sie die Einheit. Öffnen Sie GPS Werkzeuge und verwenden Sie type=garmin serial undport=usb:. Füllen Sie die Felder Layername und Ausgabedatei aus. Manchmal scheint es Probleme beimSpeichern in einen bestimmten Ordner zu geben, wenn Sie etwas wie c:\temp verwenden funktioniert es fürgewöhnlich.
Ubuntu/Mint GNU/Linux
Es wird zuerst ein Eintrag über die Rechte des Gerätes benötigt, wie beschrieben auf https://wiki.openstreetmap.org/wiki/USB_Garmin_on_GNU/Linux. Sie können versuchen eine Datei /etc/udev/rules.d/51-garmin.rules zu erstellen, die diese Regel enthält.
ATTRS{idVendor}=="091e", ATTRS{idProduct}=="0003", MODE="666"
Danach ist es nötig sicher zu gehen das das garmin_gps Kernelmodul nicht geladen ist
rmmod garmin_gps
and then you can use the GPS Tools. Unfortunately there seems to be a bug #7182 and usually QGIS freezesseveral times before the operation work fine.
BTGP-38KM Datenlogger (nur Bluetooth)
MS Windows
Der bereits erwähnte Bug lässt es nicht zu, dass Daten innerhalb von |qg| heruntergeladen werden, also müssenSie GPSBabel aus der Kommandozeile heraus oder mit Hilfe seiner Schnittstelle verwenden.
468 Chapter 18. Arbeiten mit GPS Daten

QGIS User Guide, Release 3.4
gpsbabel -t -i skytraq,baud=9600,initbaud=9600 -f COM9 -o gpx -F C:/GPX/aaa.gpx
Ubuntu/Mint GNU/Linux
Verwenden Sie den gleichen Befehl (oder Einstellungen wenn Sie die GPSBabel GUI verwenden) wie in Windows.Unter Linux ist vielleicht üblich eine Nachricht wie folgt zu erhalten
skytraq: Too many read errors on serial port
es ist einfach eine Frage des aus- und anschalten des Dateloggers und es erneut zu versuchen.
BlueMax GPS-4044 Datenlogger (sowohl BT als auch USB)
MS Windows
Bemerkung: Es muss seine Treiber installieren bevor man es unter Windows 7 verwendet. Sehen Sie in denHerstellerseiten für den richtigen Download nach.
Downloaden mit GPSBabel, mit USB und BR, gibt immer einen Fehler heraus wie
gpsbabel -t -i mtk -f COM12 -o gpx -F C:/temp/test.gpxmtk_logger: Can't create temporary file data.binError running gpsbabel: Process exited unsuccessfully with code 1
Ubuntu/Mint GNU/Linux
Mit USB
Nachdem Sie das Kabel angeschlossen haben verwenden Sie den dmesg Befehl um zu verstehen welcher Portbenutzt wird, zum Beispiel /dev/ttyACM3. Benutzen Sie dann wie immer GPSBabel aus der Kommandozeileoder der GUI.
gpsbabel -t -i mtk -f /dev/ttyACM3 -o gpx -F /home/user/bluemax.gpx
Mit Bluetooth
Verwenden Sie Blueman Device Manager um das Gerät zu verbinden und machen Sie es über einen Systemportzugänglich, starten Sie dann GPSBabel.
gpsbabel -t -i mtk -f /dev/rfcomm0 -o gpx -F /home/user/bluemax_bt.gpx
18.2 Live GPS tracking
To activate live GPS tracking in QGIS, you need to select View → Panels GPS Information Panel or pressCtrl+0. You will get a new docked window on the left side of the canvas.
Es sind 4 Bildschirme im GPS Tracking Fenster möglich:
• GPS position coordinates and an interface for manually entering vertices and features
• GPS Signalstärke von Satellitenverbindungen
• GPS Optionsansicht (siehe figure_gps_options)
With a plugged-in GPS receiver (has to be supported by your operating system), a simple click on Connect con-nects the GPS to QGIS. A second click (now on Disconnect) disconnects the GPS receiver from your computer.For GNU/Linux, gpsd support is integrated to support connection to most GPS receivers. Therefore, you first haveto configure gpsd properly to connect QGIS to it.
18.2. Live GPS tracking 469

QGIS User Guide, Release 3.4
Warnung: Wenn Sie Ihre Position in die Oberfläche aufnehmen wollen müssen Sie erst einen neuen Vektor-layer erstellen und diesen in den Bearbeitungsmodus bringen um Ihren Track aufnehmen zu können.
18.2.1 Positionskoordinaten
If the GPS is receiving signals from satellites, you will see your position in latitude, longitude and altitudetogether with additional attributes.
Figure 18.3: GPS Tracking Position und zusätzliche Attribute
18.2.2 GPS Signalstärke
Hier können Sie die Signalstärke der Satelliten von denen Sie Signale empfangen sehen.
18.2.3 GPS Optionen
Wenn es Probleme bei der Verbindung zum GPS-Gerät geben sollte können Sie innerhalb dieser Einstellungenwechseln:
• Automatisch feststellen
• Intern
• Serielles Gerät
470 Chapter 18. Arbeiten mit GPS Daten

QGIS User Guide, Release 3.4
Figure 18.4: GPS Tracking Signalstärke
• gpsd (wählt den Host, Port und das Gerät mit dem Ihr GPS verbunden ist)
A click on Connect again initiates the connection to the GPS receiver.
Sie können Hinzugefügte Objekte automatisch speichern aktivieren wenn Sie sich im Bearbeitungsmodus
befinden. Oder Sie können Punkte automatisch hinzufügen aktivieren um Punkte mit einer bestimmten Größeund Farbe der Kartenansicht hinzuzufügen.
Indem Sie das Kontrollkästchen Cursor aktivieren, können Sie den Schieberegler ver-wenden, um den Positionscursor im Kartenfenster kleiner oder größer zu machen.
You can also set an Acquisition interval (seconds) and a Distance threshold (meters) parameters to keep the cursorstill active when the receiver is in static conditions.
Das Aktivieren des Radioknopfes Karte zentrieren ermöglicht es auszuwählen, wie das Kartenfenster aktual-isiert werden soll. Dies enthält ‚immer beim Verlassen‘, wenn die aufgenommenen Koordinaten den Bereich desKartenfensters verlassen oder ‚niemals‘, um die Kartenausschnitt beizubehalten.
Schliesslich können Sie das Kontrollkästchen Logdatei aktivieren und einen Pfad angeben, wo die Logdateienüber die GPS-Messung abgelegt werden.
If you want to set a feature manually, you have to go back to Position and click on Add Point or Add Track Point.
18.2.4 Ein Bluetooth GPS fürs Live Tracking anbinden
Mit |qg| können Sie ein Bluetooth GPS für das Aufnehmen von Felddaten anbinden. Um dies durchzuführenbenötigen Sie ein Bluetooth Gerät und einen Bluetooth Empfänger auf Ihrem Computer.
Als erstes müssen Sie Ihr GPS Gerät erkennen lassen und mit dem Computer verbinden. Stellen Sie das GPS an,gehen Sie zum Bluetooth Icon in Ihrem Infobereich und suchen Sie nach einem Neuen Gerät.
On the right side of the Device selection mask make sure that all devices are selected so your GPS unit willprobably appear among those available. In the next step a serial connection service should be available, select itand click on Configure button.
Denken Sie daran dass die an die GPS Verbindung angebundenen COM Ports aus den Bluetooth Eigenschaftenresultieren.
Machen Sie die Kopplung für die Verbindung nachdem das GPS erkannt wurde. Normalerweise ist der Authori-sationskode 0000.
Now open GPS information panel and switch to GPS options screen. Select the COM port assigned to the GPSconnection and click the Connect. After a while a cursor indicating your position should appear.
Wenn |qg| keine GPS Daten empfangen kann sollten Sie Ihr GPS Gerät neustarten, 5-10 Sekunden warten unddann wieder eine Verbindung versuchen. Normalerweise funktioniert diese Lösung. Wenn Sie wieder einen
18.2. Live GPS tracking 471

QGIS User Guide, Release 3.4
Figure 18.5: GPS Tracking Optionsansicht
472 Chapter 18. Arbeiten mit GPS Daten

QGIS User Guide, Release 3.4
Verbindungsfehler erhalten vergewissern Sie sich dass kein anderer Bluetoothempfänger, der an die gleiche GPSEinheit gekoppelt ist, in Ihrer Nähe ist.
18.2.5 GPSMAP 60cs verwenden
MS Windows
Easiest way to make it work is to use a middleware (freeware, not open) called GPSGate.
Launch the program, make it scan for GPS devices (works for both USB and BT ones) and then in QGIS just click
Connect in the Live tracking panel using the Autodetect mode.
Ubuntu/Mint GNU/Linux
Wie unter Windows ist der einfachste Weg einen Server, in diesem Fall GPSD, dazwischen zu benutzen, also
sudo apt install gpsd
Laden Sie dann das garmin_gps Kernelmodul
sudo modprobe garmin_gps
Und verbinden Sie dann die Einheit. Überprüfen Sie dann mit dmesg die aktuelle von dem Gerät verwendeteEinheit, zum Beispiel /dev/ttyUSB0. Starten Sie jetzt gpsd
gpsd /dev/ttyUSB0
Und verbinden Sie sich zuletzt mit dem |qg| Live Tracking Tool.
18.2.6 BTGP-38KM Datenlogger verwenden (nur Bluetooth)
Sie können GPSD (unter Linux) oder GPSGate (unter Windows) mühelos verwenden.
18.2.7 BlueMax GPS-4044 Datenlogger verwenden (sowohl BT als auch USB)
MS Windows
Das Live Tracking funktioniert mit USB und BT Modus, mit oder ohne GPSGate, benutzen Sie einfach denAutomatisch feststellen Modus oder stellen Sie das Tool auf den richtigen Port ein.
Ubuntu/Mint GNU/Linux
Für USB
Das Live Tracking funktioniert sowohl mit GPSD
gpsd /dev/ttyACM3
oder ohne es, indem man das |qg| Live Tracking Tool direkt mit dem Gerät verbindet (zum Beispiel /dev/ttyACM3).
Für Bluetooth
Das Live Tracking funktioniert sowohl mit GPSD
18.2. Live GPS tracking 473

QGIS User Guide, Release 3.4
gpsd /dev/rfcomm0
oder ohne es, indem man das |qg| Live Tracking Tool direkt mit dem Gerät verbindet (zum Beispiel /dev/rfcomm0).
474 Chapter 18. Arbeiten mit GPS Daten

CHAPTER 19
Authentifizierungssystem
19.1 Authentifizierungssystem Übersicht
Figure 19.1: Anatomie des Authentifizierungssystems
19.1.1 Authentifikationsdatenbank
The new authentication system stores authentication configurations in an SQLite database file located, by default,at <user home>/.qgis3/qgis-auth.db.
475

QGIS User Guide, Release 3.4
Diese Authentifizierungsdatenbank kann ohne Auswirkung auf andere aktuelle QGIS Benutzereinstellungen zwis-chen QGIS Installationen bewegt werden, da sie völlig unabhängig von normalen QGIS-Einstellungen ist. EineKonfigurations-ID (eine zufällige 7-stellige alphanumerische Zeichenfolge) wird erzeugt, wenn eine Konfigura-tion zu der Datenbank gespeichert wird. Dies stellt die Konfiguration dar, wodurch die ID im Klartext als Anwen-dungskomponenten gespeichert wird (z. B. Projekt-, Plugin- oder Einstellungsdateien) ohne Offenlegung ihrerzugehörigen Anmeldeinformationen.
Bemerkung: Das übergeordnete Verzeichnis des qgis-auth.db‘kann mit der folgenden Umgebungsvariablengesetzt werden, ‘‘QGIS_AUTH_DB_DIR_PATH‘, oder mit der --authdbdirectory Option während desStarts auf der Kommandozeile.
19.1.2 Hauptpasswort
Um sensible Informationen zu speichern oder auf diese zuzugreifen, muss der Benutzer ein Hauptpasswort fes-tlegen. Ein neues Hauptpasswort wird angefordert und überprüft, wenn erstmals Daten verschlüsselt in derDatenbank gespeichert werden. Der Benutzer wird nur dann nach dem Hauptpasswort gefragt, wenn auf sen-sible Informationen zugegriffen wird. Dies wird dann für den Rest der Sitzung (bis die Anwendung verlassenwird) zwischengespeichert, es sei denn, der Benutzer wählt eine Aktion aus, seine zwischengespeicherten Wertezu löschen. Einige Fälle bei der Benutzung des Authentifizierungssystems benötigen keine Eingabe des Haupt-passworts , so wie die Auswahl der existierenden Authentifizierungseinstellungen oder eine Konfiguration einerServerkonfiguration Anwendung (wie beim Hinzufügen eines WMS-Layers).
Figure 19.2: Neues Hauptpasswort eingeben
Bemerkung: Ein Pfad zu einer Datei, die das Hauptpasswort beinhalet, kann mit Hilfe der Umgebungsvariableneingestellt werden QGIS_AUTH_PASSWORD_FILE.
Hauptpasswort verwalten
Einmal eingestellt, kann das Hauptpasswort zurückgesetzt werden, das aktuelle Hauptpasswort wird vor demZurücksetzen jedoch benötigt werden. Während dieses Prozesses ist es eine Option, eine vollständige Sicherungder aktuellen Datenbank vorzunehmen.
Wenn der Benutzer das Hauptpasswort vergisst, gibt es keine Möglichkeit es abzurufen oder außer Kraft setzen.Es gibt auch keine Mittel die verschlüsselten Informationen abzurufen ohne das Master-Passwort zu kennen.
476 Chapter 19. Authentifizierungssystem

QGIS User Guide, Release 3.4
Figure 19.3: Hauptpasswort zurücksetzen
Wenn ein Benutzer das bestehende Password drei Mal falsch eingibt, wird ein Dialog Ihnen anbieten, die Daten-bank zu löschen.
Figure 19.4: Passwortabfrage nach drei ungültigen Versuchen
19.1.3 Authentifikationskonfiguration
Sie können Authentifizierungseinstellungen über Konfigurationen in dem Authentifizierung Reiter des QGIS Op-tionen Dialog (Einstellungen→ Optionen) vornehmen.
Nutzen Sie den Knopf, um neue Konfigurationen hinzuzufügen, den Knopf um Sie zu entfernen und den
Knopf um bestehende zu bearbeiten.
Die selben Arten von Tätigkeiten für Authentifikationskonfigurationen (Hinzufügen, Bearbeiten und Entfer-nen) können auch bei der Konfiguration einer Service-Verbindung, wie der Konfiguration einer OWS-Service-Verbindung, getätigt werden. Dafür gibt es Aktionsschaltflächen innerhalb der Konfigurationsauswahl für die
19.1. Authentifizierungssystem Übersicht 477

QGIS User Guide, Release 3.4
Figure 19.5: Konfigurationen Editor
Figure 19.6: Konfigurationen von innerhalb des Konfigurationseditors hinzufügen
478 Chapter 19. Authentifizierungssystem

QGIS User Guide, Release 3.4
vollständige Verwaltungskonfigurationen die man innerhalb der Authentifikationsdatenbank findet. In diesem Fallist es nicht erforderlich in den Konfigurationen im Authentifikation Reiter zu wechseln, es sei denn Sie müssenweitere umfassende Konfigurationen vornehmen.
Figure 19.7: WMS connection dialog showing Add, Edit, and Remove authentication configuration buttons
Beim erstellen oder bearbeiten einer Authentifikationskonfiguration, ist ein Name, eine Authentifizierungsmeth-ode oder eine andere Information, die die Authentifizierungsmethode benötigt, erforderlich (mehr über die ver-fügbaren Authentifikationstypen in Authentifizierungsmethoden).
19.1.4 Authentifizierungsmethoden
Available authentications are provided by C++ plugins much in the same way data provider plugins are sup-ported by QGIS. The method of authentication that can be selected is relative to the access needed for the re-source/provider, e.g. HTTP(S) or database, and whether there is support in both QGIS code and a plugin. As such,some authentication method plugins may not be applicable everywhere an authentication configuration selector isshown. A list of available authentication method plugins and their compatible resource/providers can be accessed
19.1. Authentifizierungssystem Übersicht 479

QGIS User Guide, Release 3.4
going to Settings → Options and, in the Authentication tab, click the Installed Plugins button.
Figure 19.8: Verfügbare Liste von Methodenerweiterungen
Für neue Authentifikationsmethoden können Plugins erstellt werden, die QGIS nicht benötigen um neu kompiliertzu werden. Seitdem die Unterstützung für Erweiterung nur für C++ laufend (seit QGIS 2.12) ist, muss QGISneu gestartet werden, um dem Benutzer neue Erweiterungen verfügbar zu machen. Stellen Sie sicher, dass IhreErweiterung
Bemerkung: Die URL-Ressource ist derzeit eine nicht ausführbare Funktion, die eine bestimmte Konfigurationautomatisch wählt, wenn sie sich mit einer Ressource und gegebenen URL verbindet.
19.1.5 Hauptpasswort und Auth Konfig Hilfsmittel
Unter dem Optionen-Menü (Einstellungen → Optionen) in der Authentifikation Registerkarte gibt es verschiedeneWerkzeuge die Authentifikationsdatenbank und -konfigurationen zu verwalten:
• Input master password:
– Opens the master password input dialog, independent of performing any authentication database com-mand.
• Clear cached master password:
– Unsets the master password if it has been set via input dialog.
• Reset master password:
– Opens a dialog to change the master password (the current password must be known) and optionallyback up the current database.
• Clear cached authentication configurations: Clears the internal lookup cache for configurations used tospeed up network connections. This does not clear QGIS’s core network access manager’s cache, whichrequires a relaunch of QGIS.
• Reset master password: Replaces the current master password for a new one. The current master passwordwill be needed prior to resetting and a backup of database can be done.
480 Chapter 19. Authentifizierungssystem

QGIS User Guide, Release 3.4
Figure 19.9: Einfache HTTP Authentifikationskonfiguration
• Remove all authentication configurations: Clears the database of all configuration records, without re-moving other stored records.
• Erase authentication database: Schedules a backup of the current database and complete rebuild of thedatabase table structure. These actions are scheduled for a later time, so as to ensure other operations likeproject loading do not interrupt the operation or cause errors due to a temporarily missing database.
19.1.6 Gebrauche Authentifikationskonfiguration
Typischerweise wird eine Authentifizierungskonfiguration in einem Konfigurationsdialog für ein Netzwerk-Dienste (wie WMS) ausgewählt. Allerdings kann das Auswahl-Widget überall, wo Authentifizierung benötigtwird, eingebettet werden oder in einer Nicht-Kernfunktionalität, wie in Dritt-Beteiligten PyQGIS oder C ++ Plu-gins.
Wenn die Auswahl Keine Authentifizierung im Pop-up-Menü anzeigt, wenn nichts ausgewählt ist, wenn es keineKonfigurationen zur Auswahl gibt oder wenn eine zuvor zugewiesene Konfiguration nicht mehr in der Daten-bank gefunden wurde. Die Typ und ID Felder sind schreibgeschützt und stellen eine Beschreibung der Authen-tifizierungsmethode zur Verfügung und der entsprechenden ID der Config.
19.1.7 Python-Bindung
Alle Klassen und öffentlichen Funktionen haben sip Bindungen, außer QgsAuthCrypto, da das Managementdes Master-Passwort-Hashing und die Auth-Datenbank-Verschlüsselung von der Hauptanwendung und nicht überPython behandelt werden sollte. Siehe :ref:authentication_security_considerations‘ über Python-Zugang.
19.2. Benutzerauthentifizierung Workflows 481

QGIS User Guide, Release 3.4
Figure 19.10: ESRI Token authentication configs
482 Chapter 19. Authentifizierungssystem

QGIS User Guide, Release 3.4
Figure 19.11: OAuth2 authentication configs
19.2. Benutzerauthentifizierung Workflows 483

QGIS User Guide, Release 3.4
Figure 19.12: PKI Pfad-Authentifikationskonfiguration
Figure 19.13: PKI PKCS#12 Dateipfad Authentifikationskonfiguration
484 Chapter 19. Authentifizierungssystem

QGIS User Guide, Release 3.4
Figure 19.14: Gespeicherte Identität Authentifikationskonfigurationen
Figure 19.15: Werkzeug-Menü
Figure 19.16: Menü DB Löschverifizierung
19.2. Benutzerauthentifizierung Workflows 485

QGIS User Guide, Release 3.4
Figure 19.17: Authentication configuration selector with no authentication
Figure 19.18: Authentication configuration selector with selected config
Figure 19.19: Generischer Benutzer Workflow
486 Chapter 19. Authentifizierungssystem

QGIS User Guide, Release 3.4
19.2 Benutzerauthentifizierung Workflows
19.2.1 HTTP(S) Authentifikation
Eine der häufigsten Verbindungen findet mittels HTTP (S) statt, z.B. bei WebGIS Servern und die Authen-tifizierungsmethoden werden oft für diese Art von Verbindungen genutzt. Die Methoden haben Zugriff auf dasHTTP-Request Objekt und können sowohl den Request als auch seinen Header manipulieren. Dies ermöglichtviele Formen von Internet-basierten Authentifizierungen. Wenn über HTTP(S) mit der Standard Benutzername-/Passwort-Authentifizierungsmethode verwendet wird, wird bei der Verbindung eine HTTP-Basisauthentifizierungversucht.
Figure 19.20: Konfigurieren einer WMS-Verbindung für HTTP BASIC
19.2. Benutzerauthentifizierung Workflows 487

QGIS User Guide, Release 3.4
19.2.2 Datenbank Authentifikation
Connections to database resources are generally stored as key=value pairs, which will expose usernames and(optionally) passwords, if not using an authentication configuration. When configuring with the new auth system,the key=value will be an abstracted representation of the credentials, e.g. authfg=81t21b9.
Figure 19.21: Einstellen einer Postgress-SSL mit PKI-Verbindung
19.2.3 PKI Authentifikation
Wenn PKI-Komponenten innerhalb des Authentifikationssystems konfiguriert werden, haben Sie die Möglichkeit,Komponenten in die Datenbank zu importieren oder Dateien, die auf Ihrem System gespeichert sind, zu referen-zieren. Letzteres kann nützlich sein, wenn solche Komponenten sich häufig verändern oder wenn die Dateiendurch einen Systemadministrator verschoben werden. In beiden Fällen müssen Sie ein beliebiges Passwort spe-ichern um Zugang zu privaten Schlüsseln innerhalb der Datenbank zu haben.
All PKI components can be managed in separate editors within the Certificate Manager, which can be accessedin the Authentication tab in QGIS Options dialog (Settings → Options) by clicking the Manage Certificates button.
In the Certificate Manager, there are editors for Identities, Servers and Authorities. Each of these are containedin their own tabs, and are described below in the order they are encountered in the workflow chart above. The taborder is relative to frequently accessed editors once you are accustomed to the workflow.
Bemerkung: Because all authentication system edits write immediately to the authentication database, there isno need to click the Options dialog OK button for any changes to be saved. This is unlike other settings in theOptions dialog.
488 Chapter 19. Authentifizierungssystem

QGIS User Guide, Release 3.4
Figure 19.22: PKI Konfiguration Workflow
19.2. Benutzerauthentifizierung Workflows 489

QGIS User Guide, Release 3.4
Figure 19.23: Öffnen der Zertifikatsverwaltung
Autoritäten
Sie können verfügbare Zertifikat Autoritäten (Cas) aus dem Autoritäten Reiter im Zertifikate verwalten aus demAuthentifikation Reiter des QGIS Optionen Dialog verwalten.
Wie oben in dem Workflow-Diagramm Bezug genommen wird, ist der erste Schritt importieren oder einer Dateieine CAs zuweisen. Dieser Schritt ist optional und nicht notwendig, wenn Ihre PKI Vertrauenskette ihren Ur-sprung in einer CA hat, welche bereits auf Ihrem Betriebssystem (OS) installiert ist, wie ein Zertifikat eineskommerziellen Zertifizierungsanbieters. Falls Ihre Authentifizierung keine vertrauenswürdige CA ist, müssen Sieeine importieren oder dem Dateisystempfad eine zuweisen. (Kontaktieren Sie Ihren Systemadministrator, falls Siesich unsicher sind.)
By default, the root CAs from your OS are available; however, their trust settings are not inherited. You shouldreview the certificate trust policy settings, especially if your OS root CAs have had their policies adjusted. Anycertificate that is expired will be set to untrusted and will not be used in secure server connections, unless youspecifically override its trust policy. To see the QGIS-discoverable trust chain for any certificate, select it and click
the Show information for certificate.
Sie können die Vertrauensrichtlinien für jedes ausgewählte Zertifikat innerhalb der Kette ändern. JedeÄnderung in den Vertrauensrichtlinien eines ausgewählten Zertifikats wird nicht in der Datenbank gespeichert, bis
der Speichere Zertifikat Vertrauensrichtlinien Änderungen in der Datenbank Knopf gedrückt wird pro ausgewähltem Zertifizierung.Den Dialog schließen wird die Richtlinienänderungen nicht anwenden.
Sie können die gefilterten CAs überprüfen, sowohl die Zwischen- als auch die Stammzertifikate, denen durchKlicken auf sichere Verbindungen getraut wird oder ändern Sie die Standard-Vertrauensrichtlinie indem Sie den
Optionen Knopf klicken.
Warnung: Die Standard-Vertrauensrichtlinie ändern kann zu Problemen mit sicheren Verbindungen führen.
Sie können CAs importieren oder speichern ein Dateisystempfad aus einer Datei, welche mehrere CAs enthältoder importieren einzelne CAs. Das Standard PEM Format für Dateien, welche mehrere CA Kettenzertifikateenthalten, haben das Stammzertifikat am Ende der Datei und alle anschließend unterzeichneten Zertifikate oben,am Anfang der Datei.
490 Chapter 19. Authentifizierungssystem

QGIS User Guide, Release 3.4
Figure 19.24: Autoritäteneditor
Figure 19.25: Zertifikatsinformation Dialog
19.2. Benutzerauthentifizierung Workflows 491

QGIS User Guide, Release 3.4
Figure 19.26: Speichern der Vertrauensrichtlinien Änderungen
Figure 19.27: Autoritätenoptionen-Menü
Der CA Zertifikat-Importieren-Dialog wird alle CA Zertifikate innerhalb einer Datei finden, unabhängig von derReihenfolge und gibt auch die Möglichkeit Zertifikate zu importieren, die als ungültig betrachtet werden (fallsSie deren Vertrauensrichtlinien überschreiben). Sie können die Vertrauensrichtlinie nach dem Import außer Kraftsetzen, oder tun Sie es später in dem Autoritäten Editor.
Figure 19.28: Zertifikat importieren Dialog
Bemerkung: Wenn Sie Zertifikatinformationen in das PEM Text Feld einfügen, beachten Sie, dass verschlüsselteZertifikate nicht unterstützt werden.
Identitäten
Sie können verfügbare Client-Identitäts-Bündel über den Reiter Identitäten des Zertifikat Manager im Reiter Au-thentifizierung im Dialog QGIS Optionen. Eine Identität authentifiziert Sie gegen einen PKI-fähigen Dienst undbesteht in der Regel aus einem Client-Zertifikat und einen privaten Schlüssel, entweder als separate Dateien oderkombiniert in einer einzigen „gebündelten“ Datei. Das Bündel oder private Schlüssel sind oft Paßphrase geschützt.
492 Chapter 19. Authentifizierungssystem

QGIS User Guide, Release 3.4
Sobald Sie alle Zertifizierungsstellen (CAs) importiert haben können Sie optional alle Identitätsbündel in dieAuthentifizierungsdatenbank importieren. Wenn Sie die Identitäten nicht speichern möchten, können Sie ihreKomponentendateisystempfade innerhalb einer einzelnen Authentifizierungskonfiguration referenzieren.
Figure 19.29: Identitäteneditor
Wenn ein Identitäts-Bündel importieren, können diese Passwort-geschützt oder ungeschützt sein und CA-Zertifikate enthalten, die eine Vertrauenskette bilden. Vertrauenskette Zertifizierungen werden nicht an dieserStelle importiert; sie können separat unter dem Reiter guilabel:Authoritäten hinzugefügt werden.
Beim Import wird das Zertifikats und der Private Key eines Bündels in der Datenbank gespeichert, wobei derSpeicher des Schlüssels über das QGIS Master Passwort verschlüsselt ist. Die anschließende Verwendung desgespeicherten Bündels aus der Datenbank erfordert dann nur Eingabe des QGIS Master Passworts.
Persönliche Identitäts-Bündel bestehend aus PEM/DER (.pem / .der) und PKCS#12 (.p12/.pfx) Komponentenwerden unterstützt. Wenn ein Schlüssel oder ein Bündel passwortgeschützt ist, wird das Passwort benötigt, umdie Komponente zu validieren, bevor sie importiert wird. Wenn das Client-Zertifikat in dem Bündel ungültigist (zum Beispiel ist das Datum des Inkrafttretens noch nicht gestartet oder abgelaufen), kann das Bündel nichtimportiert werden.
19.2.4 Defekte Layer behandeln
Gelegentlich kommt es vor, dass die ID der Authentifizierungs-Konfiguration, die mit einer Projektdatei gespe-ichert wird, nicht mehr gültig ist, möglicherweise, weil die aktuelle Authentifizierungsdatenbank sich geändert hat,seitdem das Projekt zuletzt gespeichert wurde, oder aufgrund einer fehlenden Übereinstimmung der Anmeldein-formationen. In solchen Fällen öffnet sich der Dialog Defekte Layer behandeln beim Starten von QGIS.
Wenn eine Datenquelle eine ihr zugewiesene Authentifizierungs Konfigurations-ID besitzt, können Sie diese bear-beiten. Dadurch wird der Pfad der Datenquelle automatisch geändert, so wie es beim Öffnen der Projektdatei miteinem Texteditor und dem bearbeiten von Zeichenfolgen passiert.
19.2.5 Kennung der Authentifikationskonfiguration ändern
Occasionally, you will need to change the authentication configuration ID that is associated with accessing aresource. There are instances where this is useful:
19.2. Benutzerauthentifizierung Workflows 493

QGIS User Guide, Release 3.4
Figure 19.30: PEM/DER Identität importieren
Figure 19.31: PKCS#12 Identität importieren
Figure 19.32: Defekte Layer mit Authentifizierung behandeln
494 Chapter 19. Authentifizierungssystem

QGIS User Guide, Release 3.4
Figure 19.33: Defekte Layer mit Authentifikationskonfiguration bearbeiten
• Resource auth config ID is no longer valid: This can occur when you have switched auth databases addneed to align a new configuration to the ID already associated with a resource.
• Shared project files: If you intended to share projects between users, e.g. via a shared file server, you canpredefine a 7-character (containing a-z and/or 0-9) that is associated with the resource. Then, individualusers change the ID of an authentication configuration that is specific to their credentials of the resource.When the project is opened, the ID is found in the authentication database, but the credentials are differentper user.
Figure 19.34: Kennung einer Layer Authentifikationskonfiguration ändern (entsichert gelbes Textfeld)
Warnung: Das Ändern der Auth-Config-ID ist eine erweiterte Operation und sollte nur in Betracht gezogenwerden, wenn es notwendig ist. Aus diesem Grund gibt es eine Lock-Taste, die geklickt werden muss, um dasID Text-Feld vor der Bearbeitung zu entsperren.
19.2. Benutzerauthentifizierung Workflows 495

QGIS User Guide, Release 3.4
19.2.6 QGIS Server Unterstützung:
Wenn eine Projektdatei verwendet wird mit Layern, die eine Authentifizierung konfiguriert haben und vom QGISServer verwendet werden sollen, gibt es ein paar zusätzliche Schritte zu beachten, um mit QGIS die Ressource zuladen:
• Authentifizierungsdatenbank muss verfügbar sein
• Das Authentifizierungsdatenbank Hauptpasswort muss verfügbar sein
Wenn das Authentifizierungssystem initiiert wird, wird der Server die Datei qgis-auth.db im Ordner ~/.qgis2/ oder einem durch die Variable QGIS_AUTH_DB_DIR_PATH definierten Ordner ablegen. Es kannsein, dass der Server Benutzer kein HOME-Verzeichnis hat. In diesem Fall verwenden Sie die entsprechendeUmgebungsvariable, um ein Verzeichnis zu definieren, in dem der Server Benutzer Lese-/Schreibberechtigungenhat und das nicht innerhalb des Web zugänglichen Bereichs liegt.
Um das Master-Passwort an den Server zu übergeben, schreiben sie dieses in die erste Zeile einer Dateiim Pfad des Dateisystems, der durch den Server Prozess Benutzer lesbar ist und definiert ist durch dieQGIS_AUTH_PASSWORD_FILE Umgebungsvariable . Stellen Sie sicher, dass die Datei nur lesbar ist durchden Server Prozess Benutzer und nicht in einem über das Web zugänglichen Verzeichnis liegt.
Bemerkung: QGIS_AUTH_PASSWORD_FILE variable will be removed from the Server environment immedi-ately after accessing.
19.2.7 SSL Serverausnahme
Figure 19.35: SSL Serverausnahmen
Sie können SSL-Server-Konfigurationen und Ausnahmen über den Reiter Server im Abschnitt Authentifizierungdes QGIS Menüs Optionen verwalten.
Manchmal, wenn sie sich mit einem SSL-Server verbinden, gibt es Fehler beim SSL „Handshake“ oder mit demZertifikat des Servers. Sie können diese Fehler ignorieren oder eine SSL-Server-Konfiguration als eine Ausnahmeerstellen. Dies ist ähnlich wie bei Web-Browsern, wo Sie SSL-Fehler ausser Kraft setzen können, aber mit einerbesseren Kontrolle.
Warnung: Sie sollten keine SSL-Server-Konfiguration erstellen, wenn Sie keine umfassenden Kenntnissedes gesamten SSL-Setups zwischen dem Server und Client besitzen. Stattdessen wenden Sie sich besser anden Server-Administrator.
Bemerkung: Einige PKI-Setups verwenden eine völlig andere CA-Vertrauenskette, um Client-Identitäten zuvalidieren, als der Ablauf bei der Validierung eines SSL-Server-Zertifikats. Unter solchen Umständen behebt dieErstellung einer neuen Konfiguration für den Verbindungsserver nicht unbedingt das Problem, sodass sich sichden diesem Fall nur einen Serveradministrator wenden können.
496 Chapter 19. Authentifizierungssystem

QGIS User Guide, Release 3.4
You can pre-configure an SSL server configuration by clicking the button. Alternatively, you can add aconfiguration when an SSL error occurs during a connection and you are presented with an SSL Error dialog(where the error can be ignored temporarily or saved to the database and ignored):
Figure 19.36: Manuell eine Konfiguration hinzufügen
Sobald eine SSL-Konfiguration in der Datenbank gespeichert wird, kann sie bearbeitet oder gelöscht werden.
Wenn Sie eine SSL-Konfiguration vorkonfigurieren wollen und der Importdialog für Ihre Server-Verbindung funk-tioniert nicht, können Sie manuell eine Verbindung über die Python-Konsole auslösen, indem Sie den folgendenCode ausführen (Ersetzen Sie https://bugreports.qt-project.org mit der URL Ihres Servers):
from PyQt4.QtNetwork import *req = QNetworkRequest(QUrl('https://bugreports.qt-project.org'))reply = QgsNetworkAccessManager.instance().get(req)
Dies wird ein SSL-Fehler-Dialog öffnen, wenn Fehler auftreten, wo Sie die Konfiguration in die Datenbank spe-ichern können.
19.3 Sicherheitsüberprüfung
Sobald das Hauptpasswort eingegeben wird, ist die API offen für Authentifizierung configs die auf dieAuthentifizierungs-Datenbank zuzugreifen, so ähnlich wie funktioniert Firefox. Doch in der ersten Implemen-tierung gibt es keinen Schutz gegen PyQGIS Zugang. Dies kann zu Problemen führen, wenn ein Benutzer einböswilliges PyQGIS Plugin oder eine Standalone-Anwendung installiert, die den Zugriff auf die Anmeldeinfor-mationen zur Authentifizierung erhält.
Die schnelle Lösung für die anfängliche Freisetzung von Funktion ist nicht nur die meisten PyQGIS Bindungenfür das Authentifizierungssystem zu umfassen.
19.3. Sicherheitsüberprüfung 497

QGIS User Guide, Release 3.4
Figure 19.37: Konfiguration während einem SSL Fehler hinzufügen
Figure 19.38: Bestehende SSL Konfiguration
498 Chapter 19. Authentifizierungssystem

QGIS User Guide, Release 3.4
Figure 19.39: Bestehende SSL Konfiguration bearbeiten
Eine weitere einfache, wenn auch nicht robuste Lösung ist eine Kombobox hinzuzufügen in Einstellungen →Optionen → Authentifizierung (Vorgabe ist „niemals“):
"Allow Python access to authentication system"Choices: [ confirm once per session | always confirm | always allow | never]
Eine solche Einstellung der Optionen müsste an einem Ort nicht gespeichert werden, der für Python nichtzugänglich Python ist, z. B. die Authentifizierungsdatenbank und verschlüsselt mit dem Master-Passwort.
• Eine weitere Option kann es sein zu verflogen, welche Plugins der Benutzer speziell hat
• erlaubt auf Authentifizierungssystem zuzugreifen, obwohl es schwierig sein kann, abzuleiten welches Plu-gin tatsächlich abruft.
• Sandboxing Plugins, möglich in ihrer eigenen virtuellen Umgebung, würde „Cross-Plugin‘ Hacking vonAuthentifizierung configs von einem anderen Plugin reduzieren, das autorisiert ist. Dies könnte beudeuten,die Cross-Plugin Kommunikation ist gut, aber vielleicht nur zwischen Plugins von Drittanbietern.
• Eine weitere gute Lösung ist, Code-Signing-Zertifikate zu prüfen. Denn dann kann das Zertifikat des Pluginsbeim Laden validieren. Bei Bedarf kann der Nutzer auch nicht vertrauenswürdige Politiken für Zertifikateeinstellen, mit dem Plugin im Zusammenhang mit bestehenden Zertifikatsverwaltungen.
• Alternativ, Zugriff auf sensible Authentifizierungssystem Daten von Python
• konnte nie erlaubt werden und nur QGIS Kern-Widgets nutzen oder Authentifizierungs-System-Integrationen kopieren, würde es dem Plugin ermöglichen, mit Ressourcen zu arbeiten, die eine Authen-tifizierungskonfiguration haben, während Hauptpasswort und Authentifizierungs Config im Bereich derwichtigen Bereiche der Hauptapp laden.
Die gleichen Sicherheitsbedenken gelten für C ++ Plugins, obwohl es schwieriger sein wird, den Zugang zubeschränken, da es keine verbindliche Funktion gibt, einfach wie mit Python zu entfernen.
19.3.1 Einschränkungen
Die verwirrende Lizenzierung und Exportierung Probleme sind mit OpenSSL assoziiert. Um mit Qt mit SSL-Zertifikaten zu arbeiten, muss es Zugang zu den OpenSSL-Bibliotheken geben. Je nachdem, wie Qt kompiliertwurde, ist die Standard-dynamische Laufzeit auf OpenSSL-Libs verbunden (Exportbeschränkungen vermeiden).
19.3. Sicherheitsüberprüfung 499

QGIS User Guide, Release 3.4
QCA folgt einer ähnlichen Taktik, wobei durch die Verknüpfung zu QCA keine Einschränkungen entstehen, weildas QCA-ossl (OpenSSL) Plugin zur Laufzeit geladen wird. Das QCA-ossl Plugin ist mit den OpenSSL-Libsdirekt verknüpft. Packagers wäre die benötige OpenSSL-Linking Einschränkung, um sicherzustellen, dass erfülltsind, wenn sie das Plugin versenden. Könnte sein. Ich weiß es nicht wirklich. Ich bin kein Anwalt.
Das Authentifizierungssystem deaktiviert sicher selbst, wenn qca-ossl zur Laufzeit nicht gefunden wird.
500 Chapter 19. Authentifizierungssystem

CHAPTER 20
GRASS GIS Integration
GRASS integration provides access to GRASS GIS databases and functionalities (see GRASS-PROJECT in Lit-eratur und Internetreferenzen). The integration consists of two parts: provider and plugin. The provider allowsto browse, manage and visualize GRASS raster and vector layers. The plugin can be used to create new GRASSlocations and mapsets, change GRASS region, create and edit vector layers and analyze GRASS 2-D and 3-D datawith more than 400 GRASS modules. In this section, we’ll introduce the provider and plugin functionalities andgive some examples of managing and working with GRASS data.
Der Anbieter unterstützt GRASS Version 6 und 7, das Plugin unterstützt GRASS 6 und 7 (ab QGIS 2.12). QGISDistribution kann entweder Provider/Plugin für GRASS 6 oder GRAS 7 oder für beide Versionen gleichzeitigenthalten (Binärdateien haben unterschiedliche Dateinamen). Nur eine Version des Anbieters/Plugin kann zurLaufzeit jedoch geladen werden.
20.1 Beispieldatensatz
As an example, we will use the QGIS Alaska dataset (see section Downloading sample data). It includes asmall sample GRASS LOCATION with three vector layers and one raster elevation map. Create a new foldercalled grassdata, download the QGIS ‚Alaska‘ dataset qgis_sample_data.zip from https://qgis.org/downloads/data/ and unzip the file into grassdata.
More sample GRASS LOCATIONs are available at the GRASS website at https://grass.osgeo.org/download/sample-data/.
20.2 GRASS Layer visualisieren
If the provider is loaded in QGIS, the location item with GRASS icon is added in the browser tree under eachfolder item which contains GRASS location. Go to the folder grassdata and expand location alaska andmapset demo.
Sie können GRASS Raster- und Vektorebenen wie jeden anderen Layer aus dem Browser entweder durch Dop-pelklick auf Layer oder per Drag & Drop auf die Karte oder Legende laden.
Tipp: Probleme beim Laden von GRASS-Layern
501

QGIS User Guide, Release 3.4
Wenn Sie keine GRASS Locationitems sehen, überprüfen Sie Hilfe ->:Menüauswahl:‘Über‘Anbieter, obGRASS Vektor-Anbieter geladen sind.
20.3 Daten in eine GRASS LOCATION importieren via drag anddrop
In diesem Abschnitt wird Ihnen Beispielhaft gezeigt, wie Sie Raster- oder Vektordateien in eine GRASS Mapsetladen.
1. Navigieren Sie im QGIS-Browser zu dem Mapset, aus dem Sie Dateninformationen importieren wollen.
2. Um QGIS Browser einen Layer zu finden, den Sie GRASS importieren möchten finden, beachten Sie, dassSie eine andere Instanz des Browsers öffnen können (Browser Panel (2)), wenn Quelldaten zu weit von dermapset im Baum entfernt sind.
3. Drag a layer and drop it on the target mapset. The import may take some time for larger layers, you will seeanimated icon in front of new layer item until the import finishes.
When raster data are in different CRS, they can be reprojected using an Approximate (fast) or Exact (precise)transformation. If a link to the source raster is created (using r.external), the source data are in the same CRSand the format is known to GDAL, the source data CRS will be used. You can set these options in the Browser tabin GRASS Optionen.
Wenn ein Quellraster mehr Kanäle hat, wird eine neue GRASS Karte für jede Schicht mit dem <Kanalnummerr>
Suffix und eine Gruppe aller Karten mit Symbol erzeugt. Externe Raster haben ein anderes Symbol .
20.4 Managing GRASS data in QGIS Browser
• Karten kopieren: GRASS Karten können zwischen Mapsets innerhalb der gleichen Stelle mit Drag & Dropkopiert werden.
• Löschen von Karten: Rechtsklick auf eine GRASS Karte und wählen Sie :gui-Label:‘Löschen‘ aus demKontextmenü.
• Umbenennen von Karten: Rechtsklick auf eine GRASS Karte und wählen Sie: gui-Label: Umbenennen ausdem Kontextmenü.
20.5 GRASS Optionen
GRASS Optionen werden im GRASS Optionen Dialog eingestellt, welchen Sie auch durch Rechtsklick auf dieLocation oder das Mapset Element im Browser öffnen können, wenn Sie GRASS Optionen wählen.
20.6 GRASS Plugin starten
To use GRASS functionalities in QGIS, you must select and load the GRASS plugin using the Plugin Manager.
To do this, go to the menu Plugins → Manage and Install Plugins. . . , select GRASS and click OK.
The following main features are provided with the GRASS menu (Plugins → GRASS) when you start the GRASSplugin:
• Mapset öffnen
• Neues Mapset
502 Chapter 20. GRASS GIS Integration

QGIS User Guide, Release 3.4
• Schließe Mapset
• GRASS-Werkzeugkiste öffnen
• Aktuelle GRASS-Region darstelllen
• GRASS Options
20.7 GRASS Mapset öffnen
Ein GRASS Mapset muss geöffnet werden, um Zugang zu den GRASS Tools im Plugin zu bekommen (dieWerkzeuge sind deaktiviert, wenn kein Mapset geöffnet ist). Sie können ein Mapset aus dem Browser öffnen:Rechtsklick auf das Mapset Element und wählen Sie dann Mapset öffnen aus dem Kontextmenü.
20.8 Information zur GRASS-Datenbank
GRASS Daten werden in einem Ordner gespeichert, der als GISDBASE bezeichnet wird. Standardmäßig wirdder Ordner grassdata genannt und er muss erstellt worden sein, bevor man beginnt, mit dem GRASS Pluginin QGIS zu arbeiten. Innerhalb dieses Ordners sind die GRASS Daten als Projekte in Unterordnern genanntLOCATIONs organisiert. Jede LOCATION ist durch ein Koordinatenbezugssystem, Kartenprojektion und einegeographische Grenze definiert und kann darüberhinaus weitere Unterordner MAPSETs (Unterordner des OrdnersLOCATION) besitzen, um die Layer der LOCATION weiter z.B. thematisch oder räumlich zu unterteilen (sieheNeteler & Mitasova 2008 in Literatur und Internetreferenzen). Um Raster- und Vektorlayer mit den GRASSModulen zu analysieren, müssen diese zuerst in eine passende GRASS LOCATION importiert werden. (Diesist nicht ganz korrekt. Mit den GRASS Modulen r.external und v.external können Sie eine ‚read-only‘ Verknüpfung zu externen durch GDAL/OGR-unterstützte Layer erstellen, ohne die Daten importieren zumüssen. Da dies aber nicht der normale Weg für GRASS Anfänger ist, wird auf diese Möglichkeit nicht nähereingegangen.).
Figure 20.1: GRASS Daten in der Alaska LOCATION
20.7. GRASS Mapset öffnen 503

QGIS User Guide, Release 3.4
20.9 Daten in eine GRASS LOCATION importieren
Siehe Abschnitt import_data dnd um herauszufinden, wie die Daten einfach importiert per Drag & Drop in denBrowser importert werden können.
Dieser Abschnitt zeigt ein Beispiel wie man Raster- und Vektordaten in die ‚alaska‘ GRASS LOCATION aus demQGIS ‚Alaska‘ Datensatz in einem üblichen Weg, mit Hilfe von Standard GRASS Modulen, importiert. Daherverwenden wir die Landcover Rasterkarte landcover.img und die GML Vektorkarte lakes.gml aus demQGIS ‚Alaska‘ Datensatz (siehe Downloading sample data).
1. Starten Sie QGIS und laden Sie das GRASS Plugin, falls dies noch nicht geschehen ist.
2. Klicken Sie in der GRASS Werkzeugleiste das Mapset öffnen Icon um den Wählen Sie ein GRASS MapsetAssistenten zu starten.
3. Select as GRASS database the folder grassdata in the QGIS Alaska dataset, as LOCATION ‚alaska‘, asMAPSET ‚demo‘ and click OK.
4. Nun klicken Sie auf das Icon GRASS-Werkzeugkiste öffnen, damit die GRASS Werkzeuge (siehe Abschnitt DieGRASS Werkzeugkiste) zur Verfügung stehen.
5. Um die Rasterkarte landcover.img zu importieren, drücken Sie auf das Modul r.in.gdal im Mod-ulbaum Reiter. Diese GRASS Module ermöglicht es, GDAL-unterstützte Rasterdateien in eine GRASSLOCATION zu importieren.
6. Browsen Sie zum Ordner raster im QGIS ‚Alaska‘ Datensatz und wählen Sie die Datei landcover.img.
7. As raster output name, define landcover_grass and click Run. In the Output tab, you seethe currently running GRASS command r.in.gdal -o input=/path/to/landcover.imgoutput=landcover_grass.
8. When it says Successfully finished, click View Output. The landcover_grass raster layer is nowimported into GRASS and will be visualized in the QGIS canvas.
9. Um die GML Vektordatei lakes.gml zu importieren klicken Sie das Modul v.in.ogr im ModulbaumReiter. Dieses GRASS Modul ermöglicht den Import con OGR-unterstützen Vektordateien in eine GRASSLOCATION. Der Moduldialog für v.in.ogr erscheint.
10. Browsen Sie zum Ordner gml im QGIS 'Alaska' Datensatz und wählen Sie dieDatei :file:`lakes.gml als OGR Datei aus.
11. As vector output name, define lakes_grass and click Run. You don’t have to care about the otheroptions in this example. In the Output tab you see the currently running GRASS command v.in.ogr -odsn=/path/to/lakes.gml output=lakes\_grass.
12. When it says Succesfully finished, click View Output. The lakes_grass vector layer is now importedinto GRASS and will be visualized in the QGIS canvas.
20.9.1 Eine neue GRASS LOCATION erstellen
Als ein Beispiel möchten wir Ihnen zeigen, wie die GRASS LOCATION des Alaska Beispieldatensatzes erstelltwurde. Das Koordinatenbezugssystem ist Albers Equal Area mit der Einheit ‚feet‘. Diese GRASS :file:‘ LO-CATION alaska‘ wird für alle GRASS GIS Beispiele verwendet. Es ist also sinnvoll, sich diesen Datensatz zuinstallieren (siehe Abschnitt Downloading sample data).
1. Starten Sie QGIS und laden Sie das GRASS Plugin, falls dies noch nicht geschehen ist.
2. Visualize the alaska.shp shapefile (see section Loading a layer from a file) from the QGIS Alaskadataset (see Downloading sample data).
3. Klicken Sie in der GRASS Werkzeugleiste auf das Neues Mapset Icon um den Neues Mapset Assistentenzu öffnen.
504 Chapter 20. GRASS GIS Integration
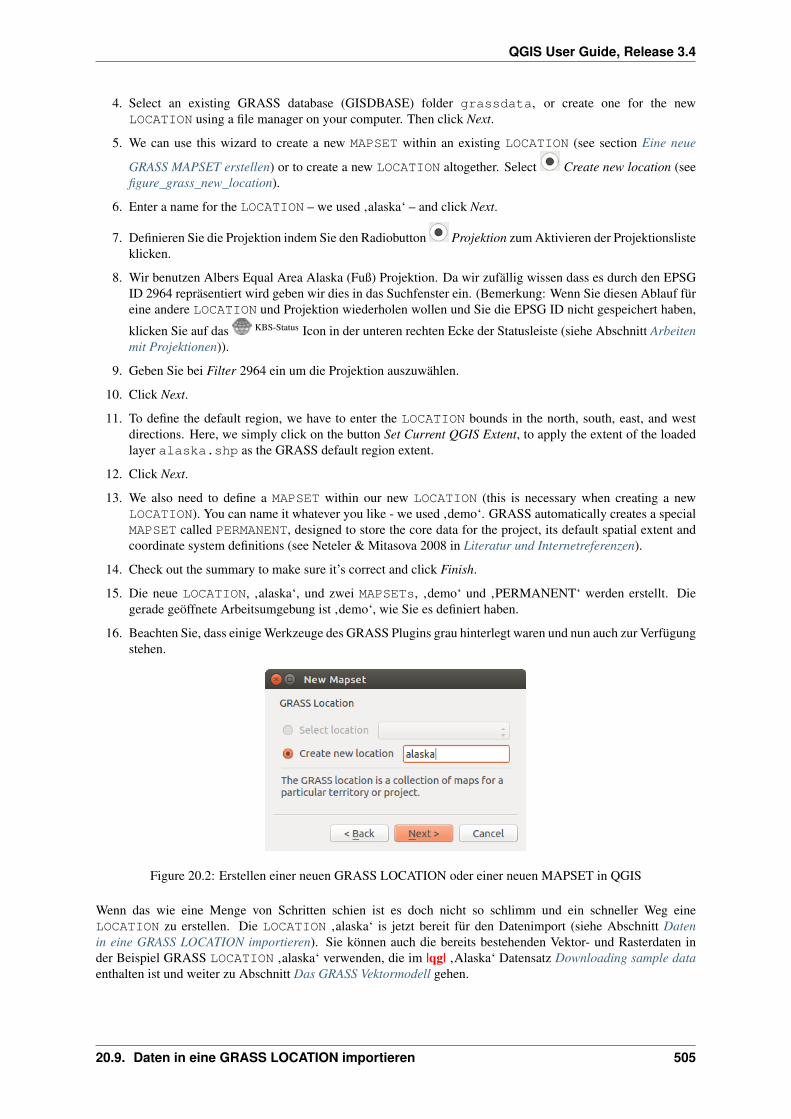
QGIS User Guide, Release 3.4
4. Select an existing GRASS database (GISDBASE) folder grassdata, or create one for the newLOCATION using a file manager on your computer. Then click Next.
5. We can use this wizard to create a new MAPSET within an existing LOCATION (see section Eine neue
GRASS MAPSET erstellen) or to create a new LOCATION altogether. Select Create new location (seefigure_grass_new_location).
6. Enter a name for the LOCATION – we used ‚alaska‘ – and click Next.
7. Definieren Sie die Projektion indem Sie den Radiobutton Projektion zum Aktivieren der Projektionslisteklicken.
8. Wir benutzen Albers Equal Area Alaska (Fuß) Projektion. Da wir zufällig wissen dass es durch den EPSGID 2964 repräsentiert wird geben wir dies in das Suchfenster ein. (Bemerkung: Wenn Sie diesen Ablauf füreine andere LOCATION und Projektion wiederholen wollen und Sie die EPSG ID nicht gespeichert haben,
klicken Sie auf das KBS-Status Icon in der unteren rechten Ecke der Statusleiste (siehe Abschnitt Arbeitenmit Projektionen)).
9. Geben Sie bei Filter 2964 ein um die Projektion auszuwählen.
10. Click Next.
11. To define the default region, we have to enter the LOCATION bounds in the north, south, east, and westdirections. Here, we simply click on the button Set Current QGIS Extent, to apply the extent of the loadedlayer alaska.shp as the GRASS default region extent.
12. Click Next.
13. We also need to define a MAPSET within our new LOCATION (this is necessary when creating a newLOCATION). You can name it whatever you like - we used ‚demo‘. GRASS automatically creates a specialMAPSET called PERMANENT, designed to store the core data for the project, its default spatial extent andcoordinate system definitions (see Neteler & Mitasova 2008 in Literatur und Internetreferenzen).
14. Check out the summary to make sure it’s correct and click Finish.
15. Die neue LOCATION, ‚alaska‘, und zwei MAPSETs, ‚demo‘ und ‚PERMANENT‘ werden erstellt. Diegerade geöffnete Arbeitsumgebung ist ‚demo‘, wie Sie es definiert haben.
16. Beachten Sie, dass einige Werkzeuge des GRASS Plugins grau hinterlegt waren und nun auch zur Verfügungstehen.
Figure 20.2: Erstellen einer neuen GRASS LOCATION oder einer neuen MAPSET in QGIS
Wenn das wie eine Menge von Schritten schien ist es doch nicht so schlimm und ein schneller Weg eineLOCATION zu erstellen. Die LOCATION ‚alaska‘ is jetzt bereit für den Datenimport (siehe Abschnitt Datenin eine GRASS LOCATION importieren). Sie können auch die bereits bestehenden Vektor- und Rasterdaten inder Beispiel GRASS LOCATION ‚alaska‘ verwenden, die im |qg| ‚Alaska‘ Datensatz Downloading sample dataenthalten ist und weiter zu Abschnitt Das GRASS Vektormodell gehen.
20.9. Daten in eine GRASS LOCATION importieren 505

QGIS User Guide, Release 3.4
20.9.2 Eine neue GRASS MAPSET erstellen
Ein Benutzer hat nur Schreibzugriff auf eine MAPSET die er oder sie erstellt hat. Das heißt dass Sie neben demZugriff zu Ihrer eigenen MAPSET Sie Karten in MAPSETs anderer Benutzer lesen können (und Sie können Ihrelesen) aber Sie nur die Karten in Ihrer eigenen MAPSET verändern und löschen können.
Alle MAPSETs beinhalten eine WIND Datei die die aktuellen Grenzkoordinatenwerte und die aktuell ausgewählteRasterauflösung speichert (siehe Neteler & Mitasova 2008 in Literatur und Internetreferenzen, und AbschnittEinstellung der GRASS Region).
1. Starten Sie QGIS und laden Sie das GRASS Plugin, falls dies noch nicht geschehen ist.
2. Klicken Sie in der GRASS Werkzeugleiste auf das Neues Mapset Icon um den Neues Mapset Assistentenzu öffnen.
3. Wählen Sie den GRASS Datenbankordner (GISDBASE) grassdata mit der LOCATION ‚alaska‘ aus woSie eine weitere MAPSET genannt ‚test‘ hinzufügen wollen.
4. Click Next.
5. We can use this wizard to create a new MAPSET within an existing LOCATION or to create a new
LOCATION altogether. Click on the radio button Select location (see figure_grass_new_location) andclick Next.
6. Geben Sie den Namen test' für die neue :file:`MAPSET ein. Unter dem Assistenten sehenSie eine List bestehender MAPSETs und die entsprechenden Besitzer.
7. Click Next, check out the summary to make sure it’s all correct and click Finish.
20.10 Das GRASS Vektormodell
Es ist wichtig, das :index:‘GRASS Vektordaten Modell ‚vor der Digitalisierung zu verstehen. Im Allgemeinenverwendet GRAS ein topologisches Vektormodell. Das bedeutet, dass Flächen nicht als geschlossene Polygonevorhanden sind, sondern als ein oder mehrere Umrandungen (Boundaries). Eine Umrandung (Boundary) zwischenzwei aneinander grenzenden Flächen ist nur einmal digitalisiert worden; beide Flächen teilen sich diese Umran-dung. Umrandungen dürfen keine Lücken haben. Eine Fläche besteht also aus einer Umrandung und einemZentroid, der diese Fläche als ein sog. Labelpunkt mit einer Attributtabelle verknüpft.
Neben den Umrandungen und Zentroiden kann eine Vektorkarte selbstverständlich auch Punkte und Linien en-thalten. Alle diese Geometrieelemente können innerhalb ein und dem selben Datensatz enthalten sein. Sie werdenin unterschiedlichen ‚Ebenen‘ innerhalb von QGIS dargestellt. Auch wenn es möglich ist, Geometrieelemente zumischen, so ist es eigentlich unüblich und wird normalerweise auch in GRASS GIS nur selten verwendet. Etwa beiNetzwerkanalysen. Im Normalfall sollten Sie versuchen, unterschiedliche Geometrietypen in unterschiedlichenDatensätzen (Layern) zu speichern.
Es ist auch möglich, unterschiedliche Inhalte des gleichen Geometrietyps in verschiendenen Ebenen eines Vek-torlayers zu speichern. Beispielsweise können Felder, Wälder und Seen in einem Vektordatensatz gespeichertwerden. Angrenzende Seen, Felder und Wälder teilen sich dann die gleiche Umrandung, jedoch haben sie sepa-rate Attributtabellen, die über ihre Ebene angesprochen wird. Darüber hinaus können Sie auch Attribute für dieUmrandungen vergeben, falls eine Umrandung gleichzeitg einen Weg darstellt. In diesem Fall könnte auch dieUmrandung eine separate Attributtabelle haben.
Die ‚Ebene‘ eines jeden Objektes wird in GRASS intern als ‚layer‘ bezeichnet. ‚Layer‘ ist die Nummer diedefiniert ob es mehr als einen Layer innerhalb des Datensatzes gibt (z.B. ob die Geometrie Wald oder See ist).Vorerst kann dies nur eine Nummer sein. In Zukunft wird GRASS auch Namen als Felder in der Benutzerober-fläche unterstützen.
Attribute können innerhalb der GRASS LOCATION als dBase oder SQLite3 oder in externen Datenbanktabellenabgelegt werden, z.B. PostgreSQL, MySQL, SQLITE3, etc.
Die Attribute in den Tabellen werden über ein sog. ‚Kategoriefeld‘ an die Geometrien des Datensatzes gehängt.
506 Chapter 20. GRASS GIS Integration

QGIS User Guide, Release 3.4
Die ‚Kategorie‘ (oder key, ID, etc) ist eine Ganzzahl, über die eine Verknüpfung zwischen den Geometrien undden Spalten in der Datenbanktabelle hergestellt wird.
Tipp: Das GRASS Vektormodell verstehen
The best way to learn the GRASS vector model and its capabilities is to download one of the many GRASStutorials where the vector model is described more deeply. See https://grass.osgeo.org/documentation/manuals/for more information, books and tutorials in several languages.
20.11 Einen neuen GRASS Vektorlayer erstellen
Um einen neuen GRASS Vektorlayer zu erzeugen, wählen Sie eines der folgenden Elemente aus dem MapsetKontextmenü im Browser:
• Neuer Punktlayer
• Neuer Linienlayer
• Neuer Polygonlayer
und einen Namen in das Dialogfeld eingeben. Eine neue Vektorkarte wird erstellt und der Layer dem Kartenfensterhinzugefügt und die Bearbeitung gestartet. Einen Typ des Layers zu wählen beschränkt nicht den Geometrietypen,der in der Vektorkarte digitalisiert werden kann. In GRASS ist es möglich, alle Arten von Geometrietypen (Punkt,Linie und Polygon) in einer Vektorkarte zu organisieren. Der Typ wird nur verwendet, um die Layer dem Karten-fenster hinzuzufügen, da QGIS von dem Layer fordert eine bestimmte Art zu haben.
Es ist auch möglich, Layer bestehenden Vektorkarten hinzuzufügen, wählen Sie ein Element oben aus dembeschriebenen Kontextmenü der bestehenden Vektorkarte.
GRASS GIS erlaubt es aufgrund des topologischen Datenmodells, die verschiedenen Geometrietypen (Punkt,Linie und Fläche) in einem Vektorlayer abzuspeichern. Aus diesem Grund ist es nicht notwendig im Vorfeldeinen Geometrietyp festzulegen. Dies unterscheidet sich von der Erstellung eines neuen Shapefile in QGIS, dennShapefiles verwenden das Simple Feature Vektormodell (siehe Abschnitt Creating new vector layers).
20.12 Digitalisieren und Editieren eines GRASS Vektorlayers
GRASS Vektorebenen können mit den Standard QGIS Digitalisierfunktionen werden digitalisiert. Es gibt jedocheinige Besonderheiten, die Sie kennen sollten, aufgrund
• GRASS topologischen Modell im Vergleich zu einfachen QGIS Funktion
• Komplexität von GRASS-Modellen
– mehrere Layer in einer Karte
– mehrere Geometrietypen in einer Karte
– Geometrieteilung von mehreren Objekte durch mehrere Layer
Die Besonderheiten sind in den folgenden Abschnitten besprochen.
Speichern, Änderungen verwerfen, rückgängig machen, wiederholen
Warnung: Alle während der Bearbeitung vorgenommenen Änderungen werden sofort auf Vektorkarten unddie dazugehörigen Attributtabellen geschrieben.
20.11. Einen neuen GRASS Vektorlayer erstellen 507

QGIS User Guide, Release 3.4
Die Änderungen werden nach jeder Operation geschrieben, es ist jedoch möglich, Rückgängig/Wiederholen zuwählen oder alle Änderungen zu verwerfen, wenn die Bearbeitung geschlossen wird. Wenn Änderungen rück-gängig gemacht werden oder Änderungen verworfen werden, wird der ursprüngliche Zustand in der Vektorkarteneu geschrieben und die der Attributtabellen.
Es gibt zwei Hauptgründe für dieses Verhalten:
• Es ist die Natur von GRASS-Vektoren aus Überzeugung zu kommen, dass der Benutzer tun will, was er tutund es ist besser, dass die Daten gespeichert werden, wenn die Arbeit plötzlich unterbrochen wird (z. B.Stromausfall)
• Die Notwendigkeit für eine effektive Bearbeitung von topologischen Daten visualisiert Informationen überdie topologische Korrektheit, solche Informationen können nur von GRASS Vektorkarte erworben werden,wenn Änderungen an der Karte vorgenommen werden.
Werkzeugleiste
Die ‚Digitalisierungsleiste‘ hat einige spezielle Werkzeuge, wenn Sie einen GRASS Layer bearbeiten:
Icon Werkzeug Zweck
Neuer Punkt Digitalisiert neuen Punkt
Neue Linie Digitalisiert neue Linie
Neue Grenze Digitalisiert neue Grenze
Neuer Zentroid Digitalisiert neuen Zentroiden (Labelpunkt für eine existierende Fläche)
Neue geschlossene Grenze Digitalisiert neue geschlossene Grenze
Table GRASS Digitizing: GRASS Digitizing Tools
Tipp: Polygone in GRASS digitalisieren
Wenn Sie ein Polygon innerhalb eines GRASS Vektorlayers erstellen wollen, digitalisieren Sie zuerst die Bound-ary der Fläche. Danach fügen Sie einen Zentroid (Labelpunkt) hinzu. Der Grund ist, dass in topologischen Layerndie Attributinformationen einer Fläche immer mit dem Zentroiden und nicht mit der Grenze verknüpft werden.
Kategorie
Kategorie, die oft als cat bezeichnet wird, ist eine Art von ID. Der Name stammt aus Zeiten, in denen GRASS-Vektoren nur einzelne Attribut „Kategorien“ hatten. Kategorien werden als Bindeglied zwischen Geometrie undAttribute verwendet. Eine einzelne Geometrie kann mehrere Kategorien haben und somit mehrere Funktionen inverschiedenen Layern darstellen. Derzeit ist es möglich, nur eine Kategorie pro Layer mit QGIS Werkzeugen zubearbeiten. Neue Funktionen haben automatische neue einzigartige Kategorien, ohne Grenzen. Grenzen bilden inder Regel nur Bereiche und stellen keine lineare Funktionen dar, es ist jedoch möglich, Attribute für eine Grenzespäter zu definieren, beispielsweise in einer anderen Ebene.
Neue Kategorien werden immer nur in derzeit bearbeiteten Layern erstellt.
Es ist nicht möglich mehrere Kategorien zuweisen, um die Geometrie mit QGIS zu bearbeiten, solchen Datenwerden wie mehrere Funktionen dargestellt und einzelne Merkmale, auch aus verschiedenen Schichten, könnengelöscht werden.
Attribute
Die Attribute des aktuell bearbeiteten Layer können nur geändert werden, wenn die Vektorkarte mehrere Layerenthält, Merkmale anderer Layer werden alle ‚<nicht editierbar (layer#)>‘ eingestellt, so werden Sie gewarnt,dass solche Attribut nicht editierbar sind. Der Grund dafür ist, dass andere Layer in der Regel andere Gruppe vonFeldern haben und haben können, während QGIS nur einen festen Satz von Feldern pro Layer unterstützt.
Wenn einer Geometrie primitive nicht eine Kategorie zugeordnet ist, wird eine neue einzigartige Kategorie au-tomatisch zugeordnet und eine neue Eintragung in der Attributtabelle erstellt, wenn ein Attribut dieser Geometrieverändert wird.
508 Chapter 20. GRASS GIS Integration

QGIS User Guide, Release 3.4
Tipp: Wenn Sie Bulk-Aktualisierung von Attributen in der Tabelle machen wollen, zum Beispiel mit dem ‚Fel-drechner‘ (Using the Field Calculator), und es einige Funktionen ohne Kategorie gibt, die Sie nicht aktualisierenwollen (in der Regel Grenzen) , können Sie diese in dem „Erweiterten Filter‘ auf cat is not null einstellen.
Stil editieren
Die topologische Symbologie ist für eine effektive Bearbeitung von topologischen Daten wesentlich. Bei Beginnder Bearbeitung, eine spezialisierter Renderer ‚GRASS Bearbeiten‘ wird automatisch auf die Ebene gesetzt undder ursprüngliche Renderer wiederhergestellt, wenn die Bearbeitung geschlossen ist. Der Stil kann in den Lay-ereigenschaften im ‚Stil‘ Reiter angepasst werden. Der Stil kann auch in der Projektdatei oder in einer separatenDatei gespeichert werden. Wenn Sie den Stil anpassen, ändern sich nicht seinen Namen, weil er zurückgesetztwird, wenn das Bearbeiten erneut gestartet wird.
Tipp: Speichern Sie die Projektdatei nicht, wenn der Layer bearbeitet wird, dies würde den Layer mit ‚EditStyle‘ speichern, was keine Bedeutung hat, wenn der Layer nicht bearbeitet wird.
Der Stil basiert auf topologischen Informationen, die vorübergehend als Feld ‚topo_symbol‘ der Tabelle hinzuge-fügt wird. Das Feld wird automatisch entfernt, wenn die Bearbeitung abgeschlossen ist.
Tipp: Entfernen Sie nicht das ‚topo_symbol‘ Feld aus der Attributtabelle, das würde das Objekt unsichtbarmachen, weil die Darstellung basiert auf dieser Spalte.
Objektfang
Um einen Bereich zu bilden, müssen Ecken verbundener Grenzen genau die gleichen Koordinaten haben. Dieskann mit dem Schnappen Werkzeug erreicht werden, wenn Kartenfenster und Vektorkarte das gleiche KBS haben.Ansonsten, koordiniert durch Umwandlung von Karte auf Kartenfenster und wieder zurück, können die Koordi-naten etwas unterschiedlich wegen Darstellungsfehler und KBS Transformationen werden.
Tipp: Layer KBS verwenden, auch für das Fenster während dem editieren.
Einschränkungen
Die gleichzeitige Bearbeitung von mehreren Layern innerhalb des gleichen Vektors wird nicht unterstützt. Diesist vor allem deswegen unmöglich, durch das nicht händeln mehrere Handhabungs Stacks für eine einzelne Daten-quelle.
On Linux and macOS only one GRASS layer can be edited at time. This is due to a bug in GRASS whichdoes not allow to close database drivers in random order. This is being solved with GRASS developers.
Tipp: GRASS Schreibberechtigung
Sie müssen der Besitzer der GRASS MAPSET, die Sie bearbeiten wollen, sein. Es ist unmöglich Datenlayer ineiner MAPSET die Ihnen nicht gehört zu bearbeiten, auch wenn Sie Schreibrechte darauf haben.
20.13 Einstellung der GRASS Region
Die Region Einstellung (Einstellung eines räumlichen Arbeitsfensters) in GRASS ist wichtig für das Arbeiten mitRasterlayern. Vektoranalysen sind standardmäßig nicht auf eine definierte Region Definition begrenzt. Aber alleneu erstellten Raster werden die räumliche Ausdehnung und Auflösung der gerade definierten GRASS Regionhaben, unabhängig von Ihrer ursprünglichen Ausdehnung und Auflösung. Die aktuelle GRASS Region ist in der$LOCATION/$MAPSET/WIND Datei gespeichert und Sie definiert die Nord-, Süd-. Ost- und Westgrenze, dieAnzahl von Spalten und Reihen sowie die horizontale und vertikale räumliche Auflösung.
20.13. Einstellung der GRASS Region 509

QGIS User Guide, Release 3.4
Es ist auch möglich, die Region mit dem Knopf Aktuelle GRASS-Region darstellen aus- bzw. einzuschalten.
The region can be modified in ‚Region‘ tab in ‚GRASS Tolls‘ dock widget. Type in the new region bounds andresolution, and click Apply. If you click on Select the extent by dragging on canvas you can select a new regioninteractively with your mouse on the QGIS canvas dragging a rectangle.
Das GRASS Modul g.region bietet viele weitere Optionen zur Einstellung der passenden Ausdehnung undAuflösung der Region für die Rasteranalyse. Das Modul g.region können Sie über die GRASS Werkzeugkistenutzen, wie in Kapitel Die GRASS Werkzeugkiste beschrieben.
20.14 Die GRASS Werkzeugkiste
Die GRASS-Werkzeugkiste ermöglicht es, GRASS Module auf Daten innerhalb einer ausgewählten GRASSLOCATION und MAPSET anzuwenden. Dazu muss im Vorfeld eine GRASS LOCATION und MAPSET geöffnetwerden, in der Sie Schreibrechte besitzen. Dies ist normalerweise garantiert, wenn Sie die MAPSET selbst erstellthaben und notwendig, damit die Ergebniskarten der Raster- und Vektoranalysen in der ausgewählten LOCATIONund :file:`MAPSET gespeichert werden können.
Figure 20.3: GRASS Werkzeuge und Modulbaum
20.14.1 Arbeiten mit GRASS Modulen
Die GRASS Shell der Werkzeugkiste bietet Zugriff auf fast alle (mehr als 300) GRASS Module über die Komman-dozeile. Um eine benutzfreundlichere Umgebung zu bieten, sind davon etwa 200 Module graphisch auswählbarund bieten einen Dialog in Form eines zusätzlichen Reiters in der Werkzeugkiste.
A complete list of GRASS modules available in the graphical Toolbox in QGIS version 3.4 is available in theGRASS wiki at https://grass.osgeo.org/wiki/GRASS-QGIS_relevant_module_list.
Es ist außerdem möglich, die GRASS Werkzeugkiste anzupassen und weitere Module zu integrieren. DieHerangehensweise ist in Abschnitt Anpassen der Module beschrieben.
As shown in figure_grass_toolbox, you can look for the appropriate GRASS module using the thematicallygrouped Modules Tree or the searchable Modules List tab.
510 Chapter 20. GRASS GIS Integration

QGIS User Guide, Release 3.4
Wenn Sie auf das grafische Icon eines Modules klicken, öffnet sich ein neuer Moduldialog mit drei Reitern Op-tionen, Ergebnis und Handbuch.
Optionen
Der Reiter Optionen stellt Ihnen in vereinfachter Form die unbedingt notwendigen Eingabeparameter zur Verfü-gung, die das Modul zum Laufen benötigt.
Figure 20.4: GRASS Werkzeuge Modul Optionen
Die zur Verfügung gestellten Modulparameter sind oftmals nicht vollständig um den Dialog einfach zu halten.Wenn Sie weitergehende Modulparamter und -flags verwenden wollen müssen Sie die GRASS Shell starten unddas Programm in der Kommandozeile benutzen.
Eine neue Funktion seit der QGIS Version 1.8.0 ist der Knopf Fortgeschrittene Optionen einblenden unterhalbder vereinfachten Moduldialoge im Reiter Optionen. Momentan ist diese Funktion nur für das Modul v.in.asciiumgesetzt. Es ist aber zukünftig für weitere Module vorgesehen und wird so die kompletten Funktionen derGRASS Module grafisch bereitstellen, ohne die GRASS Shell und somit die Kommandozeile benutzen zu müssen.
Ergebnis
The Output tab provides information about the output status of the module. When you click the Run button, themodule switches to the Output tab and you see information about the analysis process. If all works well, you willfinally see a Successfully finished message.
Handbuch
Der Reiter Handbuch zeigt die HTML Hilfeseite der GRASS Module. Sie können es zum Überprüfen weiterge-hender Modulparameter oder -flags oder um vertieftere Kenntnisse über den Anwendungszweck der Module zuerwerben benutzen. Am Ende jeder Modul Handbuchseite sehen Sie weiterführende Links zum Main Helpindex, dem Thematic index und dem Full index. Diese Links stellen die gleiche Information wie dasModul g.manual zur Verfügung.
Tipp: Ergebnisse direkt anzeigen
Wollen Sie Ihre Ergenisse direkt in der Kartenansicht ansehen, nutzen Sie den Knopf ‚Ergebnis visualisieren‘ imunteren Bereich des jeweiligen Modulreiters
20.14. Die GRASS Werkzeugkiste 511

QGIS User Guide, Release 3.4
Figure 20.5: GRASS Werkzeuge Modul Ergebnis
Figure 20.6: GRASS Werkzeuge Modul Handbuch
512 Chapter 20. GRASS GIS Integration

QGIS User Guide, Release 3.4
20.14.2 GRASS Beispielanwendung
Die folgenden Beispiele sollen die Anwendung verschiedener GRASS Module demonstrieren.
Höhenlinien aus einem DGM erstellen
Im ersten Beispiel wird eine Höhenlinienkarte aus einem Höhenraster (DEM) erstellt. Hier wird angenommendass Sie die Alaska LOCATION wie in Abschnitt Daten in eine GRASS LOCATION importieren eingerichtethaben.
• Als erstes öffnen Sie die Location, indem Sie auf das Mapset öffnen Icon klicken und dann die AlaskaLocation auswählen.
• Als nächstes drücken Sie auf das Icon GRASS-Werkzeugkiste öffnen.
• In der Liste von Werkzeugkategorien doppelklicken Sie auf Raster → Oberflächenverwaltung → Vektorkon-turlinien erzeugen.
• Jetzt wird ein einfacher Klick auf das Werkzeug r.contour einen Werkzeugdialog wie oben beschriebenöffnen (siehe Arbeiten mit GRASS Modulen).
• Geben Sie gtopo30 in Name des EIngaberasters ein.
• Geben Sie im Feld Abstand zwischen den Kontourintervallen den Wert 100 an. (Dadurch werdenHöhenlinien in einem Abstand von 100m erstellt.)
• In das Feld Name der Vektorausgabekarte geben Sie den Namen hoehen_100 an.
• Click Run to start the process. Wait for several moments until the message Successfully finishedappears in the output window. Then click View Output and Close.
Da die aktuelle GRASS Region ziemlich groß ist, kann es eine Weile dauern, bis der Layer vollständig dargestelltwird. Danach können Sie noch die Layereigenschaften verändern und eine Farbe für die Linien auswählen, diesich deutlich vom Höhenmodell unterscheidet, siehe Vektorlayereigenschaften.
Als nächstes zoomen Sie in einen bergigen Bereich im Zentrum Alaskas. Wenn Sie weit genug in die Kartehineingezoomt sind, werden Sie erkennen, dass die Höhenlinien teilweise sehr eckig erscheinen. Um das Er-scheinungsbild zu optimieren, bietet GRASS ein Modul mit dem Namen v.generalize. Dabei wird mit Hilfe desDouglas Peuker Algorithmus und der einer Reduktion der Stützpunkte eine Glättung der Linien erreicht, ohne dieGeometrien zu zerstören. Da der Ergebnislayer weniger Stützpunkte hat, ist er auch kleiner und kann schnellergeladen werden. Die Analyse wird z.B. angewendet, wenn man sehr detailierte Daten nur in einem kleinenMaßstab anzeigen möchte.
Tipp: Geometrien in QGIS vereinfachen
Note that QGIS has a Vector → Geometry Tools → Simplify geometries tool that works just like the GRASSv.generalize Douglas-Peuker algorithm.
In diesem Beispiel wollen wir nun aber etwas anderes erreichen. Die Höhenlinien, die wir mit r.contour er-stellt haben, zeigen teilweise sehr scharfe Winkel, die wir glätten möchten. Unter den Algorithmen des Modulsv.generalize befindet sich auch der Chaikens-Algorithmus, der exakt das macht, was wir möchten (auch HermiteSplines). Achten Sie aber darauf, dass es passieren kann, dass Stützpunkte nicht nur eliminiert sondern auchhinzugefügt werden können. Dadurch kann der Layer wieder langsamer geladen werden.
• Öffnen Sie die GRASS Werkzeugkiste und doppelklicken Sie die Kategorien Vektor → Karte entwickeln →Generalisierung und klicken Sie dann auf das v.generalize Modul um sein Optionsfenster zu öffnen.
• Stellen Sie sicher, dass ‚hoehen_100‘ als Vektorlayer in Feld Name der Vektoreingabekarte erscheint.
• From the list of algorithms, choose Chaiken’s. Leave all other options at their default, and scroll down tothe last row to enter in the field Name for output vector map ‚ctour_100_smooth‘, and click Run.
20.14. Die GRASS Werkzeugkiste 513

QGIS User Guide, Release 3.4
• The process takes several moments. Once Successfully finished appears in the output windows,click View Output and then Close.
• Ändern Sie nun auch die Farbe des neuen Layers, damit er sich deutlich von dem Höhenmodell und denzuvor berechneten Höhenlinien abhebt. Sie werden erkennen, dass die Kanten der neuen Höhenlinienwesentlich weicher gezeichnet sind.
Figure 20.7: GRASS Moduk v.generalize zum Glätten einer Vektorkarte
Tipp: Vektorlinien glätten mit dem GRASS Modul v.generalize
Die oben beschriebene Anwendung kann auch in anderen Situationen verwendet werden. Wenn Sie z.B. eineRasterkarte mit Niederschlagswerten haben, können Sie mit r.contour einen Isohyetallayer (konstanter Nieder-schlag) erstellen.
Erstellen eines 3D Schummerungseffekts
Es gibt verschiedene Methoden, um Höhenlayer anzuzeigen und ihnen einen 3D Schummerungseffekt zu verlei-hen. Der Gebrauch von Höhenlinien ist eine populäre Methode, die häufig angewendet wird, um topographischeKarten zu erstellen. Eine andere Möglichkeit, um einen 3D Effekt zu erzeugen ist, bietet das Hillshading. DerEffekt basiert dabei auf einem Höhenmodell. Dabei wird zuerst die Hangneigung und -richtung der Zellen bes-timmt und dann durch die Simulation des Sonnenstandes eine Reflexionswert erzeugt. Dadurch werden der Sonnezugewandte Bereiche aufgehellt und der Sonne abgewandte Bereiche (im Schatten) dunkler dargestellt.
• Fangen Sie mit diesem Beispiel an indem Sie zuerst den Rasterlayer gtopo30 laden. Öffnen Sie dieGRASS-Werkzeugkiste und unter der Raster Kategorie wechseln Sie in den Bereich Räumliche Analysen→ Geländeanalyse.
• Nun klicken Sie auf r.shaded.relief, um den Modulreiter zu öffnen.
• Ändern Sie den Wert im Feld Winkel der Sonne in Grad östlich von der Nordrichtung 270 auf 315.
• Enter gtopo30_shade for the new hillshade raster, and click Run.
• Nachdem die Karte berechnet wurde, visualisieren Sie sie und setzen Sie die Farbe des Rasterlayers aufGraustufen.
• Um die Schummerung und das Höhenmodell gtopo30 zusammen zu sehen, ziehen Sie die Schum-merungskarte in der Legende unter das Höhenmodell. Öffnen Sie dann den Dialog Layereigenschaftender Karte gtopo30, und ändern Sie die Transparenz im Reiter Transparenz auf den Wert 25%.
Die Höhenkarte gtopo30 wird nun als Farbkarte leicht transparent über der Schummerungskarte angezeigt.Dadurch entsteht ein visueller 3D Effekt. Um den Unterschied besser zu erkennen, wechseln Sie über das Kon-trollkästchen den Anzeigemodus der Schummerungskarte in der Legende und wieder zurück.
514 Chapter 20. GRASS GIS Integration

QGIS User Guide, Release 3.4
Die GRASS Kommandozeile verwenden
Das GRASS Plugin in QGIS stellt die GRASS Module oftmals in vereinfachter Form und auch nicht vollständigbereit. Es ist also grundsätzlich für Anwender gestaltet, die sich nicht so gut mit GRASS und all seinen Fähigkeitenauskennen oder nur einfacher Analysen durchführen wollen. Daher werden in den grafischen Moduldialogen oft-mals nicht alle Optionen und Parameter, die das GRASS Modul bieten bereitgestellt, um den Umgang einfacherund intuitiver zu gestalten. Wer tiefer in GRASS einsteigen möchte, er hat die Möglichkeit, sämtliche Funktion-alitäten und Module über die GRASS Kommandozeile (GRASS Shell) anzusprechen. In dem folgenden Beispielsoll eine zusätzliche Option des Moduls r.shaded.relief angesprochen werden, die nur über die Kommandozeilegenutzt werden kann.
Figure 20.8: Die GRASS Shell, Modul r.shaded.relief
Das Modul r.shaded.relief stellt einen zusätzliche Parameter zmult bereit, über den der Höhenwert relativ zuden X-Y Werten multipliziert werden kann. Dadurch wird der Schummerungseffekt noch prägnanter.
• Load the gtopo30 elevation raster as above, then start the GRASS Toolbox and click on theGRASS shell. In the shell window, type the command r.shaded.relief map=gtopo30shade=gtopo30_shade2 azimuth=315 zmult=3 and press Enter.
• Wenn die Berechnung abgeschlossen ist, wechseln Sie den Reiter Browser und Doppelklicken Sie auf dieneu erstellte Karte gtopo30_shade2, um Sie in QGIS anzuzeigen.
• Wie oben erklärt verschieben Sie die Schummerungskarte unter das gtopo30 Raster in der Legende, über-prüfen Sie dann die Transparenz des farbigen gtopo30 Layers. Sie sollten dabei erkennen, dass derSchummerungseffekt stärker verglichen mit der ersten Schummerungskarte ist.
20.14. Die GRASS Werkzeugkiste 515

QGIS User Guide, Release 3.4
Figure 20.9: Darstellen einer Schummering erstellt mit dem GRASS Modul r.shaded.relief
Rasterstatistik auf Basis eines Vektorlayer berechnen
Das folgende Beispiel zeigt, wie man univariate Statistik für Rasterwerte innerhalb von Vektorpolygonen berech-nen kann und die Werte in neue Attributspalten des Vektorlayers hinzufügt.
• Again using the Alaska data, refer to Daten in eine GRASS LOCATION importieren to import theshapefiles/trees.shp file into GRASS.
• Jetzt ist ein Zwischenschritt nötig: es müssen Zentroiden zu der importierten Baumkarte hinzugefügt werdenum es zu einem kompletten GRASS Flächenvektor (der sowohl Umrandungen als auch Zentroide enthält)zu machen.
• Wählen Sie aus der Werkzeugkiste Vektor → Karte entwickeln → Objekte verwalten und öffnen Sie dasModul v.centroids.
• Geben Sie als Name für die Ausgabe-Vektorkarte ‚forest_areas‘ an und starten Sie das Modul.
• Nun laden Sie den neuen Layer forest_areas und visualisieren Sie die verschiedenen Waldtypen inverschiedenen Farben - deciduous, evergreen und mixed. Dazu öffnen Sie den Dialog Eigenschaften des
Layers, wechseln zum Reiter Darstellung, wählen ‚Eindeutiger Wert‘ und setzen das Klassifika-tionsfeld auf ‚VEGDESC‘ (siehe auch die Beschreibung des Reiters Darstellung in Abschnitt SymbologyProperties des Vektordatenabschnitts).
• Als nächstes öffnen Sie wieder die GRASS-Werkzeugkiste und wechseln nach Vektor → Vektor mit anderenKarten aktualisieren.
• Klicken Sie auf das v.rast.stats Modul. Geben Sie gtopo30 und forest_areas ein.
• Only one additional parameter is needed: Enter column prefix elev, and click Run. This is a computation-ally heavy operation, which will run for a long time (probably up to two hours).
• Schließlich öffnen Sie den Layer forest_areas erneut und lassen Sie sich die Attributtabelle anzeigen.Dort gibt es nun weitere Spalten einschließlich elev_min, elev_max, elev_mean usw. für jedesWaldpolygon.
20.14.3 Anpassen der Module
Nahezu alle GRASS-Module können in die GRASS-Werkzeugkiste integriert werden. Eine XML-Schnittstellewertet die sehr einfachen XML-Dateien, die die Module beschreiben, aus und übernimmt die Oberflächendarstel-lung.
Beispielhaft ist hier die XML-Datei zum Modul v.buffer (v.buffer.qgm) dargestellt:
516 Chapter 20. GRASS GIS Integration

QGIS User Guide, Release 3.4
<?xml version="1.0" encoding="UTF-8"?><!DOCTYPE qgisgrassmodule SYSTEM "http://mrcc.com/qgisgrassmodule.dtd">
<qgisgrassmodule label="Vector buffer" module="v.buffer"><option key="input" typeoption="type" layeroption="layer" /><option key="buffer"/><option key="output" />
</qgisgrassmodule>
The parser reads this definition and creates a new tab inside the Toolbox when you select the module. A moredetailed description for adding new modules, changing a module’s group, etc., can be found at https://qgis.org/en/site/getinvolved/development/addinggrasstools.html.
20.14. Die GRASS Werkzeugkiste 517

QGIS User Guide, Release 3.4
518 Chapter 20. GRASS GIS Integration

CHAPTER 21
QGIS Verarbeitung Umgebung
21.1 Einführung
Dieses Kapitel stellt das QGIS Verarbeitung Umgebung, eine leistungsstarke Analyseumgebung für raumbezo-gene Daten in QGIS, vor. Verarbeitung ist eine Geoverarbeitungsumgebung, die verwendet wird, um eigene undfremde Algorithmen aus QGIS heraus aufrufen zu können, so dass räumliche Analysen produktiv und einfach zubewerkstelligen sind.
In den folgenden Abschnitten werden wir betrachten wie die grafischen Elemente dieser Umgebung benutzt wer-den und wie man das Beste aus jedem einzelnen von ihnen herausholen kann.
There are four basic elements in the framework GUI, which are used to run algorithms for different purposes.Choosing one tool or another will depend on the kind of analysis that is to be performed and the particularcharacteristics of each user and project. All of them (except for the batch processing interface, which is calledfrom the toolbox or the algorithm execution dialog, as we will see) can be accessed from the Processing menuitem (you will see more entries; the remaining ones are not used to execute algorithms and will be explained laterin this chapter).
• The Toolbox: The main element of the GUI, it is used to execute a single algorithm or run a batch processbased on that algorithm.
• The Graphical Modeler: Several algorithms can be combined graphically using the modeler to define aworkflow, creating a single process that involves several subprocesses.
• The History manager: All actions performed using any of the aforementioned elements are stored in ahistory file and can be later easily reproduced using the history manager.
• The Batch Processing interface: This interface allows you to execute batch processes and automate theexecution of a single algorithm on multiple datasets.
In den folgenden Abschnitten werden wir auf jedes dieser Elemente im Detail eingehen.
21.2 Configuring the Processing Framework
As has been mentioned, the configuration menu gives access to a new dialog where you can configure how algo-rithms work. Configuration parameters are structured in separate blocks that you can select on the left-hand sideof the dialog.
519

QGIS User Guide, Release 3.4
Figure 21.1: Verarbeitungswerkzeuge
Figure 21.2: Verarbeitungsmodellierung
520 Chapter 21. QGIS Verarbeitung Umgebung

QGIS User Guide, Release 3.4
Figure 21.3: Verarbeitung Protokoll
Figure 21.4: Batch Processing Schnittstelle
21.2. Configuring the Processing Framework 521

QGIS User Guide, Release 3.4
Along with the aforementioned Output folder entry, the General block contains parameters for setting the defaultrendering style for output layers (that is, layers generated by using algorithms from any of the framework GUIcomponents). Just create the style you want using QGIS, save it to a file, and then enter the path to that file in thesettings so the algorithms can use it. Whenever a layer is loaded by Processing and added to the QGIS canvas, itwill be rendered with that style.
Rendering styles can be configured individually for each algorithm and each one of its outputs. Just right-click onthe name of the algorithm in the toolbox and select Edit rendering styles for outputs. You will see a dialog like theone shown next.
Figure 21.5: Rendering Styles
Select the style file (.qml) that you want for each output and press OK.
Other configuration parameters in the General group are listed below:
• Use filename as layer name. The name of each resulting layer created by an algorithm is defined by thealgorithm itself. In some cases, a fixed name might be used, meaning that the same output name will beused, no matter which input layer is used. In other cases, the name might depend on the name of the inputlayer or some of the parameters used to run the algorithm. If this checkbox is checked, the name will betaken from the output filename instead. Notice that, if the output is saved to a temporary file, the filenameof this temporary file is usually a long and meaningless one intended to avoid collision with other alreadyexisting filenames.
• Keep dialog open after running algorithm. Once an algorithm has finished execution and its output layersare loaded into the QGIS project, the algorithm dialog is closed. If you want to keep it open (to run thealgorithm again with different parameters, or to better check the output that is written to the log tab), checkthis option
• Use only selected features. If this option is selected, whenever a vector layer is used as input for an al-gorithm, only its selected features will be used. If the layer has no selected features, all features will beused.
• Pre-execution script file and Post-execution script file. These parameters refer to scripts written using theprocessing scripting functionality, and are explained in the section covering scripting and the console.
Apart from the General block in the settings dialog, you will also find a block for algorithm providers. Eachentry in this block contains an Activate item that you can use to make algorithms appear or not in the toolbox.Also, some algorithm providers have their own configuration items, which we will explain later when coveringparticular algorithm providers.
21.3 The Toolbox
The Processing Toolbox is the main element of the processing GUI, and the one that you are more likely to usein your daily work. It shows the list of all available algorithms grouped in different blocks called Providers, andcustom models and scripts you can add to extend the set of tools. Hence the toolbox is the access point to runthem, whether as a single process or as a batch process involving several executions of the same algorithm ondifferent sets of inputs.
522 Chapter 21. QGIS Verarbeitung Umgebung

QGIS User Guide, Release 3.4
Figure 21.6: Verarbeitungswerkzeuge
21.3. The Toolbox 523

QGIS User Guide, Release 3.4
Providers can be (de)activated in the Processing settings dialog. By default, only providers that do not rely onthird-party applications (that is, those that only require QGIS elements to be run) are active. Algorithms requiringexternal applications might need additional configuration. Configuring providers is explained in a later chapter inthis manual.
In the upper part of the toolbox dialog, you will find a set of tools to:
• work with Models: Create New Model. . . , Open Existing Model. . . and Add Model to Toolbox. . . ;
• work with Scripts: Create New Script. . . , Create New Script from Template. . . , Open Existing Script. . .and Add Script to Toolbox. . . ;
• open the History panel;
• open the Results Viewer panel;
• toggle the toolbox to the in-place modification mode using the Edit Features In-Place button: only the algo-rithms that are suitable to be executed on the active layer without outputting a new layer are displayed;
• open the Options dialog.
Below this toolbar is a Search. . . box to help you easily find the tools you need. You can enter any wordor phrase on the text box. Notice that, as you type, the number of algorithms, models or scripts in the toolbox isreduced to just those that contain the text you have entered in their names or keywords.
Bemerkung: At the top of the list of algorithms are displayed the most recent used tools; handy if you want toreexecute any.
Figure 21.7: Die Verarbeitungswerkzeuge zeigen Suchergebnisse
To execute a tool, just double-click on its name in the toolbox.
524 Chapter 21. QGIS Verarbeitung Umgebung
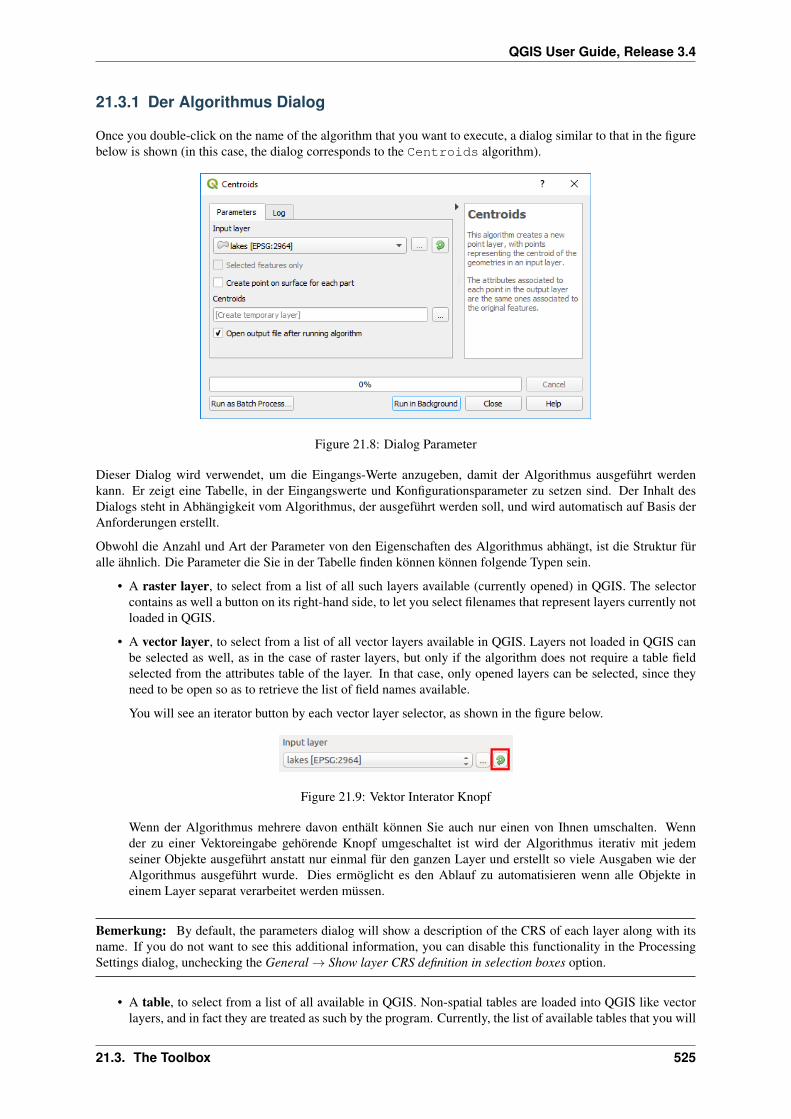
QGIS User Guide, Release 3.4
21.3.1 Der Algorithmus Dialog
Once you double-click on the name of the algorithm that you want to execute, a dialog similar to that in the figurebelow is shown (in this case, the dialog corresponds to the Centroids algorithm).
Figure 21.8: Dialog Parameter
Dieser Dialog wird verwendet, um die Eingangs-Werte anzugeben, damit der Algorithmus ausgeführt werdenkann. Er zeigt eine Tabelle, in der Eingangswerte und Konfigurationsparameter zu setzen sind. Der Inhalt desDialogs steht in Abhängigkeit vom Algorithmus, der ausgeführt werden soll, und wird automatisch auf Basis derAnforderungen erstellt.
Obwohl die Anzahl und Art der Parameter von den Eigenschaften des Algorithmus abhängt, ist die Struktur füralle ähnlich. Die Parameter die Sie in der Tabelle finden können können folgende Typen sein.
• A raster layer, to select from a list of all such layers available (currently opened) in QGIS. The selectorcontains as well a button on its right-hand side, to let you select filenames that represent layers currently notloaded in QGIS.
• A vector layer, to select from a list of all vector layers available in QGIS. Layers not loaded in QGIS canbe selected as well, as in the case of raster layers, but only if the algorithm does not require a table fieldselected from the attributes table of the layer. In that case, only opened layers can be selected, since theyneed to be open so as to retrieve the list of field names available.
You will see an iterator button by each vector layer selector, as shown in the figure below.
Figure 21.9: Vektor Interator Knopf
Wenn der Algorithmus mehrere davon enthält können Sie auch nur einen von Ihnen umschalten. Wennder zu einer Vektoreingabe gehörende Knopf umgeschaltet ist wird der Algorithmus iterativ mit jedemseiner Objekte ausgeführt anstatt nur einmal für den ganzen Layer und erstellt so viele Ausgaben wie derAlgorithmus ausgeführt wurde. Dies ermöglicht es den Ablauf zu automatisieren wenn alle Objekte ineinem Layer separat verarbeitet werden müssen.
Bemerkung: By default, the parameters dialog will show a description of the CRS of each layer along with itsname. If you do not want to see this additional information, you can disable this functionality in the ProcessingSettings dialog, unchecking the General → Show layer CRS definition in selection boxes option.
• A table, to select from a list of all available in QGIS. Non-spatial tables are loaded into QGIS like vectorlayers, and in fact they are treated as such by the program. Currently, the list of available tables that you will
21.3. The Toolbox 525

QGIS User Guide, Release 3.4
see when executing an algorithm that needs one of them is restricted to tables coming from files in dBase(.dbf) or Comma-Separated Values (.csv) formats.
• An option, to choose from a selection list of possible options.
• A numerical value, to be introduced in a spin box. In some contexts (when the parameter applies at
the feature level and not at the layer’s), you will find a Data-defined override button by its side, allowingyou to open the expression builder and enter a mathematical expression to generate variable values for theparameter. Some useful variables related to data loaded into QGIS can be added to your expression, so youcan select a value derived from any of these variables, such as the cell size of a layer or the northernmostcoordinate of another one.
Figure 21.10: Expression based input
• A range, with min and max values to be introduced in two text boxes.
• A text string, to be introduced in a text box.
• A field, to choose from the attributes table of a vector layer or a single table selected in another parameter.
• A coordinate reference system. You can select it among the recently used ones from the drop-down list orfrom the CRS selection dialog that appears when you click on the button on the right-hand side.
• An extent, to be entered by four numbers representing its xmin, xmax, ymin, ymax limits. Clicking onthe button on the right-hand side of the value selector, a pop-up menu will appear, giving you options:
– to select the value from a layer or the current canvas extent;
– or to define it by dragging directly onto the map canvas.
Figure 21.11: Ausdehnung Auswahl
Wenn Sie die erste Option wählen, sehen Sie einen Dialog wie den nächsten.
Wenn Sie den zweiten wählen, wird das Parameter-Fenster verschwinden, damit Sie durch Klicken undZiehen im Kartenfenster einen Bereich definieren können. Wenn das Rechteck definiert ist, wird der Dialogmit den Werten wieder auftauchen.
526 Chapter 21. QGIS Verarbeitung Umgebung

QGIS User Guide, Release 3.4
Figure 21.12: Ausdehnung Liste
Figure 21.13: Ausdehnung aufziehen
• A list of elements (whether raster or vector layers, tables, fields) to select from. Click on the . . . buttonat the left of the option to see a dialog like the following one. Multiple selection is allowed and when thedialog is closed, number of selected items is displayed in the parameter text box widget.
Figure 21.14: Mehrfachauswahl
• A small table to be edited by the user. These are used to define parameters like lookup tables or convolutionkernels, among others.
Klicken Sie auf den Knopf auf der rechten Seite, um die Tabelle zu sehen und zu editieren.
In Abhängigkeit vom Algorithmus kann die Anzahl der Zeilen verändert werden oder auch nicht, indem Sieauf den Knopf rechts neben dem Fenster klicken.
Bemerkung: Some algorithms require many parameter to run, e.g. in the qgisrastercalculator you have to specifymanually the cell size, the extent and the CRS. You can avoid to choose all the parameters manually when thealgorithm has the Reference layers parameter. With this parameter you can choose the reference layer andall its properties (cell size, extent, CRS) will be used.
21.3. The Toolbox 527

QGIS User Guide, Release 3.4
Figure 21.15: Fixe Tabelle
Along with the Parameters tab, you will find another tab named Log. Information provided by the algorithmduring its execution is written in this tab, and allow you to track the execution and be aware and have more detailsabout the algorithm as it runs. Notice that not all algorithms write information to this tab, and many of them mightrun silently without producing any output other than the final files.
Auf der rechten Seite des Dialogs finden Sie eine kurze Beschreibung des Algorithmus, welche Ihnen helfen denZweck und die grundlegende Idee zu verstehen. Wenn eine solche Beschreibung nicht verfügbar ist, wird dieBeschreibung nicht gezeigt werden.
For a more detailed help file, which might include description of every parameter it uses, or examples, you willfind a Help button at the bottom of the dialog bringing you to the Processing algorithms documentation or to theprovider documentation (for some third-party providers).
Bemerkung zum Thema Projektionen
Processing algorithm execution are always performed in the input layer coordinate reference system (CRS). Dueto QGIS’s on-the-fly reprojecting capabilities, although two layers might seem to overlap and match, that mightnot be true if their original coordinates are used without reprojecting them onto a common coordinate system.Whenever you use more than one layer as input to a QGIS native algorithm, whether vector or raster, the layerswill all be reprojected to match the coordinate reference system of the first input layer.
This is however less true for most of the external applications whose algorithms are exposed through the processingframework as they assume that all of the layers are already in a common coordinate system and ready to beanalyzed.
By default, the parameters dialog will show a description of the CRS of each layer along with its name, making iteasy to select layers that share the same CRS to be used as input layers. If you do not want to see this additionalinformation, you can disable this functionality in the Processing settings dialog, unchecking the Show layer CRSdefinition in selection boxes option.
If you try to execute an algorithm using as input two or more layers with unmatching CRSs, a warning dialog willbe shown. This occurs thanks to the Warn before executing if layer CRS’s do not match option.
Sie können den Algorithmus immer noch ausführen, seien Sie sich aber dessen bewusst dass dies in den meistenFällen zu falschen Ergebnissen führt, so z.B. leere Layer aufgrunddessen dass Eingabelayer nicht überlappen.
Tipp: Use Processing algorithms to do intermediate reprojection
When an algorithm can not successfully perform on multiple input layers due to unmatching CRSs, use QGISinternal algorithm such as qgisreprojectlayer to perform layers‘ reprojection to the same CRS before executing thealgorithm using these outputs.
528 Chapter 21. QGIS Verarbeitung Umgebung

QGIS User Guide, Release 3.4
21.3.2 Von Algorithmen erstellte Datenobjekte
Von Algorithmen erstellte Datenobjekte können jeder der folgenden Typen sein:
• Rasterlayer
• Vektorlayer
• Tabelle
• HTML-Datei (wird für Text und grafische Ausgabe verwendet)
These are all saved to disk, and the parameters table will contain a text box corresponding to each one of theseoutputs, where you can type the output channel to use for saving it. An output channel contains the informationneeded to save the resulting object somewhere. In the most usual case, you will save it to a file, but in the case ofvector layers, and when they are generated by native algorithms (algorithms not using external applications) youcan also save to a PostGIS, GeoPackage or SpatiaLite database, or a memory layer.
Um einen Ausgabekanal auszuwählen, klicken Sie einfach auf den Knopf auf der rechten Seite des Textfelds undSie werden ein kleines Kontextmenü mit den verfügbaren Optionen sehen.
Im häufigsten Fall werden Sie Speichern in einer Datei auswählen. Wenn Sie diese Option auswählen, werdenSie in einem Datei speichern Dialog aufgefordert werden, den gewünschten Dateipfad auszuwählen. UnterstützteDateierweiterungen werden in der Dateiformatauswahl des Dialogs gezeigt, abhängig von der Art der Ausgabeund des Algorithmus.
The format of the output is defined by the filename extension. The supported formats depend on what is supportedby the algorithm itself. To select a format, just select the corresponding file extension (or add it, if you are directlytyping the file path instead). If the extension of the file path you entered does not match any of the supportedformats, a default extension will be appended to the file path, and the file format corresponding to that extensionwill be used to save the layer or table. Default extensions are .dbf for tables, .tif for raster layers and .gpkgfor vector layers. These can be modified in the setting dialog, selecting any other of the formats supported byQGIS.
If you do not enter any filename in the output text box (or select the corresponding option in the context menu),the result will be saved as a temporary file in the corresponding default file format, and it will be deleted once youexit QGIS (take care with that, in case you save your project and it contains temporary layers).
You can set a default folder for output data objects. Go to the settings dialog (you can open it from the Settings→ Options → Processing menu), and in the General group, you will find a parameter named Output folder. Thisoutput folder is used as the default path in case you type just a filename with no path (i.e., myfile.shp) whenexecuting an algorithm.
Wenn Sie einen Algorithmus ausführen, der einen Vektorlayer im iterativen Modus verwendet, wird dereingegebene Dateipfad als Basispfad für alle erstellten Dateien, die mit Hilfe des Basisnamens benannt werdenund an die eine Nummer, die den Index der Iteration darstellt, angehängt wird, verwendet. Die Dateierweiterung(und das Format) wird für alle so erstellten Dateien benutzt.
Apart from raster layers and tables, algorithms also generate graphics and text as HTML files. These results areshown at the end of the algorithm execution in a new dialog. This dialog will keep the results produced by anyalgorithm during the current session, and can be shown at any time by selecting Processing → Results Viewerfrom the QGIS main menu.
Einige externe Anwendungen können Dateien (ohne besondere Einschränkungen bei der Dateinamen-Erweiterunghaben) als Ausgabe erzeugen, die nicht zu einer der oben genannten Kategorien gehören. Diese Ausgabedateienwerden nicht von QGIS verarbeitet (weder geöffnet noch in das aktuelle QGIS-Projekt integriert), da diese meis-tens nicht von QGIS unterstützt werden. Dies ist beispielsweise der Fall beim LAS-Format für LIDAR-Daten.Die Dateien werden erstellt, aber Sie werden nicht in QGIS angezeigt.
Für alle anderen Arten von Ausgaben finden Sie ein Kontrollkästchen, mit dem sie festlegen können, ob die Dateiin |qg| geladen werden soll oder nicht, wenn sie durch den Algorithmus erzeugt wurde. Standardmäßig werdenalle Dateien angezeigt.
Optionale Ausgaben werden nicht unterstützt, alle Ausgaben werden erstellt, aber Sie können über dasentsprechende Kontrollkästchen definieren, wenn Sie an einer bestimmten Ausgabe nicht interessiert sind, was
21.3. The Toolbox 529

QGIS User Guide, Release 3.4
es im Wesentlichen zu einer Optionale Ausgabe macht (Der Layer wird zwar erstellt, aber nur temporär im Hin-tergrund, wenn Sie das Textfeld leer lassen, und wieder gelöscht, sobald Sie QGIS verlassen).
21.4 Das Protokoll
21.4.1 Das Verarbeitung Protokoll
Jedes mal wenn Sie einen Algorithmus ausführen werden Informationen über den Prozess im Protokoll gespe-ichert. Zusammen mit den verwendeten Parametern werden auch das Datum und die Zeit der Ausführung gespe-ichert.
Auf diese Weise ist es einfach alle Arbeiten, die entwickelt wurden anhand der Verarbeiten Umgebung, zu verfol-gen und zu kontrollieren und sie auf einfache Art und Weise zu reproduzieren.
Das Protokoll ist ein Satz von Registryeinträgen, die entsprechend ihres Ausführungsdatums gruppiert werden, umleichert Informationen über einen Algorithmus, der zu einem bestimmten Moment ausgeführt wurde, zu finden.
Figure 21.16: History
Prozessinformationen werden als Kommandozeilen-Ausdruck gespeichert, auch wenn der Algorithmus aus derToolbox gestartet wurde. Dies macht es auch nützlich zu lernen, wie man die Kommandozeilen-Schnittstelleverwendet, da man damit auch einen Algorithmus mit der Toolbox anrufen und dann im History Manager sehenund prüfen kann, wie der Algorithmus von der Kommandozeile aus aufgerufen werden kann.
Apart from browsing the entries in the registry, you can also re-execute processes by simply double-clicking onthe corresponding entry: the algorithm dialog opens with parameters already filled; you can then change any ofthem to fit your needs and re-run the algorithm.
21.4.2 Das Verarbeitung Log
The history dialog only contains the execution calls, but not the information produced by the algorithm whenexecuted. That information is written to the QGIS log (View → Panels → Log Messages Panel), in a Processingtab.
Third-party algorithms are usually executed by calling their command-line interfaces, which communicate withthe user via the console. Although that console is not shown, usually a full dump of it is written to the log eachtime you run one of those algorithms. To avoid cluttering the log with that information, you can disable it for eachprovider, looking for the corresponding option in the provider entry of the settings dialog.
Einige Algorithmen können, selbst wenn Sie ein Ergebnis mit den gegebenen Eingabedaten erzeugen können,einen Kommentar oder zusätzliche Informationen hinzufügen, wenn sie potentielle Probleme mit den Daten
530 Chapter 21. QGIS Verarbeitung Umgebung

QGIS User Guide, Release 3.4
auffinden, um Sie zu warnen. Vergewissern Sie sich, dass Sie diese Nachrichten überprüfen, wenn Sie unerwarteteErgebnisse erhalten.
21.5 Die Grafische Modellierung
Die grafische Modellierung ermöglicht es, komplexe Modelle mit einer einfachen und leicht zu bedienenden Be-nutzeroberfläche zu erstellen. Beim Arbeiten mit einem GIS finden die meisten Analyse-Operationen nicht isoliert,sondern als Teil einer Kette von Operationen statt. Der grafische Modeller kann eine Kette von Prozessen in eineneinzigen Prozess einpacken. So ist es einfacher und bequemer, als einzelne Prozesse nacheinander auszuführen.Egal, wie viele Schritte und verschiedene Algorithmen es sind, sie können als Modell in einem einzigen Algorith-mus ausgeführt werden. Das spart Zeit und Mühe, besonders für größere Modelle.
Die Modellierung kann aus dem Verarbeiten Menü heraus geöffnet werden.
Der Modeller hat einen Arbeitsdialog, wo die Struktur des Modells und der Workflow dargestellt wird. Auf derlinken Seite des Fensters kann ein Bereich mit zwei Reitern verwendet werden, um neue Elemente in das Modellzu integrieren.
Figure 21.17: Modellierung
Das Erstellen eines Modells geht in zwei Schritten:
1. Definition von erforderlichen Eingaben. Diese Eingaben werden dem Paramterfenster hinzugefügt, so dassder Anwender Ihre Werte einstellen kann wenn er das Modell ausführt. Das Modell selber ist ein Algo-rithmus, also wird das Parameterfenster automatisch erstellt, so wie es mit allen Algorithmen, die in derVerarbeiten Umgebung zur Verfügung stehen, passiert.
2. Definition des Workflows. Während Sie die Eingabedaten des Modells verwenden, wird der Workflowdurch Hinzufügen von Algorithmen und Auswählen, wie diese Eingaben und Ausgaben, die von anderenAlgorithmen erzeugt werden, benutzt werden, definiert.
21.5. Die Grafische Modellierung 531

QGIS User Guide, Release 3.4
21.5.1 Definition von Eingaben
Der Erste Schritt ein Modell zu erstellen ist die Eingaben, die es benötigt zu erstellen. Die folgenden Elementefinden Sie im Eingaben Reiter auf der linken Seite des Modellierungsfensters:
• Rasterlayer
• Vektorlayer
• Text
• Tabellenspalte
• Tabelle
• Extent
• Number
• Boolean
• File
Wenn man einen Doppelklick auf eines dieser Elemente macht wird ein Dialog zum Definieren seiner Eigen-schaften gezeigt. Abhängig vom Parameter selber kann der Dialog nur ein grundlegendes Element (die Beschrei-bung, was der Benutzer sehen wird wenn er das Modell ausführt) oder mehrere beinhalten. Beispielsweise wennman einen numerischen Wert hinzufügt, wie in der nächsten Abbildung gezeigt, müssen Sie neben der Beschrei-bung des Parameters einen Standardwert und eine Wertespanne von gültigen Werten einstellen.
Figure 21.18: Model Parameters Definition
Für jede Eingabe wird ein neues Element im Modeller-Fenster erstellt.
Sie können auch Eingaben hinzufügen, indem Sie den Eingabetyp aus der Liste ziehen und es in den Modellierer,in der Position fallen lassen, wo Sie es platzieren haben möchten.
532 Chapter 21. QGIS Verarbeitung Umgebung

QGIS User Guide, Release 3.4
Figure 21.19: Model Parameters in canvas
21.5.2 Definition des Workflows
Wenn die Eingaben definiert sind, ist es Zeit die Algorithmen festzulegen. Die Algorithmen können im ReiterAlgorithmen ausgewählt werden. Die Gruppierung entspricht der Toolbox.
Figure 21.20: Model Inputs
Um einen Algorithmus einem Modell hinzuzuführen doppelklicken Sie seinen Namen oder ziehen Sie ihn per Dragand Drop hinein. Ein Ausführungsdialog mit einem Inhalt ähnlich dem, der gezeigt wird wenn der Algorithmusaus der Werkzeugkiste ausgeführt wird, erscheint. Der als nächstes gezeigte entspricht dem SAGA ‚Convergenceindex‘ Algorithmus, das gleiche Beispiel, was wir im Kapitel über die Werkzeugkiste gesehen haben.
Wie Sie sehen können bestehen einige Unterschiede. Anstelle des Dateiausgabefensters, das für die Einstellungdes Dateipfades für Ausgabelayer und -tabellen verwendet wurde, wird hier eine einfaches Textfenster verwendet.Wenn der vom Algorithmus erstellte Layer nur ein vorläufiges Ergebnis ist, das als Eingabe für einen anderenAlgorithmus verwendet wird und nicht als endgültiges Ergebnis vorgehalten werden soll, bearbeiten Sie diesesTextfenster nicht. Wenn Sie etwas eingeben heißt das, dass das Ergebnis endgültig ist und dass der Text denSie vergeben die Beschreibung für die Ausgabe, die die Ausgabe ist, die der Benutzer sieht wenn das Modellausgeführt wird, ist.
Das Auswählen des Wertes für jeden Parameter ist ebenfalls etwas schwierig, da es wichtige Unterschiede zwis-chen dem Kontext der Modellierung und der der Werkzeugkiste gibt. Wollen wir sehen wie man die Werte fürjeden Typ von Parameter vorstellen.
21.5. Die Grafische Modellierung 533

QGIS User Guide, Release 3.4
Figure 21.21: Model Algorithm parameters
• Layer (Raster und Vektor) und Tabellen. Sie werden aus einer Liste ausgewählt, aber in diesem Fall sind diemöglichen Werte nicht die Layer oder Tabellen, die momentan in QGIS geladen sind, sondern die Liste derModelleingaben des entsprechenden Typs oder andere Layer oder Tabellen, die durch Algorithmen bereitserzeugt und zum Modell hinzugefügt wurden.
• Numerical values. Literal values can be introduced directly in the text box. Clicking on the button besidethe text box, expressions can be entered. Available variables for expressions include numerical inputs of themodel, and also statistical values from available raster layers within the model.
• String. Literal strings can be typed in the corresponding text box. Clicking on the button beside the textbox, expressions can be entered, as in the case of numerical values.
• Table field. Die Felder der Elterntabelle oder -layers können nicht zur Erstellungszeit ermittelt werden, dasie von der Auswahl des Anwenders jedes mal wenn das Modell ausgeführt wird abhängen. Um den Wert fürdiesen Parameter einzustellen, geben Sie den Namen des Feldes direkt in das Textfenster ein oder verwendenSie die Liste um eine Tabellenfeldeingabe, die schon dem Modell hinzugefügt wurde, auszuwählen. DieGültigkeit des ausgewählten Feldes wird zur Laufzeit überprüft.
Sie werden in jedem Fall einen zusätzlichen Paramter genannt Parent algorithms, der nicht zugänglich ist wenn Sieden Algorithmus aus der Werkzeugkiste aufrufen, finden. Dieser Parameter ermöglicht es Ihnen die Reihenfolge inwelcher die Algorithmen ausgeführt werden, indem ein Algorithmus ausdrücklich als Eltern des aktuellen definiertwerden, festzulegen. Dies bewirkt, dass der Elternalgorithmus vor dem aktuellen ausgeführt wird.
Wenn Sie die Ausgabe eines vorherigen Algorithmus als Eingabe für Ihren Algorithmus benutzen, stellt diesimplizit den vorherigen Algorithmus als Eltern des gerade verwendeten ein (und platziert den entsprechenden Pfeilin der Modellierungsoberfläche). In einigen Fällen jedoch kann ein Algorithmus von einem anderen abhängenselbst wenn er keine Ausgabe von diesem verwendet (beispielsweise ein Algorithmus der einen SQL-Satz in einerPostGIS Datenbank ausführt und ein weiterer der einen Layer in die gleiche Datenbank importiert). Wählen Siein diesem Fall einfach den vorherigen Algorithmus im Parent algorithms Parameter aus und die zwei Schrittewerden in der richtigen Reihenfolge ausgeführt.
Once all the parameters have been assigned valid values, click on OK and the algorithm will be added to thecanvas. It will be linked to all the other elements in the canvas, whether algorithms or inputs, that provide objectsthat are used as inputs for that algorithm.
Elemente können in eine andere Position innerhalb der Oberfläche gezogen werden, um die Art wie die Mod-ellstruktur dargestellt wird zu ändern und um diese klarer und intuitiver zu machen. Verbindungen zwischen
534 Chapter 21. QGIS Verarbeitung Umgebung

QGIS User Guide, Release 3.4
Elementen werden automatisch erneuert. Sie können mit dem Mausrad vergrößern und verkleinern.
You can run your algorithm any time by clicking on the Run button. However, in order to use the algorithm fromthe toolbox, it has to be saved and the modeler dialog closed, to allow the toolbox to refresh its contents.
21.5.3 Speichern und laden von Modellen
Use the Save button to save the current model and the Open button to open any model previously saved. Modelsare saved with the .model extension. If the model has been previously saved from the modeler window, you willnot be prompted for a filename. Since there is already a file associated with that model, the same file will be usedfor any subsequent saves.
Vor dem Speichern eines Modells müssen Sie einen Namen und eine Gruppe angeben. Nutzen Sie dazu dieTextfelder im oberen Teil des Fensters.
Modelle, die im models Ordner (der Standardordner wenn Sie aufgefordert werden einen Dateinamen zumSpeichern des Modell einzugeben) gespeichert sind, erscheinen in der Werkzeugkiste im entsprechenden Baum.Wenn die Verarbeitungswerkzeuge aufgerufen werden durchsucht sie den models Ordner nach Dateien mit der.model Erweiterung und lädt die Modelle, die enthalten sind. Da ein Modell ein Algorithmus ist, kann es einfachwie jeder andere Algorithmus zur Werkzeugkiste hinzugefügt werden.
Models can also be saved within the project file using the Save model in project button. Models saved with thismethod won’t be written as .model files on the disk but will be embedded in the .qgz project file.
Project models are available in the Project models menu of the toolbox.
Die Verarbeitungsmodellierung kann im Verarbeitungskonfigurationsdialog in der Models Gruppe eingestellt wer-den.
Modelle, die aus dem Models Ordner geladen werden, erscheinen nicht nur in der Werkzeugkiste, sondern auchim Algorithmusbaum im Algorithmen Reiter des Modellierungsfensters.
Models will show up in the Browser panel , and can be run from there.
Exporting a model as an image, PDF or SVG
A model can also be exported as an image, SVG or PDF (for illustration purposes).
21.5.4 Ein Modell editieren
Sie können das Modell, das Sie gerade erstellen editieren, den Workflow neu definieren sowie die Beziehungenzwischen den Algorithmen und den Eingangsdaten, die das Modell ausmachen ändern.
Wenn Sie mit der rechten Maustaste auf einen Algorithmus im Dialog-Fenster klicken, wird ein Kontextmenügeöffnet. wie in der nächsten Abbildung zu sehen:
Figure 21.22: Rechtsklick auf den Modeler
Wird die Remove Option gewählt, bewirkt dies, dass der ausgewählte Algorithmus entfernt wird. Ein Algorithmuskann nur entfernt werden wenn keine weiteren Algorithmen von ihm abhängen. Das heißt, wenn keine Ausgabedes Algorithmus in einem anderen als Eingabe verwendet wird. Wenn Sie versuchen einen Algorithmus, von demandere abhängen, zu entfernen, wird eine Warnmeldung wie die, die Sie unten sehen können, gezeigt:
21.5. Die Grafische Modellierung 535

QGIS User Guide, Release 3.4
Figure 21.23: Kann Algorithmus nicht entfernen
Auswählen der Bearbeiten Option oder einfaches Doppelklicken auf das Symbol des Algorithmus zeigt denParameter-Dialog des Algorithmus, um die Ein- und Ausgabe Parameter-Werte zu ändern. Nicht alle Eingabe-Elemente des Modells werden in diesem Fall als verfügbare Eingänge angezeigt. Layer oder Werte, die in einemfortgeschrittenen Schritt im Workflow durch das Modell erzeugt wurden, stehen nicht zur Verfügung, wenn siezirkuläre Abhängigkeiten verursachen.
Select the new values and then click on the OK button as usual. The connections between the model elements willchange accordingly in the modeler canvas.
Ein Modell kann teilweise ausgeführt werden, indem einige der Algorithmen deaktiviert werden. Um dies zumachen, rechtsklicken Sie auf ein Algorithmus Element und wählen Sie Deaktivieren. Der ausgewählte Algorith-mus und alle diejenigen, die in dem Modell von ihm abhängen werden in grau angezeigt und nicht als Teil desModells ausgeführt.
Figure 21.24: Modell mit deaktivierten Algorithmen
Wenn Sie auf einen deaktivierten Algorithmus doppelklicken, sehen Sie ein Aktiviert Menü, welches Sie nutzenkönnen, um es wieder zu aktivieren.
21.5.5 Editieren der Modell-Hilfe Datei und der Metainformationen
You can document your models from the modeler itself. Just click on the Edit Model Help button and a dialog likethe one shown next will appear.
Auf der rechten Seite finden Sie eine einfache HTML-Seite, die anhand der Eingabeparameter und Ausgaben desAlgorithmus erstellt wurde, zusammen mit einigen zusätzlichen Einträgen wie eine allgemeine Beschreibung desModells und seines Autors. Wenn Sie den Hilfeeditor das erste Mal öffnen, sind alle diese Beschreibungen leer,Sie können Sie aber mit Hilfe der Elemente auf der linken Seite des Dialogs bearbeiten. Wählen Sie ein Elementim oberen Teil aus und schreiben Sie seine Beschreibung in das Textfeld unten.
Modell-Hilfe wird als Teil des Modells selbst gespeichert.
21.5.6 Zu den verfügbaren Algorithmen
Sie haben vielleicht bemerkt, dass einige Algorithmen, die aus der Toolbox ausgeführt werden können, nicht inder Liste der verfügbaren Algorithmen erscheint, wenn Sie ein Modell entwerfen. Um in einem Modell enthaltenzu sein, muss der Algorithmus eine korrekte Semantik haben, um im Workflow verknüpft zu werden. Wenn einAlgorithmus keine solche definierte Semantik besitzt (zum Beispiel, wenn die Anzahl der Ausgangskanäle oderLayer nicht im Voraus bekannt ist), dann ist es nicht möglich, diesen in einem Modell zu verwenden, und somiterscheint er auch nicht in der Liste.
536 Chapter 21. QGIS Verarbeitung Umgebung

QGIS User Guide, Release 3.4
Figure 21.25: Hilfeeditor
21.6 Die Batch Processing Schnittstelle
21.6.1 Einführung
All algorithms (including models) can be executed as a batch process. That is, they can be executed using not justa single set of inputs, but several of them, executing the algorithm as many times as needed. This is useful whenprocessing large amounts of data, since it is not necessary to launch the algorithm many times from the toolbox.
Um einen Algorithmus als Batch-Prozess ausführen, klicken Sie mit der rechten Maustaste auf seinen Namen inder Toolbox und wählen Sie die Option Ausführen als Batch-Prozess.
Figure 21.26: Batch Processing from right-click
Wenn Sie den Ausführungsdialog des Algorithmus geöffnet haben, können Sie die Stapelverarbeitung auch vondort starten, drücken Sie auf den Als Batch-Prozess ausführen. . . Knopf.
21.6.2 Die Parameter-Tabelle
Ausführen eines Batch-Prozesses ist vergleichbar mit der Durchführung der einmaligen Ausführung eines Algo-rithmus. Parameter-Werte müssen definiert werden, aber in diesem Fall müssen wir nicht nur einen einzelnenWert für jeden Parameter angeben, sondern eine Reihe von ihnen, einen für jedes Mal, wenn der Algorithmusausgeführt werden soll. Werte werden mit Hilfe einer Tabelle wie in der nächsten Abbildung zu sehen übergeben.
Jede Zeile dieser Tabelle stellt eine einzelne Ausführung des Algorithmus dar, und jede Zelle enthält den Werteines der Parameter. Es ist vergleichbar mit dem Parameter-Dialog, den Sie sehen, wenn Sie die Ausführung einesAlgorithmus aus der Toolbox starten, aber mit einer anderen Anordnung.
21.6. Die Batch Processing Schnittstelle 537

QGIS User Guide, Release 3.4
Figure 21.27: Batch-Prozess vom Algorithmus Dialog
Figure 21.28: Batch Processing
538 Chapter 21. QGIS Verarbeitung Umgebung

QGIS User Guide, Release 3.4
Standardmäßig enthält die Tabelle nur zwei Zeilen. Sie können weitere hinzufügen oder entfernen mit den Tastenam unteren Teil des Fensters.
Sobald die Größe der Tabelle gesetzt ist, muss sie mit den gewünschten Werten gefüllt werden.
21.6.3 Füllen der Parameter-Tabelle
Bei den meisten Parametern ist das Setzen des Wertes trivial. Geben Sie einfach den Wer ein oder wählen Siediesen aus der Liste zur Verfügung stehender Optionen, abhängig vom Parametertyp, aus.
Filenames for input data objects are introduced directly typing or, more conveniently, clicking on the . . . buttonon the right hand of the cell, which will show a context menu with two option: one for selecting from the layerscurrently opened and another to select from the filesystem. This second option, when selected, shows a typicalfile chooser dialog. Multiple files can be selected at once. If the input parameter represents a single data objectand several files are selected, each one of them will be put in a separate row, adding new ones if needed. If theparameter represents a multiple input, all the selected files will be added to a single cell, separated by semicolons(;).
Layer-Kennungen können direkt im Parametertextfeld eingegeben werden. Sie können den vollständigen Pfad zueiner Datei oder den Namen einer Ebene geben, die derzeit in der aktuellen QGIS Projekt geladen wird. Der Namedes Layers wird automatisch in seinem Quell-Pfad aufgelöst werden. Beachten Sie, dass, wenn mehrere Layerden gleichen Namen haben, könnte dies zu unerwarteten Ergebnissen führen aufgrund von Mehrdeutigkeit.
Ausgabedaten Objekte werden immer in einer Datei gespeichert und im Gegensatz zur Ausführung eines Algorith-mus aus der Toolbox, ist das vorübergehende Speichern als temporäre Datei oder Datenbank nicht gestattet. Siekönnen den Namen direkt eingeben oder im Dateiauswahldialog, wenn Sie auf den zugehörigen Button klicken.
Sobald Sie die Datei auswählen, erscheint ein neuer Dialog, der Autovervollständigung von anderen Zellen inderselben Spalte (gleiche Parameter) ermöglicht.
Figure 21.29: Batch Processing Save
Wenn der Standardwert (‚Do not autocomplete‘) gewählt ist, wird einfach der gewählte Dateiname in die aus-gewählte Zelle der Parameters Tabelle eingegeben. Wenn eine der anderen Optionen gewählt ist, werden alleZellen unter der ausgewählten automatisch anhand von definierten Kriterien ausgefüllt. So ist es erheblich ein-facher die Tabelle auszufüllen und der Stapelprozeß kann mit weniger Aufwand definiert werden.
Automatische Füllung kann durch einfaches Hinzufügen von korrelativen Zahlen zum ausgewählten Dateipfadoder Anhängen des Wertes eines anderen Feldes zu derselben Zeile erreicht werden. Dies ist besonders nützlichfür die Benennung von Ausgabedaten-Objekte entsprechend der Eingänge.
Figure 21.30: Batch Processing Dateipfad
21.6. Die Batch Processing Schnittstelle 539

QGIS User Guide, Release 3.4
21.6.4 Ausführen eines Batch-Prozesses
To execute the batch process once you have introduced all the necessary values, just click on OK. Progress of theglobal batch task will be shown in the progress bar in the lower part of the dialog.
21.7 Verarbeitung Algorithmen von der Konsole aus verwenden
Die Konsole ermöglicht es fortgeschrittenen Anwendern ihre Produktivität zu erhöhen und komplexe Operationen,die nicht anhand eines der GUI Elemente der Verarbeitung Umgebung ausgeführt werden können, durchzuführen.Modelle mit mehreren Algorithmen können anhand der Kommandozeilenssschnittstelle definiert werden undzusätzliche Operationen wie Schleifen und Bedingungssätze können hinzugefügt werden, um flexiblere und leis-tungsfähigere Workflows zu erstellen.
There is not a processing console in QGIS, but all processing commands are available instead from the QGISbuilt-in Python console. That means that you can incorporate those commands into your console work and connectprocessing algorithms to all the other features (including methods from the QGIS API) available from there.
Der Code den Sie von der Python Konsole aus ausführen können, auch wenn er keine spezifische VerarbeitungMethode aufruft, kann in einen neuen Algorithmus überführt werden den Sie später aus der Werkzeugkiste, derGrafischen Modellierung oder jeder anderen Komponente aufrufen können, so wie Sie es mit jedem anderenAlgorithmus tun würden. In der Tat sind einige Algorithmen, die Sie in der Werkzeugkiste finden können einfacheScripte.
In diesem Abschnitt werden wir uns angucken wie man Verarbeitung Algorithmen aus der QGIS Python Konsoleheraus verwendet und auch wie man Algorithmen in Python schreibt.
21.7.1 Algorithmen von der Python Konsole aus aufrufen
Das erste, was Sie machen müssen, ist die Verarbeitung Funktionen mit der folgenden Zeile importieren:
>>> import processing
Now, there is basically just one (interesting) thing you can do with that from the console: execute an algorithm.That is done using the run method, which takes the name of the algorithm to execute as its first parameter,and then a variable number of additional parameters depending on the requirements of the algorithm. So thefirst thing you need to know is the name of the algorithm to execute. That is not the name you see in thetoolbox, but rather a unique command–line name. To find the right name for your algorithm, you can use theprocessingRegistry. Type the following line in your console:
>>> for alg in QgsApplication.processingRegistry().algorithms():print(alg.id(), "->", alg.displayName())
You will see something like this (with some extra dashes added to improve readability).
3d:tessellate --------------> Tessellategdal:aspect ----------------> Aspectgdal:assignprojection ------> Assign projectiongdal:buffervectors ---------> Buffer vectorsgdal:buildvirtualraster ----> Build Virtual Rastergdal:cliprasterbyextent ----> Clip raster by extentgdal:cliprasterbymasklayer -> Clip raster by mask layergdal:clipvectorbyextent ----> Clip vector by extentgdal:clipvectorbypolygon ---> Clip vector by mask layergdal:colorrelief -----------> Color reliefgdal:contour ---------------> Contourgdal:convertformat ---------> Convert formatgdal:dissolve --------------> Dissolve...
540 Chapter 21. QGIS Verarbeitung Umgebung

QGIS User Guide, Release 3.4
That’s a list of all the available algorithm IDs, sorted by provider name and algorithm name, along with theircorresponding names.
Once you know the command-line name of the algorithm, the next thing to do is to determine the right syntax toexecute it. That means knowing which parameters are needed when calling the run() method.
There is a method to describe an algorithm in detail, which can be used to get a list of the parametersthat an algorithm requires and the outputs that it will generate. To get this information, you can use thealgorithmHelp(id_of_the_algorithm) method. Use the ID of the algorithm, not the full descriptivename.
Calling the method with native:buffer as parameter (qgis:buffer is an alias for native:buffer andwill also work), you get the following description:
>>> processing.algorithmHelp("native:buffer")Buffer (native:buffer)
This algorithm computes a buffer area for all the features in aninput layer, using a fixed or dynamic distance.
The segments parameter controls the number of line segments touse to approximate a quarter circle when creating roundedoffsets.
The end cap style parameter controls how line endings are handledin the buffer.
The join style parameter specifies whether round, miter orbeveled joins should be used when offsetting corners in a line.
The miter limit parameter is only applicable for miter joinstyles, and controls the maximum distance from the offset curveto use when creating a mitered join.
----------------Input parameters----------------
INPUT: Input layer
Parameter type: QgsProcessingParameterFeatureSource
Accepted data types:- str: layer ID- str: layer name- str: layer source- QgsProcessingFeatureSourceDefinition- QgsProperty- QgsVectorLayer
DISTANCE: Distance
Parameter type: QgsProcessingParameterDistance
Accepted data types:- int- float- QgsProperty
SEGMENTS: Segments
Parameter type: QgsProcessingParameterNumber
21.7. Verarbeitung Algorithmen von der Konsole aus verwenden 541

QGIS User Guide, Release 3.4
Accepted data types:- int- float- QgsProperty
END_CAP_STYLE: End cap style
Parameter type: QgsProcessingParameterEnum
Available values:- 0: Round- 1: Flat- 2: Square
Accepted data types:- int- str: as string representation of int, e.g. '1'- QgsProperty
JOIN_STYLE: Join style
Parameter type: QgsProcessingParameterEnum
Available values:- 0: Round- 1: Miter- 2: Bevel
Accepted data types:- int- str: as string representation of int, e.g. '1'- QgsProperty
MITER_LIMIT: Miter limit
Parameter type: QgsProcessingParameterNumber
Accepted data types:- int- float- QgsProperty
DISSOLVE: Dissolve result
Parameter type: QgsProcessingParameterBoolean
Accepted data types:- bool- int- str- QgsProperty
OUTPUT: Buffered
Parameter type: QgsProcessingParameterFeatureSink
Accepted data types:- str: destination vector file, e.g. 'd:/test.shp'- str: 'memory:' to store result in temporary memory layer- str: using vector provider ID prefix and destination URI,
e.g. 'postgres:...' to store result in PostGIS table- QgsProcessingOutputLayerDefinition- QgsProperty
542 Chapter 21. QGIS Verarbeitung Umgebung

QGIS User Guide, Release 3.4
----------------Outputs----------------
OUTPUT: <QgsProcessingOutputVectorLayer>Buffered
Now you have everything you need to run any algorithm. As we have already mentioned, algorithms can be runusing: run(). Its syntax is as follows:
>>> processing.run(name_of_the_algorithm, parameters)
Where parameters is a dictionary of parameters that depend on the algorithm you want to run, and is exactly thelist that the algorithmHelp() method gives you.
>>> processing.run("native:buffer", {'INPUT': '/data/lines.shp','DISTANCE': 100.0,'SEGMENTS': 10,'DISSOLVE': True,'END_CAP_STYLE': 0,'JOIN_STYLE': 0,'MITER_LIMIT': 10,'OUTPUT': '/data/buffers.shp'})
If a parameter is optional and you do not want to use it, then don’t include it in the dictionary.
If a parameter is not specified, the default value will be used.
Abhängig vom Parametertyp werden Werte verschieden eingeführt. Die nächste Liste gibt einen kurzen Überblickdarüber wie man Werte für jeden Typ von Eingabeparameter einführt:
• Raster Layer, Vector Layer or Table. Simply use a string with the name that identifies the data object to use(the name it has in the QGIS Table of Contents) or a filename (if the corresponding layer is not opened, itwill be opened but not added to the map canvas). If you have an instance of a QGIS object representing thelayer, you can also pass it as parameter.
• Enumeration. If an algorithm has an enumeration parameter, the value of that parameter should be enteredusing an integer value. To know the available options, you can use the algorithmHelp() command, asabove. For instance, the „native.buffer“ algorithm has an enumeration called JOIN_STYLE:
JOIN_STYLE: Join style
Parameter type: QgsProcessingParameterEnum
Available values:- 0: Round- 1: Miter- 2: Bevel
Accepted data types:- int- str: as string representation of int, e.g. '1'- QgsProperty
In this case, the parameter has three options. Notice that ordering is zero-based.
• Boolean. Use True or False.
• Multiple input. Der Wert ist ein String mit Eingabebeschreibungen getrennt durch Semikolons (;). Wie imFall von einfachen Layern oder Tabellen kann jede Eingabebeschreibung der Datenobjektname oder seinDateipfad sein.
21.7. Verarbeitung Algorithmen von der Konsole aus verwenden 543

QGIS User Guide, Release 3.4
• Tabellen Feld von XXX. Verwenden Sie einen String mit dem Namen des Feldes, das benutzt werden soll.Dieser Parameter unterscheidet zwischen Groß- und Kleinschreibung.
• Fixed Table. Geben Sie die Liste aller Tabellenwerte, die durch Kommas (,) getrennt sind und zwischenAnführungsstrichen (") eingeschlossen sind. Die Werte beginnen in der oberen Zeile und gehen von linksnach rechts. Sie können auch einen 2D-Array von Werten, die die Tabelle repräsentieren, verwenden.
• CRS. Geben Sie den EPSG Code des gewünschten KBS ein.
• Extent. Sie müssen einen String mit xmin, xmax, ymin und ymax Werten getrennt durch Kommas (,)eingeben.
Boolean, file, string und numerical parameters brauchen keien zusätzlichen Erläuterungen.
Input parameters such as strings, booleans, or numerical values have default values. The default value is used ifthe corresponding parameter entry is missing.
For output data objects, type the file path to be used to save it, just as it is done from the toolbox. If the outputobject is not specified, the result is saved to a temporary file (or skipped if it is an optional output). The extensionof the file determines the file format. If you enter a file extension not supported by the algorithm, the default fileformat for that output type will be used, and its corresponding extension appended to the given file path.
Unlike when an algorithm is executed from the toolbox, outputs are not added to the map canvas if you executethat same algorithm from the Python console using run(), but runAndLoadResults() will do that.
The runmethod returns a dictionary with one or more output names (the ones shown in the algorithm description)as keys and the file paths of those outputs as values:
>>> myresult = processing.run("native:buffer", {'INPUT': '/data/lines.shp','DISTANCE': 100.0,'SEGMENTS': 10,'DISSOLVE': True,'END_CAP_STYLE': 0,'JOIN_STYLE': 0,'MITER_LIMIT': 10,'OUTPUT': '/data/buffers.shp'})
>>> myresult['OUTPUT']/data/buffers.shp
You can load feature output by passing the corresponding file paths to the load() method. Or you could userunAndLoadResults() instead of run() to load them immediately.
21.7.2 Scripte erstellen und diese aus der Werkzeugkiste starten.
You can create your own algorithms by writing Python code. Processing scripts extendQgsProcessingAlgorithm, so you need to add some extra lines of code to implement mandatoryfunctions. You can find Create new script (clean sheet) and Create New Script from Template (template thatincludes code for mandatory functions of QgsProcessingAlgorithm) under the Scripts dropdown menu onthe top of the Processing toolbox. The Processing Script Editor will open, and that’s where you should type yourcode. Saving the script from there in the scripts folder (the default folder when you open the save file dialog)with a .py extension should create the corresponding algorithm.
The name of the algorithm (the one you will see in the toolbox) is defined within the code.
Let’s have a look at the following code, which defines a Processing algorithm that performs a buffer operationwith a user defined buffer distance on a vector layer that is specified by the user, after first smoothing the layer.
from qgis.core import (QgsProcessingAlgorithm,QgsProcessingParameterNumber,QgsProcessingParameterFeatureSource,QgsProcessingParameterFeatureSink)
import processing
544 Chapter 21. QGIS Verarbeitung Umgebung

QGIS User Guide, Release 3.4
class algTest(QgsProcessingAlgorithm):INPUT_BUFFERDIST = 'BUFFERDIST'OUTPUT_BUFFER = 'OUTPUT_BUFFER'INPUT_VECTOR = 'INPUT_VECTOR'
def __init__(self):super().__init__()
def name(self):return "algTest"
def displayName(self):return "algTest script"
def createInstance(self):return type(self)()
def initAlgorithm(self, config=None):self.addParameter(QgsProcessingParameterFeatureSource(
self.INPUT_VECTOR, "Input vector"))self.addParameter(QgsProcessingParameterNumber(
self.INPUT_BUFFERDIST, "Buffer distance",QgsProcessingParameterNumber.Double,100.0))
self.addParameter(QgsProcessingParameterFeatureSink(self.OUTPUT_BUFFER, "Output buffer"))
def processAlgorithm(self, parameters, context, feedback):#DO SOMETHINGalgresult = processing.run("native:smoothgeometry",
{'INPUT': parameters[self.INPUT_VECTOR],'ITERATIONS':2,'OFFSET':0.25,'MAX_ANGLE':180,'OUTPUT': 'memory:'},
context=context, feedback=feedback, is_child_algorithm=True)smoothed = algresult['OUTPUT']algresult = processing.run('native:buffer',
{'INPUT': smoothed,'DISTANCE': parameters[self.INPUT_BUFFERDIST],'SEGMENTS': 5,'END_CAP_STYLE': 0,'JOIN_STYLE': 0,'MITER_LIMIT': 10,'DISSOLVE': True,'OUTPUT': parameters[self.OUTPUT_BUFFER]},context=context, feedback=feedback, is_child_algorithm=True)
buffered = algresult['OUTPUT']return {self.OUTPUT_BUFFER: buffered}
After doing the necessary imports, the following QgsProcessingAlgorithm functions are specified:
• name: The id of the algorithm (lowercase).
• displayName: A human readable name for the algorithm.
• createInstance: Create a new instance of the algorithm class.
• initAlgorithm: Configure the parameterDefinitions and outputDefinitions.
Here you describe the parameters and output of the algorithm. In this case, a feature source for the input, afeature sink for the result and a number for the buffer distance.
• processAlgorithm: Do the work.
21.7. Verarbeitung Algorithmen von der Konsole aus verwenden 545

QGIS User Guide, Release 3.4
Here we first run the smoothgeometry algorithm to smooth the geometry, and then we run the bufferalgorithm on the smoothed output. To be able to run algorithms from within another algorithm we haveto define a dummy function for the onFinish parameter for run. This is the no_post_processfunction. You can see how input and output parameters are used as parameters to the smoothgeometryand buffer algorithms.
There are a number of different parameter types available for input and output. Below is an alphabetically sortedlist:
• QgsProcessingParameterBand
• QgsProcessingParameterBoolean
• QgsProcessingParameterCrs
• QgsProcessingParameterDistance
• QgsProcessingParameterEnum
• QgsProcessingParameterExpression
• QgsProcessingParameterExtent
• QgsProcessingParameterFeatureSink
• QgsProcessingParameterFeatureSource
• QgsProcessingParameterField - A field in the attributes table of a vector layer. The name of thelayer has to be specified.
• QgsProcessingParameterFile
• QgsProcessingParameterFileDestination
• QgsProcessingParameterFolderDestination
• QgsProcessingParameterMapLayer
• QgsProcessingParameterMatrix
• QgsProcessingParameterMultipleLayers
• QgsProcessingParameterNumber
• QgsProcessingParameterPoint
• QgsProcessingParameterRange
• QgsProcessingParameterRasterDestination
• QgsProcessingParameterRasterLayer
• QgsProcessingParameterString
• QgsProcessingParameterVectorDestination
• QgsProcessingParameterVectorLayer
The first parameter to the constructors is the name of the parameter, and the second is the description of theparameter (for the user interface). The rest of the constructor parameters are parameter type specific.
The input can be turned into QGIS classes using the parameterAs functions ofQgsProcessingAlgorithm. For instance to get the number provided for the buffer distance as adouble:
self.parameterAsDouble(parameters, self.INPUT_BUFFERDIST, context)).
The processAlgorithm function should return a dictionary containing values for every output defined by thealgorithm. This allows access to these outputs from other algorithms, including other algorithms contained withinthe same model.
546 Chapter 21. QGIS Verarbeitung Umgebung

QGIS User Guide, Release 3.4
Well behaved algorithms should define and return as many outputs as makes sense. Non-feature outputs, such asnumbers and strings, are very useful when running your algorithm as part of a larger model, as these values can beused as input parameters for subsequent algorithms within the model. Consider adding numeric outputs for thingslike the number of features processed, the number of invalid features encountered, the number of features output,etc. The more outputs you return, the more useful your algorithm becomes!
Feedback
The feedback object passed to processAlgorithm should be used for user feedback / interaction. You canuse the setProgress function of the feedback object to update the progress bar (0 to 100) to inform the userabout the progress of the algorithm. This is very useful if your algorithm takes a long time to complete.
The feedback object provides an isCanceled method that should be monitored to enable cancelation of thealgorithm by the user. The pushInfo method of feedback can be used to send information to the user, andreportError is handy for pushing non-fatal errors to users.
Algorithms should avoid using other forms of providing feedback to users, such as print statements or loggingto QgsMessageLog, and should always use the feedback object instead. This allows verbose logging for thealgorithm, and is also thread-safe (which is important, given that algorithms are typically run in a backgroundthread).
Handling errors
If your algorithm encounters an error which prevents it from executing, such as invalid input values or some othercondition from which it cannot or should not recover, then you should raise a QgsProcessingException.E.g.:
if feature['value'] < 20:raise QgsProcessingException('Invalid input value {}, must be >= 20'.
→˓format(feature['value']))
Try to avoid raising QgsProcessingException for non-fatal errors (e.g. when a feature has a null geometry),and instead just report these errors via feedback.reportError() and skip the feature. This helps makeyour algorithm „model-friendly“, as it avoids halting the execution of an entire algorithm when a non-fatal erroris encountered.
Ihre Scripte dokumentieren
As in the case of models, you can create additional documentation for your scripts, to explain what they do andhow to use them.
QgsProcessingAlgorithm provides the helpString, shortHelpString and helpUrl functions forthat purpose. Specify / override these to provide more help to the user.
shortDescription is used in the tooltip when hovering over the algorithm in the toolbox.
21.7.3 Pre- und Post-execution Script Hooks
Scripts can also be used as pre- and post-execution hooks that are run before and after an algorithm is run, respec-tively. This can be used to automate tasks that should be performed whenever an algorithm is executed.
Die Syntax ist identisch zu der oben erklärten Syntax, es steht aber eine zusätzliche Globalvariable genannt algzur Verfügung, die den Algorithmus, der gerade ausgeführt wurde (oder ausgeführt wird), repräsentiert.
In the General group of the processing options dialog, you will find two entries named Pre-execution script andPost-execution script where the filenames of the scripts to be run in each case can be entered.
21.7. Verarbeitung Algorithmen von der Konsole aus verwenden 547

QGIS User Guide, Release 3.4
21.8 Writing new Processing algorithms as Python scripts
In QGIS 3.4, the only way to write Processing algorithms using Python is to extend theQgsProcessingAlgorithm class.
Within QGIS, you can use Create new script in the Scripts menu at the top of the Processing Toolbox to openthe Processing Script Editor where you can write your code. To simplify the task, you can start with a scripttemplate by using Create new script from template from the same menu. This opens a template that extendsQgsProcessingAlgorithm.
If you save the script in the scripts folder (the default location) with a .py extension, the algorithm willbecome available in the Processing Toolbox.
21.8.1 Extending QgsProcessingAlgorithm
The following code
1. takes a vector layer as input
2. counts the number of features
3. does a buffer operation
4. creates a raster layer from the result of the buffer operation
5. returns the buffer layer, raster layer and number of features
from qgis.PyQt.QtCore import QCoreApplicationfrom qgis.core import (QgsProcessing,
QgsProcessingAlgorithm,QgsProcessingException,QgsProcessingOutputNumber,QgsProcessingParameterDistance,QgsProcessingParameterFeatureSource,QgsProcessingParameterVectorDestination,QgsProcessingParameterRasterDestination)
import processing
class ExampleProcessingAlgorithm(QgsProcessingAlgorithm):"""This is an example algorithm that takes a vector layer,creates some new layers and returns some results."""
def tr(self, string):"""Returns a translatable string with the self.tr() function."""return QCoreApplication.translate('Processing', string)
def createInstance(self):# Must return a new copy of your algorithm.return ExampleProcessingAlgorithm()
def name(self):"""Returns the unique algorithm name."""return 'bufferrasterextend'
def displayName(self):"""
548 Chapter 21. QGIS Verarbeitung Umgebung

QGIS User Guide, Release 3.4
Returns the translated algorithm name."""return self.tr('Buffer and export to raster (extend)')
def group(self):"""Returns the name of the group this algorithm belongs to."""return self.tr('Example scripts')
def groupId(self):"""Returns the unique ID of the group this algorithm belongsto."""return 'examplescripts'
def shortHelpString(self):"""Returns a localised short help string for the algorithm."""return self.tr('Example algorithm short description')
def initAlgorithm(self, config=None):"""Here we define the inputs and outputs of the algorithm."""# 'INPUT' is the recommended name for the main input# parameter.self.addParameter(
QgsProcessingParameterFeatureSource('INPUT',self.tr('Input vector layer'),types=[QgsProcessing.TypeVectorAnyGeometry]
))self.addParameter(
QgsProcessingParameterVectorDestination('BUFFER_OUTPUT',self.tr('Buffer output'),
))# 'OUTPUT' is the recommended name for the main output# parameter.self.addParameter(
QgsProcessingParameterRasterDestination('OUTPUT',self.tr('Raster output')
))self.addParameter(
QgsProcessingParameterDistance('BUFFERDIST',self.tr('BUFFERDIST'),defaultValue = 1.0,# Make distance units match the INPUT layer units:parentParameterName='INPUT'
))self.addParameter(
QgsProcessingParameterDistance('CELLSIZE',self.tr('CELLSIZE'),
21.8. Writing new Processing algorithms as Python scripts 549

QGIS User Guide, Release 3.4
defaultValue = 10.0,parentParameterName='INPUT'
))self.addOutput(
QgsProcessingOutputNumber('NUMBEROFFEATURES',self.tr('Number of features processed')
))
def processAlgorithm(self, parameters, context, feedback):"""Here is where the processing itself takes place."""# First, we get the count of features from the INPUT layer.# This layer is defined as a QgsProcessingParameterFeatureSource# parameter, so it is retrieved by calling# self.parameterAsSource.input_featuresource = self.parameterAsSource(parameters,
'INPUT',context)
numfeatures = input_featuresource.featureCount()
# Retrieve the buffer distance and raster cell size numeric# values. Since these are numeric values, they are retrieved# using self.parameterAsDouble.bufferdist = self.parameterAsDouble(parameters, 'BUFFERDIST',
context)rastercellsize = self.parameterAsDouble(parameters, 'CELLSIZE',
context)if feedback.isCanceled():
return {}buffer_result = processing.run(
'native:buffer',{
# Here we pass on the original parameter values of INPUT# and BUFFER_OUTPUT to the buffer algorithm.'INPUT': parameters['INPUT'],'OUTPUT': parameters['BUFFER_OUTPUT'],'DISTANCE': bufferdist,'SEGMENTS': 10,'DISSOLVE': True,'END_CAP_STYLE': 0,'JOIN_STYLE': 0,'MITER_LIMIT': 10
},# Because the buffer algorithm is being run as a step in# another larger algorithm, the is_child_algorithm option# should be set to Trueis_child_algorithm=True,## It's important to pass on the context and feedback objects to# child algorithms, so that they can properly give feedback to# users and handle cancelation requests.context=context,feedback=feedback)
# Check for cancelationif feedback.isCanceled():
return {}
# Run the separate rasterization algorithm using the buffer result
550 Chapter 21. QGIS Verarbeitung Umgebung

QGIS User Guide, Release 3.4
# as an input.rasterized_result = processing.run(
'qgis:rasterize',{
# Here we pass the 'OUTPUT' value from the buffer's result# dictionary off to the rasterize child algorithm.'LAYER': buffer_result['OUTPUT'],'EXTENT': buffer_result['OUTPUT'],'MAP_UNITS_PER_PIXEL': rastercellsize,# Use the original parameter value.'OUTPUT': parameters['OUTPUT']
},is_child_algorithm=True,context=context,feedback=feedback)
if feedback.isCanceled():return {}
# Return the resultsreturn {'OUTPUT': rasterized_result['OUTPUT'],
'BUFFER_OUTPUT': buffer_result['OUTPUT'],'NUMBEROFFEATURES': numfeatures}
Processing algorithm standard functions:
• createInstance (mandatory) Must return a new copy of your algorithm. If you change the name of theclass, make sure you also update the value returned here to match!
• name (mandatory) Returns the unique algorithm name, used for identifying the algorithm.
• displayName (mandatory) Returns the translated algorithm name.
• group Returns the name of the group this algorithm belongs to.
• groupId Returns the unique ID of the group this algorithm belongs to.
• shortHelpString Returns a localised short help string for the algorithm.
• initAlgorithm (mandatory) Here we define the inputs and outputs of the algorithm.
INPUT and OUTPUT are recommended names for the main input and main output parameters, respec-tively.
If a parameter depends on another parameter, parentParameterName is used to specify this rela-tionship (could be the field / band of a layer or the distance units of a layer).
• processAlgorithm (mandatory) This is where the processing takes place.
Parameters are retrieved using special purpose functions, for instance parameterAsSource andparameterAsDouble.
processing.run can be used to run other processing algoritms from a processing algorithm. Thefirst parameter is the name of the algorithm, the second is a dictionary of the parameters to the algo-rithm. is_child_algorithm is normally set to True when running an algorithm from withinanother algorithm. context and feedback informs the algorithm about the environment to runin and the channel for communicating with the user (catching cancel request, reporting progress, pro-viding textual feedback). When using the (parent) algoritm’s parameters as parameters to „child“algorithms, the original parameter values should be used (e.g. parameters['OUTPUT']).
It is good practice to check the feedback object for cancelation as much as is sensibly possible! Doingso allows for responsive cancelation, instead of forcing users to wait for unwanted processing to occur.
The algorithm should return values for all the output parameters it has defined as a dictionary. In thiscase, that’s the buffer and rasterized output layers, and the count of features processed. The dictionarykeys must match the original parameter/output names.
21.8. Writing new Processing algorithms as Python scripts 551

QGIS User Guide, Release 3.4
21.8.2 Handing algorithm output
When you declare an output representing a layer (raster or vector), the algorithm will try to add it to QGIS once itis finished.
• Raster layer output: QgsProcessingParameterRasterDestination.
• Vector layer output: QgsProcessingParameterVectorDestination.
So even if the processing.run() method does not add the layers it creates into the user’s current project, thetwo output layers (buffer and raster buffer) will be loaded, since they are saved to the destinations entered by theuser (or to temporary destinations if the user does not specify a destination).
If a layer is created as output of an algorithm, it should be declared as such. Otherwise, you will not be able toproperly use the algorithm in the modeler, since what is declared will not match what the algorithm really creates.
You can return strings, numbers and more by specifying them in the result dictionary (as demonstrated for „NUM-BEROFFEATURES“), but they should always be explicitly defined as outputs from your algorithm. We encouragealgorithms to output as many useful values as possible, since these can be valuable for use in later algorithms whenyour algorithm is used as part of a model.
21.8.3 Die Kommunikation mit dem Benutzer
If your algorithm takes a long time to process, it is a good idea to inform the user about the progress. You can usefeedback (QgsProcessingFeedback) for this.
The progress text and progressbar can be updated using two methods: setProgressText(text) andsetProgress(percent).
You can provide more information to the user using pushCommandInfo(text), pushDebugInfo(text),pushInfo(text) and reportError(text).
If your script has a problem, the correct way of handling it is to raise a QgsProcessingException. Youcan pass a message as an argument to the constructor of the exception. Processing will take care of handling itand communicating with the user, depending on where the algorithm is being executed from (toolbox, modeler,Python console, . . . )
21.8.4 Ihre Scripte dokumentieren
You can document your scripts by overloading the helpString() and helpUrl() methods ofQgsProcessingAlgorithm.
21.8.5 Flags
You can override the flags method of QgsProcessingAlgorithm to tell QGIS more about your algorithm.You can for instance tell QGIS that the script shall be hidden from the modeler, that it can be canceled, that it isnot thread safe, and more.
Tipp: By default, Processing runs algorithms in a separate thread in order to keep QGIS responsive while theprocessing task runs. If your algorithm is regularly crashing, you are probably using API calls which are notsafe to do in a background thread. Try returning the QgsProcessingAlgorithm.FlagNoThreading flag from youralgorithm’s flags() method to force Processing to run your algorithm in the main thread instead.
552 Chapter 21. QGIS Verarbeitung Umgebung

QGIS User Guide, Release 3.4
21.8.6 Bewährte Verfahren für das Schreiben von Skript-Algorithmen
Here’s a quick summary of ideas to consider when creating your script algorithms and, especially, if you wantto share them with other QGIS users. Following these simple rules will ensure consistency across the differentProcessing elements such as the toolbox, the modeler or the batch processing interface.
• Laden Sie keine Ergebnislayer. Lassen Sie die Verarbeitung Ihrer Ergebnisse abarbeiten und laden Sie IhreLayer, wenn nötig.
• Always declare the outputs your algorithm creates.
• Do not show message boxes or use any GUI element from the script. If you want to communi-cate with the user, use the methods of the feedback object (QgsProcessingFeedback) or throw aQgsProcessingException.
There are already many processing algorithms available in QGIS. You can find code on https://github.com/qgis/QGIS/tree/release-3_4/python/plugins/processing/algs/qgis.
21.9 Konfiguration externer Anwendungen
The processing framework can be extended using additional applications. Currently, SAGA, GRASS and R aresupported. Algorithms relying on an external applications are managed by their own algorithm provider. Addi-tional providers can be found as separate plugins, and installed using the QGIS Plugin Manager.
This section will show you how to configure the Processing framework to include these additional applications,and it will explain some particular features of the algorithms based on them. Once you have correctly configuredthe system, you will be able to execute external algorithms from any component like the toolbox or the graphicalmodeler, just like you do with any other geoalgorithm.
Standardmäßig sind alle Algorithmen, die auf einer externen Anwendung beruhen nicht Teil von QGIS und wer-den nicht automatisch aktiviert. Sie können sie im Einstellunngsdialog aktivieren. Stellen Sie sicher, dass dieentsprechende Anwendung bereits auf Ihrem System installiert ist.
21.9.1 Ein Hinweis für Windows Anwender
If you are not an advanced user and you are running QGIS on Windows, you might not be interested in readingthe rest of this chapter. Make sure you install QGIS in your system using the standalone installer. That willautomatically install SAGA and GRASS in your system and configure them so they can be run from QGIS. Allthe algorithms from these providers will be ready to be run without needing any further configuration. If installingthrough OSGeo4W application, make sure you select for installation SAGA and GRASS as well.
21.9.2 Eine Bemwerkung zu den Datenformaten
Bei Verwendung einer externen Software, bedeutet das Öffnen einer Datei in QGIS nicht, dass es auch von deranderen Software geöffnet und verarbeitet werden kann. In den meisten Fällen können sie zwar auch lesen, wasSie in QGIS geöffnet haben, aber in einigen Fällen ist das vielleicht nicht der Fall. Bei der Verwendung vonDatenbanken oder seltenen Dateiformaten, ob für Raster- oder Vektorlayer, könnten Probleme auftreten. Wenndas passiert, versuchen Sie, bekannte Dateiformate, bei denen Sie sicher sind, dass sie von beiden Programmenverstanden werden, zu verwenden, und überprüfen Sie die Ausgabe (im History und Log-Dialog) für weitereInformationen.
Das Verwenden von RASS Rasterlayern ist beispielsweise ein Fall, in dem Sie vielleicht Probleme haben undnicht in der Lage sein werden Ihre Arbeit zu vervollständigen, wenn Sie einen externen Algorithmus mit einemsolchen Layer als Eingabe aufrufen. Aus diesem Grund erscheinen diese Layer als nicht zur Verfügung stehendfür die Algorithmen.
You should, however, find no problems at all with vector layers, since QGIS automatically converts from theoriginal file format to one accepted by the external application before passing the layer to it. This adds extra
21.9. Konfiguration externer Anwendungen 553

QGIS User Guide, Release 3.4
processing time, which might be significant if the layer has a large size, so do not be surprised if it takes more timeto process a layer from a DB connection than it process a layer from a Shapefile format dataset of similar size.
Provider, die keine externe Anwendung verwenden können jeden beliebigen Layer, den Sie in QGIS öffnen kön-nen, prozessieren, da Sie ihn für Analysen anhand von QGIS öffnen.
In Bezug auf Ausgabeformate können alle von QGIS als Ausgabe unterstützen Formate verwendet werden, fürRaster- und Vektorlayer. Einige Provider unterstützen keine bestimmten Formate, aber alle können in gängigeRasterlayerformate exportieren, die später von QGIS automatisch transformiert werden können. Wie im Fall vonEingabelayern kann das, wenn eine Konvertierung benötigt wird, die Rechenzeit erhöhen.
21.9.3 Eine Bemerkung zu Vektorlayern mit ausgewählten Objekten
Externe Anwendungen können auch über die Auswahl die in Vektorlayern innerhalb von QGIS vorliegt unter-richtet werden. Das jedoch erfordert das Umschreiben aller Eingabevektorlayer, so als würden Sie ursprünglichin einem Format, das nicht von der externen Anwendung unterstützt wird, vorliegen. Nur wenn eine Auswahlbesteht, oder die Use only selected features Option in den Verarbeitungsoptionen nicht aktiviert ist, kann einLayer direkt an eine externe Anwendung übergeben werden.
In anderen Fällen wird das Exportieren von nur ausgewählten Objekten benötigt, was bewirkt, dass sich die Aus-führungszeiten verlängern.
21.9.4 SAGA
SAGA Algorithmen können von QGIS aus benutzt werden wenn Sie SAGA auf Ihrem System installiert habenund Sie die Verarbeiten Umgebung richtig konfigurieren, so dass es ausführbare Module von SAGA finden kann.Insbesondere das SAGA Kommandozeilenmodul wird benötigt um SAGA Algorithmen zum Laufen zu bringen.
Wenn Sie Windows benutzen beinhalten sowohl das Installationspaket und der OSGeo4W Installer SAGA unterQGIS und er Pfad ist automatisch konfiguriert, es muss also nichts weiter getan werden.
Wenn Sie SAGA selber installiert haben muss der Pfad zu den ausführbaren Modulen konfiguriert werden. Umdies zu tun öffnen Sie den Optionen und Konfiguration Dialog. Im SAGA Block finden Sie eine Einstellunggenannt SAGA Folder. Geben Sie den Pfad zu dem Ordner wo SAGA installiert ist an. Schließen Sie den Verar-beitungsoptionendialog und jetzt können Sie SAGA Algorithmen aus QGIS heraus ausführen.
Wenn Sie Linux benutzen, sind SAGA Binärpakete nicht in der Verarbeitung Umgebung enthalten, also müssenSie die Software selber downloaden und installieren. Bitte überprüfen Sie die SAGA Webseite für mehr Informa-tionen.
In diesem Fall braucht der Pfad zu den ausführbaren SAGA Modulen nicht konfiguriert werden und Sie wer-den diese Ordner nicht sehen. Anstelledessen müssen Sie sicherstellen, dass SAGA richtig installiert ist undseine Ordner zur PATH Umgebungsvariable hinzugefügt wurden. Öffnen Sie einfach eine Konsole und geben Siesaga_cmd ein um zu überprüfen, dass das System herausfindet, wo sich die SAGA Binärpakete befinden.
Über die SAGA KBS Einschränkungen
Die meisten SAGA Algorithmen, die mehrere Eingaberasterlayer benötigen, haben die Anforderung, dass diesedas gleiche Grid-System haben. Das heißt, dass Sie das gleiche geografische Gebiet abdecken und die gleicheZellgröße besitzen müssen, so dass Ihre korrespondierenden Grids zueinander passen. Wenn SAGA Algorithmenvon QGIS aus aufgerufen werden, können Sie jeden Layer unabhängig von Zellgröße und Ausdehnung benutzen.Wenn Mahrfachrasterlayer als Eingabe für einen SAGA Algorithmus verwendet werden, resampled QGIS sie zueinem gemeinsamen Grid-System und übergibt diese dann an SAGA (es sei denn der SAGA Algorithmus kannmit Layern aus verschiedenen Grid-Systemen operieren).
Die Definition dieses gemeinsamen Grid-Systems wird durch den Anwender kontrolliert und Sie werden dafürmehrere Parameter in der SAGA Gruppe im Einstellungen Fenster finden. Es gibt zwei Wege das Ziel-Grid-System einzustellen:
• Manuelles Einstellen. Sie definieren das Ausmaß indem Sie die Werte der folgenden Parameter setzen:
554 Chapter 21. QGIS Verarbeitung Umgebung
QGIS User Guide, Release 3.4
– Resampling min X
– Resampling max X
– Resampling min Y
– Resampling max Y
– Resampling cellsize
Beachten Sie, dass QGIS alle Eingabelayer bis zu diesem Ausmaß resampled, auch wenn sie sich nichtdamit überschneiden.
• Automatisches Einstellen aus Eingabelayern. Um diese Option auszuwählen, überprüfen Sie einfach dieUse min covering grid system for resampling Option. Alle anderen Einstellungen werden ignoriert unddas minimale Ausmaß, das alle Eingabelayer abdeckt, wird benutzt. Die Zellgröße des Ziellayers ist dasMaximum aller Zellgrößen des Eingabelayers.
Für Algorithmen, die nicht mit mehreren Rasterlayern arbeiten, oder für diejenigen, die kein eindeutiges KBSbauchen, wird kein Resampling vor dem Aufruf von SAGA durchgeführt, und die Parameter werden nicht ver-wendet.
Einschränkungen für Multi-Band-Layer
Im Gegensatz zu QGIS hat SAGA keine Unterstützung für Multikanallayer. Wenn Sie einen Multikanallayer be-nutzen wollen (so wie ein RGB oder ein Multispektralbild), müssen Sie ihn erst in Einkanalbilder aufspalten. Umdas zu tun, können Sie den ‚SAGA/Grid - Tools/Split RGB image‘ Algorithmus (der drei Bilder aus einem RGBBild erstellt) oder den ‚SAGA/Grid - Tools/Extract band‘ Algorithmus (um einen einzelnen Kanal zu extrahieren)verwenden.
Einschränkungen in der Zellgröße
SAGA geht davon aus, dass Rasterlayer die selbe Pixelgröße in X- und Y-Richtung haben. Wenn Sie mit einemLayer mit unterschiedlichen Werten für die horizontale und vertikale Pixelgöße arbeiten, erhalten Sie möglicher-weise unerwartete Ergebnisse. In diesem Fall wird eine Warnung im Verarbeitung Protokoll hinzugefügt, dasanzeigt, dass ein Layer möglicherweise nicht geeignet ist, von SAGA verarbeitet zu werden.
Logging
Wenn QGIS SAGA aufruft, findet das über die Kommandozeilen-Schnittstelle statt mit einer Reihe von Befehlen,um alle erforderlichen Operation durchzuführen. SAGA zeigt den Fortschritt, indem es Informationen an dieKonsole übergibt, die den Prozentsatz der Verarbeitung beinhaltet, zusammen mit zusätzlichen Inhalten. DieseAusgabe wird gefiltert und verwendet, um die Fortschrittsanzeige zu aktualisieren, während der Algorithmusläuft.
Sowohl die von QGIS gesendeten Befehle und die von SAGA gedruckte zusätzliche Information kann mit anderenVerarbeitung Protokollnachrichten gelogged werden und Sie könnten es nützlich finden im Detail zu verfolgenwas passiert wenn QGIS einen SAGA Algorithmus aufruft. Sie werden zwei Einstellungen finden, nämlich Logconsole output und Log execution commands um diesen Protokollierungsmechanismus zu aktivieren.
Die meisten anderen Provider, die eine externe Anwendung verwenden und diese aus der Kommandozeileaufrufen, haben ähnliche Optionen, also finden Sie sie auch an anderer Stelle in der Verarbeitungsoptionen Liste.
21.9.5 R. Creating R scripts
To enable R in Processing you need to install the Processing R Provider plugin.
Die R Integration in QGIS unterscheidet sich von der SAGA Integration, da es keinen vordefinierten Satz vonAlgorithmen gibt, den man ausführen kann (bis auf einige Beispiele). Stattdessen sollten Sie Ihre Skripte schreibenund dann über R Befehle aufrufen, ähnlich wie man es von R kennt, und in einer sehr ähnlichen Weise zu dem,
21.9. Konfiguration externer Anwendungen 555

QGIS User Guide, Release 3.4
was wir sahen, im Kapitel Verarbeitung Skripte. Dieses Kapitel zeigt Ihnen die Syntax, die Sie verwenden sollten,um die R-Befehle von QGIS anzusprechen und wie QGIS Objekte verwendet werden (Layer, Tabellen).
Das erste, was Sie tun müssen, wie wir im Fall von SAGA gesehen haben, ist zu sagen, wo sich die R Binärdateienbefinden. Sie können dies tun, indem Sie den R folder Eintrag im Verarbeitung Konfigurationsdialog ansprechen.Nachdem Sie die Parameter definiert haben, können Sie anfangen, eigene R-Skripte zu erstellen und auszuführen.
Bemerkung: for Windows user, usually the R executable file is in the C:\Program Files\R\R-3.2 folder.Add just the folder and NOT the binary!
Dies ist wieder anders in Linux. Dort müssen Sie nur sicherstellen, dass der R-Ordner in der UmgebungsvariablenPATH enthalten ist. Wenn Sie nur die Eingabe R in eine Konsole eingeben können, kann es losgehen.
Um einen neuen Algorithmus hinzuzufügen, der eine R Funktion (oder ein komplexeres RScript, das sie entwick-elt haben und das sie gerne zur in QGIS zur Verfügung stehen haben wollen) aufruft, müssen Sie eine ScriptDatei erstellen, die der Verarbeiten Umgebung, wie diese Operation durchgeführt wird, und die entsprechenden RBefehle mitteilt um das zu tun.
R Scripts Dateien habe die Erweiterung .rsx und es ist ziemlich einfach sie zu erstellen wenn Sie nur etwasgrundlegende Kenntnisse über die R Syntax und R Scripting besitzen. Sie sollten im R Scripts Ordner gespe-ichert werden. Sie können diesen Ordner in der R Einstellungen Gruppe (steht im Verarbeitungsoptionen Dialog)einstellen, genauso wie Sie es mit dem Ordner für reguläre Verarbeitung Scripts machen.
Werfen Sie einen Blick auf eine sehr einfache Scripts-Datei, die die R-Methode spsample aufruft und ein zufäl-liges Gitter innerhalb der Grenzen eines Polygon in einem bestimmten Polygon-Layer erstellt. Diese Methodegehört zum Paket zur MapTools. Grundsätzlich brauchen Sie für R-Algorithmen, die Sie in Verarbeitung fürräumliche geostatistische Analysen nutzen wollen, zumindest Kenntnisse der Pakete wie MapTools und speziellsp.
##polyg=vector##numpoints=number 10##output=output vector##sp=grouppts=spsample(polyg,numpoints,type="random")output=SpatialPointsDataFrame(pts, as.data.frame(pts))
Die ersten Zeilen, die mit einem doppelten Python Kommentarzeichen (##) beginnen teilen QGIS die Eingabendes Algorithmus, der in der Datei beschrieben wird und die Ausgaben, die er erzeugen wird, mit. Sie arbeiten mitgenau der gleichen Syntax wie den Verarbeitung Scripts, die wir bereits gesehen haben, also werden Sie hier nichtnoch einmal beschrieben.
Please have a look at the R Intro and the R Syntax Training Manual Chapters to have more information on how towrite your own R scripts-
Wenn Sie einen Eingabeparameter definieren, verwendet QGIS diese Informationen für zwei Dinge: Erstel-lung der Benutzeroberfläche, um die Benutzer nach Eingaben von Parameters zu fragen und die Schaffung einerentsprechenden R Variable, die später als Eingabe für die R-Befehle verwendet werden.
In dem obigen Beispiel erklären wir die Eingabe vom Typ Vektor mit dem Namen polyg. Bei der Ausführungdes Algorithmus wird durch QGIS R geöffnet und der Layer, der durch den Benutzer ausgewählt wurde, in einerVariablen polyg abgelegt. Der Name des Parameters ist also auch der Name der Variablen, die wir in R für denZugriff auf den Wert des Parameters nutzen (vermeiden Sie, reservierte R Begriffe als Parameter zu verwenden).
Räumliche Elemente wie Vektor- und Rasterlayer werden mit den readOGR() und brick() Befehlen einge-lesen (sie brauchen sich nicht darum kümmern diese Befehle Ihrer Beschreibungsdatei hinzuzufügen - das machtQGIS) und sie werden als Spatial*DataFrame Objekte gespeichert. Tabellenfelder werden als Strings, dieden Namen des ausgewählten Feldes beinhalten, gespeichert.
Tabellen werden anhand des read.csv() Befehls geöffnet. Wenn ein Anwender eine Tabelle eingibt, die nichtim CSV Format ist, wird diese vor dem Importieren in R konvertiert.
Zusätzlich können Rasterdateien mit Hilfe des readGDAL() Befehls anstelle von brick() eingelesen werdenindem ##usereadgdal benutzt wird.
556 Chapter 21. QGIS Verarbeitung Umgebung

QGIS User Guide, Release 3.4
Wenn Sie ein fortgeschrittener Anwender sind und nicht wollen, dass QGIS ein Objekt, das den Layer repräsen-tiert, erstellt, können Sie den ##passfilename Tag benutzen um anzuzeigen, dass Sie anstelledessen einenString mit dem Dateinamen bevorzugen. In diesem Fall ist es an Ihnen, die Datei vor dem Durchführen vonOperationen mit Daten, die es beinhaltet, zu öffnen.
Mit den oben genannten Informationen können wir jetzt die erste Zeile unseres ersten Beispiel Scripts verstehen(dabei startet die erste Zeile nicht mit einem Python Kommentar).
pts=spsample(polyg,numpoints,type="random")
Die Variable Polygon enthält bereits ein SpatialPolygonsDataFrame Objekt, damit kann es verwen-det werden, um das spsample Verfahren aufzurufen, ebenso wie die NumPoints, die die Anzahl der Punktezeigt, die zum Gitter hinzugefügt werden sollen.
Da wir eine Ausgabe vom Typ Vektor definiert haben mit dem Namen‘‘out‘‘, müssen wir nun eineVariable namens out erstellen und Spatial*DATAframe Objekt dafür erstellen (in diesem Fall einSpatialPointsDataFrame). Sie können einen beliebigen Namen für Ihre Zwischenvariablen verwenden.Stellen Sie nur sicher, dass die Variable Ihres Endergebnisses den gleichen Namen hat, den Sie zuvor definierthaben und dass sie einen geeigneten Wert enthält.
In diesem Fall muss das von der spsample Methode erhaltene Ergebnis ausdrücklich in einSpatialPointsDataFrame Objekt konvertiert werden, da es ein Objekt der Klasse ppp ist, welches keinegeeignete Klasse ist um an QGIS zurückgegeben zu werden.
If your algorithm generates raster layers, the way they are saved will depend on whether or not you have used the##dontuserasterpackage option. If you have used it, layers are saved using the writeGDAL() method.If not, the writeRaster() method from the raster package will be used.
If you have used the ##passfilenames option, outputs are generated using the raster package (withwriteRaster()), even though it is not used for the inputs.
Wenn Ihr Algorithmus keinen Layer erzeugt sondern stattdessen ein Textergebnis in der Konsole, müssen Sieangeben, dass die Konsole gezeigt wird, nachdem die Ausführung beendet ist. Um das zu tun starten Sie dieKommandozeilen, die die Ergebnisse produzieren, die Sie mit dem > (größer) Zeichen drucken wollen. DieAusgabe aller anderen Zeilen wird nicht gezeigt. Zum Beispiel ist hier die Beschreibungsdatei eines Algorithmus,der einen Test auf Normalverteilung mit einem vorhandenen Feld (Spalte) eines Vektorlayerattributes durchführt:
##layer=vector##field=field layer##nortest=grouplibrary(nortest)>lillie.test(layer[[field]])
Die Ausgabe der letzten Zeile wird gedruckt, die Ausgabe der ersten aber nicht (und auch nicht die Ausgaben vonanderen Kommandozeilen, die automatisch von QGIS hinzugefügt werden).
Wenn Ihr Algorithmus eine Grafiken erstellt (mit der plot()-Methode), fügen Sie die folgende Zeile ein:
##showplots
Dies bewirkt, dass QGIS alle grafischen Ausgaben von R in eine temporäre Datei, die geöffnet wird nachdem dieAusführung von R beendet wurde, umleitet.
Sowohl grafische als auch Konsolenergebnisse werden im Verarbeitung Ergebnisanzeige gezeigt.
Für weitere Informationen schauen Sie sich bitte die Skript-Dateien an, die Verarbeitung bereits enthält. Diemeisten von ihnen sind ziemlich einfach und werden wesentlich dazu beitragen, wie Sie Ihre eigenen erstellen.
Bemerkung: rgdal and raster libraries are loaded by default, so you do not have to add the corre-sponding library() commands (you just have to make sure that those two packages are installed in yourR distribution). However, other additional libraries that you might need have to be explicitly loaded by typing,library(ggplot2). If the package is not already installed on your machine, Processing will download and
21.9. Konfiguration externer Anwendungen 557

QGIS User Guide, Release 3.4
install it. In this way the package will be also available in R Standalone. Be aware that if the package has to bedownloaded, the first time you run the script it might take a long time.
21.9.6 GRASS
Configuring GRASS is not much different from configuring SAGA. First, the path to the GRASS folder has to bedefined, but only if you are running Windows.
By default, the Processing framework tries to configure its GRASS connector to use the GRASS distribution thatships along with QGIS. This should work without problems in most systems, but if you experience problems, youmight have to configure the GRASS connector manually. Also, if you want to use a different GRASS installation,you can change that setting and point to the folder where the other version is installed. GRASS 7 is needed foralgorithms to work correctly.
Wenn Sie Linux verwenden, müssen Sie nur noch sicherstellen, dass GRASS richtig installiert ist, und dass esproblemlos von einer Konsole ausgeführt werden kann.
GRASS Algorithmen verwenden eine Region für die Berechnungen. Diese Region kann manuell definiert werdenunter Verwendung von Werten ähnlich denen, die in der SAGA Konfiguration stehen oder automatisch, wobeidie minimale Ausdehnung aller Eingangslayer verwendet werden, wenn der Algorithmus ausgeführt wird. Wenndies das Verhalten ist, das Sie bevorzugen, können Sie es über die Option Verwende min abdecken Region in denGRASS Konfigurationsparametern definieren.
558 Chapter 21. QGIS Verarbeitung Umgebung
CHAPTER 22
Plugins
22.1 QGIS Plugins
QGIS has been designed with a plugin architecture. This allows many new features and functions to be easilyadded to the application. Some of the features in QGIS are actually implemented as plugins.
22.1.1 Kernerweiterungen und externe Erweiterungen
QGIS Plugins sind entweder als Core-Plugins oder Externe Plugins implementiert.
Core Plugins are maintained by the QGIS Development Team and are automatically part of every QGIS distribu-tion. They are written in one of two languages: C++ or Python.
Most of External Plugins are currently written in Python. They are stored either in the ‚Official‘ QGIS Repos-itory at https://plugins.qgis.org/plugins/ or in external repositories and are maintained by the individual authors.Detailed documentation about the usage, minimum QGIS version, home page, authors,and other important infor-mation are provided for the plugins in the Official repository. For other external repositories, documentation mightbe available with the external plugins themselves. External plugins documentation is not included in this manual.
To install or activate a plugin, go to Plugins menu and select Manage and install plugins. . . . Installed externalpython plugins are placed under the python/plugins folder of the active user profile path.
Pfade zu benutzerdefinierten C ++ Plugins Bibliotheken können auch unter Einstellungen → Optionen → Systemhinzugefgt werden.
Bemerkung: According to the plugin manager settings, QGIS main interface can display an icon on the right ofthe status bar to inform you that there are updates for your installed plugins or new plugins available.
22.1.2 Der Erweiterungen Dialog
The tabs in the Plugins dialog allow the user to install, uninstall and upgrade plugins in different ways. Eachplugin has some metadata displayed in the right panel:
• Informationen darüber, ob das Plugin experimentell ist
• Beschreibung
559

QGIS User Guide, Release 3.4
• Bewertungen (Sie können eine Bewertung für Ihre bevorzugte Erweiterung abgeben!)
• Elemente
• einige nützliche Links wie die Homepage, die Fehlerverfolgung und das Quellcode-Repositum
• Autoren
• verfügbare Version
At the top of the dialog, a Search function helps you find any plugin using metadata information (author, name,
description. . . ). It is available in nearly every tab (except Settings).
The Settings tab
The Settings tab is the main place you can configure which plugins can be displayed in your application. Youcan use the following options:
• Beim Start nach Aktualisierungen suchen. Wann immer ein neues Plugin oder ein Pluginupdate zurVerfügung steht wird QGIS Sie ‚bei jedem QGIS-Start‘, ‚einmal am Tag‘, ‚alle drei Tage‘, ‚jede Woche‘,‚alle zwei Wochen‘ oder ‚jeden Monat‘ informieren.
• Auch experimentelle Erweiterungen zeigen. QGIS wird Ihnen Plugins in frühen Entwicklungsphasenzeigen, die im Allgemeinen für den Produktiveinsatz ungeeignet sind.
• Show also deprecated plugins. Because they use functions that are no longer available in QGIS, theseplugins are set deprecated and generally unsuitable for production use. They appear among invalid pluginslist.
By default, QGIS provides you with its official plugin repository with the URL https://plugins.qgis.org/plugins/plugins.xml?qgis=3.0 (in case of QGIS 3.0) in the Plugin repositories section. To add external author repositories,click Add. . . and fill in the Repository Details form with a name and the URL. The URL can be of http:// orfile:// protocol type.
The default QGIS repository is an open repository and you don’t need any authentication to access it. You canhowever deploy your own plugin repository and require an authentication (basic authentication, PKI). You can getmore information on QGIS authentication support in Authentifizierung chapter.
If you do not want one or more of the added repositories, they can be disabled from the Settings tab via the Edit. . .button, or completely removed with the Delete button.
The All tab
In the All tab, all the available plugins are listed, including both core and external plugins. Use UpgradeAll to look for new versions of the plugins. Furthermore, you can use Install Plugin if a plugin is listed butnot installed, Uninstall Plugin as well as Reinstall Plugin if a plugin is installed. An installed plugin can betemporarily de/activated using the checkbox.
The Installed tab
In the Installed tab, you’ll find listed the Core plugins, that you can not uninstall. You can extend this list withexternal plugins that can be uninstalled and reinstalled any time, using the Uninstall Plugin and Reinstall Pluginbuttons. You can Upgrade All the plugins here as well.
560 Chapter 22. Plugins

QGIS User Guide, Release 3.4
Figure 22.1: The Settings tab
Figure 22.2: The All tab
22.1. QGIS Plugins 561

QGIS User Guide, Release 3.4
Figure 22.3: The Installed tab
The Not installed tab
The Not installed tab lists all plugins available that are not installed. You can use the Install Plugin button toimplement a plugin into QGIS.
Figure 22.4: The Not installed tab
The Upgradeable and New tabs
The Upgradeable and New tabs are enabled when new plugins are added to the repository or a new version
of an installed plugin is released. If you activated Show also experimental plugins in the Settings menu,those also appear in the list giving you opportunity to early test upcoming tools.
562 Chapter 22. Plugins

QGIS User Guide, Release 3.4
Installation can be done with the Install Plugin, Upgrade Plugin or Upgrade All buttons.
Figure 22.5: The Upgradeable tab
The Invalid tab
The Invalid tab lists all installed plugins that are currently broken for any reason (missing dependency, errorswhile loading, incompatible functions with QGIS version. . . ). You can try the Reinstall Plugin button to fixan invalidated plugin but most of the times the fix will be elsewhere (install some libraries, look for anothercompatible plugin or help to upgrade the broken one).
The Install from ZIP tab
The Install from ZIP tab provides a file selector widget to import plugins in a zipped format, e.g. pluginsdownloaded directly from their repository.
22.2 Using QGIS Core Plugins
22.2.1 Coordinate Capture Plugin
The coordinate capture plugin is easy to use and provides the ability to display coordinates on the map canvas fortwo selected coordinate reference systems (CRS).
1. Start QGIS, select Properties. . . from the Project menu and click on the CRS tab. As an alternative, you
can also click on the CRS icon in the lower right-hand corner of the status bar.
2. Click on the Enable on the fly projection checkbox and select a projected coordinate system of yourchoice (see also Arbeiten mit Projektionen).
3. Activate the coordinate capture plugin in the Plugin Manager (see Der Erweiterungen Dialog) and ensure
that the dialog is visible by going to View → Panels and ensuring that Coordinate Capture is enabled.The coordinate capture dialog appears as shown in Figure figure_coordinate_capture. Alternatively, youcan also look for Vector → Coordinate Capture.
22.2. Using QGIS Core Plugins 563

QGIS User Guide, Release 3.4
Figure 22.6: The Invalid tab
Figure 22.7: The Install from zip tab
Figure 22.8: Coordinate Capture Plugin
564 Chapter 22. Plugins
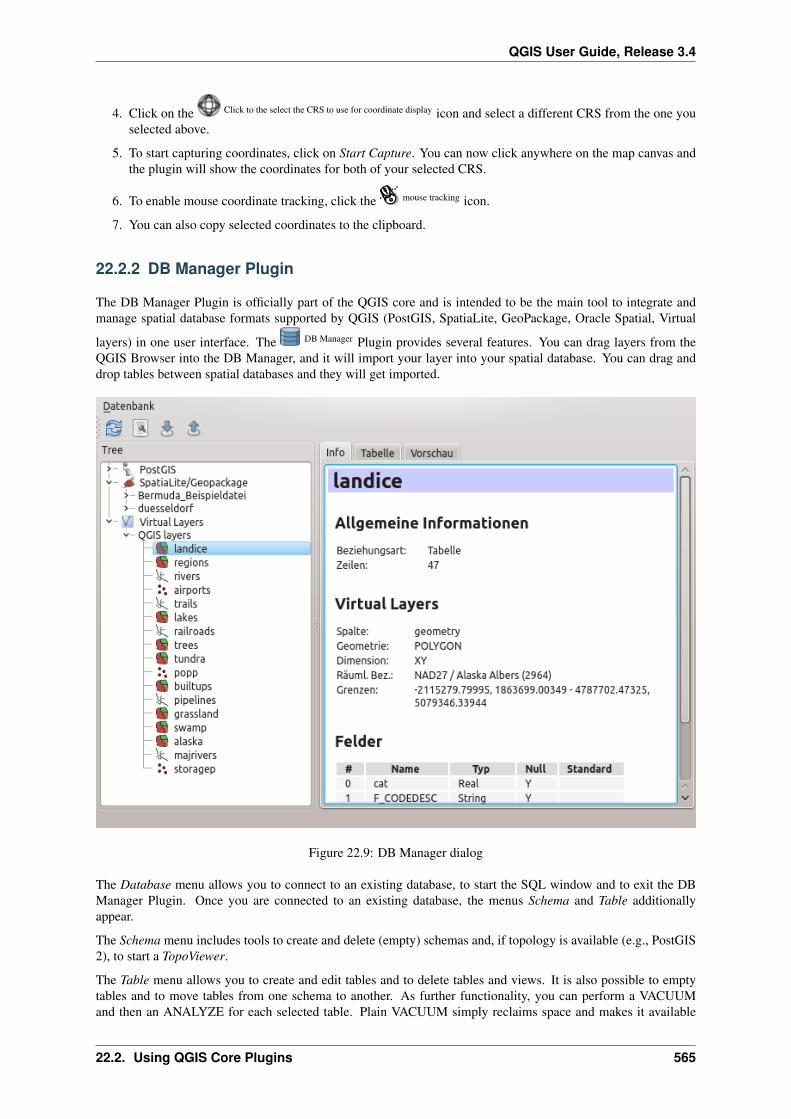
QGIS User Guide, Release 3.4
4. Click on the Click to the select the CRS to use for coordinate display icon and select a different CRS from the one youselected above.
5. To start capturing coordinates, click on Start Capture. You can now click anywhere on the map canvas andthe plugin will show the coordinates for both of your selected CRS.
6. To enable mouse coordinate tracking, click the mouse tracking icon.
7. You can also copy selected coordinates to the clipboard.
22.2.2 DB Manager Plugin
The DB Manager Plugin is officially part of the QGIS core and is intended to be the main tool to integrate andmanage spatial database formats supported by QGIS (PostGIS, SpatiaLite, GeoPackage, Oracle Spatial, Virtual
layers) in one user interface. The DB Manager Plugin provides several features. You can drag layers from theQGIS Browser into the DB Manager, and it will import your layer into your spatial database. You can drag anddrop tables between spatial databases and they will get imported.
Figure 22.9: DB Manager dialog
The Database menu allows you to connect to an existing database, to start the SQL window and to exit the DBManager Plugin. Once you are connected to an existing database, the menus Schema and Table additionallyappear.
The Schema menu includes tools to create and delete (empty) schemas and, if topology is available (e.g., PostGIS2), to start a TopoViewer.
The Table menu allows you to create and edit tables and to delete tables and views. It is also possible to emptytables and to move tables from one schema to another. As further functionality, you can perform a VACUUMand then an ANALYZE for each selected table. Plain VACUUM simply reclaims space and makes it available
22.2. Using QGIS Core Plugins 565

QGIS User Guide, Release 3.4
for reuse. ANALYZE updates statistics to determine the most efficient way to execute a query. Finally, you canimport layers/files, if they are loaded in QGIS or exist in the file system. And you can export database tables toshape with the Export File feature.
The Tree window lists all existing databases supported by QGIS. With a double-click, you can connect to thedatabase. With the right mouse button, you can rename and delete existing schemas and tables. Tables can also beadded to the QGIS canvas with the context menu.
If connected to a database, the main window of the DB Manager offers three tabs. The Info tab provides informa-tion about the table and its geometry, as well as about existing fields, constraints and indexes. It also allows youto run Vacuum Analyze and to create a spatial index on a selected table, if not already done. The Table tab showsall attributes, and the Preview tab renders the geometries as preview.
Working with the SQL Window
You can also use the DB Manager to execute SQL queries against your spatial database and then view the spatialoutput for queries by adding the results to QGIS as a query layer. It is possible to highlight a portion of the SQLand only that portion will be executed when you press F5 or click the Execute (F5) button.
Figure 22.10: Executing SQL queries in the DB Manager SQL window
Bemerkung: The SQL Window can also be used to create Virtual Layers. In that case, instead of selectinga database, select QGIS Layers under Virtual Layers before opening the SQL Window. See Creating virtuallayers for instructions on the SQL syntax to use.
22.2.3 eVis Plugin
(This section is derived from Horning, N., K. Koy, P. Ersts. 2009. eVis (v1.1.0) User’s Guide. American Museumof Natural History, Center for Biodiversity and Conservation. Available from https://biodiversityinformatics.amnh.org/, and released under the GNU FDL.)
566 Chapter 22. Plugins

QGIS User Guide, Release 3.4
The Biodiversity Informatics Facility at the American Museum of Natural History’s (AMNH) Center for Biodi-versity and Conservation (CBC) has developed the Event Visualization Tool (eVis), another software tool to addto the suite of conservation monitoring and decision support tools for guiding protected area and landscape plan-ning. This plugin enables users to easily link geocoded (i.e., referenced with latitude and longitude or X and Ycoordinates) photographs, and other supporting documents, to vector data in QGIS.
eVis is now automatically installed and enabled in new versions of QGIS, and as with all plugins, it can be disabledand enabled using the Plugin Manager (see Der Erweiterungen Dialog).
The eVis plugin is made up of three modules: the ‚Database Connection tool‘, ‚Event ID tool‘, and the ‚EventBrowser‘. These work together to allow viewing of geocoded photographs and other documents that are linked tofeatures stored in vector files, databases, or spreadsheets.
Event Browser
The Event Browser module provides the functionality to display geocoded photographs that are linked to vectorfeatures displayed in the QGIS map window. Point data, for example, can be from a vector file that can be inputusing QGIS or it can be from the result of a database query. The vector feature must have attribute informationassociated with it to describe the location and name of the file containing the photograph and, optionally, thecompass direction the camera was pointed when the image was acquired. Your vector layer must be loaded intoQGIS before running the Event Browser.
Launch the Event Browser module
To launch the Event Browser module, click on Database → eVis → eVis Event Browser. This will open theGeneric Event Browser window.
The Event Browser window has three tabs displayed at the top of the window. The Display tab is used to view thephotograph and its associated attribute data. The Options tab provides a number of settings that can be adjusted tocontrol the behavior of the eVis plugin. Lastly, the Configure External Applications tab is used to maintain a tableof file extensions and their associated application to allow eVis to display documents other than images.
Understanding the Display window
To see the Display window, click on the Display tab in the Event Browser window. The Display window is usedto view geocoded photographs and their associated attribute data.
1. Display window: A window where the photograph will appear.
2. Zoom in button: Zoom in to see more detail. If the entire image cannot be displayed in the display window,scroll bars will appear on the left and bottom sides of the window to allow you to pan around the image.
3. Zoom out button: Zoom out to see more area.
4. Zoom to full extent button: Displays the full extent of the photograph.
5. Attribute information window: All of the attribute information for the point associated with the photo-graph being viewed is displayed here. If the file type being referenced in the displayed record is not animage but is of a file type defined in the Configure External Applications tab, then when you double-clickon the value of the field containing the path to the file, the application to open the file will be launched toview or hear the contents of the file. If the file extension is recognized, the attribute data will be displayedin green.
6. Navigation buttons: Use the Previous and Next buttons to load the previous or next feature when morethan one feature is selected.
22.2. Using QGIS Core Plugins 567

QGIS User Guide, Release 3.4
Figure 22.11: The eVis display window
568 Chapter 22. Plugins

QGIS User Guide, Release 3.4
Figure 22.12: The eVis Options window
22.2. Using QGIS Core Plugins 569

QGIS User Guide, Release 3.4
Understanding the Options window
1. File path: A drop-down list to specify the attribute field that contains the directory path or URL for thephotographs or other documents being displayed. If the location is a relative path, then the checkbox mustbe clicked. The base path for a relative path can be entered in the Base Path text box below. Informationabout the different options for specifying the file location are noted in the section Specifying the locationand name of a photograph below.
2. Compass bearing: A drop-down list to specify the attribute field that contains the compass bearing asso-ciated with the photograph being displayed. If compass bearing information is available, it is necessary toclick the checkbox below the drop-down menu title.
3. Compass offset: Compass offsets can be used to compensate for declination (to adjust bearings collected
using magnetic bearings to true north bearings). Click the Manual radio button to enter the offset in
the text box or click the From Attribute radio button to select the attribute field containing the offsets.For both of these options, east declinations should be entered using positive values, and west declinationsshould use negative values.
4. Directory base path: The base path onto which the relative path defined in Figure_eVis_options (A) willbe appended.
5. Replace path: If this checkbox is checked, only the file name from A will be appended to the base path.
6. Apply rule to all documents: If checked, the same path rules that are defined for photographs will be usedfor non-image documents such as movies, text documents, and sound files. If not checked, the path ruleswill only apply to photographs, and other documents will ignore the base path parameter.
7. Remember settings: If the checkbox is checked, the values for the associated parameters will be saved forthe next session when the window is closed or when the Save button below is pressed.
8. Reset values: Resets the values on this line to the default setting.
9. Restore defaults: This will reset all of the fields to their default settings. It has the same effect as clickingall of the Reset buttons.
10. Save: This will save the settings without closing the Options pane.
Understanding the Configure External Applications window
Figure 22.13: The eVis External Applications window
1. File reference table: A table containing file types that can be opened using eVis. Each file type needs afile extension and the path to an application that can open that type of file. This provides the capability ofopening a broad range of files such as movies, sound recordings, and text documents instead of only images.
2. Add new file type: Add a new file type with a unique extension and the path for the application that canopen the file.
570 Chapter 22. Plugins

QGIS User Guide, Release 3.4
3. Delete current row: Delete the file type highlighted in the table and defined by a file extension and a pathto an associated application.
Specifying the location and name of a photograph
The location and name of the photograph can be stored using an absolute or relative path, or a URL if the pho-tograph is available on a web server. Examples of the different approaches are listed in Table evis_examples.
X Y FILE BEARING780596 1784017 C:\Workshop\eVis_Data\groundphotos\DSC_0168.JPG 275780596 1784017 /groundphotos/DSC_0169.JPG 80780819 1784015 https://biodiversityinformatics.amnh.org/\
evis_testdata/DSC_0170.JPG 10780596 1784017 pdf:https://www.testsite.com/attachments.php?\
attachment_id-12 76
Specifying the location and name of other supporting documents
Supporting documents such as text documents, videos, and sound clips can also be displayed or played by eVis. Todo this, it is necessary to add an entry in the file reference table that can be accessed from the Configure ExternalApplications window in the Generic Event Browser that matches the file extension to an application that can beused to open the file. It is also necessary to have the path or URL to the file in the attribute table for the vectorlayer. One additional rule that can be used for URLs that don’t contain a file extension for the document you wantto open is to specify the file extension before the URL. The format is — file extension:URL. The URLis preceded by the file extension and a colon; this is particularly useful for accessing documents from wikis andother web sites that use a database to manage the web pages (see Table evis_examples).
Using the Event Browser
When the Event Browser window opens, a photograph will appear in the display window if the document refer-enced in the vector file attribute table is an image and if the file location information in the Options window isproperly set. If a photograph is expected and it does not appear, it will be necessary to adjust the parameters in theOptions window.
If a supporting document (or an image that does not have a file extension recognized by eVis) is referenced in theattribute table, the field containing the file path will be highlighted in green in the attribute information window ifthat file extension is defined in the file reference table located in the Configure External Applications window. Toopen the document, double-click on the green-highlighted line in the attribute information window. If a supportingdocument is referenced in the attribute information window and the file path is not highlighted in green, then itwill be necessary to add an entry for the file’s filename extension in the Configure External Applications window.If the file path is highlighted in green but does not open when double-clicked, it will be necessary to adjust theparameters in the Options window so the file can be located by eVis.
If no compass bearing is provided in the Options window, a red asterisk will be displayed on top of the vectorfeature that is associated with the photograph being displayed. If a compass bearing is provided, then an arrow willappear pointing in the direction indicated by the value in the compass bearing display field in the Event Browserwindow. The arrow will be centered over the point that is associated with the photograph or other document.
To close the Event Browser window, click on the Close button from the Display window.
Event ID Tool
The ‚Event ID‘ module allows you to display a photograph by clicking on a feature displayed in the QGIS mapwindow. The vector feature must have attribute information associated with it to describe the location and name ofthe file containing the photograph and, optionally, the compass direction the camera was pointed when the imagewas acquired. This layer must be loaded into QGIS before running the ‚Event ID‘ tool.
22.2. Using QGIS Core Plugins 571

QGIS User Guide, Release 3.4
Launch the Event ID module
To launch the ‚Event ID‘ module, either click on the Event ID icon or click on Database → eVis → Event IDTool. This will cause the cursor to change to an arrow with an ‚i‘ on top of it signifying that the ID tool is active.
To view the photographs linked to vector features in the active vector layer displayed in the QGIS map window,move the Event ID cursor over the feature and then click the mouse. After clicking on the feature, the EventBrowser window is opened and the photographs on or near the clicked locality are available for display in thebrowser. If more than one photograph is available, you can cycle through the different features using the Previousand Next buttons. The other controls are described in the Event Browser section of this guide.
Database connection
The ‚Database Connection‘ module provides tools to connect to and query a database or other ODBC resource,such as a spreadsheet.
eVis can directly connect to the following types of databases: PostgreSQL, MySQL, and SQLite; it can alsoread from ODBC connections (e.g., MS Access). When reading from an ODBC database (such as an Excelspreadsheet), it is necessary to configure your ODBC driver for the operating system you are using.
Launch the Database Connection module
To launch the ‚Database Connection‘ module, either click on the appropriate icon eVis Database Connection or clickon Database → eVis → Database Connection. This will launch the Database Connection window. The windowhas three tabs: Predefined Queries, Database Connection, and SQL Query. The Output Console window at thebottom of the window displays the status of actions initiated by the different sections of this module.
Connect to a database
Click on the Database Connection tab to open the database connection interface. Next, use the Database Type
combo box to select the type of database that you want to connect to. If a password or username is required,that information can be entered in the Username and Password textboxes.
Enter the database host in the Database Host textbox. This option is not available if you selected ‚MS Access‘ asthe database type. If the database resides on your desktop, you should enter „localhost“.
Enter the name of the database in the Database Name textbox. If you selected ‚ODBC‘ as the database type, youneed to enter the data source name.
When all of the parameters are filled in, click on the Connect button. If the connection is successful, a messagewill be written in the Output Console window stating that the connection was established. If a connection was notestablished, you will need to check that the correct parameters were entered above.
1. Database Type: A drop-down list to specify the type of database that will be used.
2. Database Host: The name of the database host.
3. Port: The port number if a MySQL or PostgreSQL database type is selected.
4. Database Name: The name of the database.
5. Connect: A button to connect to the database using the parameters defined above.
6. Output Console: The console window where messages related to processing are displayed.
7. Username: Username for use when a database is password protected.
8. Password: Password for use when a database is password protected.
9. Predefined Queries: Tab to open the „Predefined Queries“ window.
572 Chapter 22. Plugins

QGIS User Guide, Release 3.4
Figure 22.14: The eVis Database connection window
10. Database Connection: Tab to open the „Database Connection“ window.
11. SQL Query: Tab to open the „SQL Query“ window.
12. Help: Displays the online help.
13. OK: Closes the main „Database Connection“ window.
Running SQL queries
SQL queries are used to extract information from a database or ODBC resource. In eVis, the output from thesequeries is a vector layer added to the QGIS map window. Click on the SQL Query tab to display the SQL queryinterface. SQL commands can be entered in this text window. A helpful tutorial on SQL commands is available athttps://www.w3schools.com/sql. For example, to extract all of the data from a worksheet in an Excel file, select* from [sheet1$] where sheet1 is the name of the worksheet.
Click on the Run Query button to execute the command. If the query is successful, a Database File Selectionwindow will be displayed. If the query is not successful, an error message will appear in the Output Consolewindow.
In the Database File Selection window, enter the name of the layer that will be created from the results of thequery in the Name of New Layer textbox.
1. SQL Query Text Window: A screen to type SQL queries.
2. Run Query: Button to execute the query entered in the SQL Query Window.
3. Console Window: The console window where messages related to processing are displayed.
4. Help: Displays the online help.
5. OK: Closes the main Database Connection window.
22.2. Using QGIS Core Plugins 573

QGIS User Guide, Release 3.4
Figure 22.15: The eVis SQL query tab
Use the X Coordinate and Y Coordinate combo boxes to select the fields from the database that storesthe X (or longitude) and Y (or latitude) coordinates. Clicking on the OK button causes the vector layer createdfrom the SQL query to be displayed in the QGIS map window.
To save this vector file for future use, you can use the QGIS ‚Save as. . . ‘ command that is accessed by right-clicking on the layer name in the QGIS map legend and then selecting ‚Save as. . . ‘
Tipp: Creating a vector layer from a Microsoft Excel Worksheet
When creating a vector layer from a Microsoft Excel Worksheet, you might see that unwanted zeros („0“) havebeen inserted in the attribute table rows beneath valid data. This can be caused by deleting the values for thesecells in Excel using the Backspace key. To correct this problem, you need to open the Excel file (you’ll need toclose QGIS if you are connected to the file, to allow you to edit the file) and then use Edit → Delete to remove theblank rows from the file. To avoid this problem, you can simply delete several rows in the Excel Worksheet usingEdit → Delete before saving the file.
Running predefined queries
With predefined queries, you can select previously written queries stored in XML format in a file. This is par-ticularly helpful if you are not familiar with SQL commands. Click on the Predefined Queries tab to display thepredefined query interface.
To load a set of predefined queries, click on the Open File icon. This opens the Open File window, which is usedto locate the file containing the SQL queries. When the queries are loaded, their titles as defined in the XML filewill appear in the drop-down menu located just below the Open File icon. The full description of the query isdisplayed in the text window under the drop-down menu.
574 Chapter 22. Plugins

QGIS User Guide, Release 3.4
Select the query you want to run from the drop-down menu and then click on the SQL Query tab to see that thequery has been loaded into the query window. If it is the first time you are running a predefined query or areswitching databases, you need to be sure to connect to the database.
Click on the Run Query button in the SQL Query tab to execute the command. If the query is successful, aDatabase File Selection window will be displayed. If the query is not successful, an error message will appear inthe Output Console window.
Figure 22.16: The eVis Predefined Queries tab
1. Open File: Launches the „Open File“ file browser to search for the XML file holding the predefined queries.
2. Predefined Queries: A drop-down list with all of the queries defined by the predefined queries XML file.
3. Query description: A short description of the query. This description is from the predefined queries XMLfile.
4. Console Window: The console window where messages related to processing are displayed.
5. Help: Displays the online help.
6. OK: Closes the main „Database Connection“ window.
XML format for eVis predefined queries
The XML tags read by eVis
22.2. Using QGIS Core Plugins 575

QGIS User Guide, Release 3.4
Tag Descriptionquery Defines the beginning and end of a query statement.shortde-scription
A short description of the query that appears in the eVis drop-down menu.
descrip-tion
A more detailed description of the query displayed in the Predefined Query text window.
database-type
The database type, defined in the Database Type drop-down menu in the Database Connection tab.
database-port
The port as defined in the Port text box in the Database Connection tab.
database-name
The database name as defined in the Database Name text box in the Database Connection tab.
databaseuser-name
The database username as defined in the Username text box in the Database Connection tab.
databasep-assword
The database password as defined in the Password text box in the Database Connection tab.
sqlstate-ment
The SQL command.
autocon-nect
A flag („true““ or „false“) to specify if the above tags should be used to automatically connect tothe database without running the database connection routine in the Database Connection tab.
A complete sample XML file with three queries is displayed below:
<?xml version="1.0"?><doc><query><shortdescription>Import all photograph points</shortdescription><description>This command will import all of the data in the SQLite database to
→˓QGIS</description>
<databasetype>SQLITE</databasetype><databasehost /><databaseport /><databasename>C:\textbackslash Workshop/textbackslash
eVis\_Data\textbackslash PhotoPoints.db</databasename><databaseusername /><databasepassword /><sqlstatement>SELECT Attributes.*, Points.x, Points.y FROM Attributes LEFT JOIN
Points ON Points.rec_id=Attributes.point_ID</sqlstatement><autoconnect>false</autoconnect>
</query><query><shortdescription>Import photograph points "looking across Valley"</
→˓shortdescription><description>This command will import only points that have photographs
→˓"looking acrossa valley" to QGIS</description>
<databasetype>SQLITE</databasetype><databasehost /><databaseport /><databasename>C:\Workshop\eVis_Data\PhotoPoints.db</databasename><databaseusername /><databasepassword /><sqlstatement>SELECT Attributes.*, Points.x, Points.y FROM Attributes LEFT JOIN
Points ON Points.rec_id=Attributes.point_ID where COMMENTS='Looking acrossvalley'</sqlstatement>
<autoconnect>false</autoconnect></query><query>
<shortdescription>Import photograph points that mention "limestone"</→˓shortdescription>
576 Chapter 22. Plugins

QGIS User Guide, Release 3.4
<description>This command will import only points that have photographs that→˓mention
"limestone" to QGIS</description><databasetype>SQLITE</databasetype><databasehost /><databaseport /><databasename>C:\Workshop\eVis_Data\PhotoPoints.db</databasename><databaseusername /><databasepassword /><sqlstatement>SELECT Attributes.*, Points.x, Points.y FROM Attributes LEFT JOIN
Points ON Points.rec_id=Attributes.point_ID where COMMENTS like '%limestone%'</sqlstatement>
<autoconnect>false</autoconnect></query>
</doc>
22.2.4 Geometry Checker Plugin
Geometry Checker is a powerful core plugin to check and fix the geometry validity of a layer. It is available from
the Vector menu ( Check Geometries. . . ).
Configuring the checks
The Check Geometries dialog shows different grouped settings in the first tab (Setup):
• Input vector layers: to select the layers to check. A Only selected features checkbox can be used torestrict the checking to the geometries of the selected features.
• Allowed geometry types: to allow only some geometry types like point, multipoint, line, multiline, polygonand multipolygon.
• Geometry validity: depending on geometry types, the user can choose Self intersections, Duplicate
nodes, Self contacts and Polygon with less than 3 nodes.
• Geometry properties: depending on geometry types, the user can choose Polygons and multipolygons
may not contain any holes, Multipart objects must consist of more than one part and Lines must nothave dangles.
• Geometry conditions: user can add some condition to validate the geometries with a minimal segmentlength, a minimum angle between segment, a minimal polygon area and sliver polygons detection.
• Topology checks: depending on geometry types, the user can choose Checks for duplicates, Checks
for features within other features, Checks for overlaps smaller than , Checks for gaps smaller
than , Points must be covered by lines, Points must properly lie inside a polygon, Lines
must not intersect any other lines, Lines must not intersect with features of layer , Polygons
must follow boundaries of layer .
• Tolerance: you can define the tolerance of the check in map layer units.
• Output vector layer gives the choice to the user how get the result between modify the current layer andcreate a new layer.
When you are happy with the configuration, you can click on the Run button.
The Geometry Checker Plugin can find the following errors:
• Self intersections: a polygon with a self intersection;
• Duplicate nodes: two duplicates nodes in a segment;
22.2. Using QGIS Core Plugins 577

QGIS User Guide, Release 3.4
Figure 22.17: The Geometry Checker Plugin
578 Chapter 22. Plugins

QGIS User Guide, Release 3.4
• Holes: hole in a polygon;
• Segment length: a segment length lower than a threshold;
• Minimum angle: two segments with an angle lower than a threshold;
• Minimum area: polygon area lower than a threshold;
• Silver polygon: this error come from very small polygon (with small area) with a large perimeter;
• Duplicates features;
• Feature within feature;
• Overlaps: polygon overlapping;
• Gaps: gaps between polygons.
The following figure shows the different checks made by the plugin.
Figure 22.18: Some checks supported by the plugin
Analysing the results
The results appear in the second tab (Result) and as an overview layer of the errors in the canvas (its name has thedefault prefix checked_). A table lists the Geometry check result with one error per row and columns containing:the layer name, an ID, the error type, then the coordinates of the error, a value (depending on the type of the error)and finally the resolution column which indicates the resolution of the error. At the bottom of this table, you canExport the error into different file formats. You also have a counter with the number of total errors and fixed ones.
You can select a row to see the location of the error. You can change this behavior by selecting another action
between Error (default), Feature, Don’t move, and Highlight contour of selected features.
22.2. Using QGIS Core Plugins 579

QGIS User Guide, Release 3.4
Below the zoom action when clicking on the table row, you can:
• Show selected features in attribute table;
• Fix selected errors using default resolution;
• Fix selected errors, prompt for resolution method. You will see a window to choose the resolution’smethod among which:
– Merge with neighboring polygon with longest shared edge;
– Merge with neighboring polygon with largest area;
– Merge with neighboring polygon with identical attribute value, if any, or leave as is;
– Delete feature;
– No action.
Tipp: Fix multiple errors
You can fix multiple errors by selecting more than one row in the table with the CTRL + click action.
The default action can be changed with the last icon Error resolution settings For some type of errors, you canchange the default action between some specific action or No action.
Finally, you can choose which attribute to use when merging features by attribute value.
22.2.5 Georeferencer Plugin
The Georeferencer Plugin is a tool for generating world files for rasters. It allows you to reference rasters togeographic or projected coordinate systems by creating a new GeoTiff or by adding a world file to the existingimage. The basic approach to georeferencing a raster is to locate points on the raster for which you can accuratelydetermine coordinates.
Features
Icon Purpose Icon Purpose
Open raster Start georeferencing
Generate GDAL Script Load GCP Points
Save GCP Points As Transformation settings
Add Point Delete Point
Move GCP Point Pan
Zoom In Zoom Out
Zoom To Layer Zoom Last
Zoom Next Link Georeferencer to QGIS
Link QGIS to Georeferencer Full histogram stretch
Local histogram stretch
Table Georeferencer: Georeferencer Tools
580 Chapter 22. Plugins

QGIS User Guide, Release 3.4
Usual procedure
As X and Y coordinates (DMS (dd mm ss.ss), DD (dd.dd) or projected coordinates (mmmm.mm)), which corre-spond with the selected point on the image, two alternative procedures can be used:
• The raster itself sometimes provides crosses with coordinates „written“ on the image. In this case, you canenter the coordinates manually.
• Using already georeferenced layers. This can be either vector or raster data that contain the same ob-jects/features that you have on the image that you want to georeference and with the projection that youwant for your image. In this case, you can enter the coordinates by clicking on the reference dataset loadedin the QGIS map canvas.
The usual procedure for georeferencing an image involves selecting multiple points on the raster, specifying theircoordinates, and choosing a relevant transformation type. Based on the input parameters and data, the plugin willcompute the world file parameters. The more coordinates you provide, the better the result will be.
The first step is to start QGIS, load the Georeferencer Plugin (see Der Erweiterungen Dialog) and click on Raster
→ Georeferencer, which appears in the QGIS menu bar. The Georeferencer Plugin dialog appears as shownin figure_georeferencer_dialog.
For this example, we are using a topo sheet of South Dakota from SDGS. It can later be visualized together withthe data from the GRASS spearfish60 location. You can download the topo sheet here: https://grass.osgeo.org/sampledata/spearfish_toposheet.tar.gz.
Figure 22.19: Georeferencer Plugin Dialog
22.2. Using QGIS Core Plugins 581

QGIS User Guide, Release 3.4
Entering ground control points (GCPs)
1. To start georeferencing an unreferenced raster, we must load it using the button. The raster will showup in the main working area of the dialog. Once the raster is loaded, we can start to enter reference points.
2. Using the Add Point button, add points to the main working area and enter their coordinates (see Figurefigure_georeferencer_add_points). For this procedure you have three options:
• Click on a point in the raster image and enter the X and Y coordinates manually.
• Click on a point in the raster image and choose the From map canvas button to add the X and Ycoordinates with the help of a georeferenced map already loaded in the QGIS map canvas.
• With the button, you can move the GCPs in both windows, if they are at the wrong place.
3. Continue entering points. You should have at least four points, and the more coordinates you can provide,the better the result will be. There are additional tools on the plugin dialog to zoom and pan the workingarea in order to locate a relevant set of GCP points.
Figure 22.20: Add points to the raster image
The points that are added to the map will be stored in a separate text file ([filename].points) usuallytogether with the raster image. This allows us to reopen the Georeferencer plugin at a later date and add newpoints or delete existing ones to optimize the result. The points file contains values of the form: mapX, mapY,
pixelX, pixelY. You can use the Load GCP points and Save GCP points as buttons to manage the files.
Defining the transformation settings
After you have added your GCPs to the raster image, you need to define the transformation settings for thegeoreferencing process.
Available Transformation algorithms
Depending on how many ground control points you have captured, you may want to use different transformationalgorithms. Choice of transformation algorithm is also dependent on the type and quality of input data and theamount of geometric distortion that you are willing to introduce to the final result.
Currently, the following Transformation types are available:
• The Linear algorithm is used to create a world file and is different from the other algorithms, as it doesnot actually transform the raster. This algorithm likely won’t be sufficient if you are dealing with scannedmaterial.
• The Helmert transformation performs simple scaling and rotation transformations.
582 Chapter 22. Plugins

QGIS User Guide, Release 3.4
Figure 22.21: Defining the georeferencer transformation settings
22.2. Using QGIS Core Plugins 583

QGIS User Guide, Release 3.4
• The Polynomial algorithms 1-3 are among the most widely used algorithms introduced to match sourceand destination ground control points. The most widely used polynomial algorithm is the second-orderpolynomial transformation, which allows some curvature. First-order polynomial transformation (affine)preserves collinearity and allows scaling, translation and rotation only.
• The Thin Plate Spline (TPS) algorithm is a more modern georeferencing method, which is able to intro-duce local deformations in the data. This algorithm is useful when very low quality originals are beinggeoreferenced.
• The Projective transformation is a linear rotation and translation of coordinates.
Define the Resampling method
The type of resampling you choose will likely depending on your input data and the ultimate objective of theexercise. If you don’t want to change statistics of the image, you might want to choose ‚Nearest neighbour‘,whereas a ‚Cubic resampling‘ will likely provide a more smoothed result.
It is possible to choose between five different resampling methods:
1. Nearest neighbour
2. Linear
3. Cubic
4. Cubic Spline
5. Lanczos
Define the transformation settings
There are several options that need to be defined for the georeferenced output raster.
• The Create world file checkbox is only available if you decide to use the linear transformation type,because this means that the raster image actually won’t be transformed. In this case, the Output raster fieldis not activated, because only a new world file will be created.
• For all other transformation types, you have to define an Output raster. As default, a new file ([file-name]_modified) will be created in the same folder together with the original raster image.
• As a next step, you have to define the Target SRS (Spatial Reference System) for the georeferenced raster(see Arbeiten mit Projektionen).
• If you like, you can generate a pdf map and also a pdf report. The report includes information about theused transformation parameters, an image of the residuals and a list with all GCPs and their RMS errors.
• Furthermore, you can activate the Set Target Resolution checkbox and define the pixel resolution of theoutput raster. Default horizontal and vertical resolution is 1.
• The Use 0 for transparency when needed can be activated, if pixels with the value 0 shall be visualizedtransparent. In our example toposheet, all white areas would be transparent.
• Finally, Load in QGIS when done loads the output raster automatically into the QGIS map canvas whenthe transformation is done.
Show and adapt raster properties
Clicking on the Raster properties option in the Settings menu opens the Layer properties dialog of the raster filethat you want to georeference.
584 Chapter 22. Plugins

QGIS User Guide, Release 3.4
Configure the georeferencer
• You can define whether you want to show GCP coordinates and/or IDs.
• As residual units, pixels and map units can be chosen.
• For the PDF report, a left and right margin can be defined and you can also set the paper size for the PDFmap.
• Finally, you can activate to Show Georeferencer window docked.
Running the transformation
After all GCPs have been collected and all transformation settings are defined, just press the Start georeferencing
button to create the new georeferenced raster.
22.2.6 MetaSearch Catalog Client
Introduction
MetaSearch is a QGIS plugin to interact with metadata catalog services, supporting the OGC Catalog Service forthe Web (CSW) standard.
MetaSearch provides an easy and intuitive approach and user-friendly interface to searching metadata catalogswithin QGIS.
Figure 22.22: Search and results of Services in MetaSearch
22.2. Using QGIS Core Plugins 585

QGIS User Guide, Release 3.4
Installation
MetaSearch is included by default with QGIS 2.0 and higher. All dependencies are included within MetaSearch.
Install MetaSearch from the QGIS plugin manager, or manually from https://plugins.qgis.org/plugins/MetaSearch.
Working with Metadata Catalogs in QGIS
CSW (Catalog Service for the Web)
CSW (Catalog Service for the Web) is an OGC (Open Geospatial Consortium) specification that defines commoninterfaces to discover, browse and query metadata about data, services, and other potential resources.
Startup
To start MetaSearch, click the icon or select Web → MetaSearch → MetaSearch via the QGIS main menu.The MetaSearch dialog will appear. The main GUI consists of three tabs: Services, Search and Settings.
Managing Catalog Services
Figure 22.23: Managing Catalog Services
586 Chapter 22. Plugins

QGIS User Guide, Release 3.4
The Services tab allows the user to manage all available catalog services. MetaSearch provides a default list ofCatalog Services, which can be added by pressing Add Default Services button.
To all listed Catalog Service entries, click the dropdown select box.
To add a Catalog Service entry, click the New button, and enter a Name for the service, as well as the URL(endpoint). Note that only the base URL is required (not a full GetCapabilities URL). If the CSW requiresauthentication, enter the appropriate User name and Password credentials. Clicking OK will add the service tothe list of entries.
To edit an existing Catalog Service entry, select the entry you would like to edit and click the Edit button, andmodify the Name or URL values, then click OK.
To delete a Catalog Service entry, select the entry you would like to delete and click the Delete button. You willbe asked to confirm deleting the entry.
MetaSearch allows for loading and saving connections to an XML file. This is useful when you need to sharesettings between applications. Below is an example of the XML file format.
<?xml version="1.0" encoding="UTF-8"?><qgsCSWConnections version="1.0">
<csw name="Data.gov CSW" url="https://catalog.data.gov/csw-all"/><csw name="Geonorge - National CSW service for Norway" url="https://www.
→˓geonorge.no/geonetwork/srv/eng/csw"/><csw name="Geoportale Nazionale - Servizio di ricerca Italiano" url="http://
→˓www.pcn.minambiente.it/geoportal/csw"/><csw name="LINZ Data Service" url="http://data.linz.govt.nz/feeds/csw"/><csw name="Nationaal Georegister (Nederland)" url="http://www.
→˓nationaalgeoregister.nl/geonetwork/srv/eng/csw"/><csw name="RNDT - Repertorio Nazionale dei Dati Territoriali - Servizio di
→˓ricerca" url="http://www.rndt.gov.it/RNDT/CSW"/><csw name="UK Location Catalogue Publishing Service" url="http://csw.data.gov.
→˓uk/geonetwork/srv/en/csw"/><csw name="UNEP/GRID-Geneva Metadata Catalog" url="http://metadata.grid.unep.
→˓ch:8080/geonetwork/srv/eng/csw"/></qgsCSWConnections>
To load a list of entries, click the Load button. A new window will appear; click the Browse button and navigateto the XML file of entries you wish to load and click Open. The list of entries will be displayed. Select the entriesyou wish to add from the list and click Load.
Click the Service Info button to displays information about the selected Catalog Service such as service identi-fication, service provider and contact information. If you would like to view the raw XML response, click theGetCapabilities Response button. A separate window will open displaying Capabilities XML.
Searching Catalog Services
The Search tab allows the user to query Catalog Services for data and services, set various search parameters andview results.
The following search parameters are available:
• Keywords: free text search keywords;
• From: the Catalog Service to perform the query against;
• Bounding box: the spatial area of interest to filter on defined by Xmax, Xmin, Ymax, and Ymin. Click SetGlobal to do a global search, click Map Extent to do a search on the visible area only or manually entercustom values as desired.
Clicking the Search button will search the selected Metadata Catalog. Search results are displayed in a list and aresortable by clicking on the column title. You can navigate through search results with the directional buttons belowthe search results. Clicking the View Search Results as XML button opens a window with the service response inraw XML format.
22.2. Using QGIS Core Plugins 587

QGIS User Guide, Release 3.4
Figure 22.24: Searching catalog services
588 Chapter 22. Plugins

QGIS User Guide, Release 3.4
Clicking a result will provide the following options:
• if the metadata record has an associated bounding box, a footprint of the bounding box will be displayed onthe map;
• double-clicking the record displays the record metadata with any associated access links. Clicking the linksopens the link in the user’s web browser;
• if the record is a supported web service (WMS/WMTS, WFS, WCS, ArcGIS MapServer, ArcGIS Feature-Server, etc.), the Add Data button will be enabled for the user to add to QGIS. When clicking this button,MetaSearch will verify if this is a valid OWS. The service will then be added to the appropriate QGISconnection list, and the appropriate connection dialog will then appear.
Figure 22.25: Metadata record display
Settings
You can fine tune MetaSearch with the following settings:
• Results paging: when searching metadata catalogs, the number of results to show per page. Default value is10;
• Timeout: when searching metadata catalogs, the number of seconds for blocking connection attempt. De-fault value is 10.
22.2. Using QGIS Core Plugins 589
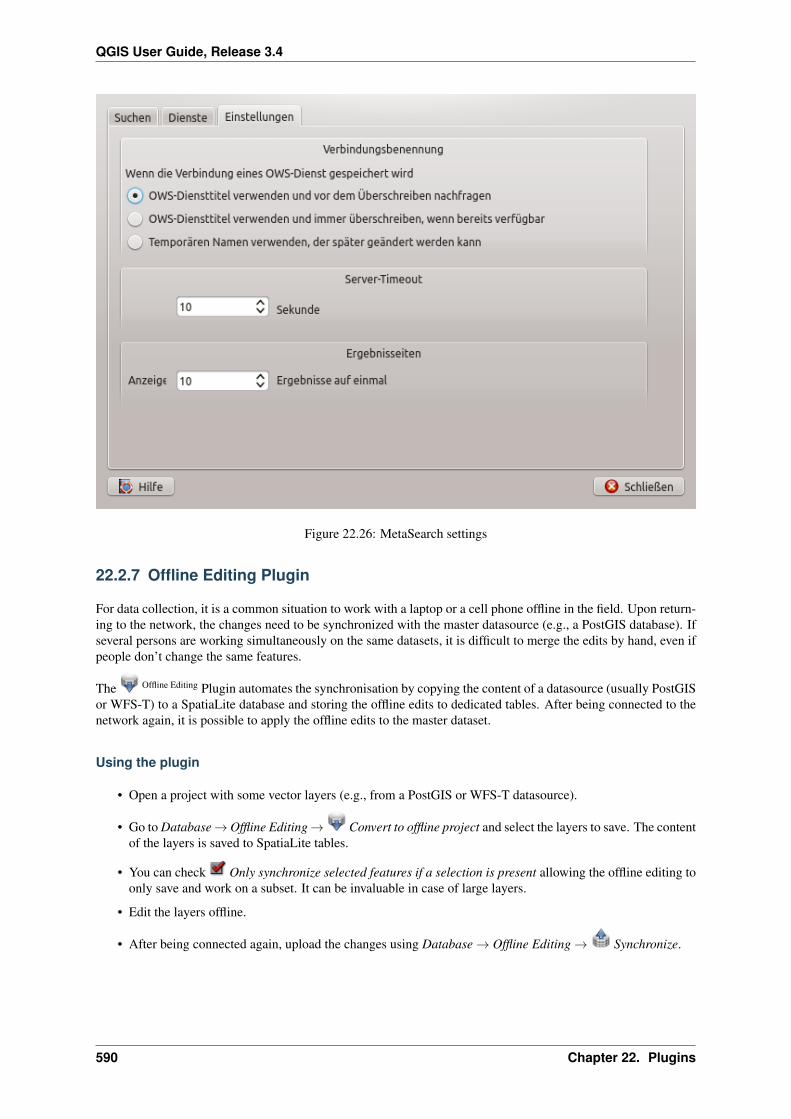
QGIS User Guide, Release 3.4
Figure 22.26: MetaSearch settings
22.2.7 Offline Editing Plugin
For data collection, it is a common situation to work with a laptop or a cell phone offline in the field. Upon return-ing to the network, the changes need to be synchronized with the master datasource (e.g., a PostGIS database). Ifseveral persons are working simultaneously on the same datasets, it is difficult to merge the edits by hand, even ifpeople don’t change the same features.
The Offline Editing Plugin automates the synchronisation by copying the content of a datasource (usually PostGISor WFS-T) to a SpatiaLite database and storing the offline edits to dedicated tables. After being connected to thenetwork again, it is possible to apply the offline edits to the master dataset.
Using the plugin
• Open a project with some vector layers (e.g., from a PostGIS or WFS-T datasource).
• Go to Database → Offline Editing → Convert to offline project and select the layers to save. The contentof the layers is saved to SpatiaLite tables.
• You can check Only synchronize selected features if a selection is present allowing the offline editing toonly save and work on a subset. It can be invaluable in case of large layers.
• Edit the layers offline.
• After being connected again, upload the changes using Database → Offline Editing → Synchronize.
590 Chapter 22. Plugins

QGIS User Guide, Release 3.4
Figure 22.27: Create an offline project from PostGIS or WFS layers
Figure 22.28: The Topology Checker Plugin
22.2. Using QGIS Core Plugins 591

QGIS User Guide, Release 3.4
22.2.8 Topology Checker Plugin
Topology describes the relationships between points, lines and polygons that represent the features of a geographicregion. With the Topology Checker plugin, you can look over your vector files and check the topology with severaltopology rules. These rules check with spatial relations whether your features ‚Equal‘, ‚Contain‘, ‚Cover‘, are‚CoveredBy‘, ‚Cross‘, are ‚Disjoint‘, ‚Intersect‘, ‚Overlap‘, ‚Touch‘ or are ‚Within‘ each other. It depends onyour individual questions which topology rules you apply to your vector data (e.g., normally you won’t acceptovershoots in line layers, but if they depict dead-end streets you won’t remove them from your vector layer).
QGIS has a built-in topological editing feature, which is great for creating new features without errors. But existingdata errors and user-induced errors are hard to find. This plugin helps you find such errors through a list of rules.
It is very simple to create topology rules with the Topology Checker plugin.
On point layers the following rules are available:
• Must be covered by: Here you can choose a vector layer from your project. Points that aren’t covered bythe given vector layer occur in the ‚Error‘ field.
• Must be covered by endpoints of: Here you can choose a line layer from your project.
• Must be inside: Here you can choose a polygon layer from your project. The points must be inside apolygon. Otherwise, QGIS writes an ‚Error‘ for the point.
• Must not have duplicates: Whenever a point is represented twice or more, it will occur in the ‚Error‘ field.
• Must not have invalid geometries: Checks whether the geometries are valid.
• Must not have multi-part-geometries: All multi-part points are written into the ‚Error‘ field.
On line layers, the following rules are available:
• End points must be covered by: Here you can select a point layer from your project.
• Must not have dangles: This will show the overshoots in the line layer.
• Must not have duplicates: Whenever a line feature is represented twice or more, it will occur in the ‚Error‘field.
• Must not have invalid geometries: Checks whether the geometries are valid.
• Must not have multi-part geometries: Sometimes, a geometry is actually a collection of simple (single-part) geometries. Such a geometry is called multi-part geometry. If it contains just one type of simplegeometry, we call it multi-point, multi-linestring or multi-polygon. All multi-part lines are written into the‚Error‘ field.
• Must not have pseudos: A line geometry’s endpoint should be connected to the endpoints of two othergeometries. If the endpoint is connected to only one other geometry’s endpoint, the endpoint is called apseudo node.
On polygon layers, the following rules are available:
• Must contain: Polygon layer must contain at least one point geometry from the second layer.
• Must not have duplicates: Polygons from the same layer must not have identical geometries. Whenever apolygon feature is represented twice or more it will occur in the ‚Error‘ field.
• Must not have gaps: Adjacent polygons should not form gaps between them. Administrative boundariescould be mentioned as an example (US state polygons do not have any gaps between them. . . ).
• Must not have invalid geometries: Checks whether the geometries are valid. Some of the rules that definea valid geometry are:
– Polygon rings must close.
– Rings that define holes should be inside rings that define exterior boundaries.
– Rings may not self-intersect (they may neither touch nor cross one another).
– Rings may not touch other rings, except at a point.
592 Chapter 22. Plugins

QGIS User Guide, Release 3.4
• Must not have multi-part geometries: Sometimes, a geometry is actually a collection of simple (single-part) geometries. Such a geometry is called multi-part geometry. If it contains just one type of simplegeometry, we call it multi-point, multi-linestring or multi-polygon. For example, a country consisting ofmultiple islands can be represented as a multi-polygon.
• Must not overlap: Adjacent polygons should not share common area.
• Must not overlap with: Adjacent polygons from one layer should not share common area with polygonsfrom another layer.
Below is the list of Core plugins provided with QGIS. They are not necessarily enabled by default.
Icon Plugin Description Manual Reference
Coordinate Capture Capture mouse coordinate in different CRS Coordinate Capture Plugin
DB Manager Manage your databases within QGIS DB Manager Plugin
eVis Event Visualization Tool eVis Plugin
Geometry Checker Check and repair errors in vector geome-tries
Geometry Checker Plugin
Georeferencer GDAL Georeference rasters with GDAL Georeferencer Plugin
GPS Tools Tools for loading and importing GPS data GPS Plugin
GRASS GRASS functionality GRASS GIS Integration
MetaSearch CatalogClient
Interact with metadata catalog services(CSW)
MetaSearch Catalog Client
Offline Editing Offline editing and synchronizing withdatabase
Offline Editing Plugin
Processing Spatial data processing framework QGIS Verarbeitung Umge-bung
Topology Checker Find topological errors in vector layers Topology Checker Plugin
22.3 QGIS Python Konsole
As you will see later in this chapter, QGIS has been designed with a plugin architecture. Plugins can be written inPython, a very famous language in the geospatial world.
QGIS brings a Python API (see PyQGIS Developer Cookbook for some code sample) to let the user interact withits objects (layers, feature or interface). QGIS also has a Python console.
The QGIS Python Console is an interactive shell for the python command executions. It also has a python fileeditor that allows you to edit and save your python scripts. Both console and editor are based on PyQScintilla2package. To open the console go to Plugins → Python Console (Ctrl+Alt+P).
22.3.1 The Interactive Console
The interactive console is composed of a toolbar, an input area and an output one.
Toolbar
The toolbar proposes the following tools:
• Clear Console to wipe the output area;
22.3. QGIS Python Konsole 593

QGIS User Guide, Release 3.4
• Run Command available in the input area: same as pressing Enter;
• Show Editor: toggles The Code Editor visibility;
• Options. . . : opens a dialog to configure console properties (see Options);
• Help. . . : browses the current documentation.
Console
The console main features are:
• Code completion, highlighting syntax and calltips for the following APIs:
– Python
– PyQGIS
– PyQt5
– QScintilla2
– osgeo-gdal-ogr
• Ctrl+Alt+Space to view the auto-completion list if enabled in the Options;
• Execute code snippets from the input area by typing and pressing Enter or Run Command;
• Execute code snippets from the output area using the Enter Selected from the contextual menu or pressingCtrl+E;
• Browse the command history from the input area using the Up and Down arrow keys and execute thecommand you want;
• Ctrl+Shift+Space to view the command history: double-clicking a row will execute the command.The Command History dialog can also be accessed from context menu of input area;
• Save and clear the command history. The history will be saved into the file ~/.qgis2/console_history.txt;
• Open QGIS C++ API documentation by typing _api;
• Open QGIS Python API documentation by typing _pyqgis.
• Open PyQGIS Cookbook by typing _cookbook.
Tipp: Reuse executed commands from the output panel
You can execute code snippets from the output panel by selecting some text and pressing Ctrl+E. No matter ifselected text contains the interpreter prompt (>>>, ...).
22.3.2 The Code Editor
Use the Show Editor button to enable the editor widget. It allows editing and saving Python files and offersadvanced functionalities to manage your code (comment and uncomment code, check syntax, share the code viacodepad.org and much more). Main features are:
• Code completion, highlighting syntax and calltips for the following APIs:
– Python
– PyQGIS
– PyQt5
594 Chapter 22. Plugins

QGIS User Guide, Release 3.4
Figure 22.29: The Python Console
– QScintilla2
– osgeo-gdal-ogr
• Ctrl+Space to view the auto-completion list.
• Sharing code snippets via codepad.org.
• Ctrl+4 Syntax check.
• Search bar (open it with the default Desktop Environment shortcut, usually Ctrl+F):
– Use the default Desktop Environment shortcut to find next/previous (Ctrl+G and Shift+Ctrl+G);
– Automatically find first match when typing in find box;
– Set initial find string to selection when opening find;
– Pressing Esc closes the find bar.
• Object inspector: a class and function browser;
• Go to an object definition with a mouse click (from Object inspector);
• Execute code snippets with the Run Selected command in contextual menu;
• Execute the whole script with the Run Script command (this creates a byte-compiled file with theextension .pyc).
Bemerkung: Running partially or totally a script from the Code Editor outputs the result in the Console outputarea.
22.3.3 Options
Accessible from the Console toolbar and the contextual menus of the Console output panel and the Code Editor,the Python Console Settings help manage and control the Python console behavior.
For both Console and Editor you can specify:
• Autocompletion: Enables code completion. You can get autocompletion from the current document, theinstalled API files or both.
– Autocompletion threshold: Sets the threshold for displaying the autocompletion list (in characters)
• Typing
22.3. QGIS Python Konsole 595

QGIS User Guide, Release 3.4
Figure 22.30: The Python Console editor
– Automatic parentheses insertion: Enables autoclosing for parentheses
– Automatic insertion of the ‚import‘ string on ‚from xxx‘: Enables insertion of ‚import‘ when specifyingimports
For Editor you can also specify:
• Run and Debug
– Enable Object Inspector (switching between tabs may be slow): Enable the object inspector.
– Auto-save script before running: Saves the script automatically when executed. This action will storea temporary file (in the temporary system directory) that will be deleted automatically after running.
• Font and Colors: Here you can specify the font to use in the editor and the colors to use for highlighting
For APIs you can specify:
• Using preloaded APIs file: You can choose if you would like to use the preloaded API files. If this is notchecked you can add API files and you can also choose if you would like to use prepared API files (see nextoption).
• Using prepared APIs file: If checked, the chosen *.pap file will be used for code completion. To generatea prepared API file you have to load at least one *.api file and then compile it by clicking the CompileAPIs. . . button.
Tipp: Save the options
To save the state of console’s widgets you have to close the Python Console from the close button. This allowsyou to save the geometry to be restored to the next start.
596 Chapter 22. Plugins
CHAPTER 23
Hilfe und Support
23.1 Mailinglisten
QGIS entwickelt sich ständig weiter, daher kann es vorkommen, dass es mal nicht so funktioniert, wie er-wartet. Die bevorzugte und effektivste Art, Hilfe zu bekommen, besteht darin, sich in die qgis-users Mailinglisteeinzuschreiben. Ihre Fragen erreichen eine breite Basis von Anwendern und die Antworten auf Ihre Fragen könnenauch anderen helfen.
23.1.1 QGIS Users
Diese Mailingliste ist englischsprachig und wird benutzt, um allgemeine aber auch spezifische Fragen zurInstallation und Benutzung von QGIS zu diskutieren. Sie können sich in die Mailingliste unter der URL:http://lists.osgeo.org/mailman/listinfo/qgis-user eintragen
23.1.2 QGIS Developers
Wenn Sie Entwickler sind und eher technische Probleme haben, können Sie sich in die englischsprachige qgis-developer Mailingliste eintragen. Diese Liste ist auch der richtige Ort, an dem Sie sich zu Themen der Bedien-barkeit von QGIS äußern können und die dort gesammelt und diskutiert werden. Die Liste ist unter der URL:https://lists.osgeo.org/mailman/listinfo/qgis-developer erreichbar.
23.1.3 QGIS Community Team
This list deals with topics like documentation, context help, user guide, web sites, blog, mailing lists, forums, andtranslation efforts. If you would like to work on the user guide as well, this list is a good starting point to ask yourquestions. You can subscribe to this list at: https://lists.osgeo.org/mailman/listinfo/qgis-community-team
23.1.4 QGIS Translations
This list deals with the translation efforts. If you like to work on the translation of the website, manuals or thegraphical user interface (GUI), this list is a good starting point to ask your questions. You can subscribe to this listat: https://lists.osgeo.org/mailman/listinfo/qgis-tr
597
QGIS User Guide, Release 3.4
23.1.5 QGIS Project Steering Committee (PSC)
This list is used to discuss Steering Committee issues related to overall management and direction of QGIS. Youcan subscribe to this list at: https://lists.osgeo.org/mailman/listinfo/qgis-psc
23.1.6 QGIS-Anwendergruppen
Einige QGIS-Gemeinschaften sind als QGIS-Anwendergruppen organisiert, um QGIS vor Ort zu fördern und zuseiner Weiterentwicklung beizutragen. Diese Gruppen sind der richtige Ort, um lokale Themen zu diskutieren,regionale oder nationale Anwendertreffen oder die Unterstützung für neue Programmfunktionen zu organisieren.Die Liste der Anwendergruppen finden Sie unter https://qgis.org/en/site/forusers/usergroups.html
You are welcome to subscribe to any of the lists. Please remember to contribute to the list by answering questionsand sharing your experiences.
23.2 IRC
We also maintain a presence on IRC - visit us by joining the #qgis channel on irc.freenode.net. Please wait for aresponse to your question, as many folks on the channel are doing other things and it may take a while for them tonotice your question. If you missed a discussion on IRC, not a problem! We log all discussion, so you can easilycatch up. Just go to https://qgis.org/irclogs and read the IRC-logs.
Commercial support for QGIS is also available. Check the website https://qgis.org/en/commercial-support.htmlfor more information.
23.3 BugTracker
Während die qgis-users Mailingliste nützlich ist, wenn es um allgemeine Fragen zu ‘wie mache ich dies oder jenesin QGIS’ geht, möchten Sie uns vielleicht auch auf richtige Fehler (Bugs) aufmerksam machen. Sie können dazuFehlermeldungen mit Hilfe des QGIS BugTracker auf https://issues.qgis.org/projects/qgis/issues eintragen. WennSie ein neues Ticket für einen Fehler erstellen, geben Sie bitte auch eine Emailadresse an, über die wir weitereInformationen von Ihnen erfragen können.
Denken Sie auch bitte daran, dass ein für Sie wichtiger Fehler nicht immer die gleiche Priorität bei anderenPersonen und besonders den Entwicklern hat. Einige Fehler sind sehr aufwendig zu reparieren und daher kann esschon mal ein wenig dauern, bis genügend Zeit vorhanden ist, ein Problem zu lösen.
Anfragen für neue Funktionen können auch in demselben System gestellt werden. Bitte geben Sie dann den TypFeature an.
If you have found a bug and fixed it yourself, you can submit either a Pull Request on the Github QGIS Project(prefered) or a patch also. The lovely redmine ticketsystem at https://issues.qgis.org/projects/qgis/issues has thistype as well. Check the Patch supplied checkbox and attach your patch before submitting your bug. Oneof the developers will review it and apply it to QGIS. Please don’t be alarmed if your patch is not applied straightaway – developers may be tied up with other commitments.
Beachten Sie, wenn Sie ein Pull-request liefern, wird Ihre Änderung in den Quellkode zusammengeführt!
23.4 Blog
The QGIS community also runs a weblog at https://planet.qgis.org/planet/, which has some interesting articles forusers and developers as well provided by other blogs in the community. You are invited to contribute your ownQGIS blog!
598 Chapter 23. Hilfe und Support

QGIS User Guide, Release 3.4
23.5 Plugins
Die Internetseite https://plugins.qgis.org stellt das offizielle QGIS Plugin Webportal dar. Hier finden Sie eineListe mit allen stabilen und experimentellen QGIS Plugins, die über das ‚Official QGIS Plugin Repository‘ zurVerfügung stehen.
23.6 Wiki
Lastly, we maintain a WIKI web site at https://github.com/qgis/QGIS/wiki where you can find a variety of usefulinformation relating to QGIS development, release plans, links to download sites, message-translation hints andmore. Check it out, there are some goodies inside!
23.5. Plugins 599

QGIS User Guide, Release 3.4
600 Chapter 23. Hilfe und Support

CHAPTER 24
Contributors
QGIS is an open source project developed by a team of dedicated volunteers and organisations. We strive to bea welcoming community for people of all race, creed, gender and walks of life. At any moment, you can getinvolved.
24.1 Authors
Below are listed people who dedicate their time and energy to write, review, and update the whole QGIS docu-mentation.
601

QGIS User Guide, Release 3.4
Tara Athan Radim Blazek K. Koy Godofredo Contr-eras
Martin Dobias
Peter Ersts Anne Ghisla Stephan Holl14. Horning
Magnus Homann
Werner Macho Denis Rouzaud Tyler Mitchell Claudia A. Engel Lars LuthmanOtto Dassau Brendan Morely David Willis Jürgen E. Fischer Yoichi KayamaAlexander Bruy Anita Graser Victor Olaya Marco Hugentobler Gary E. ShermanTim Sutton Larissa Junek Raymond Nijssen Richard Duivenvo-
ordeAndreas Neumann
Astrid Emde Yves Jacolin Alexandre Neto Alessandro Pasotti Hien Tran-QuangAndy Schmid Arnaud Morvan Akgar Gumbira Giovanni Allegri Diethard JansenAndy Allan Matthias Kuhn Chris Berkhout Carson J.Q. Farmer Steven CordwellEric Goddard Frank Sokolic Luca Casagrande Harrissou Sant-
annaSaber Razmjooei
Ilkka Rinne Jacob Lanstorp Ujaval Gandhi Jean-Roc Morreale Salvatore LarosaJoão Gaspar Joshua Arnott Thomas Gratier Marco Bernasocchi Marie SilvestreKo Nagase Larry Shaffer Luigi Pirelli Konstantinos Niko-
laouManing Sambale
Manel Clos Mattheo Ghetta Bernhard Ströbl Luca Manganelli Nathan WoodrowNick Bearman Paul Blottière Vincent Picavet Maximilian Kram-
bachRené-Luc D’Hont
Tom Chadwin Patrick Sunter Nyall Dawson Milo Van der Lin-den
Paolo Cavallini
Paolo Corti Hugo Mercier Gavin Macaulay Stefan Blumentrath Nicholas DugganDavid Adler Vincent Mora Tudor Barascu QGIS Koran Trans-
latorStéphane Brunner
Jaka Kranjc Tom Kralidis Zoltan Siki Sebastian Dietrich Uros PreloznikDick Groskamp Mezene Worku Alexandre Bus-
quetsDominic Keller Andre Mano
Chris Mayo Håvard Tveite Mie Winstrup Jonathan Willitts Giovanni ManghiMartina Savarese icephale Andrei GiordanoPezzola zstadlerRamon embelding ajazepk
24.2 Translators
QGIS is a multi-language application and as is, also publishes a documentation translated into several languages.Many other languages are being translated and would be released as soon as they reach a reasonable percentageof translation. If you wish to help improving a language or request a new one, please see https://qgis.org/en/site/getinvolved/index.html.
The current translations are made possible thanks to:
602 Chapter 24. Contributors

QGIS User Guide, Release 3.4
Lan-guage
Contributors
Ba-hasianIn-done-sian
Emir Hartato, I Made Anombawa, Januar V. Simarmata, Muhammad Iqnaul Haq Siregar, Trias Aditya
Chi-nese(Tra-di-tional)
Calvin Ngei, Zhang Jun, Richard Xie
Dutch Carlo van Rijswijk, Dick Groskamp, Diethard Jansen, Raymond Nijssen, Richard Duivenvoorde,Willem Hoffman
FinnishMatti Mäntynen, Kari MikkonenFrenchArnaud Morvan, Augustin Roche, Didier Vanden Berghe, Dofabien, Etienne Trimaille, Harrissou Sant-
anna, Jean-Roc Morreale, Jérémy Garniaux, Loïc Buscoz, Lsam, Marc-André Saia, Marie Silvestre,Mathieu Bossaert, Mathieu Lattes, Mayeul Kauffmann, Médéric Ribreux, Mehdi Semchaoui, MichaelDouchin, Nicolas Boisteault, Nicolas Rochard, Pascal Obstetar, Robin Prest, Rod Bera, Stéphane Hen-riod, Stéphane Possamai, sylther, Sylvain Badey, Sylvain Maillard, Vincent Picavet, Xavier Tardieu,Yann Leveille-Menez, yoda89
Gali-cian
Xan Vieiro
Ger-man
Jürgen E. Fischer, Otto Dassau, Stephan Holl, Werner Macho
Hindi Harish Kumar SolankiItal-ian
Alessandro Fanna, Anne Ghisla, Flavio Rigolon, Giuliano Curti, Luca Casagrande, Luca Delucchi,Marco Braida, Matteo Ghetta, Maurizio Napolitano, Michele Beneventi, Michele Ferretti, Roberto An-geletti, Paolo Cavallini, Stefano Campus
JapaneseBaba Yoshihiko, Minoru Akagi, Norihiro Yamate, Takayuki Mizutani, Takayuki Nuimura, YoichiKayama
Ko-rean
OSGeo Korean Chapter
Pol-ish
Andrzej Swiader, Borys Jurgiel, Ewelina Krawczak, Jakub Bobrowski, Mateusz Łoskot, Michał Kułach,Michał Smoczyk, Milena Nowotarska, Radosław Pasiok, Robert Szczepanek, Tomasz Paul
Por-tuguese
Alexandre Neto, Duarte Carreira, Giovanni Manghi, João Gaspar, Joana Simões, Leandro Infantini,Nelson Silva, Pedro Palheiro, Pedro Pereira, Ricardo Sena
Por-tuguese(Brasil)
Arthur Nanni, Felipe Sodré Barros, Leônidas Descovi Filho, Marcelo Soares Souza, Narcélio de SáPereira Filho, Sidney Schaberle Goveia
Ro-ma-nian
Alex Badescu, Bogdan Pacurar, Georgiana Ioanovici, Lonut Losifescu-Enescu, Sorin Calinica, TudorBarascu
Rus-sian
Alexander Bruy, Artem Popov
Span-ish
Carlos Dávila, Diana Galindo, Edwin Amado, Gabriela Awad, Javier César Aldariz, Mayeul Kauffmann
UkrainianAlexander Bruy
24.2. Translators 603

QGIS User Guide, Release 3.4
604 Chapter 24. Contributors

CHAPTER 25
Anhang
25.1 GNU General Public License
Deutsche Übersetzung der Version 2, Juni 1991. Den offiziellen englischen Originaltext finden Sie unter http://www.gnu.org/licenses/gpl.html. Diese Übersetzung wird mit der Absicht angeboten, das Verständnis der GNUGeneral Public License (GNU GPL) zu erleichtern. Es handelt sich jedoch nicht um eine offizielle oder imrechtlichen Sinne anerkannte Übersetzung. Diese Übersetzung wurde ursprünglich erstellt von Katja Lachmann.Übersetzungen im Auftrag der S.u.S.E. GmbH - http://www.suse.de. Sie wurde überarbeitet von Peter Gerwinski,G-N-U GmbH - http://www.g-n-u.de (31. Oktober 1996, 4. Juni 2000)
Copyright (C) 1989, 1991 Free Software Foundation, Inc. 59 Temple Place - Suite 330, Boston, MA 02111-1307,USA
Es ist jedermann gestattet, diese Lizenzurkunde zu vervielfältigen und unveränderte Kopien zu verbreiten; Än-derungen sind jedoch nicht erlaubt.
Vorwort
Die meisten Softwarelizenzen sind daraufhin entworfen worden, Ihnen die Freiheit zu nehmen, die Softwareweiterzugeben und zu verändern. Im Gegensatz dazu soll Ihnen die GNU General Public License, die AllgemeineÖffentliche GNU-Lizenz, ebendiese Freiheit garantieren. Sie soll sicherstellen, daß die Software für alle Benutzerfrei ist. Diese Lizenz gilt für den Großteil der von der Free Software Foundation herausgegebenen Softwareund für alle anderen Programme, deren Autoren ihr Werk dieser Lizenz unterstellt haben. Auch Sie könnendiese Möglichkeit der Lizenzierung für Ihre Programme anwenden. (Ein anderer Teil der Software der FreeSoftware Foundation unterliegt stattdessen der GNU Lesser General Public License, der Kleineren AllgemeinenÖffentlichen GNU-Lizenz).
Die Bezeichnung ‚‘freie“ Software bezieht sich auf Freiheit, nicht auf den Preis. Unsere Lizenzen sollen Ihnen dieFreiheit garantieren, Kopien freier Software zu verbreiten (und etwas für diesen Service zu berechnen, wenn Siemöchten), die Möglichkeit, die Software im Quelltext zu erhalten oder den Quelltext auf Wunsch zu bekommen.Die Lizenzen sollen garantieren, daß Sie die Software ändern oder Teile davon in neuen freien Programmenverwenden dürfen - und daß Sie wissen, daß Sie dies alles tun dürfen.
Um Ihre Rechte zu schützen, müssen wir Einschränkungen machen, die es jedem verbieten, Ihnen diese Rechte zuverweigern oder Sie aufzufordern, auf diese Rechte zu verzichten. Aus diesen Einschränkungen folgen bestimmteVerantwortlichkeiten für Sie, wenn Sie Kopien der Software verbreiten oder sie verändern.
Beispielsweise müssen Sie den Empfängern alle Rechte gewähren, die Sie selbst haben, wenn Sie - kostenlosoder gegen Bezahlung - Kopien eines solchen Programms verbreiten. Sie müssen sicherstellen, daß auch die
605

QGIS User Guide, Release 3.4
Empfänger den Quelltext erhalten bzw. erhalten können. Und Sie müssen ihnen diese Bedingungen zeigen, damitsie ihre Rechte kennen.
Wir schützen Ihre Rechte in zwei Schritten: (1) Wir stellen die Software unter ein Urheberrecht (Copyright), und(2) wir bieten Ihnen diese Lizenz an, die Ihnen das Recht gibt, die Software zu vervielfältigen, zu verbreitenund/oder zu verändern.
Um die Autoren und uns zu schützen, wollen wir darüberhinaus sicherstellen, daß jeder erfährt, daß für diesefreie Software keinerlei Garantie besteht. Wenn die Software von jemand anderem modifiziert und weitergegebenwird, möchten wir, daß die Empfänger wissen, daß sie nicht das Original erhalten haben, damit irgendwelche vonanderen verursachte Probleme nicht den Ruf des ursprünglichen Autors schädigen.
Schließlich und endlich ist jedes freie Programm permanent durch Software-Patente bedroht. Wir möchten dieGefahr ausschließen, daß Distributoren eines freien Programms individuell Patente lizensieren - mit dem Ergebnis,daß das Programm proprietär würde. Um dies zu verhindern, haben wir klargestellt, daß jedes Patent entweder fürfreie Benutzung durch jedermann lizenziert werden muß oder überhaupt nicht lizenziert werden darf.
Es folgen die genauen Bedingungen für die Vervielfältigung, Verbreitung und Bearbeitung
0. Diese Lizenz gilt für jedes Programm und jedes andere Werk, in dem ein entsprechender Vermerk desCopyright-Inhabers darauf hinweist, daß das Werk unter den Bestimmungen dieser General Public Licenseverbreitet werden darf. Im folgenden wird jedes derartige Programm oder Werk als ‚‘das Programm“ beze-ichnet; die Formulierung ‚‘auf dem Programm basierendes Werk“ bezeichnet das Programm sowie jeglicheBearbeitung des Programms im urheberrechtlichen Sinne, also ein Werk, welches das Programm, auchauszugsweise, sei es unverändert oder verändert und/oder in eine andere Sprache übersetzt, enthält. (Imfolgenden wird die Übersetzung ohne Einschränkung als ‚‘Bearbeitung“ eingestuft.) Jeder Lizenznehmerwird im folgenden als ‚‘Sie“ angesprochen.
Andere Handlungen als Vervielfältigung, Verbreitung und Bearbeitung werden von dieser Lizenz nichtberührt; sie fallen nicht in ihren Anwendungsbereich. Der Vorgang der Ausführung des Programms wirdnicht eingeschränkt, und die Ausgaben des Programms unterliegen dieser Lizenz nur, wenn der Inhalt einauf dem Programm basierendes Werk darstellt (unabhängig davon, daß die Ausgabe durch die Ausführungdes Programmes erfolgte). Ob dies zutrifft, hängt von den Funktionen des Programms ab.
1. Sie dürfen auf beliebigen Medien unveränderte Kopien des Quelltextes des Programms, wie sie ihn erhaltenhaben, anfertigen und verbreiten. Voraussetzung hierfür ist, daß Sie mit jeder Kopie einen entsprechendenCopyright-Vermerk sowie einen Haftungsausschluß veröffentlichen, alle Vermerke, die sich auf diese Lizenzund das Fehlen einer Garantie beziehen, unverändert lassen und desweiteren allen anderen Empfängern desProgramms zusammen mit dem Programm eine Kopie dieser Lizenz zukommen lassen.
Sie dürfen für den eigentlichen Kopiervorgang eine Gebühr verlangen. Wenn Sie es wünschen, dürfen Sieauch gegen Entgelt eine Garantie für das Programm anbieten.
2. Sie dürfen Ihre Kopie(n) des Programms oder eines Teils davon verändern, wodurch ein auf dem Programmbasierendes Werk entsteht; Sie dürfen derartige Bearbeitungen unter den Bestimmungen von Paragraph1 vervielfältigen und verbreiten, vorausgesetzt, daß zusätzlich alle im folgenden genannten Bedingungenerfüllt werden:
(a) Sie müssen die veränderten Dateien mit einem auffälligen Vermerk versehen, der auf die von Ihnenvorgenommene Modifizierung und das Datum jeder Änderung hinweist.
(b) Sie müssen dafür sorgen, daß jede von Ihnen verbreitete oder veröffentlichte Arbeit, die ganz oderteilweise von dem Programm oder Teilen davon abgeleitet ist, Dritten gegenüber als Ganzes unter denBedingungen dieser Lizenz ohne Lizenzgebühren zur Verfügung gestellt wird.
(c) Wenn das veränderte Programm normalerweise bei der Ausführung interaktiv Kommandos einliest,müssen Sie dafür sorgen, daß es, wenn es auf dem üblichsten Wege für solche interaktive Nutzunggestartet wird, eine Meldung ausgibt oder ausdruckt, die einen geeigneten Copyright-Vermerk enthältsowie einen Hinweis, daß es keine Gewährleistung gibt (oder anderenfalls, daß Sie Garantie leisten),und daß die Benutzer das Programm unter diesen Bedingungen weiter verbreiten dürfen. Auch mußder Benutzer darauf hingewiesen werden, wie er eine Kopie dieser Lizenz ansehen kann. (Ausnahme:Wenn das Programm selbst interaktiv arbeitet, aber normalerweise keine derartige Meldung ausgibt,muß Ihr auf dem Programm basierendes Werk auch keine solche Meldung ausgeben.)
606 Chapter 25. Anhang

QGIS User Guide, Release 3.4
Diese Anforderungen gelten für das bearbeitete Werk als Ganzes. Wenn identifizierbare Teile des Werkesnicht von dem Programm abgeleitet sind und vernünftigerweise als unabhängige und eigenständige Werkefür sich selbst zu betrachten sind, dann gelten diese Lizenz und ihre Bedingungen nicht für die betroffenenTeile, wenn Sie diese als eigenständige Werke weitergeben. Wenn Sie jedoch dieselben Abschnitte als Teileines Ganzen weitergeben, das ein auf dem Programm basierendes Werk darstellt, dann muß die Weitergabedes Ganzen nach den Bedingungen dieser Lizenz erfolgen, deren Bedingungen für weitere Lizenznehmersomit auf das gesamte Ganze ausgedehnt werden - und somit auf jeden einzelnen Teil, unabhängig vomjeweiligen Autor.
Somit ist es nicht die Absicht dieses Abschnittes, Rechte für Werke in Anspruch zu nehmen oder Ihnendie Rechte für Werke streitig zu machen, die komplett von Ihnen geschrieben wurden; vielmehr ist es dieAbsicht, die Rechte zur Kontrolle der Verbreitung von Werken, die auf dem Programm basieren oder unterseiner auszugsweisen Verwendung zusammengestellt worden sind, auszuüben.
Ferner bringt auch das einfache Zusammenlegen eines anderen Werkes, das nicht auf dem Programm basiert,mit dem Programm oder einem auf dem Programm basierenden Werk auf ein- und demselben Speicher- oderVertriebsmedium dieses andere Werk nicht in den Anwendungsbereich dieser Lizenz.
3. Sie dürfen das Programm (oder ein darauf basierendes Werk gemäß Paragraph 2) als Objectcode oder in aus-führbarer Form unter den Bedingungen der Paragraphen 1 und 2 kopieren und weitergeben - vorausgesetzt,daß Sie außerdem eine der folgenden Leistungen erbringen:
(a) Liefern Sie das Programm zusammen mit dem vollständigen zugehörigen maschinenlesbaren Quell-text auf einem für den Datenaustausch üblichen Medium aus, wobei die Verteilung unter den Bedin-gungen der Paragraphen 1 und 2 erfolgen muß. Oder,
(b) Liefern Sie das Programm zusammen mit einem mindestens drei Jahre lang gültigen schriftlichenAngebot aus, jedem Dritten eine vollständige maschinenlesbare Kopie des Quelltextes zur Verfügungzu stellen - zu nicht höheren Kosten als denen, die durch den physikalischen Kopiervorgang anfallen -,wobei der Quelltext unter den Bedingungen der Paragraphen 1 und 2 auf einem für den Datenaustauschüblichen Medium weitergegeben wird. Oder,
(c) Liefern Sie das Programm zusammen mit den Informationen, die Sie beim Angebot zur Verfügungstellen des Quelltextes, erhalten haben. (Diese Alternative ist nur für nicht-kommerzielle Verbre-itung zulässig und nur, wenn Sie das Programm als Objektcode oder in ausführbarer Form mit einementsprechenden Angebot erhalten haben, gemäß Absatz b oben.)
Unter dem Quelltext eines Werkes wird diejenige Form des Werkes verstanden, die für Bearbeitungenvorzugsweise verwendet wird. Für ein ausführbares Programm bedeutet ‚‘der komplette Quelltext‘‚: DerQuelltext aller im Programm enthaltenen Module einschließlich aller zugehörigen Modulschnittstellen-Definitionsdateien sowie der zur Compilation und Installation verwendeten Skripte. Als besondere Aus-nahme jedoch braucht der verteilte Quelltext nichts von dem zu enthalten, was üblicherweise (entweder alsQuelltext oder in binärer Form) zusammen mit den Hauptkomponenten des Betriebssystems (Kernel, Com-piler usw.) geliefert wird, unter dem das Programm läuft - es sei denn, diese Komponente selbst gehört zumausführbaren Programm.
Wenn die Verbreitung eines ausführbaren Programms oder von Objectcode dadurch erfolgt, daß derKopierzugriff auf eine dafür vorgesehene Stelle gewährt wird, so gilt die Gewährung eines gleichwerti-gen Zugriffs auf den Quelltext als Verbreitung des Quelltextes, auch wenn Dritte nicht dazu gezwungensind, den Quelltext zusammen mit dem Objectcode zu kopieren.
4. Sie dürfen das Programm nicht vervielfältigen, verändern, weiter lizenzieren oder verbreiten, sofern esnicht durch diese Lizenz ausdrücklich gestattet ist. Jeder anderweitige Versuch der Vervielfältigung, Modi-fizierung, Weiterlizenzierung und Verbreitung ist nichtig und beendet automatisch Ihre Rechte unter dieserLizenz. Jedoch werden die Lizenzen Dritter, die von Ihnen Kopien oder Rechte unter dieser Lizenz erhaltenhaben, nicht beendet, solange diese die Lizenz voll anerkennen und befolgen.
5. Sie sind nicht verpflichtet, diese Lizenz anzunehmen, da Sie sie nicht unterzeichnet haben. Jedoch gibtIhnen nichts anderes die Erlaubnis, das Programm oder von ihm abgeleitete Werke zu verändern oder zuverbreiten. Diese Handlungen sind gesetzlich verboten, wenn Sie diese Lizenz nicht anerkennen. IndemSie das Programm (oder ein darauf basierendes Werk) verändern oder verbreiten, erklären Sie Ihr Einver-ständnis mit dieser Lizenz und mit allen ihren Bedingungen bezüglich der Vervielfältigung, Verbreitung undVeränderung des Programms oder eines darauf basierenden Werks.
25.1. GNU General Public License 607

QGIS User Guide, Release 3.4
6. Jedesmal, wenn Sie das Programm (oder ein auf dem Programm basierendes Werk) weitergeben, erhält derEmpfänger automatisch vom ursprünglichen Lizenzgeber die Lizenz, das Programm entsprechend den hierfestgelegten Bestimmungen zu vervielfältigen, zu verbreiten und zu verändern. Sie dürfen keine weiterenEinschränkungen der Durchsetzung der hierin zugestandenen Rechte des Empfängers vornehmen. Sie sindnicht dafür verantwortlich, die Einhaltung dieser Lizenz durch Dritte durchzusetzen.
7. Sollten Ihnen infolge eines Gerichtsurteils, des Vorwurfs einer Patentverletzung oder aus einem anderenGrunde (nicht auf Patentfragen begrenzt) Bedingungen (durch Gerichtsbeschluß, Vergleich oder ander-weitig) auferlegt werden, die den Bedingungen dieser Lizenz widersprechen, so befreien Sie diese Um-stände nicht von den Bestimmungen dieser Lizenz. Wenn es Ihnen nicht möglich ist, das Programm untergleichzeitiger Beachtung der Bedingungen in dieser Lizenz und Ihrer anderweitigen Verpflichtungen zu ver-breiten, dann dürfen Sie als Folge das Programm überhaupt nicht verbreiten. Wenn zum Beispiel ein Patentnicht die gebührenfreie Weiterverbreitung des Programms durch diejenigen erlaubt, die das Programm di-rekt oder indirekt von Ihnen erhalten haben, dann besteht der einzige Weg, sowohl das Patentrecht als auchdiese Lizenz zu befolgen, darin, ganz auf die Verbreitung des Programms zu verzichten.
Sollte sich ein Teil dieses Paragraphen als ungültig oder unter bestimmten Umständen nicht durchsetzbarerweisen, so soll dieser Paragraph seinem Sinne nach angewandt werden; im übrigen soll dieser Paragraphals Ganzes gelten.
Zweck dieses Paragraphen ist nicht, Sie dazu zu bringen, irgendwelche Patente oder andere Eigentum-sansprüche zu verletzen oder die Gültigkeit solcher Ansprüche zu bestreiten; dieser Paragraph hat einzigden Zweck, die Integrität des Verbreitungssystems der freien Software zu schützen, das durch die Praxisöffentlicher Lizenzen verwirklicht wird. Viele Leute haben großzügige Beiträge zu dem großen Angebotder mit diesem System verbreiteten Software im Vertrauen auf die konsistente Anwendung dieses Systemsgeleistet; es liegt am Autor/Geber, zu entscheiden, ob er die Software mittels irgendeines anderen Systemsverbreiten will; ein Lizenznehmer hat auf diese Entscheidung keinen Einfluß.
Dieser Paragraph ist dazu gedacht, deutlich klarzustellen, was als Konsequenz aus dem Rest dieser Lizenzbetrachtet wird.
8. Wenn die Verbreitung und/oder die Benutzung des Programms in bestimmten Staaten entweder durchPatente oder durch urheberrechtlich geschützte Schnittstellen eingeschränkt ist, kann der Urheberrechtsin-haber, der das Programm unter diese Lizenz gestellt hat, eine explizite geographische Begrenzung der Ver-breitung angeben, in der diese Staaten ausgeschlossen werden, so daß die Verbreitung nur innerhalb undzwischen den Staaten erlaubt ist, die nicht ausgeschlossen sind. In einem solchen Fall beinhaltet dieseLizenz die Beschränkung, als wäre sie in diesem Text niedergeschrieben.
9. Die Free Software Foundation kann von Zeit zu Zeit überarbeitete und/oder neue Versionen der GeneralPublic License veröffentlichen. Solche neuen Versionen werden vom Grundprinzip her der gegenwärti-gen entsprechen, können aber im Detail abweichen, um neuen Problemen und Anforderungen gerecht zuwerden.
Jede Version dieser Lizenz hat eine eindeutige Versionsnummer. Wenn in einem Programm angegebenwird, daß es dieser Lizenz in einer bestimmten Versionsnummer oder ‚‘jeder späteren Version“ (‚‘any laterversion“) unterliegt, so haben Sie die Wahl, entweder den Bestimmungen der genannten Version zu folgenoder denen jeder beliebigen späteren Version, die von der Free Software Foundation veröffentlicht wurde.Wenn das Programm keine Versionsnummer angibt, können Sie eine beliebige Version wählen, die je vonder Free Software Foundation veröffentlicht wurde.
10. Wenn Sie den Wunsch haben, Teile des Programms in anderen freien Programmen zu verwenden, derenBedingungen für die Verbreitung anders sind, schreiben Sie an den Autor, um ihn um die Erlaubnis zubitten. Für Software, die unter dem Copyright der Free Software Foundation steht, schreiben Sie an dieFree Software Foundation; wir machen zu diesem Zweck gelegentlich Ausnahmen. Unsere Entscheidungwird von den beiden Zielen geleitet werden, zum einen den freien Status aller von unserer freien Softwareabgeleiteten Werke zu erhalten und zum anderen das gemeinschaftliche Nutzen und Wiederverwenden vonSoftware im allgemeinen zu fördern.
Keine Gewährleistung
11. Da das Programm ohne jegliche Kosten lizenziert wird, besteht keinerlei Gewährleistung für das Programm,soweit dies gesetzlich zulässig ist. Sofern nicht anderweitig schriftlich bestätigt, stellen die Copyright-Inhaber und/oder Dritte das Programm so zur Verfügung, ‚‘wie es ist‘‚, ohne irgendeine Gewährleistung,
608 Chapter 25. Anhang

QGIS User Guide, Release 3.4
weder ausdrücklich noch implizit, einschließlich - aber nicht begrenzt auf - Marktreife oder Verwendbarkeitfür einen bestimmten Zweck. Das volle Risiko bezüglich Qualität und Leistungsfähigkeit des Programmsliegt bei Ihnen. Sollte sich das Programm als fehlerhaft herausstellen, liegen die Kosten für notwendigenService, Reparatur oder Korrektur bei Ihnen.
12. In keinem Fall, außer wenn durch geltendes Recht gefordert oder schriftlich zugesichert, ist irgendeinCopyright-Inhaber oder irgendein Dritter, der das Programm wie oben erlaubt modifiziert oder verbreitethat, Ihnen gegenüber für irgendwelche Schäden haftbar, einschließlich jeglicher allgemeiner oder speziellerSchäden, Schäden durch Seiteneffekte (Nebenwirkungen) oder Folgeschäden, die aus der Benutzung desProgramms oder der Unbenutzbarkeit des Programms folgen (einschließlich - aber nicht beschränkt auf -Datenverluste, fehlerhafte Verarbeitung von Daten, Verluste, die von Ihnen oder anderen getragen werdenmüssen, oder dem Unvermögen des Programms, mit irgendeinem anderen Programm zusammenzuarbeiten),selbst wenn ein Copyright-Inhaber oder Dritter über die Möglichkeit solcher Schäden unterrichtet wordenwar.
QGIS Qt Ausnahme für die GPL
In addition, as a special exception, the QGIS Development Team gives permission to link the code of this programwith the Qt library, including but not limited to the following versions (both free and commercial): Qt/Non-commercial Windows, Qt/Windows, Qt/X11, Qt/Mac, and Qt/Embedded (or with modified versions of Qt that usethe same license as Qt), and distribute linked combinations including the two. You must obey the GNU GeneralPublic License in all respects for all of the code used other than Qt. If you modify this file, you may extend thisexception to your version of the file, but you are not obligated to do so. If you do not wish to do so, delete thisexception statement from your version.
25.2 GNU Free Documentation License
Dies ist eine inoffizielle Übersetzung der GNU Free Documentation License (FDLv1.3) ins Deutsche. Siewurde nicht von der Free Software Foundation veröffentlicht, und legt keine rechtsgültigen Bestimmungen zurVerteilung für Dokumentation fest, welche die GNU FDL verwendet - nur der englische Originaltext der GNUFDL gewährleistet dies. Dennoch hoffen wir, dass diese Übersetzung Deutsch sprechenden dazu verhilft, dieGNU FDL besser zu verstehen
Copyright 2000, 2001, 2002, 2007, 2008 Free Software Foundation, Inc
https://fsf.org/
Es ist jedermann gestattet, diese Lizenzurkunde zu vervielfältigen und unveränderte Kopien zu verbreiten; Än-derungen sind jedoch nicht erlaubt.
Einleitung
Der Zweck dieser Lizenz ist es, ein Handbuch, Fachbuch, oder ein anderes sachliches sowie nützliches Dokument‚frei‘ im Sinne von Freiheit anzufertigen: um jedermann die wirkliche Freiheit zuzusichern, es zu kopieren und neuzu verteilen, mit oder ohne Modifikation daran, entweder kommerziell oder nicht kommerziell. Zweitrangig erhältdiese Lizenz für den Autor und Herausgeber die Möglichkeit aufrecht, Anerkennung für ihr Werk zu bekommen,während Sie nicht als verantwortlich betrachtet werden fürvorgenommene Modifikationen anderer.
Diese Lizenz ist eine Art ‚Copyleft‘, was bedeutet, dass abgeleitete Werke des Dokuments ihrerseits im selbenSinne frei sein müssen. Sie ergänzt die GNU General Public License, welche eine Copyleft-Lizenz darstellt, diefür freie Software vorgesehen ist.
We have designed this License in order to use it for manuals for free software, because free software needs freedocumentation: a free program should come with manuals providing the same freedoms that the software does.But this License is not limited to software manuals; it can be used for any textual work, regardless of subjectmatter or whether it is published as a printed book. We recommend this License principally for works whosepurpose is instruction or reference.
1. Anwendbarkeit und Definitionen
Diese Lizenz trifft auf jedes Handbuch oder sonstiges Werk zu, in beliebiger Form, das einen vom Urheber-rechtsinhaber untergebrachten Hinweis mit den Worten enthält, dass es unter den Bestimmungen dieser Lizenz
25.2. GNU Free Documentation License 609

QGIS User Guide, Release 3.4
verteilt werden kann. Solch ein Hinweis gewährt eine weltweite, vergütungsfreie Lizenz von unbefristeter Dauer,um dieses Werk unter den hier festgelegten Bedingungen zu verwenden. Das ‚Dokument‘, nachstehend, beziehtsich auf jedes derartige Handbuch oder Werk. Jedes Mitglied der Öffentlichkeit ist ein Lizenznehmer und wird als‚Sie‘ angesprochen. Sie akzeptieren die Lizenz, wenn Sie die Werke kopieren, modifizieren oder verteilen, wasgewissermaßen unter dem Urheberrechtsgesetz die Erlaubnis erfordert.
Eine modifizierte Version des Dokumentes bedeutet, dass jedes Werk das Dokument selbst oder einen Teil davonbeinhaltet, entweder unverändert kopiert, oder mit Modifikationen und/oder übersetzt in eine andere Sprache.
Ein untergeordneter Abschnitt ist ein benannter Anhang oder ein Titelei-Abschnitt des Dokuments, der sichausschließlich mit dem Verhältnis der Herausgeber oder Autoren des Dokuments zum Gesamtthema des Doku-ments befasst (oder damit in Verbindung stehende Bewandtnisse), und nichts beinhaltet was direkt innerhalbdes Gesamtthemas fallen könnte. (Wenn das Dokument zu einem Fachbuch über Mathematik gehört, kann einuntergeordneter Abschnitt folglich nichts Mathematisches erläutern.) Die Beziehung könnte ein Anliegen mithistorischer Verbindung zum Thema oder ähnlicher Angelegenheiten, oder bezüglich ihrer rechtlichen, kom-merziellen, philosophischen, ethischen oder politischen Position sein.
Die ‚unveränderlichen Abschnitte‘ sind bestimmte untergeordnete Abschnitte, deren Titel zum Beispiel in demHinweis, der besagt, dass das Dokument unter dieser Lizenz freigegeben ist, als jene unveränderlichen Abschnittegekennzeichnet sind. Wenn ein Abschnitt nicht zur obigen Definition von untergeordnet passt, dann ist es nichterlaubt ihn als unveränderlich zu kennzeichnen. Das Dokument kann null unveränderliche Abschnitte enthalten.Wenn das Dokument keine unveränderlichen Abschnitte kennzeichnet, dann gibt es keine.
Die ‚Umschlagtexte‘ sind bestimmte kurze Textpassagen die als vordere Umschlagtexte oder hintere Umschlag-texte in dem Hinweis, der besagt, dass das Dokument unter dieser Lizenz freigegeben ist, verzeichnet sind. Einvorderer Umschlagtext darf höchstens 5 Wörter lang sein, und ein hinterer Umschlagtext darf höchstens 25 Wörterlang sein.
Eine ‚transparente‘ Kopie des Dokumentes bedeutet eine maschinenlesbare Kopie, in einem ansehnlichen For-mat, dessen Spezifikation für die Allgemeinheit verfügbar ist, welches geeignet ist das Dokument unkompliziertmit allgemeinen Texteditoren oder (für aus Pixeln bestehende Bilder) allgemeinen Malprogrammen oder (fürZeichnungen) irgendeinem weit verbreiteten Zeicheneditor zu überarbeiten, und das geeignet ist zur Eingabe inTextformatierer oder zur automatischen Übersetzung in eine Variante von geeigneten Formaten zur Eingabe inTextformatierer. Eine Kopie, erstellt in einem ansonsten transparenten Dateiformat, dessen Auszeichnung oderfehlende Auszeichnung derart ausgestaltet wurde, um nachträgliche Modifikation durch Leser zu behindern oderzu verhindern, ist nicht transparent. Ein Bildformat ist nicht transparent, wenn es für irgendeine beträchtlicheMenge von Text verwendet wird. Eine Kopie, die nicht ‚transparent‘ ist, wird ‚undurchlässig‘ genannt.
Beispiele von geeigneten Formaten für transparente Kopien beinhalten einfachen ASCII ohne Auszeichnung, Tex-info Eingabeformat, LaTeX Eingabeformat, SGML oder XML unter Verwendung einer öffentlich zugänglichenDTD, und standardkonformes einfaches HTML, PostScript oder PDF, vorgesehen für humane Modifikation.Beispiele für transparente Bildformate beinhalten PNG, XCF und JPG. Undurchlässige Formate beinhalten propri-etäre Formate die nur mit proprietären Textverarbeitungssystemen gelesen und bearbeitet werden können, SGMLoder XML für welche die DTD und/oder Bearbeitungswerkzeuge nicht allgemein verfügbar sind, und das maschi-nengenerierte HTML, PostScript oder PDF, erzeugt mit irgendwelchen Textverarbeitungssystemen, nur für Aus-gabezwecke.
Das ‚Titelblatt‘ bedeutet, für ein gedrucktes Buch, das Titelblatt an sich zzgl. solcher nachfolgenden Seiten dienotwendig sind, die Lesbarkeit des Materials beizubehalten, wie von dieser Lizenz erfordert, um im Titelblatt zuerscheinen. Für Werke in Formaten, welche kein Titelblatt als solches haben, bedeutet ‚Titelblatt‘ der Text nahedem bedeutendsten Auftreten des Titels dieses Werkes, ausgehend vom Anfang des Textkörpers.
Der ‚Herausgeber‘ ist jede Person oder Instanz, welche Kopien des Dokuments an die Öffentlichkeit verteilt.
Ein Abschnitt Mit dem Titel XYZ bedeutet eine benannte Untereinheit des Dokuments, dessen Titel entwedergenau XYZ ist, oder XYZ in runden Klammern, gefolgt von Text, welcher XYZ in eine andere Sprache übersetzt.(Hier steht XYZ für einen spezifischen Abschnittsnamen, weiter unten erwähnt, wie zum Beispiel ‚Danksagun-gen‘, ‚Widmungen‘, ‚Befürwortungen‘ oder ‚Verlauf‘.) Den ‚Titel‘ eines solchen Abschnitts ‚zu erhalten‘, wennSie das Dokument modifizieren, bedeutet, dass dieser ein Abschnitt ‚Mit dem Titel XYZ‘ gemäß seiner Definitionbleibt.
Das Dokument kann neben dem Hinweis, der festlegt, dass diese Lizenz auf das Dokument zutrifft, Garantie-Ausschlussklauseln beinhalten. Diese Garantie-Ausschlussklauseln werden als aufgenommen betrachtet, durch
610 Chapter 25. Anhang

QGIS User Guide, Release 3.4
Verweis in dieser Lizenz, aber nur was die Ausschließung von Garantien betrifft: Jede andere Auswirkung, diediese Garantie-Ausschlussklauseln haben können, ist ungültig und hat keine Wirkung auf die Bedeutung dieserLizenz.
2. Unveränderte Vervielfältigung
Sie dürfen das Dokument in beliebiger Form kopieren und verteilen, entweder kommerziell oder nicht kom-merziell, vorausgesetzt, dass diese Lizenz, die Urheberrechtshinweise und der Lizenzhinweis mit den Worten,dass diese Lizenz auf das Dokument zutrifft, in allen Kopien wiedergegeben werden, und dass Sie keine anderenBedingungen, welcher Art auch immer, zu jenen dieser Lizenz hinzufügen. Sie dürfen keine technischen Maß-nahmen anwenden die das Lesen oder weitere Vervielfältigung von den Kopien, die Sie erstellen oder verteilen,behindern oder kontrollieren. Allerdings können Sie Bezahlung im Austausch für Kopien entgegennehmen. WennSie eine ausreichend große Anzahl von Kopien verteilen, müssen Sie außerdem die Bedingungen in Abschnitt 3beachten.
Sie dürfen außerdem Kopien verleihen, unter den selben, oben angegebenen Bedingungen, und Sie dürfen Kopienöffentlich auslegen.
3. Vervielfältigung grosser Mengen
Wenn Sie, mehr als 100 umfassend, gedruckte Kopien eines Dokuments veröffentlichen (oder Kopien in Medien,die üblicherweise gedruckte Umschläge haben) und der Lizenzhinweis des Dokuments Umschlagtexte erfordert,müssen Sie die Kopien in Umschläge beifügen, welche eindeutig und leserlich alle diese Umschlagtexte tra-gen: vordere Umschlagtexte auf vordere Umschläge, und hintere Umschlagtexte auf hintere Umschläge. BeideUmschläge müssen, ebenso eindeutig und leserlich, Sie, als den Herausgeber dieser Kopien, identifizieren. Dervordere Umschlag muss den vollständigen Titel, mit allen Wörtern des Titels, in gleicher Weise auffallend und le-icht erkennbar darstellen. Sie dürfen darüber hinaus sonstiges Material auf die Umschläge anbringen. Vervielfäl-tigung mit Änderungen, begrenzt auf die Umschläge, sofern sie den Titel des Dokuments erhalten und dieseBedingungen erfüllen, können ansonsten als unveränderte Vervielfältigung behandelt werden.
Wenn die erforderlichen Texte für beide Umschläge zu umfangreich sind, um lesbar zu passen, sollten Sie dieersten verzeichneten (so viele, um angemessen zu passen) auf den aktuellen Umschlag setzen, und den Rest aufden nachfolgenden Seiten fortsetzen.
Wenn Sie, mehr als 100 umfassend, undurchlässige Kopien des Dokuments veröffentlichen oder verteilen, müssenSie entweder eine maschinenlesbare transparente Kopie zusammen mit jeder undurchlässigen Kopie einbeziehen,oder in bzw. mit jeder undurchlässigen Kopie eine Computer-Netzwerkadresse angeben, von welcher die all-gemeine netzwerknutzende Öffentlichkeit, unter Verwendung von Netzwerkprotokollen öffentlicher Standards,Zugang hat, um eine vollständig transparente Kopie, frei von hinzugefügtem Material, herunterzuladen. Falls Siedie letzte Option verwenden, müssen Sie angemessen überlegte Schritte unternehmen, wenn Sie mit der Verteilungvon undurchlässigen Kopien in großen Mengen beginnen, um sicherzustellen, dass diese transparente Kopie unterder angegebenen Adresse auf diese Weise zugänglich bleibt, bis mindestens ein Jahr nachdem Sie zum letztenMal eine undurchlässige Kopie (unmittelbar oder durch Ihre Vertreter oder Einzelhändler) in dieser Ausgabe andie Öffentlichkeit verteilen.
Es ist erwünscht, aber nicht erforderlich, dass Sie in Kontakt mit den Autoren des Dokuments treten, kurz bevor Sieirgendeine große Anzahl von Kopien neu verteilen, um ihnen die Möglichkeit zu geben, Sie mit einer aktualisiertenVersion des Dokuments zu versorgen.
4. Modifikationen
Sie dürfen eine modifizierte Version des Dokuments unter den oben erwähnten Bedingungen der Abschnitte 2 und3 kopieren und verteilen, vorausgesetzt, dass Sie die modifizierte Version unter genau dieser Lizenz freigeben,mit der modifizierten Version wird die Rolle des Dokuments besetzt, und somit der Lizenzierung von Verteilungund Modifikation der modifizierten Version, für jeden der eine Kopie davon besitzt. Zusätzlich müssen Sie dieseSachen in der modifizierten Version erledigen:
1. Verwenden Sie auf dem Titelblatt (und gegebenenfalls auf den Umschlägen) einen Titel der sich von dem desDokuments unterscheidet, und von jenen der vorhergehenden Versionen (die, wenn es irgendwelche gab, indem Verlaufs-Abschnitt des Dokuments verzeichnet sein sollten). Sie dürfen denselben Titel wie den einervorhergehenden Version verwenden, wenn der ursprüngliche Herausgeber dieser Version die Erlaubnis gibt.
2. Verzeichnen Sie auf dem Titelblatt, als Autoren, eine oder mehrere Personen oder Organe, verantwortlichfür die Autorschaft der Modifikationen in der modifizierten Version, zusammen mit mindestens fünf der
25.2. GNU Free Documentation License 611

QGIS User Guide, Release 3.4
Hauptautoren des Dokuments (alle seine Hauptautoren, wenn es weniger als fünf hat), es sei denn, dass sieSie von dieser Anforderung befreien.
3. Geben Sie auf dem Titelblatt den Namen des Herausgebers der modifizierten Version als den des Herausge-bers an.
4. Erhalten Sie alle Urheberrechtshinweise des Dokumentes.
5. Fügen Sie einen entsprechenden Urheberrechtshinweis für Ihre Modifikationen, angrenzend zu den anderenUrheberrechtshinweisen, hinzu.
6. Nehmen Sie, direkt nach den Urheberrechtshinweisen, einen Lizenzhinweis auf, der die öffentliche Erlaub-nis gibt, die modifizierte Version unter den Bestimmungen dieser Lizenz zu verwenden, in der Form, wieweiter unten im Anhang gezeigt.
7. Erhalten Sie in diesem Lizenzhinweis die vollständigen Listen der unveränderlichen Abschnitte und er-forderlichen Umschlagtexte, aufgeführt in dem Lizenzhinweis des Dokuments.
8. Nehmen Sie eine ungeänderte Kopie dieser Lizenz auf.
9. Erhalten Sie den Abschnitt mit dem Titel ‚Verlauf‘, erhalten Sie seinen Titel und fügen Sie ihm einen Punkthinzu, der mindestens den Titel, das Jahr, neue Autoren und Herausgeber der modifizierte Version angibt,wie auf dem Titelblatt aufgeführt. Wenn es keinen Abschnitt ‚Verlauf‘ in dem Dokument gibt, erzeugenSie einen, der den Titel, das Jahr, die Autoren und Herausgeber des Dokuments angibt, wie auf seinemTitelblatt aufgeführt, dann fügen Sie einen Punkt hinzu, der die modifizierte Version beschreibt, wie in demvorhergehenden Satz angegeben.
10. Erhalten Sie gegebenenfalls die Netzwerkadresse, aufgeführt in dem Dokument, für den öffentlichen Zu-gang zu einer transparenten Kopie des Dokuments, und ebenso die in dem Dokument aufgeführten Net-zwerkadressen, für vorhergehende Versionen, auf dem es beruht. Diese können in den Abschnitt ‚Verlauf‘untergebracht werden. Sie dürfen eine Netzwerkadresse für ein Werk auslassen, das mindestens vier Jahrevor dem Dokument selbst veröffentlicht wurde, oder der ursprüngliche Herausgeber der Version, auf die essich bezieht, die Erlaubnis gibt.
11. Für jeden Abschnitt mit dem Titel ‚Danksagungen‘ oder ‚Widmungen‘, erhalten Sie den Titel des Ab-schnitts, und erhalten Sie in dem Abschnitt vollständig den wesentlichen Gehalt und Umgangston der, vonjeglichen Mitwirkenden darin aufgeführten, Danksagungen und/oder Widmungen.
12. Erhalten Sie alle unveränderlichen Abschnitte des Dokuments, ungeändert in ihrem Text und ihren Titeln.Abschnittsnummern oder Entsprechendes werden nicht als Teil der Abschnittstitel betrachtet.
13. Löschen Sie jeden Abschnitt mit dem Titel ‚Befürwortungen‘. Solch ein Abschnitt darf nicht in die modi-fizierte Version aufgenommen werden.
14. Betiteln Sie keinen Titel eines vorhandenen Abschnitts neu, der mit ‚Befürwortung‘ betitelt ist oder inKonflikt zum Titel irgendeines unveränderlichen Abschnitts steht.
15. Erhalten Sie jegliche Garantie-Ausschlussklauseln.
Wenn die modifizierte Version neue Titelei-Abschnitte oder Anhänge beinhaltet, die als untergeordnete Abschnittequalifiziert sind und kein kopiertes Material aus dem Dokument enthalten, können Sie Ihrer Wahl nach einigeoder alle diese Abschnitte als unveränderlich bestimmen. Um dies zu tun, fügen Sie ihre Titel zur Liste derunveränderlichen Abschnitte in den Lizenzhinweis der modifizierten Version hinzu. Diese Titel müssen sich vonallen anderen Abschnittstitel unterscheiden.
Sie können einen Abschnitt mit dem Titel ‚Befürwortungen‘ hinzufügen, vorausgesetzt, dass dieser nichts enthältals nur Befürwortungen Ihrer modifizierten Version durch verschiedene Parteien Beispiel Aussagen der Begutach-tung oder dass der Text von einer Organisation als maßgebliche Definition eines Standards anerkannt wordenist.
Sie können eine Textpassage von bis zu fünf Wörtern als einen vorderen Umschlagtext, und eine Textpassagevon bis zu 25 Wörtern als hinteren Umschlagtext in der modifizierten Version hinzufügen. Nur eine Textpassagedes vorderen Umschlagtextes und eine des hinteren Umschlagtextes kann von (oder durch, von ihr, angefertigteZusammenstellung) irgendeiner Person hinzugefügt werden. Wenn das Dokument bereits einen Umschlagtextfür denselben Umschlag beinhaltet, zuvor von Ihnen hinzugefügt oder durch Zusammenstellung, angefertigt von
612 Chapter 25. Anhang
QGIS User Guide, Release 3.4
derselben Person, in dessen Namen Sie handeln, können Sie keinen weiteren hinzufügen; aber Sie dürfen denalten ersetzen, mit ausdrücklicher Erlaubnis des vorherigen Herausgebers, welcher den alten hinzufügte.
Der/die Autor(en) und Herausgeber des Dokuments geben durch diese Lizenz für keine modifizierte Version dieErlaubnis ihre Namen für Werbung zu verwenden oder Befürwortung zu behaupten oder anzudeuten.
5. Dokumente kombinieren
Sie dürfen das Dokument mit anderen, unter dieser Lizenz freigegeben, Dokumenten kombinieren, unter den Bes-timmungen, definiert in Abschnitt 4 für modifizierte Versionen, vorausgesetzt, dass Sie in die Kombination alleunveränderlichen Abschnitte aller Originaldokumente, nicht modifiziert, einbeziehen und sie alle als unveränder-liche Abschnitte Ihres kombinierten Werkes in dessen Lizenzhinweis verzeichnen, und dass Sie alle ihre Garantie-Ausschlussklauseln erhalten.
Das kombinierte Werk muss nur eine Kopie dieser Lizenz enthalten, und mehrfach identische unveränderliche Ab-schnitte können gegen eine einzelne Kopie ausgetauscht werden. Wenn es mehrfach identische unveränderlicheAbschnitte mit demselben Namen, aber unterschiedlichem Inhalt gibt, erzeugen Sie den Titel eines jeden solchenAbschnitts an seinem Ende eindeutig durch Hinzufügen, in runden Klammern, des Namens, falls bekannt, des ur-sprünglichen Autors oder Herausgebers dieses Abschnittes, oder andernfalls einer eindeutigen Nummer. NehmenSie dieselbe Anpassung bei den Abschnittstiteln in der Liste von unveränderlichen Abschnitten in dem Lizenzhin-weis des kombinierten Werkes vor.
In der Kombination müssen Sie jegliche Abschnitte mit dem Titel ‚Verlauf‘ in den verschiedenen Originaldoku-menten kombinieren und einen Abschnitt mit dem Titel ‚Verlauf‘ bilden; ebenso kombinieren Sie jegliche Ab-schnitte mit dem Titel ‚Danksagungen‘, und jegliche Abschnitte mit dem Titel ‚Widmungen‘. Sie müssen alleAbschnitte mit dem Titel ‚Befürwortungen‘ löschen.
6. Sammlungen von Dokumenten
Sie dürfen eine Sammlung erzeugen, bestehend aus dem Dokument und anderen Dokumenten, freigegeben unterdieser Lizenz, und die Einzel-Kopien dieser Lizenz in den verschiedenen Dokumenten gegen eine einzelne Kopie,die in die Sammlung aufgenommen wird, austauschen, vorausgesetzt, dass Sie die Regeln dieser Lizenz für un-veränderte Vervielfältigung jedes Dokuments in jeder anderen Hinsicht befolgen.
Sie dürfen ein einzelnes Dokument aus solch einer Sammlung entnehmen, und es individuell unter dieser Lizenzverteilen, vorausgesetzt, dass Sie eine Kopie dieser Lizenz in das extrahierte Dokument einfügen, und diese Lizenzin jeder anderen Hinsicht, bezüglich der unveränderten Vervielfältigung dieses Dokuments, befolgen.
7. Gruppierung mit unabhängigen Werken
Eine Zusammentragung des Dokuments oder seiner Ableitungen mit anderen gesonderten und unabhängigenDokumenten oder Werken, in oder zu einem Band auf einem Speicher- oder Verteilungsmedium, wird eine ‚Grup-pierung‘ genannt, wenn das Urheberrecht, das sich aus der Zusammentragung ergibt, nicht verwendet wird, umdie gültigen Rechte der Benutzer dieser Zusammentragungen darüber hinaus, was die Einzel-Werke gestatten, zubeschränken. Wenn das Dokument in eine Gruppierung aufgenommen ist, trifft diese Lizenz nicht auf die anderenWerke in der Gruppierung zu, welche nicht selbst abgeleitete Werke des Dokuments sind.
Wenn die Anforderung für Umschlagtext von Abschnitt 3 auf diese Kopien des Dokuments anwendbar ist, wennaußerdem das Dokument weniger als eine Hälfte der gesamten Gruppierung darstellt, kann der Umschlagtext desDokuments auf Umschläge, die das Dokument innerhalb der Gruppierung einklammern, untergebracht werden,oder der elektronischen Entsprechung von Umschlägen, wenn das Dokument in elektronischer Form vorliegt. An-dernfalls müssen sie auf gedruckten Umschlägen vorkommen, welche die vollständige Gruppierung einklammern.
8. Übersetzung
Übersetzung wird als eine Art von Modifikation betrachtet, also dürfen Sie Übersetzungen unter den Bestim-mungen von Abschnitt 4 verteilen. Das Austauschen unveränderlicher Abschnitte mit Übersetzungen erfordertbesondere Erlaubnis von ihren Urheberrechtsinhabern, aber Sie können Übersetzungen von einigen oder allen un-veränderlichen Abschnitten aufnehmen, zusätzlich zu den Originalversionen dieser unveränderlichen Abschnitte.Sie können eine Übersetzung dieser Lizenz aufnehmen, und alle Lizenzhinweise in dem Dokument, und jeglicheGarantie-Ausschlussklauseln, vorausgesetzt, dass Sie außerdem die englische Originalversion dieser Lizenz unddie Originalversionen jener Hinweise und Ausschlussklauseln aufnehmen. Im Falle eines Widerspruchs zwischender Übersetzung und der Originalversion dieser Lizenz oder eines Hinweises oder einer Ausschlussklausel, wirdsich die Originalversion durchsetzen.
25.2. GNU Free Documentation License 613

QGIS User Guide, Release 3.4
Wenn ein Abschnitt in dem Dokument mit ‚Danksagungen‘, ‚Widmungen‘ oder ‚Verlauf‘ betitelt ist, wird dieAnforderung (Abschnitt 4), seinen Titel (Abschnitt 1) zu erhalten, normalerweise die Änderung des tatsächlichenTitels erfordern.
9. Schlussbestimmung
Sie dürfen das Dokument nicht kopieren, modifizieren, unterlizenzieren oder verteilen, außer, als ausdrücklichunter dieser Lizenz zur Verfügung gestellt. Jeder andere Versuch es zu kopieren, zu modifizieren, zu unterlizen-zieren oder zu verteilen ist ungültig, und wird automatisch Ihre Rechte unter dieser Lizenz aufkündigen.
Jedoch, wenn Sie jeglichen Verstoß gegen diese Lizenz beenden, dann ist ihre Lizenz eines bestimmten Urhe-berrechtsinhabers wieder (a) vorläufig, sofern und solange der Urheberrechtsinhaber nicht ihre Lizenz beendet,und (b) dauerhaft, wenn der Urheberrechtsinhaber es versäumt, Sie über den Verstoß zu benachrichtigen, mitangemessenen Mitteln, vorzeitig 60 Tage nach der Beendigung.
Darüber hinaus ist Ihre Lizenz eines bestimmten Urheberrechtsinhabers wieder dauerhaft, wenn der Urheber-rechtsinhaber Sie über den Verstoß mit angemessenen Mitteln benachrichtigt, es das erste Mal ist, dass Sie eineBenachrichtigung über den Verstoß dieser Lizenz (für jedes Werk) vom Urheberrechtsinhaber erhalten, und Sieden Verstoß vorzeitig 30 Tage nach Erhalt der Benachrichtigung beseitigen.
Die Beendigung Ihrer Rechte unter diesem Abschnitt beendet nicht die Lizenzen der Parteien, welche Kopien oderRechte von Ihnen unter dieser Lizenz erhalten haben. Wenn Ihre Rechte aufgekündigt und nicht wieder dauerhaftgeworden sind, gibt Ihnen der Erhalt einer Kopie von Teilen oder Sämtlichem des gleichen Materials keine Rechte,diese zu verwenden.
10. Zukünftige Überarbeitungen dieser Lizenz
The Free Software Foundation may publish new, revised versions of the GNU Free Documentation License fromtime to time. Such new versions will be similar in spirit to the present version, but may differ in detail to addressnew problems or concerns. See https://www.gnu.org/copyleft/.
Jeder Version der Lizenz wird eine charakteristische Versionsnummer gegeben. Wenn das Dokument spezifiziert,dass eine besonders nummerierte Version dieser Lizenz ‚oder jede spätere Version‘ auf sich zutrifft, haben Sie dieWahl den Bestimmungen und Bedingungen entweder dieser spezifizierten Version oder jeder späteren Version, die(nicht als Entwurf) durch die Free Software Foundation veröffentlicht worden ist, zu folgen. Wenn das Dokumentspezifiziert, dass ein Bevollmächtigter entscheiden darf welche zukünftigen Versionen dieser Lizenz verwendetwerden können, berechtigt Sie das dauerhaft, durch die öffentliche Aussage desjenigen Bevollmächtigten über dieAkzeptanz einer Version, diese Version für das Dokument zu wählen.
11. Relizenzierung
„Massive Multiauthor Collaboration Site“ (or „MMC Site“) meint jeglichen World Wide Web Server, welcherurheberrechtsfähige Werke veröffentlicht und ferner bedeutende Möglichkeiten für jeden bietet, solche Werkezu editieren. Ein öffentliches Wiki, welches jeder bearbeiten kann, ist ein Beispiel eines solchen Servers. Eine‚Massives Multiautor Collaboration‘ (oder ‚MMC‘), enthalten im Standort, bedeutet jegliche Zusammenstellungurheberrechtsfähiger Werke, die folglich auf dem MMC-Standort veröffentlicht werden.
„CC-BY-SA“ meint die Creative Commons Namensnennung-Weitergabe unter gleichen Bedingungen 3.0Lizenz, veröffentlicht von der Creative Commons Corporation, einem gemeinnützigen Unternehmen mit Haupt-geschäftssitz in San Francisco, Californien, sowie zukünftige Copyleft-Versionen dieser Lizenz, welche durchdieselbe Organisation veröffentlicht wird.
„Einbeziehen“ bedeutet, ein Dokument zu veröffentlichen oder neu zu veröffentlichen, ganz oder teilweise, alsBestandteil eines anderen Dokuments.
Eine MMC ist „geeignet zur Relizenzierung“, wenn sie unter dieser Lizenz lizenziert wird, und wenn alle Werke,die zuerst unter dieser Lizenz irgendwo anders als auf der MMC veröffentlicht, und nachträglich ganz oder teil-weise in der MMC einbezogen wurden, (1) keine Umschlagtexte oder unveränderliche Abschnitte hatten, und (2)folglich vor dem 1. November 2008 einbezogen wurden.
Betreiber eines MMC-Standortes kann eine MMC, enthalten im Standort unter CC-BY-SA des gleichen Stan-dortes, jederzeit vor dem 1. August 2009 neu veröffentlichen, vorausgesetzt, die MMC ist für die Relizenzierunggeeignet.
Anhang: Wie Sie diese Lizenz für Ihre Dokumente verwenden
614 Chapter 25. Anhang

QGIS User Guide, Release 3.4
Um diese Lizenz in einem Dokument, das Sie geschrieben haben, zu verwenden, nehmen Sie eine Kopie derLizenz in das Dokument auf und setzen Sie die folgenden Urheberrechts- und Lizenzhinweise unmittelbar hinterdas Titelblatt:
Copyright © YEAR YOUR NAME.Permission is granted to copy, distribute and/or modify this documentunder the terms of the GNU Free Documentation License, Version 1.3or any later version published by the Free Software Foundation;with no Invariant Sections, no Front-Cover Texts, and no Back-Cover Texts.A copy of the license is included in the section entitled "GNUFree Documentation License".
Wenn Sie unveränderliche Abschnitte, vordere Umschlagtexte und hintere Umschlagtexte haben, ersetzen Sie dieZeile ‚ohne . . . Umschlagtexte.‘ durch diese:
with the Invariant Sections being LIST THEIR TITLES, with theFront-Cover Texts being LIST, and with the Back-Cover Texts being LIST.
Wenn Sie unveränderliche Abschnitte ohne Umschlagtexte haben oder eine andere Kombination der drei, vermis-chen Sie jene zwei Alternativen zu einer übereinstimmenden Situation.
Wenn Ihr Dokument nicht-triviale Beispiele eines Programmcodes enthält, empfehlen wir, diese Beispieleentsprechend unter einer freien Software-Lizenz ihrer Wahl, wie der GNU General Public License freizugeben,um deren Verwendung in freier Software zu gestatten.
25.2. GNU Free Documentation License 615

QGIS User Guide, Release 3.4
616 Chapter 25. Anhang

CHAPTER 26
Literatur und Internetreferenzen
GDAL-SOFTWARE-SUITE. Geospatial data abstraction library. https://www.gdal.org, 2013.
GRASS-PROJECT. Geographic resource analysis support system. https://grass.osgeo.org, 2013.
NETELER, M., AND MITASOVA, H. Open source gis: A grass gis approach, 2008.
OGR-SOFTWARE-SUITE. Geospatial data abstraction library. https://www.gdal.org/ogr, 2013.
OPEN-GEOSPATIAL-CONSORTIUM. Web map service (1.1.1) implementation specification. https://portal.opengeospatial.org, 2002.
OPEN-GEOSPATIAL-CONSORTIUM. Web map service (1.3.0) implementation specification. https://portal.opengeospatial.org, 2004.
POSTGIS-PROJECT. Spatial support for postgresql. http://postgis.refractions.net/, 2013.
617