Formation of a metamorphic complex along an obliquely convergent margin: Structural and...
25
Formation of a metamorphic complex along an obliquely convergent margin: Structural and thermochronological evolution of the Chugach Metamorphic Complex, southern Alaska Deta Gasser, 1,2 Emilie Bruand, 1 Kurt Stüwe, 1 David A. Foster, 3 Ralf Schuster, 4 Bernhard Fügenschuh, 5 and Terry Pavlis 6 Received 5 August 2010; revised 7 January 2011; accepted 20 January 2011; published 20 April 2011. [1] This study documents the structural and metamorphic evolution of middle to lower crust along an oblique convergent curved continental margin during a time span of ∼60 Myr. Our study documents the importance of variable obliquity during convergence which led to the development of overprinting fabrics and distinct exhumation histories along strike of the margin. We present structural analyses, 40 Ar/ 39 Ar, Rb/Sr, and zircon fission track ages from middle to lower crust exposed along the southern Alaskan margin in the Chugach Metamorphic Complex. Together with the metamorphic history and additional geochronology from the literature we derive the following tectonic evolution for this area: accretion of sediments during dextrally oblique convergence led to strain‐partitioned D 1 structures and greenschist‐facies metamorphism prior to circa 55 Ma. At ∼55–51 Ma, a margin‐parallel stretching phase with vertical thinning (D 2 ) affected the margin and led to andalusite‐sillimanite grade metamorphism and the onset of partial melting. A switch back to dextral transpression (D 3 ) shortly after D 2 led to rapid cooling of the western and central parts of the complex associated with exhumation of parts of the core of the complex until circa 46 Ma. The southeastern part of the complex cooled and exhumed regularly and slowly until circa 5 Ma due to its highly oblique orientation relative to the convergence direction. An increase in cooling and exhumation occurred after circa 5 Ma in the entire southeastern part of the complex, associated with the Neogene collision of the Yakutat terrane. Citation: Gasser, D., E. Bruand, K. Stüwe, D. A. Foster, R. Schuster, B. Fügenschuh, and T. Pavlis (2011), Formation of a metamorphic complex along an obliquely convergent margin: Structural and thermochronological evolution of the Chugach Metamorphic Complex, southern Alaska, Tectonics, 30, TC2012, doi:10.1029/2010TC002776. 1. Introduction [2] Oblique convergence between two lithospheric plates is common in ancient and active orogenic belts all over the world [e.g., Teyssier et al., 1995; Whitney et al., 2007; Abu‐Alam and Stüwe, 2009; Foster et al., 2009; Goscombe and Gray, 2009]. The resulting deformation between the two moving regions is generally termed transpression [e.g., Sanderson and Marchini, 1984]. The fabric development, the metamorphic evolution and exhumation history in such a transpressional region may differ considerably from orogen‐ normal systems, and factors such as the rate and obliquity of convergence, the ratio between simple and pure shear, the inclination and frictional properties of the bounding shear zones and spatially focused erosion may play an important role [e.g., Fossen and Tikoff, 1993; Robin and Cruden, 1994; Tikoff and Teyssier, 1994; Jones et al., 1997; Thompson et al., 1997; Teyssier and Tikoff, 1999; Czeck and Hudleston, 2003; Schulmann et al., 2003; Koons et al., 2003; Jones et al., 2004]. The southern margin of Alaska has been con- trolled by overall oblique convergence between oceanic plates of the Pacific basin and the continental part of the North American plate throughout the Cenozoic [e.g., Plafker et al., 1994]. It therefore represents an ideal natural laboratory to investigate the structural and metamorphic evolution of orogenic crust along a transpressional plate margin. [3] In this contribution we present the results of a multi- disciplinary study conducted on a metamorphic complex formed along this obliquely convergent margin: the Chugach Metamorphic Complex (CMC) (Figure 1 [ Hudson and Plafker, 1982; Sisson et al., 1989; Pavlis and Sisson, 1995, 2003]). The CMC is a 10–50 km wide and ∼350 km long upper amphibolite facies metamorphic complex which devel- oped during the Eocene in the Late Cretaceous to Paleocene 1 Department of Earth Science, University of Graz, Graz, Austria. 2 Department of Geosciences, University of Oslo, Oslo, Norway. 3 Department of Geological Sciences, University of Florida, Gainesville, Florida, USA. 4 Geological Survey of Austria, Vienna, Austria. 5 Faculty of Geo‐ and Atmospheric Sciences, University of Innsbruck, Innsbruck, Austria. 6 Department of Geological Sciences, University of Texas at El Paso, El Paso, Texas, USA. Copyright 2011 by the American Geophysical Union. 0278‐7407/11/2010TC002776 TECTONICS, VOL. 30, TC2012, doi:10.1029/2010TC002776, 2011 TC2012 1 of 25
Transcript of Formation of a metamorphic complex along an obliquely convergent margin: Structural and...

Formation of ametamorphic complex along an obliquely convergentmargin: Structural and thermochronological evolution of theChugachMetamorphic Complex, southern Alaska
Deta Gasser,1,2 Emilie Bruand,1 Kurt Stüwe,1 David A. Foster,3 Ralf Schuster,4
Bernhard Fügenschuh,5 and Terry Pavlis6
Received 5 August 2010; revised 7 January 2011; accepted 20 January 2011; published 20 April 2011.
[1] This study documents the structural and metamorphic evolution of middle to lowercrust along an oblique convergent curved continental margin during a time span of∼60 Myr. Our study documents the importance of variable obliquity during convergencewhich led to the development of overprinting fabrics and distinct exhumation historiesalong strike of the margin. We present structural analyses, 40Ar/39Ar, Rb/Sr, and zirconfission track ages from middle to lower crust exposed along the southern Alaskan marginin the Chugach Metamorphic Complex. Together with the metamorphic history andadditional geochronology from the literature we derive the following tectonic evolutionfor this area: accretion of sediments during dextrally oblique convergence led tostrain‐partitioned D1 structures and greenschist‐facies metamorphism prior to circa 55 Ma.At ∼55–51 Ma, a margin‐parallel stretching phase with vertical thinning (D2) affectedthe margin and led to andalusite‐sillimanite grade metamorphism and the onset of partialmelting. A switch back to dextral transpression (D3) shortly after D2 led to rapid coolingof the western and central parts of the complex associated with exhumation of partsof the core of the complex until circa 46 Ma. The southeastern part of the complex cooledand exhumed regularly and slowly until circa 5 Ma due to its highly oblique orientationrelative to the convergence direction. An increase in cooling and exhumation occurredafter circa 5 Ma in the entire southeastern part of the complex, associated with the Neogenecollision of the Yakutat terrane.
Citation: Gasser, D., E. Bruand, K. Stüwe, D. A. Foster, R. Schuster, B. Fügenschuh, and T. Pavlis (2011), Formation of ametamorphic complex along an obliquely convergent margin: Structural and thermochronological evolution of the ChugachMetamorphic Complex, southern Alaska, Tectonics, 30, TC2012, doi:10.1029/2010TC002776.
1. Introduction
[2] Oblique convergence between two lithospheric platesis common in ancient and active orogenic belts all overthe world [e.g., Teyssier et al., 1995; Whitney et al., 2007;Abu‐Alam and Stüwe, 2009; Foster et al., 2009; Goscombeand Gray, 2009]. The resulting deformation between thetwo moving regions is generally termed transpression [e.g.,Sanderson and Marchini, 1984]. The fabric development,the metamorphic evolution and exhumation history in such atranspressional region may differ considerably from orogen‐normal systems, and factors such as the rate and obliquity of
convergence, the ratio between simple and pure shear, theinclination and frictional properties of the bounding shearzones and spatially focused erosion may play an importantrole [e.g., Fossen and Tikoff, 1993; Robin and Cruden, 1994;Tikoff and Teyssier, 1994; Jones et al., 1997; Thompsonet al., 1997; Teyssier and Tikoff, 1999; Czeck and Hudleston,2003; Schulmann et al., 2003; Koons et al., 2003; Joneset al., 2004]. The southern margin of Alaska has been con-trolled by overall oblique convergence between oceanicplates of the Pacific basin and the continental part of theNorth American plate throughout the Cenozoic [e.g., Plafkeret al., 1994]. It therefore represents an ideal natural laboratoryto investigate the structural and metamorphic evolution oforogenic crust along a transpressional plate margin.[3] In this contribution we present the results of a multi-
disciplinary study conducted on a metamorphic complexformed along this obliquely convergent margin: the ChugachMetamorphic Complex (CMC) (Figure 1 [Hudson andPlafker, 1982; Sisson et al., 1989; Pavlis and Sisson, 1995,2003]). The CMC is a 10–50 km wide and ∼350 km longupper amphibolite facies metamorphic complex which devel-oped during the Eocene in the Late Cretaceous to Paleocene
1Department of Earth Science, University of Graz, Graz, Austria.2Department of Geosciences, University of Oslo, Oslo, Norway.3Department of Geological Sciences, University of Florida, Gainesville,
Florida, USA.4Geological Survey of Austria, Vienna, Austria.5Faculty of Geo‐ and Atmospheric Sciences, University of Innsbruck,
Innsbruck, Austria.6Department of Geological Sciences, University of Texas at El Paso,
El Paso, Texas, USA.
Copyright 2011 by the American Geophysical Union.0278‐7407/11/2010TC002776
TECTONICS, VOL. 30, TC2012, doi:10.1029/2010TC002776, 2011
TC2012 1 of 25

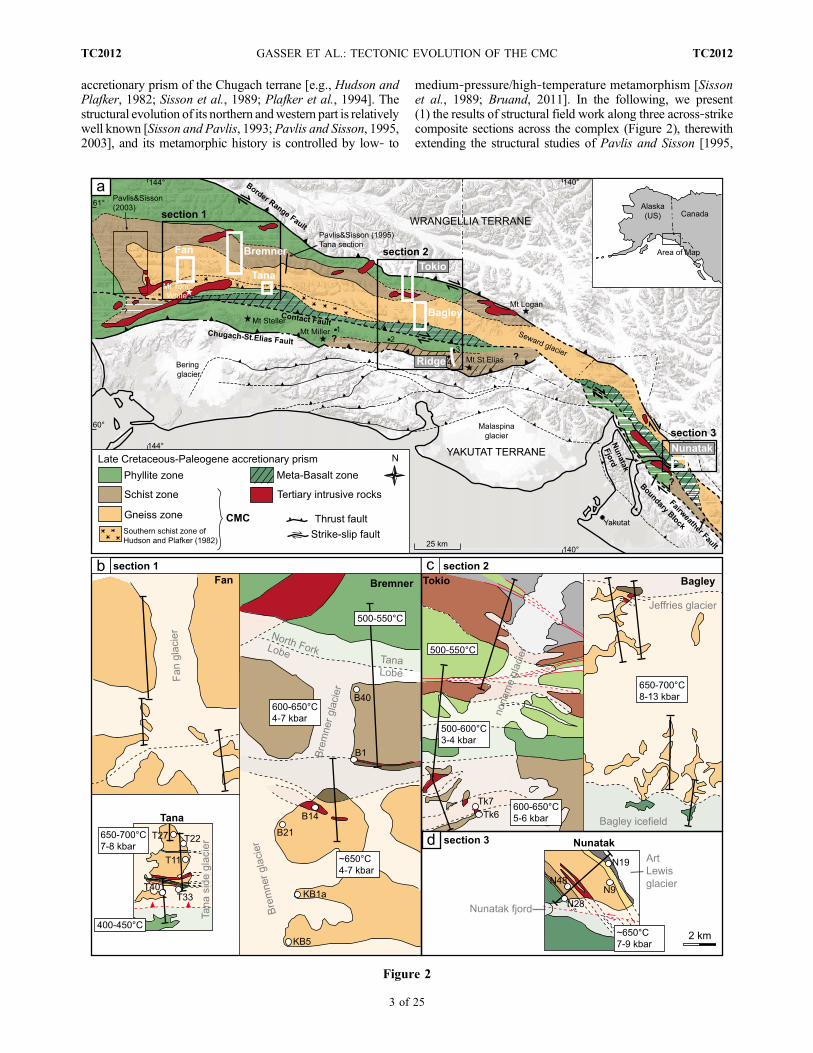
Figure 1. (a) Tectonic sketch map of Alaska showing the location of the tectonic terranes relevant for thisstudy and major Neogene faults of the northern Cordillera. (b) Geological map of the southern Alaskamargin, modified from Plafker et al. [1994], and faults of the Border Range Fault System after Pavlisand Roeske [2007]. (c) Crustal profile through the southern Alaska margin, along the Trans‐AlaskaCrustal Transect (TACT) route, after Fuis et al. [2008] and Fuis and Plafker [1991]. (d) Schematic sketch ofthe plate tectonic situation in the Pacific Basin during the Late Cretaceous to Eocene period as indicated bymagnetic anomalies preserved on the Pacific plate [after Doubrovine and Tarduno, 2008]. Resurrectionplate after Haeussler et al. [2003]. Two possible locations of the accretionary prism of the Chugach andPrince William terranes along the margin are indicated. Abbreviations of geographical locations (in italics)are as follows: Anc, Anchorage; Ba, Baranof Island; Co, Cordova; GI, Glacier Island; Ju, Juneau; KI,Knight Island; Ko, Kodiak; MtF, Mount Fairweather; Se, Seward; SeG, Seward Glacier; RP, ResurrectionPeninsula; Si, Sitka; Va, Valdez; Ya, Yakutat. Abbreviations of geological names (terrane names in boxesand bold font; faults in bold font) are as follows: ARB, Alaska Range belt; BRFS, Border Range FaultSystem; CFS, Contact Fault System; CMC, Chugach Metamorphic Complex; CSE, Chugach–St. EliasFault; CSF, Chatham Strait Fault; CT, Chugach terrane; CPC, Coast Plutonic Complex; DF, Denali Fault;DRZ, Dangerous River Zone; FF, Fairweather Fault; KF, Kaltag Fault; KIZ, Kayak Island Zone; PZ,Pamplona Zone; PWT, Prince William terrane; TF, Tintina Fault; TrF, Transition Fault; WCT, WrangelliaComposite terrane; YT, Yakutat terrane.
GASSER ET AL.: TECTONIC EVOLUTION OF THE CMC TC2012TC2012
2 of 25
accretionary prism of the Chugach terrane [e.g., Hudson andPlafker, 1982; Sisson et al., 1989; Plafker et al., 1994]. Thestructural evolution of its northern andwestern part is relativelywell known [Sisson and Pavlis, 1993; Pavlis and Sisson, 1995,2003], and its metamorphic history is controlled by low‐ to
medium‐pressure/high‐temperature metamorphism [Sissonet al., 1989; Bruand, 2011]. In the following, we present(1) the results of structural field work along three across‐strikecomposite sections across the complex (Figure 2), therewithextending the structural studies of Pavlis and Sisson [1995,
Figure 2
GASSER ET AL.: TECTONIC EVOLUTION OF THE CMC TC2012TC2012
3 of 25

2003] toward the south and east, and (2) the results of40Ar/39Ar, Rb‐Sr and zircon fission track thermochronologyconducted on the three structural transects investigated. Basedon these new thermochronological data and data from theliterature, we present cooling paths for the different parts ofthe complex. We then integrate the structural, metamorphicand temporal history to present a possible tectonic evolutionfor the complex. Our study documents the structural, meta-morphic and temporal behavior of middle to lower crust alongan obliquely convergent continental margin from ∼60 Ma tothe present.
2. Geological Setting
[4] The CMC is exposed in the Chugach–St. EliasMountains along the southern Alaskan margin (Figure 1).The southern Alaskan margin is part of the outermost tec-tonic belt of the North American Cordillera (Figure 1a[Oldow et al., 1989; Dickinson, 2009]), which resultedfrom the (ongoing) oblique convergence between oceanicplates of the Pacific Basin and the continent of NorthAmerica. The modern margin is highly curved, which leadsto dominantly dextral movement along the active Fair-weather fault system in southeastern Alaska and to thrustfaulting along the Aleutian megathrust and related faultsfarther west (Figure 1b). A block of continental and oceaniccrust, the Yakutat terrane, is currently actively colliding intothis curved margin (Figure 1b [e.g., Bruhn et al., 2004;Pavlis et al., 2004; Berger et al., 2008; Meigs et al., 2008]).[5] The rocks located inboard of the Yakutat terrane are
part of a vast, complexly deformed accretionary prism whichextends ∼2100 km along the margin from Sanak Island in thewest to Baranof Island in the southeast (Figure 1b; Chugachand Prince William terranes). This accretionary prism isemplaced along the Border Range fault system against theWrangellia composite terrane to the north (Figure 1b [Plafkeret al., 1994; Pavlis and Roeske, 2007]). The accretionaryprism is built of (1) an inboard narrow belt of Late Triassic toCretaceous mélange [e.g., Amato and Pavlis, 2010] and (2)an outboard Late Cretaceous to Eocene marine turbiditesequence intercalated with mafic volcanic rocks (Figure 1b[Nilsen and Zuffa, 1982; Plafker et al., 1994]). The accre-tionary prism is separated into the northern Chugach and thesouthern Prince William terranes by the Contact fault system(Figure 1b [Bol and Gibbons, 1992; Bol and Roeske, 1993]).[6] Paleocene to Eocene magmatic rocks intrude the
accretionary prism of the Chugach and the northern part ofthe Prince William terrane: the so‐called Sanak‐Baranofplutonic belt (Figure 1b [Hudson et al., 1979; Farris and
Paterson, 2009]). The mainly calc‐alkaline plutons areunusual because they intrude the accretionary prism in anextreme fore‐arc position: inferred coeval magmatic arcsare located a few hundred kilometers farther inboard (theAlaska Range and Coast Plutonic belts; Figure 1a [Wallaceand Engebretson, 1984; Plafker et al., 1994]). The geo-chemistry of the Sanak‐Baranof plutons indicates that theyoriginated mainly from the melting of metasedimentaryrocks of the accretionary prism, with a variable contributionfrom a more mafic end‐member [Hudson et al., 1979; Hillet al., 1981; Barker et al., 1992; Harris et al., 1996; Lytwynet al., 2000; Ayuso et al., 2009]. The age of the intru-sions ranges from ∼61 Ma in the west to ∼50 Ma in the east[Bradley et al., 1993, 2000, 2003; Sisson et al., 2003; Farriset al., 2006].[7] The CMC is exposed in the eastern part of the accre-
tionary prism and is intruded by many premetamorphic,synmetamorphic and postmetamorphic dikes and plutonsassociated with the Sanak‐Baranof belt (Figures 1b and 2a[Hudson and Plafker, 1982; Sisson and Pavlis, 1993; Pavlisand Sisson, 1995, 2003; Harris et al., 1996]). The complexconsists of two macroscopically different metamorphic units:An outer schist zone composed of fine‐grained biotite‐quartz‐plagioclase schist, which surrounds an inner gneiss zonecomposed of layered migmatitic gneisses (Figure 2a [Hudsonand Plafker, 1982]). A zone of metabasaltic rocks intercalatedwith greenschist‐ to amphibolite facies metasedimentaryrocks occurs along the southern border of the complex(Figure 2a [Lull and Plafker, 1990]). Peak metamorphicconditions reached are ∼450°C–550°C and ∼2–3 kbar in thegreenschist‐facies phyllites outside the CMC, ∼500°C–650°Cand ∼2–3 kbar in the northern schist zone and in the west-ernmost gneiss zone, ∼500°C–650°C and ∼3–7 kbar in thesouthern schist zone, and >650°C and ∼4–13 kbar in thegneiss zone, with a tendency of the higher pressures occurr-ing toward the south and east (Figures 2b–2d [Sisson andHollister, 1988; Sisson et al., 1989; Bruand et al., 2010;Bruand, 2011]). Based on these pressure ranges, rocks of thephyllite, schist, western and northern gneiss zones apparentlyreached maximum depths of ∼10–25 km whereas rocks of thesouthern and eastern gneiss zones were buried to depths ofup to ∼30–50 km.[8] Structurally, the northern schist zone and the western
gneiss zone of the CMC are dominated by three generationsof ductile fabrics [Sisson and Pavlis, 1993; Pavlis andSisson, 1995, 2003; Scharman et al., 2011].[9] 1. D1 produced a variably but generally steeply dipping
layer‐parallel pressure solution foliation (S1). In line withobservations in lower‐grade rocks to the west [e.g., Nokleberg
Figure 2. (a) Geological map of the Chugach Metamorphic Complex, according to Hudson and Plafker [1982] and resultsof this study. The locations of the three different sections presented in this study are indicated. Note that Hudson and Plafker[1982] mapped a southern schist zone in the western part of the complex (indicated with stars) which we did not encounterin our sections 1 and 2. Dots labeled 1–4 in the southern phyllite zone are locations of fixed‐wing aircraft stops weconducted in order to map the structure of the ridge between Mount Miller and Mount St. Elias. (b–d) Detailed sketch mapsof the different parts of the western, central, and southeastern sections. The location of the thermochronological samples andgeneral PT conditions from Bruand [2011] are indicated. The given PT ranges in boxes correspond to the PT ranges ob-tained on several samples from these zones, including error bars on the methods used. Scale bar in Figure 2d applies to allsections in Figures 2b–2d. Stippled line in the Fan transect of Figure 2b indicates the southern gneiss‐schist transition asmarked on the map of Hudson and Plafker [1982]. Color code as for Figure 3 for Figures 2b and 2c and as for Figure 4 forFigure 2d.
GASSER ET AL.: TECTONIC EVOLUTION OF THE CMC TC2012TC2012
4 of 25

et al., 1989; Fisher and Byrne, 1992] this deformational eventis generally interpreted as contemporaneous with accretion.[10] 2. D2 produced the first syn‐CMC metamorphic
fabric (S2) with a pronounced E‐W stretching lineationdeveloped in the schists and gneisses, associated with gentlyinclined to recumbent, close to isoclinal F2 folds.[11] 3. D3 produced a steeply dipping, ∼E‐W striking
foliation (S3) developed as a crenulation cleavage in theschist zone and as a high‐grade foliation contemporaneouswith migmatite development in the gneiss zone. D3 wasassociated with dextral shear, with localized evidence thatD3 was transpressional.[12] The CMC is less well known to the east and south of
the U.S.‐Canadian border. From the core of the St. EliasMountains through the Fairweather Range, the CMC isextensively covered by ice fields (Figure 2a), but the high‐grade metamorphism probably extends continuously to atleast the Fairweather Range (Figure 1b) and may extend asfar as Baranof Island [e.g., Pavlis and Sisson, 1995;Zumsteg et al., 2003; Bruand, 2011]. Complications occuralong the southern border of the CMC [e.g., Plafker et al.,1994]. Tectonic slivers of accretionary prism rocks withvariable metamorphic grade (e.g., the ridge from MountSteller to Mount St. Elias and the Boundary block in theNunatak Fjord area; Figure 2a) were probably dextrallydisplaced and obliquely exhumed along the Fairweather‐Contact fault system, but little is known about the timingand amount of displacement and exhumation [Hudson et al.,1977a, 1977b; Plafker et al., 1994; Sisson et al., 2003;Enkelmann et al., 2009, 2010].[13] The presence of the high‐grade CMC in the accre-
tionary prism, the near‐trench position of the Sanak‐Baranofplutonic belt and the geochemistry and age distribution ofthese plutons have been widely interpreted as the result ofthe subduction of an active oceanic spreading ridge belowthe margin, with the subducting ridge providing the heatfor metamorphosing and melting the accreted sedimentaryrocks [Marshak and Karig, 1977; Bradley et al., 1993, 2000,2003; Sisson and Pavlis, 1993; Pavlis and Sisson, 1995,2003; Haeussler et al., 1995, 2003; Harris et al., 1996;Madsen et al., 2006; Farris and Paterson, 2009]. However,due to unknown dextral displacement of the accretionaryprism along the Border Range fault system since its forma-tion (Figure 1d [e.g., Plafker et al., 1994; Roeske et al., 2003;Pavlis and Roeske, 2007]) and the incomplete plate tectonicrecord in the Pacific basin (Figure 1d [e.g., Engebretsonet al., 1985; Atwater, 1989; Doubrovine and Tarduno,2008]), different plate tectonic models have been proposedwhich could explain the Eocene tectonic history of thesouthern Alaskan margin (Figure 1d [Bradley et al., 1993,2003; Sisson and Pavlis, 1993; Pavlis and Sisson, 1995;Haeussler et al., 2003; Madsen et al., 2006]).
3. New Structural Data From the ChugachMetamorphic Complex
[14] In order to extend the structural information fromPavlis and Sisson [1995, 2003] from the northern andwestern parts of the CMC to a larger area, we mapped threeacross‐strike composite sections through the entire complex(Figure 2): (1) a western section 1, (2) a central section 2,and (3) a southeastern section 3. Access to the sections was
by fixed wing aircraft and mapping occurred on foot fromcentral camps. A total of 45 field days were conducted overtwo summers (2008, 2009). In the following, we refer to theschist and gneiss zones as macroscopically defined byHudson and Plafker [1982] and we refer to the lower‐grademetamorphic rocks outside the complex as phyllite zone.[15] Section 1 consists of three different field areas: the
Fan, Bremner and Tana transects (named after the majorglaciers close to the transects; Figures 2a, 2b, and 3a). Thesection crosses from the phyllite to the gneiss zone inthe north (Bremner transect), traverses the gneiss zone(Fan transect) and crosses from the gneiss zone to thephyllite zone in the south (Tana transect; Figure 3a). Section 2lies ∼70–90 km east of section 1 and covers the central partof the CMC (Figures 2a, 2c, and 3b). The section runs fromthe Wrangellia terrane in the north into the schist zone of theCMC (Tokio transect) and across the gneiss zone into thesouthern metabasalt zone (Bagley transect). In addition, weconducted four fixed wing aircraft stops along the highlyglaciated ridge between Mount Miller and Mount St. Elias(stops 1–4; Figure 2a) and we draw a profile across thisridge in the Mount Huxley region (Figures 2a and 3b).Section 3 lies ∼170 km southeast along strike of section 2(Figures 2a, 2d, and 4). The section is the first relativelyeasily accessible transect across the CMC southeast of thehigh‐alpine St. Elias range. The Chugach terrane in section 3is limited to a narrow strip ∼10 km in width between theBorder Range fault system in the northeast and the Fair-weather fault system in the southwest (Figures 2a and 4). Inaddition to this decrease in total width, the strike of theChugach terrane changes from ∼W‐E in sections 1 and 2 toNW‐SE in section 3. Two different lithological units com-prise the Chugach terrane in section 3 (Figure 4): a north-eastern, ∼4–5 km wide unit of variable gneisses and alteredschists and a southwestern, ∼4–5 km wide unit of fine‐grained amphibolites that are interpreted as metabasalts(Figures 2a and 4).[16] Detailed structural descriptions of each section can be
found in Text S1, and field photographs of each section canbe found in Figures S1–S3.1 A summary of our structuralobservations is presented in Figure 5 as a tectonic sequencediagram [after Forster and Lister, 2008] where the differentobservations from each transect are correlated (1) witheach other, (2) with the mineral growth events observed inthe rocks [Bruand, 2011] and (3) with the deformationalsequence observed by Pavlis and Sisson [1995, 2003] in thewestern and northern part of the complex (Figure 2a).A schematic 3‐D sketch of the complex is displayed inFigure 6. Our results together with the observations ofPavlis and Sisson [1995, 2003] and the petrological evolu-tion as described by Bruand [2011] reveal the followingstructural and metamorphic evolution in the CMC.
3.1. First Deformational Phase
[17] In the phyllite zone of sections 1 and 2 and thenorthern schist zone of section 2, tight to isoclinal folds withE‐W trending fold axes are present, accompanied by anaxial planar pressure solution foliation (Figures S1a and S2band Figure 5, correlated with D1 after Pavlis and Sisson
1Auxiliary material data sets are available at ftp://ftp.agu.org/apend/tc/2010tc002776. Other auxiliary material files are in the HTML.
GASSER ET AL.: TECTONIC EVOLUTION OF THE CMC TC2012TC2012
5 of 25

Figure
3
GASSER ET AL.: TECTONIC EVOLUTION OF THE CMC TC2012TC2012
6 of 25

[1995, 2003]). Since this fabric is the first which developedin the metasedimentary rocks, it is probably related to theaccretion of the sediments. However, it is interesting tonote that in sections 1 and 2, these early folds are asym-metric to the north, and the corresponding axial planarfoliation is south dipping, contrary to D1 structures relatedto accretion described farther west in the area of PrinceWilliam Sound which are generally north dipping andasymmetric to the south [e.g., Plafker et al., 1994]. Biotiteis present in the northern phyllite zone of section 1, whereasonly chlorite is present in the southern phyllite zone ofsection 1 and the entire phyllite zone of section 2. Peak
metamorphic conditions reached during that stage in thephyllites are ∼500°C–550°C and ∼2–3 kbar in the north and∼400°C–450°C in the south (Figures 2b and 2c [Sissonet al., 1989; Bruand, 2011]).
3.2. Second Deformational Phase
[18] In the entire schist zone of section 1, in the southernschist zone of section 2 and in the entire gneiss zone ofall sections, an originally flat‐lying penetrative foliationdefined by biotite ± sillimanite is developed, which dipsbelow the D1 fabric domain in the northern schist zone andthe phyllites of sections 1 and 2 (Figures S1b, S1c, and S2c
Figure 4. Structural profile and stereoplots from section 3 of the CMC. Stereoplots are lower hemi-sphere equal area projections, computed with StereoNett software version 2.46 of Johannes Duyster.
Figure 3. (a) Structural profiles across the western CMC separated into three parts from north to south: the Bremner, Fan,and Tana transects. (b) Structural profiles across the central CMC separated into three parts from north to south: the Tokio,Bagley and St. Elias ridge transects. Stereoplots are lower hemisphere equal area projections, computed with StereoNettsoftware version 2.46 of Johannes Duyster. The stereoplots are numbered from 1 to 14 (SP1–SP14; referenced in the text).Abbreviations are as follows: SP, Stereoplot; and, andalusite; SPS, pressure solution foliation; LSedPS, intersection lineationbetween bedding and pressure solution foliation; LSPS, stretching lineation on pressure solution foliation; SSed, sedimentarybedding; Sbt, foliation defined mainly by biotite; LSbt, stretching lineation defined by biotite; Scr, crenulation foliation; Smelt,foliation defined mainly by leucosomes and partly biotite; LSmelt, stretching lineation on Smelt; LSChl, late stretching lineationdefined by chlorite. Do1, low D3 strain intensity; Do2, intermediate D3 strain intensity; Do3, high D3 strain intensity. Seedetailed descriptions in Text S1.
GASSER ET AL.: TECTONIC EVOLUTION OF THE CMC TC2012TC2012
7 of 25

and Figure 5, correlated with D2 after Pavlis and Sisson[1995, 2003]). This fabric is axial planar to isoclinal foldswith E‐W fold axes, which are parallel to a pronounced E‐Wsubhorizontal stretching lineation. Finite strain analyses of
Pavlis and Sisson [1995, 2003] indicate that this D2 fabricrecords margin‐parallel stretching accompanied by verticalflattening which affected the lower part of the accretionaryprism. Besides this well defined pure shear component the
Figure 5. Tectonic sequence diagram for the Chugach Metamorphic Complex drawn according to themethod described by Forster and Lister [2008]. The different fabrics observed in each zone on eachtransect are correlated with each other, with the mineral growth events observed in the rocks and with thestructural scheme described by Pavlis and Sisson [1995, 2003]. F denotes observed folding phase, withthe corresponding geometrical description in subscript (shape of folds, fold vergence, orientation of foldaxes (fa)). S denotes observed planar fabric, with the following subscripts: sed, sedimentary bedding; PS,pressure solution; bt, defined by biotite; cr, crenulation; melt, defined by leucosomes. In addition, theorientation of the planar fabric is given (horizontal versus vertical). L denotes observed lineation, with str,stretching lineation and the orientation of the lineation indicated. SZ denotes observed shear zone, withorientation and shear sense indicated. HAF denotes high‐angle (close to vertical) brittle faults. Slashesbetween fabric elements indicate that they probably formed simultaneously. Gray bars indicate mineralgrowth and partial melting events relative to the fabric development.
GASSER ET AL.: TECTONIC EVOLUTION OF THE CMC TC2012TC2012
8 of 25
amount of simple shear involved in the formation of theD2 fabric is not well constrained. Sparse observations of top‐to‐the‐east shear sense perpendicular to the S2 planes andparallel to the E‐W lineation [Pavlis and Sisson, 1995, 2003](also this study) may point to an unknown amount of simpleshear deformation during the D2 deformation. The D2 fabricdevelopment is clearly contemporaneous with biotite, silli-manite and garnet growth in the schist zone and with the
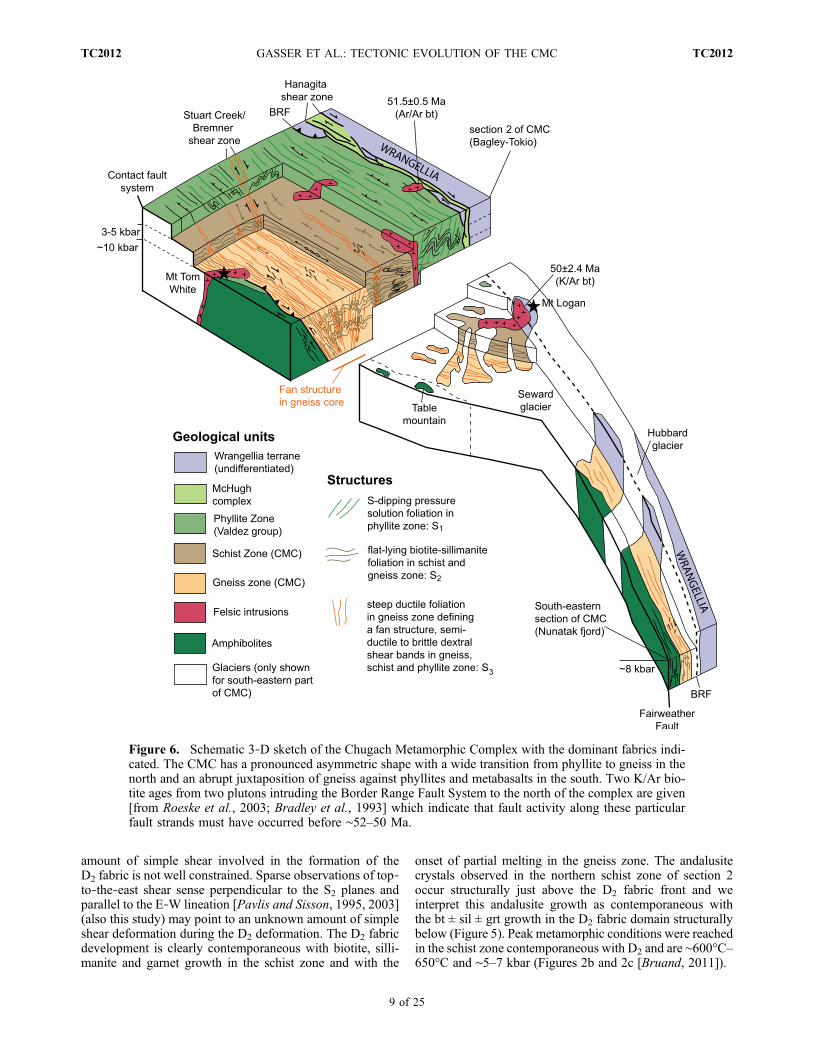
onset of partial melting in the gneiss zone. The andalusitecrystals observed in the northern schist zone of section 2occur structurally just above the D2 fabric front and weinterpret this andalusite growth as contemporaneous withthe bt ± sil ± grt growth in the D2 fabric domain structurallybelow (Figure 5). Peak metamorphic conditions were reachedin the schist zone contemporaneous with D2 and are ∼600°C–650°C and ∼5–7 kbar (Figures 2b and 2c [Bruand, 2011]).
Figure 6. Schematic 3‐D sketch of the Chugach Metamorphic Complex with the dominant fabrics indi-cated. The CMC has a pronounced asymmetric shape with a wide transition from phyllite to gneiss in thenorth and an abrupt juxtaposition of gneiss against phyllites and metabasalts in the south. Two K/Ar bio-tite ages from two plutons intruding the Border Range Fault System to the north of the complex are given[from Roeske et al., 2003; Bradley et al., 1993] which indicate that fault activity along these particularfault strands must have occurred before ∼52–50 Ma.
GASSER ET AL.: TECTONIC EVOLUTION OF THE CMC TC2012TC2012
9 of 25
3.3. Third Deformational Phase
[19] Both the schist and the gneiss zones in all threesections are overprinted by variably open to isoclinal uprightfolds with steeply dipping axial planes and E‐W fold axes(Figures S1d, S1e, and S1f and Figure 5, correlated with D3
after Pavlis and Sisson [1995, 2003]). In the schist zone, asteeply dipping, spaced crenulation cleavage is developedaxial planar to the folds and often steep brittle fault zonesare developed in the core of these folds. In the schist zone,the D3 deformation probably set in at or shortly after themetamorphic peak (Figure 5). In the gneiss zone, the D3
deformation is developed strongly domainal, with domainsof low, intermediate and high D3 strain (domains 1–3;Figure 3). In the intermediate and high D3 strain domains, anew axial planar foliation to the upright folds is developed,defined by biotite, sillimanite and leucosome layers, indi-cating that partial melting and metamorphic mineral growthwas ongoing during D3 in the gneiss zone. This newlyformed steep foliation defines a large‐scale foliation fan inthe entire gneiss zone (Figure 6). In the northern gneiss zonethe ductile stretching lineation associated with this D3 fabricis oriented subhorizontal and E‐W, whereas in the southerngneiss zone the ductile stretching lineation on the D3 foli-ation is plunging steeply to the west‐northwest (Figure 3).Finite strain measurements of Pavlis and Sisson [1995,2003] revealed a horizontal shortening component duringD3 fabric formation. Dextral shear bands, which developedsimultaneous to and overprinting the D3 foliation, point toan important dextral component of simple shear during theD3 deformation, indicating that D3 was a dextral transpres-sive event (Figure 5). The gneiss zone probably reachedits metamorphic peak mainly during this D3 deformation,with peak temperatures of ∼650°C–700°C in all sectionsand peak pressures of 4–8 kbar in section 1, ∼8–13 kbarin section 2 and 7–9 kbar in section 3 (Figures 2b–2d[Bruand, 2011]).
3.4. Postmetamorphic Shear Zones and Brittle Faultsin the South of the Complex
[20] The southern border of the CMC west of the U.S.Canadian Border is made up of a series of ductile to brittlepostmetamorphic fault zones which juxtapose high‐gradegneisses in the north against low‐grade phyllites in the south(Figures 2a and 3). The southern schist zone as proposed byHudson and Plafker [1982] between the gneisses and thephyllites does not exist and probably has been cut out bythese faults and shear zones. Muscovite‐ and chlorite‐coatedstretching lineations in these shear zones plunge to the west‐northwest and shear sense indicators reveal north‐side‐upand dextral sense of movement along these faults (Figure 3).The presence of these shear zones and faults in the south ofthe complex, together with the concentration of high D3
strain domains with down‐dip lineations along the southernborder produce a highly asymmetric final shape of thecomplex, with a wide transition from phyllites to gneisses inthe north and an abrupt juxtaposition of gneisses againstlower‐grade phyllites in the south (Figure 6).
4. Thermochronology
[21] Peak metamorphic conditions reported for the CMCare ∼600°C–650°C at depths of ∼10–20 km in the northern
schist zone and ∼600°C–700°C at depths of ∼20–50 kmin the southern and eastern gneiss zone of the complex(Figure 2 [Sisson et al., 1989; Bruand, 2011]). The timing ofthese peak metamorphic conditions is revealed by U‐Pbdating of metamorphic zircon overgrowths in the gneissesto ∼55–51 Ma all over the complex (Table 1 [Gasser,2010]). In contrast to the homogenous age of the peakmetamorphic conditions, existing thermochronological datapoint to variations in the timing of cooling and exhumationalong and across strike of the complex, with considerablyyounger ages toward the southeast [Hudson et al., 1977a,1977b; Onstott et al., 1989; Sisson et al., 1989; Sisson et al.,2003; Berger et al., 2008; Enkelmann et al., 2008, 2010].In order to constrain the timing of cooling and exhumationin more detail, we present in the following (1) a compila-tion of existing thermochronological data for the CMC,(2) new 40Ar/39Ar, Rb/Sr and fission track ages and (3) aninterpretation of these ages in terms of cooling curves forsections 1–3 of the metamorphic complex.
4.1. Summary of Previous Thermochronological Data
[22] A compilation of published 40Ar/39Ar and low‐temperature geochronology data for the three sections of theCMC is displayed in Figure 7. Since the data come fromthroughout the CMC, we extended our definitions ofsections 1–3 to include larger areas (Figure 7). The compi-lation includes five 40Ar/39Ar ages on hornblende, biotiteand plagioclase (Figure 7 [Sisson et al., 1989, 2003]). Alarge dataset of detrital zircon fission track ages of modernriver sands draining the western and central part of the CMCshow a maximum at ∼20–35 Ma [Enkelmann et al., 2008,2010], which corresponds well with two zircon fission trackages from bedrock samples from section 2 [Meigs et al.,2008] (Figure 7). One bedrock zircon fission track age isavailable for section 3, which is considerably younger thanthe ages from sections 1 and 2 (Figure 7 [McAleer et al.,2009]). River sand draining the Seward glacier area showsa very young fission track signal (<3 Ma, with some ages<1 Ma [Enkelmann et al., 2009]). In addition, four (U‐Th)/He zircon ages, 12 apatite fission track ages and 19 (U‐Th)/He apatite ages are available in the literature (Figure 7[O’Sullivan et al., 1997; Spotila et al., 2004; Berger andSpotila, 2008; Berger et al., 2008; McAleer et al., 2009;Enkelmann et al., 2010]).
4.2. New Thermochronological Data
4.2.1. The 40Ar/39Ar Dating of Muscovite and Biotite[23] Seven muscovite‐bearing samples and 12 biotite‐
bearing samples were selected for 40Ar/39Ar furnace stepheating analyses. The sample locations are displayed inFigures 2 and 7. Sample coordinates, rock type, mineralogy,PT conditions and 40Ar/39Ar ages are summarized inTable 1. Three of the seven muscovite samples come fromundeformed igneous rocks (B1, B14 and B19). B1 isderived from an up to ∼5 m thick felsic dike intruding theschist zone in the Bremner transect (Figure 2). This dike isoriented parallel to Sbt, but is internally not deformed. B14is from a several 100 meters wide felsic intrusion in thenorthern gneiss zone of the Bremner transect (Figure 2).B19 is from a ∼20 cm wide cross‐cutting pegmatitic dikeexposed in the Nunatak transect (Figure 2). In all threeigneous samples, coarse muscovite occurs randomly oriented
GASSER ET AL.: TECTONIC EVOLUTION OF THE CMC TC2012TC2012
10 of 25

Tab
le1.
Sum
maryof
AllSam
ples
UsedforGeochrono
logy
Num
ber
Transect
Latitu
de(°N)
Lon
gitude
(°W)
Rock
Typ
eMineralog
yaPTCon
ditio
nsb
U/PbZrn
c
(Ma)
±2s
40Ar/39Ar
Ms(M
a)±2
s
40Ar/39Ar
Bt(M
a)±2
sRb‐SrBt,
WR(M
a)±2
sFTZrn
(Ma)
±2s
91Asn11
d60
.823
614
4.25
00gn
eiss
Grt
650°C
±30
°Ce
52.8
±1.0
30.9
±8.6
B40
Bremner
60.888
314
3.23
84schist
Grt‐Sil‐M
s59
7°C
±50°C
f47
.6g±2.3
50.3
±0.5
B21
Bremner
60.812
414
3.31
48gn
eiss
Ms
‐48
.4±2.1
28.1
±2.8
KB1
Bremner
60.764
314
3.28
81gn
eiss
Ms‐Grt‐Sil
666°C
±30°C
e ,5.1±1.6kb
arh
50.0
±2.2
49.9
±0.5
KB5
Bremner
60.738
114
3.30
15gn
eiss
Ms
>64
0°Cf
54.0
±0.8
47.3
±2.1
48.6
±0.5
B1
Bremner
60.849
614
3.23
88dike
Qz‐Plag‐Ms
‐45
.8±2.1
B14
Bremner
60.823
314
3.27
77intrusion
Qz‐Plag‐Ms
‐53
.4±2.9
T27
Tana
60.714
614
2.91
47gn
eiss
Ms‐Grt
680°C±30
°C/7.3
±1.1kb
arh,
710°C–720
°C/8–9
kbar
i52
.6±0.8
49.2g±2.5
T22
Tana
60.710
814
2.90
36gn
eiss
Ms
‐46
.2±2.3
47.3
±2.0
T11
Tana
60.701
314
2.90
04gn
eiss
Ms‐Grt
‐47
.5g±2.3
49.4
±0.5
T33
Tana
60.685
614
2.90
34faultrock
Ms‐Sil
679°C
±30°C
e46
.9±2.1
T40
Tana
60.682
814
2.92
38gn
eiss
Ms
>64
0°Cf
54.0
±0.9
47.0
±2.0
48.5
±0.5
28.9
±2.4
Tk6
Tok
io60
.664
214
1.54
88schist
Sil(And
)‐Ms
658°C
±33
°C/6.4
±1.4kbar
h,
655°C
±30
°Ce
49.0g±2.8
Tk7
Tok
io60
.667
114
1.55
21intrusion
Ms
‐54
.0±0.8
49.1
g±2.8
Loc4
Bagley
60.554
414
1.30
30gn
eiss
Grt‐Sil‐M
s66
6°C±25
°C/8.2
±1.2kb
arh,
674°C
±30
°Ce
53.0
±0.7
47.4
±2.1
48.9
±0.5
26.0
±2.8
N9
Nun
atak
59.822
313
8.83
13gn
eiss
Ms
>64
0°Cf
51.3
±0.7
22.6g±1.1
15.8
±0.8
14.9
±0.2
N28
Nun
atak
59.815
113
8.88
27mylon
iteMs‐Grt‐Sil
644°C
±29
°C/8.2
±1.0kbar
h,
∼680
°C/∼10
kbar
i20
.0±1.0
N48
Nun
atak
59.821
013
8.87
83gn
eiss
Ms‐Grt‐Sil
‐14
.9±0.2
N19
Nun
atak
59.833
013
8.83
14pegm
atite
Qz‐Plag‐Ms
‐36
.2g±2.2
a Mineral
abbreviatio
nsafterWhitney
andEvans
[201
0].Italic
values
representthat
PTinform
ationisno
tfrom
sampleitselfbu
tfrom
othersamplefrom
thesameou
tcrop.
bPTcond
ition
sarefrom
Bruan
d[201
1].
c U‐Pbzircon
ages
arefrom
Gasser[201
0].
dSam
plecourtesy
ofV.B.Sisson.
e Biotite‐Garnetthermom
etry.
f Graph
itethermom
etry.
gError
plateauage(see
text).
hAverageP(T)calculation(Therm
ocalc).
i Pseud
osectio
nestim
ate(Therm
ocalc).
GASSER ET AL.: TECTONIC EVOLUTION OF THE CMC TC2012TC2012
11 of 25

Figure
7.Com
pilatio
nof
geochronological
data
fortheCMC.Referencesareas
follo
ws:
1,Sisson
etal.[1989];
2,O’Sullivan
etal.[1997];3,
Sisson
etal.[2003];4,
Spotila
etal.[2004];5,
BergerandSpotila
[2008];6,
Bergeret
al.
[2008];7,
Meigs
etal.[2008];8,
McA
leer
etal.[2009];9,
Enkelmannet
al.[2010];graveaccent,Gasser[2010];asterisk,
thisstudy(Table
1andFigure2).Notethat
thedefinitio
nsof
sections
1–3areenlarged
comparedto
Figure2.
GASSER ET AL.: TECTONIC EVOLUTION OF THE CMC TC2012TC2012
12 of 25

in the matrix and is interpreted to have formed during crys-tallization of the igneous rocks. One muscovite sample wascollected from the schist zone in the Tokio transect and isexposed close to a major intrusion (Tk6; Figure 2c). Thissample is affected by contact metamorphism and the devel-
opment of its muscovite flakes is contemporary to theintrusion: coarse muscovite and fine‐grained sillimanitestatically replace andalusite crystals. The other three mus-covite samples (T22, N9, N28) were collected from thegneiss zone in the Tana and Nunatak transects (Figure 2). In
Figure 8. The 40Ar/39Ar age spectra from furnace step heating experiments on seven muscovite samples.The bold ages are error‐weighted plateau ages or error plateau ages including internal and external errorsas described in section A1. The gray steps are the ones which were included in the age calculation.
GASSER ET AL.: TECTONIC EVOLUTION OF THE CMC TC2012TC2012
13 of 25
all three samples, muscovite is aligned parallel to Smelt andprobably grew before or at the metamorphic peak.[24] One of the 12 biotite‐bearing samples was collected
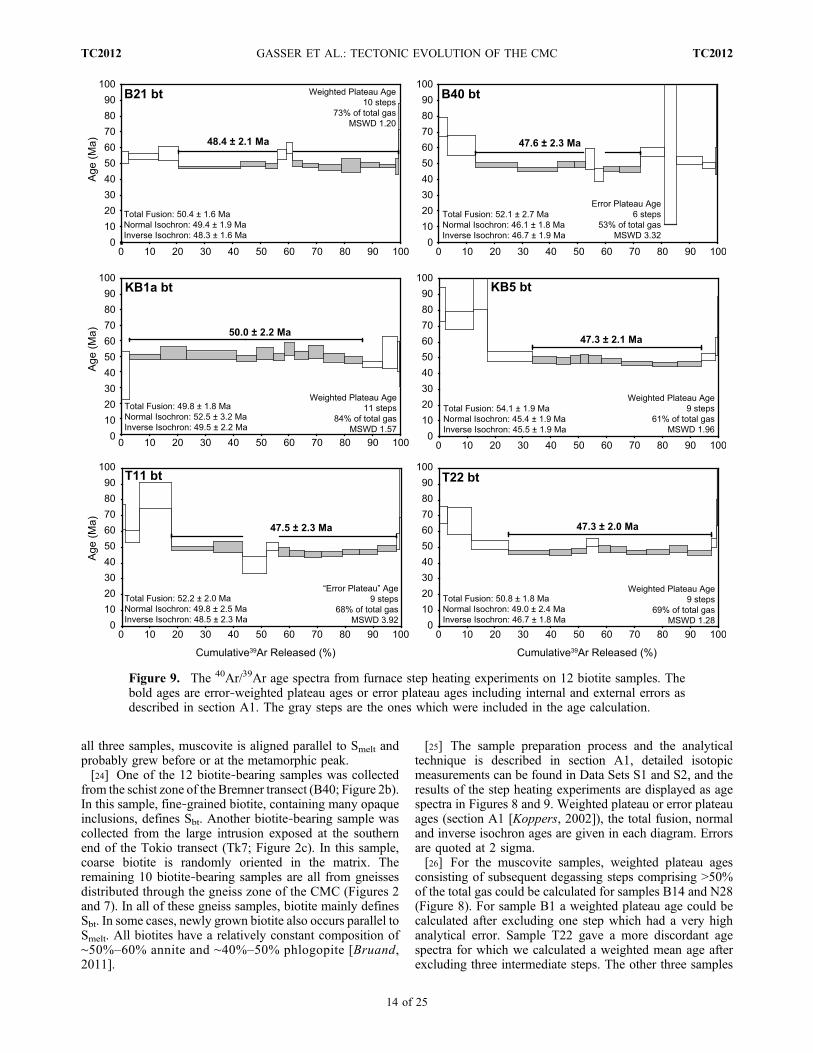
from the schist zone of the Bremner transect (B40; Figure 2b).In this sample, fine‐grained biotite, containing many opaqueinclusions, defines Sbt. Another biotite‐bearing sample wascollected from the large intrusion exposed at the southernend of the Tokio transect (Tk7; Figure 2c). In this sample,coarse biotite is randomly oriented in the matrix. Theremaining 10 biotite‐bearing samples are all from gneissesdistributed through the gneiss zone of the CMC (Figures 2and 7). In all of these gneiss samples, biotite mainly definesSbt. In some cases, newly grown biotite also occurs parallel toSmelt. All biotites have a relatively constant composition of∼50%–60% annite and ∼40%–50% phlogopite [Bruand,2011].
[25] The sample preparation process and the analyticaltechnique is described in section A1, detailed isotopicmeasurements can be found in Data Sets S1 and S2, and theresults of the step heating experiments are displayed as agespectra in Figures 8 and 9. Weighted plateau or error plateauages (section A1 [Koppers, 2002]), the total fusion, normaland inverse isochron ages are given in each diagram. Errorsare quoted at 2 sigma.[26] For the muscovite samples, weighted plateau ages
consisting of subsequent degassing steps comprising >50%of the total gas could be calculated for samples B14 and N28(Figure 8). For sample B1 a weighted plateau age could becalculated after excluding one step which had a very highanalytical error. Sample T22 gave a more discordant agespectra for which we calculated a weighted mean age afterexcluding three intermediate steps. The other three samples
Figure 9. The 40Ar/39Ar age spectra from furnace step heating experiments on 12 biotite samples. Thebold ages are error‐weighted plateau ages or error plateau ages including internal and external errors asdescribed in section A1. The gray steps are the ones which were included in the age calculation.
GASSER ET AL.: TECTONIC EVOLUTION OF THE CMC TC2012TC2012
14 of 25

Tk6, N9 and N19 did not yield statistically significantweighted plateau ages, and error plateau ages are reported(calculated using the work by Koppers [2002]). Muscoviteages from sections 1 and 2 of the CMC range from 53.4 ±2.9 Ma to 45.8 ± 2.1 Ma (±2 sigma), but only one sample(B41) is older than circa 50 Ma, with the remaining samplesgiving ages less than circa 49 Ma (Table 1 and Figure 8).Muscovite samples from section 3, however, give signifi-cantly younger ages ranging from 36.2 ± 2.2 Ma to 20.0 ±1.0 Ma (Table 1 and Figure 8).[27] For the biotite samples, weighted plateau ages con-
sisting of subsequent degassing steps comprising >50% ofthe total gas could be calculated for samples KB1a, KB5,T40 and N9 (Figure 9). Weighted plateau ages could becalculated for samples B21, T22, T33 and Loc 4 afterexcluding one to two intermediate steps (Figure 9). Nostatistically meaningful weighted plateau ages could be
calculated for samples B40, T11, T27, and Tk7 and errorplateau ages are reported for these samples (Figure 9).Biotite ages from sections 1 and 2 of the CMC range from50.0 ± 2.2 Ma to 46.9 ± 2.1 Ma, which is within error ofthe ages from the muscovites for those regions (Table 1 andFigure 9). The only biotite age from section 3 is muchyounger with 15.8 ± 0.8 Ma, which is younger than theyoungest muscovite age from this region.4.2.2. Rb/Sr Isochron Dating[28] To further evaluate the validity of the 40Ar/39Ar
weighted plateau and error plateau ages as cooling ages, wealso dated 7 of the 12 biotite separates used for 40Ar/39Ardating and one additional biotite‐bearing sample fromsection 3 by the Rb/Sr method, based on two point isochronsderived from biotite and whole rock measurements, respec-tively. The analytical technique is described in section A2,detailed isotopic measurements can be found in Data Set S3,
Figure 9. (continued)
GASSER ET AL.: TECTONIC EVOLUTION OF THE CMC TC2012TC2012
15 of 25
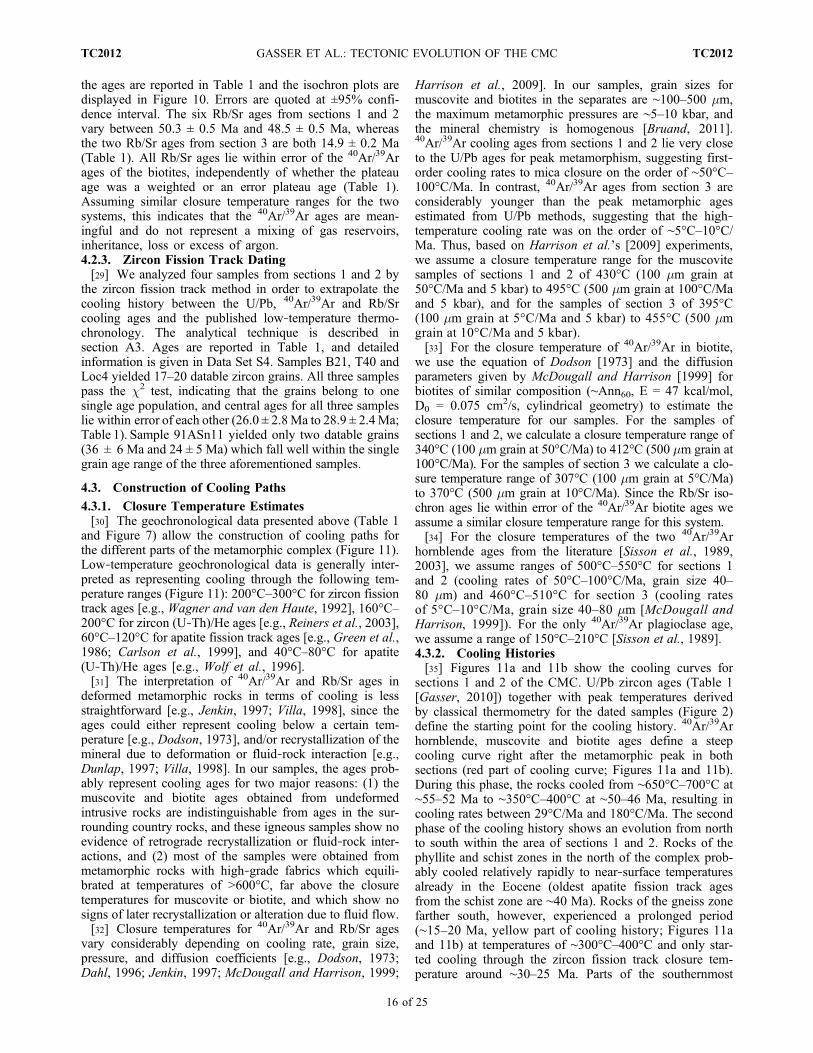
the ages are reported in Table 1 and the isochron plots aredisplayed in Figure 10. Errors are quoted at ±95% confi-dence interval. The six Rb/Sr ages from sections 1 and 2vary between 50.3 ± 0.5 Ma and 48.5 ± 0.5 Ma, whereasthe two Rb/Sr ages from section 3 are both 14.9 ± 0.2 Ma(Table 1). All Rb/Sr ages lie within error of the 40Ar/39Arages of the biotites, independently of whether the plateauage was a weighted or an error plateau age (Table 1).Assuming similar closure temperature ranges for the twosystems, this indicates that the 40Ar/39Ar ages are mean-ingful and do not represent a mixing of gas reservoirs,inheritance, loss or excess of argon.4.2.3. Zircon Fission Track Dating[29] We analyzed four samples from sections 1 and 2 by
the zircon fission track method in order to extrapolate thecooling history between the U/Pb, 40Ar/39Ar and Rb/Srcooling ages and the published low‐temperature thermo-chronology. The analytical technique is described insection A3. Ages are reported in Table 1, and detailedinformation is given in Data Set S4. Samples B21, T40 andLoc4 yielded 17–20 datable zircon grains. All three samplespass the c2 test, indicating that the grains belong to onesingle age population, and central ages for all three sampleslie within error of each other (26.0 ± 2.8Ma to 28.9 ± 2.4Ma;Table 1). Sample 91ASn11 yielded only two datable grains(36 ± 6 Ma and 24 ± 5 Ma) which fall well within the singlegrain age range of the three aforementioned samples.
4.3. Construction of Cooling Paths
4.3.1. Closure Temperature Estimates[30] The geochronological data presented above (Table 1
and Figure 7) allow the construction of cooling paths forthe different parts of the metamorphic complex (Figure 11).Low‐temperature geochronological data is generally inter-preted as representing cooling through the following tem-perature ranges (Figure 11): 200°C–300°C for zircon fissiontrack ages [e.g., Wagner and van den Haute, 1992], 160°C–200°C for zircon (U‐Th)/He ages [e.g., Reiners et al., 2003],60°C–120°C for apatite fission track ages [e.g., Green et al.,1986; Carlson et al., 1999], and 40°C–80°C for apatite(U‐Th)/He ages [e.g., Wolf et al., 1996].[31] The interpretation of 40Ar/39Ar and Rb/Sr ages in
deformed metamorphic rocks in terms of cooling is lessstraightforward [e.g., Jenkin, 1997; Villa, 1998], since theages could either represent cooling below a certain tem-perature [e.g., Dodson, 1973], and/or recrystallization of themineral due to deformation or fluid‐rock interaction [e.g.,Dunlap, 1997; Villa, 1998]. In our samples, the ages prob-ably represent cooling ages for two major reasons: (1) themuscovite and biotite ages obtained from undeformedintrusive rocks are indistinguishable from ages in the sur-rounding country rocks, and these igneous samples show noevidence of retrograde recrystallization or fluid‐rock inter-actions, and (2) most of the samples were obtained frommetamorphic rocks with high‐grade fabrics which equili-brated at temperatures of >600°C, far above the closuretemperatures for muscovite or biotite, and which show nosigns of later recrystallization or alteration due to fluid flow.[32] Closure temperatures for 40Ar/39Ar and Rb/Sr ages
vary considerably depending on cooling rate, grain size,pressure, and diffusion coefficients [e.g., Dodson, 1973;Dahl, 1996; Jenkin, 1997; McDougall and Harrison, 1999;
Harrison et al., 2009]. In our samples, grain sizes formuscovite and biotites in the separates are ∼100–500 mm,the maximum metamorphic pressures are ∼5–10 kbar, andthe mineral chemistry is homogenous [Bruand, 2011].40Ar/39Ar cooling ages from sections 1 and 2 lie very closeto the U/Pb ages for peak metamorphism, suggesting first‐order cooling rates to mica closure on the order of ∼50°C–100°C/Ma. In contrast, 40Ar/39Ar ages from section 3 areconsiderably younger than the peak metamorphic agesestimated from U/Pb methods, suggesting that the high‐temperature cooling rate was on the order of ∼5°C–10°C/Ma. Thus, based on Harrison et al.’s [2009] experiments,we assume a closure temperature range for the muscovitesamples of sections 1 and 2 of 430°C (100 mm grain at50°C/Ma and 5 kbar) to 495°C (500 mm grain at 100°C/Maand 5 kbar), and for the samples of section 3 of 395°C(100 mm grain at 5°C/Ma and 5 kbar) to 455°C (500 mmgrain at 10°C/Ma and 5 kbar).[33] For the closure temperature of 40Ar/39Ar in biotite,
we use the equation of Dodson [1973] and the diffusionparameters given by McDougall and Harrison [1999] forbiotites of similar composition (∼Ann60, E = 47 kcal/mol,D0 = 0.075 cm2/s, cylindrical geometry) to estimate theclosure temperature for our samples. For the samples ofsections 1 and 2, we calculate a closure temperature range of340°C (100 mm grain at 50°C/Ma) to 412°C (500 mm grain at100°C/Ma). For the samples of section 3 we calculate a clo-sure temperature range of 307°C (100 mm grain at 5°C/Ma)to 370°C (500 mm grain at 10°C/Ma). Since the Rb/Sr iso-chron ages lie within error of the 40Ar/39Ar biotite ages weassume a similar closure temperature range for this system.[34] For the closure temperatures of the two 40Ar/39Ar
hornblende ages from the literature [Sisson et al., 1989,2003], we assume ranges of 500°C–550°C for sections 1and 2 (cooling rates of 50°C–100°C/Ma, grain size 40–80 mm) and 460°C–510°C for section 3 (cooling ratesof 5°C–10°C/Ma, grain size 40–80 mm [McDougall andHarrison, 1999]). For the only 40Ar/39Ar plagioclase age,we assume a range of 150°C–210°C [Sisson et al., 1989].4.3.2. Cooling Histories[35] Figures 11a and 11b show the cooling curves for
sections 1 and 2 of the CMC. U/Pb zircon ages (Table 1[Gasser, 2010]) together with peak temperatures derivedby classical thermometry for the dated samples (Figure 2)define the starting point for the cooling history. 40Ar/39Arhornblende, muscovite and biotite ages define a steepcooling curve right after the metamorphic peak in bothsections (red part of cooling curve; Figures 11a and 11b).During this phase, the rocks cooled from ∼650°C–700°C at∼55–52 Ma to ∼350°C–400°C at ∼50–46 Ma, resulting incooling rates between 29°C/Ma and 180°C/Ma. The secondphase of the cooling history shows an evolution from northto south within the area of sections 1 and 2. Rocks of thephyllite and schist zones in the north of the complex prob-ably cooled relatively rapidly to near‐surface temperaturesalready in the Eocene (oldest apatite fission track agesfrom the schist zone are ∼40 Ma). Rocks of the gneiss zonefarther south, however, experienced a prolonged period(∼15–20 Ma, yellow part of cooling history; Figures 11aand 11b) at temperatures of ∼300°C–400°C and only star-ted cooling through the zircon fission track closure tem-perature around ∼30–25 Ma. Parts of the southernmost
GASSER ET AL.: TECTONIC EVOLUTION OF THE CMC TC2012TC2012
16 of 25
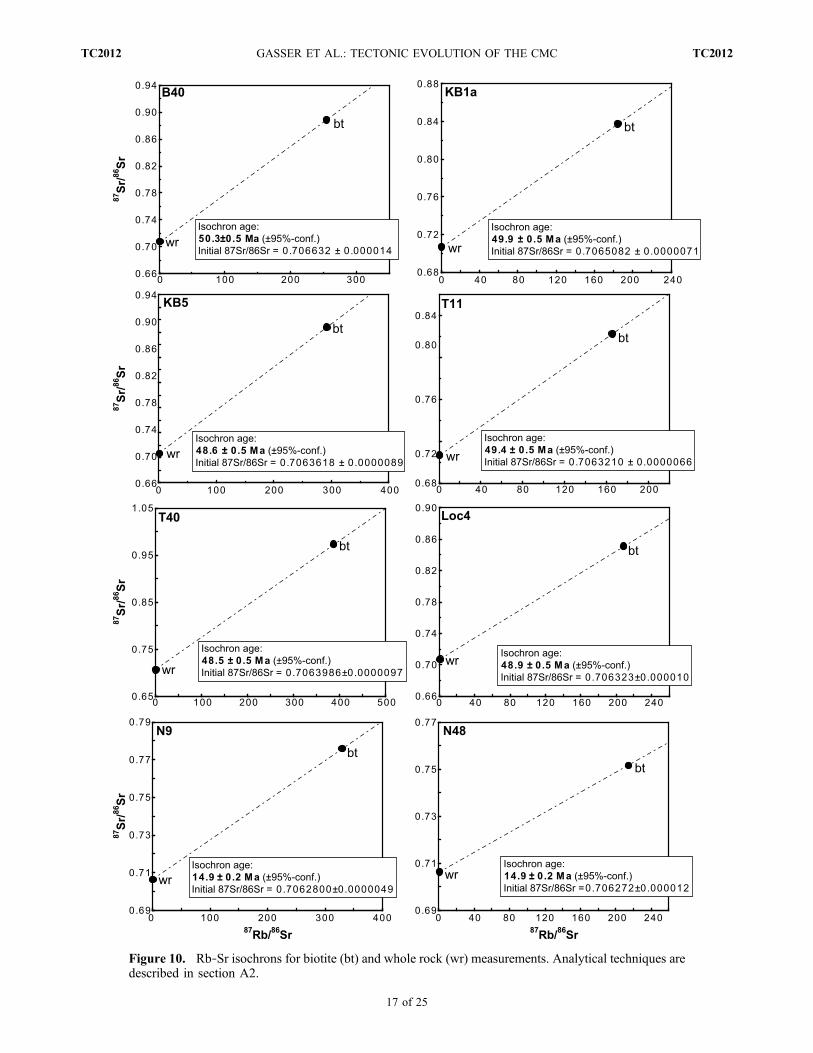
Figure 10. Rb‐Sr isochrons for biotite (bt) and whole rock (wr) measurements. Analytical techniques aredescribed in section A2.
GASSER ET AL.: TECTONIC EVOLUTION OF THE CMC TC2012TC2012
17 of 25

Figure 11
GASSER ET AL.: TECTONIC EVOLUTION OF THE CMC TC2012TC2012
18 of 25

gneiss zone even stayed at elevated temperatures of >200°Cuntil ∼10 Ma [e.g., Enkelmann et al., 2008, 2010]. The slopeof the orange cooling curves lies in the range of ∼20°C/Ma.[36] The cooling history for section 3 is significantly
different from those of sections 1 and 2 (Figure 11c). Thestarting point is defined by a U/Pb zircon age of ∼51 Ma(Table 1) corresponding to a maximum temperature of∼600°C–700°C (Figure 2). 40Ar/39Ar hornblende, musco-vite, biotite and zircon fission track ages define a slow,regular cooling curve from the peak conditions down to200°C–300°C until circa 5 Ma (green part of coolingcurve; Figure 11c). This corresponds to a cooling rate of∼6°C–10°C/Ma. The young zircon fission track and zirconand apatite (U‐Th)/He ages from the Fairweather corridorindicate a strong increase in cooling rate during the last∼5 Ma, with rates of 20°C–40°C/Ma, consistent with theirlocations within the obliquely convergent part of the St. Eliasorogen (orange part of cooling curve [Pavlis et al., 2004;Enkelmann et al., 2010]). The slightly older zircon (U‐Th)/He age from Seward glacier indicates a somewhat slowercooling, but the <3Ma zircon fission track ages found in riversands draining the Seward glacier area [Enkelmann et al.,2009, 2010] indicate that the entire strip from Seward gla-cier down to Nunatak fjord (Figure 2a) experienced rapidcooling during the last ∼5 Ma.
5. Tectonic Evolution of CMC
[37] The structural history, metamorphic evolution andthermochronological data summarized above allow a dis-cussion of the tectonic evolution of the CMC in space andtime. Our study generally supports the structural successionD1–D3 for the CMC (Figure 5) that has been recognizedpreviously by Pavlis and Sisson [1995, 2003]. D1 formedduring the initial accretion of the sediments, whereas D2 andD3 are related to metamorphism in the CMC. In the fol-lowing, the structural record, the metamorphic evolution andthe cooling and exhumation histories of the CMC are inte-grated and a possible tectonic evolution for the entirecomplex is presented in a regional context.
5.1. D1: Accretion of Sediments
[38] The D1 deformation is related to the accretion ofsediments to the continental margin during Late Cretaceous–Paleocene times [e.g., Plafker et al., 1994]. At that time, alarge accretionary prism formed which derived its sedimentsprobably mostly from the Coast Plutonic Complex, a largecontinental margin magmatic arc which is exposed to thesoutheast of the present location of the accretionary prism(Figure 1a [e.g., Nilsen and Zuffa, 1982; Farmer et al., 1993;Sample and Reid, 2003;Haeussler et al., 2005]). At the sametime, the Border Range Fault System was reactivated as alarge‐scale dextral strike‐slip system [Pavlis and Roeske,
2007]. The accretionary prism therefore represented atranspressive system with the convergent component dis-tributed on thrusts and folds within the prism and the strike‐slip component concentrated on the border of the prism. Theaccretionary prism probably either formed on the Farallonplate, and later moved dextrally across the Kula‐Farallonridge (Figure 1d [e.g., Cowan, 2003]), or it formed on theResurrection plate, which finally completely subductedbelow the margin (Figure 1d [e.g., Haeussler et al., 2003]).In both cases, the convergence between the oceanic plateand the continent must have been dextrally oblique inorder to produce the strain‐partitioned transpressional D1
deformation.[39] Such accretionary and subduction zone settings are
generally relatively cold, with typical geothermal gradientsof ∼10°C–15°C/km, leading to blueschist facies metamor-phism at depths of ∼15–20 km [e.g., Philpotts and Ague,2009]. However, given the widespread distribution of sub-greenschist facies to greenschist facies conditions all alongthe Chugach accretionary prism [e.g., Dusel‐Bacon, 1994],the initial geothermal gradient in this prism was probablyon the order of ∼20°C–25°C/km, resulting in conditionsof ∼300°C–500°C at depths of ∼15–20 km (∼4–6 kbar). Onepossible explanation for this elevated initial geothermalgradient in the accretionary prism is that it is the result of thesubduction of a spreading ridge below the margin, relatedto the intrusions of the Sanak‐Baranof plutonic belt [e.g.,Sisson et al., 1989; Sisson and Pavlis, 1993]. However, thethermal structure of an accretionary prism depends on manyfactors such as the amount of accretion and erosion, thecoefficient of basal friction, shear heating at the base,internal strain heating and the pore fluid/lithostatic pressureratio [e.g., Barr and Dahlen, 1989]. Examples of relativelyhigh thermal gradients of ∼20°C–25°C/km in accretionaryprisms without the involvement of a subducting ridge includethe Taiwan accretionary prism [Barr and Dahlen, 1989] orthe Cascadia accretionary wedge [Booth‐Rea et al., 2008].
5.2. D2: Vertical Flattening and Margin‐ParallelStretching
[40] After accretion and D1 deformation during obliqueconvergence, the deeper parts of the accretionary prism inthe area of the future CMC were subjected to D2 deforma-tion: the presence of the flat‐lying D2 fabric accompanied bya pronounced orogen‐parallel stretching lineation indicatesthat the base of the accretionary prism experienced verticalthinning and margin‐parallel stretching [e.g., Pavlis andSisson, 1995]. The D2 fabric formation was accompaniedby andalusite‐grade metamorphism just above the D2 fabricfront, sillimanite‐grade metamorphism within the schist andparts of the gneiss zone and culminated in the onset ofpartial melting in the gneiss zone. The vertical thinningduring D2 probably led to the compression of isotherms and
Figure 11. (a–c) Cooling curves for the three different sections of the CMC (Figure 7) as derived from the combination ofdifferent thermochronological methods. Black lines connect data points derived by different methods for the same sample.The sample localities are shown in Figure 7. Red indicates the rapid Eocene cooling phase which occurred in sections 1 and2 directly after the metamorphic peak. Yellow indicates the prolonged period (15–20 Ma) of slow/no cooling in the gneisszone of sections 1 and 2 of the CMC. Green indicates the slow, regular cooling from peak conditions down to 200°C–300°Cin section 3. Orange indicates cooling curves for the final cooling from 200°C–300°C to near‐surface temperatures in allsections. In sections 1 and 2, this orange cooling occurred asynchronous from north to south across the complex.
GASSER ET AL.: TECTONIC EVOLUTION OF THE CMC TC2012TC2012
19 of 25

to the presence of relatively high geothermal gradients in thelowermost phyllite, the schist and gneiss zones. Sisson andHollister [1988] and Sisson et al. [1989] derived thermalgradients of ∼35°C/km for the northern schist zone and∼65°C/km for the westernmost gneiss zone of the complex.Sisson and Pavlis [1993] and Pavlis and Sisson [1995]suggested that this could be the result of a second passageof a triple junction, which first caused the initial high geo-thermal gradient during southward migration, and thancaused the even higher gradients during northward migra-tion. However, an increase from ∼25°C/km during D1 to∼35°C–65°C/km during D2 at depths of ∼10–20 km couldalso be the result of a total vertical thinning of ∼6–10 km ofthe crustal column. Finite strain modeling of Pavlis andSisson [1995] showed that depending on the ratio of pureto simple shear during D2 deformation ∼2–7 km of verticalthinning could have occurred alone in the D2 fabric of theschist zone, making a total of ∼6–10 km thinning in theentire D2 zone a realistic value. Based on these considera-tions, the D2 vertical shortening probably could have beensufficient to produce the high geothermal gradients observedin the northern and western parts of the complex. In addi-tion, the central and eastern parts of the gneiss zone showlower geothermal gradients of 15°C–30°C/km due to highermetamorphic pressures [Bruand, 2011], making a secondpassage of a triple junction below the complex unlikely.[41] The peak metamorphic conditions are constrained to
∼55–51 Ma (Table 1 [Gasser, 2010]). The D2 deformationtherefore must have started at about the same time or shortlybefore. This period is broadly contemporaneous with a platetectonic reorganization in the Pacific basin (chron 24–21,∼53–48 Ma [Atwater, 1989]) suggesting that there might bea relationship between movements of the oceanic plates inthe Pacific basin and the strain history along the margin[Sisson and Pavlis, 1993; Pavlis and Sisson, 1995]. How-ever, since it is not well constrained what exactly happenedduring this reorganization [e.g., Byrne, 1979; Engebretsonet al., 1985; Lonsdale, 1988; Atwater, 1989; Norton, 1995],great freedom remains in interpreting the resulting boundaryforces which acted on the margin. D2 could, for example, bethe result of a short‐lived transtensional event due to a short‐term change in movement direction of the plate segmentwhich was subducting below the margin, related to the platereorganization. Or it could be the result of forces which actedinside the accretionary prism: after a decrease in convergencerate due to the plate reorganization, gravitational collapse ofthe overthickened accretionary prism could have occurredleading to the D2 stretching and vertical thinning. However,in this case extension perpendicular to the margin rather thanparallel to it would be expected.[42] Other possible reasons for D2 deformation are not
directly linked with the plate reorganization. Sisson andPavlis [1993] and Pavlis and Sisson [1995] for examplesuggested that the subduction of an oceanic spreading ridgebelow the margin could have caused the D2 deformation,with the subduction of the ridge topography inducing thevertical thinning component. The subduction of a ridge belowthe margin at the time of interest has been inferred by manyworkers and depending on where to restore the accretionaryprism along the margin, potential candidates are the ridgebetween the Kula and Farallon plates (Figure 1d) [e.g.,Bradley et al., 1993; Sisson and Pavlis, 1993; Pavlis and
Sisson, 1995; Haeussler et al., 1995]) or the ridge betweenthe Kula and Resurrection plates (Figure 1d [e.g., Haeussleret al., 2003]). Alternatively, Pavlis and Sisson [2003]explored the possibility of D2 and D3 actually being theresult of the same dextral transpressive deformation, with D2
representing a midcrustal decoupling horizon. Or, D2 couldbe the result of underplating of a buoyant package of off-scraped sedimentary rocks and oceanic crust below theaccretionary prism (as it is indicated by seismic profilescrossing Prince William Sound; Figure 1 [e.g., Fuis et al.,2008]). As a last possibility, the D2 deformation could havebeen caused by the geometry of the margin itself: it couldbe the result of the accretionary prism sliding past a releas-ing bend in the large‐scale strike‐slip system borderingthe prism.
5.3. D3: Dextral Transpression
[43] From D2 to D3, a switch from vertical thinning tohorizontal shortening and the onset of dextral shearingoccurred. A dextral transpressive shear system developedwhich heterogeneously affected the entire area. In the schistzone, open folding, crenulation foliation development andsemibrittle to brittle dextral fault zones developed, probablyassociated with fast cooling due to a relaxation of the iso-therms after the thinning of D2 ceased. In the gneiss zone,high‐temperature deformation continued and domains ofhigh and low D3 dextral transpressive shear developed. TheD3 deformation is concentrated along the southern border ofthe CMC in sections 1 and 2: in the southern gneiss zone(southern end of the Fan transect, the entire Tana transectand large parts of the Bagley transect; Figure 3) D3 isdominant and the D2 fabric is mostly transposed into thesteep D3 fabric. In addition to the higher intensity, thestretching lineation on the D3 fabric also plunges 30°–60° tothe west‐northwest in these southern parts, in contrast to thelineation in the northern parts where it is subhorizontal.Simultaneously with the D3 deformation, partial meltingoccurred extensively in the gneiss zone and melts rose alongthe D3 foliation planes to form bigger plutons whichintruded the schist zone, and which locally thermally over-printed the andalusite‐grade metamorphism present abovethe D2 fabric front in the schist zone in section 2.[44] The domains with high D3 fabric intensity and down‐
dip lineations correspond to the domains which registeredhigher peak pressures than the rest of the complex (∼7–8 kbarat the Tana transect, ∼8–13 kbar at the Bagley transect;Figures 2b and 2c), which suggests that the higher pressuresare related to this D3 deformation. We therefore interpret thatduring this dextral transpressive deformation, rocks of thegneiss zones were partly exhumed along north dipping D3
foliation planes with down‐dip lineations. This processmay represent a narrow extrusion channel in which exhu-mation occurred due to focused erosion at the surface. Sucherosion might have been a consequence of the shorteningcomponent of the D3 deformation, which was concentrated inthe southern gneiss zone and along the Contact fault andleading to the formation of topography at the surface. Thereis, in fact, significant evidence for erosion during the EarlyEocene in the Chugach terrane. Approximately 100 km westof the CMC, Early Eocene nonmarine sedimentary basinsunconformably overlie the Chugach terrane [e.g., Little andNaeser, 1989]. These sedimentary rocks record a proximal
GASSER ET AL.: TECTONIC EVOLUTION OF THE CMC TC2012TC2012
20 of 25
metasedimentary and metavolcanic source from the ChugachMountains, forming large alluvial fan complexes [Little andNaeser, 1989; Trop and Ridgway, 2007].[45] The D3 deformation with its dextral transpression is
typical for what has been the situation along the marginalready during the formation of the accretionary prism duringD1. It therefore represents a switch back after the unusual D2
event to a normal deformational regime with oblique sub-duction of oceanic plates below the continental margin.During accretion of the sediments, the strike‐slip componentof deformation was localized mainly along the Border RangeFault System inboard of the accretionary prism (termed theHanagita Fault System; Figure 1b [Roeske et al., 2003; Pavlisand Roeske, 2007]). During the renewed dextral transpres-sion of D3, this deformation concentrated farther outboard,along the Contact Fault system and within the gneissic coreof the CMC. This outboard jump and concentration of dextraltranspression could be related to the fact that the accretionaryprism was enlarged due to the accretion of the Prince Williamterrane which is located outboard of the Chugach terrane.[46] The cooling histories of the different sections of the
complex are related to this D3 deformation. The western andcentral sections show very fast cooling shortly after themetamorphic peak (Figure 11). This cooling could (1) berelated to passive thermal relaxation after the passage of asubducting ridge [e.g., Sisson and Pavlis, 1993; Pavlis andSisson, 1995; Bradley et al., 2003] and/or (2) be the resultof fast exhumation of hot material into colder regions duringD3 transpression. In the case of passive cooling, a very fastremoval of the heat source at depth is required. This is unlikelyin a plate geometry as shown by Haeussler et al. [2003] andMadsen et al. [2006] where the Kula‐Resurrection ridge issubducting parallel to the margin below the CMC. Moreover,thermal modeling of Groome and Thorkelson [2009] showedthat for a slowlymigrating triple junction (10mm/yr), the effectof ridge subduction is characterized by a protracted meta-morphic heating followed by slow cooling, particularly atdepths of >20 km, which is not observed in sections 1 and 2 ofthe CMC. Therefore, if a ridgewas subducting below the CMCduring Eocene times, it must have moved fast, and the platetectonic geometry must have been in such a way that old andcold lithosphere was subducted shortly after the passage of theridge in order to cool the rocks quickly. Since subductionvelocities at that time were relatively high (100 mm/yr or more[Doubrovine and Tarduno, 2008]), and a major plate tectonicreorganization occurred simultaneously to metamorphism inthe CMC, such a scenario with a fast moving triple junctioncould have taken place [Sisson and Pavlis, 1993; Pavlis andSisson, 1995, 2003]. However, due to uncertainties in theplate tectonic configuration this scenario is poorly constrained.[47] It is likely that the fast cooling after the metamorphic
peak in the western and central parts of the complex was theresult of additional exhumation of at least parts of the gneisszone for the following reason. Peak pressures reported bythese rocks correspond to depths of ∼20–50 km, and if onlypassive cooling would have occurred after the peak, then allof the exhumation from this depth to the surface must haveoccurred during later stages of the cooling history (from∼350°C to the surface), notably after ∼25 Ma (Figure 11).This would imply an unrecognized massive exhumation ofparts of the gneiss zone in the Neogene. In addition it wouldrequire that the exhumation took place entirely during rel-
atively low temperatures and therefore along semibrittle tobrittle faults. However, the ductile penetrative steep foliationwith down‐dip lineations developed in the gneisses wherethe highest pressures are recorded indicate that at least partsof the exhumation took place during ductile deformationshortly after the metamorphic peak. Therefore, at least forthe zones where relatively high pressures are reported, themetamorphic peak was followed by exhumation. After thefast cooling phase recorded in sections 1 and 2 of the CMC,both the gneiss and schist zones were probably at similardepths of ∼10–15 km, and the remaining exhumationoccurred asynchronously from north to south, with the schistzone reaching relatively shallow depths already in theEocene, whereas the southern gneiss zone stayed at con-siderable depths until ∼10 Ma ago (e.g., in a mechanismsimilar to that described by Enkelmann et al. [2008, 2010]).[48] Despite similar structural observations and similar
metamorphic grade, the cooling and exhumation history ofthe southeastern section of the complex is different from thewestern and central sections. Cooling and exhumationoccurred much slower and more regularly in the southeast-ern section from the metamorphic peak until relativelyrecent times (Figure 11). We suggest that this difference isthe result of the postmetamorphic tectonic configuration ofthese two segments along the margin, an interpretationwhich has important implications for the paleogeometry ofthe margin. Specifically, it has long been suggested frompaleomagnetic data [Coe et al., 1985, 1989] and the geologyof the southern Alaska margin [Nokleberg et al., 1989] thatthe Alaskan orocline (i.e., the curvature of the present‐daymargin) was in existence by Eocene time. Our results pro-vide independent support for this interpretation. If themargin was already curved during cooling and exhumationof the three sections, and the Pacific plate moved north-westward relative to North America as indicated by platetectonic reconstructions [e.g., Doubrovine and Tarduno,2008], then the western and central parts of the complexwere under constant convergence after peak metamorphism.This ongoing convergence may have led to the initial for-mation of topography and rapid exhumation of gneissicrocks shortly after the metamorphic peak, followed by anoutward jump of deformation and the accretion of outboardterranes, until the present‐day collision with the Yakutatterrane led to final exhumation. The southeastern sectionhowever would have been located along the highly obliquelyconvergent part of the margin, where highly oblique trans-pressional motion would have led to slow, regular coolingand exhumation in what Koons et al. [2010] refer to as the“oblique orogen.” The increased cooling and exhumationrate during the last ∼5–10 Ma could be the result of thefinal collision of the Yakutat terrane with the margin. In ouropinion, the different cooling and exhumation histories reg-istered by the three different sections nicely reflect the exis-tence of the Alaskan orocline at least since ∼50 Ma andillustrates the effect of different obliquity during transpres-sion on the cooling and exhumation histories of a region.
6. Conclusions
[49] The tectonic evolution of the CMC as presentedin this study represents an example for the behavior ofmiddle to lower crust along a variably oblique convergent
GASSER ET AL.: TECTONIC EVOLUTION OF THE CMC TC2012TC2012
21 of 25

continental margin during a time span of ∼60 Myr. TheCMC area is characterized by three superimposed fabrics:D1 is related to the accretion of sediments to the marginduring oblique convergence, D2 represents a short‐lived,unusual event related to forces acting on the margin due toeither the subduction of an oceanic spreading ridge and/or aplate tectonic reorganization, and D3 is the result of a switchback to transpression due to oblique convergence. Duringthe first phase of oblique convergence (D1), a large‐scaleaccretionary prism was built up, which was verticallythinned and thermally weakened during the D2 event.Deformation and exhumation concentrated in this thermallyweakened part during the subsequent renewed obliqueconvergence (D3). During this phase of transpression,the more convergent western and central parts of the com-plex experienced rapid cooling and exhumation, leading toextrusion of parts of the gneiss zone which resulted in anoverall fan shape of the complex. The more obliquely ori-ented southeastern part of the complex experienced slowand regular cooling and exhumation. Final exhumation isrelated to the Neogene collision of the outboard Yakutatterrane, which first caused slow exhumation from north tosouth in the western and central parts of the complex andthen rapid exhumation of the southern and southeasternparts of the complex along semibrittle to brittle faults.
Appendix A: Analytical TechniquesA1. The 40Ar/39Ar Method
[50] Muscovite and biotite separates were obtained bycrushing, sieving, short milling and magnetic separation offist‐sized hand specimens. The separates were then cleanedby handpicking under a binocular and only transparent,inclusion‐free grains were selected. Grain size of the finalseparates was ∼0.1–0.5 mm. The hand‐picked separateswere cleaned in distilled water in an ultrasonic bath.Approximately ∼5 mg of each sample were packed into Alfoil and stacked into a silica glass tube shielded by a 0.2 mmthick cadmium liner. Eight sample splits (each ∼5 mg) offlux monitor GA‐1550 biotite (K/Ar age 98.5 ± 0.8 1s[Spell and McDougall, 2003]) were intercalated in regularintervals between the samples. K glass and CaF2 salts wereincluded in the tube in order to monitor interfering nuclearreactions on potassium and calcium. The whole tube wasirradiated during 15 h in the core of the Oregon State Uni-versity research reactor facility. Step heating experimentswere conducted at the geochronology laboratory at theUniversity of Florida. Samples were loaded into a Mod-ifications Ltd Double vacuum resistance furnace. 14 and 16heating steps from 600°–1350°C were conducted for mus-covites and biotites, respectively, with total 15 min heatingtime per step. The extracted gas was expanded into astainless steel cleanup line and purified with two 50 L/sSAES getters. Argon isotopes were measured using aMAP215‐50 mass spectrometer in electron multiplier mode.[51] The software ArArCALC version 2.4 [Koppers,
2002] was used for data reduction. Data were correctedfor system blanks and mass discrimination. Detailed isotopicmeasurements can be found in Text S1 and Figures S1–S3.We report error‐weighted plateau ages when more thanthree high‐temperature heating steps containing >50% of thetotal released 39ArK have a MSWD that is smaller than a
statistical t Student distribution. If this is not the case, wereport error plateau ages [Koppers, 2002]. Traditional cal-culation of plateau ages based on equation (17) of Koppers[2002] does only account for analytical uncertainty, uncer-tainty on the J value determination and uncertainty onthe total decay constant of 40K. In order to also consideruncertainties on the individual le and lb decay constants,the 40K/K abundance ratio, the actual measurement of theprimary K/Ar standard and the intercalibration of secondary40Ar/39Ar standards an alternative set of age equations has tobe used [Renne et al., 1998; Min et al., 2000; Scaillet, 2000;Koppers, 2002; Fraser et al., 2008]. We therefore appliedthe recalibration tool incorporated in ArArCALC whichcalculates plateau ages based on the equations of Karnerand Renne [1998], Renne et al. [1998] and Min et al.[2000] which allow incorporating all internal and externalerrors. The physical constants used for recalculation aregiven byMin et al. [2000] and Spell and McDougall [2003].Only those recalculated ages are reported in the diagrams,Table 1 and the text.[52] The flux monitor J was determined based on a total of
29 heating steps on eight sample splits which were distrib-uted over the whole irradiation tube. The obtained J valuesscatter considerably and no gradient was detected over thetube. From the 29 heating steps we excluded (1) the stepswith the most scatter in isotopic ratio determination, (2) thesteps with only very little gas and (3) some visually selectedbad steps. We then used the remaining 13 heating steps tocalculate an error weighted mean of J = 0.00369 ±0.0001122 (±3.04%, 2s, only analytical error consideredfollowing Koppers [2002]). All isotopic data are given inData Sets S1 and S2.
A2. The Rb/Sr Isochron Method
[53] The biotite separates prepared for 40Ar/39Ar stepheating experiments (section A1) were additionally purifiedby grinding in an agate mill in alcohol, sieving and magneticseparation. Whole rock powders were obtained by milling of∼3 cm3 sized samples. Chemical sample preparation wasperformed at the Geological Survey of Austria in Viennafollowing the procedure described by Sölva et al. [2005].Sample weights used for dissolution were about 200 mg forbiotite and 100 mg for whole rock. Isotopic measurementswere done at the Department of Geological Sciences at theUniversity of Vienna. Spiked Rb ratios were measured at aFinnigan® MAT 262, whereas unspiked Sr ratios wereanalyzed at a ThermoFinnigan® Triton TI TIMS. Sr was runfrom Re double filaments, whereas Rb was evaporated froma Ta filament. On the ThermoFinnigan® Triton the 87Sr/86Srratio determined for the international standard NBS987 was0.710248 ± 4 (n = 17). The error for the calculated 87Rb/86Srratios was taken as ±1% (2 sigma). Isochron age calculationwas performed with Isoplot/Ex [Ludwig, 2003]. All isotopicdata are given in Data Set S3.
A3. Fission Track Zircon Method
[54] Zircon grains were extracted by crushing, sieving,magnetic and heavy liquid separation, and finally hand-picked. After mounting the zircons in PFA Teflon andpolishing them, fossil fission tracks were revealed by etch-ing in a eutectic mixture of NaOH/KOH at 210°C for 4 to
GASSER ET AL.: TECTONIC EVOLUTION OF THE CMC TC2012TC2012
22 of 25
8 h. External synthetic mica detectors were firmly attachedand, after irradiation, etched for 40 minutes in 40% HF at20°C. Thermal neutron irradiation was performed at theGerman Technical University München in Garching (FRM‐II reactor). Neutron flux was monitored using CN1 dosim-eter glasses. All samples have been analyzed using theexternal detector method as described by Naeser [1976] andGleadow [1981]. Ages were calculated using the zeta cali-bration method [Hurford and Green, 1983] with a zetafactor of 159 ± 3.6 using the software TRACKKEY 4.2.g[Dunkl, 2002]. Counting of fission tracks was carried outusing a Zeiss Axio Imager A1m microscope equipped withan AUTOSCAN™ stage. Only grains with their prismplanes parallel to the polished surface were used for agedating. All data are given in Data Set S4.
[55] Acknowledgments. Financial support by the Fonds zurWissenschaftlichen Förderung FWF project P‐19366 (to D. Gasser,E. Bruand, and K. Stüwe) and NSF grant EAR 0711105 (to T. Pavlis) isgreatly acknowledged. C. Carson and J. D. Champagnac are thanked for helpin the field. A. Koppers is thanked for help with the ArArCALC‐software.J. Gifford is thanked for help in the ArAr‐Lab at the University of Florida.From the University of Vienna we thank U. Klötzli and F. Biedermann forthe help with mineral separation and M. Horschinegg for help with theRb‐Sr measurements. P. Claus and J. Claus are thanked for flying in the field.Two anonymous reviewers are thanked for their constructive reviews.
ReferencesAbu‐Alam, T. S., and K. Stüwe (2009), Exhumation during oblique trans-pression: The Feiran‐Solaf region, Egypt, J. Metamorph. Geol., 27, 439–459,doi:10.1111/j.1525-1314.2009.00827.x.
Amato, J. M., and T. L. Pavlis (2010), Detrital zircon ages from the Chugachterrane, southern Alaska, reveal multiple episodes of accretion and erosionin a subduction complex, Geology, 38, 459–462, doi:10.1130/G30719.1.
Atwater, T. (1989), Plate tectonic history of the northeast Pacific and westernNorth America, in The Eastern Pacific Ocean and Hawaii, vol. N., TheGeology of North America, edited by E. L. Winterer et al., pp. 21–72,Geol. Soc. of Am., Boulder, Colo.
Ayuso, R. A., P. J. Haeussler, D. C. Bradley, D. W. Farris, N. K. Foley, andG. A. Wandless (2009), The role of ridge subduction in determining thegeochemistry and Nd‐Sr‐Pb isotopic evolution of the Kodiak batholithin southern Alaska, Tectonophysics, 464, 137–163, doi:10.1016/j.tecto.2008.09.029.
Barker, F., G. L. Farmer, R. A. Ayuso, G. Plafker, and J. S. Lull (1992),The 50 Ma granodiorite of the eastern Gulf of Alaska: Melting in anaccretionary prism in the forearc, J. Geophys. Res., 97, 6757–6778,doi:10.1029/92JB00257.
Barr, T. D., and F. A. Dahlen (1989), Brittle frictional mountain building:2. Thermal structure and heat budget, J. Geophys. Res., 94, 3923–3947,doi:10.1029/JB094iB04p03923.
Berger, A. L., and J. A. Spotila (2008), Denudation and deformation in aglaciated orogenic wedge: The St. Elias orogen, Alaska, Geology, 36,523–526, doi:10.1130/G24883A.1.
Berger, A. L., J. A. Spotila, J. B. Chapman, T. L. Pavlis, E. Enkelmann,N. A. Ruppert, and J. T. Buscher (2008), Architecture, kinematics, andexhumation of a convergent orogenic wedge: A thermochronologicalinvestigation of tectonic‐climatic interactions within the central St. Eliasorogen, Alaska, Earth Planet. Sci. Lett., 270, 13–24, doi:10.1016/j.epsl.2008.02.034.
Bol, A. J., and H. Gibbons (1992), Tectonic implications of out‐of‐sequence faults in an accretionary prism, Prince William Sound, Alaska,Tectonics, 11, 1288–1300, doi:10.1029/92TC01327.
Bol, A. J., and S. M. Roeske (1993), Strike‐slip faulting and block rotationalong the contact fault system, eastern Prince William Sound, Alaska,Tectonics, 12, 49–62, doi:10.1029/92TC01324.
Booth‐Rea, G., D. Klaeschen, I. Grevemeyer, and T. Reston (2008), Het-erogeneous deformation in the Cascadia convergent margin and its rela-tion to thermal gradient (Washington, NW USA), Tectonics, 27, TC4005,doi:10.1029/2007TC002209.
Bradley, D. C., P. J. Haeussler, and T. M. Kusky (1993), Timing of EarlyTertiary ridge subduction in southern Alaska, U.S. Geol. Surv. Bull.,2068, 163–177.
Bradley, D. C., R. Parrish, W. Clendenen, D. Lux, P. W. Layer, M. Heizler,and T. Donley (2000), New geochronological evidence for the timing of
Early Tertiary ridge subduction in southern Alaska, U.S. Geol. Surv.Prof. Pap., 1615, 5–21.
Bradley, D. C., T. M. Kusky, P. J. Haeussler, R. Goldfarb, M. Miller,J. Dumoulin, S. W. Nelson, and S. Karl (2003), Geologic signature ofEarly Tertiary ridge subduction in Alaska, in Geology of a Transpres-sional Orogen Developed During Ridge‐Trench Interaction Along theNorth Pacific Margin, edited by V. B. Sisson et al., Spec. Pap. Geol.Soc. Am., 371, 19–49.
Bruand, E. (2011), A petrological study of the Chugach MetamorphicComplex in southern Alaska, Ph.D. thesis, 204 pp., Dep. of Earth Sci.,Univ. of Graz, Graz, Austria.
Bruand, E., D. Gasser, K. Stüwe, and O. Beyssac (2010), Metamorphism ofthe Chugach Metamorphic Complex, (Alaska): New pressure estimatesquestion the ridge subduction context, Geophys. Res. Abstr., 12, 12,235.
Bruhn, R. L., T. L. Pavlis, G. Plafker, and L. Serpa (2004), Deformationduring terrane accretion in the Saint Elias orogen, Alaska, Geol. Soc.Am. Bull., 116, 771–787, doi:10.1130/B25182.1.
Byrne, T. (1979), Late Paleocene demise of the Kula‐Pacific spreading cen-ter, Geology, 7, 341–344, doi:10.1130/0091-7613(1979)7<341:LPDOTK>2.0.CO;2.
Carlson, W. D., R. A. Donelick, and R. A. Ketcham (1999), Variabilityof apatite fission track annealing kinetics: I. Experimental results, Am.Mineral., 84, 1213–1223.
Coe, R. S., B. R. Globerman, P. W. Plumley, and G. A. Thrupp (1985),Paleomagnetic results from Alaska and their tectonic implications, inTectonostratigraphic Terranes of the Circum‐Pacific Region, EarthSci. Ser., vol. 1, edited by D. G. Howell, pp. 85–108, Am. Assoc. ofPet. Geol., Stanford, Calif.
Coe, R. S., B. R. Globerman, and G. A. Thrupp (1989), Rotation of central andsouthern Alaska in the Early Tertiary: Oroclinal bending by megakinking?,in Paleomagnetic Rotations and Continental Deformation, edited byC. Kissel and C. Laj, pp. 327–342, Kluwer Acad., Dordrecht, Netherlands.
Cowan, D. S. (2003), Revisiting the Baranof‐Leech River hypothesis for EarlyTertiary coastwise transport of the Chugach–Prince William terrane, EarthPlanet. Sci. Lett., 213, 463–475, doi:10.1016/S0012-821X(03)00300-5.
Czeck, D. M., and P. J. Hudleston (2003), Testing models for obliquelyplunging lineations in transpression: A natural example and theoreticaldiscussion, J. Struct. Geol., 25, 959–982, doi:10.1016/S0191-8141(02)00079-2.
Dahl, P. S. (1996), The crystal‐chemical basis for Ar retention in micas:Inferences from interlayer partitioning and implications for geochronol-ogy, Contrib. Mineral. Petrol., 123, 22–39, doi:10.1007/s004100050141.
Dickinson, W. R. (2009), Anatomy and global context of the NorthAmerican Cordillera, in Backbone of the Americas: Shallow Subduction,Plateau Uplift, and Ridge and Terrane Collision, edited by S. M. Kayet al., Mem. Geol. Soc. Am., 204, 1–29.
Dodson, M. H. (1973), Closure temperature in cooling geochronologicaland petrological systems, Contrib. Mineral. Petrol., 40, 259–274,doi:10.1007/BF00373790.
Doubrovine, P. V., and J. A. Tarduno (2008), A revisited kinematic modelfor the relative motion between Pacific oceanic plates and North Americasince the Late Cretaceous, J. Geophys. Res., 113, B12101, doi:10.1029/2008JB005585.
Dunkl, I. (2002), Trackkey: A Windows program for calculation and graph-ical presentation of fission track data, Comput. Geosci., 28, 3–12,doi:10.1016/S0098-3004(01)00024-3.
Dunlap, W. J. (1997), Neocrystallization or cooling? 40Ar/39Ar ages ofwhite micas from low‐grade mylonites, Chem. Geol., 143, 181–203,doi:10.1016/S0009-2541(97)00113-7.
Dusel‐Bacon, C. (1994), Metamorphic history of Alaska, in The Geology ofAlaska, vol. G‐1, The Geology of North America, edited by G. Plafkerand H. C. Berg, pp. 495–533, Geol. Soc. of Am., Boulder, Colo.
Engebretson, D. C., A. Cox, and R. G. Gordon (1985), Relative motionsbetween oceanic and continental plates in the Pacific basin, Spec. Pap.Geol. Soc. Am., 206, 1–59.
Enkelmann, E., J. I. Garver, and T. L. Pavlis (2008), Rapid exhumation ofice‐covered rocks of the Chugach–St. Elias orogen, southeast Alaska,Geology, 36, 915–918, doi:10.1130/G2252A.1.
Enkelmann, E., P. K. Zeitler, T. L. Pavlis, J. I. Garver, and K. D. Ridgway(2009), Intense localized rock uplift and erosion in the St Elias orogen ofAlaska, Nat. Geosci., 2, 360–363, doi:10.1038/ngeo502.
Enkelmann, E., P. K. Zeitler, J. I. Garver, T. L. Pavlis, and B. P. Hooks(2010), The thermochronological record of tectonic and surface processinteraction at the Yakutat–North American collision zone in southeastAlaska, Am. J. Sci., 310, 231–260, doi:10.2475/04.2010.01.
Farmer, G. L., R. Ayuso, and G. Plafker (1993), A Coast Mountains prov-enance for the Valdez and Orca groups, southern Alaska, based on Nd,Sr and Pb isotopic evidence, Earth Planet. Sci. Lett., 116, 9–21,doi:10.1016/0012-821X(93)90042-8.
GASSER ET AL.: TECTONIC EVOLUTION OF THE CMC TC2012TC2012
23 of 25

Farris, D. W., and S. R. Paterson (2009), Subduction of a segmented ridgealong a curved continental margin: Variations between the western andeastern Sanak‐Baranof belt, southern Alaska, Tectonophysics, 464,100–117, doi:10.1016/j.tecto.2007.10.008.
Farris, D. W., P. Haeussler, R. Friedman, S. Paterson, R. W. Saltus, andR. Ayuso (2006), Emplacement of the Kodiak batholith and slab‐windowmigration, Geol. Soc. Am. Bull., 118, 1360–1376, doi:10.1130/B25718.1.
Fisher, D. M., and T. Byrne (1992), Strain variations in an ancient accre-tionary complex: Implications for forearc evolution, Tectonics, 11,330–347, doi:10.1029/91TC01490.
Forster, M. A., and G. S. Lister (2008), Tectonic sequence diagrams and thestructural evolution of schists and gneisses in multiply deformed terranes,J. Geol. Soc., 165, 923–939, doi:10.1144/0016-76492007-016.
Fossen, H., and B. Tikoff (1993), The deformation matrix for simultaneoussimple shearing, pure shearing and volume change, and its application totranspression‐transtension tectonics, J. Struct. Geol., 15, 413–422,doi:10.1016/0191-8141(93)90137-Y.
Foster, D. A., B. D. Goscombe, and D. R. Gray (2009), Rapid exhumationof deep crust in an obliquely convergent orogen: The Kaoko Belt of theDamara Orogen, Tectonics, 28, TC4002, doi:10.1029/2008TC002317.
Fraser, G. L., K. Hussey, and D. M. Compston (2008), Timing of Paleopro-terozoic Au‐Cu‐Bi and W‐mineralization in the Tennant Creek region,northern Australia: Improved constraints via intercalibration of 40Ar/39Arand U‐Pb ages, Precambrian Res., 164, 50–65, doi:10.1016/j.precamres.2008.03.005.
Fuis, G. S., and G. Plafker (1991), Evolution of deep structure along theTrans‐Alaska Crustal Transect, Chugach Mountains and Copper RiverBasin, southern Alaska, J. Geophys. Res., 96, 4229–4253, doi:10.1029/90JB02276.
Fuis, G. S., et al. (2008), Trans‐Alaska Crustal Transect and continentalevolution involving subduction underplating and synchronous forelandthrusting, Geology, 36, 267–270, doi:10.1130/G24257A.1.
Gasser, D. (2010), Evolution of the Chugach Metamorphic Complex ofsouthern Alaska in space and time, Ph.D. thesis, 315 pp., Dep. of EarthSci., Univ. of Graz, Graz, Austria.
Gleadow, A. J. W. (1981), Fission‐track dating methods: What are the realalternatives?, Nucl. Tracks, 5, 3–14, doi:10.1016/0191-278X(81)90021-4.
Goscombe, B. D., and D. R. Gray (2009), Metamorphic response in oro-gens of different obliquity, scale and geometry, Gondwana Res., 15,151–167, doi:10.1016/j.gr.2008.07.005.
Green, P. F., I. R. Duddy, A. J. W. Gleadow, P. R. Tingate, and G. M. Laslett(1986), Thermal annealing of fission tracks in apatite 1. A qualitativedescription, Chem. Geol., 59, 237–253, doi:10.1016/0168-9622(86)90074-6.
Groome, W. G., and D. J. Thorkelson (2009), The three‐dimensional ther-mo‐mechanical signature of ridge subduction and slab window migra-tion, Tectonophysics, 464, 70–83, doi:10.1016/j.tecto.2008.07.003.
Haeussler, P. J., D. Bradley, R. Goldfarb, L. Snee, and C. Taylor (1995),Link between ridge subduction and gold mineralization in southernAlaska, Geology, 23, 995–998, doi:10.1130/0091-7613(1995)023<0995:LBRSAG>2.3.CO;2.
Haeussler, P. J., D. C. Bradley, R. E. Wells, and M. L. Miller (2003), Lifeand death of the Resurrection plate: Evidence for its existence and sub-duction in the northeastern Pacific in Paleocene‐Eocene time, Geol.Soc. Am. Bull., 115, 867–880, doi:10.1130/0016-7606(2003)115<0867:LADOTR>2.0.CO;2.
Haeussler, P. J., G. E. Gehrels, and S. M. Karl (2005), Constraints on theage and provenance of the Chugach accretionary complex from detritalzircons in the Sitka Graywacke near Sitka, Alaska, in Studies by theU.S. Geological Survey in Alaska, 2004, edited by P. J. Haeussler andJ. P. Galloway, U.S. Geol. Surv. Prof. Pap., 1709‐F, 1–11.
Harris, N. R., V. B. Sisson, J. E. Wright, and T. L. Pavlis (1996), Evidencefor Eocene mafic underplating during fore‐arc intrusive activity, easternChugach mountains, Alaska, Geology, 24, 263–266, doi:10.1130/0091-7613(1996)024<0263:EFEMUD>2.3.CO;2.
Harrison, T. M., J. Célérier, A. B. Aikman, J. Hermann, and M. T. Heizler(2009), Diffusion of 40Ar in muscovite, Geochim. Cosmochim. Acta, 73,1039–1051, doi:10.1016/j.gca.2008.09.038.
Hill, M., J. Morris, and J. Whelan (1981), Hybrid granodiorites intrudingthe accretionary prism, Kodiak, Shumagin, and Sanak Islands, southwestAlaska, J. Geophys. Res. , 86 , 10,569–10,590, doi:10.1029/JB086iB11p10569.
Hudson, T., and G. Plafker (1982), Paleogene metamorphism of an accre-tionary flysch terrane, eastern Gulf of Alaska, Geol. Soc. Am. Bull., 93,1280–1290, doi:10.1130/0016-7606(1982)93<1280:PMOAAF>2.0.CO;2.
Hudson, T., G. Plafker, and M. A. Lanphere (1977a), Intrusive rocks of theYakutat–St. Elias area, south‐central Alaska, J. Res. U.S. Geol. Surv., 5,155–172.
Hudson, T., G. Plafker, and M. A. Lanphere (1977b), Metamorphic rocksof the Yakutat–St. Elias area, south‐central Alaska, J. Res. U.S. Geol.Surv., 5, 173–184.
Hudson, T., G. Plafker, and Z. E. Peterman (1979), Paleogene anatexisalong the Gulf of Alaska margin, Geology, 7, 573–577, doi:10.1130/0091-7613(1979)7<573:PAATGO>2.0.CO;2.
Hurford, A. J., and P. F. Green (1983), The zeta age calibration of fissiontrack dating, Isot. Geosci., 1, 285–317.
Jenkin, G. R. T. (1997), Do cooling paths derived from mica Rb‐Sr datareflect true cooling paths?, Geology, 25, 907–910, doi:10.1130/0091-7613(1997)025<0907:DCPDFM>2.3.CO;2.
Jones, R. R., R. E. Holdsworth, and W. Bailey (1997), Lateral extrusion intranspression zones: The importance of boundary conditions, J. Struct.Geol., 19, 1201–1217, doi:10.1016/S0191-8141(97)00034-5.
Jones, R. R., R. E. Holdsworth, P. Clegg, K. McCaffrey, and E. Tavarnelli(2004), Inclined transpression, J. Struct. Geol., 26, 1531–1548,doi:10.1016/j.jsg.2004.01.004.
Karner, D. B., and R. P. Renne (1998), 40Ar/39Ar geochronology of Romanvolcanic province tephra in the Tiber river valley: Age calibration of mid-dle Pleistocene sea‐level changes, Geol. Soc. Am. Bull., 110, 740–747,doi:10.1130/0016-7606(1998)110<0740:AAGORV>2.3.CO;2.
Koons, P. O., R. J. Norris, D. Craw, and A. F. Cooper (2003), Influence ofexhumation on the structural evolution of transpressional plate bound-aries: An example from the southern Alps, New Zealand, Geology, 31,3–6, doi:10.1130/0091-7613(2003)031<0003:IOEOTS>2.0.CO;2.
Koons, P. O., B. P. Hooks, T. Pavlis, P. Upton, and A. D. Barker (2010),Three‐dimensional mechanics of Yakutat convergence in the southernAlaskan plate corner, Tectonics, 29, TC4008, doi:10.1029/2009TC002463.
Koppers, A. (2002), ArArCALC—Software for 40Ar/39Ar age calculations,Comput. Geosci., 28, 605–619, doi:10.1016/S0098-3004(01)00095-4.
Little, T. A., and C. W. Naeser (1989), Tertiary tectonics of the BorderRanges fault system, Chugach Mountains, Alaska: Deformation and upliftin a forearc setting, J. Geophys. Res., 94, 4333–4359, doi:10.1029/JB094iB04p04333.
Lonsdale, P. (1988), Paleogene history of the Kula plate: Offshore evidenceand onshore implications, Geol. Soc. Am. Bull., 100, 733–754,doi:10.1130/0016-7606(1988)100<0733:PHOTKP>2.3.CO;2.
Ludwig, K. R. (2003), Isoplot/Ex Version 3.0: A Geochronological Toolkitfor Microsoft Excel, 70 pp., Berkeley Geochronol. Cent. Spec. Publ.,Berkeley, Calif.
Lull, J. S., and G. Plafker (1990), Geochemistry and paleotectonic implica-tions of metabasaltic rocks in the Valdez Group, southern Alaska, inGeological Studies in Alaska by the U.S. Geological Survey, 1989, editedby J. H. Dover and J. P. Galloway, U.S. Geol. Surv. Bull., 1946, 29–38.
Lytwyn, J., S. Lockhart, J. Casey, and T. Kusky (2000), Geochemistry ofnear‐trench intrusives associated with ridge subduction, Seldovia Quad-rangle, southern Alaska, J. Geophys. Res., 105, 27,957–27,978,doi:10.1029/2000JB900294.
Madsen, J. K., D. J. Thorkelson, R. M. Friedman, and D. D. Marshall(2006), Cenozoic to recent plate configurations in the Pacific Basin:Ridge subduction and slab window magmatism in western North Amer-ica, Geosphere, 2, 11–34, doi:10.1130/GES00020.1.
Marshak, R. S., and D. E. Karig (1977), Triple junctions as a cause foranomalously near‐trench igneous activity between the trench and volca-nic arc, Geology, 5, 233–236, doi:10.1130/0091-7613(1977)5<233:TJAACF>2.0.CO;2.
McAleer, R. J., J. A. Spotila, E. Enkelmann, and A. L. Berger (2009),Exhumation along the Fairweather fault, southeastern Alaska, based onlow‐temperature thermochronometry, Tectonics , 28 , TC1007,doi:10.1029/2007TC002240.
McDougall, I., and T. M. Harrison (1999), Geochronology and Thermo-chronology by the 40Ar/39Ar Method, 2nd ed., 269 pp., Oxford Univ.Press, New York.
Meigs, A., S. Johnston, J. Garver, and J. Spotila (2008), Crustal‐scale struc-tural architecture, shortening, and exhumation of an active, erodingwedge (Chugach/St Elias Range, southern Alaska), Tectonics, 27,TC4003, doi:10.1029/2007TC002168.
Min, K., R. Mundil, P. R. Renne, and K. Ludwig (2000), A test for system-atic errors in 40Ar/39Ar geochronology through comparison with U/Pbanalysis of a 1.1‐Ga rhyolite, Geochim. Cosmochim. Acta, 64, 73–98,doi:10.1016/S0016-7037(99)00204-5.
Naeser, C. W. (1976), Fission‐track dating, U.S. Geol. Surv. Open FileRep., 76‐190, 1–65.
Nilsen, T. H., and G. G. Zuffa (1982), The Chugach terrane: A Creta-ceous trench‐fill deposit, southern Alaska, in Trench‐Forearc Geology:Sedimentation and Tectonics on Modern and Active Plate Margins, edi-ted by J. K. Laggett, pp. 213–227, Blackwell Sci., Oxford, U. K.
Nokleberg, W. J., G. Plafker, J. S. Lull, W. K. Wallace, and G. R. Winkler(1989), Structural analysis of the southern Peninsular, southern Wrangellia,
GASSER ET AL.: TECTONIC EVOLUTION OF THE CMC TC2012TC2012
24 of 25

and northern Chugach terranes along the Trans‐Alaska Crustal Transect,northern Chugach Mountains, Alaska, J. Geophys. Res., 94, 4297–4320,doi:10.1029/JB094iB04p04297.
Norton, I. O. (1995), Plate motions in the North Pacific: The 43 Ma non-event, Tectonics, 14, 1080–1094, doi:10.1029/95TC01256.
Oldow, J. S., A. W. Bally, H. G. A. Lallemant, and W. P. Leeman (1989),Phanerozoic evolution of the North American Cordillera: UnitedStates and Canada, in The Geology of North America—An Overview,edited by A. W. Bally and A. R. Palmer, pp. 139–232, Geol. Soc. ofAm., Boulder, Colo.
Onstott, T. C., V. B. Sisson, and D. L. Turner (1989), Initial argon in am-phiboles from the Chugach Mountains, southern Alaska, J. Geophys.Res., 94, 4361–4372, doi:10.1029/JB094iB04p04361.
O’Sullivan, P. B., G. Plafker, and J. M. Murphy (1997), Apatite fission‐track thermotectonic history of crystalline rocks in the northernSaint Elias Mountains, Alaska, in Geological Studies in Alaska by theU.S. Geological Survey, 1995, edited by J. A. Dumoulin and J. E. Gray,U.S. Geol. Surv. Prof. Pap., 1574, 283–293.
Pavlis, T. L., and S. M. Roeske (2007), The Border Range fault system, inTectonic Growth of a Collisional Continental Margin: Crustal Evolutionof Southern Alaska, edited by K. D. Ridgway et al., Spec. Pap. Geol. Soc.Am., 431, 95–128.
Pavlis, T. L., and V. B. Sisson (1995), Structural history of the Chugachmetamorphic complex in the Tana River region, eastern Alaska: A recordof Eocene ridge subduction, Geol. Soc. Am. Bull., 107, 1333–1355,doi:10.1130/0016-7606(1995)107<1333:SHOTCM>2.3.CO;2.
Pavlis, T. L., and V. B. Sisson (2003), Development of a subhorizontaldecoupling horizon in a transpressional system, Chugach MetamorphicComplex, Alaska: Evidence for rheological stratification of the crust,in Geology of a Transpressional Orogen Developed During Ridge‐Trench Interaction Along the North Pacific Margin, edited by V. B.Sisson et al., Spec. Pap. Geol. Soc. Am., 371, 191–216.
Pavlis, T. L., C. Picornell, L. Serpa, R. L. Bruhn, and G. Plafker (2004),Tectonic processes during oblique collision: Insights from the St. Eliasorogen, northern North American Cordillera, Tectonics, 23, TC3001,doi:10.1029/2003TC001557.
Philpotts, A. R., and J. J. Ague (2009), Principles of Igneous and Metamor-phic Petrology, 2nd ed., 667 pp., Cambridge Univ. Press, Cambridge, U. K.
Plafker, G., J. C. Moore, and G. R. Winkler (1994), Geology of the south-ern Alaska margin, in The Geology of Alaska, vol. G‐1, The Geology ofNorth America, edited by G. Plafker and H. C. Berg, pp. 389–449, Geol.Soc. of Am., Boulder, Colo.
Reiners,W. R., Z. Zhou, T. A. Ehlers, C. Xu,M. T. Brandon, R. A. Donelick,and S. Nicolescu (2003), Post‐orogenic evolution of the Dabie Shan,eastern China, from (U‐Th)/He and fission track thermochronology,Am. J. Sci., 303, 489–518, doi:10.2475/ajs.303.6.489.
Renne, P. R., C. C. Swisher, A. L. Deino, D. B. Karner, T. L. Owens, andD. J. DePaolo (1998), Intercalibration of standards, absolute ages and un-certainties in 40Ar/39Ar dating, Chem. Geol., 145, 117–152, doi:10.1016/S0009-2541(97)00159-9.
Robin, P.‐Y. F., and A. R. Cruden (1994), Strain and vorticity patterns inideally ductile transpression zones, J. Struct. Geol., 16, 447–466,doi:10.1016/0191-8141(94)90090-6.
Roeske, S. M., L.W. Snee, and T. L. Pavlis (2003), Dextral‐slip reactivation ofan arc‐forearc boundary during Late Cretaceous–Early Eocene oblique con-vergence in the northern Cordillera, inGeology of a Transpressional OrogenDeveloped During Ridge‐Trench Interaction Along the North Pacific Mar-gin, edited by V. B. Sisson et al., Spec. Pap. Geol. Soc. Am., 371, 141–169.
Sample, J. C., and M. R. Reid (2003), Large‐scale, latest Cretaceous upliftalong the northeast Pacific Rim: Evidence from sediment volume, sand-stone petrography, and Nd isotopic signatures of the Kodiak Formation,Kodiak Islands, Alaska, in Geology of a Transpressional Orogen Devel-oped During Ridge‐Trench Interaction Along the North Pacific Margin,edited by V. B. Sisson et al., Spec. Pap. Geol. Soc. Am., 371, 51–70.
Sanderson, D. J., and W. R. D. Marchini (1984), Transpression, J. Struct.Geol., 6, 449–458, doi:10.1016/0191-8141(84)90058-0.
Scaillet, S. (2000), Numerical error analysis in 40Ar/39Ar dating, Chem.Geol., 162, 269–298, doi:10.1016/S0009-2541(99)00149-7.
Scharman, M. R., T. L. Pavlis, E. M. Day, and L. J. O’Driscoll (2011),Deformation and structure in the Chugach Metamorphic Complex, south-ern Alaska: Crustal architecture of a transpressional system from a down‐plunge section, Geosphere, in press.
Schulmann, K., A. B. Thompson, O. Lexa, and J. Ježek (2003), Strain distri-bution and fabric development modeled in active and ancient transpressivezones, J. Geophys. Res., 108(B1), 2023, doi:10.1029/2001JB000632.
Sisson, V. B., and L. S. Hollister (1988), Low‐pressure facies seriesmetamorphism in an accretionary sedimentary prism, southern Alaska,Geology, 16, 358–361, doi:10.1130/0091-7613(1988)016<0358:LPFSMI>2.3.CO;2.
Sisson, V. B., and T. L. Pavlis (1993), Geologic consequences of platereorganization: An example from the Eocene southern Alaska fore‐arc,Geology, 21, 913–916, doi:10.1130/0091-7613(1993)021<0913:GCOPRA>2.3.CO;2.
Sisson, V. B., L. S. Hollister, and T. C. Onstott (1989), Petrologic and ageconstraints on the origin of a low‐pressure/high‐temperature metamor-phic complex, southern Alaska, J. Geophys. Res., 94, 4392–4410,doi:10.1029/JB094iB04p04392.
Sisson, V. B., A. R. Poole, N. R. Harris, H. C. Burner, P. Copeland, A. D.Raymond, and W. C. McLelland (2003), Geochemical and geochronologicconstraints for genesis of a tonalite‐trondhjemite suite and associated maficintrusive rocks in the eastern ChugachMountains, Alaska: A record of ridgetransform subduction, in Geology of a Transpressional Orogen DevelopedDuring Ridge‐Trench Interaction Along the North Pacific Margin, editedby V. B. Sisson et al., Spec. Pap. Geol. Soc. Am., 371, 293–326.
Sölva, H., B. Grasemann, M. Thöni, R. Thiede, and G. Habler (2005), TheSchneeberg normal fault zone: Normal faulting associated with Creta-ceous SE‐directed extrusion in the eastern Alps (Italy/Austria), Tectono-physics, 401, 143–166, doi:10.1016/j.tecto.2005.02.005.
Spell, T. L., and I. McDougall (2003), Characterization and calibration of40Ar/39Ar dating standards, Chem. Geol., 198, 189–211, doi:10.1016/S0009-2541(03)00005-6.
Spotila, J. A., J. T. Buscher, A. J. Meigs, and P. W. Reiners (2004), Long‐term glacial erosion of active mountain belts: Example of the Chugach–St. Elias Range, Alaska, Geology, 32, 501–504, doi:10.1130/G20343.1.
Teyssier, C., and B. Tikoff (1999), Fabric stability in oblique convergenceand divergence, J. Struct. Geol., 21, 969–974, doi:10.1016/S0191-8141(99)00067-X.
Teyssier, C., B. Tikoff, and M. Markley (1995), Oblique plate motion andcontinental tectonics, Geology, 23, 447–450, doi:10.1130/0091-7613(1995)023<0447:OPMACT>2.3.CO;2.
Thompson, A. B., K. Schulmann, and J. Jezek (1997), Thermal evolutionand exhumation in obliquely convergent (transpressive) orogens, Tecto-nophysics, 280, 171–184, doi:10.1016/S0040-1951(97)00144-3.
Tikoff, B., and C. Teyssier (1994), Strain modelling of displacement‐fieldpartitioning in transpressional orogens, J. Struct. Geol., 16, 1575–1588,doi:10.1016/0191-8141(94)90034-5.
Trop, J. M., and K. D. Ridgway (2007), Mesozoic and Cenozoic tectonicgrowth of southern Alaska: A sedimentary perspective, in Tectonic Growthof a Collisional Continental Margin: Crustal Evolution of Southern Alaska,edited by K. D. Ridgway et al., Spec. Pap. Geol. Soc. Am., 431, 55–94.
Villa, I. (1998), Isotopic closure, Terra Nova, 10, 42–47, doi:10.1046/j.1365-3121.1998.00156.x.
Wagner, G., and P. van den Haute (1992), Fission‐Track Dating, 285 pp.,Enke Verlag, Stuttgart, Germany.
Wallace, W. K., and D. C. Engebretson (1984), Relationships betweenplate motions and Late Cretaceous to Paleogene magmatism in south-western Alaska, Tectonics, 3, 295–315, doi:10.1029/TC003i002p00295.
Whitney, D. L., and B. W. Evans (2010), Abbreviation for names of rock‐forming minerals, Am. Mineral., 95, 185–187, doi:10.2138/am.2010.3371.
Whitney, D. L., C. Teyssier, and M. T. Heizler (2007), Gneiss domes,metamorphic complexes, and wrench zones: Thermal and structural evo-lution of the Niğde Massif, central Anatolia, Tectonics, 26, TC5002,doi:10.1029/2006TC002040.
Wolf, R. A., K. A. Farley, and L. T. Silver (1996), Helium diffusion andlow temperature thermochronometry of apatite, Geochim. Cosmochim.Acta, 60, 4231–4240, doi:10.1016/S0016-7037(96)00192-5.
Zumsteg, C. L., G. R. Himmelberg, S. Karl, and P. Haeussler (2003), Meta-morphism within the Chugach accretionary complex on Baranof island,southeastern Alaska, in Geology of a Transpressional Orogen DevelopedDuring Ridge‐Trench Interaction Along the North Pacific Margin, editedby V. B. Sisson et al., Spec. Pap. Geol. Soc. Am., 371, 253–267.
E. Bruand, D. Gasser, and K. Stüwe, Department of Earth Science,University of Graz, Universitätsplatz 2, A‐8010 Graz, Austria. (emilie.bruand@uni‐graz.at; [email protected]; kurt.stuewe@uni‐graz.at)D. A. Foster, Department of Geological Sciences, University of Florida,
241 Williamson Hall, PO Box 112120, Gainesville, FL 32611, USA.([email protected])B. Fügenschuh, Faculty of Geo‐ and Atmospheric Sciences, University
of Innsbruck, Innrain 52, A‐6020 Innsbruck, Austria.T. Pavlis, Department of Geological Sciences, University of Texas at El
Paso, Geology 405, 500 West University Blvd., El Paso, TX 79968, USA.([email protected])R. Schuster, Geological Survey of Austria, Neulinggasse 38, A‐1030
Vienna, Austria. ([email protected])
GASSER ET AL.: TECTONIC EVOLUTION OF THE CMC TC2012TC2012
25 of 25