![Uz 75. obljetnicu života Božidara Čečuka [Božidar Čečuk 75 years old.]](https://static.fdokumen.com/doc/165x107/63348466e9e768a27a1014e9/uz-75-obljetnicu-zivota-bozidara-cecuka-bozidar-cecuk-75-years-old.jpg)
Uz 75. obljetnicu života Božidara Čečuka [Božidar Čečuk 75 years old.]
Leśne Prace Badawcze (Forest Research Papers),December 2014, Vol. 75 (4): 333–341
DOI: 10.2478/frp-2014-0030
ORIGINAL RESEARCH ARTICLE
Received 13 March 2014, accepted after revision 23 April 2014.© 2014, Forest Research Institute
Vertical distribution of Cu, Ni and Zn in Brunic Arenosols and Gleyic Podzols of the supra-flood terrace of the Słupia River as affected by litho-pedogenic factors
Jerzy Jonczak
Pomeranian University in Słupsk, Institute of Geography and Regional Studies 27 Partyzantów, 76–200 Słupsk, Poland.
Tel. +48 59 840 05 01; e-mail: [email protected]
Abstract: The aim of the study was to assess the influence of lithological and pedogenic factors in the shaping of Cu, Ni and Zn distribution patterns in the profiles of Brunic Arenosols and Gleyic Podzols of the lower supra-flood terrace of the Słupia River, which is located outside the range of significant anthropogenic sources of pollution with these metals.
The contents of the investigated metals were analysed in aqua regia extracts of samples collected from three profiles of Brunic Arenosols, formed from river sands, and three profiles of Gleyic Podzols, formed from river sands trans-formed by eolian processes.
In general, river sands contained higher amounts of Ni and Zn (2.6 – 6.9 mg·kg-1 Ni; 10.3 – 16.2 mg·kg-1 Zn) com-pared to eolian sands (1.2 – 2.4 mg·kg-1 Ni; 3.3 – 17.3 mg·kg-1), while the content of copper tended to be higher in eolian sands (1.3 – 1.9 mg·kg-1) than river sands (0.1 – 1.5 mg·kg-1). The observed differences between the two types of sand are due to the loss of fine granulometric fractions and various minerals during eolian processes. Higher con-centrations of the investigated metals in soil solum as compared to parent material are due to their uptake from deeper parts of the soil by roots and subsequent return to the soil surface as a component of litterfall. Therefore, the highest concentrations of Cu, Ni and Zn were observed in ectohumus. In the mineral component of the soil, the highest con-centrations were observed in organic matter-rich A and B horizons, which indicate close interactions between heavy metals, humic substances and iron oxides.
The vertical distribution of the investigated metals in the profiles of Gleyic Podzols indicates their leaching during podzolization. The observed contents of Cu, Ni and Zn, both in Brunic Arenosols and Gleyic Podzols, were lower than the geochemical background, which confirms that anthropogenic contamination of the studied area with these metals is marginal.
Key words: copper, nickel, zinc, Brunic Arenosols, Gleyic Podzols
1. Introduction
Parent rocks are the primary, spatially varying source of heavy metals in soils. However, dry and wet atmos-pheric depositions, throughfall and stemflow (Linberg and Turner, 1988; Saur end Juste, 1994; Skřivan et al., 1995), plant litterfall (Silva et al., 1998), as well as sur-face and ground waters (Logan et al., 1997; Paulson, 1997) are their most important secondary sources. In re-
cent centuries, anthropogenic emissions have become an important source of soil contamination with heavy met-als, having a relatively broad range of impact. Increasing environmental pollution caused by these substances in the 20th century is reflected in their elevated concentrations in the modern alluvial sediments and slope deposits (e.g. Taylor, 1996; Martin, 2000; Pasieczna, 2003; Zgłobicki, 2008). In river valleys, concentrations of heavy metals in the sediments accumulated in floodplain terraces being

334 J. Jonczak / Leśne Prace Badawcze, 2014, Vol. 75 (4): 333–341
under the anthropogenic impact are generally higher than those in the sediments of higher-located terraces accumu-lated during periods of lack of significant human activity (Brewer and Taylor, 1997).
Heavy metals present in the soil occur in various forms associated, in various ways, with other soil com-ponents. The use of suitable extraction procedures al-lows to isolate water-soluble forms, exchangeable forms and forms bounded to carbonates, iron and man-ganese oxides, organic and residual forms (Tessier et al. 1979; Sauvé et al. 2000, Singh et Kabała 2001; Konradi et al., 2005; Degryse et al. 2009). Each form differs in availability for plants and mobility. Both the forms and bioavailability of heavy metals are largely affected by a complex of physical and chemical properties of the soils, especially by their reaction (Martinez et Motto 2000; Strobel et al., 2005; McAlister et al., 2006; Fi-jałkowski et al., 2012).
Studies on concentrations of heavy metals in soils and their sequestration are conducted mainly in anthro-pogenically polluted areas. Relatively rare are studies on natural, lithopedogenic factors affecting the patterns of distribution of heavy metals in different types of soil in unpolluted areas (e.g. Ukonmaanaho et al., 2001).
This study aims to evaluate the role of lithological and pedogenic factors in shaping the vertical distribu-tion of Cu, Ni and Zn in the profiles of forest Brunic Arenosols and Gleyic Podzols in the lower supra-flood terrace of the Słupia River, located beyond the area of significant impact of anthropogenic emission sources of these pollutants.
2. Materials and methods
2.1. Site characteristics
The investigated fragment of the lower supra-flood terrace of the river Słupia is built of loose-, fine- and medium-grained river sands, with thickness of nearly 4 meters (Florek 1989). Thermoluminescent age (TL) of the sediments is about 9000 years BP (Jonczak et al. 2013). The soils formed from these sands 5100–4200 years ago were locally dispersed by wind. As a result, usually in the local depressions formed eolian covers thick to about 2 meters. The texture of aeolian sands does not differ significantly from river sands, which confirms their origin from local sources and transport over a short distance (Florek 1989). Reactivation of the aeolian processes that evolved about 400–500 years ago was related to the local deforestations (Jonczak et
al. 2013). These processes have led, in some places, to accumulation of 20–30 cm thick aeolian layers on the surface of the existing soils (profiles G-1, G-2).
Brunic Arenosols arose from river sands, while Gley-ic Podzols arose from aeolian sands, in conditions of shallow groundwater level. Gleyic Podzols character-ised with humus rich and relatively poor in free iron oxides B-horizon (Jonczak et al. 2013). At the begin-ning of the 20th century, the central part of the studied terrace was drained, which has led to reduction in the local groundwater level and gradual transformation of peat-like horizons of these soils into murshic horizons. Undoubtedly, the local deforestations and anthropogen-ic changes in species composition of forests in the past centuries were other important factors influencing soil development in this area. Today, the entire study area is covered with pine, with admixtures of spruce, oak, beech and birch. The area is located beyond the range of significant anthropogenic sources of Cu, Ni and Zn emissions. This is reflected in the low concentration of these metals even in the urban soils of Słupsk where a slight increase of the geochemical background is rarely observed (Pasieczna 2003; Parzych et Jonczak 2014).
2.2. Methods
Field studies were conducted in 2010. Fifteen soil pits were dug, soil profiles were described and sampled. The samples were collected from each genetic horizon, dried and analysed. The soils were described after the 5th edition of the Classification of Polish Soils (Mar-cinek et al. 2011). The content of heavy metals was de-termined in three profiles of Haplic Brunic Arenosols and three profiles of Gleyic Podzols (Orsteinic and Mur-schic), whose morphology was not modified by human activity (Fig. 1). Some features were observed only in profile R-1, which indicates the post-agricultural nature of the soil. The following soil properties were analysed:
– bulk density – by gravimetric method in 100 cm3 volumetric samples,
– particle-size distribution – a combined sieve and pipette method. Division into granulometric fractions and granulometric groups was done after classification of Polish Soil Science Society (PTG 2008),
– pH – by potentiometric method in a suspension with water and 1 mol·dm-3 KCl solution in 1:2.5 propor-tion of soil:water/KCl,
– soil organic carbon (Corg.) content – in mineral sam-ples by the Tiurin’s method, and in organic samples by the Alten’s method,

335J. Jonczak / Leśne Prace Badawcze, 2014, Vol. 75 (4): 333–341
– the content of Cu, Ni and Zn – in aqua regia ex-tracts (open system with reverse coolers) with micro-wave plasma atomic emission spectrometry (Agilent 4100 MP-AES). Two soil reference samples were si-multaneously analysed to control quality of analysis.
2.3. Soil characteristics
All the investigated soils have occurred in the for-est communities, with Scots pine as a dominant spe-cies for over more than a century (Table 1). These are light-textured soils of the texture of sand. The sum of silt and clay fraction does not exceed 6.9% in Brunic Arenosols (Table 2) and 4.3% in Gleyic Podzols (Table 3). The soils are characterised by acidic and very acid-ic reaction. The pHH2O in organic horizon ranges from 3.53 to 4.78 for Brunic Arenosols and from 3.62 to 4.66 for Gleyic Podzols. The pH of mineral part of the soils is generally the lowest in humus horizons and ranges from 3.81 to 4.56 in Brunic Arenosols and from 3.80 to
3.97 in Gleyic Podzols. In all profiles, the observed in-crease of pH with depth may be due to the impact of the groundwater (Tables 2, 3). Brunic Arenosols are mod-erately rich in organic carbon whose content in humic horizons ranges from 9.9 to 48.6 g·kg-1 (Table 2). Gleyic Podzols are characterised by a much higher content of this component. Humic horizon (excluding the initial humic horizon formed in young Aeolian horizons) con-tains 32.3–77.0 g·kg-1 of organic carbon, and orsteinic horizon contains 13.0–35.6 g·kg-1 (Table 3).
4. Results and discussion
The chemical and physical properties of the parent ma-terial, water regime and vegetation cover are among the main natural factors affecting vertical distribution of heavy metals during soil development (Silva et al., 1998; Rusek et al., 2005; Kabała et al. 2008). The percolative type of water regime in the temperate climate zone favours the leaching of various soil components, including heavy
Figure 1. Location of soil profiles in the area of lower supra-flood terrace of the Słupia River: G – Gleyic Podzols; R – Brunic Arenosols

336 J. Jonczak / Leśne Prace Badawcze, 2014, Vol. 75 (4): 333–341
Table 1. Groundwater level and tree-species composition of the stand in the surrounding of soil profiles (order of species according to their declining share in the stand)
Profile number
Groundwater level [m]
Components of tree-stand
R-1 2.0 Scots pine, silver birch, European beech, pedunculate oak R-2 3.0 Scots pine, pedunculate oak R-3 3.0 Scots pine, pedunculate oak G-1 1.2 Scots pine, Norway spruce, pedunculate oak G-2 2.0 Scots pine, pedunculate oak G-3 2.0 Scots pine, Norway spruce, European beech
Table 2. Selected properties of Brunic Arenosols
Soil horizon Depth[cm]
Bulk density [g·cm-3]
Textural group
Percentage of fraction <0.05 mm
[%]
pHH2O pHKCl
Corg.
[g·kg-1]
Profile R-1Ol 5–3 4.63 4.13 442.4
Ofh 3–0 4.70 4.08 433.6A 0–6 1.04 sand 0.8 3.81 2.98 48.6
A(p) 6–25 1.49 sand 6.9 4.20 3.54 9.9Bv 25–49 1.37 sand 5.0 4.67 4.20 6.1
BvC 49–68 1.48 sand 1.6 4.67 4.38 2.3Cg 68–105 1.52 sand 2.4 4.79 4.46 0.0Cg2 105–140 1.46 sand 0.5 4.94 4.52 0.0
Profile R-2Ol 10–7 4.25 3.51 461.5Of 7–4 3.84 2.78 403.8Oh 4–0 3.53 2.40 391.9
AEs 0–7 1.04 sand 1.7 4.03 2.97 10.3Bvhs 7–40 1.39 sand 0.1 4.55 4.07 6.1BvC 40–65 1.53 sand 1.9 4.05 3.33 11.0
C 65–150 1.53 sand 1.5 4.84 4.63 0.0Profile R-3
Ol 9–6 4.78 4.32 502.5Of 6–4 4.65 3.97 362.8Oh 4–0 3.99 2.99 309.3A1 0–19 1.40 sand 6.7 4.29 3.67 10.3A2 19–31 1.36 sand 4.2 4.56 4.10 7.3
ABv 31–45 1.37 sand 3.7 4.69 4.19 5.1Bv 45–70 1.45 sand 2.6 4.54 4.30 3.2Cg1 70–110 1.56 sand 0.0 4.81 4.43 0.0Cg2 110–150 1.53 sand 0.5 5.02 4.53 0.0

337J. Jonczak / Leśne Prace Badawcze, 2014, Vol. 75 (4): 333–341
metals. The intensity of this process is conditioned by the physical and physicochemical soil properties (such as tex-ture, bulk density, porosity, sorption capacity and pH) and forms of metals. The light-textured river and aeolian sands that build up the soil of the investigated fragment of the Słupia supra-flood terrace are not a limitation for the per-colating water. Also the acidic and strongly acidic soil pH is conducive to the mobility of metals. Differences in the
groundwater level may differentiate the vertical distribu-tion patterns of metals in the investigated Brunic Areno-sols and Gleyic Podzols. Today, the groundwater level is beyond the range of the solum of Brunic Arenosols and within the range of the solum of Gleyic Podzols.
Cu, Ni and Zn, which are important micronutrients for plants, are uptaken by their root systems to be partially returned to the soil surface as a component of plant lit-
Table 3. Selected properties of Gleyic Podzols
Soil horizon
Depth[cm]
Bulk density[g·cm-3]
Textural group
Percentage of fraction <0.05 mm
[%]
pHH2O pHKCl
Corg.
[g·kg-1]
Profile G-1Ol 6–4 4.33 3.65 477.6Of 4–3 4.38 3.68 415.7Oh 3–0 3.80 2.79 274.4
AEs 0–6 1.26 sand 0.4 3.80 2.96 23.5Bhs 6–18 1.47 sand 1.1 4.26 3.69 7.2
2AEs 18–31 1.37 sand 1.0 4.11 3.49 35.12Es 31–40 1.39 sand 1.0 4.30 3.56 5.42Brg 40–58 1.48 sand 4.3 4.35 3.75 35.6
2Bhsg/C 58–92 1.51 sand 0.8 4.95 4.53 3.33Cg 92–130 1.55 sand 0.7 4.85 4.62 -
Profile G-2Ol 12–10 4.55 3.97 463.7Of 10–3 3.92 2.91 348.2Oh 3–0 3.62 2.59 302.9Es 0–7 1.39 sand 1.7 3.99 3.06 16.5
Bhs/C 7–13 1.45 sand 0.0 4.90 4.34 1.72A 13–20 1.19 sand 3.1 3.95 3.27 77.02Es 20–32 1.42 sand 1.8 4.35 3.60 5.42Brg 32–51 1.54 sand 4.1 4.38 3.77 20.9
2Bhsg 51–76 1.44 sand 1.3 4.66 4.48 3.72Cg 76–123 1.56 sand 0.6 4.82 4.41 -3Cg 123–150 1.57 sand 1.5 4.94 4.55 -
Profile G-3Ol 3–0 4.66 4.15 489.7Au 0–31 1.21 sand 1.9 3.97 3.21 32.3Es 31–42 1.32 sand 1.5 4.76 3.61 5.2Brg 42–73 1.52 sand 3.1 5.17 4.03 13.0
Br/Cg 73–140 1.50 sand 0.6 5.48 4.26 4.6Cg 140–200 1.52 sand 1.8 5.77 4.48 -

338 J. Jonczak / Leśne Prace Badawcze, 2014, Vol. 75 (4): 333–341
terfall. Their concentration in litterfall depends primarily on the species composition of plant communities and the complex of environmental factors determining their bio-availability. There may be a limiting factor in litterfall de-composition when their concentration is too high (Strojan 1978, Berg et al., 1991; Cotrufo et al., 1995). The critical values of concentrations, however, are relatively high and are exceeded only in areas that are heavily contaminated anthropogenically (Tyler 1992).
The maximum concentrations of heavy metals in for-est soils usually occur in the organic horizon. It is the cu-
mulative effect of the dry and wet atmospheric deposition of these metals on the surface area, influx with litterfall and their bounding by humic substances (Tyler 1973 Bergbäck et Carlsson, 1995; Saur et Juste 1994). In addi-tion, in the studied soils, the maximum concentrations of Cu, Ni and Zn were noticed in general in the ecohumus (Tables 4, 5). The content of Cu in the Ol horizon was not much variable, despite the differences in the species composition of forest stands (Table 1), and ranged from 9.5 to 11.4 mg·kg-1 (Tables 4, 5). A slight increase in the concentration of Cu was observed in the Of, Oh and Ofh
Table 4. Vertical distribution of heavy metals in the profiles of Brunic Arenosols
Soil horizon
Depth[cm]
Cu[mg·kg-1]
Ni[mg·kg-1]
Zn[mg·kg-1]
Profile R-1Ol 5–3 10.2 8.0 60.8
Ofh 3–0 12.4 10.9 87.5A 0–6 3.9 3.4 18.2
A(p) 6–25 3.3 3.3 24.4Bv 25–49 2.5 3.5 25.0
BvC 49–68 2.1 3.9 19.7Cg 68–105 1.5 3.9 16.2Cg2 105–140 1.1 2.6 11.8
Profile R-2Ol 10–7 9.8 7.7 79.5Of 7–4 9.5 9.5 62.5Oh 4–0 11.2 12.5 73.2
AEs 0–7 1.5 2.3 12.7Bvhs 7–40 1.8 2.7 20.1BvC 40–65 1.3 2.5 15.8
C 65–150 1.0 2.7 15.5Profile R-3
Ol 9–6 11.4 12.6 47.6Of 6–4 12.3 16.1 55.0Oh 4–0 9.3 15.6 34.5A1 0–19 1.8 6.7 13.6A2 19–31 2.3 6.2 11.0
ABv 31–45 2.6 4.4 13.7Bv 45–70 0.5 6.2 12.1Cg1 70–110 0.3 5.9 10.9Cg2 110–150 0.1 6.9 10.3
Table 5. Vertical distribution of heavy metals in the profiles of Gleyic Podzols
Soil horizon
Depth[cm]
Cu[mg·kg-1]
Ni[mg·kg-1]
Zn[mg·kg-1]
Profile G-1Ol 6–4 9.5 6.6 52.9Of 4–3 10.0 7.0 49.2Oh 3–0 8.2 7.5 26.6AEs 0–6 1.9 1.4 6.6Bhs 6–18 2.2 2.4 9.5
2AEs 18–31 2.4 2.4 4.12Es 31–40 1.2 1.3 3.92Brg 40–58 1.6 2.4 7.4
2Bhsg/C 58–92 1.5 2.8 7.53Cg 92–130 1.6 3.1 8.8
Profile G-2Ol 12–10 9.7 8.1 75.1Of 10–3 9.6 9.6 66.7Oh 3–0 8.4 14.0 54.3Es 0–7 3.8 2.8 19.1
Bhs/C 7–13 1.8 3.0 21.32A 13–20 2.6 2.9 14.72Es 20–32 0.9 1.6 12.02Brg 32–51 1.2 2.2 14.4
2Bhsg 51–76 1.2 2.8 17.22Cg 76–123 1.3 2.4 17.33Cg 123–150 1.3 2.2 13.2
Profile G-3Ol 3–0 9.6 13.7 94.7Au 0–31 2.0 5.4 6.6Es 31–42 0.2 3.5 4.4Brg 42–73 0.3 6.0 8.3
Br/Cg 73–140 1.3 0.4 6.3Cg 140–200 1.9 1.2 3.3

339J. Jonczak / Leśne Prace Badawcze, 2014, Vol. 75 (4): 333–341
horizons, generally to a maximum level of 12.4 mg·kg-1. The recorded concentrations of Cu were usually sever-al times lesser than in the organic horizon in the profiles of Brunic Arenosols and Gleyic Podzols in the area of northern Poland, according to the Atlas of Polish Forest Soils (Brożek, Zwydak 2003: profiles 81, 109 (Tucho-la), 91 (Gryfino), 94 (Osie), 95, 103, 111 (Kliniska), 98 (Gdańsk), 101 (Dobrocin), 112, 120 (Wejherowo).
Much higher differences were noticed in the content of Ni and Zn. In the Ol horizon the content of Ni ranged from 6.6 mg·kg-1 in profile G-1 to 13.7 in profile G-3, and in remaining sub-horizons of ectohumus from 7.0 to 16.1 mg·kg-1 (Tables 4, 5). In turn, the Zn content ranged from 47.6 to 94.7 mg·kg-1 in the Ol horizon and from 26.6 to 87.5 mg·kg-1 in the remaining organic horizons. The observed concentrations of Ni and Zn did not differ from the values for this type of forest soils in northern Poland presented in the Atlas of Polish Forest Soils (Brożek, Zwydak: 2003 Ni from 5.1 mg·kg-1 in profile No. 91 to 13.6 mg·kg-1 in profile No. 94, and Zn from 36.0 mg·kg-1 in profile No. 81 to 82.0 in profile No.103).
Released during decomposition of plant litterfall, heavy metals are adsorbed by mineral and organic com-ponents of soil, uptaken by plant roots and microorgan-isms and leached into the deeper parts of the soil. The proportions between these processes vary in space and time. The contents of Cu, Ni and Zn in mineral horizons of the investigated soils were several times lower than in the ectohumus. Concentrations lower than the geochem-ical background values (5.4 mg·kg-1 for Cu, 4.9 mg·kg-
1 for Ni and 27.0 mg·kg-1 for Zn) confirm the lack of a significant impact of anthropogenic emission sources of these elements and very low contamination of environ-ment. The low concentration of heavy metals is also con-ditioned by the light texture of soils. Numerous studies have shown that the concentration of Cu, Ni and Zn, as well as of many other metals, is closely, positively related to the degree of disintegration of the mineral part of the soil, especially to the content of clay fraction (e.g. Kabała et al. 2008). The concentrations of Cu ranged from 0.1 to 3.9 mg·kg-1 in Brunic Arenosols, and from 0.2 to 3.8 mg·kg-1 in Gleyic Podzols. The minimum concentration of Cu occurred in the parent material and the maximum in the A and B horizons. Nickel in the mineral horizons of Brunic Arenosols amounted to 2.3–6.9 mg·kg-1, showing a slight vertical variability. The concentration of this ele-ment in Gleyic Podzols was slightly higher and amounted to 0.4–6.0 mg·kg-1. The observed maximum concentra-tions of Cu in A and B horizons of these soils indicate close association of the element with soil organic mat-
ter, which is one of the most effective sorbents of metals (Leenaers et al., 1988; Logan et al., 1997; Charriau et al. 2011). Free iron oxides are also important sorbents of metals in soils (Dąbkowska-Naskręt 2013). In the inves-tigated soils, the components were concentrated mainly in B horizons. The observed concentrations of Cu and Ni were within the range of values recorded by Brożek and Zwydak (2003) in the profiles of forest Brunic Arenosols and Gleyic Podzols in northern Poland.
The concentration of Zn in the mineral horizons of Brunic Arenosols ranged from 10.3 to 25.0 mg·kg-1 and of Gleyic Podzols from 3.3 to 21.3 mg·kg-1. Degryse and Smolders (2006) recorded a lower content of this element in anthropogenically uncontaminated Gleyic Podzols in Belgium ranging from 4.5 to 13.3 mg·kg-1. Lower values were also recorded by Brożek and Zwy-dak (2003) in Brunic Arenosols and Gleyic Podzols in Poland. The maximum concentrations of Zn in the pro-files of Brunic Arenosol were noted in enrichment and humic horizons, and minimal concentrations in the par-ent material. The distribution patterns of Zn in individ-ual Gleyic Podzol profiles varied. The maxima in G-1 profile occurred in the initial Bhs horizon and 3Cg hori-zon, in G-2 profile – in the initial Es and Bhs/C horizons, while in G-3 profile in the Brg horizon. The distribution of Zn in profiles of these soils indicates vertical transport of Zn during podsolization, with labile fractions of or-ganic matter. Degryse and Smolders (2006) observed a similar distribution pattern of Zn in the uncontaminated profiles of Gleyic Podzols. In turn, in areas contaminat-ed with Zn, the authors recorded the maximum concen-trations of the metal in humic horizons. The distribution pattern of both Zn and other heavy metals in the profiles of Gleyic Podzols may therefore be an indicator of the environmental pollution by these substances.
4. Summary
Results of the studies conducted in the area of the lower supra-flood terrace of the Słupia River highlight the role of lithogenic and pedogenic factors in the spatial and vertical variability of Cu, Ni and Zn concentrations in forest soils in the areas uncontaminated anthropogen-ically. Accumulated in the early Holocene, poorly sort-ed river sands, which are the parent material of Brunic Arenosols, contained 0.1–1.5 mg·kg-1 of Cu, 2.6–6.9 mg·kg-1 of Ni and 10.3–16.2 mg·kg-1 of Zn. During 5100–4200 BP in some places, the process of their aeo-lization occurred. As a result, in local land depressions formed small aeolian covers built of the partially sorted

340 J. Jonczak / Leśne Prace Badawcze, 2014, Vol. 75 (4): 333–341
and depleted in silt, clay and heavy minerals as com-pared to the initial material. Aeolian sands, being the parent material of Gleyic Podzols, contained slightly higher concentrations of Cu (1.3–1.9 mg·kg-1) and gen-erally lower concentrations of Ni (1.2–2.4 mg·kg-1) and Zn (3.3–17.3 mg·kg-1).
During pedogenesis, Cu, Ni and Zn were translocated by vegetation, from the deeper soil layers upwards to its surface, causing their concentration in the solum. Cur-rently, the maximum concentrations of the investigat-ed metals occur in ectohumus. This is a typical pattern found in forest soils. There were no significant differ-ences between the ectohumus of Brunic Arenosols and Gleyic Podzols in terms of metal concentration despite the spatial variation of the species composition of for-est stands. Differences were observed in the distribution patterns of Cu, Ni and Zn in the soil solum. In Gleyic Podzols, the minimum concentrations were noticed in eluvial horizons, while the maximum in orsteinic and humic horizons, which indicates metals translocation with percolating water, and close relationship of their distribution patterns with the podsolization process. Such relationships confirm the results of the studies of other authors. The maximum concentrations of the investigated metals in Brunic Arenosols occurred in humic and brunic horizons. Their distribution patterns indicate a close relationship between the metals and humic substances as well as iron oxides, as carriers and sorbents of ions.
Acknowledgements
The research was financed from the funds designated for statutory research – Pomerania University, Institute of Geography and Regional Studies, no. 13/3/13
References
Berg B., Ekbohm G., Söderström B., Staaf H. 1991. Reduction of decomposition rates of Scots pine needle litter due to heavy metal contamination, Water, Air & Soil Contamina-tion, 59, 165–177.
Bergbäck B., Carlsson M. 1995. Heritage of cadmium and lead. A case study of a Swedish accumulator factory. Sci-ence of The Total Environment, 166: 35–42.
Brewer P.A., Taylor M.P. 1997. The spatial distribution of heavy metal contaminated sediment across terraced flood-plains, Catena, 30: 229–249.
Brożek S., Zwydak M. Atlas gleb leśnych Polski. Warszawa, Centrum Informacyjne Lasów Państwowych, pp. 467. ISBN 978-83-932256-0.
Charriau A., Lesven L., Gao Y., Leermakers M., Baeyens W., Ouddane B., Billon G. 2011. Trace metal behaviour in riverine sediments: Role of organic matter and sulfides. Applied Geochemistry, 26: 80–90.
Cotrufo M.F., De Santo A.V., Alfani A., Bartoli G., De Cris-tofaro A. 1995. Effects of urban heavy metal contamina-tion on organic matter decomposition in Quercus ilex L. woods. Environmental Contamination, 89, 81–87.
Dąbkowska-Naskręt H. 2013. Nanocząsteczki – naturalne i syn-tetyczne tlenki żelaza w glebach. In: Jonczak J., Florek W. (eds.) Środowisko glebotwórcze i gleby dolin rzecznych. Poznań-Słupsk, Wydawnictwo Naukowe Bogucki: 7–11.
Degryse F, Smolders E, Parker D.R. 2009. Partitioning of met-als (Cd, Co, Cu, Ni, Pb, Zn) in soils: concepts, methodol-ogies, prediction and applications – a review. European Journal of Soil Science, 60: 590–612.
Degryse F., Smolders E. 2006. Mobility of Cd and Zn in pol-luted and unpolluted Spodosols. European Journal of Soil Science, 57: 122–133.
Fijałkowski K., Kacprzak M., Grobelak A., Placek A. 2012. The influence of selected soil parameters on the mobility of heavy metals in soils. Inżynieria i Ochrona Środowiska, 15(1): 81–92.
Florek W. 1989. Osady dna doliny Słupi i ich wiek radiowęglowy. Zeszyty Naukowe AGH. Geologia, 15(1–2): 73–102.
Huang J.H., Ilgen G., Matzner E. 2011. Fluxes and budgets of Cd, Zn, Cu, Cr and Ni in a remote forested catchment in Germany. Biogeochemistry, 103: 59–70.
Jonczak J., Olszak I., Łazarczyk A. 2013. Geneza, ewolucja i właściwości gleb niższej terasy nadzalewowej Słupi w południowej części Słupska, in: Jonczak J., Florek W. (eds.) Środowisko glebotwórcze i gleby dolin rzecznych, Poznań-Słupsk, Wydawnictwo Naukowe Bogucki: 33–40.
Kabała C., Singh B.R. 2001. Fractionation and mobility of cop-per, lead, and zinc in soil profiles in the vicinity of a copper smelter. Journal of Environmental Quality, 30: 485–492.
Kabała C., Gałka B., Karczewska A., Chodak T. 2008. Zróżnicowanie zawartości pierwiastków śladowych w glebach różnych zbiorowisk leśnych w dolinie rzeki Dobra. Roczniki Gleboznawcze, 49(3/4): 72–80.
Kalbitz K., Wennrich R. 1998. Mobilization of heavy metals and arsenic in polluted wetland soils and its dependence on dissolved organic matter. The Science of the Total En-vironment, 209: 27–39.
Konradi E.A., Frentiu T., Ponta M., Cordos E. 2005. Use of Sequential Extraction to Assess Metal Fractionation in Soils from Bozanta Mare, Romania. Acta Universitatis Cibiniensis Seria F Chemia, 8(2): 5–12.
Leenaers H., Schouten C.J., Rang M.C. 1988. Variability of the metal content of flood deposits. Environmental Geolo-gy and Water Sciences, 11: 95–106.
Lindberg S.E., Turner R.R. 1988. Factors influencing atmo-spheric deposition, stream export, and landscape accumu-lation of trace metals in forested watersheds. Water, Air and Soil Pollution, 39: 123–156.

341J. Jonczak / Leśne Prace Badawcze, 2014, Vol. 75 (4): 333–341
Logan E.M., Pulford I.D., Cook G.T., Mackenzie A.B. 1997. Complexation of Cu2+ and Pb2+ by peat and humic acid. European Journal of Soil Science, 48: 685–696.
Marcinek J., Komisarek J., Bednarek R., Mocek A., Skiba S., Wiatrowska K. 2011. Systematyka Gleb Polski, wydanie V. Roczniki Gleboznawcze 62(3): pp. 193.
Martin C.W. 2000. Heavy metal trends in floodplain sediments and valley fill, River Lahn, Germany. Catena, 39: 53–68.
Martinez C.E., Motto H.L. 2000. Solubility of lead, zinc and copper added to mineral soils, Environmental Pollution, 170: 153–158.
McAlister J.J., Smith B.J., Török A. 2006. Element parti-tioning and potential mobility within surface dusts on buildings in a polluted urban environment, Budapest. At-mospheric Environment, 40: 6780–6790.
Parzych A., Jonczak J. 2014. Pine needles (Pinus sylvestris L.) as bioindicators in the assessment of urban environmental contamination with heavy metals. Journal of Ecological Engineering, 15(3): 29–38.
Pasieczna A. 2003. Atlas zanieczyszczenia gleb miejskich Polski. Warszawa, PIG, pp 105.
Paulson A.J. 1997. The transport and fate of Fe, Mn, Cu, Zn, Cd, Pb and SO4 in a groundwater plume and in down-stream surface waters in the Coeur d’Alene Mining Dis-trict, Idaho, U.S.A. Applied Geochemistry, 12: 447–464.
PTG. 2009. Klasyfikacja uziarnienia gleb i utworów mineral-nych – PTG 2008. Roczniki Gleboznawcze 60(2): 5–17.
Rusek A., Kabała C., Drozdowska J. 2005. Zawartość ołowiu, cynku i miedzi w wybranych typach próchnic leśnych Dol-nego Śląska. Roczniki Gleboznawcze, 56(1/2): 137–146.
Saur E., Juste C. 1994. Enrichment of trace elements from long-range aerosol transport in sandy podzolic soils of southwest France. Water, Air, and Soil Pollut., 73: 235–246.
Sauvé S., Hendershot W., Allen H.E. 2000. Solid-solution par-titioning of metals in contaminated soils: dependence on
pH, total metal burden, and organic matter. Environmental Science & Technology, 34: 1125–1131.
Silva C.A.R., Lacerda L.D., Ovalle A.R., Rezende C.E. 1998. The dynamics of heavy metals through litterfall and de-composition in a red mangrove forest. Mangroves and Salt Marshes, 2: 149–157.
Skřivan P., Rusek J., Fottová D., Burian M., Minařík L. 1995. Factors affecting the content of heavy metals in bulk atmos-pheric precipitation, throughfall and stemflow in central Bohemia, Czech Republic. Water, Air, and Soil Pollution, 85: 841–846.
Strobel B.W., Borggaard O.K., Hansen H.C.B., Andersen M.K., Raulund-Rasmussen K. 2005. Dissolved organic carbon and decreasing pH mobilize cadmium and copper in soil. European Journal of Soil Science, 56: 189–196.
Strojan C.L. 1978. Forest leaf litter decomposition in the vi-cinity of a zinc smelter. Oecologia, 32: 203–12.
Taylor M.P. 1996. The variability of heavy metals in flood-plain sediments: a case study from mid Wales. Catena, 28: 71–87.
Tessier A., Campbell P.G.C., Bisson M. 1979. Sequential ex-traction procedure for the speciation of particulate trace metals. Analytical Chemistry, 51(7): 844–850.
Tyler G. 1973. Heavy metal pollution and decomposition of spruce needle litter. Oikos, 24: 402–416.
Tyler G. 1992. Critical concentrations of heavy metals in the mor horizon of Swedish forests. Solna, Swedish Environ-mental Protection Agency, Report 4078, pp. 38.
Ukonmaanaho L, Starr M, Mannio J, Ruocho-Airola T. 2001. Heavy metal budgets in two headwater forested catch-ments in background area of Finland. Environmental Pol-lution, 114: 63–75.
Zgłobicki W. 2008. Geochemiczny zapis działalności człowieka w osadach stokowych i rzecznych, Lublin, UMCS s. 240. ISBN: 978-83-227-2866-6.
Translated by: Katarzyna Mikułowska

Received 07 February 2014, accepted after revision 15 May 2014. © 2014, Forest Research Institute
Leśne Prace Badawcze (Forest Research Papers),December 2014, Vol. 75 (4): 343–352
DOI: 10.2478/frp-2014-0031
ORIGINAL RESEARCH ARTICLE
1. Introduction
Silver fir Abies alba Mill. is one of the main for-est-forming tree species in the Carpathian region. It holds the second position after the common beech with regard to the area covered and standing volume (Niemtur 2007). In 2006, forest stands with silver fir dominance, typical for the Carpathians landscape, covered app. 21% of the area of the Carpathians in Poland. This indicates a distinctive decrease with comparison to 1967, when fir stands grew on app. 28.3% of the area. In the 1960s and 1970s, accelerated dieback of silver fir stands occurred in the Carpathians as a result of combined negative ef-fects of biotic and abiotic factors (Zięba 2010).
After their perilous phase, at the present time, sil-ver fir stands indicate visible symptoms of recovery in terms of regeneration and development. All this goes to show that in the future, the importance of silver fir will increase, also because of widespread dieback of spruce stands and their all-encompassing reconstruction into mixed stands with a considerable share of silver fir (Niemtur 2007; Jaworski, Pach 2014).
In managed forests, even though silver fir trees grow slowly in the first class of age (1–20 years), they form bulky volume stands in mature phase. Silver fir trees produce larger timber volume than that of pine trees, and given appropriate site conditions, fir production can be even higher than that of Norway spruce (Dobrowols-ka 1999). Stand productivity is associated with the qual-ity of timber obtained. Silver fir timber reminds spruce in terms of the look and technical features, and there-fore, it can be used for same purposes as that of spruce (Surmiński 1983). However, in spruce stands, big tim-ber losses have been observed due to wood rot occurring regularly in the most valuable bottom part of the trunk. Wood decay processes progress significantly with stand age (Norkorpi 1979; Bernadzki 2003).
The susceptibility of Norway spruce Picea abies (L.) Karst. to wood decay caused by fungi is commonly known, and thus the majority of studies on butt rot have been focused on this species (Norokorpi 1979; Stenlid, Wästerlund 1986; Krzan 1985; Mattila, Nuutinen 2007; Kohnle, Kändler 2007). On the other hand, the signifi-cance of butt rot problem in silver fir has not been ad-
Occurrence of the silver fir (Abies alba Mill.) butt rot in protected areas
Stanisław Niemtur*, Elżbieta Chomicz, Mariusz Kapsa
Forest Research Institute, Department of Mountain Forestry, ul. Fredry 39, 30–605 Kraków, Poland
*Tel. +48 12 252 8210, fax +48 12 252 8202, e-mail: [email protected]
Abstract. The aim of the study was to analyse butt rot incidences in silver fir stands of selected nature reserves and national parks. The study included 11 stands in Carpathian forests and for comparison 4 stands outside the Carpathians. To identify butt rot in fir trees, we used the non-invasive method of acoustic tomography. We tested 30 randomly selected fir trees in each of the 15 stands using Picus Sonic tomography to determine butt rot occurrence and to assess the proportion (%) of healthy wood in cross-sections of the tree trunk. The results indicate significant differences in the frequency of butt rot in silver fir at the individual level as well as the population level. This variability in frequency was not dependent on geographical location of the investigated stands.
Key words: silver fir, butt rot, nature reserve, national park, acoustic tomography, Picus Sonic, Carpathians

344 S. Niemtur et al. / Leśne Prace Badawcze, 2014, Vol. 75 (4): 343–352
equately recognised. In subject literature, a number of fungi have been reported as the prospective cause of wood decay in silver fir. However, there is a lack of infor-mation on the extent of damage caused by fungal activity in silver fir stands. In comparison to Norway spruce, there has been reported lesser vulnerability of silver fir to wood decay (Kohnle, Kändler 2007). Quite the opposite, the results of the study carried out with the use of sonic to-mography in managed forests of the Żywiec and Silesian Beskid indicated that butt rot problem concerned spruce and fir trees to a similar degree (Niemtur et al. 2013).
Taking into consideration the lack of tree stumps in unmanaged forests, analysis of butt rot frequency in these areas have to be performed on standing trees. Up-to-date studies on standing trees have been essentially based on examination of core samples extracted at breast or root collar height (Krzan 1985). The method involves mechan-ical intrusion inside living tree tissues and, consequently, can add to disease spreading. Furthermore, it has been estimated that core sampling at breast height allows for identifying only 50% of real pathogen damages (Stenlid, Wästerlund 1986). In the protected areas, such as national parks and nature reserves, butt rot damage assessments involve avoiding destructive research methods and can be performed by means of a non-invasive procedure with the use of sonic tomography.
The aim of the present study is to identify in selected national parks and nature reserves, silver fir individu-al trees or stands representing low susceptibility to butt rot. The results obtained can serve as preliminary data for further studies on possibilities of breeding silver fir genotypes less vulnerable to fungal pathogens that cause butt rot.
2. Methods
Research plots
The study was carried out in the years 2010–2013 in silver fir stands or those with prevailing silver fir share. In the Carpathian natural-forest region, there were se-lected tree stands in Gorce National Park and in 10 nature reserves as representative for the whole moun-tain range in the region – from the Żywiec Beskid Mts. (reserves Oszast and Śrubita) to the Bieszczady Mts. (reserves Hulskie and Sine Wiry) (Fig. 1). Besides, the study comprised silver fir stands situated in the National Parks: Karkonosze, Góry Stołowe and Świętokrzyski. Additionally, there was included silver fir stand in Jata nature reserve situated beyond silver fir natural range (Fig. 1). Characteristics and location of the research plots are presented in Fig. 1 and Table 1.
Figure 1. Location of research plots I, II, III – plot evaluation categories (see Results)
1 – Hulskie, 2 – Sine Wiry, 3 – Cergowa G., 4 – Kretówki, 5 – Hajnik, 6 – Uhryń, 7 – Barnowiec, 8 – Białowodzka G., 9 – Gorce NP, 10 – Oszast, 11 – Śrubita, 12 – Góry Stołowe NP, 13 – Karkonosze NP, 14 – Świętokrzyski NP, 15 – Jata

345S. Niemtur et al. / Leśne Prace Badawcze, 2014, Vol. 75 (4): 343–352
Tomographic evaluations
Butt rot incidence in tree trunk cross-section was de-termined by means of the Picus Sonic Tomograph (Argus Electronic, Rostock, Germany). The apparatus records differences in the speed of sound wave transmission in wood depending on its features, and in a non-invasive way collects information on rot occurrence and infec-tion size in tree trunk cross-section. Detailed description of the Picus Sonic Tomograph and the principles of how it works are available at the producer’s webpage: http://www.argus-electronic.de.
In each tested stand, tomographic evaluations were carried out on 30 randomly selected silver fir trees grow-ing in the immediate vicinity. Concurrently, tree height and diameter at breast height (DBH) were measured, and tree age was determined using Pressler increment borer.
Tomographic data were collected at the height of 10 cm above the ground level. In accordance with the producer’s manual, on trunk circumference line, there were marked 8–10 measuring points depending on tree thickness. The point number 1 was always established at the northern side of the trunk. At each point, there was introduced an electrode that contacted trunk wood,
and then the electrode was magnetically contacted with a sensor. At each measuring point, three sonic impulses were induced with the use of a hammer (version Lite). The geometry of trunk cross-section was projected using appropriate distances between the measuring points, de-termined using a Picus caliper. Sensor information was radio transmitted to Picus Expert computer software (version Q72), which generated tomograms of silver fir trunk cross-sections.
Tomogram examinations
A tomogram gives an image of tree trunk cross-section at the point of measurement. Different colours visible in the tomogram indicate different stages of wood decay caused by the activity of pathogenic fungi. The colours observed in the images obtained from each tree allowed for distinction of three wood categories: healthy (with no signs of decay) – dark and light brown colour, damaged wood – blue and purple, and unknown – green. The per-centage of each category in the total area of cross-section was automatically computed by Picus Expert software.
Based on the results of tomogram examinations in 30 silver fir trees in each stand observed, the mean share
Table 1. Characteristics of research plots
NoReserve/National
ParkHeight a.s.l.
Exposure CoordinatesMain species
of standsAreaha
Year ofcreation
1 Hulskie 800 W 49°15´20.9˝N 22°33´11.4˝E Bk, Jd 189.87 1983
750 SW 49°15´41.4˝N 22°25´28.7˝E Bk, Jd 450.49 1987
650 N 49°32´7.8˝N 21°42´17.2˝E Bk, Jd, Jw 61.35 1963
400´ NE 49°42´50.7˝N 21° 54´45.1˝E Bk, Jd 95.27 1959
700 SE 49°19′50.54˝N 20°57′38.57˝E Jd 16.9 1974
750 NW 49°27´44˝N 20°51´32˝E Bk, Jd 16.52 1957
860 NE 49°29´17.8˝N 20°46´20.6˝E Bk, Jd, Jw 21.61 1924
400 NE 49°41´23˝N 20°37´53˝E Bk, Jd 67.74 1961
2 Sine Wiry
3 Cergowa G.
4 Kretówki
5 Hajnik
6 Uhryń
7 Barnowiec
8 Białowodzka Góra
9 Gorce NP 750 SW 49°34´28˝N 20°05´39˝E Jd - 1981
925–1147 NE 49°25´54˝N 19°11´16˝E Bk, Jd, Św, Jw 48.8 1971780–960 N 49°24´22˝N 19°0´42˝E Bk, Jd 25.86 1958
720 flat 50°29´32˝N 16°19´28˝E Jd - 1993
500 N 50°50´16˝N 15°38´50˝E Bk, Jd - 1959
570 S 50°53´39˝N 20°54´37˝E Jd - 1924
10 Oszast
11 Śrubita
12 Góry Stołowe NP
13 Karkonosze NP
14 Świętokrzyski NP
15 Jata 170 flat 51°57´53.9˝N 22°12´41.6˝E Jd 1116.8 1933
Notes: Bk – Fagus sylvatica L., Jd – Abies alba Mill., Św – Picea abies (L.) Karst, Jw – Acer pseudoplatanus L.

346 S. Niemtur et al. / Leśne Prace Badawcze, 2014, Vol. 75 (4): 343–352
of healthy wood and the coefficient of variation for this feature were determined. Altogether, tomograms of 450 silver fir trees from 15 stands were analysed.
In line with tomogram results, tested trees were as-signed to four classes of wood health: I class – 100% of healthy wood; II – 76–99%; III – 50–75%; IV – less than 50%. The examples of tomograms presented in Fig. 2 demonstrate decay ranges observed in the health classes.
Designed for valuation of silver fir trees on different areas studied, there was used tree scoring system for the specimens assigned to the above health classes: when in class I – 10 points, II – 7 points, III class – 4 points, and IV – 0 points. The total score of 30 silver fir trees rep-resented the stand damage extent in a given study area.
Statistical analyses
Investigated fir stands were compared in terms of the average (for 30 trees) share of healthy wood on the to-mogram. Mean comparisons were carried out with the use of one-way analysis of variance (ANOVA). Post-hoc analysis was performed using Tukey’s tests. Based on the results obtained, determination of homogeneous groups were made, that is, silver fir stands not signifi-cantly different with regard to a given feature.
Analogous comparisons were performed for the determined tree health classes. Taking into account different numbers of trees in the classes (class I – 73, II – 159, III – 162, IV – 56 trees), the differences be-tween the mean values were tested with the use of the Kruskal–Wallis test (nonparametric equivalent for one-way ANOVA). There were determined statistically sig-nificant differences between the classes with regard to the mean values of: healthy wood share determined in the tomogram, tree age and DBH. Post-hoc analysis of mean ranks for all samples was performed with the use of multiple comparison tests with computed Z statistics as described by Siegel, Castellan (1988).
All tests were performed using the tools available in Statistica 9 software.
3. Results
The tomograms obtained indicated considerable var-iability of butt rot frequency observed in the analysed stands (Table 3). Differences were notable both at an in-dividual tree level in the groups of 30 silver fir trees and between the 15 stands tested. The largest differences with regard to the number of trees with decaying wood were observed in Uhryń (Table 2, Fig. 3A) and in Gorce National Park (Table 2, Fig. 3B).
Large differences were also found between silver fir trees in nature reserves Uhryń and Hajnik – also situat-ed in the Beskid Sądecki Mts. (Leluchowskie Mts.) In Hajnik, no damage was observed in 10 silver fir trees (100% of healthy wood in trunk cross-section), where-as in Uhryń, among 30 tested trees, only 1 showed no symptoms of butt rot infection (Table 2, Fig. 3) – even though site conditions were similar in both nature re-serves. The results of tree valuation in Uhryń showed the lowest score when compared to the rest of the areas analysed, that is, 98 points (Table 2); while in Gorce National Park, the trees tested scored 266 points, and in Hajnik – 213 points. An important factor was the age of examined silver fir trees, which on average (n = 30) was: Uhryń – 135 years, Hajnik – 79 years and Gorce National Park – 99 years. However, tree age as a deci-sive factor for the extent of butt rot infection in silver firs does not clarify why the firs examined in nature re-serves Oszast and Śrubita (30 specimens in each) scored the same number of points – 121. These reserves were considerably different in terms of silver fir age – 109 and 150 years, respectively (Table 3).
The results of tree valuation carried out based on the scoring system showed no relationship between butt rot infection intensity in the wood of silver fir and distribu-tion of silver fir stands in the nature reserves and nation-al parks observed (Fig. 4).
The stands examined differed significantly with regard to the mean percentage share of healthy wood evaluated in tree cross-section tomograms (ANOVA F = 8489.470; p < 0.000). The largest difference was observed between silver fir trees in Uhryń, the most damaged by butt rot, and the Gorce National Park, the least affected by rot (Table 3, p < 0.000). Post-hoc tests allowed for the distinction of four homogeneous groups with reference to the stand percentage mean share of healthy wood in silver fir trunk cross-section. The groups comprised silver fir stands from different loca-tions in the Carpathian region and also those from the areas outside the region. The differences reliant upon
Figure 2. Tomograms of firs in health classes: Class I – 100% of undamaged wood; class II – 76–99% of undamaged wood; class III – 50–75% of undamaged wood; class IV – <50% of undamaged wood

347S. Niemtur et al. / Leśne Prace Badawcze, 2014, Vol. 75 (4): 343–352
Table 2. Tree valuation scores in studied silver fir stands
No Reserve / National Park
Number of trees in health classes:Sum of points
I100%10 pts
II75–99%
7 pts
III50–76%
4 pts
IV<50%0 pts
0×10 11×7 12×4 7×0 1251 6 14 9 1083 23 4 0 2078 13 9 0 207
10 11 9 0 2131 4 15 10 982 10 12 6 1383 10 16 1 164
1 Hulskie2 Sine Wiry3 Cergowa Góra4 Kretówki5 Hajnik6 Uhryń7 Barnowiec8 Białowodzka G.9 Gorce NP 23 4 2 1 266
1 9 12 8 1210 7 18 5 1217 18 5 0 2164 7 16 3 1538 13 3 6 183
10 Oszast11 Śrubita12 Góry Stołowe NP13 Karkonosze NP14 Świętokrzyski NP 15 Jata 2 13 15 0 171
Total 73 159 162 56
Figure 3. Tomograms of silver fir trees examined in: A. – Uhryń Reserve, B. – Gorce National Park
A.
B.

348 S. Niemtur et al. / Leśne Prace Badawcze, 2014, Vol. 75 (4): 343–352
Figure 4. Evaluation of investigated stands in 11 nature reserves (marked darker) and 4 national parks.
Table 3. Mean percentage of healthy wood on tomograms of 30 silver firs, DBH and age of examined trees
Reserve / National Park
Tree age
Diameter at breast height
Mean % share of healthy wood on 30 tomograms
Rd_zpd30
[cm]Wz[%]
m30
[%]Wz[%]
homogeneous groups Tukey HSD test
I.Uhryń 135 75.4 30.3 58.2 33.7 X -0.669Sine Wiry 92 57.3 24.2 61.5 26.7 X X 0.377Oszast 109 59.5 34.5 61.7 32.9 X X -0.205Śrubita 150 64.8 25.0 62.6 27.9 X X -0.644Hulskie 124 69.0 31.0 63.5 33.3 X X -0.366
II.145 73.5 25.2 67.7 27.1 X X -0.34195 44.5 24.1 72.1 26.3 X X X 0.42278 54.9 20.5 74.3 17.3 X X 0.089121 58.2 38.1 74.8 33.14 X X -0.436
Barnowiec Karkonosze NP Białowodzka G. Świętokrzyski NP Jata 98 56.6 20.1 74.9 15.7 X X -0.032
III.79 59.1 23.1 84.0 17.9 X X -0.05880 50.8 17.2 84.9 15.2 X X 0.193128 49.8 17.1 85.9 13.1 X X -0.36696 53.4 17.9 86.1 13.6 X X -0.212
HajnikKretówki Cergowa G.Góry Stołowe NP Gorce NP 99 76.2 22.7 94.5 15.5 X 0.005
Notation: m30 –arithmetic mean (30 trees), Wz – coefficient of variation, Rd_zp – correlation coefficient of healthy wood percentage and DBH of 30 trees examined on experimental plots; I, II, III –stand evaluation categories as in Figure 1.

349S. Niemtur et al. / Leśne Prace Badawcze, 2014, Vol. 75 (4): 343–352
stand geographical situation were not found, hence dif-ferentiation between the groups was indefinite (as a re-sult, just three groups are presented in Fig. 1). Silver fir stands in the Carpathian region were not distinguishable from those in other regions (did not form a separate ho-mogeneous group).
Even though no obvious trend was observed in the distribution of stands with analogous extent of butt rot infection, comparable damage amounts were noticeable in neighbouring stands, for example, those growing in nature reserves Hulskie and Sine Wiry or else Oszast and Śrubita (Fig. 4).
The correlation coefficients of the percentage of healthy wood in tree cross-section and tree DBH on a given area showed negative values and the relationships were statistically significant, however, only for silver firs older than 120 years. Younger trees did not show this kind of correlation or else – negative correlations as in the case of the Karkonosze National Park or Sine Wiry (Table 3).
Considerable differences in butt rot infection lev-els were observed in silver firs equally at a population (stand) level (Fig. 3 and 5) and between individual trees. Among 450 silver fir trees examined in 15 stands, there were observed 73 specimens showing no symptoms of decaying wood in their butts (I health class, Table 2) and 56 trees with one-half of wood in trunk cross-section affected by butt rot (IV health class, Table 2). Statisti-cal analysis performed (Kruskal–Wallis test) showed, that trees in different health classes differed significant-
ly with reference to: the age (H = 12.035; p = 0.007), DBH (H = 15.604; p = 0.001) and the percentage share of healthy wood (H = 303.399; p = 0.000).
The differences in the percentage of healthy wood, mean tree age and mean DBH with reference to the health classes are presented below, in Fig. 6 A, B, C.
Figure 5. Percentage of healthy wood on tomograms: mean (tag), standard error (box), standard deviation (line segments)
Figure 6. Percentage of healthy wood on tomograms (A), tree age (B) and DBH (C) in silver firs assigned to four health classes: mean (tag), standard error (box), standard deviation (line segments).

350 S. Niemtur et al. / Leśne Prace Badawcze, 2014, Vol. 75 (4): 343–352
3. Discussion
In Poland, studies on butt rot frequency in silver fir trees growing within nature reserves and national parks have not so far been conducted on a wide scale. The present study comprises the first measurement trial to evaluate a range of butt rot occurrence in silver fir stands in advanced age.
The silver fir has been perceived as the ‘ecolog-ical balance keeper’ in our forests. This species is characteristic of good natural regeneration, its young growth stages are shade tolerant and it generally is receptive to silvicultural practices. The silver fir is superior for building multi-generation stands with differentiated structure, enhancing forest biodiver-sity. Besides representing ecological value, this tree species achieves high production results. It shows great adaptation capability and grows well even be-yond its natural range (Jaworski et al. 1995; Dobrow-olska 1999; Bijak 2010).
The importance of silver fir stands will increase in the future, taking into account large-scale dieback of spruce stands in mountainous regions, and also in view of currently carried out extensive conversion of spruce monocultures into mixed stands with substantial sil-ver fir admixture (Jaworski, Pach 2014). Furthermore, in the context of ongoing climate changes, further decline of pine and spruce stands has been forecast-ed, whereas the silver fir has been listed among tree species capable of enduring changeable environment conditions (Kräuchi 1994; Ziemba 2010; Tinner et al. 2013; Jaworski, Pach 2014). Climate change will force adjusting tree species composition in reforestation areas, and consequently – the structure of future Car-pathian tree stands. For the Carpathian Mts., there is predicted temperature increase by 2–4°C until the end of 21st century (IPCC 2013). Simultaneously, there are forecasted increased precipitation during the win-ter and decreased rainfall with irregular distribution in the vegetation season. At the same time, incidence of weather anomalies will grow, which will negatively af-fect ecosystems, especially in mountainous conditions (Gori 2013; Ciscar 2014).
Assuming the most precautious prediction by the Intergovernmental Panel on Climate Change (IPCC 2013), that is, average temperature increase by 2°C at the end of 2100, it can be adjudged that altitudinal zo-nation in the Carpathian Mts. described by Hess (1965) will be shifted up. Therefore, it is highly probable that vegetation layers will react in the same way, and that
tree species now occurring in the lower parts of the mountains will find appropriate climate conditions for their development at higher elevations. For the silver fir, this may result in enhanced competition with decidu-ous tree species growing at lower elevations, mainly the common beech, and also an increased share in forests at higher elevations.
The results of the present study showed no clear trend in geographical distribution of silver fir stands with analogous extent of butt rot infection. Also, no dif-ferences in this regard were found between Carpathian silver fir stands and those with other Poland’s silver fir provenances. This means that variability of butt rot oc-currence is not reliant upon local conditions.
The age of the stands examined was the factor with the biggest effect on butt rot frequency. Increasing butt rot incidence and effectual advanced wood decompo-sition have been well documented for spruce stands (Norokorpi 1979; Krzan 1985; Bernadzki 2003; Chom-icz, Niemtur 2008; Niemtur, Chomicz 2008; Niemtur, Chomicz 2009). According to Norkopi (1979), butt rot problem starts to develop in spruce stands less than 100 years of age and most probably concerns all 300–400 years old spruce trees. Bernadzki (2003) concludes his studies on old pine stands growing on lowlands that upholding trees in forests until old age increases sig-nificantly the risk of butt rot infection. The author esti-mated probability of butt rot incidence of about 30% in 120-year-old and 60% in 200-year-old stands. Similar relationships were observed in managed silver fir stands examined during preliminary studies with regard to stand age and butt rot infection carried out in the Forest District Ujsoły (Niemtur et al. 2013).
The results of earlier studies conducted in spruce stands (Niemtur, Chomicz 2008), and in three silver fir seed orchards within the area of the Forest Districts Węgierska Górka, Limanowa and Baligród (Niemtur et al. 2011) indicated that in more than 90% of examined older trees, there occur pathological changes in tree butts. At the same time, individual silver fir specimens with no traces of damage were found, notwithstanding their old age.
The question of varied tree susceptibility to fungal pathogens was discussed, for example, by Pautasso et al. (2005). The authors believe that this variability is a direct result of natural defense strategy undertaken by forest ecosystems. The occurrence of spruce clones with lower vulnerability to damage due to Heterobasidion parviporum was described by Rodriguez et al. (2009). Żołciak et al. (2006) state fungal disease spread in pine

351S. Niemtur et al. / Leśne Prace Badawcze, 2014, Vol. 75 (4): 343–352
reforestation areas is much influenced by individual tree features since not all trees growing in vicinity of Heterobasidion annosum infected stumps are affected by this fungus. On the other hand, genetic variability in pathogens has been widely documented (Łakomy 2007; Zamponi 2007; van Diepen 2013).
Nature protection in the national parks and reserves is among others connected with in situ conservation of genetic resources of tree ecotypes with capability to adapt to wide-ranging mountainous conditions. These invaluable genetic resources are guarded within the protected areas, and being excluded from national pro-grams on seed selection, in practice they are not used in silviculture of multifunctional forests. This is a great loss since the trees growing within protected areas often have unique features and their genotypes could enhance biodiversity in reconstructed forests. The issue concerns particularly endangered tree species and those intro-duced into forests in the Carpathian and Sudety Mts. as a result of spruce forest reconstruction or afforestation of calamity areas. The silver fir is a good example of tree species whose area share in mountainous forests is constantly growing as a result of artificial and natural regeneration (Przybylska, Ziemba 2007). Identifica-tion and collection of silver fir seeds less susceptible to fungal pathogens (Rodriguez et al. 2009) could enrich genetic pool of forest breeding material and improve silviculture of new forest stands or else advance recon-struction of old ones.
5. Conclusions
Regardless of geographical location of the stands ex-amined, the age of silver fir trees was the key factor that determined the extent of tree infection by butt rot path-ogenic fungi that cause trunk wood decay.
However, in the above age-infection relationship, the exceptions were observed, which indicated responsibili-ty of other factors involved in butt rot spreading.
Explanation of reasons behind the differences in the percentage share of healthy wood in tree trunk cross-sec-tion observed between individual silver fir trees as well as at a level of the stand within the areas studied needs further research.
The study carried out within the areas of nature re-serves and national parks allowed for examination of silver fir trees much older than those growing in man-aged forests. The results obtained indicated that protect-ed trees could be more than ever useful, especially in the studies on valuable tree genotypes.
Acknowledgement
The paper comprises the results of the study car-ried out in a framework of the research project “The use of tomography in the analysis of butt rot of silver fir trees in forest stands in protected nature reserves in the Carpathian Land of Nature and Forest” financed by the Ministry of Science and Higher Education from the budget funds in the years 2010–2013 (grant 1008/B/P01/2010/39).
References
Bijak S. 2010. Tree-ring chronology of silver fir and its de-pendence on climate of the Kaszubskie Lakeland (North-ern Poland). Geochronometria, 35: 91–94.
Bernadzki E. 2003. Struktura wieku i zagrożenie zgnilizną drewna starych drzewostanów sosnowych. Sylwan, 5: 3–12.
Chomicz E., Niemtur S. 2008. Występowanie zgnilizny odzi-omkowej w wybranych drzewostanach świerkowych Kar-pat Zachodnich. Leśne Prace Badawcze, 69(3): 233–241.
Ciscar J. C. (editor) 2014. Climate Impacts in Europe. The JRC PESETA II project. Publications Office of the Euro-pean Union, Luxembourg: 1–151. http://ftp.jrc.es/EUR-doc/JRC87011.pdf [6.02.2014] ISBN 978-92-79-36833-2.
Dobrowolska D. 1999. Przyszłość jodły pospolitej (Abies alba Mill.) w naszych lasach, in: Stan i perspektywy badań z zakresu hodowli lasu. Materiały I Konferencji Leśnej, Sękocin Las, 8–19 maja 1999, p. 179–185.
Gori Y., P. Cherubini, F. Camin, N.La Porta, 2013. Fungal root pathogen (Heterobasidion parviporum) increases drought stress in Norway spruce stand at low elevation in the Alps. European Journal of Forest Research, 132: 607–619.
Hess M. 1965. Piętra klimatyczne w polskich Karpatach Zach-odnich. Zeszyty Naukowe UJ, Prace Geograficzne, 11.
IPCC. 2013. Climate change. 12. Long-term Climate Change: Projections, Commitments and Irreversibility. The Physi-cal Science Basis. http://www.ipcc.ch/ [6.02.2014]. ISBN 978-1-107-05799-1.
Jaworski A., Pach M. 2014. A comparison of lower montane natural forest (Abies, Fagus, Picea) in Oszast Reserve and spruce monocultures in the Żywiecki Beskid and Śląski Beskid. Leśne Prace Badawcze (Forest Research Papers), 75(1): 13–23. DOI 10.2478/frp-2014-0002.
Kohnle U., Kändler G. 2007. Is Silver fir (Abies alba) less vulner-able to extraction damage than Norway spruce (Picea abies)? European Journal of Forest Research, 126: 121–129.
Kräuchi N. 1994. Modelling forest succession as influenced by a changing environment. Mitteilungen der Eidgenös-sischen Forschungsanstalt für Wald, Schnee und Land-schaft, 2: 143–271.
Krzan Z. 1985. Występowanie zgnilizny odziomkowej świ-erków w drzewostanach regla dolnego Tatrzańskiego Parku

352 S. Niemtur et al. / Leśne Prace Badawcze, 2014, Vol. 75 (4): 343–352
Narodowego. Parki Narodowe, Rezerwaty Przyrody, 2: 5–16.
Łakomy P., Broda Z., Werner A. 2007. Genetic diversity of Heterobasidion spp. in Scots pine, Norway spruce and Eu-ropean silver fir stands. Acta Mycologica, 42(2): 203–210.
Mattila U., Nuutinen T. 2007. Assessing the incidence of butt rot in Norway spruce in southern Finland. Silva Fennica, 1: 29–43.
Niemtur S. 2007. Lasy karpackie: stan aktualny i próba prog-nozy. Problemy Zagospodarowania Ziem Górskich, 54: 31–44.
Niemtur S., Chomicz E. 2008. Tomografia komputerowa świ-erków w zagrożonych drzewostanach o różnym statusie ochronnym. Problemy Zagospodarowania Ziem Górskich, 55: 99–112.
Niemtur S., Chomicz E. 2009. Root rot diseases and bark beetles infestation in spruce stands of Silesian and Żywiec Beskid. Problemy Zagospodarowania Ziem Górskich, 56: 49–58.
Niemtur S., Sierota Z., Głaz J., Nowakowska J., Jachym M., Małecka M., Matras J., Piszczek J., Wójcik J., Chomicz E., Kapsa M, Kowalik W. 2011. Kierunki zagospodarow-ania lasów beskidzkich na terenach poklęskowych. Doku-mentacja naukowa z realizacji tematu BLP 340, Sękocin Stary, Instytut Badawczy Leśnictwa, p. 1–185.
Niemtur S., Chomicz E., Kapsa M. 2013. Computer tomog-raphy in wood-decay assessment of Silver fir (Abies alba Mill.) stands in Polish part of Carpathians, in: Integrating Nature and Society towards Sustainability (J. Kozak, K. Ostapowicz, A. Bytnerowicz, B. Wyżga), Springer Verlag, ISBN 978-3-642-12724-3.
Norokorpi Y. 1979. Old Norway spruce stands, amount of decay and decay causing microbes in northern Finland. Communi-cationes Instituti Forestalis Fenniae, 97(6): 1–77.
Siegel S., Castellan N. J. 1988. Nonparametric statistics for the behavioral sciences (2nd ed.) New York, McGraw-Hill Book Company.
Pautasso M., Holdenrieder O., Stenlid J. 2005. Susceptibility to fungal pathogens of forests differing in tree diversity. Ecological Studies, 176: 263–289.
Rodriguez Y. P, Gerendiain A. Z., Pappinen A., Peltola H., Pulk-kinen P. 2009. Differences in wood decay by Heterobasid-
ion parviporum in cloned Norway spruce (Picea abies). Canadian Journal of Forest Research, 39(1): 26–35.
Siwecki R., Krzan Z. 1983. Ważniejsze choroby i szkodniki, in: Jodła pospolita Abies alba Mill., (ed. S. Białobok), Warszawa-Poznań, PWN. ISBN 83-01-04028-9.
Stenlid J., Wästerlund I. 1986. Estimating the frequency of stem rot in Picea abies using an increment borer. Scandi-navian Journal of Forest Research, 1: 303–308.
Surmiński J. 1983. Właściwości techniczne i możliwości zas-tosowania drewna jodły, in: Jodła pospolita Abies alba Mill. (ed. S. Białobok), Warszawa-Poznań, PWN. ISBN 83-01-04028-9.
Tinner W., Colombaroli D., Heiri O., Henne P. D., Steinacher M., Untenecker J., Vescovi E., Allen J.R. M., Carraro G., Conedera M., Joos F., Lotter A. F., Luterbacher J., Samar-tin S., Valsecchi V. 2013. The past ecology of Abies alba provides new perspectives on future responses of silver fir forests to global warming. Ecological Monographs, 83: 419–439.
van Diepen L.T.A, Olson A., Ihrmark K., Stendlid J., James T. Y. 2013. Extensive Trans-Specific Polymorphism at the Mating Type Locus of the Root Decay Fungus Heteroba-sidion. http://mbe.oxfordjournals.org/ at University of Michigan on November 24.
Zamponi L., Paffetti D., Tegli S., Łakomy P., Capretti P., 2007. Genetic variation in Heterobasidion abietinum populations detected with the M13 minisatellite marker. The Authors Journal compilation, Berlin, Blackwell Verlag: 328–322.
Zięba S. 2010. Wskaźnikowa analiza stanu lasów karpackich w latach 1967-2006. Sylwan, 154(7): 478–487.
Żółciak A., Sierota Z., Małecka M. 2006. Przebieg choroby w uprawie sosny zwyczajnej w następstwie sztucznej inoku-lacji pniaków grzybnią korzeniowca wieloletniego. Leśne Prace Badawcze, 1: 37–55.
Authors’ contribution
S.N. – concept, manuscript preparation care, participation in fieldwork, E.Ch. – participation in fieldwork, statistical analysis, M.K. – participation in fieldwork.
Translated by: Bożena Kornatowska

Leśne Prace Badawcze (Forest Research Papers),December 2014, Vol. 75 (4): 353–358
DOI: 10.2478/frp-2014-0032
ORIGINAL RESEARCH ARTICLE
Received 05 March 2014, accepted after revision 20 May 2014.© 2014, Forest Research Institute
Rainfall parameters affect canopy storage capacity under controlled conditions
Anna Klamerus-Iwan
University of Agriculture in Kraków, Faculty of Forestry, Department of Forest Engineering, Al. 29 Listopada 46, 31–425 Kraków, Poland.
Tel. + 48 12 662 53 56, fax +48 12 4119715, e-mail: [email protected]
Abstract. The subject of this research was the interception of precipitation, which is defined as the amount of water that can be retained by the entire surface of a tree. The aim was to measure the rate of interception under laboratory conditions in order to determine influential factors. To eliminate water absorption that would occur in living trees, we employed models of deciduous and coniferous trees enabling us to examine the effect of precipitation characteristics and the surface area individually. A sprinkler system that automatically recorded the amounts of water retained on the models was set up in the laboratory. Precipitation was simulated using 5 different intensities with 3 different raindrop sizes.
Interception rates were affected by both, the intensity of the precipitation and raindrop size. The time required to reach maximum crown filling with water was variable and depended on plant surface parameters as well as simulat-ed precipitation. The maximum water capacity of crowns was not a constant value even within one tree model, but changed depending on precipitation characteristics.
Key words: area of trees, interception tank, mock trees, rainfall intensity, size of raindrops, sprinkler set
1. Introduction
Trees interception is a component of ‘atmosphere – for-est stand – soil’ balance. This phenomenon concerns the phase of balance enrichment in water. The amount of water retained on plant surface lowers the reserve of water in soil (Suliński 1993; Xiao et al. 2000; Barbier et al. 2009).
In numerical terms, the interception is a significant component of water balance. Pike and Scherer (2003) even expressed an opinion that it is a crucial problem in forest hydrology. Zinke (1967) and Webb (1975) in-dicated on the possibility of intercepting by trees even 10–30% of whole rainfall. Calder (1999) defined the value of interception on 50%. Interception, irrespec-tive of differences in species composition, structure and forest density and also in rain characteristics connected with different climate conditions, should be included in models simulating such processes like: evapotranspira-
tion, water outflow from soil, soil retention and others (Chang 2003). It could also be included in water bal-ances of special purpose, for example, in geochemical research (Hörmann et al. 1996), or in nitrogen circula-tion in atmosphere (Loescher et al. 2002) or in climate balances of afforestated areas (Okoński, Miler 2006).
Literature, in which data can be found from intercep-tion measurements performed in certain geographical and forest stands conditions is extensive. In Poland, a considerable source of data concerning interception of forest stands are numerous Olszewski’s thesis (1965, 1975, 1984). An attempt of comparison of interception size obtained in local observations was made by Pei et al. (1993). The majority of researchers interpreted trees’ interception as a difference of rainfall size over and under trees crown (Olszewski 1975, 1984; Aston et al. 1979; Jetten 1996; Feliksik et al. 1996; Calder 2001; Gomez et al. 2001; Bryant et al. 2005). Spatial and time

354 A. Klamerus-Iwan / Leśne Prace Badawcze, 2014, Vol. 75 (4): 353–358
distribution of interception is difficult to compare quan-titatively. It is hard to compare obtained results due to differentiation of methods, places and time of measure-ments (Crockford, Richardson 2000; Jong, Jetten 2007). The role of rainfall intensity in forming of plants’ in-terception size is significant, but this issue should be considered as poorly examined. That is why inter alia Asdak et al. (1998) and also Toba and Ohta (2008) pos-tulated the need for developing study and laboratory ex-periments in this area.
Research studies with the use of sprinkler in laboratory were performed by Hall and Calder (1993), Garcia–Est-ringana et al. (2010). According to results from Calder et al. (1996) and Calder (1999), crown ability for retaining water increases when size of raindrops decrease and rain intensity decreases. Similar research of interception in laboratory conditions were conducted inter alia: Pei et al. (1993), Suliński et al. (2001), Keim et al. (2006).
2. Material and methods
The experiments were performed on two mock-ups simulating deciduous and coniferous species. The use of mock-ups for research was necessary due to recognition of interception process on areas that were not chang-ing physical properties after wetting with water – both during single rain, measurement series but also research cycles. Material from which the models of trees were made was water resistant. For constructing, models used were available in garden stores, artificial branches out of which trees were formed similar to natural ones. In case of deciduous mock, the model was European beech and in case of coniferous mock – Scots pine. Artificial trees were 110 cm high. The area of mock-ups was defined as the sum of trunk’s part surface, branches and leaves/needles. Adopted was methodology of measurements based on direct scanning of trees elements or their pho-tographs. Analysis and calculations were made in Sigma Scan v.2 program.
When performing similar experiments in reference to live trees, water absorption by bark should be analysed. The results of experiments with the use of models of de-ciduous and coniferous trees were used also as control and comparison values for interception values obtained in case of live trees. Laboratory stand prepared for in-terception measurement of listed trees was described by Klamerus-Iwan et al. (2013).
On each of the models, two full cycles of experiments were performed. Every cycle had three series, each with different drops size from water sprinkler (0.4; 0.50; 0.60
mm). Within each series, five differing repetitions with rainfall intensity (5, 10, 15, 20, 25 mm/h) were performed. The scheme of experiments was presented in Klamer-us-Iwan et al. thesis (2013a). Jointly, the cycle of experi-ment in one mode included 15 repetitions of experiment.
A significant assumption during all experiments was maintenance of permanent, repetitive temperature and humidity conditions in the laboratory. Thermohygro-graph registered relative humidity at the level of 20–25% and temperature in the range of 19–23°C. Distilled water of temperature 21(±1)°C was used for the experiment. In natural conditions also, the temperature of rainfall is by 1–2°C lower than air temperature most frequently.
Bearing in mind small sizes of trees used for ex-periment, the diversity of surface had to be considered possibly scrupulously. In order to do so, measurements methodology based on direct scanning of elements on their photography (Owsiak et al. 2012) was accepted.
Statistical analysis was based on finding the fac-tors that were responsible for the size of interception obtained for each repetition of experiment. Used were multivariate significance tests (Statistica v.10). The best predictors were compared for both models jointly and separately for deciduous and coniferous species.
3. Results
Procedures used for calculating the size of examinedmodels area and also trees surface were labour-consum-ing, but they assured, however, that obtained results were very reliable and further analysis could be based on them. The surface of deciduous mock is 0.216 m2 and coniferous mock is 0.310 m2.
Crown projection on the horizontal plane, defined on the basis of picture made by a camera placed centrally over crown for both models was very similar (ratio of crown projection area to plane covered with sprinkling): deciduous model is 0.702 and coniferous model is 0.712.
Interception measurements were performed at 1-min-ute intervals. Establishing the moment of maximum in-terception occurrence for given experiment course was interpreted from interception curve. This curve showed increasing amount of water on models in time (t) of ex-periment. Values presented in Figures 1 and 2 are values of maximum water amount (Ip) that can be retained on models at defined rainfall characteristic. For each model and repetition of experiment, a different time (T) was established, which was necessary for reaching potential interception (Ip). All data are presented graphically in Figures 1 and 2 according to intensity of simulated rain-

355A. Klamerus-Iwan / Leśne Prace Badawcze, 2014, Vol. 75 (4): 353–358
fall and the size of raindrops in a division of deciduous and coniferous mock.
Factors that could explain why interception values obtained on trees models differ from each other in every repetition of experiment were searched. If interception was decided only by the size of the plant’s surface, then the Ip values would be different between mock-ups and not with change of simulated rainfall parameters. Statis-tically searched for were the best predictors for depend-ent variable, that is, potential interception.
In case of woody plants occurs a qualitative diversity of assimilation apparatus and ligneous shoots surface because their covering changes with object’s age.
In case of mock-ups made of plastic, it is hard to speak about influence of species characteristics, there-fore the size of area (A) is a value distinguishing the deciduous mock-up from the coniferous one (Table 1).
The lack of possibility of capturing typical features of coniferous and deciduous trees (natural, morpholog-ical differences of gymno – and angiosperms) made it impossible to think about influence of species charac-teristics. The influence of significant factors can be ana-lysed separately for coniferous (Table 2) and deciduous mock-ups (Table 3).
A high cognitive value would have an experiment in which both mock-ups would have the same surface and differ with features typical for coniferous and de-ciduous trees.
The construction and use of trees models for experi-ments over interception in laboratory conditions was a pioneering action. In experiment, the coniferous mock had a bigger area. In reality, such situation can only occur when comparing spruce and fir with birch. In case of the most common in Poland forest stand (pine, oak) deciduous species are the ones characterised with much greater rainfall interception area.
Figure 1. Relationship of potential interception (Ip) and rainfall intensity (S) and used droplet size (F) in the case of coniferous mock-up (MI)
Table 1. Selection of the best predictors for the variable Ip (potential interception) for both mock-ups in total (deciduous and coniferous)
Mock-ups in total (deciduous and
coniferous)
Best predictors for the variable Ip [mm]
F pA [m2] 13.496 0.001
Fi [mm] 6.276 0.00577T [min] 3.908 0.00575
Explantation:A – area of artificial trees from direct measurement,Fi – droplet size of simulated rain,T – time necessary to achieve the maximum interception,F – test FSnedecora,p – significance level.
Table 2. The best predictors for the variable Ip for model of coniferous tree
Coniferous mock-up
Best predictors for the variable Ip [mm]
F pFi [mm] 15.41 0.00048T [min] 1.82 0.20496
S [mm/h] 0.679 0.62197
Explantation:S – simulated rainfall intensity,Other as in Table 1
Figure 2. Relationship of potential interception (Ip) and rainfall intensity (S) and used droplet size (F) in the case of deciduous mock-up (ML)

356 A. Klamerus-Iwan / Leśne Prace Badawcze, 2014, Vol. 75 (4): 353–358
4. Discussion
The process of interception of a single rainfall can be compared to filling a leaky container with water. The surface of trees used in presented mock-up experiments is an equivalent of an interception container.
Quantitative differences of interception that are de-pendent on surface size can be seen vividly. It can be concluded that the size of surface is, to a great degree, a determinant of water amount retained on plants (Figures 1, 2; Table 1).
Coniferous mock was bigger and retained much less water. Such summary gives reasons for considering the influence of species characteristics on the amount of retained water. With mock-ups, it is not possible to compare the properties of bark or cuticle covering the green parts of plants. It can be puzzling whether brushy setting of needles may store more water than in case of leaves. Converting interception per unit of area and then its comparison between species seems to be correct. The influence of species characteristics was discussed in Crockford and Richardson (2000) thesis, while By-rant (2000) showed very similar loss for interception in deciduous, coniferous and mixed forest stands.
On graphs (Figures 1, 2), it seen can be vividly that size of interception was influenced by both the intensity of simulated rainfall and the size of used drops.
Hall and Calder (1993) conducted research over size of interception with the use of laser disdrometer and showed that parameters of wetting defying the amount of water that can be retained on plant depend on the size of raindrops. They suggested, in addition, that rela-tion between the size of raindrops and intensity of rain should be examined further as an important factor for interception calculation.
According to results from Calder et al. (1996) and Calder (1999) thesis, the crown capacity for retaining
water increases when raindrops are smaller and the in-tensity of rain decreases. Calder (1999) introduced a rain division to rain of first and second contact with a plant and connected it with storeys in forest stand. In later a thesis of Link et al. (2004), it was stated that the size of drops does not have such a big influence on interception of forest stands second storey because it is reached only by raindrops that have bounced from upper branches.
Calder (1999) by building stochastic models, tried to explain the loss for interception on a global scale. In zone of temperate climate, the interception in coniferous forest is very high due to small raindrops and relatively low intensity of rainfall. In tropical forests, where occur intensive rainfalls characterised by bigger drops, the in-terception is low because of ineffective wetting of plant’s surface. The difference in the size of leaves in compared forests, generally bigger in tropical forests, also contrib-utes to this effect. Pei et al. (1993) conducted experi-ments in laboratory on pine’s woods of height around 4 m and crown projection 4.21 m2. The rainfall intensity was changed 10 times from 47.4 to 147.6 mm/h. The intensity was computer-controlled. This experiment al-lowed to determine that the bigger the rainfall intensity, the less water remains on plant surface and the faster is reached maximum amount of retained water. The range of intensity in researches of Calder (1996, 1999) and Pei et al. (1993) did not match conditions of moderate zone. The range of intensity presented in this thesis, which is from 5 to 25 mm−1, is more adjusted to the one that possibly occurs in Poland. However, noticeable are the same relations of influence of rainfall intensity and the size of its drops.
Reverse relations were observed by Keim et al (2006). They conducted an experiment in the laboratory on branches of nine different tree species.
A sprinkler was used for rain production, giving an opportunity to regulate intensity from 20 to 420 mm−1 and the size of drops from 1.0 to 2.8 mm. The results of measurements showed that with the increase of sim-ulated rainfall intensity, water retention increased on branches of all species, wherein coniferous species re-tained more water than deciduous with the same coef-ficient of leaf area index (LAI). The surface of leaves turned out to be more useful equivalent of water re-taining ability than biomass. The authors also suggest a need of further research with the use of lower values of rainfall intensity.
The time needed for reaching potentially highest crown filling with water (T) (Tables 1, 2, 3) confirms that interception is not a constant value. It changes viv-
Table 3. The best predictors for the variable Ip for model of deciduous tree
Deciduous mock-up
Best predictors for the variable Ip [mm]
F pS [mm/h] 4.8078 0.02009Fi [mm] 2.7562 0.103514T [min] 1.2852 0.374507
Explantation:Other as in Tables 1, 2
357A. Klamerus-Iwan / Leśne Prace Badawcze, 2014, Vol. 75 (4): 353–358
idly with each change of plants surface and simulated rainfall parameters.
Reaching higher values of potential interception, involving the use of lower rainfall intensity and small-er raindrops, also required longer time of exposure to rain. On the basis of Kuczy’s (2007) research over re-tention properties of organic matter, a question occurs: how time (T) in research over trees interception may influence initial wetting of tree surface? It seems to be a significant determinant both of time (T) and also po-tential interception. It is impossible though to analyse on mock-ups made of plastic.
It is necessary to perform similar analysis on live trees of main forest species for verification of present-ed conclusions.
Interception is getting more meaningful in hydrolog-ical studies, especially after introducing laser measuring devices, offering wide possibilities of tracking the pro-cess of creating and transporting water drops in air.
5. Conclusions
The amount of water retained by plants depends, de-spite surface size, potential influence of species charac-teristics or surface condition, on rainfall characteristics. The bigger amount of water from rainfall may be accu-mulated in trees crown with low rainfall intensity and smaller raindrops.
The maximum water capacity of trees crown is not a constant value even within one tested trees model. It changes every time under influence of rainfall characteristics.
Acknowledgements
This study was completed, thanks to support of Min-istry of Science and Higher Education within promoter grant No. N N309298234. I would like to thank the re-viewers for valuable notes.
References
Asdak C., Jarvis P. G., Gardingen P. V. 1998. Evaporation of intercepted precipitation based on an energy balance in un-logged and logged forest areas of central Kalimantan, Indo-nesia. Agricultural and Forest Meteorology, 92: 173–180.
Aston A. R. 1979. Rainfall interception by eight small trees. Journal of Hydrology, 42: 383–396.
Barbier, S., Balandier P., Gosselin F. 2009. Influence of sev-eral tree traits on rainfall partitioning in temperate and
boreal forests: a review. Annals of Forest Science, 66(6): 602p1–602p11. DOI: 10.1051/forest/2009041.
Bryant M. L., Bhat S., Jacobs J. M. 2005. Measurements and modeling of throughfall variability for five forest commu-nities in the southeastern US. Journal of Hydrology, 312: 95–108. DOI:10.1016/j.jhydrol.2005.02.012.
Calder I. R. 1999. Dependence of rainfall interception on drop size - a reply to the comment by Uijlenhoet and Strick-er. Journal of Hydrology, 217: 164–165. DOI: 10.1016/S0022-1694(99)00003-7.
Calder I. R. 2001 Canopy processes: implications for transpi-ration, interception and splash induced erosion, ultimately for forest management and water resources. Plant Ecolo-gy, 153: 203–214. DOI: 10.1007/978-94-017-3606-0_16.
Calder I. R., Hall R. L., Rosier P. T. W., Bastable H. G., Pras-anna K. T. 1996. Dependence of rainfall interception on drops size: 2. Experimental determination of the wetting functions and two-layer stochastic model parameters for five tropical tree species. Journal of Hydrology, 185: 379–388. DOI: 10.1016/0022-1694(95)02999-0.
Chang M. 2003. Forest Hydrology: an introduction to water and forest. Boca Raton, London, New York Washington, D.C. CRC Press. ISBN 143987994X.
Crockford R. H., Richardson D. P. 2000. Partitioning of rain-fall into throughfall, stemflow and interception: Effect of forest type, ground cover and climate. Hydrological Processes, 14: 2903–2920. DOI: 10.1002/1099-1085 (200011/12)14:16/17<2903::AID-HYP126>3.0.CO;2-6.
Feliksik E., Durło G., Wilczyński S. 1996. The interception of rainfall in mixed forest stands. Zeszyty Naukowe AR Kraków, 5: 15–22.
Garcia-Estringana P, Alonso-Blazquez N, Alegre J. 2010 Water storage capacity, stemflow and water funneling in Mediterranean shrubs. Journal of Hydrology, 389: 363–372. DOI: 10.1016/j.jhydrol.2010.06.017.
Gomez J. A., Giraldez J. V., Fereres E. 2001. Rainfall in-terception by Olive trees in relation to leaf area. Ap-plied Water Management, 49: 65–76. DOI: 10.1016/j.agwat.2006.05.011.
Hall R. L., Calder I. R. 1993. Drop size modification by forest canopies-measurements using a disdrometer. Journal of Geophysical Research, 90: 465–470. DOI: 10.1029/93JD01498.
Hormann G., Branding A., Clemen T., Herbst M., Hinrichs A., Thamm F. 1996. Calculation and simulation of wind con-trolled canopy interception of a beech forest in Northern Ger-many. Agricultural and Forest Meteorology, 79 (3): 131–148.
Jetten V. G., 1996. Interception of tropical rain forest, performance of a canopy water balance model. Hydrological Process-es, 10: 671–685. DOI: 10.1002/(SICI)1099-1085(199605) 10:5<671::AID-HYP310>3.0.CO;2-A.
Jong de S. M., Jetten V. G. 2007. Estimating spatial patterns of rainfall interception from remotely sensed vegetation indi-ces and spectral mixture analysis. International Journal of

358 A. Klamerus-Iwan / Leśne Prace Badawcze, 2014, Vol. 75 (4): 353–358
Geographical Information Science, 21(5): 529–545. DOI: 10.1080/13658810601064884.
Keim R. F., Skaugset A. E., Weiler M. 2006. Storage of water on vegetation under simulated rainfall of varying inten-sity. Advances in Water Resources, 29: 974–986. DOI: 10.1016/j.advwatres.2005.07.017.
Klamerus-Iwan A., Owsiak K. 2013. Ocena konstrukcji pro-totypowego stanowiska do badań nad intercepcją drzew leśnych w warunkach laboratoryjnych [Assessment of the design of the prototype experimental station for the research on forest trees interception in the laboratory con-ditions]. Sylwan, 157(6):464–469.
Klamerus-Iwan A., Owsiak K., Szczuka M. 2013a. Zmodyfi-kowana metodyka badania intercepcji drzew w warunkach laboratoryjnych [Modified methodology of trees intercep-tion research under laboratory condition]. Infrastruktura i Ekologia Terenów Wiejskich, 4(1): 45–57.
Kucza J. 2007. Właściwości hydrologiczne materii organ-icznej gleb leśnych na przykładzie gleb pod świerczynami istebniańskimi [Hydrological properties of organic matter of forest soils as exemplified by soils under Istebna stands of Norway spruce]. Zeszyty Naukowe Akademii Rolniczej im. Hugona Kołłątaja w Krakowie 442. Rozprawy, 320: 1–176.
Link T. E., Unsworth M., Marks D. 2004. The dynamics of rainfall interception by a seasonal temperate rainforest. Agricultural and Forest Meteorology, 124(3-4): 171–191. DOI: 10.1016/j.agrformet.2004.01.010.
Loescher H. W., Powers J. S., Oberbauer S. F. 2002. Spatial variation of throughfall volume in an old growth tropical rain forest. Journal of Tropical Ecology, 18(3): 397–407.
Okoński B., Miler A.T. 2006. Klimatyczny bilans wodny terenów zalesionych Wielkopolski na przykładzie Puszczy Zielonka [Climatic water balance for forested areas of Wielkopolska region as exemplified by Zielonka Forest]. Acta Scientiarum Polonorum, Ser. Formatio Circumiec-tus, 5(2): 73–81. ISBN 978-83-89263-24-7.
Olszewski J. 1965. Pomiary opadu deszczu w grądzie (Quer-co-Carpinetum medioeuropaeum Tuxen 1936) w Białow-ieskim Parku Narodowym [Rainfall measurements in Querco-Carpinetum medioeuropaeum Tuxen 1936 in Bi-ałowieża National Park]. Sylwan, 109(3): 27–32.
Olszewski J. 1984. Intercepcja i jej wpływ na wysokość opadów atmosferycznych docierających do powierzchni gruntu w lesie. Zeszyty Problemowe Postępów Nauk Rol-niczych, 288: 245–270.
Olszewski J., Orzeł W. 1975. Intercepcja opadowa buka i sosny w Bieszczadach [Precipitation interception by beech and pine in Bieszczady Mts.]. Sylwan, 10: 45–53.
Owsiak K., Klamerus-Iwan A., Kostrzewa E. 2012. Wybrane cechy morfologiczne igieł i pędów sosny zwyczajnej w kontekście obliczania potencjalnej intercepcji pojedynczych drzew [Morphological characteristics of pine needles and branch in the context of calculating potential interception]. Infrastruktura i Ekologia Terenów Wiejskich, 3(4): 203–213.
Pei T. F., Fan S. X., Han S. W. 1993. Simulation experiment analysis on rainfall distribution process in forest canopy, Chin. Journal of Applied Ecology, 4: 250–255.
Pike R. G., Scherer R. 2003. Overview of the Potential Effects of Forest Management on Low Flows in Snowmelt-domi-nated Hydrologic Regimes. BC Journal of Ecosystems and Management, 3(1): 44–60.
Suliński J. 1993. Modelowanie bilansu wodnego w wymianie między atmosferą, drzewostanem i gruntem przy użyciu kryteriów ekologicznych [Modelling water balance in the exchange between atmosphere, tree stand and soil using ecological criteria]. Zeszyty Naukowe Akademii Rolniczej im. Hugona Kołłątaja w Krakowie, Rozpr. hab. 179 s.
Suliński J., Starzak R., Kucza J. 2001. Weryfikacja wzoru wyrażającego intercepcję drzew w zależności od natęże-nia i czasu trwania opadu deszczu, w warunkach ekspery-mentalnych. Acta Agraria et Silvestria, 39: 3–16.
Toba T, Ohta T. 2008. Factors affecting rainfall interception deter-mined by a forest simulator and numerical model. Hydrologi-cal Processes, 22(14): 2634–2643. DOI: 10.1002/hyp.6859.
Webb E. K. 1975. The interception process, in: Prediction in Catchment Hydrology (eds. T.G. Chapman, R.X. Dunin), Netley, Australian Academy of Science: 203–236.
Zinke P. J. 1967. Forest interception studies in the United States, in: International Symposium on Forest Hydrology (eds. W. E. Sopper, H. W. Hull). Pergamon, Oxford.
Xiao Q.-F., McPherson E.G., Ustin S.L., Grismer M.E. 2000. A new approach to modeling tree rainfall interception. Jour-nal Geophysical Research, 105(ND23): 29173–29188.
Translated by: Anna Wyszyńska

Leśne Prace Badawcze (Forest Research Papers),December 2014, Vol. 75 (4): 359–365
DOI: 10.2478/frp-2014-0033
ORIGINAL RESEARCH ARTICLE
Received 14 May 2014, accepted after revision 23 June 2014. © 2014, Forest Research Institute
Occurrence of black cherry (Prunus serotina Ehrh.) in the State Forests in Poland
Szymon Bijak*, Maciej Czajkowski, Łukasz Ludwisiak
Warsaw University of Life Sciences – SGGW, Faculty of Forestry, Laboratory of Dendrometry and Forest Productivity; ul. Nowoursynowska 159, 02–776 Warszawa, Poland.
*tel.: +48 22 5938 093, e-mail: [email protected]
Abstract. Among the invasive tree species identified in Polish forests, black cherry (Prunus serotina Ehrh.) appears to pose the greatest threat. The objective of this study was i), to determine the abundance of this species in the forests managed by the State Forests National Forest Holding (PGLLP) and ii), to characterise the ecological conditions that it is found in. The source data was obtained from the State Forests Information System (SILP) database. In Polish forests, black cherry mostly occurs as an understory plant and is present in a total area of 99,185 hectares, which is 1.4% of the forest area under the management of the PGLLP. Although Prunus serotina can be found within a wide range of habitats, it most commonly occurs on sites that can be considered average in terms of fertility (mixed coniferous and mixed deciduous types) developed primarily on rusty soils (podzols).
Key words: black cherry, ecological conditions
1. Introduction
Modern forest management worldwide – now direct-ed towards the production of large amounts of timber on a short-term time scale – is nowadays mainly associated with the silviculture of tree species occurring beyond their natural ranges (Woziwoda 2012). Introduction of alien tree species into Europe’s forests started in the middle of the 19th century, and it became more than ever intensive in the 20th century. Above all, the rea-son for this was the call for increasing timber produc-tion. The interest in growing new forest species was instigated by scarcity of species in native dendroflora (Bellon et al. 1977; Danielewicz, Wiatrowska 2012) and urgent needs for lumber as a result of rapidly devel-oping economy. However, for quite some time already, attention has been drawn to negative effects of intro-duced tree species, especially due to their invasive na-ture (Szwagrzyk 2000; Danielewicz, Wiatrowska 2012; Woziwoda 2012). Some alien plant species have gotten out of control and are now spreading throughout local
ecosystems causing considerable changes. These are called alien invasive species and have lately become a serious global problem, especially from the perspective of biodiversity conservation at a local level (Daniele-wicz, Wiatrowska 2012; Gazda 2012; Woziwoda 2012). Because of increasing interference of some alien spe-cies, there is a necessity to have complete knowledge on their distribution, frequency as well as conditions for growth and development within Poland.
Among invasive plant species identified in Poland’s forests, the most threatening is black cherry Prunus se-rotina Ehrh. (Namura–Ochalska 2012). In the 1950s, this species was far and wide planted so as to improve phyto-amelioration within forest monocultures, and also – for soil protection reasons (Starfinger et al. 2003). The species, which now can be found extending throughout almost the entire country (Fig. 1), used to be promot-ed for its remarkable growth in young pine stands and assistance in pine self-pruning (Dominik 1947). Rec-ommendations for planting black cherry as a support-ive species in land improvement in poor habitats were

360 Sz. Bijak et al. / Leśne Prace Badawcze, 2014, Vol. 75 (4): 359–365
included in subsequent editions of the manual ‘Forest Silviculture Principles’ (Zasady Hodowli Lasu) until the end of 1980s. Having appropriate conditions for devel-opment, black cherry has spread beyond control right through Poland’s forests with negative influence on na-tive phytocoenoses. The pressure of this tree species is now more and more visible (Halarewicz 2012; Otręba 2013), even though according to some authors, black cherry is yet to achieve the maximum of its population in Europe (Zerbe, Wirth 2006). Identification of factors affecting black cherry growth and development as well as a rate of new site colonisation seems most necessary and could become a base for building a strategy for ef-fective control of this neophyte.
Even if the importance of some invasive alien species has been constantly growing, studies on this issue with regard to forest ecosystems have been limited (Gazda 2012). Investigations on black cherry position in Po-land’s phytocoenoses have also been insufficient and in short supply. So far, the latter have focused on species dispersal and concern only in selected areas (Daniele-wicz 1994; Halarewicz, Rowieniec 2009; Halarewicz 2011b; Otręba 2013). Ecological factors affecting black cherry growth and development in different forest plant associations have been up to now sporadically addressed both in Poland (Stypiński 1977, 1979; Halarewicz 2011a, 2012; Halarewicz, Kawałko 2014) and Europe (Godefroid et al. 2005; Vanhellemont 2009)
The aim of the present study is to determine the scale of black cherry P. serotina Ehrh. incidence in Poland’s
forests managed by the State Forests National Forest Holding (PGLLP) and to depict the characteristics of site and soil conditions within the forests where this species occurs.
2. Material and methods
The source data was obtained from the State Forests Information System (SILP) and all concerned forest management units where black cherry incidence has been recorded. We gathered the records on black cher-ry locations, areas of its occurrence, forest site cate-gory as well as on soil type and sub-type. Based on these information, we determined the following fea-tures: the number and area of forest management units with black cherry specimens taking into account tree stand layers (first and second layer, brushwood, un-dergrowth, regeneration, remnants and afforestation) as well as stand age, the site category and soil types. The analyses considered the location of the stands with black cherry defined at the level of the Regional Direc-torates of the State Forests (RDLP).
SILP records from Gdansk, Lublin and Radom RDLPs do not include separate information on various Prunus species, thus forest areas under administration of these RDLPs were not considered in the present study as a consequence of the lack of chance to sort out native and alien Prunus trees. Characteristics of site and soil conditions in which black cherry occurs did not incorporate the areas of barrens, afforesta-tion areas, fire lanes, as their record in SILP database lacked information on the forest site category and soil types. Given that black cherry is an admixture species, stock volume of forest stands with black cherry share was not analysed.
3. Results
In forests managed by PGLLP, black cherry oc-curs in 32,230 management units with the total area of 99,185 ha (Table 1). There prevail the units with black cherry in the undergrowth (the number – 96.7% and the area – 97.6%). The highest number of such units is documented in RDLP Poznań (11,840 units with the total area of 35,050 ha) and RDLP Wrocław (8338 units, 25,094 ha). Considerably large area with black cherry is also recorded in RDLP Katowice (11,524 ha) and RDLP Warszawa (7092 ha). On the whole, in the first and second forest layer, black cherry occurs only in 617 units with the total area of 1793
Figure 1. Distribution of black cherry Prunus serotina Ehrh. in Poland (Zając, Zając 2001).

361Sz. Bijak et al. / Leśne Prace Badawcze, 2014, Vol. 75 (4): 359–365
ha. The majority of such units is recorded in RDLP Wrocław (159 with the total area of 455 ha). Relative-ly large areas of black cherry in the first and second
forest layer are also observed in RDLP Warszawa (358 ha), RDLP Szczecinek (305 ha), RDLP Piła (204 ha), RDLP Poznań (162 ha) and RDLP Zielona Góra (145 ha). In the rest of RDLPs studies, only individual man-agement units as such were recorded. In general, for-est stands with black cherry share are young (Table 2). Half of these are now classified in the first-age class, and only 12% of all stands with black cherry are older than 50 years. With regard to the area, there prevail units in the age classes Ia, IIb and IIIa (33%, 17% and 18%, respectively). Black cherry share in shrub layer was recorded on the total area of 594 ha, of which 57% – in RDLP Białystok and 18% – in RDLP Wrocław (Table 1). Remnants, tree groups and natural regener-ation of black cherry occur in individual management units with the total area of only 23 ha.
Even if management units with black cherry can be found throughout a quite broad range of forest site cate-gories, most often, this species occurs on the sites with medium quality in terms of soil fertility and those with relatively low moisture (Fig. 2). The units within conif-erous and mixed coniferous sites constitute the largest areas (42% and 36%, respectively). Fresh forest sites constitute 88% of the area occupied by black cherry,
Table 1. Number and area of forest units with black cherry in various stand layers in Regional Directorates of State Forests.*
RDLPRegional Directorate of
the State Forests
Stand Understory Bushesnumber area number area number area
Qty. ha Qty. ha Qty. haBiałystok 3 5.52 1852 6401.05 67 336.27
Katowice 9 36.74 3279 11,523.2 27 21.82
Kraków 7 22.13 - - - -
Krosno 1 0.54 - - - -
Łódź 1 3.73 981 3020.63 6 3.22
Olsztyn 6 12.90 20 102.80 -
Piła 66 204.14 9 32.64 - -
Poznań 61 162.29 11,840 35,049.74 106 72.54
Szczecin 18 33.86 1750 5969.42 23 13.23
Szczecinek 119 305.15 - - - -
Toruń 21 47.29 1 18.41 - -
Wrocław 159 455.05 8338 25,093.70 148 109.18
Zielona Góra 70 145.19 1034 2471.84 24 17.18
Warszawa 76 358.04 2062 7091.88 23 20.76
Total 617 1792.57 31,166 96,775.63 424 594.20
*excluding RDSF in Gdańsk, Lublin and Radom as they don’t distinguish native and alien cherry
Tabela 2. Number and area of forest units with black cherry in 10-years age classes of this species
Age (years)Number Area
Qty. % Qty. %
1–10 231 37.4% 589.93 32.9%
11–20 78 12.6% 171.82 9.6%
21–30 42 6.8% 84.31 4.7%
31–40 94 15.2% 308.81 17.2%
41–50 99 16.0% 321.22 17.9%
51–60 49 7.9% 231.35 12.9%
61–70 13 2.1% 50.12 2.8%
71–80 6 1.0% 25.75 1.4%
81–90 3 0.5% 4.05 0.2%
91–100 2 0.3% 5.21 0.3%
Total 617 100.0% 1792.57 100.0%

362 Sz. Bijak et al. / Leśne Prace Badawcze, 2014, Vol. 75 (4): 359–365
whereas the extreme sites with regard to the moisture constitute only 1% and 0.02% (marsh and dry sites, re-spectively). Black cherry trees are most often observed on rusty soils (Fig. 3). Rusty soils occur on 27.3% of forest area with black cherry, rusty podzolic soils – on 22.5%, and brown rusty soils – on 12.4%. Podzolic soils in total comprise 15% of the areas where black cherry occurs. The share of other forest soil types is relatively low (Fig. 3).
4. Discussion
Black cherry occupies 1.4% of forest area managed by PGLLP and occurs all over Poland, except for the territories situated in north- and south-eastern parts of the country (Fig. 1). This is partially reflected in the records on the occurrence of this species in the State Forests (Table 1). Location of the P. serotina intro-duction, and hence the present occurrence of this tree species, was predominantly the result of the economic decisions related to the application of the silvicultural rules and recommendations valid at a given time. At the end of 1980s, black cherry was hitherto listed as a biocenotic and useful in phyto-amelioration species in the species composition of afforestations on post-agri-cultural lands with fresh, dry and mixed coniferous sites (Zasady Hodowli Lasu 1988). According to Gazda and Augustynowicz (2012), spatial distribution of alien spe-cies occurrence in Poland’s forests can be differentiated depending on the forest layer. The share of black cher-ry in higher stand layers rarely exceeds 30%, whereas this species prevails in the undergrowth. Gazda (2013) found that P. serotina is rather rarely classified as an in-vasive species in SILP.
Black cherry is characteristic of large tolerance to different ecological conditions. The expansion of this species observed for quite a long time, has been pos-sible owing to black cherry low demands with regard to the soil conditions, its resistance to the climatic factors and ability to grow and develop fast. Black cherry grows and produces fruit even on poor and dry soils, and it is resistant to drought and frost. It can also withstand both deep shade and full light condi-tions (Stypiński 1977; Starfinger 1991; Vanhellemont 2009; Vanhellemont et al. 2010; Namura-Ochalska 2012; Halarewicz 2012). The results of the present study partially confirm the statements by other authors. However, one has to bear in mind that the presented analysis of black cherry occurrence in Poland’s State Forests principally concerns the sites where this spe-cies was deliberately and systematically planted. The results obtained can hardly be used for the description of black cherry optimal growth conditions, but can in-dicate a range of this species occurrence.
According to the results obtained, black cherry oc-curring in the State Forests mainly occupies medium sites in terms of fertility, that is, mixed coniferous forests and mixed deciduous forests. This observation was confirmed in previous studies on the occurrence of black cherry in different parts of Poland, even though
Figure 2. Share of forest site types in total area of forest units with black cherry:BMb – marsh oligo-mesotrophic, BMśw – fresh oligo-mesotrophic, BMw – wet oligo-mesotrophic, BMwyżśw – upland fresh oligo-mesotrophic, Bs – dry oligotrophic,Bśw – fresh oligotrophic, Bw – wet oligotrophic, LGśw – montane fresh eutrophic, Lł – riparian, Llwyż – uplandriparian, LMb – marsh meso-eutrophic, LMGśw – montane fresh meso-eutrophic, LMśw – fresh meso-eutrophic, LMw – wet meso-eutrophic, LMwyżśw – upland fresh meso-eutrophic, LMwyżw – upland wet meso-eutrophic, Lśw – fresh eutrophic, Lw – wet eutrophic, Lwyżśw – uplandfresh eutrophic, Lwyżw – upland wet eutrophic, Ol – alder, OlJ – alder-ash.
Figure 3. Share of soil types in total area of forest units with black cherry

363Sz. Bijak et al. / Leśne Prace Badawcze, 2014, Vol. 75 (4): 359–365
some authors point out that also coniferous sites are optimal for P. serotina (Stypiński 1977, 1979; Daniele-wicz 1994; Danielewicz, Maliński 1997; Halarewicz, Rowieniec 2009; Halarewicz, Nowakowska 2005; Halarewicz 2012). According to many authors (Star-finger 1997; Halarewicz, Nowakowska 2005; Gode-froid et al. 2005; Chabrerie et al. 2007; Verheyen et al. 2007; Closset–Kopp et al. 2007, 2011; Halarewicz, Rowieniec 2009), black cherry avoids wet sites, which is attributable, among others, to larger occurrence of the soil pathogens in wet environments. Excessive moisture in soil limits black cherry development since – as stressed by Tyszkiewicz (1949) – this species is sensitive to high ground water level. This was con-firmed by Halarewicz and Kawałko (2014) who stated that the presence of black cherry trees and shrubs on wet mixed deciduous forest sites was, for the most part, reliant upon availability of water in deeper soil layers, while excessive dampness of the ground negatively af-fected all growth stages of black cherry. On the other hand, Suszka (1967) reported that black cherry seed germination was possible only under the conditions of water availability in soil. Also, Auclair and Cottam (1971, 1973) emphasised the importance of soil water in black cherry growth.
Black cherry shows low demands in terms of soil fertility; however, it grows the best on deep and fertile soils (van den Tweed, Eijsackers 1987; Starfinger 1991, 2010; Reinhardt et al. 2003; Halarewicz 2012). Accord-ing to Stypiński (1977, 1979), this species finds opti-mal conditions for development on rusty soils as well as on brown leached soils, which was confirmed in the presented study. As reported by Halarewicz (2012) and Halarewicz and Kawałko (2014) strong acidity and low availability of nutrients in soil have no negative effects on young generation of black cherry. Also, Starfinger et al. (2003) found that in areas with widespread black cherry, soil pH was much lower compared to those with no specimens of this species. Furthermore, Chabrerie et al. (2007) reported that black cherry density was posi-tively correlated at a significant level with phosphorus content in upper soil layers. The authors believe that this relationship is a result of low demands of black cherry, which was planted on poor sites so as to increase site productivity. According to Closset–Kopp et al. (2011), soil type significantly influences black cherry growth parameters (basal area and height increment) only when combined with light availability. Nevertheless, invasion rate and size are associated with the fact that black cher-ry populates faster and wider the areas with poor soils
(podzols) compared to those with fertile soils (gleyed soils, luvisols or regosols).
In line with Godefroid et al. (2005) and Knight et al. (2008), light is a positive factor notably influencing black cherry growth; however, the importance of light condi-tions depends on tree growth stage. Halarawicz (2012) stresses that the importance of light changes during black cherry development. Strong shading results in seedling abundance. Nonetheless, even though population num-bers in the brushwood layer do not depend on light con-ditions, the shift from the youth stage into subsequent growth stages requires light availability. That is why the majority of mature black cherry specimens have been found at forest edges and in gaps or clearances within for-ests (Closset–Kopp et al. 2011; Halarewicz 2012). This demonstrates the ability of black cherry to adapt to envi-ronmental conditions and to undertake survival strategies that allow for conquering new sites (Deckers et al. 2005; Closset–Kopp et al. 2007; Halarewicz 2011b).
5. Conclusion
Black cherry (P. serotina Ehrh.) is an alien tree species in Poland’s dendroflora, which used to be in-tensively planted in the mid-20th century in forests, es-pecially in pine monocultures, with the aim to improve phyto-amelioration and to protect soils. Low ecological demands and considerably dynamic growth resulted in uncontrolled spreading out of this species all over the country. For this reason, black cherry is now considered as an invasive alien species in Polish forests. Forest management units with black cherry can be regularly observed on medium sites in terms of fertility (mixed coniferous forest and mixed deciduous forest). In Po-land, black cherry grows mainly on rusty soils, which is chiefly attributable to forest management practice and silviculture guidance operational at the time of black cherry planting throughout the country. The results ob-tained in this study confirmed up-to-date findings on black cherry site demands both under Poland’s and Eu-rope’s conditions.
Acknowledgement
The study was carried out in a framework of the pro-ject ‘Effects of selected site features on black cherry Prunus serotina Ehrh. growth in Poland’ financed from the fund of the Forest Faculty at Warsaw University of Life Sciences – SGGW – established for supporting young academics.

364 Sz. Bijak et al. / Leśne Prace Badawcze, 2014, Vol. 75 (4): 359–365
References
Auclair A. N., Cottam G. 1971. Dynamics of black cherry (Prunus serotina Ehrh.) in southern Wisconsin oak forests. Ecological Monographs 41: 153–177.
Auclair A. N., Cottam G. 1973. Multivariate analysis of radial growth of black cherry (Prunus serotina Ehrh.) in south-ern Wisconsin oak forests. The American Midland Natu-ralist 89: 408–425.
Bellon S., Tumiłowicz J., Król S. 1977. Obce gatunki drzew w gospodarstwie leśnym. Warszawa, PWRiL.
Chabrerie O., Verheyen K., Saguez R., Decocq G. 2008. Disentangling relationships between habitat conditions, disturbance history, plant diversity and American black cherry (Prunus serotina Ehrh.) invasion in an European temperate forest. Diversity and Distributions 14: 204–212.
Closset-Kopp D., Chabrerie O., Valentin B., Delachapelle H., Decocq G. 2007. When Oskar meets Alice: does a lack of trade-off in r/K-strategies make Prunus serotina a suc-cessful invader of European forests? Forest Ecology and Management 247: 120–130.
Closset-Kopp D., Saguez R., Decocq G. 2011. Differential growth patterns and fitness may explain contrasted perfor-mances of the invasive Prunus serotina in its exotic range. Biological Invasions 13: 1341–1355.
Danielewicz W. 1994. Rozsiedlenie czeremchy amerykańskiej (Prunus serotina Ehrh.) na terenie Nadleśnictwa Doświad-czalnego Zielonka. Prace Komisji Nauk Rolniczych i Komisji Nauk Leśnych, Poznańskiego Towarzystwa Przyjaciół Nauk, Wydziału Nauk Rolniczych i Leśnych 78: 35–42.
Danielewicz W., Maliński T. 1997. Drzewa i krzewy obcego pochodzenia w lasach Wielkopolskiego Parku Narodowe-go. Rocznik Dendrologiczny 45: 65–81.
Danielewicz W., Wiatrowska B. 2012. Motywy, okoliczności i środowiskowe konsekwencje wprowadzania obcych ga-tunków drzew i krzewów do lasów [Motives, circumstanc-es and environmental consequences of the introduction of alen tree and shrub species into forests]. Studia i Materiały Centrum Edukacji Przyrodniczo-Leśnej 33: 26–43.
Deckers B., Verheyen K., Hermy M., Muys B. 2005. Effects of landscape structure on the invasive spread of black cherry Prunus serotina in an agricultural landscape in Flanders, Belgium. Ecography 28: 99–109.
Dominik T. 1947. Przyczynek do znajomości wartości hodow-lanej czeremchy amerykańskiej. Sylwan 91 (1-4): 123–131.
Gazda A. 2012. Stan badań nad obcymi gatunkami drzew w polskich lasach [Alien tree species in Polish forests: the state of the research]. Studia i Materiały Centrum Edukac-ji Przyrodniczo-Leśnej 33: 44–52.
Gazda A. 2013. Występowanie drzew obcego pochodzenia na tle zróżnicowania lasów Polski południowej [Distri-bution of alien tree species in various forest communi-ties of southern Poland]. Zeszyty Naukowe Uniwersytetu Rolniczego im. Hugona Kołłątaja w Krakowie 512, ser. Rozprawy 389, Kraków.
Gazda A., Augustynowicz P. 2012. Obce gatunki drzew w polskich lasach gospodarczych: co wiemy o puli obcych gatunków drzew oraz o rozmieszczeniu wybranych tak-sonów [Alien Tree species in the polish managed forests. What do we know about ‘ alien species pool’ and spatial patterns in the distribution of these trees]. Studia i Mate-riały Centrum Edukacji Przyrodniczo-Leśnej 33: 53–61
Godefroid S., Phartyal S. S., Weyembergh G., Koedam N. 2005. Ecological factors controlling the abundance of non-native black cherry (Prunus serotina) in deciduous forest understory in Belgium. Forest Ecology and Man-agement 210: 91–105.
Halarewicz A. 2011a. Odnawianie się czeremchy amerykańsk-iej (Prunus serotina Ehrh.) na siedliskach borowych [Re-generation of black cherry (Prunus serotina Ehrh.) in coniferous forest communities]. Sylwan 155 (8): 530–534.
Halarewicz A. 2011b. Przyczyny i skutki inwazji czeremchy amerykańskiej Prunus serotina w ekosystemach leśnych [The reasons underlying the invasion of forest commu-nities by black cherry, Prunus serotina and its subsequent consequences]. Leśne Prace Badawcze 72 (3): 267–272.
Halarewicz A. 2012. Właściwości ekologiczne i skutki roz-przestrzeniania się czeremchy amerykańskiej Padus se-rotina (Ehrh.) Borkh. w wybranych fitocenozach leśnych. Wydawnictwo UP we Wrocławiu. Monografie 152. ISBN 978-83-7717-110-3.
Halarewicz A., Kawałko D. 2014. Wpływ czynników gle-bowych na występowanie Prunus serotina w fitocenozach leśnych [Effect of soil factors on the incidence of Prunus serotina in forest phytocoenoses]. Sylwan 158 (2): 117–123.
Halarewicz A., Nowakowska K. M. 2005. Stan badań nad inwazyjnym charakterem Prunus serotina Ehrh [Investi-gations on the invasive traits of Prunus serotina Ehrh.]. Annales Silesiae 34: 39–44.
Halarewicz A., Rowieniec A. 2009. Czeremcha amerykańska Prunus serotina Ehrh. na terenie Parku Krajobrazowego “Dolina Jezierzycy” [Black cherry Prunus serotina Ehrh. within the area of the Jezierzyca Valley Landscape Park]. Sylwan 153 (9): 635–640.
Knight K. S., Oleksyn J., Jagodziński A. M., Reich P. B., Kasprowicz M. 2008. Overstorey tree species regulate colonization by native and exotic plants: a source of posi-tive relationships between understorey diversity and inva-sibility. Diversity and Distributions 14: 666–675.
Namura-Ochalska A. 2012. Walka z czeremchą amerykańską Padus serotina. Ocena skuteczności wybranych metod w Kampinoskim Parku Narodowym. Studia i Materiały Centrum Edukacji Przyrodniczo-Leśnej 33: 190–200.
Otręba A. 2013. Wpływ czynników naturalnych i antropogen-icznych na rozprzestrzenianie się czeremchy amerykańsk-iej (Prunus serotina Ehrh.) w Puszczy Kampinoskiej. Praca doktorska. IGiPZ PAN, Warszawa.
Reinhart K. O., Packer A., van der Putten W. H., Clay K. 2003. Plant-soil biota interactions and spatial distribution of black cherry in its native and invasive ranges. Ecology Letters 6: 1046–1050.

365Sz. Bijak et al. / Leśne Prace Badawcze, 2014, Vol. 75 (4): 359–365
Starfinger U. 1991. Population biology of an invading tree spe-cies – Prunus serotina, in: Seitz A., Loeschcke V. (eds.). Species conservation: A population-biological approach. Basel. Birkhauser Verlag, 171–184.
Starfinger U. 1997. Introduction and naturalization of Prunus serotina in central Europe, w: Brock J. H., Wade M., Pysek P., Green D. (eds.). Plant invasions: studies from North America and Europe. Leiden, Backhuys Publishers, 161–171.
Starfinger U. 2010. NOBANIS – Invasive Alien Species Fact Sheet – Prunus serotina. Online Database of the North European and Baltic Network on Invasive Alien Species. http://www.nobanis.org/files/factsheets/Prunus_serotina.pdf [2.02.2014].
Starfinger U., Kowarik I., Rode M., Schepker H. 2003. From desirable ornamental plant to pest to accepted addition to the flora? – the perception of an alien tree species through the centuries. Biological Invasions, 5323–335
Stypiński P. 1977. Odnawianie się czeremchy amerykańskiej (Padus serotina (Ehrh.) Borkh.) w lasach na Pojezierzu Mazurskim. Sylwan 121 (10): 47–57.
Stypiński P. 1979. Stanowiska czeremchy amerykańskiej (Padus serotina (Ehrh.) Borkh.) w lasach państwowych Pojezierza Mazurskiego. Rocznik Dendrologiczny 32: 191–204.
Suszka B. 1967. Studia nad spoczynkiem i kiełkowaniem na-sion różnych gatunków z rodzaju Prunus L. Arboretum Kórnickie. Rocznik 12, 221–281
Szwagrzyk J. 2000. Potencjalne korzyści i zagrożenia związane z wprowadzaniem do lasów obcych gatunków drzew [Advantages and risks associated with introducing alien tree species to forests]. Sylwan 144 (2): 99–106.
Tyszkiewicz S. 1949. Nasiennictwo leśne. Ser. D, Podręczni-ki, Warszawa, Instytut Badawczy Leśnictwa.
van den Tweed P. A., Eijsackers H. 1987. Black cherry, a pi-oneer species or ‘forest pest’. Proceedings of the Royal Dutch Academy of Sciences 90: 59–66.
Vanhellemont M. 2009. Present and future population dynam-ics of Prunus serotina in forests in its introduced range. Praca doktorska, Ghent University, Ghent, Belgium.
Vanhellemont M., Verheyen K., Staelens J. Hermy M. 2010. Factors affecting radial growth of the invasive Prunus se-rotina in pine plantations in Flanders. European Journal of Forest Research 129: 367–375.
Verheyen K., Vanhellemont M., Stock T., Hermy M. 2007. Predicting patterns of invasion by black cherry (Prunus serotina Ehrh.) in Flanders (Belgium) and its impact on the forest understorey community. Diversity and Distribu-tions 13: 487–497.
Woziwoda B. 2012. Inwazje drzew introdukowanych w cel-ach komercyjnych jako problem globalny [Invasions of tree speciesintroduced in commercial purposes as a global problem]. Studia i Materiały Centrum Edukacji Przyrod-niczo-Leśnej 33: 113–120.
Zając A., Zając M. 2001: Atlas rozmieszczenia roślin na-czyniowych w Polsce. Kraków, Pracownia Chorologii Komputerowej Instytutu Botaniki Uniwersytetu Jagiel-lońskiego. ISBN 8391516113.
Zerbe S., Wirth P. 2006. Non-indigenous plant species and their ecological range in Central European pine (Pinus syl-vestris L.) forests. Annals of Forest Science 63: 189–203.
Zasady hodowli lasu. 1988. Warszawa, Państwowe Gosp-odarstwo Leśne Lasy Państwowe.
Translated by: Bożena Kornatowska

Leśne Prace Badawcze (Forest Research Papers), December 2014, Vol. 75 (4): 367–374
DOI: 10.2478/frp-2014-0034
ORIGINAL RESEARCH ARTICLE
Received 16 April 2014, accepted after revision 25 June 2014.© 2014, Forest Research Institute
The effects of frost conditions on forest management based on the example of the July 1996 period at Hala Izerska in the Izera Mountains
Grzegorz Urban
Institute of Meteorology and Water Management – National Research Institute, Wrocław Branch, ul. Parkowa 30, 51–616 Wrocław, Poland.
Tel. +48 71 32 00 161; e-mail: [email protected], [email protected]
Abstract. This paper presents the characteristics of a frost episode that occurred July, 20–23, 1996 in the centre of the Izera Mountains and its effects on forest management. Source data consisted of air temperature measurements originating from the author’s own and archival databases of the Institute of Meteorology and Water Management (IMGW), Voivodeship Inspectorate of Environmental Protection (WIOŚ), University of Wrocław (UWr) and the Bureau of Forest Management and Geodesy in Brzeg (BULiGL). The intensity, time of occurrence and effects of this particular episode were extreme. The estimated probability of frost in the centre of the mountain dale Hala Izerska in July at a temperature of -5.5°C two meters above ground level is 2.4%. Therefore, it can be stated that such a sharp decline of Tmin in the middle of the growing season can occur in this area once every 40–50 years. Strong, nocturnal decreases of Tmin below 0°C during the growing season occur in the Izera Mountains almost every year, causing significant damage to silviculture. The interior of the Izera Mountains, represented by mountain dale Hala Izerska, is one of the coldest or even the coldest site in Poland in terms of absolute minimums of air temperature during the growing season.
In the mountain areas, knowledge of the impact of climate, such as thermal factors, on tree stands enables silvicul-ture work to be optimised, ultimately allowing funding to be rationalised. The distinct climatic conditions of mountain basins and valleys, slopes and plateaus located at similar altitudes need to be considered.
Key words: frost, growing season, damage to forests, the Izera Mountains
1. Introduction
Climatic conditions impact forest ecosystems inmany ways. The main meteorological factors causing abiotic injury to forests include: strong wind, heavy snowfall, drought, extreme drops in air temperature, and icing or hard rime.
The issue of forest damage from atmospheric factors has been presented in many studies (Zajączkowski 1984, 1991; Mikułowski 1998, 2002, Urban 2002, Urban et al. 2000, 2005, 2011; Zachara 2006; Gil and Zachara 2006; Zachara et al. 2007). In forests, aside from the most common and most spectacular damage caused by wind and snow, other factors also result in significant
economic loss in forestry, such as when air temperatures drop below 0°C during the growing season.
Extreme temperatures are an important factor af-fecting the ecological conditions in mountain ecosys-tems, particularly the lowest temperature occurring at different times of the year. Plants, including relatively resistant spruce trees, can suffer damage from low air temperatures during the growing season quite quickly – within several hours. This particular type of weather is formed by high-pressure systems, with radiational cool-ing of the ground and lower atmosphere layers. Such weather conditions are associated with specific synoptic situations and terrain morphology, which will be de-scribed later in this paper.
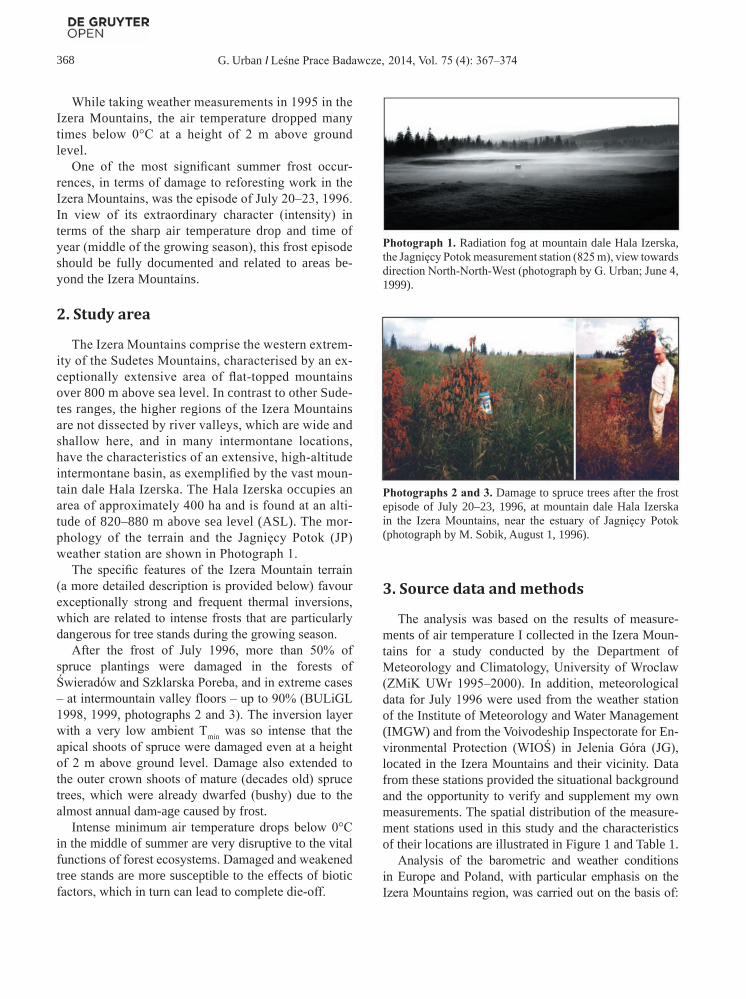
368 G. Urban I Leśne Prace Badawcze, 2014, Vol. 75 (4): 367–374
While taking weather measurements in 1995 in the Izera Mountains, the air temperature dropped many times below 0°C at a height of 2 m above ground level.
One of the most significant summer frost occur-rences, in terms of damage to reforesting work in the Izera Mountains, was the episode of July 20–23, 1996. In view of its extraordinary character (intensity) in terms of the sharp air temperature drop and time of year (middle of the growing season), this frost episode should be fully documented and related to areas be-yond the Izera Mountains.
2. Study area
The Izera Mountains comprise the western extrem-ity of the Sudetes Mountains, characterised by an ex-ceptionally extensive area of flat-topped mountains over 800 m above sea level. In contrast to other Sude-tes ranges, the higher regions of the Izera Mountains are not dissected by river valleys, which are wide and shallow here, and in many intermontane locations, have the characteristics of an extensive, high-altitude intermontane basin, as exemplified by the vast moun-tain dale Hala Izerska. The Hala Izerska occupies an area of approximately 400 ha and is found at an alti-tude of 820–880 m above sea level (ASL). The mor-phology of the terrain and the Jagnięcy Potok (JP) weather station are shown in Photograph 1.
The specific features of the Izera Mountain terrain (a more detailed description is provided below) favour exceptionally strong and frequent thermal inversions, which are related to intense frosts that are particularly dangerous for tree stands during the growing season.
After the frost of July 1996, more than 50% of spruce plantings were damaged in the forests of Świeradów and Szklarska Poreba, and in extreme cases – at intermountain valley floors – up to 90% (BULiGL 1998, 1999, photographs 2 and 3). The inversion layer with a very low ambient Tmin was so intense that the apical shoots of spruce were damaged even at a height of 2 m above ground level. Damage also extended to the outer crown shoots of mature (decades old) spruce trees, which were already dwarfed (bushy) due to the almost annual dam-age caused by frost.
Intense minimum air temperature drops below 0°C in the middle of summer are very disruptive to the vital functions of forest ecosystems. Damaged and weakened tree stands are more susceptible to the effects of biotic factors, which in turn can lead to complete die-off.
3. Source data and methods
The analysis was based on the results of measure-ments of air temperature I collected in the Izera Moun-tains for a study conducted by the Department of Meteorology and Climatology, University of Wroclaw (ZMiK UWr 1995–2000). In addition, meteorological data for July 1996 were used from the weather station of the Institute of Meteorology and Water Management (IMGW) and from the Voivodeship Inspectorate for En-vironmental Protection (WIOŚ) in Jelenia Góra (JG), located in the Izera Mountains and their vicinity. Data from these stations provided the situational background and the opportunity to verify and supplement my own measurements. The spatial distribution of the measure-ment stations used in this study and the characteristics of their locations are illustrated in Figure 1 and Table 1.
Analysis of the barometric and weather conditions in Europe and Poland, with particular emphasis on the Izera Mountains region, was carried out on the basis of:
Photograph 1. Radiation fog at mountain dale Hala Izerska, the Jagnięcy Potok measurement station (825 m), view towards direction North-North-West (photograph by G. Urban; June 4, 1999).
Photographs 2 and 3. Damage to spruce trees after the frost episode of July 20–23, 1996, at mountain dale Hala Izerska in the Izera Mountains, near the estuary of Jagnięcy Potok (photograph by M. Sobik, August 1, 1996).

369G. Urban I Leśne Prace Badawcze, 2014, Vol. 75 (4): 367–374
synoptic maps for the period of July 19–22, 1996, daily IMGW meteorological bulletins for July 19–23, 1996, the National Hydrological and Meteorological Service bul-letin of IMGW for July 1996, diagrams and data from weather balloon soundings for Wroclaw and Prague, and information from the following websites: www.knmi.nl, www.imgw.pl, www.chmi.cz, www.weather.uwyo.edu.
Indispensable data on the extent of damage in the tree stands were obtained from the Bureau of Forest Manage-ment and Geodesy in Brzeg (BULiGL, 1998 and 1999).
I defined the probability of a frost occurrence in July at mountain dale Hala Izerska with a daily Tmin equal to -5.5°C, the lowest recorded temperature during the frost episode under study. The probability was calculat-ed based on available July daily Tmin data for four years: 1998, 1999, 2004 and 2006. It was found that the level of Tmin is subject to a normal distribution with the fol-lowing parameters: mean equal to 6.68°C and a standard deviation equal to 3.842°C. This was established with the use of the Chi-square test of compatibility. The cal-culated probability was 2.4%, providing a repeatability rate for the phenomenon of every 40–50 years.
4. Results and discussion
4.1. Meteorological and morphological conditions of the weather episode of July 20–23, 1996
On July 20–23, 1996, Poland was in an area of high pressure with a North-East to South-West axis. An arctic air mass (AAm), characterised by low relative humidi-ty and very clear skies, was associated with this baric system (with a very weak horizontal gradient of atmos-pheric pressure) and fostered intense thermal radiation from the ground, consequently resulting in very intense radiational frost.
The nature of the air mass was well reflected in data retrieved from the weather balloon above Wrocław on July 21, 1996 (Table 2). The data shows a barometric pressure of 925 hPa at 875 m ASL, which is the same height as the altitude of the mountain dale Hala Izers-ka; the air mass was relatively dry (relative humidity of 57%, a saturation deficit of 5.03 hPa, determined from psychrometric tables) with a wind speed of 4 m/s from the North (Table 2).
Table 1. Measurement stations in the Izera Mountains and surrounding area
Loca
tion
of w
eath
er
stat
ion
Abb
re-
viat
ion
Alti
tude
[m A
SL]
Ope
rato
r*
Type of terrain
Jelenia Góra JG 341 IMGW Concave landform, JG Basin floorŚwieradów Zdrój ŚW 543 IMGW Convex landform, hilltop with a North-East exposure, about 80 m
above the Kwisa Valley floorSzklarska Poręba SP 650 IMGW Concave landoform, lower N portion of Szrenica slope, right side of
the Kamieńczyk Valley, about 20 m above the Kamieńczyk stream bedRozdroże Izerskie RI 770 WIOŚ Convex landform, slope just above a broad open mountain pass
connecting Wysoki Ridge and Kamienicki Ridge Jagnięcy Potok JP 825 ZMiK UWr Concave landform, flood plain at mountain dale Hala Izerska, left
bank of the Izera and left bank of the Jagnięcy Potok, about 100 m from these watercourses, about 3–4 m above the water level of the Izera, open, grassy area
Chatka Górzystów na Hali Izerskiej
CG 840 ZMiK UWr Concave landform, lower part of the slope of the Izera Valley, open and grassy
Jakuszyce JK 860 IMGW Concave landform, in the vicinity of a broad mountain pass, right bank of the Kamienna River, flood plain
Szrenica SZ 1332 ZMiK UWr Convex landform, upper part of the slope WSW
*IMGW – Institute of Meteorology and Water Management, WIOŚ – Voivodeship Inspectorate of Environmental Protection,ZMiK UWr – Department of Meteorology and Climatology, University of Wrocław.

370 G. Urban I Leśne Prace Badawcze, 2014, Vol. 75 (4): 367–374
A vertical sounding of the atmosphere was also performed above Prague (Czech Republic, situated at an altitude of 305 m ASL on the other side of the Izera Mountains). It showed that the humidity parameters of the air mass at a barometric pressure of 925 hPa were similar to the readings from Wrocław (the saturation deficit determined from psychrometric tables reached 6.2 hPa). The mass was therefore relatively dry, which helped to radiate heat from the ground.
On July 21, 1996, the middle of the growing season, the recorded air temperature at a height of 2 m above ground level was −5.5°C at the JP measurement station, and below 0°C for the next 4 days. During those same days, in the stations where conditions were conducive to the formation of extended frosts, such as Jakuszyce (JK) or JG, minimum temperatures were a few degrees higher. However, the Tmin at JK on July 21, 1996, fell below 0°C and amounted to −0.3°C (Figure 2).
An all-night radiational thermal inversion marked the course of this weather episode, clearly visible for the next four nights, between stations JP and Szrenica (SZ). The inversion also occurred between stations JG and SZ, but was of slightly shorter duration and weaker be-cause it only lasted for a few hours of the last 3 nights – for 5, 2 and 4 hours respectively. The thermal inversion disappeared in the morning hours, while the decrease in air temperature as the height ASL increased was simi-lar to the dry adiabatic lapse rate, that is, approximately
1.0°C per 100 m of increase in altitude (Figure 2).It is worth noting that at the Rozdroże Izerskie (RI),
also located in the interior of the Izera Mountains and only approximately 50 m lower than the JP site, the min-imum temperature never fell below +5.0°C. On July 21, 1996, it reached a temperature of +5.4°C. It is clear that the terrain influenced the distribution of minimum air temperature. In the case of JP, the flat-bottomed inter-montane basin favoured the formation of stagnant cold air, while the mountain pass at RI enabled the cold air to flow out and down the valley.
Based on the relationship of the minimum air tem-perature at heights of 2 m and 0.05 m above ground level with anticyclonic circulation at the Chatka Górzystów (CG) site of mountain dale Hala Izerska, the Tmin at ground level on July 21, 1996, could have reached even −10.0°C (Urban 2002). The level of minimum air temperature recorded for July 20–23, 1996, at other IMGW measurement stations in Poland never dropped as low as the values obtained from the centre of the mountain dale
Figure 1. Location of measurement stations in the area. Key to abbreviations is presented in Table 1.
Table 2. Data from a weather balloon above Wrocław on July 21, 1996, at the hour of 00:00 Coordinated Universal Time (UTC) [source: www.weather.uwyo.edu/upperair/sounding.html]
P H T Td U Mixr V L[hPa] [m ASL] [°C] [°C] [%] [g/kg] [m/s] [0–360°]
1012.0 119 12.2 6.2 67 5.91 0 01001.0 211 11.8 6.,8 71 6.23 5 10996.0 253 12.8 6.8 67 6.26 7 15991.0 296 13.8 6.8 63 6.29 8 40985.0 347 13.4 6.3 62 6.12 8 60925.0 875 9.4 1.4 57 4.60 4 5903.0 1073 7.7 0.7 61 4.48 3 40850.0 1572 3.4 −1.0 73 4.20 5 355811.0 1947 0.6 −2.8 78 3.85 5 25792.0 2136 −0.8 −3.7 81 3.69 5 10750.0 2570 −4.1 −5.8 88 3.32 6 40723.0 2862 −6.3 −7.2 93 3.09 5.5 26719.0 2960 −6.7 −11.6 68 2.20 5.5 24707.0 3038 −4.5 −25.5 18 0.68 5 17703.0 3082 −4.6 −25.6 18 0.68 5 15700.0 3116 −4.7 −25.7 18 0.68 6 5
Key: P – atmospheric pressure, H – altitude, T – air tempera-ture, Td – dew point temperature, U – humidity, Mixr – mixing ratio of water vapor, V – wind velocity, L – wind direction

371G. Urban I Leśne Prace Badawcze, 2014, Vol. 75 (4): 367–374
Hala Izerska at the JP station (Table 3). Even at the JG basin floor, at the JG synoptic station, where the abso-lute minimum air temperature of −36.9°C was recorded in Poland after World War II (Kuziemska 1983), the Tmin for that day was +3.0°C (Table 3).
The key features of the Izera Mountain terrain result in different climatic conditions than in the other ranges of the Sudetes Mountains. These include: steep slopes of high relative altitudes to the west and north; in the central part of the mountains, the presence of extensive, flat-bot-tomed depressions with very gradual decreases in altitude
along their longitudinal axes, which in many places re-semble broad intermontane basins. The enclosed depres-sions at altitudes of over 750 m ASL are a unique part of the Sudetes Mountain terrain (Migoń 1998).
During anticyclonal radiational weather conditions, the depressions in the higher regions of flat-topped mountains are places where cold air collects as it flows from the surrounding slopes, creating stagnant pools. These cold air pools play a significant role in shaping the ecology of plant communities. An additional factor favouring the development of the intensive radiational
Figure 2. The daily course of air temperatures at selected measurement stations for July 20–23, 1996. Key to abbreviations is presented in Table 1.
Table 3. Minimal air temperature [°C] at a height of 2 m (Tmin) and 0.05 m (Tmin+5) above ground level at selected IMGW synoptic stations in Poland for July 20–23, 1996 [source: IMGW Daily Meteorological Bulletin]
Stations July 20, 1996Tmin/Tmin+5
July 21, 1996Tmin/Tmin+5
July 22, 1996Tmin/Tmin+5
July 23, 1996Tmin/Tmin+5
Białystok 10/9 7/6 8/6 8/3Jelenia Góra 4/1 3/1 5/2 5/2Kasprowy Wierch 0/× −1/× 4/× 1/×Kłodzko 6/3 4/2 6/4 6/3Lębork 13/13 12/10 4/1 7/4Przemyśl 10/9 9/8 8/7 9/7Resko 5/1 6/3 6/3 8/6Siedlce 10/10 6/5 6/4 5/3Suwałki 10/9 6/4 7/5 8/2Śnieżka 1/× 2/× 5/× 6/×Wrocław 8/6 6/3 9/5 7/4Zakopane 7/7 4/3 4/4 4/2
× – measurements not taken

372 G. Urban I Leśne Prace Badawcze, 2014, Vol. 75 (4): 367–374
inversion was the extensive deforestation of the moun-tain uplands and slopes as a result of extremely detri-mental environmental conditions. This facilitated the gravitational flow of cold air into the valley. Of equal importance is also the lack of settlements in the Izera Mountain interior, which in other areas – through emis-sions of home heating systems – helped to reduce noc-turnal heat loss of far infrared radiation (Sobik 1998).
These factors cause frequent and intense thermal in-versions, which, in the warm part of the year, are limited to nighttime and relate primarily to minimum tempera-ture (Tmin). During the cold part of the year, such temper-ature inversions are much more frequent, stronger and last longer; aside from the Tmin, they also include mean daily temperature (Ti), and even the average monthly minimum temperature and monthly average, and occa-sionally also the maximum temperature Tmax (Sobik and Urban 2000, Urban 2002). Due to the relatively small horizontal dimensions of the intermontane depressions, of which mountain dale Hala Izerska is an example, the air temperature is further reduced by the absence of the warming influence of foehns, important in the for-mation of thermal conditions on the northern slopes of the Karkonosze and the Izera Mountains, as well as the neighbouring, broad JG Valley.
In order to verify the frequency and intensity of tem-perature drops below Tmin of 0.0°C in the middle of the growing season, an analysis was performed of available meteorological data near the centre of the Izera Moun-tains (1934–1938 German Meteorological Yearbook; IMGW, University of Wrocław). Temperature drops below Tmin of 0.0°C at a height of 2 m above ground level occurred constantly in this area, but were not near-ly as intense as in 1996. The lowest measured Tmin in July at mountain dale Hala Izerska from the 1934–1938 records was −1.5°C in 1935; from 1972 to 2013 at the IMGW JK weather station, it was −0.7°C in 1976; and at the University of Wrocław measurement stations op-erating since 1995 (JP, Chatka Górzystów at mountain dale Hala Izerska), −5.5°C in 1996 at JP.
Temperature records have been recorded over the longest period of time – since 1972 – at the IMGW JK weather station, which has conditions similar to those in the centre of the Izera Mountains. The average an-nual air temperature in both locations is approximately 4.0°C. However, the average annual minimum tem-perature is lower, and the average monthly minimums are lower in almost every month in the centre of the mountain dale Hala Izerska, as recorded by the JP or CG measurement stations. The largest warm season dif-
ferences in mean monthly minimum air temperature be-tween JP or CG and JK is about 1.0°C, with a maximum in August and September of 1.4°C and 1.3°C respective-ly (Urban 2002). However, when anticyclonal weather occurs in the warm season (during which the differences are greatest), the daily Tmin in the centre of the moun-tain dale Hala Izerska is usually distinctly lower than in JK – on average by approx. 2.0°C to 2.5°C. In the case of JP, the Tmin is lower than in JK by up to 2.7°C. The maximum difference between the interior of moun-tain dale Hala Izerska and the JK station even reaches 10.0°C–11.0°C (Urban 2002).
To date, the Tmin recorded at JK in July fell below 0.0°C only five times, in 1972, 1976, 1989, 1990, 1996. During the analysed frost episode of July 1996, the temperature measured was −0.3°C. In section 3, I noted that the calcu-lated probability of a July frost in the centre of mountain dale Hala Izerska with a value of −5.5°C is 2.4%. There-fore, it can be concluded that such intense drops in air temperature in the middle of the growing season occur there approximately once every 40–50 years.
4.2. The significance of the July 1996 frost in the Izera Mountains
Lindkvist et al. (2000) performed similar measure-ments in Sweden as those conducted in the Izera Moun-tains. They conducted topoclimatic measurements in the mountains of southern Sweden at an altitude of between 500 and 1200 m ASL in July–August 1996 in similar terrain and climate. While a temperature of −5.5°C was recorded at mountain dale Hala Izerska in July 1996, the Tmin in Sweden did not fall below −4.0°C, either in V-shaped or U-shaped valleys at a height of approx. 650–800 m ASL (Lindkvist et al. 2000). This fact, tak-ing into account the advection of the arctic air mass from the north, can only emphasize the depth of the Tmin drop in July 1996 at mountain dale Hala Izerska and in-tensity of this phenomenon, conditioned by the specific morphology of the Izera Mountains.
In southern Sweden, between June and September of 1994 and 1995, the lowest air temperature at 1.5 m above ground level was recorded in July at −3.2°C and in August at −9.2°C (at an intermontane valley floor), although the period of the lowest minimum temperature (from −10°C to −15°C) associated with radiation frost in this region is usually at the end of September, the end of the growing season (Lindkvist and Lindqvist 1997). Radiation frosts described by Lindkvist lasted an aver-age of a few hours.

373G. Urban I Leśne Prace Badawcze, 2014, Vol. 75 (4): 367–374
It should be noted that only a light frost (from −2 to −3°C) lasting about 3–4 hours in the middle of the grow-ing season is needed to seriously damage and dehydrate the tissues of the trees constituting the main species of mountain forests (Picea abies, Pinus sylvestris, Betula sp.) (Lindkvist and Lindqvist, 1997; Weiser, 1970). On July 21, 22 and 23, 1996, the frost at mountain dale Hala Izerska lasted 6, 3 and 5 hours, respectively.
The spruce trees growing in the Sudetes Mountains are highly resistant to winter frost. During winter dor-mancy, they can withstand air temperatures of up to −40°C, but during the growing season, they are not so hardy and their resistance drops to between −3°C and −7°C (Mikułowski 1997a, 1998). Late spring frosts cause more damage than those in early autumn (Gier-tych 1977). One- and two-year-old spruce needles are most susceptible to frost in June. This species grows rel-atively slowly in its first years of life, reaching a height of 0.5 m at 5 years of age and 1–2 m at about 10 years of age (Mikułowski 1997a). Until then, it is particularly vulnerable to ground-level frosts.
According to Modrzyński (1989) and Mikułowski (1997b), frost and other abiotic factors almost com-pletely eliminate spruce ecotypes already at the stage of cultivation that were transported from very different environment.
The analysis of topoclimatic conditions in mountains shows that lower altitudes ASL are often unfavourable for tree growth, due to, among other reasons, temper-ature inversions that lead to the formation of cold air pools in depressed terrain. Due to the higher average annual air temperature at lower hypsometric altitudes, trees planted there start to grow earlier than at higher altitudes, and thus are more sensitive to dramatic chang-es in air temperature, especially in areas where there is formation of cold air pools, than trees growing at higher locations (Mikułowski 1995ab).
5. Summary
The frost episode of July 20–23, 1996, presented in this paper was conditioned by the specific morphology of the terrain in the central part of the Izera Mountains (trough-like, high altitude deforested flat-topped moun-tains, with minimal decrease in longitudinal drop of al-titude) and the physical properties of the air mass (dry, Arctic, very clear skies).
The extreme decline of Tmin below 0°C at a height of 2 m above ground level in the centre of the Izera Mountains over many hours, occurring over 4 days and nights (with
a minimum on July 21, 1996, of −5.5°C) at the height of the growing season resulted in huge losses in managed forests. It is estimated that this frost episode damaged about 90% of the tree stand area in the interior of the Izera Mountains. The minimum temperature measured at the weather station of −5.5°C is thus far the lowest recorded value for this area in the middle of summer.
The calculated probability of a −5.5°C frost in the centre of mountain dale Hala Izerska in July is 2.4%. Therefore, it can be concluded that such an intense drop in air temperature at the height of the growing season (middle of summer) occurs at this site on average once every 40–50 years or less.
The interior of the Izera Mountains, represented by mountain dale Hala Izerska, together with adjacent val-leys, such as JP, is one of the coldest or even the coldest site in Poland in terms of absolute minimums of air tem-perature during the growing season.
In summary, the July 1996 frost episode in the Izera Mountains was an especially extreme event in terms of the time of occurrence and intensity. Extreme noctur-nal drops of Tmin below 0°C during the growing season occur in the interior of the Izera Mountains almost every year, causing significant damage to silviculture.
This review of the climatic, botanical and forest-ry issues of the Izera Mountains shows that studying thermal conditions, especially in areas prone to cold air pooling, may not only have cognitive significance in enriching our knowledge about the climate of the Sudetes Mountain and Poland, but may also have prac-tical application.
Knowledge about the impact of climate on tree stands in mountain areas, including thermal factors, should enable silviculture work to be optimised, and ultimately, allow funding to be rationalised. This may include such activities as adjusting species compo-sition and the spatial structure of stock renewal, se-lecting the right kind of planting stock, and – in areas threatened by summer frosts, that is, in the zones of the most frequent and coldest frosts, even abandoning afforestation. Most importantly, the distinct climatic conditions of intermontane basins and valleys, slopes and plateaus located at similar altitudes must be taken into consideration.
Acknowledgements
This research received no specific grant from any funding agency in the public, commercial or not-for-profit sectors.

374 G. Urban I Leśne Prace Badawcze, 2014, Vol. 75 (4): 367–374
References
Biuletyn Państwowej Służby Hydrologiczno-Meteorologicznej IMGW-PIB. Nr 7/1996.
BULiGL 1999. Plan Urządzenia Gospodarstwa Leśnego Na-dleśnictwa Szklarska Poręba na okres od 1.I.1999 r. do 31.XII.2008 r., stan na 1.I.1999 r. Brzeg, Biuro Urządzania Lasu i Geodezji Leśnej Oddział w Brzegu.
BULiGL 1998. Plan Urządzenia Gospodarstwa Leśnego Nadleśnictwa Świeradów na okres od 1.I.1998 r. do 31.XII.2007 r., stan na 1.I.1998 r. Brzeg, Biuro Urządzania Lasu i Geodezji Leśnej Oddział w Brzegu.
Codzienny Biuletyn Meteorologiczny. 19-23.07.1996. Instytut Meteorologii i Gospodarki Wodnej, Warszawa.
Deutsches Meteorologisches Jahrbuch. Teil II: Monats und Jahresergebnisse 1934–1938. Deutsches Reich. Reichs-amt für Wetterdienst. Berlin.
Giertych M. 1977. Genetyka, in: Świerk pospolity Picea abies (L.) Karst. Warszawa–Poznań, PWN, p. 287–331.
Gil W., Zachara T. 2006. Analiza szkód od wiatru w wy-branych drzewostanach świerkowych i sosnowych [Anal-ysis of wind damages in spruce and pine stands]. Leśne Prace Badawcze 4: 77–99.
Kuziemska D., 1983. O zakresie zmienności temperatury pow-ietrza w Polsce. Przegląd Geofizyczny 28, 3-4: 329–343.
Lindkvist L., Lindkqvist S. 1997. Spatial and temporal vari-ability of nocturnal summer frost in elevated complex ter-rain. Agricultural and Forest Meteorology 87: 139–153.
Lindkvist L., Gustavsson T., Bogren J. 2000. A frost assess-ment method for mountainous areas. Agricultural and Forest Meteorology 102: 51–67.
Migoń P. 1998. Rzeźba Gór Izerskich jako podłoże topokli-matycznego i ekologicznego zróżnicowania obszaru, in: K. Migała, M. Sobik (eds.) Problemy klimatyczno-botaniczne Gór Izerskich, 21–23.IX.1998, Świeradów Zdrój, p. 17.
Mikułowski M. 1995a. Koncepcja nowych form odnawiania lasu na obszarze klęski ekologicznej w Sudetach (II). Las Polski, 19: 4–6.
Mikułowski M. 1995b. Produkcja sadzonek na różnych wysokościach nad poziomem morza. Prace Instytutu Bad-awczego Leśnictwa, B, 25: 173–195.
Mikułowski M., 1997a. Klimatyczne uwarunkowania zamiera-nia i restytucji lasu w Sudetach Zachodnich. Biuletyn In-formacyjny Polskiego Towarzystwa Geofizycznego 2: 3–8.
Mikułowski M. 1997b. Problem występowania niesprzyjają-cych warunków atmosferycznych w hodowli lasu. Biblo-teczka Leśniczego, 84, Warszawa, Wyd. Świat, p. 1–16.
Mikułowski M. 1998. Zagrożenie upraw spowodowane niską temperaturą. Las Polski 20: 8–9.
Mikułowski M. 2002. Śnieg – sprawca leśnych szkód. Głos Lasu 2: 10–12.
Modrzyński J., 1989. Środowiskowe przystosowania i po-chodzenie świerka pospolitego (Picea abies (L) Karst.) w Karkonoskim Parku Narodowym. Roczniki Akademii Rol-niczej w Poznaniu 192: 5–98.
Sobik M. 1998. Specyficzne cechy klimatu Gór Izerskich , in: K. Migała, M. Sobik (ed.) Problemy klimatyczno-botaniczne Gór Izerskich, 21–23.IX.1998, Świeradów Zdrój, p. 29.
Sobik M., Urban G., 2000: Warunki termiczne zlewni Kami-onka w Górach Izerskich. Acta Universitatis Wratislavien-sis, Studia Geographica 2269, 74: 143–157.
Urban G., Bańkowski J., Sobik M. 2000. Wpływ warunków termicznych na wzrost świerka w Górach Izerskich [In-fluence of thermic conditions on spruce stands in the Izera Mountains]. Opera Corcontica 37, 2: 532–535.
Urban G. 2002. Warunki termiczne obszarów mrozowiskowych Gór Izerskich i ich wpływ na wzrost lasu. Praca doktorska. Zakład Meteorologii i Klimatologii. Instytut Geograficzny. Uniwersytet Wrocławski, p. 165.
Urban G., Sobik M., Błaś M. 2005. Pośrednie i bezpośred-nie znaczenie klimatu w funkcjonowaniu ekosystemów leśnych Gór Izerskich, in: Kostrzewski A. i Kolander R. (eds.) Zintegrowany Monitoring Środowiska Przyrodni-czego. Funkcjonowanie geoekosystemów Polski w wa-runkach zmian klimatu i różnokierunkowej antropopresji. Poznań, Wydawnictwo Naukowe „Bogucki”: 575–586.
Urban G., Gil W., Zachara T. 2011. Szkody wyrządzone przez gołoledź i śnieg na przykładzie Nadleśnictwa Herby, na tle panujących warunków pogodowych w styczniu 2010 roku [Assessment of damage to trees in the Herby Forestry District caused by glazed frosts and snow during severe we-ather in January 2010]. Leśne Prace Badawcze 3: 289–295.
Weiser C. J. 1970. Cold resistance and injury in woody plants. Science 169: 1269–1278.
Zachara T. 2006. Problem szkód w lasach powodowanych przez śnieg i wiatr oraz sposoby przeciwdziałania im [Damage to forests caused by snow and wind and the way of counteracting it]. Sylwan 10: 56–64.
Zachara T., Urban G., Gil W. 2007. Śniegołomy na terenie RDLP w Olsztynie – analiza zjawiska na przykładzie epizodu w dniach 01–07.11.2006 r. Leśne Prace Badawcze, 4: 133–142.
Zajączkowski J. 1984. Postępowanie hodowlane a odporność drzewostanów sosnowych na szkody powodowane przez śnieg. Sylwan, 9: 19–27.
Zajączkowski J. 1991. Odporność lasu na szkodliwe działanie wiatru i śniegu. Warszawa, Wyd. Świat, p. 224.
ZMiK UWr. 1995–2000. Temat badawczy. „Warunki kli-matyczne obszarów zurbanizowanych i górskich Pol-ski Południowo-Zachodniej (na przykładzie Wrocławia, Karkonoszy, Masywu Śnieżnika i Gór Izerskich)”. Zakład Meteorologii i Klimatologii Instytutu Geograficznego Un-iwersytetu Wrocławskiego.
Translated by: Barbara Przybylska

Leśne Prace Badawcze (Forest Research Papers),December 2014, Vol. 75 (4): 375–383
DOI: 10.2478/frp-2014-0035
ORIGINAL RESEARCH ARTICLE
Received 22 May 2014, accepted after revision 18 July 2014. © 2014, Forest Research Institute
Survival and growth of the Melolontha spp. grubs on the roots of the main forest tree species
Danuta Woreta, Lidia Sukovata*
Forest Research Institute, Department of Forest Protection, ul. Braci Leśnej 3, Sękocin Stary, 05–090 Raszyn, Poland
* Tel. +48 22 715 38 32; e-mail: [email protected]
Abstract. The survival, weight and relative growth rate (RGR) of the Melolontha spp. grubs feeding on roots of Quercus petraea, Q. robur, Fagus sylvatica, Betula pendula, Larix decidua, Alnus glutinosa and Pinus sylvestris, were examined.
Overall, the youngest grubs L1 were the most affected by food quality. The mortality of the grubs feeding on the roots of A. glutinosa changed most rapidly and, consequently, LT50 was the shortest (25.9 days), whereas the slowest changes in mortality with the highest LT50 values were observed on the two oak species (54.9 and 44.9 days on Q. robur and Q. petraea, respectively). The RGRs of the L1 grubs were the highest on oaks, F. sylvatica and B. pendula. The overall rate of survival of the older grubs was high (66.7–100%). It was the lowest on the roots of B. pendula (L2 grubs) and L. decidua (L3 grubs), which at the same time displayed the highest RGRs.
The interpretation of the results is difficult due to the lack of basic knowledge on the potential effects of food quality and other factors on grub metamorphosis. There is no doubt, however, that among the seven tested tree species the roots of A. glutinosa are the least favorable for the Melolontha grubs’ performance.
Key words: Quercus robur, Quercus petraea, Fagus sylvatica, Betula pendula, Larix decidua, Pinus sylvestris, Alnus glutinosa, relative growth rate, mortality, food quality
1. Introduction
The common cockchafer Melolontha melolontha(L.) and the forest cockchafer M. hippocastani F. (Scar-abaeidae family) are extremely harmful insect pests in Poland’s forests. Both species larvae feed on tree and shrub roots, which eventually leads to die-off of forest plantations and hindering of forest regeneration.
In Poland, after the World War II, there was an ur-gent need to afforest large areas of different types of unused or low-productive agricultural lands, a this were already infected by cockchafer grubs to a large extent (Woreta i Skrzecz 1996). Then, chemical pesticides of high effectiveness (DDT, HCH) were applied to control insect pests. In the years 1980–1993, application of in-secticides decreased grub infected area in Poland to less than 500 ha (Woreta 1994). Over time, environmental-ly dangerous plant protection chemicals were replaced
with new pest control means, potentially less harmful to ecosystems. Political efforts are made in the Europe-an Union (EU) to reduce soil pesticides During the last year, the European Parliament introduced legal regula-tions which recalled almost all soil insecticides in order to protect the environment (such as Regulation (EC) No 1107/2009 of the European Parliament and of the Coun-cil of 21 October 2009). The lack of efficient plant pro-tection products has resulted in the enlargement of forest regeneration areas threatened by Melolontha sp. grubs. Tree seedlings damaged by cockchafer grubs often die and need to be replaced by new ones, and sometimes the whole location needs to be reforested once again. In the years 1966–2005, the percentage share of the area which required supplementary reforestation was below 21%, and after 2005, it ranged from 26% to 53%. As a result of long lasting outbreak of Melolontha spp., con-tinuously active grub populations occurred all over the

376 D. Woreta et L. Sukovata / Leśne Prace Badawcze, 2014, Vol. 75 (4): 375–383
country. Forest reforestation has become extremely dif-ficult in infested areas due to repeated damage of tree seedling roots.
Limiting the use of insecticides brought about in-creasing interest in non-chemical methods of plant pro-tection (silvicultural, agrotechnical and biological). The present study was carried out to examine the effects of nourishment on the roots of seedlings of different forest tree species on survival and body weight of cockchafer grubs. The results could be helpful in decisions on spe-cies composition of reforestation/afforestation intended in the areas threatened by Melolontha spp.
2. Research objects and methods
Research objects
The observations were carried out on Melolontha spp grubs in developmental stages: L1, L2, and L3. The stag-es were distinguished based on the width of grub head capsule (Śliwa 1993). Precise identification of grub spe-cies was not possible due to the lack of reliable methods (Krell 2004). However, it could be stated that most of L2 and L3 grubs examined were M. hippocastani (those who survived emerged as M. hippocastani imagines).
The following forest tree species were used to feed the grubs: pedunculate oak (Quercus robur L.), sessile oak [Q. petraea (Matt.) Liebl.], common beech (Fagus sylvatica L.), silver birch (Betula pendula Roth.), black alder [Alnus glutinosa (L.) Gaertn.], European larch (Larix decidua Mill.) and Scots pine (Pinus sylvestris L.).
Research setup
The study on development and survival of cock-chafer grubs fed on seedlings of selected tree species was conducted in the years 2011-2012 and situated in the greenhouse of the Forest Research Institute (FRI), Sękocin Stary, Poland.
The study on L2 grubs started in 2011 and was con-ducted from May 20 to September 29. In the spring 2011, cockchafer grubs were collected in soil (at a depth of 20–30 cm), within the area of the Forest District Kozienice (Regional Directorate of the State Forests – RDSF -Radom, central Poland). Two-year old tree seedlings used for grub feediong were obtained from greenhouse nurseries of the Forest Districts Grójec and Chojnów (RDSF in Warsaw, central Poland), Ostrowiec Świętokrzyski (RDSF Radom) and Pniewy (RDSF in Poznan, western Poland). The cockchafer grubs which
moulted during the second half of 2011 and spent winter in FRI greenhouse were used in 2012, during observa-tions carried out on L3 grubs. Between April 20th and June 27th, L3 grubs were bred on the roots of two-year old seedlings obtained from forest nurseries in the For-est Districts: Pniewy, Chojnów and Grójec.
In 2012, there was also set up the experiment on L1 grubs collected within the area of the Forest District Lubartów (RDSF in Lublin, south-eastern Poland). L1 grubs were bred on the roots of one-year-old seedlings from the container nursery in the Forest District Jabłon-na (RDSF in Warsaw).The observations on L1 grubs were carried out from 28 May to 18 September.
The grubs (2 x L1 or 1 x L2 or 1 x L3) were placed into pots with garden soil (Agrohum Łomianki, Poland) and seedlings of the tree species tested (1/pot). The ex-periment on L2 grubs was conducted in 15 replications for each tree species, and that on L1 and L3 grubs - in 10 replications. L3 grubs were placed into the pots with the tree species used for feeding L2 grubs in 2011.
Before releasing into soil, each cockchafer grub was weighed (precision 0.001, scale AD 300, Axis Ltd., Gdańsk, Poland). Evaluations of grub survival and body weight were performed for each experimental variant every 2–3 weeks. During each evaluation as well as in cases when seedling dried, the plants were replaced with new ones.
Mathematical and statistical analysis
Mortality rate of the grub instars feeding on tested tree roots and lethal time for 50% mortality (LT50) were calculated using the Generilized Linear Model (GLM) with binomial distribution of the dependent variable and probit function. The GLM was also used to compare dy-namics (changes in time) of survival and body weight of the grubs feeding on tree species placed in pairs – paired with each other. The body weight variable had a normal distribution and the function describing the relation was presented as log: f (z) = log(z) in case of L1 grubs, and the identity function f(z) = z in case of L2 and L3 grubs. The maximum likelihood method was used for model building (Stanisz 2007). The time from the beginning of the experiment to successive measurements of robust-ness and body weight was calculated in days, and the survival was described by the number of alive (code 0) and dead grubs (code 1).
The growth of grubs was assessed based on the change of their body weight (relative growth rate, RGR), and calculated as follows (Lazarević et al. 2002):

377D. Woreta et L. Sukovata / Leśne Prace Badawcze, 2014, Vol. 75 (4): 375–383
where:Mo and Mt – initial and final insect body weight (g),Tt-o – the number of days between initial and final
weight measurements (d).Each year, RGR values were estimated for the period
from the beginning of the experiment to the second half of August. Later on, cockchafer grubs start to prepare for overwintering and feed less intensively, which is fol-lowed by the loss of body weight.
The mean values of RGR of grub feeding on seedling roots of various tree species were compared using one-way ANOVA. When the null hypothesis was rejected, the Kruskal–Wallis non-parametric test was used and the ranking averages were calculated and compared.
The statistical analyses were conducted using STA-TISTICA 10 software with the defined significance level α = 0.05 (StatSoft, Inc. 2011).
3. Results
L1 instar grubs
SurvivalIn general, L1 cockchafer larvae (collected in the For-
est District Lubartów, in the spring 2012) showed low vitality. Significant grub mortality was observed already at the start of observations (Fig. 1A). Only 11.4% of the total grub number survived between 28 May and 18 Sep-tember , and most of these fed on the roots of Q. robur (25%) and Q. petraea (20%). Furthermore, the grubs feeding on oak species had the longest LT50 – 54.9 and 44.9 days, respectively, when compared to those feeding on other tree species tested (LT50 from 25.9 to 35.4 days) (Table 1). LT50 of grubs feeding on Quercus sp. roots was significantly longer than that in grubs feeding on the roots of L. decidua and A. glutinosa, and also B. pendula. (when compared to Q. petraea) (Table 2). Mortality of grubs feeding on A. glutinosa roots was 100% already on 10 July, and its dynamics was significantly different when compared with the grubs feeding on all other tree species tested (Fig. 1a, Table 2).
Body weightFor all the tree species tested ,the changes in aver-
age body weight of L1 grubs feeding on seedling roots were similar (Fig. 1b). In June, there was observed a relatively higher increase in body weight of the grubs
developing on F. sylvatica and B. pendula seedlings and in July – on Q. robur seedlings. However, the differenc-es in grub body weight dynamics were not statistically significant (P > 0.05).
In the period of time before August 21st, RGR of grubs feeding on the tree species tested had a positive value and it did not differ significantly between tree spe-cies - even though in some cases the differences were almost two-fold. The lack of statistically significant dif-ferences can be explained by high variability of grub RGR values obtained for different tree species. The
Figure 1. Survival (A) and changes of the body weight (B) of the L1 Melolontha spp. grubs feeding on the roots of plants of various tree species in the period of 28 May–18 October 2012 and relative growth rate (RGR, mean ± SE) reached before 21 August (C)

378 D. Woreta et L. Sukovata / Leśne Prace Badawcze, 2014, Vol. 75 (4): 375–383
grubs feeding on the roots of Q. robur and F. sylvati-ca showed the highest RGR values and those on P. syl-vestris and L. deciduas – the lowest. The grubs feeding on alder seedlings were not considered in calculations since these lived only until July 10th. (Fig. 1c). After
August 21st, there was observed a decrease in body weight of the grubs feeding on the roots of P. sylvestris, B. pendula and Q. robur, and after October 4th, there was observed body weight decrease in the grubs feeding on the roots of L. decidua (Fig. 1b).
Table 1. The results of building the generalised regression model describing the dependence of the L1 Melolontha spp. grubs mortality on time and calculated values of LT50
Tree species df Log likelihood χ2 P LT50, daysQ. petraea 1 -89.32 40.13 <0.0001 44.9Q. robur 1 -87.21 47.29 <0.0001 54.9F. sylvatica 1 -72.06 53.01 <0.0001 26.2B. pendula 1 -67.27 72.64 <0.0001 35.4A. glutinosa 1 -11.88 166.18 <0.0001 25.9L. decidua 1 -55.43 82.90 <0.0001 27.9P. sylvestris 1 -68.83 68.26 <0.0001 34.0
Table 2. Comparison of mortality dynamics of the L1 Melolontha spp. grubs feeding on the roots of 7 tree species (the analysis was done for each pair of tree species; the results are presented only for the pairs, for which the interaction of tree species with time was statistically significant)
Pairs of compared tree species df Log likelihood χ2 PQ. petraea vs B. pendula 1 -156.59 4.00 0.0456Q. petraea vs L. decidua 1 -144.75 8.45 0.0037Q. petraea vs A. glutinosa 1 -101.20 66.50 <0.0001Q. robur vs L. decidua 1 -142.64 6.48 0.0109Q. robur vs A. glutinosa 1 -99.09 62.87 <0.0001A. glutinosa vs F. sylvatica 1 -83.94 55.35 <0.0001A. glutinosa vs B. pendula 1 -79.15 48.29 <0.0001A. glutinosa vs L. decidua 1 -67.31 38.90 <0.0001A. glutinosa vs P. sylvestris 1 -80.71 49.90 <0.0001
Table 3. The results of building the generalised regression model describing the dependence of the L2 Melolontha spp. grubs mortality on time and calculated values of LT50 (n.s. – the result is not statistically significant at α = 0.05)
Tree species df Log likelihood χ2 P LT50, daysQ. petraea 1 -41.75 6.92 0.0085 195.0Q. robur 1 n.s. -F. sylvatica 1 -46.77 4.37 0.0366 222.5B. pendula 1 -52.18 12.90 0.0003 147.1A. glutinosa 1 -46.94 10.98 0.0009 161.4L. decidua 1 n.s. -P. sylvestris 1 n.s. -

379D. Woreta et L. Sukovata / Leśne Prace Badawcze, 2014, Vol. 75 (4): 375–383
L2 instar grubs
SurvivalL2 grubs feeding on the roots of all studied tree spe-
cies showed high survival rate, and especially those on Q. robur and P. sylvestris (100%) (Fig. 2a). The highest mor-tality was observed in the grubs feeding on the roots of B. pendula and A. glutinosa, (33.3% and 26.6%, respective-ly), with the shortest LT50 (about 5 months - 147.1 and 161.4 days, respectively). At the same time, in the grubs feeding on F. sylvatica roots, LT50 was 222.5 days (more than 7 months) (Table 3), that is above the length of their development during one growing season. The dynamics of grub mortality on the tree species tested did not signifi-cantly differ (P > 0.05). On the whole, high grub mortali-ty was observed in July, at the time of L2–L3 molt.
Body weightGrub body weight was changing more rapidly in the
first two months of observation, (Fig. 2b). For all stud-ied tree species, the dynamics of body weight changes in the grubs feeding their roots was comparable with no statistically significant differences. However, RGR of the grubs feeding on the roots of B. pendula seedlings in the period prior to 17August was significantly higher than RGR of the grubs feeding on the roots of A. gluti-nosa (Fig. 2c). RGR value for L2 grubs fed on all the tree species was positive.
L3 instar grubs
SurvivalGenerally, L3 grub survival rate was high. At the end
of June 2012, it was from 70% for the grubs fed on the roots of L. decidua and A. glutinosa seedlings to 100% on Q. petraea seedlings (Fig. 3a). Tree species did not have significant influence on grub mortality rate (P > 0.05). For the most part, L3 grub mortality was observed at the time of molting to the pupal stage.
Body weightThe average body weight of L3 grubs feeding on the
roots of P. sylvestris was higher than that of the grubs feeding on other tree species tested (Fig. 3b). This could be due to the fact that in the previous year (2011) the grubs feeding on pine showed the highest weight in-crease. In 2012, the average body weight was changing in April and May. The least weight changeability was found in the grubs feeding on L. decidua and B. pendu-la seedlings. Starting from the end of April, the grubs
feeding on Q. petraea and A. glutinosa roots showed gradual loss of body weight. The grubs feeding on other observed tree species started losing weight in June. By the end of June all the grubs examined were already in pupal cocoons.
The rate of body weight change in the grubs feeding on the roots of L. decidua seedlings was significantly lower when compared with those on Q. petraea and Q. robur roots (Table 4). Furthermore, there significantly differed the rates of body weight changes in the grubs feeding on Quercus spp.
Figure 2. Survival (A) and changes of the body weight (B) of the L2 Melolontha spp. grubs feeding on the roots of saplings of various tree species in the period of 20 May–29 September 2011 and relative growth rate (RGR, mean ± SE) reached before 17 August (different letters indicate statistically significant differences at α = 0.05) (C)

380 D. Woreta et L. Sukovata / Leśne Prace Badawcze, 2014, Vol. 75 (4): 375–383
Tree species tested in the present study had no signif-icant effect on grub RGR all through the whole period of larval development. On the other hand, RGR values were positive in case of the grubs developing on the
seedlings of 4 out of 7 studied tree species: L. decid-ua, Q. petraea, B. pendula and P. sylvestris (Fig. 3c), whereas grub RGR when feeding on the remaining tree species was negative, with the lowest value observed in the grubs on F. sylvatica and Q. robur.
4. Discussion
Melolontha spp. grubs feed on the roots of many different plant species. However, it does not mean that food quality has no effect on their development. The literature presents only few examples of herbaceous plant negative effects on grub the number and growth. In the group of the aforementioned species, there are: buckwheat (Fagopyrum esculentum Moench) and Tar-tary buckwheat [F. tataricum (L.) Gaertn.] from the Po-lygonaceae family, common wild oat (Avena fatua L.) and couch grass [Elymus repens (L.) Gould.] from the Poaceae family, and white goosefoot (Chenopodium album L.) from the Amaranthaceae family (Satkowski 1899; Rożyński 1926; Ulatowski, 1932; 1933; Hauss and Schütte 1976; Malinowski et al. 2001). Above and beyond, the results reported have been most often based rather on general observations than detailed studies. The effect of tree species on cockchafer grubs was hardly ever studied and to our knowledge is reported only in two papers. In the article concerning M. hippocastani grubs, Gur’ânova (1954) stated that feeding on B. pen-dula was most beneficial for the growth of L1 grubs when compared to other tree species observed, whereas feeding on P. sylvestris was advantageous for L2 instar. In both cases, the grubs studied were heavier than those feeding on the roots of Q. robur. Moreover, observed grub bodies contained the largest number of fat cells in-creasing their chances to endure in adverse environment conditions. In the study by Gur’ânova (1954), M. hip-pocastani, grubs (L2) were subjected to 40-day starva-tion, which revealed that survival of the grubs feeding on P. sylvestris roots, was 75%, on B. pendula – 62.5%, and on Q. robur – only 37.5%. Based on the evaluation
Figure 3. Survival (a) and changes of the body weight (b) of the L3 Melolontha spp. grubs feeding on the roots of saplings of various tree species in the period of 20 April–27 June 2012 and relative growth rate (RGR, mean ± SE) reached before 27 June (C)
Table 4. Comparison of weight dynamics of the L3 Melolontha spp. grubs feeding on the roots of 7 tree species (the analysis was done for each pair of tree species; the results are presented only for the pairs, for which the interaction of tree species with time was statistically significant)
Pairs of compared tree species df Log likelihood χ2 PL. decidua vs Q. petraea 1 26.11 8.52 0.0035L. decidua vs Q. robur 1 21.01 4.14 0.0419Q. petraea vs B. pendula 1 22.52 4.39 0.0361

381D. Woreta et L. Sukovata / Leśne Prace Badawcze, 2014, Vol. 75 (4): 375–383
of M. hippocastani grubs developing on the roots of 7 tree and shrub species, Berezina (1957) suggested that intensive development of the grubs was related to large amounts of sugar and low nitrogen contents in the roots of studied plants. However, this dependence was not regular, as mentioned by the author herself, as well as it was not subjected to statistical analysis. At the same time, the positive effect of plant C:N ratio on insect de-velopment is commonly known (White 1984; Lincoln et al. 1993; Awmack and Leather 2002). Carbohydrates constitute the important source of energy, and the need for sugar in promptly developing insects can be signifi-cantly lower than that in insects with slow development and large movement activity (Schoonhoven et al. 2005). Melolontha spp. grubs can be associated with the sec-ond group as their development on average lasts 3 years and their movement in soil requires large energy intake.
In the present study, the largest mortality of the grubs was observed at the time of their moulting and shifting to subsequent developmental stages. This could be re-lated with large influence of, among others, food quality on the activity of hormones regulating insect physiol-ogy, such as juvenile and prothoracic hormones which affect arthropod growth and moulting (Lee et al. 2012; Andersen et al. 2013; Nijhout et al. 2014; Sangsuriya et al. 2014). In our study, L1 grubs showed the lowest vitality, which was probably due to the presence of path-ogens in the population collected in the field (high L1 grub mortality was observed already during the transfer to the laboratory). Only in case of L1 grubs, there was found significant effect of food quality (tree species) on larva mortality rate, thus it is possible that we dealt with weakened grub immunity (DiAngelo et al. 2009). In general, the grubs feeding on the roots of A. glutino-sa seedlings were dying more rapidly when compared with those feeding on the roots of Q. robur and Q. pe-traea. The survival of L2 and L3 grubs was relatively high (66.7%–100%) on all the tree species tested. The highest survival of the grubs (100%) was observed for those feeding on the roots of P. sylvestris and Q. robur, (L2) and Q. petraea (L3).
The highest body weight increase was observed in L1 and L2 instars. During the study period from 28 May to 18 September,(2011), the body weight of L1 grubs increased by approximately 300%. During 4-month-pe-riod of observation, L2 grubs feeding on the roots of studied tree species increased their body weight by approx. 250%. Schwerdtfeger (1939) found that under laboratory conditions, M. hippocastani grubs reach the weight of 1670 mg shortly before pupation, and
M. melolontha grubs – 3190 mg. In our study, the av-erage body weight of L3 grubs (measured on 12 June) was 1750 mg, which suggested that these were M. hip-pocastani grubs, and was confirmed by imagines evalu-ation after emerging from pupas. in the study pots.
The quality of food did not significantly influence the rate of changes in body weight, however L2 grubs feeding on B. pendula seedlings had significantly higher RGR than the grubs feeding on A. glutinosa. At the same time, there was observed a very interesting phenomenon related to body weight changes in L3 grubs. A small in-crease of the mean body weight was found in L3 feeding on L. decidua roots, while the weight of the grubs feed-ing on Q. petraea and A. glutinosa started to decrease already at the end of April. The weight of seedling roots of different tree species was not inspected, hence it is hard to say whether ihere was any correlation between tree root mass and grub weight. There was, however, observed that the root system of 2-year-old P. sylves-tris seedlings was significantly less developed than that of F. sylvatica and A. glutinosa saplings, even though vital characteristics of grub feeding on those species did not reflect those differences. The increase in grub body weight during the last larval instar usually lasts until reaching the so-called critical mass (Davidowitz et al. 2003, 2004).Then, the larva stops eating and starts looking for a suitable place to pupate. At that time, the weight of larvae body drops off (Nijhout et al. 2014). This could be the reason why L3 grubs feeding on Q. petraea and A. glutinosa seedlings lost weight, - these probably achieved their critical mass earlier than the grubs feeding on the rest of tree species tested.
Unexpectedly, only two grubs pupated relatively early (at the turn of May and June), whereas the rest of the grubs pupated one month later (at the turn of June and July). The length of the time needed by the grubs to find suitable pupation site depends on the concentration of juvenile and prothoracic hormones. As a rule, in in-sects just before pupation, the concentration of juvenile hormone radically decreases and that of prothoracic hor-mone increases gradually (its excretion depends on the photoperiod) (Truman 1972; Truman i Riddiford 1974; Cymborowski 1984). Cockchafer grubs developing in soil away from the light, most likely regulate molting processes by means of specific genetically coded fac-tors, which prevent from too early pupation and secure appropriate development of adult insects.
Correlations between body weight increase and tree species found in our study only partially supported the results presented by Gur’ânova (1954) and Berezina

382 D. Woreta et L. Sukovata / Leśne Prace Badawcze, 2014, Vol. 75 (4): 375–383
(1957). The grubs of all developmental stages feeding on the roots of B. pendula seedlings had the largest or one of the largest RGR values and their body weight dy-namics in the L3 stage was significantly different from that of the grubs feeding on Q. petraea seedlings. Grub survival was generally lower than the survival of grubs feeding on the roots of both oak species. The RGR of grubs bred in pots with P. sylvestris seedlings was quite high, however, only in case of grubs of L2 and L3 de-velopment phases it was higher than that of grubs bred on Q. robur seedlings.
The effect of food quality, and specifically its nitro-gen (protein) and sugar contents, on cockchafer grub development is not sufficiently explained. In general, sugars provide the grubs for energy to move around in search for food in such a difficult environment as soil. Sugars are known as phagostimulants for many insect species (Johnson and Gregory 2006). The study on her-baceous plants, carried out by the authors of the present paper, showed a significant positive effect of root sugar contents on grub body weight increase and the percent-age share of L1 larvae which successfully moulted to L2 stage (Sukovata et al. 20xx,, in revision).Further-more, larva growth depends in the main on the amount of amino acids derived from proteins taken in with diet. Deficiency of amino acids results in significant growth impairment and increased larval mortality (Lee et al. 2012; Andersen et al. 2013). Better understanding of physiological processes ongoing in grub body through-out larval development as well as the effect of food quality and other factors on these processes certainly require further research, both in view of educational and practical reasons.
5. Summary
The present study was conducted with the aim to evaluate the survival and growth rate of Melolontha spp. grubs at different developmental stages (L1, L2 and L3) feeding on different types of food (the roots of seedlings of 7 forest tree species: Q. petraea, Q. robur, F. sylvatica, B. pendula, A. glutinosa, L. decidua and P. sylvestris).
The highest susceptibility to the food type - expressed by higher mortality - was observed in the youngest grubs (L1). L1 mortality rate was the highest when the grubs were feeding on A. glutinosa roots, whereas the low-est mortality was observed in L1 grubs feeding on both Quercus species tested. Additionally, the grubs feeding on the latter as well as on, F. sylvatica and B. pendu-
la showed the largest relative increase in body weight. The survival of older grubs (L2, L3) was relatively high (66.7–100%). Mortality all the grub instars observed was the highest on A. glutinosa, B. pendula (L2) and L. decidua (L3). Despite of relatively high mortality, L2 and L3 grubs feeding on B. pendula and L. decidua showed the highest RGR values.
Interpretation of the results obtained is somewhat dif-ficult due to the lack of basic knowledge on the processes related to grub metamorphosis, especially the changes in L3 instar. The effects of the factors such as food quali-ty and environmental conditions on moulting processes are poorly understood. There is, however, no doubt that among 7 studied forest tree species, the roots of A. gluti-nosa present the least beneficial food for the development of Melolontha spp. grubs. Such information should be taken into account while planning silvicultural activities in places with constant grub infestations.
Acknowledgements
We would like to express our deep appreciation to Mr. Sławomir Lipiński and Mr. Robert Wolski for their help with laboratory experiments.
The study was conducted within the framework of the development project financed by the Nation-al Center of Research and Development (contract NR12-0096-10/2010).
References
Andersen D.S., Colombani J., Léopold P. 2013. Coordination of organ growth: principles and outstanding questions from the world of insects. Trends in Cell Biology 23(7): 336–344.
Awmack C.S., Leather S.R. 2002. Host plant quality and fe-cundity in herbivorous insects. Annual Review of Ento-mology 47: 817–844.
Berezina V.M. 1957. Ličinočnoe pitanie vostočnogo majskogo hrušča. Trudy Vsesojuznogo Instituta Zascity Rastenij 8: 37–74.
Cymborowski B. 1984. Endokrynologia owadów. Warsza-wa, Państwowe Wydawnictwo Naukowe, p. 260. ISBN 83-01-04700-3.
Davidowitz G., D’Amico L.J., Nijhout H.F. 2003. Critical weight in the development of insect body size. Evolution and Development 5: 188–197.
Davidowitz G., D’Amico L.J., Nijhout H.F. 2004. The effects of environmental variation on the mechanism that controls insect body size. Evolutionary Ecology Research 6: 49–62.
DiAngelo J.R., Bland M.L., Bambina S., Cherry S., Birnbaum M.M. 2009. The immune response attenuates growth and

383D. Woreta et L. Sukovata / Leśne Prace Badawcze, 2014, Vol. 75 (4): 375–383
nutrient storage in Drosophila by reducing insulin signal-ing. Proceedings of the National Academy of Sciences of the United States of America 106: 20853–20858.
Gur’ânova N.I. 1954. Vliânie sostava pišči na fiziologičeskoe sostoânie vostočnogo majskogo hrušča (Melolontha hip-pocastani F.). Trudy Vsesojuznogo Instituta Zascity Ras-tenij 6: 31–37.
Hauss R. von, Schütte F. 1976. Zur Polyphagie der Engerlin-ge von Melolontha melolontha L. Pflanzen aus Wiese und Ödland. Anzeiger für Schädlingskunde, Pflanzenschutz Umweltschutz, 49: 129–132.
Johnson S.N., Gregory P.J. 2006. Chemically-mediated host-plant location and selection by root-feeding insects. Phy-siological Entomology 31: 1–13.
Krell F.-T. 2004. Bestimmung von Larven und Imagines der mitteleuropäischen Melolontha-Arten (Coleoptera: Scara-baeoidea). Laimburg 1: 211–219.
Lazarević J., Perić-Mataruga V., Stojković B., Tucić N. 2002. Adaptation of the gypsy moth to an unsuitable host plant. Entomologia Experimentalis et Applicata 102: 75–86.
Lee K.P., Kwon S.-T., Roh C. 2012. Caterpillars use develop-mental plasticity and diet choice to overcome the early life experience of nutritional imbalance. Animal Behaviour 84: 785–793.
Lincoln D.E., Fajer E.D., Johnson R.H. 1993. Plant-insect her-bivore interactions in elevated CO2 environments. Trends in Ecology and Evolution 8: 64–68.
Malinowski H., Augustyniak A., Łabanowska B.H. 2001. Nowe możliwości ograniczania populacji owadów żeru-jących na korzeniach roślin. Progress in Plant Protection/Postępy w Ochronie Roślin 41: 175–181.
Nijhout H.F., Riddiford L.M., Mirth C., Shingleton A.W., Su-zuki Y., Callier V. 2014. The developmental control of size in insects. WIREs Developmental Biology 3: 113–134.
Rożyński F. 1926. W sprawie walki z chrząszczem majowym (Melolontha vulgaris). Przegląd Leśniczy 7: 32–38.
Sangsuriya P., Phiwsaiya K., Pratoomthai B., Sriphaijit T., Amparyup P., Withyachumnarnkul B., Senapin S. 2014. Knockdown of a novel G-protein pathway suppressor 2 (GPS2) leads to shrimp mortality by exuvial entrapment during ecdysis. Fish and Shellfish Immunology 37(1): 46–52.
Satkowki K. 1899. Przyczynek do środków tępienia pędraka. Sylwan 17: 52–54.
Schoonhoven L.M., van Loon J.J.A., Dicke M. 2005. In-sect-Plant Biology. Second Edition. New York, Oxford University Press, p. 421. ISBN 978-0-19-852594-3.
Schwerdtfeger F. 1939. Untersuchungen über die Wanderun-gen des Maikäfer-Engerlings (Melolontha melolontha L. und Melolontha hippocastani F.). Zeitschrift für Ange-wandte Entomologie 26: 215–252.
Sierpiński Z. 1975. Ważniejsze owady – szkodniki korzeni drzew i krzewów leśnych. Warszawa, PWRiL, p. 222.
Stanisz A. 2007. Przystępny kurs statystyki z zastosowaniem STATISTICA PL na przykładach z medycyny. Tom 2. Modele liniowe i nieliniowe. Kraków, StatSoft Polska Sp. z o.o., s. 868. ISBN 978-83-88724-30-5.
StatSoft, Inc. 2011. STATISTICA (data analysis software sys-tem), version 10. www.statsoft.com.
Śliwa E. 1993. Szkodniki korzeni drzew i krzewów. Warszawa, Oficyna Edytorska „Świat”, p. 53.
Truman J.W. 1972. Physiology of insect rhytms. I. Circadian organization of the endocrine events underlying the molt-ing cycle of larval tobacco hornworms. The Journal of Ex-perimental Biology 57: 805–820.
Truman J.W., Riddiford L.M. 1974. Physiology of insect rhytms. III. The temporal organization of the endocrine events underlying pupation of the tobacco hornworm. The Journal of Experimental Biology 60: 371–382.
Ulatowski W. 1932. Przykład walki z pędrakiem. Echa Leśne 9 (1): 5–6.
Ulatowski W. 1933. Pędrak chrabąszcza (Melolontha vulgar-is) i jego zwalczanie. Sylwan 51 (7/8/9): 251–252.
Voroncov A.I. 1982. Lesnaâ čntomologiâ. Moskva, Vysšaâ škola, p. 384.
White T.C.R. 1984. The abundance of invertebrate herbivores in relation to the availability of nitrogen in stressed food plants. Oecologia 63: 90–105.
Woreta D. 1994. Zmiany występowania szkodników korzeni drzew i krzewów leśnych w latach 1961–1993 [Changes in the occurence of pests of forest trees and bushes roots]. Sylwan 5: 37–41.
Woreta D., Skrzecz I. 1996. Szkody wyrządzane przez owady w uprawach leśnych na gruntach porolnych i możliwoś-ci ich ograniczania. Postępy Techniki w Leśnictwie 58: 34–42.
Woreta D. 1997. Możliwości ograniczania szkód powodowa-nych przez pędraki chrabąszczowatych (Melolonthinae) metodami niechemicznymi. Sylwan 5: 29–39.
Woreta D. 2013. Chrabąszcze Melolontha, in: Krótkotermi-nowa prognoza występowania ważniejszych szkodników i chorób infekcyjnych drzew leśnych w Polsce w 2013 r. Analizy i Raporty, Sękocin Stary, Instytut Badawczy Leśnictwa, 20: 90–92.
Translated by: Adam Kaliszewski

Leśne Prace Badawcze (Forest Research Papers),December 2014, Vol. 75 (4): 385–406
DOI: 10.2478/frp-2014-0036
ORIGINAL RESEARCH ARTICLE
Received 16 June 2014, accepted after revision 25 July 2014. © 2014, Forest Research Institute
Rate and direction of changes in tree species composition of natural stands in selected forest associations in the Białowieża Forest
Rafał Paluch
Forest Research Institute, Department of Natural Forests ul. Park Dyrekcyjny 6, 17–230 Białowieża, Poland.
Tel. +48 85 681 23 96, e-mail: [email protected]
Abstract. The main aim of the study was to determine changes in the species composition and structure of natural tree stands in the Białowieża Forest (BF), which occurred in the years 1975–2012, as well as to evaluate their trends, directions and rate. The study was carried out on 121 permanent research plots (50 × 50 m), which represented the most important forest phytocenoses in BF, i.e. fresh pine-whortleberry forest Vaccinio vitis-idaeae-Pinetum Sokoł. 1980, fresh mixed spruce-reed grass forest Calamagrostio-Piceetum Sokoł. 1968, oligotrophic form of hornbeam - bastard balm forest Melitti-Carpinetum Sokoł. 1976, different forms of linden- hornbeam forest: Tilio-Carpinetum Tracz. 1962, alder-ash forest Fraxino-Alnetum W. Mat. 1952 and sub-boreal spruce forest on bog moss Sphagno girgenshonii-Piceetum Polak. 1962. On the plots selected, there was measured the diameter at breast height (DBH) of all trees, as well as every tree and shrub up to 1.3 m high was counted and described with reference to species. The measurements and observations were regularly repeated every 10–15 years. The results showed that over the last period of nearly 40 years, there has increased a share of common hornbeam Carpinus betulus L. in the structure of forest stands in numerous BF associations. This tree species has expanded into different forest habitats including poor, medium fertile and wetland sites. The results obtained indicate a trend towards formation of linden-hornbeam forests in BF phytocenoses. The most evident changes were recorded in hornbeam – bastard balm forest. In natural conditions of the majority of forest associations analysed, there prevailed hornbeam trees in forest regeneration, except for the stands in fresh mixed pine forest and spruce forest on bog moss. In the latter two cases, hornbeam showed signs of its presence in the last observation period. Norway spruce (Picea abies L.) retreated into oligotrophic forest associations. In the recent decades, spruce populations have been dramatically reduced in the stands in mixed coniferous and different kinds of broadleaved forests. There have also decreased a share of light-demanding tree species, such as Scots pine (Pinus silvestris L.), pedunculate oak (Quercus robur L.) and silver birch (Betula pendula L.) in BF tree stands, including their regeneration-layer. Especially, Scots pine regeneration has not been successful.
In the short period of time (about 15 years) there has been observed rapid and outsized reduction of ash Fraxinus excelsior L. populations in natural conditions of alder-ash forests. All through the last 10–15 years, there has been also observed increased rate of change in stand species composition. The trend and rate of change in stand species com-position point out to a possibility of human intervention towards stimulation of natural regeneration so as to preserve valuable populations of threatened tree species in the Białowieża Forest.
Key words: hornbeam expansion, natural stands, permanent study plots, Białowieża Forest, ash dieback

386 R. Paluch / Leśne Prace Badawcze, 2014, Vol. 75 (4): 385–406
1. Introduction and study aims
The Białowieża Forest (BF) is among the largest andbest preserved woodlands in the East-Central European lowland. The woodland is dominated by eutrophic sites where the total share of deciduous forest sites amounts up to 60%. Coniferous forests account for several per-cent of the area only, and mixed coniferous–deciduous forests take a little more than 30% (Sokołowski 2004).
Nearly a half of the BF areas have recently been set aside and taken out of any direct human intervention, including the Białowieża National Park, nature reserves, and zones established to protect birds, fungi and other organisms. Moreover, all stands over 100 years old have been exclud-ed from all silvicultural and protective practices. The areas set aside for conservation provide an excellent opportunity to study natural ecological processes. Forest habitats of EU importance, protected under Council Directive 92/43/EEC, take almost 80% of the BF and encompass the subconti-nental linden–hornbeam forests (9170) as well as priority habitats such as bog woodland (91D0) and alluvial forests with Alnus glutinosa and Fraxinus excelsior (91E0).
Long-term analyses of stand development in the BF show that there have been considerable changes in tree species composition over the last several decades, lead-ing to, among others, the absence of pine regeneration and an increase in the frequency of hornbeam and linden (Kowalski 1982; Brzeziecki 2008; Drozdowski et al. 2012). Analogous observations (no pine regeneration, expansion of hornbeam) were also reported from other locations in the BF (Sokołowski 2004).
Results of systematic phytosociological study con-ducted in northeastern Poland as well as in the BF point out to a high dynamics of vegetation changes, including changes in stand composition (Sokołowski 1991, 2004; Paluch 2001, 2003; Czerepko and Sokołowski 2006).
A robust archive of relevant material has been gath-ered at the Forest Research Institute, encompassing phytosociological records, stand measurement data and results of long-term vegetation monitoring in permanent study plots, which were first set up as early as in 1975, mainly in northeastern Poland. The present study was undertaken with the aim to maintain uninterrupted veg-etation monitoring as continuation of the work initiated by a team headed by Professor A.W. Sokołowski
The following aims of study were adopted:1) To identify changes in stand structure and species
composition in the permanent study plots over the last three to four decades,
2) To assess trends, directions and rates of the changes,
3) To evaluate how the consequences of vegetation changes identified would affect the long-term silvicul-tural planning and needs for its modification.
2. Methods and scope of study
Nearly 300 permanent study plots (structural) have been established in a variety of forest communities in northeastern Poland since 1970s up to now. The plots sized generally 50 × 50 m, were set up with the aim to analyse changes in stand structure and species compo-sition (Sokołowski 2004). Oakwood rods were used to mark plot boundaries. Within the plots, the tree diameter at breast height (DBH) was measured in thickness classes and young trees and shrubs <1.3 m tall were counted by species. Measurements were repeated every 10–15 yr.
The continuation study in the BF was conduct-ed in 121 permanent plots (Fig. 1), which originally represented:
– fresh pine–whortleberry forest Vaccinio vitis-idae-ae-Pinetum Sokoł. 1980,
– fresh mixed spruce reed grass forest Calamagros-tio-Piceetum Sokoł. 1968,
– oligotrophic hornbeam–bastard balm forest Melit-ti-Carpinetum (MC) Sokoł. 1976,
– various forms of linden–hornbeam forest Til-io-Carpinetum Tracz. 1962,
– alder-ash forest Fraxino-Alnetum W.Mat. 1952,– sub-boreal spruce forest on bog moss Sphagno gir-
gensohnii-Piceetum (S) Polak. 1962,The study methods were based on those applied in
the earlier works by Sokołowski (1960–2004, 1991 and 2004). Geographical coordinates of study plot boundaries were determined with the use of GPS receiver (Table 1).
Based on the measurements of stand density and DBH cross sections (stand basal area) by tree species, the spe-cies composition of the stands was determined in the re-spective investigation years. To compare proportions of individual tree species in the stand species composition between the respective study periods, a similarity co-efficient was used (Brzeziecki 2008 after Bodeck et al. 2001), which was calculated using the following formula:
where:f1,i and f2,i – percent proportion of i-th species in the
study periods compared,n – total number of species in both study periods
compared.

387R. Paluch / Leśne Prace Badawcze, 2014, Vol. 75 (4): 385–406
The S coefficient fluctuated within a range from 0 to 1, where zero denotes a total lack of similarity while 1 – full similarity. The coefficient was calculated using tree number as the contribution of an individual tree species.
In order to present clearly the most important chang-es in the stand structure and species composition over the last nearly four decades, graphic visualisation of se-lected stands was made using BWINPro 6.2 mathemati-cal model of forest dynamics (Nagel 1999).
3. Results of studies
Fresh pine–whortleberry forest Vaccinium vitis-idaea-Pinetum Sokoł. 1980
The proportions and numbers of the two main stand building tree species, that is Scots pine and Norway spruce were found to undergo significant changes over the last nearly four decades of the investigation. Changes in stand
Figure 1. Permanent research plots of the Forest Research Institute and protected areas in the Białowieża Forest

388 R. Paluch / Leśne Prace Badawcze, 2014, Vol. 75 (4): 385–406Ta
ble
1. L
ocat
ion
of p
erm
anen
t stu
dy p
lots
of t
he F
ores
t Res
earc
h In
stitu
te in
the
Bia
łow
ieża
For
est
Nr.
Fore
st di
stric
tSe
ctor
(Ite
m)
Year
of p
lot
esta
blish
men
tFo
rest
code
Fore
st sit
e ty
pe*
Fore
st as
soci
atio
nCo
mpa
rtem
ent
GPS
coor
dina
tes
1H
ajnó
wka
Sitk
i19
75V
1Bś
wVa
ccin
io vi
tis-id
aeae
-Pin
etum
Sok
oł. 1
980
667B
hN
52.6
2401
E23
.667
802
Haj
nów
kaSi
tki
1973
V2
Bśw
Vacc
inio
vitis
-idae
ae-P
inet
um S
okoł
. 198
066
8Ac
N52
.622
81 E
23.6
7379
3H
ajnó
wka
Sitk
i19
85V
3Bś
wVa
ccin
io vi
tis-id
aeae
-Pin
etum
Sok
oł. 1
980
668A
cN
52.6
2510
E23
.669
674
Biał
owie
ski P
NH
woź
na19
99V
4Bś
wVa
ccin
io vi
tis-id
aeae
-Pin
etum
Sok
oł. 1
980
131C
cN
52.8
0370
E23
.844
325
Haj
nów
kaSi
tki
1973
V5
Bśw
Vacc
inio
vitis
-idae
ae-P
inet
um S
okoł
. 198
066
7Bh
N52
.624
11 E
23.6
6802
6H
ajnó
wka
Sitk
i19
73V
6Bś
wVa
ccin
io vi
tis-id
aeae
-Pin
etum
Sok
oł. 1
980
668A
cN
52.6
2381
E23
.676
797
Biał
owie
ski P
NH
woź
na19
99V
7Bś
wVa
ccin
io vi
tis-id
aeae
-Pin
etum
Sok
oł. 1
980
131C
N52
.801
70 E
23.8
4632
8H
ajnó
wka
Star
zyna
1975
CP1
BMśw
Cala
mag
rosti
o ar
undi
nace
ae-P
icee
tum
Sok
oł. 1
968
699B
bN
52.6
1554
E23
.650
679
Haj
nów
kaSt
arzy
na19
75CP
2BM
śwCa
lam
agro
stio
arun
dina
ceae
-Pic
eetu
m S
okoł
. 196
869
9Bg
N52
.613
86 E
23.6
4845
10Bi
ałow
ieża
Zwie
rzyn
iec
1975
CP3
BMśw
Cala
mag
rosti
o ar
undi
nace
ae-P
icee
tum
Sok
oł. 1
968
448B
N52
.701
07 E
23.7
7588
11Bi
ałow
ieża
Zwie
rzyn
iec
1975
CP4
BMśw
Cala
mag
rosti
o ar
undi
nace
ae-P
icee
tum
Sok
oł. 1
968
448C
N52
.698
55 E
23.7
7082
12Bi
ałow
ieża
Zwie
rzyn
iec
1975
CP5
BMśw
Cala
mag
rosti
o ar
undi
nace
ae-P
icee
tum
Sok
oł. 1
968
448D
N52
.698
57 E
23.7
7844
13H
ajnó
wka
Sitk
i19
94CP
6BM
śwCa
lam
agro
stio
arun
dina
ceae
-Pic
eetu
m S
okoł
. 196
866
8AN
52.6
2175
E23
.672
0614
Haj
nów
kaSi
tki
1994
CP7
BMśw
Cala
mag
rosti
o ar
undi
nace
ae-P
icee
tum
Sok
oł. 1
968
668C
N52
.620
99 E
23.6
7335
15H
ajnó
wka
Sitk
i19
94CP
8BM
śwCa
lam
agro
stio
arun
dina
ceae
-Pic
eetu
m S
okoł
. 196
866
8BN
52.6
2175
E23
.672
0716
Haj
nów
kaSi
tki
1994
CP9
BMśw
Cala
mag
rosti
o ar
undi
nace
ae-P
icee
tum
Sok
oł. 1
968
668C
N52
.625
19 E
23.6
7336
17H
ajnó
wka
Star
zyna
1975
CP10
BMśw
Cala
mag
rosti
o ar
undi
nace
ae-P
icee
tum
Sok
oł. 1
968
699B
bN
52.6
1597
E23
.652
6718
Haj
nów
kaLe
śna
1985
S1BM
bSp
hagn
o gi
rgen
sohn
ii-Pi
ceet
um P
olak
. 196
251
7Ba
N52
.674
82 E
23.6
8486
19H
ajnó
wka
Leśn
a19
75S2
BMb
Spha
gno
girg
enso
hnii-
Pice
etum
Pol
ak. 1
962
439A
aN
52.7
0336
E23
.630
4320
Haj
nów
kaLe
śna
1985
S3BM
bSp
hagn
o gi
rgen
sohn
ii-Pi
ceet
um P
olak
. 196
251
7Ba
N52
.674
45 E
23.6
8497
21Br
owsk
Nar
ewka
1998
MC1
LMśw
Mel
itti-C
arpi
netu
m S
okoł
. 197
618
6Dh
N52
.781
15 E
23.7
5698
22H
ajnó
wka
Star
zyna
1996
MC2
LMśw
Mel
itti-C
arpi
netu
m S
okoł
. 197
666
3Ab
N52
.625
12 E
23.5
9103
23H
ajnó
wka
Star
zyna
1974
MC3
LMśw
Mel
itti-C
arpi
netu
m S
okoł
. 197
669
8Cd
N52
.611
35 E
23.6
2219
24H
ajnó
wka
Star
zyna
1974
MC4
LMśw
Mel
itti-C
arpi
netu
m S
okoł
. 197
669
7Db
N52
.611
73 E
23.6
1918
25H
ajnó
wka
Star
zyna
1975
MC5
LMśw
Mel
itti-C
arpi
netu
m S
okoł
. 197
669
7Db
N52
.609
67 E
23.6
2028
26H
ajnó
wka
Star
zyna
1975
MC6
LMśw
Mel
itti-C
arpi
netu
m S
okoł
. 197
670
0Bd
N52
.615
15 E
23.6
6457
27H
ajnó
wka
Star
zyna
1974
MC7
LMśw
Mel
itti-C
arpi
netu
m S
okoł
. 197
672
9Bb
N52
.604
64 E
23.6
1797
28Bi
ałow
ieża
Zwie
rzyn
iec
1986
MC8
LMśw
Mel
itti-C
arpi
netu
m S
okoł
. 197
642
2Cj
N52
.703
80 E
23.7
4962
29H
ajnó
wka
Star
zyna
1974
MC9
LMśw
Mel
itti-C
arpi
netu
m S
okoł
. 197
673
0Af
N52
.607
03 E
23.6
2302
30H
ajnó
wka
Star
zyna
1974
MC1
0LM
śwM
elitt
i-Car
pine
tum
Sok
oł. 1
976
730A
fN
52.6
0431
E23
.625
3731
Haj
nów
kaSt
arzy
na19
74M
C11
LMśw
Mel
itti-C
arpi
netu
m S
okoł
. 197
673
0Af
N52
.604
07 E
23.6
2190
32H
ajnó
wka
Star
zyna
1975
MC1
2LM
śwM
elitt
i-Car
pine
tum
Sok
oł. 1
976
416B
N52
.708
89 E
23.6
6929

389R. Paluch / Leśne Prace Badawcze, 2014, Vol. 75 (4): 385–40633
Biał
owie
żaZw
ierz
ynie
c19
98M
C13
LMśw
Mel
itti-C
arpi
netu
m S
okoł
. 197
647
2Cb
N52
.687
52 E
23.7
6677
34H
ajnó
wka
Lipi
ny19
85M
C14
LMśw
Mel
itti-C
arpi
netu
m S
okoł
. 197
627
2D2
N52
.754
78 E
23.6
4858
35H
ajnó
wka
Lipi
ny19
85M
C15
LMśw
Mel
itti-C
arpi
netu
m S
okoł
. 197
627
2D1
N52
.755
62 E
23.6
4555
36H
ajnó
wka
Star
zyna
1974
MC1
6LM
śwM
elitt
i-Car
pine
tum
Sok
oł. 1
976
697D
hN
52.6
0816
E23
.615
5737
Haj
nów
kaLi
piny
1985
MC1
7LM
śwM
elitt
i-Car
pine
tum
Sok
oł. 1
976
272D
aN
52.7
5278
E23
.646
3338
Haj
nów
kaSt
arzy
na19
75M
C18
LMśw
Mel
itti-C
arpi
netu
m S
okoł
. 197
641
6CN
52.7
0289
E23
.669
8039
Haj
nów
kaSt
arzy
na19
74M
C19
LMśw
Mel
itti-C
arpi
netu
m S
okoł
. 197
672
9Bb
N52
.604
64 E
23.6
1597
40H
ajnó
wka
Haj
nów
ka19
75M
C20
LMśw
Mel
itti-C
arpi
netu
m S
okoł
. 197
641
9Ca
N52
.708
30 E
23.7
0523
41H
ajnó
wka
Leśn
a19
96Tk
1LM
wTi
lio-C
arpi
netu
m ca
lam
agro
stiet
osum
604C
bN
52.6
3968
E23
.702
4542
Haj
nów
kaSt
arzy
na19
96Tk
2LM
wTi
lio-C
arpi
netu
m ca
lam
agro
stiet
osum
569B
bN
52.6
5509
E23
.600
7843
Biał
owie
żaBi
ałow
ieża
1997
Tk3
LMw
Tilio
-Car
pine
tum
cala
mag
rosti
etos
um60
7Dc
N52
.637
37 E
23.7
5822
44Bi
ałow
ieża
Biał
owie
ża19
98Tk
4LM
wTi
lio-C
arpi
netu
m ca
lam
agro
stiet
osum
640A
aN
52.6
3586
E23
.754
7345
Brow
skBr
owsk
1998
Tk5
LMw
Tilio
-Car
pine
tum
cala
mag
rosti
etos
um38
Dg
N52
.848
03 E
23.8
7292
46H
ajnó
wka
Leśn
a19
96Tk
6LM
wTi
lio-C
arpi
netu
m ca
lam
agro
stiet
osum
575B
dN
52.6
5430
E23
.700
3547
Brow
skBr
owsk
1998
Tk7
LMw
Tilio
-Car
pine
tum
cala
mag
rosti
etos
um25
Dd
N52
.861
42 E
23.8
6895
48Bi
ałow
ieża
Biał
owie
ża19
98Tk
8LM
wTi
lio-C
arpi
netu
m ca
lam
agro
stiet
osum
546B
bN
52.6
6379
E23
.762
1649
Biał
owie
żaBi
ałow
ieża
1996
Tk9
LMw
Tilio
-Car
pine
tum
cala
mag
rosti
etos
um54
8Ag
N52
.661
89 E
23.7
8300
50H
ajnó
wka
Haj
nów
ka19
96Tk
10LM
wTi
lio-C
arpi
netu
m ca
lam
agro
stiet
osum
418A
fN
52.7
0921
E23
.685
9351
Brow
skBr
owsk
1998
Tk11
LMw
Tilio
-Car
pine
tum
cala
mag
rosti
etos
um38
DN
52.8
4603
E23
.871
9252
Biał
owie
ski P
NO
rłów
ka19
85TC
t1Lś
wTi
lio-C
arpi
netu
m ty
picu
m T
racz
. 196
237
1CN
52.7
2767
E23
.867
3553
Biał
owie
ski P
NO
rłów
ka19
85TC
t2Lś
wTi
lio-C
arpi
netu
m ty
picu
m T
racz
. 196
237
1CN
52.7
2710
E23
.867
3354
Biał
owie
ski P
NO
rłów
ka19
85TC
t3Lś
wTi
lio-C
arpi
netu
m ty
picu
m T
racz
. 196
237
1CN
52.7
2681
E23
.867
1655
Biał
owie
ski P
NO
rłów
ka19
85TC
t4Lś
wTi
lio-C
arpi
netu
m ty
picu
m T
racz
. 196
237
1CN
52.7
2627
E23
.867
2756
Biał
owie
ski P
NO
rłów
ka19
85TC
t5Lś
wTi
lio-C
arpi
netu
m ty
picu
m T
racz
. 196
237
1CN
52.7
2765
E23
.866
5657
Biał
owie
ski P
NO
rłów
ka19
85TC
t6Lś
wTi
lio-C
arpi
netu
m ty
picu
m T
racz
. 196
237
1CN
52.7
2721
E23
.866
5758
Biał
owie
ski P
NO
rłów
ka19
85TC
t7Lś
wTi
lio-C
arpi
netu
m ty
picu
m T
racz
. 196
237
1CN
52.7
2678
E23
.866
5959
Biał
owie
ski P
NO
rłów
ka19
85TC
t8Lś
wTi
lio-C
arpi
netu
m ty
picu
m T
racz
. 196
237
1CN
52.7
2632
E23
.866
4260
Brow
skBr
owsk
1998
TCt9
Lśw
Tilio
-Car
pine
tum
typi
cum
Tra
cz. 1
962
39D
bN
52.8
4735
E23
.888
7461
Brow
skN
arew
ka19
98TC
t10
Lśw
Tilio
-Car
pine
tum
typi
cum
Tra
cz. 1
962
188C
bN
52.7
8151
E23
.780
5162
Biał
owie
żaZw
ierz
ynie
c19
98TC
t11
Lśw
Tilio
-Car
pine
tum
typi
cum
Tra
cz. 1
962
310A
cN
52.7
4937
E23
.748
9763
Biał
owie
żaZw
ierz
ynie
c19
98TC
t12
Lśw
Tilio
-Car
pine
tum
typi
cum
Tra
cz. 1
962
220A
cN
52.7
7877
E23
.780
7064
Biał
owie
żaBi
ałow
ieża
1997
TCt1
3Lś
wTi
lio-C
arpi
netu
m ty
picu
m T
racz
. 196
252
4Dd2
N52
.666
95 E
23.7
9347
65H
ajnó
wka
Haj
nów
ka19
96TC
t14
Lśw
Tilio
-Car
pine
tum
typi
cum
Tra
cz. 1
962
360C
cN
52.7
2356
E23
.675
0966
Haj
nów
kaH
ajnó
wka
1996
TCt1
5Lś
wTi
lio-C
arpi
netu
m ty
picu
m T
racz
. 196
239
0Ab
N52
.721
68 E
23.6
8506
67H
ajnó
wka
Haj
nów
ka19
96TC
t16
Lśw
Tilio
-Car
pine
tum
typi
cum
Tra
cz. 1
962
418B
cN
52.7
1241
E23
.696
5868
Haj
nów
kaH
ajnó
wka
1996
TCt1
7Lś
wTi
lio-C
arpi
netu
m ty
picu
m T
racz
. 196
241
9Ac
N52
.708
77 E
23.7
0224

390 R. Paluch / Leśne Prace Badawcze, 2014, Vol. 75 (4): 385–406
Nr.
Fore
st di
stric
tSe
ctor
(Ite
m)
Year
of p
lot
esta
blish
men
tFo
rest
code
Fore
st sit
e ty
pe*
Fore
st as
soci
atio
nCo
mpa
rtem
ent
GPS
coor
dina
tes
69Bi
ałow
ieża
Zwie
rzyn
iec
1998
TCt1
8Lś
wTi
lio-C
arpi
netu
m ty
picu
m T
racz
. 196
245
1Ad
N52
.699
30 E
23.8
1214
70Bi
ałow
ieża
Biał
owie
ża19
97TC
t19
Lśw
Tilio
-Car
pine
tum
typi
cum
Tra
cz. 1
962
524D
N52
.667
95 E
23.7
9328
71Br
owsk
Brow
sk19
75TC
t20
Lśw
Tilio
-Car
pine
tum
typi
cum
Tra
cz. 1
962
38Bd
N52
.855
70 E
23.8
6960
72Br
owsk
Brow
sk19
98TC
t21
Lśw
Tilio
-Car
pine
tum
typi
cum
Tra
cz. 1
962
51Bb
N52
.843
71 E
23.8
9000
73Br
owsk
Nar
ewka
1998
TCt2
2Lś
wTi
lio-C
arpi
netu
m ty
picu
m T
racz
. 196
218
6Af
N52
.787
09 E
23.7
4882
74H
ajnó
wka
Star
zyna
1996
TCt2
3Lś
wTi
lio-C
arpi
netu
m ty
picu
m T
racz
. 196
253
6Bo
N52
.660
40 E
23.5
8273
75H
ajnó
wka
Star
zyna
1996
TCt2
4Lś
wTi
lio-C
arpi
netu
m ty
picu
m T
racz
. 196
259
9Dd
N52
.638
06 E
23.6
3230
76H
ajnó
wka
Star
zyna
1996
TCt2
5Lś
wTi
lio-C
arpi
netu
m ty
picu
m T
racz
. 196
261
3Dc
N52
.629
35 E
23.6
2130
77H
ajnó
wka
Star
zyna
1996
TCt2
6Lś
wTi
lio-C
arpi
netu
m ty
picu
m T
racz
. 196
269
5Bc
N52
.612
97 E
23.5
8811
78Bi
ałow
ieża
Zwie
rzyn
iec
1998
TCt2
7Lś
wTi
lio-C
arpi
netu
m ty
picu
m T
racz
. 196
221
7Ac
N52
.777
69 E
23.7
3339
79Bi
ałow
ieża
Zwie
rzyn
iec
1998
TCt2
8Lś
wTi
lio-C
arpi
netu
m ty
picu
m T
racz
. 196
221
8Cb
N52
.775
93 E
23.7
5167
80Bi
ałow
ieża
Biał
owie
ża19
98TC
t29
Lśw
Tilio
-Car
pine
tum
typi
cum
Tra
cz. 1
962
403C
dN
52.7
1638
E23
.908
8281
Biał
owie
żaBi
ałow
ieża
1997
TCt3
0Lś
wTi
lio-C
arpi
netu
m ty
picu
m T
racz
. 196
258
0Bc
N52
.651
24 E
23.7
7940
82Bi
ałow
ieża
Biał
owie
ża19
97TC
t31
Lśw
Tilio
-Car
pine
tum
typi
cum
Tra
cz. 1
962
582A
fN
52.6
5532
E23
.799
0083
Haj
nów
kaH
ajnó
wka
1996
TCt3
2Lś
wTi
lio-C
arpi
netu
m ty
picu
m T
racz
. 196
236
0Ca
N52
.727
42 E
23.6
6935
84H
ajnó
wka
Haj
nów
ka19
96TC
t33
Lśw
Tilio
-Car
pine
tum
typi
cum
Tra
cz. 1
962
418A
dN
52.7
0987
E23
.685
4985
Haj
nów
kaH
ajnó
wka
1975
TCt3
4Lś
wTi
lio-C
arpi
netu
m ty
picu
m T
racz
. 196
244
3AN
52.7
0105
E23
.692
7986
Haj
nów
kaH
ajnó
wka
1996
TCt3
5Lś
wTi
lio-C
arpi
netu
m ty
picu
m T
racz
. 196
244
3Ca
N52
.699
17 E
23.6
8745
87Br
owsk
Nar
ewka
1998
TCt3
6Lś
wTi
lio-C
arpi
netu
m ty
picu
m T
racz
. 196
218
5Ca
N52
.781
53 E
23.7
3922
88Br
owsk
Nar
ewka
1998
TCt3
7Lś
wTi
lio-C
arpi
netu
m ty
picu
m T
racz
. 196
218
5Db
N52
.780
96 E
23.7
4090
89Bi
ałow
ieża
Zwie
rzyn
iec
1998
TCt3
8Lś
wTi
lio-C
arpi
netu
m ty
picu
m T
racz
. 196
225
1Db
N52
.761
69 E
23.7
7414
90Bi
ałow
ieża
Zwie
rzyn
iec
1975
TCt3
9Lś
wTi
lio-C
arpi
netu
m ty
picu
m T
racz
. 196
244
5BN
52.7
0139
E23
.732
1191
Biał
owie
żaZw
ierz
ynie
c19
75TC
t40
Lśw
Tilio
-Car
pine
tum
typi
cum
Tra
cz. 1
962
447B
N52
.700
2 E2
3.76
0025
92Bi
ałow
ieża
Zwie
rzyn
iec
1975
TCt4
1Lś
wTi
lio-C
arpi
netu
m ty
picu
m T
racz
. 196
244
9AN
52.7
0087
E23
.783
1993
Biał
owie
żaZw
ierz
ynie
c19
75TC
t42
Lśw
Tilio
-Car
pine
tum
typi
cum
Tra
cz. 1
962
449B
N52
.699
69 E
23.7
9213
94Bi
ałow
ieża
Zwie
rzyn
iec
1974
TCt4
3Lś
wTi
lio-C
arpi
netu
m ty
picu
m T
racz
. 196
245
1DN
52.6
9544
E23
.821
6095
Biał
owie
żaZw
ierz
ynie
c19
74TC
t44
Lśw
Tilio
-Car
pine
tum
typi
cum
Tra
cz. 1
962
475A
N52
.693
38 E
23.8
1602
96Br
owsk
Nar
ewka
1997
TCt4
5Lś
wTi
lio-C
arpi
netu
m ty
picu
m T
racz
. 196
218
6Aa
N52
.788
09 E
23.7
4802
97H
ajnó
wka
Star
zyna
1975
TCt4
6Lś
wTi
lio-C
arpi
netu
m ty
picu
m T
racz
. 196
253
6Bb
N52
.660
40 E
23.5
8273
98H
ajnó
wka
Star
zyna
1975
TCt4
7Lś
wTi
lio-C
arpi
netu
m ty
picu
m T
racz
. 196
259
9Dd
N52
.638
06 E
23.6
3230
99H
ajnó
wka
Star
zyna
1975
TCt4
8Lś
wTi
lio-C
arpi
netu
m ty
picu
m T
racz
. 196
261
3Cc
N52
.629
35 E
23.6
2130
100
Haj
nów
kaSt
arzy
na19
75TC
t49
Lśw
Tilio
-Car
pine
tum
typi
cum
Tra
cz. 1
962
695B
aN
52.6
1157
E23
.588
4510
1Bi
ałow
ieża
Biał
owie
ża19
97TC
t50
Lśw
Tilio
-Car
pine
tum
typi
cum
Tra
cz. 1
962
582B
N52
.659
32 E
23.7
9912

391R. Paluch / Leśne Prace Badawcze, 2014, Vol. 75 (4): 385–40610
2Bi
ałow
ieża
Zwie
rzyn
iec
1998
TCt5
1Lś
wTi
lio-C
arpi
netu
m ty
picu
m T
racz
. 196
221
8DN
52.7
7993
E23
.751
9710
3Br
owsk
Brow
sk19
98F1
OlJ
Frax
ino-
Alne
tum
W.M
at. 1
952
16A
aN
52.8
7199
E23
.884
2310
4Br
owsk
Brow
sk19
98F2
OlJ
Frax
ino-
Alne
tum
W.M
at. 1
952
17Bg
N52
.871
51 E
23.9
0194
105
Brow
skN
arew
ka19
98F3
OlJ
Frax
ino-
Alne
tum
W.M
at. 1
952
185A
cN
52.7
8605
E23
.740
2510
6Br
owsk
Nar
ewka
1998
F4O
lJFr
axin
o-Al
netu
m W
.Mat
. 195
218
5Bd
N52
.786
28 E
23.7
4093
107
Biał
owie
żaBi
ałow
ieża
1997
F5O
lJFr
axin
o-Al
netu
m W
.Mat
. 195
252
4Cc
N52
.665
79 E
23.7
8738
108
Biał
owie
żaBi
ałow
ieża
1997
F6O
lJFr
axin
o-Al
netu
m W
.Mat
. 195
252
4Dd1
N52
.665
50 E
23.7
9209
109
Biał
owie
żaBi
ałow
ieża
1997
F7O
lJFr
axin
o-Al
netu
m W
.Mat
. 195
254
7Bd
N52
.660
84 E
23.7
7672
110
Biał
owie
żaBi
ałow
ieża
1997
F8O
lJFr
axin
o-Al
netu
m W
.Mat
. 195
261
0Af
N52
.643
66 E
23.7
9618
111
Biał
owie
żaBi
ałow
ieża
1998
F9O
lJFr
axin
o-Al
netu
m W
.Mat
. 195
264
1Af
N52
.634
30 E
23.7
6480
112
Haj
nów
kaH
ajnó
wka
1996
F10
OlJ
Frax
ino-
Alne
tum
W.M
at. 1
952
360C
bN
52.7
2452
E23
.669
3811
3H
ajnó
wka
Leśn
a19
96F1
1O
lJFr
axin
o-Al
netu
m W
.Mat
. 195
251
8Ad
N52
.672
19 E
23.6
8685
114
Haj
nów
kaLe
śna
1996
F12
OlJ
Frax
ino-
Alne
tum
W.M
at. 1
952
518C
bN
52.6
6607
E23
.686
8811
5Bi
ałow
ieża
Zwie
rzyn
iec
1997
F13
OlJ
Frax
ino-
Alne
tum
W.M
at. 1
952
249C
fN
52.7
6186
E23
.732
8211
6Bi
ałow
ieża
Zwie
rzyn
iec
1998
F14
OlJ
Frax
ino-
Alne
tum
W.M
at. 1
952
277D
aN
52.7
5377
E23
.731
1211
7Br
owsk
Nar
ewka
1998
F15
OlJ
Frax
ino-
Alne
tum
W.M
at. 1
952
185B
dN
52.7
8628
E23
.744
9911
8Bi
ałow
ieża
Biał
owie
ża19
97F1
6O
lJFr
axin
o-Al
netu
m W
.Mat
. 195
254
7Bd
N52
.660
84 E
23.7
7972
119
Biał
owie
żaBi
ałow
ieża
1997
F17
OlJ
Frax
ino-
Alne
tum
W.M
at. 1
952
610A
fN
52.6
4366
E23
.796
1812
0H
ajnó
wka
Leśn
a19
96F1
8O
lJFr
axin
o-Al
netu
m W
.Mat
. 195
251
8Ad
N52
.673
31 E
23.6
8715
121
Biał
owie
żaZw
ierz
ynie
c19
98F1
9O
lJFr
axin
o-Al
netu
m W
.Mat
. 195
227
7Da
N52
.751
54 E
23.7
3268
Bśw
– fr
esh
coni
fero
us fo
rest
, BM
św –
fres
h m
ixed
con
ifero
us fo
rest
, BM
b –
boog
y m
ixed
con
ifero
us fo
rest
, LM
św –
fres
h m
ixed
bro
adle
aved
fore
st, L
Mw
– m
oist
m
ixed
bre
adle
aved
fore
st, L
św –
fres
h br
oadl
eave
d fo
rest
, OIJ
– a
lder
-ash
fore
st

392 R. Paluch / Leśne Prace Badawcze, 2014, Vol. 75 (4): 385–406Ta
ble
2. C
hang
es in
spec
ies c
ompo
sitio
n an
d st
ruct
ure
in V
1 st
and
(see
Tab
le 1
) in
fres
h pi
ne-w
hortl
eber
ry fo
rest
(Vac
cini
o vi
tis-id
aeae
-Pin
etum
)
DB
H [c
m]
Pinu
s syl
vestr
isPi
cea
abie
sBe
tula
pen
dula
Que
rcus
robu
rPo
pulu
s tre
mul
aSo
rbus
auc
upar
ia19
7519
8619
9720
1219
7519
8619
9720
1219
7519
8619
9720
1219
7519
8619
9720
1219
7519
8619
9720
1219
7519
8619
9720
12Tr
ee n
umbe
r per
hec
tare
0–3
92
--
-80
15
6 22
0 21
614
8 96
20
-
8 -
108
44-
-4
--
-44
-
3.1–
7-
--
-12
0 18
8 17
2 14
844
92
28
-
4 8
12
84
--
--
--
-S
92-
--
200
344
392
364
192
188
48-
128
120
524
-4
--
-44
-7.
1–11
16
12
--
20
100
104
132
-8
36
244
4 -
--
4 -
--
--
-11
.1–1
536
4
12
-4
112
124
112
--
8 8
-4
4 -
--
--
--
--
15.1
–19
44
12
16
12-
12
84
96-
-4
4-
--
4-
--
--
--
-19
.1–2
352
40
20
16
--
20
56-
--
--
-4
4-
--
--
--
-S
148
6848
2824
224
332
396
-8
4836
48
88
-4
--
--
--
23.1
–27
60
36
12
8-
4 8
20-
--
--
--
--
--
--
--
-27
.1–3
111
6 52
20
20
--
-4
--
--
--
--
--
--
--
--
31.1
–35
44
80
72
28-
--
4-
--
--
--
--
--
--
--
-35
.1–3
924
40
72
48
--
--
--
--
--
--
--
--
--
--
39.1
–43
20
12
28
60-
--
--
--
--
--
--
--
--
--
-S
264
220
204
164
-4
828
--
--
--
--
--
--
--
--
43.1
–47
4 24
16
28
--
--
--
--
--
--
--
--
--
--
47.1
–51
4 8
16
12-
--
--
--
--
--
--
--
--
--
-51
.1–5
54
4 8
8-
--
--
--
--
--
--
--
--
--
-55
.1–5
9-
-4
20-
--
--
--
--
--
--
--
--
--
-S
1236
4468
--
--
--
--
--
--
--
--
--
--
Und
ergr
owth
h
< 13
0 cm
228
-12
-24
018
011
664
224
124
168
-88
344
564
192
1616
36-
6427
242
0-

393R. Paluch / Leśne Prace Badawcze, 2014, Vol. 75 (4): 385–406
species composition and DBH structure in one of the per-manent research plots are presented in Table 2. Pine was found to withdraw entirely from the understory layers. At the time of the study onset, there were encountered pine trees with lower DBH values, while at the time being, only thick and medium-sized pine trees were present. Neither was the recruitment of Scots pine noted in the years 1986–2012 nor did it appear in inconspicuous number (Table 2), what testifies to a complete halt of the process of natural re-generation of the species. Notwithstanding the abovemen-tioned lack of recruitment, for which a variety of causes can be held accountable, it is noteworthy to turn attention to a significant increase in the regeneration of understory spruce (trees of DBH <7 cm). Norway spruce is a major competitor for Scots pine in the forest community sur-veyed. In the year 1975, pine dominated both in numbers and stand basal area (Fig. 2), or else it was the most impor-tant component in all of the stand strata, and hence – in the whole forest community. The proportion of pine in stand species composition exceeded 60%, while that of spruce 25%. The proportions were reversed in 2012 when spruce was found to be overwhelmingly dominating in terms of tree density (Fig. 2). Over the same period, the share of birch also declined from 20% to a few percent, whereas pedunculate oak, which provided for a constant element of understory in the past, was not able to make it to the upper tier of the canopy over the last 40 years (Table 2). The
participation of oak in the stand species composition was small and accounted for a few percent (Fig. 2). Though the pine contribution decreased from almost 100% down to 80%, it still remained the dominant species in the commu-nity. On the other hand, spruce was observed to increase its contribution by several times, both in terms of tree number and stand basal area. The participation of Scots pine and silver birch was considerably reduced: in the first of the abovementioned species by almost 40%, while in the sec-ond – down to a marginal value of a few percent (Fig. 2).
Fresh mixed spruce reed grass forest Calamagrostio arundinaceae-Piceetum Sokoł. 1968
In the mixed forest community, the density of both codominant species: Norway spruce and Scots pine was reduced significantly, which was, especially evident in the case of the second of the two species (Table 3). There was a decline in the density of young trees <7 cm DBH. No natural regeneration of pine, neither seedlings or saplings <1.3 m tall nor any older recruitment (7 cm DBH) could be observed in all research plots located in the above community type throughout the whole study period. In the year 2012, only thick and medium-sized pine trees (> 20 cm DBH) were present. Young spruce trees including low spruce undergrowth were found in every research plot and in all measurement periods; how-ever, their numbers heavily depended on the density of old spruce trees (Table 3). Over the last four decades, no silver birch has been noted in any of DBH classes, except for the thinnest trees. At the onset of the study in 1975, the density of hornbeam population did not exceed a few trees per 1 ha. In 2012, there were significant numbers of hornbeam in the DBH class up to 3 cm (> 400/ha), and some individuals were even able to strengthen their position in the stand, advancing to higher DBH classes.
The most noticeable changes in the tree species den-sity were registered in the years 1997–2012. The den-sity of hornbeam, classified in the lowest DBH class, increased by about 10 times (Table 3). The hornbeam re-generation was observed to increasingly dominate in the understory, competing strongly with other tree species including Norway spruce (Fig. 3). Some hornbeam trees gained about 25 cm in DBH, which testifies to a high dynamics of the species and its expansion to mesotroph-ic sites outside its ecological optimum. Spruce, pine and birch diminished markedly in their their participation, calculated based on the species densities, while the pro-portion of hornbeam significantly increased (Fig. 4).
Things seemed different when analysing the stand basal area in respective tree species. The stand basal area in spruce and pine fluctuated only slightly – DBH incre-
Figure 2. Tree species share (according to: a – density, b – basal area) in 1975–2012, based on permanent V1 research plot (see Table 1) in fresh pine-whortleberry forest (Vaccinio vitis-idaeae-Pinetum). Other tree species: Populus tremula. Sorbus aucuparia

394 R. Paluch / Leśne Prace Badawcze, 2014, Vol. 75 (4): 385–406Ta
ble
3. C
hang
es in
spec
ies c
ompo
sitio
n an
d st
ruct
ure
in C
P1st
and
(see
Tab
le 1
) in
mix
ed fr
esh
fore
st (C
alam
agro
stio
aru
ndin
acea
e-Pi
ceet
um)
DB
H
clas
ses
[cm
]
Pice
a ab
ies
Pinu
s syl
vestr
isQ
uerc
us ro
bur
Betu
la p
endu
laCa
rpin
us b
etul
usO
ther
1975
198
619
9720
1219
7519
8619
9720
1219
7519
8619
9720
1219
7519
8619
9720
1219
7519
8619
9720
1219
7519
8619
9720
12Tr
ee n
umbe
r per
hec
tare
0–3
76
240
292
404
--
--
12
4 36
24
8-
--
116
4 12
56
49
2-
40
84
-3.
1–7
72
48
120
164
--
--
8 8
4 4
--
--
4 8
4 40
--
--
S14
828
841
256
8-
--
-20
1240
252
--
-11
68
2060
532
-40
844
7.1–
1148
44
28
32
--
--
4 -
--
--
--
-4
4 8
--
--
11.1
–15
52
28
16
20-
--
--
--
-4
--
--
--
4-
--
-15
.1–1
932
24
28
16
--
--
--
--
-8
--
--
4 -
--
--
19.1
–23
40
16
4 8
4 4
--
--
--
4 -
--
--
--
--
--
S17
211
276
764
4-
-4
--
-8
8-
--
48
12-
--
-23
.1–2
736
32
16
8
4 -
--
4 -
--
16
8 -
--
--
4-
--
-27
.1–3
140
12
16
24
4 8
--
-4
4 4
8 -
--
--
--
--
--
31.1
–35
4 44
28
12
12
4 8
--
--
-16
8
--
--
--
--
--
35.1
–39
12
8 12
16
8 12
8
4-
--
-4
8 -
--
--
--
--
-39
.1–4
316
16
20
24
12
16
8 4
--
--
4 4
--
--
--
--
--
S10
811
292
8440
4024
84
44
448
28-
--
--
4-
--
-43
.1–4
712
12
12
12
8 12
12
8
--
--
8 8
--
--
--
--
--
47.1
–51
-4
4 16
12
8 16
20
--
--
--
4 -
--
--
--
--
51.1
–55
8 12
8
88
4 -
12-
--
--
--
--
--
--
--
-55
.1–5
98
4 4
4-
-12
-
--
--
--
--
--
--
--
--
59.1
–63
--
4 4
8 12
-
4-
--
--
--
--
--
--
--
-63
.1–6
74
8 -
84
-4
4-
--
--
--
--
--
--
--
-71
.1–7
5-
--
--
-8
4-
--
--
--
--
--
--
--
-75
.1–7
9-
-4
4-
--
4-
--
--
--
--
--
--
--
-S
3240
3656
4036
5256
--
--
88
4-
--
--
--
--
Und
er-
grow
th
h <
130
cm
376
1092
304
248
--
--
228
560
292
248
244
260
-8
128
132
492
3211
2411
76-
Oth
er: S
orbu
s auc
upar
ia, A
cer p
lata
noid
es, P
opul
us tr
emul
a, M
alus
sylv
estr
is, S
alix
cap
rea

395R. Paluch / Leśne Prace Badawcze, 2014, Vol. 75 (4): 385–406
Figure 3. Visualisation of tree species composition in C1 stand in fresh mixed spruce-reed grass forest Calamagrostio arundinaceae-Piceetum in the period 1975–2012: So – Pinus sylvestris, Św – Piceaabies, Jrz – Sorbus aucuparia, Wb – Salix caprea, Os – Populus tremula, Brz – Betula pendula, Jb – Malus sylvestris, Kl – Acer platanoides, Gb – Carpinus betulus, Db – Quercus robur
Figure 4. Tree species share (according to: a – density, b – basal area) in 1975–2012, based on permanent C1 research plot (see Table 1) in fresh mixed forest (Calamagrostio arundinaceae-Piceetum). Other tree species: Sorbus aucuparia. Acer platanoides
Figure 5. Visualisation of tree species composition in M6 stand (see Table 1) in hornbeam-bastard balm forest Melitti-Carpinetum in the period 1975–2012: So – Pinus sylvestris, Św – Picea abies, Jrz –Sorbus aucuparia, Gb – Carpinus betulus, Db – Quercus robur

396 R. Paluch / Leśne Prace Badawcze, 2014, Vol. 75 (4): 385–406
ment provided compensation for declining tree numbers of the above species. The participation of hornbeam in the stand was observed to be significantly increased, while a reverse trend was noted in the case of birch (Fig. 4).
Oligotrophic hornbeam–bastard balm forest MC Sokoł. 1976
In this forest community, an exceptionally huge ex-pansion of common hornbeam was observed in the lower understory. The number of hornbeam trees in the lowest DBH class (<3 cm) increased from several tens per 1 ha in 1986 to 3.3 thousand in 2012. The species dominated the entire lower understory creating a thick second tier of the stand (Fig. 5), thus making it impossible for other tree species to regenerate. Hornbeam maintained its dom-ination among the undergrowth lower than 1.3 m, while its density in this group attained about 250 individuals/ha. Abundant recruitment of common spruce was al-ready evident at the study onset in the 1970s. Ultimately, hornbeam was observed to replace Norway spruce in the lower understory. In the higher stand layers, a marked de-cline was noted in the participation of pedunculate oak, pine and spruce. Owing to the abundance of appearing young hornbeams, the participation of this species, calcu-lated based on its numbers, increased significantly, while that of the remaining species largely declined (Fig. 6).
Over the nearly four decades long study period, the participation of pine in the stand basal area substantially
declined, while inverse trends were observed for hornbeam and spruce. The parcticipation of oak stayed at the same level (Fig. 6).
Typical linden–hornbeam forest Tilio-Carpinetum typicum Tracz.1962
The most typical changes in stand structure and species composition in this forest type are shown in the example of TCt20 plot (Table 5, see also Table 1). Generally, the fol-lowing species were found to withdraw from the linden–hornbeam stands: silver birch, Scots pine, Norway spruce and pendunculate oak, while in some stands the first three species were not encountered right from the onset of the study. The density of hornbeam, an important component of linden–hornbeam forest, steadily increased and the spe-cies became dominant in the lower and middle layers of the stand. In the year 2012, there were 1.3 thousand horn-beams in the <1.3 cm DBH class per 1 ha. It was the only species effectively regenerating in numbers up to 3.3 thou-sand per 1 ha in the recruitment and low growth (<1.3 m) story. The recruitment of linden with a small density was also observed (Table 5).
Owing to the abundance of appearing young horn-beam trees, participation of this species, calculated based on its numbers, substantially increased (Fig. 7), while that of other species largely declined. This can be explained also by the withdrawal of respective tree spe-cies from various stand layers.
Figure 6. Tree species share (according to: a – density, b – basal area) in 1975–2012 based on permanent M6 research plot (see Table 1) in fresh mixed forest
Figure 7. Tree species share (according to: a – density, b –basal area) in 1975–2012 based on permanent TCt20 research plot (see Table 1) in typical linden–hornbeam forest (Tilio-Carpinetum typicum)

397R. Paluch / Leśne Prace Badawcze, 2014, Vol. 75 (4): 385–406Ta
ble
4. C
hang
es in
spec
ies c
ompo
sitio
n an
d st
ruct
ure
in M
6 st
and
(see
Tab
le 1
) in
horn
beam
-bas
tard
bal
m fo
rest
(Mel
itti-C
arpi
netu
m)
DBH
clas
ses
[cm
]
Pice
a ab
ies
Pinu
s syl
vestr
isCa
rpin
us b
etul
usQ
uerc
us ru
bra
Sorb
us a
ucup
aria
Betu
la p
endu
la19
7519
8620
1219
7519
8620
1219
7519
8620
1219
7519
8620
1219
7519
8620
1219
7519
8620
12Tr
ee n
umbe
r per
hec
tare
0–3
484
292
12-
--
328
3324
--
-28
--
--
43.
1–7
8016
424
--
-64
5216
0-
--
--
--
--
Ʃ56
445
636
--
-96
6034
84-
--
28-
--
-4
7.1–
1148
4412
--
-16
2040
--
--
--
--
-11
.1–1
540
288
--
-4
88
--
--
--
--
-15
.1–1
928
1216
--
-4
1616
--
--
--
--
-19
.1–2
324
284
--
--
-12
--
--
--
--
-Ʃ
140
112
40-
--
2444
76-
--
--
--
--
23.1
–27
3216
4-
--
--
8-
--
--
--
--
27.1
–31
2820
8-
4-
--
8-
--
--
--
--
31.1
–35
1620
48
--
--
--
--
--
--
--
35.1
–39
1216
84
4-
--
--
--
--
--
--
39.1
–43
84
168
--
--
--
--
--
--
--
Ʃ96
7640
208
--
-16
--
--
--
--
-43
–47
88
412
124
--
--
--
--
--
--
47–5
112
88
208
--
--
--
--
--
--
-51
–55
48
1220
204
--
--
--
--
--
--
55–5
94
8-
2812
12-
--
--
--
--
--
-59
–63
--
-36
284
--
-12
4-
--
--
--
63–6
74
4-
48
8-
--
-4
--
--
--
-67
–71
--
4-
-8
--
--
--
--
--
--
71–7
5-
-4
-8
4-
--
-4
--
--
--
-79
–83
--
4-
--
--
--
-4
--
--
--
Ʃ32
3636
120
9644
--
-12
124
--
--
--
Und
ergr
owth
h
< 13
0 cm
--
128
--
--
-99
2-
-36
--
--
-12

398 R. Paluch / Leśne Prace Badawcze, 2014, Vol. 75 (4): 385–406Ta
ble
5. C
hang
es in
spec
ies c
ompo
sitio
n an
d st
ruct
ure
in T
Ct2
0 st
and
(see
Tab
le 1
) in
typi
cal l
inde
n–ho
rnbe
am fo
rest
(Tili
o-C
arpi
netu
m ty
picu
m)
DBH
clas
ses
[cm
]
Pice
a ab
ies
Que
rcus
robu
rPi
nus s
ylve
stris
Carp
inus
bet
ulus
Betu
la p
endu
laTi
lia co
rdat
a19
7519
8620
1219
7519
8620
1219
7519
8620
1219
7519
8620
1219
7519
8620
1219
7519
8620
12Tr
ee n
umbe
r per
hec
tare
0–3
6852
--
--
--
-12
492
1224
--
-40
84
3.1–
712
424
-4
--
--
-12
864
24-
--
328
4Ʃ
192
76-
4-
--
--
252
156
1248
--
-72
168
7.1–
1192
40-
4-
--
--
4052
32-
--
164
-11
.1–1
572
56-
204
--
--
436
20-
--
412
415
.1–1
956
3624
3216
4-
--
-4
404
--
-4
-19
.1–2
332
6016
48
-8
--
--
208
8-
--
-Ʃ
252
192
4060
284
8-
-44
9211
212
8-
2020
423
.1–2
720
2020
124
-12
--
--
--
--
--
427
.1–3
116
1228
2816
--
4-
--
8-
--
--
-31
.1–3
54
2016
1212
-16
4-
--
--
--
--
-35
.1–3
912
48
412
88
4-
--
-4
4-
--
-39
.1–4
3-
8-
48
824
168
--
--
--
--
-Ʃ
5264
7260
5216
6028
8-
-8
44
--
-4
43.1
–47
44
8-
48
128
4-
--
--
--
--
47.1
–51
--
48
-8
2020
12-
--
4-
--
--
51.1
–55
--
-4
48
-12
--
--
--
--
--
55.1
–59
--
-4
8-
--
24-
--
4-
--
--
59.1
–63
--
-4
8-
--
--
--
48
--
--
63.1
–67
--
4-
--
--
--
--
--
--
--
Ʃ4
416
2024
2432
4040
--
-12
8-
--
-U
nder
grow
th
h <
130
cm36
--
648
4-
--
356
432
3288
--
-11
672
132

399R. Paluch / Leśne Prace Badawcze, 2014, Vol. 75 (4): 385–406
Participation of respective tree species defined on the basis of the stand basal area (Fig. 7) changed as well. There was an increase in the contribution of hornbeam from a few to 10%, and spruce to about 10% as well. The participation of pine in the stand composition was quite alike in all the study periods, whereas birch with-drew entirely from the stand.
Reedgrass oak–hornbeam forest Tilio-Carpinetum calamagrostietosum Tracz. 1962
Table 6 illustrates changes in stand structure and species composition registered in one of the permanent research plots – Tk8 (Fig. 1). In this plot, the density of hornbeam increased enormously in the lower and middle layers of the stand as was the case with specimens of littleleaf linden classified to the <3 cm DBH class. Hornbeam gained, in terms of numbers, a marked dominance in the stand com-position (Table 6). Its participation increased distinctly in the year 2012, and attained more than 70%. At the same time, a trend was observed towards withdrawal of spruce, the density of which was halved in the respective DBH classes (Table 6). Its participation was markedly reduced, in terms of both tree numbers and stand basal area (Fig. 8) as old growth spruce trees died out and young individuals were lacking (Table 6). The share (determined on the basis
of tree density) of the remaining species, such as oak, alder, linden and birch was also reduced (Fig. 8).
On the other hand, there was an increase in the partic-ipation (defined on the basis of the stand basal area) of such species as hornbeam, oak, linden and alder, where-as a rapid decline in the participation of spruce was ob-served (Fig. 8).
Sub-boreal spruce forest on bog moss Sphagno girgensohnii-Piceetum Polak. 1962
Stages of forest stand development were totally changed in the years 1987–2012, that is when the stand after the op-timal development stage entered via destruction stage the regeneration stage with intense tree regeneration. Three decades earlier, there dominated Norway spruce with little contribution of Scots pine and single deciduous species, including European ash, black alder, pendunculate oak and birches building the undergrowth (Table 7). All the spruce and pine trees observed in the earlier study periods died out in 2012. At that time, all of the main stand components, ex-cept for pine, regenerated, including spruce and hornbeam in the undergrowth (Table 7). Spruce contribution was then highest in the lower understory. Its density attained about 700 trees/ha in the DBH class <7 cm, and 2 thousand in-dividuals per 1 ha in the recruitment and lower understory.
Despite the seemingly substantial change in the de-velopment stage of the stand surveyed (see Table 7), the participation of spruce, calculated by using various meth-ods, remained fairly unchanged (Fig. 9). Only in the years 1997–2012, this participation, calculated on the basis of tree number, increased up to about 15%. In the same way, the participation of hornbeam increased from the level of a few to 10% (Fig. 9). Throughout the period analysed, the share of individual species in the stand basal area fluctuated only marginally, that is, it oscillated within the limits of 77–84% for spruce, 10–20%, for pine, while for the remaining species – a lump change amounted to a few percent. In 2012, the participation of hornbeam in the stand basal area reached 2% (Fig. 9).
Alder-ash forest Fraxino-Alnetum W. Mat. 1952
In the years 1997–2012, the numbers of ash trees were dramatically reduced in all the stand layers in the research plot F13 (Tables 1, 8). Whereas in the year 1997, almost 800 ash trees in the DBH class <7 cm could be counted per one hectare. In the year 2012, this number reduced to about 50. The density of ash trees in the remaining DBH classes was also substantially reduced, which was particularly ev-ident among the thickest trees (Table 8). Ash is considered
Figure 8. Tree species share (according to: a – density, b – basal area) in 1998–2011 based on TCt20 research plot (see Table 1) in typical linden-hornbeam forest (Tilio-Carpinetum calamagrostietosum). Other tree species: Acer platanoides, Fraxinus excelsior, Sorbus aucuparia, Ulmus glabra

400 R. Paluch / Leśne Prace Badawcze, 2014, Vol. 75 (4): 385–406Ta
ble
6. C
hang
es in
spec
ies c
ompo
sitio
n an
d st
ruct
ure
in T
k8 st
and
(see
Tab
le 1
) in
typi
cal l
inde
n-ho
rnbe
am fo
rest
(Tili
o-C
arpi
netu
m c
alam
agro
stie
tosu
m)
DBH
cl
asse
s [c
m]
Carp
inus
be
tulu
sPi
cea
abie
sQ
uerc
us
robu
rTi
lia co
rdat
aAl
nus
glut
inos
aBe
tula
pe
ndul
aSo
rbus
au
cupa
riaAc
er
plat
anoi
des
Frax
inus
ex
celsi
orU
lmus
gla
bra
1997
2012
1997
2012
1997
2012
1997
2012
1997
2012
1997
2012
1997
2012
1997
2012
1997
2012
1997
2012
Tree
num
ber p
er h
ecta
re0–
324
1912
--
--
-38
84
84
104
412
-4
-4
-4
3.1–
728
36-
--
-28
8-
4-
4-
--
--
--
-S
5219
48-
--
-28
396
412
410
84
12-
4-
4-
47.
1–11
88
124
--
208
--
--
--
--
--
--
11.1
–15
1220
1212
--
1624
--
--
--
--
--
--
15.1
–19
48
124
--
412
--
44
--
--
--
--
19.1
–23
44
128
--
124
4-
--
--
--
--
--
S28
4048
28-
-52
484
-4
4-
--
--
--
-23
.1–2
74
1216
4-
-4
8-
44
--
--
--
--
-27
.1–3
1-
48
4-
-4
128
4-
--
--
--
--
-31
.1–3
54
-12
20-
--
-4
48
8-
-4
--
--
-35
.1–3
9-
44
12-
--
-4
8-
--
--
--
--
-39
.1–4
3-
-28
--
--
--
4-
--
--
--
--
-S
820
6840
--
820
1624
128
--
4-
--
--
43.1
–47
-4
12-
--
--
--
--
4-
--
--
--
47.1
–51
44
24-
--
--
--
--
--
--
--
--
51.1
–55
--
48
--
--
48
--
--
--
--
--
55.1
–59
--
128
--
--
--
--
--
--
--
--
59.1
–63
--
4-
44
--
--
--
--
--
--
--
67.1
–71
4-
--
4-
--
--
--
--
--
--
--
71.1
–75
--
4-
--
--
--
--
--
--
--
--
75.1
–79
--
--
-4
--
--
--
--
--
--
--
91.1
–95
--
--
44
--
--
--
--
--
--
--
95.1
–99
--
--
84
--
--
--
--
--
--
--
99.1
–103
--
--
-4
--
--
--
--
--
--
--
111.
1–11
5-
--
-4
--
--
--
--
--
--
--
-11
5.1–
119
--
--
-4
--
--
--
--
--
--
--
S8
860
1624
24-
-4
8-
-4
--
--
--
-

401R. Paluch / Leśne Prace Badawcze, 2014, Vol. 75 (4): 385–406Ta
ble
7. C
hang
es in
spec
ies c
ompo
sitio
n an
d st
ruct
ure
in S
1 st
and
(see
Tab
le 1
) in
spru
ce-b
og m
oss a
ssoc
iatio
n (S
phag
no g
irgen
sohn
ii-Pi
ceet
um)
DBH
clas
ses
[cm
]
Pice
a ab
ies
Pinu
s syl
vestr
isAc
er
plat
anoi
des
Carp
inus
be
tulu
sSo
rbus
au
cupa
riaBe
tula
pen
dula
Frax
inus
ex
celsi
orQ
uerc
us ro
bur
Oth
er
1975
1986
2012
1975
1986
2012
1975
1986
2012
1975
1986
2012
1975
1986
2012
1975
1986
2012
1975
1986
2012
1975
1986
2012
1975
1986
2012
Tree
num
ber p
er h
ecta
re0–
360
013
3255
2-
-4
44
-52
4810
428
88
288
164
2416
-60
124
--
43.
1–7
2488
112
--
364
--
816
--
--
424
-8
8-
48
-12
--
S62
414
2066
4-
-40
84
-60
6410
428
88
292
404
3224
-64
204
412
-4
7.1–
1136
244
--
--
--
-4
--
--
--
-4
4-
--
-8
--
11.1
–15
4020
--
--
--
--
--
--
--
--
--
--
--
--
-15
.1–1
948
40-
--
--
--
--
--
--
--
--
4-
--
--
4-
19.1
–23
7240
-4
--
--
--
--
--
--
--
--
--
--
--
-S
196
124
44
--
--
--
4-
--
--
--
48
--
--
484
-23
.1–2
792
36-
-8
--
--
--
--
--
--
--
--
--
--
--
27.1
–31
7664
-12
12-
--
--
--
--
--
--
--
--
--
--
-31
.1–3
588
36-
4420
--
--
--
--
--
--
--
--
--
--
--
35.1
–39
2080
-24
--
--
--
--
--
--
--
--
--
--
--
-39
.1–4
320
36-
820
--
--
--
--
--
--
--
--
--
--
--
S29
625
2-
8860
--
--
--
--
--
--
--
--
--
--
--
43.1
–47
420
--
--
--
--
--
--
--
--
--
--
--
--
-47
.1–5
14
8-
--
--
--
--
--
--
--
--
--
--
--
--
51.1
–55
-4
--
--
--
--
--
--
--
--
--
--
--
--
-55
.1–5
94
--
--
--
--
--
--
--
--
--
--
--
--
--
59.1
–63
-4
--
--
--
--
--
--
--
--
--
--
--
--
-S
1236
--
--
--
--
--
--
--
--
--
--
--
--
-U
nder
grow
th
h <
130
cm63
9226
68-
--
-20
8-
2420
-92
72-
116
16-
4416
-13
296
-4
--
Shru
bsSh
rubs
per
hec
tare
1975
1986
2012
Popu
lus t
rem
ula
-8
-C
oryl
us a
vella
na64
441
40-
Fran
gula
aln
us40
12-
Rib
es ru
brum
16-
-Lo
nice
ra x
ylos
teum
48
-D
aphn
e m
ezer
eum
--
4R
ibes
alp
inum
-40
-
Oth
er: A
lnus
glu
tinos
a, S
alix
cap
rea,
Tili
a co
rdat
a, U
lmus
gla
bra
* as
in T
able
1

402 R. Paluch / Leśne Prace Badawcze, 2014, Vol. 75 (4): 385–406
to be a very important component of the community, but withdrew entirely from the stand species composition in some of the study plots (about 20%). There was no natural regeneration of ash; therefore, its future raises concerns. In a 15-year investigation period, there was observed most significant ash dieback (70% of trees died).
The participation of ash was radically reduced in terms of both tree numbers and stand basal area (Fig. 10). The most significant changes were noted in the density of ash, as its share was reduced from 60% to a little more than 10% (Fig. 10). It should be emphasised that all the spruce trees died out (Table 8), though not long ago, the participation of spruce in the stand basal area was 20%. Significant expansion of hornbeam was noted in this forest community, in particular in the understory (Table 8). Hornbeam participation, cal-culated based on tree numbers, increased by several times, from a few percent to 20% (Fig. 10), although its share in the stand basal area increased only insignificantly. This was because in the year 2012, there dominated trees of <7 cm DBH (Table 8). Black alder was observed to increase its par-ticipation notably in the stand basal area. This participation amounted to as much as 70% in 2012 and was similar to that of ash in the year 1998 (Fig. 10). Thus black alder replaced ash as a dominant component of the tree stand.
Similarity coefficient of species participation in the surveyed forest communities
A high average similarity (the value above 0.8) of stand species composition, determined based on tree numbers, was found in the mixed spruce-reed grass community Calamagrostio arundinaceae-Piceetum (CP) only for the years 1975 and 1986. In all the remaining cases, the similar-ity coefficient attained average values (0.5–0.79) (Fig. 11). Some of the surveyed forest communities showed a steady decrease in similarity in the subsequent study periods. This was evident, in particular, in the mixed spruce reed grass forest community CP, and in the hornbeam-bastard balm forest MC (Fig. 11). This testifies to a considerable rate of changes in species composition in the above forest commu-nities. On the other hand, a considerable similarity of spe-cies composition was observed in all of the study periods in both forms of oak–hornbeam forests: Tilio-Carpinetum typicum (TCt) and Tilio-Carpinetum calamagrostietosum (Tk) as well as sub-boreal spruce forest on bog moss S. In only one period, similarity in alder-ash forest (Fraxino-Al-netum) was 0.6. w confirms significant changes in tree spe-cies composition defined based on the number of trees (Fig. 11). The lowest average similarity of stand species com-position between the onset and end of the study (S4) was found in the hornbeam–bastard balm forest (MC). The sim-ilarity value was low (less than 0.5), which means that stand species composition underwent a significant change. The
Figure 9. Tree species share (according to: a – density, b – basal area) in 1998–2011 based on permanent S1 research plot (see Table 1) in spruce-bog moss association (Sphagno girgensohnii-Piceetum). Other tree species: Acer platanoides, Tilia cordata, Alnus glutinosa, Fraxinus excelsior, Salix caprea, Ulmus glabra, Sorbus aucuparia
Figure 10. Tree species share (according to: a – density, b – basal area) in 1998–2012 based on permanent research plot F13 (see Table 1) in alder-ash forest (Fraxino-Alnetum). Other tree species: Quercus robur, Betula pendula, Sorbus aucuparia, Ulmus glabra

403R. Paluch / Leśne Prace Badawcze, 2014, Vol. 75 (4): 385–406Ta
ble
8. C
hang
es in
spec
ies c
ompo
sitio
n an
d st
ruct
ure
in F
13 st
and
(see
Tab
le 1
) in
alde
r-ash
fore
st (F
raxi
no-A
lnet
um)
DBH
cl
asse
s [cm
]
Carp
inus
be
tulu
sFr
axin
us
exce
lsior
Alnu
s gl
utin
osa
Pice
a ab
ies y
Tilia
cord
ata
Sorb
us
aucu
paria
Ulm
us g
labr
aAc
er
plat
anoi
des
Que
rcus
ro
bur
Betu
la
pend
ula
1997
2012
1997
2012
1997
2012
1997
2012
1997
2012
1997
2012
1997
2012
1997
2012
1997
2012
1997
2012
Tree
num
ber p
er h
ecta
re0–
336
8877
640
152
4-
-88
4016
-8
-16
328
-4
-3.
1–7
-16
128
3640
--
2020
--
--
--
--
--
S36
104
788
4818
844
--
108
6016
-8
-16
328
-4
-7.
1–11
-8
8-
820
--
4-
--
--
--
--
--
11.1
–15
4-
12-
4-
--
4-
--
--
--
--
--
15.1
–19
16-
204
-4
--
44
--
--
--
--
--
19.1
–23
-4
324
-4
--
-12
--
--
--
--
--
S20
1272
812
28-
-12
16-
--
--
--
--
-23
.1–2
7-
1620
4-
4-
-12
4-
--
--
--
--
-27
.1–3
1-
-12
--
-4
-8
--
--
--
--
--
-31
.1–3
5-
-4
-4
--
--
8-
--
-4
--
--
-35
.1–3
9-
-12
-12
-4
--
12-
--
--
4-
--
-39
.1–4
3-
-4
48
1616
--
--
--
--
4-
--
-S
-16
528
2420
24-
2024
--
--
48
--
--
43.1
–47
--
-4
-4
8-
--
--
--
-4
--
--
47.1
–51
--
--
12-
12-
--
--
--
--
--
--
51.1
–55
--
4-
88
--
--
--
--
--
--
--
55.1
–59
--
--
820
4-
--
--
--
--
--
--
59.1
–63
--
--
128
--
--
--
--
--
--
--
63.1
–67
--
4-
412
--
--
--
--
--
--
--
67.1
–71
--
--
44
--
--
--
--
--
--
--
71.1
–75
--
4-
-8
--
--
--
--
--
--
--
75.1
–79
--
4-
4-
--
--
--
--
--
--
--
79.1
–83
--
-4
--
--
--
--
--
--
--
--
87.1
–91
--
--
-4
--
--
--
--
--
--
--
S-
-16
852
6824
--
--
--
--
4-
--
-

404 R. Paluch / Leśne Prace Badawcze, 2014, Vol. 75 (4): 385–406
forest communities surveyed over the whole study period may be aligned along the axis of increasing similarity in the following way: hornbeam–bastard balm forest (MC), fresh pine-whortleberry forest (V), fresh mixed spruce reed grass forest (CP), alder-ash forest (F), sub-boreal spruce forest on bog moss (S), reedgrass oak–hornbeam forest (Tk) and typ-ical linden–hornbeam forest (TCt) (Fig. 11). The smallest changes in the stand species composition were observed in the oak hornbeam forests, while the largest in the mixed hornbeam–bastard balm forests (MC).
4. Discussion
Significant changes in the stand species composition were observed over the study period (15–40 years) in all the forest communities surveyed. The abovementioned period of the study is but a little a fragment of the for-est development history, and this makes it difficult to provide a reliable forecast. The present work basically corroborates the regularities of multiannual changes in species composition of natural stands in the BF, reported by such authors as Bernadzki et al. (1998); Brzeziecki (2008); Brzeziecki et al. (2010); Brzeziecki et al. (2012); Drozdowski et al. (2012) and Drozdowski (2014), and additionally provides new information on the issue con-cerning a variety of forest sites including some relatively rare in the Polish part of the BF, such as sub-boreal spruce forest on bog moss. The study results presented may be regarded as an addition to unique observations of natural forest stand development, systematically conducted over almost 80 years by successive generations of researchers from the Chair of Silviculture (KHL) at the Warsaw Uni-versity of Life Sciences. The changes occurring in stands affect entire forest phytocoenoses. The stand, ecological-ly speaking, shapes the remaining forest strata (Obmiński
1977). The stand is a key component of forest community. By creating specific microclimate, it determines the habitat for organisms, which require definite ecological conditions to live. Moreover, the stand largely dominates the soil de-velopment processes, not only by adding litter, which in-fluences the conditions of the soil upper layers, but also through its own living activities. The stand species com-position, canopy closure, age, structure and many other at-tributes control ecological conditions of the forest interior. It seems that the high dynamics of stand species compo-sition resulted from hornbeam expansion with coincident decrease in the spruce participation. Such scenario of stand development was observed in all the forest communities analysed in this study, except for mixed coniferous–decid-uous forest and sub-boreal spruce forest on bog moss. In the two above communities, spruce was observed to domi-nate the stand, while hornbeam appeared in the lower tiers as an admixture only. Hornbeam is a key element of the oak–linden–hornbeam forests giving these multitier com-munities their specific appearance. The closed canopy of hornbeam in full foliage lets only minimum sunlight to the forest floor. Hornbeam litter, rich in mineral elements, de-composes more rapidly than that of the remaining Poland’s native tree species, and its structure enables the appearance of numerous geophyte species. The presence of hornbeam in the oak–linden–hornbeam forests plays a major role in maintaining appropriate structure, species composition, environmental conditions and, above all, seasonal rhythms of the community (Faliński and Pawlaczyk 1993). The expansion of hornbeam may result, even on oligotrophic sites, in an increased homogeneity of a variety of forest communities, which may become more or less similar to an oak-hornbeam forest (Sokołowski 1991; Paluch 2001). Hornbeam is a species of competitive life strategy, which consist in monopolisation of the access to environ-
Figure 11. Similarities in tree species composition determined based on tree density in investigated forest associations during subsequent observation periods in 1975–2012

405R. Paluch / Leśne Prace Badawcze, 2014, Vol. 75 (4): 385–406
mental resources, that is, in preventing other species from regeneration, growing and developing under the hornbeam canopy. The species ensures its large life space, thanks to the development of a wide and low-framed crown, which strongly shadows the forest floor, especially on oligotroph-ic sites (Brzeziecki 2000). An umbrella-shaped crown enhances the effect of hornbeams on microclimate in the forest interior. The hornbeam expansion may be regarded as one of the reasons for changes in the species composi-tion of forest communities. Evidence of changes was so compelling that it justified the necessity for updating ear-lier phytosociological and habitat diagnoses (Sokołowski 1991, 2004; Paluch 2002). The works cited above report-ed changes in the vegetation of foremost mesotrophic and thermophilic plant communities. Based on this study, it can be demonstrated that changes of analogous character were noted in some eutrophic and swamp communities. Similar results were obtained by Czerepko and Sokołowski (2006) and Czerepko (2011) on permanent study plots estab-lished in northeastern Poland.
Based on the study carried out on the permanent plot established in the Białowieża National Park (1959–1998), Paluch (2001, 2003) indicated that floristic changes in wet habitats were considerably less pronounced. The author suggested that specific situation of wet habitats results from the fact that these sites developed on semihydrogenic and/or hydrogenic soils, where water plays a major soil-form-ing role. Hence, the communities encountered in these sites were of relatively stable and close to climax character. A high groundwater level assured the survival, but only of a limited group of tree species best adapted to such condi-tions. Moreover, swamp habitats usually develop on fertile soils with high-buffering capacity (Brzeziecki and Żybura 1998; Bernadzki et al. 1998; Paluch 2003).
The withdrawal of ash from the stand species compo-sition is not a phenomenon restricted to the BF. Massive dieback of ash trees, and generally ash in forest stands, was first noted on a large scale in Poland and in through-out Europe at the beginning of 20th century (Gil et al. 2011), and this phenomenon has continued up to now. The studies performed indicate that ash disappeared from all the stand strata under natural conditions as well. No ash regeneration can be observed any longer. In several cases, ash was found to disappear entirely from the study plots over just a 15-year-long period. It is not known when ash will start to regenerate, at the moment, there is no indication whatsoever as to when it may occur. Surely, the present health status of ash raises concerns since the condition of the still living individuals is bad.
The expansion of hornbeam is not yet over (Bernadzki et al. 1998; Brzeziecki (2008); Brzeziecki et al. (2012).
Brzeziecki (2008), when analysing the multiannual study material collected from the permanent study plots in the Białowieża National Park, considered what should hap-pen for hornbeam to withdraw. Paluch (2001) claimed that trends to establish hornbeam stands in a variety of habitats would be more pronounced, and this forecast works after 10-year period. Depletion of vital, produc-tive tree species, such as pine, spruce, oak and ash under close to natural conditions, and simultaneous increase in the participation of species having a substantially lower significance for productivity purposes, are of great im-portance for long-term sylvicultural planning. Taking into account the trends of changes recognised and the accel-eration of these changes in the BF, human intervention would be advisable in order to maintain valuable popu-lations of vulnerable species and stimulate their natural regeneration. Setting aside more and more areas and excluding them from any human intervention does not and will not support the achievement of the abovemen-tioned goals. Within this context, an important general question arises: how close our silvicultural activities may get to the natural ecological processes without failing to achieve economic and protective goals, evaluated from the human viewpoint (wind protection, soil protection, landscape protection and the like).
5. Statements and conclusions
Over a period of the last nearly four decades, thereoccurred an increase in the participation of common hornbeam in the stand species composition in many forest communities of the BF. Hornbeam was found to expand into a variety of habitats including oligotrophic, moderately fertile and wet sites.
Under natural conditions, hornbeam dominated in the regeneration in the majority of forest communities surveyed, except for mixed coniferous–deciduous forest and sub-boreal spruce forest on bog moss, though in the latter study period, it marked its presence also in the two abovementioned communities.
Spruce was found to withdraw to oligotrophic forest communities. Its numbers were drmatically reduced in stands of mixed coniferous-deciduous forests and oak–linden–hornbeam forests.
The participation of highly light demanding species such as pine, oak and birch in stand composition was markedly reduced in the stands of the BF, including also the regeneration layer. Pine is not regenerating effectively.
Over a short period of the last 15 years, there oc-curred a rapid and dramatic reduction of ash participa-tion under optimal condition of ash-alder forest.

406 R. Paluch / Leśne Prace Badawcze, 2014, Vol. 75 (4): 385–406
The rate of changes in the stand species composition accelerated over the last 10–15 years.
The trends towards changing the stand species com-position and acceleration of these changes suggest that human intervention is needed in order to preserve valuable populations of vulnerable species in the BF with the aim to support natural regeneration of the withdrawing species.
Acknowledgements
The publication received funds from the National Centre of Science, within the scope of financial means allocated to science in the years 2011–2013, awarded based on the Decision No N N309 703540.
References
Bernadzki, E., Bolibok, L., Brzeziecki B., Zajączkowski J., Żybura H. 1998. Compositional dynamics of natural for-ests in the Białowieża National Park, northeastern Poland. Journal of Vegetation Science, 9: 229–238.
Brzeziecki B. 2000. Strategie życiowe gatunków drzew leśnych [Life-history strategies of forest tree species]. Sylwan, 8: 5–14.
Brzeziecki B. 2008. Wieloletnia dynamika drzewostanów naturalnych na przykładzie dwóch zbiorowisk leśnych Białowieskiego Parku Narodowego: Pino-Quercetum i Tilio-Carpinetum. Studia Naturae, 54, 2: 9–22.
Brzeziecki B., Keczyński A., Zajączkowski J., Drozdowski S., Gawron L., Buraczyk W.et al. 2012. Zagrożone gatun-ki drzew Białowieskiego Parku Narodowego (Rezerwat Ścisły) [Threatened tree species of the Białowieża Nation-al Park (the Strict Reserve)]. Sylwan, 156 (4): 252–261.
Brzeziecki B., Żybura H. 1998. Naturalne zmiany składu gatunkowego i struktury pierśnic na siedlisku olsu je-sionowego w okresie 47 lat. Sukcesja czy regeneracja? [Natural changes in species composition and tree stand d.b.h. structure on the ash-alder forest site during 47 years period: Succession or regeneration?]. Sylwan, 141 (4): 19–31.
Czerepko J. 2011. Zmiany roślinności na siedliskach mokradeł leśnych północno-wschodniej Polski. Rozprawy i Mono-grafie, 16. Sękocin Stary, Instytut Badawczy Leśnictwa, ISBN 978-83-87647-99-5.
Czerepko J., Sokołowski A.W. 2006. Zmiany roślinności mokradeł leśnych na terenie Białowieskiego Parku Nar-odowego. In: Nauka-Przyroda-Człowiek. Materiały Kon-ferencji Jubileuszowej z okazji 85-lecia Białowieskiego Parku Narodowego: 39–58.
Drozdowski S., Brzeziecki B., Żybura H., Żybura B., Gawron L., Buraczyk W. et al. 2012. Wieloletnia dynamika starodrze-
wów w zagospodarowanej części Puszczy Białowieskiej: gatunki ekspansywne i ustępujące [Long−term dynamics of old−growth stands in the managed part of the Białowieża For-est: increasing and declining tree species]. Sylwan, 156 (9): 663–671.
Drozdowski S. 2014. Modelowanie procesów odnowieniowych w lesie naturalnym. Rozprawy Naukowe i Monografie. Warszawa, Wyd. SGGW. ISBN: 978-83-7583-492-5.
Faliński J. B., Pawlaczyk P. 1993. Zarys ekologii. In: Bugała W. (ed.) Grab zwyczajny. Poznań-Kórnik, Sorus: 157–263.
Gil W., Łukaszewicz J., Paluch R., Zachara T. 2011. Jesion wyniosły – zagrożenia i hodowla. Warszawa, PWRiL.
Kowalski M. 1982. Rozwój drzewostanów naturalnych na pow-ierzchni badawczej w Białowieskim Parku Narodowym. Rozprawy Naukowe i Monografie. Warszawa, SGGW.
Matuszkiewicz W. 1952. Zespoły leśne Białowieskiego Parku Narodowego. Lublin, Wyd. UMCS.
Paczoski J. 1930. Lasy Białowieży. Poznań, Państwowa Rada Ochrony Przyrody.
Nagel J. 1999. Konzeptionelle Überlegungen zum schrittweisen Aufbau eines waldwachstumskundlichen Simulationssys-tems für Nordwestdeutschland. Schriften aus der Forstli-chen Fakultät der Universität Göttingen und der Nieders. Forstl. Versuchsanstalt. Band 128, Frankfurt a.M., J.D. Sau-erländer’s Verlag, S. 122.
Paluch R. 2001. Zmiany zbiorowisk roślinnych i typów sied-lisk w drzewostanach naturalnych Białowieskiego Parku Narodowego [Changes in plant communities and habitat types in the natural stands of the Białowieża Primeval For-est]. Sylwan, 145 (10): 73–81.
Paluch R. 2003. Wpływ zmian składu gatunkowego i fazy ro-zwojowej drzewostanu na roślinność runa w Białowieskim Parku Narodowym [Effects of species composition changes and stand development phase on the ground vegetation in the Białowieża Primeval Forest National Park]. Prace In-stytutu Badawczego Leśnictwa, A, 13(950), 4: 39–52.
Sokołowski A.W. 1991. Zmiany składu zbiorowisk leśnych w rezerwatach Puszczy Białowieskiej. Ochrona Przyrody, 49, 2: 1–26.
Sokołowski A.W. 1993. Fitosocjologiczna charakterystyka zbiorowisk leśnych Białowieskiego Parku Narodowego. Parki Narodowe i Rezerwaty Przyrody, 12, 3: 5–190.
Sokołowski A.W. 1960–2004. Materiały archiwalne niepub-likowane – zdjęcia fitosocjologiczne, wyniki pomiarów drzewostanów na stałych powierzchniach badawczych przechowywane w IBL w Białowieży.
Sokołowski A.W. 2004. Lasy Puszczy Białowieskiej. Warsza-wa, CILP. ISBN 8388478443.
Włoczewski T. 1954. Materiały do poznania zależności między drzewostanem i glebą w czasie i przestrzeni. Prace Instytu-tu Badawczego Leśnictwa,123: 161–249.
Translated by: Bożena Kornatowska

Leśne Prace Badawcze (Forest Research Papers),December 2014, Vol. 75 (4): 407–415
DOI: 10.2478/frp-2014-0037
ORIGINAL RESEARCH ARTICLE
Received 31 March 2014, accepted after revision 28 July 2014. © 2014, Forest Research Institute
Biochemical soil activity in Taxus baccata L. stands in forest reserves and managed forests
Grażyna Olszowska
Forest Research Institute, Instytut Badawczy Leśnictwa, Zakład Ekologii Lasu Department of Forest Ecology, Sękocin Stary, ul. Braci Leśnej 3, 05–090 Raszyn, Poland.
tel. +48 22 715 04 08; e-mail [email protected]
Abstract. The aim of these studies was to estimate the enzymatic activity and chemical properties of soils of Taxus baccata L. stands in selected forest reserves as well as in managed forest stands that do not belong to reserves. Furthermore, I compared the soil fertility of both types of forest stand using a biochemical soil quality indicator. The studies were conducted in the following reserves: ‘Bogdanieckie Cisy’, ‘Cisy Rokickie’, ‘Cisy Tychowskie’, ‘Cisy w Czarnem’, as well as in managed forest stands with the same soil and habitat type as the above-mentioned reserves.
Analyses showed a lower activity of urease, asparaginase, acid phosphatase and dehydrogenase in soils of the man-aged forests than in soils of the reserves. The soil nutrient availability given by the total organic carbon, nitrogen, and alkaline cation content as well as soil sorption capacity were significantly lower outside the forest reserves. Chemical and biochemical parameters were used to calculate a biochemical index of soil fertility. The index was higher for soil in forest reserves than for soil in managed forest stands located outside reserves. The result held true regardless of the biochemical parameters used in calculation.
As has been shown in previous studies on protected areas with no cultivation that are largely influenced by natu-ral processes, biochemical indices can be very useful for comparative analyses aiming at estimating soil quality or the reaction of soil to external factors, both natural and anthropogenic.
Key words: enzymatic activity, chemical properties of soils, forest soils, forest reserves
1. Introduction
The microbial mineralisation of the organic matter guarantees the maintenance of the necessary content of nutrients for plant growth; therefore, it is believed that their activity is closely associated with the fertility and productivity of soils (Balicka 1986; Kieliszewska-Rokic-ka 2001; Zwoliński 2004; Amacher et al. 2007). Thanks to their high surface area to volume ratio that ensures a closer relationship with the environment, soil micro-or-ganisms react faster than higher organisms to changes in the soil conditions caused, for example, by stress factors or agricultural practices used in production forests. The response of micro-organisms is usually preceded by a no-ticeable change in the physical and chemical properties of
soil, hence it can be treated as an early indicator of their improvement or degradation (Caldwell 2005; Chaer et al. 2009; Piotrowska 2011; Błońska et al. 2013).
Species composition of stands is one of the factors de-termining the amount of nutrients in forest soils. The plant material (litterfall, dead roots, and root exudates) of vari-ous tree species that get to the soil is diversified in terms of chemical properties. This has a significant impact on soil quality and the quantitative–qualitative composition of soil micro-organisms as well as on the microbial decomposition of the organic matter. Błońska and Januszek (2010) demon-strated that pine forests have a greater inhibitory effect on the enzymatic activity of soils than oak forests have.
The previous studies of fresh mixed (LMśw) and fresh (Lśw) deciduous forest habitats conducted by Olszowska

408 G. Olszowska / Leśne Prace Badawcze, 2014, Vol. 75 (4): 407–415
et al. (2007) showed a discrepancy between the description of habitat types contained in the management plans of for-est districts and the actual chemical properties and the bio-chemical activity of soils. This may be due to an incorrect stand description or incorrect forest management, which can lead to the degradation of habitats manifested by both the depletion of plant communities and the deterioration of the properties of soil top layers. The parameters defining soil fertility are a more precise indicator in the typological diagnosis than the floristic and phytosociological relations, as the latter may undergo strong deformations caused by silvicultural operations. This may therefore suggest, as in-dicated by numerous studies (Leirós et al. 2000; Saviozzi et al. 2001; Russell 2005), that the properties of soils ex-pressed as their chemical composition and biological ac-tivity are a reliable indicator of soil fertility.
The literature data show that there are few studies of on the enzymatic activity of soils in nature reserves. Błońs-ka (2011a) established that the activity of dehydrogenases and urease in agricultural soils set aside for afforestation is lower than in the soils in forest reserves. The studies by Lagomarsino et al. (2011) indicated an increase in the mi-crobial activity in forest soils and a decrease in the soils under vineyards and pastures resulting from the use of the available resources and the reduction in the amount of sub-strate for soil micro-organisms A comprehensive approach to this issue should, first of all, take into account forest soils characterised by an intact system of genetic horizons. In particular, forest reserves can be used in the studies related to the monitoring of changes in the natural environment.
The aim of the research was to determine the enzy-matic activity and chemical properties of soils in the selected yew reserves and managed forests outside the reserves as well as to use the biochemical index for the comparison of soil fertility in and outside the reserves.
2. Materials and methods
The study was conducted in four lowland reserves: ‘Bogdanieckie Cisy’, ‘Cisy Rokickie’, ‘Cisy Tychowsk-ie’, ‘Cisy w Czarnem’ and in the neighbouring production forests located outside the reserves. Forests outside the re-serves had the same type of soils and habitats and a similar species composition as in the reserves (Forest Manage-ment Plans of Forest Districts: Bogdaniec (2014), Black Człuchowskie (2012), Rokita (2010), Tychowo (2008)).
The yew reserves ‘Bogdanieckie Cisy’ and ‘Cisy Rok-ickie’ lie in Pomerania. The reserve ‘Bogdanieckie Cisy’ is located in the macroregion of Pojezierze Południowopo-morskie (South Pomeranian Lake District) (314.6/7) and
in the mezoregion of Równina Gorzowska (Gorzów Plain) (314.61) (Kondracki 2002). The stands of the reserve occur in fresh mixed deciduous (LMśw) and fresh mixed conifer-ous (BMśw) forests, on Haplic Arenosols developed from loamy sands. The forest stand consists mainly of beech, pine, oak and yew. The reserve ‘Cisy Rokickie’ is located in the mezoregion of Równina Goleniowska (Goleniów Plain) (313.25), which is part of Pobrzeże Szczecińskie (Szczecin Coastal Zone). The stands in the reserve occur in the fresh mixed coniferous forest (BMśw), on former ag-ricultural, podzolic soil, sand. Pine, beech, birch, oak and yew are the common species in the reserve.
The nature reserve ‘Cisy w Czarnem’ is located in the macroregion of Pojezierze Południowopomorskie (314.6/7) and in the mezoregion of the Gwda Valley (314.68) (Kondracki 2002). The stands in the reserve grow in the moist mixed deciduous forest (LMw) hab-itat, on Saprihisti-Gleyic Podzols and in a small area of Haplic Gleysols. The prevailing area of the reserve is covered by beech pine and alder old-growth forests, with occasional spruce and yew.
The reserve ‘Cisy Tychowskie’ is located in the mac-roregion of Pobrzeże Południowobałtyckie (South Baltic Coastal Zone) (313) and mezoregion of Równina Białog-ardzka (Białogard Plain) (313.42) (Kondracki 2002). The stands of the reserve occur in moist mixed (LMw) and fresh mixed (LMśw) deciduous forest habitats, on Podzols and Haplic Gleysols. The stand consists mainly of beech, birch, and alder, with occasional hornbeam, oak, and yew.
Ten sample plots were established in each of the re-serves and five plots in each of the stands outside the reserves. In the years 2011–2013, the overall volume samples were taken from each plot (from 10 points) from organic (O) and humus (A) horizons for chemical analyses and measurements of biochemical soils.
The enzyme studies included the measurement of the activity of four enzymes: urease and asparaginase de-termined by the colorimetric method, expressed in mg N-NH4 per 10 g of soil, acid phosphatase by the color-imetric method in mg PNP per 10 g of soil and dehy-drogenase by the colorimetric method in mg of phenyl formazan (TFF) per 10 g of soil (Russell 1972). Soil chemical analyses made by the generally accepted meth-ods (Ostrowska et al. 1991) included the determination of: soil pH after adding 1M KCl by the potentiometric method, total nitrogen content by the Kjeldahl method, total organic carbon using a Leco SC-132 analyzer, the content of exchangeable base cations after leaching with 1M ammonium acetate by the atomic absorption meth-od, and hydrolytic acidity (Hh) by Kappen’s method.

409G. Olszowska / Leśne Prace Badawcze, 2014, Vol. 75 (4): 407–415
The sum of base cations (BS) and the sorption capacity of soils (Th) was calculated.
The results of chemical and biochemical meas-urements were used to calculate the value of the bio-chemical index of forest soil fertility (BW). In order to calculate the BW index values, the method of Myśkówa et al. (1996) was modified by using the formula:
BW= M2+C2+BS2+Th2
where: M – enzymatic activity of soils, C – organic carbon, BS – the sum of base cations, Th – sorption capacity.
M in the above equation was replaced by the standard-ised results of the chemical analyses and measurements of the total enzymatic activity of organic and humus ho-rizons (in standard deviation units), taking alternately, one of the tested enzymes: dehydrogenase (D), urease (U), asparaginase (A) and acid phosphatase (F).
The multivariate analysis of variance was used for the statistical assessment of the chemical and biological pa-rameters of soils in the reserves and managed forests. To verify the significance of differences in the chemical and biological parameters between organic and humus hori-zons, a nonparametric Wilcoxon test was used. The re-lationships between the biological activity and chemical properties of soils and between individual biochemical
parameters of soils were determined using the Pearson correlation coefficients, assuming 95% confidence lim-its (p < 0.05) for the verification of the significance level. Statistical calculations were performed using Statistica 10.
3. Results
Soil chemical properties
The mean values of soil chemical parameters, together with the standard error of the mean are presented in Table 1.
Soil pH on all plots, regardless of the location, was strongly acidic, whereas pH KCl in the organic (O) hori-zon was significantly lower (p < 0.001) compared to the humus (A) horizon. In the reserve ‘Bogdanieckie Cisy’, soil pH in the A horizon was significantly higher (p < 0.01) than outside the reserve, whereas soil pH in the O horizon in the reserve ‘Cisy w Czarnem’ was significantly lower (p < 0.05) than in the soils outside the reserve.
On all the plots, regardless of the place of sampling, the contents of C and M, and the sum of base cations (BS), as well as hydrolytic acidity (Hh) and sorption ca-pacity (Th) were significantly higher (p < 0.001) in the O horizon than in the humus horizon of the examined soils. The chemical analysis showed a significant cor-
Table 1. Chemical properties of soil organic and humus horizons (mean±standard error)
Study plotsSoil
horizonpHKCl N (%) C (%) BS Hh Th
Forest reserve ‘Bogdanieckie Cisy’
O 3.19±0.06 1.29±0.07 28.05±1.59 7.19±0.44 60.21±4.58 67.40±4,57
A 3.34±0.05 0.13±0.01 2.95±0.21 1.07±0.16 17.37±1.85 18.44±1.84
Managed forestsO 3.03±0.07 0.90±0.09 20.99±2.10 6.63±0.58 79.55±6.06 86.18±6.04
A 3.08±0.07 0.10±0.01 1.96±0.28 0.81±0.21 25.97±2.45 26.77±2.44
Forest reserve ‘Cisy Rokickie’
O 2.86±0.06 1.07±0.09 28.35±1.59 6.05±0.42 89.39±5.47 95.44±5.53
A 3.20±0.08 0.20±0.03 4.96±0.38 0.60±0.11 21.02±1.73 21.62±1.79
Managed forestsO 3.00±0.08 0.89±0.12 16.95±2.10 3.89±0.55 61.37±7.23 65.26±7.32
A 3.16±0.11 0.25±0.04 3.26±0.50 0.61±0.14 12.50±2.28 13.10±2.36
Forest reserve ‘Cisy w Czarnem’
O 2.92±0.02 1.62±0.09 32.93±1.77 8.38±0.72 94.10±4.90 102.48±5.27
A 2.96±0.06 0.96±0.03 17.90±1.09 1.72±0.21 46.34±6.51 48.06±6.67
Managed forestsO 3.01±0.03 1.07±0.12 15.70±2.35 5.06±0.95 35.40±6.49 40.47±6.97
A 3.11±0.08 0.38±0.04 7.00±1.44 0.77±0.28 19.63±8.61 20.39±8.83
Forest reserve ‘Cisy Tychowskie’
O 3.04±0.07 1.23±0.08 26.55±1.52 9.43±0.65 66.37±4.82 75.81±4.80
A 3.11±0.09 0.46±0.03 6.59±0.64 2.49±0.25 23.90±2.45 26.39±2.49
Managed forestsO 3.11±0.09 0.36±0.10 6.87±2.02 5.96±0.86 25.10±6.38 31.06±6.35
A 3.40±0.12 0.08±0.04 1.86±0.84 0.80±0.34 8.26±3.25 9.06±3.30

410 G. Olszowska / Leśne Prace Badawcze, 2014, Vol. 75 (4): 407–415
relation between the content of organic carbon and the place of soil sampling; statistically significantly higher values (p < 0.05) were recorded in the reserves ‘Bog-danieckie Cisy’ and ‘Cisy Rokickie’ than outside them. The content of organic carbon in the soils of the reserves ‘Cisy w Czarnem’ and ‘Cisy Tychowskie’ was two-fold higher than outside the reserves, the differences were statistically significant (p < 0.001).
There was more nitrogen in the soils in the reserves than outside them, both in O and A horizons. Significant dif-ferences in nitrogen content (p < 0.01) were found in the reserves ‘Bogdanieckie Cisy’, ‘Cisy w Czarnem’ and ‘Cisy Tychowskie’.
The soils in the reserves ‘Cisy Rokickie’, ‘Cisy w Czarnem’ and ‘Cisy Tychowskie’ showed a high content of base cations. In both examined horizons, their sum (BS) was significantly larger (p < 0.05) in the soils in the reserves than outside the reserves.
The soils in the reserve ‘Bogdanieckie Cisy’ had sig-nificantly lower (p < 0.05) hydrolytic acidity (Hh) and sorption capacity (Th) than the soils outside the reserve. In the reserves ‘Cisy Rokickie’, ‘Cisy w Czarnem’ and ‘Cisy Tychowskie’, the hydrolytic acidity and sorption capacity of soils, both in the O and A horizons were sig-nificantly higher (p < 0.05) than outside the reserves.
Enzymatic activity of soils
The activity of the enzymes was closely related to the content of organic matter, hence it was significantly higher in the O horizon (p < 0.001) than in the A horizon in all the examined soils inside and outside the reserves. (Fig. 1–4).
The activity of urease in the O horizon in all the ex-amined yew reserves was higher than that outside the re-serves. In the case of the reserves ‘Bogdanieckie Cisy’, ‘Cisy Rokickie’ and ‘Cisy Tychowskie’ these differenc-es were statistically significant, whereas in the case of the ‘Cisy w Czarnem’ reserve, they were not significant. The activity of urease in the A horizon in the reserves ‘Cisy w Czarnem’ and ‘Cisy Tychowskie’ was signifi-cantly higher than outside them (Fig. 1).
Similarly, the activity of asparaginase was higher in the O and A horizons of soils in the surveyed reserves than outside them. The observed differences were sig-nificant in the reserves ‘Bogdanieckie Cisy’, ‘Cisy w Czarnem’ and ‘Cisy Tychowskie’ (Fig. 2).
The research showed a significantly higher activity of acid phosphatase in the soils in the reserves ‘Cisy w Czarnem’ and ‘Cisy Tychowskie’ than outside them. The activity of this enzyme was also significantly higher
in the reserve ‘Cisy Rokickie’ than outside it, but only in the humus horizon (Fig. 3).
As in the case of the above-discussed enzymes, the activity of dehydrogenase in all the studied reserves was higher than outside them. The differences were statistical-
Figure 1. Mean urease activity ± standard error. 1, 2, 3, 4 – managed forests. Designation for significant differences between mean values: * p < 0.05, ** p < 0.01, ***p < 0.001.
Figure 2. Mean asparaginase activity ± standard error. Desig-nation as in Figure 1.

411G. Olszowska / Leśne Prace Badawcze, 2014, Vol. 75 (4): 407–415
ly significant only in the O horizon in the reserve ‘Bog-danieckie Cisy’ and in the A horizon in the reserve ‘Cisy w Czarnem’, whereas in other cases, the differences were not significant (Fig. 4).
The above-presented biochemical parameters were cor-related with the selected chemical parameters. The activity
of all the tested enzymes was significantly correlated with the organic carbon content as well as with the sum of cati-ons and the sorption capacity of soils. The activity of ure-ase and acid phosphatase was significantly correlated with the content of nitrogen and hydrolytic acidity. In addition, the activity of urease was significantly correlated with the
Figure 3. Mean acid phosphatase activity ± standard error. Designation as in Figure 1.
Figure 4. Mean dehydrogenase activity ± standard error. Designation as in Figure 1.
Table 2. Correlations (ryx) between biological (y) and biochemical (x) soil parameters
(x). yx
U A D N(%) C(%) BS Hh Th
organic horizonU n 0,3492** 0,4181*** 0,3658** 0,2460* 0,2725* 0,2906*A N n n n 0,2580* n 0,2442*D 0,3492** n n 0,4954*** n n n
Fkw 0,3032* 0,4930*** 0,2600* n 0,5849*** 0,2380* 0,5292*** 0,5489***humus horizon
U 0,6146*** 0,2795* 0,4963*** 0,6306*** 0,2600* 0,3962*** 0,3991***A 0,6146*** n 0,5055*** 0,5340*** n n 0,2365*D 0,3971*** n n n 0,2755* n n
Fkw 0,2795* n 0,2494* 0,6667*** 0,5871*** 0,2904* 0,4447*** 0,4478***
U – urease, A – asparaginase, D – dehydrogenases,Fkw – acid phosfatase; N(%) – nitrogen, C(%) – organic carbon, BS – the sum of basie cations, Hh – hydrolitic acidity, Th – sorption capacity; designation for significant differences between mean values: *p < 0,05, ** p < 0,01, ***p < 0,001, n – not important

412 G. Olszowska / Leśne Prace Badawcze, 2014, Vol. 75 (4): 407–415
activity of dehydrogenases, phosphatase and asparaginase, whereas the activity of acid phosphatase correlated with the activity of asparaginase and dehydrogenases (Table 2).
Biochemical soil quality index
The biochemical index of soil fertility (BW) was used to assess the fertility of the examined soils within and out-side the reserves using the selected chemical parameters in the calculations, showing the amount of nutrients in the soil, as well as the parameters determining soil biological activity (Fig. 5). Regardless of whether in the equation BW= M2+C2+BS2+Th
2, the activity of urease (U) or aspar-aginase (A) or acid phosphatase (F) and dehydrogenases (D) was used as the biochemical parameter M, the BW index was significantly higher (p < 0.001) for the soils in the reserves ‘Rokita’, ‘Czarne’ and ‘Tychowo’ than out-side them. In the case of the reserve ‘Bogdanieckie Cisy’, the BW index was also higher than outside the reserve; however, the difference was not significant.
4. Summary and conclusions
In the assessment of soil biological activity, the com-monly used parameters associated with the primary role of forest soil micro-organisms, that is, mineralisation of the organic matter, were tested. The presented research results show that enzyme activity is closely related to the content of the organic matter, as evidenced in their statis-tically higher activity in the O horizon than in the humus horizon of the soils in the reserves and in the areas located outside the reserves. Numerous literature data (Landgra et
al. 2000; Leirós et al. 2000; Šnajdr et al. 2008; Zwoliński 2008; Olszowska 2010) confirm a close relationship of enzyme activity and growth of micro-organisms with the content of organic carbon as their primary energy substrate.
Large differences in the activity of all the tested en-zymes in the soils of each of the reserves can be ex-plained by the impact of a number of environmental factors, for example, moisture, temperature and degree of oxygenation of the soil and the inflow supply of the organic matter (Bauchus et al. 1998; Côte et al. 2000). Many authors (Decker et al., 1999; Smoliński et al. 2008; Piotrowska et al. 2010) also showed a high varia-tion in the enzyme activity of arable and forest soils on a regional, local, topographic and single-tree scale.
The cycling of matter and energy in nature is one of the most important ecological processes, enabling a constant supply of nutrients necessary for plant growth. An impor-tant factor in this process is the decomposition of dead or-ganic matter getting into the soil, which is mainly the result of the activity of micro-organisms producing enzymes that are the catalysts in the reaction of mineralisation and syn-thesis of organic compounds (Burns et al. 1982; Chaer et al. 2008). Soil fertility is associated with the activity of soil enzymes, as indicated in the studies by Zak et al. (1994), Gil-Sotres et al. (2005) and Januszek (2011). The current research has shown a lower activity of urease, asparagi-nase, acid phosphatase and dehydrogenases in the soils in managed forests than in the reserves. The lower activity of enzymes may indicate a less intensive process of de-composition of the organic matter in the soils of managed forests. Soil processes in the reserves are not affected by silvicultural treatments, which may explain the higher ac-tivity of the tested enzymes. In the past, vegetation in these reserves was highly distorted as a result of anthropogenic influences, but over, at least, a few decades, it has been left to natural processes. The lack of silvicultural treatments in the form of felling and tree removal causes a constant supply of litterfall to the soil where it is decomposed by micro-organisms.
The performed comparison of enzymatic activity of the soils in nature reserves and managed forests indi-cates the impact of management operations activities on soil processes. Dinesh et al. (2004), Nourbakhsh (2007), Lagomarsino et al. (2011) demonstrated that the activity of enzymes may be a sensitive indicator of early chang-es in the soil conditions caused by silvicultural proce-dures, including timber harvesting. The positive impact of mid-field woodlots on the activity of urease, phos-phatase and protease was confirmed by Bielińska and Węgorek (2005). The earlier studies by Olszowska et al.
Figure 5. Biological index of soil fertility. Designation as in Figure 1.

413G. Olszowska / Leśne Prace Badawcze, 2014, Vol. 75 (4): 407–415
(2005, 2009) confirmed that the activity of soil enzymes and the microbial status of soils as well as their chem-ical properties were conditioned by habitat quality and generally decreased with the decrease of stand quality.
The disturbances in soil microbial activity, manifest-ed by the lower activity of soil enzymes, may affect the chemical properties of soils. This was confirmed by the tests of chemical parameters, of which the results are pre-sented in this paper. The amount of nutrients expressed as the content of organic carbon, nitrogen and base cations in the soils outside the reserves, was significantly lower than in the reserves. The sorption capacity was also lower there. According to Gonet et al. (2009), the physical and chemical properties of soils are determined not only by parent rocks and climatic conditions, but also by the meth-od of land use. Changing the species composition of forest stands is one of the main methods of human intervention in forest ecosystems. Assessing the industrial impact on the chemical modification of soils, Kusza and Strzyszcz (2005) and Kusza (2007) found that forest land, especially in the areas excluded from intensive management, such as nature reserves or national and landscape parks, provide better opportunities to study the naturally preserved soil profiles in these areas.
The physical and chemical properties of soils are strongly linked with and have a significant impact on soil organisms, and thus on the activity of enzymes (Aikio et al., 2000). A number of studies indicate a significant correlation between biological activity and soil fertility (e.g. Zwoliński 2004; Trasar-Cepeda et al. 2008). This is confirmed by the results of this study, indicating a clear dependence of the activity of enzymes on the chemical properties of soils. The above-discussed soil biochemical characteristics were significantly correlated with, at least, several parameters defining soil fertility, such as the con-tent of organic carbon, nitrogen, total base cations, hydro-lytic acidity and sorption capacity. The low values of the correlation coefficient, although statistically significant, indicate that biochemical parameters, in addition to the tested soil chemical properties, were influenced by other factors, such as soil grain-size distribution, organic matter quality determined by the species composition of stands and climatic conditions (Bauchus et al., 1998, Côte et al., 2000). All the examined biochemical parameters are relat-ed, albeit in different ways, with the process of decomposi-tion of the organic matter that guarantees the maintenance of necessary nutrient supply for plant growth. Significant correlations between the activity of the tested enzymes and parameters of soil fertility indicate that each of these parameters can be used in biochemical studies as an indi-
cator of soil quality. Soil properties are considered to be a reliable indicator of the fertility of habitats characterised, among others, by chemical composition, microbiological status and enzyme activity (Burns 1982; Lasota, 2005; Januszek 2011). The biochemical index of soil fertility (BW) was used to assess the quality of agricultural soils where its values showed a significant correlation with maize crop (Myśków et al. 1996). In this study, the BW index was higher in the reserves, compared to managed forests, regardless of which biochemical parameters were used in the calculations. The previous studies of conifer-ous lowland and mountain habitats by Olszowska et al. (2005, 2009) showed a significant correlation between the BW index, and dendrometric parameters, which indicates the usefulness of this index for the assessment of habitat quality. Zornoza et al. (2007) developed an indicator of soil fertility by using physical, chemical and biochemical parameters correlated with the content of nitrogen and or-ganic carbon. A similar correlation between soil quality and productivity was confirmed in the study by Błońska (2011b) and Błońska and Januszek (013).
The relatively minor use of biochemical tests in the diagnosis of forest soils is due to the lack of standardised analytical methods that might help interpret the results (Sariyildiz et al. 2005). The diversified forest soil profile structure as well as the impact of a number of environ-mental factors on the activity of soil enzymes make it im-possible to establish ‘norms’ of biochemical parameters for each type of soil or forest habitat, as in the case of chemical parameters (Moffat 2003; Amacher et al. 2007). Biochemical indices can therefore be very useful in the comparative studies to assess the quality of soils or their response to external factors, both natural and anthropo-genic. This study conducted in nature protection areas characterised by the ongoing natural processes and lack of management treatments proves this. This speaks for a wider use of biochemical indices in the studies of forest soils, especially when assessing the impact of stress fac-tors (e.g. industrial pollution, fires, and extreme weather events), climate change and silvicultural treatments on forests as well as in predicting their further growth.
The enzyme activity is closely related to the content of organic matter. It is statistically significantly higher in the O than in the A horizon, both in and outside the reserves.
The content of organic carbon, nitrogen and base cat-ions in the soils as well as soil sorption capacity were found to be significantly lower in the managed forests than in the reserves.
An increased activity of urease, asparaginase, acid phos-phatase and dehydrogenases in the soils in the reserves than

414 G. Olszowska / Leśne Prace Badawcze, 2014, Vol. 75 (4): 407–415
in the soils of managed forests may indicate a positive effect of the departure from forest utilisation in nature reserves.
The significant dependence of the enzyme activity on soil chemical properties supports the possibility of cal-culating a biochemical index of soil fertility (BW) which for the soils in the reserves is higher than for the soils outside the reserves, regardless of whichever biochemi-cal parameters were used in the calculations.
The biochemical index of soil fertility (BW) may be useful in comparative studies as well as in the assess-ment of soil quality or their response to external factors, whether natural or anthropogenic.
Acknowledgements
The research was financed by the Ministry from the funds appropriated for the statutory activities of the For-est Research Institute, Project No. 240103.
References
Aikio S., Väre H., Strömmer R. 2000. Soil microbial activity and biomass in the primary succession of a dry heath for-est. Soil Biology & Biochemistry 32: 1091–1100.
Amacher M.C., O’Niell K.P., Perry C.H. 2007. Soil vital signs: a new soil quality index (SQI) for assessing forest soil health. Res. Pap. RMRS-RP_65vWWW, U.S. Depart-ment of Agriculture, Forest Service.U.S. Department of Agriculture, Forest Service.
Balicka N. 1986. Wykorzystanie wskaźników mikrobiologicz-nych w analizie środowiska glebowego. Postępy Mikrobi-ologii 25 (3/4); 289–291.
Bauchus J., Paré D., Côte L. 1998. Effects of tree species, stand age and soil type on soil microbial biomass and its activity in southern boreal forest. Soil Biology & Bioche-mistry 30: 1077–1089.
Bielińska E. J., Węgorek T. 2005. Ocena oddziaływania za-drzewienia śródpolnego na aktywność enzymatyczną gleby płowej [Assessment of mid-field shelterbelt influence
on enzymatic activity of lessive soil]. Acta Agrophysica 5(1): 17–24.
Błońska E. 2011a. Enzymy glebowe i ich znaczenie w ocenie aktywności biologicznej gleb leśnych na przykładzie rezer-watów przyrody nizin i wyżyn Polski [Soil enzymes and their importance in assessing the biological activity of forest soils on the example of nature reserves in the Polish lowlands and uplands]. Roczniki Gleboznawcze 62 (4): 163–172.
Błońska E. 2011b. Soil enzyme activity as an indicator of chang-es in forest soil. Polish Journal of Soil Science 44(1):75–80.
Błońska E., Januszek K. 2010. Wpływ składu gatunkowego drzewostanów na aktywność enzymatyczną i właściwości fizykochemiczne gleb leśnych [The influence of tree spe-cies on the enzyme activity and physical-chemical proper-
ties of forest soils]. Roczniki Gleboznawcze 61/2: 5–14.Błońska E., Lasota J., Januszek K. 2013. Relation between
properties of humus horizon and oak participation in a Scots pine stands. Soil Science Annual 64 (3): 82–87.
BULiGL 2010. Plan Urządzenia Lasu dla Nadleśnictwa Rokita na okres od 1.I.2010 r. do 31.XII.2019 r., stan na 1.I.2010 r. Gorzów Wielkopolski, Biuro Urządzania Lasu i Geodezji Leśnej Oddział w Gorzowie Wielkopolskim.
BULiGL 2014. Plan Urządzenia Lasu dla Nadleśnictwa Bog-daniec na okres od 1.I.2014 r. do 31.XII.2023 r., stan na 1.I.2014 r. Gorzów Wielkopolski, Biuro Urządzania Lasu i Geodezji Leśnej Oddział w Gorzowie Wielkopolskim.
BULiGL 2008. Plan Urządzenia Lasu dla Nadleśnictwa Tychowo na okres od 1.I.2008 r. do 31.XII.2017 r., stan na 1.I.2008 r. Szczecinek, Biuro Urządzania Lasu i Geodezji Leśnej Oddział w Szczecinku
BULiGL 2012. Plan Urządzenia Lasu dla Nadleśnictwa Czarne Człuchowskie na okres od 1.I.2012 r. do 31.XII.2021 r., stan na 1.I.2012 r. Szczecinek, Biuro Urządzania Lasu i Geodezji Leśnej Oddział w Szczecinku
Burns R.G. 1982. Enzyme activity in soil: location and a pos-sible role on microbial ecology. Soil Biology & Biochem-istry 34, 423–427.
Caldwell B.A. 2005. Enzyme activities as a component of soil biodiversity: A review. Pedobiologia 49: 637—644.
Chaer G.M., Myrold D.D., Bottomley P.J. 2009. A soil quality index based on the equilibrium between soil organic mat-ter and biochemical properties of undisturbed coniferous forest soils of the Pacific Northwest. Soil Biology & Bio-chemistry 41: 822–830.
Côte L., Brown S., Paré D., Fyles J., Bauchus J. 2000. Dy-namics of carbon and nitrogen mineralization in relation to stand type, stand age and soil texture in the boreal mixed-wood. Soil Biology & Biochemistry 32: 1079–1090.
Decker K.L.M., Boerner R.E.J., Morris S.J. 1999. Scale-depend-ent patterns of soil enzyme activity in a forested landscape. Canadian Journal of Forest Research. 29 (2): 232–241.
Dinesh R., Ghoshal Chaudhuri S., Sheej T.E. 2004. Soil bi-ochemical and microbial indices in wet tropical forests: Effects of deforestation and cultivation. Journal of Plant Nutrition and Soil Science 167( 1): 24–32.
Gil-Sotres F., Trasar-Cepeda C., Leirós M.C., Seoane S. 2005. Different approaches to evaluate soil quality using biochem-ical properties. Soil Biology & Biochemistry 37: 877–887.
Gonet S., Dębska B., Dziamski A., Banach-Szott M., Zaujec A., Szombathowa N. 2009. Properties of organic matter in Haplic Luvisol under arable, meadow and forest manage-ment. Polish Journal of Soil Science 42: 139–148.
Januszek K. 2011. The enzyme activity of the forest soils of southern Poland as a measure of soil quality. Electronic Journal of Polish Agricultural Universities 14(2), #01.
Kieliszewska-Rokicka B. 2001. Enzymy glebowe i ich zna-czenie w badaniach aktywności mikrobiologicznej gleby, in: Drobnoustroje środowiska glebowego, aspekty fizjo-logiczne, biochemiczne, genetyczne. H. Dahm, A. Pokoj-ska-Burdziej (eds.). Toruń, Wyd. A. Marszałek, 37–47.

415G. Olszowska / Leśne Prace Badawcze, 2014, Vol. 75 (4): 407–415
Kondracki J. 2002. Geografia regionalna Polski. Warszawa, PWN. ISBN 8301138971.
Kusza G. 2007. Wybrane pierwiastki śladowe w glebach rezerwatu leśnego „Bazany” [The selected trace elements in soils of the forest reserve of “Bazany”]. Zeszyty Naukowe Uniwersytetu Zielonogórskiego, Inżynieria Środowiska 135/15: 142–148.
Kusza G., Strzyszcz Z. 2005. Podatność magnetyczna gleb w niektórych rezerwatach leśnych Opolszczyzny, in: II Kongres Inżynierii Środowiska, eds. L. Pawłowski, M. Dudzińska, A. Pawłowski, T.2, Monografie Komitetu In-żynierii Środowiska PAN, 33, Lublin, Wydaw. Drukarnia LIBERO DUO: 587–594. ISBN: 83-89293-16-1.
Lagomarsino A., Benedetti A., Marinari S., Pompili L., Mosca-telli M.C., Roggero P.P. et al. 2011. Soil organic C variabil-ity and microbial functions in a Mediterranean agro-forest ecosystem. Biology and Fertility of Soils 47:283–291
Landgra D., Wedig S., Klose S. 2000. Medium- and short-term available organic matter, microbial biomass, and enzyme ac-tivities in soils under Pinus sylvestris L. and Robinia pseudo-acacia L. in a sandy soil in NE Saxony, Germany. Journal of Plant Nutrition and Soil Science 168(2): 193–201.
Lasota J. 2005. Biochemical indicator of mountain forest soil fertility. Soil Science Annual 56(3/4): 42–52.
Leirós M.C., Trasar-Cepeda C., Seoane S., Gil-Sotres F. 2000. Biochemical properties of acid soils under climax vegeta-tion (Atlantic oakwood) in an area of European tempera-ture-humid zone (Galicia, NW Spain): General parameters. Soil Biology & Biochemistry 32: 733–745
Moffat A.J. 2003. Indicators of soil quality for UK forestry. Forestry 5: 547–567.
Myśków W., Stachyra A., Zięba S., Masiak D. 1996. Aktyw-ność biologiczna gleby jako wskaźnik jej żyzności i uro-dzajności. Roczniki Gleboznawcze 47(1/2): 89–99.
Nourbakhsh F. 2007. Decoupling of soil biological properties by deforestation. Agriculture, Ecosystems & Environment 121: 435–438.
Olszowska G. 2009. Ocena aktywności biochemicznej gleb le-śnych w różnych typach siedliskowych terenów górskich [Evaluation of biochemical activity in soils of different moun-tain forest site types]. Leśne Prace Badawcze 70(4): 383–394.
Olszowska G. 2010. Rozkład pionowy aktywności enzy-matycznej gleb różnych siedlisk leśnych [Vertical distri-bution of enzymatic activity in soils of different forest habitats]. Sylwan 154 (6): 405–411.
Olszowska G., Zwoliński J., Matuszczyk I., Syrek D. 2007. Zastosowanie biochemicznych charakterystyk gleb w dia-gnostyce typologicznej siedlisk leśnych [Application of biochemical soils parameters in typological diagnostics of forest sites]. Leśne Prace Badawcze 4: 83–105
Olszowska G., Zwoliński J., Matuszczyk I., Syrek D., Zwo-lińska B., Pawlak U. et al. 2005. Wykorzystanie badań ak-tywności biologicznej do wyznaczenia wskaźnika żyzności
gleb w drzewostanach sosnowych na siedliskach boru świe-żego i boru mieszanego świeżego [The use of biological ac-tivity studies to determinate a soil fertility indicator in pine stands on fresh coniferous and on mixed fresh coniferous forest sites]. Leśne Prace Badawcze 3: 17–37.
Ostrowska A., Gawliński S., Szczubiałka Z. 1991. Metody analizy i oceny właściwości gleb i roślin. Warszawa, In-stytut Ochrony Środowiska, 334 p.
Piotrowska A. 2011. Enzymes as biological indices of the soil environmental status. Ekologia i Technika 19/5: 247–260.
Piotrowska A., Długosz J., Namysłowska-Wilczyńska B., Za-morski R. 2010. Field-scale variability of topsoil dehydro-genase and cellulase activities as affected by variability of some physico-chemical properties. Biology and Fertility of Soils 47: 101–109.
Russel S. 1972. Metody oznaczania enzymów glebowych. Warszawa, PTG Komisja Biologii Gleby.
Russel S. 2005. Znaczenie badań enzymów w środowisku gle-bowym. Acta Agrophysica, Rozprawy i Monografie 3: 5–9.
Sariyildiz T., Anderson J.M., Kucuk M. 2005. Effects of tree species and topography on soil chemistry, litter quality, and decomposition in northeast Turkey. Soil Biology & Biochemistry 37: 1695–1706.
Saviozzi A., Levi-Minzi R., Cardelli R., Riffaldi R. 2001. A comparison of soil quality in adjacent cultivated, forest and native grassland soils. Plant and Soil 233: 251–259.
Smoliński S., Długosz J., Piotrowska A., Zamorski R. 2008. Spatial variability of soil dehydrogenases and cellulases activities in a field scale. Polish Journal of Soil Science, Soil Biology 41(1): 73–80.
Šnajdr J., Valášková V., Merhautová V., Herinková J., Cajthaml T., Baldrian P. 2008. Spatial variability of enzyme activities and microbial biomass in the upper layers of Quercus petraea forest soil. Soil Biology & Biochemistry 40: 2068–2075.
Trasar-Cepeda C., Leirós M.C., Gil-Sotres F. 2008. Hydrolyt-ic enzyme activities in agricultural and forest soils. Some implications for their use as indicators of soil quality. Soil Biology & Biochemistry 40: 2146–2155
Zak D.R., Tilman D., Parmenter R.R., Rice C.W., Fisher F.M., Vose J. et al. 1994. Plant production and soil microorgan-isms in late-successional ecosystems: a continental scale study. Ecology 75: 2333–2347.
Zornoza R., Mataix-Solera J., Guerrero C., Arcenegui V., Garcia-Orenes F., Mataix-Beneyto J., Morugán A. 2007. Evaluation of soil quality using multiple lineal regressions basedon physical, chemical and biochemical properties. Science of the Total Environment 378: 233–237.
Zwoliński J. 2004. Microbial biomass versus soil fertility in forest sites. Polish Journal Ecology 52(4): 553– 561.
Zwoliński J. 2008. Rozkład pionowy biomasy drobnoustrojów w glebach leśnych [Vertical distribution of microbial bio-mass in forest soils]. Leśne Prace Badawcze 69: 225–231.
Translated by: Katarzyna Mikułowska

Leśne Prace Badawcze (Forest Research Papers),December 2014, Vol. 75 (4): 417–421
DOI: 10.2478/frp-2014-0038
Received 09 April 2014, accepted after revision 30 July 2014. © 2014, Forest Research Institute
Comparing methods of energy expenditure estimation using forestry as an example
Witold Grzywiński*, Piotr S. Mederski, Mariusz Bembenek
Poznań University of Life Sciences, Department of Forest Utilisationul. Wojska Polskiego 71A, 60–625 Poznań, Poland
*Tel. +48 61 848 75 88, fax +48 61 848 77 55; e-mail: [email protected]
Abstract. In this paper the values of energy expenditure obtained with estimative methods (tables of energy expenditure, Lehmann’s method) were compared to the data obtained with a method based on pulmonary ventilation measurements. Thereby, the usefulness of estimative methods for determining energy expenditure on work stations in forestry was tested.
We compared energy expenditures for 30 forestry workstations within which 59 different activities were distin-guished. For each activity the energy expenditure was determined utilizing the three following methods: pulmonary ventilation measurement, tables of energy expenditure and Lehmann’s method.
The percentage error in energy expenditure for particular activities determined with tables ranged from -44.47% to 42.31%. The highest representation of error value (52.8%) varied between -19.9% and 5.0%. The error in energy expenditure estimation determined with Lehmann’s method is characterised by a smaller variability ranging from -31.35% to 34.13%. The highest density of error values was found in the range from -4.9% to 10.0%, which comprises 44.1% of the results. To conclude, the use of tables resulted in an underestimation of the energy expenditure value for 64.1% of activities, whereas the use of Lehmann’s method resulted in an underestimation in 49.1% of the cases.
Key words: energy expenditure, comparison of methods, forestry
1. Introduction
The energy expenditure (EE) of work is a value usedto assess physical workload. The gasometric method (indirect calorimetry), based on the volume of oxygen consumption, is commonly used for this purpose. It is a reliable method; however, it requires the use of special-ised measuring instruments. A simplified version of the calorimetric method is often used in industry to measure EE, namely by measuring lung ventilation – the volume of air inhaled or exhaled (Koradecka, Bugajska 1998).
In situations where taking measurements is not possible, estimation methods, such as EE tables and Lehmann’s method, can be applied to determine EE. In both methods, a time study of the work day needs to be taken to
determine the proportion of individual work activities to estimate the energy load of a work shift.
The tabular method uses research results on EE values from the literature published thus far. Sets of EE in for-estry are found in the work of Jakubowski (1973), Fibiger (1976), Fibiger and Rogoziński (1977), Józefaciuk and Nowacka (1993) and Grzywiński (2007), among others. When using tables, one must remember that significant differences may arise due to, among others, technological advances, work pace, the size of transported loads, work organisation, site and weather conditions, etc.
The unit of EE for specific activities is determined in two stages with Lehmann’s method. The first stage is an assessment of the body’s position during work. The EE for maintaining that position is determined from tables.
ORIGINAL RESEARCH ARTICLE

418
The second stage is an assessment of the main muscle groups involved in performing work activities and the intensity of the effort. Then, using another table, the EE associated with performing a given activity is de-termined. The net energy cost of the work is the sum of the results obtained from both stages (Lehmann 1966). It should be remembered that the tables relate to the en-ergy costs of working men. For women, the table value should be multiplied by a factor of 0.80–0.85. A modi-fied Lehmann’s method is used to determine the meta-bolic rate associated with body position, type of work and movement of the body, related to the intensity of the work performed (PN-EN ISO 8996:2005).
According to various authors, the use of estimation methods allows the EE to be specified with an accura-cy of approximately 10–20% (Konarska 1985; Kora-decka, Sawicka 1987; Rogoziński, 1988; Pałka 1990; Dębowski, Spioch 1992). In their analysis of several activities related to timber harvesting, Sowa and Kulak (1999) found large error values when calculating esti-mated EEs, reaching almost 74%. According to the au-thors, much larger errors are incurred using the tabular method than Lehmann’s method, resulting in an over-estimation of EE for specific activities and significantly changing the picture obtained of a daily workload by aggregating the EE values for subsequent activities per-formed at the workstation.
The aim of this study was to compare simple meth-ods to estimate EE with data obtained from pulmonary ventilation measurements and to assess the usefulness of estimation methods to determine the energy load for workstations in forestry.
2. Study methods
Comparisons of EE amounts were performed for 30 types of forestry work representing the basic tasks of forest management (silviculture, conservation and uti-lisation). Fifty-nine activities were distinguished in the analysed tasks, for which the EE value was determined by three methods: measurement – pulmonary ventila-tion measurements (using the MWE-1 EE meter), sets of tables, and Lehmann’s method.
When analysing the results, the baseline EE value was the measurement obtained from pulmonary ventilation results using the MWE-1 EE meter. This measure is based on the existence of an almost linear relationship between the amount of oxygen consumed during exercise and the magnitude of lung ventilation in 1 min (Kozłowski, Nazar 1999). The measurement of pulmo-
nary ventilationthe methodologyradecka, Bugajska 1998; Makowiec-Dąbrowska et al.,
and EE was carried out according to recommended in the literature (Ko-
2000).The secondary percent error (Pwe) was calculated for
the EE amount obtained from Lehmann’s method and the sets of tables according to the formula (Sowa, Kulak 1999):
where WEL/T is the EE determined by using Lehmann’s method or the set of tables, and WEP the EE determined by direct measurement methods.
3. Study results
Error in determining the EE of work activities
The secondary percent error when using the tables to determine the EE for individual activities ranged from -44.47% to 42.31% (Fig. 1). The error assessment of EE values obtained with Lehmann’s method was less variable - from -31.35% to 34.13%. The difference in the mean percent error values of the analysed methods differed significantly (p = 0.048).
The largest representation of the error value (52.8%) was in the range of -19.9% to 5.0%. The highest density of values was found for the range of -4.9% to 10.0%, which represents 44.1% of the results (Fig. 1). The use of tabular sets resulted in lowered values of EE for 64.1% of the work activities, whereas with Lehmann’s method, for 49.1% of activities.
Error in determining the energy expenditure of a work shift
Table 1 presents the EE secondary percent error val-ues for a work day (8 h) obtained using the tabular and Lehmann’s methods. The secondary percent error values of EE estimates for a work shift using the sets of tables ranged from -33.31% to 33.31%. The range of values for Lehmann’s method was smaller, from -17.67% to 26.31%. The tabular method led to under-estimating (x = -7.43%) the EE values of a shift (p = 0.014), while Lehmann’s method resulted in a slight overestimate (x = 2.35%). The tabular method resulted in underestimating the amount of EE for 56.0% of the work activities and for 46.7% of the activities with Le-hmann’s method.
W. Grzywiński et al. / Leśne Prace Badawcze, 2014, Vol. 75 (4): 417– 421

419W. Grzywiński et al. / Leśne Prace Badawcze, 2014, Vol. 75 (4): 417– 421
Figure 1. Graph of the density function of the secondary percent error (%) for the applied methods of estimating EE.
Table 1. Secondary percent error [%] of net energy expenditure for a work shift determined by the applied methods
Workstation or type of work Energy expenditure tables (%)
Lehmann’s method (%)
Planting with a standard dibble:PlanterHelper
1.09-22.49
8.2326.11
Planting with a Getinga dibble:PlanterHelper
14.10-22.70
22.3826.31
Planting with a Huffa dibble:PlanterHelper
33.31-22.40
20.8425.00
Manual soil scarification -8.02 4.44Planting with a spade:
PlanterHelper
6.09-22.80
6.217.01
Manual weeding with a scythe 5.69 -1.40Motor-manual weeding - -7.15Early cleaning with a machete 10.41 3.18Enclosing a forest plantation:
Main workerHelper
--
-3.19-16.22
Treating stumps with PgIBL - -3.74Hanging bird boxes - -7.46Late cleaning with a chainsaw 4.20 0.99Early thinning / motor-manual technology:
FellerFeller’s assistantSkidder-driver of an Ursus C-330 agricultural tractor
-10.65-14.00
-27.55
-5.78-1.14
5.61

420
4. Discussion
The study indicates that estimating the EE of individ-ual work activities may result in secondary percent errors in the range of -44% to 42% when using tables and from -31% to 34% with Lehmann’s method. For most of the work activities, using tables, resulted in underestimates of about -20%, while Lehmann’s method caused a slight un-derestimation (up to -5%) in most cases or an increase (to 10%) of EE values compared with pulmonary ventilation measurements. It was found that differences in the EE of specific activities were partially eliminated and the second-ary percent error value of EE for work shifts was reduced.
Such significant differences in the EE level between values obtained from pulmonary ventilation measurements and those estimated from the tables may be due to incom-plete information on expenditures in the literature and be-cause they originate from a period of several decades. The EE value was estimated for some activities from data for similar, but not identical, activities, which may have led to larger errors. In addition, the values provided in the liter-ature are not uniform – they are presented as net or gross EE (with basal metabolic rate), for standardised persons, lacking parameters for height, weight or body mass, with no information about the pace of work and the microcli-matic conditions. Differences may also arise from the spe-cific nature of the work in various branches of industry and the technological changes that have occurred (Koradecka, Bugajska, 1998; Makowiec-Dąbrowska et al., 1994, 2000).
In the case of Lehmann’s method, the greatest source of error may be the incorrect classification of the mus-
cle groups involved in performing the activities and an erroneous determination of the intensity of the effort. The error rate may also be significantly impacted by the pace of the work (Makowiec-Dąbrowska, 1988; Makowiec-Dąbrowska et al., 2000).
Using sets of tables from the literature to determine EE levels results in an underestimate of both individu-al work activities, as well as of an entire working day. Lehmann’s method provides greater accuracy, which would favour its use when EE measurements cannot be taken. This method can still be used to assess EE in the workplace to make improvements, assess metabolism to determine microclimatic norms or verify the guidelines for providing high-energy meals. In terms of its use to determine whether high energy meals are needed, the possibility of error at a level of 20% should be remem-bered. For this reason, the energy load should be meas-ured directly when borderline results are obtained.
5. Conclusions
The following conclusions can be drawn based on the study performed:
The method of using sets of EE tables underestimates the results of EE required for individual work activities.
Using Lehmann’s method results in a lower level of error in determining the EE for a workstation.
We found that the differences in EE for specific work activities were partially eliminated and the secondary percent error for the EE of a work shift was reduced when both estimating methods were used.
Workstation or type of work Energy expenditure tables (%)
Lehmann’s method (%)
Late thinning / motor-manual technology: Feller Feller’s assistant LKT-81skidder-driver Horse-drawn skidder (carter)
-8.58-7.99-8.78
-28.68
-3.211.37
-7.03-1.82
Late thinning / full-machine technology: Harvester operator Forwarder operator
5.13-33.31
4.54-17.67
Late thinning / full-machine technology with a mid-field:
Harvester operator Forwarder operator Feller Feller’s assistant
4.59-32.03-2.021.60
4.14-17.30
2.07-4.91

421W. Grzywiński et al. / Leśne Prace Badawcze, 2014, Vol. 75 (4): 417– 421
Acknowledgements
This study was conducted as part of a research project commissioned by the General Directorate of State For-ests entitled ‘Development of the characteristics of for-estry work in terms of its safety, hazards and workload’.
References
Dębowski M.T., Spioch F.M. 1992. Chronometrażowo-tabe-laryczna metoda oceny wydatku energetycznego. Zasto-sowania Ergonomii, 3: 67–77.
Fibiger W. 1976. Ochrona zdrowia pracowników leśnictwa. Warszawa: Wydawnictwo Lekarskie PZWL.
Fibiger W., Rogoziński A. 1977. Koszt energetyczny pracy. Warszawa, Instytut Wydawniczy CRZZ.
Grzywiński W. 2007. Ergonomia i ochrona pracy w leśnictwie. Przewodnik do ćwiczeń. Poznań: Wyd. AR.
Jakubowski R. 1973. Leśnictwo, in: Charakterystyka higien-iczna niektórych stanowisk pracy w rolnictwie i leśnictwie (W. Hołobut, ed). Warszawa: Wydawnictwo Lekarskie PZWL, pp. 149–169.
Józefaciuk J., Nowacka W. 1993. Ćwiczenia z ergonomii i ochrony pracy. Warszawa: Wyd. SGGW.
Konarska M. 1985. Metody oceny wydatku energetycznego. Bezpieczeństwo Pracy, 6: 3–8.
Koradecka D., Bugajska J. 1998. Ocena wielkości obciąże-nia pracą fizyczną na stanowiskach roboczych. Warszawa: Centralny Instytut Ochrony Pracy.
Koradecka D., Sawicka A. 1987. Ocena obciążenia organizmu pracą fizyczną. Bezpieczeństwo Pracy, 11: 9–14.
Kozłowski S., Nazar K. 1999. Wprowadzenie do fizjologii klinicznej. III Edition. Warszawa: Wydawnictwo Lekar-skie PZWL.
Lehmann G. 1966. Praktyczna fizjologia pracy. Warszawa: Wydawnictwo Lekarskie PZWL.
Makowiec-Dąbrowska T. 1988. Zasady oceny obciążenia fizycznego podczas pracy zawodowej. Zeszyty Metody-czno-Organizacyjne, 22: 15–53.
Makowiec-Dąbrowska T., Iżycki J., Radwan-Włodarczyk Z., Koszada-Włodarczyk W. 1994. Poradnik metodyczny oceny obciążenia fizycznego oraz stosowania przerw w pracy. Warszawa: Ministry of Labour and Social Policy.
Makowiec-Dąbrowska T., Radwan-Włodarczyk Z., Kosza-da-Włodarczyk W., Jóźwiak Z. W. 2000. Obciążenie fizy-czne – praktyczne zastosowanie różnych metod oceny. Łódź, Instytut Medycyny Pracy.
Pałka M. 1990. Metabolizm człowieka podczas pracy (propozycja standaryzacji badań). Bezpieczeństwo Pracy, 11: 3–6.
PN-EN ISO 8996: 2005. Ergonomia – Oznaczanie meta-bolicznej produkcji ciepła. Warszawa: PKN.
Rogoziński A. 1988. Prosta metoda oceny wydatku ener-getycznego. Bezpieczeństwo Pracy, 11–12: 9–13.
Sowa J.M., Kulak D. 1999. Analiza wydatku energetycznego pilarza przy wykonywaniu czynności obróbczych związa-nych ze ścinką i wyróbką drzew, in: Tendencje i problemy mechanizacji prac leśnych w warunkach leśnictwa wielo-funkcyjnego. Materials from the Scientific Symposium (H. Różański, ed.), Poznań, 23–24 czerwca 1999. Poznań: Katedra Mechanizacji Leśnictwa AR, pp. 165–172.
Author’s contribution
W.G. gave research idea, literature review, data collection and analysis, supervision of manuscript preparation. P.M.S. performed the study and data collection. M.B. performed the study and data collection.

Leśne Prace Badawcze (Forest Research Papers),December 2014, Vol. 75 (4): 423–427
DOI: 10.2478/frp-2014-0039
Received 13 May 2014, accepted after revision 07 July 2014. © 2014, Forest Research Institute
Afforestation and secondary succession
Robert Krawczyk
Forest District in Wielbark, ul. Czarnieckiego 19, 12–160 Wielbark, Poland
Tel. +48 600 292 788; e-mail: [email protected]
Abstract. Secondary succession is a long and complicated natural process returning forests to post agricultural lands, whereas afforestation is an attempt to speed up this process by planting trees. Massive afforestation in the twentieth century brought an increase in forest area in Poland along with management problems in these areas due to disturbances caused by root diseases. Therefore it appears necessary to employ successional processes more fully in order to create sustainable forest ecosystems.
Key words: afforestation, natural disturbances, secondary succession
1. Introduction
Forests of the temperate zone have served as a hab-itat for early humans in Europe, Northeastern United States, and also in large parts of China. Most of those forests were cleared for the needs of agriculture, as their soil and climate conditions were suitable for intensive production of food with no additional watering required (Campbell 1995).
That process, however, did not occur evenly, and forest cover changes of the discussed territories were irregular. Growth of civilisation resulted in decrease of forest area, but after wars or disease epidemics, forests in some areas returned to the sites previously used by humans. Such phenomenon of the spontaneous forest return, also called the secondary forest succession, in large degree shaped the landscape of the temperate zone (Szwagrzyk 2004).
It was only in the 19th century, when the prospect of forest disappearance due to extensive harvesting be-came obvious, that people started to introduce more sus-tainable methods of forest resource management. Those activities determined the state of forests existing today and also the return of forests to the areas, which were previously used for agriculture (Bernadzki 1997).
In France, afforestation activities were started already at the end of 18th century and by 1950, an area of about 3,400,000 ha was afforested (Strzelecki, Sobczak 1972).
The United Kingdom doubled its forest area by af-foresting of more than 1,000,000 ha in the 20th cen-tury. During the last 100 years, afforestation in Spain was 2,500,000 ha, and in Italy – 2,000,000 ha. After the World War II, Bulgaria afforested about 1,000,000 ha, and Hungary – 500,000 ha of land. Relatively few af-forestation activities were conducted in Ireland, Germa-ny and Greece (Kwiecień 1996).
2. Short history of deforestation and afforestation in Poland
Szujecki (2003) notes three main stages of the most significant deforestation events touching Polish lands: ‘12–13th centuries, when farmers started to use ploughs shod with a metal point; 16–17th centuries, when wheat and potash exports became very profitable; 19th centu-ry, when the Industrial Revolution caused huge demand for construction, mine and fuel wood’.
The first half of the 20th century led to especially large changes in forest area of Poland. Even with all the afforestation activities conducted with varying intensity
REVIEW ARTICLE

424 R. Krawczyk / Leśne Prace Badawcze, 2014, Vol. 75 (4): 423–427
from the 19th century, the forest area, only during the interwar period, decreased by about 900,000 ha (Sobczak 1996). As an outcome, the forest area of Poland constant-ly decreased from about 80% in the beginning of coun-try’s history to about 43% in the 18th century, reaching its lowest in Polish history value of 20.8% in 1945.
The turnaround of this process came only during the period 1947–1970, when after intensive afforestation practices as well as natural succession processes, the forest area of Poland increased to 27%. The average an-nual afforestation area during that time was 39,600 ha, and during its peak period of 1959–1965, it was more than 50,000 ha. In the record year of 1960, the area af-forested was 61,800 ha. During the consecutive years, the rate of afforestation started to decrease from 16,200 ha annually during the years 1971–1980 to 6,500 ha an-nually during the years 1981–1990 (Smykała 1990).
The 1990s gave a new boost to the afforestation pro-cess and their area started to systematically increase from 7,600 ha in 1991 to 23,400 ha in 2000, with the annual average area being 14,900 ha. The high level of afforestation of above 20,000 ha lasted until 2003 and after that started to decrease to lower than 5000 ha in 2012 (KPZL 2003).
Altogether, during 1947–2012, a total of 1,477,000 ha of agricultural lands was afforested. The area of forests in Poland increased by 2,694,000 ha from 6,470,000 ha in 1945 to 9,164,000 ha in 2012, which corresponds to 29.3% forest cover (the report on the state of forests, 2012).
The aforementioned 8.5% growth in forest cover mostly comes from artificial afforestation implemented during that period, while the rest of the area resulted from natural succession. Birch and pine seedlings colo-nised large areas of unused agricultural lands, especial-ly in years following the World War II. The data about such sites was not registered until the end of the 20th century, so their area could only be estimated to about 900,000 ha (Puchniarski 2000).
Such information contradicts the widespread opin-ion that secondary succession in Poland is of minor importance. Secondary succession is a widespread phe-nomenon, which appears on a large scale in all (besides Antarctica) continents. By ignoring or underestimating it, forecasting of forest cover changes in the near or far future would be inaccurate (Szwagrzyk 2004).
3. Afforestation strategy
The main goal of afforestation is to change the use of a given site by directing the reestablishment of for-
est ecosystem. Such task is, however, difficult and time consuming, and tree planting itself is only the beginning of the long and complex process.
In order to reach in the future rather stable and effec-tive development of forest ecosystem, one should model silvicultural activities on the process of natural succes-sion with special attention given to secondary forest succession. Ecosystems that originated without human interference present the optimal structures from the point of view of their species and spatial characteristics within given environmental conditions. Such processes could last several decades or even several hundred years and having two important features: large inertness or ability to resist changes and maintain relative balance, as well as large elasticity or the speed with which those ecosystems return to their balanced state after the with-drawal of a stress factor (Gorzelak 1999).
Processes that take place in nature do not always agree with economic goals. Therefore, it is highly im-portant to formulate a goal of afforestation process at each site and plan further activities according to this goal. After all, artificially planted sites aimed at timber production require different silvicultural activities from those needed for plant communities managed in order to create stable forest ecosystems (Gorzelak 1999).
An attempt to combine those two goals directed to-wards timber as well as habitat production is one of the primary reasons of faults emerging in timber stands cre-ated on agricultural lands. The reality proves that an as-sumption that the result of afforestation would come out as a stand that in given conditions provides maximum timber production as well as the most positive impact on natural environment is wrong (Rykowski 1990).
The studies of timber quality also support the need to implement different silvicultural activities in timber stands created on agricultural lands. First of all, it ap-pears that timber harvesting age should be decreased on such sites due to lesser time needed for trees to reach technical maturity (Jelonek 2013).
Awareness of this problem has existed for quite a long time. Stanisław Sokołowski in his ‘Hodowla lasu’ (‘Silviculture’) (1921) wrote: ‘When afforesting un-used lands, it would be first of all important to improve site conditions and mainly soil to such level that would allow next generation of trees to develop into tree stand with certain economic value. Initial afforestation activi-ties rarely produce stands, which have significant value, which occurs due to their uneven growth, frequent cor-rective plantings and first of all due to poor site condi-tions. It is only when soil under closed stand will obtain

425R. Krawczyk / Leśne Prace Badawcze, 2014, Vol. 75 (4): 423–427
better qualities, that young stands with better future pos-sibilities will emerge’.
On the other hand, Walerian Dakowski (1929) turned the attention to wrongful tree species selection: ‘Large sites, which are important objects of forest economy, should mainly be afforested by Scots pine. However, af-forestation with pine should be conducted very carefully. Unused lands for a long time stopped being forest soil and due to this, they lost physical and chemical soil char-acteristics, and also they lack mycorrhizal fungi. Without proper mycorrhizal associations, pine stands will not be able to develop normally and to bring good forecast in the future. On the contrary, the birch and black locust stands, regarded as pioneer species, will provide first harvest of timber so that later give way to pine’.
Władysław Płoński (1930) also acknowledged the importance of the transitional stands structured from birch, alder, aspen and even shrubs, depending on local conditions that, during one or two generations, are able to create soil conditions suitable for major tree species. He also believes that ‘success of forest plantations on agricultural lands would not be hindered by any set-backs if our management practices are based on rules dictated by nature itself, if we would restore the shifted balance of forest-forming elements following the road of evolution’.
Every forest in every place and time implements sev-eral functions simultaneously while doing it in a natural way (Principles of Silviculture, 2012). The expectations of humans from forests through the centuries were, first of all, related to the forest’s productive function. There-fore, accepted models of afforestation of agricultural lands attempted to fulfil those expectations in the best possible way. And actually economic views most often dictated the necessity to interfere into natural course of forest restoration (Gorzelak 2006).
In Poland, during the period of the most intensive afforestation, the most simple model of planting was used, which is based on planting trees into furrows on agricultural lands. Due to poor understanding of site conditions, easiness and low prices of pine seedling production, afforestations conducted during that time resulted in pine monocultures. During 1970s, affores-tation practices were placed under higher requirements related to protection and design of landscape, nature protection and enhancement of soil and water protective forest functions (Gorzelak 2006).
As the result, the quality of afforestation during sev-eral decades at the end of 20th – beginning of 21st cen-turies is definitely higher. Larger species diversity of
planted trees, which takes into account site conditions; diverse methods of soil preparation, which are adapted to specifics of agricultural lands; or inclusion of already existing tree groups into planned plantations provide an opportunity for developing sustainable, in com-parison to prior practices, plant community (Sobczak, Jakubowski 1998).
4. How to manage forests on agricultural lands?
Taking into account the fact that 25–30% of forest in Poland grows on sites that were deforested and further used for agriculture or remained fallow, demonstrates the scale of the problem (Szujecki 2003).
Currently, the ‘National program for expanding of forest cover’ (KPZL) serves as an instrument that guides the level and spatial structure of afforestation practices. It was adopted by the Council of Ministers on 28 June 1995. The main goal of this program is to create con-ditions for increasing forest cover of Poland to 30% in 2020 and to 33% in 2050 (KPZL 2003).
Previous experience of afforesting agricultural land by major forest species, among which pine holds the first place, shows that reaching mature and healthy tree stand has been possible only in a limited number of cases (Bernadzki 1990).
The main characteristics of forest stands emerging on afforested sites result from simplified species and age composition as well as specific soil and site conditions of farmlands. From the ecological point of view, such stands are closer to ‘agrocenosis’ than to forest ecosys-tems, where trophic chain presents more or less contin-uous biological stability. In that sense, first generation of forest trees on agricultural lands could not be consid-ered to be a forest, it rather constitutes a certain phase of artificially initiated forest establishment process. From the point of view of natural ecological succession, af-forestation often imposes growth of the species distinct to the current conditions of that biological community. Adaptation of such community is always accompanied by diseases, which is part of natural ecological process-es (Rykowski 1990).
One of such examples is a root rot caused by Het-erobasidion annosum (Fr.) Bref. fungi. This disease commonly occurs in tree stands planted on agricultur-al lands. It causes various pathologic changes within the stand leading to tree mortality, decrease in crown cover and often to biological degradation of the stand (Sierota 1996).

426 R. Krawczyk / Leśne Prace Badawcze, 2014, Vol. 75 (4): 423–427
That is why the role of transitional plant communities in silvicultural management could not be underestimat-ed at any stage of stand development in order to create stable semi-natural ecosystems. Good survival of for-est communities that spontaneously occupy vacant sites confirms such approach. Some such examples include vast areas of birch stands, former grasslands or wet pastures covered by black alder, as well as grey alder stands, which could be found mainly in the Low Beskid and Bieszczady Mountains (Bernadzki 1990). Similarly, pine stands originating from wild seeding are healthier, less susceptible to root rot and produce stands with more diverse age structure (Falińska, Faliński 1990).
In such a context, the inclusion of the natural suc-cession on the area of 80,000 ha during 2001–2020 into the KPZL programme should be positively evaluated (KPZL 2003).
5. Summary
Forests created on former agricultural land present one of the important problems for the contemporary sil-viculture (Bernadzki 1990).
The specifics of timber production in such areas are based, first of all, on soil characteristics described as ‘syndrome of agricultural soil’ (Sierota, Małecka 2003).
This type of agricultural habitat indicates the need to change management approach used for stands grown in such conditions (Rykowski 1990). Similarly, differ-ent technical qualities of timber obtained from such stands suggest the need for modification of timber use (Jelonek 2013).
The development of sustainable forest ecosystems on agricultural lands requires full employment of natural processes occurring there, such as establishment of pi-oneer or transitional stands. It is justified not only from ecological point of view, but also supports basics of sus-tainable forest management. Such approach decreases management risks that constantly accompany silvicul-tural decisions and result from unpredictability of natu-ral processes affecting growth of forest as a whole and each stand individually (Bernadzki 2006).
Forest growth is tied to cycle of disturbances that in-itiates processes of adaptation and growth of structures better adapted to changing environmental conditions (Dobrowolska 2010).
The forecasts related to increase in forest cover of Poland insufficiently consider the process of secondary succession (Szwagrzyk 2004). Therefore, study of spon-taneous return of forests to lands not devoted to agri-
culture has both large educational value and practical usefulness (Falińska, Faliński 1990).
Acknowledgements
The research was implemented within the framework of Extramural Doctoral Studies at the Forest Research Institute in Sękocin Stary.
References
Bernadzki E. 1990. Koncepcje hodowli lasu na gruntach po-rolnych. Sylwan 134(3–12): 51–59.
Bernadzki E. 1997. Cele hodowli lasu wczoraj i dziś. Sylwan 141(4): 23–31.
Bernadzki E. 2006. Cele hodowlane i ich realizacja w przebu-dowie drzewostanów [Silvicultural aims and their realisa-tion in stand conversion]. Sylwan 150(12): 3–11.
Campbell B. 1995. Ekologia człowieka. Warszawa, PWN, 234 p.Dobrowolska D. 2010. Rola zaburzeń w regeneracji lasu
[The role of disturbances in forest regeneration]. Leśne Prace Badawcze 71(4): 391–405. DOI 10.2478/v10111-010-0034-x.
Dakowski W. 1929. Nieużytki w Polsce. Sylwan 2: 97–104.Falińska K., Faliński J.B. 1990. Spontaniczny powrót lasu na
nieużytkach porolnych i połąkowych za sprawą sukcesji wtórnej, w: Dynamika naturalnych i półnaturalnych eko-systemów leśnych i ich związki z innymi ekosystemami w krajobrazie (red. E. Bernadzki). Warszawa, SGGW-AR, p. 61–82.
Gorzelak A. 1999. Zalesianie terenów porolnych. Warszawa, Instytut Badawczy Leśnictwa, 174 s.
Gorzelak A. 2006. Zalesianie i zadrzewianie kraju. Z dziejów Lasów Państwowych i leśnictwa polskiego 1924–2004, Tom III (1) Lata powojenne i współczesność. Warszawa, CILP.
Jelonek T. 2013. Biomechaniczna stabilność drzew a wy-brane właściwości fizyczne, mechaniczne i strukturalne ksylemu sosny zwyczajnej (Pinus sylvestris L.) wyrosłej w warunkach gruntów porolnych i leśnych. Rozprawy naukowe 455. Uniwersytet Przyrodniczy w Poznaniu.
KPZL. 2003. Krajowy program zwiększania lesistości. Warszawa, Ministerstwo Środowiska.
Kwiecień R. 1996. Zalesienia w krajach europejskich. Prace Instytutu Badawczego Leśnictwa Seria B, 27: 115–123.
Płoński W. 1930. Uprawy leśne na gruntach porolnych. Syl-wan 48(1): 1–8.
Puchniarski T. 2000. Zalesienia porolne. Krajowy program zwiększenia lesistości – poradnik od A do Z. Warszawa, PWRiL.
Raport 2013. Raport o stanie lasów w Polsce 2012. Warszawa, CILP.
Rykowski K. 1990. Problem ochrony lasu na gruntach porol-nych. Sylwan 134(3–12): 75–88.

427R. Krawczyk / Leśne Prace Badawcze, 2014, Vol. 75 (4): 423–427
Sierota Z. 1996. Zagrożenie drzewostanów na gruntach po-rolnych przez patogeny grzybowe. Sylwan 140(12): 5–15.
Sierota Z., Małecka M. 2003. Ocena zmian w drzewostanie sosnowym na gruncie porolnym po 30 latach od wykona-nia pierwszych cięć pielęgnacyjnych bez zabiegu ochron-nego przeciw hubie korzeni. Sylwan 142(12): 19–26.
Smykała J. 1990. Historia, rozmiar, i rozmieszczenie zalesień gruntów porolnych w Polsce w latach 1945–1987. Sylwan 134(3–12): 1–7.
Sobczak R. 1996. O przywracaniu lasów na grunty porolne w Polsce. Sylwan 140(5): 35–41.
Sobczak R., Jakubowski G. 1998. Weryfikacja i nowelizac-ja kompleksowych zasad leśnego zagospodarowania
gruntów porolnych. Warszawa, Dokumentacja Instytutu Badawczego Leśnictwa, p. 1–36.
Sokołowski S. 1921. Hodowla lasu. Wyd. 2, Nakładem Księgar-ni Polskiej Bernarda Połanieckiego, Lwów i Warszawa.
Strzelecki W., Sobczak R. 1973. Zalesienia nieużytków i gruntów trudnych do odnowienia. Warszawa, PWRiL.
Szujecki A. 2003. Zalesienie gruntów porolnych jako prob-lem polityczny, w: Zalesienia w Europie – doświadczenia i zamierzenia (eds. S. Zając, W. Gil) Warszawa, Instytut Badawczy Leśnictwa, p. 13–20.
Szwagrzyk J. 2004. Sukcesja leśna na gruntach porolnych; stan obecny, prognozy i wątpliwości. Sylwan 148(4): 53–59.
Zasady hodowli lasu. 2012. Warszawa, CILP.
Translated by: Adam Kaliszewski
Copyright © 2022 FDOKUMEN