75-1346309562. chintan paper
16
A Study of Cardiac Parameters using Impedance Plethysmography (IPG) in Healthy Volunteers Parmar C. V., Prajapati D. L., Chavda V. V., Gokhale P. A., Mehta H. B. and Shah C.J. J Phys Pharm Adv 2012, 2(11): 365-379 Online version is available on: www.grjournals.com Journal of Physiology and Pharmacology Advances
Transcript of 75-1346309562. chintan paper

A Study of Cardiac Parameters using Impedance
Plethysmography (IPG) in Healthy Volunteers
Parmar C. V., Prajapati D. L., Chavda V. V., Gokhale P. A., Mehta H. B. and Shah C.J.
J Phys Pharm Adv 2012, 2(11): 365-379
Online version is available on: www.grjournals.com
Journal of Physiology and Pharmacology Advances

PARMAR ET AL.
365 J. Phys. Pharm. Adv., 2012, 2(10):365-379
A Study of Cardiac Parameters using Impedance
Plethysmography (IPG) in Healthy Volunteers
1Parmar C. V.,
1Prajapati D. L.,
2Chavda V. V.,
3Gokhale P. A.,
4Mehta H. B. and
5Shah
C. J. 1Cardiovascular Lab., Dept. of Physiology, Govt. Medical College, Bhavnagar – 364001. Gujarat, India.
2Cardiovascular Lab., Dept. of Physiology, Govt. Medical College, Bhavnagar – 364001. Gujarat, India.
3Cardiovascular Lab., Dept. of Physiology, Govt. Medical College, Bhavnagar – 364001. Gujarat, India.
4Cardiovascular Lab., Dept. of Physiology, Govt. Medical College, Bhavnagar – 364001. Gujarat, India.
5Cardiovascular Lab., Dept. of Physiology, Govt. Medical College, Bhavnagar – 364001. Gujarat, India.
Abstract
Impedance plethysmography is non – invasive technique to measure blood flow in any part of the body like
heart (Impedance Cardiography), arteries or veins. As only heart rate and blood pressure is not sufficient to
access a person‟s hemodynamic status, cardiac output and other cardiac parameters measured by this simple
technique will help further to access heart‟s functional status with avoidance of all complications associated
with previous catheter related invasive techniques. Main aim of the study was to measure cardiac parameters
noninvasively in healthy volunteers of all age groups of both sex using impedance cardiography and then
compare them between different age groups. Study was done in 5 age groups (16 – 25 yrs, 26 – 35 yrs, 36 – 45
yrs, 46 – 55 yrs and > 55 yrs) and in total 400 subjects. Each group was of 80 healthy volunteers of either sex. It
was carried out on Nivomon Series computerized software in Bhavnagar region. Cardiac parameters measured
were SV – Stroke Volume, SI - Stroke Volume Index, CO – Cardiac Output, CI – Cardiac Index, LVET – Left
Ventricular Ejection Time, SVR – Systemic Vascular Resistance and SVRI - Systemic Vascular Resistance
Index. Normative baseline laboratory data obtained from 400 healthy volunteers were as: SV - 65.15 ± 13.18 ml
/ beat, SI - 38.16 ± 7.64 ml / beat / m², CO - 4.94 ± 1.09 lit. / min, CI - 2.91 ± 0.51 lit. / min / m², LVET -
357.35 ± 46.32 msecs, SVR - 1500.95 ± 305.45 dyne•sec / cm5 and SVRI - 2507.75 ± 441.63 dyne•sec / cm
5 /
m². These values were found to be consistent with normal reference range. So now these baseline normative
data will be helpful in many future research studies related to heart function in Bhavnagar region for this novel
instrument. Significant differences were found for all parameters between different age groups. LVET and SVR
were found on higher side in later ages due to atherosclerosis and other age related changes. Positive correlation
was found between BSA and SV, CO. Negative was the case for BSA and SVR. In case of gender difference in
last age group, Zo was found to be extremely higher in females due to higher fat proportion. Also SV was
significantly lower and SVR was higher in females but no difference was there for CO and LVET. Overall,
cardiac parameters were measured with this impedance technique accurately. Although there were some
Corresponding author: Cardiovascular Lab., Dept. of Physiology, Govt. Medical College, Bhavnagar – 364001. Gujarat, India. Phone: 0278-2430808, Fax: 0278-
2422011. Received on: 30 Aug 2012
Revised on: 21 Oct 2012
Accepted on: 28 Oct 2012
Online Published on: 29 Nov 2012
Original Article
ISSN: 2251-7693

A STUDY OF CARDIAC PARAMETERS USING IMPEDANCE PLETHYSMOGRAPHY (IPG) IN …
366 J. Phys. Pharm. Adv., 2012, 2(10):365-379
limitations, this technique was found to be simple, cheap and effective. If this technique is further validated and
established, than it can be used widely for many physiological and pharmacological studies on human heart.
Further, it can be used in ICU, in clinical set up for many heart disease patients, and also in CCU or in
emergency trauma centres for other critically ill patients.
Keywords: Impedance plethysmography, impedance cardiography, cardiac output, non – invasive
Introduction
Plethysmography is a technique of measuring
volume changes of an organ, the volume may be
due to blood, water or air. It is of many types like
Photo electric Plethysmography, Pneumo (Body or
Chamber) Plethysmography, Inductive
Plethysmography, Impedance Plethysmography,
Magnetic Susceptibility Plethysmography, Strain
Gauge Plethysmography (Peck Y et al. 2003) The
concern of our study is Impedance
Plethysmography that measures volume changes of
blood in chest, calf or any other region of the body
by sensing electrical resistance changes in
respective area. Impedance Plethysmography (IPG)
measures blood flow in Arteries. Occlusive
Impedance Plethysmography (OIP) measures blood
flow in Veins. Impedance Cardiography (ICG)
measures blood flow in major vessels of Cardiac
region from which Stroke Volume is obtained.
Impedance Plethysmography can also be used in
measurement of cerebral blood flow, Intra Thoracic
Fluid Volume and Determination of Body
Composition. Our study consist of measuring
Cardiac Parameters like Stroke volume (SV),
Cardiac output (CO), Systemic Vascular Resistance
(SVR) and many others using the principle of
Impedance Plethysmography that is ICG. ICG is
simple non – invasive technique and it is the major
advantage of this technique.
In ICU or emergency set up, and at OPD for
patient coming with cardiovascular complaints, only
heart rate and blood pressure is not sufficient to
access a person‟s hemodynamic status. Cardiac
output is the functional expression of cardiovascular
performance (Barde P et al. 2006). CO is measured
with many techniques like Fick‟s method, dye-
dilution and thermo dilution, of which common is
thermo dilution. All these are invasive methods
associated with complications like infection,
hemorrhage, arrhythmia etc. Further continuous CO
monitoring is not possible with these all catheter
related invasive methods. Non–invasive Impedance
Cardiography appears to be a solution for all these
problems.
The history of Impedance Plethysmography
extends back to 1932 when Atzler and Lehmann
observed changes in the Capacitance between 2
parallel plates kept across the human chest. These
changes were observed to be Synchronous with the
activity of the Heart (Babu JP et al. 1990).
Impedance Plethysmography technique that exists
today was first introduced by Jan Nayboer and co –
workers in 1940 (Nyboer J et al. 1960). Impedance
(Z) in vague term, means Electrical Resistance.
Resistance (R) means as according to Ohm‟s law,
voltage (V) to current (I) ratio. Zo indicates basal
body Impedance.
V = I / R
When current is constant, sinusoidal, means
frequency component is there, then resistance R is
called Impedance Z. Constant DC current is for
resistance measurement and constant amplitude
sinusoidal current is for impedance measurement.
Known amount of current is passed (1 mA – 4 mA),
amount of voltage is measured by voltage sensing
electrodes and so this voltage to current ratio gives
value of Impedance. Whenever constant current is
passed through any body segment, it will choose the
path with least resistance. Major arteries offer less
resistance, E.g. brachial artery in arm, femoral
artery in thigh. In case of chest region, the current
will pass through aorta. During systole, more blood
flow will give least resistance to the current due to
alignment of cells in a vessel as shown in next
figure. Least resistance will in turn be recorded as a
positive upward wave in the graph. Less blood flow
as during diastole will lead to misalignment of cells,
which in turn give more resistance to the current
and there will be a wave in the graph with less

PARMAR ET AL.
367 J. Phys. Pharm. Adv., 2012, 2(10):365-379
amplitude as compared to that during systole. Graph
during diastole is smaller, but amplitude is there
because though less as compared to systole, but
pressure is present during diastole.
Fig. 1: Path of current through vessels.
In this technique, the Electrical Impedance of
any part of the body is measured by constant current
method and variations in the impedance are
recorded as a function of time as a Graph. Since
blood is a good conductor of electricity, the amount
of blood in a given body segment is reflected
inversely in the electrical impedance of the body
segment. Pulsatile blood volume by heart, which is
systemic blood circulation, causes proportional
decrease in the electrical impedance. Variation in
the electrical impedance thus gives adequate
information about the blood circulation in any part
of the body, either Heart or any other Blood
Vessels. Difference between the instantaneous
electrical impedance and initial value of electrical
impedance (Zo) indicates blood volume in that
particular region. Value of rate of change of this
impedance will give us different measured cardiac
parameters for blood volume changes in thoracic
major blood vessels, especially aorta. A typical
impedance plethysmograph system is comprised of
a sine wave generator followed by voltage to
current converter. This constant current 4 mA is
passed through the body segment of interest with
the help of 2 surface electrodes, called as the
current electrodes (I1, I2). These electrodes may be
in the form of banded wire, loop around the body or
may be typical surface stick on type of ECG
electrodes. Voltage signal developed along the
current path is sensed with the help of another pair
of electrodes, called as the voltage electrodes (V1,
V2) (Babu JP et al. 1990).
The amplitude of the signal sensed is directly
proportional to the electrical impedance of the body
segment. Amplification and detection of this signal
gives instantaneous electrical impedance Z of the
body segment. Difference between the
instantaneous electrical impedance (Dynamic
impedance) and initial value of electrical impedance
(Zo – basal impedance) gives variation in the
impedance as a function of time, called the ∆Z(t)
waveform. First time derivative of the impedance
(dZ/dt) is obtained to give the rate of change of
impedance. With the help of this dZ/dt, used in
Kubicek‟s equation, stroke volume can be measured
(Kubicek WG et al. 1974).
Fig. 2: Electrodes placement for measuring cardiac
parameters and path of current through aorta.
There are various types of electrodes and their
method of placement across the chest wall. The
Cardiac Output Monitor by Bhabha Atomic
Research Centre (BARC) uses the four band

A STUDY OF CARDIAC PARAMETERS USING IMPEDANCE PLETHYSMOGRAPHY (IPG) IN …
368 J. Phys. Pharm. Adv., 2012, 2(10):365-379
electrodes using vertical method (also called as
Neck abdomen method) of electrode placement.
This method requires special type of band
electrodes made out of braided silver (Barde P et al.
2006). In our study, placement of electrodes are in
the form of standard stick - on type surface ECG
electrodes which has replaced now band electrodes
used earlier for cardiac parameters determination
using non-invasive Impedance Cardiography. The
four electrodes are placed above and other four
below the chest wall, inner four are voltage sensing
electrodes while outer four are stimulating or
current injecting electrodes. The graph recorded is
as follows:
Table1: Timing of various notches in the first
derivative impedance signal in Impedance
Coradiography
Event in the cardiac cycle Notch
Atrial contraction A
Closure of tricuspid valve B
Closure of aortic valve X
Closure of pulmonic valve Y
Opening snap of mitral valve O
Third heart sound Z
BCX is called the systolic wave (C wave) and
XYOZ is called the diastolic wave (O wave). Left
Ventricular Ejection Time (LVET) is measured as
shown in next figure:
Fig. 4: LVET measurement.
B corresponds to the first heart sound.
X corresponds to the second heart sound.
BX corresponds to Left Ventricular Ejection Time
(LVET).
(dZ / dt ) max is measured as the height of the
curve from B to the peak of the systolic wave (C)
(Babu JP et al. 1990 ).
Stroke Volume (SV) is measured by the
impedance signal recorded from the inner pair of
electrodes using Kubicek‟s equation (Shyu LY et al.
2000) as,
Stroke volume (SV) = k p (L / Zo) ² [LVET
(dZ / dt) max],
where k is a constant which accounts for
variation in body composition based on age, gender,
relative fat content, chest circumference;
(dZ / dt) max is the maximum rate of change of
the impedance in Ω / s;
LVET is the left-ventricular-ejection time in
seconds;
L is the inter - electrode distance in cm;
Zo is the basal impedance in Ω;
p is the blood specific resistivity computed
using hematocrit as [ 13.5 + ( 4.29 × Hematocrit ) ]
in Ω - cm.
When alternating current (AC) current is used,
the capacitance component of the impedance reacts
differently to the various electrical frequencies.
When frequency is low (20 – 100 kHz), the reactive
component may be negligible, and the specific
impedance of the tissue is close to its resistivity.
Under such conditions, the resistivity in ohms per
centimeter is 150 for blood, 63 for plasma, 750 for
cardiac muscle, 1275 for lungs, and 2500 for fat
(Backer LE et al. 1989).
Purpose of this study is to measure cardiac
parameters in healthy volunteers of all age groups
of either sex, to compare value of each parameter
between different age group and also to see gender
based differences. Each parameter measured by this
technique alone or in accordance with other
parameters, are useful in early detection of many
cardiac disease conditions. Studies in past had been
done for usefulness of non-invasive methods in
cardiac and other critically ill patients. Many studies
in past had been done for comparison between
invasive and non-invasive methods in cardiac or
any other disease patients for cardiac output and
other parameters measurement (Arunodaya R et al.
2008, Sullivan PJ et al. 1990, Belardini R et al.
1996). Only a few studies had been done in normal
healthy volunteers and that also not in a large group

PARMAR ET AL.
369 J. Phys. Pharm. Adv., 2012, 2(10):365-379
of population (Ng HWK et al. 1991). So here in our
study we have tried to establish normative baseline
laboratory data of cardiac parameters in a particular
region by measuring them in 400 healthy
volunteers, which can be used in further future
physiological, pharmacological or clinical studies
related to heart function in healthy normal subjects
and in patients of heart disease also. As also this is
relatively new study in our country as compared to
foreign countries, it is first necessary to obtain
normative baseline laboratory data in particular
region. Also as the instrument used is relatively
new, it is necessary first to check the compatibility
of this instrument by measuring parameters in
healthy volunteers and then by comparing these
with standard normal values of the same.
Materials and Methods
Present study was carried out at Cardiovascular
Laboratory, Department of Physiology, Government
Medical College ; Sir T. General Hospital and Old
Age Home, Bhavnagar after obtaining ethical
clearance from Institutional Review Board of our
Government Medical College, Bhavnagar. This
study was done to obtain normative data of cardiac
parameters in following five age groups; 1st:
16 – 25
yrs, 2nd:
26 – 35 yrs, 3rd:
36 – 45 yrs, 4th:
46 – 55 yrs
and 5th:
above 55 yrs. Each group was containing 80
healthy volunteers of either sex. 25 subjects were
excluded due to anticipatory tachycardia. 8 subjects
were excluded due to abnormal ICG waveform. It
was done on Nivomon Series Product computerized
software by L and T Company.
Subject preparation and recording
Subject was asked to sit comfortably, to be
relaxed and reassured that the procedure is totally
harmless. Informed consent and history were taken
along with Blood Pressure, Height in cm and
Weight in kg. Subject‟s name (initials), age, sex,
height, weight, ID and Bed No. if necessary were
entered the instrument. Then subject were asked to
rest in supine position on a comfortable bed and to
be relaxed with quiet breathing. Total 8 surface
electrodes were used. Among them, four were
current passing electrodes (I1, I2, I1', I2‟) delivering
constant current of 4 mA and other four were
voltage - sensing electrodes (V1, V2, V1', V2‟).
Their placements are as follows:
V1, V1‟: The base of neck on each side
(Cervical voltage sensing electrodes)
V2, V2‟: At the level of the xiphisternum on
each side at anterior axillary line (Thoracic voltage
sensing electrodes)
I1, I1‟: At top of the neck on each side 5 cm
above the cervical sensing electrodes
I2, I2 „: 5 cm below the thoracic voltage
sensing electrodes on each side
Surface stick – on type of ECG electrodes were
used to connect NICO cable with body surface.
Electrodes placement is shown in the next figure
with minimal removal of clothing and so minimal
discomfort to subjects.
Fig. 5: Electrodes placement and NICO cable
connection over body surface.
As shown in the previous figure, particular
electrode has particular color for ease of application
as: I1 – Red, V1 – Yellow, V2 – Violate and I2 -
Green (RYVG). Placement of electrodes on one
particular side, either left or right are as I1, V1, V2
and I2 above downwards, and vice versa on the
A STUDY OF CARDIAC PARAMETERS USING IMPEDANCE PLETHYSMOGRAPHY (IPG) IN …
370 J. Phys. Pharm. Adv., 2012, 2(10):365-379
other side as I1', V1', V2' and I2'. CVP was by
default taken as 5 mmHg because it is not much
altered in healthy subjects as compared to critically
ill patients. CO and other parameters were
stabilized, averaged and displayed by the
instrument. All the parameters were updated for
every beat. Values displayed were real time,
averaged over the previous eight beats. Electrodes
were carefully removed with minimum discomfort
to subject after recording is over.
Fig. 6: ICG waveform display of NIVOMON
Results
All data were calculated and analyzed by trial
version of GraphPad InStat – [DATASET1.ISD]
Statistical software. Mean age of each group were
21.12 ± 3.04, 28.26 ± 2.79, 40.05 ± 3.32, 48.52 ±
2.33 and 68.5 ± 6.9 years respectively. Number of
healthy male volunteers were in each group were
75, 73, 74, 71 and 57 respectively. And those of
females were 5, 7, 6, 9 and 23 respectively. As there
are comparable numbers of females in last age
group of more than 55 years, we had done gender
based comparison of parameters in this group.
Followings were parameters and other values
with unit of measurement; those were obtained from
Nivomon, tabulated and then analyzed by statistical
software:
Zo (ohms),
Body Surface Area (m²),
Stroke Volume (ml/beat),
Stroke volume Index (ml/beat/m²),
Cardiac Output (lit./min ),
Cardiac Index (lit./min/m²),
Left Ventricular Ejection Time ( msecs ),
Systemic Vascular Resistance (dyne·sec/cm5),
Systemic Vascular Resistance Index
(dyne·sec/cm5/m²)
Mean ± SD values of cardiac parameters overall and
within each group are shown in the Tables 1, 2.
One way ANOVA (ANalysis Of Variance)
with post test was used to compare parameters
within 5 age groups. Individual group comparisons
for each parameter with p values are shown in the
next table. Linear (Pearson) correlation coefficient
(r) indicates positive (+) or negative (-) correlation
between 2 parameters. Its value is up to ± 1. + 1
indicates strong positive correlation. It means, when
1 parameter is increased or decreased, other
parameter is also strongly increases or decreases
respectively. –1 indicates strong negative
correlation. It means, when 1 parameter is
increased, other parameter is strongly decreases and
vice versa. Values of „r‟ in each age group for
correlation between BSA with each that of SV, CO,
SVR and Zo are shown in the following Table.
As there are maximum and so comarable number of
females in last age group (more than 55 yrs: n =
23), we have done comparison of parameters
between male and female using unpaired t – test
with Welch correction in this group. Mean ± SD
values of parameters, p value and significance are
displayed in the following. table.

PARMAR ET AL.
371 J. Phys. Pharm. Adv., 2012, 2(10):365-379
Table 2: Mean ± SD values overall ( n = 400 )
Parameters Mean ± SD Parameters Mean ± SD
SV 65.15 ± 13.18 LVET 357.35 ± 46.32
SI 38.16 ± 7.64 SVR 1500.95 ± 305.45
CO 4.94 ± 1.09 SVRI 2507.75 ± 441.63
CI 2.91 ± 0.51
Table 3 : Mean ± SD values in 1st, 2
nd, 3
rd,4
th and 5
th group
Group → (1)
16 – 25 yrs
(2)
26 – 35 yrs
(3)
36 – 45 yrs
(4)
46 – 55 yrs
(5)
More than 55 yrs Parameters ↓
Zo 26.37 ± 3.5 27.46 ± 3.38 26.12 ± 3.46 28.61 ± 4.04 30.16 ± 5.34
BSA 1.72 ± 0.18 1.76 ± 0.17 1.68 ± 0.18 1.67 ± 0.14 1.63 ± 0.17
SV 63.8 ± 12.99 65.91 ± 9.2 70.23 ± 15.83 63.72 ± 11.86 62.06 ± 13.86
SI 36.14 ± 7.77 36.72 ± 7.23 41.84 ± 8.74 38.17 ± 5.72 37.95 ± 7.26
CO 4.99 ± 0.96 5.06 ± 0.85 5.23 ± 1.37 4.6 ± 1.02 4.83 ± 1.09
CI 2.9 ± 0.4 2.88 ± 0.42 3.09 ± 0.67 2.75 ± 0.48 2.95 ± 0.49
LVET 340.87 ± 42.85 347.75 ± 41.18 360.75 ± 41.85 366.87 ± 55.22 370.5 ± 43.07
SVR 1451.6 ± 240.62 1448.16 ± 239.85 1412.8 ± 317.19 1595.83 ± 319.9 1596.35 ± 348.17
SVRI 2463.01 ± 317.13 2526.2 ± 377.77 2347.01 ± 481.43 2629.22 ± 439.6 2573.31 ± 518.58
Table 4: ANOVA - p values and significance for Basal Impedance ( Zo ), Stroke Volume ( SV ), Stroke Volume Index
( SI ), Cardiac Output ( CO ), Cardiac Index ( CI ), Left Ventricular Ejection Time ( LVET ), Systemic Vascular
Resistance ( SVR ) and Systemic Vascular Resistance Index ( SVRI )
Parameters → Zo SV SI CO CI LVET SVR SVRI
Groups ↓ p p p p p p p p
1 and 2 > 0.05 > 0.05 > 0.05 > 0.05 > 0.05 > 0.05 > 0.05 > 0.05
1 and 3 > 0.05 < 0.05* < 0.001
*** > 0.05 > 0.05 < 0.05
* > 0.05 > 0.05
1 and 4 < 0.01**
> 0.05 > 0.05 > 0.05 > 0.05 < 0.01**
< 0.05* > 0.05
1 and 5 < 0.001***
> 0.05 > 0.05 > 0.05 > 0.05 < 0.001***
< 0.05* > 0.05
2 and 3 > 0.05 > 0.05 < 0.001***
> 0.05 > 0.05 > 0.05 > 0.05 > 0.05
2 and 4 > 0.05 > 0.05 > 0.05 > 0.05 > 0.05 > 0.05 < 0.05* > 0.05
2 and 5 < 0.001***
> 0.05 > 0.05 > 0.05 > 0.05 < 0.05* < 0.05
* > 0.05
3 and 4 < 0.001***
< 0.05* < 0.05
* < 0.01
** < 0.001
*** > 0.05 < 0.01
** < 0.001
***
3 and 5 < 0.001***
< 0.001***
< 0.01**
> 0.05 > 0.05 > 0.05 < 0.001***
< 0.01**
4 and 5 > 0.05 > 0.05 > 0.05 > 0.05 > 0.05 > 0.05 > 0.05 > 0.05 Note: p < 0.05 = significant. p > 0.05=not significant. *significant, **very significant, ***extremely significant.
Table 5: r values for Body Surface Area ( BSA) with Stroke Volume ( SV), Cardiac
Output (CO), Systemic Vascular Resistance (SVR) and Basal Impedance ( Zo)
BSA and
→
SV CO SVR Zo
16 – 25 yrs + 0.66 + 0.69 - 0.63 + 0.04
26 – 35 yrs + 0.42 + 0.49 - 0.45 + 0.05
36 – 45 yrs + 0.37 + 0.57 - 0.44 + 0.11
46 – 55 yrs + 0.59 + 0.62 - 0.57 + 0.06
> 55 yrs + 0.53 + 0.68 - 0.42 - 0.08
Significance YES YES YES NO Note : r value, + positive and - negative correlation

A STUDY OF CARDIAC PARAMETERS USING IMPEDANCE PLETHYSMOGRAPHY (IPG) IN …
372 J. Phys. Pharm. Adv., 2012, 2(10):365-379
Discussion
We have tried to establish normative baseline
laboratory data of all cardiac parameters for
Bhavnagar region. Table No. 2 is showing mean
values of all parameters in whole study group
containing 400 healthy volunteers. Most of values
are consistent with normal reference range (Guyton,
Ganong, Harrison). So all parameters were
measured effectively by this new instrument. These
data will be helpful in many further future
physiological, pharmacological or clinical studies.
We can study physiological factors (Sherwood
A et al. 1998, Brown CVR et al. 2005) and
pharmacological drugs (Aust PE et al. 1982,
Sharman DL et al. 2004) affecting these cardiac
hemodynamic parameters. These can be used for
screening of susceptible subjects; and then life style
modification, change of treatment or any other
intervention (Treister N et al. 2005) can be
suggested accordingly. ICG waveform can be used
to aid in diagnosis of certain valvular (Schieken RM
et al. 1981) or other cardiac diseases (Hubbard WN
et al. 1986) and then to evaluate medical or surgical
treatment for the same. It can be used to detect early
signs of developing myocardial ischemia (Mohr R
et al. 1986). It can be helpful in autonomic function
testing also (Schondorf R et al. 1993). Cardiac
output measurement can be used for the monitoring
of other diverse cardiovascular conditions and for
other purposes, like pacemaker setting during
implantation (Tse HF et al. 2003). It can also be
used in trauma centre and emergency for early
detection of shock and so appropriate management
(Asensio JA et al. 2006). CONTINUOUS CO
monitoring is very useful in ICU set up (Albert NM
et al. 2004). It can also be used for hemodynamic
monitoring during haemodialysis. So if this non –
invasive technique is established, then it will be a
great milestone in history of medical sciences.
We would able to avoid complications like
infection, hemorrhage or arrhythmia associated with
invasive catheter related CO measurement
techniques like dye – dilution, fick‟s principle or
thermodilution. Further it requires minimal removal
of clothing. So it is comfortable on the patient side
also. As it is cheap and easy non – invasive
technique with portability of instrument, a trained
staff can also take required data instead of a
qualified doctor. So it is helpful with the problem of
man – power and funding also, particularly in
developing countries.
Table 6 : Male and Female comparison in 5
th group – Mean ± SD values, p values and significance
Para. Male
( n = 57 )
Female
( n = 23 ) p value Signi.
Zo 28.24 ± 4.34 34.9 ± 4.63 < 0.0001 Extremely
BSA 1.65 ± 0.17 1.58 ± 0.15 0.076 Not quite
SV 64.32 ± 14.77 56.46 ± 9.44 0.0062 Very
SI 38.83 ± 7.6 35.75 ± 5.91 0.058 Not quite
CO 4.96 ± 1.17 4.52 ± 0.8 0.058 Not quite
CI 2.98 ± 0.51 2.86 ± 0.44 0.29 Not quite
LVET 374.21 ± 39 361.3 ± 51.64 0.28 Not
SVR 1543.12±343.8 1728.26±329.99 0.03 Yes
SVRI 2510.14±495.48 2729.86 ± 552.1 0.1 Not Note: p values are two tailed.
Distribution of different parameters within
each age group
Table No. 3 is showing Mean ± SD values of
parameters in each group. As there are more than 2
age groups for comparison of different parameters,
one way ANOVA statistical test was used.
Mean values of Basal Impedance Zo in each
age group were 26.37 ± 3.5, 27.46 ± 3.38, 26.12 ±
3.46, 28.61 ± 4.04 and 30.16 ± 5.34 respectively.
Table no. 4 and chart below indicate that Zo values
in group 5 were significantly higher than group 1, 2
and 3. There is no significant difference between
group 4 and 5. Also Zo values in group 4 were
significantly higher than group 1 and 3. Zo depends
on contents of blood, plasma and tissues like that of
lungs, muscle and more important is fat.

PARMAR ET AL.
373 J. Phys. Pharm. Adv., 2012, 2(10):365-379
Chart 1: Basal Impedance (Zo)
Higher values in group 4 and 5 are due to
higher proportion of fat as there are more number of
females and peoples of later ages. So we can
conclude that the instrument measures basal
impedance accurately.
Mean values of stroke volume in each age
group were 63.8 ± 12.99, 65.91 ± 9.2, 70.23 ±
15.83, 63.72 ± 11.86 and 62.06 ± 13.86
respectively. Table no. 4 and chart below indicate
that stroke volume was significantly higher in group
3 than groups 1, 4 and 5. There is no significant
difference between group 2 and 3. Stroke volume is
dependent on many factors. But here we can say
that in older ages SV is decreased mostly due to
increased peripheral resistance (afterload) indicating
atherosclerosis. In group 1, SV may be low due to
low metabolic rate, small heart size or may be due
to any other factor. Exact reason can‟t be ruled out.
Chart 2: Stroke Volume (SV).
Mean values of stroke volume index in each
age group were 36.14 ± 7.77, 36.72 ± 7.23, 41.84
± 8.74, 38.17 ± 5.72 and 37.95 ± 7.26 respectively.
Table no. 4 and next chart indicate that significance
is same as that of stroke volume except, stroke
index is significantly higher in group 3 than group
2. So stroke volume index should be preferably
used over stroke volume to exclude variation due to
BSA.
Mean values of cardiac output in each age
group were 4.99 ± 0.96, 5.06 ± 0.85, 5.23 ± 1.37,
4.6 ± 1.02 and 4.83 ± 1.09 respectively. Table no. 4
and next chart indicate that cardiac output is
significantly higher in group 3 than that of group 4.
Otherwise there is no any significant difference
between any other pair of groups. So the difference
seen earlier in SV is neutralized by changes in heart
rate, because CO depends on both SV and HR.
Chart 3: Stroke Volume Index (SI).
It indicates that whatever SV is there, CO is
maintained within normal range here in wide range
of ages by adjusting HR to supply each and every
part of the body tissues for continuous supply of
necessary elements. Also the cardiac output is
regulated throughout life almost directly in
proportion to the overall bodily metabolic activity.
Therefore, the declining cardiac output and index is
indicative of declining metabolic activity with age
(Guyton).
2426283032
16 –25 yrs
26 –35 yrs
36 –45 yrs
46 –55 yrs
More than
55 yrs
Zo
Zo
565860626466687072
16 –
25 yrs
26 –
35 yrs
36 –
45 yrs
46 –
55 yrs
More
than
55 yrs
SV
SV
323436384042
16 –
25 yrs
26 –
35 yrs
36 –
45 yrs
46 –
55 yrs
More
than
55 yrs
SI
SI

A STUDY OF CARDIAC PARAMETERS USING IMPEDANCE PLETHYSMOGRAPHY (IPG) IN …
374 J. Phys. Pharm. Adv., 2012, 2(10):365-379
Chart.4: Cardiac Output (CO).
Mean values of cardiac index in each age group
were 2.9 ± 0.4, 2.88 ± 0.42, 3.09 ± 0.67, 2.75 ± 0.48
and 2.95 ± 0.49 respectively. Table no. 4 and chart
below indicate that results are same as that of CO.
Only significant difference is seen between group 3
and 4 (higher value in group 3). Cardiac index is
widely used for early detection of shock. Declining
cardiac index with ageing is indicative of declining
bodily activity and so basal metabolic rate (BMR)
with age (Guyton).
Chart 5: Cardiac Index (CI).
Mean values of LVET in each age group were
340.87 ± 42.85, 347.75 ± 41.18, 360.75 ± 41.85,
366.87 ± 55.22 and 370.5 ± 43.07 respectively.
Table no. 4 and chart below indicate that mean
value of LVET was significantly higher in group 3,
4 and 5 than that of group 1. Further it was also
significantly higher in group 5 than that of group 2.
There is no significant difference between group 2,
3 and 4. It states that in old ages, LVET is on higher
side; and in younger subjects, it is on lower side.
The data obtained in previous study showed
that most of the variability in the duration of LVET
in normal children can be explained by the HR
differences (Spitaels S et al. 1974). So a regression
equation is applied for study of LVET to exclude
effect of HR differences (Weissler AM et al. 1961).
LVET increases with maturity mainly because of a
slower HR (Spitaels S et al. 1974). Values of LVET
in our study are thus consistent with earlier study in
which the duration of the left ventricular ejection
was derived from the indirect carotid artery tracing.
LVET was defined there as the interval between the
beginning of the upstroke and the trough of the
incisura (Spitaels S et al. 1974, Willems J et al.
1970).
Mean values of SVR in each age group were
1451.6 ± 240.62, 1448.16 ± 239.85, 1412.8 ±
317.19, 1595.83 ± 319.9 and1596.35 ± 348.17
respectively. Table no. 4 and chart below indicate
that the value of SVR was significantly higher in
group 4 and 5 than those of group 1, 2 and 3. Mean
arterial pressure increases (afterload) and so CO
decreases due to atherosclerotic changes in later
ages. As SVR depends on MAP (numerator) and
CO (denominator), it increases in later ages. Low
and high SVR are associated with many disease
conditions (Peters J et al. 2000).
Chart 6: Left Ventricular Ejection Time (LVET).
4.24.44.64.8
55.25.4
16 –
25 yrs
26 –
35 yrs
36 –
45 yrs
46 –
55 yrs
More
than
55 yrs
CO
CO
2.5
2.6
2.7
2.8
2.9
3
3.1
16 –
25 yrs
26 –
35 yrs
36 –
45 yrs
46 –
55 yrs
More
than
55 yrs
CI
CI
325330335340345350355360365370375
16 –
25 yrs
26 –
35 yrs
36 –
45 yrs
46 –
55 yrs
More
than
55 yrs
LVET
LVET
PARMAR ET AL.
375 J. Phys. Pharm. Adv., 2012, 2(10):365-379
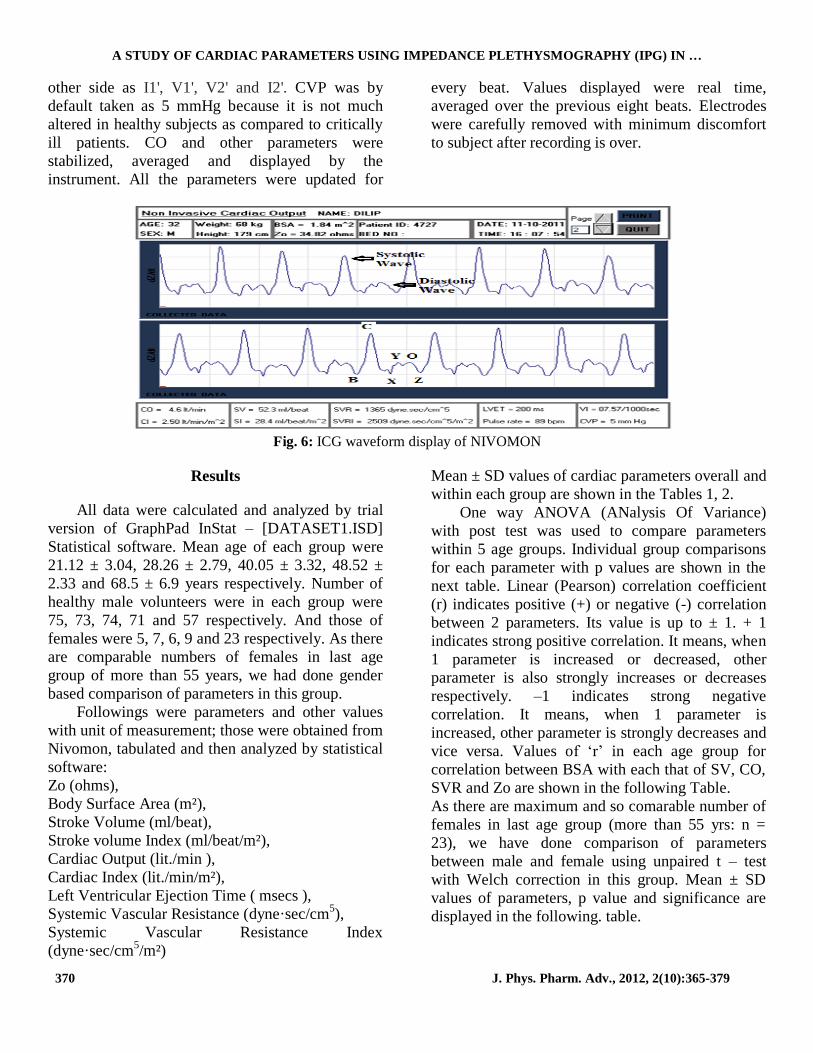
Chart 7: Systemic Vascular Resistance (SVR).
Mean values of SVRI in each age group were
2463.01 ± 317.13, 2526.2 ± 377.77, 2347.01 ±
481.43, 2629.22 ± 439.6 and 2573.31 ± 518.58
respectively. Table no. 4 and next chart indicate that
the value of SVRI in group 4 and 5 are higher than
those of group 3. There is no significant difference
between group 1, 2, 4 and 5. So most of significant
differences observed in SVR were neutralized in
SVRI due to exclusion of BSA effect. So it is
always better to use indices than that of actual value
to avoid differences arising due to BSA.
Chart 8: Systemic Vascular Resistance Index (SVRI).
Correlation between parameters
Now we consider correlation of BSA with other
parameters. Pearson correlation coefficient „r‟ was
calculated for the same. Values of „r‟ are shown in
Table no. 5. It states that significant correlation was
there between BSA and SV, CO, SVR.
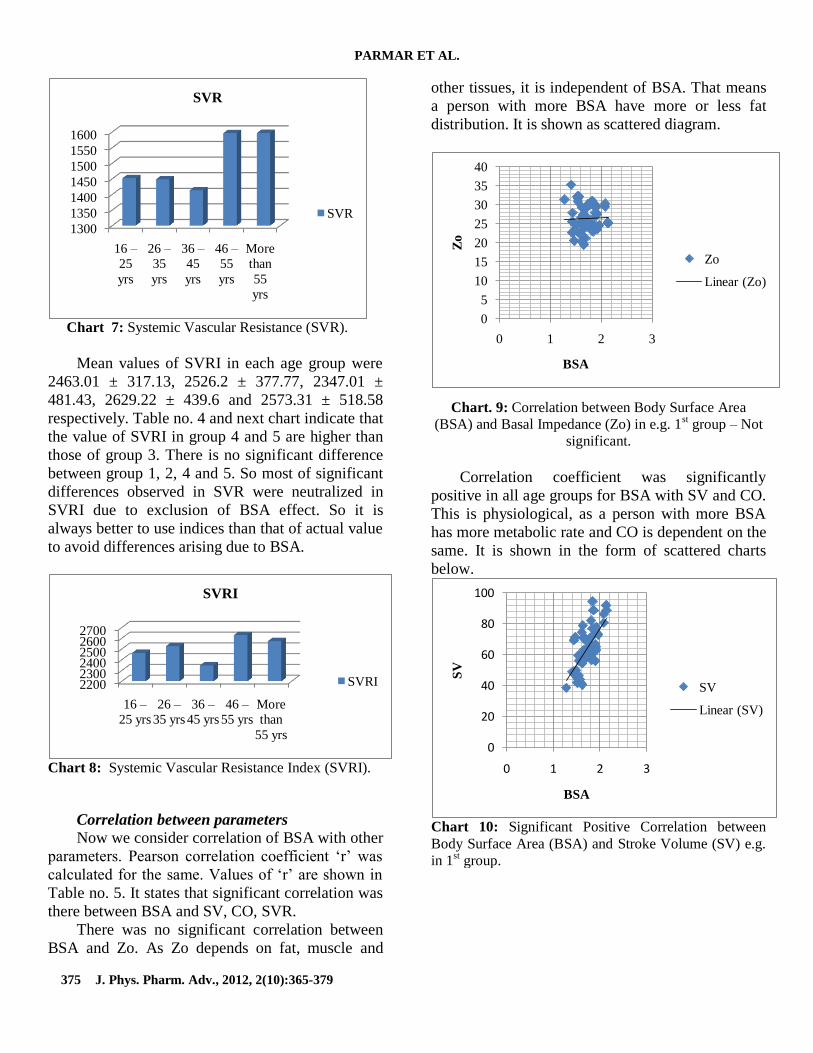
There was no significant correlation between
BSA and Zo. As Zo depends on fat, muscle and
other tissues, it is independent of BSA. That means
a person with more BSA have more or less fat
distribution. It is shown as scattered diagram.
Chart. 9: Correlation between Body Surface Area
(BSA) and Basal Impedance (Zo) in e.g. 1st group – Not
significant.
Correlation coefficient was significantly
positive in all age groups for BSA with SV and CO.
This is physiological, as a person with more BSA
has more metabolic rate and CO is dependent on the
same. It is shown in the form of scattered charts
below.
Chart 10: Significant Positive Correlation between
Body Surface Area (BSA) and Stroke Volume (SV) e.g.
in 1st group.
1300
1350
1400
1450
1500
1550
1600
16 –
25
yrs
26 –
35
yrs
36 –
45
yrs
46 –
55
yrs
More
than
55
yrs
SVR
SVR
220023002400250026002700
16 –
25 yrs
26 –
35 yrs
36 –
45 yrs
46 –
55 yrs
More
than
55 yrs
SVRI
SVRI
0
5
10
15
20
25
30
35
40
0 1 2 3
Zo
BSA
Zo
Linear (Zo)
0
20
40
60
80
100
0 1 2 3
SV
BSA
SV
Linear (SV)

A STUDY OF CARDIAC PARAMETERS USING IMPEDANCE PLETHYSMOGRAPHY (IPG) IN …
376 J. Phys. Pharm. Adv., 2012, 2(10):365-379
Chart 11: Significant Positive Correlation between
Body Surface Area (BSA) and Cardiac Output (CO) e.g.
in 1st group.
Further Table no. 5 indicates that „r‟ was
significantly negative for BSA with SVR. This is
because increased BSA is associated with increase
CO which in turn is associated with low SVR. So
we can say that this instrument measures SVR
appropriately. It is shown in the form of scattered
diagram below:
Chart 12: Significant Negative Correlation between
Body Surface Area (BSA) and Systemic Vascular
Resistance (SVR) e.g. in 1st group.
Gender based physiological difference
Table no. 6 shows the comparison of
parameters between male and female in last age
group (> 55 yrs) using unpaired t test. Although
numbers of male and female were not same,
numbers of female were maximum in this group.
And so we have selected this group for the same.
Table no. 6 and next chart indicate that, SV was
significantly higher in males but no difference for
SI. That was mainly due to effect of increased
metabolic activity. Zo was extremely higher in
females indicating more fat proportion as compared
to males.
Chart 13 : Comparison between male and female for
Basal Impedance (Zo), Stroke Volume ( SV ) and
Stroke Volume Index ( SI )
Table no. 6 and chart below indicate that, there
is no significant difference for BSA. So we can say,
this group is appropriate for comparison due to
absence of confounding factor. Also there was no
significant difference found for CO and CI.
Chart 14: Comparison between male and female
for Body Surface Area (BSA), Cardiac Output (CO)
and Cardiac Index (CI).
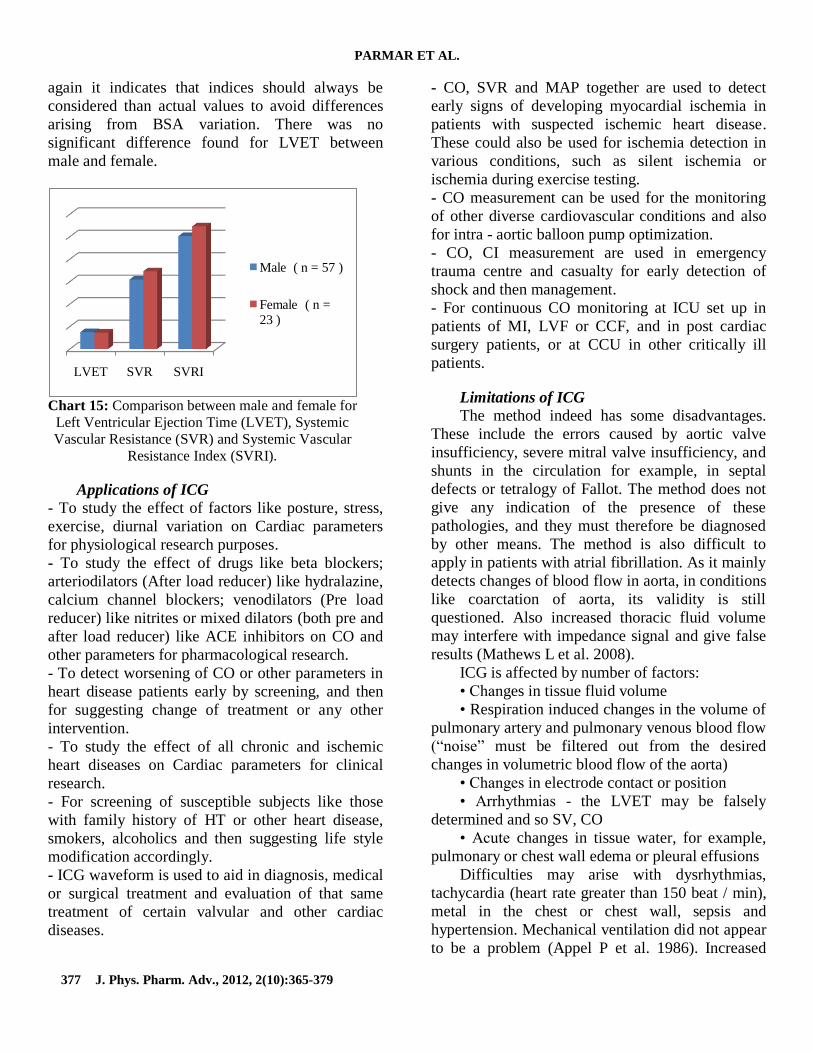
Table no. 6 and chart below indicate that,
although SVR was significantly higher in females,
no significant difference was there for SVRI. So
0
1
2
3
4
5
6
7
8
0 1 2 3
CO
BSA
CO
Linear (CO)
0
500
1000
1500
2000
2500
0 1 2 3
SV
R
BSA
SVR
Linear
(SVR)
Zo SV SI
Male ( n = 57 )
Female ( n = 23
)
BSA CO CI
Male ( n = 57 )
Female ( n =
23 )
PARMAR ET AL.
377 J. Phys. Pharm. Adv., 2012, 2(10):365-379
again it indicates that indices should always be
considered than actual values to avoid differences
arising from BSA variation. There was no
significant difference found for LVET between
male and female.
Chart 15: Comparison between male and female for
Left Ventricular Ejection Time (LVET), Systemic
Vascular Resistance (SVR) and Systemic Vascular
Resistance Index (SVRI).
Applications of ICG
- To study the effect of factors like posture, stress,
exercise, diurnal variation on Cardiac parameters
for physiological research purposes.
- To study the effect of drugs like beta blockers;
arteriodilators (After load reducer) like hydralazine,
calcium channel blockers; venodilators (Pre load
reducer) like nitrites or mixed dilators (both pre and
after load reducer) like ACE inhibitors on CO and
other parameters for pharmacological research.
- To detect worsening of CO or other parameters in
heart disease patients early by screening, and then
for suggesting change of treatment or any other
intervention.
- To study the effect of all chronic and ischemic
heart diseases on Cardiac parameters for clinical
research.
- For screening of susceptible subjects like those
with family history of HT or other heart disease,
smokers, alcoholics and then suggesting life style
modification accordingly.
- ICG waveform is used to aid in diagnosis, medical
or surgical treatment and evaluation of that same
treatment of certain valvular and other cardiac
diseases.
- CO, SVR and MAP together are used to detect
early signs of developing myocardial ischemia in
patients with suspected ischemic heart disease.
These could also be used for ischemia detection in
various conditions, such as silent ischemia or
ischemia during exercise testing.
- CO measurement can be used for the monitoring
of other diverse cardiovascular conditions and also
for intra - aortic balloon pump optimization.
- CO, CI measurement are used in emergency
trauma centre and casualty for early detection of
shock and then management.
- For continuous CO monitoring at ICU set up in
patients of MI, LVF or CCF, and in post cardiac
surgery patients, or at CCU in other critically ill
patients.
Limitations of ICG
The method indeed has some disadvantages.
These include the errors caused by aortic valve
insufficiency, severe mitral valve insufficiency, and
shunts in the circulation for example, in septal
defects or tetralogy of Fallot. The method does not
give any indication of the presence of these
pathologies, and they must therefore be diagnosed
by other means. The method is also difficult to
apply in patients with atrial fibrillation. As it mainly
detects changes of blood flow in aorta, in conditions
like coarctation of aorta, its validity is still
questioned. Also increased thoracic fluid volume
may interfere with impedance signal and give false
results (Mathews L et al. 2008).
ICG is affected by number of factors:
• Changes in tissue fluid volume
• Respiration induced changes in the volume of
pulmonary artery and pulmonary venous blood flow
(“noise” must be filtered out from the desired
changes in volumetric blood flow of the aorta)
• Changes in electrode contact or position
• Arrhythmias - the LVET may be falsely
determined and so SV, CO
• Acute changes in tissue water, for example,
pulmonary or chest wall edema or pleural effusions
Difficulties may arise with dysrhythmias,
tachycardia (heart rate greater than 150 beat / min),
metal in the chest or chest wall, sepsis and
hypertension. Mechanical ventilation did not appear
to be a problem (Appel P et al. 1986). Increased
LVET SVR SVRI
Male ( n = 57 )
Female ( n =
23 )

A STUDY OF CARDIAC PARAMETERS USING IMPEDANCE PLETHYSMOGRAPHY (IPG) IN …
378 J. Phys. Pharm. Adv., 2012, 2(10):365-379
sweating due to increased body temperature,
extremely oily skin or any other reason may prevent
effective contact of electrodes with the skin and
thus gives false results. Same is the case with hairy
skin. Impedance cardiography cannot detect exact
pathology like other non – invasive
Echocardiography or Colour Doppler, but these
techniques require a qualified radiologist or
cardiologist. And again advantage of continuous
CO monitoring remains with impedance
plethysmography only (Northridge DB et al. 1990,
Critchley LA et al. 1988).
Conclusion
Our aim was to establish normative baseline
laboratory data but numbers of females in all age
group were less (5, 7, 6, 9 and 23 only respectively
in group 1, 2, 3, 4 and 5). So, further validation is
still required. Thus here we conclude that, if
impedance cardiography is further validated and
then established, it is advantageous and helpful in
many ways and can be widely used either for
research purposes or in clinical set up.
Conflict of Interest Disclosures – None
Acknowledgements
We are thankful to our Dean Dr. B. D. Parmar
Sir and entire Physiology Department for their kind
support. We are also very thankful to our subjects
for taking part in our study, without whom, this
study could not have been possible.
References
Albert NM, Hail MD, Li J, Young JB (2004). Equivalence of
the bioimpedance and thermodilution methods in
measuring cardiac output in hospitalized patients with
advanced decompensated chronic heart failure. American
journal of critical care, Volume 13, No. 6
Appel P, Kram H, Mackabee J, Fleming A, Shoemaker W
(1986). Comparison of measurements of cardiac output
by bioimpedance and thermodilution in severely ill
surgical patients. J Critical Care Medicine., Vol. 14,
Issue 11
Arunodaya R, Gujjar K, Banakal MS, Gupta R, Talakad N
(2008) Sathyaprabha and P. S. Jairaj. Non-invasive
cardiac output by transthoracic electrical bioimpedence
in post-cardiac surgery patients: comparison with
thermodilution method. Journal of Clinical Monitoring
and Computing. DOI: 10.1007/s10877-008-9119-y
Asensio JA, Petrone P, Wo CJ, Li-Chien C, Lu K, Fathizadeh
P, et al (2006). Noninvasive hemodynamic monitoring of
patients sustaining severe penetrating thoracic,
abdominal and thoracoabdominal injuries for early
recognition and therapy of. Scandinavian Journal of
Surgery 95: 152–157.
Aust PE, Belz GG, Belz G, Koch W (1982). Comparison of
impedance cardiography and echocardiography for
measurement of stroke volume. Eur J Clin Pharmacol.
23(6):475
Babu JP, Jindal GD, Bhuta AC, Parulkar GB (1990).
Impedance plethysmography – basic principles. J
Postgrad Med; 36 ( 2 ) : 57 – 63
Backer LE (1989). Principles of impedance technique. IEEE
Eng Med Biol Mag, 2:11–15
Barde P, Jindal G, Singh R, Deepak K (2006). New method of
electrode placement for determination of cardiac output
using Impedance Cardiography. Indian J Physiol
Pharmacol; 50 (3) : 234–240
Belardini R, Cimpani N, Costani C, Blandini A, Purcara A
(1996). Comparison of impedance cardiography with
thermodilution and direct Pick methods for non-invasive
measurement of cardiac output during incremental
exercise in patients with ischemic cardiomyopathy. Am J
Cardiol 1996; 77: 1293–1301
Brown CVR, Martin MJ, Shoemaker WC, Charles CJ, Chan
L, Azarow K et al (2005). The effect of obesity on
bioimpedance cardiac index. The American Journal of
Surgery Volume 189, Issue 5, May 2005, Pages 547-551
Critchley LA (1988). Impedance cardiography: Impact of new
technology. Anesthesia
Funk DJ, Moretti EW, Gan TJ (2009). "Minimally invasive
cardiac output monitoring in the perioperative setting,"
Anesth. Analg., vol. 108, pp. 887-897.
Ganong WF. Review of medical physiology : 23th Edition.
Page : 508-515
Guyton and Hall. Textbook of medical physiology : 12th
edition. Page : 108, 232-245
Harrison‟s principles of internal medicine : 16th edition. Page :
1329
Hubbard WN, Fish DR, McBrien DJ (1986).The use of
impedance cardiography in heart failure. International
Journal of Cardiology Volume 12, Issue 1, Pages 71-79
Kubicek WG, Kotte Fj, Ramos MU, Patterson RP, Witsoe
DA, Labree JW et al (1974). The Minnesota. Impedance
cardiograph: Theory and applications. Biomed Eng; 9:
410–416
Lababidi Z, Ehmke DA, Durnin RE, Leaverton PE, Lauer RM
(1970). The first derivative thoracic impedance
cardiogram. Circulation 41:(4) 651-8
Mathews L, Singh KRK (2008). Cardiac output monitoring.
Annals of cardiac anesthesia. Volume 11 – issue 1 –
January – june 2008.
Mohr R, Rath S, Meir O, et al. (1986) Changes in systemic
vascular resistance detected by the arterial resistometer:
preliminary report of a new method tested during

PARMAR ET AL.
379 J. Phys. Pharm. Adv., 2012, 2(10):365-379
percutaneous transluminal coronary angioplasty.
Circulation, 74:780–785
Ng HWK, Walley T, Tsao Y, Breckenridge AM (1991).
Comparison and reproducibility of transthoracic
bioimpedance and dual beam Doppler ultrasound
measurement of cardiac function in healthy volunteers.
Br. J. clin. Pharmac. 32, 275-282
Northridge DB, Findlay IN, Wilson J, Henderson E, Dargie HJ
(1990). Non-invasive determination of cardiac output by
Doppler echocardiography and electrical bioimpedance.
Br Heart J. 63:93-7
Nyboer J (1960). Regional pulse volume and perfusion flow
measurements: electrical impedance plethysmography.
Arch In Med; 105: 264
Peck Y, Cheang S, Peter R, Smith (2003). An Overview of
Non-contact Photo plethysmography. Electronic systems
and control devison. Department of Electronic and
Electrical Engineering, Loughborough University, LE11
3TU, UK
Peters J, Melo J (2000). Low Systemic Vascular Resistance :
Aetiology and Outcome. PCCU - Lesson 13, Volume 14
Copyright 2000 American College of Chest Physicians
Schieken RM, Patel MR, Falsetti HL, Lauer RM (1981).
Effect of mitral valvular regurgitation on transthoracic
impedance cardiogram. Br Heart J; 45: 166-72
Schondorf R (1993). New Investigations of Autonomic
Nervous System Function. Journal of Clinical
Neurophysiology : January 1993 - Volume 10 - Issue 1
Sharman DL, Gomes CP, Rutherford JP (2004). Improvement
in Blood Pressure Control With Impedance
Cardiography - Guided Pharmacologic Decision Making.
Posted : 03/11/2004; © 2004 Le Jacq Communications,
Inc.
Sherwood A, McFetridge J, Hutcheson JS (1998).
Ambulatory impedance cardiography: a feasibility study.
Journal of Applied Physiology December 1998 vol. 85
no. 6 2365-2369
Shyu LY, Chiang CY, Liu CP, Hu WC (2000). Portable
Impedance Crdiography System for Real-Time
Noninvasive Cardiac Output Measurement. Journal of
Medical and Biological Engineering, 20(4): 193-202
2000 193
Spitaels S, Arbogast R, Fouron JC, Davignon A (1974). The
Influence of Heart Rate and Age on the Systolic and
Diastolic Time Intervals in Children. Circulation.
49:1107-1115
Sullivan PJ, Martrieau RJ, Hull KA, Miller DR(1990).
Comparison of bio impedance and thermodilution
measurement of cardiac output during aortic surgery.
Can J Anaest 1990; 37(4 pt 2): S78
Treister N, Wagner K, Paul R (2005). Jansen. Reproducibility
of impedance cardiography parameters in outpatients
with clinically stable coronary artery disease. Am J
Hypertens 2S, 44S–50S
Tse HF, Yu C, Park E, et al. (2003). Impedance cardiography
for atrioventricular interval optimization during
permanent left ventricular pacing. Pace 2003, 6:189–191
Weissler AM, Peeler G, Roehl HJR (1961). Relationship
between left ventricular ejection time, stroke volume and
heart rate in normal individuals and patients with
cardiovascular disease. Amer Heart J 62: 367.
Willems J, Roelandt J, Geest HD, Kesteloot H, Joossens J
(1970). The Left Ventricular Ejection Time in Elderly
Subjects. Circulation. 42:37-42.