
Forecasting daily pollen concentrations using data-driven modeling methods in Thessaloniki, Greece
11
Forecasting daily pollen concentrations using data-driven modeling methods in Thessaloniki, Greece Dimitris Voukantsis a, * , Harri Niska b , Kostas Karatzas a , Marina Riga a , Athanasios Damialis c , Despoina Vokou c a Department of Mechanical Engineering, Informatics Systems & Applications Group, Aristotle University, P.O. Box 483, GR-54124 Thessaloniki, Greece b Department of Environmental Science, University of Eastern Finland, P.O. Box 1627, 70211 Kuopio, Finland c Department of Ecology, School of Biology, Aristotle University of Thessaloniki, GR-54124 Thessaloniki, Greece article info Article history: Received 16 July 2010 Received in revised form 30 August 2010 Accepted 2 September 2010 Keywords: Allergy Feature selection Forecasting Genetic algorithms Neural networks Regression trees Support vector machines abstract Airborne pollen have been associated with allergic symptoms in sensitized individuals, having a direct impact on the overall quality of life of a considerable fraction of the population. Therefore, forecasting elevated airborne pollen concentrations and communicating this piece of information to the public are key issues in prophylaxis and safeguarding the quality of life of the overall population. In this study, we adopt a data-oriented approach in order to develop operational forecasting models (1e7 days ahead) of daily average airborne pollen concentrations of the highly allergenic taxa: Poaceae, Oleaceae and Urti- caceae. The models are developed using a representative dataset consisting of pollen and meteorological time-series recorded during the years 1987e2002, in the city of Thessaloniki, Greece. The input variables (features) of the models have been optimized by making use of genetic algorithms, whereas we evaluate the performance of three algorithms: i) multi-Layer Perceptron, ii) support vector regression and iii) regression trees originating from distinct domains of Computational Intelligence (CI), and compare the resulting models with traditional multiple linear regression models. Results show the superiority of CI methods, especially when forecasting several days ahead, compared to traditional multiple linear regression models. Furthermore, the CI models complement each other, resulting to a combined model that performs better than each one separately. The overall performance ranges, in terms of the index of agreement, from 0.85 to 0.93 clearly suggesting the potential operational use of the models. The latter ones can be utilized in provision of personalized and on-time information services, which can improve quality of life of sensitized citizens. Ó 2010 Elsevier Ltd. All rights reserved. 1. Introduction Pollen allergy (also known as hay fever) is a reaction of the human immune system to certain allergens carried by airborne pollen. The allergic symptoms usually start with the pollen season and vary in severity. Hay fever cannot be cured completely; however, there are several treatments to relief the symptoms. It is estimated that the overall prevalence of hay fever among European citizens is approximately 15e20% (Huynen et al., 2003), whereas the association with certain respiratory diseases, e.g., asthma are well-established, although not completely understood (Taylor et al., 2007). During the last years, allergies due to airborne pollen indi- cate an increasing trend, while the severity of allergic symptoms is also increasing in most industrialized countries affecting overall quality of life of citizens (World Allergy Organization, www. worldallergy.org). The triggering of allergic reactions is highly correlated with airborne pollen concentration levels, although there is no clear threshold value. The latter one strongly depends on the sampling methods used to monitor pollen concentrations. Thus, for olive pollen, symptoms have been reported for concentration levels ranging from 2 to 4 grains m 3 air, in Israel (Waisel et al., 2004), up to 400 grains m 3 air, in Spain (Florido et al., 1999). Generally speaking, threshold values strongly depend on the taxon, whereas different individuals might experience symptoms of varying severity for the same concentration levels. The aforementioned facts highlight the need to produce pollen concentration forecasts and disseminate this piece of information to impacted citizens, in order to better manage the severity of their allergic reactions. From the modeler’s point of view this might be interpreted as a predictive modeling task aiming at optimized * Corresponding author. Tel./fax: þ30 2310994359. E-mail address: [email protected] (D. Voukantsis). Contents lists available at ScienceDirect Atmospheric Environment journal homepage: www.elsevier.com/locate/atmosenv 1352-2310/$ e see front matter Ó 2010 Elsevier Ltd. All rights reserved. doi:10.1016/j.atmosenv.2010.09.006 Atmospheric Environment 44 (2010) 5101e5111
Transcript of Forecasting daily pollen concentrations using data-driven modeling methods in Thessaloniki, Greece

lable at ScienceDirect
Atmospheric Environment 44 (2010) 5101e5111
Contents lists avai
Atmospheric Environment
journal homepage: www.elsevier .com/locate/atmosenv
Forecasting daily pollen concentrations using data-driven modeling methods inThessaloniki, Greece
Dimitris Voukantsis a,*, Harri Niska b, Kostas Karatzas a, Marina Riga a, Athanasios Damialis c,Despoina Vokou c
aDepartment of Mechanical Engineering, Informatics Systems & Applications Group, Aristotle University, P.O. Box 483, GR-54124 Thessaloniki, GreecebDepartment of Environmental Science, University of Eastern Finland, P.O. Box 1627, 70211 Kuopio, FinlandcDepartment of Ecology, School of Biology, Aristotle University of Thessaloniki, GR-54124 Thessaloniki, Greece
a r t i c l e i n f o
Article history:Received 16 July 2010Received in revised form30 August 2010Accepted 2 September 2010
Keywords:AllergyFeature selectionForecastingGenetic algorithmsNeural networksRegression treesSupport vector machines
* Corresponding author. Tel./fax: þ30 2310994359.E-mail address: [email protected] (D. Vou
1352-2310/$ e see front matter � 2010 Elsevier Ltd.doi:10.1016/j.atmosenv.2010.09.006
a b s t r a c t
Airborne pollen have been associated with allergic symptoms in sensitized individuals, having a directimpact on the overall quality of life of a considerable fraction of the population. Therefore, forecastingelevated airborne pollen concentrations and communicating this piece of information to the public arekey issues in prophylaxis and safeguarding the quality of life of the overall population. In this study, weadopt a data-oriented approach in order to develop operational forecasting models (1e7 days ahead) ofdaily average airborne pollen concentrations of the highly allergenic taxa: Poaceae, Oleaceae and Urti-caceae. The models are developed using a representative dataset consisting of pollen and meteorologicaltime-series recorded during the years 1987e2002, in the city of Thessaloniki, Greece. The input variables(features) of the models have been optimized by making use of genetic algorithms, whereas we evaluatethe performance of three algorithms: i) multi-Layer Perceptron, ii) support vector regression andiii) regression trees originating from distinct domains of Computational Intelligence (CI), and comparethe resulting models with traditional multiple linear regression models. Results show the superiority ofCI methods, especially when forecasting several days ahead, compared to traditional multiple linearregression models. Furthermore, the CI models complement each other, resulting to a combined modelthat performs better than each one separately. The overall performance ranges, in terms of the index ofagreement, from 0.85 to 0.93 clearly suggesting the potential operational use of the models. The latterones can be utilized in provision of personalized and on-time information services, which can improvequality of life of sensitized citizens.
� 2010 Elsevier Ltd. All rights reserved.
1. Introduction
Pollen allergy (also known as hay fever) is a reaction of thehuman immune system to certain allergens carried by airbornepollen. The allergic symptoms usually start with the pollen seasonand vary in severity. Hay fever cannot be cured completely;however, there are several treatments to relief the symptoms. It isestimated that the overall prevalence of hay fever among Europeancitizens is approximately 15e20% (Huynen et al., 2003), whereasthe association with certain respiratory diseases, e.g., asthma arewell-established, although not completely understood (Taylor et al.,2007). During the last years, allergies due to airborne pollen indi-cate an increasing trend, while the severity of allergic symptoms isalso increasing in most industrialized countries affecting overall
kantsis).
All rights reserved.
quality of life of citizens (World Allergy Organization, www.worldallergy.org).
The triggering of allergic reactions is highly correlated withairborne pollen concentration levels, although there is no clearthreshold value. The latter one strongly depends on the samplingmethods used to monitor pollen concentrations. Thus, for olivepollen, symptoms have been reported for concentration levelsranging from 2 to 4 grains m�3 air, in Israel (Waisel et al., 2004), upto 400 grains m�3 air, in Spain (Florido et al., 1999). Generallyspeaking, threshold values strongly depend on the taxon, whereasdifferent individuals might experience symptoms of varyingseverity for the same concentration levels.
The aforementioned facts highlight the need to produce pollenconcentration forecasts and disseminate this piece of informationto impacted citizens, in order to better manage the severity of theirallergic reactions. From the modeler’s point of view this might beinterpreted as a predictive modeling task aiming at optimized
D. Voukantsis et al. / Atmospheric Environment 44 (2010) 5101e51115102
forecasting models of certain pollen taxa that can be used on anoperational basis. Taking into account the long term accumulationof pollen concentrations and meteorological data, we presenta data-oriented approach that can result to optimized operationalforecasting models of airborne pollen concentration levels. Thecore of this methodology consists of Computational Intelligence(CI) methods. The suitability of these methods is shown by theirinherent characteristics. Among others, CI methods: i) are capableof dealing with the complexity of the mechanisms involved in theproduction, release and dispersion of airborne pollen, ii) can beapplied for different tasks (optimization and forecasting in thiscase), iii) are computationally efficient and can be easily integratedinto existing information systems, therefore fulfilling the require-ment for operational use of the models.
Data-oriented approaches that involved CI methods have beensuccessfully applied in the past in several application domains.Within the environmental sector the application of CI methods hasbeen constantly increasing during the last years. Tasks such asforecasting air quality parameters (Karatzas and Kaltsatos, 2007;Slini et al., 2006; Kukkonen et al., 2003), identification of episodicsituations (Kolehmainen et al., 2000), provision of environmentalinformation services (Karatzas et al., 2008) or profiling of electricityuse customers (Räsänen et al., in press), have been successfullytackled by artificial neural networks, support vector machines, selforganizingmaps, genetic algorithms or other CI methods. Statisticalmethods (Stach et al., 2008; Smith and Emberlin, 2005; Angostoet al., 2005), as well as CI methods (Ranzi et al., 2003; Mitrakiset al., in press) have also been applied in order to analyze andmodel pollen concentration data. Short-term forecasting (1e2 daysahead) of pollen concentrations of allergenic taxa, is probably themost common task addressed. Artificial neural network(Rodríguez-Rajo et al., 2010; Sanchez-Mesa et al., 2002) and neuroe fuzzy models (Aznarte et al., 2007) have already been applied forthis task and proven to perform better than traditional statisticalmethods (Galán et al., 2001).
In this paper, we demonstrate the development of data-orientedforecasting models of the highly allergenic taxa: Urticaceae(nettles), Poaceae (grasses) and Oleaceae (olive) in the city ofThessaloniki, Greece. The main objectives are: i) the developmentof accurate forecasting models taking into account the datasampling reality and the resulting restrictions, therefore allowingfor operation use of the models, ii) the evaluation of CI methodsthat have not been previously applied for the task at hand, such assupport vector regression and regression trees, and iii) the opti-mization of the models by applying genetic algorithms in order tomaximize the accuracy and minimize the computationalcomplexity of the models. The objectives presented above, high-light the fundamentally different approach followed in this studycompared to previous ones, as well the potential of the methodsused to contribute with new knowledge in this research field.
2. Materials and methods
2.1. Area of study
Thessaloniki is the second largest city in Greece accounting forapproximately 1,000,000 inhabitants. The city area coversapproximately 93 km2, being one of the most densely populatedcities in Europe with the inconsiderable urban green space of 3 m2
green-space per citizen. Thessaloniki is framed by the ThermaikosGulf to the south-southwest, by the Chortiatis Mountain to thesoutheast and by the Seich-Sou forest to the northeast (Fig. 1).Furthermore, there are several forests close to the city such as theSeich-Sou and Kouri, as well as the Mt. Chortiatis forest. The pre-vailing climatic conditions are typical Mediterranean with warm to
hot, dry summers and mild, wet winters. The complex coastalformation and orography pattern of the greater Thessaloniki areafavors local circulation systems of various kinds (seaeland breeze,valleyemount winds), as well as wind channelling phenomena(Moussiopoulos et al., 2009) that prevent the transport of emittedpollutants and airborne pollen.
2.2. Pollen taxa under consideration
In the area of Thessaloniki, skin tests to pollen extracts fromPoaceae, Oleaceae and Urticaceae gave positive reactions in 40.4%,31.8% and 15.3%, respectively, of the total number (1311) of atopicpatients examined (Gioulekas et al., 2004).
The most abundant representative of Urticaceae in the localvegetation is Parietaria judaica (Fotiou et al., in press), whereas ofOleaceae, it is Olea europaea (Athanasiadis, 1986). Poaceae arerepresented by hundreds of species (Athanasiadis, 1985) and it isone of the three most abundant families in Thessaloniki regardingthe number of taxa they contain (Krigas, 2004), thus it is notpossible to identify one or two most representative species of thisfamily.
The main pollen season for all three taxa starts in March andends in June for Oleaceae, in July for Urticaceae and in Septemberfor Poaceae (Gioulekas et al., 2004). No significant shifts in themainpollen season of these taxa have been observed over the last twodecades (Damialis et al., 2007). The respective flowering seasons ofthe locally most abundant species of these families cover the periodfromMay to June for O. europaea (Damialis, 2010) and from April toSeptember for P. judaica (Fotiou et al., in press). Interestingly, ina specific study, it was found that P. judaica pollen was recorded inthe air in low quantities in autumn, although the species hada second, rather intense flowering at that time (Fotiou et al., inpress).
As flowering phenology is strongly affected by climatic condi-tions (Defila and Clot, 2001) and given that pollen emissionpatterns reflect the flowering phenology and pollen productivity ofthe regional flora (Osborne et al., 2000), annual variations ofclimatic variables are expected to have impacts on pollen concen-trations and distribution patterns.
2.3. Pollen collection, identification and counting
Airborne pollen were collected using a 7-day recording volu-metric spore trap of the Hirst design (Hirst, 1952) (Burkard), placedat approximately 30 m above the ground level, on the roof ofa building in the center of the city (latitude: 40�37059.28"N,longitude: 22�57027.20"E). The use of daily samplers is a highlydemanding and time consuming task, thus it has not been appliedfor the case of Thessaloniki. Therefore, the overall procedure ofcollecting and counting pollen concentration data is a repetitive7-day cycle task: particles are trapped on a transparent plastic tapesupported on a clockwork-driven drum that rotates at a constantrate, making a complete revolution in one week. The tape is thenremoved and cut in seven 48-mm long vertical bands, each onerepresenting a day of sampling. The identification and counting ofpollen particles of different taxa is made under a light microscope(magnification �400); Pollen grains are counted in four longitu-dinal traverses per slide (Solomon and Mathews, 1978) and pollenconcentrations are expressed as daily average pollen grains per m3
of air. Further details concerning the sampling and countingprocedure in Thessaloniki can be found in (Damialis et al., 2007).This sampling reality (pollen concentrations becoming availableonce per week, although being recorder on a daily basis) posescertain restriction on the operational applicability of the models,therefore it has to be considered in model development.

Fig. 1. The area of study. The pollen sampling and meteorological monitoring site (distance < 1 km) are within the are indicated by the black square marker (map from googlemaps).
D. Voukantsis et al. / Atmospheric Environment 44 (2010) 5101e5111 5103
2.4. Data presentation
The data used in this study consist of daily average pollenconcentration time-series of the taxa Urticaceae, Poaceae andOleaceae for the time period 1987e2002. The selected taxa areranked among the most allergenic ones (Gioulekas et al., 2004;D’Amato et al., 2007), therefore being of high interest. Further-more, meteorological parameters from the monitoring station atthe University campus, within a distance of less than 1 km from thepollen sampling site (latitude: 40�37051.90"N, longitude:22�57030.02"E). The data correspond to the same time period andresolution (Université de Thessaloniki, 1991e2003); the followingvariables were available: temperature [minimum, maximum andmean (in �C)], rainfall height (in mm), rainfall duration (in hours),relative humidity (in %), solar radiation (in mWh cm�2) and windspeed (in km h�1).
Pollen concentrations are characterized by strong seasonality,indicating their maximum values during spring or summer(depending on taxon) and almost zero concentrations duringwinter. Pollen concentrations of the taxa under consideration overthe study period are presented in Fig. 2.
Missing or erroneous values of the meteorological data (<5%)have been handled using the nearest neighbor imputation method(Junninen et al., 2004), whereas the variance scaling has been
used during model development. Finally, the data have beenseparated into two parts: the training set (1987e1999) and the testset (2000e2002), in order to develop and evaluate the models,respectively.
2.5. Methods
The forecasting models have been developed using 3 methodsoriginating from different domains of CI. Multi-Layer Perceptron(MLP) is a well-known artificial neural network implementationthat has been successfully applied in previous studies for the task athand; this was not the case for Support Vector Regression (SVR) andthe regression tree algorithm (M5P). The latter ones have not beenaddressed for pollen concentration forecasting yet, although therehave been several successful applications of these methods withinthe environmental domain. Themodels have been developed at theMatlab environment; the SVR implementation of the Spider v.1.71toolbox (available at www.kyb.tuebingen.mpg.de) was used, aswell as the WEKA (Hall et al., 2009) implementation of the M5Palgorithm.
2.5.1. Multiple linear regression (MLR)MLR is a well-known statistical method that has extensively
been used for forecasting daily average pollen concentrations

Fig. 2. Daily average pollen concentrations (in grains m�3) of Urticaceae, Poaceae and Oleaceae during the time period 1987e2002 in Thessaloniki, Greece.
D. Voukantsis et al. / Atmospheric Environment 44 (2010) 5101e51115104
(Angosto et al., 2005). In this case, MLR provides a reference framefor comparison of other methods.
2.5.2. Multi-layer perceptronMLP (Haykin, 1999) is probably the most successful imple-
mentation of artificial neural networks and have been repeatedlyused within the environmental domain to tackle classification,regression and function approximation problems. MLP models arecapable of modeling complex and highly non-linear processes,through the topology of the network; the neurons are arranged intoconsecutive layers, massively interconnected to each other. Thesecapabilities have already been successfully utilized in previousstudies, in order to forecast pollen concentrations (Rodríguez-Rajoet al., 2010), therefore making MLP one of the methods that needsto be considered when developing data-based pollen concentrationforecasting models.
In order to obtain the optimum performance of MLP models,there are several parameters that need to be set. Among the mostimportant ones is the architecture of the network, i.e., number ofhidden layers and number of neurons per layer. In this case, wehave evaluated network architectures consisting of one or twohidden layers. The number of neurons per layer has been selectedby the following possible values: {N�5,., Nþ5} for the first hiddenlayer and {0, 2, N/2, N} for the second hidden layer, where N¼(inputs þ outputs)/2. These choices have been made followingguidelines for MLP architecture (Haykin, 1999) and taking intoaccount our experience with neural networks. We have made 5runs for each possible architecture and evaluate the outcome interms of statistical indices (see Section 3.2); the best models arepresented in Section 3.2. Furthermore, we have use the resilientbackpropagation algorithm during the training of the networks,setting the maximum number of epochs at 500 and applying anearly stopping criterion (validation set proportion of 10% of thetraining set), in order to avoid overfitting.
2.5.3. Support vector regression (SVR)SVR is a modification of the initial algorithm introduced by
Vapnik (1995) capable of tackling regression problems. SVR modelshave been used in several applications within the environmental
domain (Osowski and Garanty, 2007); however, the forecasting ofpollen concentration with SVR had not been addressed before. Theselection of SVR control parameters strongly affects the perfor-mance of the resulting model. In this case, we have optimized theregularization parameter (C) and the 3-intensive zone of the model,using a simple direct search algorithm. The SVR kernel has beenchosen to be the radial basis function, whereas the g parameter ofthe kernel has been optimized using the same approach, as in thecase of C and 3.
2.5.4. M5P algorithmM5P are tree based models, capable of tackling regression tasks.
The initial algorithm was introduced by Quinlan (1992) asa combination of decision trees andmultivariate regressionmodels.In contrast to other regression trees, the leaves of the M5P treestructure consist of MLR models. This way it is possible to modellocal linearity within the data, similar to a piecewise linear func-tion. M5P models have not been previously applied in order tomodel pollen data. The complexity of the trees can be determinedby setting the minimum number of instances (M) per node. In thiscase, we evaluate trees withM ¼ {1,.,20}; Section 3.2 presents thebest performing ones.
2.5.5. Combined models (CMB)CMB models are combinations of the models presented in the
previous Sections (2.5.1e2.5.4). The individual forecasts producedby the component models are averaged in order to produce a newforecast that corresponds to the CMB model. This technique hasbeen widely used in meteorology and air quality domain, sincerandom errors cancelation during the averaging of the individualforecasts might improve the overall performance.
2.6. Feature selection
Data-based forecasting models learn to imitate dynamicprocesses, in order to provide accurate forecasts of target param-eters. The learning process is driven by data, thus it is important toexpose the model not only to data of high quality, but also torelevant and information-comprising variables (features). The
D. Voukantsis et al. / Atmospheric Environment 44 (2010) 5101e5111 5105
latter ones are not always known in advance; therefore, a selection(optimization) process, known as feature selection, is necessary inorder to identify the features that fulfill one or more objectives, e.g.,maximum performance, minimum complexity, etc.
Feature selection has been a fertile field of research within theenvironmental domain. Several methods such as the autocorrela-tion analysis (Aznarte et al., 2007), sensitivity analysis (Rodríguez-Rajo et al., 2010; Niska et al., 2005) and genetic algorithms (Niskaet al., 2004) have gradually replaced empirical criteria, originatingfrom human experience. In this case, we apply genetic algorithmsto select the optimum feature subset, since it has been proven veryrobust and efficient for the task at hand (Voukantsis et al., 2010).
Genetic algorithms can be utilized in order to identify theoptimum solution, on the basis of an objective function. A pop-ulation of individuals (in this case binary represented featuresubsets) is randomly initialized and undergoes an optimizationprocess, based on genetic recombination and mutation of theirgenotypes. Successful solutions are re-inserted in the populationwith certain probability, whereas the new individuals replace theleast fit ones of the populations (re-evaluation). The procedureterminateswhen a set of predefined criteria aremet, e.g., maximumnumber of generations. The objective function may have multipleobjective criteria. In that case, the best individuals are selected fromthe Pareto-optimal front (Goldberg, 1989).
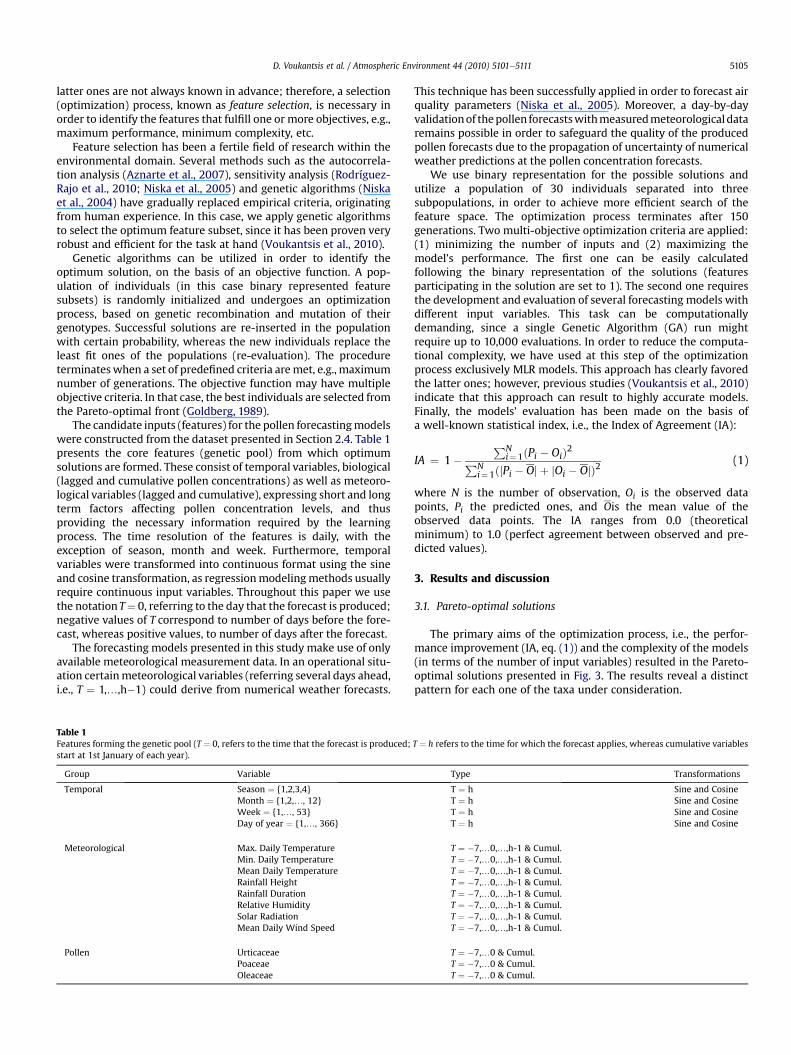
The candidate inputs (features) for the pollen forecastingmodelswere constructed from the dataset presented in Section 2.4. Table 1presents the core features (genetic pool) from which optimumsolutions are formed. These consist of temporal variables, biological(lagged and cumulative pollen concentrations) as well as meteoro-logical variables (lagged and cumulative), expressing short and longterm factors affecting pollen concentration levels, and thusproviding the necessary information required by the learningprocess. The time resolution of the features is daily, with theexception of season, month and week. Furthermore, temporalvariables were transformed into continuous format using the sineand cosine transformation, as regressionmodelingmethods usuallyrequire continuous input variables. Throughout this paper we usethe notationT¼ 0, referring to the day that the forecast is produced;negative values of T correspond to number of days before the fore-cast, whereas positive values, to number of days after the forecast.
The forecasting models presented in this study make use of onlyavailable meteorological measurement data. In an operational situ-ation certainmeteorological variables (referring several days ahead,i.e., T ¼ 1,.,h�1) could derive from numerical weather forecasts.
Table 1Features forming the genetic pool (T ¼ 0, refers to the time that the forecast is produced;start at 1st January of each year).
Group Variable
Temporal Season ¼ {1,2,3,4}Month ¼ {1,2,., 12}Week ¼ {1,., 53}Day of year ¼ {1,., 366}
Meteorological Max. Daily TemperatureMin. Daily TemperatureMean Daily TemperatureRainfall HeightRainfall DurationRelative HumiditySolar RadiationMean Daily Wind Speed
Pollen UrticaceaePoaceaeOleaceae
This technique has been successfully applied in order to forecast airquality parameters (Niska et al., 2005). Moreover, a day-by-dayvalidationof thepollen forecastswithmeasuredmeteorologicaldataremains possible in order to safeguard the quality of the producedpollen forecasts due to the propagation of uncertainty of numericalweather predictions at the pollen concentration forecasts.
We use binary representation for the possible solutions andutilize a population of 30 individuals separated into threesubpopulations, in order to achieve more efficient search of thefeature space. The optimization process terminates after 150generations. Two multi-objective optimization criteria are applied:(1) minimizing the number of inputs and (2) maximizing themodel’s performance. The first one can be easily calculatedfollowing the binary representation of the solutions (featuresparticipating in the solution are set to 1). The second one requiresthe development and evaluation of several forecasting models withdifferent input variables. This task can be computationallydemanding, since a single Genetic Algorithm (GA) run mightrequire up to 10,000 evaluations. In order to reduce the computa-tional complexity, we have used at this step of the optimizationprocess exclusively MLR models. This approach has clearly favoredthe latter ones; however, previous studies (Voukantsis et al., 2010)indicate that this approach can result to highly accurate models.Finally, the models’ evaluation has been made on the basis ofa well-known statistical index, i.e., the Index of Agreement (IA):
IA ¼ 1�PN
i¼1ðPi � OiÞ2PNi¼1ðjPi � Oj þ jOi � OjÞ2
(1)
where N is the number of observation, Oi is the observed datapoints, Pi the predicted ones, and Ois the mean value of theobserved data points. The IA ranges from 0.0 (theoreticalminimum) to 1.0 (perfect agreement between observed and pre-dicted values).
3. Results and discussion
3.1. Pareto-optimal solutions
The primary aims of the optimization process, i.e., the perfor-mance improvement (IA, eq. (1)) and the complexity of the models(in terms of the number of input variables) resulted in the Pareto-optimal solutions presented in Fig. 3. The results reveal a distinctpattern for each one of the taxa under consideration.
T ¼ h refers to the time for which the forecast applies, whereas cumulative variables
Type Transformations
T ¼ h Sine and CosineT ¼ h Sine and CosineT ¼ h Sine and CosineT ¼ h Sine and Cosine
T ¼ �7,.0,.,h-1 & Cumul.T ¼ �7,.0,.,h-1 & Cumul.T ¼ �7,.0,.,h-1 & Cumul.T ¼ �7,.0,.,h-1 & Cumul.T ¼ �7,.0,.,h-1 & Cumul.T ¼ �7,.0,.,h-1 & Cumul.T ¼ �7,.0,.,h-1 & Cumul.T ¼ �7,.0,.,h-1 & Cumul.
T ¼ �7,.0 & Cumul.T ¼ �7,.0 & Cumul.T ¼ �7,.0 & Cumul.
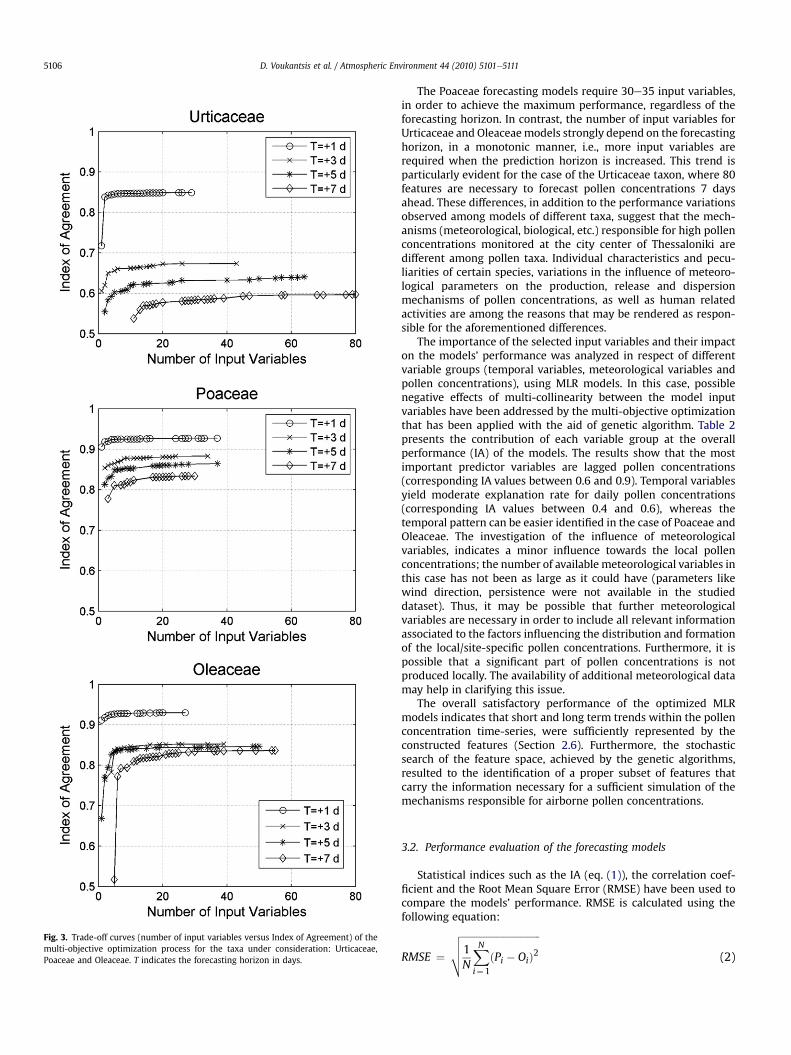
Fig. 3. Trade-off curves (number of input variables versus Index of Agreement) of themulti-objective optimization process for the taxa under consideration: Urticaceae,Poaceae and Oleaceae. T indicates the forecasting horizon in days.
D. Voukantsis et al. / Atmospheric Environment 44 (2010) 5101e51115106
The Poaceae forecasting models require 30e35 input variables,in order to achieve the maximum performance, regardless of theforecasting horizon. In contrast, the number of input variables forUrticaceae and Oleaceaemodels strongly depend on the forecastinghorizon, in a monotonic manner, i.e., more input variables arerequired when the prediction horizon is increased. This trend isparticularly evident for the case of the Urticaceae taxon, where 80features are necessary to forecast pollen concentrations 7 daysahead. These differences, in addition to the performance variationsobserved among models of different taxa, suggest that the mech-anisms (meteorological, biological, etc.) responsible for high pollenconcentrations monitored at the city center of Thessaloniki aredifferent among pollen taxa. Individual characteristics and pecu-liarities of certain species, variations in the influence of meteoro-logical parameters on the production, release and dispersionmechanisms of pollen concentrations, as well as human relatedactivities are among the reasons that may be rendered as respon-sible for the aforementioned differences.
The importance of the selected input variables and their impacton the models’ performance was analyzed in respect of differentvariable groups (temporal variables, meteorological variables andpollen concentrations), using MLR models. In this case, possiblenegative effects of multi-collinearity between the model inputvariables have been addressed by the multi-objective optimizationthat has been applied with the aid of genetic algorithm. Table 2presents the contribution of each variable group at the overallperformance (IA) of the models. The results show that the mostimportant predictor variables are lagged pollen concentrations(corresponding IA values between 0.6 and 0.9). Temporal variablesyield moderate explanation rate for daily pollen concentrations(corresponding IA values between 0.4 and 0.6), whereas thetemporal pattern can be easier identified in the case of Poaceae andOleaceae. The investigation of the influence of meteorologicalvariables, indicates a minor influence towards the local pollenconcentrations; the number of available meteorological variables inthis case has not been as large as it could have (parameters likewind direction, persistence were not available in the studieddataset). Thus, it may be possible that further meteorologicalvariables are necessary in order to include all relevant informationassociated to the factors influencing the distribution and formationof the local/site-specific pollen concentrations. Furthermore, it ispossible that a significant part of pollen concentrations is notproduced locally. The availability of additional meteorological datamay help in clarifying this issue.
The overall satisfactory performance of the optimized MLRmodels indicates that short and long term trends within the pollenconcentration time-series, were sufficiently represented by theconstructed features (Section 2.6). Furthermore, the stochasticsearch of the feature space, achieved by the genetic algorithms,resulted to the identification of a proper subset of features thatcarry the information necessary for a sufficient simulation of themechanisms responsible for airborne pollen concentrations.
3.2. Performance evaluation of the forecasting models
Statistical indices such as the IA (eq. (1)), the correlation coef-ficient and the Root Mean Square Error (RMSE) have been used tocompare the models’ performance. RMSE is calculated using thefollowing equation:
RMSE ¼ffiffiffiffiffiffiffiffiffiffiffiffiffiffiffiffiffiffiffiffiffiffiffiffiffiffiffiffiffiffiffiffi1N
XN
i¼1
ðPi � OiÞ2vuut (2)

Table 2Importance analysis of the models’ input variables in terms of the Index of Agreement of the MLR models calculated for different prediction length; Each variable group isrepresented separately (TEM: Temporal, MET: Meteorology, POL: Pollen Concentrations and ALL: All groups together).
T ¼ Urticaceae Poaceae Oleaceae
TEM MET POL ALL TEM MET POL ALL TEM MET POL ALL
þ1 0.41 0.38 0.85 0.85 0.60 0.50 0.93 0.93 0.55 0.45 0.93 0.93þ2 0.41 0.39 0.74 0.76 0.60 0.50 0.90 0.90 0.55 0.45 0.87 0.87þ3 0.41 0.38 0.64 0.67 0.60 0.50 0.87 0.88 0.55 0.45 0.83 0.85þ4 0.41 0.37 0.59 0.64 0.60 0.50 0.85 0.87 0.55 0.45 0.82 0.85þ5 0.41 0.37 0.59 0.64 0.60 0.50 0.84 0.86 0.55 0.45 0.81 0.85þ6 0.41 0.37 0.53 0.62 0.60 0.49 0.82 0.85 0.55 0.45 0.80 0.84þ7 0.41 0.37 0.47 0.60 0.60 0.50 0.80 0.83 0.55 0.45 0.80 0.84
D. Voukantsis et al. / Atmospheric Environment 44 (2010) 5101e5111 5107
where N is the number of observation, Oi are the observed datapoints and Pi are the predicted ones.
Table 3 presents the statistical evaluation of the Pareto-optimalmodels (maximum IA) presented in Section 3.1. The forecastingaccuracy of Urticaceae models is inferior compared to Poaceae andOleaceae models. This trend is evident for all models, regardless ofthe algorithm used or the forecasting horizon. High values of theRMSE can be attributed to absolute higher concentrations of Urti-caceae at the atmospheric environment; however, taking intoaccount the large number of selected features by the Urticaceaemodels (see Section 3.1), the overall inferior performance has to beattributed to taxon-specific characteristics, i.e., the lack of furthernecessary variables in order to better simulate pollen productionand release mechanisms, impact of certain invasive species withinthe Urticaceae taxon, not so clear temporal pattern, etc.. Furtherpossible input variables would be air quality parameters (nitrogenoxides), since Urticaceae is a nitrophilous taxon. High air pollutantconcentrations are very likely to have short and long term impacton pollen concentrations (Minero et al., 1998; Jäger et al., 1991;Fotiou et al., in press), especially in a polluted urban environmentsuch as the city center of Thessaloniki.
Table 3Statistical evaluation of the pollen concentration forecasting models in terms of the Inde(RMSE). T indicates the forecasting horizon (in days) (MLR: Multiple Linear Regression moM5P: Regression tree models and CMB: Combined models).
MLR MLP SVR
T¼ IA r RMSE IA r RMSE IA r
Urticaceaeþ1 0.85 0.77 7.82 0.84 0.73 9.23 0.84 0þ2 0.76 0.66 9.30 0.78 0.65 11.88 0.80 0þ3 0.67 0.56 10.16 0.69 0.53 12.94 0.73 0þ4 0.64 0.57 10.11 0.77 0.63 9.82 0.81 0þ5 0.64 0.57 10.21 0.64 0.64 22.57 0.77 0þ6 0.62 0.55 10.46 0.69 0.62 16.85 0.77 0þ7 0.60 0.52 10.68 0.67 0.62 19.50 0.75 0
Poaceaeþ1 0.93 0.88 1.89 0.93 0.85 2.04 0.92 0þ2 0.90 0.84 2.15 0.91 0.83 2.20 0.89 0þ3 0.88 0.81 2.29 0.90 0.80 2.34 0.88 0þ4 0.87 0.80 2.36 0.86 0.77 2.84 0.87 0þ5 0.86 0.79 2.39 0.85 0.77 2.94 0.87 0þ6 0.85 0.76 2.53 0.88 0.75 2.56 0.86 0þ7 0.83 0.74 2.61 0.87 0.73 2.63 0.84 0
Oleaceaeþ1 0.93 0.88 3.41 0.93 0.86 3.72 0.93 0þ2 0.87 0.79 4.33 0.89 0.80 4.41 0.87 0þ3 0.85 0.78 4.49 0.85 0.74 5.82 0.86 0þ4 0.85 0.78 4.49 0.84 0.73 5.65 0.88 0þ5 0.85 0.77 4.56 0.84 0.72 5.68 0.87 0þ6 0.84 0.76 4.61 0.87 0.78 5.48 0.86 0þ7 0.84 0.75 4.68 0.80 0.70 6.16 0.86 0
The difference between MLR and CI models is not very notice-able when the prediction refers to one day ahead. This can beattributed to the strong dependencies between pollen concentra-tions of consecutive days that become the driving predictors for thenext day’s forecast; however, when the forecasting horizonexpands to >2 days the aforementioned dependencies amongpollen concentrations fade out. This fact in addition to the lack ofavailable pollen concentration data on a daily basis (pollen databecome available once per week), requires the simulation of morecomplex mechanisms by the forecasting models, in order toprovide an accurate forecast. This is clearly not possible by MLRmodels that indicate inferior (and in the case of Urticaceae nonacceptable) performances compared to CI models. The latter onesprove that they are capable of simulating more complex and non-linear processes, thus providing a more accurate forecast of pollenconcentrations. A comparison between the CI models shows thatM5P models perform better in the case of Urticaceae, MLP modelsprovide the best forecasts for the Poaceae pollen, whereas SVRmodels indicate their best performances for the case of Oleaceae.These results indicate that the distinct learning strategy followedby each one of the algorithms is capable of providing good results;
x of Agreement (IA), the correlation coefficient (r) and the Root Mean Square Errordels, MLP: Multi-Layer Perceptron models, SVR: Support Vector Regression models,
M5P CMB
RMSE IA r RMSE IA r RMSE
.75 8.09 0.85 0.77 7.88 0.86 0.77 7.86
.67 10.56 0.80 0.66 10.05 0.82 0.70 9.32
.57 12.23 0.72 0.55 11.76 0.76 0.62 10.14
.67 10.48 0.80 0.66 10.29 0.83 0.73 8.45
.62 10.61 0.80 0.66 10.64 0.83 0.72 9.93
.62 9.98 0.83 0.72 10.18 0.82 0.71 9.37
.61 11.15 0.79 0.66 10.94 0.83 0.72 9.53
.85 2.05 0.93 0.87 1.89 0.93 0.87 1.89
.83 2.20 0.91 0.84 2.14 0.91 0.84 2.07
.80 2.36 0.81 0.76 2.60 0.89 0.83 2.18
.77 2.51 0.87 0.76 2.61 0.88 0.79 2.39
.77 2.54 0.82 0.70 2.91 0.87 0.78 2.46
.75 2.68 0.86 0.75 2.65 0.87 0.78 2.45
.72 2.79 0.79 0.67 2.96 0.86 0.76 2.52
.89 3.34 0.93 0.88 3.41 0.93 0.89 3.30
.80 4.34 0.88 0.78 4.57 0.89 0.81 4.16
.79 4.41 0.87 0.78 4.91 0.89 0.81 4.20
.80 4.36 0.74 0.60 5.92 0.88 0.80 4.30
.83 4.16 0.81 0.68 5.59 0.87 0.78 4.44
.79 4.53 0.72 0.72 5.28 0.89 0.83 4.05
.77 4.69 0.83 0.76 4.74 0.87 0.79 4.43
D. Voukantsis et al. / Atmospheric Environment 44 (2010) 5101e51115108
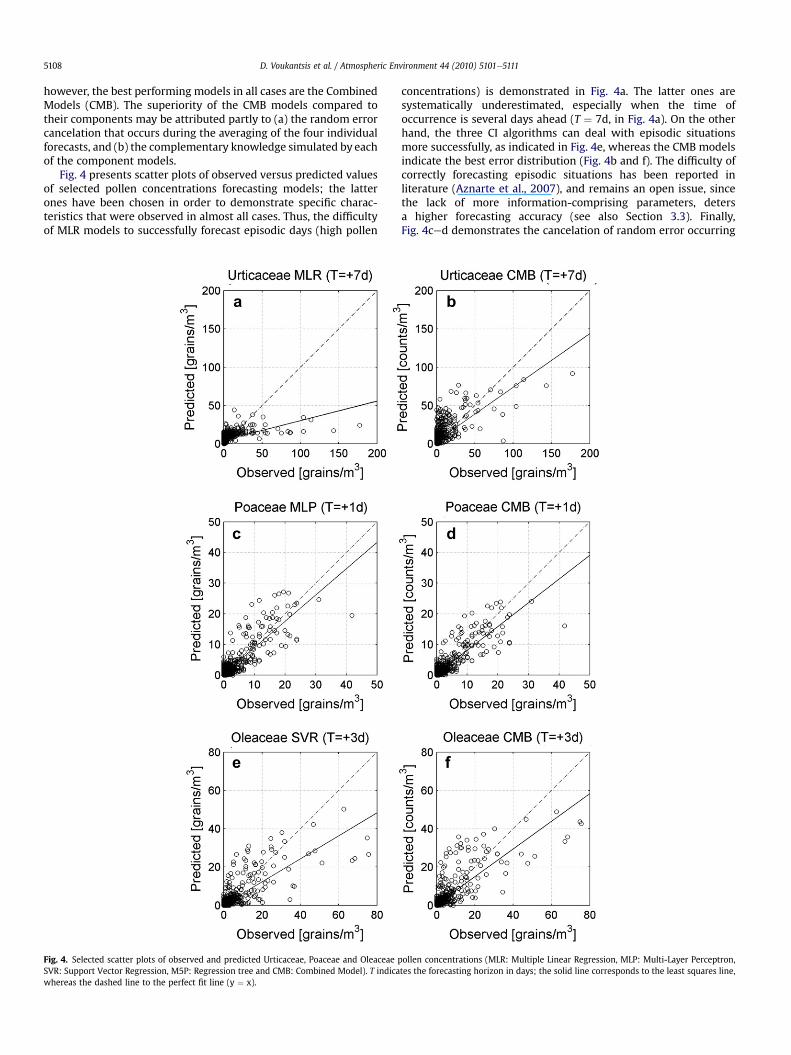
however, the best performing models in all cases are the CombinedModels (CMB). The superiority of the CMB models compared totheir components may be attributed partly to (a) the random errorcancelation that occurs during the averaging of the four individualforecasts, and (b) the complementary knowledge simulated by eachof the component models.
Fig. 4 presents scatter plots of observed versus predicted valuesof selected pollen concentrations forecasting models; the latterones have been chosen in order to demonstrate specific charac-teristics that were observed in almost all cases. Thus, the difficultyof MLR models to successfully forecast episodic days (high pollen
Fig. 4. Selected scatter plots of observed and predicted Urticaceae, Poaceae and Oleaceae pSVR: Support Vector Regression, M5P: Regression tree and CMB: Combined Model). T indicawhereas the dashed line to the perfect fit line (y ¼ x).
concentrations) is demonstrated in Fig. 4a. The latter ones aresystematically underestimated, especially when the time ofoccurrence is several days ahead (T ¼ 7d, in Fig. 4a). On the otherhand, the three CI algorithms can deal with episodic situationsmore successfully, as indicated in Fig. 4e, whereas the CMB modelsindicate the best error distribution (Fig. 4b and f). The difficulty ofcorrectly forecasting episodic situations has been reported inliterature (Aznarte et al., 2007), and remains an open issue, sincethe lack of more information-comprising parameters, detersa higher forecasting accuracy (see also Section 3.3). Finally,Fig. 4ced demonstrates the cancelation of random error occurring
ollen concentrations (MLR: Multiple Linear Regression, MLP: Multi-Layer Perceptron,tes the forecasting horizon in days; the solid line corresponds to the least squares line,

Fig. 5. Forecasts of weeks of high atmospheric pollen load (episodic situations) of (a)Urticaceae, (b) Poaceae and (c) Oleaceae (DATA: Measured pollen concentrations, MLR:Multiple Linear Regression models, MLP: Multi-Layer Perceptron models, SVR: SupportVector Regression models, M5P: Regression tree models and CMB: Combined Model).
D. Voukantsis et al. / Atmospheric Environment 44 (2010) 5101e5111 5109
by CMB models. Although both models are characterized by thesame value of the IA (0.93), by comparing the error distribution andthe RMSE of bothmodels it becomes clear that CMBmodel provideswith the most accurate forecast.
The results presented in this Section indicate that it is possible toproduce accurate forecasts of pollen concentration data severaldays ahead. The performance of the presented models is compet-itive to similar models reported in literature. Thus, Sanchez-Mesaet al. (2002) and Rodríguez-Rajo et al. (2010) have reported coef-ficient of determinations (R2) of 0.60 and 0.93 respectively for theforecasting of grass pollen in Spain, using neural networkmodeling,whereas Stach et al. (2008) resulted to a coefficient of determina-tion of 0.45 (whole grass season) for the forecasting of grass pollenin Poland, using correlation analysis. The results presented in thisstudy indicate a coefficient of determination of 0.79 (Poaceae oneday ahead, Table 3), ranking these models among the best onesreported.
3.3. Analysis of episodic situations
Fig. 5 presents the forecasted pollen concentrations duringweeks of high pollen atmospheric loads. The forecasts produced bythe models are combined in order to present the “week’s forecast”.In the case of Urticaceae (Fig. 5a), the SVR models indicate the bestperformance by accurately forecasting concentrations of approxi-mately 180 grains m�3, whereas Fig. 5c indicates the “week’sforecast” of Oleaceae pollen; in this case, M5P is the model thataccurately forecasts Oleaceae concentration of approximately75 grains m�3. The same figure reveals the conservative forecastsproduced by MLR models during episodic situations.
A careful study of similar weekly forecasts reveals that anepisodic day is very likely to be accurately forecasted by one of thethree CI models, therefore improving the output of the CMBmodel.The synergy of the CI models allows for a more reliable forecastthan each one separately, indicating different modeling approachesby each of the algorithms under consideration. Furthermore, CMBmodels provide with the most reliable predictions concerningtrends of the pollen concentration time-series. As presented inFig. 5b, this particular week is characterized by high pollenconcentrations of Poaceae; however, there is no episodic situation,such as the ones presented in Fig. 5a and c. In this, case it is evidentthat the CMB models can provide with the most accurate forecastthroughout the week, by averaging the random error of the indi-vidual models. These characteristics can be utilized in provision ofinformation services towards citizens and decision makers.Increased reliability in predicting trends of pollen concentrationtime-series or exceeding threshold values is very important, sinceprovocation of allergic symptoms is patient-dependent and largelyvarying among different individuals. Therefore, providing reliableanswers to questions such as “Are pollen concentrations of Poaceaegoing to increase or decrease tomorrow?” can help in developingpersonalized information services that could improve the overallquality of life of sensitized citizens.
4. Conclusions
In this paper, wehave adopted a data-oriented approach in orderto develop operational forecasting models of airborne pollenconcentrations for the cityof Thessaloniki, Greece. Results show thatdespite the restrictions posed by the data sampling and monitoringmethods, i.e., pollen concentration data becoming available onceperweek, it remainspossible toprovidewithaccuratedaily forecastsof pollen concentrations up to one week ahead. We have evaluatedan extensive number of possible features originating from a repre-sentative dataset of pollen concentrations and meteorological vari-ables and applied a stochastic search method (GA) in order toidentify the most relevant ones. This resulted to highly reliable andaccurate optimized models; however, an importance analysishighlighted the need for additional, meteorology related variables,

D. Voukantsis et al. / Atmospheric Environment 44 (2010) 5101e51115110
such as wind direction and persistence, in order to better modeldispersion and transport phenomena at the atmospheric environ-ment. Furthermore, a comparative analysis of the models suggestsa taxon-specific approach, by evaluating further data and featuresthat carry the necessary information to model the peculiarities ofdifferent taxa, e.g., nitrophilous, anemophilous or invasive nature ofcertain species, etc.
The statistical evaluation of the models developed in this studyindicated that CI methods were capable of better modeling thecomplex process involved at the mechanisms responsible for highairborne pollen concentrations, compared to the traditional MLRmethod. This was particularly evident when the forecast referred tomore than two days ahead, proving that the involvement of CImethods is necessary in order to come up with accurate forecastsfor one week ahead. Furthermore, the analysis of weeks of highatmospheric pollen load, suggests that CI methods are also better atforecasting episodic situations.
We have selected three methods originating from distinctdomains of CI, whereas two of them had not been addressed for thetask at hand. The results show that all the CI methods used indicategood qualities and it is case-specific which one performs better.Thus, SVR and M5P models performed equally well, compared tothe MLPmodels that have been extensively used for the forecastingof pollen concentrations, and thus should be considered for oper-ational use as well. Finally, among the most interesting findings ofthis study was the superiority of the combined model, indicatingthat a synergic use of CI methods can result to better performancethan each one separately, therefore pointing towards ensemblemodeling. The comparison of similar models already publishedrevealed the advantages of the methods that were applied in termsof the better model performance that was achieved.
Acknowledgements
The current work is related to the scientific activities of theauthors in the frame of the COST Action ES0602 (www.chemicalweather.eu) and ES0603 (www.eupollen.eu) and hasbeen partly founded (STSM-ES0602-6288) by the COST ActionES0602.
References
Angosto, J.M., Moreno-Grau, S., Bayo, J., Elvira-Rendueles, B., 2005. Multipleregression models for predicting total daily pollen concentration in Cartagen.Grana 44, 108e114.
Athanasiadis, N.H., 1985. Forest Botany. Systematics of Spermatophyts (Part I. Yia-houdi-Yapouli, Thessaloniki.
Athanasiadis, N.H., 1986. Forest Botany. Trees and Shrubs of Greek Forests (Part II.Yiahoudi-Yiapouli, Thessaloniki.
Aznarte, J.L., Sanchez, J.M.B., Lugilde, D.N., Fernandez, C.D.L., Guardia, C.D.,Sanchez, F.A., 2007. Forecasting airborne pollen concentration time series withneural and neuro-fuzzy models. Expert Systems with Applications 32 (4),1218e1225.
D’Amato, G., Cecchi, L., Bonini, S., Nunes, C., Annesi-Maesano, I., Behrendt, H.,Liccardi, G., Popov, T., van Cauwenberge, P., 2007. Allergenic pollen and pollenallergy in Europe. Allergy 62 (9), 976e990.
Damialis, A., Halley, M.J., Gioulekas, D., Vokou, D., 2007. Long-term trends inatmospheric pollen levels in the city of Thessalonikim Greece. AtmosphericEnvironment 41, 7011e7021.
Damialis, A., 2010. Patterns of pollen production and atmospheric circulation in thearea of Thessaloniki. PhD dissertation, Aristotle University, Thessaloniki. (inGreek with English summary)
Defila, C., Clot, B., 2001. Phytophenological trends in Switzerland. InternationalJournal of Biometeorology 45, 203e207.
Florido, J.F., Delgado, P.G., San Pedro, B.S., Quiralte, J., Arias de Saavedra, J.M.,Peralta, V., Valenzuela, L.R., 1999. High levels of Olea europaea pollen andrelation with clinical findings. International Archives of Allergy and Immu-nology 19, 133e137.
Fotiou, C., Damialis, A., Krigas, N., Halley, J.M., Vokou, D., Parietaria judaica floweringphenology, pollen production, viability and atmospheric circulation, andexpansive ability in the urban environment: impacts of environmental factors.International Journal of Biometeorology, in press.
Galán, C., Cariñanos, P., García-Mozo, H., Alcázar, P., Domínguez-Vilches, E., 2001.Model for forecasting Olea europaea L. airborne pollen in South-West Andalusia,Spain. International Journal Biometeorology 45, 59e63.
Gioulekas, D., Papakosta, D., Damialis, A., Spieksma, F., Giouleka, P., Patakas, D.,2004. Allergenic pollen records (15 years) and sensitization in patients withrespiratory allergy in Thessaloniki, Greece. Allergy 59, 174e184.
Goldberg, D.E., 1989. Genetic Algorithms in Search, Optimization, and MachineLearning. AddisoneWesley, Reading, Massachusetts.
Hall, M., Frank, E., Holmes, G., Pfahringer, B., Reutemann, P., Witten, I.H., 2009. TheWEKA data mining software: an update. SIGKDD Explorations 11 (1), 10e18.
Haykin, S., 1999. Neural Networks: a Comprehensive Foundation, second ed.Prentice Hall.
Hirst, J.M., 1952. An automatic volumetric spore trap. The Annals of Applied Biology39, 257e265.
Huynen, M., Menne, B., Behrendt, H., Bertollini, R., Bonini, S., Brandao, R., et al.,2003. Phenology and human health: allergic disorders. In: Report of a WHOMeeting, Rome, Italy.
Jäger, S., Spieksma, F.T.M., Nolard, N., 1991. Fluctuations and trend in airborneconcentrations of some abundant pollen types, monitored at Vienna, Leidenand Brussels. Grana 30, 309e312.
Junninen, H., Niska, H., Tuppurainen, K., Ruuskanen, J., Kolehmainen, M., 2004.Methods for imputation of missing values in air quality data sets. AtmosphericEnvironment 38, 2895e2907.
Karatzas, K., Kaltsatos, S., 2007. Air pollution modelling with the aid of computa-tional intelligence methods in Thessaloniki, Greece. Simulation ModellingPractice and Theory 15 (10), 1310e1319.
Karatzas, K.D., Bassoukos, A., Voukantsis, D., Tzima, F., Nikolaou, K., Karathanasis, S.,2008. ICT technologies and computational intelligence methods for the creationof an early warning air pollution information system. In: Proc. of the 22rdInternational Conference on Environmental Informatics and Industrial Ecology(EnviroInfo), Lueneburg, Germany, 2008, pp. 482e489.
Kolehmainen, M., Martikainen, H., Hiltunen, T., Ruuskanen, J., 2000. Forecasting airquality parameters using hybrid neural network modeling. EnvironmentalMonitoring and Assessment 65, 277e286.
Krigas, N.B., 2004. Flora and human activities in the area of Thessaloniki: Biologicalapproach and historical considerations. PhD dissertation, Aristotle University,Thessaloniki. (in Greek with English summary).
Kukkonen, J., Partanen, L., Karppinen, A., Ruuskanen, J., Junninen, H.,Kolehmainen, M., et al., 2003. Extensive evaluation of neural network modelsfor the prediction of NO2 and PM10 concentrations, compared with a deter-ministic modelling system and measurements in central Helsinki. AtmosphericEnvironment 37, 4539e4550.
Minero, F.J.G., Iglesias, I., Jato, V., Aira, M.J., Candau, P., Morales, J., et al., 1998. Studyof the pollen emissions of Urticaceae, Plantaginaceae and Poaceae at five sites inwestern Spain. Aerobiologia 14, 117e129.
Mitrakis, N., Karatzas, K., Jaeger, S., Investigating pollen data with the aid of fuzzymethods, In: Diamantaras, K., Duch, W., and Iliadis, L. (Ed.), Proceedings of the20th International Conference on Artificial Neural Networks-ICANN2010,Springer Academic Publishers, in press.
Moussiopoulos, N., Vlachokostas, C.h., Tsilingiridis, G., Douros, I., Hourdakis, E.,Naneris, C., Sidiropoulos, C., 2009. Air quality status in Greater ThessalonikiArea and the emission reductions needed for attaining the EU air qualitylegislation. Science of the Total Environment 407, 1268e1285.
Niska, H., Hiltunen, T., Karppinen, A., Ruuskanen, J., Kolehmainen, M., 2004.Evolving the neural network model for forecasting air pollution time series.Engineering Applications of Artificial Intelligence 17, 159e167.
Niska, H., Rantamaki, M., Hiltunen, T., Karppinen, A., Kukkonen, J., Ruuskanen, J.,Kolehmainen, M., 2005. Evaluation of an integrated modelling system con-taining a multi-layer perceptron model and a numerical weather predictionmodel HIRLAM for the forecasting of urban airborne pollutant concentrations.Atmospheric Environment 39, 6524e6536.
Osborne, C.P., Chuine, I., Viner, D., Woodward, F.I., 2000. Olive phenology asa sensitive indicator of future climatic warming in the Mediterranean. Plant Celland Environment 23, 701e710.
Osowski, S., Garanty, K., 2007. Forecasting of the daily meteorological pollutionusing wavelets and support vector machine. Engineering Applications of Arti-ficial Intelligence 20, 745e755.
Quinlan, R.J., 1992. Learning with continuous classes. In: Proc. of the 5th AustralianJoint Conference on Artificial Intelligence, Singapore, pp. 343e348.
Ranzi, A., Lauriola, P., Marletto, V., Zinoni, F., 2003. Forecasting airborne pollenconcentrations: development of local models. Aerobiologia 19, 39e45.
Räsänen, T., Voukantsis, D., Niska, H., Karatzas, K., Kolehmainen, M., Data-basedmethod for creating electricity use load profiles using large amount ofcustomer-specific hourly measured electricity use data. Applied Energy, inpress, doi:10.1016/j.apenergy.2010.05.015
Rodríguez-Rajo, F.J., Astray, G., Ferreiro-Lage, J.A., Aira, M.J., Jato-Rodriguez, M.V.,Mejuto, J.C., 2010. Evaluation of atmospheric Poaceae pollen concentrationusing a neural network applied to a coastal Atlantic climate region. NeuralNetworks 23, 419e425.
Sanchez-Mesa, J.A., Galan, C., Martinez-Heras, J.A., Hervas-Martinez, C., 2002. Theuse of a neural network to forecast daily grass pollen concentration in a Medi-terranean region: the southern part of the Iberian Penisula. Clinical & Experi-mental Allergy 32, 1606e1612.
Slini, T., Kaprana, A., Karatzas, K., Moussiopoulos, N., 2006. PM10forecasting forThessaloniki, Greece. Environmental Modelling & Software 21, 559e565.

D. Voukantsis et al. / Atmospheric Environment 44 (2010) 5101e5111 5111
Smith, M., Emberlin, J., 2005. Constructing a 7-day ahead forecast model for grasspollen at north London, United Kingdom. Clinical and Experimental Allergy 35,1400e1406.
Solomon, R.W., Mathews, K.P., 1978. Aerobiology and inhalant allergens. In:Middleton Jr., E., Reed, C.E., Ellis, E.F. (Eds.), Allergy. Principles and Practice, vol.2. C.V. Mosby Company, Saint Louis, pp. 899e929.
Stach, A., Smith, M., Prieto Baena, J.C., Emberlin, J., 2008. Long-term and short-termforecast models for Poaceae (grass) pollen in Poznan, Poland, constructed usingregression analysis. Environmental and Experimental Botany 62, 323e332.
Taylor, E.P., Jacobson, W.K., House, M.J., Glovsky, M.M., 2007. Links between pollen,Atopy and the asthma Epidemic. International Archives of Allergy and Immu-nology 144, 162e170.
Université de Thessaloniki, 1991e2003. Observations météorologiques de Thessa-loniki 1987e2002. Annuaire de l' Institut Météorologique et Climatologique56e71 [in French].
Vapnik, V.,1995. TheNature of Statistical Learning Theory. Springer-Verlag,NewYork.Voukantsis, D., Karatzas, K., Damialis, A., Vokou, D., 2010. Forecasting airborne
pollen concentration of Poaceae (Grass) and Oleaceae (Olive), using artificialneural networks and genetic algorithms, in Thessaloniki, Greece. In: Proceed-ings of the IEEE World Conference on Computational Intelligence (WCCI),Barcelona, Spain, 2010, pp. 2023e2028.
Waisel, Y., Mienis, Z., Kosman, E., Geller-Bernstein, C., 2004. The partial contributionof specific airborne pollen to pollen induced allergy. Aerobiologia 20 (4),197e208.