
Forbidden triads and innovation1 - OSF
47
1 Forbidden triads and innovation 1 Balazs Vedres University of Oxford Tunde Cserpes Aarhus University This article investigates the importance of forbidden triads – high weight open triads – for a wide range of success measures in the history of recorded jazz. Innovative teams face the paradox of relying on experience to generate novelty. We argue that forbidden triads, as conjunctures of dyadic experience, are the locations where successful novel combinations can be recognized and realized. Prior scholarship has sidelined such network structural diversity with strong ties, and assumed that strong ties are mostly closed, and weak ties connect to diverse structural locations. We use data on all recording sessions of more than a century of jazz to show that forbidden triad is the only consistent predictor of six measures of success that span the dualities of insiders and outsiders, and voice and trace. This network structure is also the only predictor of deep success: coinciding success in all four quadrants. Furthermore, forbidden triads that require effort beyond easy structural availability contribute in addition to voice measures of success. We discuss implications for project teams and organizations where innovation is a key goal. Keywords: innovation, social networks, forbidden triads, structural folds, jazz As most creative fields shift from individual to teamwork, challenges of innovation in teams becomes a key problem (Vera and Crossan 2005; Wuchty, Jones, and Uzzi 2007). Teams can pool experiences of members, and rely on interpersonal experience built by pairs of members (DiBenigno and Kellogg 2014), and come to a shared understanding about their task. But if the task is innovation, how does novelty spring from pooled experience? Successful innovation in teams is about solving the paradox of relying on experience but avoiding routine (Deken et al. 2016), and teams need to find a way to recognize possible novel combinations, and to realize these in a product. Teams building from prior experience run the risk of groupthink, when collectively structured cognition limits the scope of attention, and precludes novel ideas (Cerulo 2008; Vaughan 2016; Zerubavel 2015). Teams also run the risk of network closure, that further limits the collective cognitive horizon (Romero, Uzzi, and Kleinberg 2019). Closure in teams facilitates trust, and can ease knowledge transfer (Reagans and McEvily 2003), but can lock teams into routine (Uzzi and Spiro 2005). Several studies on the network antecedents of innovation found that structural diversity - the lack of closure - is key in the capacity to generate novel ideas (Ahuja 2000; Obstfeld 2005). 1 Research for this article was supported by the National Science Foundation (SES-1123807) and Central European University. We thank the assistance of Carl Nordlund in collecting and preparing data. We are grateful for comments and suggestions for David Stark, Brian Uzzi, Matthew Bothner, and workshop participants at University of Oxford. Please direct all correspondence to Balazs Vedres ([email protected]).
-
Upload
khangminh22 -
Category
Documents
-
view
0 -
download
0
Transcript of Forbidden triads and innovation1 - OSF
1
Forbidden triads and innovation1
Balazs Vedres
University of Oxford
Tunde Cserpes
Aarhus University
This article investigates the importance of forbidden triads – high weight open triads –
for a wide range of success measures in the history of recorded jazz. Innovative teams
face the paradox of relying on experience to generate novelty. We argue that forbidden
triads, as conjunctures of dyadic experience, are the locations where successful novel
combinations can be recognized and realized. Prior scholarship has sidelined such
network structural diversity with strong ties, and assumed that strong ties are mostly
closed, and weak ties connect to diverse structural locations. We use data on all
recording sessions of more than a century of jazz to show that forbidden triad is the
only consistent predictor of six measures of success that span the dualities of insiders
and outsiders, and voice and trace. This network structure is also the only predictor of
deep success: coinciding success in all four quadrants. Furthermore, forbidden triads
that require effort beyond easy structural availability contribute in addition to voice
measures of success. We discuss implications for project teams and organizations
where innovation is a key goal.
Keywords: innovation, social networks, forbidden triads, structural folds, jazz
As most creative fields shift from individual to teamwork, challenges of innovation in teams
becomes a key problem (Vera and Crossan 2005; Wuchty, Jones, and Uzzi 2007). Teams can
pool experiences of members, and rely on interpersonal experience built by pairs of members
(DiBenigno and Kellogg 2014), and come to a shared understanding about their task. But if
the task is innovation, how does novelty spring from pooled experience? Successful
innovation in teams is about solving the paradox of relying on experience but avoiding
routine (Deken et al. 2016), and teams need to find a way to recognize possible novel
combinations, and to realize these in a product. Teams building from prior experience run
the risk of groupthink, when collectively structured cognition limits the scope of attention,
and precludes novel ideas (Cerulo 2008; Vaughan 2016; Zerubavel 2015). Teams also run
the risk of network closure, that further limits the collective cognitive horizon (Romero, Uzzi,
and Kleinberg 2019). Closure in teams facilitates trust, and can ease knowledge transfer
(Reagans and McEvily 2003), but can lock teams into routine (Uzzi and Spiro 2005). Several
studies on the network antecedents of innovation found that structural diversity - the lack of
closure - is key in the capacity to generate novel ideas (Ahuja 2000; Obstfeld 2005).
1 Research for this article was supported by the National Science Foundation (SES-1123807) and Central
European University. We thank the assistance of Carl Nordlund in collecting and preparing data. We are
grateful for comments and suggestions for David Stark, Brian Uzzi, Matthew Bothner, and workshop
participants at University of Oxford. Please direct all correspondence to Balazs Vedres

2
The main stream of research on network structural diversity shares a fundamental
assumption: that strong ties and diversity are mutually exclusive. Weak ties connect to
diverse sets of actors opening access to novel information, and strong ties connect to a
homogenous set of actors with already known pieces of information. This strength of weak
ties hypothesis (Granovetter 1973) was elaborated recently in the diversity-bandwidth
tradeoff argument (Aral and Alstyne 2011), that nevertheless excluded strong tie diversity
from substantial discussion. The importance of closure in trust and collaboration is a
fundamental insight in social networks (Burt 2005). In network analytic terms, open triads of
weak ties provide access to diverse novel pieces of information, and close triads of strong ties
are trusted context for realizing a novel product.
We argue that, while as a main tendency the strength of weak ties hypothesis holds, strong
ties are sometimes open – these are the forbidden triads in Granovetter’s terms (Granovetter
1973) – and that these forbidden triads contribute to creative success. Generating a novel
idea is an exceptional event, that requires an exceptional social structure. Forbidden triads, as
such exceptional conjuncture, enable musicians to recognize and realize a new combination
of two dyadically evolved styles. Forbidden triads are at the same time an occasion to
discover diverse approaches to collaboration, and they are opportunities to rely on trusted and
strong collaborative ties to realize an emerging idea as a product.
The literature on structural folds is one exception that builds from structural diversity around
strong ties in communities. Forbidden triads are the elementary building blocks of structural
folds. Structural folds are overlapping cohesive communities that contribute to both the
recognition of a novel combination, and the realization of that novel idea as a product (De
Vaan, Stark, and Vedres 2015). Structural folds are locations of generative tension, where
creative success is more likely, but community instability is also increased (Vedres and Stark
2010). A forbidden triad is an elementary structural fold: two pairs of nodes strongly
connected, that overlap on a node. The advantage of our approach based on forbidden triads
is that triads are easier to identify, and they can be also found in networks without
overlapping communities.
Forbidden triads had not been operationalized before2. We defined two measures: the density
and the depth of forbidden triads, to characterize strong ties structural diversity in a group.
The density of forbidden triads corresponds to the amount of innovative possibilities:
opportunities to recombine collaborative practices. The average depth of forbidden triads
corresponds to the profoundness of innovative opportunities: the length of collaborative
histories, hitherto separate, that now can come to a generative contact. The two measures
solve the aggregation problem – aggregating triads to the level of the team – in two different
ways.
We see the forbidden triad as a robust structure: an organizational form that enables a team to
succeed along diverse dimensions. Whereas cohesion, smooth and efficient collaboration
might help efficiency, it does not serve innovative goals well (Obstfeld 2005). Other
structures, like diverse weak ties might help brainstorm up diverse ideas, but they might not
help realizing them (Burt et al. 2004). To test the robust, multifaceted potential in forbidden
triads, we develop the notion of deep success – success that spans the dimensions of insider
2 There were publications that claim to operationalize forbidden triads, but mistake then for any open triad
(Yang, Dong, and Chawla 2014). Works on Simmelian brokerage and structural folds operationalize structures
rich in forbidden triads, but make no reference to triadic operationalization (Krackhardt and Kilduff 2002;
Vedres and Stark 2010).

3
versus outsider origin, and behavioral trace versus explicit judgment. We show that
forbidden triads are the only predictors of all four categories of success: insider behavioral
traces (the decision to continue the band, as manifested in band survival), outsider behavioral
traces (demand for the album produced from the session), insider judgment (award from
experts), and outsider judgment (poll results from magazine readers).
Our case is jazz: a uniquely innovative field where producers succeed by novel sounds (Askin
and Mauskapf 2017), that offers many lessons to organizations (Barrett 2012; Berliner 1994;
Doffman 2011; Phillips 2013)3. We use data on 175 064 jazz recording sessions – the
complete population – spanning the entire history of recorded jazz, using the Tom Lord
discographic database. Our dataset contains information on close to two hundred thousand
jazz musicians, as they collaborate in sessions, and leave a trace of a weighted collaboration
network. We found that the sessions they participated in were more successful by six diverse
measures if their collaboration network contained a higher proportion of forbidden triads.
Forbidden triads density was the only consistent predictor of success in all six dimensions,
and the only significant predictor of deep success. As a comparison, diversity in instrument
skills was not a consistent predictor of success, and was a negative predictor of deep success,
underscoring the importance of considering diversity as structural, rather than compositional.
Weak ties structural diversity was not a consistent predictor of success, and cohesion was a
negative predictor.
Beyond investigating the impact of forbidden triads on success, we are also deploying
computational methods to separate structural availability and agency. It is difficult to directly
access evidence on organizing efforts of teams (as opposed to lucky accidents), but a
counterfactual null hypothesis can be generated for each recording session by generating a
population of objectively possible sessions, that stay within the broad constraints of
musicians and records. We assess the structural availability of forbidden triads by a
computational approach, where we simulate counterfactual random jazz worlds that were
objectively possible. We found evidence that effort to recruit musicians with forbidden triads
when such structures were not easily available had an added contribution to success measures
capturing voice: effort to overcome lack of easy availability to include musicians with strong
and diverse ties were rewarded when audiences were explicitly naming outstanding
performance.
FORBIDDEN TRIADS AND STRUCTURAL DIVERSITY
Research on team performance demonstrated the benefits of experience (Delmar and Shane
2006; Kor 2003; Vera and Crossan 2005), and the rich account of Robert Faulkner and
Howard Becker – both sociologists and active jazz musicians – shows how experience
accumulates with performance (Faulkner and Becker 2009). Musicians build a repertoire of
standards over their careers, mastering flexibility to play their parts in a wide range of styles.
As an accomplished musician puts it:
3 A piece of evidence for the innovative nature of the jazz field is the constant experimentation with diverse
instrumentations: we encountered 11,940 unique instruments (after considerable effort to clean and collapse
instrument entries). As a comparison, the largest collection of musical instruments, the MIMO project (Musical
Instrument Museums Online; mimo-international.com) lists a total of 1140 different kinds of instruments – an
order of magnitude less. From car parts to pots and digital noises, jazz musicians go far beyond conventions.

4
“…the only reason we are able to do it is because we all have enough experience under
our belts playing a lot of different kinds of things as sidemen, and we’re bringing, without
even thinking about it, we are bringing all that information to the bandstand…” (Dockery
2013:801)
It is much less clear how novel and outstanding artistic achievements can stem from past
experience. Miles Davis was a bandleader who strived to channel the experience of musicians
towards new expressions (Walser 1993), by removing them from their comfort zones:
“See, if you put a musician in a place where he has to do something different from what
he does all the time, [...] he'll be freer, will expect things differently, will anticipate and
know something different is coming down. I've always told the musicians in my band to
play what they know and then play above that. Because then anything can happen, and
that's where great art and music happens.” (Davis and Troupe 1989:220)
How should we understand that place, where a musician “has to do something different from
what he does all the time?” How can a musician be freed to expect things differently, without
disconnecting from experience that musicians rely on without even thinking about it? We
argue that the dislocation Miles Davis was after is relational. Musicians survive by
cultivating their network ties (Dowd and Pinheiro 2013), and Paul Berliner’s book on jazz
improvisation emphasizes the interpersonal nature of core jazz skills (Berliner 1994).
Musical experience evolves in collaborative ties, and as musicians meet repeatedly on the
stage and in the studio, they add to the strength of the tie between them. It is then the re-
arrangement of these ties that a leader of band, like Miles Davis can compose unexpected
constellations of experience.
If musical experience in jazz evolves in dyads, relational dislocations can be captured at the
triadic level (Balachandran and Hernandez 2018). To illustrate how Miles Davis’s band
arranged dyadic experience for innovation, we consider the most successful session of Miles
Davis – and in fact the top achievement in the history of jazz, the session on March 2, 1959
that was released on the album “Kind of Blue.” Miles brought on board a new piano player,
Wynton Kelly. Even though Kelly played only one tune on the album, “Freddie Freeloader”,
Miles acknowledged his special contribution to the freshness of the music: “Wynton’s the
light for a cigarette. He lights the fire and he keeps it going.”4 But Kelly was not a novice,
and he was not a newcomer to the musicians in the session. Considering the number of prior
co-plays as a proxy for dyadic experience, we see that Kelly recorded with Chambers and
Cobb more than ten times, but never with Miles. Miles recorded several times with Chambers
and Cobb, so the triads of Miles-Chambers-Kelly, and Miles-Cobb-Kelly combines long but
distinct dyadic experiences.
Forbidden triads measure structural diversity with strong ties. Research on structural diversity
thus far have either neglected the significance of strong ties, or have seen them as a
hindrance. The concept of structural diversity refers to the lack of local connectedness of
alters for a given ego in a network. Following Mark Granovetter’s discovery of the strength
of weak ties for structural diversity, it was repeatedly demonstrated that strong ties are more
4 Liner notes by Nat Hentoff from Wynton Kelly’s 1960 album “Kelly At Midnight”
(http://jazzprofiles.blogspot.com/2011/06/wynton-kelly-1931-1971-pure-spirit.html).

5
likely organized into closed triads than weak ties, hence early research on structural diversity
was focused on weak and open triads. In the original formulation of structural holes by
Ronald Burt, the strength of ties was seen as irrelevant for structural diversity: “Whether a
relationship is strong or weak, it generates information benefits when it is a bridge over a
structural hole.” (Burt 1995:28). The formula of structural constraint proposed by Burt in the
same book penalizes egos with mixed tie weights, but is invariant to tie weights as long as
they are equal.
In Granovetter’s original formulation, open but strong triads were seen as exceptions, and
were thus labelled forbidden triads. In his seminar article on the strength of weak ties,
Granovetter cites sociometric evidence from the sixties and seventies that strong ties tend to
be closed. As his focus was on weak bridging ties, the evidence cited was seen to mean that
the strong and open forbidden triad do not occur, as “processes of cognitive balance tended to
eliminate it” (Granovetter 1973:1364). In fact, in much of the literature on structural
diversity, the high weight of ties and the presence of closed triads are seen as an obstacle, a
hindrance to brokerage possibilities, demonstrating the negative consequences of overlapping
closed triads or dense networks around contacts (Burt 2015; Krackhardt 1999; Krackhardt
and Kilduff 2002; Reagans and Zuckerman 2008). A recent re-formulation of the strength of
weak ties thesis evaluates conditions under which strong ties might be more beneficial for
obtaining diverse information than weak ties (Aral and Alstyne 2011). However, even this
article omits to model strong tie structural diversity, as an unlikely network structure, that
nevertheless promises the most novelty. In some sense, we are exactly after the cognitive
imbalance that Granovetter cites, but we re-frame it as a potential creative force.
A forbidden triad is of interest for a relational understanding of innovation, as a forbidden
triad is a conjuncture of two dyadic histories. Following Charles Tilly, we believe that it is
relations that store history, and social dynamics emerges from relational conjunctures (Tilly
2000). Population geneticist have long recognized that evolution in separate subpopulations
results in a richer set of solutions to environmental challenges, that can be later re-combined
(Wright 1932). Recent experimental studies of cultural evolution have shown that a diversity
of separate paths leads to higher level of innovation in comparison to a completely cohesive
community (Fang et al 2010; Derex and Boyd 2016; Barkoczi and Galesic 2016; Creanza et
al 2017). In organizational settings, multiple project team memberships were shown to
increase learning (O’leary, Mortensen, and Woolley 2011). According to these studies,
communities with longer separate histories of exploration had better chances to generate
distinctive cultural combinations by avoiding early lock-ins into consensus.
The advantage of using forbidden triads over general measures of structural fragmentation
(like disconnected components, or modularity) is that forbidden triads represent the moment
when two separate cultural histories come to a conjuncture, when a novel cultural product can
be expected to arise. On Figure 1 you can follow the evolution of two dyadic collaborations,
one between musicians Paul Chambers and Miles Davis, and one between Paul Chambers
and Wynton Kelly. As a pair of musicians play repeatedly, they elaborate a joint style, and
develop a distinctive routine of co-improvisation. When we arrive to the focal session,
musician A is in a position to both recognize a novel combination, and facilitate the way the
combination can become a new musical expression. The focal session when a forbidden triad
is observed is the moment when exploration can be exploited.

6
Figure 1: Forbidden triad as conjuncture of dyadic collaborations. White nodes are simplified illustrations of
structural context in actual recording sessions. Box titles show actual session labels from the database. Sessions
on the top show repeated co-plays of Miles Davis and Paul Chambers, while sessions on the bottom show
repeated co-plays of Paul Chambers and Wynton Kelly.
FORBIDDEN TRIADS AS STRUCTURAL FOLDS
We build on research on structural folds, as a related concept of strong ties structural
diversity. Vedres and Stark argued for a crucial difference between structural folds and
structural holes, namely that the agency at the overlap of communities matters less than the
successful mobilization of the non-intersecting unique parts of overlapping communities
(O’leary, Mortensen, and Woolley 2011). The mechanism behind structural folds is
generative tension, rather than information and control benefits in brokerage: folds provoke
the generation of novelty, as overlapping communities build a product out of their diverse
experiences (De Vaan et al. 2015). The difference between structural holes and structural
folds arguments are rooted in a difference of theoretical perspective between a formalist and a
relational understanding of network processes (Erikson 2016). In a brokerage framework
network is imagined as a circuit where durable pieces of information flow freely. In contrast,
we think of network ties as locations of accumulating knowledge, and larger network
structures where interpersonal histories meet.
We argue that forbidden triads to overcome the operational difficulties of identifying
overlapping communities, and provide an easier and unambiguous way to measure the
structural folds idea (Vedres 2017). Prior work on fold networks used the number of
community memberships of a given node (Vedres and Stark 2010), or the number of
subgroup overlaps within a larger collective (De Vaan et al. 2015). Community detection is a
complex challenge, with a wide range of algorithms (Granell et al. 2015; Xie, Kelley, and
Szymanski 2013). A triadic approach overcomes these challenges, as triad types can be
identified unambiguously in any connected and weighted network with more than three
nodes. One can think of a forbidden triad is an elementary fold structure, where two
communities each with two nodes overlap.
A jazz band beyond a trio has multiple triads, and the question is how we aggregate from the
triadic level to the team level. This article uses two measures of forbidden triads: the density
of forbidden triads, and the depth of forbidden triads. These two measures correspond to two
Davis
Kelly
“Miles w Coltrane” 56 June “Miles w Evans” 57 May
“Lee Morgan” 57 March “Wynton Kelly” 58 Jan
“Kind of Blue” 59 March
Kelly
Chambers
Kelly
DavisDavis
Chambers
Chambers
Chambers
Chambers

7
distinct ways in which triads translate to innovativeness in the whole team. First, we use the
relative number of forbidden triads compared to all connected triads. With this measure we
assume a mechanism where distinct opportunities of combining dyadic experiences are
additive: more forbidden triads will result in higher success. Second, we develop a measure
that captures the average depth of forbidden triads. With this measure we assume a
mechanism where the depth of dyadic experiences that are combined in a forbidden triad is
what matters for success. The longer the experience in the two dyads that are meeting in a
conjuncture, the higher the success in the team, regardless of the frequency of forbidden
triads in the team. In sum, we distinguish the number of opportunities and the depth of
opportunities.
DEEP SUCCESS
If forbidden triads are robust structures that make musicians more innovative in a deeper,
multifunctional sense, the music they record should be successful along diverse success
measures. Success in art is often measured by just one dimension, like prestige (Fraiberger et
al 2018), number of recordings (Philips 2011; Vedres 2017), or chart position (Askin and
Mauskapf 2017). We develop the concept of deep success: success that is diverse in both the
publics and the generating mechanisms.
Considering publics, success in art is of a dual nature: one can work towards recognition in
the eyes of insiders, or strive to achieve financial success by pleasing mass audiences
(Bourdieu 1996). The sociology of art have long recognized differences of sophistication in
tastes (Hume 2015), and the diversity of roles in art worlds (Becker, Howard 1982), ranging
from protagonists on the inside to audience on the outside. The case of smooth jazz illustrates
this point: performers in this sub-genre achieved popular and financial success, but were
derided by critics as palatable, diluted, anodyne, or sellout (West 2008). Jazz scholars would
dismiss this genre as background music, a vehicle to access a wider body of listeners who
would never listen to jazz proper (Giddins and DeVeaux 2009).
The duality of insiders and outsiders is maintained because insiders have different stakes and
motivations than outsiders: in general, insiders are invested in a role structure, and thus
attributing success to others impacts their standing as well (Bourdieu and Johnson 1993;
Cattani, Ferriani, and Allison 2014). The by-product of art fields is a status system (Podolny
2008; White 2002), with critics playing a crucial role (White and White 1993).
Beyond the distinction of insiders and outsiders, we need to take another duality into account
about the mechanism through which success is conferred: the duality of voice and trace. Art
is an arena where opinions about quality, style, worth, and the nature of jazz itself are voiced
and debated (Emirbayer and Sheller 1999). Awards, critical acclaim, or polls are forms of
success by voice. But success in art can also be accumulated from traces that actions of
others leave behind, not with the intention of conferring success on an artist: declarative, and
nondeclarative aspects of consuming culture mean two paths to success for producers
(Lizardo 2017). Audiences typically vote with their feet and wallets, and the aggregated
traces of their decisions become a measure of success for the artist.
Works on the duality of art tend to conflate the insider-outsider distinction with the voice-
trace distinction: insiders have voice, outsiders leave traces. Following Jean-Louis Fabiani

8
(Fabiani 2003), we take into account the voice of outsiders, and the traces of insiders as well,
in a fourfold table.
A mechanism of success can operate in each cell of the fourfold table, to help success in the
eyes of insiders, or outsiders, or aid success by voice or by trace. A strong mechanism of
success would contribute across both dualities, to achieve deep success.
DATA AND METHODS
Our data on jazz sessions was collected from the Tom Lord Discography (Lord 2010),
arguably the most comprehensive data source on jazz (Charry 2005). The Tom Lord
Discography is a database of recording sessions, offering data on the date of a session, the
tracks recorded, the musicians present, the instruments musicians played, and the catalog
numbers of recordings that contain material from the session. We used data from the very
first sessions in 1896 to 2010. Our primary data table is a tripartite graph of sessions,
musicians, and instruments, while we also use a session table with record catalog numbers,
and date. The resulting dataset contains entries on 175 064 recording sessions, 42 929 band
leaders (or band names), 187 784 musicians, playing 11 940 different instruments. Moving
from the tripartite graph to a one-mode projection, the weighted collaborative network among
musicians for a given session was generated by summing the prior co-plays for each musician
dyads. To ensure strict temporal ordering, only sessions from year t-1 backwards were
included, if the focal session took place in year t.
Measuring jazz collaborations as a one-mode projection, capturing the total number of co-
plays did mean losing information from the original multimode data. We nevertheless think
this loss of information is valid (we aim to capture the extent of dyadic experience), and
provides sufficient structural variation in the resulting weighted graphs. Session sizes tend to
be small, with a median of 6, and a lowest quartile of 3, and a musician on average played
6.94 sessions over the career. About two thirds of the graphs are fully connected (67.4%),
where all pairs of musicians have played together at least once, leaving one third of the
sessions with structural diversity.
MEASURING STRONG TIE STRUCTURAL DIVERSITY
The concept of forbidden triads from Mark Granovetter’s seminal article (Granovetter 1973)
is clear – an open triad with strong ties is a sufficient definition. While there were several
advances to formalize Granovetter’s original argument (Fararo 1983; Pattison and Robins
2002; Tutić and Wiese 2015; Yang, Dong, and Chawla 2014), there is no empirical measure
that operationalizes the forbidden triad concept. Since the argument of structural folds is
about team level processes, we define measures of forbidden triads at the team graph level.
We propose two measures: the density of forbidden triads Fdens, and measure for the depth of
forbidden triads Fdepth. To define connected triad types including the forbidden triad, we use
two quantities: minimal triplet legs weight and weakest edge connectedness. Triplet legs are
the two stronger edges in the connected triad, 𝑤(3) and 𝑤(2), the third (that is, the strongest)
and the second strongest edge weights in ascending order of triad edge weights. (The
subscripted parenthesized numbers indicate the ascending order statistic.) Minimal triplet

9
legs weight is 𝑤(2), the second weight in ascending order, that captures the strength of the
triad edges, independently of closure.
In a weak open triad τΩw, the weakest edge 𝑤(1) = 0 (hence the triad is open), and the other
two connected edges are weak ties. In other words, 𝑤(2) < 𝑡, that is, in an open triad the
minimal legs weight is smaller than threshold 𝑡, if this threshold separates weak ties from
strong ties. A closed triad τΔ has three connected edges regardless of tie weight. And finally,
a forbidden triad τf is open in the sense that 𝑤(1) = 0, but the minimal legs weight 𝑤(2) ≥ 𝑡,
hence the two connected edges in the forbidden triad are strong ties. So the definition of
forbidden triad is:
τf = {1 𝑖𝑓 𝑤(2) ≥ 𝑡 & 𝑤(1) = 0
0 𝑜𝑡ℎ𝑒𝑟𝑤𝑖𝑠𝑒. (1)
These definitions satisfy the requirement that τ = τΩw ∪ τΔ ∪ τf. The three triad types are
summarized in Table 1.
Table 1: Definition of triad types
We calculate the density of forbidden triads as the proportion of forbidden triads of all
connected triads:
Fdens =∑ τf
∑ τ (2)
The assumption behind this measure is that what matters for creative success is the relative
frequency of forbidden triads, and not the intensity of tie weights in these triads. The more
forbidden triads a jazz session has, the more choices musicians have to pursue interesting
combinations of dyadic styles. This measure depends only on the 𝑡 threshold for a strong tie.
(In our analysis we will test the robustness of our findings to varying 𝑡.)
Similarly, we calculate the density of open triads as the proportion of all connected triads and
the density of closed triads as the proportion of all connected triads. By definition the
propensity of forbidden triads, open triads and close triads add up to one in any given
network.
We also develop a second measure of strong tie structural diversity, forbidden triads depth.
This coefficient measures the sum of geometric means of relative edge weights in open triads,
normalized by the number of open triads. Here we consider open triads τΩ regardless of the
tie weight threshold, such that τΩ = τΩw ∪ τf. This measure follows the same considerations
that underlie the development of weighted clustering coefficients, where the geometric mean

10
of relative edge weights is used, as it is more robust to outlying weight values (Onnela et al.
2005; Opsahl and Panzarasa 2009; Saramäki et al. 2007).
First, relative edge weights are calculated by dividing each weight by the maximum weight,
�̂�𝑖𝑗 = 𝑤𝑖𝑗/max (𝑤). Then we calculate the geometric mean of weights in open triads,
�̂�Ω = (�̂�(2)�̂�(3))1/2, for the two non-zero weight edges. The coefficient is then calculated by
the following formula:
Fdepth = {∑ �̂�ΩτΩ
∑ τΩ 𝑖𝑓 Fdens > 0
0 𝑜𝑡ℎ𝑒𝑟𝑤𝑖𝑠𝑒. (3)
This coefficient captures the weight of forbidden triads independently of the proportion of
such triads. Fdepthis set to zero for full graphs where ∑ τΩ =0, and Fdepth is not applicable
for graphs without any connected triads (thus sessions with empty graphs are omitted). The
measure ranges from zero, with no weight in open triads, to one, with all open triads having
ties that have the maximal tie weight in the session.
The assumption behind this measure is that it is not the number of forbidden triads that
counts, but the “depth” of them: the larger the weights in forbidden triads, the more mature
and elaborate are the artistic expressions developed in the high-weight dyads. Juxtaposing
these more elaborate dyadic experiences can then lead to more striking, novel combinations.
This measure is also normalized by the highest tie weight in the session, making the depth of
the experiences relative. The assumption behind this is that combining diverse experiences
need to compete with well-rehearsed conventions in closed triads. A depth coefficient of 0.5
suggests that there is at least one closed triad with a tie weight that is twice as high as the
weight in an open triad, regardless of the actual number of sessions that this means.
Table 2 with the weighted adjacency matrix and Figure 2 with the weighted network graph
illustrates these measures with the March 2, 1959 session of Miles Davis where three tracks
of the “Kind of Blue” album were recorded.
Table 2: Matrix of the number (upper triangle) and relative number (lower triangle) of prior co-recordings of
the musicians in the “Kind of Blue” session of Miles Davis (March 2, 1959).
1 2 3 4 5 6
1 Paul Chambers (bass) 35 12 8 22 13
2 John Coltrane (tenor sax) 1.00 1 7 16 5
3 Wynton Kelly (piano) .34 .03 11 0 1
4 Jimmy Cobb (drums) .23 .20 .31 6 10
5 Miles Davis (trumpet) .63 .46 .00 .17 8
6 Cannonball Adderley (alto sax) .37 .14 .03 .29 .23
11
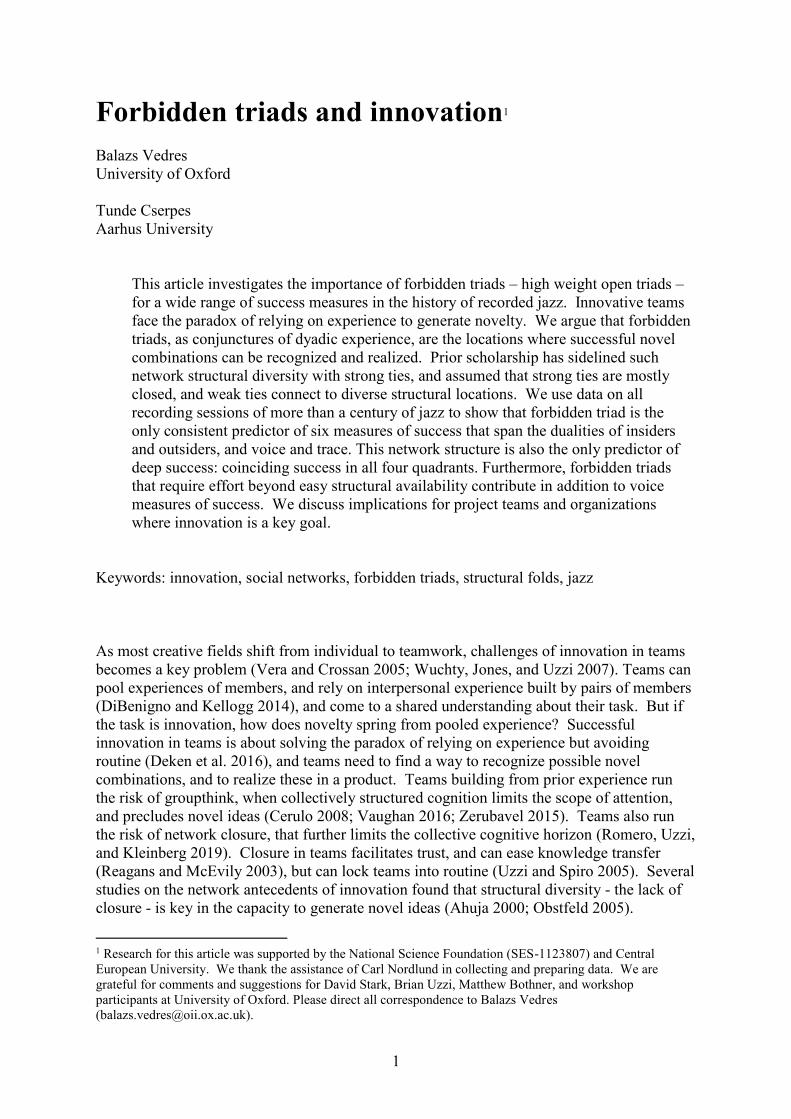
Figure 2: Graph of prior co-recordings in the example session of “Kind of Blue” (March 2, 1959). Forbidden
triads with t=2, τf1 and τf2, are marked by shaded areas.
The album resulting from this session, “Kind of Blue” is the top achievement in the history of
jazz: the most influential, most mentioned, and most re-issued jazz. As for any session in our
dataset, we show the number of prior collaborations up to the end of the preceding year, 1958
in this case. For example, as the weighted matrix shows on Table X, Paul Chambers played
in 22 sessions with Miles Davis. There is only one missing edge in the collaborations graph –
Miles Davis has never recorded in the studio with Wynton Kelly before – but this one
missing edge generates two open triads and to forbidden triads, and the rest, 16 triads are
closed. The forbidden triads density, Fdens is 0.09, and the forbidden triads depth, Fdepth is
0.22, meaning that the mean tie weight of forbidden triads was 22% of the highest tie weight.
As comparison, the weighted clustering coefficient (the mean tie weight of closed triads) is
0.21, so the weights in open triads were on average stronger than the weights in closed triads.
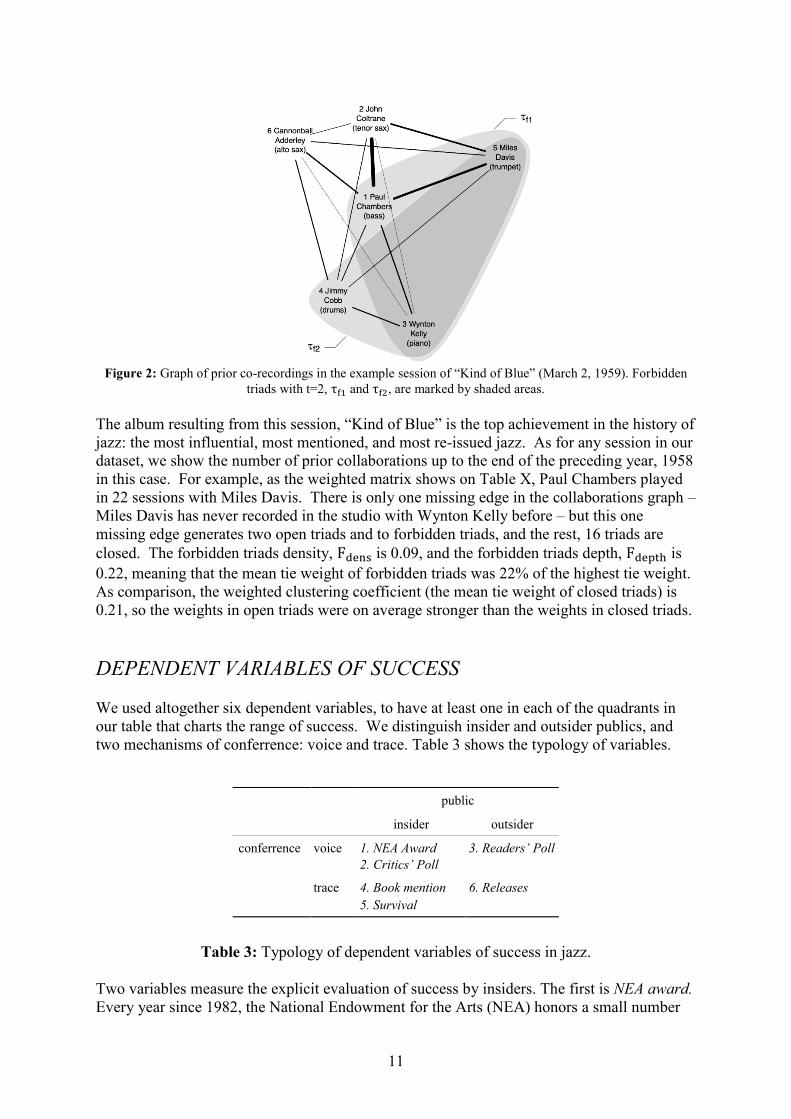
DEPENDENT VARIABLES OF SUCCESS
We used altogether six dependent variables, to have at least one in each of the quadrants in
our table that charts the range of success. We distinguish insider and outsider publics, and
two mechanisms of conferrence: voice and trace. Table 3 shows the typology of variables.
Table 3: Typology of dependent variables of success in jazz.
Two variables measure the explicit evaluation of success by insiders. The first is NEA award.
Every year since 1982, the National Endowment for the Arts (NEA) honors a small number
public
insider outsider
conferrence voice 1. NEA Award
2. Critics’ Poll
3. Readers’ Poll
trace 4. Book mention
5. Survival
6. Releases

12
of jazz musicians with this lifetime achievement award. NEA is an agency of the U.S.
government but the wider public nominates the jazz artists for consideration of this award.
The NEA Jazz Masters Fellowship goes to living musicians well embedded in their field and
is aimed at crowning their already successful career. We coded this measure as 1 for all
sessions in the career of a band preceding the year of the award and we excluded all sessions
of awarded bands in and after the year of the award.
The second indicator of success evaluated by insiders is the Critics’ Poll. One of the leading
and longest running industry periodicals, the DownBeat magazine, administers this
recognition since 1961. They survey jazz critics in several categories on a yearly basis to
capture industry sentiment. The most prestigious category of the Poll is the Hall of Fame,
which aims to honor the most outstanding artists in the field. We coded this measure as 1 for
all sessions in the career of a band preceding the year of the award and we excluded all
sessions of awarded bands in and after the year of the award.
Although industry insiders do have a prominent voice, they are not the only ones who express
their opinion about jazz music. We use one variable to indicate explicit judgment calls by
outsiders: results from Readers’ Poll surveys. Besides polling industry insiders, DownBeat
Magazine also surveys its readers on a yearly basis to pick Hall of Fame members. In fact,
this award dates back earlier than the Critics’ Poll, to 1952. There is little burden of
participating in the survey, jazz enthusiasts do not need to be subscribers of the magazine.
We coded this measure as 1 for all sessions in the career of a band preceding the year of the
award and we excluded all sessions of awarded bands in and after the year of the award.
Besides explicit judgment, social science can follow the behavioral traces of industry insiders
and outsiders to proxy the perceived success of jazz music. We measured the behavioral
traces of industry insiders in two ways. Book mentions indicate the decision by the editors
and authors to reference sessions in canonical jazz textbooks. When a jazz session was
discussed at least once in any of the books mentioned in our Appendix A, we recorded this in
a dummy variable. We assumed that these mentions aim to situate the sessions in the wider
history of jazz and as such are acknowledging accomplishment.
Survival is probably the most basic behavioral trace of performance as survival indicates the
willingness of team members to continue their career. We measured the end of survival
indirectly. We used the full range of event histories of bands that had at least two recorded
sessions. Sessions that were the last in a band’s career were coded as 1. We also calculated a
clock variable and stored the number of days from the previous recorded session in a given
band’s career trajectory. We used the exact date of the recordings to calculate this measure.
In cases where sessions were recorded on the same day, we randomized the order of those
sessions. As sessions with day ties comprise 27% of the sample, we repeated this process
several times and checked the consistency of our results.
Finally, we used a variable to indicate the behavioral traces of outsiders. Releases captured
the behavior of audiences as it manifests in purchasing albums. As releases accumulate over
time, we used an aggregate version and calculated the number of releases per decade. For its
skewness, we used the logarithmically transformed version of this variable.
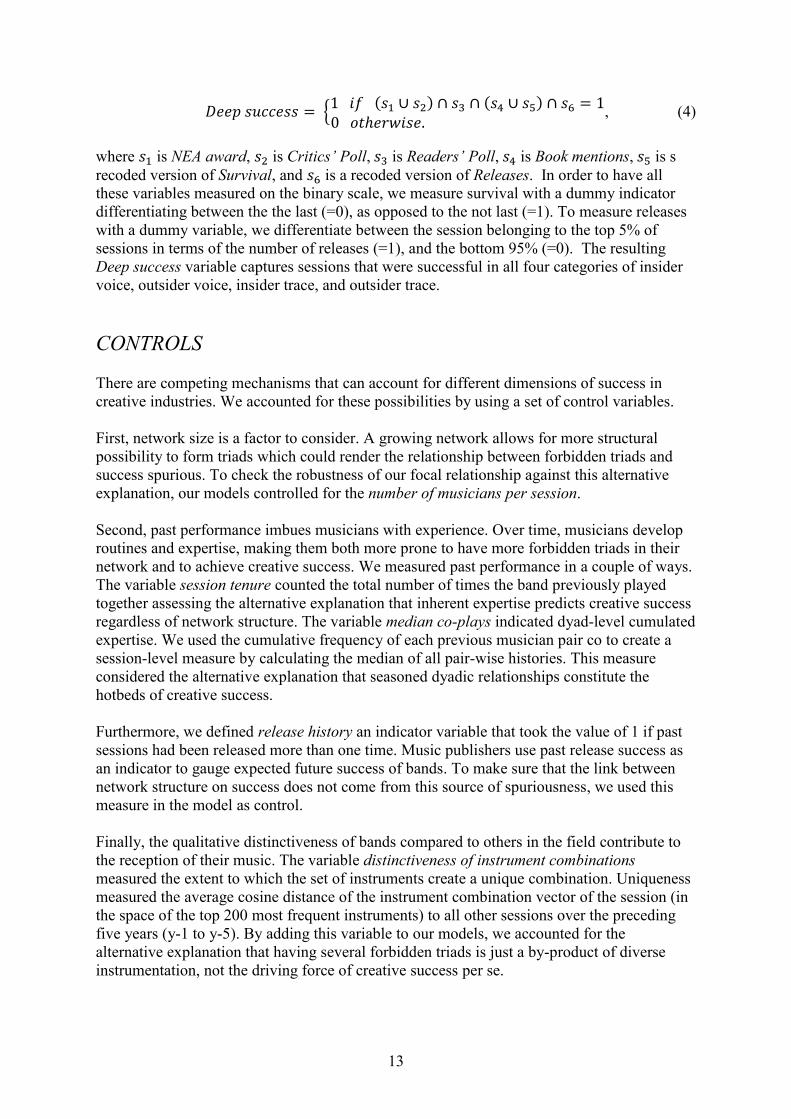
To capture coinciding success along the four categories we have defined, we coded the
variable Deep success the following way:
13
𝐷𝑒𝑒𝑝 𝑠𝑢𝑐𝑐𝑒𝑠𝑠 = {1 𝑖𝑓 (𝑠1 ∪ 𝑠2) ∩ 𝑠3 ∩ (𝑠4 ∪ 𝑠5) ∩ 𝑠6 = 10 𝑜𝑡ℎ𝑒𝑟𝑤𝑖𝑠𝑒.
, (4)
where 𝑠1 is NEA award, 𝑠2 is Critics’ Poll, 𝑠3 is Readers’ Poll, 𝑠4 is Book mentions, 𝑠5 is s
recoded version of Survival, and 𝑠6 is a recoded version of Releases. In order to have all
these variables measured on the binary scale, we measure survival with a dummy indicator
differentiating between the the last (=0), as opposed to the not last (=1). To measure releases
with a dummy variable, we differentiate between the session belonging to the top 5% of
sessions in terms of the number of releases (=1), and the bottom 95% (=0). The resulting
Deep success variable captures sessions that were successful in all four categories of insider
voice, outsider voice, insider trace, and outsider trace.
CONTROLS
There are competing mechanisms that can account for different dimensions of success in
creative industries. We accounted for these possibilities by using a set of control variables.
First, network size is a factor to consider. A growing network allows for more structural
possibility to form triads which could render the relationship between forbidden triads and
success spurious. To check the robustness of our focal relationship against this alternative
explanation, our models controlled for the number of musicians per session.
Second, past performance imbues musicians with experience. Over time, musicians develop
routines and expertise, making them both more prone to have more forbidden triads in their
network and to achieve creative success. We measured past performance in a couple of ways.
The variable session tenure counted the total number of times the band previously played
together assessing the alternative explanation that inherent expertise predicts creative success
regardless of network structure. The variable median co-plays indicated dyad-level cumulated
expertise. We used the cumulative frequency of each previous musician pair co to create a
session-level measure by calculating the median of all pair-wise histories. This measure
considered the alternative explanation that seasoned dyadic relationships constitute the
hotbeds of creative success.
Furthermore, we defined release history an indicator variable that took the value of 1 if past
sessions had been released more than one time. Music publishers use past release success as
an indicator to gauge expected future success of bands. To make sure that the link between
network structure on success does not come from this source of spuriousness, we used this
measure in the model as control.
Finally, the qualitative distinctiveness of bands compared to others in the field contribute to
the reception of their music. The variable distinctiveness of instrument combinations
measured the extent to which the set of instruments create a unique combination. Uniqueness
measured the average cosine distance of the instrument combination vector of the session (in
the space of the top 200 most frequent instruments) to all other sessions over the preceding
five years (y-1 to y-5). By adding this variable to our models, we accounted for the
alternative explanation that having several forbidden triads is just a by-product of diverse
instrumentation, not the driving force of creative success per se.

14
SAMPLES AND METHODS
Although we had information on the entire history of recoded jazz, features of the empirical
context and methodological considerations required slightly different samples for each of the
six dependent variables of interest. To estimate winning the NEA, Critics’ Poll, Readers’ poll
awards and book mentions, we fit maximum likelihood models with a logistic function to
predict whether sessions of a band were mentioned or recognized. We decided to model the
presence of any book mentions for a session, rather than the number of mentions, as there
were very few sessions (199) mentioned multiple times. We attempted to use negative
binomial and zero inflated negative binomial models, with and without fixed effects for band,
but neither of these models showed significant coefficients for our network structure
variables. Alternative specifications for all of our models are presented in the supplement.
While bands receive awards and poll nominations not sessions, we decided to use session
level models as – according to the coding scheme described previously – our mechanisms are
at the session level. We also ran models at the band level, aggregating independent variables
by taking the means, and using rare events (penalized likelihood) logistic regression, with
correction for bias resulting from rare events, that is in this case, exceedingly small number
of observations with a success outcome (King and Zeng 2001).
The sample sizes of the maximum likelihood models differed across specifications as we
excluded careers that ended before the year the awards started: 1982, 1961, and 1952
respectively. In the NEA, Critics’ Poll, Readers’ poll models, we ended our dataset in 2000,
leaving a ten-year window for the different dimensions of success to manifest. For the book
mention models, we only used sessions between 1940 and 1970 to focus on the heyday of
jazz and its later reception. We restricted all these models to sessions that have an
appropriately long history meaning at least four sessions and at least three musicians so our
network measures could be calculated.
We estimate semi-parametric piece-wise exponential models with a continuous rate of band
survival. To make the baseline relationship between the rate of survival and band career
length flexible, we include time pieces in our models for career stages (the cut-points divide
up survival time to early, mid, and late careers where we expect the baseline hazard to be
fairly constant). We only used the full range of event histories of bands that had at least two
recorded sessions. The running variable was the time elapsed between sessions and we
calculated it from the exact date of the recording until the last session or right censoring event
(Mezias and Mezias, 2000). As our survival models contain band session histories in their
entirety, we included a dummy variable, missing, to indicate sessions in which the network
was not developed enough for us to calculate structural measures.
Our strategy was the following to model the amount of releases per decade. We fit linear
models to predict the logarithmically transformed version of this measure. We use
information from the beginning of the recorded session history, the earliest year being 1896.
However, we leave a ten-year window for success to manifest so our dataset ends in 2000. As
with other models, we restrict the sample to sessions with sufficient history to calculate
network measures. Out of the six dependent variables, the number of releases was the only
measure with missing values: 1.5% of the release variables were missing. As it is customary
to not use imputation techniques on missing dependent variables, we had no option but to use
listwise deletion on these cases (Allison 2009). Our models for releases include fixed effects
for band, to estimate within-band effects, as we can assume unobserved heterogeneity in
15
releases at the band level: An album from Miles Davis will be more likely to be re-released,
regardless of the network configurations in the session, compared to a relatively unknown
jazz band.
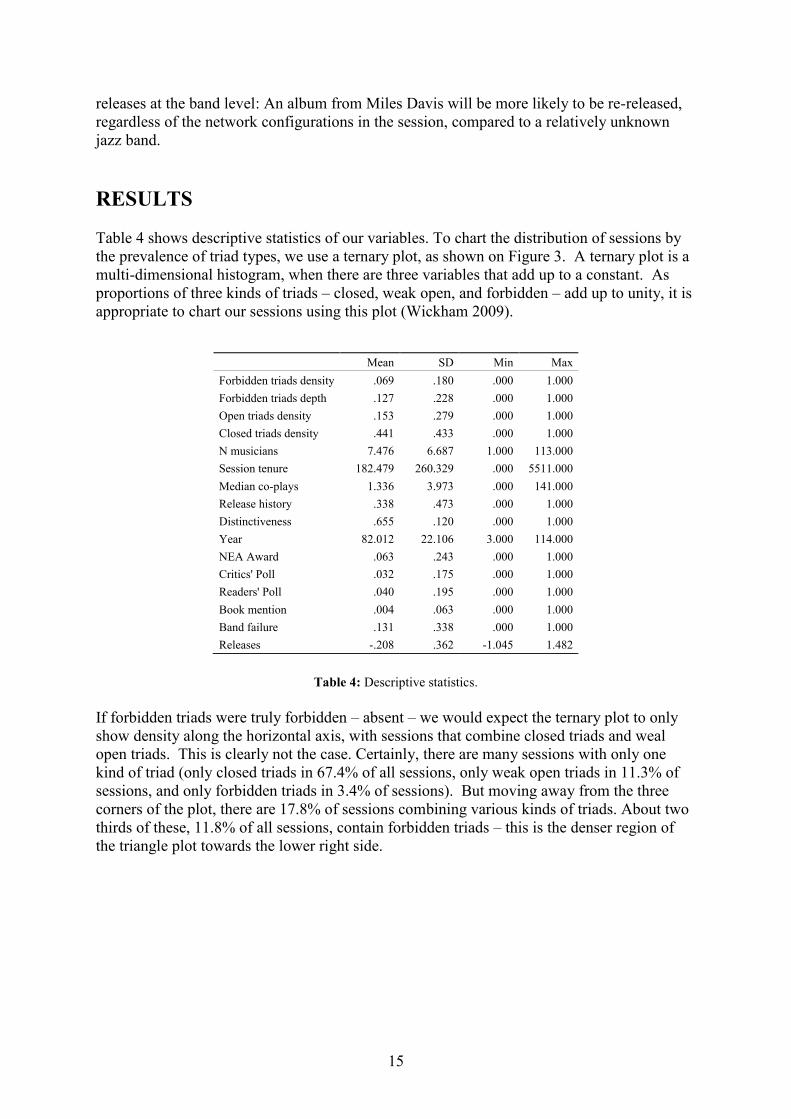
RESULTS
Table 4 shows descriptive statistics of our variables. To chart the distribution of sessions by
the prevalence of triad types, we use a ternary plot, as shown on Figure 3. A ternary plot is a
multi-dimensional histogram, when there are three variables that add up to a constant. As
proportions of three kinds of triads – closed, weak open, and forbidden – add up to unity, it is
appropriate to chart our sessions using this plot (Wickham 2009).
Table 4: Descriptive statistics.
If forbidden triads were truly forbidden – absent – we would expect the ternary plot to only
show density along the horizontal axis, with sessions that combine closed triads and weal
open triads. This is clearly not the case. Certainly, there are many sessions with only one
kind of triad (only closed triads in 67.4% of all sessions, only weak open triads in 11.3% of
sessions, and only forbidden triads in 3.4% of sessions). But moving away from the three
corners of the plot, there are 17.8% of sessions combining various kinds of triads. About two
thirds of these, 11.8% of all sessions, contain forbidden triads – this is the denser region of
the triangle plot towards the lower right side.
Mean SD Min Max
Forbidden triads density .069 .180 .000 1.000
Forbidden triads depth .127 .228 .000 1.000
Open triads density .153 .279 .000 1.000
Closed triads density .441 .433 .000 1.000
N musicians 7.476 6.687 1.000 113.000
Session tenure 182.479 260.329 .000 5511.000
Median co-plays 1.336 3.973 .000 141.000
Release history .338 .473 .000 1.000
Distinctiveness .655 .120 .000 1.000
Year 82.012 22.106 3.000 114.000
NEA Award .063 .243 .000 1.000
Critics' Poll .032 .175 .000 1.000
Readers' Poll .040 .195 .000 1.000
Book mention .004 .063 .000 1.000
Band failure .131 .338 .000 1.000
Releases -.208 .362 -1.045 1.482

16
Figure 3: Ternary plot with the relative frequency of sessions according to their triadic composition.
Correlations among independent variables do not raise concern for pairwise multicollinearity
(multicollinearity in the variable set was also not of concern; the maximal VIF was 1.29).
Correlations among the dependent variables are low (maximum is .339), which indicates that
we indeed captured diverse dimensions of success.
FORBIDDEN TRIADS AND SUCCESS For all six dependent variables, we run two models in which we use different measures of
forbidden triads: the density and depth of forbidden triads. All models control for alternative
mechanisms. Table 5 gives an overview of our results.

17
Table 5: The effect of forbidden triads on six measures of success.

18
Insider voice. We used two measures of indicators of insider voice: receiving an NEA
Award (I) and winning the Jazz Critics’ Poll (II). Higher proportion and deepening breadth of
forbidden triads both raise the odds of receiving the NEA award even after accounting for
other mechanisms that contribute to success (models I.1 and I.2). Similarly, both forbidden
triad measures are statistically significant antecedents of winning the Jazz Critics’ award (II.1
and II.2.). Forbidden triad density and depth thus consistently predict creative success
evaluated by industry insiders.
Outsider voice. One measure indicated success based on outsider voice, Readers’ Poll results
(III). Networks both dense (III.1) and deep (III.2.) in forbidden triads raise the odds of
accolade by the public. Thus, recording success evaluated not only by insiders but also by the
wider public seems to be strongly related to the structural characteristics of the band that is
recording the session.
Insider trace. We used two proxies of innovative performance measured by industry
insider’s behavior: book mentions (IV) and band survival (V). The odds of being mentioned
in a canonical book on jazz rise when the network composed of the career histories of band
members is dense in forbidden triads (IV.1). While results are similar in sign, the positive
relationship between forbidden triad depth and book mentions cannot be confirmed at the
0.05 level. As for the survival benefits of network composition, our results reveal that
survival benefits accrue to networks both with higher density and depth of forbidden triads
(V.1 and V.2). In sum, models of insider behavioral traits show that forbidden triads predict
innovative performance.
Outsider trace. One measure indicated innovative performance based on traces of the public.
Results from linear models predicting the number of releases (VI) replicate a previous finding
(Vedres 2017) and show the positive effects of both forbidden triads density (VI.1.) and depth
(VI.2.) on release numbers. It thus highlights that innovative performance measured by where
the customer’s money is going depends on the network setup of the jazz band.
DEEP SUCCESS In order to evaluate the magnitude of the effect of network structure on different measures of
success, we decided to measure all six of the dependent variables on the same scale, and use
standardized values for our independent variables. Since most of our dependent variables are
binary, this meant simplifying the dependent variable in our release model and choosing a
different model specification for our survival model. Once we set up the six dependent
variables in binary form, we repeat running the maximum likelihood models with logistic
function reported in the previous session with the difference compared to earlier models that
we standardize all independent variables in the models. The advantage of this approach that
the coefficients from the different models will become directly comparable across and within
models.
In addition to the six dependent variables, we also modeled deep success, coinciding success
in each of the four categories we have defined. Since such sessions were exceedingly rare
(206 sessions, .016%), we used a rare events penalized likelihood logit model for this
dependent variable.
Besides comparing the coefficients of forbidden triads density and depth, the variables of our
previous focus, we also compare the estimates for measures that were advanced by earlier
19
research as alternative explanations. Thus, we compare the estimates for the effect of weak
open triads, closed triads and the distinctiveness of instruments in a band.
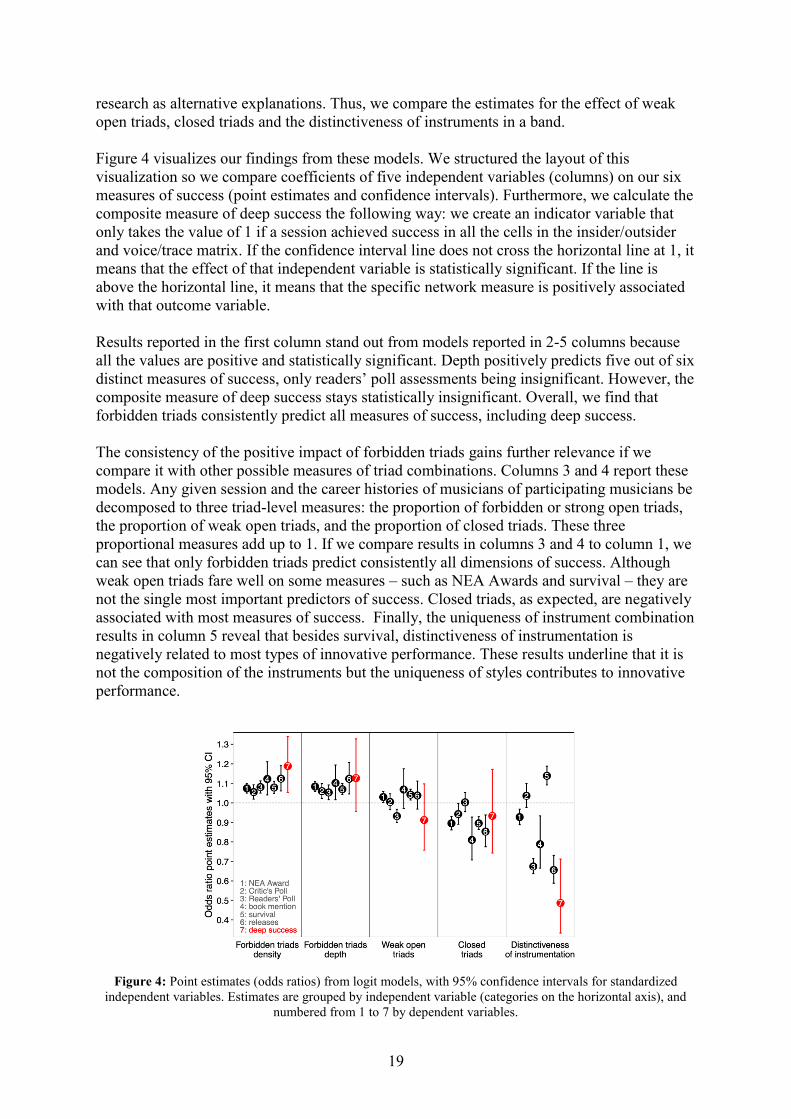
Figure 4 visualizes our findings from these models. We structured the layout of this
visualization so we compare coefficients of five independent variables (columns) on our six
measures of success (point estimates and confidence intervals). Furthermore, we calculate the
composite measure of deep success the following way: we create an indicator variable that
only takes the value of 1 if a session achieved success in all the cells in the insider/outsider
and voice/trace matrix. If the confidence interval line does not cross the horizontal line at 1, it
means that the effect of that independent variable is statistically significant. If the line is
above the horizontal line, it means that the specific network measure is positively associated
with that outcome variable.
Results reported in the first column stand out from models reported in 2-5 columns because
all the values are positive and statistically significant. Depth positively predicts five out of six
distinct measures of success, only readers’ poll assessments being insignificant. However, the
composite measure of deep success stays statistically insignificant. Overall, we find that
forbidden triads consistently predict all measures of success, including deep success.
The consistency of the positive impact of forbidden triads gains further relevance if we
compare it with other possible measures of triad combinations. Columns 3 and 4 report these
models. Any given session and the career histories of musicians of participating musicians be
decomposed to three triad-level measures: the proportion of forbidden or strong open triads,
the proportion of weak open triads, and the proportion of closed triads. These three
proportional measures add up to 1. If we compare results in columns 3 and 4 to column 1, we
can see that only forbidden triads predict consistently all dimensions of success. Although
weak open triads fare well on some measures – such as NEA Awards and survival – they are
not the single most important predictors of success. Closed triads, as expected, are negatively
associated with most measures of success. Finally, the uniqueness of instrument combination
results in column 5 reveal that besides survival, distinctiveness of instrumentation is
negatively related to most types of innovative performance. These results underline that it is
not the composition of the instruments but the uniqueness of styles contributes to innovative
performance.
Figure 4: Point estimates (odds ratios) from logit models, with 95% confidence intervals for standardized
independent variables. Estimates are grouped by independent variable (categories on the horizontal axis), and
numbered from 1 to 7 by dependent variables.

20
Modeling success in a comparable way – with logit models for all dependent variables, and
with standardized independent variables – also provides an opportunity to assess specification
sensitivity in a comparable way. By estimating models with all combinations of our six
control variables (including none at all, or any. number and combination of them – 64 models
in all), we can evaluate the sensitivity of our forbidden triads density and depth coefficients.
We found that for all dependent variables and all specifications the coefficients remained
positive and significant, with the exception of three specifications for releases.
SUCCESS AND STRUCTURAL AVAILABILITY
The previous results do not account for whether the different dimensions of innovative
success come to life solely through the opportunity of structure or they require conscious and
strategic effort of band members. In this section, we compare our empirical jazz networks to
simulated random graphs. We aim to understand whether a network rich in forbidden triads
leads to creative success depending on whether forbidden triads are more or less likely to
occur in given structures in the first place. In doing so, we separate the effects of the agency
of the band and the opportunity structure of networks. Although we will not be able to
determine if the agency of the band is an instantiation of innate instinct, cognitive heuristics
or rational-instrumental action, nevertheless, we will be able to differentiate this strategic-
conscious human action from outcomes that are results of the structural possibility.
To estimate expectations for structural availability, we generated 100 random jazz worlds by
rewiring the observed tripartite dataset (of sessions, musicians, and instruments). The
rewiring was accomplished following the principle of objective possibility: We were re-
allocating musicians to sessions in a way that could have happened in real life (with, albeit,
small probability), and avoided composing sessions that were not possible according to
available evidence. In other words, we were generating jazz worlds with synthetic sessions
that the recording companies could have recorded. These random jazz worlds are different
from the actual one on that musicians selected by our rewiring were not selected according to
their networks. They were not likely to have played with each other in the past, and they were
not likely to have been “friends of friends” either.
The first principle for rewiring was that the number of musicians in the session needed to be
preserved. Second, we were preserving the number of sessions a musician played, within a
window of one year. If a trumpet player recorded five times over the year when the session
happened, we were allocating that player to five sessions in the rewired jazz world over that
one-year period. We were also using 2, 5 and 10 year windows, but the one year window is
the closest to the logic of the jazz field, and it is also the strictest in the availability of
musicians. Third, we preserved the instrument combination of the session, as the recorded
material would have been different without the same instruments. Finally, we were only
allocating musicians to a session to fill an instrument slot if they played the instrument over
the current and previous year. Musicians often play multiple instruments, and it makes a
considerable difference if a musician has played the instrument in question only a decade in
the past.
Once we generated the random worlds, we calculated our forbidden triads density and depth
variables, and computed a Z-score measuring the distance of the observed and expected
statistics. Table 6 highlights our results. The coefficient forbidden triads = 0 covers cases
when there is no structural possibility for forbidden triads to form. The coefficient forbidden

21
triads > 0 and Z>=2 entails cases when the structural opportunity is not readily available,
and bands are very likely making a conscious effort to recruit musicians with forbidden
triads. The coefficients to these two categories can be read as comparisons to an omitted
category. This reference category covers cases with forbidden triads > 0 and Z < 2, instances
when forbidden triads in the observed session are not more likely than in the random jazz
world.
The results reveal that band effort matters differently for voice and trace outcomes.
Behavioral trace outcomes, such as book mention, survival and releases, are not associated
with conscious strategic action. The insignificant coefficients in line 2, columns 7, 9 and 11
represent that it does not matter whether the band makes a unique effort to engineer their
network. Extra opportunities do not present themselves as results of additional human effort
on top of the possibility embedded in the network structure itself.
For outcomes associated with explicit judgment, such as NEA Award, Critics’ Poll and
Readers’ Poll results, a strong association is apparent with conscious human action. The
results in line 2, columns 1, 3, and 5 highlight that compared to chance findings, network
constellations that are outcomes of conscious recruitment are richer in forbidden triads that
would be expected from structural possibilities alone. These network structures,
consequently, act as conduits of innovative success but only on explicit judgment outcomes.
These outcomes are judged by audiences, whose identity is also on the line when making
these evaluations.

22
Table 6: Models of forbidden triads with structural possibility of six measures of success.

23
DISCUSSION AND CONCLUSIONS
Our findings indicated that forbidden triads – conjunctures of two dyadic histories – are
consistent predictors of creative team success. Forbidden triads are better predictors than
weak open triads, and much better than closed triads, or a distinctive instrument combination.
The mechanism we proposed operating in such triads is generative tension: when musicians
in the session recognize how the diverse styles they built up before can become a new tune.
Recognition of a possibility and realization of a new tone happens at the same time and place,
exploration of how styles can contrast and combine and the musical product is one and the
same. As opposed to a formalist approach to networks that envisions a static circuitry of
information flow, we think of network ties as dyadic histories, part of career sequences, sites
of joint experimentation.
We think of teams as collectives composed of triads. A forbidden triad is an elementary
location for discovering a new sound, but the team is the one that creates the product. How
do forbidden triads fuel innovation at the team level? We argue for two distinct ways to
aggregate forbidden triads to the team level, that represent two possible translations of triadic
discovery to team performance. Our results show that the density of forbidden triads is a
better predictor of success than the depth of forbidden triads. It seems that the number of
innovative opportunities matter more than the profound nature of a novel combination.
Several further questions could be explored here, along the lines of recent approaches to tie
weight distribution (Bruggerman 2006): What is the role of weight inequity in the two legs of
forbidden triads? Could weight inequity in closed triads be assets for innovation?
Forbidden triads are not just about recruiting a musician with an unexpected instrument, as
we control for instrument diversity. Forbidden triads are also not merely high weight dyads,
or indications of recruiting experienced musicians with many sessions under their belts, as we
control for past experience as well. Forbidden triads density is also not just an expression of
larger band size, where a larger session might need to reach out to talent not well connected
to a core set of musicians, as we control for session size as well.
We argued for an informed diversity of dependent variables, partly because repeated tests
lend more credibility to an argument, and also because success is a multi-dimensional
phenomenon. We argue that for art-worlds the two relevant dimensions are the public
(insiders or outsiders), and the mechanism of conferring (voice or trace). Forbidden triads
density is the only variable that consistently predicts all combinations of success dimensions.
Further questions could be explored about the nature in which one kind of success breeds
another, to understand a Matthew effect in innovative success (Bol, de Vaan, and van de Rijt
2018). For example, Is being recognized by outside audiences should come before or after the
recognition by insiders?
With a simulation approach we tested whether sessions that had no easy access yet included
forbidden triads are more successful than those with forbidden triads that were easily
available. We found evidence for voice-based success that conscious effort has an additional
benefit. When it comes to judgment of quality, bands that recruit against their structural
limitations have an advantage. We believe that network research is at risk of structural
determinism, as opposed to structural possibilism: beyond assuming an immediate link
between structure and outcomes, we aimed to test for the significance of agency.

24
Our results can be easily applied to designing teams, where innovation is a goal. If the
gravity of cohesion and homophily can be counter-acted by recruiting collaborators from
diverse contexts, a team with forbidden triads can be composed. In general, an organization
that allows, or encourages the cultivation of diverse communities for any individual, will
generate overlapping communities, and forbidden triads that can be put to generative use in
composing a team.
APPENDIX A: BOOKS USED TO MEASURE MENTIONS OF
JAZZ SESSIONS
Table 7: Books used to measure mentions of jazz sessions.
Book Number of sessions
mentioned
Thom Holmes, 2005: Jazz (American Popular Music). New York, NY: Facts on
File.
261
Lewis Porter, Michael Ullman, and Edward Hazell, 1992: Jazz: From its Origins
to the Present. Upper Saddle River, NJ: Prentice Hall.
220
Benito De Mar-A Mox, 2002: El Jazz : de Nueva Orleans a Los Anos Ochenta.
Mexico City, Mexico: Fondo de Cultura Economica USA.
175
Leonard Lyons, 1980: The 101 Best Jazz Albums: A History of Jazz on Records.
New York, NY: W. Morrow.
128
Gary Giddins, and Scott DeVeaux, 2009: Jazz. New York, NY: W. W. Norton. 101
Alyn Shipton, 2008: A New History of Jazz. London, UK: Continuum. 84
Ted Gioia, 1998: The History of Jazz. London, UK: Oxford University Press. 80
Brian Priestley, 1989: Jazz on Record: A History. London, UK: Hamish
Hamilton.
78
Frank Tirro, 1993: Jazz: A History. New York, NY: W. W. Norton. 75
Mark C. Girdley, 2008: Jazz Styles: History and Analysis. London, UK: Pearson. 63
James Lincoln Collier, 1979: The Making of Jazz: A Comprehensive History.
New York, NY: Dell.
60
Ben Ratliff, 2002: Jazz: A Critics’s Guide to the 100 Most Important Recordings.
New York, NY: Times Books.
59
John Szwed, 2000: Jazz 101: A Complete Guide to Learning and Loving Jazz.
New York, NY: Hachette Book Group.
51
Richard M. Cook, and Brian Morton, 2006: The Penguin Guide to Jazz
Recordings. London, UK: Penguin Books.
47
Loren Schoenberg, 2002: The NPR Curious Listener's Guide to Jazz. New York,
NY: TarcherPerigee.
47
Gary Giddens, 2000: Riding On A Blue Note: Jazz And American Pop. Boston,
MA: Da Capo Press.
19
Eric Hobsbawm, 2014: The Jazz Scene. London, UK: Faber and Faber. 10
Barry Kernfeld, 1997: What to Listen for in Jazz. New Haven, CT: Yale
University Press.
9
Scott DeVeaux, 1999: The Birth of Bebop: A Social and Musical History.
Oakland, CA: University of California Press.
2
Ben Ratcliff, 2002: Jazz: A Critics’s Guide to the 100 most important recordings.
New York, NY: Times Books.
1
Total 1670
25
REFERENCES
Ahuja, Gautam. 2000. “Collaboration Networks, Structural Holes, and Innovation: A
Longitudinal Study.” Administrative Science Quarterly 45(3):425.
Allison, Paul D. 2009. “Missing Data.” Pp. 72–89 in The SAGE Handbook of Quantitative
Methods in Psychology, edited by R. E. Millsap and A. Maydeu-Olivares. Sage
Publications.
Aral, Sinan and Marshall Van Alstyne. 2011. “The Diversity-Bandwidth Trade-Off.”
American Journal of Sociology 117(1):90–171.
Askin, Noah and Michael Mauskapf. 2017. “What Makes Popular Culture Popular? Product
Features and Optimal Differentiation in Music.” American Sociological Review
82(5):910–944.
Balachandran, Sarath and Exequiel Hernandez. 2018. “Networks and Innovation: Accounting
for Structural and Institutional Sources of Recombination in Brokerage Triads.”
Organization Science 29(1):80–99.
Barrett, Frank J. 2012. Yes to the MessSurprising Leadership Lessons from Jazz. Harvard
Business Press.
Becker, Howard, S. 1982. Art Worlds. University of California Press.
Berliner, Paul F. 1994. Thinking in Jazz: The Infinite Art of Improvisation. University of
Chicago Press.
Bol, Thijs, Mathijs de Vaan, and Arnout van de Rijt. 2018. “The Matthew Effect in Science
Funding.” Proceedings of the National Academy of Sciences 115(19):4887–90.
Bourdieu, Pierre. 1996. The Rules of Art : Genesis and Structure of the Literary Field.
Stanford University Press.
Bourdieu, Pierre and Randal Johnson. 1993. The Field of Cultural Production : Essays on Art
and Literature. Columbia University Press.
Bruggerman, Jeroen. 2006. “The Strength of Varying Ties Strength: Comment on Aral and
Van Alstyne.” American Journal of Sociology 112(6):1919–1930.
Burt, Ronald S. 1995. Structural Holes: The Social Structure of Competition. 1. Harvard
Univ. Press paperback ed. Cambridge, Mass.: Harvard Univ. Press.
Burt, Ronald S. 2005. Brokerage and Closure. An Introduction to Social Capital. New York:
Oxford University Press.
Burt, Ronald S. 2015. “Reinforced Structural Holes.” Social Networks 43:149–161.
Burt, Ronald S., William Barnett, James Baron, Jon-Athan Bendor, Jack Birner, Matthew
Bothner, Frank Dobbin, Chip Heath, Rachel Kranton, Rakesh Khurana, Jeffrey
Pfeffer, Joel Podolny, Holly Raider, James Rauch, and Ron Burt. 2004. “Structural
Holes and Good Ideas 1.” Ajs 110(2):349–99.

26
Cattani, Gino, Simone Ferriani, and Paul D. Allison. 2014. “Insiders, Outsiders, and the
Struggle for Consecration in Cultural Fields.” American Sociological Review
79(2):258–81.
Cerulo, Karen A. 2008. Never Saw It Coming: Cultural Challenges to Envisioning the Worst.
Chicago: University of Chicago Press.
Charry, Eric. 2005. “Reviewed Work ( s ): The Jazz Discography , Version 4 . 4 [ CD-ROM ]
by Tom Lord ; 85 Years of Recorded Jazz ( 1917-2002 , A-Z Complete ) [ CD-ROM ]
by Walter Bruyninckx and Domi Truffandier.” Notes 61(3):833–837.
Davis, Miles. and with Quincy Troupe. 1989. The Autobiography. Simon and Schuster.
De Vaan, Mathijs, David Stark, and Balazs Vedres. 2015. “Game Changer: The Topology of
Creativity.” American Journal of Sociology 120(4):1–51.
Deken, Fleur, Paul R. Carlile, Hans Berends, and Kristina Lauche. 2016. “Generating
Novelty Through Interdependent Routines: A Process Model of Routine Work.”
Organization Science 27(3):659–77.
Delmar, Frédéric and Scott Shane. 2006. “Does Experience Matter? The Effect of Founding
Team Experience on the Survival and Sales of Newly Founded Ventures.” Strategic
Organization 4(3):215–47.
DiBenigno, Julia and Katherine C. Kellogg. 2014. “Beyond Occupational Differences: The
Importance of Cross-Cutting Demographics and Dyadic Toolkits for Collaboration in
a U.S. Hospital.” Administrative Science Quarterly 59(3):375–408.
Dockery, Ben. 2013. Conceptualizing the Jazz Piano Trio: Interviews and Analysis with Nine
Jazz Legends. CreateSpace Independent Publishing Platform.
Doffman, Mark. 2011. “Jammin’ an Ending: Creativity, Knowledge, and Conduct among
Jazz Musicians.” Twentieth-Century Music 8(02):203–225.
Dowd, Timothy J. and Diogo L. Pinheiro. 2013. “The Ties Among the Notes: The Social
Capital of Jazz Musicians in Three Metro Areas.” Work and Occupations 40(4):431–
464.
Emirbayer, Mustafa and Mimi Sheller. 1999. “Publics in History.” Theory and Society
28(1):727–79.
Erikson, Emily. 2016. “Formalist and Relationalist Theory in Social Network Analysis.”
Sociological Theory 31(3):219–42.
Fabiani, Jean-Louis. 2003. “The Audience and Its Legend: A Sociological Analysis of the
Avignon Festival.” The Journal of Arts Management, Law, and Society 32(4):265–77.
Fararo, Thomas J. 1983. “Biased Networks and the Strength of Weak Ties.” Social Networks
5(1):1–11.
Faulkner, Robert R. and Howard Saul Becker. 2009. “Do You Know...?”: The Jazz
Repertoire in Action. University of Chicago Press.

27
Giddins, Gary. and Scott Knowles. DeVeaux. 2009. Jazz. W.W. Norton.
Granell, Clara, Richard K. Darst, Alex Arenas, Santo Fortunato, and Sergio Gómez. 2015.
“Benchmark Model to Assess Community Structure in Evolving Networks.” Physical
Review E 92(1):012805.
Granovetter, Mark. 1973. “The Strength of Weak Ties.” American Journal of Sociology
78(6):1360–80.
Hume, David. 2015. The Philosophical Works of David Hume. New York: Arkose Press.
King, Gary and Langche Zeng. 2001. “Logistic Regression in Rare Events Data.” Political
Analysis 9(2):137–63.
Kor, Yasemin Y. 2003. “Experience-Based Top Management Team Competence and
Sustained Growth.” Organization Science 14(6):707–19.
Krackhardt, David. 1999. “The Ties That Torture: Simmelian Tie Analysis in Organizations.”
Research in the Sociology of Organizations 16:183–210.
Krackhardt, David and Martin Kilduff. 2002. “Structure, Culture and Simmelian Ties in
Entrepreneurial Firms.” Social Networks 24(3):279–290.
Lizardo, Omar. 2017. “Improving Cultural Analysis: Considering Personal Culture in Its
Declarative and Nondeclarative Modes.” American Sociological Review 82(1):88–
115.
Lord, Tom. 2010. The Jazz Discography. Vancouver, Canada: Lord Music Reference Inc.
Obstfeld, David. 2005. “Social Networks, the Tertius Iungens Orientation, and Involvement
in Innovation.” Administrative Science Quarterly 50(1):100–130.
O’leary, Michael Boyer, Mark Mortensen, and Anita Williams Woolley. 2011. “Multiple
Team Membership: A Theoretical Model of Its Effects on Productivity and Learning
for Individuals and Teams.” Academy of Management Review 36(3):461–478.
Onnela, Jukka Pekka, Jari Saramäki, János Kertész, and Kimmo Kaski. 2005. “Intensity and
Coherence of Motifs in Weighted Complex Networks.” Physical Review E -
Statistical, Nonlinear, and Soft Matter Physics 71(6):1–4.
Opsahl, Tore and Pietro Panzarasa. 2009. “Clustering in Weighted Networks.” Social
Networks 31(2):155–63.
Pattison, Philippa and Garry Robins. 2002. “Neighborhood-Based Models for Social
Networks.” Sociological Methodology 32(1):301–37.
Phillips, Damon J. 2013. Shaping Jazz : Cities, Labels, and the Global Emergence of an Art
Form. Princeton:NJ: Princeton University Press.
Podolny, Joel M. (Joel Marc). 2008. Status Signals : A Sociological Study of Market
Competition. Princeton University Press.

28
Reagans, R. E. and E. W. Zuckerman. 2008. “Why Knowledge Does Not Equal Power: The
Network Redundancy Trade-Off.” Industrial and Corporate Change 17(5):903–44.
Reagans, Ray and Bill McEvily. 2003. “Network Structure and Knowledge Transfer: The
Effects of Cohesion and Range.” Administrative Science Quarterly 48(2):240.
Romero, Daniel M., Brian Uzzi, and Jon Kleinberg. 2019. “Social Networks under Stress:
Specialized Team Roles and Their Communication Structure.” ACM Transactions on
the Web 13(1):1–24.
Saramäki, Jari, Mikko Kivelä, Jukka Pekka Onnela, Kimmo Kaski, and János Kertész. 2007.
“Generalizations of the Clustering Coefficient to Weighted Complex Networks.”
Physical Review E - Statistical, Nonlinear, and Soft Matter Physics 75(2):2–5.
Tilly, Charles. 2000. “How Do Relations Store Histories?” Annual Review of Sociology
26(1):721–23.
Tutić, Andreas and Harald Wiese. 2015. “Reconstructing Granovetter’s Network Theory.”
Social Networks 43:136–48.
Uzzi, Brian and Jarrett Spiro. 2005. “Collaboration and Creativity: The Small World
Problem.” American Journal of Sociology 111(2):447–504.
Vaughan, Diane. 2016. The Challenger Launch Decision: Risky Technology, Culture, and
Deviance at NASA. Chicago ; London: The University of Chicago Press.
Vedres, Balazs. 2017. “Forbidden Triads and Creative Success in Jazz: The Miles Davis
Factor.” Http://Arxiv.Org/Abs/1709.03787 2(1):31.
Vedres, Balazs and David Stark. 2010. “Structural Folds : Generative Disruption In.”
American Journal of Sociology 115(4):1150–90.
Vera, Dusya and Mary Crossan. 2005. “Improvisation and Innovative Performance in
Teams.” Organization Science 16(3):203–24.
Walser, Robert. 1993. “Out of Notes : Interpretation , Signification , Problem Davis and the
of Miles.” The Musical Quarterly 77(2):343–365.
West, Aaron J. 2008. “Caught Between Jazz and Pop: The Contested Origins, Criticism,
Performance Practice, and Reception of Smooth Jazz.” University of North Texas.
White, Harrison C. 2002. Markets from Networks : Socioeconomic Models of Production.
Princeton University Press.
White, Harrison C. and Cynthia A. White. 1993. Canvases and Careers: Institutional Change
in the French Painting World. Chicago, IL: University of Chicago Press.
Wickham, Hadley. 2009. Ggplot2: Elegant Graphics for Data Analysis. Springer-Verlag.
Wuchty, Stefan, Benjamin F. Jones, and Brian Uzzi. 2007. “The Increasing Dominance of
Teams in Production of Knowledge.” Science 316(5827):1036–9.

29
Xie, Jierui, Stephen Kelley, and Boleslaw K. Szymanski. 2013. “Overlapping Community
Detection in Networks.” ACM Computing Surveys 45(4):1–35.
Yang, Yang, Yuxiao Dong, and Nitesh V Chawla. 2014. “Predicting Node Degree Centrality
with the Node Prominence Profile.” Scientific Reports 4:7236.
Zerubavel, Eviatar. 2015. Hidden in Plain Sight: The Social Structure of Irrelevance.
Oxford ; New York, NY: Oxford University Press.

30
SUPPLEMENTARY MATERIAL
Table SI 1: Correlations table.
Figure SI 1: Scatterplot matrix of all variables used. Diagonal cells contain univariate density plots using the
Epanechnikov kernel with the normal scale rule. Off diagonal cells show spline smoothing (red curve) with
95% confidence interval (yellow area), and scatterplot.
(1) (2) (3) (4) (5) (6) (7) (8) (9) (I) (II) (III) (IV) (V) (VI)
Independent variables
(1) Forbidden triads density 1.000 (2) Forbidden triads depth .803 1.000 (3) Open triads density -.091 .006 1.000
(4) Closed triads density -.492 -.465 -.822 1.000
(5) N musicians -.018 .024 .056 -.039 1.000 (6) Session tenure .238 .120 .101 -.224 .217 1.000 (7) Median co-plays -.053 -.067 -.189 .195 -.077 .105 1.000 (8) Release history .071 .044 .009 -.048 .020 .146 .074 1.000 (9) Distinctiveness -.061 -.069 -.062 .089 -.085 -.147 .000 -.268 1.000
Dependent variables
(I) NEA Award .057 .036 .014 -.044 .025 .178 .048 .156 -.062 1.000 (II) Critics' Poll .027 .015 -.001 -.015 .020 .086 .030 .129 -.049 .284 1.000 (III) Readers' Poll .040 .017 -.020 -.005 .007 .109 .094 .195 -.114 .339 -.040 1.000 (IV) Book mention .019 .012 .005 -.015 -.016 .025 .019 .076 -.038 .109 .049 .164 1.000 (V) Band failure -.049 -.039 -.004 .031 .034 -.085 -.073 -.131 .025 -.105 -.068 -.086 -.026 1.000 (VI) Releases .038 .028 .011 -.032 .041 .072 .019 .256 -.029 .098 .101 .166 .098 -.083 1.000
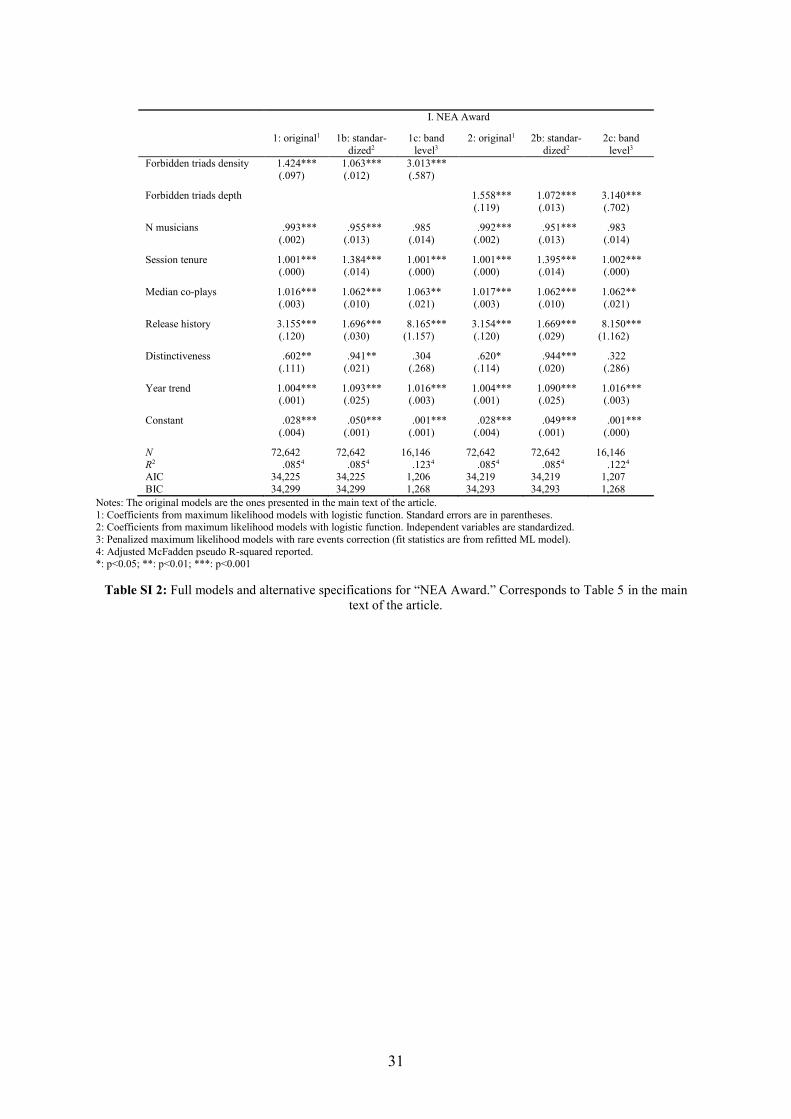
31
I. NEA Award
1: original1 1b: standar-
dized2
1c: band
level3
2: original1 2b: standar-
dized2
2c: band
level3
Forbidden triads density 1.424*** 1.063*** 3.013***
(.097) (.012) (.587)
Forbidden triads depth 1.558*** 1.072*** 3.140***
(.119) (.013) (.702)
N musicians .993*** .955*** .985 .992*** .951*** .983
(.002) (.013) (.014) (.002) (.013) (.014)
Session tenure 1.001*** 1.384*** 1.001*** 1.001*** 1.395*** 1.002*** (.000) (.014) (.000) (.000) (.014) (.000)
Median co-plays 1.016*** 1.062*** 1.063** 1.017*** 1.062*** 1.062**
(.003) (.010) (.021) (.003) (.010) (.021)
Release history 3.155*** 1.696*** 8.165*** 3.154*** 1.669*** 8.150***
(.120) (.030) (1.157) (.120) (.029) (1.162)
Distinctiveness .602** .941** .304 .620* .944*** .322
(.111) (.021) (.268) (.114) (.020) (.286)
Year trend 1.004*** 1.093*** 1.016*** 1.004*** 1.090*** 1.016*** (.001) (.025) (.003) (.001) (.025) (.003)
Constant .028*** .050*** .001*** .028*** .049*** .001***
(.004) (.001) (.001) (.004) (.001) (.000)
N 72,642 72,642 16,146 72,642 72,642 16,146
R2 .0854 .0854 .1234 .0854 .0854 .1224 AIC 34,225 34,225 1,206 34,219 34,219 1,207
BIC 34,299 34,299 1,268 34,293 34,293 1,268
Notes: The original models are the ones presented in the main text of the article.
1: Coefficients from maximum likelihood models with logistic function. Standard errors are in parentheses. 2: Coefficients from maximum likelihood models with logistic function. Independent variables are standardized.
3: Penalized maximum likelihood models with rare events correction (fit statistics are from refitted ML model).
4: Adjusted McFadden pseudo R-squared reported. *: p<0.05; **: p<0.01; ***: p<0.001
Table SI 2: Full models and alternative specifications for “NEA Award.” Corresponds to Table 5 in the main
text of the article.

32
II. Critics’ Poll
3: original1 3b: standar-
dized2 3c: band
level3 4: original1 4b: standar-
dized2 4c: band
level3
Forbidden triads density 1.387** 1.048*** 2.579***
(.140) (.018) (.682)
Forbidden triads depth 1.378** 1.051** 2.464***
(.156) (.018) (.772)
N musicians .999 .994 .984 .998 .991 .982 (.003) (.019) (.025) (.003) (.019) (.025)
Session tenure 1.001*** 1.299*** 1.001*** 1.001*** 1.308*** 1.001***
(.000) (.018) (.000) (.000) (.018) (.000)
Median co-plays 1.017*** 1.061*** 1.063** 1.017*** 1.062*** 1.062**
(.003) (.015) (.017) (.004) (.010) (.017)
Release history 2.342*** 1.696*** 6.591*** 2.324*** 1.478*** 6.602***
(.132) (.030) (1.440) (.132) (.038) (1.438)
Distinctiveness 1.619 1.058 3.983 1.653* 1.061* 4.101 (.406) (.031) (4.904) (.415) (.032) (5.052)
Year trend .979*** .618*** .990*** .978*** .617*** .990*** (.001) (.019) (.006) (.001) (.019) (.006)
Constant .052*** .019*** .001*** .051*** .019*** .001***
(.009) (.001) (.001) (.009) (.001) (.001)
N 72,255 72,255 16,145 72,255 72,255 16,145
R2 .0784 .0784 .1074 .0784 .0784 .1064
AIC 19,205 19,205 672 19,204 19,204 673 BIC 19,279 19,279 733 19,277 19,277 734
Notes: The original models are the ones presented in the main text of the article.
1: Coefficients from maximum likelihood models with logistic function. Standard errors are in parentheses.
2: Coefficients from maximum likelihood models with logistic function. Independent variables are standardized. 3: Penalized maximum likelihood models with rare events correction (fit statistics are from refitted ML model).
4: Adjusted McFadden pseudo R-squared reported.
*: p<0.05; **: p<0.01; ***: p<0.001
Table SI 3: Full models and alternative specifications for “Critics’ Poll.” Corresponds to Table 5 in the main
text of the article.

33
III. Readers’ Poll
5: original1 5b: standar-
dized2 5c: band
level3 6: original1 6b: standar-
dized2 6c: band
level3
Forbidden triads density 1.476*** 1.048*** 2.579***
(.125) (.018) (.682)
Forbidden triads depth 1.378** 1.051** 2.464***
(.156) (.018) (.772)
N musicians .985*** .994*** .984 .998 .991 .982 (.032) (.019) (.025) (.003) (.019) (.025)
Session tenure 1.001*** 1.299*** 1.001*** 1.001*** 1.308*** 1.001***
(.000) (.018) (.000) (.000) (.018) (.000)
Median co-plays 1.042*** 1.061*** 1.063** 1.017*** 1.062*** 1.062**
(.003) (.015) (.017) (.004) (.010) (.017)
Release history 3.809*** 1.696*** 6.591*** 2.324*** 1.478*** 6.602***
(.198) (.030) (1.440) (.132) (.038) (1.438)
Distinctiveness .043*** 1.058*** 3.983 1.653* 1.061* 4.101 (.010) (.031) (4.904) (.415) (.032) (5.052)
Year trend .983*** .618*** .990*** .978*** .617*** .990*** (.001) (.019) (.006) (.001) (.019) (.006)
Constant .336*** .019*** .001*** .051*** .019*** .001***
(.056) (.001) (.001) (.009) (.001) (.001)
N 72,381 72,255 16,145 72,255 72,255 16,145
R2 .1364 .1364 .1074 .1364 .1364 .1064
AIC 23,701 19,205 672 19,204 19,204 673 BIC 23,774 19,279 733 19,277 19,277 734
Notes: The original models are the ones presented in the main text of the article.
1: Coefficients from maximum likelihood models with logistic function. Standard errors are in parentheses.
2: Coefficients from maximum likelihood models with logistic function. Independent variables are standardized. 3: Penalized maximum likelihood models with rare events correction (fit statistics are from refitted ML model).
4: Adjusted McFadden pseudo R-squared reported.
*: p<0.05; **: p<0.01; ***: p<0.001 Table SI 4: Full models and alternative specifications for “Readers’ Poll.” Corresponds to Table 5 in the main
text of the article.

34
IV. Book mention 1940-1969
7: original1 7b: standar-
dized2 7c: zero inflated
NB3
8: original1 8b: standar-dized2
8c: zero inflated
NB3
Forbidden triads density 1.761** 1.103** .236 (.388) (.042) (.331)
Forbidden triads depth 1.600† 1.090† .311
(.398) (.050) (.382)
N musicians .963*** .774*** .031 .961* .763* .031
(.013) (.068) (.020) (.017) (.090) (.019)
Session tenure 1.000 1.052 -.001** 1.000 1.090 -.001** (.000) (.037) (.000) (.000) (.069) (.000)
Median co-plays 1.016* 1.059* .042* 1.015 1.063 .042* (.007) (.026) (.021) (.010) (.045) (.021)
Release history 4.800*** 2.056*** -.041 4.819*** 2.061*** -.044
(.839) (.165) (.331) (.978) (.192) (.330)
Distinctiveness .173* .812* -1.685 .173* .861* -1.676
(.124) (.069) (1.268) (.149) (.063) (1.266)
Year trend 1.099*** 8.302*** -.139*** 1.099*** 2.022*** -.138***
(.008) (1.357) (.023) (.012) (.166) (.023)
Constant .000*** .041*** 7.922*** .000*** .011*** 7.833*** (.000) (.007) (1.668) (.000) (.001) (1.658)
N 22,820 22,820 22,820 22,820 22,820 22,820
R2 .0684 .0684 .0684 .0684 AIC 3,511 3,511 4,531 3,513 3,513 4,531
BIC 3,575 3,575 4,660 3,579 3,579 4,660
Notes: The original models are the ones presented in the main text of the article.
1: Coefficients from penalized maximum likelihood models with rare events correction (fit statistics are from refitted ML model). Standard errors clustered for band are in parentheses.
2: Coefficients from penalized maximum likelihood models with rare events correction (fit statistics are from refitted ML
model). Independent variables are standardized; standard errors clustered for band are in parentheses. 3: Coefficients from the count model of a zero inflated negative binomial regression model. (Vuong test Z=8.14, indicating zero
inflation. Inflation model included controls only.)
4: Adjusted McFadden pseudo R-squared reported. †:p=.058*: p<0.05; **: p<0.01; ***: p<0.001
Table SI 5: Full models and alternative specifications for “Book mention.” Corresponds to Table 5 in the main
text of the article.
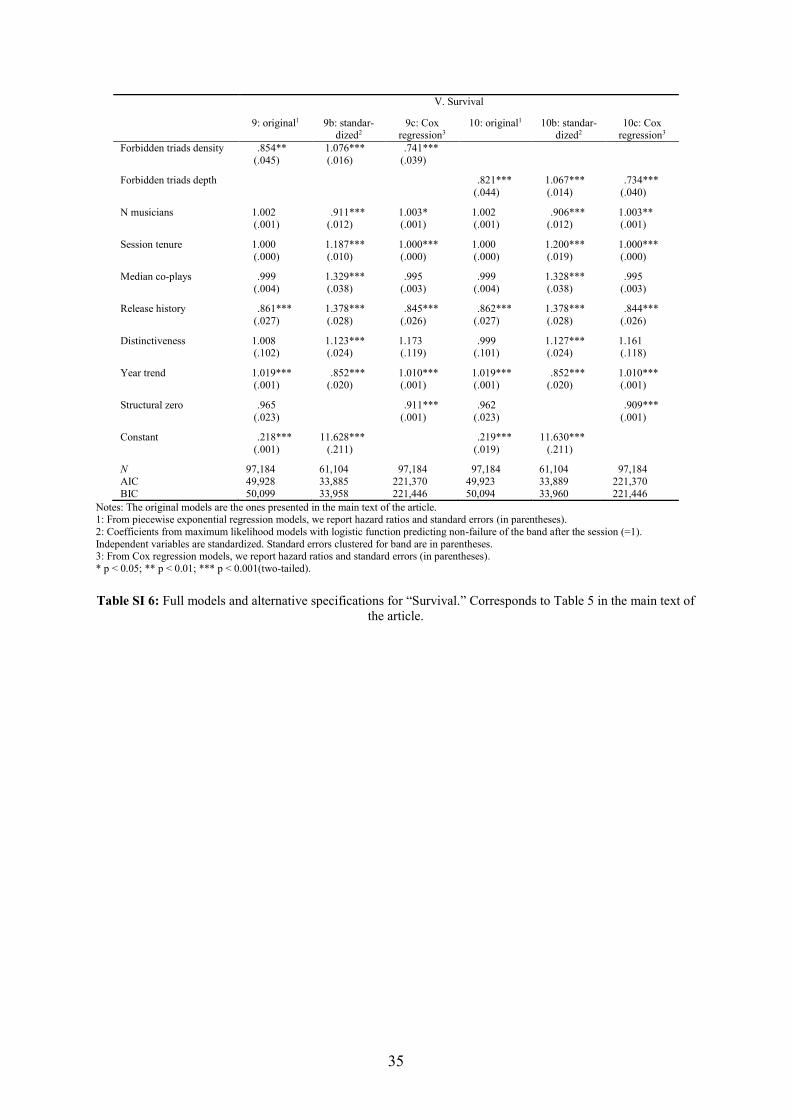
35
V. Survival
9: original1 9b: standar-
dized2 9c: Cox
regression3 10: original1 10b: standar-
dized2 10c: Cox
regression3
Forbidden triads density .854** 1.076*** .741***
(.045) (.016) (.039)
Forbidden triads depth .821*** 1.067*** .734***
(.044) (.014) (.040)
N musicians 1.002 .911*** 1.003* 1.002 .906*** 1.003** (.001) (.012) (.001) (.001) (.012) (.001)
Session tenure 1.000 1.187*** 1.000*** 1.000 1.200*** 1.000***
(.000) (.010) (.000) (.000) (.019) (.000)
Median co-plays .999 1.329*** .995 .999 1.328*** .995
(.004) (.038) (.003) (.004) (.038) (.003)
Release history .861*** 1.378*** .845*** .862*** 1.378*** .844***
(.027) (.028) (.026) (.027) (.028) (.026)
Distinctiveness 1.008 1.123*** 1.173 .999 1.127*** 1.161 (.102) (.024) (.119) (.101) (.024) (.118)
Year trend 1.019*** .852*** 1.010*** 1.019*** .852*** 1.010*** (.001) (.020) (.001) (.001) (.020) (.001)
Structural zero .965 .911*** .962 .909***
(.023) (.001) (.023) (.001)
Constant .218*** 11.628*** .219*** 11.630***
(.001) (.211) (.019) (.211)
N 97,184 61,104 097,184 097,184 61,104 097,184
AIC 49,928 33,885 221,370 49,923 33,889 221,370
BIC 50,099 33,958 221,446 50,094 33,960 221,446
Notes: The original models are the ones presented in the main text of the article. 1: From piecewise exponential regression models, we report hazard ratios and standard errors (in parentheses).
2: Coefficients from maximum likelihood models with logistic function predicting non-failure of the band after the session (=1).
Independent variables are standardized. Standard errors clustered for band are in parentheses. 3: From Cox regression models, we report hazard ratios and standard errors (in parentheses).
* p < 0.05; ** p < 0.01; *** p < 0.001(two-tailed).
Table SI 6: Full models and alternative specifications for “Survival.” Corresponds to Table 5 in the main text of
the article.

36
VI. Releases (per decade, log)
11: original1 11b: standar-
dized2 11c: zero
inflated NB3 12: original1 12b: standar-
dized2 12c: zero
inflated NB3
Forbidden triads density .018*** 1.097** .187**
(.005) (.038) (.061)
Forbidden triads depth .019*** 1.096* .187*
(.006) (.041) (.087)
N musicians .003*** 1.176* .009** .002*** 1.170* .009** (.000) (.090) (.003) (.000) (.091) (.003)
Session tenure -.000*** 1.061 -.000 -.000*** 1.079 -.000
(.000) (.050) (.000) (.000) (.050) (.000)
Median co-plays -.000 1.096** .004 -.000 1.095** .004
(.000) (.033) (.003) (.000) (.032) (.003)
Release history .237*** 3.568*** 1.271*** .237*** 3.570*** 1.272***
(.003) (.357) (.068) (.003) (.358) (.068)
Distinctiveness -.126*** .675*** -1.249*** -.125*** .680*** -1.239*** (.015) (.057) (.203) (.015) (.058) (.203)
Year trend .006*** .344*** -.043*** .006*** .342*** -.043*** (.000) (.034) (.002) (.000) (.034) (.002)
Constant -.795*** .001*** 3.198*** -.795*** .001*** 3.194***
(.014) (.000) (.166) (.014) (.000) (.164)
N 71,817 71,817 71,817 71,817 71,817 71,817
R2 .1104 .2335 .1104 .2315
AIC 8,839 162,468 8,839 162,473 BIC 8,912 162,615 8,913 162,620
Notes: The original models are the ones presented in the main text of the article.
1: Coefficients from OLS with fixed effects for band. Standard errors clustered for band are in parentheses.
2: Coefficients from maximum likelihood models with logistic function predicting top 5 percentile release variable(=1), with clustered standard errors for band. Independent variables are standardized. Standard errors clustered for band are in parentheses.
3: Coefficients from zero inflated negative binomial count model for the number of additional releases, with clustered standard
errors for band. Inflation model omitted (featured control variables only). 4: R-squared for within-band model.
5: McFadden pseudo R-squared.
*: p<0.05; **: p<0.01; ***: p<0.001
Table SI 7: Full models and alternative specifications for “Releases.” Corresponds to Table 5 in the main text of
the article.
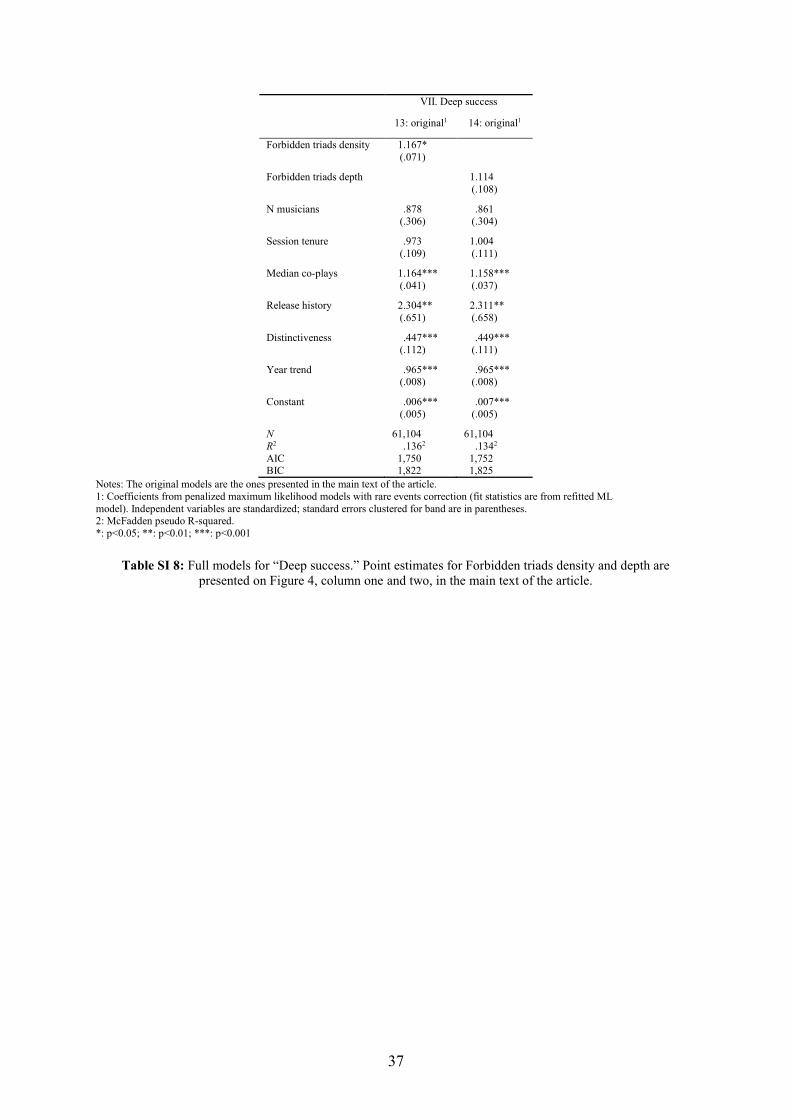
37
VII. Deep success
13: original1 14: original1
Forbidden triads density 1.167*
(.071)
Forbidden triads depth 1.114
(.108)
N musicians .878 .861 (.306) (.304)
Session tenure .973 1.004
(.109) (.111)
Median co-plays 1.164*** 1.158***
(.041) (.037)
Release history 2.304** 2.311**
(.651) (.658)
Distinctiveness .447*** .449*** (.112) (.111)
Year trend .965*** .965*** (.008) (.008)
Constant .006*** .007***
(.005) (.005)
N 61,104 61,104
R2 .1362 .1342
AIC 1,750 1,752 BIC 1,822 1,825
Notes: The original models are the ones presented in the main text of the article.
1: Coefficients from penalized maximum likelihood models with rare events correction (fit statistics are from refitted ML
model). Independent variables are standardized; standard errors clustered for band are in parentheses. 2: McFadden pseudo R-squared.
*: p<0.05; **: p<0.01; ***: p<0.001
Table SI 8: Full models for “Deep success.” Point estimates for Forbidden triads density and depth are
presented on Figure 4, column one and two, in the main text of the article.

38
Figure SI 2: Specification curves for Forbidden triads density; standardized models. For each panel,
specifications with all combinations of six control variables are sorted along the horizontal axis by the size of
the Forbidden triads density odds ratio, that is on the vertical axis. Black dashed line is at odds ratio=1, red
dashed line shows the odds ratio reported in the corresponding full model.
Figure SI 3: Specification curves for Forbidden triads depth; standardized models. For each panel,
specifications with all combinations of six control variables are sorted along the horizontal axis by the size of
the Forbidden triads depth odds ratio, that is on the vertical axis. Black dashed line is at odds ratio=1, red
dashed line shows the odds ratio reported in the corresponding full model.
● ● ● ●● ● ● ● ● ● ● ●
● ● ● ● ● ●● ●
●● ● ● ● ● ● ●
●● ● ●
●
● ●● ● ● ● ●
● ● ●● ● ●
● ● ●
● ● ●● ● ●
●● ● ● ●
● ●●●
1.00
1.05
1.10
1.15
0 20 40 60
Specifications
Forb
idde
n t
riad
s d
en
sity o
dd
s r
atio
NEA Award
● ●● ● ● ●
● ● ● ● ● ●●● ● ● ●
●● ● ● ●
● ● ● ●
● ● ●● ●
●●
● ●● ●
●●
● ●
●● ●
● ●
● ●● ● ●
● ● ●
●● ●
●● ●
●
●●
1.00
1.05
1.10
0 20 40 60
Specifications
Critics' Poll
●
● ●●● ●
● ●● ●
● ● ●● ● ● ● ● ●
●●●● ● ●
●●●● ● ● ●
●●
● ●●●
● ● ● ● ●● ● ●
● ●●● ●
●●● ● ●
●● ●
●
●●
●●
1.00
1.05
1.10
1.15
0 20 40 60
Specifications
Readers' Poll
● ●
●●● ● ●
●● ●
●● ●
● ● ●● ● ● ● ● ● ● ●
● ● ● ●
● ● ● ●
● ● ● ● ● ● ● ● ● ●●
●● ●
●●● ● ●
● ● ● ● ●● ●
● ●●●
● ●
1.00
1.05
1.10
1.15
0 20 40 60
Specifications
Book mention
● ● ● ●
●● ● ● ● ● ●
●●●● ● ● ● ● ●
● ● ● ● ● ●
●● ●
●
● ●
● ●● ● ● ●
● ●
● ●● ● ● ●
● ●
● ● ● ●
● ● ● ●
● ● ● ●● ●
● ●
1.00
1.05
1.10
1.15
0 20 40 60
Specifications
Forb
idd
en t
riad
s d
ensity o
dd
s r
atio
Survival
●
●●
●●●
●
●
●
● ●
● ●●
● ●●
●● ●
●
● ●
● ● ●● ● ●
●● ●
● ●● ● ●
● ●● ● ● ● ●
●● ● ●
● ● ● ● ●●● ●
●●
● ● ● ●
●
●
1.00
1.02
1.04
1.06
1.08
0 20 40 60
Specifications
Releases
●●●●
●●●
●●●● ●
● ● ●● ●
● ● ● ● ● ● ● ● ● ● ● ● ●● ● ● ● ● ● ●
● ● ●● ● ● ● ● ● ● ●
●● ● ● ● ●
●●● ● ●
●
●●● ●
1.00
1.05
1.10
1.15
1.20
0 20 40 60
Specifications
Deep success
●● ● ●
● ● ● ● ●● ●
● ● ●● ● ● ● ● ● ● ●
● ● ●● ● ● ● ●
●● ● ● ● ●
● ● ● ●● ●
● ●●● ● ● ● ● ●
● ● ● ●● ● ●
●●
●●●●
1.02
1.05
1.08
1.11
0 20 40 60
Specifications
Fo
rbid
de
n t
ria
ds d
epth
od
ds r
atio
NEA Award
●●●●●●● ● ●
●
●● ● ● ● ● ●
●● ● ●
●
● ● ● ●
● ● ● ● ● ●
● ●● ● ● ● ● ● ●
●●● ● ●
● ● ● ● ●● ●
●● ●
● ● ●
●
●●●
1.00
1.02
1.04
1.06
0 20 40 60
Specifications
Critics' Poll
●
●
●●
● ●● ●
● ●
● ●● ● ●
● ●●● ● ● ● ●
● ● ●●● ●
● ●●● ●
●
● ● ●●
● ● ● ●● ●
● ●● ● ● ●
●
● ●● ● ●
● ●●
● ●
● ●
1.000
1.025
1.050
1.075
0 20 40 60
Specifications
Readers' Poll
● ●
●
● ●
● ● ●● ● ● ● ● ● ●
● ● ● ● ● ● ● ●
●●
●● ● ● ● ● ●
● ● ● ● ● ● ● ● ● ● ● ● ● ● ● ●●● ● ●
●
●●●● ● ● ●
● ● ●●
1.02
1.05
1.08
1.11
0 20 40 60
Specifications
Book mention
● ●● ● ●
● ● ●●● ● ● ●
● ●●
● ● ● ●● ●
●● ● ● ● ● ● ● ● ● ● ● ● ● ●
● ●
●●
● ● ●● ●
● ● ● ● ● ● ●● ●
●
●● ●
● ● ●●●
1.02
1.05
1.08
0 20 40 60
Specifications
Fo
rbid
de
n t
ria
ds d
epth
odd
s r
atio
Survival
●●
●
●
● ●
●
● ● ●●●
● ● ●●●
●
●●
●●
●
●●
●
● ●● ● ● ● ● ● ● ● ●
●
●
●● ●
● ● ● ● ●● ● ● ● ● ●
●
● ●●
● ● ●●
●● ●
1.00
1.02
1.04
1.06
0 20 40 60
Specifications
Releases
●
●
●●
● ● ● ● ● ●● ● ● ●
●●● ● ●
● ●● ●
● ●●● ● ● ● ● ● ● ● ● ●
● ● ● ● ● ●● ●
● ●● ● ●
●
● ● ● ● ● ● ●●
● ●
●●
● ●
1.00
1.05
1.10
1.15
0 20 40 60
Specifications
Deep success

39
Figure SI 4: Marginal predictions for Forbidden triads density; standardized models. Each panel shows
marginal predictions along the range of the standardized range of Forbidden triads density variable, with the
mean marked by a vertical dashed line. The vertical axis shows relative predicted probability, with the
prediction at the minimum of Forbidden triads density=1.
Figure SI 5: Marginal predictions for Forbidden triads depth; standardized models. Each panel shows marginal
predictions along the range of the standardized range of Forbidden triads depth variable, with the mean marked
by a vertical dashed line. The vertical axis shows relative predicted probability, with the prediction at the
minimum of Forbidden triads depth=1.

40
I. NEA
Award
II. Critics’
Poll
III. Readers’
Poll
IV. Book
mention
V. Survival VI. Releases VII. Deep
success
Weak open triads density 1.030* 1.005 .932*** 1.068 1.042** 1.038 .892 (.014) (.021) (.017) (.052) (.014) (.037) (.078)
N musicians .900*** .930*** .803*** .690*** .893*** .866*** .850
(.013) (.090) (.016) (.053) (.012) (.028) (.095)
Session tenure 1.496*** 1.380*** 1.413*** 1.155*** 1.236*** 1.257*** 1.017
(.014) (.020) (.017) (.047) (.020) (.035) (.049)
Median co-plays 1.070 1.056*** 1.156*** 1.069* 1.354*** 1.109*** 1.133*** (.011) (.015) (.012) (.032) (.040) (.023) (.031)
Release history 1.160*** 1.165*** 1.280*** 1.237*** 1.727*** 1.861*** 2.329*** (.011) (.012) (.013) (.031) (.072) (.031) (.410)
Distinctiveness .930*** 1.033 .667*** .784** 1.140*** .652*** .440***
(.020) (.031) (.019) (.068) (.025) (.036) (.072)
Year trend .991*** .972*** .975*** 1.095*** .992*** .961*** .966***
(.001) (.001) (.001) (.010) (.001) (.002) (.004)
Constant .112*** .208*** .192*** .000*** 24.136*** .073*** .007***
(.008) (.019) (.016) (.000) (2.043) (.012) (.003)
N 71,691 71,694 71,445 22,299 61,104 71,817 61,104 R2 .0653 .0773 .1313 .0513 .0323 .3763 .1343
AIC 34,360 18,862 23,564 3,515 33,909 7,180 1,753
BIC 34,434 18,935 23,638 3,579 33,981 7,253 1,825
Notes: 1: Coefficients from maximum likelihood models with logistic function. Independent variables are standardized. Standard errors are in parentheses.
2: Penalized maximum likelihood models with rare events correction (fit statistics are from refitted ML model). Independent variables are
standardized. 3: Adjusted McFadden pseudo R-squared reported.
*: p<0.05; **: p<0.01; ***: p<0.001
Table SI 9: Models for the relationship between weak open triads and seven measures of success, including
deep success. Point estimates for “Weak open triads density” are presented on Figure 4, column three, in the
main text of the article.

41
I. NEA
Award1
II. Critics’
Poll1
III. Readers’
Poll1
IV. Book
mention1
V. Survival1 VI. Releases1 VII. Deep
success2
Closed triads density .895*** .942* 1.003 .810** .895*** .853** .979 (.018) (.021) (.025) (.056) (.017) (.042) (.105)
N musicians .900*** .930*** .803*** .699*** .896*** .874*** .857
(.013) (.090) (.016) (.054) (.012) (.029) (.096)
Session tenure 1.482*** 1.372*** 1.411*** 1.135** 1.212*** 1.239*** 1.008
(.014) (.019) (.017) (.047) (.020) (.036) (.050)
Median co-plays 1.081*** 1.063*** 1.166*** 1.088** 1.385*** 1.123*** 1.151*** (.011) (.015) (.012) (.032) (.042) (.022) (.029)
Release history 1.160*** 1.165*** 1.280*** 1.238*** 1.722*** 1.861*** 2.322*** (.011) (.012) (.013) (.031) (.071) (.031) (.409)
Distinctiveness .931** 1.037 .671*** .789** 1.144*** .659*** .445***
(.011) (.031) (.020) (.068) (.025) (.037) (.073)
Year trend .991*** .972*** .975*** 1.095*** .992*** .960*** .966***
(.001) (.001) (.001) (.010) (.001) (.002) (.004)
Constant .120*** .216*** .190*** .000*** 26.004*** .082*** .007***
(.009) (.020) (.016) (.000) (2.223) (.014) (.003)
N 71,691 71,694 71,445 22,299 61,104 71,817 61,104 R2 .066 .077 .053 .033 .377 .1333
AIC 34,333 18,858 23,579 3,507 8,839 7,170 1,754
BIC 34,407 18,931 23,652 3,571 8,913 7,244 1,827
Notes: 1: Coefficients from maximum likelihood models with logistic function. Standard errors are in parentheses. 2: Penalized maximum likelihood models with rare events correction (fit statistics are from refitted ML model).
3: Adjusted McFadden pseudo R-squared reported.
*: p<0.05; **: p<0.01; ***: p<0.001
Table SI 10: Models for the relationship between closed triads and seven measures of success, including deep
success. Point estimates for “Closed open triads density” are presented on Figure 4, column four, in the main
text of the article.

42
I. NEA Award
1: original1 1b: band level2 2: original1 2b: band level2
Forbidden triads density > 0, 1.227*** 11.792***
and Z ≥ 2 (.060) (2.539)
Forbidden triads density = 0 .996 .955
(.038) (.150)
Forbidden triads depth > 0, 1.138 117.153*** and Z ≥ 2 (.457) (.702)
Forbidden triads depth = 0 .931* .547***
(.032) (.073)
N musicians .993*** .989 .991*** .976
(.002) (.014) (.002) (.015)
Session tenure 1.001*** 1.002*** 1.001*** 1.002***
(.000) (.000) (.000) (.000)
Median co-plays 1.015*** 1.058** 1.016*** 1.065** (.003) (.019) (.003) (.021)
Release history 3.162*** 9.127*** 3.170*** 8.098*** (.120) (1.356) (.121) (1.158)
Distinctiveness .600** .286 .608** .367
(.111) (.269) (.112) (.330)
Year trend 1.004*** 1.019*** 1.004*** 1.017***
(.001) (.004) (.001) (.003)
Constant .029*** .001*** .031*** .002***
(.004) (.001) (.004) (.001)
N 72,642 16,146 72,642 16,146 R2 .0843 .1423 .0843 .1233
AIC 34,232 1,182 34,249 1,208
BIC 34,315 1,251 34,332 1,276
Notes: The original models are the ones presented in the main text of the article. 1: Coefficients from maximum likelihood models with logistic function. Standard errors are in parentheses.
2: Penalized maximum likelihood models with rare events correction (fit statistics are from refitted ML model).
3: Adjusted McFadden pseudo R-squared reported. *: p<0.05; **: p<0.01; ***: p<0.001
Table SI 11: Full models of structural availability, and alternative specifications for “NEA Award.”
Corresponds to Table 6 in the main text of the article.

43
II. Critics’ Poll
3: original1 3b: band level2 4: original1 4b: band level2
Forbidden triads density > 0, 1.272** 12.743***
and Z ≥ 2 (.091) (3.413)
Forbidden triads density = 0 1.176** 1.443
(.065) (.325)
Forbidden triads depth > 0, .925 30.768*** and Z ≥ 2 (.678) (1.398)
Forbidden triads depth = 0 1.091 .805
(.054) (.151)
N musicians 1.000 .992 .999 .980
(.003) (.025) (.003) (.027)
Session tenure 1.001*** 1.002*** 1.001*** 1.001***
(.000) (.000) (.000) (.000)
Median co-plays 1.014*** 1.058** 1.014*** 1.062** (.004) (.018) (.004) (.018)
Release history 2.361*** 7.142*** 2.367*** 6.670*** (.133) (1.636) (.133) (1.454)
Distinctiveness 1.489 3.583 1.508 3.975
(.375) (4.678) (.380) (5.011)
Year trend .979*** .991 .979*** .991
(.001) (.006) (.001) (.006)
Constant .048*** .001*** .052*** .001***
(.008) (.001) (.009) (.001)
N 72,255 16,145 72,255 16,145 R2 .0783 .1213 .0783 .1063
AIC 19,199 663 19,210 675
BIC 19,282 733 19,293 744
Notes: The original models are the ones presented in the main text of the article. 1: Coefficients from maximum likelihood models with logistic function. Standard errors are in parentheses.
2: Penalized maximum likelihood models with rare events correction (fit statistics are from refitted ML model).
3: Adjusted McFadden pseudo R-squared reported. *: p<0.05; **: p<0.01; ***: p<0.001
Table SI 12: Full models of structural availability, and alternative specifications for “Critics’ Poll.”
Corresponds to Table 6 in the main text of the article.

44
III. Readers’ Poll
5: original1 5c: band level3 6: original1 6c: band level3
Forbidden triads density > 0, 1.225** 11.241***
and Z ≥ 2 (.047) (2.809)
Forbidden triads density = 0 1.029 .882
(.048) (.142)
Forbidden triads depth > 0, 1.717 582.920*** and Z ≥ 2 (.790) (543.171)
Forbidden triads depth = 0 .967 .541***
(.040) (.086)
N musicians .985*** 1.009 .983*** .999
(.003) (.015) (.003) (.017)
Session tenure 1.001*** 1.001*** 1.001*** 1.001***
(.000) (.000) (.000) (.000)
Median co-plays 1.040*** 1.097** 1.041*** 1.101** (.003) (.033) (.003) (.037)
Release history 3.826*** 13.419*** 3.836*** 12.265*** (.198) (2.715) (.199) (2.451)
Distinctiveness .042*** .064 .043*** .083
(.010) (.094) (.010) (.118)
Year trend .983*** 1.004 .984*** 1.003
(.001) (.005) (.001) (.005)
Constant .340*** .002*** .361*** .004***
(.057) (.002) (.057) (.003)
N 72,381 16,146 72,381 16,146 R2 .135 .170 .135 .154
AIC 23,710 638 23,720 650
BIC 23,793 707 23,803 719
Notes: The original models are the ones presented in the main text of the article. 1: Coefficients from maximum likelihood models with logistic function. Standard errors are in parentheses.
2: Coefficients from maximum likelihood models with logistic function. Independent variables are standardized.
3: Penalized maximum likelihood models with rare events correction (fit statistics are from refitted ML model). 4: Adjusted McFadden pseudo R-squared reported.
*: p<0.05; **: p<0.01; ***: p<0.001
Table SI 13: Full models of structural availability, and alternative specifications for “Readers’ Poll.”
Corresponds to Table 6 in the main text of the article.

45
IV. Book mention 1940-1969
7: original1 7b: zero
inflated NB2 8: original1 8b: zero
inflated NB2
Forbidden triads density > 0, .945 -.024
and Z ≥ 2 (.160) (.226)
Forbidden triads density = 0 .770 -.214
(.115) (.186)
Forbidden triads depth > 0, 2.937 1.258 and Z ≥ 2 (1.877) (.985)
Forbidden triads depth = 0 .803 -.182
(.111) (.166)
N musicians .955* .028 .958* .031
(.018) (.020) (.018) (.020)
Session tenure 1.000 -.001** 1.000 -.001**
(.000) (.000) (.000) (.000)
Median co-plays 1.016 .043* 1.015 .044* (.011) (.021) (.011) (.021)
Release history 4.812*** -.077 4.793*** -.089 (.975) (.332) (.971) (.332)
Distinctiveness .184* -1.712 .184* -1.628
(.158) (1.270) (.158) (1.273)
Year trend 1.099*** -.136*** 1.099*** -.140***
(.012) (.024) (.012) (.024)
Constant .000*** 7.956*** .000*** 8.187***
(.000) (1.666) (.000) (1.678)
N 22,820 22,820 22,820 22,820 R2 .0683 .0693
AIC 3,515 4,532 3,512 4,530
BIC 3,587 4,669 3,584 4,667
Notes: The original models are the ones presented in the main text of the article. 1: Coefficients from penalized maximum likelihood models with rare events correction (fit statistics are from refitted ML
model). Standard errors clustered for band are in parentheses.
2: Coefficients from the count model of a zero inflated negative binomial regression model. (Vuong test Z=8.14, indicating zero inflation. Inflation model included controls only.)
3: Adjusted McFadden pseudo R-squared reported.
†:p=.058*: p<0.05; **: p<0.01; ***: p<0.001
Table SI 14: Full models of structural availability, and alternative specifications for “Book mention.”
Corresponds to Table 6 in the main text of the article.
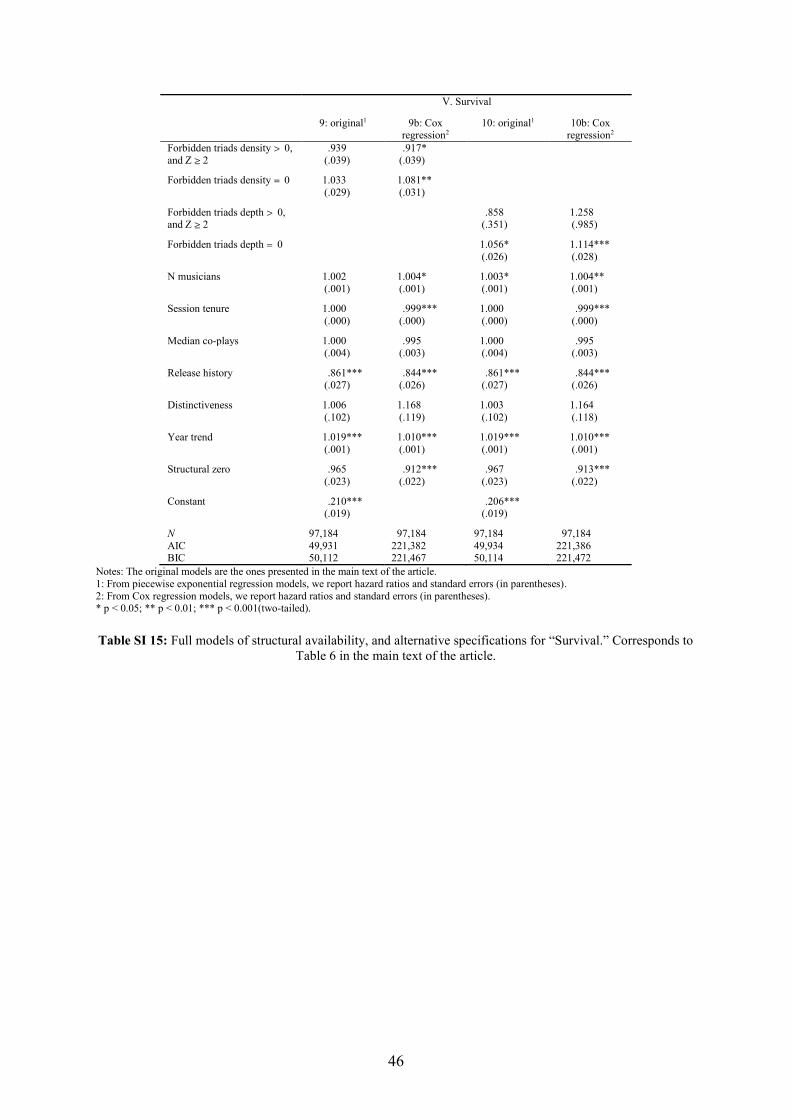
46
V. Survival
9: original1 9b: Cox
regression2 10: original1 10b: Cox
regression2
Forbidden triads density > 0, .939 .917*
and Z ≥ 2 (.039) (.039)
Forbidden triads density = 0 1.033 1.081**
(.029) (.031)
Forbidden triads depth > 0, .858 1.258 and Z ≥ 2 (.351) (.985)
Forbidden triads depth = 0 1.056* 1.114***
(.026) (.028)
N musicians 1.002 1.004* 1.003* 1.004**
(.001) (.001) (.001) (.001)
Session tenure 1.000 .999*** 1.000 .999***
(.000) (.000) (.000) (.000)
Median co-plays 1.000 .995 1.000 .995 (.004) (.003) (.004) (.003)
Release history .861*** .844*** .861*** .844*** (.027) (.026) (.027) (.026)
Distinctiveness 1.006 1.168 1.003 1.164
(.102) (.119) (.102) (.118)
Year trend 1.019*** 1.010*** 1.019*** 1.010***
(.001) (.001) (.001) (.001)
Structural zero .965 .912*** .967 .913***
(.023) (.022) (.023) (.022)
Constant .210*** .206*** (.019) (.019)
N 97,184 097,184 97,184 097,184
AIC 49,931 221,382 49,934 221,386 BIC 50,112 221,467 50,114 221,472
Notes: The original models are the ones presented in the main text of the article.
1: From piecewise exponential regression models, we report hazard ratios and standard errors (in parentheses).
2: From Cox regression models, we report hazard ratios and standard errors (in parentheses). * p < 0.05; ** p < 0.01; *** p < 0.001(two-tailed).
Table SI 15: Full models of structural availability, and alternative specifications for “Survival.” Corresponds to
Table 6 in the main text of the article.

47
VI. Releases (per decade, log)
11: original1 11b: zero
inflated NB2 12: original1 12b: zero
inflated NB2
Forbidden triads density > 0, -.004 .048
and Z ≥ 2 (.004) (.034)
Forbidden triads density = 0 -.017*** -.058
(.003) (.035)
Forbidden triads depth > 0, .003 -.063 and Z ≥ 2 (.032) (.241)
Forbidden triads depth = 0 -.016*** -.073
(.003) (.032)
N musicians .002*** .009* .002*** .009*
(.000) (.004) (.000) (.004)
Session tenure -.000*** -.001 -.000*** -.001
(.000) (.000) (.000) (.000)
Median co-plays -.000 .004 -.000 .004 (.000) (.003) (.000) (.003)
Release history .236*** 1.270*** .236*** 1.270*** (.004) (.068) (.005) (.068)
Distinctiveness -.120*** -1.229*** -.120*** -1.229***
(.021) (.202) (.021) (.202)
Year trend .006*** -.043*** .006*** -.043***
(.000) (.002) (.000) (.002)
Constant -.781*** 3.246*** -.783*** 3.263***
(.031) (.173) (.031) (.172)
N 71,817 71,817 71,817 71,817 R2 .1113 .1113
AIC 162,475 162,479
BIC 162,631 162,635
Notes: The original models are the ones presented in the main text of the article. 1: Coefficients from penalized maximum likelihood models with rare events correction (fit statistics are from refitted ML
model). Standard errors clustered for band are in parentheses.
2: Coefficients from zero inflated negative binomial count model for the number of additional releases, with clustered standard errors for band. Inflation model omitted (featured control variables only).
3: R-squared for within-band model.
†:p=.058*: p<0.05; **: p<0.01; ***: p<0.001 Table SI 16: Full models of structural availability, and alternative specifications for “Releases.” Corresponds to
Table 6 in the main text of the article.