for the Hewlett-Packard 9845B - Desktop Computer - Govinfo ...
174
AlllDb 2STbS7 ISIC utility Graphics Software for the Hewlett-Packard 9845B Desktop Computer H I; U S. DEPARTMENT OF COMMERCE |! National Bureau of Standards Washington, DC 20234 March 1982 NATIONAL BUREAU OF STANDARDS
-
Upload
khangminh22 -
Category
Documents
-
view
1 -
download
0
Transcript of for the Hewlett-Packard 9845B - Desktop Computer - Govinfo ...
AlllDb 2STbS7 ISIC utility Graphics Softwarefor the Hewlett-Packard 9845BDesktop Computer
H
I;
U S. DEPARTMENT OF COMMERCE|!
National Bureau of Standards
Washington, DC 20234
March 1982
NATIONAL BUREAU OF STANDARDS


NBSIR 82-2566
BASIC UTILITY GRAPHICS SOFTWAREFOR THE HEWLETT-PACKARD 9845BDESKTOP COMPUTER
OF STANDAP.E>S
U ^'£3
Clare Y. Trahan
Stephen W. Jensen
U.S. DEPARTMENT OF COMMERCENational Bureau of Standards
Washington, DC 20234
March 1982
Issued October 1982
U.S. DEPARTMENT OF COMMERCE, Malcolm Baldrige, Secretary
NATIONAL BUREAU OF STANDARDS, Ernest Ambler, Director

4'l
i
4v\ .
,
' ’ W

BASIC Utility Graphics Software
for a Desktop Computer
Clare Y. TrahanSteve W. Jensen

t
I
i
I:
II
f
i

ABSTRACT
This report describes an interactive BASIC language graphics utility programdesigned to facilitate easy plotting of X,Y data. The program operates on a
Hewlett Packard 9845B desktop computer, in its standard configuration, anduses a Hewlett Packard 9872A four pen digital plotter. The program allowsthe user to view X,Y data graphically and provides a broad range of plottingoptions so that publication quality graphs and transparencies may be createdusing up to four colors on the digital plotter. Data may be digitized froma user's graph on the digital plotter, generated as a user-defined function,or input directly from the computer keyboard or magnetic tape cassette.Data may be plotted on the computer CRT, on the computer's internal thermalprinter, or on the digital plotter.
KEYWORDS: BASIC; CRT; digital plotter; graphs; HP 9845B desktop computer;interactive thermal printer; magnetic cassette tape; plot; software; X,Y data.
1

TABLE OF CONTENTS
Abstract i
1. INTRODUCTION 1
2. USER DIRECTIONS and MENUS
2.1 Introduction for the User Directions 2
2.2 Data Structure and Organization 3
2.3 System set-up 3
2.4 PROGRAM OPTIONS 4
2.5 INPUT OPTIONS 4
2.6 KEYBOARD INPUT 6
2.7 TAPE INPUT 8
2.8 SET UP DIGITIZING 10
2.9 DIGITIZE FILE 10
2.10 DIGITIZING EDIT OPTIONS 12
2.11 RE-DIGITIZING OPTIONS 12
2.13 DEFINE FUNCTION 14
2.14 EDIT DATA 16
2.15 SAVE DATA 18
2.16 RETRIEVE GRAPH 20
2.17 SAVE GRAPH 20
2.18 PLOT DATA 20
2.19 SCALE TYPE 22
2.20 ENTER SCALES 22
2.21 LABELS 22
2.22 CHANGE TICKS 24
2.23 MENU 1: INPUT PARAMETERS 26
2.24 MENU 2: DIMENSIONS/PLOT OPTIONS 26
2.25 STANDARD DEVIATION 28
2.26 SCIENTIFIC NOTATION 28
2.27 ANNOTATION 30
2.28 NORMALIZE 30
2.29 SHADING 32
2.30 DIMENSIONS 32
2.31 TITLE SIZE 34
2.32 LABEL SIZE 34
2.33 NUMBER SIZE 34
2.34 MENU 3: PLOT TYPES 36
2.35 PLOT TYPES 36
2.36 MENU 4: OUTPUT MEDIA 38
2.37 STANDARD DEVIATION DIRECTIONS 38
2.38 ANNOTATION DIRECTIONS 40
2.39 DIGITAL PLOTTER 40
2.40 PLOT SIZE 42
2.41 PLOT COLORS 42
2.42 ANNOTATION COLORS 44
2.43 SPECIAL FUNCTION KEYS - PLOTTING AIDS 44
i i

3. PROGRAM DESCRIPTION
3.1 Introduction for the Program Description 46
3.2 PROGRAM PLOT 46
3.3 SUBROUTINE INIT 47
3.4 SUBROUTINE INPUT_DATA 47
-3.5 SUBROUTINE KEYBOARD 48
3.6 SUBROUTINE TAPE 48
3.7 SUBROUTINE DIGITIZE 49
3.8 SUBROUTINE DIGJNIT 49
3.9 SUBROUTINE DIGIT 50
3.10 SUBROUTINE DIG_OPTS 50
3.11 SUBROUTINE DIG EDIT 51
3.12 SUBROUTINE DEFTNE_FUNCTI0N 51
3.13 SUBROUTINE EDIT DATA 52
3.14 SUBROUTINE OPTIONS 52
3.15 SUBROUTINE SAVE DATA 53
3.16 SUBPROGRAM PLO'TDATA 53
3.17 SUBROUTINE FIND_RANGE 54
3.18 SUBROUTINE SET DEFAULTS 54
3.19 SUBROUTINE X_LlN_TO_LOG / Y_LIN_TO_LOG 54
3.20 SUBROUTINE X LOG TO LIN / Y LOG TO LIN 54
3.21 SUBROUTINE SrALE“TYPt 7. . .7 .54
3.22 SUBROUTINE ENTER SCALES 55
3.23 SUBROUTINE LABEL7 55
3.24 SUBROUTINE TIC_COUNT 56
3.25 SUBROUTINE MENU_1 56
3.26 SUBROUTINE MENU 2 56
3.27 SUBROUTINE STD ITEV 57
3.28 SUBROUTINE SCI NOT 57
3.29 SUBROUTINE TITUE SIZE 57
3.30 SUBROUTINE LABEL_SIZE 57
3.31 SUBROUTINE NUMBER_SIZE 57
3.32 SUBROUTINE DIMENSIONS 58
3.33 SUBROUTINE ANNOTATION 58
3.34 SUBROUTINE NORMALIZE 58
3.35 SUBROUTINE SHADING 59
3.36 SUBROUTINE MENU_3 59
3.37 SUBROUTINE PLOT_TYPES 59
3.38 SUBROUTINE MENU_4 603.39 SUBROUTINE CRT 603.40 SUBROUTINE PRINTER 603.41 SUBROUTINE STAN DEV 603.42 SUBROUTINE ANNOTATE 61
3.43 SUBROUTINE PLOTTER_MENU 62
3.44 SUBROUTINE SIZE 623.45 SUBROUTINE COLORS 62
i i i

APPENDIX A. PLOT MATERIALS A1
APPENDIX B. MODIFICATIONS B1
APPENDIX C. PROGRAM LISTING Cl
APPENDIX D. FLOW CHARTS D1
APPENDIX E. FIGURE INDEX El
APPENDIX F. OUTPUT EXAMPLES FI
1 ;
i V

1. INTRODUCTION
Basic Utility Graphics Software (BUGS) is a menu-driven interactive BASIClanguage software package which allows up to 5,000 data points to be input,
plotted and saved. It offers a broad range of media options to input, plot,and output the data. The user is guided interactively by a menu format. Theprogram operates on a Hewlett-Packard 9845B desktop computer in its standardconfiguration (i.e. two tape drives, internal thermal printer, CRT graphicscapabilities, and 187K of RAM with a graphics ROM). Plotter output makes useof a Hewlett-Packard 9872A digital plotter on which the following pens maybe used: digitizing pen, drafting pen, and four (black, blue, red, green )
felt tip or transparency pens. Output media on the digital plotter includestransparencies
,drawing paper, and vellum drafting paper.
A maximum of 25 data files may be plotted at one time. The user is askedto specify the number of files to be input from each input mode; i.e., digitized,generated as a user defined function, or input directly from the computerkeyboard or tape. The program then leads the user interactively througheach of the input modes selected. The maximum number of points in any onefile is equal to 5,000 divided by the total number of files to be input.When all files have been input, the user is taken to the Program OptionsMenu. Here, the user may choose to input new data, to save existing data,plot existing data, save a completed graph, retrieve a previously stored graph or
to terminate the program.When the option to plot the data is chosen the user is taken to menus to:
(1) choose scale type (linear, semi-log, log); (2) enter data ranges for X and Y
axes; and (3) enter title and axes labels. Four plot option menus are thenpresented to the user to allow modification of plotting options which are initiallyset to their defaults. If the option to plot data has previously been chosenthe user may choose to branch directly to the fourth menu (media options).
The first menu allows the user to return to re-enter or change any of thescaling and label parameters previously entered. Also, the user may change thenumber of labeled major tic marks on either axis.
The second menu presents plot and dimension options. Dimension optionsinclude changing the aspect ratio of the graph; or changing the charactersize of the title, axes labels, or labeled major tic marks. Plot optionsallow the user to normalize data, plot standard deviation, plot numbers in
scientific notation, place annotation in graph, and to shade any or all dataf i 1 es
.
The third menu allows the user to choose the plot type for each data file.Available plot types are: histograms, lines, symbols, or lines and symbols.One of 10 different line types may be selected. Any ASCII character may be usedfor the symbol, and the symbol size may be specified. The default is to plot linesusing a solid line type.
The fourth menu lists the output media. At this point the user may alsoreturn to any of the previous three option menus to change any options, or mayreturn to the Program Options Menu. Output plotting media include the computerCRT, internal thermal printer, or the digital plotter. If annotation orstandard deviation are used, they must be entered by choosing the CRT option.The printer option outputs the contents of the CRT graphic screen onto thecomputer's thermal printer. The plotter option takes the user to additionalmenus to enter the size of the plot, and the plot type to be made. Plottypes include normal and publication quality color plots on drawing paperand transparencies
,or the drafting pen on vellum drafting paper. If the
drafting pen is not chosen, the user is asked to specify colors for thetitle, axes labels, axes numbers, data files, and annotation (if used).
Since all plot options are initially set to their default values, the userneed only input data files and set scaling parameters in order to generatea plot. The user's first plot, therefore, generally requires less than 10
minutes to create. As more options are selected, the plot will take moreoperator and plotting time. Some options, such as the size options, areharder to use than others, and will require practice in order to use themeffectively. A four-color publication quality plot using all options exceptshading may be completed in 15 minutes by an experienced user.
Section 2 of this paper guides the user through each menu in the orderthat they appear in the running program. Detailed instructions are given foreach menu which describe how the user is to respond to each input request andthen informs the user of which menu BUGS will branch to next according to theoptions that he has chosen. Section 3 provides an overview of the modularstructural design of BUGS which is followed by a detailed description of thekey subroutines. Flowcharts for these subroutines may be found in APPENDIX D
and the entire program listng is given in APPENDIX C.
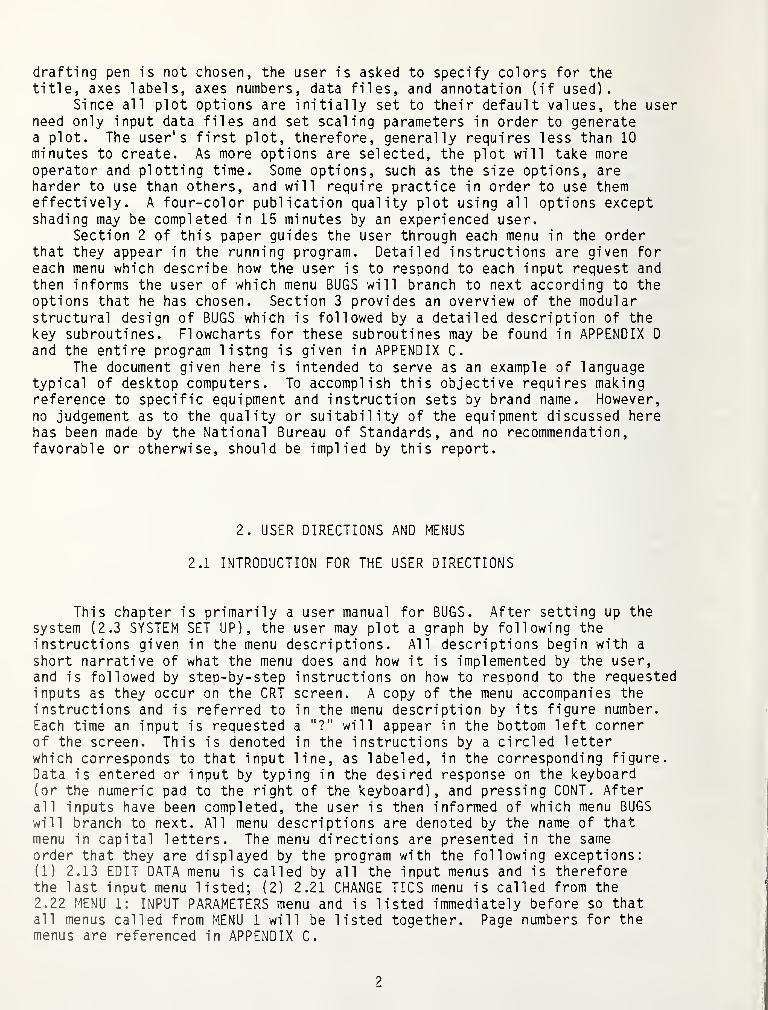
The document given here is intended to serve as an example of languagetypical of desktop computers. To accomplish this objective requires makingreference to specific equipment and instruction sets by brand name. However,no judgement as to the quality or suitability of the equipment discussed herehas been made by the National Bureau of Standards, and no recommendation,favorable or otherwise, should be implied by this report.
2. USER DIRECTIONS AND MENUS
2.1 INTRODUCTION FOR THE USER DIRECTIONS
This chapter is primarily a user manual for BUGS. After setting up the
system (2.3 SYSTEM SET UP), the user may plot a graph by following the
instructions given in the menu descriptions. All descriptions begin with a
short narrative of what the menu does and how it is implemented by the user,and is followed by step-by-step instructions on how to respond to the requestedinputs as they occur on the CRT screen. A copy of the menu accompanies the
instructions and is referred to in the menu description by its figure number.
Each time an input is requested a "?" will appear in the bottom left cornerof the screen. This is denoted in the instructions by a circled letterwhich corresponds to that input line, as labeled, in the correspondi ng figure.Data is entered or input by typing in the desired response on the keyboard(or the numeric pad to the right of the keyboard), and pressing CONT. Afterall inputs have been completed, the user is then informed of which menu BUGSwill branch to next. All menu descriptions are denoted by the name of thatmenu in capital letters. The menu directions are presented in the sameorder that they are displayed by the program with the following exceptions:(1) 2.13 EDIT DATA menu is called by all the input menus and is thereforethe last input menu listed; (2) 2.21 CHANGE TICS menu is called from the
2.22 MENU 1: INPUT PARAMETERS menu and is listed immediately before so thatall menus called from MENU 1 will be listed together. Page numbers for themenus are referenced in APPENDIX C.

2.2 DATA STRUCTURE AND ORGANIZATION
Because of the limitation of the length of the tape directory (see HP
Operating and Programming manual, page 206), related groups of data filesmay be organized into a single set made up of the files. The set is referencedon the tape by a set name of up to 6 alphanumeric characters. Associatedwith each set i s a data set descriptor as wel 1 as data file descriptors foreach file in the set. If a single data file is stored it is considered to
be a data set containing one file, and it will have a set name and both a set
and file descriptor. In the KEYBOARD, DIGITIZING and DEFINE FUNCTION modes,the user is asked to input a file descriptor for each file that is input.
A data set may contain up to 25 files and 5,000 data points. The maximum
number of points in any one data file is equal to 5,000 divided by the total
number of files in that set. An ERROR 64 (subscript out of range) will occur if
in at least one file the user has tried to enter more than the maximum number
of points allowed. The user must be especially careful of this in inputingdata from tape.
When the data is saved on tape, all the files that have been input (since
either starting the program or since the last time the input option (#1) in
the 2.4 PROGRAM OPTIONS menu) are saved on the tape as a data set along with
all set and file desciptors.2.3 SYSTEM SET UP
By using the auto-start feature of the 9845B, the program will be loaded and
started automatically after performing the following operations:
1) Turn the desktop computer off.
2) Insert the BUGS program tape into the RIGHT tape drive (:T15).
3) Insert a data tape into the LEFT tape drive (:T14).
4) Ensure that the AUTOST key located in the upper left of the keyboardis in.
5) Turn the computer on.
6) Turn digital plotter on. The POWER button is located at the bottomright corner of the plotter.
It is important that the program tape be loaded in the right tape drive
(:T15) before turning the machine on. If the user does not wish to use theauto-start feature, skip Steps 1,4 and 5 and type LOAD "AUTOST", and pressEXECUTE. When the tape drive stops, press RUN.
The 9872A digital plotter should be set up when the program is loaded.If the plotter is not turned on when it is addressed to digitize or plot a
data file-the following will occur : (1) A fatal error; (2) the program will
be terminated; and (3) all data in the memory will be lost. The user will
then have to begin the program over by pressing RUN and re-entering the data.
To set up the digital plotter:1) Clear everything off the platten as the pen will move diagonally
across the platten to its starting position.2) Push in the power button located on the front of the plotter near
the bottom right hand corner.
3) Set up felt tip pens as follows: PEN #1: BLACK PEN #3: GREENPEN #2: BLUE PEN #4: RED
For directions on how to load plotting media, refer to the 2.38 DIGITAL PLOTTER menu.
3

2.4 PROGRAM OPTIONS
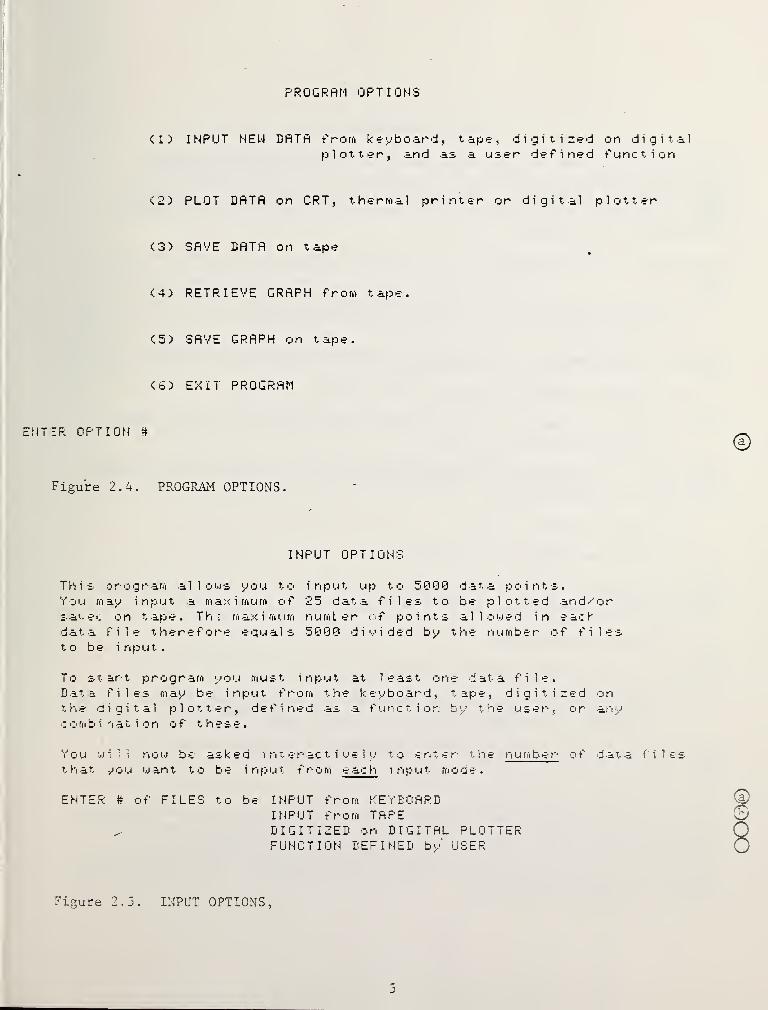
The user has access to any portion of the program through this menu. Thisis the main pivot point of the program, and the user will always be returnedto this menu until the program is terminated by choosing option #6. Seefigure 2.4 for a printout of the program options.
Explanation of PROGRAM OPTIONS:
1) Input data. The new data to be input will erase from memory any datapreviously entered. BUGS then branches to 2.5 INPUT OPTIONS.
2) Plot data. BUGS branches to the 2.18 SCALE TYPE menu if this is the firsttime that this option has been chosen since starting the program;otherwise it branches to the 2.17 PLOT DATA menu.
3) Save data. BUGS branches to the 2.14 SAVE DATA menu.
4) Retrieve graph. BUGS branches to the 2.15 RETRIEVE GRAPH menu.
5) Save graph. BUGS branches to the 2.16 SAVE GRAPH menu.
6) Exit program. BUGS is terminated.
a) Enter the number which corresponds to the desired option.
If option #6 was not chosen follow the directions given in the explanationabove, otherwise END OF PROGRAM will be displayed. The user may begin theprogram again by pressing the RUN key.
2.5 INPUT OPTIONS
In this menu BUGS is seeking user input of the number of files to be
input from each input media. Input media include the computer keyboard,magnetic tape, digitizing a user's graph on the digital plotter, or generatinga user defined function.
Figure 2.5 shows the printout of the narrative for the input menu. Lines a-dwill be displayed one at a time, and the user is expected to input the numberof files to be input from that input mode.
a-d) As each input request is made (e.g. INPUT from KEYBOARD) enter thenumber of files to be input from that input media, or press CONT if
no files will be input from that particular input media.
If the number of files to be input is out of range (less than one or greater than
25), press CONT and wait until the menu is rewritten on the screen and repeat stepsa-d.
After user entry of the number of files to be entered for each input mode,BUGS selects the appropriate modes in the sequence 2.5 KEYBOARD INPUT,2.7 TAPE INPUT, 2.8 SET UP DIGITIZING, 2.12 DEFINE FUNCTION. Only the menusfor input with nonzero number of files will be selected.
4
PROGRRM OPTIONS
< 1 ) INPUT NEW DRTfl from keyboardpi otter, an
d
tape, digitized on digitala user d e f i e d f u n c t i o n
<2) PLOT DATA on CRT, thermal printer or digital plotter
<3) SAVE DATA on tape
’'f >
<4) RETRIEVE GRAPH from tape.
<5) SAVE GRAPH on tape.
EXIT PROGRAM
ITER OPTION if
Figure 2.4. PROGPvAIi OPTIONS.
INPUT OPTIONS
This program allows you toYou may input a maximum ofs a' e 1. o n tape. T h ; m ax i m 1.
1
m
data file therefore equalsto be i r’l p ij t
.
i n p u t u p t o 5000 d af. a p o i n t s .
25 data files to be plotted andxornumt er C'f points allowed in each5000 d i i d e d b y t h e ri u m b e r of file
s
To start program you must input at least one data file.Data files may be input from the keyboard, tape, digitized ont he d i g i t a 1 pi o t ter', d e f i ri e d as a f u r'l o t i o r b y t. hi e u s e r-
,o r ari y
c o m b i 'I at i o n of these.
You will r'low be asked i nt er'ac t i ve 1 y to enttr ri i.-i m b e r- of data filest ki at y)o u w an t t o be i n p u t f r o m e ac h i n p u t m ode.
ENTER # of FILES to be INPUT from KEYBOARDINPUT from TAPEDIGITIZED on DIGITAL PLOTTERFUNCTION DEFINED by’ USER
Figure 2.3. INPUT OPTIONS

2.6 KEYBOARD INPUT
This input mode allows the user to input data from the computer keyboard.The user must begin by entering a file descriptor for this file and thenumber of points to be input. The directions on this page will be repeatedfor each file that the user has specified is to be input from the keyboard.The printout for this menu is figure 2.6.
See Section 2.2 for an explanation of what file descriptors are and how they are
used.
a) Enter file descriptor for this file, or press CONT if no file descriptoris desired.
The menu informs the user of the maximum number of data pairs allowed for this file.
b) Enter the number of data pairs to be input
c) Enter 1 if there is a constant interval between the X values, else
press CONT and go to Step g.
X values will be computed by incrementing the initial X value by the X interval
every time a Y value is input.
d) Enter the first X value
e) Enter the value of the X interval
Input the Y values, one at a time, starting with the Y value which correspondsthe the initial X value.
f) Input Y data values
If there is a constant X interval, skip Step g.
g) User must now input all X,Y data pairs for this file. Input X
value and press CONT. Input Y value and press CONT.
The user is now taken to the 2.13 EDIT DATA menu to review and/or edit this
data file.
If more files are to be input from the keyboard, repeat directions on this pagefor the next data file. If more files are to be input from other input modes,
BUGS branches to the next input mode in the sequence 2.7 TAPE INPUT,2.8 SET UP DIGITIZING, 2.12 DEFINE FUNCTION. Only menus for input with non-zeronumber of files will be selected. If no more files are to be input, BUGS branchesto the 2.4 PROGRAM OPTIONS menu.
6

INPUT FROM KEVEOHRD
ENTER LABEL FOR DATA FILE # 1 ...UP TO 20 CHRACTERS
AON MANY DATA PAIRS ARE TO EE INPUT INTO FILE # 1 ?
MAXIMUM ALLOWED IS 5000
IF DATA HAS CONSTANT INTERVAL BETWEEN X V ALUES ... ENTER 1
INPUT FIRST VALUE FOR X i . e . Xl’:;r:' = ''>
INPUT THE INCREMENT BETWEEN ADJACENT X VALUES
INPUT Y VALUES
INPUT S 1
INPUT X VALUE. .. PRESS CONT... ENTER Y VALUE
INPUT S 1
Figure 2.6. KEYBOARD INPUT.

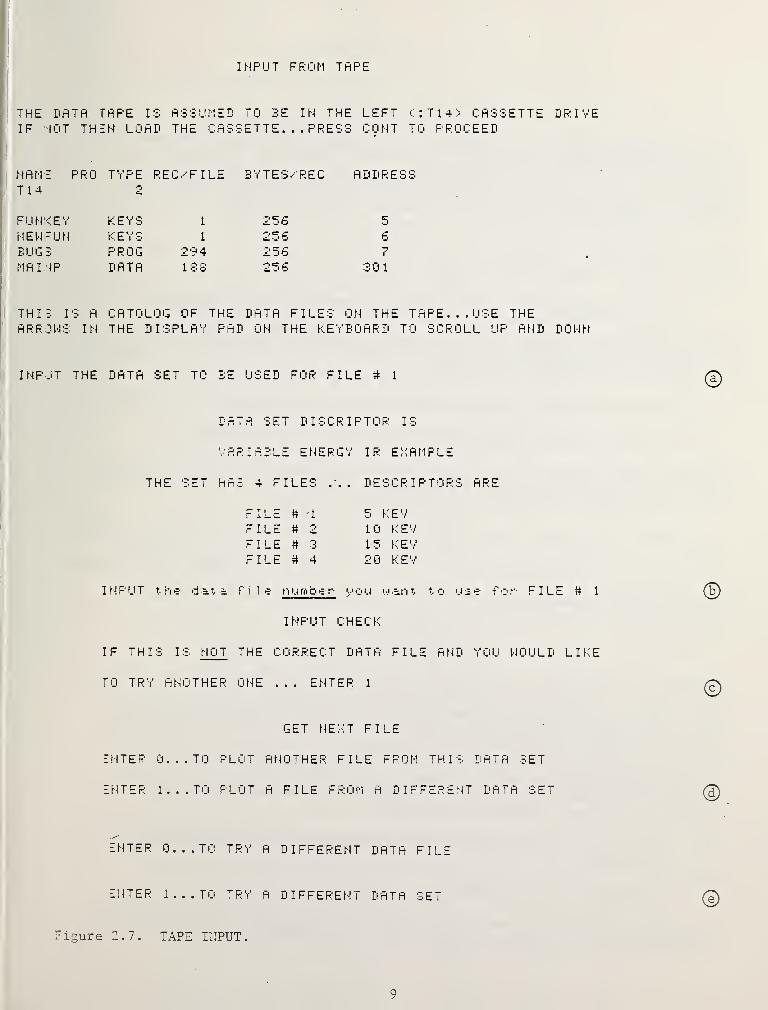
2.7 TAPE INPUT
This menu begins by listing the data set names contained on the tape in
the left tape drive (:T14) and the user is asked to input the desired setname. The set descriptor is then displayed, along with a numbered list ofthe file descriptors for that set. The user then enters the correspondingnumber for the desired file. See Section 2.2 for an explanation of the datastructure and organization; and the use of set names, set descriptors andfile descriptors. Figure 2.7 contains a printout of this menu.
If the list of set names on the tape runs off of the screen, the user mayscroll up and down the list by pressing the arrows in the display pad at thetop center of the keyboard.
a) Enter the name of the set that is to be used... Up to 6 alphanumericcharacters. The name must be one of those listed on the screen.
The set and file descriptors are then listed on the screen, and the user mustchoose a file to be input.
b) Enter the number which corresponds to the file to be input; or if
none of these is the correct file, press CONT and return to Step a.
BUGS now branches to the 2.13 EDIT DATA menu so that the user may review and/oredit data to verify if this is the correct data file.
c) If this is not the correct file, enter 1 and go to Step e; else
proceed to the next step.
If there are no more files to be input, BUGS branches to 2.4 PROGRAM OPTIONS.If there are no more files to be input from tape, BUGS branches to the nextinput mode.
The user now inputs the next file from the tape. The user may choose to
input the file from the same set that the previous file was input from, or
the user may input the file from a different set.
d) Enter 1 to use a different set for data entry and return Step a,
or press CONT to get another file from this set and go to Step b.
The user now may choose to try another file from the same set that the previousfile was taken from, or the user may try a different set.
e) Enter 1 to try a different set and go to Step a, or press CONT to
try a different file from this set and go to Step b.
INPUT FROM TRPE
THE DATA TRPE IS ASSUM — n TO BE IN THE LEFT ;::Ti4> cassetteIF NOT TH EN LOAD THE C rl b S ETTE... PRESS CONT TO PROCEED
NAME PRO TYPE REC.''FIL c BYTESr-REC RDDRE C»
T14 c.
FUNKEY KEYS 1 256 5
NEM-UN KEYS 1 256 6
BUGS PROG 294 256 7
MAINP DATA 1S3 256 301
THIS IS A CATOLOG OF THE DATA FILES ON THE TAPE... USE THEARR3MS IN THE DISPLAY PAD ON THE KEYBOARD T U S L' R U L L U P A N D
INPUT THE DATA SET TO BE USED FOR FILE # 1
LPTP SET niSCRIPTOR IS
VRRIH3LE ENERGY IP EKhMPLE
THE SET HhS 4 FILES . DESCRIPTORS ARE
FILE # 1
FILE # 2
FILE # 3
FILE # 4
5 LEV10 f
IS ^
20 ^
:.EV
::ev
::ev
©
INPUT t h>=- data, fill? n u rn b = r you |.•.la^t to uie for FILE # 1
INPUT CHECK
IF THIS IS NOT THE CORRECT DHTfi FILE AND YOU MOULD LIKE
TO TRY ANOTHER ONE . . . ENTER 1
GET NEXT FILE
ENTER 0...T0 PLOT ANOTHER FILE FROM THIS DATA SET
ENTER 1...T0 PLOT A FILE FROM A DIFFERENT DATA SET
©
©
ENTER 0.,.T0 TRY A DIFFERENT DATA FILE
EiJTER 1...T0 "RY A DIFFERENT DATA SET
Figure 2.7. TAPE lEPUT
.
©
9

2.8
SET UP DIGITIZING
To digitize files, the user is required to initialize digitizing parameters foreach graph to be used by (1) digitizing the four corners of the graph, (2)
entering the scale type to be used (linear, semi -log, log), and (3) enteringthe scale range for each axis. Since this is done once for each graph, theuser enters the number of files to be input on the current graph. See figure
2.8
for a printout of the menu as it appears on the CRT screen.
Follow directions in the menu to set up the digital plotter. The user maydigitize one or more files per graph.
a) Enter the number of files to be digitized from the current graph.
Follow directions to digitize the corners of the graph. Each time a corneris digitized, the computer will beep and figure 2.6b, 1-4 will be displayed one
at a time for the corresponding corner.
b) Digitize corners, then press CONT when all the corners are digitized.
c) Choose a scale type by entering corresponding option number.
The user is now asked to enter the minimum and maximum values which correspondto the digitized corners of the X and Y axes. If the axis is on a log scale,powers of ten must be entered (e.g. .001,1000).
d) Enter the minimum and maximum values for the X axis separated by a comma.
e) Enter the minimum and maximum values for the Y axis separated by a comma.
The digitizing parameters for this graph are now initialized. BUGS nowtakes the user to the DIGITIZE FILE menu.
2.9
DIGITIZE FILE
This menu allows the user to digitize the current file. Initially, the digitizingpen is moved to the lower left corner of the plotter by the program. The userthen digitizes a file by using the arrows on the digital plotter to positionthe digitizing pen over the point to be digitized, and pressing the ENTERkey on the plotter and continuing this process until all desired data pointshave been digitized. The user exits the digitizing mode (thus ending thefile) by pressing the PI button on the digital plotter. The user is givenan opportunity later in the program to re-digitize, add or delete points.Figure 2.9 contains a printout of the menu.
a) Enter data file descriptor. See section 2.2 for an explanation of file
desri ptors
.
b) Digitize file by following directions given in figure 2.9.
The program now takes the user to the 2.10 DIGITIZING EDIT OPTIONS menu so theuser may have an opportunity to check and/or edit the current file.
10

DIGITIZE
TO SET UP PLOTTER FOR DIGITIZIHG:
a;> TURN PLOTTER OHLOAD GRfiPH flNYHHERE ON PLflTTEH
CS) PUT DIGITIZIHG PEN INTO THE LEFTMOST PEN HOLDER
INPUT THE HUMBER OF DIFFERENT FILES THRTYOU HFlHT TO DIGITIZE OH THIS GRAPH ?
INITIALIZE GRAPH
TO Di:iTIZE: Pr€-ss PEN BONN button on PLOTTERPosition D I G I T I Z I fi G PEN o e r p o i n t to b € digitizedPress ENTER b u 1 1 o n on PLOTTER to in p u t t ^•| e point
< 1 > DIGITIZE 1 ouer 1 eft c o r n e r o f g r ap h f r arn e
<2> DIGITIZE 1.4 p per 1 eft c o r n e r o f g r ap hi f r am e
DIGITIZE p p e r rig h t c o r n e r o f g r ap h f r arri e
<4> DIGITIZE 1 o u e r r i g h t corner ot' graph f rari’ie
CORNER # 1
CORNER # 2
CORNER # 3
CORNER # 4
DIGITIZEDDIGITIZEDDIGITIZEDDIGITIZED
PRESS CONT uhen you haue DIGITIZED all four corners
SCALE TYPE
ENTER 1...IF PLOTENTER 2. . . IF PLOTENTER 3... IF PLOTENTER 4... IF PLOT
IS LINEARIS N-LIN, Y-LOGIS X-LOG, Y-LINIS X - L 0 1: ,
Y -LOG
iOTE: IF YOU ARE CHOOSING A LOG AXIS, THE SCALE LIMITSFOR THAT AXIS MUST EE POMERS OF TEN U . e . .Gl,100>
©
©
G R A P H R A N G E
r' o ij i.,i ill n o I'.i b e as k e d t. C' i n p i.-i t f. h >= 1 i rn i t s o f t hi e i c a 1 e s
n>n each ax i a of the graph that you are- di gi t i zi ng
I N PUT THE X A X I S: G F: A F' H LIMIT S C MIN, M A X I
INPUT THE Y AXIS GRAPH LIMITS f MIN, MAX::'
©©
Figure 2.8. SET UP DIGITIZING.
11

2.10 DIGITIZING EDIT OPTIONS
In this menu the user has an opportunity to check and edit the current digitizedfile. For edit options, see figure 2.10.
Explanation of digitizing edit options:
(1) Digitized data are plotted on the screen so that user may see what thedigitized data looks like.
(2) Digitized data are printed on the thermal printer.
(3) Digitized data are edited numerically, reviewed on the screen or printedon the thermal printer.
(4) Digitized data are edited by re-digitizing points, adding points, or
deleting points on the digital plotter.
When an option is chosen, BUGS will branch to the appropriate service routineand then return to this menu.
a) Enter option number desired, or press CONT to exit digitizing edit.
If option #3 is chosen, BUGS takes the user to the 2.13 EDIT DATA menu. If
option #4 is chosen, BUGS takes the user to the 2.11 RE-DIGITIZING OPTIONS menu.
If more files are to be digitized from this graph, BUGS returns to 2.9 DIGITIZEFILE. If more files are to digitized from a different graph, BUGS returnsto 2.8 SET UP DIGITIZING. If more files are to be input as a user definedfunction, BUGS branches to 2.12 DEFINE FUNCTION. If no more files are to be
input, it branches to 2.4 PROGRAM OPTIONS.
2.11 RE-DIGITIZING OPTIONS
The user now has an opportunity to edit the digitized file by re-digitizing,adding or deleting points. THIS EDIT OPTION CANNOT BE USED IF THE ORIGINALGRAPH HAS BEEN MOVED SINCE THE FILE WAS DIGITIZED. Upon selection of thisoption, the digitizing pen is moved by the computer immediately to the firstdigitized point for user comparison with the original graph. The user may
then delete that point or re-digitize and add points until he chooses to
let the computer move to the following digitized point or return to the
2.10 DIGITIZING EDIT OPTIONS menu. See figure 2.11 for re-digitizing options.
Directions for re-digitizing options:
1) Re-digitize a point:a) "RE-DIGITIZE THIS POINT NOW" is displayed.b) Reposition digitizing pen to the new position.c) Re-digitize point by pressing ENTER button on the plotter.d) When beep is heard, point is re-digitized.e) Press CONT.
2) Add a point:
a) "DIGITIZE NEW POINT" is displayed.b) Follow directions in option #1 to digitize a new point.
3) Delete a point:a) "DATA POINT DELETED" is displayed.b) Press CONT.
4) Exit re-digitizing.a) Enter option number or press CONT to go on to the next point.
12

DIGITIZE files:
Y o u ar e a 1 1 o ij ۥ d to DIGITIZE u p to 5000 points per fileDigitizing ao c '.4 r ac y is gene r a 1 1 y 3 :: ,
t h e r e f ore, t h r e e
sig n i f i c an t digits w ill be digitized
< 1 ) ENTER DESCRIPTOR for this d at a f i 1 e . . . U p t o 2 0 c h ar ac t e r s
<2> TO DIGITIZE: Press PEN DONN button on PLOTTERPosition DIGITIZING PE N o u e r p o i n t to be digitizedPress ENTER button on PLOTTER to i n p l4 t the p o i n t
<3) DELETE H POINT: Digitize that sarrie point twice in a row
(4> TO EXIT: DIGITIZING mode PRESS PIPRESS ENTER
NTZR DHTi DESCRIPTOR - 0Figure 2.9. DIGITIZE FILES.
DIGITIZING EDIT OPTIONS
OPTION 4
< 1 ) PLOT D fl T R on CRT
PRINT DRTR on THERhRL PRINTER
< 3 > EDIT DRTR using N U M E R I C R L '.
' a 1 u e s f o r- e d i t
< 4 > EDIT DRTR using your o r i 'p i n a 1 graph on DIGITRL PLOTTER
F R E S S: C 0 N T TO E X IT D I C I T I Z E r- o u t i r'l e ar'i d
r e t u r'- n t o P R U C R R M 0 P T I 0 N b'
Figure 2^.10. DIGITIZING EDIT OPTIONS.
©
13

RE-DIGITIZING OPTIONS cont.
a) Enter the edit option number or press CONT to go on to the next point.
When all the points have be edited, the user is returned to the 2.10 DIGITIZINGEDIT OPTIONS menu.
2.12 DEFINE FUNCTION
This input mode allows the user to input data by generating a function of onevariable (X). The user is requested to input the number of data points to be
generated and the minimum and the maximum X values. The X data are generated by
adding an even interval (which is equal to the X data range divided by thenumber of points to be input) to each successive X value starting with the X
minimum that is input by the user. The Y value is generated by inserting the
corresponding X value into the function defined by the user. To change theprogram to allow for functions of more than one variable see APPENDIX B.
The directions on this page are repeated for each file that the user hasspecified is to be input as a function. Figure 2.12 contains a printout ofthis menu.
a) Enter the file descriptor for this file. See Section 2.2 for an
explanation of file descriptors and how they are used.
The maximum number of points allowed per file is 5000 divided by the total
number of files.
b) Enter the number of points to be input into this data file.
All tri gonometric functions will be computed using degrees. To change this
to radians or gradians: (1) Type RAD or GRAD; (2) Press EXECUTE.
c) Enter the X minimum and maximum for the data range of the functionseparated by a comma.
To define the function, follow the directions in figure 2.12d.
d) Define a function of a singl
e
variable X.
The user is now taken to the 2.13 EDIT DATA menu to review and/or edit thisdata file.
If more files are to be defined, repeat the directions on this page for the
next data file. If there are no more files to be input BUGS branches to the
2.4 PROGRAM OPTIONS menu.
14

RE-DIGITIZING OPTIONS
DO NOT r'
e
rn o 'v' e G R R P H f r- o rn i t s p o s i t- i o ri on D I G I T R L P L 'D T T E R .
The DIGITIZING PEN i...i ill be e t e p p e d ac r o s e G R R P H s h w i n g % h e
0 o i n t s w h i c h o ou h ao e DIGITIZED.
OPTION #
<n RE-DIGITIZE R POINT
<2> RDD R POINT
<3) DELETE R POINT
C4> EXIT RE-DIGITIZING and RETURN to DIGITIZING OPTIONS
INTER OPTION #...To go on to NEXT point PRESS CONT 0
Figure 2.11. RE-DIGITIZING OPTIONS.
INPUT R FUNCTION
INPUT file DESCRIPTOR for this FUNCTION 0
INPUT NUMBER OF POINTS that you want to plot for
this FUNCTION. .. MRX
I
MUM number RLLONED is 2000 0NOTE
RL_ TRIGONOMETRIC FUNCTIONS WILL BE COMPUTED IN DEGREES
INPUT the D R T R R R N G E f o r X X M I N,X M R J< > ©
TO DEFINE function:
1 > P R E 'I '? k 0 :5 f: e c i a 1 F L4 n c t. i o r'l e u p p e r r i q hi t c o r- n e r o f k t- y b o ar- d )
‘'. 2 > TYPE in function using HP format as described in the0 fj e r at i n q an d P r o g r am m i n g M ari u a 1 , C h a pi t e r 4
( 3 > P R E S S S T 0 R E K E 't' . . . 1 o c it e d d i r e c t 1 v-' ib o u e t h e r i g hi t SHIFT K E Y
PRESS CONT TO CONTINUE ©
Figure 2.12. DEFINE FUNCTION.
15
2.13 EDIT DATA
This menu gives the user a chance to review and/or edit current data file.
See figure 2.13 for the editing options.
Explanation of Edit Options:
(1) Print data pairs on the screen in groups of 18 at a time
(2) Input new X,Y values for a selected data pair
(3) Print data on thermal printer
When an editing option is chosen, BUGS will branch to the appropriate serviceroutine and then return to this menu.
a) Enter option number or press CONT to go back to the input mode.
If selected option was number 1 or 3, a numbered list of the data will be
printed; and the user repeats to Step a until CONT is pressed to return to
the appropriate input menu.
For the edit data option, the user must know the number which corresponds to
the data point that he desires to change.
b) Enter the number of the data pair to change.
c) Enter new data values for both X and Y, separated by a comma.
d) Enter 1 to change another data pair and go to Step b, or press CONTto exit editing and return to Step a.
16

OPPORTUNITY TO REVIEW RND EDIT DRTfi FOR FILE #1 ***
Figure
<1) REVIEW DRTR
<2> EDIT DRTR
C3;-' PRINT DRTR ON THERMRL PRINTER
ENTER the OPTION # that you would like to uae.
^RESS CONT TO CONTINUE ON TO NEXT FILE
©
EDIT DRTR
INPUT THE # FOR THE DRTR PRIR YOU WRNT TO MODIFY
K = 1 Y = 1
INPUT NEW VRLUES FOR X,Y
TO CONTINUE EDITING ENTER 1
2.13. EDIT DATA.
©
©
17
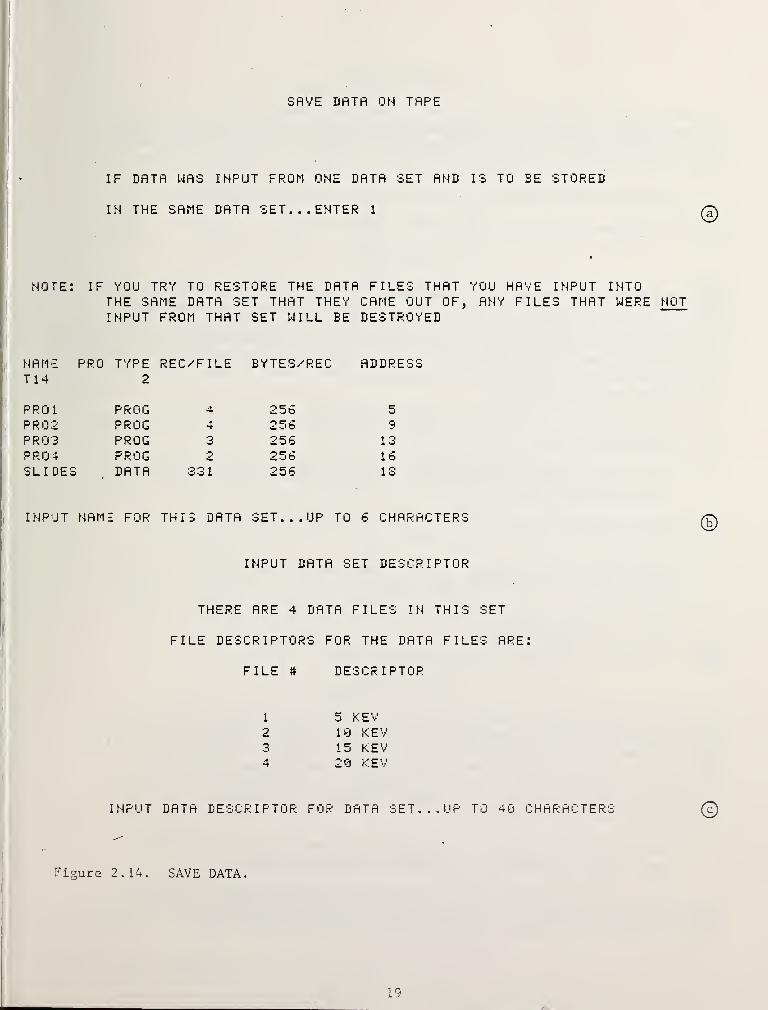
2.14 SAVE DATA
The data may be stored on the magnetic tape cassette in the left tape drive(:T14). A11 the files that have been input either since starting the programor since last choosing the input option in the 2.4 PROGRAM OPTIONS menu aresaved on the tape as a set. The user must specify a name for the set thatis used to reference the data on the tape. The program then lists the filedescriptors that have been input and the user is requested to supply a setdescriptor for the new set. If all the files were taken from the same set,
the user has the option to re-save the data into that same set. See Section2.2 for an explanation of the data structure and organization, and figure2.14 for a printout of this menu.
If the user chooses to save the data into the same set, BUGS destroys the
data that is there and writes the new data into that set.
a) Enter 1 to store the input data back into the same data set, or pressCONT to create a new set for the input data.
If the option to store data into the same set was chosen, BUGS returns to
the 2.4 PROGRAM OPTIONS menu.
The data set name that is input is used to reference the the data set on the
tape. The name may be up to 6 alphanumeric characters starting with a letter.Ensure that the name is not one of those already listed.
b) Enter the data set name.
c) Enter a data set descriptor. . .Up to 40 characters.
BUGS now returns to the 2 4 PROGRAM OPTIONS menu.
18
SAVE DfiTfl OH TAPE
IF DATA WAS INPUT FROM ONE DATA SET AND IS TO EE STORED
IN THE SAME DATA SET... ENTER 1
NOTE: IF YOU TRY TO RESTORE THE DATA FILES THAT YOU HAVE INPUT INTOTHE SiAME DATA S ET THAT THEY CAME OUT OF, ANY FILES THAT WEREINPUT FROM THAT SET WILL EE DESTROYED
NAME PRO TYPE REC/FILE BYTES/REC ADDRESST14 2
PROl PROG 4 256 5
PR02 PROG 4 256 9
PRO 3 PROG 3 256 13PR04 PROG 2 256 16SLIDES DATA 331 256 13
INPUT NAME FOR THIS DATA SET. . . UP TO 6 CHARACTERS
INPUT DATA SET DESCRIPTOR
THERE ARE 4 DATA FILES IN THIS SET
FILE DESCRIPTORS FOR THE DATA FILES ARE:
FILE # DESCRIPTOR
5 KEV10 KEV15 KEV20 KEV
1
2
3
4
INPUT DATA DESCRIPTOR FOR DATA SET. UP TO 40 CHARACTERS
Figure 2.14. SAVE DATA

2.15
RETRIEVE GRAPH
This menu allows the user to retrieve a previously stored graph. A list ofthe graph names as they are referenced on the tape will be displayed, and theuser is asked to enter the name of the desired graph. The graph may then be
plotted and revised. An example display for this menu is given in figure 2.15.
a) Enter the graph name as it appears in the list on the screen.
BUGS now branches directly to 2.35 MENU 4: OUTPUT MEDIA.
2.16
SAVE GRAPH
Completed graphs may be stored on the magnetic cassette tape in the left tapedrive (:T14). The user has the option to re-store a graph into a previouslycreated file, or create a new file. In the latter case the user must supplya new graph name that is used to reference the graph on the tape. BUGS savesthe plotting parameters along with all the files used in the graph so
there is no need to separately save the data files. For an example printoutof this menu see figure 2.16.
If the user chooses to restore a graph into the same graph file, BUGS destroysthe old graph and stores the new graph in its place.
a) Enter 1 to store a graph back into the same graph file, or press CONT
to create a new graph file.
If the option to store the graph into the same data set was chosen, BUGSreturns to the 2.4 PROGRAM OPTIONS menu.
b) Enter a new graph name of up to 6 alphanumeric characters. Ensure thatthe name is not one of those already listed.
c) Enter a graph descriptor of up to 40 chracters.
BUGS now returns to the 2.4 PROGRAM OPTIONS menu.
2.17
PLOT DATA
Since the user has already been through all the scaling parameter and plotoption menus once, he now has the option to skip directly to 2.35 MENU 4: OUTPUTMEDIA and use all the parameters from the previous plot. In MENU 4 the userhas access to all the other plot option menus if any changes are desired.If the user does not choose to use this option, all plot options are set to
their defaults and the user must re-enter the scaling parameters. See figure12 for a printout of this menu.
a) Enter 1 to use previously input scale parameters and plot options, or
press CONT to reset all plot options to their defaults.
If the user did not choose to use the previous parameters BUGS branches to
the 2.18 SCALE TYPE menu. If the user did choose to use the previous parametersBUGS branches to 2.35 MENU 4: OUTPUT MEDIA.
20

RETRIEVE GRRPH
NAME PROT14
TYPE2
REC/FILE EYTES.'REC RDDR
PROl PROG 4 256 5
PR02 PROG 4 256 9
PROS PROG 3 256 1 3
PRO 4 PROG 2 256 1 6
SLIDES DRTR 831 256 18
INPUT THE FILE NAME OF THE GRRPH TO EE RE
Figure 2.15. RETRIEVE GRAPH.
SAVE GRRPH GN TRPE
IF THIS G-rPH UnS RETRIEVED FROM THE TRPE RND ISTO SE RE-=TORED INTO THRT SRME DRTR FILE... ENTER 1
nrn: proT14
TYPE2
REC/FILE EYTES.'REC A D D Fj E S S
PROl PROG .4 256PROS PROG 4 256 9
PR03 PROG 3 256 1 3
PR04 PROG 2 256 16SLI DES DATA 831 256 i •»
INPUT NRN - FOR THIS DATA SET. . . UP TO 6 CHARACTERS
INPUT GRAPH DESCRIPTION
IN='UT THE NAME OF THE DRTR FILE DESCRIPTOR
FOR THIS GRRPH... UP TO 40 CHARACTERS
Figure 2.16. SAVE GRAPH.
lU jSE P L j T OPl 1 0^^S i SCALE PARAV. ETERo rr!L'P1
THE P F: E V I 0 1! S R U N . . . E N T E R 1
Figure 2.1/. PLOT DATA.
2.18
SCALE TYPE
In this menu the user must choose linear, semi -log or log scales for the plot.The extremes of the data set will be displayed so that the user may analyzewhich scale type to use, i.e. if there is a very wide data range on an axis,a log scale should be chosen for that axis. See figure 2.18.
a) Enter the number that corresponds to desired scale type.
BUGS now branches to the 2.19 ENTER SCALES menu.2.19
ENTER SCALES
In this menu the user must input the minimum and maximum values of the scalerange for each axis. These values appear as the first and last numbers thatare labeled on that axis. By entering values that are inside that data range,only that specific portion of the data within those values will be plotted on
the graph. The printout of this menu is contained in figure 2.19.
If the axis uses a log scale, values entered must be powers of ten.
a) Enter minimum and maximum values to be used on the X axis, separatedby a comma.
b) Enter minimum and maximum values to be used on the Y axis, separatedby a comma.
If the 2.19 ENTER SCALES or 2.18 SCALE TYPE menus were accessed by choosingoptions #2 or #3 from 2.22 MENU 1: INPUT PARAMETERS, BUGS returns to theMENU 1 menu. If this is the first time BUGS has taken the user to the ENTERSCALES and/or SCALE TYPE menus since the program was started, BUGS branchesto the 2.20 LABELS menu.
2.20
LABELS
In this menu the user may input a title and labels for the axes. The titlemay be up to 30 characters and the axes labels may be up to 20 characters.To change the length allowed for these parameters, see APPENDIX B. See figure
2.20
for the printout of this menu.
a) Enter title up to 30 characters, or enter" " to clear the title.
b) Enter label for the X axis of up to 20 characters, or enter" " to
clear X axi s 1 abel
.
c) Enter label for the Y axis of up to 20 characters, or enter" " to
clear Y axi s 1 abel
.
BUGS now branches to 2.22 MENU 1: INPUT PARAMETERS.
22

INPUT SCALE TYPE
Figure
Figure
PRES::
Figure
EXTREMES of this DATA SET ire...
Km in = 0 X m ix = 1 2 S
Ym i n •21 . :3G 75 Y m ax = 0
You now must CHOOSE the TYPE of graph
TO PLOT LINEAR ... ENTER 1
TO PLOT X-LIN Y-LOG . . . ENTER 2
TO PLOT X-LOG Y-LIN . . . ENTER 3
TO PLOT LOG-LOG . .
.
ENTER 4
to PLOT
©
2.18. SCALE TYPE.
ENTER SCALE FOR X AXIS
K COORDINATE RANGE: 0 TO 128
ENTER the MINI M U M an d M A X I M U M a 1 u e s f o n t h e X A I 3
ENTER SCALE FOR Y AXIS
©
( COORDINATE RANGE: -21.:3675 TO O
E li T E R the M I N I M U M an d M A X I M U M v a 1 u e s f o r t ^| e Y A I 3
2.19. ENTER SCALES.
INPUT TITLE AND AXES LABELS
INPUT TITLE FOR PLOT. . . UP TO 3 0 CHARACTERS
INPUT LABEL FOR THE X AXIS. .
.
UP TO 20 CHARACTER
INPUT LABEL FOR THE Y AXIS. .
.
UR T 0 2 0 CHARACTER
CONT TO CONTINUE
2.20. LABELS.
©
23

2.21 CHANGE TICKS
This menu allows the user to change the number of labeled major tic markson a linear axis. After the data range for the axis is displayed the useris asked to input the number of major tics that divides most evenly into the
range. The range is equal to the difference in the maximum and minimum valuesthat were input for each axis in the 2.19 ENTER SCALES menu. To change the rangethe user must return to the MENU 1 menu and choose option #3. Log axes areset automatically by the program and cannot be changed. The printout of thismenu is contained in figure 2.21.
NOTE: Using default size for numbers, there should be no more than 8
major tics on the X axis, and no more than 6 characters per number(including minus sign and decimal point) on either axis.
If the scale type chosen was not log-log skip Step a.
a) If the user has chosen a log-log scale in the 2.18 SCALE TYPE menu, the
number of labelled major tic marks is set automatically. PressCONT and BUGS will return to 2.22 MENU 1: INPUT PARAMETERS.
The range that is displayed is equal to the difference between maximum and
minimum values that were entered in 2.19 ENTER SCALES.
If the X axis is using a log scale, skip to Step d.
b) Input the number of major tics that will divide most evenly into theX range.
c) Enter 1 to try a different number of tics and go to Step b, or pressCONT.
If Y is on a log scale, BUGS returns to 2.22 MENU 1: INPUT PARAMETERS.
d) Input the number of major tics that will divide most evenly into the
Y range.
e) Enter 1 to try a different number of tics and go to Step d, or pressCONT.
BUGS now returns to 2.22 MENU 1: INPUT PARAMETERS.
24

CHRNGE TICK INTERVRLS
T’OU MRY CHANGE THE HUMBER OF MAJOR TICK INTERVALS
FOR LINEAR AXES ONLY
PRESS CONT TO CONTINUE ©
X AXIS MAJOR TICK INTERVAL
The RANGE that you hiue chosen for- the X AXIS is 1
MAJOR TICK INTERVAL = RANGEMAJOR TICKS
How many MAJOR TICKS do you want on X AXIS...
DEFAULT is 4
>< MAJOR TICK INTERVAL = .25 X MINOR TICK INTERVAL = .05
rO TRY AGAIN. .. ENTER 1 ©
Y AXIS MAJOR TICK INTERVAL
The RANGE that you haue chosen for the Y AXIS is 1
MAJOR TICK INTERVAL = RANGEMAJOR TICKS
4 o w m any MAJOR TICKS do y o u w an t on Y A X IS...
DEFAULT is 4
/ MAJOR TICK INTERVAL = .25 Y MINOR TICK INTERVAL = .05
rO TRY AGAIN. .. ENTER 1 ©
Figure 2.21. CHANGE TICKS.

2.22 MENU 1: INPUT PARAMETERS
This menu allows the user to change the scaling parameters and labels that wereinput in the 2.18 SCALE TYPE, 2.19 ENTER SCALES, and 2.20 LABELS menus. In
addition the user may change the number of labeled major tic marks on eitheraxis. If an option number is entered the program will branch to the appropriatemenu and then return the user to this menu. Parameters that have been inputwill appear on the screen. See figure 2.22 for an example menu.
Directions for options:1. The program branches to the 2.20 LABELS menu.2. The program branches to the 2.18 SCALE TYPE menu.3. The program branches to the 2.19 ENTER SCALES menu.4. The program branches to the 2.21 CHANGE TICS menu.
Step a may be repeated until the user chooses to exit this menu.
a) Enter option number, or press CONT to exit this menu.
If this is the first time to MENU 1 since the start of the program, or if the
defaults are being used, BUGS branches to 2.23 MENU 2: DIMENSIONS/PLOT OPTIONS.If this menu was selected as option #4 from 2.35 MENU 4: OUTPUT MEDIA, BUGSreturns to MENU 4.
2.23 MENU 2: DIMENSIONS/PLOT OPTIONS
This menu allows the user to normalize the data, plot annotation or standarddeviation, to shade any or all files, label linear axes in scientific notation,change the aspect ratio of the graph, or change the size of the title, axes
labels or axes numbers. If an option number is entered the program will
branch to the appropriate menu and then return the user to this menu. An exampleprintout of this menu may be found in figure 2.23.
Directions for options:1. The program branches to the 2.26 ANNOTATION menu.
2. The program branches to the 2.27 NORMALIZE menu.3. The program branches to the 2.25 SCIENTIFIC NOTATION menu.
4. The program branches to the 2.24 STANDARD DEVIATION menu.
5. The program branches to the 2.28 SHADING menu.6. The program branches to the 2.29 DIMENSIONS menu.7. The program branches to the 2.30 TITLE SIZE menu.8. The program branches to the 2.31 LABEL SIZE menu.9. The program branches to the 2.32 NUMBER SIZE menu.
a) Enter option number, or press CONT to exit this menu.
The options is processed and then BUGS returns to MENU 2. Step a may be
repeated until the user chooses to exit this menu.
If this is the first time to MENU 2 or defaults are being used, BUGS branchesto 2.33 MENU 3: PLOT TYPES. If this menu was selected as option #5 from2.35 MENU 4: OUTPUT MEDIA, BUGS returns to MENU 4.
26

MENU 1: REVIEW INPUT PARAMETERS
OPTION #
<1> . TITLE:
-ABELS - X axis:Y AXIS:
<2> SCALE TYPE: LINEAR
0> SCALE : X MIN = 0 X MAX = 1
Y MIN =0 Y MAX = I
<4) MAJOR TICKS X AXIS: 4 MAJOR TICK INTERVALS OF .25Y AXIS: 4 MAJOR TICK INTERVALS OF .25
TO CHANGE ANY OF THESE P ARAMETERS ... ENTER OPTION
PRESS CONT TO CONTINUE
Figure 2.22. MENU 1: INPUT PARAMETERS.
©
MENU 2: DIMENSIONxPLOT
opt: ON< 1
)
=LOT OPTIONS
ANNOTATION: NO
<2) NORMALIZE: NO
<3) SOIENTIFIC NOTATION: NO
<4) STANDARDDEVIATION: NO
SHADING - FILES: ELASTIC
TO CHAN3E ANY OF THESE PARAMETERCURRESP3ND3 TO OPTION #
PRESS CONT^ TO CONTINUE
OPTIONS
DIMENSION OPTIONSOPTION #
DIMENSIONS - X AXIS:Y AXIS:
C7> TITLE SIZE: 1
CO LABEL SIZE: 1
<9> NUMBER SIZE: 1
. INPUT NUMBER THAT
©
Figure 2.23. MENU 2: DIMENSIONS /PLOT OPTIONS
27

2.24 STANDARD DEVIATION
The user may plot an error bar on the graph. The user is asked to inputthe numerical value of one standard deviation and the number of standarddeviations to plot. Because the user must use the cursor to position theerror bar on the graph, the graph must be plotted on the CRT before it is
plotted on the digital plotter. See 2.36 STANDARD DEVTATION DIRECTIONS fora complete explanation of how to input the standard deviation error bar.
See figure 2.24 for a printout of this menu.
a) Enter 1 to place standard deviation on the graph or press CONT to nothave standard deviation plotted on the graph.
If standard deviation was not chosen, BUGS returns directly to 2.20 MENU 2:
DIMENSIONS/PLOT OPTIONS.
b) Enter the number! c value for one standard deviation.
The user may plot one, two or three standard deviations.
c) Enter the number of standard deviations to plot.
BUGS now returns to the 2.23 MENU 2: DIMENSIONS/PLOT OPTIONS menu.
2.25 SCIENTIFIC NOTATION
The user has the option to have linear axes labeled using scientific notation.Log axes will automatically be labeled as powers of ten. If the number size,
the size of the X axis (see 2.29 DIMENSIONS), and the plot size are set to
their defaults or larger, the Y axis label will be out of the medium plottingrange. To plot the Y label, ensure that;
Number size x (X axis size/100) x Plot size <= 0.8.
Plot size is only used on the digital plotter and is always set to 1 on the
CRT and the internal printer. See figure 2.25 for a printout of this menu.
a) Enter 1 to use scientific notation, or press CONT to use the standardnotation.
BUGS now returns to 2.23 MENU 2: DIMENSIONS/PLOT OPTIONS.
23

STAHDhRD dev I hT I on
TO DISPLAY STD DEV ERROR EAR OH GRAPH ENTER 1
ENTER THE VALUE FOR 1 STANDARD DEVIATION
©
ENTER THE NUMBER OF STANDARD DEVIATIONS TO PLOT... FROM 1 TO 3 ©
Figure 2.24. STANDARD DEVIATION.
SCIENTIFIC NOTATION
Jser may ha^e SCIENTIFIC NOTATION on the LINEAR AXES
LO: AXES win AUTOMATICALLY be labelled as POWERS of 10
NOTE: If SCIENTIFIC NOTATION is used on the Y AXIS, the Y AXIS LABELwill not be printed on the CRT or on the DIGITAL PLOTTER i f thedefault NUMBER SIZE of 1 is used. To print the Y AXIS LABEL, choosea NJMEER SIZE of .3 or- SMALLER. On the DIGITAL PLOTTER, thesituation may also be remedied by choosing a PLOT SIZE of .8 or SMALLER.
TO USE SCIENTIFIC NOTATION ENTER ®
Figure 2.25. SCIENTIFIC NOTATION.

2.26 ANNOTATION
This menu allows the user to place annotation in the graph and choosethe annotation size. Because the annotation labels will be entered on theCRT screen after the graph is plotted, the user must plot the graph on theCRT screen before plotting it on the digital plotter. See 2.37 ANNOTATIONDIRECTIONS for a complete explanation of how the annotation is entered. A
copy of this menu may be found in figure 2.26.
a) Enter 1 if annotation is desired in the graph, or press CONT if annotationis not desired.
If annotation is not desired BUGS returns to 2.23 MENU 2 ;DIMENSIONS/PLOT OPTIONS.
The default size for annotation is 1. If the user wishes to change the sizeof the annotation, he may do so by entering a size multiplier. For example:if the user enters 2, the annotation will be twice the size of the default; if
the user enters .5, the annotation will be half the size of the default. Generally,the multiplier should be between .85 and 1.
b) Input number between 0 and 2 to multiply default size by, or pressCONT to use the default size.
BUGS now returns to 2.23 MENU 2: D lEMSIONS/PLOT OPTIONS.
2.27 NORMALIZE
In this menu the user may multiply the X and/or Y values of any file by a
constant. The data ranges for each file are displayed and the user is askedif any files are to be normalized. If so the user must input the file number,
the normalization factor for the X values and the normalization factor for
the Y values of that file. The printout for this menu is found in figure2.27.
Steps a and b may be repeated until the user chooses to exit this menu.
a) Enter 1 to normalize a data file, or press CONT.
If no files are to be normalized BUGS returns to 2.23 MENU 2: D IMEMSIONS/PLOTOPTIONS.
The user must input a normalizing factor for both the X and Y values. If
the user does not wish either X or Y values to be normalized, he may enter a
one (1) as the factor.
b) Enter the file number, the X normalization factor and the Y normalizationfactor.
BUGS now branches back to Step a.
30

flNNCiTFiTIGH
TO PLACE flNHOTflTION OH YOUR GRAPH ... ENTER 1
^-JARNING: If you wish to use AHHOTAT I OH on the DIGITAL PLOTTER
you ni u s
t
FIRST PLOT graph on the CRT
Input MULTIPLIER between O and 2 for the AHHOTAT I OH
CHARACTER S I ZE ... DEFAULT is 1
Figure 2.26. ANNOTATION.
NORMALIZE
Y-MAX-17.08620
DATA RANGES FOR FILES ARE:
FILE #
1
2
X-MIH-.04-.04
X-MAX1230
Y-MIH. 04. 04
NOTE: THE HE! I VALUES FOR DATA PAIRS H 1 1 I. BE ROUNDEDTO FOUR SIGNIFICANT DIGITS
TO NORMALIZE A DATA FILE ... ENTER 1
.ENTER FILE #, MULTIPLIER FOR X DATA, MULTIPLIER FOR Y DATA
Figure 2.27. NORMALIZE

2.28 SHADING
This menu allows any or all data files to be shaded. The user will be askedif at least one file will be shaded. If so, the file descriptors are displayedone at a time and the user is asked to indicate whether that particular fileis to be shaded. Figure 2.28 shows an example printout of this menu.
a) Enter 1 to shade any file, or press CONT if no files are to be shaded.
If no files are to be shaded BUGS returns to 2.23 MENU 2 :DIMENSIONS/PLOT OPTIONS.
The file numbers and descriptors are now displayed one at a time. The computerbeeps and displays "SHADE THIS FILE?".
b) Enter 1 to have this file shaded, or press CONT to leave file unshaded.
Repeat Step b for each file. When all files have been displayed BUGS returnsto 2.23 MENU 2: DIMENSIONS/PLOT OPTIONS.
2.29 DIMENSIONS
The user may change the aspect ratio and/or the size of the graph. The user will
be asked to enter the dimensions of both the X side (horizontal) and the Y
side (verticle) of the plot in pre-defined graphic units. The maximum sizeallowed is 120 X units by 80 Y units, which is the total area of the screenin graphic units. On the plotter, one (1) inch is approximately equal to the
ten (10) graphic units. The total graphics units along one axis equalsaxis length times the plot size. For example: A graph that has X axis length=40,Y axis length=40, and plot size = 1 has total plotting area in inches of:
X axis: (40 x D/IO = 4; Y axis: (40 x D/IO = 4; Area: 4" x 4"
Calculate the desired plot dimensions in inches and multiply these by ten.
Remember, however, that the entire graph may be scaled down by a constant in
2.39 PLOT SIZE.
a) Enter in the size of the X side in graphic units, or press CONT to usethe default size.
b) Enter in the size of the Y side in graphic units, or press CONT to use
the default size.
BUGS returns to 2.23 MENU 2: DIMENSIOMS/PLOT OPTIONS.
32

SHADING
YOU MAY HAVE A PARTIAL FILLING OF THE SPACEBELOW YOUR CURVE IN THE DATA PLOT
NOTE: CHOOSING THIS WILL MEAN THAT THE PLOT WILL TAKE3 TIMES AS LONG
TO CHOOSE THIS OPTION ... ENTER 1 ©FILE # - DESCRIPTOR
1 5 KEV
ro SHADE THIS FILE... ENTER 1 - ELSE PRESS CONT
Figure 2.28. SHADING.
DIMENSION PLOT
DEFAULT SIZE FOR PLOTTING IS lOO X UNITS BY 60 Y UNITS
ENTER SIZE FOR X AXIS...1 TO 120
ENTER SIZE FOR Y AXIS...1 TO 90
Figure 2.29. DIMENSIONS.
©
®
33
2.30
TITLE SIZE
The user may change the size of the title, axes labels, or axes numbers fromthe default size of 1. This is done by entering a factor by which the defaultsize will be multiplied. If the user enters a factor of two, the output of
these parameters will be twice the size of the default. Likewise, if the
user enters .5, the output will be half the size of the default. The labelsand numbers are also automatically scaled to the length of the axis and theplot size (if the digital plotter is used), so the user must take somewhatof a trial and error approach. For examples see APPENDIX F. The printoutof the TITLE SIZE, AXES LABEL SIZE and NUMBER SIZE has been combined intofigure 2.30 LABEL DIMENSIONS. Listed below are some example size factors.
Example sizes:
si ze=0 Single pointsize=l-l .5. . .Normal size on plotsize=2-3 Most effective if hardcopy plot is to be 3 x 5 inches or less
Figure 2.30a LABEL DIMENSIONS is a printout of the query for the title size factor.
a) Enter a number from 0 to 3 by which the the default size will be
multiplied, or press CONT to use the default size.
BUGS now returns to 2.23 MENU 2: DIMENSIONS/PLOT OPTIONS.
2.31
LABEL SIZE
See figure 2.30b for a printout of the query in the LABEL SIZE menu. For an
explanation of how the size factor is used, see 2.30 TITLE SIZE.
b) Enter a number from 0 to 3 by which the default axes label sizewill be multiplied, or press CONT to use the default size.
BUGS now returns to 2.23 MENU 2: DIMENSION/PLOT OPTIONS.
2.32
NUMBER SIZE
See figure 2.30c for a printout of this query in the LABEL SIZE menu. For an
explanation of how the size factor is used, see 2.30 TITLE SIZE.
c) Enter a number between 0 and 3 by which the default number sizewill be multiplied, or press CONT to use the default.
BUGS now returns to 2.23 MENU 2: DIMENSION/PLOT OPTIONS.
34

TITLE SIZE
INPUT MULTIPLIER BETWEEN 0 RND 3 FOR TITLE
DEFAULT IS 1 ©
AXES LABEL SIZE
INPUT MULTIPLIER BETWEEN 0 AND 3 FOR X AND Y LABEL SIZE
DEFAULT IS 1
NUMBER SIZE
ENTER MULTIPLIER BETWEEN 0 AND 2... DEFAULT IS ©
Figure 2.30. LABEL DIMENSIONS.
!
35
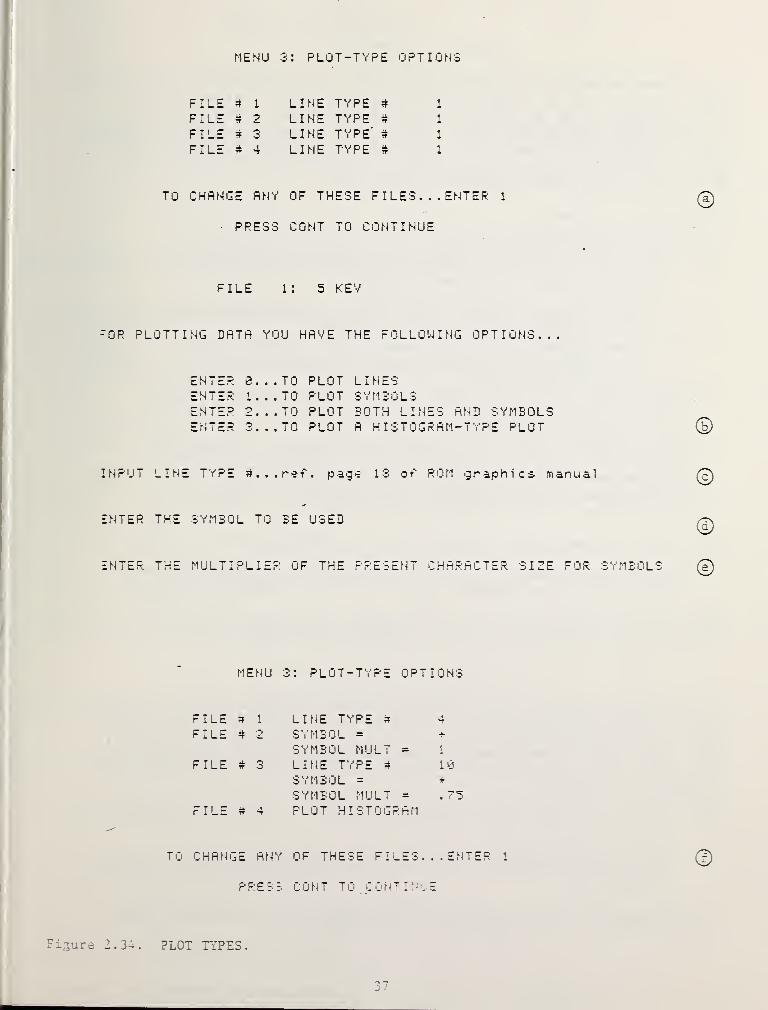
2.33 MENU 3: PLOT TYPES
This menu displays the files, their descriptors and the plot types chosen by
the user. The default type is a solid line. The user is asked if any changesare desired. If so the program branches to the 2.34 PLOT TYPES menu where theuser may input a different plot type for all the files. Figure 2.33 showsan example of MENU 3 when all defaults are used; then the 2.34 PLOT TYPESmenu (2.33b); and an example again of MENU 3 when options 1-4 are chosenfrom the 2.34 PLOT TYPES menu.
Choice of plot types are:
(1) Lines with choice of line type.
(2) Symbols with choice of symbol and symbol size.
(3) Lines and symbols.
(4) Histogram.
Step a may be repeated until the user chooses to exit this menu.
a) Enter 1 to change a plot type, or press CONT if no change is desired.
If no changes are desired the BUGS branches to 2.35 MENU 4: OUTPUT MEDIA.If changes are desired BUGS branches to the 2.33 PLOT TYPES menu and then returnsto this menu.
2.34 PLOT TYPES
In this menu the user may change the plot type of any or all files. Eachfile will be presented one at a time. The user may then choose to plotlines, symbols, lines and symbols, or histograms. There are 10 differentline types, any ASCII character may be used as a symbol, and the symbol sizemay be chosen. The program returns to 2.33 MENU 3: PLOT TYPES after all fileshave been presented. See figure 2.33.
a) Enter the option number, or press CONT if user does not wish to changethe plot type for this file.
If the plot type selected is a histogram, skip Steps b-d. If the plot type is
symbols only, skip Step b.
Information on line types is on page 18 of the ROM Graphics Manual.
b) Enter the line type number, or press CONT if no change is desired.
If the plot type selected does not use symbols, skip Steps c-d.
c) Enter a new symbol, or press CONT no change is desired.
d) Enter a number to multiply the default symbol size by, or press CONT if
the user does not wish to change the symbol size.
Repeat Steps a through d until plot types have been selected for all the files.After all files have been presented the program returns to 2.33 MENU 3: PLOT TYPES.The new plot types will then be displayed. See figure 2.33f.
36
MENU 3: PLOT-TYPE OPTIONS
FILE # 1 LINE TYPE # 1
FILE W 2 LINE TYPE S 1
FILE s 3 LINE TYPE' ^ 1
FILE # 4 LINE TYPE # 1
TO CHRNGE RNY OF THESE F I LES . . . ENTER 1
PRESS CONT TO CONTINUE
FILE l: 5 KEV
-OR PLOTTING DATA YOU HAVE THE FOLLOWING OPTIONS...
ENTER 0. . . TO PLOT LINESENTER 1...TO PLOT SYMBOLSENTER 2... TO PLOT BOTH LINES AND SYMBOLSENTER 3... TO PLOT A H I STOGR AM-T','PE PLOT
INPUT LINE TYPE #...ri?f. page 13 of ROM graphics manua.1
ENTER THE SYMBOL TO BE USED
ENTER THE MULTIPLIER OF THE PRESENT CHARACTER SIZE FOR SYMBOLS
MENU 3: PLOT-TYPE OPTIONS
FILE ^ 1
FILE 4 2
FILE 4 3
FILE 4 4
LINE TYPE 4 4
SYMBOL = +
SYMBOL MULT = i
LINE TYPE 4 10SYMBOL =
SYMBOL MULT = .75PLOT HISTOGRAM
TO CHANGE ANY OF THESE FIlES. .ENTER 1
PRESS CONT TO CON” I ML
E
2.34. PLOT rSPES
.

2.35MENU 4: OUTPUT MEDIA
In this menu the user is presented with options to plot the graph on the CRTscreen, internal thermal printer, or the digital plotter. Options are alsogiven to return to any of the other option menus. After choosing any optionthe user is returned to this menu. If no options is chosen BUGS returns to
the 2.4 PROGRAM OPTIONS menu. See Section 2.42 SPECIAL FUNTION KEYS - PLOTTINGAIDS for instructions on how to use the Special Function Keys for plotting.The printout of this menu is given in figure 2.35.
Directions for options:1. Data is plotted on the screen using all scale parameters and plot
options that have been entered.If the user has selected annotation or standard deviation option:
Wait until data is finished plotting.Press CONT.If the standard deviation option was chosen, BUGS branches to the
2.36 STANDARD DEVIATION DIRECTIONS menu.
If the annotation option was chosen, BUGS branches to the2.37 ANNOTATION DIRECTIONS menu where the annotation labels may be
entered on the graph.2. Whatever was plotted last on the screen is dumped onto the printer.
If this is the first time to MENU 4 since the start of the program,the user must plot data on the screen first.
3. Data is pi otted on the digital plotter using up to 4 pen colors or a
drafting pen. BUGS now branches to the 2.38 DIGITAL PLOTTER menu.
4. BUGS branches to the 2.22 MENU 1: INPUT PARAMETERS menu.
5. BUGS branches to the 2.23 MENU 2: DIMENSIONS/PLOT OPTIONS menu.6. BUGS branches to the 2.33 MENU 3: PLOT TYPES menu.
Step a may be repeated until the user chooses to exit this menu.
a) Enter option number and follow the directions given above, or pressCONT to exit plot mode and return to the 2.4 PROGRAM OPTIONS menu.
After each option has been serviced, BUGS returns the user to this menu until
the user chooses to return to the 2.4 PROGRAM OPTIONS menu.
2.36 STANDARD DEVIATION DIRECTIONS
If the standard deviation option has been chosen, the sigma error bar is enteredby waiting until the graph has finished plotting on the CRT; positioning the
cursor to the bottom of the desired position of the error bar; and pressingCONT. The cursor is positioned by using the arrows in the display pad whichis located at the top center of the computer keyboard. See figure 2.36 for the
printout of this menu.
After the graph has finished plotting, press CONT.
1) Press CONT to get back to the graphics screen.
2) Position the cursor to the bottom of the desired position of the bar.
3) Press CONT.
If the annotation option was chosen, BUGS branches to the annotation menu;otherwise it returns to 2.35 MENU 4: OUTPUT MEDIA.
38

MENU 4: OUTPUT MEDIR
OPTION # OPTION 4
( 1 > C R I 'I 4 > MENU 1 : INPUT PRRRMETERS
:.2> THERMRL PRINTER •:;5) MENU 2 : DI MENS IONS.-^OPT IONS
• (3) DI3ITRL PLOTTER < 6 > MENU O a PLOT TYPES
INPUT OPTION # THRT CORRESPONIiS TO NHRT YOU URNT TO DO
OR -'RE3S ;:ONT TO GO ERCK TO PROGRRM OPTIONS
Figure 2.35. MENU 4: OUTPUT MEDIA.
PLOT STRNIiRRIi DEV I RT I ON
THE PROGRRM IS NON RERDV TO PLOT THE SIGMR ERROR ERR.
<1) PRESS CONT TO GO ERCK TO THE PLOT ON THE CRT
<2> POSITION THE CURSOR RT_.THE BOTTOM OF WHERE THE ERROR ERR MILLEE PLOTTED
U > P R E S S C U N T
THE PROGRRM NILL THEN PLOT THE ERROR ERR ON THE CRT
It ^RESS CONT TO RETURN TO MENU 4: OUTPUT MEDIR
r
11Figure 2.36. STANDARD DEVIATION DIRECTIONS.
II N t 3
R
E N LI 'J r! E fl D TO LET 't' ij U P R U '/ IDE R f-IN iJ i R T I ij f-1 F ij R THE
GRR-'H NHIOH YOU HRVE JUST DRRNN
!
I
POSITION THE CURSOR TO THE LEFT EDGE OF THE POSITION WHERE YOU
j;
WRNI TO SIRRT YOUR LREEL RND PRESS CONTI,
j|THE SCREE f WILL PRUSE TO THE KEYBORRD MODE RND YOU THEN ENTERTHE RNNOT3TION THRT YOU WRNT
CONrirJUE iS MR NY TIMES RS YOU WRNTI
'0 EYIT R INOTRTION, .. ENTER SRME CURSOR POINT TWICE
. . .T-fi OTR-T RNNOTRTION PRESS C 0 N T
Figure 2.37. .\InNOTATION DIRECTIONS.39

2.37 ANNOTATION DIRECTIONS
If annotation has been chosen, the user may enter up to 30 annotation labelsof up to 30 characters each by: (1) Positioning the cursor to the left edgeof desired label position; (2) Pressing CONT to digitize that label position,(3) Entering the label from the keyboard; and (4) Pressing CONT to see the
label printed on the graph. This process is repeated until user chooses to
exit annotation mode by digitizing the same label position twice in a row.
The cursor is positioned by using the arrows at the top center of the keyboard.See figure 2.37 for a printout of the menu.
1) Press CONT to return to the graphics display and then position thecursor to the desired position for the first letter of the label.
2) Press CONT and then enter the label of up to 30 characters from the keyboard.
3) Repeat steps 1 and 2 for all annotation labels. After the last label
has been plotted, press CONT twice to exit the annotation mode.
BUGS now returns the user to 2.35 MENU 4: OUTPUT MEDIA.
2.38 DIGITAL PLOTTER
The digital plotter allows the user to create normal and publication qualityplots on paper or transparenci es using up to four pen colors, or using the
drafting pen on vellum drafting paper. APPENDIX F contains an example of
each plotting medium. For more information on the different types of pens
and papers that can be used, see APPENDIX A. See figure 2.38 for digital
plotter options and examples of how long each option takes to plot.
To set up the digital plotter:
1) Turn plotter on.
2) To load plotting medium:a) Press CHART LOAD.
b) Place paper on platten.c) Press CHART HOLD.
Plot time will increase with the number of plot options used. A publicationquality graph with one file using shading will require about 5 minutes.
a) Enter option number.
BUGS now takes the user to 2.39 PLOT SIZE menu.
40

niGITRL PLOTTER
T h >= r e ar ^ t f-i r e e o u t- p i.j t- rn e dT u rn o p t i o n s f o r t. h >= d i q i t- a 1 p 1 o 1 1 e r
OPTION< 1 )
< 2 ;'
C 3 ':>
C4>
FELT TIP PENS - NORNfiL QURLITYFELT TIP PENS -
- PUEL I CRT I ON QURLITYTRRNSPRRENCIESDRRFTING PEN
J s i n g d e f au Its, the t i m e it t ak e t o p 1 o t o n e g r ap h i.< sing,4s i ng one dat a file is:
< 1 Normal Qualit',' - about two minutes< 2 > Public at i on qual i t y
- t i c e as 1 ong(. 3 y T an s p ar e n c i e s - t u i c e as 1 o n g<4> Drafting pen - four times as long.
I N P U T t h e 0 P T I 0 N # t h at u o u '•.i o 1.4 Id • i k e t o u s e
Figure 2.38. DIGITAL PLOTTER.
INPUT PLOT SIZE
You now haue a chance to pick the plot size
P 1 o t s i z e m 1.4 s t b e a n u m b e r f r o m O t o 1
EYRNPLES:
S I Z E = 1 . 0 0 . . . F 1.4 1 1 plot t e r 1 i m i t s
S I Z E = 0 . E 5 . . .St an d ar d S 1 2 >c 11 i n c h fj ag e
S I Z E = 0 . 0 01 . . . S i n g 1 e fj o i ri t o n t ki e fj ag e-
INPUT PLOT SIZE ?
Figure 2.39. PLOT SIZE.
LI

2.39 PLOT SIZE
Plot time will significantly decrease as plot size decreases from the defaultsize of 1. The default size will plot the graph exactly as it appeared on
the CRT screen. Therefore, if any part of the graph except for the far rightside is plotted off the screen when plotted on the CRT (such as title, axeslabels, or axes number), these parameters will also not be plotted on thedigital plotter when the default size is used. To allow room to plot theseparameters, choose a smaller plot size. See figure 2.39 for a printout of thismenu and example plot sizes.
a) Enter plot size (number from 0 to 1).
BUGS now takes the user to the 2.40 PLOT COLORS menu if the drafting pen optionwas not chosen. If the drafting pen option was chosen, BUGS plots the graph,and returns the user the user to 2.35 MENU 4: OUTPUT MEDIA.
2.40 PLOT COLORS
This menu gives the user an opportunity to select colors for the plotparameters if the drafting pen option was not chosen in the 2.38 DIGITAL PLOTTERmenu. The user may continue to change pen colors for any parameter until no
more parameters are chosen. Choosing a pen number of 0 will cause that plotparameter not to be plotted. This is useful in plotting different data fileson different transparenci es for viewgraph presentations. The program thentakes the user to 2.41 ANNOTATION COLORS if annotation is to be used, or plotsthe graph and returns the user to 2.35 MENU 4: OUTPUT MEDIA. Figure 2.40 givesan example printout for this menu.
a) Enter the number that corresponds to the parameter that is to be changed,or press CONT to exit PLOT COLORS menu.
If no parameters were changed, BUGS takes the user to 2.41 ANNOTATION COLORSif annotation is used, or returns the user to 2.35 MENU 4: OUTPUT MEDIA after the
graph has been plotted.
If a file (option #4) was not chosen, skip Step b.
b) Enter number that corresponds to the file to be changed.
c) Enter number between 0 and 4 for the new pen color.
The user may now have the menu rewritten to see new parameter colors displayed.
d) Enter one to review new parameter colors, or press CONT to input
next color option.
BUGS now returns the user to Step a. This gives the user the option to
continue changing colors or to exit this menu.
42

PLOT COLORS
PEN 41 - BLACK PEN 43 - GREENT
'
.PEN 42 - BLUE PEN 44 - RED
<1> TITLE : BLACK <2) AXES LABELS: BLACK
<3) RXES RND TICK NRRK3: ELRCK
<4) FILE #
1 - RED; 5 KEV2 - BLUE: 10 KEV3 - GREEN: 15 KEV4 - RED: 20 KEV
rO CHRNGE R COLOR ... ENTER OPTION # - t-1se PRESS CONT TO CONTINUE
INPUT FILE S
INPUT NEN PEN #
rO REVIEW HEW COLORS ... ENTER 1 - PRESS CONT TO CONTINUE
Figure 2.40. PLOT COLORS.
ANNOTATION COLORS
PEN 41 - BLACK PEN 43 - GREENPEN 42 - BLUE PEN 44 - RED
LABEL 4
1 > BLACK - C R on SI2) RED * - 5 k e o
3) BLUE - + - 10 keo4
)
GREEN - 4 - 20 k e o
5) BLACK -g, - 40 ^;:eu
©
©Figure 2.41. Al-^NOTATION COLORS.
TO CHiNGE R COLOR ... ENTER LREEL 4 - else PRESS CONT to CONTINUE
INPUT NEW PEN #
T 0 R E v' E I W N E W C 0 L 0 R S . . . E N T E R 1 - P R E S :E; C 0 N T T 0 C 0 N T I N U E
©©©©
2.41 ANNOTATION COLORS
This menu gives the user an opportunity to select colors for the annotationlabels. The user may continue to change pen colors for the labels until no
more labels are chosen. Figure 2.41 contains a printout for this menu.
a) Enter the number of the annotation label to change, or press CONTto exit this menu.
If user has chosen to exit this menu, BUGS will plot the graph and return to
2.35 MENU 4: OUTPUT MEDIA.
b) Enter the number for the new pen color.
The user may now have the option to have this menu rewritten to see new label
colors displayed.
c) Enter 1 to reveiw new label colors, or press CONT to enter to
label color.
BUGS now returns the user to Step a. This gives the user the option to
continue changing colors or to exit this menu.
2.42 SPECIAL FUNCTION KEYS-PLOTTI NG AIDS
Before plotting a graph on the CRT or the digital plotter, the Special FunctionsKeys (SFK's) located in the upper right hand corner of the keyboard may be
used to switch plotting parameters on and off, center the graph on the digital
plotter, plot previously input annotation and standard deviation directly on
the CRT to avoid having to input them each time, and have access to basic9845 system commands at the push of button. The default is ON for all keys.
SWITCHES: The frame, tic marks, numbers, axes labels, data files, shading,annotation, and standard deviation may be switched on or off before plottingby pressing the appropriate SFK to turn the parameter on, and SHIFT SFK to
turn it off. It is especially helpful when editing a single portion of the
graph to turn off other parameters in order to save plotting time. It can
also be used effectively in viewgraph presentations by displaying differentparts of the graph serially on different transparencies.
CENTERING THE GRAPH: To center a graph on the digital plotter, the user mustdetermine the X and Y offsets in inches and multiply this value by ten.
Positive values move the graph to the right or up while negative values moveit to the left or down. Once these are determined, input the X offset by
pressing SFK k2, typing in the offset, and pressing CONT. The Y offset is
entered the same way, using SFK k3.
PLOTTING ANNOTATION AND STANDARD DEVIATION DIRECTLY ON THE CRT: Every time the
user chooses to plot on the CRT, the annotation and standard deviation mustbe input again. The user may avoid this and plot all previouly input
44

annotation and standard deviation on the screen directly by pressing SFK kl.
By pressing SHIFT kl before the CRT option is chosen in MENU 4: OUTPUT MEDIA,the user may return to the input the input mode.
BASIC 9845 SYSTEM COMMANDS: Below are listed some basic 9845 system commandswhich the user might find helpful. NOTE: These commands do NOT effect the runningof the BUGS program.
GRAPHICS The 9845 has two CRT modes: the alphanumeric screen whichEXIT GRAPHICS presents all menus; and the graphics on screen which the graph
is plotted. Any time the alphanumeric screen is displayed,the user may display the graph by pressing SFK k5 (GRAPHICS).Likewise SHIFT k5 will return the user to the alphanumericscreen, if the graphics screen is currently being displayed.
PRINTER IS 0 PRINTER IS 0 causes the 9845 to print on the internal thermalPRINTER IS 16 printer while PRINTER IS 16 causes the system to print on the
CRT. Each time one of the BUGS menus is printed on thethermal printer, the sytem will skip to the top of the next page.
SFK k6 will print on the printer. SFK k7 will print on the CRT.
CAT :T15 The CAT statement will list the directories of the tapes in eitherCAT :T14 the right (:T15) or the left (:T14) tape drives. SHIFT k7 will list
:T15 while SHIFT k6 will list :T14.
SUMMARY OF KEYS:
PLOTTING SFK's
SFK SHIFT SFK
kl Plot annotation and standarddeviation directly on CRT
k2 Input horizontal offsetk3 Input vertical offset
k8 Plot frame.k9 Plot tic marks.klO Plot numbers.kll Plot axes labels and title.kl2 PI ot al 1 fi 1 es
kl3 Plot shading.kl4 Plot annotation.kl5 Plot standard deviation.
Input annotation and standard deviationon CRT.
No frame.No tic marks.No number.No axes labels or title.No files.
No shading.No annotation.No standard deviation.
FUNCTION SFK's
k5 GRAPHICS EXIT GRAPHICSk6 PRINTER IS 0 CAT :T14'<7 PRINTER IS 16 CAT :T15
45

3. PROGRAM DESCRIPTION
3.1 INTRODUCTION TO PROGRAM DESCRIPTION
This introduction is intended to provide a broad overview of the programstructure followed by a guide on the use of the subroutine descriptions.
PROGRAM PLOT (1) declares all variables, (2) takes the user to the PROGRAMOPTIONS menu to manipulate and plot data, and (3) terminates the program.The centerpoint of the program is the OPTIONS subroutine which outputsthe PROGRAM OPTIOTIS menu and divides the program into the five basicprogram modes that (1) INPUT DATA, (2) SAVE DATA, (3) RETRIEVE GRAPHS,(4) SAVE GRAPHS, and (5) PLOT DATA. The INPUT DATA subroutine drivesthe four input modes: (1) KEYBOARD; (2) TAPE; (3) DIGITIZE; and (4)
DEFINE FUNCTION. SAVE DATA and SAVE GRAPH are stand alone subroutinesthat save the data files and completed graphs, respectively. RETRIEVEGRAPH is also a stand alone subroutine that retrieves a previously storedgraph. The PLOT DATA subroutine supervises the input of the scale parametersand plot options, and the output of the plot. It's centerpoint is the
MENU_4 subroutine which presents the MENU 4: OUTPUT MEDIA menu thatallows the user to choose the output media or return to any of the otherplot option menus. The actual plotting is driven by the PLOT subroutine.
This program is modular in design. Each subroutine typically performsonly one specific task such as initializing variables, outputing menus,computing data, or plotting the graph. The subroutine descriptionstherefore begin with a statement of the function of that subroutine. A
definitions of the variables follows. Some variables which occur throughoutthe program are given only a brief description and a reference to anothersubroutine description containing a more complete definition of thatvariable. Most subroutine descriptions include a line by line explanationof the logic. The subroutine descriptions end with a list of the subroutinesthat call the subroutine.
All subroutine descriptions are denoted by the subroutine name in capital
letters. Menus that are output by the subroutine are denoted by the nameof the menu as given in the menu instruction (Chapter 2) and their
corresponding figure numbers.
Most subroutine descriptions have an accompanying flowchart which may be
found in APPENDIX D. A listing of the entire program is given in APPENDIXC. APPENDIX E contains an index to all of the subroutine flowcharts,menus, and 1 i sti ngs.
3.2 PROGRAM PLOT
FUNCTION: Input, save and plot up to 10 data files at a time for a total
of 2,000 data points.
LINE #: 20: Set up COMMON and initialize variables.30: Take the user to the PLOT OPTIONS menu and branch to the appropriate
subroutines according to the user's chosen option.
40: End program.
46
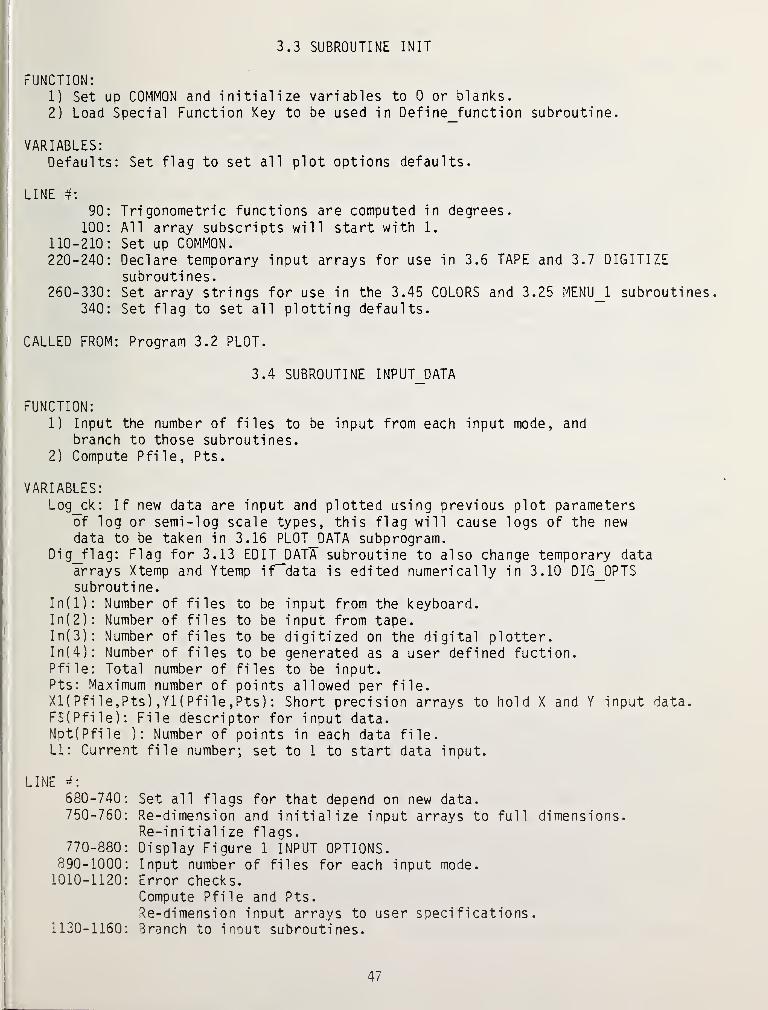
3.3 SUBROUTINE INIT
FUNCTION:
1) Set up COMMON and initialize variables to 0 or blanks.
2) Load Special Function Key to be used in Define_function subroutine.
VARIABLES:Defaults: Set flag to set all plot options defaults.
LINE #:
90: Tri gonometric functions are computed in degrees.
100: All array subscripts will start with 1.
110-210: Set up COMMON.220-240: Declare temporary input arrays for use in 3.6 TAPE and 3.7 DIGITIZE
subroutines.260-330: Set array strings for use in the 3.45 COLORS and 3.25 MENU_1 subroutines.
340: Set flag to set all plotting defaults.
CALLED FROM: Program 3.2 PLOT.
3.4 SUBROUTINE INPUT DATA
FUNCTION:
1) Input the number of files to be input from each input mode, andbranch to those subroutines.
2) Compute Pfile, Pts.
VARIABLES:Log_ck: If new data are input and plotted using previous plot parameters
of log or semi -log scale types, this flag will cause logs of the newdata to be taken in 3.16 PL0T_DATA subprogram.
Dig_flag: Flag for 3.13 EDIT_DATA subroutine to also change temporary dataarrays Xtemp and Ytemp if data is edited numerically in 3.10 DIG_0PTSsubrouti ne.
In(l): Number of files to be input from the keyboard.In(2): Number of files to be input from tape.In(3): Number of files to be digitized on the digital plotter.In(4): Number of files to be generated as a user defined fuction.Pfile: Total number of files to be input.Pts: Maximum number of points allowed per file.Xl(Pfile,Pts) ,Yl(Pfile,Pts) : Short precision arrays to hold X and Y input data.F$( Pfile): File descriptor for input data.Npt( Pfile ): Number of points in each data file.LI: Current file number; set to 1 to start data input.
LIME680-740:750-760:
770-880:890-1000:1010 - 1120 :
1130-1160:
Set all flags for that depend on new data.
Re-dimension and initialize input arrays to full dimensions.Re-initial ize flags.Display Figure 1 INPUT OPTIONS.Input number of files for each input mode.Error checks.Compute Pfile and Pts.
Re-dimension input arrays to user specifications.Branch to i nout subroutines.
47

SUBROUTINE INPUT_DATA cont.
CALLED FROM: Program 3.2 PLOT.
Subroutine 3.14 OPTIONS.
3.5 SUBROUTINE KEYBOARD
FUNCTION: Input In(l) data files from the computer keyboard.
VARIABLES:Key: Counter for the number of files that have been input from the keyboard.
When Key>In(l), exit subroutine.X0: Initial X value if there is a constant X interval.Dx: Value of constant X interval.X1(L1,I) ,Y1(L1,I) ,Ll,Pfile.Npt(Ll) ,F$(L1) : See 3.4 INPUT_DATA subroutine.
LINE #:
1190-1380: Output Figure 2.6a-c INPUT FROM KEYBOARD; input F$(L1) ,Npt(Ll)1390-1470: Output Figure 2.6f; Input X,Y data pairs if there is no constant
X interval
.
1480-1580: Output Figure 2.6 d,e,g; input X0,Dx; input Y data values.1610-1163: Input next data file.
CALLED FROM: Subroutine 3.4 INPUT_DATA.
3.6 SUBROUTINE TAPE
FUNCTION: Input In(2) data files from tape.
VARIABLES:
Tape: Counter for the number of files that have been input from the tape.When Tape > In(2), exit subroutine.
D$: Name for the data set to be input from tape.A$: Data set descriptor for D$.
Nfile: Number of files in D$.
Ntemp(Nfile) : Number of points in each file of D$.
Ftemp( Nfi le ) : File descriptors for D$.
Xtemp( Pfi 1 e,Pts ) ,Ytemp( Pfi 1 e,Pts ) : Short precision temporary data arraysto hold X and Y data from tape.
Ifile: Number of data file from the D$ data set that the user has chosen to input.
LINE #:
1650-1760:1770-1192:1930-2140:2150-2200:
2210:
2200-2300:
2310-2410:
Display Figure 2.7a INPUT FROM TAPE; input DS ;Compute C$.
Input data into temporary data arrays.Display Figure 2.7b; input Ifile.
Put selected data file into permanent data array.Give user a chance to review data file to verify that this
is the correct data file.
Display Figure 2.7c; input A1
.
If this is the correct file (A1=0), increment tape and filecounters. If Tape > In(2), return to 3.4 INPUT_DATA subroutine.
Display Figures 2.7d-e; input Al.
Go back to get a different data set or a different data file
from current data set depending on Al.
CALLlD FROM: Subroutine 3.4 INPUT DATA.
48

3.7 SUBROUTINE DIGITIZE
FUNCTION: Digitize In(3) data files using the digital plotter. Each new
graph is initialized by digitizing the corners, and inputting the
scale type and scale ranges. The user chooses to digitize morethan one file per graph, the graph need not be re-initialized.After the file is digitized into Xtemp(Ll,K) and Ytemp(Ll,K),the data is rotated and scaled into Xl( LI ,I ) ,Y1( LI ,I )
.
VARIABLES:Dig_flag: Set flag for 3.13 EDIT DATA subroutine to change temporary data
arrays Xtemp and Ytemp if digTtized values are to edited numerically.Digitt: Counter for the number of files that have been digitized.Graph: Counter for the number of files that have been digitized off of
the current graph.
Gr: Number of files to be digitized from the current qraph.Scaleck: Flag to scale data to user units.
CALLING TREE:
DIG_INIT: Input number of files to be input from current graph.
Digitize corners of current graph.Input scale type.Input scale ranges for the axes.
DIGIT: Digitize data file from the current graph.DIG_0PTS: Check and/or edit digitized file.
DIG SCALE: Rotate and scale digitized file.RUTATE: Rotate data and corners.RESCALE: Scale data.
ROUND: Round data to three significant digits.DIG_PL0T: Plot rotated unsealed temporary data file on the CRT.EDIT_DATA: Edit data numerically and review.HARD: Print digitized data on the thermal printer.DIG_EDIT: Edit unsealed, unrotated digitized data by re-di gi ti zing
selected points.ROTATE_BACK: Rotate the temporaray data back to original position.
Set Scaleck flag to rescale permanent data file.
CALLED FROM: Subroutine 3.4 INPUT_DATA.
3.8 SUBROUTINE DIGJNIT
FUNCTION: Digitize corners of the graph to allow rotation and scaling of the
digitized data.Input scale type.Input scale ranges for the axes.
VARIABLES:Gr: Number of files to be digitized from the current graph.Xframe(*) ,Yframe(*) : Digitized corners of current graph.Pt: Scale type.
Xmn,Xmx ,Ymn,Ymx : Scale ranges for the X and Y axes.Check_lgt: Test if the scale ranges that have been input for a log axis
are powers of ten.
49

SUBROUTINE DIG INIT cont.
LINE #;
2710-2880: Output Figure 2.8a SET UP DIGITIZING; input Gr.
2890-2960: Output Figure 2.8b.2970-1050: Digitize corners of the current graph.1060-3180: Output Figure 2.8c; input Pt.
3190-3460: Output Figure 2.8d-e; input Xmn,Xmx,Yinn,Ymx
CALLED FROM: Subroutine 3.9 DIGIT.
3.9 SUBROUTINE DIGIT
FUNCTION: Digitize file number LI.
VARIABLES:K: Number of points digitized.XtempjYtemp: Temporary arrays for digitized data. See 3.7 DIGITIZE Subroutine.
Data will be rotated but not scaled in these arrays.
LINE #:
3480-3600: Output Figure 2.9 DIGITIZE FILES; input F$(L1).3610-3730: Digitize file number LI.
3650: Test to end digitizing.3670: Test to delete a point.
3700-3410: Signal end of digitizing.
CALLED FROM: Subroutine DIGITIZE.
3.10 SUBROUTINE DIG_0PTS
FUNCTION: Scale data for permanent data array, rotate temporary data array,present digitizing edit options to the user, input the optionnumber that the user has selected, and branch to appropriate subroutines.
VARIABLES:Ed: Passed to the HARD subroutine to flag program to print the data on the
thermal printer instead of the CRT.Scaleck: Scale check. Counts the number of digitizing edit options that
have been chosen in 3.10 DIG_0PTS. When Scaleck=l, it flags DIG_0PTS to
branch to DIG_SC^LE to scale digitized data to user units. By
incrementing it each time an option is chosen, data is only scaledonce, except to be rescaled after going to 3.11 DIG_EDIT where it has been
set back to 0.
D0: Digitizing edit option number input by the user.
LINE #:
3750-3940: Output Figure 2.10 DIGITIZING EDIT OPTIONS; input D0.
3880: Increment scaling flag.3950: Scale digitized data once.
3960-3980: Branch to appropriate subroutines or return to 3.7 DIGITIZINGsubroutine if user did not input an option number.
CALLED FROM: Subroutine 3.7 DIGITIZING.
50

3.11 SUBROUTINE DIG EDIT
FUNCTION: Let the user edit the digitized data by stepping the digitizingpen to the points that have been digitized and allowing the
user to re-digitize, delete or add additional points.
VARIABLES:K: Number of points in file number LI.
I: Point that is to be changed or deleted.I+l: Point to be added..
LINE #:
4770-4860:4870:
4880:
4910:
4930:4990-5020:5030-5080:5090-5150:5160-5250:
Output Figure 2.11 RE-DIGITIZING OPTIONS.Reset flag to scale the data.
Rotate the data back to its original values.
Step digitizing pen to point number I.
Input option number.Branch to appropriate options.Re-digitize point I.
Delete point I by bumping down all subsequent points by 1.
Add a point by digitizing a new point and bumping all
subsequent points up by 1.
CALLED FROM: Subroutine 3.10 DIG OPTS.
3.12 SUBROUTINE DEFINE_FUNCTION
FUNCTION: Allow user to input the number of data files (stored in In(4)) by
defining a function and storing it directly into the program at
line 5770.
VARIABLES:Function: Counts the of files that have been defined. Used to flag the
return to 3.4 INPUT DATA subroutine.Xmnn,Xmxx: Data range Tor the function of X input by the user.Inc: Increment between X values ( ( Xmxx-Xmnn )/Npt( LI ) ).
Start: Initial X value.
LINE f:
5280-5560: Output Figure 2.12a-c DEFINE FUNCTION; incut FS(Ll) ,Npt(Ll) ,Xmxx,Xmnn5570-5620: Output Figure 2.12d.5630-5720; Generate data by adding a constant interval to Xmnn to get the
X value, and using that X value in the user defined functionto obtain the correspondi ng Y value.
5740-5750: Get the next function.5770: Function that has been defined and stored by the user.
CALLED FROM; Subroutine 3.4 INPUT DATA.
51

3.13 SUBROUTINE EDIT_DATA
FUNCTION: Allow the user to choose to print, review or edit file number LI,
and branch to appropriate subroutine until user choosed to exitedit mode.
VARIABLES:Ed: Edit option number chosen by the user.
Dig_flag: If EDIT_DATA has been called from DIG OPTS subroutine, changetemporary data files Xtemp and Ytemp also an"? scale them back to
plotter units.
00: Counter to print data on the CRT in groups of 18.
LINE #:
5780-5910: Display Figure 9a EDIT DATA; input Ed.
5920-5930: Depending on the user's choice:
(1) Branch to REVIEW subroutine to print on CRT.
(2) Branch to EDIT_IT subroutine to display Figure ; input new X
and Y data values for data pair ^A1
.
(3) Branch to HARD subroutine to print on thermal printer.5940: Repeat until the user choosed to exit edit mode.
CALLED FROM:
Subroutine KEYBOARD.Subroutine TAPE.Subroutine DIGITIZE.Subroutine DEFINE FUNCTION.
3.14 SUBROUTINE OPTIONS
FUNCTION: This is the main pivot point in the program. User will alwaysbe returned to this menu until option -4 is chosen. Program control
will then be returned to the main program which will call a subroutineto terminate the program.
VARIABLES:A1 : Options number input by the user.
LINE =:
410-540: Output Figure 2.4 PROGRAM OPTIONS; input Al.
550-610: Branch to subroutines or return to 3.2 PROGRAM PLOT.
CALLED FROM: 3.2 PROGRAM PLOT.
52

3.15 SUBROUTINE SAVE_DATA
FUNCTION: If the data were input from tape, they may be restored into
the same data set on tape. If the data were input in the other
modes, they may be stored into a new set on tape.
VARIABLES:D$: Data set name input by the user.
AS: Data set descriptor input by the user.Nr: Number of records to create for the data set storage.Mxnpt: The largest number of points in any one file.
Restore: Flag to store data into the same set.
LINE #:
6450-6520: Output Figure 2.14a SAVE DATA; input Al.
6530-6570: Output Figure 2.14b; input D$.
6570-6680: Compute Mxnpt, Nr; purge the old file; and create a new file
on the tape.6690-6770: Output Figure 2.14c; input AS.
6780-6900: Print data onto the tape.
CALLED FROM: Subroutine 3.14 OPTIONS.
3.16 SUBROUTINE PL0T_DATA
FUNCTION: Present all user with all scaling and plot options and plot on
CRT, thermal printer or digital plotter.
VARIABLES:Defaults: Flag to set all the plot options the their defaults and to force
the user to run through all the plot option menus.An: Flag input by the user to use the previous run's parameters. In the
program it will cause the program to scale the data if a log axis is
used and skip directly to MENU_4 subroutine.Log_ck: Flag that new data have b^en input. Set at the INPUT_DATA subroutine
LINE #:
7950-8040: Pass the COMMON variables.8050: Save the total number of files.8060: If the graph was retrieved from tape, skip directly to 3.38 Menu_48070: If Defaults is true, the plot options will be set to their
defaults and the user must enter all scale options.8080-8110: Output Figure 2.17 PLOT DATA menu and input An.
8130: Find the ranges of the data files.8140-8150: If there are new data and the user wishes to plot a log scale
take logarithms of the new data.8170-3230: Go to all the plot option menus.
CALLED FROM: Subroutine 3.14 OPTIONS.
53

3.17
SUBROUTINE FIND_RANGE
FUNCTION: Find the X and Y data ranges for each file and for the entire data set.
VARIABLES:X_min(*) ,X_max{*) ,Y_min(*) ,Y_max(*) : Data ranges for each file to be used
in 3.34 NORMALIZE subroutine.Xmin ,Xmax,Ymin,Ymax: Data ranges for entire data set to be used in
3.21 SCALE_TYPE and 3.22 ENTER_SCALES subroutines.
CALLED FROM:
Subprogram 3.16 PL0T_DATA.Subroutine 3.21 SCALE TYPE.Subroutine 3.34 NORMAUIZE.3.18
SUBROUTINE SET_DEFAULTS
FUNCTION: Set all plot options to their defaults and set Default flag to false.
CALLED FROM: Subprogram 3.16 PL0T_DATA.
3.19
SUBROUTINES X_LIN_T0_L0G and Y_LIN_T0_L0G
FUNCTION: Scale the data set from user input form to graphing form.
CALLED FROM:
Subprogram 3.16 PLOT DATA.Subroutine 3.21 SCALr TYPE.
3.20
SUBROUTINES X_L0G_T0_LIN and Y_L0G_T0_LIN
FUNCTION: Scale data set back from graphing form to user input form.
CALLED FROM: Subroutine 3.21 SCALE_TYPE.
3.21
SUBROUTINE SCALE TYPE
FUNCTION:
1) Convert data to and from plotting units if log or semi-log scale typeswere chosen by the user.
2) Input scale type.3) Branch to 3.22 ENTER_SCALES subroutine to input X and Y scale range.
VARIABLES:Pt: Scale type input by the user.
54

SUBROUTINE SCALE TYPE cont.
LINE #:
9090-9110:
9120:9130-9510:9520-9530:
9550:
Convert data from log form to linear form if previous scale
type chosen was log for either axis.
Find ranges for the data set.
Output Figure 2.18 SCALE TYPE menu; input Pt.
Convert data to log form for log axes.
Get new scale ranges.
CALLED FROM: Subprogram 3.16 PL0T_DATA.Subroutine 3.25 MENU 1.
3.22 SUBROUTINE ENTER_SCALES
IFUNCTION: Input scale ranges for the X and Y axes.
VARIABLES:Xmn,Xmx,Ymn,Ymx: Values input by the user for the X and Y axis
1scaling ranges.
Nx,Ny: Distance between minor tics on the linear axes, or the number of
major tics on the log axes.Xm,Ym: Number of major ticks.Xt,Yt: Value of the minor tics in user units on linear axes.
Dmin,Dmax: Check if input values for log axes are powers of ten.
iLINE #:
|i 9570-9590: Output Figure 2.19a ENTER SCALES,j 9610-9830: Enter Xmn,Xmx for log axis.
9850-9930: Enter Xmn,Xmx for linear axis.9940-9960: Output Figure 2.19b.
9980-10180: Enter Ymn,Ymx for log axis.10200-10280: Enter Ymn,Ymx for linear axis.
I
CALLED FROM:
\Subroutine 3.21 SCALE TYPE.Subroutine 3.25 MENU T.
3.23 SUBROUTINE LABELS
I
i
II
FUNCTION: Input title and axes labels for the plot.
VARIABLES:TS: Title.XS: X axis label
.
YS : Y axi s 1 abel
.
CALLED FROM:
Subprogram 3.16 PLOT DATA.Subroutine 3.25 MENU~1
.
55
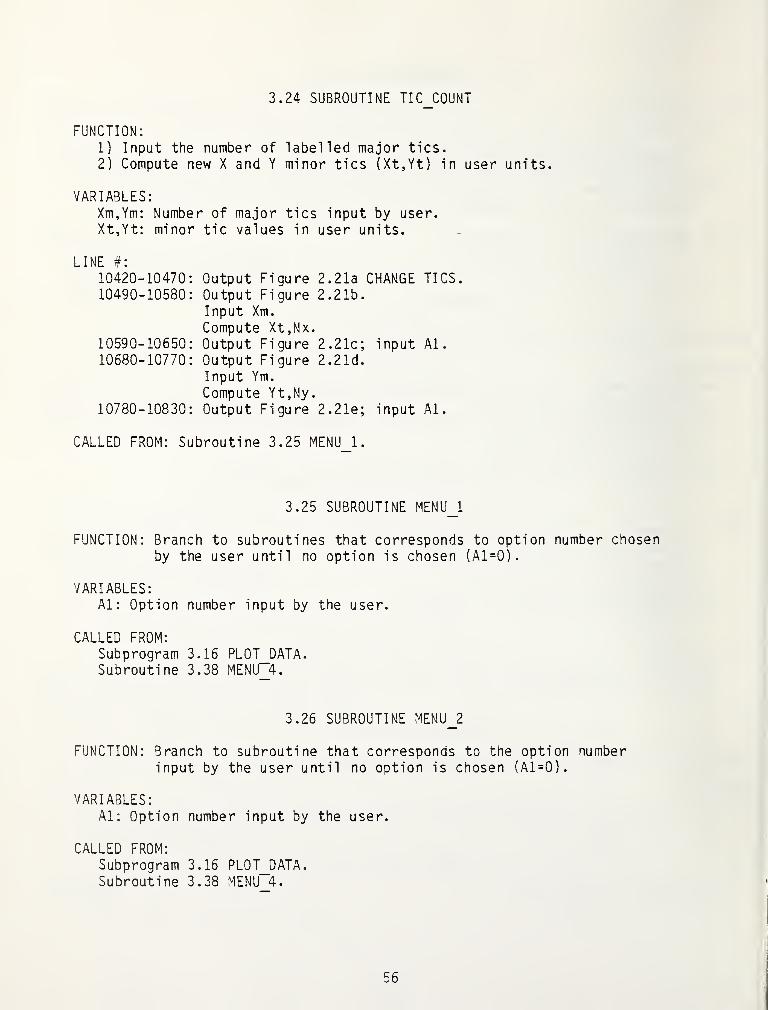
3.24
SUBROUTINE TIC COUNT
FUNCTION:
1) Input the number of labelled major tics.
2) Compute new X and Y minor tics (Xt,Yt) in user units.
VARIABLES:Xm,Ym: Number of major tics input by user.
Xt,Yt: minor tic values in user units.
LINE #:
10420-10470: Output Figure 2.21a CHANGE TICS.10490-10580: Output Figure 2.21b.
Input Xm.
Compute Xt,Nx.10590-10650: Output Figure 2.21c; input Al.
10680-10770: Output Figure 2.21d.Input Ym.
Compute Yt,Ny.10780-10830: Output Figure 2.21e; input Al.
CALLED FROM: Subroutine 3.25 MENU 1.
3.25
SUBROUTINE MENU_1
FUNCTION: Branch to subroutines that corresponds to option number chosenby the user until no option is chosen (A1=0).
VARIABLES:Al: Option number input by the user.
CALLED FROM:
Subprogram 3.16 PL0T_DATA.Subroutine 3.38 MENU~4.
3.26
SUBROUTINE MENU_2
FUNCTION: Branch to subroutine that corresponds to the option numberinput by the user until no option is chosen (A1=0).
VARIABLES:Al: Option number input by the user.
CALLED FROM:
Subprogram 3.16 PL0T_DATA.Subroutine 3.38 MENU~4.
56

3.27SUBROUTINE STD DEV
FUNCTION: Output the 2.24 STANDARD_DEVIATION menu, input the standarddeviation flag; and if standard deviation is used, input the
value of one standard deviation and the number of standarddeviations to plot.
VARIABLES:Sd: Input flag to plot standard_deviation.Num_sd: Number of standard deviations to plot.
Std: Value of one standard deviation.
CALLED FROM: Subroutine 3.26 MENU_2.
3.28
SUBROUTINE SCI_N0T
FUNCTION: Output the 3.25 SCIENTIFIC NOTATION menu, and input the flag
to use scientific notation.
VARIABLES:Sci_not: Flag to plot scientific notation.
CALLED FROM: Subroutine 3.26 MENU_2.
3.29
SUBROUTINE TITLE_SIZE
FUNCTION: Output the figure 2.30 TITLE SIZE menu and input Tsize. Tsize will
be used in the LABEL subroutine which is called from the PLOT subroutine.
VARIABLES:Tsize: Character size multiplier for the title.
CALLED FROM: Subroutine 3.26 MENU_2.
3.30
SUBROUTINE LABEL_SIZE
FUNCTION: Output the figure 2.31 LABEL SIZE menu and input Lsize. Lsize will
be used in the LABEL subroutine which is called from PLOT subroutine.
VARIABLES:Lsize: Character size multiplier for the X and Y axes labels.
CALLED. FROM: Subroutine 3.26 MENU_2.
3.31
SUBROUTINE NUMBER_SIZE
FUNCTION: Output the figure 2.32 NUMBER SIZE menu and input Nsize. Nsize will
be used in the NUMBER subroutine which is called from PLOTsubrouti ne.
VARIABLES:NSize: Character size multiplier for the labels for the major tics on the
X and Y axes.
CALLED FROM: 3.26 MENU 2.
57

3.32
SUBROUTINE DIMENSIONS
FUNCTION: Resetplot aspect ratios to their defaults, output 2.29 DIMENSIONSmenu and input sizes.
VARIABLES:Xsize,Ysize: Length of horizontal and vertical sides of the graph
in graphic units.
CALLED FROM: 3.26 MENU 2.3.33
SUBROUTINE ANNOTATION
FUNCTION: Output 2.26 ANNOTATION menu, input annotation flag and input annotationsize if annotation is to be used.
VARIABLES:Annot: Flag use annotation in graph.Asize: Character size multiplier for annotation.
CALLED FROM: 3.26 MENU 2.
3.34
SUBROUTINE NORMALIZE
FUNCTION: If data are normalized, set flag and normalize the selecteddata file.
VARIABLES:X_min(Ll),X max(Ll) ,Y_min(Ll) ,Y max(Ll): Data ranges for file number LI.
X_min${ LI),I’_max$(Ll )7Y_mi n${ LlT,Y_maxS( LI ) : Character values of the
data ranges for file number LI.
Norm: Flag that a file has been normalized.Xmult,Ymult: Multipliers for the X and Y data values.File: File number to be normalized.
LINE #:
12300-12470: Output Figure 2.27 NORMALIZE; input Al.
12490: Set normalize flag.12500: Input File, Xmult, Ymult.
12510-12590: Normalize data file number File.
12600-12590: Set display string for use in 3.26 MENU_2.12700: Find new values for the data ranges.
CALLED FROM: 3.26 MENU 2.
58

r
3.35
SUBROUTINE SHADING
FUNCTION: Input flag if a data file is to be shaded and if so inputwhich data files are to be shaded.
VARIABLES:Shade: Flag if any data file is to be shaded.Shade(Ll): Flag to shade file number LI. Used in PLOT subroutine.
Shade$(Ll): Print character for LI in 3.26 MENU_2.Ll$: Print LI as a character in the 3.35 SHADING menu.
LINE #:
12760-12830: Output Figure 3.35a SHADING; input Shade.12860-12940: Output Figure 3.35b; input shade flags for each file.
12950-13040: Set output string for use in Menu_212950-13040: Set up output string for use in 3.26 MENU_2.
CALLED FROM: 3.26 MENU 2.
3.36
SUBROUTINE MENU_3
FUNCTION: Output 2.33a MENU 3: PLOT TYPES and input Al. Branch to 3.37 PLOT_TYPESjt subroutine until user chooses to exit this menu (A1=0).
I VARIABLES:Al: Flag to change plot types.
r CALLED FROM:
I' Subprogram 3.16 PL0T_DATA.Subroutine 3.38 MENU 4.
3.37
SUBROUTINE PLOT TYPES
FUNCTION: Output 2.33b PLOT TYPES menu for each file and input new plot typeand line type, symbol and symbol size, if used.
VARIABLES:Pl(Ll):Lt(Ll):
LS(Ll)
:
Cm(Ll):
Plot type for file number LI. Used in PLOT subroutine.Line type for file number LI. Used in LINES subroutine which is
called from PLOT subroutine.Symbol for file number LI. Used in SYMBOLS subroutine which is
called from PLOT subroutine.Symbol size for file number LI.
CALLED FROM; 3.36 MENU 3.
I59

3.38SUBROUTINE MENU 4
FUNCTION: Branch to subroutine that correspond to the option numberentered by the user from 2.35 MENU 4: OUTPUT MEDIA menu untilno option is chosen (A1=0). The user has options to plotdata on the CRT, thermal printer and digital plotter or theuser may return to any of the other three options menus.
VARIABLES:Al: Option number
CALLED FROM: 3.16 PL0T_DATA.
3.39
SUBROUTINE CRT
FUNCTION: Set plotting variables to the CRT defaults and plot data on the CRT.
VARIABLES:S: Set the size of the plot to the size of the CRT.XdpjYdp: Set plotting offsets to 0. Used in PLOT subroutine to center
the graph on the digital plotter platten.
CALLED FROM: 3.38 MENU 4.
3.40
SUBROUTINE PRINTER
FUNCTION: Dump whatever is on the graphics CRT onto the thermal printer.
CALLED FROM: 3.38 MENU 4.
3.41
SUBROUTINE STAN_DEV
FUNCTION: If the PLOT subroutine is called from the CRT subroutine, this
subroutine allows the user to digitize the bottom of the desiredposition of the error bar. However, if PLOT was called fromthe PLOTTER subroutine, the error bar is plotted where the lasterror bar position was digitized.
VARIABLES:Sdx,Sdy: Coordinates for the digitized position of the error bar.
Nsd_gu: Length of the error bar in graphic units.Num_sd: The number of standard deviation ot plot. Input in the
3.27 STD_DEV subroutine.Nsd: Value of one standard deviation. Input in the 3.27 STD_DEV subroutine.
LINE #:
18240-18320: Output 2.36 STANDARD DEVIATION DIRECTIONS menu.18330-18350: Set cursor on screen; digitize position; find length of bar.
18360-18410: Draw the error bar.
18420-18510: Draw plus or minus the number of standard deviations.
CALLED FROM: Subroutine PLOT.
60

3.42 SUBROUTINE ANNOTATE
FUNCTION: If called from the CRT subroutine, user is allowed to enterup to thirty annotation labels by digitizing the point wherethe annotation is to be labeled and then entering the
annotation label from the keyboard. The user signals the
end of the annotation by digitizing the same point twice.If called from the PLOTTER subroutine, the annotationwill be plotted where it was last entered from the CRT.
VARIABLES:
L: Subscript for the annotation array.Ann: Number of labels input. Used in 3.45 COLORS to input colors
for the annotation labels.Xa(L),Ya(L): X,Y coordinate of the first letter of annotation label number L.
Asize: Character size multiplier for the annotation. It is input by
the user in the ANNOTATION subroutine.
LOGIC:
Output 3.37 ANNOTATION DIRECTIONS menu.
Until user chooses to stop inputting annotation, set a loop to:
a) Digitize position for the label.b) Input labels from the keyboard (PI abel $(L) )
.
c) Write the label on the CRT.
d) Exit loop when the same point is digitized twice i.e.
Xa{L-l)=Xa(L) and Ya(L-l)=Ya(L)
.
If plotting on the digital plotter;a) Pick pen for label
.
b) Skip everything but the labeling in line #15670.
LINE #:
18580-18660: Output Figure 3.37 ANNOTATION DIRECTIONS menu.
.18690: Put cursor on the CRT screen.
18720&18760: Test to exit annotation loop.18740: Digitize label position on the CRT.
18780-18850: Label the annotation.
CALLED FROM:
3.39 CRT.
Subroutine PLOTTER.
61
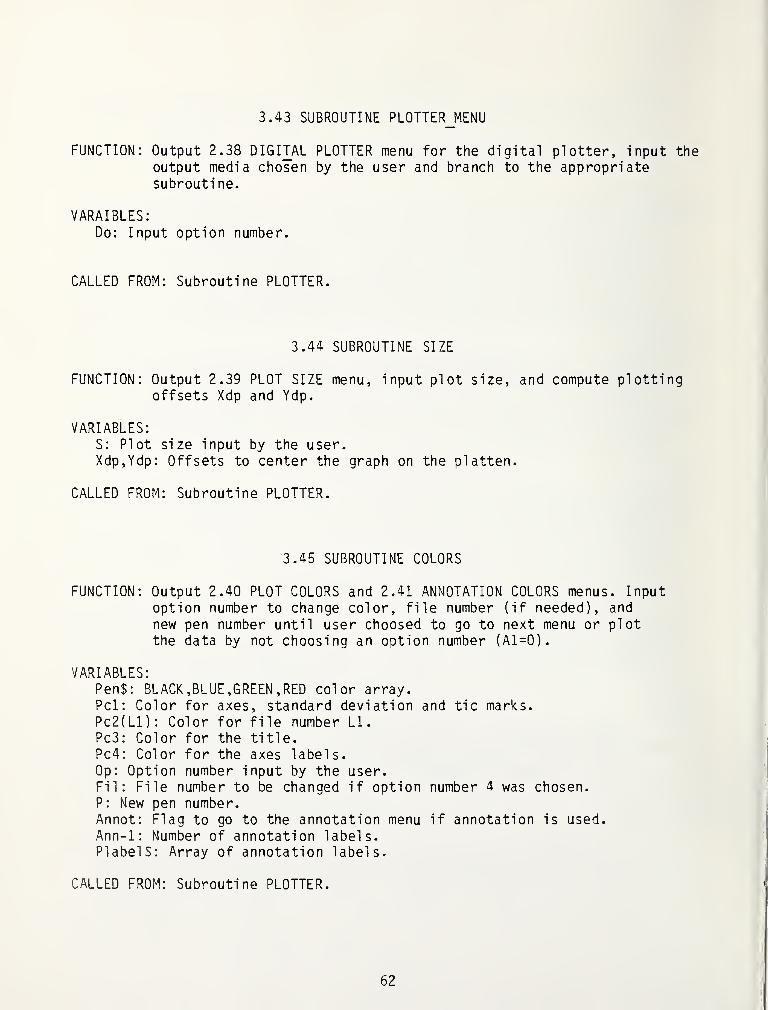
3.43
SUBROUTINE PLOTTERJIENU
FUNCTION: Output 2.38 DIGITAL PLOTTER menu for the digital plotter, input theoutput media chosen by the user and branch to the appropriatesubroutine.
VARAIBLES:Do: Input option number.
CALLED FROM: Subroutine PLOTTER.3.44
SUBROUTINE SIZE
FUNCTION: Output 2.39 PLOT SIZE menu, input plot size, and compute plottingoffsets Xdp and Ydp.
VARIABLES:S: Plot size input by the user.Xdp, Ydp: Offsets to center the graph on the platten.
CALLED FROM: Subroutine PLOTTER.
3.45
SUBROUTINE COLORS
FUNCTION: Output 2.40 PLOT COLORS and 2.41 ANNOTATION COLORS menus. Inputoption number to change color, file number (if needed), and
new pen number until user choosed to go to next menu or plotthe data by not choosing an option number (A1=0).
VARIABLES:Pen$: BLACK , BLUE, GREEN , RED color array.Pci: Color for axes, standard deviation and tic marks.Pc2(Ll): Color for file number LI.
Pc3: Color for the title.Pc4: Color for the axes labels.Op: Option number input by the user.Fil: File number to be changed if option number 4 was chosen.P: New pen number.Annot: Flag to go to the annotation menu if annotation is used.
Ann-1: Number of annotation labels.PlabelS: Array of annotation labels.
CALLED FROM: Subroutine PLOTTER.
62

APPENDIX A: MATERIALS
A

4

APPENDIX A: MATERIALS
This appendix contains tips on the output media materials that may be usedon the internal thermal printer and/or the digital plotter. The appendixis broken up into sections describing the (1) paper; (2) pens; and (3)
miscellaneous materials. Each section begins with a description on the
best use of each material followed by a list of these materials thatcontains a description of the material, the order number, and the quantityper order.
Section 1: PAPER
INTERNAL THERMAL PRINTER: Hewlett Packard produces two types of thermal
paper: (1) continuous roll; and (2) perforated 8.5 x 11 inch roll with
black print. One graph using all the size defaults uses two-thirds of
an 8.5 X 11 inch page. If the perforated paper is used and the TOP OF FORMbutton on the 9845 is not pressed after one graph, the next graph will
be plotted over the perforation leaving a one inch gap in the graph.For this reason the continuous paper is the one recommended.
DESCRIPTION ORDER # QUANTITY
HP continuous blue print 92161R 6 rolls
thermal paper
HP perforated Page-Perf 92161D 6 rollshigh contrast black printthermal paper
DIGITAL PLOTTER:
PLOTTING WITH FELT TIP PENS: The drawing paper is a medium weight cottonfiber paper that definitely produces the best results. It yields a
clear solid line and does not darken or wrinkle easily. If slides of
plots are to be made, this is the only paper recommended.
Thermal paper may also be used. It yields a bright, clear line, butdarkens and wrinkles easily. However, it is a good idea to use thisas scrap paper for trial plots before plotting on the more expensivepaper or transparencies
.
PLOTTING WITH THE DRAFTING PEN: The drafting pen can be used on
almost any kind of paper, but the vellum drafting paper yields themost pleasing results.
PLOTTING TRANPARENCIES: By far the best transparency film used so far
is made by Hewlett Packard as it does not smear.
PLOTTING WITH SPECTRUM PENS: The Spectrum Graphics Kit is new fromHewlett Packard. The kit contains subtractive ink pens, i.e., pens thatblend their colors together as they overwrite each other. It is
definitely recommended to use spectrum paper with the spectrumpens. The inks will blend on different types of paper; but they
A1
appear dark and mixing more than two colors generally produces black.The stacked bar chart effect in Figure 7 of APPENDIX F was created byassigning a different color to each file and shading.
Section 2: PENS
FELT TIP PENS: The Hewlett Packard felt tip pens for the digitalplotter come in regular tip (0.3 mm) and broad tip (0.7 mm). Regulartip pens work well for everything but should especially be used if theplot size is less than 0.65. The broad tip pens are good for (1) paperthat doesn't absorb ink well (such as the vellum) (2) making numbers,title and axes labels stand out more; and (3) making the shadingcompletely solid.
TRANPARENCY PENS: Hewlett Packard transparency pens should be usedon the Hewlett Packard transparency film. Felt tip pens should not beused on the tranparency film because it smears badly. The transparencypens also come in two tip widths and are used in the same way as thefelt tip pens. If the program is being used to make viewgraphs, thebroad tip pens should be used.
DRAFTING PEN: The Hewlett Packard liquid ink drafting pen is the onlysatisfactory drafting pen that has been tried so far. It is used justas the felt tip pens are; however, because it is bigger, the user mustbe careful that the plotter does not try to put the pen away into oneof the pen stables as this can cause considerable damage to the plotter.
SPECTRUM PENS: Hewlett Packard claims that the new subtractive ink penscan create up to 100 different colors. They work especially well forlarge shaded areas. There are only 12 distinct colors that may be
created, while the other 90 rely on adding differing concentrationsof dots on another color, causing the eye to blend them togetherinto another slightly different shade. Figure 7 in APPENDIX F shows
the three primary colors (yellow, magenta, and cyan) and the intermediatecolors produced by mixing 2 colors together. Care should be takenwhen using these pens that the pens stables have been cleaned outcarefully with a cotton tipped swab, and they should not be used in
conduction with the regular felt tip pens.
DESCRIPTION ORDER # QUANTITY
TransparenciesSpectrum Paper
9270-0639 100 8.5"xll" sheets9280-0516 100 8.5"xll" sheets
DESCRIPTION ORDER # QUANTITY
Narrow tip felt tip
plotting pens
5060-6810 1 pack of 4 colors(black, blue, red, green)
Wide tip felt tipplotting pens
5060-6858 1 pack of 4 colors(black, blue, red, green)
A2
DESCRIPTION ORDER # QUANTITY
Narrow tip transparency 5060-6818 1 pack of 4 colorsplotting pens (black, blue, red. green)
Wide tip transparency 5060-6819 1 pack of 4 colorsplotting pens (black, blue, red. green)
Drafting pen body 07580-60025 Each
Narrow drafting pen tip 9200-0588 EachWide drafting pen tip 9260-0579 EachDrafting pen caps 4320-0365 Each
Spectrum plotting pens 5060-6855 1 pack of 4 colors(black, blue, red. green)
Section 3: MISCELLANEOUS
TAPES: The only storage medium used by this program is the magneticminicassette tapes that may be ordered from Hewlett Packard.
KITS: Hewlett Packard provides a transparency kit and a spectrumgraphics kit. The transparency kit contains 200 sheets of transparencyfilm, a 1 ounce bottle of ink solvent, and one package each of blue,black, red, green; and violet, gold, orange, and black pens in
broad and regular tips. The spectrum graphics kit contains 100sheets of spectrum paper and four packages of spectrum pens. Thesekits do not save any money but they are more convenient to order.
DESCRIPTION
HP magnetic mini-
cassette tapes
Spectrum Graphics Kit
Transparency
ORDER # QUANTITY
98200A Box of 5
9872-60069 Each
17055A Each
A3


APPENDIX B: MODIFICATIONS


APPENDIX 3: MODIFICATIONS
In using BUGS, there are occasions which require changes to be made in the
program to accommodate a particular graph. Below are listed some changesthat have been needed most frequently.
A line of the program may be changed by:
1) Pressing the STOP key to the right of the alphnumeric keyboard.Typing EDITLINE and the number of the line to be changed.
Pressing EXECUTE.Typing in the desired change, using the arrows in the display pad
to move the cursor.
the STORE key located directly above the right SHIFT key.
the RUN key located beneath the STOP key to begin the program
2 )
3)
4)
5)
6 )
7)
Pressi ngPressi ngover.
BUGS mayRESTORE
'
be changed permanently on the program tape by typing'BUGS" and pressing EXECUTE.
Modifying Plot Input.
, '-VDdifying array and string dimensions: All data and plotting arraysare declared in the INIT and SET DEFAULTS subroutines. Data arraysare declared by the array name followed by parentheses containingthe number of elements in the array. String arrays are similar withthe addition of the number of characters contained in each elementdeclared in brackets after the parentheses. NOTE: If the numbe»'
of elements or characters allowed in an array is changed, the usermay not store the graph on taoe unless 1) the user makes this a
permanent change in the program and restores any previously storedgraphs in the new format; or 2) Make sure that the changes in the programhave been made again before the graph is retrieved.1. Change the number of annotation labels allowed:
Line = 150,180,210: Change the subscripts in Xa, Ya, Labels, and ^laoel
to the new number of annotation labels allowed.18700: Change the 40 to the new number of labels allowed.
2. Change the number of characters allowed in string variables. Belowis a list of all string variables that may be changed.
Ti tl e:
X axi s 1 abel
:
Y axi s 1 abel
:
Annotation labels:. Define a function of moreboth the program and the special function keychanged.
1. In the program, line = 5700 must be changed to call the function ofall the variables that are to oe oassed. Variaoles may be addedby inserting the new variaoles seoarated by commas within theparentheses
.
2. ~he soecial function key file must be changed by:
TS[30]
xsrzo]YS[20]Labels (40) [30]than one variaole: ^o chanae the function
^ile "?UNKEY" must oe
0 and then prs
;nE key in the
ssing EXECUTE
.
edit oad at the
a. Typing EDIT KEYb. ^ress the DEL L
keyboard.c. Add new variaoles within the parentheses '’n
they are listed in the orogram line = 5700.d. Press EXECUTE.
too left of the
the same order as

e. To change the program permanently:1) Press special function key k0.
2) Type PURGE "FUNKEY" and then press EXECUTE.f. Type STORE KEY "FUNKEY" and then press EXECUTE.
III. Modifying plotting defaults: All defaults are set in the Set_defaultssubroutine. There are two kinds of defaults used: (1) variables that flagthe use of an option; and (2) size and dimension specifiers. Belowis a list of the plot defaults that may be changed that contains theprogran variable name and function with their default values.
A. Size specifiers:
B. Options Flags:
C. Graph parameters:
D. Miscellaneous:
Function Variable name Defaul
t
Title size Ts i ze 1
Axes label size: Lsize 1
Number size: Nsize 1
Annotation size: Asize 1
Length of X axis: Xsize 100
Length of Y axis:
, Yes=l)Ysize 60
Shadi ng: Shade No
Standard deviation Sd No
Annotation Annot No
Scientific Notation Sci not No
Plot type Pl(*) Li nes
Line type Lt(*) Sol i d
Symbol L$(*)11*11
Frame Frame 1
Tic marks Axes 1
Numbers Number 1
Axes labels Label 1
Ti t1 e
X axis label
Y axis label
Major tici nterval
s
T$
X$
Y$
Xm,Ym
Null
Nul 1
Null
4
IV. iModifying Plot Output.A. Modifying histogram bar width: The width of the bar is given by half
the distance between the smallest interval between any two X valuesminus two graphics units. For many plots, this gap appears much too
small. To change this, replace the 4 in line 17650 with five timesthe new width. NOTE: The bars appear much thicker on the CRT thanon the plotter.
B2

APPENDIX C: PROGRAM LISTINGS
C


P R 0 G R fl M PLOT #############10 !
###S#20 GOSJB Init30 GOSJB Options40 GOSJB End_i
t
50 End: EJD ! ################# END PLOT ##########.######‘it it#
60 !
70 !
S0 Init: ! ################ SUBROUTINE TO INITIRLIZE PROGRflfl ##########90 DEG100 OPTION BASE 1
no COM F$ <25) C20],SHORT XK 25 , 200 ) ,
Y 1< 25 , 200 )
120 COM INTEGER Npt < 25 ), Dsfau 1 t s , Log_c k , Pf i 1 e , PK 25 Lt < 25 >, Pc 2 < 25
)
130 COM INTEGER Pt,Xrri
,Ym
,Xs i zs
,Ys i zs ,
Norm , Shads ,flnnot
,Sd
,F i 1 e
,Nt
, Nx
,
Ny140 COM INTEGER Pc 1 , Pc 3 , Pc 4 , Sc i not , Num_sd , Rnn , Frame , fixes , Number , Labs1
15Gt COM SHORT Xmx ,Xmn
,Ymx
, Ymn , Xt , Yt ,Ts i zs
, Ls i zs ,Ns i ze
,fls i ze
,Xmu 1 1 ,
Ymu 1 t
,S
160 COM SHORT X_max < 25 ) ,X_m i n < 2^-, Y_ma;::; C 25 > , Y_m i n < 25 > ,
Xa< 40 ) ,Ya< 40 )
,
C m < 2 5 ) ,A d 0 ,
Y d p170 COM SHORT Xmax , Xm i n , Ymax , Ym i n , Sdx
,Sdy , Nsd ,
Opt i ons130 COM LS < 25 ) C 1 ] , T5 : 30 ] , Xi C 20 ] , Y$ C 20 ] , V$ C 1 0 ] , P$ ( 4 > C 1 2 ] , Labs 1 $ < 40 ) [
3
, 03’ 190 COM PsnS<4> C53 , Shades C 30 3 , NormS[3200 COM X maxS‘:25) C 123 ,
X mi nS< 25 > C 12 3
i
210 COM INTEGER Norm<25>, S h ad s < 2 5 ) ,PI
: 220 SHO RT Xt smp < 25 , 200 ) ,
Y
t s m p < 2 5 , 200 >
1
230 Ifi T E G E R t s m p < 2 5 )
i! 240 DIM fiSC303 , ES[303 , CSC 303 , DSC63 , Ft
: 250 !
260 PsnP< n = "BLACK">; 2 7 0 Per 2)="BLUE"' 230 Psn5C3>="GREEN
"
,290 Psn£<4)="RED"
1 300 PSC 1> = "LINEAR"; 310 PS< 2)="X-LIN, Y-LOG"
320 PS( 3>="X-L0G, Y-LIN"; 330 PSn> = "X-LOG, Y-LOG"
340 D s f au 1 t s = 1
35036037 0
3303904 00410420
RETUR J
it
it
PROGRAM OPTIONS
Optio-is: PRINT PAGE; LIN<2);TRE<30)
;"PROGRAM OPTIONS"
PR rrr L I N < 2 > ;TAB a 5 > ;
"C n input NEN bath f rom keyboard
,
t ap s T
Cl
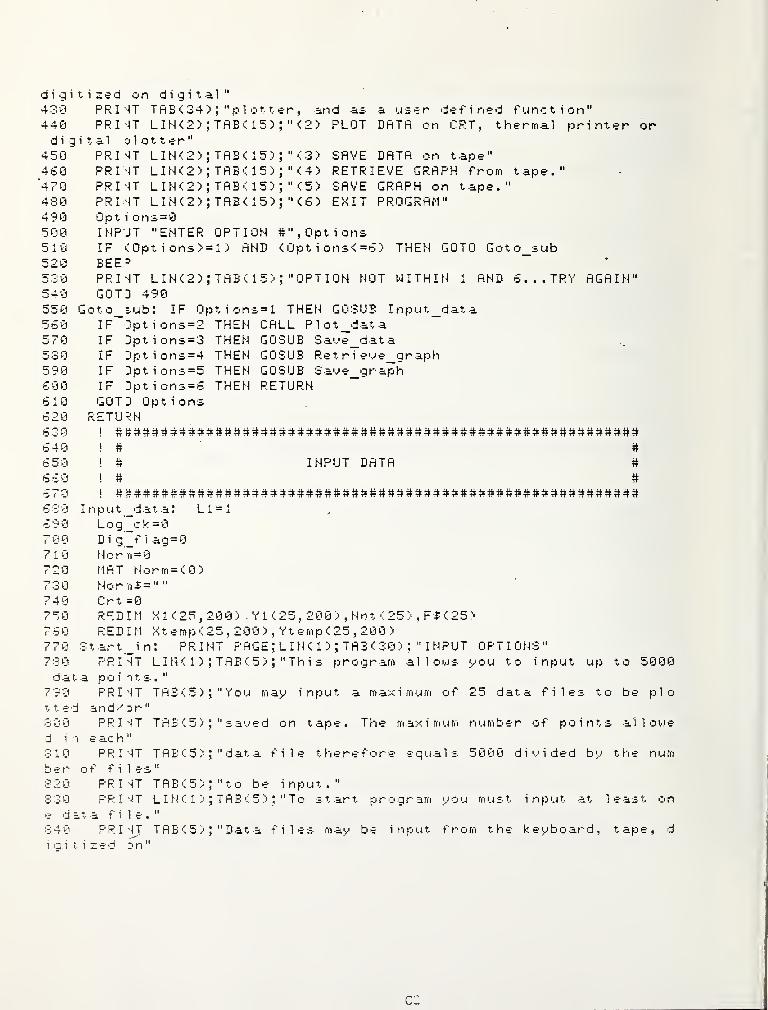
d i g i tized on digit a430 PRUT TRBC34)4 40 PR I 'IT LIN (2);digital blotter"
450 PR I 'IT LIN<2);4G0 PR I 'IT LIN<2);470 PR I -IT LIN<2);430 PR I -IT LIN<2);490 Opt i ons=0500 INPUT "ENTER510 IF <0ptions>=520 BEE =
530 PRI'IT LIN<2);540 GOTO 490550 jOto_eub: IF Op560 IF 0ptions=2570 IF 3ptions=3530 IF Dptions=45 9 0 IF Opt i ons=5600 IF Opt i ons=6610 GOTO Options620 RETURN6306 40 ! #
650 ! ^
6 O 0 ! #
570630 Input data: LI690 L o g _c k = 0
7 0 0 Dig fiag=0710 N o r pi = 0
720 M R T N o r m = < 0 )
730 Nor iii = " "
740 Crt =0
750 RFDIM XI <25,
2
760 REDIM Xtemp<2770 :Ei t ar t in: P R I
N
730 PRl’'lT LIN<1);dat a points.
"
790 PRI'IT TRB<5);tted an d'' or “
3 0 0 PRI'IT TRB<5);d i 'I each"3 1 0 PRI'IT TRBC5);ber of files"320 PRUT TRB<5);S 3 0 PRI'JT LIN<1);e d e t a file."3 4 0 PRI'IT TRB<5);1 g 1 f.
1 z e d D n "
otter, and as a user defined function"15); "<2) PLOT DRTfl on CRT, thermal printer or
15); "<3) SRVE DRTR on tape"15); "<4) RETRIEVE GRRPH from tape.":i5);"<5) SRVE GRRPH on tape.":15);"<S) EXIT PROGRRM"
RND < Opt i ons< =5 ) THEN GOTO Goto sub
d at a
INPUT DRTR
PRGE; LIN< 1 ) ;TRBC30)
;"INPUT OPTION::
iB^5);"Thi3 program allows y
may i nput
a'v' e d on tape. The m ax i m u
m
at a file t here f o r e e q u a 1
s
o u to input up to 5000
maximum of 25 data files to be plo
n u m b e r o f p o i n t s all o w e
5 0 0 0 d i u i d e d b t hi e n u m
i nputp r o q r am y o u rn u s t
may be input from the
input at least on
k e y b o an d , tape, d
c:
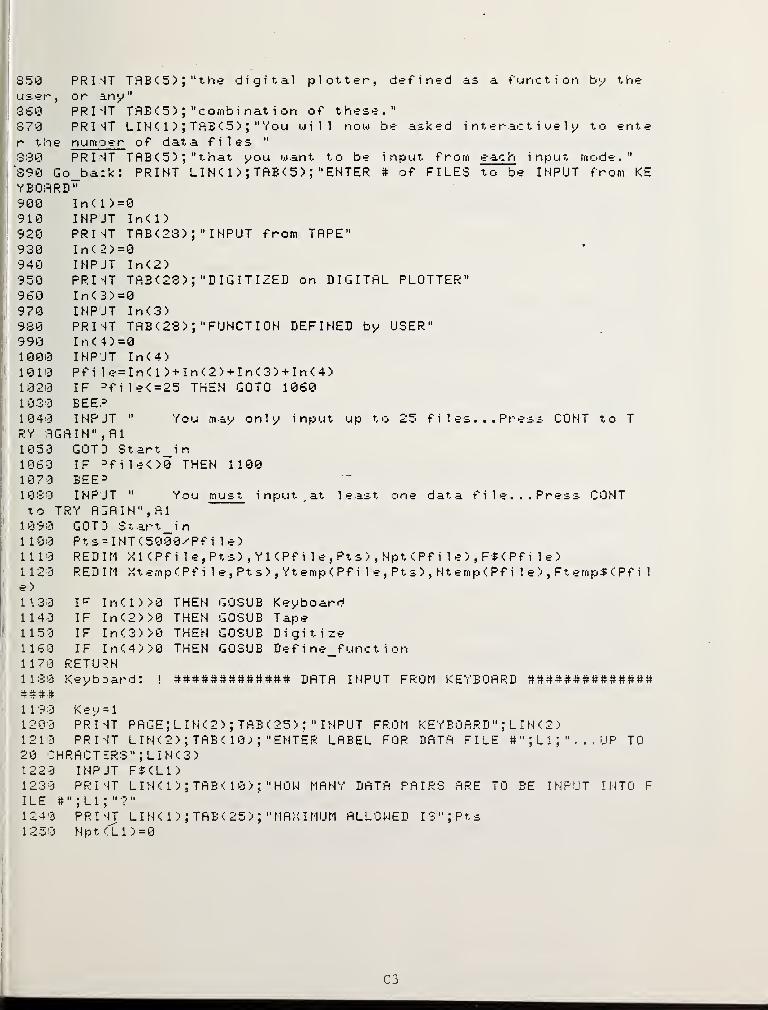
850 PRINT TRB<5) ; '^the digital plotter, defined asuser, or any
"
360 PRINT TRE < 5 > ; " c onib i nat i on of these II
870 PRUT LIN< 1 ; ;TRB<5>
;"You will now be asked in
r the numoer of data files "
330 PRINT TRB<5>;"that you want to be i n p u t fro m
390 Go bark; PRINT LIN< 1 ); TflE<5) ; "ENTER # of FILESYBORRD> 11
900 InU >=0910 IMPJT In<n920 PRINT TRB<28) ;" IMPUT from TfiPE"
930 In< 2)=0940 IMPJT In (2)950 PRINT TRB< 23 ); "DIGITIZED on DIGITAL PLOTTER"960 In< 3)=0970 IMPJT In<3)930 PRINT TRB<28) ; "FUNCTIOH DEFINED by USER"990 In< 4)=01000 INPUT In<4)1010 Pf i 1 e= I n < 1 > + 1 n < 2 ) + 1 n < 3 > + 1 n < 4
)
1020 IF =fne< =25 THEM GOTO 10601030 EEE.=
1040 I HP JT " You may only input up to 25 f i 1 es ... Press COHT to T
RY 0GflIM",Rl1050 GOTO Start_in1060 IF =fi1e<>0 THEM 11001070 BEE^10S0 IMPJT " You must input, at least one data file... Press CONTto TRY fl:flIM",fll
1000 GOTO Start_in1100 Pts = IMT'.:5000/Pf i 1 e)1110 REDIM XI <Pf i 1 e, Pts) ,
YKPf i 1 e, Pts>,Hpt <Pf i 1 e > ,
F$ < Pf i 1 e :
1120 R E D I M X t e rn p < P f i 1 e , P t s ) ,Y t e m p < P f i 1 e
,P t s ) ,
M t e rn p < P f i 1 e ) ,F t e m p $ < P f i 1
e )
I1130 ln<l)>0 THEM GOSUB Keyboard1140 IF In<2)>0 THEM GOSUB Tape1150 IF In<3)>0 THEM GOSUB Digitize1160 IF In*' 4>>0 THEM GOSUB Def i ne_f unc t i on1170 RETU=?M1180 Keyboard: ! DFITR IMPUT FROM KEYEORRD
1190 Key=l.1200 PRMT PRGE; LIM(2>
;TRB<25> IMPUT FROM KEYEORRD L IH< 2 >
1210 PRI-JT LIM'.-:2);TRE< 10; ;
"ENTER LRBEL FOR DRTR FILE # ";L 1 ;
". . , UP TO
i 20 CHRRCTERS" ; LIMC3)1220 IMPJT F^ <L1 ;
1230 PRUT LIM< r;;TRB-:: lo; : "HOW MRNY DRTR PRIRS RRE TO EE INPUT INTO F
ILE ; LI ; "?"
f1240 PRINT LIMa ; ;
TfiB';25';;"MRXIMUM RLLOWED IS";Pts
t1250 M p t < L 1 ; = 0
I
C3

1260 INPJT Npt<Ll)1270 IF ^pt<Ll)<>0 THEN GOTO 131
O
1230 BEE=1290 PRUT LIH<2?
;TflBUO)
;"YOU MUST INPUT RT LERST ONE DRTR PAIR"
1300 GOT 3 1230•1310 IF ^pt<LlK=Pts THEN GOTO 13501320 BEE=-
1330 PRI'^T LIN<2);TRBa0)
;"THE MAXIMUM NUMBER OF POINTS FOR ";Pfile;"
FIL£(S) IB " ; Pts; " . . . TRY AGAIN"1340 GOTO 12301350 PRUT LUK2) ; TABUO^ ;
" IF DATA HAS CONSTANT INTERVAL BETWEEN X VRLUES. . . ENTER 1
"
1360 Al=31370 INPJT A11330 IF Al = l THEN GOTO Constant__x1390 PRUT PAGE1400 PRUT LIN<2)
;TAB< 10> ;" INPUT X V ALUE ... PRESS CONT... ENTER Y VAL
UE";LINC2J1410 FOR 1=1 TO Npt(Ll)1420 BEEP1430 PRINT TAB ( 20; INPUT # ";I1440 INPUT XI <L1
,I
1450 INPUT Y1 <L1 , I
>
1460 NEXT I
1470 GOTO Fixit1430 Const an V_x: PRINT L I N < 3 > ; TAB < 1 0 X
;" I NPUT FIRST VALUE FOR X <i.e.
XlCl >=?> "
1490 INPJT X01500 PRUT LIN<2; ;
TRB( 10> ;" INPUT THE INCREMENT BETWEEN ADJACENT X VALMES"i510 INPJT Dx1520 PRUT PAGE; LIN<2>
;TAB <20 INPUT Y VALUES"
1530 FOR 1=1 TO Npt<Ll>1540 XI <L1
,I )=X0 + < I-n*Dx
1550 BEEP1560 PRINT LIN<2> ; TAB<20>
;" INPUT # ";I
1570 INPUT Y1 <L1 , I
>
1530 NEXT I
1590 C$="KEYBOARD"1 6 0 'Ii Fixit: G 0 3 U B E d i t _d at a1610 L 1 = _ 1 + 1
1620 K e y = K e y -f-
1
1630 IF <^y<=In<l) THEN GOTO 12O01640 RETURN1650 Tape: ! DATA INPUT FROM TAPE ###################1660 PRUT PAGE; LIN<4> ;
TAE<25>;
" INPUT FROM T APE ";L I N < 2 j'
167 0 PRUT "THE DATA TAPE IS ASSUMED TO EE IN THE LEFT < : T 1 4 ) CASSETTE DRIVE"1630 PRUT "IF NOT THEN LOAD THE C ASSETTE ... PRESS CONT TO PROCEED";L I N < 2 ;

Ib9'3 IHPJT fll
1700 Ta.p?=l1710 Cat: CAT ":T14‘'
1720 PRUT LIN<2);"THIS IS R CRTOLOG OF THE DRTR FILES ON THE TAPE...USE THE"
' 1730 PRINT "ARROWS IN THE DISPLAY PAD ON THE KEYBOARD TO SCROLL UP AND DOWN"1740 PRINT LIN<2> ;" INPUT THE DATA SET TO BE USED FOR FILE #";L1;LIN<2)
1750 INPUT1760 C$=D$8<" : T14"1770 ON ERROR GOTO Nariii?_err
1730 ASSIGN #1 TO C$1790 OFF ERROR1300 READ #1 ; A$, Nf i 1
e
1310 RE DIM Nt ?trip < Nf i 1 •= ) ,Ft C Nf i 1 e >
1 320 RED I M Xt ernp < Nf i 1 e ,5000-' Nf i 1 e > ,
Yt e-mp < Nf i 1 «•,5000/Nf i 1 e )
1330 R E 9 D 4 1 5N t != rn p ^ ,
F t fi'i p $ ( * )
1340 FDR K=1 TO Nf i 1
e
1850 FOR J=1 TO Ntemp<K)136'3 READ #l;Xtemp<K,J)1370 NEXT J
1330 FOR J=1 TO NtempCK)1390 READ 1 ;
Ytemp<K, J)1900 NEXT J
1910 NEXT K
1920 ASSIGN #1 TO *
1930 Pick file: PRINT PAGE1940 PRINT LIhK2:'
;tab k23)
;"DATA SET DISCRIPTOR IS "
;L I N < 2 > ;
TAB < 23 ) ;A$
;
L I N < 3 >
1950 PRINT TAB (15); "THE SET HAS " ; Nf i 1 e;
" F I LES ... DESCRIPTORS ARE"; LIN < 2 )
I960 FDR 1=1 TO Nf 1 1
e
1970 PRINT USING 1930; "FILE # "I , Ft empS ( I
)
1930 IMAGE 25X, 6A, DD, 5X, 20A1990 NEXT I
2 0 0 '3 P R I '•! T L I N ( 3 ) ;T A E < 1 0 ) ;
" I N P U T the d at a f i 1 e n u rri b e r y o u w an t to u
se for FI_E #";L12010 I f i 1 e=02020 INPUT Ifile2030 IF Ifi le=0 THEN GOTO Cat2040 K=Ifile2050 IF (Ifi1e)0) AND < I f i 1 e< Nf i 1 e+ 1 ) THEN GOTO 209O2060 EEE^2 0 7 3 PR I UT LIN(2) ; TAB( 15)
;
"FILE # IS NOT WITHIN THE SET... TRY AGAIN"2030 GOTD 20202 0 9 0 IF -U. e rn p ( Ifi 1 e ) < = P t s THEN GOTO Fin2100 BEE^'
2110 PR I UT PAGE; LIN(4> ; TAB ( 3 0 )
;
"DIMENSION ERROR"2123 PR I \ J LIN<4> ; TAB (20.) ;
"THIS FILE HAS ";Nternp( If i 1 e)^20; " POINTS I
C5

N I r ."
2130 PRIMT LIN<25 ; TflEC 10) ; "THE MfiXIMUM NUMBER OF POINTS ALLOWED FOR "
;Pfi1e;" -ILE<S) IS ";Pts2140 GOTO 23702150 Fill: Fi <L1 )=Ftempf < If i 1 e)•2160 FOR K=1 TO Nt emp < I f i 1 e )
2170 XKLl,K)=Xterrtpaf i 1 e, K)
2130 YKLl,K)=Ytemp< If i 1 e, K)
2130 NEXT K
2200 NptCLl)=Nternp<Ifile)2210 GOSJB Edit_data2220 PRINT PAGE; LIhK6) ; TflB<30) INPUT CHECK"2230 PRUT LIN<4)
;TAB( 10) ;
" IF THIS IS NOT THE CORRECT DATA FILE ANDYOU WOULD LIKE"
PRUT LIN<2);TABOO)
;"TO TRY ANOTHER ONE ... ENTER 1"
Agai n=0I HP JT AgainIF 4gain=l THEN GOTO 2370Ll=_l+1T ap ? = Tap>?+
1
IF rape>In':2) THEN RETURNPRI -iT PAGE; LIN':;4) ;
TAB<30);"GET NEXT FILE"
PRI4T LIN < 4) ;TABOO) ; "ENTER 0...TO PLOT ANOTHER FILE FROM THIS D
ATA SET"2 3 3 0 PRINT LINC2); TAB< 10)
<1 "ENTER 1 . . . TO PLOT A FILE FROM A DIFFERENTDATA SET"2340 A1 = 0
2350 INPJT A12360 ON il+1 GOTO P 1 c k f 1 1 P*
,C.at
2370 PRINT LIN<4); TAB'.'. 10) J"ENTER 0. . . TO TRY A DIFFERENT DATA FILE"
o' iU' J PRINT LIN<2); TAE< 10)
9"ENTER 1 . . . TO TRY A DIFFERENT DATA SET"
2 3 '? '5 Al = 3
2400 INPJT A12410 ON Rl+1 GOTO P 1 c k f i 1 8
,Cat
2420 Nar.it _ern: E = ERRN2430 IF E053 THEN GOTO 24302440 BEE=2450 PRINT LIN<2); "ERROR 53: IMPROPER FILE NAME ...PRESS CONT TO TRY AGAIN"2460 INPUT A12470 GOTO Cat2430 IF E056 THEN GOTO 25302490 EEE=2500 PRIiT "ERROR 56: FILE NAME DOES NOT EX I ST ... PRESS CONT TO TRYR G A I N "
2510 INPJT A12520 GOTO Cat2530 GOTO Erron_^nd2540 RETURN2530 Digitize: ! ############### DIGITIZED INPUT
C5

2560 C$="DIGITIZED"2570 D i g _f 1 ag = 1
,
2530 D i g i 1 1 = 1
1;2590 GOS JB D
ig_i n i
t
S' 2600 Graoh=
1
2610 GOSJB Digit2620 Seal e’ck=0
:2630 GOSJB Dig opts
' 2640 Ll=_l+11 2650 Gr a,oh=Graph+
1
' 2660 Digitt=Digitt+l2670 IF Digitt>In<3) T
2630 IF :raph<=Gr THEN2690 GOT3 25902700 RETURN2710 Dig_init: i ### SUBROUTINE TO DIGITIZE CORNERS OF GRAPH2720 PRINT PAGE; LIN'CS)
;TRB< 30) ; "DIGITIZE"
PRINT LINO);TAB< 15) ;
"TO SET UP PLOTTER FOR DIGITIZING:"PRINT LIN<2) ; TA3< 19) ;
" < 1 ) TURN PLOTTER ON"PRINT TAB<19);"C2) LOAD GRAPH ANYWHERE ON PLATTEN"PRINT TAB<19);"(3) PUT DIGITIZING PEN INTO THE LEFTMOST PEN HOL
27302740275027S0DER"277 3
273027902300231023202330
PRINT LINO) ;TAB-: 15) INPUT THE NUMBER OF DIFFERENT FILES THAT"
PRINT TRB<17);"V0U WANT TO DIGITIZE ON THIS GRAPH ?"
Gr=0
IF Gr<>0 THEN 2350BEEPPRINT LIN< 1 ) ; TAEC3) ; "YOU MUST INPUT AT LEAST ONE FILE ON THIS
GRAPH. . . TRY AGAIN"2340 GOTO 23002350 IF Gr + Di gi tt-K = In'0) THEN GOTO 23902360 BEEP2370 PRINT LIN< 1 ) ;
TABO);"THE NUMBER OF GRAPHS LEFT TO BE DIGITIZED
I 3 ";
I n < :. ) -D i g i 1 1 + 1 ;" . . . TF Y AGAIN"
2330 GOTO 23002390 PRINT PAGE; TABOO) ;
"
INITIALIZE GRAPH"
12900 PRINT LIN< 1 ) ; TAEC5)
;
"TO DIGITIZE: ^ress PEN DOWN button on PL
1
OTT'ER"
? 2910- -4 >1
1 292.11
PRINT TfiB< IS) ; "Posi
t
ion DIGITIZING PEN o u e r p o i n t to be d i g i t i z
PRINT TAE< 13) ;"Press ENTER bL4tton jn PLOTTER: to input th e point
' 2930 PRINT LIN< 1 ) ; TRB< 15) ;"U) DIGITIZE 1 o i.j e r 1 e f t c o r n r o f graph f
ram?": 294 3 PRINT LIN< 1 ) ;
TABUS) ;"0) DIGITIZE 1.4 p p e r 1 e f t c o r n e r o f graph f
r am ?•
"
2950 PRINT LINC 1 ) ;TABUS) ;"0) DIGITIZE u p p e r r
ig h t c o r n e r of graph
; T f aiTi e "
296 0 PRINT LINU ) ;TABUS) ;"'-:4) DIGITIZE 1 o u e r r i g h t c o r ri e r o f graph

f r am e ";L I -K 1 )
2970 PLOTTER IS 7,5, "9872A"2930 PEJ 1
2990 FOR 1=1 TO 4
3000 DIGITIZE X f r arn e < I ) ,Y f r .am e ( I )
3010 BEEP3020 = RINT TAB < 23) ; "CORNER DIGITIZED".3030 NEXT I
3040 PRINT LIN( 1 ); TAB ( 12) ; "PRESS CONT when you have DIGITIZED al
1 f o u r Cl
3050 IN=-UT Al .
3060 PRINT PAGE; LIN(6) ; TAB(31 ); "SCALE TYPE"
3070 PRINT L I N < 2 )
;
TAB(21 ); "ENTER 1 . . . IF PLOT IS LINEAR"
3080 PRINT TAB(21
)
; "ENTER 2. . . IF PLOT IS X-LIN, Y-LOG"3090 PRINT TAB(21
)
; "ENTER 3. . . IF PLOT Ib i^“L0Lj5 Y-LIN"3100 PRINT TAB(21
)
; "ENTER 4. . . IF PLOT IS X-LOG, Y-LOG"3 1 1 '0 PRINT L I N < 2 )
;
TAB< 10) ; "NOTE: IF YOU ARE CHOOSING A LOG AXIS, T
HE 3 DALE -IMITS "
3120 PRINT TABC 16) ;"F0R THAT AXIS MU3 T BE POWERS OF TEH < i . e. .01,100 )
"
;
L I N < 2 )
3130 Pt =0
3140 IN^-UT Pt315:3 IF <Pt>0) RND <Pt<5> THEN GOTO 319031 GO EE£P3170 PRINT LIN< n ;
TAB < IS) INPUT is not within range... TRY AGAIN"3130 GOTO 3140 --
319 3 PRINT PAGE; LIN'; 3) ;TAB (27)
;"GRAPH RANGE"
3200 PRINT L I N ( 3 ) ;TAB 1 0 ) ;
" You will now be asked to input the limitsof the scales"
3210 PRINT TAB<10);"on each axis of the graph that you are diigitizin
9 "
322 3 PRINT L I N < 2 ) ;TAB ; 1 5 ) ;
" I NPUT THE x AXIS GRAPH LIMITS MIN, MAX)"323 3 IN^lJT Xmn,Xmx3240 IF Xmx-Xrnn<>0 THEN GOTO 32303250 BEEP3260 PRINT L I N ( 2 ) ;
TAB 1 0 ) ;" The graph range rn u s t be greater than 0.
..TRY AGAIN"3270 GOTO 32303230 IF Pt<3 THEN GOTO 33503290 C h ? c k _ 1 g t = I N T >; L G T < X m X ) ) - L G T < X m X ) + I N T L G T X m n ) ) - L G T < X m n )
3300 IF Check_lgt=0 THEN GOTO 33503310 BEEP3320 PRINT L I N 2 ) ;
T A B ; 10); " T h e g r afj h limit s f or a 1 o g ax i s rn u s t b
e
powers of 10"
333 3 PRINT TAB ; 1 O ) ;
"-r. i . e . . 00 1 ,
1 OO0 ) . . . TR Y AGAIN"3340 GOTO 32303350 PRINT LI1K2) ; TAE( 15) ;
" INPUT THE Y AXIS GRAPH LIMITS (MIN, MAX)"3360 IN^UT Ymn,Ymx3370 I F m x - Y rn n < > 0 THEN GOT 0 3 4 1 v3
3330 BEEP
C8

3390 PRINT LIN<2);TAB'- 10> ;
"The graph range must be greater than 0.
c.TRY AGAIN"3400 uOrO 33603410 IF <Pt=n OR <Pt=3) THEN GOTO 34703420 Ch ?c k_l gt = I NT < LGT < Ymx > ) -LGT < Ymx > + I NT < LGT < Ymn >
) -LGT < Ymn >
3430 IF Check_lgt=0 THEN GOTO 34703440 PRINT L I N c; 2 > ;
T A E ( 1 0 > ;" T h e g r ap h limits for a log ax i s must b
e
p o ijj e r s o f 1 0 "
3450 PRINT TABaO);
" < i . e. . 00 1 ,1 000 > . . . TRY AGAIN"
3460 GOTO 33603470 RETURN3430 Digit: ! ########### SUBROUTINE TO DIGITIZE FILES ###!*##########^####3490 PRINT PAGE; TAE< 30) ; "DIGITIZE FILES:"3500 PRINT LIN<2) ; TAE< 15) ; "You are allowed to DIGITIZE up to";Pts;"po i n t s per file"3510 PRINT TAB < 1 5 ) ;
" D i g i t i z i ng accuracy is gener al 1 y 3’'., therefore,three"3520 PRINT TAB < 1 5 )
;" s
ign i f i c ant digits will be digitized"
3530 PRINT LIN<2);TAB<8)
;" 1 ) ENTER DESCRIPTOR for this data file
...Up to 2Q characters"3540 PRINT LIN<2) ; TAB<S) ;
" (2) TO DIGITIZE: Press PEN DOWN but ton o.-i PLOTTER"3550 PRINT TAB 26 ) ;
" Pos i t i on DIGITIZING PEN ouer point to be digitized "
3563 PRINT TAB ( 26 );" Press ENTER button on PLOTTER to input the poin t
"
3570 PRINT LINa ) ; TAB<3) ; " ^3) . DELETE A POINT: Digitize that samepoint twize in a row"3530 PRINT LIN<2) ; TAB<S) ;
" <4) TO EXIT: DIGITIZING mode PRESS PIII
3590 PRINT TAB <33) ; "PRESS ENTER"3600 LUPUT "ENTER DATA DESCRIPTOR -",Ff(LD3610 K=13620 PI. 3TTER IS 7, 5, "9372 A"
3630 D i '
3 : D I G I T I Z E X t e rn p < L 1 ,K ) ,
Y t e m p < L 1 ,K )
3640 BE::P
3650 IF (XtempCLl , K)=0) AND < Yt emp C L 1 ,K ) =0 ) THEN Exit
3660 IF K=1 THEN GOTO 36803670 IF < Xt emp < L 1 ,
K ) =Xt emp < L 1 , K- 1 ) ) AND 'XYt emp L 1 ,K ) =Yt emp < L 1 ,
K- 1 ) )
THEN K=K-23680 K=<+13 6 9 '3 G 0 T 3 Dig370 3 Exit: IF KOI THEN K = K-13710 BEEP3723 WAIT 5003730 BEEP3740 RETURN3750 Dig_Dj3ts:! ### SUBROUTINE FOR DIG. OUTPUT OPTIONS S.: EDITING3760 E d = 3
C9
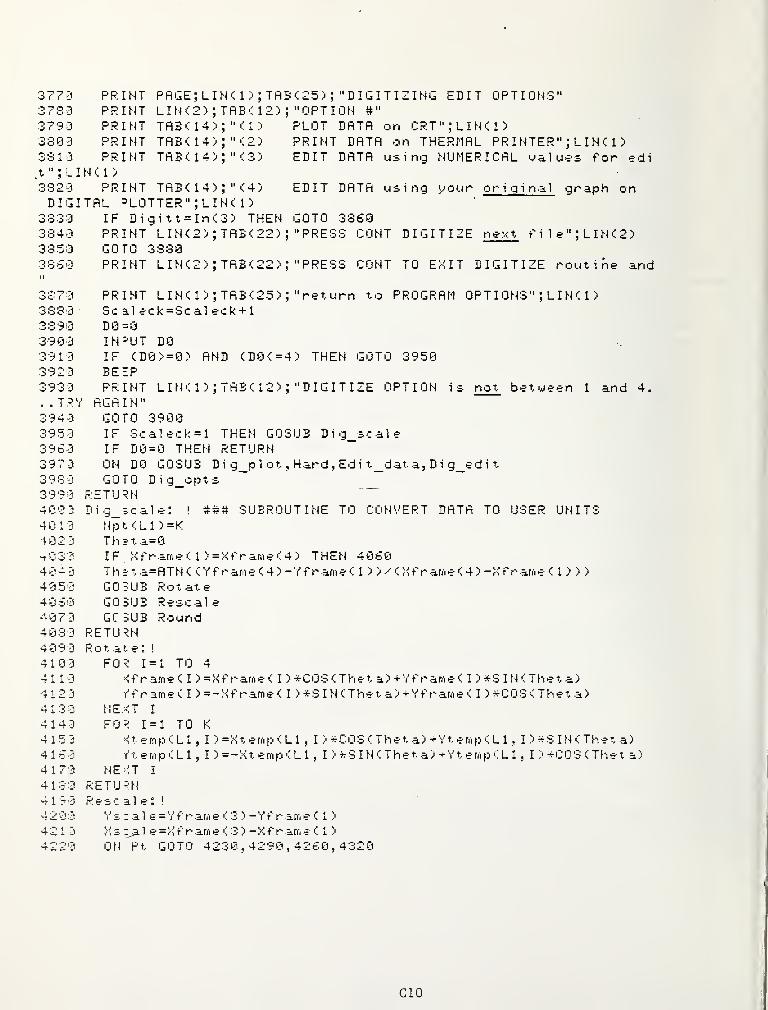
3770 PRINT PAGE; LIN< 1 ;; TRB<25> ; "DIGITIZING EDIT OPTIONS"37S0 PRINT LIN(2> ; TAB< 12> ; "OPTION #"
3790 PRINT TAB<14>;"a> PLOT BATA on CRT";LINa)3S00 PRINT TAB< 14) ;
" <2> PRINT DATA on THERMAL PR I NTER " ; L I N < 1
)
3310 PRINT TAB<14);"<3) EDIT DATA using NUMERICAL values for sdi.t "
;L I Na
)
3S20 PRINT TAB < 1 4 );
" < 4 ) EDIT DATA using your o r i g i n a 1 graph onDIGITAL BLOTTER"
;LINO )
3330 IF Digitt=In(3) THEN GOTO 33603840 PRINT LIN<2) ; TAB<22) ; "PRESS CO NT DIGITIZE next file"; LIN (2)3850 GOTO 33303860II
PRINT LIN(2) ; TAB<22) ; "PRESS CONT TO EXIT DIGITIZE routine and
3873 RRINT LIN( 1 ) ; TAB(25);
" r e t u r n to PROGRAM OPTIONS" ; LIN( 1
)
3S80 Sc al eck=3cal eck + 1
3890 D0=03900 IN=UT D03910 IF (D0>=0) AND (D0<= 4) THEN GOTO 3950392 3 BEEP393 3 PRINT LIN( 1 ) ; TAB( 12) ; "DIGITIZE OPTION is not between 1 and 4.
..TRY AGAIN"3940 GOTO 390039511 IF Scale-ck = l THEN GOSUB Dig_scale3960 IF D0=0 THEN RETURN397 3 ON DO GOSUB D i g_p 1 ot , Hard ,
Ed i t_dat a, D i g_ed i t.
3980 GOTO Dig_opts3990 RETURN40011 Dig_H.cals: ! 4## SUBROUTINE TO CONVERT DATA TO USER UNITS4013 Npt('Ll)=K4023 Th?ta=0nO30 I F Xfr ame < 1 ) =Xf r anis 4 ) THEN 4O604 0 “ J T I'l : t a= A T N C[ k Y f r arii e 4 ) — Y f r arn e ( 1 ) ) / ^ X f r ani e- 1 4 ) ~ X f r aru e- ‘I 1 ) ) )
4050 G 0 ? U B R o t at e
4060 GOSUB Rescale407 3 GC SUB Round4080 RETURN4 0 9 3 Rotate: !
4100 F 0 < 1 = 1 TO 4
4113 kf r ame < I ) = Xf r arne < I ) *C0S < The t a) +Yf r ame C I ) *S I N < Thet a)4120 f’ f r arn e < I ) = - X f r' am e < I ) * S I N < T h e t a ) + Y f r' am e < I ) ^ C 0 S C T h eta)4130 NEXT I
4143 F09 1=1 TO K
415 3 Xt ernp (LI, I ) =Xt ernp (LI, I ) ^COS ( Thet a) +Yt ernp (LI, I ) ^S I N ( Thet a)416 3 ft ernp ( L 1 ,
I ) =-Xt ernp (LI, I ) *S I N ( Thet a) +Yt ernp (LI, I ) *C0S ( Thet a)
4173 NEXT I
4180 RETUtN^190 Resc al e: !
420 3 Y s ; a 1 e = Y f r arn e ( 3 ) - Y f r arn e ( 1 )
421-1 X s 1 e = X f r arn e 8 ) — X f r arn e ( 1 )
4220 ON Pt GOTO 4230,4290,4260,4320
CIO
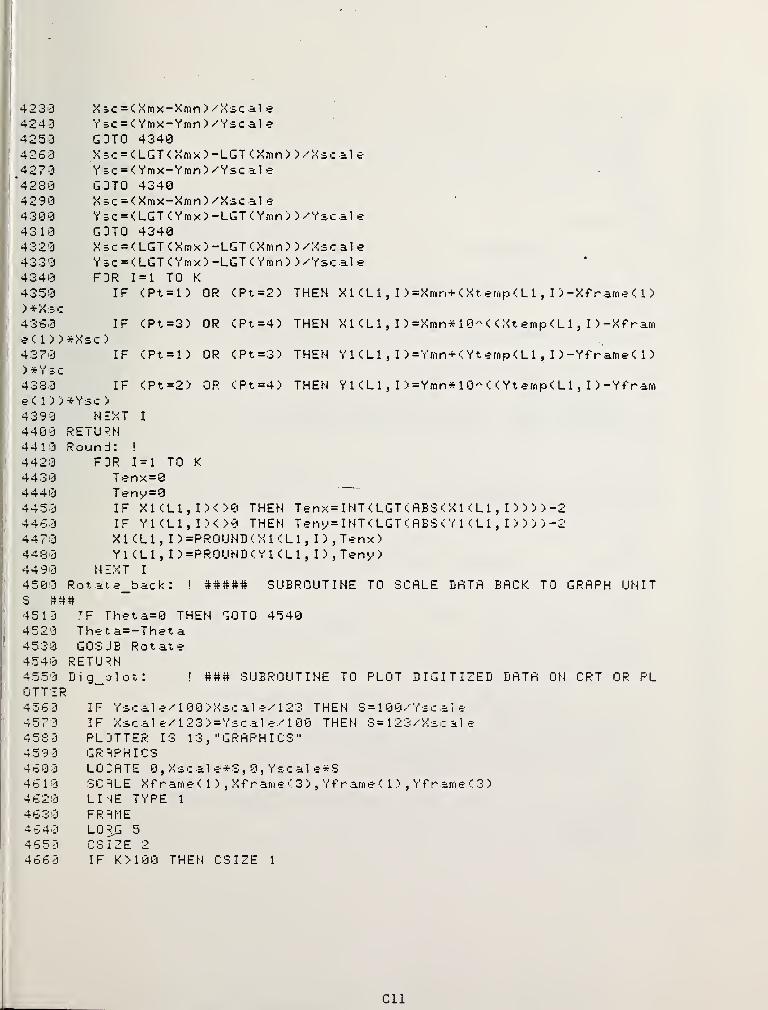
4239 X5C = <Xmx-Xmn)/Xscal e
4240 Y 5C = < Ymx-Yrnn ) xYsc a] e
4250 G3T0 43404260 X5C = <LGT<Xmx)-LGT''.Xmn) )/Xscal e
4270 Y sc = < Ymx-Ymn ) /Ysc a1
e
*4230 GOTO 43404290 X sc = < Xmx-Xmn > /Xsc al •=
4300 Y sc = < LGT < Ymx ) -LGT ( Ymn > ) /Ysc al
e
4310 G3T0 43404320 Xsc = <LGT<Xmx:>-LGT<Xmn> >xXsc a1 e
4330 Ysc = <LGT<Ymx>-LGT<Ymn) )xYs c a 1 e
4340 F3R 1=1 TO K
4350 IF <Pt=l) OR <Pt=2) THEN XK L 1 , I ) =Xmn+ < Xt emp <L1,I>- X f r am e ( 1
)
) *X sc
4360 IF <Pt=3) OR <Pt=4) THEN X 1 < L 1 , I ) =Xrnn* 1 0-'' < < Xt emp < L
1
, I> -Xfr am
e< 1 ) )*Xsc >
4370 IF <Pt =n OR CPt=3> THEN Y 1 < L 1 ,I > =Ymn+ < Yt ernp < L 1 , I > -Yframe< 1
">
)*Ysc4330 IF <Pt=2> OR <Pt=4) THEN YKLl
,I >=Ymn*10'''; < Yternp<Ll
, I ) -Yframe(l)>*Ysc)4390 NEXT I
4400 RETURN4410 Round: !
4420 FDR 1=1 TO K
4430 Tenx=04440 Teny=04450 IF X 1 < L 1 ,
I X >0 THEN Tenx = I NT (LGT ( ABS ( X 1 ( L 1 ,I > > >> -2
446 '3 IF YKL1,I>00 THEN T e n y = I NT ( LGT ( ABS ( Y 1 ( L 1 ,I) > > > -2
4470 XKLl, I >=PR0UND':;XK L 1 ,I > , Tenx >
4430 Yl <L1,
I )=PR0IJHD<YKL1,
I ) ,Teny >
4490 HZXT I
4500 Rot,ate_back : ! S#### SUBROUTINE TO SCALE DATA BACK TO GRAPH UNITS ft##
4513 Theta=0 THEN GOTO 45404520 The t a=-Thet
a
4530 G03JB Rotate4540 RETURN4550 Dig_olot: ! ### SUBROUTINE TO PLOT DIGITIZED DATA ON CRT OR PLOTTER4 3 6 >1 IF Y s c a 1 e X 1 0 0 > X 3. c a 1 e 1 2 U THEN 3=10 0 Y seal e
4570 IF Xscal e/123> = Ysca1 e.-'100 THEN S= 1 23/Xi.: al e
4530 PL3TTER IS 1 3,
" GR APH I C3
"
4590 GRAPHICS4 60 3 L 0 3 A T E O , X s c a 1 e * S , 0 ,
Y
s c a 1 e * S
4 6 1 ;3 3 C 4 L E X f r am e < 1 > ,X f r am e *' 3 > ,
Y f r am e < 1 > ,Y f r am e (3 )
4620 LUE TYPE 1
4630 FRiME4640 LO^ 5
4653 C3IZE 2
4660 IF K>100 THEN CSIZE 1

4670 m^E Xtemp<Ll,
1 > ,Yt.ernp<Ll
,1 >
4630 FDR 1=1 TO K
4690 LRflW XternpCLl, I),Yt,.?mp<Ll, I)
4700 L$="0"4710 LABEL L^.4720 MOVE Xt emp < L 1 , I ) , Yt emp < L 1 , I
)
4730 NEXT I
4740 PAJSE4750 EXIT GRAPHICS4760 RETURN4770 Diq_?dit: ! ### SUBROUTINE TO EDIT DIGITIZED DATA USING DIGITAL P
LOTTER4730 PRINT PAGE; LIN (2> ; TAB< 25 >; "RE-DIGITIZING OPTIONS"4790 PRINT L I N < 2 ) ;
TAB < 1 0 > ;" DO NOT rernoue GRAPH from its position on
DIGITAL P-OTTER.
"
4300 PRINT TAB<10);"The DIGITIZING PEN will be stepped across GRAPHs h o I.J i n g t n e
4310 PRINT4320 PRINT4330 PRINT4340 PRINT4350 PRINT4360 PRINTING OPTIONS"
TAE<10) ; "poi nts which you haoe DIGITIZED."LINCl ) ;
TAB'^S)TABC 10> ;
" < 1 >
TABaO);
" C2>TAB< 10) ;
" <3>TA3a0)
;" <4)
"OPTION #"
RE-DIGITIZE A POINT ";LIN<1)ADD A POINT ";LIN(1)DELETE A POINT"; LINO)EXIT RE-DIGITIZING and RETURN t o DIGITIZ
487 0 Scale ck=04330 GO SUB Rotate_back4390 PLOTTER IS 7,5,"9372A"4900 FQ5 1=1 TO K
4910 10VE Xtemp<Ll , I ) , Ytemp<Ll , I
)
4923 91=04930 INPUT " ENTER OPTION #...To go on to NEXT point PRESSCONT" , A1
4940 IF (A1>=0) AND <A1<=4) THEN GOTO 49904950 BEEP4 560 =RINT L’.N(2)
;TAB<3)
;"OPTIOY # is no^ b?tjeen 1 and 4... Pres
s CONT and TRY AGAIN"497 3
493 3
4 9905 0 0 '0
5010502 0
5 0 3 01
5 0 4 3
505050605070TER next5030509 3
= AUSEGOTO 4730IF A1=0 THEN GOTO 5250IF A 1=4 THEN RETURNIF Al=3 THEN GOTO 5090IF Al=2 THEN GOTO 5160[I ISP TAB< 10) ;
"RE-DIGITIZE this POINT NON.-0 I NTER Xt emp < L 1 ,
I ) ,Yt ernp < L 1 ,
I )
DIGITIZE Xt emp < L 1 , I ) , Yt emp < L 1 ,I
)
BEEPINPUT " DATA POINT RE-DIGITIZED.OPTION #",A1GOTO 5250-OR J=I TO K-1
P R E S S C 0 N T to E
N
C12

51 130 Xtenip<Ll,J>=Xtenip<Ll,J+l>5110 Yt emp < L 1 , J ) =Yt emp < L 1 , J+ 1
)
5120 '^EXT J
5130 INPUT " DflTR POINT DELETED ... PRESS CONT to ENTER next OPTION #",R1‘5140 <=K-15150 :OTO 52505160 POINTER XtempCLl
,n ,
YternpCLl , n5170 FOR J=K TO I+l STEP -1
513 !ii Xternp<Ll,J+l)=Xtemp<Ll,J)5190 Ytemp<Ll , J+1 )=Ytemp<Ll , J>
5200 NEXT J
5210 DISP " DIGITIZE NEW POINT NOW"5220 D I G I T I ZE Xt emp < L 1 ,
I + 1 ) ,Yt e-mp ( L 1 ,
I + 1 )
5230 BEEP5240 INPUT " NEW POINT D I G I T I ZED . . . PRESS CONT to ENTER n
ext 0PTI04 #",R15250 NE><T I
5260 GOSJB Rot a.t e_ba.c
k
5270 RETURN5230 Def i Te_fun.:t i on: ! ########## SUBROUTINE TO LET USER ######5290 ! ###### DEFINE R FUNCTION TO PLOT ####5300 C^=" FUNCTION"5310 FDR Function=l TO In<4)5320 PRINT PRGE; LINU TRB';27) ;" INPUT R FUNCTION"5330 PRINT LINC3)
;TRB< 15:- ;" INPUT file DESCRIPTOR for this FUNCTIO
N"5340 INPUT F$<Ln5350 PRINT LIN<2)
;TRE< 15> ;
'^INPUT NUMBER OF POINTS that you want t
o p 1 o t f o •'
"
5360 PRINT L I N C 1 > ; TRB < 1 5 );
" t h i s FUNCT I ON . . . MRX I MUM number RLLOWEDis ";Pts
5370 Npt<Ll)=05330 INPUT Npt<Ll)5390 IF NptCLl)>0 THEN GOTO 54305400 BEEP5410 PRINT LINC 1 > ; TRBC is;:'
;"You must INPUT the NUMBER of POINTS
to be p 1 o t ed . . . TRY RGRIN"5420 GOTO 53805430 IF Npt<LlK=Pts THEN GOTO 5430
40 BEEPPR I NT . L I N Cl > ; TRE < 1 5 >
; "The NUMBER of po i nt s you have I NPUT i
s
545450g r e- at e r
5460547054305490
PR I NT TRE C 15);" than " ; Pt s ;" . . . TRY RGR I
N
"
GOTO 5330PRINT LINC2) ; TRBC33) ; "NOTE"PRINT LI N 1 ) ;
TRB ( 3 ) ;" RLL TR I GONOMETR I C FUNCT I ONS WILL BE COM
PUT ED IN DEGREES"55L1J
X )"
PRINT L I N ( 2 ) ; TRB C 1 5 ) ;" I NPUT t he DRTR RRHGE f or CX MIN.X MR
C13
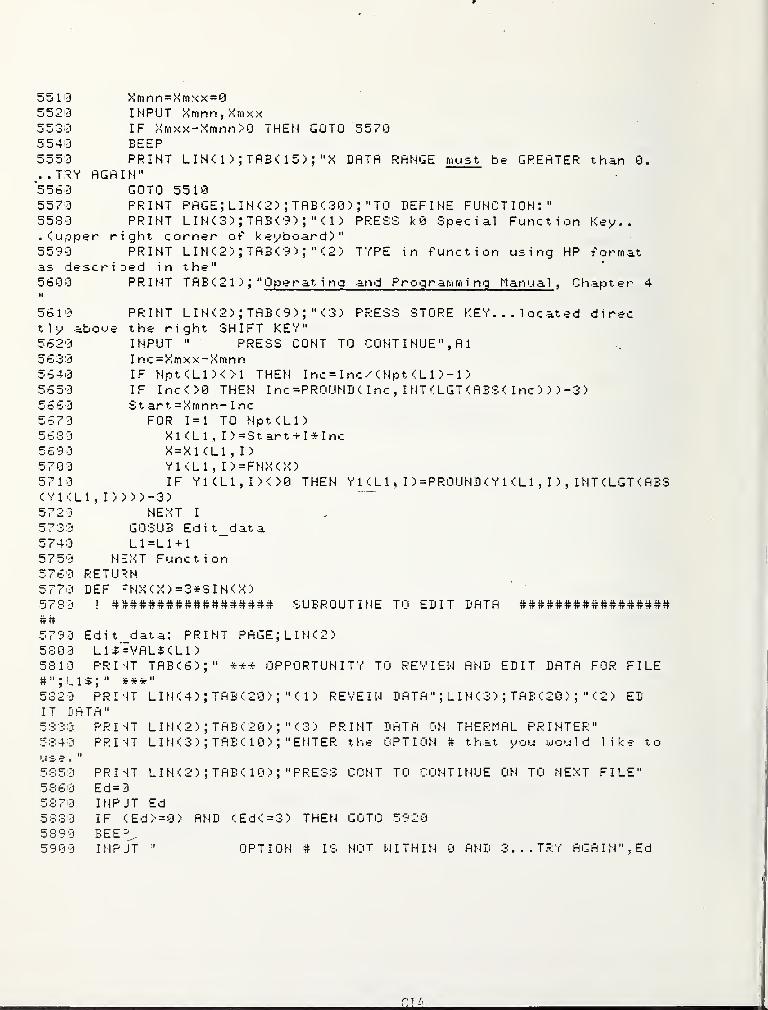
5510 X m n n = rt m X X = 0
5520 INPUT Xmnn,Xmxx5530 IF Xrnxx-Xmnn>0 THEN GOTO 55705540 BEEP5550 PRINT LIN< 1 ) ; TRB< 15> ; "X DflTR RANGE must be GREATER than 0...TRY AGAIN"’55i50 GOTO 55105570 PRINT PAGE; LIN<2) ; TABC30> ; "TO DEFINE FUNCTION:"5530 PRINT LIN<3) ; TABC9) ;
" < 1 ) PRESS kO Special Function Key.,.(ujoperrightcornerofkeyboard)"5590 PRINT L I N < 2 > ;
T AB < 9 > ;" 2 > TYPE in function using HP format
as described in the"5600 PRINT TAB < 2 1 )
;
"
Operat i nq and Proqr amm i nq Manual , Chapter 4
5610 PRINT LIN<2) ; TAB<9) ;" C3) PRESS STORE KEY . . . 1 oc at ed di rec
tly aboue the right SHIFT KEY"5620 INPUT " PRESS CONT TO CONTINUE", A
1
5630 Inc=Xmxx-Xmnn5640 IF Npt<Ll>01 THEN I nc = I nc x < Npt ( L 1 > -n5650 IF IncOO THEN I nc =PR0UND (I nc
,I NT ( LGT ( ABS < I nc > ) ) -3 )
5560 St art =Xmnn- 1 nc5670 FOR 1=1 TO Npt<Ll)5 6 3 ij X 1 < L 1 ,
I ) = 3 1 ar t + I I n c
5690 X =XKL1,I)5700 YKLl
,I;=FNX<X>
5710 IF YKL1,I)<>0 THEN Y 1 1 , I ) =PR0UND < Y K L 1 ,I ) ,
I NT ( LGT < ABS< YKLl
,I > > ) >-3)
5720 NEXT I
5730 GO SUB Edit_data5740 L1=L1+15750 NEXT Function5760 RETlJriN
5770 DEF -NX<X)=3*3IN<X:)5730 ! #»################ SUBROUTINE TO EDIT DATA #################ff #
5790 Edit data: PRINT PAGE;LIN<2>5300 L1$'=VAL$<;L1)5310 PRIdT TAB<6>;“ *** OPPORTUNITY TO REVIEN AND EDIT DATA FOR FILE
5320 PRINT LIN(4);TAB<20>
;" < 1 ; REVEIN D ATA "
;L I N C 3 > ;
TAB < 20 >;
" < 2 ) EDIT DATA"5330 PRINT LIN<2> ; TRB(20)
;" C3> PRINT DATA ON THERMAL PRINTER"
5340 PRINT LIN<3> ; TAB( 10) ; "ENTER the OPTION 4 that you would like to
5350 PRINT 1—1
5360 Ed=3537 Oi INP JT Ed5 A; ;3 0 IF <Ed > = 0)5 3 9 BEE='^
5 9 0 0 INP JT Cl
>> ; TAB< 10) ; "PRESS
AND (Ed<=3> THEN
OPTION 4 IS
CONT TO CONTINUE 0
G 0 T 0 592 0
NOT N I THIN 0 AND 3
TO NEXT FILE"
..TRY AGAIN", Ed

5910 GOTD 58805920 IF Zd=0 THEN RETURN5939 ON Ed G03UB Reve i w , Ed i t_i t , Har
d
5940 GOTD Edit_data5950 RETURN.5960 Edit_it: PRINT PAGE; LIN<2> ; TflE<30)
;"EDIT DATA"
5970 PRIST LIN<2);TABUO) INPUT THE # FOR THE DATA PAIR YOU WANT TO
MODIFY"5930 INPJT A1
5990 IF <A1>0) AND < A 1< Npt < L 1 > + 1 ) THEN GOTO Ok
6000 BEE^6010 INPJT " # FOR DATA PAIR IS GUT OF RANGE.. TRY AGAIN",A16020 GOTO 59906030 Ok: =-RINT LIN<2;
;TAEU0>
;= "
;X 1 L 1 , A 1> ;
" Y =";YKL1,A1>6040 PRIST LINC2) ; TABC10> INPUT NEW VALUES FOR X,Y"6050 INPJT XKLl, Al), YKLl, Al>6060 IF SOT Dig_f1ag THEN GOTO 61106070 IF <Pt = l) OR <Pt=2) THEN Xt emp < L 1 , A 1 ) = < X 1 C L 1 , A 1
> -Xmn ) /Xsc +Xframe< 1 )
6030 IF <Pt=3) OR <Pt;=4) THEN Xt emp •:! L 1 ,A 1> =LGT < X 1 < L 1 ,
A 1 /Xmn ) /Xsc +Xf
r
am e < 1 >
‘ 6090 IF <Pt = l> OR <Pt = 3) THEN Yt >=-mp < L 1 ,A 1 > = < Y 1 < L 1 ,
A 1 ) - Ymn /Ysc +Yf rame
I
a
)
i 6100 IF <Pt=2> OR <Pt=4) THEN Yt emp < L 1 , A 1 > =LGT < Y 1 < L 1 , A 1 > /Ymn ) /Ysc +Yf
r
am e < 1
)
i 6110 A 1 = 0
6120 PRIST LIN<2) ; TABCIO) ; "TO CONTINUE EDITING ENTER 1"' 6130 INPJT A
1
1 6140 IF 91=1 THEN GOTO Edit_it' 6150 RETURNi6160 RiS'v'e’iij: PRINT PAGE
r 6170 Hard: IF Ed=3 THEN PRINTER IS 0
1 6130 PRIST TABt 20) ; "DATA SET: ";C:J
;L I Na )
t 6190 PRIST TfiB<20) ; "DATA FILE #";Ll;" ";Fi<LDS: 6200 PRIST LIN<2)! 6 2 1 j PRIST USING 6220; "PAIR # ";"X VALUE" ;"Y VALUE"
i
6220 I MADE 9X, 20A, 20A, 20A16230 C0=0
'j6240 FDR 1=1 TO Npt<Ll)
} 6250 X1$ =VAL$<X1 <L1 , I ) )
jS6260 Y1$ = VAL^;< Y1 ‘•'Ll
,I ) )
l!6270 !$=•• -g^VALfa)6230 PRINT USING 6220; I^; X 1 $ ;
Y 1 $
6290 C0=C0+
1
1 6300 IF <C0<13) OR <Ed=3) THEN GOTO 634016310 C0 = 0
5320 PRINT "PRESS CONT TO CONTINUE"6330 INPUT A1
S 6340 NEXT I
6350 IF Ed=3 THEN PRINTER IS 16
! (
.LC13

6360 IF :d=l THEN PAUSE6370 RETU'^N6330 End_?dit : RETURN
###»###.6400 1
#
6410 !
S
SAVE DATA ON DATA TAPE
6420 1
6440 3aue_da,ta: !
6450 PR ITT PAGE; LIN<3>;TflB<30:-
;"SAVE DATA ON TAPE"
6460 PRITT LIN<4);TAB< 10> ;
" IF DATA WAS INPUT FROfl ONE DATA SET AND ISTO BE STDRED"
6470 PR ITT LIN-; n;TAB( 10) ;
" IN THE SAME DATA SET... ENTER 1"
6430 PRITT LINC4);TAB-.:4)
;"NOTE: IF YOU TRY TO RESTORE THE DATA FILE
S THAT YOJ HAVE INPUT INTO "
6490 PRITT TAB<10);"TH£ SAME DATA SET THAT THEY CAME OUT OF, ANY FILE5 THAT WE?E NOT "
6500 PRITT TAB< 10) INPUT FROM THAT SET WILL BE DESTROYED"6510 Restore=06320 INPJT Restore6530 PRITT PAGE6540 CRT ":T14"655 3 PRITT L I hK 2 ) ;
" I NPUT NAME FOR THIS DATA SET... UP TO 6 CHARACTERS"6560 INPJT D$6570 0^=0^:^." : T1 4"
6530 IF ^estore=l THEN PURGE C4:
6 5 9 M X n 0 1 = - 9 9 9 9 9
6600 Npt =0
6610 FDR Ll=l TO Pf i 1
e
6620 IF Npt < L 1 ) ) = Mxnpt THEN Mxi pt=Nptc:Ll)6630 Npt =Npt +Npt < L 1 ) *26 6 4 10 NEXT LI6650 Nr = 52+32*Pf i 1 e+4*Npt6550 Nr=INTaTr/30)+l6 6 7 J CREATE C T , N r , 3 0
6 6 8 21 IF ^ e s t o r e = 1 THEN S k i p_ 1 ab e 1
669 3 PRITT P AGE;L I N 2 ) ; TAB C 25 ) ;
" I NPUT DATA SET DESCRIPTOR"6700 PRITT LINC2)
;TAE':;20)
;"THERE ARE Pf i 1 e ;" DATA FILES IN THIS SET"
6713 PRITT LIH< 1) ; TAE( 17) ; "FILE DESCRIPTORS FOR THE DATA FILES ARE:"672 3 PRITT L I N < 1 ) ;
TAB 25 ) ;" F I LE # DESCR I PTOR "
;L I N ( 2 )
6 7 3 21 FDR K = 1 TO P f i 1 e
6740 PRINT TAE<26) ; K; TAE<35) ; Fi aO6750 NEXT K
6760 PR I'iT LI N < 4 ) ;TAB 1 O ) ;
" I NPUT DATA DESCR I PTOR FOR DATA SET ... UP TO40 CHARACTERS"
C16

6770678067906300681063206 8 3
63406350636068706330639069006910692069306940RND69501 "
6960 R e s t o r e = 0
6970 INPJT Restor?693 3 P R I I T P fi G E
6990 CAT ":T14"7000 PRUT LIN<2) ;
" INPUT NAME FOR THIS DATA SET... UP TO 6 CHARACTERS"7013 INPJT7023 C^=D^&":T14"7033 IF ^estore=l THEN PURGE C$7043 Mxnot =-999997050 Npt =0
7060 FDR Ll=l TO Pf i 1
e
707 3 IF Npt < L 1 ) > = Nxnpt, THEN Mxnpt. =Npt < L 1 )
703 3 Npt, =Np*. +Npt '' L 1 3 *27090 NEXT LI7100 Nr=343 +Ann*100 +25*45 + 52 + 32*Pfi le + 4*Npt-7110 Nr=INT<Nr/80)+l7120 CREATE C$,Nr,S07130 IF Aestore=l THEN GOTO Sk
i p_g7143 PRI-JT PAGE; LnK4;
;TAE';28)
;" INPUT GRAPH DESCR I PT I ON "
7153 PRUT LIN<3>;TAB<13> INPUT THE NAME OF THE DATA FILE DESCRIPTOR
INPJT A$Skip d: GOSUB Print_dataRETURNPrint_data: C$ = D$:5< " : T 1
4
"
ASSIGN #2 TO C$PRINT #2; A$, Pf i 1 e, Npt
FOR Ll=l TO Pf
i
FOR J=1 TO Npt<Ll)PRINT #2;xk;li,j>
NEXT J
FOR J=1 TO Npt<L.l>PRINT'#2; Y1 <L1 , J>
NEXT J
NEXT LIRETURNSave graph: !
PRI’aT page; LIN<3) ;TAB<25)
;"SAVE GRAPH ON TAPE"
PRIiT LIN< TAB< 10> ;" IF THIS GRAPH NAS RETRIEVED FROM THE TAPE
PRINT TABa0);"TO BE RE-STORED INTO THAT SAME DATA FILE... ENTER
7163 PRINT LIN< n ; TABCOl >; "FOR THIS GRAPH... UP TO 40 CHARACTERS"
7173 INPJT A$713 3 Skip_g: GOSUB Print_dat.a719 '3 0 p t 1 o n = 4
720 3 PRI NT #2; Def aul ti, Log_ck,PI , Lt.
,Norm ^
7213 PRINT # 2 ;S h ad e
,A n n o t
,S d
,F i 1 e , f i t
,N
X m X,X m n
> ,P c 2 < * > 5
P t , X ill,
rn , X s i z e,
N' s i z e
,N
,P c 1 5
P c 3 5P c 4 , S c i r'l o t
,N u m_s d
,
C17

7220 PR I NT #2 ;Yrnx
,Ymn
,Xt
1 on7230 PRINT # 2 ;
X_m ax C * ) , X
X rn i n
7240 PRINT # 2 ; Y m ax , Y min,•nn
7253 PRINT # 2 ;S h ad e S
,N 0 r
7260 FDR 1=1 TO Ann+17270 PRINT #2;Xa(I),7230 NEXT I
7290 ASSIGN #2 TO *
7300 RETURN7310 Tape7320 IF E
7330 BEE =
7343 PRI N
7350 GOTD7360 IF E
7370 BEE=>
7330 PRI N
RENT TAPE"7390 PR^^T LIH(4) ;
TnBa0>;"AND PRESS CONT TO SAVE DATA SET"
740 3 PRI'^T LINC4>;TABC 10) ;
"NOTE: TAPE MUST BE INITIALIZED"7410 GOTO 63107423 IF 1053 THEN GOTO Error_end7430 BEE=7440 PRI'^T LIN<4) ;
TA3< 10) ;"ERROR 53: IMPROPER FILE NAME... TRY AGAIN"
7453 GOTO 65507463 Erro-_end: PRINT P AGE ; L I N < 5 ); TAB ( 20 );" UNRECOVERABLE ERROR"7470 Er=ERRL7483 PRINT L I N < 3 ) ; TAB < 1 O )
;" ERROR ";E;"ON LINE";Er;" YOU MUST BEGIN PR
OGRAM AGAIN";LINO)
7493 GOSJB End_i
t
7500 Ret r i e"...>e_gr aph
:
!
7513 PRINT PAGE7520 CAT ":T14"7530 PRINT LINO); "INPUT THE FILE NAME OF THE GRAPH TO EE RETRIEVED"7540 INPJT Di7550 C$=DT2<" : T14"7560 ASSIGN #3 TO C$7 570*7 C- »-«
( sJ O d
75907 60 3
s
)
7610762 3
76337 6 4 i3
7650
READ 43; AS, Pf i 1
e
Pt s=INT< 25*200/ Pfi 1 e)REDIM Npt C Pf i 1 e ) ,
Ff < Pf i 1 e ) ,K 1 Pf i 1 e
,Pt s ) ,
Y 1 ( Pf i 1 e,Pt s )
R E D I M N t e rri pi P t' i 1 e ) ,F t e rri S P f i 1 e ) ,
X t e rri p:' ( P t' i 1 e,P t s ) ,
Y t e rii po 'O f' i 1 e,P t
READ 43;Npt(!*),F$‘-'!*)
FDR Ll=i TO Pf i 1
e
FOR J=1 TO NptOl)- READ #3;XKL1,J)
NEXT J
CIS

7630 FOR J=1 TO Npt<7670 READ #3;YKL17330 NEXT J
7690 NEXT LI7700 READ #3;Default3,Log_Nor rn
7710 READ #3 ; Shade , Annot ,
S
rn X,
y. rn n
7720 REA D #3 ;Ymx
,Yrrin
,Xt
,Yt
ons7730 READ #3; X_max'l*> , X_mirri i n
7740 REA D #3 ;Ymax
,Yrn i n
,Sdx
r
7750 READ # 3 ; 3 h ad e $ , N o r m $
,
7760 IF Annot=0 THEN 78107770 FOR 1=1 TO Ann+17730 READ #3; Xa'l I ) ,
Ya<7790 NEXT I
?S00 RSSIGN * TO #37310 CRL_ Plot_data7323 RETJRN7330 ! END PROGRRM ROUTINE ##############7340 End_it: PRINT PRGE;LIN<;S>7350 PRI'^T TRBC33)
;"END OF PROGRAM"
7330 GOTO End —7370 RETJRN733 0 ! ############7390 ! # #
7900 ! # SET UP PARAMETERS FOR PLOT #
7910 ! ^ #
7920 ! ################################7930 SUB =1ot_data7940 DEG7950 CON Ff<*), SHORT XK*),VK*1'7930 COM INTEGER Npt < ^ 1'
,Def au 1 t s
,Log_c k
,Pf i 1 ^ ,
P 1 < * > ,Lt C * ) ,
Pc 2 < * ;
797 0 COM INTEGER P t,X m
,Y m , X 3 i z e
,Y s. i z e , N o r ni
,S h ad e
,A n n o t
,3 id
,F i I e
,N t
,N x
,
Ny793 0 COM INTEGER P c 1 ,
P c 3 ,P c 4 ,
S c i n o t,N u rfi_3 d
,A n n
,F r am e
,Axes, Label
,N u m b e
r
7 9 9 -0 C 0 M SHORT X rn x,X m n
,Y m x
,Y m n
,X t.
,Y t
,T 3 i z e , L s i z e , N 3 i z e . A 3 i z e
,X m u 1 t , Y m
u 1 t.,S
3000 IJ 0 M S' H 0 R T XI m ax '1*1', X rn i n ( * 1',Y rn ax '1 * .'
,Y‘_rn i n ', * > ,
X! a ) ,Y a '1 * ) , C rn '1 -s-
) ,
X d p ,Y d p
3 010 C 0 M SHORT X rn ax,X rn i ri
,Y rn ax
,Y rn i n
,S d x , S: d y ,
N 3 d,
i0 p t i o n 3
3 0 ci J COM L T '1 * ) ,T T
,X f
,Y ^ T
jP -f ( * ,
Label ^ * X,P e r'l $ <1 * 1'
,3 h ad e *
,N o r' rn T
303 '0 C 0 M X_rn a>c X_rn i n $ '1 * ) ,Y_rn ax $ '1 * > ,
Y_rn i r'l T ( * )
8040 COM I NTEGER Norm < * ) ,Shade C * > ,
P 1 abe 1 '1 * >•
3050 NfiVes=Pfile3 0 3 >1 IF 0 p t T o n 3 = 4 THEN 3230
1 C19

3073 IF Defaults THEN 81703083 PRINT PRGE; LUKE;
;TflEUO;'
;"TO USE PLOT OPTIONS $< SCALE PARAMETE
RS FROM"3093 PRINT TABaO);"THE PREVIOUS RUN... ENTER 1"
8103 A n = 0
.8113 IN=UT An3123 IF AnOl THEN GOTO 81703133 G03UB Find_range3143 IF <Log_ck=0> AND <<Pt=3> OR <Pt=4>> THEN GOSUB X_lin_to_log3153 IF <Log_ck=0) AND <CPt=2> OR <Pt=4>’; THEN GOSUB Y_lin_to_log3163 GOTO 32303173 G 0 3 U B S e t _d e f au 1 1 s
3133 GOSUB Scale_type8193 GOSUB Labels8203 GOSUB Menu_l8213 GOSUB Menu_23220 GOSUB Menu_33233 GOSUB Men u_43243 SUBEDIT325 0 S e t _ j e f au Its: !
3263 RESTORE 32803 2 7 ^3 READ T s i z e , L s i z e
,N s i z e ,
A s i :: e ,X s i z e
,V s i z e
,N o n m
,S h ad e
,S d
,Y rn
,X m
,S p t
,P t
,A n
,A n 'I o t
3233 DATA 1 , 1 , 1 , 1 ,103, 60 , 0 ,O , 0, 4, 4, 1,
1 , 0,0329 0 READ S c i n o t , Dp_ i n i t , A n n , F r am e , A x e s , N u m b e r , L ab e
1
3303 DATA O, 1 ,0,1,1, 1,1
3313 D e f au 1 t s = 0
3323 T^=" "
r*. II IIw *-• 'J A —
3340 Y$=" "
3353 MAT P1=<0)3 3 6 !0 MAT L t = < 1 )
3370 MAT Cm=<l)8383 Mil' Pc2=('l)3393 Pc 1=134 03 Pc 3 = 1
r413 Pc4=l3423 MAT Plabel=<l)3433 FDR L=1 TO 403443 Label 4:'CL> = " "
3453 NEXT L
3463 MAT Xa=<0)3470 MAT Ya=<0)3430 FDR Ll=l TO 133493 LS'rLl) = "*"
8503 NEXT Li3513 RETURN352 0 F i n '0 an g e : !
8533 Xmi "1 = 99999
C20

3540 Xma:< =-999993550 Yrrii 0 =999993560 Ymax=-999993570 FDR Ll = l TO Pf i 1 ?
8530 X mi n<Ll >=99999•8590 X max <L1 >=-999998600 Y mi n<Ll >=999993610 Y max<Ll >=-999993620 NEXT LI8630 FDR Ll = l TO P+'i 1 e
8640 FOR 1=1 TO Npt(Ll>3650 IF XKLl,I>>Xmax THEN X m ax = X 1 ; L 1 , 1 >
8663 IF XI <L1 , I > >X max<Ll
>
THEN X max<Ll >=XKL1,
I >
8670 IF XKLl,
I XXmi n THEN Xm i n=X KLl, I >
3630 IF XKLljIXX min<Ll> THEN X mi n<Ll >=XKL1,I >
869 3 IF YKLl,
I > >Ymax THEN Ymax =YKLl,
I >
87V30 IF YKLl,
I > >Y max<Ll > THEN Y max<Ll >=YKL1,
I >
3710 IF YKLl,
I XYmi n THEN Ymi n=Y K L 1 , I >
3720 IF YK L 1 ,I X Y m i n < L 1
>
THEN Y mi n<Ll >=YKL1, I >
8730 NEXT I
3740 NEXT LI3750 RETURN8 7 60 Y 1 i -1 to log: !
8770 FDR Ll=l TO Pf i 1
e
3730 FOR 1=1 TO Npt<Ll>8790 YKLl
,I > =LGT<YKL1
,I > >—
8300 NEXT I
3310 NEXT LI3320 Log c k = 1
S 3 o 0 RETURN3340 X 1 i 0 to log:!8350 FDR Ll = l TO Pf i 1 e
8860 FOR 1=1 TO Npt<Ll>8370 XKLl
,I >=LGT<XKL1
,
I > >
8 3 3 0 NEXT I
3390 NEXT LI8900 Log c k = 1
3910 RETURN8920 Y log to 1 i n : !
3930 FDR Ll=l TO Pf i 1
e
3940 FOR 1=1 TO Npt<Ll>3950 YKLl
,I > = 10'^YKL1
,I >
3960 YKLl,
I >=pround<;yk L 1 ,I > , I NT < LGT ( RES ( VK L 1 ,
I > ^
397 3 NEXT I
3930 NEXT LI3990 RETURN9000 X log to 1 i n : I
9010 FDR Ll=l TO Pf i 1
e
9023 FOR 1=1 TO Npt<Ll)9 030 XK L 1 ,
I > = 1 O-'-X 1 L 1 ,I 'l

•5* 04090539060907090S 3
.9090910091139120913 3
9140915 3
9160917391S091909200921392239230LOT”9240925 3
92609273923392909300931 3
932093309340935093609370R 0 .
"
93S0G H I I 'l
939094009413942 3
943094409450946 3
RO .
”
9 4 7 J
GRIN943 3
X 1 < L 1 ,n =PROUHD oa < L
1
,I >
,I HT < LGT < RBS < X 1 < L 1 ,
I
> > )> -4
)
NEXT I
NEXT LIRETU9NScal?_type: ! SUBROUTINE TO CHOOSE SCRLE TYPE ########IF ^t>2 THEN G03UB X_log_to_HnIF <Pt=2) OR (Pt=4) THEN GOSUB Y_log_to_linIF <Pt=2) OR <Pt=4) THEN Ym=4G 0 S J B Find_r an g e
Sca1?_it: PRINT PAGE L I N < 2 ) ;TAB 23 ) ;
” I NPUT SCALE TYPE"PRUT LIN<:2)
;TABCIO)
;"EXTREMES of this DATA SET are . . . "
; L I N < 2 >
Xmi n^=VAL$<Xmi n>Xmax^=VAL^<Xmax>P R I H T USING 9 1 8 0
;"
X
m i
n
= " ;
X
m i
n
f "
X
m ax = " ;
X
m ax $
IMAGE 9X, 7A, 20A, 7A, 20AYmi 'i$=VAL* < Ym i n
)
Yma=<$ =VAL$<Ymax>PRINT LIN<1)PRINT USING 9130; "Ym in = "
;Ym i n$
," Yrnax = "
;Ymax$
PRINT LINO) ;TA3C 10> ; "You nou must CHOOSE the TYPE of graph to P
PRINT LIN< 1 > ; TAB^ 15) ; "TO PLOT LINEAR ... ENTER 1"
PRINT TAB<15);"T0 PLOT X-LIN Y-LOG ... ENTER 2"
PRINT TAEda); "TO PLOT X-LOG Y-LIN ... ENTER 3"
PRINT TAB<15);"T0 PLOT LOG-LOG ... ENTER 4"
Pt = 3 _INPJT PtIF <Pt>=l) ANB Ot<=4) THEN GOTO 9340B£E='
INPJT " Option not within range...TRY AGAIN", Pt
GOTO 9300IF =t=l THEN 9550IF ^t=3 THEN GOTO Check _x m
n
Chec<_ymn: IF Ymin>0 THEN GOTO Ymn_okPRINT PAGE; LIN O) ;
TABOO);"Y v'ALUES ARE LE3S THAN OR EQUA^ TO ZE
PRINT LINC 1 ) ;TAB''17)
;"THIS IS NOT ALLOWED FOR A LOG PLOT... TRY A
II
PRINT LIN<6) ; TABC30) ; "PRESS CONT TO TRY AGAIN"INPJT A1Pt = 1
GOTO Sc al e_i
t
Ymn_Dk: IF Pt=2 THEN 9520C h e c < _x rn n : IF X m i n > 0 THEN 9520EEE=’
PRI NT PAGE; LIN<S);TAB(20)
;"X V'ALUES ARE LESS THAN OR EQUAL TO 2E
PRINT LINC 1 ); TAB':; 17) ;"THIS IS NOT ALLOWED FOR A LOG PLOT... TRY A
PRINT LINC2) ; TAB C 30) ; "PRESS CONT TO TRY AGAIN"
C22 J
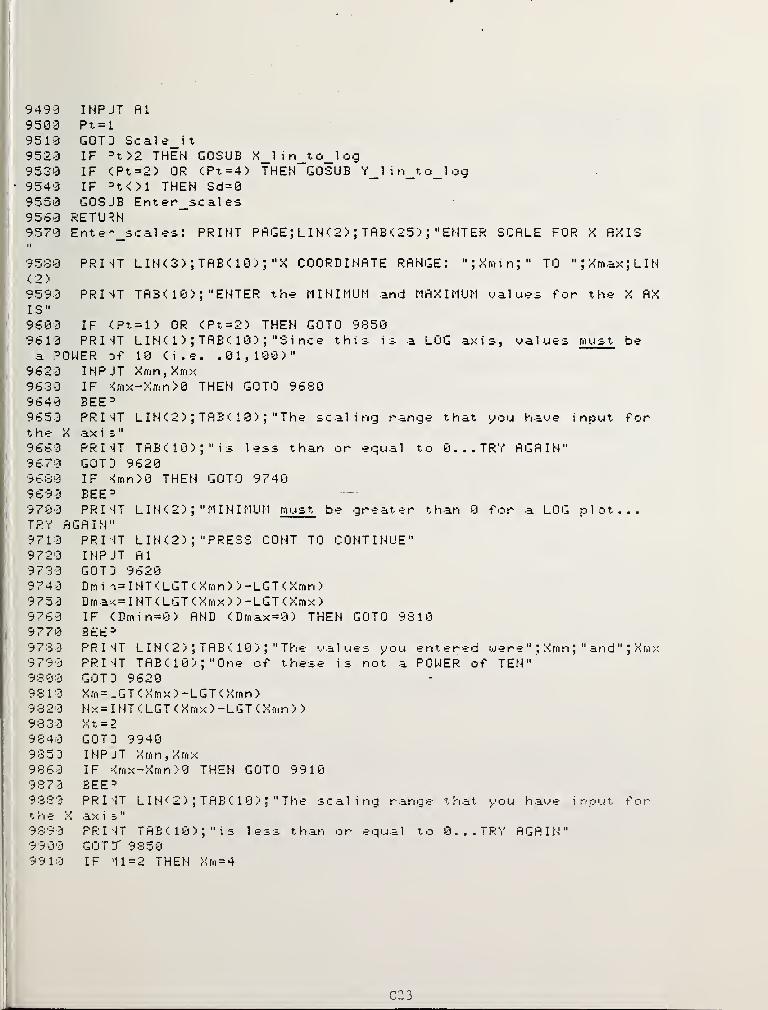
9490 INPUT A19500 Pt = l
9510 GOTD Scale it
9520 IF =t>2 THEN GOSUB X 1 i n to log9530 IF <Pt=2) OR <Pt=4) THEN GOSUB ’ Y_1 i n_t o_l og
' 9540 IF =t01 THEN Sd = 09550 GOSUB Enter scales9560 RETURN9570 Ent e ''_scal es : PRINT PAGE; LIN<2) ; TAB < 25) ; "ENTER
9530 PRUT LIN<3>;TflE< 10) ;
"X COORDINATE RANGE: ";Xrriin;'' TO "JXmax<2)9590 PRUT TAB< 10) ;
"ENTER the MINiriUM and MAXIMUM ^^al ues for theIS"9600 IF <Pt=l) OR <Pt=2) THEN GOTO 98509610 P R I T L I N < 1 ) ;
T A B < 1 0 ) ;" S i n : e this is a LOG ax is, oa 1 u e s ni u s t
a POWER Df 10 <i.e. .01,100)"9620 INPJT Xmn,Xnix9630 IF -imx-Xmn>0 THEN GOTO 96309640 BEE=9650 PRI^T L I N < 2 ) ;
T AB < 1 8 ) ;" The scalin>g range that you have input
the X axis."
9660 PRI'iT TAB < 1 0 ) ;"
i s less than or equal to 0...TRY AGAIN"9670 GOTD 96209 6 o 0 IF m n ) 0 THEN ij 0 T 0 9740969 3 BEE=-
9700 PR I -IT LIN<2) ;"MINIMUM must be greater than 0 for a LOG plot.
TRY AGAIN"9710 PRI-IT LIN<2)
;"PRESS CONT TO CONTINUE"
9720 INPJT A19730 GOTO 962097 40 Dmi -^=INT<LGT<Xmn) >-LGT''sXrnn)
9750 Dm a:<= I NT < LGT < Xmx ) ) -LGT < Xmx )
97 60 IF <Drnin = 0) AND <Drnax = 0) THEN GOTO 93109770 BEE='
;973 3 PR I 'IT LIN<2); TAB(10);"The m
\9790 PR I -IT TAB (10) ;"0ne of these
' 9300 GOTD 96209310 Xm=_GT(Xmx)-LGT(Xmn)
\9320
; 9330i 9840^ 9350
Nx=INT(LGT<XmXt = 2
1j 0 T D 9940
X ) - L G T ( X m r'l ) )
I N P j T X m n,X m x
93 6 9 IF Krrix-Xmn>0 THEN GOTO 9918937 3 BEE^9 3 3 PR I -IT LIN<2); TAB ( 10) ; "The s
t f'l e X ax i e
"
989 9 PRI IT TABU0) ;"is less than, 9900 GOTr 935099 10 IF 11=2 THEN y, m = 4
IS
;L I
N
X AX
be
f or
;Xmx
C23

9920 Xt = <Xmx-Xmn)/<5^tXrft)9930 Nx= I NT < < Xrnx-Xmn > / t Xt *5 > )
9940 PRI -^T PAGE; LIN< 2) ;TRB<25>
;"ENTER SCALE FOR Y AXIS"
9950 PRUT LIN<3> ; TABaO) ;"Y COORDINATE RANGE: ";Ymin;" TO ";Ymax;LIN
< 2 )
•9960 PRUT TAB< 10) ; "ENTER the MINIMUM and MAXIMUM ^^al ues for the Y AXIS"9970 IF <Pt=l) OR <Pt=3) THEN GOTO 102O09 9 S 0 P R I T L I N < 1 ) ;
T A B ‘s 1 0 ) ;" S i n c e this i s a LOG ax is, o a 1 u e s must be
a POWER Df 10 (i . e. . 01 , 100)
"
9990 INPUT Ymn,Ymx10000 IF r’mx-Ymn>0 THEN GOTO 1005010010 EEE^10020 PRIUT L I N < 2 ) ; TAB < 1 0 )
;" The scaling range that you haue input for
the Y ax is
"
10030 PRINT TAB<10);"is less than or equal to 0...TRY AGAIN"10040 GOTO 999010050 IF Ymn>0 THEN GOTO 10090100S0 BEE=-
lOOrO PRINT L I N < 2 ) ;TAB 'C 1 0 ) ;
" M I N I MUM m u s t be greater than 0 for a LOGplot ... TRY AGAIN"10030 GOTO 999010090 Dm i
^1 = I NT < LGT < Yrnn ) ) -LGT < Ymn )
10100 Dma:c=INT<LGTO'mx) )-LGT(Ymx)10110 IF <Dmin = 0) AND v:Dmax = 0) THEN GOTO 1016010100 EEE^10130 PRINT L I N < 2 ) ; TAB < 1 0 )
;" The values you entered were "jYmn;" and
'i' m X
10140 PRINT TAB < 10) ; "Si nee this is a LOG axis, values m u s t be a POWER of 10 k i . e. .01,100)"10150 GOTO 999010160 Yrn= _GT < Ymx ) -LGT < Ymn )
10170 Ny=INT<LGTCYmx)-LGT<Ymn)
)
10130 Yt=l10150 GOTO 1029010200 INPUT Ymn,Ymx10210 IF Tmx-Ymn>0 THEN GOTO 1026O10220 BEE=10230 PRINT LIN<2);TAB<10);"The scaling range that you have input fort e Y ax i e
"
10240 PRINT TAB(10);"is less than or equal to 0...TRY AGAIN"10250 GOTO 1020010260 IF -11=2 THEN Yrn = 4
102 70 Y t = < S' m X - Y rn n ) X C 5 * Y rn )
1 0 2 3 0 N y = I N T < < Y rn x - Y m n ) x < Y t * 5 ) )
10290 RETURN10300 Labels:! ########## INPUT LABELS AND TITLE ###########4########10310 PRINT PAGE; LIN<2) ; TAE<20) INPUT TITLE AND AXES LABELS"10320 PRI-TT LIN<4) ; TAB< 12) INPUT TITLE FOR PLOT... UP TO 30 CHARACTERS
C24
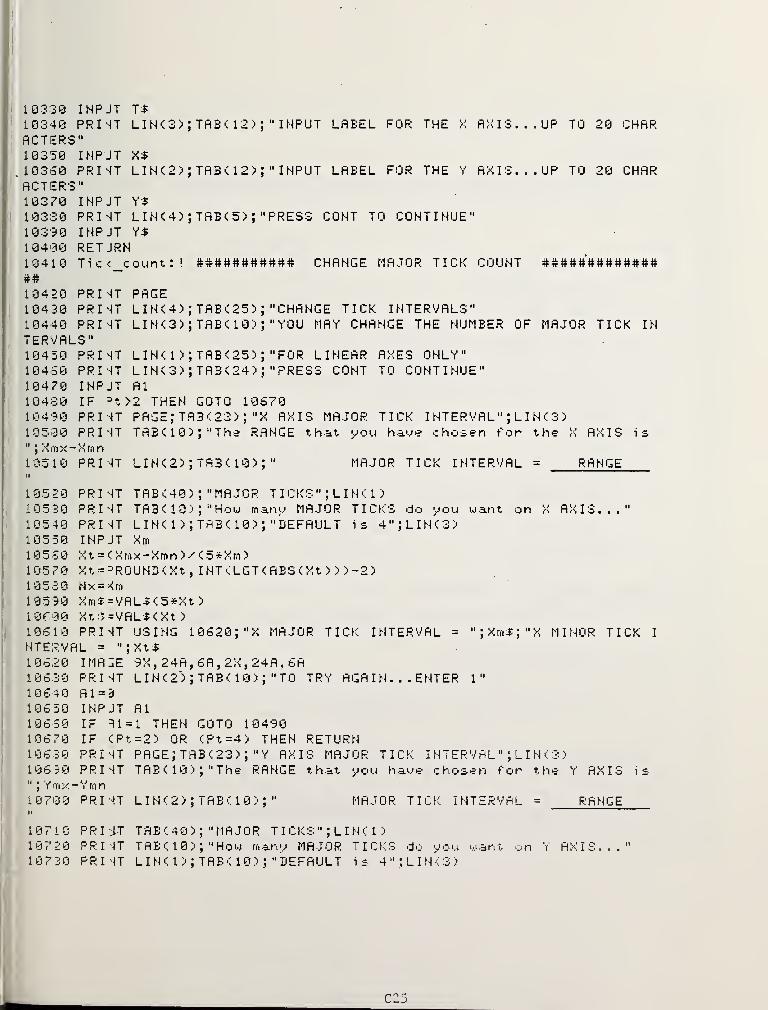
10330 INPJT T$10340 PRI4T LIN <3> ; TflB< 12> INPUT LREEL FOR THE X AXIS... UP TO 20 CHARACTERS"10350 INPUT X$
.10360 PRI4T LIN<2>;TABa2> INPUT LABEL FOR THE Y AX IS... UP TO 20 CHAR
ACTERS"103P0 INPJT10330 PRUT LIN<4) ;
TAB<5) ; "PRESS CONT TO CONTINUE"10390 INPJT10400 RETJRN10410 Tic<_count:! CHANGE MAJOR TICK COUNT##10420 PRINT PAGE10430 PRINT LIN<4) ; TAB<25) ; "CHANGE TICK INTERVALS"10440 PRINT LIN<3) ; TAB< 10> ; "YOU MAY CHANGE THE NUMBER OF MAJOR TICK INTERVALS"10450 PRINT LIN< 1 > ; TAB<25) ; "FOR LINEAR AXES ONLY"10450 PRINT LIN<3> ; TAB(24) ; "PRESS CONT TO CONTINUE"104P0 INPJT A110430 IF =t>2 THEN GOTO 1067010490 PRINT PAGE; TA3(23>
;"X AXIS MAJOR TICK I NTERVAL "
;L I N ' 3 )
10500 PRINT TABa0);"The RANGE that you hau.? chosen for the X AXIS is"
;XiTix-Xmn
10510 PRI NT LIN<2) ; TABaO) ;" MAJOR TICK INTERVAL = RANGE
10520 PRINT TAB <40) ; "MAJOR T I CKS " ; L I N C 1
>
10530 PRINT TAB < 1 0 >;
" How many MAJOR TICKS do you want on X AXIS..."10540 PRINT L I N( 1 ); TAB < 10> ; "DEFAULT is 4";LIN<3>10550 INPJT Xm1 0560 Xt = C. Xmx-Xmn ) / < 5*Xm
)
10570 Xt = ^ROUND<Xt,INTCLGT< ABS-;Xt ) ) )-2>
10530 Nx=Nm10590 Xni4:=VAL^ <5*Xt )
10f00 XtJ=VAL$<Xt)10610 PRINT USING 10620; "X MAJOR TICK INTERVAL = ";Xm$;"X MINOR TICK I
NTERVAL = ";Xt$10620 I MAZE 9X, 24A, 6A, 2X, 24A, 6A10630 PRINT LIN<2> ; TAB(10J ; "TO TRY AGA I N . . . ENTER 1"
10640 A 1 = 3
10650 INPJT A110660 IF =11 = 1 THEN GOTO 1049O10670 IF <Pt=2) OR <Pt=4) THEN RETURN10630 PRINT PAGE; TAB < 23) ;
"Y AXIS MAJOR TICK I NTERVAL " ; L I N ( 3
>
106 30 PRINT T A E < 1 0 );
" T h e RANGE that y o u h ay e c h o s e n f o r t h e Y AXIS is"
;Ymx'- Y rn n
10700II
PR I NT
10 710 PR I U-T
107 20 PRINT107 5 0 PRINT
MAJOR TICK INTERVAL = R A N ij E
C25

10740 INPJT Ym1 0730 Yt = < Ymx- Ymn !) / < 5*Ym
>
107 S0 Yt = =R0UHD< Yt,
I NT < LGT < flES < Yt, > > > -2 >
10770 Hy=Ym10730 Yrn$=VflL$<5*Yt >
.10730 Yt$=VflL$<Yt)10300 PRI4T USING 1O620;"Y MAJOR TICK INTERVAL = ";Yrn$;‘‘Y MINOR TICK I
NTERVAL = ";Yt$10310 PRUT LIN<2)
;TAB< 10) ; "TO TRY AGA I N . . . ENTER 1"
10820 Al=310330 INPJT A110340 IF 31=1 THEN GOTO 1063010850 RETJRN10360 M e n .4 l: PRINT PAGE10370 PR I JT TAB<25)
;
"MENU i:
1 03 3 0 PRUT "OPTION #"
10330 PRUT " < 1 ) TITLE:10300 PRUT L I N < 1 ) ;
"
10310 PR I JT 11
103-20 PRUT L I N < 1 );
"
(2)103 30 X rn n ? =VALi(Xmn)10340 Xmx 1 = VALiCXmx)1 0350 Yrnn5 = VALi<Ymn)
REVEIW INPUT PARAMETERS" ; LIN< 1
)
";T$
LABELS - N AXIS: "
;
Y AXIS: ";y^SCALE TYPE: " ; Pi ( Pt ) ; L IN< 1
)
10360 Ymxi=VALi< Ymx)103 70 PRUT USING 1 1040; "(3) SCALE X MIN =
ja:ii /•.
1 0 3 3 0 PRUT U S I G 1 1 0 5 O;
""
;" Y M I N =
~"
;Y rr. n $ ,
" Y M A
10330 PRUT LINCl)11000 IF =t<3 THEN PRINT " < 4 ) MAJOR TICKS - X
JOR TICK INTERVALS OF ";Xt^511010 IF =t>2 THEN PRINT " <4) MAJOR TICKS - X
JOR TICKS"
";Xmni,"X ma:
" ; Ymxi
AXIS: ";Xni;
AXIS: ";Xrn;
MA
MA
11030 IF (Pt=l) OR <Pt=3) THEN PRINT TRB(25);"Y AXIS: ";Ym;" MAJOR TICK INTERVALS OF ";Yt*5i:030 IF <P^=2) OR (Pt--^4) THEN PRIN"^ TAB(25);"Y AXIS: ";Yni;" MAJOR T"CKS
"
11040 IMAGE 2X, 22 A, 10 A, 16 A, 3 A, 3
A
11050 IMAGE 2X, 22A, 3A, 16A, 3A, 3A1 1060 PRUT LIN<1);"T0 CHANGE ANY OF THESE P ARAMETERS ... ENTER OPTION #
1 10 70 PRUT LIN< 1 ); "PRESS CONT TO CONTINUE"1 1030 A 1=01 1030 IN='IJT A111130 IF A 1=0 THEN RETURN11110 ON A 1 G 0 S U E L ab e 1 s
,S c a 1 e_t u p e ,
E n t e r _s c a 1 € s,T i c k _c o i.j ri
t
11120 GOTO Manu_l11130 RETJRN11140 Men.4_2: PRINT P AGE ;
TAB ( 22 ) ;" MENU 2: B I MENS I ON/ PLOT OPTIONS";LIN
< 2 ) ^1 M :50 PR I -JT US I NG 111 60 ;
" PLOT OPT I ONS ";
" D I MENS I ON OPT I OHS "
C26

11163 IMR:E 9X, 12R, 27K, l?fl
11170 PRUT "OPTION TRB<41 >; "OPTION #"
11130 INR:E 2X,29R,4D11190 IMR:E 2X,27R,4D11230 Rsi ze$=VRL$tRsi ze>‘11210 IF 9nnot=0 THEN PRINT USING 11230; "<1)11220 IF =lnnot<>0 THEN PRINT USING 11230; "<DZE = ";Rsize$11230 IMR:E #,2X,33R,7R112 40 PRI'<T " DIMENSIONS - X RXIS:";X311250 PRI4T TRB<62);"Y RXIS:";Ysize11260 IF 4orm=0 THEN PRINT USING 112S0;"11270 IF '<orm<>0 THEN PRINT USING 11233;; Norms11230 IMRGE #, 27R, 17R11290 PRUT "(7) TITLE SIZE:11300 IF ^OT Sc i not THENON: NO"11310 IF
rnnotrtion:RNNOTRTION;
NO" ; "
"
YES - SI
1 ze
<2><2)
NORMRLIZE:NORNRLIZE
NO ", "
"
- FILE:
";Tsize;Ln-Kl)^OT Sc i not THEN PRINT USING 11320;"
3c i not THEN PRINT USING 11320;" <3)
<3> SCIENTIFIC NOTRTI
SCIENTIFIC NOTRTI on:YES"11320113 30
113301136011370
IMR3EPR I ^Timr:ePRINTPRINT
4, 44R" < 3 )
irJ4 4R
LR3EL SIZE: " ; Ls i ze ; L IN<
n
STRNDRRD "
" ; Nsi zeDEV I RT I ON:
;Nurn_3d; "SIGMR ERR
USING 11340; " <4)" <9) NUMBER SIZE:
IF 3d<>0 THEN PRINT " DEV I RT I ON: +/-"
OR BRR";LIN<n1 1330 IF 3d = 0 THEN PRINT " DEV I RT I ON: N0";LIN<1)11390 IF 5h.ide = 0 THEN PRINT " SHRDING: NO"11430 IF 5hade<>0 THEN PRINT USING 11410;" <5> SHRDING - FILES: "
;Sh idt’S
IMR6E 27R,30RPRINT LIN<1);" TO CHRNGE RNY OF THESE PRRRMETERS . . . I NPUT NUMBER
11410114 20THRT'
1 1 430114 401 14 50114601147011430
PRINTPR I NTR1 = 0
IMP JT
" CORRESPONDS TO OPTION #"
LIN< 1 ); "PRESS CONT TO CONTINUE"
R1IF 31=0 THEN RETURNOH 31 GOSUB Rnnot at i on
,Normal i ze
,Sc i _not
,St d_d€ '-,'
,Shad i ng
,D i rneni. i
o n s,T i t 1 e _s i z e , L ab e
1_s i z e , N u m b e r_s i z e
11430 GOTO Menu_2RET JRN! STRNDHRD DEVIRTION #################44St d _deo : PR I NT PRGE ; L I N ( 4 > ; TAB ( 23 > ;
" STRNDRRD DEV I RT I ON
"
IF S't = i then goto 11580PRINT LIN<3)
;TRBa2>
;"STRNDRRD DEVIATION MAY EE USED ON R LINERR
1150011510115201153011540SCALE ON^Y"11550 priTt LIN<2) ; TRB<29)
;
11550 PRU3EPRESS CONT TO CONTINUE"
C27

11570 RETJRN11530 PRUT LIMC4)
;TRB< 15> ;
"TO DISPLAY STD DEV ERROR EAR ON GRAPH ENTER 1"
11590 Sd=311600 INPJT Sd.11610 IF 3d=0 THEN RETURN11620 Crt=011630 Nsd =SQR <20000* < Ymax- Ymi n) >.'2000011640 PRInIT LIN<4>
;TAB< 13> ;
"ENTER THE VALUE FOR 1 STANDARD DEVIATION"11650 INPJT Nsd11660 PRINT LIN<3> ; TAB<3> ; "ENTER THE NUMBER OF STANDARD DEVIATIONS TOPLOT. . . BETWEEN 1 AND 3"
11670 INPJT Num sd11630 IF <Num_5d>=l> AND <Num_sd<=3> THEN RETURN11690 BEE=11700 INPJT "THE NUMBER OF STANDARD DEVIATIONS TO PLOT MUST BE BETWEEN
1 AND 3... TRY RGB IN
" , Num_sd11710 GOTD 1163011720 RETJRN11730 Sci not: ! SCIENTIFIC NOTATION #####4########11740 PRI'nT page; LIN<3> ; TAB<25> ; "SCIENTIFIC NOTATION"11750 PRINT LIN<2> ; TAB< 18> ; "User may h-aoe SCIENTIFIC NOTATION on the L
INEAR AXES"1 1760 PRINT LIN< 1 > ; TAB<3> ; "LOG AXES will AUTOMATICALLY be labelled asPOWERS of 10"
11770 PRINT LIN<2>IS, the Y AXIS LABEL11730 PRINT TAB<7>LGTTER if the"11790 PRINT TAB<7>AXIS LA3E-, choose11300 PRINT TAB<7>
NOTE: If SCIENTIFIC NOTATION is used on the Y AXH*
will not be printed on the CRT or on the DIGITAL P
default NUMBER SIZE of 1 is used. To print the Y
a NUMBER SIZE of .3 or SMALLER. On the DIGITAL PLOTTER, the"11310 PRINT TAB<7) ; "s
SIZE of .3 or SMALLERi t uat i on
II
may also be remedied by choosing a PLOT
1 13 20 Sci 'tot =011330 PRINT LIN<3> ; TAB<20> ; "TO USE SCIENTIFIC NOTATION ENTER 1
"
11340 INPJT Sci not11350 RETJRN11360 Title_size:! INPUT TITLE SIZE #######4#############11370 PRINT PAGE; LIN< 4 >; TAB<30> ; "TITLE SIZE"11330 PRINT LIN<5> ; TAE< 15) ;
" INPUT MULTIPLIER BETWEEN 0 AND 3 FOR TITLE
1 1390 PRINT LIN<2> ; TAB < 15> ;"DEFAULT IS 1"
11900 INPJT Tsize11910 RETJRN11920 Label_size:! INPUT LABEL SIZE ###################1 19 30 PRI NT PAGE; LIN<4>
;TAB<30> ; "A:^\ES LABEL SIZE"
11940 PRINT LINf 5> ; TAB < 10) ;" INPUT MULTIPLIER BETWEEN 0 AND 3 FOR X AND
C2S

Y LABEL SIZE"11950 PR I -IT LIN<2) ;
TAB< 10> ; "DEFAULT IS I'-
ll 960 INPJT Lsize119P0 RETJRN119S0 !#»################## INPUT NUMBER SIZE ####################11990 Num3er_si ze: PRINT PAGE ; L I N C 4 ) ; TAB < 39 >
;" NUMBER SIZE"
12000 PRUT LIN<;2>;TAB( 15) ;
"ENTER MULTIPLIER BETWEEN 0 AND 2... DEFAULT13 1
"
12010 INPJT Nsize12020 RETJRN12030 Dimensions:! ############ INPUT DIMENSIONS FOR PLOT###!*##12040 PRUT PAGE; LI N<4) ;
TAB<2S>;"DIMENSION PLOT"
120 30 PRUT LIN<2);TABC 10) ;
"DEFAULT SIZE FOR PLOTTING IS lOO N UNITS B
Y 60 Y UNITS"12060 PRUT LIN<2)
;TAB<20)
;"ENTER SIZE FOR X AXIS...1 TO 120"
12070 INPJT Xsize12080 PRI4T LIN<2) ; TAB< 20) ; "ENTER SIZE FOR Y AXIS...1 TO SO"12090 INPJT Ysize12100 RETJRN12110 Annotation: I it######### ANNOTATION AND SIZE ##################12120 PRINT PAGE; LIN •:2)
;TAB < 36) ; "ANNOTATION"
12130 PRINT LIN<3) ; TAB<20) ; "TO PLACE ANNOTATION ON YOUR GRAPH... ENTER 1"
12140 Amot=012150 I'!PUT Annot12130 I- Annot=0 THEN RETURN12U0 C"t=012130 PRINT LIN (3) ; TAEv 10) ; "WARNING: If you wish to use ANNOTATIONon the DIGITAL PLOTTER"12190 PRINT LINC 1 ) ;
TABaS);"you must FIRST PLOT graph on the CRT"
12200 PRINT LIIKS) ; TAE<20) ; "Input MULTIPLIER between 0 and 2 for theANNOTATI 3N"12210 PRINT LIN< 1 ) ;
1 AB<2 3) ; "CHAR Ac TER S xZE. .. DEFAULT is 1"
12220 A s i ze = 1
12230 I MPUT A s i z e
122 40 I - <As ize>=0) AND < Asi ze<=2) THEN RETURN12250 BEEP12260 I JPUT II CHARACTER £ i Z ‘=‘ MULTIPLIER must be0 ind 2... TRY AGAIN",Asize122P0 GOTO 12240122 30 RET iP.N
12230 Nor-fialize:! ########## NORMALIZE DATA FILES #############1 2300 PRUT PAGE
;L I N ( 2 ) ;
TAB C 29 > ;" NORMAL I ZE "
12310 PRUT LIN<2);TAE<22)
;"DATA RANGES FOR FILES ARE : "
;L I N 2 )
1 2320 I MA 3E 1 OX,
1 OA,
1 2A , 1 2A , 1 2A,
1 2A123 30 PRUT USING 12320;"FILE # "
," X-M I N "
," X-MAX "
," Y-M I N "
," Y-MAX "
12340 FOR Ll=l TO Pfile12350 L1$ = '7ALT <L1 )

123t'0
12370123301 233012400$<Liy-124101242012430 PRUT LINO)
;TflB< 1 1 ); "NOTE: THE NEW VALUES FOR DATA PAIRS WILL
BE ROUNDED"12440 PRUT TABa7);"T0 FOUR SIGNIFICANT DIGITS"12450 PRUT LIN<2>
;TAB< 13) ;
"TO NORMALIZE A DATA FILE ... ENTER- 1"
12460 Al=312470 INPUT A
1
12430 IF =il<>l THEN RETURN
1 n$ < L 1 ) =VALf (. X_m i n < L 1 ) )
Y_m i n •$ < L 1 ) = V A L T < ‘i'_rri i n0 1 ) )
X_max$ < L 1 ) =VAL$ ( X_max L 1 ) )
Y_max$ < L 1 ) =V AL$ < Y_max < L 1 )
)
PRINT USING 12410;L1$; X_m i n$ ( L 1 ) ;X_rrtax$ < LI); Y_rii i n$ < L 1 ) ;
Y_rnax
IMAGE 12X, 3A, 12A, 12A, 12A, 12ANEXT LI
12430 Nor ^1=1
12500 INPUT " ENTER FILE #, MULTIPLIER FOR X DATA, MULTIPLIERFOR Y DATA"
,Fi 1 e, XmLjl t
,YmuU
12510 FDR K=1 TO Npt<Fil^)1 2520 XK F i 1 e
,K ) =X 1 C F i 1 e
,K ) *Xmu 1 t.
12530 IF XI <Fi 1 e, K)=0 THEN GOTO 12550125 40 X 1 < F i 1 e
,K ) =PR0UND < XK F i 1 e
,K ) ,
I NT LGT <; AES ' XK F i 1 e,K ) ) ) ) -3 )
12550 Y 1 < F i 1 e,K ) =Y 1 < F n e
,K ) *Yrnu 1 t
12560 IF YKFile,K)=0 THEN GOTO 1253012570 Y1 (Fi 1 e, K)=PROUND<YKFi 1 e, K)
,I NT < LGT < ABS < Y 1 ( F i 1 e, K) ) ) )-3)
12530 NEXT K
12530 N o r Ti < F n e ) = F i 1 e
12600 1=1
12610 K=21 2620126 3012640126 501 2660126 70126301263012700127101272012730127401275012760127 70
FDR Ll=l TO Pf i 1
e
IF Norm<Ll)=0 THEN GOTO 12680IF LI >3 THEN K=3Normal I
,I+K] = "4"2xVALS <L1 )2<"
,
"
I=I+K+1J = L1
NEXT LIIF J<10 THEN NormSCI-n = " "
G 0 S U B Fin d_r an g e! BEEP !
! P3USE !
G 0 T D o r rn a 1 i :z e
RETURN
& & 0 '>w >>
.•i •> I'l r. .> •'t it t'i
•i'. •:< *>: '.X •,;4 Oc <x
'i-; <x 'i-: Gx •-< '!x
M .> r. > .> c* •> 0•>: cc
Shading:! #####4# SHADING FOR A SINGLE LINE GRAPH ####4######PR I UT PAGE; LIN'iS)
;TAEC30)
;"SHADING"
PRI UT LIN<3);TABU5)
;"YOU MAY HAVE A PARTIAL FILLING OF THE SPAC
12730 PRINT TAB< 15) ; "BELOW YOUR CURVE IN THE DATA PLOT"12730 PRINT LIN< 1 ) ; TAE<3) ; "NOTE: CHOOSING THIS WILL MEAN THAT THE PLOT WILL T3KE"12300 PR ITT TAB (15); "3 TIMES AS LONG"
C30

12S10 PRUT LIN(2>;TRB< 15) ; "TO CHOOSE THIS OPTION ... ENTER 1"
1 2 3 2 0 3 h =L d e = 0
12330 INPJT Sh^de12340 IF 5hade=0 THEN RETURN12350 PRI'^T PAGE.12830 PRUT Ln-K2)
;TAB ‘;25) ; "FILE # - DESCRIPTOR"
12370 FDR Ll=l TO Pf i 1
e
12330 L1$=VAL$<L1)12390 PRINT USING 1 2900 ; L 1 $ ; F$ < L 1
)
12900 IMAGE 26X,7A,20A12910 BEEP12920 Shade<Ll)=012930 INPUT " TO SHADE THIS FILE... ENTER 1 - ELSE PRESS C
ONT" , Shad?<Ll
>
12940 NE.XT LI12950 1=1
12930 K=212970 FDR Ll=l TO Pfi 1
e
12930 IF Shade<Ll)01 THEN GOTO 1303012990 IF LI >9 THEN K=313000 Shadei: I ,
I+K] = "4"‘iVAL$<;Ll )S<",
"
13010 I=I+K+113020 J=L113030 NEXT LI13040 IF J<10 THEN Shaded C
I - 1]= " "
13050 RETJRN13030 Menj_3:PRINT PAGE
;TAB 25 MENU 3: PLOT-TYPE OPT I ONS "
;L I N < 2 >
130P0 FDR L 1=1 TO Pfi 1
e
13030 IF PULI) =3 THEN PRINT TAB < 20 ) ;" F I LE #";L1;" PLOT HISTOGRAM
H
130 30 IF <PKL1)=0) OR <PKL1)=2) THEN PRINT T AB < 20 ) ;" F I LE #";L1;"
LINE TV=E # ";Lt''LD13130 IF P1CL1) = 1 THEN PRINT TAB C 20 ) ;
" F I LE ; L 1;
" SYMBOL =
" ; L5<L1
)
13110 IF PKL1)=1 THEN PRINT TAK 3 1 );" SYMBOL ";Lf;LD13120 IF <P1CL1)=2) OR <P1(L1)=1) THEN PRINT T AB ( 3 1 );" SYMBOL MULT= ";Cm<Ll)13150 NEXT LI13140 PRI4T LIN(:2)
;TAB':. 17) ;
"TO CHANGE ANY OF THESE F I LES . . . ENTER 1"
13150 PRUT LINCl ); TAB-: 25) ;"PRESS CONT TO CONTINUE"
13150 A 1 = 3
131 ?0 INPJT A113130 IF 51=0 THEN RETURN131 ?0 GOSJB Plot_types13200 GOTD Menu_313210 RETJRN13220 P] oi_types>: \ ######## INRUT PLOT TYPES13230 !
13240 FDR Ll = l TO Pfil€-13250 PRINT PAGE; LI N< 2)
C31
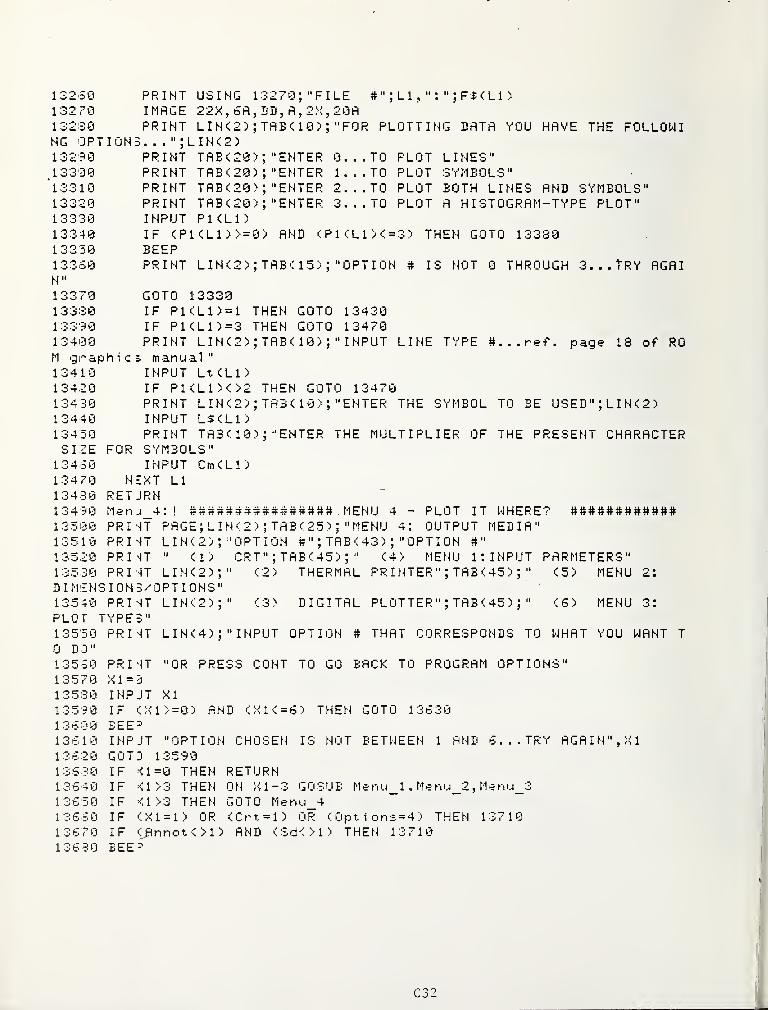
132o0 PRINT USING 13270; "FILE #" ; L 1
,"
:
" ; F$ <
L
13270 IMAGE 22X , 6fl , DD , fl , 2X , 20A13230 PRINT LIN<2)
;TflSaO)
;"FOR PLOTTING DATA YOU HAVE THE FOLLOWI
NG OPTIONS. ..
" ; LIN<2)13290 PRINT TAE(;20>
;"ENTER 0...T0 PLOT LINES"
,13300 PRINT TAB^20) ; "ENTER 1 . . . TO PLOT SYMBOLS"‘l3310 PRINT TAB c:20>
;"ENTER 2... TO PLOT BOTH LINES AND SYMBOLS"
13320 PRINT TAB<20) ; "ENTER 3... TO PLOT A HISTOGRAM-TYPE PLOT"13330 INPUT PKLl)13340 IF <P1<L1>> = 0> AND <PKLn<=3> THEN GOTO 1333013350 BEEP13330 PRINT LINC2)
;TAB': 15;'
;"OPTION # IS NOT O THROUGH 3... TRY AGAI
N "
13370 GOTO 1333013330 IF Pl(Ln = l THEN GOTO 1343013390 IF PKL1)=3 THEN GOTO 1347013400 PRINT LIhK2) ; TABC 10> ;" INPUT LINE TYPE page 18 of ROM gi'aphics manual"13410 INPUT Lt<Ll)13420 IF PKLn<>2 THEN GOTO 1347013430 PRINT LIN <2> ; TAB< 10> ; "ENTER THE SYMBOL TO BE USED";LIN<2)13440 INPUT l$<:li;13450 PRINT TA3< 10) ; "ENTER THE MULTIPLIER OF THE PRESENT CHARACTERSIZE FOR SYMBOLS"13430 INPUT Cm<Ll)13470 NEXT LI13430 RETJRN13490 Men.4_4: ! MENU 4 - PLOT IT WHERE? ############13500 PRUT PAGE; LIN<2)
;TAB<25)
;"MENU 4: OUTPUT MEDIA"
13510 PRINT LIN -:2) ;"OPTION # "
;T AB : 43 ) ;
" OPT I ON #"
13520 PRINT " <1) CRT";TAB':45)
;
" «:4) MENU 1: INPUT PARMETERS"13530 PRINT LIN<2);“ <2) THERMAL PR I NTER " ; TAB < 45 )
;" <5) MENU 2:
DIM3NSI0N5/0PTI0NS"135 40 PRINT LINC2);" <3) DIGITAL PLOTTER "; TAB < 45 );
" <:6) MENU 3:
PLOT TYPES"13550 PRINT LIN<4) ;" INPUT OPTION # THAT CORRESPONDS TO WHAT YOU WANT T
0 DO"13530 PRINT "OR PRESS CONT TO GO BACK TO PROGRAM OPTIONS"13570 XI =d13530 INPJT XI13590 IF <X1> = 0) AND '':X1<=3) THEN GOTO 1333013300 BEE=13310 INPJT "OPTION CHOSEN IS NOT BETWEEN 1 AMU 5... TRY AGAIN", XI13320 GOTO 1359013330 IF N1=0 THEN RETURN13340 IF N 1 > 3 THEN 0 N 1 - 3 G 0 S U B M e nu_ 1 , M e nu_2 ,
M e n u_313350 IF Nl>3 THEN GOTO Menu_413330 IF <X1 = 1) OR ^Crt = l> OR Opt i ons = 4 > THEN 13710133 70 IF <^nnot01) AND CSdOl) THEN 1371013330 EEE='
C32
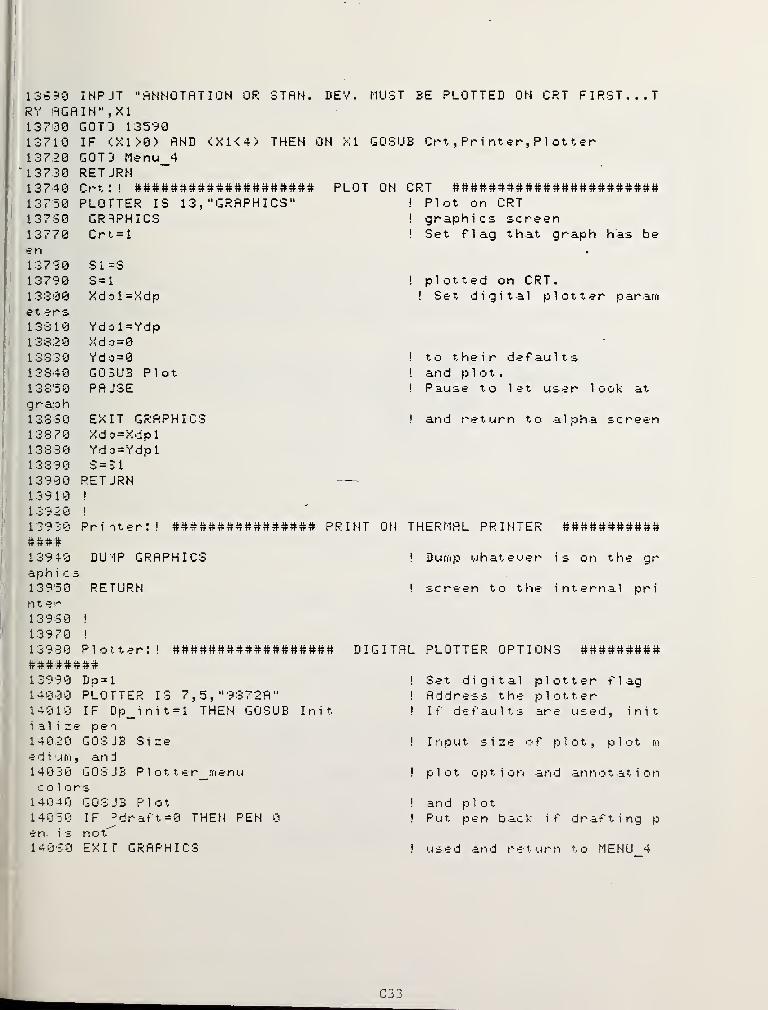
136?0 INPJT "flNNOTRTION OR STRH. DEV. MUST BE PLOTTED ON CRT FIRST...TRV RGRIN‘‘,X113700 GOTO 135S013710 IF <X1>0> RND CX1<4> THEN ON XI GOSUB Cr t , Pr i nt er , P 1 ot t er13720 GOTD Menu_413730 RETJRN13740 Crt;! #################### plot ON CRT #######################13750 PLOTTER IS 13, "GRAPHICS" ! Plot on CRT137S0 GRAPHICS ! graphics screen13770 Crt = l j Set flag that graph has be€* n
13730 S 1 =s13790 3=1 ! plotted on CRT
.
13300 X d 0 1 = X d p Set digital plotter par arn
e t e r s
13310 Vd Cl 1 =Ydp13820 Xdo = 0
13330 Ydo = 0 ! to their defaults13340 GOSUB Plot ! an d plot.13350 PR JSE ! Pause to let user look at
g r a:o h
1 3 b' 3 U EXIT GRAPHICS ! and return to alpha screen133 70 Xdo=Xdpl13380 Ydo=Ydpl13390 b — o 1
13900 RETJRN13910 1
13920 !
139 30 Printer:! PRINT ON THERMAL PRINTER ##########4
139 40 DU ‘IP GRAPHICS ! Dump uhateuer is on the graph i 0 s
13950 RETURN ! screen to the internal print >?r
13980 I
13970 !
13980 Plotter:! ################## DIGITAL PLOTTER OPTIONS ####4####
13990 Dp=l 1 Set digital p 1 o 1 1 e r flag1 4 0 0 0 PLOTTER IS 7,5,"9S72A" 1 A d d r e s s the pi o 1 1 e r
1401 0 IF Op_init=l THEN GOSUB Init 1 I f d e f au 1 t s ar e u s e id,
initi a1 i z e p e "I
14020 G 0 S J E Size ! I r'l p u t size o f p lot, plot m
a d i rri,
an d
140 30 i3 0 S J B Plotter m e n u ! plot o p t i o n an d an n o t at i o n
col o r s
1 4 0 4 0 GOSJB Plot ! and plot14050 IF ='draft=0 THEN PEN O ! Put pen back if draf t i nq pc-n i
=. not'^
14080 EXIT GRAPHICS ! used and return to MENU 4to MENU 4

! Reset plotter flag1 4 0 r 0 D p = 3
14030 RETJRN14030 Init:Pcl=l14100 MAT Pc2=<n14110 Pc3=l14120 Pc 4 = 1
14130 MPT Plabel=<l>14140 Pc5=l14 150 Pdraft.=014150 Dp_init=014170 RETJRH14130 Si z = : PRINT PAGE ; L I N C2 ) ; TAB < 23 >
;" I NPUT PLOT SIZE"
14130 PRINT L I H < 2 ) ; TAB < 1 5 >;
" You now have a chance to pick the plot siz
14200 PRINT L I N < 1 > ;TAB :! 1 5 > ;
" P 1 ot size fii u s t be a number between 0 and1 "
14210 PRI NT L IN C3) ; TAB< 15) ; "EXAMPLES: "
14220 PRINT LIhK 1 ) ; TABC20) ; "SI2E=1 . 00. . . Ful 1 plotter14230 PRINT TAB<20) ; "SIZE=0. 65. .. Standard 3 1/2 x 11
14240 PRINT TAB<20) ; "SIZE=0. 00. . . Si ngl e point on the14250 INPJT " INPUT PLOT SIZE ?",S14260 IF <S>=0) AND <S<=1> THEN RETURN14270 BEE^14230 INPJT " PLOT SIZE is not betweenCONT AND TRY AGAIN", A
1
14230 GOTO 1425014300 RETJRN14310 P 1 o 1 1 er_nienu : PR I NT PAGE
; L I N < 2 ) ;TAB ( 30 ) ;
" D I G I TAL PLOTTER ";L I N < 2
)
14320 PRINT T A B ( 1 0 ) ;" T h e r e ar e t h r e e o u t p i.j t m e d i u m options for the dig
i t a1plotter:"
1 i fii i t s "
inch pagepage"
0 and 1... PRESS
14330 PRINT143N0 PRINT14350 PRINT14360 PR I NT14370 PRINT14330 PRINTh u =. i n g
"
14330 PR I NT14400 PR I NT14410 PRINT1441:0 PRINT144 50 PR I NT14 440 Do = l
14450 INPJTo
LIN< 1 ) ; TAE< 17)
;
TAB< 13) ;
"< 1
)
TAB< 13) ;
" ;2)
TAB': 13) ;
"
IS)
TAB': 13) ;
"
<4)TAB< 10) ;
" Us i ng
"OPTION #"
FELT TIP PENS - NORMAL QUALITY"FELT TIP PENS - PUBLICATION QUALITY"TPANSPEPANC'ES"DRAFTING PEN";LIN<1)defaults, the time it take to plot one grap
TAB< 10) ;
TAB< 13) ;
TRE< 13)
;
TAB C 13) ;
TAB': 13);
' u s i n g one dat a file i s : " ; L I N < 1
)
' < 1 ) Nor m a 1 Q u a 1 it - ab o u t t w o m i n u t e s "
’ < 2 ) Public at i o n q u a 1 it y - t w i c e as 1 o n g‘ < 3 ) T an s p ar e n c i e s - t i,i i r e as 1 o n g
"
' 4 > Drafting pen - f our times as long. L I N ( 2 )
II
I N PUT the 0 P T I 0 N # t h at y o u w o lj 1 d like to tJ s e" ,
D
14460 IF c;Do>=1> and (Do<=4) THEN GOTO 145O014470 BEE-14430 INPJJ" " OPTION # NOT WITHIN RANGE ... PRESS CONT AND TRY AGAIN", =11
C34

14490 GOTD 14450145 '11 0 OH Do G 0 S U B H o rm a. 1 ,
P u b ,P u b ,
D r af t
14510 RETJRN14520 Nornal : OUTPUT 7, 5; "VS 8"
14530 G03JB Colors14540 RETJRH14550 Pub: OUTPUT 7, 5; "VS 3"
145 '50 GOSJB Colors14570 RETJRN14580 DraPt: OUTPUT 7,5; "VS 1"
m . / s e c . )
14590 GOSJB Init14600 PdraPt=l14610 PR I 'IT PAGE; LIH<4)
;TflB<25;
I
Plot, fast, <3 c rn . s e c . >
and go get colors
! Plot slow <3 c ri i . / s e c . )
! and get c o 1 o r
s
! Plot at drafting speed <1 c
! Set dfrafting flag"DRAFTING PEN"
14620 PRI'IT LIN<4>;TAB<20>
;"LOAD THE DRAFTING PEN NOW"
14630 PR I 'IT LIN<4>;TAEa0)
;"PRESS CONT TO CONTINUE"
14640 PAUSE14650 RETJRN14660 Col^rsCPRINT PAGE ; L IN C 2 ) ; TAB < 30 >
;" PLOT COLORS"
14670 PR I 'IT LIN< 1 > ;TR3C20> ;
"PEN #1 - BLACK PEN #3 - GREEN"14630 PR I 'IT TAB<20);"PEN #2 - BLUE PEN #4 - RED"14690 PR I -IT LIN<2>
;TAB< 15>
S LABELS: ";Pen$<Pc4)14700 PR I -IT LIN< n
;TRBC 15>
14710 K=3147 20 PR I 'IT LINa);TA3a5>14730 FDR Ll = l TO Pf i 1 e
14740 ET =F$<LnCl]14750 Pen$="“147 50 IF Pc2<Ll)<>0 THEN Pen$ =Pen$ ( Pc 2 < L 1 ^
)
14770 PRINT TA3<21);L1;" - ";Pen$;"14730 NEXT LI14790 0p=- il=P=014800 INPJT " TO CHANGE A COLORCONI TO CDNTINUE",Op14810 IF Dp=0 THEN GOTO 1502014820 IF <0p>=l> AND (0p<=4) THEN GOTO 1436014330 BEE=14840 INPJT " OPTION # NOT WITHIN RANGE PRESS CONT AND TRY AGAI
"<n TITLE: ";Pen$<Pc3>;TAE<39>; "<2> AXE
"<3';' AXES AND TICK NARKS-: ";Pen$<P.:D
"(4) FILE #"
; F$<L1 >
ENTER OPTION # - else PRESS
N ", A 1
14350 GOTD 1430014860 IF Dp<>4 THEN GOTO 1492014370 INPJT " INPUT FILE #",Fil14350 IF Cril>=l) AND <Fil<=Pfi1e) THEN GOTO 1492014390 BEE=-
14900 INPJT " FILE # NOT WITHIN RANGE ... PRESS CONT AND TRY AGAIN"
14910 GOTD 1437014920 INPJJ " INPUT NEW PEN #",P149 30 IF (P> = 0) AND (P-<=4) THEN GOTO 14970
C35
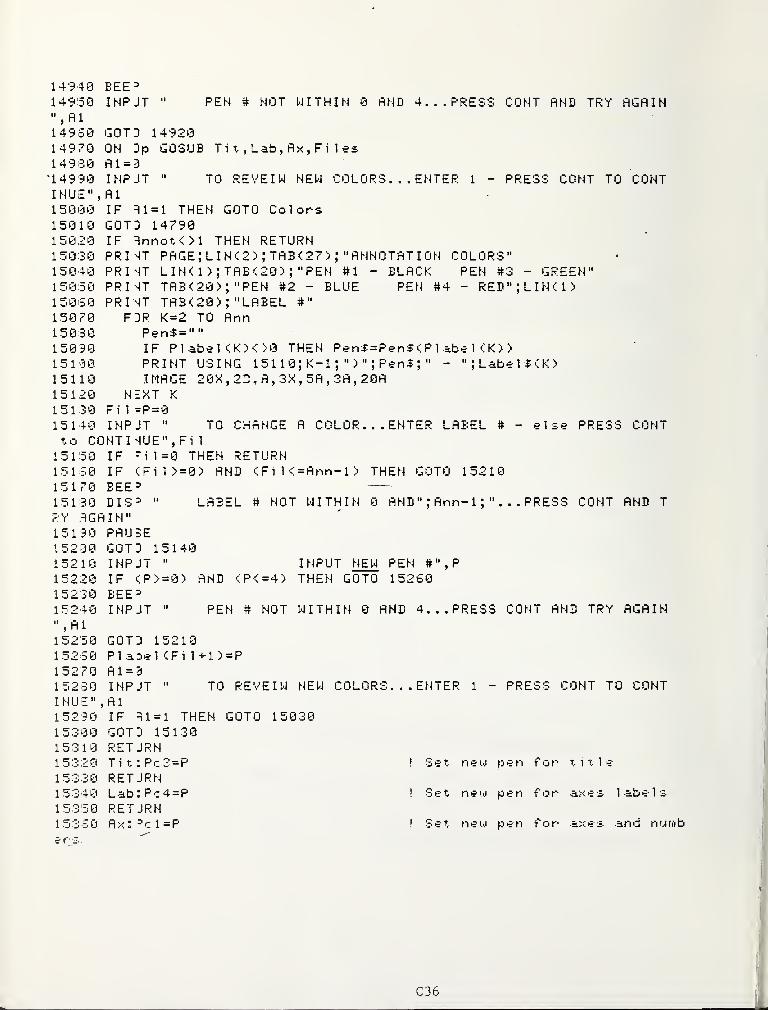
14940 EEE=14950 INPJT ' PEN # NOT WITHIN 0 AND 4... PRESS CONT AND TRY AGAIN", A 1
14960 GOTO 1492014970 ON Dp GOSUB Tit, Lab, Ax, Files149S0 Al=3•14990 INPJT " TO REVEIW NEW COLORS ... ENTER 1 - PRESS CONT TO CONTINU£",A115000 IF 31=1 THEN GOTO Colors15010 GOTO 1479015020 IF 3nnot01 THEN RETURN15030 PRI4T PAGE; LIN<2> ; TAB <27; ; "ANNOTATION COLORS"15040 PR I 'IT LIN< 1 ) ;
TAB<20);"PEN #1 - BLACK PEN #3 - GREEN"
150 50 PR I 'IT TAB<20);"PEN #2 - BLUE PEN i*4 - RED";LIN<i;15060 PRI'IT TAB<20)
;"LABEL #"
15070 FDR K=2 TO Ann15030 Pen$=""15090 IF Plabel<K)<>0 THEN Pen$=Peni < P 1 abe 1 < K ;
>
15100 PRINT USING 1 5 1 1 0 ; K- 1;
")
" ; Pen^ ; " - Label $<K;15110 IMAGE 20X, 2D, A, 3X, 5A, 3A, 20A15120 NEXT K
15130 Fi 1 =P=015140 INPJT " TO CHANGE A COLOR ... ENTER LABEL # - else PRESS CONTto CONTI 'lUE"
,Fi 1
15150 IF -il=0 THEN RETURN15160 IF <Fil> = 0) AND <Fn< = Anr-i; THEN GOTO 1521015170 BEE=15130 DIS=> " LABEL # NOT WITHIN O AND "; Ann- 1
;"... PRESS CONT AND T
RY AGAIN"15190 PAUSE15200 GOTD 1514015210 INPJT " INPUT N^ PEN #",P15220 IF <P>=0; AND <P<=4> THEN GOTO 1526015230 BEE=15240 INPJT " PEN # NOT WITHIN 0 AND 4... PRESS CONT AND TRY AGAIN"
,A1
15250 GOTD 1521015260 PI a^el <Fi 1 +1 )=P15270 Al=315230 INPJT " TO REVEIW NEW COLORS ... ENTER 1 - RRESS CONT TO CONTI HUE" , A115290 IF 31=1 THEN GOTO 15O3015300 GOTD 1513015310 RETJRN15320 Tit: Pc3=P ! Set n e I.J pen for title15330 RETJRN1534 0 Lab: Pc4=P ! Set n e i.d p e n f o r ax e s 1 ab els15350 RETJRN15360 Ax : =’c 1 =P ! Set n e w p e n for axes and numbe r S-
C36

! Set, new pen color for file #
1537015330Fi 1
1533015400•154101542015430154401545015430AXES15470154301543015500155101552015530
RET JRNFi 1 ss: Pc2(Fi 1 >=P
RET JRN##############################
# #
# PLOT DflTfl #
# #
Plot: !
! TAKE LOGS OF SCALE RANGES FOR THE LOGIF ^t, = l then GOTO
GOTO
15550
15500IF =t=3 THENYmx =LGT < Ymx
)
Ymn=LGT <Ymn)IF =t,=2 THEN GOTO 15550Xnix =LGT (. XiTtx )
Xrnn =LGT < Xmn )
! PLOT AREA = 20*PLOT SIZE + PLOTTER DISPLACEMENTS <Xdp,Ydp)FOR LOWER X AND LEFT Y AXES
155 40 ! X C20^SIZE OF AXIS Xs i ze,Ys i ze > ) *PLOT SIZE + DISPLA
CEMENTS FOR THE TOP X AND RIGHT Y SIDES15550 LOCATE 20*3 + Xdp, < 20 +Xs i ze > -^S + Xdp , 20*S +Ydp
,< 20 + Ys i ze > ^S + Ydp
SCA_E Xrnn,Xmx
,Yrnn
,Ymx ! Scale graph irito user units
IF Dp AND NOTPdraft THEN PENLINE TYPE 1
IF -rame THEN
Pc 1
FRAME
THEN GOSUB A;
15530155 70
15530155 98I HE TYPE15600 IF Axe;
TS15610 IF Dp AND NOT Pdraft THEN PEN Pci15620 IF 'lumber THEN GOSUB NumberHies UNITE15630 If^ Op AND NOT Pd^'.aft THEN PEN Pc 3
15640 IF _abel THEN GOSUB LabelS in GRAPHIC UNITS1565015630156 7015650156 9 0
I Draw FRAME using a solid L
! Draw TIC MARKS in USER UNI
! LABEL axes NUMBERS in GRAP
! LABEL TITLE and AXES LABEl
FOR Ll=l TO Pfile ! PLOT FILES in USER UNITSIF Dp AND NOT Pdraft THEN PEN Pc 2 LI)LOCATE 2 0 * S + X d p ,
2 O + X s i z e ) * S + d p , 2 0 S + Y dp, '' 2 O + Y s i z e ) * S + Y d pSCALE X m n
,X m x
,Y rn n
,Y m x
IF PKL1)=3 THEN GOSUB Histogram15700 IF <PKL1)=0) OR ( P 1 < LI) =2) THEN GOSUB Lines15710 IF CPi(Ll)=l> OR ( P 1 < Ll)=2) THEN GOSUB Swrnbols15720 IF Shade AND <P1 c;li )< > 3 ) THE N G 0 S U E S h ad e_ i
t
157 50 N EXT LI157 40 IF Op AND NOT Pdraft THEN PEN Pci13750 SET :u15730 IF 5d THEN GOSUB Stan dew ! PLOT STANDARD DEVIATION in GRAPH I
CS UNITS157 70 IF Annot THEN GOSUB A fi n o t ate ! PLOT ANNOTATION in GRAPHICS UNITS
C37

15730 IF ^t=l THEN GOTO 1535015730 IF ='t=3 THEN GOTO 15320 ! Corvj ert SCALE RANGES b ac k to LINEFiR 'v> al ue s
15300 Y ni X = 1 0 Y rn X ! f o r L 0 ij ax e s
15310 Y mn = 1 0 Y m n
,15320 IF =t=2 THEN GOTO 1535015330 Xmx = 10'^Xnix
15340 Xmn = 1 0''Xnin
15850 RET JRN1533 0 fix DRAW AXES ###########4*#######»15370 LINE TYPE 1
15330 Xi=<Xmx-Xmn>/90 ! CoiTipute size of X minor ti
c
15890 Yi =<Yrnx-Ymn)/70 ! Compute size of Y minor ti
c
15900 I- Pt=l THEN GOTO 1332015910 I- Pt=3 THEN GOTO 1609015920 F3R K = Ymn TO Yrnx-1 ! Draw tics for Y log - leftside15930 HOVE Xmn,K15940 DRAW Xmn+Xi*2,K ! Draw major tic15950 FOR L=2 TO 9
159 50 MOVE Xmn, K+LGT<L) ! Draw mi n or tics15970 DRAW Xrnn + X i
,K + LGT < L >
1 5930 NEXT L
15990 NEXT K
1300 0 FDR K=Ymn TO Ymx-1 ! Y log - right side13010 MOVE Xrnx,K
13020 DRAW Xnix-Xi*2,K13030 FOR L=2 TO 9
13040 MOVE Xrnx, K +LGT<L)13050 DRAW Xmx-Xi , K+LGT<L)13030 NEXT L
130 70 •'’EXT K
1 3 0 3 0 I- Pt=2 THEN GOTO 1329013090 FDR K = Xmn TO Xrnx-1 ! Draw tics for 'X log - bottQ rn s i 1de15100 MOVE KjYmn13110 DRAW K,Ynin +Yi*2 ! Maj or tics13120 FOR L=2 TO 9
1 3 1 3 0 MOVE K +LGT<L),Yn-m ! M i n o r tics
1314 0 DRAW K + LIjT(L), 'r' rn n + Y i
13150 NEXT L
13130 NEXT K
1 3 1 7 0 FDR K = Xrnri TO Xrnx-1 ! Top side13130 MOVE K,Yrnx13190 DRAW K,Yrnx-Yi*213200 ^ FOR L=2 TO 9
13 210 MOVE K + LGT':L) ,Yr'*:^<
C38

I
I
I
i
I
I
I
16220 DRAW K+LGT<L),Ymx-Yi
16230 NEXT L
16240 NEXT K
162 50 I- Pt=4 THEN RETURN16250 AXES 0,Yt,Xmn,'r’mn,5,5,3 ! Y 1 i n e ar axes - 5 minor ti
cs between major tics on eac h ax i s wit h a16270 AXES 0 , Yt , Xmx , Ymx , 5 , 5 ,
3
! tic s i z e = 3
16230 RETURN16290 A XE3 Xt , 0 , Xmn , Ymn ,5,5,3 ! X line ar ax e s
16300 AXES Xt , 0 , Xmx , Ymx,5
,5
,3 .
16310 RETURN16320 AXES Xt
,Yt ,
Xmn,Ymn
,5
,5
,3 ! X and Y 1 i near axes
16330 AXES Xt,Yt,Xmx,Ymx,5,5,3163 40 ! AXES 0,Yt,Xmn,Ymn,5,5,3 >i:
f* it ft I'l (i I'l i)i I'l i*( •'i t‘i 0 i) A 0 lb 0 0 0•>; •:< w c< •;< '.X >4< '.X VK <x 6: ^ Cx & Cm & w w
16350 RET JRN16350##
Numoer: ! NUMBER AXES
163P01633016390164301641016420164301644016450ER16460t h'2’
164^0t, b .? 1 o w
16430al f way16490in t it
e
165 301651 0
f n ij m b e r
1652016530r V a 1 u <5
165 4016550165S0165 701653016590166001 6 6 1 0
u 0
set:uL0C3TE 0, 130-s-S, 0, 100*SCSI 2E 3. 75*S*Nsi ze*<Xsi ze.'-lOO)
Xs=3. 75-s-Hsi za-s-9^'15^<X3i ze^’lOO)Ys=3. 75*N31 ze*(Xsi ze/100>lor: 4
FDR 1=0 TO NxIF Pt<3 THEN GOTO 16530 —MOVE 2 0 •S' 3 -!-X 3 i z s- * S ^ I / N X + X d p , .
V-f=" 10"
LABEL V^
LI$ = VRL5(Xrftn+I )
)
Lu = LEN<lJ$)
MOVE ( 2 0 + ( L u + 2 ) * X 3 X 2 s S + X s i z ^
LABEL U5
GOTO 16770X n w m = X m n + )'. t 5 * I
IF Xnurn = 0 THEN Xexp = 8
IF Xnurn = 0 THEN GOTO 16570X e X p = I H T ( L G T ( A B 3 < X n u rn > > )
IF ScinotOl THEN GOTO 16700MOVE 20*3 + 5sXsi ze* I sXt *Sx < Xrn;
X n u rri = D R 0 U N D < 'A n u m x 1 0 ' X e x p ,2 >
^FIXED 1
V$ =VAL^ O-^nurii)fJ."xl0"
! C o m p u t e width of n u m b e r
s
! Compute h i e g h t of numbers
! 3kip to 15820 if not log axis;0-l . 5sYs>*S+Ydp IMOVE TO CENT
! Place number in the middle of
! major tick and half the heigh
! the X axis. Place exponent h
! the height of the number and
i-sSsIxNx + Xdp, k20-Ys)*S + Ydp! middle of the e n t i r' e 1 e n g h t o
! i.e. M0U$"! If linear ax is, c o m p u t e n u m b e
! and value of the e;>cp orient
:
- A m n > -t X d p , ( 2 O - 1 . 5 -s Y s ) -s- S + Y d p! R o u n d n u m b e r' to d . d
! L ab e 1 m an t i s s a

166201663 0
166401 6 6 D 0
1 666 0
.9
166 70) 3 'i' d p16630166301670016710t digits16720ry1673016740167'50 !
1676016770 N
STANDARDLABELLv=LEN<V$)Ui=VAL$<Xexp>Lu=LEH<U$) ! Plac^ exp. the same a for lo
MOVE < 20 + < Lo + Lu ) *Xsx2 > trS +5*Xs
LABEL U$GOTO 16770MOVE 20 + S + 5 +Xsi ze+ 1 +Xt
<
Xrfix-Xrrin ) +Xdp,
< 20-1 . 5 + Ys > +S +YdpX n u m = P R 0 U N D < ‘A n u rn
,X e x p - 3 ) ! R o u n d n u m b e r to 3 s i g n i g i c an
V$=VAL$ < Xnum ) ! and add leading 0 if nec essa
IF CXnum<n AND <Xnum>0) THEN V$ = ‘*0"2cV$
IF <Xnum>-l) AND <Xntjm<0> THEN V-S= " -0 " S<VAL$ < ABS < Xnum >
)
LORG 7
LABEL V$EXT I
16730 lor: 2
16730 IF (Pt=2> OR <?t=4) THEN GOTO 16370 ! Skip to log section for lo
g a:x i s
16300 Len=016810 F:R 1=0 TO Ny16820 G03UB Ynumber ! Find the length of the longe s t fT u rn b e ^
163 30 Ln = LEN<V$)16340 IF Ln>Len THEN Len=Ln1 6350 NEXT I
16360 L u = 0/
1 6 o 7 0 FDR I = 0 TO N
y
! Loop for number of maj or t i
c s
16330 IF <Pt = l> OR <Pt=3;' THEN ij 0 T 0 16330 ! Skip to 1
i
near section16330 Ly = LEN<VALf <Ymr > 'r
! Find 1 n g t h of longest expon e n t
16900 IF LEN<VAL$< Ymx> ) >Ly THEN Ly=LEN<VAL$<Ymx)
)
! P 1 ac e "10"
W 1 'd t iT of16310 MOVE < 20- < ( Ly+2 > +Xs+ . 5+Ys ) > +S+Xdp , 20+S+Ys i ze+S* I /Ny+Ydp ! entire n i.j rn b = r aw ay16320 V$="10" ! from the left Y axis side16330 LABEL V$ ! Label exp. the width of Ion
g e s t exp.16940 MOVE < 20- ( Ly +Xs+ . S + Ys > > *S+Xdp,
'
( 2 0 + Y s ••• 2 ) + S + Y s i z e + S + I ••••' N y + Y d p !
away f r o Yi t hi e
1 69 50 Vi = VAL4 <Yrnn+I ) ! left Y ax is side1 6360 LABEL1 6 3 7 0 GOTO 172001 6 3 o 0 JF ScinotOl THEN GOTO 17170 ! Skip to s t an d ar' d n i.r m b e r s
1 6330 Y n u rn = Y rn n + Y t + 5 + I ! C 0 rn p u t e t hi e w a 1 u e o f t f'l e n u
f
I
I
I!
C40

m b e r
17000 IF Ynum=0 THEN Yexp=0 I and the exponent17010 IF Ynum=0 THEN GOTO 1704017020 Yexp=INT (LGT <ABS<Ynum> ) )
17030 Ynum =PROUND < Ynunv^ 1 0-^Yexp,- 1 > ! Compute mantissa d.d
17040 FIXED 1
17050 V$ = VAL$<Ynum)'^c"xl0"17030 STANDARD170 70 U$=VAL$<Yexp)17030 Lu=LEN<V$) I P 1 ac e n u m b e r the w i d t h of t
he whole *
170 90 Lu=LEN<U$) ! number away from the Y ax i s
17100 MOVE ( 2 0 - < L u + L u ) * X s - . 5 * Y s ) * S + <dp, 20*S+Ysi ze*S* I /Ny+Ydp17110 LABEL V$ I Place exp, t f't e width of theexp. auay'
17120 MOVE <20-Lu*Xs-. 5*Ys)*S +Xdp, -:;20 +YiX2>*S + Ysi ze^S*I/Ny +Ydp ! f
rom Y a.x i s
17130 LABEL U$17140 Lyt=L^^ + Lu ! Find length of longest number17150 IF Lyt>Ly THEN Ly=Lyt17150 GOTO 1720017170 G0SU3 Ynurnber ! For standard numbers, get Y
number17130 MOVE (. 20-LenHfXs- . 5*Ys > ^S +Kdp
,20*S + 5-^Ys i ze^Yt * I eS/ < Ymx-Ymn > +Y
dp* ~
17130 LABEL Wt , ! P 1 ac e i t the width of the 1
0 n g ? s t
17200 NEXT I ! number away from the Y axis17210 RETJRN17220 YnuTiber: Ynum =Ymn + Yt I ! Compute ual ue of the number17230 IF Ynum=0 THEN GOTO 1725017240 Ynum=DR0UND C Ynum , 3 > ! round to 3 significant digit s
17250 V$=VAL$ < Ynum ; ! and add leading 0 if necessary172 50 IF <Ynum<D AND <Ynum>0> THEN Vf=''0"&V$172 70 IF (Ynum>-1) AND (Ynum<0> THEN V^ = " -0 " 27v'AL$ < AES : Ynum > )
17230 RETJRN17230 Label:! LABEL AXES AND TITLE 4###########
17300 set:u17310 LOCATE 0 , 1 30*S , 0 , 1 00*S01. size17320 lor: 4
17330 C3IZE 5^S*Tsize17340 IF Dp=0 THEN GOTO 1737017350 F^R 1=0 TO 0
r
17330 A=I/10
! S e t c H u n i t s t o w hole pi
! D e f i n e title size
! M ak e title a little thick e
I o fi t ki e digi t- a 1 pi o 1 1 e r

17370 n 0 V E C 2 0 + X s i z
e
/ 2 > * S + A d p + ft , ( 2 5 + Y i i z e > * S + Y d p ! M o y e title to t
he middle17330 IF Dp THEN PEN Pc 3 ! of X axis and 5 units aboue graph17390 LREEL17400 IF Dp=0 THEN GOTO 17430•17410 NEXT I
17420 F:R 1=0 TO 0
f the17430 LORG 6
17440 CSIZE 5*S*Lsize
17450 MOVE < 2 0 + X s i z e 2 ) * S + X d p + fl5 < 2 0 -
in the17430 IF Dp THEN PEN Pc 4
ter174P0 LRBEL X^17430 LORG 4
174?0 MOVE (! 20-Len^Xs- 1 . 5*Ys > -it-S +Xdp,
17500 IF Scinot=l THEN MOVE <20-<Ly^*S+Ydp+I/1017510 IF <Pt=2) OR <Pt=4) THEN MOVE<20+Ysi ze^2>*S+Ydp+I/1017520 LDIR 99
! Make axes labels thicker o
! plotter! Define label character siz
2 . 5-*Ys i) *S +Ydp ! Place X l abel
! middle of X axis and 1 let
! size below the numbers
•'20 + Ysi zex2)*S +Ydp + fl
Xs+1 . 5*Ys) >*S + Xdp, <20 + Ysi ze/2)
<20-< <Ly + 2)*Xs+l . 5*Ys) )*S +Xdp,
! Place Y label in the middle o P the17530 LR3EL Y5 ! Y ax i s and 1 letter size t
o t h e 1 e f t
17540 LDIR 0 ! of the Y numbers and rotat
17550 IF <Dp=0> OR (Pdraft=l) THEN RETURN17530 NEkT I
175P0 RETJRH17530 Histogram;! PLOT HISTOGRAM ###############17590 X i
i = < Xmx-Xmn > /Xs i ze* . 25* < 1 xS > I If shading is used, make t
h
e shade .25 graphic unitsap ar t
17300 Xi =9999917310 FOR 1=2 TO Npt(Ll) I Find the smallest distancebet w-een
17320 J = X1 <L1,
I )-XKLl,I-l > I any 2 points
17330 IF J<Xi THEN Xi=J17340 NEXT I
1 7 3 1' 0 X i = < i - 2 0 * X i i > x 2 ! ALGORITHM: Draw a rectangle u i t :
17330 FOR 1 = 1 TO Npt'TLl) I HEIGHT= Y walue Y 1 ( L 1 ,I > )
17370 MOVE XI <L1,
I )-Xi , Ymn ! WIDTH= + Xi
17330 DRAW X 1 < L 1 ,I ) -X
i, Y 1< L 1 , I
>
! X i = (Smallest d i s t an c e be
t
ween any17 390 DRAN XI -rLl
,I >+Xi
5YKLl
,I ) I 2 points - 1 graphic
n i t
C42

177001771017720
17730.177401/41775017750177701773017790
DRAW XI <L1 , I >+Ki , Ymn '
! (4*Xii)) /2IF ShadeOl THEN GOTO 17760FOR Ix =XKLl ,
I >-Xi +Xi i TO X K L 1 ,I) +X i -X i i STEP X i i !
& & & & & lie Sc & '3<
MOVE Ix,YmnDRAW Ix,Yl'Xl,I) ! Shade Histogram with lines
NEXT Ix ! graphic unit apartNEXT I
RETURN!
I
17300 Lines:! ########4*############## PLOT LINES ##################17310 MOVE XK L 1 , n , Y 1 < L 1 ,
1 > I Moue pen t o f i rst dat a pai r
17320 LINE TYPE Lt<Ll) •
I Set line type chosen in PLOT_TYPES17830 FOR J=1 TO Npt<Ln17840 DRAW XI <L1 , J) , Y1 <L1 , J)
17850 NEXT J
17360 RETURN173^0 !
17330 !
17390 Symbols:! PLOT SYMBOLS44
17900 LINE TYPE 1 I Make sure symbol is draw soli d
17910 C S I Z E C m ( L 1 3 . 3 S ! Set c h ar ac ter size ~ 3.3 i s
def au 1
t
179 20f p Cl i n t
LORG 5
17930e f ;-' ame
FOR 1 = 1 TO Nptc;Ll>
17940 IF <X1 1.4L1,
I KXmn> OR17950 IF c;y 1 <L1 ,
I XYmn) OR17960 MOVE XI 1 LI
,I i-
,Y1 <L1
,
17970 LABEL L^CLl)17930 NEXT I
1799018000 !
RETURN
! Label symbol in the center o
I M ak e s u r e p o i n t is w i t h i n t h
>4 1 L 1 , I> >Xmx > THEN GOTO 17930ri CLl
,I) >Ymx> THEN GOTO 17930
! Moue pen and label symbol
13010 I
13020 3ha:ie_it:! 4f44# 44 4?44 44 44 ##44##44#44#44##44#44#44#44 SHADING 44 44 44 #44# 4444 4444 #44##44
1444#
130 30 LINE TYPE 1
130 40 X i = < X m X - X m n ) / X s i z e * . 2 5 * < 1 3 > I f1 ak e s f'l ad e lines 1 ' 4 g r ap h i c u n
i t apart130 50 S t o p = I N T ( < X 1 '• L 1 , N p t < L 1 > ) - 44 1 < L 1 ,
1 > > / ! 4 i > ! C o m p i.j t e # of s
h
ade lines to draw130 50 X f = X 1 ( L 1 ,
1 > ! I n i t 1 a 1 i z e X u a 1 u e o f fir s t s h ade line ^
13061 K=1
C43

1S0701307113072180731S0P4.13120
i nt13130131401815013160131 701813013131131901820013210###»13220
FOR 1=0 TO StopX1=XKL1,K)X2 =XKLl,K+nY1=YKL1,K)Y2 =YKL1,K+1)IF Y20Y1 THEN GOTO 13150 !If Y o-al ues of adjacent points
are equal get next po
Yf = YlGOTO 13160Yf=<Xf-Xl )/<X2-Xl >*<Y2-Yn+YlM 0 V E X f
,Y m n ! D r aw s h ad e 1 i n e
DRflWXfjYf IGetnextshadelineXf=Xf+XiIF Xf>=X2 THEN K=K+1
NEXT I
RETJRNStan dew: ! ################### DRRW +x- STD. DEV. #############
IF Dp THEN 13350 If plotter is used skip i nput p Etr t
13230 EXIT GRfiPHICS132 40 PR I 'IT PfiGE; LIN< 1 > ;
TflBC20);"PLOT STRNDflRD DEV I RT I ON"
13250 PRIMT LIN<2);TRBC 10) ; "THE PROGRRN IS NOW RERDY TO PLOT THE SIGMfl
ERROR BR5."132 50 PRUT LIH< 1 ) ; TRBC 10) ;
" < 1 ) PRESS CONT TO GO BRCK TO THE PLOT ONTHE CRT"13270 PR I IT TRB<10);"<2) POSITION THE CURSOR RT THE BOTTOM OF WHERE THE ERROR B=lR WILL"13230 PRI'IT TRB<15);"BE PLOTTED"13290 PRI 4T LIN< 1 ) ;
TRB-: 10) ;" <3) PRESS CONT"
13300 PRIMT LINU ) ;TRB< 10) ;
"THE PROGRRM WILL THEN PLOT THE ERROR BAR 0
N THE CRT"13310 PRIHT LIN< 1 ) ; TRB< 10) ; "PRESS CONT TO RETURN TO MENU 4: OUTPUT M
EDI R"
13320 INPJT R113321 GRAPHICS13330 POI'ITER 60,70,2 ! Allow user to digitize wher e t h e
13340 DIGITIZE Sdx,Sdy1 3 3 50 N 3 d _g u = Y s i z e / < Y m x - Y m n ) N s d
r i !'i t o
! error bar will be plotted! C o n w e r t user unit e r r o r b a
133 30 MOVE133 30 DRR -^1
13330 MOV E
h e b ar1 3- 3 9 0 DRR 4
1 3400 MOVE13410 DRR 4
13420 LOR :
S d X * S + X dp, S d
y
+ Y dp ! g r ap h i c unitsSdx*S+Xdp , < Sdy+2*Num_3d*Nsd_gu ) ^S+Ydp ! Draw error bar< Sdx- . 2 ) ^3 +Xdp
,^ Sdy + 2-i^Nurn_sd*Nsd_gu ) *S + Ydp ! Dr aw ends on t
( S d X + . 2 ) * S + X d p ,
' S d y + 2 N u rii_s d N s d_g u ) * S + Y d p( S d x - . 2 ) * 3 + X d p ,
S d y -S' 3 + Y d p< Sdx+ . 2 ) *S + Xdp
,Sdy-^^-S +Ydp
2 [Label number of standard d
C44

XdfD ,< Sdy + Ni.ui'i_sd*Nsd_gu > *3 +Ydp ! i r*i the middle of
! Find size of character in
! units
eu i at i ons13430 MOVE <Sdx+2:the b ar13440 CSIZE 3.5*313450 U=3. 5*<9/15)*S•grajoh i c
13460 U$=" + "S<VflL$':Hum_sd>Sc"o"
134P0 LRBZL U$13430 MOVE < Sdx+2 ) *S+Xdp , < 3dy+Num_sd*Nsd_gu+ . 3 ) *S+Ydp13490 LABEL "
! Label minus sign13500 MOVE < 3dx+2 . 25 > *3+4*U+Xdp , < Sdy +Hum_sd*Nsd_gu+ . 2 > *S+Ydp13510 LABEL ! Make "o" into a sigma by ad d i I'l g a13520 RET JRN ! bar on top of it
13530 Annotate; ! ####!+############# ANNOTATION ############4########444413540 C3IZE 4*S*Asize ! Set character size13550 LORE 2 ! Labe 1 from r
ight most c harac
t er13560 IF Dp=l THEN 137O0 ! On plotter, skip input sect i on13561 NAir 50013570 EXIT GRAPHICS ! Force user to press key to t
r i g g e r a1p ha s c r e e
n
13530 PRI-IT PAGE; LIN(4> ; "NE ARE NOW READY TO LET YOU PROVIDE ANNOTATION FOR THE" —135 30 PR I -IT "GRAPH WHICH YOU HAVE JUST DR A WN "
;L I N 1>
13500 PRUT "POSITION THE CURSOR TO THE LEFT EDGE OF THE POSITION WHIGH YOU "
13510 PRI4T "WANT TO START YOUR LABEL AND PRESS CONT " ; L I N < 1 >
13520 PRI'IT "THE SCREEN WILL PAUSE TO THE KEYBOARD MODE AND YOU THEN E
NTER"13530 PRUT "THE ANNOTATION THAT YOU WANT "
; L I N < 2 >
135 40 PR I 'IT "CONTINUE AS MANY TIMES AS YOU WANT"13550 PRllT LIN<2);"TU EXIT ANNOTAT i ON ... ENTER S.-illE CURSOR POxNT VWICEII
13560 PR I IT LIN<2) ;" . . . TO START ANNOTATION PRESS CONT"
1 3 5 Z 0 PAUSE ! F o r c e user to go b ac k 1 0 grap hies135Z1 GRAPHICS1 3 5 3 0 CSIZE .5135 30 POUTER 50,70,2 ! sc reen and set cursor1 3 7 ’3 0 F 3 R L = 2 TO 30 ! Up to 29 labels13710 ! I f o n p 1 o t T. e r c h e c k i f p o i nt I..J as d i g i t i z e d t w i c e
1 3 :
'
il 0 IF < D p = 1 > AND < < X a L > = X a < L - 1 > AND < Ya-:;L:'=Ya(L-l > > ) THEN RETURN137 30 ! I f n o t o n p 1 o 1 1 e r
,d i g i t i z e n e X t label posit ion
137 40 IF Dp=0 THEN DIGITIZE Xa<L>,Ya ::l>
13750 -^1 If this is the same posit i on , ex i t annot at 1 on 1 0 op13760 IF <Dp = 0> AND <Xa';;L>=Xa<L-l AND ( Y a( L > =Ya( L- 1 > > THEN RETUR
C45
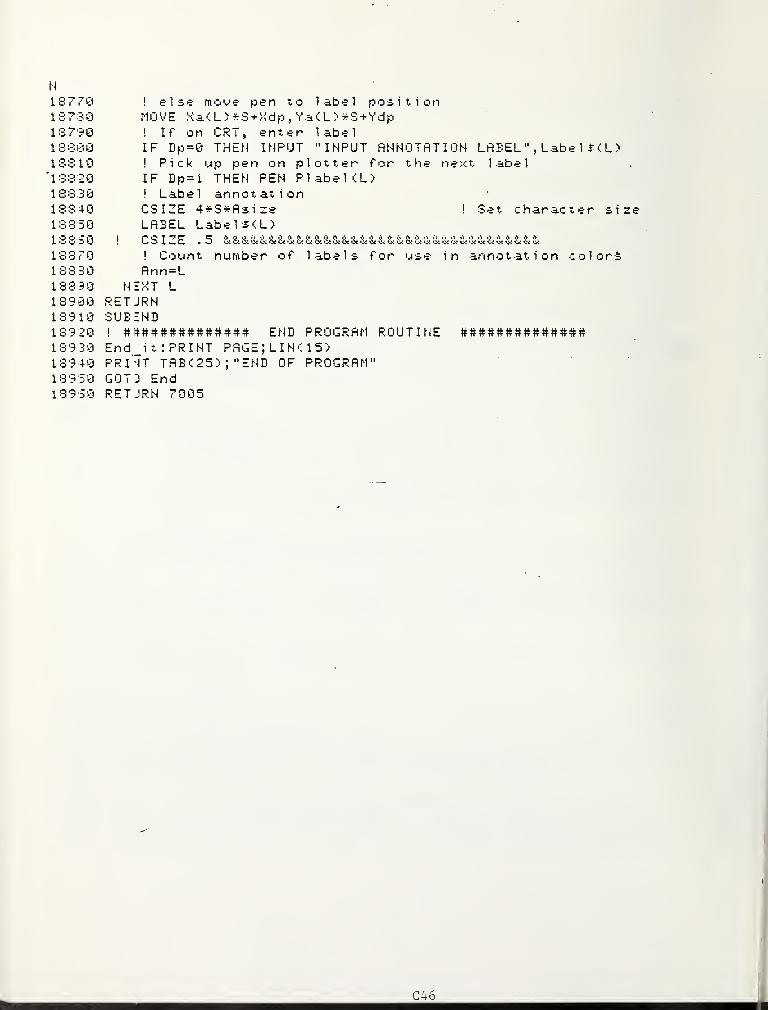
N
IS? 70187S0137901330013310'1332018330183401 3 3 5 0
133 501337013330133 501890018910139 20139 30139 4013950139 50
I
! el S'? m'Dve pen to label positionMOVE Xs<L)*S+Xdp, Ya<L>*S+Ydp
! If on CRT, enter labelIF Dp = 0 THEN INPUT "INPUT ANNOTATION LABEL ", Labe 1 ^ < L
>
! Pick up pen on plotter for the n ext 1 ab e
1
IF Dp=l THEN PEN PlabeKL>! Label annotationCSIZE 4*S*Asize ! Set character si
LABEL LabelSCL)C 3 I li. E • 5 Sc 'i< kx 8< 'is Ci L 8c & Si & S< 3< <1< Si 2s L 3-: S< 'i; •!< & Sc
A A t*) •> it it
'i< Ks< •>; •;>: Cc
! Count number of labels for use in annotation col or
^
Ann = L
NEXT L
RET JRNSUBEND! END PROGRAM ROUTINE ############4#End it:PRINT PAGE
;L I N : 1 5 >
PRl'4T TAB'CZS);"END OF PROGRAM"
GOT 3 EndRETJRN 7005
C46

APPENDIX D: FLOW CHARTS
0


PLOT P^OCRAi-I DRIVER
INITSet up coinmon
tnltiallze fla
LOAD SFK's
INPUT DATA'rom Keyboard,:ape. Plotter,)efine functior
OPTIONSInput" new~3ataSave dataPlot data.End nro§ra:n
e:.'d it
Output endmessage andend:3 ?togran
s
"J
(S
SUBROUTINE
Set DEGREcSPrint on the CRT (1G>Arrays start at 1
LOAD SEK'S
y
RETURN ^
INPUT DATA. SUBROUTINE
D1

SUBROUTINE KEYBOARD
D2

SUBROUTINE TAPE
&
&
OUTPUTSair.e set?Figure 3d
INPUTA1
vEDOUTPUT
CatalogueFigure 3a
INPUT D$
_5_INPUT
fASSIGN ifl;D$:T14
READ’^1;A$,N£iIe(*),
NtempC*) ,Fl;ecp(*)
/XtempC*) ,Yce=?(*)
4OUTPUT .
'File MenuFigure 3b
INTUTIfile
COMPUTEXl(*)=Xtemp(*)'Yl(*)=Ytetnp(*)Npt(Ll)=Ntenp(Ifile)
ir
EDIT DATA
Reveiw/edit da :a
OUTPUTInput check
I
Figure 3c
INPUTAgain
Y U=Ll+iTape=Tapc+l
OUTPUTSame sec?Figure 3e
INPUTA1

SUBROUTINE DIG INIT
UU -J'u «
Scale T>*pe
rigura 4d
SUBROUTINE DIGITIZE
D4
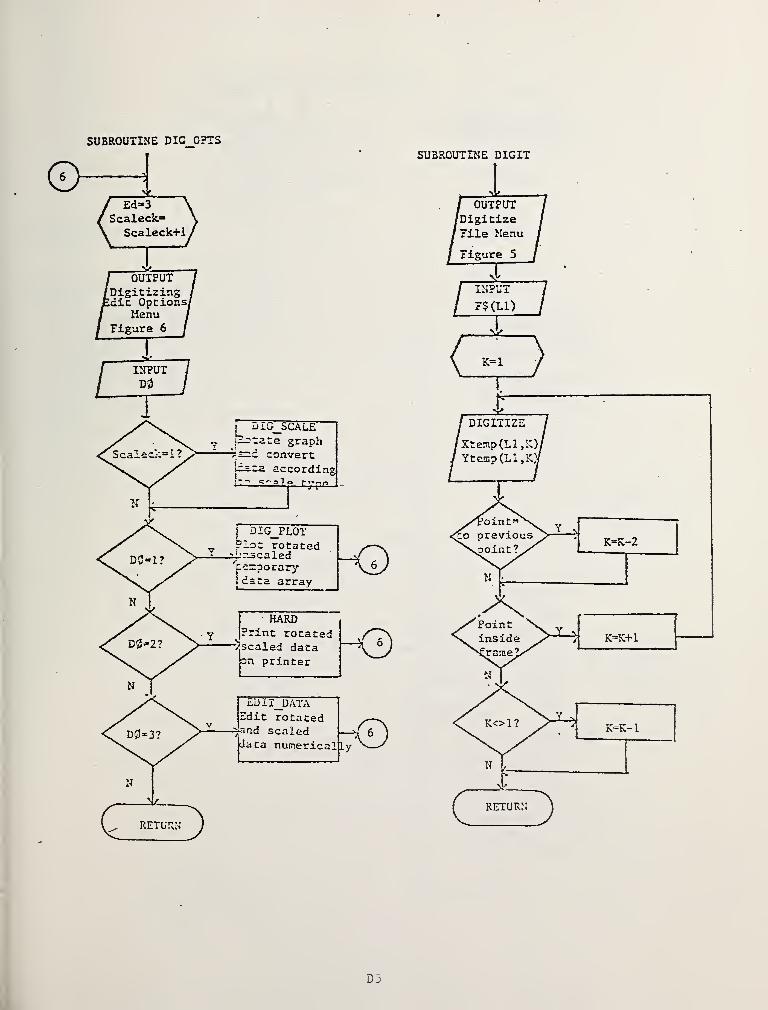
SUBROUTINE DIG OPTS
Ed=«3
Scaleck“Scaleck+i
,
OUTPUT[Digitizingidle Options/
MenuFigure 6
biG_SCALE"^tate graphand convert
according
DIG_PLOTPlot rotatedbr-scaledtenporaryI data array
• HARDPrint rotated
?.scaled data -50
£.L)II dataEdit rotated
JY^ s
data numerical Ly
SUBROUTINE DIGIT
D5

D6

SUBROUTINE DEFINE FUNCTION
D7

SUBROUTIi;E SAVE DATA SUBROUTII.T: OPTIOIiS
D8

SUBROUITNE ENTER SCALES
LD9
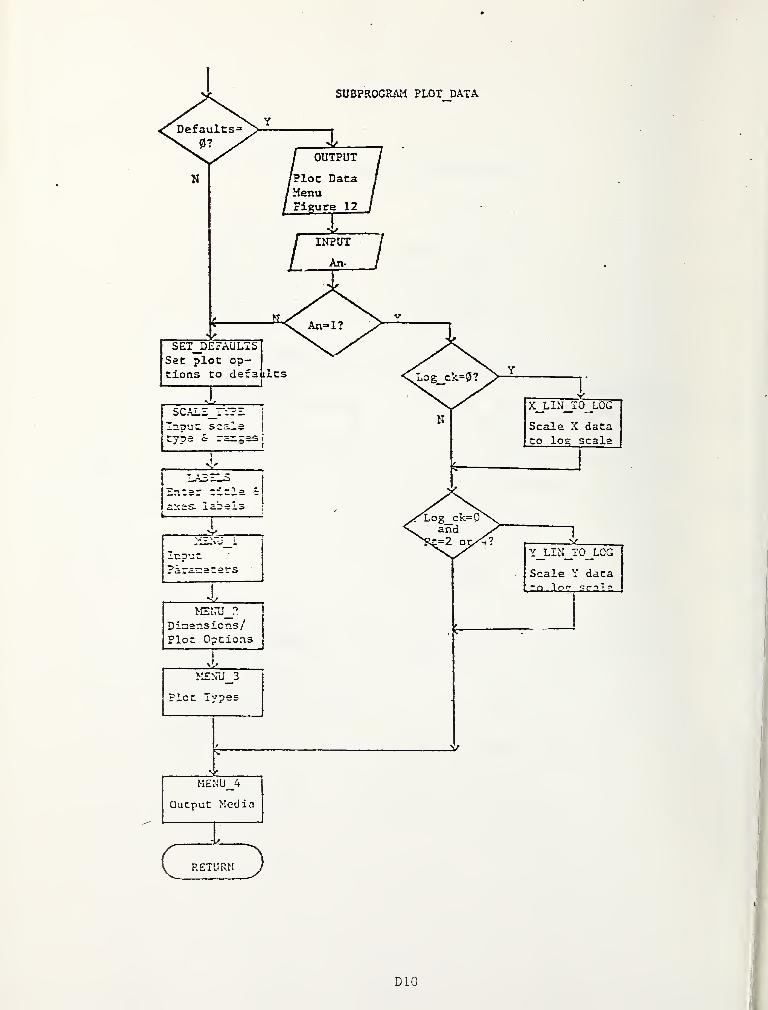
DIO

SUBROUTINE MENU 1 SUBROUTINE MENU 3
OUTPUT/InputfParsmetersOptions Meny
Figure 17
ENTER SCALESEnter newscale rangesfor both axes
TIC_COUNTChange numberof major tic
intervals
'RETURN
G-0
Dli
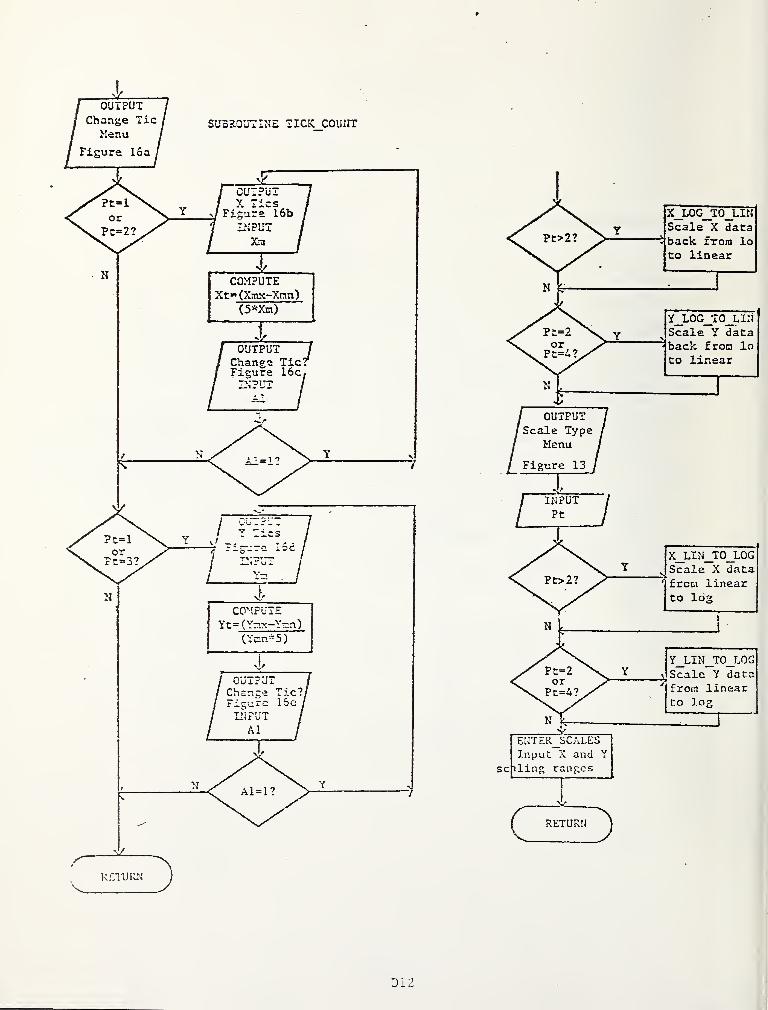
D12

SUBROUTINE PLOT TYPES
D13

SUBROUTINE NENU_2
D14
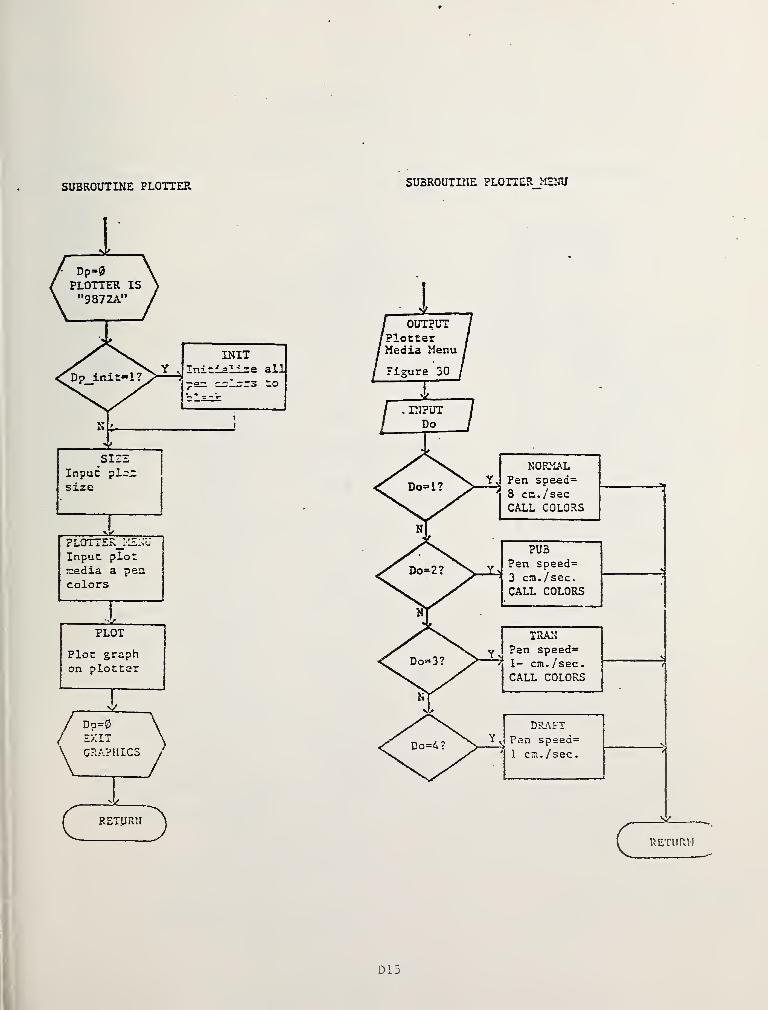
SUBROUTINE PLOTTER SUBROUTINE PLOTTER ME^RJ
D15

SUBROUTIIIE tIEIJU 4
SUBROUTI^^E CRT
1/plotter I5\
CRT GRAPHICSX
^Xdp=»0 Ydp=0 !
^‘\1J
PLOTPlot data on
GRAPHICSScreen
PAUSEEXIT GEAEEI'US
/
SUBROUTINE ?RINT^>.
DUTi?
GR(\?HICS
^( RETURN J
CRT
y -V Plot graph
on the CRT13
PRINTERDump Graphics
screen onto
printer
PLOTTER
Y Ploc graph4^ / on digital
plotter
MENU_1
V Return CO che
Scale options
Hena'"^'
MENU_2Return to the.
Plot options/
dimensions
MENU_3Y
VReturn to the
Plot types '\
Menu
).3
D16

D17

SUBROUTINE PLOT
Pt-1?
EXECUTELOCATE AreaSCALE GU'sDraw FRA2IE
IAXES
Draw tic narks
I
Label Nunbers|
Label title S
Avoq ’>;<bels
0
=3?
COMPUTE
Yrax=LGT(Ymx)
Ymn=LGT (Ymn)
*
COMPUTE
Xmx^LGT (Xmx)
Xmn=LGT (Xna)
EXECUTE’
PEN Pc2(Ll)LOCATE FrameSCALE UU’s
;
HISTOGRAt‘1
Draw Hiscoeramfor file if Liand shade ifShade(Ll)=l
i
LINES
Draw lines^ / using line
ty*s>e Lt(Li)
SYMBOLSraw symbolssing L$(L1)
/ size=C(n(Ll
)
SHADE IT
^ V Shade file i7
—^ LI if i l: isn'
a histogram
D13
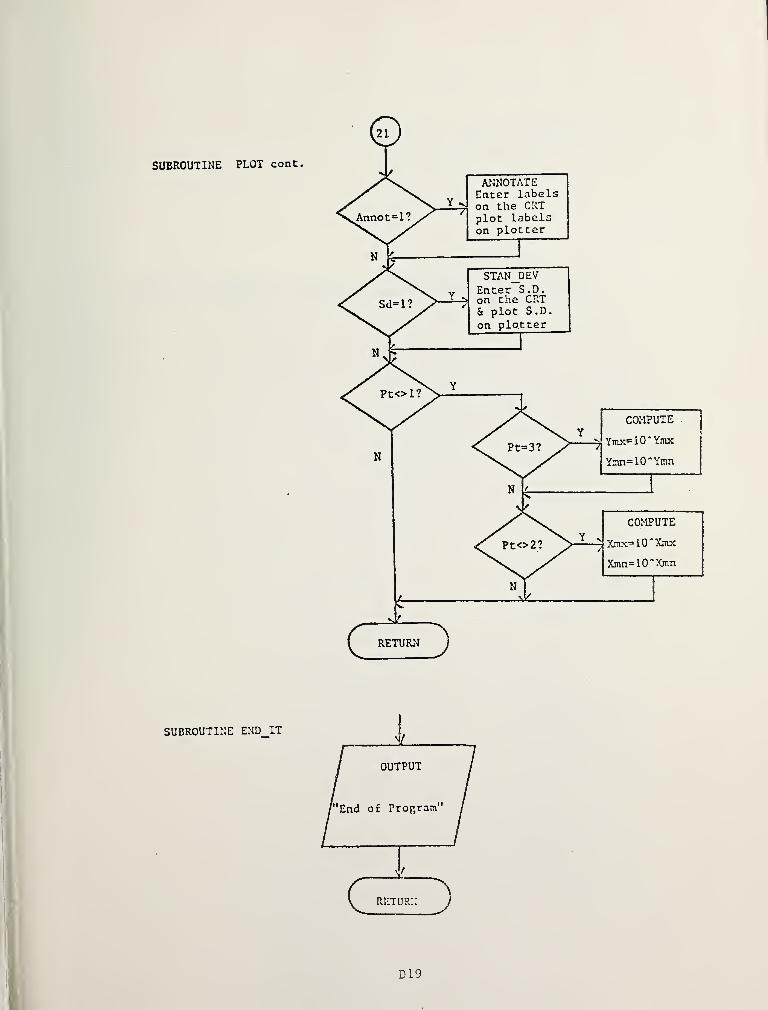
21
SUBROUTINE
SUBROUTINE
PLOT cont.
END IT iOUTPUT
End of Program'

yjn.
i’oS
1̂ ?
.7S^'
dGf ^*r «
rH iff’ •
^ --:V ra • =r '---
‘
^.-. u.- - 5*- ^ :^'-:
Ml,"W:
'
i
. ?*.
*»
Flo*
e,4*’'
.-J'g
rli?- ,i?frt<i|5
I '.v" v-f^:i ta yi '
^'v-3
I*
''
J
(C
-.X'
;''f'Os.•^
: r; •>n
,XN"''-^
>j:^ V mj
i'
Ef’’:''(
r\
m. iMft
(»* In^'
-• iiiJ**
’ &;-m,' 7^;
f
I .^T
3
n ‘V . : • *
* '.',;
."V
'^'j- {-

APPENDIX E: INDEX OF FIGURES, FLOWCHARTS AND SUBROUTINES


APPENDIX E: INDEX TO MENU, LISTING AND FLOWCHART FIGURES
I. MENUS: M
A MENU 1: INPUT PARAMETERS, 26ANNOTATION,30 MENU 2: DIMENSIONS/PLOT OPTIONS ,26
ANNOTATION COLORS,44 MENU 3: PLOT TYPES, 36
ANNOTATION DIRECTIONS ,40 MENU 4: OUTPUT MEDIA,38C N
CHANGE TICS ,24 NORMALIZE ,30
D P
DEFINE FUNCTION ,14 PLOT COLORS ,42
DIGITAL PLOTTER, 40 PLOT DATA, 20DIGITIZE FILE ,10 PLOT SIZE ,42
DIGITIZING EDIT OPTIONS, 12 PLOT TYPES, 36
DIMENSIONS ,32 PROGRAM OPTIONS,
4
E R
EDIT DATA ,16 RE-DIGITIZING OPTIONS ,12
ENTER SCALES, 22 S
I SAVE DATA, 18INPUT OPTIONS,
4
SCALE TYPE, 22
K SCIENTIFIC NOTATION ,28
KEYBOARD INPUT,
6
SET UP DIGITIZING, 10
L SHADING,32LABEL DIMENSIONS,34 STANDARD DEVIATION, 28LABELS ,22 STANDARD DEVIATION DIRECTIONS ,38
T
TAPE INPUT,
8
II. LISTINGS OF ALL SUBROUTINES:A F N
ANNOTATE , C45 FILES, C37 NORMAL, C35
ANNOTATION, C29 FIND RANGE, C20 NORMALIZE, C29AX,C36 H NUMBER, C39
AXES,C38 HARD, Cl 5 NUMBER SIZE,C29C HISTOGRAM, C42 0
COLORS, C35 I OPTIONS, Cl
CRT,C33 INIT,C1 P
D INPUT 0ATA,C2 PL0T,C37DEFINE FUNCTION, C13 K PLOTTER, C33DIG EDIT,C12 KEYBOARD, C3 PLOTTER MENU,C34DIG INIT,C7 L PLOT TYPES, C31
DIGIT, C9 LAB,C36 PRINTER, C33DIGITIZE, C6 LABEL, C41 PROGRAM PLOT, ClDIG 0PTS,C9 LABELS, C24 PUB,C35DIG PL0T,C11 LABEL SIZE,C28 R
DIG SCALE, CIO LINES, C43 RESCALE, CIODIMENSIONS, C29 M REVIEW, CIS
DRAFT,C35 MENU 1,C26 RETRIEVE GRAPH, C18E MENU-2,C26 ROTATE, CIOEDIT DATA,C14 MENU 3,C31 ROTATE BACK, Cl
1
EDIT IT, CIS MENU_4,C32 ROUND, CllEND IT,C19ENTFR SCALES, C23
El

s
SAVE_DATA,C16SAVE_GRAPH,C17SCALE TYPE,C22SCI_NUT,C28SET_DEFAULTS,C20SIZE,C34SHADING, C30
SHADE_IT,C43STAN_DEV,C44STD_DEV,C27SUBPROGRAM PLOTJATA , C19
SYMBOLS, C43
T
TAPE,C4TICK_COUNT,C25TIT,C36TITLE_SIZE,C28
X
X LIN_T0_L0G,C21X_L0G_T0_LIN,C21
Y
Y LIN_TO L0G,C21Y LOG TO LIN, 021
III. FLOWCHARTSC
COLORS ,D17
CRT,D16D
DEFINE_FUNCTI0N,D7DIG_EDIT,D6DIG_INIT,D4DIGIT, D5DIGITIZE ,D4
DIG_0PTS,D5E
END_IT,D19ENTER SCALES, D9
I
INIT,D1INPUT_DATA,D1
K
KEYBOARD, D2M
MENU_1,D11MENU_2,D11MENU_3,D14MENU_4,D16
0
OPTIONS, D8
P
PL0T,D18PLOTTER, D15PL0TTER_MENU,D15PL0T_TYPES,D13PRINTER, D16PROGRAM PL0T,D1
S
SAVE_IT,D8
SHADING, D13SUBPROGRAM PLOT_DATA ,D10
T
TAPE,D3TICK COUNT, D12
E2
APPENDIX F: OUTPUT EXAMPLES
F

I

APPENDIX F: OUTPUT EXAMPLES
Appendix F contains examples of the plotting options available. Listed beloware the examples and the plot options that are used in the order that they appearusing the materials recommended in Appendix A.
VARIABLE ENERGY1) Thin tipped felt tip pens used on cotton drawing paper.
2) Multiple data files using line types 1,4, 6, 8 and symbols #,&,*, and +.
3) Scientific notation.4) Standard deviation.
5) Graph dimensions 60x80 graphic units.
6) Plot size .65.
7) Five major tics on the Y axis, four major tics on the X axis.
MONTE CARLO LINE PROFILE1) Shading using wide tip pen.
2) Annotation.3) Y values normalized by 1000.
4) Data input from keyboard.
PZT5A1) Drafting pen on vellum.
2) Data digitized off plotter from experimental curve.
3) Dimensions 80x80, plot size .5, graph ends up 4"x4".
RELATIVE AREA1) No frame, tics, numbers, title, or axes labels.2) Picture digitized from a hand drawing.
3) Numbers and title have been input using the annotation option.
BA lOOEV
1) HP transparency film using the HP transparency thin tipped pens.
2) Logarithmic scale on the Y axis.3) Annotation used for the Figure caption.
SPECTRUM SINE WAVE
1) HP spectrum paper and pens.
2) Fourteen distinguishable colors using up color combinations of up to
three colors.3) Sine waves input from the Define Function mode using 36 sine waves with
amplitudes ranging from 17 to 2 and X data range of 0 to 360.
HARDWARE PRODUCTION COMPANY1) Histogram plots for three data files.2) Histograms are shaded.3) Spectrum pens were used. Overwriting the first data file (magenta)
by the second (yellow), created the green color for nails. Overwritingwith the third file (cyan) created the purple color for bolts.
4) The lines in the key were digitized after the histogram graph wascompleted.
5) Notice the ten major tics on the Y axis.
FI


VRRIRBLE ENERGY
-2
MONTE CARLO LINE PROFILE0.4
+>
^03QJ
•0mm
o
q-
^ 0.20ouuif)
m0.
1
0
CR on SI20 Kev
-0.25
T
0.5 mm ui^de
10 nm beam0.14 mm th i ck40 deg. edge
0 0.25 0.5
X Rx 1 s (
M
1 c r ome t
e
r s
)
0.7
F2

Travel
(Micrometers)
Rpp lied Volt age
\I
F3


RELATIVE AREA OF MEASUREMENT POSITIONS
F4

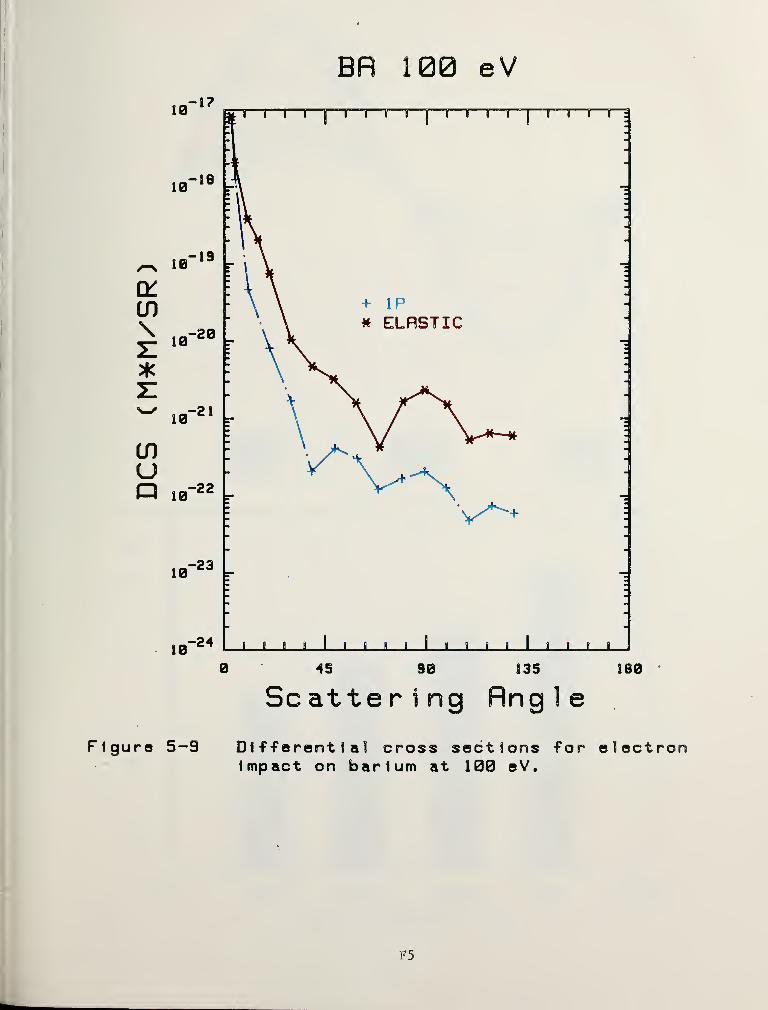
DCS
(M*M/SR)
BR 100 eV
Figure 5-9 Differential cross sections for electronImpact on barium at 108 eV.
F5


Millions
ot
Dollars
ifl£i<;s
100
90
00
70
60
50
40
30
20
10
0
1977 1978 1979 1980 1981
Yearly Production
1982
F6


NBS-n4A (REV. 2-80
U.S. DEPT. OF COMM.
4.
BIBLIOGRAPHIC DATASHEET (See in struct/on s)
1. PUBLICATION ORREPORT NO.
NBSIR 82-2566
TITLE AND SUBTITLE
2. Performing Organ, Report No, 3. Publication Date
October 1982
BASIC Utility Graphics Software for a Desktop Computer
5. AUTHOR(S)
Clare Y. Trahan and Stephen W. Jensen
6. PERFORMING ORGANIZATION (If joint or other than NBS. see in struction s)
NATIONAL BUREAU OF STANDARDSDEPARTMENT OF COMMERCEWASHINGTON, D.C. 20234
7. Contract/Grant No.
8. Type of Report & Period Covered
9. SPONSORING ORGANIZATION NAME AND COMPLETE ADDRESS (Street. City. State. ZIP)
10. SUPPLEMENTARY NOTES
I
I Document describes a computer program; SF-185, FIPS Software Summary, is attached.
11. ABSTRACT (A 200-word or less factual summary of most significant information. If document includes a significant
bibliography or literature survey, mention it here)
This report describes an interactive BASIC language graphics utility programdesigned to facilitate easy plotting of X,Y data. The program operates on a
Hewlett-Packard 9845B desktop computer, in its standard configuration, anduses a Hewlett-Packard 9872 A four pen digital plotter. The program allowsthe user to view X,Y data graphically, and provides a broad range of plottingoptions so that publication quality graphs and transparencies may be createdusing up to four colors on the digital plotter. Data may be digitized froma user's graph on the digital plotter, generated as a user defined function,or input directly from the computer keyboard or magnetic tape cassette. Datamay be plotted on the computer CRT, on the computer's internal thermal printer,or on the digital plotter.
12. KEY WORDS (Six to twelve entries; alphabetical order; capitalize only proper names; and separate key words by semicolon s)
BASIC; CRT; digital plotter; graphs; HP 9845B desktop computer; interactive;internal thermal printer; magnetic cassette tape; plot; software; X,Y data
1
j
13. AVAILABILITY 14. NO. OF '
' xj Unlimited
ii
For Official Distribution. Do Not Release to NTIS
PRINTED PAGES
151
j 1
Order From Superintendent of Documents, U.S. Government Printing Office, Washington, D.C.20402. 15. Price
i
Order From National Technical Information Service (NTIS), Springfield, VA. 22161 $15.00
•jSCOMM-OC 5043-P80

' AftaanHA^Jte
vfj*
' iH_ '
-SI
VI ,.-jepV’'
,
• >., ^':, 31 , ' •»IIhhII
llL.
‘3
, ip#|<|»«ttW ua3«S!l<iK?0 ^e'T«3»l»r«An^^
wifu J ***_^ <»|
''
i|l<»iiiMNiW||»Wi«M»><^«^*«>i^^ mn »it«wftS>'
awjiah
' . JK ^ "-t - - i.^ms f^f^^rn *•' ' A'
^>bfrix*rte; s ',
tis7ii),,ti!n«i(i t Er*»Hi
|i i "<fw I III ll<ll^’ll^
iyil^» 1l i»^p#i w ui i*^»l^pi4^j4JgB|^fcfc^^^
iL »< i'.v#<|y(i-. vV v:. ,;^cv>6««naV' OA,
6 tt0‘ i«*j,v-io ,€*tfl '7^ v-n:?v> f ^o sai^i^nXq
galX.3»35Jajfj »tb " ^
t*-. jii^*«t '^-M<P’'ns 3 /.;;- .-m>|t i i^jrjrolq' oo' s.
I'
• "'’VjijB' M ,,»* ,’•’1 *'•'' 'flri 4U'
-.uHfi-tf-'-l^f ,-»’7«,v'L^iv«» TioX^' Ys?q»^s; iv^*Ai0'=|3bl^.-J’a;:-.a.«-''
: ...V-"'.
...:_.4-. ..j^tS-''
0, ^ V..._
w'vtfl^;"',
'*'•:;I? **
' ’*»at^'
,. ..^Isfi'^ *W(0 I#i^r1%0'>|l5»^
.j-'UXi ;^s*3/#liif u .w - in»)y^t%ym.4^ wsH »slw<
fit. ..’ '
.- V.^^'^' ', ®
• "SI .'. 'iffll'’'®'. '"^ '
' W '
)