
for official use only - World Bank Documents
174
Document of THE WORLD BANK FOR OFFICIAL USE ONLY Report No. 24503-RW THE REPUBLIC OF RWANDA POVERTY REDUCTION STRATEGY PAPER AND JOINT IDA-IMF STAFF ASSESSMENT JULY 18, 2002 AFTP3 Africa Region This document has a restricted distribution and may be used by recipients only in the performance of their official duties. Its contents may not otherwise be disclosed without World Bank authorization Public Disclosure Authorized Public Disclosure Authorized Public Disclosure Authorized Public Disclosure Authorized
-
Upload
khangminh22 -
Category
Documents
-
view
4 -
download
0
Transcript of for official use only - World Bank Documents

Document ofTHE WORLD BANK
FOR OFFICIAL USE ONLY
Report No. 24503-RW
THE REPUBLIC OF RWANDA
POVERTY REDUCTION STRATEGY PAPER
AND
JOINT IDA-IMF STAFF ASSESSMENT
JULY 18, 2002
AFTP3Africa Region
This document has a restricted distribution and may be used by recipients only in theperformance of their official duties. Its contents may not otherwise be disclosed withoutWorld Bank authorization
Pub
lic D
iscl
osur
e A
utho
rized
Pub
lic D
iscl
osur
e A
utho
rized
Pub
lic D
iscl
osur
e A
utho
rized
Pub
lic D
iscl
osur
e A
utho
rized

FOR OFFICIAL USE ONLY
INTERNATIONAL DEVELOPMENT ASSOCIATION ANDTHE INTERNATIONAL MONETARY FUND
RWANDA
Poverty Reduction Strategy Paper - Joint Staffs Assessment
Prepared by the Staffs of the World Bank and the International Monetary Fund
Approved by Callisto Madavo and Gobind T. Nankani (IDA) andA.Bio-Tchane and Masood Ahmed (IMF)
July 18 2002
I. OVERVIEW
1. Rwanda's Poverty Reduction Strategy Paper (PRSP), building on the InterimPoverty Reduction Strategy Paper (I-PRSP) reaffirms the commitment of theGovernment to sustainable poverty reduction. Based on intensive consultations, the PRSPprovides a comprehensive poverty diagnosis and spells out the government's strategy andpriority actions to reduce poverty in Rwanda.
2. The PRSP is comprehensive. It encompasses: (i) a participatory process both withinthe government, and with civil society and the donor community; (ii) a comprehensive povertydiagnosis; (iii) country ownership with the Government in the lead; (iv) a frank discussion ofissues and challenges faced: (v) a comprehensive strategy on socio-economic transformation ofthe country with a long-term perspective; and (vi) a detailed plan for monitoring andevaluation. This PRSP is innovative in linking its analysis and strategies to traditional decisionand problem resolution systems. The PRSP also presents the government's assessment of risksinvolved in implementing the PRSP, mainly: (i) political conflict in the country and the region;(ii) external shocks, especially due to lower commodity prices for coffee and tea; (iii) capacityconstraints of the Government; and (iv) financial constraints.
3. The Government's intention is to update the PRSP every two years, along withannual updates to reflect evolving circumstances and ensure that It remains on course. Asa part of this process, the C-overnment plans to conduct surveys such as the Household LivingStandards Survey (every five years), the Core Welfare Indicators Questionnaire (annually), andPublic Expenditure Tracking Survey (every 3 years), and initiate Citizen Report Cards.Moreover, the Government has demonstrated its commitment to improve public expendituremanagement (PEM) for better public service delivery, and to this end has adopted the MediumTerm Expenditure Framework (MTEF), which has been supported by the Bank, the Fund andsome bilateral donors.
4. The Government's effort in putting together the PRSP is highly commendable andfurther efforts will be needed to refine the proposals to facilitate implementation. Theparticipation in the PRSP process and sense of ownership are impressive. The PRSP hasarticulated a strategy of social and economic transformation that Rwanda needs to make the
This document has axrestricted distribution and may be used by recipients only inthe performance of their official duties. Its contents may not be otherwise disclosedwithout World Bank authorization.
-2 -
transition to peace, stability and development. While the broad thrust of the strategy is clearand sectoral strategies are well articulated in some areas, for instance education, HIVIAIDs,technology and health, in some sectors - transportation, rural development, private sector,financial sector, institutional capacity building, the way forward is less clear. The PRSPrecognizes this gap and has proposed a program for elaborating sector strategies. The staffssuggest that this effort should put emphasis on strategies for cross-cutting areas such asenvironment, private sector development including the financial sector, and capacity building.The PRSP team also carried out costings of priority programs and prepared the different
-financing scenarios included in the Annex of the PRSP. This work has to be regarded aspreliminary and needs further refinement with a view to use it in the MTEF projections. Whilethe PRSP made an effort to identify sources of growth, further analytical work is needed in thisarea. The PRSP agenda is challenging and assistance from the development partners forfinancing of development programs and capacity building is essential for success.
II. COUNTRY OWNERSHIP AND PARTICIPATORY PROCESS
5. The country ownership of the PRSP process has been consistently strong. ThePRSP process was well received in Rwanda, a country with a tradition of consultation.Government commitment to poverty reduction and to participation was reflected in theemphasis on these issues in both the Vision 2020 published in 1998, and the I-PRSP, publishedin 2000. Countrywide consultations undertaken in the course of 1999 and 2000 by the NationalUnity and Reconciliation Commission (URC) identified poverty as a major obstacle to nationalreconciliation in Rwanda, confirming the link between poverty and national reconciliation, asnoted in Vision 2020. As a result of the PRSP, government officials at all levels have embracedpoverty reduction as the key objective of government policy.
6. The National Poverty Reduction Program (NPRP), set up in 2000 in the Ministryof Finance and Economic Planning, coordinated the PRSP. The Participatory PovertyAssessment (PPA) was conducted nationwide and had three components: (i) National PovertyAssessment (NPA); (ii) Butare pilot of the community action plan; and (iii) Policy RelevanceTest (PRT). The NPA was conducted at the district level and was based on standardParticipatory Rural Appraisal techniques in which each community (or person) ranked theproblems faced. The Butare pilot was also conducted at the community level, but went a stepfurther by developing action plans to solve the problems that were identified in the NPAsurvey. The PRT assessed existing policies and those proposed in the I-PRSP at the individualand community levels for their effectiveness, inclusiveness and level of participation.
7. The elaboration of the PRSP involved an extensive consultative process. The I-PRSP was used to build support for the PRSP process. Its consultations focused at governmentand political levels, including the political parties and the members of the National Assembly,and key stakeholders including local authorities, commune development committees, religiousgroups, NGOs and community associations. The consultative process of the full PRSPconcentrated at the grass roots levels and the results of the process have informed theidentification of priority areas for the Poverty Reduction Strategy (PRS). The PRSP recognizesthe key role of sector strategies in implementing the PRS and for extensive continuingconsultations within the government and the civil society on these strategies to ensure theirconsistency with poverty reduction. The sector ministries in the Government participated fully
-3 -
in the national validation workshop that reviewed the priorities, and in developing theexpenditure frameworks that reflected the results of the consultations. The Governmentregularly consulted the Bank and Fund missions and other development partners as a part of itsconsultative process. At a Government-organized conference in November 2001 in Kigali,attended by the civil society, the representatives from all bilateral and multilateral donors, aswell as the Bank and the Fund, donors provided feedback on the draft PRSP, and indicated theirsupport for the implementation of the PRS.
8. The PRSP has been written with the Rwandese population as the primaryaudience and it is therefore quite elaborate. The National Poverty Reduction Program(NPRP) conducted the PRSP process in a very open way. It worked closely with otherGovernment officials and representatives of civil society and shared progress reports with alarge group of people in Rwanda and elsewhere by e-mail. While the Rwandese welcomed thecontribution from outsiders, they relished the opportunity to articulate their own vision andideas to the world. The Government plans to publish the PRSP in English, French, andKinyarwanda, make it publicly available and conduct workshops and other consultations on theimplementation of the PRS. The wide dissemination will promote a continuing and constructivepublic debate on poverty reduction and public policy and performance. The coordination unit ofthe NPRP will be transformed into Strategic Planning and Poverty Reduction and will assistagencies in developing PRS implementation plans as well as monitoring progress.
III. POVERTY DIAGNOSIS
9. The PRSP provides a sound assessment of living conditions in Rwanda, with dataobtained through a wide variety of surveys. These surveys were conducted over a two-yearperiod with help from various donors, including DfID, UNDP, USAID and the World Bank.They include: the Core Welfare Indicators Questionnaire (CWIQ) 2001, Demographic andHealth Survey (DHS) 2000, Multiple Indicator Cluster Survey (MICS) 2001, Household LivingConditions Survey (HLSS) 2001, the Food Security Survey '2000/01, and the PublicExpenditure Tracking survey (PETS). With the results from these surveys and the qualitativeinformation on the characteristics of households in Rwanda from the NPA, the PRSP set out acomprehensive analysis based on a wide range of indicators, including those related to income,consumption, health, education, access to water, crop production, nutrition, women's fertility,income distribution and region. The results of the 2003 population census will be reflected inthe next PRSP update. The staffs commend the Government for this extensive undertaking inthe face of substantial capacity constraints.
10. The PRSP candidly discusses the factors that contributed to high levels of povertyin Rwanda and draws on examples of policies that worked in other countries. While thePRSP clearly sets out the relationship between poverty in Rwanda, long-term structural issuesand the effects of the genocide, it would benefit from a better analysis of the effect of thecountry's conflicts (not only the genocide) and past policies of exclusion, and the impact ofrecent government policies on poverty. For example, it would be useful to assess the causes ofa large increase in the Gini-coefficient and the significant urban-rural divide and identifyassociated policy implications.
-4 -
IV. PROPOSED ACTIONS
A. PRSP Priorities, Targets, and Monitoring System
11. The PRSP aims to reduce poverty to less than half the 2001 level by 2015 andimprove social indicators in line with the UN Millennium Development Goals (MDGs).The PRSP set out a private sector-led growth strategy and identified the transformation ofagriculture and the rural economy as the engine of growth in the medium-term. This strategy isbroadly in line with the pre-PRSP strategy of the Government but the PRSP process hasresulted in broader ownership and consensus on the approaches to implementation. The PRSPproposes a partnership between the Govermnent, the civil society, the private sector and thedonor community for attacking poverty, in contrast to the past approach that relied exclusivelyon the Government, the national budget, and donor funded programs. It also identifiedprioritization and sectoral strategy development as the key instruments for focusing publicactions on poverty reduction and improving the effectiveness of these actions. The PRSPidentified six broad priority areas: (i) rural development and agricultural transformation; (ii)human development; (iii) economic infrastructure; (iv) good governance; (v) private sectordevelopment; and (vi) institutional capacity building, compiled a matrix of policy actions foreach of these areas, anrd identified specific budget priority programs in each area and providedpreliminary costings. The identification of these priority areas and budget programs was basedon the results of the PRSP consultations. The staffs agree with the overall growth strategy andwelcome the emphasis on agriculture and rural development and on increasing the effectivenessof public actions.
12. The PRSP's poverty reduction goals are very challenging, requiring exceptionalefforts. The poverty reduction target would require average annual growth of real GDP of 7-8percent over a sustained period. The staffs believe that this target will be difficult to reach by2015. The PRSP average growth projections for next 15 years of about 6 percent, whileconsistent with recent performance, are still ambitious as conflicts and insecurity in Rwandaand neighboring countries could continue to undermine the effective use of resources and deterthe investments that are needed to achieve and sustain such growth rates. Progress on thebroader MDG targets (infant and matemal mortality, increase in literacy, education of girls)would require sustained support from the donor community.
13. The PRSP's approach to monitoring and evaluation of the targets are adequateand well defned in the PRSP. The institutional structure proposed for the data collection andanalysis and the monitoring mechanism for the PRSP process are ambitious and commendable.The list of indicators is comprehensive and consistent with the MDGs. Routine monitoring ofperformance indicators for all priority areas will be on an annual basis, coordinated by an entityestablished for this purpose (the Poverty Observatoire). Larger surveys, to be conducted everyfive years, will supplement annual monitoring and validate the poverty indicators. Citizens'Report Cards, if implemented, could also be an important monitoring tool. The PRSP presents atable of indicators, with medium-to-long term targets, for monitoring performance. The staffssuggest a similar table be prepared, with annual targets, to be used to monitor progress on theimplementation of the PRSP. The staffs are ready to work with the Government on a set ofindicators and on formulating the targets. The staffs note that the Govemment will require
-5 -
substantial assistance from its partners to fully implement the monitoring and evaluationprogram, particularly to build up the capacity to collect and maintain statistics.
B. Macroecononiic Framework and Financing
14. The PRSP commits to a set of policies aimed at reducing macroeconomicimbalances over time. Macroeconomic stability is seen as crucial to stimulating export-based,private sector-led growth. The staffs consider that the projected average growth rate isachievable, provided that current plans for macroeconomic policies are being implemented.
15. The PRSP states explicitly the need for certain transitional expenditures, onaccount of which the consolidation in the fiscal deficit is being somewhat lengthened.While relatively large in the short-term, staffs agree that expenditures in areas such asdemobilization or gacaca, the system for accelerated resolution of the cases of the genocidesuspects, are necessary for the country's reconciliation and development and thus growthenhancing in the longer term.
16. A number of revenue measures are envisaged to support the authorities' povertystrategy. The measures were chosen to be as of a progressive nature as possible in order tominimize any negative social impact. In addition, they were designed to increase the degree ofharmonization with tax systems of neighboring countries, and to rely on a broad tax base ratherthan on high rates. The set of measures is carefully balanced and should achieve thoseobjectives.
17. Rwanda's macroeconomic sustainability including its external position is subjectto uncertainty, given its exposure to terms-of-trade shocks and the large level of thecurrent account deficit. However, Rwanda's economy remains relatively closed with exportsonly accounting for 9 percent of GDP, and it is not expected that Rwanda's capital account willbe opened in the near-term. Given the existing risks, the PRSP provides for a strong build up inofficial reserves that provide sufficient flexibility to counter future terms-of-trade shocks.
18. The financing of the PRSP is realistic and every effort has been made to limit theimpact on debt sustainability. Nevertheless, the net present value of debt to exports (on apost-HIPC basis) is projected to increase from 180 percent of GDP in 2001 to 211 percent by2004. However, on the basis of a modest continuation of the fiscal consolidation process andtaking into consideration productivity gains resulting from the measures to improve exports, thetargeted ratio of 150 percent can be reached by 2014. It would be essential, in this regard, fordonors to align their own strategies with the PRSP and to extend additional support in the formof grants.
C. Structural and Human Resource Policies
19. The PRSP's proposals are broadly in line with the strategy for poverty reductionby private sector-led rapid economic growth. The PRSP identifies the key structuralimpediments to growth (low productivity in agriculture, scarce human resources, high transportcosts, etc.) and stresses that structural and institutional reforms are essential to facilitate privateinvestment, promote enterprise development, exports, and market-based agriculture. However,some of the reforms needed to achieve these objectives are not well reflected in the PRSP dueto its focus on detailed actions, some which may not be justified by its analysis. For instance,
-6 -
the PRSP does not establish a strategic justification for the proposals to establish anAgricultural Development Corporation to guide marketing and extension. The discussion on thefinancial sector does not address the fundamental problems of the sector, particularly thedifficult legal environment and the lack of competition. The staffs feel-that the proposals for thetransformation of the Caisse Hypothecaire into a housing bank and the establishment of aguarantee fund for agricultural loans are inappropriate in the fragile financial sector. Rather, theemphasis should be on strengthening the commercial banking system by enforcing bankingregulations, facilitating loan recovery, privatizing government holdings in the banks andbuilding capacity. Staffs are particularly concerned about PRSP's advocacy of subsidies tocredit unions and other microfinance institutions. Subsidies are likely to undermine thesustainability of these institutions.
20. The PRSP identified agriculture and rural development as the engine of growth inthe medium-term. Agriculture remains the main economic activity for the vast majority ofrural dwellers but land scarcity, the degradation of the land, and related declines inproductivity, have led to widespread rural poverty. While the PRSP articulates detailed strategyand actions for agriculture, there is little in terns of a rural development strategy. Theagricultural strategy seeks to transform the sector from subsistence to market based, promotethe adoption of improved inputs and new and appropriate technologies, and reverse thedegradation of the environment. However, the problems of the rural environments (isolationfrom markets, poor purchasing power of rural dwellers, poor economic and socialinfrastructure) where agriculture takes place need to be addressed to facilitate thetransformation. To its credit, the PRSP proposes small-scale rural credit to support agricult;ixe,and public works schemes to help revitalize farm and non-farm activity, repair infrastructureand undertake environmental protection works. Land is scarce in Rwanda and land andresettlement issues are controversial. The PRSP presents some key elements of the proposedland policy and land laws. The staffs note that the land law has been under preparation for closeto five years. The PRSP indicates a welcome shift to a more participatory approach in theimplementation of the controversial imidugudu (grouped settlements) policy. The PRSP alsorecognizes the urgency for arresting environmental degradation but does not articulate astrategy for doing this.
21. The PRSP recognizes that exports will be an important source of growth forRwanda. Given the importance of export development, the staffs would encourage anintegrated discussion of the ongoing initiatives for export development and the policies andprospects in a future annual report or PRSP update. Privatization of the key state enterprisessuch as in coffee and tea is expected to provide immediate stimulus to exports. However, thestaffs note that after the initial burst of activity in 1999/2000, the pace of the implementation ofthe privatization program has slowed down. The importance of regional cooperation/integrationwas recognized but there was little discussion of how this can be achieved and the role Rwandamight play in achieving it.
22. The PRSP stresses the importance of sound infrastructure for nationalreintegration and the reduction of poverty. However, for a land locked country, the optionsidentified in the PRSP do not fully reflect the issues of corridor road transport facilitation anddevelopment, which are vital for Rwanda's extemal trade. In addition, the institutional reformsneeded to build and maintain private sector and community involvement in transportinfrastructure financing and service delivery ought to be emphasized in the PRSP. With regards

-7 -
to water and sanitation, the PRSP rightly emphasizes the supply of water to households but thebroader and important issue of the management of water resources does not receive attention.
23. Human development received a strong emphasis in the PRSP, reflecting itsimportance to the well being of the population and for the transformation of the economyfrom subsistence agriculture to more knowledge intensive activities. The PRSP's discussionof human development recognizes the key challenges and proposes appropriate approaches.This is probably due to the intensive focus on these issues in the last five years and in the PRSPconsultations as well the availability of new data on social sector performance, particularlyfrom the DHS, the PETS and the CWIQ survey. The staffs welcome the continuing priority toresettlement and reintegration, support to vulnerable groups, elimination of gender disparitiesand fighting the HIV/AIDS epidemic, the emphasis on access, quality, relevance, and equity inprimary education and the proposal for government assistance to improve access of the poor tohealth services. However, the PRSP could usefully address the implications of the changingroles of local and central authorities in education and health and the associated resourcetransfers.
D. Governance and public sector management
24. The PRSP reaffirms the Government's commitment to good governance generallyand transparency, and accountability in the use of public resources. Poor governance wasidentified in the consultations of the National Unity and Reconciliation Commission as a one ofthe major causes of disunity in Rwanda. The PRSP's treatment of good governance as one ofthe basic requirements of sustained poverty reduction reflects the acceptance of its importanceto the transition program in Rwanda. Actions in this area, which were identified in the I-PRSP,will be complemented by strengthening the institutions responsible for audit and inspection andincreased dissemination of information on government operations. Staffs commend theGovernment for the progress already made in these areas, including decentralization and civilservice reform, especially given prevailing capacity constraints. The focus of actions in thejustice area is appropriately on the implementation of the gacaca, however,the staffs suggestthat actions on commercial, civil and criminal justice systems, particularly on the access of thepoor to these systems, should begin to receive attention. Furthermore, the PRSP could haveelaborated further on the plans to establish an Office of the Ombudsman to deal with corruptionand injustice.
25. The PRSP's focus on effective public actions as a key element for povertyreduction requires improvements in public expenditure management (PEM). The staffswelcome the emphasis on improving the effectiveness of public actions through the sectorstrategy process, the prioritization of expenditures, the collaboration with supporting partners,and the implementation of the MTEF. The staffs note that the significant progress made inprioritizing the budget, monitoring expenditures, and the introduction of the MTEF provides asound building block for the future. The key PEM challenges include improving inaccountability, monitoring outcomes and strengthening implementation and service delivery.The staffs suggest that the realignment of human resources to priority activities should receiveas much emphasis as the allocation of financial resources. Furthermore capacity buildingefforts in the local authorities should focus on the implementation of programs in priority areas.
-8 -
26. The PRSP identifies institutional capacity building as one of the six priorities forpublic actions. However, the PRSP does not address the issue in a comprehensive way.Institutional capacity building for the public sector needs to be addressed in the context of abroad reform of the sector. The staffs encourage the authorities to develop a strategy to meetthis challenge.
V. POTENTIAL RISKS
27. The success of this ambitious strategy for growth and poverty reduction rests onthree pillars-peace and stability, implementation, and adequate financing. The fragilityof prospects for peace, security and national reconciliation in Rwanda is underscored by itslong history of conflict and the continued conflict in the Great Lakes region. Long-termpolitical stability will be key to future security and peace.
28. The fragile social capital and the limited institutional capacity of the Governmentare potential obstacles to the success of the extensive economic and socio-political reformsunder implementation. The active support of the people is critical for the success of thesereform programs. The gacaca requires the active participation of the people and, moreover, itsimplementation presents a huge logistical challenge. The limited capacity at all levels of theGovernment and the private sector constitutes the most serious risk to the successfulimplementation of the PRSP. The authorities recognize the problem of capacity and plan toaccelerate human resource development.
29. Achievement of the PRSP's poverty reduction objectives will require sustainedeconomic growth at a high level. Beyond the peace dividend and improved capacity building,this will depend on taking advantage of the benefits of market integration, including under theCommon Market for Eastern and Southern Africa (COMESA), improved efficiency associatedwith privatization, and increased investment as reform efforts are consolidated. Failure tocapitalize on these elements would clearly limit growth prospects.
30. Failure to bring about improvements in fiscal revenue performance wouldjeopardize the reduction in macroeconomic imbalances. Even if the high imbalances can befinanced by additional foreign savings-the risks to macroeconomic stability would persist.Debt sustainability could be adversely affected and so would be the attainment of pricestability. This would have a negative effect on the growth of private sector savings andinvestment, upon which the poverty strategy depends to a large extent.
VI. OVERALL ASSESSMENT
31. The staffs of the World Bank and the IMF consider that this PRSP provides a soundbasis for Bank and Fund concessional assistance and for debt relief. The staffs recommend thatthe respective Executive Directors of the World Bank and the IMF reach the same conclusion.
The Government of Rwanda
Poverty Reduction Strategy Paper
National Poverty Reduction Programme
Ministry of Finance and Economic Planning
June 2002
1

INTRODUCTION 6
1.1 Priority areas ......................................... 6
1.2 The special context ofpoverty in Rwanda .... 6.....................................61.2.1 Structural features.61.2.2 The legacy of genocide ........................................ 71.2.3 Rwanda's assets in the fight against poverty ......................................... 81.2.4 Progress since 1994 ........................................ 8
1.3 Rwanda's development strategy ...................................... 91.3.1 Long term development: Vision 2020 ........................................ 91.3.2 Short- term challenges within the PRSP ....................................... 91.3.3 The role of Government ....................................... 10
1.4 How the PRSP has been prepared ...................................... 01.4.1 The Interim Poverty Reduction Strategy Paper (I-PRSP) .101.4.2 The Participatory Poverty Assessment (PPA) .101.4.3 Other surveys.111.4.4 Priority actions and costings .111.4.5 Consultations within Government and with other parties .12
2 CHARACTERISTICS AND ANALYSIS OF POVERTY IN RWANDA 13
2.1 Poverty in Rwanda: an overview .................................. 132.1.1 Poverty indicators.132.1.2 The definition of poverty .132.1.3 The evolution of poverty at the national level .142.1.4 The characteristics of poor households .142.1.5 Community Action Planning Pilot: 'ubudehe mu kurwanya ubukene .152.1.6 Poverty by region.162.1.7 Poverty and inequality.18
2.2 Agricultural productivity and incomes ................................ 182.2.1 Agricultural productivity .182.2.2 Commercialisation.192.2.3 Activity and time use .192.2.4 Investment and savings by the poor .202.2.5 Environmental investments .20
2.3 The quality oflife and human resources ................................. 212.3.1 Health.212.3.2 Education and literacy.232.3.3 Water and sanitation .252.3.4 Housing.262.3.5 Cooking and lghting.27
2.4 Economic infrastructure ........................... 27
2.S Social capital and reconciliation ........................... 28
3 THE POVERTY REDUCTION STRATEGY: BASIC PRINCIPLES AND PRIORITIES 29
3.1 Economic growth and poverty reduction .................................. 293.1.1 Why economic growth is essential for poverty reduction .293.1.2 What rate of economic growth is feasible in Rwanda . 293.1.3 Agriculture and livestock as the primary engine of growth .303.1.4 Increasing and diversifying exports and finding new engines of growth .303.1.5 The impact of growth on poverty .31
3.2 Human development .................. 31
2
3.3 Macroeconomic stability ..................................... 31
3.4 Theframework of governance and partnership ..................................... . 323.4.1 The role of Government.323.4.2 Development partners.3................: 33.4.3 The private sector.333.4.4 Non-Governmental, civil society and community based organisations .343.4.5 The involvement of communities.34
3.5 Prioritising Public Actions3......................... 34
3.5.1 The six broad priority areas of the poverty reduction strategy ............................................................... 343.5.2 Developing sector strategies ............................................................... 35
4 THE POVERTY REDUCTION STRATEGY: SECTORAL ACTIONS 36
4.1 Agricultural transformation, and rural development ............................................................... 364.1.1 Support to agriculture and livestock and supportive environmental actions ............................................... 364.1.2 Land and settlement ................................................................. 414.1.3 Credit and savings institutions ...................................................... ,. 424.1.4 Employment promotion and labour-intensive public works ...................................................... 43
4.2 Human resource development and improving the quality of life ................................................... 434.2.1 Health.434.2.2 Family planning.454.2.3 Education and Training .................................... 4...... , , , , , . ..... 454.2.4 Early Childhood Care and Development (ECCD) .461.1.3 Primary Education.464.2.5 Secondary Education ................... 4.,,,,,,,,,,,,,,,,,,,,,,7............,.. 47
4.2.6 Tertiary Education.484.2.7 Science and Technology.49............. 4
4.2.8 Technical Education and Vocational Training ................................... 494.2.9 Mass Education and Functional Adult Literacy .504.2.10 Girls' Education.504.2.11 IHV/AID S Programme in Schools .514.2.12 Water and sanitation.514.2.13 H ousing and resettlement .53
4.3 Economic infrastrrcturee.544.3.1 Road transport ......................................... s..,, 554.3.2 Railway and air travel .......................................... . . . . .. 554.3.3 Transport and communications at the grass-roots level ......................................... 554.3.4 Energy for the formal sector.564.3.5 Energy for poor households and rural enterprises .5643.6 Communications ................
4.4 Good Governance ...... 574.4.1 Security and demobilisation.584.4.2 National reconciliation. 54.4.3 Human Rights.604.4.4 Criminal justice system and Gacaca.604.4.5 Constitutional reform and democratisation.6 4.4.6 Decentralisation.624.4.7 Decentralisation at the cellule level: ubudehe mu kurwanya ubukene .624.4.8 Civil s ervice reform ........................ 634.4.9 Accountability and transparency .
4.5 Building an enabling environmentfor private sector development ................................................... -654.5.1 Investment promotion and private sector representation .654.5.2 Financial sector reform .664.5.3 Commercial justice reform .66
3
4.5.4 Privatisation .............664.5.5 Manufacturing ............. 674.5.6 Mining ............... 674.5.7 Tourism ...... 684.5.8 Artisanal activities ............ 684.5.9 Services ............ 68
4.6 Social capital to support vulnerable groups.68
4.7 Cross cutting Issues: technology, gender, environment, imidugudu, HI V/AIDS, employment, capacity-building andinequality.69
5 THE MACROECONOMIC FRAMEWORK, EXPENDITURE MANAGEMENT AND SECTORAL STRATEGYPROCESS FOR POVERTY REDUCTION 74
5.1 The objectives of macroeconomic policy: macroeconomic stability and incentives for growth . .745.1.1 The impact of international trade agreements .74
5.2 The macroeconomic frameworkk.755.2 .1 G row th ........................................... 755.2.2 Fiscal policy ............................................ 755.23 External balances ........................................... 765.2.4 Monetary policy ...................... 775.2.5 Prices and exchange rate ........................................... 775.2.6 External financing requirement and external debt burden ........................................... 775.2.7 Domestic debt and expenditure management ........................................... 77
5.3 Expenditure for poverty reduction .. 775.3.1 Criteria for prioritisation ................................. 775.3.2 Institutional structures for prioritisation ................................. 785.33 Priority programmes ................. 785.3.4 Costing priority programmes ................................. 7853.5 The proposed expenditure programme ................................. 795.3.6 F inancing and delivering the extra resources ................................. 79
5.4 Public expenditure management.795.4.1 The budgetary system.79
5.5 Resource mobilisation and tax policy.805.5.1 Taxation.805.5.2 Donor resources.81
5.6 The etr StrateS tr atProco cess815.6.1 The role of sector strategies.815.6.2 Ensuring that proJects are consistent with the PRSP and sector strategies.84
6 MONITOR1NG AND EVALUATION OF POVERTY 85
6.1 The institutionalframework for monitoring poverty.856.1.1 The Poverty Observatoire.856.1.2 The role of the statistics department.866.1.3 The role of the line ministries.866.1.4 The rol e of the MTEF ...................................................... 7986
6.2 Indicators for poverty monitoring.866.2.1 Performance indicators.88
6.3 Master plan of studies and surveys.906.3.1 Surveys to be conducted.906.3.2 Information dissemination, feedback and access.91
Appendix A: Community Action Planning: 'ubudehe mu kurwanya ubukene '.92
Appendix B: Regional Profile of Poverty.98
5. .1 T h b dg ta y y te ......................................................................................... 7
7 ANNEXES 101
7.1 Annex 1: Applying the criteria for public expenditure ...................................... 101
7.2 Annex 2: Tables for Section 2 ...................................... 108
7.3 Annex 3: Tables for Section 3 ...................................... 114
7.4 Annex 4: Tables for Section S ...................................... 117
7.5 Annex 5: Key Economic and Financial Indicators ...................................... 121
7.6 Annex 6: Revised list of Priority Programmes for 2002 ...................................... 1 22
7.7 Annex 7: The proposed expenditure programme ...................................... 1267.7.1 Scenario 2 (Constrained) Projections are based on Minecofin estimates (for discussion) and do not imply
ceilings ....................................... 1267.7.2 Scenario 3 (Unconstrained) Projections are based on Minecofin estimnates (for discussion) and do not implyceilings..136
7.8 Annex 8: The Policy Ma trix.148
5
1 INTRODUCTION
1. The Government of Rwanda strongly believes in the right of all its people to live a life free frompoverty, hardship, oppression and insecurity. Rwanda's Govermnent is committed to securing for all itscitizens a full range of social, economic and political rights and to working with its people to reducepoverty and exclusion. Since the war and genocide of 1994, we have achieved considerable progress ineconomic, political and social recovery by adopting radical reforms. We now need to develop a coherentstrategy for sustainable development and poverty reduction, avoiding the economic stagnation whichcharacterised the past.
2. This document presents Rwanda's strategy for poverty reduction and economic growth. It has beendeveloped through a national consultative process, in which the priorities of the poor have been addressedand technical analysis has been used to develop a set of priority actions. It will form the basis of ournational planning effort over the next decade, guiding Government's expenditures and other actions. Itwill also provide a framework within which communities, the private sector, civil society, and externaldonors can form a partnership to reduce the acute poverty and deprivation of our people. It is not ablueprint, but a living document, and will be updated every two years to take into account sectorstrategies, which are being developed.
1.1 Priority areas
3. Through extensive national consultations, six broad areas have been identified where action is to betaken on a priority basis. Ranked by importance, these are:
* Rural development and agricultural transformation* Human development* Economic infrastructure* Governance* Private sector development* Institutional capacity-building
1.2 The special context of poverty in Rwanda
4. Rwanda's poverty is the outcome of both economic and historical factors. First, the economicstructure reflects a chronic failure to achieve productivity increases in a context of a large and growingpopulation. This failure became increasingly evident in the 1980s and 'early 1990s, leading to severestructural problems. Second, the war and genocide of 1994 left a horrific legacy, further impoverishingthe country and leaving a number of specific problems and challenges
1.2.1 Structuralfeatures
5. While Rwanda's economy has experienced high population growth, economic transformation haslagged behind. Both external factors and national policies have contributed to this. Although agriculturalproduction per capita and crop yields were declining steadily since the mid-1980s, economic policy didnot do enough to encourage agricultural transformation. Moreover, the country suffered massive terms oftrade shock when international coffee prices fell. As a result, per capita income fell sharply during the1980s and early 1990s. The country now faces the following microeconomic structural problems:
6
* Low agricultural productivity, which was aggravated by the failure of past agricultural policies, inparticular the failure to make the transition in the early 1980s from low-value agriculture to high-value farming. As a result, farners do not have the resources to risk investing in technological andmethodological change.
* Low human resource development, especially in literacy and skills development.* Limited employment opportunities, with an oversupply of unskilled workers in comparison to their
low demand.* High population density and growth.* High transport costs, on account of Rwanda's landlocked position, which have been aggravated by the
imposition of axle weight limits in neighbouring countries. Internal transport costs also pose a majorconstraint, partly because of the decapitalisation of the rural sector.
* Environmental degradation, with a chronic decline in soil fertility, poor water management, anddeforestation.
6. The failure to address these microeconomic problems has contributed to an economy characterisedby:
* A very weak export base of US$ 16 per capita compared to an average of US$ 100 in sub-SaharanAfrica, with a heavy dependence on the export of agricultural products, particularly tea and coffee.
* Vulnerability to external price shocks. Our earnings from coffee exports fell from $45 million in 1997to $26 million in 1999 because the price dropped to less than half, even though volume increased.
* A narrow revenue base, averaging 8.7% of GDP in the period 1995-1997, compared to an average of17.7% of GDP in sub-Saharan Africa.
* Low measured private investment at only 8% of GDP in 1999. Net smallholder investment inanimals, crops and terraces, which may not fully be reflected in the national accounts, was probablynegative between the early and late 1990s.
1.2.2 The legacy of genocide
7. Between April and July 1994, there was a systematic campaign of genocide aimed at completelyeliminating a substantial section of the population, and killing many others who opposed the ideology.We continue to live with the consequences of the genocide, which profoundly affected the lives of allRwandese.
8. Up to 1 million people were killed and 3 million fled into exile in neighbouring countries. Shelter andcapital stock were reduced both in the household and small business sectors. Till today poor householdshave not been able to replenish their livestock holdings. Parts of the country are now facing a serious lackof infrastructure as a result of destruction during the war and the movement of people into areas that werepreviously sparsely populated. Networks of social links, in rural and urban areas, have been damaged,impeding internal commerce. About 107,000 people are in prison awaiting trial for genocide-relatedcrimes, imposing a large economic burden both on the state and particularly on the women and childrenresponsible for feeding them. The experience of violence, including the systematic use of rape, hastraumatised a high proportion of the population whose physical and mental health continue to be severelyaffected. The prevalence of HIV has increased dramatically in part as a consequence of large-scalepopulation movements and the use of rape as a weapon. The prevalence is 11.2% nationally and 10.8% inrural areas, compared to a rate of 1.3% in rural areas in 1986. As a result of these factors, humanresources have been drastically reduced. In 1995, 79% of core civil servants had not completed secondaryeducation; this proportion fell to 51% by 1998.
7
9. The war and genocide left 85,000 child-headed households. Some of the children have since grown upor been absorbed into other households, but most of them still face a higher burden of responsibility andwork than their peers. A high proportion of households are headed by women (34% in 1996) and byfemale widows (21% in 1996). Men form the minority of the adult population. While prisoner andwidow-headed households are often amongst the poorer households, the high proportion of femalehousehold heads has also presented a challenge to the traditional gender roles in Rwanda.
10. The continued external security threats, including the insurgencies of 1996/7 and 2001, remain aserious obstacle to recovery. There is an acute need for political development to aim at reconciliation andto forge a new sense of national identity and social cohesion. Open debate with collective responsibilityfor development needs to replace the culture of passive obedience, which left people open to political andsectarian manipulation.
1.2.3 Rwanda's assets in thefight againstpoverty
11. Rwandese society has a number of positive features, including institutions of traditional socialorganisation, which can be harnessed for the struggle against poverty. These include:
* Umuganda, the tradition of work on public projects.* Ubudehe, the tradition of mutual assistance.* Gacaca, the tradition of communal resolution of disputes. This has been adapted to deal with the
legacy of genocide cases, and might subsequently be used to help with the resolution of disputesabout land.
* Umusanzu, the tradition of support for the needy and contribution to the achievement of a commongoal.
* Linguistic homogeneity; the overwhelming majority speak Kinyarwanda. Two internationallanguages, French and English, are also increasingly widely spoken, although a large proportion ofpeople speak only Kinyarwanda.
* High population density, which reduces some of the costs of service provision.
1.2.4 Progress since 1994
12. Since 1994, stability and security have been restored. Political and administrative structures havebeen established which decentralise power to the local level and encourage popular participation.Economic growth has been significant throughout the years of recovery, and a major programme ofeconomic and political liberalisation has been achieved.
13. Despite the speed of our recovery, we still face challenges in shelter, demobilisation, the legalsystem, and the restructuring of political institutions. The history of conflict has left a very complexlegacy of questions about the assignment of property rights. Equally, it is now necessary for theGovernment to provide infrastructure and other basic services to support sustained economic growth.Without energetic public action, growth would be likely to falter, making poverty reduction impossible.Energetic public action to accelerate economic growth is therefore central to the PRSP.
8
1.3 Rwanda's development strategy
1.3.1 Long term development: Vision 2020
14. The actions in the PRSP are set within the overall vision of Rwanda's development set out in Vision2020. This document identifies the key objectives that need to be attained for Rwanda to become amiddle-income country by 2020. (Box 1.1)
<U. rl - i 'Box 1.1. Key Obiectives in Rwanda'sVision 2020: ' ' .,
,L Good political and eco'nomic governance:;Good-governance is essential to sudc-ssfudevelopmeni. Securityis an absolute prerequisite, as.Rwanda's experience hasclearly sho.n. Respect for hqurnn iights and increased',', popular p,articipation-in !Go'erriment, t,hrough4the:bortoin-up-approach-to democratisation,.are critical. Equallyimportant is the establishment of sound economi management and.macroeconomic stabiity.,
22 Rural economic transformation: In order to raise agricultural 'incomes and generate opportunitiest to. earnincomes outside agriculture, the rural economy needs to.be recapitalised.and transformed. This can be achievevd
' by building on'-the traditional strengths of the rural Rwandese 'economy an.d:' i ntroiucing new technologies.
-3` f Development, of services and manufacturing: -As' incomes nse& ,we need to develop: other engines of growth -and to transform our economy. 'We',therefore need to increase competitiveness in servic'es'and industry. Keysectors identified,are.the're-establishment of Rwvanda as aa regional trade and service centre, by strengtheningour use of uiformation and communication technology (ICT),andd,byerico'uragitg the.development of tourism.In the -manufacturing sector 'there' are oppornunies to expand Lhe.production.of mass consuier goods, in
-. .~~~~~~6p t.- Iisrer go,
pardicular ofgarwtents.hI
4., Human resource velopment: Rwanda currently imports human resources withinthe region and has scarce!human capacitv. An increase in educational attainment is needed'at all levels., Better health care is needed'io'
, reverse the decline in'health indicators andto'1con,frorinthe major killer diseases, HAIVAIDS and nmlaria. '-:,,
I5. Development and promiotion of the private sector. Private-sector development calls, for, further liberalisatioh,privatisation and enhanced public-private partnership `In. order to lower the ,risks of doing' businegs in Rwan'da',and to encourage the formalisation of existing informal enterpnses,ithe whole'gael firaiework for.businessneeds to be reiewed.:
. Regional and international-econ-omic integration:.Rwanda-has joined the Common. Market for Eastern and.' Southern Africa (CONfESA) with a three .year phasing in penod of the free trade area.; We are comnmitted to
joining the East Afiican Conirunity d an'd,tdexpioiting-.the-.opportunities 'offered'by international trade'agreenients, including the World'Trade Organisanon and',the-recent Aficail Grdth and Opportunities'Act(AGOA) in theLUSA.,, - -, - '' -3 :"> -" . ,r
.7. Poverty reduction: ,The reduction .o poverty' isnot -a separate objective,'but the,effectof-the achieveiemi6tof.our other.objectives.;A concern vith the reduction ofinequalitineeds to undation oal public acions.This includes reducinig inequali,ties arising fromngender and age.. ', . . . -.
1.3.2 Short- term challenges within the PRSP
15. In addition to supporting the long-term aims of Vision 2020, the PRSP also considers a number ofshort-term challenges that need to be met immediately. These challenges include the impact ofHIV/AIDS, the need to ensure shelter for those households that still lack it, the process of demobilisationand reintegration, and the use of labour-intensive approaches to public works. There is currently highunderemployment in rural and urban areas. As a result, wages are low. This offers a window ofopportunity for the effective management of labour-intensive public works, which will provide necessaryinfrastructure for rural and environmental development, and supplement the incomes of the poor.
9
1.3.3 The role of Government
16. While the National Poverty Reduction Programme (NPRP) located in the Ministry of Finance andEconomic Planning (MINECOFIN) coordinates the PRSP, it is implemented through the various actionsthat Government and other parties undertake in each sector. The PRSP therefore rests upon six mainpillars for government action:
* Institutional and legal changes, including the work of the three constitutionally mandatedcommissions (The National Unity and Reconciliation Commission, National Human RightsCommission and the Constitutional Commission), privatisation policy and land policy.
* The resolution of regional conflict.* The prioritisation of public expenditure in a coherent programme, in accordance with the
Medium-Term Expenditure Framework (MTEF).* The development of sector strategies that will help define action plans within each sector.* The development of decentralised and participatory structures and capacities at province, district
and cellule level* The establishment of principles, indicators and institutional mechanisms for development
monitoring.
1.4 How the PRSP has been prepared
17. The PRSP has been prepared by the National Poverty Reduction Programme, which was set up in2000 in the Ministry of Finance and Economic Planning. There have been numerous stages and inputs inthe development of the PRSP.
1.4.1 The Interim Poverty Reduction Strategy Paper (I-PRSP)
18. The I-PRSP, which was finalised in November 2000, represents the Government of Rwanda's firstassessment of the actions needed to reduce poverty and generate pro-poor economic growth. It wasofficially adopted by Cabinet and provided the starting point for discussion and consultation and theframework for developing further ideas.
1.4.2 The Participatory Poverty Assessment (PPA)'
19. The PPA had three specific aims - generating an accurate profile and diagnosis of what poverty is inRwanda, evaluating the policies proposed in the I-PRSP, and starting a longer-term process in which poorpeople would generate and implement their own solutions. There were three components to the PPA:
National Poverty Assessment (NPA)
20. The NPA was a national survey, using standard Participatory Rural Appraisal techniques and wasconducted at the district level. The process was carried out with communities in one sector in everydistrict (more than 100 sites) and yielded information on:
* Different categories and characteristics of poverty* A ranking of the problems faced by the community* An analysis of gender roles* A discussion of the issues surrounding land ownership and tenure
'Reports of the NPA and PRT are available upon request from the National Poverty Reduction 1'rogramme. The Butare pilot data will alsobe available in the future.
10
Butare Pilot of 'ubudehe mu ku,wanya ubukene' - Community Action Planning
21. The Butare pilot took the methodology a stage firther. The exercise was conducted at the cellulelevel where, after ranking their problems, communities went on to develop action plans to solve theproblems they identified. A detailed analysis of the coping strategies of one of the poorest householdswas also undertaken. This approach will be followed on a national level in 2002 as part of thedecentralisation process. Examples and detail of the pilot are presented in Appendix 1.
Policy Relevance Test (PRT)
22. The PRT looked more specifically at existing policy and those proposed in the I-PRSP. After around of discussion with line ministries the policies were evaluated primarily using stratified socio-economic focus group discussions. The policies were assessed for their relevance to individuals and totheir communities on the basis of their effectiveness, inclusiveness, and level of participation. They alsolooked at providing solutions to problems identified.
1.4.3 Other surveys
23. In the last year, several important data sources have become available. These include:
* The Core Welfare Indicators Questionnaire (CWIQ) 2001, which gathers data on households' livingconditions and use of public services
* The Demographic and Health Survey (DHS) 2000, which gathers data on women's fertility and healthand the health of their children
* The Multiple Indicator Cluster Survey (MICS) 2001, which gathers data on further aspects of theeducation, water supply and nutrition of a subset of the households included in the DHS
* The Household Living Conditions Survey 2001 (EICV), which gathers a comprehensive set ofinformation on a large sample of households, covering consumption, income, education, health andother dimensions
* The Food Security Survey 2000/01, which gathers detailed information on crop production from asub-sample of households from the sample used for the EICV, and is related to surveys conductedearlier during the 1980s and 1990s.
* The Public Expenditure Tracking Survey (PETS) 2001, which examines the flow of funds to servicesin the health and education sectors.
* The national consultations conducted by the National Unity and Reconciliation Commission (NURC)in 2000.
1.4.4 Priority actions and costings
24. The NPA process has demonstrated the priorities of the communities. At the same time, a detailedexercise has been undertaken to cost the ministries' needs in each of their defined priority programmes.As a result of this work, as well as that of the participants in the National Validation Workshop, and otherconsultations within Government, the following has been achieved:
* a list of criteria for expenditures has been defined* a revised list of priorities was produced, which will be used to protect expenditures in the budget
process.* a detailed expenditure programme was undertaken, which shows the existing projections for
programmed recurrent and development expenditure. It also shows the proposed increase inexpenditure which will be undertaken as resources become available.
1.4.5 Consultations within Government and with other parties
25. The PRSP aimis to present an integrated programme, ensuring that different sectoral strategies arecoherent and are well designed to reduce poverty. To this end, discussions have been held withinGovernment, coordinated by the National Programme for Poverty Reduction. Most ministries andGovernment agencies have contributed directly to the document through written submissions, correctionsand comments. The zero draft was also considered in October 2001 by a national validation workshop towhich representatives of all stakeholders were invited. Particular attention was given to the criteria for,and content of, expenditure prioritisation, the planning structure, and partnership. Wide national andinternational circulation of the initial outline and drafts of the document for comment and feed back havealso greatly enriched the final document. Ministries were also consulted regarding the policy matrix (seeAnnex 8), which details policy proposals for all sectors.
26. In addition to this, policies in several sectors were articulated more fully and fast progress was madeon decentralisation. Moreover an improved macroeconomic framework was developed, which includesdeeper analysis of the likely sources and rate of future economic growth.
12
2 CHARACTERISTICS AND ANALYSIS OF POVERTY IN RWANDA
2.1 Poverty in Rwanda: an overview2
2.1.1 Poverty indicators
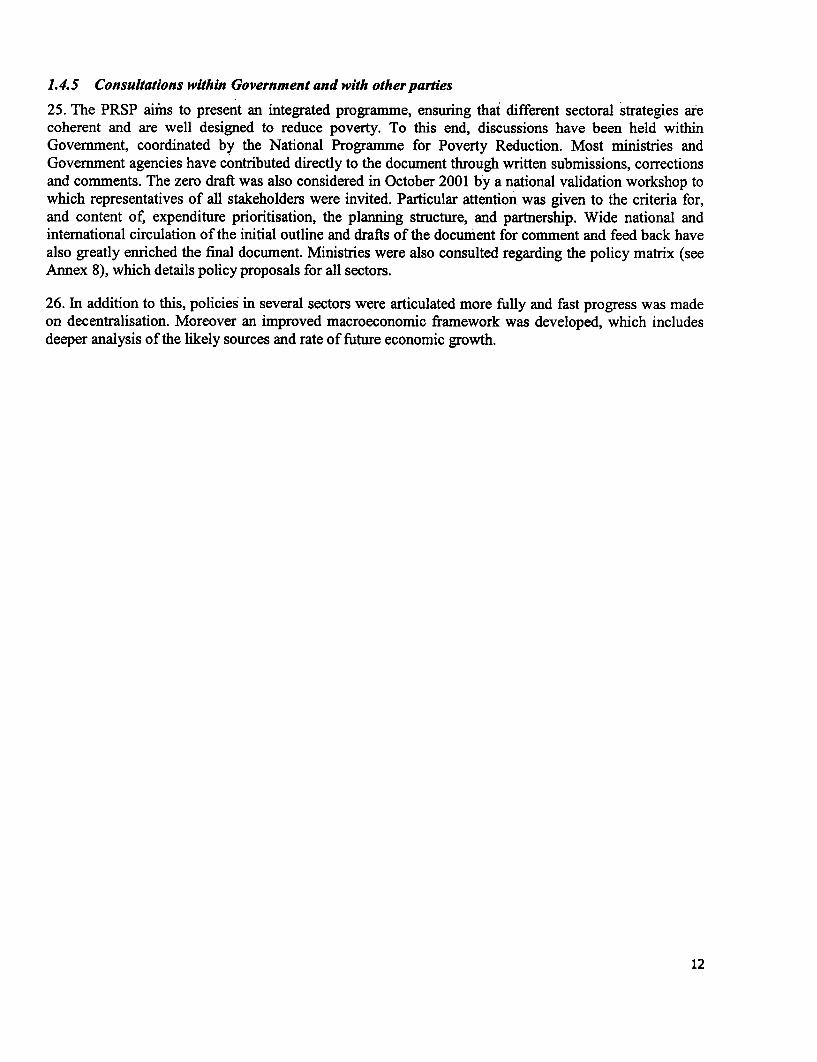
Table 2.1 shows the current state of some important indicators in Rwanda.
Table 2.1 Indicators of Economic Development and Poverty in Rwanda (2000)
Indicator Current level Source Year
Population' 7.979.930 EICV 2000
Female 4.276.787 EICV 2000
Male 3.703.142 EICV 2000
Kigali urban 7 % EICV 2000
Other urban 2.9 % EICV 2000
Rural 90.1 % EICV 2000
Proportion of population below the poverty line 60.29% EICV 2000
Life Expectancy 49 years DHS 2000
Maternal mortality per 100 000 births 810 DHS 2000
Infant mortality per 1,000 (proportion who die before 107 DHS 2000
first birthday) ._
Child mortality per 1,000 (proportion who die before 198 DHS 2000
5 th birthday)
HIV prevalence 13.7 DHS 2000
(15-49 years)
Total fertility rate (average number of children 5.8 DHS 2000
during childbearing years)
Contraceptive prevalence rate 4% DHS 2000
Proportion of children completely immunised <5yrs 72% MINISANTE 2000
Fertiliser used per ha 2 Kg/an MINAGRI 2000
Gross primary enrolment (ratio of primary school 100.0 MINEDUC 2000/1
children of any age to the primary-school age group) .
Net primary enrolment (proportion of children of 73.3 MINEDUC 2000/1
school going age going to school)
Gross secondary enrolment 10.2 MINEDUC 2000
Net secondary enrolment 6.0 MINEDUC 2000
Adult literacy (> 15years) 52,36 % EICV 2000
-Female 47.79 % EICV 2000-Male 58,06% EICV 2000
Malnutrition DHS 2000
Low height for age (stunting) 42,7%Low weight for age (underweight) 29%
2.1.2 The definition ofpoverty
27. It is important to remember that the experience and effects of poverty are unique for each
individual, household and community and that no two people experience it in the same way. However, for
analytical and policy development purposes we need some standardised definitions of poverty at all these
2 This section draws on the evidence of the various statistical surveys as well as the National Participatory Assessment. In general, the
evidence is satisfactorily consistent.3 Population growth rates are currently all projections from past data and will be confirmed in the 2003 Population Census. The most
commonly used estimates are 2.5% and 2.9%.
13

levels. The National Participatory Assessment, combined with the statistical surveys, has provided thesedefinitions. At an individual level a man or woman is considered poor if they:
* Are confronted by a complex of inter-linked problems and cannot resolve them* Do not have enough land, income or other resources to satisfy their basic needs and as a result live in
precarious conditions; basic needs include food, clothing, medical costs, children's schooling etc.* Are unable to look after themselves* Their household has a total level of expenditure of less than 64,000 Rwf per equivalent adult in 2000
4prices, or if their food expenditures fall below 45,000 Rwf per equivalent adult per annum.
At the household level, land owned, household size and characteristics of the head of households wereimportant criteria for poverty. In particular, households headed by widows, children, the elderly and thehandicapped are deemed likely to be poor. At the community level, the shortage of economic and socialinfrastructure and of natural resources are important criteria for poverty.
2.1.3 The evolution ofpoverty at the national level
Until now, poverty in Rwanda has been monitored by using movements in consumption to extrapolatefrom the household survey of 1985, making certain distributional assumptions. The poverty line was setat a level where 46% of the households in the 1985 survey fell below it. Poverty, in this statisticalapproach, is measured by the real value of households' expenditures; if a household's real expenditure,including own-produced food, falls below a certain level, it is considered poor. Using this approach,Table 2.2 shows the estimated proportion of the population below the poverty line.
28. As the data show, poverty was increasing in the late Table 2.2 Movements in Poverty since 19851980s and early 1990s. The proportion of households, rather YearI Percentage of householdsthan individuals, below the poverty line reached 53% in 1993. Rural Urban TotaIn 1994 as a result of the genocide, poverty rose dramatically. ISince 1994, poverty has fallen every year, but still remains 1985 48.4 16.1 45.7much higher than before the genocide. The CWIQ survey 1990 50.3 16.8 47.5conducted in 2001 confirms the improvement. The 2001 1994 82.4 27.5 77.8Household Living Conditions Survey (EICV) found that 1995 76.6 25.5 72.4nationally, 60% of people fall below the poverty line. This 1997, 74.1 24.7 70.0finding is not comparable to the previous series, since the 1998 70.7 23.6 66.8survey and poverty line differ. It will be used as a baseline for 1999 69.3 23.1 65.4the measurement of changes in poverty in the future. 2000 est. 67.9 22.6 64.1
Source: 1985 Household Survey
2.1.4 The characteristics ofpoor households
29. As part of the Participatory Poverty Assessment (PPA), the 'ubudehe mu kurwanya ubukene' pilotgenerated substantial amounts of grassroots information on people's poverty situation and the survivalstrategies they used. As part of this process, communities defined social categories for their households.The six most common categories defined are presented in Table 2.3.
4 This definition uses the poverty line derived from the household survey of 2001. Total expenditures were calculated for the sample ofhouseholds, including the monetary value of home-produced food. These expenditures were deflated by a regional price index at the time ofthe survey, giving an index of real expenditure for the household. These expenditures were then divided by an index of the household size'equivalent adults), which takes into account the fact that children's nutritional requirements are smaller than those of adults. The level ofzxpenditures necessary to meet nutritional standards for food intake and a corresponding amount of non-food consumption was thenzalculated, and used as the poverty line. This approach corresponds to intemational best practice.
14
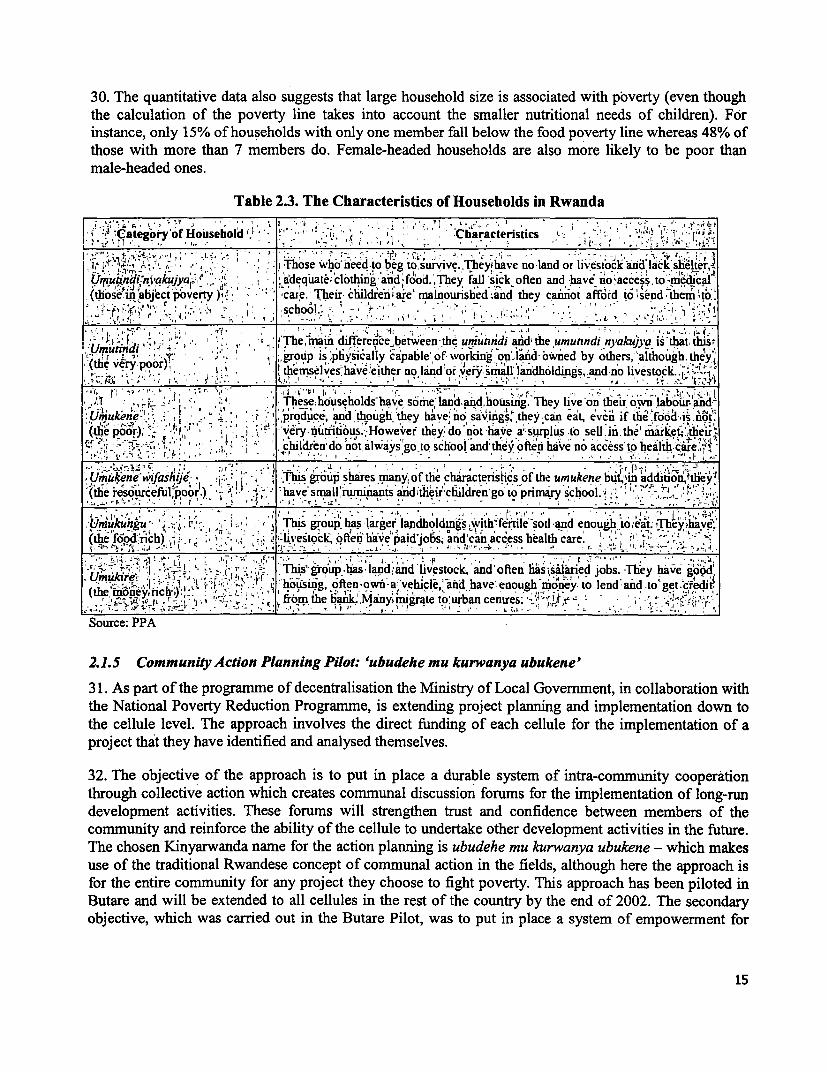
30. The quantitative data also suggests that large household size is associated with pbverty (even though
the calculation of the poverty line takes into account the smaller nutritional needs of children). Forinstance, only 15% of households with only one member fall below the food poverty line whereas 48% of
those with more than 7 members do. Female-headed households are also more likely to be poor than
male-headed ones.
Table 2.3. The Characteristics of Households in Rwanda
i .Cateiory'of Household ' - ' . ChaCracteishics I , ; .r ;-.|'"l-.:, , - -- ,. -. ,,,, - . sh-el',7; ,> '-teL t;
i[tivaitujya,' *t T | '; ' 1 '-' i hose wh&'d'eed.to beg tosurvi . y eolandoriestockad:lck'Iu.n,ua, F:,2: : adeqtialr cl6thihg:anid food.,They al inooaccessntoadec-
(those5 in abject poverty) ' cai,e. Their tildiiefiiaie mainourisled:and they caiinot afford toOsend them, o.l
4 g,I,r-, ' V, i ' .i. sbo 1. - *'. -'
.iU * J; .d !, j t, A ,,, !' 11 ' ,a'T' diff erente,betrveen -the umuthdi adte umunndimnyakjya ismthattn s
(thie very'poor),' ' " ''% ' ,group iS; sikal!y c4able'of workinj on land-bwned by others,`althoughbthey'VCIY'' L'-"; ; s { | 2 4 ' i themr!selves have either no a'ndcoryvery's-mall landholdings, and nolivestock '
These;householdshave s6mrelanahdhousing.Tbey live on their own labour.andt
ukne , . .pr , and though they have o, saving's' they can eat, even if the food is ot,
(the poor) "' Eiij,' | ;;|,,j ,; - -very nutmtious. -However they'Ido not have asurplus .10 selUin the' market,-'f eiir
f2, .-3; ffi..~n' ,. a ,c,hildrenhdo ot always go to school and e t6l eV aeno access- to carthe0 OShrc1thedsoth
Um'uken'e~ wzfashse ^ ,- '" i 'This gop shares any; of the c tens cs of tbe umukene but, dino,t
'(theresourceful poor') '^t it ! i2' : h-have small'ruants anditheir c d rengo' to primary 'chool j;'' i
U-Emukungu -, .-: { . ; 1 .. .. | This group has larger landholdmgs .with'lfertil& sod and enou to;eay, a
(the;food nc)s ,, vestocK e ofeiib've paid job nd'c ccessbealth caren iTey have
i This gruj., lhad and ivestock, and 'often hsis&aried jobs They have good'
phousug, ofen.ow -a vehicl'e nbd have enough po ney' to lend and to'get'credit,2'A' W5t;JE .o'v' from the lib.Ak.IManyanigrate to:urban centres 4 '
Source: PPA
2.1.5 Community Action Planning Pilot: 'ubudehe mu kurwanya ubukene'
31. As part of the programme of decentralisation the Ministry of Local Government, in collaboration with
the National Poverty Reduction Programme, is extending project planning and implementation down to
the cellule level. The approach involves the direct finding of each cellule for the implementation of a
project that they have identified and analysed themselves.
32. The objective of the approach is to put in place a durable system of intra-community cooperation
through collective action which creates communal discussion forums for the implementation of long-run
development activities. These forums will strengthen trust and confidence between members of the
community and reinforce the ability of the cellule to undertake other development activities in the future.
The chosen Kinyarwanda name for the action planning is ubudehe mu kurwanya ubukene - which makes
use of the traditional Rwandese concept of communal action in the fields, although here the approach is
for the entire community for any project they choose to fight poverty. This approach has been piloted in
Butare and will be extended to all cellules in the rest of the country by the end of 2002. The secondaryobjective, which was carried out in the Butare Pilot, was to put in place a system of empowerment for
15
selected poor families identified by the community (one per cellule). This creates an analysis of povertycarried out by the poor themselves, which deals with realistic issues of their own situation within theirown existing opportunities and skills.
33. Thus, the action planning process aims to strengthen the concepts of local governance, accountability,transparency and empowerment at the community level. It highlights people's capacity at the grass-rootslevel for problem analysis and strategy formulation and implementation. The strategies must becommunity defined with majority participation. This builds in accountability and encourages communitydialogue and participation in local governance. For further information on this approach, andexamples of the community and household level processes, see appendix A.
2.1.6 Poverty by region
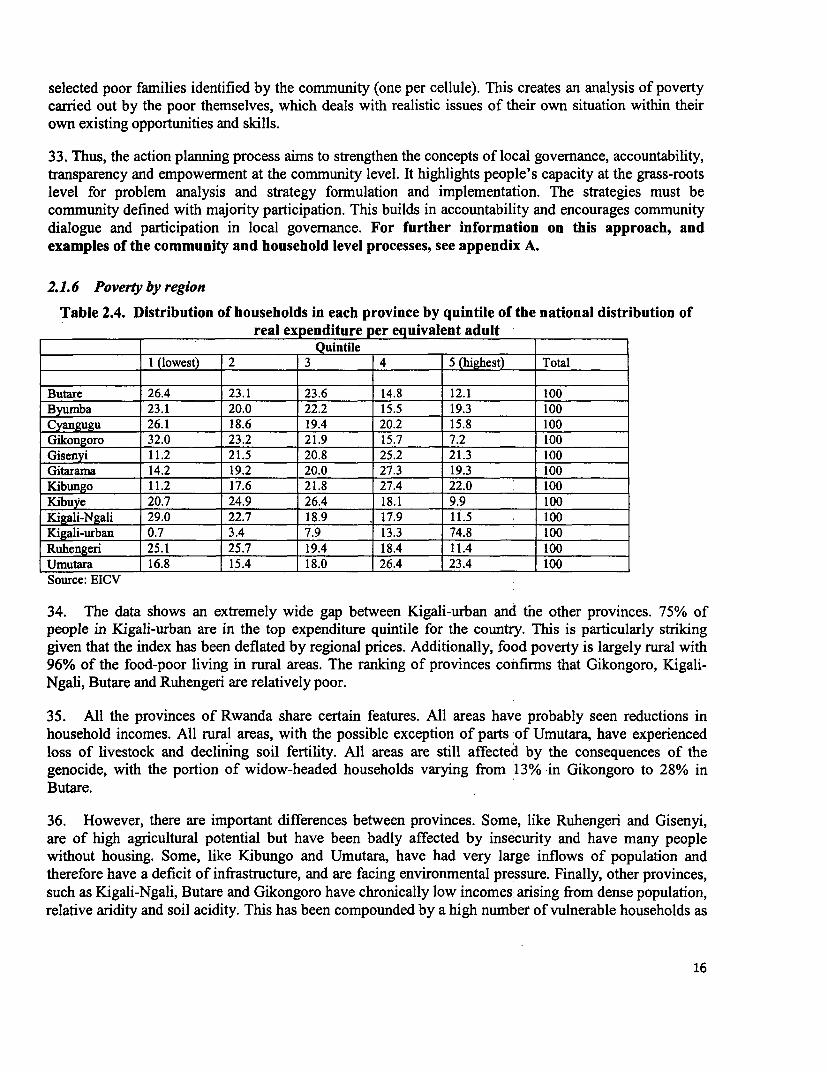
Table 2.4. Distribution of households in each province by quintile of the national distribution ofreal expenditure per equivalent adult
Quintile1 (lowest) 2 3 4 5 (highest) Total
Butare 26.4 23.1 23.6 14.8 12.1 100Byumba 23.1 20.0 22.2 15.5 19.3 100Cyangugu 26.1 18.6 19.4 20.2 15.8 100Gikongoro 32.0 23.2 21.9 15.7 7.2 100Gisenyi 11.2 21.5 20.8 25.2 21.3 100Gitarama 14.2 19.2 20.0 27.3 19.3 100Kibungo 11.2 17.6 21.8 27.4 22.0 100Kibuye 20.7 24.9 26.4 18.1 9.9 100Kigali-Ngali 29.0 22.7 18.9 17.9 1.5 100Kigali-urban 0.7 3.4 7.9 13.3 74.8 100Ruhengeri 25.1 25.7 19.4 18.4 11.4 100Umutara 16.8 15.4 18.0 26.4 23.4 100Source: EICV
34. The data shows an extremely wide gap between Kigali-urban and the other provinces. 75% ofpeople in Kigali-urban are in the top expenditure quintile for the country. This is particularly strikinggiven that the index has been deflated by regional prices. Additionally, food poverty is largely rural with96% of the food-poor living in rural areas. The ranking of provinces confirms that Gikongoro, Kigali-Ngali, Butare and Ruhengeri are relatively poor.
35. All the provinces of Rwanda share certain features. All areas have probably seen reductions inhousehold incomes. All rural areas, with the possible exception of parts of Umutara, have experiencedloss of livestock and declining soil fertility. All areas are still affected by the consequences of thegenocide, with the portion of widow-headed households varying from 13% in Gikongoro to 28% inButare.
36. However, there are important differences between provinces. Some, like Ruhengeri and Gisenyi,are of high agricultural potential but have been badly affected by insecurity and have many peoplewithout housing. Some, like Kibungo and Umutara, have had very large inflows of population andtherefore have a deficit of infrastructure, and are facing environmental pressure. Finally, other provinces,such as Kigali-Ngali, Butare and Gikongoro have chronically low incomes arising from dense population,relative aridity and soil acidity. This has been compounded by a high number of vulnerable households as
16
a result of the genocide, and has been aggravated by the recent drought. Within provinces, Ginicoefficients range from 0.324 to 0.433, with inequality levels being highest within Cyangugu, Butare andKigali-urban, and lowest in Kibuye and Gitarama. There are also important differences in the incidence ofconsumption poverty across provinces. The proportion of poor is highest in Gikongoro where 77.2% ofthe population are poor. In the provinces of Butare, Kibuye, Kigali-Ngali and Ruhengeri more than 70%of the residents have consumption levels below the poverty line, and they are disproportionatelyassociated with women-headed households.
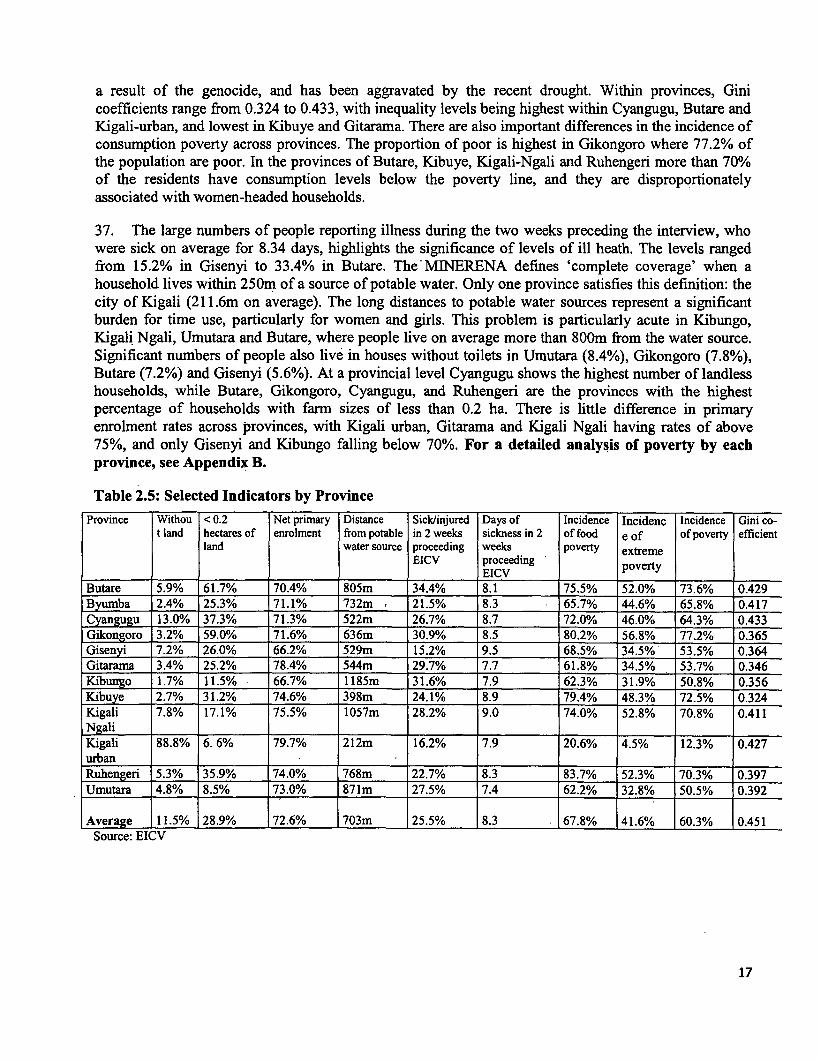
37. The large numbers of people reporting illness during the two weeks preceding the interview, whowere sick on average for 8.34 days, highlights the significance of levels of ill heath. The levels rangedfrom 15.2% in Gisenyi to 33.4% in Butare. The MlNERENA defines 'complete coverage' when ahousehold lives within 250m of a source of potable water. Only one province satisfies this definition: thecity of Kigali (211.6m on average). The long distances to potable water sources represent a significantburden for time use, particularly for women and girls. This problem is particularly acute in Kibungo,Kigali Ngali, Umutara and Butare, where people live on average more than 800m from the water source.Significant numbers of people also live in houses without toilets in Umutara (8.4%), Gikongoro (7.8%),Butare (7.2%) and Gisenyi (5.6%). At a provincial level Cyangugu shows the highest number of landlesshouseholds, while Butare, Gikongoro, Cyangugu, and Ruhengeri are the provinces with the highestpercentage of households with farm sizes of less than 0.2 ha. There is little difference in primaryenrolment rates across provinces, with Kigali urban, Gitarama and Kigali Ngali having rates of above75%, and only Gisenyi and Kibungo falling below 70%. For a detailed analysis of poverty by eachprovince, see Appendix B.
Table 2.5: Selected Indicators by ProvinceProvince Withou < 0.2 Net primary Distance Sick/injured Days of Incidence Incidenc Incidence Gini co-
t land hectares of enrolment from potable in 2 weeks sickness in 2 of food e of of poverty efficientland water source proceeding weeks poverty extreme
EICV proceeding poverty_ _ _ _ _ _ _ _ _ _ _ _ _ _ _ _ _ _ _ _ _ _ _ _ _ _ _ _E IC V
Butare 5.9% 61.7% 70.4% 805m 34.4% 8.1 75.5% 52.0% 73.6% 0.429Byumba 2.4% 25.3% 71.1% 732m 21.5% 8.3 65.7% 44.6% 65.8% 0.417Cyangugu 13.0% 37.3% 71.3% 522m 26.7% 8.7 72.0% 46.0% 64.3% 0.433Gikongoro 3.2% 59.0% 71.6% 636m 30.9% 8.5 80.2% 56.8% 77.2% 0.365Gisenyi 7.2% 26.0% 66.2% 529m 15.2% 9.5 68.5% 34.5% 53.5% 0.364Gitarama 3.4% 25.2% 78.4% 544m 29.7% 7.7 61.8% 34.5% 53.7% 0.346Kibu2Ro 1.7% 11.5% 66.7% 1185m 31.6% 7.9 62.3% 31.9% 50.8% 0.356Kibuye 2.7% 31.2% 74.6% 398m 24.1% 8.9 79.4% 48.3% 72.5% 0.324Kigali 7.8% 17.1% 75.5% 1057m 28.2% 9.0 74.0% 52.8% 70.8% 0.411
Kigan 88.8% 6. 6% 79.7% 212m 16.2% 7.9 20.6% 4.5% 12.3% 0.427urban I_ _ _ _ _ _ _ __ _ __ _ _ _
Ruhengeri 5.3% 35.9% 74.0% 768m 22.7% 8.3 83.7% 52.3% 70.3% 0.397Umutara 4.8% 8.5% 73.0% 871m 27.5% 7.4 62.2% 32.8% 50.5% 0.392
Average 11.5% 28.9% 72.6% 703m 25.5% 8.3 67.8% 41.6% 60.3% 0.451Source: EICV
17
2.1.7 Poverty and inequality
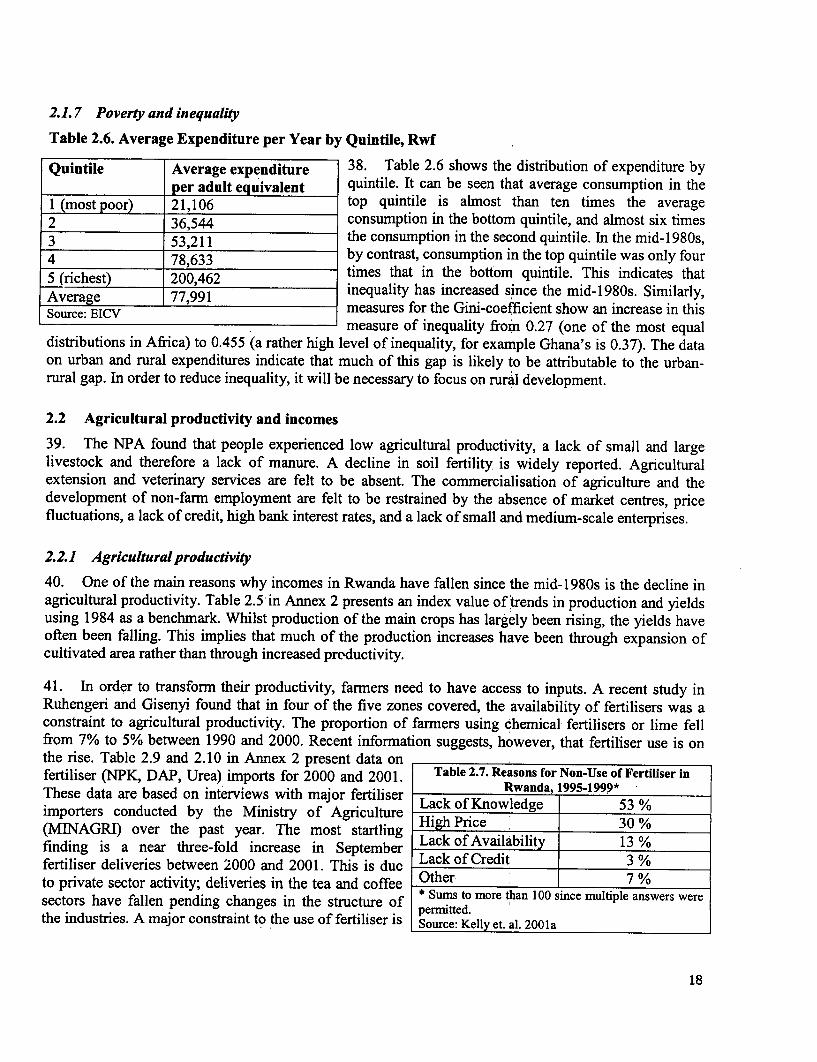
Table 2.6. Average Expenditure per Year by Quintile, Rwf
Quintile Average expenditure 38. Table 2.6 shows the distribution of expenditure byper adult equivalent quintile. It can be seen that average consumption in the
1 (most poor) 21,106 top quintile is almost than ten times the average2 36,544 consumption in the bottom quintile, and almost six times3 3,211 the consumption in the second quintile. In the mid-1980s,
53,211 by contrast, consumption in the top quintile was only four78,633 times that in the bottom quintile. This indicates that
5 (richest) 200,462 inequality has increased since the mid-1980s. Similarly,
Source: EICV measures for the Gini-coefficient show an increase in thismeasure of inequality from 0.27 (one of the most equal
distributions in Africa) to 0.455 (a rather high level of inequality, for example Ghana's is 0.37). The dataon urban and rural expenditures indicate that much of this gap is likely to be attributable to the urban-rural gap. In order to reduce inequality, it will be necessary to focus on rural development.
2.2 Agricultural productivity and incomes
39. The NPA found that people experienced low agricultural productivity, a lack of small and largelivestock and therefore a lack of manure. A decline in soil fertility is widely reported. Agriculturalextension and veterinary services are felt to be absent. The commercialisation of agriculture and thedevelopment of non-farm employment are felt to be restrained by the absence of market centres, pricefluctuations, a lack of credit, high bank interest rates, and a lack of small and medium-scale enterprises.
2.2.1 Agriculturalproductivity
40. One of the main reasons why incomes in Rwanda have fallen since the mid-1980s is the decline inagricultural productivity. Table 2.5 in Annex 2 presents an index value of trends in production and yieldsusing 1984 as a benchmark. Whilst production of the main crops has largely been rising, the yields haveoften been falling. This implies that much of the production increases have been through expansion ofcultivated area rather than through increased productivity.
41. In order to transform their productivity, farmers need to have access to inputs. A recent study inRuhengeri and Gisenyi found that in four of the five zones covered, the availability of fertilisers was aconstraint to agricultural productivity. The proportion of farmers using chemical fertilisers or lime fellfrom 7% to 5% between 1990 and 2000. Recent information suggests, however, that fertiliser use is onthe rise. Tablc 2.9 and 2.10 in Annex 2 present data onfertiliser (NPK, DAP, Urea) imports for 2000 and 2001. Table 2.7. Reasons for Non-Use of Fertiliser in
Thesedataareb ninterviews with m rfertiliser Rwanda, 1995-1999*T'hese data are based on itrewwthmajor fetlsrLack of Knowledge 53 %importers conducted by the Ministry of Agriculture Lac e 3 %(MINAGRI) over the past year. The most startling of Aviai 3 %finding is a near three-fold increase in September Lack of Availability 13 %fertiliser deliveries between 2000 and 2001. This is due Lack of Credit 3 %to private sector activity; deliveries in the tea and coffee Other 7 %sectors have fallen pending changes in the structure of * Sums to more than 100 since multiple answers werepermitted.the industries. A major constraint to the use of fertiliser i Source: Kely et. al. 2001a
18
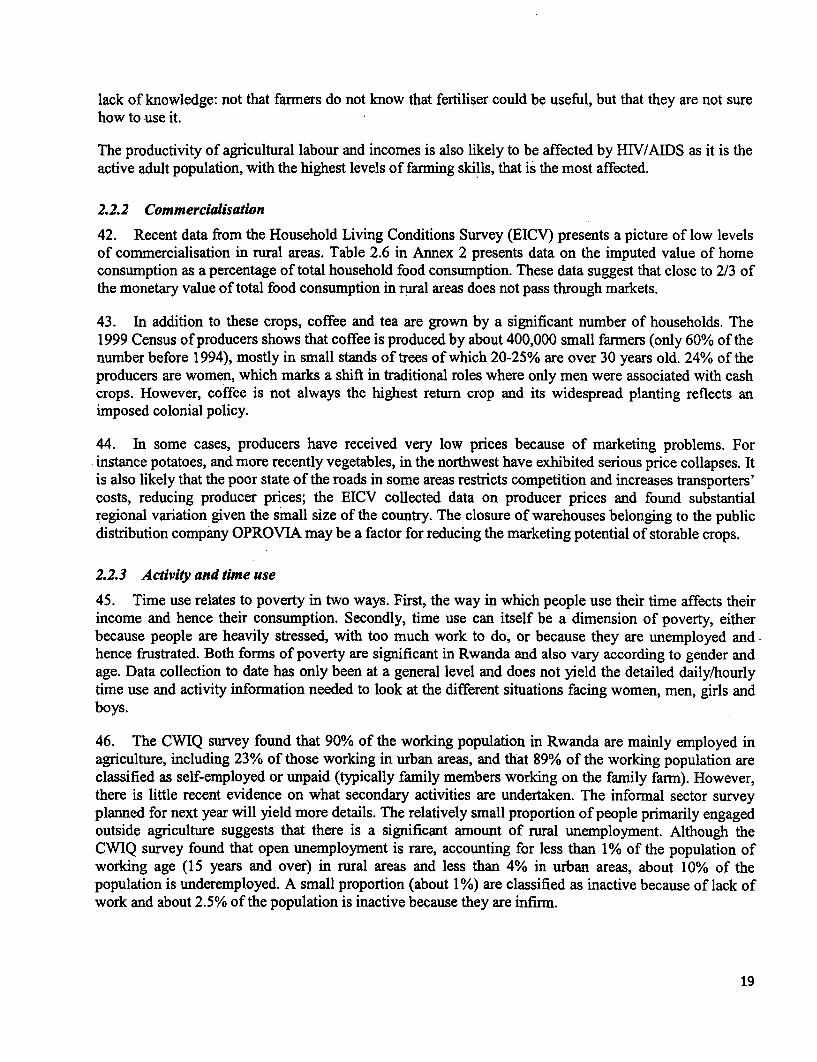
lack of knowledge: not that farmers do not know that fertiliser could be useful, but that they are not surehow to use it.
The productivity of agricultural labour and incomes is also likely to be affected by HIV/AIDS as it is theactive adult population, with the highest levels of farming skills, that is the most affected.
2.2.2 Commercialisation
42. Recent data from the Household Living Conditions Survey (EICV) presents a picture of low levelsof commercialisation in rural areas. Table 2.6 in Annex 2 presents data on the imputed value of homeconsumption as a percentage of total household food consumption. These data suggest that close to 2/3 ofthe monetary value of total food consumption in rural areas does not pass through markets.
43. In addition to these crops, coffee and tea are grown by a significant number of households. The1999 Census of producers shows that coffee is produced by about 400,000 small farmers (only 60% of thenumber before 1994), mostly in small stands of trees of which 20-25% are over 30 years old. 24% of theproducers are women, which marks a shift in traditional roles where only men were associated with cashcrops. However, coffee is not always the highest return crop and its widespread planting reflects animposed colonial policy.
44. In some cases, producers have received very low prices because of marketing problems. Forinstance potatoes, and more recently vegetables, in the northwest have exhibited serious price collapses. Itis also likely that the poor state of the roads in some areas restricts competition and increases transporters'costs, reducing producer prices; the EICV collected data on producer prices and found substantialregional variation given the small size of the country. The closure of warehouses belonging to the publicdistribution company OPROVIA may be a factor for reducing the marketing potential of storable crops.
2.2.3 Activity and time use
45. Time use relates to poverty in two ways. First, the way in which people use their time affects theirincome and hence their consumption. Secondly, time use can itself be a dimension of poverty, eitherbecause people are heavily stressed, with too much work to do, or because they are unemployed andhence frustrated. Both forms of poverty are significant in Rwanda and also vary according to gender andage. Data collection to date has only been at a general level and does not yield the detailed daily/hourlytime use and activity information needed to look at the different situations facing women, men, girls andboys.
46. The CWIQ survey found that 90% of the working population in Rwanda are mainly employed inagriculture, including 23% of those working in urban areas, and that 89% of the working population areclassified as self-employed or unpaid (typically family members working on the family farm). However,there is little recent evidence on what secondary activities are undertaken. The informal sector surveyplanned for next year will yield more details. The relatively small proportion of people primarily engagedoutside agriculture suggests that there is a significant amount of rural unemployment. Although theCWIQ survey found that open unemployment is rare, accounting for less than 1% of the population ofworking age (15 years and over) in rural areas and less than 4% in urban areas, about 10% of thepopulation is underemployed. A small proportion (about 1%) are classified as inactive because of lack ofwork and about 2.5% of the population is inactive because they are infirm.
19

47. Participatory and anecdotal evidence shows that time use varies both by age and gender. Muchunderemployment is found among young men who have not yet married. Whether or not this group ispoor in consumption terms, they suffer from the lack of employment opportunities. Hence the generationof employment opportunities needs to be an important objective of the poverty reduction strategy.
48. Many women are in a very different position, being very: heavily burdened by domesticresponsibility. This is particularly true for widows with young children and for prisoners' wives (seePoverty Note, World BanklMINECOFIN 1998). In some cases, widows have plots of land which theycannot adequately farm. Unfortunately, they are generally too poor to, employ wage labour to farm thisland. In addition to time use, women are probably less able to exert choice over their activities than men,because men are expected to control many of the decisions within the household. This is an aspect ofpoverty which may be of considerable importance in influencing the well being of the two genders.
2.2.4 Investment and savings by the poor
49. Monetary savings are not currently a feature of poor households. In the National ParticipatoryAssessment (NPA) it was found that only the umukire, or money-rich, have any contact with formalsavings institutions. The most important asset for a poor rural househoid is land and the size and fertilityof land holdings was one of the most important factors determining the categories of poverty into whichhouseholds were classified in the NPA. Although land is bought and sold in Rwanda, there has beenpersistent doubt about its legal status, partly because legislation has sometimes imposed unrealisticminimum limits on land size. Most, but not all, of the population have access to land, but in very limitedamounts; the CWIQ survey finds that 85% of rural households report that they own land, but the averageholding is just 0.71 hectares and 95% of farmers farm 2 hectares or less. In this context, it is important tonote that on all major crops, smaller farms have been found to yield more than larger farms in Rwanda asin other countries (Clay et al. 1996). The small size of farms is a problem for farmers' incomes, but notfor productivity.
50. In addition to land, the NPA and all other data clearly outline the primary importance of housingand livestock as assets and determinants of poverty. As noted above, there are a significant number ofhouseholds without adequate housing. Livestock levels also fell dramatically during the genocide (Table2.7 in Annex 2); The distribution of cattle also changed, with some larger herds entering the country inthe north. The food security studies conducted by Save the Children Fund found that most households inall the areas they surveyed had lost much of their livestock. This is extremely serious for the farmingsystem, because the use of manure is essential for preserving the fertility of the soil, and for preparing thesoil structure for the use of chemical fertiliser. The use of organic inputs in farming declined from 95% to69% of farmers, and from 70% to 57% of area, between 1990 and 2000.
2.2.5 Environmental investments
51. In addition to the reduction in the use of modem and traditional inputs, environmental practices alsodeclined during the 1990s. The proportion of farms in the crop survey using conservation investments fellfrom 93% in 1990 to 65% in 2000, and the area covered by such investments fell from 76% to 65%.
20
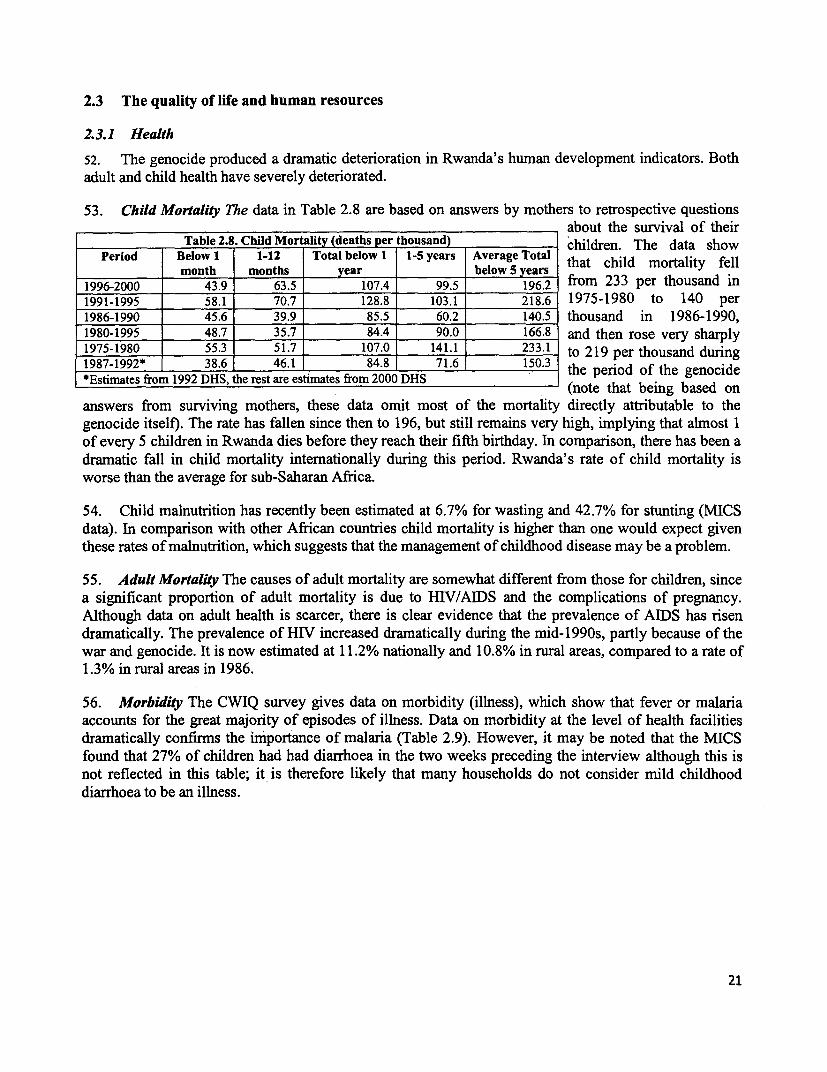
2.3 The quality of life and human resources
2.3.1 Health
52. The genocide produced a dramatic deterioration in Rwanda's human development indicators. Bothadult and child health have severely deteriorated.
53. Child Mortality The data in Table 2.8 are based on answers by mothers to retrospective questionsabout the survival of their
Table 2.8. Child Mortality (deaths per thousand) children. The data showPeriod Below 1 1-12 Total below 1 1-5 years Average Total child morta fell
month months year below 5 years that child mortality fell1996-2000 43.9 63.5 107.4 99.5 196.2 from 233 per thousand in1991-1995 58.1 70.7 128.8 103.1 218.6 1975-1980 to 140 per1986-1990 45.6 39.9 85.5 60.2 140.5 thousand in 1986-1990,1980-1995 48.7 35.7 84.4 90.0 166.8 and then rose very sharply1975-1980 55.3 51.7 107.0 141.1 233.1 to 219 per thousand during1987 1992* 38.6 46.1 84.8 71.6 150.3 the period of the genocide-*Estimates from 1992 DHS, the rest are estimates from 2000 DHS (note that being based on
answers from surviving mothers, these data omit most of the mortality directly attributable to thegenocide itself). The rate has fallen since then to 196, but still remains very high, implying that almost 1of every 5 children in Rwanda dies before they reach their fifth birthday. In comparison, there has been adramatic fall in child mortality internationally during this period. Rwanda's rate of child mortality isworse than the average for sub-Saharan Africa.
54. Child malnutrition has recently been estimated at 6.7% for wasting and 42.7% for stunting (MICSdata). In comparison with other African countries child mortality is higher than one would expect giventhese rates of malnutrition, which suggests that the management of childhood disease may be a problem.
55. Adult Mortality The causes of adult mortality are somewhat different from those for children, sincea significant proportion of adult mortality is due to HIV/AIDS and the complications of pregnancy.Although data on adult health is scarcer, there is clear evidence that the prevalence of AIDS has risendramatically. The prevalence of HIV increased dramatically during the mid-1990s, partly because of thewar and genocide. It is now estimated at 11.2% nationally and 10.8% in rural areas, compared to a rate of1.3% in rural areas in 1986.
56. Morbidity The CWIQ survey gives data on morbidity (illness), which show that fever or malariaaccounts for the great majority of episodes of illness. Data on morbidity at the level of health facilitiesdramatically confirms the importance of malaria (Table 2.9). However, it may be noted that the MICSfound that 27% of children had had diarrhoea in the two weeks preceding the interview although this isnot reflected in this table; it is therefore likely that many households do not consider mild childhooddiarrhoea to be an illness.
21
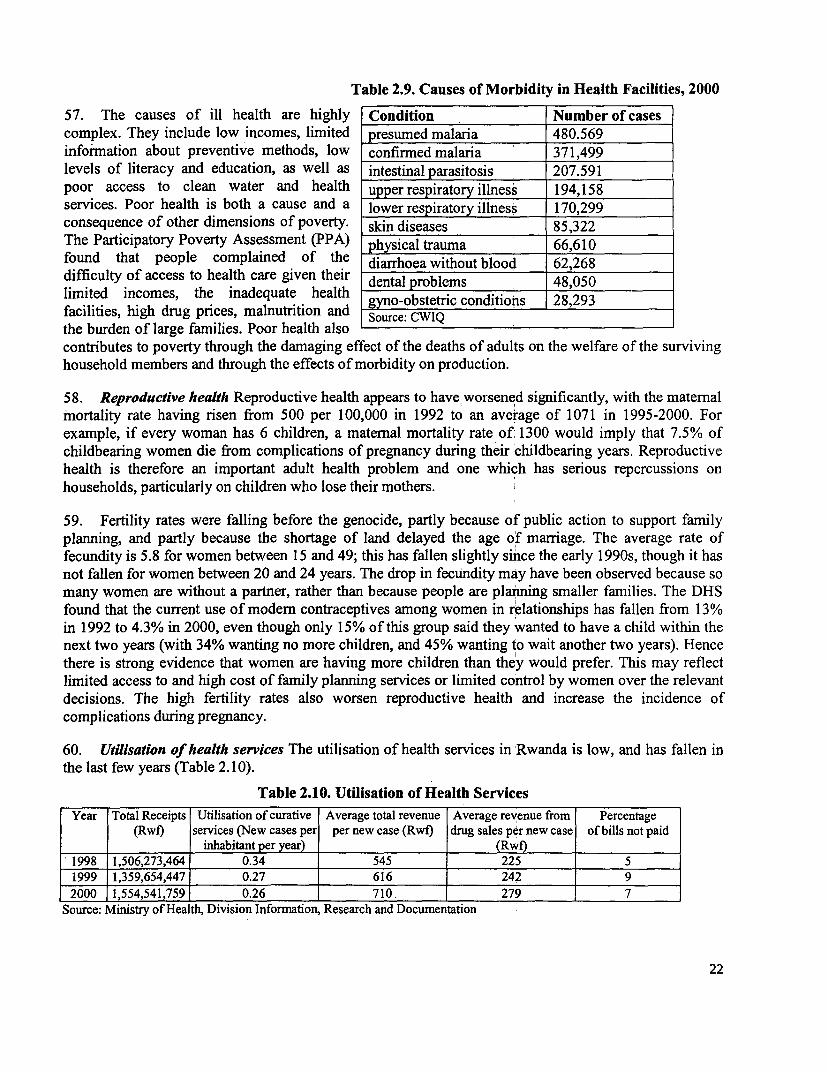
Table 2.9. Causes of Morbidity in Health Facilities, 200057. The causes of ill health are highly Condition Number of casescomplex. They include low incomes, limited presumed malaria 480.569information about preventive methods, low confirmed malaria 371,499levels of literacy and education, as well as intestinal parasitosis 207.591poor access to clean water and health upper respiratory illness 194,158services. Poor health is both a cause and a lower respiratory illness 170,299consequence of other dimensions of poverty. skin diseases 85,322The Participatory Poverty Assessment (PPA) physical trauma 66,610found that people complained of the diarrhoea without blood 62,268difficulty of access to health care given their dental problems 48,050limited incomes, the inadequate health deno-oblems 48,293facilities, high drug prices, malnutrition and gynoSobstetric conditiois 28,293Source: CWIQthe burden of large families. Poor health alsocontributes to poverty through the damaging effect of the deaths of adults on the welfare of the survivinghousehold members and through the effects of morbidity on production.
58. Reproductive health Reproductive health appears to have worsened significantly, with the maternalmortality rate having risen from 500 per 100,000 in 1992 to an average of 1071 in 1995-2000. Forexample, if every woman has 6 children, a maternal mortality rate of, 1300 would imply that 7.5% ofchildbearing women die from complications of pregnancy during their childbearing years. Reproductivehealth is therefore an important adult health problem and one which has serious repercussions onhouseholds, particularly on children who lose their mothers.
59. Fertility rates were falling before the genocide, partly because of public action to support familyplanning, and partly because the shortage of land delayed the age of marriage. The average rate offecundity is 5.8 for women between 15 and 49; this has fallen slightly since the early 1990s, though it hasnot fallen for women between 20 and 24 years. The drop in fecundity may have been observed because somany women are without a partner, rather than because people are planming smaller families. The DHSfound that the current use of modern contraceptives among women in relationships has fallen from 13%in 1992 to 4.3% in 2000, even though only 15% of this group said they wanted to have a child within thenext two years (with 34% wanting no more children, and 45% wanting to wait another two years). Hencethere is strong evidence that women are having more children than they would prefer. This may reflectlimited access to and high cost of family planning services or limited control by women over the relevantdecisions. The high fertility rates also worsen reproductive health and increase the incidence ofcomplications during pregnancy.
60. Utilisation of health services The utilisation of health services in Rwanda is low, and has fallen inthe last few years (Table 2.10).
Table 2.10. Utilisation of Health ServicesYear Total Receipts Utilisation of curative Average total revenue Average revenue from Percentage
(Rwf) services (New cases per per new case (Rwf) drug sales per new case of bills not paidinhabitant per year) (Rwf)
1998 1,506,273,464 0.34 545 225 51999 1,359,654,447 0.27 616 242 92000 1,554,541,759 0.26 710. 279 7
Source: Ministry of Health, Division Information, Research and Documentation
22
61. The CWIQ survey illustrates the reasons for low usage of health services (Table 2.16 in Annex 2).Health services, although available, are often perceived as too expensive for the poor to use them. TheCWIQ survey confirms this perception; in the 4 weeks before the survey, 23% of people had consultedmedical services, and 15% of people had been ill but had not consulted a health provider because of thecost. As with education, cost turns out to be a much more powerful deterrent than distance; it is also thecause of dissatisfaction in 80% of the cases where people are dissatisfied (followed by the failure oftreatment and the long queues). Interestingly, rural residents are as likely to consult a service provider asurban residents, but this includes the traditional sector. When services are consulted, the public hospitalsare the most frequently used provider (33.6%), followed by pharmacies (29.1%), health centres (12%),and traditional healers (11.4%), the last being mainly in rural areas.
62. Data from the EICV sheds more light on the incidence of health care by consumption group. Table2.17 in Annex 2 breaks down the patients in different kinds of facilities by income group. These figuresshow that 95% of patients in private clinics and 65% of those in hospitals come from the richest 40% ofhouseholds. Patients in health centres are more representative of the population, but even here the bottom40% of households are underrepresented, accounting for only 32% of male patients and just 25% offemale patients. Poverty, therefore, seems to be a constraint in accessing the health system, despite theexistence of exemption schemes. Extra public spending on health centres is more likely to reach the poorthan extra public spending on hospitals.
63. Preventive health services are of critical importance in improving health. Across the wholepopulation, the MICS survey found that 62% of children had a fully completed vaccination card. Afurther 9% of mothers reported that their children had received a full set of vaccinations. Thus 71% ofchildren had received total coverage for all vaccinations; in addition, many children had been vaccinatedagainst some, but not all, diseases. This is one of the few indicators that is better in rural areas than inurban ones. Mosquito nets, by contrast, are widespread in urban areas but scarce in rural ones; more thana third of children in urban areas sleep under a mosquito net, 80% of which are treated with insecticide,whereas only 2% of rural children do.
2.3.2 Education and literacy
64. In the past, Rwanda has had higher rates of primary enrolment than many African countries, butmuch lower rates of secondary and tertiary enrolment. However, the data on literacy reveal substantialdeficiencies even at the most basic levels of education. The EICV estimates the rate of literacy at 47.8%for women and 58.1% for men. Table 2.18 in Annex 2 shows considerable differences between incomegroups as regards the completion of primary school, but few differences by gender. The data show that15% of people in the 1st quintile completed primary school whereas 53% of people in the 5th quintile didso. Adult literacy therefore needs to be integrated with socio-economic activities in rural areas. TheCWIQ survey found a strong relation with age. The share of the population aged between 16 and 35 yearsold that has attained an educational level of at least Primary 6 is double compared with the populationover 35 years of age.
65. Education at secondary and higher levels is extremely low. 33% of the population of 15 years andabove have no education, and 60% have only primary education. 7.1% have post-primary or secondaryeducation, and only 0.4% have some tertiary education. Current educational enrolment has beenincreasing. Most people in Rwanda now have some access to primary education for their children.However, access to secondary and tertiary education is much more limited. The number of children inprimary and secondary schools are given in table 2.19 in Annex 2.
23

66. Aggregate population data are not known precisely since the census of 1991, so estimates of theoverall rate of enrolment are inevitably approximate. However, the fast growth in the total number ofstudents at all levels makes it clear that enrolment rates have been rising. The estimated gross and netprimary enrolment rates are now 100% and 73% respectively. These estimates correspond closely withthe estimates from the CWIQ survey, where the net rate of enrolment was found to be 77% in primaryschool and 7% in secondary school. The big difference between net and gross rates arises because manychildren over 12 are still in primary school. In secondary education, the official gross and net rates arejust 10.2% and 6.0%, which remain very low.
67. Gender-disaggregated data from the CWIQ show that the rate of enrolment for girls is as high asthat for boys in primary education, and higher in secondary education. 'However, the administrative datareveal that there are more boys than girls in public secondary schools, and more girls than boys in privatesecondary schools. Possible reasons for this difference include the practice of boarding in publicsecondary schools, differential performance in examinations, and sexual harassment. It has been revealedthat sexual harassment by staff was a problem experienced by girls in secondary schools in various partsof the country.
68. The EICV data allow us to estimate the incidence of primary and secondary education by incomegroup in Table 2.20 in Annex 2. It can be seen that primary school children are much more representativeof the population than secondary school children. 21% of children in public primary schools are in thebottom expenditure quintile, compared to 4% of those in public secondary schools. 74% of students inpublic secondary schools come from the richest 40% of households.
69. Dropout rates in primary schools are high, estimated at 12%, with repetition at 37%. The CWIQdata gives some evidence on the reasons for ceasing Table 2.11: Reasons for not attending School, among thoseto attend school. The expense, exam failure and work who have attended school in the past.are the main reasons for dropping out. Girls are more I Boys Girls 7-13 14-19likely than boys to be away from school because of Per cent not attending 25.6 27.9 4.3 48.8work. Distance from schools does not appear to be an Reason for not attendi ng:important deterrent, even for secondary schools. This Too old/young 4.2 2.7 0.0 3.7is despite the fact that almost half of households are Distance 0.2 0.4 0.0 0.3at least 30 minutes from a primary school and that Expense 36.9 343 40.7 13568
Work 13.0 19.3 10.6 16.8two thirds of households are more than an hour from Useless 10.2 8.0 13.0 8.7a secondary school. Illness/pregnancy 8.0 9.7 18.1 8.5
Failed exam 28.9 27.6 16.0 29.370. The primary educational system is almost Got married 0.1 1.2 0.0 0.7entirely public or grant-maintained, and fees are low, Other 4.4 3.6 6.2 3.8at Rwf 300 per pupil per year. In secondary Note: children who have never attended school are noteducation, 56% of students are in public schools or included in this table. Source: CWIQ
government-assisted schools and fees are much higher, at Rwf 2 1,000 per pupil per year. Both private andpublic sectors have been expanding fast, and the rate of transition from the final year of primary school tosecondary school has risen to 42% in 2000.
71. The expansion of student numbers has been accompanied by an expansion of facilities and teachingstaff. The number of primary schools has risen over the last seven years from 1,882 before the genocideand 1,283 after the genocide in 1993/4 to 2,142 in 2000/1. The number of secondary schools hasincreased from 280 before the genocide to 378 in 2000/1 .The number of primary school teachers has risen
24
from 16,285 in 1993/4 to 28,698 in 2000/1, and the number of secondary school teachers has risen from3,886 in 1996/7 to 6,499 in 2000/1.
72. Two concerns that arise are the quality of teaching achieved during this rapid expansion and theincidence of the benefits of education (i.e. which income groups have access to education). Quality islikely to be challenged by the introduction of courses in English and French throughout primaryeducation, and it will therefore be important to monitor quality. The CWIQ surveys provide someevidence on the aspects of quality that are of most concern to households. These indicate that the mainconcern is the shortage of furniture and materials. In primary schools, 49.6% are dissatisfied, and in over90% of cases the reason is to do with books or other supplies, not the poor quality or absence of a teacher;the results are similar in secondary education. These findings correspond with intemational evidence,which shows that textbooks are a critical input in determining educational outcomes.
2.3.3 Water and sanitation
73. Water supply raises two main concerns for poverty reduction: the time spent fetching water, and thequality of water collected and used in the home. Table 2.22 in Annex 2 shows estimates from the CWIQsurvey of the time taken to fetch water. Water supply is often a long way from the household, imposing asignificant burden, particularly on the time of women and girls. For instance, more than one in fivehouseholds in Umutara are more than an hour away from their water source. This has implications for thequality of women's and girls' lives, their economic productivity, and their access to education.
74. Rural water supply Rural water supply in Rwanda is provided through three main systems: (a)simple piped water systems (788)5, with standpipes (7421), or individual connections (2483), (b)protected spring catchments (18241), and (c) complex piped systems that span across two or moreDistricts (50), and across more than one province (10).
75. Tables 2.23 and 2.24 in Annex 2 present survey evidence on the kind of water source used. Thesedata apparently conflict, perhaps because of definitional differences or because of sampling (theproportion in rural areas using pipes is very different in the CWIQ and MICS surveys). The limitedinformation, however, suggests that despite significant investments in the past, sustained access to safewater sources has probably declined in rural areas6 . The 1996 Sector Policy for Water and Sanitationsuggests that based on the water distribution points established over the years, coverage in rural areasshould have been close to 70 percent. However, by 2000, using norms related to number of users served,the coverage may have declined to 44 percent, taking into account the actual condition of facilities7 .Rehabilitation of systems along with effective community based management systems are the key toincreasing access to safe water supply.
76. This poor and declining condition of access to water supply is observed despite the relatively goodlevel of water resources in Rwanda, with adequate rainfall, a large number of springs in the lowers slopes,
5 The figures in parenthesis are the numbers of systems or connections, based on information from the Inventory of Rural WaterSupply Systems, 2001 maintained by MINERENA.6 For example, proportion of households using taps, standpipes or protected springs, as a source of water seems to have gone downfrom 79 percent in 1995 (based on UNICEF information) to 67 percent in 2001 (as per the MICS information). This is also reflected in thehigh rehabilitation requirements ranging from about 35 to 45 percent for most hardware in rural water supply systems, based on anassessment done for the Social Sector Expenditure Review in 1996 and reported in the report by Groom S. (1999) Water Supply andSanitation Sector in Rwanda, mimeo.7 Based on World Bank (2000), Project Appraisal Document for Rural Water Supply and sanitation Project, p. 3. A differentestimate by Groom S. (1997) suggests somewhat better coverage at 50 percent (p.3).
25
many lakes, rivers and high ground water tables. However, with a large number of hills, and the tendencyof the population to settle in high-lying areas, distances to water sources in low-lying springs are oftenlong and result in drudgery and extra time spent by women collecting water. While some of the complexpiped water systems have been in response to this factor, their complex management has resulted in poormaintenance, high costs and low operational efficiency. Electrogaz is operating most of these at highlysubsidised costs. Unfortunately, despite favourable rainfall, little use is made of rainwater catchments,except by a few health centres and churches. This is being addressed by a water-harvesting component inthe settlement programme.
77. Urban water supply Electrogaz, a Government owned company for water, electricity and gas,provides drinking water in urban areas (Kigali plus the ten other town centres). While information onactual coverage in urban areas is not readily available, it is not likely to exceed 60 percent of thepopulation, of which about half receives the water through standpipes8 . It is most likely that the privateconnections are largely confined to middle and upper income areas and households, and the poorer groupsin unauthorised settlements and in peri-urban areas have no access to the limited services provided by thiscompany. The situation has probably worsened due to the large influx of people to urban areas since theevents of 1994. The poor at present are probably dependent on either unsafe sources or have to purchasewater at high prices. A detailed assessment for the poor in urban areas is essential, especially in thecontext of the private sector participation that is envisaged.
78. Sanitation and hygiene promotion The limited information available on sanitation in terms ofpopulation with latrines suggests very high coverage at around 85 percent in rural areas. However, only0.8 percent of these are 'hygienic', and safe hygiene practices are not prevalent.9 For example, even in theWater and Environmental Sanitation (WES) project, the evaluation study found that the hygiene andenvironmental sanitation component was not effectively implemented. This adversely affects the potentialbenefits of improved household sanitary facilities. In the project areas, diarrhoea and other water andhygiene related disease conditions rank among the major causes of morbidity and mortality, and childrenbelow the age of five years were particularly adversely affected."0 Poor sanitation facilities also contributeto problems of drinking water quality with settlements often situated on higher grounds and water sourcesat lower levels, resulting in contaminants being washed into water collection zones.
79. While separate information on urban areas is not available, the situation is likely to be even worsewith the higher residential densities in these areas and limited or no sewerage facilities in most urbancentres. Limited available information for Kigali suggests that a fourth of all households had access tolatrines with septic tanks and another half had dry pit latrines. The municipal authority managed onlyabout 15 percent of liquid wastes; all other wastes and latrines lead to pollution in some form. Thesituation of sanitation in institutional settings is also poor. Only 20 % of primary schools in both rural andurban areas have latrines. The situation in secondary schools, prisons, health centres and markets is alsopoor and requires the urgent provision of communal latrines.
2.3.4 Housing
80. Since 1995 Rwanda has experienced massive refugee and returnee movements with far reachingconsequences. This has been coupled with internal displacement of people resulting in increased
Based on the World Bank, Draft Appraisal Report for the Third Water Supply Project as reported on Groom S. op.cit.9 Based on information reported in World Bank (2000), Project Appraisal Document for Rural Water Supply and sanitation Project, p.3.And UNICEF and Government of Rwanda (2001), Report of the Evaluation of the Water and Environmental Sanitation Programme, mimeo.'0 UNICEF and Govemment of Rwanda (2001), op. cit.
26
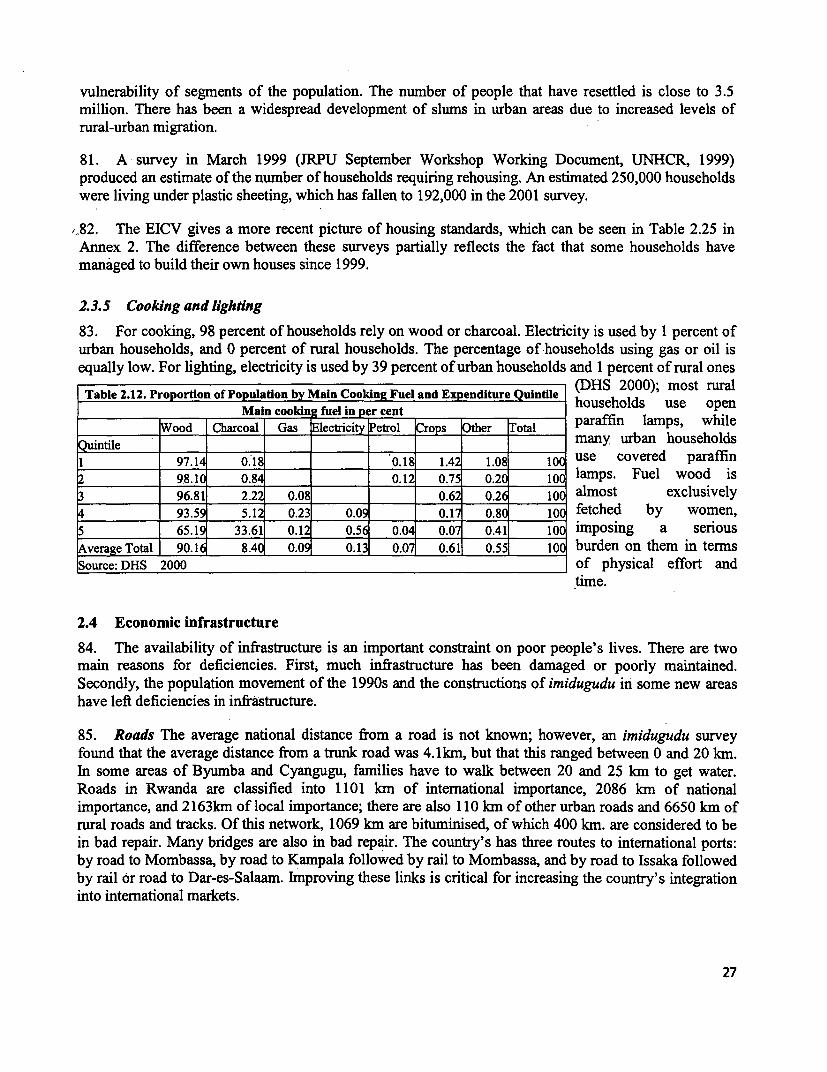
vulnerability of segments of the population. The number of people that have resettled is close to 3.5million. There has been a widespread development of slums in urban areas due to increased levels ofrural-urban migration.
81. A survey in March 1999 (JRPU September Workshop Working Document, UNHCR, 1999)produced an estimate of the number of households requiring rehousing. An estimated 250,000 householdswere living under plastic sheeting, which has fallen to 192,000 in the 2001 survey.
p_82. The EICV gives a more recent picture of housing standards, which can be seen in Table 2.25 inAnnex 2. The difference between these surveys partially reflects the fact that some households havemanaged to build their own houses since 1999.
2.3.5 Cooking and lighting
83. For cooking, 98 percent of households rely on wood or charcoal. Electricity is used by 1 percent ofurban households, and 0 percent of rural households. The percentage of households using gas or oil isequally low. For lighting, electricity is used by 39 percent of urban households and 1 percent of rural ones
Table 2.12. Pro ortion of Population by Main Cooking Fuel and Expenditure Quintile (DHS 2000); most ruralP ~~~~~~~~~~~~~~~~~~~households use open
Main cooking fuel in er cent ldsu opeWood Charcoal Gas Electricity Petrol Crops Other Total paraffin lamps, while
Quintile rop_ ____ ______ ____ ____ __ many urban households1 97.1a 0:1 _____ _____ 0.1 1.4; 1.08 10C use covered paraffin
2 R______ 98.10 0.84 0.12 0.75 0.20 10o lamps. Fuel wood is3 96.81 2.22 0.08, 0.6, 0.26 10( almost exclusively4_________ 93.59 5.12 0.23 0.09 0.17 0.8( lO fetched by women,5 65.1 33.61 0.1 0.56 0.04 0.0 0.41 10 imposing a seriousAverage Total 90.16 8.40 0.09 0.13 0.07 0.61 0.55 101 burden on them in termsSource: DHS 2000 of physical effort and
time.
2.4 Economic infrastructure
84. The availability of infrastructure is an important constraint on poor people's lives. There are twomain reasons for deficiencies. First, much infrastructure has been damaged or poorly maintained.Secondly, the population movement of the 1990s and the constructions of imidugudu in some new areashave left deficiencies in infrastructure.
85. Roads The average national distance from a road is not known; however, an imidugudu surveyfound that the average distance from a trunk road was 4.1km, but that this ranged between 0 and 20 km.In some areas of Byumba and Cyangugu, families have to walk between 20 and 25 km to get water.Roads in Rwanda are classified into 1101 km of international importance, 2086 km of nationalimportance, and 2163km of local importance; there are also 110 km of other urban roads and 6650 km ofrural roads and tracks. Of this network, 1069 km are bituminised, of which 400 km. are considered to bein bad repair. Many bridges are also in bad repair. The country's has three routes to international ports:by road to Mombassa, by road to Kampala followed by rail to Mombassa, and by road to Issaka followedby rail or road to Dar-es-Salaam. Improving these links is critical for increasing the country's integrationinto international markets.
27
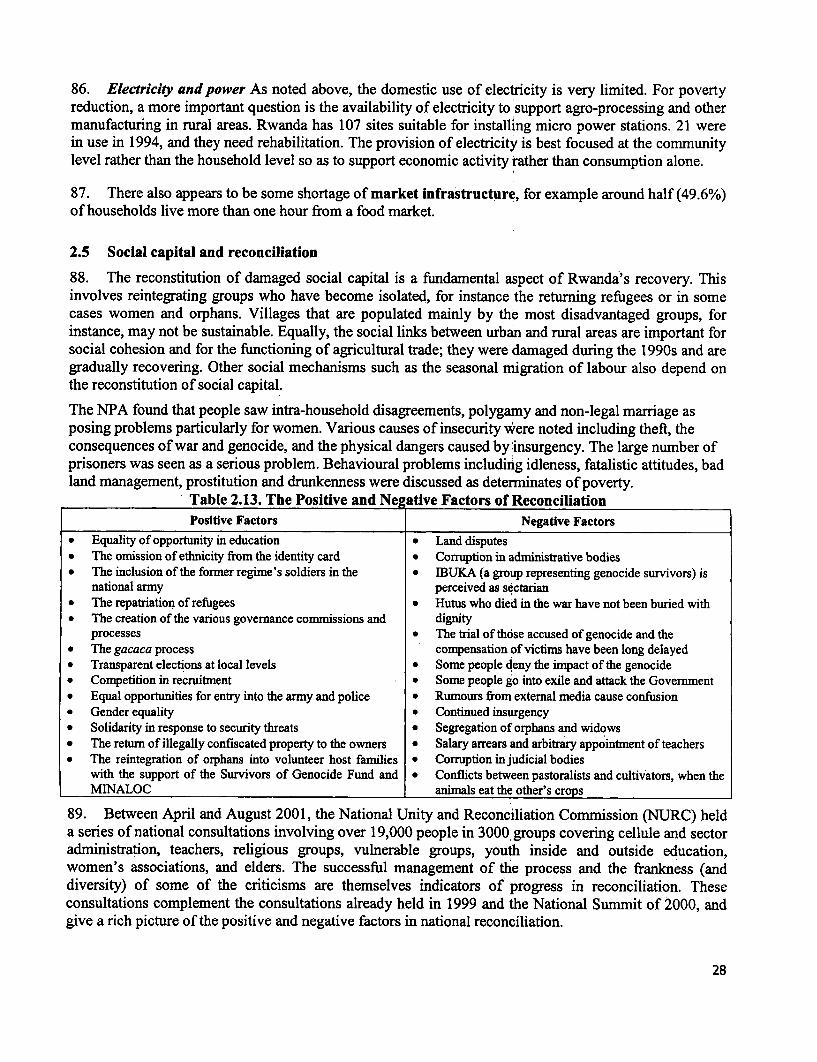
86. Electricity and power As noted above, the domestic use of electricity is very limited. For povertyreduction, a more important question is the availability of electricity to support agro-processing and othermanufacturing in rural areas. Rwanda has 107 sites suitable for installing micro power stations. 21 werein use in 1994, and they need rehabilitation. The provision of electricity is best focused at the communitylevel rather than the household level so as to support economic activity rather than consumption alone.
87. There also appears to be some shortage of market infrastructure, for example around half (49.6%)of households live more than one hour from a food market.
2.5 Social capital and reconciliation
88. The reconstitution of damaged social capital is a fundamental aspect of Rwanda's recovery. Thisinvolves reintegrating groups who have become isolated, for instance ;the returning refugees or in somecases women and orphans. Villages that are populated mainly by the most disadvantaged groups, forinstance, may not be sustainable. Equally, the social links between urban and rural areas are important forsocial cohesion and for the functioning of agricultural trade; they were damaged during the 1990s and aregradually recovering. Other social mechanisms such as the seasonal migration of labour also depend onthe reconstitution of social capital.
The NPA found that people saw intra-household disagreements, polygamy and non-legal marriage asposing problems particularly for women. Various causes of insecurity were noted including theft, theconsequences of war and genocide, and the physical dangers caused by insurgency. The large number ofprisoners was seen as a serious problem. Behavioural problems including idleness, fatalistic attitudes, badland management, prostitution and drunkenness were discussed as determinates of poverty.
Table 2.13. The Positive and Ne ative Factors of ReconciliationPositive Factors Negative Factors
* Equality of opportunity in education * Land disputes* The omission of ethnicity from the identity card * Corruption in administrative bodies* The inclusion of the former regime's soldiers in the * IBUKA (a group representing genocide survivors) is
national army perceived as sectarian* The repatriation of refugees * Hutus who died in the war have not been buried with* The creation of the various governance commissions and dignity
processes * The trial of those accused of genocide and the* The gacaca process compensation of victims have been long delayed* Transparent elections at local levels * Some people deny the impact of the genocide* Competition in recruitment * Some people go into exile and attack the Government* Equal opportunities for entry into the army and police * Rumours from external media cause confusion* Gender equality * Continued insurgency* Solidarity in response to security threats * Segregation of orphans and widows* The return of illegally confiscated property to the owners * Salary arrears and arbitrary appointment of teachers* The reintegration of orphans into volunteer host families * Corruption in judicial bodies
with the support of the Survivors of Genocide Fund and * Conflicts between pastoralists and cultivators, when theMINALOC animals eat the other's crops
89. Between April and August 2001, the National Unity and Reconciliation Commission (NURC) helda series of national consultations involving over 19,000 people in 3000 groups covering cellule and sectoradministration, teachers, religious groups, vulnerable groups, youth inside and outside education,women's associations, and elders. The successful management of the process and the frankness (anddiversity) of some of the criticisms are themselves indicators of progress in reconciliation. Theseconsultations complement the consultations already held in 1999 and the National Summit of 2000, andgive a rich picture of the positive and negative factors in national reconciliation.
28
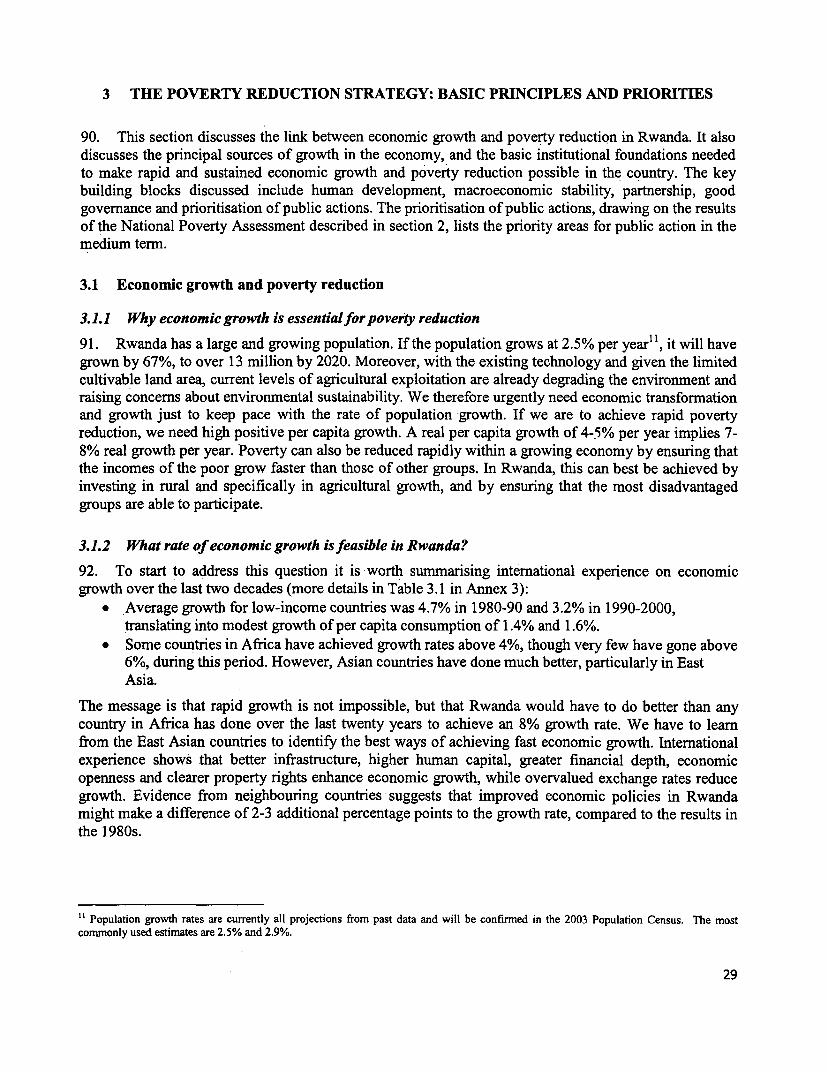
3 THE POVERTY REDUCTION STRATEGY: BASIC PRINCIPLES AND PRIORITIES
90. This section discusses the link between economic growth and poverty reduction in Rwanda. It alsodiscusses the principal sources of growth in the economy, and the basic institutional foundations neededto make rapid and sustained economic growth and poverty reduction possible in the country. The keybuilding blocks discussed include human development, macroeconomic stability, partnership, goodgovernance and prioritisation of public actions. The prioritisation of public actions, drawing on the results
of the National Poverty Assessment described in section 2, lists the priority areas for public action in themedium term.
3.1 Econonic growth and poverty reduction
3.1.1 Why economicgrowth is essentialfor poverty reduction
91. Rwanda has a large and growing population. If the population grows at 2.5% per yearl, it will havegrown by 67%, to over 13 million by 2020. Moreover, with the existing technology and given the limitedcultivable land area, current levels of agricultural exploitation are already degrading the environment andraising concerns about environmental sustainability. We therefore urgently need economic transformationand growth just to keep pace with the rate of population growth. If we are to achieve rapid povertyreduction, we need high positive per capita growth. A real per capita growth of 4-5% per year implies 7-
8% real growth per year. Poverty can also be reduced rapidly within a growing economy by ensuring thatthe incomes of the poor grow faster than those of other groups. In Rwanda, this can best be achieved byinvesting in rural and specifically in agricultural growth, and by ensuring that the most disadvantagedgroups are able to participate.
3.1.2 What rate of economicgrowth is feasible in Rwanda?
92. To start to address this question it is worth summarising international experience on economicgrowth over the last two decades (more details in Table 3.1 in Annex 3):
* Average growth for low-income countries was 4.7% in 1980-90 and 3.2% in 1990-2000,translating into modest growth of per capita consumption of 1.4% and 1.6%.
* Some countries in Africa have achieved growth rates above 4%, though very few have gone above6%, during this period. However, Asian countries have done much better, particularly in EastAsia.
The message is that rapid growth is not impossible, but that Rwanda would have to do better than anycountry in Africa has done over the last twenty years to achieve an 8% growth rate. We have to learnfrom the East Asian countries to identify the best ways of achieving fast economic growth. Internationalexperience shows that better infrastructure, higher human capital, greater financial depth, economicopenness and clearer property rights enhance economic growth, while overvalued exchange rates reducegrowth. Evidence from neighbouring countries suggests that improved economic policies in Rwandamight make a difference of 2-3 additional percentage points to the growth rate, compared to the results inthe 1980s.
11 Population growth rates are currently all projections from past data and will be confirmed in the 2003 Population Census. The most
commonly used estimates are 2.5% and 2.9%.
29
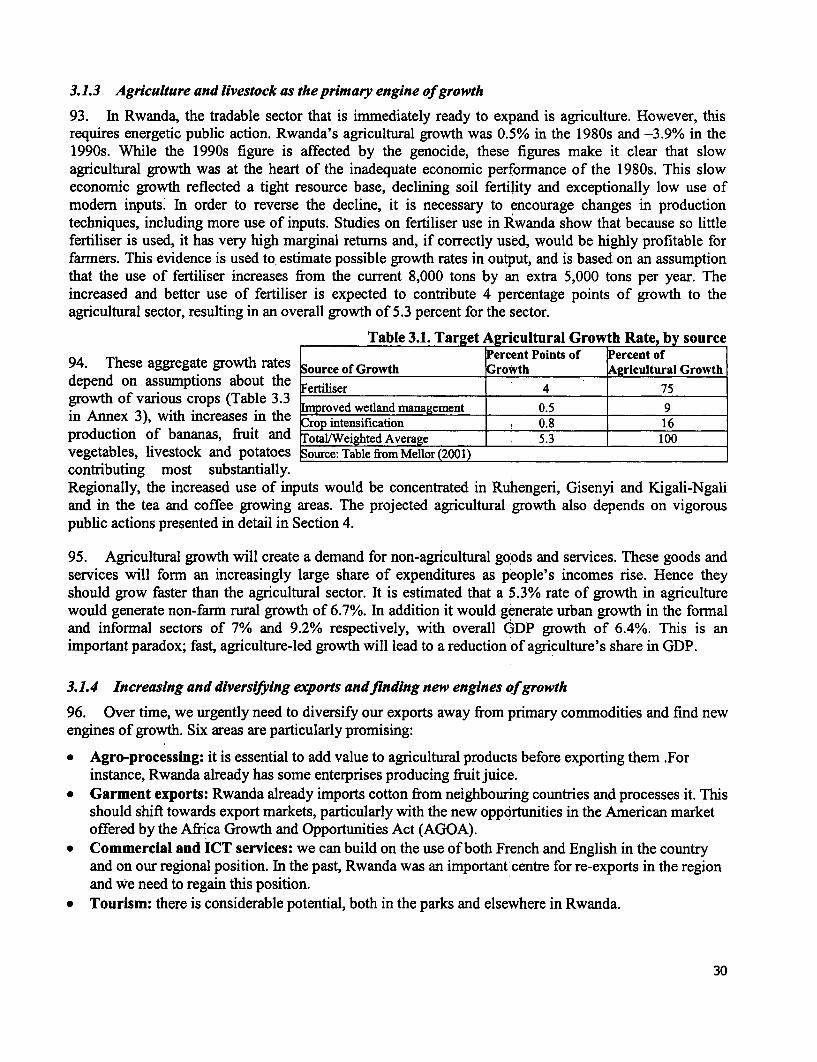
3.1.3 Agriculture and livestock as the primary engine of growth
93. In Rwanda, the tradable sector that is immediately ready to expand is agriculture. However, thisrequires energetic public action. Rwanda's agricultural growth was 0.5% in the 1980s and -3.9% in the1990s. While the 1990s figure is affected by the genocide, these figures make it clear that slowagricultural growth was at the heart of the inadequate economic performance of the 1980s. This sloweconomic growth reflected a tight resource base, declining soil fertility and exceptionally low use ofmodem inputs. In order to reverse the decline, it is necessary to encourage changes in productiontechniques, including more use of inputs. Studies on fertiliser use in Rwanda show that because so littlefertiliser is used, it has very high marginal returns and, if correctly used, would be highly profitable forfarmers. This evidence is used to estimate possible growth rates in output, and is based on an assumptionthat the use of fertiliser increases from the current 8,000 tons by an extra 5,000 tons per year. Theincreased and better use of fertiliser is expected to contribute 4 percentage points of growth to theagricultural sector, resulting in an overall growth of 5.3 percent for the sector.
Table 3.1. Target Agricultural Growth Rate, by sourcePercent Points of Percent of94. These aggregate growth rates Source of Growth Growth Agricultural Growth
depend on assumptions about the Fertiliser 4 75growth of various crops (Table 3.3 mproved wetland management 0.5 9in Annex 3), with increases in the Crop intensification , 0.8 16production of bananas, fruit and Total/Weighted Average . 5.3 100vegetables, livestock and potatoes Source: Table from Mellor (2001)contributing most substantially.Regionally, the increased use of inputs would be concentrated in Ruhengeri, Gisenyi and Kigali-Ngaliand in the tea and coffee growing areas. The projected agricultural growth also depends on vigorouspublic actions presented in detail in Section 4.
95. Agricultural growth will create a demand for non-agricultural goods and services. These goods andservices will form an increasingly large share of expenditures as people's incomes rise. Hence theyshould grow faster than the agricultural sector. It is estimated that a 5.3% rate of growth in agriculturewould generate non-farm rural growth of 6.7%. In addition it would generate urban growth in the formaland informal sectors of 7% and 9.2% respectively, with overall GDP growth of 6.4%. This is animportant paradox; fast, agriculture-led growth will lead to a reduction of agriculture's share in GDP.
3.1.4 Increasing and diversifying exports andfinding new engines of growth
96. Over time, we urgently need to diversify our exports away from primary commodities and find newengines of growth. Six areas are particularly promising:
* Agro-processing: it is essential to add value to agricultural products before exporting them .Forinstance, Rwanda already has some enterprises producing fruit juice.
* Garment exports: Rwanda already imports cotton from neighbouring countries and processes it. Thisshould shift towards export markets, particularly with the new opportunities in the American marketoffered by the Africa Growth and Opportunities Act (AGOA).
* Commercial and ICT services: we can build on the use of both French and English in the countryand on our regional position. In the past, Rwanda was an important centre for re-exports in the regionand we need to regain this position.
* Tourism: there is considerable potential, both in the parks and elsewhere in Rwanda.
30
* Mining: this is often a small-scale activity with a direct impact on poverty. While last year's priceboom in tantalite is now over, the development of this sector will be encouraged, as even with thecurrent low price, it is still a very viable high value export.
* Export of skills within the region: Currently Rwanda imports skilled labour from neighbouringcountries, even for such basic activities as mechanics. We need to invest in the resource of ourpopulation so that we can compete more effectively within the regional labour market.
3.1.5 The impact of growth on poverty
97. The effects of growth on poverty depend on its sectoral pattern. Growth can be accompanied byincreased or reduced inequality. However, economies which have followed an agriculture-led strategyhave seen much more pro-poor growth than those where growth has been concentrated in the other partsof the economy. Because Rwanda's growth strategy is based on agriculture, it is specifically designed tobe pro-poor. Table 3.2 shows the effect of an equal 7% real growth rate in consumption and 2.5%population growth, on the number and proportion of poor people in Rwanda. Under this scenario the
proportion of people belowTable 3.2. Projected poverty given 7% growth in consumption and 2.5% growth in the poverty line falls to lesspopulation the halfa to lessYear 2001 2005 2010 2015 than half, to 25% by 2015,Total population 7,979,930 9,028,558 10,214,984 11,557,317 and the number of peopleNumber below poverty line 4,810,780 4,347,408 3,732,207 2,889,966 below the poverty line alsoProportion below poverty line 60.3 % 48.5 % 36.5 % 25.0 % falls substantially.
3.2 Human development
98. Poverty is not only about low incomes, but incorporates other aspects of life. The Government ofRwanda's objective is that every Rwandese citizen should be healthy, educated and housed. Because ofour history, our educators have a special responsibility to develop an independence of mind and anunprejudiced and non-sectarian set of attitudes among our children, in addition to developing their skills.
99. The PRSP places considerable importance on actions outside the formal education system includingvocational education and functional adult literacy. The high rate of population growth imposes a seriousconstraint on our development. Evidence discussed above indicates that this rate could be substantiallyreduced if women had access to family planning services. The objective is also linked to populareducation and functional adult literacy (FAL). Well-designed programmes of FAL for women can help toreduce fertility, and the existing programme of adult literacy places emphasis on family planning. Theseobjectives have to be achieved with very limited fiscal resources. We will therefore seek imaginativeways to promote human development, including encouraging the private sector to provide these services.
3.3 Macroeconomic stability
100. The term 'macroeconomic stability' refers to an economic environment that is predictable enoughfor agents to make sound plans; this requires low and predictable inflation. High inflation is associatedwith unpredictability and is often a symptom of a lack of budgetary discipline; it also discouragessavings, especially for the poor, by reducing the returns to cash and low-interest savings accounts, andtends to discourage exports by reducing competitiveness. High inflation particularly hurts the poor as theyhave limited means to preserve the value of their assets, including their labour, in a high inflationaryenvironment. The government is committed to macroeconomic stability.
31
101. Macroeconomic stability also requires that levels of expenditure, and particularly of consumption,should grow in a stable and predictable way. This requires a sustainable programme of publicexpenditure. The objectives of low and predictable inflation and predictable expenditures can conflict;especially where financial markets are weakly developed. Our strategy for macroeconomic stabilitytherefore depends on avoiding inflationary financing and gradually developing a range of financialinstruments to allow us to smooth out expenditure during short-term revenue fluctuations. Themacroeconomic framework that ensures stability and long-term sustainability is discussed in greater detailin Section 5.
102. However, the analysis earlier in the paper showed that there is a need to invest in the short run inorder to recapitalise the rural economy through for example community action plans and labour-intensivepublic works, providing employment while non-agricultural opportunities are scarce, and take advantageof the opportunities for public works offered by the current, comparative low level of wages. Hence, iffunds can be found, there is a strong case for a short-run increase in this form of expenditure above itslong-run level. This will ultimately add to the credibility of our macroeconomic reform programme,because it will increase the productive and export capacity of the economy as well as protecting theenvironment and saving future costs of rehabilitation.
3.4 The framework of governance and partnership
103. Poverty reduction cannot occur in circumstances of anarchy and severe insecurity, where socialcohesion is breaking down and basic socio-economic institutions such as markets are collapsing or thereis severe macroeconomic instability. Some basic degree of good governance is therefore a prerequisite forpoverty reduction. In addition, good governance contributes directly to people's well-being, beyond itsimportance for economic prosperity, by providing institutions and mechanisms through which people'svoices can be heard This allows them to influence and participate in public decision-making andenhancing their well-being and sense of empowerment and ownership which in turn makes developmentsustainable. Good governance is therefore a prerequisite for poverty reduction. The Government iscommitted to mainstreaming good governance. Democratisation, decentralisation, the observance ofhuman rights, the regular Participatory Poverty Assessment (PPA) and particularly the nationalimplementation of ubudehe mu kurwanya ubukene, which was piloted in Butare, are key processesthrough which this will be achieved.
104. In Rwanda, good governance, conflict and economic prosperity are deeply interlinked. The threat ofinsecurity remains very real. Rwanda has been afflicted by ongoing insurgency, which has have causedconsiderable suffering and has deterred investment. Hence adequate security expenditure and regionalcooperation in conflict resolution, in addition to good governance, are essential to preventing insecurity.Broad consultation is particularly necessary in a country emerging from conflict, and cooperation on localquestions can help direct attention away from the divisive national politics of the past. Our history posessome specific challenges in achieving good governance, including judicial expenditures, demobilisation,reconciliation, and the assignment of land tenure and property rights. The National Conference on GoodGovernance for Poverty Reduction in Rwanda, held in November 2001, addressed these challenges indetail and the resulting national governance strategy paper has been incorporated into the PRSP.
3.4.1 The role of Government
105. The Government of Rwanda is committed to ensuring an environment in which people can be free,content and prosperous, and can participate in the decisions that affect their lives. This requires political
32
stability and security in the country, a respect for human rights, and democratic institutions of governancewhich allow effective popular participation without jeopardising stability. Moreover for democracy tofunction properly, the Government must be transparent and accountable. Also crucial is strengthening theseparation of powers and ensuring that Parliament and the judiciary play their respective roles effectively.Domestic revenue per capita is srmaller in Rwanda than in almost any other economy in the world, and thepublic sector faces exceptional challenges. Intervention is required in areas such as housing, which canusually be left to the private sector. For this reason, the Government has to be selective in the roles ittakes on and imaginative in identifying cost-effective ways of carrying out its functions.
106. This does not mean that the role of the state in Rwanda is minimal. The state will focus oninterventions in areas where there are strong reasons to intervene for the public good: where markets failand where outcomes would be highly unequal if left to the market. It will not intervene in areas whereequitable and efficient outcomes can be expected from private sector activity, in the absence ofintervention.
3.4.2 Development partners
107. The shortage of resources, combined with the magnitude of need, makes it inevitable that donorresources will fund a considerable proportion of public action for some timne to come. The assistance ofdevelopment partners is very much appreciated. It is, however, essential to ensure that Governmentremains in charge of the agenda of public action. If individual donors develop donor projects in isolation,they are likely to be ineffective, inequitable and wasteful. Moreover, there is a serious risk that projectsdesigned by donors may be based on international practices and pricing structures that are inappropriatefor Rwanda. The development of strong sector strategies within the overall framework provided by thePRSP, is intended to provide the coordinating framework for Government and donor actions within eachsector and ensuring geographical coverage
108. A joint Government and donor document 'Guidelines for Productive Aid Coordination in Rwanda'has been prepared which proposes concrete long-term and short-term steps for effective coordination tosupport the implementation of the PRSP. The starting point for this document will be the PRSP itself andthe key means of implementation will be the MTEF, which will work through the sector strategyprocesses (discussed in more detail in Section 5.6). This document sets out proposals for the longer-terminstitutional and operational framework for delivering the PRSP, and the aid coordination requirementsassociated with this. The document also proposes the more immediate measures that will be required tostart this process and the actions required to ensure that the current use of donor resources is optimalwithin the PRSP framework.
3.4.3 The private sector
109. The role of the private sector in poverty reduction is central; this includes the formal private sectoras well as the informal sector, including small-scale agriculture. Our strategy therefore includes a majoremphasis on private sector development as well as identifying possible roles for the private sector withinactivities where the state has a leading role. It is increasingly understood that this approach will work bestif the private sector is fully involved in the formulation of policy.
33
3.4.4 Non-Governmental, civil society and community based organisations
110. Civil society, non-Governmental and community based organisations (CSOs, NGOs and CBOs),both local and international, and other non-state actors such as religious organisations, trade unions andthe media all have an important role in the Poverty Reduction Strategy. First, the state sometimescontracts such organisations to deliver publicly funded services. For instance, religious hospitals are fullyintegrated within the public health system. It may be possible to extend this approach to other areas.Secondly, NGOs may often work effectively in areas where the state has limited capacity, for instance inaddressing the specific problems of street children. Thirdly, CSOs and CBOs have a vital role asinterlocutors between people and the state, participating in sensitisation campaigns, assisting withdetermined priorities, particularly in the context of decentralisation, and in contributing to public debateby advocacy and research on particular issues. CSOs and CBOs are expected to play a key role in thefight against HIV/AIDS. Finally, these organisations can help to monitor the outcomes of Governmentprogrammes. A free and responsible media and press will strengthen the process of transparency andaccountability. The liberalisation of radio airwaves and the promotion of an independent press areinitiamives which will enhance the capacity and participation of civil society.
111. The Government is fully committed to providing the 'enabling enVironment' for civil society. Thisincludes efforts to ensure appropriate legal frameworks and finding the right balance between thecoordination of civil society and the need to ensure their independence.
3.4.5 The involvement of communities
112. People in Rwanda have historically had little role in the policy formulation and implementationprocess. We are committed to changing this relationship between the people and the state. The NationalPoverty Assessment (NPA) has been a first key step in introducing the priorities of communities into theplanning and expenditure processes at central and local levels of administration. It also lays thefoundation for assisting communities themselves to mobilise their own resources to overcome theproblems they face and to support the delivery of public goods which are valued by the community. In thepast, communities were required to deliver labour free of charge to construct public goods such as roadsand bridges and environmental goods. We intend to build on this tradition with communities managingtheir own labour and focussing on the community's own priorities. One important issue which arises inthis context is how far we should expect voluntary labour, and to what extent the labour should be paid.One approach being pursued is to allow communities themselves to decide whether to use communalfunds to pay for labour or just to pay for materials and contribute labour free of charge. The developmentof participatory local government structures focusing on the Community Development Committee andaction planning capacity at the cellule level through the ubudehe mu kurwanya ubukene mechanism willsupport this process.
3.5 Prioritising Public Actions
3.5.1 The six broadpriority areas ofthepoverty reduction strategy
113. To make rapid progress in poverty reduction, effective public action is essential. The demands onthe public sector are numerous and to be effective, prioritisation will underpin action. The Governmenthas established priorities and needs to act on them. One of the roles of the consultative process of thePRSP, such as the NPA, is to help establish priorities for public action.' Building on the consultations asdiscussed in Section 2, six broad priority areas for poverty reduction have been identified and listed in
34
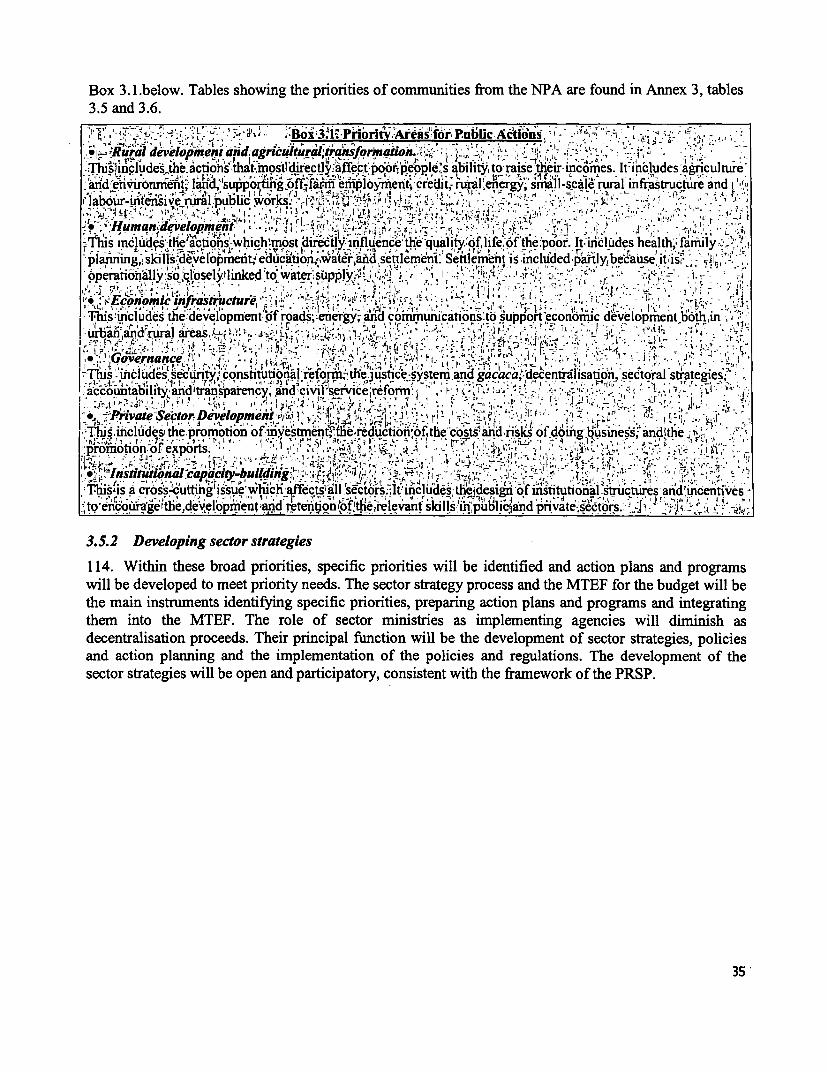
Box 3.1 .below. Tables showing the priorities of communities from the NPA are found in Annex 3, tables3.5 and 3.6.
!c,Riil i a A'A_ .:Box32i .PIjor9 IreasrPub cActi '' ';f- L
.@~ develapen;taRndy a~rgitral, r)a ormaoni'i-" ;"; 'I'; ;';Thislinciudes t. actiohirha .MQstldqirectly -affect poorT people 's abiltyto raisetheir incomes. It includes agnculwLe:and enirounme-nt; I supportiin' gff--fd%etipIor'ment; credit,rural'energy' smrall-scale'rural infr'astructure and '
.' *,4-I:= . ?,5 , t. 1 '' 1 ',-
Teis rnclrdes tfeactit s whichRmost Wdirectly'nfluence theeoqyutlityioflifeofthepoor It;includes health; faruly-'pinin;s llsdvlpnn,euair,iae;dsettlem ent: Se tem'ent is; nclu"ded: taiiy1because itiisi -' ,iiopeurn ennalsyveruselyulined' to ,ater sipply;-; i . -; i -
I .- coiimk4iYratv?ulur- , ' 4 II.. 4',7','t-'},'-' opn onm t !r4=.<, tt,,,,-:T,*i
This inudes' the ditel'opments of roads;energy, and communications to support',econoic development boIthin
'ThI .mclues secunty,cnstntucnarefonw hedustmce system.and gacaca,deendalisapony sectoral strateies.accountability andItransparncy and c ivil Jservice,refo rm , i s . -, , -. . .. - . V
I-F * % Prvae Seor.Dveomenk''A rS ' El^- $l% ''''4ri 'r~ i ! :. 1es;This.ncludeslthe.pomotion ofkidwveastmeireduction of the costs and risls of doingU ! at h
tidh diErro-'Fe ihfta I ' I .di - , "T,- ; -
~~~~~~~~~~~~~~~~~~~~1: -.j. ,J -
This!Is a crs-uhg su lc affect.s.all.sectors..lt includes theidesign of instutunonal structures-and'micenti'ves .to enco urage`tle1de'velo-pmrereand retentey'ft adelevano skills in- sublpapnndopniuvtesc o 1 r' '; /3.5.2 Developing sector strategies
114. Within these broad priorities, specific priorities will be identified and action plans and programswill be developed to meet priority needs. The sector strategy process and the MTEF for the budget will bethe main instruments identifying specific priorities, preparing action plans and programs and integratingthem into the MTEF. The role of sector ministries as implementing agencies will diminish asdecentralisation proceeds. Their principal function will be the development of sector strategies, policiesand action planning and the implementation of the policies and regulations. The development of thesector strategies will be open and participatory, consistent with t he PRSP.
35'
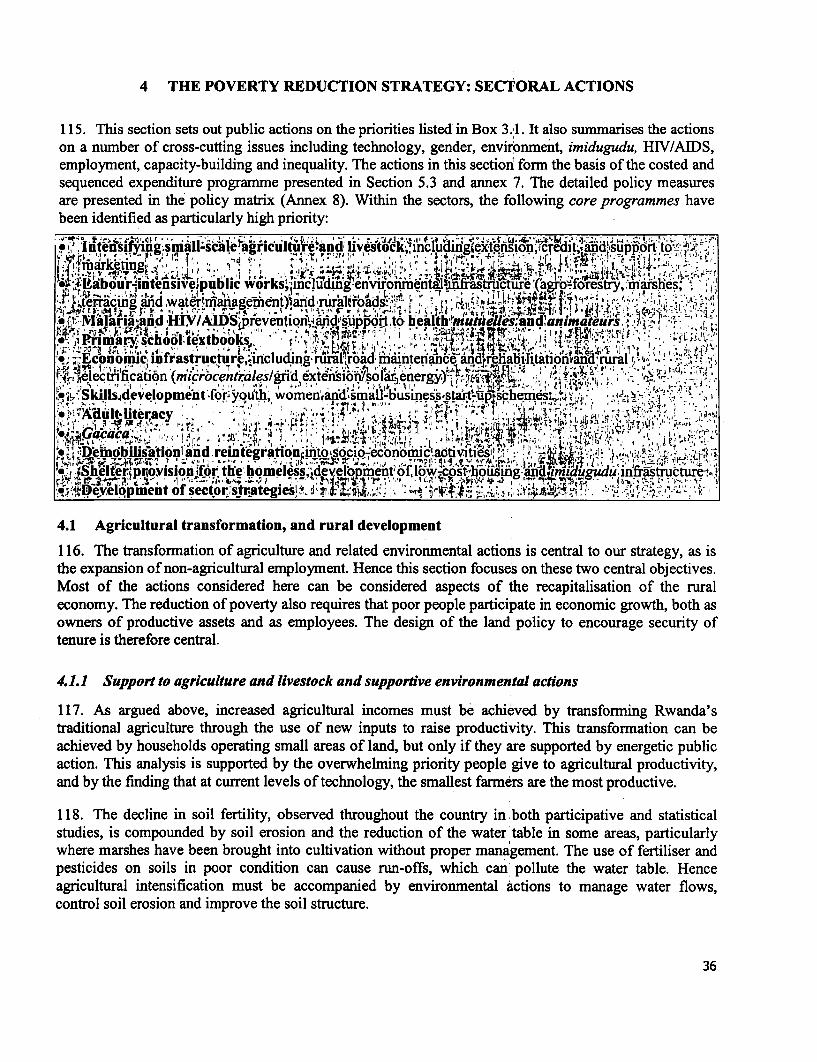
4 THE POVERTY REDUCTION STRATEGY: SECTORAL ACTIONS
115. This section sets out public actions on the priorities listed in Box 3.1. It also summarises the actionson a number of cross-cutting issues including technology, gender, environment, imidugudu, HIV/AEDS,employment, capacity-building and inequality. The actions in this section form the basis of the costed andsequenced expenditure programme presented in Section 5.3 and annex 7. The detailed policy measuresare presented in the policy matrix (Annex 8). Within the sectors, the following core programmes havebeen identified as particularly high priority:
Nl -,Iariagcn d,/Ir ig uu'aa tu
; abour,intenshvllue.utbliwoksdl.dfe endm fivs taktrntlur (irigieksnsionrhcesd''dk' goX . -i v, s 'i
i.artdareh5 'l'tat:'.and'rura
rt *g`lsbdu`opmensfeiqutih, womenu gendaIl-os"s- .e! -.,-, r , . I I 9 -4 d urs 'es
i Dev.eopmeto reinrstaege dm ,,.- *r tivitiesV ;,,, '1.'; Ie't, E'^
4.1 Agricultural transformation, and rural development
116. The transformation of agriculture and related environmental actions is central to our strategy, as isthe expansion of non-agricultural employment. Hence this section focuses on these two central objectives.Most of the actions considered here can be considered aspects of the recapitalisation of the ruraleconomy. The reduction of poverty also requires that poor people participate in economic growth, both asowners of productive assets and as employees. The design of the land policy to encourage security oftenure is therefore central.
4.1.1 Support to agriculture and livestock and supportive environmental actions
117. As argued above, increased agricultural incomes must be achieved by transforming Rwanda'straditional agriculture through the use of new inputs to raise productivity. This transformation can beachieved by households operating small areas of land, but only if they are supported by energetic publicaction. This analysis is supported by the overwhelming priority people give to agricultural productivity,and by the finding that at current levels of technology, the smallest farmers are the most productive.
118. The decline in soil fertility, observed throughout the country in both participative and statisticalstudies, is compounded by soil erosion and the reduction of the water table in some areas, particularlywhere marshes have been brought into cultivation without proper management. The use of fertiliser andpesticides on soils in poor condition can cause run-offs, which can pollute the water table. Henceagricultural intensification must be accompanied by environmental actions to manage water flows,control soil erosion and improve the soil structure.
36
119. The design of public actions to support agriculture has to start by identifying a limited set of cropswhich will be supported by research and extension. These crops need to be actually or potentiallycompetitive, so that their production will maximise household incomes. MINAGRI has identified fivemajor crops which will be targeted for expansion: rice, maize, potatoes, soya and beans, in addition to thetraditional cash crops, tea and coffee. Currently, small stands of coffee are grown in some areas where itis not competitive, and it will be necessary to focus efforts on those parts of the country to whici it ismost suited. Similarly, Rwandese rice is not competitive, because of the poor quality of the seed stockand the limited use of modem inputs. Agricultural strategy will therefore have to judge how feasible it isto make rice competitive in the medium term, and will encourage the replanting of coffee in those areaswhere it can be competitive.
120. In Rwanda's case, increased output will have to come from increased use of traditional and modeminputs. Manure or compost is needed to prepare the soil for the use of chemical fertiliser, but half ofhouseholds do not have livestock and a third of farmers do not use manure. For farmers within thesubsistence sector, increased use of traditional inputs is therefore the most attractive immediate strategy,as a preparation for the use of chemical inputs and commercialisation. In the case of farmers who haveentered the market, technical studies have shown that with good practice, modem fertiliser can makegood commercial returns for farmers on certain crops in Rwanda. The strategy will therefore be topromote the use of modem inputs on those crops where it is known to be profitable. It will also beimportant to encourage farmers to expand the areas of the most profitable crops.
121. Projections have been developed by MINAGRI, by OCIR-Cafe, and by independent analysts, of thelikely expansion of production in the medium term. An analysis carried out by MINAGRI is based onestimates of the commercial returns to fertiliser and shows considerable growth potential in the potatosector in Gisenyi and Ruhengeri, as well as in livestock. Because potato farmers are alreadycommercialised, it is anticipated that they will be more willing than other farmers to use fertiliser. Overtime, the use of fertiliser should spread across the economy.
122. Once the most promising technologies have been identified, there are nine critical activities whichneed to be undertaken: research, extension, input development, finance, infrastructure, marketing,livestock development, cash crop development and sector planning. Each of these actions is essential tothe achievement of agricultural growth and they are therefore of the very highest priority for the povertyreduction strategy.
Research and Extension:
123. Research is undertaken by the Institute for Agricultural Research (ISAR) and other researchinstitutions. Human capacity was devastated by the genocide, but is recovering. It will be essential toprioritise a few crops and use adaptive research which draws evidence from abroad and applies it to theproblems faced by Rwandese households (reflecting the fact that most of these crops are grown as part ofan integrated production system). Adaptive research on farms will therefore be important. Research alsoneeds to examine market prospects for export crops. There is a potential synergy between existingresearch efforts and the programme of science and technology being developed by the Ministry ofEducation, which is discussed below.
124. Extension is needed particularly during the process of technical transformation. One of the maindisincentives to using fertiliser is a lack of knowledge about it. Efficient and effective systems to deliveragricultural technologies to farmers are a prerequisite for improving farmers' knowledge on the
37
management and maintenance of crops and modem inputs. Extensiorn will focus on adaptive research,decentralisation of delivery systems, and the greater involvement of beneficiaries. Extension services atthe district level are severely limited and many lower-level extension staff have been retrenched. It willtherefore be important to ensure the system works effectively, particularly in view of decentralisation, andthat the officers are fully equipped to perform their functions. Currently, farmer demonstration plots arebeing emphasised, and it will be necessary to keep the programme under review to see if the informationis reaching farmers, and whether the introduction of farmer field schools is worthwhile. Funding for thisactivity will come mainly from the district budgets. Some extension will be private sector; the teafactories, for instance, should have good commercial reason to ensure 'that the smallholders who supplythem produce good quality tea.
125. While extension will focus on agricultural transformation, it will also be necessary to provide someadvice for farmers who are not yet ready to absorb the risk of trying to use modem inputs or who wish togrow drought-resistant crops. The extension service will liase with the national information generated bythe ubudehe mu kurwanya ubukene programme at District level.
Input development
126. Input development is a public sector activity at the foundation level. The Government will supportthe seed sector so that the population can acquire seeds at an affordable price. Some countries, such asMalaysia, have successfully increased production by subsidising the distribution of seedlings to farners,and this approach is being adopted by OCIR Cafe as a short-term measure, which is also financing theprovision of pesticides out of a levy on producers. Chemical fertilisers are currently being used by only5% of Rwandese farmers and even if farmers do use fertilisers the results may be disappointing if theyuse it incorrectly, or use the wrong kind. The Government will encourage more fertiliser traders to enterthe market and fertiliser demonstrations will be conducted for farmers.
Livestock
127. In the case of livestock, the Government has encouraged the importation of improved breeds. Theuse of village bulls and artificial insemination have the potential to improve the quality of the livestockpopulation. Disease and pest eradication is an important public sector role in both livestock andagriculture. In particular, brucellosis, tuberculosis and trypanosomiasis need to be controlled in livestock,and water hyacinth, which impedes fishing, can be eradicated by the use of an appropriate predator.Finance for agriculture is discussed, together with other financing needs, in the section on finance below.
Infrastructure
128. Infrastructure includes both general economic infrastructure, which is discussed elsewhere in thissection, and specific agricultural and environmental infrastructure. Sustainable agricultural developmentwill depend on the restoration of terracing or bunding, better management of the marshes, watercatchments and reforestation on some hillsides where erosion is becoming a problem. The rehabilitationof marshlands and hill-sides has particular potential for the development of Rwanda's agricultural sector.However, their development must be accompanied by measures to diffuse suitable technologies andpractices among farmers to ensure their efficient management. Most of these actions will be undertaken atthe community level, but communities will need technical guidance. The costs are substantial and justifychannelling a significant amount of money to lower levels in order to finance this form of labour-intensive public works.
38
Marketing
129. Marketing will be undertaken mairily by the private sector. However, there are several importantpublic sector roles here. First, MINAGRI will undertake studies of regional markets to ensure that thecrops which are expanding fast can find a market. Secondly, continued public support to a system ofmarket information is needed. Thirdly, there have been a number of price collapses in the last few years,particularly for potatoes and vegetables in surplus areas. These may have been intensified by a lack of
storage facilities at farm and community level, and because private sector trade is only graduallyrecovering to its former levels. Price changes will be closely monitored. MINAGRI will monitor fertilisermarkets to ensure that the strategy of increased input use is proceeding. Fertiliser will not be subsidiseddirectly, in order to encourage the growth of private trade. However, the coffee office plans to supply it ascredit on kind. Finally, communities will be encouraged to form farmers' groups to cooperate withmarketing. It is anticipated that this will be much easier to organise in the imidugudu.
Coffee and tea
130. OCIR-The and OCIR-Cafe will be re-organised as industry based organisations with representativesfrom the public sector, the private sector, the processors and marketers and the farmers. The lawsenabling this reform have been adopted by the National Assembly. OCIR-Cafe will support users inselected Districts with the acquisition of improved seedlings, pesticides, fertilisers, pruning shears anddrying tables. These inputs will be provided on a credit system with some subsidy element in some cases.The dilapidated pulping machines will be rehabilitated, with a view to long-run ownership andmanagement by farmers' groups. Private investment in washing stations has started, and will beencouraged; a number of washing stations are being privatised, in some cases by being sold to producers'associations. A significant expansion in quantity and quality is expected in response to these measures, itis envisaged that production can rise from 17,800 tones in 1999 to 29,400 tonnes in 2005.
131. The tea industry is being privatised. A tea board will replace OCIR-The, with responsibility foroverseeing the development of the tea sector, coordinating discussions between factory owners and teagrowers. A concern is that tea growers should not be exploited by the factories, who will in many casesbe effectively monopoly buyers; to avoid this, a voluntary framework of cooperation is envisaged for theindustry. It is envisaged that the factories will grow tea on the core plantation while also buying it fromoutgrowers. The enterprises will also provide credit in kind and extension to the growers. These actionsshould lead to a large increase in processing capacity while retaining the high quality of Rwanda's tea.
Institutional Development
132. Sector planning will be crucial to achieving this strategy and increasing exports. As will thestrengthening of MINAGRI and other related agencies.
P~~aii'nuig.'J ~ :7 Actionis-ij ' A PublicAExpenfit6re Review in Ai cultue 0il be0 .- ;A sectoraltstrategy coveringagnrculture;andlrelater 1isp-cnpsiron,eentwilbeX ey eop y,' Costs forepabided labour-intensive1public' %o rkrere f
.urgency, The costs6ftTcf satyasi e@ediftue -mme
qAshut tonastructihel'; : -' * ':-The mark eting agd exten-sion departm ent t the centr al INA levelr needs strenh ng.. '
39

zi
C13 auaj - tb10 - __ - - , , j - . "J5 - - -o- -.7 - ,lu
(UCL 0W.--, om
0UT4
q>-7 1 _.�Dm -Q) .0t: 74'L-- 0
.,tv .7.,CL o__ C13 U
'O=u
QJCd
tn).tA In
-U.-O-U --T> -- r--. - - - r :I
L I.L-w-� 1.- 1- .- - .;. I - --- . .7 ;6
Cd .0=,. - ,, Zr(n -'tn -clU- t3'
.-D,;oz C13M
O
En14 u'
tb(U :3.cn 4)- ELZ (U., O cd U U.JT . . !Z- E - "'i - . ) i
EA00 -
a --.
Cdr, cr,-'I--
boq).
C'sr r3 z:
La ... ...- oIV
U O.. 0CU >1 to E'A A� _cd:. 0.XZr Cd .Of . .... -0OL UJS
-.! -tnM- co - :;U j;
7f EA -(UC13, r. -.0., 'ntnU O' tn I=
U;.- CL-Nto) 1.2 C0
0> --O
ea-En taM.- CL
0-O' 46 -E -0 w U
o'_ . _--- . 0 E � coLn do
:, t - -0 - - . ->- - - - -O - . 0
.r U.-=-= .0-0, -,A.... M0- W C.. 0Z< Z E E'
0-cu 0 O�Etn. 0>
0 0 M(AL-cn- -- .__ s. - 0-1-0 ;3
0 0 O-W _tn - M-C Q)_ O.-.0 0 25 v =zF- -- U zz-- -- ; tn,;Li-;-_j_ M- V�0 !qi--- E.0 ---a : --
oi
r- co ..U
r_ On
C's O' -0.
on. -0 Z.2
cd V) -O'
coq)�'- 0- 0
0 a._> C%3 -,ULO.- L.. A,
coO' U U U U03
0 .-Z :9 .-O E O`E�A > r- 'C' '00-A V-La W Q). CA Co 0 rA
O.'.. UE U- tn�O "w--C,=, C, U.. c
W. 4G-
4.1.2 Land and settlement
133. Land is the most important productive asset owned by most Rwandese households. It has alsohistorically been a source of dispute and conflict. Rwanda has a legacy of disputed land rights, arisingpartly from the lack of legal status for land title and partly from the return of people whose land has beenoccupied by others. Hence the provision of security and the resolution of land disputes are importantobjectives of the Government. The Land Policy and Land Law are now in draft. They include thefollowing proposals:
134. According to the Land Policy:* All Rwandese enjoy the same rights of access to land, implying no discrimination against women* All land should be registered for security. The title will be tradable, but not in a way that fragments
plots below 1 hectare.* Land use should be optimal* Households will be encouraged to consolidate plots to ensure that each holding is not less than 1
hectare; there will'also be a ceiling of.5Oha. This will be achieved by the family cultivating incommon rather than fragmenting the plot through inheritance.
* Land administration will be based on a reformed cadastral system* The system of land administration is under consideration* The rights of occupants of urban land will be recognised, on condition that they conform to
established rules* Urban master plans will be developed* Marshlands are in the state's private domain, and will be allocated to individuals on a concession by
the M1NITERE on condition of good management.
135. The draft Land Law specifies that:* People with customary holdings under 2 hectares, and those with customary holdings between 2 and
30 hectares where the owner has a project and a development plan, will be recognised as owners.* Transfer of title deeds requires prior consent of all family members.* A land tax will be imposed.* Undeveloped land reverts to the state's private domain after three years.* Holders of ubukonde land (originally distributed by the clan head), known as abagererwa, will have
the same rights as other customary owners.
136. The objective of the law and the policy is to ensure better land management while conferringsecurity on the existing occupants of the land. It will be important to devise cost-effective methods ofresolving disputes at a community level, and to ensure.that the 1 hectare minimum is not misunderstoodto imply the expropriation of any current occupants. Traditionally, local dispute-resolution about land wasconducted by the local gacaca. Many households hold several plots at different altitudes both as aninsurance mechanism and to spread their labour over the year. As non-agricultural incomes rise, it shouldbe possible for households to diversify their income sources and therefore reduce their need for this kindof insurance. It will be important to recognise that such practices indicate, not that farmers are ignorant orirrational, but that their behaviour is a response to the constraints they face.
137. The process of allocating title will involve the communities. It may be both cheaper, and moretransparent, to conduct a survey which settles titles in each community on a particular occasion, ratherthan to allow individuals to apply opportunistically to register particular pieces of land. One importantgender issue is that many marriages are informal. The rights of women and children in informal
41
relationships need protection. This can perhaps best be provided at community level, with guidance fromthe centre.
A A~~~CiiOlns ' . 1 | j - . : . -; icfi j S | z p -i~~ ~~~ : .4S}4 -.1 '_¢ , ,,,,> ;, ,^ ,, .
'Cabinet and Parliamnent will review-the draftlan'd pblicyian'd'Iandil a6 by the.end of 2002.iOnce the law arid ipolicy are adopted, irifor'aitin ivill be idiss nateddabout the&policy,iencouraging
people tofeei secureand making family,rmmbebs,awvrae6of-.theirin'ghrs'!,.. . L, ,A' ';cost-effective, participatory and 6cally 'accesible system of-allc'alihg-form'al o.wn%erslipnrights will
' bedeveioped: Tjheoptionofsyst&manc jtIing,'ll c ' n . .
Cost-effective mechanisms for resolving'disputes-will be'establish;e-at the !ocal level.--
4.1.3 Credit and savings institutions
138. The strategy for raising incomes depends on investments rade by poor households. Theseinvestments can be facilitated by reducing the price of the investment, ensuring that people have access tosavings institutions, and ensuring access to credit. There are a number of distinct needs for credit.Microfinance institutions, including rotating credit in kind for livestock, have often successfully handledfinancing of livestock and of small trade. Seasonal credit raises very different problems, because thedemand for funds is simultaneous so that rotating credit or group lending does not work. This need can bemet in a number of ways: by credit in kind, which is likely to be offered by the privatised tea factories.The credit system for lending to coffee traders is also under consideration.
139. There have been several recent studies of microfinance, which have documented the varyingpractices of different agencies and repayment rates achieved. However, there is no comprehensivenational estimate of the number of people currently reached by microfinance, nor of the costs of diffearentschemes. This information is needed badly in order to assess the merits of public support to the sector. Allof these schemes may need some public support. Intemational evidence on microfinance and on creditunions indicates that many successful institutions rely on subsidy for aNvery sustained period, and that thisuse of public funds can have high returns. Hence the Government will aim to support all these forms ofcredit where it proves necessary.
The;NBkRas deyeloped a)egdalf'amwork.ad ridelatory 'otfUcture micncew c vicllbe'% irfiplemeied in2002. ,ff 4 ${ :^; r '; ' - ! r. K . I
| Studies will. be isidne.on I ent orms of teretlon to suppomicrofiandebejin~ing.r2O:i ~?4 ~ '-A ~ ~ 'I'
u! 'i Better coa nri afio6m nm&dto ensurre.thcohere nce oef thediverse inr't even'tions 'this spctorJTe, NBRj is_ tomn1 1AIonin,tr, J-- l r
*;! nim s ltm.sc im l' ansure that admnistration does'not-'
5 - 't afgytaiApropo .. i4trir h r . ft
4,~ ~ ~ ~ ~ ~ ~~4
SpcLlceme~ntlos r4; Mr'H .
V'..'The Banqiiees' n elgmeehanism to finance Irfanners..oups&7vith! ona ;
*£ i The IN3kiviI nti - it t6'mprtesfrfiyei~ousa~.ar rcsig-,,~IAs,aer inputsa tof be& eprovided-
42
- The poverty4edu1cti6h tpr oj'& $,kDistiicts'in T ;
; for iivstock «parialtiaII°,yrus e j i'gr.becceIlerae: 0p ..The estabIishrnehtzofan iAgncuItiuralCredit GuaranWtee' undtwl,Kbe exp ored--' -jJ. L>l-
4.1.4 Employment promotion and labour-intensive public works
140. It is central to the poverty strategy that non-agricultural employment in rural areas should increase.In the long term, this will occur as agricultural incomes rise and demand is generated for non-agriculturalgoods and services. In the short run, however, there is a strong case for an increase in employmentgenerated by rural public works, to reduce the level of unemployment and take advantage of the fact thatreal wages are currently low. Government is therefore developing a programme of environmentallysustainable labour-intensive public works for the development of soil and water management and forestrymanagement. The programme will include terracing and bunding, wetland and watershed management,soil conservation, lime crushing and economic infrastructure such as feeder roads. These projects inaddition to creating employment in the rural economy also support agricultural production.
141. The modalities for this programnme are under development, but community participation in theidentification of actions will be essential. The wage paid will be high enough to attract the ruralunemployed but not to divert people from highly productive activities. Some such schemes in othercountries (such as the Mahrashtra Employment Guarantee Scheme) have guaranteed employment toanyone who reports for work; the feasibility of this will be investigated. It is also aimed that thisprogramme will be specifically targeted at woman, so as to encourage them to participate as much aspossible. To increase the capacity of the rural economy to produce non-agricultural goods and servicesand hence boost rural employment, two important actions discussed below are support to ruralelectrification and vocational education.
.. Govenment wiJlrpr are ioitis fo'i>the ul nration 6* asus ti axia bointensiveruralplia. okw .s. pnl) ti w 's ri d e22 dlviJl i
4.2 Human resource development and improving the quality of life
142. The studies surveyed in Section 2 showed that human development indicators at all levels are poor,and that access to the relevant social services is limited. It is important to manage the delivery of socialservices now to achieve three major objectives: the prevention of disease, an increase in the accessibilityof social services and an improvement in the quality of social services. Where these objectives can beachieved through private finance, this will be preferred. Better targeting of social sector expenditurestoward the poor is a major issue. In addition, Rwanda faces a particular problem inherited from the warand genocide, in the large number of homeless people. Public action to resolve this problem is urgentlyneeded.
4.2.1 Health
143. The main objectives of the health sector are:
* The prevention of disease, particularly malaria and HIV/AIDS.* To provide increased access to basic health care, particularly through the reduction of costs to the
poor and the provision of health information at the community level.* To ensure improvements in the quality of health services.
43
144. Both adult and child health have deteriorated in Rwanda, and we are now experiencing worseoutcomes than the African average. The community prioritisation gave a very high priority to health careas ill health severely reduces the productivity and incomes of poor households. Moreover malaria andHIV/AIDS are seriously debilitating conditions which not only result in mortality, but also increase afamily's expenses on health care. Although health is known to respond to education and increasedincome, there is certainly a need to improve the availability of preventive and basic health services for thepeople of Rwanda. The National Policy for 2000 lists priorities in the health sector and a recent workshoprefined these priorities to focus on: malaria, HIV/AIDS, tuberculosis, nutrition, reproductive health, infantdiseases, public hygiene, and improved access to primary care (including through mutuelles, animateurs,and improvement in quality).
145. Cost is the main deterrent to the use of the medical system, though quality may also be important.The access to health facilities is being improved by the introduction of mutuelle schemes, in whichhouseholds prepay for health insurance for a year. So far nine pilot programmes have been operated. Takeup rates vary from below 10% to above 50% in the most successful ca ses. The most successful scheme,Ruhondo in Ruhengeri, has been characterised by a very strong partnership between the mutuelle and thelocal health centre. The schemes require careful sensitisation, so that members of the mutuelle understandwhich services they are entitled to and at what price.
146. Information on preventative health and some very basic curative techniques would deal with mostof the major diseases affecting the people of Rwanda, which include malaria, HIV/AIDS, and childdiarrhoea. Emphasis is therefore placed on those working at a community level: the cellule level healthanimateurs, community health workers, traditional birth attendants and traditional health practitioners.The animateurs are already being used to disseminate preventive measures. Consideration is being givento providing them and other community level health practitioners with some basic curative training and astock of drugs. If feasible, this could transform the access of the population to basic modem healthservices. The community action planning approach ubudehe mu kurwanya ubukene programme,(discussed below) will support these animateurs. There has been some progress in increasing the use ofbed-nets in urban areas but as yet little in rural areas. We will explore the use of subsidy to achievegreater coverage, particularly in the rural areas. As information is1 a critical determinant of healthoutcomes, MINISANTE is working with a popular radio show to disseminate health messages, amongother strategies.
Ihedentrlisation tte dhealthreonand healthi dstnct j -, ..- 4 * P. *Tv9**f*nay h ff@ ew-u'p' lp,'t oi.,ket i 'oho,
2 g WAi Ti .. V t'
~~ the ~~ ~ ~~4~~' *~K t 'n-u 79ecst tbr'Hyss.e AE1tJSvel bgr hajes sbEenidesiM e FTHUtaU oU shteyl t,gnea11..
44
.; ulue'lies:vill be'in`t'ro;duced more wivdely in,2002, building on the lessons of the most successfulschemes. Sensitisatiori, start,up support, and ranagement tining will be needed. The role ofHlV/AIDS' su'fferers also needs to be carefullv iasiessed.
', Animate6rs will provide guida,nce to famrilies on when and foiw to access medical services. The_'i"' provision of medical servi&es by th'e animateurs is under cornsider-aion.
"~ Facilitation ifor the.animateurs,' who'arei volunteers but sometimes receive benefits such as bicycles,
i'' will be empsised at the district level. -
i- Information packages will be developed to comm'unity. level action planning needs for informationand mechanisms jto support the animateurs in';a demrand-7led'way in 2002.
Prevention ' - I.
* The yaccination prograrnme will c'ontiniue.to be supported, wj'fi the bbjective of achieving universalcoverage. . ! -
* A programme is envisaged for 2002 to'subsidise the provision,of mrosquito nets 'in rural areas at rates
that thneru#aI poorcan afford-' i' , Public information will be promoted for.allpreventable diseases, usi' the most cost-effective
,methods, inclu'ding radio advertisements and the intr;oduction of health issues into popular dramatic-programmes , ,
* , As part -of the HIVAIDS strategy,? goups at particularly high risk of HIV i nfection will be targeted
,for sensitisation; for instance youn'g men and women, truck drivers,'soldiers and other public ser"ants-who travel -frequently, and'women'wh"o-depend;on prostitution for their liveliloods.
.. Condoriis will be fmade avai.lable'thr'oghbut the country over, the next few years.
*.. Cornmunities, will be. encouraged to take local environmental-actiorns;t,o-discouriage'rnosquitoes.
4.2.2 Family planning
147. Population growth in Rwanda poses a serious challenge. It is estimated that the population willreach over 13 million by 2020, which will undermine the natural resource base and economicdevelopment. The Demographic and Health Survey indicates that the use of contraception is low, eventhough the majority of women do not want to have a child within the next two years. Variousinterventions have been identified which are likely to bring down the birth rate without interfering withpeople's free choice. The most obvious is access to reproductive health services including familyplanning. Public information is also important. These two approaches can be merged by trainingmidwives to give mothers advice about birth control, an approach that has worked successfully in some
countries (with a cadre of young, specially trained midwives). Finally, the promotion of female adultliteracy has had a major impact on fertility in some highly populated countries.
; - . - |.i. ,; ., 1_ ,|,,1 fl ., t -3 ,,Actions -;
"-* Fertility concerns vwill,be mainstreaiied into,health inforration and'adult literacy courses in 2002.* Midwvive's ill,betenc&uiaged tciproJide}'adviceon'familyplanntng. '
* The Governlihehi willin'sure the avail,abi,li'ty'of-rep;oductivehealth services at the district level.
4.2.3 Education and Training
148. Quality Basic Education for All (EFA) is the first priority for the education sector. In addition,technical and vocational skills in specialised disciplines at the secondary and tertiary levels, the educationand training of girls and the provision of education in ICT will receive special focus.
45
T St te ic ssues -I eV k, :: . j ;. A l Ser.-Wide.,Approach-( S1pA is-6 de elpe&& forth'e- icietN.sei.e of txesources avaiab; fi 4 ector . ' i .' ' t
a A-Elly,osted ErA planw ll-be ready(by3Septer ber.20~02a.-. F 14' 'L 1,' ¢ 7,l .':1s.K -- f;";''
i.* M nriitor,ng and evaluation mechanism will be.trengt eiede- , se 'e` j | -
4.2.4 Early Childhood Care and Development (ECCD)
149. Early Childhood Care and Development (ECCD) provides intellectual and social development,which are a strong foundation for effective primary education. The large number of widow-headed andchild-headed households restricts women from working and children from going to school, as they'remainat home to look after the younger members of the family. The provision of pre-school facilities for thesehouseholds would enable more women to work and more children to attend schools.
.J~~ L1
. *~~~~. Actions .
A" I n -ECCD vllbedevelo edduringf23;- gcvr ' ai d pe;1'eaam'g-'m-a t enal.based.ona"nappropriate curricul um!
M* ,'4 ih. jprivate sector, churcbes .and civil socjety 'i i l -ouragidfto continue,tolparicipate nin -ECCD'.j,
1.1.3 Primary Education
150. Primary education is the most critical part of basic education as it caters for a large number ofchildren. Evidence within the region shows that completing primary education may increase incomes byabout 40%. In addition, primary education has major impacts on health outcomes, particularly girls'education on fertility rates and child mortality and morbidity. Basic literacy and numeracy are also linkedto increases in agricultural productivity and small enterprise development. Improved educationaloutcomes can support better governance. Finally, primary education is an essential input into higherlevels of education. The quality of education delivered at the primary level is the most significantdeterminant of sustained enrolment. It is therefore important to 'ensure high quality in primary educationif high-quality secondary and tertiary education are to be delivered.
151. Primary education in Rwanda presently (2001) has a gross enrolment rate of 99.9% and a netenrolment rate of 73.3%. However the system is suffering from high drop out and repetition rates of12.8% and 37.6% respectively at the national level, indicating significant quality and efficiency problems.
152. The priority now is to address the issue of quality and relevance so as to increase learningachievements. This will have to be done first, by critically evaluating and reviewing the curricula. Thecurricula should also provide the necessary foundation for mastery of the, three languages - Kinyarwanda,English and French. This policy will be very expensive and challenging because manry teachers do notspeak more than two of these languages. However, considering the long-term impact of this programmeon development, the cost is justified. Given the importance of Science and Technology in this century, thecurriculum should also provide a foundation for this. To support the delivery of this curriculum, there is aneed to increase the non-wage expenditures in education. Both the CWIQ survey and other empiricalevidence show that school textbooks are a critical input. Several efforts have been made to increaseteacher motivation, such as the establishment of centres for both in-service and pre-service primaryschool teacher training.
46
153. In addition to quality and relevance, another important issue to consider is the question of equity.There is no disparity between the enrolment of boys and girls but there have been substantial disparitiesin achievement.
154. There may also be a need to target more funds to schools. Currently, some schools receive suppliesin kind from district offices, as well as varying levels of funds from NGOs, school fees and other income-generating activities, however schools receive no funds from the central level, except salaries. In poorcommunities, a significant proportion of children may not be able to pay fees. As a result the purchase ofbasic supplies and the maintenance of buildings becomes very difficult, contributing to the poor state ofrepair of many schools, and the reduction of teacher and pupil motivation. Channelling some modestfunds directly to poor schools would reduce these problems.
,e_ -- The .overhnmentM]l c6nt nuet tosuApntp ce tranEngr - r.
Thrz'Se curriculum xvillbe evalueated.an8drevieved in an effort to rdc i3i'edr t- r e tiso that we,can achieve UPE (Univ - Education).by20Qea- ig t
. The,- e.;quality lof prmary education iviil be irnpro;yed by.i Leh- I ttexroo,nyp .-rov'ing f&ndsf'osschoolsto,buy'nona'geinoputs Thie,plan',to: i' books*'t 'usects fo
--.,'-onein three pupils every year,-eadingto ,oie book per p'uilif- bob' last' eeyears'! .T.~ 'Beeducational-Attainament of sch6oldhildren will-be mo or4i?treor ;;2002 1 ;
;-E&6 Ehebtl in pn dua ,iD-be >creasled a&Enr6A'iet inprim ary education,iW be mnr dd6a~4estingothei specific-. ~ ~ Jcornstra~ttAaiua1ti~comm1un~ites. j , -
* Speci alattention will be jpjaid to'developing'ab'ilities in science and-technology. - '
4.2.5 Secondary Education
1.5. Secondary education provides a mixture of direct and indirect poverty benefits. Some children insecondary education come from poor backgrounds, although in Rwanda the poorest have very littleaccess. Secondary education includes training for primary school teachers and the provision of thenecessary skills required in the labour market. It includes courses in technical education, teacher trainingand vocational training. Potential access to secondary education is a central motivation for parents'decision to invest in primary schooling for their children. In countries where the chance of access tosecondary schools has not kept pace with primary enrolment, enrolment in primary education has fallen.
156. The private and public sectors play a complementary role in secondary education. However, there isa need for quality control especially in private secondary schools. Pupils who perform well in the nationalend-of-primary examinations, generally go to public secondary schools; whilst those who do not performwell are the ones who join private secondary schools. The evidence surveyed in Section 2 (Table 2.18)shows that less than 5% of secondary school children come from the bottom expenditure quintile, in bothprivate and public sectors, indicating that the fees charged in secondary schools deter most of the pooresthouseholds. The under-representation of girls in public sector secondary education (45.6% for 2000/01) isalso a concern, although they are over-represented in private secondary schools (56.3% for 2000/01). Thisis due to the fact that girls do not perform very well in national examinations.
157. Immediate efforts should be made to provide the opportunity for more access to secondary schoolsas the system moves towards UPE and then EFA. The long-term objective is to have nine years of basiceducation to include the first cycle of secondary education, instead of six years of primary education as itis now. The private sector, religious bodies and civil society will play a bigger role in this sub-sector. The
47
lack of qualified teachers and the poor state of science teaching and near absence of ICT in secondaryschools will be the two main priorities. Participation of girls in these fields will have to be raised.
~~ ~~~Actioins. 1~ j.': .
*:- e,t1Ah'c'ui'cul,' ' , ill be'revise ks;ta gifzin 2002L1 i''-''Ir.''4,! ''dil ;- q ;s,'tJl7_;DX 1`
T' h' T overnmeitA ilI :i iean' e xpenditr 'o.'dbooks -a dglabZoaratory *equipment".as'wel' 'a o-5 § izns'tnct and e_quipm4fnit'tiof,-clasrooms �^ ' l' 1 't' a-. l ,;'v -r'5: ,fj- 2' -
lare p.opepooves He8t,backounds'will-be'given-greate,raccs, pbicse ay n schoosi stinriecE o og -wi , i'
4.2.6 Tertiary Education
158. Higher learning institutions provide teaching and performn other functions that are relevant topoverty reduction, such as applied research and consultancy in critic al areas including food security,epidemics and conflict. The poverty benefits from expenditure on higher education come, not from thedirect income benefits to them, but from the contribution graduates can make to society, includingemployment, revenue generation and providing public services. In particular, graduates from tertiary.institutions can provide basic services like health and education. Most of the beneficiaries of tertiaryeducation are not poor, and tertiary education in Rwanda is available only to a very small minoritypeople. Rwanda is lagging behind the sub-Saharan average for tertiary enrolment. This situation is ahindrance to development especially when knowledge is going to be highly marketable commodity forRwanda.
159. The current approach to public tertiary education is being reviewed to make it more efficient. TheGovernment has started to introduce cost sharing through a student loan scheme. A significant element inexpenditure is support to students on foreign bursaries. While this is important for national development,it is only reasonable that beneficiaries should pay back some of the costs out of the incomes theygenerate. It may also be possible to locate some scholarships in foreign universities for the most giftedstudents, at no fiscal cost to the Government.
160. The private sector in tertiary education is expanding. The public institutions such as Kigali Institutefor Science and Technology (KIST) are starting to admit private studehts and demand is said to exceedthe number of places available. It is hoped that the private sector will be able to fund an increasingproportion of tertiary education over time, in some subjects commercial sponsorship may be an option.Higher Learning Institutes will need to increase efficiency, and expand their income generating activitiesas well as strengthening their partnership with the private sector. It will be important to subsidise accessfor the ablest students from poorer backgrounds.
4 4~~~~~~~~~~~~~4
~~ 2 finance is~~b~ing cond~~8d,, using4 shaiing mecbaniem, . t
_5 -v
i.~Rreearh aonsultanct ffreevn tv e spa enitheii 4
48
4.2.7 Science and Technology
161. Science and Technology teaching and research are important public goods but have for a long timehave not been emphasised enough due to poor teaching and under-funded research. Science teaching at alllevels of education will form the heart of the education system. The Government is introduicing aprogramme in Science and Technology, including projects on medical applications of local biodiversity,agricultural processing and energy. It will be important for these programmes to liase with existingprogrammes such as agricultural research and the private sector, in order to avoid duplication and ensurecommercial exploitation.
162. Another important area concerns new technologies such as Information and Communication
Technology (ICT) and Geographical Information System (GIS). ICT contributes to the enhancing of thelearning process by the facilitation of distance learning and the improvement of education delivery. GISprovides detailed information on school mapping and geographical school-level data and provides a toolfor the planning and management of Rwanda's education system. The teaching of Science andTechnology, Research, ICT and GIS are crucial for economic-transformation and globalisation.
I :'~~ :Actionis'.. n.
; The tea'ingof Sciencan d Tec n ology ilsbe e atention; - i
* Scientific,and technological resech t adirect impac ;n povey reducttons -asbiogas and ferti'sersi wi Ildeffl ib%uiied- a'' s"u - -. . P :-srtet1 - -*ICT.iindGISas ikey new btectsh6gasaf6r niti6nal developiient; -will;'e supported.F,.
4.2.8 Technical Education and Vocational Training
163. Technical education is offered in technical schools in the second cycle of secondary education.Vocational training is offered at two levels. The first type (Formation Professionnel) is offered afterprimary education and produces artisans. The second type (Enseignement Professionnel) includes coursessuch as Nursing and Agro-Veterinary, which are offered at the second cycle of secondary school.
164. There is an urgent need for Rwandese people to invest in skills. At present many technicians, suchas mechanics, are imported from neighbouring countries. Therefore there is a chance for Rwandesepeople to increase their incomes by learning these trades. In the long run, Rwanda should become a netexporter of skills within the region rather than a net importer. Vocational training has been mentioned as aneed in participatory studies. The Ministry of Youth, Sport and Culture (MIJESPOC) supports vocationaltraining centres. These training centres provide a year's training to disadvantaged young people, selectedon the basis of a local survey. Training takes place for half a day on weekdays. The centres are currentlyinadequately funded and need rehabilitation. There are also courses offered by voluntary organisations,including religious organisations.
165. One important policy issue is the role of the private sector. There is a serious risk with state-ledschemes that the skills produced are either not marketable or quickly experience excess supply.Therefore, there is a need to introduce appropriate technologies relevant to local needs and materials.Currently, the state-run system has no mechanism to monitor the employment of those it trains. Efforts toinvolve private sector employers in the identification of the skills to be provided should be strengthened.It may be more efficient for the private sector to operate training schemes, funded by a training fund.There is therefore a need to carry out further study of the best way to finance and deliver this training.
-; -, ' ;, .*~2, -i, '1}\-- i *.~3P*-' * ; m; s r; ,,, --- wF,9
49
t- @ - t-, - & | A-~ctin ; : .i ,10.! , .
- Trainingcentres 'aihe disttict level will be rehabilitated and eqwiped and sup-ort will be provided toh ehe staff. . ,- -
' A mechanrism will be, developed to link the sysie'rn more clos'iy with-thehneeds expressed by;-employers.- ''' '';: '' 5',, -h,;a>'
., The Goverrnment,:in consultations with thie private sector, will considerthe creation of incentives for.- ~ vietri inclb~ding-prn , ,wilcnie mhes. aino ncnie o:,,the pnrva'e sector to provide training, app'renticeship schemes. ' L '' -;
,4 A technical school (ETO) 'willi be establiibedin the provinces tbaUa're currenlly without one.
4.2.9 Mass Education and FunctionalAdultLiteracy
166. Mass education is considered a poverty reducing priority due to its grassroots involvement incommunities and the likely benefits of improved levels of adult education, including positive effects onpeople's participation in input and output markets, population growth and community development. Indensely populated countries, programmes of female adult literacy associated with family planning havehad very dramatic impacts on the fertility rate.
167. This programme combines the aims of raising literacy rates (to 80% of the population by 2010)with the mass education of the population on topical issues such as family planning, agriculture, etc. Thisis done through training teachers and providing pedagogical materials to education centres in all Sectorsand Districts, which are the key priorities in the programme. The absence or poor condition of theeducational centres is less of a concern in the immediate future for two reasons. First because almost allDistricts and Sectors already have a centre of some sort, and second because those Sectors that requirenew centres should make use of existing primary school facilities.
168. At the central level, the Government will seek to improve its, collaboration with the local andinternational NGOs and religious organisations that run education priogrammes. Currently there is notenough coordination of activities with these other groups. A workshop will be held by the end of 2002 toimprove these relationships and to guide partner programmes.
' Better coordinationwvith NGOs and other partners responsible or literacy and'edu'cation. 'Incre'ased finding will be provided 'mainly for'edagogicalmnat6rialsg to support thte: natio'nal -programmeo popular education'. - ''' ' j .'
* Prim~ary school teachers will be tained for adult eduction;.startiig in 2003 i *
4.2.10 Girls'Education
169. The education of girls yields high economic and social returns in the areas of fertility, and maternaland child health. Yet, despite substantial progress, the participation of girls in school still lags behindboys. Many of the impediments to the enrolment and continued attendance of girls in school (such assexual harassment by peers and teachers, the social expectations from girls, and the lack of boardingfacilities) are specific to their gender, and require a special emphasis on girls' education in order toovercome them. In addition to the direct costs of schooling, the education of girls has indirect costs forthe family, particularly through the loss of their domestic work.
4 -I 1 L 1 J h .r -- -., fi ;>_ .z -.- -- '* 7I.~ . ,f - :F- ;
50
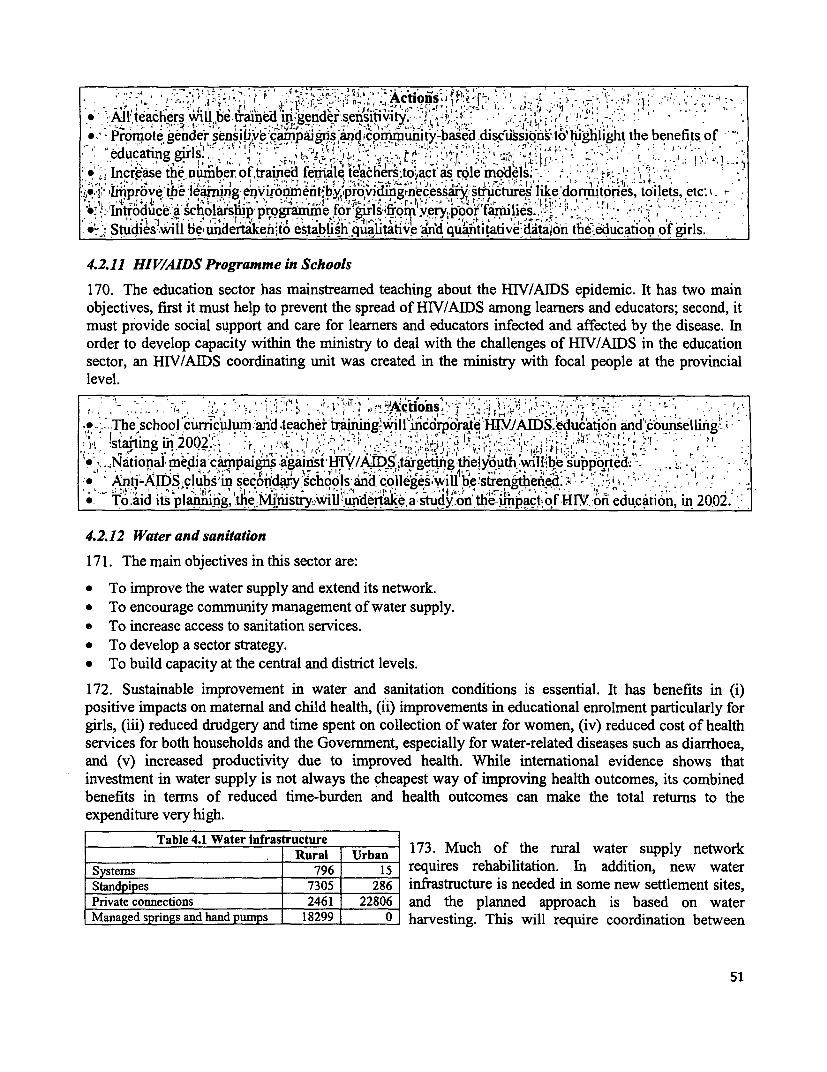
A ll teachers wVill be tra in,gn. s .ii -'f !I* '* d ~~r-sns y~ec iampa gende sendsit
Promote gender sensitiye'6'ainjaigns andicornmuhiry-based discussions to h ighlght the benefits of
lncrease te nuber of tra'ned fX te ers' to',acr as role',, x, lMprovewthe learnfing ,ennir6ent*ys liken dormitones, t6'liets, etc:
* 7 nrd uce-' a'sc h olIar's hip Ip-rog j = ~e fio-r' 1`4fro'm" yery,-poorrn ies".,-'-' .' -' '
W ' St ies' U bLunder e.do es,t 4th,a, it t v ,ndqu,nti.ta vetato'n te7 education o'f girls
4.2.11 HIVIAIDS Programme in Schools
170. The education sector has mainstreamed teaching about the HIV/AIDS epidemic. It has two mainobjectives, first it must help to prevent the spread of HIV/AIDS among learners and educators; second, itmust provide social support and care for learners and educators infected and affected by the disease. Inorder to develop capacity within the ministry to deal with the challenges of HIV/AIDS in the educationsector, an HIV/AIDS coordinating unit was created in the ministry with focal people at the provinciallevel.
.-. T..eschool cumcum 'an'd teacher trtgia- 'w incorporate HJVJAIDS.educaton and c sing
I stailing in 2002.'_22 *~*.4 22~I
m' ' National ac gs against SLtargeting *hlyut will b s oe r .2
; Anti-AIDS -clubs- in secondary schools and colleges:will be strengthenbed: D.
* To.aid its planing,'tlie Mihistry wiiindekea sdyon the na educAtion, in 20O2.
4.2.12 Water and sanitation
171. The main objectives in this sector are:
* To improve the water supply and extend its network.* To encourage community management of water supply.* To increase access to sanitation services.* To develop a sector strategy.* To build capacity at the central and district levels.
172. Sustainable improvement in water and sanitation conditions is essential. It has benefits in (i)positive impacts on maternal and child health, (ii) improvements in educational enrolment particularly forgirls, (iii) reduced drudgery and time spent on collection of water for women, (iv) reduced cost of healthservices for both households and the Government, especially for water-related diseases such as diarrhoea,and (v) increased productivity due to improved health. While international evidence shows thatinvestment in water supply is not always the cheapest way of improving health outcomes, its combinedbenefits in terms of reduced time-burden and health outcomes can make the total returns to theexpenditure very high.
Table 4.1 Water infrastructure 173. Much of the rural water supply networkRural Urban
Systems 796 15 requires rehabilitation. In addition, new waterStandpipes 7305 286 infrastructure is needed in some new settlement sites,Private connections 2461 22806 and the planned approach is based on waterManaged springs and hand pumps 18299 0 harvesting. This will require coordination between
51
the Ministry of Energy, Water and Natural Resources (MINERENA) and the Ministry of Land,Resettlement and Environment (M1NITERE), as it affects the construction of houses. MINERENA aimsto achieve 72% coverage by 2015 from the current level of 52%.
174. The responsibility for planning and strategy development for the sector is with the Department ofWater and Sanitation (DEA) in MINERENA. However, under the emerging decentralisation framework,responsibility for ensuring the provision of these services now rests with the districts and provinces. Thiswill require a shift in the role of the DEA to being a facilitator and supporting the districts and provincesin their functions. However, for sanitation, greater coordination at the: central level is required with theMinistry of Health (MINISANTE), the Ministry of Education (MINEDUC) and the Ministry of LocalGovernment (MINALOC).
175. For rural water supply, the 1996 Sector Policy envisages that expenditure for operation andmaintenance will be borne entirely by user groups, along with some share in capital costs. Thus, publicresources will be needed to meet these capital subsidies as well as to support capacity development forsector institutions such as MINERENA and water user associations. In addition, district and provincialadministrations will need to be supported for planning and supporting water user associations. Theframework for inter-Governmental fiscal transfers is being developed in accordance with the concept ofdecentralisation, in order to ensure that the assignment of revenues matches the expenditure assignments.This along with the Common Development Fund (CDF), will have implications for the financing of waterand sanitation services.
176. Sector funding, especially for new investments, has largely been through external funds. Pastapproaches have been characterised by discrete externally funded projects, without a clear sector-wideapproach for the entire country. This results in a piecemeal and uncoordinated approach. As a result it hasheld back the implementation of the 1996 sector policy, as well as the subsequent strategy developed in1999, and has also reduced donor interest in the sector. It is, therefore, imperative to adopt aprogrammatic sector-wide approach. This will not only enable MINERENA to develop a sector strategyand investment plan in coordination with the group of development partners, with a view to achievingoverall and sustainable improvements in sector performance, but will also increase the flow of resourcesto the sector.
177. Rural water supply. Under the strategy developed in 1999, a demand-led approach is envisaged forthe supply of rural water and sanitation. Key elements of this approach are being incorporated into theongoing Rural Water Supply and Sanitation Project. This project, along with some other smaller projects,is likely to increase the coverage from an estimated 44 percent to 50 percent. To further enhance coveragein a sustainable manner, the emphasis will be on learning from a pilot project, from which approaches fora countrywide scaling-up will be developed. The further development of the strategy will involve:
* Redefining the sub-project cycle using a demand responsive approach* Restructuring and capacity building at M1NERENA at central and province levels* Capacity building of districts to develop sub-projects for accessing funds* Promoting private sector and NGO role in planning and maintenance of the rural water supply* Developing uniform cost recovery policies, including guidelines for the complex systems;* Developing guidelines for accessing funds from the CDF and other mechanisms* Water harvesting is being promoted under the settlement programme (see below). This technology
needs to be integrated into' the water sector
52
178. Urban water supply is run by Electrogaz. This will be a commercial operation. However, during theperiod of the management contract there will be some investment expenditures, whose financing needs tobe considered (private-public partnerships are one option). Electrogaz no longer has a legal monopoly,and private provision will be encouraged. A specific strategy focusing on the urban poor will bedeveloped to ensure that access for the poor is enhanced through these measures. MINERENA will firstdevelop an assessment of the water and sanitation condition of the urban poor to identify the key issues.Moreover, municipal capacity for the management of solid waste, with the collaboration of the privatesector, needs to be developed for environmental sanitation.
179. Sanitation. Sanitation will be promoted. It is estimated that only 10% of the population has accessto adequate sanitation. The objective is to achieve 50% coverage by 2015 through sensitising the ruralpopulation and promoting improved latrines (ECOSAN).
~~~~~~~~~~~.4. "1 kfi..,Sf , e.-!, . ;t consi. !
*Weiwil] irnlplement'a prdr- eTforirehabil'itating th,e ral.'vater-supply wvithin.th n'ext 3 years
Astrategy for,ex tending coveraige wll be developed, examl;ning the most cost-effective options,.'-includiig,water,barvsting: '.- .
@'-'We'Evil1 iprove the' legal' and, irisfitutionai framework foir water- management. 'I ~ -* j Som unli fastictifreZ Will 'e'reb,abjlitated durig 2003-05; . ; -'. -
* .' (:Lommnunltyvmanagement,of water- suppwly,will.be strengtheried; - -- , ~ - - -* -We'will p4o'te' oll amewo~r rtend
- We 41-research policiies:where.the pollute'pays andthe user pas.
4.2.13 Housing and resettlement
180. The main objectives in this sector are:
* To rehouse the families who live in extremely poor conditions, often under plastic sheeting.* To develop a sustainable settlement policy, in which (i) the planning of imidugudus (designated
rural settlement areas) is participatory, and (ii) urban housing plans ensure security of tenure andstrict zoning.
181. There are two connected, major issues in housing and resettlement: the long-run question of thepattern of settlement, and the short-run need for rehousing. The Government is committed to supportingagglomerated sites for new rural housing. The development of grouped settlements, imidugudu, isintended to foster social cohesion, promote security, facilitate service delivery, and encourage thedevelopment of off-farm activities and the commercialisation of agriculture. The initial implementation ofthis policy faced some difficulties, including poor planning and site selection, as well as the lack ofparticipation from beneficiaries. This resulted in a shortage of infrastructure as well as the creation ofsome unsustainable communities, which consisted entirely of vulnerable people.
182. As a result, the sites now being designed are much smaller so that people have access to their fields.The relocation of people -to imidugudu will be voluntary, and the planning of these imidugudu will beparticipatory, although the construction of.isolated settlements will not be allowed. The urgent task is tomainstream imidugudu into infrastructure provision, so that each sector addresses the specific needs ofthe imidugudu within their overall strategy. To this end, focal points for settlement are being establishedin each sectoral ministry. The imidugudu will be developed into sustainable communities, avoiding thesegregation of particular groups of vulnerable people.
53
183. To address the need for rehousing, a community-based approach is needed. Communityparticipation is expected both in identifying the needs and in building the houses. The Government hascompleted a survey of housing needs, which has estimated that 192,000 families need rehousing. In someareas settlement of demobilised soldiers is a problem.
184. Urban housing is often poorer in quality than rural housing, despitemuch higher incomes. This maybe because materials are more expensive, or it may reflect insecurity of tenure; thus people do not investheavily in their housing. The master plans for urban areas are under development and will aim to ensuresecurity for existing occupants while applying strict zoning criteria for new constructions. Subsidisedcredit for low-income urban housing has been suggested. This needs to be carefully reviewed for itsimpact, particularly in terms of increasing the urban-rural gap.
-A d6 RundTable Corfrence w camed62to ;rgasefunding for roofing iand'- i,water ar,h,estingkits, itsp'ro'grammeis't eatda,hg' pfin,tyF;, lw : ;' -'
* T bution mofing~~~~~~~nd e fhouses" ,willb0- .he distribution of roofing,ar.d water hiuNestihg«kits,,as-w4eI 'tas th e onstrk.tion' --oss',lbe'uriderjtaken'in 2002 ,or:2003, 'ai the lat,est. ommuitiest-will iffplb ' p-mnt ,pr e th '-.;-2 eiit, this ~~~~~~~programme, wt'guidaceifr6omntM Governinent and assi'stancefrom other organisations, wherenecessary ;
*, ,i ' Theifocai'points in sectoral ministnes will ensure that,settlemeiir-rlated qestion are integrated intonueade'quiat&ifa 'i~relVtkigeted.fdhdc6si-efezi''j sector strategies.4i e aim is io ensure d- ir rast-u c re by'
'-tnerventions designed to.support I6caJ needs . ;, I .'. ..
4.3 Economic infrastructure
185. The main objectives in the infrastructure sector are the following:
Transport* To maintain and rehabilitate the rural road network so as to promote trade.* To encourage greater competition in air transport.* To investigate the feasibility of an international rail link.
Energy* To reduce the cost of electricity by increasing domestic production.* To begin rural electrification in order to promote economic activities.
Communications* To encourage competition in this private sector activity.
186. Rwanda has high transport, energy and communications costs and most of its population has limitedaccess to infrastructure. In order to promote economic development, it is imperative to reduce these costs,and increase access to infrastructure. It is particularly important to increase the access to energy in ruralareas in order to increase off-farm employment opportunities, which can have a direct impact on thereduction of poverty. The provision of infrastructure needs to be supported by appropriate fiscalmeasures. The importation of energy should be replaced by local production if this reduces costs. TheGovernment will explore opportunities for private participation wherever possible, using subsidy asappropriate to promote better access for the poor. The impact of petroleum taxation on the costs ofmoving goods is discussed in Section 5.
54
4.3.1 Road transport
187. Rwanda faces two major problems with transport infrastructure: its weak international links, whichimpose high transport costs on traded goods, and the poor state of the rural transport network, whichcontributes to the high margins on internal trade. Access to commerce and markets was a significantpriority in the NPA.
188. The need to commercialise agriculture implies that returns to roads are likely to become higher andmore widely appreciated over time. For instance, the construction of the road from Gitarama to Kibuyehas cut travel time from 6 hours to 1.45 hours, and increased the producer price of a kilo of coffee fromRwf 180-200 to Rwf 240.
189. Road maintenance and selected rehabilitation are priorities. Because of the very high costs ofinfrastructure, there is a need to prioritise carefully and examine opportunities for private provision in thissector. We will also explore the technical feasibility of using labour-intensive methods, which have beenfound to be cheaper than capital-intensive techniques in neighbouring countries. The shortage of publictransport is also mentioned as a constraint on the movement of goods and people and access to socialservices. A public-private partnership involving ONATRACOM, the public bus company, is envisaged.
I; - . ~~~~~~Actionsr*7 Road and'bridge maintenance wii be'treated as. a high p riity,,withan.emphasisor labour-itensIive-
'_imethods Linked to'the prograrne 'of labou-r-intensive public works,6identified in'Section 4. l. ;'' We wll implemrernta'aprogran, -40e.t mantain e 4Q0 km toflroads, iif bAd 'repair, a d upgrade selectekd
'- roads starting 'f rom 2002. 1This progrinmeji needs tob'e im.plemented as-fist,as, possible -because'''f ersetla`y4Wi!l iratcrsset'uo'stn in'the future. 7The.existing progra' i'e will be 'refined byiquantitatie'
,. -1 ,estimates oi:f,ratesofretur' to differen projects/, '- ' r .' i'mp, 'e'el .fi,
. Urb7n ;roads' Will be treated -aL a lowe ' i eir sma er dert im t-' ''casies'where,they-impose a demo'strable:andliiigent constraint. ; ': ;,'-','
; A'pubicdprivatepartne ship v.iil be.adoptedto.reiiforce the.public trport netWork.
4.3.2 Railway and air travel
190. International links will be strengthened by the further development of Kanombe airport in Kigali.Greater competition in air transport and more frequent flights are needed. Rwanda's horticulture industryfaces a more serious transport constraint than other such industries in the region. If Kanombe airport canbecome a regional hub, the prospects for high-value-added agricultural exports and tourism will beenhanced. There may be a role here for public-private partnership. Another priority is the development ofbetter facilities at Issaka for Rwandese transporters using the railway line between Dar-es-Salaam andIssaka. This is likely to be a private sector project, and Govement is negotiating the details of theconcession. A study on the feasibility of extending the railway from Issaka to Kigali is being prepared.
4.3.3 Transport and communications at the grass-roots level
191. Below the level of the road network, there are local tracks that link households to the market. Often,people live on the hills and market their crops in the valleys, which imposes a heavy burden. Rwanda has
55

some traditional forms of transport such as non-motorised carts, which are used to bring agriculturalproducts to the roadside. MINITRACO is therefore planning a study of the rural transport sector. Likelypossibilities include the introduction of donkeys and cheap non-motorised or motorised transport,including bicycles and the wooden scooters traditionally used around the country.
.7 'v -- qV 04 ~ '~ ~4fi~' ~"' $ Av,
f.an 3u-bi mu k nyauibue,ne or6 am, au.t willdtionall' in; i- proVid~fetfids'that!could'beu uedfo&,the iniprov ient bfl a'track s' 4- .
O r ` 4-A :,-:, jl7,echn callsudlesRlwll undertikenon traditional f msvof tranfsport aiswpart of the science and
0 .tec. noJogS.rpr.airnev ';. ,;* '1| F; A* 1 ,'--;'> i V -t' SiLX i'.- *' '--1;
4.3.4 Energy for the formal sector
192. The price of energy in Rwanda is very high by regional standards, although payment by theconsumers has in the past been very poorly enforced. A significant proportion of Rwanda's electricity isimported from Uganda, and the Congo (Ruzizi I, owned by the Congo and Ruzizi II, whose ownership isshared between Congo, Burundi and Rwanda); Rwanda's own capacity is just 26.75 MW whereasaverage consumption is about 35 MW, which can rise at peak times above 40 MW. Although electricity iscurrently only 1% of the country's energy balance, it is essential for the development of the formal sector.
193. Investment in and improved management of Electrogaz, and can bring down the cost of energy byexploiting natural gas reserves in Lake Kivu and the country's peat reserves. Provided that it can beproduced more cheaply in Rwanda than we can import it, it makes sense to invest in generating capacityand to export the electricity produced. Investments are planned in the Nyabarongo power plant, whichwill produce 27.5 MW, and in a gas-powered station exploiting the production of methane gas. It isanticipated that the investment in methane will be undertaken by the private sector. The rehabilitation ofthe 21 micro power stations (microcentrales) and the exploitation of some of the 86 other available sitesare also envisaged.
194. An important policy question is the financing of this investment, given that Electrogaz will remainin the public sector for the next five years; discussions are under way. Private sector participation is beingsought for the exploitation of the gas reserves in Lake Kivu, and is also, likely to be appropriate for theexploitation of peat reserves.
t w o ri m n >ll;,, b ;, e xpl ored in;ttJ iti~~~~~ ~~ ~ ~ ~~ 1,ctinsxstat - "~n~ Ib
.,F.inManterohons?o&.arl'rehabI nms eXtorw b.e xvenion ad;prlulry ojetadgsepotto. 4,h -L,;-:.l . I,i @ 4i#.;iS - .. , . -I * -J - e , i. .a
l * -I eRi2ilcte 1wl bew p or 1pcat and .~2 0 -II 4I IL
4.3.5 Energy for poor households and rural enterprises
195. Rural electrification is likely to have high returns in Rwanda, because of the high populationdensity and the need to expand the non-agricultural sector. Rural electrification is carried out byMIeERENA, and consists both of extension to the network and local power generation. The mainpoverty impact will not be through domestic use but the through the encouragement of agro-processing
56

and other small-scale manufacturing enterprises. It will also be important to spread awareness aboutenergy conservation methods and the dangers of electricity.
196. There is a very strong case for subsidy to support rural electrification, as the infrastructure is ineffect a public good and the beneficiaries are relatively poor. Further work is needed to assess whether thestate should provide this service or should create incentives for the private sector to do so. Grid extensionis much cheaper than power generation, and there is a strong case for extending the grid to rural areas inanticipation of the development of non-farm agricultural activities and agricultural processing.
197. The provision of solar cells is a small investment at the level of the individual enterprise and istherefore best achieved by the private sector or the community. However, the state may have a role inresearch and dissemination.
198. Most energy consumed for domestic purposes is currently in the form of wood or charcoal. TheGovernment will consider the best methods of promoting the use of improved stoves and solar dryers andwater heaters, as well as the use of kerosene for cooking. The programme of reforestation will helphouseholds meet their energy needs sustainably; it may be necessary to introduce improved stovessimultaneously. Since wood is to some extent a community resource, the use of an improved stove maymerit subsidy.
F. - - 2 si S i j ; ;; : s ; i i -. .: -.
A, A rogrianmme o'f-rural el-ctnfflct on vllb.bffiounted, after tcaefuIIconsiderationQof.the'best',pnvate-'2OO2~O5~The~emph~is ~viIPbe ~ haingelctricty a~adieM6 for
^ '. econ'omi c ac,tivtlesy, note,on m f6~~ ~~d ~thef6r hodh)nOalth~lis stlgek~;,~ be1, eiin'; te andeconn'ection' of2illa's ialr1eady yclose top6wer-lines Wi:l-b'e high p'riorities
,WebIfrnionh aboutn iprvrdgtoyesa1dotaed form -of OW7 c9s ie ergy' ',pos''';'si'blyt6bidis6e Man aftrt calef tU3yf- '
..4>-i, 'iIdelldryers;and,wat r4heaters.ae;projct,that, may'be undetakaen:att ,comtit;^hleho,I-or:enterpnse-leve.' Governrnent wiuproviureievant ormationtandsupoirt research',nd:.possiblY,j';
4.3.6 Communications
199. With the privatisation of Rwandatel, investment in communications will mainly be a private sectoractivity. The availability of mobile and fixed wireless phones makes it possible to increase the ease ofcommunication between urban and rural areas, with considerable benefits in terms of commercialisationand the bargaining power of farmers. For instance, while a mobile or fixed wireless phone is a very largeinvestment for a poor household, it may be possible for a farmers' group to buy a mobile phone andarrange suitable times for traders to collect produce.
4.4 Good Governance
200. The objectives of the Governance sector are as follows:
Security and demobilisation* To continue to participate in regional conflict-resolution.* To reduce the size of the army through the sustainable demobilisation of soldiers
57
National reconciliation* The mainstream the work of the National Unity and Reconciliation Commission throughout all
sectors, particularly at the grassroots level.
Human rights* To promote the work of the National Human Rights Commission throughout the country, particularly
in the connection of decentralization and gacaca
Criminal justice* To implement the traditional gacaca court in 2002, for trying genocide crimes.* To improve the running of prisons
Constitutional reform* To consult the population in the development of the new constitution.
Decentralisation* To provide funds to the districts through the CDF, and to build capacity and provide sufficient
guidance for their management.* To extend decentralisation down to the cellule level through the ubudehe mu kurwanya ubukene
process.
Civil service reform* To provide suitable training and incentives for ministry staff.
Good governance* To ensure accountability and transparency at all levels.
201. Rwanda has in the past suffered the most devastating effects of bad governance. Good governanceinvolves the respect for human rights, the provision of physical security so that citizens can live withoutfear, and the continuance of political stability by allowing the people to participate in a meaningful way inthe decisions that affect their lives; It is our objective to implement the highest international standards ofhuman rights through institutional structures that reflect our specific history. Good governance alsoincludes a free and fair legal system and the provision of accountability and transparency in order allowthe full functioning of democracy. The National Conference on Good Govemance for Poverty Reductionheld in Rwanda in November, 2001, addressed the challenges in detail and advanced the elaboration ofthe national strategy on governance.
4.4.1 Security and demobilisation
202. Promoting internal and regional security is essential to the achievement of poverty reduction inRwanda. The Government will continue to participate actively in efforts to resolve the conflicts inneighbouring countries and to ensure the security of its borders. For defensive reasons Rwanda has beeninvolved in the conflict in DRC since 1997; we seek a peaceful solution which removes the threat ofinsurgency and allows all the people of Rwanda to live without fear and allow the development of fulltrading relationships.
203. As security improves, there is a 'peace dividend'; it will be possible to shift expenditures away fromdefence. However, the need to support demobilisation poses a specific challenge. Demobilised soldiersare a valuable human resource, often possessing organisational skills. It is critical that this group haseconomic opportunities, and some temporary support will be provided to help them reintegrate intocivilian life.
58
204. The Rwanda Demobilisation and Reintegration Commission is responsible for the programme, incooperation with the Unity and Reconciliation Commission. Over the period 1997-2001, 16,125 RwandanPatriotic Arrny (RPA) troops were demobilised and reintegrated and about 15,000 ex-FAR (ForcesArmees Rwandaises) were reabsorbed into the RPA in accordance with the Arusha Agreement. About20,000 ex-FAR have returned to their communities and may need support for reintegration. The objectiveis to demobilise a further 20,000 troops, reducing the size of the arny to 20-25,000 in the long run.Finally, there are still genocidaire troops in the rebel forces in Congo. Some of these have recently beencaptured and are now in camps in Rwanda. Shelter for demobilised soldiers has been identified as aproblem in the consultations held by the NURC. There are therefore two tasks outstanding:
* Support to the demobilisation of the RPA.* Support to the ex-FAR and other rebel forces that have returned.
205. Two rmajor forms of support have been given. First, there has been a 'safety net' cash payment fordemobilised RPA soldiers. The allowance needed to support a veteran for ten months is estimated at Rwf90,000 for shelter and Rwf 270,000 for living costs. An allowance of this kind will be paid to demobilisedRPA soldiers. Secondly, since 1999 support was provided in the form of formal and vocational education(provided by the Veterans Vocational Centre in Butare), microfinance and toolkits. There is also a need toallocate land for those veterans who wish to return to rural areas (as the majority do) and have no landalready. All returnees need this form of support. Additionally health support needs to be providedincluding voluntary HIV testing and counselling, and information for behavioural change.
206. Policy issues arising are:
* The level of the safety net allowance needs to be set at an affordable level, given the numbers ofpeople who will qualify for it.
* The kind of training provided needs to be linked to the private sector's demand for skills andintegrated into the general policy on training and employment generation.
* The strategy for community-based labour-intensive public works, discussed below, will offeropportunities for ex-soldiers to exercise their practical and organisational skills.
Once demobilisation has been successfully undertaken, there are fiscal savings in the order of Rwf120,000 per soldier in wages and more in non-wage costs. The MTEF shows reduction of defencespending by RWF 4.5 billion annually over the three years 2001-4.
- .Rwa t ue;rX ,I' t,Actions, t 4,44l rcodfncUeation,p9cipat- ego"n'a 0cre t
20.The.dV National Unityand Reconiia.WthiAonCommisiorepang(UC,a cj,frtheatedsintMarche199,tas heas
reu it egraftintadfcnc iliation,rop etio te re hde~ovelopmen~th an dd lating i h paneadce.o1is wewII
4.42 National reconciliation
207. The National Unity and Reconciliation Commission (NURC), created in March 1999, has the taskof leading national efforts to promote unity and reconciliation, essential for sustainable humandevelopment and lasting peace.
208. Since its creation, it has conducted a series of local and national consultations and civic education atprovincial and district levels, as well as at the national level. The first round of consultations found thatpoverty, bad govemance and leadership, and lack of justice were the main causes of disunity in Rwanda
59
The first national summit on unity and reconciliation, held in October 2000, discussed and endorsed thesefindings .The findings of the most recent wave of consultations are summarised in Section 2.5. Thesefindings are useful for assessing future progress with regard to citizens' perceptions on reconciliation.
209. The NURC also organises training sessions or ingando aimed at promoting unity and reconciliation.These have been targeted at specific groups including youth, opinion leaders and, recently, ex-rebels andother returnees from the DRC. The decentralisation process also presents an opportunity for the NURC tostrengthen reconciliation efforts at the grass-roots level.
210. The NURC has developed a three-year draft Action Plan and implementation strategy, which hasbeen presented to donors and NGOs for comment and feedback, with the additional aim of identifyingfinancial commitments. The Action Plan outlines an ambitious strategy lover the coming years, includingprogrammes related to the decentralisation process and the monitoring of gacaca, to ensure thatreconciliation efforts are maximised through both of these processes.
*-The T URC,will continue to;undertake' c'i''ivic e'ducnd�ha a tional-grass co in.:- r U ;@
diti.on tbo.a -regular national surin ii't 4 ,X?RG x4S, -i ill-c'ontinue hvo !d-tra ings essiont(ingando.),.;incliiding.sessionsi'forthe reintegration
ffhe.NIRG.willcontinu to hoI tne~ai'mai tr aio
Wwork with'otherffiThstrieis.a ma nstreamn GvcrlniipoWIGouit¶4" ';l ;iyvic.education.on reconciliatio.n:will Ibelintegrated into'the natioloiacu c';u`u r!r ih 2002'
4.4.3 Human Rights
211. In the post-conflict context, the promotion and protection of human rights remains crucial. TheGovernment is committed to supporting the integration of human rights issues into all its programmes.The link between human rights and poverty reduction needs to be stressed. In particular, the 'right todecide' of local communities on development priorities is central to the PRSP. The National HumanRights Commission (NHRC), an independent institution established in March 1999, has the importantmandate of examining and prosecuting human rights violations comrmitted in Rwanda, sensitising thepopulation on human rights, and instituting legal proceedings in case' of human rights violations. TheNHRC also works closely with local and international NGOs as the sharing of experiences andknowledge between all human rights actors is' vital. The decentralisation process will also offeropportunities for human rights issues to be better integrated into the work of the CommunityDevelopment Committees (CDCs) at the grassroots level. The fact that the NHRC has recentlyestablished 10 regional offices (with 2 staff posted in each) will permit the Commission to work moreclosely with human rights organisations and the population in the provinces.
frl~~~~~~~~~~~~~~~~~~~~~~~~~~~~~~~~4, Zmf w,ltc -1U5.um4s.n'agntlo b*o'A't�nw=ars,Nbsil ''-l .1 ' ,i X j-
. n 1 . 4 I i , .: a.;w`
'Th'N-R(Nati 9J-6iIHumhfir oi%qn. onluiti~~promnot'e a'ndprotect
4.4.4 Criminaljustice system and Gacaca
212. The justice system remains seriously over-stretched, with about 107, 000 people in prison mostly onsuspicion of genocide-related crimes. Recognising that ordinary legal procedures could not cope with this
60
backlog, the Government is implementing a community-based process where traditional institutions ofdispute-resolution, the gacaca courts, are constituted to deal with the genocide cases, except thosesuspects accused of masterminding the genocide or committing very serious crimes. The population hasbeen sensitised to this process and elections for the membership of the courts have been held successfully,with very high turnout. Gacaca trials will start next year and the intention is to complete the processwithin the next five years. Once gacaca is completed, the long-run prison population will become clearer.However, in the short term, it is important to reduce the costs of energy in prisons and research will becarried out into the most efficient ways to do this.
213. The police force is being reformed with a community-policing approach. In 2000, 3500 policemenwere put in place. The appropriate size of the police force needs to be considered. Because Rwanda'sresources are exceptionally fiscally scarce, it will be necessary to consider working with a lower ratio ofpolice to population than in other African countries, especially as crime rates are reported to be notparticularly high. The Local Defence Forces may be appropriate institutions to maintain local law andorder; evidence on the popular perception of these institutions is highlighted in the NPA.
214. In the medium term, there will also be a need to design judicial institutions that offer adequateaccess to the poor, particularly for land disputes (discussed in section 4.1.2). However, the prioritycurrently is to manage the gacaca process. This will in turn strengthen the rest of the judicial system asgenocide cases are cleared. (Commercial justice is discussed below in the section on private sectordevelopment.)
,Actions - -
j ,-iThega.caca-pro, e~ssiIllbegn i'm2002. ." n. The target size for the police force and the role of Local Defence Forces will be reviewed in'2002.* 'Mechanisms forlpi ce to be accou'table to the local comrnunities v ill be strengthened.;' Laws tht.discriminateagainst women or other groups will be replaced, starring,in 2002.
! O.'. A sector;strategy for Public Order and Safetylwill be.developed, stairting in' 2002 .- '
.t' Ivpestimenis nexpanding 'piso'r.rp'ce'will be considered once the long-run size of the prson;: :lo. popuiation is established.; ' j t;
ln*.S i6vesthn4entsin biogas facilities will be'undertAkenJin pnsons, subject to confirmation of the highlyp,ositie econiCret r , l.l ' .,* l . -' - .; -
4.4.5 Constitutional reform and democratisation
215. The Constitutional Commission is currently coordinating a national consultation process for thedevelopment of the new constitution. This will determine the type of electoral system to be used fornational elections in 2003, the nature of the executive, legislative and judicial bodies and decision-makingprocedures, the legal framework, the charter of human rights and so on. The Commission is currentlysensitising the population on the process. Civil society organisations (CSOs)' will also be involved incontributing to the development of the constitution. The political system under development will bedemocratic and will encourage political debate. It will, however, include safeguards against the re-emergence of sectarian politics.
216. The democratisation process is already well underway in Rwanda. Elections at local levels havebeen successfully held (in 1999 at the cellule level and in March 2001 at the district level) and the countryis committed to moving towards national elections in the2003.
tq- ,F -, ,,-lEr', = ;. j' . ; , ; ,*,,r , ' L- ,'', ie ,. - -- 1. 7 -- - .. .. -. ,....
61
41,~~~~~~~~~~~~~~~~~~~~~~~~~~~~~~~~~~~~~~~~~~~~~~~~~~~~~~~~~~~~~~~~~~~~~~1
-,party do bdgud c ais dra winu' cd,ct. 'oati aX''pblificia's'-hnw;constition,@willF,dev oed'ithbe idel d gto ii '.al consultation 'process du g 2 jJ
r.2tibnaileIectiobsiai e2to00Yed Qd Iia!'200E
4.4.6 Decentralisation
217. Decentralisation is central to the creation of democratic structures of governance in Rwanda.Encouraging people to work together at a local level is central to overcoliing the divisions that have beenso destructive in the past. We are creating a sense of local ownership of public programmes, which hasbeen lacking. Decentralisation also allows local Governments to respond to local needs, and can increasethe accountability of Government to the people.
218. The decentralisation policy and law have been published in 2001. The main unit of localGovernment will be at the level of the district (formerly calledi the Commune), with anotheradministrative layer at the level of the province (formerly the Prefecture). There are 106 districts and 11provinces and the City of Kigali. Elections have been held at the District level, replacing the formersystem where officials at the District level were centrally appointed. .
219. The Common Development Fund (CDF) has been set up which will eventually commit 10% ofgovernment revenue to fund development programmes identified by the districts. The draft law on theoperational modalities is being finalised and under this law a portion of government revenue (2.5% in2002 rising to 5% percent in 2003) will be dedicated to the CDF. To avoid disruption to the functioningof the central Government, the pace of implementation will depend on the availability of fiscal resourcesand the time required establishing the administrative mechanisms for CDF management. In 2001,provinces and districts have developed budgets in the MTEF format including proposals for the CommonDevelopment Fund. It is envisaged that in the future this will be extended to allocating resources tocellule level through the community action planning methodology being developed in the ubudehe mukurwanya ubukene approach outlined below.
220. Decentralisation will change, but not reduce, the responsibility of sectoral ministries. Most sectoralministries will shift from being implementers to providing policy guidance to the provinces and thedistricts.
rFica['frsftodistncts amountin to. J na ,,ienuei& e begn 0in'the 2002
e udg,etPF6fj2O -2 bizihon6,,6wfhas b'delita 6RAtdtBr'-the$ -e .;F 4-e
-l .e e the,fd iStibeiv.,beetwenn; resources.mandR,,e§o6ieisililisthes h dis" 1c idvel.tpo-.,-
: etween theentrwe.an ;s jets alo ing:ieveepment. fope*r:s'.ystems of monitormg,' X
t isecttransparencas edot Iut Relegance;andrs,up fX
4.4.r7 Decentralisation at the cellule level: ubudehe mu kurwanya ubukene
221. Decentralisation is also being pursued below the District level, under the community actionplanning or ubudehe mu kurwanya ubukene approach, which is currently being developed. Ubudeheis the
62
traditional Rwandese practice and cultural value of working together to solve problems, and refersprimarily to collective action at the harvest.
222. The objective of the ubudehe mu kurwanya ubukene approach is to revive and foster collectiveaction at community level. This is achieved by developing bottom-up budgeting and planning systemsthat articulate communities' needs, and by building upon local Government structures of CommunityDevelopment Committees. This cellule level action planning exercise is seen as becoming the direct basisfor decentralised planning and budgeting through the district level Medium Term ExpenditureFrameworks. This linkage has already been established with joint budget and poverty assessment trainingat the District level in 2001.
223. Each cellule will go through a process of collectively defining and analysing the nature of povertyin their community. This will be done using a number of standard analysis tools including socialmapping, seasonality, preference scoring and process techniques, all of which have been tested in Butareprovince. The first step is to look at local categories of poverty, the characteristics of each category,mobility between categories, the causes and impacts of poverty, the role of security, risk andvulnerability, social cohesion, crime and conflict and social exclusion. The cellule will then go on toidentify and analyse the characteristics of the problems that they face. This list of analysed problems isthen ranked in terms of priority, and the one that the community wants to spend the most of its own time,effort and resources to resolve selected. From there, they develop action plans to address the problemsthey have prioritised. This will promote the development of community-led problem solving and ruralrecapitalisation. A central information centre, in cooperation with sectoral ministries, will developpackages of information for specific problems that the cellules encounter; cellules will be encouraged tocontact the information centre. For instance, a cellule facing a problem of soil erosion or fertility declinewill be able to access technical information about the best methods to tackle this problem.
224. Cellules are to be allocated around US $1000 each year, for which external funds will be allocatedfor at least the next two years. The details of the mechanisms by which cellules will access funds arecurrently under discussion. Cellule representatives to supervise the programme will be trained, using acascade system. The methodology and examples of the action planning are detailed in Appendix 1.
7"-'' 'm np ubuket''ean1e'''l ;;' blo heIniiaJeiis fl 'iovncs
.2 ~~~~.ngs2002.(Se'ealso.pp.end Afor'det'alsmd;'expl;es.of.ub* ji sliGi ' lel''~~~~~~~~~~~~~~~~~~~~~~~~~~Aj,enixA-fr eriPs~ . ~ ~ i
4.4.8 Civil service reform
225. Since 1998, the missions of ministries have been revised, new ministerial structures (the cadresorganiques) have been developed, and a legal framework for the Public Service has been developedwhich aims at:
* Satisfaction of popular needs* Management of the productivity of public servants* Development of human capacities in the public service* A new salary structure reflecting a new job classification* The creation of the Public Service Commission which will guarantee neutrality in recruitment,
performance evaluation, promotion and disciplinary measures.
226. The Rwanda Institute of Management and Administration and the Rwanda Health InsuranceSociety have been established to improve capacity and incentives for public servants.
63
227. It is important to recognise that most public servants are better off than the majority of Rwandese.The essential poverty impact of measures in the public service therefore comes from its effects on thequality of services delivered. It is therefore important that incentives are' targeted towards those areas ofGovernment that are suffering difficulty in recruiting, retaining or motivating staff of adequate quality.Ministerial structures need to reflect the tasks that are assigned to them w,ithin a sector strategy. Hence therestructuring of ministries needs to be closely linked to the development of sector strategies.
J§j4 * 'ulat ofnt - ;llScl e manageient'odc'f Se iui Sit - d,;S ionzTh,Io$I~aii4:w 1l i6eintesevcs~through7-he-ocil popu 6ti o partiipate' i6he:h adfietP 6 ubi ser 9.?de
urnaf-ipacity.toll"bed eeIpedd;throUgh'training iu ' it e computens~ationf oflhuman resource management, uinclud d payroll will,br"carne'a-'o-u'taa"the
tiefficiehnilu'sfe'i6f new.l,techniolo'gywill: e pOrom oted du 'ng2'00 2.' - ' ' it -- 'i, P-rid"at_stector'and,civil' societpy ' iciptinvillbeen' ageby ab ,iiwV,woicde 'dp" o3't;
;114 A 'A, i.~- 7.4 IT._.en 9
;'^'P?olc'y-,'zlto-getherwthfithe~programmeoirfrein-se'rtiong-isc5us 'e l |b ; e2. ' ii.,~i'~-Tec rasific'at'i6VofZ0bUicserVants ' ilthe ereulriNsatiof r w e1i n mpentediin'2003'- ,'i
of.coidmmnicati'on andsensitisatiori nwiIl'be'carde ut6itonhthiminple e'ntation' op publi'
4.4.9 Accountability and transparency
228. The Government is committed to strengthening accountability and transparency. In Rwanda, this ismore than just a technical matter; basic freedoms and human rights depend on making Governmentaccountable and transparent. The achievement of reconciliation and the development of trust require aculture of openness.
229. Since 1998, the National Tender Board and the Office of the Auditor General of State Financeshave been established. This has been a considerable achievement, as comparable organisations have notexisted in Rwanda before. The Auditor General's reports on some ministries, Government agencies andprojects have been submitted to the President, and copied to Parliament and the Supreme Court. Actionhas been taken against some officials as a result, and a study has also been mounted to examine off-budget transactions and integrate them into the budget. Just as importantly, the work of the AuditorGeneral has highlighted the relatively poor capacity in ministries to exercise proper financialmanagement. As a result, greater emphasis on training has been given, and the establishment andstrengthening of internal audit units undertaken. Several further audit reports are to be delivered beforethe end of the year.
230. As decentralisation proceeds, there needs to be better public information about fiscal flows. Forinstance, if funds are sent to schools, this fact needs to be publicised so that parents can hold theheadmaster accountable for the use of the funds.
231. Formal accounting mechanisms at the level of the district need to be established, in a manner that isrealistic given the available human resources. The decentralisation policy allows for internal auditors atthe district level-and periodic audits by the Auditor General.
dtb is beifi !~kN to' retif -. .1,rb1eihs:id~tfe.ii ~ t~.,~r** "*!' i"' ____' m b ' v'
64
4.5 Building an enabling environment for private sector development
232. The main objectives for private sector development are:
* To energetically encourage investment from the private sector.* To reform the financial sector with the aim of restoring financial soundness.* To review all legislation in the commercial justice area.* To promote the privatisation of several enterprises and implement a regulatory structure.* To privatise and regulate the manufacturing sector.* To ensure the better management and regulation of mining.* To promote tourism.* To establish a legal framework and a support network for the artisan sector.* To implement an ICT strategy in the services sector.
233. This section is concerned with actions to provide major economic infrastructure and develop theformal private sector, which will become increasingly important as the economy develops. Actionstargeted specifically to the sectors of the economy in which the poor are mainly employed are consideredin Section 5.3. The poverty benefits of actions to promote the formal private sector come partly throughthe commercialisation of the economy, especially the creation of demand for agricultural products, andpartly through the employment generated and the tax revenue raised from successful private enterprises.These benefits will increase over time as more poor people enter employment in the formal private sector,and are likely to be greatest in labour-intensive activities directed at the export market. The Governmentwill seek to create an enabling environment for the formal private sector, without distorting incentives ordiscriminating against the informal or small-scale agricultural sector.
4.5.1 Investment promotion and private sector representation
234. The Rwanda Investment Promotion Authority (RIPA), which liases with the Private SectorFederation (PSF), supports investment promotion in Rwanda. RIPA is establishing a one-stop window forinvestors, enabling them to deal with bureaucratic requirements more easily. More information is neededon the constraints experienced by investors, and RIPA is funding studies on this. The PSF will bemounting a project to identify clusters of potential competitive advantage, and will also operate amatching fund for technical assistance to the private sector. The Agribusiness Centre in Kigali alsoprovides funds for research in this area.
235. Three areas of action require particular attention. First, Rwanda needs to market itself aggressivelyas a location for investment. Secondly, we need to know more about the constraints that currentlyconfront investors. High energy prices are one such constraint, as are water, telecommunications andtransport. Thirdly, we need to involve the private sector more closely in the design of public policy.Sectoral policy discussions should include representation from the relevant private enterprises. It shouldbe noted that the private sector in agriculture consists mainly of small producers, who should berepresented in policy discussions.
-' R ep Actio1ir.i~ tiA s* Theone-sop sop, or investors~wiII cdntttnue6 to besiigeid ~ - .
*R Rersentation, fromh reIe,vant .p'n'vate"s'e'tor. busmnesses wIle ouhtGin-p.oli. icusos
pp wedn es,to ideii'ibethe.,ooitdaints, do'inv '
- Legal 're Irwii be b deen to iinprpveincenti' esbeg rng .;
65
4.5.2 Financial sector reform
236. One of the consequences of the war and genocide was to damage the quality of the banks' portfolio,as many enterprises were physically damaged and some borrowers left the country. One constraint torestoring the financial soundness of the banks has been the lack of legal rmechanisms for foreclosure. Thishas a significant effect on the poor because the operations affected include food-processing facilities. Theachievement of bank solvency is also the best way to bring down interest rates in the long run, becausehigh interest rates reflect either an uncompetitive market or a risky envirdnment for lending. A very smallproportion of commercial banks' lending is directly to agriculture. Thislis less surprising than it seems,since the smallholders who farm most land in Rwanda are not likely,to be able to deal with formalcommercial banks. The credit needs of this sector, and the role of the Banques Populaires in meetingsthese needs, are discussed in Section 2.2.4 and 4.1.3. Commercial bariks do have a role, however, infunding agro-processing, trade, and larger agricultural enterprises where' these have spin-off benefits forthe poor. An Agricultural Credit Guarantee Fund would also provide support to this sector.
I . ~~~ct.ions :.'-~Actib.
- t Bank supervision within the Natiohal Bank of Rwanda (NBR) is being.strenghened.C.-* A-reyview 'of bi.s' lending procedures is being done. - ;I, ,,
* The arbitration centre has been established, andmwill be gi,ven legal4Uthbrityh . ',
Foreclosure on non-performinig,loans is,being improved -by,the refo'rm ofithe ioio'pare.system.I
* A-diagnostic.,audii of the Banques Populaires has been conducted andia planIfora thefr rest:c,tm ng`,is-,.-
bileing agreled'. -i '2' - ''. '
' The Caisse'.Hypothecaire"'s being restructured as a housing bank, and a businesjlsiih,s abse-er
* j The Caisse Social is affected by unresolved arrears,from' Gove'rnm"ent't,i'chi 'ae unde- negBtia ion
'An. 'external audit of the NBR wiljeconducted*by-March 2002'..' - I.Fuli audits,of:three banks ivill beconducted in 2002,lahd on-s irn'sp' tj';n all 'banksevery year
- willUbe'istituted by 2004. *, ' . -: 4'. 1 a
4.5.3 Commercialjustice reform
237. The Commission on Constitutional and Legal Affairs is reviewing the status of all legislation inRwanda. There is a particular need to identify any legal obstacles that pose an impediment to privatesector development.
r J; _ 1;, ' :r . e , . .lActions i -,
*-A CommnercialCour t'is being,set.up, 1I L I'.
; A Tax C6o,ut and a S mall Claims Court are being cors idered - ' .-
Over 2002, th'eGovernment will consult the,private secto'r aout any needs fortlegal re'form.
4.5.4 Privatisation
238. Privatisation is important for poverty-reduction in Rwanda, as most of the enterprises to beprivatised require extensive investment, and the state does not have the resources to undertake this. Someof these enterprises, such as Electrogaz provide basic infrastructure that will influence the prospects forinvestment in the whole of the formal sector. Others, includinig food processing plants and possiblyhotels, can provide markets for the products produced by the small-scale agricultural and livestock sector.Other enterprises will provide significant amounts of employment. As well as the financial constraint, the
66
relative efficiency of the private sector in delivering productive output is an important reason forprivatisation.
239. There are some concerns about privatisation. One is that a country with a badly damaged image willbe forced to sell its assets off cheaply (or that no-one will bid at all). In this case, it may be better toassign a management contract and wait to sell the asset when the country's image has improved.However, in most of the cases in Rwanda, the costs of delay are likely to outweigh the benefits. Anotherconcern is that the enterprise may behave as a monopolist or a monopsonist (a monopoly buyer). In thiscase, consumers and producers may suffer because prices for outputs (such as electricity) are too high andprices for inputs (such as green tea) are too low. For this reason a sound regulatory structure is essential;in some cases, the Government may also choose to participate as a shareholder. Finally, some of theenterprises offer an opportunity to confer some assets directly on relatively poor producers. The mostimportant example is the tea plantations.
240. The Government is also concerned to ensure that the privatisation process helps the development ofan entrepreneurial.class in Rwanda. Providing funds for Rwandese people to participate will have indirectbenefits for economic growth that may stem from the development of the entrepreneurial class. Someshares in enterprises have been reserved for Rwandese investors (for instance, 43% of the shares ofRwandatel). The Government attaches great importance to ensuring that the privatisation process iswholly transparent, for both national and foreign participants. Since 1998 we have privatised aconsiderable number of enterprises and have established a timetable for the remaining ones.
;~~~~~~~~~~~~~~~~~~~~~~~~~~~~~~~~' -~*, t. !" '- i'; -'' ' *' '-7 '' I '' ' '1s 1b F, ' 1 . ., 1 |t | .. ~- _- r , . _ --.7 ' r- ' *i -1 " , I
* -The ne,w 'egF at zstucurs Ulbe imiIehmented over 2402 ;3,. o z .4.5.5 Manufacturing
241. The operation of manufacturing enterprises is a private sector role and the Government iswithdrawing from this sector through the privatisation programme. The establishment of the OfficeRwandais de Normalisation will help to regulate product quality. The implications of trade policy forpotential manufacturing exports are discussed in Section 5.1.1.
*fl~~ Office R~A-C.'d K. tL 1,1~ W -The 'Offic6widai'sde,No'rlisdtiontio .s been estabi eied aohit eo
4.5.6 Mining
242. Before 1985, the mining sector represented between 10% and 38% of export receipts. Public sectoractivities in prospecting have not yet located any deposits suitable for large-scale commercialexploitation, but small-scale, low capital investment mining is significant. Price fluctuations have led tothe closure of some mines, but there has recently been an important boom in the market for tantalite thathas generated exports and re-exports from Rwanda. The sector lacks an overall plan, and results of pastresearch are scattered and difficult to locate. The most promising investment opportunities are inconstruction materials. Metallic substances require more investigation. A Mining Code is needed toencourage private investment.
67
4.5.7 Tourism
243. Tourism was a major export before 1994. The parks, scenery: and climate are major assets.However, relatively high prices and weak infrastructure are a constraint.. The Government has apromotional role and responsibility for some public goods in this sector. Increased competition in airtravel (discussed in section 4.3.2) is important.
g04;sialgr-.fCr; ie to2t; t is ez PI r d';
lonanagementn of-ithe national parks,,tleiFd6Y,el6prent ofen l 4 fia &ameworkiaid apr,ootion,,ofthetcountr 's_imnage.ffor visitors-andi.nvestors.',; - r.,.> i 2 Yr 1
4.5.8 Artisanal activities
244. The Government has established a centre for the support of small-scale enterprises (CAPMER),which provides support services. Establishment of a legal framework and a national support network areenvisaged.
T|:s~hej Ai-'i '- .' 1 W 1 1......... * Xs-"i' ;~ *,. ,,, ;1 +j ;[ ,;;,,,' -l The-es'tablishmentlof a legal franework anda',nationa support ne . '
4.5.9 Services
The Government has developed a long-term ICT strategy for the future development of Rwanda'scompetitive advantage in this sector.
: 20.s ys J,;Cstrategy mentde. -
4.6 Social capital to support vulnerable groups
245. MINALOC is currently developing a social protection policy, which will also assess the roles,management and effectiveness of existing special funds that have been created to support vulnerablegroups. Including the Fund for the Survivors of Genocide and Massacres (VGF), a fund for the protectionof children in difficult circumstances, and a proposed fund for the handicapped and for the needy at thedistrict level. The NURC consultations found that some people were concerned about the management ofthe Survivors' Fund.
246. Many of the key actions to support vulnerable groups have to be undertaken by communities withlocal leadership. The development of social capital, by community-managed activities, is important inorder to generate the sense of solidarity. Some groups, particularly the Batwa, may be unable toparticipate fully in community activities, and there is a risk that their needs will be overlooked. Also,some communities consist largely of vulnerable groups, and these communities need special support.
247. In accordance with these principles, MINALOC has changed its approach to the management of thespecial funds under its control. MINALOC no longer deals with projects for vulnerable groups directly. Itis responsible for disbursing funds to the Provinces and consequently to the Districts which are thenresponsible for allocating funds amongst associations. Individual projects must be under the umbrella of
68
an association so as to ensure better management of the project and its funds. At the local level,associations have to coordinate with the NGOs that are carrying out vulnerable group projects in theirarea to limit duplication and resource wastage. NINALOC is now able to focus on policy formulation andthe setting up of funds for various vulnerable groups. A new proposal under consideration by Governmentis to develop the existing mechanisms into a social solidarity fund to which Government and the privatesector would both contribute.
- .~~~ j '.I. '~~~Actions-
* We will provide support throdgh e6'iGe nocid,Tr' ,fd 'dth`:sOe ia ddI -2002 guidance wi1l be given Joiloc ea'dership o towards vuninerable o
* Some vulnerable groups are pirticiularly at risk from 'HTV/AI)S ` u` ido`hs who'bave'1ost assets,,and chiild-beaded households,;and measures will'be targeteci at'them., -m . : -~~ - ~: 7 -.. -. , .., -F 4 10 '' .1 - . I . , I $" . ,. -J
* The future'modalities 'fordnglthe-ppbial' fiidsZfor,diadvantaged ,groupis, including the possibiity,of pnvatesectorpartici:paton' will betkept,underrevi ew.v ,
4.7 Cross cutting Issues: technology, gender, environment, imidugudu, HIV/AIDS, employment,capacity-building and inequality
248. There are a number of cross-cutting issues which have implications in all sectors. Actions in theseareas are taken within all sectors (outlined in section 5.3); these issues must therefore be mainstreamedinto sector strategies rather than just treated as separate policies.
249. Every sector strategy must take into consideration each of these cross-cutting issues in all policyand programme formulation. The areas considered are technology, gender, environment, imidugudu,HIV/AIDS, employment, capacity-building and inequality.
Technology
250. In most of the cases discussed above, Rwanda's economic growth will depend on technologicaltransformation. We need to use available and emerging technologies in an imaginative way to suit ourcircumstances. This is particularly true in agriculture, where our strategy is based on the use of improvedmodem inputs, and in information and communications technology, where we aim to establish acomparative advantage.
251. The Government of Rwanda recognises the role that Information Communication Technology(ICT) can play in accelerating 'the socio-economic development of Rwanda towards an information andknowledge based economy. The emerging information revolution offers Rwanda a window ofopportunity to leap-frog the stage of industrialisation and transform her subsistence economy into aservice-sector driven, high value-added information and knowledge based economy that can compete onthe global market.
252. The Government has therefore established the Rwanda Information Technology Agency (RITA)and developed a twenty-year strategy ICT-led socio-economic development framework and an integratedplan for 2001-5. This contains the following broad strategies:
* To promote and encourage the development and utilisation of ICT within the economy and society* To transform Rwanda into an IT literate nation* To improve the efficiency of the civil and public service* To improve the information and communications infrastructure of Rwanda
69
* To transform the educational system using ICT* To improve the human resource development capacity of Rwanda* To develop a legal, institutional and regulatory framework to support ICT* To promote social and cultural interaction within the society.
Gender
253. We have acted to increase female political representation, setting up women's councils at allpolitical levels and promoting affirmative action in local administration. The new marital and inheritancecode has strengthened the opportunities for co-ownership of assets by married couples, and the new landpolicy will support women's land rights. Women's funds have been established at the District level. TheGovernment has ratified the Convention on the Elimination of all forms of Discrimination againstWomen (CEDAW). All public services need to ensure that access, utilisation and impact are equitablebetween women and men. The evidence surveyed so far indicates that there is. little gender gap in primaryor secondary education in aggregate, but that the profiles of private and public sectors differ quitesignificantly.
254. The Ministry of Gender and the Promotion of Women (MIGEPROFE) will assist sectoral ministriesin ensuring that the objectives of the National Gender Policy are mainstreamed and monitored in eachsectoral strategy. It will be mandatory for all ministries to follow this policy. The Gender Action Plan wasadopted in August 2000. The main areas of action are as follows:* Poverty: analysis and adaptation of macroeconomic policies, actions to encourage female
entrepreneurship, and review of credit delivery and banking practices.'* Policy development: conduct a review of all existing data and statistics to produce a more fully gender
disaggregated analysis. This will be used to undertake a full review of all existing governmentpolicies and provide the basis of improved advocacy and monitoring. Guidelines and modalities forgender mainstreaming will also be drawn up and gender sensitisation of key staff in all line ministriesand other institutions undertaken.
* Education: integration of gender in the curriculum, sensitisation about the importance of femaleeducation, functional literacy; better female access to ICT.
* Legalframework: full implementation of CEDAW, the implementation of the Gender Legal ActionPlan that was prepared in partnership with civil society, reduction of violence against women throughthe introduction of appropriate legislation and the training of paralegal staff; and encouraging couplesto legalise their marriage status.
* Decision-making: encourage gender balance in appointed and elected positions; increase women'scapacity to participate in decision-making and leadership
* HIV/AIDS and reproductive health: prioritise the reduction of maternal morbidity and mortality; makehealth services gender-sensitive; increase resources for women's health: promote multi-sectoralapproach to fight HIV/AIDS.
Environment
255. The three major environmental problems in Rwanda relate to water, soil and biomass. Theseproblems are intimately linked with actions in the water, energy and agricultural sectors. Henceenvironment is a cross-cutting issue and an environmental perspective needs to be taken in each case. Theprimary objective of environmental policy in Rwanda will be to ensure that economic development issustainable and does not destroy the natural resources on which it depends through full marshland
70
drainage or inappropriate use of agro-chemicals. The organisational structure of environmental regulationand policymaking is under review.
256. It is important to appreciate that apart from regulation, most of the positive interventions to supportenvironmental protection are taken within other sectors. In particular, infrastructure such as terracing,reforestation and water management within marshes will be undertaken as part of the agriculturalstrategy. The clarification of property rights to be achieved by land policy will also be essential to ensurethat people have an incentive to invest in their land. For both these reasons, it is envisaged that theMinistry of Land, Resettlement and Environment (MINITERE) should play an important role in theformulation of agricultural policy. The process of reforestation will also be supported by actions in theenergy sector, encouraging more efficient use of fuelwood and substitution into other fuels. Themanagement of water supply will be supported by MINERENA as well as actions to encourage waterharvesting in the settlement and housing sector.
Imidugudu
257. The Government is committed to encouraging people to live in imidugudu, i.e. grouped settlements.The success of this policy will depend on the provision of adequate social and productive infrastructure.For this reason, the location of imidugudu will have implications for all the sectoral ministries. Assectoral strategies develop, it will be essential to mainstream this consideration within them. For thisreason, focal points have been established in each ministry to address issues of human settlement.
258. It is recognised that some of the early implementation of the imidugudu policy was hasty andproblematic in some places, partly reflecting the level and speed of the influx of returning refuges and thevery difficult security situation in which it was undertaken. For this reason the selection of sites forimidugudu will become a much more participatory exercise. New construction in rural areas outside thedesignated sites will be prohibited, but the community will be thoroughly involved in identifying wherethe sites are to be. Implications for agriculture and for infrastructure provision will be taken into account,implying that the average sites will be smaller than was originally envisaged, so that the distance to plotsis kept down, reducing the danger of crop theft and encouraging investment in technology and inputs.
HIV/AIDS
259. HIV/AIDS, like malaria, has a devastating impact on the whole society, because of its effect on theadult population, creating new dependants and undermining human development and economic growth. .It is estimated that 400 000 adults are currently infected with HIV and that 5-10% develop AIDS everyyear. The Government has developed a proposal for a national strategy for multi-sectoral interventionsagainst HIV/AIDS. The programme has been costed at US$68 million over five years. The areas ofintervention are:
* Prevention of HIV transmission by reinforcing information, education and communication* Provision of voluntary testing and counselling* Promotion of the use of protection* Reinforcement of the treatment of sexually transmitted diseases* Safety of the blood supply* Prevention of mother-child transmission* Medical and psycho-social care of people with AIDS* Support to affected individuals and families
71
* Development of research* Coordination of activities* Regional collaboration in the campaign against HIV/AIDS* Human resource development
260. These interventions will mainly be implemented through sectoral strategy processes, and the costswill therefore need to be reviewed as these sectoral ministries refine their estimates of the costs of theirwhole programme. The process of mainstreaming these interventions into sectoral strategies is under way.Underlying factors such as gender relations, poverty, inequality and lack of access to information need toremain a key focus. It is important to emphasise that Rwanda is well endowed with social, political andreligious structures which can be harnessed to transmit awareness of the causes and prevention ofHIV/AIDS; by using these structures, it should be possible to reduce the costs of spreading awareness.
Inequality
261. Poverty responds both to the average level of income and the extent of inequality. As discussedabove, the level of inequality in Rwanda has risen since the mid-1980s, the Gini-coefficient increasingfrom 0.27 to 0.455, mainly because of a widening urban-rural gap. It is important for poverty reduction toseek to reverse or at least halt this increase.
262. The effects of policies on income distribution need to be mainstreamed in all sectors. Examplesinclude the distributional effects of taxation, the incidence of the benefits of public services, and thebalance of public goods across sector. The PRSP attempts to mainstream distributional considerationsthroughout. In particular, the agriculture-led nature of the strategy will tend to increase incomes in ruralareas, and the development of sectoral strategies will aim to increase the accessibility of all publicservices to the poor and to prioritise the public services that have direct poverty benefits.
263. Perceptions of inequality and social exclusion in the broadest sense have been a major feature ofRwanda's history and were the basis for the manipulation of the Rwandese people and ethnicisation of allaspects of life which laid the foundation for the genocide of 1994. Reducing poverty, inequality andbuilding an inclusive society must be the basis of unity and reconciliation and the mainstreaming of thework of National Unity and Reconciliation Commission (NURC) into every sector of policy and life inRwanda.
Capacity-building
264. The genocide left an acute shortage of skilled personnel in public and private sectors. Capacity-building is therefore a fundamental aspect of public policy. However, it cannot be treated as a separateactivity but needs to be an integral part of sector strategies. Investment in particular skills is successfulonly when people have the opportunity and incentive to use their skills productively. Many countries havedeveloped skills in the public sector, only to find that their technicians then leave for better-paid jobsoutside the country. We need therefore to develop an enabling management culture in which those whoupgrade their skills are rewarded by being given the opportunity to exercise them and sometimes throughfinancial incentives. Thus for the more effective management of institutions, management informationsystems and skills is vital.
72
Employment
265. Underemployment can cause suffering and frustration even when it is not associated with incomepoverty. This is particularly important to a post-conflict society, where young people's energies need tobe put to good use. This implies that every sector of Government needs to seek opportunities for labour-intensive methods of carrying out their objectives. In particular, the development of infrastructure in ruraland urban areas is well suited to a labour-intensive approach.
266. A major expansion of labour-intensive public works is being put in place as part of ruraldevelopment. MINAGRI, MINITERE, MINITRACO and MINALOC will need to liase in this process.MIFOTRA will play a coordinating role in this sector, as it is responsible for the National EmploymentPolicy. To this end, MIFOTRA is currently considering the introduction of a National Programme forReintegration. It will be necessary to consider the links between this programme and other publicinitiatives.
73

5 THE MACROECONOMIC FRAMEWORK, EXPENDITURE MANAGEMENT ANDSECTORAL STRATEGY PROCESS FOR POVERTY REDUCTION
5.1 The objectives of macroeconomic policy: macroeconomic stability and incentives for growth
267. Our macroeconomic policy has two fundamental objectives: to ensure macroeconomic stability, andto create incentives for growth. Macroeconomic stability ensures that agents can trust the economicenvironment in which they operate. In addition, growth in a liberalised economy requires that theincentives exist to encourage investment in the most dynamic sectors. The proposed macroeconomic andmicroeconomic policies are outlined in the policy matrix (Annex 8).
268. In the last few years, the economy has been liberalised through the reduction of tariffs in line withthe objectives of the Cross Border Initiatives of COMESA. The coffee export tax has been removed, teaprices have increased to reflect world prices more closely, and foreign exchange has been liberalisedincluding the introduction of foreign-currency deposits and a weekly auction. Rwanda is a member ofCOMESA, and will progressively remove the taxes on trade within the COMESA region by the end of2004.
269. Opening up the economy also requires the removal of taxes on the imported inputs that go intoexport products. Such taxes undennine the re-export sector and make some processing activitiesunprofitable. There are three possible ways of doing this: (a) by creating a free trade or export processingzone; (b) by removing all taxes on trade so that imports would be liable to VAT and excises, but not toimport duty; (c) creating a functioning duty-drawback scheme, so that exporters can claim back the taxesthey pay on imported inputs. The disadvantages of an export-processing zone, however, are thesubstantial investments needed to establish them and the weak linkages between enterprises inside thezone and those outside it. However, such linkages are central to the development strategy of Rwanda. Aproperly functioning duty drawback scheme would, therefore, have the same advantages as an export-processing zone, but without its disadvantages. In the case of rerexports, a bonded warehouse approachcan be undertaken, where goods imported for re-export are kept in bonded .warehouses while inside thecountry. The private sector has raised the question of incentives for re-exports during discussions for thePRSP, and this will be addressed further.
270. High inflows of aid and public expenditure on local goods and services can reduce the incentive toexport. However, if the extra spending supports the country's export capacity by increasing agriculturalproductivity and reducing transport costs, the benefits should outweigh the disincentives to exporters. Theevolution of incentives will be monitored by closely following the movements of the real exchange rate.In accordance with best practice, the central bank will intervene in the market to smooth out short-termfluctuations while allowing the exchange rate to adjust to fluctuations such as export price movements.
Ij ~ ~ ~ ~ 4 LA*ictio~ 1
r ~ ~ ~ ~ ~ ~ ~ ~ .I* The c06fnt'systerno 6iet ngeiltl,beternm,tro i Ms6asitosenurd-that 'deviations-.,- from them _ut
5.1.1 The impact of international trade agreements
271. The Uruguay round of the WTO has set a timetable for the liberalisation of markets in developedcountries. After a transitional period, quotas on the most important commodities will be eliminated,preferences will be phased out, and tariffs will be reduced. While these changes help developing countriesin general, the impact on African countries is uncertain as the agreement also involves removing
74
preferences that were of benefit to them. During the' transitional period, the USA and the EU have takensome specific actions to support African exports. The most significant of these is the Africa Growth andOpportunities Act (AGOA). This opens US markets to African commodities, particularly garments, onpreferential tariff terms. The preferences will last until 2008 for countries that use their own rawmaterials, but only until 2004 for those that import it. Entry to COMESA will expose Rwandesebusinesses to competition from other African countries, in addition to offering them new opportunities forexport within the region. It is therefore all the more important to make Rwandese enterprisesinternationally competitive, especially by reducing the cost of energy.
' Rn''Rwa'n' de'se enterpnises' wull'ecouagt'ev iofhnewoppqu e-su n O
5.2 The macroeconomic framework
Annex 5 presents a macroeconomic framework agreed with the Bretton Woods institutions and consistentwith the baseline expenditure scenario presented in Annex 7. A Poverty and Social Impact Assessment isbeing conducted to examine the macroeconomic and poverty impact of possible increased expenditures(presented as 'constrained' and 'unconstrained' scenarios in Annex 7, and discussed below); the findingsof this study will be taken into account in the review of the PRGF.
5.2.1 Growth
272. Even before the events of September 11, 2001 in the United States there were signs that the slumpin financial markets, as well as diminishing demand and economic activity in industrial countries, hadstarted to affect the economic performance of developing countries. Although the magnitude of theimpact will depend on consumer and business confidence in the industrial countries, it is clear thatdeveloping countries will have reduced access to international financial markets and that lower demandwill cause commodity prices to fall. This will have a direct impact on Rwanda through falling tea andcoffee prices and will delay investment in exports and tourism. Moreover, security concerns are alsotranslating into higher costs for airline transport, reduced tourism and higher transportation costs forimports. The impact on oil prices is uncertain as both demand and supply are expected to fall.
273. These considerations have been taken into account in the macroeconomic projections, particularlyfor 2002, and a cautious view of growth prospects has been adopted. The growth rates projected are 7.3%in 2002, 6.1% for 2003, and 6.2% for 2004. Predicted growth in the primary sector is based on themedium-term analysis discussed in Section 3.2. Primary sector growth is predicted to start at 5.2% andaccelerate over the period, as the effect of increased input use reinvigorates the soil. Manufacturing ispredicted to accelerate sharply at 11.5% in 2002, and then slow down to a more sustainable rate of growthof around 7%. These projections are based on the expansion of specific manufacturing capacity, includingtobacco and brewing. The service sector is projected to grow more slowly, reflecting the depressingimpact on the transport sector of the recent events. Mining is expected to contract after the recenttemporary boom.
5.2.2 Fiscalpolicy
274. The Government is committed to ensuring that its expenditure programme does not lead tounsustainable imbalances. The measures monitored include the overall deficit. The overall deficit can becalculated either by including or excluding external grants. Short-term macroeconomic management also
75
depends on the methods of financing the deficit. Specifically, domestic financing from the banking sectoris rigorously controlled, as it is likely to encourage monetary expansion and lead to higher inflation.
275. Sustainability in Rwanda, while requiring deficit reduction in the long run, also necessitatestemporary increases in expenditure. The expenditures proposed in the enhanced scenarios presented inAnnex 7 have been carefully designed to reduce rather than increase permanent recurrent commitments.For example the promotion of the use of bed-nets, maintenance of roads, expenditure on environmentalinfrastructure, spending on HIV/AIDS, labour-intensive public works to absorb temporaryunemployment, demobilisation and gacaca are all likely to reduce, rather than increase, the futureobligations of the Government. Correspondingly, the construction of new facilities and the recruitment ofnew staff have been restricted. This temporary increase is thus designed to enhance, rather than reduce,long-term sustainability. For this reason, a temporary increase in the primary and overall deficits is notonly consistent with, but also actually supportive of, long-run sustainability.
276. Details of the expenditure programme and the associated improvements in expenditure managementare presented in Section 5.5, 4.4.9/10 and Annex 7. The expenditures in Scenarios 2 and 3 of Annex 3will be considered subject to the findings of the Poverty and Social Impact Assessment (PSIA), thereview of the macroeconomic programme taking these findings into account, and the availability ofresources. The PSIA (which is being conducted by independent researchers) will be concerned toreconcile the needs for poverty-reducing expenditures with the need for a prudent and stablemacroeconomic programme, and will be discussed extensively with all stakeholders.
277. The Government is undertaking comprehensive reforms of the taxation system with a view toincreasing the efficiency and equity of the tax system as well as increasing the revenue ratio, (discussedfurther in Section 5.5.1 and Annex 5, Table 5.2). The commercialisation of small-scale agriculture andlivestock will also increase the revenue ratio over time, as rural producers start to buy goods and payindirect taxes. However, fiscal prudence dictates caution in the projection of the revenue ratio. This is notto be confused with a weak commitment to the objective of raising the tax ratio, which the Governmentviews as extremely important. The revenue ratio to GDP is projected to rise over the three years.
[;. i- pc ateicome tax rate ~S redu'ci a ill' I I
l;; rf wiEoth frates;'wllet 7i'+e;h'tlprl7ln ofops 0foSt re,O S no;external ;
Re t wg e nd Authjem II ti nc S.n e
5.2.3 External balances
278. Exports are expected to increase between 2002 and 2004, because of an increase in coffee exportsdue to the implementation of the Action Plan, and an increase in tea exports in 2003 and 2004 because ofthe impact of privatisation. The international prices of coffee and tea are projected to fall in 2002 (takinginto account recent events) and rebound thereafter. There should also be some increase in the export ofcommodities such as potatoes, traded within the region, although accurate measurement of cross-bordertrade for these commodities is difficult. Imports are projected to rise.
76
5.2.4 Monetary policy
279. The money supply is expected to increase over 2002-04, reflecting increased economic activity. Theincreases in money supply can be accounted for mainly by increases in net foreign assets and in credit tothe private sector, rather than credit to the public sector. For 2002, the target for broad money growth hasbeen set in line with nominal GDP growth of 9.4 percent.
5.2.5 Prices and exchange rate
280. Inflation is projected to rise from 2% to 3% over Scenario 1. The exchange rate is expected todepreciate slightly in real terms.
5.2.6 Domestic debt, expenditure management external debt burden
281. Existing domestic debt is being addressed. In 2002, the Auditor General completed an investigationof Rwf 27 billion in claims (arrears). A plan for repayment of domestic arrears, including someconversion into treasury bills, has been developed. Better debt management will require the developmentof better measures for commitment control. A cash budgeting system has been put in place and strictercommitment procedures are being followed since January 2001, when a Cash Planning Division wascreated within the Budget Department. The impact of the enhanced scenarios on external debt will dependon their method of financing. We will seek to obtain the additional resources in the form of grants ratherthan loans; the induced increases in exports and revenue will improve the measures of debt sustainability.
* Government expenditure:wilIlbe controlled by;th'e e"ofa comitien(and control system and by'therestructrngof existig:,domestic deb5. - -F
5.3 Expenditure for poverty reduction
5.3.1 Criteria for prioritisation
282. Given the need to prioritise actions within the framework of the priority programmes, the followingcriteria have been used, and will be used in future, to prioritise expenditure. The criteria were discussedby two working groups at the validation workshop for the PRSP and have been revised in light of theworking groups' recommendations.
* Expenditures must contribute, whether directly or indirectly, to the reduction of poverty. Expenditureswill be targeted at those activities which the private sector cannot realistically be expected toundertake.
* Expenditures will target those activities which can be shown to have high socio-economic impact, asmeasured by rates of return or other quantitative criteria.
* Expenditures will target the activities that commnunities have identified as important to them.* Expenditures will be directed to well planned activities for which realistic and modest unit costs have
been identified and where there is a well-developed expenditure proposal.* In cases where the previous two criteria are not met but the activity meets the other criteria, priority
will be given to supporting policy development and planning in the sector.* Expenditures that reduce future recurrent costs will be prioritised, for instance bed-nets, non-wage
funds (books, materials and teacher training) to schools, road maintenance, and water supply.* Expenditures will be targeted at those activities which can affordably be extended to the whoie
relevant target population, rather than those which could only be delivered to a few.
77
* Activities that are labour intensive and create necessary infrastructure for development will beprioritised.
* Activities that favour disadvantaged groups, including activities which address gender or age-basedinequities and protect the rights of children, and activities that reduce economic inequality will beprioritised.
These criteria have been applied to the various expenditure proposals in the priority programmes detailedin Annex 5. In addition to the PPA and the priorities identified by working groups at the validationworkshop for the PRSP, information has been used from the CWIQ, the costing exercise performed aspart of the preparation of the PRSP, documents prepared for the Public Investment Programme, and othersources. The actions included in each sector and outlined in Section 4 are derived from this analysis.
5.3.2 Institutional structures for prioritisation
283. The Ministry of Finance and Economic Planning is responsible for advising the Cabinet onexpenditure prioritisation, through the budgetary process. Within MINECOFIN, frequent liaison betweenthe Budget Department, CEPEX, the NPRP and the Strategic Planning Department will be essential toensure that a consistent approach to prioritisation is applied throughout the recurrent and developmentbudgets. The 2002 budget preparation and prioritisation has already benefited from this collaboration.This coordination will be strengthened over the course of the next year and MIECOFIN will also liasewith sectoral groups (ministries, local authorities, and other stakeholders) to ensure that a wide range ofviews is taken into account. The aim is that increasingly the sector strategy process will take on the roleof developing clear prioritisation within each sector.
5.3.3 Priority programmes
284. Within the recurrent budget, a subset of programmes has been identified as high-priority forpoverty-reduction. This subset plays three roles:
* The share of expenditure on high-priority programmes is to rise and is monitored. When theprogramme definition is changed, figures are calculated both for old and new programmes to ensurethat changes in the share are not due to redefinition.
* The programmes are earmarked for a higher rate of expenditure growth in the recurrent budget* The programmes are protected from within-year budget cuts.The overwhelming majority of expenditures on the development budget correspond to priorityprogrammes in the recurrent budget. The list of priority programmes has been revised during this budgetround, using the criteria discussed above. The revised list is presented in Annex 6.
5.3.4 Costing priority programmes
285. To refine the prioritisation further, all sectoral ministries with priority programmes provided costedestimates of their needs as part of the preparation for the PRSP. These costings were financiallyunconstrained, being restricted only by concerns of policy and practicality. Ministries were asked toprovide unit costs and quantities for each input. This exercise will provide an important basis for sectoralplanning. The costings were scrutinised for technical accuracy and policy coherence, in the light of thecriteria.
78
5.3.5 The proposed expenditure programme286. As anticipated, the need for expenditure is considerably greater than existing resources. In additionto the baseline, Annex 7 presents two scenarios for a proposed comprehensive expenditure programme.The first scenario represents the total, unconstrained expenditure required to fully meet the needs ofpoverty reduction. It presents a broad range of expenditures, based on the submissions of ministrycostings, but reviewed using the criteria presented above. The second scenario is constrained to anadditional expenditure of just Rwf 50 billion, which better highlights the programmes' financial priorities.Expenditure already programmed is presented in the first three columns, and the proposed increase ispresented in the second three columns. The total programme is presented in the last three columns. Ineach case, the proposed increased expenditures are based on costed proposals, although the detail of thecosting varies by sector. The tables also show the recurrent and development expenditures alongside eachother and whether additional expenditures are specifically proposed at the central or local level. Importantfeatures include the following:
* An increase in labour-intensive public works on reforestation, terracing and wetland and water shedmanagement, agricultural extension and credit. These are designed to support agriculturaltransformation while providing better environmental sustainability and increasing employment.
a An increase in preventive spending in health and some support to reducing selected drugs prices andsupporting the development of mutuelles, aimed to improve access to the health system* An increase in road maintenance and rehabilitationa An increase in the provision of textbooks for primary education* A short-term increase in shelter provision to resolve the problem of lack of shelter.
5.3.6 Financing and delivering the extra resources287. The extra expenditure covers both the recurrent and capital budgets, and most of it will be at thelocal level. Hence the allocation of expenditure will be indicative rather than exact. The funds may flowthrough the recurrent transfers to districts, through the Common Development Fund (CDF), through theubudehe mu kurwanya ubukene programme, or by direct transfers to facilities. It is important that enoughresources are also made available to meet the recurrent needs of services such as agricultural extension,road maintenance, health and education. The Government will consult donors on the form in which theycan contribute to these priorities. We anticipate that donors will need a variety of funding mechanisms,including budget and project support.
5.4 Public expenditure management
5.4.1 The budgetary system
288. The budget is based on submissions from the ministries, coordinated by the Budget Department andassisted by CEPEX for the development budget. The development budget is prepared by CEPEX andpresented in the form of the Public Investment Programme (the PIP), which translates actions within eachprogramme into projects. The programme classification on the two budgets is being harmonised with afull merger planned during 2002.
289. Both the recurrent and capital budgets use a 3-year forward planning approach, although theirplanning approaches have not been integrated in the past. The 2002-4 PIP is now in draft and anintegrated forward projection can be presented for both recurrent and development budgets. In the spiritof the MTEF approach, the objective is to integrate these two processes as closely as possible, so that thetime-frame and programme definitions are the same, and that decisions on the magnitudes would be taken
79
at the same time and by the same people. The PIP presentation remains essential to show how individualprojects relate to the overall programme, as well as to show the aggregate implications of projects thathave already been negotiated or are in the course of negotiation. Sectoral strategies will be reflected in thepresentation of projects in the PIP.
290. The end product is the Finance Law. This presents a one-year recurrent budget and a three-yearsummary of the PIP. In the event that extra resources are forthcoming in 2002, as assumed in Scenarios 2and 3 of the macroeconomic framework, a budget revision will be presented to Parliament to authorisethe corresponding expenditures.
5.5 Resource mobilisation and tax policy
5.5.1 Taxation
291. Tax policy aims to increase revenue mobilisation while raising revenue in an equitable way, inorder to cause as little economic distortion as possible. In the last few years, the Rwanda RevenueAuthority (RRA) has been established, excise taxes have been shifted to a value-added basis, the incometax has been reformed, and trade taxes have been greatly reduced. This year a VAT has been introducedsmoothly. Most of these changes will have progressive benefits and will bring about an improvement inefficiency. The structure of taxation is shown in Tables 5.2 and 5.3 in Annex 5.
292. Rwanda's revenue remains a small proportion of GDP. The main reason for this is the low share ofoutput brought to market. The share will rise as the economy commercialises, but the macroeconomicprojections 'deliberately take a cautious view of the likely evolution of the tax share, in order not to makeunrealistically high expenditure projections that would later need to be reduced. Revenue measures underconsideration include reforms to remove enterprises' exemptions on VAT, and to introduce excise onsome luxury items. PTA tariffs will be replaced by COMESA ones, elirninating import duties on goodsimported from COMESA countries. Table 5.4 in Annex 5 shows the main reforms being implementedand those being considered.
293. Three issues of importance for poverty are transport costs, local taxation and the operation of theduty drawback. Imported petroleum is currently taxed at a rate of 96% (including excise tax and VAT).Taxation of travel for leisure purposes is almost certainly progressive. However, the impact of taxation onfuel used to move goods is harder to assess, since some of this tax falls on small-scale producers. Iftransporters and other related businesses are in the income tax net, they will be able to write the costs offagainst income, reducing the potential disincentive effect. We are hoping to extend information about theincome tax, with a simplified tax return, so that small entrepreneurs will be within this net. The petroleumtax might, however, still pose a disincentive for farmers' groups, unless they can register as corporateentities. Another concern is the environmental implication of the tax on kerosene. However, it can be seenthat the petroleum tax produced 12% of revenue in 2000, and therefore it would be necessary to findcompensating revenue measures before considering a reform. As the tax base expands and the tax reformsare consolidated, reform may become more desirable. For these reasons the effect of petroleum taxationon the commercialisation of the rural economy and on the incentive to use environmentally friendlycooking fuels will be kept under review.
294. The new decentralisation policy introduces a reform of local taxation. A property tax will beintroduced to support local Governments' revenue base. The regressive head tax and livestock tax are tobe abolished. Currently, local Governments are acutely short of resources and there are reports that some
80

authorities are levying income taxes, although the legal framework allows only for a highly regressiveflat, head and livestock tax. A clear framework for realistic and progressive local taxation is thereforeneeded; better-of households should be expected to pay more than the poor. Fiscal transfers from thecentre will remain a major part of districts' and provinces' incomes.
- - Loca;e ill e- 'refor ned'inilii n t ihdfi decentr~fsa tion6 poziGnadiproprerty;ta ewill t5e!.r4~'.i f,.4
-. , . itrod ce-t- .:;, J.-_l-- .;-;,r.,,_
5.5.2 Donor resources
295. As noted above, the Government prefers to receive resources on the most flexible terms. However,many donors prefer to provide project support rather than budget support. The Government will discusswith donors the best way to integrate projects into the overall strategy. Three principles are central:- Projects should be conceived within a sector strategy and consistent with the priorities of the sector.- Projects should have cost structures appropriate to the Rwandese economy. For instance, tendering
procedures should not exclude local contractors by imposing unrealistic requirements.- Development partners should consult the Government's Proposal Guideline document for donor
implementation of the PRSP, soon to be finalised, and the joint donor and Government document,'Guidelines for Productive Aid Coordination in Rwanda'.
A fast exit strategy for donor assistance would imply severe contractions of public services. The focus inthe medium term must be on ensuring that the Government manages resource flows in an integrated way.
5.6 The Sector Strategy Process
5.6.1 The role of sector strategies
296. Through the implementation of a more integrated MTEF process, ministries will be able to furtherdevelop sector strategies to reinforce planning and budgeting processes. A sector strategy is acomprehensive vision and strategy for an entire sector, which informs all support to that sector (thepublic sector, all development partners including NGOs, and the private sector), and is implementedthrough a common framework and a public expenditure programme. In Rwanda, improving the sectorstrategy process is vital for the effective planning and budgeting of Rwanda's scarce resources. Atpresent, all ministries draft separate ministerial policies that sometimes overlap (such as agriculture andenvironment) and at times duplication may occur due to insufficient coordination of programmes andresources. Some ministries have already begun to improve their coordination with other agencies andtheir efforts must be supported and encouraged by MINECOFIN and donors. The strategies will bedrafted by Government and will build on existing policies and plans, Public Expenditure Reviews,Thematic Consultations, the 2001 PRSP costings, and strategy documents and research prepared by otherstakeholders. The development of sector strategies can be expected to have the following benefits:
* Improvement of the planning and budgeting processes as ministries and donors work more closelytogether to implement one strategy in each sector.
* Increased coordination within programme areas will create clarification of responsibilities, reduce theburden on overstretched government resources and increase ministries' capacity to absorb financing.As ministries increasingly plan and budget together, their resources, particularly capacities, skills andknowledge can be pooled.
81
* Better sectoral coordination will also save scarce funds as less programme duplication occurs withinpolicies.
* Donor coordination will be greatly improved as donors follow a common strategy for policies withina sector. This will enable ministries to have greater control over the allocation of donor resourceswhich should be consistent with comprehensive sector strategy.
* The sector strategy process will serve to formalise working relationships between MINECOFIN, lineministries and donors. They will clarify who should work with whom, and who is responsible forwhat. This will create a formal sector structure through which better coordination can be achieved.
297. The first step toward sector strategies is ensuring that ministries in the same sector, work closertogether in preparing their programmes and align their budgets. In order to do this, the sector and ministryresponsibilities must be clearly delineated. Below is a proposed list of sectors (table 5.1), which werereviewed in consultation with stakeholders; each row in the table corresponds to a 'sector group' andsuggests the principal and supporting ministries and organisations that should be members of each group.Govermnent budgets will continue to be detailed by programme under the heading of each Ministry,though eventually budget programmes will be classified solely under their respective sector. The sectorstrategy approach implies coordinated planning between those ministries who work in the same area, suchas MINEDUC and MIJESPOC, or MINAGRI and MINITERE.
298. As ministries and all development partners work together in a more coordinated manner within theirrespective sector groups, separate ministerial policies can be unified into one comprehensive, sectoralframework for more effective and efficient resource allocation. A model to further develop this sectorstrategy process could include the following:
* T dentification of the principal government agencies in each sector with responsibility for thecoordination of the sectoral group and development of the sector strategy.
* Identification of the key donors in each sector and coordination with them, with the assistance ofUNDP who have been nominated as a facilitating agent for this process. This is developed further inthe joint Government and donor document, 'Guidelines for Productive Aid Coordination in Rwanda'.
* The NPRP will participate in order to ensure that each sector strategy is consistent with the nationalplanning framework of the PRSP.
* MINECOFIN, MINALOC, MINICOM, MINITERE, MIGEPROFE, NURC and CNLS must makesome input into all sector strategies to ensure that economic strategy, decentralisation, trade issues,and environmental and gender sensitivity are incorporated.
* The private sector will have substantial representation in each group.* Parliament would be informed of progress at regular intervals.
82
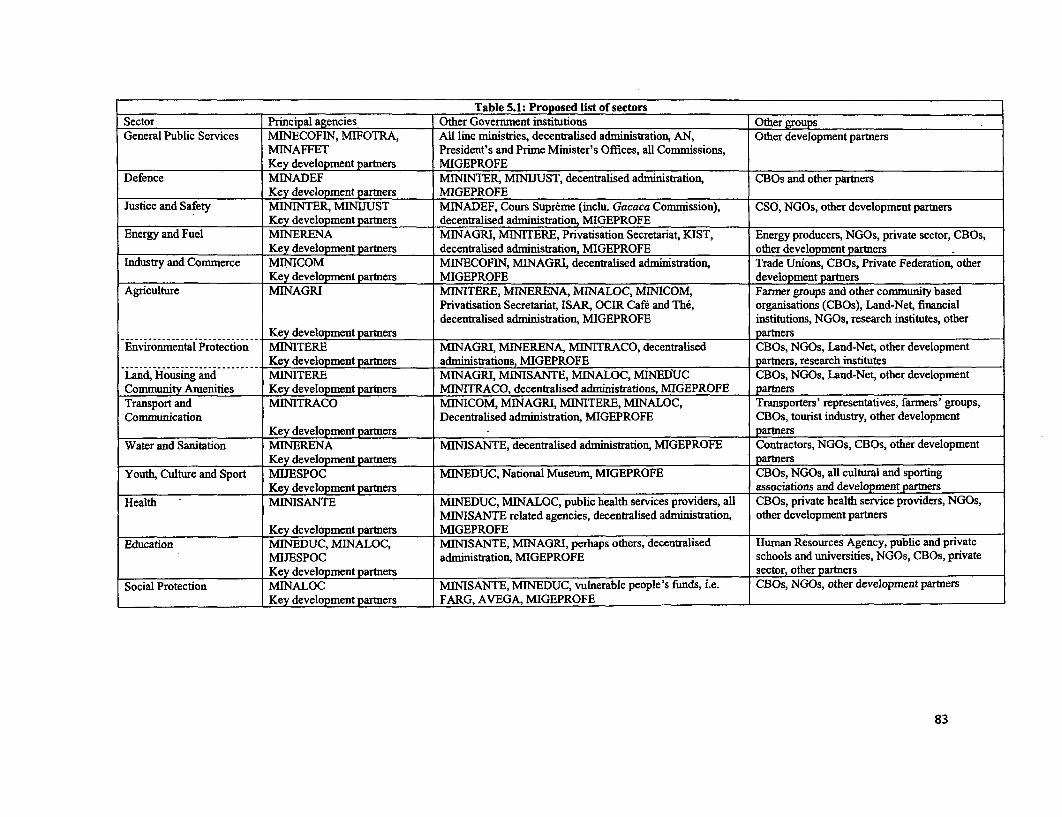
Table 5.1: Proposed list of sectorsSector Principal agencies Other Government institutions Other groupsGeneral Public Services MINECOFIN, MIFOTRA, All line ministries, decentralised administration, AN, Other development partners
MINAFFET President's and Prime Minister's Offices, all Commissions,Key development partners MIGEPROFE
Defence MINADEF MININTER, MINIJUST, decentralised administration, CBOs and other partnersKey development partners MIGEPROFE
Justice and Safety MININTER, MINUUST MINADEF, Cours Supreme (inclu. Gacaca Commission), CSO, NGOs, other development partnersKey development partners decentralised administration, MIGEPROFE
Energy and Fuel MINERENA MINAGRI, MINITERE, Privatisation Secretariat, KIST, Energy producers, NGOs, private sector, CBOs,Key development partners decentralised administration, MIGEPROFE other development partners
Industry and Commerce MINICOM MINECOFIN, MINAGRI, decentralised administration, Trade Unions, CBOs, Private Federation, otherKey development partners MIGEPROFE development partners
Agriculture MINAGRI MINITERE, MINERENA, MINALOC, MINICOM, Farmer groups and other community basedPrivatisation Secretariat, ISAR, OCIR Cafe and The, organisations (CBOs), Land-Net, financialdecentralised administration, MIGEPROFE institutions, NGOs, research institutes, other
Key development partners partnersEnvironmental Protection MINITERE MINAGRI, MINERENA, MINITRACO, decentralised CBOs, NGOs, Land-Net, other development
- Key development partners administrations, MIGEPROFE partners, research institutesLand, Housing and MINITERE MINAGRI, MINSANTE, MINALOC, MINEDUC CBOs, NGOs, Land-Net, other developmentCommnunity Amenities Key development partners MINITRACO, decentralised administrations, MIGEPROFE partnersTransport and MINITRACO MINICOM, MINAGRI, MINITERE, MINALOC, Transporters' representatives, farmers' groups,Communication Decentralised administration, MIGEPROFE CBOs, tourist industry, other development
Key development partners partnersWater and Sanitation MINERENA MiNISANTE, decentralised administration, MIGEPROFE Contractors, NGOs, CBOs, other development
Key development partners partnersYouth, Culture and Sport MIJESPOC MINEDUC, National Museum, MIGEPROFE CBOs, NGOs, all cultural and sporting
Key development partners associations and development partnersHealth MINISANTE MINEDUC, MINALOC, public health services providers, all CBOs, private health service providers, NGOs,
MINISANTE related agencies, decentralised administration, other development partners.__________________ Key development partners MIGEPROFEEducation MINEDUC, MINALOC, MlN'SANTE, MINAGRI, perhaps others, decentralised Human Resources Agency, public and private
MIJESPOC administration, MIGEPROFE schools and universities, NGOs, CBOs, privateKey development partners sector, other partners
Social Protection MINALOC MINISANTE, MINEDUC, vulnerable people's funds, i.e. CBOs, NGOs, other development partnersKey development partners FARG, AVEGA, MIGEPROFE
83

299. Once constituted, the sector group would draw together existing strategies and policies to developthe sector strategy. It would supervise submissions to the MTEF and the PIP and would eventuallyprepare a sector budget framework paper. As a starting point for this process the PRSP will be brokendown into separate, sectoral documents that contain the analysis, principles and priorities, policies andactions, and the indicators for each sector. It is envisaged that the revision of the PRSP, in two years time,will be largely based on the sector strategies themselves.
300. A full sector strategy would vary according to the sector, but would be expected to include a clearvision of the overall development of the sector, with a comprehensive set of policies which articulates andjustifies the roles to be played by the public sector at central and local levels, the private sector andcommunities. It would present a fully detailed MTEF for each ministry, supported by input prices andquantities, for all recurrent and development expenditures. The strategy would also include a consolidatedmonitoring review for the year of outputs and performance against MTEF outputs and PRSP actions forthe sector. It would also detail the roles, functions, programmes and expenditures of other players andstakeholders. A final important factor would be a clear focus on the benefits of the strategy for the poor,including an analysis of the incidence of expenditures using EICV data where available and user surveyssuch as citizen's report cards and data gathered within the PPA.
301. In order to achieve this agenda, it will be essential to strengthen the planning functions of the leadministries in each sector. The appropriate balance of line ministry staff and local and internationalconsultants would be decided within each sector. Some extra resources will need to be made available toministries for this purpose; the saving of future waste and duplication within each sector will amplyjustify the spending of these funds. No formal costing has yet been attempted for this exercise and thecosts will depend on the sectors.
5.6.2 Ensuring that projects are consistent with the PRSP and sector strategies
302. The coordinating role of the PRSP's planning framework, and the importance of the sectorstrategies within it, implies a need to ensure that new initiatives are consistent with the PRSP. While theexpenditure programme presented here is not irrevocable, departures from this programme do need to bescrutinised in order to ensure that they are consistent with the priorities of the poverty reduction strategy.Sectoral ministries and donors therefore need to keep MINECOFIN informed of any new initiatives orchanges in their priorities, and will be expected to justify such changes with reference to the criteriaestablished above. Technical departments within MINECOFIN, including CEPEX, the BudgetDepartment and NPRP, will examine submissions to the Development Committee to ensure that theymeet these conditions.
84
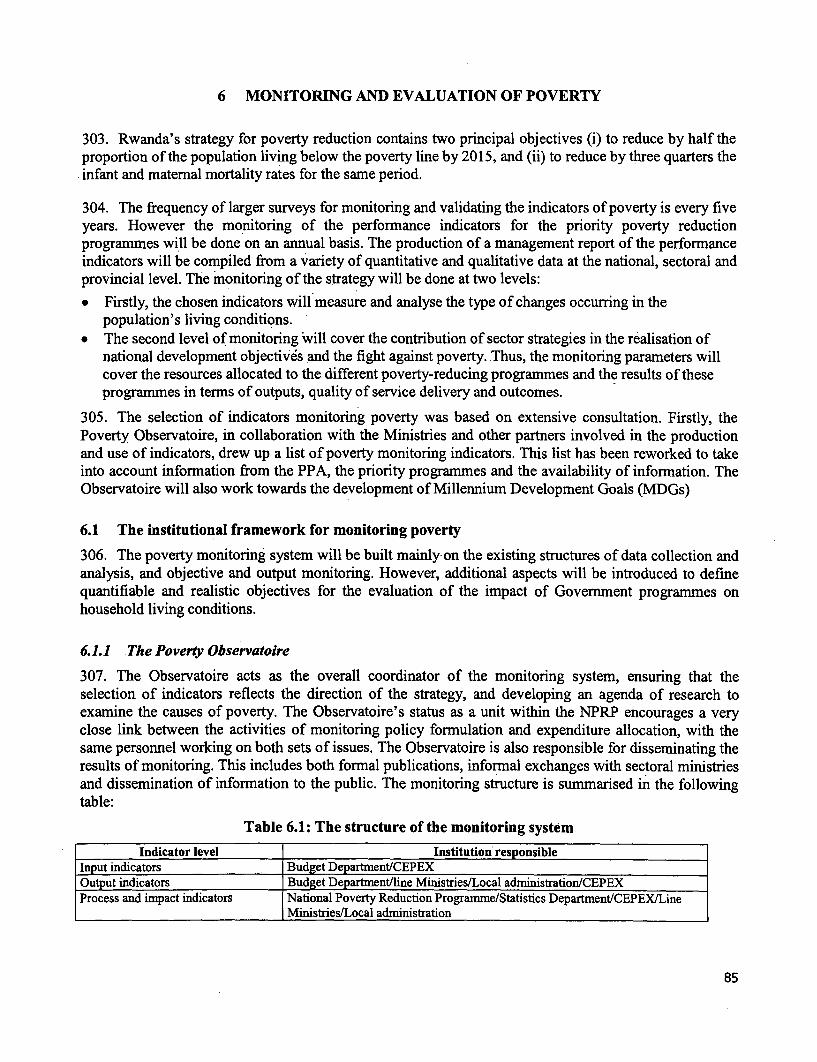
6 MONITORING AND EVALUATION OF POVERTY
303. Rwanda's strategy for poverty reduction contains two principal objectives (i) to reduce by half theproportion of the population living below the poverty line by 2015, and (ii) to reduce by three quarters theinfant and maternal mortality rates for the same period.
304. The frequency of larger surveys for monitoring and validating the indicators of poverty is every fiveyears. However the monitoring of the performance indicators for the priority poverty reductionprogrammes will be done on an annual basis. The production of a management report of the performanceindicators will be compiled from a variety of quantitative and qualitative data at the national, sectoral andprovincial level. The 'monitoring of the strategy will be done at two levels:
* Firstly, the chosen indicators will measure and analyse the type of changes occurring in thepopulation's living conditions.
* The second level of monitoring Will cover the contribution of sector strategies in the realisation ofnational development objectives and the fight against poverty. .Thus, the monitoring parameters willcover the resources allocated to the different poverty-reducing programmes and the results of theseprogrammes in terms of outputs, quality of service delivery and outcomes.
305. The selection of indicators monitoring poverty was based on extensive consultation. Firstly, thePoverty Observatoire, in collaboration with the Ministries and other partners involved in the productionand use of indicators, drew up a list of poverty monitoring indicators. This list has been reworked to takeinto account information from the PPA, the priority programmes and the availability of information. TheObservatoire will also work towards the development of Millennium Development Goals (MDGs)
6.1 The institutional framework for monitoring poverty
306. The poverty monitoring system will be built mainly on the existing structures of data collection andanalysis, and objective and output monitoring. However, additional aspects will be introduced to definequantifiable and realistic objectives for the evaluation of the impact of Government programmes onhousehold living conditions.
6.1.1 The Poverty Observatoire
307. The Observatoire acts as the overall coordinator of the monitoring system, ensuring that theselection of indicators reflects the direction of the strategy, and developing an agenda of research toexamine the causes of poverty. The Observatoire's status as a unit within the NPRP encourages a veryclose link between the activities of monitoring policy formulation and expenditure allocation, with thesame personnel working on both sets of issues. The Observatoire is also responsible for disseminating theresults of monitoring. This includes both formal publications, informal exchanges with sectoral ministriesand dissemination of information to the public. The monitoring structure is summarised in the followingtable:
Table 6.1: The structure of the monitoring system
Indicator level Institution responsibleInput indicators Budget Department/CEPEXOutput indicators Budget Department/line Ministries/Local administration/CEPEXProcess and irnpact indicators National Poverty Reduction Programune/Statistics Department/CEPEX/Line
Ministries/Local administration
85
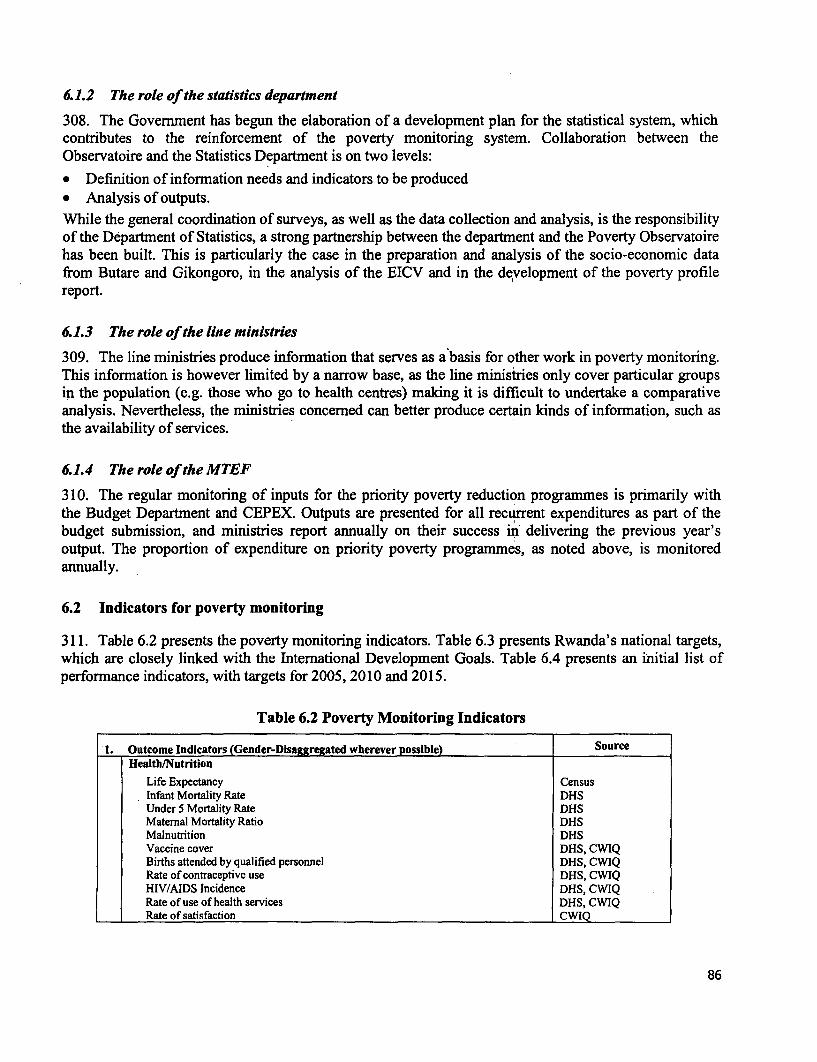
6.1.2 The role of the statistics department
308. The Government has begun the elaboration of a development plan for the statistical system, whichcontributes to the reinforcement of the poverty monitoring system. Collaboration between theObservatoire and the Statistics Department is on two levels:
* Definition of information needs and indicators to be produced* Analysis of outputs.While the general coordination of surveys, as well as the data collection and analysis, is the responsibilityof the Department of Statistics, a strong partnership between the department and the Poverty Observatoirehas been built. This is particularly the case in the preparation and analysis of the socio-economic datafrom Butare and Gikongoro, in the analysis of the EICV and in the development of the poverty profilereport.
6.1.3 The role of the line ministries
309. The line ministries produce information that serves as a basis for other work in poverty monitoring.This information is however limited by a narrow base, as the line ministries only cover particular groupsin the population (e.g. those who go to health centres) making it is difficult to undertake a comparativeanalysis. Nevertheless, the ministries concerned can better produce certain kinds of information, such asthe availability of services.
6.1.4 The role of the MTEF
310. The regular monitoring of inputs for the priority poverty reduction programmes is primarily withthe Budget Department and CEPEX. Outputs are presented for all recurrent expenditures as part of thebudget submission, and ministries report annually on their success in delivering the previous year'soutput. The proportion of expenditure on priority poverty programmes, as noted above, is monitoredannually.
6.2 Indicators for poverty monitoring
311. Table 6.2 presents the poverty monitoring indicators. Table 6.3 presents Rwanda's national targets,which are closely linked with the International Development Goals. Table 6.4 presents an initial list ofperformance indicators, with targets for 2005, 2010 and 2015.
Table 6.2 Poverty Monitoring Indicators
1. Outcome Indicators (Gender-Disaggregated wherever possible) SourceHealth/Nutrition
Life Expectancy CensusInfant Mortality Rate DHSUnder 5 Mortality Rate DHSMatemal Mortality Ratio DHSMalnutrition DHSVaccine cover DHS, CWIQBirths attended by qualified personnel DHS, CWIQRate of contraceptive use DHS, CWIQHIV/AIDS Incidence DHS, CWIQRate of use of health services DHS, CWIQRate of satisfaction CWIQ
86
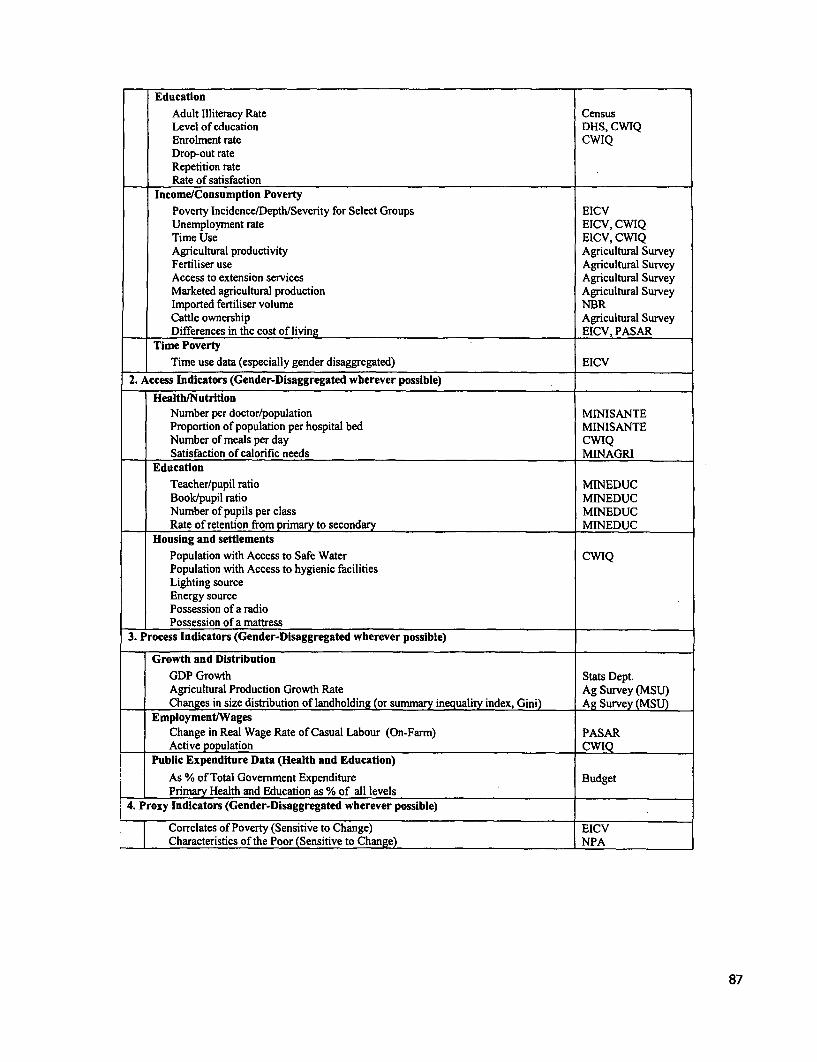
EducationAdult Illiteracy Rate CensusLevel of education DHS, CWIQEnrolment rate CWIQDrop-out rateRepetition rateRate of satisfaction
Income/Consumption PovertyPoverty Incidence/Depth/Severity for Select Groups EICVUnemployment rate EICV, CWIQTime Use EICV, CWIQAgricultural productivity Agricultural SurveyFertiliser use Agricultural SurveyAccess to extension services Agricultural SurveyMarketed agricultural production Agricultural SurveyImported fertiliser volume NBRCattle ownership Agricultural SurveyDifferences in the cost of living EICV, PASAR
Time PovertyTime use data (especially gender disaggregated) EICV
2. Access Indicators (Gender-Disaggregated wherever possible)
Health/NutritionNumber per doctor/population MINISANTEProportion of population per hospital bed MINISANTENumber of meals per day CWIQSatisfaction of calorific needs MINAGRI
EducationTeacher/pupil ratio MINEDUCBook/pupil ratio MINEDUCNumber of pupils per class MINEDUCRate of retention from primary to secondary MINEDUC
Housing and settlementsPopulation with Access to Safe Water CWIQPopulation with Access to hygienic facilitiesLighting sourceEnergy sourcePossession of a radioPossession of a mattress
3. Process Indicators (Gender-Disaggregated wherever possible)
Growth and DistributionGDP Growth Stats Dept.Agricultural Production Growth Rate Ag Survey (MSU)Changes in size distribution of landholding (or summary inequality index, Gini) Ag Survey (MSU)
Employment/WagesChange in Real Wage Rate of Casual Labour (On-Farm) PASARActive population CWIQ
Public Expenditure Data (Health and Education)
As % of Total Government Expenditure BudgetPrimary Health and Education as % of all levels
4. Proxy Indicators (Gender-Disaggregated wherever possible)
Correlates of Poverty (Sensitive to Change) EICVCharacteristics of the Poor (Sensitive to Change) NPA
87
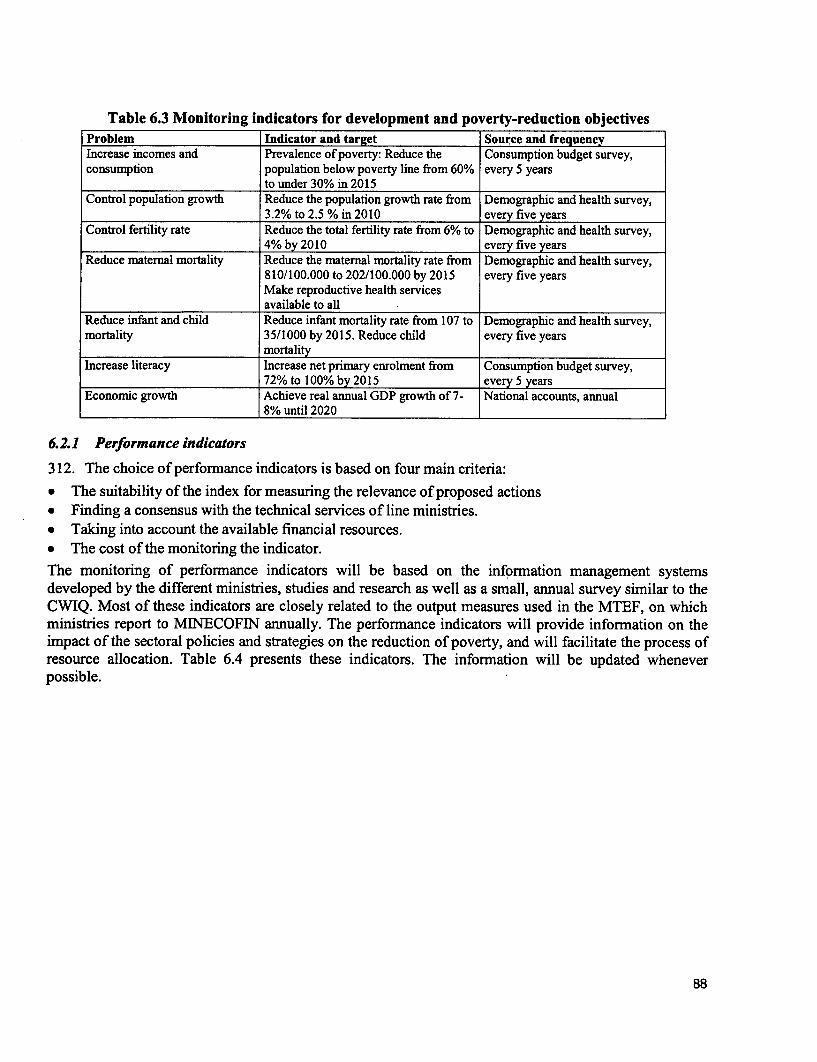
Table 6.3 Monitoring indicators for development and poverty-reduction objectivesProblem Indicator and target Source and frequencyIncrease incomes and Prevalence of poverty: Reduce the Consumption budget survey,consumption population below poverty line from 60% every 5 years
to under 30% in 2015Control population growth Reduce the population growth rate from Demographic and health survey,
3.2% to 2.5 % in 2010 every five yearsControl fertility rate Reduce the total fertility rate from 6% to Demographic and health survey,
4% by 2010 every five yearsReduce maternal mortality Reduce the matemal mortality rate from Demographic and health survey,
810/100.000 to 202/100.000 by 2015 every five yearsMake reproductive health servicesavailable to all
Reduce infant and child Reduce infant mortality rate from 107 to Demographic and health survey,mortality 35/1000 by 2015. Reduce child every five years
mortalityIncrease literacy Increase net primary enrolment from Consumption budget survey,
72% to 100% by 2015 every 5 yearsEconomic growth Achieve real annual GDP growth of 7- National accounts, annual
8% until 2020
6.2.1 Performance indicators
312. The choice of performance indicators is based on four main criteria:
* The suitability of the index for measuring the relevance of proposed actions* Finding a consensus with the technical services of line ministries.* Taking into account the available financial resources.* The cost of the monitoring the indicator.The monitoring of performance indicators will be based on the information management systemsdeveloped by the different ministries, studies and research as well as a small, annual survey similar to theCWIQ. Most of these indicators are closely related to the output measures used in the MTEF, on whichministries report to MINECOFIN annually. The performance indicators will provide information on theimpact of the sectoral policies and strategies on the reduction of poverty, and will facilitate the process ofresource allocation. Table 6.4 presents these indicators. The information will be updated wheneverpossible.
88
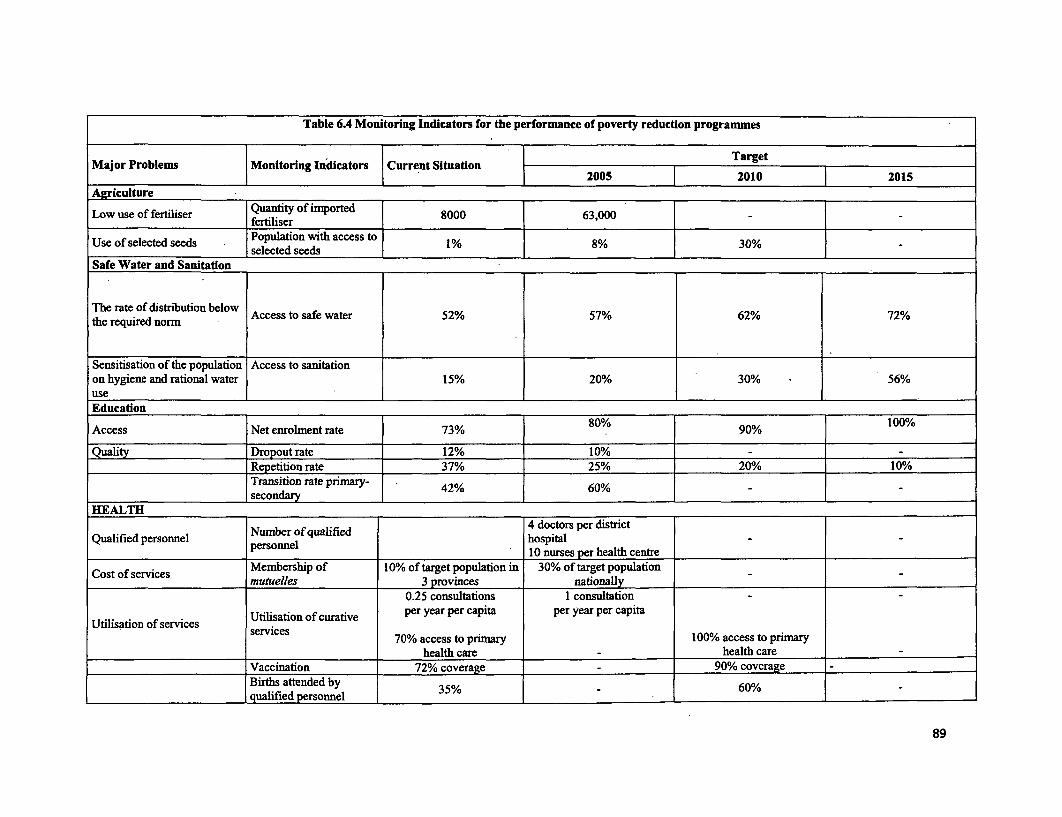
Table 6.4 Monitoring Indicators for the performance of poverty reduction programmes
.ndicators Current Situation [ TargetMajor Problems Monitoring Indicators Current Situation
._______________________ 2005 2010 2015Agriculture
Low use of fertiliser fertiie irn d 8000 63,000 -
Use of selected seeds Population with access to 1% 8% 30%selected seeds
Safe Water and Sanitation
.he rate of distribution below Access to safe water 52% 57% 62% 72%the required norm
Sensitisation of the population Access to sanitationon hygiene and rational water 15% 20% 30% 56%use .Education
Access Net enrolment rate 73% 80% 90% 100%
Quaity Dropout rate 12% 10% ___
Repetition rate 37% 25% 20% 10%Transition rate primary- 42% 60%
I secondaryHEALTH
Number of qualified 4 doctors per districtQualified personnel personnel hospital
. 10 nurses per health centre
Cost of services Membership of 10% of target population in 30% of target populationmutuelles 3 provinces nationally
0.25 consultations I consultation
Uti.isa.ion of services Utilisation of curative per year per capita per year per capitaUtilsation of services .services 70% access to primary 100% access to primary
health care health careVaccination 72% coverage 90% coverageBirths attended by 35° 60%qualified personnel .
89
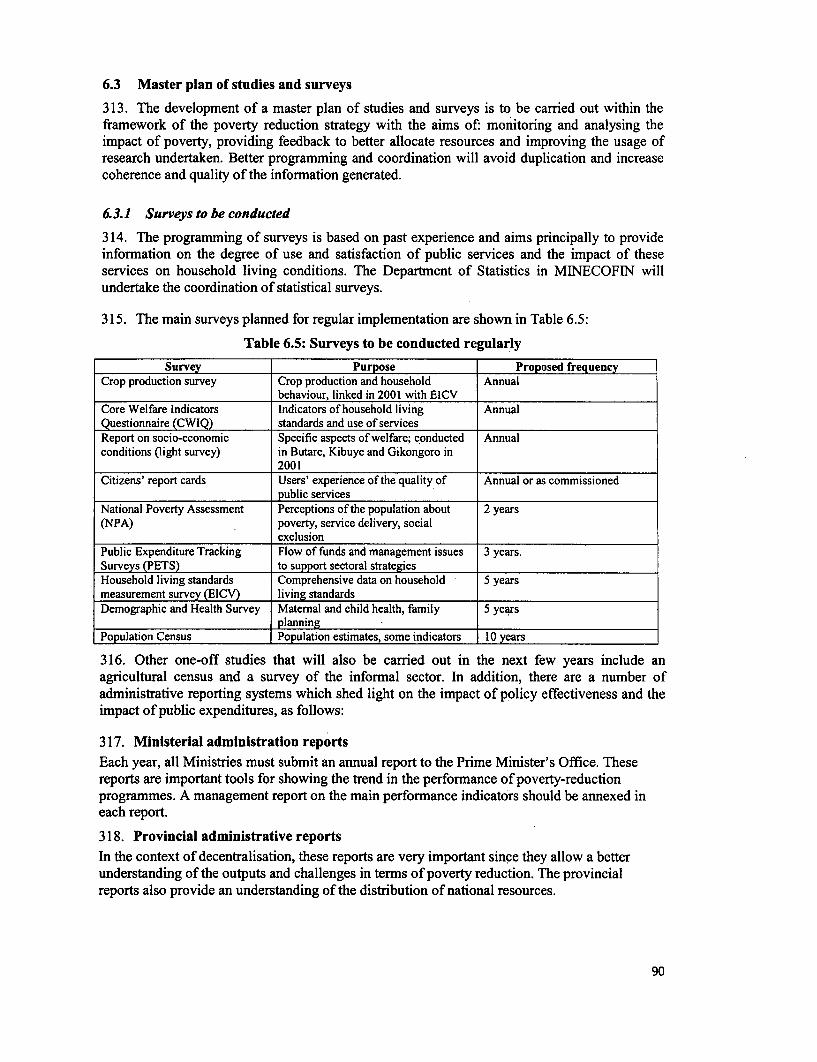
6.3 Master plan of studies and surveys
313. The development of a master plan of studies and surveys is to be carried out within theframework of the poverty reduction strategy with the aims of: monitoring and analysing theimpact of poverty, providing feedback to better allocate resources and improving the usage ofresearch undertaken. Better programming and coordination will avoid duplication and increasecoherence and quality of the information generated.
6.3.1 Surveys to be conducted
314. The programming of surveys is based on past experience and aims principally to provideinformation on the degree of use and satisfaction of public services and the impact of theseservices on household living conditions. The Department of Statistics in MINECOFIN willundertake the coordination of statistical surveys.
315. The main surveys planned for regular implementation are shown in Table 6.5:
Table 6.5: Surveys to be conducted regularlySurvey Purpose Proposed frequency
Crop production survey Crop production and household Annualbehaviour, linked in 2001 with EICV
Core Welfare Indicators Indicators of household living AnnualQuestionnaire (CWIQ) standards and use of servicesReport on socio-economic Specific aspects of welfare; conducted Annualconditions (light survey) in Butare, Kibuye and Gikongoro in
2001Citizens' report cards Users' experience of the quality of Annual or as commissioned
public servicesNational Poverty Assessment Perceptions of the population about 2 years(NPA) poverty, service delivery, social
exclusionPublic Expenditure Tracking Flow of funds and management issues 3 years.Surveys (PETS) to support sectoral strategiesHousehold living standards Comprehensive data on household 5 yearsmeasurement survey (EICV) living standardsDemographic and Health Survey Maternal and child health, family 5 years
planningPopulation Census Population estimates, some indicators 10 years
316. Other one-off studies that will also be carried out in the next few years include anagricultural census and a survey of the informal sector. In addition, there are a number ofadministrative reporting systems which shed light on the impact of policy effectiveness and theimpact of public expenditures, as follows:
317. Ministerial administration reportsEach year, all Ministries must submit an annual report to the Prime Minister's Office. Thesereports are important tools for showing the trend in the performance of poverty-reductionprogrammes. A management report on the main performance indicators should be annexed ineach report.
318. Provincial administrative reportsIn the context of decentralisation, these reports are very important since they allow a betterunderstanding of the outputs and challenges in terms of poverty reduction. The provincialreports also provide an understanding of the distribution of national resources.
90
319. Feedback from the populationParticipatory poverty research and assessments allow us to define the priority problems and themechanisms used by communities to resolve these problems. This ubudehe mu kurwanyaubukene exercise will be important for the definition of national priorities and policy optionsand generating greater participation in community development. The Citizen's Report Cardswill also provide vital feedback.
320. Evaluation of the impact of policies and programmes on the reduction of povertyBased on the information produced through the different instruments mentioned above, theimpact assessment will be carried out to generate information that will advance the nationaldevelopment strategy. The main programmes that will be monitored regularly are selected usingthe national poverty reduction priorities and are mainly those relative to developing the ruraleconomy, developing human resources and the protection of vulnerable groups. A keyinstrument in this process will be the development of a capacity outside of Government, in anindependent research institution, to carry out Citizens' Report Cards.
6.3.2 Information dissemination,feedback and access
321. The main objective of the poverty monitoring system is to provide relevant informationand promote constructive public debate on the challenges, solutions and progress in povertyreduction in Rwanda. The information gained through the monitoring system must becontinuous, recent, reliable and, above all, available to all stakeholders involved in the povertyreduction process. This involves providing information in a manner that is accessible tocommunities.
322. Measures that make available the relevant information to those concemed help to improvethe national statistical system and reinforce the poverty monitoring system capacities so as toensure the regular and reliable production of information on the poverty situation and trends.Reinforcement of the capacities of the Statistics Department in MINECOFIN and the statisticalservices within the line ministries and the decentralised structures will contribute to makingstatistical data more widely available.
323. The central role of the Poverty Observatoire in the preparation of the PRSP has enabledthe development of a system of poverty monitoring and analysis. Impact and performanceindicators have been defined and their frequency of production was determined. Each year, areport on the poverty situation will be prepared based on the research carried out in the country.The new poverty profile will be prepared each time a Household Living Conditions Survey(EICV) is carried out. The information produced will be available in documentation centres,decentralised administration offices and in other appropriate structures.
91
Appendix A: Community Action Planning: 'ubudehe mu kurwanya ubukene'
324. As part of the process of decentralisation, the Ministry of Local Government is carryingout a participatory process of project planning and implementation down to cellule level. Theprocess has so far been piloted in every cellule in Butare province and during the course of 2002it will be extended to every province and cellule in the country. The approach is based on thetraditional concept of communal action and is named 'ubudehe mu kurwanya ubukene' inKinyarwanda. It involves the direct funding of a project in every cellule and also in someindividual poor households. Within with the entire community, every household is firstcategorised by social category, then the community's most important problem is selected and acosted strategy devised to tackle it. In the household stage the community select one poor familyfor further assistance. This family also identify their main problem and cost a strategy totransform their situation.
325. The community process starts with the cellule members collectively drawing a social map(see map below), this maps out their community and details every household's location, theirsocial category, type of shelter, all social and economic infrastructure and landmarks in thecellule, such as water points, schools, shops, roads etc. The map is first drawn on the groundusing local materials and later copied onto a piece of cloth for the community to keep as a toolfor future planning. This exercise ensures that every family is acknowledged and represented inthe process, that none are excluded and everyone's needs can be better identified.
326. So as to identify the social category of each household in the cellule, the community thenshare their understanding of poverty, its causes and consequences. The community itself defineshow many categories of poverty/wealth they recognise and how they categorise the people intheir community. They then categorise every household into each of the categories, themaximum number of which found in a cellule was six, though some cellules identify just four orfive of them depending on the status of the families found in their community. The mostcommon categories are detailed in section 2.1.4.
327. Next, the community explain the various development problems they face and prioritisethem using 'preference scoring'. This involves listing all of the problems facing the communityand then comparing these problems in pairs by identifying the characteristics of each. Thesecharacteristics are then scored out of 10 according to their importance. This stage involvedeverybody in the community. From this detailed analysis, the community is able to choose oneof their most significant problems to address; one that would have the greatest impact on thecommunity and which was feasible to tackle.
328. Once everyone agrees on a problem, the community members proceed to developing a listof activities to be carried out to achieve their development transformation, and they estimate thecost of each activity and outline its time frame. Next, community members select two groups ofpeople, one to implement the process and one to monitor and provide any necessary correctiveaction.
329. Relevance testing is then undertaken with every beneficiary, particularly those who werenot involved in the process, to make sure that all the community members came to a consensuson the strategy. This will also be done with technicians who can give technical and practicalinformation and with local government who give funding information and any otherstakeholders who can assist. This ensures that the strategy chosen is feasible and sustainable.The strategy is then signed by all members of the community to endorse it. Once these stagesare completed, the cellule can receive the financing for the strategy. The funding mechanismthat could be used is the depositing of funds in district branches of the Banques Populaires andthe cellule residents withdrawing their funds from them.
92
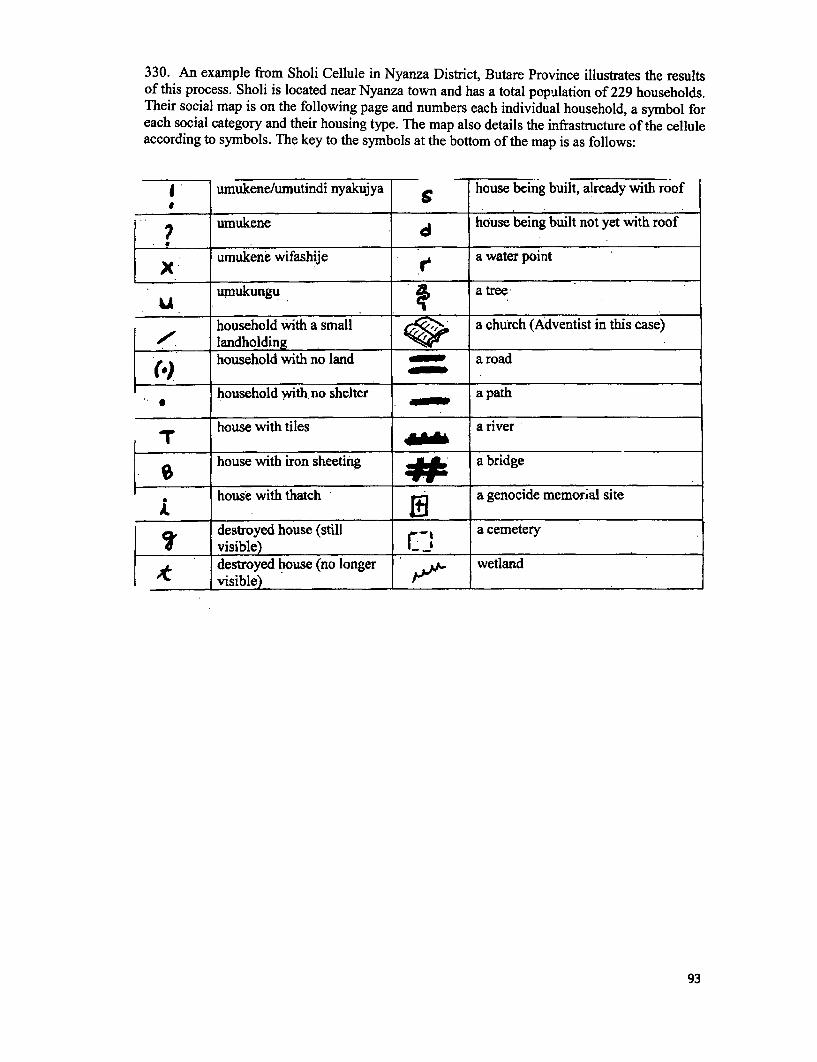
330. An example from Sholi Cellule in Nyanza District, Butare Province illustrates the resultsof this process. Sholi is located near Nyanza town and has a total population of 229 households.Their social map is on the following page and numbers each individual household, a symbol foreach social category and their housing type. The map also details the infrastructure of the celluleaccording to symbols. The key to the symbols at the bottom of the map is as follows:
umukene/umutindi nyakujya house being built, already with roof
umukene house being built not yet with roof
Xmukene wifashije a water point
umukungu a tree
household with a small a church (Adventist in this case)100 landholding
.K lahohoold with no land a road
household with. no shelter a path
T house with tiles a river
house with iron sheeting a bridge
1 house with thatch a genocide memorial site
destroyed house (still - a cemetery7_______ visible) i,
destroyed house (no longer wetlandvisible)
93
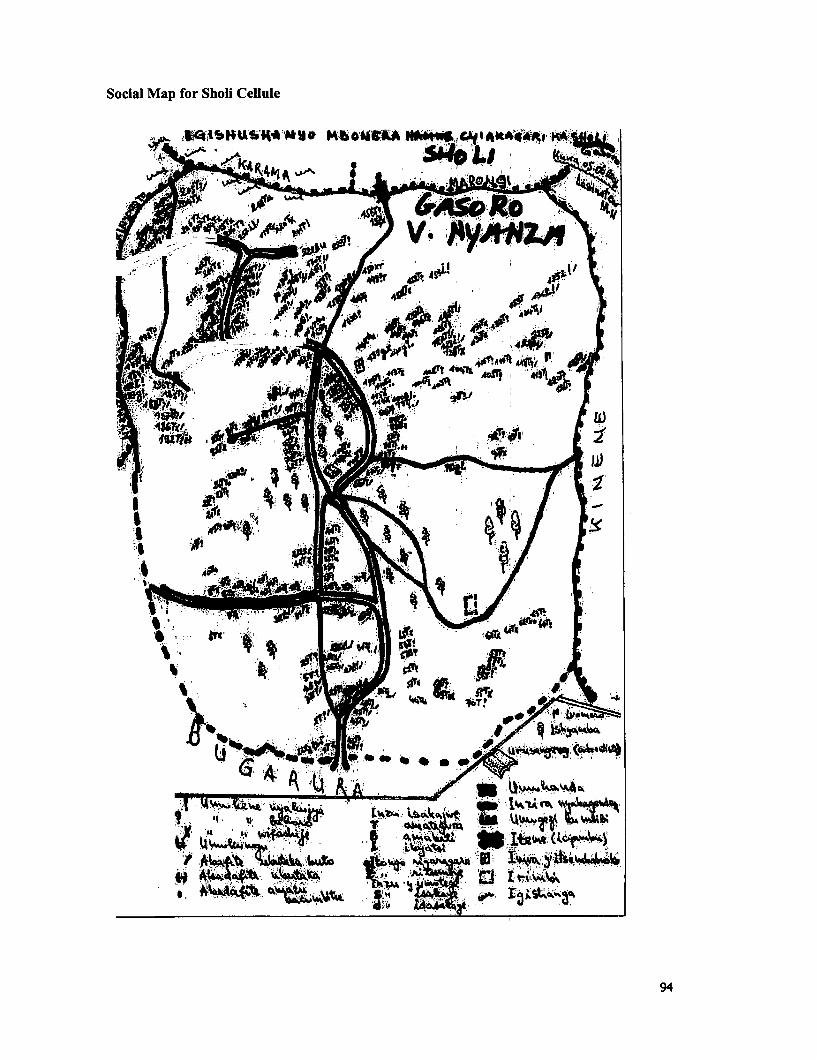
Social Map for Sholi Cellule
1M M
0 A~~~~~~4~~~ 4 D
}*s , ( F ~~~~~~~~~~~~~~~~~I,..#f^
94
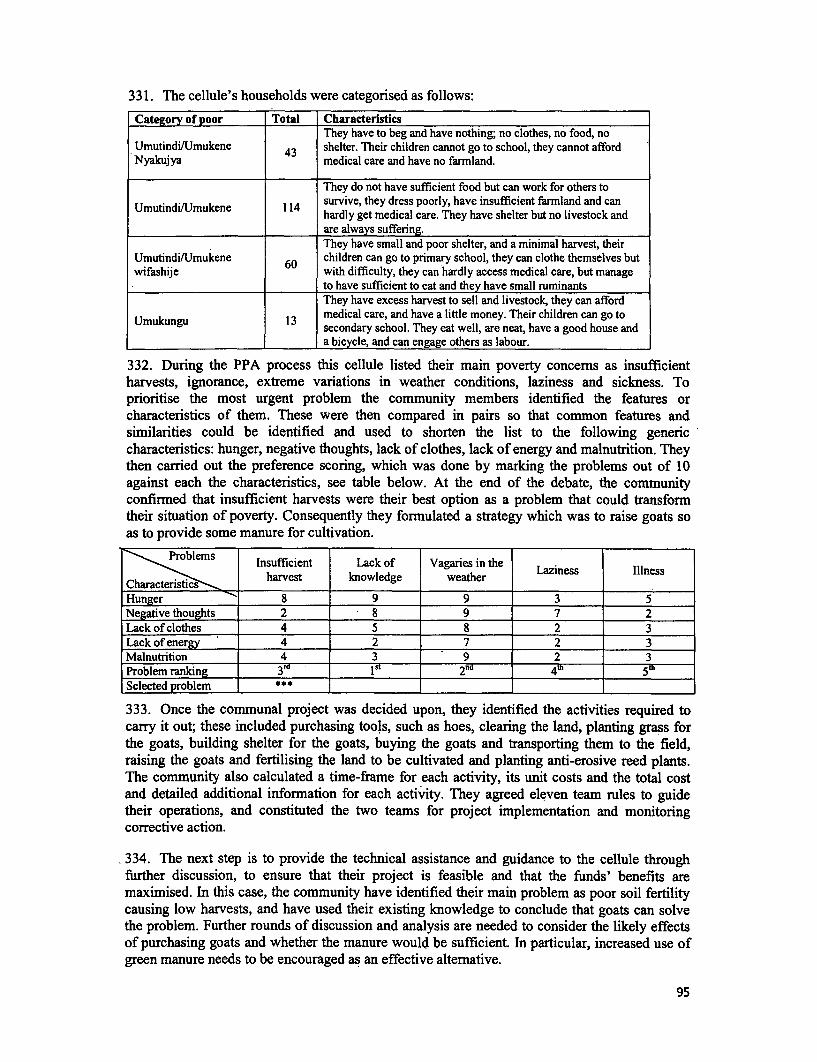
331. The cellule's households were categorised as follows:
Category of poor Total CharacteristicsThey have to beg and have nothing; no clothes, no food, no
UmutindiWUmukene 43 shelter. Their children cannot go to school, they cannot affordNyakujya medical care and have no farmland.
They do not have sufficient food but can work for others toUmutindiWUmukene 114 survive, they dress poorly, have insufficient farmland and can
hardly get medical care. They have shelter but no livestock andare always suffering.They have small and poor shelter, and a minimal harvest, their
UmutindWUmukene 60 children can go to primary school, they can clothe themselves butwifashije with difficulty, they can hardly access medical care, but manage
to have sufficient to eat and they have small ruminantsThey have excess harvest to sell and livestock, they can afford
Umuk u13 medical care, and have a little money. Their children can go toUmukungu 13 secondary school. They eat well, are neat, have a good house and
a bicycle, and can engage others as labour.
332. During the PPA process this cellule listed their main poverty concems as insufficientharvests, ignorance, extreme variations in weather conditions, laziness and sickness. Toprioritise the most urgent problem the community members identified the features orcharacteristics of them. These were then compared in pairs so that common features andsimilarities could be identified and used to shorten the list to the following genericcharacteristics: hunger, negative thoughts, lack of clothes, lack of energy and malnutrition. Theythen carried out the preference scoring, which was done by marking the problems out of 10against each the characteristics, see table below. At the end of the debate, the communityconfirmed that insufficient harvests were their best option as a problem that could transformtheir situation of poverty. Consequently they formulated a strategy which was to raise goats soas to provide some manure for cultivation.
\P roblems Insufficient Lack of Vagaries in theharvest knowledge weather Laziness Illness
Character shcunger 8 9 9 3 5
Negative thoughts 2 8 9 7 2Lack of clothes 4 5 8 2 3Lack of energy 4 2 7 2 3Malnutrition 4 3 9 2 3Problem ranking 3f1 S 2nd 4th 5Selected problem ___
333. Once the communal project was decided upon, they identified the activities required tocarry it out; these included purchasing tools, such as hoes, clearing the land, planting grass forthe goats, building shelter for the goats, buying the goats and transporting them to the field,raising the goats and fertilising the land to be cultivated and planting anti-erosive reed plants.The community also calculated a time-frame for each activity, its unit costs and the total costand detailed additional information for each activity. They agreed eleven team rules to guidetheir operations, and constituted the two teams for project implementation and monitoringcorrective action.
,334. The next step is to provide the technical assistance and guidance to the cellule throughfurther discussion, to ensure that their project is feasible and that the funds' benefits aremaximised. In this case, the community have identified their main problem as poor soil fertilitycausing low harvests, and have used their existing knowledge to conclude that goats can solvethe problem. Further rounds of discussion and analysis are needed to consider the likely effectsof purchasing goats and whether the manure would be sufficient. In particular, increased use ofgreen manure needs to be encouraged as an effective altemative.
95
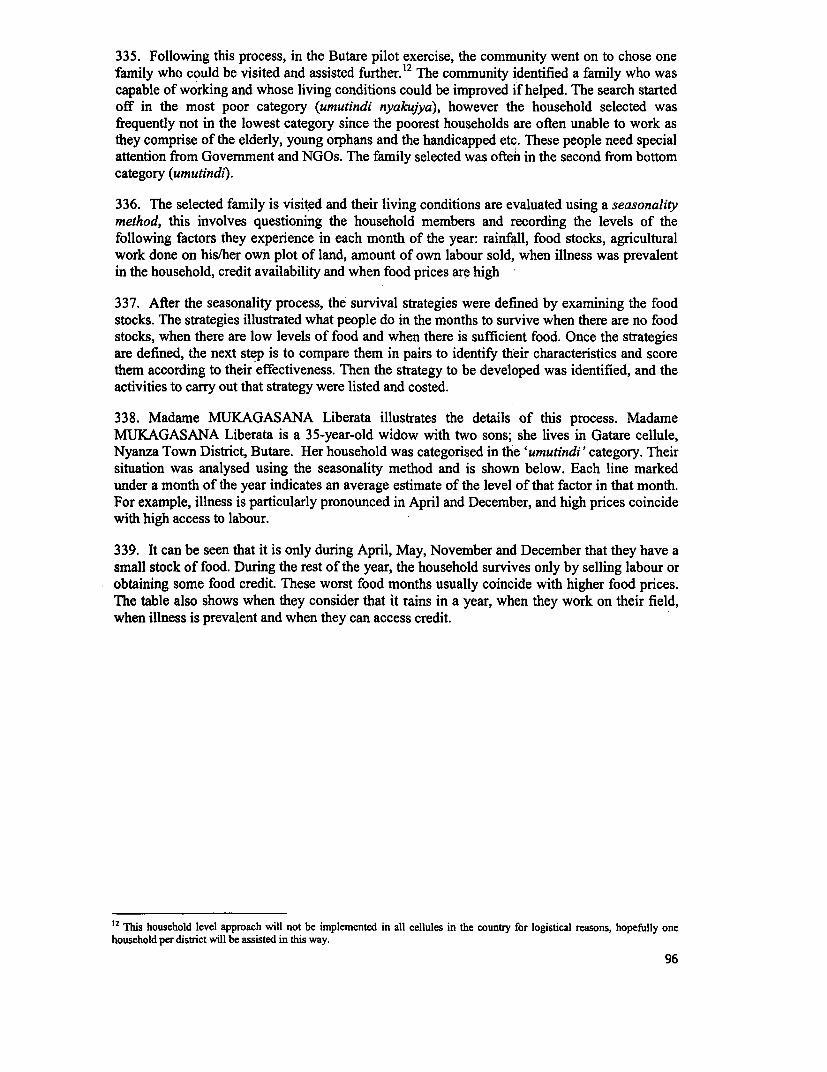
335. Following this process, in the Butare pilot exercise, the community went on to chose onefamily who could be visited and assisted further.12 The community identified a family who wascapable of working and whose living conditions could be improved if helped. The search startedoff in the most poor category (umutindi nyakujya), however the household selected wasfrequently not in the lowest category since the poorest households are often unable to work asthey comprise of the elderly, young orphans and the handicapped etc. These people need specialattention from Government and NGOs. The family selected was often in the second from bottomcategory (umutindi).
336. The selected family is visited and their living conditions are evaluated using a seasonalitymethod, this involves questioning the household members and recording the levels of thefollowing factors they experience in each month of the year: rainfall, food stocks, agriculturalwork done on his/her own plot of land, amount of own labour sold, when illness was prevalentin the household, credit availability and when food prices are high
337. After the seasonality process, the survival strategies were defined by examining the foodstocks. The strategies illustrated what people do in the months to survive when there are no foodstocks, when there are low levels of food and when there is sufficient food. Once the strategiesare defined, the next step is to compare them in pairs to identify their characteristics and scorethem according to their effectiveness. Then the strategy to be developed was identified, and theactivities to carry out that strategy were listed and costed.
338. Madame MUKAGASANA Liberata illustrates the details of this process. MadameMUKAGASANA Liberata is a 35-year-old widow with two sons; she lives in Gatare cellule,Nyanza Town District, Butare. Her household was categorised in the 'umutindi' category. Theirsituation was analysed using the seasonality method and is shown below. Each line markedunder a month of the year indicates an average estimate of the level of that factor in that month.For example, illness is particularly pronounced in April and December, and high prices coincidewith high access to labour.
339. It can be seen that it is only during April, May, November and December that they have asmall stock of food. During the rest of the year, the household survives only by selling labour orobtaining some food credit. These worst food months usually coincide with higher food prices.The table also shows when they consider that it rains in a year, when they work on their field,when illness is prevalent and when they can access credit.
12 This household level approach will not be implemented in all cellules in the country for logistical reasons, hopefully onehousehold per district will be assisted in this way.
96
340. Seasonality Table
Month Jan Feb Mar Apr May June July Aug Sept Oct Nov Dec
FactorsRainfall
Food stock
Working in thefield
I_ __ _ __ IIllness
Selling labour
Price variations l l l l_l__ l l I _
Access to.
creditADst l _ _ __ _ _ I l _ _ _ _
341. The household then considered the strategies they use to cope throughout the year. Thishouseholds survival strategies included: cultivating sweet potatoes, selling labour, eating littleand eating nothing. They carried out preference scoring, as at the community level, to mark thecharacteristics of each strategy out of ten. The strategies were compared with a view todeveloping one that the household would invest their energy in so as to transform their situationof poverty. The results are illustrated in the table below.
Strategies Cultivating swet Sellng labour Adults eat fittle Adults eat nothiCharacteristics potatoes Selling ntiDevelops quickly 10 7 0 0Helps the family 10 8 3 0Aids a good night's sleep 10 9 8 0Resists stealing 10 8 4 0Gives energy 10 6 4 0Easily managed _0 8 0Passes the day 8 7 7 0Avoids children's tears 10 8 8 8
342. The strategy that was consequently selected to be developed was growing sweet potatoessince it had the greatest positive effect on the family's well being. It fed the family reliably andadequately whereas selling labour was difficult to rely upon and was tiring, and eatinginsufficiently only benefited the children of the house since they could eat more.
97
343. Key Conclusions* For the community action planning, the strategies must be community defined and managed
so as to build in accountability and majority participation, and also to encouragecommunities to engage in dialogue, to plan for their development and to strengthendecentralisation and good govemance.
* Communities must in engage sufficient discussion and infomnation to ensure that they havedevised appropriate solutions for their problems; in particular poor soil fertility causing lowharvests may not be sufficiently resolved by the purchase of livestock for manure.
* The strategies should create labour sale opportunities during periods of hunger, i.e. whenneither food nor agricultural work is available; employment must not be provided duringperiods which conflict with existing labour opportunities. Consequently, employmentopportunities should help to curb prices during high periods.
* The process should create space for the community to choose locally appropriate technologyand skills. The process enhances the opportunities for their development.
* The Butare pilot highlights people's capacity at the grass roots level for problem analysisand strategy formulation and implementation if the appropriate environment is createdthrough support and incentives.
* The pilot also shows that misunderstandings and errors are inevitable but that making errorsis a vital part to a process of learning from experience, which enhances ownership andcommitment.
Appendix B: Regional Profile of Poverty
344. Butare had low household incomes before the genocide, and the genocide has left it withthe highest proportion of widow-headed households in the country (28%). The province has thehighest child mortality in the country, at over 300 per thousand (1996 socio-demographicsurvey). The province has benefited from funds for the assistance of widows, but concems wereraised at the province-level consultation about the management of these funds. This provincehas a lower agricultural potential and the high population density has reinforced declining soilfertility and interest in wetland reclamation. Deforestation is also a particular problem, andindustry (which is centred in the main town) has been damaged. The conflict in Burundi alsoreduces the level of commerce that passes through Butare.
345. Byumba was a relatively well-off area before the war, with incomes raised by work on thetea plantations and by migration to other areas. The province is one of the most denselypopulated in Rwanda and now has the highest number of vulnerable groups. It experiencedsubstantial population movement and most returnees have been able to return to their formerproperties. However shelter remains a serious problem with about 30,000 households underplastic sheeting and 23,000 households with severely damaged houses. Some of the newsettlements are a long way from water supply. Child mortality, at 227 per thousand is high. Thewheat factory is not functioning, impeding agricultural development. In this province, need forhealth care has been reported as the first priority.
346. Cyangugu is somewhat geographically isolated from the rest of the country. It has limitedinfrastructure and has been severely affected by the insecurity in the region. Lakes and forestscover a third of the province, making cultivable land scarce. However, important areas ofmarshland offer potential for improving food production. Access to potable water is very lowand fuel shortages are resulting in deforestation. Access to health care is one of the majorproblems.
347. Gikongoro is densely populated and depended heavily in the past on migration outwards.The household food economy study in 1997 showed that the loss of this option was having a
98

severe effect on the income of poor households. The province is characterised by soil acidityand erosion, which contribute to it being one of the poorest provinces with a problem of chronicfood insecurity for many households. Child mortality is high, at 220 per thousand. While there issome tea production in the area, it is less profitable than in other regions.
348. Gisenyi is an area of very high agricultural potential, with a strong tradition of cashcropping and the highest use of fertiliser, particularly on potatoes. However, insecurity has had asevere impact and there is a substantial need for provision of shelter (around 100,000households). Damaged infrastructure and the decay of the trading network means that crops aresometimes left rotting in the fields because people cannot market them. The province-levelconsultation showed that insecurity remains a serious concern for people, and that the reductionin cross-border trade has been problematic. Some returnees are acutely poor, particularly in theeastern part of the province. Insecurity has produced particularly severe destocking which hasreinforced the decline in soil fertility.
349. Gitarama formerly depended heavily on migration outwards. Access of returnees to landis a problem and high population density has resulted in loss of agricultural productivity becauseof plot fragmentation and over-exploitation of land. Parts of the province are currently severelyaffected by drought and there are reports of people migrating outwards, from some districtswhere cultivated marshlands have dried up, in response to the distress.
350. Kibungo was relatively well off prior to the war. With its low population and high returnsto labour, it attracted workers from other regions. However with a major population influx afterthe genocide, it is now relatively poor. There is a lack of infrastructure. The proportion ofwidows is very high (26%) and about 76,000 households live under plastic sheeting.Educational enrolment is relatively low, with some children living at a distance of 20 kilometresfrom the nearest school. The province often suffers from drought, resulting in a relativelylimited water supply. This imposes a further burden on the large number of households who arealready short of labour. Child mortality, at 254 per thousand, is the second highest in thecountry. There has been a vigorous programme of promoting settlement in imidugudu (areasspecially designated for resettlement) and there are areas of severe deforestation. The fishingindustry has under-exploited potential.
351. Kibuye, despite its acid soils and high levels of erosion, has very high potential foragriculture, particularly coffee. It was very isolated in the past, particularly due to the poor roadinfrastructure, and still suffers from a general deficit of infrastructure in some areas. Parts of itare thus very poor but the availability of lakes and wetlands presents an opportunity to increaseagricultural production. However, the new road has greatly reduced its earlier inaccessibility andisolation, and market integration seems to be increasing accordingly.
352. Kigali-Ngali includes some of the poorest areas in the country, despite its location close tothe capital city. It is densely populated, soil fertility is declining, coffee trees are old, access towater is poor, and the region has been affected by a period of poor rains. Child mortality is high,at 220 per thousand. Bugesera is particularly poor, with severe depletion of livestock andextensive distress sales; the livestock price halved during the recent drought. Wetlandmanagement and irrigation are being explored as solutions. People have begun to migrate out todifferent areas in response to the distress. The close access to Kigali should make it possible todevelop activities that serve the capital city. Access to health care has been identified as a majorproblem.
353. Kigali-urban has experienced a sharp increase in population since 1994. Like other capitalcities in the region, it has lower child mortality than the rest of the country, but higher HIVprevalence. Unemployment is widespread and the province-level consultation revealed concernsabout begging and drug abuse. The large population influx has put a strain on urban
99
infrastructure, especially for water and sanitation. While there are pockets of severe poverty inKigali, as a whole the urban-rural gap is very marked.
354. Ruhengeri is a high-potential area that has been severely affected by insecurity. There issevere destocking, and a very large need for rehousing (around 100,000 households). Theexploitation of its agricultural potential is impeded by various factors: factories are out ofoperation, storage facilities are inadequate, there is limited information on prices, transport costsare high partly due to the poor state of the roads, there is lack of competition in trade and ashortage of producers' organisations. Some areas on the border with Gisenyi are particularlyvery poor.
355. Umutara is a new province with a major population influx. This is putting pressure onexisting infrastructure leaving Umutara with a shortage of water and transport. In addition, theenvironment is being degraded with overgrazing and deforestation in places. Fuel wood is beingsold at 700 Rwf a bundle in some areas. There is a major need for investment in infrastructureand for the establishment of sustainable systems of production on land which has not carriedsuch a large population before. A large project for community-based infrastructure has recentlybeen launched.
356. The decentralisation policy will allow each province to develop an approach to itsdevelopment which is appropriate, within the overall principles of poverty-reduction outlined inthe PRSP. As regards transport infrastructure and agricultural research, there may be a trade-offbetween investing in the most productive areas (particularly in the north-west) and targeting thechronically poor areas (particularly in the central and southern region).
357. The CWIQ survey has defined a poverty profile by province, and a poverty profile basedon the EICV data is currently being finalised. However, the provinces that appear to be thepoorest are quite different from those that report the most difficulty in satisfying food needs.One possible explanation for this is that the price of food may be very low in some provincessuch as Gisenyi; this would lead to low nominal food expenditure, even if real food expenditu'rewas,above average. These findings are therefore very provisional and will be revisited when thehousehold survey data are available.
100
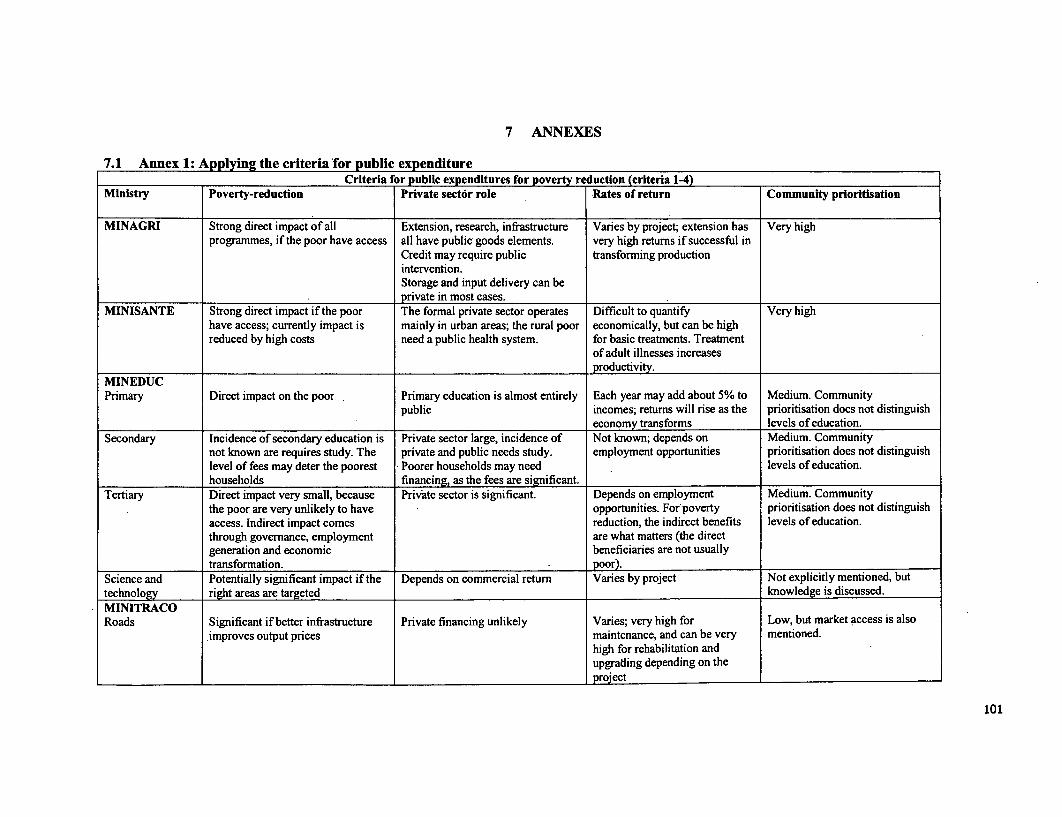
7 ANNEXES
7.1 Annex 1: Applying the criteria for public expenditureCriteria for public expenditures for poverty r duction (criteria 14)
Ministry Poverty-reduction Private sector role Rates of return Conmmunity prioritisation
MINAGRI Strong direct impact of all Extension, research, infrastructure Varies by project; extension has Very highprogrammes, if the poor have access all have public goods elements. very high returns if successful in
Credit may require public transforming productionintervention.Storage and input delivery can be
.__ __ _ __ _ __ _ __ _ _ _ private in most cases.MINISANTE Strong direct impact if the poor The formal private sector operates Difficult to quantify Very high
have access; currently impact is mainly in urban areas; the rural poor economically, but can be highreduced by high costs need a public health system. for basic treatments. Treatment
of adult illnesses increases.productivity.
MINEDUCPrimary Direct impact on the poor Primary education is almost entirely Each year may add about 5% to Medium. Community
public incomes; returns will rise as the prioritisation does not distinguisheconomy transforms levels of education.
Secondary Incidence of secondary education is Private sector large, incidence of Not known; depends on Medium. Communitynot known are requires study. The private and public needs study. employment opportunities prioritisation does not distinguishlevel of fees may deter the poorest Poorer households may need levels of education.households financing, as the fees are significant.
Tertiary Direct impact very small, because Private sector is significant. Depends on employment Medium. Communitythe poor are very unlikely to have opportunities. For poverty prioritisation does not distinguishaccess. Indirect impact comes reduction, the indirect benefits levels of education.through governance, employment are what matters (the directgeneration and economic beneficiaries are not usuallytransformation. . poor).
Science and Potentially significant impact if the Depends on commercial return Varies by project Not explicitly mentioned, buttechnology right areas are targeted knowledge is discussed.MINITRACORoads Significant if better infrastructure Private financing unlikely Varies; very high for Low, but market access is also
improves output prices maintenance, and can be very mentioned.high for rehabilitation andupgrading depending on theproject
101
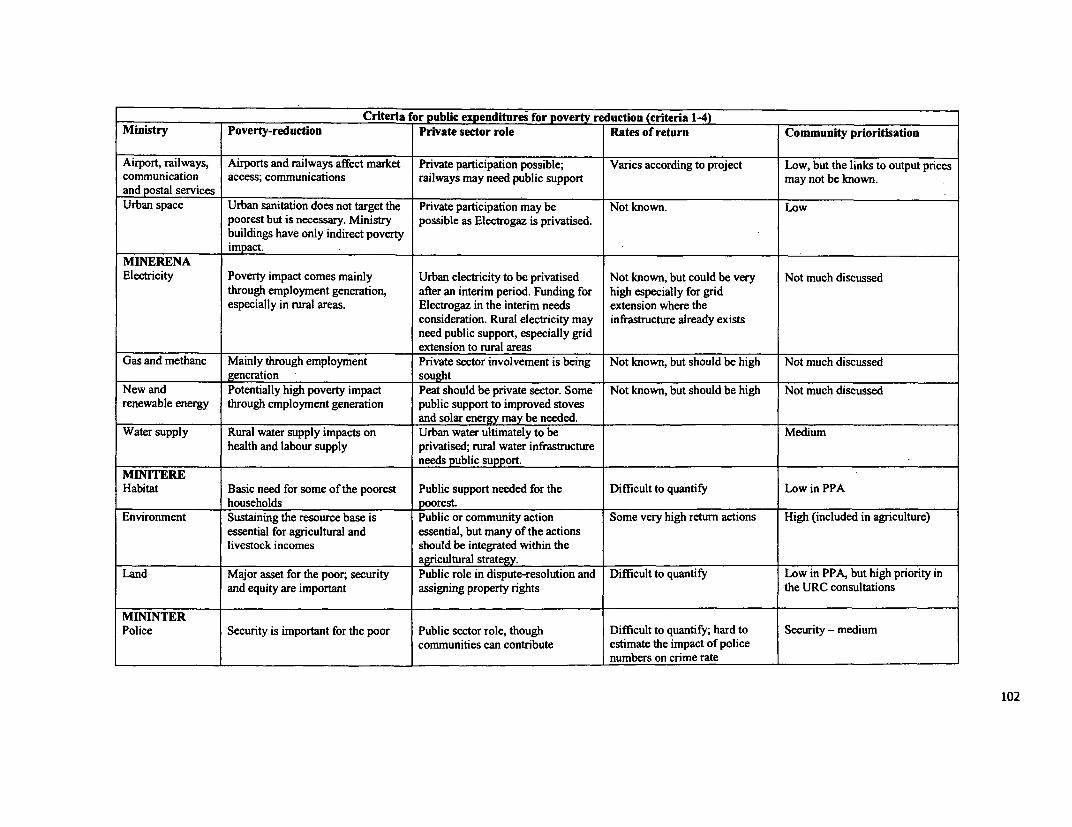
______________ Criteria for public expenditures for pove reduction (criteria 14)Ministry Poverty-reduction Private sector role Rates of return Community prioritisation
Airport, railways, Airports and railways affect market Private participation possible; Varies according to project Low, but the links to output pricescommunication access; communications railways may need public support may not be known.and postal servicesUrban space Urban sanitation does not target the Private participation may be Not known. Low
poorest but is necessary. Ministry possible as Electrogaz is privatised.buildings have only indirect povertyimpact.
MINERENAElectricity Poverty impact comes mainly Urban electricity to be privatised Not known, but could be very Not much discussed
through employment generation, after an interim period. Funding for high especially for gridespecially in rural areas. Electrogaz in the interim needs extension where the
consideration. Rural electricity may infrastructure already existsneed public support, especially gridextension to rural areas
Gas and methane Mainly through employment Private sector involvement is being Not known, but should be high Not much discussedgeneration sought
New and Potentially high poverty impact Peat should be private sector. Some Not known, but should be high Not much discussedrenewable energy through employment generation public support to improved stoves
and solar energy may be needed.Water supply Rural water supply impacts on Urban water ultimately to be Medium
health and labour supply privatised; niral water infirastructureneeds public suport.
MINITEREHabitat Basic need for some of the poorest Public support needed for the Difficult to quantify Low in PPA
households pOorest.Environment Sustaining the resource base is Public or community action Some very high return actions High (included in agriculture)
essential for agricultural and essential, but many of the actionslivestock incomes should be integrated within the
agricultural strateg.Land Major asset for the poor; security Public role in dispute-resolution and Difficult to quantify Low in PPA, but high priority in
and equity are important assigning property rights the URC consultations
MININTERPolice Security is important for the poor Public sector role, though Difficult to quantify; hard to Security - medium
communities can contribute estimate the impact of policenumbers on crime rate
102
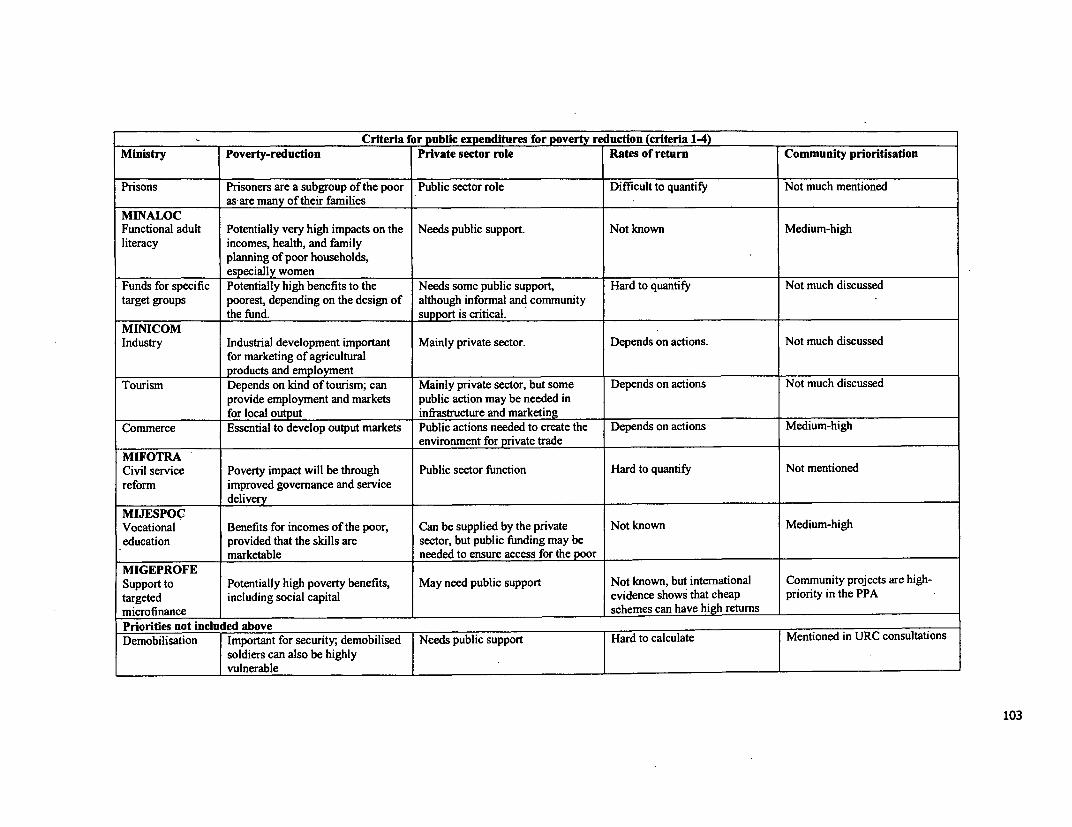
Criteria for public expenditures for poverty reduction (criteria 14)Ministry Poverty-reduction Private sector role Rates of return Community prioritisation
Prisons Prisoners are a subgroup of the poor Public sector role Difficult to quantify Not much mentionedas-are many of their families
MINALOCFunctional adult Potentially very high impacts on the Needs public support. Not known Medium-highliteracy incomes, health, and family
planning of poor households,especially women
Funds for specific Potentially high benefits to the Needs some public support, Hard to quantify Not much discussedtarget groups poorest, depending on the design of although informal and community
the fund. support is critical.MINICOMIndustry Industrial development important Mainly private sector. Depends on actions. Not much discussed
for marketing of agriculturalproducts and employment
Tourism Depends on kind of tourism; can Mainly private sector, but some Depends on actions Not much discussedprovide employment and markets public action may be needed infor local output infrastructure and marketing
Commerce Essential to develop output markets Public actions needed to create the Depends on actions Medium-highenvironment for private trade
MIFOTRACivil service Poverty impact will be through Public sector function Hard to quantify Not mentionedreform improved governance and service
deliveryMIJESPOCVocational Benefits for incomes of the poor, Can be supplied by the private Not known Medium-higheducation provided that the skills are sector, but public funding may be
marketable needed to ensure access for the poorMIGEPROFESupport to Potentially high poverty benefits, May need public support Not known, but international Community projects are high-targeted including social capital evidence shows that cheap priority in the PPAmicrofinance schemes can have high returnsPriorities not included aboveDemobilisation Important for security; demobilised Needs public support Hard to calculate Mentioned in URC consultations
soldiers can also be highlyvulnerable
103
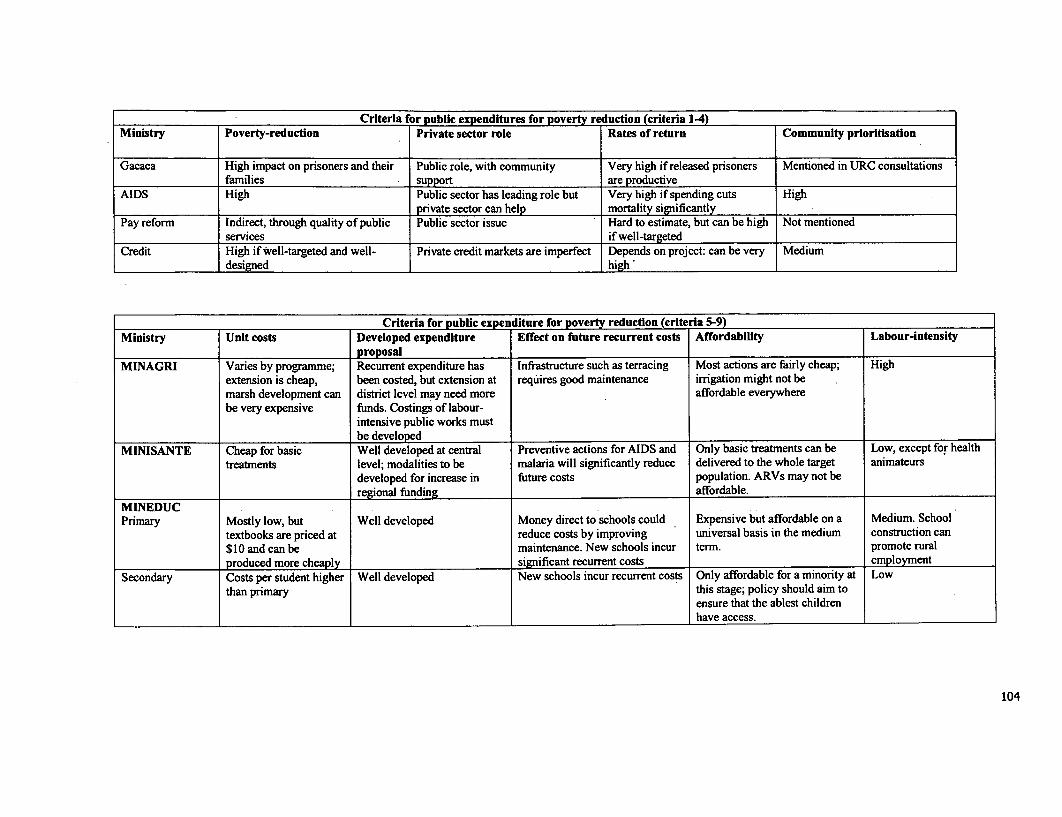
Criteria for public expenditures for pove reduction (criteria 1-4)Ministry Poverty-reduction Private sector role Rates of return Community prioritisation
Gacaca High impact on prisoners and their Public role, with community Very high if released prisoners Mentioned in URC consultationsfamilies support are productive
AIDS High Public sector has leading role but Very high if spending cuts Highprivate sector can help mortality significantly
Pay reform Indirect, through quality of public Public sector issue Hard to estimate, but can be high Not mentionedservices if well-targeted
Credit High if well-targeted and well- Private credit markets are imperfect Depends on project: can be very Mediumdesigned high
Criteria for pubic expe diture for poverty reduction (crit ria 5-9)Ministry Unit costs Developed expenditure Effect on future recurrent costs Affordability Labour-intensity
proposalMINAGRI Varies by programme; Recurrent expenditure has Infrastructure such as terracing Most actions are fairly cheap; High
extension is cheap, been costed, but extension at requires good maintenance irrigation might not bemarsh development can district level may need more affordable everywherebe very expensive funds. Costings of labour-
intensive public works mustbe developed
MINISANTE Cheap for basic Well developed at central Preventive actions for AIDS and Only basic treatments can be Low, except for healthtreatments level; modalities to be malaria will significantly reduce delivered to the whole target animateurs
developed for increase in future costs population. ARVs may not beregional funding affordable.
MINEDUC .Primary Mostly low, but Well developed Money direct to schools could Expensive but affordable on a Medium. School
textbooks are priced at reduce costs by improving universal basis in the medium construction can$10 and can be maintenance. New schools incur term. promote ruralproduced more cheaply significant recurrent costs employment
Secondary Costs per student higher Well developed New schools incur recurrent costs Only affordable for a minority at Lowthan primary this stage; policy should aim to
ensure that the ablest childrenhave access.
104
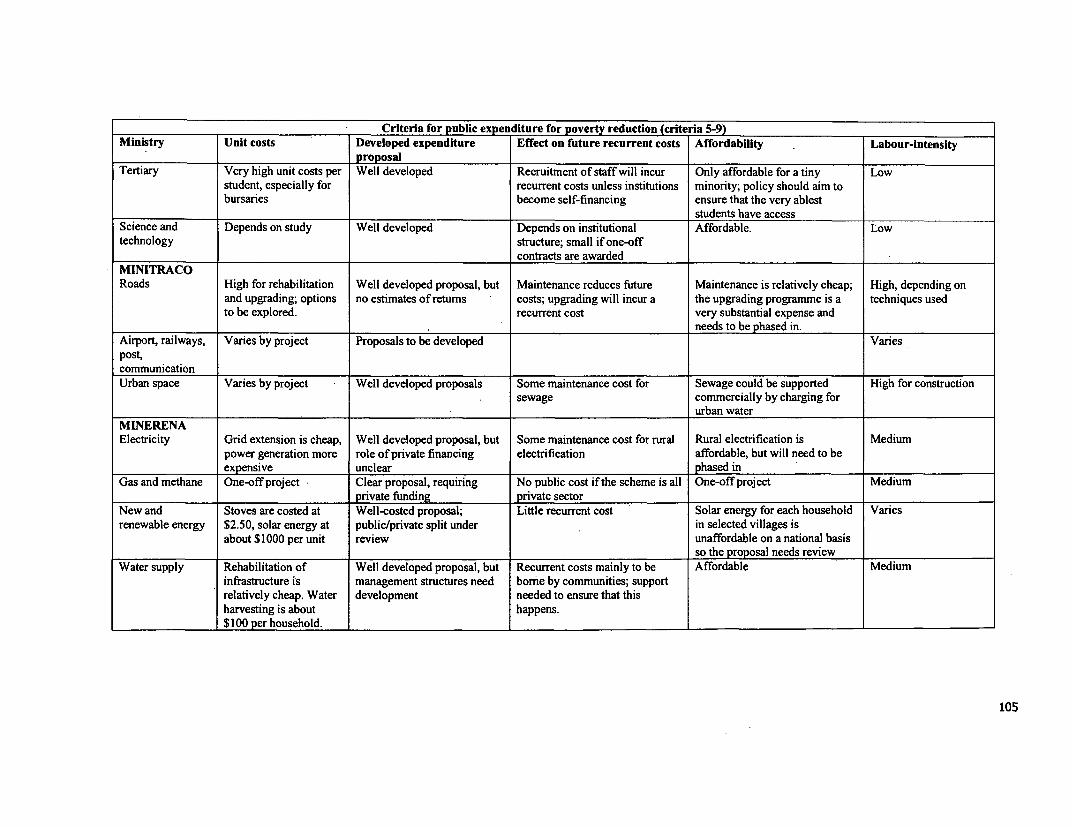
Criteria for public expenditure for poverty reduction (criteria 5-9)Ministry Unit costs Developed expenditure Effect on future recurrent costs Affordability Labour-intensity
proposalTertiary Very high unit costs per Well developed Recruitment of staff will incur Only affordable for a tiny Low
student, especially for recurrent costs unless institutions minority; policy should aim tobursaries become self-financing ensure that the very ablest
students have accessScience and Depends on study Well developed Depends on institutional Affordable. Lowtechnology structure; small if one-off
contracts are awardedMINITRACORoads High for rehabilitation Well developed proposal, but Maintenance reduces future Maintenance is relatively cheap; High, depending on
and upgrading; options no estimates of retums costs; upgrading will incur a the upgrading programme is a techniques usedto be explored. recurrent cost very substantial expense and
needs to be phased in.Airport, railways, Varies by project Proposals to be developed Variespost,communicationUrban space Varies by project Well developed proposals Some maintenance cost for Sewage could be supported High for construction
sewage commercially by charging forurban water
MINERENAElectricity Grid extension is cheap, Well developed proposal, but Some maintenance cost for rural Rural electrification is Medium
power generation more role of private financing electrification affordable, but will need to beexpensive unclear phased in
Gas and methane One-off project Clear proposal, requiring No public cost if the scheme is all One-off project Mediumprivate funding private sector
New and Stoves are costed at Well-costed proposal; Little recurrent cost Solar energy for each household Variesrenewable energy $2.50, solar energy at public/private split under in selected villages is
about $1000 per unit review unaffordable on a national basisso the proposal needs review
Water supply Rehabilitation of Well developed proposal, but Recurrent costs mainly to be Affordable Mediuminfrastructure is management structures need borne by communities; supportrelatively cheap. Water development needed to ensure that thisharvesting is about happens.$100 per household.
105
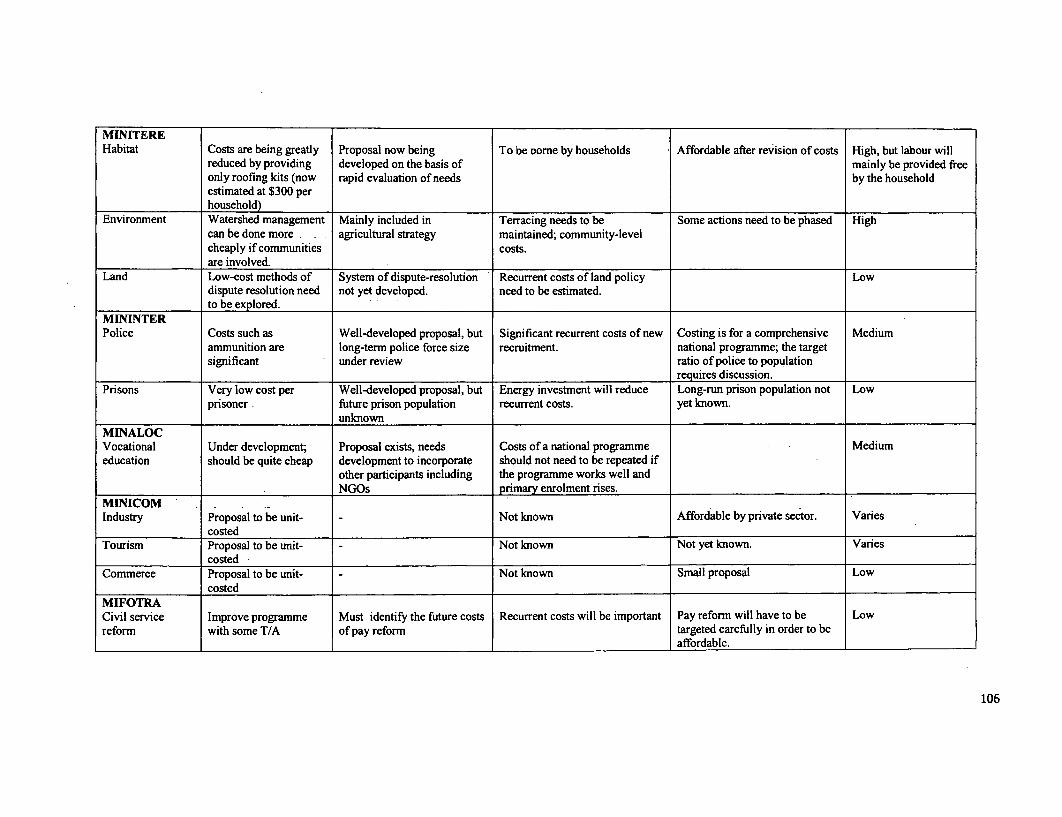
MINITEREHabitat Costs are being greatly Proposal now being To be oome by households Affordable after revision of costs High, but labour will
reduced by providing developed on the basis of mainly be provided freeonly roofing kits (now rapid evaluation of needs by the householdestimated at $300 perhousehold).
Environment Watershed management Mainly included in Terracing needs to be Some actions need to be phased Highcan be done more . agricultural strategy maintained; community-levelcheaply if communities costs.are involved.
Land Low-cost methods of System of dispute-resolution Recurrent costs of land policy Lowdispute resolution need not yet developed. need to be estimated.to be explored. .
MININTERPolice Costs such as Well-developed proposal, but Significant recurrent costs of new Costing is for a comprehensive Medium
ammunition are long-term police force size recruitment. national programme; the targetsignificant under review ratio of police to population
requires discussion.Prisons Very low cost per Well-developed proposal, but Energy investment will reduce Long-run prison population not Low
prisoner future prison population recurrent costs. yet known.unknown
MINALOCVocational Under development; Proposal exists, needs Costs of a national programme Mediumeducation should be quite cheap development to incorporate should not need to be repeated if
other participants including the programme works well and.____________ NGOs primary enrolment rises.
MINICOMIndustry Proposal to be unit- - Not known Affordable by private sector. Varies
costedTourism Proposal to be unit- - Not known Not yet known. Varies
costedCommerce Proposal to be unit- - Not known Small proposal Low
costedMIFOTRACivil service Improve programme Must identify the future costs Recurrent costs will be important Pay reform will have to be Lowreform with some T/A of pay reform targeted carefully in order to be
affordable.
106
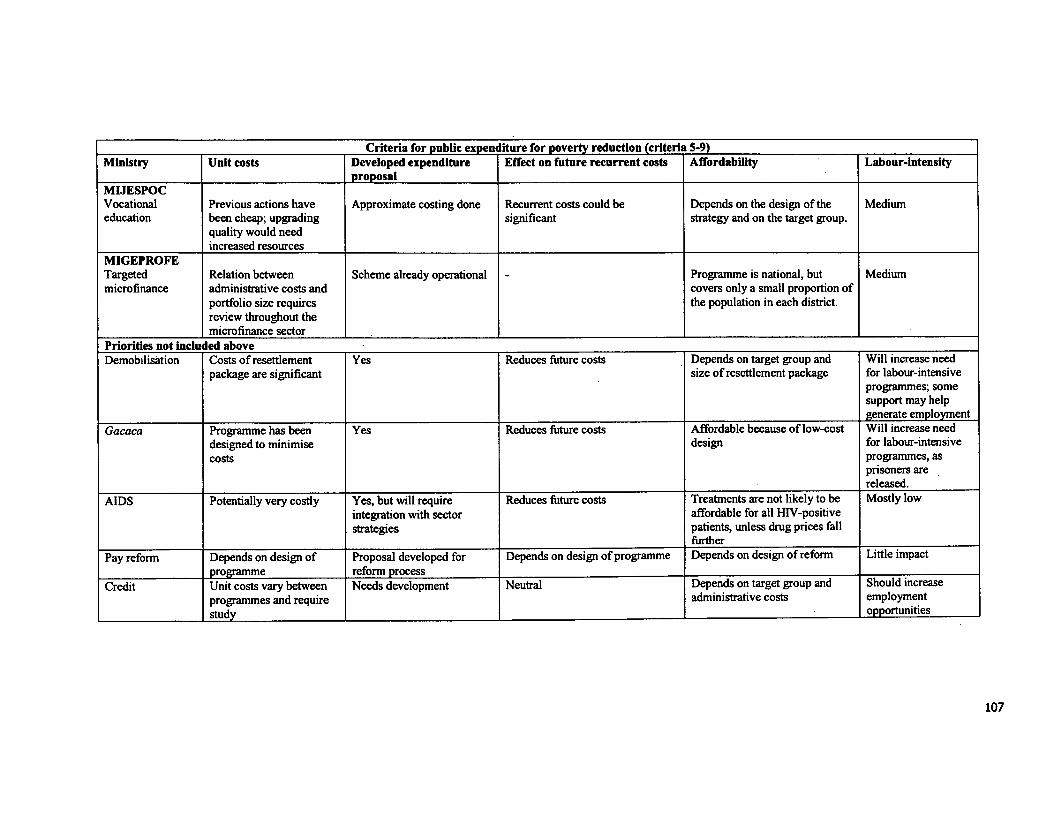
Criteria for public expen liture for poverty reduction (criteria 5-9)Ministry Unit costs Developed expenditure Effect on future recurrent costs Affordability Labour-intensity
proposalMIJESPOCVocational Previous actions have Approximate costing done Recurrent costs could be Depends on the design of the Mediumeducation been cheap; upgrading significant strategy and on the target group.
quality would needincreased resources
MIGEPROFETargeted Relation between Scheme already operational Programme is national, but Mediummicrofinance administrative costs and covers only a small proportion of
portfolio size requires the population in each district.review throughout themicrofinance sector .
Priorities not included aboveDemobilisation Costs of resettlement Yes Reduces future costs Depends on target group and Will increase need
package are significant size of resettlement package for labour-intensiveprogrammes; somesupport may helpgenerate employment
Gacaca Programme has been Yes Reduces future costs Affordable because of low-cost Will increase needdesigned to minimise design for labour-intensivecosts programmes, as
prisoners are______ ______ ______ ______ released.
AIDS Potentially very costly Yes, but will require Reduces future costs Treatments are not likely to be Mostly lowintegration with sector affordable for all HIV-positivestrategies patients, unless drug prices fall
furtherPay reform Depends on design of Proposal developed for Depends on design of programme Depends on design of reform Little impact
programme reform processCredit Unit costs vary between Needs development Neutral Depends on target group and Should increase
programmes and require administrative costs employmentstudy opportunities
107
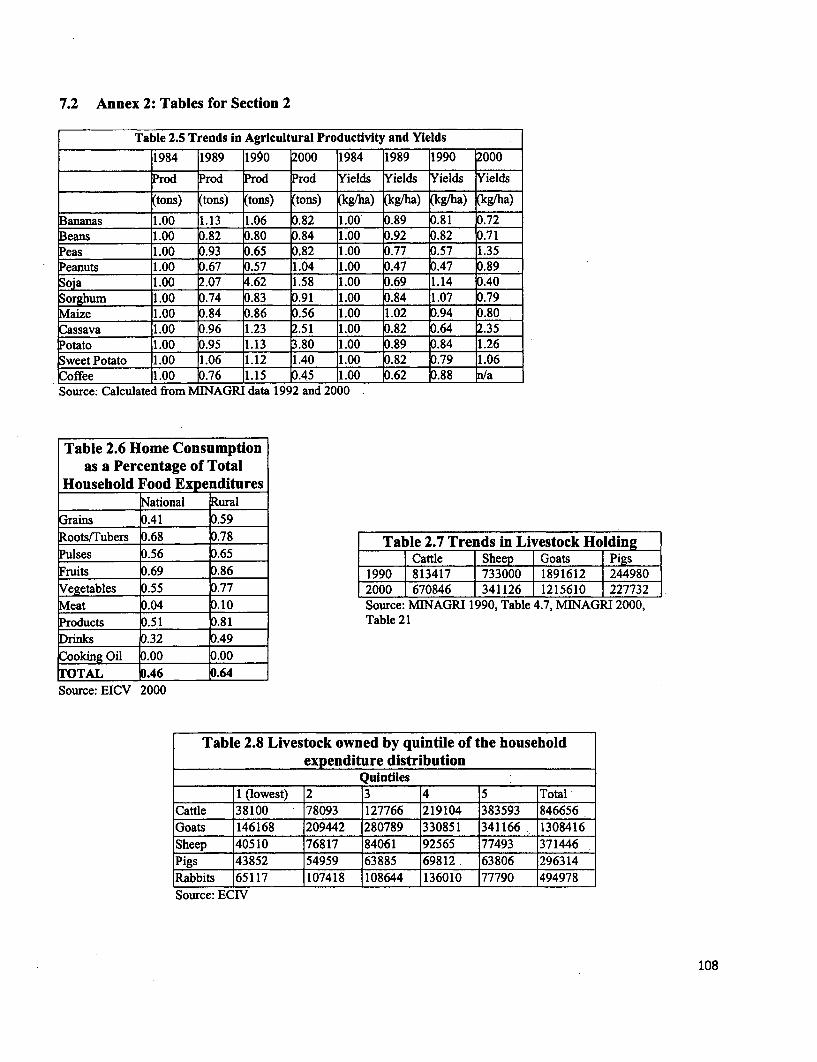
7.2 Annex 2: Tables for Section 2
Table 2.5 Trends in Agricultural Productivity and Yields1984 1989 1990 2000 1984 1989 1990 2000
Prod Prod Prod ?rod Yields Yields Yields Yields
(tons) (tons) (tons) tons) (kg/ha) (kg/ba) (kg/ha) (kg/ha)
Bananas 1.00 1.13 1.06 D.82 1.00 0.89 0.81 .72eans 1.00 .82 D.80 0.84 1.00 0.92 .82 .71Peas 1.00 .93 D.65 0.82 1.00 .77 .57 1.35eanuts 1.00 .67 D.57 1.04 1.00 .47 A7 .89
Soja 1.00 .07 4.62 1.58 1.00 .69 .14 .40Sorghum 1.00 .74 D.83 0.91 1.00 .84 1.07 .79aize 1.00 .84 0.86 .56 1.00 1.02 .94 .80assava 1.00 .96 1.23 .51 1.00 .82 .64 .35otato 1.00 .95 1.13 .80 1.00 .89 .84 1.26weet Potato 1.00 1.06 1.12 1.40 1.00 .82 .79 1.06
Coffee 1.00 .76 1.15 .45 1.00 .62 .88 aSource: Calculated from MINAGRI data 1992 and 2000
Table 2.6 Home Consumptionas a Percentage of Total
Household Food Expe dituresN__ ational Rural
Grains 0.41 0.59Roots/Tubers 0.68 0.78 Table 2.7 Trends in Livestock HoldingPulses 0.56 0.65 Cattle | Sheep Goats PigFruits 0.69 0.86 1990 813417 733000 1891612 244980
Vegetables 0.55 0.77 2000 670846 341126 1215610 227732Meat 0.04 .10 Source: MINAGRI 1990, Table 4.7, MINAGRI 2000,Products .51 .81 Table 21Drinks 0.32 D.49Cooking Oil 0.00 .00TOTAL 0.46 D.64Source: EICV 2000
Table 2.8 Livestock owned by quintile of the householdexpenditure distribution
Quintiles .
1 (lowest) 2 3 4 5 TotalCattle 38100 78093 127766 219104 383593 846656Goats 146168 209442 280789 330851 341166 1308416Sheep 40510 76817 84061 92565 77493 371446Pigs 43852 54959 63885 69812 63806 296314Rabbits 65117 107418 108644 136010 77790 494978Source: ECIV
108
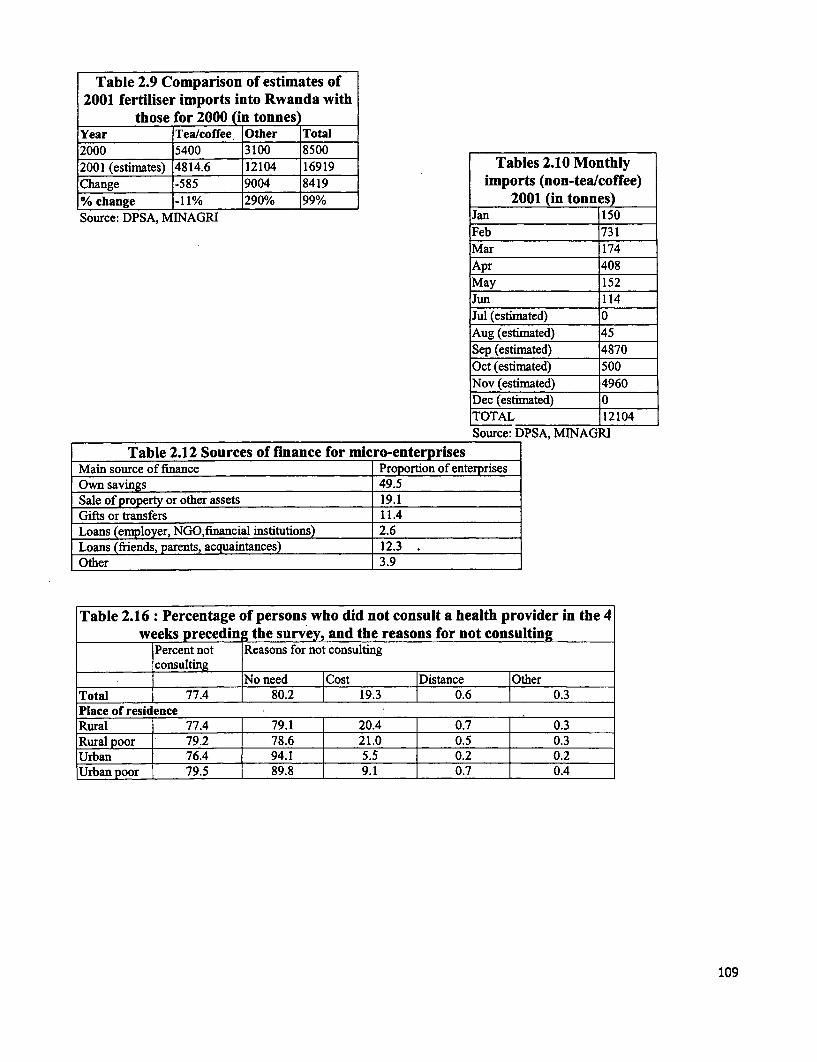
Table 2.9 Comparison of estimates of2001 fertiliser imports into Rwanda with
those for 2000 (in tonnesYear Tea/coffee Other Total2000 5400 3100 85002001 (estimates) 4814.6 12104 16919 Tables 2.10 MonthlyChange -585 9004 8419 imports (non-tea/coffee)% change -11% 290% 99% 2001 (in tonnes)Source: DPSA, MINAGRI Jan 150
Feb 731
Mar 174
Apr 408
May 152
Jun 114
Jul (estirated) 0
Aug (estimated) 45
Sep (estimated) 4870
Oct (estimated) 500Nov (estimated) 4960
Dec (estimated) 0TOTAL 12104
Source: DPSA, MINAGRI
Table 2.12 Sources of finance for micro-enterprisesMain source of finance Proportion of enterprisesOwn savings 49.5Sale of property or other assets 19.1Gifts or transfers 11.4Loans (employer, NGO,financial institutions) 2.6Loans (friends, parents, acquaintances) 12.3Other 3.9
Table 2.16 : Percentage of persons who did not consult a health provider in the 4weeks preceding the survey, and the reasons for not consulting
Percent not Reasons for not consultingconsulting
No need Cost Distance OtherTotal 77.4 80.2 19.3 0.6 0.3Place of residenceRural 77.4 79.1 20.4 0.7 0.3Rural poor 79.2 78.6 21.0 0.5 0.3Urban 76.4 94.1 5.S 0.2 0.2Urban poor 79.5 89.8 9.1 0.7 0.4
109

Table 2.17 Breakdown of atients in each kind of facility by quintile of household expenditure distributionPlace of consultation Quintiles Total
I (lowest) 2 3 4 5 (highest)male 20.4 18.1 16.6 27.2 17.6 100
Consultant's home female 18.6 20.6 22.5 22.5 15.8 100total 19.4 19.5 19.9 26.6 16.6 100male 30.7 8.1 17.7 24.2 19;2 100
Patient's home female 36.0 12.8 20.1 9.5 21.7 100total 33.6 10.7 19.0 16.1 20.6 100male 7.6 14.0 15.9 26.6 35.8 100
Hospital female 9.5 10.8 12.5 19.7 47.5 100total 8.8 12.0 13.8 22.2 43.2 100male 21.9 15.9 11.5 29.4 21.3 100
Pharmacy female 13.8 13.0 19.5 27.7 ; 26.0 100_ total 17.7 14.4 15.7 28.5 23.7 100male 0 0 1.5 11.0 87.5 100
Clinic (private) female 0 0 9.3 3.0 87.7 100total 0 0 5.0 7.4 87.6 100male 14.6 17.8 20.4 18.5 28.4 100
Dispensary female 11.2 10.6 15.5 28.6 34.1 100total 12.8 13.9 17.8 24.1 31.4 100male
Maternity female 13.9 16.4 16.8 17.8 35.1 100total 13.9 16.4 16.8 17.8 35.1 100male 16.2 16.2 25.4 22.2 20.2 100
Health centre female 12.2 15.3 18.8 30.5 23.2 100total 14.0 15.7 21.9 26.6 21.8 100
. male 17.1 29.2 25.4 11.1 17.2 100Other female 19.4 13.8 24.6 23.0 19.1 100
total 18.5 19.8 24.9 18.3 18.4 100
Table 2.18 Primary ed cation attainment by quintile and sexI Primary education by %
Quintile . Not completed Completed TotalMale 85.01 14.99 100
I Female 84.46 15.54 100Total 84.71 15.29 100Male 79.25 20.75 100
2 Female 78.96 21.04 100Total 79.10 20.90 100Male 73.34 26.66 100
3 Female 73.34 26.66 100Total 73.34 26.66 100Male 63.64 36.36 100
4 Female 62.68 37.32 100Total 63.15 36.85 100Male 47.52 52.48 100
5 Female 46.61 53.39 100Total 47.07 52.93 100
Male 68.38 31.62 100Total Female 68.37 31.63 100
110

Table 2.19: Number of students in education:(Rat of increase in parentheses )
Primary Secondary Higher93/4 1,174,448 (pre-genocide) 54,815 (pre-genocide) 4,597
820,232 (post-genocide) 3,077 (post-genocide)94/5 941,012 (14.7%) 2,82195/6 1,039,657 (10.5%) 50,000 4,196 (48.7%)96/7 1,154,768 (11.1 %) 82,224 (64.4%) 4,440 (5.8%)97/8 1,270,733 (10.0%) 90,840 (10.5%) 4,548 (2.4%)98/9 1,288,663 (1.4 %) 105,292 (15.9%) 5,943 (30.7%)99/0 1,431,692 (11.1 %) 125,124 (18.8%) 7,224 (21.6%)00/01 1,476,272 (3.1 %) 141,163 (12.8 %)
Table 2.20: Incidence of primary and secondary education by quintile of the nationalhousehold expenditure distribution
Type of school Quintile1 2 3 4 5 Total
Boys 20.4 23.4 19.1 18.8 18.3 100Public primary Girls 22.2 21.6 20.9 19.5 15.8 100
Total 21.3 22.5 20.0 19.1 17.0 100'Boys 1.0 4.1 17.5 15.3 62.1 100
Private primary Girls 4.1 12.7 10.3 27.0 45.9 100Total 2.5 8.3 14.0 21.0 54.3 100Boys 27.1 23.8 22.7 17.0 9.3 100
Grant-maintained Girls 27.0 21.9 22.5 19.3 9.2 100Total 27.1 21.9 22.3 19.3 9.2 100Boys 3.7 15.0 13.9 27.8 39.6 100
Public secondary Girls 4.8 9.3 11.8 32.2 42.0 100Total 4.3 12.0 12.8 30.1 40.8 100Boys 2.7 8.7 4.7 28.8 55.1 100
Private secondary Girls 0 5.1 9.0 30.6 55.3 100Total 1.1 6.5 7.3 29.9 55.2 100Boys 5.6 1.6 5.0 38.2 49.5 100
Grant-maintained secondary Girls 1.0 9.2 7.8 29.0 53.0 100Total 3.1 5.7 6.5 33.3 51.4 100
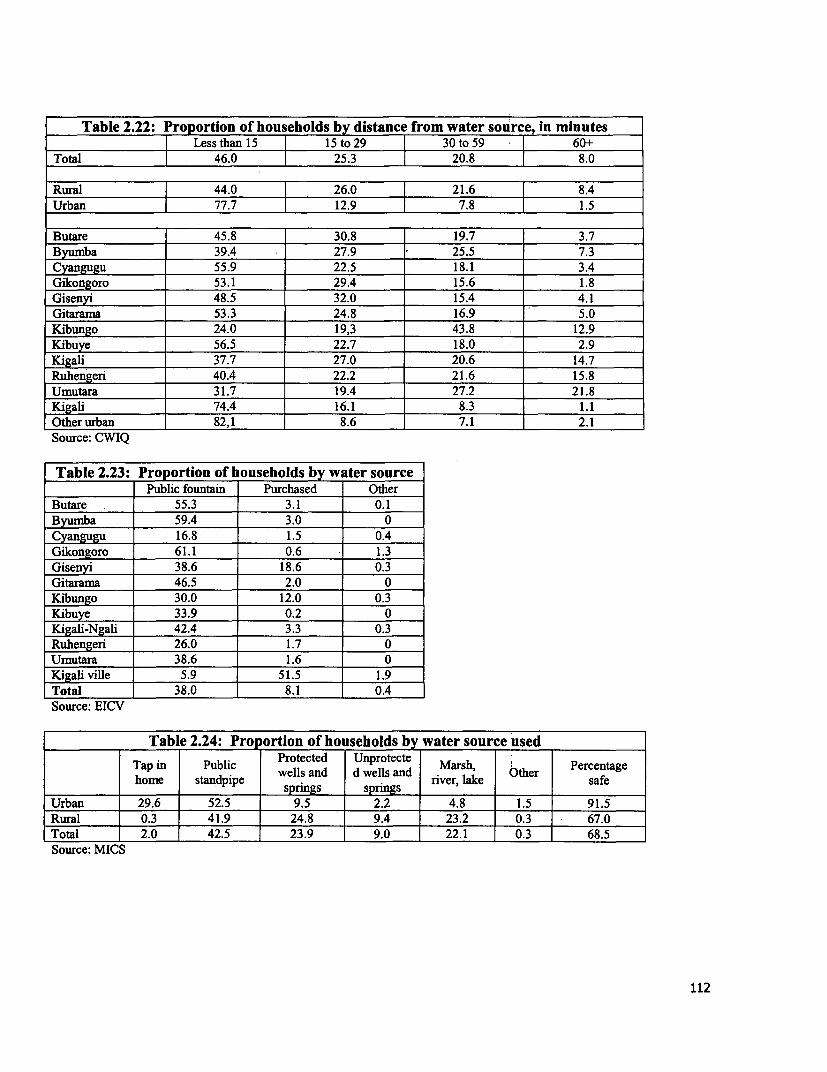
Table 2.22: Proportion of households by distance from water source, in minutes_ Less than 15 15to 29 30 to 59 60+
Total [ 46.0 25.3 20.8 8.0
Rural 44.0 | 26.0 21.6 | 8.4Urban ( 77.7 J 12.9 1 7.8 J 1.5
Butare 45.8 30.8 19.7 3.7Byumba 39.4 27.9 25.5 7.3Cyangugu 55.9 22.5 18.1 3.4Gikongoro 53.1 29.4 15.6 1.8Gisenyi 48.5 32.0 15.4 4.1Giuarama 53.3 24.8 16.9 5.0Kibungo 24.0 19,3 43.8 12.9Kibuye 56.5 22.7 18.0 2.9Kigali 37.7 27.0 20.6 14.7Ruhengeri 40.4 22.2 21.6 15.8Umutara 31.7 19.4 27.2 21.8Kigali 74.4 16.1 8.3 1.1Other urban 82,1 8.6 7.1 2.1Source: CWIQ
Table 2.23: Proportion of households by water sourcePublic fountain Purchased Other
Butare 55.3 3.1 0.1Byumba 59.4 3.0 0Cyangugu 16.8 1.5 0.4Gikongoro 61.1 0.6 1.3Gisenyi 38.6 18.6 0.3Gitarama 46.5 2.0 0Kibungo 30.0 12.0 0.3Kibuye 33.9 0.2 0Kigali-Ngali 42.4 3.3 0.3Ruhengeri 26.0 1.7 0Umutara 38.6 1.6 0Kigali ville 5.9 51.5 1.9Total 38.0 8.1 0.4Source: EICV
Table 2.24: Pro ortion of households by water source usedTap in Public Protected Unprotecte Marsh, Percentagehome standpipe wells and d wells and river, lake Other safe
_______ __ ____ ___ ___ _______ springs springs ye, l kUrban 29.6 52.5 9.5 2.2 4.8 1.5 91.5Rural 0.3 41.9 24.8 9.4 23.2 0.3 67.0Total 2.0 42.5 23.9 9.0 22.1 0.3 68.5Source: MICS
112
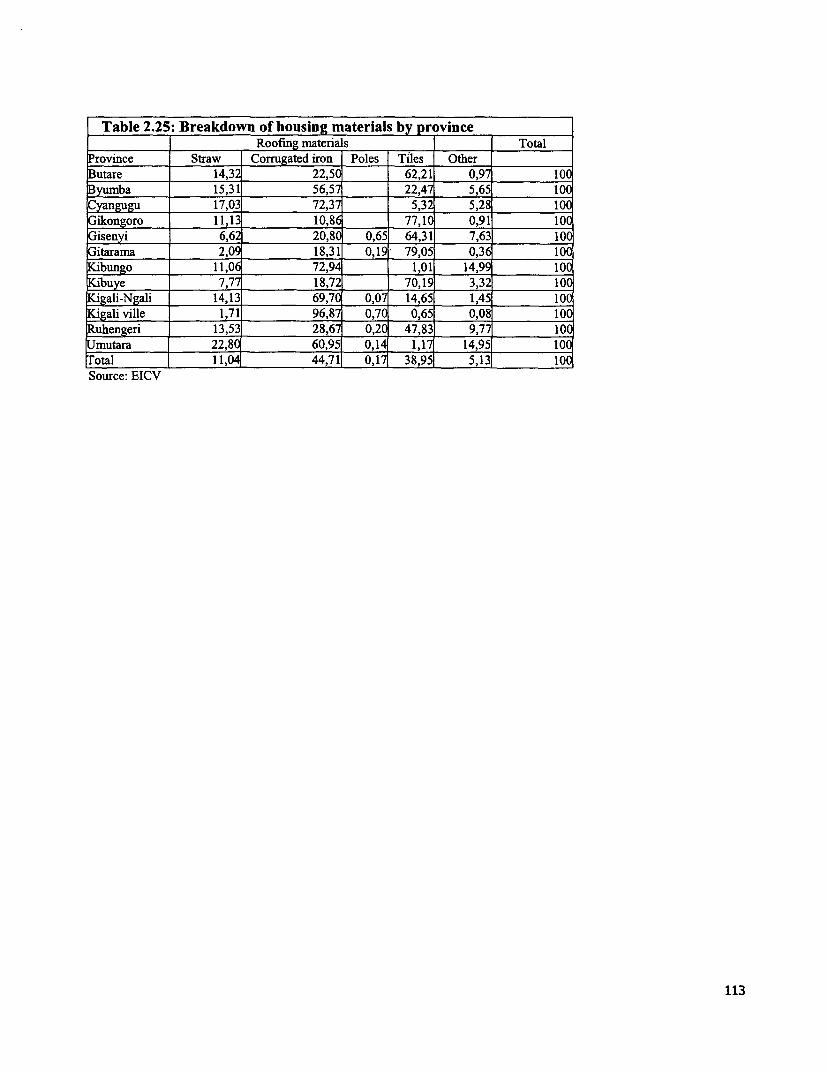
Table 2.25: Breakdown of housing materials by provinceRoofing materials Total
Province Straw Corrugated iron Poles Tiles OtherButare 14,32 22,50 ___ 62,21 0,97 10C
Byumba 15,31 56,57 22,47 5,65 10oCyangugu 17,03 72,37 5,32 5,28 10(ikongoro 11,13 10,86 77,10 0,91 10(Gisenyi 6,6, 20,80 0,65 64,31 7,63 10(
itarama 2,05 18,31 0,1 79,05 0,36 10(Kibungo 11,01 72,94 1,01 14,99 10Kibuye 7,71 18,72 70,19 3,3 10Kigali-Ngali 14,13 69,70 0,07 14,65 1,45 10(
gali ville 1,71 96,87 0,70 0,65 0,08 10(uhengeri 13,53 28,67 0,2C 47,83 9,7 10mutara 22,81 60,95 0,14 1,17 14,95 10(otal 11, 44,71 0,17 38,95 5,13 10(
Source: EICV
113
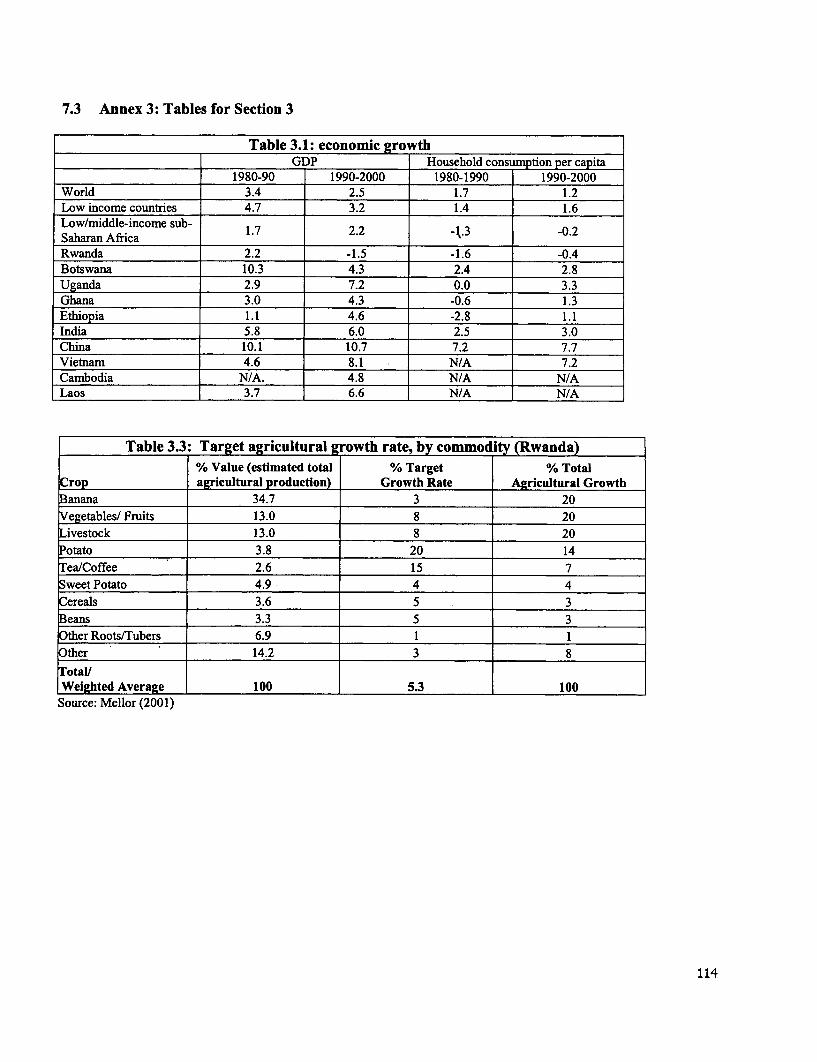
7.3 Annex 3: Tables for Section 3
Table 3.1: economic growthGDP Household consumption per capita
1980-90 1990-2000 1980-1990 1990-2000World 3.4 2.5 1.7 1.2Low income countries 4.7 3.2 1.4 1.6Low/middle-income sub- 1.7 2.2 -1.3 -0.2Saharan Africa _____
Rwanda 2.2 -1.5 -1.6 -0.4Botswana 10.3 4.3 2.4 2.8Uganda 2.9 7.2 0.0 3.3Ghana 3.0 4.3 -0.6 1.3Ethiopia 1.1 4.6 -2.8 1.1India 5.8 6.0 2.5 3.0China 10.1 10.7 7.2 7.7Vietnam 4.6 8.1 N/A 7.2Cambodia N/A. 4.8 N/A N/ALaos 3.7 6.6 N/A N/A
Table 3.3: Target agricultural g owth rate, by commodity (Rwanda)% Value (estimated total % Target % Total
Crop agricultural production) Growth Rate Agricultural GrowthBanana 34.7 3 20Vegetables/ Fruits 13.0 8 20Livestock 13.0 8 20Potato 3.8 20 14Tea/Coffee 2.6 15 7Sweet Potato 4.9 4 4Cereals 3.6 5 3Beans 3.3 5 3Other Roots/Tubers 6.9 1 1
Other 14.2 3 8otalU
Weighted Average 100 5.3 100Source: Mellor (2001)
114
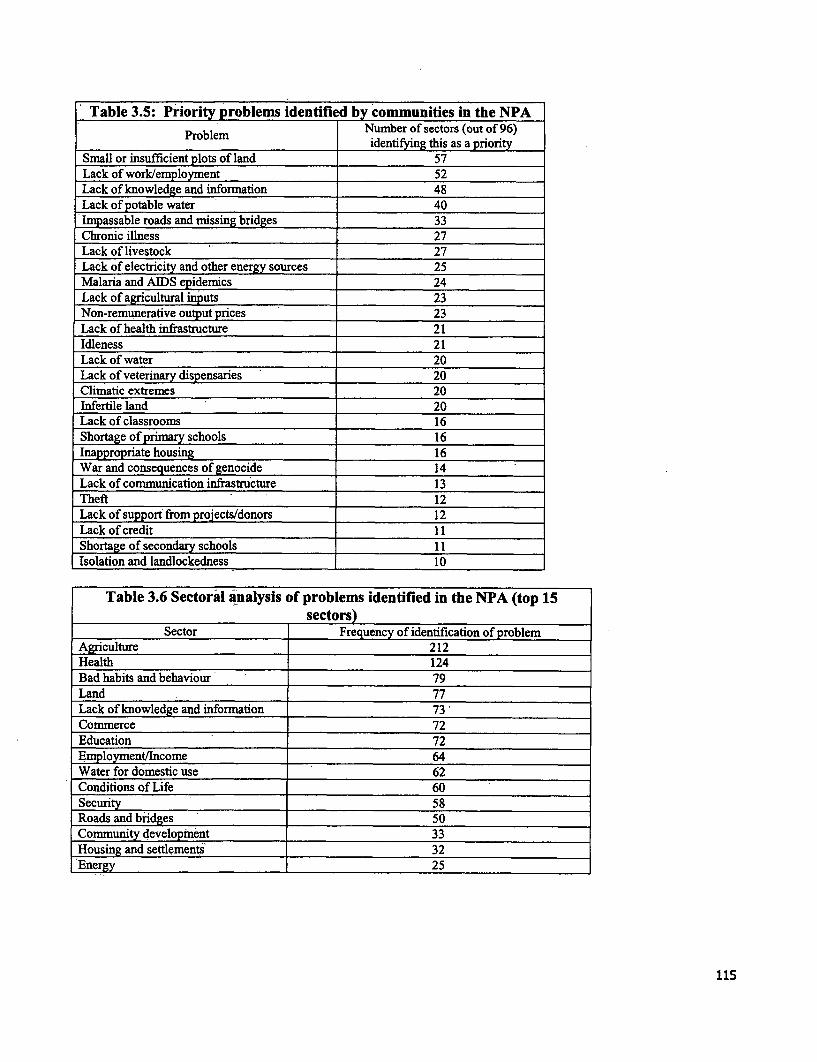
Table 3.5: Priority problems identified by communities in the NPA. .~~~~Pobe Numiber of sectors (out of 96)Problem identifying this as a priority
Small or insufficient plots of land 57Lack of work/employment 52Lack of knowledge and information 48Lack of potable water 40Impassable roads and missing bridges 33Chronic illness 27Lack of livestock 27Lack of electricity and other energy sources 25Malaria and AIDS epidemics 24Lack of agricultural inputs 23Non-remunerative output prices 23Lack of health infrastructure 21Idleness 21Lack of water 20Lack of veterinary dispensaries 20Climatic extremes 20Infertile land 20Lack of classrooms 16Shortage of primary schools 16Inappropriate housing 16War and consequences of genocide 14Lack of communication infrastructure 13Theft 12Lack of support from projects/donors 12Lack of credit 11Shortage of secondary schools 11Isolation and landlockedness 10
Table 3.6 Sectoral analysis of problems identified in the NPA (top 15sectors)
Sector Frequency of identification of problemAgriculture 212Health 124Bad habits and behaviour 79Land 77Lack of knowledge and infornation 73Commerce 72Education 72Employment/Income 64Water for domestic use 62Conditions of Life 60Security 58Roads and bridges 50Community development 33Housing and settlements' 32Energy 25
115
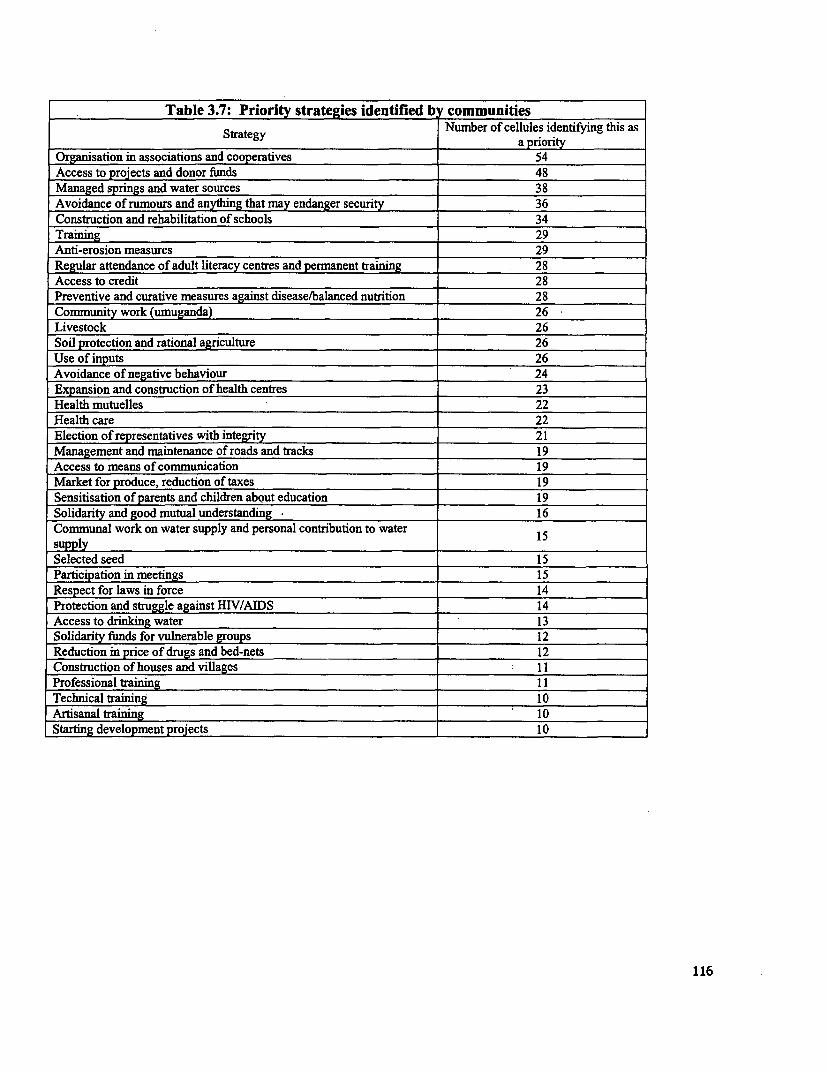
Table 3.7: Priorit strategies identified b communitiesStrategy Number of cellules identifying this asa priority
Organisation in associations and cooperatives 54Access to projects and donor funds 48Managed springs and water sources 38Avoidance of rumours and anything that may endanger security 36Construction and rehabilitation of schools 34Training 29Anti-erosion measures 29Regular attendance of adult literacy centres and permanent training 28Access to credit 28Preventive and curative measures against disease/balanced nutrition 28Community work (umuganda) 26Livestock 26Soil protection and rational agriculture 26Use of inputs 26Avoidance of negative behaviour 24Expansion and construction of health centres 23Health mutuelles 22Health care 22Election of representatives with integrity 21Management and maintenance of roads and tracks 19Access to means of communication 19Market for produce, reduction of taxes 19Sensitisation of parents and children about education 19Solidarity and good mutual understanding _ _1_6Communal work on water supply and personal contribution to water 15supplySelected seed 15Participation in meetings 15Respect for laws in force 14Protection and struggle against HIW/AIDS 14Access to drinking water 13Solidarity funds for vulnerable groups 12Reduction in price of drugs and bed-nets 12Construction of houses and villages 11Professional training 11Technical training 10Artisanal training 10Starting development projects 10
116
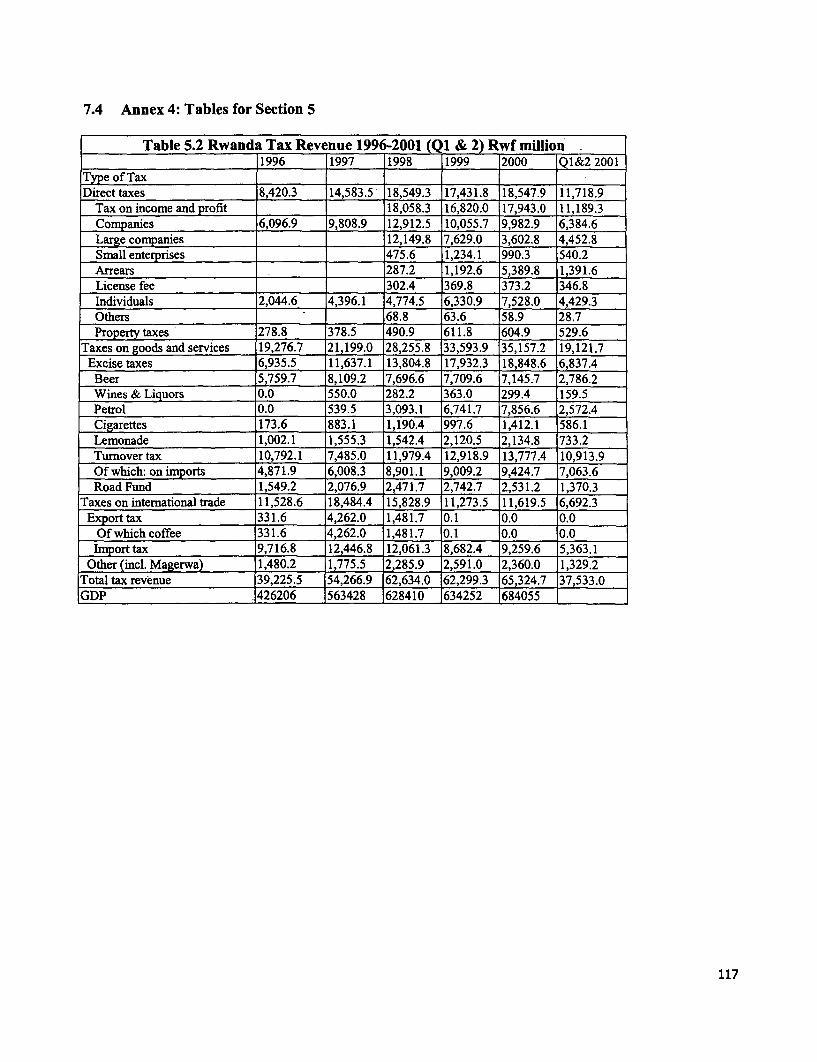
7.4 Annex 4: Tables for Section 5
Table 5.2 Rwanda Tax Revenue 1996-2001 (QI & 2) Rwf million_ _1996 1997 1998 1999 2000 Q1&2 2001
Type of Tax IDirect taxes 8,420.3 14,583.5 18,549.3 17,431.8 18,547.9 11,718.9
Tax on income and profit 18,058.3 16,820.0 17,943.0 11,189.3Companies 6,096.9 9,808.9 12,912.5 10,055.7 9,982.9 6,384.6Large companies 12,149.8 7,629.0 3,602.8 4,452.8Small enterprises 1475.6 1,234.1 990.3 540.2Arrears 287.2 1,192.6 5,389.8 1,391.6License fee 302.4 369.8 373.2 346.8Individuals 2,044.6 4,396.1 4,774.5 6,330.9 7,528.0 4,429.3Others 68.8 63.6 58.9 28.7Property taxes 278.8 378.5 490.9 611.8 604.9 529.6
Taxes on goods and services 19,276.7 21,199.0 28,255.8 33,593.9 35,157.2 19,121.7Excise taxes 6,935.5 11,637.1 13,804.8 17,932.3 18,848.6 6,837.4
Beer 5,759.7 8,109.2 7,696.6 7,709.6 7,145.7 2,786.2Wines & Liquors 0.0 550.0 282.2 363.0 299.4 159.5Petrol 0.0 539.5 3,093.1 6,741.7 7,856.6 2,572.4Cigarettes 173.6 883.1 1,190.4 997.6 1,412.1 586.1Lemonade 1,002.1 1,555.3 1,542.4 2,120.5 2,134.8 733.2Turnover tax 10,792.1 7,485.0 11,979.4 12,918.9 13,777.4 10,913.9Of which: on imports 4,871.9 6,008.3 8,901.1 9,009.2 9,424.7 7,063.6Road Fund 1,549.2 2,076.9 2,471.7 2,742.7 2,531.2 1,370.3
Taxes on international trade 11,528.6 18,484.4 15,828.9 11,273.5 11,619.5 6,692.3Export tax 331.6 4,262.0 1,481.7 0.1 0.0 0.0
Of which coffee 331.6 4,262.0 1,481.7 0.1 0.0 0.0Import tax 9,716.8 12,446.8 12,061.3 8,682.4 9,259.6 5,363.1
Other (incl. Magerwa) 1,480.2 1,775.5 2,285.9 2,591.0 2,360.0 1,329.2Total tax revenue 39,225.5 54,266.9 62,634.0 62,299.3 65,324.7 37,533.0GDP 426206 563428 628410 634252 684055
117
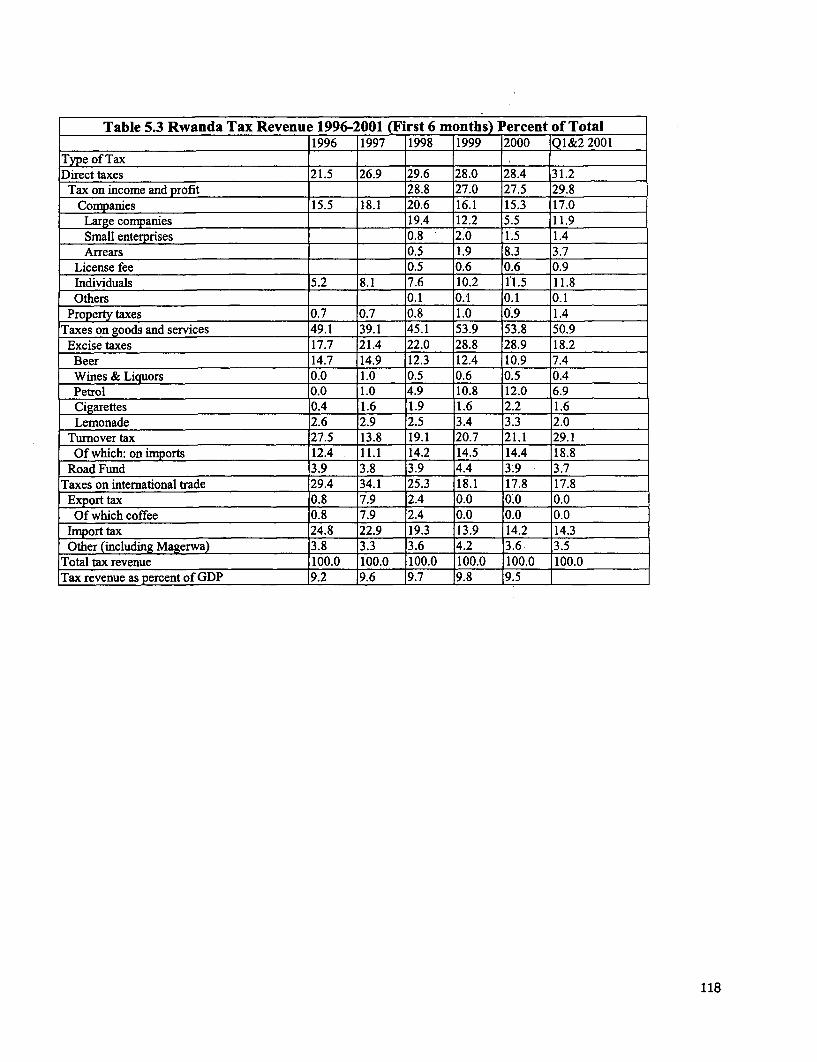
Table 5.3 Rwanda Tax Revenue 1996-2001 (First 6 months) Percent of Total1996 1997 1998 1999 2000 Q1&2 2001
Type of Tax lDirect taxes 21.5 26.9 29.6 28.0 28.4 31.2
Tax on income and profit 28.8 27.0 27.5 29.8Companies 15.5 18.1 20.6 16.1 15.3 17.0
Large companies 19.4 12.2 5.5 11.9Small enterprises 0.8 2.0 1.5 1.4Arrears 0.5 1.9 8.3 3.7
License fee 0.5 0.6 0.6 0.9Individuals 5.2 8.1 7.6 10.2 1'1.5 11.8Others _0,1 0.1 0.1 0.1
Property taxes 0.7 0.7 0.8 1.0 0.9 1.4Taxes on goods and services 49.1 39.1 45.1 53.9 53.8 50.9
Excise taxes 17.7 21.4 22.0 28.8 28.9 18.2Beer 14.7 14.9 12.3 12.4 10.9 7.4Wines & Liquors 0.0 1.0 0.5 0.6 0.5 0.4Petrol 0.0 1.0 4.9 10.8 12.0 6.9Cigarettes 0.4 1.6 1.9 1.6 2.2 1.6Lemonade 2.6 2.9 2.5 3.4 3.3 2.0
Turnover tax 27.5 13.8 19.1 20.7 21.1 29.1Of which: on imports 12.4 11.1 14.2 14.5 14.4 18.8
Road Fund 3.9 3.8 3.9 4.4 3.9 3.7Taxes on international trade 29.4 34.1 25.3 18.1 17.8 17.8
Export tax 0.8 7.9 2.4 0.0 0;0 0.0Of which coffee 0.8 7.9 2.4 0.0 0.0 0.0
Import tax 24.8 22.9 19.3 13.9 14.2 14.3Other (including Magerwa) 3.8 3.3 3.6 4.2 3.6 3.5
Total tax revenue 100.0 100.0 100.0 100.0 100.0 100.0Tax revenue as percent of GDP 9.2 9.6 9.7 9.8 9.5
118
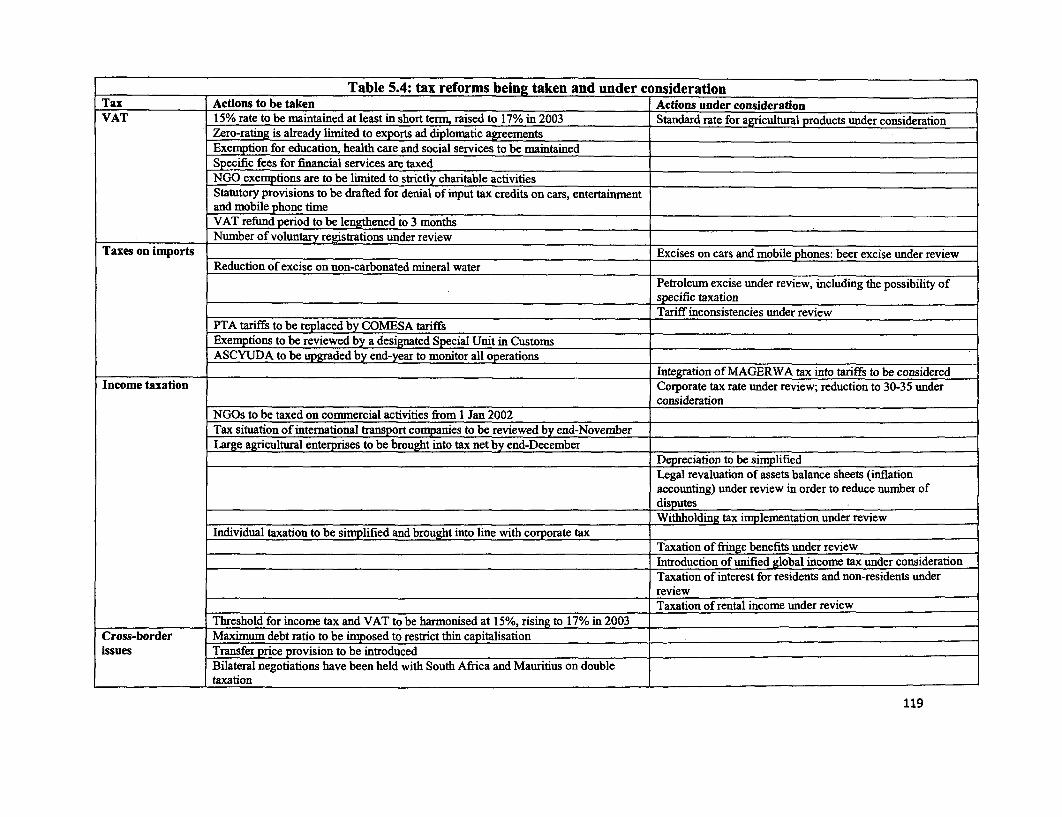
Table 5.4: tax reforms being taken and under considerationTax Actions to be taken Actions under considerationVAT 15% rate to be maintained at least in short term, raised to 17% in 2003 Standard rate for agricultural products under consideration
Zero-rating is already limited to exports ad diplomatic agreementsExemption for education, health care and social services to be maintainedSpecific fees for financial services are taxedNGO exemptions are to be limnited to strictly charitable activitiesStatutory provisions to be drafted for denial of input tax credits on cars, entertainmentand rnobile phone timeVAT refind period to be lengthened to 3 monthsNumber of voluntary registrations under review
Taxes on imports Excises on cars and mobile phones: beer excise under reviewReduction of excise on non-carbonated mineral water
Petroleum excise under review, including the possibility ofspecific taxationTariff inconsistencies under review
PTA tariffs to be replaced by COMESA tariffsExemptions to be reviewed by a designated Special Unit in CustomsASCYUDA to be upgraded by end-year to monitor all operations
Integration of MAGERWA tax into tariffs to be consideredIncome taxation Corporate tax rate under review; reduction to 30-35 under
considerationNGOs to be taxed on commercial activities from 1 Jan 2002Tax situation of international transport companies to be reviewed by end-NovemberLarge agricultural enterprises to be brought into tax net by end-December
_ndividual txtotobsipfdanbruhitliewtcoorttx_______Depreciation to be sirnplifiedLegal revaluation of assets balance sheets (inflationaccounting) under review in order to reduce number of
. . ~~~~~~~~~~~~~~~~~~~disputes. TrsofoinmtaadVTtbhm idat5,iigoWithholding tax ir%plenentation under review
Individual taxation to be simpsfied and brought into line with corporate taxTaxation of fuinge benefits ubder reviewIntroduction of unified global income tax under considerationTaxation of interest for residents and non-residents underreviewTaxation of rental income under review
Threshold for income tax and VAT to be harmonised at 15%, rising to 17% in 2003lCross-border Maximnum debt ratio to be imposed to restrict thin capitalisation_issues Transfer price provision to be introduced_
Bilateral negotiations have been held with South Africa and Mauritius on doubletaxation
119
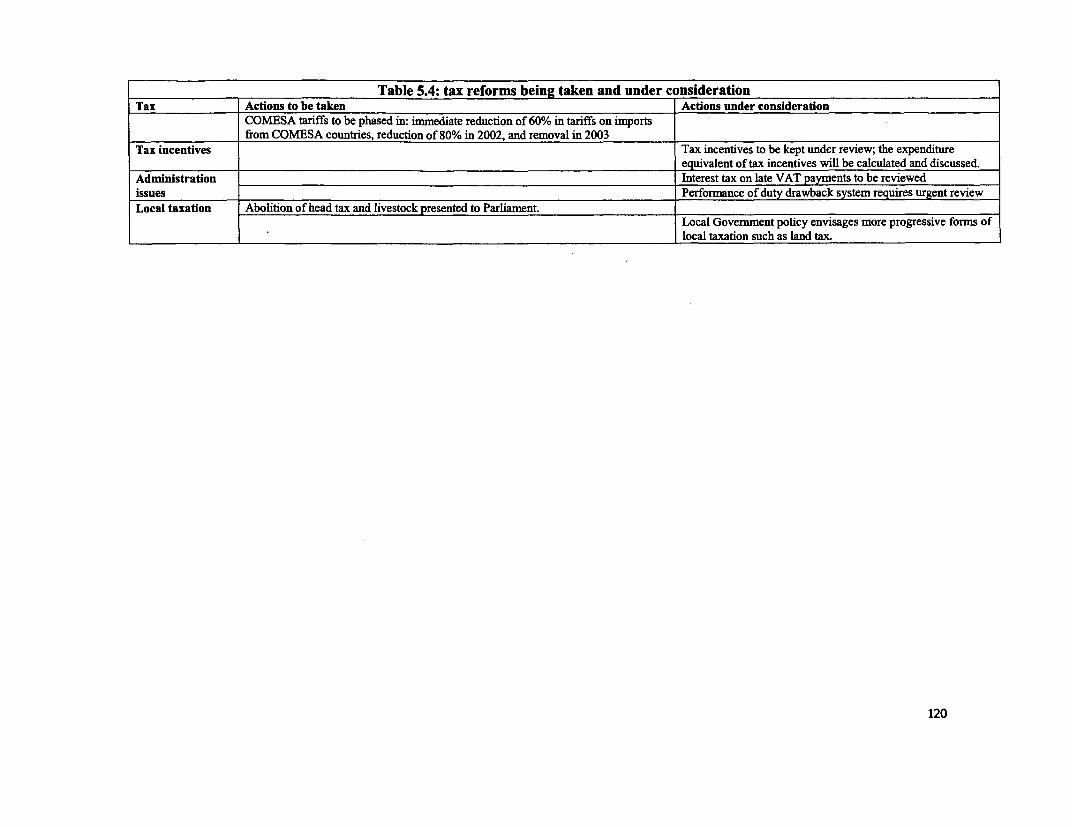
Table 5.4: tax reforms being taken and under considerationTax Actions to be taken Actions under consideration
COMESA tariffs to be phased in: immediate reduction of 60% in tariffs on importsfrom COMESA countries, reduction of 80% in 2002, and removal in 2003
Tax incentives Tax incentives to be kept under review; the expenditureequivalent of tax incentives will be calculated and discussed.
Administration Interest tax on late VAT payments to be reviewedissues Performance of duty drawback system requires urgent reviewLocal taxation Abolition of head tax and livestock presented to Parliament.
Local Government policy envisages more progressive forms oflocal taxation such as land tax.
120
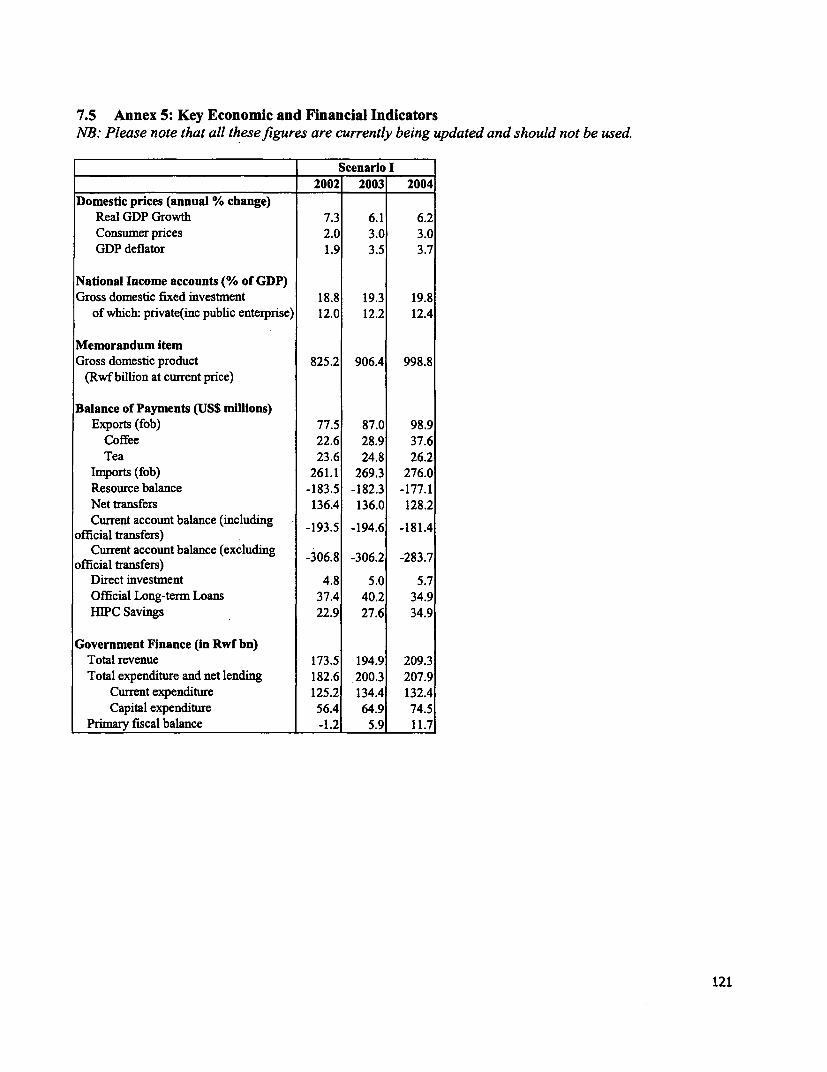
7.5 Annex 5: Key Economic and Financial IndicatorsNB: Please note that all these figures are currently being updated and should not be used.
Scenario I2002 2003 2004
Domestic prices (annual % change)Real GDP Growth 7.3 6.1 6.2Consumer prices 2.0 3.0 3.0GDP deflator 1.9 3.5 3.7
National Income accounts (% of GDP)Gross domestic fixed investment 18.8 19.3 19.8
of which: private(inc public enterprise) 12.0 12.2 12.4
Memorandum itemGross domestic product 825.2 906.4 998.8
(Rwf billion at current price)
Balance of Payments (US$ millions)Exports (fob) 77.5 87.0 98.9
Coffee 22.6 28.9 37.6Tea 23.6 24.8 26.2
hmports (fob) 261.1 269.3 276.0Resource balance -183.5 -182.3 -177.1Net transfers 136.4 136.0 128.2Current account balance (including -193.5 -194.6 -181.4
official transfers)Current account balance (excluding -306.8 -306.2 -283.7
official transfers)Direct investment 4.8 5.0 5.7Official Long-term Loans 37.4 40.2 34.9HIPC Savings 22.9 27.6 34.9
Government Finance (in Rwf bn)Total revenue 173.5 194.9 209.3Total expenditure and net lending 182.6 200.3 207.9
Current expenditure 125.2 134.4 132.4Capital expenditure 56.4 64.9 74.5
Primary fiscal balance -1.2 5.9 11.7
121
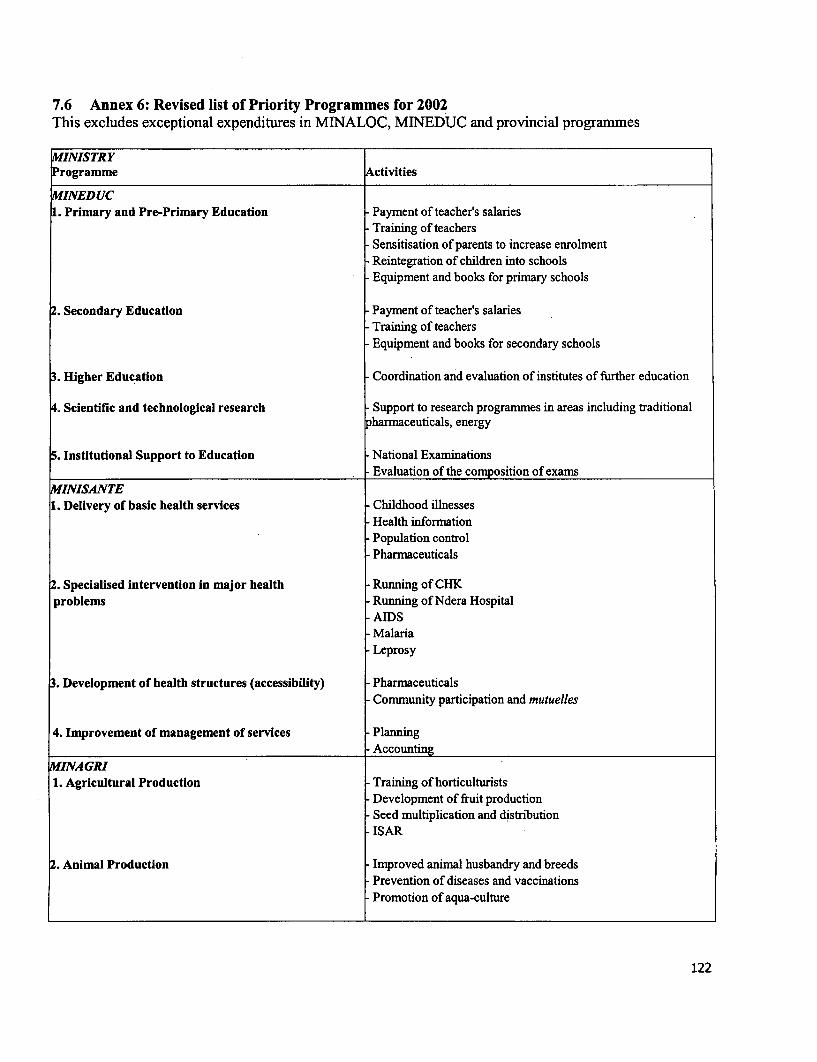
7.6 Annex 6: Revised list of Priority Programmes for 2002This excludes exceptional expenditures in MINALOC, MlNEDUC and provincial programmes
MINISTRYProgramme Activities
MINEDUC1. Primary and Pre-Primary Education Payment of teacher's salaries
Training of teachersSensitisation of parents to increase enrolmentReintegration of children into schoolsEquipment and books for primary schools
2. Secondary Education Payment of teacher's salariesTraining of teachersEquipment and books for secondary schools
3. Higher Education Coordination and evaluation of institutes of further education
Scientific and technological research Support to research programmes in areas including traditionalharmaceuticals, energy
5. Institutional Support to Education National ExaminationsEvaluation of the composition of exams
MINISANTE1. Delivery of basic health services Childhood illnesses
Health informationPopulation controlPharmaceuticals
2. Specialised intervention in major health Running of CHKproblems Running of Ndera Hospital
AIDSMalariaLeprosy
3. Development of health structures (accessibility) PharmaceuticalsCommunity participation and mutuelles
4. Improvement of management of services Planning- Accounting
MINAGRI1. Agricultural Production Training of horticulturists
Development of fruit productionSeed multiplication and distributionISAR
2. Animal Production Improved animal husbandry and breedsPrevention of diseases and vaccinations
- Promotion of aqua-culture
122
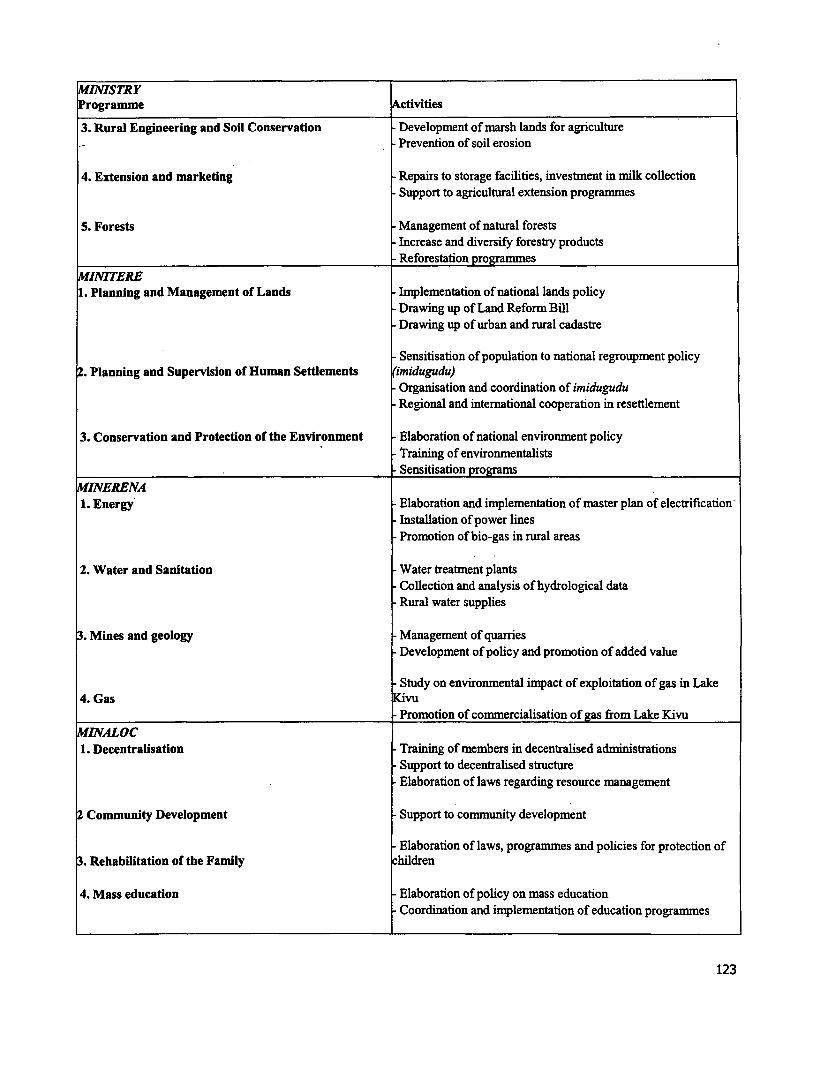
MIISTRYProgramme Activities
3. Rural Engineering and Soil Conservation Development of marsh lands for agriculture- Prevention of soil erosion
4. Extension and marketing Repairs to storage facilities, investment in milk collectionSupport to agricultural extension programmes
5. Forests Management of natural forestsIncrease and diversify forestry products
- Reforestation programmes
MINITERE1. Planning and Management of Lands Implementation of national lands policy
Drawing up of Land Reform BillDrawing up of urban and rural cadastre
- Sensitisation of population to national regroupment policy2. Planning and Supervision of Human Settlements (imidugudu)
Organisation and coordination of imiduguduRegional and international cooperation in resettlement
3. Conservation and Protection of the Environment Elaboration of national environment policy- Training of environmentalists
.___ ___ ____ ___ ___ ____ ___ ____ ___ __ - Sensitisation program s
MNERENA1. Energy Elaboration and implementation of master plan of electrification
Installation of power linesPromotion of bio-gas in rural areas
2. Water and Sanitation Water treatment plantsCollection and analysis of hydrological dataRural water supplies
Mines and geology Management of quarriesDevelopment of policy and promotion of added value
Study on environmental impact of exploitation of gas in Lake4. Gas Kivu
_ Promotion of commercialisation of gas from Lake Kivu
MINALOC1. Decentralisation Training of members in decentralised administrations
Support to decentralised structure- Elaboration of laws regarding resource management
2 Community Development Support to community development
Elaboration of laws, programmes and policies for protection of3. Rehabilitation of the Family children
4. Mass education Elaboration of policy on mass educationCoordination and implementation of education progranmmes
123
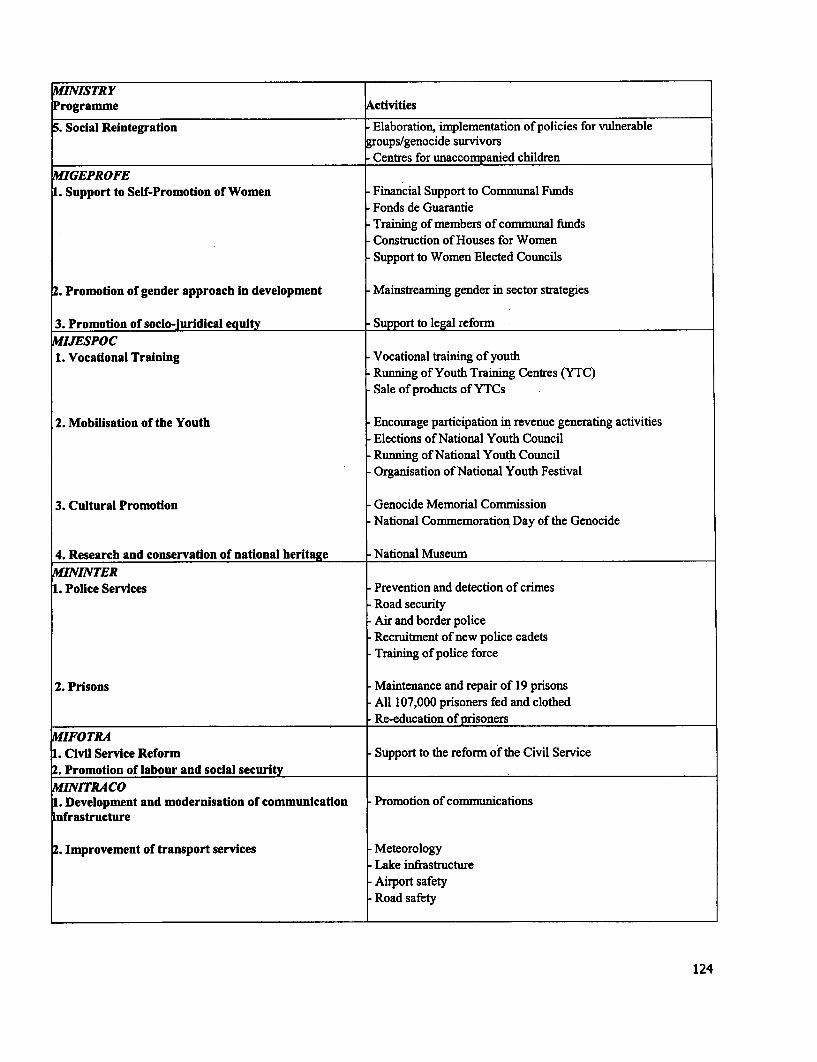
MINISTRYProgramme Activities
5. Social Reintegration Elaboration, implementation of policies for vulnerablegroups/genocide survivors
Centres for unaccompanied children
MIGEPROFE1. Support to Self-Promotion of Women Financial Support to Communal Funds
Fonds de GuarantieTraining of members of communal fundsConstruction of Houses for WomenSupport to Women Elected Councils
2. Promotion of gender approach in development Mainstreaming gender in sector strategies
3. Promotion of socio-juridical equity Support to legal reformAIJESPOC1. Vocational Training Vocational training of youth
Running of Youth Training Centres (YTC)Sale of products of YTCs
2. Mobilisation of the Youth Encourage participation in revenue generating activitiesElections of National Youth CouncilRunning of National Youth CouncilOrganisation of National Youth Festival
3. Cultural Promotion Genocide Memorial CommissionNational Commemoration Day of the Genocide
4. Research and conservation of national heritage National MuseumMINVINTER1. Police Services Prevention and detection of crimes
Road securityAir and border policeRecruitment of new police cadetsTraining of police force
2. Prisons Maintenance and repair of 19 prisonsAll 107,000 prisoners fed and clothedRe-education of prisoners
MIFOTRA1. Civil Service Reform Support to the reform of the Civd Service2. Promotion of labour and social securityMINITRACO1. Development and modernisation of communication Promotion of communicationsinfrastructure
2. Improvement of transport services MeteorologyLake infrastructureAirport safetyRoad safety
124
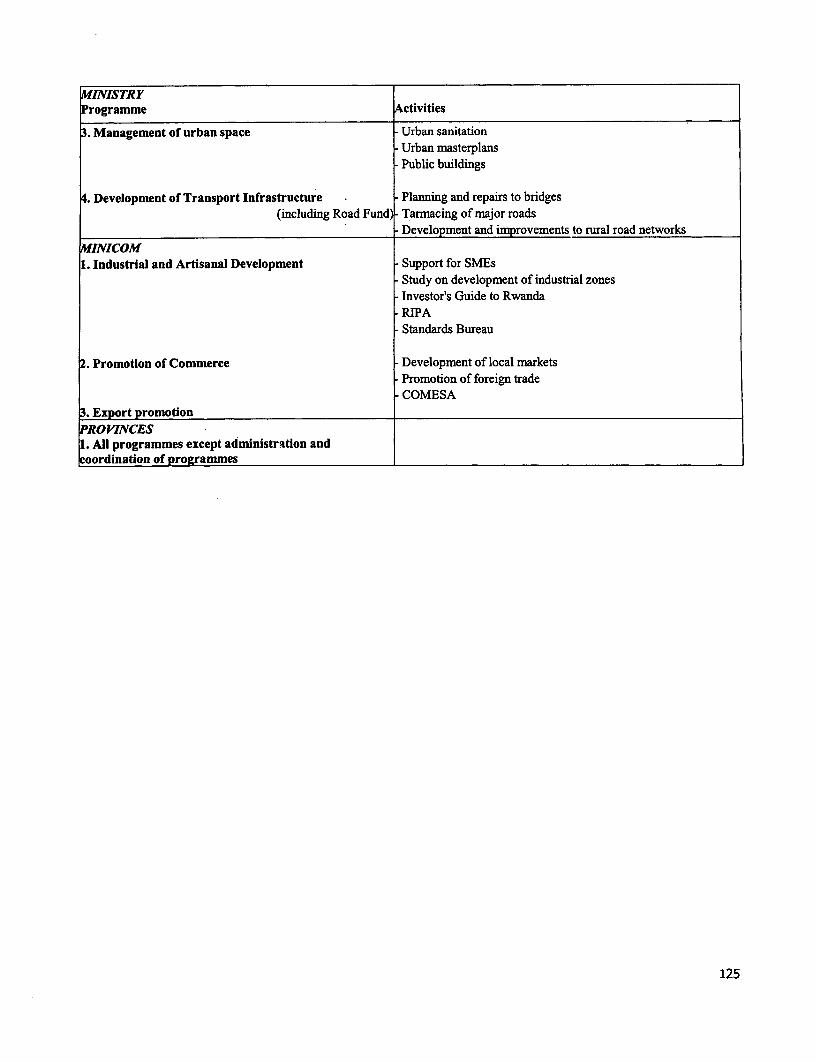
MINISTRYProgramme Activities
3. Management of urban space Urban sanitationUrban masterplansPublic buildings
. Development of Transport Infrastructure - Planning and repairs to bridges(including Road Fund) - Tarmacing of major roads
- Development and improvements to rural road networks
MINICOM1. Industrial and Artisanal Development Support for SMEs
- Study on development of industrial zones- Investor's Guide to Rwanda- RIPA
Standards Bureau
. Promotion of Commerce - Development of local markets- Promotion of foreign trade-COMESA
. Export promotionVROIVCES
1. All programmes except administration andkoordination of programmes
125
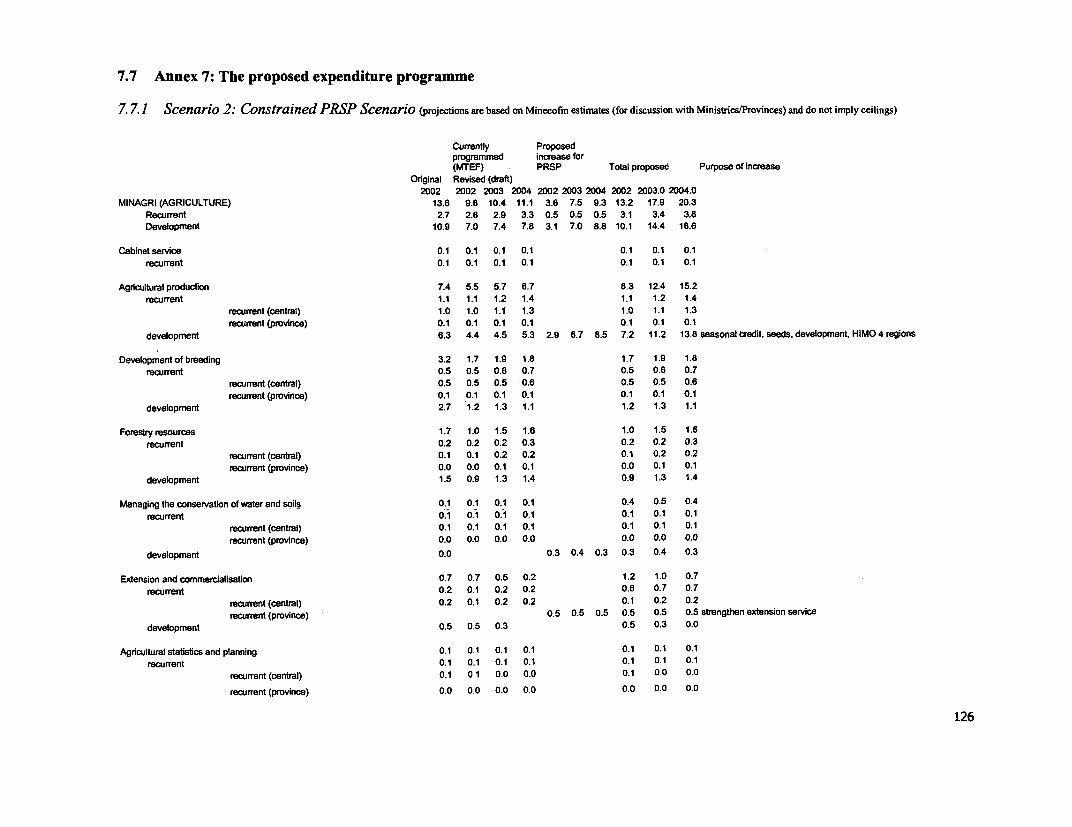
7.7 Annex 7: The proposed expenditure programme
7.7.1 Scenario 2: Constrained PRSP Scenario (projections are based on Minecofin estimates (for discussion with Ministries/Provinces) and do not imply ceilings)
Currently Proposedprogrammed increase for(MTEF) PRSP Total proposed Purpose of increase
Original Revised (draft)2002 2002 2003 2004 2002 2003 2004 2002 2003.0 2004.0
MINAGRI (AGRICULTURE) 13.6 9.6 10.4 11.1 3.6 7.5 9.3 13.2 17.9 20.3Recurrent 2.7 2.6 2.9 3.3 0.5 0.5 0.5 3.1 3.4 3.8Development 10.9 7.0 7.4 7.8 3.1 7.0 8.8 10.1 14.4 16.6
Cabinet service 0.1 0.1 0.1 0.1 0.1 0.1 0.1recurrent 0.1 0.1 0.1 0.1 0.1 0.1 0.1
Agricultural production 7.4 5.5 5.7 6.7 8.3 12.4 15.2recurrent 1.1 1.1 1.2 1.4 1.1 1.2 1.4
recurrent (central) 1.0 1.0 1.1 1.3 1.0 1.1 1.3recurrent (province) 0.1 0.1 0.1 0.1 0.1 0.1 0.1
development 6.3 4.4 4.5 5.3 2.9 6.7 8.5 7.2 11.2 13.8 seasonal credit, seeds, development, HIMO 4 regions
Development of breeding 3.2 1.7 1.9 1.8 1.7 1.9 1.8recurrent 0.5 0.5 0.6 0.7 0.5 0.6 0.7
recurrent (central) 0.5 0.5 0.5 0.6 0.5 0.5 0.6recurrent (province) 0.1 0.1 0.1 0.1 0.1 0.1 0.1
development 2.7 1.2 1.3 1.1 1.2 1.3 1.1
Forestry resources 1.7 1.0 1.5 1.6 1.0 1.5 1.6recurrent 0.2 0.2 0.2 0.3 0.2 0.2 0.3
recurrent (central) 0.1 0.1 0.2 0.2 0.1 0.2 0.2recurrent (province) 0.0 0.0 0.1 0.1 0.0 0.1 0.1
development 1.5 0.9 1.3 1.4 0.9 1.3 1.4
Managing the conservation of water and soils 0.1 0.1 0.1 0.1 0.4 0.5 0.4recurrent 0.1 0.1 0.1 0.1 0.1 0.1 0.1
recurrent (central) 0.1 0.1 0.1 0.1 0.1 0.1 0.1recurrent (province) 0.0 0.0 0.0 0.0 0.0 0.0 0.0
development 0.0 0.3 0.4 0.3 0.3 0.4 0.3
Extension and commercialisation 0.7 0.7 0.5 0.2 1.2 1.0 0.7recurrent 0.2 0.1 0.2 0.2 0.6 0.7 0.7
recurrent (central) 0.2 0.1 0.2 0.2 0.1 0.2 0.2recurrent (province) 0.5 0.5 0.5 0.5 0.5 0.5 strengthen extension service
development 0.5 0.5 0.3 0.5 0.3 0.0
Agricultural statistics and planning 0.1 0.1 0.1 0.1 0.1 0.1 0.1recurrent 0.1 0.1 0.1 0.1 0.1 0.1 0.1
recurrent (central) 0.1 0.1 0.0 0.0 0.1 0.0 0.0
recurrent (province) 0.0 0.0 0.0 0.0 0.0 0.0 0.0
126
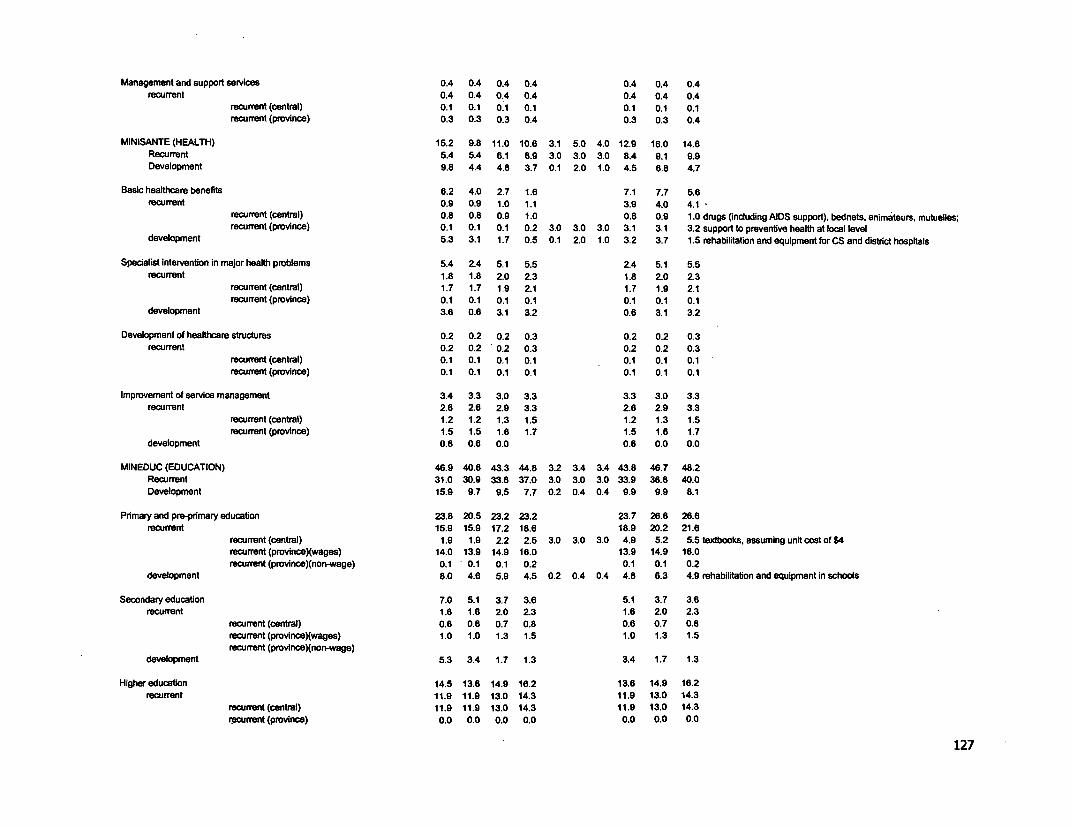
Management and support services 0.4 0.4 0.4 0.4 0.4 0.4 0.4
recurrent 0.4 0.4 0.4 0.4 0.4 0.4 0.4
recurnent (central) 0.1 0.1 0.1 0.1 0.1 0.1 0.1
recurrent (prmvince) 0.3 0.3 0.3 0.4 0.3 0.3 0.4
MINISANTE (HEALTH) 15.2 9.8 11.0 10.6 3.1 5.0 4.0 12.9 16.0 14.8Recurrent 5.4 5.4 6.1 6.9 3.0 3.0 3.0 8.4 9.1 9.9
Development 9.8 4.4 4.8 3.7 0.1 2.0 1.0 4.5 6.8 4.7
Basic healthcare benefits 6.2 4.0 2.7 1.6 7.1 7.7 5.6
recurrent 0.9 0.9 1.0 1.1 3.9 4.0 4.1
recurrent (central) 0.8 0.8 0.9 1.0 0.8 0.9 1.0 drugs (induding AIDS support). bednets, animateurs. mutuelles;
recurrent (province) 0.1 0.1 0.1 0.2 3.0 3.0 3.0 3.1 3.1 3.2 support to preventve health at local level
development 5.3 3.1 1.7 0.5 0.1 2.0 1.0 3.2 3.7 1.5 rehabilitation and equipment for CS and district hospitals
Specialist intervention in major health problems 5.4 2.4 5.1 5.5 2.4 5.1 5.5
recurrent 1.8 1.8 2.0 2.3 1.8 2.0 2.3
recurrent (central) 1.7 1.7 1.9 2.1 1.7 1.9 2.1
recurrent (province) 0.1 0.1 0.1 0.1 0.1 0.1 0.1
development 3.6 0.6 3.1 3.2 0.6 3.1 3.2
Development of healthcare structures 0.2 0.2 0.2 0.3 0.2 0.2 0.3
recurrent 0.2 0.2 0.2 0.3 0.2 0.2 0.3
recurent (central) 0.1 0.1 0.1 0.1 0.1 0.1 0.1
recurrent (province) 0.1 0.1 0.1 0.1 0.1 0.1 0.1
Improvement of service management 3.4 3.3 3.0 3.3 3.3 3.0 3.3
recurrent 2.6 2.6 2.9 3.3 2.8 2.9 3.3
recurrent (central) 1.2 1.2 1.3 1.5 1.2 1.3 1.5
recuffent (province) 1.5 1.5 1.6 1.7 1.5 1.6 1.7
development 0.8 0.6 0.0 0.8 0.0 0.0
MINEDUC (EDUCATION) 46.9 40.6 43.3 44.8 3.2 3.4 3.4 43.8 46.7 48.2
Recurrent 31.0 30.9 33.8 37.0 3.0 3.0 3.0 33.9 36.8 40.0
Development 15.9 9.7 9.5 7.7 0.2 0.4 0.4 9.9 9.9 8.1
Primary and pre-primary education 23.8 20.5 23.2 23.2 23.7 26.6 26.6
recurrent 15.9 15.9 17.2 18.6 18.9 20.2 21.6
recurrent (central) 1.9 1.9 2.2 2.5 3.0 3.0 3.0 4.9 5.2 5.5 textbooks, assuming unit cost of $4
recurrent (provinceXwages) 14.0 13.9 14.9 16.0 13.9 14.9 16.0
recurrent (province)(non-wage) 0.1 0.1 0.1 0.2 0.1 0.1 0.2
development 8.0 4.6 5.9 4.5 0.2 0.4 0.4 4.8 6.3 4.9 rehabilitation and equipment in schools
Secondary education 7.0 5.1 3.7 3.6 5.1 3.7 3.6
recurrent 1.6 1.6 2.0 2.3 1.6 2.0 2.3
recurrent (central) 0.6 0.6 0.7 0.8 0.6 0.7 0.8
recurrent (provinceXwages) 1.0 1.0 1.3 1.5 1.0 1.3 1.5
recurrent (pmvinceXnon-wage)development 5.3 3.4 1.7 1.3 3.4 1.7 1.3
Higher education 14.5 13.6 14.9 16.2 13.6 14.9 16.2
recurrent 11.9 11.9 13.0 14.3 11.9 13.0 14.3
recurrent(central) 11.9 11.9 13.0 14.3 11.9 13.0 14.3
recurent (province) 0.0 0.0 0.0 0.0 0.0 0.0 0.0
127
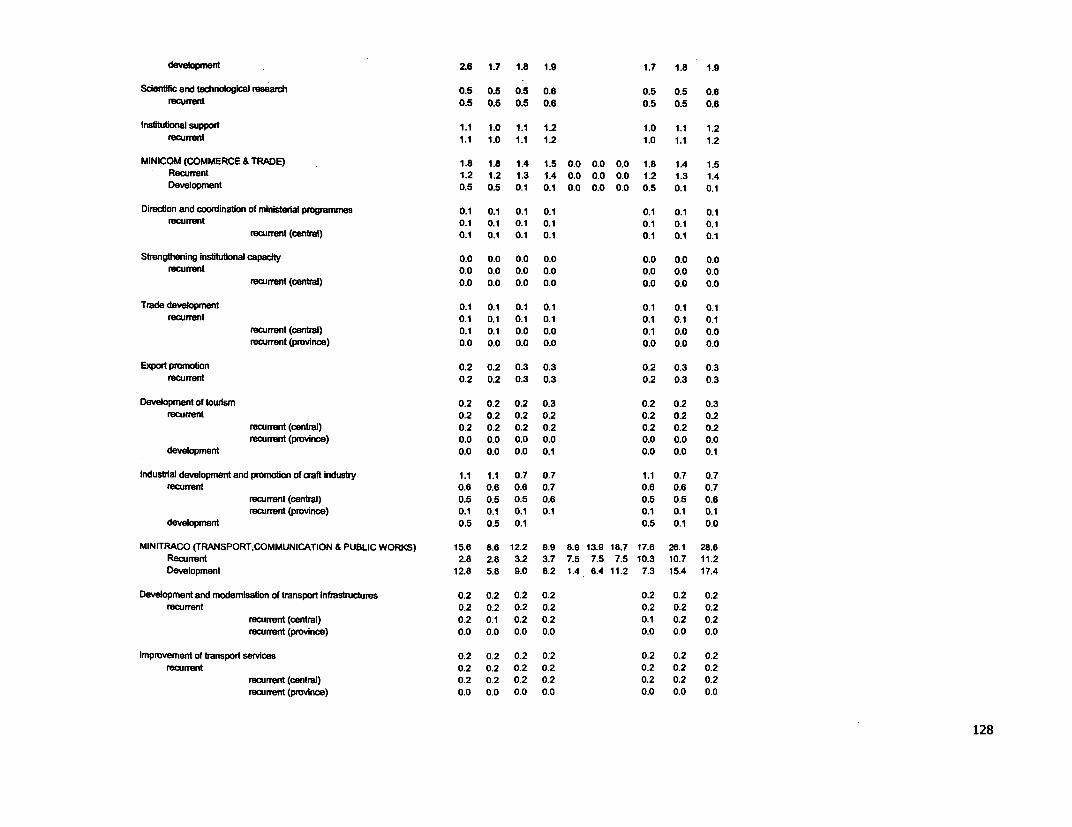
development z6 1.7 1.8 1.9 1.7 1.8 1.9
Scientific and technoogical research 0.5 0.5 0.5 0.6 0.5 0.5 o.erem.rent 0.5 0.5 0.5 0.6 0.5 0.5 0.6
Institutional support 1.1 1.0 1.1 1.2 1.0 1.1 1.2
recurrent 1.1 1.0 1.1 1.2 1.0 1.1 1.2
MINICOM (COMMERCE & TRADE) 1.8 1.8 1.4 1.5 0.0 0.0 0.0 1.8 1.4 1.5
Recumrent 1.2 1.2 1.3 1.4 0.0 0.0 0.0 1.2 1.3 1.4
Development 0.5 0.5 0.1 0.1 0.0 0.0 0.0 0.5 0.1 0.1
Direcfion and coordination of ministeral programmes 0.1 0.1 0.1 0.1 0.1 0.1 0.1
recuffent 0.1 0.1 0.1 0.1 0.1 0.1 0.1recumnrt (central) 0.1 0.1 0.1 0.1 0.1 0.1 0.1
Strengthening insitutional capacity 0o0 0.0 0.0 0.0 0.0 0.0 0.0
recurrent 0.0 0.0 0.0 0.0 0.0 0.0 0.0
recurrnt (central) 0.0 0.0 0.0 0.0 0.0 0.0 0.0
Trade development 0.1 0.1 0.1 0.1 0.1 0.1 0.1
recuent o. 0.1 0.1 0.1 0.1 0.1 0.1
recurrent (central) 0.1 0.1 0.0 0.0 0.1 0.0 0.0
recurrent (province) 0.0 0.0 0.0 0.0 0.0 0.0 0.0
Export promotion 0.2 0.2 0.3 0.3 0.2 0.3 0.3
recurrnt 0.2 0.2 0.3 0.3 0.2 0.3 0.3
Development of tourism 0.2 0.2 0.2 0.3 0.2 0.2 0.3
recurrent 0.2 0.2 0.2 0.2 0.2 0.2 0.2
recurrent (central) 0.2 0.2 0.2 0.2 0.2 0.2 0.2
recurrent (province) 0.0 0.0 0.0 0.0 0.0 0.0 0.0
development 0.0 0.0 0.0 0.1 0.0 0.0 0.1
Industrial development and promotion of craft Industry 1.1 1.1 0.7 0.7 1.1 0.7 0.7
recurrent 0.6 0.6 0.6 0.7 0.6 0.6 0.7
recunrent (central) 0.5 0.5 0.5 0.6 0.5 0.5 0.6
recurrnt (province) 0.1 0.1 0.1 0.1 0.1 0.1 0.1
development 0.5 0.5 0.1 0.5 0.1 0.0
MINITRACO (TRANSPORT,COMMUNICATION & PUBLIC WORKS) 15.6 8.6 12.2 9.9 8.9 13.9 18.7 17.6 26.1 28.6
Recurrent 2.8 2.8 3.2 3.7 7.5 7.5 7.5 10.3 10.7 11.2
Development 12.8 5.8 9.0 6.2 1.4 6.4 11.2 7.3 15.4 17.4
Development and modemisation of transport infrastructures 0.2 0.2 0.2 0.2 0.2 0.2 0.2
recurrent 0.2 0.2 0.2 0.2 0.2 0.2 0.2
recurrent (central) 0.2 0.1 0.2 0.2 0.1 0.2 0.2
recurrent (province) 0.0 0.0 0.0 0.0 0.0 0.0 0.0
Improvement of transport services 0.2 0.2 0.2 0:2 0.2 0.2 0.2
recurrent 0.2 0.2 0.2 0.2 0.2 0.2 0.2
reurent (central) 0.2 0.2 0.2 0.2 0.2 0.2 0.2
recurrent (province) 0.0 0.0 0.0 0.0 0.0 0.0 0.0
128
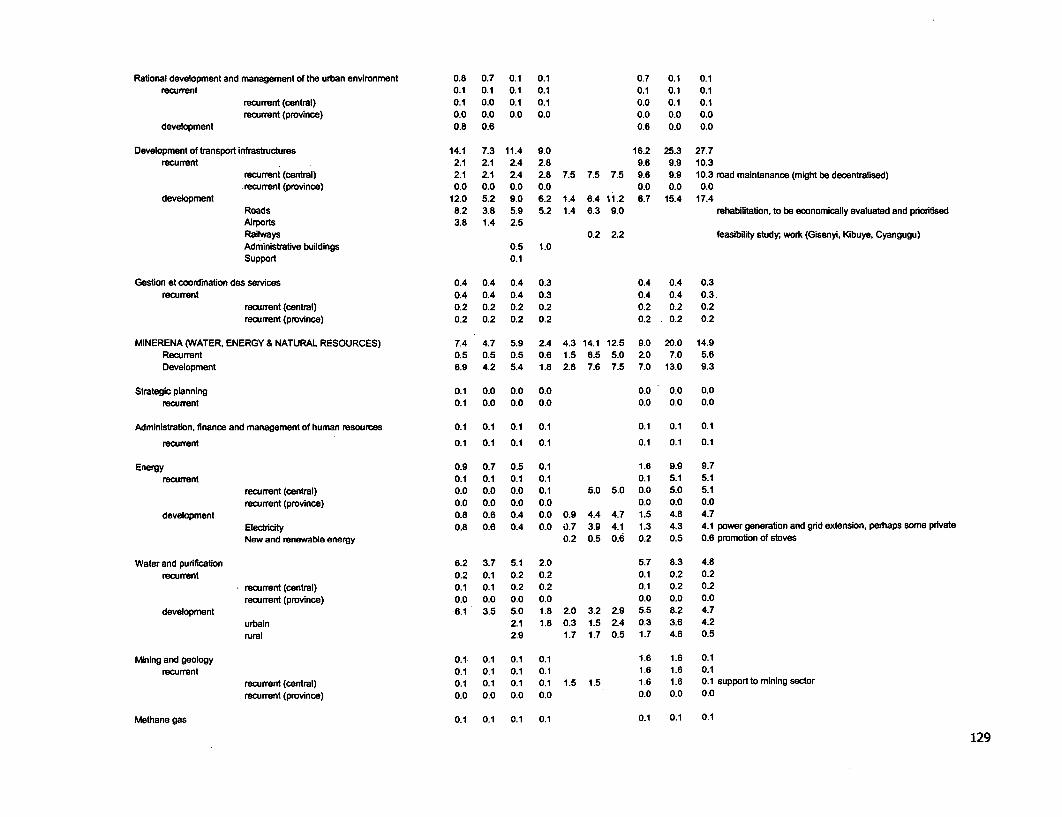
Rational development and management of the urban environment 0.8 0.7 0.1 0.1 0.7 0.1 0.1recurrent 0.1 0.1 0.1 0.1 0.1 0.1 0.1
recurrent (central) 0.1 0.0 0.1 0.1 0.0 0.1 0.1recurrent (province) 0.0 0.0 0.0 0.0 0.0 0.0 0.0
development 0.8 0.6 0.6 0.0 0.0
Development of transport infrastructures 14.1 7.3 11.4 9.0 16.2 25.3 27.7recurrent 2.1 2.1 2.4 2.8 9.6 9.9 10.3
recurrent (central) 2.1 2.1 2.4 2.8 7.5 7.5 7.5 9.6 9.9 10.3 road maintenance (might be decentralised)recurrent (province) 0.0 0.0 0.0 0.0 0.0 0.0 0.0
development 12.0 5.2 9.0 6.2 1.4 6.4 11.2 6.7 15.4 17.4Roads 8.2 3.8 5.9 5.2 1.4 6.3 9.0 rehabilitation, to be eronomically evaluated and pforitisedAirports 3.8 1.4 25Railways 0.2 2.2 feasibility study, work (Gisenyi, Kibuye, Cyangugu)Administrative buildings 0.5 1.0Support 0.1
Gestion et coordination des services 0.4 0.4 0.4 0.3 0.4 0.4 0.3recurrent 0.4 0.4 0.4 0.3 0.4 0.4 0.3.
recurrent (central) 0.2 0.2 0.2 0.2 0.2 0.2 0.2recurrent (province) 0.2 0.2 0.2 0.2 0.2 0.2 0.2
MINERENA (WATER, ENERGY & NATURAL RESOURCES) 7.4 4.7 5.9 2.4 4.3 14.1 12.5 9.0 20.0 14.9Recurrent 0.5 0.5 0.5 0.6 1.5 8.5 5.0 20 7.0 5.6Development 6.9 4.2 5.4 1.8 2.8 7.6 7.5 7.0 13.0 9.3
Strategic planning 0.1 0.0 0.0 0.0 0.0 0.0 0.0recurrent 0.1 0.0 0.0 0.0 0.0 0.0 0.0
Administration, finance and management of human resources 0.1 0.1 0.1 0.1 0.1 0.1 0.1
recurrent 0.1 0.1 0.1 0.1 0.1 0.1 0.1
Energy 0.9 0.7 0.5 0.1 1.6 9.9 9.7recurrent 0.1 0.1 0.1 0.1 0.1 5.1 5.1
recurrent (central) 0.0 0.0 0.0 0.1 5.0 5.0 0.0 5.0 5.1recurrent (province) 0.0 0.0 0.0 0.0 0.0 0.0 0.0
development 0.8 0.6 0.4 0.0 0.9 4.4 4.7 1.5 4.8 4.7Electricity 0.8 0.6 0.4 0.0 0.7 3.9 4.1 1.3 4.3 4.1 power generation and gnd extension, perhaps some privateNew and renewable energy 0.2 0.5 0.6 0.2 0.5 0.6 promotion of stoves
Water and purification 6.2 3.7 5.1 2.0 5.7 8.3 4.8recurrent 0.2 0.1 0.2 0.2 0.1 0.2 0.2
recurrent (central) 0.1 0.1 0.2 0.2 0.1 0.2 0.2recurrent (province) 0.0 0.0 0.0 0.0 0.0 0.0 0.0
development 6.1 3.5 5.0 1.8 2.0 3.2 2.9 5.5 8.2 4.7urbain 2.1 1.8 0.3 1.5 24 0.3 3.6 4.2rural 2.9 1.7 1.7 0.5 1.7 4.6 0.5
Mining and geology 0.1 0.1 0.1 0.1 1.6 1.6 0.1recurrent 0.1 0.1 0.1 0.1 1.6 1.6 0.1
recurrent (central) 0.1 0.1 0.1 0.1 1.5 1.5 1.6 1.6 0. 1 supportto mining sectorrecurrent (province) 0.0 0.0 0.0 0.0 0.0 0.0 0.0
Methane gas 0.1 0.1 0.1 0.1 0.1 0.1 0.1
129
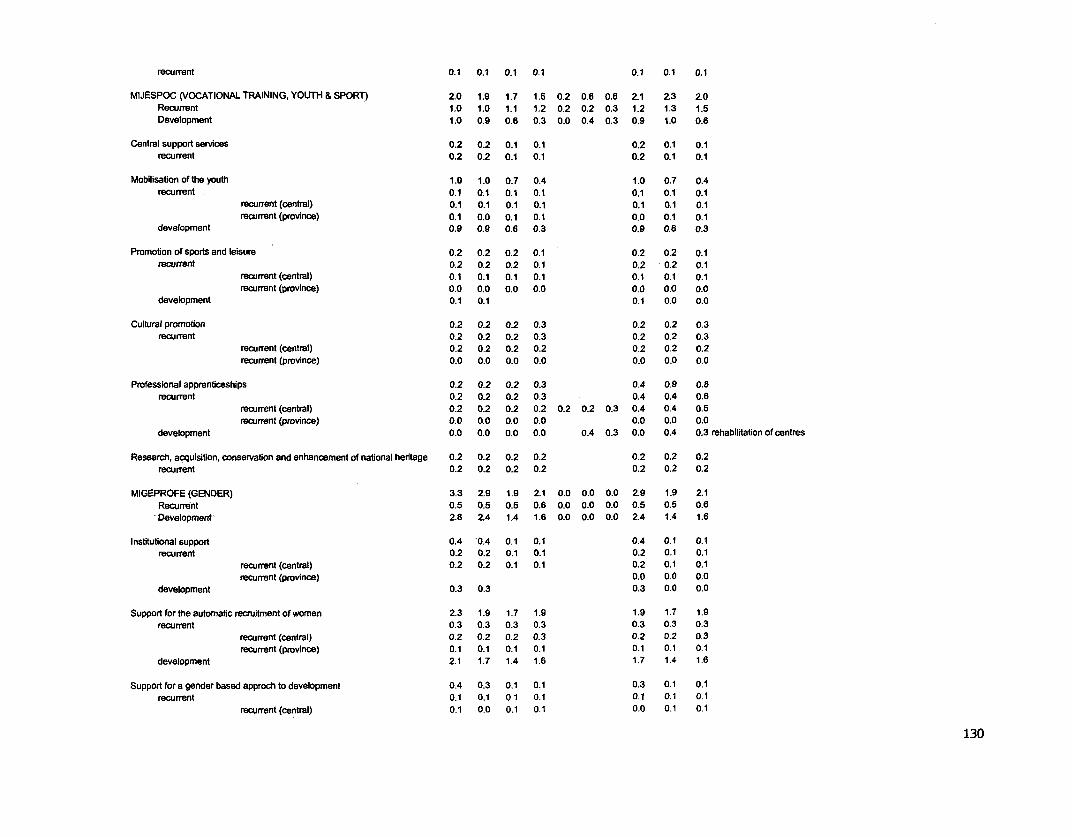
recurrent 0.1 0.1 0.1 0.1 0.1 0.1 0.1
MIJESPOC (VOCATIONAL TRAINING, YOUTH & SPORT) 2.0 1.9 1.7 1.5 0.2 0.6 0.6 2.1 2.3 2.0Recurrent 1.0 1.0 1.1 1.2 0.2 0.2 0.3 1.2 1.3 1.5Development 1.0 0.9 0.6 0.3 0.0 0.4 0.3 0.9 1.0 0.6
Central support services 0.2 0.2 0.1 0.1 0.2 0.1 0.1recurrent 0.2 0.2 0.1 0.1 0.2 0.1 0.1
Mobilisation of the youth 1.0 1.0 0.7 0.4 1.0 0.7 0.4recurrent . 0.1 0.1 0.1 0.1 0.1 0.1 0.1
recurrent (central) 0.1 0.1 0.1 0.1 0.1 0.1 0.1recurrent (province) 0.1 0.0 0.1 0.1 0.0 0.1 0.1
development 0.9 0.9 0.6 0.3 0.9 0.6 0.3
Promotion of sports and leisure 0.2 0.2 0.2 0.1 0.2 0.2 0.1recurrent 0.2 0.2 0.2 0.1 0.2 0.2 0.1
recurrent (central) 0.1 0.1 0.1 0.1 0.1 0.1 0.1recurrent (province) 0.0 0.0 0.0 0.0 0.0 0.0 0.0
development 0.1 0.1 0.1 0.0 0.0
Cultural promotion 0.2 0.2 0.2 0.3 0.2 0.2 0.3recurrent 0.2 0.2 0.2 0.3 0.2 0.2 0.3
recurrent (central) 0.2 0.2 0.2 0.2 0.2 0.2 0.2recurrent (province) 0.0 0.0 0.0 0.0 0.0 0.0 0.0
Professional apprenticeships 0.2 0.2 0.2 0.3 0.4 0.9 0.8recurrent 0.2 0.2 0.2 0.3 0.4 0.4 0.6
recurrent (central) 0.2 0.2 0.2 0.2 0.2 0.2 0.3 0.4 0.4 0.5recurrent (province) 0.0 0.0 0.0 0.0 0.0 0.0 0.0
development 0.0 0.0 0.0 0.0 0.4 0.3 0.0 0.4 0.3 rehabilitation of centres
Research, acquisition, conservation and enhancement of national hertage 0.2 0.2 0.2 0.2 0.2 0.2 0.2recurrent 0.2 0.2 0.2 0.2 0.2 0.2 0.2
MIGEPROFE (GENDER) 3.3 2.9 1.9 2.1 0.0 0.0 0.0 2.9 1.9 2.1Recurrent 0.5 0.5 0.5 0.6 0.0 0.0 0.0 0.5 0.5 0.6Development 2.8 Z4 1.4 1.6 0.0 0.0 0.0 2.4 1.4 1.6
Institutional support 0.4 0.4 0.1 0.1 0.4 0.1 0.1recurrent 0.2 0.2 0.1 0.1 0.2 0.1 0.1
recurrent (central) 0.2 0.2 0.1 0.1 0.2 0.1 0.1recurrent (province) 0.0 0.0 0.0
development 0.3 0.3 0.3 0.0 0.0
Support for the automaticrecruitment of wromen 2.3 1.9 1.7 1.9 1.9 1.7 1.9recurrent 0.3 0.3 0.3 0.3 0.3 0.3 0.3
recurrent (centrai) 0.2 0.2 0.2 0.3 0.2 0.2 0.3recurrent (province) 0.1 0.1 0.1 0.1 0.1 0.1 0.1
development 2.1 1.7 1.4 1.6 1.7 1.4 1.6
Support fora gender based approch todevelopment 0.4 0.3 0.1 0.1 0.3 0.1 0.1recurrent 0.1 0.1 0.1 0.1 0.1 0.1 0.1
recurrent (central) 0.1 0.0 0.1 0.1 0.0 0.1 0.1
130
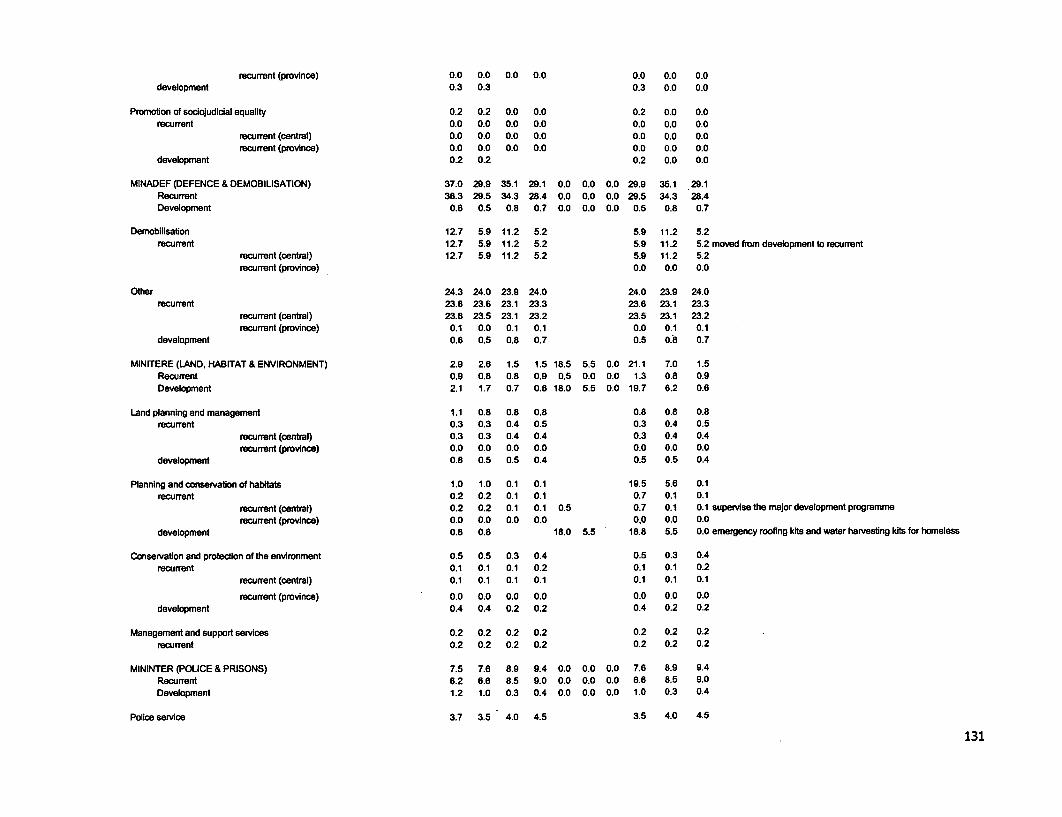
recurrent (province) 0.0 0.0 0.0 0.0 0.0 0.0 0.0development 0.3 0.3 0.3 0.0 0.0
Promotion of sociojudicdal equality 0.2 0.2 0.0 0.0 0.2 0.0 0.0recurrent 0.0 0.0 0.0 0.0 0.0 0.0 0.0
recurrent (central) 0.0 0.0 0.0 0.0 0.0 0.0 0.0recurrent (province) 0.0 0.0 0.0 0.0 0.0 0.0 0.0
development 0.2 0.2 0.2 0.0 0.0
MINADEF (DEFENCE & DEMOBILISATION) 37.0 29.9 35.1 29.1 0.0 0.0 0.0 29.9 35.1 29.1Recurrent 38.3 29.5 34.3 28.4 0.0 0.0 0.0 29.5 34.3 28.4Development 0.6 0.5 0.8 0.7 0.0 0.0 0.0 0.5 0.8 0.7
DemobilDsation 12.7 5.9 11.2 5.2 5.9 11.2 5.2recurrent 12.7 5.9 11.2 5.2 5.9 11.2 5.2 moved from development to recurrent
recurrent (central) 12.7 5.9 11.2 5.2 5.9 11.2 5.2recurrent (province) 0.0 0.0 0.0
Other 24.3 24.0 23.9 24.0 24.0 23.9 24.0recurrent 23.6 23.6 23.1 23.3 23.6 23.1 23.3
recurrent (central) 23.6 23.5 23.1 23.2 23.5 23.1 23.2recurrent (province) 0.1 0.0 0.1 0.1 0.0 0.1 0.1
development 0.6 0.5 0.8 0.7 0.5 0.8 0.7
MINITERE (LAND, HABITAT & ENVIRONMENT) 29 2.6 1.5 1.5 18.5 5.5 0.0 21.1 7.0 1.5Recurrent 0.9 0.8 0.8 0.9 0.5 0.0 0.0 1.3 0.8 0.9Development 2.1 1.7 0.7 0.6 18.0 5.5 0.0 19.7 6.2 0.6
Land planning and management 1.1 0.8 0.8 0.8 0.8 0.8 0.8recurrent 0.3 0.3 0.4 0.5 0.3 0.4 0.5
recurrent (central) 0.3 0.3 0.4 0.4 0.3 0.4 0.4recurent (province) 0.0 0.0 0.0 0.0 0.0 0.0 0.0
development 0.8 0.5 0.5 0.4 0.5 0.5 0.4
Planning and conservatlon of habitats 1.0 1.0 0.1 0.1 19.5 5.6 0.1recurrent 0.2 0.2 0.1 0.1 0.7 0.1 0.1
recurrent (central) 0.2 0.2 0.1 0.1 0.5 0.7 0.1 0.1 supervise the major development programmerecurrent (province) 0.0 0.0 0.0 0.0 0.0 0.0 0.0
development 0.8 0.8 18.0 5.5 18.8 5.5 0.0 emergency roofing kits and water harvesting kits for homeless
Conservation and protecton of the environment 0.5 0.5 0.3 0.4 0.5 0.3 0.4recurrent 0.1 0.1 0.1 0.2 0.1 0.1 0.2
recurrent (central) 0.1 0.1 0.1 0.1 0.1 0.1 0.1
recurrent (province) 0.0 0.0 0.0 0.0 0.0 0.0 0.0development 0.4 0.4 0.2 0.2 0.4 0.2 0.2
Management and support services 0.2 0.2 0.2 0.2 0.2 0.2 0.2recurrent 0.2 0.2 0.2 0.2 0.2 0.2 0.2
MININTER (POLICE & PRISONS) 7.5 7.6 8.9 9.4 0.0 0.0 0.0 7.6 8.9 9.4Recurrent 6.2 6.6 8.5 9.0 0.0 0.0 0.0 6.8 8.5 9.0Development 1.2 1.0 0.3 0.4 0.0 0.0 0.0 1.0 0.3 0.4
Police service 3.7 3.5 4.0 4.5 3.5 4.0 4.5
131
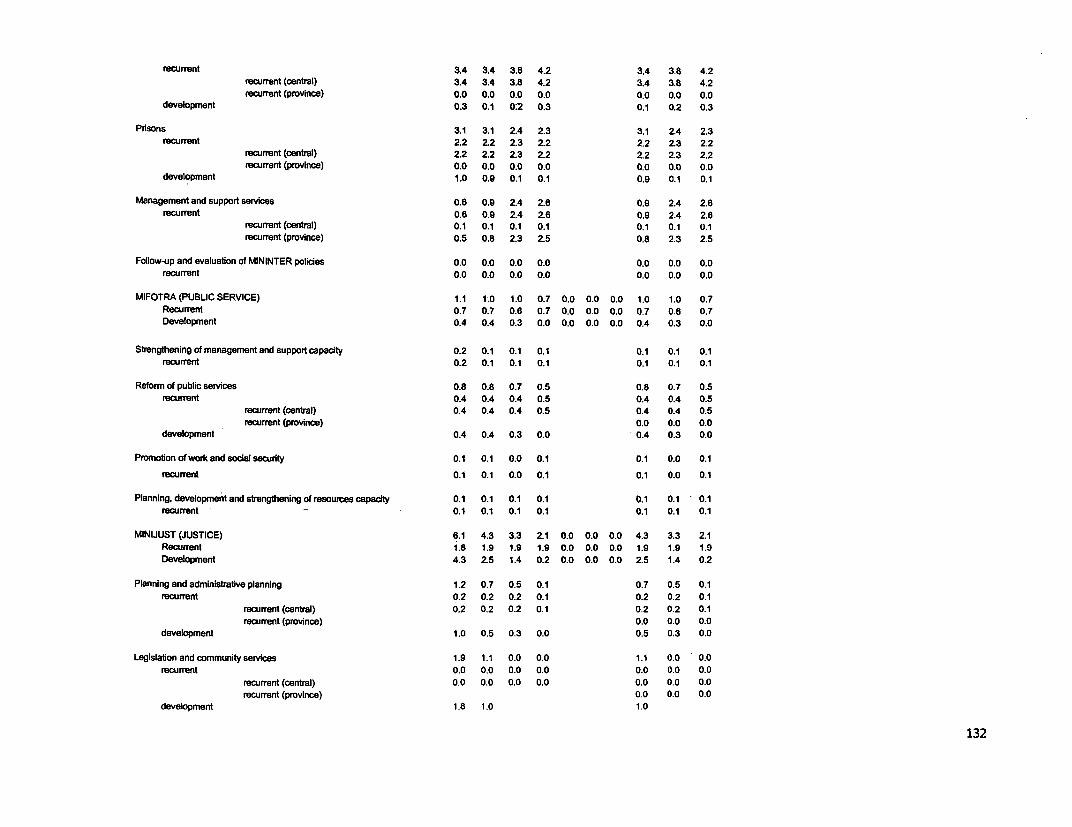
recurrent 3.4 3.4 3.8 4.2 3.4 3.8 4.2recurrent (central) 3.4 3.4 3.8 4.2 3.4 3.8 4.2recurrent (province) 0.0 0.0 0.0 0.0 0.0 0.0 0.0
development 0.3 0.1 02 0.3 0.1 0.2 0.3
Prisons 3.1 3.1 2.4 2.3 3.1 24 2.3recumrrent 22 22 2.3 2.2 2.2 2.3 2.2
recurent (central) 2.2 2.2 2.3 2.2 2.2 2.3 2.2recurrent (province) 0.0 0.0 0.0 0.0 0.0 0.0 0.0
development 1.0 0.9 0.1 0.1 0.9 0.1 0.1
Management and support services 0.6 0.9 2.4 2.6 0.9 2.4 2.6recurrent 0.6 0.9 2.4 2.6 0.9 2.4 2.6
recurrent (central) 0.1 0.1 0.1 0.1 0.1 0.1 0.1recurrent (province) 0.5 0.8 2.3 2.5 0.8 2.3 2.5
Follow-up and evaluation of MININTER policies 0.0 0.0 0.0 0.0 0.0 0.0 0.0recurrent 0.0 0.0 0.0 0.0 0.0 0.0 0.0
MIFOTRA (PUBLIC SERVICE) 1.1 1.0 1.0 0.7 0.0 0.0 0.0 1.0 1.0 0.7Recurrent 0.7 0.7 0.6 0.7 0.0 0.0 0.0 0.7 0.6 0.7Development 0.4 0.4 0.3 0.0 0.0 0.0 0.0 0.4 0.3 0.0
Strengthening of management and support capacity 0.2 0.1 0.1 0.1 0.1 0.1 0.1recurrent 0.2 0.1 0.1 0.1 0.1 0.1 0.1
Reform of public services 0.8 0.8 0.7 0.5 0.8 0.7 0.5recurrent 0.4 0.4 0.4 0.5 0.4 0.4 0.5
recurent (central) 0.4 0.4 0.4 0.5 0.4 0.4 0.5recurrent (province) 0.0 0.0 0.0
development 0.4 0.4 0.3 0.0 0.4 0.3 0.0
Promotion of work and social security 0.1 0.1 0.0 0.1 0.1 0.0 0.1
recumnt 0.1 0.1 0.0 0.1 0.1 0.0 0.1
Planning, development and strengthning of resources capacity 0.1 0.1 0.1 0.1 0.1 0.1 0.1recurrent 0.1 0.1 0.1 0.1 0.1 0.1 0.1
MINIJUST (JUSTICE) 6.1 4.3 3.3 21 0.0 0.0 0.0 4.3 3.3 2.1Recurrent 1.8 1.9 1.9 1.9 0.0 0.0 0.0 1.9 1.9 1.9Development 4.3 Z5 1.4 0.2 0.0 0.0 0.0 2.5 1.4 0.2
Planning and administrative planning 1.2 0.7 0.5 0.1 0.7 0.5 0.1recurrent 0.2 0.2 0.2 0.1 0.2 0.2 0.1
recurent (central) 0.2 0.2 0.2 0.1 0.2 0.2 0.1recumrent (province) 0.0 0.0 0.0
development 1.0 0.5 0.3 0.0 0.5 0.3 0.0
Legislation and community services 1.9 1.1 0.0 0.0 1.1 0.0 0.0
recurrent 0.0 0.0 0.0 0.0 0.0 0.0 0.0recurrent (central) 0.0 0.0 0.0 0.0 0.0 0.0 0.0recumrent (province) 0.0 0.0 0.0
development 1.8 1.0 1.0
132

Instituftonal relations 0.0 0.0 0.0 0.0 0.0 0.0 0.0recurrent 0.0 0.0 0.0 0.0 0.0 0.0 0.0
Regulation of litigation and state affairs 0.0 0.0 0.0 0.0 0.0 0.0 0.0recurrent 0.0 0.0 0.0 0.0 0.0 0.0 0.0
Ensuring the efficient functioning of the judicial system 2.7 2.2 2.4 1.6 2.2 2.4 1.6recurrent 1.3 1.3 1.3 1.4 1.3 1.3 1.4
recurrent (central) 1.2 1.2 1.3 1.4 1.2 1.3 1.4recurrent (province) 0.0 0.0 0.1 0.1 0.0 0.1 0.1
development 1.4 1.0 1.1 0.2 1.0 1.1 0.2
Respect and application of the law 0.2 0.2 0.2 0.1 0.2 0.2 0.1recurrent 0.2 0.2 0.2 0.1 0.2 0.2 0.1
Legislative reform 0.1 0.1 0.1 0.1 0.1 0.1 0.1recurrent 0.1 0.1 0.1 0.1 0.1 0.1 0.1
Training and retraining of judicial personnel 0.1 0.1 0.0 0.0 0.1 0.0 0.0recurrent 0.1 0.1 0.0 0.0 0.1 0.0 0.0
COURS SUPREME (SUPREME COURT) 3.0 3.0 2.8 1.7 0.0 0.0 0.0 3.0 2.8 1.7Recurrent 2.6 2.6 2.6 1.6 0.0 0.0 0.0 2.6 2.6 1.6Development 0.4 0.4 0.2 0.1 0.0 0.0 0.0 0.4 0.2 0.1
Control, verification and adjustment of state accounts 0.1 0.1 0.1 0.1 0.1 0.1 0.1recurrent 0.1 0.1 0.1 0.1 0.1 0.1 0.1
Study, research and management of magistrates careers 0.0 0.0 0.0 0.0 0.0 0.0 0.0recurrent 0.0 0.0 0.0 0.0 0.0 0.0 0.0
Court and tribunals administration 0.5 0.5 0.3 0.2 0.5 0.3 0.2recurrent 0.1 0.1 0.1 0.1 0.1 0.1 0.1
recurrent (central) 0.1 0.1 0.1 0.1 0.1 0.1 0.1recurrent (province) 0.0 0.0 0.0
development 0.4 0.4 0.2 0.1 0.4 0.2 0.1
Interpretation and applicaton of the law 0.2 0.2 0.2 0.2 0.2 0.2 0.2recurrent 0.2 0.2 0.2 0.2 0.2 0.2 0.2
Gacaca jurisdictions 2.0 2.0 2.0 1.1 2.0 2.0 1.1recurrent 2.0 2.0 2.0 1.1 2.0 2.0 1.1
recurrent (central) 2.0 2.0 2.0 1.1 2.0 2.0 1.1recurrent (province) 0.0 0.0 0.0 0.0 0.0 0.0 0.0
Strategic planning 0.2 0.2 0.2 0.1 0.2 0.2 0.1recurrent 0.2 0.2 0.2 0.1 0.2 0.2 0.1
MINALOC (LOCAL GOVERNMENT) 16.6 14.0 15.0 16.6 0.5 0.5 0.5 14.5 15.5 17.1Recurrent 9.0 9.2 10.0 11.1 0.5 0.5 0.5 9.7 10.5 11.6Development 7.6 4.8 5.0 5.5 0.0 0.0 0.0 4.8 5.0 5.5
133
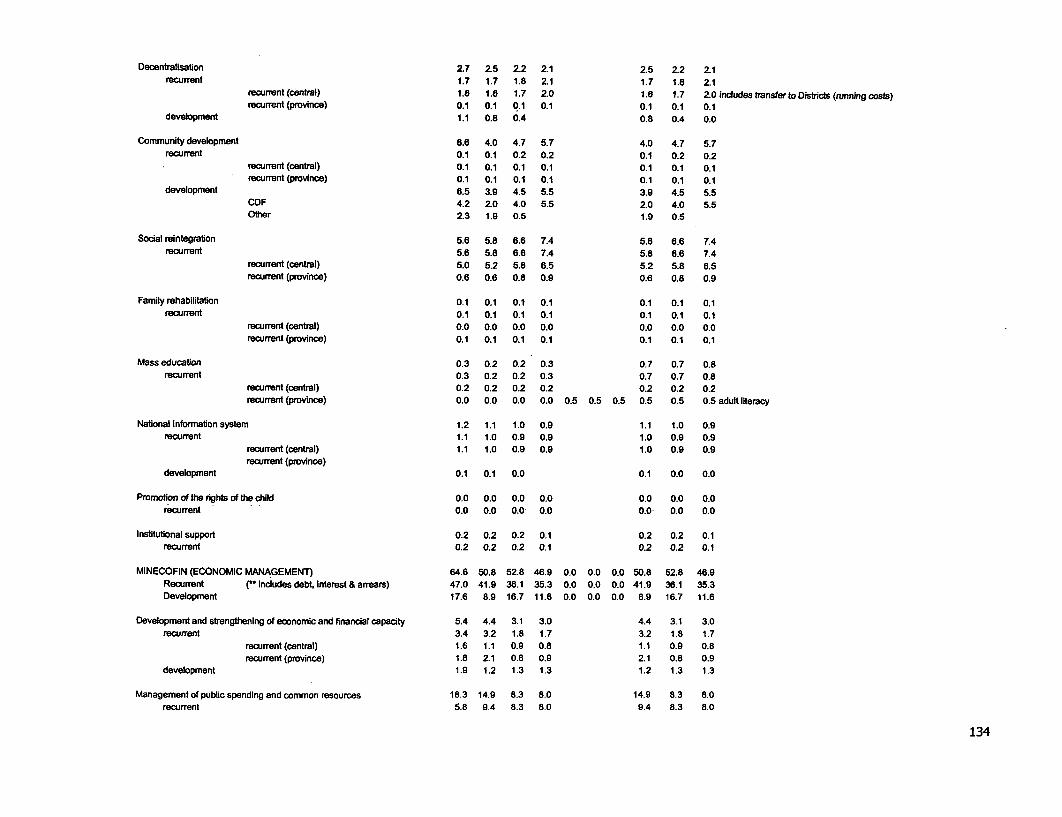
Decentralisaton 2.7 Z5 2.2 2.1 2.5 2.2 2.1recurrent 1.7 1.7 1.8 2.1 1.7 1.8 2.1
recurrent (central) 1.8 1.6 1.7 2.0 1.6 1.7 20 indudes transfer to Districts (running costs)recurrent (province) 0.1 0.1 0.1 0.1 0.1 0.1 0.1
development 1.1 0.8 0.4 0.8 0.4 0.0
Community development 6.6 4.0 4.7 5.7 4.0 4.7 5.7recurrent 0.i 0.1 0.2 0.2 0.1 0.2 0.2
recurrent (central) 0.1 0.1 0.1 0.1 0.1 0.1 0.1recurrent (province) 0.1 0.1 0.1 0.1 0.1 0.1 0.1
development 6.5 3.9 4.5 5.5 3.9 4.5 5.5CDF 4.2 2.0 4.0 5.5 2.0 4.0 5.5Other 2.3 1.9 0.5 1.9 0.5
Social reintegration 5.6 5.8 6.6 7.4 5.8 6.6 7.4recurrent 5.6 5.8 6.6 7.4 5.8 6.6 7.4
recurrent (central) 5.0 5.2 5.8 6.5 5.2 5.8 6.5recurrent (province) 0.6 0.6 0.8 0.9 0.6 0.8 0.9
Family rehabilitation 0.1 0.1 0.1 0.1 0.1 0.1 0.1recurrent 0o1 0.1 0.1 0.1 0.1 0.1 0.1
recurrent (central) 0.0 0.0 0.0 0.0 0.0 0.0 0.0recurrent (province) 0.1 0.1 0.1 0.1 0.1 0.1 0.1
Mass education 0.3 0.2 0.2 0.3 0.7 0.7 0.8recurrent 0.3 0.2 0.2 0.3 0.7 0.7 0.8
recurrent (central) 0.2 0.2 0.2 0.2 0.2 0.2 0.2recurrent (province) 0.0 0.0 0.0 0.0 0.5 0.5 0.5 0.5 0.5 0.5 aduft literacy
National information system 1.2 1.1 1.0 0.9 1.1 1.0 0.9recurrent 1.1 1.0 0.9 0.9 1.0 0.9 0.9
recurrent (central) 1.1 1.0 0.9 0.9 1.0 0.9 0.9recurent (province)
development 0.1 0.1 0.0 0.1 0.0 0.0
Promotion of the rights of the child 0.0 0.0 0.0 0.0 0.0 0.0 0.0recurrent - 0.0 0.0 0.0 0.0 0.0- 0.0 0.0
Institutionai support 0.2 0.2 0.2 0.1 0.2 0.2 0.1recurrent 0.2 0.2 0.2 0.1 0.2 0.2 0.1
MINECOFIN (ECONOMIC MANAGEMENT) 64.6 50.8 5Z8 46.9 0.0 0.0 0.0 50.8 52.8 46.9Recurrent r includes debt, interest & arrears) 47.0 41.9 36.1 35.3 0.0 0.0 0.0 41.9 36.1 35.3Development 17.6 8.9 16.7 11.6 0.0 0.0 0.0 8.9 16.7 11.6
Development and strengthening of economic and financial capacity 5.4 4.4 3.1 3.0 4.4 3.1 3.0recurrent 3.4 3.2 1.8 1.7 3.2 1.8 1.7
recurrent (central) 1.6 1.1 0.9 0.8 1.1 0.9 0.8recurrent (province) 1.8 2.1 0.8 0.9 2.1 0.8 0.9
development 1.9 1.2 1.3 1.3 1.2 1.3 1.3
Management of public spending and common resources 18.3 14.9 8.3 8.0 14.9 8.3 8.0recurrent 5.8 9.4 8.3 8.0 9.4 8.3 8.0
134
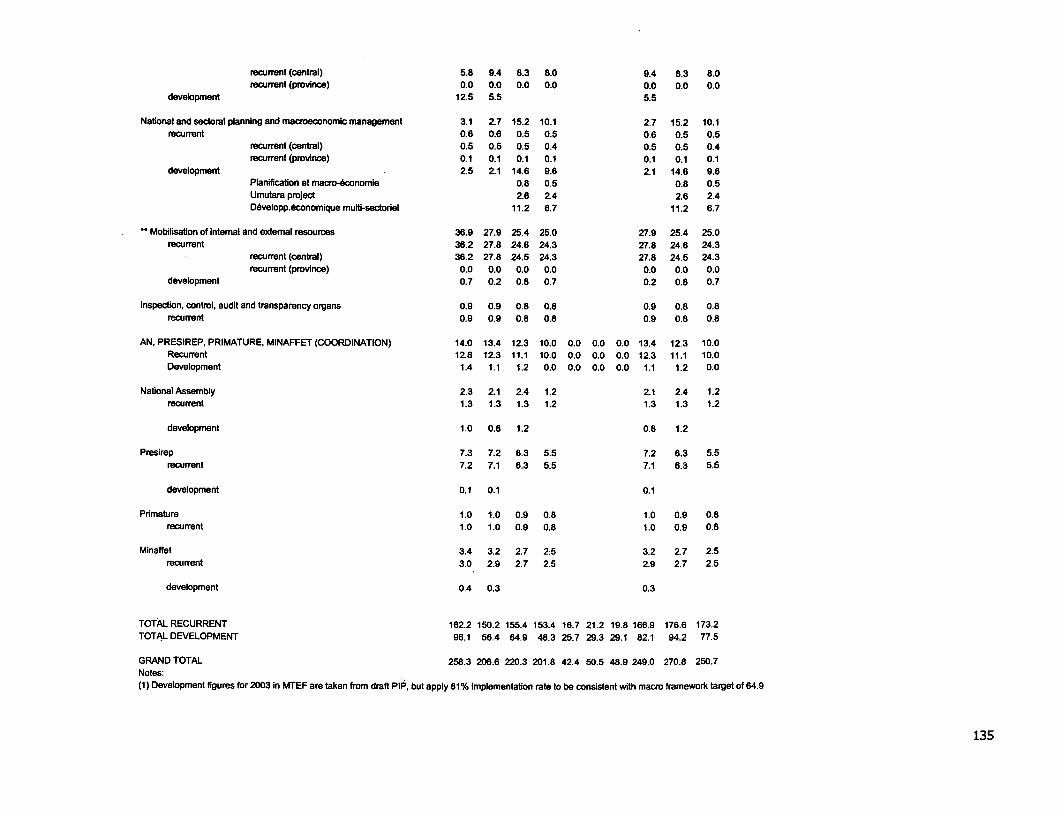
recurrent (central) 5.8 9.4 8.3 8.0 9.4 8.3 8.0recurrent (province) 0.0 0.0 0.0 0.0 0.0 0.0 0.0
development 12.5 5.5 5.5
National and sectoral planning and macrmeconomic management 3.1 Z7 15.2 10.1 2.7 15.2 10.1recurrent 0.6 0.6 0.5 0.5 0.6 0.5 0.5
recurrent (central) 0.5 0.5 0.5 0.4 0.5 0.5 0.4recurrent (province) 0.1 0.1 0.1 0.1 0.1 0.1 0.1
development . 2.5 2.1 14.6 9.6 2.1 14.6 9.6Planification et macro-nconomie 0.8 0.5 0.8 0.5Umutara project 2.6 2.4 2.6 2.4Developp.economique murt-sectoriel 11.2 6.7 11.2 6.7
Mobilisatlon of intemal and extemal resources 36.9 27.9 25.4 25.0 27.9 25.4 25.0recurrent 36.2 27.8 24.6 24.3 27.8 24.6 24.3
recurrent (central) 36.2 27.8 24.5 24.3 27.8 24.5 24.3recurrent (provinrce) 0.0 0.0 0.0 0.0 0.0 0.0 0.0
development 0.7 0.2 0.8 0.7 0.2 0.8 0.7
Inspection, control, audit and transparency organs 0.9 0.9 0.8 0.8 0.9 0.8 0.8recurrent 0.9 0.9 0.8 0.8 0.9 0.8 0.8
AN, PRESIREP, PRIMATURE, MINAFFET (COORDINATION) 14.0 13.4 12.3 10.0 0.0 0.0 0.0 13.4 12.3 10.0Recurrent 12.6 12.3 11.1 10.0 0.0 0.0 0.0 12.3 11.1 10.0Development 1.4 1.1 1.2 0.0 0.0 0.0 0.0 1.1 1.2 0.0
Nafional Assembly 2.3 2.1 2.4 1.2 2.1 2.4 1.2recurrent 1.3 1.3 1.3 1.2 1.3 1.3 1.2
development 1.0 0.8 1.2 0.8 1.2
Presirep 7.3 7.2 6.3 5.5 7.2 6.3 5.5recurrent 7.2 7.1 6.3 5.5 7.1 6.3 5.5
development 0.1 0.1 0.1
Prmature 1.0 1.0 0.9 0.8 1.0 0.9 0.8recurrent 1.0 1.0 0.9 0.8 1.0 0.9 0.8
Minaffet 3.4 3.2 2.7 2;5 3.2 2.7 2.5recurrent 3.0 2.9 2.7 2.5 2.9 2.7 2.5
development 0.4 0.3 0.3
TOTAL RECURRENT 162.2 150.2 155.4 153.4 16.7 21.2 19.8 166.9 176.6 173.2TOTAL DEVELOPMENT 96.1 56.4 64.9 48.3 25.7 29.3 29.1 82.1 94.2 77.5
GRAND TOTAL 258.3 206.6 220.3 201.8 42.4 50.5 48.9 249.0 270.8 250.7Notes:(1) Development figures for 2003 in MTEF are taken from draft PIP, but apply 81% implementation rate to be consistent with macro framework target of 64.9
135
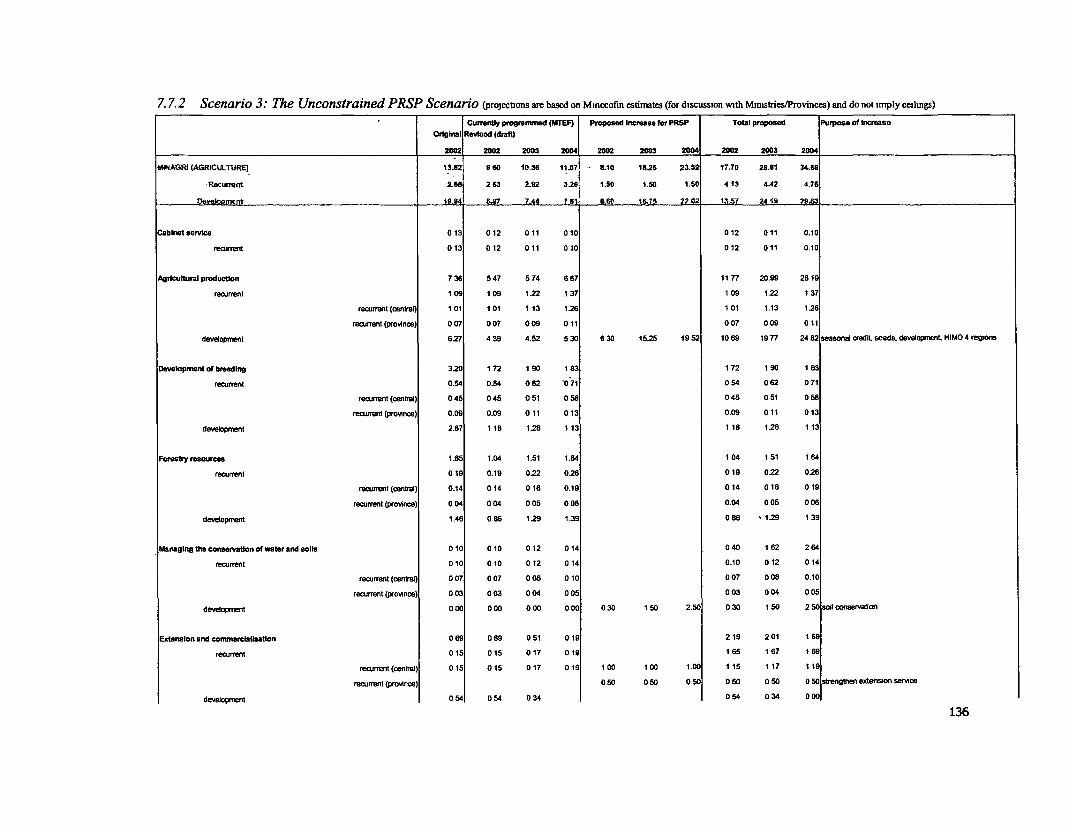
7.7.2 Scenario 3: The Unconstrained PRSP Scenario (projecons are based on Mtnecofin estimates (for discussion vwth Mimstries/Provinces) and do not imply cemings)
Currently programnmd (MTEF) Proposed Increase for PRSP Tatal proposed Purpose of IncreaseOriginal Revisod (drft)
2002 2002 2003 2004 2002 2003 2004 2002 2003 2004
MINAGRI (AGRICULTUR) 13.62 960 - 10.M 11.07 - 6.10 1625 23.52 17.70 26.61 34.59
-Recurmff 2-. 2 63 2.92 2.26 1.50 1.5 160 412 4A42 4.76
tlavejomnnt 10.8141 5. 7.44 7 81 5.68 16.75 22 02 12.57 2418 29863
Cabinet sorvice 0 13 012 0 11 0 10 012 011 0.10
recurrent 0 13 012 011 0 10 012 011 0.10
Agricultural production 7 36 547 574 6 67 1177 20.99 2619
recurrent 1 09 109 1.22 1 37 109 1.22 137
recurrent(centran) 101 101 113 1.26 101 1.13 126
recurrent (province) 0 07 0 07 009 0 11 0 07 0 09 0 11
devebopnent 6.27 439 4.52 5 30 630 15.25 19 52 1069 1977 24 82seasonalcrae seeds. developmaent HIMO4 regons
Developmnent of breeding 320 172 190 1 3 172 190 183
recurrent 0.54 0.54 062 0 71 0 54 0 62 0 71
recurnent (orentl) 0 45 0 45 0 51 0 58 0 45 0 51 058
recurrent(provmnce) 0.09 0.09 011 0 13 0.09 011 013
developrrent 2.67 118 128 113 116 1.28 113
Forestry resources 1.65 1.04 1.51 1.64 104 151 164
recurrent 0 19 0.19 0.22 026 019 0.22 0.26
recurrent(crntral) 0.14 014 016 0.19 014 016 019
recurnent (province) 0 04 0 04 0 05 0 06 0.04 0 05 000
developrent 1.46 0 86 129 1.39 086 1.29 1 39
larnaglngttheconservationofwaterandsolils 0 10 010 012 014 040 162 264
recurrent 0 10 010 012 0 14 0.10 012 014
recurrent (central) 0 07 0 07 0 08 010 0 07 0 08 0.10
recurrent (province) 0 03 0 03 0 04 0 05 0 03 0 04 0 05
developrrent 000 0 00 0 00 0 00 0 30 150 2.50 0 30 150 2 50oscoinervatiOn
Extension and comnercsltlsatton 0 69 069 051 019 219 201 169
recurrent 0 15 015 017 0 19 165 167 169
recurrnt (centrtf) 015 015 017 01 9 100 100 1 00 1 15 1 17 1 19
recurrent (province) 05 0 0 50 0 50 0 so 0 50 050 strengthen extension sermce
development 0 54 0 54 0 34 0 54 0 34 0 00
136
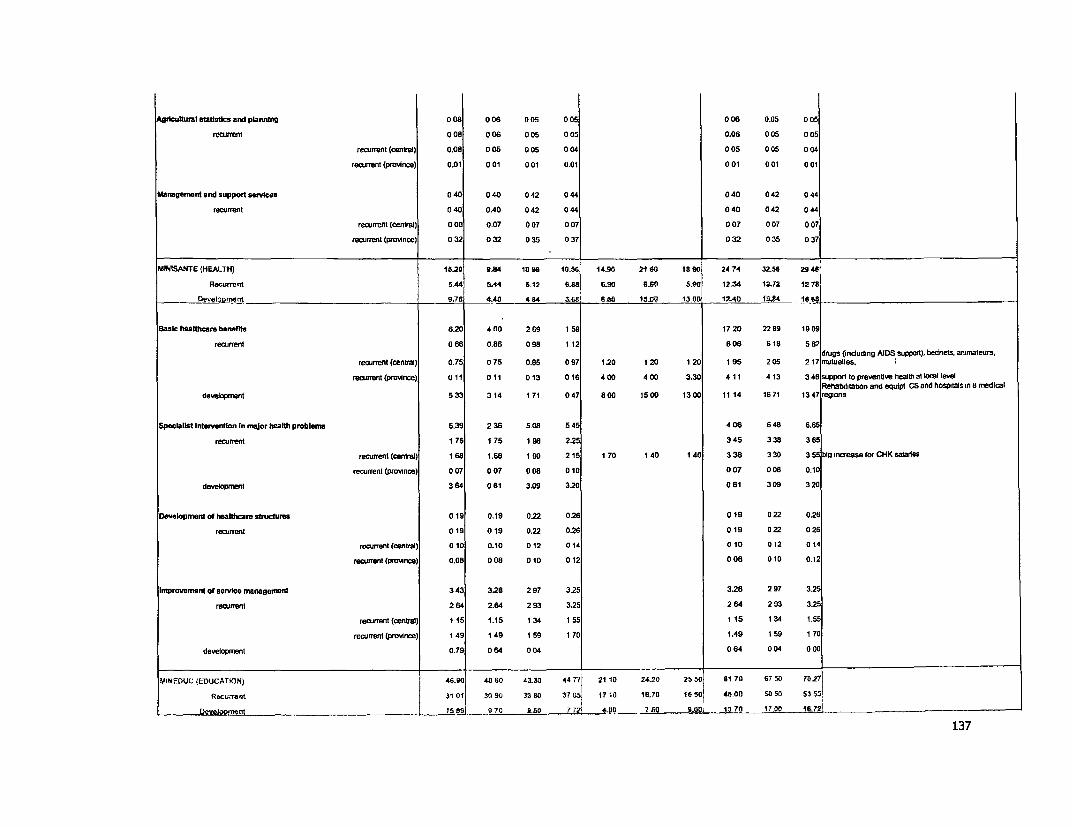
Agrtculturtl rattsMc and ptnnirng 0 08 0 06 0 05 005 0 06 0.05 0 05
recurrent 0 08 006 0 05 0 05 0.06 0 05 0 05
recunent (central) 0.08 005 005 0 04 0 05 005 0 04
recuffent (ProvAnce) 0.01 0 01 0 01 0.01 001 0 01 0 01
tAanagerrent and support serAces 0 40 040 0 42 0 44 040 0 42 0 44
recurrent 0 40 0.40 0 42 0 44 0 40 0 42 0 44
recurrent (cenbtrE| 00 o 0.07 0 07 0 07 007 0 07 0 07
recurent (provlnce) 0 32 0 32 0 35 0 37 0 32 0 35 0 37
MINIANrTE (NEALTH) 16.20 9.84 10t 10. 5 14.n 2160 18#0 2474 32.56 29
Recurrent 5,44 5.44 612 .6 aim0 5.5 12.34 1272 12 78
Qeveloument S.7t 4.40 4 84 .60 816 15.0 130a 12.40 15.84 1i6s _" _
Basic healthcan benfs 6.20 4 00 2 69 1 59 17 20 22 89 19 09
recufrent 0 86 0.86 0 98 1 12 605 6 18 5 62 dus(nuhgAD uPr) ent.aiaer.
recurrent (Centrl) 0.75 075 0.85 097 1.20 120 120 195 205 217 mnuluelles. I
reacuent(prOrtnCe) 011 011 013 016 400 400 3,30 411 413 346 suppartto prvenvhehaIlhaStIlOCIlevelRehabilitabon and equlpt CS and hosptals in 8 medical
developnent 5 33 314 171 047 a80 1500 1300 1114 1671 1347 regrons
SpecislISt Intwventton In major heath problems 5.39 2 36 508 5 45 4 06 6 48 6.85
recurrent 1 75 1 75 1 98 2.25 345 3 38 3 65
rfcufent(oWniai | 168 1.68 190 215 170 140 140 338 330 35 bigincres8for CHKIsalades
recuffent (province) 0 07 0 07 0 08 0 10 0 07 0 08 0.10
development 3 64 0 61 3.09 3.20 0 61 3 09 320
Oewelopnent ot healthare sbucts 019 0.19 0.22 0.28 019 0 22 0.26
recurrent 019 019 0.22 026 019 022 026
reaurent (central) 010 0.10 012 014 0 10 012 014
recufrent (pronce) 0.08 0 08 010 012 0 08 010 0.12
Improvewmnt of serice managmfent 3 43 3.28 2 97 3.25 3.28 2 97 325
rectinet 2 64 2.64 2 93 3.25 2 64 2 93 325
recuff3nt (cenlra) 1 15 1.15 1 34 1 58 15 1 34 1.55
recurrent(prridnce) 149 149 159 170 1A9 159 170development 0.79 0 64 0 04 0 64 0 04 006
MINEDUC (EDUCATION) 46.90 4060 43.0 44771 21 1D 24.20 2530 6170 675 sn t
Recurent 3101 30 90 33 80 37 05 17 10 16.70 16 48 5050 50o5
Develomerit _ Al t9 70 9.50 772 4.00 7 __ 9.00 5 13 70 17 . 16,721-
137
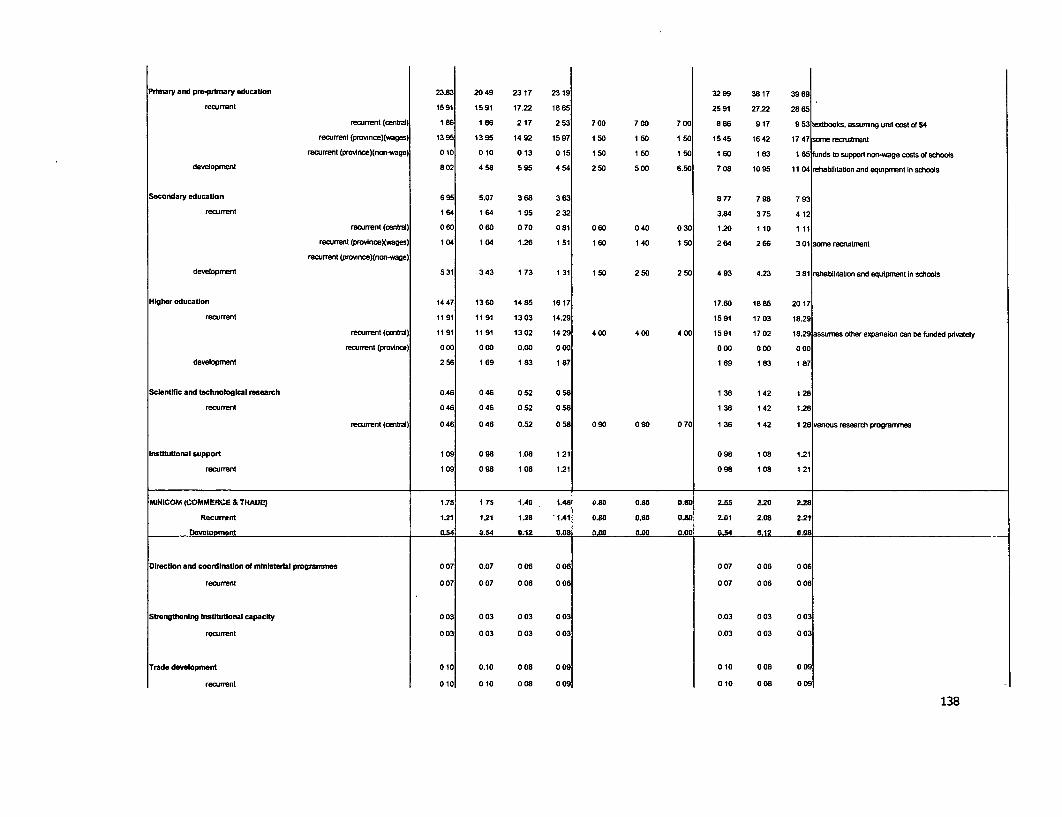
Primary and pro-prmarty education 23.8 20 49 23 17 23 19 32 99 38 17 39 69
recrunent 15 91 15 91 1722 18 65 25 91 27.22 28 65
recurrent(centra) 1 8 186 217 253 700 700 700 886 917 9 53extbooks,assuingurutcostofS4
recurrent(prvmncexwages) 13 95 1395 1492 1597 150 150 150 1545 1642 1747 sone reietnrent
recurrent (province)(non-wage) 0 10 0 10 0 13 0 15 1 50 1 50 1 50 1 60 1 63 1 65 funds to support nan-wage costs of schools
development 8 02 458 595 454 250 500 6.50 708 1095 1104 rehabtlitaton and equpnmnt in schools
Secondary education 6 95 5.07 3 68 3 63 8 77 7 98 793
recurfent 1 64 164 195 2 32 3.84 3 75 412
recurrent(central) 0 8 060 070 081 060 040 030 1.20 110 111
recurrent (provinceXwages) 1 04 1 04 126 1 51 1 60 1 40 1 50 264 266 301 some recruitment
recurrent (province)(non-wage)
development 5 31 3 43 1 73 1 31 1 50 2 50 2 50 4 93 423 3 81 rehablitabon and equlpment in schools
Higher education 14 47 1360 1465 16 17 17.60 1885 2017
recurrent 11 91 1191 1303 14.29 1591 1703 18.29
rtcurrent(central) 1191 1191 1302 14 2 400 400 400 1591 1702 18.29 assumesotherexpansioncanbefundedprivateiy
recurrent (province) 0|00 0 00 0.00 000 0 00 0 00 0 00
developrnent 2 56 169 163 1 87 169 183 187
Scientific and technological research 0.46 0 46 0 52 0 58 1 36 1 42 1 28
recurrent 0 4 046 052 0 5 136 142 1.28
recurrent (central) 0 46 0 46 0.52 0 58 0 90 090 0 70 1 36 1 42 1 28 vanous research prograrrnes
Institutional support 1 09 098 1.08 1 21 098 1 08 1.21
recurrent 109 0 98 1 08 1.21 0 98 1 08 1 2
MIOIOM (COMMEICE & TRADq 1.75 17TS 1.48 - . 0.80 08 0.8. 2.55 220 228
Recurrent 1.21 121 1.28 I Om O.80 0.80 2.01 2.08 2.2
DtVelgineeit 0.54 0.54 0.12 0.08 0.00 0.09 0.00 0.84 812 0.08
Direction and coordination of ministerlal progran0nes 07 0.07 0 06 0 09 0 07 0 06 009
recurrent 0 07 0 07 0 06 0 09 0 07 0 06 0 06
Strengthening Institutional capacity 0 03 0 03 0 03 0 03 0.03 0 03 0 03
recurrent 0 03 0 03 0 03 0 03 0.03 0 03 0 03
Trade development 010 0.10 0 08 0 09 010 0 08 0 09
recurent 010 010 0 08 0 09 010 0 08 009
138
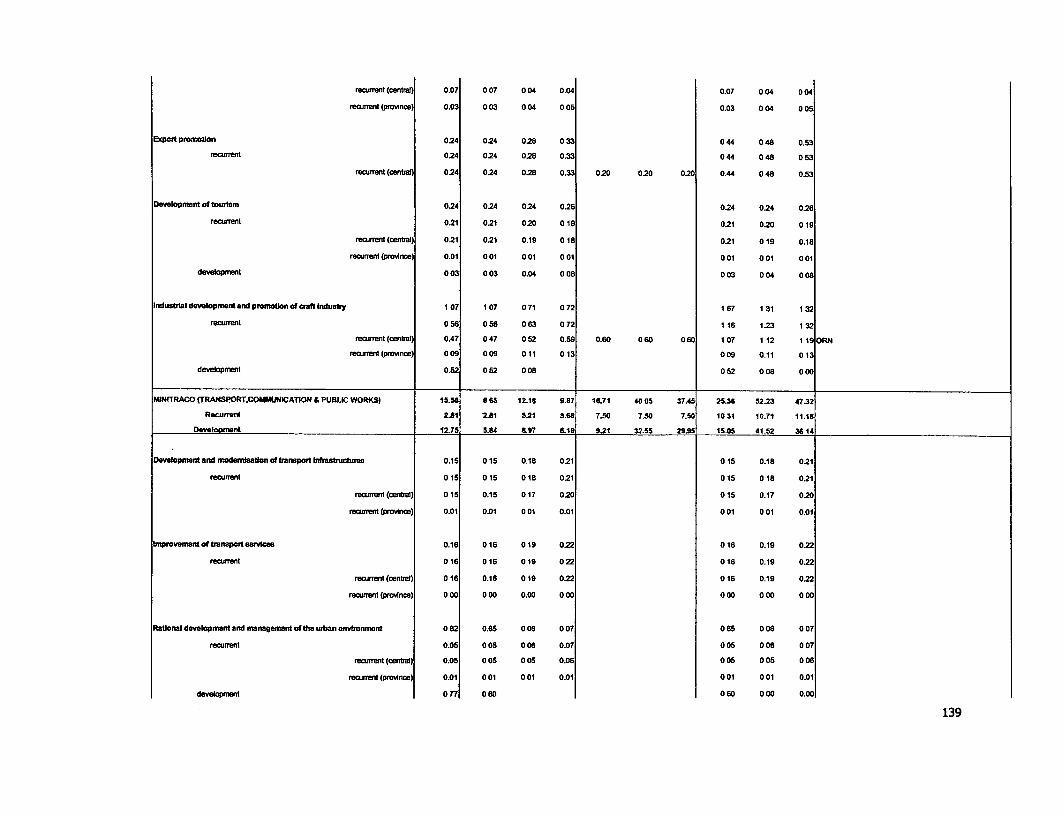
rellue (central) 007 0 07 0 04 0.04 0.07 0 04 004
reajrrent (provnce) 0.03 003 0 04 0 05 0.03 0 04 0 05
Exp-t prnaUon 024 024 028 0 33 0 44 0 48 0.53
recurfent 024 024 028 0.33 0 44 0 48 053
remurent (ct) 024 024 028 0.33 0.20 020 0.20 0.44 0 48 0.53
Development of tourilm 024 024 024 026 024 024 026
recurfent 021 021 020 019 021 020 019
remjffent (oentral) 021 021 0.19 018 0.21 019 0.18
recurfent (province) 0.01 001 0 01 0 01 001 0 01 0 01
developmrwlt 003 003 0.04 0 08 0 03 004 008
Industrial development and prwnoton of aaft Industry 1 07 1 07 0 71 0 72 1 67 1 31 1 32
recuffent 056 058 063 072 116 1.23 1 32
rncrrent(central) 0.47 047 052 0.59 0.60 060 080 107 1 12 1 1b ORN
recurrent (pronce) 0 09 0 09 oil 0 13 0 09 0.11 0 13
developmnln 0.52 0 52 0 08 0 52 008 000
MINITRACO (TRANSPORT.COMU ICATION & PUBLIC WORKS) 15 8 65 12.10 9.87 18.71 40 05 37.45 28.38 52.23 47.32
Reuwrre 2Jt 2.81 3.21 S.6 7S50 7.50 7.50 10 31 10.71 11.18
telooni 12.75 5.4 8.97 5.1S 921 32.55 29.95 15.05 41.52 36 14
Development and modenlaationoftransport nftsuctire 0.15 015 0.18 0.21 015 0.18 021
recurrent 015 015 018 0.21 015 018 021
recurent (centrat) 015 0.15 0 17 020 0 15 0.17 0.20
recnrren torovince) 0.01 0.01 001 0.01 0 01 0 01 0.01
bmprovement of transport services 0.18 016 0 19 022 0 16 0.19 022
rerrenlt 016 016 019 0 22 016 0.19 0.22
refurrent (central) 016 0.16 019 022 016 0.19 022
recumtent (prrnce) 0 00 0 00 0.00 0 00 0 00 000 000
Ratonal development and mtnagement of the urWban envtronment 0 82 0.65 0 06 0 07 0 65 0 08 0 07
recurrent 0.05 0 0 006 0.07 0 05 008 007
recuren (central) 0.05 005 00 8 0.08 008 005 009
recumrnt (proince) 0.01 0 01 0 01 0.01 0 01 0 01 0.01
deveopment 0 77 0 60 0 60 0 00 0.001
139
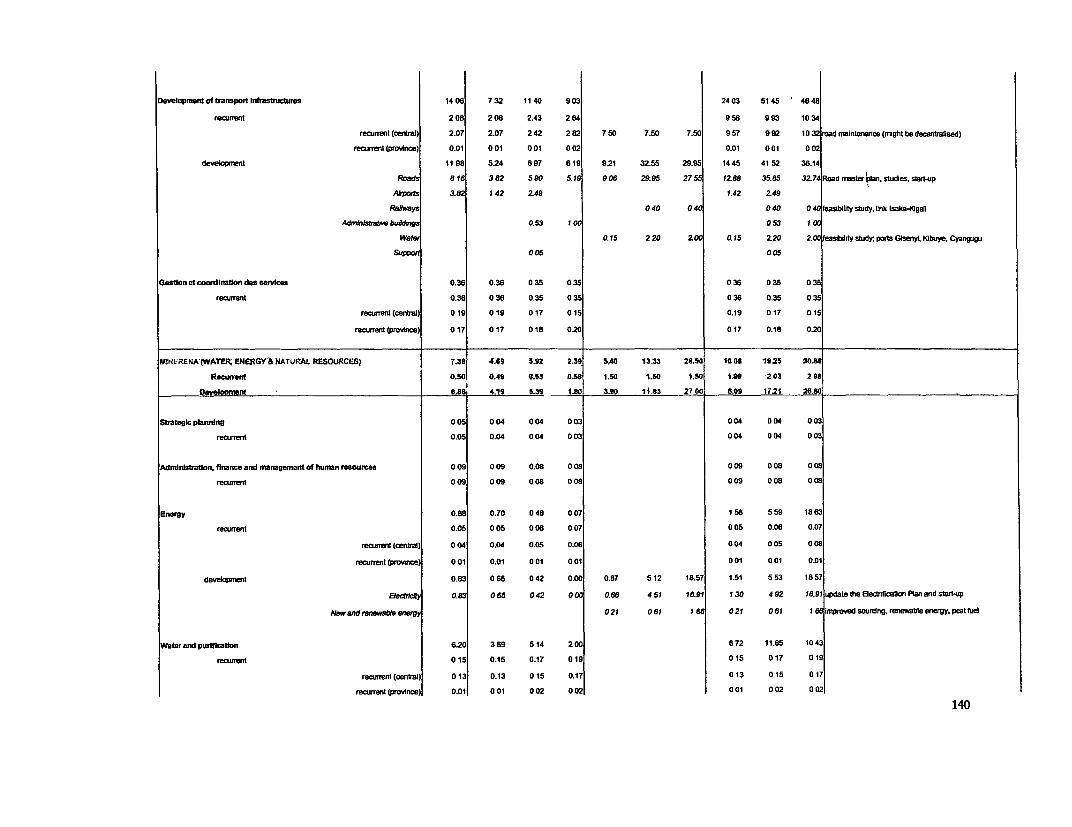
Devetopmdntoftransporttntfstinclzff 14 0 732 1140 903 2403 5145 ' 4648
rencrent 2 08 208 2.43 284 958 993 1034
reoumnt (centra) 2.07 2.07 2 42 2 82 7 50 7.50 7.50 9 57 9 92 10 32mad niantenance (rght be deenbaised)recuwr et(pra4noe) 0.01 0 01 001 0 02 0.01 0 01 002
devexopment 11 98 5.24 897 619 9.21 32.55 29.95 1445 4152 36.14
Rcads 81 382 590 5S19 906 29.95 27 126.8 35.85 327 RcadnmsterpIan,stuies, start-upAbt:ofls 3. 1 42 Z49 1.42 Z49
Radays 040 04 040 0 40 feasibility study, link Isaka-tgaliAdminstrat"e bud*iS3 0.53 1 a 0 53 1 a
Wate 0.15 220 Z. 0.15 Z20 2. hfasibihtystudy' ports GCseny4, Kibuye, Cyangugusuppcwi ~~005 a005
Gestdon coordmtton des seem 0.36 0.36 0 35 0 3 0 36 0 35 03recurrent 0.38 0 36 0.35 0 3 0 36 0.38 038
recumnt (centrat) 01 9 019 017 0 15 0.19 017 015
rerrent (provino0 ) 017 017 018 020 017 0.18 020
MINERENA(WATERK ENERGY& NATURAAL RESOUlRCES) 7.3 469 5.92 2.59 SAO 13.33 28.5 1Q 0O 125 3Qt_0RaCtRent 0.C0 0.49 0.53 058 1.50 1.50 1.0S 1.99 203 2 98
obvomnent el6s 4.IS .39 10 3..90 11.83 270i .99 17.21 283.8
Strategtc planntng 0 05 004 0 04 0 03 0 04 0 04 003recurrent 0.05 0.04 0 04 0 03 0 04 0 04 003
Admintltratton, finance and managenmnt of human resources 009 0 09 0.08 008 0 09 0 08 008recuffent 0 09 0 09 008 0 08 009 0 08 008
twgY 0.88 0.70 048 007 156 559 1883rcumnet 0.05 0 05 008 0 07 0 05 0.06 0.07
recunwa (cenntra) 0 04 0.04 0.05 0.06 0 04 0 05 0 06
recumrnt (prw nce) 0 01 0.01 0 01 001 0 01 001 0.01
devdoeanuent 0.83 065 042 0.00 0.87 512 18.57 1.51 553 1857
Ek&* 0.83 065 0 42 0 00 0.88 4 51 15.91 1 30 4 92 16.91 updata the Eleednficatia Ptan and start-up
Naew and renewable energy 021 061 1 021 0 61 1 8 inpoved sourdng, renewable energy, peat uet
Watar and puftication 6.20 369 5 14 2 00 6 72 11.85 10 43reoumtsnt 015 0.15 0.17 019 015 017 019
reourmnl (cuntrat) 013 0.13 015 0.17 013 015 017
recuTnt (Wovince) 0.01 0 01 0 02 0 02 0 01 002 002
140
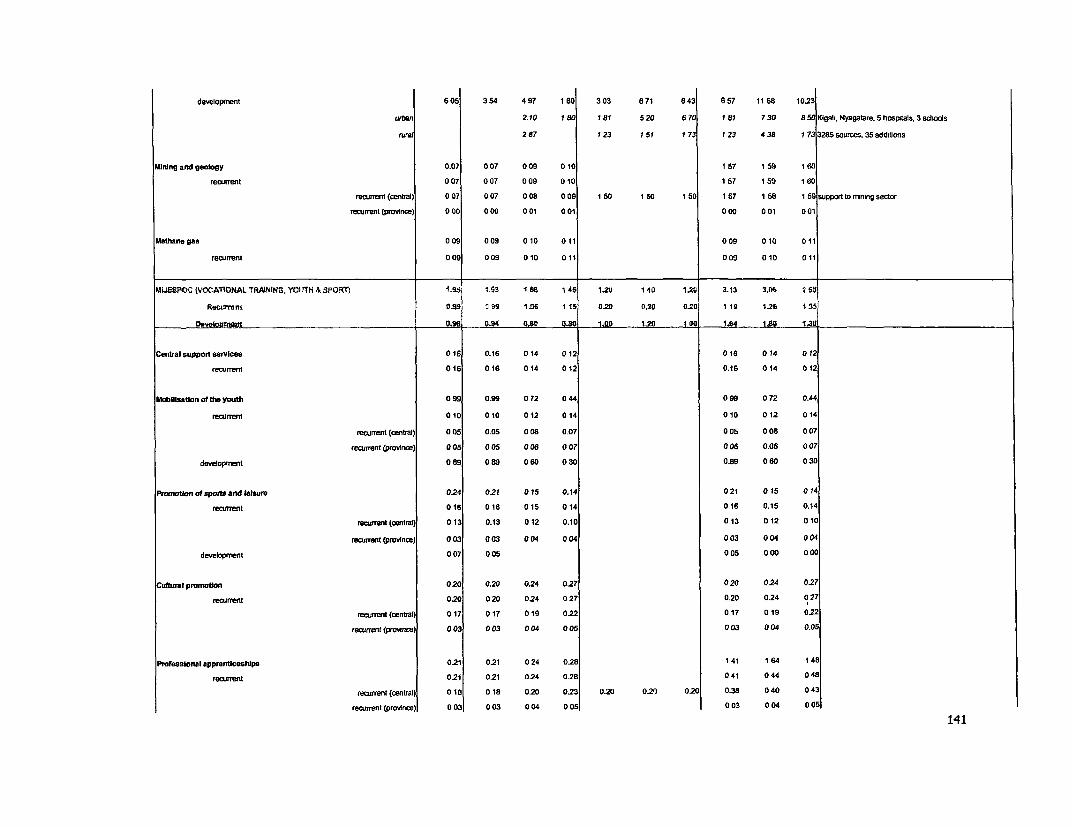
development 6 05 3 54 4 97 180 3 03 6 71 8 43 6 57 1168 10.23
urban 210 180 1 81 520 6 70 181 730 85 Kiga, Nyagatare. 5hospitals, 3schools
rura 2 87 123 151 1 73 1 23 4 38 1 733285 sootrc s35 addiJons
Mining and geology 0.07 0 07 0 09 010 1 57 1 S9 160recurTent 007 007 009 010 157 1 59 160
recurrent (central) 0 07 0 07 0 08 0 09 1 50 150 1 50 157 158 1 59 upport to mning sectorrtcurnent Wrodnce) 0 00 0 00 0 01 0 01 0 00 0 01 0 01
Methane gas 09 0 09 0 10 0 11 0 09 0 10 0 11
recurrent 009 009 010 0 11 009 010 011
MIUCEPOC JVOCATW AL TRAINING, YCUTtN& SPORT) 1.98 1.93 188 148 tAo 140 12A 3.13 3.0 26_5
Recurrnt 099 0 39 1.06 1 13 020 0.20 02 1 19 1-26 135
_ _ O*ff 0.94 0.60 020 lth 1.20Q 1 gO I94 1 AG 1.30
Central support serces 016 0.16 014 012 018 014 012recurrent 016 016 014 0 12 0.16 014 012
Mobltisaston of the youth 0 99 0.99 072 04 0 99 0 72 0.44
recurrent 010 010 012 0 14 010 012 014
recurTent (e0ntrat) 0 05 0.05 0 06 0.07 0 05 0 06 0 07
recureent ro'tne 005 O 05 006 0 07 005 0.06 007
developnent 0 89 0 89 0 60 0 30 0.89 0 60 030
Promotion ofsportandteisure 0.24 0.21 015 0.14 021 015 014recurrent 016 016 015 014 016 0.15 0.14
rnuTrent (cntral| 0 13 0.13 012 0.10 013 012 010
reaurrent 0p4oncer 003 003 0 04 0 04 0 03 0 04 0 04
development 0 07 0 05 0 05 0 00 000
Cultural promotion 0.20 0.20 0.24 027 020 024 0.27recurrent 0.20 0 20 0.24 0 27 020 0.24 0 27
remnant (central) 017 017 019 0.22 017 019 0.22
recuffent rowncel 003 0 03 004 005 0 03 004 0.
Professlonal apprentUceshtps 0.21 0.21 0 24 0.28 1 41 1 64 1 48recurrent 0.21 021 024 026 041 044 048
recurrent (oentral) 016 018 0.20 023 0.20 0.21 0.20 0.38 0 40 0 43
reanc t u or(p nce) 0 03 0 03 0 04 005 0 03 0 04 0 05
141
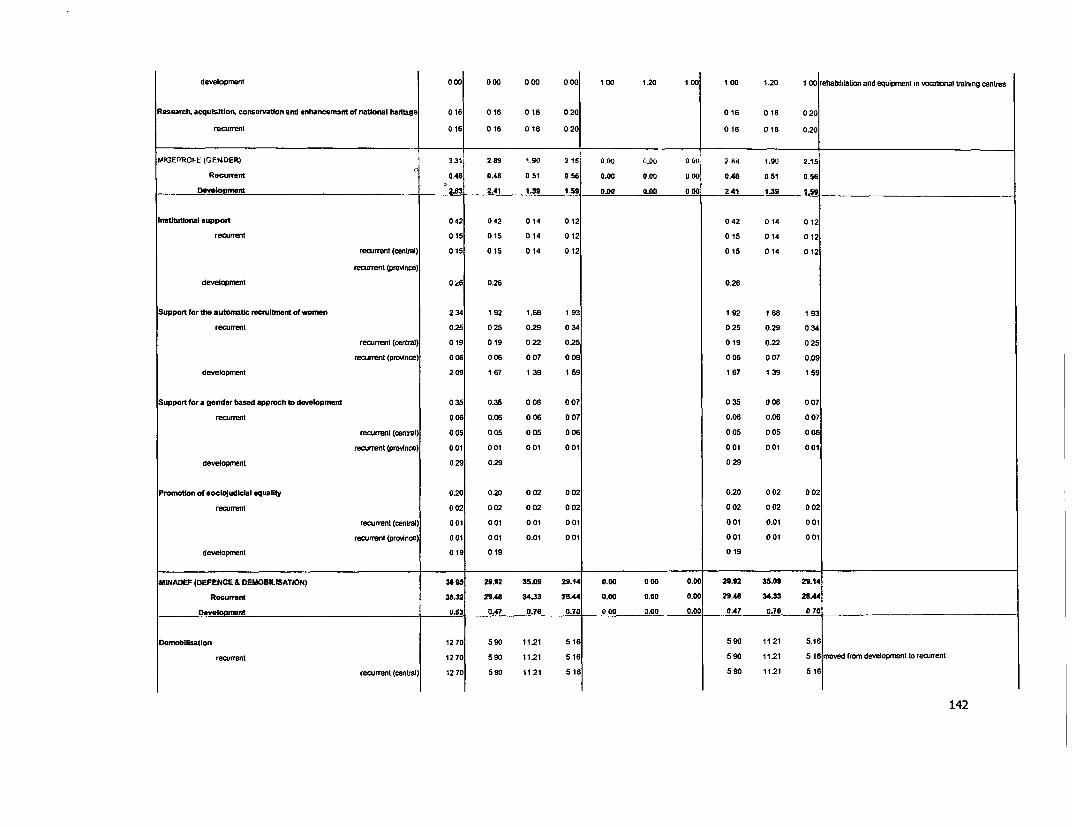
development 0 00 0 00 0 00 0 00 1 00 120 1 00 1 00 1.20 1 00 rehatictaton and equipment n vorati tralWning centes
Ressamch,aczubistlon cornservation and ntancerm6ntof tJorlherltle 0016 016 018 0 20 016 018 020
recurrent 0 16 016 018 0 20 016 018 0.20
MIGEPROFE (GENDER) 331 280 1S80 2l l 000 0.00 0 (I 289 1.80 2.1.5Recwrat CA8 OAB 0 51 056 0.00 000 0 00 0.4 0 51 0.58
D0valooment 2.03 2.41 1.39 1.5I 0.00 a.00 000 241 1.39 1.59
lnstituUonal suppoft 0 42 0 42 0 14 012 0 42 0 14 012recurrent 0 15 015 014 012 015 014 012
recunent (central) 015 015 014 012 015 014 012
recun ent (pwovnce)
developmient 0 2 0.26 0.26
Support for the automatic recultinent of women 2 34 1 92 1.68 1 93 1 92 1 68 1 93recurrent 0.25 0 25 0.29 0 34 0 25 029 034
recurrent (centr2t) 0 19 0 19 0 22 0.25 0 19 0.22 0 25
recurrent (province) 0 06 0 06 0 07 0 09 0 06 0 07 0.09development 2 09 167 139 1 59 167 139 159
Support for a gender based approch to development 0 35 0.35 0 06 0 07 0 35 0 06 0 07
recurrent 000 0.06 0 06 0 07 0.06 0.06 0 07
recurent (centrat) 0 05 0 05 0 05 0 06 0 05 0 05 0 06
recurrent (province) 0 01 0 01 0 01 0 01 0 01 0 01 0 01
developmient 0 29 0.29 0 29
Promotion of sockloudlcal quallty 0.20 0.20 0 02 0 02 0.20 0 02 0 02recurrent 0 02 0 02 0 02 0 02 0 02 0 02 0 02
recurrent (centW) 0 01 0 01 0 01 0 01 001 0.01 0 01
recurrent (province) 0 01 001 0.01 0 01 0 01 0 01 0 01developffent 019 019 019
MENADEF (DEFIENCE & DE6SAOLISATiON) 36 95 29.U2 35.09 29.14 0.00 0 00 0.00 29.92 35.0S 29.14Recurrntt 38.32 25.4J 34.33 2(144 0.00 0.00 0.00 29.4U 343 28.44
DeveloOmerit 0.63 0.47 0.76 0.70 000 0.00 0.0 0 OA? 0TS 0 70
DemobilLsatton 1270 590 11.21 516 590 1121 5.16
recument 1270 590 11.21 516 590 11.21 516 frvedrfomdevetopmienttorecuffent
recurnent(centrat) 1270 590 1121 516 590 1121 516
142
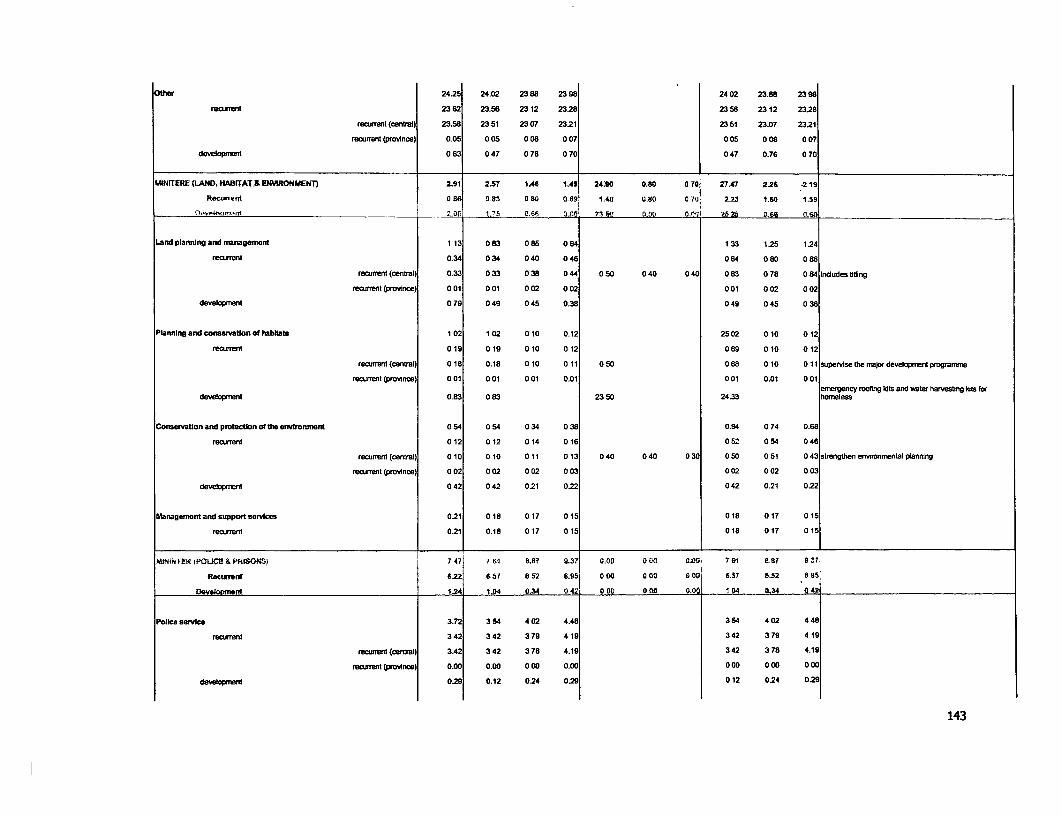
Oter 24.25 24.02 23 88 2398 24 02 23.88 23 98
reCurrent 232 23.56 23 12 23.28 23 56 23 12 23.28
reurent (central) 23.8 23 51 23 07 2321 23 51 23.07 23.21
recurrent (provinoe) 0.05 0 05 0 06 0 07 005 0 06 0 07
developTent 0 63 0 47 0 76 0 70 0 47 0.76 0 70
. ~~~~~~~~ .MtINIERSE(LAND,4{ABRrATA ENVItONMEN-T 2.91 2.57 1M 1.4 24 0.80 )070 27.47 2.26 -219
Recurrent 0 81 0 83 0 80 0.89 1t40 0.80 0 70 2.23 1.60 1.5S
tivrjo.¶ni Z,OJ t1,75 o.56 ;O so 0110 oPJ 25 25 0.68 06
Landpannlngand nanagemrnt 113 083 085 0 4 133 125 124
recurrent 0.34 0 34 0 40 0 46 0 84 0 80 0 86
recurent (central) 0.33 0 33 0 38 0 44 0 50 0 40 0 40 0 83 0 78 0 84lndudes ttlng
recurmnt (province) 0 01 001 0 02 0 02 0 01 0 02 002
developent 0 79 0 49 0 45 0.38 0 49 0 45 038
Planning and consevatlon of habitats 1 02 1 02 0 10 0.12 25 02 0 10 0 12
recurmnt 019 019 010 012 0 o9 010 0 12
recurTent (central) 018 0.18 010 011 050 068 010 011 supervisetheffaJordevelopment progranene
recrrent(prowAnce) 0 01 0 01 0 01 0.01 0 01 0.01 0 010 Oergency rooflng tbts and water harvestng ats flr
developmet 0.83 0 83 23 50 24.33 homeless
Conservaton and protectlon of the envlronmnt 0 54 0 54 0 34 0 38 0.94 0 74 0.68
recurrent 012 012 014 0 16 052 054 0 46
recurrentW(cntrat) 0 10 0 10 011 0 13 0 40 0 40 0 30 0 50 0 51 0 43 strengthenemnronwntal planning
recurrent (province) 0 02 0 02 0 02 0 03 0 02 0 02 0 03
development 0 42 0 42 0.21 0.22 0 42 021 0.22
Managenintandsupportservices 0.21 018 017 015 018 017 015
recurrent 0.21 0.18 017 015 018 017 015
MNiNTER tPOLIE & PRiSONS) 7 47 7 61 887 9.3 8 .O 0 00 0.00 7 e1 &87 9'7
Recurrent 6.22 6 57 8 52 8.85 0 00 0 00 000 6.57 8.52 8a5
Devsokomnt 1.24 1.04 0.34 0 42. 0 00 0.00 0.0 1 0 8 03 4
Pollte servke 3.72 3 54 4 02 4.48 3 54 4 02 4 48
recurrent 342 3 42 3 79 4 19 3 42 3 79 4 19
recuent (central) 3.42 3 42 3 78 4.19 3 42 3 78 4.19
renunent (pro-Ance) 0.00 0.00 0 00 0.00 0 00 0 00 000
develPent 029 0.12 0.24 029 0 12 0.24 0.29
143
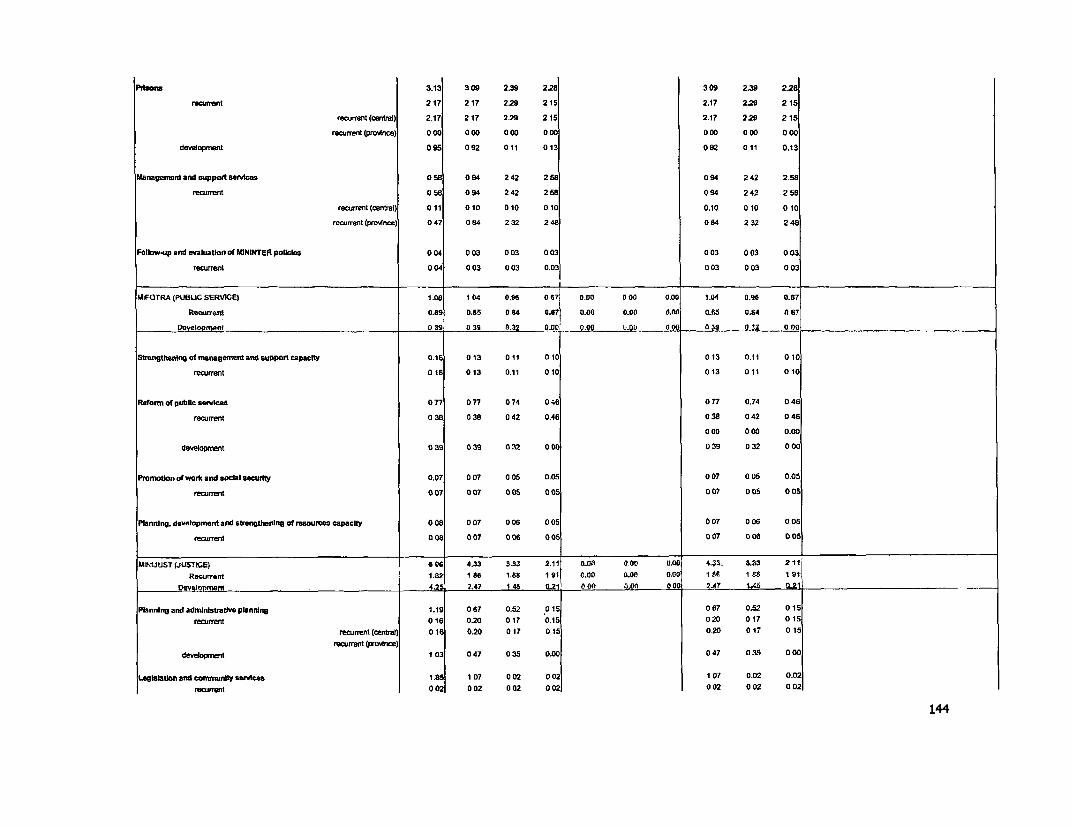
Pilsofs 3.13 3 09 2.39 228 309 2.39 228oyrertn 217 217 229 2 15 2.17 229 215
rennent (cNtral) 2.17 217 229 215 2.17 2.29 215recuffentprno4e) 0 00 000 0 00 0 00 0 00 0 00 0 00
development 0 95 0 92 011 013 0 92 0 11 0.13
Managemant and suppot services 0 8 094 2 42 2 58 0 94 2 42 2.58recnurent 0 58 0 94 2 42 2 58 0 94 2 42 2 58
recurrent(central) 011 010 010 010 0.10 010 010recurrent (provnce) 0 47 0 4 2 32 2 4t 08 4 2 32 2 48
Follow-up and evaluatlor of MNINTER pollcles 0 04 0 03 0 03 0 03 0 03 0 03 0 03recurnt O 04 0 03 0 03 0.03 0 03 0 03 0 03
MlFOTRA(PU8UC SERVICE) 1 8 1 04 0,96 0 67 0.0 800 0.00 t.04 o09 0.67Recurrent 0.69 0.05 0 64 0.67 0.00 0.00 o.e 0.6:i 0.S4 0a 7
O39 0 38 9.2 .00 09 . 0.00 05 03 00Lt o 3tt ~~~~~~~~~02 40 t oX_O -0, 0IS 0 32 0 Ot_
Strengthentng of nanag0ment and suppo1t capacity 0.16 0 13 0 11 0 10 0 13 0.11 0 10reoumrent 018 013 0.11 010 013 011 010
Reform of public servtce 077 0 77 0 74 0 46 0 77 0.74 0 46recurrent 0 38 0 38 0 42 0.46 038 0 42 0 44
0 00 0 00 0.00
developentt 0 3 0 39 0 32 000 0 39 0 32 0 00
Pronotlon of work and socl securtty 0.07 0 07 0 05 0.05 0 07 0 05 0.05recuffent 0 07 007 005 0 05 0 07 0 05 0 05
Planning, d.velopment and strengthenina af neouces Capacity 0 08 0 07 0 06 0 05 0 07 0 0 0 05reurrent 008 0 07 006 005 0 07 0 06 0 05
MiNIJUST (JUST") 6 06 4.33 333 2.11 0.00 e.o0 0o0 4.3, 3.33 211RecttOM nt 1.,2 1 s 1.84 191 0.00 0. 00o o.W 16 I eS 1 St
Oretor,rnent 4.2: 2.47 144 0., 00o oo o.0o o 001 247 14.4 c5 2 ___________________42_ _._2__21
Planning and adminlstratve planning 1.19 0 67 0.52 0 15 0 67 0.52 0 15recurmnt 016 0.20 017 0.15 0 20 017 015
renxrent(nrntira) 016 0.20 017 015 020 017 015recurrent (proince)
deveapment 103 0 47 0 35 0.00 0 47 0 35 0 00
Legislation and conmunrtan sarAIces 1.85 1 07 0 02 0 02 1 07 0.02 0.02recurent 0 02 0 02 0 02 002 0 02 0 02 0 02
144
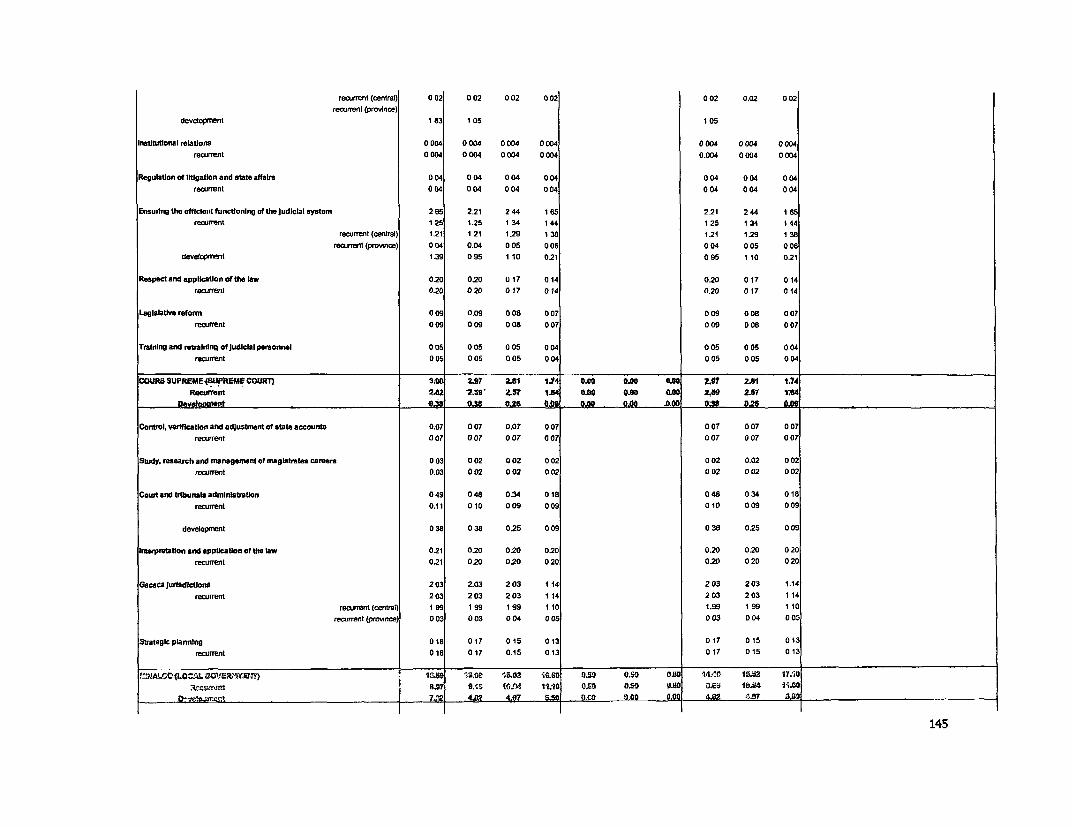
recurrent (oentral) 0 02 0 02 0 02 002 0 02 0.02 0 02reururent @nrovtace)
developnient 183 105 105
Institutonal reoations 0 004 0 004 0 004 0 004 0 004 0 004 0 004recurrent 0 004 0 004 0 004 0 004 0.004 0 004 0 004
RegubaUon of ltgation and stat affatrr 0 04 0 04 0 04 0 04 0 04 0 04 0 04recurmnt 0 04 0 04 0 04 0 04 0 04 0 04 0 04
Ensurlng the effIcItnt functloning of the ludicIal system 2 65 2.21 2 44 1 65 221 2 44 1 65recTurrent 125 1.25 134 1 4 1 25 134 144
recunent(central) 121 121 129 1 3 1.21 129 138renrrmnt (prounce) 0 04 0.04 0 05 0 0 0 04 0 05 006
development 1 .9 095 1 10 0.21 095 1 10 0.21
Respectandappitcatonofthelaw 0.20 0.20 017 0 14 0.20 017 014recmmni 0.20 020 017 014 0.20 017 014
Legislatve refonn 009 0.09 0 Ofl 00 08 0 0remrrent 009 0 09 0 08 0 07 0 09 0 08 0 0
Training and retratning of iudictal personnel 0 05 0 05 0 05 0 0 0 05 0 05 0 04recnrent 0 05 0 05 0 05 0 04 0 05 0 05 0
COUa8SUPREME{SUPkEIECOURt) 3 2W7 2.81 1.14 D.oo 0.O0 (0.0 Z7 2.81 1.74RseCrlNt Z39; os ST ¶ 0m 0.00 0.00 2,e ZS7 1,4
q m 03t S.W 025 0.00 0.0D 0.00 0.41 0 0.25 0
Coritrol, vedflcataon and adjustment of state accounts 0.07 0 07 0.07 0 07 0 07 0 07 0 07recurrent 0 07 0 07 0 07 007 0 07 0 07 0 07
Study, research and marnagen"rit of magtates rcareers 0 03 0 02 0 02 0 02 0 02 0.02 0 02reawuent 0.03 0 02 0 02 002 0 02 0 02 002
Court and triburals administration 0 49 0 48 0.34 0 18 0 48 0 34 018recunent 0.11 010 009 009 010 009 009
developnent 0 38 0 38 025 0 09 0 38 025 009
Interpretatlon and appliteation of the taw 0.21 0.20 020 0.20 0.20 0.20 0 20recurrent 021 020 0.20 0 20 020 0 20 0 20
Gacaca jurladctlona 2 03 Z03 2 03 114 2 03 203 1.14recurent 2 03 2 03 2 03 114 2 03 2 03 114
reamrrent(central) 1 99 199 199 110 1.99 199 110recu-nt (pmnce) 0 03 003 0 04 005 0 03 0 04 0 05
Strategic planntng 0 18 017 015 0 13 017 015 013reunrrent 018 017 015 0 13 017 015 013
L-?IA= (LCKAL ;;VE k-V6EMM 169 1B0 1802 10.0G 0. 0.69 n.f0 14f0 15.52 17.10cArCrt¶I 8.07 S.'s ftoA 11.10 0.60 00 0.0 0. 10.4 11.00
_ _ _ _ _ _ _ _ ? 4 4.f7 S0 ti,SD 0.00 40 53A7
145
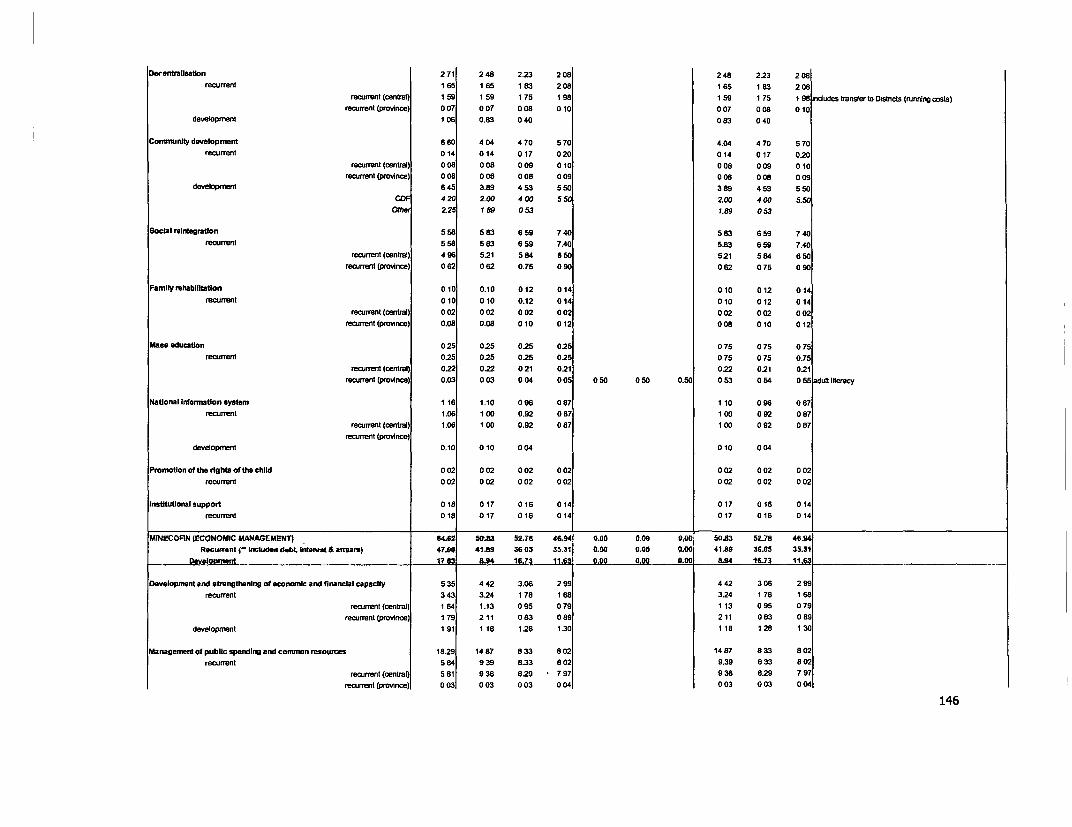
Derentrallsatlon 2 71 2 48 223 208 2 48 223 208recurrant 165 165 183 2 08 165 183 2 08recurrent (central) 15 9 15 9 1 75 1 98 1 59 1 75 1 98indudes transfer to Dstnrcts (running costs)
renmrent (province) 0 07 0 07 0 08 010 0 07 0 08 010development 1 06 0.83 0 40 0 83 0 40
Comnrunity development 6 60 4 04 4 70 5 70 4.04 4 70 5 70recurrent 014 014 017 0 20 014 017 0.20
recurrent (entral) 0 08 0 08 0 09 010 0 08 009 010recurrent ( nrovne) 006 0 06 0 08 0 09 0 08 0 08 009
deveopmnent 6 45 3.89 4 53 5 50 3 89 4 53 550CDI 4 24 200 4 00 5 ZOO 4 00 5.
Othe Z2 189 053 1.89 053
SocIal reintegration 5 58 5 83 6 59 740 5 83 6 59 740recurrent 5 58 5 83 6 59 7.40 5.83 6 59 7.4
rectrment(oentral) 496 5.21 584 6 50 521 584 650reurreont t( nce) 0 62 0 62 0.75 0 90 0 62 0 75 090
Family rehabltitaton 010 0.10 012 0 14 010 012 014recurrent 0 10 010 0.12 014 010 012 014
recuffent (cental) 0 02 0 02 0 02 0 02 0 02 0 02 002recurrent (pm'noe) 0.08 0.08 010 0 12 0 08 010 012
Mass education 0 25 0.25 0.25 0.25 0 75 0 75 0 75recurrent 0.25 0.25 025 0.25 0 75 0 75 0.75
recurrent (central) 022 0.22 0 21 0.21 0.22 021 0.21recurrent (protnce) 0.03 0 03 0 04 0 05 05 0 0 50 0.50 0 53 0 54 0 |adutt lteracy
Natonal Information system 1 16 1.10 0 96 0 87 1 10 0 96 0 87recurrent 1.06 100 0.92 0 87 100 0 92 0 87
recuent (central) 1.06 100 0.92 0 87 100 0 92 0 87recurrent (province)
developmnent 0.10 010 0 04 010 0 04
Pronotton of the right of the chtd 0 02 0 02 0 02 0 02 0 02 0 02 0 02recurrent 0 02 0 02 0 02 0 02 0 02 0 02 002
instituttonal support 01 8 0 17 016 0 14 017 016 014rectrrent 018 017 016 0 14 017 016 014
MtNECOFIN (OCONOGdC MNAGEMlitN 84,2 580 52.78 46.94 0. 0 00 00W 0Sam3 62.78 483Rocur.eu ntrnckKdsddetit. inrtenst& arreamr) 47.900 41.s 3868 35.3 06 o.oe 0.00 41.89 38.05 35.31
Devetofement 17,63 8a.4 t6.73 11.6 0je 0.90 9.00 894 16.73 11 .J
Development and strengthening of econornic and tinanelal capacIty 5 35 4 42 3.06 2 9 4 42 3 06 298recurrent 3 43 3.24 178 1 8 3.24 178 168
recurrent (centran) 1 64 1.13 0 95 0 79 1 13 0 95 0 79recurrent (pronce) 1 79 2 11 0 83 0 89 2 11 0 83 0 89
development 191 118 1.28 1.30 118 128 130
Mtanagemnent of public spending and common resources 1829 14 87 8 33 8 02 14 87 8 33 8 02recurrent 5 84 9 39 8.33 8 02 9.39 8 33 8 02
recurrent (centW) 581 9 38 829 7 97 9 36 8.29 7 97recurrent (pvinoe) 0 03 0 03 0 03 0 04 0 03 0 03 0 04
146
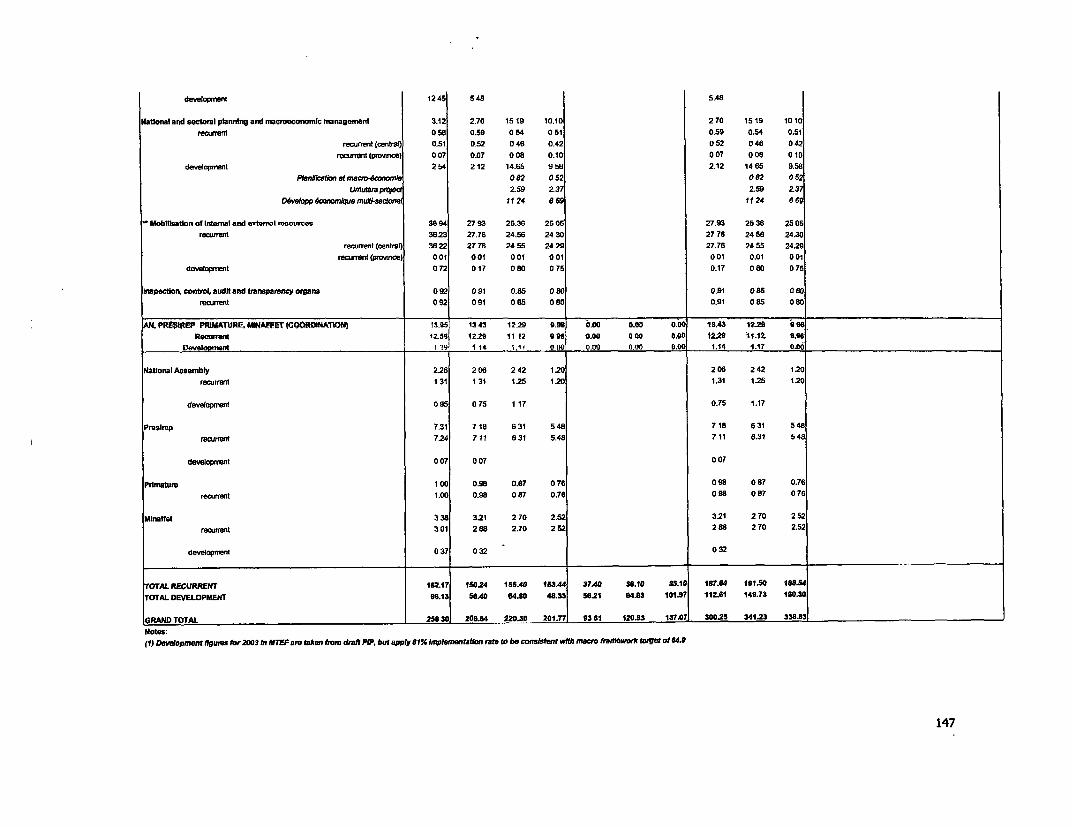
develtopnwnt 12 45 5 48 5,48
National and sectoral planntng and macroeconomic nianagement 3.12 2.70 1519 10.10 2 70 1519 1010reurrent 0 se 0.59 0 54 0 51 0.59 0.54 0.51
recurt (contrad) 0.51 0.52 0 46 0.42 0 52 0 46 042rearrent (promnce) 0 07 .7 0 08 0.10 0 07 0 08 010
developrnat 2 54 2 12 14.65 9 58 2.12 14 65 9.58Plbn detiet maacrEwnomle 082 0 5 082 052
Ltmuta,a prqd 2.59 2.3 Z59 Z3DdVemopp 4conmqueM 1124 6 69 1124 669
Mobillatlon of ntemnl and exteal msources 38 94 27 93 25.36 25 05 27.93 25 36 25 05recurrent 36.23 27.76 24.56 24 30 27 76 24 56 24.30
recuffent (cenl) 38f22 27 76 24 55 2429 27.76 24 55 2429recjurent l(p nce) 0 01 001 001 0 01 0 01 0.01 0 01
developMnwt 0 72 017 0 80 0 75 0.17 0 80 0 75
naPetlcton. co.WoI andit and tbanspamaey orpns 0 92 0 91 0.e6 0 8 0.91 0a85 0Orecurent 0 92 091 0 85 0 80 0.91 0 8S 0 8
ANK PR EP PRtMATURE. OMAFFET (COOlDItNTION) I95 13 43 12-29 9.9 0.00 0.0 0.00 13.43 1229 S0Recraw 12.50 1229 t1 12 9SS6 O. 000 0.00 12t 11.12 S.91
Dev.teoM nt I "9 1 14 117 0a 08 0o 0,0t 0.00 1.14 1.17 0.od ____
Natonal Assembly 2.26 206 242 1.20 206 242 1.20reojrrelnt 1 31 1 31 1.25 1.20 1.31 1.25 120
devefoprrent 0 95 0 75 117 0.75 1.17
Prasirep 7.31 718 631 548 718 631 548recumnul 7.24 711 631 5.48 711 6.31 548
development 0 07 0 07 0 07
Prbatur 1 00 0.98 0.87 0 76 0 98 0 87 0.76rmcufent 1.00 0.98 0 87 0.76 0 98 0 87 0 76
lbnaffet 3 38 3.21 270 2.62 3.21 270 252recurmnt 301 2 88 2.70 2 52 2 88 2 70 2.52
developnwnt 0 37 0 32 0 32
TAL RECURRENT 162.17 150.24 185.40 183.44 37.40 36.10 35.10 187.84 191.50 188.54TOTAL DEVELOPME.NT 96.13 56.40 64.90 48.'33 5621 84.83 101.97 112.61 149.73 180.5o
GRAND TOTAL 258 30 206.64 220.30 201.77 93 61 120.93 137.07 300.25 341.23 338.8:3Notes:(1) Devefopment flgures fr2003 In MTEFare taken tem draftPIP, autyppI81% nkmentaion rate to be consastert with macro Famorewo* ttVet of64.9
147
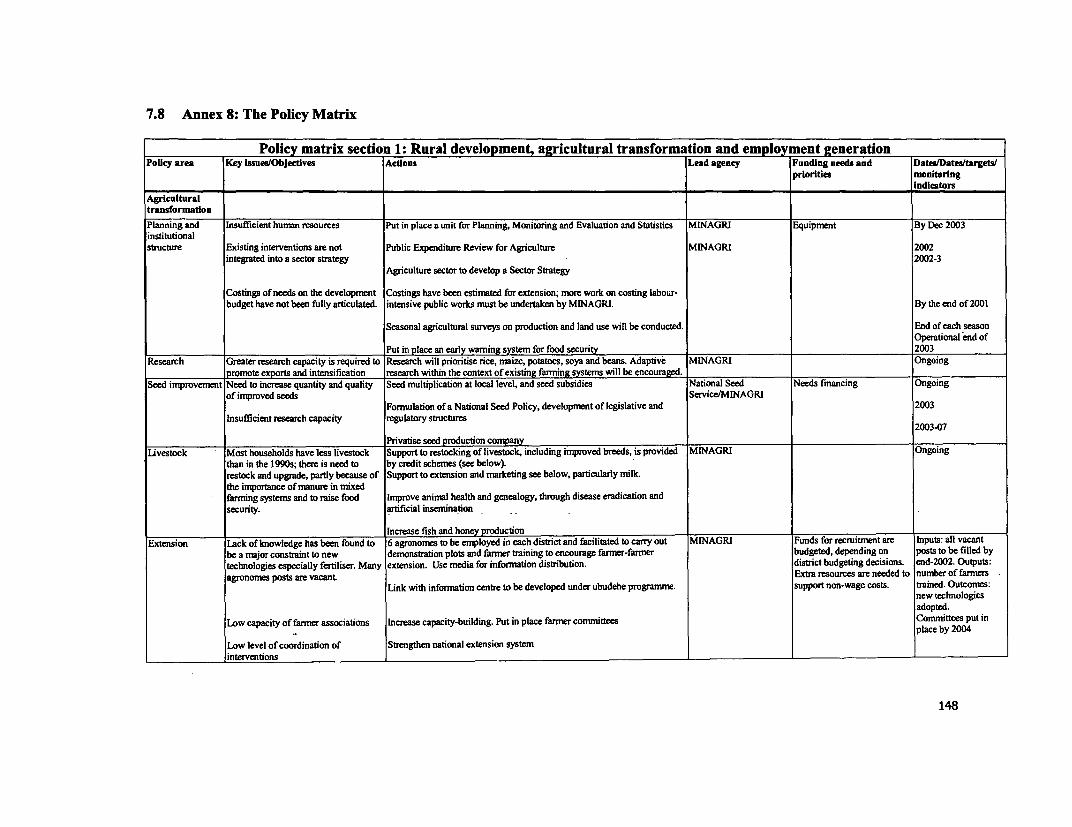
7.8 Annex 8: The Policy Matrix
Policy matrix section 1: Rural development, agricultural transformation and empiovment generationPolicy area Key Issues/Objectives Actions Lead agency Funding needs and DatesoDates/targets/
priorities nmonitoringindicatorsAgricultural
transformation
Planning and Insufficient human resources Put in place a unit for Planning, Monitoring and Evaluation and Statistics MINAGRI Equipment By Dec 2003institutionalstructure Existing interventions are not Public Expenditure Review for Agriculture MINAGRI 2002integrated into a sector strategy 2002-3
Agriculture sector to develop a Sector Strategy
Costings of needs on the development Costings have been estimated for extension; more work on costing labour-budget have not been fully articulated. intensive public works must be undertaken by MINAGRI. By the end of 2001
Seasonal agricultural surveys on production and land use will be conducted. End of each seasonOperational end of
Put in place an early waming system for food security 2003Research Greater research capacity is required to Research will prioritise rice, maize, potatoes, soya and beans. Adaptive MINAGRI Ongoingromote exports and intensification research within the context of existing farming systems will be encouraged.Seed inprovement Need to increase quantity and quality Seed multiplication at local level, and seed subsidies National Seed Needs financing Ongoingof improved seeds Service/MINAGRI
Formulation of a National Seed Policy, development of legislative and 2003Insufficient research capacity regulatory structures 200307
Privatise seed production companyLivestock Most households have less livestock Support to restocking of livestock, including improved breeds, is provided MINAGRI Ongoingthan in the 1990s; there is need to by credit schemes (see below).
restock and upgrade, partly because of Support to extension and narketing see below, particularly milk.the importance of manure in mixedfanming systems and to raise food Improve animal health and genealogy, through disease eradication andsecurity. artificial insemination
i Increase fish and honey productionExtension Lack of knowledge has been found to 6 agronomes to be employed in each district and facilitated to carry out MINAGRI Funds for recruitment are Inputs: all vacant
be a major constraint to new demonstration plots and farmer training to encourage farmer-farmer budgeted, depending on posts to be filled bytectmologies especiaUly fertiliser. Many extension. Use media for information distnbution. district budgeting decisions. end-2002. Outputs:agronomes posts are vacant Extra resources are needed to number of farmers
Link with information centre to be developed under ubudehe programme. support non-wage costs. trained. Outcomes:new technologiesadopted.
Low capacity of farmer associations increase capacity-building. Put in place farmer committees Committees put inplace by 2004
Low level of coordination of Strengthen national extension systeminterventions
148
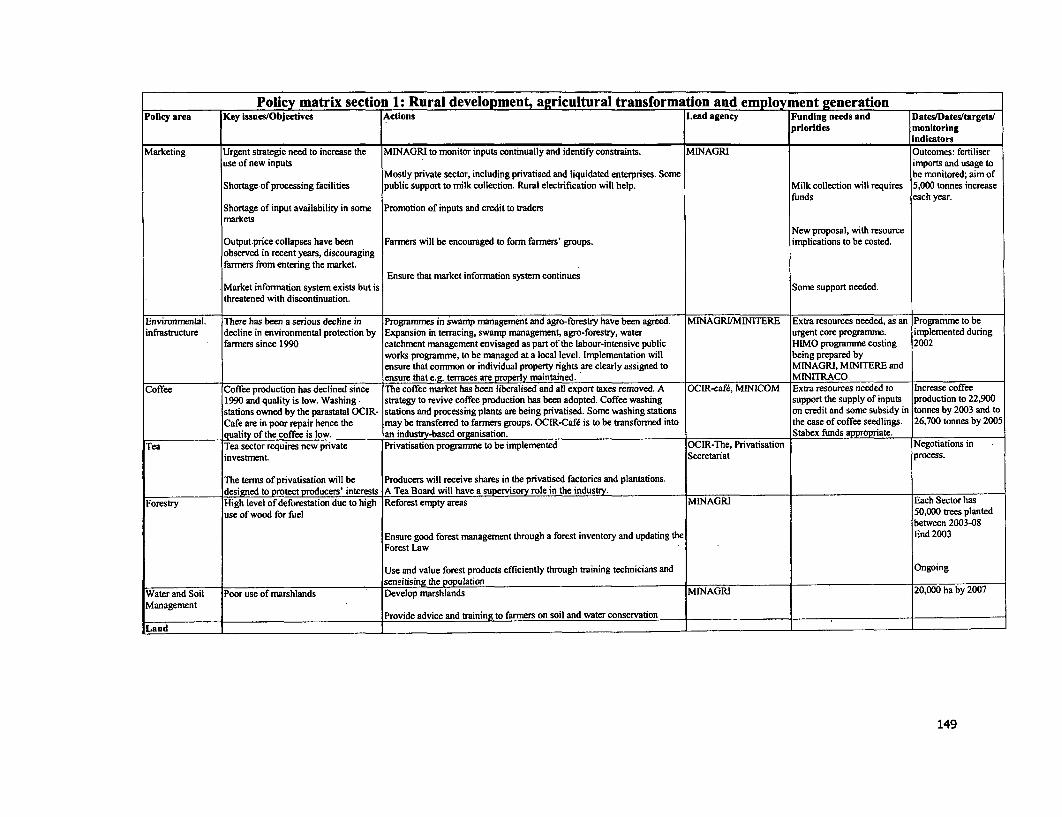
Policy matrix section 1: Rural development, agricultural transformation and emDloyment generationPolicy area Key Issues/Objectives Actions Lead agency Funding needs and Dates/Datesttargets/
priorities monitoringIndicators
Marketing Urgent strategic need to increase the MINAGRI to monitor inputs continually and identify constraints. MINAGRI Outcomes: fertiliseruse of new inputs imports and usage to
Mostly private sector, including privatised and liquidated enterprises. Some be monitored; aim ofShortage of processing facilities public support to milk collection. Rural electrification will help. Milk collection will requires 5,000 tonnes increase
funds each year.Shortage of input availability in some Promotion of inputs and credit to tradersmarkets
New proposal, with resourceOutput.price collapses have been Farmers will be encouraged to form farmers' groups. implications to be costed.observed in recent years, discouragingfarmers from entering the market.
Ensure that market information system continuesMarket information system exists but is Some support needed.threatened with discontinuation.
Environnental. There has been a serious decline in Programmes in swamp management and agro-forestry have been agreed. MINAGRI/MINITERE Extra resources needed, as an Programme to beinfrastructure decline in environmental protection by Expansion in terracing, swamp management, agro-forestry, water urgent core programme. implemented during
farmers since 1990 catchment management envisaged as part of the labour-intensive public HIMO programme costing 2002works programme, to be managed at a local level. Implementation will being prepared byensure that common or individual property rights are clearly assigned to MINAGRI, MINITERE andensure that e.g. terraces are properly maintained. MINITRACO.
Coffee Coffee production has declined since The coffee market has been liberalised and all export taxes removed. A OCIR-cafe, MINICOM Extra resources needed to Increase coffee1990 and quality is low. Washing. strategy to revive coffee production has been adopted. Coffee washing support the supply of inputs production to 22,900stations owned by the parastatal OCIR- stations and processing plants are being privatised. Some washing stations on credit and some subsidy in tonnes by 2003 and toCafe are in poor repair hence the may be transferred to farmers groups. OCIR-Cafd is to be transfonned into the case of coffee seedlings. 26,700 tonnes by 2005quality of the coffee is low. an industry-based organisation. Stabex funds appropriate.
Tea Tea sector requires new private Privatisation programme to be implemented OCIR-The, Privatisation Negotiations ininvestment Secretariat process.
The terms of privatisation will be Producers will receive shares in the privatised factories and plantations.designed to protect producers' interests A Tea Board will have a supervisory role in the industry.
Forestry High level of deforestation due to high Reforest empty areas MINAGRI Each Sector hasuse of wood for fuel 50,000 trees planted
between 2003-08Ensure good forest management through a forest inventory and updating the End 2003Forest Law
Use and value forest products efficiently through training technicians and Ongoingsensitising the population
Water and Soil Poor use of marshlands Develop marshlands MINAGRI 20,000 ha by 2007Management
Provide advice and training to farmers on soil and water conservationLand
149
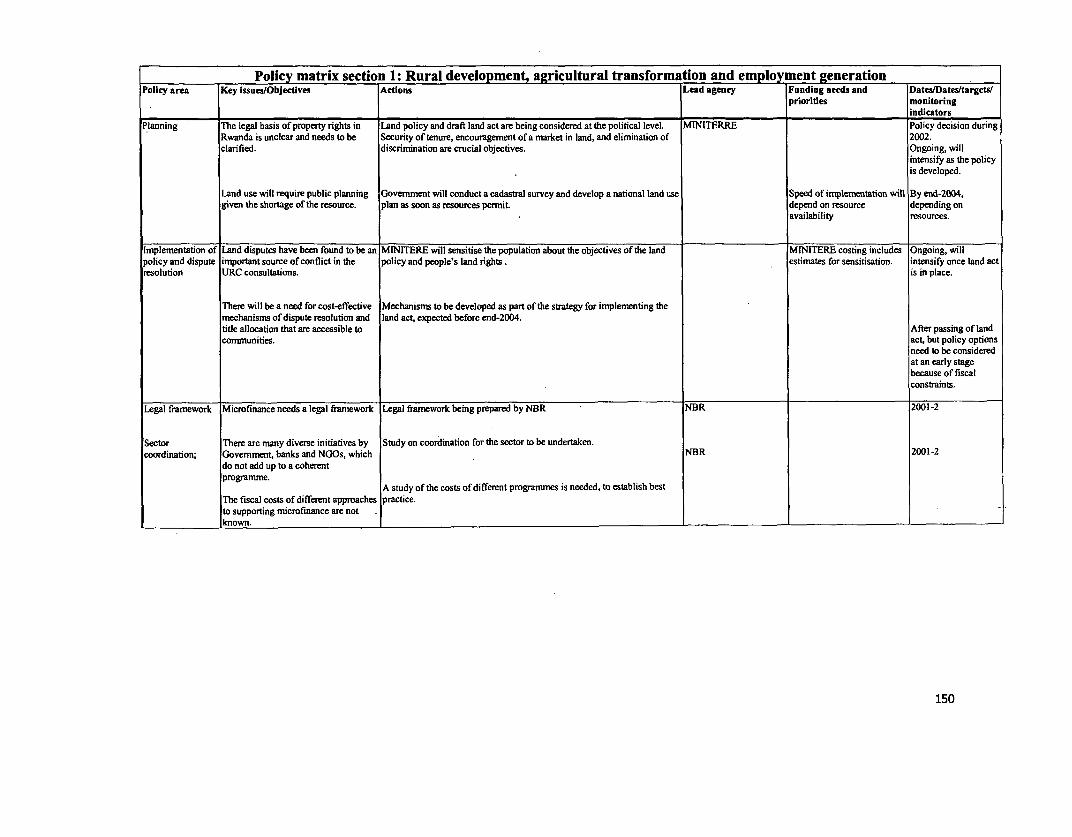
__________ Policy matrix section 1: Rural development, agricultural transformation and employ ment generationPolicy area Key issues/Objectives Actions Lead agency Funding needs and Dates/Dates/targets/priorities monitoring.____________ _____________________________________________________Iindicators
Planning The legal basis of property rights in Land policy and draft land act are being considered at the political level. MINITERRE Policy decision duringRwanda is unclear and needs to be Security of tenure, encouragement of a market in land, and elimination of 2002.clarified. discrimination are crucial objectives. Ongoing, willintensify as the policyis developed.
Land use will require public planning Government will conduct a cadastral survey and develop a national land use Speed of imnplementation will By end-2004,given the shortage of the resource, plan as soon as resources pernnit depend on resource depending onavailability resources.
Implementation of Land disputes have been found to be an MINITERE will sensitise the population about the objectives of the land MINITERE costing includes Ongoing, willpolicy and dispute important source of conflict in the policy and people's land rights . estirates for sensitisation. intensify once land actresolution URC consultations. is in place.
There will be a need for cost-effective Mechanisms to be developed as part of the strategy for implementing themechanisms of dispute resolution and land act, expected before end-2004.title allocation that are accessible to
After passing of landcommunities. act, but policy optionsneed to be consideredat an early stagebecause of fiscalconstraints.
Legal framework Microfinance needs a legal framework Legal framework being prepared by NBR NBR 200 -2
Sector There are many diverse initiatives by Study on coordination for the sector to be undertaken.coordination; Govemnent, banks and NGOs, which NBR 2001-2do not add up to a coherent
programme.A study of the costs of different progranmnes is needed, to establish best
The fiscal costs of different approaches practice.to supporting microfinance are not . .known. _
150
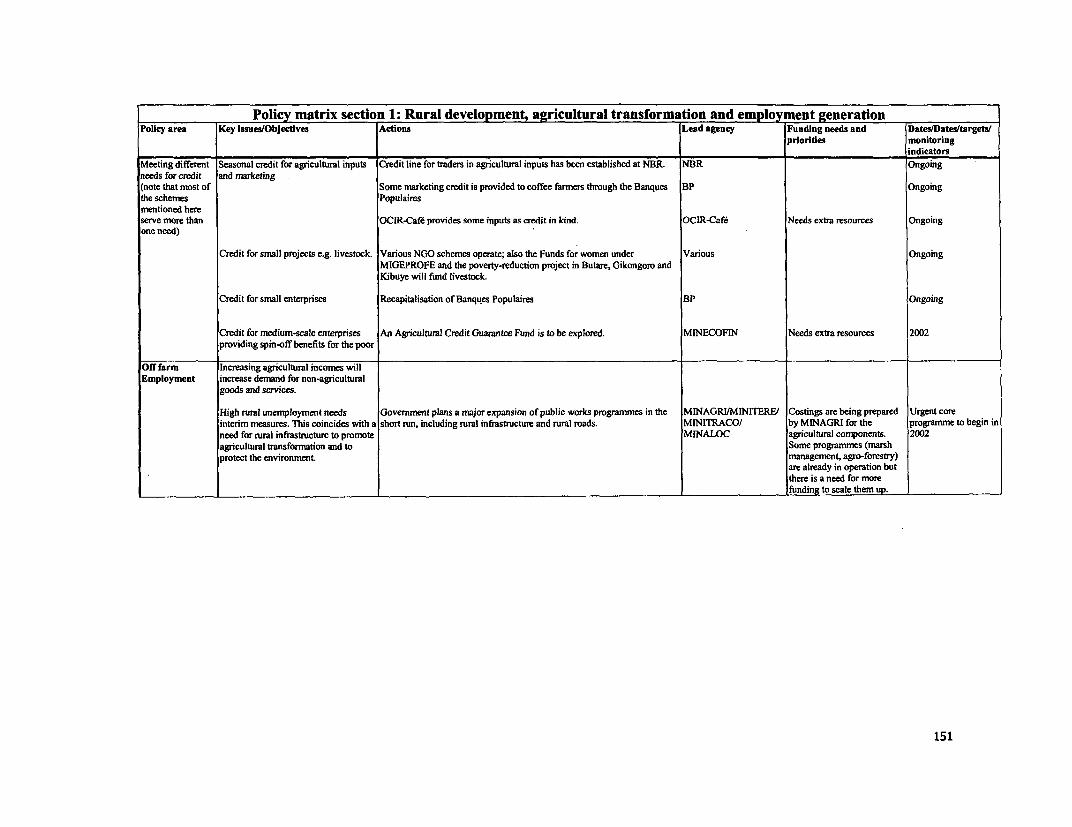
Policy matrix section 1: Rural development agricultural transformation and employ ment enerationPolicy area Key Issues/Objectives Actions Lead agency Funding needs and Dates/Datesttargets/
priorities monitoringindicators
Meeting different Seasonal credit for agricultural inputs Credit line for traders in agricultural inputs has been established at NBRI NBR Ongoingneeds for credit and marketing(note that most of Someni marketing credit is provided to coffee farmers through the Banques BP Ongoingthe schemes Populairesmentioned hereserve more than OCIR-Cafe provides some inputs as credit in kind. OCIR-Caf6 Needs extra resources Ongoingone need)
Credit for small projects e.g. livestock Various NGO schemes operate; also the Funds for women under Various OngoingMIGEPROFE and the poverty-reduction project in Butare, Gikongoro andKibuye will fund livestock.
Credit for small enterprises Recapitalisation of Banqu,es Populaires BP Ongoing
Credit for medium-scale enterprises An Agricultural Credit Guarantee Fund is to be explored. MINECOFIN Needs extra resources 2002providing spin-off benefits for the poor
Off farm Increasing agricultural incomes willEmployment increase demnand for non-agricultural
goods and services.
High rural unemployment needs Govenninent plans a major expansion of public works programmes in the MINAGRI/MINITERE/ Costings are being prepared Urgent coreinterim measures. This coincides with a short run, including rural infrastructure and rural roads. MINITRACO/ by MINAGRI for the progranmme to begin inneed for rural infrastructure to promote MINALOC agricultural components. 2002agricultural transformation and to Some programmes (marshprotect the environment. management, agro-forestry)
are already in operation butthere is a need for morefunding to scale them up.
151
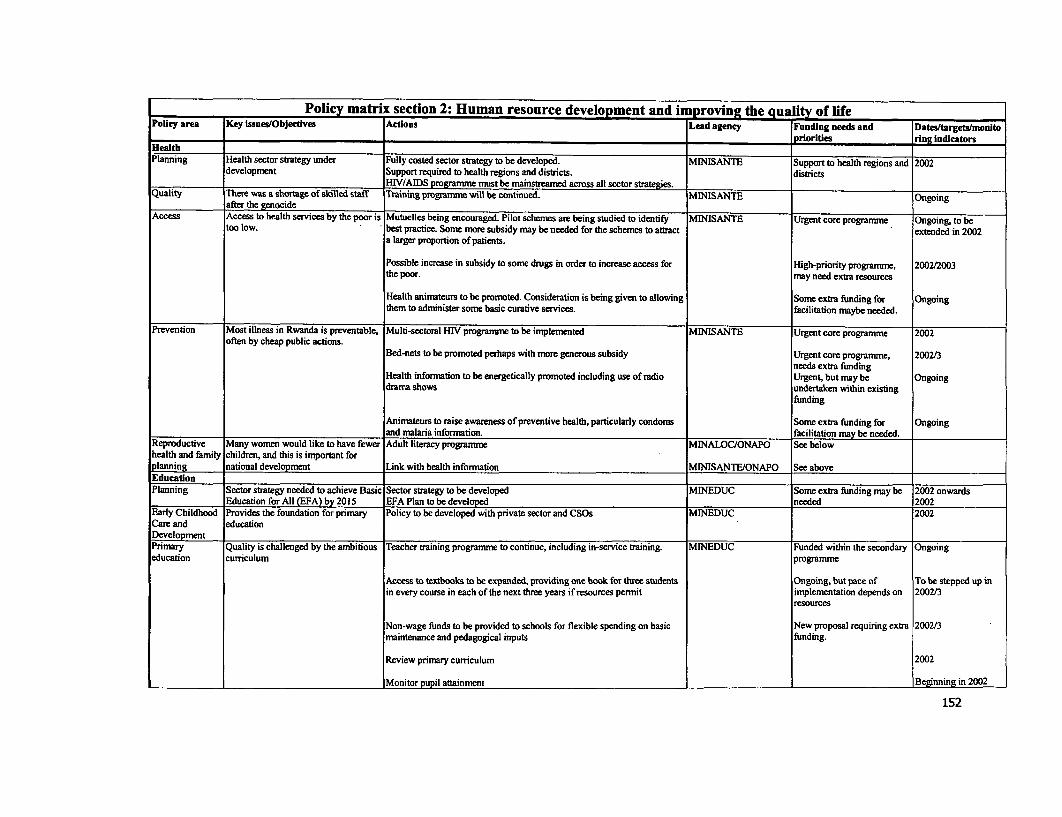
Policy matrix section 2: Human resource development and improving the qua lit of life lPolicy area Key Issues/Objectives Actions Lead agency Funding needs and Dates/targets/monito
___________th___________________________ priorities ring indicators
Planning Health sector strategy under Fully costed sector strategy to be developed. MINISANTE Support to health regions and 2002development Support required to health regions and districts. districts
HIV/AIDS programme must be mainstreamed across all sector strategies.Quality There was a shortage of skilled staff Training progamnme will be continued. MINISANTE Ongoing
after the genocideAccess Access to health services by the poor is Mutuelles being encouraged. Pilot schemes are being studied to identify MINISANTE Urgent core programme Ongoing, to be
too low. best practice. Somne more subsidy may be needed for the schemes to attract extended in 2002a larger proportion of patients.
Possible increase in subsidy to some drugs in order to increase access for High-priority programme, 2002/2003the poor. may need extra resources
Health anirnateurs to be prornoted. Consideration is being given to allowing Some extra funding for Ongoingthem to administer some basic curative services. facilitation maybe needed.
Prevention Most illness in Rwanda is preventable, Multi-sectoral HIV programne to be implemented MINISANTE Urgent core programme 2002often by cheap public actions.
Bed-nets to be promoted perhaps with more generous subsidy Urgent core programme, 2002/3needs extra funding
Health infornation to be energetically promoted including use of radio Urgent, but may be Ongoingdrama shows undertaken within existing
funding
Animateurs to raise awareness of preventive health, particularly condoms Some extra funding for Ongoingand mnalaria information, facilitation may be needed.
Reproductive Many women would like to have fewer Adult literacy programme MINALOC/ONAPO See belowhealth and family children, and this is important forplanning national development iink with health infomiation MINISANTE/ONAPO See aboveEducationPlanning Sector strategy needed to achieve Basic Sector strategy to be developed MINEDUC Some extra funding may be 2002 onwards
Education for All (EFA) by 2015 EFA Plan to be developed needed 2002Early Childhood Provides the foundation for primary Policy to be developed with private sector and CSOs MINEDUC 2002Care and educationDevelopmentPrimary Quality is challenged by the ambitious Teacher training programne to continue, including in-service training. MINEDUC Funded within the secondary Ongoingeducation curriculum programme
Access to textbooks to be expanded, providing one book for three students Ongoing, but pace of To be stepped up inin every course in each of the next three years if resources permit implementation depends on 2002/3
resources
Non-wage funds to be provided to schools for flexible spending on basic New proposal requiring extra 2002/3maintenance and pedagogical inputs funding.
Review prirary curriculum 2002
Monitor pupil attainment Beginning in 2002
152
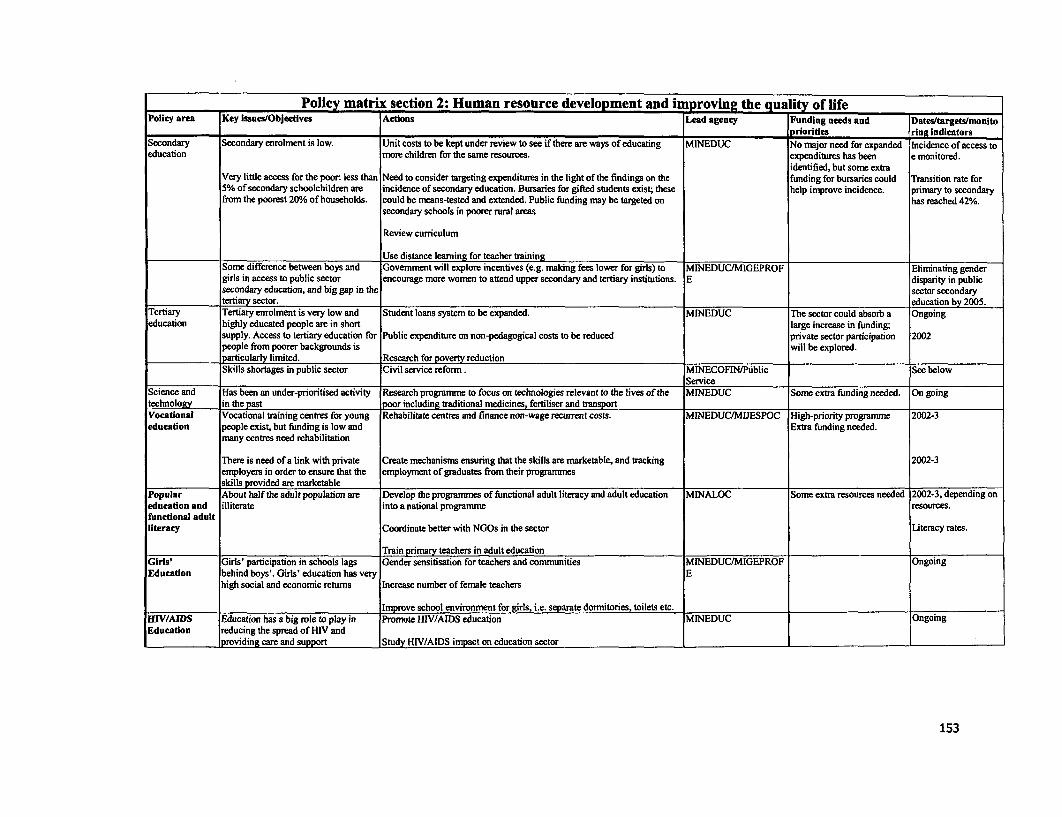
Policy matrix section 2: Human resource development and i proving the qua lity of lifePolicy area Key Issues/Objectlves Actions Lead agency Funding needs and Dates/targets/monito
________________ rloridles rine indicatorsSecondary Secondary enrolment is low. Unit costs to be kept under review to see if there are ways of educating MiNEDUC No major need for expanded Incidence of access toeducation more children for the same resources. expenditures has been e monitored.
identified, but some extraVery little access for the poor: less than Need to consider targeting expenditures in the light of the findings on the funding for bursaries could Transition rate for5% of secondary schoolchildren are incidence of secondary education. Bursaries for gifted students exist; these help improve incidence. primary to secondaryfrom the poorest 20% of households. could be means-tested and extended. Public funding may be targeted on has reached 42%.
secondary schools in poorer rural areas
Review curriculum
Use distance leaming for teacher trainingSome difference between boys and Govemment will explore incentives (e.g. making fees lower for girls) to MINEDUC/MIGEPROF Eliminating gendergirls in access to public sector encourage more women to attend upper secondary and tertiary institutions. E disparity in publicsecondary education, and big gap in the sector secondarytertiary sector. education by 2005.
Tertiary Tertiary enrolment is very low and Student loans system to be expanded. MINEDUC The sector could absorb a Ongoingeducation highly educated people are in short large increase in funding;
supply. Access to tertiary education for Public expenditure on non-pedagogical costs to be reduced private sector participation 2002people from poorer backgrounds is will be explored.particularly limited. Research for poverty reductionSkills shortages in public sector Civil service reform. MINECOFIN/Public See below
ServiceScience and Has been an under-prioritised activity Research programme to focus on technologies relevant to the lives of the MINEDUC Some extra funding needed. On goingtechnology in the past poor including traditional medicines, fertiliser and transportVocational Vocational training centres for young Rehabilitate centres and finance non-wage recurrent costs. MINEDUC/MIJESPOC High-priority programme 2002-3educaton people exist, but funding is low and Extra funding needed.
many centres need rehabilitation
There is need of a link with private Create mechanisms ensuring that the skills are marketable, and tracking 2002-3employers in order to ensure that the employment of graduates from their programmesskills provided are marketable
Popular About half the adult population are Develop the programmes of functional adult literacy and adult education MINALOC Some extra resources needed 2002-3, depending oneducation and illiterate into a national programme resources.functional adultliteracy Coordinate better with NGOs in the sector Literacy rates.
Train primary teachers in adult educationGirls' Girls' participation in schools lags Gender sensitisation for teachers and communities MINEDUC/MIGEPROF OngoingEducatdon behind boys'. Girls' education has very E
high social and economic retums Increase number of female teachers
Improve school environment for girls, i.e. separate domitories, toilets etc.HLV/AIDS Education has a big role to play in Promote HIV/AIDS educaton MINEDUC OngoingEducadon reducing the spread of HIV and
providing care and support Study HIV/AIDS impact on education sector
153
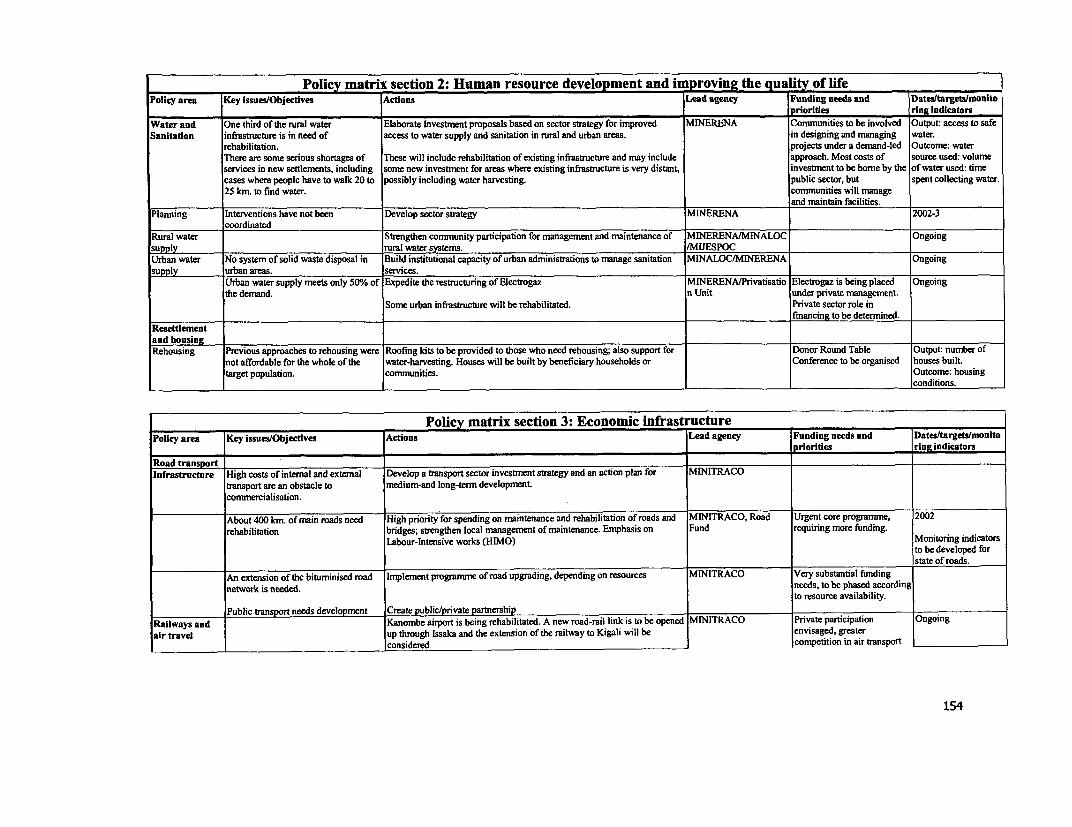
________ Policy matri section 2: Human resource development and i roving the quatof lifePolicy area Key Issues/Objectives Actions Lead agency Funding needs and Datesttargetstonito
priorities ring IndicatorsWater and One third of the rural water Elaborate Investment proposals based on sector strategy for improved MINERENA Communities to be involved Output: access to safeSanitation infrastructure is in need of access to water supply and sanitation in rural and urban areas. in designing and managing water.
rehabilitation. projects under a demand-led Outcome: waterThere are some serious shortages of These will include rehabilitation of existing infrastructure and mnay include approach. Most costs of source used: volumeservices in new settlements, including some new investment for areas where existing infrastructure is very distant, investment to be bome by the of water used: timecases where people have to walk 20 to possibly including water harvesting. public sector, but spent collecting water.25 km. to fnd water. communities will manage
and maintain facilities.Planning Interventions have not been Develop sector strategy MINERENA 2002-3
coordinatedRural water Strengthen community participation for management and maintenance of MINERENA/MINALOC Ongoingsupply rural water systems. /MUESPOCUrban water No system of solid waste disposal in Build institutional capacity of urban administrations to manage sanitation MINALOC/MINERENA Ongoingsupply urban areas. services.
Urban water supply meets only 500/0 of Expedite the restructuring of Electrogaz MINERENA/Privatisatio Electrogaz is being placed Ongoingthe demand. n Unit under private management.
Some urban infrastructure will be rehabilitated. Private sector role infinancing to be determined.
Resettlementand housineRehousing Previous approaches to rehousing were Roofing kits to be provided to those who need rehousing; also support for Donor Round Table Output: number ofnot affordable for the whole of the water-harvesting. Houses will be built by beneficiary households or Conference to be organised houses built.
target population. communities. Outcome: housingconditons.
Policy matrix section 3: Economic infrastructure |Policy area Key issues/Objectives Actions Lead agency Funding needs and Dates/targetstmonito
priorities ing indicators!lad transport_
_ _ _ _ _ _ _Infrastructure High costs of internal and extemal Develop a transport sector investment strategy and an action plan for MINiTRACO
transport are an obstacle to medium-and long-term developmentcommercialisation.
About 400 km. of main roads need High priority for spending on maintenance and rehabilitation of roads and MINITRACO, Road Urgent core programme, 2002rehabilitation bridges; strengthen local management of maintenance. Emphasis on Fund requiring more funding.
Labour-Intensive works (HIMO) Monitoring indicatorsto be developed forstate of roads.
An extension of the bituminised road Implement programme of road upgrading, depending on resources MINITRACO Very substantial fundingnetwork is needed. needs, to be phased according
to resource availability.Public transport needs development Create public/private partnership
Railways and Kanombe airport is being rehabilitated. A new road-rail link is to be opened MiNiTRACO Private partcipaton Ongoingair travel up through issaka and the extension of the railway to Kigali will be envisaged, greater
considered competition in air transport
154

Polie matrix section 3: Economic infrastructurePolicy area Key issuestObjecdves Actions Lead agency Funding needs and Dates/targets/imonito
_________ _____________________ ________________________ _ priorides ring indicatorsGrass-roots Rural tracks The ubudehe programme will provide funds that could be used to support MINiTRACO 2002transport local transport needs.
Intermediate forns of transport are KIST is working on ipqroved forns of local transport. Ongoingrequired to carry produce betweenhouseholds and the narket. Donkeys may be promoted.
Energy for the High energy costs are a serious investnent in new power generation and better m anagement of Electrogaz MINERENA Some public support to Ongoingformal sector constraint on fornmal sector expansion are needed to bring energy costs down. investnent in Electrogaz isneeded.
Gas and methane to be exploited. Gas and methane to be 2002-3developed by private sector.
Energy for poor Very low access to electricity for Rural electrification to be promoted by grid extension and/or building of MINERENA Urgent core programme, 2002-3households and economic activity in rural areas. microcentrales requiring extra resourcesruralenterprises Low-cost stoves can reduce costs of Promotion of improved stoves MINERENA Some extra resources needed.
fuel to households and protect theenvironment
Develop Promotion of private investment in all teleconimunication market segments MiNITRACO Law was passed incommunications through open competitive licensing regime, and build institutional capacity May 2001; regulatoryinfrastructure for policy development and sector regulation. reform ongoing.
Rwandatel to be offered for sale.
Ensuring financial self-sufficiency of Office National des Postes (ONP) for March 2002._sustained delivery of affordable services.
Policy Matrix section 4: GovernancePoflcy Area Key Issues/Objectves Actions Lead Agency Funding needs and Dates/targetsWmiofitori
priorites ng indicatorsSecurity Intemal and external security has greatly Rwanda strongly supports the Lusaka Framework for peace in the Great GOR Reduction in expenditure Implerentation ofimproved since 1997. To ensure this Lakes region. Peace in the region will permit a reduction in military shares envisaged in next Lusaka agreement.progress is maintained, regional conflicts expenditures. few years.need to be resolved. _ _ _ _ _ _ _ _ _ _ _ _ _ _ _ _ _ _ _ _ _ _ _ _Demobllisadlon Retuming troops need support RPA veterans will received a transitional cash package. All retuming Comnmission for Extra resources needed. 2002-3
soldiers will receive support to their reintegration, organised through Demobilisation andthe community receiving them. Reintegration __ivities_are_on_ing
Nadonal National reconciliation is a requirement The Unity and Reconciliation Commission (URC) was established in Unity and Reconciliation Activities are ongoingreconciliation for sustainable poverty reduction. March 1999 and has undertaken major national consultations. A Commnissionnational summit is held regularly and the URC undertakes civiceducation, conflict mediation and community initiatives. etionHuman rights The Govemment is committed to The Human Rights Conmmission's 4-year plan of action includes HRC Successful completionestablishing a culture in which human materials and skills development, civic education and sensitisation, and of the Constitution.rights are respected and abuses are monitoring and reporting of human rights including investigating HRC to develop otherreported and punished allegations of abuses since May 1999. indicators by end-2001Criminal justice 107,000 people are in prison awaiting trial Elections to the gacaca courts have been held and trials are due to MINIJUST/Supreme 2002-4system and for genocide-related crines begin in 2002. Court
155
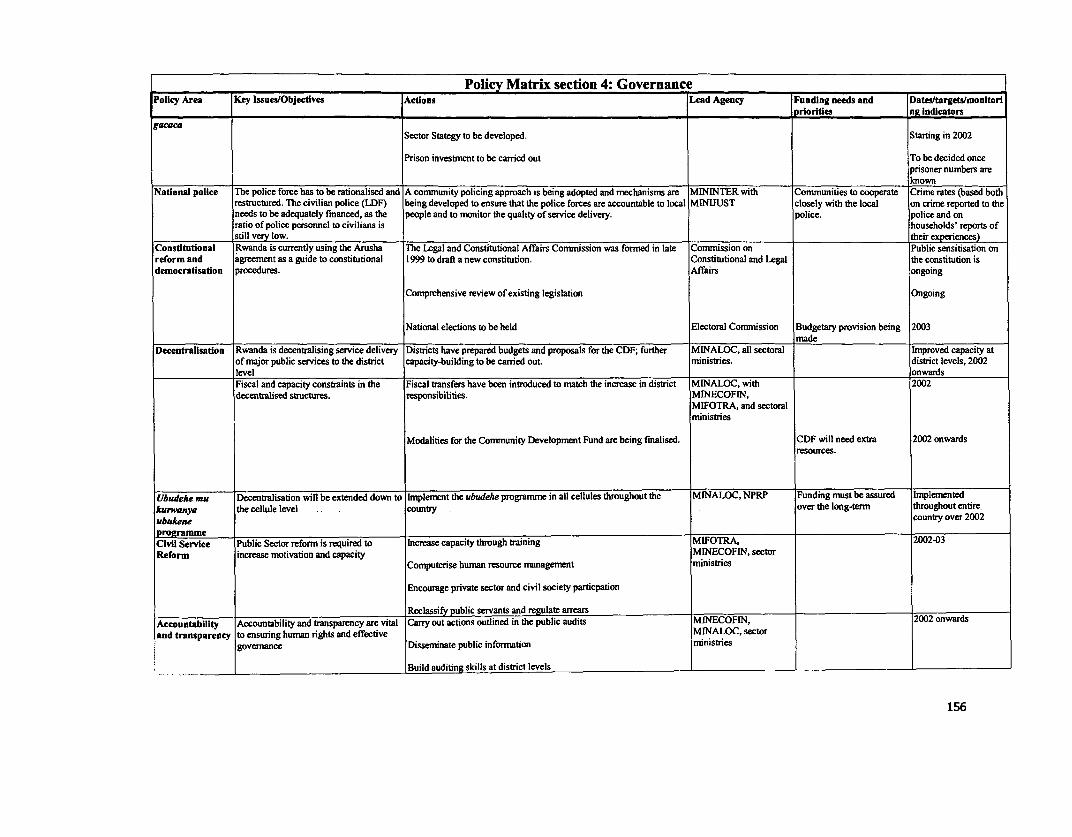
Policy Matrix section 4: GovernancePolicy Area Key Issues/Objectives Actions Lead Agency Funding needs and Dates/targets/monitoriI _ _ _ _ _ _ _ _ _ _ _ ____________________________ ________________________________________________ ________________ priorities ng indicatorsgacac
Sector Stategy to be developed. Starting in 2002
Prison investment to be carried out To be decided onceprisoner numbers areknownNational police The police force has to be rationalised and A connmunity policing approach is being adopted and mechanisms are MiNINTER with Communities to cooperate Crime rates (based bothrestructured. The civilian police (LDF) being developed to ensure that the police forces are accountable to local MINUUST closely with the local on crime reported to theneeds to be adequately financed, as the people and to monitor the quality of service delivery. police. police and onratio of police personnel to civilians is households' reports ofstill very low. their experiences)Constitutional Rwanda is currently using the Arusha The Legal and Constitutional Affairs Commission was fonned in late Commission on Public sensitisation onreform and agreement as a guide to constitutional 1999 to draft a new constitution. Constitutional and Legal the constitution isdemocratisation procedures. Affairs ongoing
Comprehensive review of existing legislation Ongoing
National elections to be held Electoral Commission Budgetary provision being 2003
Decentrallsation Rwanda is decentralising service delivery Districts have prepared budgets and proposals for the CDF; further MINALOC, all sectoral Improved capacity atof major public services to the district capacity-building to be carried out ministries, district levels, 2002level onwardsFiscal and capacity constraints in the Fiscal transfers have been introduced to match the increase in district MINALOC, with 2002decentralised structures. responsibilities. MINECOFIN,
MIFOTRA, and sectoralministries
Modalities for the Conmunity Development Fund are being finalised. CDF will need extra 2002 onwardsresources.
Ubudehe mu Decentralisation will be extended down to implement the ubudehe programme in all cellules throughout the MiNALOC, NPRP Funding must be assured Implementedkur-ya the cellule level country over the long-term throughout entireubukene country over 2002prorammme
Civil Service Public Sector reforn is required to Increase capacity through training MIFOTRA, 2002-03Reform increase motivation and capacity MINECOFIN, sectorComputerise human resource rnanagement ministries
Encourage private sector and civil society particpation
Reclassify public servants and regulate arrearsAccountability Accountability and transparency are vital Carry out actions outlined in the public audits MINECOFIN, 2002 onwardsand transparency to ensuring hunian rights and effective MINALOC, sector
govemance Disseminate public information ministries
Build auditing skills at district levels
156

l_________ _____________________ Policy matrix section 5: Private sector development ___secton____Pivate_sctor_en
PoUcy area Key Issues/Objectives Acffons Lead agency Funding needs and Datesftargetsumnltorin___________ ________________________ ~~~~~~~~~~~~~~~~ ~~~~~~ ~~priorities u Indicators
Investment Low level of private investment RIPA has established a one-stop shop for investors, and will fund studies RIPA Ongoingpromotion to identify constraints.
Restructure CPMER (Centre de Promotion des Petites et MoyennesEntreprises) to provide services to support SMEs.
Private sector Strengthen dialogue between the public The operational capacity of the newly established Private Sector MINICOM/MINECOFI Ongoingrepresentation and private sector. Federation is being strengthened. PSF will also carry out studies on N
potential competitive advantages.2002-3
Increased private sector representation to be achieved in the sectorstrategy process in each sector.
Financial sectorreform
Following events of the early 1990s, the Restructuring of commercial banks is ongoing and will continue. NBR Commercial banksfinancial soundness of the financial cooperating with NBRIsystem was severely damaged. Full audits of three banks 2002
ON-site inspection of all banks every year. Canry out a review of bank 2004lending procedures
NBR will strengthen supervision and the bank regulatory framework.March2002
Extemal audit of NBRComnercial legal reforn is needed to An Arbitration Centre has been established and commercial tribunals are MINIJUST/MINICOM 2002ensure that contracts are enforceable being developed and will be given legal authorityOther financial institutions need reform Caisse Hypothecaire to develop business plan as a housing bank CHR December 2001
Debts owed to Caisse Social by Government are under negotiation CSR, MINECOFIN Ongoing
Commercial Legal obstacles exist for private Govemment to consult private sector on their needs MINICOM, 2002-3Jusffce reform investmnents A Commercial Court will be set up MINECOFIN 2002Privatisation Explore options to accelerate Acceleration of privatisation process in accordance with the timetable Privatisation Secretariat Number of enterprises
privatisation and increase the privatised.participation of Rwandese in the process. A privatisation trust fund is being considered to widen Rwandese
ownership in privatised companies.Improved service delivery by utilities Electrogaz (water, electricity) to be put under private management. MINECOFIN, December 2001
Privatisation Unit,
Offer 51 percent of Rwandatel (telecommunications) to a strategic MINERENA, March 2002investor. MINITRACO
Multi-repulatory agency to be established .OngoingSpecific sectors IManufacturing The Government needs to ensure that Office Rwandaise de Normalisation has been established and will MINICOM, ORN Ongoing
standards are hamionised monitor standards.
157
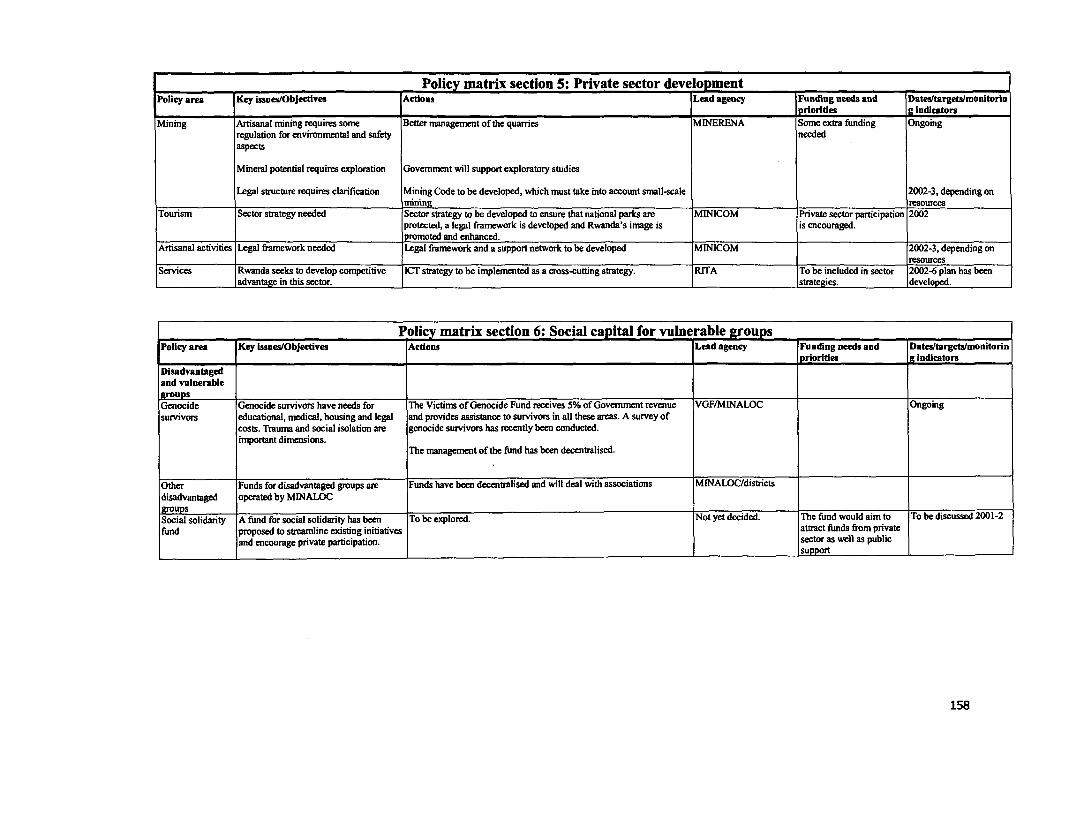
l_____________________ Policy matrix section 5: Private sector deve lopmentPolicy rea Key issues/Objectives Actions Lead agency Funding needs and Datesftargetslmonitorinl _ _ _ _ _ _ _ _ _ _ _ I_ _ _ _ _ _ _ _ _ _ _ _ _ _ _ _ _ _ _ _ _ _ _ _ _ L _ _ _ _ _ _ _ _ _ _ _ _ _ _ _ _ _ _ _ _ _ _ _ _ _ _ _ _ _ _ _ _ _ _ _ _ _ _ _ _ _ _ _ _ _ _ _ _ _ _ _ _ _ _ _ _ _ _ _ _ _ ipriori't es g IndicatorsMining Artisanal mining requires some Better management of the quarries MINERENA Some extra funding Ongoingregulation for environmental and safety needed
aspects
Mineral potential requires exploration Government will support exploratory studies
Legal structure requires clarification Mining Code to be developed, which must take into account small-scale 2002-3, depending onrnimneng resourcesTourism Sector strategy needed Sector strategy to be developed to ensure that national parks are MINICOM Private sector participation 2002protected, a legal framework is developed and Rwanda's image is is encouraged.pormoted and enhanced.
Artisanal activities Legal framework needed Legal framework and a support network to be developed MINICOM 2002-3, depending onresourcesServices Rwanda seeks to develop competitive ICT strategy to be implemnented as a cross-cutting strategy. RITA To be included in sector 2002-6 plan has beenadvantage in this sector. strategies. developed.
Policy matrix section 6: Social capital for vulnerable groupsPolicy area Key Issues/Objectives Actions Lead agency Funding needs and Dates/targetslmonitorinl _ _ _ _ _ _ _ _ _ _ _ _ _ _ _ _ _ _ _ _ _ _ _ _ _ _ _ _ _ _ _ _ _ _ _ _ _ _ _ _ _ _ _ _ _ _ _ _ _ _ _ _ _ _ _ _ _ _ _ _ _ _ _ _ _ _ _ _ _ _ _ _ _ _ prioribes g IndicatorsDisadvantagedand vulnerable
Genocide Genocide survivors have needs for The Victims of Genocide Fund receives 5% of Government revenue VGF/M[NALOC Ongoingsurvivors educational, medical, housing and legal and provides assistance to survivors in all these areas. A survey ofcosts. Trauna and social isolation are genocide survivors has recently been conducted.important dimensions.
The management of the fund has been decentalised.
Other Funds for disadvantaged groups are Funds have been decentralised and will deal with associations MINALOC/districtsdisadvantaged operated by MINALOCgroupsSocial solidarity A fund for social solidarity has been To be explored. Not yet decided. The fund would aim to To be discussed 2001-2fund proposed to streamline existing initiatives attract funds from privateand encourage private parlicipation. sector as well as public
I support
158
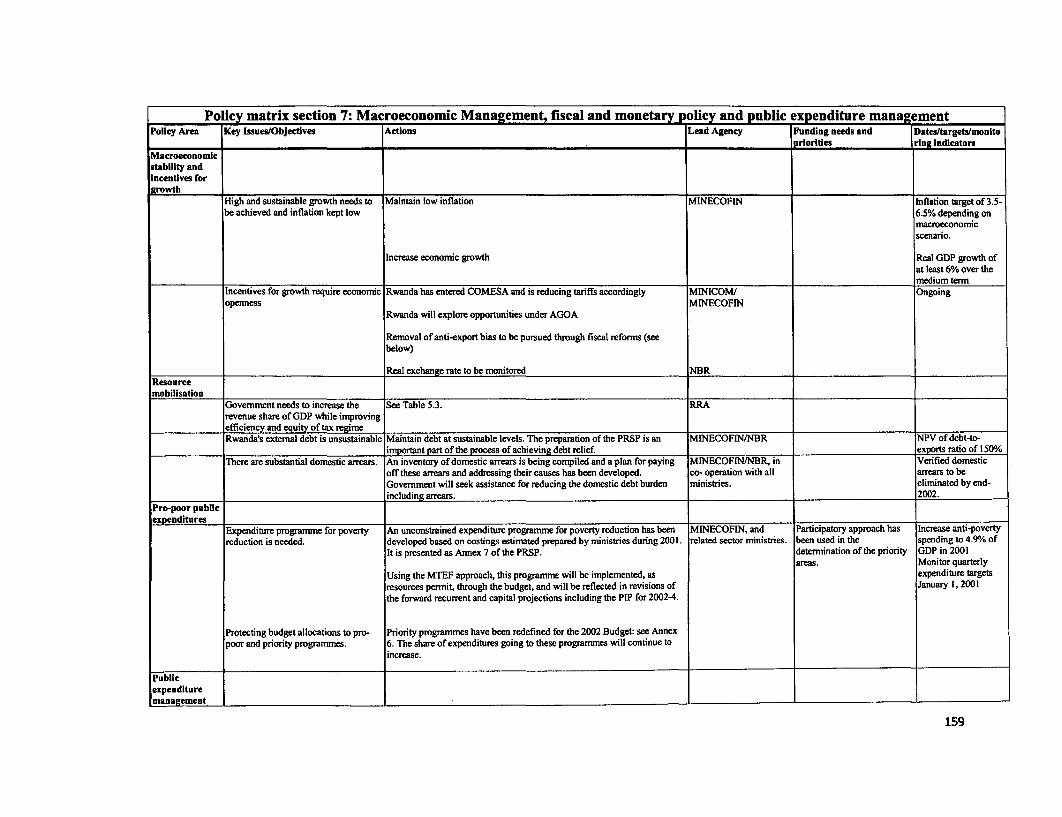
Policy matrix section 7: Macroeconomic Management, fiscal and monetary policy and public expenditure managementPolicy Area Key Issues/Objectfves Actions Lead Agency Funding needs and Dates/targeta/monito
.__ _ _ _ _ __ __ __ __ __ __ __ _ _ __ __ __ __ __ __ __ __ __ ___ __ __ ___priori riorties ring indicators
Macroecononicstability andincentives forgrowth
High and sustainable growth needs to Maintain low inflation MINECOFIN Inflation target of 3.5-be achieved and inflation kept low 6.5% depending on
macroeconomicscenario.
Increase economic growth Real GDP growth ofat least 6% over the
imedium termIncentives for growth require economic Rwanda has entered COMESA and is reducing tariffs accordingly MINICOM/ Ongoingopenness MINECOFIN
Rwanda will explore opportunities umder AGOA
Removal of anti-export bias to be pursued through fiscal reforms (seebelow)
Real exchange rate to be monitored NBRResourcemobilisation
Govemnment needs to increase the See Table 5.3. RRArevenue share of GDP while improvingefficiency and equity of tax regimeRwanda's extemal debt is unsustainable Maintain debt at sustainable levels. The preparation of the PRSP is an MINECOFIN/NBR NPV of debt-to-
important part of the process of achieving debt relief exports ratio of 150%There are substantial domestic arrears. An inventory of domestic arrears is being compiled and a plan for paying MINECOFIN/NBR, in Verified domestic
off these arrears and addressing their causes has been developed. co- operation with all srears to beGovemment will seek assistance for reducing the domestic debt burden ministries. eliminated by end-including arrears. 2002.
Pro-poor publicexpenditures
expenditures Expenditure programme for poverty An unconstrained expenditure programme for poverty reduction has been MINECOFIN, and Participatory approach has Increase anti-povertyreduction is needed. developed based on costings estimated prepared by ministries during 2001. related sector ministries. been used in the spending to 4.90% of
It is presented as Annex 7 of the PRSP. determination of the priority GDP in 2001areas. Monitor quarterly
Using the MTEF approach, this programnme will be implemented, as expenditure targetsresources perrnit, through the budget, and will be reflected in revisions of January 1, 2001the forward recurrent and capital projections including the PIP for 2002-4.
Protecting budget allocations to pro- Priority programmes have been redefined for the 2002 Budget: see Annexpoor and priority programmes. 6. The share of expenditures going to these programmes will continue to
increase.
Publicexpendituremanasement .
159
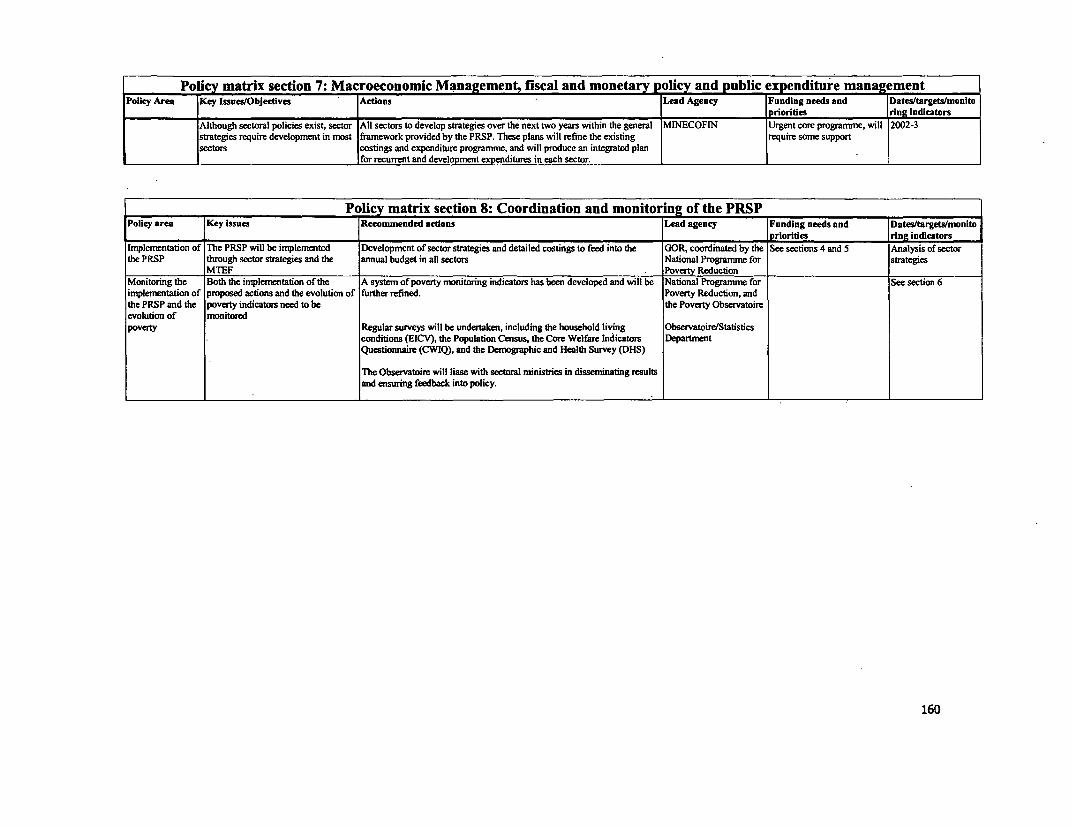
Polcy matrix section 7: Macroeconomic Management, fiscal and monetary policy and public expenditure managementPolicy Area Key Issues(Objectives Actions Lead Agency Funding needs and Dates/targets/monlto
priorides ring indicatorsAlthough sectoral policies exist, sector All sectors to develop strategies over the next two years within the general MINECOFIN Urgent core progranme, will 2002-3strategies require development in mnost framework provided by the PRSP. These plans will refine the existing require some supportsectors costings and cxpenditure programrne, and will produce an integrated plan
for recurrent and development expenditures in each sector.
Policy matrix section 8: Coordination and monitoring of the PRSPPolicy area Key issues Recommended actions Lead agency Funding needs and Dates/targets/monito
____ ~priorities ring indicatorsImplementation of The PRSP will be implemented Developnment of sector strategies and detailed costings to feed into the GOR, coordinated by the See sections 4 and 5 Analysis of sectorthe PRSP through sector strategies and the annual budget in all sectors National Programne for strategies
MTEF Poverty ReductionMonitoring the Both the implementation of the A system of poverty monitoring indicators has been developed and will be National Programnme for See section 6imnplementation of proposed actions and the evolution of further refined. Poverty Reduction, andthe PRSP and the poverty indicators need to be the Poverty Observatoireevolution of nonitoredpoverty Regular surveys will be undertaken, including the household living Observatoire/Statistics
conditions (EICV), the Population Census, the Core Welfare Indicators DepartmentQuestionnaire (CWIQ), and the Demographic and Health Survey (DHS)
The Observatoire will liase with sectoral mninistries in disseminating resultsand ensuring feedback into policy.
160


I MAGING- -
!~~~~~~~~~~~~~~~~~~~~~~~~~~~~~~~~~~~~~~~~~~~~~~~~~~~~~~~~~~~~~~~~~~~~~~~~~~~~~~~~~~~~~~~~~~~~~~~~~~~~~~~~~~~~~~~~~~~~~~~~~~~~~~~~~~~~~~~~~~~~~~~~~~~~~~
t Report No.: 24503 RW
i Type: OAS


![sequential.ppt [Read-Only]](https://static.fdokumen.com/doc/165x107/6319ca5fc51d6b41aa04902b/sequentialppt-read-only.jpg)


![ICND10S08A [Read-Only]](https://static.fdokumen.com/doc/165x107/6316f88cf68b807f880375d2/icnd10s08a-read-only.jpg)

