For 50 Years, Polluters Knew PFAS Chemicals Were ...
719
For 50 Years, Polluters Knew PFAS Chemicals Were Dangerous But Hid Risks From Public As far back as 1950, studies conducted by 3M showed that the family of toxic fluorinated chemicals now known as PFAS could build up in our blood. By the 1960s, animal studies conducted by 3M and DuPont revealed that PFAS chemicals could pose health risks. But the companies kept the studies secret from their employees and the public for decades. Here is a timeline of internal memos, studies and other company documents detailing the two companies’ history of deception.
-
Upload
khangminh22 -
Category
Documents
-
view
0 -
download
0
Transcript of For 50 Years, Polluters Knew PFAS Chemicals Were ...

For 50 Years, Polluters Knew PFAS Chemicals Were Dangerous
But Hid Risks From PublicAs far back as 1950, studies conducted by 3M
showed that the family of toxic fluorinated chemicals now known as PFAS could build up in
our blood. By the 1960s, animal studies conducted by 3M and DuPont revealed that PFAS chemicals could pose health risks. But the companies kept the studies secret from their employees and the
public for decades.
Here is a timeline of internal memos, studies and other company documents detailing the two
companies’ history of deception.

1950 – 3M mice study reveals that PFAS builds up in blood.
1956 – Stanford University study finds that PFAS binds to proteins in human blood.
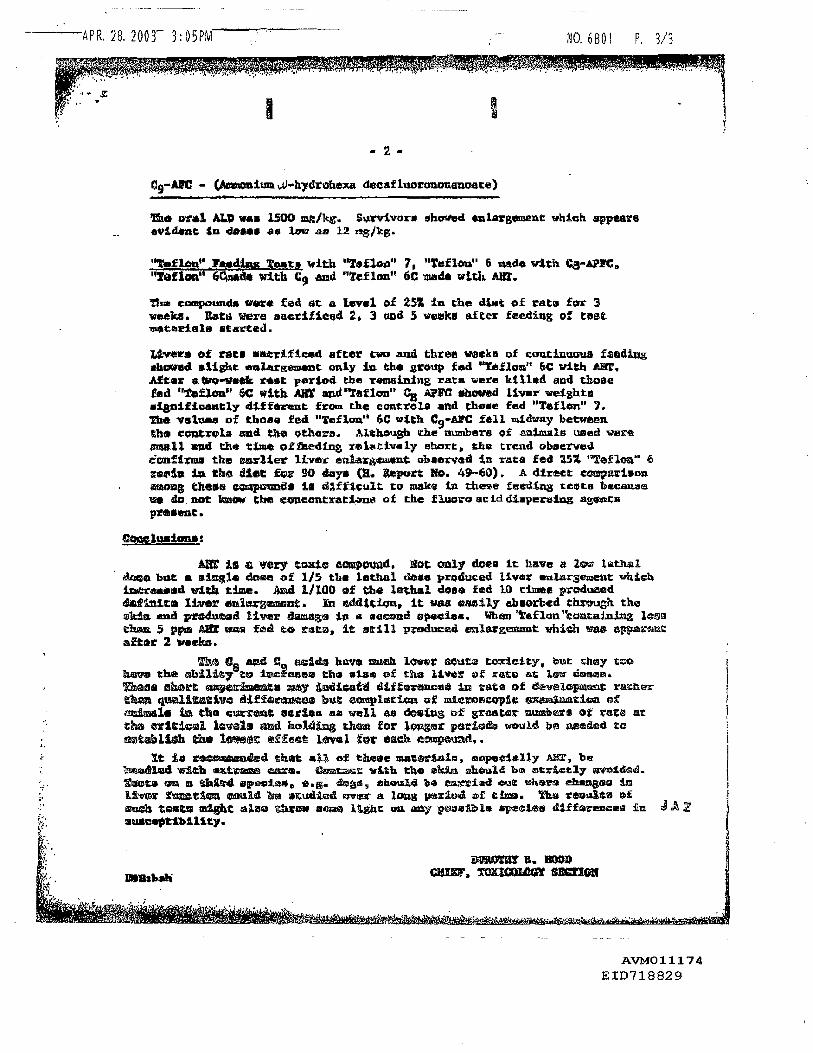
1961 – DuPont toxicologist warns that PFAS chemicals enlarge rat and rabbit livers.
1962 – Volunteers who smoke PFAS-laced cigarettes get “polymer fume fever.”
1963 – 3M technical manual deems PFAS toxic.
1965 – DuPont rat study shows liver damage and increased spleen size.
1966 – The Food and Drug Administration rejects a DuPont petition to use PFAS chemicals as a food additive, citing liver studies.
1966 – 3M study finds that PFAS causes “acute oral toxicity” in rats.
1970 – 3M warns Fire Journal, the magazine of the National Fire Protection Association, that PFAS is toxic to fish.
1970 – DuPont scientists say PFAS is “highly toxic when inhaled.”
1973 – DuPont finds there is no safe level of exposure to PFAS in food packaging.
1975 – 3M is informed that PFAS builds up in human blood samples.
1975 – DuPont warns 3M about “toxic effects” of PFAS in food packaging.
1977 – 3M tests workers and animals to measure PFAS in blood.
1977 – 3M finds PFOS, the PFAS chemical in the company’s Scotchgard fabric treatment, “more toxic than anticipated.”
1978 – 3M animal tests find lesions on spleen, lymph nodes and bone marrow.
1978 – 3M concludes that PFOS and PFOA, a PFAS chemical used to make DuPont’s Teflon, “should be regarded as toxic.”
1979 – DuPont survey of employees in its Parkersburg, W.Va., Teflon plant finds possible evidence of liver damage.
1981 – 3M and DuPont reassign female workers after animal studies reveal PFAS damages the eyes of the developing fetus.
1983 – 3M identifies PFAS’ potential harm to the immune system as a cause for concern.
1984 – 3M documents rising fluorine levels in workers’ blood.
1984 – DuPont detects PFAS in the tap water in Little Hocking, Ohio, but does not alert the local water utility.
1987 – 3M PFOA animal study finds tumors.
1989 – 3M study finds elevated cancer rates among PFAS workers.

1990 – 3M study finds risk of testicular cancer from exposure to PFOA, also known as C8.
1992 – DuPont study finds elevated cancer rates among workers.
1992 – Former 3M scientist finds male PFOA workers more likely to die from prostate cancer.
1995 – DuPont scientist expresses concern over long-term PFAS health effects.
1997 – DuPont study finds heightened cancer rates among workers at the Parkersburg plant.
1998 – 3M scientists report that PFAS moves through the food chain.
1998 – 3M provides EPA evidence that PFAS accumulates in blood.
1998 – 3M animal study finds liver damage from PFAS exposure.
1999 – 3M scientist describes PFOS as “the most insidious pollutant since PCB.”
2000 – 3M animal study finds liver damage from PFOS exposure.

.. ---.,,,,,.... ..... ........ ,, .. ,.'
fl!'ti,���tORMULA;tl�lHJG:t{'\filAL PORM!JLA t .... • ,.:.:":.�· ;.· •• ·::·�·' ,,;·)",<,
. •'.'. • �M'�'h
c4
F7Ho2c
3F
7COOH
toxicity ',{.:��/: :',. ·, ' ·•'.'· :' ', ,:
. :•
J�ij,.'i' ,vciGANISM 1 mice �f!1:,F . 0;1 :CONc�,x·tA.'l'!ON 1 ./.-,{: '
1":'.''·.•� t .•l· •·' ,, .. a.,;., • .._ .
·.
l\:/1MEt Perf'luorobutyric . Acid
,i.Jtv::::.·· ... ;:. ".. . ..... ·: .· · :PJ.$QrtI�TI9N Of TEST oral; 1ntraper1tonea.l, and intravenous
Ilt:'.:{;;�•�;[ .�. �l��So• mg./)rg. orai
t
l1lltuma'•+!rES'l · 72 hrs.
., -��(�jf�fi:�10 •: . 1001
:,,
lE. l wk 435-cm;,- (24 hrs.)
:'.i!ii: :iii .Rfj,ort i/lCl/SO ,;,;DA:ra • ....mt;....»�· ''. i · , ·· · . · · sU'BM1'.srrgn: �•V:i&, a.. ,1·, · · · ·
' i'!1t. 41't���f--���. �fMM\,u•�lll'fu•c• •nt1t111a1H - ,,._ut\'II• dll u.• "· ��-
1009.0001
755 (24 hours)
Exhibit 1009
State of Minnesota v. 3M Co.,
Court File No. 27-CV-10-28862
3MA02497530

PERFLUOROOCTANOIC ACID INTERACTIONS WITH HUMAN SERUM ALBUMIN
BY GORDON I,. NORDBY* AND J. MURRAY LUCK
(Prom the Department of Chemistry, Stanford University, Stanford, California)
(Received for publication, August 1, 1955)
For several years perfluorooctanoic acid (1) (CFB. (CF&. COOH) has been used in this laboratory as a protein precipitant (2). Qualitatively it has been observed to bind so completely to proteins that little of the pre- cipitant remains in the filtrate; this is an obvious advantage in chromatog- raphy and in various analytical procedures.
The purpose of the present study is to define the conditions under which perfluorooctanoic acid will effect a precipitation of human serum albumin and to describe in detail the interaction between these two reactants. Human serum albumin was used because of its unusual properties in bind- ing a variety of ions.
Materials
A solution of human serum albumin (decanol procedure) was electro- dialyzed at 40 volts per cm. against conductivity water and clarified by pressure filtration through a sterilizing filter pad. The product was lyo- philized and stored at 3”; appropriate amounts of the powder were removed as needed for the preparation of albumin solutions.
Sodium perfluorooctanoate (PF8) solutions were prepared by carefully neutralizing a 0.5 per cent aqueous solution of the acid with a minimal volume of sodium hydroxide.
Procedure
Precipitation-A number of buffered 0.3 per cent solutions of serum al- bumin in PF8 were prepared. Each solution was distinctive with respect either to its PF8 concentration or to its pH, the latter being determined by 0.1 M McIlvaine buffers (3). The pH of each solution was between 4.25 and 5.25. The PF8 concentration of each solution was such that the mole ratio (PFS to albumin) ranged between 0 and 200.’ The solutions were thoroughly mixed, allowed to stand for 15 minutes, and centrifuged in a clinical centrifuge at room temperature for 20 minutes. For conditions under which the protein in a given solution was only partially precipitated, opaque supernatant solutions were sometimes formed; in all other cases the
* Public Health Service Research Fellow of the National Heart Institute. 1 A value of 61,500 was used for the molecular weight of human serum albumin (4).
399
by guest on May 21, 2019
http://ww
w.jbc.org/
Dow
nloaded from

400 PERFLUORO ALBUMIN PRECIPITANT
supernatant solutions were clear. An aliquot of each supernatant liquid, or solution if no precipitate existed, was then analyzed for protein by the Lowry et al. modification of the Folin test (5). PF8 does not interfere with this analysis. The percentage of albumin that was precipitated from each solution under the stated conditions of pH and PF8 concentration was calculated. The results appear in Fig. 1.
Anion Binding-A number of 0.3 per cent albumin solutions were pre- pared in radioactive PF8. The ratio (PFS to albumin) in each solution was between 80 and 200. The solutions were then titrated at 25” to about pH 3 with hydrochloric acid. In the course of the titration between pH
FIG. 1. The percentage of human serum albumin precipitated from aqueous solu- tion is a function of the pH of the solution and the molar ratio (PFS to albumin) in the system. For example, at pH 4.75 and a molar ratio (PFS to albumin) of 60, about 48 per cent of the albumin is precipitated.
4 and 3, the protein precipitated completely; several 0.005 ml. aliquots were removed from each supernatant liquid, placed on aluminum disks, and immediately dried under an infra-red lamp. The disks were then placed on an automatic sample changer which operated into a gas flow counter (6). The time required for an arbitrary number of counts was recorded for the sample on each disk. After making suitable corrections for ethciency and background interference in the counting, the relative ac- tivities of the samples were determined and compared with the original activities of their respective solutions before the titration was started. The molar ratio (bound PF8 to albumin) in each solution was then calcu- lated as a function of the molar ratio (PF8 to albumin). The data are given in Fig. 2.
Hydrogen Ion Binding-A number of 0.3 per cent albumin solutions were
by guest on May 21, 2019
http://ww
w.jbc.org/
Dow
nloaded from

G. L. NORDBY AND J. M. LUCK 401
prepared. Half of the solutions contained that concentration of PF8 for which the molar ratio (PF8 to albumin) was 196; the remaining solutions contained an equivalent concentration of sodium chloride. Each solution
BOUND PFB
100
A z B
FIG. 2. Curve A, the molar ratio (PFS to albumin) in a system determines the number of PF8 anions that bind to each albumin molecule. Curve B, the reciprocal of the number of PF8 anions bound to each albumin molecule is plotted against the molar ratio (albumin to free PF8).
I D
i
FIG. 3. The number of hydrogen ions bound to an albumin molecule is a function of the pH of the solution. Curve A represents 1 mole of albumin in the presence of sodium PFS; Curve B represents 1 mole of albumin in the presence of sodium chloride.
was then titrated at 25“ with either hydrochloric acid or sodium hydroxide. The amount of hydrogen ion bound by the albumin, or dissociated from it, was calculated quite directly from the total acid or base added to a given solution and the amount of acid or base actually present in the solution as reflected by its pH. Subsequently, the charge on the albumin molecule was calculated as a function of pH. The data are presented in Fig. 3.
by guest on May 21, 2019
http://ww
w.jbc.org/
Dow
nloaded from

402 PERFLUORO ALBUMIN PRECIPITANT
DISCUSSION
Precipitation-Although Fig. 1 indicates a certain critical range of pH and PF8 concentration which must prevail for the precipitation of human serum albumin, it also indicates in a qualitative manner the conditions under which most other proteins would be expected to precipitate. Three rather striking features are noted for attention. (1) The conditions of pH and ionic strength under which complete albumin precipitation occurs are very mild. (2) The precipitation of albumin is completely reversible with respect to pH. An albumin precipitate formed in a PF8 solution can be completely dissolved by making the solution somewhat alkaline (pH 6 to 7) to the pH at which precipitation occurred. The minimal pH to which the solution must be raised will depend, of course, upon the PF8 concentration of the solution. (3) In acidic solutions, the precipitation of albumin is irreversible with respect to the PF8 concentration. Provided that an albumin precipitate is dialyzed against an appropriately acidic solution, it will not dissolve appreciably as the concentration of PF8 in equilibrium with the precipitate decreases. However, the PF8 precipitant can readily be dialyzed from albumin in neutral or slightly alkaline solu- tions.
Anion Binding-The scope of Curve A in Fig. 2 is restricted at the upper limit by the rather low solubility of PF8 in aqueous solution and at the lower limit by the concentration of PF8 which would adequately precipi- tate albumin under the conditions of the experiments. However, it is clear from the graph that a considerable number of PF8 anions bind to each albumin molecule. The molar ratio (bound PF8 to albumin) increases quite rapidly as the PF8 concentration is increased. In contrast, the molar ratio (bound PF8 to albumin) decreases very slowly as the molar ratio (PF8 to albumin) is decreased below about 120. In solutions containing the minimal concentration of PF8 which is effective in completely precipi- tating a given concentration of albumin, the PF8 is almost completely re- moved from the solution as part of the precipitating complex.
The data of Curve A are treated by an expression derived by Klotz (7); the results appear as Curve B of Fig. 2.
1 -= r
Y&C;+;
In the above equation, r is the molar ratio (bound PF8 to albumin), n is the molar ratio (maximal bound PF8 to albumin), c is the molar ratio (free PF8 to albumin) in the solution, and K is a constant proportional to the equilibrium constant for the PF8 anion-binding reaction. The parame- ters in the above equation are l/r and l/c. Although there is no a priori evidence that the equation does apply to PF8 anion binding, it can be as-
by guest on May 21, 2019
http://ww
w.jbc.org/
Dow
nloaded from

G. L. NORDBY AND J. M. LUCK 403
sumed, by virtue of the linearity of a portion of Curve B, that the equation does apply to the linear portion. The indicated extrapolation to infinite PF8 concentration reveals that a maximum of 63 PF8 anions bind to an albumin molecule by reactions having nearly the same equilibrium con- stant. Additional anions are bound to albumin at high PF8 concentrations by some less easily described series of reactions. At very high PF8 con- centrations, Curve B of Fig. 2 becomes nearly vertical; therefore the max- imal number of PF8 anions that can possibly bind to an albumin molecule cannot be calculated by the evidence available. In contrast, a study of octanoic acid anion binding by Teresi and Luck (8) reveals that a total of 36 octanoate ions binds to two types of sites on the albumin molecule. Preliminary isotope dilution studies indicate that the PF8 anions are re- versibly bound to the albumin molecule.
Hydrogen Ion Binding-Two hydrogen ion binding curves for human serum albumin are depicted in Fig. 3. These binding curves are com- pletely applicable to reversible titrations over the pH range illustrated. It is readily apparent from these curves that PP8 strongly influences the albumin molecule charge in acid solution. A similar effect has been ob- served by Steinhardt (9) for the titration of wool protein in the presence of 2,4,6-trinitroresorcinol, picric acid, or flavianic acid.
By means of the equation described above, the extrapolation of Curves A and B to infinite hydrogen ion concentration indicates that the maximal number of bound hydrogen ions per albumin molecule is 107 in each case. This number agrees with that found by Tanford (10). Thus, the charge on the albumin molecule in extremely acid solutions in the presence of that concentration of PF8 represented by a molar ratio (PF8 to albumin) of 196 does not exceed 28; 79 PF8 anions are bound under these conditions. The dotted line in Fig. 3 represents the difference between Curves A and B as a function of pH. The maximal difference between the two curves is near pH 4.25 at which an extra 64 hydrogen ions are bound by the al- bumin in the presence of PF8. The significance of the coincidence between the 64 extra hydrogen ions and the 63 strongly bound PF8 anions which are bound to the albumin is not known at this time; but the coincidence is so striking that it is brought to attention. Finally, it is apparent that Curves A and B coincide above pH 8. This is additional, although incon- clusive, evidence that the PF8 completely dissociates from the albumin molecule in alkaline solutions.
SUMMARY
It has been shown that human serum albumin can be reversibly precip- itated from aqueous solution under mildly acid conditions in the presence of low concentrations of perfluorooctanoic acid. In the formation of the
by guest on May 21, 2019
http://ww
w.jbc.org/
Dow
nloaded from

404 PERFLUORO ALBUMIN PRECIPITANT
precipitate, the albumin molecule binds both hydrogen ions and perfluoro- octanoate ions to form, under the conditions of the experiments described, a complex that has a net charge of almost zero.
Acknowledgment is made to the Cutter Laboratories for a sample of Fraction V (ll), decanol human serum albumin, and to the Minnesota Mining and Manufacturing Company for a sample of perfluorooctanoic acid. Carboxyl-labeled (C14) perfluorooctanoic acid was obtained through the Atomic Energy Commission from the Minnesota Mining and Manu- facturing Company.
Addendum-Klevens and Ellenbogen have recently published their research on the van der Waals association of bovine serum albumin in the presence of perfluoro acids (12).
BIBLIOGRAPHY
1. Kauck, E. A., and Diesslin, A. R., Ind. and Eng. Chem., 43,2332 (1951). 2. Luck, J. M., Griffin, A. C., Boer, G., and Wilson, M., J. Biol. Chem., 206, 767
(1954). 3. McIlvaine, T. C., J. Biol. &em., 49, 183 (1921). 4. Charlwood, P. A., Biochem. J., 61, 113 (1952). 5. Lowry, 0. H., Rosebrough, N. J., Farr, A. L., and Randall, R. J., J. Biol. Chem.,
193, 265 (1951). 6. Nye, W. N., and Teresi, J. D., Anal. Chem., 23,643 (1951). 7. Klotz, I. M., Arch. Biochem., 9, 109 (1946). 8. Teresi, J. D., and Luck, J. M., J. Biol. Chem., 194,823 (1952). 9. Steinhardt, J., Ann. New York Acad. SC., 41,287 (1941).
10. Tanford, C., J. Am. Chem. Sot., ‘73, 441 (1950). 11. Cohn, E. J., Gurd, F. R. N., Surgenor, D. M., Barnes, B. A., Brown, R. K.,
Derouaux, G., Gillespie, J. M., Kahnt, F. W., Lever, W. F., Liu, C. H., Mittel- man, D., Mouton, R. F., Schmid, K., and Uroma, E., J. Am. Chem. Sot., 72, 465 (1950).
12. Klevens, H. B., and Ellenbogen, E., Discussions Faraday Sot., 18, 277 (1954).
by guest on May 21, 2019
http://ww
w.jbc.org/
Dow
nloaded from

Gordon L. Nordby and J. Murray LuckALBUMIN
SERUMINTERACTIONS WITH HUMAN PERFLUOROOCTANOIC ACID
1956, 219:399-404.J. Biol. Chem.
http://www.jbc.org/content/219/1/399.citation
Access the most updated version of this article at
Alerts:
When a correction for this article is posted•
When this article is cited•
alerts to choose from all of JBC's e-mailClick here
tml#ref-list-1
http://www.jbc.org/content/219/1/399.citation.full.haccessed free atThis article cites 0 references, 0 of which can be
by guest on May 21, 2019
http://ww
w.jbc.org/
Dow
nloaded from


An Epidemic of Polymer-Fume FeverCharles E. Lewis, MD, and Gerald R. Kerby, MD
An "epidemic" of polymer-fume fever involved 36 of61 employees in one industry over a 90-day period. Allof those involved demonstrated the classic history of aninfluenza-like syndrome, with fever and chills occuringseveral hours after exposure to the products of pyrolysisof polytetrafluoroethylene (Teflon). The majority of casesresulted from the smoking of cigarettes which were con-taminated with a fine dust of this material. A study ofpulmonary function of all workers involved demonstratedchanges that could be accounted for only on the basis ofsmoking habits. Three persons experienced changes inpulmonary function consistant with mild obstruction ofthe airways, in association with the onset of symptoms.While no serious consequences were observed, the effectsof these illnesses upon the health and productivity of thegroup could have been prevented.
Within ten years after the first description ofthe properties of polymers of tetrafluoro-
ethylene (Teflon, Fluon) the first account of theireffects on man appeared in the medical literature.In 1951, Harris described four cases of "polymer-fume fever."1 The signs, symptoms, and naturalhistory of this malady were similar to those of"metal-fume fever," which was described by Thack-rah in 1831. In the interval since 1951, there havebeen several reports of illness resulting from ex¬posure to the products of pyrolysis when thesepolymers are heated to temperatures in excess of300 C.2'3 Also, false reports of fatal illnesses result¬ing from such exposures have appeared in the med¬ical literature.4During a 90-day period in the summer of 1964,
an "epidemic" of polymer-fume fever occurred in a
large industrial plant. Thirty-six out of 61 workersin a single department were affected. This studyreports an epidemiologic investigation of this out¬break, as well as the results of pulmonary-functionstudies performed on the men in this environment.
Process and Events Preceding InvestigationThe department involved manufactured small,
light-weight sub-assemblies which required metalbonding, using epoxy resins. These parts were as¬sembled on a "tool" or assembly block. The unitthen was autoclaved at increased pressure and
temperature to cure the resin. A parting compoundwas applied to the tool or assembly unit to permitseparation of the sub-assembly from the tool afterautoclaving. This process was originally carried outin a large, open space and had not been attendedby any medical difficulties.
For editorial comment see page 406.
In April 1964 the sub-assembly operation wasmoved to a balcony location in the same generalplant area. On May 13 it became necessary to en¬close and air-condition the area to improve the en¬vironmental conditions for a more efficient assem¬bly of the unit. During the same week, a differentparting compound was substitued for the originalsilicone-base material.Approximately 40 of the men in this department
work on a day or an evening shift in the subassem-bly enclosed area (A). The other personnel in thedepartment (25 men) are employed on the balcony,which is an open area (B) in the same generalplant. These men handle the "tools" or assemblyblocks and prepare them for reuse after they comefrom the autoclave.Symptoms of polymer-fume fever first appeared
among the group in area A as early as May 14 (theday after the air conditioning was installed).Symptoms also appeared in the group working inthe same department, but outside the enclosed airconditioning (area B) during May. The symptomsnoted by the workers in area B were milder thanin those in area A.
MethodsA history form was used to collect data from all
employees working in areas A and B. All membersof group A and those with complaints of polymer-
Table 1.—Frequency of Various Complaints Among36 Workers With Symptoms of Polymer-Fume Fever% of Total of 61
Complaint No. WorkersTightness of chest 31 51Malaise 30 49Shortness of breath 26 43Headache 24 39Cough 22 36Chills 22 36Temperature, 100-104 F(37.8-40 C) 20 33
Sore throat 6 10Sputum 1 1.6
From the departments of preventive medicine and medicine,University of Kansas Medical School, Kansas City, Kan.Reprint requests to Department of Preventive Medicine, Uni-
versity of Kansas Medical Center, Rainbow Blvd at 39th St, Kan-sas City, Kan. 66103 (Dr. Lewis).
Downloaded From: https://jamanetwork.com/ by Jared Hayes on 07/19/2019

Table 2.—Relationship of Smoking to Symptomsof Polymer-Fume Fever
Group ASymptoms No Symptoms Total
Smoke 14 6 20Do not smoke 7 13 20Totals 21 19 40
Group BSmoke 13 1 14Do not smoke 2 5 7Totals 15 6 21
Both GroupsSmoke 27 7 34Do not smoke 9 18 27Totals 36 25 61
fume fever symptoms in group B were subjectedto ventilatory-function studies. Forced expiratorycapacity (FEC), forced expiratory volume in onesecond (FEVi), and maximum midexpiratory flowrate between 25% and 75% of the forced expira¬tory capacity (MMF) were measured on a 6-literrecording vitalometer, using the best of two ormore efforts. The peak-flow rate (PFR) was mea¬sured with a peak-flow meter as the best of threeefforts. Histories and spirometric measurementswere done at the beginning of the day shift (be¬tween 7 and 9 am), and were repeated at the endof the shift (between 2 and 3:30 pm). The sameprocedure was followed for the second, or evening,shift. Special attention was paid to eliciting anypast history of hay fever, asthma, or other respira¬tory disease, and a quantitative estimate of smok¬ing was made.
ResultsIn area A symptoms developed in 12 workers
during May; two became symptomatic in June,five in July, and one in August. In area B, the on¬set of symptoms was as follows: six in May, two inJune, six in July, and one in August.Table 1 demonstrates the frequency with which
various symptoms were observed in the 61 em¬ployees interviewed. Symptoms developed in 59%of the group, or 36 workers. The most frequentcomplaint was a tightness of the chest, which wasdescribed with some difficulty by many of the work¬ers. Descriptions such as "difficult to get a breath"and "a sort of squeezing feeling" were among the
Table 3.—Physical Measurements in Area ATemperature 72 FRelative humidity 62%-50%Room volume 21,600 cu ftFresh air changes 5.5/hourTotal air changes 20/hour
most common given. General malaise and fatigue,particularly involving the lower extremities, werethe next most common complaints. Only one sixthof those who were symptomatic claimed to haveirritation of the throat, and only one worker hada cough productive of sputum.A characteristic history of the illness was re¬
corded. With two exceptions, the workers noticedsymptoms after being at work four to five hours,and usually immediately after the afternoon smokebreak. Chills and fever occurred approximately 12hours after the onset of exposure and approximate¬ly 5 to 6 hours after the onset of the first symp¬toms. Attacks occurred at least once per week inmost workers. Some stated that some symptomsdeveloped every day at work in area A or B.Table 2 presents data on the relationship of
symptoms and smoking habits. Among those withsymptoms, only nine of the 36 persons did notsmoke. Among those without symptoms, sevengave a positive history of smoking. Of this group,two had worked in the area only four days; oneworked only outside areas A and B; one was inarea A only two minutes every second or third day;and one spent three days per week doing a time-and-motion study in areas A and B.Table 3 gives data regarding ventilation and phys¬
ical measurements of the environment in area A.The results of the spirometric studies are dem¬
onstrated in Tables 4-7. FEC, MMF, and PFR areexpressed as percentage of predicted normal forage, or age and height, according to standardtables.5 7 FEVi is expressed as a percent of FEC.There was a general reduction of all of these valuesin the group of smokers as contrasted to the non-smokers. Since these two groups are almost identi¬cal to those with symptoms of polymer-fume feverand those without, there are very few data avail¬able for use in separating the effects of smokingand the effects of environmental exposure. How¬ever, Table 6 shows the means of the two small
Table 4.—Mean Values of Pulmonary Function StudieBaselinet Following Exposure!
Group
FEC,Pre¬dicted
No. Normal SD
FEVi,%FEC SD
MMF,%Pre¬dictedNormal SD
PFR,Pre¬dictedNormal SD
FEC,%Pre¬
dictedNormal SD
FEVi,%FEC SD
MMF,Pre¬dictedNormal
All subjects 47 93 18.2 86.7 12.2 87.5 25.1 94.3 14.5 94.2 14.9 86.8 9.0 86.5SP_26.3
PFR,%Pre¬dictedNormal SD95.2 16.6
Subjects withrespiratorysymptoms 24 90.1 20.3 85.3 15.6 87.1 28.7 90.7 14.6 90.3 13.6 87.0 9.6 79.0 20.3 90.2 20.9
Subjects withoutrespiratorysymptoms 23 96.0 15.9 88.1 8.5 87.9 21.7 98.0 14.1 98.4 15.9 86.5 16.1
t valueProbability
1.11<0.3
0.75 0.11 1.75 1.98<0.5 >0.5 <0.1 <01
_0.13_>0.5
94.7_2.05<0.05
100.6 13.51.95
<0.1• t tests for all four function tests—before vs after exposure showed P>0.05.t Forced expiratory capacity, FEC: forced expiratory volume in 1 second. FEVi; maximum midexpiratory flow rate between 25% and 75% of theforced expiratory capacity, MMF; peak-flow rate, PFR; and standard deviation, SD.
Downloaded From: https://jamanetwork.com/ by Jared Hayes on 07/19/2019

Table 5.—Mean Values of Pulmonary Function Studies*
Group
Baseline! Following ExposuretFEC,%Pre¬dicted
No. Normal SDFEVi,%FEC SD
MMF,%Pre¬dictedNormal SD
PFR,%Pre¬dictedNormal SD
FEC,%Pre¬dictedNormal SD
FEVi,%FEC SD
MMF,%Pre¬dictedNormal SD
PFR,%Pre¬dictedNormal SD
29 90.4 14.6 86.9 3.1 86.9 31.5 91.0 91.3 14.5 86.9 2.5 82.8 23.7 90.7 18.218 97.1 22.3 86.2 16.2 88.4 9.5 99.6 12.4 98.6 15.4 86.5 11.7 92.2 29 102.1 11.7
1.24 0.18 0.19 2.04 1.59 0.14 1.16 2.31<0.3 >0.5 >0.5 <0.05
*t tests for all four function tests—before vs after exposure showed P>0.05t Forced expiratory capacity, FEC: forced expiratory volume in 1 second. Frr*art uvnir^tAi*!/ /»arvariti/ KAhA P" no^lf-f\r\\%/ r -a t ti PFOH or*rf ctan^ard riö\/i s*fri r»
<0.2 >0.5 <0.3 <0.05
forced expiratory capacity, MMF; peak-flow rate, PFR.
second, FEVi; maximum midexpiratory flow rate between 25% and 75% of theand standard deviation, SD.
groups—those with symptoms who do not smoke,and those who do not have symptoms and who dosmoke. These suggest that the difference may beattributed completely to the effects of cigarettesmoking.As indicated in the tables, there was no signifi¬
cant change in the results of the tests of functionat the beginning and at the end of the work shift.This was true in both groups—smokers and non-smokers.As demonstrated in Table 7, only three patients
showed a significant change in their pulmonary-function studies during the course of the day atwork. One of these gave a history of asthma; onehad a history of hay fever. The changes notedduring the day in these individuals are suggestiveof the development of obstructive changes in theairways. One of these men had some improvementin pulmonary function after the inhalation ofisoproterenol.
CommentThis "epidemic" of polymer-fume fever illus¬
trates very well the interaction of agent, host, andenvironment in the causation of illness. The pres¬ent outbreak would seem to be explained accord¬ing to the following sequence of events: The newparting compound was a telomere of polytetrafluoro-ethylene with a molecular weight of 3,700-5,000,which existed as a fine dust on the tools. Cigarettesbecame indirectly contaminated with small parti¬cles of this material which had been deposited onthe workers' hands. Inhalation of the products ofpyrolysis of polytetrafluoroethylene produced thesyndrome in those who smoked contaminated ciga¬rettes. The occurrence of symptoms in a few menwho did not smoke would seem to be related to thefact that a small hot-air gun was used in the appli¬cation of the epoxy resin in the subassembly. Thisgun has a heating element that reaches a temper-
ature of 750 F. In all probability, the air currentsgenerated by this gun resulted in dispersion of theparticles of polymer, which subsequently reachedthe heating element. With two possible sources ofthermal degradation of the polymer—the heatingelement of the hot-air gun and the cigarettes—itwould seem that an adequate supply of pyrolysisproducts of the polymer was available.The epidemic pursued a rather lengthy course
because of two factors: (1) management had con¬fidence in the innocuous properties of the new part¬ing compound, and (2) changes in ventilation hadbeen associated with the onset. As complaints ofsymptoms began to accumulate, the ventilationwas changed so that in area A, air-conditionersbrought in 25% outside air rather than providing100% recirculated air. This change in ventilationseemed to reduce the severity of symptoms, but itdid not completely eliminate them. The spread ofthe complaints of symptoms in area B was alsosomewhat baffling initially. The increase in ventila¬tion would have decreased somewhat the ambient-air concentration of these products of pyrolysis.This would not have helped those who were smok¬ing contaminated cigarettes.In retrospect, the history given by these em¬
ployees was classical for polymer-fume fever. It israther interesting that seven men specifically iden¬tified the new parting compound as the agentwhich they felt was causing the problem. This issignificant with regard to the Oslerian aphorismabout "listening to the patient."In 1955, Sherwood reported seven cases of
polymer-fume fever and related it to a history ofsmoking in the workers." In the literature therehave appeared second-hand reports of deaths re¬sulting from inhalation of the pyrolysis productsof polymers of tetrafluoroethylene. These haveproved to be difficult to exterminate and have hadat least one rebirth in the past two years. There
Table 6.—Mean Values of Pulmonary Function StudiesBaseline" Following Exposure'
Group
FEC,%Pre¬dicted
No. Normal SD
FEV.,%FEC SD
MMF,%Pre¬dictedNormal SD
PFR,%Pre¬dictedNormal SD
FEC,%Pre¬dictedNormal
FEVi,%SD FEC
MMF,%Pre¬dicted
SD Normal SD
PFR,%Pre-dietedNormal
Nonsmokers withsymptoms 91.6 14.5 85.0 4.4 87.3 5.5 99.6 2.5 94.2 10.6 84.2 2.2 86.0 5.4 100
Smokers withoutsymptoms
SD
5.6
symptoms"
6 91.1 12.7 92.6 4.9 93.0 25.3 94.5 14.9 93.0 8.1 91.2 3.0 104.8 23.0 93.4 12.4• Forced expiratory capacity, FEC; forced expiratory volume in 1 second, FEVi; maximum midexpiratory flow rate between 25% and 75% of thforced expiratory capacity, MMF; peak-flow rate, PFR; and standard deviation, SD.
Downloaded From: https://jamanetwork.com/ by Jared Hayes on 07/19/2019

Table7.—Patients Demonstrating Significant Reductionin Pulmonary Function During and After 8-Hour Exposure
"FEC—beforeafter
FEVi—beforeafter
MMF—beforeafter
PFR-beforeafter
Patient 13.5 liters3.1 liters2.32.1
litersliters
2.2 liters/sec1.9 liters/sec480 liters/min310 liters/min
Patient 23.4 liters3.3 liters3.4 liters2.6 liters2.8 liters/sec2.7 liters/sec250 liters/min220 liters/min
Patient 34.4 liters4.4 liters4.0 liters3.8 liters5.5 liters/sec3.7 liters/sec680 liters/min720 liters/min
* Forced expiratory capacity, FEC; forced expiratory volume in 1 sec¬ond, FEVi; maximum midexpiratory flow rate between 25% and 75%of the forced expiratory capacity, MMF; peak-flow rate, PFR; and stand¬ard deviation, SD.
seems to be little doubt that teflon itself has ratherremarkable properties, including a physiologic in¬ertness. However, when heated to above 300 C,the products of its thermal degradation are capableof producing a short-lived "influenza-like syndrome"in almost all those inhaling these by-products.Numerous studies have attempted to character¬
ize these breakdown products. They consist ofhigher-chain fluorocarbons, the most toxic of whichis isooctofluorobutylene.9Capodaglio studied four cases of polymer-fume
fever and stated that three of four showed abnor¬mal pulmonary function for six weeks to six monthsafter exposure.10 Data derived in this study wouldindicate that changes in respiratory functionswhich occur while at work are minimal and con¬sistent with mild obstructive disease in the airway.Gandevia studied the pulmonary function of work¬ers exposed to toluene di-isocyanate (TDI) vapor.11A decrease of 180 cc in FEVi on successive dayswas noted and said to be significant. One half ofall the subjects (all smokers) showed an increasedsensitivity to inhalation of histamine aerosol.
The decrease in pulmonary function in the groupwith symptoms of polymer-fume fever is consis¬tent with differences noted between smoking andnonsmoking populations, as reported in previousstudies.1215One of the most severely affected workers was
on two occasions admitted to a hospital, withsevere respiratory distress and x-ray findings sug¬gestive of pulmonary edema. This patient's symp¬toms and x-ray changes responded rapidly tocorticotropin (ACTH). Such a case was recentlyreported.18The mechanism by which pyrolysis products pro¬
duce fever is not known. Cavagna et al,17 and Perniset al18 have showed a degranulation of polymorpho¬nuclear leukocytes after their exposure to teflon.They suggest that release of endogenous pyrogenis the mechanism for the production of the syn¬drome.It is apparent from this study that, despite ade¬
quate warning in the manufacture's brochure, andreports in the medical literature, polymer-fumefever may not be recognized. It is also apparentthat workers handling the dust of such polymerscannot smoke in the work area. A past history ofhay fever, asthma, or other pulmonary disease alsois probably sufficient cause to exclude such a work¬er from exposure to these materials. While thedisease process is short and self-limited, it cansignificantly reduce the operational effectiveness ofa department, as well as produce unnecessary ill¬ness in man. Sufficient knowledge is available toclassify this as a preventable disease.
Generic and Trade Names of DrugCorticotropin (ACTH)—Acth, Acthar, Corticotropin.
References
1. Harris, D.K.: Polymer-Fume Fever, Lancet 2:1008-1011 (Dec1) 1951.2. Challen, P.J.R.; Sherwood, R.J.; and Bedford, J.: "Fluon"
(Polytetrafluoroethylene): Preliminary Note on Clinical andEnvironmental Observations, Brit J Industr Med 12:177-181(April) 1955.3. Harris, D.K.: Some Hazards in Manufacture and Use of
Plastic, Brit J Industr Med 16:221-229 (July) 1959.4. Toxicological Aspects of Plastic Industry, memorandum,
National Advisory Council for Aeronautics, September 1956.5. Baldwin, E.DeF.; Cournand, A.; and Richards, D.W., Jr.:
Pulmonary Insufficiency: I. Physiological Classification, ClinicalMethods of Analysis, Standard Values in Normal Subjects, Medi-cine 27:243-278 (Sept) 1948.6. Flint, D.M., and Khan, M.O.: Clinical Use of Peak Flow
Meter, Brit Med J 2:1231-1233 (Nov 10) 1962.7. Kory, R.C., et al: Veterans Administration\p=m-\ArmyCoopera-
tive Study of Pulmonary Function, Amer J Med 30:243-258 (Feb)1961.8. Sherwood, R.J.: Hazards of Fluon (Polytetrafluoroethylene),
Trans Assn Industr Med Officers 5:10-12 (April) 1955.9. Zapp, J.A.; Limperos, G.; and Brinker, K.C.: Toxicity of
Pyrolysis Products of "Teflon," Tetrafluoroethylene Resin, readbefore the American Industrial Hygiene Association, April 1955.10. Capodaglio, E.; Monarca, G.: and Divito, V.G.: Respiratory
Syndrome From Intermediate Volatile Products of Polytetra-
fluoroethylene, Rass Med Industr 30:124-139 (March-April) 1961.11. Gandevia, B.: Studies of Ventilatory Capacity and Hista-
mine Response During Exposure to Isocyanate Vapour in Poly-urethane Foam Manufacture, Brit J Industr Med 20:204-209(July) 1963.12. Franklin, W., and Lowell, F.C.: Unrecognized Airway Ob-
struction Associated With Smoking: Probable Forerunner ofObstructive Pulmonary Emphysemia, Ann Intern Med 54:379-386(March) 1961.13. Zamel, N.; Youssef, H.H.; and Prime, F.J.: Airway Resis-
tance and Peak Expiratory Flow Rate in Smokers and Non-Smok-ers, Lancet 1:1237-1241 (June 8) 1963.14. Anderson, D.O., and Ferris, B.G.: Role of Tobacco in Causa-
tion of Chronic Respiratory Disease, New Eng J Med 267:787-793(Oct 18) 1962.15. Wilson, R.H., et al: Pulmonary Pathologic Physiology of
Persons Who Smoke Cigarettes, New Eng J Med 262:956-961(May 12) 1960.16. Robbins, J.J., and Ware, R.L.: Pulmonary Edema From
Teflon Fumes: Report of Case, New Eng J Med 271:360-361 (Aug13) 1964.17. Cavagna, G.; Finulli, M.; and Vigliani, E.C.: Experimental
Study on Pathogenesis of Teflon Fume Fever, Med Lavoro 52:251-261 (April) 1961.18. Pernis, B.; Cavagna, G.; and Finulli, M.: Degranulation of
Polymorphonuclear-leukocytes Exposed to Zinc Oxide or TeflonParticles, Med Lavoro 52:649-652 (Nov) 1961.
Downloaded From: https://jamanetwork.com/ by Jared Hayes on 07/19/2019

3M BRAND FLUOROCHEMiCAL
SURFACTANTS FC-95, FC-98~ FC-128~ I:C-134, I:X-161~
FC-170, FX-172 Exhibit
1042 State of Minnesota v. 3M Co.,
Court File No. 27-CV-10-28862
3MA01201629
1042.0001

CONTENTS
Introduction
Surfaces or Interfaces Surface Tension Sur factant s Fluorochemical Sur factants Measurement of Surface Tension
Characteristics of 3M Brand Fluorochemical Surfactants Solubility of 3M Brand Fluorochemical Surfactants Handling and Use Surface Properties
Introduction Surface Tensions in Water Surface Tensions in Acids
1. Hydrochloric Acid 2. Nitric Acid 3. Phosphoric Acid 4. Sulfuric Acid
Surface Tensions in Alkali 1. Potassium Hydroxide 2. Sodium Hydroxide
Surface Tensions in Other Media Inter facial Tension Emulsific ation Foaming Power Wetting Power
Applications of 3M Brand Fluorochemical Surfactants Introduction Guide to the Selection of 3M Brand Fluorochemical Surfactants Cleaners
I. Alkaline Cleaners 2. Bottle Cleaners 3. Concrete Gleaners
Corrosion Inhibit0rs - Corrosion l~esistant Films i. Corrosion Inhibitors - General 2. Ste el 3. Protective Coatings
Dips, Etches, and Strikes i. Aluminum Bright Dip 2. Copper and Brass Bright Dips 3. Aluminum Acid Etch 4. Aluminum Base Etch 5. Magnesium Etches 6. Copper Strikes
Electrolytic Processes I. Chrome Plating 2. Nickel Plating 3. Electrochemicai Milling
Evaporation Inhibition Organic l~eactions
i. Hydrolysis 2. Sulfonation
Paper Pulping
1042.0002 3MA01201630

CONTENTS (¢ontinced)
Pickling or Descaling 1. Steel 2. Stainless Steel 3. Spring Steel
Resins and Plastics Solvents ~" at e r Treatments
Waxes I. 2.
Toxicity Bibliography
Open Cooling Water Systems Closed Heating Systems
.~I!~sdine Systems "Lock and Key" Systems
1042.0003 3MA01201631

3M Brand Fluorochemical Surfactants TITLE:
June 15, 1963 Date Issued : Y-ISTD
Supersedes Issue of:
INTRODUCTION
Surfaces or Interfaces
Oil and water do not mix, hence, there is a boundary between them. These boundaries, known as surfaces or interfaces, exist between liquids and liquids, liquids and solids, solids and solids, solids and gases, and liquids and gases.
solid-sos interface
liquid-solid interface
liquid-gas interface
luid-liquid interface
Surface Tension
Liquids often behave as though there is an elastic skin stretched on
their surface, A water glass, for example, can be filled to a point where the
water level is above the rim of the glass, or a needle can be floated on the surface of the water. The strong "elastic membrane" or high surface tension of the water makes these effects possible. If you were to add a detergent to
IMPORTANT NOTICE TO PURCHASER: All statements, technical information and recommendations contained heroin are based on tests we believe to be reliable, but the accuracy or completeness thereof is not guaranteed, and the following is made in lieu of all warranties,
express or implied:
Seller’s and nmnufacturer’s only obligation shall be to replace such quantity of the product p,av~d to be defective. Neither seller
nor manufacturer shall be liable for any injory~ loss or damage, direct or consequential= arising out of the use of or the inability to use the product. Before using, user shall determine the suitability of the product fat his intended use, and user assumes all risk and liability
whatsoever in connection therewith.
No statement or recommendation not contained herein shall have any force or effect unless in an agreement signed by officers of
seller and manufect umr ¯
Since the manufacturer of the product described in this technical data sheet has no means of �ontrolling the final use of the product
by the consumer or user, it is the responsibility of the immediate purchaser and any intermediate seller or sellers In inform the user of
the purposes for which the product may be fit and suitable and of the properties of the product, including the precautionary measures
which must be taken in order to ensure the safety of the user and of other third persons and property.
WARNINGI Do not take internally. Avoid breathing dust. Wash thoroughly after handling,
1042.0004 3MA01201632
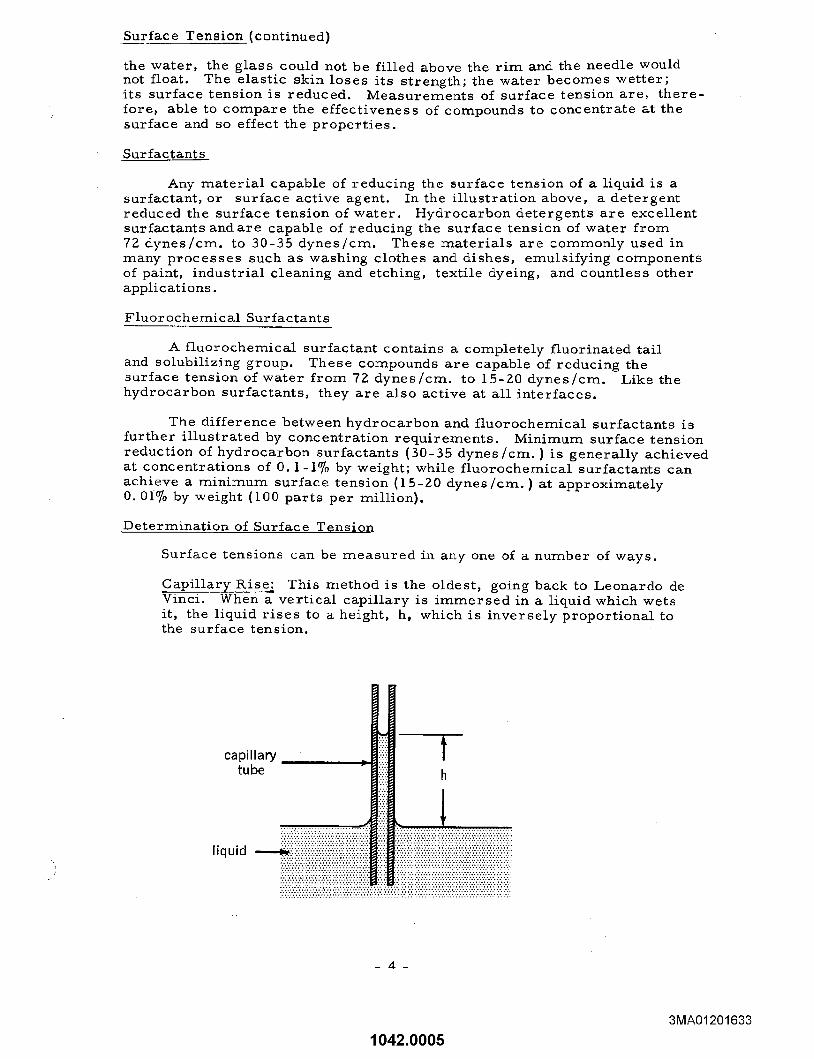
Surface Tension (continued)
the water, the glass could not be filled above the rim and the needle would not float. The elastic skin loses its strength; the water becomes wetter; its surface tension is reduced. Measurements of surface tension are, there- fore, able to compare the effectiveness of compounds to concentrate at the surface and so effect the properties.
Surfactants
Any material capable of reducing the surface tension of a liquid is a surfactant, or surface active agent. In the illustration above, a detergent reduced the surface tension of water. Hydrocarbon detergents are excellent surfactantsandare capable of reducing the surface tension of water from 72 dynes/crn, to 30-35 dynes/ca. These materials are commonly used in many processes such as washing clothes and dishes, emulsifying components of paint, industrial cleaning and etching, textile dyeing, and countless other applications.
Fluor ochemical Sur factants
A fluorochernical surfactant contains a completely fluorinated tail and solubilizing group. These compounds are capable of reducing the surface tension of water from 72 dynes/crn, to 15-20 dynes/crn. Like the hydrocarbon surfactants, they are also active at all interfaces.
The difference between hydrocarbon and fluorochemical surfactants is further illustrated by concentration requirements. IV[inirnnurn surface tension reduction of hydrocarbon surfactants (30-35 dynes/ca. ) is generally achieved at concentrations of 0.1- l~o by weight; while fluorochemical surfactants can achieve a minimum surface tension (15-20 dynes/ca. ) at approximately 0.0i% by weight (i00 parts per million).
Determination of Surface Tension
Surface tensions can be measured in any one of a number of ways.
Capillary Rise_: This method is the oldest, going back to Leonardo de Vinci. When a vertical capillary is immersed in a liquid which wets it, the liquid rises to a height, h, which is inversely proportional to the surface tension.
capillary tube
t
4-
1042.0005 3MA01201633

Determination of Surface Tension (continued)
The internal radius of the capillary tube, density of the liquid, and the acceleration due to gravity must also be known. Exact measure- ments of height and radius of the capillary are extremely difficult; hence, accuracy of the method is limited.
Drop Weight: The weight of a drop which falls from a capillary tube is proportional to the surface tension of the liquid and the radius of the capillary. Instruments currently available, called drop-counter.< and stalagmometers, are based on this principle. A serious disad- vantage of the method exists, however, in that drops must be formed very slowly, only one in every several minutes. This measurement is neither accurate nor rapid.
P~upture of the Surface. "Tensiometer": Probably the fastest and most reliable method of surface tension measurement is the pull-ring method by duNouy. The procedure measures the "tension" or pull required to c&use a ring to break free from the liquid surface. The tensile force is proportional to the surface tension.
ring
liquid
The accuracy of the duNouy Tensiometer is especially great if liquids having similar properties are compared. It is also a fast procedure, capable of measuring surface tension of rapidly aging systems. Platinum rings are used; hence, clean-up between measurements is simplified over the capillary methods.
Additional information on surface tension measurements is found in the bibliography references (I, Z). The extremely low surface energy of the fluorocarbon tail is also discussed (5, 4).
1042.0006 3MA01201634

CHAI<.~CTEP~ISTICS OF 3M BRAND FLUOROCHEMICAL SURFACTANTS
The main features which distinguish these materials from conventional surfact~nts are as follows:
i. Stability a. Chemical Several are stable in 90% H202, anhydrous
hydrazine, hot concentrated mineral acids, and alkalis.
b. Thermal Certain members of this family are stable up to 750°F.
c. Biological - Some are completely resistant to biological attack.
Surface Activity a. Aqueous Systems-
b. Organic Systems -
c. Wetting -
d. Foams -
Capable o.f surface tension reduction, I0-I 5 dynes/cm, lower than conventional surfactants.
Many 3M surfactants are active in organic systems, causing reductions in the surface tensions of organic solvents.
Wetting of materials can be greatly improved.
Or, a variety of substrates can be made hydrophobic and/or oleophobic.
Stable, long-lasting foams can be produced
in media which would be destructive to
conventional surface active agents. Low foaming materials are also available.
3. Efficiency
a. Economical Effective at extremely low concentrations,
frequently .at 50-100 parts per million or less.
1042.0007 3MA01201635

SOLUBILITY OF FLUOI~OCARBON SURFACTANTS
SOLUBILITY Grams Surfactant per I000 Grams of Solvent,
SOLVENT FC-95 FC-98 FC-128 FC-134 FX-161 FC- 170 FX- 172
Acetone I00 20 Z > I0 > I000 600 i000 Benzene 0.8 0.2 0.2 0.6 2 500 1 Carbon Tetra-
chloride 0.04 0.04 0. 1 Nil 0.8 470 Z Ethyl Alcohol Z Z0 10 100 80 > 1000 > 1000 Heptane 0.03 0.09 0.03 Nil 0.7 7 1 Isopropyl Alcohol 3 30 8 10 > 1000 > 1000 > 1000 Isopropyl Ether 0.1 0.3 0. Z 0.04 Z0 250 15 Methyl Alcohol 60 40 60 80 70 > i000 > i000 Perchloro-
ethylene 0.07 0.09 0.2 0.04 0.7 690 i00 Toluene 1 0.9. 0.1 0. 1 1 550 I0 Water 2 10 200 > 5 I0 > 300 > 500
(gel) (gel) (gel) (Foam)
Procedure Used Above: Saturated surfactant solutions were equilibrated and filtered. Solubilities were determined after evaporation of the solvent.
SOLUBILITIES IN ACIDS AND ALKALI
FC-95 FC-98 FX-161
1 Hydrochloric acid, . Hydrochloric acid, 37% Nitric acid, 1 Nitric acid, 70°/o
1 Phosphoric acid, 1 Phosphoric acid, 85% Sulfuric acid, 1 2½%
Sulfuric acid, 97%
1 <10 < 0.01 0. I 1 < 20 < 0.01
>5 >I >i I0 ~ i0 < 0.01 0.5
Potassium hydroxide, 20%
1042.0008 3MA01201636

HANDLING AND USE
The solubilities of the 3M Bra~nd Fluorochemical Surfactants in aqueous and organic media are usually lower than those of conventional hydrocarbon surfactants. Although the solubility limits of a given 3M surfactant in water may be 0.1% or less, this is not necessarily restrictive of its capacity to function effectively. However, the surfactant must have some solubility in a system if it is to be effective. Surface tension should be checked when solubility is in question, to determine whether or not the material is actually present in adequate levels to affect surface properties of the system significantly. Examination for color change and foaming can also be used as guides to indicate adequate solubility. In the case of surfactant use as a priz~ary emulsifier, addition levels higher than 0.1% are usually required. Their use as secondary emulsifiers or stabilizers may not require use levels greater than this.
Where solubilities are not sufficient to achieve results in a particular media, it is recommended that the use of cosolvents be investigated. In many cases this will mean the addition of only a few percent of a cosolvent (or cosolvents) to form a binary or ternary system. For example, the addition of 5% acetone or isopropanol greatly increases the solubility of many fluorochemical surfactants in water. Similar examples occur with organic systems.
Because of low solubilities, 3M Brand Surfactants may be slow to dissolve. The use of heat will greatly increase solution rates and is recommended whenever possible. In some cases, pre-dissolving the surfactant in a small amount of a compatible solvent in which its solubility is large will greatly facilitate its solution. In such cases, very little of the pre-solvent will be needed; in fact, simple wetting out of a solid surfactant will often serve to increase its rate and degree of solution. It should be emphasized that :
Wherever possible, the surfactant should be added to a liquid system in a compatible liquid form. (This will insure that all of the surfactant which has been added is being utilized. )
The following is intended as a guide to helpful cosolvents for various 3M Brand Fluorochemical Surfactants.
SURFAC TANT
FC -95 FC-98 FC - 128
FC -I 34
COSOLVENTS FOR WATER SOLUTIONS
COSOLVENTS FOR
O RGANIC SO LU TIONS
Acetone or Methanol Acetone or Is opt opanol Acetone Methyl cellosolve or Dimethyl formamide
FX-161 Acetone or Same as FC-95 Is opt opanol
FC- 170 None required Toluene AIc ohol
FX- 172 Acetone or Acetone Is opr opanol I s opr opanol
-8-
’50:50 CCl4:methanol or 50:50 acetone :isopropanol Same as above
Carbon tetrachloride
1042.0009 3MA01201637

SURFAC E PROPERTIES
Surface tension zmeasurements are included to show the effect Of 3M ]Stand Fluorochemical Surfactants in water, various acids, alkalis, and other media.
Generally speaking, lowered surface tension values imply better wetting properties of the surfactant solution. This is true for many of them in many media. However, some of these surfactants are very capable of preferential absorption on many surfaces which, in effect, would de- crease the wettability of that surfactant solution to that particular surface. An example of this diverse effect is the use of Fluorochemical Surfactants in hydrochloric acid. FC-95 will cause a great increase in the rate of ’ attack of HCI on aluminum, while FX-161 can actually stop the corrosion of aluminum by formation of a tenacious monomolecular corrosion- resistant barrier film on the aluminum. It should be emphasized that the surfactant effects just described are very selective.. The solvent, surfactant, and substrate are dependent upon one another. Our laboratories will be pleased to assist in the selection of the proper fluorochernical surfactant for problem applications upon receipt of complete information on the system and the effects desired.
Unless stated to the contrary, all surface tension data presented were obtained with a duNouy tensiometer on solutions which had aged
16-24 hours prior to measurement. (See introduction)
SURFACE TENSIONS IN WATER
Figure 1 compares surface tension vs. concentration of 3IV[ Brand Fluorochemical Surfactants in water. It should be noted that extremely low concentrations of FC-I 54 and FC- 170 give remarkably low surface tensions in water. For example, 0. 001% (parts per million) F6-134 reduces the surface tension of water from about 72 dynes/centimeter to about 24 dynes/era.
Figure 2 represents the effect of temperature on the surface tensions of FC-1 Z8 and FC-134 solutions; each at concentrations of 0.1, 0.01, and 0. 001 (1, 000, 100, and 10 ppm respectively).
-9-
1042.0010 3MA01201638

SURFACE TENSION, 25°C., DYNES/CM.
o o
-10-
1042.0011 3MA01201639
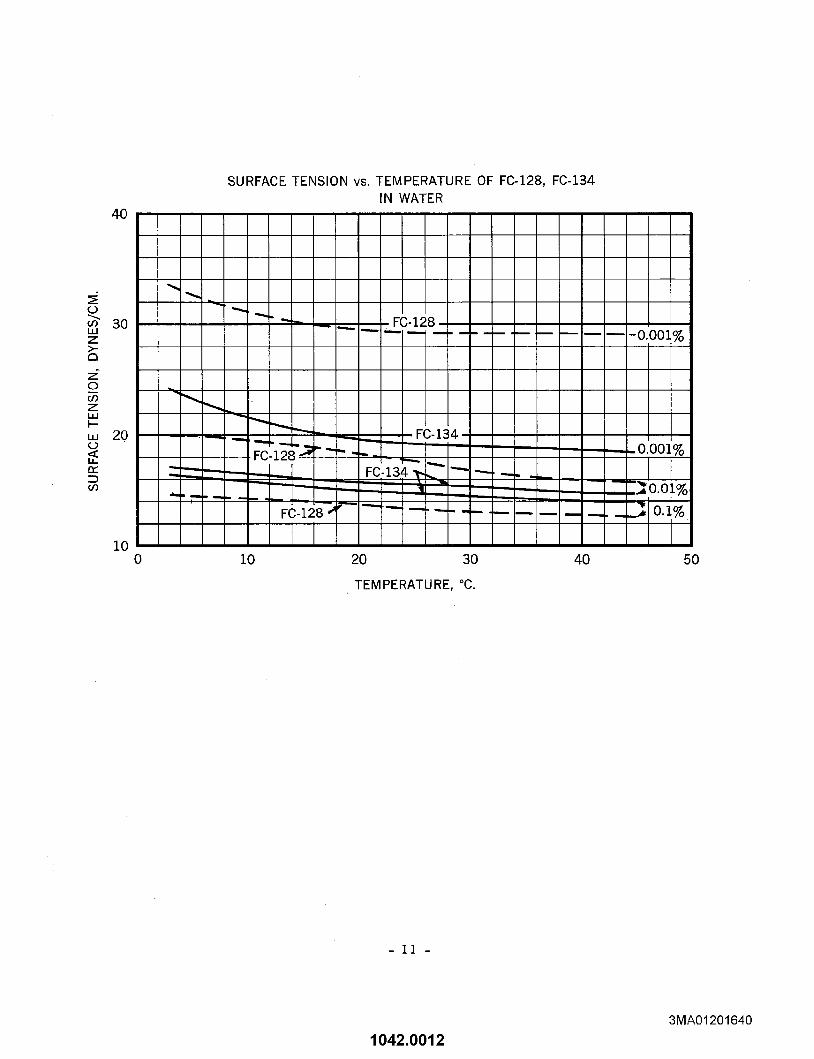
4O
SURFACE TENSION vs. TEMPERATURE OF FC-128, FC-134 IN WATER
TEM PERATU RE, °C.
-11 -
1042.0012 3MA01201640

SURFACE TENSIONS IN ACIDS
The stability of certain 3M Brand Fluorochemical Surfactants to strong mineral acids provides a unique means of reducing surface tensions of these highly corrosive chemicals. Certain of the fluoro- chemical surfactants are extremely stable in these acids even at elevated temperatures, and are often the only ma[erials which provide surface activity in these media.
The effectiveness of materials such as FC-95 and FC-98 in reducing surface tension of acidic media is in marked contrast to their effect in water. The importance of solution pH is, therefore, not to be overlooked. Both solubility and activity are dependent on pH, the presence of other dissolved salts, etc.
i. Hydrochloric Acid
1 Curves for FC-95 in iZ~%, Z5%, and 37% hydrochloric acid are found in Figure 3. Note that minimum surface tension is attained at from 50 to I00 ppm (.005-0.01%) FC-95.
-IZ-
1042.0013 3MA01201641

SURFACE TENSION, DYNES/CM
-13-
o
9
~0 0
0
1042.0014 3MA01201642

Nitric Acid
Figure 4 presents surface tension vs. concentration curves for
FC-95 in IZ½, Z5, 50, 70, and 90% HNO3. Bar charts are included
showing the effect of FC-95 and FC-128 in white fuming nitric acid.
The area at the left of the bar chart indicates the surface tension
of the pure acid.
-14-
1042.0015 3MA01201643

Z
m
o
SURFACE TENSION, DYNES/CM
o o
-15-
o
1042.0016 3MA01201644

3. Phosphoric Acid
Curves indicating the effect of FG-95 in IZ½, ZS, 50, and 85%
H3PO4 are given in Figure 5. Note that minimum surface tensions
are achieved at concentrations of 50-500 ppm (0. 005-0.05g0)FC-95.
-16-
1042.0017 3MA01201645

I!11 o
SURFACE TENSION, DYNES/CM.
o o o o
9
17-
1042.0018 3MA01201646

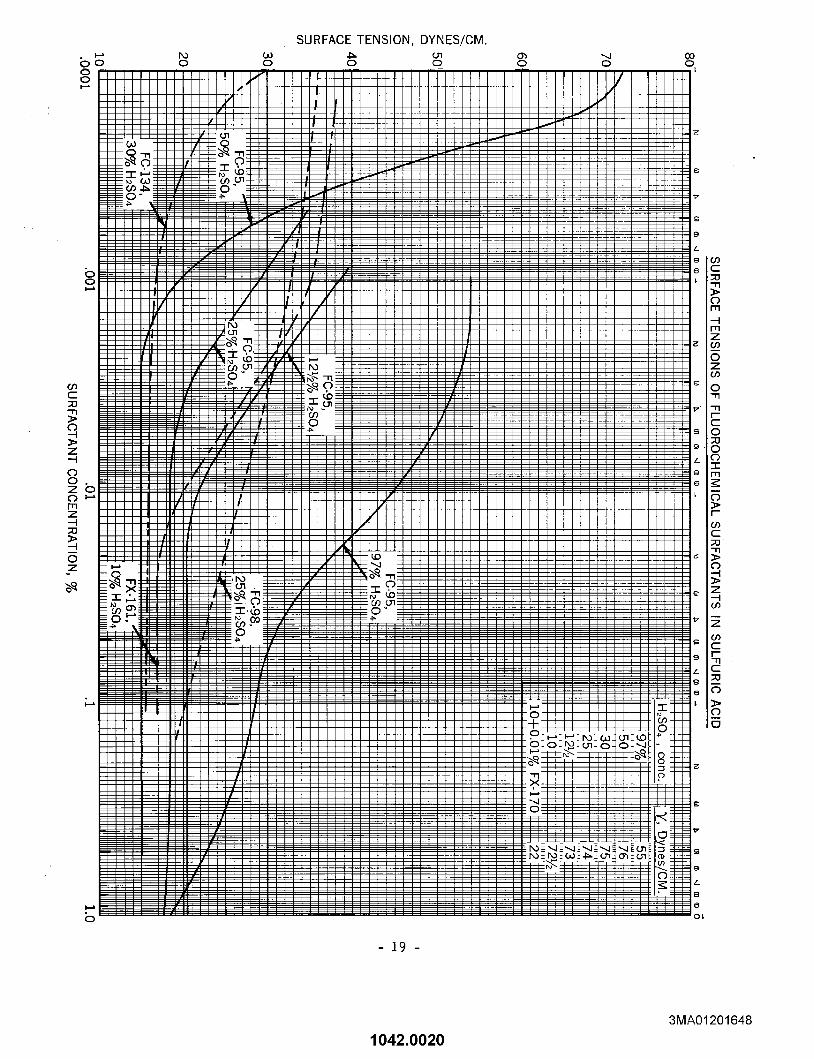
4. Sulfuric Acid
IV[any 3M Brand Fluorochemical Surfactants show excellent
surface activity in sulfuric acid as shown in Figure 6. Curves of
surface tension vs. concentration are given for FC-95 in IZ½, 25,
50, and 97% HzSO4, for FC-98 in Z5% H2SO4, for FC-134 in 30%
HzSO4, and for FX-161 in 10% H2SO4. By way of comparison, the
surface tensions of the pure sulfuric acid solutions are given in the
upper right-hand corner.
-18-
1042.0019 3MA01201647
-I
0 . ~ o
0
III c)
SURFACE TENSION, DYNES/CM.
-19 -
1042.0020 3MA01201648

In acid media it is often possible to observe an even lower
surface tension with time. The following table illustrates this effect.
FC-1 34 in 30% Sulfuric Acid vs. Time
Concentration of FC- 134%
Freshly mixed
After 48 hrs. standing
After 48 hrs. standing plus heating 16 hrs. @78°C.
0. 1 0.01 0.001 0. 0001
15.2 16.4 Z4.4 71.9
15.5 16.0 16.8 29.4
14.1 Z4.5
SURFACE TENSIONS IN ALKALI_S
3M Brand Fluorochemical Surfactants show excellent surface
tension reduction at low concentrations in alkaline systems.
Potas sium Hydroxide
Curves for the effect of FC-95 in I0 and 25% KOH are given in Figure 7.
- Z0 -
1042.0021 3MA01201649

SURFACE TENSION, DYNES/CM
- Z1 -
9
/-
6
O[
1042.0022 3MA01201650

Sodium Hydroxide
Surface tension vs. concentration curves are presented in Figure 8
for FC-95 in 10 and 25% NaOH and for FC-98 and FC-128 in 25% NaOH.
Bar charts illustrate the effect of other surfactants in 10, 40 and 50~0
NaOH. The bars at the left indicate the surface tension of the
solution without surfactant.
1042.0023 3MA01201651

SURFACE TENSION, DYNES/CM
o 0
1042.0024 3MA01201652

SURFACE TENSIONS IN OTHEP~ MEDIA
The following bar chart, Figure 9 presents data on surface tensions of a variety of media containing fluorochemical surfactants:
Z.
3.
4.
5.
6.
10% Acetic acid
20% Calcium chloride
95% Hydr azine
o 30% Hydrogen Peroxide (at 18 C.)
50% Lithium Bromide
20% Sodium Chloride
Effectiveness and stability in such rigorous media as hydrazine and hydrogen peroxide is an important characteristic of these versatile surfactants.
- Z4 -
1042.0025 3MA01201653

Z
Z
100
iiiiiiiiiiiiiiiiii~iiiiiiL_ o.~ FC-128
8O 6O 5~D 40 30 20 10
"IAIO/Bq NA(] ’NOI£Nql :~ov.~a ns
- 25 -
1042.0026 3MA01201654

SUP~FACE TENSION REDUCTION IN DETERGENTS
FC-1 34 effectively reduces the surface tension of a commercial dishwashing compound (0.8% in water at 145°F. )as noted below:
FC-I 34 CONCENTRATION SURFACE TENSION, dynes/cm.
0 (control) 30. 3
O. 002 21.0
0. 003 16.2
0. 005 14.2
A comparison of these values with points on the curve of FC-134 in water, Figure I, indicates a slight synergistic effect between the two compounds.
INT ERFAC IAL TENSION
The interracial tensions between acids and organic liquids can be greatly reduced with FC-95. For example, the interfacial tension b~tween concentrated hydrochloric acid and an organic ester, tributyl aconitate, was lowered from 12.6 to i. 8 dynes/cm by the addition of 0.5% FC-95 to the acid phase. Figure 10 illustrates the effect of FC-95 on the interfacial tension between n-decane and dilute sulfuric acid solutions of various strengths:
FIGURE 10
INTERFACIAL TENSION OF DEGANE-DILUTE SULFURIC ACID
SOLUTIONS CONTAINING FC-95
MOLAR CONCENTRATION OF SULFURIC ACID SOLUTION
- Z6 -
1042.0027 3MA01201655

EMULSIFIG ATION
Fluorochemical surfactants are effective emulsifiers. However, it is usually necessary to use concentrations equal to those required for hydrocarbon surfactants which often imposes an economic restriction on their use. Those applications which are destructive to conventional surfactants by heat or chemical attack are excellent areas for the use of the fluorochemicals as emulsifiers.
Synergistic effects are often encountered when fluorochemical surfactants are used in addition to conventional hydrocarbon emulsifier blends. Effectiveness at considerably lower total surfactant concentration is often realized.
Many vinyl polymers have been prepared by emulsion polymerization utilizing fluorochemical surfactants as the emulsifiers (see U. S. Patent 2, 559,752). It has been demonstrated that significantly lower emulsifier concentrations may be used when fluorocarbons are used instead of hydrocarbon emulsifiers.
FC-IZ8 and FC-170 are used to advantage for emulsifying liquids of low surface energy (silicones and fluorocarbons). An homogenizer is generally required.
FX-17Z is an excellent stabilizer for latexes.
In applications where wetting is required, but where emulsification is not desired, fluorochemical surfactants should receive first consideration. Here, the normal, very low concentrations are used to provide excellent wetting with a low degree of emulsification.
FC- 170 is also used to break cetain emulsions.
- 27 -
1042.0028 3MA01201656
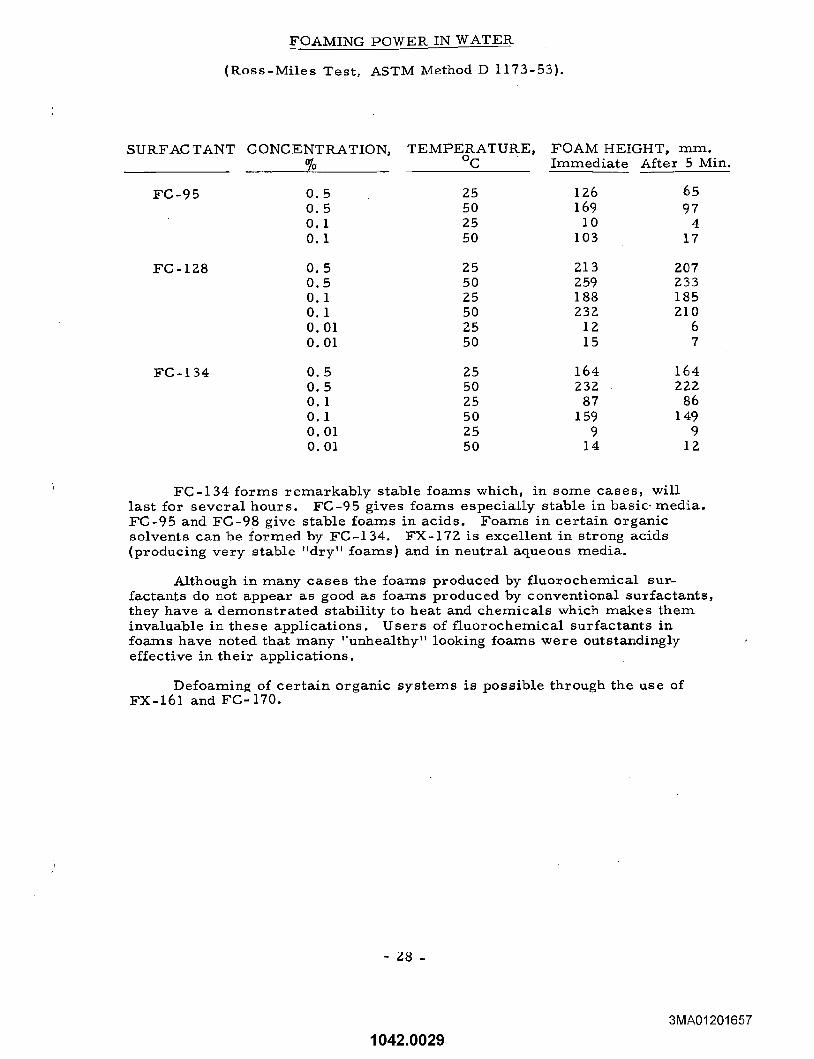
FOAIVilNG POWER IN WATER
(Ross-Miles Test, ASTM Method D i173-53).
SU RFAC TANT
FC-95
FC-134
CONCENTRATION, TEMPERATURE, FOAM HEIGHT, ram.
% °C Immediate After 5 Min.
O.5 -25 126 65 0.5 50 169 97 0. I 25 I0 4 0.1 50 103 17
0.5 Z5 gI3 Z07 0.5 50 Z59 Z33 0. i 25 188 185 0. i 50 23Z ZI0 0.01 25 iz 6 0.01 50 15 7
0.5 25 164 164 0.5 50 232 222 0. i 25 87 86 0.1 50 159 149 0.01 Z5 9 9 0.01 50 14
FC-134 forms remarkably stable foams which, in some cases, will last for several hours. FC-95 gives foams especially stable in basic, media. FC-95 and FC-98 give stable foams in acids. Foams in certain organic solvents can be formed by FC-134. FX-17Z is excellent in strong acids (producing very stable "dry" foams) and in neutral aqueous media.
Although in many cases the foams produced by fluorochemical sur- factants do not appear as good as foams produced by conventional surfactants, they have a demonstrated stability to heat and chemicals which makes them invaluable in these applications. Users of fluorochemical surfactants in foams have noted that many "unhealthy" looking foams were outstandingly effective in their applications.
Defoamin£ of certain organic systems is possible through the use of FX-161 and FC-170.
-
1042.0029 3MA01201657

FOAMING POWER IN OTHER MEDIA
Foams produced by many surfactants are sensitive to water hardness
and pH of the solution. These conditions have been tested with FC-128
where it was found that FC-128 produces its maximum foam at a pH of
about I0. As the pH decreases, the foam does also. At a pH of 7 or
below, little or no foam is produced.
Hardness in water also reduces the foams in FC-128 solutions.
This factor is easily overcome by the use of water softening or se-
questering agents.
WETTING POWER IN WATER
(Draves-Clarkson Test - Reference: American Association of Textile
Chemists and Colorists Technical Manual and Yearbook).
SURFAOTANT CONCENTRATION, TEMPERATURE, SINKING TIME
% °C. sec.
FC-95 0. I 25 over 300 0. i 50 24 0. I 70 35
FC-128 0 0 0 0 0 0
1 25 52 1 50 13 1 70 7 05 25 223 05 50 30 05 70 19
FC-134 0.05 Z5 over 300 0.05 70 Z5
FX-172 and FC-170 also show excellent wetting power. FX-172 is superior to FC-128 and FC-134 and considerably better th~n FX-161 and FC- 170 in the wetting of fabrics at the 0.05-0. i% level.
- Z9 -
1042.0030 3MA01201658

APPLICATIONS OF 31M BRAND FLUOROCHER[ICAL SURFACTANTS
New uses for this class of industrial surfactants are continually being found. Examples of their diverse applications are presented below. These commercial products will continue to find additional problems which they can so.effectively and economically. In this respect they are augmented by a ,~owing list of experimental laboratory fluoro- chemical surfactants ~hose structures are specifically designed for an even wider area of Consumer applications. A request to our laboratories with full particulars as to the system involved and effects desired will result in recommendations of the experimental or production fluorochemical surfactants most likely suited to your application.
The highly specific nature of these materials makes any generalizations regarding their use extremely difficult. The "Guide to the Use of 31V1 Brand Fluorochemical Surfactants" on the following page lists the most important properties of each commercial product. The major outstanding charac- teristic of each product is underlined for emphasis.
It should be added that in comparative evaluations of these materials, it is frequently observed that one surfactant performs best in one test
while another is definitely superior in a different effect. It is then very advisable to evaluate surfactant blends. These blends provide the major
effects required and, synergistically, can often show performance vs. concentration characteristics superior to either surfactant alone. These effects are available with blends of fluorochemical surfactants as well as with hydrocarbon/fluorochemical surfactant blends.
- 30-
1042.0031 3MA01201659

0 0 o o
0
~N ~
O~ O0
~0 ~ O0
- 31 -
1042.0032 3MA01201660

C LEANERS
FC-98 possesses outstanding surface activity in highly alkaline systems. Concentrations as low as 0.00Z% (Z0 parts per million) in caustic at 50°C. result in surface tensions of 30 dynes per cm. FG-95 and FC-IZ8 are similarly effective.
I. ALKALINE C LEANERS
.. Commercial alkaline cleaners are highly selective and specific in their cleaning action. The high chemical stability and surface activity of the fluorochemical surfactants offer a new approach to improving the efficiency and broadening the selectivity range of these alkaline cleaners.
The following formulation is typical of an effective alkaline cleaner used to remove paint and other deposits from steel:
5% sodium hydroxide O. 01% FC-128 Temperature : 180°F.
The use of FC-IZ8 in the cleaner requires half the immersion time and doubles its effective life.
An alkaline cleaning bath used on missile_products uses iZ ppm FC-IZ8. Cleaning speed is increased substantially at lower cost than the previous systems.
BOTTLE CLEANERS
These are used primarily where removal of aluminum labels is necessary. FC-98at5ppm is superior to FC-95 primarily due to the requirement of supplying the cleaner in a concentrate form containing 50% iNaOH + 5% gluconic acid. FC-95 is not sufficiently soluble to be used in this concentrate.
3. C ONCI~ETE CLEANERS
Phosphoric-hydrochloric acid concrete cleaners show improved wetting of oily surfaces when FC-134 is used at levels of 25-100 ppm.
- 32 -
1042.0033
3MA01201661

CORROSION INHIBITORS -
C(~RROSION RESISTANT FILMS
It has been found that 3M Brand Fluorochemical Surfactants act as corrosion inhibitors in various metal-acid systems. They may be used as
additives to the acid media or they may be applied as a thin, protective film on the metal prior to contact with the acid. In some cases, they exhibit
a pronounced synergistic effect with organic corrosion inhibitors.
I. CORROSION INHIBITORS - GENERAL
Examples of corrosion inhibiting power of fluorochemical surfactants as shown in following data:
SYSTEM
304 Stainless steel in 10% hydrochloric acid at 1B0°F.
Same, with 0.01% FC-134
Aluminum in 2N (7%) hydrochloric acid at 75°F.
Same, with 0.01 FC-134
CORROSION RATE, MILS PER YEAR
175
21
1410
190
From the above, the effectiveness of FC-134 in reducing corrosion of aluminum and stainless steel in hydrochloric acid is evident.
The importance of inhibitor concentration and its means of addition is illustrated in the following data:
SYSTEM
i 100 Aluminum in 10% hydrochloric acid at 75°F.
Same, with 0.07.% FX-161 ¯ " Same, with 0. Z~o FX-161 ¯
Same, with 2.0% FX-161 ~;
CORROSION RATE, MILS PER YEAR
2320
710 2O4 Z64
STEEL
A very smooth etch is obtained when FC-95 is used in conjunction
with thio-urea or ethyl mercaptan as a corrosion inhibitor for cold rolled steel in 5~/0 HzSO4. A synergistic effect is observed with ethyl mercaptan and FC-9 5.
The following table lists corrosion rates, in mils per year, for
the various systems.
# FX-161 added as 10% solution in acetone ¯ ~ No cosolvent used. FX-161 was not all being utilized
- 33 -
1042.0034 3MA01201662

2. STEEL (continued)
INHIBITION OF CORROSION ON COLD ROLLED STEEL BY 5% HzSO4
AT ROOM TEMPERATURE
Inhibitor CORROSION RATE . MILS PER YEAR
0-4 hrs. 0-146 hrs. 146-1035 hrs.
None 456
O. 5% FC-95 275
0. 01190 Thiourea 0.011% Thiourea + 0.5% FC-95 0.093% Ethyl mercaptan 0.09 390 Ethyl mercaptan + 0.5% FC-95
8.8 15.6 8.1 12.5 4.9 13.4 5.0 i.I
3. PROTECTIVE COATINGS
Properly applied, FX-161 and FC-I 34 will improve the tarnish re- sistance of many metals exposed to corrosive environments as long as flushing conditions do not prevail. These films have oil and water repel- lency and resistance to fingerprinting. On sealed, anodized aluminum, increased salt spray resistance results, and 3% hydrochloric acid will not attack the surface. Similar effects have been noted on other metals including steel, brass, and copper. An effective procedure for preparation of these thin films is described below:_
FX- 161 on Aluminum
FX-161 is best applied to aluminum from acetone, alcohol, alcohol:water, or acetone:water solutions. Usually 0.5-2.0% solutions of FX-161 in isopropanol, ethanol, or acetone suffice to assure uniform coat - ings in single immersion dips of 10-30 seconds.
The aluminum to be dipped should first be cleaned and degreased completely (so that no water break is noted). Common xlegreasing solvents followed by a dip in dilute base and a complete flushing rinse will properly prepare the surface. Abrasive cleaning with "SCOTCHBRITE" following the degreasing is also recommended.
Slow removal of treated pieces from the bath will insure almost complete drainage. It is often possible to observe during withdrawal that the bath no longer "wets" the piece. Pieces should immediately be given a quick rinse in distilled water to remove any excess solution which, upon drying, might cause spotting. Heating the metal after treatment often im- proves the permanence and tenacity of the film.
The presence of the film is easily detected because of the auto- repellency of the bath (it no longer "wets" the metal) or by placing a drop of mineral oil on the surface. The drop ahould "bead up" showing a contact angle of 45° or more.
- 34 -
1042.0035 3MA01201663

// Contact Ansle, 8
/ / /7/ / / / Wetti n8 N on-wetti ng
Note that where wetting occurs, the contact angle, 8, is very small. A drop exhibiting non-wetting has a large contact angle and there is no tendency for the drop to spread.
FC-134 is applied in the same manner from the same solvents or from
acidified water. It provides good tarnish resistance for copper and brass
even in the presence of high humidity and HZS or SO2. Fingerprint and soiling resistance are also improved.
- 35-
1042.0036 3MA01201664

DIPS, ETCHES, AND STRIKES
Unusual effects are frequently observed when the fluorochemical surfactants are included in etches, strikes, strippingsolutions, and dips utilized to achieve matte, or bright finishes, and the like. Such effects may include either accelerated reaction rate, inhibition of reaction, improved appearance and uniformity of attack, protection from staining after dipping, and development of water repellent surfaces.
1. ALUMINUM BRIGHT DIPS
FC-95 in a concentration of 0. 005% (50 parts per million) causes an increase in the reaction rate of conventional phosphoric-nitric acid-based
aluminum bright dips.
TREATMENT REACTION RATES
mg per sq. in. per 15 sec.
Aluminum in 90% phosphoric acid + 10% nitric acid at 170°F.
Same, with 0.005% (50 ppm) FC-95 11.7
Improved brightening is imparted. Due to the formation of a layer of foam at the bath surface, the mist and spray normally associated with these baths is eliminated.
FC-98 has a similar effect in these dips in the 25-50 ppm range. Increased reaction rate, improved brightening, and reduced drag-out losses OCCUr ¯
FC-134 and FX-161 are useful in i0-15% hydrochloric acid bright dips for aluminum. Here, however, reaction rate is sharply reduced allowing very smooth, blue-bright finishes on aluminum alloys which would normally be spotty after such a dip. (See Corrosion Inhibitors.)
2. GOPPEP~ AND BRASS BRIGHT DIPS
FC-134 and .FX-161 produce brighter finisheg with reduced drag-out and improved stain resistance when incorporated into a 50% sulfuric 25% nitric, trace hydrochloric acid, copper bright dip solution. Superior fingerprint resistance and a lo~°er degree of staining in nitrous oxide fumes is imparted when the final rinses contain 0.05-0. i% of the sarn_e__surfactant. plus 10-20% alcohol.
Similar advantageous effects are obtained with brass:
TREATMENT REAC TION RATE
mg per sq. in. per 30 sec.
Brass in 50% Sulfuric acid + 25% Nitric acid at 75°F. 7.8
Same, with 0.02% FX-161 9.5
- 36 -
1042.0037 3MA01201665

Z. COPPER AND BRASS BRIGHT DIPS (continued)
Drag out losses were reduced 25% and the brass was brighter after treatment with the bright dip containing 0.02~0 (200 ppm) FX-161.
3. ALUMINUM ACID ETCH
Smoother etches are obtained in a 15% hydrochloric acid system at 150-180°F. when 0.01% FC-134 or FX-161 is used. The reaction rate is reduced. (See Corrosion Inhibitors). The same quantities of FC-95 or FC-98 will sharply raise the rate of etch. If this is desired, FC-98 is preferred since FC-95 can cause blackening.
4. ALUMINUM BASE ETCH
FX-161 and FC-134 can be utilized in 2% sodium hydroxide to alter etching rates. For example, at 75°F 0.01% FC-I 34 will reduce the rate of attack about 10g0 while 0. 0290 FX-161 can increase this rate by 0-2070. Due to the speed of reaction, little or no increase in rate is observed during a short etch with FX-161. A longer immersion is required to show the 2090 rate increase. The use of either surfactant will reduce surface tension of the bath which should result in reduced losses due to drag out.
5. MAGNESIUM ETCHES
In a Z0% chromic acid or in an 8% nitric - Z% sulfuric acid etch. 50 ppm FC-95 sharply raises the rate of attack.
FC-95 and FC-98 are also effective in mist suppression, elimination of gray powder, and in producing a more desirable miscroscopically pebbled coating in chrome pickle for magnesium. This is a sodium dichromate, nitric acid solution at 70-90°F. FC-95 is suggested at the 0.02% level; FC-98 at 0.08%.
6. COPPER STRIKES
FC-134 and FX-161 are effective in a 3% copper sulfate, 3% sulfuric acid, 0.5% Carbowax Z0M formulation. Used at the 0.0 1-0. 1% level, these surfactants allow a several-fold increase in immersion time for the same deposition of copper. This results in a plating which is considerably more durable.
- 3? -
1042.0038 3MA01201666

ELECTROLYTIC PROCESSES
1. CHKOME PLATING (5, 6)
FG-95 andFG-98 possess extreme chemical resistance and surface activity in acid media. They are used to eliminate misting of decorative chrome plating baths, du_e to their ability to develop stable, fine foam blankets on top of the bath. In addition, drag out losses are reduced considerably and hazards to operating personnel are minimized. Decreased exhaust velocities and reductions in corrosion of exhaust systems is also attained.
These surfactants generally leave some pin holes in hard chrome plates but can be used to advantage in those applications where such an effect is tenable.
NICKEL PLATING
FX-161, 20 ppm, is useful as a non-foaming surfactant in the Watts
type bright nickel plating bath. A significant reduction in surface tension
of the bath is effected even at this low concentration.
3. ELECTROCHEMICAL MILLING
FC-128 has been shown effective in increasing the rate of metal removal in these applications at 10-100 ppm concentrations. Surface tension of a 25~0 sulfuric acid drilling electrolyte for a nickel alloy was reduced from 75 to Z5 dynes/era.
FX-161 at I0-I00 ppm increases the rate of milling by a factor of about 2 without foaming. FC-I Z8 causes foaming at these concentrations.
- 38 -
1042.0039
3MA01201667

EVAPORATION INHIBITION
P~educing losses from evaporation is readily accomplished through
the use of fluorochemical surfactants. The following illustrates the types
of effects obtained in this application.
1. 1, 1, 1-Trichloroethane - Tests were conducted in open beakers, not in a draft, at room temperature
SAMPLE SOLVENT I~ETENTIO~ after 114 hours
Control 19 0.01% FX-17Z 90 0.1% FX-17Z 9Z
2. Methylene Chloride - Tests were conducted in wide-mouth jars at room temperature in the draft of a laboratory hood. Approximating commercial practice, a layer of water was floated on the top of the solvent. The height of each phase remaining after 2 days is recorded.
Water Phase
Original thickness, mm.
P~etention, %
Sur factant Used
None FC-IZ8 FC-I 34 FX-172
11.5 14.0 14.0 6.5 0 Zl II 0
Methylene Chloride Phase Original thickness, mm Retention, %
57.5 75.5 76.0 75.5 . ZZ 98.7 98.7 91.4
A sample with no water layer and no surfactant evaporated to dryness within six hours. FO-128 and FC-134were used at 100 ppminthe water phase; FX-172 at I00 ppm in the methylene chloride phase.
3. JP-I Aviation Kerosene - This jet fuel was evaluated at 140°F in a laboratory hood for 84’ hours.
SAMPLE FUEL RETENTION
after 84 hours
C ont r ol 52% 100 ppm FX-172 63%
Inhibition of solvent evaporation with fluorochemical surfactants is highly specific as to the solvent type. Our laboratories will be pleased to assist in selecting the best surfactant for a particular solvent.
- 39 -
1042.0040 3MA01201668

PICKLING O1< DESCALING OF STAINLESS STEEL
A 10% hydrochloric acid bath is effectively inhibited by 0.01%
FC-134. Corrosion is essentially stopped 30-60 seconds after immersion.
I%ESINS AND PLASTICS
The addition of Fluorochemical Surfactants to liquid resins reduces their surface tensions considerably. For example, the addition o£ 0.1% FC-134 to a liquid epoxy resin, reduced the surface tension to 34 dynes/cm. after 1 hour (from 48 dynes]cm, without surfactant). Such effects can be used to advantage to speed up the wetting of glass fibers or other fillers for the resin, to increase the rate of release of trapped air bubbles from these viscous resin systems, and to improve wetting of concrete, metal or other substrates to which they may be applied.
FC- 170 in 0.1% concentration added to a phenolic resin (55% solids)
from a 50:50 cellosolve:water solution, will reduce surface .tension from 46.5 dynes/cm, to 24. Z dynes/cm. Improved speed and.~th6roughness of wetting asbestos or other fillers will result.
FC-1 Z8 and FC-170 may be used as wetting, a~gents for water on poly- ethylene or other plastics. Unlike conventional surface active agents,
they do not cause stress-cracking.
In many resin systems, water, oil, or ’soil resistance can be upgraded by the incorporation of small quantities of 5M ]~rand Fluorochemical Sur factants.
SOLVENTS
FC-128 and FX-161 speed up the rate of removal of epoxy resin based paints from magnesium and al~rninum by methylene chloride paint strippers. Solvent evaporation maybe reduced by certain fluorochemical surfactants. This effect is highly selective depending on the particular solvent involved since the solubility of the surfactant in the solvent is an extremely important factor. See the Evaporation Inhibition Section.
- 40 -
1042.0041 3MA01201669

WATER TREATMENTS
1. Open Cooling Water Systems (8)
Laboratory studies indicated low corrosion rates would be obtained on mild steel in synthetic coolir, g water if FC-95 were used in conjunction with the noraml chromatic inhibitor. A summary of these 6-day test results of corrosion rate in mils per year follows:
CORROSION RATES OF MILD STEEL CORROSOMETER PROBES IN SYNTHETIC COOLING WATER
INHIBITOR CORROSION RATE, Mils Per Year
None 60+
15 ppm Chromates
Z5 ppm Chromate 40 ppm Chromate
7.5 4.6 3.3
5 ppm FC-95 + 15 ppm Chromate*
5 ppm FC-95 +,40 ppm Chromate 3.2 0.6
I0 ppm FC-95 + 15 ppm Chromate* I0 ppm FC-95 + 25 ppm Chromate
10 ppm FC-95 + 40 ppm Chromate
Z.9 0.4 0.4
*pH 4.0-4.5; all others pH 6.5-7.5
As a result of this laboratory work, this effect was verified in a forced draft cooling tower for 300 ton air conditioning condenser. The cooling system operated twelve hours a day and had a cap~acity of 3000 gallons. The circulating water temperature averaged 85-F., and the heat exchanger surface temperature was about i05°F. Circulation rate was 900 gpm, and blow-down averaged 4 gpm initially. After the first 49 days of the 115-day test, blowdownwas discontinued to increase the scaling potential of the water.
Results were monitored with mild steel Corrosometer probes. With no inhibitor, a corrosion rate of 73 mpy was obtained. A level of
60 ppm chromate for filming the system, followed by 15 ppm chromate for film maintenance gave a Z. 5 mpy corrosion rate. The addition of l0 ppm FC-95 to the 15 ppm chromate reduced the rate to 1.2 mpy in 3 weeks and to 0.9 mpy in 7 weeks. Duplication of the synergistic effect noted in
the laboratory work was excellent.
Closed Heating System (8)
Another application of fluorochemical surfactants in the water treatment field has been in closed heating systems. Their use as a corrosion inhibitor in these systems evolved during an investigation of a somewhat unrelated problem, that of wear on pump seal rings in closed heating systems..
41 -
1042.0042 3MA01201670

Z. Closed Heating System (8) (continued)
The graphite seal rings were wearing to failure at a rapid rate in systems inhibited with 300 ppm chromate. It was believed that most of this wear was due to the evaporation of the high chrom~te water at the seal surface forming abrasive chromate crystals.
One of the systems in which a failure had taken place was charged
with the combination Z5 ppm chromate - I0 ppm FC-95. New graphite seal rings were measured by micrometer and installed in the pumps. Mild steel and Admiralty brass probes also were installed in the system. Results of this evaluation are shown below:
CORROSION AND SEAL WEAI~ EVALUATION
PERIOD INHIBITOi~ CORI~OSION IIATE, mpy SEAL RING WEAR
" Steel Admiralty mils/month
8.5 months None i. 1 - i. 6 6 weeks 500 ppm Chromate 0.4 - 28.6 8 months 25 ppm chromate 0. I 0.1 0.4
+ I0 ppm FC-95
It is seen that besides maintaining or reducing the low corrosion rate, the FC-95 - low chromate combination inhibitor markedly reduced seal wear rates. It is possible that the surfactant is also acting as a surface lubricant on the seal rings.
4Z-
1042.0043 3MA01201671

WAXES
1. Alkaline Systems
Self-polishing floor waxes, based on polystyrene or acrylic emulsions are an excellent application for fluorodhemical surfactants (7). These
products require a high gloss, excellent durability to acid or neutral media, ease of application, stain and abrasion resistance, re-buffability, re- coatability, and ready removal with alkaline cleaners.
A typical formulation follows :
85 pbw - ]Emulsion polymer, 40% solids 5-10 pbw - Wax emulsion
5-10 pbw - Alkali soluble resin Z pbw - Plasticizer 1 pbw - Fluorochemical surfactant, i% solution
The emulsion polymer is the basic vehicle and can be acrylic, styrene, or a blend of the two. The wax emulsion gives buffability to the system. In the acrylic system, the alkali soluble resin acts as a leveling agent, while in the polystyrene system it acts as a carrier for the polymer and promotes ease of removal with alkaline cleaners. A plasticizer is required for the styrene systems - not for the acrylics. FC-IZ8 or FC-134 are used to improve leveling, gloss, wetting power, and minimize streaking. At low concentrations (70 parts per million) no adverse effects on water resistance are noted.
2. "Lock and Key" Systems
The "Lock and Key" systems are those which employ resins which are insoluble in alkaline compounds, such as soaps and detergents, and which can be easily removed with acidic cleaners. The major advantages of these systems are:
(i.) Scrubability with household cleaner s without r emoving the finish.
(Z.) Higher gloss due to easy re-coatability, and
(3.) Easy removal.
Formulation of these products is basically the same as the alkaline
soluble systems, excpt that the resins are modified for acid solubility -
alkali insolubility. Here, again, the fL, orochemical surfactant does what normal surfactants could do in improving the compatibility and/or solubility of the various phases in each other, but at a level which will not cause sensitivity of the dried film to water or alkali
In applications of this type, it is recommended that both FC-IZ8 and FC-134 be evaluated and compared.
- 43 -
1042.0044 3MA01201672

TOXICITY
Toxicity classifications of 3M Brand Fluorochemical Surfactants range from slightly toxic to moderately toxic. Listed below are LD50 values obtained by determination of acute oral dosage to adult rats and mice.
LD50 SURFAG TAINT gm/IKg of Body Wgt.
FG -9 5 0.45
FG-98 0.18
FG -1 Z8 0.75
FC-I 34 0.5
FX-161 6.2
FC- 170 3. Z
FX-17Z 2.0
C LASSIFIC AT IOIW
moderately toxic
moderately toxic
slightly toxic
slightly toxic
slightly toxic
slightly toxic
slightly toxic
Due care should be exercised in handling these materials until further information is availabl,e on their physiological properties.
- 44 -
1042.0045 3MA01201673

BIB LIOGRAPH Y
"Surface Chemistry, Theory and Applications, " J. J. Bikerman, Second Edition, 1958, Academic Press, Inc., pp. 4-23.
"Surface Chemistry, Theory and Industrial Applications, " Lloyd I. Osipow, ACS Monograph 153, 1962, Reinhold Publishing Corporation, pp. 18-21.
3. Ellison, A. H., and Zisman, W.A., J. Phys. Chem., 58:260 (1954)
Guenthner, i~. A., and Vietor, M. L., I & E C Product Research and Development, I: 165 (1962)
Absolute Control of Chromic Acid IV[ist; G. Hama, W. Frederick, D. !Vlillage, and H. Brown; American Industrial Hygiene Association Quarterly, 15: 3, September, 1954.
6. U.S. Patents Z, 750,334 and Z,750, 337.
7. U.S. Patent 2,937,098.
"Fluorochemical Surfactants Control Diverse Corrosion Problems, R. D. Burke, J. B. Kittredge, J. S. Spira and i%1. L. Vietor, presented at the 1963 Gonference of the National Association of Corrosion Engineers, New York, N. Y., March 14, 1963.
- 45 -
1042.0046 3MA01201674

BRANCH OFFICES
Atlanta 5925 Peachtree Industrial Blvd. Chamblee, Georgia
Boston 155 Fourth Avenue Needham Heights 94, Mass.
Buffalo Post Office Box 2012 Buffalo 6, New York
Chicago 6850 South Harlem Avenue Argo Post Office Bedford Park, Illinois
Cincin nati 4835 Para Drive Cincinnati 37, Ohio
Cleveland 12200 Brookpark Road Cleveland 30, Ohio
Dallas 2121 Santa Anna Avenue Dallas 28, Texas
Detroit 411 Piquette Avenue Detroit 2, Michigan
High Point 2401 Brevard Street High Point 4, North Carolina
Los Angeles 6023 South Garfield Avenu~e Los Angeles 22, California
New York 700 Grand Avenue Ridgefield, New Jersey
New York 99 Park Avenue New York 16, New York
Philadelphia 5698 Rising Sun Avenue Philadelphia 20, Pennsylvania
St. Louis 10725 Baur Blvd. St. Louis 32, Missouri
St. Paul 935 Bush Street St. Paul 1, Minnesota
San Francisco 320 Shaw Road So. San Francisco 10, California
Washington, D.C. 425 13th Street, N.W. Washington 4, D.C.
1042.0047 3MA01201675
AR226-2824/ ¿ c ó - ó / 9 ¿ > - ¿ 5 ~
International Research and Development Corporation
SPONSOR: E.I. duPont de Nemours and Company
MATERIAL:- SUBJECT: Ninety-Day Feeding Study in the Rat.-
Development Corporation
Collaborators:R. H. Buller, Ph.D., Director of Pharmacology R. G. Geil, D.V.M., Director of Pathology
Date : November 30, 1965
SSoinpany Sanitized. Does not contain TSCA CB1

International Research and Development Corporation
Page 1
I. SYNOPSIS
In a 90-day feeding study, male and female albino rats were fed diets containing H ^ t levels of 100, 500 or 2500 ppm. After 35 days of continuous'feeding, the 500 and 2500 ppm. dietary levels were increased to 1000 and 5000 ppm., respectively for the remainder of the study. After the prescribed 90-day period of compound administration, representative animals were placed on a withdrawal study.
All rats appeared essentially normal with respect to behavior and appearance throughout the study.
No adverse effect on body weight gain was found at any dietary level employed in this study, both in the active compound administration phase and in the withdrawal period.
Average total weekly food consumption measured in grams/rat/week in those groups fed 100 and 500 - 1000 ppm. the dietcompared favorably with the control rats throughout the study. At the 2500 - 5000 ppm. dietary level, food consumption of the male raps ranged from 1.1 to 8.7 per cent less than control male rats, and food consumption of the female rats ranged from 5.2 to 16.4 per cent less than the female control rats. These differences were first noted in the 8th week for males and in the 4th week for females and continued throughout the treatment period.
No meaningful differences in food consumption were reflected by the treated groups of rats in comparison to the control group on the basis pf grams of food consumed per day per kilogram of body weight.
No compound-related hematologic or biochemical changes were found
Company Sanitized. Does not contain TSCA CBJ
International Research and Development Corporationii!ii
Page 2
at the 100 and 500 - 1000 ppm. dietary levels of ^ However,slightly decreased values for erythrocyte counts, hematocrits and hemoglobin concentrations were found for males and females at the 2500 - 5000 ppm. level, particularly at the terminal (90-day) clinicopathology examination. Urinalyses were normal at all times.
Compound-related changes observed at the 90-day necropsy examination consisted of increased liver and kidney weight at the 1000 and 5000 ppm. dosage levels and pale yellowish livers in some male rats from the 500 - 1000 and 2500 - 5000 ppm. dosage levels. In histologic section, only livers from the 2500 - 5000 ppm. dosage level showed any change and this consisted of a slight hypertrophy of centrolobular hepatocytes. The increase in l^ver and kidney weights and centrolobular hepatocyte hypertrophy persisted with diminished magnitude through 21 days of compound withdrawal. Similar organ weight and histologic changes were observed at the 30 and 60-day interim sacrifices .
Company Sanitized. Does not contain TSCA CBf

international Research and Development Corporation
Page 3
II. COMPOUNDThe test compound was received from E. I. duPont de Nemours and
Company, Wilmington, Delaware, on June 19, 1965. It was a brown amorphous solid in containers bearing the labe]
Haskell No. 4212."
Company Sanitized. Does not contain TSCA CB>

international Research and Development Corporation
Page 4
III. CLINICAL STUDIES:A. METHODS:
1. General Procedure:Eighty male (weighing from 45 to 64 grams) and eighty female
(weighing from 47 to 63 grams) albino rats of the Charles River strain were used for this study.
The rats were housed individually in cages suspended above the droppings in an air-conditioned room throughout the study and were fed a diet of Purina Laboratory Chow for rats ad libitum. Water also was available at all times.
The animals were divided into one control group and three treated groups of 20 male and 20 female rats each.
The rats in each sex group were selected so that the average body weight of each group was similar to that of the other groups of the same sex.
2. Compound Administration:incorporated into the standard powdered laboratory
diet of Purina Laboratory Chow and offered to the treated groups of rats ad libitum. The test diet was freshly prepared each week and the compound-in-diet levels mixed so that the rats received^[|^|^^at dietary levels of 100, 500, or 2500 ppm. In the sixth week of compound administration those groups receiving 500 or 2500 ppm. were increased in concentration to dietary levels of 1000 or 5000 ppm., respectively. Those animals receiving 100 ppm. o f ^ m | ^ i n the diet continued to receive this level throughout the 13-week study period.
The control groups of rats received the powdered diet of Purina Laboratory Chow, but without
Company Sanitized, Does not contain TSCA CBf

Inzer national Research and Development Corporation
Page 5
Following 13 weeks of compound administration rats in all groups were sacrificed and subjected to necropsy examination with the exception'of certain selected animals from the control‘group and from the treated groups at the 1000 and 5000 ppm. dietary levels which were continued on study in a compound withdrawal phase. The withdrawal phase of this study will: be reported in its entirety in a subsequent and separate report.
3. Observations:The control and test animals were observed daily for mortality,
alteration in general appearance and behavior, and signs of pharmacodynamic and/or toxic effects.
Body weights, food consumption, and food efficiency values were recorded for each rat weekly throughout the study.
4. Laboratory Tests:a. Hematology:
Hematologic examination consisted of erythrocyte counts,1 . 2 Ttotal and differential leucocyte counts, hematocrits , and hemoglobin
concentrations. These studies were performed individually on 6 maleand 6 female rats randomly selected in the control and each test groupduring the control period and again at 30, 60, and 90 days.
b. Urinalysis:Urine samples were obtained from the same animals at the
same time intervals used to obtain blood for hematology. Urinalysis
Coulter Particle Size Counter, Model A., Coulter Electronics,590 W. 20th Street, Hialeah, Florida.
2 Miller, S., Microcapillary Method, Textbook of Clinical Pathology, 1960, Williams and Wilkins Company, Philadelphia, Pa., p. 43.3 Miller, S., Cyanmethemoglobin Method, Textbook of Clinical Pathology, 1960, Williams and Wilkins Company, Philadelphia, Pa., p. 35.
v , -"¡any Sanitized. Does no! contain TSCA C~!?

International Research and Development Corporation
Page 6
consisted of qualitative tests for glucose,bilirubin^, occult b l o o d , a n d albumin,^’ measurements of volume, andspecific gravity, and microscopic examination of the urinary sediments.
c. Biochemistry:Biochemical examinations were conducted at the same inter
vais as for hematology. Serum transaminase (SGOT and SGPT) . and' plasma alkaline phosphatase determinations^ were performed on 6 male
45678 9
10
111213
1415
"Combistix" (Ames Reagent Strips)."Clinistix" (Ames Reagent Strips)."Clinitest" (Ames Reagent Tablets)."Ictotest" (Ames Reagent Tablets)."Heraastix" (Ames Reagent Strips)."Hematest" (Ames Reagent Tablets)."Occultest" (Ames Reagent Tablets)."Albustix" (Ames Reagent Strips)."Bumintest" (Ames Reagent Tablets).Heller's Ring Test, Practical Physiologic Chemistry, Hawk, Oser and Summerson, 13th Ed., p. 830.Beckman Expanded Scale pH Meter, Model No. 76.Reitman, S., and Frankel, S., Colorimetric Method for the Determination of Serum Transaminase Activity, Am. J. of Clin. Path., ¿8: 56,1957.
^ Marsh, W., Modified King-Armstrong Method, Clin. Chem. 5: 119, 1959.
npany Sanitized. Does not contain TSCA CBI

international Research and Development Corporation
Page 7
and 6 female rats randomly selected from the control and treated groups. The animals chosen for hematology values were not used for these biochemical determinations.
B. RESULTS:1. General Behavior and Appearance:
No adverse changes in behavior or appearance were encountered that could be related to the administration
Animals in the control and all treated groups appeared essentially normal each day with the exception of an occasional rat in each group that exhibited slight nasal and/or ocular porphyrin discharge.
Other incidental findings, unrelated to compound administration, included one treated female animal (Rat #14374) at the 5000 ppm. dietary level which exhibited a swollen nose in the 13th week of study, one treated male (Rat #14298) at this dietary level which exhibited a mass on the flank from the 16th week (withdrawal period) until terminal necropsy examination, and one treated male (Rat #14324) at this same dietary level which exhibited destruction of the right eye, from the 15th week to the terminal (in the withdrawal period) necropsy examination.
2. Body Weights (Tables 1-8 and Figures 1 and 2):a. Control:
The control animals maintained body weight curves which were consistent with those curves exhibited by control animals of the same age and strain maintained in these laboratories from time-to-time.
b. 100 and 500 ppm.*:Male and female rats at these dietary levels maintained
body weights which paralleled closely those of their respective control groups.* 500 ppm. dietary level increased to 1000 ppm. in the 6th week of study.
zmpany Sanitized. Does not contain TSCA CBS

International Research ana Development Corporation
i Page 8Ij ■ ■
c. 2500 ppm.* **:No marked body weight changes occurred among male and female
rats at this dietary level during the course of compound administration. Male animals in the 9th week exhibited a body weight gain 8.8 per"cent less than control males. This difference in body weight gain persisted for the duration of the study period. During the withdrawal phase of this study the greatest decrease in body weight gain occurred. Even then, however, this difference was only about.10 per cent less than that of the male control animals.
Female treated animals in this group in the 7th week of study exhibited a weight gain which was 11.5 per cent less than that of the control female animals. This difference in body weight gain persisted for the duration of the treatment period. The greatest difference in body weight gain of the female group was noted in the 12th week of study at which time a difference of only 11.7 per cent occurred.
3. Food Consumption (Tables 10 and 11):a. Grams/Rat/Week:
Average total weekly food consumption for male and female rats in those groups receiving 100 ppm. and 500 ppm.* compared favorably with similar measurements obtained from the control group.
Treated rats receiving 2500 ppm.** showed food consumption values less than those of control animals beginning in the 4th week for treated females and in the 8th week for treated males. This decrease in food consumption continued throughout the study period and ranged from 1.1 to 8.7 per cent for the males and 5.2 to 16.4 per cent for the females in this group. The decreased food consumption in this* 500 ppm. dietary level increased to 1000 ppm. in the 6th week of study.** 2500 ppm. dietary level increased to 5000 ppm. in the 6th week of study.
Company Sanitized. Does not contain TSCA CBI

international Research and Development Corporationr
Page 9
S)
group continued in both sexes for the duration of the treatment period.
b. Grams/Kg,/Day: -No biologically meaningful differences were observed on
food consumption in the treated groups of rats when compared with the control group on a basis of grams/kg./day food consumed.
4. Survival (Table 9):Other than for those animals subjected to interim necropsy
examination at 30 and 60 days, all control and treated animals survived the course of study with two exceptions. One control female (Rat #14160) succumbed in the terminal (13th) week of study and one treated male (Rat #14212) at the 100 ppm. level of succumbed in the11th week of study.
5. Laboratory Tests: a. Hematology:
No compound-related hematologic changes were found at the 100 and 500 ppm. dietary levels At the 2500 ppm. level,group values for both sexes, with respect to erythrocyte count, hematocrit and hemoglobin concentration, generally were slightly lower than those for the control animals and rats at the 100 and 500 ppm. dietary levels of though some changes in these parameterswere seen at the 60-day interval of examination, they were overall more pronounced after 90 days of compound administration. It is of interest that inspection of these values for individual rats in the high dietary level groups failed to reveal marked changes for any given animal, that is, whereby that animal's value would tend to markedly lower the group average, but rather that lower values, with a relatively small spread from individual to individual, were found for most of these rats.
Company Sanitized. Does not contain TSCA CUt

International Research and Development Corporation
Page 10
Group average values are summarized for male rats in Table 12 and for female rats in Table 13. Individual values for all male and female rats appear in Tables 14 through 17. .
b. Plasma Biochemistry:No compound-related changes were found at any period of
examination with respect to serum alkaline phosphatase activity or serum glutamic pyruvic transaminase (SGPT) or serum glutamic oxalacetic transaminase (SGOT) activities.
Values obtained in these studies appear in Tables 18 through21.
c. Urinalysis :Urinalysis examinations failed to reveal changes which were
considered to be related to treatment with the test compound. Results of these measurements appear in Tables 22 through 25.
Company Sanitized. Doss noi contain TSCA C M
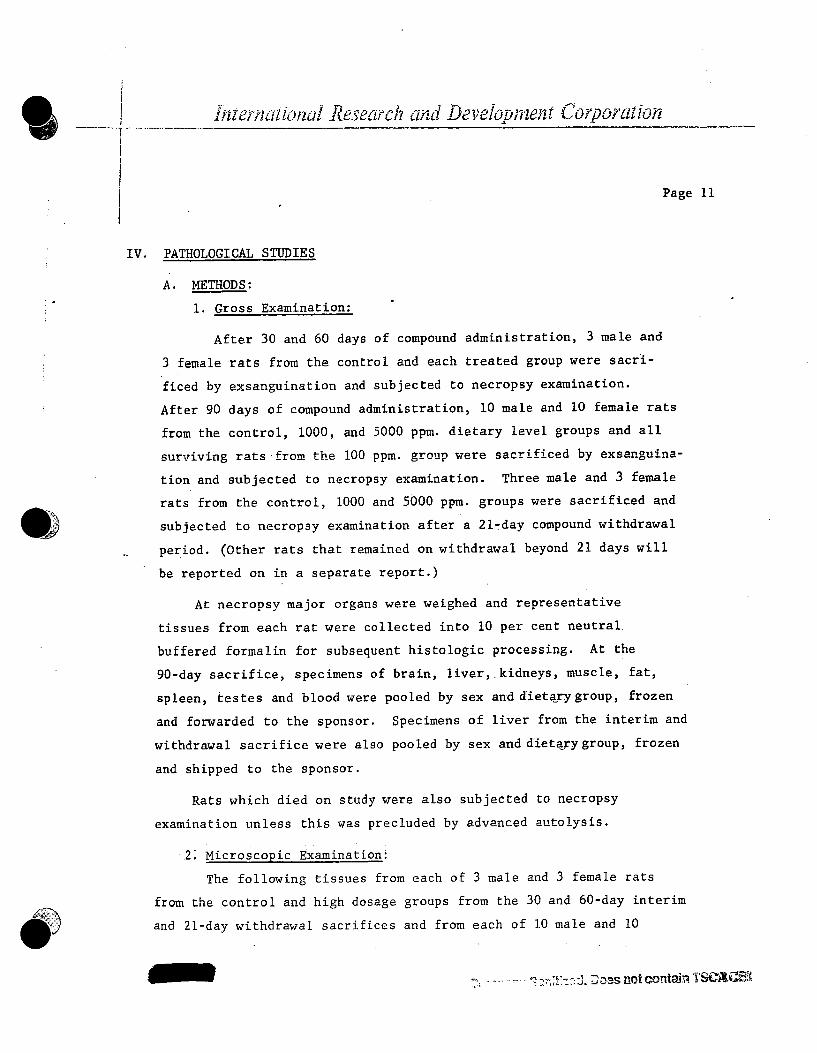
Iniernaiional Research and Development Corporation
Page 11
IV. PATHOLOGICAL STUDIESA. METHODS:
1. Gross Examination:After 30 and 60 days of compound administration, 3 male and
3 female rats from the control and each treated group were sacrificed by exsanguination and subjected to necropsy examination.After 90 days of compound administration, 10 male and 10 female rats from the control, 1000, and 5000 ppm. dietary level groups and all surviving rats from the 100 ppm. group were sacrificed by exsanguination and subjected to necropsy examination. Three male and 3 female rats from the control, 1000 and 5000 ppm. groups were sacrificed and subjected to necropsy examination after a 21-day compound withdrawal
. period. (Other rats that remained on withdrawal beyond 21 days will be reported on in a separate report.)
At necropsy major organs were weighed and representative tissues from each rat were collected into 10 per cent neutral buffered formalin for subsequent histologic processing. At the 90-day sacrifice, specimens of brain, liver, kidneys, muscle, fat, spleen, testes and blood were pooled by sex and diet jry group, frozen and forwarded to the sponsor. Specimens of liver from the interim and withdrawal sacrifice were also pooled by sex and dietary group, frozen and shipped to the sponsor.
Rats which died on study were also subjected to necropsy examination unless this was precluded by advanced autolysis.
2\ Microscopic Examination:The following tissues from each of 3 male and 3 female rats
from the control and high dosage groups from the 30 and 60-day interim and 21-day withdrawal sacrifices and from each of 10 male and 10
-.Doss go! contain TSGi.€S®

International Research and Development Corporation
Page 12
female control and high dietary group rats from the 90-day terminal sacrifice were paraffin-embedded, sectioned, stained with hematoxylin and' eosin and examined microscopically:
Sections of liver from 10 male and 10 female rats from the 1000 ppm. level - 90-day sacrifice rats were also processed as above and examined.
B. RESULTS: ‘1. Gross Pathology (Table 26) and Organ Weights (Tables 2.7 and 28):
Compound related gross changes observed at necropsy were limited to male rats from the 1000 and 5000 ppm. dietary level groups and consisted of pale, yellowish livers in some but not all male rats from the 5000 ppm. dietary level group and in a few rats from the 1000 ppm. dietary level group.
None of the rats dying on study died of compound related causes. Rat #14160 (Control) died of pneumonia. Autolysis precluded diagnostic necropsy of Rat #14212 (100 ppm.).
Compound related variations in organ weights were limited to the livers and kidneys of treated rats. At the 90-day sacrifice there was a moderate increase in actual and relative liver weights of the 1000 and 5000 ppm. dietary level rats. This increase was also seen in the 5000 ppm. dietary level rats at the 60-day interim
brainspinal cord peripheral nerve eyepituitarythyroidparathyroidadrenallung
heartspleenlymph nodethymusbone marrowsalivary glandstomachsmall intestine large intestine
pancreasliverkidneysurinary bladder testes or ovaries prostate or uterus skeletal muscle skin bone
Company Sanitized. Does not contain TSCÂ CBii

International Research and Development Corporaiion
Page 13
sacrifice and in the 2500 ppm. dietary level rats at the 30-day interim sacrifice. After 21 days of compound withdrawal, a slrght increase in*liver weight persisted at the 5000 ppm. dietary level. -
Mean actual and relative kidney weights were slightly^m the 1000 and 5000 ppm. dietary level rats at the 90-day sacrifice.Kidney weights were also slightly increased in the 1000 and 5000 ppm. level rats at the 60-day interim sacrifice and 21-day withdrawal sacrifice and in the 500 and 2500 ppm. level at the 30-day interim sacrifice. Although the values from the interim and withdrawal sacrifices represent only 3 rats per sex group, these variations in kidney weights always had a dietary-level relationship.
2. Histopathology (Tables 29 and 30):Compound related histopathologic changes were found only in
the livers of rats from the highest (2500-5000 ppm.) dietary level and consisted of slight hypertrophy of centrolobular hepatocytes.Affected liver cells had cytoplasm which was less coarsely granular and more homogeneous than the unaffected cells at the periphery of the liver lobules and in the livers of rats in the control and lower dietary levels. This change, to a slight degree was seen after 30 days at the 2500 ppm. level. After this group was raised to 5000 ppm., the change was more marked at the 60 and 90-day sacrifices. A very slight change persisted in the 5000 ppm. level male rats sacrificed after a 21-day compound withdrawal period. This liver change was always more marked in male rats and was seen only at the highest (2500-5000 ppm.) dietary level.
No lesions in other organs were considered to have been of compound related origin. No histologic basis was found for the slight increase in kidney weights in treated rats.
■oany Sanitized. Does not contain TSCAGBli

t~ /£ 0 - r 9 a - £ 'T"Ninety-Day Feeding Study in the Rat.
1414214143141441414514146141471414814149141501415114152141531415414155141561415714158141591416014161Me an
555456 56565557 6055585650575751585758 505455
93 68 99 8394 91 88101:72 83 67 5263 71 676473 54 76 4875
12995134 107 136123124135 103 116114 93 82116115105106 9912491
112
149123163130161141 149 162 126137 133 122 117142 139 121 132146147 128138
175136187142184160170177149158154138141160161134153156 162 148157
185144207159196179178199164181171143156 170 161 154 149 181157144169
195 155 249 166. 217 184 197 215191 189 189 166 172192196 153 172 199 189 178188
Sacrificed 169 191260 285Sacrificed Sacrificed191 214 230 213 202 203 183 195 203 210 166 190 219 206192203
231249261243237235231 237239 243 165232240 221 231234
198296
218241265243224 226 207225 223 241 174244 232 215 214229
Sacrificed 306 314
221 236252 268Sacrificed 252 271224 234Sacrificed216233244250178215250239226236
248246258261185236264256236251
Company Sanitized. Does not contain TSCA CBS 0>OQ
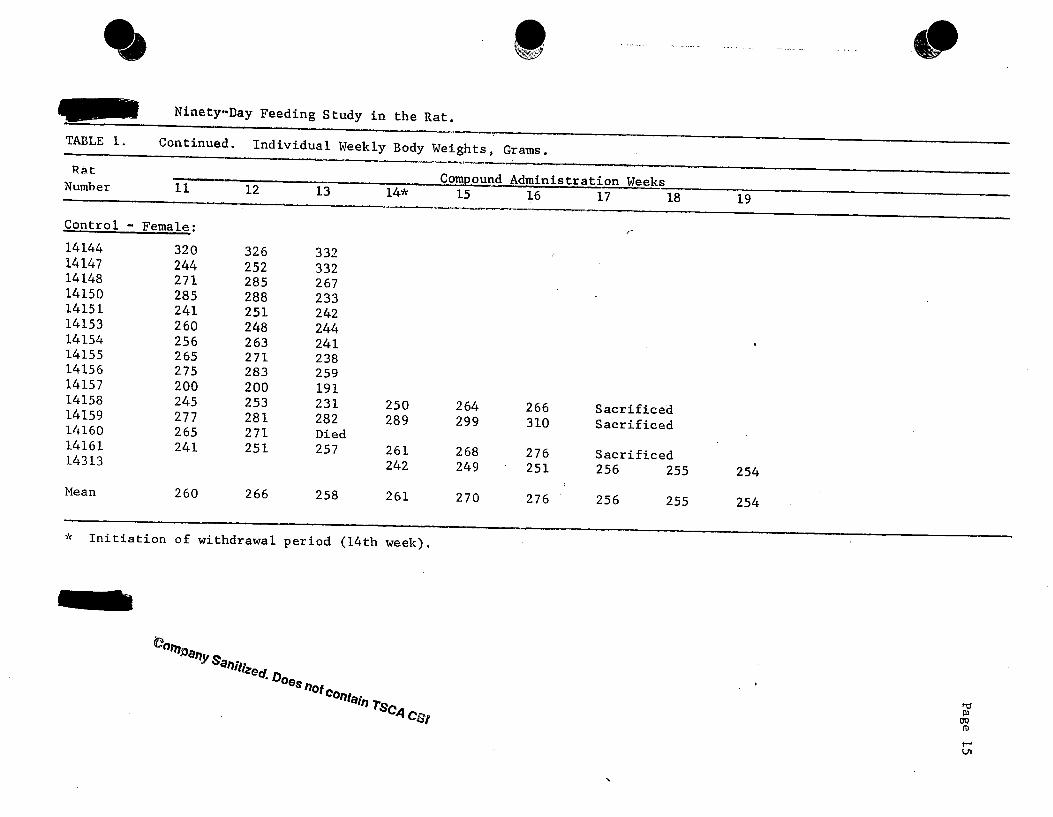
Ninety*Day Feeding Study in the Rat.TABLE 1. Continued. Individual Weekly Body Weights, Grams.RatNumber --------- —— _ ..........Compound Administration Weeks1 i LjL 1J 14* 15 16 17 18 19Control - Female :1414414147141481415014151141531415414155141561415714158141591416014161 14313Mean
320 326244 252271 285285 288241 251260 248256 263265 271275 283200 200245 253277 281265 271241 251
260 266
332332267233242244241238259191231282Died257
258
250 264 266289 299 310261 268 276242 249 251261 270 276
SacrificedSacrificedSacrificed256 255 254256 255 254
Initiation of withdrawal period (14th week),
aniti'¿Gtf ;oesnotc°ntiain r«C>
C&t
Page 15

Ninety-Day Feeding Study in the RatTABLE 2. Individual Weekly Body Weights, Grams.Rat
NumberControl Period1 2 1 2
Control - Male:14162 64 99 143 18514163 62 97 151 20714164 60 100 89 16914165 59 94 157 21414166 55 92 133 17514167 50 67 103 14514168 61 98 147 18914169 45 74 113 14314170 58 95 136 18514171 51 83 119 15814172 60 83 152 20514173 52 55 105 15314174 51 64 113 15514175 54 76 137 18514176 57 76 136 18014177 54 71 123 16714178 62 64 117 15314179 52 66 130 18114180 53 67 120 17214181 55 67 128 177Mean 55 79 128 175
^OTOpany Sanitized. Does not contain TSCA
/

' *
Compound Administration Weeks3 4 5 6 7 8 9 10
230 244 263 Sacrificed256 294 309 338 354 388 402 412229 288 324 366 388 446 461 480251 309 346 Sacrificed211 248 274 300 321 344 360 37 0187 231 260. 290 311 308 Sacrificed243 276 308 Sacrificed224 274 307 337 365 39.5 413 433231 265 285 317 348 380 Sacrificed191 260 257 287 310 349 364 390263 307 300 336 371 417 441 467199 242 263 291 306 334 346 370204 238 273 318 341 373 382 412234 251 293 317 370 422 449 469222 264 294 328 354 390 393 420209 241 271 300 •318 336 341 358200 '234 250 283 311 340 Sacrificed231 238 261 322 347 380 395 420224 272 300 334 360 388 398 423234 241 300 344 373 401 409 441224 261 287 318 344 376 397 420
03OQfOON

Ninety-Day Feeding Study in the Rat.TABLE 2. Continued. Individual Weekly Body Weights, Grams.RatNumber Compound Administration Weeks
11 12 13 14* 15 16 17 18 19
Control - Male :14163 406 391 37514164 505 505 49514166 398 409 38314169 446 453 43114171 412 423 38514172 488 483 47814173 389 405 37614174 427 440 40114175 498 496 50614176 442 452 42514177 365 374 357 396 402 414 Sacrificed14179 435 455 461 479 489 500 Sacrificed14180 415 463 461 489 472 ■ 514 Sacrificed14181 451 463 472 476 466 497 506 515 52214314 538 518 556 574 571 58514315 512 503 523 539 544 559Mean 434 444 429 482 475 501 540 543 555
* Initiation of withdrawal period (I4th week).
eompan, Sa"fed- Doe, no, TSCA cp
Page 17

Ninety-Day Feeding Study in the Rat.TABLE 3. Individual Weekly Body Weight, Grams.RatNumber Control Period Compound Administration Week«?1 2 1 2 3 4 5 6 7 8 9 10100 ppm. - Female:1418214183141841418514186141871418814189141901419114192141931419414195141961419714198141991420014201
56 86 11251 77 12359 82 11355 87 11057 101 14455 76 10955 80 11155 63 9155 88 11653 84 12254 60 10653 67 11361 73 . 9059 69 10757 65 10550 58 . 9862 76 12351 60 10253 70 12359 65. 115
131 151 167153 171 203126 145 165135 154 174176 210 252134 155 175124 139 149119 150 168137 154 176153 177 187127 141 172141 158 181124 148 160133 157 175147 159 179121 146 157141 167 195125 141 144147 165 184152 179 183
175 Sacrificed210 231 250182 194 211186 Sacrificed251 275 290194, 206 230162 Sacrificed177 198 216180 200 211208 223 241174 185 193199 210 222179 203 221190 211 231183 199 213179 197 207202 220 237180 197 215197 212 224208 235 245
262 273 285218 Sacrificed303 307 331245 252 269230 245 257225 225 242258 269 286207 215 234238 Sacrificed234 Sacrificed245 243 ' 265227 236 267227 238 258253 259 ■ 270236 241 256244 246 264263 271 275
Mean 56 74 112 137 158 177 191 212 227 242 251 269
Company Sanitized. Does no! contain TSCA CB! TJo
ce

Ninety-Day Feeding Study in the Rat.
1418314186141871418914190141911419214195141961419714198141991420014201
2903'45271272 248 287 236 280 277 251 283 261273 298
306353285 274 255 303 248286 276 262 296 269 278 301
283333258252227283221261247244278-273285308
Mean 277 285 268
Does no! contain TSCA CBI
Page IS
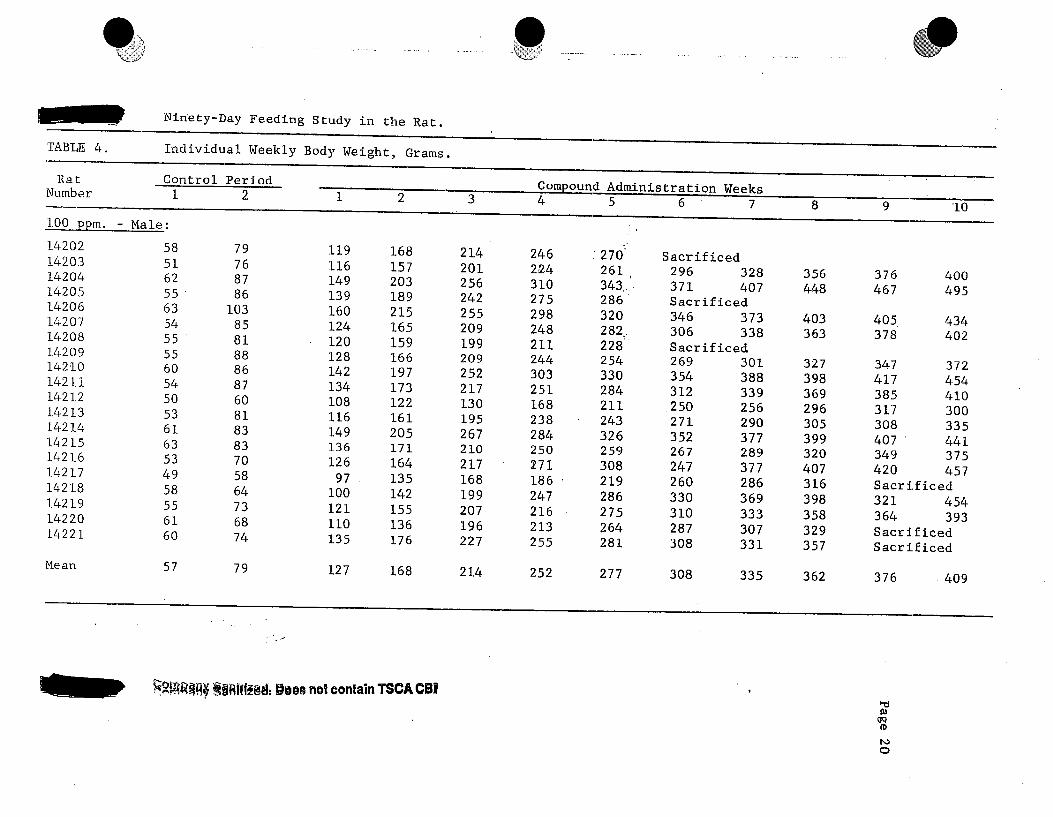
Ninety-Day Feeding Study in the Rat
TABLE 4. Individual Weekly Body Weight, GramsRat Control Period
Number 1 2 1100 ppm. - Male:14202 58 7914203 51 7614204 62 8714205 55 8614206 63 10314207 54 8514208 55 8114209 55 8814210 60 8614211 54 8714212 50 6014213 53 8114214 61 8314215 63 8314216 53 7014217 49 5814218 58 6414219 55 7314220 61 6814221 60 74Mean 57 79
119 168116 157149 203139 189160 215124 165120 159128 166142 197134 173108 122116 161149 205136 171126 16497 135100 142121 155110 136135 176127 168
________ Compound Administration Weeks3 4- 5 6 7
214 246 : 270' Sacrificed201 224 261 296 328256 310 343..' 371 407242 275 286 Sacrificed255 298 320 346 373209 248 282, 306 338199 211 228 Sacrificed209 244 254 269 301252 303 330 354 388217 251 284 312 339130 168 211 250 256195 238 243 271 290267 284 326 352 377210 250 259 267 289217 271 308 247 377168 186 ■ 219 260 286199 247 286 330 369207 216 275 310 333196 213 264 287 307227 255 281 308 331214 252 277 308 335
8
356 448403363327398 369 296 305399 320 407 316 398 358 329357362
9 10
376 400467 495405 434378 402347 372417 454385 410317 300308 335407 441349 375420 457Sacrif iced321 454364 393SacrificedSacrificed376 409
igRifßed: Bees net contain TSCÄ CBf

Ninety-Day Feeding Study in the Rat.TABLE 4. Continued. Individual Weekly Body Weight, Grams. •Rat Compoiand Administration Weeks11 12 13 14 15 16 17 18 19100 ppm. - Male:14203 411 440 42714204 521 527 51514206 450 468 432 •
14207 423 436 41014209 385 398 36314210 462 477 48114211 432 456 43214212 Died14213 353 368 34814214 446 456 44814215 385 405 38314216 482 501 50014218 473 496 50714219 406 421 430Mean 433 450 437 *
Wffeetf Dna Does
tsca CBl Page 21

Ninety-Day Feeding Study in the RatTABLE 5. Individual Weekly Body Weight, Grams.Rat
NumberControl Period Compound Administration Weeks1 2 1 2 3 4 5 6 7 8 9 10
500 ppm. - Female:*1.4222 55 88 126 153 177 190 204 Sacrificed14223 60 83 116 134 154 172 181 195 202 213 Sacrificed14224 58 92 111 127 141 163 185 200 212 238 273 26014225 48 59 ' 91 115 136 141 154 Sacrificed14226 57 73 115 140 161 182 188 204 215 223 235 24714227 57 92 130 157 178 201 210 .. 230 244 256 264 27614228 55 86 130 154 166 178 197 Sacrificed14229 55 78 113 140 160 174 184 202 215 237 254 26114230 55 90 119 134 147 158 175 190 202 215 Sacrificed14231 52 76 114 153 184 195 219 237 254 272 287 30314232 50 57 100 134 147 174 186 204 216 234 241 25314233 52 64 105 125 130 148 160 170 181 191 201 20414234 59 73 110 129 140 140 164 176 187 195 Sacrificed14235 58 68 119 148 175 201 214 255 249 266 279 29714236 56 76 117 150 171 193 213 216 236 242 248 26314237 52 52 86 123 145 146 168 188 200 212 221 22314238 50 77 119 150 171 195 199 211 222 227 236 24314239 57 74 129 146 163 183 198 206 221 234 242 25314240 55 75 117 138 154 157 188 197 214 224 230 24514241 55 72 100 128 144 143 180 188 200 206 216 236Mean 55 75 113 139 157 172 188 204 216 229 243 255
Dosage level increased in the 5th week of study to 1000 ppm.
Company Sanitized. Does not contain TSCA CBS ndPi

Ninety-Day Feeding Study in the Rat.TABLE 5.
_500 ppm, - Femaie142241422614227 1422914231142321423314235142361423714238142391424014241 14306 14308 14320
267 279 263246 257 239244 282 269265 277 270310 314 268255 269 251212 216 207304 312 299262 272 254232 244 234253 256 242 263259 266 261 262256 263 ■ 259 274235 245 246 254
254249234
276 278 Sacrificed272 279 Sacrificed278 280 Sacrificed269 267 269 282266 270 272 284258 266 265 273236 241 246 250
276284283253
Mean 257 268 254 256 265 269 263 272 274
Company Sanitized. Does no! contain TSCA CBl
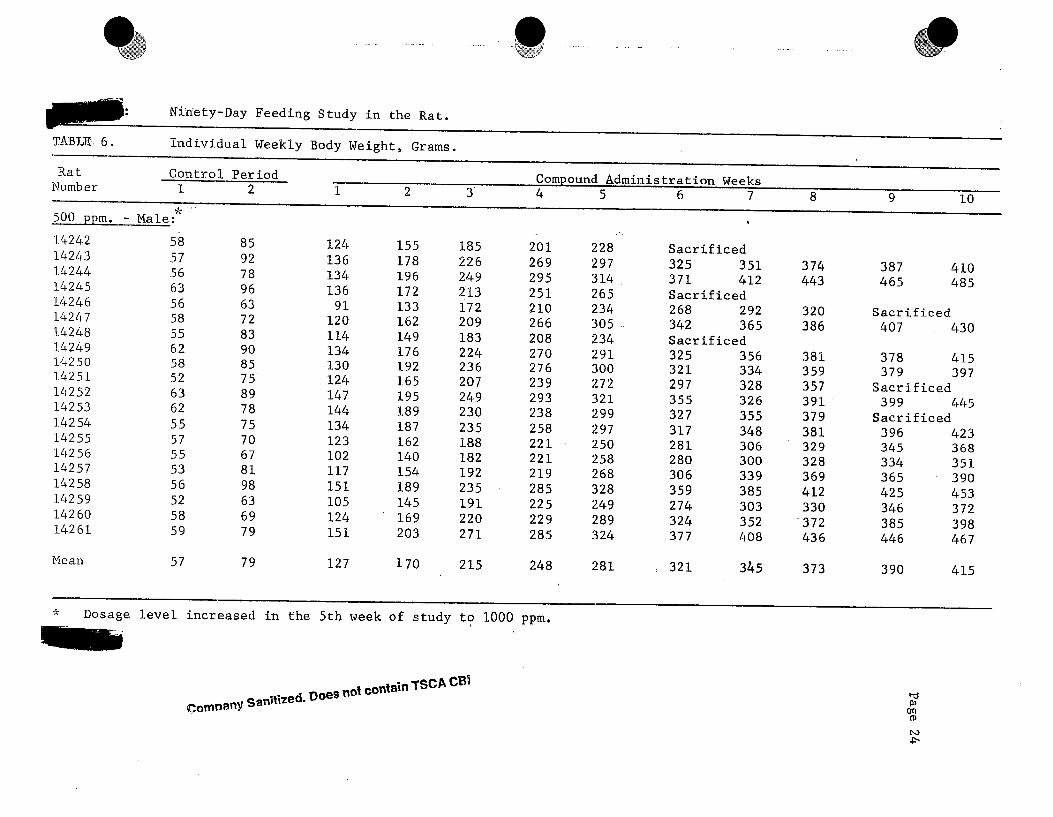
TABLE. 6.Ninety-Day Feeding Study in the Rat. Individual Weekly Body Weight, Grams.
RatNumber Control Period
1 2 Compound Administration Weeks
500 ppm. - * 'Male:14242 58 85 124 155 185 201 2281424.3 57 92 136 178 226 269 29714244 56 78 134 196 249 295 31414245 63 96 136 172 213 251 265L4246 56 63 91 133 172 210 23414247 58 72 120 162 209 266 30514248 55 83 114 149 183 208 23414249 62 90 134 176 224 270 29114250 58 85 130 192 236 276 30014251 52 75 124 165 207 239 27214252 63 89 147 195 249 293 32114253 62 78 144 189 230 238 29914254 55 75 134 187 235 258 29714255 57 70 123 162 188 221 25014256 55 67 102 140 182 221 25814257 53 81 117 154 192 219 26814258 56 98 151 189 235 285 32814259 52 63 105 145 191 225 249142 60 58 69 124 169 220 229 28914261 59 79 151 203 271 285 324Mean 57 79 127 170 215 248 281
* Dosage level increased in the 5th week of study to 1000 ppm.
6 7 8 9 10
Sacrificed325 351 374 387 410371 412 443 465 485Sacrificed268 292 320 Sacrificed342 365 386 407 430Sacrificed325 356 381 378 415321 334 359 379 397297 328 357 Sacrificed355 326 391 399 445327 355 379 Sacrificed317 348 381 396 423281 306 329 345 368280 300 328 334 351306 339 369 365 390359 385 412 425 453274 303 330 346 372324 352 372 385 398377 408 436 446 467321 345 373 390 415
Company Sanitized. Does not contain t s c a c b ih300(I»

TABLE 6. Continued. Individual Weekly Body Weights, Grams.
Ninety-Bay Feeding Study in the Rat.
RatNumber
500 ppm.1424314244 142471424914250 1425214254142551425614257142581425914260142611432114322 14325Mean
~ Male:445 435 422509 525 499449 471 447434 451 441412 431 411453 463 434452 437 428382 396 380369 377 348408 415 390478 499 477 517384 404 419 435400 417 434 452500 520 548 568
507516549
434 446 434 506
496 545 S a c r ific e d446 465 S a c r ific e d458 476 S a c r ific e d542 563 582 612 632487 532 538 559 544497 531 545 550 549525 562 569 586 577
493 525 559 577 576
Initiation of withdrawal period (14th week).
Company Sanitized. Doesnot contain TSCACBI

Ninety-Day Feeding Study in the Rat.
TABLE 7. Individual Weekly Body Weights, Grams.kat Control Period ___________________ Compound Administration. WeeksNumber 1 2 1 2 3 4 5 6 7 8 9 10* 2500 ppm. - Female14262 52 87 120 138 164 174 181* Sacrificed14263 53 79 119 145 166 182 200 230 246 264 Sacrificed14264 53 71 107 124 140 149 160 169 180 195 194 20714265 55 72 104 127 143 154 165 Sacrificed14266 50 63 78 109 133, 153 171 181 195 208 222 228 .14267 55 76 113 134 147 163 175 188 202 216 223 23214268 63 85 114 132 137 135 158 Sacrificed14269 56 86 115 130 148 163 173 182 192 200 202 21614270 56 85 116 136 151 161 171 174 184 193 Sacrificed14271 60 95 134 161 180 187 212 225 240 246 256 26014272 58 74 117 134 148 158 173 186 193 200 207 21314273 51 66 116 140 161 169 185 197 202 210 220 22614274 47 61 99 133 151 171 182 195 206 219 215 22514275 57 75 122 144 168 174 198 207 222 233 Sacrificed14276 52 63 107 135 148 162 179 191 209 226 231 24314277 52 66 106 134 152 151 168 188 196 208 205 22314278 47 55 85 115 141 149 174 189 198 216 221 23014279 61 76 123 144 160 155 185 206 211 222 230 23614280 56 75 126 154 178 173 204 221 233 244 256 26514281 53 66 108 132 146 142 171 180 189 193 207 207Mean 55 75 113 136 154 161 179 196 207 218 221 229
* Dosage level increased in the 5th week of study to 5000 ppm.
Company Sanitized. Does not co p ^ n T S C A C JI
N5G>

142641426614267 1426914271142721427314274142761427714278142791428014281 14311 14326 14329Mean *
205 216 201226 228 213234 244 213214 217 208261 264 244207 210 204226 233 223226 218 212262 260 263228 232 212229 241 231 249 259 270 Sacrificed236 239 237 257 254 269 Sacrificed274 276 276 278 284 285 Sacrificed214 216 218 222 239 245 252 258 257233 246 253 260 278 278233 236 239 246 258 261198 202 209 207 220 218232 235 225 239 246 253 241 254 254
* Initiation of withdrawal period. (14th week)
Company Sanitized. Does not contain TSCA CBI
Page 27

Ninety-Day Feeding Study in the Rat.TABLE 8. Individual Weekly Body Weights, Grams.Rat
NumberControl Period
* 2500 ppm. -1428214283142841428514286142871428814289142901429114292142931429414295142961429714298142991430014301Mean
1 2 1 2 3 4 5ti a u lull
6W fci fciK.0
7 8 9 10la le60 80 117 141 184 225 246 Sacrificed53 84 124 151 193 237 268 299 321 343 354 37455 76 129 182 219 277 310 351 382 416 440 45455 84 133 178 226 260 283 Sacrificed52 65 92 125 147 173 203 222 245 270 291 30255 84 133 181 227 262 289 308 332 357 371 38846 71 193 171 227 265 274 Sacrificed60 98 151 194 249 298 322 373 404 437 Sacrificed56 84 125 154 193 234 275 314 335 366 387 39957 60 107 163 206 228 271 306 332 354 370 38152 69 72 104 138 181 203 239 273 297 315 33457 82 143 184 228 261 285 312 339 364 Sacrificed58 82 133 165 207 231 266 291 315 337 339 35564 92 149 189 228 265 294 341 378 416 Sacrificed61 84 144 189 .231. . 272 295 321 345 363 365 38558 75 133 196 247 281 323 363 396 385 422 44652 82 107 140 178 214 236 258 284 306 312 33163 89 143 190 241 290 325 351 378 406 411 43555 78 114 135 197 215 272 303 325 342 345 37052 76 132 169 205 240 271 292 312 332 345 37056 80 129 165 209 245 276 308 335 358 362 380
increased in the 5th week of study to 5000 ppm.
Company Sanitized. Does not contain TSCA CBt

Ninety-Day Feeding Study in the Rat.TABLE 8. Continued. Individual Weekly Body Weights, Grams.RatNumber 11 12 13 14* Compound Administration Weeks15 16 17 18 1925ÜU DDTTl . - Male :14283 394 410 39314284 478 507 49714286 318 328 31614287 400 414 40114290 415 425 41314291 401 410 38514292 344 373 35714294 367 388 36414296 405 418 41214297 468 480 45614298 349 465 32714299 453 463 47614300 381 395 40714301 382 398 414143271432814324Mean 397 420 401
341 339 342 Sacrificed472 473 512 Sacrificed416 429 442 Sacrificed431 447 448 466 486 508362 377 390 497 427 433492 500 517 537 550 556461 478 489 500 516 531425 435 449 500 495 507
* Initiation of withdrawal period. (14th week)
Company Sanitized. Does not contain TSCACB3
Page 29

Group Mean Body Weights. Female RatsFIGURE 1.500 «S3 Control
450 O 100 ppm.
400 A 500 ppm. - 1000 ppm.
350 — o 2500 ppm. - 5000 ppm.
300
250
200 -
150 - (©© ©
100 _
50 ©®
0 1 ___ 1 1 ___1_ 10 0 1 2 3 4
<§ ®AÒ
Ao fi
o Ao '
c
J------- J --------- 1--------- 1______ I______1 I I I I I______ L7 8 9 10 11 12 13 14 15 16 17 18
COMPOUND ADMINISTRATION WEEKS ^ »• I OQ> fl)
Ju
Company Sanitized. Does not contain TSCA CBi

FIGURE 2. Group Mean Body Weights. Male RatsA
C
__I19
Company Sanitized. Does not contain TSCA CBI
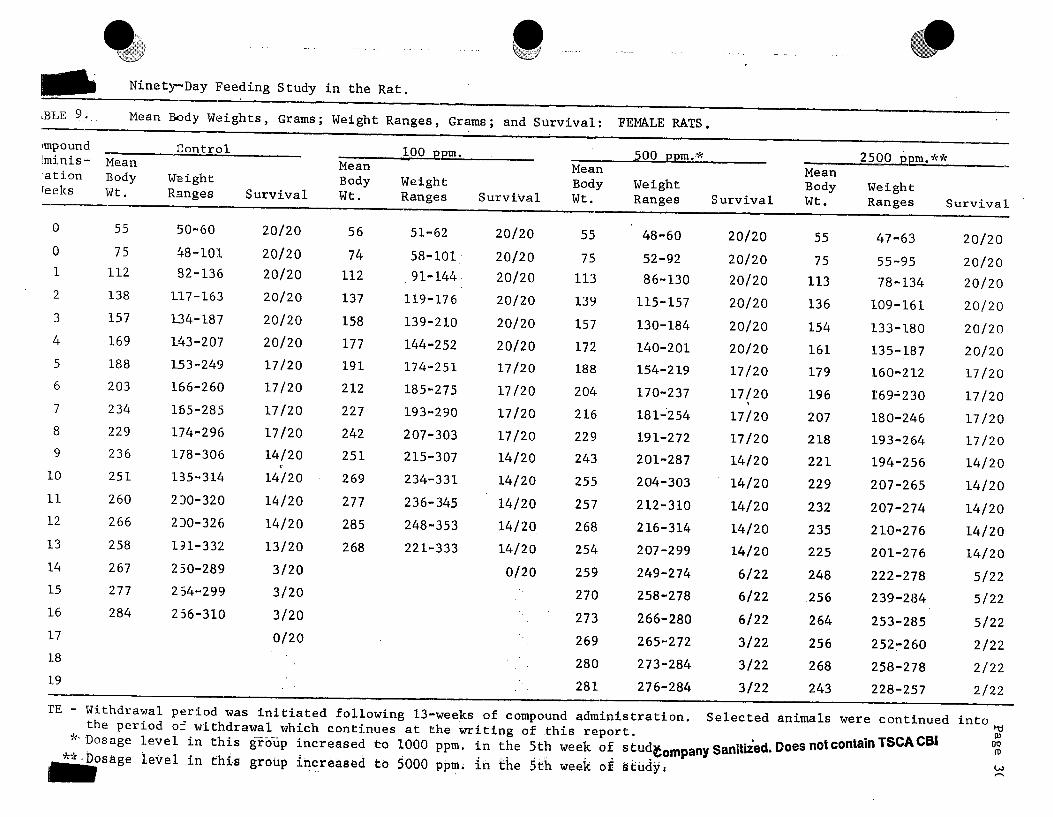
Ninety-Day Feeding Study in the Rat.ÆLE 9 . Mean Body Weights, Grams; Weight Ranges, Grams; and Survival: FEMALE RATS •impoundSminis-ationfeeks
Control 100 ppm. 500 ppm.* **MeanBodyWt.
WeightRanges Survival
MeanBodyWt.
WeightRanges Survival
MeanBodyWt.
WeightRanges Survival
MeanBodyWt.
WeightRanges Survival
0 55 50-60 20/20 56 51-62 20/20 55 48-60 20/20 55 47-63 20/200 75 48-101 20/20 74 58-101 20/20 75 52-92 20/20 75 55-95 20/201 112 82-136 20/20 112 .91-144 20/20 113 86-130 20/20 113 78-134 20/202 138 117-163 20/20 137 119-176 20/20 139 115-157 20/20 136 109-161 20/203 157 134-187 20/20 158 139-210 20/20 157 130-184 20/20 154 133-180 20/204 169 143-207 20/20 177 144-252 20/20 172 140-201 20/20 161 135-187 20/205 188 153-249 17/20 191 174-251 17/20 188 154-219 17/20 179 160-212 17/206 203 166-260 17/20 212 185-275 17/20 204 170-237 17/20 196 169-230 17/207 234 165-285 17/20 227 193-290 17/20 216 181-254 17/20 207 180-246 17/208 229 174-296 17/20 242 207-303 17/20 229 191-272 17/20 218 193-264 17/209 236 178-306 14/20 251 215-307 14/20 243 201-287 14/20 221 194-256 14/2010 251 135-314 14/20 269 234-331 14/20 255 204-303 14/20 229 207-265 14/2011 260 230-320 14/20 277 236-345 14/20 257 212-310 14/20 232 207-274 14/2012 266 230-326 14/20 285 248-353 14/20 268 216-314 14/20 235 210-276 14/2013 258 191-332 13/20 268 221-333 14/20 254 207-299 14/20 225 201-276 14/2014 267 250-289 3/20 0/20 259 249-274 6/22 248 222-278 5/2215 277 254-299 3/20 270 258-278 6/22 256 239-284 5/2216 284 256-310 3/20 273 266-280 6/22 264 253-285 5/2217 0/20 269 265-272 3/22 256 252-260 2/2218 280 273-284 3/22 268 258-278 2/2219 281 276-284 3/22 243 228-257 2/22
awai period was initiated following 13-weeks of compound administration. Selected animals were continued into the Peri°d o_ withdrawal which continues at the writing of this report.
f' Dosage level in this group increased to 1000 ppm. in the 5th week of s tudgompany Sanitized. Does not contain TSCA CB1Jj^osage level in this group increased to 5000 ppm, ih the 5th week of study,
aoit)LO

lBLE
Niinety-Day Feeding Study in the Rat.
impoundIminis-ationieeks
ControlMean Body Wt.
WeightRanges Survival
0 55 45-64 20/200 79 55-100 20/201 128 89-157 20/202 175 143-214 20/203 224 187-263 20/204 261 231-309 20/205 287 250-346 17/206 318 283-366 17/207 344 306-388 17/208 376 308-446 17/209 397 341-461 14/2010 420 358-480 14/2011 434 365-505 14/2012 444 374-505 14/2013 429 357-506 14/2014 447 242-538 7/2315 443 249-518 7/2316 465 251-556 7/2317 469 256-574 4/2318 471 255-571 4/2319 480 254-585 4/23TE - Withdrawal period was initiate
s, Grams ; Weight Ranges, Grams ; and Survival: MALE RATS..... 1
100 DDÏÏI. 500 DDm *MeanBodyWt.
WeightRanges Survival
MeanBodyWt.
WeightRanges Survival
MeanBodyWt.
WeightRanges Survival
57 49-63 20/20 58 52-63 20/20 56 45-64 20/2079 58-103 20/20 80 63-98 20/20 80 60-98 20/20127 97-160 20/20 127 91-151 20/20 129 72-193 20/20168 122-215 20/20 169 125-203 20/20 165 104-196 20/20214 130-267 20/20 215 172-271 20/20 209 138-249 20/20252 168-310 20/20 248 201-293 20/20 245 173-298 20/20277 211-343 17/20 281 234-324 17/20 276 203-325 17/20308 250-371 17/20 321 268-377 17/20 308 222-373 17/20335 256-407 17/20 345 292-412 17/20 335 245-404 17/20362 296-448 17/20 373 320-443 17/20 358 270-437 17/20376 317-467 14/20 390 334-465 14/20 362 291-440 14/20409 300-495 14/20 415 351-485 14/20 380 302-454 14/20429 353-521 13/20 434 369-509 14/20 397 318-478 14/20446 368-527 13/20 446 377-525 14/20 420 328-507 14/20437 363-515 13/20 434 348-548 14/20 401 316-497 14/200/20 472- 234-568 8/24 378 198-492 9/25
461 236-542 8/24 387 202-500 9/25489 241-563 8/24 399 209-517 9/25496 246-582 5/24 394 207-537 6/25511 250-612 5/24 410 220-550 6/25511 253-632 5/24 418 218-556 6/25
„ . j - ‘ „ --- “ wwv* i.uii.uwiuS j.j-wt;eK.5s ox compound administratiperiod of withdrawal which continues at the writing of this report.** nno!gS i‘eVei ^ ÎÎ-3 s*oup lncreased to 1000 ppm. in the 5th week of study.' 86 level ln thls SrouP increased to 5000 ppm. in the 5th week of study.
Sam1i2ea- D* » - contain TSCA CB,
into th0>oo(D

TABLE 10. FEMALE RATS: Mean Food Consumption, Grams/Rat/Week and Grams/Kilogram/Day; Compound Consumption asMiligrams/Kiloerams/Dav and Fnnd H uunsumpcion as
Ninety-Day Feeding Study in the Rat.
Compound CONTROLtrationweek
FOODg/r/wk g/kg/d Eff.
01 96.1 122.32 110.5 114.5 0-243 110.8 100.6 0.174 104.4 88.1 0.115 113.8 86.7 0.176 105.7 74.4 0.147 111.5 67.9 0.288 113.2 70.7 -.049 108.1 65.3 0.0710 102.4 58.2 0.1511 112.6 61.6 0.0912 116.2 62.4 0.0513 123.9 68.6 -.0514 ***5 8.0 54.3 + .0915 110.7 57.0 + .0916 114.0 57.4 + .06
100 ppm.FOOD CPD,
500 ppm. *FOOD CPD, 2500 ppm. **
FOODg/r/wk g/kg/d Eff. mg/kg/d g/r/wk g/kg/d Eff. mg/kg/d g/r/wk g/kg/d Eff.
1718 19
99..6 126.8 12..7110..7 115.3 0.23 11,.5116..6 105.7 0.18 10..6113,.7 91.5 0.17 9..2113,.1 84.8 0.12 8..5110,.8 74.5 0.13 7..5115..4 72.7 0.13 7..3117,.7 69.4 0.13 6..9112,.8 64.1 0.08 6..4121,.4 64.3 0.15 6..4129..4 66.8 0.06 6..7124..0 62.1 0.06 6..2128..1 68.3 13 6,.8
. 98.9111.9117.9 108.1 110 .2105.5110.5111.7112.2123.9116.7116.8 128.8
***59.7113.7 111.0 109.3 111.0110.7
124.8115.1107.089.583.574.073.1 69.965.8 69.465.062.372.457.560.058.2 58.056.856.2
0.23 0.15 0.14 0.15 0.15 0.11 0.12 0.12 0.10 0.02 0.09 -.11 +.05 + .10 + .03 -.04 + .01 +.01
62.4 57.653.544.841.874.073.169.965.855.9 65.062.372.4
91.4107.0 108.995.4107.6100.2102.7103.5 93.6107.8 98.0 97.2
112.0 ***66.8
118.0115.2121.0119.5111.5
115.9112.5101.384.586.073.071.0 67.960.667.260.359.171.163.766.061.4 67.663.865.4
CPD.mg/kg/d
0 . 21 0.17 0.07 0.17 0.17 0.11 0 . 10 0.03 0.07 0.03 0.03 -.09 + .20 + .07 + .07 -.07 + .10 -.22
289.8304.0253.3211.3215.0365.0355.0339.5303.0336.0301.5295.5355.5
, - Withdrawal period was initiated following-13-weeks of compound administration, into the period of withdrawal which continues at the writing'of this report.
* Dosage level increased to 1000 ppm. in the 5th week of study.** Dosage level increased to 5000 ppm. in the 5th week of study.***' Grams/rat/4 days.
Selected animals were
Does no! contain TSCA CBf
continued
hd(Ü0Q(DN5

CompoundAdministrationweek
CONTROL . ______ FOOD________g/r/wk g/kg/d Eff.
01 108.82 135.53 150.34 151.75 151.06 146.67 . 155.18 165.29 154.1
10 159.911 158.112 162.813 184.814 ***80 -. 415 145.116 159.017 162.018 149.319 149.5
121,.1 ■110,.996,,083..175,,3 0. 1165,,7 0.2164,.5 0. 1762,.8 0. 1955,,4 0. 1454.,3 0. 1452,, 1 0.0952,.5 o.0661,.5 0845.,0 +. 1346,,7 0348,.8 + .1449,.3 + .0245,.2 + .0144,,6 +.06
------IQOi-PPtn. ________ _ ______500 ppm.*______ FOOD_______ CPD. _____ FOOD _____g/r/wk g/kg/d Eff. mg/kg/d g/r/wk g/kg/d Eff.
_______ _ _____ 2500 ppm. **CPD. ______ FOOD_______
mg/kg/d g/r/wk g/kg/d Eff.CPD.
mg/kg/d
99.6 118.3 11.8 100.4 112.6126.3 107.1 0.33 10.7 128.8 108.9141.9 94.9 0.32 9.5 144.9 96.3151.1 85.7 0.25 8.6 145.3 83.9152.8 78.7 0.20 7.9 154.9 78.6148.0 68.5 0.21 6.9 150.0 66.7157.1 66.9 0.18 6.7 151.6 62.9158.2 62.4 0.17 6.2 161.8 61.9154.1 58.5 0.09 5.9 148.6 54.4166.6 58.2 0.20 5.8 162.5 55.9175.2 58.3 0.11 5.8 164.4 54.1170.9 54.7 0.10 5.5 159.6 51.1186.2 60.9 -.07 6.1 181.3 59.7***89.3 47.2
150.3 46.6' 169.0 49.3
167.4 48.2145.0 40.5161.8 45.2
56.3 112.2 124.0 310.00.33 54.5 121.6 10-5.5 0.30 263.80.31 48.2 140.5 95.7 0.31 239.30.23 42.0 145.0 84.5 0.25 211.30.21 39.3 151.9 78.6 0.20 196.50.26 66.7 149.9 69. § 0.21 347.50.16 62.9 152.3 65.1 0.18 325.50.17 61.9 154.1 61.5 0.15 307.50.11 54.4 140.7 55.5 0.03 277.50.15 55.9 146.8 38.7 0.12 293.50.12 54.1 156.4 56.2 0.03 281.00.08 51.1 150.6 51.2 0.03 256.0-.07 59.7 178.5 63.6 -.11 318.0+ .24 ***79.6 52.6 -.17-.07 138.8 51.2 -.06+ .17 138.4 49.6 + .09+ .04 138.3 50.3 -.04+.10 143.5 50.0 + .110 145.5 49.8 + .05NOTE - Withdrawal period was initiated following 13-Weeks of compound administration
into the period of withdrawal which continues at the writing of this report.* Dosage level increased to 1000 ppm. in the 5th week of study.
** Dosage' level increased to 5000 ppm. in the 5th week of study.*** Grams/rat/4 days.
Company Sanitized. Does not contain TSCA CBi|
Selected animals were continued
*T}o>0 9fl>U>W

Page 34
•>Ninety-Day Feeding Study in the Rat.
fa
TABLE 12. Summary of Hematologic Values for Male Rats.
HematologyCompound Administration Month Control 100 ppm. 500 ppm. * 2500 ppm. * *
Hematocrit, %
Hemoglobin gms./100 ml.
Erythrocytes, xlO / cmm.
Leucocytes,xlO3/ CT1ÏÏT1.
Neutrophils, 7» Seg., T,
Non-Seg., 7»
Lymphocytes, %
Monocytes, %
Eosinophils, 7»
Basophils, T.
0 47 45 45 441 48 46 47 432 48 45 45 383 48 47 45 38
0 12.7 12.7 12.3 12.41 14.6 14.1 14.5 13.32 15.9 15.2 15.3 13.23 15.7 15.0 14.7 12.0
0 6.38 6.04 6.21 6.041 6.60 6.74 6.43 6.312 '7.21 7.55 7.35 6.293 7.16 7.05 7.06 5.90
0 10 75 9.90 12.48 11.301 11.79 11.21 8.83 8.622 11.22 9.40 11.24 11.933 15.25 10.28 11.15 11.55
0 15 . 15 15 121 7 17 14 112 14 - 13 14 113 17 20 16 80 1 1 0 11 0 0 0 02 0 0 0 03 0 0 0 0
0 83 82 83 851 90 82 85 872 83 84 84 873 80 78 82 89
0 1 1 1 11 2 0 1 12 3 2 1 13 2 0 1 10 0 1 1 11 1 1 0 12 0 1 1 13 1 2 1 20 0 0 0 01 0 0 0 02 0 0 0 03 0 0 0 0
)up increased to 1000 ppm. in the 5 th week of study.)up increased to 5000 ppm. in the 5 th week of S tudy.
Com
nany
San
itiz
ed. D
oes
not c
onta
in T
SC
A C
B!

Page 35Ninety-Day Feeding Study in the Rat.
TABLE 13. Summary of Hematologic Values for Female Rats.
HematologyCompound Adminis tration Month Control 100 ppm. 500 ppm.* 2500 ppm,
Hematocrit, % 0 , 49 45 46 461 49 46 45 432 46 44 41 333 45 47 40 33
Hemoglobin 0 13.3 12.3 12.4 12.9gms./lOO ml. 1 15.1 14.4 14.4 13.5
2 -15.8 14.8 14.3 11.73 15.6 14.9 13.6 10.6
Erythrocytes, 0 6.63 6.38 6.23 6.51xlO^/cmm. 1 7.13 6.82 6.51 6.30
2 6.74 6.81 6.57 5.443 6.64 6.82 6.21 5.54
Leucocytes, xlO'Y cmm.
0 12.64 13.72 11.73 11.721 9.41 . 7.40 9.08 11.532 11.76 9.27 8.76 8.673 10.96 9.04 10 il4 11.38
Neutrophils, % .
Seg., % 0 14 11 14 111 15 17 14 152 15 13 17 123 11 20 11 8
Non-Seg., % 0 0 0 0 01 0 0 0 02 0 0 0 03 1 0 0 0
Lymphocytes, "L 0 83 87 84 881 81 81 84 842 '82 83 79 873 85 77 88 90
Monocytes, % 0 1 2 1 11 2 1 1 12 2 2 2 13 2 2 0 1
Eosinophils, 7« 0 1 0 1 01 2 1 1 02 1 2 2 03 1 1 1 1
Basophils, 7= 0 0 0 0 01 0 0 0 02 0 0 0 03 0 0 0 0
* Dosage level in this group increased to 1000 ppm. in the 5th week of study. ** Dosage level in this group increased to 5000 ppm. in the 5th week of study.
,mpa
ny S
anifÎ
2ed-
Doe
s no
! con
tain
TSC
A C
Bi

TABLE 14.Ninety-Day Feeding Study in the Rat,
^dividual Rat Hematologic Values during Control Period.RatNo. & Hematocrit Hemoglobin Erythrocvtes t T°tal ------- - - -ex ______ Y______ gms./lQQ ml. (xl06/cmm.) ^ " ‘Z-Sag.z *osinc,pillla Basoph
Control: ------ -— — — ------ ----- Z-------- L % %14163M14167M14173M14175M14178M14181MMean14143F14146F14150F14154F14157F14160FMean100 ppm.14204M14208M14210M14205M14216M14220MMean14184F 14189F 14191F 14194F 14198F 1420 If Mean
46504546 48 454748 4848 5049 49 49
494344 4345464546 414546 45 49 45
1 2 . 614.0 12.312.712.612.012.713.212.513.2 13.9 13.113.613.3
13.413.4 12.1 12.2 12 .0 12.912.712.111.112.012.611.7 14.1 12.3
6.096.90 6.42 6.01 6.945.91 6.386.146.14 6.89 6.98 6.40 7.22 6.63
6.505.406.205.816 .106.236.046.025.556.076.256.028.366.38
7.2914.0012.8210.3211.528.5710.7516.1812.3414.1813.039.7410.3812.64
9.658.6312.967.366.4414.369.9025.6714.3110.5510.639.7811.4013.72
713 319
21915919208 7
2114
161516 1913 8151514 6 5111411
10021010000000
00210010000000
9284 6985 78 918390 80 759192 7884
788481788790828184 92 9585 84 87
03 04 0 0 11131001
41010114120322
00000000020111
20110110100106
'bompany Sanitized. Does not contain TSCA ÇB»Company San^zcd. l o . . z c : ia t
00000000000000
00000000000000T3p>TOn>LOCTv

Ninety-Day Feeding Study in the Rat
500 ppm14244M14247M14249M14251M14255M14257MMean14225F14227F 1423IF 14233F 14236F 14241F Mean2500 ppm.:14284M 14288M 14290M 14295M 14298M 14301M Mean14264F 14267F 14269F 14276F 14278F 14281F Mean
44464443424444464645 51434546
12.512.9 12.412.3 12.0 12.012.413.012.9 12.2 13.7 12.213.412.9
6.03 6.48 6 . 0 1 5.72 6.22 5.776.046.256.586.136.767.166.206.51
15.1410.3213.888.9210.30 9.2111.3011.6211.108.9611.3517.479.8411.72
181210111381213711981811
10101011001000
798887868590 858591878990 8188
20120211210211
00111010011000
00000000000000
Company Sanitized. Does not contain TSCA CBI inn>to

TABLE 15.Rat
Ninety-Day Feeding Study in the Rat.Individual Rat Hematologic Values at One Mpnth.
No. & Hematocrit Sex %
Hemoglobin gms./lOO ml
Control:
TotalErythrocytes Leucocytes Neutrophils (xlO /cmm.) (xl03/cmm.) Seg.% Non-Seg.%
14162M 50I4165M 4614168M 471417LM 4714174M 4814177M 47Mean 4814142F 4814144F 4814146F 5014148F 5114150F 4714153F 49Mean 49100 ppm.:
15.4 13.9 14.814.514.414.514.614.715.2 15.515.214.315.4 15.1
7.186. 666.806.226.446.306.60
14.40 814.75 69.27 614.34 510.88 77.08 1011.79 7
0000000
6.877.048.127.276.616.897.13
7.82 148..80 1911,.60 1810,,53 177,,00 1410,,72 99.,41 15
0000000
14202M 44 13.614205M 48 14.814208M 47 14.614211M 45 13.714214M 49 13.814217M 45 14.1Mean 46 14.114182F 47 14.214185F 44 13.614188F 46 14.314191F 48 14.814194F 45 13.914197F 46 14.4Mean 46 14.4
Company Sanitized. Do<
6.32 19.706.73 7.107.08 8.226.54 6.787.03 11.696.72 13.776.74 11.216.69 9.156.68 3.976.91 8.647.10 6.987.28 6.536.30 9.156.82 7.40
not contain TSCA CB1
725309
237176
461118 118 17
00000000300000
DifferentialLympHocytes Monocytes Eosinophils Basophil^
7° % %
8691 90 9492 88 9082777780808981
53311121131312
90 174 o69 088 l76 o92 l82 o91 149 l87 081 186 291 181 1
10100113321312
00000000001000
21121012120101
00000000000000
'T)MOP(Dto

f )TÂBLt
Ninety°Day Feeding Study in the Rat, Continued. Individual Rat Hematologic Values at One Month,
RatNo, HematocritS ex %
u , . . TotalHemoglobin Erythrocytes Leucocytes NeutroohoisgtBS , /100 m!, (xioe/c^.) (*l03/L..)
14242M 5114245M 4514248M 4714251M 4614254m 47Ï.4257M 48Mean 4714222F 451422.5F 4614228F 4514231F 4514234F 4614237F 45Mean 452500 ODm.:
15.913.614.613.914.714.514.514.414.314.4 14.214.414.5 14.4
7.076.036.776.175.996.55 6.436.55 6.83 6.20 6.42 6.69 6.35 6.51
7.487.849.7511.628.168.138.8311.499.657.689.955.799.909.08
171491210
' 20 148101121201414
01000000001000
14282M 14285M 14288M 14291M 14294M 14297M Mean14262F14265F14268F14271F14274F14277FMean
42 13.244 13.942 12.645 13.741 12.545 13.943 13.344 13.642 13.346 14.641 13.040 12.944 13.843 13.5
6.02 9.796.57 11.495.93 8.826.68 6.716.14 6.546.50 8.346.31 8.626.12 19.296.07 9.087.19 6.285.96 13.435.95 8.846.53 12.236.30 11.53
8 0ii 09 018 011 010 011 09 016 014 018 016 016 115 0
C o m p ly Doss not contain TSCA CB|
Differential Lymphocytes Monocytes Eosinoph 1
% T
82 084 190 187 190 079 085 190 289 187 077 1.79 183 184 1
1 00 00 00 00 01 00 00 00 02 00 00 02 01 0
91 088 190 182 085 389 087 188 383 1 -85 080 183 181 2 '84 1
1 00 00 00 01 01 01 00 00 01 01 00 00 00 0
Page 3
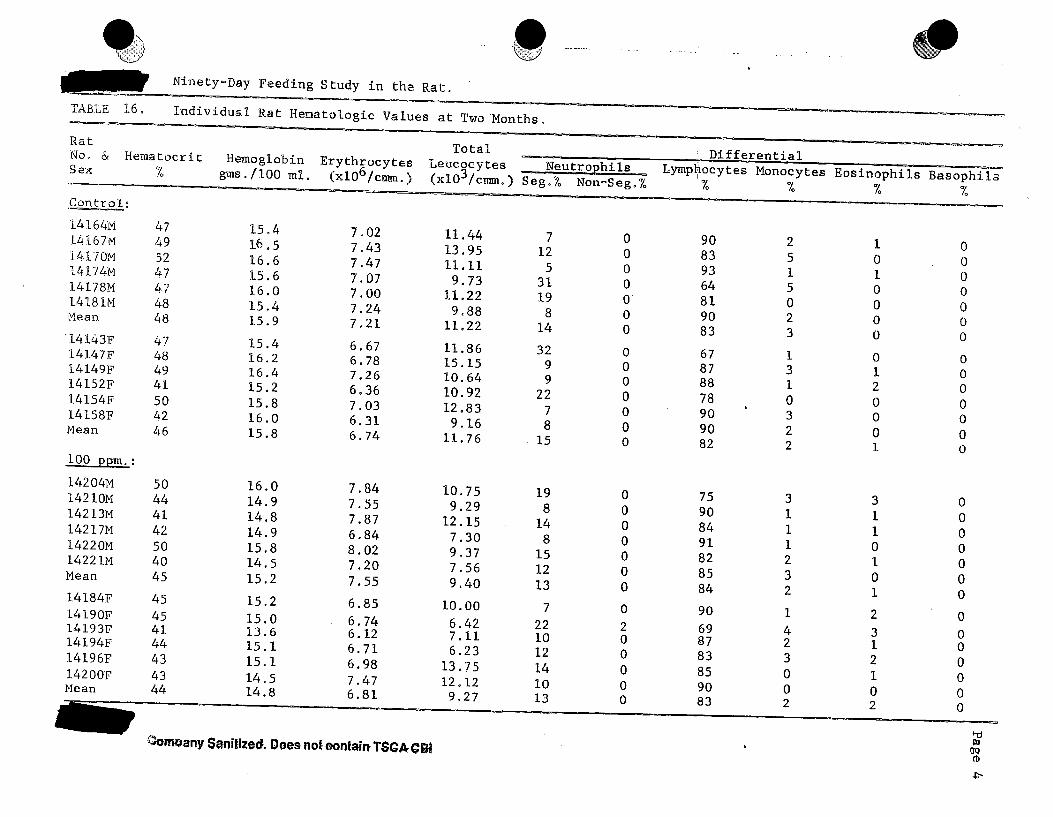
TABLE 16 Individual Rat Hematologic Values at Two MonthsRat TotalNo. & Hematocrit Hemoglobin Erythrocytes Leucocytesb e x /„ •nnn /1 A r t H .' n « K i . Q . J
Differential
Control :gms./l55 mï. " ( x f f j w ) (ïïoVc^O Lymphocytes Monocytes Eosinophils Basophils
14164m 4714167 m 4914170M 5214174M 4714178M 4714181M 48Mean 4814I43F 4714147F 4814149F 4914152F 4114154F 5014158F 42Mean 46100 pom.:
15.4 7.021^.5 7.4316.6 7.4715.6 7.0716.0 7.0015.4 7.2415.9 7,2115.4 6.6716.2 6.7816.4 7.2615.2 6.3615.8 7.0316.0 6.3115.8 6.74
11.44 713.95 1211.11 59.73 3111.22 199.88 811.22 1411.86 3215.15 910.64 910.92 2212.83 79.16 811.76 15
0 900 830 930 640 810 900 830 670 870 880 780 900 900 82
25150231310322
1 00 01 00 00 00 00 00 01 02 00 00 00 01 0
14204M 14210M 14213M 14217M 14220M 14221M Mean14184F14190F14193F14194F14196F14200FMean
50 16.044 14.941 14.842 14.950 15.840 14.545 15.245 15.245 15.041 13.644 15.143 15.143 14.544 14.8
7.84 10.757.55 9.297.87 12 .156.84 7.308,.02 9,.377,.20 7,.567,.55 9,.406,.85 10..006,,74 6..426., 12 7,,116.,71 6,,236..98 13.,757.47 12. 126.81 9.27
^ m oany Sanitized. Poes no! eonfain TSGA GBI
19814 815 12137
22101214 10 13
0 750 900 840 910 820 850 840 902 690 870 830 850 900 83
3 31 11 11 02 13 02 11 24 32 13 20 10 02 2
00000000000000
t;cu0Qrd

TABLE 16.Ninety-Day Feeding Study in the Rat.
Continued. Individual Rat Hematologic ValuesRatNo. 6 Hematocrit Hemoglobin Erythrocytes oex % gms./100 ml. (xl06/cmm.)
TotalLeucocytes(xlC)3/cmm, )
1000 ppm.14243M .14246M 14251M 14253M 14257M 14261M Mean14223F 14226F 14230F 14234F 1423-7F 14240F Mean5000 ppm.14283M14289M14293M14295M14297M14300MMean14263F14270F14273F14275F14279F14281FMean
42 15.446 15.247 15.446 14.846 15.942 15.145 15.342 15.543 14.241 14.337 13.643 15.838 12.441 14.3
7.71 9.977.11 12.047.42 12.476.94 8.868.03 10.67.6.89 13.437.35 11.247.28 8.346.63 6.646.28 10.286.63 6.176.85 13.435.77 7.686.57 8.76
42 13.334 12.035 12.336 12.738 13.644 15.038 13.237 13.029 11.235 12.133 11.830 10.433 11.733 11.7
6.33 11.966.12 17.506.09 11.206.13 6.976.08 14.496.96 9.466.29 11.935.60 11.575.31 5.165.64 9.555.47 8.904.93 6.785.68 10.075.44 8.67
Company Sanitized. Does not contain TSCACBS
at Two Months.
---------------------- Differential-- Neutrophils Lymphocytes MonocytesSeg.% Non-Seg.% % y
23 013 011 015 16 013 114 016 118 08 024 028 06 017 0
75 184 187 l82 l93 o82 284 l81 o72 592 074 162 894 079 2
7 023 017 08 04 09 111 010 114 08 08 017 017 012 0
92 076 181 191 * 094 187 387 187 284 291 192 o81 182 o87 1
Eosinophils%
Basophils?/o
12111212501202
00000000000000
10111010000110
00000000000000
PSTOCD
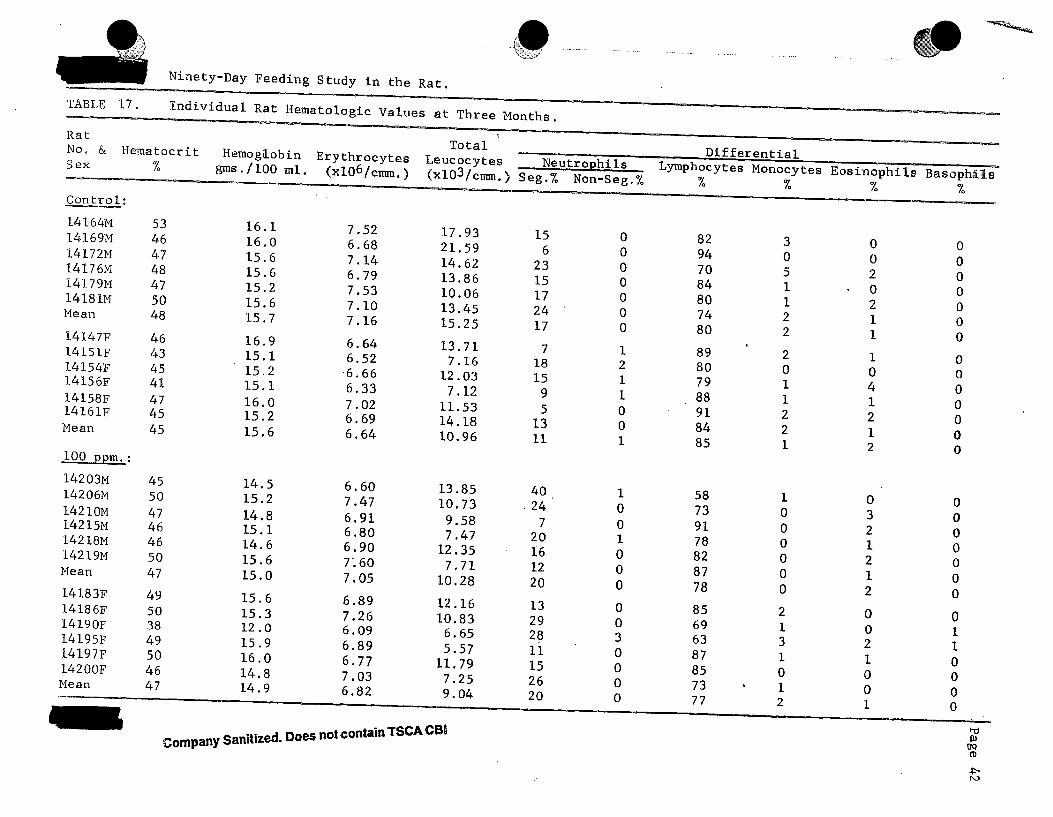
<9Ninety-Pay Feeding Study in the Rat.
TABLE 17. Individual Rat Hematologic Values at Three Months. Rat iNo.6, He»,toctit JJmoglobtn Erythrocytes LeococyL Differential
Control :gms./ÏOOml. "ciloE^c™" (xl03/c™!> Eycphocytes Monocytes Eosinophils Basophils'
■ ~— — ------ s' ° /o to % yo
14164M14169M14172M14176M14179M14181MMean14147F14151F14154F14156F14158F14161FMean100 ppm.:14203M 14206M 14210M 14215M 14218M 14219M Mean14183F14186F14190F14195F14197F14200FMean
53 16.146 16.047 15.648 15.647 15.250 15.648 15.746 16.943 15.145 15.241 15.147 16.045 15.245 15.6
7.52 17 .936.68 21 .597.14 14,,626..79 13,.867,.53 10,.067,.10 13,.457,.16 15,.256..64 13..716..52 7.,166.,66 12.,036.33 7.127.02 11.536.69 14. 186.64 10.96
45 14.550 15.247 14.846 15.146 14.650 15.647 15.049 15.650 15.338 12.049 15.950 16.046 14.847 14.9
6.60 13.857.47 10.736.91 9.586.80 7.476.90 12.357-.60 7.717.05 10.286.89 12.167.26 10.836.09 6.656.89 5.576.77 11.797.03 7.256.82 9.04
Company Sanitized. Does not contain TSCA CBS
15 0 82 3 0 o623
00
9470
05 00 0
1517
00
8480
11 ' 0 9
u0
24 0 74 2 i 017 0 80 2 l 0
07 1 89 2 0000
181595
2110
80798891
0112
041913
11 01 84
8521 1
2000
40 1 58 1 n 0o24 0 73 0 37
20 01 91
7800 21 0
16 0 82 0 2 u12 0 87 0 120 0 78 0 2
u013 0 85 2 0 n29 0 69 1 n28
ii30
6387
31 21
11
152620
000
857377
012
001
0000
0)0Qfl>4>ro

Ninety-Day Feeding Study in the Rat.TABLE 17. Continued. Individual Rat Hematologic Values at Three Months.
, . . . . . . TotalNo. & Hematocrit Hemoglobin Erythrocytes Leucocytes Neutrophils ' Sex_______ ^______ gms./lQQ ml. (xl06/cmm.) (xl03/cmm.) Seg.% Non-Seg.%500 ppm.:14244M 48 15.6 7.5914247M 45 14.4 6.9114252M 47 15.1 7.2814255M 44 13.9 6.4814257M 46 15.0 7.2714260M 43 14.0 6.82Mean 45 14.7 7.0614224F 43 14.2 6.1414227F 36 12.7 6.0714232F 41 14.6 6.5214236F 45 14.6 6.3914238F 39 12.8 6.2214240F 38 12.6 5.90Mean 40 13.6 6.212500 ppm.:14283M 38 12.1 6.2014287M 35 11.8 5.2914291M 37 11.9 5.8214294M 35 11.0 5.1514297M 41 11.8 6.1914300M 41 13.4 6.73Mean 38 12.0 5.9014266F 31 9.7 5.2514269F 34 10.5 5.0414272F 36 11.6 6.3814276F 34 10.5 5.5414278F 30 9.5 5.4214281F 36 12.0 5.63Mean 33 10.6 5.54
Company Sanitized. Does not contain TSCA CB1
8.1810.448.5311.3512.5015.8911.159.4012.13 12.637.029.949.7010.14
13.878.4110.1812.1813.5511.1211.5513.37 13.638.959.4514.55 8.3511.38
7 2391231131661816136811
687114138881082108
00000000000000
00010100101000
____ D i f f e r e n t i a l ______________ _____Lymphocytes Monocytes Eosinophils Basophils
7° 7o % 7o
92 0 1 074 0 3 090 0 1 086 0 2 068 1 0 084 2 1 082 1 1 093 0 1 082 0 0 084 0 0 087 0 0 094 0 0 089 1 2 088 0 1 0
93 1 0 091 0 1 092 1 0 084 0 4 094 1 1 079 4 3 089 1 2 091 0 1 089 2 0 088 2 0 089 1 1 095 2 1 088 1 1 090 1 1 0
TJ01ot)IP■F-CO

Page 44
TABLE 18.
Group
Ninety-Day Feeding Study in the Rat.
Individual and Mean Results of Biochemical Studies During Control Period
Rat No. Alkaline Phosphatase SGOT^ SGPT^Control, Female 14142 78
14145 78.14149 7514153 10514156 9314154 14144 14147 1415214155 14158 14160
45
Mean 79Control, Male 14162 99
14164 9314166 5714172 9314177 931417914170 14168 14174 141761418014171
99
Mean 89100 ppm., Female 14183 36
14188 4814192 3914199 4814182 9014196 14185 14190 14193 1420014197 14195
45
Mean 51Serum Glutamic Oxalacetic Transaminase Serum Glutamic Pyruvic Transaminase
34 2427 2429 2328 2328 2330 2529 24
29 2330 2231 2427 2232 2329 2630 23
26 2229 2329 2229 2529 2429 2429 23
Sanitized. Does notCompanycontain TSCA CB1

Ninety-Day Feeding Study in the Rat
TABLE 18. Continued. Individual and Mean Results of BiochemicalStudies During Control Period.
Group Rat No. Alkaline Phosphatase SGOT^ SGPT^100 ppm., Male 14202
1420914211 1421914214 14221 14203 142061421214215 14218 14217
Mean
578763939636
72500 ppm., Female 14230
1422414222 14240
- 1423514232 14229 1422814223 14239 14237 14234
Mean
908784969990
91500 ppm., Male 14242
14245 1424814252 1425414258 1424314246 1425014253 1425614259
Mean
515754933987
64Serum Glutamic Oxalacetic Transaminase Serum Glutamic Pyruvic Transaminase
29 2327 2330 2329 2326 2430 2629 23
29 2425 2229 2230 2228 2527 2228 23
27 2229 2226 2429 2227 2225 2327 22
Company Sanitizes. Does no! co.,„ J'SCA

Page 46
Ninety-Day Feeding Study in the Rat.
TABLE 18. Continued. Individual and Mean Results of BiochemicalStudies During Control Period •
Group Rat No. Alkaline Phosphatase SGOT1 SGPT22500 ppm., Female 14271 39
14266 7514262 5714273 9914274 7814277 6914268 27 2214265 32 2414263 28 2114272 31 2414275 28 2314280 29 23Mean 70 29 23
2500 ppm. , Male 14282 9014286 9014296 5114283 5114289 9314297 4814287 32 2714291 27 2514300 26 2414285 29 2214292 29 2314299 27 21Mean 71 28 24
Serum GlutamicO Serum Glutamic
Oxalacetic TransaminasePyruvic Transaminase
Company Sanitized. Does not contain TSCA C9!

%Page 47
NinetyDay Feeding Study in the Rat.
TABLE 19. Individual and Mean Results of Biochemical Studies at One Month.
Group Rat No. Alkaline Phosphatase SGOT1 SGPT2■ Control, Female 14143 60 26 2414145 84 28 2514147 ' 90 25 2314149 78 26 2514151 96 24 2314154 72 28 25
] Mean 80 26 24Control, Male 14163 72 25 24i 14166 53 24 21! 14169 129 25 2414172 63 28 23; 14175 114 27 24! 14178 129 . 24 24Mean 93 26 23
^ 100 ppm., Female 14183 45 26 2314186 75 26 2414189 117 25 24| 14192 54 25 22: 14195 108 25 2314198 114 25 24Mean 86 25 23100 ppm., Male 14203 84 25 2414206 129 27 2514209 132 27 2414212 105 26 2314215 105 26 2414218 126 25 23Mean 114 26 24500 ppm., Female 14223 52 28 2514226 99 28 2514229 84 26 2314232 117 27 2314235 123 28 2614238 102 26 25Mean 96 27 25
fi) Serum Glutamic Oxalacetic TransaminaseSerum Glutamic Pyruvic Transaminase
Company Sanitized. Does not contain TSCA CBP

t
Ninety-Day Feeding Study in the Rat.
Page 48
TAB.LE 19. Continued. Individual and Mean Results of BiochemicalStudies at One Month.
i
i
Group Rat No. Alkaline Phosphatase SGOT1 SGPT500 ppm., Male 14243 72 27 2314246 132 27 25. 14249 132 . 26 2414252 96 26 2414255 87 25 23. 14258 132 25 25Mean 109 26 242500 ppm., Female 14263 84 28 2414266 51 27 2414269 60 26 2314272 72 28 2414275 84 28 2414278 45 28 25Mean 66 . 28 242500 ppm., Male 14283 72 28 2314286 117 27 2414289 117 24 2314292 69 25 23
14295 105 26 2314298 81 25 24Mean 94 26 24
Serum Glutamic Oxalacetic TransaminaseSerum Glutamic Pyruvic Transaminase
Company Sanitized. Doss not contain TSCA CBi

TABLE 20.Ninety-Day Feeding Study in the Rat.
Individual and Mean Results of Biochemical Studies at Two Months.Group Rat No. Alkaline Phosphatase
Control, Female 14144 6014148 73.14150 5914151 5614153 6714155 67Mean 64
Control, Male 14163 5414166 3814169 7914171 9814172 7814173 78Mean 71
100 ppm., Female 14183 3114186 4714187 5814192 3914195 3614198 37Mean 41
100 ppm., Male 14203 5614206 3614209 11114211 6414216 3314219 46Mean 58
1000 ppm., Female 14224 6214227 5814229 6414232 6314235 4614236 27Mean 53
SGOT1 SGPT'27 2126 2425 - 2219 2225 2226 2225 2228 2028 2326 2327 2424 2425 2226 2324 2123 2325 2224 2130 2229 2226 2225 2428 2127 2227 2229 2429 2328 2326 2127 2229 2426 2231 2225 2127 22
Serum Glutamic Oxalacetic TransaminaseSerum Glutamic Pyruvic Transaminase
Company Sanitized. Doesno.conmin t s c a c b ,
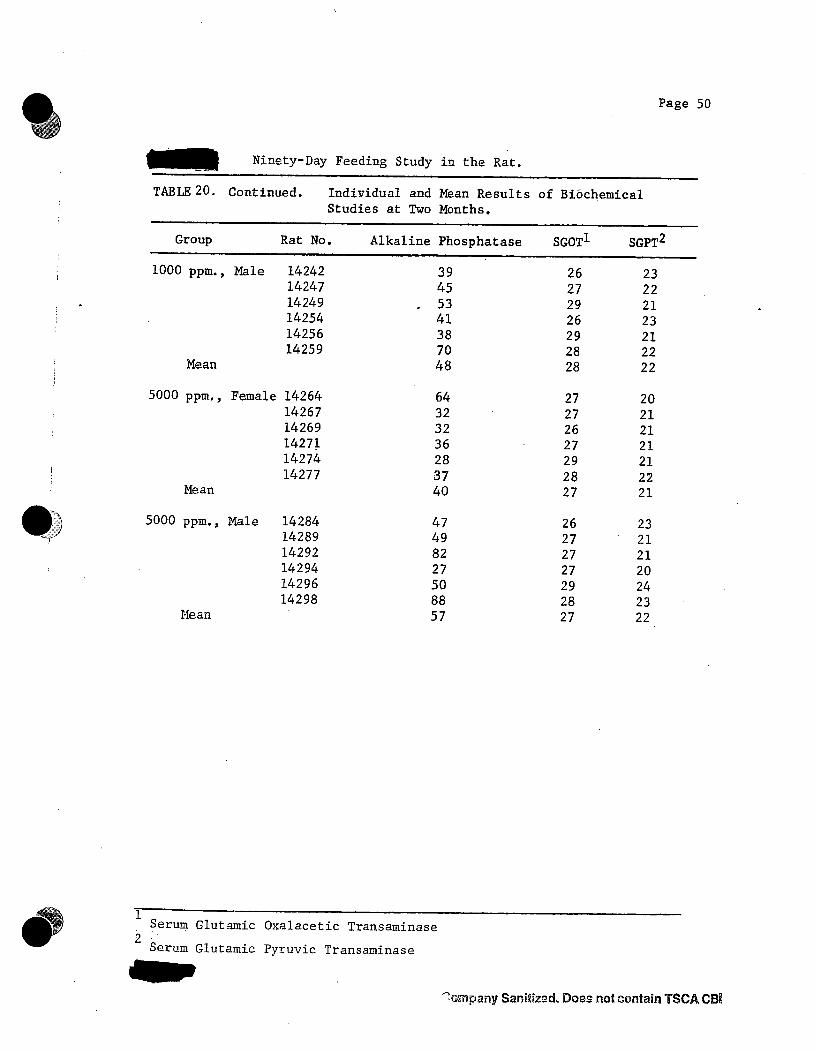
Page 50
Ninety-Day Feeding Study in the Rat.TABLE 20. Continued. Individual and Mean Results of Biochemical
Studies at Two Months.Group Rat No. Alkaline Phosphatase SGOT1 SGPT2
1000 ppm., Male 14242 39 26 2314247 45 27 2214249 . 53 29 21. 14254 41 26 2314256 38 29 2114259 70 28 22Mean 48 28 22
5000 ppm., Female 14264 64 27 2014267 32 27 2114269 32 26 2114271 36 27 2114274 28 29 2114277 37 28 22Mean 40 27 21
5000 ppm., Male 14284 47 26 2314289 49 27 2114292 82 27 2114294 27 27 2014296 50 29 2414298 88 28 23Mean ' 57 27 22
Serum Glutamic Oxalacetic Transaminase Serum Glutamic Pyruvic Transaminase
Company Sanitized. Does not contain TSCACBi

Page 51
TABLE 21.Ninety-Day Feeding Study in the Rat.
Individual and Mean Results of Biochemical Studies at Three Months.
Group Rat No. Alkaline Phosphatase SGOT1 SGPT2
Control, Female 14144 26 30 2314248 59 . . 23 24! 14155 21 26 2214157 20 28 2214159 31 27 23■ j 14160 28 28 26Mean 31 27 23Control, Male 14174 24 26 21
i 14171 30 26 2314173 32 27 2214175 79 25 251 14177 77 27 2414180 107 28 27
<t>Mean 58 27 24
TOO ppm., Female 14187 22 ' 25 22. 14189 29 26 2314192 18 25 21i 14196 14 22 2114198 68 23 2214199 32 24 21Mean 31 24 22
100 ppm., Male 14204 16 24 2214207 25 23 2114209 47 26 2014211 25 25 2114213 35 24 2114216 41 22 9 ?Mean 32 24 211000 ppm., Female 14226 39 23 2414229 53 26 2414233 73 25 2314235 55 25 2514237 50 25 2214239 22 23 20Mean 49 25 23
Serum Glutamic Oxalacetic2
TransaminaseSerum Glutamic Pyruvic Transaminase
Company Sanitized. Does not contain TSCA CK

Page 52
Ninety-Day Feeding Study in the Rat.
TABLE 21. Continued. Individual and Mean Results of BiochemicalStudies at Three Months.
Group Rat No1000 ppm., Male 14243
14250 14254 14256 14259 14261
Mean5000 ppm., Female 14264
14277 14271 14274 14280 14279
Mean5000 ppm., Male 14284
14286 14290 14292 14296 14298
Mean
Alkaline Phosphatase SG0T* SGPT24143152687344126191818261621
49663775453351
292526 23 23 22 2525252526 282526272524242424 .25
27221920 23 22 2222212022221921
24242122222122
Serum Clutamic Oxalacetic Transaminase Serum Glutamic Pyruvic Transaminase
Company Sanitized. Does not contain TSCA CBl
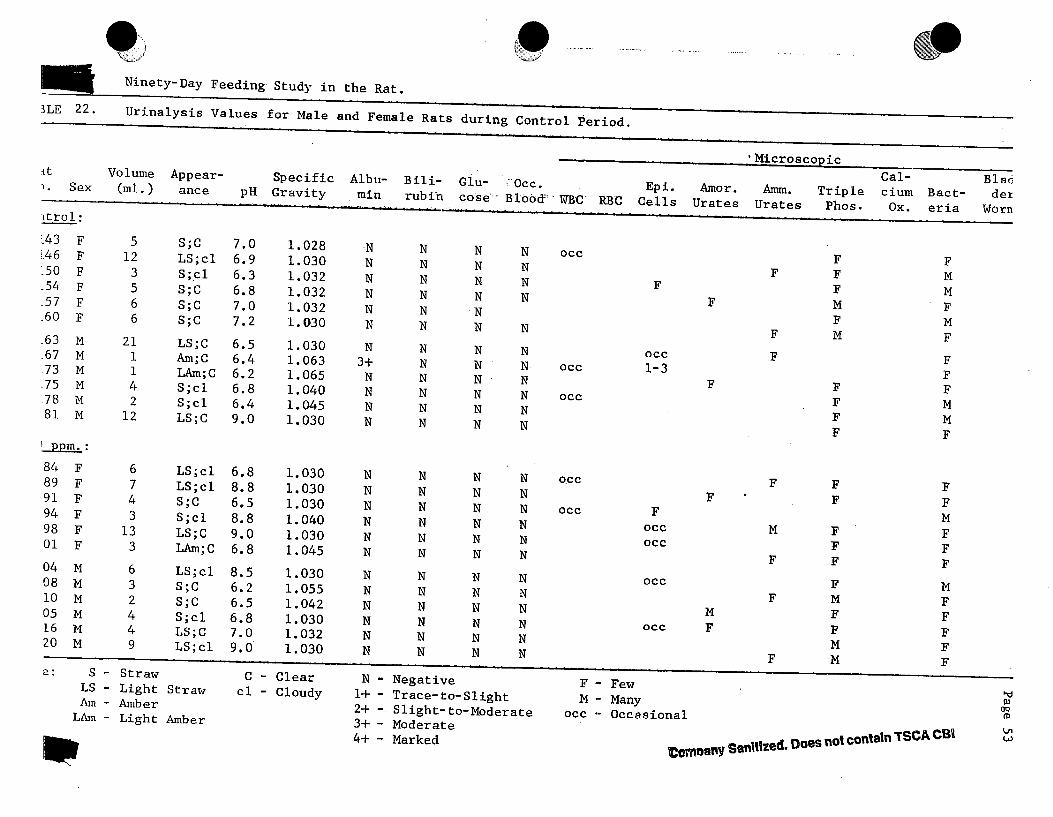
SexVolume (ml. )
Appearance Specific
pH Gravity Albu- Bili- Glu- Occ. Epi.min rubin cose Blood' WBC RBC Cells Amor. Amm. Triple
Urates Urates Phos.Cal- Blaecium Bact- dei Ox. eria Worn
L43146150.54.57.60.63.67.73.75
FFFFFFMMMM
.78 M
.81 M1 ppm. :848991949801
FFFFFF
04 M 08 M 10 M05 M 16 M 20 M
512356 6
21114 2
12
674313363 24 4 9
S;C LS; cl S; cl S;C S;C S;CLS;C Am; C LAm;C S;cl S ; cl LS;C
LS; cl LS ; cl S ;C S;cl LS;C LAm;CLS;cl S ;C S;C S;cl LS ; C LS;cl
7.0 6.96.36.87.07.26.56.46 .2 6.86.49.0
6.88.86.58.89.06.88.56.26.56.87.09.0
1.0281.0301.0321.0321.0321.0301.030 1.063 1.065 1.040 1.0451.030
1.0301.0301.030 1.0401.030 1.0451.030 1.055 1.0421.030 1.0321.030
N N N N OCCN N N NN N N NN N N NN N NN N N NN N N N3+ N N N occN N N NN N N N occN N N NN N N N
N N N N o.ccN N N NN N N N occN N N NN N N NN N N N
occ1-3
FF
Foccocc
occ
occ
MF
MF
Straw Light Straw AmberLight Amber
ClearCloudy
*
N - Negative 1H— Trace-to-Slight 2+ - Slight-to-Moderate 3+ - Moderate 4+ - Marked
Few ManyOccasional
FFFMFM
FFFF
FFFFFFMFFMM
FMMFMFFFFMMF
FFMFFFMFFFFF
©emoany Sanfflzed. Does not contain TSCÄ CB!
Page 53

Ninety-Day Feeding Study in the Rat.LE 22. continued. Urinalysis Values for Male and Female Rats during Control Period';
41 F44* M 47 M 49 M 51 M 55 M 57 Mppm.
5457597 6
7851
FFFFFF
54 M ?8 M »0 M >5 M 18 M •1 M
133373445 46 4
16
2144 2225
10121
S;CSjclS;CS;clLS;clLAm;CS;C S ;cl S; cl S;cl LS;cl S; cl
AmjC S; cl LS;C S; cl S;C DS;CS; C S; cl S;cl LS;cl S; cl Am;C
6.38.86.38.06.56.06.29.08.36.76.76.5
6.56.97.07.37.49.07.09.09.09.06.96.2
1.0451.0421.0451.0401.0301.0451.040 1.035 1.0321.0451.0301.042
1.0651.0301.0301.030 1.033 1.0421.0481.0531.0371.0301.030 1.055
*
SLSDSAmLAm
StrawLight Straw Dark Straw AmberLight Amber
Gcl
ClearCloudy
N N N N occN N N NN N N N CM1rHN N N NN N N NN N N NN N N NN N N NN N N N occN N N NN N N NN N N N
N N N NN N N N occN N N NN N N N occN N N N occN N N N FN N N NN N N N occN N N NN N N N occN N N N occN N N . N occ 2-3N - Negative F - Few1+ - Trace-to- Slight M - Many2+ - Siight-to-Moderate L - Loaded3+ - Moderate occ - Occasion4+ - Marked
F M FF MF FF F M MF FF F FF F FF M F MM M MF F O C C Mocc occ Mocc M F M
F M M FF occ MF O C C occ FM occ MM M FF F FF M occ MM MM F. F M MM M LF F F* Occasional uric acid
Comp!m,S 3 * e d .D o « n o,1 contain TSCftCBI
030Q(DLn-O

\
Ninety-Day Feeding Study in the Rat,LE 23. Urinalysis Values for Male and Female Rats at One Month.
t Volume Appear-. Sex (ml.) ance
Microscopic_________ ____________Oai- Blad-
Specific Albu- Bili— Glu- Occ. Epi. Amor. Amm. Triple cium Bact- derpH Gravity min rubin cose Blood WBC RBG Gells Urates Urates Phos. Ox. eria Worm:
trol :62 M 12 LS;cl 8.5 1.013 N N N N CMr—1 F F65 M 12 LS;cl 7.9 1.016 N . N N N occ F M occ M6 8 M 17 LS-; cl 8.9 1.014 N N N N 1-2 M F F71 M 4 LS;cl 7.2 1.048 N N N N F F M74 M 15 LS ; cl 7.0 1.013 N N N N O C C M F F77 M 9 LS ; cl 6.9 1.020 N N N N 1-2 F F42 F 10 LS ;cl 6.5 1.017 N N N N F M45 F 7 S;cl 9.0 1.041 N N N N F M F46 F 15 LS; cl 7.1 1.012 N N N N F F F.48 F 6 DAm;C 8.9 1.031 N N N N CM1r—1 F F F50 F 12 LS;cl 6.2 1.011 N N N N occ M53 F 7 S;cl 6.9 1.035 N N N N F • F Mt ppm. ::02 M 7 S; cl 7.0 1.044 N N N N F F F M:05 M 26 LS;cl 7.3 1.008 N N N N F M F:08 M 10 S;cl 6.9 1.021 N N N N F F O C C'.11 M 16 LS;cl 9.0 1.009 N N N N occ M M occ:i4 M 14 S;cl 6.5 1.013 N N N N 1-2 F M occ-17 M 10 S;cl 6.3 1.021 N N N N occ F F M.82 F 4 S ; cl 7.0 1.042 N N N N F L F.85 F 13 LS; cl 7.1 1.011 N N N N occ F F.88 F 14 LS;C 9.0 1.007 N N N N F F F.91 F 12 LS;cl 6.8 1.016 N N N N F M.94 F 7 S ;cl 9.0 1.019 N N N N occ F M F.97 F 9 S ;cl 6.5 1.017 N N N. N occ F F MLe: S - Straw C - Clear N - Negative F - Few
LS - Light Straw cl - Cloudy 1+ - Trace-to- Slight M - Many Q>DAm - Dark .Amber 2+ - Slight-to-Moderate L - Loaded 0>
3+ - Moderate occ - Occasional Lnm It 4+ “ Marked Gompany Sanitized. Does not contain T S C A C03 Ui
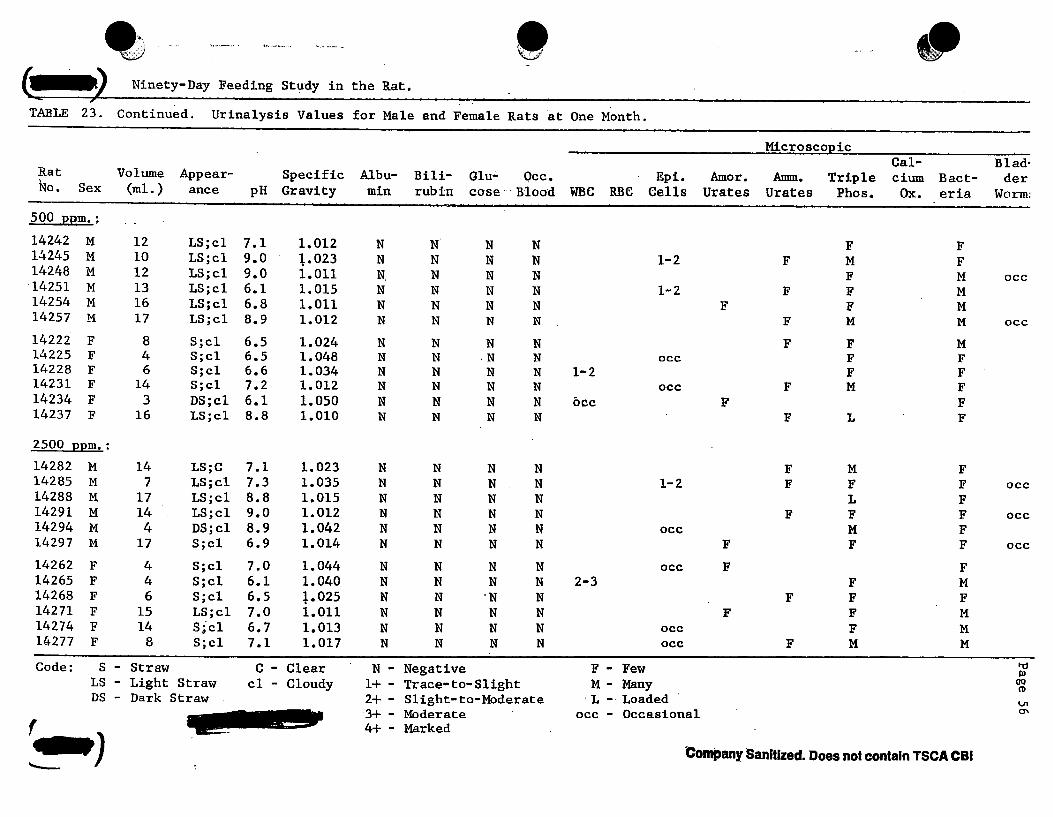
Ninety-Day Feeding Study in the RatTABLE 23. Continued Urinalysis Values for Male and Female Rats at One Month.
Rat Volume Appear- Specific Albu-No. Sex (ml.) ance pH Gravity min
________________________ Microscopic __________________Cal- Blad-
Bill- Glu- Occ. Epi. Amor. Amm. Triple cium Bact- derrubin cose Blood WBC RBG Cells Urates Urates Phos. Ox. eria Worm;
500 ppm.: 14242 M 12 LS; cl 7.1 1.012 N N N14245 M 10 LS; cl 9.0 1.023 N N N14248 M 12 LS; cl 9.0 1.011 N N N14251 M 13 LS;cl 6.1 1.015 N N N14254 M 16 LS; cl 6.8 1.011 N N N14257 M 17 LS; cl 8.9 1.012 N N N14222 F 8 S;cl 6.5 1.024 N N N14225 F 4 S; cl 6.5 1.048 N N ■ N14228 F 6 S; cl 6.6 1.034 N N N14231 F 14 S;cl 7.2 1.012 N N N14234 F 3 DS; cl 6.1 1.050 N N N14237 F 16 LS; cl 8.8 1.010 N N N
N F FN 1-2 F M FN F MN 1-2 F F MN F F MN F M MN F F MN occ F FN CM1T—< F FN occ F M FN OCC F FN F L F
occ
occ
2500 ppm.:14282 M 14 LS;C 7.1 1.02314285 M 7 LS; cl 7.3 1.03514288 M 17 LS; cl 8.8 1.01514291 M 14 LS; cl 9.0 1.01214294 M 4 DS; cl 8.9 1.04214297 M 17 S;cl 6.9 1.01414262 F 4 S;cl 7.0 1.04414265 F 4 S;cl 6.1 1.04014268 F 6 S;cl 6.5 1.02514271 F 15 LS;cl 7.0 1.01114274 F 14 S; cl 6.7 1.01314277 F 8 S;cl 7.1 1.017Code: S - Straw C - Clear
LS - Light Straw cl - CloudyDS - Dark !Straw
N N N NN N N N 1-2N N N NN N N NN N N N occN N N NN N N N occN N N N 2-3N N N NN N N NN N N N O C C
N N N N occN - Negative F - Few
1 + - Trace-to-Slight M - Many2+ - Slight-to-Moderate L - Loaded3+ - Moderate occ - Occasion!4+ - Marked
F M FF F F O C C
L FF F F O C C
M FF F F O C C
F FF M
F F FF F M
F MF M M
T)<D(TO(DLnON
Company Sanitized. Does not contain TSCA CBI

TABLE 24.Ninety-Day Feeding Study in the Rat.Urinalysis Values for Male and Female Rats at- Two Months.
MicroscopicCal- Blad”
Rat Volume Appear- Specific Albu- Bili- Glu- Occ. Epi. Amor. Amm. Triple eium Bact- derNo. Sex (ml.) ance pH Gravity min rub in cose Blood WBC BBC Cells Urates Urates Phos. Ox. eria WcrrmfControl:14164 M 28 LS;cl 7.0 1.015 N N N N M M M IF14167 M 16 LS;cl 7.1 1.022 N N N N M F M14170 M 12 LS; cl 7.0 1.028 N N N N M F M IF14174 M 25 LS;cl 9.0 1.014 N N N N F F14178 M 24 LS;cl 7.5 1.012 N N N N OCC M F M14181 M 30 LS;cl 8.0 1.009 N N N N F F M 1?14143 F 6 LS;cl 7.5 1.030 N N N N occ F F M14147 F 13 LS;C 7.7 1.022 N N N N F M M14149 F 6 S;cl 9.0 1.030 N N N N F M F14152 F 11 LS;cl 9.0 1.024 N N N N F L F14154 F 3 S;C 6.2 1.065 N N N N F occ M F14158 F 4 S;C 6.0 1.047 N N N N : f F F F100 D D m . :14204 M 30 LS ;C , 7.8 1.016 N N N N M M F F14210 M 18 LS;cl 8.8 1.022 N N N . N OCC F F F M T14213 M 21 LS;cl 9.0 1.016 N N N N F M F F F14217 M 17 S;cl 9.0 1.015 N N N N F F F F14220 M 30 LS;cl 8.0 1.008 N N N N occ F F M IF14221 M 23 LS;cl 9.0 1.011 N N N N F F F14184 F 4 S;cl 7.5 1.044 N N N N occ M M F14190 F 20 LS;cl 8.4 1.008 N N N N F M F14193 F 24 LS;cl 6.4 1.006 N N N N M OCC M14194 F 6 S;cl 9.0 1.028 N N N N M F M M14196 F 5 S;cl 6.8 1.028 N N N N F F M14200 F 8 S;cl 6.2 1.030 N N N N F FCode: S - Straw - C - Clear N - Negative F - Few
LS - Light Straw cl - Cloudy 1+ - Trace-to-Slight M - Many 0)2H— Slight-to-Moderate 3+ - Moderate 4+ - Marked
L - Loaded occ - Occasional
OQ(Dt_n
Company Sanitized. Does not contain TSCA CBt

XNinety-Day Feeding Study in the Rat.TABLE 24. Continued. Urinaysis Values for Male and Female Rats at Two Months
Microscopic______________________Cal- Blad-
Rat Volume Appear- Specific Albu- Bili- Glu- Occ. Epi- Amor. Amm. Triple cium Bact- derNo. Sex (ml.) ance pH Gravity min rubin cose Blood WBC RBC Cells Urates Urates Phos. Ox. eria Worm:1000- ppm. :14243 M 24 LS;cl 9.0 1.013 N N N N F F F F14246 M 16 LS;cl 6.8 1.017 N N N N F M F14251 M 12 LS;cl 6.0 1.026 N N N N occ F F F • F F14253 M 30 LS;C 7.8 1.010 N N N 1+ F F Mmu MM lì LS:clLSjcl h i 1.0131.015 NN NN NN NN FF FF MF14223 F 11 S;cl 7.2 1.013 N N N N F M OCC M14226 F 10 S;cl 9.0 1.030 N N N N F M F14230 F 12 LS;cl 8.8 1.016 N N N N F F F M14234 F 7 S;cl 6.4 1.023 N N N N F F F M14237 F 14 LS;C 7.5 1.010 N N N N F f: E14240 F 15 LS;cl 7.8 1.009 N N N N F M M5000 ppm. :14283 M 14 LS;cl 9.0 1.021 N N N N M F F F14289 M 27 LS;cl 9.0 1.013 N N N N F F F14293 M 10 S;cl 9.0 1.034 N N N N occ F F F F14295 M 40 LS;cl 9.0 1.006 N N N N F F F M14297 M 27 LS;cl 9.0 1.012 N N N N F F F F14300 M 23 LS;cl 6.7 1.010 N N N N F M F F14263 F 12 S;cl 7.0 1.020 N N N N F F F14270 F 10 S;cl 7.2 1.017 N N N N occ F F F14273 F 14 LS;cl 9.0 1.013 N N N N F M F14275 F 5 Am;cl 8.5 1.024 N N N N F M M M14279 F 8 S;C 6.0 1.026 N N N N F F F14281 F 4 S;C 8.2 1.028 N N N N F F FCode: S - Straw C - Clear N - Negative F - Few
LS - Light Straw c \ - Cloudy 1+ - Trace-to- Slight M - Many 0>
Am - Amber 2+ - Slight-to-Moderate L - Loaded (D3+ - Moderate occ - Occasional Ln
OO4+ - Marked
Company Sanitized. Does not contain TS C A C B l

Ninety-Day Feeding Study in the Rat.Urinalysis Values for Male and Female Rats at Three Months
MicroscopicCal- Blad-
Rat Vo lume Appear- Specific Albu- Bili- Glu- Occ. Epi. Amor. Amm. Triple cium Bact- derNo. Sex (ml.) ance pH Gravity min rub in cose Blood WBC RBC Cells Urates Urates Fhos. Ox. eria Worm,Control:14164 M 8 LS;cl 6.8 1.053 N N N N F M M J?14169 M 7 S;cl 7.3 1.055 N N N N F F M F ;F14172 M 11 LS;cl 9.0 1.035 N N N N F F M :f14176 M 5 S;cl 6.5 1.066 N N N N 1-2 F M F T14179 M 4 S;cl 7.8 1.058 N N N N F F M F T14181 M 7 S;cl 6.9 1.052 N N N N F M F 3?14147 F 1 S;C 6.1 1.080 N N N N F F F14151 F 2 S;C 6.3 1.069 N N N N F M F14154 F 2 S;cl 7.4 1.065 N N N N occ F M M14156 F 2 S;cl 6.1 1.065 N N N N F F F F14158 F 1 S;C 6.0 1.080 N N N N 1-2 F F F14161 F 2 S;C 6.7 1.065 N N N N occ occ F M F100 ppm.:14203 M 7 S;cl 6.7 1.058 N N N N F F M14206 M 7 LS;cl 7.0 1.048 N N N . N F F F M14210 M 6 S;cl 9.0 1.055 N N N N 2-3 F F F14215 M 3 DS;cl 6.0 1.080 N N N N F F M F14218 M 9 S;cl 9.0 1.045 N N N N F F F :f14219 M 6 LS;cl 6.3 1.049 N N N N occ M F14183 F 1 S;C 6.0 1.080 N N N N F F F14186 F 6 LS;cl 8.0 1.045 N N N N F L F14190 F 6 S;cl 7.0 1.035 N N N N 1-2 F F M14195 F 6 LS;cl 6.2 1.035 N N N N F F M14197 F 1 S;C 7.7 1.072 N N N N M F F14200 F 2 S;cl 6.0 1.065 N N N N O C C F M FCode: S - Straw C - Clear N - Negative F - Few JDLS - Light Straw cl - Cloudy 1+ " Trace-to-Slight M - Many OQ<DDS - Dark :Straw 2+ - Slight-to-Moderate L - Loaded Ln
9
3+ - 4+ -
ModerateMarked
occ - Occasional
Company Sanitized. Does not contain TSCA CBI

KNinety-Day Feeding Study in the Rat.
TABLE 25. Continued. Urinalysis! Values"for Mâle, and: Female :Rats at Three Months.
MicroscopicCal- Blad-Rat Volume Appear- Specific Albu- Bili- Glu- Occ. Epi. Amor. Amm. Triple cium Bact- derNo. Sex (ml.) ance pH Gravity min rub in cose Blood WBC RBC Cells Urates Urates Phos. Ox. eri a Woxmi
1000 ppm; :14244 M 10 LS; cl 7.0 i.035 N N N 3+* OCC F F M W14247 M 6 S;cl 6.8 1.057 N N N N F M :f14252 M 5 S;cl 6.6 1.065 N N N N 2-3 F F F ,F14255 M 4 S;C 6.0 1.065 N N N N OCC F F F F14257 M 10 LS;cl 9.0 1.037 . N N N • 2-3 F M M H14260 M 3 S;cl 6.7 1.073 N N N N 1-2 F M F14224 F 5 S;cl 9.0 1.045 N N N N F F M14227 F 2 S;C 6.7 1.068 N N N N F F F14232 F 3 S;cl 5.9 1.057 N N N N OCC F F M14236 F 2 S;C 6.0 1.075 N N N N 1-2 F F F14238 F 2 S;cl 6.5 1.065 N N N N F F F14240 F 1 S;C 6.2 1.078 N N N N F F F5000 ppm.:14283 M 2 Am; Cl 6.2 1.075 N N N N occ F F F F14287 M 4 S;cl 6.8 1.073 N N N N F F F F14291 M 6 S;cl 8.8 1.045 2+ N N ' N F M m :f14294 M 2 DS;cl 7.7 1.080 N N N N F M F F14297 M 4 DS;C 6.1 1.075 N N N N OCC F F F :f14300 M 4 S ; cl 6.8 1.065 N N N N F F F F M14266 F 1 S;C 7.0 1.080 N N N N F F F14269 F 2 S;cl 6.2 i.068 N N N N occ F M F14272 F 1 DS;C 5.8 1.065 N N N N OCC F F M F14276 F 1 DS;C 6.6 1.065 N N N N 1-2 F M F14278 F 2 S;C 6.3 1.065 N N N N 1-2 F M F14281 F 1 DS;C 6.0 1.080 N N N N 1-2 F F MCode: S - Straw C - Clear N - Negative F - Few ►U
LS - Light Straw cl - Cloudy 1+ - Trace-to-Slight M - Many OQDS - Dark ,Straw 2+ - Slight-to-Moderate L - LoadedAm - Amber 3+ - Moderate OCC - Occasional O
)
4+ - Marked * Repeat 3+
Company Sanitized. Does not contain TSCA CBI

Ninety-Day Feeding Study in the Rat.
Rats were normal except as noted below:
Control:14165 M thymus Few petechial hemorrhages.
14146 F uterus Mild hydrouterus.
100 PESI: ■14202 M lung Moderate pneumonia.
14208 M lung Mild pneumonia.
14185 F uterus Mild hydrouterus.
2500 DDm. : 14288 M spleen Slightly enlarged.14262 F spleen Slightly enlarged.
<* m )
Company Sanitized. Does not contain TSCA CBI
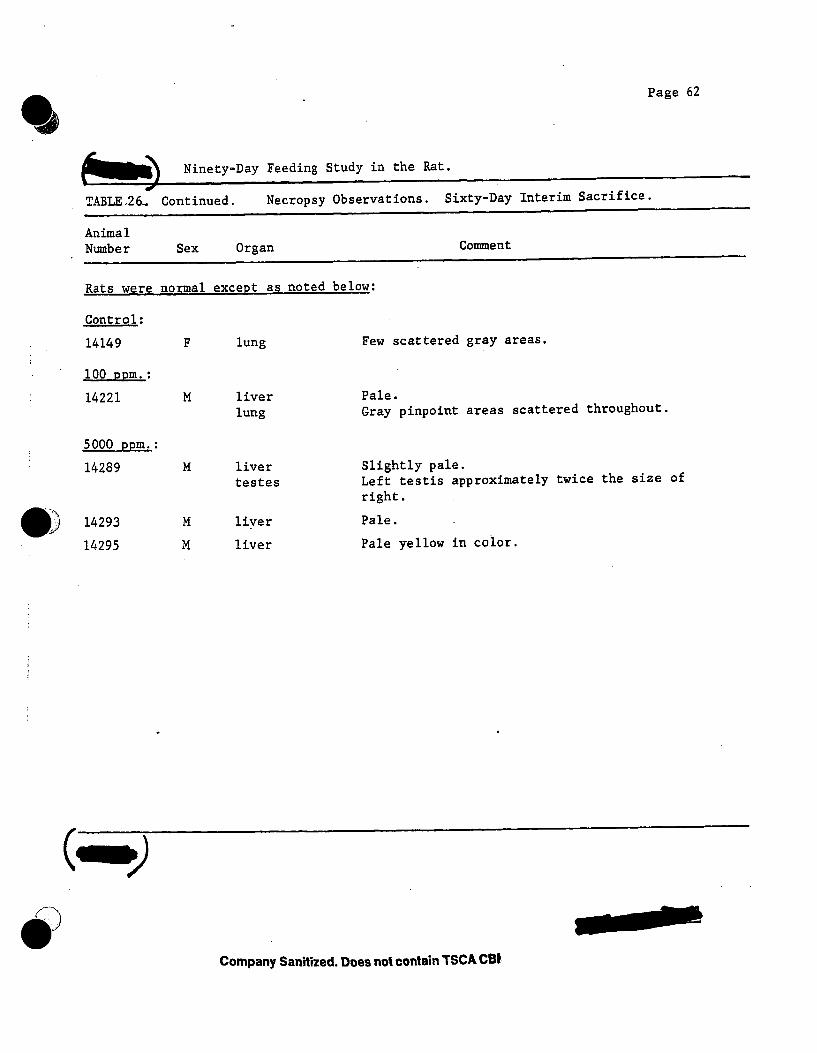
Page 62
%
èNinety-Day Feeding Study in the Rat.
TABLE-26- Continued. Necropsy Observations. Sixty-Day Interim Sacrifice.
AnimalNumber Sex Organ Comment
Rats were normal except as noted below:
Control:14149 F lung Few scattered gray areas.
100 D D m . :
14221 M liverlung
Pale.Gray pinpoint areas scattered throughout.
5000 ppm.:14289 M liver
testesSlightly pale.Left testis approximately twice the size of right.
14293 M liver Pale.14295 M liver Pale yellow in color.
Company Sanitized. Does not contain TSCA CBI

Page 63
TABLE 26.
Ninety-Day Feeding Study in the Rat.Continued. Necropsy Observations. Ninety-Day Terminal Sacrifice.
AnimalNumber Sex Organ Comment
Rat were normal except as noted below:
Controlr14175 M lung Mild pneumonia.14153 F lung Mild pneumonia.
100 DDm.:14214 M lung Mild pneumonia.
1000 DDm. :14252 M liver Slightly yellowish.14254 M lung Mild pneumonia.14227 F- abdominal
cavity 6 mm. firm hemorrhagic area in abdominal fat14233 F lung Mild pneumonia. -14237 F lung Mild pneumonia.
5000 DDm.:14284 M liver Slight yellowish cast.14286 . M lung Mild pneumonia.14291 M liver Slight yellowish cast.14294 M liver Slight yellowish cast.14297 M liver .Slight yellowish cast.14266 F lung Moderate pneumonia and bronchiectasis.14274 F kidney Hydronephorsis, right kidney.
Company Sanitized. Does not contain TSCA CBI

Page 64
AnimalNumber Sex Organ Comment
Pats were normal except as noted below:
5000 ppm.:1429914300
MM
liverl iv e r
Slightly pale. Slightly pale.
Company Sanitized. Does not contain TSCA CBI

age 65
Ninety-Day Feeding Study in the Rat.
27. Mean Actual (Grams) and Relative (X Body Weight) Organ Weights.Terminal Body Wt. Gm.__
DietaryLevel Sex „„ Gm. % Gm. % Gm. % Gm. % Gm.
30-Day Interim Sacrifice:0 M 315 0.970 F 202 0.70
100 M 268 0.70100 F 212 0.69500 M 243 0.62500 F 188 0.472500 M 277 1.122500 F 173 0.5960-Dav Interim Sacrifice:
0 M 355 0.760 F 233 0.52
100 M 338 0.79100 F 230 0.52
j|000 M 355 0.74^000 F 210 0.545000 M 412 0.905000 F 232 0.6290-Day Terminal Sacrifice:
0 M 495 1.080 F 270 0.71
100 M 469 1.14100 F 284 0.81
1000 M 452 0.971000 F 284 0.775000 M 425 0.985000 F 237 0.8121-Day Compound Withdrawal:
0 M 490 0.700 F 297 0.56
1000 M 507 0.911000 F 287 0.615000 M 440 0.615000 F 277 0.57
0.308 14.11 4.479 0.0390.347 8.74 4.327 0.0690.261 11.65 4.347 0.0440.326 7.28 3.434 0.0540.255 10.06 4.136 0.0370.250 8.26 4.394 0.0540.404 15.68 5.661 0.0440.341 8.65 5.000 0.068
0.214 13.02 3.668 0.0620.22 8.25 3.541 0.0700.234 10.91 3.228 0.0480.226 8.00 3.478 0.0650.208 12.94 3.645 0.0460.257 7.89 3.757 0.0750.218 21.71 5.269 0.0710.267 12.04 5.190 .0.067
0.218 14.12 2.853 0.0660.263 8.17 3.026 0.0750.243 14.19 3.026 0.0570.285 8.27 2.912 0.0710.215 15.02 3.323 0.0600.271 10.59 3.729 0.0870.231 20.38 4.795 0.0570.342 10.95 4.620 0.072
0.143 14.82 3.024 0.0560.189 9.17 3.087 0.0730.179 17.41 3.434 0.0650.213 9.35 3.258 0.0770.139 16.55 3.761 0.0580.206 10.75 3.881 0.083
0.010 2.66 0.844 2.99 0.9490.034 1.73 0.856 0.089 0.0400.020 2.22 0.828 2.69 1.0030.025 1.56 0.736 0.092 0.0400.015 2.30 0.946 2.74 1.1270.029 1.86 0.990 0.097 0.0500.016 2.80 1.011 2.74 0.9890.039 1.85 1.069 0.123 0.070
0.017 2.62 0.738 3.07 0.8650.030 1.72 0.738 0.133 0.0600.014 2.53 0.749 3.30 0.9760.028 1.70 0.739 0.132 0.0600.013 2.70 0.761 3.08 0.8680.036 1.92 0.914 0.162 0.0800.017 3.46 0.840 3.82 0.9270.029 2.36 1.017 0.145 0.060
0.013 2.87 0.580 3.32 0.6700.028 1.73 0.641 0.154 0.0570.012 2.95 0.629 3.39 0.7230.025 1.87 0.658 0.171 0.0600.013 3.05 0.675 3.39 0.7500.031 2.30 0.810 0.155 0.0550.013 3.33 0.783 3.37 0.7930.030 2.25 0.949 0.142 0.060
0.014 2.97 0.606 3.36 0.6860.025 2.09 0.704 0.224 0.0800.013 3.36 0.663 3.59 0.7090.027 2.25 0.784 0.177 0.0600.013 3.18 0.723 3.32 0.7550.030 2.45 0.884 0.162 0.060
DCompany Sanitized. Does not contain TSCA CBI

Thymus Heart Lung Thyroid Brain PituitaryGm. 1 Gm. . 1 Gm. % Gm. % Gm.. 1 Gm. %
0.90 0.286 1.15 0.3650.68 0.337 0.78 0.3860 .73 Q,.272 0.98 0.,3660.47 0,.222 0.69 0.,3250.67 0..276 0.94 0.3860.71 0,.378 0.77 0.4100.74 0,.267 1.06 0.3830.59 0,.341 0.68 0.393
0,.64 0..180 1.41 0.,3970.57 0,.244 0.86 0.,3690.79 0..234 1.17 0., 3460,.50 0,.217 0.76 0.,3300..66 0..186 1.09 0.,3070,.56 0,.267 0.81 0.,3860,.90 0..218 1.36 0.,3300..56 0..241 0.85 0.,366
0.. 66 0. 130 1.37 0.2770,.51 0.,189 0.84 0.3110.,64 0.,136 1.42 0.3030.52 0. 183 0,.87 0.3060.59 0. 131 1,.32 0.2920.50 0.176 0..98 0.3450. 66 0.155 1,.29 0.3040.50 0.211 0..85 0.359
0. 79 0.161 1..32 0.2690.52 0.175 0..89 0.3000.84 0.166 1.,51 0.2980.58 0.202 0.,84 0.2930. 67 0.152 1.,28 0.2910. 62 0.224 0.,93 0.336
1.63 0.517 0.023 0.0071.32 0.653 0.021 0.0101.56 0.582 0.027 0.0101.25 0.590 0.018 0.0081.58 0.650 0.024 0.0101.28 0.681 0.024 0.0131.65 0.596 0.018 0.0061.34 0.774 0.018 0.010
1.91 0.538 0.026 0.0071.16 0.498 0.024 0.0101.70 0.503 0.027 0.0081.44 0.626 0.036 0.0161.92 0.501 0.022 0.0071.41 0.671 0.033 0.0162.06 0.500 0.030 0.0071.34 0.578 0.025 0.011
2.02 0.408 0.028 0.0061.37 0.507 0.025 0.0092.11 0.450 0.027 0.0061.40 0.493 0.024 0.0082.08 0.460 0.028 0.0061.48 0.521 0.031 0.0111.91 0.449 0.025 0.0061.54 0.650 0.022 0.009
2.47 0.504 0.035 0.0071.53 0.515 0.026 0.0092.29 0.452 0.036 0.0071.63 0.568 0.029 0.0101.82 0.414 0.030 0.0071.60 0.578 0.030 0.010
1.86 0.591 0.009 0.0031.79 0.886 0.007 0.0031.74 0.649 0.009 0.0031.74 0.820 0.009 0.0041.84 0.757 0.008 0.0031.74 0.926 0.008 0.0041.96 0.708 0.006 0.0021.80 1.040 0.004 0.002
1.61 0.454 0.014 0.0041.79 0.768 0.011 0.0051.88 0.556 0.010 0.0031.75 0.761 0.012 0.0052.00 0.563 0.010 0.0031.87 0.890 0.010 0.0051.98 0.481 0.012 0.0031.86 0.802 0.013 0.006
1.92 0.388 0.014 0.0031.82 0.674 0.013 0.0051.99 0.424 0.011 0.0021.87 0.658 0.013 0.0051.96 0.434 0.013 0.0031.89 0.665 0.013 0.0052.00 0.471 0.010 0.0021.85 0.781 0.010 0.004
2.07 0.422 0.010 0.0021.87 0.630 0.012 0.0042.12 0.418 0.014 0.0031.95 0.680 0.014 0.0052.01 0.457 0.012 0.0031.90 0.686 0.012 0.005
Company Sanitized. Does not contain TSCA CB!

Ninety-Day Feeding Study in the Rat
TABLE 28. Organ Weights, GramsAnimal Terminal , Testes/No. & GrouD Sex
WeightGrams
Soleen Liver Adrenals Kidnevs Ovaries Thymus Heart Lune Thyroid Brain Pituitary
30-DAY INTERIM SACRIFICE:Control:14162 M 270 1.09 12.02 0.024 2.35 3.06 0.75 0.90 1.44 0.020 1.84 0.00714165 M 360 0.92 17.02 0.051 3.11 2.81 0.93 1.43 1.68 0.024 1.83 0.01014168 M 315 0.89 13.30 0.043 2.52 3.10 1.01 1.12 1.76 0.025 1.92 0.00814142 F 205 0.52 8.63 0.079 1.79 0.084 0.79 0.79 1.30 0.022 8.80 0.00814145 F 175 0.99 8.11 0.056 1.50 0.063 0.53 0.71 1.22 0.020 1.78 0.00614146 F 225 0.60 9.49 0.071 1.91 0.120 0.71 0.85 1.45 0.021 1.80 0.007100 D D m .
14202 M 275 0.94 12.51 0.044 2.39 2.76 0.81 0.93 1.84 0.025 1.90 0.00914205 M 300 0.67 13.42 0.050 2.41 3.11 0.69 1.07 1.47 0.027 1.72 0.00814208 M 230 0.50 9.02 0.038 1.86 2.19 0.70 0.93 1.37 0.029 1.61 0.01014182 F 280 0.57 7.75 0.060 1.61 0.110 0.60 0.72 1.30 0.030 1.70 0.01014185 F ' 190 1.10 7.81 0.053 1.67 0.092 0.41 0.65 1.36 0.012 1.72 0.01014188 F 165 0.40 6.28 0.048 1.42 0.075 0.39 0.70 1.08 0.012 1.79 0.007500 onm, 14242 M 225 0.49 9.49 0.028 2.16 2.83 0.50 0.99 1.76 0.033 1.73 0.00614245 M 270 0.79 11.02 0.046 2.52 2.82 0.93 1.03 1.60 0.023 2.00 0.01014248 M 235 0.59 • 9.66 0.036 2.21 2.56 0.58 0.79 1.38 0.016 1.78 0.00714222 F 205 0.50 9.20 0.052 1.96 0.084 0.80 0.81 1.31 0.028 1.71 0.00714225 F 160 0.40 7.08 0.051 1.59 0.083 0.45 0.70 1.14 0.026 1.71 0.00714228 F 200 0.50 8.51 0.060 2.04 0.123 0.87 0.80 1.38 0.018 1.79 0.0092500 DDm.: 14282 M 255 0.71 14.75 0.061 2.49 2.29 0.65 0.96 1.46 0.026 1.93 0.00514285 M 290 0.90 15.29 0.051 2.90 2.83 0.88 1.02 1.40 0.019 2.01 0.00614288 M 285 1.76 16.99 0.019 3.00 3.10 0.70 1.20 2.08 0.010 1.94 0.00714262 F 195 0.99 10.35 0.079 2.12 0.100 0.67 0.76 1.41 0.021 1.81 0.00314265 F 170 0.47 7.78 0.056 1.70 0.117 0.61 0.65 1.14 0.013 1.75 0.00214268 F 155 0.32 7.82 0.068 1.74 0.153 0.50 0.63 1.47 0.020 1.83 0.006
Company Sanitized. Does not contain TSCA CBI
Page 67

Ninety-Day Feeding Study in the Rat."table 2.8. Continued. Organ Weights , Grams.Animal No. &GrouD Sex
TerminalWeightGrams
Soleen Liver Adrenals KidnevsTestes/Ovaries Thymus Heart Lung Thyroid Brain Pituitary
21-DAY COMPOUND WITHDRAWAL:Control: / 14177 M 420 0.60 11.80 0.050 2.67 3.30 0.58 1.18 2.43 0.030 2.21 0.01014179 M 520 0.65 14.98 0.064 3.02 3.29 0.88 1.41 2.23 0.034 2.07 0.01014180 M 530 0.85 17.68 0.055 3.22 3.50 0.90 1.38 2.75 0.042 1.93 0.01014158 F 280 0.42 8.48 0.071 1.98 0.185 0.41 0.93 1.57 0.041 1.80 0.01114159 F 320 0.53 9.34 0.072 2.15 0.248 0.64 0.90 1.50 0.018 1.92 0.01014161 F 290 0.73 9.70 0.075 2.15 0.239 0.51 0.85 1.52 0.020 1.90 0.0141000 DDm.14258 M 560 1.05 18.65 0.064 3.65 3.80 0.90 1.70 2.23 0.035 2.15 0.01414259 M 470 0.63 17'. 40 0.068 3.20 3.55 0.83 1.41 2.30 0.034 2.00 0.01514260 M 490 1.05 16.17 0.062 3.23 3.41 0.80 1.41 2.34 0.038 2.22 0.01214238 F 280 0.68 8.90 0.081 2.26 0.180 0.52 0.80 2.11 0.027 1.98 0.01514239 F 290 0.57 9.63 0.069 2.40 0.192 0.61 0.91 1.42 0.023 1.81 0.01014240 F 290 0.59 9.52 0.081 2.09 0.160 0.60 0.82 1.35 0.037 2.06 0.0175000 DDm, 14298 M 340 0.55 11.10 0.051 2.80 3.32 0.58 1.05 1.64 0.018 2.01 0.01214299 M 535 0.78 22.95 0.074 3.75 3.40 0.75 1.60 2.09 0.044 2.13 0.01414300 M 445 0.50 15.61 0.048 2.98 3.25 0.68 1.20 1.72 0.028 1.90 0.01014278 F 280 0.57 11.10 0.087 2.30 0.124 0.61 0.88 1.70 0.029 1.78 0.00914279 F 260 0.53 10.13 0.085 2.52 0.160 0.60 0.92 1.32 0.034 1.93 0.01414280 F 290 0.62 11.01 0.077 2.52 0.203 0.65 1.00 1.78 0.028
«
1.98 0.013
Company Sanitized. Does not contain TSCA CBI
Page 68

, Ninety-Day Feeding Study in the Rat.TABLE 28. Continued. Organ Weights, Grams. -
Animal Terminal Testes/No. & Weight Spleen Liver Adrenals Kidnevs Ovaries Thvmus Heart Lune Thvroid Brain PituitarvGroup Sex Grams60-DAY INTERIM SACRIFICE:Control: «14167 M 340 0.81 13.13 0.058 2.60 3.14 0.69 1.16 1.67 0.027 1.81 0.01414170 M 385 0.71 14.70 0.069 2.90 2.89 0.70 1.48 2.03 0.027 1.20 0.01714178 M 340 0.75 11.24 0.059 2.36 3.19 0.52 1.58 2.02 0.025 1.81 ' 0.01114143 F 200 0.49 7.28 0.059 1.55 0.170 0.49 0.75 1.07 0.015 1.87 0.0114149 F 260 0.47 8.88 0.071 1.90 0.100 0.69 0.98 1.22 0.031 1.74 0.00914152 F 240 0.59 8.58 0.080 1.71 0.130 0.53 0.84 1.19 0.027 1.75 0.014100 ppm. :14217 M 325 0.79 11.78 0.051 2.69 3.32 0.83 1.13 1.60 0.037 2.01 0.01014220 M 340 0.79 10.52 0.053 2.31 3.31 0.96 1.22 1.81 0.025 1.71 0.00914221 M 350 0.79 10.44 0.041 2.59 3.27 0.59 1.15 1.69 0.019 1.92 -14184 F 215 0.41 0.062 1.61 0.144 0.45 0.70 1.15 0.044 1.79 0.01214193 F 235 0.54 8.29 0.064 1.66 0.135 0.47 0.80 1.78 0.023 1.73 0.01314194 F 240 • 0.61 7.70 0.069 1.82 0.118 0.58 0.78 1.38 0.042 1.73 0.0101000 ppm,, ;14246 M 320 0.62 11.75 0.050 2.57 2.70 0.60 1.12 1.95 0.024 1.91 0.01014251 M 360 0.79 14.00 0.048 3.09 3.17 0.62 1.11 1.81 0.029 1.99 0.01214253 M 385 0.81 13.08 0.041 2.45 3.37 0.77 1.05 2.01 0.014 2.09 0.00814223 F 215 0.55 8.24 0.081 1.89 0.138 0.58 0.89 1.40 0.042 1.82 0.01014230 F 220 0.65 8.01 0.076 2.01 0.200 0.50 0.88 1.62 0.038 1.90 0.00914234 F 195 0.41 7.42 0.068 1.85 0.149 0.60 0.66 1.21 0.018 1.90 0.0105000 ODDI , J14289 M 450 0.71 26.05 0.070 3.49 1.69, 2.95 1.00 1.40 1.89 0.029 1.90 0.01414293 M 355 1.34 16.75 0.067 3.33 3.32 0.91 1.38 2.19 0.036 1.96 0.01314295 M 430 0.66 22.33 0.075 3.56 3.49 0.78 1.29 2.11 0.025 2.08 0.00914263 F 265 0.50 13.71 0.074 2.46 0.168 0.68 0.87 1.29 0.021 1.80 0.01914270 F 200 0.55 10.29 0.063 2.20 0.079 0.50 0.80 1.44 0.033 1.88 0.01214275 F 230 0.80 12.11 0.065 2.41 0.188 0.50 0.89 1.30 0.022 1.90 0.007
Company Sanitized. Does not contain TSCA CBI
Page 69
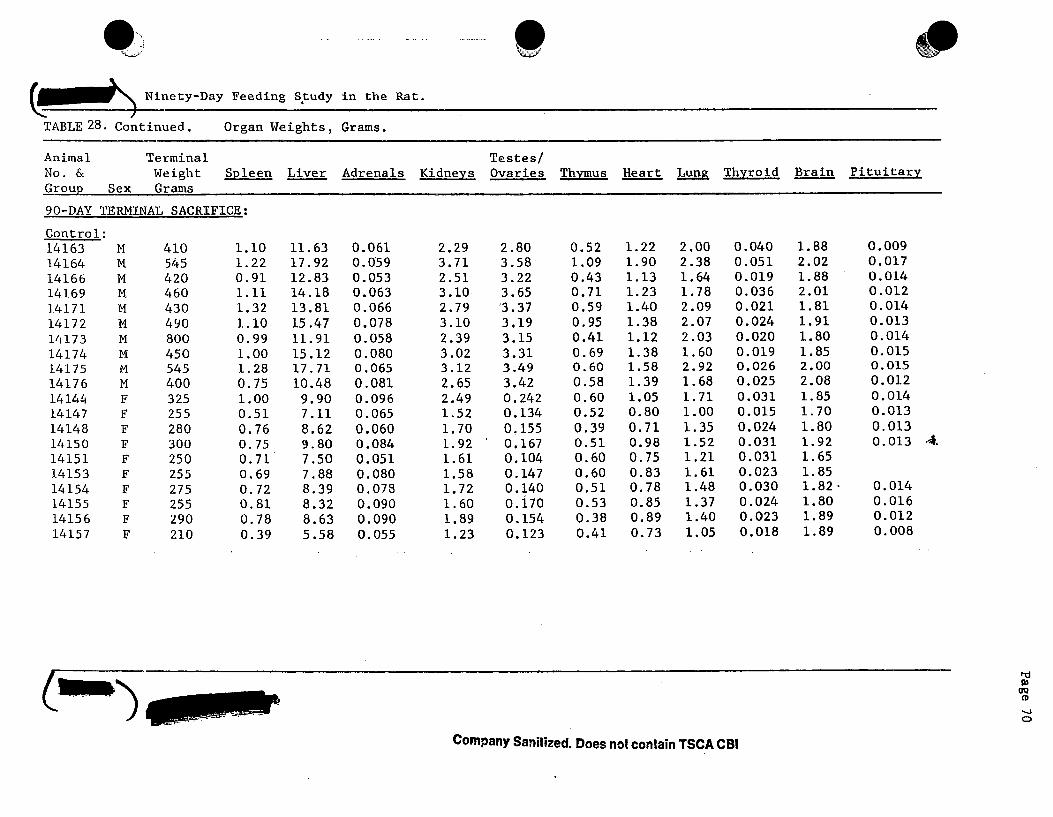
Ninety-Day Feeding Study in the Rat.TABLE 28. Continued Organ Weights, Grams.Animal Terminal Testes/No. & Group Sex
WeightGrams
Spleen Liver Adrenals Kidneys Ovaries Thvmus Heart Lung Thvroid Brain Pituitary
90-DAY TERMINAL SACRIFICE:Control ;14163 M 410 1.10 11.63 0.061 2.29 2.80 0.52 1.22 2.00 0.040 1.88 0.00914164 M 545 1.22 17.92 0.059 3.71 3.58 1.09 1.90 2.38 0.051 2.02 0.01714166 M 420 0.91 12.83 0.053 2.51 3.22 0.43 1.13 1.64 0.019 1.88 0.01414169 M 460 1.11 14.18 0.063 3.10 3.65 0.71 1.23 1.78 0.036 2.01 0.01214171 M 430 1.32 13.81 0.066 2.79 3.37 0.59 1.40 2.09 0.021 1.81 0.01414172 M 490 1.10 15.47 0.078 3.10 3.19 0.95 1.38 2.07 0.024 1.91 0.01314173 M 800 0.99 11.91 0.058 2.39 3.15 0.41 1.12 2.03 0.020 1.80 0.01414174 M 450 1.00 15.12 0.080 3.02 3.31 0.69 1.38 1.60 0.019 1.85 0.01514175 M 545 1.28 17.71 0.065 3.12 3.49 0.60 1.58 2.92 0.026 2.00 0.01514176 M 400 0.75 10.48 0.081 2.65 3.42 0.58 1.39 1.68 0.025 2.08 0.01214144 F 325 1.00 9.90 0.096 2.49 0.242 0.60 1.05 1.71 0.031 1.85 0.01414147 F 255 0.51 7.11 0.065 1.52 0.134 0.52 0.80 1.00 0.015 1.70 0.01314148 F 280 0.76 8.62 0.060 1.70 0.155 0.39 0.71 1.35 0.024 1.80 0.01314150 F 300 0.75 9.80 0.084 1.92 0.167 0.51 0.98 1.52 0.031 1.92 0.013 4.14151 F 250 0.71 7.50 0.051 1.61 0.104 0.60 0.75 1.21 0.031 1.6514153 F 255 0.69 7.88 0.080 1.58 0.147 0.60 0.83 1.61 0.023 1.8514154 F 275 0.72 8.39 0.078 1.72 0.140 0.51 0.78 1.48 0.030 1.82 • 0.01414155 F 255 0.81 8.32 0.090 1.60 0.Ì70 0.53 0.85 1.37 0.024 1.80 0.01614156 F 290 0.78 8.63 0.090 1.89 0.154 0.38 0.89 1.40 0.023 1.89 0.01214157 F 210 0.39 5.58 0.055 1.23 0.123 0.41 0.73 1.05 0.018 1.89 0.008
Company Sanitized. Does not contain TSCA CBI

Ninety-Day Feeding Study in the Rat.FABLE 28 . Continued. Organ Weights, Grams.Animal Sto. & SrouD
Terminal Weight
Sex GramsSpleen Liver Adrenals
Testes/Kidneys Ovaries Thvmus Heart Lung Thyroid Brain Pituitary
90-DAY TERMINAL SACRIFICE:LOO ppm.:L4203 M 455 1.49 1.4.08 0.051 2.50 3.05 0.41 1.43 2.28 0.019 1.85 0.0071.4204 M 560 0.99 17.48 0.061 3.38 3.70 0.60 1.73 2.10 0.025 1.93 0.01414206 M 465 1.20 14.60 0.067 3.25 3.50 0.60 1.38 2.72 0.024 2.08 0.01114207 M 435 1.20 12.02 0.060 3.05 3.93 0.82 1.22 1.74 0.023 2.08 0.00914209 M 400 1.21 12.0/ 0.054 2.72 3.19 0.44 1.28 1.90 0.025 1.82 0.00914210 M 5 20 1.24 15.48 0.053 2.79 3.10 1.11 1.39 2.20 0.021 1.90 0.01014211 M 470 1.48 13.78 0.035 3.10 3.42 0.36 1.43 1.95 0.039 2.19 0.01114213 M. 380 1.03 11.20 0.051 2.61 3.43 0.58 1.20 1.62 2.09 0.00914214 M 485 1.02 14.03 0.061. 2.89 3.50 0.60 1.46 2.71 0.027 2.09 0.01314215 M 420 0.70 12.49 0.056 2.80 3.33 0.90 1.30 2.08 0.028 2.00 0.01114216 M 535 0.90 15.90 0.055 3.29 3.32 0.59 1.50 2.02 0.036 1.97 0.01314218 M 520 1.41 17.65 0.081 3.02 3.74 0.72 1.71 2.21 0.022 1.83 0.01514219 M 450 1.00 13.65 0.055 2.95 2.85 0.54 1.40 1.90 0.029 2.08 0.01014183 F 310 0.64 8.78 0.076 1.93 0.210 0.50 0.80 1.52 0.028 1.78 0.01414186 F 345 0.81 9.62 0.093 2.15 0.203 0.58 1.14 1.34 0.034 2.02 0.01414187 F 280 0.81 8.00 0.074 1.77 0.186 0.44 0.79 1.21 0.026 1.90 0.01814189 F 265 1.10 8.40 0.081 1.91 0.183 0.81 0.83 1.42 0.027 1.73 0.01514190 F 255 0.70 7.58 0.067 1.58 0.165 0.33 0.71 1.29 0.023 1.75 0.01114191 F 290 1.22 7.51 0.061 1.96 0.168 0.56 0.92 1.43 0.016 1.89 0.01214192 F 245 0.68 7.58 0.069 1.80 0.161 0.30 0.72 1.43 0.023 1.91 0.01114195 F 280 0.71 8.50 0.093 2.01 0.161 0.60 0.93 1.30 0.026 1.88 0.01414196 F 270 0.89 8.59 0.064 1.80 0.177 0.48 0.89 1.53 0.028 1.92 0.00814197 F 260 0.54 7.32 0.049 1.72 0.116 0.49 0.88 1.28 0.022 1.77 0.01214198 F 295 1.00 8.40 0.055 1.79 0.181 0.42 0.79 1.60 0.014 1.92 0.01314199 F 280 0.76 8.83 0.050 1.81 0.170 0.61 1.01 1.41 0.019 1.81 0.01514200 F 285 0.81 8.80 0.077 1.98 0.119 0.71 0.81 1.37 0.023 1.87 0.01414201 F 310 0.68 7.88 0.084 1.99 0.198 0.48 0.93 1.50 0.020 2.09 0.013
Company Sanitized. Does not contain TSCA CBI
Page 71
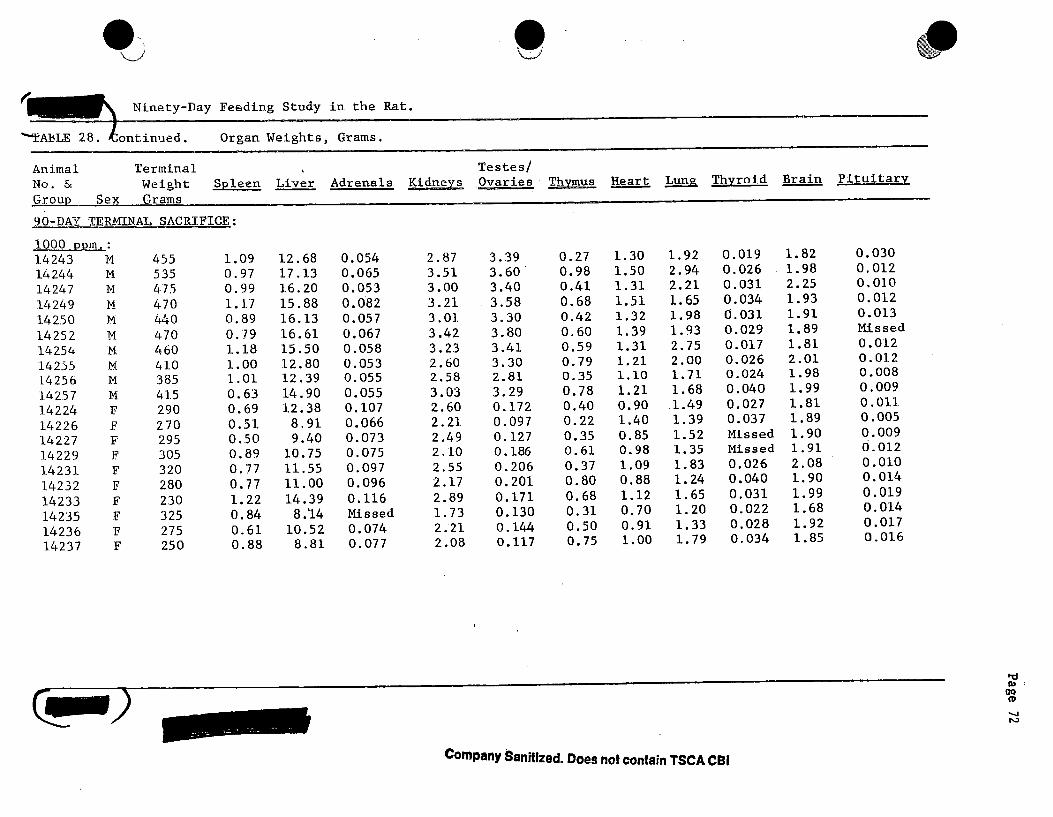
'mm9\ Ninety-Day Feeding Study in the Rat''TABLE 28. Continued. Organ Weights, Grams.Animal Terminal ,No. & Weight Spleen Liver AdrenalsGroup Sex Grams90-DAY TERMINAL SACRIFICE:1000 ppm.:14243 M 455 1.09 12.68 0.05414244 M. 535 0.97 17.13 0.06514247 M 475 0.99 16.20 0.05314249 M 470 1.17 15.88 0.08214250 M 440 0.89 16.13 0.05714252 M 470 0.79 16.61 0.06714254 M 460 1.18 15.50 0.05814255 M 410 1.00 12.80 0.053L4256 M 385 1.01 12.39 0.05514257 M 415 0.63 14.90 0.05514224 F 290 0.69 12.38 0.10714226 F 270 0.51 8.91 0.06614227 F 295 0.50 9.40 0.07314229 F 305 0.89 10.75 0.07514231 F 320 0.77 11.55 0.09714232 F 280 0.77 11.00 0.09614233 F 230 1.22 14.39 0.11614235 F 325 0.84 8.14 Missed14236 F 275 0.61 10.52 0.07414237 F 250 0.88 8.81 0.077
Kidneys
2.873.513.003.213.01 3.42 3.23 2.60 2.58 3.03 2.602.21 2.49 2.10 2.55 2.17 2.89 1.73 2.21 2.08
Testes/Ovaries Thymus Heart
3.39 3.603.40 3.583.30 3.803.413.30 2.81 3.29 0.172 0.097 0.127 0.186 0.206 0.201 0.171 0.130 0.144 0.117
0.270.980.410.680.420.600.590.790.350.780.400 .2 20.350.610.370.800.680.310.500.75
1.301.501.311.511.321.39 1.31 1.21 1.10 1.21 0.901.40 0.85 0.98 1.09 0.88 1.12 0.70 0.91 1 .0 0
Lung Thyroid Brain Pituitary
1.92 0.0192.94 0.0262.21 0.0311.65 0.0341.98 0.0311.93 0.0292.75 0.0172.00 0.0261.71 0.0241.68 0.0401.49 0.0271.39 0.0371.52 Missed1.35 Missed1.83 0.0261.24 0.0401.65 0.0311.20 0.0221.33 0.0281.79 0.034
1.82 0.0301.98 0.0122.25 0.0101.93 0.0121.91 0.0131.89 Missed1.81 0.0122.01 0.0121.98 0.0081.99 0.0091.81 0.0111.89 0.0051.90 0.0091.91 0.0122.08 0.0101.90 0.0141.99 0.0191.68 0.0141.92 0.0171.85 0.016
Company Sanitized. Does not contain TSCA CBI
Page 72

Ninety-Day Feeding Study in the Rat.‘TABLE 28. Continued. Organ Weights , Grams. 7Animal No. &Group Sex
TerminalWeightGrams
Spleen Liver Adrenals KidneysTestes/Ovaries Thvmus Heart Lung Thvroid Brain Pituitary
90-DAY TERMINAL SACRIFICE:1.000 D D m . :14293 M 455 1.09 12.68 0.054 2.87 3.39 0.27 1.30 1.92 0.019 1.82 0.03014244 M 535 0.97 17.13 0.065 3.51 3.60 0.98 1.50 2.94 0.026 1.98 0.01214247 M 4 75 0.99 16.20 0.053 3.00 3.40 0.41 1.31 2.21 0.031 2.25 0.01014249 M 470 1.17 15.88 0.082 3.21 3.58 0.68 1.51 1.65 0.034 1.93 0.012142.50 M 440 0.89 16.13 0.057 3.01 3.30 0.42 1.32 1.98 0.031 1.91 0.01314252 M 470 0.79 16.61 0.067 3.42 3.80 0.60 1.39 1.93 0.029 1.89 Missed14254 M 460 1.18 15.50 0.058 3.23 3.41 0.59 1.31 2.75 0.017 1.81 0.01214235 M 410 1.00 12.80 0.053 2.60 3.30 0.79 1.21 2.00 0.026 2.01 0.0121.4 256 M .385 1.01 12 .’39 0.055 2.58 2.81 0.35 1.10 1.71 0.024 1.98 0.00814257 M 415 0.63 14.90 0.055 3.03 3.29 0.78 1.21 1.68 0.040 1.99 0.00914224 F 290 0.69 12.38 0.107 2.60 0.172 0.40 0.90 1.49 0.027 1.81 0 . 0 1 1
14226 F 270 0.51 8.91 0.066 2.21 0.097 0.22 1.40 1.39 0.037 1.89 0.00514227 F 295 0.50 9.40 0.073 2.49 0.127 0.35 0.85 1.52 Missed 1.90 0.00914229 F 305 0.89 10.75 0.075 2.10 0.186 0.61 0.98 1.35 Missed 1.91 0.01214231 F .320 0.77 11.55 0.097 2.55 0.206 0.37 1.09 1.83 0.026 2.08 0.01014232 F 280 0.77 11.00 0.096 2.17 0.201 .0.80 0.88 1.24 0.040 1.90 0.01414233 F 230 1.22 14.39 0.116 2.89 0.171 0.68 1.12 1.65 0.031 1.99 0.01914235 F 325 0.84 8.14 Missed 1.73 0.130 0.31 0.70 1.20 0.022 1.68 0.01414236 F 275 0.61 10.52 0.074 2.21 0.144 0.50 0.91 1.33 0.028 1.92 0.01714237 F 250 0.88 8.81 0.077 2.08 0.117 0.75 1.00 1.79 0.034 1.85 0.016
Company Sanitized. Does not contain TSCA CBI
Page 72

Ninety-Day Feeding Study in the Rat.TABLE 28. Continued. Organ Weights , Grams. 4Animal Terminal Testes/No. & Weight Spleen Liver Adrenals Kidnevs Ovaries Thvmus Heart Lung Thyro id Brain PituitaryGroup Sex Grams90-DAY TERMINAL SACRIFICE:5000 d o d i . :14283 M 420 1.30 19.57 0.058 3.30 3.30 0.58 1.21 1.88 0.024 2.04 0.01014284 M 525 1.02 25.68 0.065 3.91 2.87 1.32 1.43 2.35 0.035 2.09 0.01514286 M 345 0.98 15.13 0.059 2.62 3.21 0.69 0.91 2.18 0.023 2.08 ' 0.00814287 M 425 1.11 20.11 0.050 3.30 3.39 0.80 1.30 1.98 0.029 2.10 0.01114290 M 430 0.90 21.49 0.059 3.38 3.60 0.42 1.58 1.61 0.027 1.92 0.01214291 M 410 0.51 21.65 0.060 3.18 3.20 0.59 1.17 2.02 0.031 1.83 0.01014292 M 390 1.19 19.82 0.050 3.20 3.49 0.63 1.20 1.42 0.019 2.02 0.00914294 M 395 0.77 18.30 0.054 3.30 3.40 0.30 1.38 2.09 0.021 1.90 0.00814296 M 430 1.12 19.82 0.054 3.31 3.60 0.79 1.42 1.60 0.023 1.92 0.01014297 M 480 0.91 22.19 0.058 3.80 3.61 0.51 1.28 1.92 0.017 2.05 0.01114264 F 220 0.90 9.84 0.063 2.00 0.146 0.41 0.78 1.38 0.020 1.78 0.01014266 F 225 0.83 11.40 0.077 2.03 0.122 0.80 2.93 0.018 1.88 0.01114267 F 250 0.48 10.85 0.067 2.28 0.178 0.58 0.72 1.28 0.019 1.80 0.01214269 F 220 0.58 11.01 0.068 2.25 0.092 0.53 0.83 1.13 0.024 1.91 0.011 .14271 F 270 1.08 11.91 0.072 2.78 0.57 0.98 1.40 0.018 1.7914272 F 215 0.67 9.57 0.083 1.80 0.130 0.58 0.70 1.32 0.032 1.91 0.01014273 F 240 0.70 11.75 0.062 2.38 0.180 0.42 0.90 1.21 0.018 1.98 0.00714274 F 240 1.51 10.41 . 0.059 2.45 0.107 0.51 0.83 1.60 0.015 1.81 0.00814276 F 250 0.48 11.30 0.085 2.12 0.144 0.43 1.03 1.61 0.031 1.81 0.01314277 F 235 0.83 11.41 0.079 2.40 0.182 0.48 0.95 1.51 0.025 1.78
Company Sanitized. Does not contain TSCA CBI
Page 73

: Page 74
Ninety-Day Feeding Study in the Rat.TABLE 29. Incidence of Histopathologic Lesions. _
30 DayInterim Sacrifice Control 2500 ppm. M F M F
60 DayInterim Sacrifice Control 5000 ppm. M F M F
brain - no lesion 3/3 3/3 3/3 3/3 3/3 3/3 3/3 3/3
- glial nodulesspinal cord - no lesion 3/3 3/3 2/2 3/3 3/3 3/3 3/3 3/3
peripheral nerve - no lesion 3/3 3/3 3/3 3/3 3/3 3/3 3/3 3/3
eye - no lesion 3/3 3/3 3/3 3/3 3/3 3/3 3/3 2/2
pituitary - no lesion 2/2 3/3 2/2 1/1 3/3 2/2 3/3 2/2
thyroid - no lesion 3/3 3/3 3/3 3/3 3/3 3/3 3/3 3/3
parathyroid - no lesion 1/1 3/3 3/3 2/2 1/1adrenal - no lesion 3/3 3/3 3/3 3/3 3/3 3/3 3/3 3/3
- ossificationlung - no lesion 3/3 2/3 3/3 2/3 3/3 2/3 3/3 3/3
- chronic respiratory disease 1/3 1/3 1/3
heart - no lesion 3/3 3/3 3/3 3/3 3/3 3/3 3/3 3/3
- arteritisspleen - no lesion 3/3 3/3 2/3 3/3 3/3 3/3 3/3 3/3
- hematopoiesis 1/3lymph node - no lesion 3/3 3/3 3/3 3/3 2/2 3/3 3/3 3/3
thymus - no lesion 3/3 3/3 3/3 3/3 3/3 3/3 3/3 3/3
bone marrow - no lesion 3/3 3/3 3/3 3/3 3/3 3/3 3/3 3/3
saliv'ary gland - no lesion 3/3 3/3 3/3 3/3 3/3 2/2 3/3 3/3
stomach - no lesion 3/3 3/3 3/3 3/3 3/3 3/3 3/3 3/3small intestine - no lesion 3/3 3/3 3/3 3/3 3/3 3/3 3/3 3/3large intestine - no lesion 3/3 3/3 3/3 3/3 3/3 3/3 2/3 3/3
- nematodes 1/3
Company Sanitized. Does not contain TSCA CB
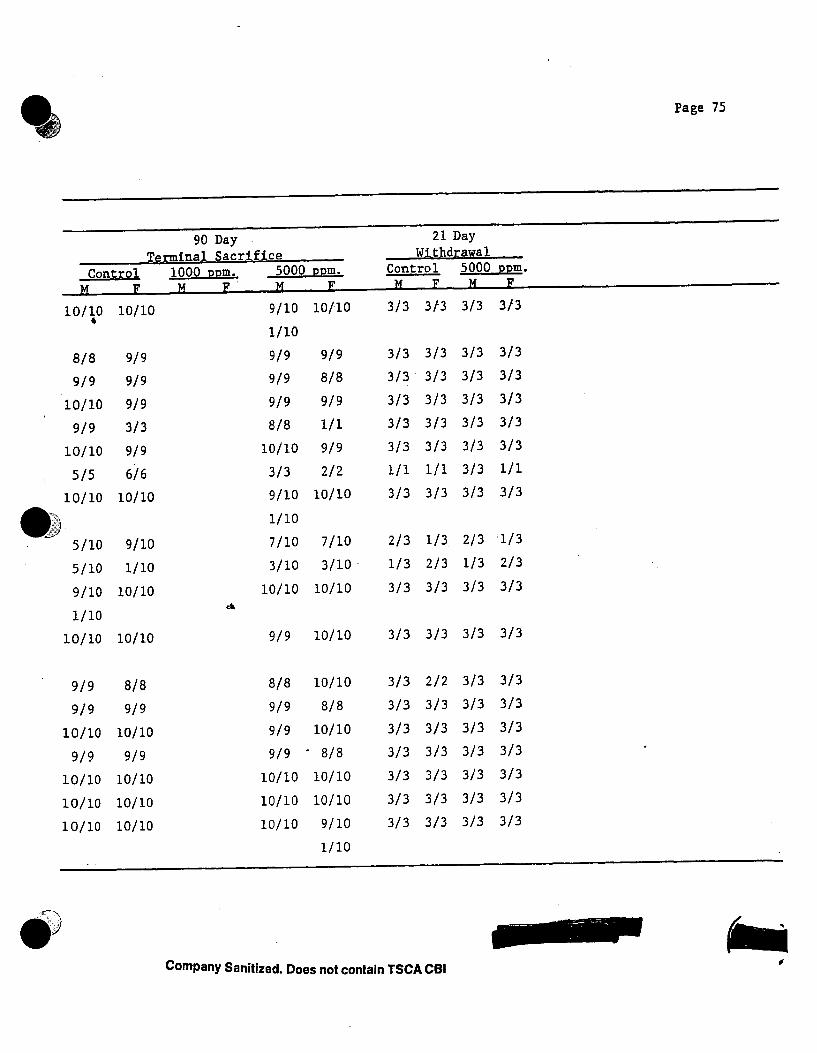
Page 75
90 Day 21 DayTerminal Sacrifice_______ ___ Withdrawal.ie
Control 1000 Dom. 5000 DDm. ControlM T?5000M
DDm,F__M__
10/10F__
10/10_M____E— ___ n---
9/10_ J L -------10/10 3/3 3/3 3/3 3/3
1/108/8 9/9 9/9 9/9 3/3 3/3 3/3 3/39/9 9/9 9/9 8/8 3/3 3/3 3/3 3/3
10/10 9/9 9/9 9/9 3/3 3/3 3/3 3/39/9 3/3 8/8 1/1 3/3 3/3 3/3 3/3
10/10 9/9 10/10 9/9 3/3 3/3 3/3 3/3: 5/5 6/6 3/3 2/2 1/1 1/1 3/3 1/1
10/10 10/10 9/10 10/10 3/3 3/3 3/3 3/3
• j 5/101/10
2/3 1/39/10 7/10 7/10 2/3 1/35/10 1/10 3/10 3/10 1/3 2/3 1/3 2/39/10 10/10 10/10 10/10 3/3 3/3 3/3 3/31/10
10/10 10/10 9/9 10/10 3/3 3/3 3/3 3/3
9/9 8/8 8/8 10/10 3/3 2/2 3/3 3/39/9 9/9 9/9 8/8 3/3 3/3 3/3 3/3
10/10 10/10 9/9 10/10 3/3 3/3 3/3 3/39/9 9/9 9/9 ' 8/8 3/3 3/3 3/3 3/3
10/10 10/10 10/10 10/10 3/3 3/3 3/3 3/310/10 10/10 10/10 10/10 3/3 3/3 3/3 3/310/10 10/10 10/10 9/10 3/3 3/3 3/3 3/3
1/10
¥Company Sanitized. Does not contain TSCA CBI

•j!.age 76
Ninety-Day Feeding Study in the Rat.^ — —Stable 2 9. continued. Incidence of Histopathologic Lesions.
30 Day 60 Day Interim Sacrifice Interim Sacrifice
Tissue and LesionControl 2500 ppm. Control 5000 ppm. m f m f m f m f
pancreas - no lesion 3/3 3/3 3/3 3/3 3/3 3/3 3/3 3/3pancreatitis, focal
liver - no lesion 2/3 3/3 0/3 2/3 2/3 2/3 0/3 0/3- portal inflammatory infiltrate 1/3 1/3 1/3 1/3 1/3 1/3- centrolobular change 3/3 3/3 2/2
kidney - no lesion 3/3 3/3 3/3 2/3 3/3 3/3 3/3 3/3- focal nephritis 1/3- hyaline droplets
urinary bladder - no lesion 2/3 3/3 3/3 3/3 3/3 3/3 3/3 3/3- siminal plug 1/3
W . . .testes or ovaries - no lesion 3/3 3/3 3/3 3/3 3/3 3/3 2/3 3/3- edema 1/3
prostate or uterus - no lesion 3/3 3/3 3/3 3/3 3/3 3/3 3/3 3/3- hydrometra
skeletal muscle - no lesion 3/3 3/3 3/3 3/3 3/3 3/3 3/3 3/3skin - no lesion 3/3 3/3 3/3 3/3 3/3 3/3 3/3 3/3bone - no lesion 3/3 3/3 3/3 3/3 3/3 3/3 3/3 3/3
Company Sanitized. Does not contain TSCA CBI

Page 77
90 Day 21 DayTerminal Sacrifice_____ Withdrawal
ControlM T?
ruij.ua i 1000 DDm. 5000
1 * 1 G1 ° Control 5000
MDDm,FM F M F M F
10/10 10/10 10/10 10/10 2/3 3/3 3/3 3/31/3
7/10 5/10 7/10 6/10 1/10 2/10 2/3 2/3 0/3 0/33/10 5/10 3/10 4/10 1/10 8/10 1/3 1/3 1/3 3/31/10 9/10 2/10 2/38/10 10/10 10/10 9/10 3/3 3/3 3/3 2/3
1/10 1/32/106/8 9/9 10/10 9/9 1/2 3/3 3/3 •3/3
k}2/8 1/2^!o/io 10/10 10/10 10/10 3/3 3/3 3/3 3/3
10/10 9/10 10/10 10/10 3/3 3/3 2/2 2/21/10
9/9 10/10 10/10 9/9 3/3 3/3 3/3 3/39/9 10/10 9/9 6/6 3/3 3/3 3/3 3/3
; L0/10 10/10 10/10 10/10 3/3 3/3 3/3 3/3
Company Sanitized. Does not contain TSCA CBI

Page 78
Ninety-Day Feeding Study in the Rat*— VTABLE 3Q. Histopathologic Observations. Thirty-Day Interim Sacrifice.
AnimalNumber Sex Tissue Comment
Control :14162 M liver Mild portal lymphocytic infiltrate.14165 M No lesion.14168 M urinary bladder Seminal plug.14142 F No lesion ...14145 F lung Small focus of pneumonic consolidation.141462500 DDm.:
F No lesion.
14282 M liver Slight hypertrophy of centrolobular hepatocytes.14285 M liver Slight hypertrophy of centrolobular hepatocytes
with loss of coarse cytoplasmic granularity.14288 M liver
spleen
Slight hypertrophy of centrolobular hepatocytes with loss of usual coarse granularity.Moderate hematopoétic activity. 1
14262 F liverkidney
Mild portal lymphocytic infiltrate.Mild focal interstitial lymphocytic infiltrate.
14265 F lung Moderate peribronchial lymphoid hyperplasia.14268
_______
F
*
No lesion.
Company Sanitized. Does not contain TSCA CBI

Page 79
Ninety-Day Feeding Study in the Rat.
TABLE 30. Continued. Histopathologic Observations. Sixty-Day Interim Sacrifice.
AnimalNumber Sex Tissue Comment
Control:14167 M No lesion.14170 M No lesion.14178 M liver Slight portal lymphocytic infiltrate.14143 F No lesion.14149 F liver Slight portal lymphocytic infiltrate. _
14152 Flung Few small scattered foci of pneumonic consolidation.
No lesion.
5000 DDm. 14289 M large intestine Nematodes.
14293 M
testesliver
liver
One testis was edematous and had reduced spermatogenic activity.Hypertrophy of hepatocytes which was more pronounced in the centrolobular area; hepatocytes appeared to have higher glycogen content than controls.Moderate hypertrophy of hepatocytes,. predominately
14295 M liver
centrolobular with loss of coarse granularity. Moderate portal lymphocytic infiltrate with scattered small nodules of proliferated reticuloendothelial cells in liver parenchyma.Hypertrophy of hepatocytes, primarily centrolobular,
14263 F liver
hepatocytes appeared to contain more glycogen than control.Slight hypertrophy of hepatocytes, predominately
14270 F livercentrolobular.Slight portal lymphocytic infiltrate.
14275 F liver Slight hypertrophy of centrolobular hepatocytes.
«
Company Sanitized. Does not contain TSCA CBI

Page 80
Ninety-Day Feeding Study in the Rat.
TABLE 39. Continued. Histopathologic Observations. Ninety-Day Terminal Sacrifice.
AnimalNumber Sex Tissue Comment
Control :14163 M lung Moderate perivascular lymphocytic cuffing.14164 M urinary bladder Seminal plug.14166 M No lesion.14169 M kidney Small numbers of hyaline droplets in epithelium
of convoluted tubules.liver Slight portal lymphocytic infiltrate and bile
duct proliferation. ,14171 M lung Moderate perivascular lymphocytic cuffing
with localized pneumonitis.14172 M urinary bladder
lungSeminal plug.Slight perivascular lymphocytic cuffing, •peribronchial lymphoid hyperplasia.
14173 M lungkidney
Slight peribronchial lymphoid hyperplasia. Moderate numbers of hyaline droplets inepithelium of convoluted tubules.
14174 M No lesion.14175 M liver Slight portal lymphocytic infiltrate,
centrolobular hepatocytes less coarsely
lunggranular.Slight perivascular lymphocytic cuffing.
14176 M liver Slight portal lymphocytic infiltrate.heart Moderate mural necrosis and perivascular
inflammatory infiltrate of a coronary vessel.14144 F No lesion.14147 F No lesion.14148 F liver Slight portal lymphocytic infiltrate and bile
duct proliferation.
Company Dpgg notaonialn TSCJ\
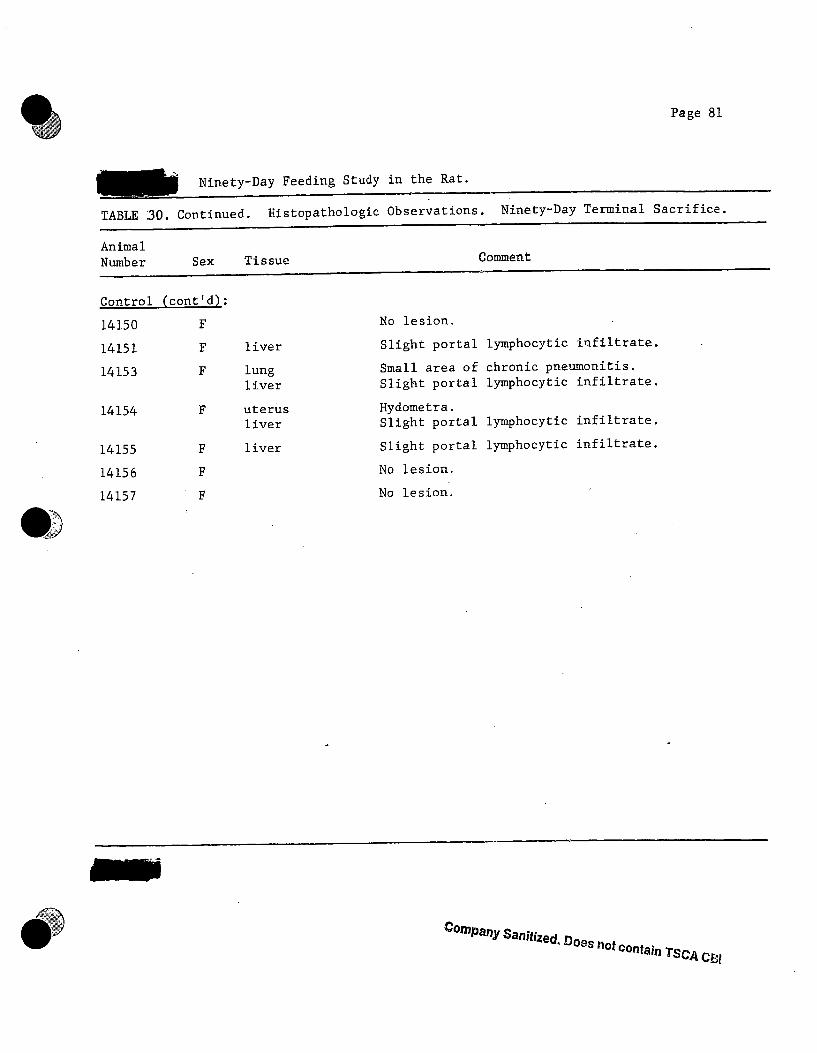
Page 81
Ninety-Day Feeding Study in the Rat.TABLE 30. Continued. Histopathologic Observations. Ninety-Day Terminal Sacrifice.
AnimalNumber Sex Tissue Comment
Control (cont'd):14150 F No lesion.14151 F liver Slight portal lymphocytic infiltrate. -14153 F lung
liverSmall area of Slight portal
chronic pneumonitis, lymphocytic infiltrate.
14154 F uterusliver
Hydometra. Slight portal lymphocytic infiltrate.
14155 F liver Slight portal lymphocytic infiltrate.14156 F No lesion.14157 F No lesion. '
Con,pany Sanitized. Doesnotcontain Tsca CBl

Page 82
Ninety-Day Feeding Study in the Rat.
TABLE 30. Continued. Histopathologic Observations . Ninety-Day Terminal Sacrifice.
AnimalNumber Sex Tissue Comment
1000 D D m . ,. Liver Only:14243 M . No lesion.14244 M No lesion.14247 M Slight portal lymphocytic infiltrate.14249 M ■ No lesion.14250 M No lesion.14252 M No lesion.14254 M No lesion.14255 M No lesion.14256 M Slight portal lymphocytic infiltrate.14257 M Slight portal lymphocytic infiltrate.14224 F No lesion.14226 F No lesion.14227 F No lesion.14229 F Slight portal lymphocytic infiltrate.14231 F No lesion.14232 F Slight portal lymphocytic infiltrate.14233 F Slight portal lymphocytic infiltrate.14235 F Slight portal lymphocytic infiltrate.14236 . F No lesion.- -14237 F No lesion.
&ompan¥ Sanitized. Does not contain 73GA§S^

Page 83
Ninety-Day Feeding Study in the Rat.
TABLE 30. Continued. Histopathologic Observations. Ninety-Day Terminal Sacrifice.
AnimalNumber Sex Tissue Comment
5000 ppm.:14283 M liver Centro lobular hepatocytes slightly hypertrophied
cytoplasm less coarsely granular than in hepatocytes at periphery of lobules.
14284 M liverlung
Centrolobular hepatocytes less coarsely granular than those at periphery.Slight peribronchial lymphoid hyperplasia.
14286 M brainlungliver
Glial nodules in medulla, structure resembling Sarcosporidia also present.Slight perivascular lymphocytic cuffing, area of pneumonic consolidation.Centrolobular hepatocytes less granular than those at periphery of lobule, slight portal lymphocytic infiltrate.
14287 M adrenal...liver
Area of osteoid and bone in cortex of one adrenal.Cytoplasm of centrolobular hepatocytes less ■ coarsely granular than cytoplasm of hepatocytes at periphery, slight portal lymphocytic infiltrate.
14290 M No lesion.14291 M liver Cytoplasm of centrolobular hepatocytes less
coarsely granular than cytoplasm of hepatocytes at periphery of lobules.
14292 M liverlung
Centrolobular hepatocytes less coarsely granular than those at periphery of lobules. Slight peribronchial lymphoid hyperplasia. _
14294 M liver Centrolobular hepatocytes less coarsely granular than those at periphery of lobule.
14296 M liver Marked portal lymphocytic infiltrate, centrolobular hepatocytes slightly less granular than those at periphery of lobule.
©OJWpany SanHizeti. Does no! conu*, T8CA cbi
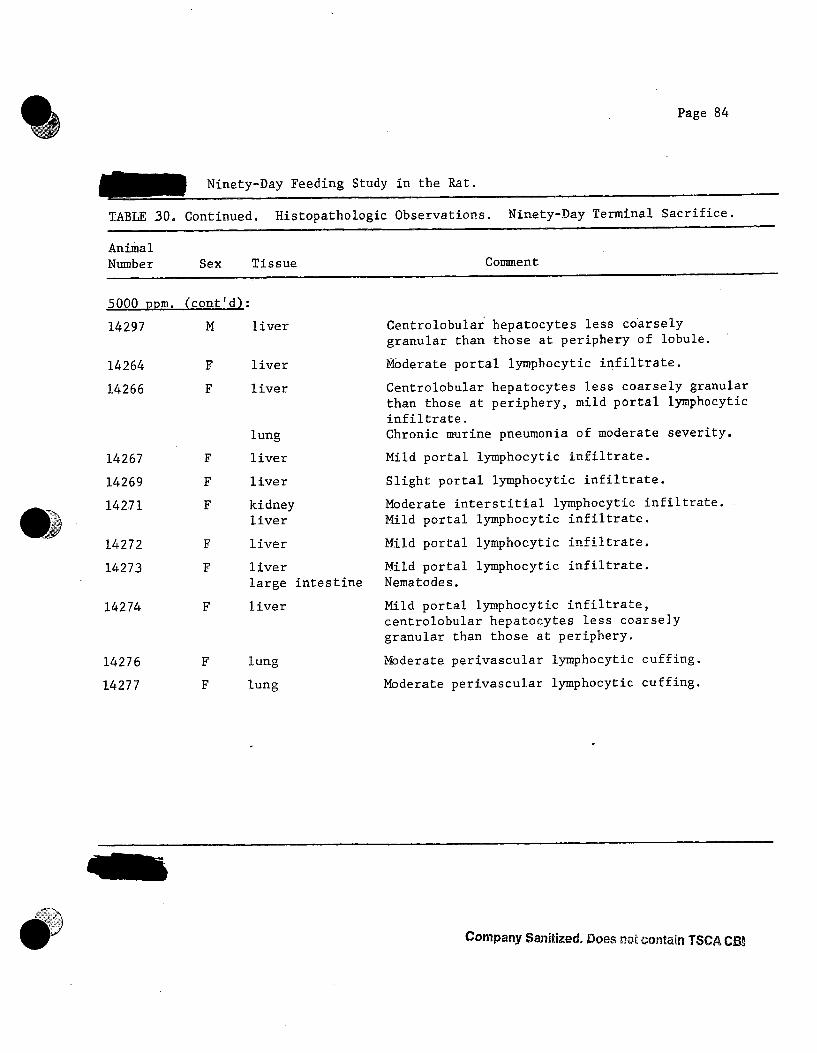
Page 84
Ninety-Day Feeding Study in the Rat.
TABLE 30. Continued. Histopathologic Observations. Ninety-Day Terminal Sacrifice.
AnimalNumber Sex Tissue Comment
5000 D D m . Ccont'd) m
14297 M liver Centrolobular hepatocytes less coarsely granular than those at periphery of lobule.
14264 F liver Moderate portal lymphocytic infiltrate.14266 F liver Centrolobular hepatocytes less coarsely granular
than those at periphery, mild portal lymphocyticinfiltrate.
lung Chronic murine pneumonia of moderate severity.14267 F liver Mild portal lymphocytic infiltrate.14269 F liver Slight portal lymphocytic infiltrate.14271 F kidney Moderate interstitial lymphocytic infiltrate. .
liver Mild portal lymphocytic infiltrate.14272 F liver Mild portal lymphocytic infiltrate.14273 F liver Mild portal lymphocytic infiltrate.
large intestine Nematodes.14274 F liver Mild portal lymphocytic infiltrate,
centrolobular hepatocytes less coarsely granular than those at periphery.
14276 F lung Moderate perivascular lymphocytic cuffing.14277 F lung Moderate perivascular lymphocytic cuffing.
Company Sanitized, Does not contain ISCA CBJ
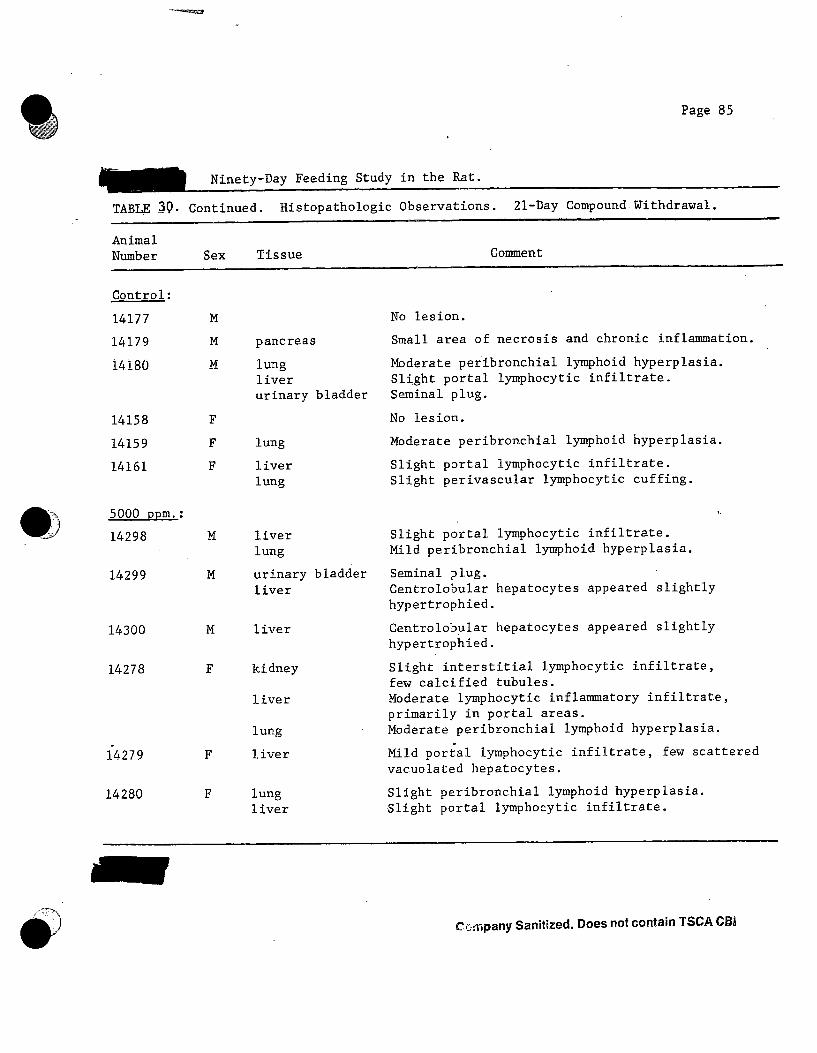
Page 85
Ninety-Day Feeding Study in the Rat.TABLE 3Q. Continued. Histopathologic Observations. 21-Day Compound Withdrawal.
AnimalNumber Sex Tissue Comment
Control:14177 M No lesion.14179 M pancreas Small area of necrosis and chronic inflammation.1418Ô M lung
liverurinary bladder
Moderate peribronchial lymphoid hyperplasia. Slight portal lymphocytic infiltrate.Seminal plug.
14158 F No lesion.14159 F lung Moderate peribronchial lymphoid hyperplasia.14161 F liver
lungSlight portal lymphocytic infiltrate. Slight perivascular lymphocytic cuffing.
5000 ppm.: ••14298 M liver
lungSlight portal lymphocytic infiltrate. Mild peribronchial lymphoid hyperplasia.
14299 M urinary bladder liver
Seminal plug.Centrolobular hepatocytes appeared slightly hypertrophied.
14300 M liver Centrolobular hepatocytes appeared slightly hypertrophied.
14278 F kidneyliverlung
Slight interstitial lymphocytic infiltrate, few calcified tubules.Moderate lymphocytic inflammatory infiltrate, primarily in portal areas.Moderate peribronchial lymphoid hyperplasia.
14279 F liver Mild portal lymphocytic infiltrate, few scattered vacuolated hepatocytes.
14280 F lungliver
Slight peribronchial lymphoid hyperplasia. Slight portal lymphocytic infiltrate.
Company Sanitized. Does not contain TSCA CBi

E. 1. DU PONT DE NEMOURS & COMPANY
WILMINGTON. DELAWARE 19898 INCORPORATED
i..
LEGAL DEPARTMENT
CC: F. E. French, Jr., Orchem M. Hayek, Orchem Tech. S. E. Krahler, Orchem-Jackson Lab. 5 . E. Smith, O r c h e m Tech. J . W . Clayton/H. Sherman, Haskell Lab. J. A. Nelson, Orchem-Jackson Lab.
March 23, 1966
H. A. LIPS ORGANIC CKEMICALS DEPARTMENT
FOOD ADDITrVE PETITION NO. 5B1747 "ZONYL" F P PAPER FLUORIDIZER
S. E. Krahler, H. Sherman and the undersigned met w i t h Messrs. Blumenthal, McLaughlin, O r r and Detwiler of FDA on March 22, 1966, t o determine whether t he re i s a basis upon which the above Food Additive P e t i t i o n may be approved.
I a i t i a l ly , w e inquired of t h e FDA o f f i c i a l s as t o the reasons f o r not accepting t h e P e t i t i o n f o r f i l i n g . They ind ica t ed tha t w i t h respect t o compounds w i t h which they a r e not familiar, two-year feeding s tudies are the usual s tandard requirement. i e s a r e u t i l i z e d , they now look f o r a no-erfect l ev el of 1 , 000 . 'l'h e rn~ m p p r o x h % y 1 ppm might migrate i n t o the food and, therefore, FDA would requi re no e f f e c t a t t he 1,000 ppm l e v e l . The t o x i c i t y da ta a t t h e 1,000 ppm level. d i d show some enlargement o f l i v e r s , although unaccompanied by his- t o l o g i c a l changes. Such an enlargement i s considered an " e f f e c t " by FDA s ince, w i t h only the ninety-day s tudies , they a r e unwil l ing t o speculate as t o whether t he e f f e c t would inc rease o r decrease a f t e r feeding w a s continued f o r two years . days the r e s u l t s look t h e i r worst, and that , i f continued f o r two years , the apparently adverse r e s u l t s a t n ine ty days might we l l appear without s lgn i f icance a t the end o f two years .
I n t h e event ninety-day stud-
bAun dxba wn- s u m i t t e d ina l ca t ed
They indica ted that o f t e n a t the end of' n ine ty 1 :
There thus was no b a s i s upon which we could per- suade FDA t o accept 1 ppm i n food on the basis of our ninety-day s t u d i e s . Since a d d i t i o n a l toxicidy s t u d i e s would appear t o be out or" the quest ion f o r reasons of time and.money, we approached the problem on the basis

Y
H. A . LIPS -2 - March 23, 1966
tha t undoubtedly ac tua l migration would be s i g n i f i c a n t l y less than 1 ppm. We presented t h e revised ca l cu la t ions based on ZONYL RP treatment of 0.25% (OWP) and compared the average ppm ext rac t ion of ZONYL RP solids aga ins t such e x t r a c t i o n s based upon 0.50% (OWP) treatment. We b a s i c a l l y t o l d them we could l i v e with a regula t ion l h i t e d t o .5 ppm ex t r ac t ion . FDA ind ica ted that t h i s would be unsa t i s f ac to ry .
I
Hc would be acceptable- submitted. Th ev d
However, FDA d id i n d i c a t e tha t .1 ppm probably would be acceptable based upon t h e t o x i c i t y data a l ready submitted. Th ev uia not inax- g what number
I - v e accgptable but a t l e a s i m a r l y mow The l i m i t s: acceptaD I -
Dr. McLaughlin advanced an i n t e r e s t i n g i d e a as t o what a c t u a l l y i s causing t h e t o x i c reac t ion i n t h e compound. H e r eca l l ed t h a t diethylamine s a l t has been known t o cause increased l i v e r weight without h i s to log- i c a l change. D r . Blumenthal confirmed t h i s by re ference t o t o x i c i t y da ta developed by the Mellon I n s t i t u t e f o r Union Carbide. Thus i t may be tha t the diethylamine salt rather than t h e perf luoroalkyl phosphate i s t h e bad ac to r . I f so, FDA would be more inc l ined t o approve our p e t i t i o n s ince they have some f a m i l i a r i t y w i t h diethylamine salts and are r e l u c t a n t t o approve a p e t i t i o n involving per- f l uo roa lky l phosphates wi th which they a re t o t a l l y un- familiar. Also, there i s always t h e p o s s i b i l i t y t h a t we could e l imina te the diethylamine salt, thereby el iminat ing t h e t o x i c i t y problem. However, we did not i n d i c a t e that t h i s was a p r a c t i c a l a l t e r n a t i v e since, even i f the d i - ethylamine s a l t were eliminated, we would s t i l l have t o submit d a t a on the perf luoroalkyl phosphate or else abso- l u t e l y prove t h a t the diethylamine sal t was causing t h e t o x i c i t y .
.5 ppm i s not acceptaple mu .I ppm wouici 'b e -
Our task i s now threefo ld . First, Technical Lab will have t o determine the maximum l e v e l a t which we can expect customers t o apply. ZONYL t o the surface o f paper- board. Obviously, t h i s f igu re w i l l have t o be rather p r e c i s e s ince we cannot a f f o r d t o have a l e v e l of app l i - c a t i o n any higher than i s ; abso lu te ly necessary f o r prac- t i c a l commercial use. Secondly, Jackson Lab w i l l then

Ho A - LIPS -3- March 23, 1966
have t o conduct ex t r ac t ion tests based upon the l e v e l of app l i ca t ion determined by Technical Lab. Probably two o r t h r e e sets of ex t r ac t ion t e s t s should be run on l e v e l s of app l i ca t ion close t o t h e f i g u r e determined by Technical Lab. and Wesson Oil. Third, we w i l l need a write-up by Haskell as t o any ideas they m i g h t have on the t o x i c i t y of t h e di- ethylamine sa l t .
..
These ex t r ac t ion tests need only be run on water
The above information w i l l then he prepared as a supplement t o t he original p e t i t i o n and we will no doubt take it down t o FDA and review i t w i t h them. tremely d i f f i c u l t t o specula te on the ppm figure which FDA w i l l accept but probably it w i l l not accept anything more than ' .3 . T h i s must be borne i n m i n d i n determining l e v e l s of appl ica t ion .
It i s ex-
RHR: df

FRO^ MASON HAYEK D. & C. Technical Laboratory
Room215, Ext. 2975 Please For For For Noteand Note and Forwarded DISCUSS Ap- At- Infar- forward Return Per Your Wlth proval tentton matian To file To Sender Request
G

c
_ I
. . TABLr I-Trris OF R A W A J D r I l O C E S S E D FbODS
J. Nonacid aqorous roduc t s may contain salt or mger dr both (ply nbosr i.0).
XL Add. S C ~ C O U S products; m3y contnln salt or ruga? or both. m d lncludinp oll-ln-uxtcr emu!- '
rakrer-!ndllcmu:sion: oflow-or h1gh.Int content. IV. Dniry nroducts nnd rnodlC--""--. l ,W.,Y. .>_
cs. hiph- or 1OV-h:. - 8. O!l-In-an:cr emulsions, high- or I o a - I ~ l . moi<turc f i l s and Oils. rages: .~ Contnlnlna up to 8 pcrccnt of nlwhol. *B. r;oaalcotmllc.
C ContainlnE more thnn 8 prrcent of nlcohol. fn. Bok;p prodi!cls other t h n n tho- Included under
A bloiit hak VI11 p? 1X nl rhl; tab!..
_ _ . . . . . - --.. - . __ ~ .. . . . . - . . .
c
c- -
I
.

1053.0001
Exhibit
State of Minnesota v. 3M Co., Court File No. 27-CV-10-28862
1053

1053.0002

1053.0003

1053.0004

1053.0005

1053.0006

1053.0007

1053.0008

1053.0009

CHEMICAL CONCENTRATES A SUBSIDIARY OF BAKER INDUSTRIES, INC.
FORT WASHINGTON. PA. 19034
The Editor Fire Journal
·PHONE (215) Ml 6-9400
15 June 1970
National Fire Protection Association 60 Batterymarch Street Boston, Massachusetts 02110
Sir:
At the recent NFPA Meeting in Toronto information about the toxicity of "Light Water 11 was asked of me frequently. We had made a limited study.on the effects of 11Light Water" on marine life in preparation for substantial and controlled field tests. Thes_e effects were highly derogatory to marine l:iie and the entire test program had to be abandoned to avoid severe local stream pollution. lam asked by co'ncerned people to report our data on the ''Light "\Vater' 1 studied and doherewith comply.
The. only commercially available product was FC-194 and this was checked over a range wh ich allowed·for 48"£old to 16, 000-fold dilution. These results are reported. Other "Light Water" formulations not commercially available were also checked and the results were similar.
A sei·ies of five tcn-ga.llon tanks were u;;c,.l' a.nd the sc were stocked and restocked with a recommended group of hardy fis4. Tank temperatures were maintained at 72°F :!: 2°F, uniform aeration maintained by Tiger pumps and filter.
..
Each tank, fitted with stainless lids� housed a) 3 goldfish (average length 2-1/4 inches, average weight 1-1/2 grams), b) 2 Blackmoors {average length 2-1/2 inches, averageweight 3 grams) and c) 2 Calicos (average length 2 inches,average weight 1-1 /2 grams). There wei·e fed standard fishfood at a rate of 0,. 025 grams per tank per day. The tankscontained nine gallons of tapwater and .Coam concentrate asshown in the following summary chart.
1083.0001
Exhibit
1083 State of Minnesota v. 3M Co.,
Court File No. 27-CV-10-28862
3M_MN02267863
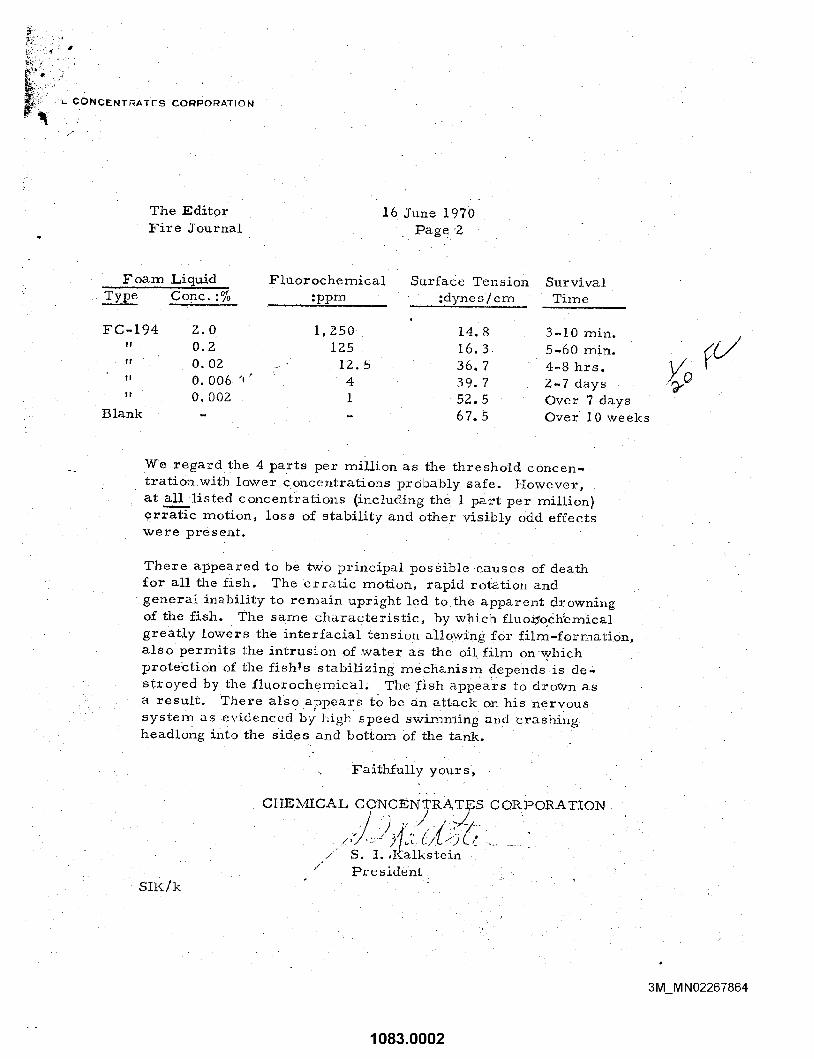
The Editor Fire ~[ourn~l
16 June 1970 Page ’2
Foam Liquid Fluorochemical S~rface Tension Survival ,TYPe Cone. :% :ppm :dyne s / crn Time
FC-194 Z. 0 i, Z50 14.8 3-10 rain. " 0.Z 125 16.3 5-60 rain. " 0.02 _ 12.5 36.7 4-8 hrs. " 0. 006 ’ 4 39. ? 2-7 days " 0.00Z 1 52.5 Over 7 days
Blank - - 67.5 Over I0 weeks
V~e regard the 4 parts per million as the threshold concen- tration with lower concentrations probably safe. I-Iowever., at all listed concentrations (inclnding the 1 part. per million) erratic motion, loss of stability and other visibly Odd effects ~vere present.
There appeared to be t~vo principal possible causes of death for all the lisle. The erratic motion, rapid rotation and gener.al inability to renlain upright led to the apparent drowning of the fish. The san]e characteristic, by which fluo~qe_h~emical greatly lowers the interracial tension al1~wfng for filrn-forn~ation, also permits the intrusion of ~vater as the oil film on~vhich protection of the fish~s s~abilizing mechanism depends’-is de- stroyed by the fluoroche~nical; The .fish appears to dro~vn as a result. There also appears to bc an attack on his nervous systeFn as evidenced by hi!~h speed swirnn~ing and crashing headlong into the sides and bottom of the tank.
Faithfully your s,
CHE IVilCA L C O’NC El C OR PORA TION
/ S. I. ,I~alkstein / President
3M MN02267864
1083.0002

Complainant's
Exhibit No. 5
DU P O N T D E NEMl ? l o MP AMY INCOI SATES
~. O, - o x ':-?,]7
PARKEAS3 : !, W.VA. 0 : 0 0 0
CC: J. w. Amachor T. L. Miller-Pile: 11-0-4
PLASTICS DLPARTr>!*NT
i ' e b r - x x r I B , 1970
COMPANY CONFIDENTIAL
TO: J. MITCHELL, JR." PLASTICS DEPARTMENT EXPERIMENTAL STATION
PROM: W. E. HILTON • FLUOROCAREONS DIVISION WASHINGTON WORKS
(?-/£/ r<i)
REQUEST FOR TOXICOLOGICAL INFORMATION "TEFLON"® DIVISION CHEMICALS
Past studies ;ade at Haskell Laboratory hav : indicated that ammonium psofluprooctonate (C-8 APPC), •,-. is used in the preparation of "Teflon"® dispersions, is highly toxic when inhaled and moderately toxic when injeot—l. However data are not —ailable on the chronic local o: chronlc systemic effect of the ..impound in the solid ooai s .-.:: dissolved in "Teflon" dispo sions,
A ]»;:.; . ediCr . history of employes- In the dispersion's ares, revealed that with the exception of two eases of dermetitus, which were probably due more to temperature and moisture than specific chemicals, there have riot been any Indication o oxicological effects of chemicals. slant Medical group awa: of the potential effects of the .0: chemicals and •oonitoi oo.oo amployees, both individually and statin: ticall;
We -..:. in ;sted in deter nln,:; the ,'stemic effect for repetitious skin _ mta . of short duration with ('-8 APFC powder and with the aqueous dispersion of polytetrafluoroethyle containing 1-8 (or chlorendic icid). We are also interested xi determining the chronic effect of inhalation of minute quantities of 1-8 APPC. addition to knowing the* iffee .0 would like guidance on the personnel equipment 3 oassary for adequate protection against these effects Would you determine the cost of each separate study, the potential for be: official data
:••€ - -
o o
o
EID123138 \ ) > ^
Source: https://www.industrydocuments.ucsf.edu/docs/knpw0228

r
J. MITCHELL, JR. - 2 - February 18, 1970
beyond our ability to extrapolate existing qualitative data, and if the following data is sufficient for Haskell Lab's purposes.
C-8 APFC Charging
REDACTED
000081
Source: https://www.industrydocuments.ucsf.edu/docs/knpw0228

»
J. MITCHELL, JR. - 3 - February 18, 1970
* T
REDACTED
0OOO82
Source: https://www.industrydocuments.ucsf.edu/docs/knpw0228

c Haskell Number
HASKELL LABORATORY FOR TOXICOLOGY AND INDUSTRIAL MEDICINE ""
SAMPLE SUBMITTED FOR TOXICITY EVALUATION
Department P l a s t i c s DlviBion F luoroca rbons Location Washington Works
Systematic Name of Chemical:
Ammonium P e r f l u o r o o c t t a n o a t e '' .••''..•.••..•• . ' ':•:• ••••>'> .... •'• '•>.'-.% ..'•-.
•Synonym, Product Name and/or Designations:' •" i
.3M's Wet t ing Agent FC-1^3, C-8 APFC" " ' ' : . ' ' / •V'*'-"'. '•''', ••':';': ."':'''l ..:.'*
Formula: .'•'..'
C F 3 ' ( C F 2 ) 6 COONH ' ' " " • ' . '" ' :<:'. " •'•':"
Sample: Code No,; r Lot""No, Amount ; ' • :>-
Grade Color White Form : Mol. Wt,.
Special Handling Requirements
I s I t explosive in air7 No in oxygen7 ? i f so, at vhat concentrations? ,
Active Ingredient C-8 APFC 95 <j> ' - .
Composition, i f a mixture (are percentages by weight or volume?) C-8 952 Minimum •••.-.... C-6 5% Maximum
.Impurities ( identi ty and amounts; are percentages by velght or volume?) • C-6 5% Maximum • |
Decomposes-150°C © 25'C Neg l igab l e (Attach HE Properties: MP — BP — Vpy"" curve i f
v .'.. . © Max. Proceaa Tenm. 100°C . ava i l ab l e ) 2% Aqueous S o l u t i o n
Sp.Gr. nfll Min y a p o r Density (air » l ) \ e Flash Point (Open CUP) j (Closed cup)_
Solubili ty (Quantitative, i f possible) in vater Yes • Acetone
Ethanol Vegetable o i l Other Solvents
.Proposed Use: , ; ' ' , • i ,- \
• I n g r e d i e n t i h P o l y m e r i z a t i o n Rec ipe ; . •, ' ••;-.:.
Present Stage of Development.: Research ; .Begigarks MTg, l.Salea
\
V i (OVER)
.-M ..•x ::.
o o o o
\ 'OOOOS3 EID123141
Source: https://www.industrydocuments.ucsf.edu/docs/knpw0228

r
• •'•• r
Employee Exposure
1. Concentration of material in process 1200 PPM
2, Solvent and other chemicals present Water , D i s u c c i n i c Acid Peroxide
3. I s exposure by inhalation X skin absorption X other
h, hkodmum temperature of material in process 100°C ___
5. I s the compound present i n the atmosphere in the form of vapor'" No
mist No dust SI j g h t
6. Maximum concentration l i ke ly to be present in atmosphere Unknown
7. What type of vent i la t ion i s in use? H 1 S h Volume .
i 8, What type of protective clothing i s worn? l lG l o v e s > g°.gEles ••• Dust Mask
9. Exposure i s for hours ' " minutes per day See Attached L&ster
Consumer Exposure '"'"'"'
What is possibility of;
1. Ingestion
2. Inhalation
3. Skin contact
k. Eye contact
Experience to Date
By Employee
'Very Slight'
Minor Quantity
Fair
Slight
NOTE:
Have any clinical signs of toxicity such as headaches, difficulty in breath-* . ing, dizziness, nausea, skin or eye irritation, etc., been reported by persons > iwho have been in contact with the chemical? If so, "please list them and desr '••' 'cribe circumstances under which they occurred. ...'i.-r-'VV,)'.•«?»•
See Attached Letter for Write-Up • - ^
r . i'
i r ' i
i -
w No
: • ••.-•'. ••,;•"•: ":: • •••••;••' • " . * . i ^ ^ i ^ M
NOTE: Haskell Laboratory will retain the unused portion of stable, nonflammable, -,...".•• nonvolatile, low toxicity samples for 5 years unless requested to.'return ; :;•.:• >/',''•;;to sender immediately after testing. After 5 years, ths samples will be'
: discarded or returned to the appropriate department. It is suggested • •; • 'that the sender also retain a suitably identified portion of the sample • f .sent for toxicity evaluation, for his own future reference. ..
i . . . . . . . . i
^ • i m
•.'.'.. i.i'..".-. ' /;'.:;;.' '.:•. ' K - /:: Signature' W'.' E." ' H i l t o n ' ' Date 2 /13/70 h'--v '
-.;,•.;.' :•->•:•:$ £;l ; > ' ^ . ^ H o V ^ i | 6 # k EID123142 •:«
1 o o J — * o o «3
Source: https://www.industrydocuments.ucsf.edu/docs/knpw0228

« C r
J. MITCHELL, JR. February 18, 1970
TABLE I
Ammonium Perfluorooctanoate (C-8 APFC)
Formula: CF3 (CF2)g COONH^,
Manufacturer: 3M (FC-143)
Previous Tests:
Inhalation, MR No. 1198, Haskell Laboratory Report _.- ..;., _T.Tr^L.:r".~J%£~ • c^~Ne-f-l:6Q«S9^ "'-
Oral, MR No. 604, Haskell Laboratory Report No. 55-61,
Chlorendic Acid
Formula: CnH^OijClg
Manufacturer: Hooker Electrochemical Company
Previous Tes ts :
Ora l , MR No. 604, Haskel l Laboratory Report No. I - 6 3 .
EID123143
000085
o © © o
Source: https://www.industrydocuments.ucsf.edu/docs/knpw0228

NINETY -DA‘Y FEEDING STUDY IN RATS A”I DOGS WXTH ZONYL@ RP
-__I-.--
Haskel l Laboratory Report KO. 68-73
Medical Rese(arch P r o j e c t No. 1491
1 C. F. Reinhard t / J . A. Zapp, Jr.
2 P. E. Smith, J:r./H. J. Trochimowicz/B. W. Karrh
3 J. R. Earnes / J . G. Aftosmis/R. S. Wari tz
4 J. F. Morgan
5 D. B. Hood
6 H. Sherman
7 C . S. Hornberger \
8 F. D. G r i f f i t h
9 Haskel l Laboratory F i l e
10-15 C. W. Maynard, Jr . , Organic Chemicals Department Jackson Laboratory
NINETY-DAY FEEDING STLTDY I N KATS AND DOGS WITH ZC)NyL@ RP
1
Haskell Laboratory R e p o r t N o . 68-73
- Medical Research P r o j e c t No. 1491
--
Report by:
Chief, Oral Toxicology Sect ion
Approved f o r Biochemistry: \LJL~&~,dLV / Xohn R. Barnes -- //
C , i e f , iochemi-stry SectFon L# 1 / / / c , L. _! ,’/
f / / , , ( 1 Approved f o r Pathology: -
-. 1 - . ,
I ,f - James G. Aftosrais
Chief, Pathology Sec t ion
Approved by: Charles F. Reinhardt A s s i s t a n t Director
NB 958, pp. 120-167 E0579
HS : dhg Date: February 23, 1973

NINETY-DAY FEEDING STUDY I N RATS AND DOGS WIT11 ZONYL@ KP --
Haskell Laboratory Report No. 68-73
Medical Research P r o j e c t No. 1491
This feeding s tudy w a s performed by Mrs. Kathleen C a r r o l l under t h e d i r e c t i o n of D r . Henry Sherman. The c l i n i c a l l abora tory and 'biochemistry t es t s were performed by Mrs. Louise L. Adams, M r . Norman W. Henry, 111, M r . John R. Pennington, Jr., and Miss Adele M. Pochomis under t h e d i r e c t i o n of Dr. John K. Barnes. Gross pathology and p repa ra t i cn of s l i d e s were c a r r i e d out by D r . Rudolf Cv.lik, D r . K. P. Lee, Mr. August H. Stenholm, M r . W i l l i a m I. Swan, M r . F ranc is U l m e r , M r . Anthony T. DiLorenzo, M r s . Jean A. Houck and M-rs. Joan A. Ijimeler under t h e d i r e c t i o n of Dr . James G. Aftosmis. His topa thologic eva lua t ion of t h e t i s s u e s w a s conducted by D r . Edwin F. S t u l a under D r . Aftosmis ' d i r e c t i o n .
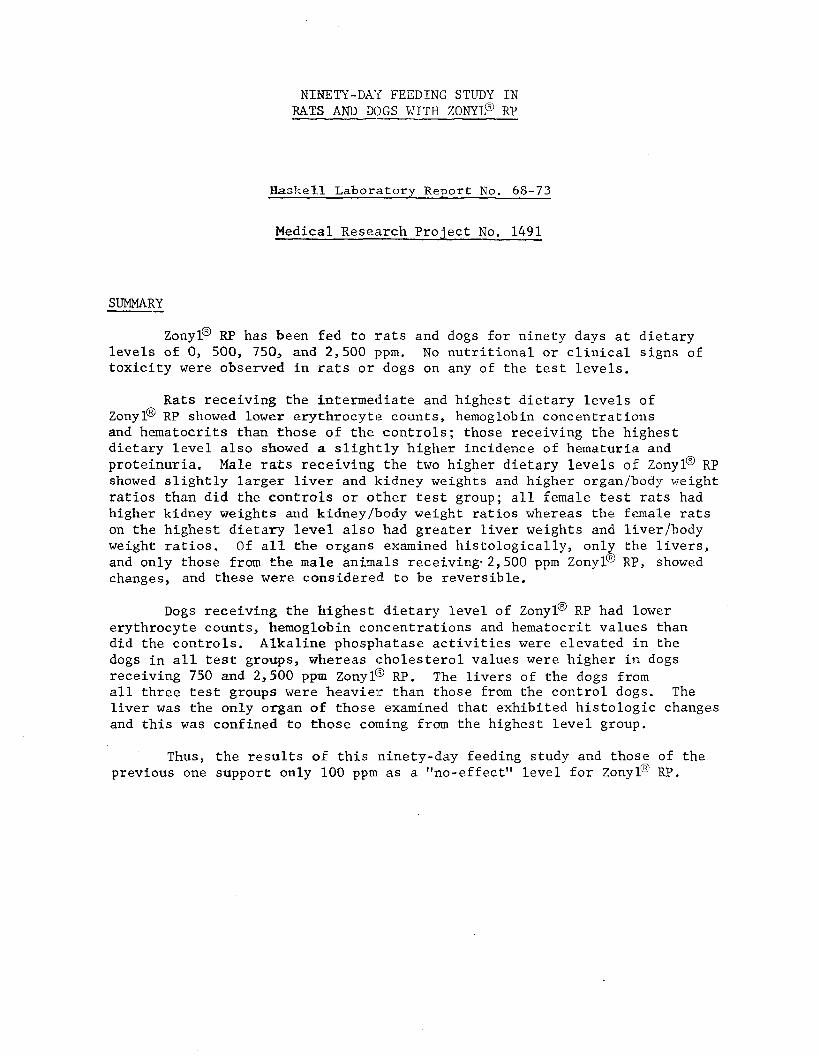
NINETY-DAY FEEDING STUDY I N RATS AND DOGS WITH ZONYL@ RP
Haskell Laboratory R e p o r t N o . 68-73
Medical Research P r o j e c t No, 1491
SUMMARY
Zonyl@ RP has been f e d t o ra t s and dogs f o r n ine ty days a t d i e t a r y l e v e l s of 0, 500, 750, and 2,500 ppm. No n u t r i t i o n a l o r c l i n i c a l s igns of t o x i c i t y were observed i n r a t s o r dogs on any of t h e t es t levels .
Rats r e c e i v i n g t h e i n t e r m e d i a t e and h ighes t d i e t a r y l e v e l s o f Zonyl@ RP showed l o w e r e r y t h r o c y t e counts , henoglobin concen t r a t ions and hematocr i t s than those o f t h e c o n t r o l s ; those r ece iv ing t h e h ighes t d i e t a r y l e v e l a l so showed a s l i g h t l y h ighe r incidence of hematuria and p r o t e i n u r i a , Male r a t s r e c e i v i n g t h e two h igher d i e t a r y levels o f Zonyl@ RP showed s l i g h t l y l a r g e r l i ve r and kidney weights and h ighe r organ/body weight r a t i o s than d i d t h e c o n t r o l s o r o t h e r t es t group; a l l female t e s t ra ts had higher kidney weights and kidney/l>ody weight r a t i o s whereas t h e female r a t s on t h e h ighes t d i e t a r y level a l s o had g r e a t e r l i v e r weights and l i ve r /body weight r a t i o s . Of a11 t h e organs examined h i s t o l o g i c a l l y , on ly the l i v e r s , and only those from the m a l e animals rece iv ing .2 ,500 ppm Zonyl@ RP, showed changes, and t h e s e w e r e cons idered t o be r eve r s ib l e .
Dogs r e c e i v i n g t h e h i g h e s t d i e t a r y l e v e l of Zonyl@ RP had lower e ry th rocy te counts , hemoglobin concen t r a t ions and hematocr i t va lues than d id t h e c o n t r o l s . Alkaline phosphatase a c t i v i t i e s were e l eva ted in t he dogs i n a l l t e s t groups, whereas c h o l e s t e r o l values were h ighe r i n dogs r ece iv ing 750 and 2,500 ppm Zony1@ RP. all t h r e e t e s t groups were heavier than those from t h e c o n t r o l dogs. The l i v e r w a s t h e only organ of those examined t h a t exhib i ted h i s t o l o g i c changes and t h i s was confined t o t h o s e corning from t h e h ighes t l e v e l group.
The l i v e r s of t he dogs from
Thus, t h e r e s u l t s of t h i s ninety-day feeding s tudy and those of t he previous one support on ly 100 ppm as a ~ ~ n o - e f f e c t ~ l l e v e l f o r Zonyl@ RP.

- 2 -
A . RATS
PROCEDURE
F i f t y male and 50 female weanling a lb ino r a t s (ChR-CD) were housed i n p a i r s , sexes s e p a r a t e , i n suspended s t a i n l e s s s t e e l w i r e cages and fed ground P u r i n a Laboratory Chow (GPLC) wi th 1% corn o i l (CO) added. During a pre - t e s t per iod of f i v e days, t h e animals were observed wi th r e s p e c t t o food consumption, e a t i n g h a b i t s , and weight gain. They w e r e d iv ided i n t o four equal average-weight groups of 10 male and 18 female ra ts each a t t h e end of t h i s per iod on the b a s i s of weight ga in and freedom from gross r e s p i r a t o r y d i s o r d e r s o r o the r c l i n i c a l s igns of d i s e a s e , The g r o u p were then ass igned a t random t o r ece ive t h e fo l lowing d i e t s :
Computer
I (Control) ( I and 2) GPLC + 1% CG
Group Groups Diet
I1 (3 and 4) GPLC + 1% CO + 500 ppm Zonyl@ RP I11 (5 and 6) GPLC + 1% CO + 750 ppm Zonyl@ RP IV GPLC + 1% CO + 2,500 ppm Zonyl@ W (7 and 8 )
The h ighes t d i e t a r y level (2,500 ppm) had been suggested by t h e FDA t o a c t as a b r i d g e between t h e present s tudy and the one con- ducted e a r l i e r under MRO-840. The t e s t ma te r i a l w a s added as a c t i v e ing red ien t , Zonyl@ RP, p r e s e n t i n t h e s l u r r y a t a 35% Concentration. An amount of water was added t o t h e con t ro l d i e t equiva len t t o t h a t con- t r i b u t e d by t h e 35% aqueous s l r r r ry t o the d i e t i n Group I V . Die t s were prepared f r e s h each week and s to red a t r e f r i g e r a t o r temperature u n t i l used.
The animals were weighed once a week during t h e e n t i r e study. Food consumption d a t a w e r e ob ta ined on a group and sex b a s i s a t the t i m e s t h e animals w e r e weighed.
During t h e tes t , the animals were examined r o u t i n e l y f o r any abnormal behavior and any c l i n i c a l man i fe s t a t ions of t o x i c i t y .
Hematological, u r i n e and bicchemical ana lyses were conducted on t e n male and t e n female rats from each group a f t e r they had been on t h e i r r e spec t ive d i e t s for one, two, and t h r e e months. Hematological eva lua t ions inc luded an e r y t h r o c y t e count, a measure of hemoglobin con- cen t r a t ion , 8 measure of t h e hematocri t , and a t o t a l and d i f f e r e n t i a l whi te blood c e l l count . Ur ine ana lys i s cons i s t ed of a measure o f t he 24-hour u r i n e volume, c o n c e n t r a t i o n i n mil l iosmoles and c r e a t i n i n e , a tes t f o r sugar, blood, p r o t e i n , and urobiliTlogen, and an observa t ion of t h e color, appearance, and pH. Specimens wi th a nega t ive t e s t f o r blood were combined t o form two pools of u r i n e f o r each group and the sediment from t h e s e p o o l s examined microscopical ly . A l l specimens wi th a p o s i t i v e test f o r b lood were examined sepa ra t e ly . I n t h e biochemical tests, t o measure l i v e r func t ion , a l k a l i n e phosphatase and glutamic- pyruvic transaminase a c t i v i t i e s and b i l i r u b i n conLentrat ion were measured i n blood t aken from thie t a i l s o f 10 males and 10 females i n each group.
i

- 3 -
A . RATS - (Continued)
PROCEDURE (Continued)
Af t e r 91-98 days of cont inuous feeding, a l l t h e animals i n each The fol lowing organs group were s a c r i f i c e d by CHC13 adminis t ra t ion .
were weighed: brain, h e a r t , lungs, l i v e r , spleen, kidney, t e s t i s , stomach, adrena l , and p i t u i t a r y . Organs o r t i s s u e s , preserved i n fo rma l in and s t a ined wi th hematoxylin-eosin, included, i n a d d i t i o n t o t h o s e l i s t e d above, t h e fo l lowing: eye, e x o r b i t a l l a c r i n a l gland, s c i a t i c nerve, sk in , mammary gland, bone marrow, lymph node, s k e l e t a l muscle, t rachea, a o r t a , s a l i v a r y gland, esophagus, colon, cecw,, duo- denum, ur ina ry bladder , p r o s t a t e and seminal v e s i c l e s , u t e r u s , F a l l o p i a n tubes, ovary, t hy ro id , parathyroid, and thymus. The above t i s s u e s from t h e c o n t r o l and h i g h e s t l e v e l groap (2,500 ppm) were eva lua ted h i s t o p a t h o l o g i c a l l y ; only the l i v e r s from t h e animals i n the o t h e r two t e s t groups w e r e examined h i s topa tho log ica l ly .
RESULTS
1. Weight Gain
Average body weight curves f o r c o n t r o l and tes t groups of animals are p l o t t e d i n Figure I ; average body weights and average weight ga ins a r e summarized i n Tables I, 11, V and VI.
The presence o f 2,500 ppm Zonyl@ RF i n t h e d i e t of male and female r a t s d i d not adversely a f f e c t t h e i r r a t e of weight gain.
2 . Food ConsumDtion
A summary o f the average d a i l y food corzsumption da ta , computed as grams inges ted p e r rat f o r each group, i s presented i n Tables 111, IV and V.
There were no meaningful d i f f e rences among the con t ro l and t e s t groups w i t h r e spec t t o t h e amount of food they consumed over t h e e n t i r e t e s t .
3 . Food Ef f i c i ency
Food e f f i c i e n c y da ta , ca l cu la t ed a s gram weight ga in p e r gram of food consumed, a r e presented i n Tables III-V.
There were no meaningful d i f f e r e n c e s among c o n t r o l and t e s t groups w i t h r e s p e c t t o food e f f i c i e n c y .

- 4 -
A . RATS (Continued) -- RESULTS (Continued)
4 . Dose
The average daily ingestion of test material during each week was calculated in milligrams of Zonyl@ RP per kilogram of body weight; t:hese data are presented in Table VI.
The decline in the average dose of test material received by animals observed in this study is normal and typical of that observed in most feeding studies where rapidly growing animals are used initially and the concen- tration of test material i s kept constant throughout the test.
5. Clinical Observations
None of the test animals in any o f the three test groups exhibited any clinical signs of toxicity during the entire test that could be attributed to the test material.
6 . Mortality
None of the animails in the control and test groups died during the entire feeding study. 7. Hematology
The results of the periodic hematological examina- tions conducted on rats fed the various levels of Zonyl@ RP and their controls are surrunarized in Table V I I .
The erythrocyte count, hemoglobin concentration and hematocrit of the rats fed Zonyl@ RP were lower than those of the controls at 7’50 pprn and above. A one-way analysis of variance showed that the treatment with Zonyl@ RP had a significant effect on these measurements. The values for these measurements, observed in the males but not the females fed 7510 ppm Zonyl@ RP, were signifi- cantly (p < 0.05) lower than those for the controls. Both sexes were affected by a level of 2,500 ppm in the diet. The calculated hematologic indices, mean corpuscular volume (MCV) and mean corpuscular hemoglobin (MCH) indicated that the erythrocytes of the rats fed 2,500 ppm Zonyl@ RP were macrocytic and hypochromic, There were no effects on the number or distribution of leucocytes.

- 5 -
A. RATS (Continued) - RESULTS (Continued)
8. U r i n a l y s i s
The results of t h e pe r iod ic u r ine ana lyses conducted on rats f e d va r ious l e v e l s of Zonyl@ RP a re summarized i n Table V I I I .
A s l i g h t l y h ighe r incidence of hematuria and
A l l o t h e r measurements and p r o t e i n u r i a occurred i n t h e ra ts fed 2,500 ppm Zonyl@ RP than i n the o t h e r groups. observa t ions m a d e on t h e u r i n e of t h e t r e a t e 6 r a t s d i d not d i f f e r from t h o s e of t h e con t ro l s .
9. Biochemistry
The results of t h e pe r iod ic biochemical measure- ments conducted on t h e blood of rats fed var ious l e v e l s of Zonyl@ RP are summarized i n Table I X .
No effect on any of t h e biochemical measurements was found t h a t could be r e l a t e d t o the .presence of t h e Zonyl@ RP i n the d i e t .
- 10. Patholopy
A summary of t h e average weights of s e l e c t organs taken from the c o n t r o l and t e s t groups 'is presented i n Table X; organ/body weight r a t i o s are summarized i n Table X I .
Among t h e tes t groups, male animals r e c e i v i n g the in te rmedia te aad h i g h leve ' l s of Zonyl@ RP showed h ighe r average l i v e r and k idney weights ; both l iver /body weight and kidney/body weight r a t i o s were a l s o s l i g h t l y g r e a t e r i n these groups. Among the feinale tes t groups, a l l showed h ighe r average kidney weights and kidney/body weight r a t i o s than d id t h e c o n t r o l s ; average ' l i ve r weights and l i ve r /body weight r a t i o s were s l i g h t l y g r e a t e r i n t h e animals r ece iv ing 2,500 ppm ZonyY@ RP than i n t h e o t h e r t e s t groups o r t h e con t ro l .
A summary o f t h e h i s topa tho log ic f ind ings i s presented i n Table X I I , where 0 = no abnormal i t ies de tec ted , + = s l i g h t degree of l e s i o n present , ard X = organ n o t on s l i d e .
i
1
Test chemica l - r e l a t ed h i s topa tho log ic e f f e c t s were
Examination of t he found only i n the l i v e r s of m a l e ra ts fed t h e h i g h e s t (2,500 ppm) d i e t a r y l e v e l of Zonyl@ RP. l i v e r s from rats t h a t rece ived t h e two lower l e v e l s of the t n s t chemical d i d not r e v e a l any compound-related e f f e c t s .

- 6 -
A. KATS - (Continued) RESULTS (Continued)
10. Pathology (Continued)
The liver changes observed in the males in the highest dietary level group consisted of fatty change, cytornegaly, and cytoplasmic hyaline dr'oplets. This type of liver change is considered to be reversible.
:B. DOGS
PROCEDURE
During a pre-test period of approximately one month, 16 male and 16 female beagle dogs, 9 to 14 !months old, were given Wayne Dog Krums@ and water ad libitum between 3 : 'OO p.m. and 7:OQ a.m. Animals were examined daily for any abnormal behavior and any clinical nanifesta- tions of toxicity. During this period, specimens of blood and urine were collected from each dog twice for clinical laboratory exam: 1 na- tions. The tests included in t'hese examinations are listed below:
Hematology: Erythrocyte count, hemoglobin concentration, hematocrit, total and differential leucocyte count.
Urinalysis : An observation of color, appearance and pH; a measure of the 24-hour urine volume, creatinine, and osmolality; a test for sugar, blood, protein, acetone, urobi 1 inogen, and bilirubin ; a microscopic examinat ion of the sediment. Biochemistry: Glucose,urea-nitrogen, creatinine, cholesterol, alkaline phosphatase, glutamic -pyruvic transaminase, bilirubin, tlotal protein, albumin, and albumin/globulin ratio
Four males and four females were allocated to each of the four groups on the basis of normal clinical and nutritional evaluations and assigned at random to receive t'he following diets:
Diet - Group I (Control) Wayne Dog Food (Krums@)
I1 Krum.@ .f 500 ppm Zonyl@ RP 111 Kr,ums@ + 750 ppm Zonyl@ RP IV Kr,ums@ + 2,500 ppm Zonyl@ RP
Diets were prepared fresh each week. Diet was offered ad libitum to the dogs between 3:OO p . m . and 7:OO a.m.; water was available at all times.

- 7 -
i
-- E. DOGS (Continued)
PROCEDURE -- (Continued)
Diet consumption and body weight da t a were obta,.ied each week and c a l c u l s t i o n s were made t o determine the approximate d a i l y dose each week o f ZonylB RP p e r ki logram of body weight. d a i l y f o r any c l i n i c a l s i g n s of' t o x i c i t y .
Animals w e r e examined
The same c l i n i c a l l a b o r a t o r y examinations made dur ing t h e p re - t e s t pe r iod were conducted on each dog a f t e r one, two, and t h r e e months of feeding.
A f t e r 98-105 days of cont inuous feeding, all dogs were s a c r i - f i c e d by e l e c t r o c u t i o n and submit ted t o gross and h i s toFa tho log ic eva lua t ion . Organ weights were obtained f o r t h e fo l lowing: b ra in , h e a r t , lungs, l i v e r , spleen, psLncreas, kidney, t z s t i s , p r o s t a t e , stomach, thymus, adrena ls , p i t u i t a r y , and thyroid. Organs and t i s s u e s w e r e preserved i n formal in and s t a ined wi th hematoxylin- e o s i n ; t h e s e inclcded, i n addi t . ion t o those mentioned aboveg the fo l lowing : epididymis, F a l l o p i a n tubes, ao r t a , esophagus, u t e rus , ovary, duodenum, cecum, mammary gland, u r ina ry b ladder , s p i n a l cord, t r achea , s a l i v a r y gland, bone marrow, lymph node, colon, s c i a t i c nerve, s k e l e t a l muscle, eye, arid sk in . A l l t i s s u e s taken from t h e dogs on t h e c o n t r o l d i e t and h i g h e s t t e s t l e v e l d i e t were eva lua ted h i s t o l o g i c a l l y ; only t h e l i ve r s f rom the animals r ece iv ing t h e l o w and in t e rmed ia t e l e v e l s of ZonylB FLP were examined h i s t o l o g i c a l l y . l i v e r s from t h e c o n t r o l and h i g h e s t l e v e l dogs were s t a i n e d wi th Oil Red 0.
The
RESULTS
1. Body Weight
The weekly body weight d a t a of t h e i n d i v i d u a l dogs a r e presented i n Tables XI11 and X I V .
All dogs, control. and t e s t , showed normal body weight ga ins during t h e s tudy .
2 . D i e t Consumption - Values c a l c u l a t e d f o r average d a l l y d i e t consmip-
t i o n f o r each dog a r e presented i n Tables XV and X V I .
T5e amount of d i e t consumed by iach dog va r i ed from week t o week. However, t hese w a s no adverse e f f e c t by the t e s t m a t e r i a l upon d i e t in take .
3. Dose
The average d a i l y i n t a k e of Zonpl@ RP ill m l l 1 . i - grains p e r kilogram of body weight was ca l cu la t ed f o r each dog; t hese r e s u l t s a r e presented i n Tables X V I I and XVIII.
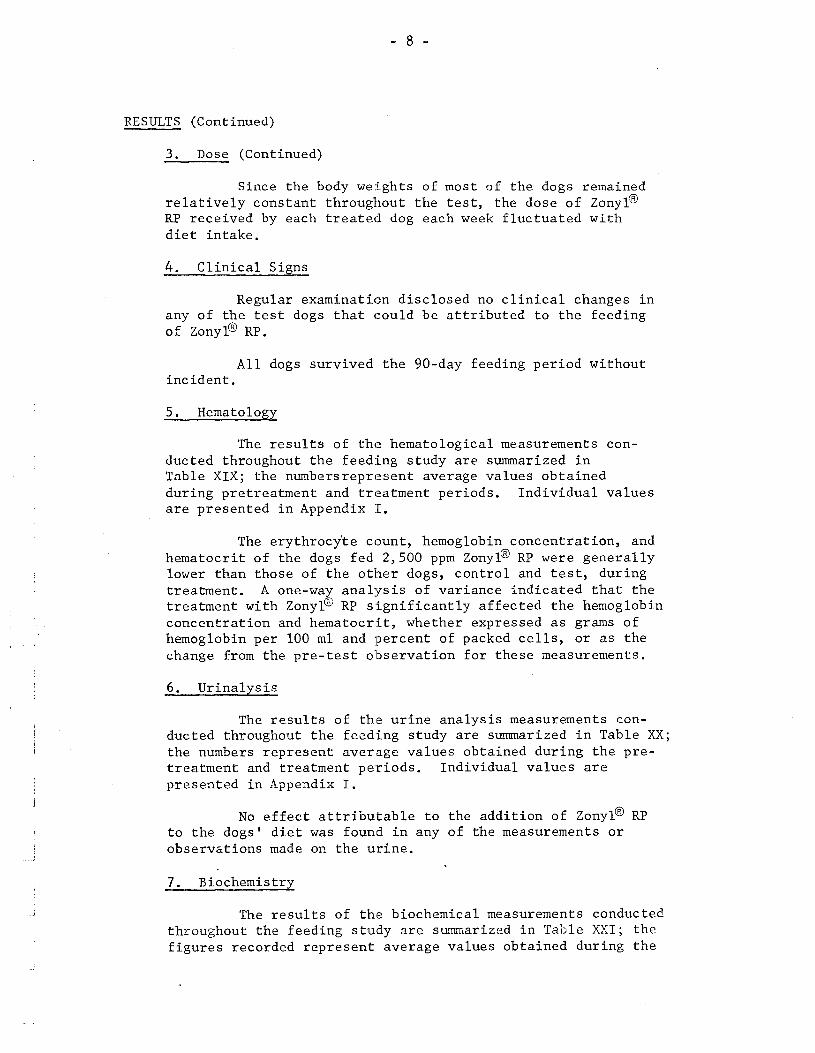
- 8 -
RESULTS (Continued)
3 . Dose (Continued)
Since the body weights of most of the dogs remained relatively constant throughout the test, the dose of Zonyl@ R.P received by each treated dog each week fluctuated with diet intake.
4 . Clinical Signs
Regular examination disclosed no clinical changes in any of the test dogs that could be attributed to the feeding of ZonyP RP.
A l l dogs survived the 90-day feeding period without incident.
5, Hematology
The results of thc hematological measurements con- ducted throughout the feedtng study are summarized in Table XIX; the numbersrepresent average values obtained during pretreatment and treatment periods. Individual values are presented in Appendix I.
The erythrocyte count, hemoglobin concentration, and hematocrit of the dogs fed 2,500 ppm Zonyl@ RP were generally lower than those of the other dogs, control and test, during treatment. A one-way analysis of variance indicated that the treatment with Zonyl@ RP significantly affected the hemoglobin concentration and hematocrit, whether expressed as grams of hemoglobin per 100 ml and percent of packed cells, o r as the change from the pre-test olbservation for these measurements.
6. Urinalysis
The results of thIe urine analysis measurements con- ducted throughout the feeding study are summarized in Table XX; the numbers represent avercage values obtained during the pre- treatment and treatment periods. Individual values are presented in Appendix I .
No effect attributable to the addition of Zonyl@ RP t o the dogs' diet was founid in any of the measurements or observations made on the urine.
7. Biochemistry
The results of the biochemical measurements conducted throughout the feeding study are summarized in Table XYI; the figures recorded represent average values obtained during the
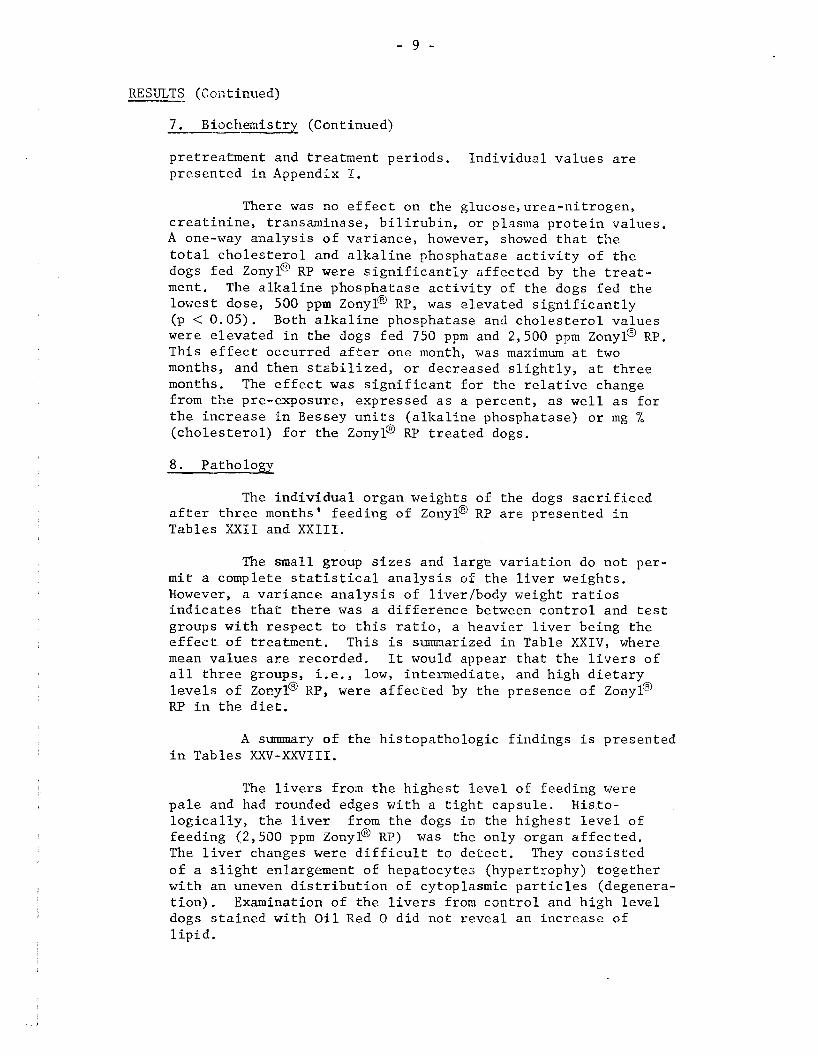
- 9 -
RE SLITS (C o fit inued)
- ~ I _ 7. Biochemistry (Continued)
pre t rea tment and t rea tment per iods . Ind iv idua l va lues are presented i n Appendlx I.
There w a s no e f f e c t on t h e g lucose ,urea-n i t rogen , c r e a t i n i n e , t ransaminase, b i l i r u b i n , o r p lasma p r o t e i n va lues , A one-way a n a l y s i s o f va r i ance , however, showed t h a t t h e t o t a l c h o l e s t e r o l and a l k a l i n e phosphatase a c t i v i t y of t h e dogs f ed Zonyl@ RP were s i g n i f i c a n t i y a f f e c t e d by t h e t r e a t - ment. The a l k a l i n e phosphatase a c t i v i t y of t h e dogs f ed t h e lowest dose, 500 ppm Zany@ RP, w a s e leva ted s i g n i f i c a n t l y (p < 0.05). were e l eva ted i n the clogs f ed 750 pprn and 2,500 ppm Zonyl@ RP. This e f f e c t occurred a f t e r one month, w a s maximzm a t two months, and then s t s b i l i z e d , o r decrsased s l i g h t l y , a t t h r e e months. The e f f e c t w a s s i g n i f i c a n t f o r t h e r e l a t i v e change from t h e pre-exposure, expressed as a percent , as w e l l as f o r t h e i n c r e a s e -in Bessey u n i t s ( a l k a l i n e phosphatase) o r mg % ( c h o l e s t e r o l ) f o r the Zonyl@ RP t r e a t e d dogs.
Both a l k a l i n e phosphatase anti c h o l e s t e r o l va lues
8. Pathology
The i n d i v i d u a l organ weights of t he dogs s a c r i f i c e d a f t e r t h r e e months' feed ing of Zonyl@ R? are presented i n Tables XXII and X X I I I .
The s m a l l group s i z e s and l a r g e v a r i a t i o n do n o t per - m i t a complete s t a t i s t i c a l a n a l y s i s of t h e l i v e r weights . However, a va r i ance a n a l y s i s of l iver lbody weight r a t i o s i n d i c a t e s t h a t t h e r e w a s a d i f f e r e n c e between c o n t r o l and tes t groups w i t h r e s p e c t t o t h i s r a t i o , a heavier l i v e r be ing t h e e f f e c t o f t rea tment . This i s summarized i n Table X X I V , where mean va lues are recorded. It would appear t h a t t h e l i v e r s of a l l t h r e e groups, i.e., low, in te rmedia te , and h igh d i e t a r y levels of Zonyl@ RP, w e r e a f f e c t e d by t h e presence of Zonyl@ RP i n t h e d i e t .
A summary of t h e h i s topa tho log ic f ind ings i s presented i n Tables XXV-XXVIII.
The l i v e r s from t h e h i g h e s t l e v e l of feeding were p a l e and had rounded edges w i t h a t i g h t capsule . H i s to - l o g i c a l l y , t h e l i v e r from t h e dogs ir! the h ighes t l e v e l of feeding (2,500 ppm Zonyl@ RP) w a s t he only organ a f f e c t e d . The l i v e r changes w e r e d i f f i c u l t t o d e t e c t . They c o n s i s t e d o f a s l i g h t enlargement of hepatocytes (hypertrophy) toge the r w i th an uneven d i s t r i b u t i o n of cytoplasmic p a r t i c l e s (degenera- t i o n ) . Examination of t h e l ivers from c o n t r o l and h i g h l e v e l dogs s t a i n e d wi th O i l Red 0 d id not r evea l an i n c r e a s e of l i p i d .
. _ ,

- 10 -
RESULTS (Continued)
8. Pathology (Continued)
i
No compound-related abnormalities were detected in the livers of the dogs receiving 500 and 750 ppm Zonyl@ RP.
DISCUSSION
In the previously-reported ninety-day feeding study in rats and dogs (MRO-840), the lowest level fed, io0 ppm, was considered the "no- effect" level. did produce changes in both rats and dogs. In rats, this consisted of hematological changes at 2,500-5,000 ppm, increased liver aiid kidney weights at 500-1,000 ppm and 2,500-5,000 ppm levels, and pale yellowish livers in some male rats at the mid and highest levels; histologic changes were observed in only the livers from the highest level, 2,500- 5,000 ppm. In dogs, plasma cholesterol and alkaline phosphatase were elevated in those fed 2,500-5,000 ppm Zonyl@ RP, suggesting liver damage. Liver weights were increased at the middle and highest dietary levels; histologic changes were observed in only the livers of dogs recelving the highest dietary level.
The other two levels, 500-1,000 ppm arid 2,500-5,000 ppm,
The present study confirms the results obtained earlier. There does not appear to be a "no-effect" level in this present study. since increased liver and kidney weights were observed at the lowest dietary level in rats and since increased alkaline phosphatase activity and increased liver weights were observed in the lowest level in the dogs.
Thus, the results of this ninety-day feeding study and those of the previous one support only 100 ppm as a I~no-effect" level for Zany@ W.
SUMMARY Zonyl@ W has been fed to rats and dogs for ninety days at dietary
levels of 0, 500, 750, and 2,500 ppm. No nutritional or clinical signs of toxicity were observed in rats or dogs on any of the test levels.
Rats receiving the intermediate and highest dietary levels of Zonyl@ RP showed lower erythrocyte counts, hemoglobin concentrations and hematocrits than those of the controls; those receiving the highest dietary level also showed a slightly higher incidence of hematuria and proteinuria. Male rats receiving the two higher dietary levels of Zonyl@ RP showed slightly larger liver and kidney weight:s and higher organ/body weight ratios than did the controls or other test group; all. female test rats had higher kidney weights and kidney/bodjj weight ratios whereas the female rats on the highest dietary level also had greater liver weights and liver/body weight ratios. O f all the organs examined histologically, only the livers, and only those from the male animals receiving 2,500 ppm Zonyl@ RP, showed changes, and these were considered to be reversible.
Dogs receiving the highest dietary level of Zonyl@ RP had lower erythrocyte counts, lower hemoglobin concentrations, and hematocrit values
- 11 -
SUMMARY (Continued)
than d i d the controls. Alkaline phosphatase activities were elevated in the dogs in all test groups, whereas cholesterol values were higher in dogs receiving 750 and 2,500 ppm Zonyl@ RP. The livers of the dogs from a l l three test groups were heavier than those from the control dogs. The liver was the only organ of those examined that exhibited histologic changes and this was confined to those coming from the highest level group.
Thus, the results of this ninety-day feeding study and those of the previous one support only 100 ppm as a "no-effect" level for zonyl@ RP.
I

5OC
4oc
30C
20(
BCDY \VEIGWTS OF MALE 8 FEMALE RATS FED VARIOUS LEVELS OF ZONYL@ R P
FIG. I
FEMALES
M F

TABLE I
AVERAGE BODY WEIGHTS AND AVEJUGE WEIGHT G A I N S OF MALE RATS FED VARIOUS LEVELS OF ZONYL@ KP
-I__-
Days on Tes t
0 7
1 4 2 1 28 35 42 49 56 63 70 7 7 84 9 1
0- 7 7-14
14-21 21-28 28-35 35-42 42-49 49-56 56-63 63-70 70-77 77-84 84-91
ZonyP RP - -.__
G r o u p I G r o u p I1 G r o u p I11 G r o u p I V - --.- 750- ppm - 2,500 ppm 500 ppm C o n t k o 1
A v e r a g e I3ody Weight (gm)
70 123 179 233 2 66 32 1 358 388 411 432 45 2 472 487 500
53 56 54 33 55 37 30 2 3 2 1 20 20 15 1 3
69 I 2 0 :t 74 227 2 80 32 3 358 390 413 43 1 45 1 470 482 497
69 119 172 229 2 67 320 358 396 42 3 44 1 461 478 492 5 10
A v e r a g e Weight G a i n (9)
51 54 53 53 43 35 32 23 18 20 19 12 15
50 53 57 38 53 38 38 27 1 8 20 1 7 14 1 8
68 1 1 7 168 221 267 310 345 377 404 42 3 448 471 489 495
49 51 53 46 33 35 32 27 19 25 23 18 6

TABLE T I
AVERAGE BODY WEIGHTS AND AVEMGE WEIGHT GAINS OF FEMALE RATS FED VARIOUS LEVELS OF ZOrSrL@ RP
Days on Tes t --
0 7
14 2 1 28 35 42 49 56 63 7 0 77 84 9 1
0- 7 7- 14
14-21 21-28 28-35 35-42 42-49 49-56 56-63 63-70 70-77 77-84 84-91
- Zonyl@ RP Group I Grloup I1 Group I11 Group IV Control - 500 ppm 750 ppm 2,500 pprn
Average Body Weight (g&
69 113 147 170 189 205 220 2 38 2 50 250 259 2 7 0 279 2 82
44 35 22 19 1 6 15 18 12 0 9
11 9 3
70 114 148 173 194 :208 :225 :236 :247 253 2 60 2 68 276 277
70 110 149 175 196 2 14 228 2 44 257 2 62 2 7 3 2 86 290 2 95
Average Weight Gain (gm)
44 34
* 25 2 1 14 17 11 11 6 7 8 8 1
40 39 26 2 1 1 8 14 1 6 1 3
5 11 13 4 5
70 112 150 176 195 208 217 236 246 247 261 267 2 75 276
42 38 26 19 13 9
19 10
1 14 6 8 1
,
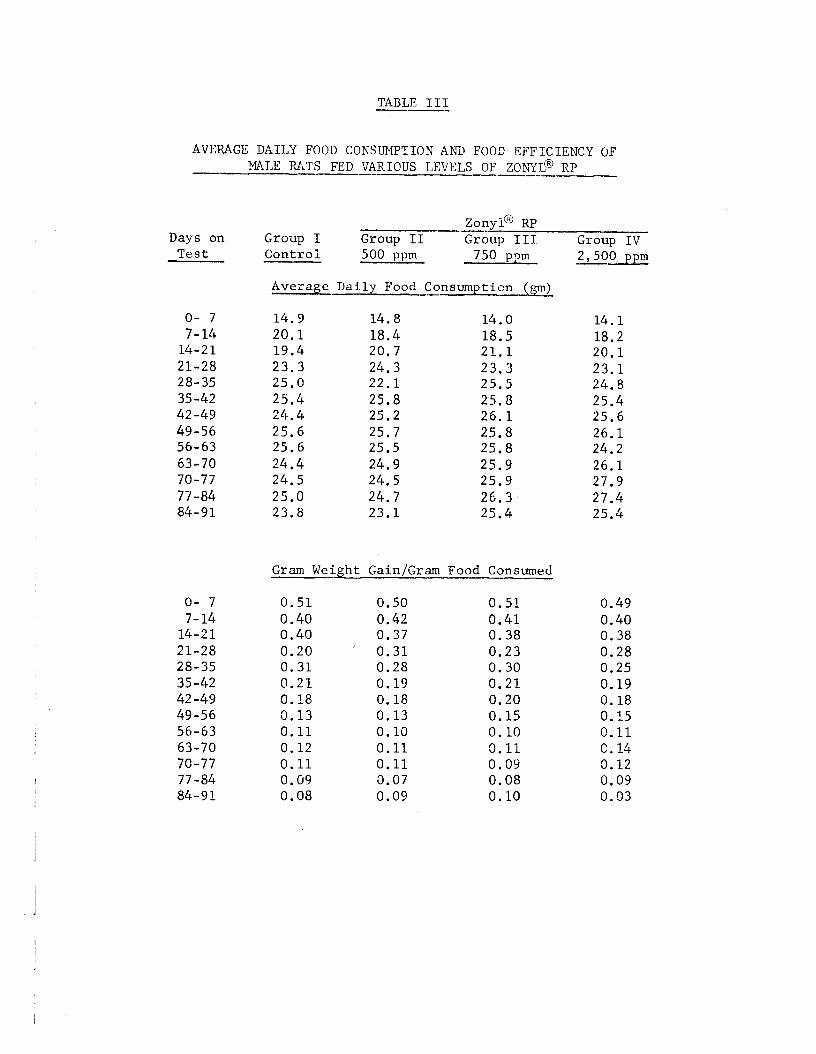
TABLE 111
AVERAGE DAILY FOOD CONSUMPTION AND FOOD E F F I C I E N C Y OF =LE FATS FED VARIOUS LEVELS OF ZOhYTp RP
I_ -_ -I---
Days on T e s t
0- 7 7-14
14-21 21-28 28-35 35 -42 42 -49 49-56 56-63 63 - 70 70-77 77-84 84-91
0- 7 7 - 14
14-21 21-28 28-35 35-42 42-49 49-56 56-63 63-70 70-77 77-84 84-91
Zany@ w 3 ---
G r o u p I G r o u p I1 Group 111 G ~ O U P IV C o n t r o i 500 p p m -- 750- p p m
Average D a i l y Food C o n s u m p t i c n (p> I__--
14.9 20.1 19.4 23.3 25.0 25.4 24.4 25.6 25.6 24.4 24.5 25.0 23.8
14.8 18.4 20.7 24.3 22.1 25.8 25.2 25.7 25.5 24.9 24.5 24.7 23.1
G r a m WeigL.t G a i n - 0 .51 0.40 0.40 0.20 0 .31 0 . 2 1 0 .18 9.13 0.11 0.12 0.11 0.09 0.08
0.50 0.42 0.37
' 0.31 0.28 0.19 0.18 0.13 0.10 0.11 0.11 0.07 0.09
14.0 18.5 21.1 23.3 25.5 25.8 26 .1 25.8 25.8 25.9 25.9 26.3 25.4
:ram Food Consumed
0 .51 0.41 0.38 0.23 0.30 0.21 0.20 0.15 0.10 0.11 0 .09 0.08 0.10
- 2,500 p p m
14.1 18.2 20.1 23.1 24.8 25.4 25.6 26.1 24.2 26.1 27.9 27.4 25.4
0.49 0.40 0.38 0.28 0.25 0.19 0.18 0.15 0.11 C . 14 3.12 0.09 0.03
i

TABLE IV ----
I
AVERAGE DAILY FOOD CONSUXPTION AND FOOD EFFICIENCY OF FWALE RATS FED VARIOUS LEVELS OF ZONYLO KP -
Days on Test
0- 7 7- 14
14-21 21-28 28-35 35-42 42 -49 49-56 56-63 63-70 70-77 77-84 84-91
0- 7 7-14
14 -21 21-28 28-35 35-42 42 -49 49-56 56-63 63-70 70-77 77-84 84-91
- Zonyl@ RP Group I Group I1 G r c u p 111 Grcrup I V
5010 ppm 750 ppm - C ont r o 1
Average Daily Food Consumption (gm)
13 .5 16.1 12 .9 17 .0 17 .6 17 .8 18.2 18.8 21.2 16 .2 18 .2 18 .5 17 .0
14 .0 16.9 16 .8 18.2 16.9 19.1 17.7 20 .4 20 .6 17 .6 19 .2 19 .0 16 .9
13 .0 16.0 15 .6 17 .3 17 .2 18 .1 18.8 19.1 18 .3
- 1 7 . 3 20.2 18 .6 17.9
G r a m Weight - Gain/Gram Food Consumed
0 . 4 6 0.31 0 . 2 4 0 . 1 6 0 .13 0.12 0.14 0 .09
0.08 0.08 0 .07 0 . 0 2
-
0.45 0.29 0 .21 0 .16 0.12 0 .13 0 .09 0.08 0 . 0 4 0.06 0.06 0 . 0 6 0.01
0 .44 0 .35 0 . 2 4 0.17 0.15 0.11 0 .12 0.10 0 .04 0 .09 0.09 0.03 0 .04
2 ,500 ppm
1 3 . 1 15.9 14.7 17.4 16.9 17.3 18 .1 18.9 18.2 17.3 18.9 18.3 16.5
0 .46 0 .34 0.23 0.16 0.11
0.15 0.08 0.01 0.11 0.05 0.06 0.01
0 . oa

TABLE V
AVEMGE WEIGHT GAIN, FOOD CONSUbPTTON, AND FOOD EFFICIENCY DATA, CALCUIATED AT APPROXIMATELY MONTHLY INTERVALS, OF MALE AND
FEMALE RATS FED VARIOUS LEVELS 3F ZONYL@ RP
Days on
Group Test I 0-28
(Control) 28-56 56-91 Tota l
I1 0-28 (500 PPm 28-56 Zonyl@ RP) 56-91
T o t a l
MALES Weight Food Con- F o o d
Gain sumption E f f i - (gm) (gm) ciency 196 544 0.36 145 703 0.21 89 8163 0.10
430 2110 0.20 2 11 548 0.38 133 692 0.19 84 85 9 0.10 42 8 2099 0.20
I11 0-28 198
Zonyl@ RP) 56-91 87 T o t a l 441
(750 PPm 28-56 156
IV 0-28 199 (2500 p 28-56 137 ZonylgmRJ?) 56-91 91
Total 427
539 0.37 723 0.22 905 0.10
2 lG7 0.20
529 0.38 7 :13 0.19 9:17 0.10 2 ll59 0.20
_I Fu"MALES Weight Food Con- F o o d
Gain sumption E f f i - (gm) (pi) ciency 120 417 0.29 61 507 0.12 32 637 0.05
2 13 1561 0.14 124 4.6 1 0.27 53 519 0.10 30 654 0.05
207 1634 0.13
12 6 434 61 5 12 38 647 225 1593
1.25 42 8 51 499 30 62 5
206 1552
0.29 0.12 0.06 0.14 0.29 0.10 0.05 0.13
. .. 1

I
Days on T e s t
0- 7 7-14
14-2 1 21-28 28-35 35-42 42 -49 49-56 56-63 63-70 70-77 77-84 84-91
0- 7 7- 14
14-21 21-28 28-35 35 -42 42 -49 49-56 56-63 63-70 70-77 77-84 84-91
'TABLE VI
AVERAGE DAILY INTAKE OF ZGhYL@ RP -
Average Dose in Milligrams/Kilogram/Day -- Zonyl@ RP
Group IV Group I1 Group 111 500 p p m 750 ppm -
MALES
'7 8 6 3 5 2 4 8 :3 7 3 8 34 3 2 3 0 2! 8 Z! 7 i! 6 i! 4
FENALES 7 6 ti 5 52 5i 0 41 2 44 3 8 4.2 4.1 34 3; 6 3; 5 31 1
112 95 79 7 0 65 57 52 47 45 4 3 41 41 38
108 92 7 2 7 0 63 61 60 57 53 4 8 5 3 4 9 46
2,500 pprn
382 3 19 259 237 2 15 194 177 167 144 149 152 i 4 2 12 9
36 1 303 226 2 34 209 204 200 196 185 170 173 169 150

TABLE ?I1
SUMMARY OF HEMATOLOGIC MEASUREMENTS ON RATS FED ZONYL@ RP FOR THREE MONTHS
Erythrocytes x 106/-3
PPm MALE s in Months on Test
Diet 1 2 3 0 5.98 6.14 6.38 500 - 5.65 5.70 7 50 5.64 5.39 I 6.12
5.87
15.2 500 1 1319 I I 15.6 1 750
Hemoglobin
4.65 6.04
2,500 I 5.58
13.4
750 12.9 Leucocytes 500
4.92 5.27
43
13.2 12.6 12.4 10.7 14.1 12.3
2,500 0
13.3 1 13.7 15.5 43 I 45 49
Neutrop hi1 s I 750
14.9 11.8
41 10.8
FEMALES I
32 10.5
I Months on Test 6
1 I 3 I 2 1
I 2,500 I 13.7 1 15.9 14.5
I - I 5.38 1 5.66
I 2,500 2 1
- 4 3 41 i 3 3
19 77
19 74
- 9.3 10.2 I 10.6
500 7 50
2,500
Lymphocytes I %
- 21
- 75 75 72 75 75 73 79 76
5.93 5.17
16.6 15.9 16.2 15 .3 46 44 45 42
7 . 1 7.3 8.9
10.1 20 20 19 21 76 77 78 75

TABLE VI1 (Continued) - S W A R Y OF HEMATOLOGIC MEASWDIENTS ON RATS FED ZONYL@ RP FOR THFEE MONTHS
Mor,oc y t e s %
1 Eo;inophils
1 Basophi ls 1 %
Atypical C e l l s z
Nucleated RBC ' s per 100 WBC's
PPm YALE S i n Months on Test
Diet 1 j 2 3 0 1.0 0.9 0 .1 500 - 0.6 0.6 7 50 1.5 0.4 0 .1
2,500 1.4 0.5 0.5 0 2.0 2.4 2.5 500 2 . 3 2 . 1 750 1.1 3.2 2.8
2,500 1.4 2.2 2.9 0 0.1 0 0 500 - 0.1 0.1 750 0.1 0.1 0
2,500 0 0 0 .1 0 0 0 0 500 0 0 750 0 0 0
2,500 0 0 0 0 0 0.1 0 500 - 0 0 7 50 0 0.1. 0
-
I
I I 2,500 I o I 0 I , 0 I
0.3 -
FEMALES Months on Test
I 1 i 1 i 9
1.0 0.5 0.1 , I 0.7
- 0.1 0 0
0 - p---t-m 0 0 0
0 0 0.1 0 0.1 0.1 0 0 0 0 0 0

TABLE VI11 SUMMARY OF URINALYSIS DATA ON RATS FED ZONYL@ RP FOR THREE MONTHS
1 ; 2 13 19
15 15
K4LES i n I Months on T e s t --
3 14 12 15
0 500
ml/24 hrs . 750 2,500
0
17.4 i I 2,5GO 1760 i - 1 0 9.2
19 1 1 7 1 6 18 15 18
15 20 2 1 1349 169C 1857
i c n LJ. Y
1 L 7 10. I j Creatinine i 506 ! -
f mg/24 hrs . i 750 j 9.5 i 17.8 1 17.0
2,500 1 0 0 0 0 500 0 0 750 0 0 0
- 1)
Sugar Number Abnormal
- 2,500 0 0 0
I 13 I 18 1 13 11590 1 1473 I 1619
1926 11849 1792 I 1852
1) Number +!- o r g r e a t e r by C l i n i t e s e
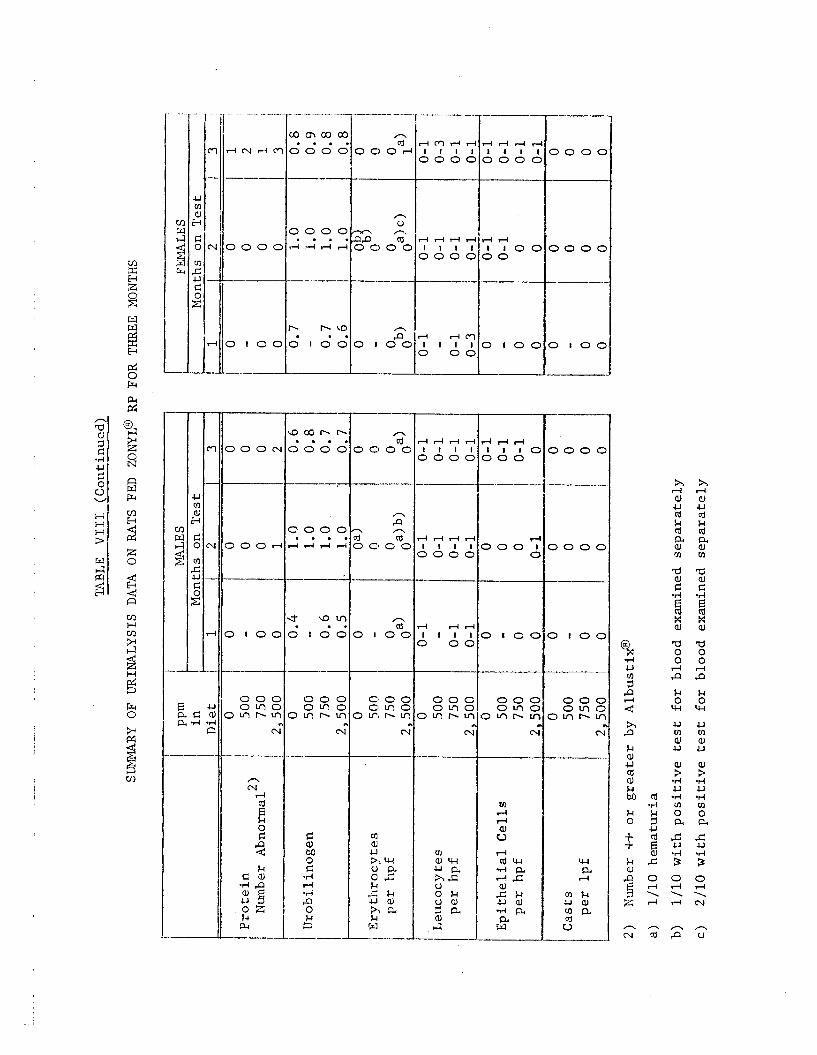
n a a, 7 G
.I4 u s 0 V H H H 3
w J
W
0 I 0 0
---- Q c o b b
3 0 0 N 0 O 0 0 . . . a
~-
0 0 0 0 . . . , 3 O O r l r - l r l r l 4 -I
--
4. a m . . 3 1- I O 0 0 : 0 0
0 0 0 0 0 0 o m 0 o m 0 3 m b m o m b m t--- ----t----
n hl d
-4
n (d
O C I O C
(d 0 I O C
% 3 5
.rl u
4 h P
k a, u rd a, Fc bo
k 0
?:
5 k w P
x A c\1

- - L _ _ -
SUMMARY OF BIOCKEMIC
Alka l ine Phosphatase Bessey Units
Transaminase R e i tman-F r anke 1 Unit s
B i 1 i rub i n m g %
L ME
- PPm MALES i n Months on Test
D i e t 1 2 3
0 44 38 32 500 - - - 750 47 38 33
2,500 41 33 1 24
0 18 12 8 500 - - 750 18 10 9
2,500 18 1 2 18
0 1.1 1.7 0.6 500 - - - 750 0.6 1.5 0.3
2,500 0.5 1.4 0.4
TABLE Ix SUREIENTS ON RATS FED ZONYL@ RP FOR THREE
2
22
23 20
19
18 ' 2 1
-
-
3
19
17 14
14
12 15
-
-
iONTHS
I FEMALES Months on Test

a r( 0
0
24 0
0
b m I-! rl 0 0
0 0
'f: 0
0
m I-! 0
0
N l-4 0
0
-f rf 0
0
m m 0
0
0 cn I-!
b hl 0
m b m
ri b
0
In m h rl
0 -3 N
0 m r-!
6 N
N
a3 m 0
0
m In 0
0
m b 0
0
m 00 0
0
m m 0
0
a 0 0
0 0
2 b
a 0
N
m 0
N
m m m I-! r-!
In u3 Lo 4- rf I-!
4- 0
(Y
u3 m m
N N
m
rl m m
I I I I
\o 4-
m
0 m G
m 4-
cr) u3 I-! a
c J , w ;5 h
a3
N m
0 b
0 .
u3 -3 d N
b
N
N m rl
m cv N
m W 0
m In
0
m m 0
0 0
ul b
l-l I-!
4. N
m rl
N N
m m w
N 4 N
u3 co I-!
Ln m 4
I-! a m cn 0 0
b cn 0
b m 0
m i-4
N
m d N
u3 N 0 0 N hl
a3 0
\c) 0
N c.1
4- N In
u3 a3 a3 m N N
u3 0 m
u3 I-. N
0 0 In
/? E4 FC
A 2- 0 k
I-4 u e 0 V W N

m
ii0 h N r. 4
m 0 0
0
rl rl 0
0
0 m 0
rl LD
0
N a3
m a m 0 0 0 0 0 0
0 0 0
cu 0 0
0
N rl 0
0
r-i if
0
r. \o
0
cn a 0
N 0 0
0
0 r( 0
0
03 rn 0
m LD
0
m r. 0
2 0
m m m
03 4- 0
0 m 0
d 4- 0
'9 0 0
N 0 0
0
rl rl 0
0
4 d 0
h a 0
0 m 0
2 0
4- 4- if
cn d 0
cn N
0
4- if 0
s 2: k
I n 0 n N
cu v
pl p: 0
m a IA N C J N 0 0 0
c o 0
N m 0
3
;?; o m u r m 0 0 0
m m 0
I I I I
2 0
0, r-i d
m r(
0
c\ rl
0
m rl
0
rl if m
03 3 0
m -4
0
if i f 0
n rl 0 k
HC, C 0 U W
r. rl
0 0 0
0 rl
m u ) b r n m m
4- 03 m
0 co if
r. 4-
0
rl
0 0
s a rl \u
0
r. \u
0
cn N
0
N cr) m cr)
0 0
N m 0
u, m 0
I I 2 p:
0 m 4- 0
N O 03 m b r . a r. 0 0 0 3
Err 0 9 1
rn i
n n pc 2 c4

H H x w ;I m a
a3.4.4 - 0 O I yr
v) >. c 3
s z n rn U
~ r w a m
o z w 0 In
Q X M
J V
ASVl 0 v\
OTV) 01 U
+ z m N In
3
V L
r
9
3
0
0
3
c)
0
0
0
0
0
0
P
3
0
3 2
3 0
c; '3
3 3
3 0
0 0
C 3
0
'30
00
0 3
0 3
3 6
0 3
00
00
Q > = Q x 3 0 3 0 3 0 3 0 0 0
0 (3 '3 3 3 3 0 0 a 3 0 0 0
o o = x 0 3 3 0 3 0 0 3 0 .b +
3 3 Q x 3 3 ~3 3 3 0 3 3 o a
0 0 0 x o o 3 0 3 3 00 O Q
0 3 0 Y O 3 0 0 0 0 0 0 3
0 0 0 x 3 0 3 0 00 0 0 0 0
0 0 3 0 3 0 0 0 0 6 0 0 0 0
x 0 0 3 0 3 0 0.3 0 0 0 ' 0 0
3 0 Q >c 3 0 0 0 0 0 00 01
0 0 x x o o o a o o o o 0 0
3 0 0 x 0 0 3 c) 0 0 00 0 0

TABLE XI1 (Continued)
HI ST.OPATHOLOGY TO-=ATE_ SUMMARY - RAT PAGE - l - A
JULY 10, 1972 HASKELL k' - 7247 TEST d --33 HR, # - 149100L C O H P @ U N D - "ZOr<YL" i P ( 3 5 % SLURRY OF "ZONYL" RP)
ANIHAL Y 7558 7561 7550 7574 7565 7539 7541 ?536 .7568 7598 7546 7555 7575 $581 7550 7544
c + + + 4
0 0 0 0 0 0 Q 0 0 0 0 0 0 0 0 0 0 0 O I O
0 0 0
d 0
3 0 0
0 0 0 0
0 0 0 0 0 0 0 0 0 0
0 0 0 0 0 0 0 0 0 0 0 0 0 0 0 0 0
0
0 0 0 0 0 0 0 0 0 0 0 0
0
0 0 0 0 0 a 0 0
0 0 0 a
0 0 0 0 0
C G 0
0 0 0 i;
0 0 0 0 D 0 0 0 0 0 0 0 0 0 0
0 0 0 0 0 0 0 0 0 0 0 0 cj 0 - 0
0 3 0 0 0 0 0 0 0 0 0 0 0 3 0
0 0 0 0 0 0 0 0 0 0 0 0 J 0 L!
0 0 0 0 C 0 0 0 0 0 n 0 0 9 0
0 0 0 0 0 0 0 0 0 0 0 0 0 0 0
0 0 0 0 X X X X X n X X X X X W
0 0 X X X X x X - X x X x X x X
0
0 0 0 0 0 0 0 0 0 0 0 0 0 0 0 f j

r
m Y
< P n < 4
v r P vl i: I n
a
r c(
0
0
0 P G 0 r rn 4
b 4
Y
r
+
'+
0
+ 0
0 0
+ + o
c a
00
00
00
00
G O
00
O C
0 c.
m c
c o
0 0
4 C n
cn
,"
00
0 0
00
0 0
O D
G O
00
00
00
c o
O t
00
c o
G O
a 2
0
C
0
0
0
0
0
0
0
c
i3
C
0
0
C
C
0
X
C
c
0
t
0
0
c
0
x
c
C
c
C
0
0
0
CJ
C
0
0
0
C
0
G
c
C
c
c o o o c
0
C
0
0
0
C
0
0
C
C
c;
C
C
c
- L
0
0
x
0
C
0
C
C
C
C
C
x
c C
r - b-.
P
VI -4 J2 C - c 5 m (r
-
n
C
0
0
0
C
0
0
C
0
C
C
C
0
C
CJ
c
C
C
0
0
C
0
0
C'
c -?
0
L.
c.
c:
C,
C:
C'
0
o
0
c
c)
0
0
0
c
C
c
a
0
C
0
"
G O
c o
c o
0
0 0
c'c
00
0 0
c o
G O
0 0
G O
G O
c u
J C
z c
C
0
0
0
0
0
C
0
0
0
0
C
C
C
G
0
z. ... c C .
e W
*A I w
ul N
VI It w
VI c1
(i. x h,
N E.
w n w
N 0-
w n c p
N 4
(nno
w W
V I m w
N 4
W 7 . W
N 4
w - n v
N 9
~ n n r
ru a
W ~ I -
w 0
W - n N
h L-
b-8 T N
N VI 4 0 0 0
N VI
* O -0
N W. 4 0 9 0
N w 40
3 0
I
9
Q hr
w
4 0
-J rw
4 N
-.I N
4 W
4 VI
co 3
N w.
0 0 o c
r\ yi b. (3 .- 0
2
p,
v)
-4 0 P
f 0 r C 0 -< 4 0 I U * -4 m c', c x ;L P 72 4
I
H
P ZP 0 rn
I
N

J 0 bn r-
2 9 h
i3 0 0 " 3 3 3 3
0 0 0 3 0 3 .o 3
0 3 0 000 0 0
o o o 3 3 0 a 3
0 0 0 0 0 0 3 0
0 3 0 . 3 0 X X C
3 3 3 2 3 x x o 4 m 4 r-
m rn d r-
o 3 o 000 o o
0 0 0 0-00 0 0
3 0 0 3 0 x x o
0 0 3 0 0 0 x o
0 0 3 0 0 3 0 x x o 0 0 0 000 2 m o o o 0 0 0 N 9 F.
IC 0 0 0 0 0 0 -4 9 r-
0 0 0 0 0 0 0 0 0 0
Q O 0 0 0 0 0 x x o
9 0 3 0 0 0 0 x x o m + 3 0 0 0 0 4- UI r-
U 0 0 0 0 0 3 P m r-
0 0 3 5 0
0 3 ' 3 0 0
0 3 c o 3
0 0 x x o
3 0 0 x o
0 3 x x o m + 0 0 0 0 0 3 U' ;n F-
1:
-1
I z C
a I

0
0 0
c o
0 0
0 0
0 0
00
0 0
0
;r 3 -- w c n 7J
00
0
0 0
00
00
O G + 0
00 0 "
o c 00
c
0
0
0
0
0
0
0
0
cj
0
0
c
0
C
0
t
0
0
0
0
0
0
0
0
C
c
0
0
0
0
0
0
0
0
c
t
0
0
x
- J c. n JI z C n + C & rn v)
.-I
1
3
c
0
0
0
0
0
0
0
G
C
0
0
0
0
0
0
0
0
3
' 0
0
0
0
00
00
0 0
00
00
00
0 0
00
0
C
c
0
0
0
0
0
m n U
W 0
w. n w
N 0.
w Ti 0
N 4.
WIT0
N 0.
mncn
W )..
v:TQ
N 4
vine
' h ) d vlnr
h; VI
w n o
& cc v: x LJ
P -J
w z - 4
v, N
VIZC.
U. Q w I I w
\- )\I
V Z N
..

TABLE XTI-B (Continued)
HISTOPATHOLOGY TU-DATE SUNXARY - RAT
HASKELL ff - 7247 TESP-# - 3 3 - _ MR. C - 1491001 COKPUUNO - -IONYL~ tip ( 3 5 1 SLURRY OF m z o N ; I i w R P )
PAGE - 3-A
JULY 101 1972.
7632 7602 7603 7613 7590 7589 7600 7614 7542 7572 7547 7559 7563 7583 7564 7582
0 0 0 0 0 o c 0
0 0 0 0 0 0 0 0
0 0 0 0 0 . o 0 0
0 0 0 0 0 0 C 0 0 0 0 0 0 0 0 0 0 0 0 0 0 0 0 0
0 0 0 0 0 0 0 0
0 0 0 0 0 0 0 0
X
X
0
0
0
X
0
0
0 0
0
0
X
X
0
x
X
0
0 0 0
0 0 0
0 0 0
0 0 C
0 0 0
X X x
X . X
0 0 0
0
X
X
G
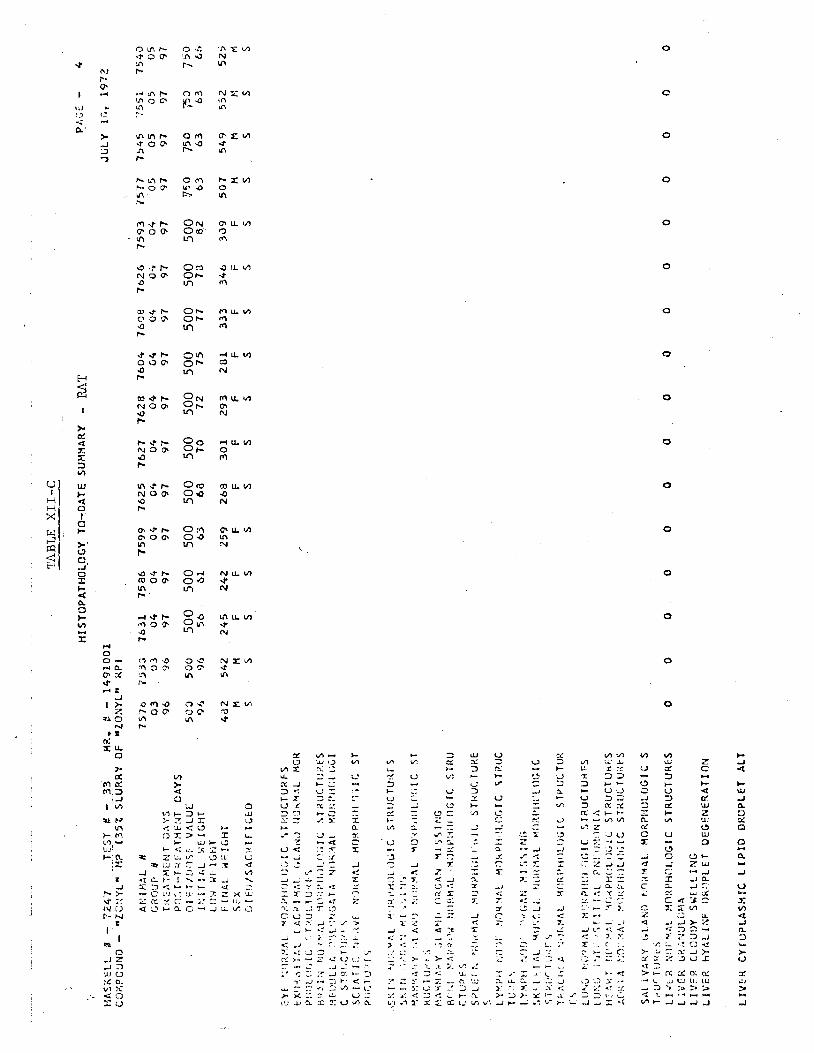
vl ?i
-,: n T 13
0
0
0
0

I
* Y U a: x 3 VI
'UJ 4
I a
- w a d 0 3
I ! i .-i

I
v) *. 4
b- lr
0
0
0
0
0
0
0
0
0 ,
0
0

i
E 3

TABLE X I 1 1
BODY WEIGHTS OF INDIVIDUAL MALE DOGS FED ZONYL@ RP
Dog Weekly Weight i n Kilograms Group No. 0 1 2 3 4 5 6 7 8 9 10 11 1 2 13 Avg.
1150 8.1 6.2 8.6 8 .1 7 .9 8.0 8.1 8.2 8 .2 8 .3 8.2 8.4 8.4 8 .4 8.2 I 1154 11.2 10.9 11.0 11.1 11.0 11.0 10.8 11 .2 11.1 11.3 11.4 11 .2 11.4 11.5 11 .2
(C cntrol) 1158 11.4 11.4 11.4 11.6 11.1 11.5 11.5 11.8 11.8 12.0 11.8 11 .7 12.0 11.9 11.6 1162 9.5 9.2 9.2 9.4 9.3 9.5 9.6 9.7 9.5 9.6 9.7 9.6 9 . 7 5.9 9.5
1153 10.8 11.3 11.1 11.4 11.1 11.2 11.3 11.5 11.4 11.6 1 1 . 2 11.5 1 1 . 7 1 1 . 6 1.1.3 I1 1155 9.3 9.2 9.4 9.5 9.4 9 . 4 9 .5 9.6 9.8 9 .8 9.8 10.0 10.0 9.8 9.6
(560 ppm 1159 14,O 14.9 14.0 14.3 14.2 14.2 14.3 14.6 14.4 14.8 14.8 14.9 14.7 15.0 15.5 Zonyl@ RP) 1165 9.0 9.5 9.5 9 . 8 9.5 9 .6 9.4 9 . 8 9.6 9 . 8 9.9 9 . 8 9.7 9 .9 9.6
1152 11 .2 11.0 11.1 11.3 11.4 11.2 11.3 11 .7 11.3 11.4 11 .7 11.5 11 .6 11.8 11.4 111 1156 8.3 8 .2 8 .3 8.4 8.1 8.1 8 . 2 8 .3 8.4 8.2 8.6 8 .3 8.4 8.3 8.3
(750 PPm 1160 9.1 9 . 1 9.0 9 . 1 9 .1 9 . 3 9.3 9.5 9.4 9.4 9 . 4 9.4 9.4 9.4 9 . 3 Zonyl@ RP) 1164 7.8 7.5 7 . 6 8.0 7 .8 7.9 7.8 8.2 8.1 8.0 8 .0 8.0 7 . 9 8.0 7.9
1151 10.8 10.6 10.6 10.7 1G.4 10.8 10.8 10.8 10.8 11.0 11.0 10.9 10.7 i0 .5 10.7 i v 1157 10.5 10.8 10.7 l l . C 10.8 10.6 10.8 10.9 10.8 11.2 11.1 11.0 11.1 i 0 . 9 10.9
(2,500 ppm l l G l 9.0 8.7 8.8 8.8 8.8 8.8 8.5 8.9 8.8 8.9 8 .8 8.8 9.0 8.9 8 .8 Zonyl@ RP) 1163 9.8 10.0 10.1 10.2 10.0 10.2 10.3 10.5 10.5 10.4 10.6 10.8 10.5 10.5 10.3

TABLE X I V
BODY WEIGHTS OF INDIVIDUAL FEMALE DOGS FED ZONYL@ KP
Dog Weekly Weight i n Kilograms I
Group No. 0 1 2 3 4 5 6 7 8 9 10 11 12 13 Avg.
1137 10.5 10.6 10.7 10.9 10.7 10.8 10.9 11.0 11.0 10.8 10.9 11.0 11.0 10.9 10.8 I 1141 11.8 12.0 12.0 12.0 12.2 12.0 11 .7 11.6 11.5 11.5 11.4 11.5 11.4 11.5 11.7
(Control) 1145 8.0 7.8 8.0 8.3 8.2 8 .2 8 .4 8.5 8.5 8.4 8.8 9.0 9.2 9 . 1 8.4 1147 8.3 8.7 8.6 8.8 8.6 9.0 9.1 9.2 9 . 2 9.4 9 . 3 9.4 9.5 9.4 9 . 1
1135 8 . 2 8.1 8.1 8.3 8.4 8.5 8.7 8.5 8.5 8.5 8 . 2 8.3 8.2 8 .4 8.4 11 1140 7.0 7.0 7.0 7.2 7.0 7 . 1 7 .2 7.3 7.3 7.2 7 . 3 7.3 7.3 7 .2 7 .2
(500 ppm 1143 8.1 8 .8 8.0 8 .2 8.0. 8.4 8.8 8.6 8.6 8.4 8.5 8 . 6 8.8 8 .6 8.4 Zonyl@ RP) 1149 6.3 6.5 6.6 6.8 6.8 6.8 6.8 6.9 6.9 7.0 7 . 1 7.0 6 .9 7.0 6 .8
1,136 13.0 13.3 13;2 13.3 13.4 13.7 13.8 14.1 14.4 14.9 15.2 15.3 15.3 1.5.1 14.1 I11 1139 8.0 7 . 8 7.8 7.9 7.9 8.0 8.0 8.4 8.5 8.4 8.4 5.7 8.7 8.5 8.2
(750 PPm 1144 9.2 8.5 8.3 8.8 8.6 8.8 8 . 7 8.9 8.8 8.8 8.8 8.9 9.0 9.0 8 .8 Zonyl@ RP) 1148 9 . 5 9 .8 9.4 9.6 9.4 9.8 9.8 10.0 10.0 10.2 10.2 10.2 10.7 10.6 10.0
1134 6.0 6.1 6 .1 6.2 6.1 6.2 6.4 6.4 6.5 6.6 6.6 6.7 6 . 7 6.7 6.4 I V 1138 8.8 8.4 8.9 9.4 9.3 9.5 10.0 9.8 10.2 9.8 9 .8 9.5 9.4 9.2 9.4
(2,500 pm 1142 9.6 9 .2 9.0 9.2 8.8 8.4 8.4 8.4 8.5 8.6 8.5 8.4 8.4 8.3 8.7 Zony’K RP) 1146 7.0 7.0 7 . 1 7.0 6.9 . 6.8 6.9 6.8 7.2 7.0 6 .8 6.6 6.4 6.5 6 . 8
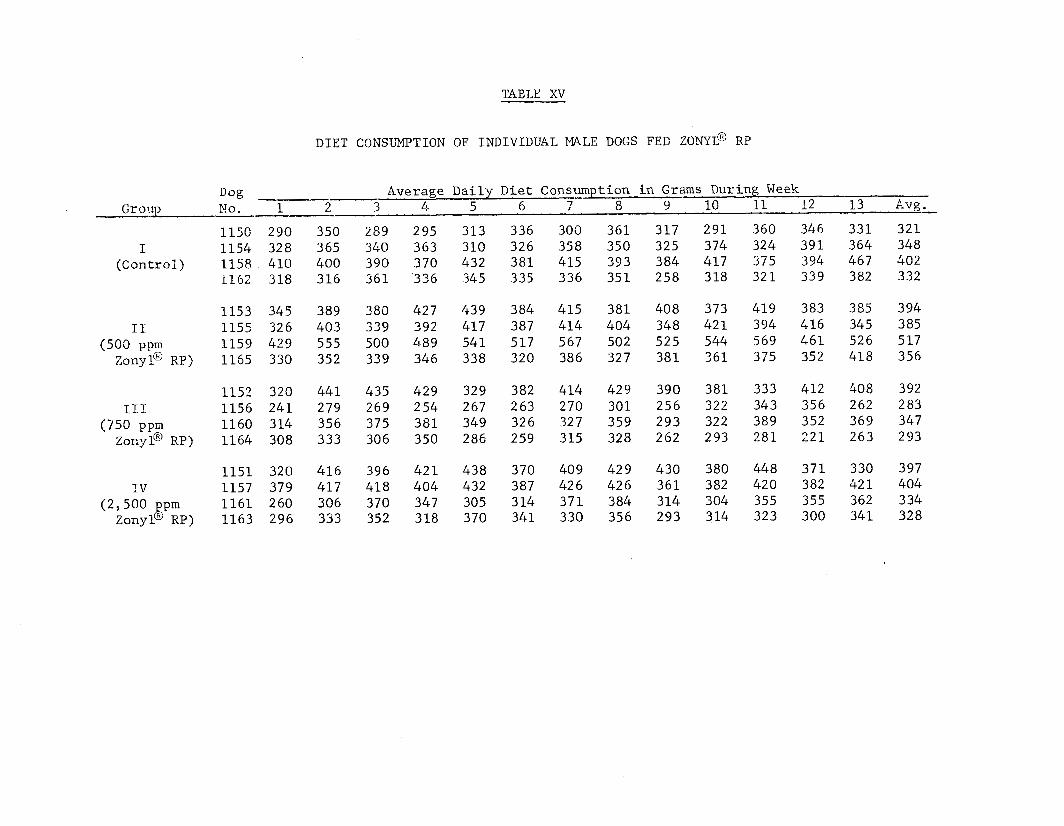
TABLE XV
D I E T C9NSL;MPTION OF I N D I V I D U A L MALE DOGS F E D ZONYL@ RP
D o g I Average D a i l y D i e t Consumption i n Grams D u r i n g Week Group KO. 1 2 3 4 5 6 7 8 9 10 I1 12 13 Avg .
1150 290 350 289 295 313 336 300 361 317 291 360 346 331 321 I 1154 328 365 340 363 310 326 358 350 325 374 324 391 364 348
(Contro 1) 1158 410 400 390 370 432 381 415 393 384 417 375 394 467 402 1162 318 316 361 336 345 335 336 351 258 318 321 339 382 332
1153 34.5 389 380 427 439 384 415 381 408 373 419 383 385 394 I1 1155 326 4 0 3 339 392 417 387 414 404 348 421 394 416 345 385
( 5 0 0 ppm 1159 429 555 500 489 541 517 567 502 525 544 569 4 6 1 526 517 Zonyl@ RP> 1155 330 352 339 346 338 320 386 327 3 8 1 361 375 352 418 356
1152 320 441 435 429 329 382 414 429 390 381 333 412 408 392 111 1156 2 4 1 279 269 2 5 4 267 263 270 301 256 322 343 356 262 283
( 7 5 0 ppn 1160 314 356 375 381 349 326 327 359 293 322 389 352 369 347 Zor ,y l@ RP) 1164 308 333 306 350 286 259 315 328 262 293 2 8 1 2 2 1 263 293
1151 320 416 396 4 2 1 438 370 409 429 430 380 448 371 330 397 IV 1157 379 417 418 404 432 387 426 426 361 382 420 382 4 2 1 404
( 2 , 5 0 0 p m 1161 260 306 370 347 305 314 3 7 1 384 314 304 355 355 362 334 Z o n y l RP) 1163 296 333 352 318 370 341 330 356 233 314 323 300 341 328

TABLE XVI
DIET CONSUMPTION OF INDIVIDUAL FEMALE DOGS FED ZONYL@ RP
Dog Average Daily D i e t Consumption i n G r a m s During Week Group No. 1 2 3 4 5 6 7 8 9 10 11 12 13 Avg.
T. (Con tro I)
I 1 ( 5 0 0 PPm
Zany@ RP)
I 1 1 ( 7 5 0 p p n
Zonyl@ RP)
IV Zon:7l &p;p
( 3 , 5 0 0
1137 382 396 406 1141 428 373 372 1145 263 287 303 1147 200 198 280
1135 251 323 329 1140 265 267 283 1143 258 297 375 1149 349 362 369
1136 427 409 368 1139 304 317 317 1144 197 290 304 1148 346 372 361
1134 279 270 280 1138 300 448 422 1142 275 277 309 1146 244 267 261
364 338 453 287 2 8 4 2 0 1 321 334
332 320 277 254. 380 392 362 412
426 388 357 309 305 298 364 382
2 8 4 320 414 350 277 183 252 2 8 4
378 38b 391 312 316 338 358 374 364 286 280 395 356 401 4.70 452 500 389 331 290 259 226 311 312 285 274 285 262 327 321 359 295 318 306 330 295
329 319 356 355 305 244 202 331 307 273 329 301 232 231 200 261 285 2 6 6 386 343 338 362 326 247 349 338 338 359 369 366 373 337 367 381 409 370
429 450 492 538 449 455 403 420 435 283 319 331 293 257 332 310 240 305 313 291 271 259 296 308 317 307 289 353 335 318 360 244 272 402 380 345
293 3 1 1 261 253 251 276 2 6 0 280 278 399 377 370 398 352 233 254 319 357 261 344 328 342 256 352 421 429 320 256 255 282 217 198 276 104 248 242

TABLE X V I I
AVER4GE DOSES OF I N D I V I D U A L MALE DOGS F E D ZONYLa RP -
Dog Average D a i l y Dose i n Mill igrams /Kilograms dur2ng Week Group N o . 1 2 3 4 5 6 7 8 9 10 11 12 13 A v g .
- c _
1150 - - - - - - - - - - - - - - I 1154 - - - - - - - - - - - - - -
Cont ro l 1158 - - - - - - - - - - - - - - 1162 - - - - .-
1153 45 50 1 7 19 20 17 18 1 7 18 1 6 18 1 6 17 22 I1 1155 5 1 62 18 2 1 22 2 1 22 2 1 18 22 20 2 1 17 26
500 pprn 1159 42 5 5 13 17 19 18 20 1 7 18 18 19 1 6 18 2 3 Zonyl@ RP 1165 51 5 3 18 18 18 17 20 17 20 18 19 i 8 2 1 2 4
1152 62 V U Q L L 7 28 26 25 2 2 L / 26 33 111 1156 6 3 73 2 4 2 3 2 5 2 4 25 2 7 2 3 29 31 32 2 3 32
750 ppm 1160 7 4 8 5 31 31 2 8 2 6 26 2 9 2 3 26 31 2 8 29 3 6 30 30 25 2 8 26 2 1 25 37
- - - - - - - - -
0 7 9 7 LI ? L L V 9 0 2 8 22
ZonyiB IIP 1164 8 7 9 4 2 9 33 2 8 2 5 ~~ ~- - ~~ ~~
8 6 78 113 I V 1157 230 2 5 3 9 7 9 3 1 0 1 9 0 98 9 9 82 85 9 6 8 7 96 116
2 , 5 0 0 ppm 1161 19@ 2 2 3 105 99 8 7 9 1 106 109 89 86 101 100 1 0 1 114 Zonyl@ Rl? 1163 192 2 1 4 86 79 92 84 79 85 70 75 75 7 1 81 9 9
1151 192 252 9 4 9 9 103 8 6 95 9 9 99 86 102

TABLE X V I I I
AVERAGE DOSES BY INDIVIDUAL FEMALE DOGS FED ZONYL@ RP
Dog Average Daily Dose i n M i l l i g r a m s / K i l o g r a m d u r i n g Week Group -- N o . 1 2 3 4 5 6 7 8 9 10 11 12 13 Avg.
1135 44 57 20 20 19 19 1 9 2 1 2 1 18 15 12 20 2 4 2 4
19 2 5 29 25
19 . 2 3 2 1 16 1 6 14 18 20 I1 1140 5 4 54 20 20 18 20 2 1 19 14 20
Zoilyl@ RP 1'149 7 8 78 2 8 27 30 26 27 26 27 24 26 27 500 ppm 1143 44 50 2 3 2 4 2 4 22 20
i v 2,500 ppm Zofiyl? RP
1136 1.139 1134 1 I48
1134 1.138 1 I 4 2 1246
--
69 66 2 1 2 4 82 87 30 34 50 7 4 26 2 6 76 83 28 2 9
300 284 115 114 224 334 115 110 188 195 85 77 224 245 93 90
2 1 2 9 2 6 30
1 2 9 93 5 3
104
2 0 2 1 22 2 3 2 4 26 2 8 22 26 29 30 2 6 2 3 29 27 21.
22 2 5 26 26 26 23 27 25 27 25 2 4 27 18 20 29 27
~~
30 36 31 34
116 1 2 1 IO2 96 95 105 97 135 108 95 92 9 9 90 6 1 67 86
78 102 98 99 104 105 125 128 94 94 101 76 7 2 103 40 97
137 12 1 110 110

u VI aJ Y I a !-I k
---t---
-1-
I-
2 0 0 0
> o o o
3 0 0 0
o o c o m c > m - v

m r - m
e C J co
ooo/ 0 0 0 o m 0 o m 0 3 m r - t A 0 m r . m
GI hl I
VI 0) 4J h u 0 F:
d
0 0 0 o m 0 o m r - l n
CY
m aJ U
0 F: 0-
9
s
3 o o c
--
3 Q O C
3 o o c
I_-.
3 o o c
o o c o m c 0 m r . I . C
) O O O
- .-
> o o o
> o o o
> o o o
3 0 0 0
3 0 0 0
--
3 0 0 0
-__.-__
0 0 0 0

TABLE XX
SW-MARZT OF LTINALYSIS DATA ON DOGS F E D ZONYL@ Kp FOR THREE MONTHS
V o lurne ml/24 hrs .
I 1 PP" MALES i n Months on T e s t
D i e t 1 Pre-Test* 1 2 : 3 0 178 135 165 150 500 1 228 1 209 180 1 176 '750 I 178 I 134 I 114 116
Pre-Test 1 2 ; 3
1638 1790 1 1906 1 1875 1 1951
Osmolality 109 1 1482 mOs /L
2,500 1 266 1 163 0 I 1549 I I944
159 199 1775 2004
I 2,500 I 1513 I 1503 0 I 142 179
I
B iL irub in 500 5 3 4 ' 4 4 4 4 2 3 4
Number Positive
1651 1 1516 173 I 207
FEMALES
- 1.527 177
I
PIonths on T e s t
1456 1594 1859 175 184 170
96
1 2,500 116 0 0
Xuniber Positive 0 1 0
Sugar 0 Number Abnormal 750 0
2,500 0 0 0
Acetone 500 0 Number Positive 750 0
mg/100 ml 753 145 C 1: eat in ine
731ood
-
169 140 I 149 I 150 153 I 150 1 97 ! 140
114 153 ' 158 137 179 . 192 98 158 145
0 0 0 0
0 0 0 0 0 0 0 0 0 0 0 0 0 0 0 0 0 0 0 0 0 0 0 0 0 0 0
1 l;: 203 1 209 1 151
1648 1900 I 1684
1 I 0 1 0 0 0 2 0 0 0 0 0 0 0 0 0 0 0 0 0 0 0 0 0 0 0 0 0 0 0 0 0 0 0 2 3 4 , 0 1 2 3 3 4
1861 1725 I 1807
1366 1639 1635 I 1627 1 1348
0 0 0 0 0 0 0 0 0 0 0 3 4 4
130 1.13 154 160 15 1 I 1 1 2 1 1 2 6 1 194 119 I 106 I 125 1 170
0 I o ! o ! 0
0 l o 1 2 1 2
Average of the measurement per dog f o r volume, osmolality, creatinine; number positive or abnormal in eight specimens for blood, sugar, acetone, Silirubin, protein.

1- ----I-- > D O 0
3 O C O
.___
f I ; I ; I ~ I O i > 0 0 oi 0 0 0 0 -I -
____
m r n 4 t - I 0000 I I I I D O C C l
NNrlc‘) I I I 1 0 0 0 0

TABLE XXI
SUMMARY OF BIOCHEMICAL MEASURENENTS ON DOGS FED ZONYL@ RP FOR THREE MONTHS
1 Glucose 1 rng z? I I
i i Urea Nitrogen I mg %
500 750
2 ,500 0 SO0 750
, 2,500
-__- I
4.2 6.4 4.k 4 . 4 8 7 8 7 6 .3 6 .2 6 . 1 6.0
M4LE S
3.2 3 .3 1 3.0 6.9 8 .1 8 .2 ' 6.6 6 .9 1 5 . 3
10.7 11.3 1 11 .7 17 15 13 14 15 11 15 18 17 11 15 13
6 . 1 6 .2 6 .4 6.0 6 .2 6.2
6.2 6.2 I 6*1 6.3 1 6 .3 5 . 9 '
r-. i rans aninas e Reitman-Frankel Units
i
Total Proteir?
FEMALES Months on Test Pre-test I , I____
? -3
0 500 750
2 ,500 0 500
6 . 1 1 6.1 ' 6 . 5 6.8

-t----
o o o l o o c o m o O ~ O o m - i n Olnh11!
hl “1
c o c n m c o o o c . . .
c ~ c o r - r . . . o o o c
a r - m r o o o c . . .
o o c o m c 0 m - I .
C
c \ I h l h l C
o o o c . . .
m h l h l c o o o c . . .
d - f r n @ o o o c . . .
C J r l C v C
o o o c . . .

OKGAN WIGHTS IN GRAMS OF INDIVIDUAL MALE DOGS SACRIFICED AFTER THREE MONTHS' FEEDING OF ZONYL@ RP
k
I 1158 12.0 90 106 127 397 3G 40 64 25 11.8 5.2 110 9.5 1 . 3 0.068 0.85 Cont ro l 1154 11.5 73 102 175 332 2 7 32 70 19 7.0 6 .9 55 8 .3 1 . 7 0.059 0.92
1162 11.0 74 111 132 301 25 29 69 24 5.0 6.3 92 5.8 1 . 2 0.070 0.76 11.50 8.0 77 76 95 270 24 25 47 14 4.6 4.6 86 9.2 1.0 0.056 0.74
I1 1153 11.5 73 108 174 409 36 25 73 24 5 .3 5.6 93 36.3 1 . 5 0.077 0.45 1165 9.9 71 90 144 400 26 29 59 21 4.9 5.0 93 13.7 1 . 2 0.06b 0.25
2:y%mRP 1159 14.9 85 143 191 593 22 32 77 32 8.0 8.8 128 13.7 1.8 0 .08L 1.02 -- 1155 10.0 75 74 153 370 20 25 70 14 8.9 4.9 86 4.3 1.1 0.06b 0.91 I I1 1164 8 .2 69 68 120 320 15 32 57 17 6.4 6.2 74 8.8 0.8 0.059 0.25
750 ppm 1160 9.8 82 95 1 2 1 357 24 29 55 17 5.9 4.8 E30 13.2 1.4 0.044 0.65 Zong?@ RP 1152 11.8 9 1 88 157 454 29 26 59 1 7 1 1 . 2 4.9 108 9 . 6 1 . 6 0.057 0.96
1156 8 . 6 85 60 1 2 1 309 2 3 18 46 17 7 .3 3.2 78 8.7 0 .9 0.064 0.57 I 'J 1163 10.3 84 84 113 486 2 4 25 68 25 6.2 5.6 99 11.0 1 .5 0.084 1 . 2 1
2,50d ppm 1161 9.0 81 80 113 493 20 18 62 19 3.4 4.4 87 9.8 1.1 0.064 0.65 Zonyl@ RP 1151 11.0 75 87 149 541 22 22 60 20 3.3 5.6 108 1.6.6 1 .0 0.050 1.10 - 1157 11.0 50 101 197 516 29 32 63 16 4 .3 4 .0 99 6.7 1 . 2 0.073 0.86

TABLE XXIII
ORGAN h R I G H T S I N GRAMS OF INDIVIDUAL FEMALE DOGS SACRIFICED AFTER THJXEE MONTHS' F E L D I N G OF ZONYL@ RP _.
G r o u p D o g No. Body Wt. 0
G .r( cd k p9 -
u rn F 7
1-11 -
z 111 a,
rn cd 6
c a c 8 h k a LJ
I 1137 11.4 73 107 172 349 25 24 57 103 6.2 1.1 0,072 1.19 Control 1141 11.7 76 107 161 372 23 20 66 111 14.5 1.8 0.058 1.63
1145 9.2 75 65 140 347 19 26 46 83 7.6 1.7 0.G59 0.31 1147 9.6 65 94 152 308 28 31 62 92 12.3 2.0 0.078 0.65
I1 1135 8.3 68 81 114 356 22 22 54 87 5.3 1.0 0.076 0.37 114'2 7.5 65 60 95 274 22 21 43 76 10.2 1.0 0.072 0.70
1141 7.6 75 78 134 357 15 22 42 80 4.4 1.6 0.054 1.06 111 1148 10.8 74 74 126 352 16 21 44 77 11.4 1.5 0.062 1.03
750 ppm 1139 8. G 78 73 138 416 23 30 60 83 11.7 1.8 0.071 0.82 ZoriyP KP 1144 9.4 60 67 113 350 17 2 1 47 75 6.9 1.3 0.06G O.&8
1136 15.3 84 99 189 533 30 30 69 117 13.9 1.5 0.074 0.85 I3 1146 6.8 72 55 90 342 11 21 39 76 6.3 1.2 0,061 0.57
2,500 & P i p 1138 9.2 82 80 109 520 17 24 54 80 11.7 1.8 13.049 0.37
Zonyl 1142 3.6 76 79 104 430 2 1 24 53 76 9.0 1.2 0.056 G.74 --- 11 34 6.8 73 67 80 351 12 22 42 70 10.2 1.7 0.035 0.22
j;oo:Y%*RP 1143 8.8 81 70 121 397 19 30 46 88 1?.6 1.4 n.074 0 . 7 G

TABLE XXIV ---
AVERAGE LIVER WEIGHTS A-ND LIVER/BODY WEIGHT U T I O S OF DOGS FED ZONYLG’ RP -
MALES FENALES L ive r F i n a l L i v e r F ina l
Body Weight Weight L i v e r lireight -- x 100 Bcdy I J e i E -- (kg) (g) - X 100 PPm Body Weight Weight Liver Weight Zonyl@ RP (kg) ( g > Body Weight
f 0 10.4 325 3.15 10.5 344 3.29
I1 5 00 11.6 442 3.82 8.0 346 4.28
ZIT. 750 9.6 3 60 3.75 11.0 413 3.83
I V 2,500 10.3 509 4.95 7.8 411 5 .22
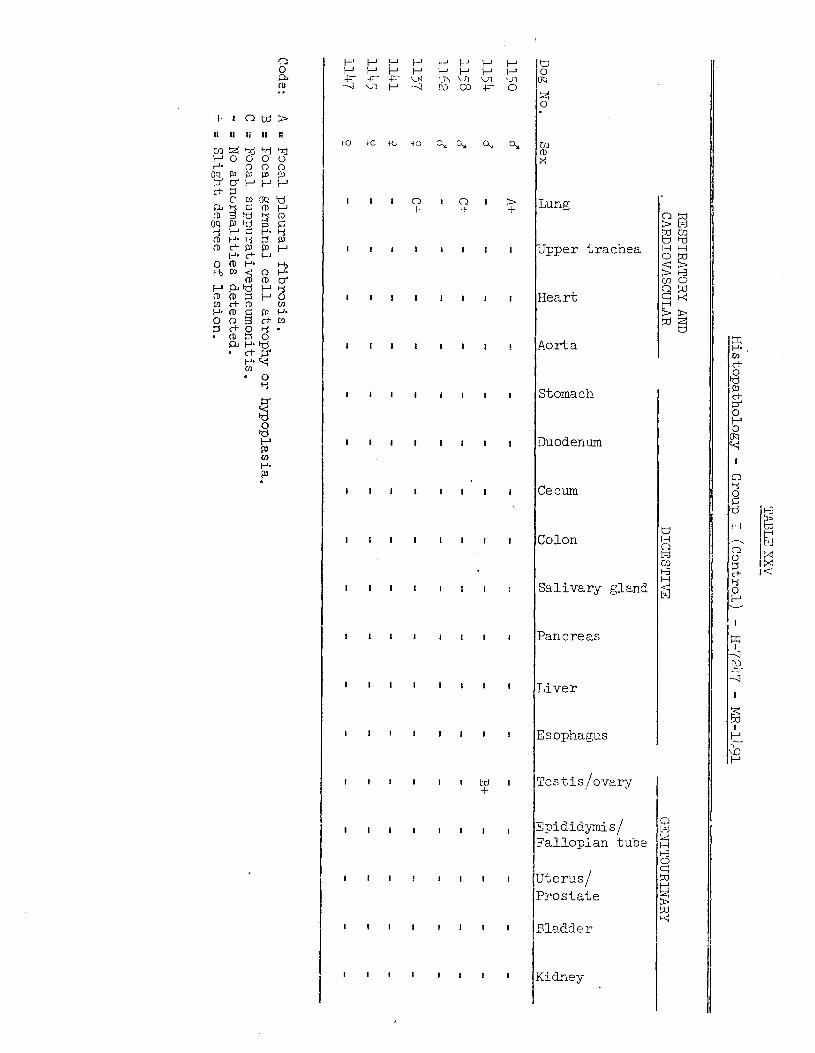
..
i i i I I 4 M I +
I I I I I I I
I I I I I I I
I I I I II I I I
' 0 c:
I
z Test i s /ovary
Epididymis/ 8 Fal loplan tube 5
3 H Uterus/
9 * P r o s t a t e z Ble&jey
? I I I c z I c 2 I + +
I I I I I I I I
I I I I I l l I
I l l I I l l I
I I I I I I I I
I l l I I l l I
I l l 1 I l l 1
I l l I I l l I
I I I I I I I I
1 1 1 1 I l l I
I I I I I I I I
I I J I I I I !
Lung
Upper t rachea
Heart
Aorta
Stomach
Duodenum
Cecum
Colon
Sa l iva ry
Pan e re as
Liver
Esophagus

P P c- -4
a ‘0
+c
I
I
I
1
I
I
I
I
I
I
I
I
I
I
I
P I-‘ -F ul
m u?
+o
I
I
I
I
I
I
I
1
I
I
I
I
I
I
I
I-J
I-J G
v3 \L)
to
I
I
0
I
I
I
I
I
I
0
I
I
I
I
I
1-‘ + ‘d -3
u? \D
io
I
I
I
1
I
I
I
I
I
0
I
I
I
I
I
P tJ o? Iu
v3 03
a,
I
I
I
I
I
I
I
I
I
0
0
I
I
I
I
P P vl a3
u? (r,
a,
I
I
0
I
I
I
I
I
I
0
I
I
1
I
I
P P ‘a F-
m co
a,
I
I
0
I
I
I
I
I
I
0
I
I
I
i
I
I-J P vl 0
I--‘ 0 F
a,
I
I
0
I
I
I
I
I
I
I
I
I
I
I
I
P i t u i t a r y
rhyro i d
Parathyroid
Adrena 1
S k e l e t a l $us cle Sciatic Nerve
Bmin
Spinal Cord
3ye
hnmary ;land
Skin
Bone Marrow
Spleen
mymus
Lymph ??ode

RESPIRATORY ME2 CAFDIOVASCULAI? DIGESTIVE GZNITOURINARY
w e 1 6
Code: C = Focal suppurat ive pne-m,onitis. B Focal germinal c e l l a t rophy o r hypoplasia. D = Ee2atocyt,e hy-pertrophy and degenerat ion. - = KO abnornial i t ies de tec ted . i = S l i g h t degree of l e s ion .
++ = Moderate degree of’ l e s i o n .

..
I I I I I I I I I I
I I I I I I I I
I
~ I I I I I I I I
Y P,
I I I I I I I I I
1 I
I I I I I I I I I
ct P.
I I I I I I I I I I
I I l l 1 I I I I
Skele t a1 Mus c l e
I I I I I I I I
I I I I I I I I
I I O 0 0 0 0 0
I I I I I l l 1
I I I I I I I I
I I I I I I I I
I I M I I I I I +
S c i a t i c Nerve
Brain
Sp ina l Cord
Mammary Gland
Skin
Bole Marrow
Spleen
Thyr.us
Lpmh Node

TABLE S X V I I
Histopathology ---- - Group 11 - I{-72'47 - MR-1491
Dog N o .
1155
1159
--
1165 m53
Sex
cr c?
6
d
- Liver ---
e
I_
Cock: - E No abnormalities detected.

TABLE X,XV I11 -----
Histopathology - Group 111 - H-72k7 - XR-1491
Dog No. 115 6 1152 1160 1164
1136 1144 1139
11b8
Sex
tC
d
d d
- Live r
Code: - No abnormalities detected.

APPENDIX I

APPENDLY I (1) C L I N I C A L LAEORATORY DATA OX I N D T V I E U A L DOGS
FE3 ZONYIL@ IV FOR TIBEE MQNTIIS
Hema t o 1 o z
Erythrocytes Hemog lob i n Hematocrit Leucocy tes DIFFERENT TAL
Seg. Juv , Myel.
Neutrophi ls
Ljmp ho c y t e s Eosinophi ls Monocytes Basophils Atypical s Nucleated RBC
B i o chemi s t r y
Glucose Urea Nitrogen Cholesterol. Alk. Phos. GPT To ta l P r o t e i n A/G Crea t in ine B i l i r u b i n Albumin
Ur ina lys i s
Volume Appearance 0 s m o l a I i t y Occult Blood Sugar Acetone PE Urobilinogen R i l i r u b i n P r o t e i n Crea t in ine MICROS C OP I C
RBC ' s WBC ' s E p i t h e l i a l Bacteria Cast Sperm
6.56 1 6 . 1 40
8.1
63 62 1 0
24 10
2 1 c)
0
118 22
110 2 .9 6 6.4 1.10 0.6 0.3 3.7
185 D, Y, C1, P
1950 N N N 6.8 1.0 P
Tr' 132
0 0-2
0 2-1- 0 0
6.84 17.4 45
8.5
52 52 0 0
44 4 0 0 0 0
119 1 7
130 3.0 5 6.3 1.28 0.8 0 . 4 3.5
160 I>, Y, C l , P
1373 N N N 7.0 1. 0 P
T r 108
0 1-4 0 2+ 0
1-5
7.84 18.6 50
9.3
74 7 3 1 0
2 1 4 1 0 0 0
120 17
120
15 2.6
6 .2 1.44 0.5 0.4 3 . 7
155 A, C 1 2146
N T r N 6. E 1.0 P 1+
150
0 0-3
0 2+ 0 0
7.24 18.3 49 11.2 50 50
0 0
28 22
0 0 0 0
132 1 9
130
16 2.5
6.2 1.02 0.8 0 .5 3.1
125 D,Y, C 1 , I?
2159 N N N 6.8 1.0 P 1-i-
166
0 0- 1
0 2 f 0
2-6
7.23 1.9.2 49 11.5
57 57 0 0
28 13
2 0 0 0
134 1.3
120
14 2.3
6 . 1 0.97 0.7 0.2 3.0
110 D,Y, C 1 2081
N N PJ 7.0 1.0 P I+
2 1 2
0 0
0- 1 2-t 0
5-10

APPENDIX I (2) CLlnTICAL LAH@R%'CORY EATA G N LPU'DIVIDURL DOGS
FED ZCNYI,@ W FOR T P ? E MONTHS - ----- -- --- -
Dog NO.: 1156 Sex: Male Group : Contro l
-I__--- - Months on T e s t ----_
3 ------ Con t r o 'I 1 2 I_--- -- Henatology
Erythrocytes Hemoglobin Hematocrit k euc o cy t e s DIFFERENTIAL
Neutrophi ls Seg. Juv. Mysl.
Lyxnphoc y t e s Eos inophi l s Mon.ocy t e s Basophi ls A typ i c a 1 s Nucleated RZC
Biochemistry
Glucose Urea Nitrogen Choles t e r o 1 Alk. Phcs. GPT Total P r o t e i n A /G Crea t in ine B i 1 i rub in Albumin
Ur ina lys i s
Volume Appearance Osmolali ty Occul t Blood Sugar Acetone PH Urob i 1 in0 gen B i l i r u b i n P r o t e i n Crea t in ine MICROSCOPIC
RBC ' s r$Bc ' s Ep i t h el. i a 1 E a c t e r i a Cast Sperm
7.28 18.7 51 15.0
7 4 7 1
3 0
22 4 0 0 0 0
150 13
145
1 2 4.7
6.4 1.04 0.5 0.1 3.3
245 P, c1, P 1357
N N N 7.0 1.0 P 1+
130
0 0
0- 1 2-k 0
0- 1
7.24 18.1 48 11.5
70 70 0 0
24 6 0 0 0 0
124 10
175 4.9 5 6.6 1.07 0.8 0 .1 3.4
275 Y, c1, P 1194
I\I N N 7.2 0.1 P N
114
0 0 0 1-1- 0 0
8.04 19.4 54 12.5
67 67
0 0
25 7 1 0 0 0
180 14
145
20 3.4
6.2 1.. 17 0.6 0.4 3.3
205 A , C l 1740
N Tr
N 7.0 1.0 I?
T r 133
0 0
0 - L 2-l- 0
1-4
7.88 7.64 19.0 1 9 . 2 4 9 5 1- 1 2 . 1 13.. 7
63 63 0 0
32 5 0 0 0 0
126 10
160
13 3.8
6.3 1.14 0.8 0 . 2 3.4.
68 66
2 0
2 3 9 0 0 0 0
i24 1 2
150
1 2 3.3
6.7 1.24 0.8 0.2 3.7
270 185 Y , C I , P D, Y , Ci, P 1 I42 1845
N N N N N N 7 . 2 7.2 0 .1 1.0 N ?
T r T r 114 180
0 0 0 0 0 0-1 1+ l+ 0 0
2-4 0
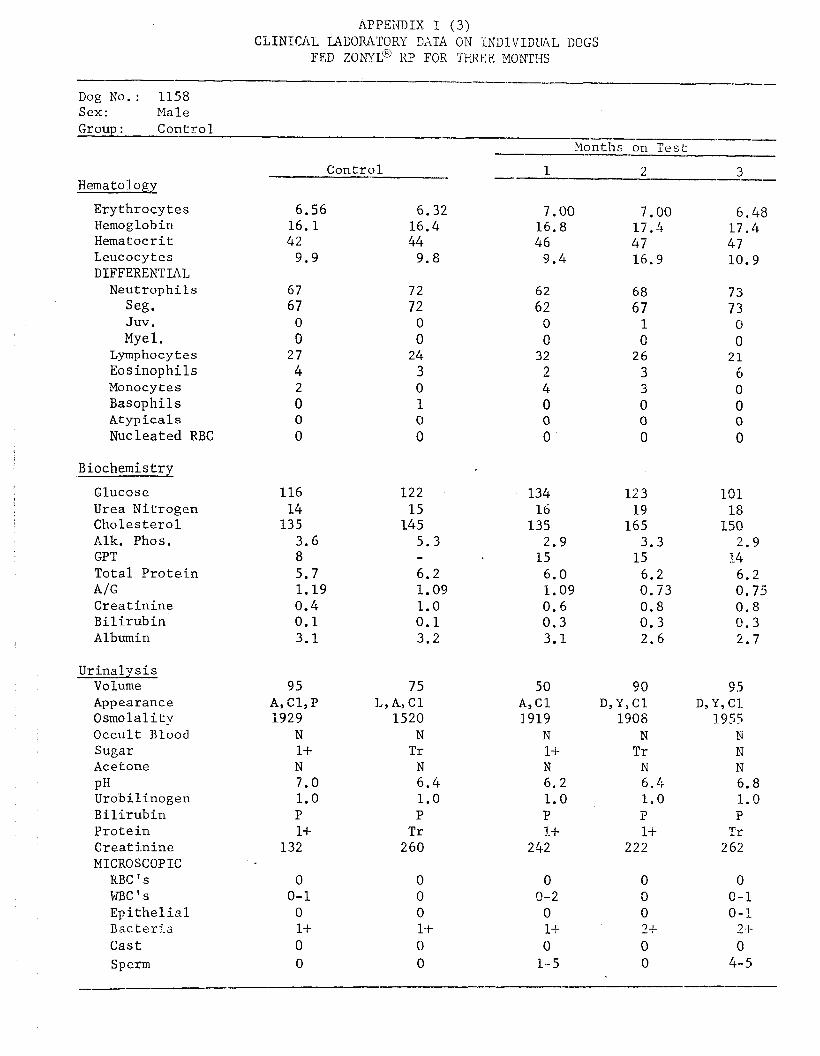
hPPE”l\rl)IX I ( 3 ) CLINICAL LABORATORY 9ATA ON INSl’JIDITAL DOGS
FED ZONYL@ KP FOR THREE MONTHS
Dog No.: 1158 Sex: Male
- - ---._IF--
Group : Control Months on T e s t
,l
Hematology Erythrocytes Herno g l o b in Hema t oc r it Leucocytes DIFFERENTIAL
Seg.
Mye 1.
Neu trop hi 1 s Juv .
Lymphocytes Eosinophils Monocytes Basophils At yp ic a 1 s Nucleated RBC
Biochemistry Glucose Urea Nitrogen Cholesterol Alk. Phos. GPT Total Protein Creatinine B i 1 irub in Albumin
A / G
Urinalysis Volume Appearance Osmolality Occult Blood Sugar Acetone PH Urobilinogen Bilirubin Protein C r eat i.nine MICRO SC OP IC RBC s WBC’S Epithelial B tic t er j. a Cast Sperm
Control
6.56 6.32 16.1 16.4 42 44
9.9 9.8 67 67 0 0
27 4 2 0 0 0
116 14 13 5 3. G 8 5.7 1.19 0.4 0.1 3.1
95 A, C 1 , P 1929
N 1+ N 7.0 1.0 P 1+
132
0 0-1 0 I+ 0 0
72 72 0 0
24 3 0 1 0 0
122 15 145 5.3 - 6.2 1.09 1.0 0.1 3.2
75 129 A, C 1
1520 N Tr N 6.4 1.0 P Tr 2 60
0 0 0 1-t 0 0
7.00 16.8 46
9 . 4
62 62 0 0
32 2 4 0 0 0
134 16 135 15 2.9
6.0 1.09 0.6 0.3 3.1
50 A , C 1 1919
N 14- N 6.2 1.0 P 1 +
242
0 0-2 0 1+ 0 1-5
3
7.00 17. $ 47 16.9
68 67 1 0
26 3 3 0 0 0
123 19 165 15 3.3
6.2 0.73 0. 8 0.3 2.6
30 D, Y, C1
1908 N Tr N 6.4 1 , o P It-
222
0 0 0
0 0
3 4 - 0
6.48 17.4. 47 10.9
7 3 7 3 0 0
21 6 0 0 0 0
131 15
150
14 2.9
6.2 0.75 0.8 0.3 2.7
9 5 D, Y, C 1 1925
N N N 6.8 1.0 P
T r 2 62
0 0 - 1 0,-1 2 -+ 0 4-5

9-E 0
+I I-0
0 0
I-T 0
+Z 0 0 0
z-0 0
+I c - T c-1
0
1-0 0
4- Z T -0
0 0
0 0
+I 0
1-0 0
061 +T
d 0 *1 z 'L N N N 268'1
d <T3 'A 5LT
'78 T +-t
d 0.1 O'L
N N N TL6T
dci3'V OiX
Z€1 1;c J
0.1 7. "L
N N N SiTST.
d '13 'v ('1 5zz
827: . +I
d 0'1 0'8
N N N 9551
d '13 'A 'a 091
0.I z '0 9'0
00 *T 0'9
5, *I %J I
5+?1 11 8TT
S 'E I '0 5'0
8f 'T 1'9
6*€ 51
OET 01 ZIT
9 *€ T '0 L '0
90'1 6'9
8 s '9
0'71 8 "71 T
Z 'E 1'0 5.0
90 'I Z'9
6 0'5
5T T 6 82 T
0 0 0 T '7 5z 9 0 OL OL
0 0 0 0 IT zz 0 0 s9 59
0 0 0 2 8 €Z 0 Z s9 L9
0 0 0 * Z LZ 0 0 L9 L9
E'TT 917
T 'L7: 08 -9
6 '91 9'7
Z*LT OZ'L
8'91 0'7
9 'ST. 80 '9
9 *'71 017
E*S1 80 '9

APPEFJIX I (5) CLINICAL LABOP3TGRY DATA O N I N D I V I D U A L DOGS
FED ZONYLO IC? FOR THT3?E NOVTHS -- ---- ---
Dog No.: 1153 Sex; Male
--- Group: 500 ~ P I X
-_ Months or1 T e s t
Control 1 9
Hematology
Erythrocytes Hemoglobin Hematocrit Leucocytes DIFFEREhT U L
Neutrophi ls Seg. Juv . My el.
Lymphocytes Eo s inop h i 1 s Monocytes Basophils AtypFcals Nucleated RBC
7.00 7.68 17.3 18.8 48 50 13.3 11.1
7.84 8.08 7.60 18.7 19.7 18.7 52 53 50 11.0 15.4 9.9
66 66 0 0
30 4 0 0 0 0
60 60 0 0
34 2 4 0 0 0
62 61 1 0
33 2 3 0 0 0
62 6 1 1 0
30 8 0 0 0 0
63 62 1 0
28 7 2 0 0 0
Biochemistry
Giuc o s e
Cho les t e ro l Alk. Phos. GPT To ta l Proteim A / G C r e a t i n i n e B i l i r u b i n Albumin
I I Urea Nitrogen 116 13
140 6.4 9 6.2 1.39 0.4 0.1 3.6
158 14
160 6 .1 7 6.5 0.89 0.8 0.1 3.1
140 2 1
100
20 7.8
6.3 1.21 0 . 4 3.4
-
142 18
170
18 8.2
6.3 1.18 0.9 0.3 3.4
104 23
160
10 8.6
6.6 0.98 0.9 0.4 3 .3
Ur ina lys i s
Vo lune Appearance 0 smo l a l i t y Occult Blood Sugar Acetone PH Urobilinogen €3 i 1 i r u b i n P r o t e i n Crea t in ine MICROSCOPIC
RBC s WBC'S Ep i t h e l ihl B a c t e r i a Cast Sperm
245 185 Y , C l , P 1268
N N E 7.0 1.0 P
T r 118
215 110 2 10 D,Y, C1, P
1331 N N N 6.8 1.. 0 P
T r 138
A, CL, P 1147
Y , c1, P 605
' i ,Cl,P 1567
N N N 8.0 0 .1 N N
66
N N M 7.0 0.1 P
T r 88
N N w 7.6 0.1 P 1 -I-
130
0 0 0 3+ 0 0
0 0- 1
0 %+ 0 0
0 0-1
0 3+ 0
1-5
0 0 0 2 t- 0
2-5
0 0
0-1. 2+ 0
3-10

~~ ~
T - 0 0
+E 0 0 0
80Z +T
d 0.1 8'9
N N N T8T Z
6cT3cBcTT 551
?'E 1'0 L'O
O€ 'I 1'9 TI
0 *ZT stl E 11 OZT
0 0 0 0 E 8Z 0 0 63 69
Z "6 T+7
6 *ST 7'3 '3
0 0 +Z
0 0 0
a5r +I d
0.1 0 'L N N N 9961
d'~3 'A 'a 581
€ *€ z '0 8 '0 90'T
5.9 E1
9 'OT 091 -cz 9ZT
0 0 0 0 P SZ 0 T: L9 89
S-ZT ?-+7
T '9T 9L.9
1-0 0
+T 0 0 0
VZT +I N
0 *T O'L
M 1x8
N 6181
CT 'T3(8 5 ZT
0.E 5 '0 9'0
00 '7: 0'9
'I '8 SI s€T 9z oz'c
0 0 0 0 9 8Z 0 0 99 99
Z *CT Zt7
9 '5T 95.9
0 0 0 0
+Z +Z 0 1-0 z-c 0
0 0
' Z6 N d
0.1 0 'L N N N €LZT
d 'i3 <A SBZ
Z *€ 1'0 8 '0
80'7: T '9
fi T 'L
S€7: LI 9-t T
0 0 0 E 6 9z 0 0 z9 z9
901 JL N
1'0 O'L N N N 8LVT
dCT3 'A S6T
6'Z 1.0 9'0 00 'T 8.5 9
9'L 51 T oz ZT T
0 0 0 I 9 8Z 0 0 s9 59
6 *E1 0.U. LE 6E
tl '7-t G *?T 89 *S Z6'S
E z T

API?EImIX 1 ( 7 ) CLIKIrAL WljORATORi’ DATA ai? I3XlIVLDUAL DOGS
FED ZOhYlp RP FOR TIiliWi’ MONTHS
Dog No.: 1159 Sex: Male
- I_- --- Group: 500 PPKJ MorTths on Test:
2 --*---
3 L - Hematology
Erythrocytes Hemoglobin Hematocrit Leucocytes DIFFERENTIAL Neutrophils
Seg . Juv. Mye 1.
Lymphocyte s Eosinophils Monocytes Bas op hi 1 s Atypical s Nucleated RBC
5.64 5.60 15.2 15.3 40 39 11.0 12. 3
5.84 14.9 39 12.6
5.48 14.3 36 13.7
5.60 14.3 36 12.9
72 7i 1 0
27 1 0 0 0 0
60 60 0 0
32 5 3 0 0 0
ti0 58
2 0
3 1. 5 4 0 0 0
75 75 0 0
17 6 2 0 0 0
7: 70 1 0
23 6 G 0 0 0
Biochemistry Glucose Urea Nitrogen Cholesterol Alk. Phos. GPT Total Protein A /G Creatinine Bilirubin Albumin
116 18
165 6.6 7 6.2 0.92 0.5 0.1 3.0
124 1 7
175 6.4 6 6.3 1.48 0.9 0.1 3.8
118 17
175 7 . 5 9 6 .1 1.40 0.5 0.2 3.6
118 17
1.09 19
185
12 8.3
6. P 0.93 0.9 0.2 2.9
195
13 8.7
6.0 1.13 0.8 0.1 3.2
Urinalysis Volume Appearance 0 smoia li ty Occult Blood Suger Acetone PH Urob i 1 inog en B i 1 i r ub in Protein Creatinine MICROSCOP IC RBC ’ s WBC’S Eplthelial Bacteria Cast Sperm
350 L,Y,Cl,P
560 N N N 6.2 0. 1. N N
* 52
165 Y,Cl,P 112 I
N N Tu’ 7.2 1 , o P Tr 130
185 D, A, c1, P
19(+5 N Tr N 7.4 1.0 P 1+
163
235 A, C1, P I929
K Tr
N 7.0 0 . 1 P Tr
182.
275 L, A, Cl, P
1656 N N N 7.0 1.0 P
T r 170
0 0 0 0 0 0 2+ 3+ 0 0 0 0
0 0 0-1 24- 0
0-1
0 0 0 2+ 0 0-1
0 5-10 0-1
2+ 0
0-2

C ontro 1 -- Hematology Erythrocytes Hemoglobin Hematocrit Leucocytes DIFFERENTIAL
Neutrophils Seg. Juv, Myel.
Lymphocy t €2 s Eo s inophil s Mono cy t e s Bas op h i 1 s Atypical s Nucleated RBC
Biochpmistry Glucose Urea Nitrogen Cholesterol blk. Phos. GPT To ta l Protein
A /G Creatinine bilirubin Albmin
Urinalysis Vo lune Appearance Osmolality Occult Rlood Sugar Acetone Urobilinogen €3 i 1 irub in Protein Creatinine MICROSCOPIC
RBC ' s WRC'S E p i t h e l i a l 8acreria Cast
PH
Sperm .
4.96 13.2 33 10.4
60 60
0 0
38 1 0 1 0 0
134 12 - 6.5
6.2 1.11
0.2 3.3
12
"
200 L , A , C l , P
1283 N N N 7.2 0 .1 P Tr
- 114
0 0-1 0- 1
3+ 0 0
5 .92 15.7 42 16.2
64 64 0 0
35 1 0 0 0 0
150 16
135 4 .8 7 6.2 1.35 G. 9 0.1 3.6
240 L), Y, c1, P
1136 N N N 6.8 0.1 P Tr 92 *
0 0 0 I+ 0 0
Months on T e s t
1 2 3 -- 7.24
17.6 49 15.0
62 62
0 0
35 3 0 0 0 0
182 23 150
13 4.2
5.5. 1.03 0.6 0.3 2.8
310 Y , C 1 1016 * N
N N 6.8 0.1 P N
76
0 0 0 3+ 0 0
6.48 16.6 44 13.2
69 69 0 0
30 0 1. 0 0 0
116 18
170
14 4.8
6.1 1.22 0.8 0 .2 3.4
190 A , C I , P 169s
N N N 7.0 1.0 P 1+
142
0 G-1 0 2+ 0
0 - 3
6.32 16 .3 44 12 .2
66 66 0 0
27 7 0 0 0 0
116 25
160
12 4. 0
6 . 1 0.91 0.9 0 . 2 2.9
65 Y, CI 1383
N N IT 7.0 0.1 P Tr 116
0 0-3
0 2+ 0 0-1

APPENDIX I (9) CLINICAL WEORATORY DATA ON INDIVIDUAL, DOGS
FEE ZOhTL@ RP FOR TXRET: NONTHS - .-- -I---_ ----
Dog No.: 1152 Sex: Male Group : 750 ppm
.-- -- - -- Mcnths on T e s t
___I---
Hematology Erythrocytes Hem0 g lob i n Hematocrit Leucocytes DIFFERENTIAL
Seg . Juv. Myel.
Neutrophils
Lymphocyte s Eosinophi ls Monocytes Basophi Is A typ i c a1 s Nucleated KBC
- B i e c h emi s t r y
Glucose. Urea Nitrogen Cho les t e ro l A3.k. Phos. GPT To ta l P r o t e i n A /G Crea t in ine B i l i r u b i n A 1 burn i n
TJriiialysis
Volume Appearance 0 smo l a 1 i t y Occult Elood Sugar Acetone PH Urob i1 inogen I3 i. l f r u b i n P r o t e l n Crea t in ine MICROSCOPIC
RBC I s
WBC s Ep i t h e 1 ia! B a c t e r i a Cast Sperm
-
-- Control
6.56 6.80 16.9 17.0 4 5 45
8.9 8.2
69 68 1 0
26 2 3 0 0 0
112 16
150 4.2 7 6.4 1.23 0.5 0.1 3.5
105 A, C 1 , P 1850
N N N 7.2 0.1 P 1+
236
0 0 0 2+ 0 0
66 65 1 0
31 0 3 0 0 0
120 24
165 4.4 6 6.4 1.05 1.1 0 .1 3.3
150 D,Y, c:, P
1987 N N N 7.0 1.0 P
T r 180
0 0 0 2. + 0
0-1
- 1 2 3
7 .04 7.36 7.08 17.1 17.9 17.8 4 8 49 49 10.9 13.6 11.8
7 8 7 8 0 0
22 0 0 0 0 0
116 28
185
15 8.1
6 . 3. 1.55 0 , 6 0.2 3.7
1.10 A , C 1 2120
N T r N 6.4 1.0 P
T r 180
0 0
c-1 2-1- 0 0
7 4. 7 4 0 0
25 1 0 0 0 0
120 2 3
2 15
2 1 8 .3
6.3 1 .28 0.9 0.3 3.5
135
242 0 N
T r li 6.8 I. * 0 P 1+
182
? > , Y , C l , P
0 0-4
0 2 -I- O
0- 1
68 68 0 0
28 1 3 0 0 0
11 i 19
195
19 6.5
6.2 0.80 1.0 0 . 2 2.8
180
1861 N
T r N 7.0 1 . 0 P I f
180
3 , Y , C1,P
0 0-1 0-2
2+ 0 0
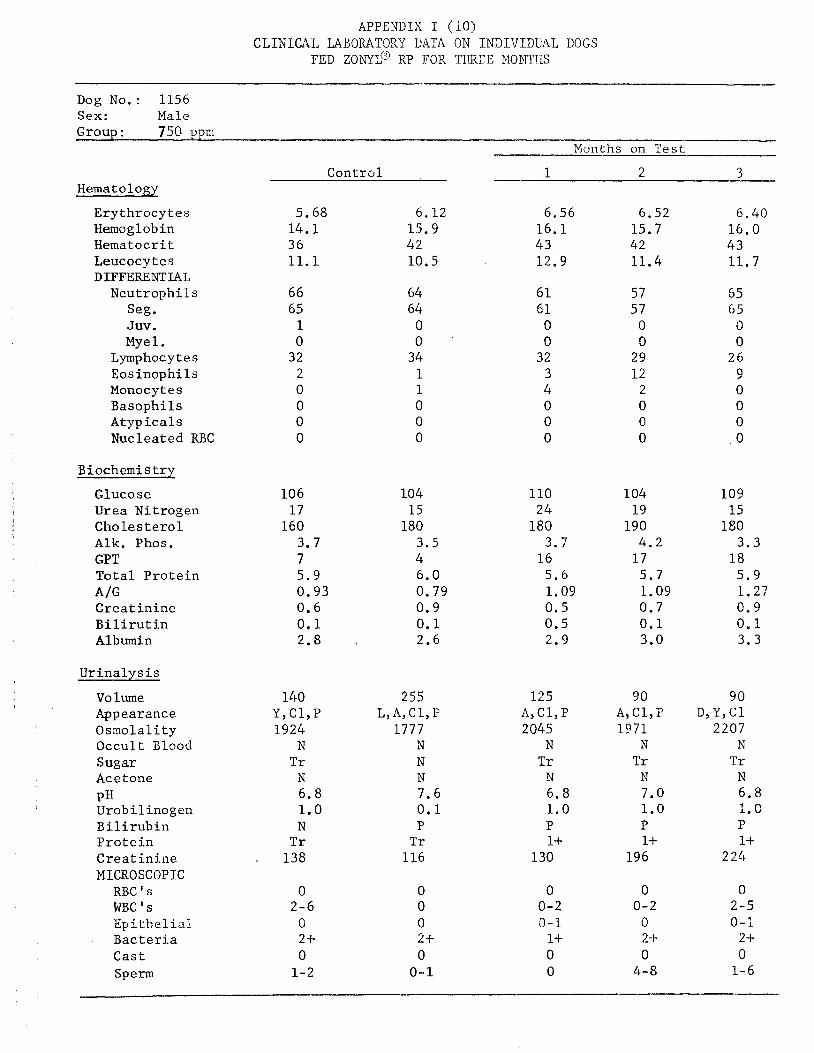
APPENDIX I ( i o ) C L I N I C A L LABORA'TORY DATA ON INDIVIDUAL DOGS
FED ZONY.L@ IS' FOR THREE MOM'1'HS
Dog N o . : 1156 Sex: Male Group: 750 ppni
--_I_ -- Moiiths on Test
1 2 3 - Control Hema t o 1 ogy Erythrocytes Hemoglobin Hematocrit Leucocytes DIFFERENTIAL Neutrophils Seg. Juv , Myel.
Lymphocyte s Eosinophils Monocytes Basophils Atypicals Nucleated RBC
Biochemistry Glucose Urea Nitrogen Cholesterol A l k . Phos. GPT Total Protein A/G Creatinine Bilirut in Albumin
Urinalysis Vo lune App earznce 0 smo 1 a1 i ty Occult Blood Sugar Acetone PH Urobilinogen B i lirubin Protein Creatinine MICROSCOPIC
RBC ' s me's Ep it 11 e 1 ia 1 Bacteria Cast Sperm
5.68 14.1 36 11.1 66 65 1 0
32 2 0 0 0 0
106 17
160 3.7 7 5.9 0.93 0.6 0.1 2.8
140 Y,Cl,P 1924
N Tr N 6.8 1.0 N Tr 138
0 2-6
0 2+ 0
1-2
6.12 15.4 42 10.5 64 64
0 0
34 1 1 0 0 0
104 15 180
3.5 4 6.0 0.79 0.9 0.1 2.6
255 L, A, C1, F
1777 N N N 7.6 0.1 P Tr 116
0 0 0 2+ 0 0- 1
6.56 16.1 43 12.9
61 61 0 0
32 3 4 0 0 0
110 24 180
16 3.3
5.6 1.09 0.5 0.5 2.9
125 A, C1, P 2 045
N Tr N 6.8 1.0 P 1+
130
0 0-2 0-1 I+ 0 0
6.52 15.7 42 11.4 57 57
0 0
29 1 2 2 0 0 0
104 19
190
17 4.2
5.7 1.09 0.7 0.1 3.0
90 A, C1,P 1971
N Tr N 7.0 1.0 P 1+
196
6.40 16.0 43 11.7
55 65 i) 0
26 9 0 0 0 0
109 15
180
18 3.3
5.9 '1.27 0 '9 0.3. 3.3
90 D, Y, C1 2207
N Tr N 6.8 I. 0 P 1+
224
0 0 0-2 2-5
0 0- 1 24- 2+ 0 0
4-8 1-6

APPENDIX I (11) CLINICAL LABOPLATORY DATA O N iNI ) IVl DUAL DOGS
FED ZONYL@ RP FOR TIEEE Mi)PJTlIS
Dog No.: 1160 Sex: Male - Group : 750 ppin ------. I ---
Months .--- on Test
Hematology
Erythrocytes Hemog lob i n Hematocrit Leucocyte s D IFFERENT IAL
Seg. Juv . Myel.
Neutrophi ls
Lymphocytes Eos inop h i 1 s Monocytes Basophils Atyp i ca l s Nucleated RBC
B i o c hemi s t r y
Glucose Urea Nitrogen Cho les t e ro l Alk. Phos. GPT T o t a l P r o t e i n A / G C r e a t i n i n e B i l i r u b i n Albumin
4
U r i n a l y s i s Volume Appearance 0 smolal i t y Occult Blood Sugar Acetone PH Urobilinogen B i l i r u b i n P r o t e i n C r e a t i n i n e MICROSCOP I C
RBC ' s WBC'S E p i t h e l i a l Bacteria Cast Sperm
5.92 5.68 15.5 15.7 39 4 2
8 . 1 8.5
69 69 0 0
29 1 1 0 0 0
108 11 160
5.2 8 5.8 1.23 0.4 0.1 3 . 2
205 Y, c1, P i 2 1 5
N N N 7.0 0.1 P
T r 112
0 0 0 14 0 0-1
67 67 0 0
30 2 1 0 0 0
112 6
180 5 . 3 6 6.4 1.62 0.7 0.1 4.0
170 Y, c i , P 1289
N N N 7.0 1.0 P
T r 130
0 0 0 2;- 0 0
6.20 6.44 6.40 16.3 16.9 17 .2 43 4 2 46 9. 6 a. 9 14.4
74 7 3 1 0
25 0 1 0 0 0
104 19
200
13 7.2
5.8 1.06 0.4 0.2 3.0
115 A, c1 1992
N T r
N 6.8 0 .1 P
T r 140
0 0- 1
0 2+ 0
0-2
70 70 0 0
29 1. 0 0 0 0
1.12 15
2 30
16 8.0
6,2 1.22 0.7 0.2 3.4
70 D , Y , C 1 , P 1577
N Tr N 7 . 2 0 .1 P
T r 19 6
0 0 0 2+ 0 0
80 80 0 0
18 2 0 0 C G
104 2 0
200
16 6 . 1
6 .3 0 , 88 0.8 0 .2 2.9
130 L, A, GI, P
2151 N N N 6.8 1.0 P 1+
180
0 0
3-1 21- 0
0-1

APPENDIX I (12) CLINICAL LAEOEUTORI' DATA ON I NDITJJDUAL DOGS
FED ZONYL@ W FOR TlXEE XONTHS - --
D o g No.: l l G 4 Sex: K a l e Group: 750 ppm -
_I_
Months on Tes t -- i 2 3 - Control
H e m t o 1 ogy
Erythrocytes Hemog lob i n Hematocrit Leucocyt es DIFFERENTIAL
Seg. Juv. Myel.
Neutr ophi 1 s
Lymphocytes Eos inophi l s Mcnocyt e s Basophi ls A typ ica l s Nucleated RBC
Biochemistry
Glucose U r e a Nitrogen C h o l e s t e r o l Alk. Phos. GPT Total P r o t e i n A /G C r e a t i n i n e B i l i r u b i n Albumin
U r i n a l y s i s
V o lume Appearanci? Osmolal i ty O c c u l t Blood Sugar Acetone PH Urobi l inogen B il i r u t i n P r o t e i n C r e a t i n i n e MICROSCOFIC
RBC ' s WBC'S Ep i the1 ia 1- Bac te r i a Cast Sperm
6.24 16.8 44 17.1
59 59
0 0
32 5 4 0 0 0
114 11
140 4. 2 8 5.8 1.04 0.4 0.1 3.0
225 D, Y , C1, Y
1373 N N N 7 . 0 0.1 P
T r - 132
0 0 0 I+ 0 0
5.76 15.1 40 16.3
62 62 0 0
29 9 0 0 0 0
114 9
155 4.4
15 6.3 1.00 0.8 0.1 3.2
170 P, c1, P 1478
N N N 7 . 4 1.0 N N
118
0 0 0 21- 0
0-1
6.40 15.7 4 2 18.3
67 67 0 0
27 6 0 0 0 0
114 12
170
14 7.4
6.1 1.29 0.5 0.2 3.4
185 Y, c1, P 1341
N T r
N 7.0 1.0 P 1+
96
0 0- 1
0 3+ 0
0-3.
6.28 16.0 42 16.2
66 64 2 0
20 14 0 0 0 0
12 7 1 2
199
17 7 . 2
6 . 1 1.12 0.6 0.1 3.2
160 D, Y, C1, P
1535 N N N 7.2 0.1 P
T r 14.2
0 0 0 2 f 0 0
6.56 16.7 44 14.6
6 4 64 0 0
2 5 11 0 0 0 0
110 li
180
15 5.3
6.2 1.13 0.7 0.1 3 .3
65 Y, c1 1404
N N N 6.8 1, G P 1+
182
0 0- 1 0-1 4+ 0 0

AP'PEKDIX I (13) CLINICAL LABORATORY DATA ON I N D I V I D U A L DOGS
EED ZONY.L@ RP FOR THREE MONTHS -- ----
D o g N o . : 1151 Sex: Malt Group : 2500 E r n
Months on Test Contro i 1 2 3
Hema t o 1 o g7T -J
Erythrocytes Hemoglobin Hematocrit Leucocytes DIFFERENT U L Neutrophils Sego Juv . Myel.
Lymphocytes Eosinophils Mono cy t e s Bas ophi 1 s Atypicals Nucleated RBC
B i oc hem i s try Glucose Urea Nitrogen Chole s tero 1 Alk. Phos. GPT Total Protein A /G Creatinine Bilirubin Albumin
Urinalysis Volume Appearance 0 sm9 la1 i ty Occult Blocjd Sugar Acetone PH Urobilinogen Bilirubin Protein Creatinine MICROSCOPIC RBC ' s WBC ' s E p i t h e 1 i a' Bacteria Cast Sperm .
6.64 17 .2 46 13.0
72 71 1 0 23 5 0 0 0 0
92 18 150 5.5 5 6.6 1.07 0.4 0.2 3.4
2 60 L,A, C1, Y
1651 N N N 7.0 0. i P
T r . 128
0 0 0 2+ 0 0
6.48 7.00 17.3 16.5 45 45 12.1 16.7
62 62 0 0 37 1 0 0 0 0
114 14
155 5.4 4 5.1 1.04 0.8 0.1 3.1
130 D,T,Cl ,P
1745 N N N 7.6 1.0 P Tr 154 . 0 0-1
0 2+ 0 0
67 64 3 0
26 7 0 0 0 0
. 94 21
185 10.8 10 5.9 1.05 0.6 0.2 3.0
105 1730
N N N 7.0 1.0 P Tr 108
Y, c1
0 0-1
0 3+ 0
0-1
6.68 16-4 43 16.5
67 67 0 0 27 5 1 0 0 0
108 24
2 30 13.6 12 6.3 0.78 0.7 0 . 1 2.8
125 A, C1, E. 1908
N N N 7.0 1.0 P Tr
168
0 0 0 2+ 0
0- 1
6.20 16.3 43 21.9
SO 77 3 0 14 5 1 0 0 0
102 10
203 12.2
9 6.2 1.21 0.7 0.1 3.4
100 1824
f: N N 6.8 1.0 P Tr
220
0 0- 3 \?- 1. 4+ 0 0
D , Y , C1 ,P
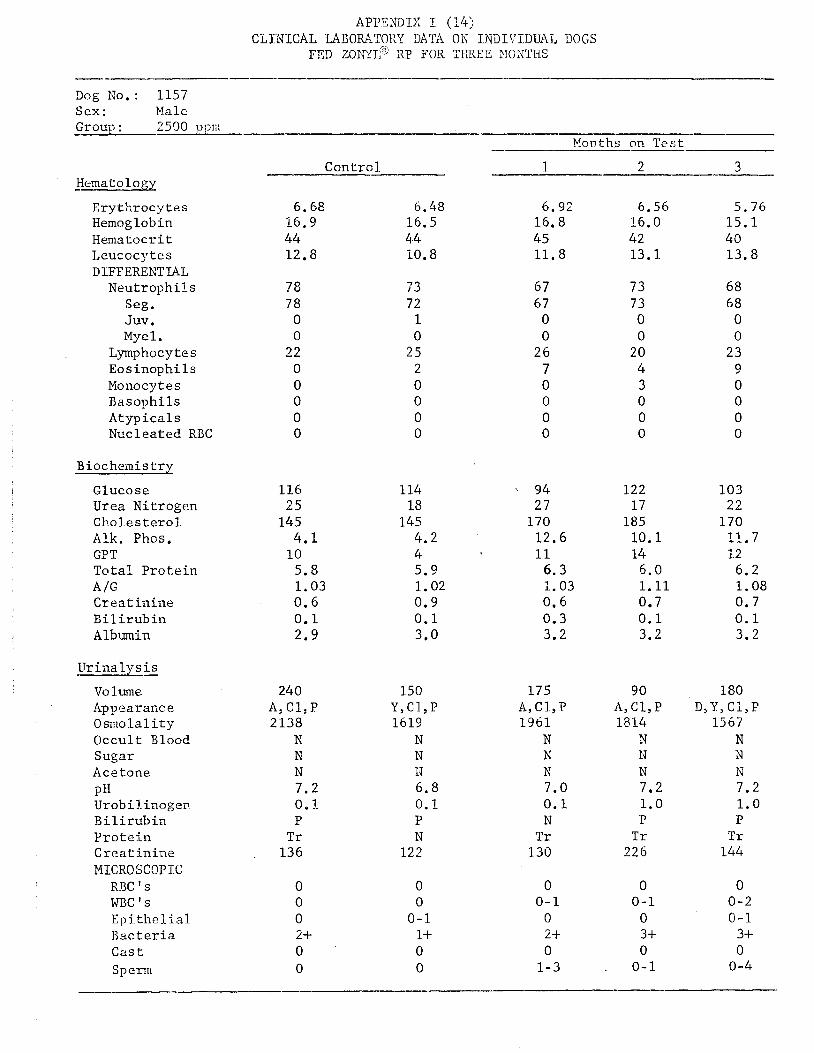
APi!ENDLX I: (14 ) CLXNICAL ZABORA'KXY DATA ON 1NDIG'II)UhL DOGS
FED ZONYl? RY FOR THREE NONTIIS
Dog No.: 1157 Sex: Male - Group : 2590 p p m - --._I-- _I_
Mcnths on Test --
Hematology
Ery th rocy te s Hemoglobin Hematocrit Leucocytes DIFFERENTIAL
Neutrophi l s Seg. Juv . Myel.
Lymp hoc y t G s Eo s i n o p h i l s No no cy t e s Basophi ls A typ ica l s Nucleated RBC
Biocheinis t r y I Glucose
Urea Nitrogen C h o l e s t e r o l Alk. Phos. CP T T o t a l P r o t e i n A /G C r e a r i n i n e Bi l i r u b i n Albumin
U r i n a l y s i s - Vo lune hpp2aranc e 0 snio l a 1 it y Occul t Blood Sugar Acetone PH Urob i l . inog ezl B i l i m b i n P r o t e i n C r e a t i n i n e MICROSCOPIC
RBC s WBC I s Epithelial Bac. t er i a Cast Spenn
6.68 6.48 i G , 3 16.5 44 4.4 12.8 io . 8
78 7 8 0 0
22 0 0 0 0 0
116 25
145
10 4.1
5.8 1.03 0. 6 0.1 2.9
240
2 138 N N N 7.2 0 . 1 P
T r 136
A, C I , I?
0 0 0 2+ 0 0
73 72 1 0
25 2 0 0 0 0
114 18
145 4.2 4 5.9 1.02 0.9 0.1 3.0
150
1619 N N I? 6.8 0. L P N
122
Y , C I , P
0 0
0-1 1+ 0 0
6.92 6.56 5.76 16.8 16.0 15 .1 45 42 40 11 .8 13.7. 13.8
67 67 0 0
26 7 0 0 0 0
' 9 4 27
170 12.6 11
6 . 3 I. 03 0.6 0.3 3.2
175 A, CI., P 1 9 b l
N N N 7.0 0.1 N
T r 130
0 0- 1
0 2+ 0
1-3
73 73 0 0
20 4 3 0 0 0
122 17
185 10.1 14 6.0 1.11 0.7 0.1 3.2
90 A, c1, P 1814
N I? N 7.2 1.0 P
T r 226
68 68
0 0
23 9 0 0 0 0
103 22
170 11.7 12
6.2 1.08 0.7 0.1 3.2
180 D,Y, C1,F 1567
N N N 7.2 1.0 P
T r 144
0 0 0-1 0-2
0 0-1 3+ 3+ 0 0
0-1 0-4

APPENDIX 1 (15) CLINICAL LABORATORY DATA ON I N D I V I D U A L DOGS
FED ZONYL@’ KP FOR T’dREE MONTHS
-____-_ll.l----l_l-__.-
Dog N o . : 1161 Sex : Male Group : 2500 ppm
I-- - -- Months on T c s c
Hematology Ery th rocy te s Hemog 1 ob i n Hematocrit Leucocytes DIFFERENTIAL
Seg . J u v . Myel.
Neu t roph i l s
Lymp hoc y t e s Eos inoph i l s Monocytes Basophi ls A t yp i c a 1 s Nucleated RBC
Biochemistry
Glucose Urea Nitrogen C h o l e s t e r o l A l k . Phos. GPT T o t a l P r o t e i n
C r e a t i n i n e E i l i r u b i n Albumin
A /G
U r i n a l y s i s
Volume Appearance 0 s m o la1 i t y Occult Blood Sugar AceEont: PH Urobi l inogen B i 1 i r u b i n P r o t e i n C r e a t i n i n e MICROSCOPIC
RBC ’ s WBC ‘s Ep i the1 ia 2 Bacteria Cast Sperm
Con tr o 1
6.64 17.0 44
8.3
61 61 0 0
36 3 0 0 0 0
119 20
130 3.7 9 6 .3 1.08 0.5 0.1 3.3
140 D, Y, C1, P
1961 P N N 6.8 1.0 N
T r 156
0 0- 1
0 2-t- 0
0 - 1
6.60 16.8 44
8.9
56 56
0 0
35 8 1 0 0 0
120 1 2
140 3.6 8 6 . 1 1.18 0.7 0.1 3.3
120 L, A, C1, P
2272 N N N 7.0 1 .0 N
T r 174
0 2-6
0 I+ 0 0
1 2 3
6.68 15.8 42 12 .3
66 64 - 3
0 22 11 1 0 0 0
105 30
160
1 2 8.6
6.2 1.08 0.6 0.3 3.2
180
1955 N N N 6 .8 1.0 P
T r 120
0 2- 10 0-1
2+ 0
0-2
A, c1
6.1.2 15.1 39 10.8
65 65 0 0
32 3 0 0 0 0
112 22
190
1 7 8.7
6 .4 1.09 0.7 0.2 3.3
150 D, Y, Cl, P
216& N N N 7.0 1.0 P 1+
i52
0 1-5 0 21- 0 0
6.52 15.7 42 11.6
67 67
0 0
27 5 1 0 0 0
10c 27
180 10.1 14
6.4 1.28 0 .8 0.2 3.6
170 r?, Y , c1
2 l G 3 N N N 6.8 1 .0 P
T.r 150
0 0-3 0 -’ 2
2+ 0
5-10

APPENDIX I (16) C L I N I C A L LABORATORY DATA ON INCTVIDUAL DOGS
FED ZONYL@ W FOP, THREE MONTHS
Dog No.: 1153 S e x : Male Group: 2500- - - -
-- Months on T e s t
Herna to logy
Erythrocytes Hemoglobin Hemat Gcr i t Ecuco cy t es DIFFERENTIAL Neutrophils
Seg. Juv . Myel.
Lyrnp ho cy t e s Eosinophils Monocytes Bas ophi 1 s Atypicals Nucleated RBC
B ischemis try Glucose Urea Nitrogen Cholesterol A l k . Phos. GPT Total Protein
Creatinine Bilirubin Albumin
I
A JG
Urinalysis Vo luae Appearance Osmolality Occult Blood Sugar A c e tone PH Urobilinogen €3 il i r u b in Protein C r e a t in ine MICROSCOPIC
RBC ' s WBC ' s Epithelial Bacteria C a s t Spenn
Control 1 2 3
5.12 5.24 5.76 6.Q8 5.88 13.1 13.7 13.8 14.6 14.2 33 35 36 38 37 12.4 12.8 11.8 13.4 14.1
76 75 1 0
23 1 0 0 0 0
112 1 3
150 5.0 9 5.6 0.98 - 0.1 2.8
6 30 L,Y,Cl ,P
248 N N N 7 . 0 0.1 N N
- 18
67 66 1 0
27 6 0 0 0 0
124 1 2
165 3.8 9 5.9 1.18 0.7 0.1 3.2
4 60 L ,Y ,C l ,P
47 1 N N N 7.0 0.1 N N
38
63 62 1 0 31
6 0 0 0 0
110 14
2 10 10.8 11 6.2 1.02 0.6 0.2 3.1
190 L, Y, c1
352 N N N 7.6 0.1 N N
34
68 68
0 0
2 4. 6 2 0 0 0
127 20
220 12.7 1.6 6.4 0.94 0.8 0.5 3 . 1
270 Y, Cl , ? 718
N N N 7 . 2 0.1 N Tr 84
73 70
3 0
2 1 6 0 0 0 0
122 18
2 00 12.8 15 6.3 0.95 0.8 0.5 3.1
345 Y, c1, P
570 N N N 7.0 0.1 P N
66
0 0 0 0 0 0-5 0-2 0- 1 0-2 0
0 0 0- 1 0 0- 1 4+ 3+ 4+ 3+ 4+ 0 0 0 0 0 0 0 0 0 0

I
APPENDIX I ( 1 7 ) CLINICAL TJSOKh’I~Ol iY DATA ON INDIVID‘U4L DOGS
FED ZOhYI,@ RI? FGR THREE MONTIiS
Dog No.: 1137 Sex: Female Group : C o n t r o 1
C on t r o 1 - Hemat o 1 o gy
Ery th rocy te s Hemo g 1 ob i n Hematocrit Leucocytes DIFFERENTIAL
Seg. Juv. Mye 1.
Neu t roph i l s
Lymphocytes Eos inoph i l s Monocytes Bas oph i 1 s Atyp i c a 1 s Nucleated RBC
Biochemistry
Glucose Urea Nitrogen C h o l e s t e r o l Alk. Phos. GPT T o t a l P r o t e i n A/G C r e a t i n i n e B i l i r u b i n Albumin
Ur i n a l y s i s
Volume Appearance 0 smo la 1 i t y Occu l t Blood Sugar Ace tone PH Urobi l inogen B i 1 i r u b i n P r o t e i n C r e a t i n i n e MICROS C OP IC
RBC ’ s WBC ‘s E p i t h e l i a l Bacteria Cast
6.72 6.68 17.8 18.3 47 4 8 12.4 11.4
60 58
2 0
28 12 0 0 0 0
114 10
160 4.5 7 6.4 1.20 0.5 0.1 3.5
12 5 D,Y, C1, P
1359 N N N 8.5 1.0 P
T r 146
0 0
0- 1 3-1- 0
62 62 0 0
25 10
3 0 0 0
109 12
150 4.7 3 5.5 1.15 0.5 0.2 2 .9
235
1651 N N N 6 .8 1.0 N
T r 114
I), Y, c1, P
0 0- 1
0 It- 0
-..
Months on ‘rest 2 1 2 2
7.40 18.5 s1 13.1
76 76 0 0
20 4 0 0 0 0
111 16
160 4.1 8 6.3 1. S O 0.5 0.2 3 .8
165 A, C1, F 2 142
N T r N 6.8 1.0 P
T r 164
0 2- 8
0 24- 0
7.28 7.’76 18.3 19.7 51 5 4 10.6 9 .1
71 7 1 0 0
2 4 5 0 0 0 0
110 19
185 3.9 9 6.4 1 . 2 1 0.7 0.2 3.5
190 A , C l , P 2013
N N N 5.0 1.0 P
T r 168
66 66 0 0
25 9 0 0 0 0
101 26
165 10.1 15
6.7 1.06 0.8 0.2 3 . 4
14.0 A , C l , P 1646
N N N 6.8 1.0 P 14-
156
0 0 0 0 0 0 2.+ 2+ 0 0

APPENDTX I (13) CLINICAL LABCfip,',CORY D?LTA ON IHDIVIDU4L DOGS
FED ZONYL@ RP FOR TITREE MONTHS
Dog N o . : 1141 SEX: Female Group : Control ---
Con - t ro 1 - Hematology
Ery th rocy te s Hemoglobin Hema t o c r i t Leucocytes DIFFERENT Lc\L
Seg. Juv . Mye 1.
Neut rophi l s
Lymphocytes Eosinophils Monocytes Basophils Atyp ica l s Nucleated RBC
Biochemistry Glucose Urea Ni t rogen Cholesterol A l k . Phos. GPT Total P r o t e i n A /G C r e a t i n i n e B i 1 i r u b in Albumin
Urinal-ys i s
Volume Appearance 0 smo l a 1 i t y Occul t Blocd Sugar Acetone P H Urobi l inogen B i l i r u b i n P r o t e i n C r e a t i n i n e MICROSCOP IC
RBC ' s h%C ' s Ep ithe E a 1 B a c t e r i a C a s t
6.52 6.60 1.7.5 17.6 45 45 10.4 11.1
72 72
0 0
21 6 1 0 0 0
114 10
145
10 5.0
6.3 0.92 0.5 0.1 3.0
250 D, Y, G I , P
1546 N N N 7.0 l a 0 N
T r . 144
0 0- 1 0-2
2+ 0
74 7 1 3 0
15 8 3 0 0 0
112 15
140 5.3 3 6.5 0.95 0.7 0.3 3.2
190 L, A, C1, P
2018 N N N 6.6 1.0 N
T r 152
0 0
0- 1 14- 0
6.00 6.64. 6.28 14.9 17.2 16.2 39 45 43
9.0 10.8 7.8
7 3 73 0 0
26 1 0 0 0 0
112 17
1.90
1 2 4.1
6.3 1.10 0.6 0.2 3.3
150 D, Y, c1, P
1625 N
T r N 7.0 1.0 N
T r 142
77 7 5
2 0
2 0 2 1 0 0 0
147 11
160
1.9 3.6
6.3 1.23 0.3 0.1 3.5
85 D, Y, c1, P
1924 N N N 8.0 1.0 P
T r 2 30
65 65 0 0
27 6 2 0 0 0
112 16
14 5
13 4.3
6.2 1.50 0.8 c. 1 3.7
175 A , C I , P 1856
N N x 7.0 1.0 N
T r 174
0 0 0 0 G- 1 0-2
0- 3 0-1 1- 5 3+ 3t- 2 I- 0 0 0

API'EPLOIX I (19) CLINICAL WBORATOr;" DATA CN I N D I V I D U A L DOGS
FED ZONYI? RP FOR THREE MONTHS
Dog No. : 1145 Sex: Female
-.---- Group : Control
Months on Test: - - ~ ~
Hematology Erythrocytes Hem0 g 1 ob in Hematocrit Leucocyte s DIFFERENTIAL Neutrophils Seg. Juv . Myel.
Lymphocytes Eosinophils Monocytes Basophils At yp ica 1 s Nucleated RBC
Biochemistry I Gluco s e 1 Urea Nitrogen
Cholesterol Alk. Phos. GPT Total Protein A /G Creat inirie B i 1 iru t in Albumin
Urinalysis Volume App earanc e Osmolality Occult Blood Sugar Ace tone PH Ur ob i 1 inog en Bilirubin Protein Creatinine MICROSCOPIC
REC ' s WBC'S E p i t h e l i a l Bacteria Cast
C o n t r c) 1 --
7.08 6.72 16.9 16.0 43 41
9.2 11.2
74 74 0 0
24 2 0 0 0 0
106 13
155 3.5 7 5.9 1.16 0.7 0.6 3.2
190 Y, c1, P 12 89
N N N 7.6 1.0 N N
12 8
0 0 0- 1 2t 0
64 63 1 0
30 3 3 0 0 0
118 11
175 3.4 6 5.9 1.47 0.8 0.2 3.5
80 A, c1, P 2303
N N N 8.0 1.0 N Tr
236
0 0-1
0 1+ 0
1 2 3
6.88 7.20 6.76 16.2 17.8 16.8 43 47 42
9.5 12.6 8.3
78 78 0 0
20 2 0 0 0 0
110 14
155
10 3.5
5.4 1.58 0.6 0.2 3.3
110 A, C1, E! 1824
N Tr N 7.2 1 .0 P
T r 186
74 74 0 0
26 0 0 0 0 0
118 15
160
17 3.2
5.7 0.99 0.8 0.2 2.8
120 I), Y, Cl, P 1871
N N N 7.0 1.0 P 1+
196
66 65 1 0
33 1 0 0 0 0
102 2 1
295
13 3.1 6.5 1.32 1.0 0.2 3.7
175 L, A, CI, P
1735 N Tr
zu' 7.0 l.0 P I+
180
0 0 0 0 0 0 0-1 0-1 0
2+ 21- 14- 0 0 0

Hematology Erythrocytes Her'og 1 ob in Hematocrit Leucocytes DIFFXRF,NI"L
Seg. Juv . Myel.
Neutrophils
Lpphocyt e s Eosinophils Monocytes Basoph i 1 s Atyp icals Nucleated RBC
Biochemistry Glucose Urea N i t r o g e n Cholesterol Aik. Phos. GPT Total Protein AfG Creatinine Bilirubin A 1 bml iil
Ur ina l y s is Vo lune Appearance 0 smo i a 'li t y Occult Blood Sugar Ace tone PH Urobilinogen Bilirubin Protein Creatinine
MICROSC OP IC RRC ' s WBC ' s E p i i3 he 3. i a i Bacteria Cast
6.32 16. I. 43 11.8
6 1 63. 0 0
27 11 1 G 0 0
1 14 20 170
4.4 8 6.8 1.04 0 . 8 0.1 3 .5
150 P, c1, P 1073
N N N 6.8 0.1 P
T r 152
0 0-2 0-1
2+ 0
6.52 1 7 . 1 44 11.5
60 60 0 0
30 6 4 0 0 0
110 22
170 3.9 5 6.4 1 .02 1.1 0. I 3.2
50 D:,Y,Cl
1945 N N N 7.0 1.0 N TS
340
0 0
0 -2 2+ 0
6.16 15.5 43 17 .2
60 60 0 0
34 5 1 0 0 0
100 36 150
4.0 6 5.8 0.38 1.0 0.2 2.9
80 D,Y, C 1
2023 N
Tr x 6.4. 1.0 I' Tr
208
0 0 0 1-k 0
6.6G 17. i 45 15.2
66 66 0 0
28 5 1 0 0 0
116 4 1
165
10 3.6
5.7 0.94 1.2 0.1 2.8
140 D,Y, C1.
1367 N N N 7.2 0.1 P Tr
138
0 0 0 24- 0
5.84 17.4 46 12.8
60 59 1 0
24 16 0 0 G 0
109 46
175 3,1 3 5.8 1 . 2 7 I.. 8 0.1 3.2
110 i), Y , c i
lli.99 N N N 7 .0 1. (3
P T r
170
0 0 0 2-l- 0

APPENDIX I ( 2 1 ) CL1.NICA.L TAJSOXAI'OR'r' DATA OI\! INL;IVIL'UAL DOGS
FED ZCII.F.iI? RP FOR THREE, M9NTIlS
Dog No.: 1135 Sex: Female Group : 500 ppm --- .-
.I_ Months on Test 1 2 3 -- Con t r c) 1 - Hematology
Erythrocytes Hemoglobin Hematocrit Leucocytes DIFFERENT IAL
Seg. Juv . Myel.
Neutrophi 1 s
Lymp ho cy t e s Eo s inophils Monocytes Basophils Atyp ica 1 s Nucleated RBC
Biochemistry Glucose Urea Nitrogen Choles t ero 1 Alk. Phos. GPT Total Protein A /G Crea t inine Bilirubin Albumin
Urinalysis Volume Appearance Osmolality Occult Blood Sugar Acetone PH Urobilinogen Ril irubin Yr o t e in Crea t in h e MICROSCOP IC RBC ' s WBC'S Epithelial Bacteria Cast
7.04 18.8 49 10.9
66 66 0 0
32 1 1 0 0 0
102 13
130 7.0 6 6.7 1.40 0.5 0.2 3.9
60 D,Y, C1, P
1871 N Tr N 6.6 0.1 N Tr 202
0 0- 1 0-2 1i- 0
5.68 14.6 47 1 l . 2
7 2 7 1 1 0
25 0 3 0 0 0
110 150
6.6 - 9 5 .8 1.09 0.5 0 .2 3.0
a
165
1.136 N N N 7.0 0.1 N Tr 83
Y, c1, P
0 0-2
0 1-1 0
7.08 17.8 4 8 11.4
7 1 69
2 0
24 5 0 0 0 0
118 11
2 05 8.0 9 5.8 1.05 0.6 0.3 3.0
160 A, C1, P 1.467
N 1+ N 8.0 1.0 P 1+
118
0 0- 1 0 - 5 24- 0
7.24 18.0 48 12.4
7 4 72
2 0
2 4 2 0 0 0 0
104 23
235
10 6.5
6.6 0.90 0.7 0.4 3.1
160 D,Y, C1,P
1488 N Tr N 7.0 1.0 N
T r 154
0 0
0- 1 24- 0
6.64 16.5 43 1.1.2
60 58
2 0
22 16 2 0 0 @
1.10 22
285 4.2 4 6 . 8 0 . so 0.8 0.3 3.0
145 A, C 1 2098
N N N 6.8 1.0 P Tr
182
0 0 0 1+ 0

APPiUTDIX I (22 ) C L I N I C A L LABORATORY DATA ON IXD?VIl)l.JAL DOGS
FED ZONYL@ RP FOR THREE hIONTES
Dog No, : 1140 Sex: Female Group : 500 ppm -~ I-_- -
Months on T 2 s t
Hematology
Erythrocytes Hemog lob i n Hematocrit Leucocytes DIFFERENTIAL
Neu t r o p h i i s Seg. Juv . Myel.
L ymp ho cy t e s Eosinophi ls Monocytes Bas oph i 1 s Atyp ica l s Nucleated RBC
Biochemistry
Glucose Urea Ni txogen C ho l e s t e r o l Alk. Phos. GP T T o t a l P r o t e i n
Crea t in tne B i l i r u b i n Alb,min
--
A /G
U r i n a l y s i s
Volume Appearance Osmola l i t y Occult Blood Sugzr Ace tone PH U r ob i 1 irio g en B I1 i r u b i n P r o t e i n Crea t in ine MICROSCOP I C
KBC I s wsc I s Ep i t h e 1 i a l Bac te r i a Cast
Contro 1
6.20 6.40 15.5 16.5 41 44
8.2 7.3
62 72 6 1 71 1 1 0 0
34 26 3 2 0 0 1 0 0 0 0 0
119 10 170 10.7 7 6.1 1.25 0.8 0.1 3.4
485 L, Y, c1, P
209 N N N 7.2 0.1 N I?
- 14
0 0-2 0-2 3t- 0
122 9
170 10.9
3 6.0 1.30 0.6 0 .1 3.4
165 Y, CI., P
951 N N N 8.0 0.1 N N
74- *
0 0
0- 1 2 4- 0
6.44 6.68 6.16 16.4 17.1 15.7 45 45 4 1 10.5 11.1 7.7
6 1 61 0 0
33 4 2 0 0 0
120 17
165
10 8.3
5.9 1.15 0.5 0.3 3.2
100 D , P , C l
13 10 N
T r N 7.2 1.0 N
T r 102
0 0-2
0 1+ 0
69 69 0 0
26 5 0 0 0 0
110 22 170
6.9 9 6.1 1 .12 0 .6 0.3 3.2
90 A, c 1. 2151
N hl 7.2 1.0 P I.+
204
m 1.1:
0 0-1
0 I+ 0
68 6 8 0 0
25 7 0 0 0 0
117 17
200 4. 7 6 6 . 1 1.54 0.7 0.3 3.7
85
1814 N N N 7.2 1.. 0 P 1+
196
D, ‘I, C I , I?
0 0
0- I 23- 0

APP'ET\QIil I ( 2 3 ) CLINICAL LABORATORY DATA ON T N D I V I D U A L DOGS
FED ZOhTLp RP FOR TIXEE MONTHS _ _ ~ -
Dog No. : 1143 Sex : Female Group: 500 p ~ m
Months on Test
Hemato logy Erythrocytes EIemog lobin Hematocrit Leucocytes DIFFERENTIAL
Neu trophi 1 s Seg. Juv. Myel.
Lymp hoc y t- e s Eosinophil s Monocytes Bas op hi 1 s Atyp ica 1 s Nucleated RBC
Biochemistry Glucose Urea Nitrogen Cholesterol Alk. Phos. GPT Total Protein A /G Creatinine B il i rub in Albumin
Urinalvsis Vo lane App ear anc e Osmol-ality Occul t Blood Sugar Acetone PH IJrobi linogen Bi 1 irubin P r o t e in Creatinine MICROSCOPIC
RBC ' s WBC ' s Ep i t 11 e 1 i a 1 Bacte.ria Cast
Contro l 1 2 3
5.84 6.28 5.72 6.40 5.92 14.3 1.5.8 13.8 i5 .9 15.7 36 41 3 7 40 41 16.1 14.8 11.3 15.5 11.3
70 68
2 0
24 1 5 0 0 0
116 11
145 3.7 7 6.1 1.12 0.5 0.1 3.2
150
120.5 N N N 7 . 0 1.0 N
T r ,- 144
Y: c1, P
74 7 3 1 0 17 5 4 0 0 0
112 12
i60 4.7 4 6.4 1.05 0 . 8 0.1 3.3
140 Y, C i , P 1079
N N hT 6.8 1.0 ?;I
T r 146
68 68 0 0
30 2 0 0 0 0
93 32
170
11 6.5
5.7 0.97 0.6 0.3 2 .8
170 D , Y , C l
1320 N N M 6.8 1.0 N
T I 102
60 60
0 0
31 9 0 0 0 0
106 32
200 5.4 9 6.6 0.99 0.7 0.8 3.3
67 67 0 0
29 4 0 0 0 0
109 33
220
11 4.1
6.6 1.34 0.9 0 .9 3.8
150 205 Y , C l , P D,Y,CI,P 1714 1252
N N N N 1: N 6.8 7.0 1.0 0 .1 P P
T r Tr 146 114
0 0 0 0 0 0 0 0-1 0 0 0 0- 1 0 0 0 2+ I-!- 34- 4+ 1+ 0 0 0 0 0

APPENDIX I (24 ) CLINICAL TABORATIDRY DATA O X INDTVLDUAL DOGS
FED ZOinL'B PZ FOR THREE MONTIE
Dog No.: 11/+s! Sex: Female Group : - - -_-__.-
500 ppin
Heriia t 0 10 gy
Ery th rocy te s Hemo g 1 ob in Hemat oc r it T,euco cy t e s DIFFERENTIAL
Neutrophi 1 s Seg. Juv . Myel.
Lymphocytes Eos inoph i l s Monocytes Basophi ls A t yp ica 1 s Nucleated RBC
Biochemistry Glucose Urea Nitrogen Cho les t e ro l Alk. Phos. GPT To ta l PrOteiTi A /G C r e a t i n i n e B i l i r u b i n Albumin
U r i n a l y s i. s
Vo lune Appearance O smo la1 i t y Occult Rlood Sugar Acetcm P 11 L'r o b i 1 ino g en B i l i r u b i n P r o t e i n C r e a t i n i n e MICROSCOPIC
REC ' s \JBc ' s Ep i t 12 c 1 i a 1 B ac. t c r i a Cast
Control --
6.64 15.9 43 11.5
78 78 0 0
22 0 0 0 0 0
104 39 170
2.0 9 6.7 0.76
0.1 2.9
-
100 L, A, c1
1950 N N N 6.4 0.1 N N
184
0 0
0- 1 2+ 0
6.40 15.6 41 16.0
75 74 1 0
2 3 0 2 0 0 0
170 37
150 5.2 9 6.2 1.11 1.1 0.1 3 . 3
90 A, C 1 2525
P N M 6 . 4 0.1 N N
184 .
0 0
0- 1 3+ 0
lvlonths on T e s t -- --
I
1 2 3 ---
4.20 14.8 40
9.2
65 65 0 0
33 1 1 0 0 0
116 23
180 10.7 19 5.6 1.03 0.6 0.2 2.8
130 D, A, C1, P
2460 I? 1+ N 6.6 1.0 N
T r 130
0 0- 1 0- 1 1+ 0
6.76 16.6 43 12.6
70 70 0 0
28 1 1 0 0 0
112 23
2 15 10.7 11 5.6 0.87 0.7 0.2 2.6
195 D, Y, c1, P
1.546 N N
7.0 1.0 N
T r 112
0 0- 1
0 2+ 0
p.J
6.52 16.0 43 11.0
77 75 2 0
22 1 0 0 0 0
89 26
2 15 11.2 13
6.4 0.89 0.8 0.7 3.0
165 L,A,Cl,P
2281 N
T r N 6.4 1.0 P
T r 148
0 0- 1 0-4
2+ 0

APPISRDIX I (25) C L I N I C A L LAEORATOIIY DATA ON I N D I V I D U A L DOCS
FED ZQNYT? RP FOR THREE MONTHS
Dog No.: 1136 Sex: Female - Group : 750 ppm --
Con t r o 1
- Mocths on T e s t -I-__~-
1 2 3 Hematology
ErythrGcytes Hemoglobin Hema t o c r it Leucocytes DIFFERENTIAL
Neutrophi ls Seg. Juv, Myel.
Lymp hoc y t e s Eos inop h i Is Mono cy t e s Basophils A typ ica l s Nucleated RBC
Biochemistry
Glucose Urea Nitrogen Choles t e r o i Alk. Phos. GPT To ta l P r o t e i n A /G Creat inine B i l i r u b i n Albumin
U r i n a 1ys i s Volume Appearance 0 smo la l i t y Occult Blood Sugar Ac P tone PH U r ob i 1 irio g er? B i l i m b i n P r o t e i n C r e a t i n i n e PZICROSCCPIC
RBC s TJRC s E p i t l i e l i a 1 B a c t e r i a Cast
6.40 17.4 46 17.3
6 8 68 0 0
27 5 0 0 0 0
102 12
120 4.8 5 6.4 1.24 0.5 0.1 3.5
275 D, Y, C 1 , Y
1677 N N N 7.0 0.1 N
T r - I30
0 0
0-1 1+ 0
6.64 17.7 46 14.0
64 61
3 0
24 10
2 0 0 0
90 1 2
140 4.7 2 5.9 1.50 0.7 0.2 3.5
185 3, Y, C 1 , F
1388 N N N 8.2 1.0 N
T r 1 i o
0 0 3-i
24- 0
7.04 6.48 6.88 17.4 16.2 17.3 48 42 46 16.9 14.8 10.5
7 1 6 8
3 0
21 8 0 0 0 0
94 2 1
2 10 6.3 8 6.3 0.75 0.6 0.4 2,8
195 A, c1, I? 1772
N Tr
N 7.0 1.0 N Tr
114
0 0-1 0 .- 1
I+ 0
63 6 2 1 0
26 11 0 0 0 0
106 1 2
275 7.6 9 6.6 0.98 0.6 0. 1. 3 . 3
49 49
0 0
33 18 0 0 0 0
109 12
235 7.9 7 6.9 0 . G3 0.6 0.2 2.7
135 150 D , Y , C l , P D , T , C l , P
1609 1735 N Tr
N 8.2 1.0 P
T r 132
N Tr N 7.2 1.0 P
T c 242
0 0 0 1-5
C - 2 c-3 I.+ 3+ 0 0

DO& N o . : 1139 Sex: Female
-7-
_.-_I_ -I
Group: /20 13pIll Months on T e s t
Hzma t o lo=
Erythrocytes %,og l o b i n Hema t oc r it 'I, e uc o c y t e s DIFFERENTIAL
Neutrophi ls Seg. Juv a
Myel. Lymphocyte s Eosinophi ls Monocytes Basophils Atypicabs Nucleated MC
Biocheini s t r y
G l u c o s e Urea Nitrogen Cho les t e ro l Alk. Phos. GPT T o t a l P r o t e i n h /G Crea t in ine B i l i r u b i n A 1.bumin
Urinaly s i s
Vo lune APPe- ar anc e 0 smo l a 1 i t Occult Blood Sugar A c e tone PH Urob i 1 ino g en Bil . irubin P r o t e i n Crea t in ine MICROSCOPIC
RBC ' s WBC'S Ep i t h e 1 i a 1 h c t e r i a Cast
Cont ro l --
6.08 6 .24 16.7 17.4 43 45 12.7 11.8
66 66 0 0
29 2 3 0 0 0
104 19
170 6.1 7 6.2 0.97 0.5 0.1 3.1
160 Y , C l , P 1399
N N E 7.0 1.0 N
T r 112
0 0-2 0-1
2+ 0
70 68 2 0
27 1 2 0 0 0
110 13
170 5.9 3 6.2 1.00 0.6 0 .1 3.1
80 Y , C l , P 12 10
N N N 7 .0 0.1 N
T r 128
0 0-2 0 2 -r 0
1 2 3 -
4.40 7.28 6.64 16.5 18.5 17. I 44 48 45 11.5 16.6 10.8
7 1 7 1 0 0
24 5 0 0 0 0
98 2 I.
190
12 9.6
5.8 1.35 0.6 0.3 3.3
90 Y, c3. '2535
N T r
N 2.0 1.0 P
T r 94
79 78 1 0
2 1 0 0 0 0 0
120 14
250 10.1 1.3
6.4 1.16 0.7 0.1 3.4
75 Y , C l , P 1493
P N N 7 . 0 0.1 P
T r 172
62 62
0 0
30 5 3 0 0 0
99 15
34.0 9.3 9 6.8 0.92 0.6 0 .1 3.3
90 Y,C1 1562
N N N 7 . 2 1. . 0 P
T r 158
0 1.-6 0 0- 1 0-2 0-2 0- 1 0- 1 0-4
I+ 24- 2 -t 0 0 0

Hemnto lo= -- Erythrocyte s Beniog l o b irr Rexatocri t Leucocytes D IF FFRE W TAL
Neutrop h i 1 s Seg. Juv. Myel.
Lyrrpliocytes Eo s inop h i 1 s Monocyte s Basophils Atypica l s Nucleated R a C
B i o c h emi s t r l Glucose U r e a Ni t rogen Cho 1 e s i: c r c 1. Alk. Phos. GP'T Tota l P r o t e l ~ i A /G Crn-atinine 3 i 1 ir ub i n Albmin
--.-~-_._
- Urina lys i s
Volume A? p e 3r anc e 0 smo l a 1 i ty Siigar Acetone PH Uro!, i 1. inoger I
B i l i r u b i n P r o t e i n C r e a t i n i.ne MICROSCOPlC
REC ' S
wsc ' s Epi the lLai Bac te r i a Cast
O C C l l l t E l O G r !
c on t Ti) ..- 1
6.40 15.0 38 12.4
80 77
3 0 17
2 1 0 0 0
1 1 2 18
160 4.0 7 5.9 1.31 0.6 0.2 3.3
1.50 D,Y, C1,P
1898 N T\T N 7.0 1.0 P
T r , 1.84
0 0 0 2-k 0
6.80 17.3 45 11.0
72 7 1 1 0
25 3 0 0 0 0
115 19
185 3.5 4 6 . 1 1.32 0 . 8 0.2 3.5
150 A, Cl, P i877
N T r N 7.0 1,rJ N Tr
188 ,
0 0 0 2+ 0
7.32 18.2 50 1 l .4
79 79
0 0
20 1 0 0 0 0
80 25
200 4 . 4
6.1 1.25 0.7 0.6 3.4
a
135 A, c1 1 5 66
N 1+ N 6.6 1.0 P
T r 125
0 0
0-1 3+ 0
7.76 19.2 50 13.4
77 7 5
2 0
22 1 0 0 0 0
i04 27
245 6.4 9 6.6 1.10 0 .9 0.7 3.5
145 A, C1 1898
N N x 5.6 1.0 P N
I48
0 0 0 1 4- 0
7.12 18.1 4 8 12.5
70 67
3 0
29 1 0 0 0 0
100 26
2 15
9 6.5 1.13 0.8 1 . 2 3.4
a. 6
195 A, C1, P 2 194
N N N 6.8 1.0 P
T r 166
0 0- 1 0 - 3
2+ 0

n .. 3 -- I. --- Con t I: o I ------- Hematology Erythrocytes Hemoglobin Hematocrit Leucocytes DIFFERENTIAL
Neutrophil‘s Seg. Juv . Myel.
Lymphocytes Eosinophi ls Monocytes Basophi l s Atypical s Nucleated RBC
- 3iocherni.s tT G 111 co s e Urea Ni t rogen Cholesterol Alk. Phos. GPT Total Protein Creatinine Ri L irubin A Ibwnin
A /G
Urinalysis V o lune Appearance Osmolality Occult Blood Sugar X c e t m p PH Urobilinogen B i 1 irub in Pro t e in Cr ea t Cnin? r”1CROScOPIC
RBC ‘ s WBC ‘ s E p i t h e l i a 1 Bzc t e r ia Ca s t
6.28 15.8 42
9.2
59 58 1 0
41 0 0 0 0 0
PO6 26
150 3.1 8 5.8 1,11
0.2 3.1
-
115 D, Y, C1, P
1777 N N N 6.8 1.0 P
T r 174
0 0-1 0 -- 1.
2-l- 0
6.88 16.5 43 11.8
7 1 70 1 0
29 0 0 0 0 0
116 25
160 2.9 5 5.9 1.10 0,8 0.4 3.1
1 LO
1856 1\T 14 ra 6.8 1 , 0 P N
184
:D, Y, c1
0 0 c)
14- 0
7.08 1.7.0 47 12.9
56 S 6
0 G
34 8 2 0 0 0
108 2 5
235
12 4.4
6.2 1.24 0.7 0.3 3.4
180 D , Y , c1
1436 N N N 7 .0 1.0 P
T-r 1.14
0 0 0 3-l- 0
7.28 17.7 46 14.4
51 50
1 0
38 9 2 0 0 0
123 22
260
13 4.6
6.3 1.03 0.8 0.3 3,2
33 Y, c1
392 P N hT 7.0 0 .1 P
T r SO
0 0-1 0-2 i-l- 0
7.16 17.3 46 1 1 . 2
67 66 1 0
28 5 0 0 0 0
112 31
3 10
1 1 3 .4
7.0 0.94 0. t3 0.4 3 . 4
125 D , Y , C l
2034. N
T r N 7 . 0 1.0 P
Tr 208
0 0- 1 0 - 2
2-1- 0

APPENDIX I (29) CLINICAL MBORATOKY DATA ON I N D I V I D U A L DOGS
FED ZONYL@ R? FOR 'L'HREE MONTHS - ~ - ~~ ~
Dog No.: 1134 Sex: Female Group: 2500 I pprll -
- Months on T e s t --
Hematology Erythrocytes Hemoglobin Hematocrit Leucocytes DIFFERENTIAL
Seg. Juv . Myel.
Neutrophi 1 s
Lymphocytes Eo s inophi 1s Monocytes Basophils Atypicals Nucleated RBC
Biochemisrry
Gluco s e Urea Nitrogen Cho l e s t e r o 1 Alk. Phos. GPT To ta l P r o t e i n AIG Crea t in ine B i l i r u b i n Albumin
U r i n a l y s i s
Volume Appearance Osmolality Occult Blood Sugar Acetcne PH Urobilinogen B i l i r u b i n P r o t e i n Crea t in ine MICROSCOPIC
RBC s WEC'S Epi.thelia I B a c t e r i a Cast
Control
5.68 6 .64 17. G 18.1 44 46 10.5 9.0
57 57
0 0
38 3 2 0 0 0
11.2 11
140 4.4 8 6.3 1.37 0.5 0.1 3.6
120 D, Y, C1, P
2116 N
T r N 7.0 1.0 N
T r . 156
6 5 65 0 0
30 3 2 0 0 0
100 9
155 6.8 3 6 .2 1.15 0.6 0.2 3.3
130 D, Y, C 1 , P
1798 N
T r 1i 7.0 1.0 N
T r 124 .
0 0 0- 1 0
0 0-1 2+ 1+ 0 0
6.40 6.60 16.8 17.1 45 44
9.0 13.2
67 66 1 0
27 3 3 0 0 0
9 1 13
235 15.4 14
6.5 0.94 0.6 0 .3 3.1
165 A, C 1 , P 1724
N T r
N 6.8 1.0 N N
116
7 5 7 3
2 0
19 4 2 0 0 0
110 1 6
2 93 17.7 24
6.7 0.97 0.8 0.2 3.3
1.75 D, Y, C 1 , P
1436 N N N 7.0 1.0 P N
100 0 0
0- 1 0 0 0 3+ 3+ 0 0
6.60 16.8 44
9.1
68 68
0 0
29 3 0 0 0 0
124 17
285 15.2 17
6.8 1.05 0 .8 0.5 3.5
170 A , C l , P 1903
N N N 7.2 1.0 P It-
144.
0 0
0- 1 3+ 0

Hematology Erythrocytes Hemoglobin Remat o c r i t Leucocytes D IFFEREhT IAL
Seg. Juv , Myel.
Neutrophi ls
Lymphocytes Eo s inoph i Is Monocytes Bas ophi 1 s A t yp ?'.c a 1 s Nucleated RBC
B j. o ch e m i s t r y
Glucose Urea Nitrogen Cho 1 e s t e ro I Alk. Phos. GPT T o t a l P r o t e i n A /G C r e a t i n i n e B i l i r u b i n Albumin
-
Urinalps i s
Volume Appe- a1 - anc e 0 smo l a 1 ?Lty Occult Blood Sugar Acetone PH Urob j- 1 h o g en B i l i r u b i n Fro t e i n Crea t in ine MICKOSCOPIC
RBC ' s WBC ' s E p i t he I i x 1 Bac te r i a Cast
C on t r 02
6.52 17.1 44
8.5
73 72 1 0
22 3 2 0 0 0
104 14
175 8.0 6 6.5 1.09 0.4 0 .1 3.4
270 Y, C1, P 1399
N N N 7.0 0.1 N
T r 104
0 0- 1 0-1
2-1- 0
6.58 17.4 45
7.7
69 69 0 0
20 8 3 0 0 0
1.02 I. 1
180 7.6 3 6.3 0.97 0.6 0.2 3.1
380
93 1 N N R 7.0 0.1 N N
72
0 0 -1 0- 1 4-k 0
Y, c1, P
-_-- Months on Test -___I-
1 2 3
5.84 1.4.9 39 10.7
70 70
0 0
28 2 0 0 0 0
90 2 1
348 12.8 11.
6.6 0.88 0.6 0 .3 3.1
415 Y, C 1
b s4 N N N 6.8 0.1 N N
48
0 0
0-1 3 -I- O
5.16 12.8 3 1
9.7
77 75
2 0
23 0 0 0 0 0
120 17
436 14.1 16
6.7 0.78 0.7 0.2 2.9
2 30 Y, C I , P
8bL N N K 7.0 1.0 P N
82
0 0- 1
9 4-t- 0
6. 1.6 15.3 41
7 .4
63 60 3 0
34 1 2 0 0 0
108 3.6
275 13.5 17
6.3 1.28 0 . 8 0.2 3.5
1.75 A, C1, D
1420 $1 N N 7.2 1.0 N
Ilr 158
0 0 0-1
2-t- 0

0 +z 0
0 0
8iT J6 N
0.1 O'L N N N Fi9T-Z
d'T3'V 591
6'Z z-0 O'T.
98 '0 c.9
9'8 SI
SEZ IZ 201
0 0 0 T ET 5z 0 0 T9 I9
5 '8 6E
6 '9T ZL '5
$0 P* 0 nr rrt
P w3 ps P. or nw (Drt YO P- a 0 851 JL N
0 'T 9'9 N N N 55€Z
d '13 cv 591
I @€
5'0 3 '0
68 '0 9'9
1'6 91
092 8Z 801
0 0 0 0 L LZ 0 0 99 99
L *VT 09
6 *ST. 95 'z;
0 +z 1-0 1-0
0
P9T JZ N
0'1 O'L
N XL N 99TZ
S1 1 d 'I3 'v
T'E z "0 L'O
z0 *T. T. '9
T'9 91
59z €Z Z6
0 0 0 0 9T OE 0 Z ZS VS
c *ET 9C
9 *ET. 87,'s
0 +T E-0 0 0
'7+; I JL N
0.I 8'9 N 1J-A lZ ZLZZ
d 'T3 'V '7 Si1
€*€ ZOO
8 '0 ZO.1
9 '9 E
8 *E ss1 oz oz1
0 0 C 0 L 8Z 0 0 59 s9
E'ZT I ?
F"9T 00 '9
0 -I-T
0 0
SOT N N
5 '0 8'9
N N N 99iT
d cl 3 A Ca 09Z
V'E 9 '0 9'0
T.1 *1 9'9
8 5'E
0.91 6Z 01 1
0 0 0 0 9E €Z 0 I 09 It/
I'9T 19
1 O9T. 9L 'S

Dog Eo. : 1146 Sex: Fema I. P.
Group: 2500 ppm ._ I- --- --___- ---_-
Hematology
Ery th rocy te s Hemoglobin Hema t: o c r i t Leucocytes D IFPERFAT 1A L
Neutrophils Seg. J iv . Myel.
Lymphocytes Eosinophi ls Nonocy t e s Basophi ls Atyp icals Nucleated RBC
Ricchemis try
G luco s e Urea Nitrogen C h o l e s t z r o l Alk. Phos, GFT T o t a l P r o t e i n A /G C r e a t i n i n e B i l i r u b i n Albumin
---
Urinalysis V o l u n e Appearance 0 srnd2 13- 1 Lty Occcrlt Blood Sugar Acetone P d Urobilinogen B i l i r u b i n P r o t e i n C r e a t i n i n e MICROSCOF I C
RBC ' S WBC ' s E p L t he 1 i a. 1 E s c t c r i a Cast
-
Control .--
6.48 15.4 40 11.1 67 66 1 0
31 0 2 0 0 0
97 1s
155 3.8 6 5.8 1.17 0.6 031 3.1
2 00
1. I85 N N B! 7.2 0.1 N
T r 108
0 0
0-1 2-!- 0
Y, c1, P
6,72 16.7 44
8.6
64 64 0 0
35 1 0 0 0 0
108 15
175 4.0 3 6.0 1.41 0.7 0. I. 3.5
110 Y, Cl
74.3 N N N 7.0 0.1 N Tr
136
0 0-2 0- 1
3 t- 0
5.88 14.3 38 11.4.
6 1 6 1
0 (>
31 5 3 0 0 0
110 26
260
11 7.8
6.3 1.07 0.6 0.2 3 - 3
140
124.7 N w N 7.0 0.1 N Tr 96
0 0-1 0-1
?i+ 0
Y, c1, P
6.00 14. 2 36 12.3
65 65 0 0
34 0 1 0 0 0
116 2 3
2'70
17 3 . 3
6.2 1.06 0.8 0.1 3.2
80 D , Y , C ;
1.724 N N N 7 . 2 1. (i N
Tr 158
0 0
0-2 I! t- 0
5.58 15.0 39 12 .6
62 62
0 0
30 6 2 0 0 0
112 19
2 30
12 8.9
6.6 1.28 0.9 0 . 1 3.7
95 D,A, C1, P
1942 M
T r N 8.0 1.0 P 1+
198
0 0 0-1
2-1- 0

August 20, 1975 ~ubject. Fluorocarbons in Human
Blood P] asma
CONFIDENTIAL
TO : L. C. KROGH - COMMERICAL CHEMICAL DIVISION - 223-6SE J. D. LAZERTE - COMMERCIAL CHEMICAL DIVISION - 236-1
~[ A. NEWMARK - CENTRAL RESEARCH - 201-2W A. PENDERGRASS - MEDICAL DEPARTMENT - 220-2E
FROM: G. H. CRAW~FORD - PHOTOGRAPHIC PRODUCTS - 209-1S
Record of a Telephone Conversation - August 14, 1975
Person calling Dr. William Guy College of Medicin~ University of Florida Gainesville, Florida
Dr. Guy called again, following up on the su0ject (vide my earlier memo) to see if we had any further i,]eas as to possible sources of the fluorocarbon carboxy[ic acids found in human blood samples from Texas and New Yo~k. I got John Pendergrass on the line and Guy brought in a Dr. Tays (who apparently was involved in the original observation).
The original sampling involved plasma specim.]ns from Albany, New York, Rochester, New York (low natural fluoride in the water) Hillsborough, Texas, Andrews, Texas, .and Corpus Christi, Texas (high natural fluoride). There was no measurable difference by region (10-6 molar F-). F19 NI4R studies run by Prof. Wallace Brey (Dept. of Chem., U. of F.) indicate that the fluorine is or@anic and the suspected species is fluorocarbon carboxylic acid with a C6 or C7 fluoroalkyl group. Dr. Brey suspects a branched end on the chain, e.g. perfluoro t-butyl.
The discussion involved Dr. Guy’s speculatiw~ questions as to where such a "universal" presence of such compounds in human blood could come from. (The compounds are not present in laboratory animals.) These included:
i. Biosynthesis from inorganic F-.
2. Biosynthesis from aerosol freons (but th,~y don’t find chlorine).
Made Available by 3M for Inspection and Copying as Confidential Information: Subject to Protective Order In Palmer v. 3M, No, C2-04-6309
3MA10034962
1118.0001

Te]ephone Conversation - Dr. Wi] ] ~am Guy A~gust 20, 1975 ~ ag~ -2-
3. Teflon cookware.
4. "Scotchgarded" fabrics.
Somewhere he got the information that 3M’s ~luorocarbon carboxyl]c acids are used as surfactants and wanted to know if they were present in "Scotchgard" or other items in general use by the public. We plead ignorance but advised him that "Scotchgard" was a polymeric material not a F.C. acid.
Apparently an earlier (’59-’60) study turned up similar quantities of F- in human plasma (not necessarily FC derived); this would presumably antedate the increased use of either "Scotchgard" or "Teflon" cookware.
They have done experiments involving water boiled in Teflon cookware with negative results.
We suggested obtaining plasma specimens from uncivilized areas, e.g. New Guinea where they don’t use too much "Teflon" cookware or "Scotchgard".
Of all the unlikely explanations above, the least unlikely is residual FC 143 (or whatever) we sell to DuPont to polymerize TFE in Teflon cookware. This is still pretty far-fetched. This was not (I hasten to say) suggested to ]]r. Guy.
We adopted a position of scientific curiosity and desire to assist in any way possible and suggested tha: our own analytical people might be able to clarify D:$. Brey’s NMR findings (I know Wallace Brey from way back. He is highly respected, conservative and not given to fri~,olous speculations).
After we hung up I called CRL Analytical, ta_ked to John McBrady and Richard Newmark. It turns out that Newmark is acquainted with Brey and has, in fact, published in a NMR journal edited by Brey.
My recommendation (with J.P.’s concurrence) :.s to get Richard in touch with Brey, obtain spectra for his own interpretation perhaps samples to run on our equipment, etc. in other words, keep scientists talking to scientists in the spirit of cooperative scientific inquiry.
On the positive side - if it is confirmed to our satisfaction that everybody is going around with fluorocarbon surfactants in their bloodstreams with no apparent ill-effe<.ts, are there some medical possibilities that would bear l<oking into? We
Made Available by 3M for Inspection and Copying as Confidential Information: Subject to Protective Order In Palmer v. 3M, No, C2-04-6309
3MA10034963
1118.0002

Telephone Conversation - Dr. William Guy August 20, 1975 Page -3-
know that fluorocarbons are good oxygen carriers (but this is straight FC-75, not dissolved FC 143). Can fluorocarbon surfactants improve the hemodynamics, wettinj and capillary permeation of blood in cases of atherosclerosis, kidney blockage, senility and the like? Can hemolysis, plate[et destruction and other blood damage during hemodialysis and cardiovascular surgical procedures be reduced by fluorocarbon surfactants? This is speculation (but not completely wild}. I would like to suggest that we consider some animal expeciments to see just how much of these materials can, in fact, be tolerated in the bloodstream - both from a defensive point of view and for the above (to me) intriguing reasons. Wlat do you think, John?
GHC/Ir
Made Available by 3M for Inspection and Copying as Confidential Information: Subject to Protective Order In Palmer v. 3M, No, C2-04-6309
3MA10034964
1118.0003

!
de: L.S. Cove 223-6SE
L.J. Hals W. Caldwe ll
L.C. Krogh 223-6SE
J.E. Long 220-2E
W.H. Petersen 223-6SE
W.F. Scown 223-6SE
MIHN|SOTA MINING & MFG. CO.
R. J. SEFFL - 236-2A Cl~ Wilmlngton~ Delaware
@~ 12/5/7~
~ J.D. LAZERTE - 2~6-1
COMPANY: E. I. duPont
PERSONNEL: duPont l[enry Moncure, Jr., Resear.~h Manager,
Fluorocarbon Div. Pe~er~hlmner, Hesearch Supervisor, Fluorocarbon
i~ , .~ ~--~,Homopolymers
Mike Kaplan, Toxlcologlst, Has~ell Labs. Jim Terrll[, Toxlcolog~st, Haskell Labs.
L. J. Ilals L. S. Cove J. E. Long R. J. Seffl
DuPont is co~ce~ned about the possible toxic effects of FC-143 in the Teflon K used in Harshaw "Dustless Process" because of its possible use in, or in (ontact with, food products.
Henry Moncure emphasized that duPont is not advocating ’the use of Teflon K in food applications and actually recommends against such use. They do not plan to file for an FDA clearance for Teflon K. Howe---~er, they do recognize that they can not control all applications and they would llke tc haw~ defensive information available to support their Dositlon in the event that a problem does arise.
Henry Gibson reported on toxicity studies carried out with FC-143 arid Teflon K (containing 0.25~ FC-143) some 10-15 years ago.
Acute oral toxicity: FC-14$--A~ .670 mg/kg. Teflon K--"Innocuous"
Sub acute toxicity: i0 day study on rats fed a diet of 25% Teflon K (25-30 g/kg).
Observations: Enlarged livers, up to three times the welg~t of the control depending upon which
(of several tested) fluoro surfactant was used. This appeared to be a function of the surface activity of the surfactant. Others were worse than FC-143. With FC-143 the liver to body weight ratio was 4.8 vs the control of 3.5. In all cases the enlargement effect was reversible but did require "much time". The other sub acute effect
1124.0001 3MA10024380

Field Letter ",. k.J. Seffl E.I. DuPont - Pa~;e 2
noted was lne reduction in sleeping times of rats treated with pentathoL thus indicating possible rapid de-toxJflcatlon of the drug by ~,ne test group. Further details of this study will be dlscusze~’ on a one-to-one basis b~t~ee:] H. ~.l~man_~and J. Long.
DuPont claims that unsintered Teflon dispersion which does not contain FC-143 does no~ p~oduce the above ~ted sub acute effects. Therefore they desire defe[~slve !n?ormation and want to know to what extent 3M will be willing to provide them with information on FC-143 relative to possible inhalation toxicity--sub acute, and ~ata with which to establish an oral "no effect level".
It was agreed that J~:n Long and H~q~ry ~man would get back to- gether regarding the details of their" tests to date. Subsequently Jim will determine what tests he de<~ms advisable and make his recom- mendations to the Co,~:~.rcial Chemicals Division who in turn will eormmunlcate wlth duPont as to what our program, if any, will be.
1124.0002 3MA10024381
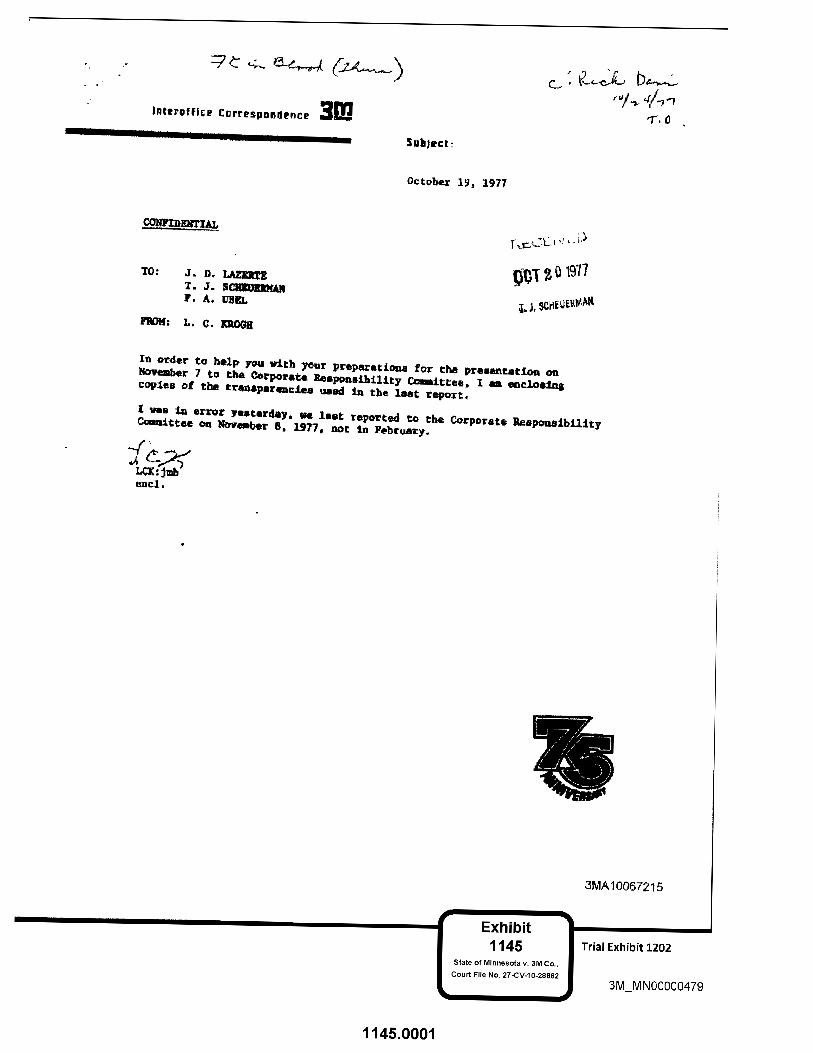
Interoffice Cnt’responllence 3~
Subject:
19, 1977
~.J.
In o~der ~o he~p you with your preparations for N~r 7 to ~ ~rate ~s~nstb~ltty ~lCcee, cop~es of ~ tr~ar~ ~8 ~ ~ ~he last
~ttee ~ ~ 8, 1977, ~ in February.
encl.
3MA10067215
Trial Exhibit 1202
3M_MN00000479
1145.0001
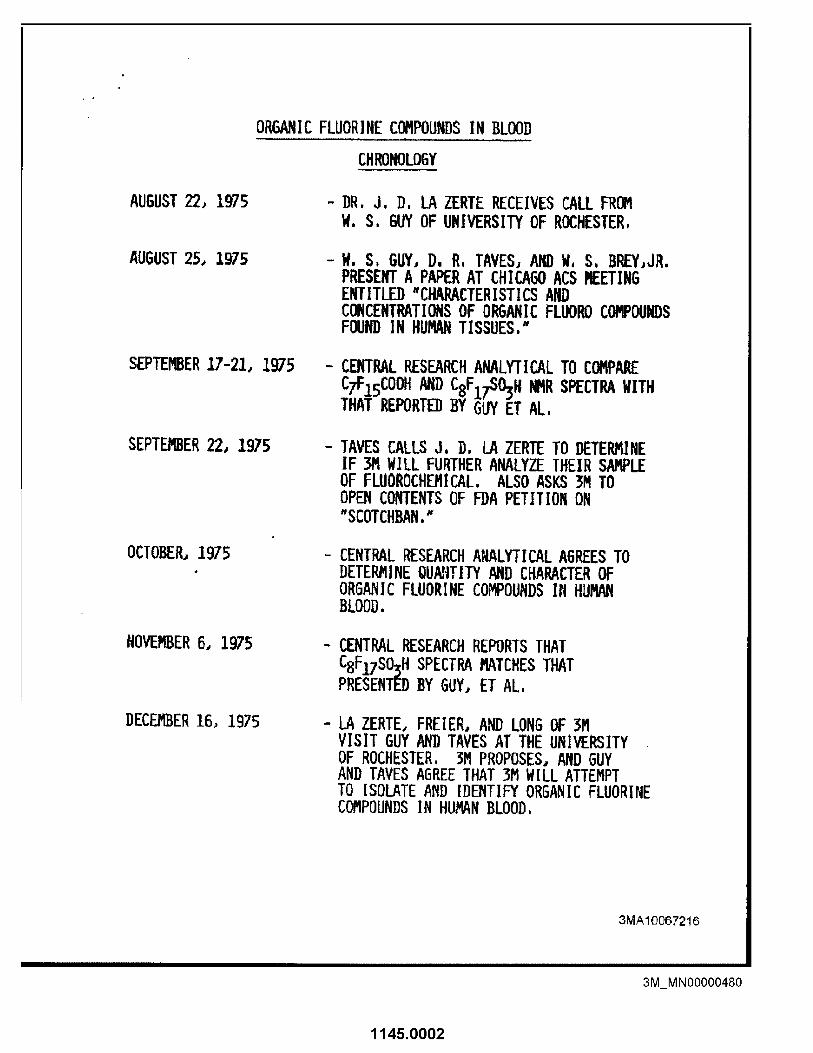
ORGANIC FLUORINE C~POUNI)S IN BLOOI)
CHRONOLOGY
AUGUST 22,, 1975
AUGUST 25, 1975
SEPTEMBER 17-21, 1975
SEPT~ER 22, 1975
OCTOBER, 1975
NOVEMBER 6, 1975
DECEMBER 16, 1975
- DR. J. D. LA ZERTE RECEIVES CALL FROM W. S. GUY OF UNIVERSITY OF ROCHESTER.
W, S, GUY, D. R. TAVES, AND W, S. BREY,JR. PRESENT A PAPER AT CHICA.r’.,-O ACS MEETING ENTITLED "CHARACTERISTICS AND CONCENTRATIONS OF ORGANIC FLUORO COMPOUNDS FOUND IN HUMAN TISSUES,"
CENTRAL RESEARCH ANALYTICAL TO COMPAP, E C7FIsCOOH AND CBF17SO~H ~R SPECTRA WITH THAT REPORTED BY GUY ET AL.
TAVES CALLS J. D. LA ZERTE TO DETE~INE IF 3M WILL FURTHER ANALYZE THEIR SAMPLE OF FLUOROCHEMiCAL. ALSO ASKS 3M TO OPEN CONTENTS OF FDA PETITION ON "SCOTCHBAN."
CENTRAL RESEARCH N~LYTICAL AGREES TO DETE~INE QUANTITY AND CHARACTER OF ORGANIC FLUORINE COMPOUNDS I~i HUMAN BLOOD.
CENTRAL RESEARCH REPORTS THAT CBF17SO3H SPECTRA MATCHES THAT PRESE~T{D BY GUY, ET AL.
LA ZERTE, FREIER, AND LONG OF 3M VISIT GUY AND TAVES AT THE UNIVERSITY OF ROCHESTER. ~M PROPOSES, AND GUY AND TAVES AGREE THAT 3M WILL ATTEMPT TO ISOLATE AND IDENTIFY ORGANIC FLUORINE COMPOUNDS IN HUMAN BLOOD.
3MA 10067216
3M MNO0000480
1145.0002

CHRONOLOGY - PAGE 2
FEBRLIARY 17, 1976
APRIL 14, 1976
JUNE 29, 1976
AUGUST 23,. 1976
AUGUST 26, 1976
SEPTEMBER 9, 1976
SEPTEMBER 17, 1976
OCTOBER 8, 1976
CENTRAL RESEARCH ANALYTICAL DEVELOPS AN ACCURATE ANALYI’ICAL METHOD FOR DETERMINING PARTS PER BILLION QUANTITIES OF ORGANIC FLUORINE COMPOUNDS IN HUMAN BLOOD. METHOD TESTED ON BLOOD FROM AMERICAN RED CROSS AND VALUE AGREES WITH THOSE IN LITERATURE.
FOUR ~RATORY PEP, SONNEL HAVE BLOOD SAMPLES ANALYZED. CONCENT~TION OF ORGANIC FLUORINE COMPOO~S IN SOME PERSOIWNEL 100 TIMES NORMAL.
- SOME CH~LITE PERSONNEL SHOW ORGANIC FLUORINE COMPOUNDS AT 1,000 TIMES NORMAL.
- CORDOVA PERSONNEL E~POSED TO FLUORO- CHEMICALS HAVE UP TO 50 TIMES NORMAL VALUES,
CENTRAL RESEARCH ISOLATES AND IDENTIFIES ORGANIC FLUORINE COMPOUNDS FROM BLOOD OF CHEMOLITE PERSON AS CTF15COOH.
MICE FED "SCOTCHBAN." HAD q, o00 TIMES NORMAL ORGANIC FLUORINE COMPOUP~S.
- CFIF SO-," IDENTIFIED AS ORG~IO FLUORINE
- DECATUR PLANT PERSONNEL FOUND TO HAVE UP TO 300 TIMES NORMAL LEVELS.
INDIVIDUALS EXPOSED TO FLUOROCHEMICALS OVER 20 YEARS AGO HAVE NORMAL ORGANIC FLUORINE COMPOUND LEVELS.
3MA10067217
3M MN00000481
1145.0003

CHRONOLOGY - PA6E 3
OCTOBER 28, 1976 - DR, LEON SINGER OF THE BIOCHEMISTRY DEPART~NT. UNIVERSITY OF MINNESOTA. CALLS TO OBTAIN SAMPLES OF CTFlsCOOH._ _ DR, SINGER REPORTS THAT HE HAS HAD CONVERSATIONS glTH TAVES. ALSO REPORTS THAT ANIP, ALS FED INORGANIC FLUORIDE SHOW INCREASES IN ORGANIC FLUORINE BLOOD ~WEL,
3 MA 10067218
3M MN00000482
1145.0004
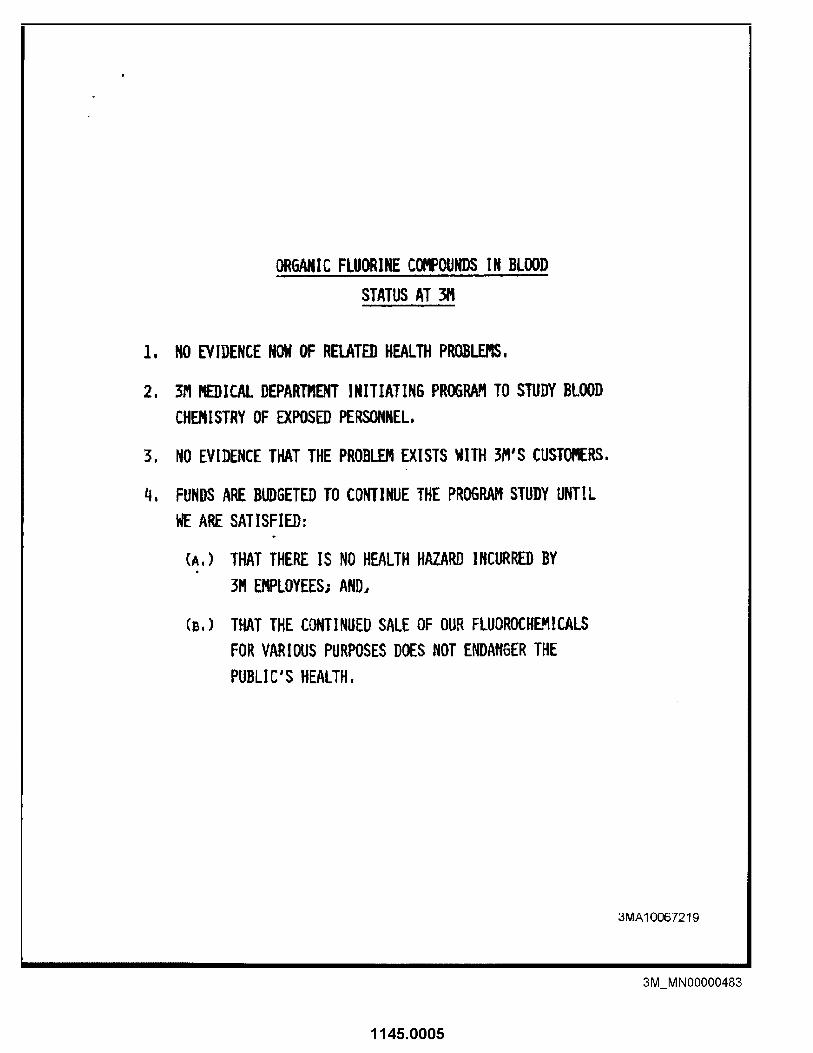
OR6ANIC FLUOR]I~ COMPOUNDS IN BLOOD STATUS AT 94
NO EVIDENCE NOW OF RELATED HEALTH PROBLEMS,
3M ~ICAL DEPARTMENT INITIATING PR{)6~I TO STUDY BLOOD CHEMISTRY OF EXPOSED PERSONNEL,
NO EVIDENCE THAT THE PROBLEM EXISTS WITH 3M’S CUSTOMERS.
FUNDS ARE BUDGETED TO CONTINUE THE PROGRAM STUDY UNTIL WE ARE SATISFIED:
(A,) THAT THERE IS NO HEALTH HAZARD INCURRED BY 3M EMPLOYEES; AND,
(e.) THAT THE CONTINUED SALE OF OUR FLUOROCHE~IICALS FOR VARIOUS PURPOSES DOES NOT ENDANGER THE PUBLI C’S HEALTH.
I III
3MA10067219
3M MN00000483
1145.0005

FLUOR]NE C~ENT OF BLOOD SERI.I~
1, LITERATURE VALUES
2, 3M CONTROLS
3. LABORATORY BUILDING 2~6
4. CORDOVA
5. CHEHOLITE
6, DECATUR
ORGANIC FLUORINE P,P.B,
2 - 1~0 Ave. 30
10 - 80
q30 - 3,100
160 - 630
510 - 38,800
150 - %840
INORGANIC
FLUORINE P.P,B,
~ - 170 AvE. 20
qO - 60
30 - 360
50 - 870
50 - gO
40 - 210
3MAt 0067220
3M MN00000484
1145.0006

SOURCES OF FLUORINE
TOOTHPASTE, I)EIITAL CARE,
FLUORIDIZED WATER
ORGANIC 3M ~3 CF2 CF2 CF2 CF2 CF2 CF2COOfl
CF3 CF2 CF2 CF2 CF2 CF2 CF2 CF2 S03H
OTHERS STEROIDS TRANQUILIZERS ANESTHETICS HERBICIDES TEFLON AEROSOL PROPELLANTS REFRIGERANTS
3MA10067221
3M MN00000485
1145.0007

FC-~5, FC-143 and FM-3422 - 90 Day Subacute Toxicity Studies
Conducted at IRDC - Review of Final Reports and Summary
OVERALL SUMMARY AND RECOMMENDATIONS
FC-95 was the most toxic of the three compounds studied and certainly more toxic than anticipated. It produced mortalities in rats at a dietary dose of i00 ppm (20 mg/kg/day) and in monkeys at an oral dose of 4.5 mg/kg/day. The primary target organs in rats were the liver, hematopoietic tissues and upper gastrointestinal tract and in monkeys, the gastrointestinal tract although no pathological lesions were reported. FC-143 appeared to be the least toxic of the three compounds studied and produced no mortalities in rats at dietary doses as high as I000 ppm (~ i00 mg/kg/day). However, definite evidence of liver toxicity was seen at the high dose. In monkeys, FC-143 caused deaths at oral doses of i00 (4/4) and 30 (3/4) mg/kg/day and evidence of effects on hematopoietic tissue at these lethal doses. Like FC-95 and FM-3422, FC-143 also produced clinical evidence of gastrointestinal toxicity but no associated pathological lesions. FM-3422 caused deaths in rats at dietary doses of i000, 3000 and i0,000 ppm (~ I00, 300 and i000 mg/kg/day respectively) and in monkeys (1/4) at an oral dose of 30 mg/kg/day. The primary target organ in rats appeared to be the liver although there was some gross evidence of kidney and upper gastrointestinal tract involvement as well. In monkeys, the gastrointestinal tract was affected clinically, but there were no pathological lesions reported at necropsy.
The goals of conducting these 90 day subacute toxicity studies of i) defining doses for chronic experiments and 2) obtaining general toxicological information on the three compounds appear to have been met. However, several questions surfaced that deserve further clarification. The apparent effect of FC-95 on the liver and hematopoietic system of rats should be studied for reversibility. The question of clinical gastroinestinal signs in monkeys with all three compounds without any gross or microscopic pathology is certainly perplexing, but may not be worth further pursuit since the oral route is not a likely one for man. If another study with FC-143 is conducted to help define the gastrointestinal and hematopoietic effects, the dog should be considered. Since the most likely route of exposure in plant workers is by inhalation, an inhalation study, probably with FM-3422, could be useful in evaluating any effects via pulmonary exposure. Mary Case and Bill McCormick are preparing protocols for follow-up to the toxicity questions mentioned.
Because of the apparent persistence of these fluorochemicals in the body, the most important question remains possible long term effects. Although lifetime rodent studies have limitations in predicting chronic effects (carcinogenesis) for man, they are still considered the most reliable indicators available. Unless there are adequate data through human epidemiological evalu- ations that can reasonably assure relative safety of these compounds following long term exposure, lifetime rodent studies should be undertaken as soon as possible. It maybe possible to limit the number of compounds evaluated in life- time rodent studies to one or two if metabolic data can be used to establish a common linkage between compounds.
1199.0001
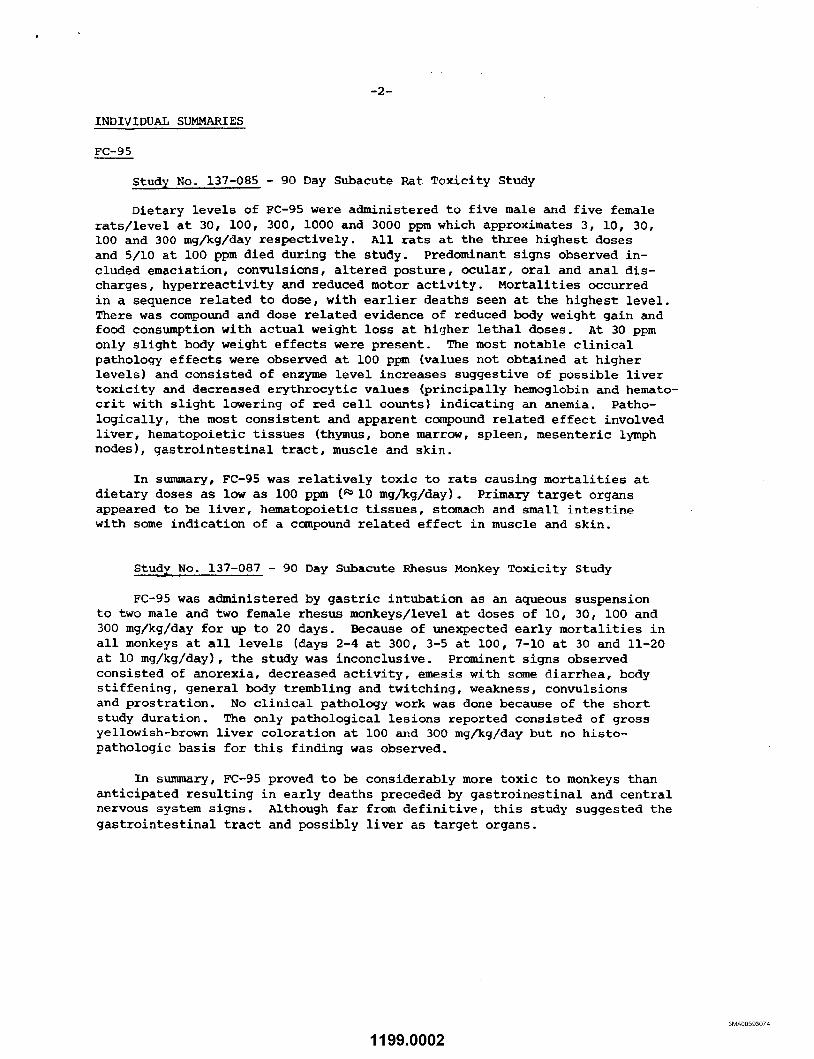
-2-
INDIVIDUAL SUMMARIES
FC-95
Study No. 137-085 - go Day Subacute Rat Toxicity Study
Dietary levels of FC-95 were administered to five male and five female rats/level at 30, I00, 300, i000 and 3000 ppm which approximates 3, i0, 30, i00 and 300 mg/kg/day respectively. All rats at the three highest doses and 5/10 at i00 ppm died during the study. Predominant signs observed in- cluded emaciation, convulsions, altered posture, ocular, oral and anal dis- charges, hyperreactivity and reduced motor activity. Mortalities occurred in a sequence related to dose, with earlier deaths seen at the highest level. There was compound and dose related evidence of reduced body weight gain and food consumption with actual weight loss at higher lethal doses. At 30 ppm only slight body weight effects were present. The most notable clinical pathology effects were observed at i00 ppm (values not obtained at higher levels) and consisted of enzyme level increases suggestive of possible liver toxicity and decreased erythrocytic values (principally hemoglobin and hemato- crit with slight lowering of red cell counts) indicating an anemia. Patho- logically, the most consistent and apparent compound related effect involved liver, hematopoietic tissues (thymus, bone marrow, spleen, mesenteric lymph nodes), gastrointestinal tract, muscle and skin.
In summary, FC-95 was relatively toxic to rats causing mortalities at dietary doses as low as i00 ppm (~ l0 mg/kg/day). Primary target organs appeared to be liver, hematopoietic tissues, stomach and small intestine with some indication of a compound related effect in muscle and skin.
Stud~. No. 137-087 - 90 Day Subacute Rhesus Monkey Toxicity Study
FC-95 was administered by gastric intubation as an aqueous suspension to two male and two female rhesus monkeys/level at doses of I0, 30, i00 and 300 mg/kg/day for up to 20 days. Because of unexpected early mortalities in all monkeys at all levels (days 2-4 at 300, 3-5 at i00, 7-10 at 30 and 11-20 at I0 mg/kg/day), the study was inconclusive. Prominent signs observed consisted of anorexia, decreased activity, emesis with some diarrhea, body stiffening, general body trembling and twitching, weakness, convulsions and prostration. No clinical pathology work was done because of the short study duration. The only pathological lesions reported consisted of gross yellowish-brown liver coloration at I00 and 300 mg/kg/day but no histo- pathologic basis for this finding was observed.
In summary, FC-95 proved to be considerably more toxic to monkeys than anticipated resulting in early deaths preceded by gastroinestinal and central nervous system signs. Although far from definitive, this study suggested the gastrointestinal tract and possibly liver as target organs.
1199.0002

Study No. 137-092 - 90 Day Subacute Rhesus Monkey Toxicity Study (Second Study )
Since all monkeys died in the first FC-95 study (137-087), a second experiment was conducted using oral garage doses of 0.5, 1.5 and 4.5 mg/kg/day a~ministered to two male and two female monkeys/dose. The controls were the same monkeys used in the first FC-95 e~periment. All 4.5 mg/kg monkeys ex- hibited signs of gastrointestinal tract toxicity (anorexia, emesis, black stools, dehydration) starting on day 1 or 2 of. the study, and all died or were sacrificed in extremis between weeks 5-7." Prior to death, these monkeys showed marked or severe rigidity, convulsions, general body tremors, prostration and loss of body weight. The monkeys at lower doses all survived, but evidence of gastrointestinal toxicity was observed both at 1.5 and 0.5 mg/kg/day. The only consistent clinical pathology observation reported was decreased alkaline phosphatase values at all three doses. No gross pathological lesions considered compound related were observed and the only microscopic pathology of apparent compound relationship consisted of lipid depletion in the adrenals, atrophy of pancreatic exocrine cells and atrophy of the serous alveolar cells of the submandibular salivary glands in high dose monkeys. These latter effects may be due to general debilitation of the animals.
In summary, FC-95 was relatively toxic to rhesus monkeys producing deaths at doses as low as 4.5 mg/kg/day in 5-7 weeks. The apparent target organ was the upper gastrointestinal tract although no pathological lesions were reported even at the high dose.
FC-143
Study No. 137-089 - 90 Day Subacute Rat Toxicity Study
Dietary levels of FC-143 administered to five male and five female rats/level were 10, 30, I00, 300 and i000 ppm which approximates I, 3, i0, 30 and i00 mg/kg/day respectively. Clinically, the only effect observed was slightly decreased body weight gains at 300 and lO00 ppm. Clinical pathology abnormalities reported in high dose male rats only included slightly lowered erythrocyte counts, and elevated BUN and alkaline phosphatase values. There were several other vari- ations from control groups in the clinical pathology parameters including fairly consistent lowering of calcium levels at all doses, but these were not considered abnormal based on the contract laboratory’s comparison to background control data. Pathological abnormalities were confined to the liver and included gross enlarge- ment and discoloration at i000 ppm, increased organ weights at I000 and 300 ppm and several microscopic changes at i000 ppm.
In summary, FC-143 was well tolerated in rats at doses up to and including 300 ppm (~ 30 mg/kg/day). There was obvious liver toxicity at I000 ppm ( ~ I00 mg/kg/day), but no mortalities occurred.
1199.0003

-4-
Study No. 137-090 - 90 Day Subacute Rhesus Monkey Toxicity Study
FC-143, suspended in 0.5% methocel, was administered by gastric intubation to two male and two female rhesus monkeys/dose at 3, i0, 30 and I00 mg/kg/day. All high dose monkeys died during weeks 2-5 and 3/4 30 mg/kg monkeys died during the last half of the study. All monkeys that died showed clinical evidence of gastrointestinal toxicity (anorexia, emesis, dark stools), but there were no associated pathological lesions found at necropsy. No mortalities occurred and only occasional signs of gastrointestinal effects were reported at the two lower doses except for one i0 mg/kg monkey that had signs of gastrointestinal toxicity for several days late in the study. There were a few abnormalities reported in clinical pathology parameters, but no consistent pattern was observed. Gross and microscopic pathological lesions were restricted to the two highest dose levels and consisted of lipid depletion in adrenals, hypocellularity of bone marrow and atrophy of lymphoid follicles of the spleen and lymph nodes.
In summary, FC-143 was less toxic than FC-95 in rhesus monkeys but, at lethal doses (i00 and 30 mg/kg/day), evidence of effects on hematopoietic tissue was seen. Like FC-95, the gastrointestinal tract also appeared to be a target organ although this was not confirmed on histopathological examination.
FM-3422
Stud[ No. 137-086 - 90 Day Subacute Rat Toxicity Study
FM-3422 was administered in the diet to five male and five female rats/level at 30, i00, 300, I000, 3000 and 10,O00 ppm which corresponds to approximately 3, i0, 30, i00, 300 and I000 mg/kg/day respectively. All rats at the i000, 3000 and i0,000 ppm levels died between days 9 and 29. Prominent signs observed in these rats included emaciation, altered posture, convulsions, reduced motor activity and/or increased sensitivity. At 30 ppm, a slight decrease in body weight gain in females was the only clinical effect reported. There were also some slight abnormalities in serum enzyme levels, but no pronounced trends. Likewise, minimal effects were seen at I00 ppm. At 300 ppm there appeared to be increased compound related clinical signs, decreased body weight gain and food consumption, depressed hematological parameters and several alterations in clinical chemistry values. Pathologically, the liver was grossly enlarged with accentuated lobulation and discoloration with the 300 ppm group being more severely effected than the i000 or 3000 ppm rats. This apparent reversed order of toxicity related to dose could be due to the early mortalities of the high dose rats and, therefore, a short dosing duration. The liver abnormalities seen grossly were associated with increased liver weights and microscopic lesions. Some kidney discoloration and evidence of stomach irritation were also observed grossly at 300 ppm.
In summary, FM-3422 was lethal at doses of i000, 3000 and I0,000 ppm which is approximately i00, 300 and i000 mg/kg/day respectively. The liver appeared to be the primary target organ, but there was gross pathological evidence of possible kidney and stomach involvement at the 300 ppm level also.
1199.0004

-5-
Study 137-088 - 90 Day Subacute Rhesus Monkey Toxicity Study
FM-3422, suspended in propylene glycol, was administered by gavage to two male and two female monkeys/level using doses of i, 3, i0 or 30 mg/kg/day. The vehicle appeared to cause anorexia early in the study necessitating volume reduction from 5 to 2 ml/kg. The only mortality occurred in one high dose monkey the last week of dosing. Gastrointestinal signs consisting of emesis, diarrhea and black stools with mucus or bloody mucus were seen in most monkeys from most groups. There were no clinical pathology observations that appeared to be significant cc~pound effects. Pathological lesions reported included lipid depletion of adrenals and atrophy of pancreatic exocrine glands at 30 mg/kg only.
In summary, FM-3422 caused mortality at 30 mg/kg in 1/4 monkeys and appeared to primarily effect the gastrointestinal tract although there was no supporting microscopic evidence.
..It< ,’, .- . ,. Date
RAN/Imr
1199.0005


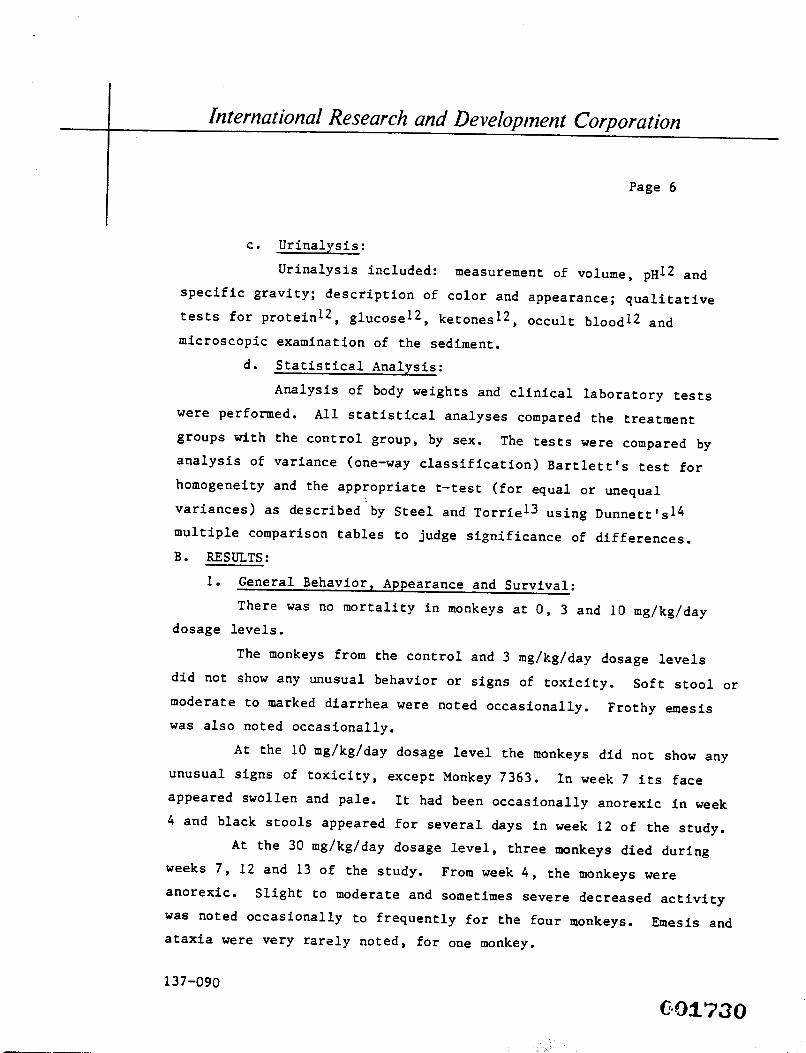


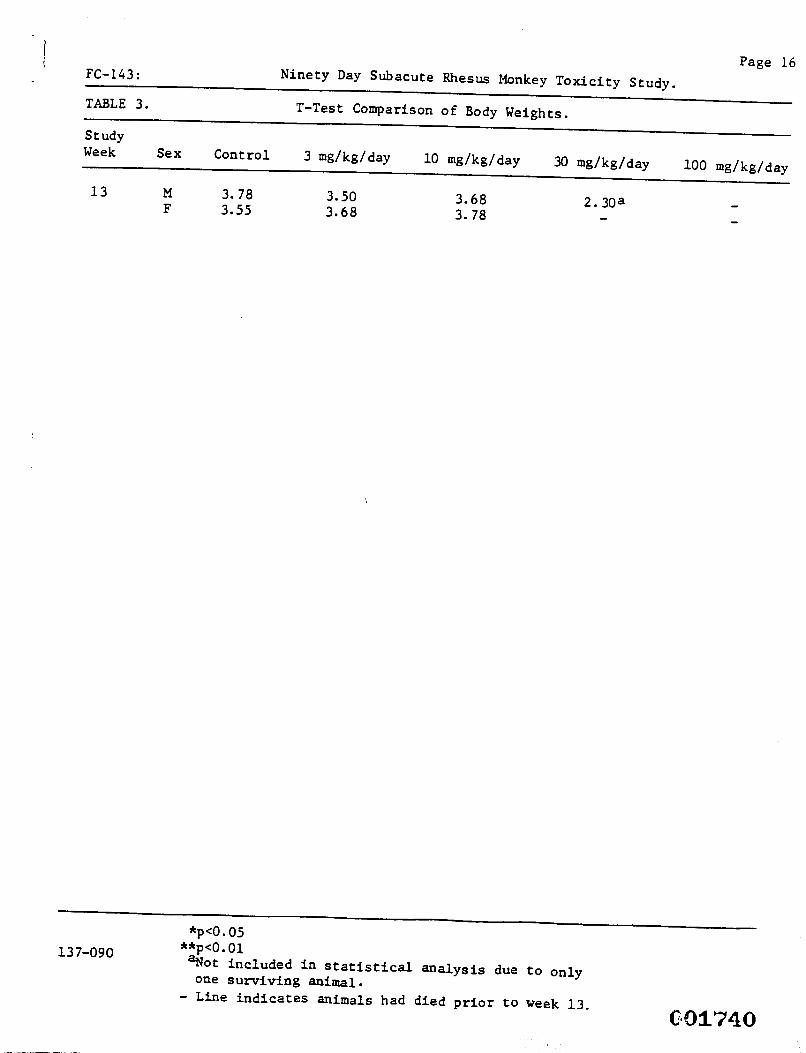
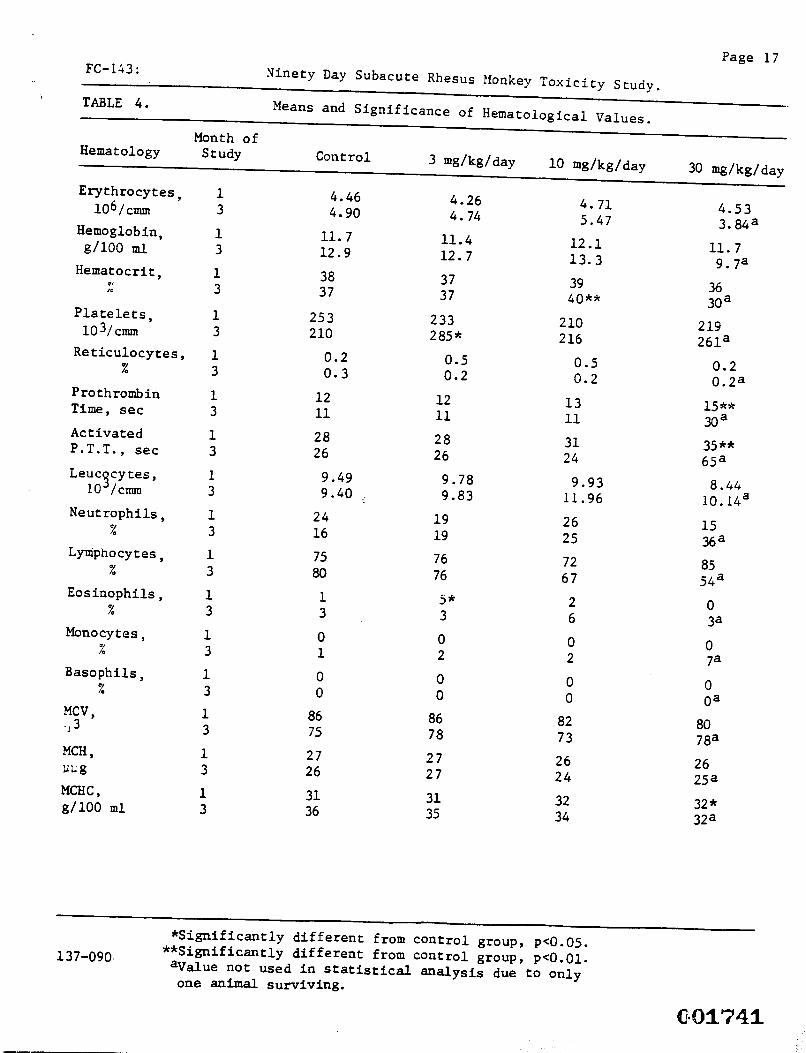

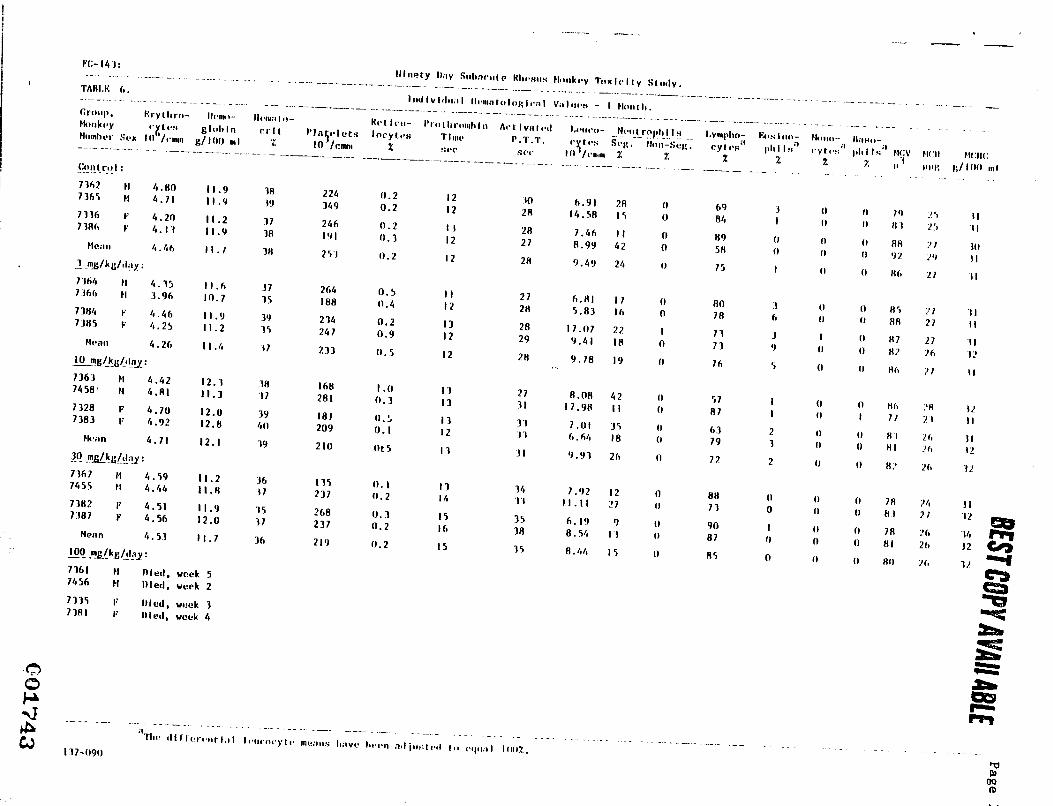


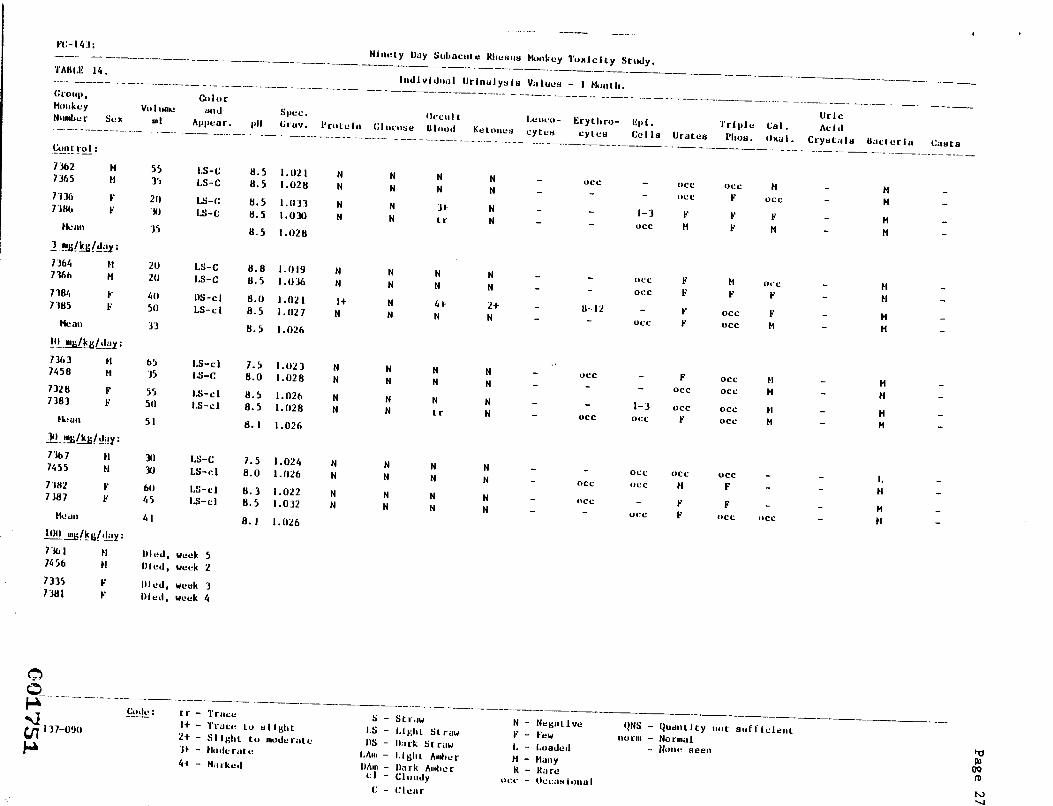


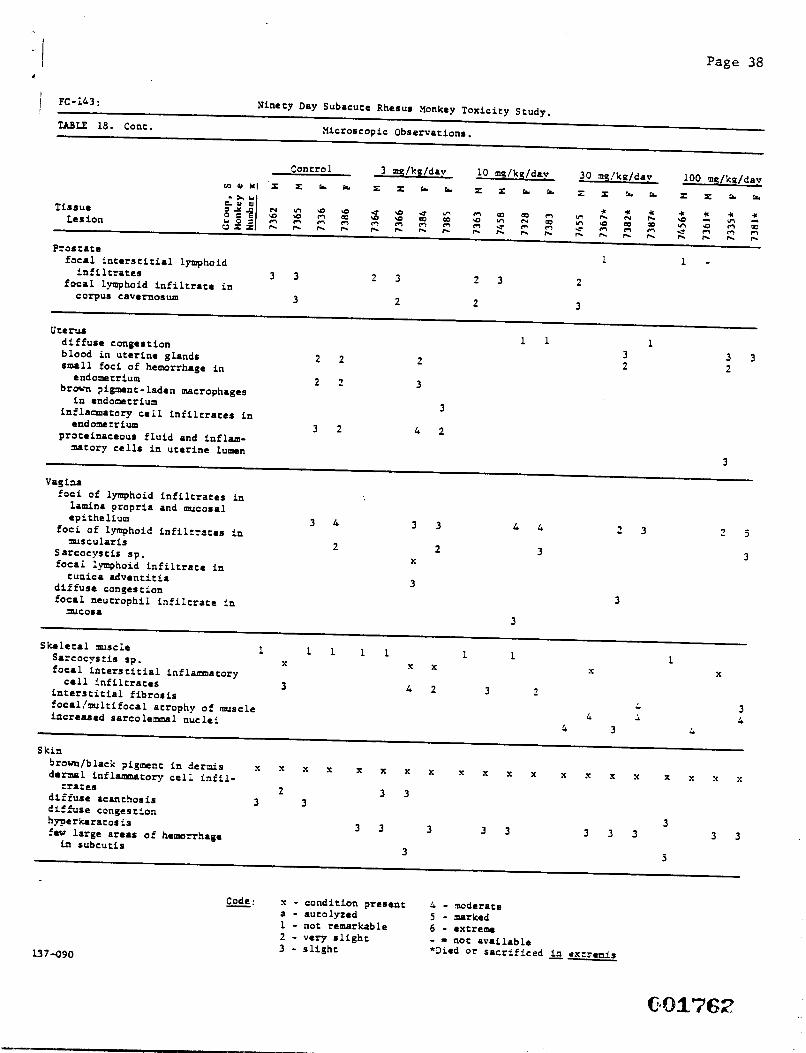


I~l~rofl;ct
lily 11.
H. l, F, AS[ 219-2 ~l, [. LOt(G 21L~),.-2E R. A. H[J.SOH 218-3 R. E. OBER 218-2 ~. A. P~OKOP 2)5-3B
Those present ~et on April 28, 1978 to discuss results of Lhe ~ d~y adl] studies carried ~t zt I.R.D.C. 1he ~$1~ ~ Of s~t~ ~ ~ usln9
plet~ in ~y. ~ up-to-da~ s~tus s~ of 111 s~4~ ~s su~11~ by J. E. Long ~ ts at~ch~ ~ ~se atN~s. A ~le~ ~rt f~ I.R.D.C., ~)~1ng hts~t~lo91~ai ~ h d~ b ~ or ~ly for ~ rat s~tes a~ later tn t~ fall foe ~ ~y e~r~tS.
After a very brief discuss|on of the most iI~lmt rtsults fr1~ th~ antml studies, N. T. ~se, J. E. Long, R. A. ~l~n l~ R. E. ~lg~ t~t FC-95, ~-~22 a~ FC-1U s~ld ~ ~as ~xlc ~!~ of toxicity ~s left u~efin~.
R. E. 0bet inquired as’to the tyl~ and ~nt$ of Im!~rttles present in FC-95. FN-3422 an~ FC-143. ~ t~dtles. If sufflcl~tly ~xlc, c~ld cause ~er~s c~cluslon f~ t~ enl~l s~tes. ~rt~ ~ dlKusslon, tt w, ~tnted ~t ~t FC-95 ~s ~n tdentlft~ In ~ b1~ of rats ~lch ~re f~ F~22. T~ ~estton a~se as ~t~r ~-~t~t ~ an t~ ~rtty in FM-~22. The ans~r~s ~t kn~. L A. ~ q~ ~ ~pply ~ c~lttee ~th al1 available l~fo~ti~ ~ t~dtf, ~t I~ K-9~, ~-~22 a~ FC-143.
~CE.:IIEO
3MA10067059
CONFIDENTIAL - SUBJECT TO A PROTECTIVE ORDER ENTERED IN HENNEPIN COUNTY DISTRICT COURT, NO. 27-CV-10-28862
3M MN00053074
1174.0001

R. E. Ober raised the question as tO wh|ch FC-g5 ~u|d ca~e g~eat~st worker exposu~. Because or the many products relstod to ~ese c~s, ~ deftnt~
Hygiene s~uld s~ ~ t~ tn l~ttf~H ex~sure ~la~ ~ ~M22 a~
A discussion them ~k place on t~vtng the cap~bllit~y ~ ~tll~tq for
R. A, Nelson and J. E. L~ felt ~t fC-9S ~ld ~ I~tf]~ as ~t~ present ~fo~ p~tng vt~ t~ s~l," sl~e tt I~ ~slble ~t m l~- ~llte of FC-95 might ~ res~slb)e for ~xlc ~f~ ~ ~a tt~lf. R. E. ~r ~ such states ms su~]~]. (t ~ mg~ ~t a~lytlcal ~rk on FC-95 (n t~ se~ ~ )i~r of ~ ~1~ ~ as rapidly as ~ssible.
]t was questioned why FC-95. F1~.3422 and FC-143 were cho~m for the studies, FC.143 and FC-95 have be~ fouad In tee employ. FN-3422 is Inter~late which goes into a variety of prOduCt.~.. R. E. ~ ~S~ ~t e t~ year study on ~-3~2Z ~uld gtve lnf~tion ~ ~ ~ff~ts of and ~ss]ble m~lltes, it was og~ ~ ~ls s~t~ ~ld g~v~a further consecration.
R.A, Nelson stated that ].R.D.C. ts now savln9 monkeys for tee t~o year antml sLudies. If we are to use these animls, we m~st p~rc~ fJw~ ~ow at a cost of $61,280 and ~y $78~ ~r ~nth ~ mtn~tn ~, i.R.D.C. ~nts an ~ns~r by ~y ], 1978, If ~ ~ not purc~se aM ~tn~tn ~ ~ys, ~ my ~ available later for t~ anlml states. ~r, ~l~e It ~l ~t ~t be~ d~id~ wlth cer~Int] t~t ~ke~ wtll M u~ In ~ ~ ~r s~dies, t~se p~s~t rec~ ~t purc~t~ t~ ~ ~t th]~ t]~.
3MA10067060
CONFIDENTIAL - SUBJECT TO A PROTECTIVE ORDER ENTERED IN HENNEPIN COUNTY DISTRICT COURT, NO. 27-CV-10-28862
3M MN00053075
1174.0002

-3-
Those present again considered the aunt}able toxicity data on FC-95, FH-34ZZ and F1~-~43, It ~as ~tnt~ out that ~}e rats fed FC-]43 at the 1~ ~ ~evel ~d ~ut 50 p~ FC-]43 tn their bl~ and that one Ch~lite ~rter
rats had liver d~scoloratlon ~f~les ~d ~ne). It ~s concl~ed that the llver discoloration tn rats associated wJth a bl~ level of ~ p~ suggests a ~ssfb]e h~n ~alth prob]~ for l~ivJduals w~ ~ve this ~eve] (or a~ve) In their b]o~ for long ~rl~s of tt~. T~se present also co~]ud~ the foisting:
As concluded previously by the full con~ittee, available data in man indicates that no substantial risk exists under the Toxic Substances Control Act. However, those present urgent]y rec(x~ended that al! reasonable steps be taken i~edtately to reduce exposure of e~loyees to these COBpoundL
It ~as also agreed that:
R. E. O~r will ~ake pPoposals on ~etabolic studies and ~ke a presentation to tt~ c~Ittee on such studies.
R. A. Prokop and J. E. Long will ~ke certain that Rtker has all previous analytical and toxicological data involving fluor~chmlcals in blood.
A protocol should be written for sa~pltng of employees blood.
It will be necessary to have a method for analyzing FC-95, 1~-342Z and FC-143 in the food used in antra| studies.
Su~! tied by
R. A. Prokop
RAP:dr
attachcent
3MA100~7061
CONFIDENTIAL - SUBJECT TO A PROTECTIVE ORDER ENTERED IN HENNEPIN COUNTY DISTRICT COURT, NO. 27-CV-10-28862
3M MN00053076
1174.0003

Iii.sui.tnmn#
I E* I . iiu PONT DE NEMOURS G COMPANY
Wi LM I NGTON, DELAWARE 19898 I H C D * * D R ~ ? ~ O
E M P L O Y E 5 R'CLATIOMS DEPARTMENT
CC: B, W. Kar rh , H . D , V. A. Brewster, M.D. s. Pel1 W, A . Bower-PP&R-Parkersl R . ~yer-PP&R-Pa~kcrsburg G. A. Ploeger-PP&R-Parker R . M. Shepherd-PP&R-D-12(
I .
PERSONAL & CONFIDENTIAL August 28 , 1979
Y , L, POWER, M.D. P P & R DEPARTMENT PARKERSBURG, W. VA, MEDICAL SUPERINTENDENT, . .
STATUS REP,ORT ON t 7 A S H I N G T O N WORKS LIVER FUNCTION SURVEY AND CORONARY HEART DISEASE hlORTALITY STUDY
B . W. Karrh asked me to look i n t o t h e liver funqtim test r e s u l t s for w .o rke r s w i t h C-8 exposure, and Y. L, Power iasked me to examine myocardial i n f a r c t i o n cases and deaths at t h e Planr. S. Pel1 and €2. M. Shepherd agreed t h a t these i t e m s should be in- vestigated.
Ply preliminary results suggest t h a t C-8 exposed w o r k e r s may possibly have positive liver function t e s t s more o f t e n t h a n t h e p l a n t population as a w h o l e , and that the number of a c t i v e wage roll employees;- having myocardial ' i n f a r c t i o n s from 1974 '
th rough 1977 was somewhat h i g h e r than.was expected based on Company-wide experience, findings, t h e following steps are being taken:
@ 0 !:&
A s a c o n s e q u e n c e of these p r e l i m i n a r y
(1) Liver f u n c t i o n survey - Y. L. Power is having every t e n t h a c t i v e
employee's most recent SMA-12 t e s t results photocopied and sent to me. Included on each workerls SMA-12 sheet w i ' l l be name, the date t h e blood chemistries were done
* : *,,.k
and the worker's _,age .-:'ox - G . A. Ploeger is g a t h e r i n g exposure history records f o r every worker selected by Y. L.
Power above (over 2 2 0 workers ' ) . These e x - 8 posure histories will c o n t a i n the worker-'s name, social security number, birth date, and out of the Teflon area, and t h e job ~
Tef lon area.
'
2 Pa- a s s , date h i r e d , dates in a
I-, . titles held during each period spent in CD
-G
E w a
ED0802 14 . . ...
Kris Thayer
Ply preliminary results suggest t h a t C-8 exposed w o r k e r s may possibly have positive liver function t e s t s more o f t e n t h a n t h e p l a n t population as a whole, and that the number of a c t i v e wage roll employees;- having myocardial ' i n f a r c t i o n s from 1974 ' through 1977 was somewhat h i g h e r than.was expected based on Company-wide experience, findings, t h e following steps are being taken: @ 0 !:& As a consequence of these preliminary

’fill i~ DP~FT
April 15, 190i
related fluoroehumical£ affected eye dev~lop~eat i~l the ~etus~& of
according to Ph~l Raths~ manager of the Chemical R~source~ Division
The: x:ome.n are being reu~signed to jobs in the .’,dSaccnt 3Y I’ii~n
1253.0001 3MA00047947

-30-
1253.0002 3MA00047948

Internal Correspondence
CONF ID~NT IAL
From:
Subject:
Date:
F. D. GRIFFITH - MEDICAL - 220-2E-02 L. F. LUDFORD - CORPORATE INFORMATION - 225-5N-04 W. C. MCCORMICK - MEDICAL - 220-2E-02 D. E. ROACH, M.D. - MEDICAL - 220-2E-02
F. A. UBEL, M.D. - (3-5181) -MEDICAL - 220-2E-02
Phone conversation from Dr. !’cKusick - DuPont - ].2/14/8~~
December 14, 1981
"This is what we are going to tell our employees and we are going to start telling them at 1:00 o’clock on Wednesday, December 16."
"On April 1 we advised you that 3M in a preliminary study had observed birth defects in the eyes of unborn rats when C-8, also known as FC-143 or ammonium perfluoro- octanoate, was fed to pregnant female rats. Based upon thosefindings, we decided it was necessary to exclude female employees of childbearing capability from areas where there is potential for exposure to C-8. We indicated further studies by DuPont and 3M would be undertaken promptly to determine the signifi- cance, if any, of the findings as they might relate to employee exposure. We would like to share with you the results of these studies that we have today."
"Thus far, based on our review of the results of the further studies, it does not seem that the observed effects on the eyes of the unborn rats were due to C-8. Also, in the new studies, rat pups delivered by C-8 exposed females showed no eye defects. Rather, it is believed that in the Original studies, 3M’~ technique for the very difficult job of preparing the fetal eye tissue for microscopic examination resulted in the alterations noted".
"3M has another toxicological test underway that will be completed in the first quarter of 1982. At that time we expect to have all the data available and will assess if it is necessary to continue excluding female employees of childbearing capability from areas of potential exposure. Until final determination is made, we con- tinue to advise that employees defer giving blood until the blood level of C-8 returns to background levels. We also advise that females who have an organic flouride level above background should consult with their personal physician prior to contemplating pregnancy. We will provide all information we have on C-8 to employees’ personal physicians".
FAU:mam¢~~~~
1266.0001 3MA00257805

TO: R. L. BOHON - ENVTRONMENTAL LAB (EE&PC) - 21-2ki-05 M. T. CASE - RIKER SAFETY EVALUATION - 218-3S-03
J. D. JOHNSON - RIKER DRUG METABOLISM - 270-3S-05 W. C. MCCORMICK - TOXICOLOGY SERVICES - 220-ZE-02 A. M. NORBERG - I&CS R&D REGULATORY AFFAIRS - ZZ3-5N-06 W. H. PEARLSON - CONMERCIAL CHENICALS DIV. - 223-6S-04 P. F. RIEHLE - CHEMOLITE FACTORY ADMINISTRATION - 41-1 D. E. ROACH - MEDICAL DEPARTMENT - Z20-2E-02 T. J. SCHEUERMAN - OFFICE OF GENERAL COUNSEL - 220-12E-02 W. F. gCOWN - COI~qERCIAL CHEMICALS DIV. MARKETING - 223-5S-04 S. D. SORENSON - INDUSTRIAL HYGIENE - 220-2E-0~ J. K. SUGG - INDUSTRIAL HYGIENE ADM. - 220-2E-02 A. C. WEST - COt’gqERCIAL CHEMICALS LAB - 236-2B-01
F. D. Griffith - Toxicology Services - 220-2E-02 D. F. Hagen - Gen. Res. Analytical Services - 201-IW-29 L. C. Krogh - Executive - 220-14W-03 J. D. LaZerte - Commercial Chemicsl Lab -236-IB-21 S. M. Leahy - Executive - 220-13E-33 J. J. McKeown - I&CS R&D Administration - 220-4E-01 R. E. Ober - Riker Drug Metabolism - 270-3S-05 F. A. Ubel - Medical Department - 220-2E-02
1279.0001 3MA10067173

TO LIST From: A. M. NORBERG - I&CS R&D REGULATORY AFFAIRS - 223-5N-06
W. H. PEARLSON - COMMERCIAL CHEMICALS DIV. 223-6S-04 Su~ecl
Minutes of Fluorochemical Study Committee Meeting, March 16, ]983 Dale:
April 8, 1983
The Fluorochemical Study Committee met on March 16, 1983 with the following members and invited participants in attendance:
R. L. BOHON - ENVIRONMENTAL LAB (EE&PC) - 21-2W-05 * M. T. CASE - RIKER SAFETY EVALUATION - 218-3S-03
R. J. DAVIS - OFFICE OF GENERAL COUNSEL - 220-12E-02 J. D. JOHNSON - RIKER DRUG METABOLISM - 270-3S-05
* W. C. MCCORMICK - TOXICOLOGY SERVICES - 220-2E-02 * A. M. NORBERG - I&CS R&D REGULATORY AFFAIRS - 223-5N-06 * W. H. PEARLSON - COF~IERCIAL CHEMICALS DIV. - 223-6S-04 * P. F. RIEHLE - CHEMOLITE FACTORY ADMINISTRATION - 41-! * D. E. ROACH - MEDICAL DEPARTMENT - 220-2E-02
T. J. SCHEUERMAN - OFFICE OF GENERAL COUNSEL - 220-12E-02 W. F. SCOWN - COI~4ERCIAL CHEMICALS DIV. MARKETING - 223-5S-04
* S. D. SORENSON - INDUSTRIAL HYGIENE - Z20-2E-02 J. K. SUG6 - INDUSTRIAL HYGIENE ADM. - 220-2E-02
* A. C. WEST - COI~ERCIAL CHEMICALS LAB - Z36-2B-O!
*Members of Fluorochemical Study Committee
The Committee met to review the current status of "fluorochemicals (FC)-in- blood" and discuss future FC worker monitoring and laboratory research directions.
Bill McCormick (Toxicology Services) reviewed toxicity studies completed and on-golng. He sulmnarized the FC toxicity standing today as:
Building a stronger data base to describe the results of toxicity testing of FC. The results from teratogenicity studies are not cause for concern. Fluorochemicals are not mutagenic and to date not carcinogenic.
In follow-up discussions he suggested those areas for potential animal in vitro research with highest priority given to:
First: platelet aggregation effects
Second: immunosuppressive effects Third: male reproductive effects or Third: hemopoetic system.
1279.0002 3MA10067174

Minutes of Fluorochemical Study Committee Meeting March 16, 1983 Page 2
Jim Johnson (Riker Drug Metabolism) reviewed FC metabolism studies and stressed the significant increased experience 3M has gained with methods that will greatly facilitate future research activities.
Summarizing his research, Johnson stated radiometric data from small numbers of rats indicate:
FC-807 absorption after oral administration is due mostly to absorption of the monoester. FC-95, FC-143, and N-ethyl FDSE are well absorbed after oral administration. The anions of FC-95 and FC-143 and metabolites of N-ethyl FOSE are slowly excreted, Cholestyramine treatment for several days enhances fecal elimination of radioactivity and decreases plasma and liver radioactivity after administration of labeled FC-95 or FC-143. In addition, probenecid appears to enhance urinary elimination of the anion of FC-143.
Don Roach (Medical Department) presented a summary of the clinical work and future planned medical activities.
Clinical Work: Epidemiology mortality study results revealed no adverse deaths, slightly decreased incidence of coronary heart disease (CHD), and the healthy worker syndrome. Clinical Health Evaluation continues with 80-90% voluntary participation.
- Decatur Control Study results were presented.
- Blood fluorine testing using Dr. V’s biphenyl system. Generally the worker’s blood fluorine levels are falling. In some specific areas where opportunities for higher exposure exist, the workers’ fluorine blood levels have dropped at a slower rate and in a few incidences leveled.
Future Planning Includes: Phase II Health Evaluations changed to every two year basis, from more frequent intervals.
Epidemiology to be brought up-to-date using records accumulated during last five years. Leonard M. Schuman did oPiginal FC study. 3M would contract with him for update. Assessment in higher exposure areas of ways to reduce further exposure, for example through personal hygiene and engineering modifications.
Roach will continue to monitor the health of 3M workers through the clinical Health Evaluations (every two years) and the FC levels of workers with 5-10 ppm in blood (every six months).
He expressed concern that the FC in worker’s blood is not falling to the extent anticipated, and he asked if further reduction in worker exposure could be accomplished.
1279.0003 3MA10067175

Minutes of Fluorochemical Study Committee Meeting March t6, 1983 Page 3
GENERAL RECOMMENDATIONS EMERGING:
Continue to monitor workers’ health and FC blood levels by Health Evaluations--that is, physical examinations every two years. Measure FC in blood every six months in workers with FC levels greater than 5 ppm.
Advise workers through meetings to continue reducing FC exposure by different handling procedures and through altered persona] hygiene.
- Eliminate dried FC materials in plant environment, if possible.
- Schuman should update epidemiology study.
- Investigate engineering modifications in higher exposure areas.
- In workers with higher FC blood levels (e.g., 15 ppm and greater), specific organic fluorine compounds in blood should be identified.
RESEARCH QUESTION POSED:
What are the specific organic fluorine compounds in blood of workers? This involves working with Don Hagen (CRL) to see if it is feasible to adapt Hagen’s gas chromatographic/Helium Microwave plasma detector (GC/MPD) system to worker blood samples. It is crucial to initiate this soon since larger volumes of blood will need to be drawn during the current and on-going Health Evaluations to accommodate these further studies.
SPECIFIC RECOMMENDATIONS:
Once we know the specific organic fluorine compounds in workers’ blood, efforts to relate human metabolism of FC to anlmal metabolism of FC should continue.
Although a data base on metabolism and toxicity of FC in rats has been started, further toxicity studies might be suggested from identi- fication of specific compounds in human blood and urine samples if these compounds have not been previously studied in toxicity tests. In addition, specific questions as to protein binding, body burden and the possibility of affecting the rate of elimination may be further addressed by experiments in the metabolism laboratory.
It was agreed that we need to continue the Health Evaluation monitoring program and laboratory research programs to try to elucidate the effects 3M’s FC have on our workers and potentially on consumers using our products.
A. M. Norberg Secretary Fluorochemical Study Committee
W. H. Pearlson Chair Fluorochemical Study Committee
1279.0004 3MA10067176

~ CO: ~. Ahlness - Spec. Chem. - 223-6S-04 : ; D, D. Dworak - Che~, Fluoro Mrs. Che~ol~te Center - A. K~dlehoover ~. D. ~renson - M~ic~, Ind. ~iene Se~. - 2~0-2~0E
D. Fong
~ ~gineering controls to reverse this trend.
RLA -
To: P, F. ~E - SP~Z~TY CH~IC~ DIVZBZOR~CR~OL~E~ hl-i
F~om: D.E. ROACH, M.D. - MEDICAL SERVICES
August 31, 198~
months - ~_tendency for these levels in a number of ~eoDle to no
~a~llng ’~ro~ur~s, pro;er Use ’o~ prot~ti~e-~ulpmen~,
beln~ seen, UnZO~Kt~y, o~ s~plin~ h~ n~ ~w~ s~tlcient t~e ~ elapse slnc~ you inltiat~d a ~or pr~r~ %o revlew ~rsonn~ ~li~ of fluor0ch~ic~s. T~refore~ o~ most
I ~ enclosing some copies of the slides that demonstrate the above sltuatlo~. As soon as we receive the recent test samplin~, we will ~ in con%~¢~ wlth you.
AS~achmen~ S
Exhibit 1313
State of Minnesota v. 3M Co.,
Court File No. 27-CV-10-28862
3M MN03269963
1313.0001

4O
35
Cr~w A
CONFIDENTIAL - SUBJECT TO A PROTECTIVE ORDER ENTERED IN HENNEPIN COUNTY DISTRICT COURT, NO. 27 C\/-1 fl-gRRR9
1313.0002
3M MN03269964

35,
3O
5
Crew B
1981 1982
(~03588
CONFIDENTIAL-SUBJECT TO A PROTECTIVE ORDER ENTERED IN HENNEPIN COUNTY DISTRICT COURT, NO. 27 C\/-I~-gRRR9
1313.0003
3M MN03269965
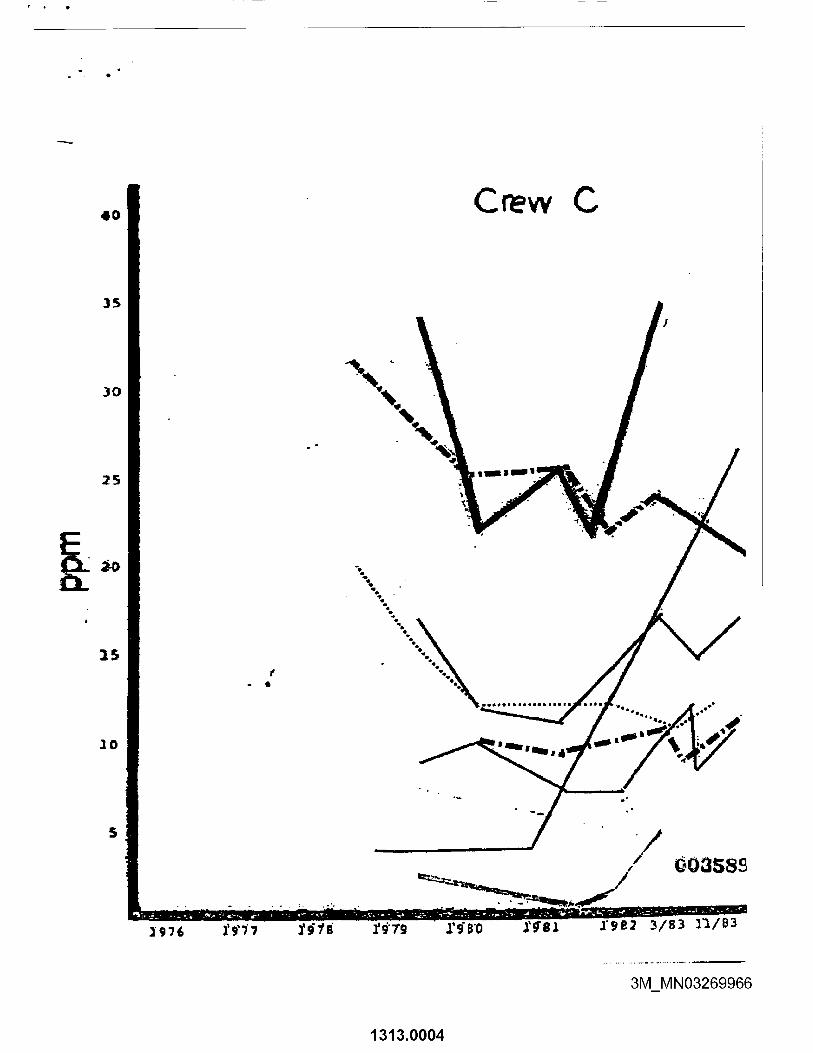
35
~5
35
5
f
Crew
I982 3/~3 3"J./B3
3M MN03269966
1313.0004

__ pc/'/)
C-9 �PLING (1'1ARCH - J�E 1984)
LOCAT I CN
PKSBG-Ho-1E TAP
�-DRINK F'TN
DI ST . CTR-WELL
�SHINGTCN-STORE TAP
LUBECK-STORE TAP
�. HOCKING-STORE TAP
BELLEVILLE-PRilJATE �ELL
REEDSVILLE-STORE TAP
RAVEN�OOD-STORE TAP
RACINE-STORE TAP
POINT PLE�SA'-IT-STORE TAP
GALLIPOLIS-STORE TAP(*)
DISTANCE (HILE$)
7.5 UPSTREJ)l-1
0.25 DCJ.,N
3
12
14
29
74
79
D°""
c-e PPJ(Q,6 LIMIT)
<
<
<
l.2,l.O
1.�
0.9,0.6
<
<
<
<
<
<
C*) NEAREST CCH1Ll'HTY TO TAKE WATER DIRECTLY FR01 OHIO RIVER.
EID103022
> :.,:;
Susan Staley

Phone Conversation Report
U
.... n n n .......... : ........... ±: ....
1342.0001 3MA10014327

UNIVERSITY OF MINNESOTA TVVlN CITIES
Division of Environmental and Occupational Health School of Public Health Box 197 Mayo 420 Delaware Street S.E. Minneapolis, Minnesota 55455
April 6, 1989
Larry R. Zobel, M.D. Staff Physician 3M Center Medical Department 220-2E-02 St. Paul, F~ 55144-1000
Dear Larry;
Enclosed please find the tables containing the results of the comparison with the Minnesota population. As I mentioned on the telephone, these must be interpreted cautiously because of the uncertainty regarding the Minnesota rates prior to 1959. Deaths among the study cohort occurred in 41 states; therefore, the U.S. rates may be more appropriate.
As you will see from the tables, the results are similar to those presented" previously which used the U.S. rates. The only consistent finding between the two comparisons is for prostatic cancer which we addressed in our initial report. For cancer of the digestive organs and peritoneum there was a statistical~y significant excess (SMR=176, 95% C.L.=I.09, 2.69) for the entire cohort. However, this was not found among the Clinical Division employees. Furthermore, no single site within the gastrointestinal tract was elevated suggesting that this was probably due to chance. Also worth noting is the fact that these are not sites typically associated with chemical exposures.
If you have any questions please feel free to call me at 626-4810.
~ sI ncerely,
J~S_. Mandel, Ph.D.
,~,~sociate Professor
HEALTH SCIENCES
Made Available by 3M for Inspection and Copying as Confidential Information: Subject to Protective Order In Palmer v. 3M, No. C2-04-6309
3MA00632313
1357.0001
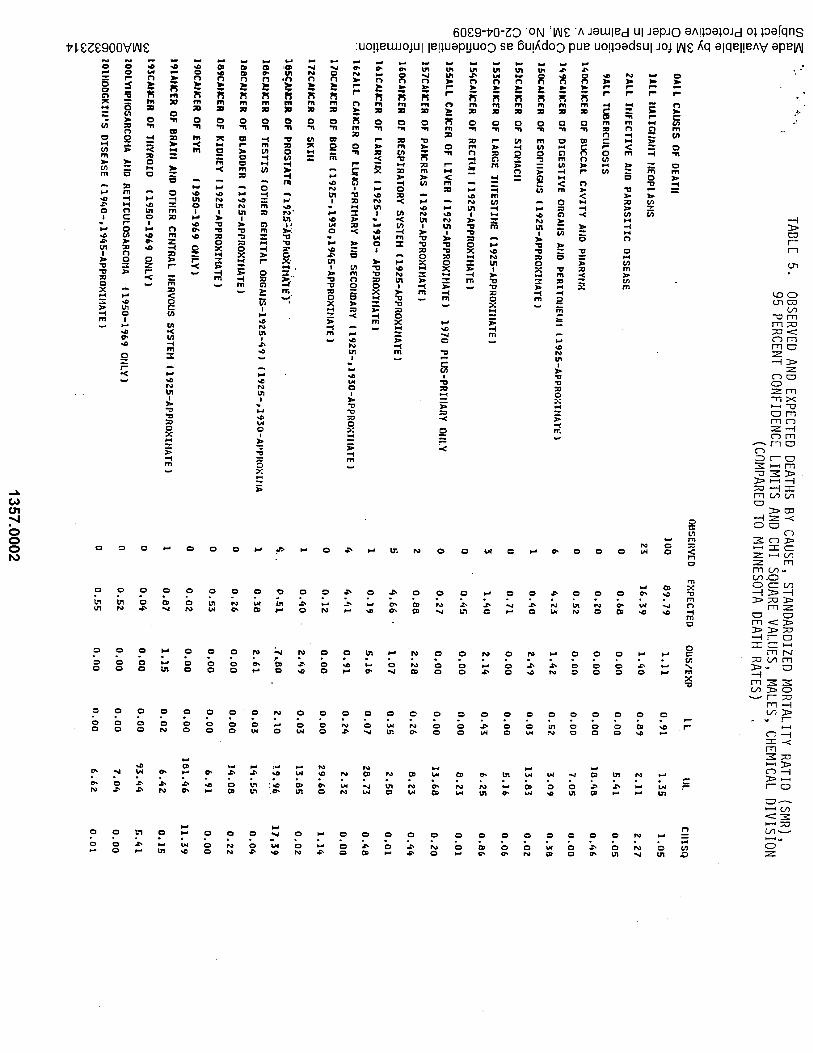
TADLE 5.
OBSERVED AND EXPECTED DEATHS BY CAUSE, STANDARDIZED M
ORTALITY RATIO
(SMR),
95 PERCENT CONFIDENCE LIMITS AND CHI
SQUARE VALUES, M
ALES, CHEMICAL D
IVISION
(COMPARED TO MINNESOTA DEATH RATES)
OALL
CAUSES OF D
EATII
JAIL I~LE
CI|A
IIT HEOPLASHS
2ALL
IHF
E£T
IVE
M
ID
PA
RA
SIT
IC
DIS
EA
SE
9ALL
~E
RC
UL
OS
[S
16
0E
M[E
R
OF
B~
CA
L
CA
VIT
Y
AIID
PIIA
RY
I~
I~gC
AI~
ER
O
F D
IGE
ST
IVE
OR
GAN
S A
rID
PE
RX
TOIIE
IJI! (1925-A
PP
RO
XII.IA
TE
I
]50C
M~
ER
O
F E
SO
PIIA
~
( 1925-AP
PR
O~
]HA
TE )
]5]C
MR
ER
O
F S
T~
-I~C
II
170CA
I~E
R
OF
BO
I|E
(19
25
-p1
93
0,1
9~
5-A
PP
RO
XZ
HA
TE
)
172CA
I~E
R
OF
SK
It!
!_6
~E
R O
F PROSTATE
186CA
I~E
R
OF
TE
ST
IS
(OT
IIER
GE
I|ITA
L O
RG
AI|S
-1925-~
9)
(1925-~
]9~
O_A
PP
RO
~[tlA
]08
CA
I~E
R
OF
BLA
DD
ER
|19
2~
-AP
PR
OX
Z|~
TE
)
]89
CA
t~E
R
OF
K/D
NE
Y
! 1925-AP
PR
OX
EH
AT
E)
190¢At~E
R O
F EYE 11950-1969 O
NLY)
19IM
~E
R
OF
BR
AZ
t] AfJD
O
TIIER
CE
HTR
AL
fiER
V~
S
SY
STE
H
11925-AP
P~O
XE
LIATE
)
~
19IC
kiE
R
OF
TilY
RO
ID
11950-1
969
OH
LY)
~
ZOO
LYIIP
IIOS
AR
C~A
MID
RE
TZCU
LOS
AR
CO
HA
11
95
0-1
96
9
OtlL
Y]
o
~
ZO
|IIOD
GK
III’S
DIS
EA
SE
(19~
O-~
19~
5-A
PP
RO
~II.|A
TE
)
o.1
OB
SE
ItVE
D
100
23 0 o o 1 o 3 0 0 Z 5 1 0 1 1 o 0 0 1 0 0 0
EX
PE
CTE
D
69
.79
16.3
9
0,6
8
O.Z
O
0.~
0
0.7
1
1.~
0
0.4
5
0.2
7
0.8
8
0.1
9
0.1
2
0.4
0
0.~
8
O,2
6
0.~
0.0
2
0.8
7
0.0
~
0.S
Z
0.~
5
OB
S/E
XP
LL
tJL C
IIISq
1.1
1
0.9
1
1.3
5
1.0
5
1.~
o
0.8
9
Z.ll
Z.2
7
0.0
0
0.0
0
5.4
1
o.o
s
o.o
o
o.o
o
18.~
8
0.4
6
o.o
o
o.o
o
7.0
5
o.o
o
1.4
2
O.~
Z
~.o
9
o.~
8
Z.4
9
0.0
3
13.8
3
O.o
Z
o.o
o
o.o
o
5.1
6
0.06
2.1
~
0.~
3
6.2
5
0.8
6
0.0
0
0.0
0
8,23 0
.01
0,0
0
0,0
0
13.6
8
0.20
Z.2
0
O.g
6
8.Z
3
0,~
4
1.0
7
0.3
~
2.5
0
0.0
1
5.1
6
0.0
7
28.7
~
0.4
8
0,9
1
0.2
4
Z,3
Z
0.0
0
O.O
0 0
.00
29.6
0
1.1
4
Z.~
9
0.0
3
13.8
~
0.0
2
.7~
80
2.1
0
1.9
,~
17
,39
Z.6
1
0.0
3
14
.55
0.0
4
0.0
0
0,0
0
14.0
8
0.2
2
0.0
0
0.0
0
6.9
1
0.0
0
0.0
0
O.O
O
181.~
6
11.3
9
1.1
5
O,O
Z
6.4
2
0.1
5
0,0
0
0.0
0
93.4
4
5.4
1
0.00 0
.00
7.0
~
0.00
0.0
0
0.0
0
6.6
2
0.0
1
1357.0002

20
~L
EI~
EIIIA
A
IID
ALE
UK
EIIIA
208CM
ICE
R
OF
OTIIE
R
LY
llPI|A
TIC
TIS
SU
E
(]95
0-1
96
9
OH
LY)
Z09A
LL LY
IIPIIO
PO
ZE
TIC
CA
tlCE
R
ZIO
BE
IIIG#I
HE
OP
LAS
IIS
IP[U
S
~S
PE
CIF
ZE
D)
ZqO
ALLE
RG
IC ~
EtiD
~R
ItlE ~tlE
~AB
OLIC
~t~
TR
ITIO
tlAL
DIS
EA
SE
S
( 1950-1
969
OrlI.Y
)
250DI~
BE
TE
S
HE
LLITU
S
280ALL
DIS
EA
SE
S
OF
BLOO
D
AIID
BLO
OD
-FO
RItIIIG
O
RG
AI]S (Ig
ZS
-~lg
]O_
AP
PR
OX
IIIAT
]IgI~
I~A
L~
PS
YC
II~IE
UR
OT
IC~
AIID
PE
RS
OH
ALITY
D
ISO
RD
ER
S
(1950-1
969
OrlLY
)
]20A
LL
DIS
EA
SE
S
OF
/IER
VO
US
5YS
TE
II AH
D
SE
IlSE
OR
GAN
S
]90
AL
L
DIS
EA
SE
S
OF
CIR
CU
LATO
RY
SY
STE
H
]9]C
IIR~
IIC
RIIE
~IA
TIC
IIEA
RT
DIS
EA
SE
(19
25
-AP
PR
OX
[HA
TE
)
~IO~R
TE
RIO
SC
LER
OT
IC
IIEA
RT
DIS
EA
SE
~ IH
CL
UD
]I~
CIID
(]92~
-AP
PR
O~
IIIA/E
)
~5OA
LL V
AS
CU
LAR
LES
IOIIS
OF
CN
S
~60AL
L
RE
SP
IRA
TOR
Y
DIS
EA
SE
S
{1925-=19]O
_AP
PR
OX
IHA
TE
)
~80A
LL P
IIE~
I~IIA
I 19
25
-tlg]O
-AP
PR
OX
IffAT
E )
~gZE
ItPIIY
SE
IIA
( 19
50
-~ 1955
AP
PR
OX
ItIAT
E )
qg~A
ST
IIItA
I ] 92
5- s 19]O
-AP
PR
OX
IHA
TE I
5ZO
ALL
DIS
EA
SE
S
OF
DIG
ES
TIV
E
SY
ST
EIf
~I]A
LL
GA
STR
IC
ArID
D~
DE
IIAL
ULC
ER
5~
]CIR
RII~
IS
OF
LIVE
R
580ALL
DIS
EA
SE
S
OF
GE
tiITO
-UR
INA
RY
SY
ST
Etl
-682cIIgOtllC
IIE
PIIR
ITIS
709ALL
DIS
EA
SE
S
OF
TIlE SKIP(
MID
CE
LLULA
R
TIS
SU
E
739ALL
DIS
EA
SE
S
OF
TIlE
BO
llES
AND
OR
GA
t|S
OF
tlOV
EIIE
NT
"79
9S
YIIP
TO
IIS,S
EIlIL
ITY
~A
I|D
ILL
DE
FII|E
D
CO
HD
ITIO
IIS
DO
OA
LL E
XI"E
RllA
L C
AU
SE
S
OF
DE
ATII
801ALL
AC
CID
EIlT
S
8]O
I~O
R
VE
IIICLE
A
CC
IDE
tlTS
)>.~
’~959S
UIC
IDE
0
0
TO
TAL
RESIDUAL
(.~
0
1 1
lOre 3
o~ 7 7
1 1
12 z 3 o o o 1 1
27 9 1
2.6
3
1.4
2
6.6
9
0.~
9
4.7
4
3.7
1
1.8
6
3.2
1
96
.73
2,8
9
72.8
8
10.5
8
8.6
8
3.0
9
O.q
3
11
.45
1,1
2
6,8
8
2.1
6
0.9
1
0.1
~
0.5
2
1.6
6
~2
.17
3~
,27
21
,~2
10
,86
-6~
,D8
0.0
0
2.1
1
O. 90
0.0
0
0.8
~
0.8
1
Z.Z
8
0.Sq-
O. 9~
1.0
8
1. o~.
1.1
5
0.6
6
0.8
1
0,9
7
0 2.3
4
1.0
5
1.7
8
0.0
0
D.O
O
0.00
0.6
0
0.8
8
0.8
9
1.2
6
0.8
3
-O.O
Z
0.0
0
0.3
3
0.0
0
0.2
3
0.1
6
0.0
3
0.0
1
0.1
9
0.88
O.Z
1
0.9
2
0.2
6
0.3
2
0.~
0
0.0
1
0.0
3
0 0.2
0
0.0
9
0.0
0
0.0
0
0.0
0
0.0
3
o.o
1
0.6
5
0.6
2
0.83
0.3
8
1.4
0
6.1
5
1.9
5
7.5
0
2.1
6
2.3
6
]2.6
8
3.0
0
Z.7
3
1.3
0
3,0
3
1.4
3
1.3
6
1.6
6
Z.8
~
Z.86
13.0
2
1.8
3
1.2
7
1.7
0
~.0
~
10
.78
1.1
8
1.2
~
1.8
3
1.5
7
1.7~>
0.8
1
0.0
1
0.0
0
0.0
1
0.0
1
0.0
1
O.0
7
0.0
3
OJ’,7
0,0
5
1.5
5
0.90
0.1
6
0.0
5
O. 10
O,O
l
0.0
0
0,1
3
1.6
6
1.2
7
0.1
8
0.9
2
0.0
0
0.0
1
0,6
Z
0.3
7
1.2
0
0.1
7
1357.0003
C.4tlC
ER
RE
~ZDU
AL
1357.0004

AGENDA C-8 REVIEW - APRIL 26. 1990
I. INTRODUCTION - HOWARD SMITH
II. TOXICITY STATUS - - GERRY KENNEDY
o RESULTS OF HASKELL TESTICULAR EFFECTS STUDY
o STATUS OF 3M STUDY - NOEL FOR LIVER EFFECTS
III. REVIEW OF ALL PERSONNEL AIR
MONITORING AND BLOOD DATA - HOWARD SMITH
IV. REVIEW OF AIR, WATER, LAND PROGRAMS - BILL CRAWLEY - CALVIN CHIEN
(HYDROGEOLOGIST)
V. PATH FORWARD - HOWARD SMITH
HAS/IS 4/3/90
EID924242
Source: https://www.industrydocuments.ucsf.edu/docs/xypw0228

INVESTIGATION OF HORMONAL MECHANISMS
FOR C-8 INDUCED LEYDIG CELL ADENOMA
MARK HURTT & JON COOK. HASKELL
0 IN THE TWO-YEAR 3M FEEDING STUDY, A DOSE-DEPENDENT
INCREASE IN LEYDIG CELL ADENOMAS (TESTICULAR TUMORS) WAS
OBSERVED. BECAUSE C-8 WAS NEGATIVE IN TWO SHORT-TERM
TESTS, THE MECHANISM OF THE TUMOR INDUCTION BY C~8 WAS
INVESTIGATED. SPECIFICALLY, THE EFFECT OF C-8 TREATMENT
ON THE HORMONAL STATUS WAS EXAMINED.
o THE RESULTS FROM THE STUDY SUGGEST THAT THE INDUCTION OF
LEYDIG CELL ADENOMA BY C-8 IS HORMONALLY MEDIATED.
o ALTHOUGH THE DATA FROM THE STUDY WAS FAR FROM FIRM OR
COMMANDING, THE STUDY SCIENTISTS DID FEEL IT DID NOT
PRECLUDE A HUMAN ROUTE FOR TESTICULAR TUMORS.
o THIS STUDY IS SUPPORTIVE OF THE LOW LEVEL BENIGN
TESTICULAR TUMORS IN THE 3M STUDY AND SUPPORTS OUR
EXISTING LOW AEL.
HASMITH/IS
4/12/90
EID924243
Source: https://www.industrydocuments.ucsf.edu/docs/xypw0228

Du PONT HUMAN RESOURCES Wilmington, Delaware 19898
CONFIDENTIAL
Y.L POWER, M.D.
WASHINGTON WORKSPOLYMERS
cc: A.J. Playtis GA Ploeger
W.E. Fayerweather {letter only)
August 28, 1992
WASHINGTON WORKS - SURVEILLANCE DATA MORTAU]Y AND CANCER INCIDENCE
As requested, attached for Washington Works are results of cancer incidence surveillance for 1956--1989 and mortality survelllance for 1957-1991. These data are generated from Du Pont's Company-wide epidemiologic surveillance program.
To assist in your interpretation and evaluation of the findings. I've included a desaiption of the methodology used . Accotnpanying the surveillance tables is a summary of the major findings. If these findings include a statistically significant excess(es). futher follow-up may be recommended.
Please call me at 773-4552 after you have had a chance to review the surveillance results so we can discuss what additional follow-up, if any. is warranted.
,..-·,
�w�JUDY WALRATH EPIDEMIOLOGY SECTION N-11510773-4552
Better Thing5 for Beller Living HR·l m,: 1,
AJP009997
AJP009997
1376.0001
Exhibit
1376 State of Minnesota v. 3M Co.,
Court File No. 27-CV-10-28862
3MA00748630
L
A THESIS SUBMITTED TO THE FACULTY OF THE GRADUATE SCHOOL
OF THE UNIVERSITY OF MINNESOT. BY
FRANK DAVIS GILLILAND
IN PARTIAL FULFILLMENT OF THE REQUIREMENTS FOR THE DEGREE OF
DOCTOR OF PHILOSOPHY/ENVIRONMENTAL HEALTH
OCTOBER, 1992
1
' I I
3M MN03112178

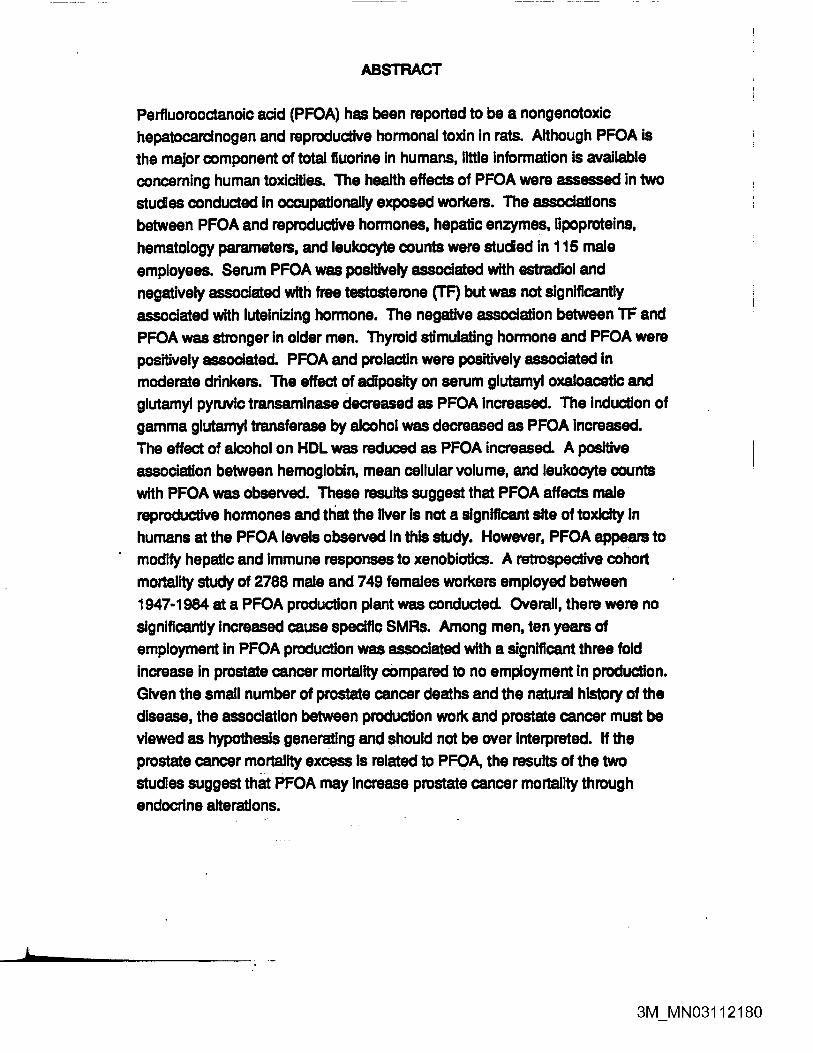


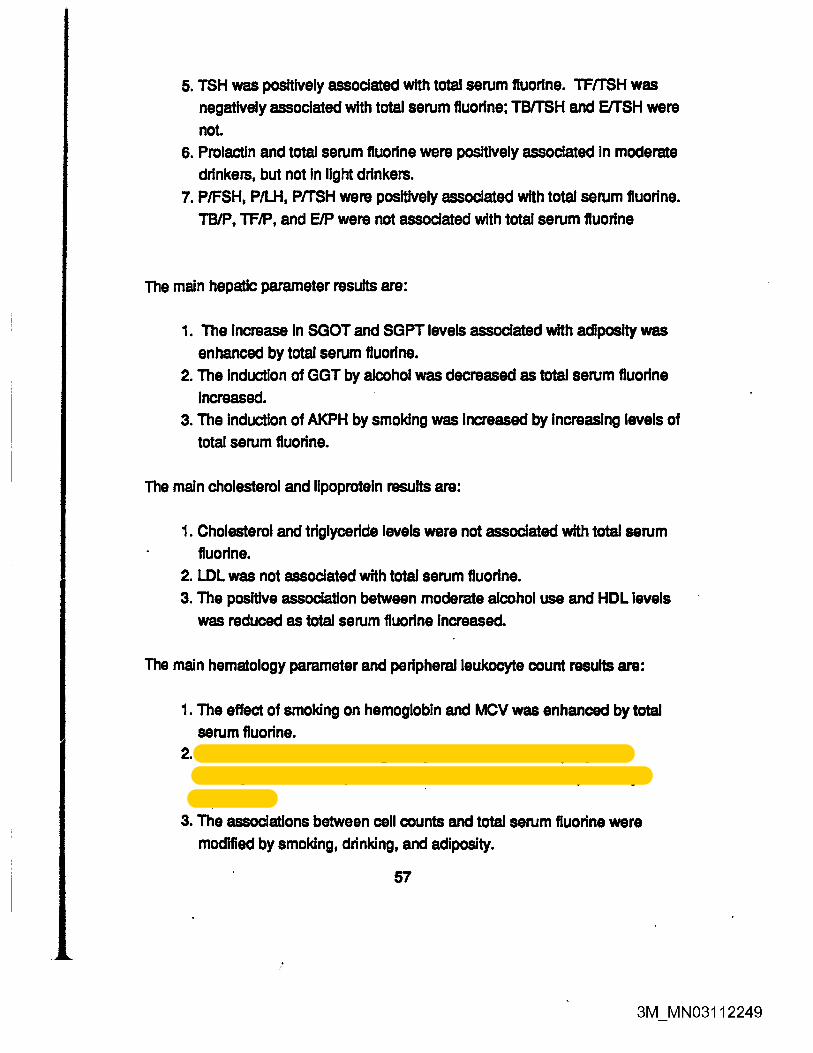


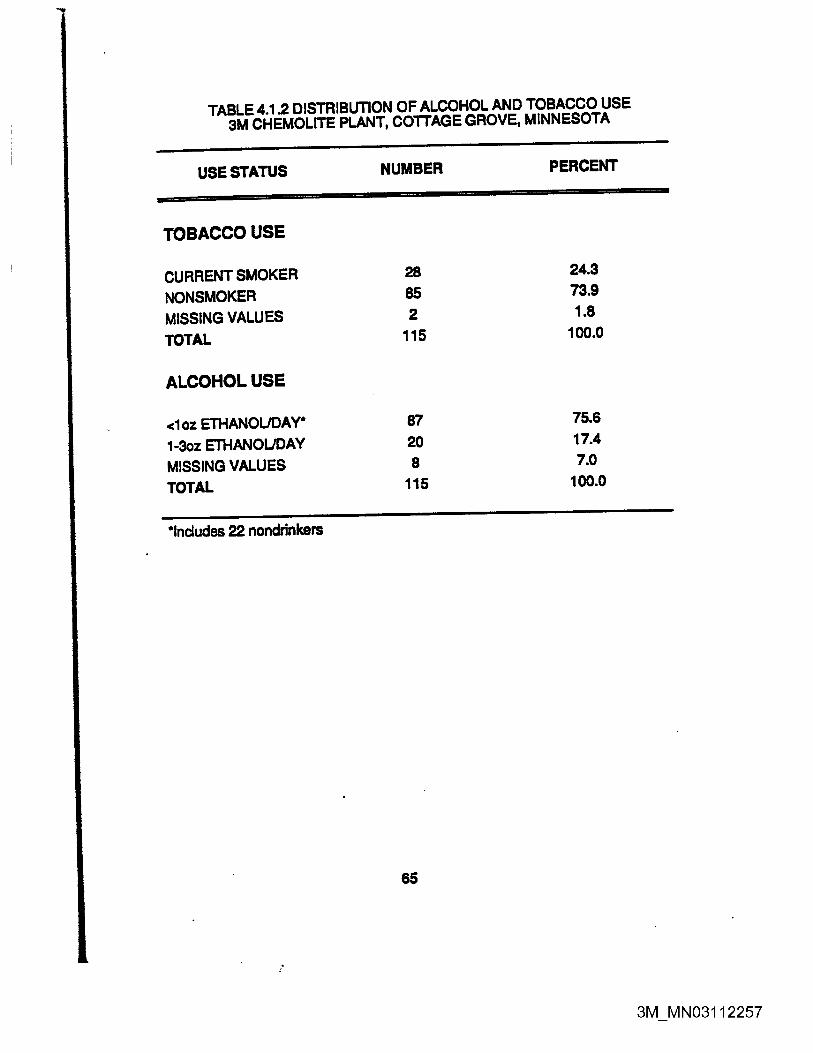
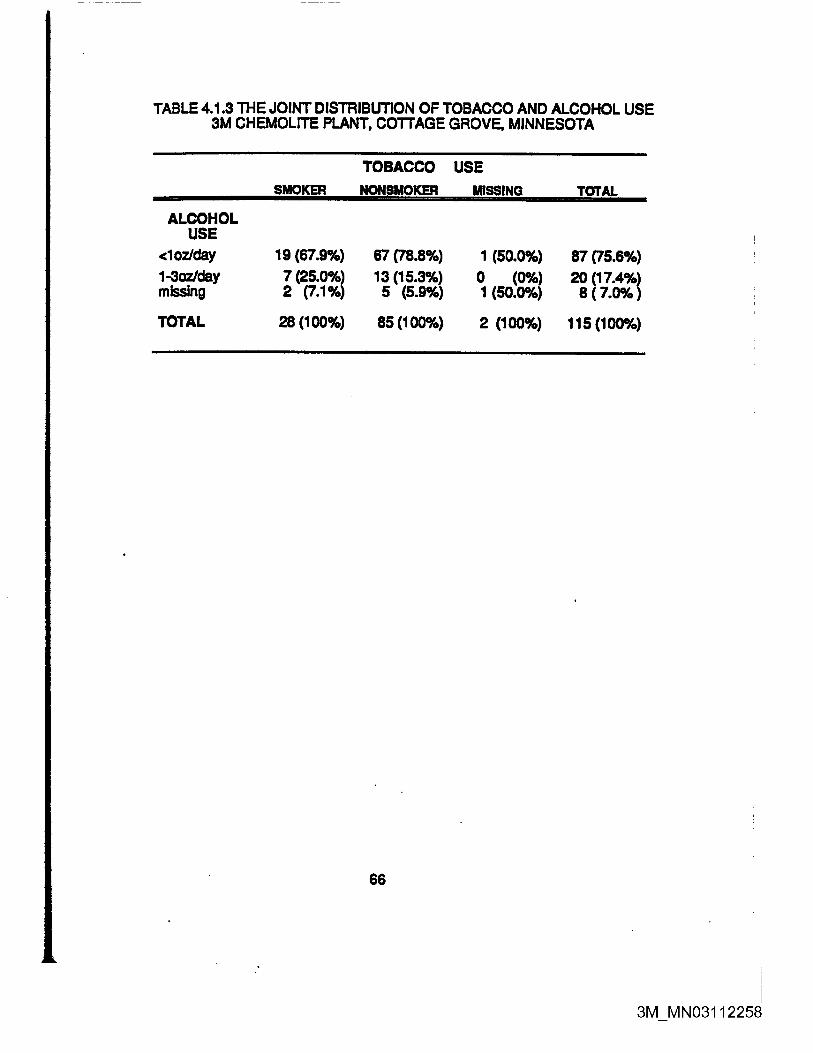


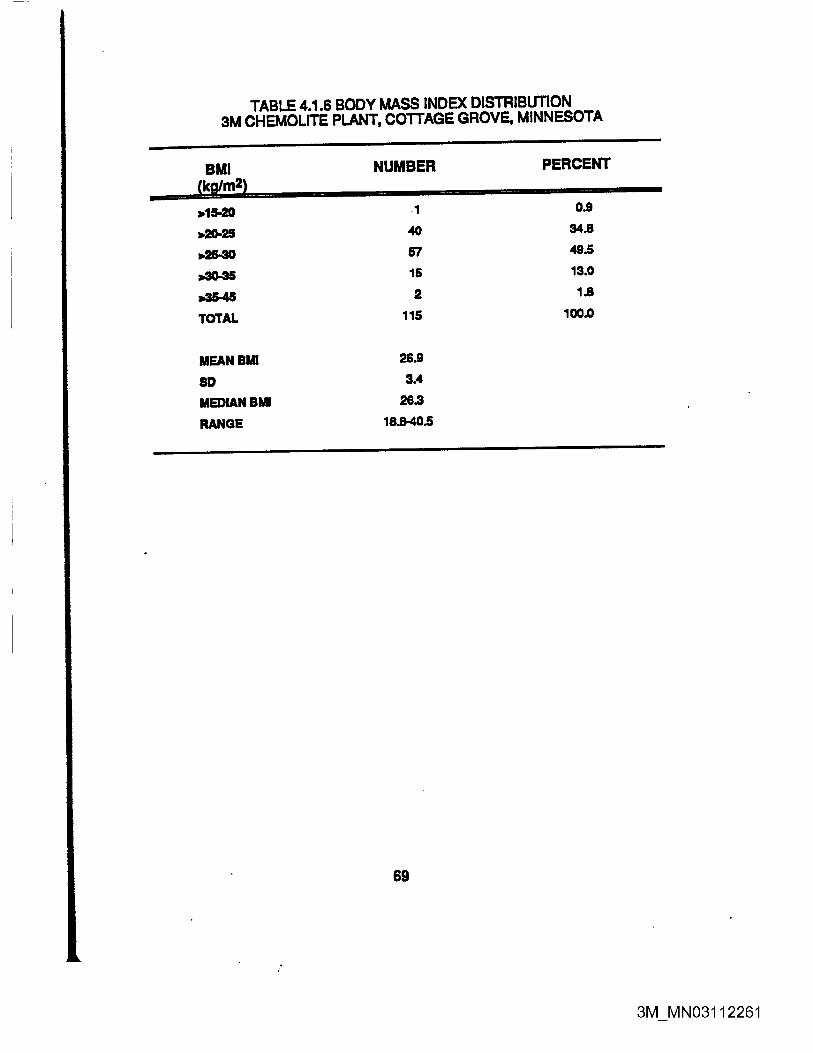


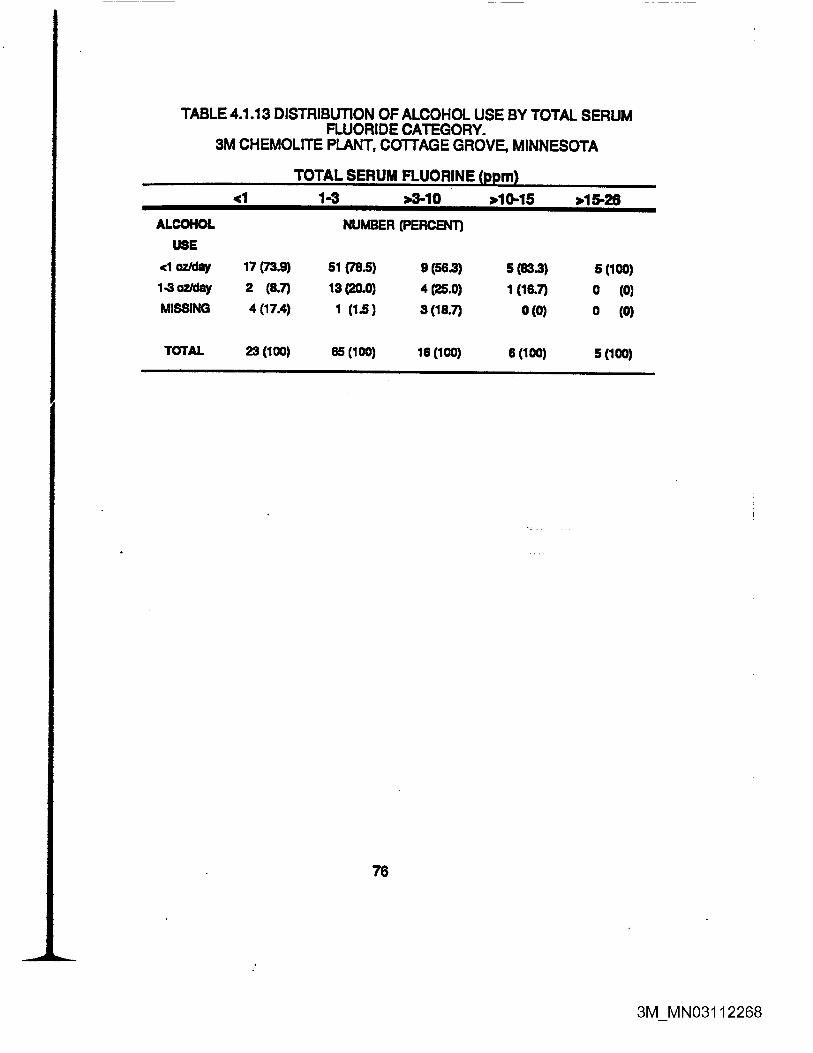

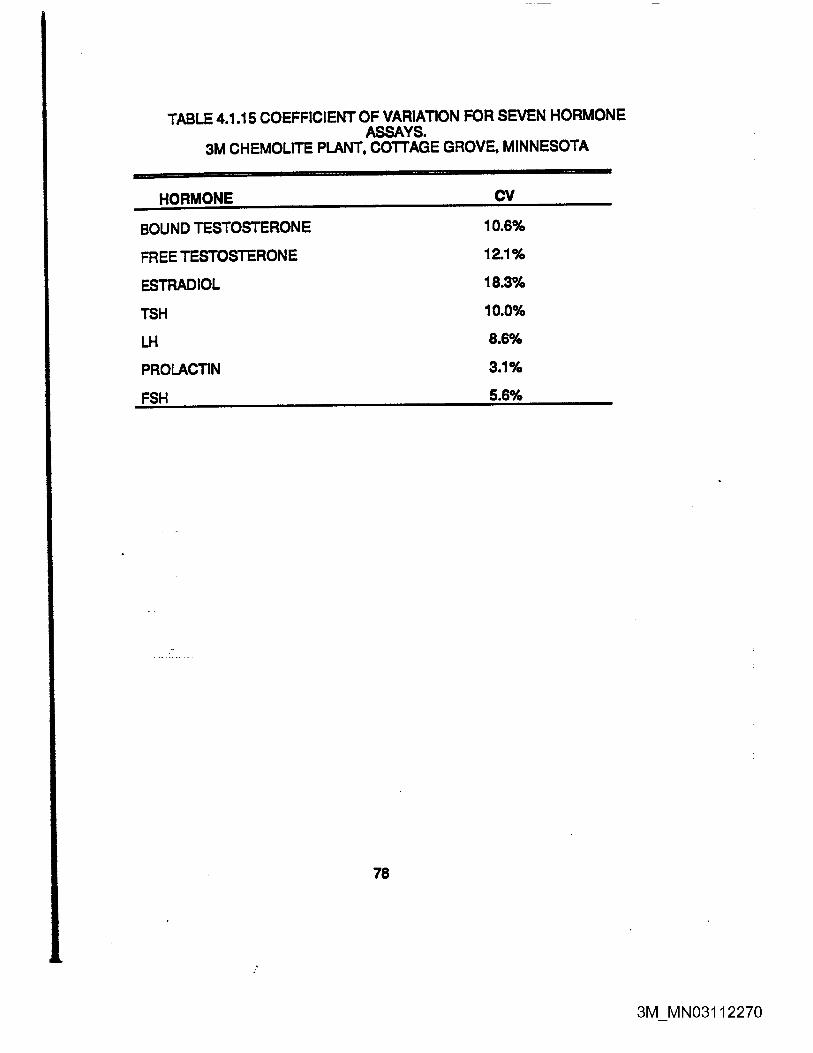

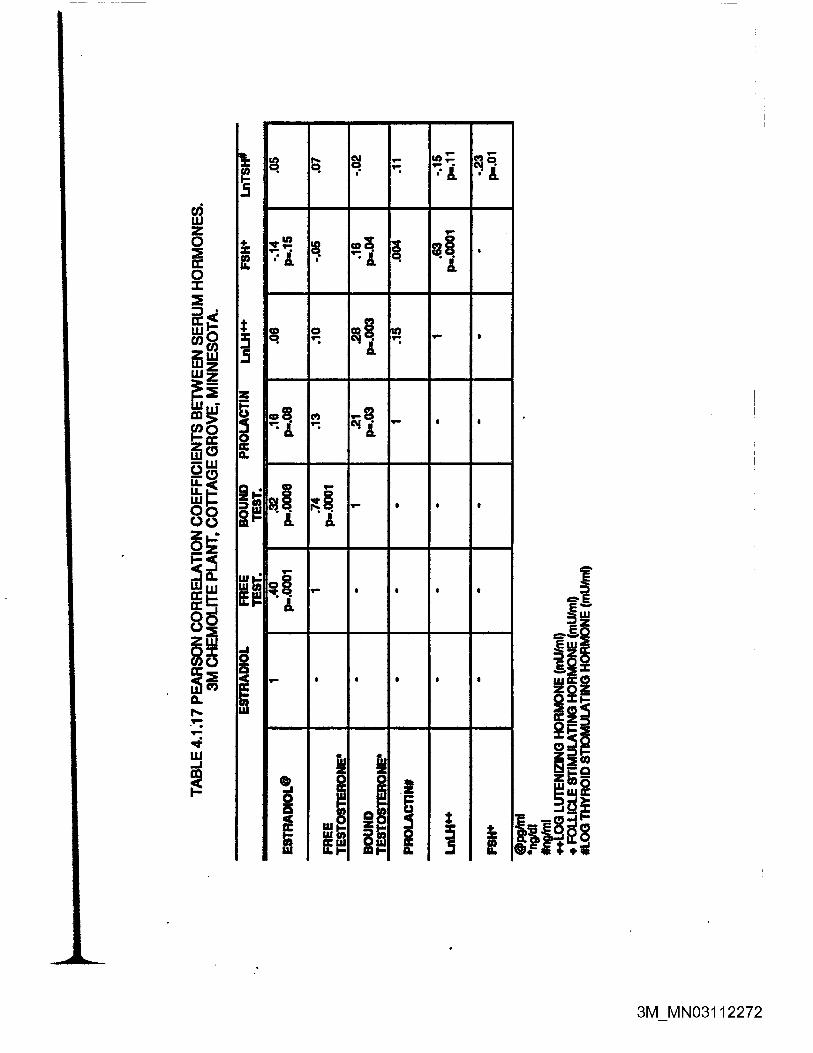


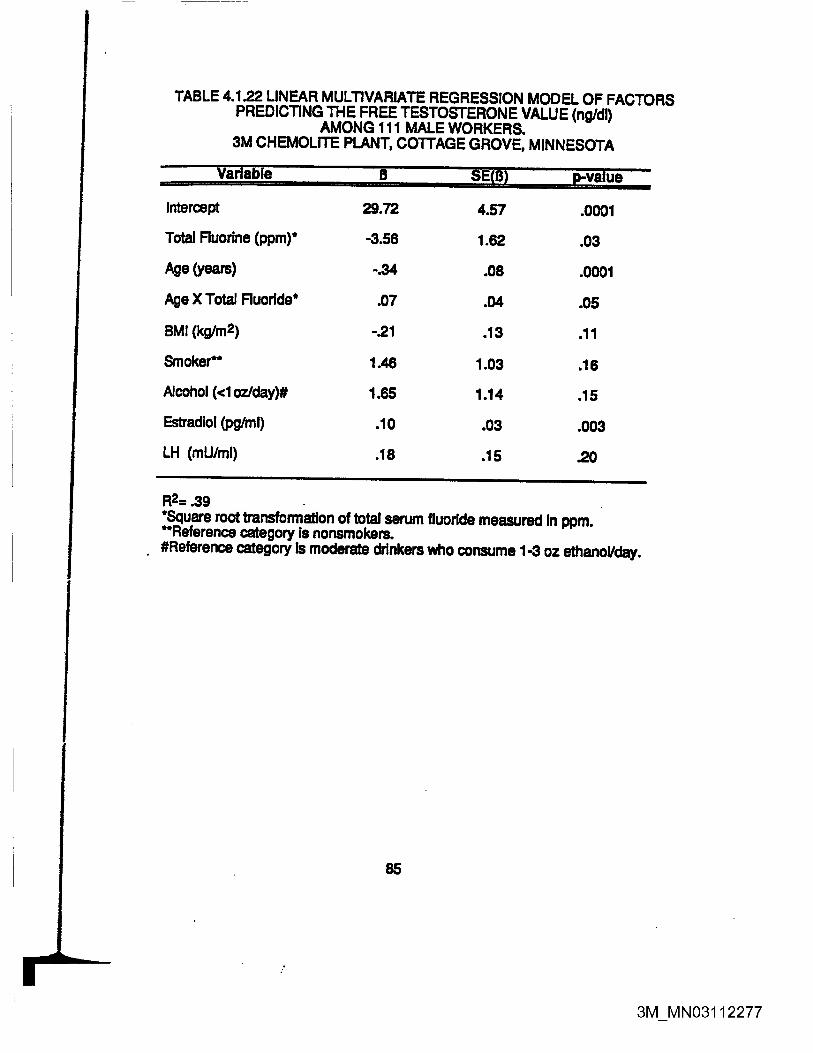


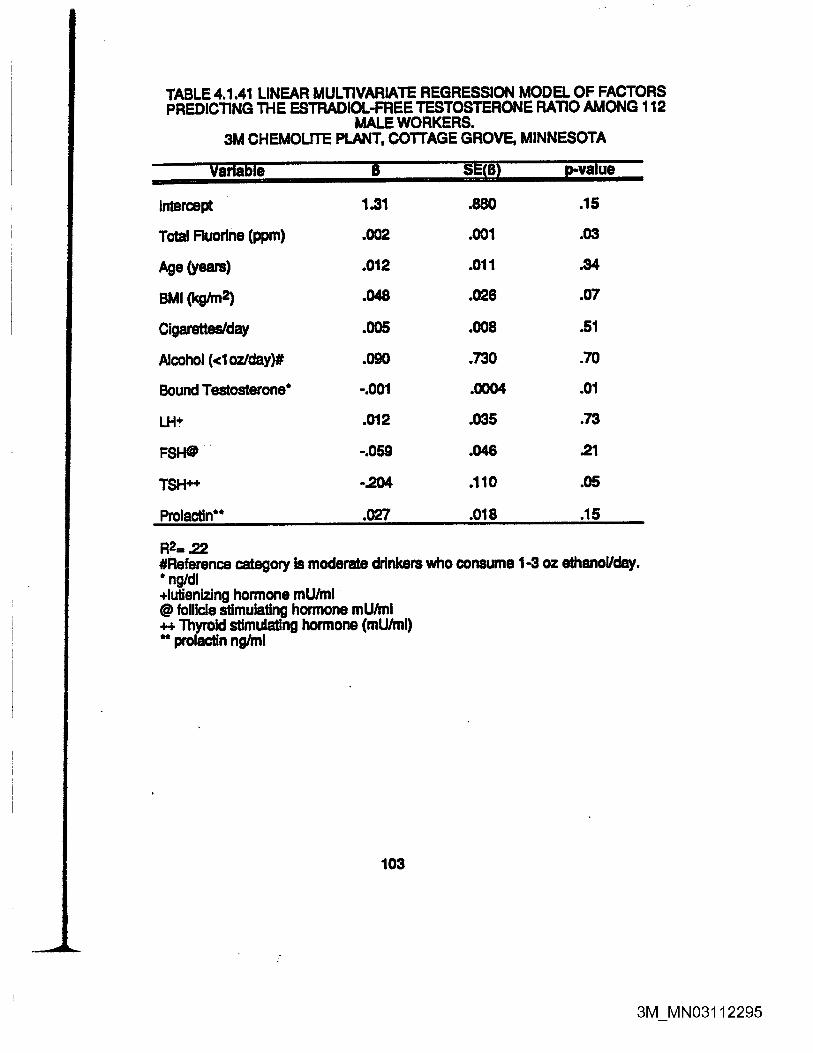


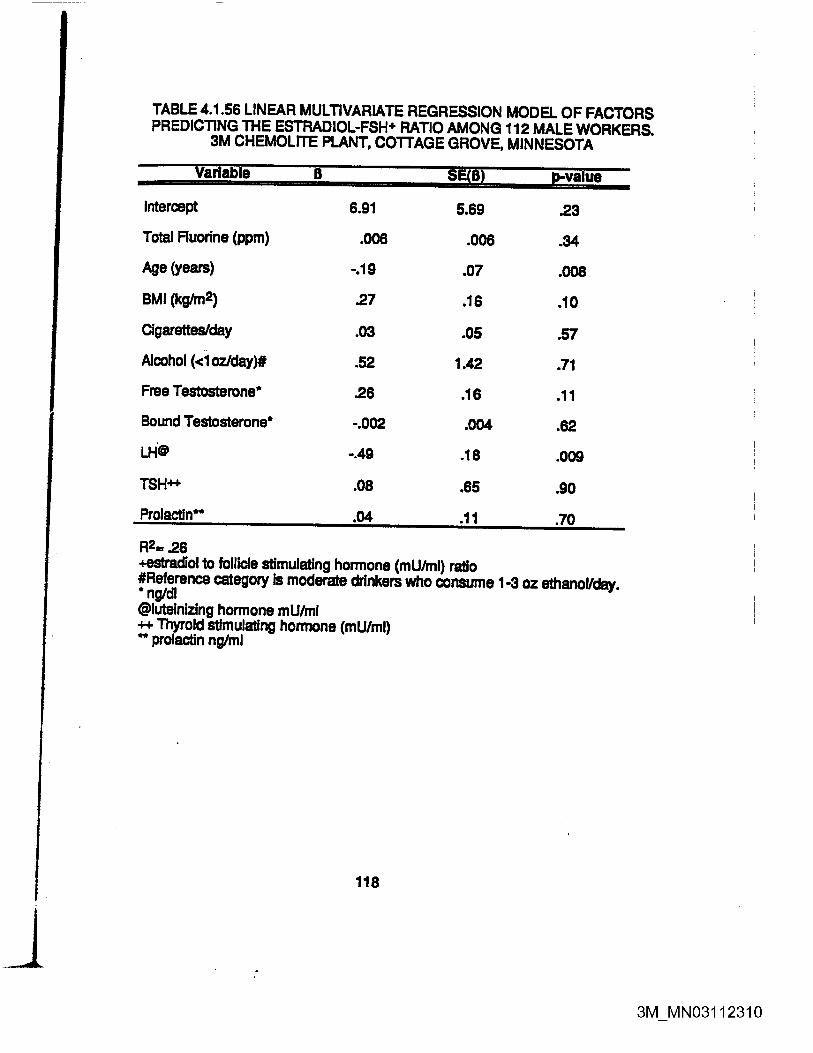


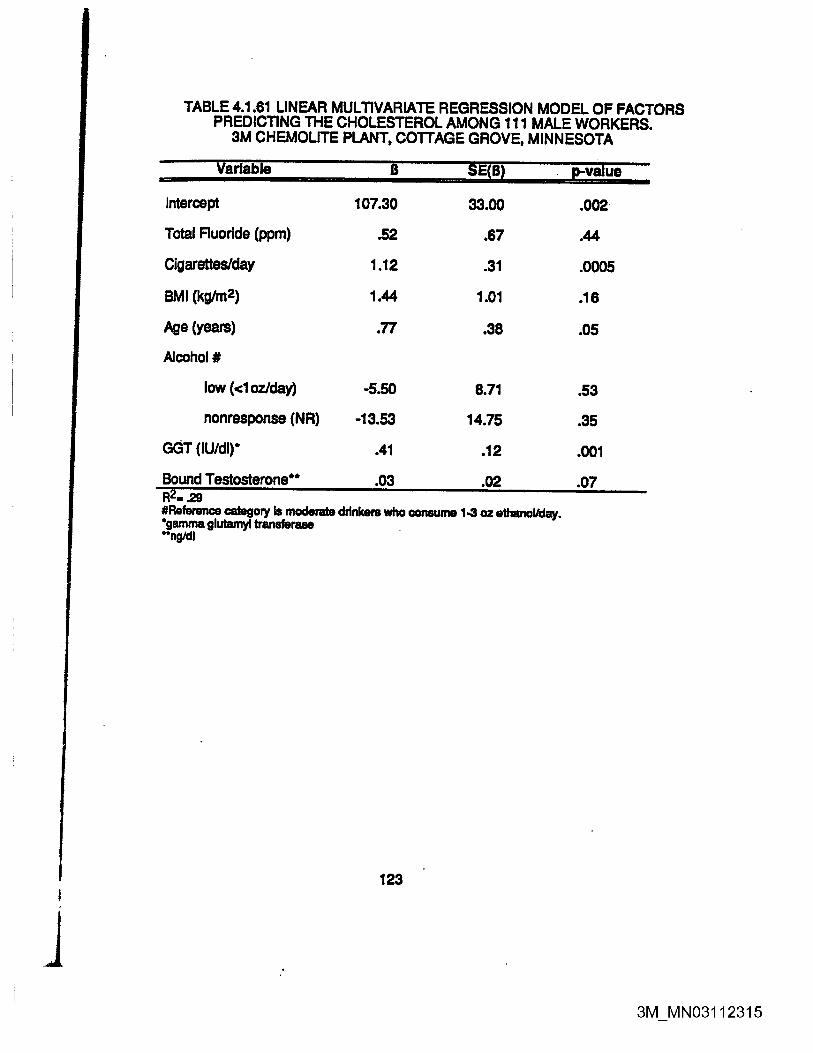
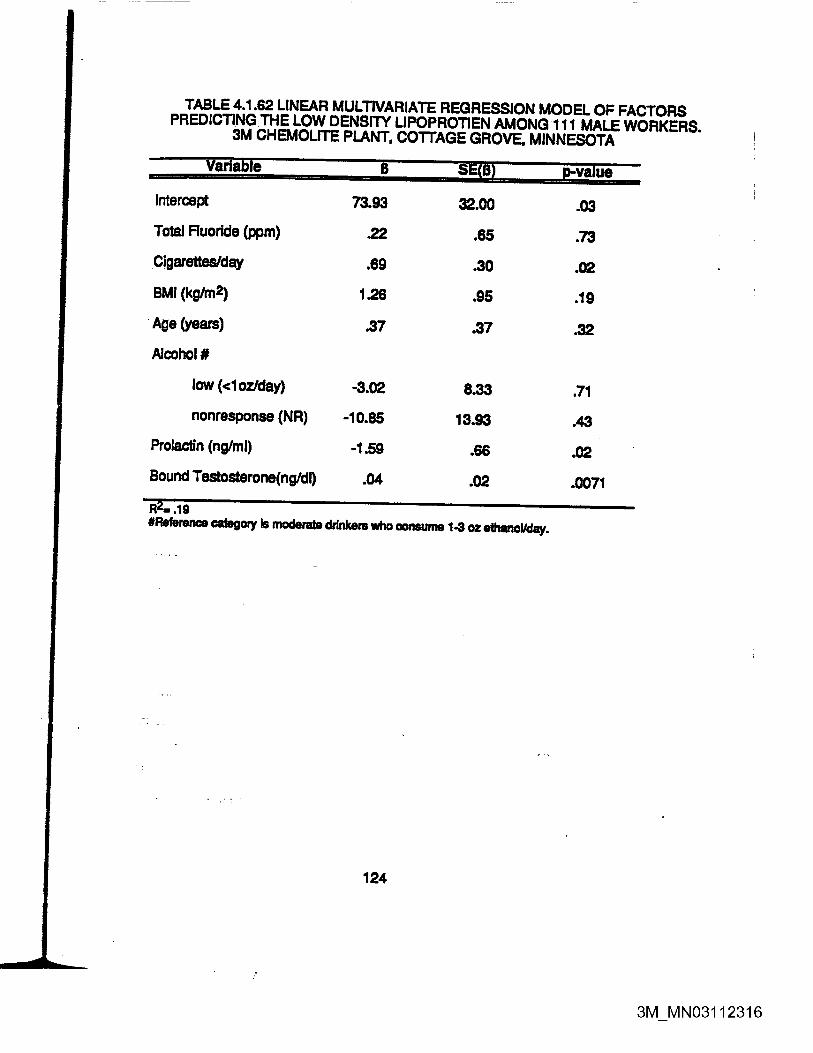


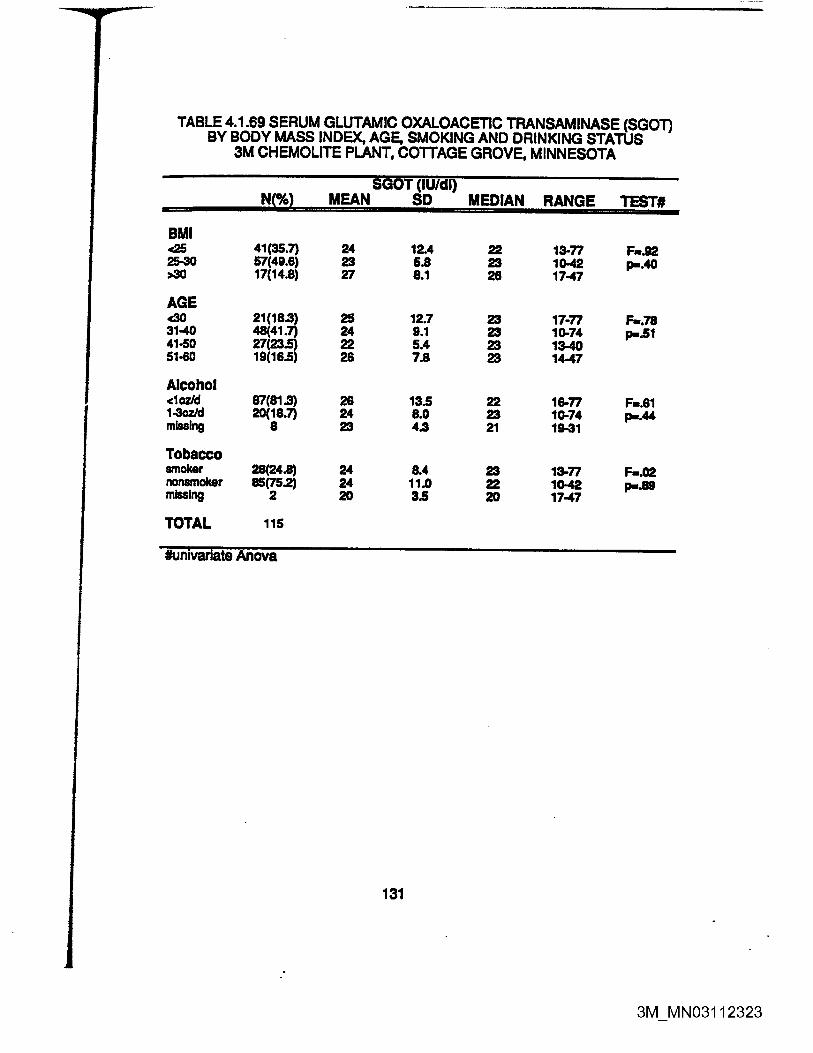


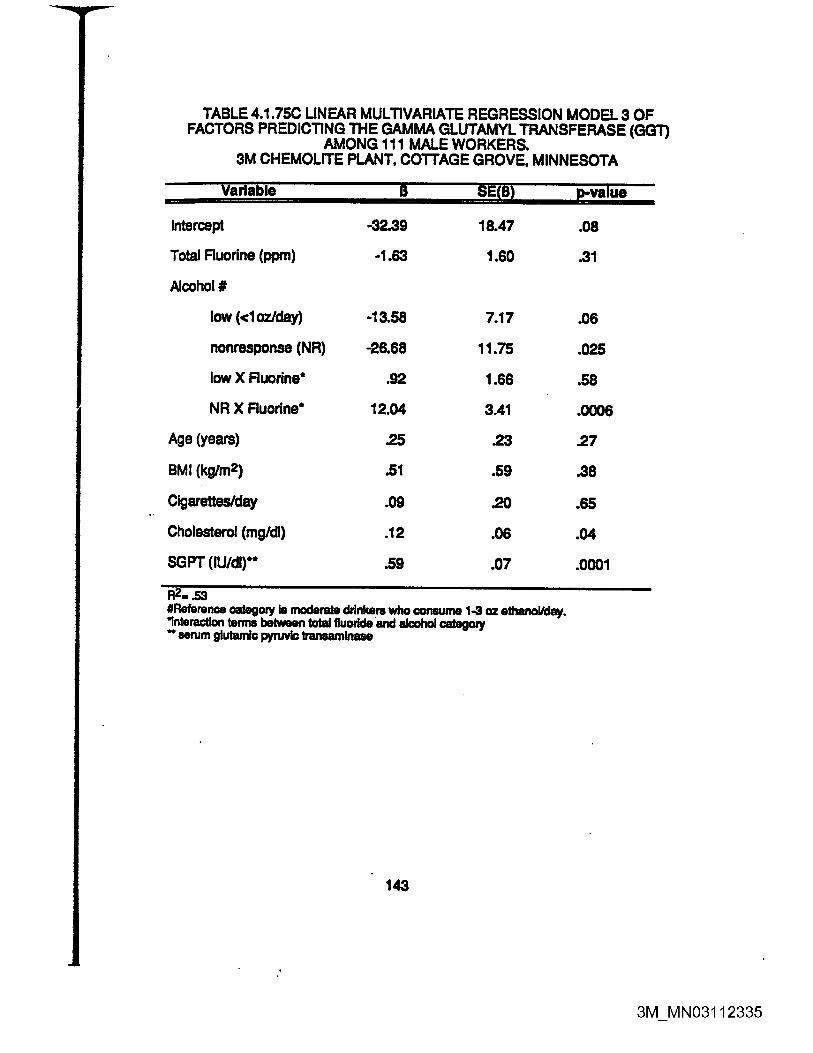


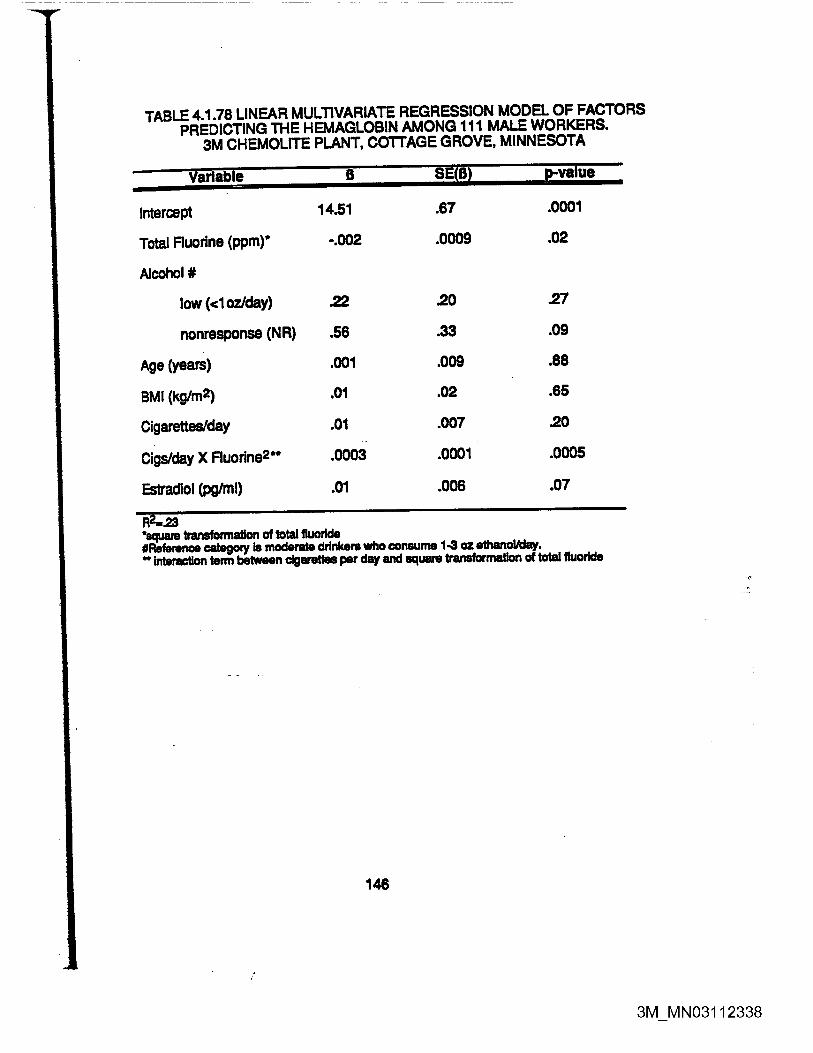


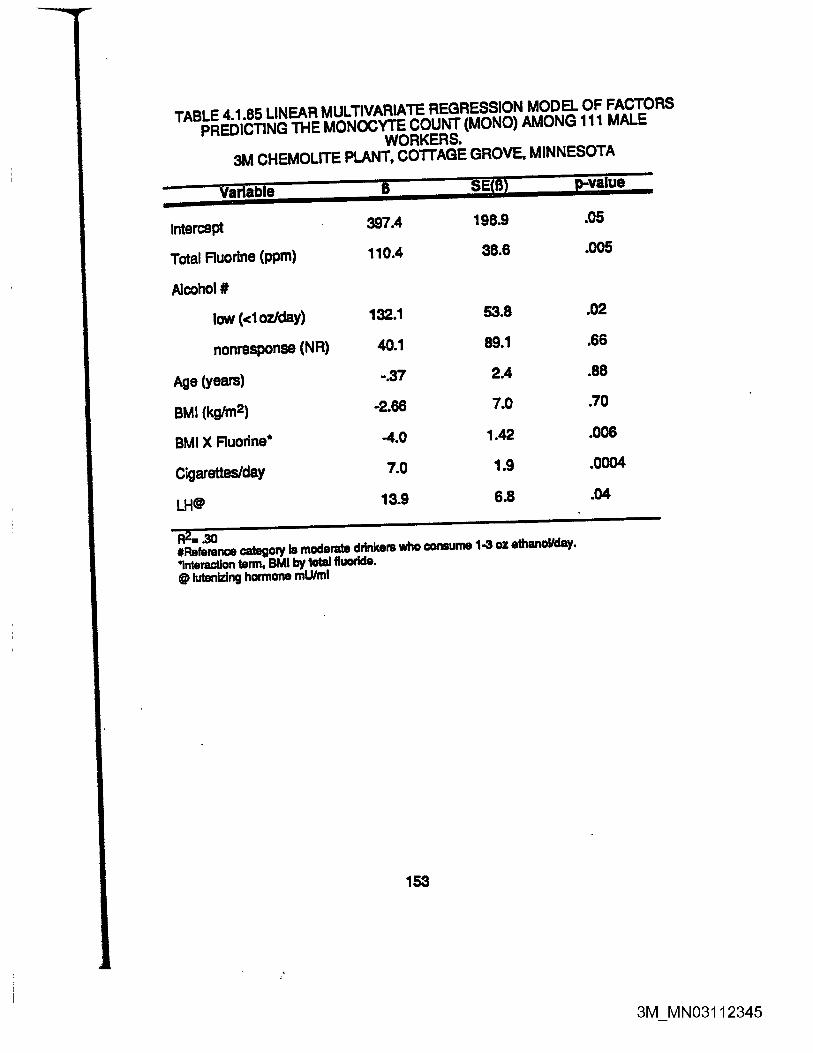


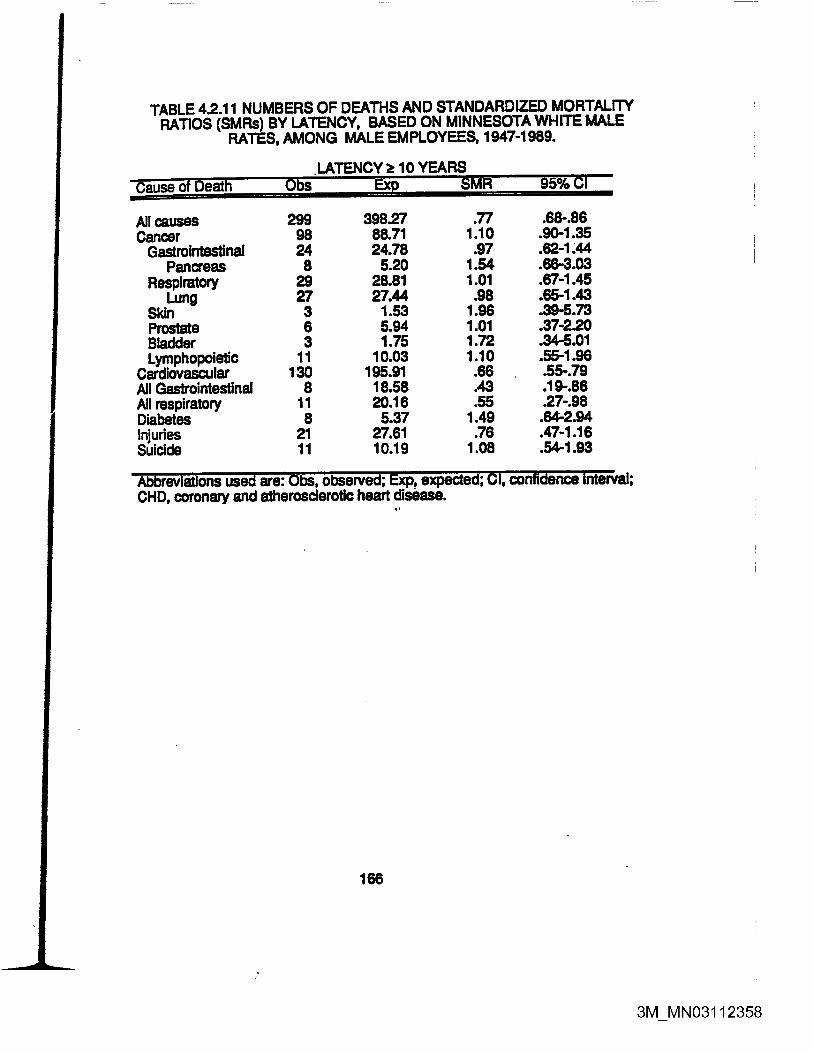


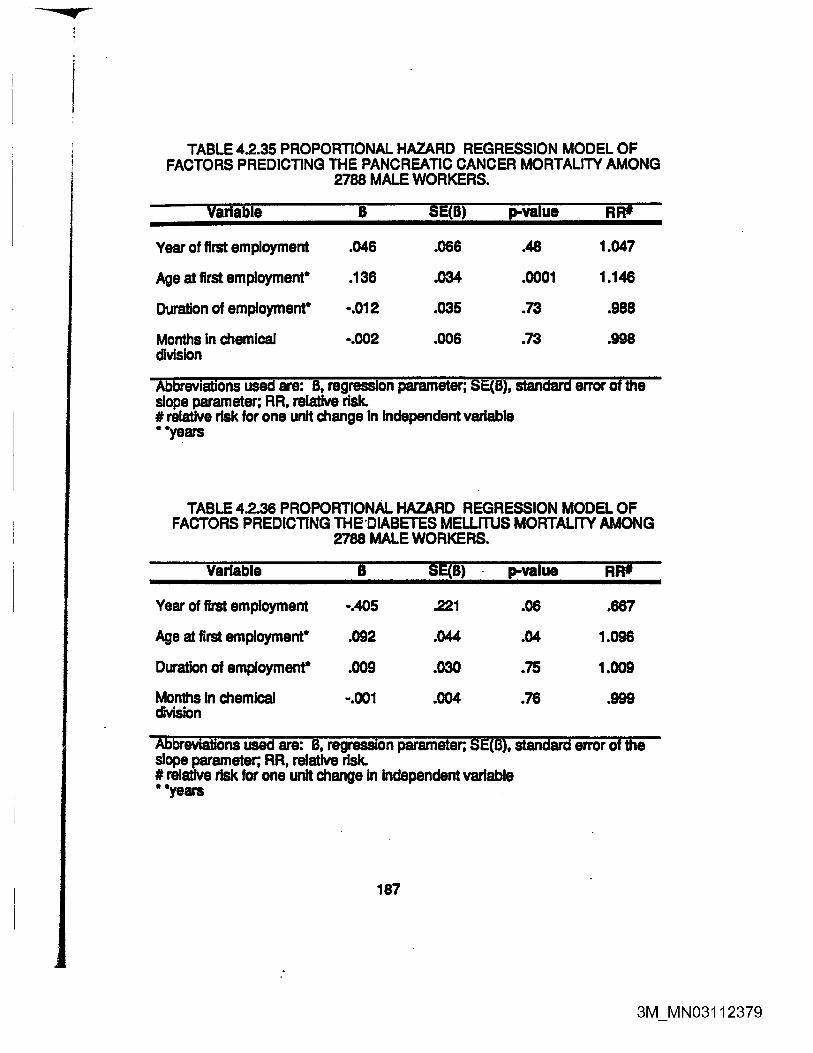


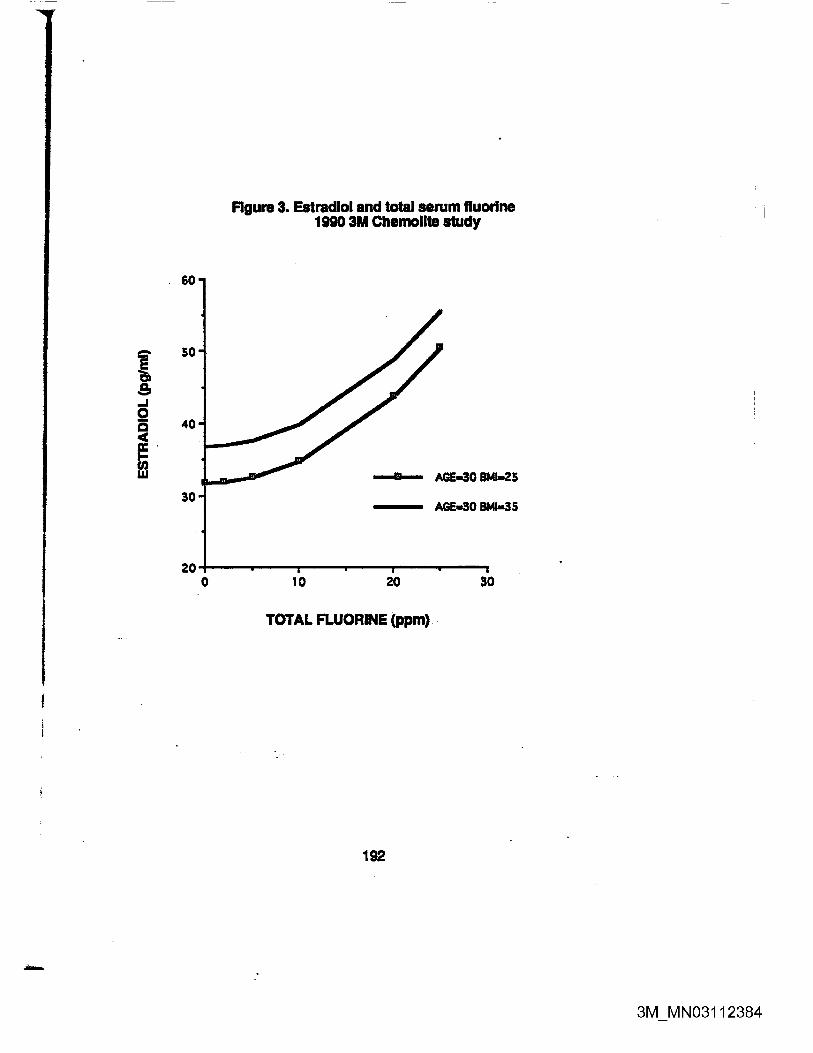


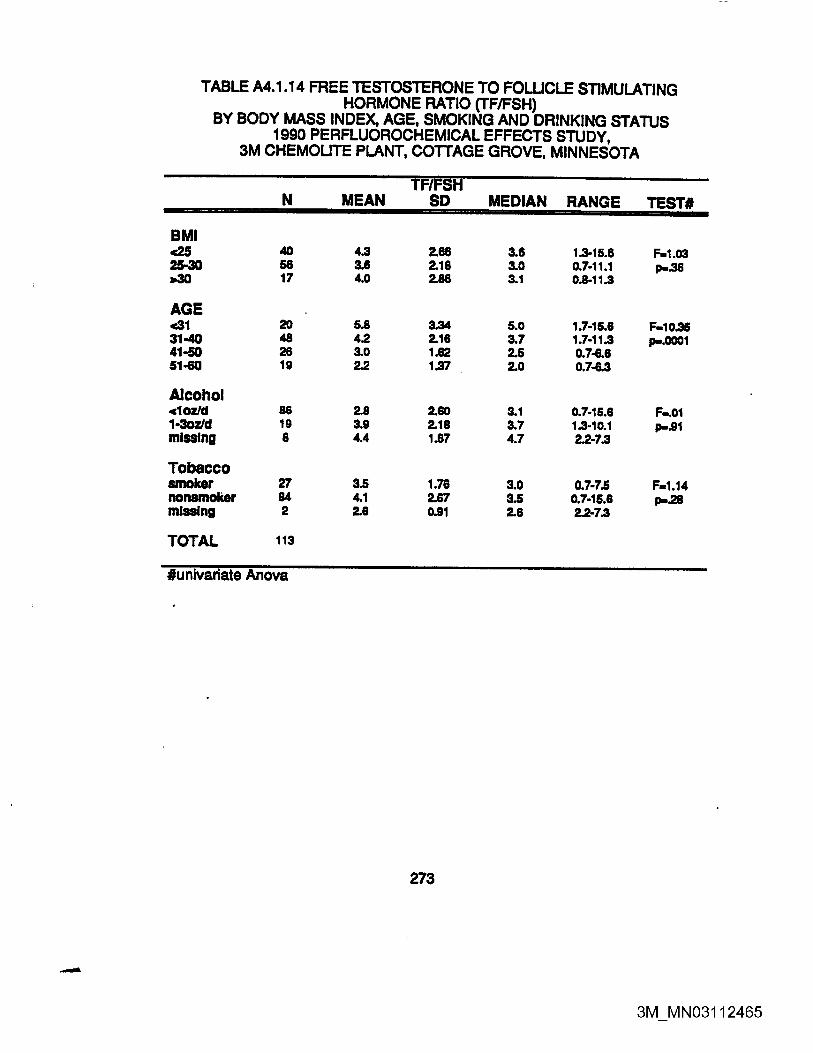


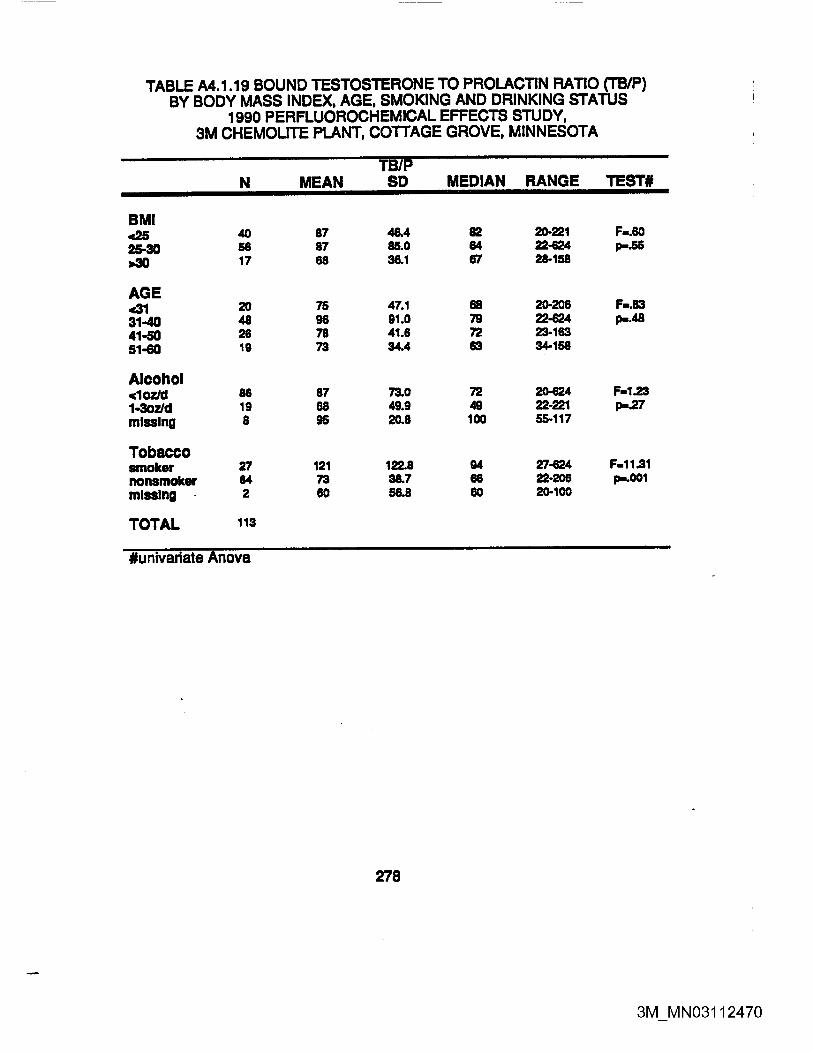
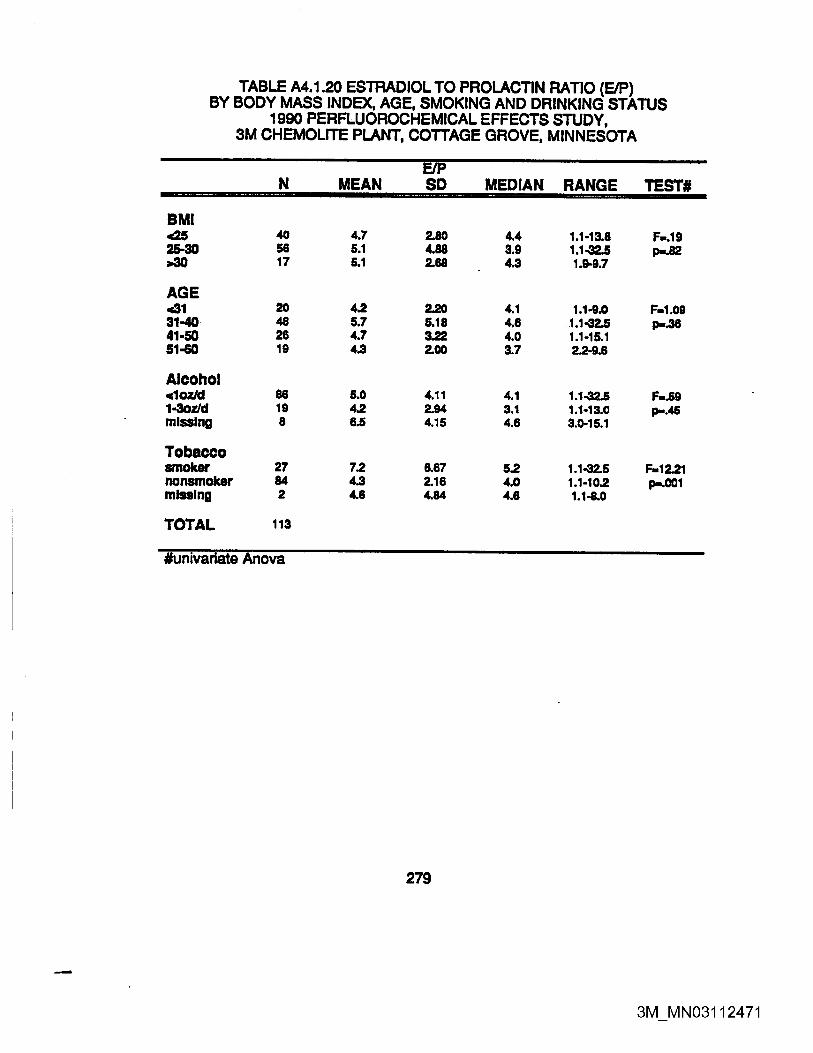


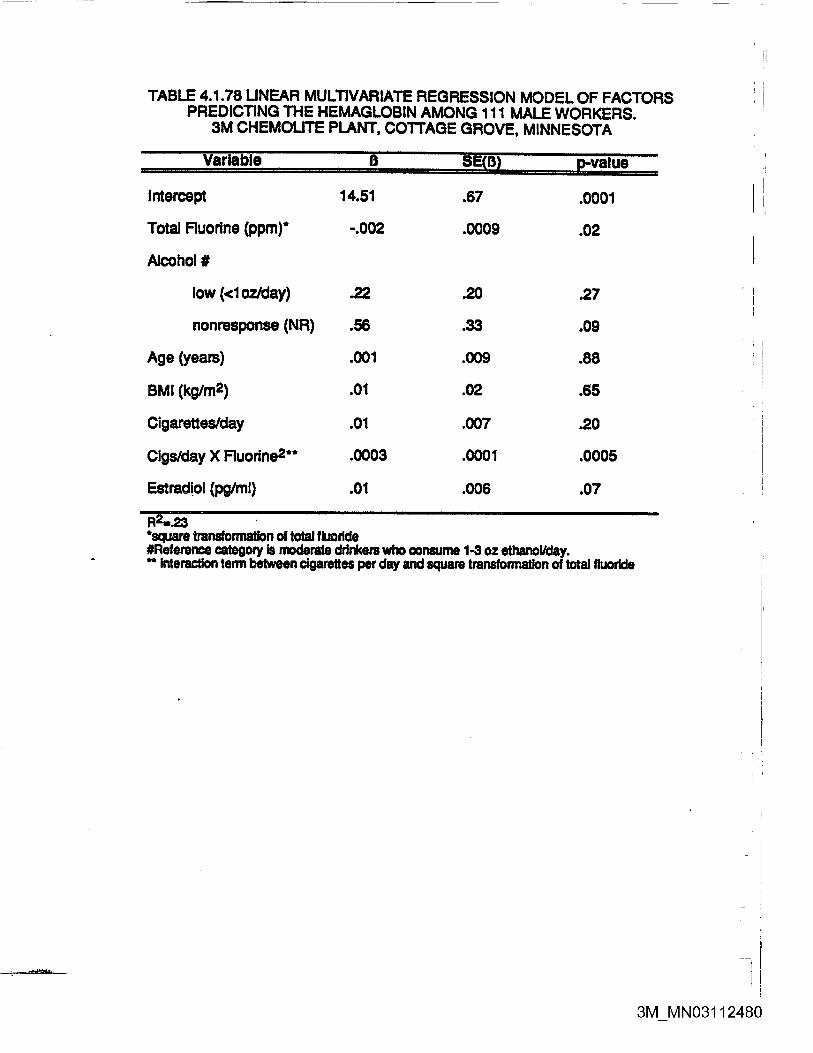

PI.2094 DuPonl fluoropraduets 1007 Market Street Wilmington. 0E19898
mws> DuPont Fluoroproducts
February 21,1995
Dr. Lance L. Simpson Jefferson Clinical Center In Environ. Medicine Room 314-Jah, Jefferson Medical College 1020 Locust St. Philadelphia, PA 19107
Dear Dr. Simpson:
As we discussed over the telephone recently, we are interested in establishing a corporate policy on medical surveillance for our employees, particularly for the blood monitoring of telomeric acid fluorides, including perfluorooctanoic acid (C 8). We are concerned about the potential long-term human health effects of these materials considering they all appear to have long biological half-lives. Your expertise is necessary to assist us in the design, conduct and interpretation of a monitoring program. Specifically, we are interested in a blood monitoring program design which includes relevant test batteries. The outcome of this program would be to ensure that our industrial hygiene programs are adequate to protect our employees from any potential adverse effects.
In addition to the above, we would also like you to suggest certain studies that we could conduct that would allow us to utilize our large toxicological database in developing a human risk model. We would like to discuss this program in greater depth with you, outlining in some detail the existing toxicity data that we have collected, and define more completely our issues on this blooding monitoring program.
Please contact me at your earliest convenience in order that we can facilitate this program. Thank you for your consideration.
Sincerely,
William J. rbck.Ph.D. Toxicology Consultant
WJB/jat
bcc: J . Walrath ^ o o 00
o o
EID098719
1 I ilu P.-r: ,te :.w.,a-» jixl CiiraiijF-i, ® Pruned on Raveled P.
Source: https://www.industrydocuments.ucsf.edu/docs/jypw0228

D.670
cc: W.J. Brock W.J. Vogler
February 10,1997
TO: A.J. PLAYTIS - EP - WASHINGTON WORKS G.A PLOEGER - EP WASHINGTON WORKS Y.L POWER, M.D. - HR - WASHINGTON WORKS
PERSONAL AND CONFIDENTIAL
WASHINGTON WORKS MORTALITY AND CANCER SURVEILLANCE RESULTS
Attached is the final report on the updated mortality and cancer incidence surveillance results for Washington River Works. The final report incorporates the results of the recommendations we made to you in the draft report.
Feel free to contact Bill Brock (366-5213) or Bill Vogler (366-5448) should you have any questions.
I'll be leaving the DuPont Company effective today, February 10th. I've enjoyed working with you all and wish you the best.
Qjl^lMtl^L JUDYWALRATH SENIOR EPIDEMIOLOGIST EPIDEMIOLOGY COMPETENCY HASKELL LAB, CR&D
Attachment
o o to
as
Source: https://www.industrydocuments.ucsf.edu/docs/znpw0228

CONFIDENTIAL
DuPont Epidemiology Surveillance
Report
MORTALITY AND CANCER INCIDENCE SURVEILLANCE
AT WASHINGTON WORKS
Requester: Gerald A. Ploeger External Affairs/Litigation
Washington Works
Judy Walrath, Ph.D. Senior Epidemiologist
Haskell Laboratory Central Research & Development
Report Completion Date: 6/30/96 Pagel of 14
o o to
Source: https://www.industrydocuments.ucsf.edu/docs/znpw0228

CONFIDENTIAL
MORTALITY AND CANCER INCIDENCE SURVEILLANCE
AT WASHINGTON WORKS
TABLE OF CONTENTS
INTERPRETATION OF EPIDEMIOLOGIC SURVEILLANCE DATA
Sources of Surveillance Data
Methods
Tests of Statistical Significance
Interpretation of Statistically Significant Results
CANCER INCIDENCE SURVEILLANCE -1956-1992
Discussion and Recommendations
Table 1. Observed/Expected Cancer Incidence Results for Male Employees
Table 2. Observed/Expected Cancer Incidence Results for Female Employees
MORTALITY SURVEILLANCE -1957-1993
Discussion and Recommendations
Table 3. Observed/Expected Mortality Results for Male Employees
Table 4. Observed/Expected Mortality Results for Female Employees
SUMMARY
Source: https://www.industrydocuments.ucsf.edu/docs/znpw0228

D.670.4
CONFIDENTIAL
INTERPRETATION OF EPIDEMIOLOGIC SURVEILLANCE DATA
Enclosed are tables for Washington Works showing (1) cancer incidence surveillance from 1956 through 1992 among active employees and (2) mortality surveillance from 1957 through 1993 among active employees and pensioners. For each specific cause, the number of observed cases/deaths (OBS) is compared to the number expected (EXP) based on the experience of the entire Company. Comparison is made by the ratio of the observed to the expected numbers of cases/deaths (OBS/EXP). Accompanying each table is descriptive text which summarizes the major findings.
Sources of Surveillance Data
Since 1956, cancer cases that occur among active employees in the U.S. are recorded in the DuPont Cancer Registry. Through 1988, cases have been reported to the Registry primarily by diagnoses entered on Accident and Health Insurance (A&H) claims and by death certificates that accompany life insurance claims filed by beneficiaries of deceased employees. Since 1988, insurance claims data are being used to ascertain diagnoses of cancer among active employees. Beginning in 1977, registry data sources were supplemented by Cancer Registry Report forms submitted by Company physicians. The Cancer Registry does not include cases diagnosed among employees whose cancer was first diagnosed after retirement or after employment termination due to reasons other than pension.
Deaths that occur among active and pensioned employees in the U.S. are recorded in the DuPont Mortality Registry that was initiated in 1957. Deaths are identified through life insurance claims filed by beneficiaries of deceased employees. Deaths that occur among employees terminated without pension are not included since there is no uniform mechanism for identification of these deaths.
Methods
To determine expected numbers of cases/deaths for the standardized analysis, cancer incidence and mortality rates for DuPont employees (and pensioners for mortality), specific for 5-year age categories, gender and payroll class (i.e., wage or salary roll), are computed for each cause category shown in the enclosed tables. Then, the Company-wide incidence/mortality rates are multiplied by the cumulative mid-year population of employees (and pensioners, where applicable) from each location, specific for age, gender and payroll class, over the entire study period. The sum of the products over all age groups is the expected number of cases or deaths.
Standardized analyses are preferred because they provide age-adjusted expected numbers and are based on actual plant populations, in isolated cases where accurate population data are not available, proportionate incidence or mortality analyses are presented. In these analyses, the observed distribution of cases/deaths by cause is compared with that expected derived from proportions which occur throughout the entire Company. Proportions can be misleading, however, as it is possible to have an unusual
o o
- 3 -
Source: https://www.industrydocuments.ucsf.edu/docs/znpw0228

CONFIDENTIAL
distribution of cases/deaths without there being any excess rate for any specific cause. For example, if a plant has a lower death rate from heart disease than the rate in the Company as a whole, the proportion of deaths from other causes would be inflated (compared to that of the entire Company) in order that proportions for all causes add up to 100 percent.
Tests of Statistical Significance
To test whether the observed to expected ratios (OBS/EXP) given in the tables differ significantly from 1.00, we determine the probability that the difference between the observed and expected numbers occurred by chance alone. This probability value is obtained from the Poisson probability distribution. The difference is considered statistically significant if the probability value is less than 0.10 using the two-tailed test. In the two-tailed test, statistically significant deficits as well as excesses are denoted. Statistical significance is tested only if either the observed or expected number of cases or deaths is four or more.
Interpretation of Statistically Significant Results
The designation of a statistically significant excess often suggests the need for further investigation to determine whether the excess may have occurred because of some agent at the plant. However, an excess may also occur because of environmental and other factors associated with increased risks, such as smoking, diet, alcohol, ethnic origin, socioeconomic status or genetic factors.
Chance alone may account for a statistically significant difference. When the level of statistical significance is set at 0.10, one should expect to find a statistically significant difference in about 10 out of every 100 comparisons due to chance alone, even when no specific causative factor is responsible.
The magnitude of the difference, expressed as the ratio of observed to expected numbers (OBS/EXP), must also be considered in data interpretation. The OBS/EXP ratio and its corresponding probability value should be considered together in assessment of the difference between an observed and expected number.
It may be that the observed number for a particular cause is greater than the expected number, but the difference is not statistically significant. In this instance, it does not necessarily follow that a particular agent at the plant may not be associated with the moderate excess. If the number of persons at the plant exposed to the agent is small, excess morbidity or mortality in that group would be difficult to detect because of dilution by data from the rest of the plant. Also, it may be too soon for effects of an agent to be manifested by excess morbidity or mortality.
Source: https://www.industrydocuments.ucsf.edu/docs/znpw0228

CONFIDENTIAL
CANCER INCIDENCE SURVEILLANCE -1956-1992
Male Employees (Table 1)
Among male employees at Washington Works from 1956-1992,149 cancer cases are reported and 132 expected. The total observed/expected case ratio is 1.25 for male salary and 1.07 for male wage employees.
Buccal cavity and pharynx
Cancers of the buccal, or oral, cavity and pharynx are statistically significantly elevated among male wage (9 cases and 3.1 expected) and all male employees (10 cases versus 4.6 expected). One case has been reported since the last surveillance update through 1989 and 0.3 would have been expected. Anatomic sites are lip (4 cases), other parts of mouth (1 case), oropharynx (1 case), pharynx (2 cases) tongue (1 case) and salivary gland (1 case).
Primary risk factors for oral cancers are use of smokeless tobacco, alcohol usage and tobacco smoking. Although several occupational groups have been reported to have an excess of this cancer (e.g. those employed as metal, textile or steel workers and plumbers and asbestos workers), occupational exposures are not suspected to play a major role in the etiology of this disease. An exception is that persons employed in occupations with prolonged exposure to sunlight have a greater risk of lip cancer.
Recommendations (and Results):
Determine smoking histories, with particular attention to information on use of smokeless tobacco, if available. 'Out of 10 cases, 7 smoked cigarettes for a number of years before diagnosis, 2 were nonsmokers and 1 case could not be determined. Information on the use of smokeless tobacco was not available.'
Consider use of educational materials: on the adverse health effects from use of smokeless tobacco and importance of regular dental hygiene visits in screening oral cancers. 'As part of our Wellness program, it is our current practice to distribute American Cancer Society literature on smokeless tobacco usage to anyone who is at risk according to their wellness appraisal. The site has also run several clinics for people who are attempting to quit smoking. The policy of only allowing smoking outdoors has also focused attention on its dangers.'
Add work history of one additional case to previous work history review of 9 cases. 'The 10 cases show no commonality of exposure. Also, for 2 cases the date of diagnosis is less than one year after they were hired, and for 2 others the diagnosis was within 5 years of hiring. This would make it unlikely that exposure at the site was the cause of the disease. Of the remaining 6 cases, 4 were cigarette smokes and 2 were nonsmokers.'
- 5 -
Source: https://www.industrydocuments.ucsf.edu/docs/znpw0228

CONFIDENTIAL
Kidney and other urinary cancers
The category of kidney cancer and other urinary cancers is no longer statistically significant in male employees. No kidney cancer cases have been reported since 1989. At that time, examination of work histories of the 9 cases identified no commonality that would suggest a workplace causality.
Multiple myeloma
A three fold excess of multiple myeloma is seen among male employees (5 cases are observed versus 1.6 expected). An additional case was reported in 1990, which results in statistical significance. Among female employees, 2 cases were observed and less than .1 expected. Statistical significance, however, is only tested on four or more cases.
Suspected risk factors for multiple myeloma are familial history, exposure to ionizing radiation and increased age. Occupational groups that have been reported to have an increased risk of mortality from multiple myeloma are farmers, copper smelter workers exposed to arsenic, rubber workers, petroleum refinery workers and workers exposed to asbestos, plastics, cutting oil, wood dust and leather.
Recommendation (and Result! Work histories of all 7 cases were examined in late 1992, shortly after the last surveillance results on cancer incidence were issued. No unusual patterns were observed which would be indicative of a common workplace exposure. This work history review should be expanded and reassessed after inclusion of the one additional case. ' The additional case does not change the previous conclusion of no commonality of exposure.'
Other lymphoma
A statistically significant excess of 'other lymphoma' continues among all male employees (8 cases versus 3.8 expected). One additional case has been reported since 1989 whereas 0.8 would have been expected. Seven cases are reported to be malignant lymphoma, not otherwise specified, and one is nodular lymphoma.
Occupational risk factors are difficult to determine from the literature since most studies report only on mortality and in mortality studies, deaths from all lymphatic cancers and leukemia are generally grouped together. Mortality from lymphomas has been reported to be elevated among chemists, rubber workers, petroleum refinery workers, and less consistently in several other occupational groups.
Source: https://www.industrydocuments.ucsf.edu/docs/znpw0228

D.670.8
CONFIDENTIAL
Recommendation fand Result) Work histories of the 7 cases reported through 1989 had been examined and no
job or work area clusters were noted. The work history of the one additional case should be determined and compared with those of the previously examined 7 work histories. 'The additional case does not change the previous conclusion of no commonality of exposure. Also, one case was diagnosed less than half a year after to transfer to the site.'
Leukemia
The elevation in leukemia previously reported among male wage and all male employees is no longer statistically significant (9 cases are reported and 5.1 would be expected). A1991 case-control study of leukemia at Washington Works found no association between work in any area at the plant and development of leukemia. We will continue to monitor for any additional cases.
Malignant melanoma
Incidence of malignant melanoma is elevated among men in the salary roll, with 8 cases reported and 3.8 expected. This finding was not present in the most recent surveillance report through 1989. Since then, 1 case has been reported and .55 would have been expected. Incidence is somewhat lower than expected in the wage roll, with 5 cases observed and 7.3 expected. This pattern follows reports in the general population, where non-manual workers are at greater risk than manual workers of developing malignant melanoma. The effect, however, does not appear to be related to occupational factors.
In the general population, the incidence of malignant melanoma has been rising rapidly. The major risk factor is believed to be excessive sunlight exposure, particularly in the first 20 years of life. Although an excess of malignant melanoma has been reported in several occupational epidemiology studies, no consistent patterns have been seen and no chemical etiologic agent is suspected.
Recommendations (and Results) Since malignant melanoma is the most deadly form of skin cancer, early diagnosis is a crucial factor for a favorable prognosis. We recommend distribution of literature available through the local branch of your American Cancer Society which describes characteristics of moles which may indicate the presence of malignant melanoma and the need for urgent professional medical consultation. 'Our Wellness Consultant has prepared an employee training package on the dangers of skin cancer which will be used in the near future.'
3 As a precautionary measure, we recommend examination of the work histories of S the 8 salary roll cases to ensure that no jobs or work areas are more in common 8 than would be expected. 3
- 7 -
Source: https://www.industrydocuments.ucsf.edu/docs/znpw0228

D.670.9
CONFIDENTIAL
These 8 cases do not appear to have any commonality of exposure. One individual worked for 5 years at Savannah River and another worked for 10 years at Sabine River. Both locations provide ample opportunity for exposure to strong sunlight. Two other cases were diagnosed 4-6 years after transfer to the site, which is shorter than the 10-20 year latency period typical for melanoma.'
Female Employees (Table 2)
There are no statistically significant excesses or deficits in the cancer experience of female employees at Washington Works during 1956-1989. Overall, 20 cancer cases were reported and 14.9 expected; 7 of these cases were breast cancer, compared with 5.2 expected. In the wage roll, 10 cases were observed versus 5.8 expected, and in the salary roll, 10 cases versus 9.0 expected.
o o
8 -
Source: https://www.industrydocuments.ucsf.edu/docs/znpw0228
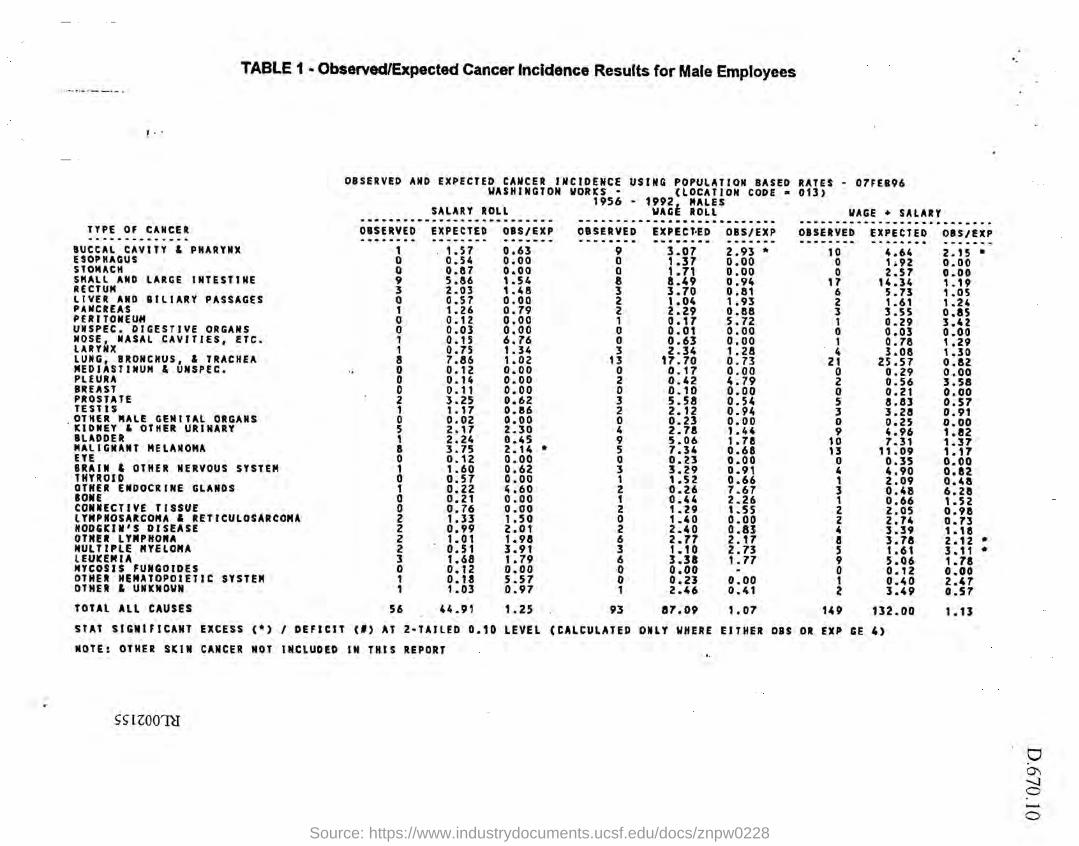
TABLE 1 • Observed/Expected Cancer Incidence Results for Male Employees
OBSERVED AMD EXPECTED CAMCER INCIDENCE USING POPULATION BASED RATES - 07FEB96 WASHINGTON WORKS - (LOCATION CODE « 013)
1956 - 1992. HALES SALARY ROLL WAGE ROLL WAGE • SALARY
TYPE OF CANCER
BUCCAL CAVITY & PHARYNX ESOPHAGUS STOMACH SHALL AND LARGE INTESTINE RECTUM LIVER AND BILIARY PASSAGES PANCREAS PERITONEUM UMSPEC. DIGESTIVE ORGANS NOSE, NASAL CAVITIES, ETC. LARYNX LUNG, BRONCHUS, & TRACHEA MEDIASTINUM A UNSPEC. PLEURA BREAST PROSTATE TESTIS OTHER MALE GENITAL ORGANS KIDNEY A OTHER URINARY BLADDER MALIGNANT MELANOMA EYE BRAIN A OTHER NERVOUS SYSTEM THYROID OTHER ENDOCRINE GLANDS BONE CONNECTIVE TISSUE LYMPHOSARCOMA A RET ICULOSARCOMA HODGKIN'S DISEASE OTHER LYMPHOMA MULTIPLE MYELOMA LEUKEMIA MYCOSIS FUNGOIDES OTHER HEMATOPOIETIC SYSTEM OTHER A UNKNOWN
TOTAL ALL CAUSES
OBSERVED EXPECTED OBS/EXP OBSERVED EXPECTED OBS/EXP OBSERVED EXPECTED OBS/EXP
1 0 0 9 3 0 1 0 0 1 1 8 0 0 0 2 1 0 5 1 8 0 1 0 1 0 0 2 2 2 2 3 0 1 1
1.57 0.54 0.87 5.86 2.03 0.57 1.26 0.12 0.03 0.15 0.75 7.86 0.12 0.14 0.11 3.25 1.17 0.02 2.17 2.24 3.75 0.12 1.60 0.57 0.22 0.21 0.76 1.33 0.99 1.01 0.51 1.68 0.12 0.18 1.03
0.63 0.00 0.00 1.54 1.48 0.00 0.79 0.00 0.00 6.76 1.34 1.02 0.00 0.00 0.00 0.62 0.86 0.00 2.30 0.45 2.14 • 0.00 0.62 0.00 4.60 0.00 0.00 1.50 2.01 1.98 3.91 1.79 0.00 5.57 0.97
9 0 0 8 3 2 2 1 0 0 3 13 0 2 0 3 2 0 4 9 5 0 3 1 2 1 2 0 2 6 3 6 0 0 1
3.07 1.37 1.71 8.49 3.70 1.04 2.29 0.17 0.01 0.63 2.34 17.70 0.17 0.42 0.10 5.58 2.12 0.23 2.78 5.06 7.34 0.23 3.29 1.52 0.26 0.44 1.29 1.40 2.40 2.77 1.10 3.38 0.00 0.23 2.46
2.93 * 0.00 0.00 0.94 0.81 1.93 0.88 5.72 0.00 0.00 1.28 0.73 0.00 4.79 0.00 0.54 0.94 0.00 1.44 1.78 0.68 0.00 0.91 0.66 7.67 2.26 1.55 0.00 0.83 2.17 2.73 1.77 •
0.00 0.41
10 0 0 17 6 2 3 1 0 1 4
21 0 2 0 5 3 0 9 10 13 0 4 1 3 1 2 2 4 8 5 9 0 1 2
4.64 1i92 2.57 14.34 5.73 1.61 3.55 0.29 0.03 0.78 3.08
25.57 0.29 0.56 0.21 8.83 3.28 0.25 4.96 7.31 11.09 0.35 4.90 2.09 0.48 0.66 2.05 2.74 3.39 3.78 1.61 5.06 0.12 0.40 3.49
2.15 0.00 0.00 1.19 1.05 1.24 0.85 3.42 o.oo 1 .29 1.30 0.82 0.00 3.58 0.00 0.57 0.91 0.00 1.82 1.37 1.17 0.00 0.82 0.48 6.28 1.52 0.98 0.73 1.18 2.12 3.11 1.78 0.00 2.47 0.57
56 44.91 1.25 93 87.09 1.07 149 132.00
STAT SIGNIFICANT EXCESS (*) / DEFICIT {») AT 2-TAILED 0.10 LEVEL (CALCULATED ONLY WHERE EITHER OBS OR EXP GE 4)
NOTE: OTHER SKIN CANCER NOT INCLUDED IN THIS REPORT
1.13
SS1200T2I
Source: https://www.industrydocuments.ucsf.edu/docs/znpw0228

TABLE 2 - Observed/Expected Cancer Incidence Results for Femaia Employees
OBSERVED AND EXPECTED CANCER INCIDENCE USING POPULATION BASED RATES WASHINGTON WORKS - (LOCATION CODE » 013)
1956 - 1992. FEHALES SALARY ROLL WAGE ROLL
07FEB96
WAGE • SALARY
TYPE OF CANCER
BUCCAL CAVITY & PHARYNX ESOPHAGUS STOMACH SMALL AND LARGE INTESTINE RECTUM LIVER AND BILIARY PASSAGES PANCREAS PERITONEUM NOSE, NASAL CAVITIES, ETC. LARYNX LUNG, BRONCHUS, A TRACHEA BREAST CERVIX OTHER FEMALE GENITAL ORGANS KIDNEY & OTHER URINARY BLADDER MALIGNANT MELANOMA EYE BRAIN A OTHER NERVOUS SYSTEM THYROID OTHER ENDOCRINE GLANDS BONE CONNECTIVE TISSUE LYMPHOSARCOMA A RETICULOSARCOMA HODGKIN'S DISEASE OTHER LYMPHOMA MULTIPLE MYELOMA LEUKEMIA MYCOSIS FUNGOIDES OTHER A UNKNOWN
OBSERVED EXPECTED OBS/EXP OBSERVED EXPECTED OBS/EXP OBSERVED EXPECTED OBS/EXP
0 0 0 0 0 0 0 0 0 0 0 4 0 0 0 0 2 0 0 1 0 0 0 0 0 0 2 1 0 0
TOTAL ALL CAUSES 10
STAT SIGNIFICANT EXCESS (*) / DEFICIT (i) AT 2-TAILEC 0
NOTE: OTHER SKIN CANCER NOT INCLUDED IN THIS REPORT
0 . 0 6 0 . 0 0 0 . 0 9 0 . 4 2 0 . 1 3 0 . 0 2 0 .05 0 . 0 0 0 . 0 1 0 .04 0 . 4 9 3 . 2 3 1.53 1 .03 0 . 0 3 0 . 0 7 0 . 4 4 0 . 0 1 0 . 1 3 0 . 3 1 0 . 0 0 0 . 0 8 0 . 0 9 0 . 1 4 0 . 1 9 0 . 1 4 0 . 0 9 0 . 1 4 0 . 0 0 0 . 1 0
9 . 0 3
ED 0 .
0 . 0 0 0 . 0 0 0 . 0 0 0 . 0 0 0 . 0 0 0 . 0 0 0 . 0 0
• 0 . 0 0 0 . 0 0 0 . 0 0 1.24 0 . 0 0 0 . 0 0 0 . 0 0 0 . 0 0 4 . 5 9 0 . 0 0 0 . 0 0 3 . 2 3
-0 . 0 0 0 . 0 0 0 . 0 0 0 . 0 0 0 .00
2 2 . 8 1 7 . 2 2
-0 . 0 0
1.11
10 LEVEL
0 0 0 0 0 0 0 0 0 0 1 3 4 0 0 0 1 0 0 0 0 0 1 0 0 0 0 0 0 0
0 . 1 7 0 . 0 0 0 . 0 0 0 . 2 0 0 . 1 4 0 . 1 2 0 . 0 2 0 . 0 0 0 . 0 0 0 . 0 1 0 . 1 4 1 .99 1 .53 0 . 4 6 0 . 1 7 0 . 0 2 0 . 2 2 0 . 0 0 0 . 0 0 0 . 0 6 0 . 0 6 0 . 0 0 0 . 0 7 0 . 0 6 0 . 0 3 0 . 1 9 0 . 0 0 0 . 0 9 0 . 0 0 0 . 0 6
0 . 0 0 -•
0 . 0 0 0 . 0 0 0 . 0 0 0 . 0 0 0 . 0 0
-0 . 0 0 7 . 0 1 1 .51 2 . 6 2 0 . 0 0 0 . 0 0 0 . 0 0 4 . 4 8
• 0 . 0 0 0 . 0 0 0 . 0 0
. 1 3 . 3 9
0 . 0 0 0 . 0 0 0 . 0 0
-0 . 0 0
• 0 . 0 0
0 0 0 0 0 0 0 0 0 0 1 7 4 0 0 0 3 0 0 1 0 0 1 0 0 0 2 1 0 0
10 5.82 1.72 20 1
(CALCULATED ONLY WHERE EITHER OBS OR EXP GE 4)
0 .23 0 . 0 0 0 . 0 9 0 . 6 2 0 . 2 7 0 .14 0 . 0 7 0 . 0 0 0 . 0 1 0 .05 0 .63 5 .22 3 .06 1.49 0 . 1 9 0 . 0 9 0 . 6 6 0 . 0 1 0 .13 0 . 3 7 0 . 0 6 0 . 0 8 0 .16 0 . 2 0 0 .21 0 .32 0 . 0 9 0 . 2 3 0 . 0 0 0 . 1 7
4 . 8 5
0 .00 0 .00 0 .00 0 .00 0 .00 0 .00 0 .00 0 .00 0.00 0.00 1.59 1.34 1.31 0 .00 0 .00 0 .00 4 .55 0 .00 O.OO 2.74 0 .00 0 .00 6 .22 0 .00 0 .00 0.00
22 .81 4 .32
-0 .00
1.35
9SI300TH
Source: https://www.industrydocuments.ucsf.edu/docs/znpw0228

D.670.12
CONFIDENTIAL
MORTALITY SURVEILLANCE -1957-1993
Male Employees and Pensioners (Table 31
The overall mortality experience of male wage and all male employees at Washington Works continues to be statistically significantly lower than expected. For the time period 1957-1993, a total of 444 deaths are observed among all male employees and pensioners at the site and 494 would have been expected based on DuPont mortality rates (Table 3).
All malignant neoplasms
A statistically significant deficit of deaths is seen for all cancers combined among male wage (72 deaths versus 88.6 expected) and all male employees and pensioners (115 deaths versus 141.3 expected). None of the individual cancer cause of death categories show a statistically significant deficit in mortality.
Mortality from lymphatic and hematopoietic neoplasms, a category which is elevated in the incidence surveillance results, is close to expected.
Other heart disease
Mortality from "other heart disease" is elevated, with 17 deaths reported and 10.7 expected. This category has shown an excess in previous reports, but the ratio of observed to expected deaths has not been not statistically significant until now. This residual grouping comprises non-specific 'heart failure' and other ill-defined descriptions and complications of heart disease; i.e. acute and chronic pulmonary disease, acute pericarditis, acute and subacute endocarditis, acute myocarditis, other disease of pericardium and endocardium, cardiomyopathy, conduction disorders and cardiac dysrhythmias. No occupational risk factors are suspected.
Arteriosclerosis
There is a statistically significant excess of deaths from arteriosclerosis among all male employees (4 deaths versus 1.3 expected). Arteriosclerosis, a condition characterized by thickening and loss of elasticity of arterial walls, has no known occupational risk factors. Years of death are 1977,1978,1992 and 1993, and ages at death are 50 and 78 (three).
Motor vehicle accidents
Motor vehicle accidental deaths were higher than expected in the male salary roll, with 8 deaths observed and 3.7 expected. Four of these deaths were recent, 2 in 1990 and 2 in 1993. There is a marked deficit of deaths from "other accidents" in the male wage roll.
Suicide
There is a marked deficit of suicide among male wage and all male employees.
o o ,—* -~1
- 1 1 -
Source: https://www.industrydocuments.ucsf.edu/docs/znpw0228

D.670.13
CONFIDENTIAL
Female Employees and Pensioners (Table 4)
Among female employees and pensioners, 16 deaths are observed and 11.9 expected. No unusual patterns are seen with respect to individual cause of death categories.
f o o
12-
Source: https://www.industrydocuments.ucsf.edu/docs/znpw0228

TABLE 3 - Observed/Expected Mortality Results for Male Employees
OBSERVED AND EXPECTED DEATHS USING POPULATION-BASED RATES WASHINGTON WORKS - (LOCATION CODE - 013)
1957 - 1993. HALES SALARY ROLL WAGE ROLL
14FEB96
WAGE + SALARY
CAUSE OF DEATH
NALIGNANT NEOPLASMS BUCCAL CAVITY X PHARYNX DIGESTIVE ORGANS RESPIRATORY SYSTEM BREAST GENITAL ORGANS URINARY ORGANS LYMPHATIC, ETC. OTHER X UNSPECIFIED TOTAL MALIGNANT NEOPLASMS
CEREBROVASCULAR DISEASE
DISEASES OF THE HEART CHRONIC RHEUMATIC HEART DISEASE ARTERIOSCLEROTIC HEART DISEASE CHRONIC ENDOCARDITIS HYPERTENSIVE HEART DISEASE OTHER HEART DISEASE
OTHER CARDIOVASCULAR DISEASE RHEUMATIC FEVER HYPERTENSION WITHOUT MENTION OF HEART GENERALIZED ARTERIOSCLEROSIS OTHER
EXTERNAL CAUSES OF DEATH MOTOR VEHICLE ACCIDENTS SUICIDE HOMICIDE OTHER ACCIDENTS
OTHER CAUSES INFLUENZA PNEUMONIA NEPHRITIS X NEPHROSIS TUBERCULOSIS OF RESPIRATORY SYSTEM DIABETES MELLITUS PEPTIC ULCER APPENDICITIS HERNIA X INTESTINAL OBSTRUCTION CIRRHOSIS OF THE LIVER EMPHY SENA SYMPTOMS X ILL-DEFINED CONDITIONS RESIDUAL UNSPECIFIED
TOTAL ALL CAUSES
OBSERVED EXPECTED OBS/EXP OBSERVED EXPECTED OBS/EXP OBSERVED EXPECTED OBS/EXP
1 10 16 0 X 1 5 6 A3
0.88 14.05 16.76 0.10 4.24 3.07 6.14 7.47
52.70
1.13 0.71 0.95 0.00 0.94 0.33 0.81 0.80 0.82
8.08 0.74
2 62 1 0 17
0 2 2 7
8 1 0 4
0 5 0 0 1 0 0 0 3 1 1
13 0
0.73 55.29 0.32 1.46
10.67
0.02 0.52 0.49 3.74
3.74 3.68 0.48 3.69
0.04 2.72 0.96 0.05 1.34 0.46 0.06 0.28 2.07 1.26 1.66
15.75 0.09
2.74 1.12 3.15 0.00 1.59 *
0.00 3.84 4.07 1.87
2.14 * 0.27 0.00 1.08
0.00 1.84 0.00 0.00 0.75 0.00 0.00 0.00 1.45 0.79 0.60 0.83 0.00
3 16 24 0 3 5 10 11 72
1.79 21.57 32.92 0.09 6.50 4.21 9.59 11.94 88.62
1.67 0.74 0.73 0.00 0.46 1.19 1 .04 0.92 0.81
10 15.57 0.64
179 172.34 1.04
2 91 0 1
20
0 1 2 5
10 4 1 4
0 4 1 0 4 0 0 1 2 4 2
24 0
!65
0.80 98.91 0.60 1.97
19.38
0.02 0.74 0.79 5.65
15.58 9.29 2.78
10.59
0.11 5.53 2.15 0.22 3.53 0.71 0.03 0.36 3.73 2.56 3.27
26.84 0.89
321.21
2.50 0.92 0.00 0.51 1.03
0.00 1 .35 2.52 0.88
0.64 0.43 « 0.36 0.38 «
0.00 0.72 0.47 0.00 1.13 0.00 0.00 2.81 0.54 1.56 0.61 0.89 0.00
0.83 #
4 26 40 0 7 6 15 17
115
16
4 153
1 1
37
0 3 4 12
18 5 1 8
0 9 1 0 5 0 0 1 5 5 3
37 0
444
2.68 35.62 49.68 0.19 10.74 7.28 15.73 19.40
141.32
23.65
1.53 154.20
0.91 3.43
30.06
0.04 1.26 1.28 9.39
19.32 12.97 3.25
14.28
0.15 8.24 3.10 0.27 4.87 1.17 0.09 0.64 5.80 3.83 4.93
42.60 0.98
493.55
1.49 0.73 0.81 0.00 0.65 0.82 0.95 0.88 0.81 *
0.68
2.61 0.99 1.09 0.29 1.23
0.00 2.38 3.12 • 1.28
0.93 0.39 # 0.31 0.56
0.00 1.09 0.32 0.00 1.03 0.00 0.00 1.57 0.86 1.31 0.61 0.87 0.00
0.90 *
STAT SIG EXCESS (*> / DEFICIT (#) AT 2-TAILED 0.10 LEVEL (CALCULATED ONLY WHERE EITHER OBS OR EXP GE 4)
6SIZ00TH
Source: https://www.industrydocuments.ucsf.edu/docs/znpw0228

TABLE 4 - Observed/Expected Mortality Results for Female Employees
OBSERVED AND EXPECTED DEATHS USING POPULATION-BASED RATES • UFEB96 WASHINGTON WORKS - (LOCATION CODE * 013)
1957 - 1993, FEMALES SALARY ROLL WAGE ROLL WAGE • SALARY
CAUSE OF DEATH OBSERVED EXPECTED OBS/EXP OBSERVED EXPECTED OBS/EXP OBSERVED EXPECTED OBS/EXP
MALIGNANT NEOPLASMS BUCCAL CAVITY & PHARYNX 0 DIGESTIVE ORGANS 0 RESPIRATORY SYSTEM 0 BREAST 0 GENITAL ORGANS 0 URINARY ORGANS 0 LYMPHATIC, ETC. 1 OTHER I UNSPECIFIED 1 TOTAL MALIGNANT NEOPLASMS 2
CEREBROVASCULAR DISEASE 0
DISEASES OF THE HEART CHRONIC RHEUMATIC HEART DISEASE 0 ARTERIOSCLEROTIC HEART DISEASE 2 CHRONIC ENDOCARDITIS 0 HYPERTENSIVE HEART DISEASE 0 OTHER HEART DISEASE 1
OTHER CARDIOVASCULAR DISEASE RHEUMATIC FEVER 0 HYPERTENSION WITHOUT MENTION OF HEART 0
, GENERALIZED ARTERIOSCLEROSIS 0 OTHER 0
EXTERNAL CAUSES OF DEATH MOTOR VEHICLE ACCIDENTS 1 SUICIDE 0 HOMICIDE 0 OTHER ACCIDENTS 0
OTHER CAUSES INFLUENZA 0 PNEUMONIA 0 NEPHRITIS & NEPHROSIS 0 TUBERCULOSIS OF RESPIRATORY SYSTEM 0 DIABETES HELLITUS 1 PEPTIC ULCER 0 APPENDICITIS 0 HERNIA & INTESTINAL OBSTRUCTION 0 CIRRHOSIS OF THE LIVER 0 EMPHYSEMA 0 SYMPTOMS & ILL-DEFINEO CONDITIONS 1 RESIDUAL 2 UNSPECIFIED 0
0.04 0 .52 0 .56 1 . H 0 .48 0 . 0 7 0 . 4 7 0 . 4 9 3 . 7 7
0 . 4 7
0 . 1 0 0 . 8 2 0 .01 0 .04 0 . 2 7
0 . 0 0 0 .02 0 . 0 0 0 . 1 0
0 . 5 9 0 .25 0 .15 0 . 1 3
0 . 0 1 0 .11 0 . 0 1 0 . 0 0 0 .05 0 . 0 0 0 . 0 0 0 . 0 0 0 . 0 6 0 .05 0 .11 0 . 7 9 0 . 0 1
0 . 0 0 0 . 0 0 0 . 0 0 0 . 0 0 0 . 0 0 0 . 0 0 2 . 1 4 2 . 0 4 0 . 5 3
0 . 0 0
0 . 0 0 2 . 4 4 0 . 0 0 0 . 0 0 3 . 6 6
_ 0 . 0 0
-0 . 0 0
1 .69 0 . 0 0 0 . 0 0 0 . 0 0
0 . 0 0 0 . 0 0 0 . 0 0
. 1 9 . 5 0
--.
0 . 0 0 0 . 0 0 8 . 9 8 2 . 5 4 0 . 0 0
0 . 0 0 0 . 2 7 0 . 1 6 0 . 8 7 0 . 0 9 0 . 1 8 0 . 2 3 0 . 1 5 1 .96
0 . 2 9
0 . 0 0 0 .35 0 . 0 0 0 . 0 0 0 . 2 0
0 . 0 0 0 . 0 0 0 . 0 0 0 . 0 3
0 . 3 8 0 . 1 5 0 . 2 3 0 . 0 5
0 . 0 0 0 . 0 1 0 . 0 3 0 . 0 0 0 . 0 1 0 . 0 0 0 . 0 0 0 . 0 0 0 . 0 1 0 . 0 0 0 . 0 3 0 . 1 7 0 . 0 6
0 . 0 0 0 . 0 0 0 . 0 0 1.14 0 . 0 0 0 . 0 0 0 . 0 0 6 . 5 8 1 .02
3 . 4 7
_ 0 . 0 0
-0 . 0 0 0 . 0 0
, .
0 . 0 0 0 . 0 0
2 . 6 4 0 . 0 0 0 . 0 0 0 . 0 0
, 0 . 0 0 0 . 0 0
-0 . 0 0 0 . 0 0
--
0 . 0 0 -
0 . 0 0 6 . 0 5 0 . 0 0
0 .04 0 .79 0 .72 2 .02 0 . 5 7 0 .25 0 . 7 0 0 .64 5 .74
0 .00 0 .00 0 .00 0 .50 0 .00 0 . 0 0 1.44 3 .11 0 .70
0.76 1.32
0 . 1 0 1 .17 0 .01 0 .05 0 . 4 7
0 .00 0 .02 0 .00 0 .13
0 .97 0 .40 0 .38 0 .18
0 .01 0 .12 0 .03 0 .00 0 .06 0 .00 0 . 0 0 0 .00 0 . 0 7 0.05 0.15 0.95 0 .06
0 .00 1.71 0 .00 0 .00 2 .12
m 0 .00 o.oo 0 .00
2 .06 0 .00 0 .00 0 .00
0 .00 0 .00 o.oo
. 17 .29
0 . 0 0 -•
0 .00 1 8 . 8 7
6 .89 3 .15 0 . 0 0
TOTAL ALL CAUSES 10 7 .92 1 .26 3 . 9 4 1 .52 16 11 .86 1.35
09lcWra
Source: https://www.industrydocuments.ucsf.edu/docs/znpw0228

D.670.16
CONFIDENTIAL
SUMMARY
The first draft of this document contained recommendations for consideration by your site to follow-up on positive surveillance findings. The final surveillance report includes results of recommendations and follow-up actions taken by the site.
Results of these surveillance data were communicated to employees at the plant site.
o o to
15
Source: https://www.industrydocuments.ucsf.edu/docs/znpw0228

~,~ Richard E. Purdy 12/03/98 11:53 AM
To: Georjean L. Adams/US-Corporate/3M/US@3M-Corporate CO: Subject: Risk to the environment due to the presence of PFOS
In the attached analysis of possible risk of ecological harm due to environmental levels of PFOS, I concluded there is a significant risk of harm. In addition to this, my review of the available data on the properties of PFOS, indicates that the sink for it in the environment is biota. We know of nothing that it has more affinity for than blood serum and liver components. Other persistent pollutants have a high affinity for sediment, but PFOS does not. So, PFOS can’t be trapped and buried like they can. It likely continues to partition into biota from the other compartments in the environment; thus the levels we are seeing in eagles and other biota is likely to climb each year.
I believe all this taken together constitutes a significant risk that should be reported to EPA under TSCA 8e.
Pioneer Food Chain Risk Assessment of PFO
Made Available by 3M for Inspection and Copying as Confidential Information: Subject to Protective Order In Palmer v. 3M, No. C2-04-6309
1533.0001
3MA00242688

Pioneer Risk Assessment of Adverse Effects in Marine Mammals from PFOS in the Food Chain
Rich Purdy 3 December 1998
Introduction:
PFOS (perfluorooctanesulfonate) was found in two of three populations of naive rats--fl~at is, rats not knowingly exposed to PFOS. The rats that had PFOS in their blood were fed food fl~at contained fishmeal. Incomplete studies indicate that PFOS is in fishmeal. This is consistent with the observation that fledgling eagles that eat predominately fish contain PFOS in their blood.
Most fishineal is made from menhaden (Brevoortia tyrranus)(Drafl Report: Sources ofFish Food Constituents By Jolm Giesy and Paul MeMe, Septelnber 6, 1998). Menhaden eat planklon and are considcrcd a second link in the US Atlantic coastal food chain. Thcy arc in turn catcn by other species of fish, which are in turn eaten by other fish, mammals and birds. The mass of menhaden is so great that their catch represents 40% of the US commercial finfish fisheIies.
Since these fish appear to contain PFOS, it seemed prudent to calculate the amount of PFOS that might be transferred up the food chain and compare this value to a concentration that causes adverse effects. These calculations do not contain precise data so the evaluation is approximate. The purpose is to see whether predicted enviromnental concentrations are anywhere near concentrations that cause effects.
This assessment was organized and performed in accordance with the guidance given by EPA in Guidelines for Ecological Risk Assessment (EPA!630/R-95/002F April 1998). The process presented in these guidelines is a repetitive one where a risk assessment is updated or redone when new information is available. The new information can be generated by other processes or generation can be driven b~y the risk assessment.
Problem Formulation:
A study of rats not purposely exposed to PFOS found that they had siguificant levels of it in their livers. The likely source was the fishmeal in their diet. ff PFOS is in fish then other fish, fish eating mammals and birds are consuming PFOS. The concentrations found are not likely to cause toxic responses, but what about after biomagmfication through a food chain?
The hypothesis to test: The concentration of PFOS in food of marine animals causes adverse effects.
It was decided to keep the problem narrow in this assessment in order to simplify the analysis. This is not to imply that this is the most important or only problem. In addition tlfis is a pioneer and possibly first iteration of this assessment. Refinements in the analysis and more data will allow other iterations if this pionccr asscssmcnt indicatcs thcrc may bc a significant risk. Thc purposc of this pionccr asscssmcnt is to determine the magnitude of the risk and whether other iterations are warranted.
1533.0002 3MA00242689

Analysis
Characterization of Exposure:
The task of this characterization is to estimate the concentration of PFOS in the food chain organisms that eat menhaden and the concentration in the animals comprising the ne~ two steps in the food chain. Two examples of Ihe many food chaius possible are:
Menhaden -> cod -> seal -> killer whale Menhaden ->carnivores fish 1 -> carnivores fish 2 -> seal
For the purposes of this analysis the biomagnification by fish and mammals is about the same. This is supported by the metabolic rates, daily consumption and growth rates published (Fugacity-Based Model of PCB Bioaccumulation in Complex Aquatic Food Webs, Jan Campfcns and Donald Mackay in Environ. Sci. Technol. 31,577-583(1997) and Wildlife Exposure Factors Handbook, EPA/600/R-93/187 December 1993). Based on the data in these references and recollection from other readings, an average biomagnification valne is 9.
In an evaluation of PFOS in the hvers of r~’ffve rats an average level found in male and female 10-14 week rats was 0.09 mg/kg. The food label listed fishmeal as the fifth ingredient. According to labeling standards, fisluneal was less than 20% of the food. For tiffs analysis it is assumed that fishmeal made up 16% of the food and th~t it was the only source of PFOS. This value could be too high xvhich wonld mean the ultimate calculated tissuc levels would bc low, but the value cannot bc too low by much because the most it could be is 19%. If an animal were to eat 100% fish, as many fish and sea mammals do, it should have about 6 times as much in its livers as these rats do. That level would be 0.56mg/kg (0.09mg/kg/0.16).
This is the estimated level in the liver, which is the organ that contains most of the PFOS. The blood contains the next lfighest level. Work with rats has shown that blood contains about 1/6 the amom~t of PFOS to be found in the liver. Assmning that the liver mass is 3% and blood is 8% the mass of an animal and that the concentration in other organs is insignificant in comparison to the levels in liver and blood, then the total body burden of PFOS in the first step of the food chain above menhaden is 0.062mg/kg (0.56mg/kg X 0.03 + (0.56mg/kg/6) X 0.08)
The level in the second food chain link then would be nine times this level or 0.56 mg/kg.
Using data on seals, the accumulated dose at time of whelping is calculated. It is assumed that 100% of PFOS consumed is retained. Data for ldller whale food consumption sexual maturation was not immediately available, but they are assumed to be similar.
The mean time for sexual maturi .ty for female harbor seals is 5.5 years and gestation is 11 months (Wildlife Exposure Factors Handbook, EPA/600/R-93/187 December 1993). So for up to 77months before whelping a seal was assumed to be eating fish with the above calculated concentration of 0.56 mg~kg PFO$. Seals eat 6-8% of their weight per ~y in fish. They eat 13% their first year nnd 10% xvhen gestating For the ease of calculation it was assmned that an 80kg seal eats 8% or 6.4kg/day. This works out to 15 X 103 kg of fish (77months X 30days/month X 6.4kg/day). Assuming the fish a seal consumed contained 0.56mg/kg, then a seal would consume about 8.4 X 10³ mg PFOS (0.56mg/kg X 15 X 103 kg). This works out to a cumulative dose before xvhelping ef about 105mg/kg (8.4 X10³ mg/80kg)
This cumulative dosc can bc uscd for scals that arc two food chain lcngths above mcnhadcn. This is probably not the norm. The average seal is probably one food chain length above menhaden. But this calculated cumulative dose probably represents that seen by populations of killer whales that eat seals.
1533.0003 3MA00242690

Characterization of Ecological Effects:
In a two generation rat stu@ it was found that 34%or the pups born to ammals dosed by gavage 1.6 mg/kg per day PFOS were born dead or died within four days of birth. For the purposes of this assessment rats arc assumed to be an adequate test surrogate species for marine mammals. There is uncertainty both to whether marine malnlnals sucla as seals, sea lions, and killer whales are less sensitive or lunre sensitive than rats.
The lowest dose of 1.6mg/kg tlmt caused an adverse effect was given for 6 weeks before mating, the week of mating and the 22 days of gestation for a total of 71 days. The cumulative dose up to the time of whelping is 113mg/kg.
It has been reported that natural populations of sea lions are experiencing significant reproductive dysftmction (Peter Ross, Enviromnental Centaminants and the Risk of Adverse Effects in Marine Malmnals: An Ovexwiew, 1998 SETAC Almual Meeting). Also 70% of a ringed seal pepulafion was not rcproducing. This is highcr than the norm. Apparently some field biologists believe killer whale reproductions has declined, but there has been no scientific study to verify this.
Risk Characterization:
The predicted cumulative dose of PFOS through t~vo food chain links to sea mammals such as seals, sea lions, killer whales ~nd porpoises was calculated to be abom 105 mg/kg. Tlfis valne is about the same as the calculated cumulative dose of 113 mg/kg PFOS that causes reproductive impairment to mammals. Thus there is a significant risk. There is not enough input data to calculate uncertainty in this risk. Such data is needed to reevaluate the degree of risk.
1533.0004 3MA00242691

SC1F~NCE PUBLICATION STRATEGY
Publication of scientific and technical information on the FC issue should follow a strategic plan so that key findings can be understood in the context of the published scientific literature. Under this strategy, the science needed to evaluate the safety o£PFOS (i.e. the available occupational and toxico!ogy studies) will be published -- or in press -- and thus available to be cited when the publication on serum levels in the general population is published. This will allow the serum level findings to be placed in an understandable, credible context which demonstrates that there is no medical or scientific basis to attribute any adverse health effects to 3M products. In this strategy, the analytical methodology will be published concurrently with the serum level findings.
The strategy is described as a series of steps with a timeline for each activity, The strategy begins with a brief summary of the scientific and technical studies published or publically available:
Key Studies and Reports Available
Ubel, F.A., and others, "Health status of plant workers exposed to fluorochemicals - a preliminary report," American Industrial Hygiene Association Journal, vol. 41, pages 584-589, 1980. (Published study of 3M workers showing no ill health effects of occupational exposure to fluorgchemieals.)
Gilliland, F.D. and Mandel, J.S., "Mortality among employees in a PFOA production plant," Journal of Occupational Medicine, vol. 35, pages 950-954, 1993 (Pubtished sludy of 3M employees showing no increased mortality due to occupational exposure to PFOA.).
Gilliland, F.D. and Mandel, J.S., "Serum perfluorooctanoic acid and hepatic enzymes, lipoproteins and cholesterol: a study of occupationally exposed men," American Journal of Industrial Medicine, vol. 29, pages 560-568, 1996 (Published study of l15 3M employees showing no toxicity to the liver due to occupational exposure to PFOA.).
Key B.D., and others, "Critical review: Fluorinated organics in the biosphere," Environmental Science and Technology, vol. 3 I, pages 2445-2454, 1997. (PFOS is described as "important commercially as a surfactant and as a precursor of other fluorinated surfactant3; "as "resistant to biological attack, "and as an inhibitor of "gap junction intercellular communication (GJIC) in rat liver epithelial cells cultured in vitro." The paper reports that "inhibition of GJIC has been tmpficated in tumor promotion during carcinogenesis, teratogenesis and reproductive dysfunction. ")
Reich, C., "Re: TSCA Section 8(e) -- Perfluorooctane Sulfonate -- Docket Numbers 8EHQ- 1180-373; 8EHQ-1180-374; 8EHQ-0381-0394," 3M letter to Office of Toxic Substances, United States Environmental Protection Agency, May 15, 1998. (This document, which will soon
1535.0001 3MA00729193

SCIJENCE PUBLICATION STRATEGY, page 2
become pub#cly available through the TSCA 8e Office, reports the presence of very low (part per billion) levels of PFOS in blood sera samples for individuals with no known occupational exposure to fluorochemicals.)
Olsen, G.W., "An epidemiologic investigation of reproductive hormones in men with occupational exposure to peffluorooctanoic acid," Journal of Occupational and Environmentat Medicine, vol. 40, pages 614-622, 1998. (Stud)i" by 3M Medical Department showing no significant hormonal changes in 191 men occupational exposed to PFOA.).
Reich, C., "Re: TSCA 8(E) SUBSTANTIAL RISK NOTICE ON: N-Ethyl Perfluorooctyl sulfonamido ethanol and Perfluorooctane Sulfonate, Docket Numbers 8EHQ-1180-373; 8EHQ- 1180-374; 8EHQ-0381-0394," 3 M letter to Office of Toxic Substances, United States Environmental Protection Agency, September 14, 1998. (This document, which will become publicly available through the TSCA 8e Office, reported that PFOS, when administered to female rats at oral doses of 1.6 or 3.2 milligrams per kilogram body weight per day during pregnancy, significantly reduced pup survival. PFOS also reduced the average gain in body weight of the female rats during pregnancy, with the weight gain at the 3.2 milligrams per kilogram dose of only 87% of the control (no PFOS) rats.)
Strategy for Publication of Key Studies
The PFOS worker study, prepared by Dr. JeffMandel and others in the 3M Medical Department, is in final review before submission to an occupationally-focused medical journal. (This paper will report no adverse biological health effects from exposure to PFOS, based on medical monitoring of workers.) Comment: publication of this paper is key to demonstrating there is no medical or scientific basis to attribute any adverse health effects to exposure to PFOS. Recommendations: 1) The journal should be selected on the basis of interest in the paper and ability to ensure peer review as quickly as possible. 2) Target submission of the paper by December 15, 1998; acceptance for publication within three months of submission. 3) With this plan, this key study could be cited as early as March 15, 1999.
PFOS mitochendria study, by Dr. Ken Wallace of the University of Minnesota School of Medicine in Duluth, is being prepared for submission to a peer-reviewed science journal. (Paper will demonstrate PFOS’s mechanism of action on energy metabolism in a test tube (in vitro) system.) Comment: this paper will be useful for demonstrating a possible mechanism of toxicity of PFOS. However, without the toxicology studies discussed below, the findings are of limited utility for a safety assessment.
1535.0002 3MA00729194

SCIENCE PUBLICATION STRATEGY, page 3
Recommendations: 1) The journal should be selected on the basis of interest in the paper and ability to ensure peer review in a timely manner. 2) Target: submission of the paper by March 1999; acceptance for publication within six months of submission. 3) With this plan, this study could be cited by September 1999.
The PFOS teratology study, conducted by the 3M Toxicology Department, has been completed. A manuscript of the results, possibly including blood level measurements, could be prepared for publication or presentation at a science conference. (Paper will demonstrate that exposure to high doses of PFOS to pregnant animats does not cause birth defects in the offspring. The blood level mea~Ttrements will allow correlations between doses administered in this study and blood levels in animals and humans.) Comment: since the study reports largely negative findings (no birth defects), it may be difficuk to publish even with the blood level measurements. Consideration should be given to combining this study with the results of the 3M and pubfished subchronic toxicity studies discussed below. Recommendations: 1) Dr. Chris Wilkinson, a well respected toxicologist with Jellinek, Schwartz & Connolly, Inc., in Washington, D.C., who has been briefed on the FC issue, should be hired to review the study and provide a recommendation on publication of a paper on the teratology study and blood level measurements. 2) Assuming that Dr. Wilkinson and the 3M Toxicology Department agree to submit a paper on the teratology study, Dr. Wilkinson should draft the paper, make final revisions based on 3M review and comments, and submit the paper for publication in a peer reviewed toxicology journal. 3) Target: one month for the recommendation and decision on publication. If the decision is made to proceed with publication, target is three months for completion of the draft paper, one month for 3M review and comment, one month for final revision and submission to a peer-reviewed toxicology journal and three months for acceptance. 4) With this plan, the teratology study could be cited as early as August 1999.
PFOS subchronic toxicology studies, conducted by 3M or reported in the scientific literature, could be summarized and a manuscript prepared for publication. (The paper wouM review what is known about the toxicity of PFOS from animal studies, prior to conduct ofthe current studies by 3M. ) Recommendations: 1) This paper should review, or at least cite, other published toxicity studies on PFOS in addition to the subchronic studies, i.e. all of the published toxicity studies discussed under "Summary of Toxicology Studies" in the "Current Summary" document.
1535.0003 3MA00729195
SCIENCE PUBLICATION STRATEGY, page
2) Dr. Wilkinson should be hired to review the studies and draft a paper for publication. 3) Target: six months for completion of the draft paper, one month for 3M review and comment, one month for final revision and submission to a peer-reviewed toxicology journal and three months for acceptance.
The analytical methods developed to allow specific detection of PFOS in serum levels with a low part per billion detection limit should be written up for publication in a peer reviewed analytical chemistry journal. ( This paper wouM need to contain data on PFOS levels in serum to document the utility and accuracy of the analytical method) Recommendations: 1) Dr. Wilkinson should be asked to recommend an analytical chemist to prepare a paper for publication on the analytical methods. 2) Assuming that Dr. Wilkinson’s recommendation is acceptable to the Analytical Department, the analytical chemist consultant should draft the paper with Dr. Wilkinson’s assistance, make final revisions based on 3M review and comments, and submit the paper for publication in a peer reviewed analytical chemistry journal. 3) Target: one month for the recommendation and decision on the consultant. Once a decision is made on the consultant, the target is three months for completion of the draft paper, one month for 3M review and comment, one month for final revision and submission to a peer-reviewed toxicology journal and three to six months for acceptance. 4) With this plan, the analytical study could be cited as early as August 1999.
Additional serum level data is needed to document blood levels of PFOS for publication of a peer reviewed science publication. (Thispaper wouM document what is known about PFOS levets in serum artd assess the safety of current exposure levels based on the worker study [paper #1 above], and the toxicology studies [papers 2-4 above] that have been completed. The paper wouM need to reference the analytical methods cited in paper #5). Recommendations: 1) A decisions should be made by the 3M Medical Department with the advise of the Legal Department and the Core Team as to what additional data is needed and a plan developed to generate the needed data. 2) The 3M Medical Department should supervise the collection of serum samples with analysis of PFOS levds by the Analytical Department or a contract laboratory approved by them. 3) Dr. Wilkinson should be hired to review the serum data and draft a paper for publication. 4) Target: finalize plans by January 1, 1999, three months to collect samples and analyze the data, three months for completion of the draft paper, one month for 3M review and comment, one month for final revision and submission to a peer-
1535.0004 3MA00729196

SCI]ENCE PUBLICATION STRATEGY, page 5
reviewed toxicology journal and three months for acceptance. 5) With this plan, the serum study could be cited as early as November 1999.
1535.0005 3MA00729197
Pathology Review of Reported Tumorigenesis in a Two Year Study of FM-3924 in Rats
November 25,1998
BY
Pathology Associates International 6217 Centre Park Drive
West Chester, Ohio 45069
Telephone (513) 779-9600 Fax (513) 779-9603
0 0 3 0 9 3
US00004554

Pathology Reviewof Tumors Reported in Rats Given FM-3924
Introduction: This report presents an independent assessment of tumorigenesis data obtained from a study to determine the chronic toxicity and carcinogenic potential of the fluorochemical FM-3924 in rats. The study, entitled "Two Year (Diet) Toxicity / Carcinogenicity Study of Fluorochemical FM-3924 in Rats," was sponsored by the 3M Company, St. Paul, Minnesota. Biophase procedures were conducted at Riker Laboratories, Inc., between April, 1981 and May, 1983 and were in compliance with FDA Good Laboratory Practice (GLP) guidelines. At Riker Laboratories, Leonard J. Sibinski, BA, served as the Study Director. Following in-life procedures, all major organs and tumors were processed into microslides and examined by Robert G. Geil, DVM, DACVP. Dr. Geil’s findings and interpretations were incorporated into the final report for the study.
For the tumorigenesis review, the complete study report, including all relevant pathology data was forwarded to Pathology Associates International (PAI), West Chester, Ohio for examination by Richard H. Bruner, DVM, DACVP. The sponsor (3M) regarded original pathology interpretations by Dr. Geil as adequate, and examination of microscopic tissue sections was not included in the review process. Specific objectives of the review were to evaluate tumor data and to provide an opinion relative to the potential relationship of reported neoplasms with the test material based upon: 1. The incidence and morphology of observed tumors and associated proliferative and non-proliferative lesions. 2. A literature review to examine the biologic behavior and carcinogenetic potential of similar fluorochemicals, 3. Contemporary knowledge of tumor mechanistic data, especially with respect to possible epigenetic pathways, 4. Consideration of chronic toxicity, immunosuppression, hormonal modulation or ancillary biochemical interactions which may serve as modulating factors in the development of tumors in this study, and5. Personal experience in evaluating rodent carcinogenesis bioassays.
Review Procedures and Findings
1. Reported tumorigenesis and ancillary pathologic changes for FM-3924:Based upon reported pathology findings, the review pathologist concurred that treatment-related changes were present at both the 1-Year (interim) and 2-Year (terminal) sacrifices as well as in some unscheduled deaths. At the 1-Year interim sacrifice, treatment-related changes were generally restricted to the liver and were characterized by a dose-dependent increase in hepatocellular cytomegaly, vacuolation and necrosis along with slightly increased inflammatory cell infiltrates. Cytomegaly
1

and vacuolation were generally consistent with treatment-induced perturbation of liver cell metabolism resulting in hypertrophy via proliferation of peroxisomes and/or smooth endoplasmic reticulum (P-450 enzyme induction). Hepatocellular necrosis was largely attributed to chronic liver cell swelling with compromised metabolism and/or reduced blood perfusion (hypoxia).
Treatment-related microscopic findings in unscheduled deaths and animals continued until the terminal (2-Year) sacrifice included persistent hepatocellular cytomegaly and vacuolation in both sexes. Additionally, cystoid degeneration ("spongiosis hepatis") of the liver was significantly increased in high dose males. Most notably, hyperplastic nodules were increased in the liver of both sexes and hepatocellular adenomas and carcinomas were increased in females.
Based upon reported pathology data, dietary levels of 100 ppm FM-3924 for two years resulted in unequivocal hepatocellular cytomegaly, vacuolation and cystoid degeneration as well as increased hyperplastic nodules in both sexes and increased adenomas and carcinomas in high dose females. Although increased hepatocellular neoplasms were not reported in males, it is likely that some of the "hyperplastic nodules" (in both sexes) would be regarded as hepatocellular adenomas if contemporary diagnostic criteria were applied (1). It is noteworthy, also, that hepatic cytomegaly was observed in males given 10 and 30 ppm of the test matereial suggesting that a NOEL for hepatocytomegaly was not achieved for males assigned to this investigation
2. Literature review of the biologic behavior and carcinogenic potential of fluorochemicals
The reviewer regarded the test material (N-ethylperfluorooctanesulfonamido ethanol) as a unique xenobiotic with unknown structure-activity relationships. A limited literature review was conducted to determine if the biological behavior, including tumorigenesis, of similar fluorochemicals had been reported. The literature review included a survey of rodent carcinogenesis bioassays completed by the National Toxicology Program (NTP) and select scientific journals and biological extracts. Although no carcinogenesis bioassays with "complex" fluorochemicals were discovered, several relevant reports concerning subchronic investigations were located. Additionally, several reports, including the NTP 2-year bioassay of sodium fluoride were available to provide perspectives on the biological effects of long-term fluoride exposure. Results of these studies are briefly summarized as follows:
1. Subchronic toxicity studies in rats with "complex" fluorochemicals have identified treatment-related hepatocellular hypertrophy (cytomegaly) similar to findings with FM-3924. In studies conducted by Van Rafelghem et al, a single intraperitoneal injection of perfluoro-w-decanoic acid (PFDA) in several rodent
2 OOôloi

species resulted in persistent hepatocellular swelling which, ultrastructurally, was characterized by peroxisomal proliferation (12).
In subchronic studies sponsored by the 3M Company, Griffith and Long administered ammonium perfluorooctanoate to rats, mice and monkeys via oral routes (3). At doses of 30 ppm or greater, rats displayed hepatocellular hypertrophy. This change was more prevalent and severe in males. Noteworthy was the observation that all mice given doses of 1000 ppm ad libidum and all monkeys given 100 mg/kg/day (gavage) died preterminally. Additionally, all monkeys given 30 mg/kg/day displayed anorexia, emesis, black stools, facial pallor, and prostration; and one monkey given 10 mg/kg/day displayed anorexia, black stools and facial pallor. Liver effects, however, were not observed in monkeys assigned to these studies. Furthermore, microbial assays using five Salmonella stains and one Saccharomyces strain, with and without metabolic activation, did not reveal mutagenic activity for the test material.
2. Review of studies relating to the chronic toxicity of fluoride and fluoride- containing compounds was limited to the NTP 2-year carcinogenesis bioassay of sodium fluoride and select environmental studies of fluoride in cattle. In the NTP study, treatment-related pathologic changes were not observed in the liver o f rats given dietary concentrations of up to 175 ppm sodium fluoride in the drinking water for two years (11). Furthermore, in an extensive survey of cattle exposed to high environmental fluoride concentrations for lifetime periods, increased liver disease or neoplasia was not reported although many animals exhibited dental and skeletal changes typical of advanced fluorosis (9).
3. Mechanisms resulting in increased hepatocellular nodular hyperplasia and neoplasia in rats given FM-3924:
Results of possible genotoxicity studies with FM-3924 were not provided to the review pathologist. It was reasoned that this complex fluorochemical probably was not strongly mutagenic and that most biologic effects were due to perturbation of liver cell metabolism, with peroxisomal proliferation and general disruption of multiple metabolic pathways. Accordingly, it is likely that the development of liver cell tumors (and nodular hyerplasia) was associated with epigenetic mechanisms, possibly including peroxisomal proliferation and genetic damage (ploidy) associated with oxidative stress and/or altered regulation of the cell cycle. Following publication of the final report for this study (1988), numerous journal articles have been published which identify carcinogenesis in rodents following exposure to non-genotoxic test materials. Subsets of these chemicals which induce liver cell tumors in rodents are characterized by antecendent hepatocyto- megaly and peroxisomal proliferation (2,5,6,8).
ooaios
US00004!

4. Effects of ancillary biochemical interactions which may have served as tumor promoters:
Comments relative to all metabolic aberrations which may have influenced liver cell tumorigenesis in this study would be largely speculative. It should be noted, however, that hepatic toxicity was unequivocally linked with ingestion of FM-3924, and at high dose levels liver cell alterations had resulted in necrosis. Correspondingly, accelerated proliferation of hepatocytes would be expected to repair damaged tissue, and may have served as a tumor promoter (10). Although it should be emphasized that increased liver cell proliferation which may occur in rodents following exposure to many toxic materials does not invariably result in increased tumor formation, most pathologists agree that cell damage which promotes in increased mitotic activity may contribute to tumor formation (4,10,13).
5. Personal opinion relative to a relationship between proliferative lesions and FM-3924 observed in this study:
It is my opinion that distinct increases in hepatocellular neoplasms in high dose females, combined with increased hyperplastic nodules in both sexes are clear indicators that the test material should be regarded as a liver carcinogen in Sprague Dawley rats. Other proliferative lesions and neoplasms were considered to be spontaneous alterations or secondary to the systemic effects of altered hepatocellular metabolism (7). Based upon histomorphologic changes observed in this study, it is likely that epigenetic mechanisms (especially peroxisomal proliferation, oxidative stress and other factors which deregulate the cell cycle) were key factors in the development of hepatocellular proliferative lesions. Ancillary data which would support epigenetic pathways for tumorigenesis in this study would provide a rationale for selection of exposure thresholds in humans. Based upon reference literature available for the preparation of this review, liver damage, including carcinogenesis, has not been reported in humans exposed to test materials that promote hepatocytomegaly and neoplasia in rodents via peroxisomal proliferation and associated metabolic perturbations
Additional Information which might Contribute to the SafetyAssessment of FM-3924
1. Mutagenesis assays or ancillary procedures to establish the genotoxic potential of the test material.
2. Cell proliferation studies to provide an index treatment-related increases in the cell cycle.
3. Ultrastructural analyses or contemporary analytical procedures to confirm the possible peroxisomal proliferation and ancillary metabolic perturbations.
4. Recovery studies to establish the persistence of liver cell effects following subchronic exposures to FM-3924.
US000I

Conclusions: Based upon review of the information available in the study report, it is my opinion that dietary FM-3924 for 2 years resulted in chronic liver changes (megalocytosis) in males at all dose levels (10, 30 and 100 ppm) and for females at the high dose concentration (100 ppm). At the high dose level, hyperplastic nodules were increased in both sexes and hepatocellular tumors (adenomas and carcinomas) were increased in females. Incidence values for liver proliferative lesions indicated-that FM- 3924 should be regarded as a liver carcinogen for Sprague Dawley rats under the conditions of this study. The presence of persistent, dose-dependent liver cell cytomegaly suggested that epigenetic mechanisms were causative for tumorigenesis in this study, and that safe exposure thresholds may be established providing that toxicokinetic and ancillary data do not indicate additional adverse effects such as reduced excretion and bioaccumulation.
Richard H. Bruner, DVM, DACVP Date '
References
1. Goodman, D.G., Maronpot, R.R., Newbeme, P. M., Popp, J.A. and Squire,R.A. Proliferative and Selected Other Lesions of the Liver in Rats (Draft Proposal).SSNDC Guides for Toxicologic Pathology. STP/ARP/AFIP, Wash., D.C. (1993).
2. Green, S. Receptor-Mediated Non-Genotoxic Carcinogenesis: New Models for Risk Assesment 1 Human Exp. Tox. (10): 390-395 (1991).
3. Griffith, F.D. and Long, L E. Animal Toxicity Studies with Ammonium Perfluorooctanoate. Am. Ind Hyg. Assoc. J. (41): 576-583 (1980).
4. Huff, J Absence of Morphologic Correlation Between Chemical Toxicity and Chemical Carcinogenesis. Environ. Health Perspect. 101 (Suppl. 5):45-54 (1993).
5. Lalwani, N.D., Dethloff, L.A., Haskins, J.R., Robertson, D.G., and De La Iglesia,F. A. Increased Nuclear Ploidy, Not Cell Proliferation Is Sustained in the Peroxisome Proliferator-Treated Rat Liver. Tox. Path. (25)No.2. 165-176 (1997).
6. McDonald, J.S., Lankas, G.R. and Morrissey, R.E. Toxicokinetic and Mechanistic Considerations in the Interpretation of the Rodent Bioassay. Tox. Path, (22) No. 2. 124-140(1994).
7. McMartin, D.N., Sahota, P.S., Gunson, D.E., Han Hsu, H.and Spaet, R.H. Neoplasms and Related Proliferative Lesions in Control Sprague-Dawley Rats from
0 0 3 1 0 4 s

Carcinogenicity Studies. Historical Data and Diagnostic Considerations. Tox. Path. (20) No. 2,212-225 (1992).
8. Schafer, K.A. Cell Cycle: A Review. Vet. Path. (35) No. 6. 461-478 (1998).9. Shupe. J.L., Bruner, R.H., Seymour, J.L. and Alden, C.L. The Pathology of Chronic
Bovine Fluorosis; A Review. Tox. Path, (20) No.2. 274-285 (1992).10. Swenberg, J.A, Cell Proliferation and Chemical Carcinogenesis: Conference
Summary and Future Directions. Environ. Health Perspect. 101 (Suppl. 5) 153-158 (1993). ............... ...............
11. US Department of Health and Human Services. NTP TR 393. NTP Technical Report on Toxicology and Carcinogenesis Studies of Sodium Fluoride in F-344 Rats and B6C3F1 Mice (drinking water) (1990).
12. Van Rafelghem, M.J., Mattie, D.R., Bruner, R.H. and Anderson, M.E. Pathological and Hepatic Ultrastructural Effects of a Single Dose of Perfluoro-n-decanoic Acid in the Rat, Hamster, Mouse and Guinea Pig. Fund & Appi Tox. (9), 522-540 (1987).
13. Ward, J.M., Uno, H., Kurata, Y., Weghorst, C.M. and Jang, J. Cell Proliferation Not Associated with Carcinogenesis in Rodents and Humans, Environ. Health Perspect. 101 (Suppl. 5): 125-136 (1993).
0 0 3 1 0 5;6

28 March 1999
To: 3M
I resign my position as Environmental Specialist effective 6 April 1999. My resignation is prompted by my profound disappointment in 3M’s handling of the environmental risks associated with the manufacture and use of perfluorinated sulfonates (PFOS)(CAS# 29081-56-9) and its precursors~ such as ethyl FOSE alcohol (CAS #1691-99-2) and methyl FOSE alcohol (CAS #24448-09-7).
Perfluorooctansefulfonate is the most insidious pollutant since PCB. It is probably more damaging than PCB because it does not degrade, whereas PCB does; it is more toxic to wildlife; and its sink in the environment appears to be biota and not soil and sediment, as is the case with PCB.
I have worked within the system to learn more about this chemical and to make the company aware of the dangers associated with its continued use. But I have continually met roadblocks, delays, and indecision. For weeks on end I have received assurances that my samples would be analyzed soon--never to see results. There are always excuses and little is accomplished. I can illustrate with several examples.
¯ For more than twenty years 3M; s ecotoxicologists have urged the company to allow testing to perform an ecological risk assessment on PFOS and similar chemicals. Since I have been assigned to the problem a year ago, the company has continued its hesitancy.
¯ Over a period of seven months I made frequent requests that ecological risk consultants be hired to help me plan toxicky testing, environmental sampling, chemical fate studies, and ecological risk procedure. I still have not received authorization even to bring people in to interview-. I requested, very frequently, over a nine-month period, a sample of chemical to send out for fate property and ecotoxicity testing. Finally I was provided with one that apparently the division had had all along.
¯ I put together a pioneer risk assessment on PFOS that indicated a greater than 100% probability of harm to sea mammals, based on preliminary data on the concentration of PFOS in menhaden fish meal. The 8e committee told me that they would like to reconsider the assessment aider wc had a validated value for fishrncal. That analysis was given high priority by the committee. After three months the analysis is still not done--not because there were technical problems, but because management did not actually give the analysis high priority.
¯ 3M submitted a TSCA 8e last May. There is tremendous concern within EPA, the country, and the world about persistent bioaccumulative chemicals such as PFOS. Just before that submission we found PFOS in the blood &eaglets--eaglets still young enough that their only food consisted offish caught in remote lakes by their parents. This finding indicates a widespread environmental contamination and food chain transfer and probable bioaccumulation and bio-magnification. This is a very significant finding that the 8e reporting rule was created to collect. 3M chose to
1001.0001 3MA00480715

report simply that PFOS had been found in the blood of animals, which is true but omits the most significant information.
One of our customers, Griffin, has data on some of our chemicals. They developed this data for pesticide registration purposes. I started regularly asking for permission to visit Griffin and view the data last May. Their data can help us plan our studies of similar chemicals. It can also indicate if there is an unforeseen risk to certain biota or via certain exposure pathways. It was ten months before I was allowed to visit Griffin, at which time I did not get to see the data. I have to return another time to see it. 3M waited too long to tell customers about the widespread dispersal of PFOS in people and the environment. We knew before May of 1998, yet 3M did not start telling customers until January of 1999. I felt guilty about this and told customers I personally knew earlier. Still, it was not as early as it should have been. I kept waiting for 3M to do its duty, as I was continually assured that it would. Some of the customers have done risk assessments on the PFOS precursor they use. They assume there is not a background in the environment and in wildlife. Since there is a background, their risk assessments are inaccurate. Thus they can make inappropriate business decisions and not realize that their use of PFOS precursors contributes to an aggregate risk. 3M continues to make and sell these chemicals, though the company knows of an ecological risk assessment I did that indicates there is a better than 100% probability that perfluorooctansulfonate is biomagnifying in the food chain and harming sea mammals. This chemical is more stable than ninny rocks. And the chemicals the company is considering for replacement are just as stable and biologically available. The risk assessment I performed was simple, and not worst case. If worst case is used, the probability of harm exceeds 100,000%.
3M told those of us working on the fluorochemical project not to write down our thoughts or have email discussions on issues because of how our speculations could be viewed in a legal discovery process. This has s~mied intellectual development on the issue, and stifled discussion on the serious ethical implications of decisions
I have worked to the best of my ability within the system to see that the right actions are taken on behalf of the environment. At almost every step, I have been assured that action will be taken--yet I see slow or no results. I am told the company is concerned, but their actions speak to different concerns than mine. I can no longer participate in the process that 3M has established for the management of PFOS and precursors. For me it is unethical to be concerned with markets, legal defensibility and image over environmental safety.
Sincerely,
Rich Purdy
1001.0002 3MA00480716
ARMfi-OI«
iÙ > T - - S
Draft Report
26-Week Capsule Toxicity Study with Perfluorooctane SulfonicAcid Potassium Salt (PFOS; T-6295) in Cynomolgus Monkeys
PREPARED FOR:3M
COVANCE STUDY NUMBER: 6329-223
VOLUME I of II
0 0 2 6 3 6
US00004524

C O V / W iC E >THB O m iO PUEHT MRV1CM COMPAQ
UNAUDITED DRAFT April 12,2000
Sponsor:
3MSt. Paul, Minnesota
PINAL REPORT
Study Title:
26-Week Capsule Toxicity Study with Perfluorooctane Sulfonic Acid Potassium Salt (PFOS; T-6295) in Cynomolgus Monkeys
Author:
Peter J. Thomford, PhD
Study Completion Date:
To be determined
Testing Facility:
Covance Laboratories Inc.3301 Kinsman Boulevard
Madison, Wisconsin 53704-2595
Laboratory Study Identification:
Covance 6329-223
Sponsor Study Identification:
3M Study No. T-6295.7
Volume I of II
Page 1 of 821
002637
US00004525

Covan ce 6329-2233MT-6295.7
COMPLIANCE STATEMENT
26-Week Capsule Toxicity Study with Perfluorooctane Sulfonic Acid Potassium Salt (PFOS; T-6295) in Cynomolgus Monkeys
All aspects of this study were in accordance with the Environmental Protection Agency Good Laboratory Practice Standards, 40 CFR 792.
Peter J. Thomford, PhD DateStudy DirectorCovance Laboratories Inc.
Andrew M. Seacat, PhD DateStudy Monitor 3M
002638
US00004526

STUDY IDENTIFICATION
Covance 6329-2233MT-6295.7
26-Week Capsule Toxicity Study with Perfluorooctane Sulfonic Acid Potassium Salt (PFOS; T-6295) in Cynomolgus Monkeys
Test Material Perfluorooctane Sulfonic Acid Potassium Salt (PFOS; T-6295)
Sponsor 3MToxicology Services Building 220-2E-02,3M Center St. Paul, Minnesota 55144-1000
Study Monitor Andrew M. Seacat, PhD 3M651.575.3161
Alternate Study Monitor Marvin T. Case, DVM, PhD 3M Toxicology Services 651.733.5180
Study Location Covance Laboratories Inc.3301 Kinsman Boulevard Madison, Wisconsin 53704-2595
Study Director Peter J. Thomford, PhD Covance Laboratories Inc.PO Box 7545Madison, Wisconsin 53707-7545 608.241.7207
Study Timetable Study Initiation Date In-Life (Experimental) Start Date In-Life Termination Date Experimental Termination Date
August 20, 1998 August 26, 1998 March 7, 2000 To be determined
3 002639
US00004527

Covance 6329-2233M T-6295.7
KEY PERSONNEL
26-Week Capsule Toxicity Study with Perfluorooctane Sulfonic Acid Potassium Salt (PFOS; T-6295) in Cynomolgus Monkeys
Study Director
Study Toxicologist
Study Coordinator
Manager, Large Animal Toxicology
Supervisor, Dose Formulation
Associate Director, Laboratory Animal Medicine
Clinical Pathologist
Supervisor, Clinical Pathology
Anatomic Pathologist
Supervisor, Anatomic Pathology
Supervisor, Anatomic Pathology
Consultant
Peter L Thomford, PhD
Dale Aldridge, BS
Elizabeth A. Disch, BA
Sharon Dunn, LATG, AT
Dixie Bushee, BS, LATG
Donna J. Clemons, DVM, MS Diplomate, ACLAM
Robert L. Hall, DVM, PhD Diplomate, ACVP (Clinical Pathology)
Ronald Markevitch, BS, MT (ASCP)
Robert A. Leedle, DVM, PhD Diplomate, ACVP
Laurie J. Schuller, BA LAT
Kimberly W. Durland, BS, HT
Stephen I. Bistner, DVM Diplomate, ACVO Veterinary Ophthalmologist
0 0 2 6 4 04
US00004528

Covance 6329-2233M T-6295.7
CONTENTSVOLUME I OF n Page
ABSTRACT......................................................................................................................... 9
PURPOSE........................................................................................................................... 12
REGULATORY COMPLIANCE............................................................................ 12
TEST MATERIAL, VEHICLE, AND SOLVENT............................................................ 12Test Material.................................................................................................................. 12Vehicle................................................................................................................. 12Solvent............................................................................................................................13Gelatin Capsules............................................................................................................. 13Reserve (Archive) Samples.............................................................................................13Disposition..................................................................................................................... 13
TEST ANIMALS AND HUSBANDRY............................................................................13Animals...........................................................................................................................13Identification.................................................................................................................. 14Justification.....................................................................................................................14Husbandry.......................................................................................................................14Acclimation.... ......................................................................................................... „... 15
PROCEDURES.................................................................................................................. 15Group Designations and Dosage Levels........................................................................ 15Dosing Procedures..........................................................................................................16Dose Analyses............................................................ 17Observation of Animals..................................................................................................17Clinical Pathology.......................................................................................................... 18Blood Hormone Determination...................................................................................... 19Serum PFOS Level Determination.................................................................................19Additional Serum Collection.........................................................................................20Urine and Feces PFOS Level Determination.................................................................20Additional Fecal Samples.............................................................................................. 20Interim Liver Biopsy Samples.......................................................................................20Terminal Liver Biopsy Samples.....................................................................................21Anatomic Pathology - Terminal Sacrifice..................................................................... 21Anatomic Pathology - Recovery Sacrifice..................................................................... 24Statistical Analyses.........................................................................................................25Record Retention............................................................................................................25
002641
US00004529

Covance 6329-2233M T-6295.7
CONTENTS (Continued)VOLUME I OF n Page
RESULTS AND DISCUSSION.........................................................................................26Observation of Animals....... .......................................................................................... 26Clinical Pathology...........................................................................................................28Palmitoyl Co A Oxidase Determination.......................................................................... 28Blood Hormone Determination.......................................................................................28Anatomic Pathology........................................................................................................29
CONCLUSION................................................................................................................... 30
SIGNATURES.....................................................................................................................31
REFERENCES.................................................................................................................... 32
OPHTHALMOLOGY REPORT........................................................................................33
PATHOLOGY REPORT.................................................................................................... 34
COMMENTS ON THE DATA..........................................................................................41
CODES, ABBREVIATIONS, AND UNITS......................................................................43General Codes and Abbreviations.................................................................................. 44Codes for Clinical Pathology.........................................................................................45Abbreviations and Units for Clinical Hematology......................................................... 48Abbreviations and Units for Clinical Chemistry............................................................ 50Abbreviations and Units for Clinical Urinalysis............................................................ 52Codes for Anatomic Pathology.......................................................................................53
FIGURES1 Mean Body Weight Data - Treatment...................................................................... 552 Mean Body Weight Data - Recovery........................ 56
TABLES1 Summary of Clinical Observations - Treatment......................................................572 Summary of Clinical Observations - Recovery (Days 186 through 365)................ 613 Summary of Clinical Observations - Recovery (Days 366 through 561)................624 Summary of Ophthalmic Observations - Treatment................................................645 Summary of Ophthalmic Observations - Recovery..................................................666 Summary of Body Weight Data (kg) - Treatment....................................................677 Summary of Body Weight Data (kg) - Recovery.....................................................728 Summary of Clinical Hematology Data - Day -27..................................................809 Summary of Clinical Hematology Data - Day 37 ............................................... 84
10 Summary of Clinical Hematology Data - Day 62.................................................. 8811 Summary of Clinical Hematology Data - Day 91....................................................92
6 002642
US00004530

CONTENTS (Continued)VOLUME I OF H Page
TABLES12 Summary of Clinical Hematology Data - Day 153.................................................. 9613 Summary of Clinical Hematology Data - Day 182................................................ 10014 Summary of Clinical Hematology Data - Day 217................................................ 10415 Summary of Clinical Hematology Data - Day 245................................................ 10816 Summary of Clinical Hematology Data - Day 274................................................ 11217 Summary of Clinical Hematology Data - Day 322................................................ 11618 Summary of Clinical Hematology Data - Day 364................................................ 12019 Summary of Clinical Hematology Data - Day 456...................... 12420 Summary of Clinical Hematology Data - Day 546................................................ 12821 Summary of Clinical Chemistry Data - Day -27.....................................................13222 Summary of Clinical Chemistry Data - Day 37......................................................13823 Summary of Clinical Chemistry Data - Day 62......................................................14424 Summary of Clinical Chemistry Data - Day 91......................................................15025 Summary of Clinical Chemistry Data - Day 153....................................................15626 Summary of Clinical Chemistry Data - Day 182....................................................16227 Summary of Clinical Chemistry Data - Day 217....................................................16828 Summary of Clinical Chemistry Data - Day 245....................................................17429 Summary of Clinical Chemistry Data - Day 274....................................................18030 Summary of Clinical Chemistry Data - Day 322....................................................18631 Summary of Clinical Chemistry Data - Day 364....................................................19232 Summary of Clinical Chemistry Data - Day 456................................................... 19833 Summary of Clinical Chemistry Data - Day 546...................................................20434 Summary of Clinical Urinalysis Data - Day -27.................................................... 21035 Summary of Clinical Urinalysis Data - Day 3 7 ..................................................... 21236 Summary of Clinical Urinalysis Data - Day 6 2 ..................................................... 21437 Summary of Clinical Urinalysis Data - Day 9 1 ..................................................... 21638 Summary of Clinical Urinalysis Data - Day 153........ 21839 Summary of Clinical Urinalysis Data - Day 182...................................................22040 Summary of Clinical Urinalysis Data - Day 217...................................................2224 1 Summary of Clinical Urinalysis Data - Day 245................................................... 22442 Summary of Clinical Urinalysis Data - Day 274................................................... 22643 Summary of Clinical Urinalysis Data - Day 322...................................................22844 Summary of Clinical Urinalysis Data - Day 364...................................................23045 Summary of Clinical Urinalysis Data - Day 456 .................................... 23246 Summary of Clinical Urinalysis Data - Day 546...................................................23447 Summary of Palmitoyl CoA Oxidase Determinations...........................................23648 Summary of Organ Weight Data........................................................................... 238
Covance 6329-223_____________________________________________________________________ 3M T-6295.7
7 002643
US00004531

CONTENTS (Continued)VOLUME I OF H Page
TABLES49 Incidence of Macroscopic Observations - Terminal Sacrifice............................... 26850 Incidence of Macroscopic Observations - Recovery Sacrifice..............................27151 Incidence of Microscopic Observations - Terminal Sacrifice................................ 27252 Incidence of Microscopic Observations - Recovery Sacrifice............................... 282
APPENDIX 1.................................................................................................................... 283Protocol Deviations.......................................................................................................284Protocol..........................................................................................................................288Protocol Amendment No. 1 ...................................................................................... 306Protocol Amendment No. 2 .......................................................................................... 315Protocol Amendment No. 3 .......................................................................................... 323
APPENDIX 2.................................................................................................................... 329Individual Animal Fate Data.........................................................................................330Individual Clinical Observations....................................................................... 332Individual Ophthalmic Observations............................................................................ 474
APPENDIX 3.................................................................................................................... 489Individual Body Weight Data (kg)................................................................................490
VOLUME n OF II
APPENDIX 4 .................................................................................................................... 504Individual Clinical Hematology Data........................................................................... 505Individual Clinical Chemistry Data.............................................................................. 565Individual Clinical Urinalysis Data.............................................................................. 637
APPENDIX 5.................................................................................................................... 685Individual Palmitoyl CoA Oxidase Determinations.....................................................686Individual Anatomic Pathology Data........................................................................... 690
APPENDIX 6.................................................................................................................... 769Summary and Individual Blood Hormone Determination........................................... 770
APPENDIX 7 .................................................................................................................... 808Cell Proliferation Report.............................................................................................. 809
Covance 6329-223_____________________________________________________________ ______________ 3M T-6295.7
8 002644
US00004532

ABSTRACT
The purpose of this study was to assess the effect of the test material, Perfluorooctane Sulfonic Acid Potassium Salt [PFOS; T-6295 (hereafter referred to as PFOS)] on critical enzyme levels, hormones, and other selected biochemical parameters when administered daily by oral capsule to cynomolgus monkeys for at least 26 weeks. The treatment period was followed by an approximate 52-week recovery period.
Male and female cynomolgus monkeys were assigned to four groups (six animals/sex in Groups 1, 3, and 4; four animals/sex in Group 2). Each group received dose preparations containing the vehicle, lactose, or 0.03, 0.15, or 0.75 mg of PFOS/kg of body weight/day (mg/kg/day). Two animals/group in Groups 1, 3, and 4 were in a recovery period and were not treated for at least 52 weeks following the 26 week treatment period.
Food was provided ad libitum, except when animals were fasted. Water was provided ad libitum. The animals were observed twice daily (a.m. and p.m.) for mortality and raoribundity. At least once daily, animals were examined for abnormalities and signs of toxicity, and food consumption was assessed qualitatively. Ophthalmic examinations were done before initiation of treatment and during Weeks 26 and 52. Body weight data were recorded weekly before initiation of treatment, on Days -1 and 1, and weekly thereafter. Blood and urine samples were collected for clinical hematology, clinical chemistry, and urinalysis tests before initiation of treatment and at specified intervals during treatment and recovery. Blood was also collected for blood hormone and PFOS level determinations before, during, and after treatment at specified intervals. Feces and liver samples were also collected at specified intervals. On Day 155 (Week 23), one male given 0.75 mg/kg/day died, and on Day 179 (Week 26), one male given 0,75 mg/kg/day was sacrificed due to poor health. On Days 184 and 185 (Week 27), four animals/sex/group (Groups 1 through 3) and four females and two males (Group 4) were anesthetized, weighed, exsanguinated, and necropsied. At necropsy at the scheduled and unscheduled sacrifices, a serum sample was collected, macroscopic observations were recorded, selected organs were weighed, and selected tissues were collected and preserved. Microscopic examinations were done on tissues from each animal in the control and high-dose groups and selected tissues from animals in the low- and mid-dose groups. Tissues were also collected for palmitoyl CoA oxidase determination, cell proliferation evaluation, PFOS determination, and electron microscopy. Additionally, the bile was collected from the gallbladder, and the gallbladder was preserved. At the recovery sacrifice on Day 549, the remaining Group 4
002645
Covanoe 6329-223______________________________________________________ __________________3MT-6295.7
' 9
US00004533

Covance 6329-2233M T-6295.7
animals were anesthetized, weighed, exsanguinated, and necropsied. Macroscopic observations were recorded and specified tissues and serum were collected. Remaining animals in Groups 1 and 3 were donated or transferred to a follow-up study,Covance 6329-268.
At all dose levels, clinical observations, ophthalmic observations, and palmitoyl C6A oxidase determinations do not appear to be affected by treatment with PFOS.
Two males given 0.75 mg/kg/day died during treatment. These deaths were preceded by some adverse clinical observations (constricted pupil, pale gums, abnormal feces, excessive salivation, labored respiration, dehydrated appearance, hypoactive, ataxic, recumbent, low food consumption) and appeared to be related to the administration of PFOS. When compared with animals given the control material, covariate adjusted mean body weights (CAM) for males given 0.75 mg/kg/day were slightly lower beginning at Week 21, and for females given 0.75 mg/kg/day CAM body weights were, in general, significantly lower beginning at Week 11. Similar decreases were not seen in the other treated groups; therefore, this finding is likely test material-related. Test material-related effects on body weights were not apparent during recovery. Low food consumption was noted sporadically for animals in the groups given the control material and 0.03 mg/kg/day throughout treatment. The incidence of low food consumption was generally higher in the groups given 0.15 or 0.75 mg/kg/day as compared to an im als
given the control material and appeared to be test material-related. During recovery, effects on food consumption were reversed.
Estradiol values were generally lower on Days 62, 91, and 182 in males given 0.75 mg/kg/day, although because of the variation in the data only the Day 182 value was significant. Estrone values were generally higher in all of the treated females on Days 37, 62, and 91, although because of the variation in the data none of these values were significantly different, and this difference was not apparent on Day 182.Triiodothyronine values were notably lower in both males and females given 0.15 and 0.75 mg/kg/day on Days 91 and 182. With the single exception of males given 0.15 mg/kg/day on Day 91, all values were significantly lower. During recovery were occasional instances in which the hormone values in treated groups differed slightly from those of controls, but those differences were not consistent over time or between sexes, were not clearly dose-related, and did not appear to be clearly related to the administration of the test material. Apparent differences in the sexual maturity of both males and females used in this study complicates the interpretation of the hormone data.
00264610
US00004534
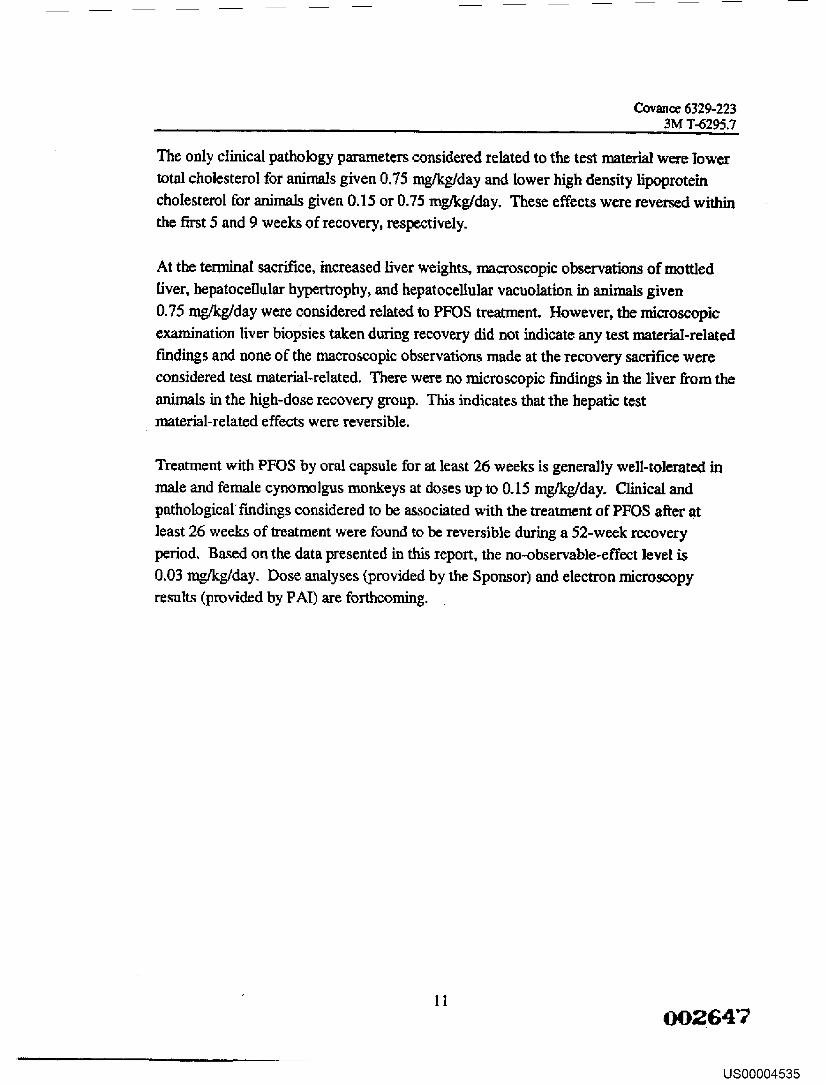
The only clinical pathology parameters considered related to the test material were lower total cholesterol for animals given 0.75 mg/kg/day and lower high density lipoprotein cholesterol for animals given 0.15 or 0.75 mg/kg/day. These effects were reversed within the first 5 and 9 weeks of recovery, respectively.
At the terminal sacrifice, increased liver weights, macroscopic observations of mottled liver, hepatocellular hypertrophy, and hepatocellular vacuolation in animals given 0.75 mg/kg/day were considered related to PFOS treatment. However, the microscopic examination liver biopsies taken during recovery did not indicate any test material-related findings and none of the macroscopic observations made at the recovery sacrifice were considered test material-related. There were no microscopic findings in the liver from the animals in the high-dose recovery group. This indicates that the hepatic test material-related effects were reversible.
Treatment with PFOS by oral capsule for at least 26 weeks is generally well-tolerated in male and female cynomolgus monkeys at doses up to 0.15 mg/kg/day. Clinical and pathological findings considered to be associated with the treatment of PFOS after at least 26 weeks of treatment were found to be reversible during a 52-week recovery period. Based on the data presented in this report, the no-observable-effect level is 0.03 mg/kg/day. Dose analyses (provided by the Sponsor) and electron microscopy results (provided by PAI) are forthcoming.
Covan ce 6329-223_____________________________________________ _____________ ________________ 3M T-6295,7
1100264?
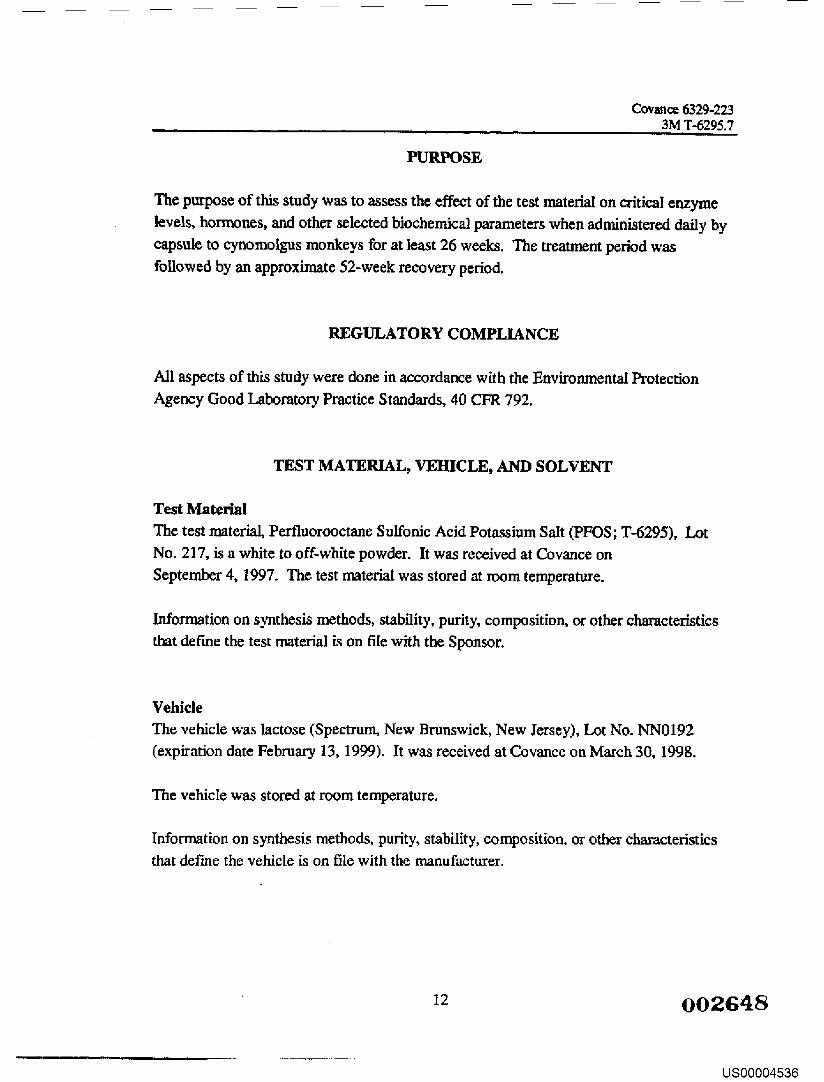
PURPOSE
The purpose of this study was to assess the effect of the test material on critical enzyme levels, hormones, and other selected biochemical parameters when administered daily by capsule to cynomolgus monkeys for at least 26 weeks. The treatment period was followed by an approximate 52-week recovery period.
Covance 6329-223_______________________________________________________ ___________________ 3M T-6295.7
REGULATORY COMPLIANCE
All aspects of this study were done in accordance with the Environmental Protection Agency Good Laboratory Practice Standards, 40 CFR 792.
TEST MATERIAL, VEHICLE, AND SOLVENT
Test MaterialThe test material, Perfluorooctane Sulfonic Acid Potassium Salt (PFOS ; T-6295), to t No. 217, is a white to off-white powder. It was received at Covance on September 4,1997. The test material was stored at room temperature.
Information on synthesis methods, stability, purity, composition, or other characteristics that define the test material is on file with the Sponsor.
VehicleThe vehicle was lactose (Spectrum, New Brunswick, New Jersey), Lot No. NN0192 (expiration date February 13, 1999). It was received at Covance on March 30,1998.
The vehicle was stored at room temperature.
Information on synthesis methods, purity, stability, composition, or other characteristics that define the vehicle is on file with the manufacturer.
002648
US00004536

Covante 6329-2233M T-6295.7
SolventThe solvent was acetone (Spectrum, Gardena, California), Lot No. LH0253, (expiration date June 2000). It was received at Covance on June 23, 1997. The solvent was stored at room temperature.
Information on synthesis methods, composition, or other characteristics that define the solvent is on file with the manufacturer.
Gelatin CapsulesGelatin capsules, Size Nos. 2 (Lot No. 122932, expiration date June 12,2003) and 4 (Lot No. 544043, expiration date August 1, 2002) were manufactured by Torpac Inc., (Fairfield, New Jersey). Lot No. 122932 was received at Covance on June 12,1998, and Lot No. 544043 was received on September 1 and November I I , 1998. The capsules were stored at room temperature. A copy of the Certificate of Analysis provided by the manufacturer is maintained in the data.
Reserve (Archive) SamplesA reserve sample (1 g) of each lot of the test material, vehicle, and each test materiaiylactose dilution was taken and stored at room temperature. These samples were transferred to the Sponsor after completion of the treatment phase (see Protocol Deviations).
DispositionRemaining test material will be retained at Covance for use in possible future studies.
TEST ANIMALS AND HUSBANDRY
AnimalsYoung adult to adult cynomolgus monkeys were obtained from Covance Research Products Inc. (Denver, Pennsylvania) on June 30, 1998. The animals weighed 2.4 to 4.4 kg at initiation of treatment.
002649
US00004537
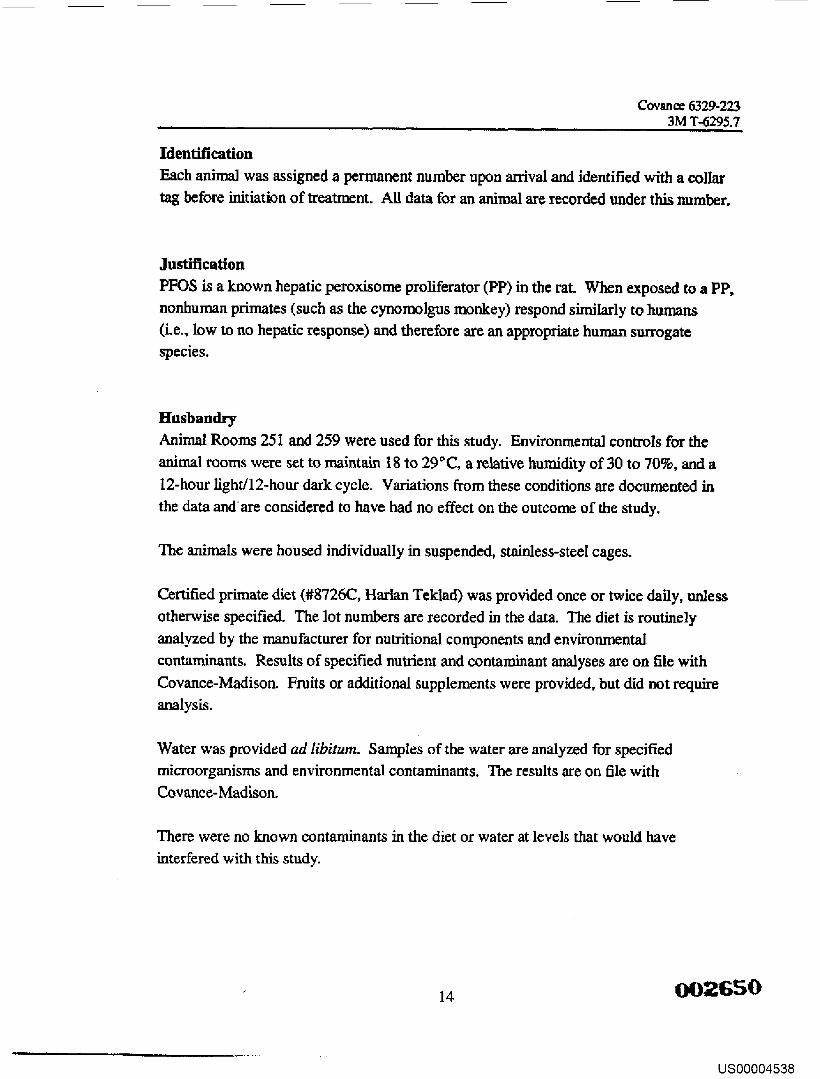
IdentificationEach animal was assigned a permanent number upon arrival and identified with a collar tag before initiation of treatment. All data for an animal are recorded under this number.
Covance 6329-223______________________________________________ _____________________________3M T-6295.7
JustificationPFOS is a known hepatic peroxisome proliferator (PP) in the rat When exposed to a PP, nonhuman primates (such as the cynomolgus monkey) respond similarly to humans (Le., tow to no hepatic response) and therefore are an appropriate human surrogate species.
HusbandryAnimal Rooms 251 and 259 were used for this study. Environmental controls for the animal rooms were set to maintain 18 to 29 °C, a relative humidity of 30 to 70%, and a 12-hour light/12-hour dark cycle. Variations from these conditions are documented in the data and are considered to have had no effect on the outcome of the study.
Hie animals were housed individually in suspended, stainless-steel cages.
Certified primate diet (#8726C, Harlan Teklad) was provided once or twice daily, unless otherwise specified. The lot numbers are recorded in the data. The diet is routinely analyzed by the manufacturer for nutritional components and environmental contaminants. Results of specified nutrient and contaminant analyses are on file with Covance-Madison. Fruits or additional supplements were provided, but did not require analysis.
Water was provided ad libitum. Samples of the water are analyzed for specified microorganisms and environmental contaminants. The results are on file with Covance-Madison,
There were no known contaminants in the diet or water at levels that would have interfered with this study.
002650
US00004538

Covan ce 6329-2233M T-6295.7
AcclimationTwenty-four males and 24 females were received on June 30,1998, and acclimated in Animal Room 251 for 57 days before initiation of treatment. In general, animals in this shipment appeared healthy. During acclimation, the animals were examined for abnormalities indicative of health problems. In addition, three tuberculosis tests, a physical examination, and a fecal flotation for parasites were performed on each animal.
PROCEDURES
This study was conducted in accordance with the Protocol dated August 20,1998, and Protocol Amendment Nos. 1, 2, and 3. The protocol, protocol amendments, and protocol deviations are in Appendix 1.
Group Designations and Dosage LevelsSelection o f animals for the study was based on data collected during acclimation. Animals were assigned to treatment groups using a computerized blocking procedure designed to achieve body weight balance with respect to treatment group.
GroupDose Level
(mg/kg/day)“Total Material Dose Level
(mg/kg/day)bNumber of Animals Males Females
1 0“ 30“ 6d ------ 6*-------2 0.03 15b 4 43 0.15 6C 6d 6d4 0.75 30c 6d 6da The control group (Group 1) received the equivalent amount of lactose in
gelatin capsules as the total material administered to Group 4.b The low-dose (Group 2) received the test material diluted with lactose
(1:499, w:w).c The mid-dose (Group 3) and high-dose (Group 4) groups received the test
material diluted with lactose (1:39, w:w). d Two animals in Groups 1, 3, and 4 designated as recovery animals were
treated for at least 26 weeks, then treatment was discontinued, and the animals were observed for reversibility, persistence, or delayed occurrence of toxic effects for at least 52 weeks posttreatment.
15 002651
US00004539

Dosing ProceduresVehicle. Dose levels were based on the vehicle as supplied for Group 1. For Group 1 dose preparations, the specified amount of lactose was weighed, transferred into gelatin capsules, and the top and bottom halves of each capsule were joined. Capsules were prepared at least once weekly.
Test Material. The test material/lactose preparations for Groups 2 through 4 were diluted once before initiation of treatment; capsules were prepared at least once weekly.
A specified amount of test material was weighed, placed into a labeled mixing container, and the appropriate volume of acetone was added. After stirring manually until the test material was dissolved, the required amount of lactose was weighed and transferred to the container. The components were mixed thoroughly using a spatula. The prepared test material dilution was stirred periodically while allowed to stand exposed to the air until the acetone had evaporated. Preparations were diluted to facilitate capsule preparation.
Samples of the finished mixture for dose analyses were taken directly from the container.
The dose preparations were stored at room temperature between capsule preparations.The appropriate amount of prepared test material was weighed and transferred into Size 2 (Days 1 through 8) or 4 (Days 9 through 184) gelatin capsules and the top and bottom halves of each capsule were joined. Size 4 capsules were used instead of Size 2 to better facilitate dose administration. Individual daily doses were based on the most recently recorded body weight, with the exception of doses given on days when body weight measurements were performed; on those days, the previous body weight was used.
All capsule preparations were stored at room temperature until used for dosing.
Method of Administration. Gelatin capsules were used to facilitate comparison with data from previous toxicology studies that used the oral route. Also, oral is the most likely route of exposure in humans. Partial or intact capsules were noted in the vomitus of several animals on occasion; however, this is not considered to have adversely affected the results of the study.
The dose preparations were administered orally in gelatin capsules once daily 7 days/week for at least 26 weeks (see Protocol Deviations for exceptions).
Covan ce 6329-223._____________________________________________ _ _ _ _ _ _____________________ 3M T-6295.7
002G5216
US00004540
Covance 6329-2233M T-6295.7
Dose AnalysesHomogeneity and stability analyses were the responsibility of the Sponsor.
Samples (approximately 1 g each) were taken from the top, middle, and bottom of the test material/Iactose preparations on Day -15 for homogeneity analysis. Samples collected from the middle of the preparations were also designated for prestudy stability analysis.A set of samples (approximately 1 g each) were taken from the low- and high-dose test material/Iactose preparations at the end of the treatment phase for test material content analysis.
All samples were stored at room temperature until sent under ambient conditions to the Sponsor for analysis. Results of dose analyses will be provided for inclusion in the final report
Observation of AnimalsClinical Observations. The animals were observed twice daily (a.m. and p.m.) for mortality and moribundity. Animals were also observed at least once daily (a.m.) for signs of poor health or abnormal behavior, and food consumption was assessed qualitatively; only abnormal findings were recorded. Once weekly and on the day of scheduled sacrifice, each animal was observed; abnormal findings or an indication of normal was recorded (see Protocol Deviations for exceptions). Additionally, postdose observations were recorded during treatment approximately 30 to 90 minutes after the last dose administration; only abnormal findings were recorded.
Ophthalmology. Ophthalmic examinations were done on each animal before initiation of treatment, before the scheduled terminal sacrifice during Week 26, and during Week 52 (see Protocol Deviations). The pupils were dilated with 1% Mydriacyl® and the anterior portion of the eye, optic media, and ocular fundus were examined with an indirect ophthalmoscope by a board-certified ophthalmologist.
Body Weights. Individual body weight data were recorded weekly before initiation of treatment, on Day -1, on the first day of treatment, and weekly thereafter. Body weights were also recorded for animals sacrificed at unscheduled intervals.
00265317
US00004541
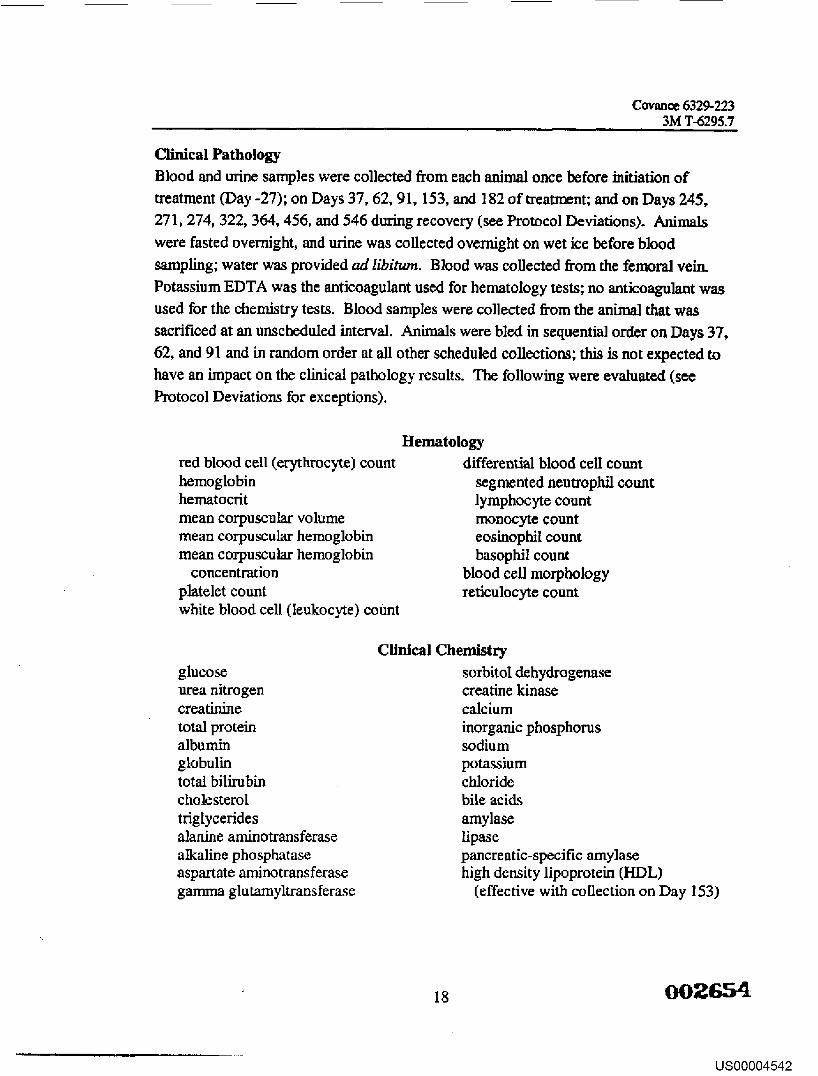
Covan ce 6329-2233M T-6295.7
Clinical PathologyBlood and urine samples were collected from each animal once before initiation of treatment (Day -27); on Days 37, 62, 91,153, and 182 of treatment; and on Days 245, 271, 274, 322, 364,456, and 546 during recovery (see Protocol Deviations). Animals were fasted overnight, and urine was collected overnight on wet ice before blood sampling; water was provided ad libitum. Blood was collected from the femoral vein. Potassium EDTA was the anticoagulant used for hematology tests; no anticoagulant was used for the chemistry tests. Blood samples were collected from the animal that was sacrificed at an unscheduled interval. Animals were bled in sequential order on Days 37, 62, and 91 and in random order at all other scheduled collections; this is not expected to have an impact on the clinical pathology results. The following were evaluated (see Protocol Deviations for exceptions).
Hematologyred blood cell (erythrocyte) counthemoglobinhematocritmean corpuscular volume mean corpuscular hemoglobin mean corpuscular hemoglobin
concentration platelet countwhite blood cell (leukocyte) count
blood cell morphology reticulocyte count
differential blood cell count segmented neutrophil count lymphocyte count monocyte count eosinophil count basophil count
Clinical Chemistryglucoseurea nitrogencreatininetotal proteinalbuminglobulintotal bilirubincholesteroltriglyceridesalanine aminotransferasealkaline phosphataseaspartate aminotransferasegamma glutamyltransferase
sorbitol dehydrogenase creatine kinase calciuminorganic phosphorussodiumpotassiumchloridebile acidsamylaselipasepancreatic-specific amylase high density lipoprotein (HDL)
(effective with collection on Day 153)
18 002654
US00004542

Covance 6329-2233M T-6295.7
Urinalysisvolume (approximately 16 hours) specific gravity pH
bilirubinbloodurobilinogenmicroscopic examination of sediment appearance
proteinglucoseketones
Blood Hormone DeterminationBlood samples (approximately 5 mL) were collected from each animal three times before initiation of treatment (Days -50, -40, and -27); on Days 37,62, 91, and 182 of treatment; and on Days 217, 245, 274, 322, 364,458, and 549 during recovery. Animals were fasted overnight. Blood was collected from a femoral vein without using an anticoagulant. Samples were allowed to clot and centrifuged within 1 hour after collection; serum was harvested. The serum was divided into two approximately equal aliquots and stored in a freezer, set to maintain -60 to-80°C, until packed on dry ice and shipped to Ani Lytics Inc. for analysis of cortisol, testosterone, estradiol, estrone, estrío 1, thyroid stimulating hormone, total triiodothyronine, and total thyroxin. Beginning with the collection on Day 322 the samples were also analyzed for free triiodothyronine and free thyroxin.
Serum PFOS Level DeterminationBlood samples (approximately 2 mL) were collected from each animal once before initiation of treatment (Day-27); during Weeks 1 (Day 7), 2 ,4 ,6 , 8,12,16, 20,24, and 26, and 27 (Day 183) of treatment; and during Weeks 27 (Days 184, 185, and 187), 28 (Day 190), 29 (Day 198), 30 (Day 204), 31 (Day 211), 35, 39, 43,47, 51,53, 57,61, 65, 69, 73,77, and 79 (see Protocol Deviations). Animals were fasted overnight and water was provided ad libitum. Blood was collected from a femoral vein without using an anticoagulant. Samples were centrifuged within 1 hour after collection and serum was harvested. Serum samples were stored in a freezer, set to maintain -60 to-80°C, until packed on dry ice and shipped to the Sponsor for analysis. Results will reported separately.
0 0 2 6 3 519
US00004543

Covance 6329-223____ 3M T-6295.7
Additional Serum CollectionAt the scheduled terminal necropsy and the necropsy of Animal No. 105506 (Group 4 male), blood samples (approximately 20 mL) were collected from the vena cava at the time of exsanguination. Samples were collected without using an anticoagulant and centrifuged within 1 hour of collection. Serum was harvested and stored in a freezer, set to maintain -60 to -80°C, until packed on dry ice and shipped to the Sponsor for possible future analysis.
An aliquot (0.8 ml) of the additional serum collection samples collected from all animals from Groups 1, 2, 3, and 4 sacrificed at the terminal necropsy were sent on dry ice by the Sponsor to AniLytics for total triiodothyronine, total thyroxin, free triiodothyronine, and free thyroxin determinations.
Urine and Feces PFOS Level DeterminationUrine [at least 2 mL (see Protocol Deviations)] and feces (at least 5 g) were collected overnight on the first day of recovery (Day 184) and on Days 189, 216, 275,321, and 366 during recovery. In addition, a 24-hour sample of urine and feces was collected before the completion of 52 weeks of recovery. Except for the first day of recovery, animals were not fasted. Samples were stored in a freezer set to maintain -10 to -30°C, until they were packed on dry ice and shipped to the Sponsor. The samples will be analyzed for PFOS. Results will be reported separately.
Additional Fecal SamplesDuring Week 23, a fresh fecal sample (up to 5 g) was collected from all animals in the control and high-dose groups. Samples were collected in white polypropylene containers after pans were cleaned in the morning to ensure that the fecal samples were not more than 6 hours old (see Protocol Deviations). Samples were packed on dry ice and shipped to the Mayo Clinic for analysis.
Interim Liver Biopsy SamplesA sample of liver (approximately 1 to 2 g) was collected by biopsy from animals in Group 4 only during recovery [Week 57 (Day 393), on the same day as the serum PFOS blood collection]. This sample was divided into four portions as follows.
200 0 2 6 5 6

C avan« 6329-2233M T-6295.7
One subsample was preserved in 10% neutral-buffered formalin, embedded in paraffin, sectioned, stained with hematoxylin and eosin (duplicate slides were prepared), and examined microscopically.
The second subsample was flash-frozen in liquid nitrogen and stored in a freezer, set to maintain -60 to -80° C, until shipped to the Sponsor for analysis (see Protocol Deviations). Results will be reported separately.
The third subsample was processed to block stage for electron microscopic evaluation. The tissue blocks and a hematoxylin and eosin-stained slide for light microscopy were transferred to PAL Tissues will be processed and evaluated by electron microscopy by PAL A report will be provided by PAI for inclusion in the final report.
The fourth subsample was flash-frozen in liquid nitrogen and stored in a freezer, set to maintain -60 to -80 °C, until transferred to the Sponsor for possible future analysis.
Terminal Liver Biopsy SamplesA sample of liver (approximately 1 g) was collected by biopsy from all animals in Group 3 during recovery [Week 80 (Day 554), one week after the serum PFOS blood collection (see Protocol Deviations)]. This sample was flash-frozen in liquid nitrogen and stored in a freezer, set to maintain -60 to -80 °C, until shipped to the Sponsor for analysis. Results will be reported separately.
Anatomic Pathology - Terminal SacrificeNecropsy. A necropsy was done on Animal No. 105509 (Group 4 male) that died on Day 155 (Week 23) and Animal No. 105506 (Group 4 male) that was sacrificed in a moribund condition on Day 179 (Week 26). During Week 27 (Days 184 and 185) four animals/sex/group (Groups 1 through 3) and four females and two males (Group 4) were fasted overnight, anesthetized with ketamine and xylazine, weighed, bled for required tests, exsanguinated, and necropsled. Animals were necropsied in random order.
The necropsy included a macroscopic examination of the external surface of the body; all orifices; the cranial cavity; the external surface of the brain; the nasal cavity and paranasal sinuses; cervical tissues and organs; and the thoracic, abdominal, and pelvic cavities and viscera.
21 002657

Covance 6329-2233M T-6295.7
Organ Weights. At scheduled and unscheduled sacrifices, the following organs (when present) were weighed; paired organs were weighed separately.
Organ-to-body weight percentages and organ-to-brain weight ratios were calculated.
Palmitoyl CoA Oxidase Determinations. Representative samples of the right lateral lobe of liver were collected from each animal at the scheduled sacrifice, weighed, flash-frozen in liquid nitrogen, and stored in a freezer, set to maintain -60 to -80°C, until analyzed for palmitoyl CoA oxidase activity.
Cell Proliferation Evaluation. Representative samples of the left lateral lobe of the liver, left and right testes, and pancreas were collected and preserved in zinc formalin. A second set of tissues (representative samples of the left lateral lobe of the liver, left and right testes, and pancreas) preserved in formalin without zinc were also prepared. After fixation, samples were embedded in paraffin and shipped to Pathology Associates International (PAI) for proliferation cell nuclear antigen (PCNA) evaluation, including the examination of slides stained with hematoxylin and eosin (see Protocol Deviations). Results were provided by PAI for inclusion in the final report (Appendix 7).
Liver PFOS Determination. A section of liver (approximately 20 g) was collected from each animal at the scheduled sacrifice, weighed, flash-frozen in liquid nitrogen, and stored in a freezer, set to maintain -60 to -80°C, until shipped with plasma samples to the Sponsor. Results will be reported separately.
Gallbladder and Bile Collection. At the scheduled terminal sacrifice for each animal, bile was collected from the gallbladder, measured, transferred into a cryovial, and flash-frozen in liquid nitrogen. The gallbladder, once emptied, was weighed, and a section (approximately 4 to 5 mm) from the mid-portion was collected. The remaining gallbladder was placed in a cryovial and flash-frozen in liquid nitrogen. The bile and gallbladder samples were stored on dry ice until transferred to a freezer set to maintain
adrenal (2) brainepididymis (2) kidney (2) liver
pancreas testis (2)thyroid (2) with parathyroid
ovary (2)
22 002658
US00004546

Covan ce 6329-2233M T-6295.7
-60 to -80°C. Sandies were packed on dry ice and shipped to the Sponsor for possible future analysis.
Tissue Preservation. The following tissues (when present) or representative samples were collected and preserved in 10% neutral-buffered formalin, unless otherwise specified (see Protocol Deviations).
adrenal(2) aorta brain cecum cervix colon duodenum epididymis (2) esophaguseyes [(2) preserved in Davidson’s
fixative for all sacrificed animals] femur with bone marrow (articular
surface of the distal end) gallbladder heart ileum jejunum kidney (2) lesions liver lungmammary gland mesenteric lymph node
Histopathology. Tissues (as appropriate) were embedded in paraffin, sectioned, stained with hematoxylin and eosin, and examined microscopically from each animal in the control and high-dose groups (see Protocol Deviations for exceptions). In addition, liver and thymus for all animals in the low- and mid-dose groups and spinal cord gray matter from females in the low- and mid-dose groups were embedded in paraffin, sectioned, stained with hematoxylin and eosin, and examined microscopically. Other tissues, as appropriate, will be retained for possible future examination.
ovary (2)pancreaspituitaryprostaterectumsalivary gland [mandibular (2)] sciatic nerve seminal vesicle (2) skeletal muscle (thigh) skinspinal cord (cervical, thoracic, and
lumbar) spleensternum with bone marrow stomachtestis [(2) preserved in Bouin’s
solution for all sacrificed animals] thymusthyroid (2) with parathyroid tracheaurinary bladderuterusvagina
002659
US00004547

Covance 6329-2233M T-6295.7
Bone marrow smears from the sternum of each animal at scheduled and unscheduled sacrifices were prepared, stained with Wright’s stain, and retained for possible examination.
Electron Microscopy, A sample of the liver was collected from each animal at the scheduled terminal sacrifice. Tissues were processed into blocks and, along with a hematoxylin and eosin-stained slide, were shipped to PAI for analysis. Results will be provided for inclusion in the final report
Anatomic Pathology - Recovery SacrificeTermination. Remaining animals in Group 1 were donated on Day 549 and remaining animals in Group 3 were transferred to Covance 6329-268 on Day 560. On Day 549, remaining animals in Group 4 were fasted overnight, anesthetized with ketamine and xylazine, weighed, exsanguinated, and necropsied.
The necropsy of the animals in Group 4 included a macroscopic examination of the external surface of the body; all orifices; the cranial cavity; the external surface of the brain; the nasal cavity and paranasal sinuses; cervical tissues and organs; and the thoracic, abdominal, and pelvic cavities and viscera.
Liver Samples. Samples of liver were collected from animals in Group 4 as follows.
One sample was preserved in 10% neutral-buffered formalin, embedded in paraffin, sectioned, stained with hematoxylin and eosin (duplicate slides were prepared), and examined microscopically.
The second sample was flash-frozen in liquid nitrogen and stored in a freezer, set to maintain -60 to -80°C, until shipped to the Sponsor for analysis. Results will be reported separately.
The third sample was processed to block stage for electron microscopic evaluation. The tissue blocks and a hematoxylin and eosin-stained slide for light microscopy were transferred to Pathology Associates International (PAI). Tissues will be processed and evaluated by electron microscopy by PAI. A report will be provided by PAI for inclusion in the final report.
OOZSBG
US00004548
Covance 6329-2233M T-6295.7
Additional Tissue and Serum Samples. Samples of lung, kidney, spleen, thyroid, brain, abdominal fat, heart, (approximately 3 g each), and bile and serum (each as much as possible) were collected. These samples were flash-frozen in liquid nitrogen and stored in a freezer, set to maintain -60 to -80DC, until shipped to the Sponsor for possible future analysis.
Statistical AnalysesLevene’s test (Levene, 1960) was done to test for variance homogeneity. In the case of heterogeneity of variance at p < 0.05, transformations were used to stabilize the variance. Comparison tests took variance heterogeneity into consideration.
One-way analysis of variance [ANOVA (Winer, 1971a)] was used (if applicable) to analyze initial body weights, organ weights, palmitoyl CoA oxidase activities, continuous clinical pathology values, and blood hormone determinations. If the ANOVA was significant, Dunnett’s t-test (Dunnett, 1964) was used for control versus treated group comparisons.
One-way analysis of covariance [ANCOVA (Winer, 1971b)] was used to analyze body weights, with initial body weights as the covariate. If the ANCOVA was significant, covariate-adjusted means were used for control versus treated group comparisons.
Group comparisons (Groups 2 through 4 versus Group 1) were evaluated at the 5.0%, two-tailed probability level. Only data collected on or after the first day of treatment were analyzed statistically. Statistical analyses were not performed on data collected during recovery.
Record RetentionAll raw data, documentation, records, protocol, and specimens generated as a result of this study will be archived in the storage facilities of Covance-Madison for a period of 1 year. One year after the submission of the final report, the Sponsor will determine the final disposition of the materials. All raw data stored on magnetic media and the protocol, study correspondence, and an original copy of the final report will be retained by Covance-Madison.
25 002GG1

Co van ce 6329-223 3M T-629S.7
Within 1 year after submission of the final report, all of the aforementioned materials from the Sponsor’s designees (Ani Lytics Inc., 3M E T. & S, Mayo Clinic, and Pathology Associates International) will be sent to the Sponsor (Andrew Seacat, PhD, 3M) by the Sponsor’s designees.
RESULTS AND DISCUSSION
Observation of AnimalsClinical Observations. Clinical observations are summarized in Tables 1, 2, and 3; individual data are presented in Appendix 2. Individual animal fate data are also presented in Appendix 2.
Animal Nos. 105506 and 105509 given 0.75 mg/kg/day (Group 4 males) did not survive to the scheduled terminal sacrifice. All other animals survived to the scheduled study termination. No clinical observations noted in the animals that survived to the terminal sacrifice or recovery were attributable to the administration of PFOS.
Animal No. 105509 (Group 4 male) died after dosing on Day 155 (Week 23). On Day 154 (Week 22) observations of constricted pupil in both eyes and pale gums were noted. Observations noted on Day 155 prior to dosing included few, mucoid, liquid, and black-colored feces and low food consumption. Approximately 15 minutes after dosing, the animal was observed as hypoactive with labored respiration and pale gums. This animal also appeared dehydrated and was cold to the touch. These observations persisted until approximately 30 minutes postdose when the animal was also noted as recumbent. Shortly thereafter, the animal died during an examination by a laboratory animal veterinarian. An enlarged liver was detected by palpation. The cause of death was determined to be pulmonary necrosis with severe acute inflammation.
On Day 179 (Week 26), Animal No. 105506 (Group 4 male) was sacrificed in a moribund condition. Low food consumption was noted on Day 178 (Week 26) and at the a.m. observation interval on Day 179. Approximately 5 to 10 minutes postdose on Day 179, the animal had excessive salivation, labored respiration, and hypoactive and ataxic behavior. With the exception of excessive salivation, these findings continued to be observed approximately 3 hours postdose. The cause of the moribund condition was not determined.
26 OOZSGZ
US00004550

Two additional animals had noteworthy observations during treatment. One female in the group given the control material, Animal No. 105529, was examined by a laboratory animal veterinarian on Day 5 (Week 1) due to observations of dehydration, thin appearance, clear oral and nasal discharge, excessive salivation, and audible respiration. This animal was diagnosed with pneumonia and treated with Lactated Ringer’s solution and antibiotics. This animal had recovered by Day 14 (Week 2). Animal No. 105534 (Group 4 female) was diagnosed with a tapeworm infection during Week 23 and was treated with praziquantel. Neither infection was test material-related.
Clinical observations during recovery were typical of laboratory primates.
Ophthalmology. Ophthalmic observations are summarized in Table 4; individual data are presented in Appendix 2.
There were no ophthalmic observations at the Week 26 or Week 52 examinations that were test material-related. Animal No. 105529 (Group 1 female) was noted as having increased myelination of the right optic nerve at the baseline and Week 52 ophthalmic examinations. Because this is a permanent, congenital condition, it was noted at the baseline and recovery examinations only and is not related to treatment with PFOS.
Body Weights. Body weight data are illustrated in Figures 1 and 2 and summarized in Tables 5 and 6; individual data are presented in Appendix 3.
Covariate-adjusted mean (CAM) body weights were slightly lower in males given 0.75 mg/kg/day when compared with males given the control material beginning at Week 21; the difference was significant at Weeks 23 and 27. In females given 0.75 mg/kg/day, CAM body weights were significantly lower at Weeks 11 through 16,19 through 23, and 25 through 27 when compared with females given the control material. These decreases were likely test material-related.
Differences in body weights were not apparent during the recovery period.
Food Consumption. Food consumption data are summarized in Tables 1,2, and 3 (Summary of Clinical Observations); individual data are included in the individual clinical observations in Appendix 2.
Covan oe 6329-223_____________________________________ _______________________________________ 3M T-6295,7
27
002663
usoooo^
Covance 6329-2233M T-6295.7
Low food consumption was noted sporadically for animals in the groups given the control material and 0.03 mg/kg/day. The incidence of low food consumption was generally higher in the groups given 0.15 and 0.75 mg/kg/day as compared to animals given the control material and appeared to be test material-related. During recovery, instances of low food consumption were sporadic and were similar for animals in the control and treated groups.
Cluneal PathologyHematology, clinical chemistry, and urinalysis data are summarized in Tables 7 through 45; individual data are presented in Appendix 4.
Administration of PFOS was associated with moderately to markedly lower total cholesterol for males and females given 0.75 mg/kg/day and high density lipoprotein cholesterol for males and females given 0.15 or 0.75 mg/kg/day. During the treatment period, the effect on total cholesterol became progressively worse over time. The effect on cholesterol was reversed within 5 weeks of the end of treatment, and the effect on high density lipoprotein cholesterol was reversed within 9 weeks of the end of treatment. Of uncertain relationship to administration of PFOS was lower total bilirubin concentration for males given 0.75 mg/kg/day and higher serum bile acid concentration for males given 0.75 mg/kg/day. These potential effects of the test material were very mild, and neither was considered adverse.
Palmitoyl CoA Oxidase DeterminationPalmitoyl CoA oxidase determinations are summarized in Table 46; individual data are presented in Appendix 5.
Results of palmitoyl CoA oxidase determinations were not considered to be related to the test material.
Blood Hormone DeterminationSummary and Individual Blood Hormone Data are presented in Appendix 6.
28 002664
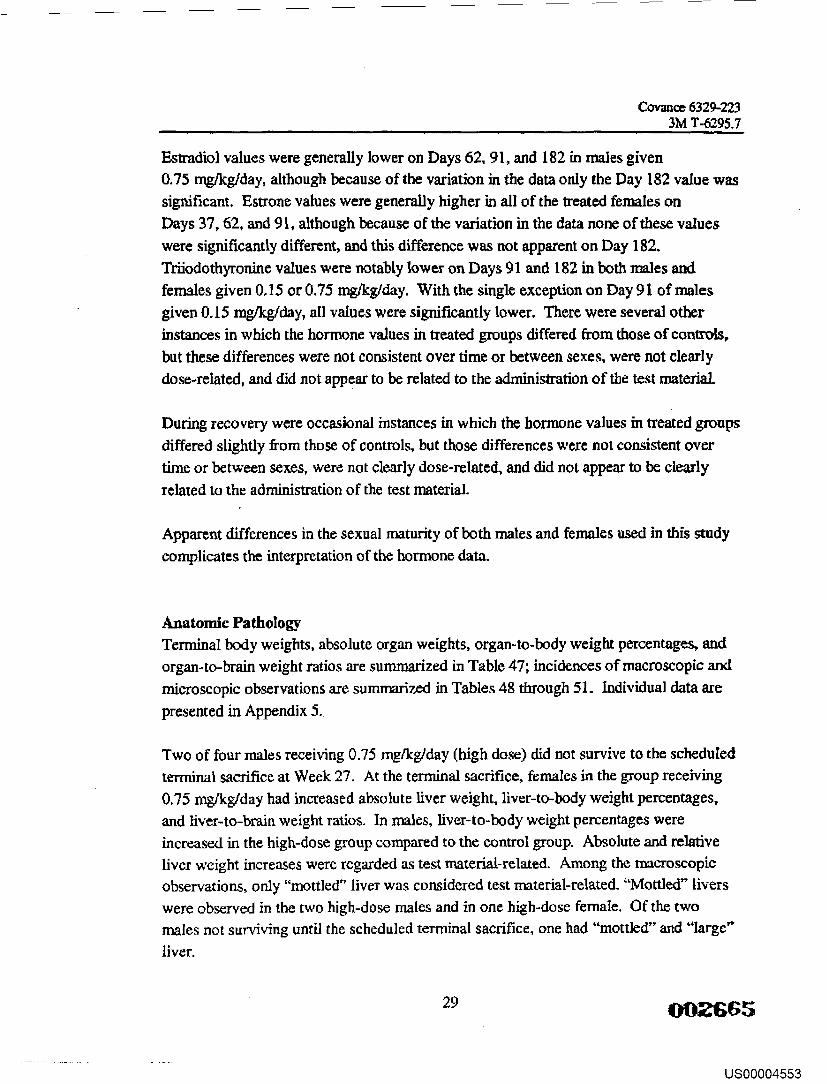
Covance 6329-2233M T-6295.7
Estradiol values were generally lower on Days 62, 91, and 182 in males given 0.75 mg/kg/day, although because of the variation in the data only the Day 182 value was significant. Estrone values were generally higher in all of the treated females on Days 37,62, and 91, although because of the variation in the data none of these values were significantly different, and this difference was not apparent on Day 182. Triiodothyronine values were notably lower on Days 91 and 182 in both males and females given 0.15 or 0.75 mg/kg/day. With the single exception on Day 91 of males given 0.15 mg/kg/day, all values were significantly lower. There were several other instances in which the hormone values in treated groups differed from those of controls, but these differences were not consistent over time or between sexes, were not clearly dose-related, and did not appear to be related to the administration of the test material
During recovery were occasional instances in which the hormone values in treated groups differed slightly from those of controls, but those differences were not consistent over time or between sexes, were not clearly dose-related, and did not appear to be clearly related to the administration of the test material.
Apparent differences in the sexual maturity of both males and females used in this study complicates the interpretation of the hormone data.
Anatomic PathologyTerminal body weights, absolute organ weights, organ-to-body weight percentages, and organ-to-brain weight ratios are summarized in Table 47; incidences of macroscopic and microscopic observations are summarized in Tables 48 through 51. Individual data are presented in Appendix 5.
Two of four males receiving 0.75 mg/kg/day (high dose) did not survive to the scheduled terminal sacrifice at Week 27. At the terminal sacrifice, females in the group receiving 0.75 mg/kg/day had increased absolute liver weight, liver-to-body weight percentages, and liver-to-brain weight ratios. In males, liver-to-body weight percentages were increased in the high-dose group compared to the control group. Absolute and relative liver weight increases were regarded as test material-related. Among the macroscopic observations, only “mottled” liver was considered test material-related. “Mottled” livers were observed in the two high-dose males and in one high-dose female. Of the two males not surviving until the scheduled terminal sacrifice, one had “mottled” and “large” liver.
002665
US00004553