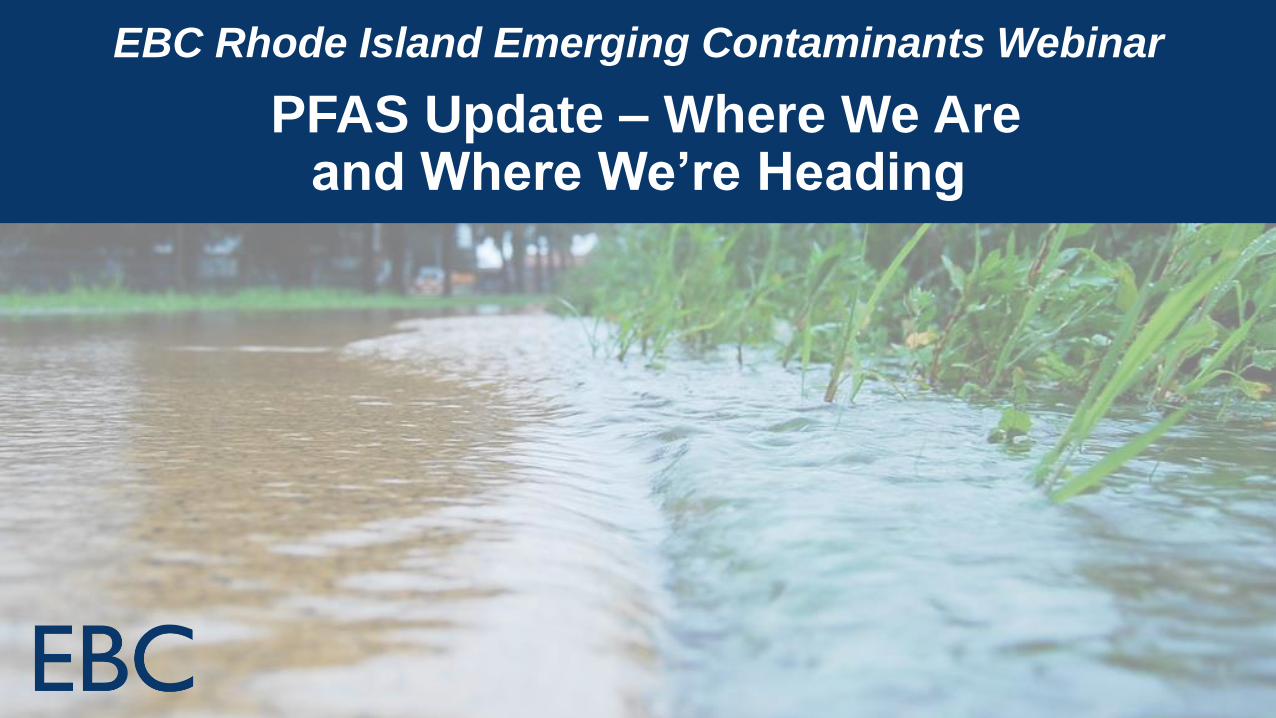
PFAS Update – Where We Are and Where We're Heading
115
EBC Rhode Island Emerging Contaminants Webinar PFAS Update – Where We Are and Where We’re Heading
-
Upload
khangminh22 -
Category
Documents
-
view
0 -
download
0
Transcript of PFAS Update – Where We Are and Where We're Heading
EBC Rhode Island Emerging Contaminants Webinar
PFAS Update – Where We Are and Where We’re Heading
Environmental Business Council of New England
Energy Environment Economy
Welcome
Rick Mandile
Chair, EBC Rhode Island Chapter
Principal, Sage Environmental

Thank you to our Sponsor

Environmental Business Council of New England
Energy Environment Economy
Introduction
Steve LaRosa
Program Co-Chair & Moderator
Technical Leader
Weston & Sampson
Environmental Business Council of New England
Energy Environment Economy
PFAS: What Are They and Why Should We Care?
Karen Kinsella
Senior Technical Specialist
GZA GeoEnvironmental, Inc.
PFAS: What Are They and Why Should We Care?Karen Kinsella
GZA GeoEnvironmental, Providence, Rhode Island
Environmental Business CouncilRhode Island Emerging Contaminants
November 5, 2020 PFAS Update
EBC Rhode Island Emerging Contaminants Program • PFAS Update • November 5, 2020
Outline
2
• Overview• Uniqueness of the carbon-fluorine bond• Perfluoroalkyl vs. polyfluoroalkyl substances• Uses, sources• Non-polymers vs. polymers• Why so different?• Public perception• Risk communication
EBC Rhode Island Emerging Contaminants Program • PFAS Update • November 5, 2020
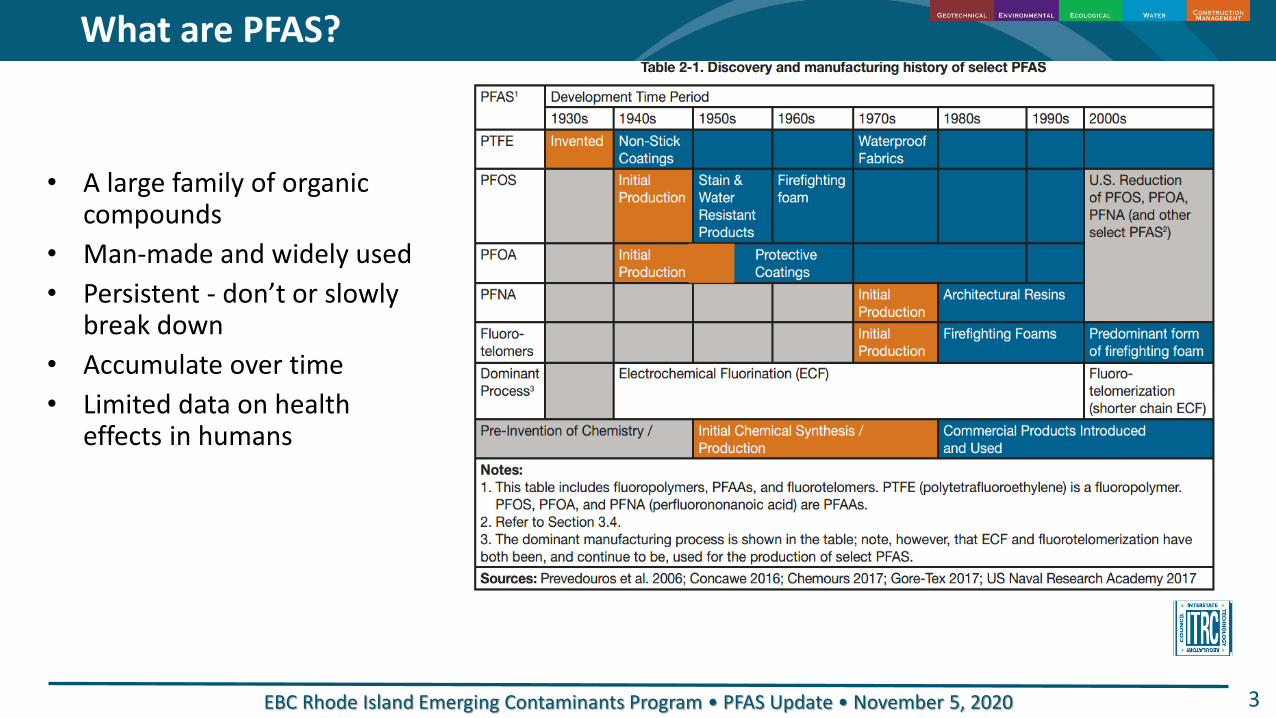
What are PFAS?
3
• A large family of organic compounds
• Man-made and widely used
• Persistent - don’t or slowly break down
• Accumulate over time
• Limited data on health effects in humans
EBC Rhode Island Emerging Contaminants Program • PFAS Update • November 5, 2020 4
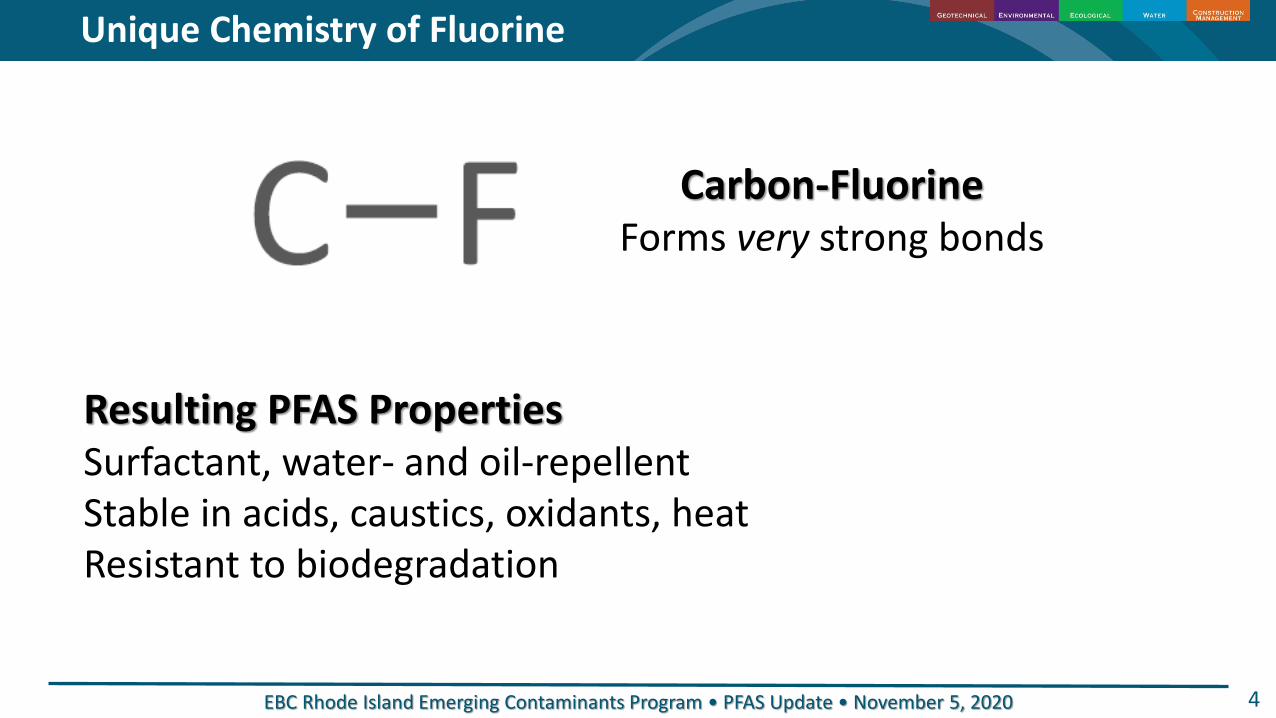
Carbon-FluorineForms very strong bonds
Resulting PFAS PropertiesSurfactant, water- and oil-repellentStable in acids, caustics, oxidants, heatResistant to biodegradation
Unique Chemistry of Fluorine
EBC Rhode Island Emerging Contaminants Program • PFAS Update • November 5, 2020
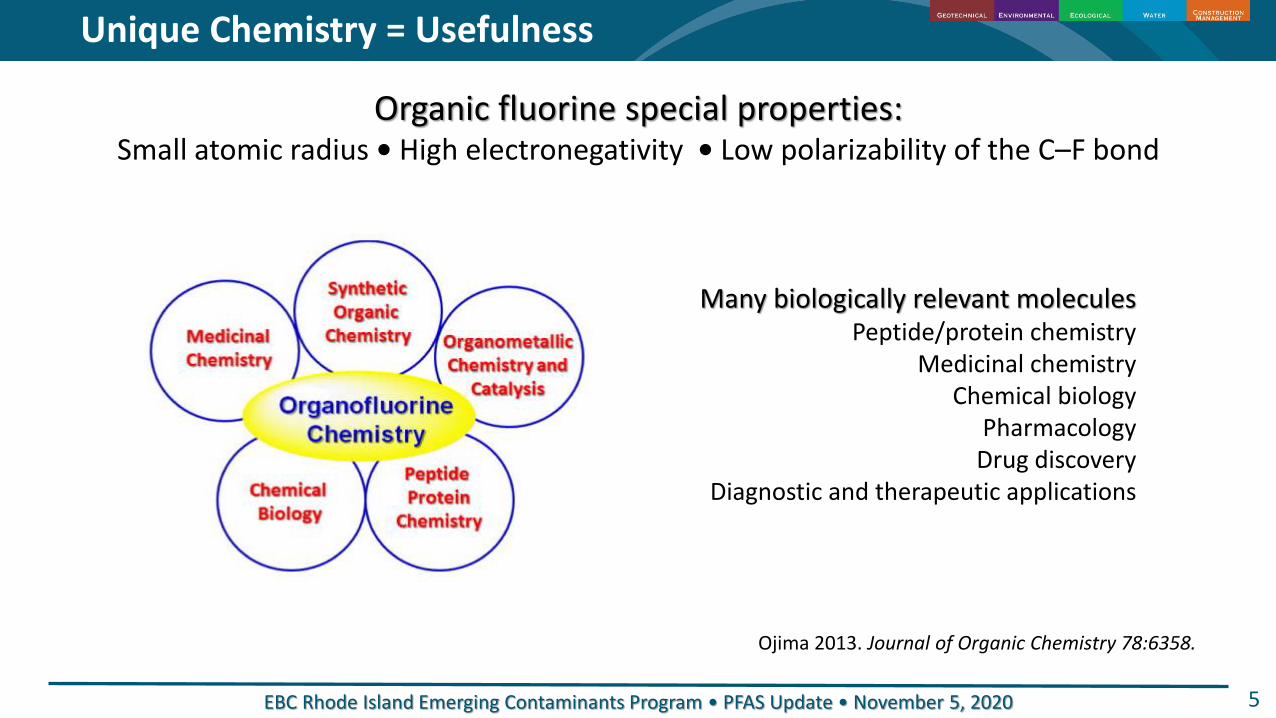
Unique Chemistry = Usefulness
5
Organic fluorine special properties:Small atomic radius • High electronegativity • Low polarizability of the C–F bond
Many biologically relevant molecules Peptide/protein chemistry
Medicinal chemistryChemical biology
PharmacologyDrug discovery
Diagnostic and therapeutic applications
Ojima 2013. Journal of Organic Chemistry 78:6358.
EBC Rhode Island Emerging Contaminants Program • PFAS Update • November 5, 2020
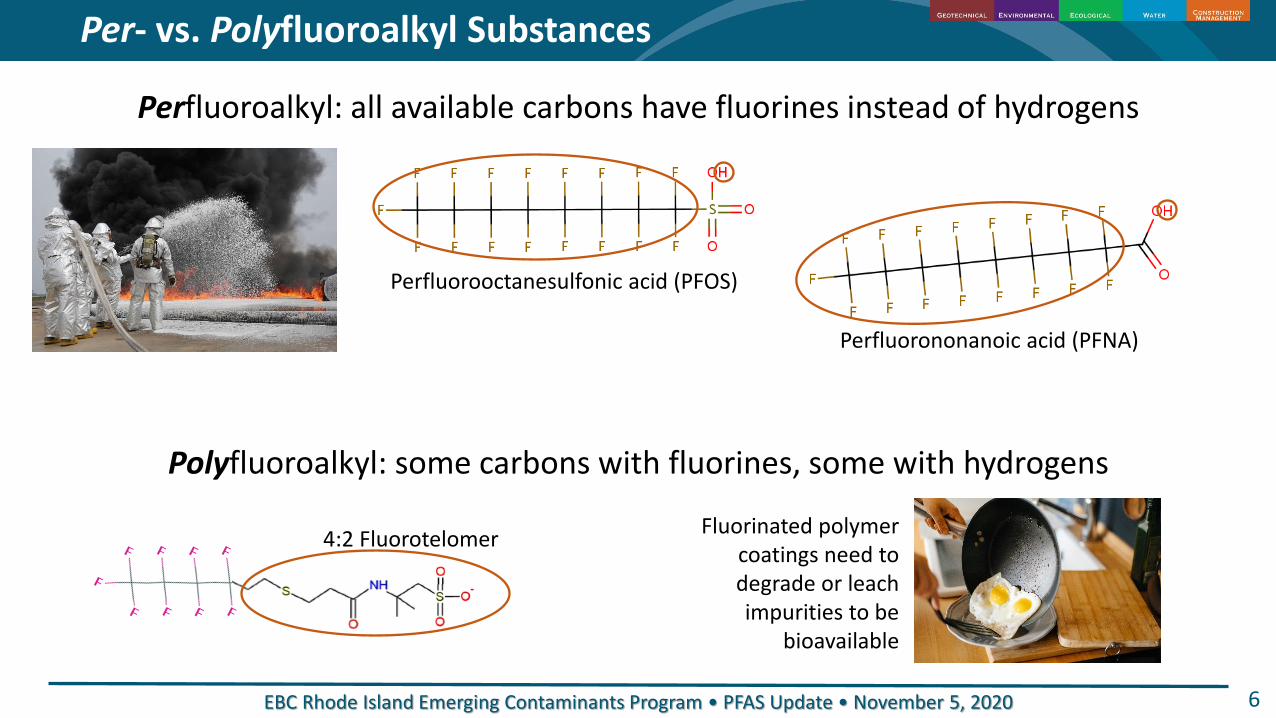
Per- vs. Polyfluoroalkyl Substances
6
Perfluoroalkyl: all available carbons have fluorines instead of hydrogens
Polyfluoroalkyl: some carbons with fluorines, some with hydrogens
Fluorinated polymercoatings need to degrade or leach impurities to be
bioavailable
4:2 Fluorotelomer
Perfluorononanoic acid (PFNA)
Perfluorooctanesulfonic acid (PFOS)
EBC Rhode Island Emerging Contaminants Program • PFAS Update • November 5, 2020
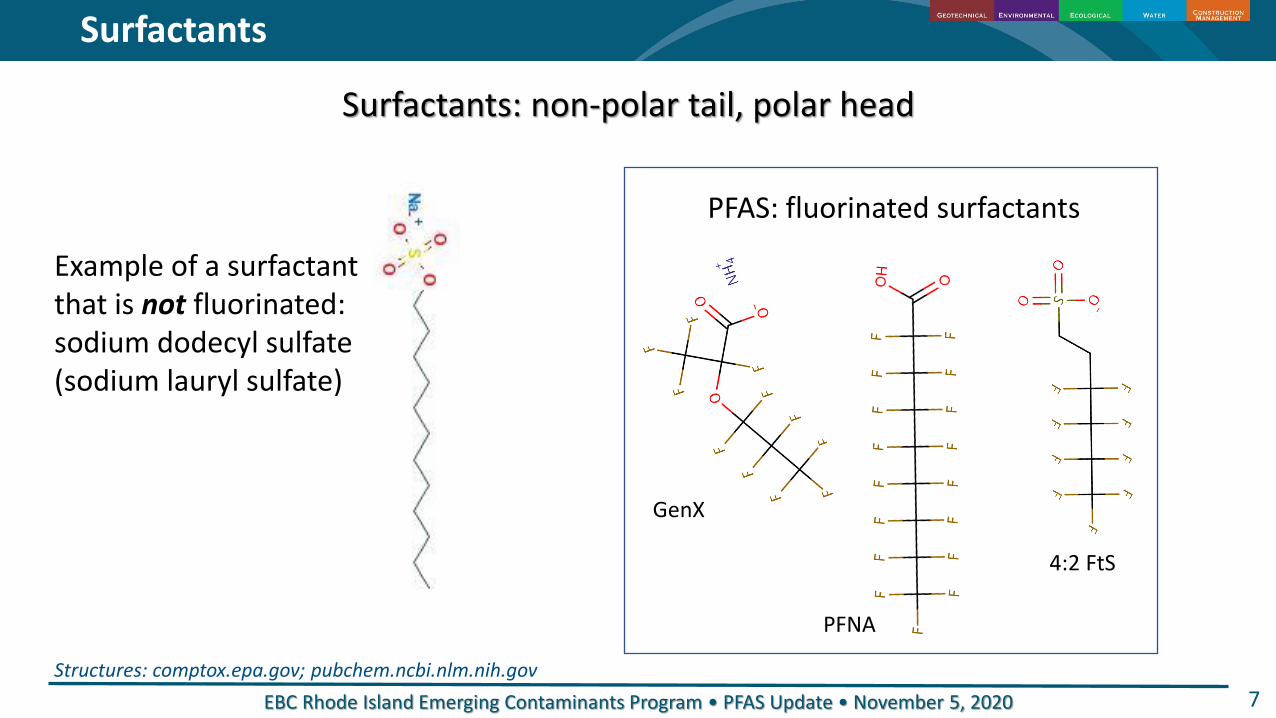
Surfactants: non-polar tail, polar head
Surfactants
7Structures: comptox.epa.gov; pubchem.ncbi.nlm.nih.gov
Example of a surfactantthat is not fluorinated: sodium dodecyl sulfate (sodium lauryl sulfate)
PFAS: fluorinated surfactants
4:2 FtS
GenX
PFNA

EBC Rhode Island Emerging Contaminants Program • PFAS Update • November 5, 2020 8
Unique Chemistry: Specialty Surfactants
Fluorocarbon “Tail” = Hydrophobic and Oleophobic
Functional Group “Head” = Hydrophilic
Taryn McKnight, Eurofins-TestAmerica

EBC Rhode Island Emerging Contaminants Program • PFAS Update • November 5, 2020 9
• Aqueous Film Forming Foams (AFFF) – firefighting• Water/stain/oil/grease/heat/chemical resistant coatings• Textiles, leather, and clothing (including carpet and furniture)• Mist suppression for metal plating and anodizing• Chemical and heat-resistant seals• Fluoropolymer production• Fuel cell membranes• Cable and wiring• Lubricants• Pesticides
Unique Chemistry: Specialty Surfactants

EBC Rhode Island Emerging Contaminants Program • PFAS Update • November 5, 2020
PFAS Get Complicated Fast
10
PFOS is a PFSA
PFOA is a PFCA
Teflon™ is a PTFE
EBC Rhode Island Emerging Contaminants Program • PFAS Update • November 5, 2020
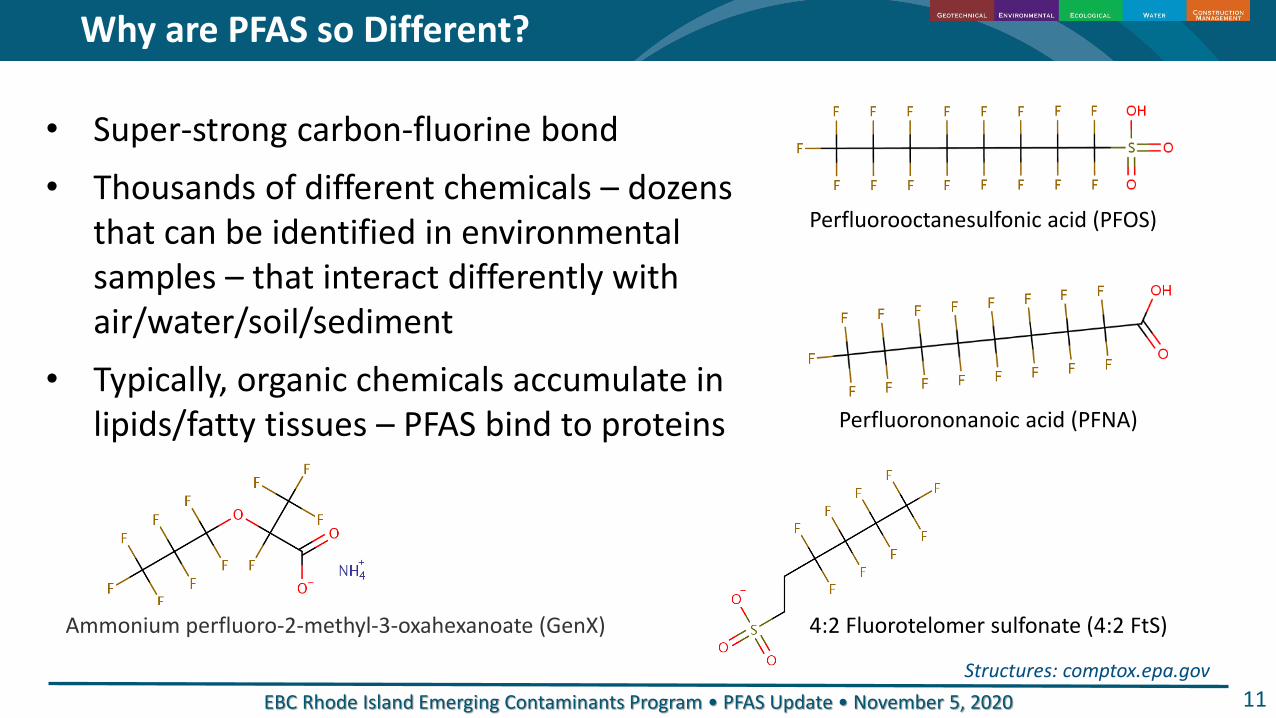
• Super-strong carbon-fluorine bond
• Thousands of different chemicals – dozens that can be identified in environmental samples – that interact differently with air/water/soil/sediment
• Typically, organic chemicals accumulate in lipids/fatty tissues – PFAS bind to proteins
Why are PFAS so Different?
11
Perfluorooctanesulfonic acid (PFOS)
Perfluorononanoic acid (PFNA)
Structures: comptox.epa.gov
4:2 Fluorotelomer sulfonate (4:2 FtS)Ammonium perfluoro-2-methyl-3-oxahexanoate (GenX)
EBC Rhode Island Emerging Contaminants Program • PFAS Update • November 5, 2020 12
PFAS partitioning between solids and water
PFAS are diverse – polarity alone is quite variable:
o Negatively charged (anions)
o Positively charged (cations)
o Both positive and negative charges (zwitterions)
o Neutral
Many of the useful fluorinated surfactants are anions:
o PFOS and replacements used in firefighting foams
o PFOA and replacements used to manufacture fluoropolymers
Soil/Sediment Groundwater/Surface Water
EBC Rhode Island Emerging Contaminants Program • PFAS Update • November 5, 2020
>
Partitioning to Soil and Sediment
13
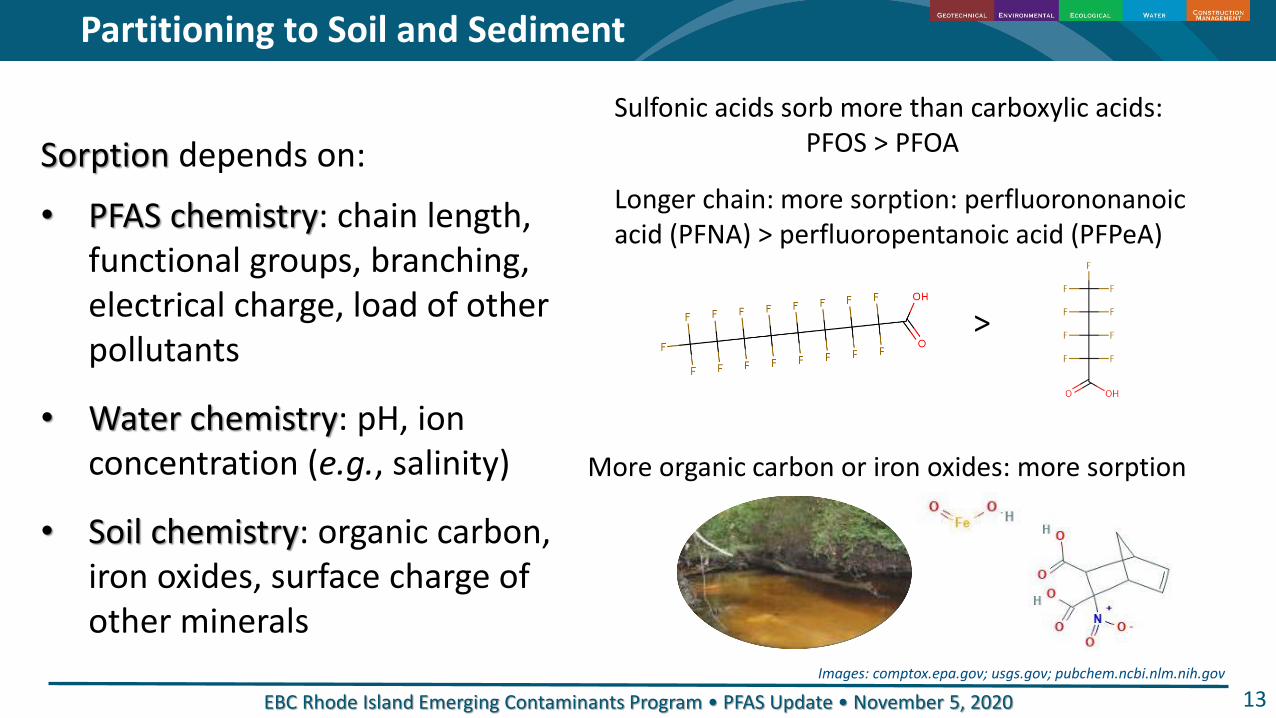
Sorption depends on:
• PFAS chemistry: chain length, functional groups, branching, electrical charge, load of other pollutants
• Water chemistry: pH, ion concentration (e.g., salinity)
• Soil chemistry: organic carbon, iron oxides, surface charge of other minerals
Longer chain: more sorption: perfluorononanoicacid (PFNA) > perfluoropentanoic acid (PFPeA)
More organic carbon or iron oxides: more sorption
Sulfonic acids sorb more than carboxylic acids: PFOS > PFOA
Images: comptox.epa.gov; usgs.gov; pubchem.ncbi.nlm.nih.gov

EBC Rhode Island Emerging Contaminants Program • PFAS Update • November 5, 2020
How much is a part per trillion or a nanogram per liter?
• 1 grain of sugar in an Olympic sized pool
• 1 second in 320 centuries
• 30 gallons of water in Lake Michigan
14

EBC Rhode Island Emerging Contaminants Program • PFAS Update • November 5, 2020
Adapted from Marine Pollution Studies Laboratory at the Moss Landing Marine Laboratories
Non-Detect0Detected but not
QuantifiedQuantified
Quantified withStatistical Rigor
Method Detection Limit
Limit of Detection
Reporting Limit /Practical Quantitation
Limit
Contaminant Concentration
15
Know your limits – your accuracy depends on it!
EBC Rhode Island Emerging Contaminants Program • PFAS Update • November 5, 2020
Jump on the Band Wagon
What is driving the race to zero?
• Increased awareness? Public perception? Improved quantitation limits?
• Total PFAS appear to be going up as more lab standards become available and additional chemicals can be analyzed.
• States use different toxicological endpoints and conservative exposure factors.
• The recent trend in the States is to set Maximum Contaminant Levels (MCLs) for some PFAS to less than 20 ppt (PFOA, PFNA, PFHxS, PFOS), although PFAS like GenX, PFBS, PFHxA are generally set higher.
16
EBC Rhode Island Emerging Contaminants Program • PFAS Update • November 5, 2020
Risk Perception Challenges
17
According to the CDC, studies re possible relationships between levels of PFAS in blood and harmful health effects in people involve different
groups of people, different exposures, and different PFAS. The different studies reported a variety of health outcomes. Animal studies suggest a variety of ailments – but human and animal studies don’t match well.
What we do know is that some PFAS can bioaccumulate and have been associated with toxicity in some animal studies.
If the toxicological studies have not yet provided a clear definition of human risk, how do we explain why States are setting regulatory limits?
Agency for Toxic Substances and Disease Registry – Centers for Disease Control and Prevention https://www.atsdr.cdc.gov/pfas/health-effects/
EBC Rhode Island Emerging Contaminants Program • PFAS Update • November 5, 2020
Public Perception
18
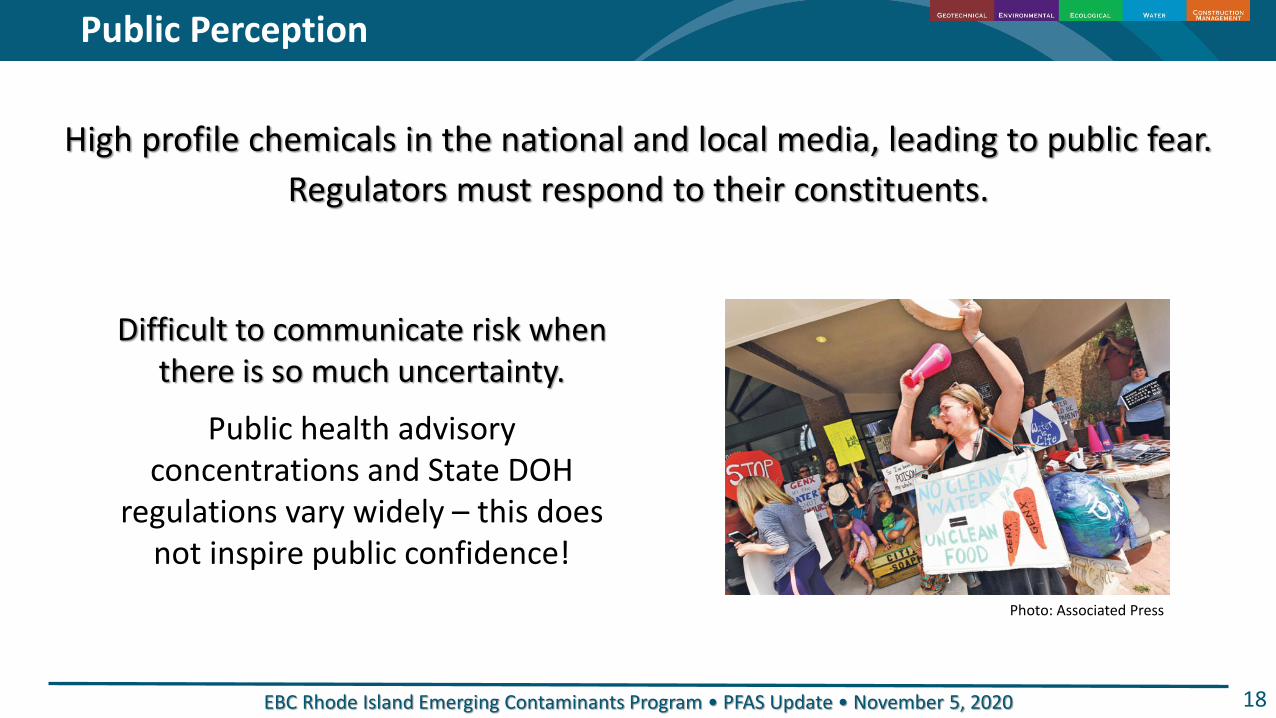
High profile chemicals in the national and local media, leading to public fear.
Regulators must respond to their constituents.
Difficult to communicate risk when there is so much uncertainty.
Public health advisory concentrations and State DOH
regulations vary widely – this does not inspire public confidence!
Photo: Associated Press
EBC Rhode Island Emerging Contaminants Program • PFAS Update • November 5, 2020
Risks and Misperceptions
19
Important to put PFAS that are currently regulated in some states in the context of chemicals with known, well-
established risks to human health.
Misconception that PFAS compounds are as toxic or more toxic than other chemicals, which may or may not be true,
or which in some cases we know not to be true.
Avram Frankel https://waterwelljournal.com/pfas-roundtable/
EBC Rhode Island Emerging Contaminants Program • PFAS Update • November 5, 2020
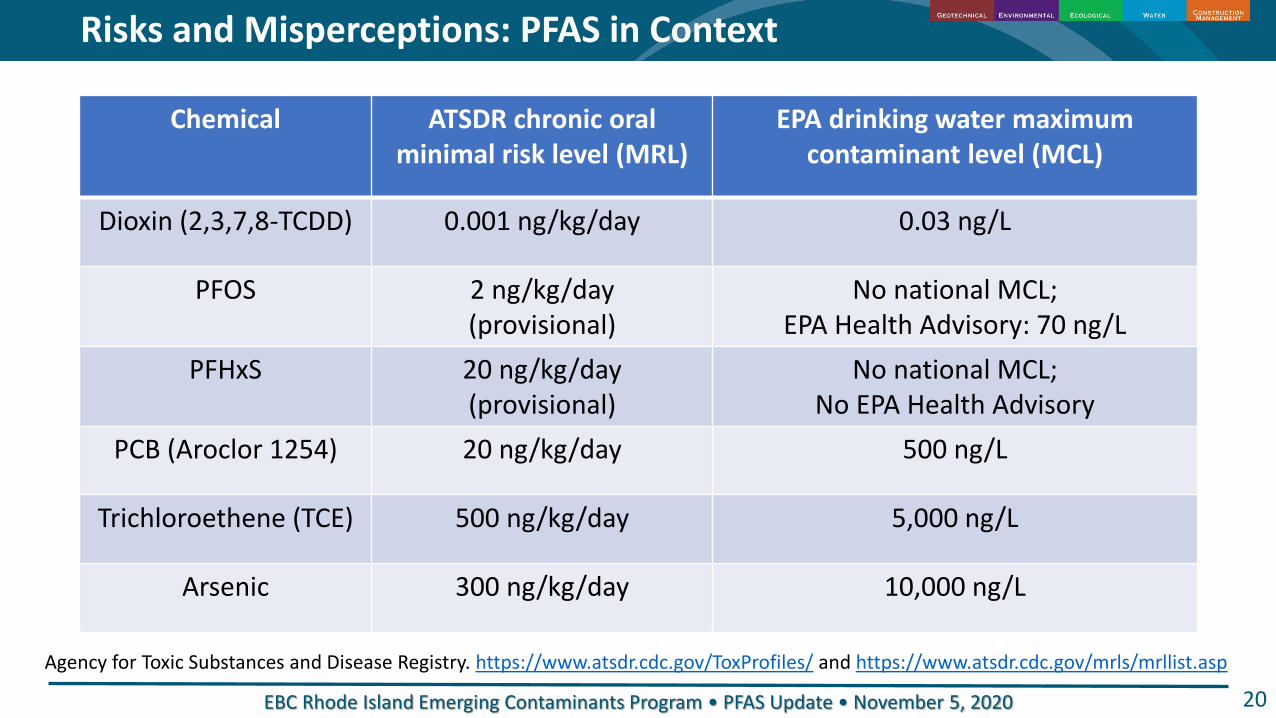
Risks and Misperceptions: PFAS in Context
20
Agency for Toxic Substances and Disease Registry. https://www.atsdr.cdc.gov/ToxProfiles/ and https://www.atsdr.cdc.gov/mrls/mrllist.asp
Chemical ATSDR chronic oral minimal risk level (MRL)
EPA drinking water maximum contaminant level (MCL)
Dioxin (2,3,7,8-TCDD) 0.001 ng/kg/day 0.03 ng/L
PFOS 2 ng/kg/day (provisional)
No national MCL;EPA Health Advisory: 70 ng/L
PFHxS 20 ng/kg/day (provisional)
No national MCL;No EPA Health Advisory
PCB (Aroclor 1254) 20 ng/kg/day 500 ng/L
Trichloroethene (TCE) 500 ng/kg/day 5,000 ng/L
Arsenic 300 ng/kg/day 10,000 ng/L
EBC Rhode Island Emerging Contaminants Program • PFAS Update • November 5, 2020
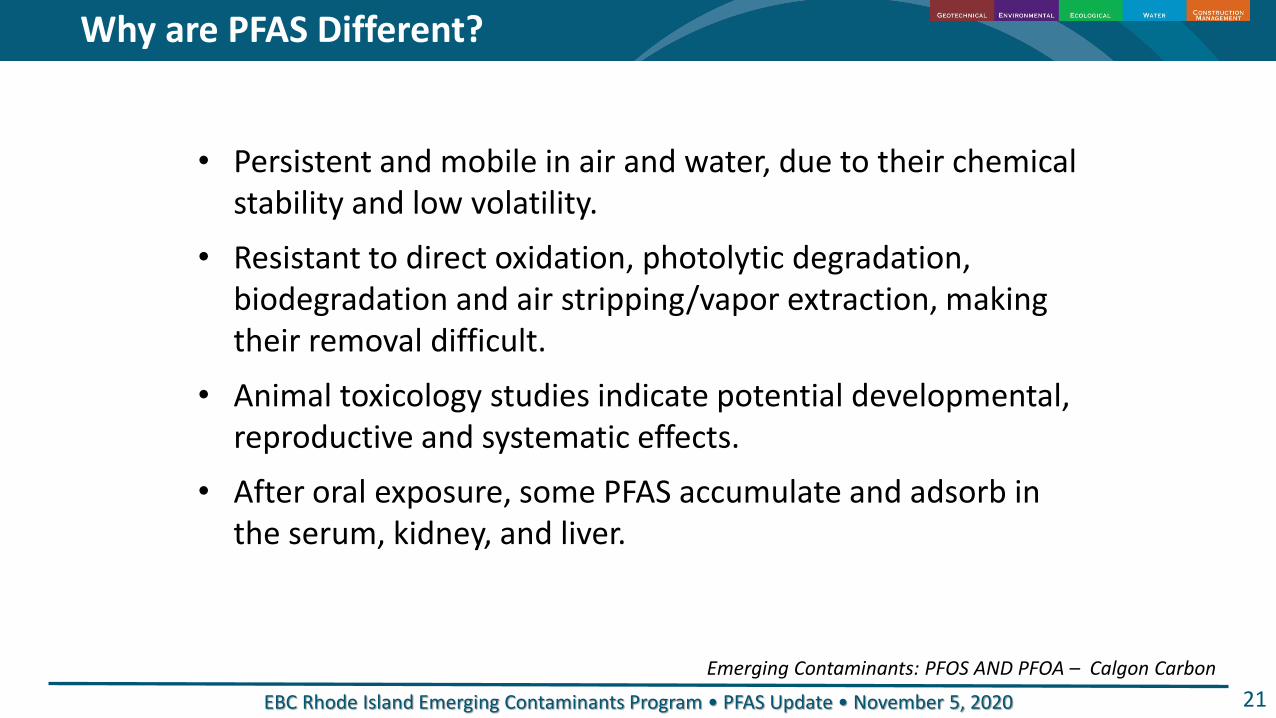
Why are PFAS Different?
21
• Persistent and mobile in air and water, due to their chemical stability and low volatility.
• Resistant to direct oxidation, photolytic degradation, biodegradation and air stripping/vapor extraction, making their removal difficult.
• Animal toxicology studies indicate potential developmental, reproductive and systematic effects.
• After oral exposure, some PFAS accumulate and adsorb in the serum, kidney, and liver.
Emerging Contaminants: PFOS AND PFOA – Calgon Carbon
EBC Rhode Island Emerging Contaminants Program • PFAS Update • November 5, 2020
https://www.epa.gov/pfas
https://hero.epa.gov/hero/index.cfm/content/howto
https://www.secnav.navy.mil/eie/pages/pfc-pfas.aspx
https://www.atsdr.cdc.gov/pfas/health-effects/
https://www.ngwa.org/what-is-groundwater/groundwater-issues/Groundwater-and-PFAS
https://pfas-1.itrcweb.org/
Environmental Business CouncilRhode Island Emerging Contaminants
November 5, 2020 PFAS Update
Environmental Business Council of New England
Energy Environment Economy
Burrillville Release – What Happened, What’s Been Done and What’s Next
Steve LaRosa
Technical Leader
Weston & Sampson
Rick Mandile
Principal
Sage Environmental
Nick Noons
Environmental Engineer
Rhode Island DEM

Oakland PFAS Contamination
Rhode Island Department of Environmental
Management
2017 Surveillance Monitoring Study
◼ Rhode Island Department of Health (RIDOH)
initiated a state-wide sampling effort of small
public water systems, license bottlers, and
licensed childcare facilities.
◼ Collaborative effort with RIDEM and Brown University Superfund Research
Program (Dr. Jennifer Guelfo)
DEM Involvement
◼ Potential source identification and mapping
❑ Water Resources, Waste Management, Emergency Response, Planning & Development
◼ In the event of an exceedance, DEM would be tasked with the subsequent source
investigation
❑ Contracted Weston & Sampson in advance via TAC
◼ Experience working with other New England States on response to PFAS contamination
❑ Bennington, VT

2017 Surveillance Monitoring Study
◼ Potential Sources and Information Considered
❑ Airports
❑ Fire Training Areas
❑ EPCRA Tier II
❑ Industrial Facilities with certain NAICS Codes
❑ DOD Facilities and NPL Sites
❑ Electroplating Operations
❑ Oil Terminals (Tank Farms)
❑ Wastewater Lagoons
❑ Emergency Response Incidents
❑ *Team from Brown University conducted separate geospatial analysis of potential impacts across
the State
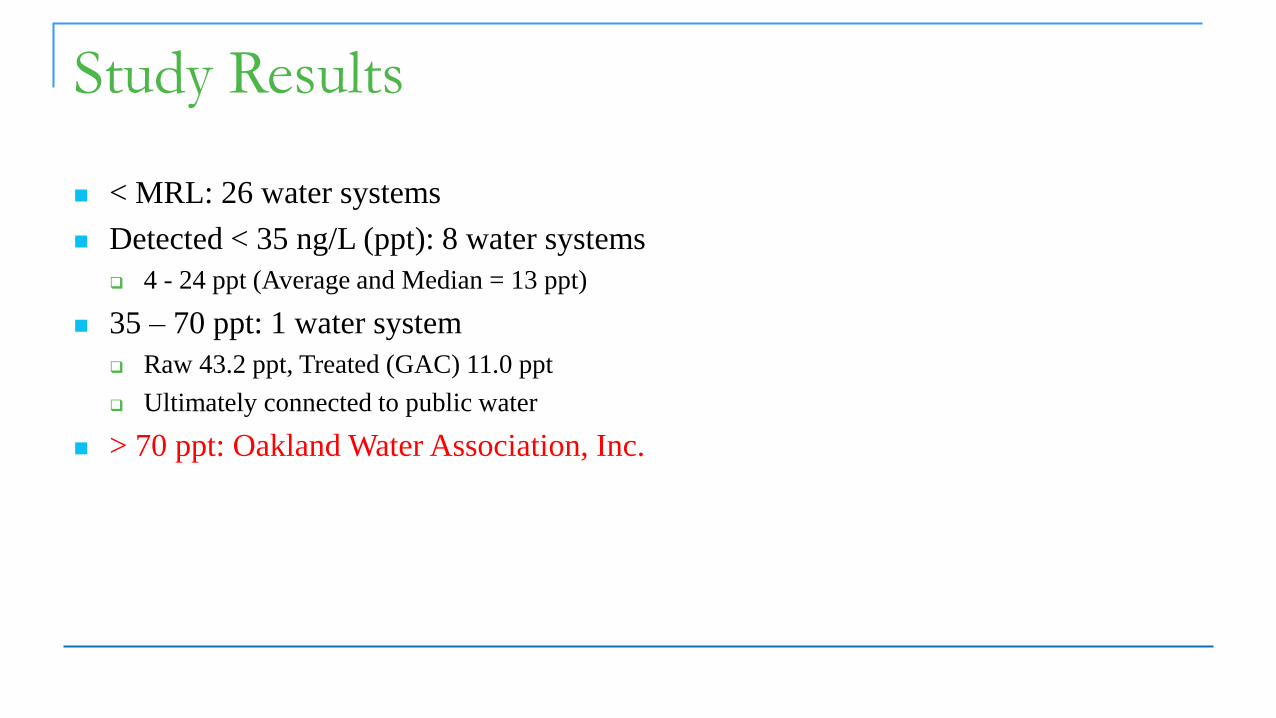
Study Results
◼ < MRL: 26 water systems
◼ Detected < 35 ng/L (ppt): 8 water systems
❑ 4 - 24 ppt (Average and Median = 13 ppt)
◼ 35 – 70 ppt: 1 water system
❑ Raw 43.2 ppt, Treated (GAC) 11.0 ppt
❑ Ultimately connected to public water
◼ > 70 ppt: Oakland Water Association, Inc.
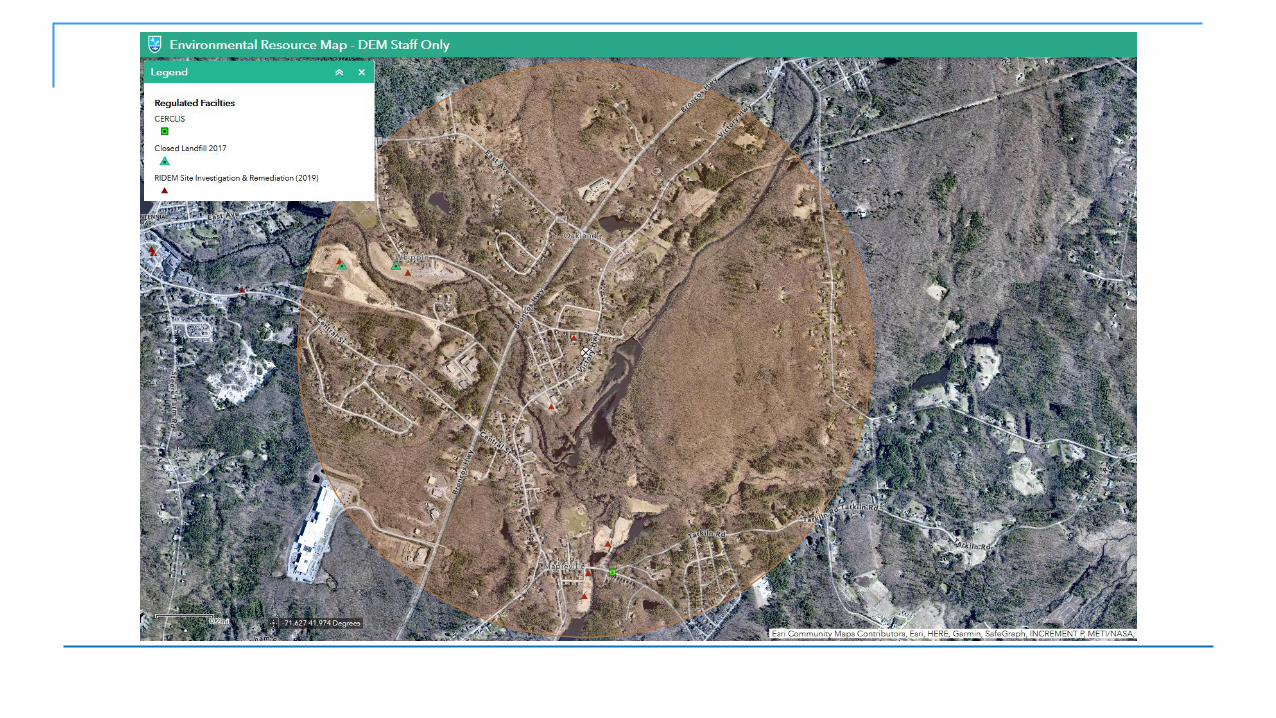

Brown University Geospatial Risk Evaluation
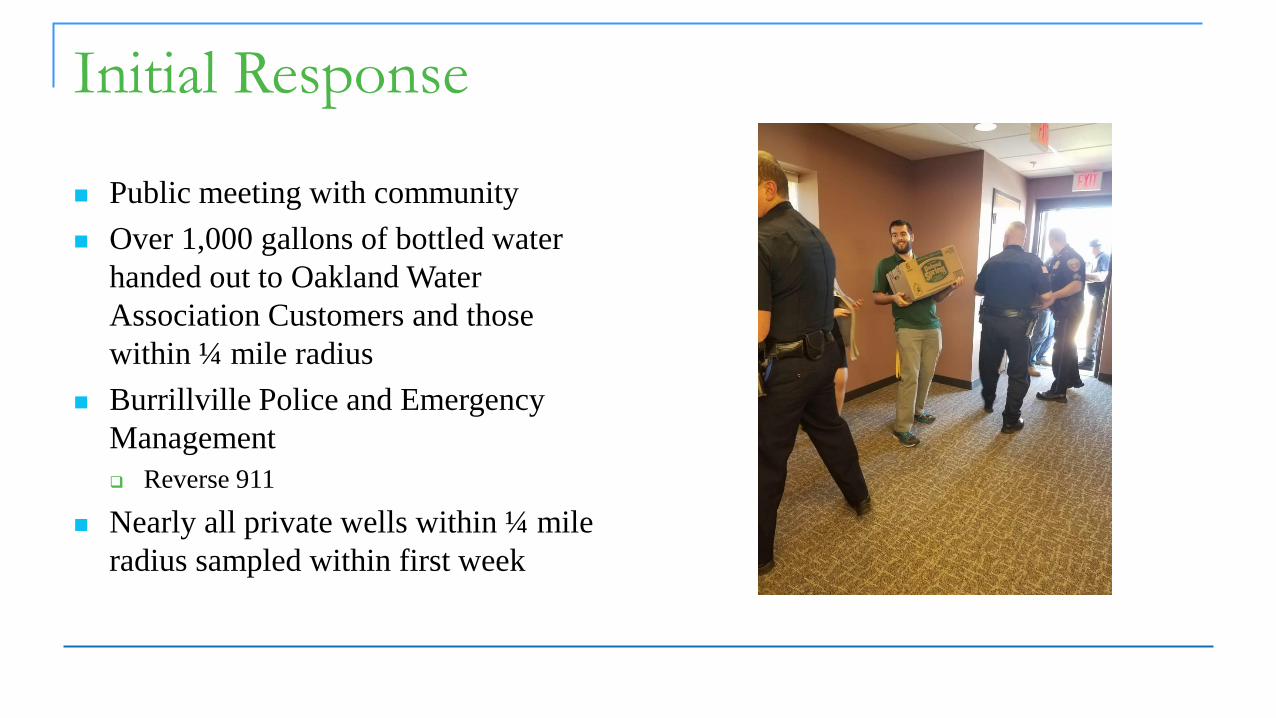
Initial Response
◼ Public meeting with community
◼ Over 1,000 gallons of bottled water
handed out to Oakland Water
Association Customers and those
within ¼ mile radius
◼ Burrillville Police and Emergency
Management
❑ Reverse 911
◼ Nearly all private wells within ¼ mile
radius sampled within first week

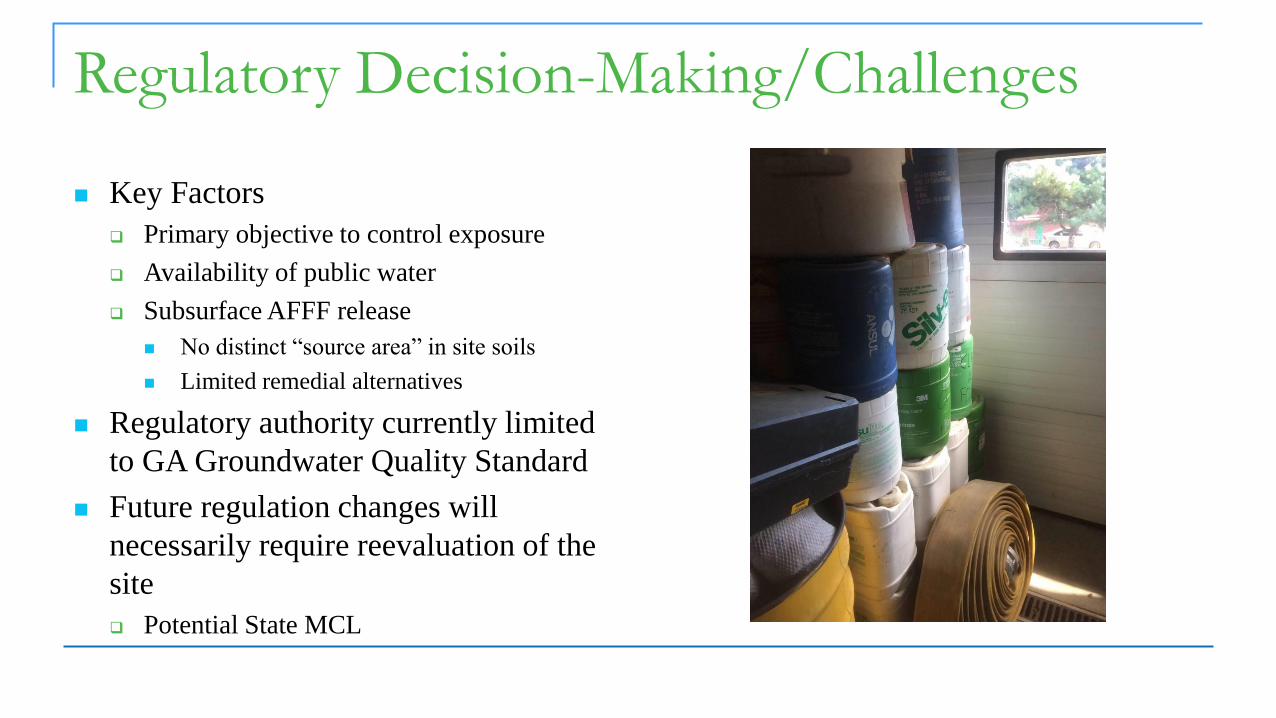
Regulatory Decision-Making/Challenges
◼ Key Factors
❑ Primary objective to control exposure
❑ Availability of public water
❑ Subsurface AFFF release
◼ No distinct “source area” in site soils
◼ Limited remedial alternatives
◼ Regulatory authority currently limited
to GA Groundwater Quality Standard
◼ Future regulation changes will
necessarily require reevaluation of the
site
❑ Potential State MCL
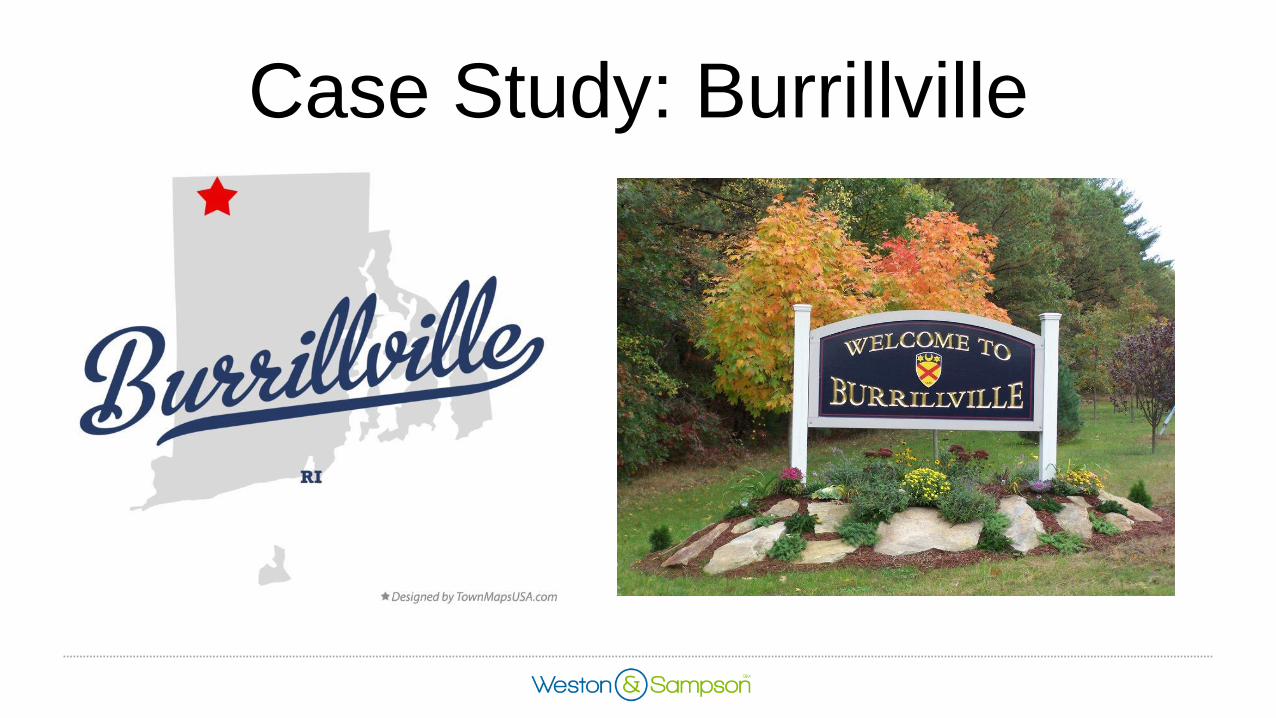
Case Study: Burrillville
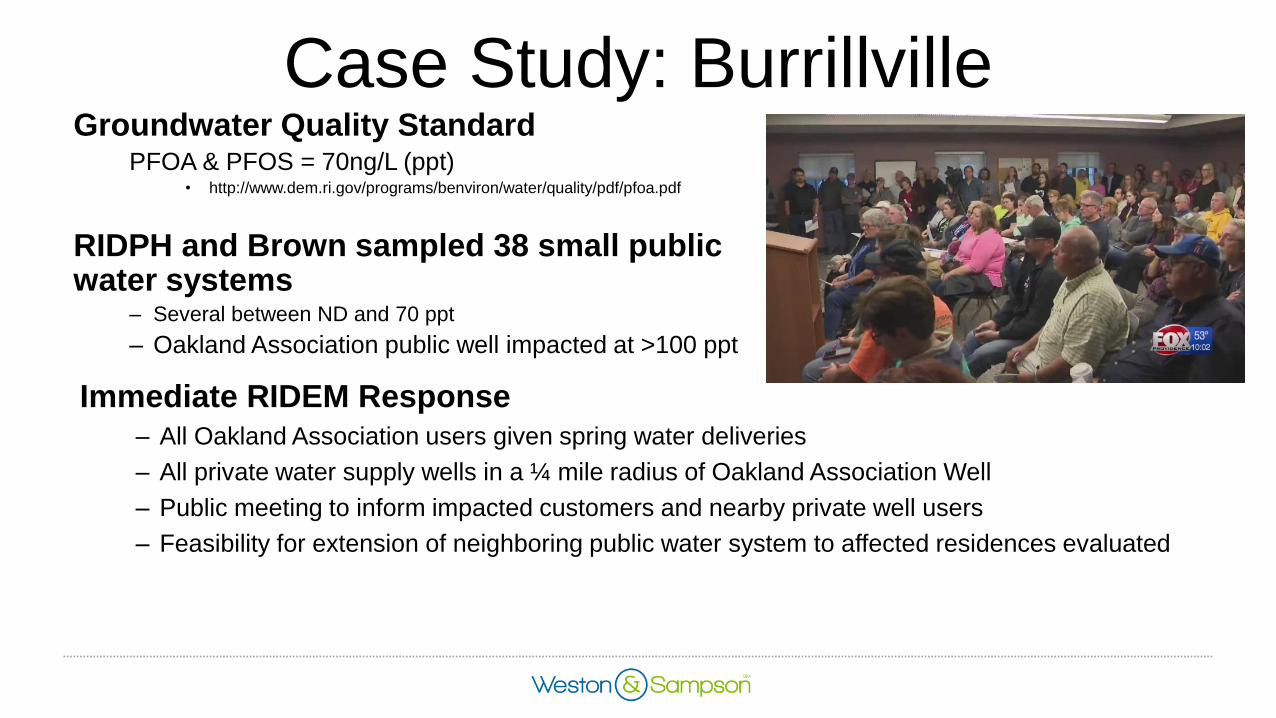
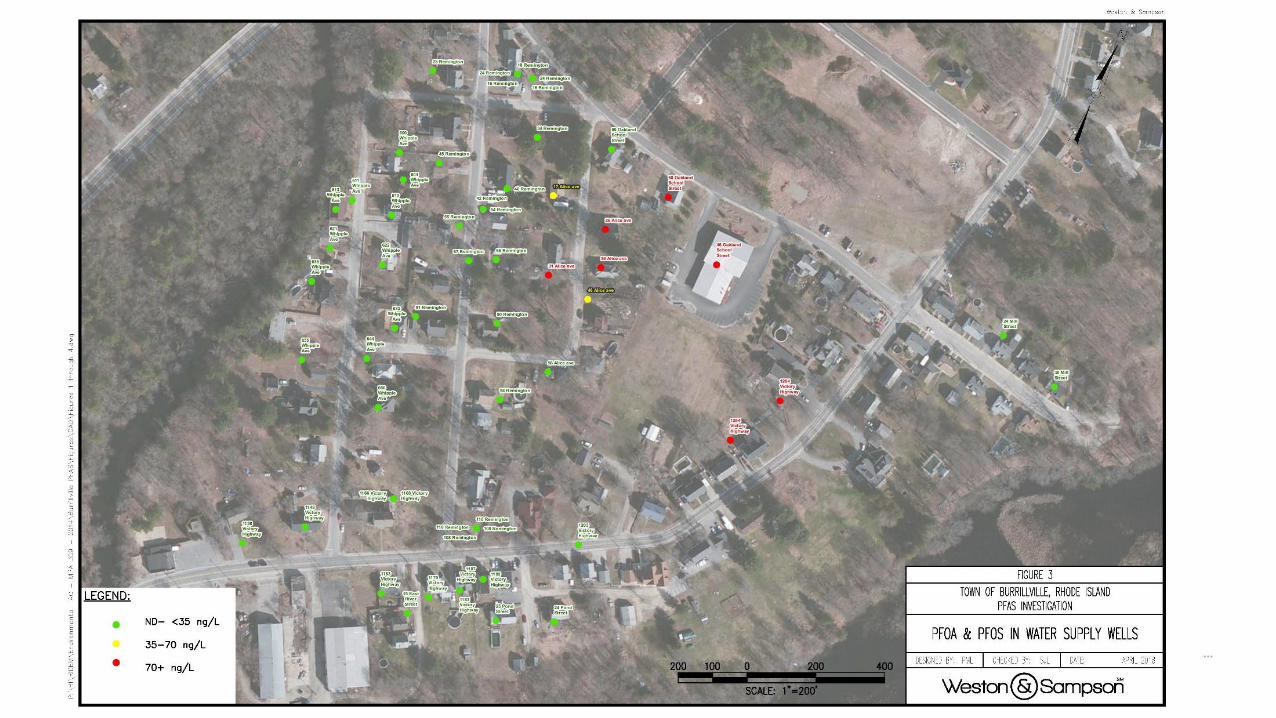
Case Study: BurrillvilleGroundwater Quality Standard
PFOA & PFOS = 70ng/L (ppt)• http://www.dem.ri.gov/programs/benviron/water/quality/pdf/pfoa.pdf
RIDPH and Brown sampled 38 small public water systems
– Several between ND and 70 ppt
– Oakland Association public well impacted at >100 ppt
Immediate RIDEM Response– All Oakland Association users given spring water deliveries
– All private water supply wells in a ¼ mile radius of Oakland Association Well
– Public meeting to inform impacted customers and nearby private well users
– Feasibility for extension of neighboring public water system to affected residences evaluated
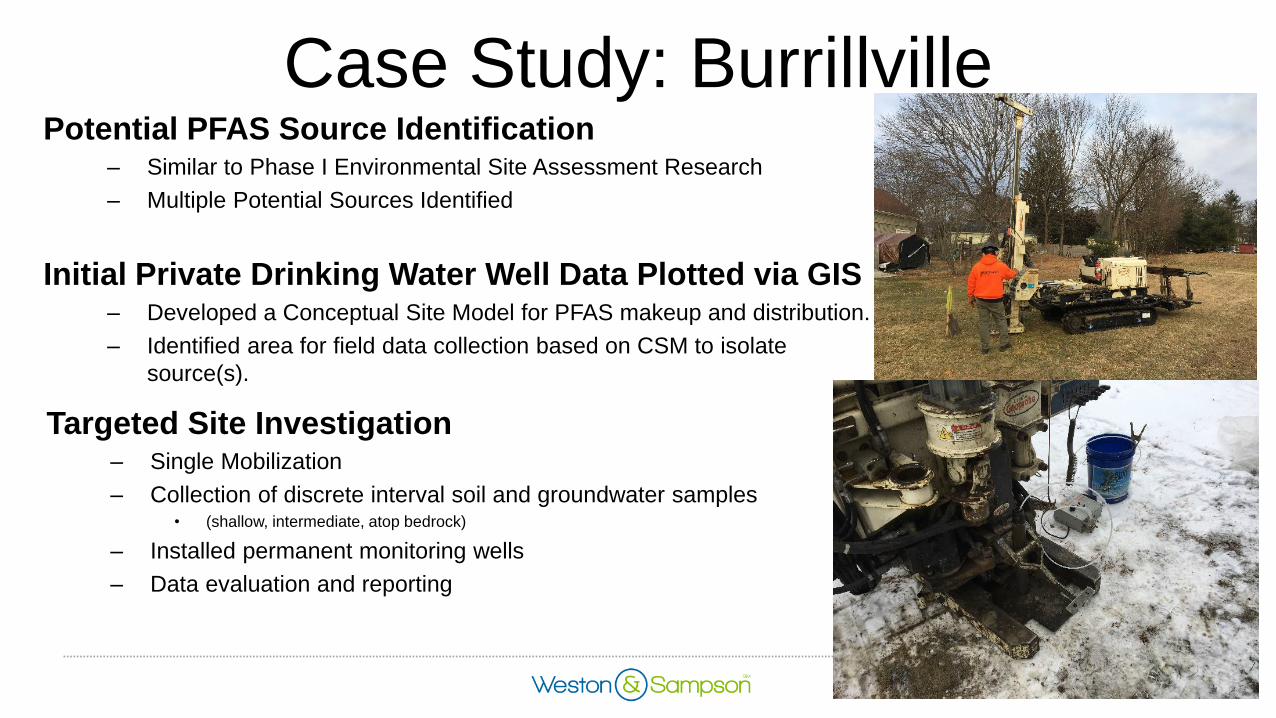
Case Study: BurrillvillePotential PFAS Source Identification
– Similar to Phase I Environmental Site Assessment Research
– Multiple Potential Sources Identified
Initial Private Drinking Water Well Data Plotted via GIS– Developed a Conceptual Site Model for PFAS makeup and distribution.
– Identified area for field data collection based on CSM to isolate
source(s).
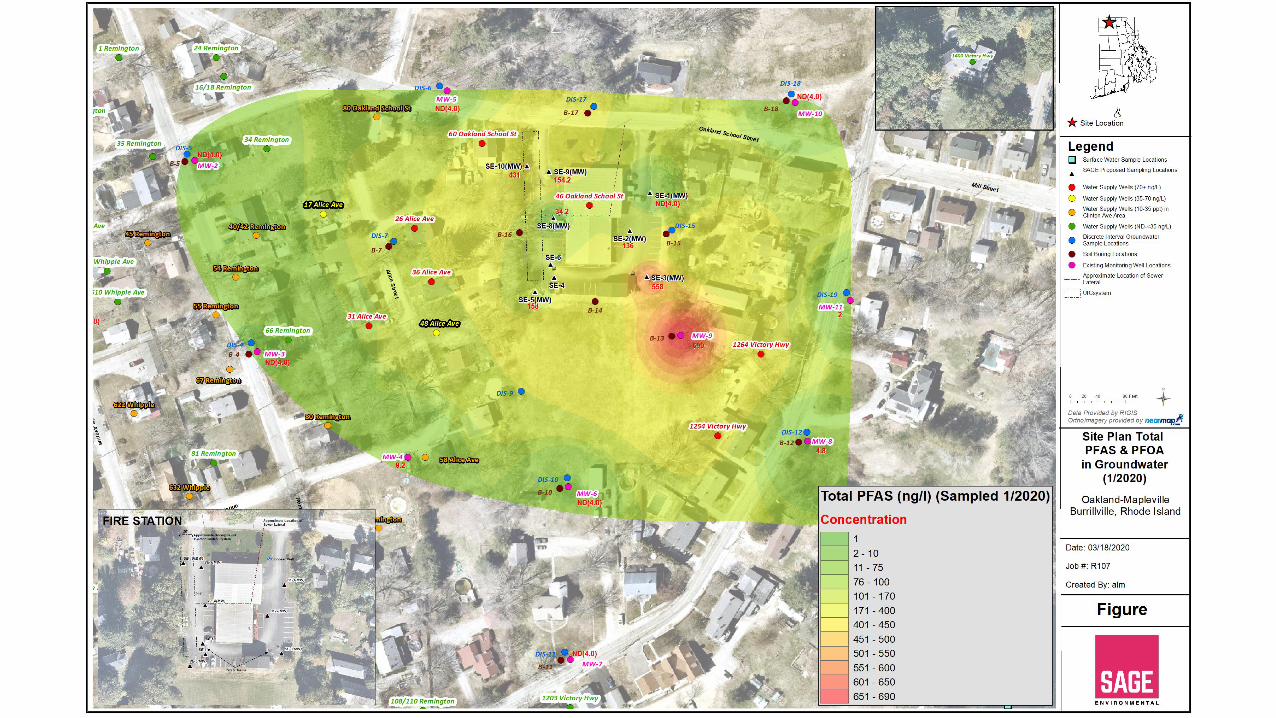
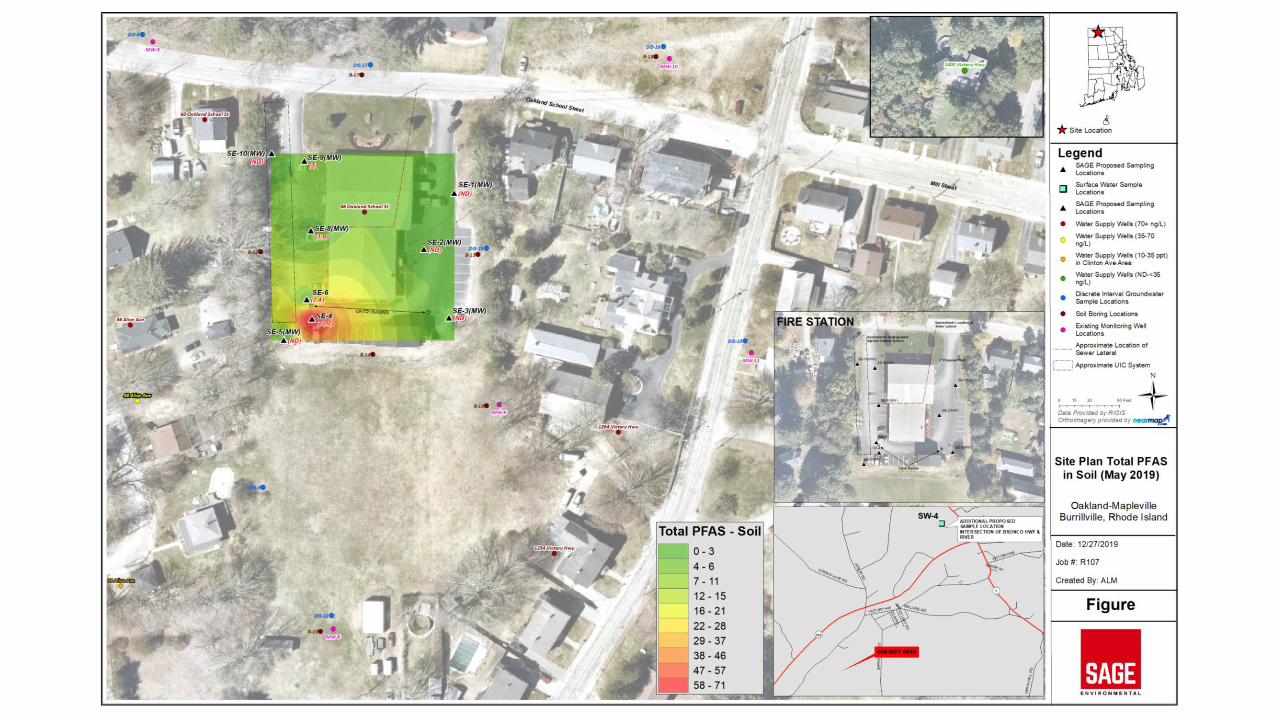
Targeted Site Investigation – Single Mobilization
– Collection of discrete interval soil and groundwater samples • (shallow, intermediate, atop bedrock)
– Installed permanent monitoring wells
– Data evaluation and reporting

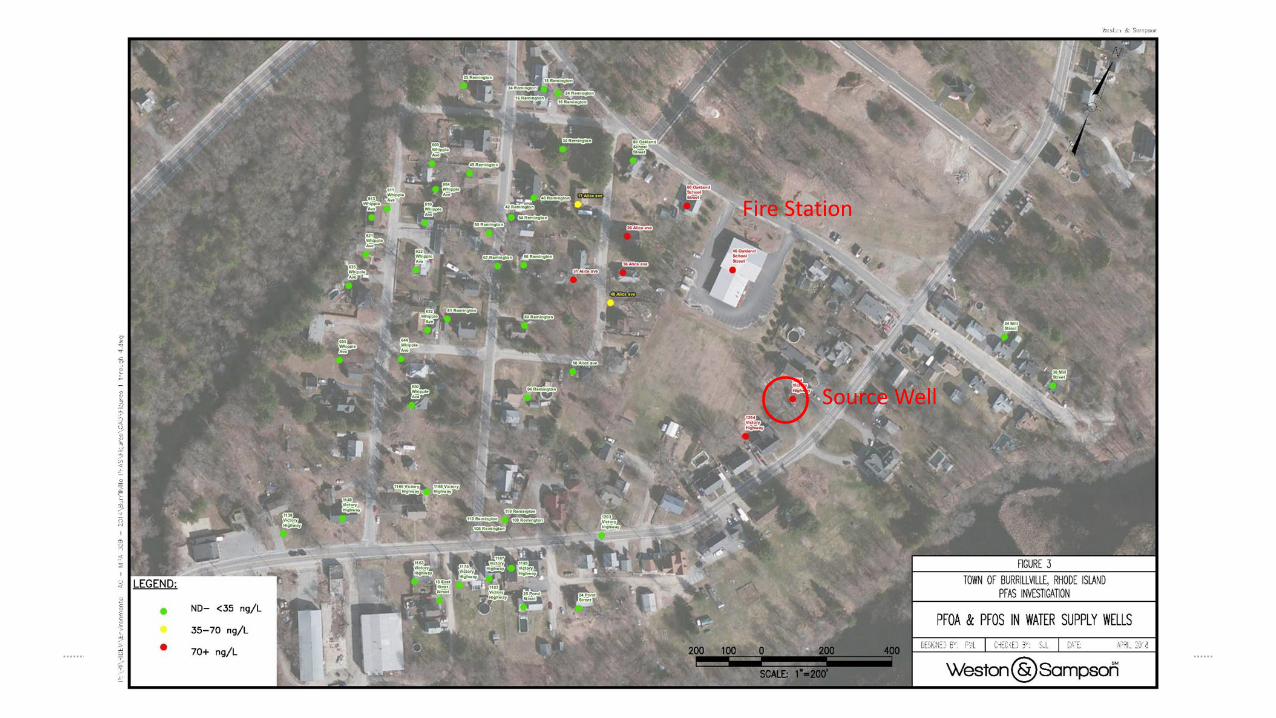
Fire Station
Source Well


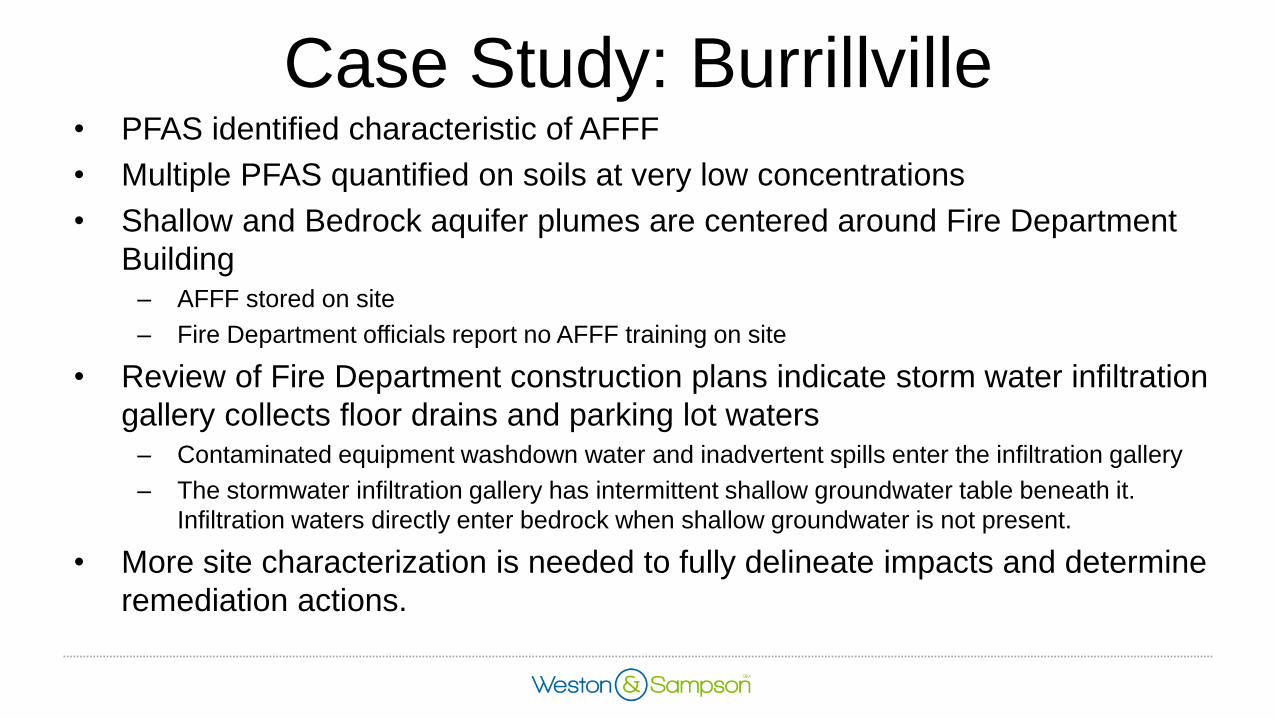
Case Study: Burrillville• PFAS identified characteristic of AFFF
• Multiple PFAS quantified on soils at very low concentrations
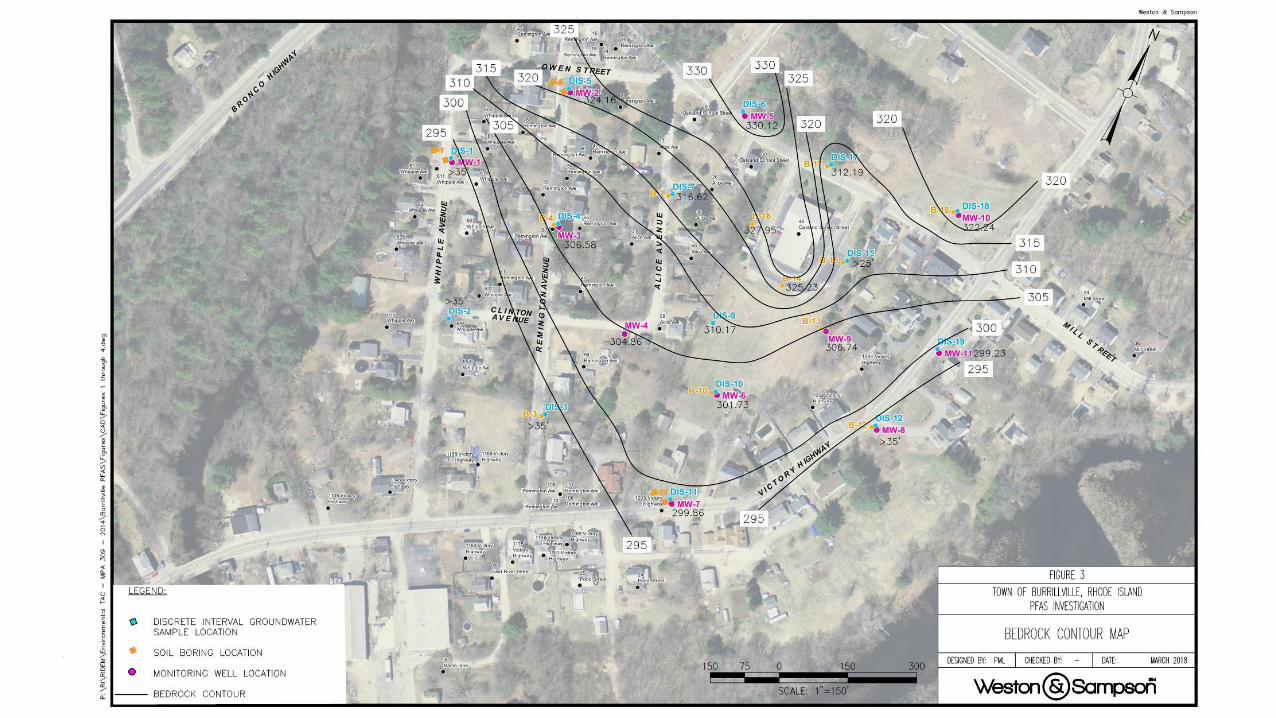
• Shallow and Bedrock aquifer plumes are centered around Fire Department
Building– AFFF stored on site
– Fire Department officials report no AFFF training on site
• Review of Fire Department construction plans indicate storm water infiltration
gallery collects floor drains and parking lot waters– Contaminated equipment washdown water and inadvertent spills enter the infiltration gallery
– The stormwater infiltration gallery has intermittent shallow groundwater table beneath it.
Infiltration waters directly enter bedrock when shallow groundwater is not present.
• More site characterization is needed to fully delineate impacts and determine
remediation actions.
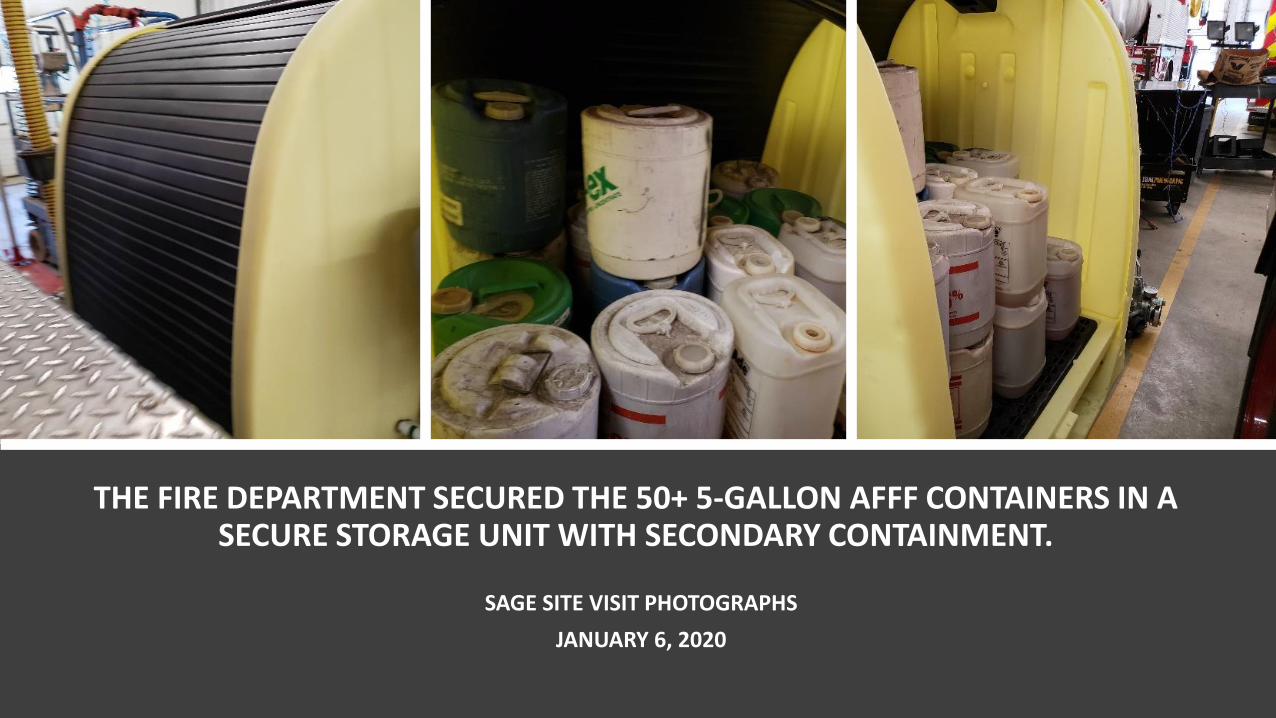
THE FIRE DEPARTMENT SECURED THE 50+ 5-GALLON AFFF CONTAINERS IN A SECURE STORAGE UNIT WITH SECONDARY CONTAINMENT.
SAGE SITE VISIT PHOTOGRAPHS
JANUARY 6, 2020
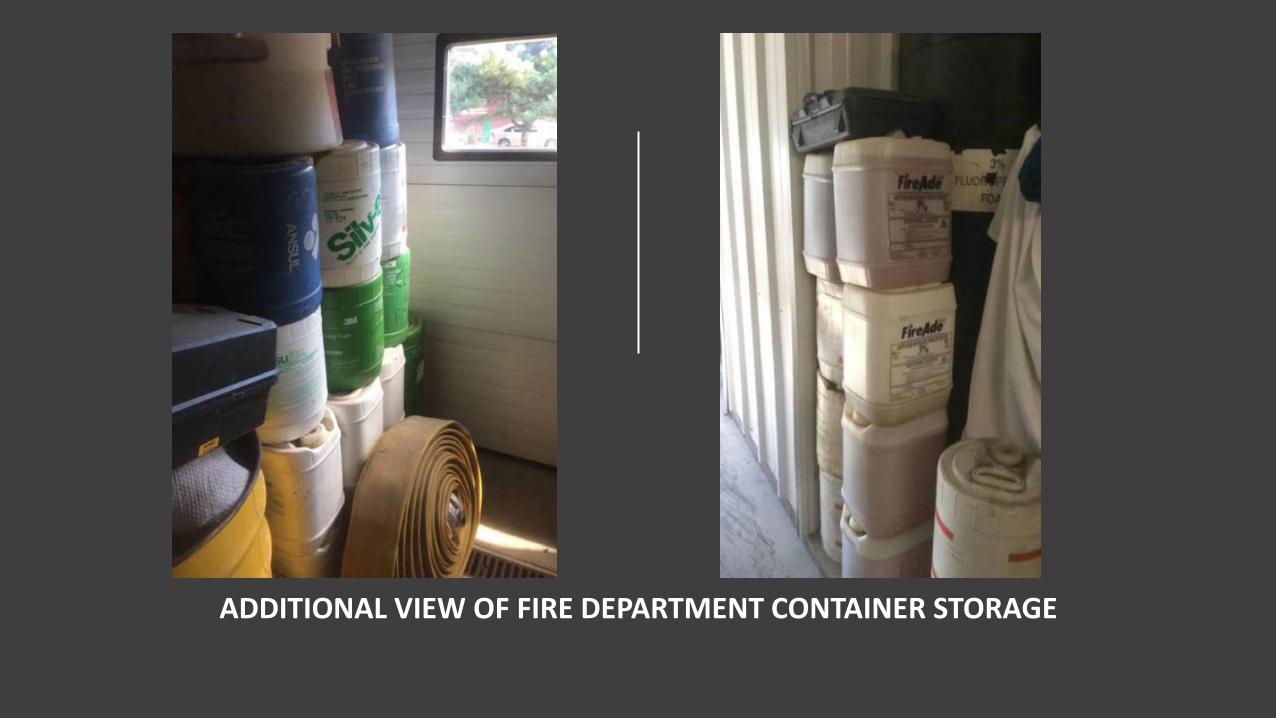
ADDITIONAL VIEW OF FIRE DEPARTMENT CONTAINER STORAGE

Oakland Mapleville Water Line Extension Project
THE PROVIDENCE JOURNAL / BOB BREIDENBACH
Environmental Business Council of New England
Energy Environment Economy
Regulatory Status Update –Where Do We Stand Now and What’s Coming
Mark Dennen
Supervising Environmental Scientist
Office of Land Revitalization and
Sustainable Materials Management
Rhode Island
Amy Parmenter
Interim Chief, Supervising
Environmental Scientist
Center for Drinking Water Quality
Rhode Island DOH

RIDEM/ OFFICE OF LAND REVITALIZATION
& SUSTAINABLE MATERIALS MANAGEMENT
Mark Dennen, CPG
Supervising Environmental Scientist
Materials Management Program
401-222-2797 ext. 7112
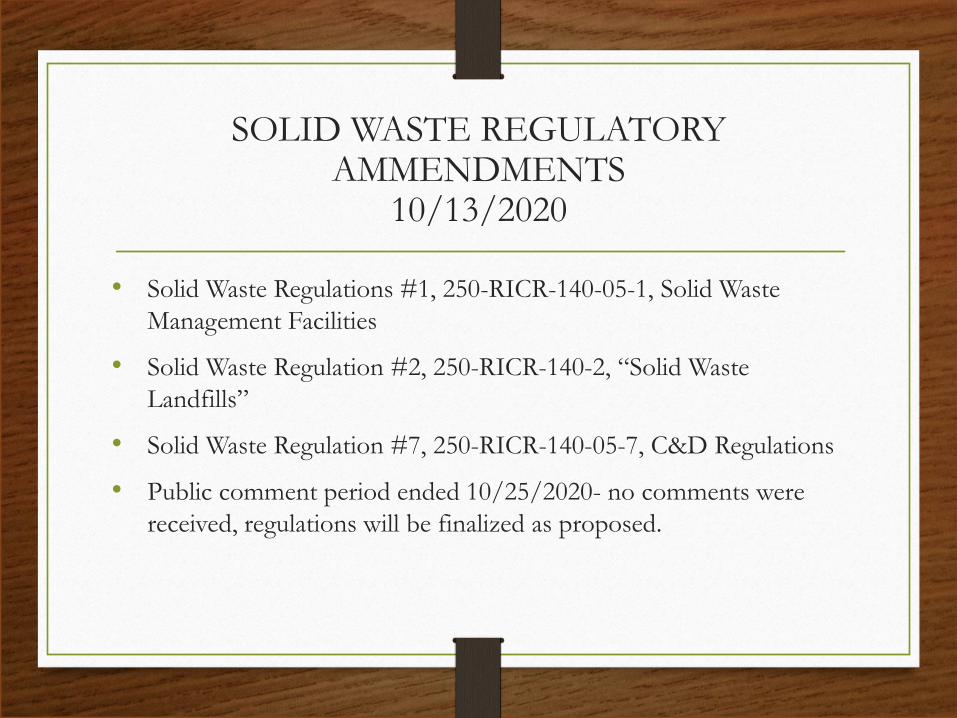
SOLID WASTE REGULATORY AMMENDMENTS
10/13/2020
• Solid Waste Regulations #1, 250-RICR-140-05-1, Solid Waste
Management Facilities
• Solid Waste Regulation #2, 250-RICR-140-2, “Solid Waste
Landfills”
• Solid Waste Regulation #7, 250-RICR-140-05-7, C&D Regulations
• Public comment period ended 10/25/2020- no comments were
received, regulations will be finalized as proposed.
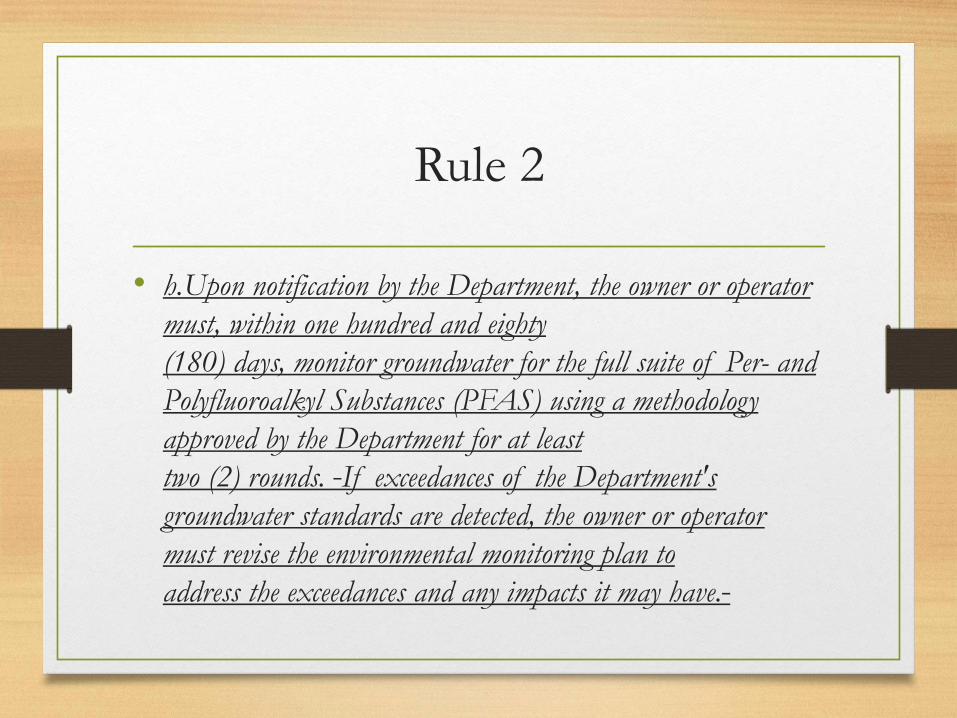
Rule 2
• h.Upon notification by the Department, the owner or operator
must, within one hundred and eighty
(180) days, monitor groundwater for the full suite of Per- and
Polyfluoroalkyl Substances (PFAS) using a methodology
approved by the Department for at least
two (2) rounds. If exceedances of the Department's
groundwater standards are detected, the owner or operator
must revise the environmental monitoring plan to
address the exceedances and any impacts it may have.

PFAS TESTING
• Require 2 rounds of PFAS groundwater monitoring for PFAS (Per- and polyfluoroalkyl substances), specifically those PFAS included in the target analyte list for EPA Method 537.1
• Includes all currently regulated compounds (PFOA and PFOS
• Target analyte list for EPA Method 537.1 in both groundwater and drinking water
• Not very prescriptive in how testing will be done as regulatory changes often outpaced by science.
Why?
• Goal is to establish a baseline
• Too expensive at $300/sample to require quarterly
monitoring.
• Conducted Fiscal Analysis
Benefits
• PFAS has emerged as a significant concern in
drinking water only over the last several years.
• Rhode Island Department of Health is currently in
the process of promulgating drinking water
standards for these compounds
• Without PFAS baseline sampling data, it is not
possible to ascertain if any current or former landfills
are threatening public water supplies.
Cost
• Assume average landfill has 4 wells
• Estimated cost $300/sample
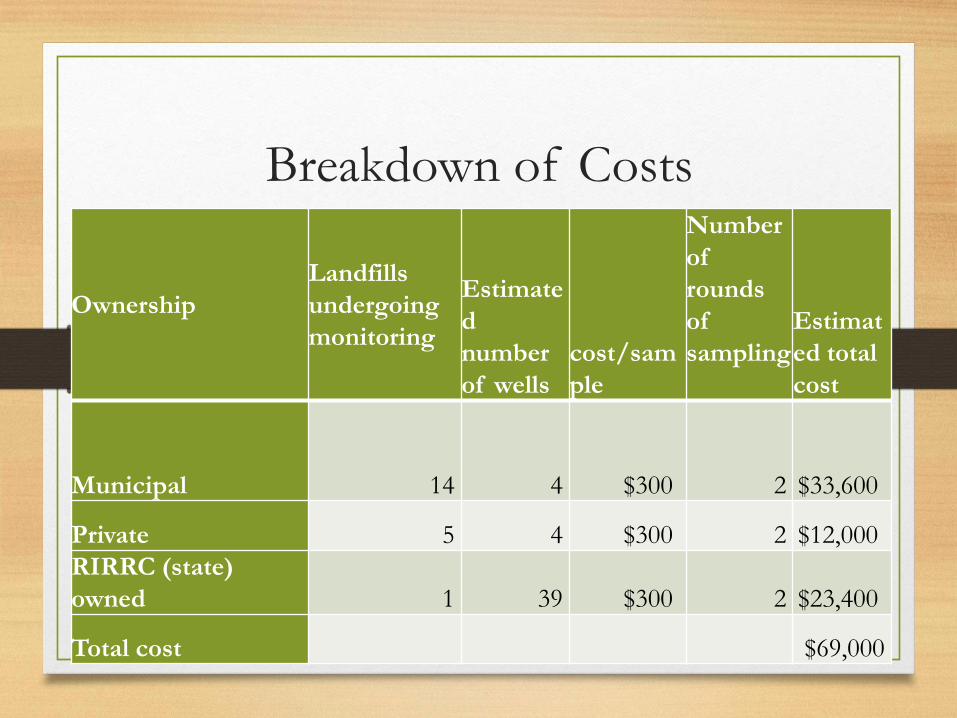
Breakdown of Costs
Ownership
Landfills
undergoing
monitoring
Estimate
d
number
of wells
cost/sam
ple
Number
of
rounds
of
sampling
Estimat
ed total
cost
Municipal 14 4 $300 2 $33,600
Private 5 4 $300 2 $12,000
RIRRC (state)
owned 1 39 $300 2 $23,400
Total cost $69,000
We Get Results- Now What?
• May require additional monitoring based on results.
• May look more closely at potentially impacted
drinking water.
• Treatment of aquifers not realistic
• Hydraulic controls
• Capping
Composting and PFAS
• Biosolids most likely contain PFAS.
• Testing difficult as the EPA-approved laboratory
procedures in use are those for drinking water.
• Most commercial labs are using their own “modified
Method 537” making comparisons difficult.
• At this time, no reasonable way to reduce PFAS in
compost other than control of input.

Questions?

RIDOH PFAS in Drinking Water Update
November 5, 2020
PFAS Webinar
Environmental Business Council of NE, Inc.
PFAS Vulnerability Study 2017-2019
• Major Partners:
• RI Dept. of Environmental Management
• Brown University – Dr. Robert Hurt
• Texas Tech University – Dr. Jennifer Guelfo
• RI Dept. of Children, Youth, & Families

PFAS Vulnerability Study 2017-2019
• Potentially Vulnerable Water Systems:
• Large PWS (UCMR3)
• Communities, water bottlers, food
processors, licensed child cares w/DW
source:
• w/in 1 mile of potential PFAS facility
• w/in ½ mile of fire station
• Schools w/own public wells

PFAS Vulnerability Study 2017-2019
• Airports
• Fire academy
• EPCRA Tier II
• Industrial Facilities –certain NAICS codes
• High, Medium, Low Priority
• St. Gobain Plastics
• CERCLIS and CERCLIS NPL
• Wastewater Lagoons
• Military Sites
• Chrome Platers
• Large ASTs
• Fire foam used in emerg. response
• Facilities ID’d by Brown University
In bold are those within 1 mile of priority public wells
Potential PFAS Facilities:
PFAS Vulnerability Study 2017-2019
• Potential PFAS Facilities (cont.):
• Fire Stations
• Schools
PFAS Vulnerability Study 2017-2019
• # Sampled (analyzed 9-14 PFAS):
• 82 PWS
• 5 child cares
• Percentage PWS Sampled:
• 87% of Rhode Islanders’ drinking water
• 97% of RI’ers on public water
• 100% serving >10,000 people
• 49% Community water systems
• 100% schools with their own public wells
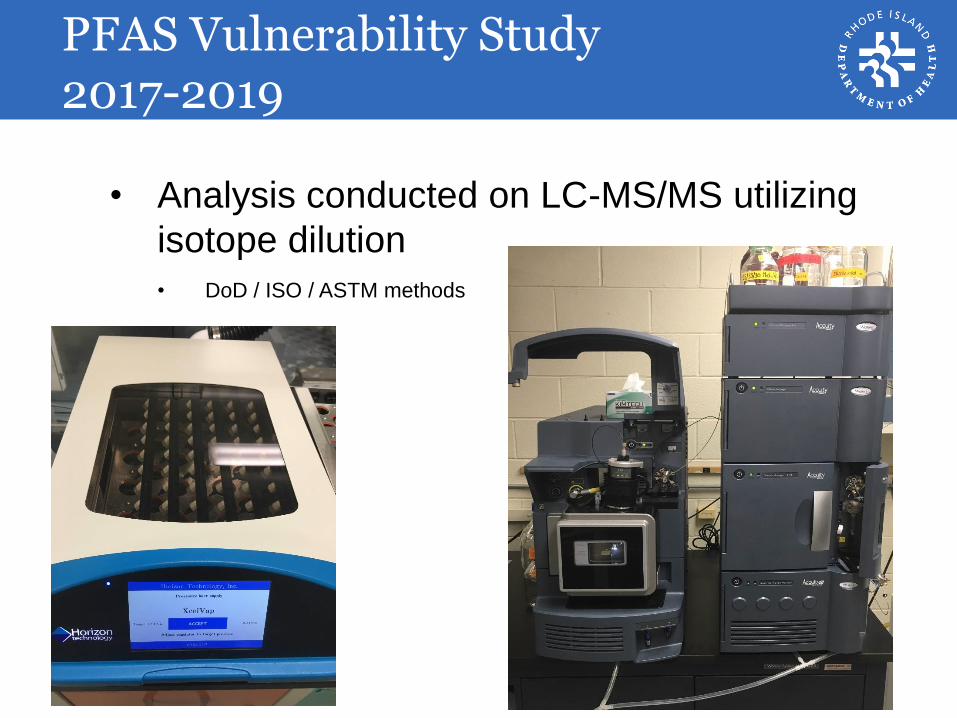
PFAS Vulnerability Study 2017-2019
• Analysis conducted on LC-MS/MS utilizing
isotope dilution
• DoD / ISO / ASTM methods
Technical Advisory Group
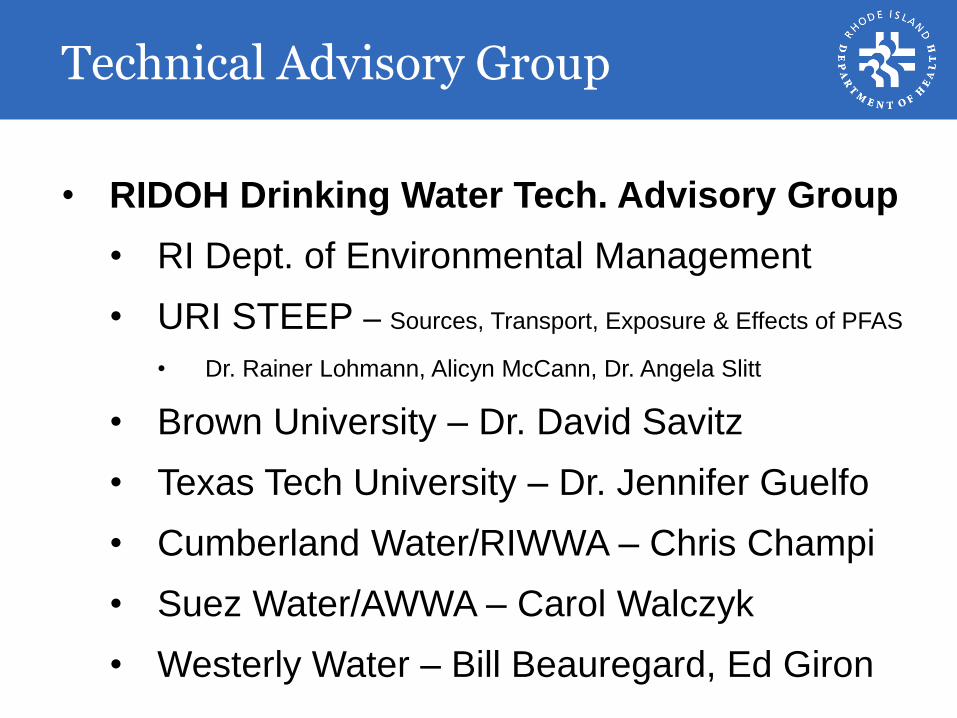
• RIDOH Drinking Water Tech. Advisory Group
• RI Dept. of Environmental Management
• URI STEEP – Sources, Transport, Exposure & Effects of PFAS
• Dr. Rainer Lohmann, Alicyn McCann, Dr. Angela Slitt
• Brown University – Dr. David Savitz
• Texas Tech University – Dr. Jennifer Guelfo
• Cumberland Water/RIWWA – Chris Champi
• Suez Water/AWWA – Carol Walczyk
• Westerly Water – Bill Beauregard, Ed Giron
PFAS Vulnerability Study 2017-2019
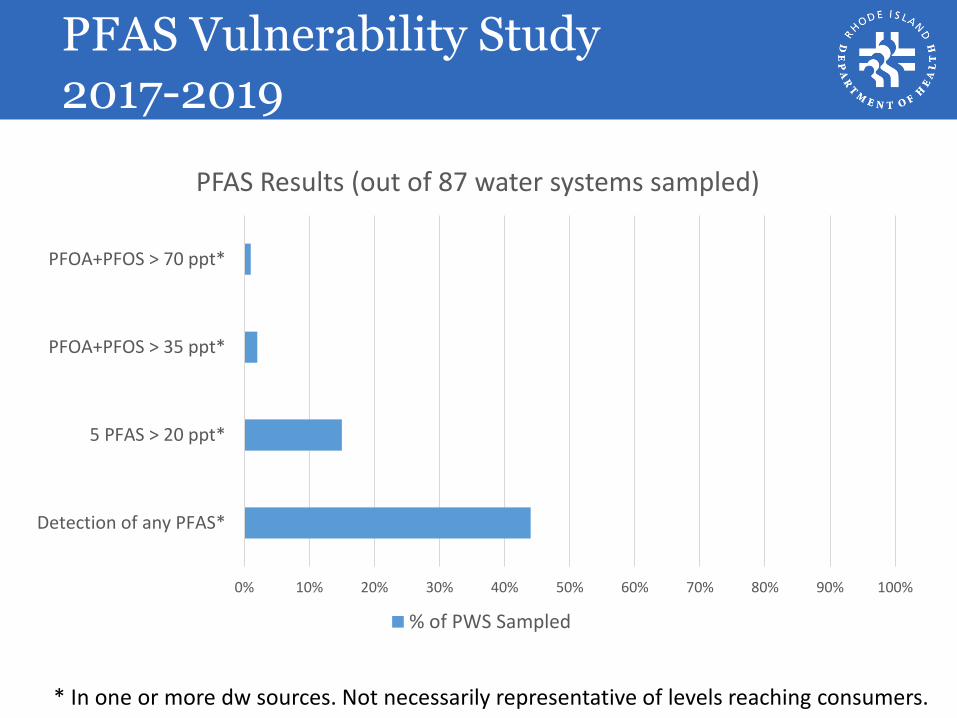
0% 10% 20% 30% 40% 50% 60% 70% 80% 90% 100%
Detection of any PFAS*
5 PFAS > 20 ppt*
PFOA+PFOS > 35 ppt*
PFOA+PFOS > 70 ppt*
PFAS Results (out of 87 water systems sampled)
% of PWS Sampled
* In one or more dw sources. Not necessarily representative of levels reaching consumers.
PFAS Vulnerability Study 2017-2019
0
5
10
15
20
25
30
35
0
20
40
60
80
100
120
# o
f W
ater
Sys
tem
s
pp
t
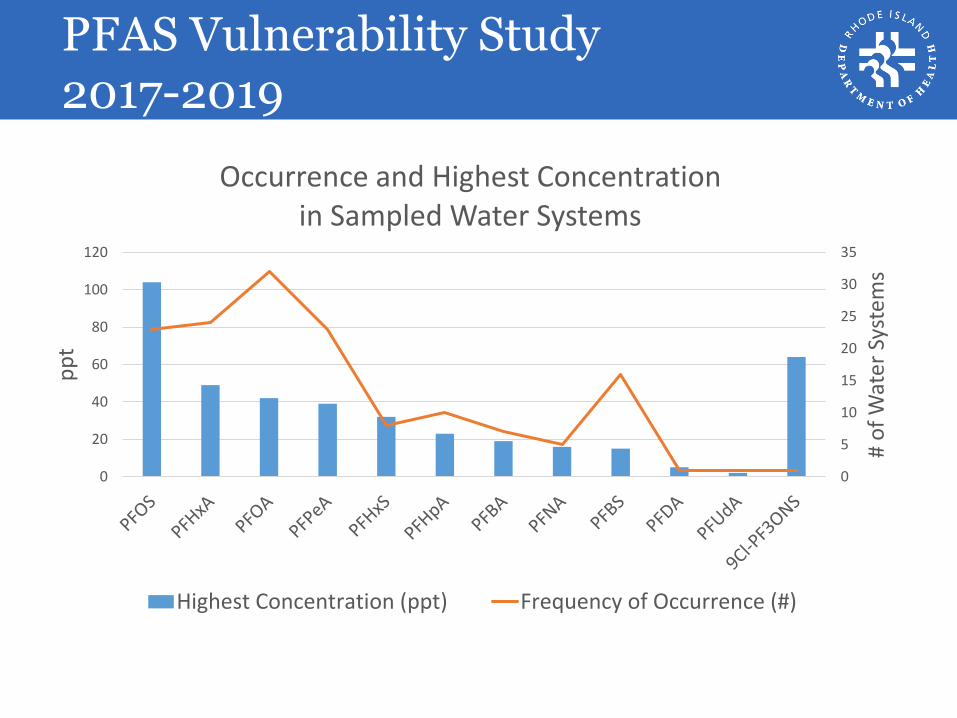
Occurrence and Highest Concentration in Sampled Water Systems
Highest Concentration (ppt) Frequency of Occurrence (#)
PFAS Vulnerability Study 2017-2019
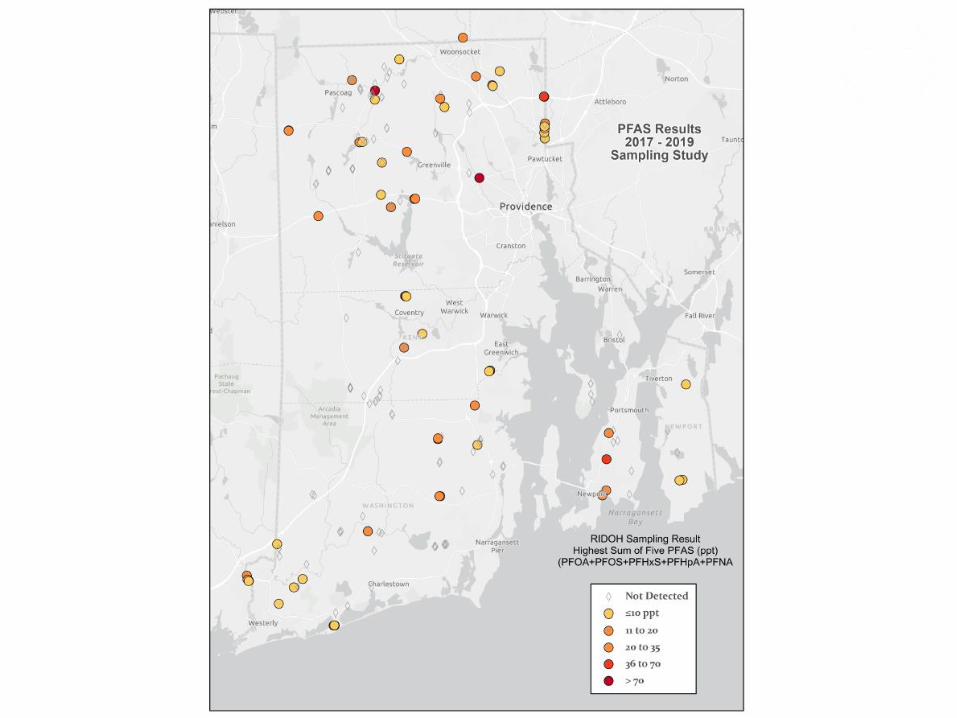
PFAS Vulnerability Study 2017-2019
RI Process for Establishing Regulations
We must follow a process defined by the
federal Safe Drinking Water Act:
1. Determine whether there is a need
2. Determine a drinking water concentration that
fully protects human health
3. Examine the feasibility, benefits, and costs of
the health-based approach and any alternatives
4. Determine an approach, that in the opinion of
the Director, best balances the costs and
benefits
14
Cost-Benefit Analysis
• Costs
• State & water system implementation costs:
• Northeast Water Solutions, Inc. (NWSI)
• Determined costs based on:
• Individual PWS results from 2017-2019 study
• MCL of 70 ppt, 35 ppt, 20 ppt, 10 ppt, or 2 ppt
• PWS annual water volume & flow rate
• GAC
• Safety factor: with & without (PFAS conc &
costs)
Other Costs
• Other costs
• PWS sampling & analysis
• RIDOH Lab equipment & standards upgrades
• RIDOH database compliance add-on (IT contract)
• RIDOH staff
• Rule/compliance management
• Engineering review & approval/SRF review
• Bottled water
• Contract: community outreach workshops
Exposure Assessment
• Which PFAS are of concern?
• Which PFAS found in RI?
• Consider them individually or combined? Do
they do the same thing? Have the same effects?
• What health effects do they cause?
• What’s an acceptable level of exposure? (RfD)
• Who is most at risk?
• What percent of exposure can come from
drinking water vs. other sources?
• How much PFAS can be in drinking water
without exceeding RfD?17
Predicted Health Benefits
Reducing PFAS in drinking water will
improve health:
• Better immune function
• Slightly larger babies
• Slightly lower cholesterol
Other benefits are also expected, but
are less measurable or less
significant
18
Benefits in RI
• Use RI data with each potential MCL – actual
PFAS found in drinking water, population
served, amount of change in PFAS level if lower
to below the MCL
• Affects on health of newborns
• Risk of death from ischemic heart disease
• Economic impact of the health benefits
19
Regulation Development
• Hired temporary employee March – July
• Unpaid legal student scholar
• Reviewed other states, compared w/SOC
framework
• Massachusetts
• Michigan
• New Hampshire
• New Jersey
• New York
• Vermont
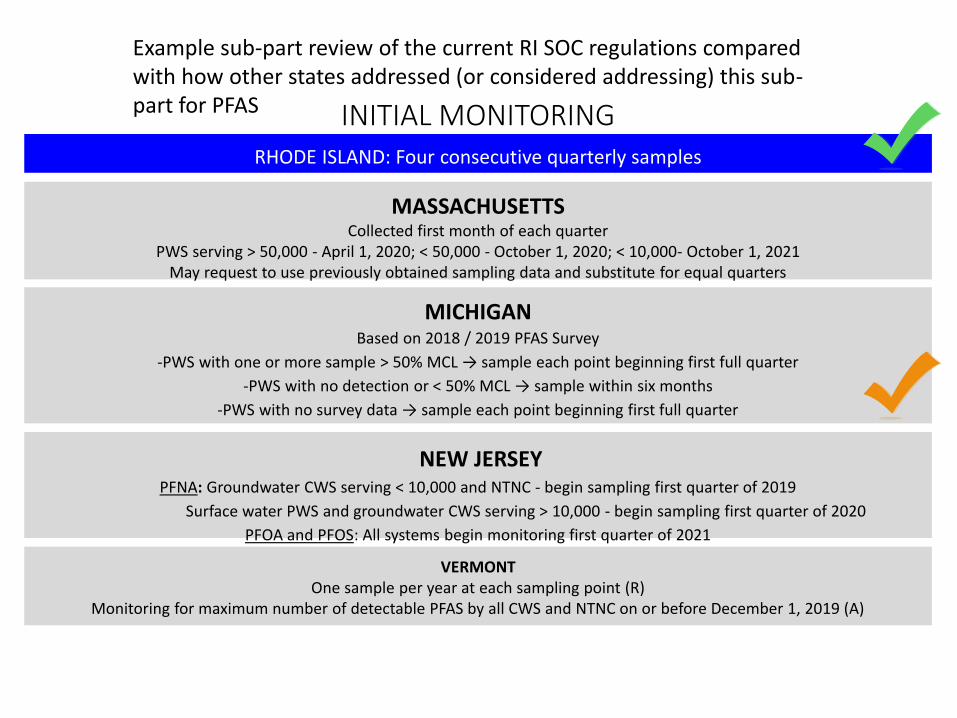
INITIAL MONITORINGRHODE ISLAND: Four consecutive quarterly samples
MASSACHUSETTSCollected first month of each quarter
PWS serving > 50,000 - April 1, 2020; < 50,000 - October 1, 2020; < 10,000- October 1, 2021May request to use previously obtained sampling data and substitute for equal quarters
MICHIGANBased on 2018 / 2019 PFAS Survey
-PWS with one or more sample > 50% MCL → sample each point beginning first full quarter
-PWS with no detection or < 50% MCL → sample within six months
-PWS with no survey data → sample each point beginning first full quarter
NEW JERSEYPFNA: Groundwater CWS serving < 10,000 and NTNC - begin sampling first quarter of 2019
Surface water PWS and groundwater CWS serving > 10,000 - begin sampling first quarter of 2020
PFOA and PFOS: All systems begin monitoring first quarter of 2021
VERMONTOne sample per year at each sampling point (R)
Monitoring for maximum number of detectable PFAS by all CWS and NTNC on or before December 1, 2019 (A)
Example sub-part review of the current RI SOC regulations compared with how other states addressed (or considered addressing) this sub-part for PFAS
Meetings w/Governor’s Office
• Draft regulations
• Cost-benefit analysis
• Proposed RIDOH supplemental budget
Amy B. Parmenter
Interim Chief
Supervising Environmental Scientist
Center for Drinking Water Quality
Rhode Island Department of Health
Environmental Business Council of New England
Energy Environment Economy
Analytical Methods Update
Jim Occhialini
Vice President
Alpha Analytical
PFAS Analytical Methods Update
Jim Occhialini
Alpha Analytical
EBC Rhode Island Emerging Contaminants Webinar: PFAS Update – Where We Are and Where We’re Heading
11/05/2020

1
LOOKING AHEAD
INDUSTRY develops
new cmpds
REGULATORS
take interest
NEW COMPOUNDS added to PFAS
lists
NO lab method,
NO ref std
/
Lack of standardized methods
Lack of reference standards
Multiple compound lists
Differing state specific
requirements
2
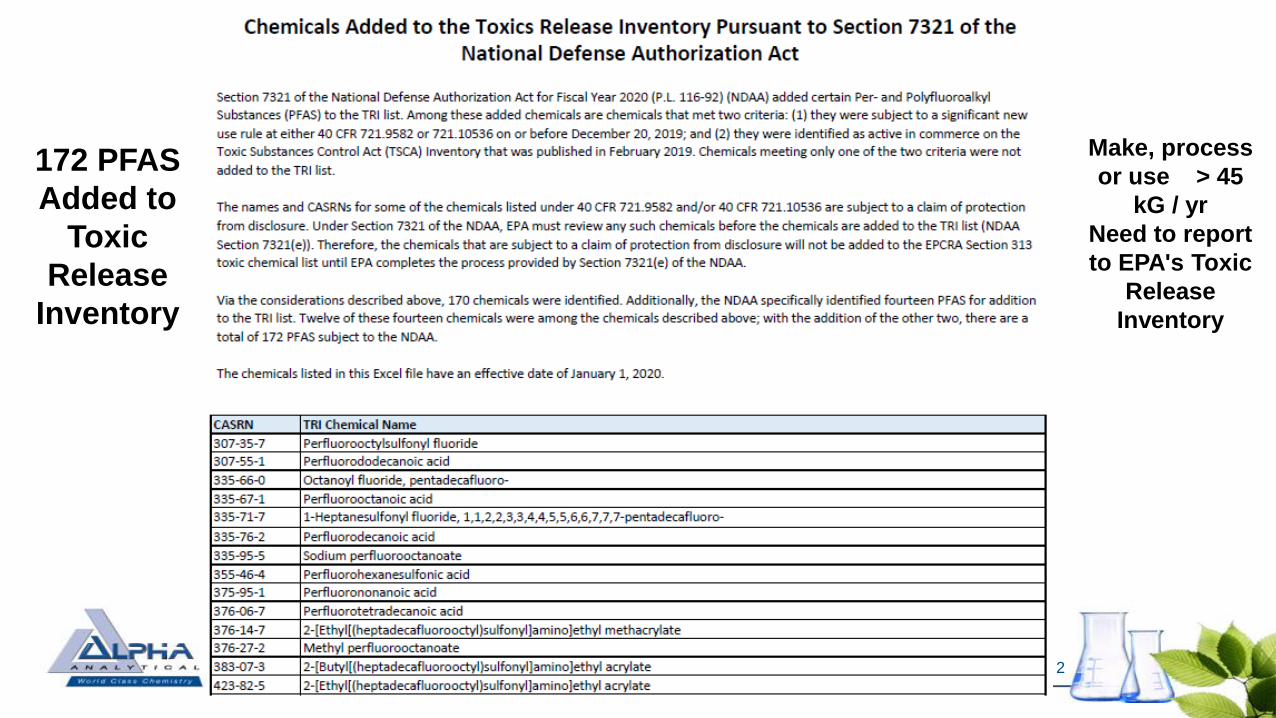
Make, process
or use > 45
kG / yr
Need to report
to EPA's Toxic
Release
Inventory
172 PFAS
Added to
Toxic
Release
Inventory
3
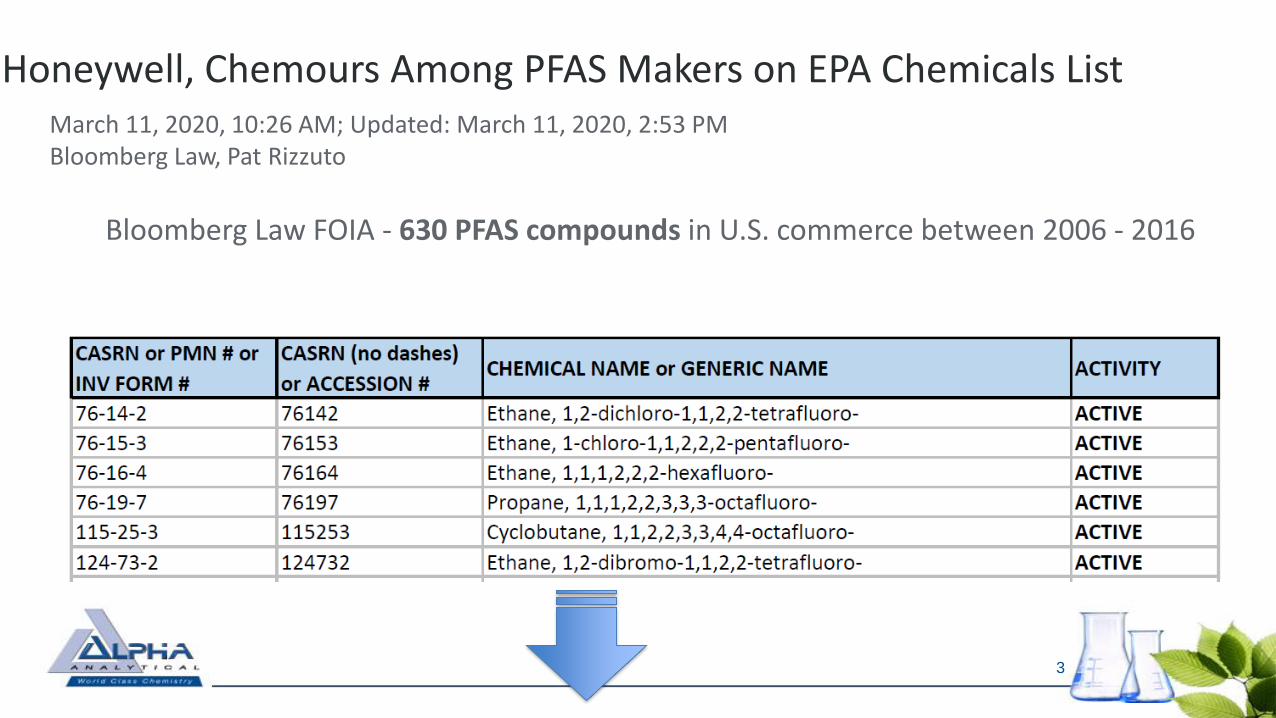
Honeywell, Chemours Among PFAS Makers on EPA Chemicals List March 11, 2020, 10:26 AM; Updated: March 11, 2020, 2:53 PM Bloomberg Law, Pat Rizzuto
Bloomberg Law FOIA - 630 PFAS compounds in U.S. commerce between 2006 - 2016
Topics for Discussion
Drinking water methods
Other method options
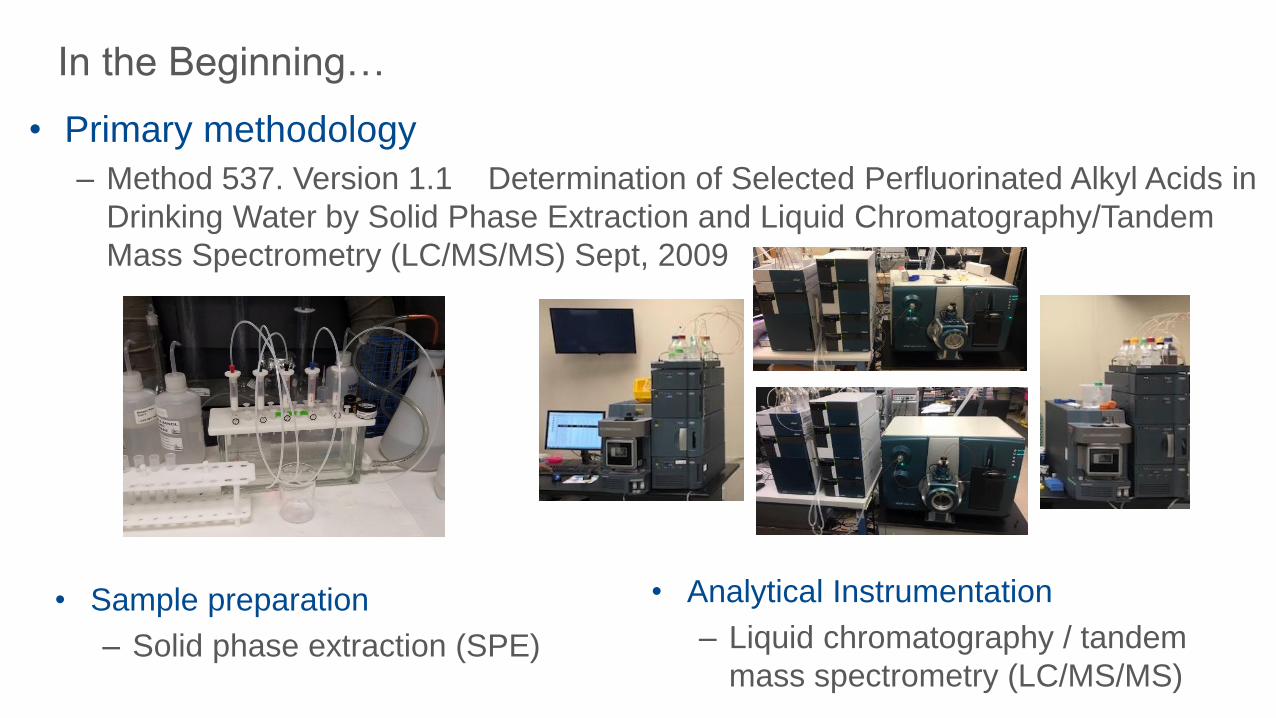
In the Beginning…
• Primary methodology
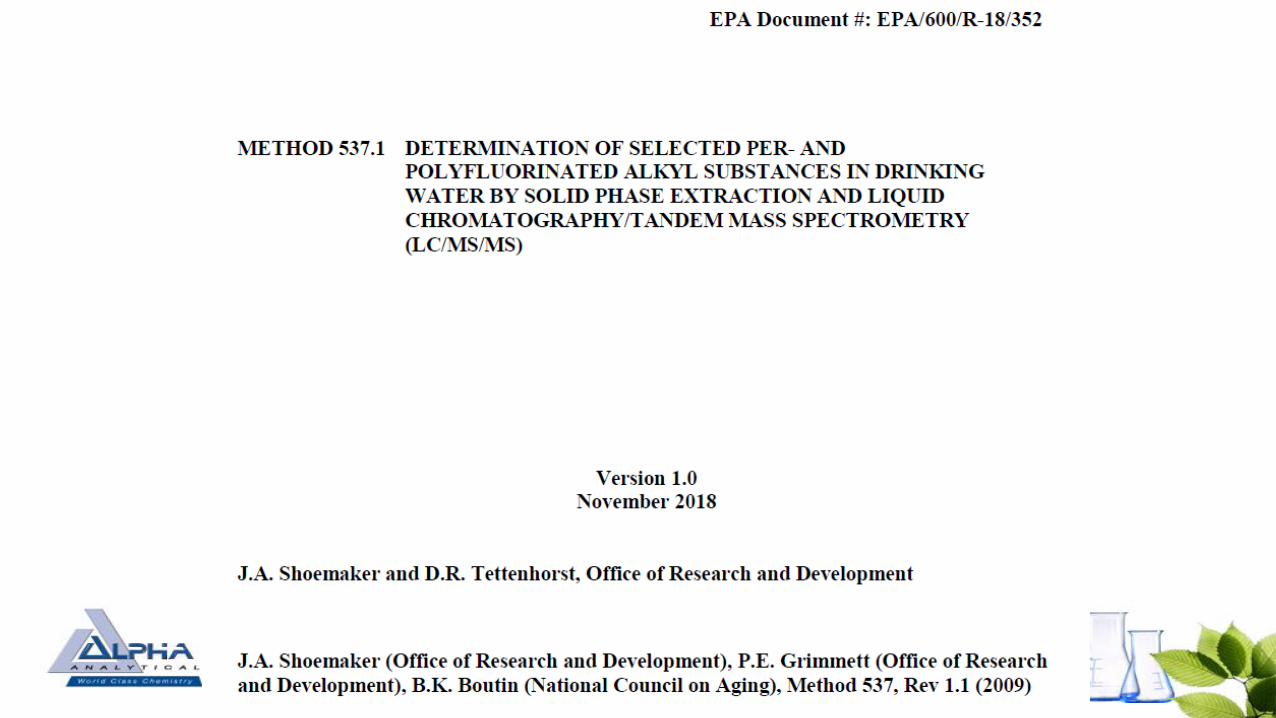
– Method 537. Version 1.1 Determination of Selected Perfluorinated Alkyl Acids in
Drinking Water by Solid Phase Extraction and Liquid Chromatography/Tandem
Mass Spectrometry (LC/MS/MS) Sept, 2009
• Sample preparation
– Solid phase extraction (SPE)
• Analytical Instrumentation
– Liquid chromatography / tandem
mass spectrometry (LC/MS/MS)
6
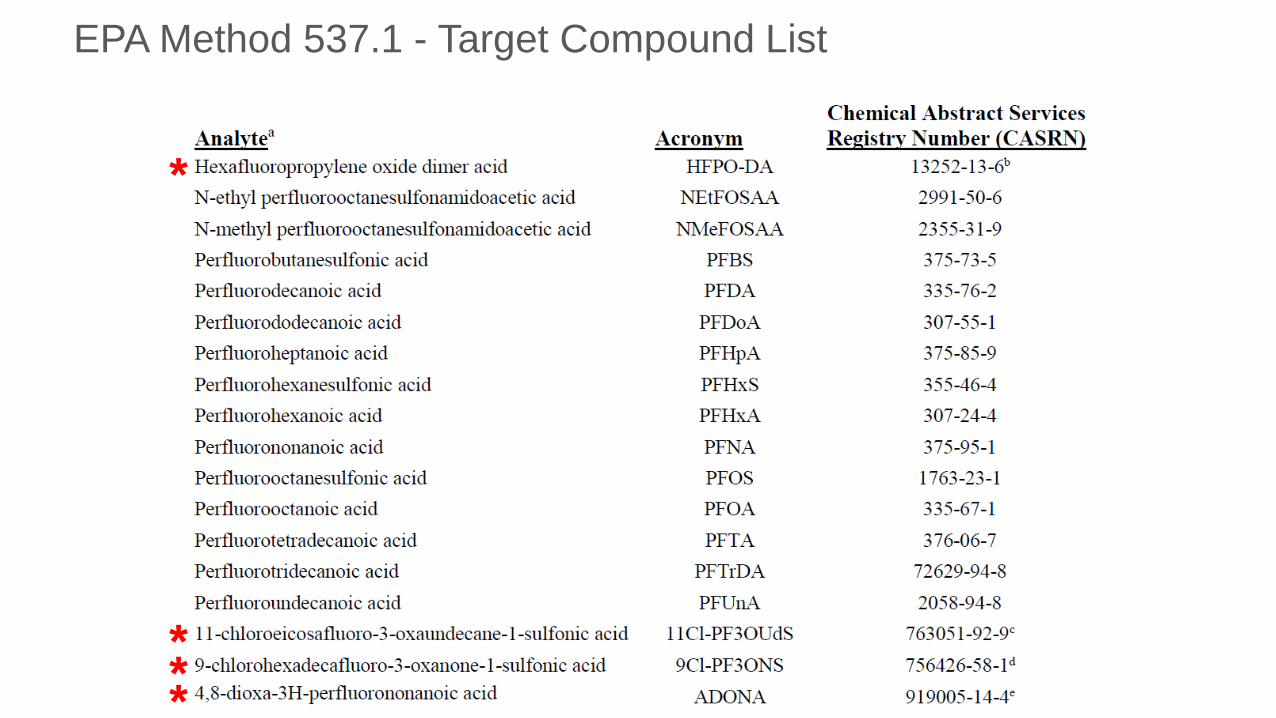
EPA Method 537.1 - Target Compound List
7
*
***
8
F
F
O
F
F
F
F
F F
F
F
F
O
O
H
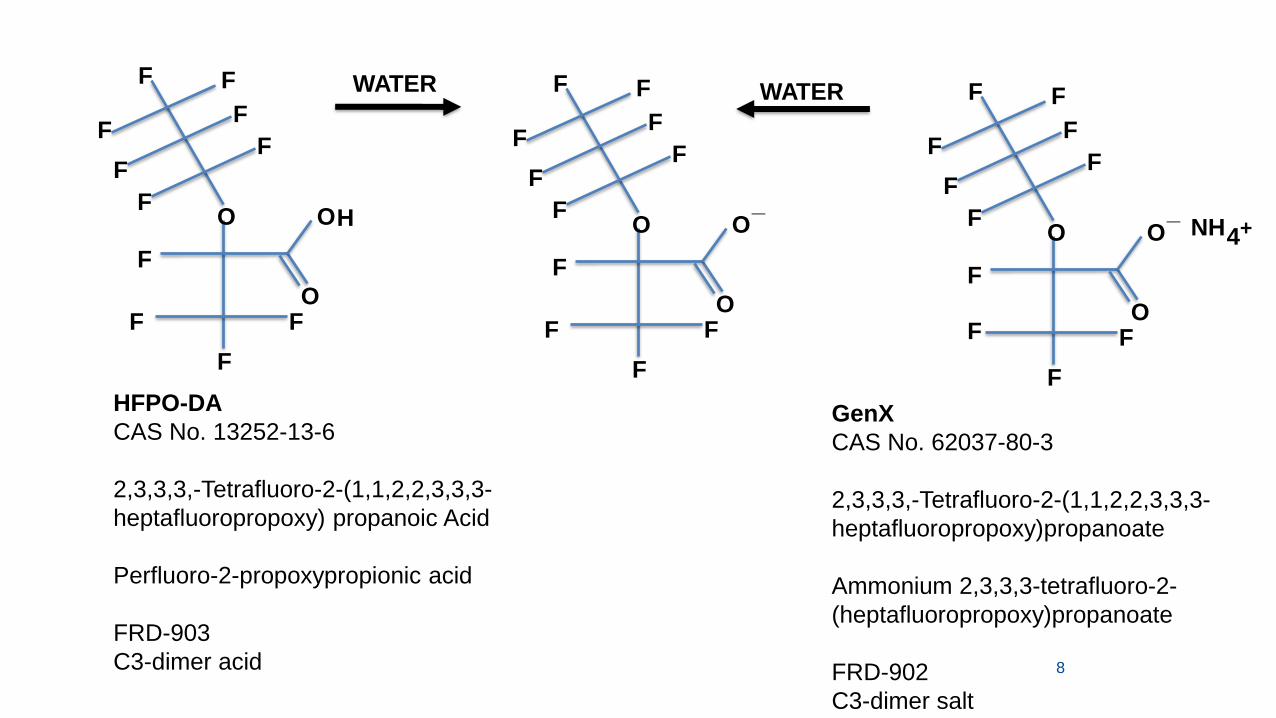
HFPO-DA
CAS No. 13252-13-6
2,3,3,3,-Tetrafluoro-2-(1,1,2,2,3,3,3-
heptafluoropropoxy) propanoic Acid
Perfluoro-2-propoxypropionic acid
FRD-903
C3-dimer acid
F
F
O
F
F
F
F
F F
F
F
F
O
O
_NH4+
GenX
CAS No. 62037-80-3
2,3,3,3,-Tetrafluoro-2-(1,1,2,2,3,3,3-
heptafluoropropoxy)propanoate
Ammonium 2,3,3,3-tetrafluoro-2-
(heptafluoropropoxy)propanoate
FRD-902
C3-dimer salt
F
F
O
F
F
F
F
F F
F
F
F
O
O
_
WATER WATER
9
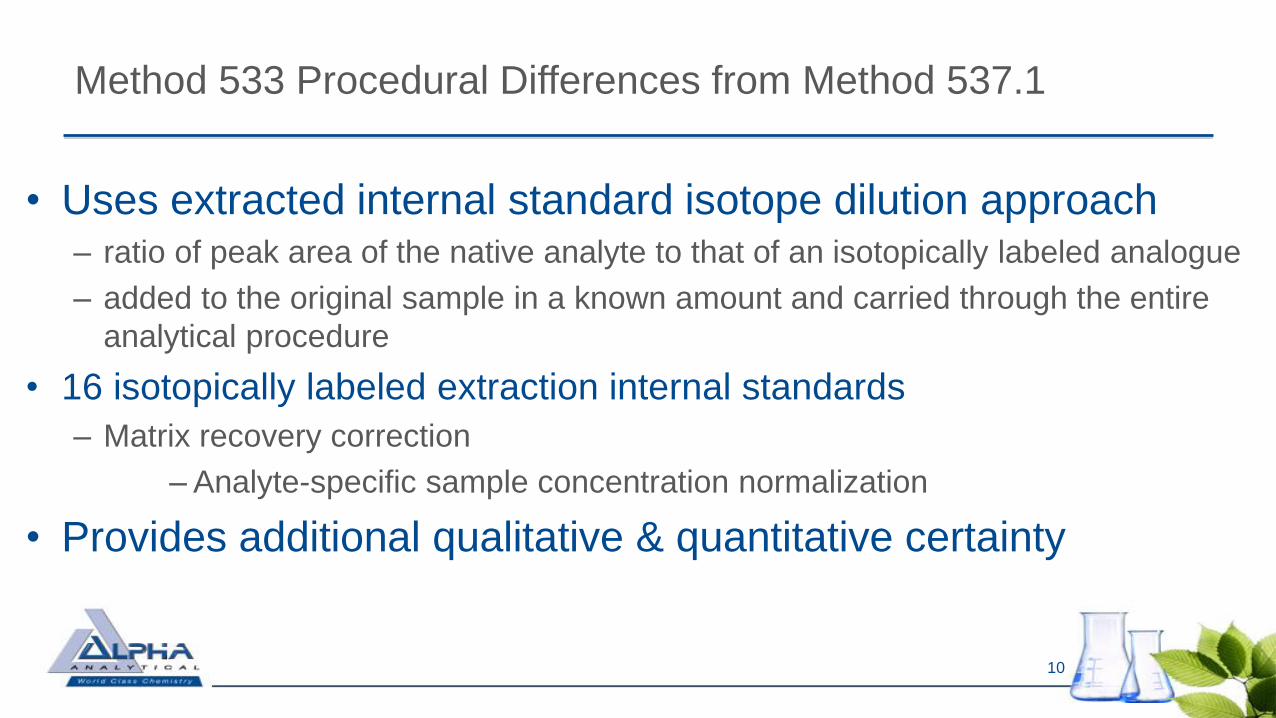
• Uses extracted internal standard isotope dilution approach– ratio of peak area of the native analyte to that of an isotopically labeled analogue
– added to the original sample in a known amount and carried through the entire
analytical procedure
• 16 isotopically labeled extraction internal standards
– Matrix recovery correction
– Analyte-specific sample concentration normalization
• Provides additional qualitative & quantitative certainty
10
Method 533 Procedural Differences from Method 537.1
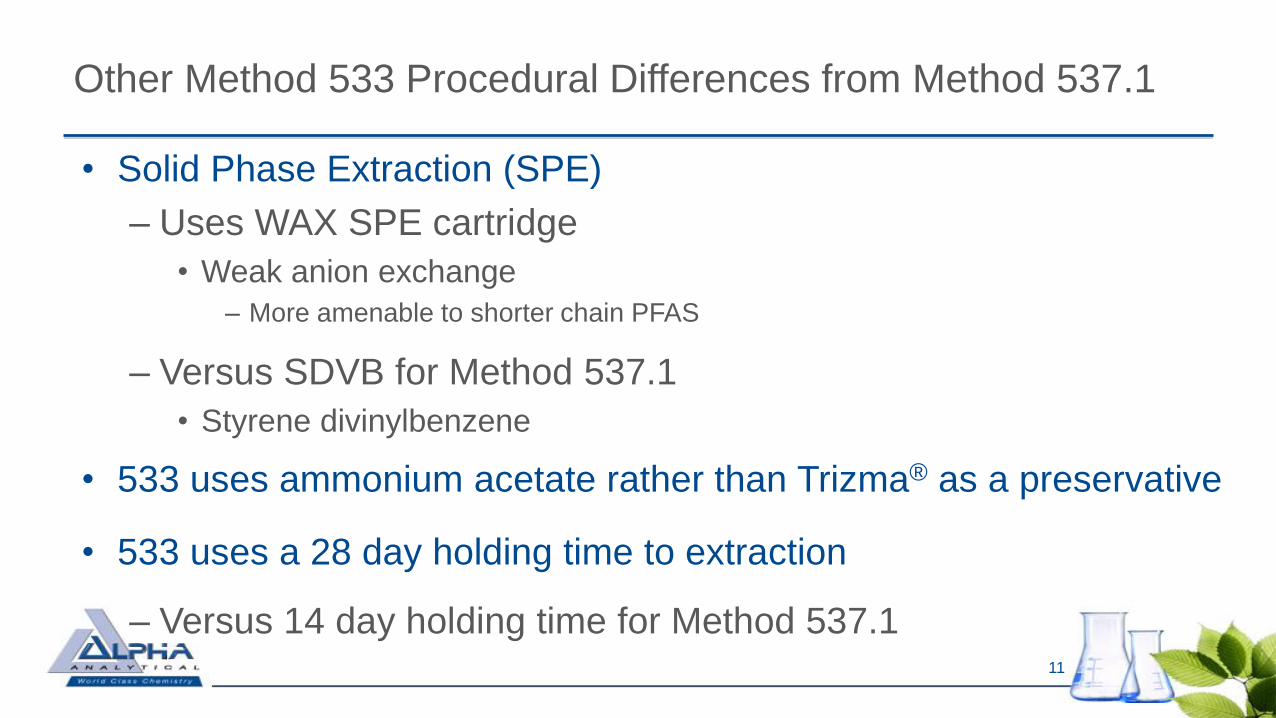
Other Method 533 Procedural Differences from Method 537.1
• Solid Phase Extraction (SPE)
– Uses WAX SPE cartridge
• Weak anion exchange
– More amenable to shorter chain PFAS
– Versus SDVB for Method 537.1
• Styrene divinylbenzene
• 533 uses ammonium acetate rather than Trizma® as a preservative
• 533 uses a 28 day holding time to extraction
– Versus 14 day holding time for Method 537.111
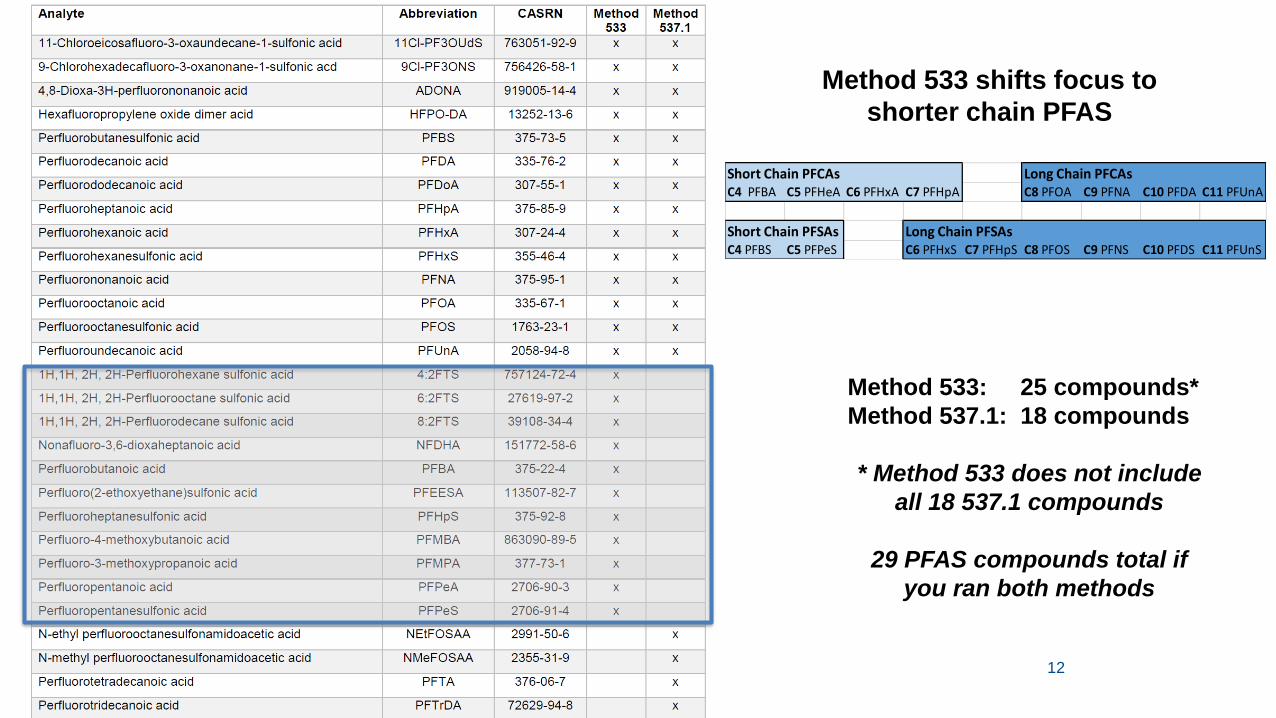
12
Method 533 shifts focus to
shorter chain PFAS
Short Chain PFCAs Long Chain PFCAsC4 PFBA C5 PFHeA C6 PFHxA C7 PFHpA C8 PFOA C9 PFNA C10 PFDA C11 PFUnA
Short Chain PFSAs Long Chain PFSAsC4 PFBS C5 PFPeS C6 PFHxS C7 PFHpS C8 PFOS C9 PFNS C10 PFDS C11 PFUnS
Method 533: 25 compounds*
Method 537.1: 18 compounds
* Method 533 does not include
all 18 537.1 compounds
29 PFAS compounds total if
you ran both methods
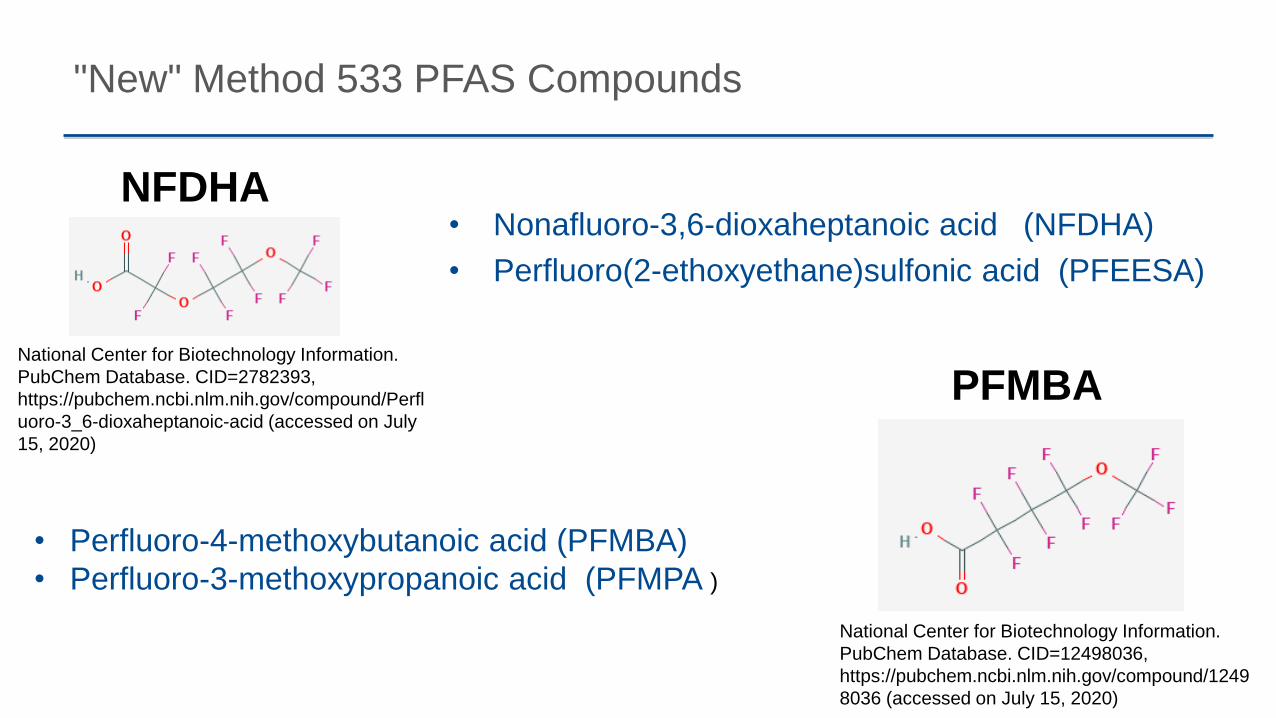
"New" Method 533 PFAS Compounds
• Nonafluoro-3,6-dioxaheptanoic acid (NFDHA)
• Perfluoro(2-ethoxyethane)sulfonic acid (PFEESA)
• Perfluoro-4-methoxybutanoic acid (PFMBA)
• Perfluoro-3-methoxypropanoic acid (PFMPA )
National Center for Biotechnology Information.
PubChem Database. CID=2782393,
https://pubchem.ncbi.nlm.nih.gov/compound/Perfl
uoro-3_6-dioxaheptanoic-acid (accessed on July
15, 2020)
NFDHA
National Center for Biotechnology Information.
PubChem Database. CID=12498036,
https://pubchem.ncbi.nlm.nih.gov/compound/1249
8036 (accessed on July 15, 2020)
PFMBA
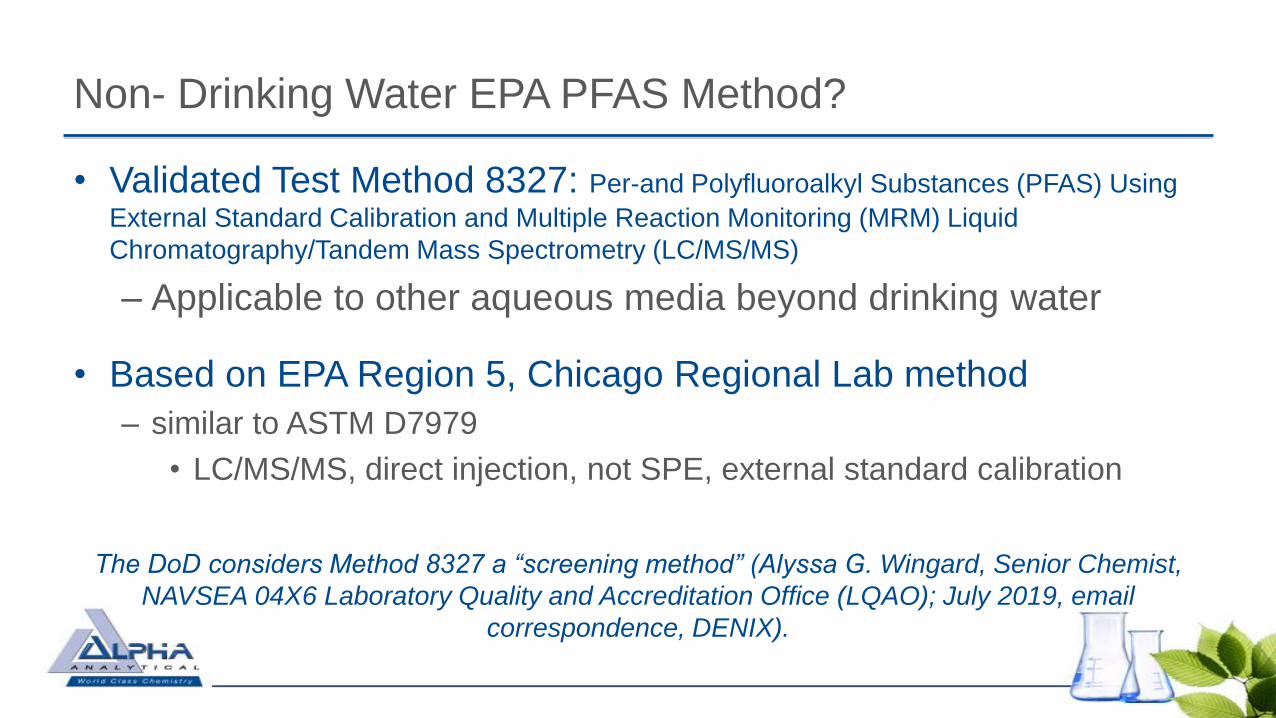
Non- Drinking Water EPA PFAS Method?
• Validated Test Method 8327: Per-and Polyfluoroalkyl Substances (PFAS) Using
External Standard Calibration and Multiple Reaction Monitoring (MRM) Liquid
Chromatography/Tandem Mass Spectrometry (LC/MS/MS)
– Applicable to other aqueous media beyond drinking water
• Based on EPA Region 5, Chicago Regional Lab method
– similar to ASTM D7979
• LC/MS/MS, direct injection, not SPE, external standard calibration
The DoD considers Method 8327 a “screening method” (Alyssa G. Wingard, Senior Chemist,
NAVSEA 04X6 Laboratory Quality and Accreditation Office (LQAO); July 2019, email
correspondence, DENIX).
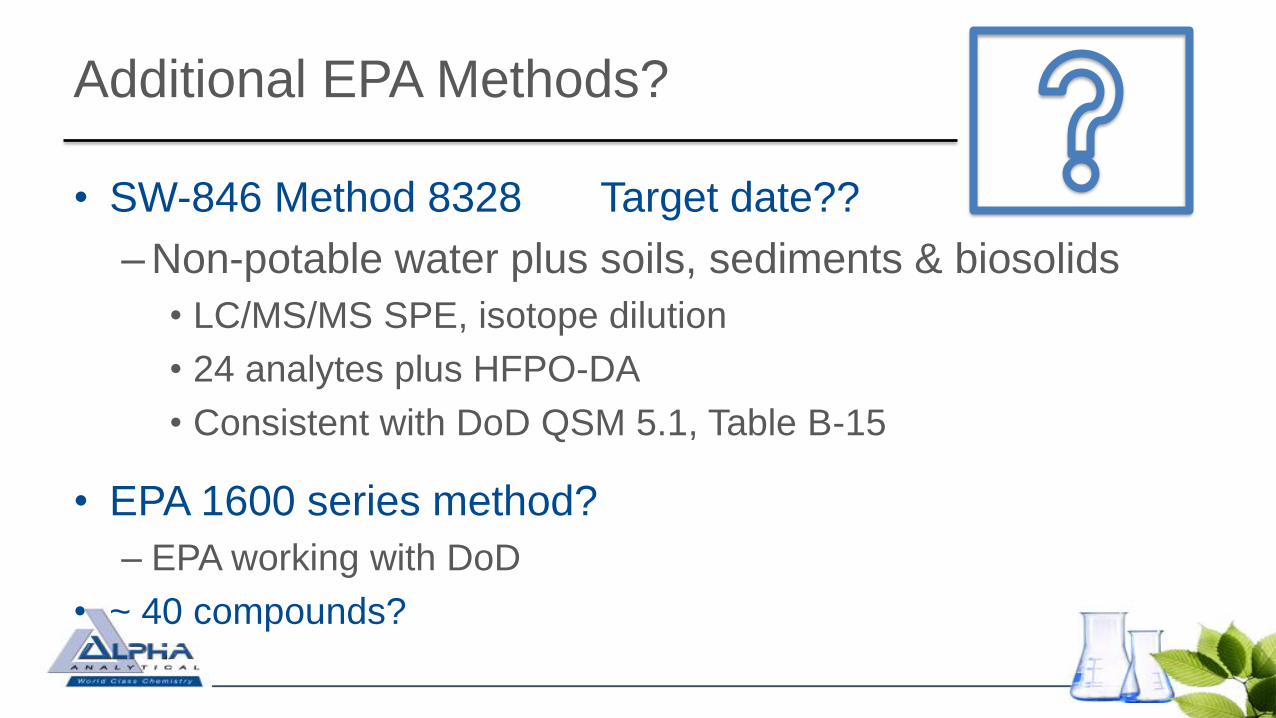
Additional EPA Methods?
• SW-846 Method 8328 Target date??
– Non-potable water plus soils, sediments & biosolids
• LC/MS/MS SPE, isotope dilution
• 24 analytes plus HFPO-DA
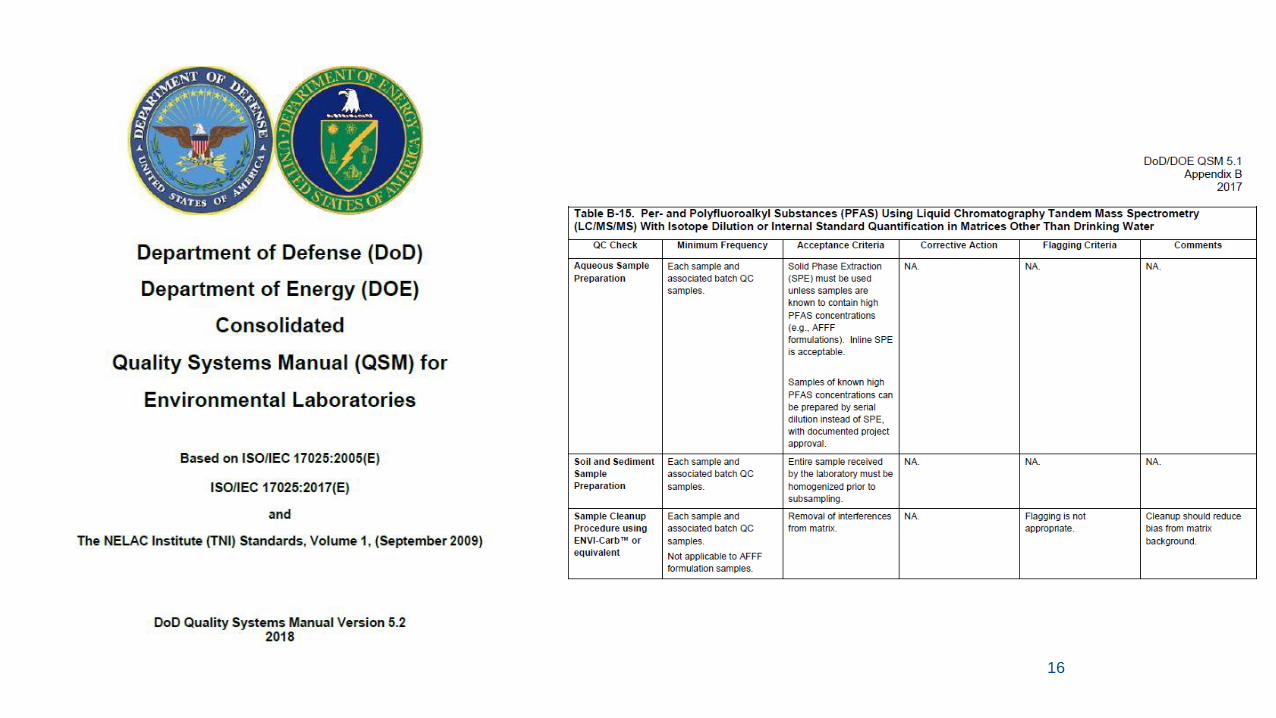
• Consistent with DoD QSM 5.1, Table B-15
• EPA 1600 series method?
– EPA working with DoD
• ~ 40 compounds?
16
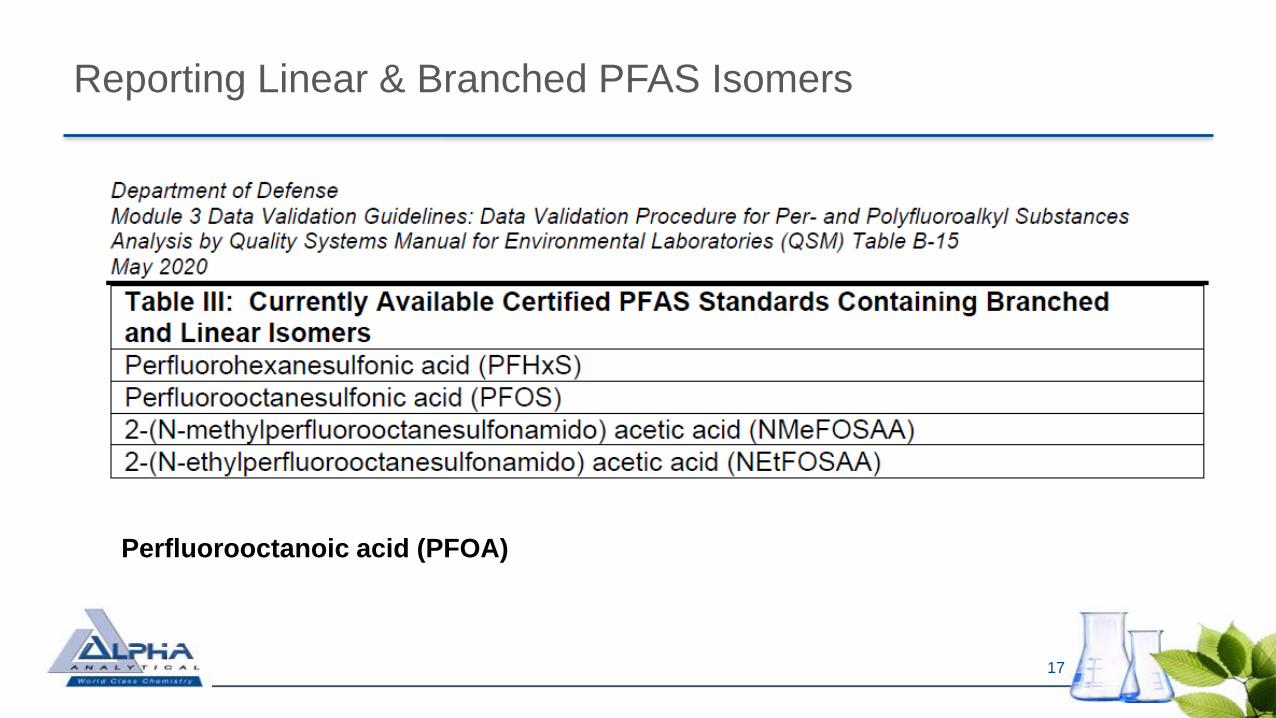
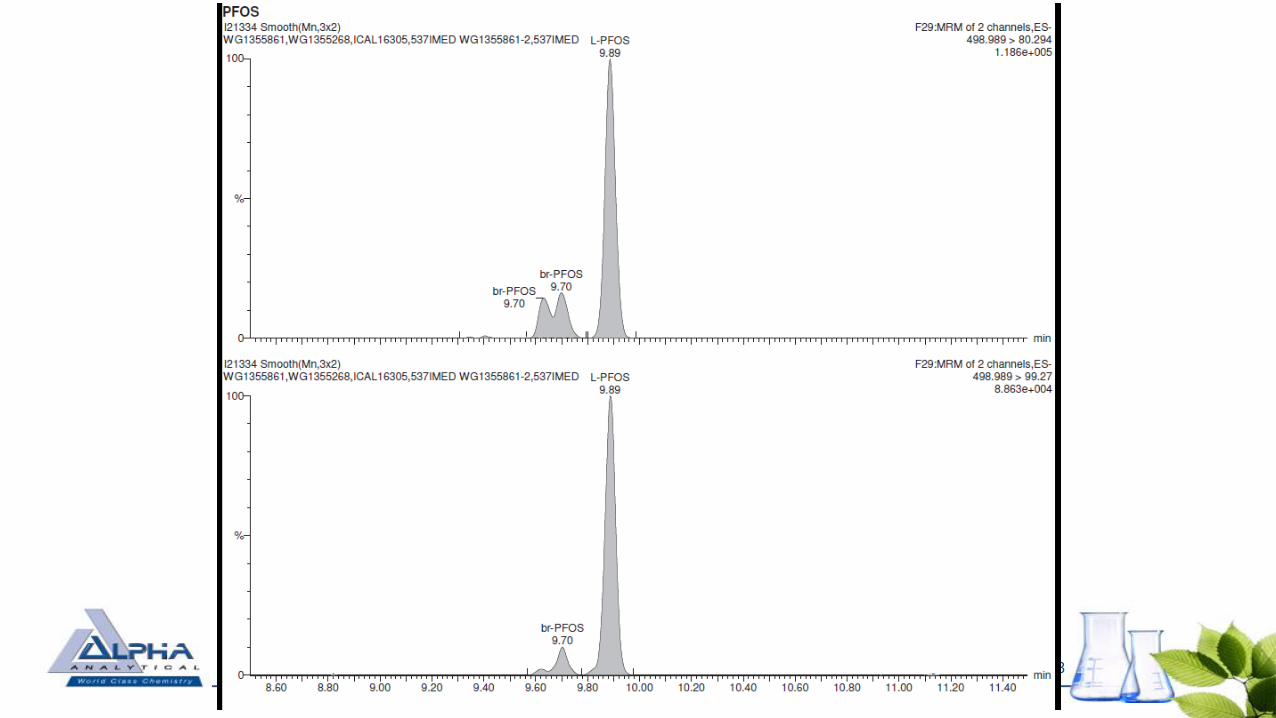
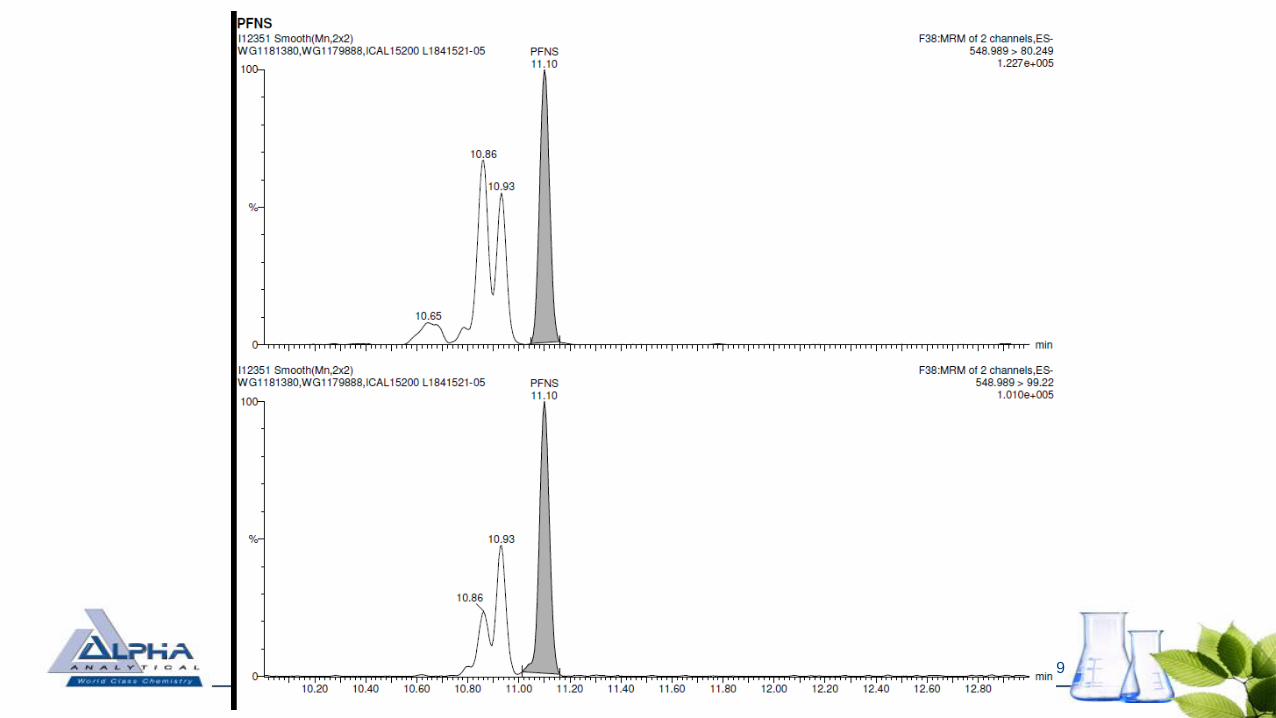
Reporting Linear & Branched PFAS Isomers
17
Perfluorooctanoic acid (PFOA)
18
19
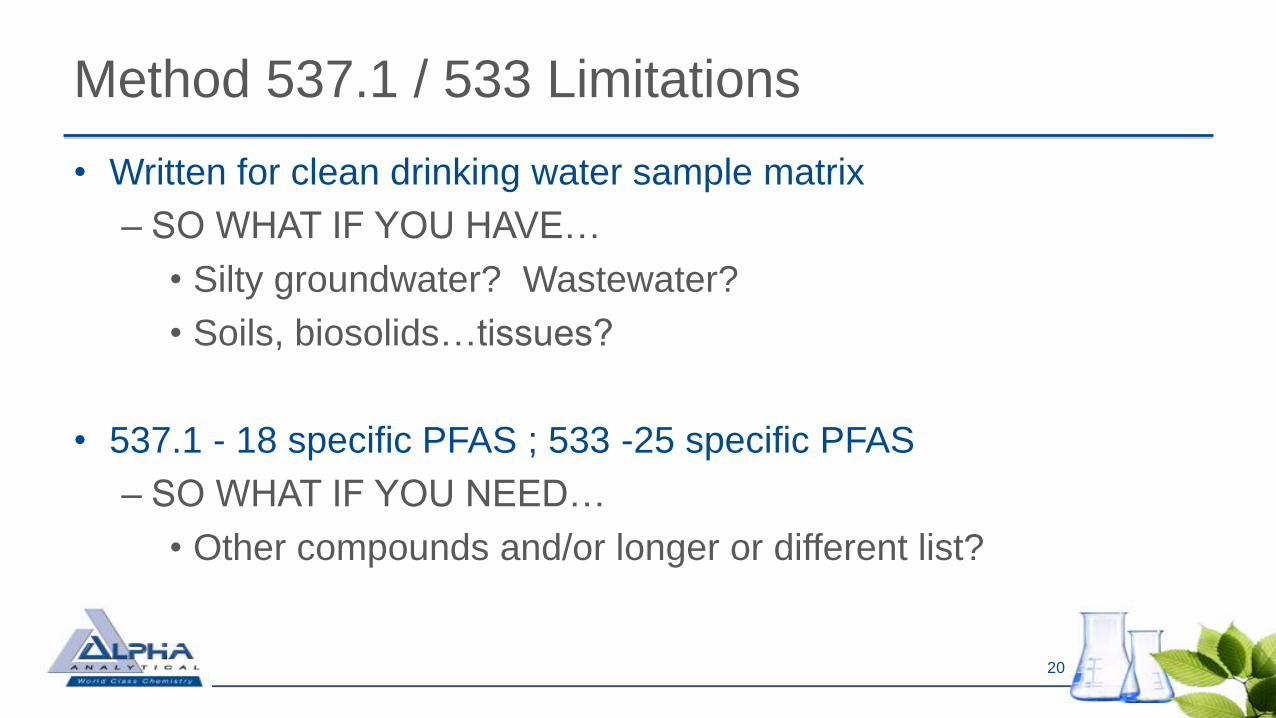
Method 537.1 / 533 Limitations
• Written for clean drinking water sample matrix
– SO WHAT IF YOU HAVE…
• Silty groundwater? Wastewater?
• Soils, biosolids…tissues?
• 537.1 - 18 specific PFAS ; 533 -25 specific PFAS
– SO WHAT IF YOU NEED…
• Other compounds and/or longer or different list?
20
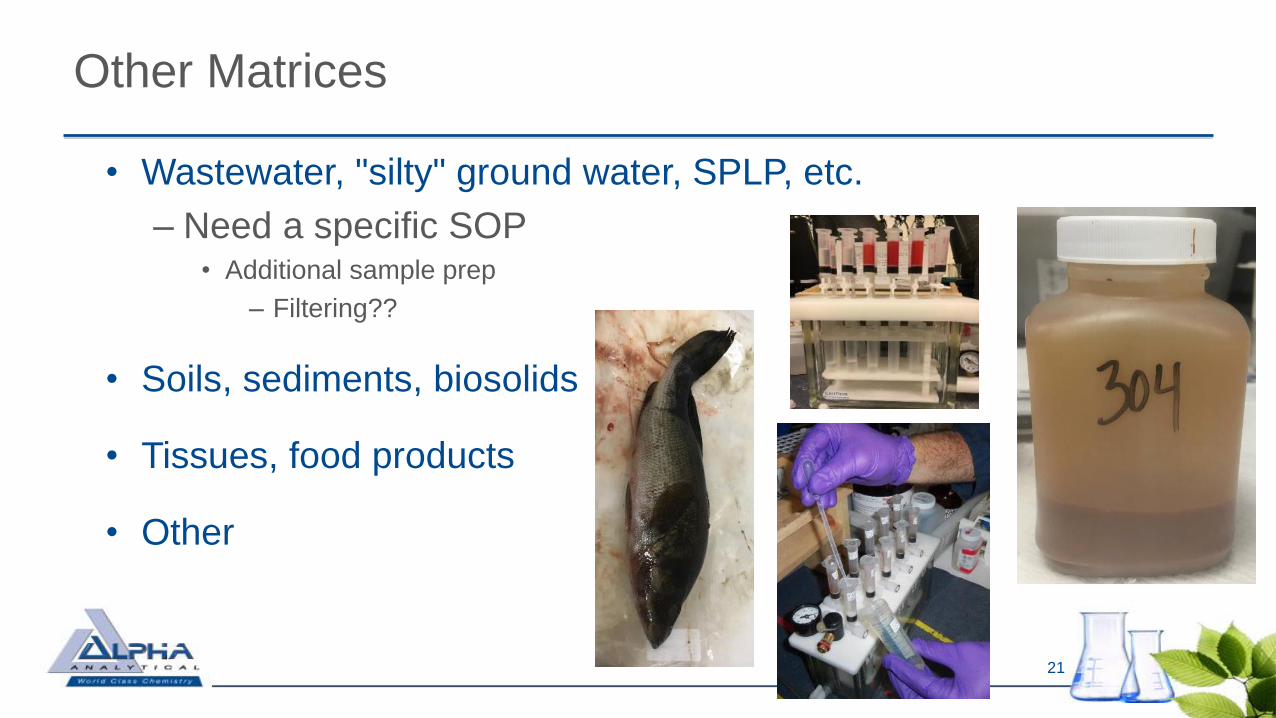
Other Matrices
• Wastewater, "silty" ground water, SPLP, etc.
– Need a specific SOP • Additional sample prep
– Filtering??
• Soils, sediments, biosolids
• Tissues, food products
• Other
21

Landfill Waste Stream Study
22
photo courtesy Sanborn, Head & Associates, Inc.

23
Anything else?
- TOP, SPLP, other method sources?
Moving target, stay current
Wrap Up
Alpha AnalyticalJim Occhialini
Moderated Discussion
Moderator: Ed Summerly, Program Co-Chair, GZA
Panelists:
• Terry Gray, Deputy Director, RI DEM
• Mark Dennen, RI DEM
• Karen Kinsella, GZA GeoEnvironmental, Inc.
• Steve LaRosa, Weston & Sampson
• Rick Mandile, Sage Environmental
• Nick Noons, RI DEM
• Jim Occhialini, Alpha Analytical
• Amy Parmenter, RI DOH