for 2005-2012 - West Virginia Department of Education
287
West Virginia State Performance Plan for 2005-2012 & 2010-2011 Annual Performance Report Individuals with Disabilities Education Act - Part B Office of Special Programs Submitted to U.S. Office of Special Programs by West Virginia Department of Education July 2012
-
Upload
khangminh22 -
Category
Documents
-
view
0 -
download
0
Transcript of for 2005-2012 - West Virginia Department of Education

West VirginiaState Performance Planfor 2005-2012&2010-2011 Annual
Performance ReportIndividuals with Disabilities Education Act - Part B
O�ce of Special Programs
Submitted to U.S. O�ce of Special Programsby West Virginia Department of Education
July 2012

West Virginia Board of education
2011-2012
L. Wade Linger Jr., PresidentGayle C. Manchin, Vice President
Robert W. Dunlevy, Secretary
Michael I. Green, MemberPriscilla M. Haden, MemberLloyd G. Jackson II, MemberLowell E. Johnson, MemberJenny N. Phillips, MemberWilliam M. White, Member
Paul Hill, Ex OfficioInterim Chancellor
West Virginia Higher Education Policy Commission
James L. Skidmore, Ex OfficioChancellor
West Virginia Council for Community and Technical College Education
Jorea M. Marple, Ex OfficioState Superintendent of Schools
West Virginia Department of Education


West Virginia Part B FFY 2010 SPP/APR Response Table
FFY 2010 SPP/APR Response Table West Virginia Page 1 of 14
Monitoring Priorities and Indicators Status of APR Data/SPP Revision Issues OSEP Analysis/Next Steps
1. Percent of youth with IEPs graduating from high school with a regular diploma.
[Results Indicator]
The State’s FFY 2010 reported data for this indicator are 57.5%. OSEP was unable to determine whether there was progress or slippage because 2009-2010 was the first year for the four-year cohort rate. The State did not meet its FFY 2010 target of 80%.
The State reported the required graduation rate calculation and timeline established by the Department under the Elementary and Secondary Education Act (ESEA). This means that the State submitted the most recent graduation data that the State reported to the Department as part of its Consolidated State Performance Report (CSPR).
OSEP looks forward to the State’s data demonstrating improvement in performance in the FFY 2011 APR, due February 1, 2013.
In reporting data for this indicator in the FFY 2011 APR, States must use the same data they used for reporting to the Department under Title I of the ESEA, using the adjusted cohort graduation rate required under the ESEA.
2. Percent of youth with IEPs dropping out of high school.
[Results Indicator]
The State’s FFY 2010 reported data for this indicator are 3.1%. These data represent progress from the FFY 2009 data of 3.5%. The State did not meet its FFY 2010 target of 3.0%.
OSEP looks forward to the State’s data demonstrating improvement in performance in the FFY 2011 APR.
3. Participation and performance of children with IEPs on statewide assessments:
A. Percent of the districts with a disability subgroup that meets the State’s minimum “n” size that meet the State’s AYP targets for the disability subgroup.
[Results Indicator]
The State’s FFY 2010 reported data for this indicator are 0%. These data represent slippage from the FFY 2009 data of 1.9%. The State did not meet its FFY 2010 target of nine districts making AYP.
OSEP looks forward to the State’s data demonstrating improvement in performance in the FFY 2011 APR.
3. Participation and performance of children with IEPs on statewide assessments:
B. Participation rate for children with IEPs.
The State’s FFY 2010 reported data for this indicator are 97.02% for reading and 97.02% for math. The FFY 2009 data were 97.04% for reading. These data represent progress from the FFY 2009 data of 97.01% for math. The State met its FFY 2010 targets of 95%.
The State provided a Web link to 2010 publicly-reported assessment results.
OSEP appreciates the State’s efforts to improve performance.
West Virginia Part B FFY 2010 SPP/APR Response Table
FFY 2010 SPP/APR Response Table West Virginia Page 2 of 14
Monitoring Priorities and Indicators Status of APR Data/SPP Revision Issues OSEP Analysis/Next Steps
[Results Indicator]
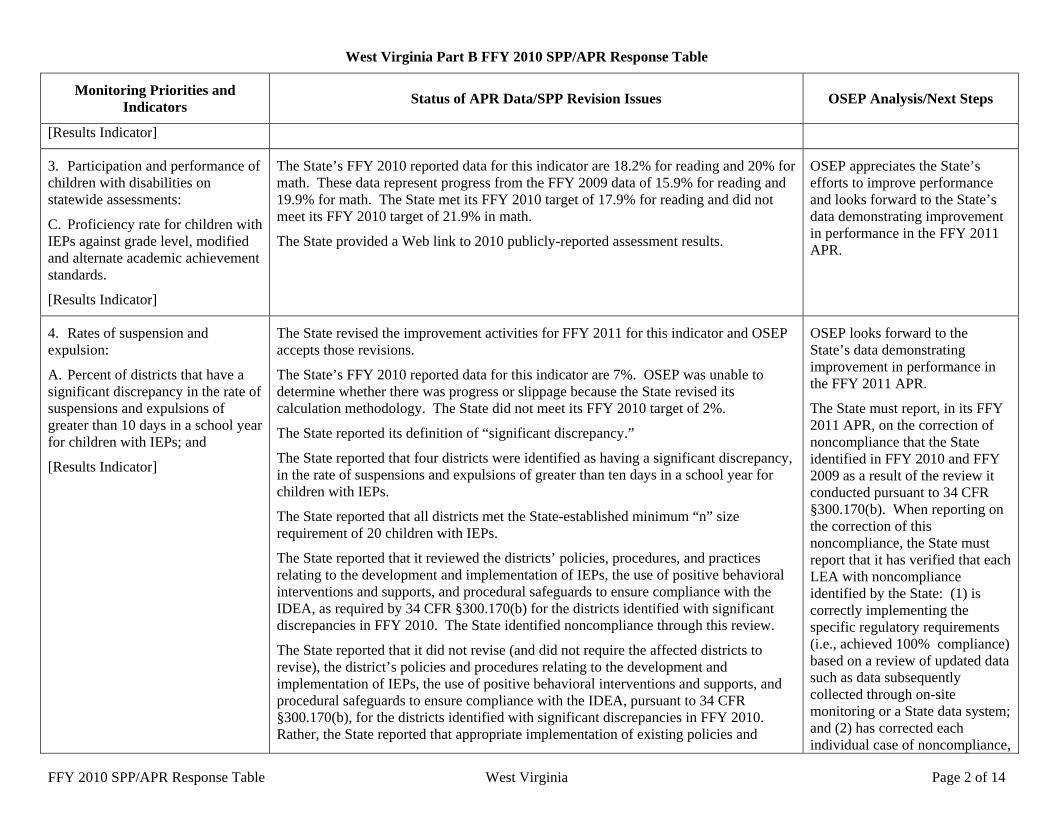
3. Participation and performance of children with disabilities on statewide assessments:
C. Proficiency rate for children with IEPs against grade level, modified and alternate academic achievement standards.
[Results Indicator]
The State’s FFY 2010 reported data for this indicator are 18.2% for reading and 20% for math. These data represent progress from the FFY 2009 data of 15.9% for reading and 19.9% for math. The State met its FFY 2010 target of 17.9% for reading and did not meet its FFY 2010 target of 21.9% in math.
The State provided a Web link to 2010 publicly-reported assessment results.
OSEP appreciates the State’s efforts to improve performance and looks forward to the State’s data demonstrating improvement in performance in the FFY 2011 APR.
4. Rates of suspension and expulsion:
A. Percent of districts that have a significant discrepancy in the rate of suspensions and expulsions of greater than 10 days in a school year for children with IEPs; and
[Results Indicator]
The State revised the improvement activities for FFY 2011 for this indicator and OSEP accepts those revisions.
The State’s FFY 2010 reported data for this indicator are 7%. OSEP was unable to determine whether there was progress or slippage because the State revised its calculation methodology. The State did not meet its FFY 2010 target of 2%.
The State reported its definition of “significant discrepancy.”
The State reported that four districts were identified as having a significant discrepancy, in the rate of suspensions and expulsions of greater than ten days in a school year for children with IEPs.
The State reported that all districts met the State-established minimum “n” size requirement of 20 children with IEPs.
The State reported that it reviewed the districts’ policies, procedures, and practices relating to the development and implementation of IEPs, the use of positive behavioral interventions and supports, and procedural safeguards to ensure compliance with the IDEA, as required by 34 CFR §300.170(b) for the districts identified with significant discrepancies in FFY 2010. The State identified noncompliance through this review.
The State reported that it did not revise (and did not require the affected districts to revise), the district’s policies and procedures relating to the development and implementation of IEPs, the use of positive behavioral interventions and supports, and procedural safeguards to ensure compliance with the IDEA, pursuant to 34 CFR §300.170(b), for the districts identified with significant discrepancies in FFY 2010. Rather, the State reported that appropriate implementation of existing policies and
OSEP looks forward to the State’s data demonstrating improvement in performance in the FFY 2011 APR.
The State must report, in its FFY 2011 APR, on the correction of noncompliance that the State identified in FFY 2010 and FFY 2009 as a result of the review it conducted pursuant to 34 CFR §300.170(b). When reporting on the correction of this noncompliance, the State must report that it has verified that each LEA with noncompliance identified by the State: (1) is correctly implementing the specific regulatory requirements (i.e., achieved 100% compliance) based on a review of updated data such as data subsequently collected through on-site monitoring or a State data system; and (2) has corrected each individual case of noncompliance,

West Virginia Part B FFY 2010 SPP/APR Response Table
FFY 2010 SPP/APR Response Table West Virginia Page 3 of 14
Monitoring Priorities and Indicators Status of APR Data/SPP Revision Issues OSEP Analysis/Next Steps
procedures was required.
The State reported that noncompliance identified in FFY 2009 through the review of policies, procedures, and practices, pursuant to 34 CFR §300.170(b), was partially corrected.
unless the child is no longer within the jurisdiction of the LEA, consistent with OSEP Memorandum 09-02, dated October 17, 2008 (OSEP Memo 09-02). In the FFY 2011 APR, the State must describe the specific actions that were taken to verify the correction.
4. Rates of suspension and expulsion:
B. Percent of districts that have: (a) a significant discrepancy, by race or ethnicity, in the rate of suspensions and expulsions of greater than 10 days in a school year for children with IEPs; and (b) policies, procedures or practices that contribute to the significant discrepancy and do not comply with requirements relating to the development and implementation of IEPs, the use of positive behavioral interventions and supports, and procedural safeguards.
[Compliance Indicator]
The State revised the improvement activities for FFY 2011 for this indicator and OSEP accepts those revisions.
The State’s FFY 2010 reported data for this indicator are 21.05%. OSEP was unable to determine whether there was progress or slippage because the State revised its calculation methodology. The State did not meet its FFY 2010 target of 0%.
The State reported its definition of “significant discrepancy.”
The State reported that 15 districts were identified as having a significant discrepancy, by race or ethnicity, in the rate of suspensions and expulsions of greater than ten days in a school year for children with IEPs. The State reported that it reviewed the districts’ policies, procedures, and practices relating to the development and implementation of IEPs, the use of positive behavioral interventions and supports, and procedural safeguards to ensure compliance with the IDEA, as required by 34 CFR §300.170(b) for the districts identified with significant discrepancies in FFY 2010. The State also reported that 12 districts were identified as having policies, procedures or practices that contribute to the significant discrepancy and do not comply with requirements relating to the development and implementation of IEPs, the use of positive behavioral interventions and supports, and procedural safeguards.
The State reported that all districts met the State-established minimum “n” size requirement of 20 children with IEPs in at least one race/ethnicity category.
The State reported that it did not revise (and did not require the affected districts to revise), the districts’ policies and procedures relating to the development and implementation of IEPs, the use of positive behavioral interventions and supports, and procedural safeguards to ensure compliance with the IDEA, pursuant to 34 CFR §300.170(b), for the districts identified with significant discrepancies in FFY 2010. Rather, the State reported that appropriate implementation of existing policies and
The State did not, until FFY 2011, determine whether districts with a significant discrepancy, by race or ethnicity, in the rate of suspensions and expulsions of greater than 10 days in a school year for children with IEPs, based on FFY 2009 data, had policies, procedures or practices that contribute to the significant discrepancy and do not comply with requirements relating to the development and implementation of IEPs, the use of positive behavioral interventions and supports, and procedural safeguards, and therefore did not make findings of noncompliance until FFY 2011. Because the State reported less than 100% compliance for FFY 2010 (greater than 0% actual target data for this indicator), the State must report on the status of correction of noncompliance identified in FFY 2011 for this indicator for districts with a significant discrepancy based on FFY 2009

West Virginia Part B FFY 2010 SPP/APR Response Table
FFY 2010 SPP/APR Response Table West Virginia Page 4 of 14
Monitoring Priorities and Indicators Status of APR Data/SPP Revision Issues OSEP Analysis/Next Steps
procedures was required.
The State reported that noncompliance identified in FFY 2009 as a result of the review it conducted pursuant to 34 CFR §300.170(b) was timely corrected.
discipline data. The State must demonstrate, in the FFY 2011 APR, that these districts have corrected the noncompliance, including that the State verified that each district with noncompliance: (1) is correctly implementing the specific regulatory requirement(s) (i.e., achieved 100% compliance) based on a review of updated data such as data subsequently collected through on-site monitoring or a State data system; and (2) has corrected each individual case of noncompliance, unless the child is no longer within the jurisdiction of the district, consistent with OSEP Memo 09-02. In the FFY 2011 APR, the State must describe the specific actions that were taken to verify the correction.
If the State is unable to demonstrate compliance with those requirements in the FFY 2011 APR, the State must review its improvement activities and revise them, if necessary to ensure compliance.
5. Percent of children with IEPs aged 6 through 21 served:
A. Inside the regular class 80% or more of the day; B. Inside the regular class less than 40% of the day; or
The State’s reported data for this indicator are:
FFY 2009 Data
FFY 2010 Data
FFY 2010 Target Progress
A. % Inside the regular class 68.1 67.4 61.5 -0.70%
OSEP appreciates the State’s efforts to improve performance and looks forward to the State’s data demonstrating improvement in performance in the FFY 2011 APR.

West Virginia Part B FFY 2010 SPP/APR Response Table
FFY 2010 SPP/APR Response Table West Virginia Page 5 of 14
Monitoring Priorities and Indicators Status of APR Data/SPP Revision Issues OSEP Analysis/Next Steps
C. In separate schools, residential facilities, or homebound/hospital placements.
[Results Indicator]
80% or more of the day
B. % Inside the regular class less than 40% of the day 7.9 8.4 8.0 -0.50%
C. % In separate schools, residential facilities, or homebound/hospital placements
1.9 1.7 1.0 0.20%
These data represent progress for 5C and slippage for 5B from the FFY 2009 data. The State met its FFY 2010 target for 5A, but did not meet its targets for 5B and 5C.
6. Percent of children aged 3 through 5 with IEPs attending a:
A. Regular early childhood program and receiving the majority of special education and related services in the regular early childhood program; and B. Separate special education class, separate school or residential facility.
[Results Indicator; New]
The State is not required to report on this indicator in the FFY 2010 APR. The State must provide FFY 2011 baseline data, an FFY 2012 target, and improvement activities through FFY 2012 in the SPP it submits with the FFY 2011 APR.
7. Percent of preschool children age 3 through 5 with IEPs who demonstrate improved:
A. Positive social-emotional skills (including social relationships); B. Acquisition and use of knowledge and skills (including early language/communication and early literacy); and C. Use of appropriate behaviors to meet their needs.
The State revised the improvement activities for FFY 2011 for this indicator and OSEP accepts those revisions.
The State’s reported data for this indicator are:
Summary Statement 1 FFY 2009 Data
FFY 2010 Data
FFY 2010 Target
Outcome A: Positive social-emotional skills (including social relationships) (%)
74 77 75
Outcome B: 67 69 68
OSEP appreciates the State’s efforts to improve performance and looks forward to the State’s data demonstrating improvement in performance in the FFY 2011 APR.
The State must report progress data and actual target data for FFY 2011 with the FFY 2011 APR.

West Virginia Part B FFY 2010 SPP/APR Response Table
FFY 2010 SPP/APR Response Table West Virginia Page 6 of 14
Monitoring Priorities and Indicators Status of APR Data/SPP Revision Issues OSEP Analysis/Next Steps
[Results Indicator] Acquisition and use of knowledge and skills (including early language/ communication) (%) Outcome C: Use of appropriate behaviors to meet their needs (%)
72 75 73
Summary Statement 2 FFY 2009 Data
FFY 2010 Data
FFY 2010 Target
Outcome A: Positive social-emotional skills (including social relationships) (%)
82 82 83
Outcome B: Acquisition and use of knowledge and skills (including early language/ communication) (%)
64 65 65
Outcome C: Use of appropriate behaviors to meet their needs (%)
83 82 84
These data represent progress and slippage from the FFY 2009 data. The State met part of its FFY 2010 targets for this indicator.
8. Percent of parents with a child receiving special education services who report that schools facilitated parent involvement as a means of improving services and results for children with disabilities.
[Results Indicator]
The State revised the improvement activities for FFY 2011 for this indicator and OSEP accepts those revisions.
The State’s FFY 2010 reported data for this indicator are 34%. These data represent slippage from the FFY 2009 data of 36%. The State did not meet its FFY 2010 target of 38%.
In its description of its FFY 2010 data, the State addressed whether the response group was representative of the population.
OSEP looks forward to the State’s data demonstrating improvement in performance in the FFY 2011 APR.
9. Percent of districts with disproportionate representation of racial and ethnic groups in special
The State’s FFY 2010 reported data for this indicator are 0%. These data remain unchanged from the FFY 2009 data of 0%. The State met its FFY 2010 target of 0%.
The State reported that two districts were identified with disproportionate representation
OSEP appreciates the State’s efforts regarding this indicator.
West Virginia Part B FFY 2010 SPP/APR Response Table
FFY 2010 SPP/APR Response Table West Virginia Page 7 of 14
Monitoring Priorities and Indicators Status of APR Data/SPP Revision Issues OSEP Analysis/Next Steps
education and related services that is the result of inappropriate identification.
[Compliance Indicator]
of racial and ethnic groups in special education and related services. The State also reported that no districts were identified with disproportionate representation of racial and ethnic groups in special education and related services that was the result of inappropriate identification.
The State provided its definition of “disproportionate representation.”
The State reported that all 57 districts met the State-established minimum “n” size requirement of 20 students with disabilities in at least one race/ethnicity category for overrepresentation and 50 students with disabilities in at least one race/ethnicity category for underrepresentation.
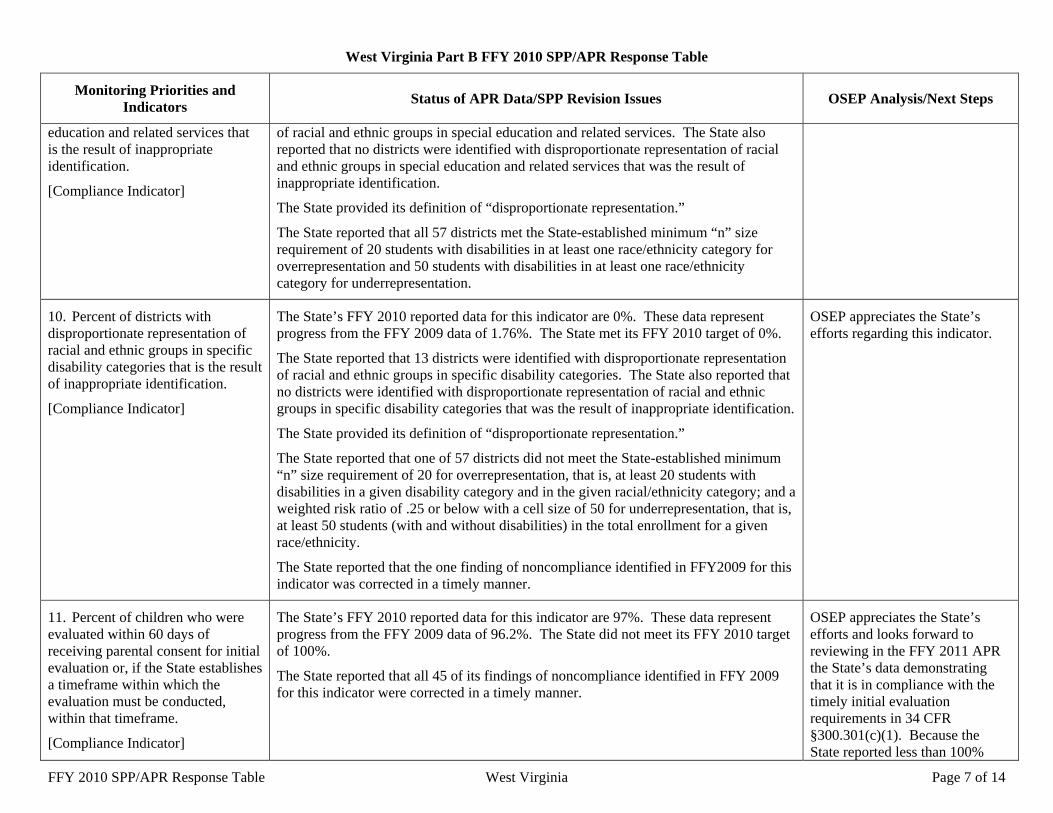
10. Percent of districts with disproportionate representation of racial and ethnic groups in specific disability categories that is the result of inappropriate identification.
[Compliance Indicator]
The State’s FFY 2010 reported data for this indicator are 0%. These data represent progress from the FFY 2009 data of 1.76%. The State met its FFY 2010 target of 0%.
The State reported that 13 districts were identified with disproportionate representation of racial and ethnic groups in specific disability categories. The State also reported that no districts were identified with disproportionate representation of racial and ethnic groups in specific disability categories that was the result of inappropriate identification.
The State provided its definition of “disproportionate representation.”
The State reported that one of 57 districts did not meet the State-established minimum “n” size requirement of 20 for overrepresentation, that is, at least 20 students with disabilities in a given disability category and in the given racial/ethnicity category; and a weighted risk ratio of .25 or below with a cell size of 50 for underrepresentation, that is, at least 50 students (with and without disabilities) in the total enrollment for a given race/ethnicity.
The State reported that the one finding of noncompliance identified in FFY2009 for this indicator was corrected in a timely manner.
OSEP appreciates the State’s efforts regarding this indicator.
11. Percent of children who were evaluated within 60 days of receiving parental consent for initial evaluation or, if the State establishes a timeframe within which the evaluation must be conducted, within that timeframe.
[Compliance Indicator]
The State’s FFY 2010 reported data for this indicator are 97%. These data represent progress from the FFY 2009 data of 96.2%. The State did not meet its FFY 2010 target of 100%.
The State reported that all 45 of its findings of noncompliance identified in FFY 2009 for this indicator were corrected in a timely manner.
OSEP appreciates the State’s efforts and looks forward to reviewing in the FFY 2011 APR the State’s data demonstrating that it is in compliance with the timely initial evaluation requirements in 34 CFR §300.301(c)(1). Because the State reported less than 100%

West Virginia Part B FFY 2010 SPP/APR Response Table
FFY 2010 SPP/APR Response Table West Virginia Page 8 of 14
Monitoring Priorities and Indicators Status of APR Data/SPP Revision Issues OSEP Analysis/Next Steps
compliance for FFY 2010, the State must report on the status of correction of noncompliance identified in FFY 2010 for this indicator.
When reporting on the correction of noncompliance, the State must report, in its FFY 2011 APR, that it has verified that each LEA with noncompliance identified in FFY 2010 for this indicator: (1) is correctly implementing 34 CFR §300.301(c)(1) (i.e., achieved 100% compliance) based on a review of updated data such as data subsequently collected through on-site monitoring or a State data system; and (2) has completed the evaluation, although late, for any child whose initial evaluation was not timely, unless the child is no longer within the jurisdiction of the LEA, consistent with OSEP Memo 09-02. In the FFY 2011 APR, the State must describe the specific actions that were taken to verify the correction.
If the State does not report 100% compliance in the FFY 2011 APR, the State must review its improvement activities and revise them, if necessary.
12. Percent of children referred by Part C prior to age 3, who are found eligible for Part B, and who
The State revised the improvement activities for FFY 2010 for this indicator and OSEP accepts those revisions.
OSEP appreciates the State’s efforts and looks forward to reviewing in the FFY 2011 APR

West Virginia Part B FFY 2010 SPP/APR Response Table
FFY 2010 SPP/APR Response Table West Virginia Page 9 of 14
Monitoring Priorities and Indicators Status of APR Data/SPP Revision Issues OSEP Analysis/Next Steps
have an IEP developed and implemented by their third birthdays.
[Compliance Indicator]
The State’s FFY 2010 reported data for this indicator are 99.26%. These data represent progress from the FFY 2009 data of 96.6%. The State did not meet its FFY 2010 target of 100%.
The State reported that all 18 of its findings of noncompliance identified in FFY 2009 for this indicator were corrected in a timely manner.
the State’s data demonstrating that it is in compliance with the early childhood transition requirements in 34 CFR §300.124(b). Because the State reported less than 100% compliance for FFY 2010, the State must report on the status of correction of noncompliance identified in FFY 2010 for this indicator.
When reporting on the correction of noncompliance, the State must report, in its FFY 2011 APR, that it has verified that each LEA with noncompliance identified in FFY 2010 for this indicator: (1) is correctly implementing 34 CFR §300.124(b) (i.e., achieved 100% compliance) based on a review of updated data such as data subsequently collected through on-site monitoring or a State data system; and (2) has developed and implemented the IEP, although late, for any child for whom implementation of the IEP was not timely, unless the child is no longer within the jurisdiction of the LEA, consistent with OSEP Memo 09-02. In the FFY 2011 APR, the State must describe the specific actions that were taken to verify the correction.
If the State does not report 100% compliance in the FFY 2011 APR, the State must review its

West Virginia Part B FFY 2010 SPP/APR Response Table
FFY 2010 SPP/APR Response Table West Virginia Page 10 of 14
Monitoring Priorities and Indicators Status of APR Data/SPP Revision Issues OSEP Analysis/Next Steps
improvement activities and revise them, if necessary.
13. Percent of youth with IEPs aged 16 and above with an IEP that includes appropriate measurable postsecondary goals that are annually updated and based upon an age appropriate transition assessment, transition services, including courses of study, that will reasonably enable the student to meet those postsecondary goals, and annual IEP goals related to the student’s transition services needs. There also must be evidence that the student was invited to the IEP Team meeting where transition services are to be discussed and evidence that, if appropriate, a representative of any participating agency was invited to the IEP Team meeting with the prior consent of the parent or student who has reached the age of majority.
[Compliance Indicator]
The State revised the improvement activities for FFY 2010 for this indicator and OSEP accepts those revisions.
The State’s FFY 2010 reported data for this indicator are 98.1%. These data represent progress from the FFY 2009 data of 95%. The State did not meet its FFY 2010 target of 100%.
The State reported that all 41 of its findings of noncompliance identified in FFY 2009 for this indicator were corrected in a timely manner.
OSEP appreciates the State’s efforts and looks forward to reviewing in the FFY 2011 APR the State’s data demonstrating that it is in compliance with the secondary transition requirements in 34 CFR §§300.320(b) and 300.321(b). Because the State reported less than 100% compliance for FFY 2010, the State must report on the status of correction of noncompliance identified in FFY 2010 for this indicator.
When reporting on the correction of noncompliance, the State must report, in its FFY 2011 APR, that it has verified that each LEA with noncompliance identified in FFY 2010 for this indicator: (1) is correctly implementing 34 CFR §§300.320(b) and 300.321(b) (i.e., achieved 100% compliance) based on a review of updated data such as data subsequently collected through on-site monitoring or a State data system; and (2) has corrected each individual case of noncompliance, unless the child is no longer within the jurisdiction of the LEA, consistent with OSEP Memo 09-02. In the FFY 2011 APR, the State must describe the

West Virginia Part B FFY 2010 SPP/APR Response Table
FFY 2010 SPP/APR Response Table West Virginia Page 11 of 14
Monitoring Priorities and Indicators Status of APR Data/SPP Revision Issues OSEP Analysis/Next Steps
specific actions that were taken to verify the correction.
If the State does not report 100% compliance in the FFY 2011 APR, the State must review its improvement activities and revise them, if necessary.
14. Percent of youth who are no longer in secondary school, had IEPs in effect at the time they left school, and were:
A. Enrolled in higher education within one year of leaving high school; B. Enrolled in higher education or competitively employed within one year of leaving high school. C. Enrolled in higher education or in some other postsecondary education or training program; or competitively employed or in some other employment within one year of leaving high school.
[Results Indicator]
The State’s reported data for this indicator are:
FFY 2009 Data
FFY 2010 Data
FFY 2010 Target Progress
A. % Enrolled in higher education 19.49 12.2 21.0 -7.29%
B. % Enrolled in higher education or competitively employed
48.84 44.6 50.3 -4.24%
C. % Enrolled in higher education or in some other postsecondary education or training program; or competitively employed
63.57 64.4 65.1 0.83%
These data represent progress for 14C and slippage for 14A and 14 B from the FFY 2009 data. The State did not meet of its FFY 2010 targets for this indicator.
In its description of its FFY 2010 data, the State addressed whether the response group was representative of the population.
OSEP looks forward to the State’s data demonstrating improvement in performance in the FFY 2011 APR.
15. General supervision system (including monitoring, complaints, hearings, etc.) identifies and corrects noncompliance as soon as possible but in no case later than
The State’s FFY 2010 reported data for this indicator are 97.8%. These data represent progress from the FFY 2009 data of 96.1%. The State did not meet its FFY 2010 target of 100%.
The State reported that 582 of 595 findings of noncompliance identified in FFY 2009 were corrected in a timely manner and that the 13 remaining findings subsequently were
OSEP appreciates the State’s efforts and looks forward to reviewing in the FFY 2011 APR, the State’s data demonstrating that the State timely corrected noncompliance identified in FFY

West Virginia Part B FFY 2010 SPP/APR Response Table
FFY 2010 SPP/APR Response Table West Virginia Page 12 of 14
Monitoring Priorities and Indicators Status of APR Data/SPP Revision Issues OSEP Analysis/Next Steps
one year from identification.
[Compliance Indicator]
corrected by February 1, 2012.
The State reported that 16 findings of noncompliance identified in 2008 for this indicator were corrected.
2010 in accordance with 20 U.S.C. 1232d(b)(3)(E), 34 CFR §§300.149 and 300.600(e), and OSEP Memo 09-02.
In reporting on correction of findings of noncompliance in the FFY 2011 APR, the State must report that it verified that each LEA with noncompliance identified in FFY 2010: (1) is correctly implementing the specific regulatory requirements (i.e., achieved 100% compliance) based on a review of updated data such as data subsequently collected through on-site monitoring or a State data system; and (2) has corrected each individual case of noncompliance, unless the child is no longer within the jurisdiction of the LEA, consistent with OSEP Memo 09-02. In the FFY 2011 APR, the State must describe the specific actions that were taken to verify the correction. In addition, in reporting on Indicator 15 in the FFY 2011 APR, the State must use the Indicator 15 Worksheet.
Further, in responding to Indicators 4A, 4B, 11, 12, and 13 in the FFY 2011 APR, the State must report on correction of the noncompliance described in this table under those indicators.
16. Percent of signed written The State’s FFY 2010 reported data for this indicator, as of January 31, 2012, are OSEP appreciates the State’s

West Virginia Part B FFY 2010 SPP/APR Response Table
FFY 2010 SPP/APR Response Table West Virginia Page 13 of 14
Monitoring Priorities and Indicators Status of APR Data/SPP Revision Issues OSEP Analysis/Next Steps
complaints with reports issued that were resolved within 60-day timeline or a timeline extended for exceptional circumstances with respect to a particular complaint, or because the parent (or individual or organization) and the public agency agree to extend the time to engage in mediation or other alternative means of dispute resolution, if available in the State.
[Compliance Indicator]
95.4%. These data represent progress from the FFY 2009 data of 82.4%. The State did not meet its FFY 2010 target of 100%.
Note that States are allowed to amend their FFY 2010 IDEA section 618 Dispute Resolution data until July 2012.
OSEP’s FFY 2009 SPP/APR Response Table, dated June 20, 2011, required the State to provide, with its FFY 2010 APR, due February 1, 2012, an assurance that it did not routinely extend the 60-day timeline for complaints received in November or December of 2011. In its FFY 2010 APR, the State provided the required assurance.
efforts and looks forward to reviewing the State’s FFY 2011 IDEA section 618 data, demonstrating that it is in compliance with the timely complaint resolution requirements in 34 CFR §300.152.
17. Percent of adjudicated due process hearing requests that were adjudicated within the 45-day timeline or a timeline that is properly extended by the hearing officer at the request of either party or in the case of an expedited hearing, within the required timelines.
[Compliance Indicator]
The State’s FFY 2010 reported data for this indicator, as of January 31, 2012, are 100%. These data are based on three due process hearings. The State met its FFY 2010 target of 100%.
Note that States are allowed to amend their FFY 2010 IDEA section 618 Dispute Resolution data until July 2012.
OSEP appreciates the State’s efforts in achieving compliance with the due process hearing timeline requirements in 34 CFR §300.515.
18. Percent of hearing requests that went to resolution sessions that were resolved through resolution session settlement agreements.
[Results Indicator]
The State reported, as of January 31, 2012, that all three resolution sessions resulted in settlement agreements.
The State reported fewer than ten resolution sessions held in FFY 2010. The State is not required to meet its targets or provide improvement activities in any fiscal year in which fewer than ten resolution sessions were held.
Note that States are allowed to amend their FFY 2010 IDEA section 618 Dispute Resolution data until July 2012.
OSEP looks forward to reviewing the State’s data in the FFY 2011 APR.
19. Percent of mediations held that resulted in mediation agreements.
[Results Indicator]
The State’s FFY 2010 reported data for this indicator, as of January 31, 2012, are 58.8%. The State did not meet its FFY 2010 target of 85%.
Note that States are allowed to amend their FFY 2010 IDEA section 618 Dispute
OSEP looks forward to reviewing the State’s data in the FFY 2011 APR.

West Virginia Part B FFY 2010 SPP/APR Response Table
FFY 2010 SPP/APR Response Table West Virginia Page 14 of 14
Monitoring Priorities and Indicators Status of APR Data/SPP Revision Issues OSEP Analysis/Next Steps
Resolution data until July 2012.
20. State reported data (618 and State Performance Plan and Annual Performance Report) are timely and accurate.
[Compliance Indicator]
The State’s FFY 2010 reported data for this indicator are 100%. These data remain unchanged from the FFY 2009 data of 100%. The State met its FFY 2010 target of 100%.
OSEP appreciates the State’s efforts in achieving compliance with the timely and accurate data reporting requirements in IDEA sections 616 and 618 and 34 CFR §§76.720 and 300.601(b). In reporting on Indicator 20 in the FFY 2011 APR, the State must use the Indicator 20 Data Rubric.

SPP Template – Part B West Virginia
State Revised February 1, 2012
Part B State Performance Plan: 2005-2012 Page 1 (OMB NO: 1820-0624 / Expiration Date: 2/29/2012)
West Virginia State Performance Plan
2005-2012
Individuals with Disabilities Education Act (IDEA 2004)
Part B
Office of Special Programs
Revised February 1, 2012 with clarifications April 17, 2012
West Virginia Department of Education

SPP Template – Part B West Virginia
State Revised February 1, 2012
Part B State Performance Plan: 2005-2012 Page 2 (OMB NO: 1820-0624 / Expiration Date: 2/29/2012)
Table of Contents
West Virginia State Performance Plan Revisions FFY 2010 Submitted February 1, 2012
Overview of State Performance Plan Development .................................................................................. 3
Indicator 1 – Graduation ............................................................................................................................. 9
Indicator 2 – Dropout ................................................................................................................................ 16
Indicator 3 – Assessment ........................................................................................................................ 20
Indicator 4A – Suspension ....................................................................................................................... 29
Indicator 4B – Suspension by Race/Ethnicity .......................................................................................... 34
Indicator 5 – Educational Environment – Ages 6-21 ................................................................................ 41
Indicator 6 – Educational Environment – Ages 3-5 .................................................................................. 46
Indicator 7 – Early Childhood Outcomes ................................................................................................. 47
Indicator 8 – Parent Involvement ............................................................................................................. 55
Indicator 9 – Disproportionality – All Disabilities ...................................................................................... 65
Indicator 10 – Disproportionality – Specific Disabilities ........................................................................... 71
Indicator 11 – Child Find .......................................................................................................................... 78
Indicator 12 – Early Childhood Transition ................................................................................................ 82
Indicator 13 – Secondary Transition ........................................................................................................ 87
Indicator 14 – Post School Outcomes ...................................................................................................... 93
Indicator 15 – General Supervision ........................................................................................................ 102
Indicator 16 – Complaint Timelines ........................................................................................................ 111
Indicator 17 – Due Process Hearing Timelines...................................................................................... 114
Indicator 18 – Resolution Sessions ....................................................................................................... 116
Indicator 19 – Mediation ......................................................................................................................... 118
Indicator 20 – Timely and Accurate Data ............................................................................................... 120

SPP Template – Part B West Virginia
State Revised February 1, 2012
Part B State Performance Plan: 2005-2012 Page 3 (OMB NO: 1820-0624 / Expiration Date: 2/29/2012)
Part B State Performance Plan (SPP) for 2005-2012
Overview of the State Performance Plan Development:
Development of the Initial State Performance Plan, 2005 The West Virginia Department of Education (WVDE) promotes a statewide system of accountability, training and technical assistance to county school districts to improve results for all students. Within its ESEA Consolidated Application, the state has set high expectations for students with disabilities to attain the same standards as all students. The WVDE and the Office of Special Programs(OSP) within the previous IDEA Improvement Plan developed in 2002 with direct involvement of stakeholder groups statewide and the current State Performance Plan have committed significant resources to improving student results and ensuring compliance with the Individuals with Disabilities Education Improvement Act of 2004 (IDEA 2004). The West Virginia Advisory Council for the Education of Exceptional Children (WVACEEC) has been the primary stakeholder group responsible for ongoing review of the earlier State Improvement Plan and Annual Performance Report. WVACEEC is established under West Virginia Code Section 18-20–6 and receives ongoing financial support from the OSE. Members are appointed by the State Superintendent of Schools and serve three-year terms. Members represent a spectrum of groups and agencies with an interest in special education, including parents of children with disabilities, individuals with disabilities, public and private school administrators, vocational rehabilitation, early intervention and others as required by law. WVACEEC has been involved throughout the development of the State Performance Plan. OSP staff began working on SPP development in July 2005, beginning the discussion of new and revised performance and compliance indicators and data requirements at the statewide training for special education administrators on the Continuous Improvement and Focused Monitoring System (CIFMS), which has been developed over the past two years with assistance from the National Center on Special Education Accountability Monitoring (NCSEAM). CIFMS indicators were reviewed to align with the draft SPP indicators to begin the process of local district data collection and self-assessment. A majority of local districts were represented at this training. OSP staff responsible for various indicators received a presentation on the SPP in August and began analyzing data and drafting targets and indicators. During 2004-2005, an existing workgroup had been researching disproportionality issues and developing technical assistance materials for districts. This group consisted of stakeholders from local districts and OSP staff. Based on this research, the OSP developed options for calculation and definitions of disproportionate representation. The options were presented to WVACEEC in a public meeting in September 2005, and their recommendations for these definitions were incorporated into the SPP. Similar proposed options were developed for significant discrepancy in suspension rates. The interagency Making A Difference steering committee contributed to the early childhood outcomes plan. Both the early childhood outcomes plan and the early childhood transition planning process had stakeholder involvement through Partners Implementing Early Care and Education Services (PIECES) and the Early Childhood Transition Steering Committee, interagency committees with representatives from all major agencies involved in early care and education. A survey related to priorities and state initiatives for improving results was designed and distributed to a variety of groups including the state Special Education Administrators’ Fall Conference, West Virginia Council for Exceptional Children conference, Reading First conference, Parent Committee (Cedar Lakes), Response to Intervention training, training for Office of Institutional Education Programs (state operated programs including all correctional facilities), district Parent Educator Resource Centers, Beginning Teachers Institutes and a Federal Programs workshop. Over four hundred surveys were collected from

SPP Template – Part B West Virginia
State Revised February 1, 2012
Part B State Performance Plan: 2005-2012 Page 4 (OMB NO: 1820-0624 / Expiration Date: 2/29/2012)
these stakeholder groups. Results of the survey supported major OSP initiatives and provided extensive comments related to all the issues surveyed. The survey asked respondents to prioritize the student performance indicators. Highest priorities for the OSP to address were identified by the survey as: Higher achievement in reading and mathematics for students with disabilities; progress of young at-risk children (ages 3-5) in social skills and early language/literacy; and increased student instructional time in the regular class, less in special education class. Respondents were then asked to prioritize OSP initiatives related to student performance. Initiatives in order of importance were: Differentiated instruction, early intervention in literacy and language development, and co-teaching. Of new initiatives specific to IDEA 2004 implementation, Response to Intervention model for reading intervention and identification of learning disabilities, extension of a developmental delay category to age 9, and piloting a three-year IEP were priorities. Identified priorities are included in the activities for the applicable SPP indicators. The draft SPP was presented to WVACEEC at their public meeting November 10, 2005 for their recommendations. WVACEEC recommendations, stakeholder surveys and public comment were reviewed and incorporated into the final SPP submitted to the U.S. Department of Education, Office of Special Education Programs (OSEP) on December 2, 2005. Revisions to the State Performance Plan, Submitted February 1, 2007 West Virginia’s plan was approved by the U.S. Department of Education, Office of Special Education Programs (OSEP) in March 2006. The plan included baseline data, measurements, targets and activity plans for a six-year period related to three priorities:
Free appropriate public education in the least restrictive environment (FAPE in the LRE); Disproportionality by race/ethnicity; and Effective general supervision, including effective preschool and post school transition.
Within these priorities, state and district performance and compliance on twenty indicators are measured against targets set through the stakeholder process. Initiatives to improve services and increase student performance throughout the next six years are included. The state’s Continuous Improvement and Focused Monitoring System (CIFMS) and the Dispute Resolution System ensure identification and correction of noncompliance with IDEA 2004 and Policy 2419: Regulations for the Education of Students with Exceptionalities and timely resolution of disputes between parents and districts. In its response letter, date March 15, 2006, OSEP requested WVDE to make several improvements to the SPP, submitted December 2, 2005. Therefore, the applicable revisions are reflected in the revised SPP and in the respective sections of the Annual Performance Report (APR). In the overview of each affected section, the specific issues addressing OSEP’s letter and the revisions made are outlined. Additionally, improvement activities have been revised for several indicators in response to staff and stakeholder involvement. All changes to the SPP have been incorporated into this document. The APR sections may be found in a separate document. Revisions to the State Performance Plan, Submitted February 1, 2008 The State Performance Plan and second Annual Performance Report (APR) summarized West Virginia’s progress toward each of the twenty performance and compliance indicators outlined in the six-year SPP. At its November 9, 2007 meeting, WVACEEC, the primary stakeholder group representing parents of children with disabilities, public school and private school teachers and administrators, agencies serving students with disabilities and higher education, reviewed 2006-2007 progress data measuring the targets set for all performance indicators. In addition, they reviewed options and approved criteria for examining race/ethnicity data for underrepresentation in identification of students with disabilities. WVACEEC again reviewed the criteria for underrepresentation, approved targets for Indicator 14 – Postschool Outcomes and reviewed the final document at the January 25, 2008 meeting.

SPP Template – Part B West Virginia
State Revised February 1, 2012
Part B State Performance Plan: 2005-2012 Page 5 (OMB NO: 1820-0624 / Expiration Date: 2/29/2012)
Throughout 2006-2007, numerous additional stakeholder groups were involved in the data review and improvement activities for specific indicators. The WVDE director of special education, at the request of the State Superintendent of Schools, convened a High Needs Task Force, which brought together school, community and higher education representatives from around the state to address needs and planning for groups with low achievement in reading and mathematics, including student with disabilities, African-American students and economically disadvantaged students. Recommendations of this broad stakeholder group resulted in a state high needs plan, portions of which support and extend the SPP activities submitted in December 2005. The relevant activities have been incorporated into Indicator 3. Improving Results for Student in High Need Populations, A Strategic Plan, West Virginia Department of Education, revised August 25, 2006, provides the full report of this task force. Parents were represented through a workgroup consisting of parents and representatives of parent-centered organizations, which meets periodically with the WVDE parent coordinator to review data and provide input to activities for the parent involvement indicator. Additionally, the Parent Educator Resource Centers (PERCs) provided assistance to parents at the local level who had difficulty in completing the surveys. The PERCs also were provided the results of the surveys from their districts so they would know how to adjust their programs. (Indicator 8). Similarly, the WVDE adolescent coordinator reviewed data and activities for the adolescent transition and post-school outcomes indicators (Indicators 13 and 14) with the statewide transition workgroup of school and community stakeholders. As described in the SPP, the WVDE preschool (Section 619) coordinator continued to work collaboratively with major state-level stakeholder groups, which provided and reviewed data for the APR and SPP indicators related to preschool children. The Early Childhood Transition Steering Committee and Partners Implementing Early Care and Education System (PIECES) continued to provide input on universal pre-k and inclusive early education programs (Indicator 6), assessment and progress toward early childhood outcomes (Indicator 7) and transition from early intervention services (WV Birth to Three) to public school services (Indicator 12). Following OSEP’s approval of the SPP, a copy was posted on the WVDE website and a public information executive summary document was published and disseminated in paper and web-based formats to inform the public of the plan. Various workgroups and individual staff members carried out the activities in the plan. Data collections for new indicators were initiated within the West Virginia Education Information System (WVEIS). An exit survey of students leaving school was conducted and contracts were awarded for early childhood outcomes assessment and reporting and a parent survey. To develop the APR, each indicator was assigned to one or more WVDE special education coordinators, who were responsible for analyzing the data provided by the IDEA, Part B data manager and other sources relative to their indicator. Beginning in September 2007, the assistant director and the data manager, who coordinated APR development, held meetings with staff responsible for the indicators to provide forms, instructions and technical assistance information obtained from OSEP. Staff members participated in OSEP’s technical assistance conference calls relative to their indicators. Revisions to the State Performance Plan, Submitted February 1, 2009 Revisions to the SPP submitted February 1, 2009 primarily consisted of new or revised activities taken as a result of technical assistance and changes to the general supervision/monitoring system. Revised activities include: 1) specific revisions to the Indicator 11 data collection and process for identification and correction of noncompliance; 2) analysis of Indicator 13 data to identify specific reasons for noncompliance in IEP development; 3) provision of targeted training; 4) development of an online IEP with transition resources and helps; 5) development of a plan of new improvement activities across Indicators 1, 2, 13 and 14, including revisions to ensure identification and correction of noncompliance; and 3) substantial changes to the monitoring and District Self-Assessment components of the Continuous Improvement and Focused Monitoring System to ensure correction of noncompliance. These revisions were integrated into the SPP and publically posted at the following WVDE website: http://wvde.state.wv.us/osp/datareports.html .

SPP Template – Part B West Virginia
State Revised February 1, 2012
Part B State Performance Plan: 2005-2012 Page 6 (OMB NO: 1820-0624 / Expiration Date: 2/29/2012)
Revisions to the State Performance Plan, Submitted: February 1, 2010 The SPP and fourth APR summarized West Virginia’s progress toward each of the twenty performance and compliance indicators outlined in the six-year SPP. At its December 2009 meeting, WVACEEC, the primary stakeholder group representing parents of children with disabilities, public school and private school teachers and administrators, agencies serving students with disabilities and higher education, reviewed 2008-2009 progress data measuring the targets set for all performance indicators. In addition, they reviewed options and approved 1) graduation targets that aligned with Title I of ESEA; 2) a static 8% LRE target for the SE:SC category for Indicator 5; 3) a minimum cell size increase to 20 for Indicators 4A and 4B; and 4) targets for Indicator 7 that will increase by 1% each year over the baseline rates for each of the two summary statements across all three outcome areas. Additionally, per OSEP’s Measurement Table, the following changes were introduced to data source, measurements, and targets, and are reflected in the current SPP/APR. Data for Indicators I, 2, and 4 are now required to lag one year. Graduation (Indicator 1) and dropout (Indicator 2) data and calculations both align with ESEA. Statewide achievement results of students with disabilities (Indicator 3) align to ESEA. Thus, proficiency rates now include only students with disabilities who were enrolled for a full academic year. Indicators 13 and 14 include revised measurements with no reporting requirements in the APR aside for corrections in Indicator 13. The systems and processes for Indicators 13 and 14 are being revised for incorporation into the SPP in 2011. Lastly, language changes and less significant revisions were made to Indicators 5, 6, 11, 12, and 15. Revisions to the State Performance Plan, Submitted: February 1, 2011 As required by OSEP, West Virginia’s February 1, 2011 submission of the SPP was extended to include targets and activities through FFY 2011 and FFY 2012. Throughout 2010-2011, numerous stakeholders groups were involved in the data review, improvement activities, and target setting for specific indicators. Staff members participated in OSEP’s technical assistance conference calls relative to their indicators. WVDE staff worked closely with their OSEP state contact, participating in three SPP/APR technical assistance phone discussions from June 2010 through January 2011. The technical assistance centered around disproportionality procedures and Indicator 3 and 7 revised baselines. Technical assistance with the OSEP state contact and team was also obtained during the WV Verification Visit during November/December 2010 regarding achievement and least restrictive environment. Additionally, OSP devoted significant resources during the 2009-2010 year with LEAs correcting and verifying noncompliance to meet the requirements of OSEP Memo 09-02. OSP staff met with the WVACEEC in October and December 2010 to examine current indicator performance in relation to targets and activities for the SPP extension through FFY 2012, as required by OSEP. The Council responded to current performance and approved or revised OSP’s recommendations for targets and revised activities through school year 2012-2013. OSP staff also convened with the state level Parent Partnership Workgroup in November 2010 and obtained valuable input on targets and activities for the child specific and parent partnership indicators. Stakeholder input received from special education administrators in August 2009 was also incorporated in the target setting process, as well as input received from the leadership during the multiple meetings convened with WVDE staff during the 2010-2011 school year. The extended SPP and fifth APR summarized West Virginia’s progress toward each of the twenty performance and compliance indicators outlined in the six-year SPP. Specific changes to the FFY 2009 SPP are as follows:
1. All twenty indicators have targets and activities extended through FFY 2012 (2012-2013).

SPP Template – Part B West Virginia
State Revised February 1, 2012
Part B State Performance Plan: 2005-2012 Page 7 (OMB NO: 1820-0624 / Expiration Date: 2/29/2012)
2. The activity format has been restructured for all twenty indicators. Activities are generally stated in the SPP / APR with more detailed descriptions, work plans and evaluations aligned directly to the SPP / APR on action plans for state and regional use for implementation at the LEA level.
3. Completed SPP activities were deleted from the current submission to enhance readability. The completed activities are publically available at the OSP website with the FFY 2008 SPP/APR:
http://wvde.state.wv.us/osp/datareports.html. 4. SPP Indicators 4B, 13 and 14 are new or revised indicators for FFY 2009. 5. Indicators 3 and 7 have revised baselines for FFY 2009 and revised targets for FFY 2010-2012,
although the FFY 2009 APR compares performance against targets previously approved in prior SPPs.
6. Indicators 9 and 10 procedures have been revised to include a test of statistical significance. 7. Memo 09-02 has been fully incorporated in SPP procedures and reporting for all appropriate
compliance indicators. 8. For Indicator 8, WVDE has opted to extend the approved sampling plan through FFY 2012 rather
than develop a new plan. This means that LEAs sampled in Years I and 2 of the current plan will be re-administered the surveys during FFY 2011 and FFY 2012, respectively.
Revisions to the State Performance Plan, Submitted: February 1, 2012 The SPP and sixth APR summarized West Virginia’s progress toward each of the twenty performance and compliance indicators outlined in the six-year SPP. At its December 2011 meeting, WVACEEC, the primary stakeholder group representing parents of children with disabilities, public school and private school teachers and administrators, agencies serving students with disabilities and higher education, reviewed 2010-2011 progress data measuring the targets set for all performance indicators, as well as the activities for each indicator. In addition, they reviewed options and approved: 1) a new methodology for calculating significant discrepancy for Indicators 4A and 4B outlined in OSEP guidance issued in August and September 2011; 2) a new data collection process for Indicator 13 wherein the data will be obtained through cyclical monitoring for the APR submission due February 1, 2013; and 3) revisions to the State’s system of general supervision as outlined in Indicator 15. The OSP also notified the WVACEEC and OSEP that the state’s contractor for Indicator 8 had discontinued services, and a search for an alternative contractor was being conducted. Finally, per measurement table requirements, OSP in conjunction with WVACEEC reviewed its improvement activities for Indicator 16 to ensure they will enable the OSP to provide data in the FFY 2010 APR, due February 1, 2012, demonstrating that the WVDE is in compliance with the timely complaint resolution requirements in 34 CFR §300.152. Public Reporting
To fulfill the public reporting requirements, the FFY 2010 (2010-2011) SPP / APR will be posted on the
OSP Web site http://wvde.state.wv.us/osp/datareports.html by February 15, 2012. Additionally, the
2010-2011 (FFY 2010) district data profiles will be posted at the above Data Reports site as soon as possible but no later than 120 days per regulations. This information will include the district data and whether the district met the state targets for 2010-2011.
State Determination for FFY 2009 State Performance Report/Annual Performance Report
Upon review of the 2009-2010 Annual Performance Report, submitted February 1, 2011, the U.S. Department of Education, Office of Special Education Programs (OSEP), issued a letter to Dr. Jorea M. Marple, State Superintendent of Schools, informing her of the Department’s determination under the Individuals with Disabilities Education Act (IDEA 2004), section 616(d) that West Virginia needs assistance in meeting the requirements of Part B of the IDEA. Despite high levels of compliance for Indicators 9, 10, 11, 12, 15, 17 and 20, OSEP cited the specific factor affecting the determination was WV’s FFY 2009 data for compliance Indicator 16 (82.4%).

SPP Template – Part B West Virginia
State Revised February 1, 2012
Part B State Performance Plan: 2005-2012 Page 8 (OMB NO: 1820-0624 / Expiration Date: 2/29/2012)
As required, the state’s determination status was disseminated through presentations by Pat Homberg, Executive Director, Office of Special Programs, at the state’s fall conference for special education administrators in September 2011 in Roanoke, West Virginia. The determination was also included in the published copy of the FFY 2009 SPP/ APR which was provided to stakeholders and posted publicly on the OSP Web site as part of this APR.
Broad Stakeholder Input As stated previously, the WVACEEC is the primary stakeholder group for the APR, representing parents of children with disabilities, public school and private school teachers and administrators, agencies serving students with disabilities and higher education. Meeting eight times a year, Council accepts public testimony in a different district each meeting and hears district, Regional Education Service Agency (RESA) and WVDE presentations on the status of special education services and issues. Based on the broad stakeholder input, the WVACEEC issues an annual report, to which the West Virginia Board of Education officially responds. OSP staff met with the WVACEEC in October and December 2010 to examine current indicator performance in relation to targets and activities for the SPP extension through FFY 2012, as required by OSEP. The Council responded to current performance and approved or revised OSP’s recommendations for targets and revised activities through school year 2012-2013. Throughout 2011-2012, numerous additional stakeholder groups were involved in the data review and improvement activities for specific indicators. Parents continued to be represented through a workgroup consisting of parents and representatives of parent-centered organizations, which meets periodically with the WVDE parent coordinator to review data and provide input to activities for the parent involvement indicator. Additionally, the Parent Educator Resource Centers (PERCs) provided assistance to parents at the local level who had difficulty in completing the surveys and used the results of the surveys from their districts to improve their programs (Indicator 8). Similarly, the WVDE adolescent coordinator reviewed data and activities for the adolescent transition and post-school outcomes indicators (Indicators 13 and 14) with the statewide transition workgroup of school and community stakeholders. As described in the SPP, the WVDE preschool (Section 619) coordinator continued to work collaboratively with major state-level stakeholder groups, which provided and reviewed data for the APR and SPP indicators related to preschool children. WVDE Continuous Quality Improvement Council and Early Childhood Advisory Council continued to provide input on universal pre-k and inclusive early education programs, assessment and progress toward early childhood outcomes (Indicator 7) and transition from early intervention services (WV Birth to Three) to public school services (Indicator 12).
For additional revisions to other SPP indicators, please see the Overview of Annual Performance Report Development in Indicator 1 of the APR.

SPP Template – Part B West Virginia
State Revised February 1, 2012
Part B State Performance Plan: 2005-2012 Page 9 (OMB NO: 1820-0624 / Expiration Date: 2/29/2012)
Part B State Performance Plan (SPP) for 2005-2012
Monitoring Priority: FAPE in the LRE
Indicator 1: Percent of youth with IEPs graduating from high school with a regular diploma.
(20 U.S.C. 1416 (a)(3)(A))
Measurement: States must report using the graduation rate calculation and timeline established by the Department under the ESEA.*
Graduation rate calculation:
The calculation for West Virginia’s graduation rate under the ESEA Consolidated Application Accountability Workbook is as follows: the total number of graduates with a regular diploma divided by the sum of the total number of graduates plus the dropouts for the four years of high school for this class of graduates as represented in the following formula:
gt /(gt+ d12
t + d11
(t-1) + d10
(t-2) + d9
(t-3))
Where: g = graduates t = year of graduation d = dropouts 12, 11, 10, 9 = grade level
For students with disabilities (SWD), the total number of (SWD) graduates with a regular diploma divided by the sum of the total number of SWD graduates plus the SWD dropouts for the four years of high school for this class.
*Please note that WV will begin reporting the 4-year adjusted cohort graduation rate in the SPP / APR submitted February 1, 2012.
Overview of Issue/Description of System or Process:
West Virginia has two diploma options: the regular high school diploma, for which all students must earn a specified number of credits; and a modified diploma, which is an option only for students with severe disabilities who cannot meet the requirements for a regular diploma, even when the instructional objectives are delivered in altered form or with different strategies, as determined by the IEP Team. (See attached Policy 2510: Assuring the Quality of Education: Regulations for Education Programs (2510) definition of diploma, modified diploma and graduation requirements for a regular diploma.) All graduation rate formulas use only those graduating with a regular diploma. West Virginia Code requires compulsory school attendance until age 16.
The ESEA Consolidated State Application Accountability Workbook and Policy 2320: A Process for Improving Education: Performance Based Accreditation System require a graduation rate of 80 percent for a high school or a district to make adequate yearly progress. A school or a district also is considered to have met AYP if it has made improvement toward the standard.

SPP Template – Part B West Virginia
State Revised February 1, 2012
Part B State Performance Plan: 2005-2012 Page 10 (OMB NO: 1820-0624 / Expiration Date: 2/29/2012)
Baseline Data for FFY 2004 (2004-2005):
For 2004-2005, the graduation rate was as follows:
ALL STUDENTS STUDENTS WITH DISABILITIES
(1) Graduates
(2) Dropouts
(3) Graduates
+ Dropouts
Rate=
(1)/(1)+(2)*100 (1)
Graduates (2)
Dropouts
(3) Graduates
+ Dropouts Rate
17,057
3,190 20247 84% 2171* 714 2885 75.3%
(2) Dropouts = Total of dropouts from 2005 – grade 12; 2004 - grade 11; 2003 grade 10; 2002 – grade 9. *Section 618 data
Discussion of Baseline Data:
The above data are based on a combination of data collected electronically from Special Education Student Information records and enrollment information collected for all students, both within the West Virginia Education Information System (WVEIS). These data were compiled for purposes of the State Performance Plan and reporting ESEA graduation rates. West Virginia’s graduation rate for adequate yearly progress under the ESEA Consolidated Application Accountability Workbook is 80 percent for all students and subgroups, including students with disabilities. Therefore, for 2004-2005, West Virginia made the target of 80 percent for all students, with 84 percent graduating with a regular diploma, but did not make the target for students with disabilities, with 75.3 percent graduating with a regular diploma.
FFY Measurable and Rigorous Target:
2005 (2005-2006) At least 75.8% of youth with IEPs will graduate from high school with a regular diploma
2006 (2006-2007) At least 76.5% of youth with IEPs will graduate from high school with a regular diploma
2007 (2007-2008) At least 80.0% of youth with IEPs will graduate from high school with a regular diploma
2008 (2008-2009)
At least 80.0% of youth with IEPs will graduate from high school with a regular diploma
2009 (2009-2010) At least 80.0% of youth with IEPs will graduate from high school with a regular diploma
2010 (2010-2011) At least 80% of youth with IEPs will graduate from high school with a regular diploma
2011 (2011-2012) At least 80% of youth with IEPs will graduate from high school with a regular diploma
2012 (2012-2013) At least 80% of youth with IEPs will graduate from high school with a regular diploma

SPP Template – Part B West Virginia
State Revised February 1, 2012
Part B State Performance Plan: 2005-2012 Page 11 (OMB NO: 1820-0624 / Expiration Date: 2/29/2012)
Improvement Activities/Timelines/Resources:
Activities for Indicators 1 - graduation, 2 - dropout, 13 – secondary transition planning and 14 - post school outcomes are interrelated and directed toward planning, instruction, services and linkages to ensure positive post school outcomes for students with disabilities. Technical assistance accessed through national centers and conferences has emphasized the interconnectedness of these indicators and the benefits of creating a comprehensive plan of improvement activities. As a result, indicator activities for 1, 2, 13 and 14 were combined in 2007-2008 and are encompassed under the umbrella of the West Virginia Transition Collaborative Community of Practice (WVTCCoP).
Improvement Activities - Indicators 1, 2, 13 and 14 Timelines Resources Status
13. 1 Collect and review data annually from the Indicator 13 file review checklist for each district.
2008-2013 WVDE Stakeholder committee LEA
Active
13.2 / 1.4 / 2.4 Provide professional development and guidance materials for documenting transition services in the IEP and implementation of evidence-based transition strategies.
2008-2013 WVDE Active
13.3 Verify correction of noncompliance for Indicator 13 by reviewing updated samples of IEPs for compliance, as well as verifying correction of any individual IEPs with noncompliances. WVDE staff will review the data and notify the district of compliance status and actions to be taken. Districts failing to correct noncompliances will receive further targeted technical assistance and corrective actions, including onsite reviews, additional corrective activities and enforcement.
2008-2013 WVDE LEA
Active Revised 2011
13.4 / 1.8 / 2.8 Develop and maintain a Showcase for Transition on the WVDE website (success stories of students, teams, programs, to connect transition services for school age students with post school outcomes of former students).
2009-2013 WVDE TA Centers NSTTAC, NDPC-N, SD materials Assessments
Active
13.5 Embed help boxes and links to transition guidance documents on the WVDE website into the statewide online IEP system. Develop a report or audit within the system for IEPs of transition age students to determine compliance with the Transition IEP Checklist. Incorporate standards-based IEP guidance into the online IEP.
2008-2013
WVDE, NSTTAC materials
Active
1.1 / 2.1 Partner with National Dropout Prevention Center for Students with Disabilities to strengthen the implementation of evidence-based graduation and dropout prevention strategies in WV.
2011-2013 NDPC-SD WVDE
New 2011
1.2 / 2.2 Manage/support the WV Transition Collaborative Leadership Team to oversee the implementation of a coordinated state-wide plan for post secondary transition services and programs.
2005-2013 WVDE Active Revised 2011
1.3 / 2.3 Manage/support the West Virginia Transition Collaborative Community of Practice (WVTCCoP) to
2005-2013 WVDE Active

SPP Template – Part B West Virginia
State Revised February 1, 2012
Part B State Performance Plan: 2005-2012 Page 12 (OMB NO: 1820-0624 / Expiration Date: 2/29/2012)
Improvement Activities - Indicators 1, 2, 13 and 14 Timelines Resources Status
provide educators the opportunity to share best practices, access experts in the field and interact with other educators throughout the state. Emphasis of the WVTCCoP is to recruit and support district staff responsible for implementation of transition requirements to assist in the development of skills related to improving transition services for students with disabilities.
1.7 / 2.7 Recruit and support Transition Teams in all RESAs to assist in the identification of local, regional and state resources to support the development and implementation of best practices.
2011-2013 WVDE RESA
Active Revised 2011
1.9 / 2.9 Collaborate with external agencies and internal offices (e.g., Offices of Assessment and Accountability, Instruction, School Improvement) to improve transition services, graduation rates, dropout rates and post school outcomes for SWDs.
2005-2013 WVDE Active Revised 2011
14.1 Collect and disseminate annually Exit and One Year Follow-up Survey results with various stakeholder groups with an emphasis on increasing data use and response rates at the district level.
2005-2013 WVDE Active
ATTACHMENT
Below are the requirements in effect for the 2005-2009 school years: Policy 2510: Assuring the Quality of Education: Regulations for Education Programs (2510, Revised April 2007. Policy 2510 was again revised in July 2008. The current policy may be accessed at: http://wvde.state.wv.us/policies/.
5.6.9. High School Diploma. County boards of education shall award a high school diploma to every student who
has completed the standard graduation requirements. a. An eligible student with disabilities who has been determined by an IEP Team to be unable even with extended learning opportunities and significant instructional modifications to meet state and county standard graduation requirements may receive a modified diploma.
GRADUATION REQUIREMENTS
5.6.1. Adolescent education (Grades 9-12) Programs of Study
Chart V (C) Adolescent (9-12) Graduation Requirements (Effective 2005-2006)
These graduation requirements are effective for students entering grade 9 in the school year 2005-2006 through 2007-2008. Courses needed for graduation require mastery of approved content standards and objectives. Students who do not demonstrate mastery of the content standards and objectives shall be provided extra help and extra time through intervention strategies.
SPP Template – Part B West Virginia
State Revised February 1, 2012
Part B State Performance Plan: 2005-2012 Page 13 (OMB NO: 1820-0624 / Expiration Date: 2/29/2012)
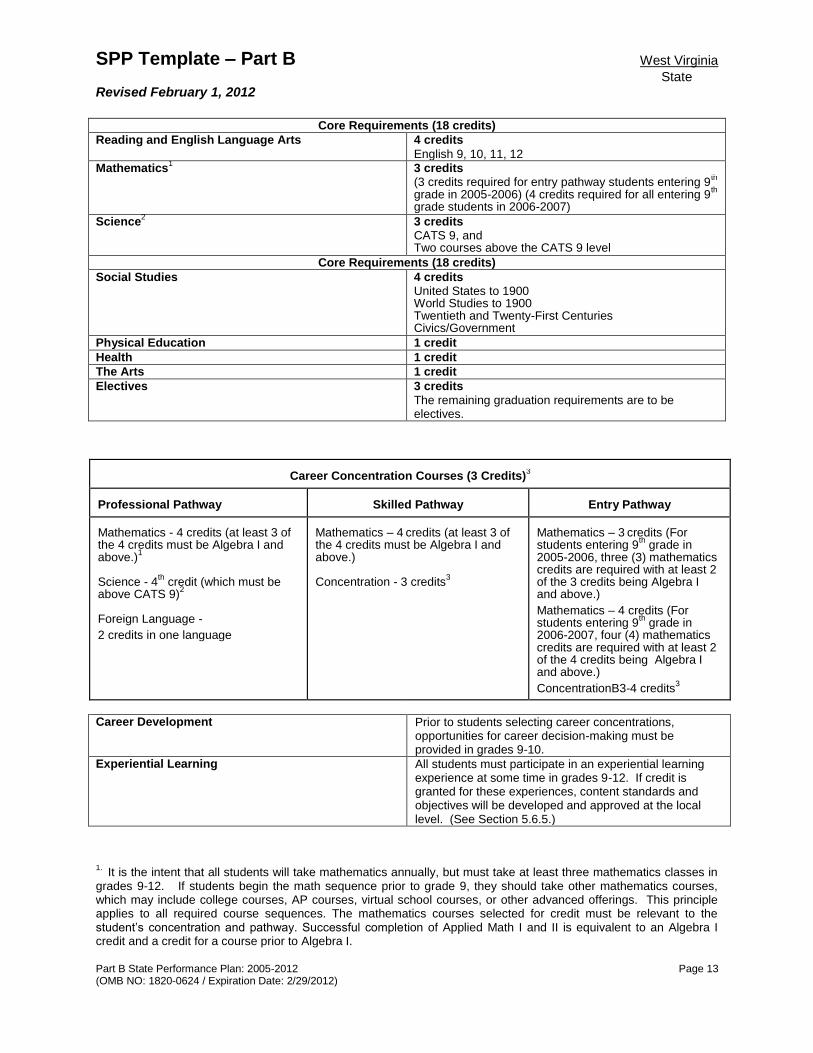
Core Requirements (18 credits)
Reading and English Language Arts 4 credits
English 9, 10, 11, 12
Mathematics1
3 credits (3 credits required for entry pathway students entering 9
th
grade in 2005-2006) (4 credits required for all entering 9th
grade students in 2006-2007)
Science2
3 credits CATS 9, and Two courses above the CATS 9 level
Core Requirements (18 credits)
Social Studies 4 credits United States to 1900 World Studies to 1900 Twentieth and Twenty-First Centuries Civics/Government
Physical Education 1 credit
Health 1 credit
The Arts 1 credit
Electives 3 credits
The remaining graduation requirements are to be electives.
Career Concentration Courses (3 Credits)
3
Professional Pathway
Skilled Pathway
Entry Pathway
Mathematics - 4 credits (at least 3 of the 4 credits must be Algebra I and above.)
1
Science - 4
th credit (which must be
above CATS 9)2
Foreign Language -
2 credits in one language
Mathematics – 4
credits (at least 3 of
the 4 credits must be Algebra I and above.) Concentration - 3 credits
3
Mathematics – 3
credits (For
students entering 9th
grade in 2005-2006, three (3) mathematics credits are required with at least 2 of the 3 credits being Algebra I and above.)
Mathematics – 4 credits (For students entering 9
th grade in
2006-2007, four (4) mathematics credits are required with at least 2 of the 4 credits being Algebra I and above.)
ConcentrationB3-4 credits3
Career Development Prior to students selecting career concentrations, opportunities for career decision-making must be provided in grades 9-10.
Experiential Learning
All students must participate in an experiential learning experience at some time in grades 9-12. If credit is granted for these experiences, content standards and objectives will be developed and approved at the local level. (See Section 5.6.5.)
1. It is the intent that all students will take mathematics annually, but must take at least three mathematics classes in
grades 9-12. If students begin the math sequence prior to grade 9, they should take other mathematics courses, which may include college courses, AP courses, virtual school courses, or other advanced offerings. This principle applies to all required course sequences. The mathematics courses selected for credit must be relevant to the student’s concentration and pathway. Successful completion of Applied Math I and II is equivalent to an Algebra I credit and a credit for a course prior to Algebra I.

SPP Template – Part B West Virginia
State Revised February 1, 2012
Part B State Performance Plan: 2005-2012 Page 14 (OMB NO: 1820-0624 / Expiration Date: 2/29/2012)
2.
With Parental/Guardian consent, students with a declared skilled level major in vocational agriculture will, upon successful completion of a Robert C. Beach Vocational Agriculture credit in grade 11 or 12, be exempt from the third required unit of credit in science. To be eligible as a required unit for graduation, the vocational agriculture education course must: (1) build on the concepts and skills in CATS 9; (2) be taught at a level of greater complexity and depth than that of vocational agriculture courses in grades 9 and 10; (3) have WVBE approved content standards and objectives; and (4) receive WVBE approval as a vocational agriculture course that qualifies as a Robert C. Beach Vocational Agriculture credit. (See Section 13.78.) The school shall: (1) have on file a Parental/Guardian Consent Form with signatures of the student, parent/guardian(s) and authorized school official, that acknowledges the understanding that this class does not represent a substitute for the knowledge, skills and competencies of a third unit of science and that this course does not meet the requirement for the additional unit of laboratory science that West Virginia colleges and universities have for admission; and (2) review with the student and his/her parents/guardians, as verified by the Parental/Guardian Consent Form, that the required third unit of science must be successfully completed if a student should change his/her major from entry or skilled level vocational agriculture education prior to graduation from high school. 3.
Concentration credits are to be taken by all students. Entry level career and technical students must complete four units in a concentration. The four concentration units provided students in entry-level technical majors and two of the concentration units at the skilled level must be consistent with those defined in the Required Technical Courses by Career Concentration technical assistance document published by the WVDE. Each technical concentration in a school shall obtain and maintain an appropriate industry recognized accreditation/certification, when one is available, and shall provide students the opportunity to obtain an industry-recognized credential as part of the instructional program.
Chart V (D) Adolescent (9-12) Graduation Requirements (Effective 2008-2009)
These graduation requirements are effective for students entering grade 9 in the school year 2008-2009 and thereafter. Courses needed for graduation require mastery of approved 21st century content standards and objectives. Students who do not demonstrate mastery of the content standards and objectives shall be provided extra help and extra time through intervention strategies.
Core Requirements (18 credits)
Reading and English Language Arts1 4 credits
English 9, 10, 11, 12
Mathematics2
4 credits
Science3
3 credits Physical Science Biology or Conceptual Biology Chemistry or Conceptual Chemistry
Social Studies4 4 credits
World Studies to 1900 United States Studies to 1900 Twentieth and Twenty-First Centuries Studies Civics for the 21
st Century
Physical Education 1 credit
Health 1 credit
The Arts 1 credit
Electives 2 credits
The remaining graduation requirements are to be electives.
Career Concentration Courses (4 Credits)
5
Professional Pathway Skilled Pathway Science - 4
th credit (which must be above Physical
Science)
Foreign Language - 2 credits in one language
Concentration – 1 additional credit required related to the selected career concentration
Concentration - 4 additional credits required related to the selected career concentration

SPP Template – Part B West Virginia
State Revised February 1, 2012
Part B State Performance Plan: 2005-2012 Page 15 (OMB NO: 1820-0624 / Expiration Date: 2/29/2012)
Career Development Prior to students selecting a concentration and pathway, opportunities for career decision-making must be provided in grades 9-10.
Experiential Learning
All students must participate in an experiential learning experience at some time in grades 9-12. If credit is granted for these experiences, content standards and objectives will be developed and approved at the local level. (See Section 5.6.5)
Technology Students in grades 9-12 shall be provided integrated opportunities within the core requirements to master the standards for Policy 2520.14. It is recommended that all students take at least one course in technology applications during grades 9-12. It is also recommended that all students complete an online learning experience during grade 9-12.
Senior Year All West Virginia High School students shall be fully enrolled in a full day of high school and/or college credit bearing courses. It is recommended that students complete a senior project to add rigor and relevance to the senior year.
1. Students in the professional pathway and college bound students in the skilled pathway, who do not achieve the
State assessment college readiness benchmark for English, shall be required to take a college transition English course during their senior year. This course must be offered annually.
2.
It is the intent that students in the professional pathway will take mathematics annually, but must take at least three mathematics classes in grades 9-12. The recommended course sequence, which may include college courses, AP courses or virtual school courses, for students in the professional pathway is Algebra I, Geometry, Algebra II, Trigonometry, and Pre-Calculus. The mathematics courses selected for credit must be relevant to the student’s concentration. Students in the professional pathway and college bound students in the skilled pathway, who do not achieve the State assessment College readiness benchmark for mathematics, shall be required to take a college transition mathematics course during their senior year. It is also the intent that students in the skilled pathway will take mathematics annually, but must take at least three mathematics classes in grades 9-12. The recommended course sequence in the skilled pathway is Algebra I, geometry, conceptual mathematics, college transition mathematics or Algebra II. College Transition Mathematics must be offered annually. 3.
Physical Science, Biology or Conceptual Biology and Chemistry or Conceptual Chemistry shall be taken in consecutive order. Conceptual course credits may not be accepted by four-year higher education institutions. 4.
It is highly recommended that students take the high school social studies courses in the listed sequence to ensure maximum understanding of the material to be learned. World Studies to 1900, United States Studies to 1900, Twentieth and Twenty-First Centuries Studies and Civics for the 21
st Century should be taken in consecutive order.
The social studies content standards and objectives are constructed in such a way that information progresses sequentially through time periods and builds the foundation for successful achievement of the complex concepts that follow. The senior course, Civics for the 21
st Century, has been written to deliver rich academic content within
relevant context for students entering the world of work and college.
5.
The four credits taken by career/technical concentrators must be consistent with those identified for WVDE approved career/technical programs of study. Each career/technical concentration in a school shall obtain and maintain an appropriate industry-recognized accreditation/certification, when one is available, and shall provide students the opportunity to obtain an industry recognized credential as part of the instructional program.

SPP Template – Part B West Virginia
State Revised February 1, 2012
Part B State Performance Plan: 2005-2012 Page 16 (OMB NO: 1820-0624 / Expiration Date: 2/29/2012)
Part B State Performance Plan (SPP) for 2005-2012
Overview of the State Performance Plan Development:
See Indicator 1.
Monitoring Priority: FAPE in the LRE
Indicator 2: Percent of youth with IEPs dropping out of high school.
(20 U.S.C. 1416 (a)(3)(A))
Measurement: States must report using the dropout data used in the ESEA graduation rate calculation and follow the timeline established by the Department under the ESEA.
Dropout Rate Calculation for Students with Disabilities:
Number of dropouts who are students with disabilities divided by the number of students with disabilities in grades 7-12.
WV reports an event dropout statistic for all students and an identical statistic for students with disabilities. This statewide dropout measure -- which is calculated annually and was submitted in prior APRs -- includes all students with disabilities in the state grades 7-12.
Overview of Issue/Description of System or Process:
Through the 2009-2010 school year, West Virginia Code permitted students to withdraw from enrollment, that is, drop out of school, if they were age 16 or older. The West Virginia Report Card required by West Virginia Code reports the dropout rate for all students for the state and each district. The dropout rate for students with disabilities is reported publicly on the WVDE’s Special Education Data website.
Prior to FFY 2008, the specific formula for dropout rate for students with disabilities is students with disabilities reported as “dropped out” on the Section 618 exit report divided by students with disabilities enrolled in grades 7-12. For all students, the formula is dropouts (obtained from school enrollment reports) divided by public school enrollment grades 7-12.
Beginning with the FFY 2008 APR (based on 2007-2008 data), the dropout statistic for SWDs was aligned directly with the dropout statistic for all students. Students with disabilities who dropped out during the school year but returned by October were no longer counted as dropouts.
Baseline Data for FFY 2004 (2004-2005):
West Virginia Dropout Rates 2004-2005
Number of Dropouts Number Enrolled Percentage
All Students 3487 127,987 2.75%
Students with Disabilities
931 20462 4.55%

SPP Template – Part B West Virginia
State Revised February 1, 2012
Part B State Performance Plan: 2005-2012 Page 17 (OMB NO: 1820-0624 / Expiration Date: 2/29/2012)
The dropout rate for all students for 2004-2005 was 2.75 percent compared to a rate of 4.55 percent for students with disabilities. Therefore, the rate for students with disabilities exceeds that for all students by 1.80 percentage points.
Discussion of Baseline Data:
The dropout rates for all students and for students with disabilities are calculated the same way. Data in the baseline year came from two different sources, however. Students with disabilities data are taken from Section 618 data submissions, generated from the Special Education Student Information records in WVEIS. The reporting year for Section 618 data is July 1 through June 30. Data for the West Virginia Report Card dropout rate that must be reported for all students under state code are taken from WVEIS student enrollment records. Data are not finalized for the 2004-2005 school year until the following fall. Students who may have dropped out during the school year but return by October are not counted as dropouts.
FFY Measurable and Rigorous Target
2005 (2005-2006)
The percentage of youth with IEPs who withdraw from enrollment during high school will decrease to 4.25%
2006 (2006-2007)
The percentage of youth with IEPs who withdraw from enrollment during high school will decrease to 4.00%
2007 (2007-2008)
The percentage of youth with IEPs who withdraw from enrollment during high school will decrease to 3.65%
2008 (2008-2009)
The percentage of youth with IEPs who withdraw from enrollment during high school will decrease to 3.35%
2009 (2009-2010)
The percentage of youth with IEPs who withdraw from enrollment during high school will decrease to 3.00%
2010 (2010-2011)
The percentage of youth with IEPs who withdraw from enrollment during high school will decrease to 2.75%
2011
(2011-2012)
The percentage of youth with IEPs who withdraw from enrollment during high school will decrease to 2.75%
2012
(2012-2013)
The percentage of youth with IEPs who withdraw from enrollment during high school will decrease to 2.75%

SPP Template – Part B West Virginia
State Revised February 1, 2012
Part B State Performance Plan: 2005-2012 Page 18 (OMB NO: 1820-0624 / Expiration Date: 2/29/2012)
Improvement Activities/Timelines/Resources:
Activities for Indicators 1 - graduation, 2 - dropout, 13 – secondary transition planning and 14 - post school outcomes are interrelated and directed toward planning, instruction, services and linkages to ensure positive post school outcomes for students with disabilities. Technical assistance accessed through national centers and conferences has emphasized the interconnectedness of these indicators and the benefits of creating a comprehensive plan of improvement activities. As a result, indicator activities for 1, 2, 13 and 14 were combined in 2007-2008 and are encompassed under the umbrella of the West Virginia Transition Collaborative Community of Practice (WVTCCoP).
Improvement Activities – Indicators 1, 2, 13 and 14 Timelines Resources Status
13. 1 Collect and review data annually from the Indicator 13 file review checklist for each district.
2008-2013 WVDE Stakeholder committee LEA
Active
13.2 / 1.4 / 2.4 Provide professional development and guidance materials for documenting transition services in the IEP and implementation of evidence-based transition strategies.
2008-2013 WVDE Active
13.3 Verify correction of noncompliance for Indicator 13 by reviewing updated samples of IEPs for compliance, as well as verifying correction of any individual IEPs with noncompliances. WVDE staff will review the data and notify the district of compliance status and actions to be taken. Districts failing to correct noncompliances will receive further targeted technical assistance and corrective actions, including onsite reviews, additional corrective activities and enforcement.
2008-2013 WVDE LEA
Active Revised 2011
13.4 / 1.8 / 2.8 Develop and maintain a Showcase for Transition on the WVDE website (success stories of students, teams, programs, to connect transition services for school age students with post school outcomes of former students).
2009-2013 WVDE TA Centers NSTTAC, NDPC-N, and SD materials Assessments
Active
13.5 Embed help boxes and links to transition guidance documents on the WVDE website into the statewide online IEP system. Develop a report or audit within the system for IEPs of transition age students to determine compliance with the Transition IEP Checklist. Incorporate standards-based IEP guidance into the online IEP.
2008-2013
WVDE NSTTAC materials
Active
1.1 / 2.1 Partner with National Dropout Prevention Center for Students with Disabilities to strengthen the implementation of evidence-based graduation and dropout prevention strategies in WV.
2011-2013 NDPC-SD WVDE
New 2011
1.2 / 2.2 Manage/support the WV Transition Collaborative Leadership Team to oversee the implementation of a coordinated state-wide plan for post secondary transition services and programs.
2005-2013 WVDE Active Revised 2011
1.3 / 2.3 Manage/support the West Virginia Transition Collaborative Community of Practice (WVTCCoP) to provide educators the opportunity to share best practices,
2005-2013 WVDE Active

SPP Template – Part B West Virginia
State Revised February 1, 2012
Part B State Performance Plan: 2005-2012 Page 19 (OMB NO: 1820-0624 / Expiration Date: 2/29/2012)
Improvement Activities – Indicators 1, 2, 13 and 14 Timelines Resources Status
access experts in the field and interact with other educators throughout the state. Emphasis of the WVTCCoP is to recruit and support district staff responsible for implementation of transition requirements to assist in the development of skills related to improving transition services for students with disabilities.
1.7 / 2.7 Recruit and support Transition Teams in all RESAs to assist in the identification of local, regional and state resources to support the development and implementation of best practices.
2011-2013 WVDE RESA
Active Revised 2011
1.9 / 2.9 Collaborate with external agencies and internal offices (e.g., Offices of Assessment and Accountability, Instruction, School Improvement) to improve transition services, graduation rates, dropout rates and post school outcomes for SWDs.
2005-2013 WVDE Active Revised 2011
14.1 Collect and disseminate annually Exit and One Year Follow-up Survey results with various stakeholder groups with an emphasis on increasing data use and response rates at the district level.
2005-2013 WVDE Active

SPP Template – Part B West Virginia
State Revised February 1, 2012
Part B State Performance Plan: 2005-2012 Page 20 (OMB NO: 1820-0624 / Expiration Date: 2/29/2012)
Part B State Performance Plan (SPP) for 2005-2012
Overview of the State Performance Plan Development:
See Indicator 1. OSEP’s SPP Response Letter In its response letter dated March 15, 2006, the U.S. Department of Education, Office of Special Education Programs (OSEP) approved West Virginia’s State Performance Plan. Regarding Indicator 3, OSEP directed West Virginia to revise the Measurable and Rigorous Targets for Indicator 3A to clarify how many counties making AYP the state expects to increase each year. The requested revisions have been made to that section.
(The following items are to be completed for each monitoring priority/indicator.)
Monitoring Priority: FAPE in the LRE
Indicator 3: Participation and performance of children with IEPs on statewide assessments:
A. Percent of the districts with a disability subgroup that meets the State’s minimum “n” size that meet the State’s AYP targets for the disability subgroup.
B. Participation rate for children with IEPs.
C. Proficiency rate for children with IEPs against grade level, modified and alternate academic achievement standards.
(20 U.S.C. 1416 (a)(3)(A))
Measurement:
A. AYP percent = [(# of districts with a disability subgroup that meets the State’s minimum “n” size that meet the State’s AYP targets for the disability subgroup) divided by the (total # of districts that have a disability subgroup that meets the State’s minimum “n” size)] times 100.
B. Participation rate percent = [(# of children with IEPs participating in the assessment) divided by the (total # of children with IEPs enrolled during the testing window, calculated separately for reading and math)]. The participation rate is based on all children with IEPs, including both children with IEPs enrolled for a full academic year and those not enrolled for a full academic year.
C. Proficiency rate percent = ([(# of children with IEPs enrolled for a full academic year scoring at or above proficient) divided by the (total # of children with IEPs enrolled for a full academic year, calculated separately for reading and math)].
Overview of Issue/Description of System or Process:
West Virginia’s Accountability System and Measures of Adequate Yearly Progress
Policy 2320: A Process for Improving Education: Performance Based Accreditation System sets forth the measures for determining AYP for West Virginia public schools. AYP is determined by student achievement, student participation rate in the statewide assessment, graduation rate for schools with grade 12 and attendance rate for elementary and middle school data.

SPP Template – Part B West Virginia
State Revised February 1, 2012
Part B State Performance Plan: 2005-2012 Page 21 (OMB NO: 1820-0624 / Expiration Date: 2/29/2012)
Policy 2320: A Process for Improving Education: Performance Based Accreditation System also includes a safe harbor provision for meeting AYP. Safe harbor is available to the public school/district/state that fails to meet AYP for the achievement indicator, i.e., percentage of students attaining mastery in reading/language arts and mathematics on the West Virginia Educational Standards Test – Second Edition (WESTEST 2) or the West Virginia Alternate Performance Task Assessment (APTA) in grades 3-8 and 11 for 2008-09 and thereafter. In order to meet AYP using the safe harbor provision, the school/district/state must: 1) decrease by ten percent from the preceding year the number of students in the less than mastery subgroup in reading/language arts and mathematics on the WESTEST 2 or APTA in grades 3-8 and 11 for 2008-09 and thereafter; and 2) have made progress on one or more of the other indicators or be at/above the target goal for that indicator (attendance and graduation rate); and 3) attain a 95 percent participation rate in the current year or a two or three year average.
Policy 2340: West Virginia Measures of Academic Progress, sets forth requirements of the assessment system, including the statewide achievement test, the WESTEST 2 and APTA. The Students with Disabilities: Guidelines for Participation in West Virginia Measures of Academic Progress provides guidance on selection and use of testing accommodations.
Regular Assessment Based on Grade Level Standards: In Spring 2009, students in West Virginia participated for the first time in the West Virginia Educational Standards Test – Second Edition (WESTEST 2). The WESTEST 2 is the revised statewide assessment aligned to measure student performance on the West Virginia 21
st Century Content Standards and Objectives (CSOs). Effective July
2008, the revised WV 21st Century CSOs were designed to be more rigorous, relevant and challenging
while also incorporating the use of 21st century tenchnology tools. Because the CSOs assessed via the
WESTEST 2 require higher depth-of-knowledge, the WESTEST 2 is inherently a substantially more difficult standards-based assessment noncomparable to the original WESTEST. Due to the noncomparability of the two statewide assessments, a return to baseline in the SPP was deemed necessary.
The WESTEST 2 is administered annually to students in grades 3 through 8 and grade 11 to meet Title I and ESEA requirements. Developed through a contract with CTB/McGraw-Hill, the WESTEST 2 was designed in a way to assess as many students as possible without special accommodations and to provide accommodations for those students with disabilities determined by their IEP Teams to need them. All available accommodations are designed to ensure scores are valid and the assessment reflects what the student knows and can do on the grade level achievement standards. “Nonstandard” or invalid modifications and off-level assessment are not allowed for participation in the WESTEST 2.
The WESTEST 2 scores are reported in five performance levels: novice, partial mastery, mastery, above mastery and distinguished, with mastery and above being considered proficient, that is, meeting the grade level standard.
Distinguished: Student demonstrates knowledge, comprehension, application, analysis, synthesis and evaluation of skills, which exceed the standard. Above Mastery: Student demonstrates knowledge, comprehension, application and analysis of skills, which exceed the standard. Mastery: Student demonstrates knowledge, comprehension and application of skills, which meet the standard. Partial Mastery: Student demonstrates knowledge and recall of skills toward meeting the Standard Novice: Student does not demonstrate knowledge and recall of skills needed to meet the
standard.

SPP Template – Part B West Virginia
State Revised February 1, 2012
Part B State Performance Plan: 2005-2012 Page 22 (OMB NO: 1820-0624 / Expiration Date: 2/29/2012)
Alternate Assessment Based on Alternate Academic Achievement Standards: Transitioning from a datafolio-based alternate assessment, the West Virginia Alternate Performance Task Assessment (APTA) was constructed in 2006 with stakeholder input to measure the West Virginia Alternate Academic Achievement Standards delineated in Policy 2520.16: West Virginia Alternate Academic Achievement Standards. Policy 2520.16 provides a framework for teachers of students with the most significant cognitive disabilities to teach skills and competencies essential for independent living, employment and postsecondary education.
Participation in APTA is limited to students with significant cognitive disabilities, and, for accountability purposes, scores are reported in accordance with ESEA requirements, which place a 1 percent cap on scores that can be counted as proficient based on alternate achievement standards. APTA is administered in reading/language arts and mathematics to students in grades 3 through 8 and grade 11 whose IEPs mandate participation in an alternate achievement test.
APTA Eligibility Criteria are as follows:
The student must have a current IEP;
Multidisciplinary evaluation and educational performance data support the following: o The student exhibits significant impairment of cognitive abilities and adaptive skills to the
extent that he/she requires instruction in the West Virginia Alternate Academic Achievement Standards linked to the WV 21st Century Content Standards and Objectives (CSO’s) and access skills (social, motor and communication) not directly addressed in the CSOs, but embedded in instructional standards-based activities.
o The student cannot participate in the WESTEST 2 and other components of the WV-MAP, even with accommodations. The reasons why the student cannot participate must be clearly stated on the IEP.
o In addition, if the student is fourteen years of age or older, and has been determined by the IEP Team to be unable to complete the state and county standard graduation requirements necessary to earn a standard diploma, even with extended learning opportunities and significant instructional modifications, the student will work toward a modified diploma. Please note, not all students earning a modified diploma must take the APTA; however, students working toward a standard diploma do not meet criteria for the APTA.
If the student meets all criteria, the IEP document must include justification for change in curriculum and change to the alternate assessment.
APTA scores are reported in four performance levels: novice, partial mastery, mastery and above mastery, with mastery and above being considered proficient, that is, meeting the grade level standard.
Above Mastery: Student demonstrates knowledge, comprehension, application and analysis of skills, which exceed the standard. Mastery: Student demonstrates knowledge, comprehension and application of skills, which meet the standard. Partial Mastery: Student demonstrates knowledge characterized by errors and/or omissions, and the student performs tasks with assistance. Novice: Student demonstrates knowledge characterized by fragmented and incomplete performance, and the student attempts to perform tasks with assistance.
Revision to Regular Academic Achievement Standards
For the Spring 2010 administration of the WESTEST2, based on analysis of student scores in the initial year of administration, the cut scores required for proficiency were increased to align more closely with

SPP Template – Part B West Virginia
State Revised February 1, 2012
Part B State Performance Plan: 2005-2012 Page 23 (OMB NO: 1820-0624 / Expiration Date: 2/29/2012)
proficiency levels in the National Assessment of Educational Progress. No changes were made to the assessment itself, or to the Content Standards and Objectives. As a result, student scores and the percent proficient declined, including the scores of students with disabilities, even though the students may in fact have made progress from 2009 based on scale scores.
Starting Point Considerations: In August 2009, West Virginia requested flexibility in the state accountability plan under Title I of ESEA to reset starting points on the new 2009 WESTEST 2. More specifically, West Virginia requested that starting points be reset utilizing the averages of the 2008-2009 and 2009-2010 administration of the WESTEST 2. In a response letter from Dr. Thelma Melendez de Santa Ana of the U. S. Department of Education on August 25, 2009, the request for resetting starting points and subsequent targets was accepted. Due to the approval of the request, revised targets under ESEA are still being considered. However, WVDE – in consultation with stakeholders- reset the SPP targets from FFY 2010-2012 based on the actual 2009-2010 Indicator 3 data. The 2009-2010 Indicator data was used as a new baseline due to the more rigorous cut scores per baseline data discussion below. Baseline Data for FFY 2009 (2009-2010): A. Percent of districts meeting the State’s AYP objectives for progress for disability subgroup: West Virginia has 55 school districts participating in accountability in accordance with the approved ESEA Consolidated State Application Accountability Workbook. Of these, 53 LEAs in 2009-2010 had 50 or more students in the students with disabilities subgroup, which is the minimum cell size for subgroup accountability under the Accountability Workbook. One district met AYP status for both participation rate and testing proficiency. B. Participation rate for students with IEPs in a regular assessment against grade level standards and alternate assessment against alternate achievement standards: Participation rate for students with IEPs in a regular assessment (WESTEST 2) and alternate assessment (APTA) was 97.13% for mathematics and 97.04% for reading language arts. Participants are students who took the test and received a valid score. Nearly three percent of students with disabilities did not participate in statewide testing in mathematics (618 students) and reading language arts (637 students). In mathematics, eight students did not participate because their parents opted out of testing; 184 students had approved medical emergencies; and the remaining 426 students were absent. In reading language arts, seven students did not participate because their parents opted out of testing; 188 students had approved medical emergencies; and the remaining 442 students were absent.
Participation Rate
Statewide Assessment – 2009-2010
Math Assessment
Grade 3
Grade 4
Grade 5
Grade 6
Grade 7
Grade 8
Grade 11
Total
# %
a Children with IEPs 3,768 3,561 3,025 2,950 2,880 2,903 2,450 21,537 100.0%
b
IEPs in regular assessment with no accommodations 1,841 1,235 763 598 604 620 770 6,431 29.86%
c
IEPs in regular assessment with accommodations 1,556 1,991 1,934 2,010 1,903 1,894 1,267 12,555 58.30%

SPP Template – Part B West Virginia
State Revised February 1, 2012
Part B State Performance Plan: 2005-2012 Page 24 (OMB NO: 1820-0624 / Expiration Date: 2/29/2012)
d
IEPs in alternate assessment against alternate standards 295 273 275 277 272 275 266 1,933 8.98%
g Overall (b+c+d) Participation Rate 3,692 3,499 2,972 2,885 2,779 2,789 2,303 20,919 97.13%
Children included in a but not included in the other counts above
Account for any children with IEPs that were not participants in the narrative.
76 62 53 65 101 114 147 618 2.87%
Statewide Assessment – 2009-2010
Reading Assessment
Grade 3
Grade 4
Grade 5
Grade 6
Grade 7
Grade 8
Grade 11
Total
# %
a Children with IEPs 3,768 3,561 3,025 2,950 2,880 2,903 2,450 21,537 100.0%
b
IEPs in regular assessment with no accommodations 1,877 1,268 801 722 762 808 996 7,234 33.59%
c
IEPs in regular assessment with accommodations 1,516 1,958 1,895 1,885 1,740 1,702 1,040 11,736 54.49%
d
IEPs in alternate assessment against alternate standards 294 273 275 277 271 275 265 1,930 8.96%
g Overall (b+c+d) Participation Rate 3,687 3,499 2,971 2,884 2,773 2,785 2,301 20,900 97.04%
Children included in a but not included in the other counts above
Account for any children with IEPs that were not participants in the narrative.
81 62 54 66 107 118 149 637 2.96%
C. Proficiency rate for students with IEPs against grade level standards and alternate academic achievement standards: The State Performance Plan targets of 68.5% and 70.3% of students with IEPs [enrolled for a Full Academic Year (FAY)] performing at or above proficiency in mathematics and reading language arts, respectively, were not met. Rather, 19.9% and 15.9% of students with IEPs performed at or above proficiency in mathematics and reading language arts on the WESTEST 2 and APTA.

SPP Template – Part B West Virginia
State Revised February 1, 2012
Part B State Performance Plan: 2005-2012 Page 25 (OMB NO: 1820-0624 / Expiration Date: 2/29/2012)
Disaggregated Target Data for Math Performance: # and % of students with IEPs scoring proficient or higher on WESTEST 2 and APTA
Statewide Assessment – 2009-2010
Math Assessment Performance Total
Grade 3
Grade 4
Grade 5
Grade 6
Grade 7
Grade 8
Grade 11 # %
Children with IEPs enrolled for a FAY scoring at or above proficiency
1,034 755 588 444 433 323 253 3,830 19.9% at or above proficient
Children with IEPs enrolled for a FAY
3,403 3,235 2,720 2,647 2,538 2,497 2,142 19,182
Disaggregated Target Data for Reading Performance: # and % of students with IEPs scoring proficient or higher on WESTEST 2 and APTA
Statewide Assessment – 2009-2010
Reading Assessment Performance Total
Grade 3
Grade 4
Grade 5
Grade 6
Grade 7
Grade 8
Grade 11 # %
Children with IEPs enrolled for a FAY scoring at or above proficiency
832 579 445 353 342 288 209 3,048 15.9% at or above proficient
Children with IEPs enrolled for a FAY
3,399 3,235 2,719 2,645 2,532 2,492 2,140 19,162
The WVDE publicly reports LEA and statewide assessment results for students with disabilities at the following URL: http://wveis.k12.wv.us/nclb/OSEcf/Data/replist1.cfm .
1) Participation for students with IEPs who are administered the regular and alternate assessment with and without accommodations are available at http://wveis.k12.wv.us/nclb/OSEcf/data/Accommod09.cfm?sy=11.
2) State, county and district level public Assessment results for WESTEST 2 and APTA:
District Example – Barbour County: http://wveis.k12.wv.us/nclb/pub/Assessment/avgsch_assess.cfm?sy=11&year=11&cn=002&sn=201 Other districts’ assessment data are available through the main public reporting site: http://wveis.k12.wv.us/nclb/pub/index.cfm . Users must select the county and school of interest and the report labeled “WESTEST2 Assessment Data: School/County/State Data Comparison” to obtain the desired results.
3) State, county and district level public AYP/FAY results for WESTEST 2 and APTA:
District Example: http://wveis.k12.wv.us/nclb/public_eleven/replistd3.cfm?sy=11&year=11&xrep=0&cn=002&school=201&sn=201&coname=BARBOUR&rpage=index.cfm&rptnum=11b11

SPP Template – Part B West Virginia
State Revised February 1, 2012
Part B State Performance Plan: 2005-2012 Page 26 (OMB NO: 1820-0624 / Expiration Date: 2/29/2012)
Select Schools, School List, School Name and Sub Group Details to access students with disability AYP results by school. State and County Reports: http://wveis.k12.wv.us/nclb/public_eleven/reptemplate.cfm?cn=999
Discussion of Baseline Data:
West Virginia continues to assess over 95 percent of children with IEPs in the statewide assessments. Achievement results demonstrated only one in every five SWDs (19.9%) was proficient in mathematics and even fewer SWDs (15.9%) were proficient in reading language arts. As discussed in the FFY 2008 APR, a more rigorous WESTEST2 was administered during May 2009. Proficiency rates decreased from 40% in both Mathematics and Reading/Language Arts in comparison to the original WESTEST and APTA to 28.6% and 24.2% in mathematics and Reading/Language Arts, respectively, in 2008-2009 with administration of the WESTEST2 and APTA. In May 2010, higher cut scores for proficiency on the WESTEST2 were introduced to align statewide proficiency levels with National Assessment of Educational Progress (NAEP) results. In 2010, the WVDE worked with national TAC experts, the State Assessment Advisory Committee and CTB to identify statistically sound cut scores that allow transition to more rigorous national and international standards. Using the higher cut scores, proficiency of SWDs on WESTEST2 and APTA was 19.9% and 15.9% in mathematics and Reading/Language Arts for FFY 2009. The significant drop in proficiency levels from FFY 2008 to FFY 2009 is chiefly attributed to a planned increase in the proficiency cut scores in the regular statewide assessment one year after the introduction of the new statewide assessment. A similar drop in mathematics and Reading/Language Arts proficiency levels was observed in the ALL group as well as the other subgroups reported under ESEA in West Virginia. Any growth observed in future years is likely to be both statistically and clinically significant given the rigorous nature of the assessment and the cut scores.
FFY Measurable and Rigorous Target for Original WESTEST
Revised February 1, 2007
2005 (2005-2006)
A. Nine districts (16.6%) will make AYP for the students with disabilities subgroup. B. Maintain participation rate of 95% or higher C. Reading – Increase 5.6% to 42.1%
Math – Increase 5.8% to 41.1%
2006 (2006-2007)
A. Fifteen districts ( 27.7%) will make AYP for the students with disabilities subgroup B. Maintain participation rate of 95% or higher C. Reading - Increase 6.4% to 48.5%
Math – Increase 6.6% to 47.7%
2007 (2007-2008)
A. Twenty-one districts (38.8%) will make AYP for the students with disabilities subgroup.
B. Maintain participation rate of 95% or higher C. Reading - Increase 7.3% to 55.8% Math – Increase 7.1% to 54.8%
2008 (2008-2009)
A. Twenty-seven districts (50%) will make AYP for the students with disabilities subgroup.
B. Maintain participation rate of 95% or higher C. Reading - Increase 7.4% to 63.2% Math - Increase 7.2 to 62.0%
2009 (2009-2010)
A. Thirty-two districts (59.2%) will make AYP for the students with disabilities subgroup. B. Maintain participation rate of 95% or higher

SPP Template – Part B West Virginia
State Revised February 1, 2012
Part B State Performance Plan: 2005-2012 Page 27 (OMB NO: 1820-0624 / Expiration Date: 2/29/2012)
C. Reading - Increase 7.1 % to 70.3% Math - Increase 6.5% to 68.5%
Year
Measurable and Rigorous Targets for WESTEST 2 Revised February 1, 2011
3a: AYP for disability subgroup targets
3b: Participation Rate
3c: RLA targets 3c: Mathematics targets
FFY 2010 (2010-2011)
9 districts will make AYP
95% 17.9% 21.9%
FFY 2011 (2011-2012)
9 districts will make AYP
95% 19.9% 23.9%
FFY 2012 (2012-2013)
9 districts will make AYP
95% 21.9% 25.9%
Improvement Activities/Timelines/Resources:
Improvement Activity Timeline Resources Status
3.1 Provide targeted technical assistance to districts identified as not meeting or in danger of not meeting state targets based on evaluation of data provided by WVDE in order to improve performance on this indicator.
2005-2013 WVDE RESA
Active Revised 2011
3.2 / 3.3 / 3.4 Provide information on evidence based practices and strategies for improving performance on this indicator including three tiered support system, which addresses the academic and behavioral needs of all students; Center for Early Literacy Learning Toolkits; effective co-teaching practices; visual phonics..
2005-2013 WVDE RESA
Active Revised 2011
3.5 Support through the Autism Project development of services and programs to increase school districts’ capacity to serve students with Autism Spectrum Disorder (ASD).
2011-2013 WVDE Autism Training Center
New 2011
3.6 Provide training and professional development for development and implementation of improvement plans.
2011-2013 WVDE RESA
New 2011
3.7 Provide professional development on accommodations and modifications to improve the achievement of students of students with disabilities.
2005-2013 WVDE Active Revised 2011
3.8 Provide professional development on Phonemic Awareness through the WVDE Intensive Phonological Awareness Project
2005-2013 WVDE Active

SPP Template – Part B West Virginia
State Revised February 1, 2012
Part B State Performance Plan: 2005-2012 Page 28 (OMB NO: 1820-0624 / Expiration Date: 2/29/2012)
(IPAP).
3.9 Support development of services and programs to increase school districts’ capacity to serve students with sensory impairments.
2005-2013 WVDE Marshall University
Active Revised 2011
3.10 Provide professional development on formative benchmark assessments and/or instructional tools.
2008-2013 WVDE OSP Active
5.6 Develop, implement and train on online Standards Based IEPs to promote achievement of SWDs.
2008-2013 WVDE
Active
5.8 Provide professional development through the Special Education Technology Integration Specialist (SE-TIS) initiative.
2008-2013 WVDE Active, Revised 2011
5.9 Provide professional development on eaching and Technology for Students with Significant Disabilities (T1) Project.
2009-2013 WVDE
Active Revised 2011

SPP Template – Part B West Virginia
State Revised February 1, 2012
Part B State Performance Plan: 2005-2012 Page 29 (OMB NO: 1820-0624 / Expiration Date: 2/29/2012)
Part B State Performance Plan (SPP) for 2005-2012
Overview of the State Performance Plan Development:
See Indicator 1 (The following items are to be completed for each monitoring priority/indicator.)
Monitoring Priority: FAPE in the LRE
Indicator 4A: Rates of suspension and expulsion: Percent of districts that have a significant discrepancy in the rate of suspensions and expulsions of greater than 10 days in a school year for children with IEPs (20 U.S.C. 1416(a)(3)(A); 1412(a)(22))
Measurement: Percent = [(# of districts that have a significant discrepancy in the rates of suspensions and expulsions for greater than 10 days in a school year of children with IEPs) divided by the (# of districts in the State)] times 100. Include State’s definition of “significant discrepancy”: A significant discrepancy for Indicator 4A is defined as two times the WV State rate (i.e., 3.28%) for students with IEPs suspended or expelled greater than 10 days based upon the 2009-2010, 618 discipline data.
Overview of Issue/Description of System or Process: Requirements governing suspension and expulsion of all students are found in WV Code §18A -5-1A Safe Schools Act, which provides disciplinary actions may not conflict with IDEA or State Board policy. Policy 2419: Regulations for the Education of Students with Exceptionalities outlines the procedural safeguards required for removal from school of a student with a disability, paralleling IDEA 2004. Policy 4373: Student Code of Conduct applies to all students. The principal has authority to suspend a student or to recommend expulsion to the district Board of Education, in accordance with the above statutes, policies and regulations. The West Virginia Education Information System (WVEIS) contains a discipline module for maintaining individual student records at the school level. Each disciplinary offense, including suspensions and expulsions, is recorded by the school administrator or designee with the offense, the action and the number of days for the disciplinary action. The disciplinary records and all individual student demographic information, including race/ethnicity, are then collected at the end of each school year for IDEA 2004, Section 618 Table 5 reporting and for use in the State Performance Plan and Annual Performance Report.
Definition of Significant Discrepancy and Methodology WV has revised its definition of a Significant Discrepancy within the current Indicator 4A in accordance with OSEP guidance released in August and September 2011. Following submission of the FFY 2009 APR, West Virginia was informed by OSEP that its methodology for calculating significant discrepancy for Indicator 4B needed revision. The Data Accountability Center (DAC) released a guidance document and provided a session at the OSEP Mega Leadership Conference in August 2011 regarding recommended options for calculating significant discrepancy. Additionally, West Virginia received specific direct technical assistance via phone conference. The OSP data manager presented the issue to the West Virginia Advisory Council for the Education of Exceptional Children (WVACEEC) at its December 2011
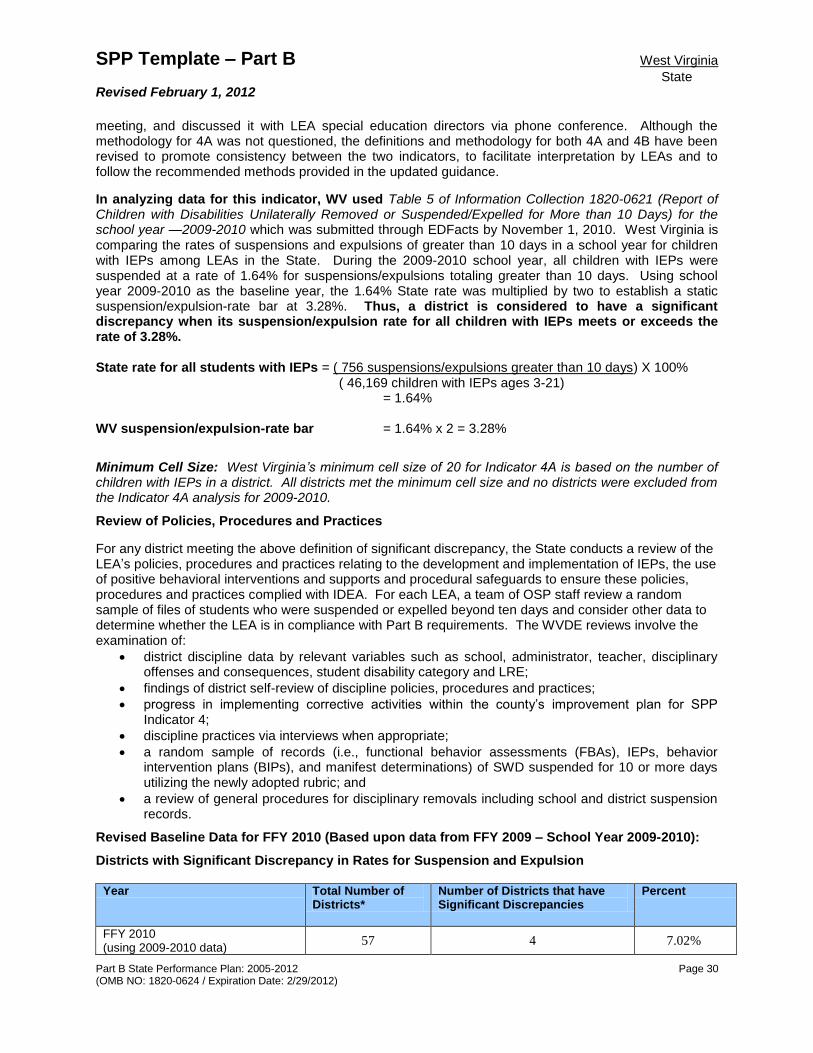
SPP Template – Part B West Virginia
State Revised February 1, 2012
Part B State Performance Plan: 2005-2012 Page 30 (OMB NO: 1820-0624 / Expiration Date: 2/29/2012)
meeting, and discussed it with LEA special education directors via phone conference. Although the methodology for 4A was not questioned, the definitions and methodology for both 4A and 4B have been revised to promote consistency between the two indicators, to facilitate interpretation by LEAs and to follow the recommended methods provided in the updated guidance.
In analyzing data for this indicator, WV used Table 5 of Information Collection 1820-0621 (Report of Children with Disabilities Unilaterally Removed or Suspended/Expelled for More than 10 Days) for the school year —2009-2010 which was submitted through EDFacts by November 1, 2010. West Virginia is comparing the rates of suspensions and expulsions of greater than 10 days in a school year for children with IEPs among LEAs in the State. During the 2009-2010 school year, all children with IEPs were suspended at a rate of 1.64% for suspensions/expulsions totaling greater than 10 days. Using school year 2009-2010 as the baseline year, the 1.64% State rate was multiplied by two to establish a static suspension/expulsion-rate bar at 3.28%. Thus, a district is considered to have a significant discrepancy when its suspension/expulsion rate for all children with IEPs meets or exceeds the rate of 3.28%. State rate for all students with IEPs = ( 756 suspensions/expulsions greater than 10 days) X 100% ( 46,169 children with IEPs ages 3-21) = 1.64% WV suspension/expulsion-rate bar = 1.64% x 2 = 3.28%
Minimum Cell Size: West Virginia’s minimum cell size of 20 for Indicator 4A is based on the number of children with IEPs in a district. All districts met the minimum cell size and no districts were excluded from the Indicator 4A analysis for 2009-2010.
Review of Policies, Procedures and Practices
For any district meeting the above definition of significant discrepancy, the State conducts a review of the LEA’s policies, procedures and practices relating to the development and implementation of IEPs, the use of positive behavioral interventions and supports and procedural safeguards to ensure these policies, procedures and practices complied with IDEA. For each LEA, a team of OSP staff review a random sample of files of students who were suspended or expelled beyond ten days and consider other data to determine whether the LEA is in compliance with Part B requirements. The WVDE reviews involve the examination of:
district discipline data by relevant variables such as school, administrator, teacher, disciplinary offenses and consequences, student disability category and LRE;
findings of district self-review of discipline policies, procedures and practices;
progress in implementing corrective activities within the county’s improvement plan for SPP Indicator 4;
discipline practices via interviews when appropriate;
a random sample of records (i.e., functional behavior assessments (FBAs), IEPs, behavior intervention plans (BIPs), and manifest determinations) of SWD suspended for 10 or more days utilizing the newly adopted rubric; and
a review of general procedures for disciplinary removals including school and district suspension records.
Revised Baseline Data for FFY 2010 (Based upon data from FFY 2009 – School Year 2009-2010):
Districts with Significant Discrepancy in Rates for Suspension and Expulsion
Year Total Number of Districts*
Number of Districts that have Significant Discrepancies
Percent
FFY 2010 (using 2009-2010 data)
57 4 7.02%

SPP Template – Part B West Virginia
State Revised February 1, 2012
Part B State Performance Plan: 2005-2012 Page 31 (OMB NO: 1820-0624 / Expiration Date: 2/29/2012)
Using the previous definition of significant discrepancy, three districts were identified in February 2011. Because West Virginia is changing its definition in accordance with recent OSEP guidance on methodology, two of the previously identified districts no longer meet the definition, while the other district was identified with a significant discrepancy under the new definition as well. Three additional districts have been identified under the new definition. All six districts received a review of policies, procedures and practices and correction of noncompliance as applicable; however, the districts no longer meeting the definition were not included in the target data.
Discussion of Baseline Data:
In FFY 2010, 4 of 57 districts, or 7.02% percent of districts, evidenced a significant discrepancy based on the revised definition by meeting or exceeding the 3.28% state suspension/expulsion bar for students with IEPS. The target of 2 percent was not met, however, the target was set based on the original rather than the revised definition. .Slippage is partially attributed to the revised definitions of Significant Discrepancy and the increased minimum cell size, resulting in no LEAs being excluded. It is important to note, however, a small statewide decrease was observed in the percentage of students with disabilities suspended over ten days in the school year from SY 2008-2009 (1.8%) to SY 2009-2010 (1.64%). Review of Policies, Procedures and Practices for FFY 2010: A total of six districts received a SEA level review of policies, procedures and practices based upon SY 2009-2010 discipline data. As indicated previously, three LEAs had been identified for the review in February 2011. Their reviews were conducted no later than April 30, 2011 and each district received written notification of the identified noncompliance in the implementation of district discipline procedures by June 30, 2011. When the state changed its Indicator 4A definition of a significant discrepancy to align with OSEP guidance, three additional districts were identified in addition to Hampshire County, the previously identified district. Following their SEA level reviews, two of the three new districts were identified with noncompliance, which will require correction consistent with OSEP memo 09-02.
Comparison of Rates for Students with and without Disabilities Based on Unduplicated Count of Students
2004-2005 Students with Disabilities (SWD)
Students without Disabilities (SWOD)
Total Students
a. Suspensions over 10 days 925 2367 3292
b. Enrollment 49,825 229,623 279,457
Suspension Rate: a. divided by b.
1.86% 1.03% 1.18%
Relative Difference: (1.856-1.030)/1.030*100 = 80.23%
2005-2006 Students with Disabilities (SWD)
Students without Disabilities (SWOD)
Total Students
a. Suspensions over 10 days 920 2394 3313
b. Enrollment 49,677 230,111 279,788
Suspension Rate: a. divided by b.
1.9% 1.0% 1.18%
Relative Difference: (1.852-1.040)/1.040*100 = 78.0%
2006-2007
Students with Disabilities (SWD)
Students without Disabilities (SWOD)
Total Students
a. Suspensions over 10 days 834 2514 3348
b. Enrollment 48,980 232,318 281,298
Suspension Rate: a. divided by b.
1.7% 1.1% 1.19%

SPP Template – Part B West Virginia
State Revised February 1, 2012
Part B State Performance Plan: 2005-2012 Page 32 (OMB NO: 1820-0624 / Expiration Date: 2/29/2012)
Relative Difference: (1.702-1.082)/1.1082*100 = 55.9%
2007-2008 Students with Disabilities (SWD)
Students without Disabilities (SWOD)
Total Students
a. Suspensions over 10 days 801 2615 3416
b. Enrollment 47468 234,246 281,714
Suspension Rate: a. divided by b. 1.7% 1.1% 1.2%
Relative Difference: State Relative Difference (1.7%-1.1%)/1.1%*100 = 51.2%
2008-2009 Students with Disabilities (SWD)
Students without Disabilities (SWOD)
Total Students
a. Suspensions over 10 days 825 2726 3551
b. Enrollment 46,833 235,894 282,727
c. Suspension Rate: a. divided by b. 1.8% 1.2%
1.3%
Relative Difference SWD rate - SWOD rate/SWOD rate*100 State Relative Difference (1.8%-1.2%)/1.2%*100 = 50.0%
2009-2010 Students with Disabilities (SWD)
a. Suspensions over 10 days 756
b. Enrollment 46,169
c. Suspension Rate: a. divided by b. WV State Rate = 1.64%
FFY Measurable and Rigorous Target – Section A
2005 (2005-2006)
A decrease of 4% (from 82% to 78%) in the number of WV’s districts (from 45 to 43) without evidence of a significant discrepancy between students with disabilities (SWD) and non-disabled students will occur.
2006 (2006-2007)
A decrease of 5% (from 87% to 82%) in the number of WV’s districts (from 48 to 45) without evidence of a significant discrepancy between SWD and non-disabled students will occur.
2007 (2007-2008)
A decrease of 4% (from 91% to 87%) in the number of WV’s districts (from 50 to 48) without evidence of a significant discrepancy between SWD and students without disabilities will occur
2008 (using 2007-2008)
Required data lag begins per OSEP’s
mandate
A decrease of 4% (from 95% to 91%) in the number of WV’s districts (from 52 to 50) without evidence of a significant discrepancy between SWD and students without disabilities will occur.
2009 (using 2008-2009
data)
No more than five percent of districts will be identified by the State as having significant discrepancies in the rates of suspensions and expulsions for greater than 10 days in a school year of children with IEPs.
2010 (using 2009-2010
data)
No more than two percent of districts will be identified by the State as having significant discrepancies in the rates of suspensions and expulsions for greater than 10 days in a school year of children with IEPs.
2011 (using 2010-2011
data)
No districts (0%) will be identified by the State as having significant discrepancies in the rates of suspensions and expulsions for greater than 10 days in a school year of children with IEPs.
2012 (using 2011-2012
data)
No districts (0%) will be identified by the State as having significant discrepancies in the rates of suspensions and expulsions for greater than 10 days in a school year of children with IEPs.

SPP Template – Part B West Virginia
State Revised February 1, 2012
Part B State Performance Plan: 2005-2012 Page 33 (OMB NO: 1820-0624 / Expiration Date: 2/29/2012)
Improvement Activities/Timelines/Resources:
Improvement Activities
Indicators 4A and 4B
Timeline Resources Status
4.1 Provide targeted technical assistance to districts identified as not meeting state targets based on evaluation of data provided by WVDE in order to improve performance on this indicator.
2005-2013 WVDE RESA
Active Revised 2011
4.2 Support the implementation of a statewide system of School- Wide Positive Behavior Support (SW-PBS) including Early Childhood PBS.
2005-2013 WVDE Active Revised 2011
4.3 Recruit and develop “Models of Success” in Schoolwide Positive Behavior Support to improve programs and services in WV using established criteria.
2011-2013 WVDE LEA
Active Revised 2011
4.4 Develop guidance and professional development resources on discipline procedures and support for appropriate behavior for students with disabilities and disseminate professional development to LEAs and schools.
2012-2013 WVDE Revised April 2012
4.5 Develop guidance and professional development resources on discipline procedures for students with disabilities and disseminate professional development to LEAs and schools.
2011-2013 WVDE Active Revised 2012
4.6 Examine options for identifying significant discrepancies for the next SPP/APR cycle.
2011-2013 WVDE Active Revised 2011
4.7 Implement the Continuous Improvement and Focused Monitoring Process Annual Desk Audit including a review of district policies, procedures and practices when a significant discrepancy in suspension is determined.
2005-2013 WVDE Active
4.8 Continue system level work on mental health issues for school age children.
2005-2013 WVDE LEA
Active Revised 2011
4.9 Develop guidance for using the three tiered intervention process to determine eligibility for students suspected of having a behavior and/or emotional disability.
2008-2013 WVDE RESA LEA
Active Revised 2011
4.10 Provide information on evidence based practices and strategies for improving performance on this indicator.
2011-2013 WVDE New 2011
4.11 Provide training on revised Indicator 4 data analysis and implementation of discipline procedures for students with disabilities.
2011 – 2013
WVDE
New

SPP Template – Part B West Virginia
State Revised February 1, 2012
Part B State Performance Plan: 2005-2012 Page 34 (OMB NO: 1820-0624 / Expiration Date: 2/29/2012)
Part B State Performance Plan (SPP) for 2005-2012
Overview of the State Performance Plan Development:
See Indicator 1 (The following items are to be completed for each monitoring priority/indicator.)
Monitoring Priority: FAPE in the LRE
Indicator 4B: Rates of suspension and expulsion:
Percent of districts that have: (a) a significant discrepancy, by race or ethnicity, in the rate of suspensions and expulsions of greater than 10 days in a school year for children with IEPs; and (b) policies, procedures or practices that contribute to the significant discrepancy and do not comply with requirements relating to the development and implementation of IEPs, the use of positive behavioral interventions and supports, and procedural safeguards.
(20 U.S.C. 1416(a)(3)(A); 1412(a)(22))
Measurement: Percent = [(# of districts that have: (a) a significant discrepancy, by race or ethnicity, in the rates of
suspensions and expulsions of greater than 10 days in a school year of children with IEPs; and (b) policies, procedures or practices that contribute to the significant discrepancy and do not comply with requirements relating to the development and implementation of IEPs, the use of positive behavioral interventions and supports, and procedural safeguards) divided by the (# of districts in the State)] times 100.
Include State’s definition of “significant discrepancy”: A significant discrepancy for Indicator 4B is defined as two times the WV State rate (i.e., 3.28%) for students with IEPs suspended or expelled greater than 10 days based upon the 2009-2010, 618 discipline data.
Overview of Issue/Description of System or Process:
Requirements governing suspension and expulsion of all students are found in WV Code §18A -5-1A Safe Schools Act, which provides disciplinary actions may not conflict with IDEA or State Board policy. Policy 2419: Regulations for the Education of Students with Exceptionalities outlines the procedural safeguards required for removal from school of a student with a disability, paralleling IDEA 2004. Policy 4373: Student Code of Conduct applies to all students. The principal has authority to suspend a student or to recommend expulsion to the district Board of Education, in accordance with the above statutes, policies and regulations.
The West Virginia Education Information System (WVEIS) contains a discipline module for maintaining individual student records at the school level. Each disciplinary offense, including suspensions and expulsions, is recorded by the school administrator or designee with the offense, the action and the number of days for the disciplinary action. The disciplinary records and all individual student demographic information, including race/ethnicity, are then collected at the end of each school year for IDEA 2004, Section 618 Table 5 reporting and for use in the State Performance Plan and Annual Performance Report.

SPP Template – Part B West Virginia
State Revised February 1, 2012
Part B State Performance Plan: 2005-2012 Page 35 (OMB NO: 1820-0624 / Expiration Date: 2/29/2012)
The State must provide a definition of “significant discrepancy” referencing the comparison methodology used and the measure of how the rates were calculated (e.g. rate ratio, rate difference, comparison to a State average, or other).
The State must choose one of the following comparison methodologies to determine whether significant discrepancies, by race or ethnicity, are occurring (34 CFR §300.170(a)):
Compare the rates of expulsions and suspensions of greater than 10 days in a school year for children with IEPs among LEAs in the State; or
The rates of expulsions and suspensions of greater than 10 days in a school year for children with IEPs in each LEA compared to the rates for nondisabled children in the same LEA.
If the State used a minimum “n” size requirement report the number of districts excluded from the calculation of rates as a result of using the minimum ‘n’ size.
If significant discrepancies, by race or ethnicity, occurred, and the district with discrepancies had policies, procedures, or practices that contributed to the significant discrepancy and do not comply with the requirement relating to the development and implementation of IEPs, the use of positive behavioral interventions and supports, and procedural safeguards, the State must describe how it ensured that such policies and procedures and practices were revised to comply with applicable requirements. In reporting on correction of noncompliance, the State must report consistent with OSEP Memorandum 09-02 dated October 17, 2008.
Definition of Significant Discrepancy
The definition of a Significant Discrepancy has been revised within the current Indicator 4B in accordance with OSEP guidance released in August and September 2011. Following submission of the FFY 2009 APR, West Virginia was informed by OSEP that its methodology for calculating significant discrepancy for Indicator 4B needed revision. The Data Accountability Center (DAC) released a guidance document and provided a session at the OSEP Mega Leadership Conference in August 2011 regarding recommended options for calculating significant discrepancy. Additionally, West Virginia received specific direct technical assistance via phone conference. The OSP data manager presented the issue to the West Virginia Advisory Council for the Education of Exceptional Children (WVACEEC) at its December 2011 meeting, and discussed it with LEA special education directors via phone conference. The definition and methodology for both 4B has been revised consistent with the recommended methods provided in the updated guidance.
In analyzing data for this indicator, the State must:
Use the data collected on Table 5 of Information Collection 1820-0621 (Report of Children with Disabilities Unilaterally Removed or Suspended/Expelled for More than 10 Days) for the school year —2009-2010 due, November 1, 2010. Sampling from State’s 618 data is not allowed.
Definition of Significant Discrepancy and Methodology
The rates of suspensions and expulsions of greater than 10 days in a school year for children with IEPs are being compared among LEAs in the State. During the 2009-2010 school year, all children with IEPs were suspended at a rate of 1.64% for suspensions/expulsions totaling greater than 10 days. Using school year 2009-2010 as the baseline year, the 1.64% State rate was multiplied by two to establish a static suspension/expulsion-rate bar at 3.28%. Thus, a district has a significant discrepancy when its suspension/expulsion rate for children with IEPs in any given race/ethnicity category exceeds 3.28%.

SPP Template – Part B West Virginia
State Revised February 1, 2012
Part B State Performance Plan: 2005-2012 Page 36 (OMB NO: 1820-0624 / Expiration Date: 2/29/2012)
State rate for all students with IEPs = ( 756 suspensions/expulsions greater than 10 days) X 100% ( 46,169 children with IEPs ages 3-21) = 1.64% Suspension/expulsion-rate bar = 1.64% x 2 = 3.28% Suspension/expulsion rates by race/ethnicity:
Race/ethnicity category Suspensions/expulsions greater than 10 days
Child Count Percent
American Indian / Native Alaska
1
52
1.92%
Asian 0 154 0.00%
Black / African American 88 2425 3.63%
Hispanic 7 380 1.84%
Two or more races 1 194 0.52%
Native Hawaiian / Pacific Islander
0
2
0.00%
White (non Hispanic) 659 42962 1.53%
Minimum Cell Size: The minimum cell size of 20 for Indicator 4B is based on the number of children with IEPs in a specific race/ethnicity category in a district. All districts met the minimum cell size for at least the white race/ethnicity category. No districts were excluded from the analysis. Review of Policies, Procedures and Practices For any district meeting the above definition of significant discrepancy, the State conducts a review of the LEA’s policies, procedures and practices relating to the development and implementation of IEPs, the use of positive behavioral interventions and supports and procedural safeguards to ensure these policies, procedures and practices complied with IDEA. For each LEA, a team of OSP staff review a random sample of files of students who were suspended or expelled beyond ten days and consider other data to determine whether the LEA is in compliance with Part B requirements. The WVDE reviews involve the examination of:
district discipline data by relevant variables such as school, administrator, teacher, disciplinary offenses and consequences, student disability category and LRE;
findings of district self-review of discipline policies, procedures and practices;
progress in implementing corrective activities within the county’s improvement plan for SPP Indicator 4;
discipline practices via interviews when appropriate;
a random sample of records (i.e., functional behavior assessments (FBAs), IEPs, behavior intervention plans (BIPs), and manifest determinations) of SWD suspended for 10 or more days utilizing the newly adopted rubric; and
a review of general procedures for disciplinary removals including school and district suspension records.
The number of LEAs found in noncompliance divided by the total number of LEAs provides the percentage reported for the Indicator 4B measurement. For any LEA identified with significant discrepancy, the OSP conducts the aforementioned review through desk audit and/or onsite. Prior to the onsite, documentation and data are reviewed, including, as applicable, district discipline policies, student handbooks, existing District Self-Assessment (ADA) improvement plans, if any, and detailed analysis of discipline data. Onsite review includes student file reviews, including IEP reviews and discipline

SPP Template – Part B West Virginia
State Revised February 1, 2012
Part B State Performance Plan: 2005-2012 Page 37 (OMB NO: 1820-0624 / Expiration Date: 2/29/2012)
documentation for students suspended and interviews with school personnel as appropriate regarding practices and procedures.
Revised Baseline Data for FFY 2010 (using 2009-2010 data):
4B(a). LEAs with Significant Discrepancy, by Race or Ethnicity, in Rates of Suspension and Expulsion
4B(a). Districts with Significant Discrepancy, by Race or Ethnicity*, in Rates of Suspension and Expulsion:
Year Total Number of Districts**
Number of Districts that have Significant Discrepancies by Race or Ethnicity
Percent**
FFY 2010 (using 2009-2010 data)
57 15 26.32%
4B(b). Districts with Significant Discrepancy, by Race or Ethnicity, in Rates of Suspensions and Expulsions; and policies, procedures or practices that contribute to the significant discrepancy and do not comply with requirements relating to the development and implementation of IEPs, the use of positive behavioral interventions and supports, and procedural safeguards.
Year Total Number of Districts*
Number of Districts that have Significant Discrepancies, by Race or Ethnicity, and policies, procedures or practices that contribute to the significant discrepancy and do not comply with requirements relating to the development and implementation of IEPs, the use of positive behavioral interventions and supports, and procedural safeguards.
Percent**
FFY 2010 (using 2009-2010 data)
57 12 21.05%
Discussion of Baseline Data:
Approximately, one quarter (26.3%) of West Virginia’s 57 districts met or exceeded the State bar of 3.28% for one or more race/ethnicities. Ten districts had significant discrepancies for the Black race/ethnicity category whereas one district was found to have significant discrepancies for both the Black and Hispanic race/ethnicities. The remaining four districts were identified with significant discrepancies in the White race/ethnicity category.
Review of Policies, Procedures, and Practices (using 2009-2010 data): If any districts are identified with significant discrepancies: Fifteen districts received a SEA level review of policies, procedures and practices based upon SY 2009-2010 discipline data for Indicator 4B. Reviews were conducted prior to the April 2012 clarification period per OSEP’s requirements.
Review Process: The SEA review of the LEAs identified with significant discrepancies by race/ethnicity specifically involved the examination of:

SPP Template – Part B West Virginia
State Revised February 1, 2012
Part B State Performance Plan: 2005-2012 Page 38 (OMB NO: 1820-0624 / Expiration Date: 2/29/2012)
findings of district self-review of discipline policies, procedures and practices;
progress in implementing corrective activities within the county’s improvement plan for SPP Indicator 4/CSADA Indicator 1.9;
discipline practices via interviews when appropriate;
a random sample of records (i.e., evaluations, IEPs, behavior intervention plans, and manifest determinations) of SWD suspended for 10 or more days utilizing the newly adopted rubric;
a review of general procedures for disciplinary removals including school and district suspension records; and data analyses at the district level to compare the suspension type, frequency and duration of all students with IEPs as compared to students with IEPs in the race/ethnicity category exceeding the state-bar.
Results of State’s Review of LEA’s policies, procedures and practices based on 2009-2010 Data: Three of the fifteen districts identified as having a significant discrepancy were found to have appropriate policies, procedures and practices. The other twelve districts were found to have noncompliance relating to the development and implementation of IEPs, the use of positive behavioral interventions and supports and procedural safeguards to ensure these policies, procedures and practices complied with IDEA.
Findings of noncompliance were primarily the result of the LEAs failure to: 1) determine, on a case-by-case basis, if the student’s suspension constituted a change of placement; 2) record discipline and attendance data accurately in WVEIS; 3) adequately address behavior through the use of positive behavior supports, interventions and strategies; or 4) revise an IEP and behavior intervention plan (BIP) to address the functional behavior assessment (FBA) results for the reasons for which students were assigned to long term suspensions.
The specific findings were issued to each district in writing. Districts are required to correct student specific noncompliance and to demonstrate implementation of specific regulatory requirements as soon as possible but no later than one year. Because all districts have adopted Policy 2419 as their local procedures, revisions to policy and procedures was not required. Rather, appropriate implementation of existing policies and procedures was required. The OSP will review district improvement plans and/or corrective action plans by May 15, 2012. Subsequent to district training, the OSP will request an updated sample of student records and determine whether the districts have corrected individual student noncompliances and if districts are correctly implementing regulatory requirements within one year of the initial notification of noncompliances. The OSP will report on correction of noncompliance in the FFY 2011 and 2012 APRs.
FFY Measurable and Rigorous Target
2009 (using
2008-2009 data)
0% Percent of districts will have: (a) a significant discrepancy, by race or ethnicity, in the rate of suspensions and expulsions of greater than 10 days in a school year for children with IEPs; and (b) policies, procedures or practices that contribute to the significant discrepancy and do not comply with requirements relating to the development and implementation of IEPs, the use of positive behavioral interventions and supports, and procedural safeguards.
2010 (using 2009-2010 data)
0% Percent of districts will have: (a) a significant discrepancy, by race or ethnicity, in the rate of suspensions and expulsions of greater than 10 days in a school year for children with IEPs; and (b) policies, procedures or practices that contribute to the significant discrepancy and do not comply with requirements relating to the development and implementation of IEPs, the use of positive behavioral interventions and supports, and procedural safeguards.
2011 (using 2010-2011 data)
0% Percent of districts will have: (a) a significant discrepancy, by race or ethnicity, in the rate of suspensions and expulsions of greater than 10 days in a school year for children with IEPs; and (b) policies, procedures or practices that contribute to the significant discrepancy and do not comply with requirements relating to the development and implementation of IEPs, the use of positive behavioral interventions and supports, and procedural safeguards.
2012 0% Percent of districts will have: (a) a significant discrepancy, by race or ethnicity, in the

SPP Template – Part B West Virginia
State Revised February 1, 2012
Part B State Performance Plan: 2005-2012 Page 39 (OMB NO: 1820-0624 / Expiration Date: 2/29/2012)
(using 2011-2012 data)
rate of suspensions and expulsions of greater than 10 days in a school year for children with IEPs; and (b) policies, procedures or practices that contribute to the significant discrepancy and do not comply with requirements relating to the development and implementation of IEPs, the use of positive behavioral interventions and supports, and procedural safeguards.
2013 (using 2012-2013 data)
0% Percent of districts will have: (a) a significant discrepancy, by race or ethnicity, in the rate of suspensions and expulsions of greater than 10 days in a school year for children with IEPs; and (b) policies, procedures or practices that contribute to the significant discrepancy and do not comply with requirements relating to the development and implementation of IEPs, the use of positive behavioral interventions and supports, and procedural safeguards.
Improvement Activities/Timelines/Resources:
Improvement Activities
Indicators 4A and 4B
Timeline Resources Status
4.1 Provide targeted technical assistance to districts identified as not meeting state targets based on evaluation of data provided by WVDE in order to improve performance on this indicator.
2005-2013 WVDE RESA
Active Revised 2011
4.2 Support the implementation of a statewide system of School Wide Positive Behavior Support (SW-PBS) including Early Childhood PBS.
2005-2013 WVDE Active Revised 2011
4.3 Recruit and develop “Models of Success” in Schoolwide Positive Behavior Support to improve programs and services in WV using established criteria.
2011-2013 WVDE LEA
Active Revised 2011
4.4 Develop guidance and professional development resources on discipline procedures and support for appropriate behavior for students with disabilities and disseminate professional development to LEAs and schools.
2012-2013 WVDE Revised April 2012
4.5 Develop guidance and professional development resources on discipline procedures for students with disabilities and disseminate professional development to LEAs and schools.
2011-2013 WVDE Active Revised 2012
4.6 Examine options for identifying significant discrepancies for the next SPP/APR cycle.
2011-2013 WVDE Active Revised 2011
4.7 Implement the Continuous Improvement and Focused Monitoring Process Annual Desk Audit including a review of district policies, procedures and practices when a significant discrepancy in suspension is determined.
2005-2013 WVDE Active
4.8 Continue system level work on mental health issues for school age children.
2005-2013 WVDE LEA
Active Revised 2011
4.9 Develop guidance for using the three tiered intervention process to determine eligibility for students suspected of having a
2008-2013 WVDE RESA LEA
Active Revised 2011

SPP Template – Part B West Virginia
State Revised February 1, 2012
Part B State Performance Plan: 2005-2012 Page 40 (OMB NO: 1820-0624 / Expiration Date: 2/29/2012)
behavior and/or emotional disability.
4.10 Provide information on evidence based practices and strategies for improving performance on this indicator.
2011-2013 WVDE New 2011
4.11 Provide training on the revised Indicator 4 data analysis and review process.
2011 – 2013 WVDE
New 2012

SPP Template – Part B West Virginia
State Revised February 1, 2012
Part B State Performance Plan: 2005-2012 Page 41 (OMB NO: 1820-0624 / Expiration Date: 2/29/2012)
Part B State Performance Plan (SPP) for 2005-2012
Overview of the State Performance Plan Development:
See Indicator 1.
(The following items are to be completed for each monitoring priority/indicator.)
Monitoring Priority: FAPE in the LRE
Indicator 5: Percent of children with IEPs aged 6 through 21 served:
A. Inside the regular class 80% or more of the day;
B. Inside the regular class less than 40% of the day; and
C. In separate schools, residential facilities, or homebound/hospital placements.
(20 U.S.C. 1416(a)(3)(A))
Measurement:
Measurement:
A. Percent = [(# of children with IEPs served inside the regular class 80% or more of the day) divided by the (total # of students aged 6 through 21 with IEPs)] times 100.
B. Percent = [(# of children with IEPs served inside the regular class less than 40% of the day) divided by the (total # of students aged 6 through 21 with IEPs)] times 100.
C. Percent = [(# of children with IEPs served in separate schools, residential facilities, or homebound/hospital placements) divided by the (total # of students aged 6 through 21 with IEPs)] times 100.
Overview of Issue/Description of System or Process
West Virginia’s commitment to inclusive education is long-standing. West Virginia educates over 98 percent of its students with disabilities in the 55 local school districts and in public regular schools. West Virginia continues to provide most special education services in inclusive settings to the extent appropriate to meet individual needs. Requirements for placement in the least restrictive environment are set forth in Policy 2419: Regulations for the Education Students with Exceptionalities, which includes definitions of placement options paralleling the OSEP definitions. The WVDE’s Office of Institutional Education Programs administers educational programs for all students within state correctional facilities and other facilities requiring placement by a state agency or court, including a small number of students with disabilities. West Virginia Schools for the Deaf and the Blind is a separate facility serving those populations. Additionally, students are provided special education services when they are placed by Department of Health and Human Resources in out-of-state facilities.
All students are expected to have access to the general curriculum, which is defined in the Policy 2520: Content Standards and Objectives for West Virginia Schools (CSOs). All students with disabilities are required to participate in statewide assessment, with 91.0 percent participating in assessment of the CSOs on grade level standards and 8.9 percent participating in alternate assessment on alternate academic achievement standards linked to grade level standards in 2005.

SPP Template – Part B West Virginia
State Revised February 1, 2012
Part B State Performance Plan: 2005-2012 Page 42 (OMB NO: 1820-0624 / Expiration Date: 2/29/2012)
Within the Continuous Improvement and Focused Monitoring System (CIFMS) Section 618 educational environment data are analyzed and reviewed annually to ensure students with disabilities are educated within the least restrictive environment. LEAs address their own progress through improvement plans. WVDE verifies LEA progress on the LRE indicator during on-site visits.
Baseline Data for FFY 2004 (2004-2005)
Environment
Number Percentage
A. Regular Education: Full - Time (RE:FT) SPECIAL EDUCATION OUTSIDE REGULAR CLASS LESS THAN 21% OF THE DAY 24830 55.5%
Regular Education: Part-Time (RE:PT) SPECIAL EDUCATION OUTSIDE REGULAR CLASS AT LEAST 21% OF DAY AND NO MORE THAN 60% OF DAY 14899 33.3%
B. Special Education: Separate Class (SE:SC) SPECIAL EDUCATION OUTSIDE REGULAR CLASS MORE THAN 60% OF DAY 4290 9.6%
C. Facilities/Out-of-School Environment Includes: PUBLIC SEPARATE SCHOOL PRIVATE SEPARATE SCHOOL PUBLIC RESIDENTIAL FACILITY PRIVATE RESIDENTIAL FACILITY HOMEBOUND/HOSPITAL (OSE)
699 1.6%
TOTAL 44718 100%
Educational Environments Students with
Disabilities, Ages 6-21
December 1, 2004
0
5000
10000
15000
20000
25000
30000
RE:F
T
RE:P
T
SE:SC
Facilitie
s/O
SE
Nu
mb
er

SPP Template – Part B West Virginia
State Revised February 1, 2012
Part B State Performance Plan: 2005-2012 Page 43 (OMB NO: 1820-0624 / Expiration Date: 2/29/2012)
Discussion of Baseline Data:
In conjunction with the December 1 child count educational environment data are submitted by each school district. In 2004-2005, 55.5 percent of students with disabilities ages 6-21 were in Regular Education: Full-Time (removed from the regular education setting less than 21 % of the school day). This is an increase of 4.6 percent compared to 2003-2004. The percentage reflected for the Special Education: Separate Class (SE: SC) placement was 9.63, a decrease from 10 percent in 2003-2004. Separate class placement is defined as removed from the regular education setting more than 60 percent of the school day. The combined facilities and homebound/hospital placement includes students served in public or private schools, residential placements and homebound/ hospital placement, which in West Virginia is called Special Education: Out-of-School Environment. In 2004-2005, 1.6 percent of students with disabilities ages 6-21 were served in these environments.
FFY Measurable and Rigorous Target
2005 (2005-2006)
A. The percent of students with IEPs ages 6 through 21 inside the regular class 80% or more of the day will increase by 1% (56.5%).
B. The percent of students with IEPs ages 6 through 21 inside the regular class less than 40% of the day will decrease by 1% (8.6%).
C. The percent of students with IEPs ages 6 through 21 served in public or private separate schools, residential placements or homebound or hospital placements will decrease by 0.1% (1.5%).
2006 (2006-2007)
A. The percent of students with IEPs ages 6 through 21 inside the regular class 80% or more of the day will increase by 1% (57.5%).
B. The percent of students with IEPs ages 6 through 21 inside the regular class less than 40% of the day will decrease by 1% (7.6%).
C. The percent of students with IEPs aged 6 through 21 served in public or private separate schools, residential placements or homebound or hospital placements will decrease by 0.1% (1.4%).
2007 (2007-2008)
A. The percent of students with IEPs ages 6 through 21 inside the regular class 80% or more of the day will increase by 1% (58.5%).
B. The percent of students with IEPs ages 6 through 21 inside the regular class less than 40% of the day will decrease by 1% (6.6%).
C. The percent of students with IEPs ages 6 through 21 served in public or private separate schools, residential placements or homebound or hospital placements will decrease by 0.1% (1.3%).
2008
(2008-2009)
A. The percent of students with IEPs ages 6 through 21 inside the regular class 80% or more of the day will increase by 1% (59.5%).
B. The percent of students with IEPs ages 6 through 21 inside the regular class less than 40% of the day will remain at or below 8.0%
C. The percent of students with IEPs ages 6 through 21 served in public or private separate schools, residential placements or homebound or hospital placements will decrease by 0.11% (1.2%).
2009
(2009-2010)
A. The percent of students with IEPs ages 6 through 21 inside the regular class 80% or more of the day will increase by 1% (60.5%).
B. The percent of students with IEPs ages 6 through 21 inside the regular class less than 40% of the day will remain at or below 8.0%
C. The percent of students with IEPs aged 6 through 21 served in public or private separate schools, residential placements or homebound or hospital placements will decrease by 0.11% (1.1%).

SPP Template – Part B West Virginia
State Revised February 1, 2012
Part B State Performance Plan: 2005-2012 Page 44 (OMB NO: 1820-0624 / Expiration Date: 2/29/2012)
FFY Measurable and Rigorous Target
2010
(2010-2011)
A. The percent of students with IEPs ages 6 through 21 inside the regular class 80% or more of the day will increase by 1% (61.5%).
B. The percent of students with IEPs ages 6 through 21 inside the regular class less than 40% of the day will remain at or below 8.0%
C. The percent of students with IEPs ages 6 through 21 served in public or private separate schools, residential placements or homebound or hospital placements will decrease by 0.1% (1.0%).
2011
(2011-2012)
A. The percent of students with IEPs ages 6 through 21 inside the regular class 80% or more of the day will be maintained at or above 61.5%.
B. The percent of students with IEPs ages 6 through 21 inside the regular class less than 40% of the day will remain at or below 8.0%.
C. The percent of students with IEPs ages 6 through 21 served in public or private separate schools, residential placements or homebound or hospital placements will remain at or below 1.0%.
2012
(2012-2013)
A. The percent of students with IEPs ages 6 through 21 inside the regular class 80% or more of the day will be maintained at or above 61.5%.
B. The percent of students with IEPs ages 6 through 21 inside the regular class less than 40% of the day will remain at or below 8.0%
C. The percent of students with IEPs ages 6 through 21 served in public or private separate schools, residential placements or homebound or hospital placements will remain at or below 1.0%.
Improvement Activities/Timelines/Resources
Improvement Activity Timeline Resources Status
5.1 Provide targeted technical assistance to districts identified as not meeting or in danger of not meeting state targets based on evaluation of data provided by WVDE in order to improve performance on this indicator.
2005-2013 WVDE OSEP RESA
Active Revised 2011
5.2 / 5.3 Provide professional development on evidence based instructional strategies for differentiated instruction to promote placement with nondisabled peers to the maximum extent appropriate.
2005-2013 WVDE Active
5.2 / 5.4 Provide professional development on evidence based instructional strategies for three-tiered models to promote placement with nondisabled peers to the maximum extent appropriate.
2005-2013 WVDE RTI Specialists
Active
5.2 / 5.5 Provide professional development on evidence based instructional strategies for co-teaching to promote placement with nondisabled peers to the maximum extent appropriate.
2005-2013 WVDE
Active Revised 2011
5.6 Develop, implement and train on online Standards Based IEPs to promote provision of services with nondisabled peers to the maximum extent appropriate.
2008-2013 WVDE
Active
5.7 Continue to implement and evaluate the Alternate Identification and Reporting (AIR) project.
2008-2013 WVDE Active

SPP Template – Part B West Virginia
State Revised February 1, 2012
Part B State Performance Plan: 2005-2012 Page 45 (OMB NO: 1820-0624 / Expiration Date: 2/29/2012)
Improvement Activity Timeline Resources Status
5.8 Provide professional development through the Special Education Technology Integration Specialist (SE-TIS) initiative.
2008-2013 WVDE Active, Revised 2011
5.9 Provide professional development on Teaching and Technology for Students with Significant Disabilities (T1) Project.
2009-2013 WVDE
Active Revised 2011
5.10 Continue to monitor a sample of Out-of-State facilities annually and coordinate an Interagency Agreement Committee to address out-of-state residential placement issues for students with disabilities placed by DHHR and the court system.
2009-2013 WVDE Active
5.11 LEAs exceeding the SE:SC target of 8% will continue to conduct a procedures and practices review for a random sample of students educated in SE:SC placements.
2005-2013 WVDE Active

SPP Template – Part B West Virginia
State Revised February 1, 2012
Part B State Performance Plan: 2005-2012 Page 46 (OMB NO: 1820-0624 / Expiration Date: 2/29/2012)
NO REPORT REQUIRED
Part B State Performance Plan (SPP) for FFY 2009 (2009-2010)
Overview of the Annual Performance Report Development:
Monitoring Priority: FAPE in the LRE
Indicator 6: Percent of children aged 3 through 5 with IEPs attending a:
A. Regular early childhood program and receiving the majority of special education and related services in the regular early childhood program; and B. Separate special education class, separate school or residential facility.
(20 U.S.C. 1416(a)(3)(A))
Measurement: A. Percent = [(# of children aged 3 through 5 with IEPs attending a regular early childhood program and receiving the majority of special education and related services in the regular early childhood program) divided by the (total # of children aged 3 through 5 with IEPs)] times 100.
B. Percent = [(# of children aged 3 through 5 with IEPs attending a separate special education class, separate school or residential facility) divided by the (total # of children aged 3 through 5 with IEPs)] times 100.

SPP Template – Part B West Virginia
State Revised February 1, 2012
Part B State Performance Plan: 2005-2012 Page 47 (OMB NO: 1820-0624 / Expiration Date: 2/29/2012)
Part B State Performance Plan (SPP) for 2005-2012
Overview of the State Performance Plan Development:
See Indicator 1.
Monitoring Priority: FAPE in the LRE
Indicator 7: Percent of preschool children aged 3 through 5 with IEPs who demonstrate improved:
A. Positive social-emotional skills (including social relationships);
B. Acquisition and use of knowledge and skills (including early language/ communication and early literacy); and
C. Use of appropriate behaviors to meet their needs.
(20 U.S.C. 1416 (a)(3)(A))
Measurement:
Outcomes:
A. Positive social-emotional skills (including social relationships);
B. Acquisition and use of knowledge and skills (including early language/communication and early literacy); and
C. Use of appropriate behaviors to meet their needs.
Progress categories for A, B and C:
a. Percent of preschool children who did not improve functioning = [(# of preschool children who did not improve functioning) divided by (# of preschool children with IEPs assessed)] times 100.
b. Percent of preschool children who improved functioning but not sufficient to move nearer to functioning comparable to same-aged peers = [(# of preschool children who improved functioning but not sufficient to move nearer to functioning comparable to same-aged peers) divided by (# of preschool children with IEPs assessed)] times 100.
c. Percent of preschool children who improved functioning to a level nearer to same-aged peers but did not reach it = [(# of preschool children who improved functioning to a level nearer to same-aged peers but did not reach it) divided by (# of preschool children with IEPs assessed)] times 100.
d. Percent of preschool children who improved functioning to reach a level comparable to same-aged peers = [(# of preschool children who improved functioning to reach a level comparable to same-aged peers) divided by (# of preschool children with IEPs assessed)] times 100.
e. Percent of preschool children who maintained functioning at a level comparable to same-aged peers = [(# of preschool children who maintained functioning at a level comparable to same-aged peers) divided by (# of preschool children with IEPs assessed)] times 100.
Summary Statements for Each of the Three Outcomes:
Summary Statement 1: Of those preschool children who entered the preschool program below age expectations in each Outcome, the percent who substantially increased their rate of growth by the time they turned 6 years of age or exited the program.

SPP Template – Part B West Virginia
State Revised February 1, 2012
Part B State Performance Plan: 2005-2012 Page 48 (OMB NO: 1820-0624 / Expiration Date: 2/29/2012)
Measurement for Summary Statement 1:
Percent = # of preschool children reported in progress category (c) plus # of preschool children reported in category (d) divided by [# of preschool children reported in progress category (a) plus # of preschool children reported in progress category (b) plus # of preschool children reported in progress category (c) plus # of preschool children reported in progress category (d)] times 100.
Summary Statement 2: The percent of preschool children who were functioning within age expectations in each Outcome by the time they turned 6 years of age or exited the program.
Measurement for Summary Statement 2: Percent = # of preschool children reported in progress category (d) plus [# of preschool children reported in progress category (e) divided by the total # of preschool children reported in progress categories (a) + (b) + (c) + (d) + (e)] times 100.
Overview of Issue/Description of System or Process:
West Virginia’s Section 619 preschool outcomes measurement is part of statewide process for improving results for all children. Originally, this initiative was called the Making a Difference initiative; however, in recent years this initiative has become part of the Universal Pre-k system and been rolled into the efforts for improving instruction and results for all young children. The system continues to include all the core partners: Head Start, Child Care, West Virginia Birth to Three (Part C), private for profits and non-profits and faith based programs. In Policy 2525: Universal Pre-k, West Virginia’s Universal Access to a Quality Early Education System, WVDE in collaboration with community programs serving young children has built the foundation for quality early childhood programs. Adoption of a Mandatory Curriculum
In 2004, all counties were required to adopt a mandatory curricula framework to implement the early childhood Early Learning Standards Frameworks. An assessment component was mandated. Forty-nine of 55 county school districts adopted and are using the Creative Curriculum for Preschool, a curriculum published by Teaching Strategies, Inc. All fifty-five counties are utilizing the Creative Curriculum on-line system for outcomes assessment data collection and reporting.
Population of Children to be included in the Assessment West Virginia’s system is designed to provide ongoing assessment and outcome data for all children served through the Universal Pre-k system. Approximately 10,000 children are served through this system. The core participating partners in the system are Section 619 Preschool Special Education, Head Start Collaborative Sites, Title I preschool and child care collaborative pre-k sites. All children, including all children with disabilities ages 3 through 5, are assessed and/or reported through the Teaching Strategies, Inc./Creative Curriculum assessment and reporting system.
Assessment/Measurement Tool
Teaching Strategies, Inc. has incorporated into the web-based on-going curriculum and assessment system the capacity for states to report the national early childhood outcomes data directly from data teachers regularly enter into the system. The system streamlines the important and time-intensive work of linking curriculum, assessment, communication and reporting. Teachers build the electronic portfolio for each child. The electronic portfolio is based on the teacher’s record of on-going observations and assessments. The information entered into the electronic portfolio for the child can be used to generate a variety of reports for teachers, administrators and state-level reporting. The state-level report uses the electronic portfolio assessment information collected at specific points throughout the year to determine and report baseline and student progress data relative to the three required early childhood outcomes (positive social-emotional skills, including social relationships; acquisition and use of knowledge and skills, including early language/communication and early literacy; and use of appropriate behaviors to

SPP Template – Part B West Virginia
State Revised February 1, 2012
Part B State Performance Plan: 2005-2012 Page 49 (OMB NO: 1820-0624 / Expiration Date: 2/29/2012)
meet their needs). The Creative Curriculum Developmental Continuum results then are converted into the corresponding performance levels on the seven-point Early Childhood Outcomes Center (ECO) Child Outcomes Summary Form (COSF).
In addition, Teaching Strategies, Inc. has developed and added components to their data system that will allow districts and the speech language pathologists not using Creative Curriculum to summarize data from their assessments using the COSF and enter the data into the Creative Curriculum system. With all assessments thus converted into the COSF scale, all children’s results can be combined for determining baseline and student progress data for APR reporting and analysis of program effectiveness, providing an accountability system for all preschool children within the state. Comparable to Same Age Peer Definition West Virginia has adopted the definition developed by the national Early Childhood Outcomes Center for “comparable to same-aged peers”. Teaching Strategies’ web-based program translates and coverts the data from the Creative Curriculum assessment into the seven point scale of the COSF and allows districts using other assessments summarized by the COSF to enter their data. Scores of 6 or 7 reflect age-expected development. A “7” is assigned to a child showing age-appropriate functioning for whom there are no concerns related to the outcome, and “6” is assigned to a child whose functioning is generally considered age-appropriate but for whom there are some concerns. Children who are rated 6 or 7 at both entry and exit are children who maintained functioning at a level comparable to same age peers. Children scoring below 6 at entry who attain 6 or 7 upon exit have improved functioning to that of same-aged peers. Personnel Conducting Assessments The primary individual responsible for on-going assessment in the classroom is the teacher, or, the service provider, such as a speech therapist, with the assistance of the IEP team if the child is receiving speech services only and is not in a classroom. The teacher is responsible for planning the child’s assessment and collaborating with other team members such as therapists, child care providers, classroom assistants and family members. Team members may also enter progress data into the web-based system for children through a team central approach. A comprehensive plan for professional development is incorporated into the system. Timelines
Children are assessed and progress ratings are completed as part of the online assessment system. Assessment checkpoints are as follows.
Check point Observation and Documentation
Ratings Completed Online Data Finalized
Fall August 26 (or first day of program)
September 28 – October 28
October 29
Winter October 30 January 10 – February 13
February 14
Spring February 15 April 29 - May 30 May 31
Summer (Year round programming)
June 2 July 10 – August 13 August 14
Children entering Mid Year
On entry 6 to 10 weeks from date of entry then proceed with checkpoint season
Nearest checkpoint

SPP Template – Part B West Virginia
State Revised February 1, 2012
Part B State Performance Plan: 2005-2012 Page 50 (OMB NO: 1820-0624 / Expiration Date: 2/29/2012)
Reporting
Because online recording of observations and assessment ratings is required in the Universal Pre-k system, a variety of reports may be generated. The system can generate detailed, consolidated group progress reports that inform teachers and administrators and fulfill state and federal reporting requirements in the formats necessary. The system can combine assessment information for groups of children to illustrate progress over time, provide instant information about each classroom at a given time, show progress/developmental gains, compare program information and create concise executive summary reports. Additionally, for the purposes of reporting to OSEP, the system analyzes data according to the five OSEP progress categories.
Quality Assurance
West Virginia is committed to professional development as the key to reliable and valid use of assessments for outcomes data. Professional development opportunities include direct training on assessment systems, linking content standards and curriculum, effective practices including taking observation notes, documentation, results-driven instructional planning and the use of data to plan teaching approaches in the classroom. Additionally, WVDE employed a coordinator to address quality and professional development for early childhood outcomes system.
Baseline Data for FFY 2009 (2009-2010):
Baseline has been reset based on 2009-2010 outcome data per the cut score changes noted in the Revisions to the Assessment Cut Score discussion below. Please note, however, data in the FFY 2009 APR for Indicator 7 were compared against the targets established in the FFY 2008 APR.
Improvement data for all students with IEPs who met the entry and exit criteria for data collection are reported below.
Outcome A: Positive social-emotional skills (including social relationships)
OSEP Progress Categories Number of Children
Percent of Children
a. children who did not improve functioning 131 5%
b. children who improved functioning, but not sufficiently to move nearer to functioning comparable to same-aged peers
152 6%
c. children who improved functioning to a level nearer to same-aged peers but did not reach it
204 8%
d. children who improved functioning to reach a level comparable to same-aged peers 597 22%
e. children who maintained functioning at a level comparable to same-aged peers 1599 60%
Total with IEPs 2683 100%
Outcome B: Acquiring and using knowledge and skills
OSEP Progress Categories Number of Children
Percent of Children
a. children who did not improve functioning 229 9%
b. children who improved functioning, but not sufficiently to move nearer to functioning comparable to same-aged peers
326 12%

SPP Template – Part B West Virginia
State Revised February 1, 2012
Part B State Performance Plan: 2005-2012 Page 51 (OMB NO: 1820-0624 / Expiration Date: 2/29/2012)
OSEP Progress Categories Number of Children
Percent of Children
c. children who improved functioning to a level nearer to same-aged peers but did not reach it
404 15%
d. children who improved functioning to reach a level comparable to same-aged peers 700 26%
e. children who maintained functioning at a level comparable to same-aged peers 1024 38%
Total with IEPs 2683 100%
Outcome C: Taking appropriate action to meet needs
OSEP Progress Categories Number of Children
Percent of Children
a. children who did not improve functioning 134 5%
b. children who improved functioning, but not sufficiently to move nearer to functioning comparable to same-aged peers
146 5%
c. children who improved functioning to a level nearer to same-aged peers but did not reach it
177 7%
d. children who improved functioning to reach a level comparable to same-aged peers 540 20%
e. children who maintained functioning at a level comparable to same-aged peers 1686 63%
Total with IEPs 2683 100%
Summary Statements
Baseline Data Reset based upon 2009-2010 outcomes
Outcome A Positive Social Emotional Skills (including Social Relationships)
Outcome B Acquisition and Use of Knowledge and Skills (including early language/communication and early literacy)
Outcome C Use of Appropriate Behaviors to Meet Needs
Of those children who entered or exited the program below age expectations in Outcome domain, the percent who substantially increased their rate of growth by the time they turned 6 years of age or exited the program
74% 67% 72%
The percent of children who were functioning within age expectations in Outcome domain by the time they turned 6 years of age or exited the program
82% 64% 83%

SPP Template – Part B West Virginia
State Revised February 1, 2012
Part B State Performance Plan: 2005-2012 Page 52 (OMB NO: 1820-0624 / Expiration Date: 2/29/2012)
Discussion of Baseline Data:
The data collection includes children who entered 2006-2007, 2007-2008 or 2008-2009 and exited the program in 2009-2010. Children must have been in the program at least six months. All children whose services were initiated during this time in the districts are included in the system. Each school year the number of children participating in the system increase so the data reported continues to become more representative of children served in the state. All districts began using the Creative Curriculum on line system August 2006. In 2009-2010, progress data were collected for 2,681 children; of that number 66% were males and 34% were females. The data incorporated 390 classrooms from fifty-five school districts. Twenty-one percent were 3 – 4 years of age and 79% were 4 – 5 years of age. Among the 2681 assessed, the proportion of children reported as African American was 4%. This reflects an additional 176 children and an additional 157 classrooms over 2008-09. The percentages of children in the progress categories demonstrated an increase. The data include children who received services for two or three years depending on the age of entry of the child. The data exclude those children who have been in program for fewer than six months.
Of those children who entered or exited the program below age expectations, the percent who substantially increased their rate of growth by the time they turned 6 years of age or exited the program was 74 percent in the social-emotional domain; 67 percent in the acquisition and use of knowledge and skills; and 72% in the use of appropriate behaviors.
Overall, 82 percent of children functioned within age expected range in the social-emotional domain (Outcome A) by the time they turned 6 years of age or exited the program, as compared to 64 and 83 percent, respectively, in Outcome Areas B (Acquisition and Use of Knowledge and Skills) and C (Use of Appropriate Behaviors to Meet Needs).
Overall, the FFY 2009 baseline data is significantly lower than outcome data presented in the FFY 2008 SPP. The lower scores are believed to be largely attributed to the cut score changes.
Revisions to the Assessment Cut Scores Over the past three years, the states using the publishers’ system for reporting progress of young children have noted a larger than expected proportion of typically developing children. A review of the data found children rated a 6 or a 7 were performing below what would be considered typical development for their age. . All states using the seven point scale were experiencing higher than expected numbers of children as performing at a typical level. Teaching Strategies and Early Childhood Outcomes Center partnered to review the original conversion process built within the on-line system. A set of methods were developed to revise and validate the new process for the cut-scores are used for the conversion within the on-line assessment system. The analysis of this process found children with and without disabilities were used in the sample from the original research. The assessment data was used to estimate age expected functioning for the children. The age expected performance was used to benchmark either the seven or the nine points along a range of typical development for each age band. A sample of children with disabilities performance was compared to the benchmarks. The validation of the new scores was based on the previous research and the federally reported state data. As a result of the new cut scores in the system children must have higher scores to be rated as performing similar to same age peers within the system. The new cut scores ensure that the data being reported are a more accurate representation of the status of the children. It does change the summary statements data used to establish targets. It does not reflect an actual decrease in the performance of the children from FFY 2008 to FFY 2009; only a change in the measurement. to the data more accurately report PreK outcomes. The data for the progress categories indicate a better picture of the children falling

SPP Template – Part B West Virginia
State Revised February 1, 2012
Part B State Performance Plan: 2005-2012 Page 53 (OMB NO: 1820-0624 / Expiration Date: 2/29/2012)
within reporting categories. The majority of children are not longer falling into category e; however, West Virginia still has a higher percentage of children in this category. Measureable and Rigorous Targets Please note that the FFY 2009 targets were based on FFY 2008 baseline data. All other targets were developed with stakeholder input based on the FFY 2009 actual data (i.e., now the revised baseline) given the changes to cut scores.
Summary Statements Measureable and Rigorous Targets
Outcome A Positive Social Emotional Skills
Measureable and Rigorous Targets
Outcome B Acquisition and Use of Knowledge and Skills
Measureable and Rigorous Targets
Outcome C Use of Appropriate Behaviors to Meet Needs
1. Of those children who entered or exited the program below age expectations in Outcome domain, the percent who substantially increased their rate of growth by the time they turned 6 years of age or exited the program
FFY 2009 87.1%
FFY 2009 85.1%
FFY 2009 87.8%
FFY 2010 75%
FFY 2010 68%
FFY 2010 73%
FFY 2011 76%
FFY 2011 69%
FFY 2011 74%
FFY 2012 77%
FFY 2012 70%
FFY 2012 75%
2. The percent of children who were functioning within age expectations in Outcome domain by the time they turned 6 years of age or exited the program
FFY 2009 90.8%
FFY 2009 90.2%
FFY 2009 93.7%
FFY 2010 83%
FFY 2010 65%
FFY 2010 84%
FFY 2011 84%
FFY 2011 66%
FFY 2011 85%
FFY 2012 85%
FFY 2012 67%
FFY 2012 86%

SPP Template – Part B West Virginia
State Revised February 1, 2012
Part B State Performance Plan: 2005-2012 Page 54 (OMB NO: 1820-0624 / Expiration Date: 2/29/2012)
Improvement Activities/Timelines/Resources:
Improvement Activity Timeline Resources Status
7.1 Provide targeted technical assistance to districts identified as not meeting or in danger of not meeting state targets based on evaluation of data provided by WVDE in order to improve performance on this indicator.
2005-2013 WVDE OSP WVDE OSR
Active Revised 2011
7.2 Provide information on evidence based practices and strategies for improving performance on this indicator including Camp GIZMO, ECPBS, Training Connections, Celebrating Connections.
2005-2013 WVDE OSP WVDE OSR
Active
7.3 Redesign the early childhood assessment process for data collection of outcomes and coordinate with Universal Prek System.
2010-2013 WVDE OSP WVDE OSR
New 2010
7.4 Provide Early Learning Scale (ELS) training to improve administration of ELS assessment and data collection and reporting for Early Childhood Outcomes.
2010-2013 WVDE OSP WVDE OSR
New
7.5 Partner with Technical Assistance Center on Social Emotional Intervention for Young Children to access experts in the field.
2011-2013 WVDE WVDHHR TACSEI
New 2011

SPP Template – Part B West Virginia
State Revised February 1, 2012
Part B State Performance Plan: 2005-2012 Page 55 (OMB NO: 1820-0624 / Expiration Date: 2/29/2012)
Part B State Performance Plan (SPP) for 2005-2012
Overview of the State Performance Plan Development:
See Indicator 1.
(The following items are to be completed for each monitoring priority/indicator.)
Monitoring Priority: FAPE in the LRE
Indicator 8: Percent of parents with a child receiving special education services who report that schools facilitated parent involvement as a means of improving services and results for children with disabilities.
Measurement:
Percent = [(# of respondent parents who report schools facilitated parent involvement as a means of improving services and results for children with disabilities) divided by the (total # of respondent parents of children with disabilities)] times 100.
Overview of Issue/Description of System or Process:
Parent Involvement and Support in West Virginia
Parent involvement in West Virginia is supported by Parent Educator Resource Centers (PERCs), local district opportunities, West Virginia Parent Training and Information (PTI) and other parent agencies. The WVDE provides direct training, conferences and technical assistance related to issues of parents of students with disabilities, facilitates communication among parent agencies and coordinates and supports PERCs. Local district PERCs employ at least one parent and one educator part-time to provide training and technical assistance specifically to meet parents’ needs. In 2005, 40 of West Virginia’s 55 county school districts operated PERCs, either specific to parents of students with disabilities or in collaboration with Title I to serve all parents. The State Improvement Grant (SIG) includes a sub-grant to West Virginia Parent Training Information (WVPTI), which is the state’s federally-funded parent center. WVDE’s Parent Partnerships workgroup brings together representatives of 11 parent organizations in West Virginia to address statewide issues of mutual concern.
Several interagency alliances have been forged to enhance our commitment to parents. The WVDE supports interagency parent training opportunities through collaboration with the Department of Health and Human Resources, the Governor’s Cabinet for Families and Children, and the Comprehensive System of Care. The WVDE has been active in the Mountain State Family Alliance, working with families, community-based services and school IEP teams to provide wrap-around services to prevent out-of-state placements and to transition students from such facilities to the home community.
To promote parents’ participation in decision-making for their children, the WVDE produces a variety of informational materials for parents and provides direct assistance. Parent-friendly materials such as Hand in Hand, a handbook that describes parents’ rights and responsibilities under IDEA 2004 and Policy 2419 and brochures explaining the dispute resolution processes, enhance parents’ capacity to participate in the special education process. Although all WVDE special education staff are available to assist parents, WVDE’s parent coordinator has primary responsibility for assisting parents and coordinating parent related issues and activities. A toll-free phone line with the number disseminated to all parents of students with disabilities through the Procedural Safeguards notice that is used by all districts provides

SPP Template – Part B West Virginia
State Revised February 1, 2012
Part B State Performance Plan: 2005-2012 Page 56 (OMB NO: 1820-0624 / Expiration Date: 2/29/2012)
direct parent access to the parent coordinators and other staff. In addition, the West Virginia Deafblind Project provides direct technical assistance and training to families, an Annual Family Weekend and regional group meetings.
The WVDE supports a five-day Camp Gizmo which takes place in July on the grounds of the West Virginia Schools for the Deaf and Blind. Over 75 volunteers work in teams to support 25 families of children with complex disabilities. Volunteers are professionals in fields of medicine, education and technology. They provide evaluation services, assistive technology awareness and hands on opportunities, wheel chair fittings, workshops on topics related to student needs and ample leisure activities.
Parent participation in district, state and national activities is encouraged in a variety of ways. Grants to PERCs support technology upgrades and parent attendance at state and national conferences, such as the National Autism Conference and the Mid-South Family Forum. Families of the Council for Exceptional Children’s (CEC’s) Yes I Can winners are supported to attend the CEC international conference,
WVDE involves parents as stakeholders throughout the monitoring and accountability process. In the District Self-Assessment component of the Continuous Improvement and Focused Monitoring System (CIFMS), the district’s special education director, staff and a steering committee made up of stakeholders, including parents, review data annually, assess whether the standards are met and design an improvement plan for indicators not met. The primary stakeholder group for development of the SPP and APR, West Virginia Advisory Council for the Education of Exceptional Children (WVACEEC) includes parent representation. Finally, WVDE conducts a parent survey to measure state and district-level partnership efforts, as described below.
Measuring Parent Partnership Efforts
To collect statewide and district-level data regarding parent partnership efforts, the West Virginia Department of Education conducted a survey developed by the National Center for Special Education Accountability Monitoring (NCSEAM). In January 2002, NCSEAM established the Parent/Family Involvement Workgroup to provide guidance on the development of a set of survey instruments that would yield reliable, valid and useful measures of families’ perceptions and involvement in the early intervention and special education process. The instrument development work was coordinated by Dr. Batya Elbaum, Associate Professor of Education and Psychology at the University of Miami. Dr. William P. Fisher, Jr. of MetaMetrics, Inc. served at the project’s measurement consultant.
Although NCSEAM developed four measurement scales. OSEP determined the School Efforts to Partner with Parents scale could be used to measure SPP Indicator 8, the percentage of parents with a child receiving special education services who report that schools facilitated parent involvement as a means of improving services and results for children with disabilities. Therefore, WVDE, with approval of WVACEEC, elected to implement this scale, with 25 questions selected from the NCSEAM item bank by WVDE staff.
WVDE contracted with Avatar International, Inc. to conduct the survey, using the customized survey. Because a customized survey had not been developed for parents of preschool children, Avatar mailed the standard NCSEAM Section 619 item instrument to this group. The Section 619 instrument measures the following: Preschool special education partnership efforts and quality of services scale (50 items), impact of preschool special education services on your family and parent participation. The combined partnership efforts and quality of services scale was used for the Indicator 8 analysis. Since all items have been scaled together, it was possible to combine the results of the two surveys.
Sampling Plan
In its SPP response letter dated March 15, 2006, the U.S. Department of Education, Office of Special Education Programs (OSEP) approved West Virginia’s State Performance Plan. In that letter OSEP

SPP Template – Part B West Virginia
State Revised February 1, 2012
Part B State Performance Plan: 2005-2012 Page 57 (OMB NO: 1820-0624 / Expiration Date: 2/29/2012)
directed the state to submit a revised sampling plan describing how the data for Indicator 8 were collected for FFY 2005. After receipt of the SPP response letter and subsequent discussions with Dr. Larry Wexler regarding the sampling plan, it was determined West Virginia needed to explain its sampling plan in further detail and confirmed that the method originally selected was acceptable. Districts to be surveyed over the six year period were selected to ensure representation of disabilities, race/ethnicity, district size and various regions of the state. All parents of students with disabilities in the selected districts are surveyed, and all districts are surveyed within the six years. Dr. Elbaum reviewed the method and agreed this should provide a representative sample.
The original plan to collect baseline data, submitted with the December 2005 SPP, was revised and implemented as follows:
The WVDE’s vacant Parent Coordinator position was filled January 19, 2006. The parent coordinator had primary responsibility for the logistics of the survey, so implementation was delayed until that time.
A sampling frame was created that provided a representative sample based on the state’s demographics, with all parents in a selected group of districts being surveyed each year. All districts will be surveyed once within a six year period. Each of West Virginia’s 55 school districts has less than 50,000 students. (See attached sampling plan)
After receipt of the SPP response letter and subsequent discussions with OSEP including Dr. Larry Wexler regarding the sampling plan, it was determined that West Virginia needed to explain its sampling plan in further detail and confirmed that the method originally selected was acceptable. Districts to be surveyed over the six year period were selected to ensure representation of disabilities, race/ethnicity, district size and various regions of the state. Dr. Elbaum reviewed the method and agreed this should provide a representative sample.
West Virginia contracted with Avatar International, Inc. to conduct the survey. Addresses of all parents were extracted from individual student special education records for all students with disabilities enrolled and were provided to Avatar, which printed, mailed, received, processed and analyzed the surveys. Dr. Fisher, now working with Avatar, completed the survey report. Therefore, confidentiality of parent responses was maintained.
Due to a lengthy state government contracting process, surveys were not disseminated during the school year as WVDE had envisioned. The surveys in West Virginia were mailed to parents during the summer. Consequently, PERC staff were not available to assist parents.
The WVDE survey contained 25 questions from the Part B Schools’ Efforts to Partner with Parents Scale, selected according to the instructions provided for the NCSEAM Item Bank. The additional Section 619 preschool survey contained 100 questions and covered all three scales developed by NCSEAM for that population.
The survey cover letter from WVDE provided the special education parent coordinator’s toll-free phone number. The coordinator provided phone assistance to parents who requested it, including reading the surveys to them over the phone.
Newspaper advertisements and parent brochures were provided to alert parents in participating districts.
The Parent Partnerships workgroup will review the results and use them in developing their plans for parent support. The PERCs will also review the results for use in refining their services to parents across districts.
Results of the survey were shared with the WVACEEC at their December 2006 meeting, and those results were used to set improvement targets for the SPP.

SPP Template – Part B West Virginia
State Revised February 1, 2012
Part B State Performance Plan: 2005-2012 Page 58 (OMB NO: 1820-0624 / Expiration Date: 2/29/2012)
Special education directors from the districts surveyed will be invited to participate in a teleconference to discuss the results and implications for improvement planning.
In 2010, WVDE, in conjunction with its stakeholder groups, elected to re-administer the parent survey during the SPP extension to districts previously sampled during Years 1 and 2 of the current cycle. In FFY 2011, districts surveyed in Year 1 will again participate. In FFY 2012, districts surveyed in Year 2 will participate.
Baseline Data for 2005-2006 (FFY 2005)
The standard used to determine parent agreement with the indicator was the NCSEAM standard. The reported percentage represents parents with a .95 likelihood of a response of “ agree,” “strongly agree” or “very strongly agree” with item 131 on the NCSEAM survey’s Partnership Efforts scale: ‘The school explains what options parents have if they disagree with a decision of the school.” Results of the Section 619 survey and the 25 question school-age survey relative to this indicator are as follows.
West Virginia Parent Survey 2005-2006
Percentage of parents agreeing that schools facilitated parent involvement as a means of improving services and results for children with disabilities
Percent at or above standard
# Valid Responses
Mean SE of mean SD
West Virginia Parents
28% 1145 542 1.3% 145
External Benchmark from NCSEAM Pilot
17% 2705 481 0.7% 135
Discussion of Baseline Data
Representativeness of the Sample
The sample included nine districts, 7226 Part B surveys and 639 Section 619 surveys. Surveys were mailed to parents of all children with disabilities in the selected districts who were enrolled in May 2006. The demographics of the sample included the following:
Two large (1000-4000 SWD), four medium (500-1000 SWD) and three small districts (under 500 SWD). The ratio of school age to preschool was 7.8 in the sample and 7.5 in the population.
Race/ethnicity composition of the survey sample was comparable to that of the state as a whole.
Race/Ethnicity of Students with Disabilities (SWD) in Survey Sample Compared to SWD in West Virginia Districts
2005-2006
American Indian/Alaska
Native Asian/Pacific
Islander Black Hispanic White (not Hispanic)
Selected Districts
0.17 0.30 4.71 0.35 94.46

SPP Template – Part B West Virginia
State Revised February 1, 2012
Part B State Performance Plan: 2005-2012 Page 59 (OMB NO: 1820-0624 / Expiration Date: 2/29/2012)
State 0.14 0.28 5.27 0.53 93.78
All eight regions of the state (RESAs) were represented in the sample.
Representativeness of the Responses
7865 surveys were mailed. Of this number, at total of 1156 were returned, or 14.7 percent. Of these 1145 were usable. Based on the NCSEAM sample calculator, a return of 1045 was needed to assure a .95 confidence level) ( +- .3). Therefore, the return exceeded the minimum needed for the state.
Among the returned surveys, all disabilities were represented in the following proportions:
Representation of Parents of Children by Disability in Survey Returns
Return % State %
Autism 28 2.4% 708 1.4%
Behavior Disorders 35 3.1% 2085 4.2%
Speech/language 259 22.6% 14713 29.6%
Hearing impairment 11 1.0% 478 1.0%
Learning disabilities 346 30.2% 15877 32.0%
Mental impairment 191 16.7% 8598 17.3%
Other health impairment 171 14.9% 4379 8.8%
Orthopedic impairment 12 1.0% 182 0.4%
Preschool special needs 81 7.1% 2235 4.5%
Traumatic brain injury 4 0.3% 122 0.2%
Blind/partially sighted 7 0.6% 282 0.6%
Representativeness of Parent Survey Sample
Based on Disability
2006
0.0%
10.0%
20.0%
30.0%
40.0%
Sample
Population
Sample 3.9 0.3 28.6 0.0 0.9 15.9 0.7 10.6 1.4 32.0 5.5 0.2
Population 4.2 0.6 29.6 0.0 1.0 17.3 0.4 8.8 1.4 32.0 4.5 0.2
BD B/P CD D/B HI MI PH OH AU LD PS TB

SPP Template – Part B West Virginia
State Revised February 1, 2012
Part B State Performance Plan: 2005-2012 Page 60 (OMB NO: 1820-0624 / Expiration Date: 2/29/2012)
Deafblindness 0 18 0.0%
Total 1145 100.0% 49677 100.0%
Race/Ethnicity of Parents of Students with Disabilities (SWD) in Surveys Returned
2005-2006
American Indian/Alaska
Native Asian/Pacific
Islander Black Hispanic White (not Hispanic)
Number 2 7 36 4 1096
% 0.17 0.61 3.1 0.34 95.7
The return sample included representation of all disabilities with the exception of deafblindness. Speech/language impairment was overrepresented, and other health impairment was under represented. Parents of African-American students were not as well represented as other groups. Pre-k through grade 12 were represented with Ns ranging from a high of 108 in kindergarten to 25 in grade 12.
The survey is an ordered series of items, listed with values or calibrations representing the level of expected agreement by parents, based on research conducted by NCSEAM. Items on the scale below the mean of 542 attained by WV parents represent items with which parents agreed. Items above were agreed to by fewer parents, and, therefore, represent areas that may be addressed by improvement activities.
Survey responses indicate parent agreement with the following: Teachers and administrators were viewed positively regarding sensitivity to the needs of students with disabilities and their families, consideration of family values and availability and good working relationship with parents. Parents agreed they were encouraged to participate in the decision making process for their child, and were given adequate time and information to participate in the IEP process.
Areas of less agreement or disagreement, and thus potential areas for improvement included the following: Teachers and administrators did not communicate regularly, offer a variety of ways to communicate or seek out parent input. Parents did not always agree that they had choices in services or had questions answered regarding procedural safeguards or participation of their child in statewide assessment. It would appear from these results that parents generally may feel welcomed and included when they approach the school for information, conferences and IEP meetings, but they are less positive relative to activities that require a more proactive approach by the district or relate to areas of potential conflict. (See attachment for full list of survey questions.)
In addition to the responses received, the return rate suggests a need for improvement. While the return was adequate for a representative sample with a 95% confidence level, in terms of percentage the 14 percent return rate raises concerns about parents’ willingness to participate in the survey. This is West Virginia’s first state-level parent survey, so as the process becomes more familiar to state and local staff and more publicized to parents, the return may increase. Parents may not be familiar with how anonymous surveys are conducted and may not have clearly understood its purpose. Several parents who contacted the WVDE parent coordinator for assistance in completing the survey stated they were afraid to complete the survey because they “didn’t want to get any one in trouble”. The lower return rate of African-American parents also may indicate less familiarity or comfort with the process. Furthermore, the extent to which the sample is representative of parents with low literacy levels cannot be determined. Because the contract delays resulted in the survey being disseminated during the summer, the impact of a reduced availability of assistance for parents who could not read or did not understand the survey is of concern. Timing and technical assistance issues will be resolved in 2006-2007.
District Results

SPP Template – Part B West Virginia
State Revised February 1, 2012
Part B State Performance Plan: 2005-2012 Page 61 (OMB NO: 1820-0624 / Expiration Date: 2/29/2012)
Parents of all children and youth with disabilities enrolled were surveyed in nine districts. While the results may be discussed in terms of agreement of those who responded, the return sample was not large enough to draw inferences for individual districts.
FFY Measurable and Rigorous Target
2005 (2005-2006)
Baseline – 28% of parents report that schools facilitated parent involvement as a means of improving services and results for children with disabilities.
2006 (2006-2007)
30% of parents report that schools facilitated parent involvement as a means of improving services and results for children with disabilities.
2007 (2007-2008)
32% of parents report that schools facilitated parent involvement as a means of improving services and results for children with disabilities.
2008 (2008-2009)
34% of parents report that schools facilitated parent involvement as a means of improving services and results for children with disabilities.
2009 (2009-2010)
36% of parents report that schools facilitated parent involvement as a means of improving services and results for children with disabilities.
2010 (2010-2011)
38% of parents report that schools facilitated parent involvement as a means of improving services and results for children with disabilities.
2011
(2011-2012)
39% of parents report that schools facilitated parent involvement as a means of improving services and results for children with disabilities.
2012
(2012-2013)
40% of parents report that schools facilitated parent involvement as a means of improving services and results for children with disabilities.
Improvement Activities/Timelines/Resources:
Improvement Activity Timeline Resources Status
8.1 Provide targeted technical assistance to districts identified as not meeting or in danger of not meeting state targets based on evaluation of data provided by WVDE in order to improve performance on this indicator.
2005-2013 WVDE RESA
Active Revised 2011
8.2 Provide information on evidence based practices and strategies for improving performance on this indicator.
2005-2013 WVDE RESA
Active Revised 2011
8.3 Support through the Autism Project, PERCs and TPI the provision of materials, information, training, and resource referrals for parents of children with Autism Spectrum Disorder (ASD).
2011-2013 WVDE Parent Training and Information Autism Training Center
New 2011
8.4 Support West Virginia Parent Education Resource Centers (PERCs) and West Virginia Parent Training Information (PTIs)
2005-2013 WVDE
Active Revised 2011

SPP Template – Part B West Virginia
State Revised February 1, 2012
Part B State Performance Plan: 2005-2012 Page 62 (OMB NO: 1820-0624 / Expiration Date: 2/29/2012)
Improvement Activity Timeline Resources Status
to provide training, resources and materials regarding parent/family involvement to families, LEAs and technical assistance providers.
8.5 Support through WV PERCs a parent mentor program that provides technical assistance and support to parents of students with disabilities.
2011-2013 WVDE
New 2011
8.6 Recruit and develop “Models of Success” in parental involvement to improve programs and services in WV using established criteria.
2011-2013 WVDE New 2011
8.7 Conduct annual surveys of parents to inform improvement with an emphasis on improving response rate.
2007-2013 WVDE Active
Sampling Plan
West Virginia will implement the National Center on Special Education Accountability Monitoring (NCSEAM) Parent Survey Part B Efforts Scale to meet the requirements for this indicator. Twenty-five questions have been selected from the NCSEAM item bank following the selection guidelines. The survey will be distributed annually to parents of students with disabilities in nine or ten selected districts to ensure all districts are surveyed within a six-year period.
Describe the population represented:
The population represented is parents of students with disabilities ages 3-21 in West Virginia. West Virginia has 55 county school districts, with enrollment ranging from approximately 1, 000 to 28,000 students. Based on 2005-2006 child count and enrollment data, statewide the percentage of students with disabilities within school enrollment is 18 percent, with districts ranging from 15.3 to 23.3 percent. Within that 18 percent, 6 percent of students in enrollment are identified with specific learning disabilities, 5 percent speech/language impairments, 3.2 percent mental impairment and 1.5 percent other health impairment. All other categories are under 1 percent. These totals also include students in state-operated programs.
Student enrollment by race/ethnicity for 2005-2006 is 93.58 percent White, 4.93 percent Black, 0.64 percent Asian, 0.73 percent Hispanic and 0.12 percent American Indian. Race/ethnicity percentages for students with disabilities, ages 6-21 are: White – 93.7 percent, Black – 5.3, Hispanic – 0.5, Asian – 0.3, American Indian – 0.1. West Virginia is primarily rural, i.e., not densely populated, with no concentrated large urban areas. Among students with disabilities, 66 percent are male and 34 percent are female.
Describe how the State ensures that the sample is representative of the population it is trying to represent:
A representative sample is achieved in two ways (1) by obtaining a returned sample size exceeding the minimum number required to make statistical inferences about the population; and (2) by ensuring the population surveyed within the districts selected includes representation of race/ethnicity groups and parents of students with various disabilities similar to the statewide population Additionally, districts will be selected to represent rural and less rural areas of the state and the eight geographic regions delineated by Regional Education Service Agencies.
A sampling frame was developed to ensure surveying all districts and West Virginia Schools for the Deaf and the Blind at least once during a six-year period beginning with 2005-2006. West Virginia has no districts with 50,000 or more student enrollment, and most districts are relatively small. Statewide, West Virginia had 49, 677 students with disabilities in December 2005.

SPP Template – Part B West Virginia
State Revised February 1, 2012
Part B State Performance Plan: 2005-2012 Page 63 (OMB NO: 1820-0624 / Expiration Date: 2/29/2012)
Within the yearly sample of districts, selection has been stratified to ensure representation within the sample corresponds to the following statewide demographics:
Composition of race/ethnicity of students of the combined sample will be comparable to the composition of the state, + or – 2 percent.
Representation a minimum of one large, three small and three medium size districts.
Representation of the four major disability categories, speech/language impairments, specific learning disabilities, mental impairment and other health impairment and a combined low incidence group.
Additionally, obtaining a return sample that will allow inferences regarding individual districts is a major concern. Therefore, all parents of students with disabilities within the selected districts will be surveyed; approximately 8000 per year.
Describe the sampling procedures followed
Districts to be surveyed each year were selected by dividing the 55 districts and WVSDB into six groups, with the percentage of students by race/ethnicity comparable to the state percentages in December 2005, and selecting from large, medium and small districts according to student enrollment. While the districts have been selected for the six-year period, as demographics change, the comparability to state demographics will be reexamined to ensure continued representation. No sampling occurs within districts. All parents of students with disabilities within the selected districts will be surveyed, including all parents of preschool children with disabilities (ages 3-5). WVEIS has written a program to extract parents’ names and addresses and individual student demographic information, including birthdate, race/ethnicity, disability and gender from the individual student information records for the selected districts. This process ensures all parents of all identified students will be surveyed. This file will be generated each year and provided to the contractor, Avatar International, Inc. for use in mailing the surveys and analyzing the returns.
Describe the method/process to collect data.
The file generated by WVEIS in March each year (in 2005-2006 it was generated in May) with parent names addresses and demographic information is provided to the contractor for the parent survey. The contractor prints and mails the survey, with a cover letter signed by the state director of special education. The letter encourages parents to request assistance from state and local parent coordinators in completing the survey, if needed. Parent Educator Resource Centers in the districts surveyed are informed of the survey and assist by sending home information to parents regarding the survey. Subsequent surveys will be conducted during the spring prior to the close of school. Surveys are returned to the contractor for processing, analyzing the data and writing the report.
Describe how the SEA addresses any problems with: (1) response rates; (2) missing data; (3) selection bias; and (4) confidentiality.
How many responses are necessary to reasonably draw inferences about the population?
A return of 940 surveys out of an estimated 7865 sample of 10 districts in the first year and 900 out of a sample of 9 districts the following year will yield results at a 95 percent confidence level +/- 3 percent. The needed return is 1045 for the entire population of 49, 677 based on the December 1, 2005 child count according to the sample calculator at www.surveysystem.com/sscalc.htm. The return needed will be recomputed each year based on the actual number of surveys mailed. Sample calculations based on student

SPP Template – Part B West Virginia
State Revised February 1, 2012
Part B State Performance Plan: 2005-2012 Page 64 (OMB NO: 1820-0624 / Expiration Date: 2/29/2012)
census were found to overestimate the parent sample, due to duplication of parents with more than one student in special education.
If surveys are used how will the State address incomplete surveys? (e.g., answers to specific questions consistently missing)
Count all complete responses for reporting purposes. Item analysis will be conducted and the survey will be revised in subsequent years, if specific questions are found to be unreliable.
How will the State ensure that the sample will be selected in a manner that does not bias the results in that inferences will not be able to be made regarding the population?
Districts are selected to ensure representation of the demographics described above. All parents in selected districts will be surveyed. All districts will be surveyed within a six year period.
What threshold will be used to determine if responses would violate confidentiality?
Since survey questions are not personally identifiable and do not include student-specific information, reporting of aggregated survey information should not pose a confidentiality issue. Reporting will be aggregated at the district and state level. Additionally, the WVDE suppresses any cells less than 10 in public reporting of student information to ensure personally-identifiable student information is not disclosed.
Describe how the plan meets the State and local reporting requirements as delineated in the SPP directions.
Each local district will be surveyed and reported once within a six-year period. Districts surveyed each year will be selected as described above to ensure the sample is
representative of the population and of large, medium and small and rural/less rural districts.
A representative state-level return with a return sample size meeting statistical requirements described above will allow inferences to be made about the statewide population.
Results based on returns received from local districts will be reported to the extent the return is adequate for making inferences. To obtain the best possible results, all parents of students with disabilities within the selected local districts will be surveyed.

SPP Template – Part B West Virginia
State Revised February 1, 2012
Part B State Performance Plan: 2005-2012 Page 65 (OMB NO: 1820-0624 / Expiration Date: 2/29/2012)
Part B State Performance Plan (SPP) for 2005-2012
Overview of the State Performance Plan Development:
See Indicator 1.
(The following items are to be completed for each monitoring priority/indicator.)
Monitoring Priority: Disproportionality
Indicator 9: Percent of districts with disproportionate representation of racial and ethnic groups in special education and related services that is the result of inappropriate identification.
(20 U.S.C. 1416(a)(3)(C))
Measurement:
Percent = [(# of districts with disproportionate representation of racial and ethnic groups in special education and related services that is the result of inappropriate identification) divided by the (# of districts in the State)] times 100.
The state’s current definition of disproportionate representation is a weighted risk ratio of 2.0 or higher with a cell size of 20 for overrepresentation and a weighted risk ratio of .25 or below with a cell size of 50 for underrepresentation. Districts determined to be over or underrepresented must conduct a review of its policies, practices and procedures to determine whether the disproportionate representation is a result of inappropriate identification. The process for the review of the districts’ policies, practices and procedures is described below.
Overview of Issue/Description of System or Process:
West Virginia’s school population among the 55 public school districts in October 2005 was 93.6 percent white, 4.9 percent African-American and less than 1 percent in each of the other race/ethnicity categories. Students with disabilities represented 17.8 percent of enrollment; therefore, the state had a predominantly white population with a high identification of students as students with disabilities. This condition poses some barriers to measuring disproportionate representation. Enrollment data including race/ethnicity and disability from the Section 618 December 1 child count of students with disabilities and the Second Month (October) Enrollment count for all students were used to calculate disproportionate representation. These data are generated from individual student records maintained in the West Virginia Education Information System (WVEIS) for all students.
Students by Race/Ethnicity 2005-2006 In 55 West Virginia Districts
White Black Hispanic American
Indian Asian Total
Students with Disabilities
40623 2283 231 60 122 43,319
93.8% 5.3% 0.5% 0.1% 0.3% 100.0%
All Students 261,853 13,786 2,040 329 1,799 279,807
93.6% 4.9% 0.7% 0.1% 0.6% 100.0%
Prior to 2004, West Virginia used the Office of Special Education Program (OSEP) composition formula to determine disproportionality, with a 20 percent higher identification of students with disabilities for a group

SPP Template – Part B West Virginia
State Revised February 1, 2012
Part B State Performance Plan: 2005-2012 Page 66 (OMB NO: 1820-0624 / Expiration Date: 2/29/2012)
compared to the group’s percentage in the school enrollment being considered disproportionate. In 2004-2005, a workgroup was formed to review disproportionality issues and develop technical assistance. The workgroup included West Virginia Department of Education (WVDE) personnel and representatives from districts who had successfully implemented plans to address Office for Civil Rights (OCR) concerns. Data were analyzed using the spreadsheet application provided by Westat, a contractor for OSEP, providing both composition and risk ratio data at the state and district level. The National Center for Culturally Responsive Education Systems (NCCRESt) materials and the weighted risk ratio method were investigated, and options including composition and weighted risk ratio were presented to the West Virginia Advisory Council for the Education of Exceptional Children (WVACEEC) in September 2005. The WVACEEC recommended the method and definition that has been adopted for the SPP Indicators 9 and 10. With regard to the state’s definition of disproportionate representation, the weighted risk ratio method was selected because it is a more reliable method for states with smaller minority populations than the composition method previously used. The weighted risk ratio method directly compares the relative size of two risks by dividing the risk for a specific racial/ethnic group by the risk for a comparison group. It answers the question, “How likely is it a student from one racial/ethnic group will be identified as a student with a specific disability compared to the risk for a student from all other racial/ethnic groups, when weighted according to the racial/ethnic demographics of the state?” When any group reaches a cell size of 20 or more for overrepresentation or 50 or more for underrepresentation, the analysis is reported. The weighted risk ratio calculation is as follows:
Step 1: Calculate risk for each group Black Students with Disabilities/Black Enrolled Asian Students with Disabilities/Asian Enrolled….etc. Step 2: Calculate State composition for each group Enrolled Black students/All enrolled; Asian…etc. Step 3: Calculate weighted risk ratio [1 - State Black Composition/ * District Black SWD risk] / [(State American Indian
Composition /* District American Indian SWD Risk)+[State Asian ….etc for all others] Do not calculate if less than 20 enrolled
In 2007, the WVDE received OSEP’s response table indicating although the state was addressing overrepresentation in its Annual Performance Report, it was not addressing underrepresentation, which is a component of disproportionate representation. Subsequently, the state was directed to conduct an analysis of two years of data for underrepresentation and to submit its results in the FFY 2007 APR. In 2009, after a review of the individual districts’ self-assessment reports, the WVDE recommended a change in cell size for overrepresentation from 10 to 20. This recommendation was based on the repeated emergence of the same districts as disproportionate and the inclusion of the same students in the districts’ overall numbers of students in the all disabilities group. As these districts, through repeated reviews of policies, practices and procedures utilizing varied procedures (protocols, rubrics, file review checklists), continued to declare the district’s status as compliant on this self-assessment indicator, it became evident a change in cell size may be necessary. Furthermore, the WVDE acknowledged research practices indicate a larger cell size is statistically more reliable. The adjustment to a cell size of 20 will increase statistical reliability and ensure the state is identifying districts with growing numbers of new students identified for special education needing to be examined for inappropriate identification. The recommendation for an increase in the cell size was presented to the West Virginia Advisory Council for approval in January 2009. The change went into effect for the review of the district’s December 1, 2008 child count and enrollment data. An analysis of underrepresentation was added to the district self-assessment indicators pertaining to disproportionate representation in April 2008. Therefore, in the review of the FFY 2007 data, two districts

SPP Template – Part B West Virginia
State Revised February 1, 2012
Part B State Performance Plan: 2005-2012 Page 67 (OMB NO: 1820-0624 / Expiration Date: 2/29/2012)
emerged with underrepresentation of Asian students. Based on a review of achievement test data in each district, Asian students achieved proficiency in high numbers, supporting the low rates of identification. In summary, the State met the compliance target for this indicator for both under and overrepresentation.
In 2010, the WVDE revised procedures for determining inappropriate identification by adding a test of statistical significance to the procedures for determining disproportionate representation after consulting with the OSEP state contact for West Virginia. Therefore, in the analysis of the December 1, 2009 child count data (for the February 1, 2011 APR submission), the WVDE applied the Z-Tests of Two Proportions and/or Chi-Square Tests to the data for any district identified in the initial analysis.
Determining Inappropriate Identification Calculating disproportionate representation is the first step in the process for determining whether districts inappropriately identified students. The second step is determining whether the disproportionate numbers are a result of inappropriate policies, practices and procedures, such as discriminatory pre-referral, referral, evaluation and eligibility practices. Examples of such practices may include the lack of access to educational opportunities, including effective instruction, access to and participation in the general curriculum and the consideration of analyzed achievement data to guide instructional intervention. The district self-assessment includes an indicator for inappropriate identification, which districts had reviewed with little guidance in previous years. In December 2005, WVDE developed and provided districts a protocol to use in reviewing their policies practices and procedures for overrepresentation. Districts meeting the definition for disproportionate representation based on the December 1, 2004 child count were required to conduct the review and submit the completed protocol and supporting documentation to the WVDE in January 2006 as part of the district self-assessment, which was extended to January 2006 for this purpose. Upon submission, WVDE compliance staff reviewed the documentation and determined one district had disproportionate overrepresentation that resulted from inappropriate identification. This district was notified and required to submit an improvement plan by February 2006 to effectively correct the noncompliance within one year. The district’s improvement plan was approved by the WVDE. The district submitted a progress report in October 2006, which was reviewed by WVDE personnel and determined a more detailed protocol was needed to effectively guide districts in the examination of their policies, practices and procedures. Prior to districts’ completing the district self-assessment for 2005-2006, which was due December 2006, the WVDE submitted a technical assistance request to NCCRESt. The state requested NCCRESt’s assistance in training districts to use the more in-depth rubric developed by the center for determining whether district policies, practices and procedures may be leading to inappropriate identification of minority students for special education and related services. In 2005-2006, the WVDE identified a second district as having disproportionate representation as defined by exceeding the weighted risk ratio of 2.0 and a cell size of 10 for black students with disabilities compared to other groups, based on the December 1, 2005 child count data. This district was required to conduct the self-assessment for submission in December 2006. In October 2006, the two districts identified in 2004-2005 and 2005-2006 (and the districts identified with disproportionate representation in Indicator 10) were required to form cross-district teams, and the teams were required to attend a technical assistance training conducted by the WVDE in collaboration with NCCRESt. The training included an overview of disproportionality with regard to overrepresentation, a review of NCCRESt’s revised rubric for district self-assessment and an introduction to resources for addressing disproportionality. The district teams then used the rubric as a self-study tool to examine general and special education policies, practices and procedures to determine whether the disproportionate overrepresentation was a result of inappropriate identification. Districts submitted the results as part of their district self-assessment due in December 2006.

SPP Template – Part B West Virginia
State Revised February 1, 2012
Part B State Performance Plan: 2005-2012 Page 68 (OMB NO: 1820-0624 / Expiration Date: 2/29/2012)
The rubric included 23 indicators spanning four standards: 1) Core Functions - access to equitable educational opportunities for all students; 2) Instructional Services – learning environments at all grade levels are designed to support and produce academic achievement; 3) Individualized Education – students with disabilities and general education peers are assured access to and participation in the general education curriculum; and 4) Accountability – student performance on statewide and district assessment is analyzed and used to guide instruction and school improvement. The results of the self-assessment analysis were submitted with the district’s December 2006 self-assessment and scored by WVDE personnel. The results were then used to determine inappropriate identification for the most recently identified district and to determine whether the inappropriate identification in the district identified based on the 2004 child count had been corrected. A review of the Submission of the district self-assessment and utilization of the NCCRESt rubric will continue to be the method for determining inappropriate identification for districts having disproportionate representation. To ensure districts appropriately consider all policies, practices and procedures for determining underrepresentation, the WVDE developed a tool entitled ‘District Review of Policies, Practices and Procedures for Disproportionate Representation” in September 2009. This tool assists districts in conducting the mandatory review for determining the compliance status for Indicators 2.1 and 2.2 with regard to underrepresentation. Each district demonstrating disproportionate underrepresentation will be directed to complete the review process utilizing this tool to document its results. Each district will maintain this documentation in its CSADA file. The districts review is verified by OSP via and onsite visit or desk audit. When noncompliance is identified, OSP issues a letter of finding and indicates how the LEA is to correct child specific noncompliances and demonstrate correct implementation of the regulatory requirements consistent with OSEP memo 09-02. Data for FFY 2004 (2004-2005) Because districts identified with disproportionate representation in both 2004-2005 and 2005-2006 ultimately were reviewed using the NCCRESt rubric, two sets of data are available. Data were collected using Section 618 December 1, 2004 and December 1, 2005 child count data for students with disabilities and the Second Month Enrollment data for all students. The electronic spreadsheet developed by Westat was used to calculate the state risk ratio and the district weighted risk ratios for all disabilities and each disability category. Districts with a weighted risk ratio of 2.0 and a minimum cell size of 10 were required to examine policies, practices and procedures utilizing a tool developed by the WVDE for assessing whether the disproportionate representation was a result of the inappropriate identification of minority students. The results of the review of 2004 data were then used as the basis for determining the district’s status (Compliant (C) Non-Complaint (NC) or in Need of Improvement (N)) on the district self-assessment Indicator 4.19. A copy of the Protocol for Assessing District Disproportionality is attached.
District Reviewed for Inappropriate Identification
FY 2004 (2004- 2005)
0 districts with inappropriate identification/ 55 districts x 100 = 0%
District Weighted Risk Ratio Number of Students Affected
Protocol Review Status
Hampshire 2.09 15 Compliant

SPP Template – Part B West Virginia
State Revised February 1, 2012
Part B State Performance Plan: 2005-2012 Page 69 (OMB NO: 1820-0624 / Expiration Date: 2/29/2012)
Discussion of Data:
When the WESTAT calculation formula was applied to the 2004-2005 data, one district (Hampshire) emerged as having a disproportionate overrepresentation of minority students in special education and related services as evidenced by a weighted risk ratio of 2.09 and a cell size of 15. After the mandatory review of its policies, practices and procedures utilizing the self-assessment protocol, the district determined its status on the district self-assessment Indicator 4.19 as compliant, indicating its disproportionate representation was not a result of inappropriate identification. The WVDE special education monitoring team verified the district’s compliance status through the review of the submitted assessment protocol and the district’s supporting documentation. As the WVDE determined the district’s review and status determination was acceptable, no improvement activities or policy revisions were necessary. The district again reviewed its practices using the more detailed NCCRESt protocol in October 2006, with the same result.
Baseline Data for FFY 2005 (2005-2006):
District Reviewed for Inappropriate Identification FY 2005 (2005- 2006)
0 districts with inappropriate identification/ 55 districts x 100 = 0%
District
Weighted Risk Ratio Number of Students Affected
Protocol Review Status
Jackson 2.44 13 Compliant
The same procedure was utilized to conduct the analysis of child count data for the 2005-2006 school year. Again, one district (Jackson) emerged as having disproportionate representation of minority students in special education and related services based on a weighted risk ratio of 2.44 and a cell size of 13 students.
This district completed the new review process by completing the NCCRESt rubric after the training in October 2006. The protocol and rubric then were returned to the WVDE to be scored by an internal team utilizing NCCRESt’s recommended scoring procedure. At the completion of the scoring session, each district was notified of its score and corresponding compliance status. The scoring procedure follows:
A score of 60 - 69 resulted in a rating of At Standard (87-100%)
A score of 52 - 59 resulted in a rating of Developing/At Standard (75- 86%)
A score of 46 - 51 resulted in a rating of Developing (67 - 74%)
A score of 45 or below resulted in a rating of Beginning and an Improvement Plan was required (Below 66%)
The district identified as having disproportionate representation in the all disabilities category had a rubric score of 66 and, was therefore determined to be at standard or compliant on the self-assessment indicator. Consequently, no improvement plan was required.
FFY Measurable and Rigorous Target
2005 (2005-2006)
NA
2006 (2006-2007)
0% of districts with disproportionate representation of racial and ethnic groups in special education and related services that is the result of inappropriate identification.
2007 (2007-2008)
0% of districts with disproportionate representation of racial and ethnic groups in special education and related services that is the result of inappropriate identification.
2008 (2008-2009)
0% of districts with disproportionate representation of racial and ethnic groups in special education and related services that is the result of inappropriate identification.
2009 (2009-2010)
0% of districts with disproportionate representation of racial and ethnic groups in special education and related services that is the result of inappropriate identification.

SPP Template – Part B West Virginia
State Revised February 1, 2012
Part B State Performance Plan: 2005-2012 Page 70 (OMB NO: 1820-0624 / Expiration Date: 2/29/2012)
FFY Measurable and Rigorous Target
2010 (2010-2011)
0% of districts with disproportionate representation of racial and ethnic groups in special education and related services that is the result of inappropriate identification.
2011 (2011-2012)
0% of districts with disproportionate representation of racial and ethnic groups in special education and related services that is the result of inappropriate identification.
2012 (2012-2013)
0% of districts with disproportionate representation of racial and ethnic groups in special education and related services that is the result of inappropriate identification.
Improvement Activities/Timelines/Resources:
Improvement Activities Timelines Resources Status
9.2 / 10.2 Support the implementation of evidence based practices for the provision of primary academic and behavioral interventions (e.g., RTI and School-wide and Early Childhood PBS).
2005-2013 WVDE Active
9.1 / 9.3 / 10.1 / 10.3 Provide training and clarification on the state’s definition of under- and overrepresentation and the policy, procedure and practice review process for districts identified with disproportionate representation.
Conduct SEA reviews of policies, procedures and practices to identify noncompliance and provide technical assistance to ensure correction of noncompliance.
2009-2013 WVDE
Active
9.4 / 10.4 Provide training and professional development resources to districts identified with inappropriate identification.
2011-2013 WVDE New 2011
9.5 / 10.5 Create a guidance document for speech language pathologists and administrators which will facilitate appropriate implementation of the procedures for the identification, evaluation and eligibility of students for speech language disorders. This document will be posted on the Web site.
2011-2013 WVDE
Active
9.6 / 10.6 Participate in professional development opportunities focused on improving results for at risk students to gain an increased awareness and understanding of effective strategies to address disproportionality in the state and individual districts.
2007-2013 WVDE TA Centers
Active
9.7 / 10.7 Provide training and professional development resources for eligibility determinations across the categorical areas.
2005-2013 WVDE
Active

SPP Template – Part B West Virginia
State Revised February 1, 2012
Part B State Performance Plan: 2005-2012 Page 71 (OMB NO: 1820-0624 / Expiration Date: 2/29/2012)
Part B State Performance Plan (SPP) for 2005-2012
Overview of the State Performance Plan Development:
See Indicator 1.
(The following items are to be completed for each monitoring priority/indicator.)
Monitoring Priority: Disproportionality
Indicator 10: Percent of districts with disproportionate representation of racial and ethnic groups in specific disability categories that is the result of inappropriate identification.
(20 U.S.C. 1416(a)(3)(C))
Measurement: Percent = [(# of districts with disproportionate representation of racial and ethnic groups in specific disability categories that is the result of inappropriate identification) divided by the (# of districts in the State)] times 100.
The state’s current definition of disproportionate representation is a weighted risk ratio of 2.0 or higher with a cell size of 20 for overrepresentation and a weighted risk ratio of .25 or below with a cell size of 50 for underrepresentation. Districts determined to be over or underrepresented must conduct a review of its policies, practices and procedures to determine whether the disproportionate representation is a result of inappropriate identification. The process for the review of the districts’ policies, practices and procedures is described below.
Overview of Issue/Description of System or Process:
West Virginia’s school population among the 55 public school districts in October 2005 was 93.6 percent white, 4.9 percent African-American and less than 1 percent in each of the other race/ethnicity categories. Students with disabilities represented 17.8 percent of enrollment; therefore, the state had a predominantly white population with a high identification of students as students with disabilities. This condition poses some barriers to measuring disproportionate representation. Enrollment data including race/ethnicity and disability from the Section 618 December 1 child count of students with disabilities and the Second Month (October) Enrollment count for all students were used to calculate disproportionate representation. These data are generated from individual student records maintained in the West Virginia Education Information System (WVEIS) for all students. Prior to 2004, West Virginia used the Office of Special Education Programs (OSEP) composition formula to determine disproportionality, with a 20 percent higher identification of students with disabilities for a group compared to the group’s percentage in the school enrollment being considered disproportionate. In 2004-2005, a workgroup was formed to review disproportionality issues and develop technical assistance. The workgroup included West Virginia Department of Education (WVDE) staff and representatives from districts that had successfully implemented plans to address Office for Civil Rights (OCR) concerns. Data were analyzed using the spreadsheet application provided by Westat, providing both composition and risk ratio data at the state and district level. The National Center for Culturally Responsive Education Systems (NCCRESt) materials and the weighted risk ratio method were investigated, and options including composition and weighted risk ratio were presented to the West Virginia Advisory Council for the Education of Exceptional Children (WVACEEC) in September 2005. The WVACEEC recommended the method and definition that has been adopted for the SPP Indicators 9 and 10. With regard to the state’s definition of disproportionate representation, the weighted risk ratio method was selected because it is a more reliable method for states with smaller minority populations than the

SPP Template – Part B West Virginia
State Revised February 1, 2012
Part B State Performance Plan: 2005-2012 Page 72 (OMB NO: 1820-0624 / Expiration Date: 2/29/2012)
composition method previously used. The weighted risk ratio method directly compares the relative size of two risks by dividing the risk for a specific racial/ethnic group by the risk for a comparison group. It answers the question, “How likely is it that a student from one racial/ethnic group will be identified as a student with a specific disability compared to the risk for a student from all other racial/ethnic groups, when weighted according to the racial/ethnic demographics of the state?” When any group reaches a cell size of 20 or more for overrepresentation or 50 or more for underrepresentation, the analysis is reported. An example of the weighted risk ratio calculation is as follows:
Step 1: Calculate risk for each group Black Students with Behavior Disorders /Black Enrolled Asian Students with Behavior Disorders/Asian Enrolled….etc. Step 2: Calculate State composition for each group Enrolled Black students/All enrolled; Asian…etc. Step 3: Calculate weighted risk ratio [1 - State Black Composition/ * District Black BD risk] / [(State American Indian
Composition /* District American Indian BD Risk)+[State Asian ….etc for all others] Do not calculate if less than 20 and 50 enrolled respectively, for over and
underrepresentation. In 2007, the WVDE received OSEP’s response table indicating although the State was addressing overrepresentation in its APR, it was not addressing underrepresentation, which is a component of disproportionate representation. Subsequently, the State was directed to conduct an analysis of two years of data for underrepresentation and to submit its results in the FFY 2007 APR. In 2009, after a review of the individual districts’ self-assessment reports, the WVDE recommended a change in cell size for overrepresentation from 10 to 20. This recommendation was based on the repeated emergence of the same districts as having disproportionate representation and the inclusion of the same students in the districts’ overall numbers of students in the specific disability categories. As these districts, through repeated reviews of policies, practices and procedures utilizing varied procedures (protocols, rubrics, file review checklists), continued to determine the district’s status as compliant on this self-assessment indicator, it became evident a change in cell size may be necessary. Furthermore, the WVDE acknowledged research practices indicate a larger cell size is statistically more reliable. The adjustment to a cell size of 20 will ensure the State is identifying districts with growing numbers of new students identified for special education that need to be examined for inappropriate identification. The recommendation for an increase in the cell size was presented to the WVACEEC for its approval in January 2009. This change went into effect for the review of the district’s December 1, 2008 child count and enrollment data.
In 2010, the WVDE revised procedures for determining inappropriate identification by adding a test of statistical significance to the procedures for determining disproportionate representation after consulting with the OSEP state contact for West Virginia. Therefore, in the analysis of the December 1, 2009 child count data (for the February 1, 2011 APR submission), the WVDE applied the Z-Tests of Two Proportions and/or Chi-Square Tests to the data for any district identified in the initial analysis.
Determining Inappropriate Identification
Calculating disproportionate representation is the first step in the process for determining whether districts inappropriately identified students for special education and related services. The second step is determining whether the disproportionate numbers are a result of inappropriate policies, practices and procedures, such as discriminatory pre-referral, referral, evaluation and eligibility practices. Examples of such practices may include the lack of access to educational opportunities, including effective instruction, access to and participation in the general curriculum and the consideration of analyzed achievement data to guide instructional intervention.

SPP Template – Part B West Virginia
State Revised February 1, 2012
Part B State Performance Plan: 2005-2012 Page 73 (OMB NO: 1820-0624 / Expiration Date: 2/29/2012)
In December 2005, the WVDE developed and disseminated to districts, a protocol to use in reviewing policies practices and procedures for overrepresentation. Districts meeting the definition of disproportionate representation based on the December 1, 2004 child count were required to conduct the review and submit the completed protocol and supporting documentation to WVDE in January 2006 as part of the district self-assessment, which was extended to January 2006 for this purpose. Upon submission, WVDE personnel reviewed the documentation and determined seven districts had disproportionate overrepresentation resulting from inappropriate identification. These districts were notified and required to submit an improvement plan by February 2006 to effectively correct the noncompliance within one year. The districts’ improvement plans were approved by the WVDE. The districts submitted progress reports in October 2006, which were reviewed by WVDE personnel, at which time determined a more detailed protocol was needed to effectively guide districts in the examination of their policies, practices and procedures.
Based on December 1, 2005 child count data, eight districts were identified as having disproportionate overrepresentation as defined by exceeding the weighted risk ratio of 2.0 with a cell size of 10. Of the eight, one district emerged with disproportionate representation in two disability categories. Prior to the districts’ completion of the district self-assessment for 2005-2006, which was due December 2006, the WVDE submitted a formal technical assistance request to NCCRESt and obtained a technical assistance agreement. The state requested NCCRESt’s assistance in training districts to use the more in-depth protocol and rubric developed by the center for determining whether district policies, practices and procedures were inappropriate. In October 2006, the eight districts identified in 2004 and 2005 (and the two districts identified with disproportionate representation in Indicator 9) were required to form cross-district teams, and the teams were required to attend a technical assistance training conducted by the WVDE in collaboration with NCCRESt. The training included an overview of disproportionality with regard to overrepresentation, a review of NCCRESt’s revised rubric for districts’ self-assessment and an introduction to resources for addressing disproportionality. The district teams then used the rubric as a self-study tool to examine general and special education policies, practices and procedures to determine whether the disproportionate overrepresentation was a result of inappropriate identification. Districts submitted the results as part of their district self-assessment due in December 2006. The rubric includes 23 indicators spanning 4 standards: 1) Core Functions - access to equitable educational opportunities for all students; 2) Instructional Services – learning environments at all grade levels are designed to support and produce academic achievement; 3) Individualized Education – students with disabilities and general education peers are assured access to and participation in the general education curriculum; and 4) Accountability – student performance on statewide and district assessment is analyzed and used to guide instruction and school improvement. The results of the assessment were submitted with the December 2006 self-assessment and scored by WVDE personnel, then used to determine inappropriate identification for the 2005 child count and to determine correction of inappropriate identification based on the 2004 child count.

SPP Template – Part B West Virginia
State Revised February 1, 2012
Part B State Performance Plan: 2005-2012 Page 74 (OMB NO: 1820-0624 / Expiration Date: 2/29/2012)
Data for FFY 2004 (2004-2005)
Table 1 FY 04 (2004-2005)
5 divided by 55 x 100 = 9% of districts – FY 04
Category of Disability
Total Number
of Districts
District Number of Students Affected
Weighted Risk Ratio
Self Assessment Status
Behavior Disorders
4 A: Monongalia 15 3.39 Noncompliant (Inappropriate ID)
B: Marion 12 3.33 Noncompliant (Inappropriate ID)
C: Ohio 10 2.33 Noncompliant (Inappropriate ID)
D: Kanawha 45 2.20 Noncompliant (Inappropriate ID)
Mental Impairment
3 E: Logan 11 2.39 Compliant
F: Mercer 56 2.09 Compliant
G: Fayette 27 2.08 Noncompliant (Inappropriate ID)
Discussion of Data:
For FFY 04, when the Westat calculation formula was applied, seven districts were identified as having disproportionate overrepresentation of minority students in two disability categories (behavior disorders, mental impairments) based on a weighted risk ratio of 2.0 or greater and a minimum cell size of 10. Of those seven, four districts were identified as having disproportionate representation in the area of behavior disorders and three districts in the area of mental impairments. All seven districts were required to examine policies, practices and procedures to determine whether the disproportionate representation was due to inappropriate identification using the Protocol for Assessing District Disproportionality developed by WVDE. Based on the examinations, five districts determined the disproportionate representation was due to inappropriate identification resulting in a determination of noncompliance on the district self-assessment Indicator 4.19. Two of the seven districts were determined compliant. After the review of the district’s protocols and submitted documentation, the WVDE provided verification that the districts had appropriately determined their status. Thus, the five districts identified as noncompliant were required to submit improvement plans in the self-assessment designed to correct the non-compliances within one year. During the review of the plans, the WVDE provided necessary feedback regarding additions and/or revisions to the plans and contacted districts if additional information was required.
By October 20, 2006, each non-compliant district was required to submit a progress report to the WVDE summarizing progress or slippage on improvement activities. The WVDE reviewed and provided feedback to the districts on the progress reports in late November, 2006. When a district did not indicate progress on this indicator, a more rigorous plan to proactively address the noncompliance was required.

SPP Template – Part B West Virginia
State Revised February 1, 2012
Part B State Performance Plan: 2005-2012 Page 75 (OMB NO: 1820-0624 / Expiration Date: 2/29/2012)
Baseline Data for FFY 2005 (2005-2006)
Table 2 FY 05 (2005–2006)
2 Districts with Inappropriate Identification / 55 x 100 = 3.6% of Districts
Category of Disability
Total Number
of Districts
District Number of Students
Affected & Population
Weighted Risk Ratio
District Status
Behavior Disorders
5 A - Berkeley 25 / Black 2.07 Noncompliant (Inappropriate ID)
B - Kanawha 44 / Black 2.48 Compliant
C – Marion 14 / Black 3.48 Compliant
D - Monongalia 15 / Black 3.17 Noncompliant (Inappropriate ID)
E - Ohio 12 / Black 2.92 Compliant
Mental Impairments
2 F - Hancock 13 / Black 2.14 Compliant
G - Mercer 57 / Black 2.16 Compliant
Specific Learning Disabilities
2 B - Kanawha 13 / Hispanic
2.27 Compliant
H - Logan 19 / Black 2.06 Compliant
For FFY 05, the WVDE internal team analyzed the December 1, 2005 Child Count data for disproportionate representation. Nine districts emerged as having disproportionate representation of minority students in special education and related services based on a weighted risk ratio of 2.0 or greater and a minimum cell size of 10 students. Of these districts, five were identified as having disproportionate representation in the category of behavior disorders, with weighted risk ratios ranging from 2.07 to 3.48. Two emerged as disproportionate in the category of mental impairments with weighted risk ratios of 2.14 and 2.16. Two districts had disproportionate representation in the specific learning disabilities category, and, for the first time, a district was identified for disproportionate representation of Hispanic students. This group of district teams participated in the NCCRESt training described above and used the NCCRESt rubric for reviewing their policies, practices and procedures to determine whether identification was inappropriate. The completed rubrics were submitted to WVDE, and WVDE personnel scored each one based on the recommended NCCRESt scale as follows:
A score of 60 - 69 resulted in a rating of At Standard (87-100%)
A score of 52 – 59 resulted in a rating of Developing/At Standard (75- 86%)
A score of 46 - 51 resulted in a rating of Developing (67 - 74%)
A score of 45 or below resulted in a rating of Beginning (Below 66%) Inappropriate identification is defined as a score of 45 or below, requiring the District to report noncompliance on the district self-assessment and submit an improvement plan. Based on these scores determined by WVDE, the districts then reported their results in the district self-assessment in December 2006, providing an improvement plan if they were determined noncompliant due to inappropriate identification. Two districts were considered noncompliant based on the rubric results and were required to submit improvement plans. The rubric results for the two districts were indicative of the following: 1) a lack of professional development pertaining to culturally responsive curriculum and instructional practices (differentiated instruction) to address individual learning needs; 2) a failure to identify barriers and needs related to increased engagement and success for diverse students; 3) the lack of a tiered model of effective interventions to address learning and behavioral difficulties prior to or in lieu of referral for special education services; 4) a failure to identify and select assessment

SPP Template – Part B West Virginia
State Revised February 1, 2012
Part B State Performance Plan: 2005-2012 Page 76 (OMB NO: 1820-0624 / Expiration Date: 2/29/2012)
instruments that minimize bias for culturally diverse students; 5) failure to analyze and evaluate disciplinary data across race/ethnicity, gender disability and educational environment and utilize the results to address specific areas for intervention; and 6) a lack of collaboration across general and special education at the school level. The improvement plans were required to include activities to address the specific deficiencies and to bring the district into compliance within one year. Progress would be reported in the districts’ next self-assessment submission in December 2007. During the 2007-2008 school year, the WVDE piloted a draft Disproportionality File Review Checklist (Overrepresentation) in four districts wherein disproportionate overrepresentation had occurred on a recurring basis over the past three years. The districts were requested to randomly select files of students eligible for special education in the Emotional Behavior Disorder, Mental Impairment and Specific Learning Disability categories who were contributing to the disproportionate representation in the district. Similarly, an equal number of files were requested for non-minority students eligible in the same categories, if available. In order to draw further comparisons and conclusions, WVDE personnel reviewed files of both black and white students who had been referred for a multidisciplinary evaluation and had an eligibility committee meeting, but were found ineligible for special education. A thorough analysis of the data collected from the file reviews indicated the piloted form is an effective tool for districts to utilize in determining whether inappropriate and/or discriminatory procedures and/or practices are being employed within the districts. This form has been added to the district Comprehensive Self-Assessment Desk Audit (CSADA), will be utilized by any new districts determined to have disproportionate representation and replaces the former rubric. It is further suggested, for any district previously identified with disproportionate representation, to utilize the form to review the files of any newly identified students to ensure the policies and procedures have been effectively implemented. Subsequently, as a result of OSEP’s response table for the FFY 2006 APR, the WVDE acknowledged disproportionate representation includes both over and underrepresentation, and developed and provided guidance through the self-assessment process for reviewing the district’s policies, practices and procedures with regard to inappropriate underrepresentation. The CSADA Workbook guides districts through the process of examining the demographic data, achievement and progress data, the Student Assistance Team (SAT) data pertaining to referrals for multidisciplinary evaluations, the evaluation procedures and eligibility determinations, if applicable, for the non-identified students in the underrepresented race/ethnic groups. The districts must then determine the appropriateness of the identification, referral, evaluation and eligibility procedures implemented for that particular group of students. To ensure districts appropriately consider all policies, practices and procedures for determining underrepresentation, the WVDE developed a tool entitled ‘District Review of Policies, Practices and Procedures for Disproportionate Representation” in September 2009. This tool assists districts in conducting the mandatory review for determining the compliance status for Indicators 2.1 and 2.2 with regard to underrepresentation. Each district demonstrating disproportionate underrepresentation will be directed to complete the review process utilizing this tool to document its results. Each district will maintain this documentation in its CSADA file. The districts review is verified by OSP via and onsite visit or desk audit. When noncompliance is identified, OSP issues a letter of finding and indicates how the LEA is to correct child specific noncompliances and demonstrate correct implementation of the regulatory requirements consistent with OSEP memo 09-02.
FFY Measurable and Rigorous Target
2005 (2005-2006)
NA
2006 (2006-2007)
0% of districts with disproportionate representation of racial and ethnic groups in specific disability categories that is the result of inappropriate identification.
2007 0% of districts with disproportionate representation of racial and ethnic groups in

SPP Template – Part B West Virginia
State Revised February 1, 2012
Part B State Performance Plan: 2005-2012 Page 77 (OMB NO: 1820-0624 / Expiration Date: 2/29/2012)
FFY Measurable and Rigorous Target
(2007-2008) specific disability categories that is the result of inappropriate identification.
2008 (2008-2009)
0% of districts with disproportionate representation of racial and ethnic groups in specific disability categories that is the result of inappropriate identification.
2009 (2009-2010)
0% of districts with disproportionate representation of racial and ethnic groups in specific disability categories that is the result of inappropriate identification.
2010 (2010-2011)
0% of districts with disproportionate representation of racial and ethnic groups in specific disability categories that is the result of inappropriate identification.
2011
(2011-2012)
0% of districts with disproportionate representation of racial and ethnic groups in specific disability categories that is the result of inappropriate identification.
2012
(2012-2013)
0% of districts with disproportionate representation of racial and ethnic groups in specific disability categories that is the result of inappropriate identification.
Improvement Activities/Timelines/Resources:
Improvement Activities Timelines Resources Status
9.2 / 10.2 Support the implementation of evidence based practices for the provision of primary academic and behavioral interventions (e.g., RTI and School-wide and Early Childhood PBS).
2005-2013 WVDE Active
9.1 / 9.3 / 10.1 / 10.3 Provide training and clarification on the states’ definition of under- and overrepresentation and the policy, procedure and practice review process for districts identified with disproportionate representation.
2009-2013 WVDE
Active
9.4 / 10.4 Provide training and professional development resources to districts identified with inappropriate identification.
2011-2013 WVDE New 2011
9.5 / 10.5 Create a guidance document for speech language pathologists and administrators which will facilitate appropriate implementation of the procedures for the identification, evaluation and eligibility of students for speech language disorders. This document will be posted on the website.
2011-2013 WVDE
Active
9.6 / 10.6 Participate in professional development opportunities focused on improving results for at risk students to gain an increased awareness and understanding of effective strategies to address disproportionality in the state and individual districts.
2007-2013 WVDE TA Centers
Active
9.7 / 10.7 Provide training and professional development resources for eligibility determinations across the categorical areas.
2005-2013 WVDE
Active

SPP Template – Part B West Virginia
State Revised February 1, 2012
Part B State Performance Plan: 2005-2012 Page 78 (OMB NO: 1820-0624 / Expiration Date: 2/29/2012)
Part B State Performance Plan (SPP) for 2005-2012
Overview of the State Performance Plan Development:
Monitoring Priority: Effective General Supervision Part B / Child Find
Indicator 11: Percent of children who were evaluated within 60 days of receiving parental consent for initial evaluation or, if the State establishes a timeframe within which the evaluation must be conducted, within that timeframe. (20 U.S.C. 1416(a)(3)(B))
Measurement:
a. # of children for whom parental consent to evaluate was received
b. # determined not eligible whose evaluations were completed within 60 days (or State established timeline)*
c. # determined eligible whose evaluations were completed within 60 days (or State established timeline)*
Account for children included in a. but not included in b. or c. Indicate the range of days beyond the timeline when the evaluation was completed and any reasons for the delays.
Percent = [(b.+c.)/(a.)]X100.
*West Virginia Policy 2419: Regulations for the Education of Students with Exceptionalities has established a timeline of 80 days from receipt of written parental consent to the completion of the eligibility committee determination as the timeline for completion of initial evaluations.
Please note that the measurement has changed to include only parts A and C. However, the original measurement (parts A, B and C) were maintained in the SPP to make the baseline data understandable to readers.
Overview of Issue/Description of System or Process:
Implementing regulations for IDEA 2004, 34 Code of Federal Regulations §300.301 (c) state, “initial evaluation must be conducted within 60 days of receiving parental consent for evaluation; or if the State establishes a timeframe within which evaluations must be conducted, within that timeframe.” West Virginia Policy 2419: Regulations for the Education of Students with Exceptionalities, Chapter 3, Section 1.A, effective January 11, 2010, as well as the Policy 2419 in effect when for the 2005 SPP, establishes a timeframe of 80 days from receipt of written parental consent for evaluation to the completion of the initial evaluation and eligibility committee determination. A multidisciplinary evaluation must be completed prior to the eligibility committee meeting. Therefore, the timeframe within which the initial evaluation must be completed is defined as the time between written parental consent and the eligibility committee report date. The West Virginia Department of Education (WVDE) uses the eligibility date for monitoring purposes, which marks the end of the evaluation process with a specific date documented on the eligibility committee report form and provides a consistent date across districts for monitoring both evaluation and reevaluation timelines.

SPP Template – Part B West Virginia
State Revised February 1, 2012
Part B State Performance Plan: 2005-2012 Page 79 (OMB NO: 1820-0624 / Expiration Date: 2/29/2012)
Child Find
The process for child find and initial evaluations of students in West Virginia is as follows:
Districts are responsible for child find in West Virginia as specified in Policy 2419;
Districts establish a child identification system which includes referrals from the initial screening process, student assistance teams (SAT), private/religious schools, parents and other interested persons;
Districts conduct sweep screenings in the areas of hearing, vision, speech and language for all students entering preschool or kindergarten and all students entering public and private schools for the first time;
Districts conduct developmental screening for children under compulsory school age at the request of a parent and in cooperation with other agencies;
Student Assistance Teams (SATs) in each school receive written referrals from teachers, agencies, parents and/or other interested parties for students who are experiencing academic and/or behavioral difficulties. A SAT is a trained school-based team, which manages a formal intervention process addressing academic, behavioral and functional needs of all students. A SAT reviews individual student needs and either recommends appropriate instructional and/or behavioral intervention strategies within the general education program or refers the student for a multidisciplinary evaluation;
Evaluation teams or SATs (consisting of appropriate members) make decisions regarding the appropriate evaluations; and
Districts complete the initial multidisciplinary evaluation upon receipt of written parental consent. Qualified professionals conduct the evaluations, notify the parents and convene the Eligibility Committee (EC), which determines the eligibility within 80 calendar days of receipt of written parental consent for evaluation.
Data Collection Process
Districts maintain data through the West Virginia Education Information System (WVEIS) Student Special Education information component containing data fields for collecting dates of referral, parental consent for initial evaluation and eligibility determination, as well as eligibility status and if eligible, the category of exceptionality.
Districts were issued a memorandum in September 2005 mandating the use of the above data fields to facilitate data collection for compliance with the 80-day timeline for initial evaluations.
The WVDE extracts the individual student data through the WVEIS to report the number of evaluations completed within the 80-day timeline, the number of evaluation exceeding the 80-day timeline and the reasons for exceeding the timeline.
The WVDE collects this data for Indicator 11 reporting every year in June. Districts are then given the opportunity to examine data for data entry errors.
Currently (FFY 2009) the WVDE extracts data three more times during the school year providing districts time to correct data entry errors only.
Baseline Data for FFY 2005 (2005-2006):
Evaluation Timelines Baseline Data 2005-2006
Indicator 11 Measurement Number %
a. Students with consent for initial evaluation 2005-2006 8563 100
b. Students determined not eligible within timelines 1905 22.2
c. Students determined eligible within timelines 5162 60.3
Total with determinations within timelines 7067 82.5
Percent = [(b.+c.)/(a.)]X100

SPP Template – Part B West Virginia
State Revised February 1, 2012
Part B State Performance Plan: 2005-2012 Page 80 (OMB NO: 1820-0624 / Expiration Date: 2/29/2012)
Evaluation Timelines Baseline Data 2005-2006
Students not in b. or c.:
Students not in b. or c. due to missing data 465 5.4
Students not in b. or c. due to exceeding timelines 1031 12.0
Reasons for exceeding timelines:
Acceptable reasons
Extenuating circumstances resulting in school closure 10 1.0
Excessive student absences 43 4.2
Parent refused consent 4 0.4
Parent failed to produce student for evaluation or interrupted the process 91 8.8
Parent request for rescheduling 96 9.3
Other (provide justification) 15 1.5
Transferred into school during the evaluation process 39 3.8
Student no longer in county 17 1.6
Total 315 30.6
Unacceptable reasons
No reason specified 716 69.4
Discussion of Baseline Data:
For 2005-2006, 1031 or 12% of the initial evaluations exceeded the 80-day timeline. Data indicated districts exceeded the timeline by a span of 1-99 days. Justifiable reasons were provided for 315 or 30.6% of the evaluations.
For 716 or 69.4% of the initial evaluations exceeding 80 days, no reason was provided.
For 2005-2006, student data remained missing for 465 or 5.4% of the student records after the verification process. This was the first data collection and analysis conducted at the state level. Heightened district of the responsibility to enter and maintain this data should improve the accuracy of student records.
For 2005-2006, districts obtained consent for 8563 students for initial evaluations. Of those, 7067 or 82.5% were conducted within the established 80-day timeline.
During state-wide administrator conferences, districts were made aware this indicator requires 100% compliance. Exceeding the 80-day timeline for 12% of initial evaluations is unacceptable. Further review revealed 51 of 57 entities (55 districts, Office of Institutional Education Programs and the West Virginia Schools for the Deaf and Blind) or 89% of districts were out of compliance. Through a self-assessment process, districts are required to develop and implement an improvement plan.
FFY Measurable and Rigorous Target
2005 (2005-2006)
NA
2006 (2006-2007)
100% of students with written parental consent for initial evaluation have evaluations completed within the 80-day timeline established by West Virginia Policy 2419
2007 (2007-2008)
100% of students with written parental consent for initial evaluation have evaluations completed within the 80-day timeline established by West Virginia Policy 2419
2008 (2008-2009)
100% of students with written parental consent for initial evaluation have evaluations completed within the 80-day timeline established by West Virginia Policy 2419
2009 (2009-2010)
100% of students with written parental consent for initial evaluation have evaluations completed within the 80-day timeline established by West Virginia Policy 2419
2010 (2010-2011)
100% of students with written parental consent for initial evaluation have evaluations completed within the 80-day timeline established by West Virginia Policy 2419

SPP Template – Part B West Virginia
State Revised February 1, 2012
Part B State Performance Plan: 2005-2012 Page 81 (OMB NO: 1820-0624 / Expiration Date: 2/29/2012)
FFY Measurable and Rigorous Target
2011 (2011-2012)
100% of students with written parental consent for initial evaluation have evaluations completed within the 80-day timeline established by West Virginia Policy 2419
2012 (2012-2013)
100% of students with written parental consent for initial evaluation have evaluations completed within the 80-day timeline established by West Virginia Policy 2419
Improvement Activities/Timelines/Resources:
Improvement Activities Timeline Resources Status
11.1 Provide targeted technical assistance to districts identified as not meeting state targets based on evaluation of data provided by WVDE in order to improve performance on this indicator.
2009-2013 WVDE RESA
Active Revised 2011
11.2 Provide trainings or reminders for LEAs on data collection, monitoring requirements and best practice management strategies in the area of initial evaluation timelines.
2009-2013 WVDE RESA
Active
11.3 Continue to implement the Request for Evaluation / Reevaluation form designating a box for districts to enter the date a district received the signed permission form. This is a state mandated process form districts must use.
2008-2013 WVDE Active
11.4 Improve the accuracy of district data entry and monitoring process for Indicator 11 by maintaining and improving the initial evaluations timeline data and reporting features in WVEIS including audits, queries and SEQUEL reports.
2008-2013 WVDE OSP WVDE WVEIS RESA
Active
11.5 Collect initial evaluation timelines data four times per year to improve data quality and communication to districts regarding accurate initial evaluation data entry process.
2009-2013 WVDE OSP WVDE WVEIS
Active
11.6 Provide a letter of finding to all districts not meeting the target for initial evaluations requiring them to submit an improvement plan for this self-assessment indicator not met.
2009-2013 WVDE Active

SPP Template – Part B West Virginia
State Revised February 1, 2012
Part B State Performance Plan: 2005-2012 Page 82 (OMB NO: 1820-0624 / Expiration Date: 2/29/2012)
Part B State Performance Plan (SPP) for 2005-2012
Overview of the State Performance Plan Development:
See Indicator 1
(The following items are to be completed for each monitoring priority/indicator.)
Monitoring Priority: Effective General Supervision Part B/ Effective Transition
Indicator 12: Percent of children referred by Part C prior to age 3, who are found eligible for Part B, and who have an IEP developed and implemented by their third birthdays.
(20 U.S.C. 1416(a)(3)(B))
Measurement:*
a. # of children who have been served in Part C and referred to Part B for Part B eligibility determination. b. # of those referred determined to be NOT eligible and whose eligibility was determined prior to their
third birthdays. c. # of those found eligible who have an IEP developed and implemented by their third birthdays. d. # of children for whom parent refusal to provide consent caused delays in evaluation or initial services. e. # of children who were referred to Part C less than 90 days before their third birthdays.
Account for children included in a but not included in b, c, d or e. Indicate the range of days beyond the third birthday when eligibility was determined and the IEP developed and the reasons for the delays.
Percent = [(c) divided by (a - b - d - e)] times 100.
*Please note that section d and e of Indicator 12 were added in the 2006-2007 and 2008-2009 APRs, respectively, after the original baseline data were collected. Consequently, these data elements are not reflected in the baseline data below.
Overview of Issue/Description of System or Process
Major activities related to the transition of children from Part C to Part B are coordinated by West Virginia’s Early Childhood Transition Steering Committee, which includes representatives from the Department of Education, Head Start, Department of Health and Human Resources, West Virginia Birth to Three (WV BTT), Regional Education Service Agencies (RESAs), Regional Administrative Units (RAUs), county superintendents, teachers and Child Care Resource and Referral Agency. The vision of the Committee is for local communities in West Virginia to have effective transition policies and practices for all young children birth through five years of age that will:
maximize positive outcomes for children through effective early childhood programs that are compatible as the child moves from one setting to another;
foster positive ongoing relationship between families, professionals and among participating agencies; and
result in a smooth transition process for children, families and entities involved.
The Early Childhood Transition Steering Committee works toward the vision by providing supports for effective transitions at the local level. The committee implements the early childhood statewide conference, maintains a website, develops and disseminates common procedures and forms, trains local interagency collaborative teams, develops model forms, agreements and processes to use at

SPP Template – Part B West Virginia
State Revised February 1, 2012
Part B State Performance Plan: 2005-2012 Page 83 (OMB NO: 1820-0624 / Expiration Date: 2/29/2012)
the local level and publishes materials for parents, teachers and service providers, such as The Early Childhood Provider Quarterly and the web-based interagency agreement template.
A Family Exit survey was developed to capture input from families. The Transition Steering Committee provided feedback on data resulting from the survey. Two sessions at the Celebrating Connections Early Childhood Conference highlighted the transition resources available to local providers. Information regarding the resources was also included in the Provider Quarterly magazine. All the committee products were used in higher education early childhood summer inclusion courses. The committee developed and disseminated the West Virginia Early Childhood Resources Awareness Packet/CD containing the products developed to facilitate transition. The transition information was also incorporated into training for the Apprenticeship for Child Development Specialist (ACSD) program. During 2004-2005, child find and transition were the responsibilities of the WV BTT providers and the local district, rather than the state-level agencies.
WV BTT and the West Virginia Department of Education (WVDE) have been collaborating on ways to capture and match the data elements between the two agencies. Beginning in 2003-2004, districts were required to maintain in the individual WVEIS Student Special Education Information record referral, eligibility and IEP dates for students referred by WV BTT. Transition Data for eligible students were captured, but ineligible students were not included in the records. Reasons for exceeding timelines were not required for federal reporting at that time.
WV BTT and the WVDE collaboratively have revised the process for child find and tracking of transition for children turning age three. The information for children exiting the Part C system currently is being sent directly to the local districts by the state WV BTT office. This is information is also provided to the WVDE, which will track the status of referrals and the accuracy of data maintained by the district. This process will ensure complete and accurate data for both the Part B and Part C Annual Performance Report and for ensuring compliance with transition requirements.
Baseline Data for FFY 2004 (2004-2005)
Children Referred from WV Birth to Three (Part C) to Public School Districts
2004-2005
Referred by Part C, WV BTT to Part B
Not Eligible for Part B
Eligible with IEPs
TOTAL 535 (a) 12 445
Determined by Third Birthdate
6 (b) 256 (c )
Percent = c divided by a – b times 100. 256/(535-6) *100 = 48.4%
Students unaccounted for in a, b, or c:
6 - eligibility determined after the third birthdate (range of days)
4 - Parents declined evaluation/services
10 - Eligible with no IEP
64 – reported referred by Part C with no Part B record

SPP Template – Part B West Virginia
State Revised February 1, 2012
Part B State Performance Plan: 2005-2012 Page 84 (OMB NO: 1820-0624 / Expiration Date: 2/29/2012)
Discussion of Baseline Data:
Baseline data indicate 48.4 percent of students referred by WV BTT to Part B public school districts who were found eligible had IEPs developed and implemented by their third birthdates. Of the 535 students referred, 445 or 83 percent were found eligible and received IEPs.
Because the Department of Health and Human Resources (DHHR) is the lead agency for WV Birth to Three and age 3-5 services are the responsibility of public schools under the WVDE, the data systems are separate. During 2004-2005, efforts were made to maintain and collect data in both systems that could be matched to provide the information needed for the previous Annual Performance Report. WV Birth to Three collected status upon exit (eligible for Part B, referred for Part B eligibility, not eligible for Part B). WVDE required districts to maintain referral dates, referral sources, eligibility status, exceptionality, eligibility dates and IEP dates for all students, with the information on children turning three from July 1, 2004 through June 30, 2005 being relevant to reporting baseline for the SPP. For 2004-2005, data on students found eligible were to be maintained in the WVEIS Special Education Student Information records. Data collected were incomplete, however, and districts were contacted by phone and asked to submit the missing information.
Most districts did not maintain WVEIS records on ineligible students, because a process had not been developed to generate records for students who were not enrolled in public schools. Records for ineligible students were to be maintained separately. Because reporting on ineligible students was not required for the previous Annual Performance Report, these records are incomplete for 2004-2005. Reasons for delays beyond the third birthdate were not a data element required for 2004-2005, and this information is not specifically available in student records. For 2005-2006, a process has been developed and districts have been notified through a memorandum from the WVDE to enter referral, eligibility and IEP data for all students, including those not found eligible.
Per our interagency agreement and a clarification letter from the U.S. Department of Education, in February 2005, WV Birth to Three and WVDE now are sharing student information for purposes of child find. This has allowed us to establish a state-level system for notifying districts of incoming Part C students and tracking their transition process to ensure maintenance compliance with timelines.
Plan for Ensuring Compliance with Child Find Requirements
School districts were notified of the continuing student WVEIS record requirements, including maintenance of referral, evaluation, eligibility status and IEP dates and of the new WV Birth to Three notification process and the WVDE tracking process.
WV Birth to Three will notify districts and the WVDE of students exiting their program, giving sufficient notice prior to the third birthdate.
The WVDE requires districts to return a form indicating the actions taken regarding students for whom notification is received. The WVDE will track to ensure eligibility is determined and IEPs are implemented, as appropriate, by the third birthdate. This provides additional documentation, which can be used to verify WVEIS records.
Technical assistance and professional development will be provided to districts and WV Birth to Three providers to facilitate collaboration and improve the transition process.
When a district fails to meet timelines, the WVDE will investigate reasons why timelines were not met. Technical assistance and/or referral to the WVDE monitoring team will be provided as appropriate. Noncompliance will be addressed through the District’s Self-
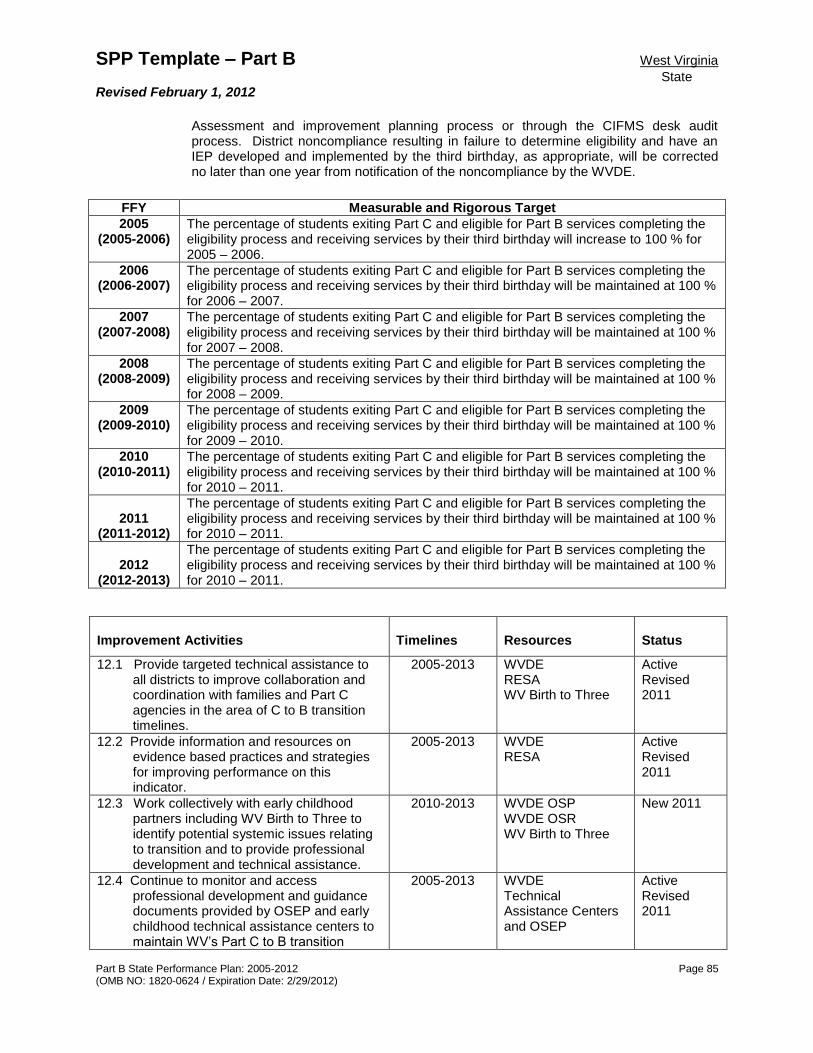
SPP Template – Part B West Virginia
State Revised February 1, 2012
Part B State Performance Plan: 2005-2012 Page 85 (OMB NO: 1820-0624 / Expiration Date: 2/29/2012)
Assessment and improvement planning process or through the CIFMS desk audit process. District noncompliance resulting in failure to determine eligibility and have an IEP developed and implemented by the third birthday, as appropriate, will be corrected no later than one year from notification of the noncompliance by the WVDE.
FFY Measurable and Rigorous Target
2005 (2005-2006)
The percentage of students exiting Part C and eligible for Part B services completing the eligibility process and receiving services by their third birthday will increase to 100 % for 2005 – 2006.
2006 (2006-2007)
The percentage of students exiting Part C and eligible for Part B services completing the eligibility process and receiving services by their third birthday will be maintained at 100 % for 2006 – 2007.
2007 (2007-2008)
The percentage of students exiting Part C and eligible for Part B services completing the eligibility process and receiving services by their third birthday will be maintained at 100 % for 2007 – 2008.
2008 (2008-2009)
The percentage of students exiting Part C and eligible for Part B services completing the eligibility process and receiving services by their third birthday will be maintained at 100 % for 2008 – 2009.
2009 (2009-2010)
The percentage of students exiting Part C and eligible for Part B services completing the eligibility process and receiving services by their third birthday will be maintained at 100 % for 2009 – 2010.
2010 (2010-2011)
The percentage of students exiting Part C and eligible for Part B services completing the eligibility process and receiving services by their third birthday will be maintained at 100 % for 2010 – 2011.
2011
(2011-2012)
The percentage of students exiting Part C and eligible for Part B services completing the eligibility process and receiving services by their third birthday will be maintained at 100 % for 2010 – 2011.
2012
(2012-2013)
The percentage of students exiting Part C and eligible for Part B services completing the eligibility process and receiving services by their third birthday will be maintained at 100 % for 2010 – 2011.
Improvement Activities Timelines Resources Status
12.1 Provide targeted technical assistance to all districts to improve collaboration and coordination with families and Part C agencies in the area of C to B transition timelines.
2005-2013 WVDE RESA WV Birth to Three
Active Revised 2011
12.2 Provide information and resources on evidence based practices and strategies for improving performance on this indicator.
2005-2013 WVDE RESA
Active Revised 2011
12.3 Work collectively with early childhood partners including WV Birth to Three to identify potential systemic issues relating to transition and to provide professional development and technical assistance.
2010-2013 WVDE OSP WVDE OSR WV Birth to Three
New 2011
12.4 Continue to monitor and access professional development and guidance documents provided by OSEP and early childhood technical assistance centers to maintain WV’s Part C to B transition
2005-2013 WVDE Technical Assistance Centers and OSEP
Active Revised 2011

SPP Template – Part B West Virginia
State Revised February 1, 2012
Part B State Performance Plan: 2005-2012 Page 86 (OMB NO: 1820-0624 / Expiration Date: 2/29/2012)
Improvement Activities Timelines Resources Status
process and guidance documents.
12.5 Continue to participate on the WVDE Continuous Quality Improvement Council and Early Childhood Advisory County and collaborate with other early childhood agency partners to disseminate PD and provide seamless transitions from Part C to Part B and into kindergarten.
2005-2013 WVDE EC Transition Steering Committee, Training Connections and WV Birth to Three
Active Revised 2012
12.6 Improve the data system and verification process to ensure efficient and timely correction of noncompliance with technical assistance from MSRRC and in collaboration with WVBTT.
2011-2013 MSRRC, WVDE OSP WVDE WVEIS WV Birth To Three
New 2011

SPP Template – Part B West Virginia
State Revised February 1, 2012
Part B State Performance Plan: 2005-2012 Page 87 (OMB NO: 1820-0624 / Expiration Date: 2/29/2012)
Part B State Performance Plan (SPP) for 2005-2012
Overview of the State Performance Plan Development:
See Indicator 1
Monitoring Priority: Effective General Supervision Part B / Effective Transition
Indicator 13: Percent of youth with IEPs aged 16 and above with an IEP that includes appropriate measurable postsecondary goals that are annually updated and based upon an age appropriate transition assessment, transition services, including courses of study, that will reasonably enable the student to meet those postsecondary goals, and annual IEP goals related to the student’s transition services needs. There also must be evidence that the student was invited to the IEP Team meeting where transition services are to be discussed and evidence that, if appropriate, a representative of any participating agency was invited to the IEP Team meeting with the prior consent of the parent or student who has reached the age of majority.
(20 U.S.C. 1416(a)(3)(B))
Measurement: Percent = [(# of youth with IEPs aged 16 and above with an IEP that includes appropriate measurable postsecondary goals that are annually updated and based upon an age appropriate transition assessment, transition services, including courses of study, that will reasonably enable the student to meet those postsecondary goals, and annual IEP goals related to the student’s transition services needs. There also must be evidence that the student was invited to the IEP Team meeting where transition services are to be discussed and evidence that, if appropriate, a representative of any participating agency was invited to the IEP Team meeting with the prior consent of the parent or student who has reached the age of majority) divided by the (# of youth with an IEP age 16 and above)] times 100.
Overview of Issue/Description of System or Process:
Transition services are determined through a variety of overlapping activities developed by the Individualized Education Program (IEP) team. The IEP should clearly document that the services and annual goals are coordinated to reasonably enable the student to meet his/her postsecondary goals. The student receives a variety of career exploratory activities prior to age 16 to inform his or her choices regarding postsecondary goals. School staff coordinates transition services with the support of the parent and the community. Active student participation in the IEP process is vital, as well as preparation for this participation. Transition IEP requirements are outlined in Policy 2419: Regulations for the Education of Students with Exceptionalities and in Policy 2510: Assuring Quality of Education: Regulations for Education Programs for all students.
To verify transition services are designed as required by Policy 2419 to enable the student to meet the postsecondary goals identified in the IEP, the WVDE implements student and parent surveys and includes secondary transition indicators in the Comprehensive Self-Assessment Desk Audit (CSADA) and onsite data verification components of the Continuous Improvement and Focused Monitoring System (CIFMS), as well as on-site compliance monitoring of districts. Indicator 13 Data Collection 2010-2011 (and prior years): Data for this indicator are collected through the CSADA monitoring process required of all local educational agencies. The OSP draws a random sample of students whose IEPs will be reviewed from the most recent December child count file. The sample is posted for LEA access within the online CSADA system, along with the required questions to

SPP Template – Part B West Virginia
State Revised February 1, 2012
Part B State Performance Plan: 2005-2012 Page 88 (OMB NO: 1820-0624 / Expiration Date: 2/29/2012)
be answered when each IEP is reviewed. The sample includes approximately 10 percent (minimum of 5 per district / maximum of 40 per district) of the LEA’s students ages 16 or older as of December 1. Districts are permitted to request replacement students for their IEP review sample only when a SWD selected in the original sample has been verified by the OSP as having left the jurisdiction of the LEA. As each IEP is reviewed, the answers to each required question are entered online. The online system then calculates the compliance status and creates summary reports of the IEP reviews for the LEA and state staff. With involvement of their steering committees, LEAs determine their status on the secondary transition indicator. A Yes-Compliant (Y) or No-Noncompliant (N) response is required for each of the questions in the Transition IEP Checklist with the exception of Question #8: Agency Involvement, which may have a Does Not Apply (NA) response. An NA response is acceptable for a given year or situation contingent upon the individual student’s transition needs. For example, agency involvement may not be needed: 1) where an independent living goal is to live in a “shared apartment”, and the family is facilitating this independently; or 2) where the goal is to work in a family business, and the family prefers to facilitate this transition without outside agency support. A No-Noncompliant (N) response for any question on the IEP Checklist results in a noncompliant IEP, requiring an improvement plan to be submitted to WVDE using the web-based system. District Review: CIFMS procedures require districts to review transition IEP compliance using the Transition File Review Checklist. Specific to annual IEP goals and transition services that will reasonably enable the student to meet the post-secondary goals, the review checklist includes the following eight questions:
1. Are there appropriate measurable postsecondary goals that address education or training, employment, and (as needed) independent living?
2. Are the post secondary goals updated annually?
3. Is there evidence that the measurable postsecondary goals were based on age-appropriate
transition assessment(s)?
4. Are there transition services in the IEP that will reasonably enable the student to meet his or her postsecondary goals?
5. Do the transition services include courses of study that will reasonably enable the student reach
his/her postsecondary goals?
6. Is/are there annual IEP goals related to the student’s transition service needs?
7. Is there evidence that the student was invited to the IEP Team meeting where transition services were discussed?
8. Is there evidence that a representative of any participating agency(s) was invited to the IEP Team meeting with the prior consent of the parent or adult student?
The LEA staff evaluates compliance of their IEPs with involvement of their CSADA steering committee and submits the results to WVDE through the web-based system, along with an improvement plan if noncompliance was determined. LEAs submitted the results of IEP reviews based on 2009-2010 data, that is, the sample of students taken from the December 1, 2009 child count, to the WVDE in April 2010. Correction of Noncompliance: If a district is noncompliant (N) on any question for any IEP reviewed, an improvement plan must be submitted to correct the deficiency. IEPs found to be noncompliant must be corrected by the LEAs per OSEP memo 09-02 and verified as corrected by the OSP for SPP/APR

SPP Template – Part B West Virginia
State Revised February 1, 2012
Part B State Performance Plan: 2005-2012 Page 89 (OMB NO: 1820-0624 / Expiration Date: 2/29/2012)
reporting. Corrected IEPs of SWDs who remain in the jurisdiction of the LEA are submitted to OSP for verification. OSP provides written communication to the special education director that the IEP has or has not been corrected. The written communication generally includes a chart displaying the noncompliance area and the correction status. OSP provides verbal and written communications to special education directors who fail to provide the corrected IEPs within the specified timelines to obtain the data on correction, which is reported in the SPP/APR. For students reported by LEAs as no longer in the district, OSP verifies the students have exited (moved, graduated or dropped out) through WVEIS student enrollment records to ensure correction of the noncompliance is no longer required. Compliance with specific regulatory requirements is verified by requesting an updated sample of transition-age IEPs from districts previously identified with noncompliance. This sample is obtained from districts during the late fall/early winter period (November through January), considering district professional development schedules regarding documentation of transition in the IEP. IEP/transition documentation is reviewed and determined compliant or noncompliant by OSP staff for SPP/APR reporting. OSP collects additional documentation/data at the same time regarding steps the LEA has taken or plans to take to assure all subsequent IEPs for students with disabilities age 16 and over in the LEA document transition services adequately. Revision to Indicator 13 Monitoring Process and Data Collection. Under new monitoring procedures, the OSP will change the data collection process for Indicator 13 during the 2011-2012 school year. OSP will collect and report the transition age IEPs reviewed during cyclical monitoring visits for the 13-15 districts monitored each year. This will ensure all LEAs are reviewed and reported for Indicator 13 at least once during each four-year monitoring cycle. However, OSP will continue to mandate the annual self-assessment process which includes Indicator 13 to ensure continual improvement for all districts. Change to the data collection process emerged in tandem with improvement to the overall monitoring system and a revised file review process supported through technical assistance from the Mid-South Regional Resource Center. Changes to monitoring procedures have been reviewed by stakeholders, including local special education administrators and the West Virginia Advisory Council for the Education of Exceptional Children. Technical Assistance Process to Persistently Noncompliant Districts: In June 2009, WVDE was notified that the state was in “Needs Assistance” in meeting the requirements of the Individuals with Disabilities Education Act of 2004. This determination was made, in part, due to continuing noncompliance with regulations in the area of secondary transition. At that time, OSP mandated persistently noncompliant districts participate at least annually in root cause analysis and program planning for effective transition services. The root cause process and transition planning materials for persistently noncompliant districts may be found at the following website: http://wvde.state.wv.us/osp/Transition/transitiontrainingpacket.html .
Baseline Data for FFY 2009 (2009-2010):
IEPs Reviewed for Transition Goals and Services
2009-2010
Number of IEPs reviewed 807
Number in compliance 766
Percentage of files reviewed in compliance 95.0 % (766/807*100)
Number of students ages 16+ (December 1, 2009 child count)
8,195
Sample size required for .95 confidence level with 735

SPP Template – Part B West Virginia
State Revised February 1, 2012
Part B State Performance Plan: 2005-2012 Page 90 (OMB NO: 1820-0624 / Expiration Date: 2/29/2012)
3.45 % confidence interval
Discussion of Baseline Data:
In West Virginia, 8,195 students with disabilities were 16 years of age or older as of December 1, 2009. Using the Transition File Review Checklist, 807 files of these students (9.85%) were reviewed. Among the 807 files reviewed, over 130 schools and all disability categories including deafblindness, were represented. Results of that review found 95.0% percent or 766 of the student files were in compliance. One hundred percent compliance is required on this indicator. Data were due to WVDE April 1, 2010. Among the 57 LEAs, 47 out of 57 or 82.46 percent were in compliance. For any file reviewed and found noncompliant, an improvement plan was required. Of the ten districts (i.e., 17.54%) with noncompliances, four have been identified as persistently noncompliant. Each of the four districts participated in WVDE mandated professional development in September 2009. At this training, districts were required to conduct a root cause analysis and plan for effective transition practices for SWDs. Measureable and Rigorous Target: Indicator 13 measurement was revised by OSEP in 2009 to include: 1) if a student was invited to the IEP Team meeting wherein transition services were discussed and 2) if postsecondary goal(s) are updated annually. The 100% compliance targets remain in effect.
.
FFY Measurable and Rigorous Target
2005 (2005-2006)
100% of IEPs for youth aged 16 and above include coordinated, measurable, annual IEP goals and transition services that will reasonably enable the student to meet the post-secondary goals
2006 (2006-2007)
100% of IEPs for youth aged 16 and above include coordinated, measurable, annual IEP goals and transition services that will reasonably enable the student to meet the post-secondary goals
2007 (2007-2008)
100% of IEPs for youth aged 16 and above include coordinated, measurable, annual IEP goals and transition services that will reasonably enable the student to meet the post-secondary goals
2008 (2008-2009)
Revised Indicator: No SPP / APR submission required
2009 (2009-2010)
Revised Indicator: SPP submission only
2010 (2010-2011)
100% of IEPs for youth aged 16 and above includes appropriate measurable postsecondary goals that are annually updated and based upon an age appropriate transition assessment, transition services, including courses of study, that will reasonably enable the student to meet those postsecondary goals, and annual IEP goals related to the student’s transition services needs. There also must be evidence that the student was invited to the IEP Team meeting where transition services are to be discussed and evidence that, if appropriate, a representative of any participating agency was invited to the IEP Team meeting with the prior consent of the parent or student who has reached the age of majority.
2011
(2011-2012)
100% of IEPs for youth aged 16 and above includes appropriate measurable postsecondary goals that are annually updated and based upon an age appropriate transition assessment, transition services, including courses of study, that will reasonably enable the student to meet those postsecondary goals, and annual IEP goals related to the student’s transition services needs. There also must be evidence that the student was invited to the IEP Team meeting where transition services are to be discussed and evidence that, if appropriate, a representative of any participating agency was invited to the IEP Team meeting with the prior consent of the parent or student who has reached the age of majority.

SPP Template – Part B West Virginia
State Revised February 1, 2012
Part B State Performance Plan: 2005-2012 Page 91 (OMB NO: 1820-0624 / Expiration Date: 2/29/2012)
FFY Measurable and Rigorous Target
2012
(2012-2013)
100% of IEPs for youth aged 16 and above includes appropriate measurable postsecondary goals that are annually updated and based upon an age appropriate transition assessment, transition services, including courses of study, that will reasonably enable the student to meet those postsecondary goals, and annual IEP goals related to the student’s transition services needs. There also must be evidence that the student was invited to the IEP Team meeting where transition services are to be discussed and evidence that, if appropriate, a representative of any participating agency was invited to the IEP Team meeting with the prior consent of the parent or student who has reached the age of majority.
Improvement Activities/Timelines/Resources:
Activities for Indicators 1 - graduation, 2 - dropout, 13 – secondary transition planning and 14 - post school outcomes are interrelated and directed toward planning, instruction, services and linkages to ensure positive post school outcomes for students with disabilities. Technical assistance accessed through national centers and conferences has emphasized the interconnectedness of these indicators and the benefits of creating a comprehensive plan of improvement activities. As a result, indicator activities for 1, 2, 13 and 14 were combined in 2007-2008 and are encompassed under the umbrella of the West Virginia Transition Collaborative Community of Practice (WVTCCoP). Please note although activities are combined across indicators, they are numbered according to the primary indicator to which they apply.
Improvement Activities – Indicators 1, 2, 13 and 14 Timelines Resources Status
13.1 Collect and review data annually from file reviews of transition IEPs conducted through on-site monitoring of districts. .
2008-2013 WVDE Stakeholder Committee LEA
Active Revised 2012
13.2 Provide professional development and guidance materials for documenting transition services in the IEP and implementation of evidence-based transition strategies.
2008-2013 WVDE Active
13.3 Verify correction of noncompliance for Indicator 13 by reviewing updated samples of IEPs for compliance, as well as verifying correction of any individual IEPs with noncompliances. WVDE staff will review the data and notify the district of compliance status and actions to be taken.
Districts failing to correct noncompliances will receive further targeted technical assistance and corrective actions, including as appropriate onsite reviews, additional corrective activities and enforcement.
2008-2013 WVDE LEA
Active Revised 2011
13.4 Develop and Maintain a Showcase for Transition on the WVDE website (success stories of students, teams, programs, to connect transition services for school age students with post school outcomes of former students).
2009-2013 WVDE TA Centers NSTTAC, NDPC-N, SD materials Assessments
Active
13.5 Embed help boxes and links to transition guidance documents on the WVDE website into the statewide online IEP system. Develop a report or audit within the system for IEPs of transition age students to
2008-2013
WVDE NSTTAC materials
Active

SPP Template – Part B West Virginia
State Revised February 1, 2012
Part B State Performance Plan: 2005-2012 Page 92 (OMB NO: 1820-0624 / Expiration Date: 2/29/2012)
Improvement Activities – Indicators 1, 2, 13 and 14 Timelines Resources Status
determine compliance with the Transition IEP Checklist. Incorporate standards-based IEP guidance into the online IEP.
1.1 / 2.1 Partner with National Dropout Prevention Center for Students with Disabilities to strengthen the implementation of evidence-based graduation and dropout prevention strategies in WV.
2011-2013 NDPC-SD WVDE
New 2011
1.2 / 2.2 Manage/support the WV Transition Collaborative Leadership Team to oversee the implementation of a coordinated state-wide plan for post secondary transition services and programs.
2005-2013 WVDE Active Revised 2011
1.3 / 2.3 Manage/support the West Virginia Transition Collaborative Community of Practice (WVTCCoP) to provide educators the opportunity to share best practices, access experts in the field and interact with other educators throughout the state. Emphasis of the WVTCCoP is to recruit and support district staff responsible for implementation of transition requirements to assist in the development of skills related to improving transition services for students with disabilities.
2005-2013 WVDE Active Revised 2011
1.7 / 2.7 Recruit and support Transition Teams in all RESAs to assist in the identification of local, regional and state resources to support the development and implementation of best practices.
2011-2013 WVDE and RESA
Active Revised 2011
1.9 / 2.9 Collaborate with external agencies and internal offices (e.g., Offices of Assessment, Curriculum and Instruction, School Improvement) to improve transition services, graduation rates, dropout rates and post school outcomes for SWDs.
2005-2013 WVDE Active Revised 2011
14.1 Collect and disseminate annually Exit and One Year Follow-up Survey results with various stakeholder groups with an emphasis on increasing data use and response rates at the district level.
2005-2013 WVDE Active

SPP Template – Part B West Virginia
State Revised February 1, 2012
Part B State Performance Plan: 2005-2012 Page 93 (OMB NO: 1820-0624 / Expiration Date: 2/29/2012)
Part B State Performance Plan (SPP) for 2005-2012
Overview of the State Performance Plan Development:
See Indicator 1
Monitoring Priority: Effective General Supervision Part B / Effective Transition
Indicator 14: Percent of youth who are no longer in secondary school, had IEPs in effect at the time they left school, and were:
A. Enrolled in higher education within one year of leaving high school.
B. Enrolled in higher education or competitively employed within one year of leaving high school.
C. Enrolled in higher education or in some other postsecondary education or training program; or competitively employed or in some other employment within one year of leaving high school.
(20 U.S.C. 1416(a)(3)(B))
Measurement:
A. Percent enrolled in higher education = [(# of youth who are no longer in secondary school, had IEPs in effect at the time they left school and were enrolled in higher education within one year of leaving high school) divided by the (# of respondent youth who are no longer in secondary school and had IEPs in effect at the time they left school)] times 100.
B. Percent enrolled in higher education or competitively employed within one year of leaving high school = [(# of youth who are no longer in secondary school, had IEPs in effect at the time they left school and were enrolled in higher education or competitively employed within one year of leaving high school) divided by the (# of respondent youth who are no longer in secondary school and had IEPs in effect at the time they left school)] times 100.
C. Percent enrolled in higher education, or in some other postsecondary education or training program; or competitively employed or in some other employment = [(# of youth who are no longer in secondary school, had IEPs in effect at the time they left school and were enrolled in higher education, or in some other postsecondary education or training program; or competitively employed or in some other employment) divided by the (# of respondent youth who are no longer in secondary school and had IEPs in effect at the time they left school)] times 100.*
Overview of Issue/Description of System or Process:
Achieving competitive employment and/or enrolling in postsecondary school within one year of leaving high school are measures of student progress toward independent adult living. In accordance with Indicator 14 specifications, WVDE has designed a One-Year Follow Up Survey to evaluate post-school outcomes for youth who had IEPs in effect at the time they exited high school. The One-Year Follow-Up Survey was revised in August 2009 and administered May through September 2010 to students who exited school during 2008-2009. Surveys were administered to all students with disabilities who graduated with a regular diploma or some other credential, dropped out or aged out of high school. In addition to collecting the required information (i.e., postsecondary education and/or employment), WVDE collects data on reasons for not working or attending school, living arrangements and transportation,

SPP Template – Part B West Virginia
State Revised February 1, 2012
Part B State Performance Plan: 2005-2012 Page 94 (OMB NO: 1820-0624 / Expiration Date: 2/29/2012)
community/agency involvement (e.g., ADA eligibility) and perceptions of skills/training provided during high school. WVDE also has constructed an Exit Survey, administered at the time of exit to capture student perspectives on supports, extracurricular/work experiences, career preparation and IEP participation during high school and expectations after exit. These data are useful in helping high school teachers develop more responsive programs to the needs of youth with disabilities. Additionally, Exit Survey responses from youth who dropped out include reason(s) for dropping out of school. Both One-Year Follow Up and Exit Survey results are disaggregated for youth who dropped out and are reported in Indicator 2. Definitions WVDE utilizes the following definitions provided by OSEP to operationalize parts A, B and C of the Indicator 14 measurement.
Enrolled in higher education as used in measures A, B and C means youth have been enrolled on a full- or part-time basis in a community college (two year program) or college/university (four or more year program) for at least one complete term at any time in the year since leaving high school.
Competitive employment as used in measures B and C means youth have worked for pay at or above the minimum wage in a setting with others who are nondisabled for a period of 20 hours a week for at least 90 days at any time in the year since leaving high school. This includes military employment.
Enrolled in other postsecondary education or training as used in measure C, means youth have been enrolled on a full- or part-time basis for at least 1 complete term at any time in the year since leaving high school in an education or training program (e.g., Job Corps, adult education, workforce development program, vocational technical school which is less than a two year program).
Some other employment as used in measure C means youth have worked for pay or been self-employed for a period of at least 90 days at any time in the year since leaving high school. This includes working in a family business (e.g., farm, store, fishing, ranching, catering services ).
School Leaver Population Data Collection
West Virginia is not sampling for the One Year Follow-Up survey. A census method is utilized. All students with IEPs reported as exiting school from July 1, 2008 through June 30, 2009 received a survey, based on the individual student data collected for the Section 618 exit report. Section 618 data are collected electronically through WVEIS individual student records, which provide basic student enrollment information, (school, district, birthdate, race/ethnicity, gender) as well as individual student special education records, which contain the method of exit, date of exit and disability. For purposes of this survey, the parents’ names and addresses are being extracted from student records and matched to the students reported in the Section 618 exit file as leaving school. Names and addresses are provided to district special education directors for use in disseminating and collecting the One Year Follow-Up Surveys. Therefore, all exiting students with the exception of those reported as returned to regular education, moved but known to be continuing their education and died, are included in the population to be surveyed. West Virginia Exit Survey
In addition to the demographics collected for all students leaving school through the individual record system, West Virginia has been conducting an exit survey, which the exiting student and/or parent complete at the time of exit. The Exit Survey has two components, a student survey and a parent survey. The survey currently collects a variety of information from all students with disabilities graduating/exiting each school year, including dropping out, and their parents to assist the district and WVDE in determining postsecondary goals and plans for employment and schooling. The survey collects future education

SPP Template – Part B West Virginia
State Revised February 1, 2012
Part B State Performance Plan: 2005-2012 Page 95 (OMB NO: 1820-0624 / Expiration Date: 2/29/2012)
plans specific to the type of education each is planning to pursue (#8), as well as work-related training obtained during high school (#1-5). Procedures for One Year Follow-Up Survey for Students Exiting in 2008-2009
Student and parent names and addresses for all students reported as exiting, including students who dropped out, during 2008-2009 were provided by WVEIS to district special education directors.
Surveys were distributed and administered at the LEA through a combination of methods including phone interview, web-based survey and traditional mailing of a printed copy. The One Year Follow-Up Survey was then administered to the former students. If the former student was unavailable or required assistance, a designated family member could represent the youth as the respondent.
School staff was encouraged to assist students and/or parents with completion of the survey in a variety of methods to maximize response rates. Respondents also had the option of submitting the survey directly to WVDE if he or she desired to remain anonymous.
Districts were encouraged to facilitate completion of the exit survey by the parent and student at or near the time the student exits. Students and parents of students who drop out were asked to complete a Dropout Supplement Form in addition to the Exit Survey. Exiting students and parents are advised at the time of exit that a Follow-Up Survey will be sent in one year.
The One Year Follow-Up Survey information was obtained directly from the former student only. The survey may be conducted by phone interview or mail at the discretion of the district. Any respondent who wishes to remain anonymous may submit a mailed survey directly to WVDE.
The One Year Follow-Up Survey for students exiting 2008-2009 was collected May through September 2010. Completed surveys were submitted to the WVDE, which compiled the survey results.
A summary and comprehensive reporting of survey results is posted on the WVDE website at http://wvde.state.wv.us/ose/transition and will be available in hard copy format.
Use of Survey Results
Results are provided to districts and are available on the WVDE website.
Districts will use their post-school outcomes data in the District Self-Assessment process to determine, with input of their steering committees, need for improvement planning.
WVDE will use the results with its stakeholder groups to analyze outcomes and identify professional development and technical assistance needs.

SPP Template – Part B West Virginia
State Revised February 1, 2012
Part B State Performance Plan: 2005-2012 Page 96 (OMB NO: 1820-0624 / Expiration Date: 2/29/2012)
Baseline Data for FFY 2009 (2009-2010):
Students Exiting in 2008-2009
One-Year Follow-Up Surveys Conducted May-September 2010
A. Percent enrolled in higher education 19.49%
B. Percent enrolled in higher education or competitively employed within one year of leaving high school
48.84%
C. Percent enrolled in higher education, or in some other postsecondary education or training program; or competitively employed or in some other employment
63.57%
Number of students returning surveys: 862
Number students exiting 3208
Response rate (862/3208*100) 26.9%
There were 862 total respondents.
1 = 168 respondent leavers were enrolled in “higher education”. 2 = 253 respondent leavers were engaged in “competitive employment” (and not counted
in 1 above). 3 = 69 of respondent leavers were enrolled in “some other postsecondary education or
training” (and not counted in 1 or 2 above). 4 = 58 of respondent leavers were engaged in “some other employment” (and not counted
in 1, 2, or 3 above). Thus,
A = 168 (#1) divided by 862 (total respondents) = 19.49% B = 168 (#1) + 253 (#2) divided by 862 (total respondents) = 48.84% C = 168 (#1) + 253 (#2) + 69 (#3) + 58 (#4) divided by 862 (total respondents) = 63.57%
Demographics of the 2008-2009 students exiting school and of survey respondents are as follows:
Students with Disabilities Exiting School 2008-2009 by Basis of Exit
Exiting Students Surveys Received
Graduated with regular high school diploma
2122 66.15%
693 80.39%
Received a certificate 260 8.10% 68 7.89%
Reached maximum age 5 0.16% 1 0.12%
Dropped out 822 25.62% 100 11.60%
Total 3208 100.00% 862 100.00%
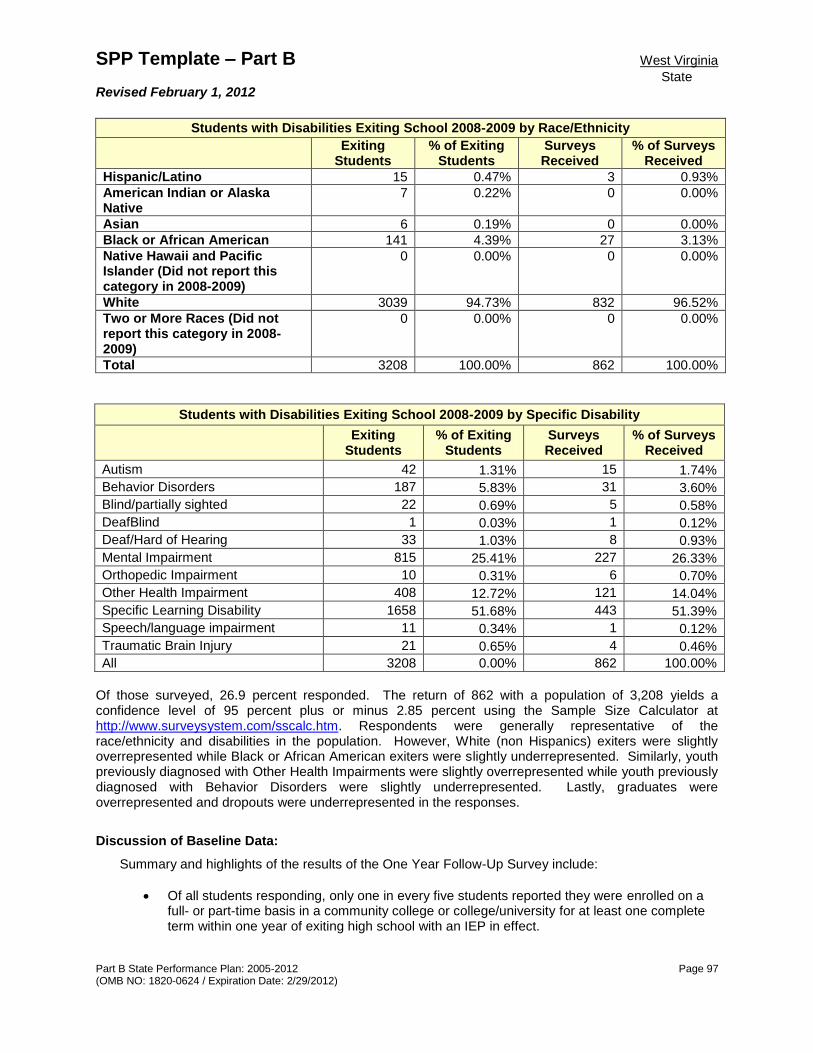
SPP Template – Part B West Virginia
State Revised February 1, 2012
Part B State Performance Plan: 2005-2012 Page 97 (OMB NO: 1820-0624 / Expiration Date: 2/29/2012)
Students with Disabilities Exiting School 2008-2009 by Race/Ethnicity
Exiting Students
% of Exiting Students
Surveys Received
% of Surveys Received
Hispanic/Latino 15 0.47% 3 0.93%
American Indian or Alaska Native
7 0.22% 0 0.00%
Asian 6 0.19% 0 0.00%
Black or African American 141 4.39% 27 3.13%
Native Hawaii and Pacific Islander (Did not report this category in 2008-2009)
0 0.00% 0 0.00%
White 3039 94.73% 832 96.52%
Two or More Races (Did not report this category in 2008-2009)
0 0.00% 0 0.00%
Total 3208 100.00% 862 100.00%
Students with Disabilities Exiting School 2008-2009 by Specific Disability
Exiting
Students % of Exiting
Students Surveys Received
% of Surveys Received
Autism 42 1.31% 15 1.74%
Behavior Disorders 187 5.83% 31 3.60%
Blind/partially sighted 22 0.69% 5 0.58%
DeafBlind 1 0.03% 1 0.12%
Deaf/Hard of Hearing 33 1.03% 8 0.93%
Mental Impairment 815 25.41% 227 26.33%
Orthopedic Impairment 10 0.31% 6 0.70%
Other Health Impairment 408 12.72% 121 14.04%
Specific Learning Disability 1658 51.68% 443 51.39%
Speech/language impairment 11 0.34% 1 0.12%
Traumatic Brain Injury 21 0.65% 4 0.46%
All 3208 0.00% 862 100.00%
Of those surveyed, 26.9 percent responded. The return of 862 with a population of 3,208 yields a confidence level of 95 percent plus or minus 2.85 percent using the Sample Size Calculator at http://www.surveysystem.com/sscalc.htm. Respondents were generally representative of the race/ethnicity and disabilities in the population. However, White (non Hispanics) exiters were slightly overrepresented while Black or African American exiters were slightly underrepresented. Similarly, youth previously diagnosed with Other Health Impairments were slightly overrepresented while youth previously diagnosed with Behavior Disorders were slightly underrepresented. Lastly, graduates were overrepresented and dropouts were underrepresented in the responses.
Discussion of Baseline Data:
Summary and highlights of the results of the One Year Follow-Up Survey include:
Of all students responding, only one in every five students reported they were enrolled on a full- or part-time basis in a community college or college/university for at least one complete term within one year of exiting high school with an IEP in effect.

SPP Template – Part B West Virginia
State Revised February 1, 2012
Part B State Performance Plan: 2005-2012 Page 98 (OMB NO: 1820-0624 / Expiration Date: 2/29/2012)
Twenty-nine percent (i.e., 253) of all students maintained they were competitively employed and not enrolled in higher education. Most students participating in the workforce within one year of exiting high school reported being employed in unskilled, entry level jobs. Those most frequently cited were clerks, cashiers, caregivers/nursing assistants, food service industry and laborer positions.
Eight percent stated that they were enrolled in other postsecondary education or training ,such as adult education, a workforce development program or a vocational-technical school with a duration less than two years.
Nearly seven percent of all respondents indicated they were participating in some other employment including noncompetitive employment, self-employment or family business.
Sixty-four percent of youth reported they were enrolled in higher education, or in some other postsecondary education or training program or competitively employed or in some other employment within one year of exiting high school with an IEP in effect.
Conversely, more than one-third (i.e., 314 youth) of all respondents reported they were not participating in any form of postsecondary education, training or employment within one year of leaving high school.
Sixteen percent of all students responding indicated they receive some type of health insurance benefits.
Meanwhile, 5.6% and 16.4% reported they receive scholarship support and financial aid, for postsecondary education or training, respectively.
20%
29%
15%
36%
One year follow up for youth who exited school in 2008-2009 with an IEP in effect:
Enrolled in higher education
Competitively employed
Enrolled in other type of postsecondary education / training or engaged in "some other employment"
Not enrolled in postsecondary educator or employed

SPP Template – Part B West Virginia
State Revised February 1, 2012
Part B State Performance Plan: 2005-2012 Page 99 (OMB NO: 1820-0624 / Expiration Date: 2/29/2012)
One in every five former student indicated he or she is supported by an adult agency. The most widely cited support agency is the West Virginia Division of Rehabilitation Services.
Among students who were neither employed nor enrolled in some type of postsecondary school, the most frequently cited these reasons were:
Unable to find work and
Unable to work because of disability. Former students indicated skills they needed more of while in school were:
Practical reading, writing, and math for work and daily living
Money management skills, and
Job seeking and job keeping skills. Although it was not possible to match the exit survey to the one-year follow-up on an individual basis, it appears the reality of post school opportunities did not comport with expectations and experiences the students had while still in school. Improving academics related to work, improving job seeking and keeping skills and identifying supports in the community could improve outcomes for these students. These results clearly indicate that school staff must improve services to students with disabilities so former students can successfully pursue their goals and find meaningful work in their areas of preference.
FFY Measurable and Rigorous Targets
A. Percent of youth who are no longer in secondary school, had IEPs in effect at the time they left school, and were enrolled in higher education within one year of leaving high school will increase to:
B. Percent of youth who are no longer in secondary school, had IEPs in effect at the time they left school, and were enrolled in higher education or competitively employed within one year of leaving high school will increase to:
C. Percent of youth who are no longer in secondary school, had IEPs in effect at the time they left school, and were enrolled in higher education or in some other postsecondary education or training program; or competitively employed or in some other employment within one year of leaving high school will increase to:
2010 (2010-2011)
21.0%
50.3%
65.1%
2011
(2011-2012)
22.5%
51.8%
66.6%
2012
(2012-2013)
24%
53.3%
68.1%

SPP Template – Part B West Virginia
State Revised February 1, 2012
Part B State Performance Plan: 2005-2012 Page 100 (OMB NO: 1820-0624 / Expiration Date: 2/29/2012)
Improvement Activities/Timelines/Resources:
Activities for Indicators 1 - graduation, 2 - dropout, 13 – secondary transition planning and 14 - post school outcomes are interrelated and directed toward planning, instruction, services and linkages to ensure positive post school outcomes for students with disabilities. Technical assistance accessed through national centers and conferences has emphasized the interconnectedness of these indicators and the benefits of creating a comprehensive plan of improvement activities. As a result, indicator activities for 1, 2, 13 and 14 have been combined and are encompassed under the umbrella of the West Virginia Transition Collaborative Community of Practice (WVTCCoP). Please note although activities are combined across indicators, they are numbered according to the primary indicator to which they apply.
Improvement Activities Timelines Resources Status
13. 1 Collect and review data annually from the Indicator 13 IEP file review checklist for each district.
2008-2013 WVDE Stakeholder Committee LEA
Active
13.2 / 1.4 / 2.4 Provide professional development and guidance materials for documenting transition services in the IEP and implementation of evidence-based transition strategies.
2008-2013 WVDE Active
13.3 Verify correction of noncompliance for Indicator 13 by reviewing updated samples of IEPs for compliance, as well as verifying correction of any individual IEPs with noncompliances. WVDE staff will review the data and notify the district of compliance status and actions to be taken.
Districts failing to correct noncompliances will receive further targeted technical assistance and corrective actions, including as appropriate onsite reviews, additional corrective activities and enforcement.
2008-2013 WVDE LEA
Active, Revised 2011
13.4 / 1.8 / 2.8 Develop and maintain a Showcase for Transition on the WVDE website (success stories of students, teams, programs, to connect transition services for school age students with post school outcomes of former students).
2009-2013 WVDE TA Centers NSTTAC, NDPC-N, SD materials Assessments
Active
13.5 Embed help boxes and links to transition guidance documents on the WVDE website into the statewide online IEP system. Develop a report or audit within the system for IEPs of transition age students to determine compliance with the Transition IEP Checklist. Incorporate standards-based IEP guidance into the online IEP.
2008-2013
WVDE NSTTAC materials
Active
1.1 / 2.1 Partner with National Dropout Prevention Center for Students with Disabilities to strengthen the implementation of evidence-based graduation and dropout prevention strategies in WV.
2011-2013 NDPC-SD WVDE
New 2011
1.2 / 2.2 Manage/support the WV Transition Collaborative Leadership Team to oversee the implementation of a coordinated state-wide plan for post secondary transition services and programs.
2005-2013 WVDE Active Revised
2011

SPP Template – Part B West Virginia
State Revised February 1, 2012
Part B State Performance Plan: 2005-2012 Page 101 (OMB NO: 1820-0624 / Expiration Date: 2/29/2012)
Improvement Activities Timelines Resources Status
1.3 / 2.3 Manage/support the West Virginia Transition Collaborative Community of Practice (WVTCCoP) to provide educators the opportunity to share best practices, access experts in the field and interact with other educators throughout the state. Emphasis of the WVTCCoP is to recruit and support district staff responsible for implementation of transition requirements to assist in the development of skills related to improving transition services for students with disabilities.
2005-2013 WVDE Active
1.7 / 2.7 Recruit and support Transition Teams in all RESAs to assist in the identification of local, regional and state resources to support the development and implementation of best practices.
2011-2013 WVDE RESA
Active Revised 2011
1.9 / 2.9 Collaborate with external agencies and internal offices (e.g., Offices of Assessment and Accountability, Instruction, School Improvement) to improve transition services, graduation rates, dropout rates and post school outcomes for SWDs.
2005-2013 WVDE Active Revised 2011
14.1 Collect and disseminate annually Exit and One Year Follow-up Survey results with various stakeholder groups with an emphasis on increasing data use and response rates at the district level.
2005-2013 WVDE Active

SPP Template – Part B West Virginia
State Revised February 1, 2012
Part B State Performance Plan: 2005-2012 Page 102 (OMB NO: 1820-0624 / Expiration Date: 2/29/2012)
Part B State Performance Plan (SPP) for 2005-2012
Overview of the State Performance Plan Development:
See Indicator 1
(The following items are to be completed for each monitoring priority/indicator.)
Monitoring Priority: Effective General Supervision Part B / General Supervision
Indicator 15: General supervision system (including monitoring, complaints, hearings, etc.) identifies and corrects noncompliance as soon as possible but in no case later than one year from identification.
(20 U.S.C. 1416 (a)(3)(B))
Percent of noncompliance corrected within one year of identification:
a. # of findings of noncompliance. b. # of corrections completed as soon as possible but in no case later than one year from
identification. Percent = [(b) divided by (a)] times 100.
For any noncompliance not corrected within one year of identification, describe what actions, including technical assistance and enforcement actions that the State has taken.
Overview of Issue/Description of System or Process:
Continuous Improvement and Focused Monitoring System
West Virginia’s Continuous Improvement and Focused Monitoring System (CIFMS) has been operational since 2005. The framework for the WVDE’s monitoring system had relied heavily on the districts’ self-assessment process which has been in place for nearly a decade. This process has been an invaluable tool for districts to evaluate compliance and more importantly identify areas of strength and weakness for continuous improvement. The expectation was districts would conduct an in depth analysis resulting in extensive planning and implementation generating positive outcomes for students with exceptionalities. The WVDE placed a high level of confidence in the self-assessment process as an efficient means to monitor each district annually. This allowed additional time to monitor specific indicators of dropout rate, least restrictive environment (LRE), reading proficiency and suspension rate for districts falling below acceptable targets. At its inception, this shift in practice was not only supported but encouraged by OSEP and national technical assistance centers. The WVDE explored national practices and conducted an internal review to evaluate the effectiveness of the monitoring process. The internal evaluation motivated the WVDE to revise the monitoring process to ensure the state had in place a level of services providing a foundation of support for students with exceptionalities in West Virginia. Therefore, the WVDE refined the monitoring process to ensure an effective monitoring system to address its responsibility for a general supervision system for enforcing the requirements of IDEA and continuous improvement.
West Virginia’s monitoring system is the result of technical assistance originally provided by the National Center for Special Education Accountability Monitoring (NCSEAM), input from a statewide stakeholders’ group and a work group of district special education administrators. The revised system parallels the principles and components of the focused monitoring system developed by the U.S. Department of
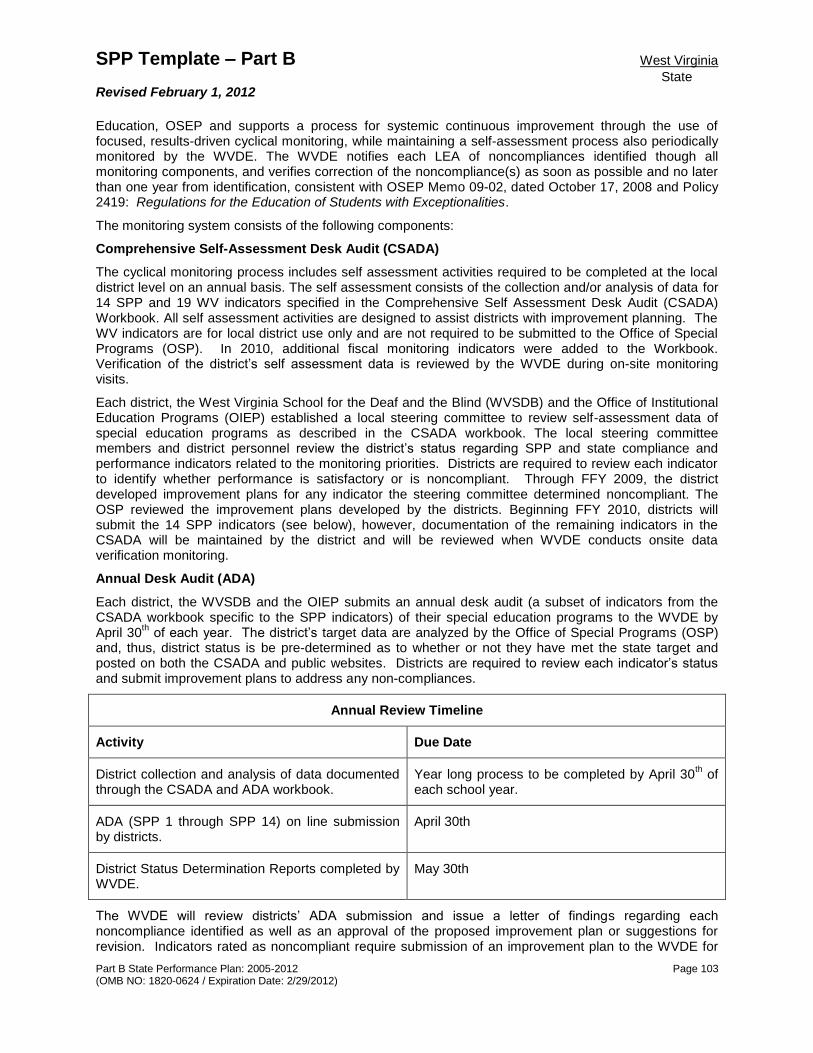
SPP Template – Part B West Virginia
State Revised February 1, 2012
Part B State Performance Plan: 2005-2012 Page 103 (OMB NO: 1820-0624 / Expiration Date: 2/29/2012)
Education, OSEP and supports a process for systemic continuous improvement through the use of focused, results-driven cyclical monitoring, while maintaining a self-assessment process also periodically monitored by the WVDE. The WVDE notifies each LEA of noncompliances identified though all monitoring components, and verifies correction of the noncompliance(s) as soon as possible and no later than one year from identification, consistent with OSEP Memo 09-02, dated October 17, 2008 and Policy 2419: Regulations for the Education of Students with Exceptionalities.
The monitoring system consists of the following components:
Comprehensive Self-Assessment Desk Audit (CSADA)
The cyclical monitoring process includes self assessment activities required to be completed at the local district level on an annual basis. The self assessment consists of the collection and/or analysis of data for 14 SPP and 19 WV indicators specified in the Comprehensive Self Assessment Desk Audit (CSADA) Workbook. All self assessment activities are designed to assist districts with improvement planning. The WV indicators are for local district use only and are not required to be submitted to the Office of Special Programs (OSP). In 2010, additional fiscal monitoring indicators were added to the Workbook. Verification of the district’s self assessment data is reviewed by the WVDE during on-site monitoring visits.
Each district, the West Virginia School for the Deaf and the Blind (WVSDB) and the Office of Institutional Education Programs (OIEP) established a local steering committee to review self-assessment data of special education programs as described in the CSADA workbook. The local steering committee members and district personnel review the district’s status regarding SPP and state compliance and performance indicators related to the monitoring priorities. Districts are required to review each indicator to identify whether performance is satisfactory or is noncompliant. Through FFY 2009, the district developed improvement plans for any indicator the steering committee determined noncompliant. The OSP reviewed the improvement plans developed by the districts. Beginning FFY 2010, districts will submit the 14 SPP indicators (see below), however, documentation of the remaining indicators in the CSADA will be maintained by the district and will be reviewed when WVDE conducts onsite data verification monitoring.
Annual Desk Audit (ADA)
Each district, the WVSDB and the OIEP submits an annual desk audit (a subset of indicators from the CSADA workbook specific to the SPP indicators) of their special education programs to the WVDE by April 30
th of each year. The district’s target data are analyzed by the Office of Special Programs (OSP)
and, thus, district status is be pre-determined as to whether or not they have met the state target and posted on both the CSADA and public websites. Districts are required to review each indicator’s status and submit improvement plans to address any non-compliances.
Annual Review Timeline
Activity Due Date
District collection and analysis of data documented through the CSADA and ADA workbook.
Year long process to be completed by April 30th of
each school year.
ADA (SPP 1 through SPP 14) on line submission by districts.
April 30th
District Status Determination Reports completed by WVDE.
May 30th
The WVDE will review districts’ ADA submission and issue a letter of findings regarding each noncompliance identified as well as an approval of the proposed improvement plan or suggestions for revision. Indicators rated as noncompliant require submission of an improvement plan to the WVDE for

SPP Template – Part B West Virginia
State Revised February 1, 2012
Part B State Performance Plan: 2005-2012 Page 104 (OMB NO: 1820-0624 / Expiration Date: 2/29/2012)
correction within one year. Correction of the identified issue(s) within one year is monitored through the district’s Progress Report. If upon review the district has failed to correct a noncompliance, the WVDE notifies the district in writing requiring further action to correct the noncompliance within the subsequent year.
Annual On-Site Monitoring Process The WVDE ensures the requirements of Part B of the Individuals with Disabilities Education Act (IDEA) are implemented by districts through the annual monitoring process. As required under the WV State Code §18-20-7 the OSP must conduct random unannounced on-site reviews at least every four years in each district, OIEP and the WVSDB. In accordance with IDEA and WV Code, the purpose of the on-site visit is to ensure LEAs are appropriately implementing identification procedures, complying with any and all applicable laws and policies, delivering services, verifying enrollment and attendance reports, recommending changes and fulfilling other duties as may be established by the state board. The district selection process includes a review of 1) performance levels and distance from SPP targets; 2) graduation and dropout rates; 3) demographics of district; 4) determinations (rubric); 5) complaints and due process hearing decisions; 6) Least Restrictive Environment (LRE) and 7) student enrollment/special education enrollment. Each year 14 districts are selected to receive an on-site monitoring review.
Revisions to Continuous Improvement and Focused Monitoring Process -2011-2012 During FY2010, monitoring procedures were revised, with technical assistance from Mid South Regional Resource Center, to more closely reflect West Virginia Code §18-20-7, which requires compliance review teams conduct random unannounced on-site reviews of districts at least every four years (approximately 14 districts per year) for the purpose of reviewing identification procedures, complying with any or all applicable laws and policies, delivering services and verifying enrollment and attendance reports. Districts are selected each July on a cyclical schedule to ensure each district receives an on-site visit within a four-year cycle. In addition, the OSP completed one (1) interagency monitoring of an out-of-state facility where students are placed by the courts for non-educational purposes. In addition to the cyclical monitoring process, districts may receive a focused monitoring visit. Focused Monitoring is an on-site monitoring process where an LEA may receive a visit based on an identified need or other data source (i.e. an LEA receiving a large number of complaints on a specific issue) brought to the attention of the OSP. In addition, the OSP may resolve a complaint regarding alleged violations that occurred outside the one-year timeline through the focus monitoring process. This process may occur concurrently with a Compliance On-Site Monitoring or independently. A Focused Monitoring will drill down within the LEA’s data to identify root causes and solutions to an on-going issue of compliance, performance or both. Each Focused Monitoring is individualized to the district and the situation. Previously, Indicator 13 data was collected through the annual CSADA/ADA submission based on each district’s review of student files selected by the SEA. The SEA then issued findings of noncompliance based on the district’s review. Districts have demonstrated consistent improvements in meeting secondary transition requirements. The SEA has strengthened the process for obtaining Indicator 13 data by sampling transition services and files during the on-site monitoring visits rather than relying on self-assessment data. Districts will continue the self-assessment process to review files however, the OSP will now collect Indicator 13 data through a sampling process during the on-site visits. This process is outlined in the Indicator 13 narrative. To meet the aforementioned needs, the OSP has extended ongoing improvement activities through 2013 and has added additional activities. The General Supervision System continues to identify and verify correction of district noncompliance as soon as possible but in no case later than one year from written notification, to conduct on-going professional development and to provide technical assistance to LEAs and RESAs. Professional development provided to LEAs includes annual training regarding the

SPP Template – Part B West Virginia
State Revised February 1, 2012
Part B State Performance Plan: 2005-2012 Page 105 (OMB NO: 1820-0624 / Expiration Date: 2/29/2012)
monitoring procedures, analysis of district data for the ADA and other areas as determined by the OSP staff regarding compliance.
Internal Data Analysis The OSP reviews data throughout the year. In addition to the self-assessment and the focused monitoring processes, an internal WVDE monitoring team conducts an analysis or “desk audit”, reviewing performance and compliance data and evidence from multiple sources, including other monitoring activities, complaint investigations and due process hearings. OSP staff reviews state, RESA and district level data by enrollment size groups and/or by RESA region. District level data are used for a variety of purposes including: district selection for targeted technical assistance, selection for on-site reviews, selection for work with RESAs, selection for participation in various initiatives, selection for annual disproportionality and discipline reviews and compliance with fiscal requirements. This process facilitates investigation and remediation of district systemic noncompliance and/or statewide systemic issues that require WVDE’s action. Based on this review, WVDE may conduct follow-up activities including, but not limited to, telephone calls, correspondence, technical assistance and/or on-site visits. Failure of the district to meet reporting timelines or significant evidence of noncompliance determined through complaint investigations, due process complaints, or other WVDE sources also result in targeted technical assistance and/or on-site reviews. Annual Determination Status Using an adopted state rubric, the OSP computes districts’ annual “determination status.” The areas used to determine status includes graduation rate, assessment data, LRE, non-compliances, accurate and timely data submission and supervision of finances. Districts are assigned a status similar to those provided to states by OSEP. Districts are provided technical assistances to address areas of weakness, can be subjected to additional general supervision activities and/or sanctions. Complaint Management System
The complaint management system ensures corrective actions are implemented in a timely manner for any complaint investigation resulting in a finding of noncompliance for the district. WVDE complaint investigators are responsible for implementing the system. When a violation is found, the letter of findings (LOF) contains specific corrective activities and timelines by which the activities must be completed and for which the district must provide documentation to the WVDE.
Corrective actions must be completed within the timelines specified in the LOF, generally 15 days unless otherwise specified. Documentation of corrective actions submitted by the district is reviewed and approved by the WVDE within 10 business days of receipt. If a submitted corrective action is not approved, the district is notified in writing and provided written technical assistance to ensure that acceptable corrective activities are completed in accordance with specified requirements. Timelines for completion of these additional activities are determined on a case-by case basis. If the resubmitted corrective action is approved, the district is notified in writing that the case is closed.
In general, corrective activities are developed, submitted and approved within timelines specified in the LOFs. However, when the actions taken by the district do not satisfy the requirements set forth in the LOF, the WVDE provides the district written notice of possible enforcement sanctions.

SPP Template – Part B West Virginia
State Revised February 1, 2012
Part B State Performance Plan: 2005-2012 Page 106 (OMB NO: 1820-0624 / Expiration Date: 2/29/2012)
Due Process Hearing System
The WVDE administers the due process system in accordance with the requirements of IDEA 2004 and Policy 2419: Regulations for the Education of Students with Exceptionalities. The WVDE employs a coordinator who is responsible for implementing and monitoring the due process hearing system, including the implementation of due process hearing decisions.
The WVDE implements specific procedures to ensure that non-compliances identified in due process hearing decisions are corrected within one year from date of the written decision. Upon receipt of a due process hearing decision with identified non-compliances and subsequent directives for the district, the WVDE requires the district to submit written documentation that verifies the correction of the noncompliance (i.e., the hearing officer’s decision has been implemented) by a specified date. If the WVDE verifies the correction of the noncompliance, the WVDE notifies the district in writing. If the district fails to submit the required documentation by the specified date, follow-up correspondence and technical assistance, if appropriate, are provided prior to notifying the district of possible enforcement sanctions. In addition, in accordance with 34 C.F.R. §300.661, the WVDE investigates complaints alleging a district’s failure to implement a due process hearing decision.
Out-of-State Monitoring
The West Virginia (WV) Department of Health & Human Resources (DHHR) through the Bureau of Children & Families (BCT), the Bureau of Medical Services (BMS) and the West Virginia Department of Education (WVDE) through the Office of Institutional Education Programs (OIEP) and the Office of Special Programs (OSP) have engaged in a collaborative effort to evaluate and monitor the quality of services provided by out-of-state facilities to ensure children are in a safe environment, provided behavioral health treatment and educational services commensurate with acceptable standards as set forth by both agencies. Each calendar year a team representing WVDHHR and WVDE conduct reviews of selected Out-of-State Facilities (OSF) serving students with disabilities (SWD) and general education students from West Virginia placed by the West Virginia Department of Health and Human Resources (WVDHHR).
In addition, to receive funding for services as specified in the service agreement, each facility must ensure students who are identified in accordance with IDEA and Policy 2419 are: 1) in the custody of WVDHHR; 2) processed through an Interagency Planning and Placement Committee (IPPC) or other interagency services plan meeting involving the agencies responsible for implementing the child and family’s service plan; 3) are placed at the facility by WVDHHR for non-educational purposes; 4) are identified in the Family and Children Tracking System (FACTS), the WVDHHR Placement List; 5) were identified as eligible for special education services under IDEA and Policy 2419 prior to placement; 6) have a current IEP; and 7) are receiving special education and related series by certified personnel in accordance with a current IEP. In accordance with the WVDE Out-of-State Monitoring Procedures, after the on-site review a report is issued within 90 calendar days of the exit conference and corrective activities are specified, if appropriate.
FFY Measurable and Rigorous Target
2007 (2007-2008)
100% Compliance – General supervision system (including monitoring, complaints, hearings, etc.) identifies and corrects as soon as possible but in no case later than one year from identification.
2008 (2008-2009)
100% Compliance – General supervision system (including monitoring, complaints, hearings, etc.) identifies and corrects as soon as possible but in no case later than one year from identification.
2009 (2009-2010)
100% Compliance – General supervision system (including monitoring, complaints, hearings, etc.) identifies and corrects as soon as possible but in no case later than one year from identification.

SPP Template – Part B West Virginia
State Revised February 1, 2012
Part B State Performance Plan: 2005-2012 Page 107 (OMB NO: 1820-0624 / Expiration Date: 2/29/2012)
FFY Measurable and Rigorous Target
2010 (2010-2011)
100% Compliance – General supervision system (including monitoring, complaints, hearings, etc.) identifies and corrects as soon as possible but in no case later than one year from identification.
2011
(2011-2012)
100% Compliance – General supervision system (including monitoring, complaints, hearings, etc.) identifies and corrects as soon as possible but in no case later than one year from identification.
2012
(2012-2013)
100% Compliance – General supervision system (including monitoring, complaints, hearings, etc.) identifies and corrects as soon as possible but in no case later than one year from identification.
Baseline Data for FFY 2004 (2004-2005):
Recalculated Baseline Information
In the initial SPP, monitoring findings and the number of non-compliances corrected within one year were reported separately for various components of the general supervision system. In response to the revised measurement for SPP Indicator 15, data previously submitted with the SPP in December 2005 were recalculated. The number of findings corrected within one year from on-site monitoring visits including out-of-state monitoring, district self-assessments, state complaint letters of findings (LOFs) and due process hearings were totaled and divided by the total number of noncompliance findings to derive the percentage of non-compliances corrected in one year. Some errors of reporting non-compliances in the wrong year previously reported in the SPP were corrected. During the 2003-2004 year, a total of 206 non-compliances had been identified through the WVDE’s General Supervision components including the district self-assessment and state complaints. No findings of noncompliance were identified through due process hearings. These 206 non-compliances were required to be corrected within one year of notification by WVDE. Of these non-compliances, 186 were corrected during 2004-2005, that is, within one year, resulting in an overall correction rate of 90.3 percent for 2004-2005. The table below provides the detailed recalculated baseline data from 2004-2005 grouped by priority areas and followed by the corresponding 2005-2006 data, which is discussed in the Annual Performance Report

SPP Template – Part B West Virginia
State Revised February 1, 2012
Part B State Performance Plan: 2005-2012 Page 108 (OMB NO: 1820-0624 / Expiration Date: 2/29/2012)
Attachment 1 – Page 1 of 2 West Virginia Baseline (Corrected in 2004-2005) and Actual Target Data for 2005-2006 Issues by Monitoring
Priority General Supervision Process 03-04
Findings Corrected in 04-05
04-05 Findings
Corrected in 05-06
FAPE in the LRE IEP Process CIMP* 13 13 16 6
LOF * 10 10 6 6 Focused Monitoring 3 3
Out-of-State Facilities 6 5 9 9 IEP Implementation LOF 8 8 8 8
Focused Monitoring 1 1
Out-of-State Facilities 1 1 0 0
Initiation of IEP Services LOF 2 2 1 1 Provision of Transportation
LOF 0 0 1 1
Provision of Staff LOF 3 3 1 1 Out-of-State Facilities 5 4 5 5
Certified Personnel Focused Monitoring 1 1 0 0 Child Find CIMP 2 2 12 7
Focused Monitoring 0 0 1 1 Discipline Procedures CIMP
Consultation, FBAs & BIPs 42 33 37 18
Focused Monitoring 0 0
CIMP Following discipline procedures
24 18 24 11
LOF Discipline Procedures 3 3 2 2 Focused Monitoring Discipline Procedures
1 1 0 0
LRE – school age CIMP Only removed when appropriate
3 3 9 6
Focused Monitoring 1 1
LRE – preschool CIMP Only removed when appropriate
0 0 8 4
Parent involvement LOF Parent Participation 1 1 1 1 Focused Monitoring 1 1
Out-of-State Facilities 2 2 0 0 Total 125 107 148 94
Disproportionality Disproportionate representation resulting from inappropriate identification
Focused Monitoring 0 0
CIMP Comprehensive evaluation
5 5 4 3
LOF Evaluation Components//team membership
2 2 0 0

SPP Template – Part B West Virginia
State Revised February 1, 2012
Part B State Performance Plan: 2005-2012 Page 109 (OMB NO: 1820-0624 / Expiration Date: 2/29/2012)
Procedural Safeguards Confidentiality CIMP 7 7 3 3 Records Disclosure LOF 1 1 1 1 Parents provided Procedural Safeguards
CIMP 5 5 3 1
PWN CIMP 12 12 22 12 LOF 2 2 2 2
Out-of-State Facilities 1 1 1 1
Transfer of rights notice CIMP 5 5 8 7 Protections for students not yet eligible
LOF 2 2
DPH Decision Implementation
LOF 1 1
Total 34 34 42 29
Grand Total 206 186 266 167
LOF Inappropriate eligibility 1 1 0 0
Total 8 8 4 3
Attachment 1 – Page 2 of 2
West Virginia Baseline (Corrected in 2004-2005) and Actual Target Data for 2005-2006 Baseline Target
Monitoring Component 03-04 Findings
Corrected in 04-05
04-05 Findings
Corrected in 05-06
Effective General Supervision Evaluation Timelines LOF 0 0 2 2
Focused Monitoring 0 0
Out-of-State Facilities 3 3 3 3
Part C children transitioning have IEP developed and implemented by 3rd birthday
CIMP 2.10 6 6 10 7
Transition Services Focused Monitoring 0 0 1 1
CIMP Student invited to meeting
8 8 10 7
CIMP Agency Rep invited to meeting
12 11 20 9
CIMP IEP includes transition services to prepare student to meet post-secondary outcomes
7 7 16 10
State reported data timely and accurate.
CIMP Accurate reporting 3 2 9 1 Focused Monitoring 1 1
Total 39 37 72 41

SPP Template – Part B West Virginia
State Revised February 1, 2012
Part B State Performance Plan: 2005-2012 Page 110 (OMB NO: 1820-0624 / Expiration Date: 2/29/2012)
Discussion of Recalculated Baseline:
Non-compliances were analyzed and grouped into the following categories: FAPE in the LRE, Disproportionality, Effective General Supervision and Procedural Safeguards There were 125 issues of noncompliance reported within the area of FAPE in the LRE of which 107or 85.6 percent were corrected in less than one year. Issues corrected within one year were those identified in the areas of child find efforts, IEP development and implementation, provision of appropriate staff, LRE and parent involvement. The fifteen issues not corrected within one year involved districts’ failure to properly follow the discipline procedures for students with disabilities. Two violations were not corrected by an out-of-state because WVDE took action prohibiting the facility from serving West Virginia students.
There were 8 issues regarding disproportionality. These issues were related to the evaluation and eligibility of students from minority ethnic or racial groups. One hundred percent of these issues were corrected in less than one year.
There were 39 issues within the area of Effective General Supervision of which 37 or 94.9 percent were corrected in less than one year. The issues corrected within one year were in the areas of IEP development and implementation by Part B for children transitioning from Part C, 16 year old students being invited to attend IEP meetings, other agency representatives being invited to attend IEP meetings, appropriate development of post-secondary outcome statements and accurate/timely reporting of data. Two compliance issues not corrected within one year were related to accurate and timely data reporting. Technical assistance was provided by the WVDE Part B data manager and the monitors assigned to these districts to ensure accurate and timely maintenance of data and submission of reports. In the area of Procedural Safeguards 33 issues were identified. The issues within this topic were confidentiality of records, provision of procedural safeguards, prior written notice, notice of the transfer of rights at the age of majority, and the failure of a district to implement a due process hearing decision. One hundred percent of these issues were corrected in less than one year.
Improvement Activities/Timelines/Resources:
Improvement Activity Timeline Resources Status
15.1 Work with Mid-South Regional Resource Center (MSRRC) to review and revise the compliance monitoring system.
2010 – 2012 WVDE RESA MSRRC
New 2011
15.2 Provide a comprehensive general supervision system to ensure timely correction of non-compliances.
2005 – 2013 WVDE RESA
Active Revised 2011
15.3 Provide technical assistance through the RESA Special Education staff for development and implementation of corrective action plans.
2010 – 2013 WVDE RESA
New 2011
15.4 Manage system to ensure timely correction of non-compliance.
2005 – 2013 WVDE Active Revised 2011
15.5 Provide information on evidence based practices and strategies for improving performance on this indicator.
2010 – 2013 WVDE RESA
New 2011
15.6 Develop an electronic data management system to effectively collect, disaggregate and report district results on compliance and performance indicators associated with monitoring, complaint investigation, mediation and due process.
2010 – 2013 WVDE New 2011

SPP Template – Part B West Virginia
State Revised February 1, 2012
Part B State Performance Plan: 2005-2012 Page 111 (OMB NO: 1820-0624 / Expiration Date: 2/29/2012)
Part B State Performance Plan (SPP) for 2005-2012
Overview of the State Performance Plan Development:
See Indicator 1. (The following items are to be completed for each monitoring priority/indicator.)
Monitoring Priority: Effective General Supervision Part B / General Supervision
Indicator 16: Percent of signed written complaints with reports issued that were resolved within 60-day timeline or a timeline extended for exceptional circumstances with respect to a particular complaint, or because the parent (or individual or organization) and the public agency agree to extend the time to
engage in mediation or other alternative means of dispute resolution, if available in the State.
(20 U.S.C. 1416(a)(3)(B))
Measurement:
Percent = (1.1(b) + 1.1(c)) divided by (1.1) times 100.
Overview of Issue/Description of System or Process:
The West Virginia Compliance Management System (CMS) requires all written, signed complaints alleging Individuals with Disabilities Education Act (IDEA) of 2004 or Policy 2419 noncompliance be investigated and a letter of findings be issued within 60 days of receipt of the complaint or in accordance with specific timelines for exceptional circumstances. An electronic tracking system manages all intake information, tracks timelines and maintains a record of all components of the investigation, including letters of findings and completion of corrective activities. Baseline Data for FFY 2004 (2004-2005): Data for West Virginia Compliance Management System
Reporting Period 2004-2005
Complaints Filed 56
Complaints Investigated 30 53.5%
Complaints with Violations 20 66.6%
Complaints with no Violations 10 33.3%
Not Investigated 25 44.6%
Insufficient
Withdrawn
14 11*
Complaint Investigations Completed within Timelines 27 90%
LOF Issued within 60 day Timeline 19 63.3%
LOF issued within extended timeline 8** 26.6%
Complaint investigations exceeding 60 day timeline 2 6.7%
Deferred 1
* Complaints withdrawn based on early resolution of the complaint issues ** Complaints issued within extended timelines for exceptional circumstances

SPP Template – Part B West Virginia
State Revised February 1, 2012
Part B State Performance Plan: 2005-2012 Page 112 (OMB NO: 1820-0624 / Expiration Date: 2/29/2012)
WV SPP Attachment 1 for the Report of Dispute Resolution Under Part B of the Individuals with Disabilities Education Act, Complaints, Mediations, Resolution Sessions, and Due Process Hearings, with data required for Indicators 16, 17, 18 and 19 may be found at the end of the SPP document.
Discussion of Baseline Data:
A total of 56 letters of complaint were submitted to the Office of Special Education Programs (OSEP) from July 1, 2004 through June 30, 2005. Of the 56 letters, 14 were determined insufficient based on the absence of one or more of the three sufficiency criteria. One of the 31 sufficient complaints is being held in abeyance pending the results of a due process hearing. Of the remaining 30 complaint letters, 11 were withdrawn due to early resolution of the complaints and 27 were completed within the 60-day timeline or a timeline extended for exceptional circumstances. Two letters were not completed within the required timeline. One letter was issued one day late due to the complexity of the issues (student not yet eligible) and the need for the complaint investigator to consult with an expert for clarification and legal interpretation based on the findings in the investigation. The second letter was 14 days late due to the number of students involved in the investigation, the legal guardianships of the students, the complexity of the issues and the districts’ and agency’s responsibilities for the provision of the student’s special education services.
FFY Measurable and Rigorous Target
2005 (2005-2006)
100% of signed written complaints with reports issued are resolved within 60-day timeline or a timeline extended for exceptional circumstances.
2006 (2006-2007)
100% of signed written complaints with reports issued are resolved within 60-day timeline or a timeline extended for exceptional circumstances.
2007 (2007-2008)
100% of signed written complaints with reports issued are resolved within 60-day timeline or a timeline extended for exceptional circumstances.
2008 (2008-2009)
100% of signed written complaints with reports issued that were resolved within 60-day timeline or a timeline extended for exceptional circumstances with respect to a particular complaint, or because the parent (or individual or organization) and the public agency agree to extend the time to engage in mediation or other alternative means of dispute resolution, if available in the State.
2009 (2009-2010)
100% of signed written complaints with reports issued that were resolved within 60-day timeline or a timeline extended for exceptional circumstances with respect to a particular complaint, or because the parent (or individual or organization) and the public agency agree to extend the time to engage in mediation or other alternative means of dispute resolution, if available in the State.
2010 (2010-2011)
100% of signed written complaints with reports issued that were resolved within 60-day timeline or a timeline extended for exceptional circumstances with respect to a particular complaint, or because the parent (or individual or organization) and the public agency agree to extend the time to engage in mediation or other alternative means of dispute resolution, if available in the State.
2011
(2011-2012)
100% of signed written complaints with reports issued that were resolved within 60-day timeline or a timeline extended for exceptional circumstances with respect to a particular complaint, or because the parent (or individual or organization) and the public agency agree to extend the time to engage in mediation or other alternative means of dispute resolution, if available in the State.
2012
(2012-2013)
100% of signed written complaints with reports issued that were resolved within 60-day timeline or a timeline extended for exceptional circumstances with respect to a particular complaint, or because the parent (or individual or organization) and the public agency agree to extend the time to engage in mediation or other alternative means of dispute resolution, if available in the State.

SPP Template – Part B West Virginia
State Revised February 1, 2012
Part B State Performance Plan: 2005-2012 Page 113 (OMB NO: 1820-0624 / Expiration Date: 2/29/2012)
Improvement Activities/Timelines/Resources:
Improvement Activity Timeline Resources Status
16.1 Manage current program to maintain
compliance with 60 day timeline for
resolution of child complaints.
2006 – 2013 WVDE
Active
16.2 Provide online training of complaint
system for stakeholders.
2011 – 2013 WVDE
RESA
New 2011
16.3 Evaluate the effectiveness and efficiency
of early resolution process.
2011 – 2013 WVDE New 2011
16.4 Create guidance document on dispute
resolution and post on WVDE OSP
website.
2011 – 2013 WVDE New 2011

SPP Template – Part B West Virginia
State Revised February 1, 2012
Part B State Performance Plan: 2005-2012 Page 114 (OMB NO: 1820-0624 / Expiration Date: 2/29/2012)
Part B State Performance Plan (SPP) for 2005-2012
Overview of the State Performance Plan Development:
See Indicator 1. (The following items are to be completed for each monitoring priority/indicator.)
Monitoring Priority: Effective General Supervision Part B / General Supervision
Indicator 17: Percent of fully adjudicated due process hearing requests that were fully adjudicated within the 45-day timeline or a timeline that is properly extended by the hearing officer at the request of either party or in the case of an expedited hearing, within the required timelines.
(20 U.S.C. 1416(a)(3)(B))
Measurement:
Percent = (3.2(a) + 3.2(b)) divided by (3.2) times 100.
Overview of Issue/Description of System or Process:
The West Virginia Department of Education (WVDE) administers the due process system in accordance with the requirements of Individual with Disabilities Education Act (IDEA) of 2004. In addition, a court case (Boles v. Board of Education of the County of Kanawha (S.D. W.V. 1989) established specific requirements for the selection and qualifications of due process hearing officers (e.g., due process hearing officers must be attorneys). The hearing officers are not employees of the agency and are assigned on a rotational basis.
The due process system is a one-tier system. Due process hearing requests are filed in writing with the WVDE, which contracts on a per hearing basis with one of the five due process hearing officers, all of whom are trained at least annually on the provisions of the IDEA, applicable federal and state regulations and legal interpretations by federal and state courts. In addition, the training addresses the knowledge and ability to conduct hearings in accordance with appropriate, standard legal practice, the knowledge and ability to render and write decisions.
The WVDE employs a coordinator to administer the due process hearing system, including in-take, assignments, financial administration, coordination of training, monitoring of timelines and follow-up to verify and monitor the timely implementation of due process hearing orders. The coordinator manages the administration of the due process hearing process through the West Virginia Compliance Management System (CMS) which tracks the assignment and timelines, including extensions, for each due process hearing.
Baseline Data for FFY 2004 (2004-2005):
Due Process Hearing Data 2004-2005
Hearings Requested Hearings Fully Adjudicated
Decisions Within 45 Day Timeline
Decisions Within Extended Timeline
18 6 1 5
WV SPP Attachment 1 for the Report of Dispute Resolution under Part B of the IDEA, Complaints, Mediations, Resolution Sessions, and Due Process Hearings, with data required for Indicators 16, 17, 18 and 19 may be found at the end of the SPP document.

SPP Template – Part B West Virginia
State Revised February 1, 2012
Part B State Performance Plan: 2005-2012 Page 115 (OMB NO: 1820-0624 / Expiration Date: 2/29/2012)
Discussion of Baseline Data:
Eighteen due process hearings were requested in 2004-2005. Of the 18 hearings requested, six were fully adjudicated. All six decisions or 100 percent were rendered within the required timelines: 1) one decision was issued within the 45-day timeline, and 2) five decisions were rendered within extended timelines.
FFY Measurable and Rigorous Target
2005 (2005-2006)
100% of fully adjudicated due process hearing requests are within the 45-day timeline or a timeline that is properly extended and documented by the hearing officer at the request of either party of the hearing.
2006 (2006-2007)
100% of fully adjudicated due process hearing requests are within the 45-day timeline or a timeline that is properly extended and documented by the hearing officer at the request of either party of the hearing.
2007 (2007-2008)
100% of fully adjudicated due process hearing requests are within the 45-day timeline or a timeline that is properly extended and documented by the hearing officer at the request of either party of the hearing.
2008 (2008-2009)
100% of adjudicated due process hearing requests that were adjudicated within the 45-day timeline or a timeline that is properly extended by the hearing officer at the request of either party or in the case of an expedited hearing, within the required timelines.
2009 (2009-2010)
100% of adjudicated due process hearing requests that were adjudicated within the 45-day timeline or a timeline that is properly extended by the hearing officer at the request of either party or in the case of an expedited hearing, within the required timelines.
2010 (2010-2011)
100% of adjudicated due process hearing requests that were adjudicated within the 45-day timeline or a timeline that is properly extended by the hearing officer at the request of either party or in the case of an expedited hearing, within the required timelines.
2011
(2011-2013)
100% of adjudicated due process hearing requests that were adjudicated within the 45-day timeline or a timeline that is properly extended by the hearing officer at the request of either party or in the case of an expedited hearing, within the required timelines.
2012
(2012-2013)
100% of adjudicated due process hearing requests that were adjudicated within the 45-day timeline or a timeline that is properly extended by the hearing officer at the request of either party or in the case of an expedited hearing, within the required timelines.
Improvement Activities/Timelines/Resources:
Improvement Activity Timeline Resources Status
17.1 Manage current program to maintain compliance with 45-day timeline for due process hearing requests.
2005 – 2013 WVDE
Active Revised 2011
17.2 Provide training for due process hearing officers.
2005 – 2013 WVDE Legal Training Consultant
Active Revised 2011
17.3 Provide online training of due process hearing system for stakeholders.
2011 – 2013 WVDE
New 2011

SPP Template – Part B West Virginia
State Revised February 1, 2012
Part B State Performance Plan: 2005-2012 Page 116 (OMB NO: 1820-0624 / Expiration Date: 2/29/2012)
Part B State Performance Plan (SPP) for 2005-2012
Overview of the State Performance Plan Development:
See SPP Indicator 1.
(The following items are to be completed for each monitoring priority/indicator.)
Monitoring Priority: Effective General Supervision Part B / General Supervision
Indicator 18: Percent of hearing requests that went to resolution sessions that were resolved through resolution session settlement agreements.
(20 U.S.C. 1416(a)(3(B))
Measurement: Percent = (3.1(a) divided by 3.1) times 100.
Overview of Issue/Description of System or Process:
The West Virginia Department of Education (WVDE) employs a coordinator to administer the due process complaint system, including the procedures for resolution sessions. The primary purpose of the resolution session, which is the responsibility of the district, is to resolve the issues in a pending due process complaint. When a parent or assigned attorney files a due process complaint, the Office of Special Programs (OSP) assigns a due process hearing officer and notifies the district of its responsibility to conduct a resolution session within 15 days of the due process complaint request. The resolution session is scheduled and convened by the district with the parents and relevant members of the Individualized Education Programs (IEP) Team who have knowledge of the facts identified in the request to discuss the due process complaint and provide the opportunity to resolve the complaint. The meeting must be held unless the parents and the district agree in writing to waive such a meeting or agree to mediation.
If the district has not resolved the basis for the due process complaint to the parent’s satisfaction within 30 calendar days of the receipt of the due process complaint, the due process hearing may occur, and the timeline for issuing a decision begins at the expiration of the thirty-day resolution period. If an agreement is reached, and neither party voids the agreement within the required three-business day review period, the signed legally binding agreement is forwarded to the OSP and the assigned hearing officer. A party intending to void an agreement must send the other party and the hearing officer a written, signed, dated statement to this effect. The hearing officer will schedule a hearing if no resolution is reached within 30 days or if the resolution is voided within three business days of the dated agreement.
Baseline Data for FFY 2005 (2005-2006):
Resolution Session Data for 2005-2006
Resolution Sessions Held 3.1
Settlement Agreements 3.1(a)
% Sessions with Resolution (3.1(a) divided by 3.1) times 100.
2
2
100%
See also Table 7 Report of Dispute Resolutions Under Part B.

SPP Template – Part B West Virginia
State Revised February 1, 2012
Part B State Performance Plan: 2005-2012 Page 117 (OMB NO: 1820-0624 / Expiration Date: 2/29/2012)
Discussion of Baseline Data:
A review of the resolution session data collected during the 2005-2006 reveals 13 due process complaints received and two resolution sessions held resulting in two settlement agreements. One hearing was conducted, while the remaining due process hearing complaints were withdrawn or resolved through formal mediation. Of the 13 due process complaints, the parents and the district agreed to waive the resolution sessions and participate in mediation in four cases. Of the four mediations requested, three (3) resulted in mediation agreements. The other six due process complaints were withdrawn before the required 15 day timeline to hold the resolution session. Therefore, 92 percent of all hearing complaints filed in West Virginia during 2005-2006 were resolved without a due process hearing. Parents and districts in West Virginia have demonstrated a willingness to use alternatives to due process hearings to resolve complaints in an efficient and effective manner.
FFY Measurable and Rigorous Target
2005 (2005-2006)
West Virginia had fewer than 10 resolution sessions, therefore, no targets or improvement activities are required at this time.
2006 (2006-2007)
West Virginia had fewer than 10 resolution sessions, therefore, no targets or improvement activities are required at this time.
2007 (2007-2008)
West Virginia had fewer than 10 resolution sessions, therefore, no targets or improvement activities are required at this time.
2008 (2008-2009)
West Virginia had fewer than 10 resolution sessions, therefore, no targets or improvement activities are required at this time.
2009 (2009-2010)
West Virginia had fewer than 10 resolution sessions, therefore, no targets or improvement activities are required at this time.
2010 (2010-2011)
Seventy-five percent of hearing requests that went to resolution sessions will be resolved through resolution session settlement agreements, if West Virginia has 10 or more resolution sessions
2011 (2011-2012)
Seventy-five percent of hearing requests that went to resolution sessions will be resolved through resolution session settlement agreements, if West Virginia has 10 or more resolution sessions.
2012 (2012-2013)
Seventy-five percent of hearing requests that went to resolution sessions will be resolved through resolution session settlement agreements, if West Virginia has 10 or more resolution sessions.
Improvement Activities/Timelines/Resources:
Improvement Activity Timeline Resources Status
18.1 Manage current program to maintain resolution session outcomes.
2005 – 2013 WVDE
Active Revised 2011
18.2 Provide online training of resolution process for stakeholders.
2011 – 2013 WVDE
New 2011

SPP Template – Part B West Virginia
State Revised February 1, 2012
Part B State Performance Plan: 2005-2012 Page 118 (OMB NO: 1820-0624 / Expiration Date: 2/29/2012)
Part B State Performance Plan (SPP) for 2005-2012
Overview of the State Performance Plan Development:
See Indicator 1. (The following items are to be completed for each monitoring priority/indicator.)
Monitoring Priority: Effective General Supervision Part B / General Supervision
Indicator 19: Percent of mediations held that resulted in mediation agreements.
(20 U.S.C. 1416(a)(3)(B))
Measurement:
Percent = (2.1(a)(i) + 2.1(b)(i)) divided by (2.1) times 100.
Overview of Issue/Description of System or Process:
The West Virginia Department of Education (WVDE) administers the mediation system in accordance with the requirements of Individuals with Disabilities Education Act (IDEA) of 2004 and employs a coordinator to coordinate this system, including in-take, assignments, financial administration, coordination of training and monitoring of timelines. The coordinator manages the mediation process through the West Virginia Compliance Management System (CMS) which tracks the assignment of mediators and corresponding information and timelines.
The WVDE contracts with seven mediators, all of whom are trained at least annually regarding provisions of the Individuals with IDEA 2004, applicable federal and state regulations and legal interpretations by federal and state courts. In addition, the training addresses the knowledge and ability to conduct effective mediations, including the mediation process.
Mediation requests are submitted in writing to the WVDE. Upon receipt of a mediation request, the WVDE assigns a mediator on a rotational basis.
Baseline Data for FFY 2004 (2004-2005):
West Virginia Mediations 2004-2005 (July 1, 2004-June 30, 2005)
Total Mediations 2004-2005
Mediation Requests 28
Mediations Conducted (Total) 24
Mediations Resulting in Agreements 17 (71%)
Hearing-Related Mediations
Mediations Conducted 4
Mediations Resulting in Agreements 2 (50%)
Mediations Not Related to Hearing Requests
Mediations Conducted 20
Mediations Resulting in Agreements 15 (75%)
Mediations Not held (Withdrawn or Pending) 4

SPP Template – Part B West Virginia
State Revised February 1, 2012
Part B State Performance Plan: 2005-2012 Page 119 (OMB NO: 1820-0624 / Expiration Date: 2/29/2012)
WV SPP Attachment 1 for the Report of Dispute Resolution Under Part B of the IDEA, Complaints, Mediations, Resolution Sessions, and Due Process Hearings, with data required for Indicators 16, 17, 18 and 19 may be found at the end of the SPP document.
Discussion of Baseline Data:
The WVDE received a total of 28 mediation requests during 2004-2005. 24 mediations were conducted (four requests were withdrawn) and of the 24 mediations, 17 or 71 percent resulted in mediation agreements. The number of mediations resulting in agreements for non-hearing related mediations was significantly higher than for hearing related mediations. 75 percent or 15 of the 20 non-hearing related mediations resulted in agreements whereas 50 percent or two of the four mediations related to a due process hearing resulted in agreements.
Parents and districts access the mediation system to resolve disputes. Both hearing-related mediations and non-hearing related mediations have increased. Data, including district and parent surveys, indicate parents and districts are selecting mediation as an alternative to filing a due process hearing due to its positive results.
Targets are no longer required for less than 10 mediations in a year. The following targets, beginning with 75%, will resume at such time West Virginia has 10 mediations.
FFY Measurable and Rigorous Target
2005 (2005-2006)
* 75% of mediations held result in mediation agreements.
2006 (2006-2007)
* 77% of mediations held result in mediation agreements.
2007 (2007-2008)
* 79% of mediations held result in mediation agreements.
2008 (2008-2009)
* 81% of mediations held result in mediation agreements.
2009 (2009-2010)
* 83% of mediations held result in mediation agreements.
2010 (2010-2011)
* 75% of mediations held result in mediation agreements.
2011 (2011-2013)
* 75% of mediations held result in mediation agreements.
2012 (2012-2013)
* 75% of mediations held result in mediation agreements.
Improvement Activities/Timelines/Resources:
Improvement Activity Timeline Resources Status
19.1 Manage current program to maintain mediation outcomes.
2005 – 2013 WVDE
Active Revised 2011
19.2 Provide online training of mediation process for stakeholders.
2011 – 2013 WVDE New 2011
19.3 Provide training for impartial mediators. 2005 – 2013 WVDE Legal Training Consultant
Active Revised 2011

SPP Template – Part B West Virginia
State Revised February 1, 2012
Part B State Performance Plan: 2005-2012 Page 120 (OMB NO: 1820-0624 / Expiration Date: 2/29/2012)
Part B State Performance Plan (SPP) for 2005-2012
Overview of the State Performance Plan Development:
See Indicator 1.
(The following items are to be completed for each monitoring priority/indicator.)
Monitoring Priority: Effective General Supervision Part B / General Supervision
Indicator 20: State reported data (618 data and State Performance Plan and Annual Performance Report) are timely and accurate.
(20 U.S.C. 1416(a)(3)(B))
Measurement:
State reported data, including 618 data, State Performance Plan, and Annual Performance Reports,
are:
a. Submitted on or before due dates (February 1 for child count, including race and ethnicity; placement; November 1 for exiting, discipline, personnel and dispute resolution; and February 1 for Annual Performance Reports and assessment); and
b. Accurate, including covering the correct year and following the correct measurement.
Overview of Issue/Description of System or Process:
Section 618 Data
All data for West Virginia Section 618 Annual Data Reports are collected through the West Virginia Education Information System (WVEIS), with the exception of the dispute resolution report, which is collected in a separate database.
WVEIS is a statewide dedicated computer network for maintaining all school and district records including student information, personnel information and financial information. All basic student records are maintained by school staff, and all special education student records are maintained by the district special education staff and/or school staff, at the district’s option. All individual student records have a statewide unique student identifier. Individual student records are not maintained or viewed at the SEA level, however.
Basic student information and special education information records contain fields to enter appropriate codes in the individual file, thus maintaining individual student data related to the required data elements for federal reporting, e.g., disability codes, educational environment, exit, referral information, evaluation and IEP dates. Discipline information is collected using a data module available at the school, with each offense, action and number of days entered at the time the action occurs.
To collect data for reporting purposes, a program has been written for each state and federal report, including enrollment and student-related Annual Data Reports. The program compiles an electronic file containing all the data elements needed for the report and generates detail and summary reports.
The WVEIS establishes a calendar for all data collections, including general education and special education, which is posted on the WVEIS website as of July 1. The WVDE issues a memorandum to the

SPP Template – Part B West Virginia
State Revised February 1, 2012
Part B State Performance Plan: 2005-2012 Page 121 (OMB NO: 1820-0624 / Expiration Date: 2/29/2012)
local special education director one month prior to each required federal and state data report, explaining instructions, definitions and requirements and reminding districts of the deadline for submission. Definitions and required codes for student records are established and published in the WVEIS Standards for Maintaining Student Data Systems manual, available on the website wveis.k12.wv.us. Definitions closely follow those from the OSEP Data Dictionary, and instructions parallel those outlined in the federal instructions.
WVEIS staff and the IDEA, Part B data manager provide training and updates at a statewide data conference in June, and WVEIS staff meet with district and RESA WVEIS coordinators in December. Each of the eight regions of the state has a WVEIS coordinator, who provides further training and technical assistance to local WVEIS districts contacts, special education directors, principals and secretaries responsible for creating and maintaining student records and running required reports. The state WVEIS office and IDEA Part B data manager also provide direct technical assistance. WVEIS maintains a website with the submission calendar, Standards Manual and documentation for using the record systems.
Assessment Data
Assessment data are compiled and reported by the WVEIS staff, using WVEIS student information and the assessment scoring file from the CTB/McGraw-Hill for the West Virginia Educational Standards Test (WESTEST) and Office of Student Assessment’s scoring center for the West Virginia Alternate Assessment.
Participation of all students is tracked using a combination of West Virginia Education Information System (WVEIS) Basic Student Information Records, Enrollment Records, Special Education Student Information records, WESTEST results provided by CTB/McGraw Hill and West Virginia Alternate Assessment scoring results. The process for determining and verifying participation and results is as follows:
Prior to testing, an enrollment file of all students is collected from the individual student records, which contains a unique identifier for each student enrolled. Test booklets are preslugged for each student using a bar code.
During testing, any additional students not having pre-slugged booklets or scan sheets had a bio-grid completed by the test administrator to include the student number.
At the beginning of test week, a second electronic enrollment file is pulled to document the students enrolled in each of the tested grades and in each subgroup. Test accommodation student data are pulled at this time, and county test coordinators are required to monitor accommodations.
All student test records and scores from both WESTEST and Alternate Assessment are then matched to the test week enrollment file to determine participation. An electronic file with all students in enrollment and their corresponding test record for those who participated is created.
Prior to the release of school results, test and participation data are sent by WVEIS to the districts for verification and correction as appropriate.
The final verified results are used for reporting. Using this file, separate comparisons were made for WESTEST and Alternate Assessment
statewide and by district for reading and mathematics on each test by grade level.
Complaint Management System and Due Process and Mediation System
The WVDE maintains a web-based Complaint Management System, which maintains all complaints filed, correspondence, letters of findings, corrective activities, issues and tracks dates and timelines associated with all of the above. This system is the source for dispute resolution data related to Indicator 16. The WVDE also maintains a web-based Due Process and Mediation System, which maintains and tracks all information related to these processes, including date filed, hearing officer selection, tracking of timelines,

SPP Template – Part B West Virginia
State Revised February 1, 2012
Part B State Performance Plan: 2005-2012 Page 122 (OMB NO: 1820-0624 / Expiration Date: 2/29/2012)
issues, decisions, agreements and corrective activities. This system is the data source for dispute resolution data related to Indicators 17-19.
Continuous Improvement and Focused Monitoring System
The CIFMS maintains a website for local districts to obtain and review their data and to submit the results of their Annual Desk Audit (ADA).
Special Education District Profiles Public Website
In addition to providing data for the Annual Data Reports, State Performance Plan and Annual Performance Report, the WVDE maintains a public website to publicly report state and district data profiles. Data may be retrieved by district and includes state comparison data. Detailed data are available to those with access (district special education directors), and data with small cell sizes suppressed to protect confidentiality are available to the public. Public data currently include child count by age, disability, race/ethnicity, gender and limited English proficiency, placement and assessment results. Additional data and analyses are available to districts for use in their Continuous Improvement and Focused Monitoring Process District Self-Assessment. A District Data Profiles site is available to include public reporting of state and district performance on the SPP/APR indicators.
Baseline Data for FFY 2004 (2004-2005):
A. State reported data are submitted on or before due dates. All 2003-2004 annual data reports due November 1, 2004, were submitted on time, with no corrections required by WESTAT. The child count and educational environment reports were submitted February 1, 2005. The Annual Performance Report for 2003-2004 was submitted by the extended due date provided by OSEP in accordance with the 2002-2003 APR letter, that is, sixty days from receipt of the letter. B. State reported data are accurate.
All state reported data submitted during 2004-2005 were verified by WESTAT as accurate. West Virginia was the first state accepted to submit the Annual Data Exit Report through the Education Data Exchange Network (EDEN) for 2004-2005. OSEP conducted a data verification monitoring in West Virginia in the fall of 2003, expressing no noncompliance issues regarding state procedures and practices for accurate and timely data.
Process for Ensuring Accuracy
All data begin with accurate and complete individual student records maintained at the school and district level. District staff runs the appropriate report program, which provides audits and opportunities to check and correct data entry. They print the final report, which they check and verify prior to the district superintendent’s sending it under his or her user ID, which serves as signature to any verifications required by the Department.
Reports are submitted to WVEIS as electronic files containing the necessary data elements to generate the report. The reports are generated, checked for accuracy by the Part B data manager, corrected by the districts as necessary, and then combined into the federal annual data report for submission to OSEP/DAC or EDEN. WV is an EDEN only state. All 618 reports are currently submitted electronically through EDEN, with the exception of dispute resolution which is submitted to OSEP/DAC in a DTS format.
Although WV is EDEN only, WV continues to using the spreadsheets provided by DAC/WESTAT to perform the basic audits for all 618 collections. These audits, in addition to the error reports triggered in EDEN ensure the accuracy of files submitted to EDEN.

SPP Template – Part B West Virginia
State Revised February 1, 2012
Part B State Performance Plan: 2005-2012 Page 123 (OMB NO: 1820-0624 / Expiration Date: 2/29/2012)
Discussion of Baseline Data:
All data collected and reported to OSEP to meet Section 618 requirements have been verified as accurate. Data required for the SPP and Annual Performance Reports that go beyond the Section 618 data, for example, data to compare students with disabilities and all students on graduation rates and dropout rates, are more challenging to audit and correct. Although all student information is maintained in WVEIS, data require matching of several electronic files compiled from records maintained in different components of WVEIS by various personnel at the school and district level. Tracking students exiting Part C, West Virginia Birth to Three Programs, with Department of Health and Human Resources as the lead agency requires significant inter-agency collaboration.
FFY Measurable and Rigorous Target
2005 (2005-2006)
100% of reports submitted accurately and by the established due date.
2006 (2006-2007)
100% of reports submitted accurately and by the established due date.
2007 (2007-2008)
100% of reports submitted accurately and by the established due date.
2008 (2008-2009)
100% of reports submitted accurately and by the established due date.
2009 (2009-2010)
100% of reports submitted accurately and by the established due date.
2010 (2010-2011)
100% of reports submitted accurately and by the established due date.
2011 (2011-2012)
100% of reports submitted accurately and by the established due date.
2012 (2012-2013)
100% of reports submitted accurately and by the established due date.
Improvement Activities/Timelines/Resources:
Improvement Activity Timeline Resources Status
20.1 Maintain and continue to improve the private website accessed by district administrators to provide data and analysis needed for Continuous Improvement and Focused Monitoring Process District Self-Assessment and district performance on State Performance Plan Indicators.
2005-2013 WVDE WVEIS WVDE OSP
Active
20.2 Maintain and continue to improve the public website to display all district and state data required for public reporting under IDEA 2004.
2005-2013 WVDE WVEIS WVDE OSP
Active
20.3 Complete and submit State Performance Plan.
2005-2013 WVDE West Virginia Advisory Council for the Education of Exceptional Children
Active
20.4 Audit, correct and verify data for all 618 collections and related SPP/APR data requirements.
2005-2013 WVDE WVEIS WVDE OSP
Active

SPP Template – Part B West Virginia
State Revised February 1, 2012
Part B State Performance Plan: 2005-2012 Page 124 (OMB NO: 1820-0624 / Expiration Date: 2/29/2012)
Improvement Activity Timeline Resources Status
20.5 Provide training to district personnel on data requirements, definitions, maintaining records and reporting.
2005-2013 WVDE WVEIS WVDE OSP
Active
20.6 Maintain and continue to improve current WVEIS support page with special education definitions, codes, and reporting procedures.
2005-2013 WVDE WVEIS WVDE OSP
Active
20.7 Update contract with Avatar and re-administer NCSEAM parent partnership survey to counties surveyed in years 1 and 2 in original sampling plan.
2010-2013 WVDE Contractor
Active
20.8 Collaborate with the Office of Research to design activity evaluations and analyze activity effectiveness.
2010-2013 WVDE WVEIS WVDE OSP
Active
20.9 Develop guidance on the 4-year adjusted cohort graduation rate for LEAs.
2010-2013 WVDE Active

West Virginia
Annual Performance Report
FFY 2010
2010-2011
Individuals with Disabilities Education Act
(IDEA 2004)
Part B
Office of Special Programs
February 1, 2012
clarifications submitted on April 17, 2012
West Virginia Department of Education

APR Template – Part B (4) West Virginia.
State
Part B State Annual Performance Report for FFY2010 Page 1
Table of Contents
West Virginia Annual Performance Plan FFY 2010 Submitted February 1, 2012
Overview of Annual Performance Report Development ............................................................................ 2
Indicator 1 – Graduation ............................................................................................................................. 5
Indicator 2 – Dropout ................................................................................................................................ 15
Indicator 3 – Assessment ........................................................................................................................ 21
Indicator 4A – Suspension ....................................................................................................................... 38
Indicator 4B – Suspension by Race/Ethnicity .......................................................................................... 46
Indicator 5 – Educational Environment – Ages 6-21 ................................................................................ 53
Indicator 6 – Educational Environment – Ages 3-5 .................................................................................. 62
Indicator 7 – Early Childhood Outcomes ................................................................................................. 63
Indicator 8 – Parent Involvement ............................................................................................................. 70
Indicator 9 – Disproportionality – All Disabilities ...................................................................................... 77
Indicator 10 – Disproportionality – Specific Disabilities ........................................................................... 81
Indicator 11 – Child Find .......................................................................................................................... 88
Indicator 12 – Early Childhood Transition ................................................................................................ 93
Indicator 13 – Secondary Transition ........................................................................................................ 98
Indicator 14 – Post School Outcomes .................................................................................................... 107
Indicator 15 – General Supervision ........................................................................................................ 118
Indicator 16 – Complaint Timelines ........................................................................................................ 129
Indicator 17 – Due Process Hearing Timelines...................................................................................... 132
Indicator 18 – Resolution Sessions ....................................................................................................... 135
Indicator 19 – Mediation ......................................................................................................................... 137
Indicator 20 – Timely and Accurate Data ............................................................................................... 140

APR Template – Part B (4) West Virginia.
State
Part B State Annual Performance Report for FFY2010 Page 2
Part B State Annual Performance Report (APR) for FFY2010 (2010-2011)
Overview of the Annual Performance Report Development:
In December 2005, the West Virginia Department of Education embarked on a new six-year State Performance Plan (SPP) under the Individuals with Disabilities Education Act of 2004 (IDEA 2004) focusing on improved results for students with disabilities in West Virginia. Developed with guidance from the West Virginia Advisory Council for the Education of Exceptional Children (WVACEEC) and input from teachers, administrators and parents, the SPP set high expectations and committed significant resources for students with Individualized Education Programs (IEPs), consistent with the state’s goals for all students.
West Virginia’s plan was approved by the U.S. Department of Education, Office of Special Education Programs (OSEP), in March 2006. The plan included baseline data, measurements, targets and improvement activities for a six-year period related to three priorities:
Free appropriate public education in the least restrictive environment (FAPE in the LRE); Disproportionality by race/ethnicity; and Effective general supervision, including effective preschool and post school transition.
Within these priorities, state and district performance and compliance on twenty indicators are measured against targets set through the stakeholder process and reported in the Annual Performance Report (APR). Updates on implementation of improvement activities and identification and timely correction of noncompliance through the state’s Continuous Improvement and Focused Monitoring System (CIFMS) and the Dispute Resolution System are reported.
Following OSEP’s approval of the SPP, a copy was posted on the WVDE website, and a public information executive summary document was published and disseminated in paper and web-based formats to inform the public of the plan. Various workgroups and individual staff members carried out the activities in the plan. Subsequent Annual Performance Reports were submitted in February 2007, 2008, 2009, 2010 and 2011 detailing data collected and progress made on the SPP indicators. Each year following OSEP’s approval, the revised State Performance Plan and Annual Performance report were posted online and provided to all districts and other stakeholder groups, including WVACEEC, West Virginia Developmental Disabilities Council, Parent Training Information, West Virginia Advocates and Regional Education Service Agencies.
State Determination for FFY 2009 State Performance Report/Annual Performance Report
Upon review of the 2009-2010 Annual Performance Report, submitted February 1, 2011, the U.S. Department of Education, Office of Special Education Programs (OSEP), issued a letter to Dr. Jorea M. Marple, State Superintendent of Schools, informing her of the Department’s determination under the Individuals with Disabilities Education Act (IDEA 2004), section 616(d) that West Virginia needs assistance in meeting the requirements of Part B of the IDEA. Despite high levels of compliance for Indicators 9, 10, 11, 12, 15, 17 and 20, OSEP cited the specific factor affecting the determination was WV’s FFY 2009 data for compliance Indicator 16 (82.4%).
As required, the State’s determination status was disseminated through presentations by Pat Homberg, Executive Director, Office of Special Programs, at the state’s fall conference for special education administrators in September 2011 in Roanoke, West Virginia. The determination was also included in the published copy of the FFY 2009 SPP/ APR which was provided to stakeholders and posted publicly on the OSP Web site as part of this APR.

APR Template – Part B (4) West Virginia.
State
Part B State Annual Performance Report for FFY2010 Page 3
Broad Stakeholder Input
As stated previously, the WVACEEC is the primary stakeholder group for the APR, representing parents of children with disabilities, public school and private school teachers and administrators, agencies serving students with disabilities and higher education. Meeting eight times a year, Council accepts public testimony in a different district each meeting and hears district, Regional Education Service Agency (RESA) and WVDE presentations on the status of special education services and issues. Based on the broad stakeholder input, the WVACEEC issues an annual report, to which the West Virginia Board of Education officially responds. OSP staff met with the WVACEEC in October and December 2011 to examine current indicator performance in relation to targets and activities for the SPP extension through FFY 2012, as required by OSEP. The Council responded to current performance and approved or revised OSP’s recommendations for revised activities, definitions and/or data collection methodologies through school year 2012-2013.
Throughout 2011-2012, numerous additional stakeholder groups were involved in the data review and improvement activities for specific indicators. Parents continued to be represented through a workgroup consisting of parents and representatives of parent-centered organizations, which meets periodically with the WVDE parent coordinator to review data and provide input to activities for the parent involvement indicator. Additionally, the Parent Educator Resource Centers (PERCs) provided assistance to parents at the local level who had difficulty in completing the surveys and used the results of the surveys from their districts to improve their programs (Indicator 8). Similarly, the WVDE adolescent coordinator reviewed data and activities for the adolescent transition and post-school outcomes indicators (Indicators 13 and 14) with the statewide transition workgroup of school and community stakeholders. As described in the SPP, the WVDE preschool (Section 619) coordinator continued to work collaboratively with major state-level stakeholder groups, which provided and reviewed data for the APR and SPP indicators related to preschool children. The WVDE Continuous Quality Improvement Council and Early Childhood Advisory Council continued to provide input on universal pre-k and inclusive early education programs, assessment and progress toward early childhood outcomes (Indicator 7) and transition from early intervention services (WV Birth to Three) to public school services (Indicator 12).
APR Development
To develop the APR, each indicator was assigned to one or more WVDE assistant directors and special education coordinators, who were responsible for analyzing the data relative to their indicator. Beginning in July 2011, the executive director, assistant directors and data manager who coordinated APR development held meetings with staff responsible for the indicators to provide forms, instructions and technical assistance information obtained from OSEP. Staff members participated in OSEP’s technical assistance conference calls relative to their indicators. WVDE staff worked closely with their OSEP state contact and other OSEP/TA staff, participating in multiple SPP/APR technical assistance calls from September 2011 through January 2012. The technical assistance targeted: 1) revising WV’s methodology for calculating significant discrepancy for Indicators 4A and 4B; 2) a new data collection process for Indicator 13 wherein the data will be obtained through cyclical monitoring for the APR submission due February 1, 2013; and 3) revisions to the State’s system of general supervision as outlined in Indicator 15. The OSP also notified the WVACEEC and the OSEP state contact that the state’s contractor for Indicator 8 had discontinued services and a search for an alternative contractor was being conducted. Finally, per measurement table requirements, OSP in conjunction with WVACEEC reviewed its improvement activities for Indicator 16 to ensure they will enable the OSP to provide data in the FFY 2010 APR, due February 1, 2012, demonstrating that the WVDE is in compliance with the timely complaint resolution requirements in 34 CFR §300.152.

APR Template – Part B (4) West Virginia.
State
Part B State Annual Performance Report for FFY2010 Page 4
The 2010-2011 Annual Performance Report (APR) marks the sixth year of West Virginia’s progress toward each of the twenty performance and compliance indicators outlined in the eight-year extended SPP cycle. As previously stated, in October and December 2011, the WVACEEC held a SPP/APR work session wherein targets and activities were discussed with subsequent approval for WVDE action. The WVACEEC also reviewed 2010-2011 progress data measuring the targets set for all performance indicators. Additional improvement activities were approved to supplement activities already accomplished. The Council also responded to and approved revised definitions and/or data collection methodologies through school year 2012-2013 for Indicators 4A, 4B and 13.
In January 2012, individual indicators were reviewed internally by WVDE staff and externally by the Mid South Regional Resource Center. The reviews were conducted to assure measurement table compliance, technical adequacy of data and clarity of reporting. The APR for FFY 2010 was submitted to OSEP on February 1, 2012.
To fulfill the public reporting requirements, the FFY 2010 (2010-2011) SPP / APR will be posted on the OSP Web site http://wvde.state.wv.us/osp/datareports.html by February 15, 2012. Additionally, the 2010-2011 (FFY 2010) district data profiles will be posted at the above Data Reports site as soon as possible but no later than 120 days per regulations. This information will include the district data and whether the district met the state targets for 2010-2011.

APR Template – Part B (4) West Virginia.
State
Part B State Annual Performance Report for FFY2010 Page 5
Monitoring Priority: FAPE in the LRE
Indicator 1: Percent of youth with IEPs graduating from high school with a regular diploma.
(20 U.S.C. 1416 (a)(3)(A))
Measurement: States must report using the graduation rate calculation and timeline established by the Department under the Elementary and Secondary Education Act (ESEA).
West Virginia utilized the federally mandated 4-Year Adjusted Cohort Graduation Rate for AYP purposes beginning in August 2011 as established by ESEA. The calculation is as follows for students with IEPs:
=
West Virginia’s Four-Year Adjusted Cohort Graduation Rate guide is available online at http://wveis.k12.wv.us/wveis2004/documents/WVFour-YearAdjustedCohortGraduationRate.pdf . The guide includes specific information on the students with disabilities subgroup as well as general definitions and answers to frequently asked cohort questions.
FFY Measurable and Rigorous Target
FFY 2010
(using 2009-2010 data)
At least 80.0% of youth with IEPs will graduate from high school with a regular diploma.
4-Year
Adjusted
Cohort
Graduation
Rate
# of cohort members with IEPs who earned a regular high school diploma by the end of the 2009-2010 school year
# of first-time 9th graders in fall 2006 (starting cohort) who had IEPs at any period during high school plus students with IEPs who transfer in, minus students with IEPs who transfer out, emigrate, or die during school years 2006-2007, 2007-2008, 2008-2009, and 2009-2010

APR Template – Part B (4) West Virginia.
State
Part B State Annual Performance Report for FFY2010 Page 6
Actual Target Data for FFY 2010 (2009-2010 data)
Graduation Rates
2009-2010
YEAR
ALL Youth Youth WITH IEPs
Students receiving standard diplomas within 4 years of being first time 9th graders in 2006-2007
Cohort Denominator
Rate =
Students receiving standard diplomas within 4 years of being first time 9th graders in 2006-2007
Cohort Denominator
Rate =
Target Data
2009-2010 16,635 21,759 76.4 2049 3566 57.5%
Discussion of Improvement Activities Completed and Explanation of Progress or Slippage that occurred for FFY 2010 (based on 2009-2010 data):
The 4-year adjusted cohort graduation rate for students with IEPs for 2009-2010 was 57.5%. Only students with IEPs graduating with a standard diploma within 4 years of entering high school are counted as graduates. Fifth and sixth year graduates and students graduating with a modified diploma are not included in the calculation. The target was not met.
Because 2009-2010 is the first year for the 4-Year Cohort Rate, prior year data are not available for determination of progress or slippage. The 4-Year Cohort Rate and the WV Completer Rate, used for this indicator in prior years, are not comparable calculations. When comparing the 2009-2010 WV Completer Rate statistic to the 2008-2009 rate, a 2 percentage point gain was evident for students with
84.0 85.1 84.6 84.0 83.8 84.3 76.4
75.3 72.7 73.1 77.3 75.7 78.3
57.5
0
10
20
30
40
50
60
70
80
90
100
2004-2005 2005-2006 2006-2007 2007-2008 2008-2009 2009-2010 2009-2010
Pe
rce
nt
School Year
Graduation Rates All Students and Students with Disabilities
All Students
Students with Disabilities

APR Template – Part B (4) West Virginia.
State
Part B State Annual Performance Report for FFY2010 Page 7
IEPs, showing progress has been made. Conversely, the 4-Year Cohort Rate for all students in West Virginia was 76.4%, compared to 57.5% for students with disabilities, revealing nearly a 20 percentage point gap between students with and without IEPs, as compared to a six point gap based on the Completer Rate in the prior year. This increase in the gap illustrated by the 4-Year Cohort Rate is at least in part explained by the exclusion of students with disabilities who graduated in more than four years from the calculation. Although it seems reasonable to expect it may take a student with a disability longer than four years to graduate, given the rigorous graduation requirements, only graduation within four years counts toward the target. The need for increased time appears to disproportionately affect students with disabilities compared to other students. The same requirements for graduation with a standard diploma, data collection and calculation are used for all students and students with disabilities. Requirements for earning a standard diploma for all students who graduated in 2009-2010 are defined by Policy 2510: Assuring the Quality of Education: Regulations for Education Programs (2510). Policy 2510 graduation requirements, revised in July 2008 (see attachment).
Improvement Activities Completed in FFY 2010 (2010-2011)
Professional Development and Guidance Materials - Documenting Transition and Evidence-Based Transition Strategies
The WVDE OSP offers professional development for transition primarily through the WV Transition Collaborative Community of Practice (TCCoP) face-to-face meetings at least one to two times per year. Participants typically are district and school staff assigned to coordinate secondary transition services for students with disabilities and special education administrators. Attendance at each meeting ranges from 40 to 60. Topics for each meeting are generated from a variety of sources including exit and follow up surveys, IEP Checklist for Transition results, districts, leadership team input, agency council (Rehabilitation Services, Developmental Disabilities) participation and information from national technical assistance centers related to transition. A transition component is included in semi-annual special education administrator conferences. Approximately five (5) districts request face-to-face PD specific to transition early in the school year annually. The transition coordinator collaborates quarterly with career technical education (CTE) administrators and provides supplemental course support for CTE staff at the higher education level. Current publications, websites and books are a focus for periodic teleconferences. Book study participants average thirty per topic. Additional opportunities exist for presentations to targeted groups of staff, agencies, parents, adult clients, students and others.
Showcase for Transition on WVDE Website
The transition coordinator presented ideas and possible projects for development of student, family and district stories for creation of a showcase section on the transition web pages during the May, 2010, TCCoP meeting. The parent chair of the state Developmental Disabilities Council (DDC) volunteered to tell the story of her son from her perspective. The story was developed with the transition coordinator and presented at the WV Board of Education meeting October, 2010, in conjunction with a discussion about autism and later at the December meeting of the WV TCCoP. The story has been published to the WVDE Transition web pages at http://wvde.state.wv.us/osp/Transition/TransitionIntro.html.
NDPC SD Intensive TA Grant 2011-2013
The WVDE OSP was awarded a grant (January, 2011) for intensive technical assistance (TA) from the National Dropout Prevention Center for Students with Disabilities (NDPC SD) through 2013. A teleconference call with NDPC SD staff and internal WVDE team for the grant was held (February, 2011) to develop the timeline for year one and to provide details of expectations from the NDPC SD. Twelve districts originally applied to participate in the intensive TA opportunity, and a thirteenth was added in June, 2011. Seven of those districts were also identified for TA and receive intensive intervention because of OSP compliance issues. Stakeholder members from advocacy agencies, Rehabilitation Services and the WV Developmental Disabilities Council were obtained as was a large and diverse WVDE team with membership of twenty-two (22) staff from various offices to assure coordination for dropout.

APR Template – Part B (4) West Virginia.
State
Part B State Annual Performance Report for FFY2010 Page 8
During March (2011) twenty-eight (28) participating WVDE staff and representatives of the twelve participating districts attended an initial two-day meeting with NDPC SD staff. Participants were guided to examine existing WV data and develop an understanding of the TA grant and goals. During June (69 participants) and July (57 participants) of 2011, district teams and WVDE staff worked intensively for four days with NDPC SD staff to understand the research, examine interventions and strategies, make decisions based on data and develop action and implementation plans. The WVDE OSP disseminated The Last Dropout: Stop the Epidemic to all TA Grant members, including all district team members and encouraged to conduct a book study. TA Grant members communicate primarily via email to stay current on new materials (i.e. Dissemination of Reentry Programs for Out-of-School Youth with Disabilities NDPC SD publication), submit action plans and obtain notice for important events (i.e. WV Student Success Summit and Regional Truancy meetings).
West Virginia’s Four-Year Adjusted Cohort Graduation Rate: Questions & Answer Guide was developed to assist districts in understanding of the graduation cohort. Input from the TA grant districts was obtained at each meeting. This document was one of three goals for WV’s intensive TA grant application. A second goal for WV has been to raise awareness and develop a deep understanding of various data sources regarding dropout prevention, intervention and recovery. Discussion and development of an early warning system reflects a direct link to this goal. The final component of WV’s plan involves the development of a dropout prevention tool for use by an LEA to assist with creating a customized dropout prevention intervention program specifically for students with disabilities.
TA grant participants had the opportunity to be involved in multiple opportunities for professional development and collaboration through financial grants from OSP to each district for each of the three years of participation. The second WV Student Success Summit and announcement of Innovation Zone grant opportunities for dropout prevention were offered by the WVDE. WV Senate Bill 228 was passed in March of 2011, where WV code was changed to address dropout prevention. Requirements in the Bill included implementation of an electronic system for early warning indicators, a separate category of innovation zones for dropout prevention and recovery, opportunities for collaboration, requirement for district school attendance assistants, GED Option program development. The mandatory school attendance age for the state is now at 17.
Truancy meetings sponsored by the WV Supreme Court of Appeals occurred throughout the state where the public was informed about the establishment of partnerships between the judiciary and education system to address attendance issues at all programmatic levels. Attendance directors statewide and special education administrators from the thirteen grant districts collaborated to examine district attendance policies for alignment with the state attendance policy and to identify barriers in October, 2011.
Documents and other information are posted at https://sites.google.com/site/ospdropoutprevention/.
WV Transition Collaborative Community of Practice (TCCoP) and Leadership Team
The WVDE maintains a leadership team for the WV TCCoP to assist in identification of needs and to plan professional development and guidance for all components of transition services for LEA and school level staff for implementing transition services. Representatives from selected LEAs and agency staff collaborate with the transition coordinator at the WVDE and participate in the annual State Planning Institute sponsored by the National Secondary Transition Techical Assistance Center (NSTTAC), the National Post School Outcomes Center and (NPSO) and NDPC SD. Members of the leadership team developed a guide for transition in WV and presented the draft to WV TCCoP participants at the May 2011 statewide meeting. Documents for meetings are posted at https://sites.google.com/a/wvde.k12.wv.us/wv-tccop/l.
The WV TCCoP meets at least annually to provide statewide professional development opportunities for LEAs regarding implementation of all components of transition services. Two meetings of the WV TCCoP were held during 2010-2011 (December, May). The two day December professional development opportunity targeted transition topics in six areas: 1) secondary literacy, 2) transition planning for students with significant disabilities, 3) jigsaw book study for graduation and dropout: Helping Students Graduate, 4) Showcase, stories of success from former students with disabilities, 5) policy and procedures for transition services, and 6) collaboration and linkages with WV Department of

APR Template – Part B (4) West Virginia.
State
Part B State Annual Performance Report for FFY2010 Page 9
Rehabilitation Services. Participants received and participated in a jigsaw version of a book study for Helping Students Graduate and studied graduation/dropout data for students with disabilities. The purpose was for participants to return to their LEA to initiate discussions and to begin the process of understanding the particular challenge in WV for students with disabilities and to begin to blend knowledge gained from the NDPC SD Intensive TA Grant activities. At this same meeting and in a follow up email individuals and RS staff had the opportunity to volunteer for an intensive book study using A Guide to Vocational Assessment. Twenty-two participants volunteered for a series of eight one-hour teleconferences and a commitment of reading approximately fifty pages per call from January through April. The result of the study was development of a deep understanding of vocational assessment as well as transition assessment for school-age students.
The subsequent two-day meeting of the TCCoP in May focused primarily on post secondary goals and development of the Summary of Performance (SOP) where guidance from Dr. James Patton of Austin, TX, was provided. Additional topics included: 1) Developmental Disabilities Council coordination, 2) Showcase, stories of success from districts, 3) review of the developing WVDE OSP guidance document for transition, 4) guided website exploration, 5) understanding graduation and dropout calculations, 6) exit and Follow Up Surveys results, and 7) linking transition assessments to transition services. The format for professional development at the WV TCCoP meetings involves active engagement of participants with minimal lecture style presentations.
The WVDE OSP maintains an electronic listserv for the WV TCCoP for communications of all types. Participants of the WV TCCoP have the opportunity to collaborate quarterly with Rehabilitation Services (RS), Community Rehabilitation Program (CRP) providers and other agency partners in the six WV RS District Transition Teams that have been established for regions of the state (see below). The annual WV Council for Exceptional Children Conference was held during November 2010 where the topic was Transitions.
Agency Collaboration and Transition Teams
The transition coordinator collaborates at least monthly with RS and WV Developmental Disabilities Council (DDC). Both agencies are existing members of the WV TCCoP. Established RS District Transition Teams bring together RS staff, CRP providers and LEA staff. Teams meet quarterly with a focus on development of relationships and to broaden understanding of services. At least four LEAs have partnered with Transition Team members to present informational fairs for students and parents for 2010-2011. SEA and RS staffs attend some district meetings to promote further development. The RS school counselor coordinator and transition coordinator participated in the Mid Atlantic Transition Leadership Council for 2010-2011. RS and the SEA partnered to conduct district level discussion and guidance for improving services to students and families. The WVDE transition coordinator met with the RS supervisor and district Employment Specialists for each district to discuss and plan supports to district special education staff. Additionally, the DDC sponsored a Wills/Trusts presentation for interested parties that was attended by approximately 10 educators and parents from the districts.
The DDC administered a grant for 2010-2011 and beyond to support development of transition services through coordination of activities with the WVDE OSP. The first grant to a CRP helped the transition coordinator to identify non-typical students with disabilities for a pilot CTE program for direct instruction in the general education setting to teach occupational skills in the student’s preferred area of interest. The grant assisted the WVDE OSP in identification of student characteristics and contributed to a guidance document for program implementation for 2012-2013. A second grant supported development of new CRP providers comprised of school personnel to support exiting students in a supported work setting in local businesses the summer following graduation/exit. The program has been successful in districts not previously considered positive for job development. The transition coordinator serves as the state representative on the DDC at quarterly meetings.
Exit Survey
In 2010-2011, the transition specialist coordinated the distribution, analysis and reporting of Exit Surveys and One-year Follow-up Surveys in West Virginia. The Exit Survey conducted each year at the time students leave school (see below) provides insight into factors affecting graduation rates. During 2010-

APR Template – Part B (4) West Virginia.
State
Part B State Annual Performance Report for FFY2010 Page 10
2011, 1,987 students with disabilities in grades 9 through 12 participated in the exit survey. Return rate of the exit survey was 68.4% (i.e., 1,987 respondents divided by 2,904 total graduates with standard or modified diploma, total drop-outs and total number of students reaching maximum age).
2009-2010 Exit Survey Findings
Fifteen, nineteen and sixty percent of SWD reported entry, professional, and skilled career pathways, respectively.
Thirty-nine percent of SWD maintained they earned a certificate in a Career and Technical program concentration.
Twenty-five percent of SWD reported earning the industry credential from a Career and Technical program concentration.
Approximately 1 out of every 4 SWD (i.e., 26.1%) indicated he or she failed to obtain job experience while in high school.
Eighteen and sixteen percent of SWD purported they intend to pursue a 4-year and 2-year degree program, respectively.
Nineteen and fourteen percent of SWD purported they intend to pursue a career and technical/vocational program or on-the-job training/apprenticeship, respectively.
Forty-one percent of SWD indicated they have a current driver’s license (not a learner’s permit), which will allow them increased access to employment or postsecondary education.
One in three SWD (i.e., 32.5%) intend to live independently or with friends immediately after high school.
SWD indicate high levels of self-advocacy. Seventy-seven percent of SWD reported their own ideas and suggestions were incorporated into their most recent IEP meeting, while more than eight out of ten SWD are comfortable discussing their special needs and asking for assistance.
Between 85 and 90 percent of SWD purported schools were helpful 1) connecting them to further education; 2) developing work related skills (e.g., self-initiative, teamwork, use of technology); and 3) developing confidence to continue in education.
Three in every four SWD (i.e., 75.5%) reported that the school staff helped them talk about their disabilities.
Dislike of school of the school environment and the lack of interest and motivation were the most frequently cited deterrents to graduating (see Indicator 2 APR discussion).
For a discussion of the One-Year Follow-Up Survey, please see Indicator 14.
Data Collection for ESEA and Section 618. Exit data are collected by WVEIS and submitted through EDEN. Both the EDFacts coordinator and data manager identified discrepancies in school and special education exit data and worked with districts to resolve discrepancies and ensure accurate individual student data files and federal reporting for both ESEA and Section 618.
Revisions, with Justification, to Proposed Targets / Improvement Activities / Timelines / Resources for FFY 2011.
. No revisions are proposed at this time for Indicator 1.

APR Template – Part B (4) West Virginia.
State
Part B State Annual Performance Report for FFY2010 Page 11
ATTACHMENT
GRADUATION REQUIREMENTS
Below are the requirements in effect for the 2009-2010 school year: Policy 2510: Assuring the Quality of Education: Regulations for Education Programs (2510, Revised April 2007. Policy 2510 was again revised in July 2008 and 2011.
5.6.1. Adolescent education (Grades 9-12) Programs of Study
Chart V (C) Adolescent (9-12) Graduation Requirements (Effective 2005-2006)
These graduation requirements are effective for students entering grade 9 in the school year 2005-2006 through 2007-2008. Courses needed for graduation require mastery of approved content standards and objectives. Students who do not demonstrate mastery of the content standards and objectives shall be provided extra help and extra time through intervention strategies.
Core Requirements (18 credits)
Reading and English Language Arts 4 credits English 9, 10, 11, 12
Mathematics1
3 credits (3 credits required for entry pathway students entering 9
th grade
in 2005-2006) (4 credits required for all entering 9th grade
students in 2006-2007)
Science2
3 credits CATS 9, and Two courses above the CATS 9 level
Core Requirements (18 credits)
Social Studies 4 credits United States to 1900 World Studies to 1900 Twentieth and Twenty-First Centuries Civics/Government
Physical Education 1 credit
Health 1 credit
The Arts 1 credit
Electives 3 credits The remaining graduation requirements are to be electives.
Career Concentration Courses (3 Credits)
3
Professional Pathway
Skilled Pathway
Entry Pathway
Mathematics - 4 credits (at least 3 of the 4 credits must be Algebra I and above.)
1
Science - 4
th credit (which must be
above CATS 9)2
Foreign Language - 2 credits in one language
Mathematics – 4
credits (at least 3 of
the 4 credits must be Algebra I and above.) Concentration - 3 credits
3
Mathematics – 3
credits (For
students entering 9th
grade in 2005-2006, three (3) mathematics credits are required with at least 2 of the 3 credits being Algebra I and above.) Mathematics – 4 credits (For students entering 9
th grade in
2006-2007, four (4) mathematics credits are required with at least 2 of the 4 credits being Algebra I

APR Template – Part B (4) West Virginia.
State
Part B State Annual Performance Report for FFY2010 Page 12
and above.) ConcentrationB3-4 credits
3
Career Development Prior to students selecting career concentrations, opportunities for career decision-making must be provided in grades 9-10.
Experiential Learning
All students must participate in an experiential learning experience at some time in grades 9-12. If credit is granted for these experiences, content standards and objectives will be developed and approved at the local level. (See Section 5.6.5.)
1. It is the intent that all students will take mathematics annually, but must take at least three mathematics classes in
grades 9-12. If students begin the math sequence prior to grade 9, they should take other mathematics courses, which may include college courses, AP courses, virtual school courses, or other advanced offerings. This principle applies to all required course sequences. The mathematics courses selected for credit must be relevant to the student’s concentration and pathway. Successful completion of Applied Math I and II is equivalent to an Algebra I credit and a credit for a course prior to Algebra I.
2. With Parental/Guardian consent, students with a declared skilled level major in vocational agriculture will, upon
successful completion of a Robert C. Beach Vocational Agriculture credit in grade 11 or 12, be exempt from the third required unit of credit in science. To be eligible as a required unit for graduation, the vocational agriculture education course must: (1) build on the concepts and skills in CATS 9; (2) be taught at a level of greater complexity and depth than that of vocational agriculture courses in grades 9 and 10; (3) have WVBE approved content standards and objectives; and (4) receive WVBE approval as a vocational agriculture course that qualifies as a Robert C. Beach Vocational Agriculture credit. (See Section 13.78.) The school shall: (1) have on file a Parental/Guardian Consent Form with signatures of the student, parent/guardian(s) and authorized school official, that acknowledges the understanding that this class does not represent a substitute for the knowledge, skills and competencies of a third unit of science and that this course does not meet the requirement for the additional unit of laboratory science that West Virginia colleges and universities have for admission; and (2) review with the student and his/her parents/guardians, as verified by the Parental/Guardian Consent Form, that the required third unit of science must be successfully completed if a student should change his/her major from entry or skilled level vocational agriculture education prior to graduation from high school.
3. Concentration credits are to be taken by all students. Entry level career and technical students must complete four
units in a concentration. The four concentration units provided students in entry-level technical majors and two of the concentration units at the skilled level must be consistent with those defined in the Required Technical Courses by Career Concentration technical assistance document published by the WVDE. Each technical concentration in a school shall obtain and maintain an appropriate industry recognized accreditation/certification, when one is available, and shall provide students the opportunity to obtain an industry-recognized credential as part of the instructional program.
Chart V (D) Adolescent (9-12) Graduation Requirements (Effective 2008-2009)
These graduation requirements are effective for students entering grade 9 in the school year 2008-2009 and thereafter. Courses needed for graduation require mastery of approved 21st century content standards and objectives. Students who do not demonstrate mastery of the content standards and objectives shall be provided extra help and extra time through intervention strategies.
Core Requirements (18 credits)
Reading and English Language Arts1 4 credits
English 9, 10, 11, 12
Mathematics2
4 credits
Science3
3 credits Physical Science Biology or Conceptual Biology

APR Template – Part B (4) West Virginia.
State
Part B State Annual Performance Report for FFY2010 Page 13
Chemistry or Conceptual Chemistry
Social Studies4 4 credits
World Studies to 1900 United States Studies to 1900 Twentieth and Twenty-First Centuries Studies Civics for the 21
st Century
Physical Education 1 credit
Health 1 credit
The Arts 1 credit
Electives 2 credits The remaining graduation requirements are to be electives.
Career Concentration Courses (4 Credits)
5
Professional Pathway
Skilled Pathway
Science - 4
th credit (which must be above Physical
Science) Foreign Language - 2 credits in one language Concentration – 1 additional credit required related to the selected career concentration
Concentration - 4 additional credits required related to the selected career concentration
Career Development Prior to students selecting a concentration and pathway, opportunities for career decision-making must be provided in grades 9-10.
Experiential Learning
All students must participate in an experiential learning experience at some time in grades 9-12. If credit is granted for these experiences, content standards and objectives will be developed and approved at the local level. (See Section 5.6.5)
Technology Students in grades 9-12 shall be provided integrated opportunities within the core requirements to master the standards for Policy 2520.14. It is recommended that all students take at least one course in technology applications during grades 9-12. It is also recommended that all students complete an online learning experience during grade 9-12.
Senior Year All West Virginia High School students shall be fully enrolled in a full day of high school and/or college credit bearing courses. It is recommended that students complete a senior project to add rigor and relevance to the senior year.
1. Students in the professional pathway and college bound students in the skilled pathway, who do not achieve the
State assessment college readiness benchmark for English, shall be required to take a college transition English course during their senior year. This course must be offered annually.
2. It is the intent that students in the professional pathway will take mathematics annually, but must take at least three
mathematics classes in grades 9-12. The recommended course sequence, which may include college courses, AP courses or virtual school courses, for students in the professional pathway is Algebra I, Geometry, Algebra II, Trigonometry, and Pre-Calculus. The mathematics courses selected for credit must be relevant to the student’s concentration. Students in the professional pathway and college bound students in the skilled pathway, who do not achieve the State assessment College readiness benchmark for mathematics, shall be required to take a college transition mathematics course during their senior year.
It is also the intent that students in the skilled pathway will take mathematics annually, but must take at least three mathematics classes in grades 9-12. The recommended course sequence in the skilled pathway is Algebra I, geometry, conceptual mathematics, college transition mathematics or Algebra II. College Transition Mathematics must be offered annually.

APR Template – Part B (4) West Virginia.
State
Part B State Annual Performance Report for FFY2010 Page 14
3. Physical Science, Biology or Conceptual Biology and Chemistry or Conceptual Chemistry shall be taken in
consecutive order. Conceptual course credits may not be accepted by four-year higher education institutions.
4. It is highly recommended that students take the high school social studies courses in the listed sequence to ensure
maximum understanding of the material to be learned. World Studies to 1900, United States Studies to 1900, Twentieth and Twenty-First Centuries Studies and Civics for the 21
st Century should be taken in consecutive order.
The social studies content standards and objectives are constructed in such a way that information progresses sequentially through time periods and builds the foundation for successful achievement of the complex concepts that follow. The senior course, Civics for the 21
st Century, has been written to deliver rich academic content within
relevant context for students entering the world of work and college.
5. The four credits taken by career/technical concentrators must be consistent with those identified for WVDE
approved career/technical programs of study. Each career/technical concentration in a school shall obtain and maintain an appropriate industry-recognized accreditation/certification, when one is available, and shall provide students the opportunity to obtain an industry recognized credential as part of the instructional program.

APR Template – Part B (4) West Virginia.
State
Part B State Annual Performance Report for FFY2010 Page 15
Part B State Annual Performance Report (APR) for FFY 2010 (2010-2011)
Overview of the Annual Performance Report Development:
See Indicator 1.
Monitoring Priority: FAPE in the LRE
Indicator 2: Percent of youth with IEPs dropping out of high school.
(20 U.S.C. 1416 (a)(3)(A))
Measurement: States must report using the dropout data used in the ESEA graduation rate calculation and follow the timeline established by the Department under the ESEA.Dropout Rate Calculation for Students with Disabilities:
Number of dropouts who are students with disabilities divided by the number of students with disabilities in grades 7-12 as reported through WVEIS enrollment records*
*WV collects and reports an annual event dropout rate. This calculation is used for all students and students with disabilities in WV and includes grades 7-12.
FFY Measurable and Rigorous Target
FFY 2010
[using FFY 2009 (2009-2010) data]
The percentage of youth with IEPs who withdraw from enrollment during high school will decrease to 3.00%
Actual Target Data for FFY 2010 (2009-2010 data):
West Virginia Dropout Rates 2005-2010
Year Student Population Number of Dropouts
Number Enrolled
Percentage Grades 7-12
2004-2005
All Students 3,487 127,987 2.72%
Students with disabilities 931 20,462 4.55%
2005-2006
All Students 3361 126,819 2.70%
Students with disabilities 955 20,038 4.77%
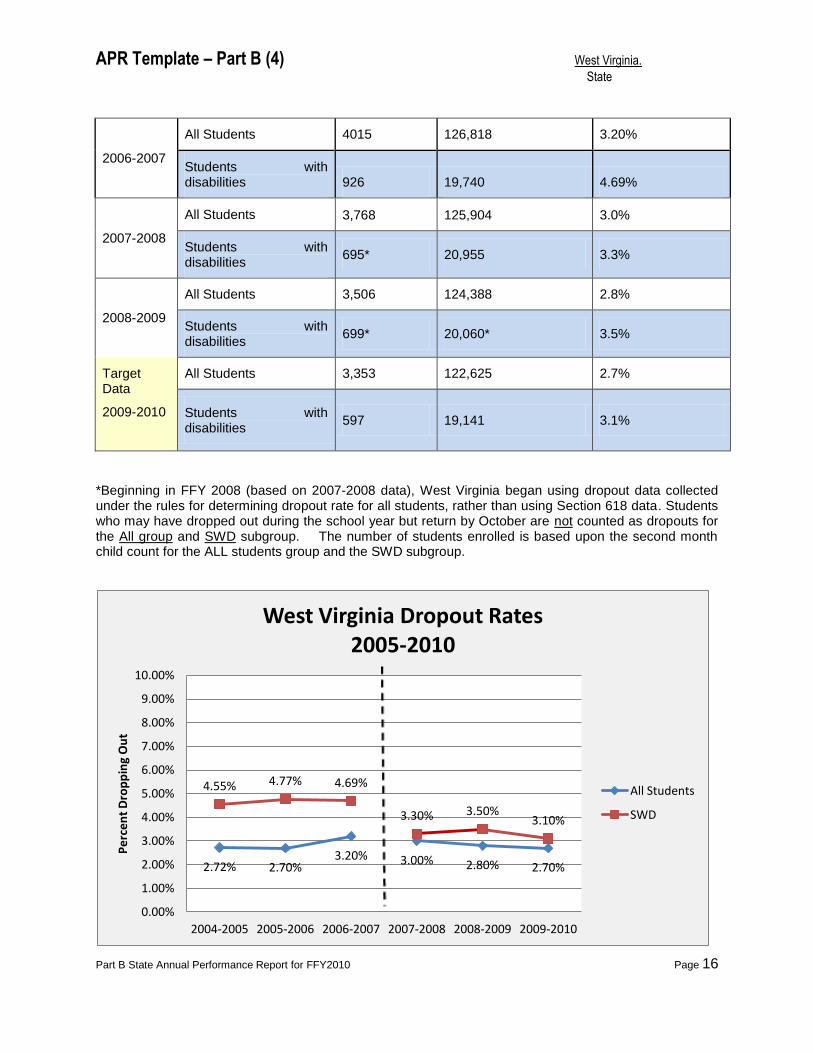
APR Template – Part B (4) West Virginia.
State
Part B State Annual Performance Report for FFY2010 Page 16
2006-2007
All Students 4015 126,818 3.20%
Students with disabilities 926 19,740 4.69%
2007-2008
All Students 3,768 125,904 3.0%
Students with disabilities
695* 20,955 3.3%
2008-2009
All Students 3,506 124,388 2.8%
Students with disabilities
699* 20,060* 3.5%
Target Data
2009-2010
All Students 3,353 122,625 2.7%
Students with disabilities
597 19,141 3.1%
*Beginning in FFY 2008 (based on 2007-2008 data), West Virginia began using dropout data collected under the rules for determining dropout rate for all students, rather than using Section 618 data. Students who may have dropped out during the school year but return by October are not counted as dropouts for the All group and SWD subgroup. The number of students enrolled is based upon the second month child count for the ALL students group and the SWD subgroup.
2.72% 2.70% 3.20% 3.00% 2.80% 2.70%
4.55% 4.77% 4.69%
3.30% 3.50% 3.10%
0.00%
1.00%
2.00%
3.00%
4.00%
5.00%
6.00%
7.00%
8.00%
9.00%
10.00%
2004-2005 2005-2006 2006-2007 2007-2008 2008-2009 2009-2010
Pe
rce
nt
Dro
pp
ing
Ou
t
West Virginia Dropout Rates 2005-2010
All Students
SWD

APR Template – Part B (4) West Virginia.
State
Part B State Annual Performance Report for FFY2010 Page 17
The dropout rate for students with disabilities for 2009-2010 was 3.1%, therefore, the target of 3.0% was not met. The dropout rate for all students in 2009-2010 was 2.7%. West Virginia Code in 2009-2009 permitted students to withdraw from enrollment, that is, drop out of school if they were age 16 or older. Students who may have dropped out during the school year but return by October are not counted as dropouts for the All group and SWD subgroup. The number of students enrolled is based upon the second month child count for the ALL students group and the SWD subgroup.
Discussion of Improvement Activities Completed and Explanation of Progress or Slippage that occurred for 2010-2011 (FFY 2010) based on 2009-2010 data:
Despite missing the target by 0.1%, the dropout rate appears to be trending downward. The rate benefitted from the change in data collection in 2007-2008, which allowed students who returned to school the following October to be removed from the dropout count, as is the case for all students. Given the dramatic drop in the graduation rate resulting from initiation of the 4-Year Cohort Rate, while the dropout rate remains stable, it is apparent dropouts alone do not account for the low graduation rate. As was discussed in Indicator 1, students with disabilities who graduate in five or six years may be contributing to this difference.
Exit Surveys
Exit surveys and the One Year Follow-Up surveys have consistently demonstrated over the past 5 years that students most frequently report dropping out of school due to: 1) dislike of school and/or 2) lacking interest or motivation to attend school. Additional information regarding the Exit Survey may be found in Indicator 1. A summary of the One-Year Follow-Up Survey may be found in Indicator 14.
Improvement Activities Completed in FFY 2010 (2010-2011):
Professional Development and Guidance Materials - Documenting Transition and Evidence-Based Transition Strategies
The WVDE OSP offers professional development for transition primarily through the WV Transition Collaborative Community of Practice (TCCoP) face-to-face meetings at least one to two times per year. Participants typically are district and school staff assigned to coordinate secondary transition services for students with disabilities and special education administrators. Attendance at each meeting ranges from 40 to 60. Topics for each meeting are generated from a variety of sources including exit and follow up surveys, IEP Checklist for Transition results, districts, leadership team input, agency council (Rehabilitation Services, Developmental Disabilities) participation and information from national technical assistance centers related to transition. A transition component is included in semi-annual special education administrator conferences. Approximately five (5) districts request face-to-face PD specific to transition early in the school year annually. The transition coordinator collaborates quarterly with career technical education (CTE) administrators and provides supplemental course support for CTE staff at the higher education level. Current publications, websites and books are a focus for periodic teleconferences. Book study participants average thirty per topic. Additional opportunities exist for presentations to targeted groups of staff, agencies, parents, adult clients, students and others.
Showcase for Transition on WVDE Website
The transition coordinator presented ideas and possible projects for development of student, family and district stories for creation of a showcase section on the transition web pages during the May, 2010, TCCoP meeting. The parent chair of the state Developmental Disabilities Council (DDC) volunteered to tell the story of her son from her perspective. The story was developed with the transition coordinator and presented at the WV Board of Education meeting October, 2010, in conjunction with a discussion about

APR Template – Part B (4) West Virginia.
State
Part B State Annual Performance Report for FFY2010 Page 18
autism and later at the December meeting of the WV TCCoP. The story has been published to the WVDE Transition web pages at http://wvde.state.wv.us/osp/Transition/TransitionIntro.html.
NDPC SD Intensive TA Grant 2011-2013
The WVDE OSP was awarded a grant (January, 2011) for intensive technical assistance (TA) from the National Dropout Prevention Center for Students with Disabilities (NDPC SD) through 2013. A teleconference call with NDPC SD staff and internal WVDE team for the grant was held (February, 2011) to develop the timeline for year one and to provide details of expectations from the NDPC SD. Twelve districts originally applied to participate in the intensive TA opportunity, and a thirteenth was added in June, 2011. Seven of those districts were also identified for TA and receive intensive intervention because of OSP compliance issues. Stakeholder members from advocacy agencies, Rehabilitation Services and the WV Developmental Disabilities Council were obtained as was a large and diverse WVDE team with membership of twenty-two (22) staff from various offices to assure coordination for dropout.
During March (2011) twenty-eight (28) participating WVDE staff and representatives of the twelve participating districts attended an initial two-day meeting with NDPC SD staff. Participants were guided to examine existing WV data and develop an understanding of the TA grant and goals. During June (69 participants) and July (57 participants) of 2011, district teams and WVDE staff worked intensively for four days with NDPC SD staff to understand the research, examine interventions and strategies, make decisions based on data and develop action and implementation plans. The WVDE OSP disseminated The Last Dropout: Stop the Epidemic to all TA Grant members, including all district team members and encouraged to conduct a book study. TA Grant members communicate primarily via email to stay current on new materials (i.e. Dissemination of Reentry Programs for Out-of-School Youth with Disabilities NDPC SD publication), submit action plans and obtain notice for important events (i.e. WV Student Success Summit and Regional Truancy meetings).
West Virginia’s Four-Year Adjusted Cohort Graduation Rate: Questions & Answer Guide was developed to assist districts in understanding of the graduation cohort. Input from the TA grant districts was obtained at each meeting. This document was one of three goals for WV’s intensive TA grant application. A second goal for WV has been to raise awareness and develop a deep understanding of various data sources regarding dropout prevention, intervention and recovery. Discussion and development of an early warning system reflects a direct link to this goal. The final component of WV’s plan involves the development of a dropout prevention tool for use by an LEA to assist with creating a customized dropout prevention intervention program specifically for students with disabilities.
TA grant participants had the opportunity to be involved in multiple opportunities for professional development and collaboration through financial grants from OSP to each district for each of the three years of participation. The second WV Student Success Summit and announcement of Innovation Zone grant opportunities for dropout prevention were offered by the WVDE. WV Senate Bill 228 was passed in March of 2011, where WV code was changed to address dropout prevention. Requirements in the Bill included implementation of an electronic system for early warning indicators, a separate category of innovation zones for dropout prevention and recovery, opportunities for collaboration, requirement for district school attendance assistants, GED Option program development. The mandatory school attendance age for the state is now at 17.
Truancy meetings sponsored by the WV Supreme Court of Appeals occurred throughout the state where the public was informed about the establishment of partnerships between the judiciary and education system to address attendance issues at all programmatic levels. Attendance directors statewide and special education administrators from the thirteen grant districts collaborated to examine district attendance policies for alignment with the state attendance policy and to identify barriers in October, 2011.
Documents and other information are posted at https://sites.google.com/site/ospdropoutprevention/.

APR Template – Part B (4) West Virginia.
State
Part B State Annual Performance Report for FFY2010 Page 19
WV Transition Collaborative Community of Practice (TCCoP) and Leadership Team
The WVDE maintains a leadership team for the WV TCCoP to assist in identification of needs and to plan professional development and guidance for all components of transition services for LEA and school level staff for implementing transition services. Representatives from selected LEAs and agency staff collaborate with the transition coordinator at the WVDE and participate in the annual State Planning Institute sponsored by the National Secondary Transition Techical Assistance Center (NSTTAC), the National Post School Outcomes Center and (NPSO) and NDPC SD. Members of the leadership team developed a guide for transition in WV and presented the draft to WV TCCoP participants at the May 2011 statewide meeting. Documents for meetings are posted at https://sites.google.com/a/wvde.k12.wv.us/wv-tccop/l.
The WV TCCoP meets at least annually to provide statewide professional development opportunities for LEAs regarding implementation of all components of transition services. Two meetings of the WV TCCoP were held during 2010-2011 (December, May). The two day December professional development opportunity targeted transition topics in six areas: 1) secondary literacy, 2) transition planning for students with significant disabilities, 3) jigsaw book study for graduation and dropout: Helping Students Graduate, 4) Showcase, stories of success from former students with disabilities, 5) policy and procedures for transition services, and 6) collaboration and linkages with WV Department of Rehabilitation Services. Participants received and participated in a jigsaw version of a book study for Helping Students Graduate and studied graduation/dropout data for students with disabilities. The purpose was for participants to return to their LEA to initiate discussions and to begin the process of understanding the particular challenge in WV for students with disabilities and to begin to blend knowledge gained from the NDPC SD Intensive TA Grant activities. At this same meeting and in a follow up email individuals and RS staff had the opportunity to volunteer for an intensive book study using A Guide to Vocational Assessment. Twenty-two participants volunteered for a series of eight one-hour teleconferences and a commitment of reading approximately fifty pages per call from January through April. The result of the study was development of a deep understanding of vocational assessment as well as transition assessment for school-age students.
The subsequent two-day meeting of the TCCoP in May focused primarily on post secondary goals and development of the Summary of Performance (SOP) where guidance from Dr. James Patton of Austin, TX, was provided. Additional topics included: 1) Developmental Disabilities Council coordination, 2) Showcase, stories of success from districts, 3) review of the developing WVDE OSP guidance document for transition, 4) guided website exploration, 5) understanding graduation and dropout calculations, 6) exit and Follow Up Surveys results, and 7) linking transition assessments to transition services. The format for professional development at the WV TCCoP meetings involves active engagement of participants with minimal lecture style presentations.
The WVDE OSP maintains an electronic listserv for the WV TCCoP for communications of all types. Participants of the WV TCCoP have the opportunity to collaborate quarterly with Rehabilitation Services (RS), Community Rehabilitation Program (CRP) providers and other agency partners in the six WV RS District Transition Teams that have been established for regions of the state (see below). The annual WV Council for Exceptional Children Conference was held during November 2010 where the topic was Transitions.
Agency Collaboration and Transition Teams
The transition coordinator collaborates at least monthly with RS and WV Developmental Disabilities Council (DDC). Both agencies are existing members of the WV TCCoP. Established RS District Transition Teams bring together RS staff, CRP providers and LEA staff. Teams meet quarterly with a focus on development of relationships and to broaden understanding of services. At least four LEAs have partnered with Transition Team members to present informational fairs for students and parents for 2010-2011. SEA and RS staffs attend some district meetings to promote further development. The RS school counselor coordinator and transition coordinator participated in the Mid Atlantic Transition Leadership Council for 2010-2011. RS and the SEA partnered to conduct district level discussion and guidance for improving services to students and families. The WVDE transition coordinator met with the RS supervisor
APR Template – Part B (4) West Virginia.
State
Part B State Annual Performance Report for FFY2010 Page 20
and district Employment Specialists for each district to discuss and plan supports to district special education staff. Additionally, the DDC sponsored a Wills/Trusts presentation for interested parties that was attended by approximately 10 educators and parents from the districts.
The DDC administered a grant for 2010-2011 and beyond to support development of transition services through coordination of activities with the WVDE OSP. The first grant to a CRP helped the transition coordinator to identify non-typical students with disabilities for a pilot CTE program for direct instruction in the general education setting to teach occupational skills in the student’s preferred area of interest. The grant assisted the WVDE OSP in identification of student characteristics and contributed to a guidance document for program implementation for 2012-2013. A second grant supported development of new CRP providers comprised of school personnel to support exiting students in a supported work setting in local businesses the summer following graduation/exit. The program has been successful in districts not previously considered positive for job development. The transition coordinator serves as the state representative on the DDC at quarterly meetings.
Revisions, with Justification, to Proposed Targets / Improvement Activities / Timelines / Resources for FFY 2011:
No revisions are proposed at this time for Indicator 2.

APR Template – Part B (4) West Virginia.
State
Part B State Annual Performance Report for FFY2010 Page 21
Part B State Annual Performance Report (APR) for FFY 2010
Overview of the Annual Performance Report Development:
See Indicator 1
Monitoring Priority: FAPE in the LRE
Indicator 3: Participation and performance of children with IEPs on statewide assessments:
A. Percent of the districts with a disability subgroup that meets the State’s minimum “n” size that meet the State’s AYP targets for the disability subgroup.
B. Participation rate for children with IEPs.
C. Proficiency rate for children with IEPs against grade level, modified and alternate academic achievement standards.
(20 U.S.C. 1416 (a)(3)(A))
Measurement:
A. AYP percent = [(# of districts with a disability subgroup that meets the State’s minimum “n” size that meet the State’s AYP targets for the disability subgroup) divided by the (total # of districts that have a disability subgroup that meets the State’s minimum “n” size)] times 100.
B. Participation rate percent = [(# of children with IEPs participating in the assessment) divided by the (total # of children with IEPs enrolled during the testing window, calculated separately for reading and math)]. The participation rate is based on all children with IEPs, including both children with IEPs enrolled for a full academic year and those not enrolled for a full academic year.
C. Proficiency rate percent = ([(# of children with IEPs enrolled for a full academic year scoring at or above proficient) divided by the (total # of children with IEPs enrolled for a full academic year, calculated separately for reading and math)].
Targets for FFY 2010 (2010-2011):
FFY 2010 Measurable and Rigorous Targets
Districts Meeting AYP for Disability Subgroup (3A)
Participation for Students with Disabilities (3B)
Proficiency for Students with Disabilities (3C)
Targets for FFY 2010
(2010-2011) 9 districts will make AYP
Reading Math Reading Math
95% 95% 17.9% 21.9%

APR Template – Part B (4) West Virginia.
State
Part B State Annual Performance Report for FFY2010 Page 22
3.A - Actual AYP Target Data for FFY 2010:
Districts with a disability subgroup that meet the State’s minimum “n” size AND met the State’s AYP target for the disability subgroup.
Target: Nine districts will meet AYP.
Year Total Number of Districts
Number of Districts Meeting the “n” size
Number of Districts that meet the minimum “n” size and met AYP for FFY 2010
Percent of Districts
FFY 2010 (2010-2011)
55
48
0 0%
West Virginia has 55 school districts participating in accountability in accordance with WV’s ESEA Consolidated State Application Accountability Workbook. Of these, 48 LEAs have 50 or more students in the students with disabilities subgroup who were enrolled for a full academic year at the LEA level, which is the minimum cell size for subgroup accountability under the Accountability Workbook. No districts met AYP for achievement targets. The target of nine districts was not met.
Three districts met AYP status for the disability subgroup, but only for participation rate, because they did not meet the subgroup size for achievement accountability calculation. This is because they had 50 or more students with disabilities enrolled during test week, but less than 50 who were in the district for a full academic year (FAY) as required to be included in adequate yearly progress calculations.
3.B - Actual AYP Target Data for FFY 2010:
The percentage of students with disabilities enrolled during the test window who participated in the state assessments is as follows:
Mathematics – 97.02%
Reading – 97.02%
Disaggregated Target Data for Math Participation:
Statewide Assessment –
Mathematics Assessment
Grade
3
Grade
4
Grade
5
Grade
6
Grade
7
Grade
8
Grade
11 Total
#
Total
%
a Children Enrolled with IEPs 3615 3404 3117 2,788 2,894 2,808 2,382 21,008
b
IEPs in regular assessment with no accommodations 1,695 1,178 681 533 507 610 724 5,928 28.22%

APR Template – Part B (4) West Virginia.
State
Part B State Annual Performance Report for FFY2010 Page 23
Statewide Assessment –
Grade
3
Grade
4
Grade
5
Grade
6
Grade
7
Grade
8
Grade
11
Total
#
Total
%
c
IEPs in regular assessment with accommodations 1,569 1,846 2,096 1,896 2,037 1,824 1,219 12,487 59.44%
d
IEPs in alternate assessment against alternate standards 288 295 268 288 269 284 275 1,965 9.36%
g
Overall Participation Rate
98.3% 97.5% 97.7% 97.5% 97.2% 96.8% 93.1% 20,382 97.02% (b+c+d)/Enrolled
Children included in a but not included in the other counts above
Account for any children with IEPs that were not participants in the narrative.
63 85 72 71 81 90 164 628 2.98%
Disaggregated Target Data for Reading Participation:
Statewide Assessment –
Reading Assessment
Grade Grade Grade Grade Grade Grade Grade Total
3 4 5 6 7 8 11 # %
a Children Enrolled with IEPs 3615 3404 3117 2,788 2,894 2,808 2,382 21,008
b
IEPs in regular assessment with no accommodations 1,716 1,210 707 551 6 618 655 881 6,338 30.17%
c
IEPs in regular assessment with accommodations 1,547 1,814 2,067 1,879 1,925 1,782 1,066 12,080 57.50%
d
IEPs in alternate assessment against alternate standards 289 293 270 287 268 283 274 1,964 9.35%

APR Template – Part B (4) West Virginia.
State
Part B State Annual Performance Report for FFY2010 Page 24
g
Overall
98.4% 97.4% 97.7% 97.5% 97.1% 96.9% 93.2% 20,382 97.02%
Participation Rate
(b+c+d)/Enrolled
Children included in a but not included in the other counts above
Account for any children with IEPs that were not participants in the narrative.
63 87 73 71 83 88 161 626 2.98%
The targets for participation in assessment were met, with 97.02% of students with disabilities enrolled test week participating in both the mathematics and the reading language arts assessment. Of the 626 students who did not participate in the assessments, 192 were medical emergencies, eight were parental opt out and the remainder were absent. Students who participated with accommodations were allowed only approved accommodations outlined in the West Virginia Guidelines for Participation in State
Assessment (https://sites.google.com/a/wvde.k12.wv.us/oaar-file-cabinet/general-1)
to ensure valid test results.
3.C – Actual Performance Target Data for FFY 2010
The percentage of students with disabilities enrolled for a full academic year who were proficient is indicated below. These percentages include students who were assessed using the state achievement test on grade level standards (WESTEST2) and the alternate assessment on alternate achievement standards.
Mathematics – 20.0%
The target of 21.9% for mathematics was not met, and the percent proficient increased only slightly over 2010.
Reading – 18.2 %
The target of 17.9% for reading language arts was exceeded by 0.3 percentage points.

APR Template – Part B (4) West Virginia.
State
Part B State Annual Performance Report for FFY2010 Page 25
Disaggregated Target Data for Math Performance
Statewide Assessment
2010-2011
Math Assessment Performance Total
Grade 3
Grade 4
Grade 5
Grade 6
Grade 7
Grade 8
Grade 11
#
%
a
Children with IEPS enrolled for a FAY scoring at or above proficiency
949 862 637 439 448 384 343 4062
b Children with IEPS enrolled for a FAY
3542 3301 3027 2690 2798 2703 2298 20,358
c
Overall % Proficient
(a/b)* = %
26.8 26.1 21.0 16.3 16.0 14.2 14.9 20.0 %
0
5
10
15
20
25
Mathematics Reading
Pe
rce
nt
Pro
fici
en
t
Students with Disabilities Enrolled Full Academic Year (FAY)
2010
2011

APR Template – Part B (4) West Virginia.
State
Part B State Annual Performance Report for FFY2010 Page 26
Disaggregated Target Data for Reading Performance
Statewide Assessment
2010-2011
Reading Assessment Performance Total
Grade 3
Grade 4
Grade 5
Grade 6
Grade 7
Grade 8
Grade 11
#
%
a
Children with IEPS enrolled for a FAY scoring at or above proficiency
857 739 514 417 482 397 297 3703
b Children with IEPS enrolled for a FAY
3542 3301 3027 2690 2798 2703 2298 20,358
c
Overall % Proficient
(a/b)* = %
24.2 22.4 17.0 15.5 17.2 14.7 12.9 18.2 %
Discussion of Improvement Activities Completed and Explanation of Progress or Slippage that occurred for FFY 2010:
The target of 21.9% for mathematics was not met, and the percent proficient increased only slightly over 2010. Little progress was made in mathematics achievement. Mathematics has not been the focus of state improvement activities in past years, as the date for mathematics to be incorporated into Response to Intervention for the elementary grades was delayed to July 1, 2010, with RTI being phased into middle and high schools in subsequent years. While the state’s Response to Intervention initiative (now called Support for Personalized Learning) has emphasized reading from its inception, the mathematics component has received less attention. Recognizing the need for professional development for special education teachers in mathematics instruction, the OSP embarked on the Mathematics Academies in the summer of 2011.
The target of 17.9% for reading language arts was exceeded by 0.3 percentage points. This is attributed in part to the many reading-focused improvement activities implemented in the state by the OSP, including the State Personnel Development Grant (Bridges to Literacy), Phonemic Awareness Training, Response to Intervention (Support for Personalized Learning) and the General Supervision Enhancement Grant, which in part provided professional development in strategic reading. Response to Intervention for reading in the elementary grades became mandatory for identification of students with learning disabilities July 1, 2009, and had been implemented in many schools prior to that date. These above activities are described in greater detail below.

APR Template – Part B (4) West Virginia.
State
Part B State Annual Performance Report for FFY2010 Page 27
Technical Assistance to LEAs to Improve Student Results
Targeted technical assistance was provided to districts identified as most in need of improvement through data analysis, LEA determinations and compliance monitoring. During 2010-2011, the OSP invited 14 districts to participate in the improvement process with WVDE, RESA and national TA providers over the course of three meetings: Fourteen district teams participated in the first session on improving results for students with disabilities in February 2011. This initial session was devoted to the student specific indicators used in the LEAs’ Annual Desk Audits (ADA). Districts were provided data online for the April 2011 ADA. They received both navigational instruction regarding how to access county specific indicator data, as well as the measurement and data source for each indicator. OSP staff demonstrated online navigation of the improvement plan component of the ADA wherein districts are required to submit plans for each Indicator wherein the LEA fails to meet the state target. Small group sessions thereafter focused on effective-research based strategies and raising student achievement. In April 2011, the fourteen special education directors were invited to attend the Spring Leadership Conference which targeted a 2-day improvement activity planning process. The North Central Regional Resource Center staff used the IT Guide: Thinking Through Improvement Tools and Strategies to Guide Improvement Efforts as the framework for the training. The sessions included an introduction to the State Performance Plan, educational accountability, and responsibilities of IDEA 2004 and a focus on data quality and the use of the PIER process for establishing and maintaining improvement efforts.
Prioritizing areas for improvement, setting targets and benchmarks,
Selecting effective Improvement activities,
Evaluating process and impact, and
Reporting progress on improvement efforts. In June 2011, the fourteen districts teams attended the final two days of improvement work using the PIER process. Day 1 consisted of review of the IT Kit and the PIER process for district teams and included an introduction to the WV DP21 tool which provides districts more real-time data for student achievement, discipline and attendance. During Day 2, districts and OSP staff evaluated and revised improvement plans for the district ADA submissions in small group work sessions, thus concluding their yearlong efforts.
See the Sound Visual Phonics
Visual Phonics is a multisensory approach, using tactile, kinesthetic, visual and auditory feedback to improve the reading, writing and speech skills in deaf and other children who do not readily learn from traditional reading programs. The program is comprised of 45 hand cues and written symbols that help students make the connection between written and spoken language. Professional development was provided to teachers of the deaf/hard of hearing, speech language pathologists and educational interpreters. At the conclusion of this awareness level training, participants/districts interested in implementing this tool were able to receive support for on-going professional development from a newly created VP Focus Implementation Team. Support provided last year to the team was continued throughout the 2010-2011 year as well. During the 2011-2012 year, WVDE will support a subset of the Focus
Mathematics Academies The Office of Special Programs began to partner with districts in the eight Regional Education Service Agencies (RESAs) to provide special educators over a four-year period in grades kindergarten (K) through twelve (12) the opportunity to improve student achievement in mathematics by deepening their understanding of mathematics and providing them with the experience of

APR Template – Part B (4) West Virginia.
State
Part B State Annual Performance Report for FFY2010 Page 28
learning math in a student-centered classroom. Carnegie Learning, Inc. math experts challenge the special educators’ understanding and beliefs about mathematics and the teaching of math. The Mathematics Academies create a targeted learning experience for specific math content areas and grade levels. The special educators gain a better understanding of the connection between early math concepts and algebraic thinking. In addition, each special educator has access to research-based web-based learning tools, MATHia and/or Cognitive Tutor, to use throughout the year to reflect on their own mathematical understanding and teaching practices and to make connections between content-deepening tasks, the software, and classroom instruction.
Expected outcomes include: (1) enhanced teacher content knowledge and instructional practices in math (2) resulting student achievement gains in math, especially among special education students and (3) emerging math communities of practice throughout RESAs and/or districts.
Individual participant learning outcomes include:
Deepening teachers’ understanding of mathematics to meet the rigor of the West Virginia Next Generation Mathematics Standards and Objectives and move from a rote understanding of procedures to a deeper understanding of concepts;
Developing teachers’ mathematical reasoning and problem solving capabilities;
Increasing opportunity for special educators to reflect, self-evaluate their own teaching practices, and to refine lessons in ways that promote discourse, student communication, and active engagement;
Improving teachers’ dispositions toward teaching mathematics because of the impact these feelings have on student attitudes; and
Creating and participating in math communities of practice that build teacher leadership and skills in peer collaboration
Four five-day Mathematics Academies for middle and high school special educators were conducted during the summer of 2011 in four different sites throughout the state. A total of 119 special educators participated in the first cohort (2011-2013). The content for Year 1 focused on Proportional Reasoning. Follow-ups will be conducted in 2011-2012. The content for Year 2 will focus on Developing Algebraic Thinking. A second cohort of 150 elementary, middle and high school special educators is scheduled to begin in the summer 2012 and end in the spring of 2014. A comprehensive multi-faceted evaluation of the first cohort’s involvement designed by a collaborative team from the WVDE and Carnegie Learning, Inc. is being implemented. Preliminary results from the Post PD Survey of the summer 2011 Mathematics Academies are as follows: 97.3% - training was high quality; 98.6% - training was specific and content-focused; 97.3% training was hands-on and included active learning opportunities; 83.6% - it was a good start (usefulness); 87.7% - look forward to practicing/applying the knowledge/skills in my classroom (or work setting) during the upcoming school year; 62.5% - training was very closely aligned with school’s/program’s goals for instructional improvement (26.4% somewhat aligned); 91.7% - adequate amounts of materials/resources provided; 91.5% materials were high quality (i.e., based on recent research and evidence-based); and 98.6% - trainers were knowledgeable about the topic.
Literacy Academies. The Office of Special Programs offered Literacy Academies for special educators serving students in grades 5-9 who struggle with literacy and access to informational text. Refer to Indicator 5 for additional information.
Professional Development – Three-Tiered Models
Alternate Identification and Reporting (AIR) Project In 2008 the OSP, in consultation with the Office of Special Education Programs (OSEP), initiated the AIR project in 24 schools representing six school districts. The purpose was to explore and evaluate a model of eligibility for special education absent the

APR Template – Part B (4) West Virginia.
State
Part B State Annual Performance Report for FFY2010 Page 29
assignment of a specific disability category. The AIR schools continued to implement the three-tiered model for identifying students needing intervention for academic difficulties, and during 2010-2011, participated in professional development to expand the model to include students with behavior concerns.
The WVDE Office of Research conducted an evaluation of the AIR Project and the final report was issued in January 2012. The evaluation focused on the four primary goals of the AIR project:
1. Establish and reinforce the commonality of instructional and behavioral needs for students; 2. Transition teachers, administrators and parents to a model of support that is based on students’
instructional and behavioral needs and not defined areas of disability; 3. Diminish the burden that labels appear to place on students emotionally and the associated low
expectations of their teachers; and 4. Contribute to the national dialogue associated with research related to early intervention,
response to intervention (RTI) and appropriate instruction and support for students who demonstrate the need for the protections of IDEA (WVDE, 2010).
In evaluating the goals of the AIR Project, six evaluation questions were asked: 1. What changes are associated with the AIR program in the general education classrooms?
[Project Goal 1] 2. What changes are associated with the AIR program in the special education classrooms? [Project
Goal 1] 3. Are there changes in school personnel’s use of a model of support focused on students’
instructional and behavioral needs rather than on defined areas of disability since the inception of the AIR program? [Project Goal 2]
4. Are there changes in affected parents’ interaction with schools and relevant committees since the inception of the AIR program? [Project Goal 2]
5. Are there changes in students’ interactions and behavior since the inception of the AIR program? [Project Goal 3]
6. Do students with disabilities attending AIR schools academically outperform students with similar disabilities in non-AIR schools in mathematics and reading/language arts? [Project Goal 3]
Summary of Findings and Discussion
Regarding its first goal of establishing and reinforcing the commonality of instructional and behavioral needs for students, survey data indicate the AIR Project has made limited progress. Although special education students are seen as spending more time in the general education classroom, school personnel indicate that they need more support for this change not to be disruptive. Support in the form of training on differentiated instructional tools and classroom management tools was identified as a need. However, the AIR process seems to have increased collaboration between special education and general education teachers. The process has also contributed to higher implementation and better understanding of the 3-tier process.
The AIR Project has made some progress in transitioning teachers, administrators and parents toward a model of support that is based on the student’s instructional and behavioral needs and not a defined area of disability. However, considerable progress still needs to be made in reducing the paperwork and burden of both AIR and the 3-tier model on personnel, providing needed resources and generating a feeling of engagement among those most responsible for implementing the program and among parents.
Additionally, the survey results suggest the AIR process has made progress with students in diminishing the burden that a label appears to place on them emotionally and the associated low expectations according to survey respondents. Although the majority of the respondents did not think the AIR process has made students more self-confident or successful academically or behaviorally, at least half of two of the respondent groups reported that the process has reduced social stigma for special

APR Template – Part B (4) West Virginia.
State
Part B State Annual Performance Report for FFY2010 Page 30
education students and engendered more positive interactions between general and special education students.
Lastly, analyses in this study reveal some higher, though statistically insignificant, gains in test scores for AIR students in mathematics (both cohorts) and reading (Cohort 2 only). It is likely this finding may have been affected by attrition, as there were 79 fewer students in 2011 for Cohort 1 and 33 fewer students in 2011, reducing the power of the tests. Including these students may have resulted in slightly different outcome. It is possible these students moved out of the district, or they may have qualified for special education in a non-AIR category. However, it is unclear whether their absence affected the gain scores for the two groups. Regardless, it appears that AIR students have made only limited gains in test scores compared to non-AIR students. The complete AIR Evaluation Report will be made available online at the WVDE Office of Research link: https://sites.google.com/a/wvde.k12.wv.us/research-filecabinet/research-projects .
State Personnel Development Grant (SPDG): Building Bridges to Literacy
West Virginia received a SPDG grant in 2007. A detailed description of this grant and its goals can be found in the State’s FFY 2008 APR. Implementation of the SPDG grant continued into school year 2010-2011 with a focus on retention of special educators and RTI specialist activities.
RTI
Eight regional RTI Specialists provided professional development and technical assistance to district and school-level personnel to help establish necessary infrastructure components for the delivery of both reading and mathematics interventions. In all, 467 professional development and/or technical assistance events occurred during the 2010-2011 school year. These events occurred in a total of 51 of WV’s 57 LEAs.
Type of Event Number of events % of events Number of attendees**
Number of special educator
attendees***
Planning for professional development
32 6.9 95 0
Professional development
185 39.6 4455 617
Technical assistance
242 51.8 1424 265
Other* 8 1.7 96 9
Total 467 100 6070 891
*Other includes: audience centered facilitation, classroom observations and PD planning, follow up, observer, planning for prin. meeting, professional learning community, program review, report RTI events, and visit and informational meeting. All occur just once with a prevalence of 0.2. **Estimates of the number of attendees may include duplicated counts across events. *** The number of special educator attendees represents a proportion of total attendees, not additional participants.

APR Template – Part B (4) West Virginia.
State
Part B State Annual Performance Report for FFY2010 Page 31
Beginning in March of 2011, all offices in the WVDE began engaging in collaboration with the new State Superintendent of Schools and the new Associate Superintendent of Curriculum and Instruction to restructure RTI and embed the process within a Support for Personalized Learning landscape. This restructuring focused on the new Superintendent’s priority of meeting the personal needs of each student. It aims to strengthen general education’s role in customizing learning time, resources, staffing, curriculum, instruction and assessment for all students including struggling learners and those who are exceeding state and national standards. Roll-out of Support for Personalized Learning will occur during school year 2011-2012. Autism In November 2010, the OSP established the West Virginia Autism Collaborative Community of Practice (WVACCoP) to develop guidance for identification and intervention planning by LEA personnel serving students with Autism Spectrum Disorder (ASD) and for their families. The Autism Training Center, Marshall University Graduate College, West Virginia University, Team Autism and LEA representatives participated in this effort. Outcomes included:
Professional development on assessment was provided to 44 school psychologists in collaboration with the WV School Psychologists Association, Marshall University School Psychology Program and the Autism Training Center. On April 30-May 1, participants were trained to administer the Autism Diagnostic Observation Schedule (ADOS), the definitive assessment instrument for ASD.
The OSP provided ADOS assessment kits to each of the eight Regional Education Service Agencies (RESAs) for use by the school psychologists.
The OSP collaborated with RESA special education directors, funded by OSP, to train at least two people from each region as Nonviolent Crisis Intervention Trainers.
The OSP participated in the department’s proposed revision of the state discipline policy.
The WVACCoP developed a guidance document on Autism Spectrum Disorders: Services in WV Schools. The document was published by WVDE July 2011. This document will provide the foundation for professional development to be provided to LEAs during 2010-2012 through a partnership with the Autism Training Center.
Online IEP
The WVDE Online IEP continued to expand and undergo revisions during the 2010-2011 school year. The revisions included a user interface with new online forms and improved user friendliness. A Meeting Notice Manager was added. The manager allows a user to create and track a meeting notice for each IEP in development. Also, the error messages users receive were streamlined to provide instructions for correction and reporting procedures which eliminated the unintelligible debugging codes.
The infrastructure was upgraded to support periods of heavy usage. The infrastructure updates include a software upgrade which handles multiple requests simultaneously and decreased the likelihood of slowdowns when heavy periods of use arise.
Online IEP Usage and Training Statistics:
Total number of IEPs created up through 11/1/2011 – 81,378 Total number of SBIEP helpdesk inquiries fielded through 9/30/2011 – 1,258 Total number of counties where SBIEP training took place through 9/30/2011 – All 8 RESAs
twice and central locations 6 times (all 57 districts have been trained) Total number of people trained on SBIEP through 9/30/2011 - 1,050 Official updates and communications -6 to the field including administrators and users

APR Template – Part B (4) West Virginia.
State
Part B State Annual Performance Report for FFY2010 Page 32
All districts are fully implementing the Online IEP
Accommodations and Modifications for Students with Disabilities
West Virginia Accessible Instructional Materials (WV AIM) - In the fall 2010, West Virginia developed and launched the WV AIM initiative to disseminate information regarding accessible instructional materials for students with print disabilities. In addition to the WV Instructional Resource Center designated Bookshare and Recording for the Blind and Dyslexic (RFB&D) as authorized users who may access NIMAS source files from the NIMAC. In 2011, West Virginia was been selected as one of seven states to receive targeted technical assistance (TTA) from the National Center on Accessible Instructional Materials (AIM). Through this targeted assistance the WV AIM Coordinating Committee will develop state and district procedures and process to ensure eligible students with print disabilities receive instructional resources in a timely manner in accordance with IDEA. Eligible students with print disabilities include those with a visual impairment, physical limitations or an organic dysfunction. Additionally, guidance regarding the decision-making process of the IEP teams in determining eligibility for print disabilities will be developed. Additional information is available at:
http://wvde.state.wv.us/osp/accessiblematerials.html
Assessment Accommodations
Braille errors in several of the WV Alternate Performance Task Assessment (APTA) test books were identified. As a result and in collaboration with the Office of Assessment and Accountability (OAA), a small workgroup comprised of teachers of the visually impaired has been established to conduct a thorough review and make appropriate corrections to all Braille versions of the APTA.
WVDE Phonological Awareness Program: New Personnel Orientation Training
The WVDE conducted state-side training in The Phonological Awareness Program. The program has expanded to over 300 schools and continues to demonstrate that effective prevention and early intervention programs can increase the reading skills of poor readers. Many schools experience personnel changes that may impact delivery of the Phonological Awareness program, so the purpose of this training is to address that need in addition to training new schools. During the year, RTI specialists assisted the WVDE/OSP in the provision of technical assistance for the program.
Improve Quality of Teachers for Students with Sensory Impairments:
WVDE continued to maintain Marshall University Graduate Program for teacher certification in vision impairments and deaf/hard of hearing to meet the on-going personnel shortage in this area and, consequently, the unique need of these students. During 20010-2011, nine (9) teachers on permit received certification in visual impairments and three (3) received certification for the deaf/hard of hearing. Future teachers entering either certification program at Marshall University will be able to attend tuition free.
Increase the Skills of Educational Interpreters
Initial Paraprofessional Certification-Educational Interpreter requires a minimum of 3.0 on the Educational Interpreters Performance Assessment (EIPA) or certification by an appropriate agency (RID or NAD/NCI). (Paraprofessional Certificate -one-year certificate, renewable a maximum of one time). Permanent

APR Template – Part B (4) West Virginia.
State
Part B State Annual Performance Report for FFY2010 Page 33
Paraprofessional Certification-Educational Interpreter requires a minimum of 3.5 on the EIPA or certification by RID or NAD/NCI. To support interpreters in attaining certification, mentors are being provided. In partnership with the WV Commission for the Deaf and Hard of Hearing, interpreters (sign specialists) who have not meet the standards for an initial certificate or who are working toward permanent certification are paired with a trained mentor.
A Lead Mentor coordinates the mentorship project. Information concerning this program may be found at:
https://sites.google.com/site/mentorprogramforwv/. Data continue to indicate a steady increase in the skill development of the educational interpreter with a strong correlation between the improved skills and participation in the WV Educational Interpreter Mentor Program. In partnership with the Commission for the Deaf and Hard of Hearing, ten additional skill building workshops were offered throughout the year for the mentees and all educational interpreters. Sessions currently operate from February to October each year.
Of the 82 reported educational interpreters in West Virginia, thirty-five (35) have obtain WVDE certification or have their application pending. Paraprofessional Certification-Educational Interpreter, requires the interpreter to meet the requirements for a paraprofessional certificate as well and the interpreting requirements as listed above; the chart below reflects the significant increase in sign skills only.
CVI Mentors
Cortical Visual Impairment (CVI) is recognized as the leading cause of visual impairments in North America. This recognition has found a professional world unprepared to meet this explosive need. Yet research shows that improvement in visual functioning is expected. In 2003, West Virginia partnered with Vermont, Maryland and Delaware to identify and train four mentors per state in the areas of assessment and intervention. Spring 2011, the four West Virginia mentors submitted their personal professional development plans to further their knowledge and contribution in this field.
Four professionals were identified to become CVI Partners over the next two years: one Occupational Therapist, two teachers of the visually impaired and one teacher of children with significant disabilities. In the Fall 2011, the five partners and four mentors will participate in a three-day multi-state conference and two scheduled webinars with the identified national consultant. Over the next two years the partners will observed/assisted the mentors in their assessments and interventions.
In order to meet the continuous demand for professional development from both Part C and Part B providers, a comprehensive training website has been designed and can be found at:
http://wvde.state.wv.us/osp/vi/cvi/
2003 2011
2.9 and below 55 18
3.0 and above 17 65
0 10 20 30 40 50 60 70
Nu
mb
er
of
Edu
cati
on
al
Inte
rpre
ters
West Virginia EIPA Score Comparison 2003 and 2011

APR Template – Part B (4) West Virginia.
State
Part B State Annual Performance Report for FFY2010 Page 34
Special Education Technology Integration Specialist Initiative (SE-TIS)
The goal of the SE-TIS program is to increase student achievement by increasing teacher capacity to effectively integrate technology into the curriculum. The SE-TIS program provides instruction to teachers and field support in the following activities:
Educational Technology: Technology offers some of the best opportunities for delivering instruction to engage students in authentic learning, addressing multiple intelligences, and adapting to students' learning styles.
Professional Development: Teachers who work with youth at high risk of academic failure need to
feel supported and have an avenue by which they can continue to develop skills, techniques, and
learn about innovative strategies.
Active Learning: Active learning embraces teaching and learning strategies that engage and involve
students in the learning process. Students find new and creative ways to solve problems, achieve
success, and become lifelong learners when educators show them that there are different ways to
learn.
Individualized Instruction: Each student has unique interests and past learning experiences. An
individualized instructional program for each student allows for flexibility in teaching methods and
motivational strategies to consider these individual differences.
Action Research: SE-TIS are expected to present results of action research in their classroom to
peers. Teachers analyze the quality of their teaching strategies on student engagement and
achievement.
During the 2010-2011 school year, 21 special educators received laptop computers and digital cameras and participated in 320 hours of technology rich curriculum training to obtain an advanced credential. WVDE provides the TIS candidate and TIS authorized teachers an on-going professional learning community and field support, for as long as they serve as special educators. A more detailed description
of the SE-TIS initiative is available at the following link: http://wvde.state.wv.us/osp/SETIS.html.
Upon completion of the SE-TIS program, participants will:
Know – SE-TIS will know what technology tools are available for use in schools. SE-TIS will know
what actions are necessary to lead teachers in the use of technology to increase student engagement
and achievement.
Understand – SE-TIS will understand how technology can be purposefully integrated into curriculum
to increase student engagement and achievement.
Do – SE-TIS will provide leadership, modeling and training for fellow teachers in their school. SE-TIS
will use technology tools to increase student engagement and achievement in their classroom.
During the 2010-2011 summer and school year, each participating SE-TIS obtained professional development on the following formative/benchmark assessments and/or instructional tools.
Intel Elements Course – Assessing Projects: Using Assessment to Improve Teaching and Learning
SE-TIS complete a 45 hour online course involving the research and theory behind successful assessment and study a wide variety of assessment strategies. Teachers complete an Intel

APR Template – Part B (4) West Virginia.
State
Part B State Annual Performance Report for FFY2010 Page 35
action plan and submit at least 3 different assessments that they use in their classroom. These must include actual student artifacts such as scored rubrics or checklists or audio or video recordings of face to face teacher-student or peer to peer conferences. For more information and
examples of assessments see http://educate.intel.com/en/AssessingProjects/OverviewAndBenefits/.
Acuity
https://sites.google.com/a/wvde.k12.wv.us/oaar-file-cabinet/acuity-1
Acuity is a web-based platform that provides schools with assessment, feedback, scoring and reporting. Acuity provides formative assessments designed to inform teaching and improve student learning. Standard benchmark tests are available and teachers may design custom tests. The platform and training are available for all West Virginia public school students in grades 3-12 at no cost to counties or schools. Students who were blind experienced difficulty navigating through this program; therefore Braille versions are available to all students who are blind or have low vision.
WV Writes
https://sites.google.com/a/wvde.k12.wv.us/oaar-file-cabinet/writing-roadmap-2 WV Writes is a web-based, online essay scoring tool that provides students with the opportunity for unlimited practice sessions for writing essays on a variety of prompts. The program saves teaching time and offers students the valuable practice they need to build writing skills and confidence. WV Writes is available for all West Virginia public school students in grades 3-12 at no cost to counties or schools. This program offers 1) assessment, 2) feedback, 3) scoring and 4) reporting
TechSteps
http://www.edvation.com/techsteps-home/ TechSteps is not an assessment instrument; it is an instructional tool that allows WVDE to garner the level of technology literacy of 8th grade students as federally required. The techSteps teach Attain points are used in the determination of basic technology literacy for the federal reporting system EDEN. In 2011, at the request of the WVDE, Edvation (creator of techSteps) added additional accessibility features to their software. These features include text read aloud, multiple text size settings, the ability to record student assessment results at grades one above and below the actual student level and specific instructional strategies for reading support in grades 6-12.
In May of 2011, the TIS candidates completed a reflective survey regarding how the program had affected their school’s human, organizational, structural and material capacities. Results showed that the program had a very large effect on these capacities. Detailed results of this survey can be found at
http://wvde.state.wv.us/osp/TISSurveyResults2010-11.pdf .
A mixed method case study evaluation model was utilized for SE-TIS presently in the program. A
complete description of this plan can be found at http://wvde.state.wv.us/osp/TISEvaluationProposal.pdf. Results of the administrator and co-teacher surveys will be available early in 2012.

APR Template – Part B (4) West Virginia.
State
Part B State Annual Performance Report for FFY2010 Page 36
Teaching and Technology for the Students with Significant Disabilities (T1 Project)
http://wvde.state.wv.us/osp/T1.html
This 3 year project provides professional development for teachers of the 1% population. In the first year “mentor” teachers and district leaders were targeted with best practices and technology integration PD and then were asked to be prepared to train all teachers in their regional area. During the second year, training occurred throughout all 8 regional districts with 53 LEAs involved. The trainings involved communication and literacy strategies for students with severe cognitive disabilities, Acuity items for the alternate achievement standards and the use of computer software to utilize, modify and create computer based interactive learning activities and assessments for student use. These trainings were provided at no cost to the districts.
A T1 Statewide Conference completed district participation on July 21-22, 2011. Keynotes for the conference were the WV State Superintendent of Schools and Dr. Karen Erickson from the Center for
Literacy and Disabilities Studies, University of North Carolina. The agenda included Apple Accessibility, Bookshare, Acuity, Don Johnston Literacy Tools, interactive whiteboard, WV Assistive Technology System and other technology trainings addressing scripted stories, schedule development and prevention of impeding behaviors. District leaders met with teams to develop year-long PD plans for their districts.
The design of the T1 project is based on results from a technology survey of educators who administer the Alternate Performance Task Assessment (APTA). Overall, survey results suggested an under-utilization of standard technology for students with exceptional needs. For details regarding this survey
see https://sites.google.com/site/seteachers1/home/survey-results. A follow-up survey is planned for 2012.
Public Reporting Information: WVDE’s public reports of assessment results conforming with 34 CFR §300.160(f) are available at the following link:
1) State, county and district level public participation counts and percentages for WESTEST 2 and APTA:
http://wveis.k12.wv.us/nclb/OSEcf/data/Accommod09.cfm?sy=11
(Please note that County level links are in the first left hand column in Table 1. County and State level rates by grade are found in Tables 2 and 3. School level links are in the upper right hand corner. )
2) State, county and district level public assessment results for WESTEST 2 and APTA:
District Example – Barbour County:
http://wveis.k12.wv.us/nclb/pub/Assessment/avgsch_assess.cfm?sy=11&year=11&cn=002&sn=201
Other districts’ assessment data are available through the main public reporting site: http://wveis.k12.wv.us/nclb/pub/index.cfm . Users must select the county and school of interest and the report labeled “WESTEST2 Assessment Data: School/County/State Data Comparison” to obtain the desired results.

APR Template – Part B (4) West Virginia.
State
Part B State Annual Performance Report for FFY2010 Page 37
3) State, county and district level public AYP/FAY results for WESTEST 2 and APTA:
District Example:
http://wveis.k12.wv.us/nclb/public_eleven/replistd3.cfm?sy=11&year=11&xrep=0&cn=002&school=201&sn=201&coname=BARBOUR&rpage=index.cfm&rptnum=11b11
Select Schools, School List, School Name and Sub Group Details to access students with disability AYP results by school.
State and County Reports: http://wveis.k12.wv.us/nclb/public_eleven/reptemplate.cfm?cn=999
Revisions, with Justification, to Proposed Targets / Improvement Activities / Timelines / Resources for FFY 2011 (if applicable):
No revisions are proposed.
Select District and School Here
Select WESTEST2 Assessment Data: School/ County/State Data Comparison Here

APR Template – Part B (4) West Virginia.
State
Part B State Annual Performance Report for FFY2010 Page 38
Part B State Annual Performance Report (APR) for FFY 2010 (2010-2011)
Overview of the Annual Performance Report Development:
See Indicator 1.
Monitoring Priority: FAPE in the LRE
Indicator 4A: Rates of suspension and expulsion:
Percent of districts that have a significant discrepancy in the rate of suspensions and expulsions of greater than 10 days in a school year for children with IEPs
(20 U.S.C. 1416(a)(3)(A); 1412(a)(22))
Measurement:
Percent = [(# of districts that have a significant discrepancy in the rates of suspensions and expulsions for greater than 10 days in a school year of children with IEPs) divided by the (# of districts in the State)] times 100.
Include State’s definition of “significant discrepancy”:
A significant discrepancy for Indicator 4A is defined as two times the WV State rate (i.e., 3.28%) for students with IEPs suspended or expelled greater than 10 days based upon the 2009-2010, 618 discipline data.
Overview of Issue/Description of System or Process:
Requirements governing suspension and expulsion of all students are found in WV Code §18A -5-1A Safe Schools Act, which provides disciplinary actions may not conflict with IDEA or State Board policy. Policy 2419: Regulations for the Education of Students with Exceptionalities outlines the procedural safeguards required for removal from school of a student with a disability, paralleling IDEA 2004. Policy 4373: Student Code of Conduct applies to all students. The principal has authority to suspend a student or to recommend expulsion to the district Board of Education, in accordance with the above statutes, policies and regulations.
The West Virginia Education Information System (WVEIS) contains a discipline module for maintaining individual student records at the school level. Each disciplinary offense, including suspensions and expulsions, is recorded by the school administrator or designee with the offense, the action and the number of days for the disciplinary action. The disciplinary records and all individual student demographic information, including race/ethnicity, are then collected at the end of each school year for IDEA 2004, Section 618 Table 5 reporting and for use in the State Performance Plan and Annual Performance Report.
Definition of Significant Discrepancy and Methodology
The definition of Significant Discrepancy has been revised within the current Indicator 4A in accordance with OSEP guidance released in August and September 2011. Following submission of the FFY 2009 APR, West Virginia was informed by OSEP that its methodology for calculating significant discrepancy for Indicator 4B needed revision. The Data Accountability Center (DAC) released a guidance document and provided a session at the OSEP Mega Leadership Conference in August 2011 regarding recommended options for calculating significant discrepancy. Additionally, West Virginia received specific direct technical assistance via phone conference. The OSP data manager presented the issue to the West Virginia Advisory Council for the Education of Exceptional Children (WVACEEC) at its December 2011 meeting, and discussed it with LEA special education directors via phone conference. Although the methodology for 4A was not questioned, the definitions and methodology for both 4A and 4B have been

APR Template – Part B (4) West Virginia.
State
Part B State Annual Performance Report for FFY2010 Page 39
revised to promote consistency between the two indicators, to facilitate interpretation by LEAs and to follow the recommended methods provided in the updated guidance.
In analyzing data for this indicator, West Virginia used Table 5 of Information Collection 1820-0621 (Report of Children with Disabilities Unilaterally Removed or Suspended/Expelled for More than 10 Days) for the school year —2009-2010 which was submitted through EDFacts by November 1, 2010.
West Virginia is comparing the rates of suspensions and expulsions of greater than 10 days in a school year for children with IEPs among LEAs in the State. During the 2009-2010 school year, all children with IEPs were suspended at a rate of 1.64% for suspensions/expulsions totaling greater than 10 days. Using school year 2009-2010 as the baseline year, the 1.64% State rate was multiplied by two to establish a static suspension/expulsion-rate bar at 3.28%. Thus, a district is considered to have a significant discrepancy when its suspension/expulsion rate for all children with IEPs meets or exceeds the rate of 3.28%.
State rate for all students with IEPs = ( 756 suspensions/expulsions greater than 10 days) X 100%
( 46,169 children with IEPs ages 3-21)
= 1.64%
Suspension/expulsion-rate bar = 1.64% x 2 = 3.28%
Minimum Cell Size: The minimum cell size of 20 for Indicator 4A is based on the number of children with IEPs in a district. All districts met the minimum cell size and no districts were excluded from the Indicator 4A analysis for 2009-2010.
FFY Measurable and Rigorous Target
FFY 2010
(using FFY 2009 (2009-2010) data)*
No more than two percent of districts will be identified by the State as having significant discrepancies in the rates of suspensions and expulsions for greater than 10 days in a school year of children with IEPs.
*As required in the OSEP measurement table, FFY targets and data are lagged by one year.
Actual Target Data for FFY 2010 (using 2009-2010 data)
Districts with Significant Discrepancy in Rates for Suspension and Expulsion
Year Total Number of Districts*
Number of Districts that have Significant Discrepancies
Percent
FFY 2010
(using 2009-2010 data) 57 4 7%
Using the previous definition of significant discrepancy, three districts were identified in February 2011. Because West Virginia is changing its definition in accordance with recent OSEP guidance on

APR Template – Part B (4) West Virginia.
State
Part B State Annual Performance Report for FFY2010 Page 40
methodology, two of the previously identified districts no longer meet the definition, while the other district was identified with a significant discrepancy under the new definition as well. Three additional districts have been identified under the new definition. All six districts received a review of policies, procedures and practices and correction of noncompliance as applicable; however, the districts no longer meeting the definition were not included in the target data.
Discussion of Baseline Data:
In FFY 2010, 4 of 57 districts, or 7% percent of districts, evidenced a significant discrepancy based on the revised definition by meeting or exceeding the 3.28% state suspension/expulsion bar for students with IEPS. The target of 2 percent was not met, however, the target was set based on the original rather than the revised definition. .Slippage is partially attributed to the revised definitions of Significant Discrepancy and the increased minimum cell size, resulting in no LEAs being excluded. It is important to note, however, a small statewide decrease was observed in the percentage of students with disabilities suspended over ten days in the school year from SY 2008-2009 (1.8%) to SY 2009-2010 (1.64%).
Comparison of Rates for Students with and without Disabilities Based on Unduplicated Count of Students
2004-2005 Students with Disabilities (SWD)
Students without Disabilities (SWOD)
Total Students
a. Suspensions over 10 days 925 2367 3292
b. Enrollment 49,825 229,623 279,457
Suspension Rate: a. divided by b.
1.86% 1.03% 1.18%
Relative Difference: (1.856-1.030)/1.030*100 = 80.23%
2005-2006 Students with Disabilities (SWD)
Students without Disabilities (SWOD)
Total Students
a. Suspensions over 10 days 920 2394 3313
b. Enrollment 49,677 230,111 279,788
Suspension Rate: a. divided by b.
1.9% 1.0% 1.18%
Relative Difference: (1.852-1.040)/1.040*100 = 78.0%
2006-2007
Students with Disabilities (SWD)
Students without Disabilities (SWOD)
Total Students
a. Suspensions over 10 days 834 2514 3348
b. Enrollment 48,980 232,318 281,298
Suspension Rate: a. divided by b.
1.7% 1.1% 1.19%
Relative Difference: (1.702-1.082)/1.1082*100 = 55.9%
2007-2008 Students with Disabilities (SWD)
Students without Disabilities (SWOD)
Total Students
a. Suspensions over 10 days 801 2615 3416
b. Enrollment 47468 234,246 281,714
Suspension Rate: a. divided by b. 1.7% 1.1% 1.2%
Relative Difference: State Relative Difference (1.7%-1.1%)/1.1%*100 = 51.2%
2008-2009 Students with Disabilities (SWD)
Students without Disabilities (SWOD)
Total Students

APR Template – Part B (4) West Virginia.
State
Part B State Annual Performance Report for FFY2010 Page 41
a. Suspensions over 10 days 825 2726 3551
b. Enrollment 46,833 235,894 282,727
c. Suspension Rate: a. divided by b. 1.8% 1.2%
1.3%
Relative Difference SWD rate - SWOD rate/SWOD rate*100 State Relative Difference (1.8%-1.2%)/1.2%*100 = 50.0%
2009-2010 Students with Disabilities (SWD) a. Suspensions over 10 days 756
b. Enrollment 46,169
c. Suspension Rate: a. divided by b. WV State Rate = 1.64%
Review of Policies, Procedures, and Practices (completed in FFY 2010 using 2009-2010 data):
Six districts received a SEA level review of policies, procedures and practices based upon SY 2009-2010 discipline data, although the districts no longer meeting the definition were not included in the target data.
Review Process for All Identified Districts. The State conducted reviews of the six LEAs’ policies, procedures and practices relating to the development and implementation of IEPs, the use of positive behavioral interventions and supports and procedural safeguards to ensure these policies, procedures and practices complied with IDEA. For each LEA, a team of OSP staff reviewed a random sample of files of students who were suspended or expelled and considered other data to determine whether the LEA is in compliance with Part B requirements.
The WVDE reviews specifically involved the examination of:
district discipline data by relevant variables such as school, administrator, teacher, disciplinary offenses and consequences, student disability category and LRE;
findings of district self-review of discipline policies, procedures and practices;
progress in implementing corrective activities within the county’s improvement plan for SPP Indicator 4A;
discipline practices via interviews when appropriate;
a random sample of records (i.e., functional behavior assessments (FBAs), IEPs, behavior intervention plans (BIPs), and manifest determinations) of SWD suspended for 10 or more days utilizing the newly adopted rubric; and
a review of general procedures for disciplinary removals including school and district suspension records.
Districts Identified Under Prior Definition. As indicated previously, three LEAs (i.e., Marion, Putnam and Hampshire) had been identified for the review in February 2011. Each SEA level review was conducted no later than April 30, 2011. Hampshire had a significant discrepancy based on 2008-2009 data and had been identified with noncompliance. The April 2011 review based upon the 2009-2010 data indicated the district had not corrected the noncompliance. Actions taken regarding continued noncompliance are described below in the FFY 2009 Findings of Noncompliance Not Timely Corrected section. Findings of noncompliance were also identified through the Marion and Putnam County reviews. These districts received written notification of the identified noncompliance relating to the development and implementation of IEPs, the use of positive behavioral interventions and supports and procedural safeguards to ensure these policies, procedures and practices complied with IDEA in the implementation of district discipline procedures by June 30, 2011. Marion and Putnam Counties were required to correct

APR Template – Part B (4) West Virginia.
State
Part B State Annual Performance Report for FFY2010 Page 42
student specific noncompliance and to demonstrate implementation of specific regulatory requirements as soon as possible but no later than one year. Because all districts have adopted Policy 2419 as their local procedures, revisions to policy and procedures was not required. Rather, appropriate implementation of existing policies and procedures was required. Districts Identified Under Revised Definition (included in target data). When the state changed its Indicator 4A definition of a significant discrepancy to align with OSEP guidance, four districts were identified. Three were identified only under the new definition (i.e., Harrison, Wirt and McDowell), while Hampshire County, a previously identified district, was also identified under the new definition. Initial reviews for the three newly identified LEAs were conducted prior to February 1, 2012.
One of the four districts (i.e., Harrison) was found to have appropriate policies, procedures and practices. Two newly identified districts (i.e., Wirt and McDowell) received letters of findings of noncompliance relating to the development and implementation of IEPs, the use of positive behavioral interventions and supports and procedural safeguards to ensure these policies, procedures and practices complied with IDEA. Both districts were required to correct student specific noncompliance and to demonstrate implementation of specific regulatory requirements as soon as possible but no later than one year. Because all districts have adopted Policy 2419 as their local procedures, revisions to policy and procedures was not required. Rather, appropriate implementation of existing policies and procedures was required.
As noted above, Hampshire received a verification review, because it had been previously identified with noncompliance. The review found the district continued to demonstrate noncompliance. This district received a notice of continued noncompliance and actions to be taken, including correction of all student specific noncompliance and additional actions to correct the continued noncompliance. Actions taken regarding continued noncompliance in Hampshire County are described below in the FFY 2009 Findings of Noncompliance Not Timely Corrected section. Common Findings of Noncompliance for All Districts: Noncompliance was primarily the result of the LEAs’ failure to: 1) determine, on a case-by-case basis, if the student’s suspension constituted a change of placement; 2) record discipline and attendance data accurately in WVEIS; 3) adequately address behavior through the use of positive behavior supports, interventions and strategies; or 4) revise an IEP and behavior intervention plan (BIP) to address the functional behavior assessment (FBA) results for the reasons for which students were assigned to long term suspensions.
Discussion of Improvement Activities Completed and Explanation of Progress or Slippage that occurred in FFY 2010:
West Virginia collects discipline data through WVEIS, which requires school-level personnel to enter individual student data regarding disciplinary offenses, actions taken and number of days. These data are compiled by the district into an electronic file, which is submitted to WVDE and is used to generate the Section 618 discipline report and suspension rates for the APR. Data are provided individually for all students for the reporting year July 1 through June 30. All data are verified by districts prior to and after submission to WVEIS. Additionally, the OSP examined the data by school to ensure all schools were participating. As districts and schools continue to examine their data both for reporting purposes and for District Self-Assessment, awareness of the unique disciplinary procedures as well as positive behavior interventions and supports is increasing. This is having a positive effect on the suspension rate in certain districts. Statewide the number of students with disabilities suspended or expelled decreased from 825 to 756, and the percentage decreased slightly (0.16 percentage points).
Improvement Activities Completed in FFY 2009 (2009-2010): The following activities were initiated and/or completed during 2009-2010.

APR Template – Part B (4) West Virginia.
State
Part B State Annual Performance Report for FFY2010 Page 43
Technical Assistance
WVDE provided professional development on Indicator 4A and 4B for all special education administrators at the OSEP leadership conference in September 2010. More targeted technical assistance was provided to counties during their onsite monitoring exit conferences for Indicators 4A and 4B and to the 14 districts identified as needs assistance during the 2010-2011 school year.
The OSP has convened a team to update, develop and disseminate professional development models on discipline requirements under IDEA and WV Policy 2419. This work is ongoing with dissemination expected during the spring and summer of 2012 and is coinciding with department –wide work on the expected student behavior policy revisions.
All RESA special education directors updated their Nonviolent Crisis Prevention certification during the 2010-2011 school year and are training trainers at the district level. WVDE and RESA co-sponsored a statewide CPI instructors training in June 2011. Sixteen people attended representing eight counties and four RESAs.
PBS
The initial Early Childhood Positive Behavior Supports (ECPBS) training has been provided to a total of 450 preschool, childcare and Head Start programs in the state. Two districts implementing ECPBS district-wide have provided the training to all kindergarten teachers and assistants this school year. The WVDE is offering this training to other districts interested in implementing ECPBS district-wide.
The School-Wide Positive Behavior Supports initiative is ongoing. Districts/schools must apply and go through a selection process outlined on the PBS website once administrative commitment is obtained. A total of 6 new school teams were trained this year.
School-Based Mental Health
During 2010-2011, three LEAs participating in the OSP’s School-Based Mental Health initiative began implementation of the three-tiered model in seven pilot schools. Included were four elementary schools, one middle school, one high school and one alternative school. All schools were provided training in Positive Behavior Supports, if they had not previously received it, and each school was provided ongoing technical assistance with strategic planning and implementation from a mentor, either OSP staff or a designated SBMH committee member. Each school implemented the School-wide Information System to provide data to inform the process. All implemented School-wide Positive Behavior Supports as their universal intervention and developed a collaborative relationship with the local mental health center to provide ongoing supportive mental health services and social skills training.
Correction of FFY 2009 Findings of Noncompliance Do not report on the correction of noncompliance unless the State identified noncompliance as a result of the review required by 34 CFR §300.170(b).
1. Number of findings of noncompliance the State made during FFY 2009 (the period from July 1, 2009 through June 30, 2010) using 2008-2009 data
2
2. Number of FFY 2009 findings the State verified as timely corrected (corrected within one year from the date of notification to the district of the finding)
1
3. Number of FFY 2009 findings not verified as corrected within one year [(1) minus (2)]
1

APR Template – Part B (4) West Virginia.
State
Part B State Annual Performance Report for FFY2010 Page 44
Verification of Correction (either timely or subsequent):
In March and April 2011, the two districts identified with noncompliances for Indicator 4A based upon SY 2008-2009 data received a review of their practices and procedures to determine whether 1) all individual instances of noncompliance and been corrected and 2) the districts were correctly implementing specific regulatory requirements. Reviews were conducted as described above, including an updated a random sample of records (i.e., functional behavior assessments (FBAs), IEPs, behavior intervention plans (BIPs), and manifest determinations) of SWD suspended for 10 or more days utilizing the newly adopted rubric.
One of two districts corrected the FFY 2009 findings of noncompliance within one year of district notification through demonstrating compliant individual file reviews and implementation of specific regulatory requirements. This district has corrected both student specific and systemic noncompliances in the area of discipline. WVDE verified the district implemented the required professional development with staff regarding discipline procedures. Agendas and attendance records were provided to WVDE by districts required to conduct such trainings. To verify correct implementation of regulatory requirements, WVDE requested an updated sample of IEPs/FBAs for students receiving greater than 10 days of out-of-school suspensions/expulsions. The updated sample was reviewed via desk audit. The second agency (Hampshire) exhibited additional noncompliances, therefore, timely correction was not achieved. Additionally, this district continued to exhibit a significant discrepancy based on data year 2009-2010 and the revised definition.
Correction of FFY 2009 Findings of Noncompliance Not Timely Corrected (corrected more than one year from identification of the noncompliance):
4. Number of FFY 2009 findings not timely corrected (same as the number from (3) above)
1
5. Number of FFY 2009 findings the State has verified as corrected beyond the one-year timeline (“subsequent correction”)
0
6. Number of FFY 2009 findings not yet verified as corrected [(4) minus (5)] 1
Actions Taken if Noncompliance Not Corrected:
The remaining LEA with uncorrected noncompliance received three onsite reviews during 2011-2012 to determine whether the correction had occurred. The OSP verified continued noncompliance. Special Education Administrator turnover has been identified as a key root cause to high suspension rates and implementation of regulatory requirements in the LEA not verified as corrected. This district has had three special education administrators in the past three years. Despite the turnover, the district is implementing improvement activities and making advances. The district is participating in the National Dropout Prevention Center for Students with Disabilities initiative, which includes a substantial data analyses and intervention component around positive behavior supports and school climate. Declines have already been noted in the district’s suspension rates for SY 2010-2011 though they will not be reported in the APR until February 2013. The following additional actions are being taken regarding the continued noncompliance:
Training was conducted at the district level through the support of the RESA 8 special education coordinator during March 2012. The district is scheduled for an onsite monitoring the week of April 16, 2012. At this time, OSP will reassess the district’s correction status on Indicator 4a.

APR Template – Part B (4) West Virginia.
State
Part B State Annual Performance Report for FFY2010 Page 45
The OSP is issuing a Level One letter of enforcement requiring the district to correct the noncompliance. The district will be required to seek technical assistance to review and revise procedures and practices, provide professional development to staff responsible for implementation and monitor implementation of discipline procedures for students with disabilities.
The OSP will provide additional technical assistance and subsequent review of student files and other documentation to determine whether 1) individual noncompliances have been corrected and 2) specific regulatory requirements are being implemented will be conducted to ensure the district achieves compliance.
Revisions, with Justification, to Proposed Targets / Improvement Activities / Timelines / Resources for FFY 2011
As a result of revisions to the definition of significant discrepancy and continued findings of noncompliance, the OSP has reviewed its improvement activities for this indicator. WVDE initiatives in effect beginning July 1, 2012 for all students will have a positive impact on this indicator. Policy 4373: Safe and Supportive Schools is a major revision of several policies, including the Student Code of Conduct, related to student behavior and discipline. The purpose of the revision was to strengthen positive approaches to changing student behavior as well as to provide consistency in disciplinary actions for all students. Revisions to Policy 2419: Regulations for the Education of Students with Exceptionalities also take effect July 1. Support for Personalized Learning, which is to be implemented for all students, includes positive support to assist students in developing appropriate behavior. Guidance documents and professional development regarding all three initiatives will be provided to districts and schools. The following additional activities have been revised/added.
Improvement Activity Timeline Resources Status
4.4 Develop guidance and professional development resources on discipline procedures and support for appropriate behavior for students with disabilities and disseminate professional development to LEAs and schools.
2012-2013 WVDE Revised April 2012
4.11 Provide training on the revised Indicator 4 data analysis and review process.
2011 – 2013 WVDE
New

APR Template – Part B (4) West Virginia.
State
Part B State Annual Performance Report for FFY2010 Page 46
Part B State Annual Performance Report (APR) for FFY 2010
Overview of the Annual Performance Report Development:
See Indicator 1
Monitoring Priority: FAPE in the LRE
Indicator 4B: Rates of suspension and expulsion:
Percent of districts that have: (a) a significant discrepancy, by race or ethnicity, in the rate of suspensions and expulsions of greater than 10 days in a school year for children with IEPs; and (b) policies, procedures or practices that contribute to the significant discrepancy and do not comply with requirements relating to the development and implementation of IEPs, the use of positive behavioral interventions and supports, and procedural safeguards. (20 U.S.C. 1416(a)(3)(A); 1412(a)(22))
Measurement:
Percent = [(# of districts that have: (a) a significant discrepancy, by race or ethnicity, in the rates of suspensions and expulsions of greater than 10 days in a school year of children with IEPs; and (b) policies, procedures or practices that contribute to the significant discrepancy and do not comply with requirements relating to the development and implementation of IEPs, the use of positive behavioral interventions and supports, and procedural safeguards) divided by the (# of districts in the State)] times 100.
Overview of Issue/Description of System or Process:
Requirements governing suspension and expulsion of all students are found in WV Code §18A -5-1A Safe Schools Act, which provides disciplinary actions may not conflict with IDEA or State Board policy. Policy 2419: Regulations for the Education of Students with Exceptionalities outlines the procedural safeguards required for removal from school of a student with a disability, paralleling IDEA 2004. Policy 4373: Student Code of Conduct applies to all students. The principal has authority to suspend a student or to recommend expulsion to the district Board of Education, in accordance with the above statutes, policies and regulations.
The West Virginia Education Information System (WVEIS) contains a discipline module for maintaining individual student records at the school level. Each disciplinary offense, including suspensions and expulsions, is recorded by the school administrator or designee with the offense, the action and the number of days for the disciplinary action. The disciplinary records and all individual student demographic information, including race/ethnicity, are then collected at the end of each school year for IDEA 2004, Section 618 Table 5 reporting and for use in the State Performance Plan and Annual Performance Report.
The State must provide a definition of “significant discrepancy” referencing the comparison methodology used and the measure of how the rates were calculated (e.g. rate ratio, rate difference, comparison to a State average, or other).
The State must choose one of the following comparison methodologies to determine whether significant discrepancies, by race or ethnicity, are occurring (34 CFR §300.170(a)):
Compare the rates of expulsions and suspensions of greater than 10 days in a school year for children with IEPs among LEAs in the State; or

APR Template – Part B (4) West Virginia.
State
Part B State Annual Performance Report for FFY2010 Page 47
The rates of expulsions and suspensions of greater than 10 days in a school year for children with IEPs in each LEA compared to the rates for nondisabled children in the same LEA.
If the State used a minimum “n” size requirement report the number of districts excluded from the calculation of rates as a result of using the minimum ‘n’ size.
If significant discrepancies, by race or ethnicity, occurred, and the district with discrepancies had policies, procedures, or practices that contributed to the significant discrepancy and do not comply with the requirement relating to the development and implementation of IEPs, the use of positive behavioral interventions and supports, and procedural safeguards, the State must describe how it ensured that such policies and procedures and practices were revised to comply with applicable requirements. In reporting on correction of noncompliance, the State must report consistent with OSEP Memorandum 09-02 dated October 17, 2008.
Revised Definition of Significant Discrepancy
The definition of a Significant Discrepancy has been revised within the current Indicator 4B in accordance with OSEP guidance released in August and September 2011. Following submission of the FFY 2009 APR, West Virginia was informed by OSEP that its methodology for calculating significant discrepancy for Indicator 4B needed revision. The Data Accountability Center (DAC) released a guidance document and provided a session at the OSEP Mega Leadership Conference in August 2011 regarding recommended options for calculating significant discrepancy. Additionally, West Virginia received specific direct technical assistance via phone conference. The OSP data manager presented the issue to the West Virginia Advisory Council for the Education of Exceptional Children (WVACEEC) at its December 2011 meeting, and discussed it with LEA special education directors via phone conference. The definition and methodology for 4B has been revised consistent with the recommended methods provided in the updated guidance.
In analyzing data for this indicator, the State must:
Use the data collected on Table 5 of Information Collection 1820-0621 (Report of Children with Disabilities Unilaterally Removed or Suspended/Expelled for More than 10 Days) for the school year —2009-2010 due, November 1, 2010. Sampling from State’s 618 data is not allowed.
Definition of Significant Discrepancy and Methodology
West Virginia is comparing the rates of suspensions and expulsions of greater than 10 days in a school year for children with IEPs among LEAs in the State. During the 2009-2010 school year, all children with IEPs were suspended at a rate of 1.64% for suspensions/expulsions totaling greater than 10 days. Using school year 2009-2010 as the baseline year, the 1.64% State rate was multiplied by two to establish a static suspension/expulsion-rate bar at 3.28%. Thus, a district has a significant discrepancy when its suspension/expulsion rate for children with IEPs in any given race/ethnicity category exceeds 3.28%.
State rate for all students with IEPs = ( 756 suspensions/expulsions greater than 10 days) X 100%
( 46,169 children with IEPs ages 3-21)
= 1.64%
Suspension/expulsion-rate bar = 1.64% x 2 = 3.28%

APR Template – Part B (4) West Virginia.
State
Part B State Annual Performance Report for FFY2010 Page 48
Suspension/expulsion rates by race/ethnicity:
Race/ethnicity category Suspensions/expulsions greater than 10 days
Child Count Percent
American Indian / Native Alaska
1
52
1.92%
Asian 0 154 0.00%
Black / African American 88 2425 3.63%
Hispanic 7 380 1.84%
Two or more races 1 194 0.52%
Native Hawaiian / Pacific Islander
0
2
0.00%
White (non Hispanic) 659 42962 1.53%
Minimum Cell Size: WV’s minimum cell size of 20 for Indicator 4B is based on the number of children with IEPs in a specific race/ethnicity category in a district. All districts met the minimum cell size for at least the white race/ethnicity category. No districts were excluded from the analysis.
Actual Target Data for FFY 2010 (using 2009-2010 data)
FFY Measurable and Rigorous Target
FFY 2010
(using 2009-2010 data)
0% (Compliance Indicator)
For this indicator, report data for the year before the reporting year (use 2009-2010 data).
a) 15 districts (26.3%) have significant discrepancies by Race or Ethnicity; b) 12 districts (21.0%) were found to have significant Discrepancies, by Race or Ethnicity, and policies, procedures or practices
that contribute to the significant discrepancy and do not comply with requirements relating to the development and implementation of IEPs, the use of positive behavioral interventions and supports, and
procedural safeguards.

APR Template – Part B (4) West Virginia.
State
Part B State Annual Performance Report for FFY2010 Page 49
Fifteen districts were found to exceed the 3.28% state suspension/expulsion bar. Four of the 15 districts were also reported in Indicator 4A, because their significant discrepancies were identified for the majority white race group. Although the 4 districts’ white race/ethnicity category exceeded the 3.28% bar, the underlying issue for all four districts, as indicated by their policy, practices and procedures review, was high suspension/expulsion rates overall and thus, significant disparities were not evident by race/ethnicity. Other reviews are still in progress and will be completed by the clarification period.
4B(a). Districts with Significant Discrepancy, by Race or Ethnicity*, in Rates of Suspension and Expulsion:
Year Total Number of Districts**
Number of Districts that have Significant Discrepancies by Race or Ethnicity
Percent**
FFY 2010 (using 2009-2010 data)
57 15 26.32%
4B(b). Districts with Significant Discrepancy, by Race or Ethnicity, in Rates of Suspensions and Expulsions; and policies, procedures or practices that contribute to the significant discrepancy and do not comply with requirements relating to the development and implementation of IEPs, the use of positive behavioral interventions and supports, and procedural safeguards.
Year Total Number of Districts*
Number of Districts that have Significant Discrepancies, by Race or Ethnicity, and policies, procedures or practices that contribute to the significant discrepancy and do not comply with requirements relating to the development and implementation of IEPs, the use of positive behavioral interventions and supports, and procedural safeguards.
Percent**
FFY 2010 (using 2009-2010 data)
57 12
21.05%
Includes all WV districts
Review of Policies, Procedures, and Practices (using 2009-2010 data): If any districts are identified with significant discrepancies:
Fifteen districts received a SEA level review of policies, procedures and practices based upon SY 2009-2010 discipline data for Indicator 4B. Reviews were conducted prior to the April 2012 clarification period per OSEP’s requirements.

APR Template – Part B (4) West Virginia.
State
Part B State Annual Performance Report for FFY2010 Page 50
Review Process: The SEA review of the LEAs identified with significant discrepancies by race/ethnicity specifically involved the examination of:
findings of district self-review of discipline policies, procedures and practices;
progress in implementing corrective activities within the county’s improvement plan for SPP Indicator 4/CSADA Indicator 1.9;
discipline practices via interviews when appropriate;
a random sample of records (i.e., evaluations, IEPs, behavior intervention plans, and manifest determinations) of SWD suspended for 10 or more days utilizing the newly adopted rubric;
a review of general procedures for disciplinary removals including school and district suspension records; and data analyses at the district level to compare the suspension type, frequency and duration of all students with IEPs as compared to students with IEPs in the race/ethnicity category exceeding the state-bar.
Results of State’s Review of LEA’s policies, procedures and practices based on 2009-2010 Data:
Three of the fifteen districts identified as having a significant discrepancy were found to have appropriate policies, procedures and practices. The other twelve districts were found to have noncompliance relating to the development and implementation of IEPs, the use of positive behavioral interventions and supports and procedural safeguards to ensure these policies, procedures and practices complied with IDEA.
Findings of noncompliance were primarily the result of the LEAs failure to: 1) determine, on a case-by-case basis, if the student’s suspension constituted a change of placement; 2) record discipline and attendance data accurately in WVEIS; 3) adequately address behavior through the use of positive behavior supports, interventions and strategies; or 4) revise an IEP and behavior intervention plan (BIP) to address the functional behavior assessment (FBA) results for the reasons for which students were assigned to long term suspensions.
The specific findings were issued to each district in writing. Districts are required to correct student specific noncompliance and to demonstrate implementation of specific regulatory requirements as soon as possible but no later than one year. Because all districts have adopted Policy 2419 as their local procedures, revisions to policy and procedures was not required. Rather, appropriate implementation of existing policies and procedures was required. The OSP will review district improvement plans and/or corrective action plans by May 15, 2012. Subsequent to district training, the OSP will request an updated sample of student records and determine whether the districts have corrected individual student noncompliances and if districts are correctly implementing regulatory requirements within one year of the initial notification of noncompliances. The OSP will report on correction of noncompliance in the FFY 2011 and 2012 APRs.
Discussion of Improvement Activities Completed and Explanation of Progress or Slippage that occurred in FFY 2010:
OSEP provided States clarification and written guidance on Indicators 4A and 4B in August and September of 2011. The state has revised its definition of significant discrepancy by race/ethnicity and the minimum cell requirements to comply with OSEP’s guidance. For this reason, progress or slippage cannot be reported at this time.
Activities Completed
WVDE provided professional development on Indicator 4A and 4B for all special education administrators at the OSEP leadership conference in September 2010. More targeted technical assistance was

APR Template – Part B (4) West Virginia.
State
Part B State Annual Performance Report for FFY2010 Page 51
provided to counties during their onsite monitoring exit conferences for Indicators 4A and 4B and to the 14 districts identified as needs assistance during the 2010-2011 school year.
The OSP has convened a team to update, develop and disseminate guidance and professional development on discipline requirements under IDEA and Policy 2419: Regulations for the Education of Students with Exceptionalities. This work was delayed during 2011, because WVDE was undergoing a major revision of all other policies related to student behavior and discipline, resulting in one comprehensive policy, Policy 4373: Expected Behavior in Safe and Supportive Schools, effective July 1, 2012. The team will reconvene in 2012 to develop guidance for implementing the new policy in conjunction with the procedural safeguards for students with disabilities in IDEA and Policy 2419. New guidance and professional development resources will be disseminated in spring and fall 2012 .
All RESA special education directors updated their Nonviolent Crisis Prevention certification during the 2010-2011 school year and are training trainers at the district level. WVDE and RESA co-sponsored a statewide CPI instructors training in June 2011. Sixteen people attended representing eight counties and four RESAs.
School Wide-PBS and Early Childhood PBS activities can be referenced in other APR Indicators (e.g., 7 and 9 and 10).
Correction of FFY 2009 Findings of Noncompliance
7. Number of findings of noncompliance the State made during FFY 2009 (the period from July 1, 2009 through June 30, 2010) using 2008-2009 data
2
8. Number of FFY 2009 findings the State verified as timely corrected (corrected within one year from the date of notification to the district of the finding)
2
9. Number of FFY 2009 findings not verified as corrected within one year [(1) minus (2)]
0
The OSP assures OSEP that the two districts above have been timely corrected according to Memo 09-02 requirements.
Correction of FFY 2009 Findings of Noncompliance Not Timely Corrected (corrected more than one year from identification of the noncompliance):
10. Number of FFY 2009 findings not timely corrected (same as the number from (3) above)
0
11. Number of FFY 2009 findings the State has verified as corrected beyond the one-year timeline (“subsequent correction”)
0
12. Number of FFY 2009 findings not yet verified as corrected [(4) minus (5)] 0

APR Template – Part B (4) West Virginia.
State
Part B State Annual Performance Report for FFY2010 Page 52
Verification of Correction (either timely or subsequent):
For those findings for which the State has reported correction, describe the process the State used to verify that the district is correctly implementing the specific regulatory requirement(s).
Correction for Indicator 4B for both districts was verified through review of student files and 618 discipline data via onsite visits. Correction of child specific noncompliances was verified by the OSP through review of documentation. Additionally, an updated sample of data was reviewed, i.e., files of subsequent student suspensions were reviewed, and the OSP determined the districts were correctly implementing specific regulatory requirements.
Revisions, with Justification, to Proposed Targets / Improvement Activities / Timelines / Resources for FFY 2011(if applicable):
As a result of revisions to the definition of significant discrepancy and continued findings of noncompliance, the OSP has reviewed its improvement activities for this indicator. WVDE initiatives in effect beginning July 1, 2012 for all students will have a positive impact on this indicator. Policy 4373: Safe and Supportive Schools is a major revision of several policies, including the Student Code of Conduct, related to student behavior and discipline. The purpose of the revision was to strengthen positive approaches to changing student behavior as well as to provide consistency in disciplinary actions for all students. Revisions to Policy 2419: Regulations for the Education of Students with Exceptionalities also takes effect July 1. Support for Personalized Learning, which is to be implemented for all students, includes positive support to assist students in developing appropriate behavior. Guidance documents and professional development regarding all three initiatives will be provided to districts and schools. The following additional activities have been revised/added.
Improvement Activity Timeline Resources Status
Develop guidance and professional development resources on discipline procedures and support for appropriate behavior for students with disabilities and disseminate professional development to LEAs and schools.
2012 – 2013 WVDE
Revised April 2012
4.11 Provide training on the revised Indicator 4 data analysis and review process.
2011 – 2013 WVDE
New

APR Template – Part B (4) West Virginia.
State
Part B State Annual Performance Report for FFY2010 Page 53
Part B State Annual Performance Report (APR) for FFY 2010 (2010-2011)
Overview of the Annual Performance Report Development:
See Indicator 1.
Monitoring Priority: FAPE in the LRE
Indicator 5: Percent of children with IEPs aged 6 through 21 served:
A. Inside the regular class 80% or more of the day;
B. Inside the regular class less than 40% of the day; and
C. In separate schools, residential facilities, or homebound/hospital placements.
(20 U.S.C. 1416(a)(3)(A))
Measurement:
A.Percent = [(# of children with IEPs served inside the regular class 80% or more of the day) divided by the (total # of students aged 6 through 21 with IEPs)] times 100.
B.Percent = [(# of children with IEPs served inside the regular class less than 40% of the day) divided by the (total # of students aged 6 through 21 with IEPs)] times 100.
C. Percent = [(# of children with IEPs served in separate schools, residential facilities, or homebound/hospital placements) divided by the (total # of students aged 6 through 21 with IEPs)] times 100.
FFY Measurable and Rigorous Target
2010
(2010-2011)
A. The percent of students with IEPs ages 6 through 21 inside the regular class 80% or more of the day will increase by 1% (61.5%).
B. The percent of students with IEPs ages 6 through 21 inside the regular class less than 40% will remain at or below 8.0%
C. The percent of students with IEPs aged 6 through 21 served in public or private separate schools, residential placements or homebound or hospital placements will decrease by 0.1% (1.0%).
Actual Target Data for 2010-2011 (FFY 2010):
A. 67.4% B. 8.4% C. 1.7% (see table below for calculations)

APR Template – Part B (4) West Virginia.
State
Part B State Annual Performance Report for FFY2010 Page 54
Educational Environments for Students with Disabilities Ages 6-21
2004-2005 2005-2006 2006-2007 2007-2008 2008-2009 2009-2010 2010-2011
Number % Number % Number % Number % Number % Number % Number %
A. General Education : Full - Time (GE:FT) (inside regular class 80% or more of school day)
24,830 55.5%
26,626 60.7%
27,372 63.6% 27,959 66.7% 27,866 67.8%
27,503
68.1% 26,558 67.4%
B. Special Education: Separate Class (SE:SC)
(inside regular class less than 40% of school day)
4,290 9.6% 3,900 8.9% 3,494 8.1% 3270 7.8% 3,247 7.9%
3,221
8.0% 3,303 8.4%
C. Facilities/Out-of-School Environment (SS,RF,OSE)
699 1.6% 770 1.8% 746 1.7% 772 1.8% 770 1.9% 664 1.6% 663 1.7%
Includes:
Separate Schools
Residential Facilities
Home/Hospital (out-of-school environment)
Total Ages 6-21 44,718
43,844
43,041
42,006
41,079
40,415 39,400

APR Template – Part B (4) West Virginia.
State
Part B State Annual Performance Report for FFY2010 Page 55
In 2006-2007, new educational environment categories were created for students parentally placed in private schools and for correctional facilities. Students in these placements previously were reported in the other categories, primarily in general education options.
In conjunction with the December 1 child count, educational environment data are submitted by each school district. Data are collected through WVEIS from individual student records. In 2010-2011, 67.4 percent of students with disabilities ages 6-21 were in General Education Full-Time (GE:FT- inside regular class 80% or more of school day). This represents a 0.7 percentage point decrease in school age SWDs served in the GE:FT environment, as compared to 2009-2010, nevertheless, it exceeds the target of 61.5 percent.
Placement of school age SWDs in West Virginia in Special Education: Separate Class (SE:SC inside regular class less than 40% of school day) environments in December 2010 increased slightly to 8.4 percent, compared to 8.0 percent of school age SWDs in 2009-2010. Both the actual number of students and the percentage increased. Therefore, the SE: SC target of 8.0 percent was not met.
The combined facilities and homebound/hospital placement includes students served in separate special schools, residential placements and homebound/ hospital placement, which in West Virginia is called Special Education: Out-of-School Environment. In 2010-2011, 1.7 percent of students with disabilities ages 6-21 were served in facilities/homebound compared to 1.6 percent in 2009-2010. The target of 1.0 percent was not met, rather placement increased by 0.1 percentage points.
Discussion of Improvement Activities Completed and Explanation of Progress or Slippage that occurred for 2010-2011 (FFY 2010).
While the target was met for students placed in the General Education: Full-Time educational environment, both the number and percentage decreased. The small increase in Special Education: Separate Class accounts for a portion of this reduction. However, the bulk of the decrease appears to be
0
10
20
30
40
50
60
70
80
Pe
rce
nt
of
Stu
de
nts
wit
h D
isab
iliti
es
Percentage of Students with Disabilities in Educational Environments
General Ed: Full-Time
Special Ed: Separate Class
Facilities/Out-of-School Env.

APR Template – Part B (4) West Virginia.
State
Part B State Annual Performance Report for FFY2010 Page 56
related to an overall decrease in numbers of students with disabilities, resulting in a reduction in both GE:FT and the General Education: Part-Time environment.
The gradual increasing trend observed in the GE:FT environment appears to have plateaued in FFY 2008. At the LEA level, districts ranged from 46.5 to 90 percent in this placement. Ten districts out of 55 (excluding institutional LEAs), were found to have fewer than 60% of their school age population of SWDs in GE:FT environments, compared to seven last year. At the upper end of the continuum, 8 LEAs were found to have 80-89% of SWDs educated in the GE:FT environments, an increase of one LEA over last year. On a larger scale, West Virginia was seven percentage points above the national average (60.5%) for GE:FT environments (www.ideadata.org).
Regarding placement in Facilities/Out-of-School Environment, the actual number of students placed in these environments decreased by one, but the percentage increased due to the overall decrease in number of students with disabilities within the state. Of the 663 students included within this least restrictive environment (LRE) category, the residential placements declined slightly with 83 SWDs (i.e., 12.5%) were educated in out-of-state residential facilities due to placement by the court system and/or West Virginia Department of Health and Human Resources (WVDHHR) placement for non-educational reasons, and 85 were placed at West Virginia Schools for the Deaf and the Blind. The increase, therefore, is attributed to an increase in students served in the home/hospital (Out-of-School Environment) placement, from 423 students in 2009 to 434 in 2010.
Placement in Special Education: Separate Class increased by 82 students, despite a decrease in other placements. This is the first actual increase since 2004. While not a large increase, it indicates eight percent represents a rigorous target for the state.
The percent of school age SWDs educated in the SE:SC environment has ranged between 7.8-8.4% since school year 2006-2007. Districts range from 0.0 to 14.2 percent, with 22 of 55 districts (excluding institutional LEAs) exceeding the eight percent target. Ten districts educate more than 10% of their school age SWDs in a SE:SC environment, compared to six last year.
Overall, West Virginia is more inclusive than the national average, having 5.84 percentage points fewer . school age SWDs educated in the SE:SC environment, compared to 14.24% nationally (www.ideadata.org). Only ten states educate a lower percentage than West Virginia in the SE:SC setting.
The high level of inclusion is attributed to long-standing OSP support for inclusive placements, the District Self-Assessment process within the Continuous Improvement and Focused Monitoring System, described below, and other improvement activities promoting access to the general education curriculum.
Improvement Activities
Continuous Improvement and Focused Monitoring System (CIFMS)
The CIFMS instructions for the April 2011 annual desk audit submission required districts exceeding the 8% target for SE:SC conduct an internal review to determine why the 8% target was exceeded. WVDE provided districts with a sample of students with SE: SC placements and recommendations for this self-review process, which included the following instructions:
Ensure the student’s Least Restrictive Environment (LRE) is correctly calculated in the Individualized Education program (IEP) and entered in to WVEIS.
Review the student’s IEP to ensure the services page is accurately reflecting the location of services (GEE/SEE);
Ensure the LRE Considerations on the placement page were appropriately addressed, including annual placement determination based on the IEP; chronologically appropriate settings with age appropriate non-exceptional peers; education in a general classroom with the use of supplementary aids and services; potentially harmful effects of the selected LRE placement on the student and the quality of the student’s services and placement as close to home as possible, in the school the student would normally attend if not exceptional, unless the IEP requires other arrangements.
Review the student’s IEP to ensure the annual goals and present levels of educational performance substantiate the level of need for services as delineated on the services page;

APR Template – Part B (4) West Virginia.
State
Part B State Annual Performance Report for FFY2010 Page 57
Review the student’s evaluation data to ensure consideration for placement was appropriate; and
Review district data to ascertain if categorical disabilities automatically result in an LRE of 2.
Although districts were not required to formally submit the results of their review to OSP, districts reported the self review was beneficial in identifying errors in the data entry process and/or calculation of minutes. Moreover, this review generated important questions about work-based and community based experiences for youth with IEPs and how such minutes should be assigned and calculated in LRE.
Targeted Technical Assistance to Selected LEAs. Targeted technical assistance was provided to districts identified as most in need of improvement through data analyses, LEA determinations and compliance monitoring. During 2010-2011, the OSP invited 14 districts to participate in this process with WVDE, RESA and North Central Regional Resource Center staff. Three sessions were held to lead the districts through a process of data analysis/root cause analysis; logic model and improvement planning design; and implementation and performance evaluation. The IT Kit Process was used from the North Central Regional Resource Center to guide the district improvement process. OSP found that time spent with districts on improvement planning did lead to higher quality improvement plans from the outset. However, movement through the IT kit process proved to leave the district administrators dissatisfied as the process was not differentiated to meet district individual needs. In coming years, the process will be revised with assistance from the Mid-South Regional Resource Center to allow ample time for district level planning, consultation with OSP and regional resource center staff, and collaboration time with other districts to share successful strategies. Additional SEA level time must also be reserved for district follow-up and monitoring of results-oriented initiatives. (See Indicator 3 for additional information.)
Mathematics Academies. The Office of Special Programs began to partner with districts in the eight Regional Education Service Agencies (RESAs) to provide special educators over a four-year period in grades kindergarten (K) through twelve (12) the opportunity to improve student achievement in mathematics by deepening their understanding of mathematics and providing them with the experience of learning math in a student-centered classroom. Deeper understanding of the new mathematics standards for all students and of mathematical reasoning and problem solving will enhance teachers’ ability to support students in the general education curriculum and promote successful inclusion in general education settings. Carnegie Learning, Inc. math experts challenge the special educators’ understanding and beliefs about mathematics and the teaching of math. The Mathematics Academies create a targeted learning experience for specific math content areas and grade levels. The special educators gain a better understanding of the connection between early math concepts and algebraic thinking. In addition, each special educator has access to research-based web-based learning tools, MATHia and/or Cognitive Tutor, to use throughout the year to reflect on their own mathematical understanding and teaching practices and to make connections between content-deepening tasks, the software, and classroom instruction.
Expected outcomes include: (1) enhanced teacher content knowledge and instructional practices in math (2) resulting student achievement gains in math, especially among special education students and (3) emerging math communities of practice throughout RESAs and/or districts.
Individual participant learning outcomes include:
Deepening teachers’ understanding of mathematics to meet the rigor of the West Virginia Next Generation Mathematics Standards and Objectives and move from a rote understanding of procedures to a deeper understanding of concepts;
Developing teachers’ mathematical reasoning and problem solving capabilities;
Increasing opportunity for special educators to reflect, self-evaluate their own teaching practices, and to refine lessons in ways that promote discourse, student communication, and active engagement;
Improving teachers’ dispositions toward teaching mathematics because of the impact these feelings have on student attitudes; and
Creating and participating in math communities of practice that build teacher leadership and skills in peer collaboration

APR Template – Part B (4) West Virginia.
State
Part B State Annual Performance Report for FFY2010 Page 58
Four five-day Mathematics Academies for middle and high school special educators were conducted during the summer of 2011 in four different sites throughout the state. A total of 119 special educators participated in the first cohort (2011-2013). The content for Year 1 focused on Proportional Reasoning. Follow-ups will be conducted in 2011-2012. The content for Year 2 will focus on Developing Algebraic Thinking. A second cohort of 150 elementary, middle and high school special educators is scheduled to begin in the summer 2012 and end in the spring of 2014. A comprehensive multi-faceted evaluation of the first cohort’s involvement designed by a collaborative team from the WVDE and Carnegie Learning, Inc. is being implemented. Preliminary results from the Post PD Survey of the summer 2011 Mathematics Academies are as follows: 97.3% - training was high quality; 98.6% - training was specific and content-focused; 97.3% training was hands-on and included active learning opportunities; 83.6% - it was a good start (usefulness); 87.7% - look forward to practicing/applying the knowledge/skills in my classroom (or work setting) during the upcoming school year; 62.5% - training was very closely aligned with school’s/program’s goals for instructional improvement (26.4% somewhat aligned); 91.7% - adequate amounts of materials/resources provided; 91.5% materials were high quality (i.e., based on recent research and evidence-based); and 98.6% - trainers were knowledgeable about the topic.
Literacy Academies. Lessons learned by working with the co-teaching pairs through the “Strategic Reading/Language Arts Instruction for Middle School Students” professional development emphasized significant challenges surrounding three of the strands of best practice, specifically: school-wide commitment to a set of research-based instructional strategies, ongoing assessment for learning and school schedules and routines that support flexible grouping. In response, General Supervision Enhancement Grant (GSEG) resources were used to revise the content focus of the professional development and take it directly into two districts (i.e., 59 teacher participants) as content literacy academies. These academies focused on establishing literacy as a shared responsibility across all subject areas and grades. In these academies, general and special educators representing all the core content areas worked side-by-side to learn how to operationalize a gradual release of responsibility process that would support more differentiation and more student engagement. They learned about specific text demands in their content area materials and examined the vertical progression of concepts and skills through content specific work teams. Collaborative classroom investigations were designed, implemented and shared. Building both the content and collaboration skills of co-teachers supports student achievement in the general education classroom.
Participants in these district level academies were surveyed to discern their perception of the relevance of this professional development. Results clearly indicated deeper understanding and commitment to the literacy needs of the students these teachers serve. They, like those who participated in the “Strategic Reading/Language Arts Instruction for Middle School Students” professional development, demonstrated shifting from a focus on need for more materials towards a deeper understanding of how to more effectively use resources that were already available to them. One of the districts went on, the following summer, to provide a very well attended and received Literacy Academy designed by the Regional
Education Service District and the RTI Specialist who had attended the academy, described above. During 2011-2012, literacy academies will be available to applicants from all districts in an effort to scale up best practices.
Professional Development – Three-Tiered Models
Alternate Identification and Reporting (AIR) Project. In 2008 the OSP, in consultation with the Office of Special Education Programs (OSEP), initiated the AIR project in 24 schools representing six school districts. The purpose was to explore and evaluate a model of eligibility for special education absent the assignment of a specific disability category. The AIR schools continued to implement the three-tiered model for identifying students needing intervention for academic difficulties, and during 2010-2011, participated in professional development to expand the model to include students with behavior concerns.

APR Template – Part B (4) West Virginia.
State
Part B State Annual Performance Report for FFY2010 Page 59
The WVDE Office of Research conducted an evaluation of the AIR Project and the final report was issued in January 2012. The evaluation focused on the four primary goals of the AIR project:
1. Establish and reinforce the commonality of instructional and behavioral needs for students; 2. Transition teachers, administrators and parents to a model of support that is based on students’
instructional and behavioral needs and not defined areas of disability; 3. Diminish the burden that labels appear to place on students emotionally and the associated low
expectations of their teachers; and 4. Contribute to the national dialogue associated with research related to early intervention,
response to intervention (RTI) and appropriate instruction and support for students who demonstrate the need for the protections of IDEA (WVDE, 2010).
In evaluating the goals of the AIR Project, six evaluation questions were asked: 1. What changes are associated with the AIR program in the general education classrooms?
[Project Goal 1] 2. What changes are associated with the AIR program in the special education classrooms? [Project
Goal 1] 3. Are there changes in school personnel’s use of a model of support focused on students’
instructional and behavioral needs rather than on defined areas of disability since the inception of the AIR program? [Project Goal 2]
4. Are there changes in affected parents’ interaction with schools and relevant committees since the inception of the AIR program? [Project Goal 2]
5. Are there changes in students’ interactions and behavior since the inception of the AIR program? [Project Goal 3]
6. Do students with disabilities attending AIR schools academically outperform students with similar disabilities in non-AIR schools in mathematics and reading/language arts? [Project Goal 3]
Summary of Findings and Discussion
Regarding its first goal of establishing and reinforcing the commonality of instructional and behavioral needs for students, survey data indicate the AIR Project has made limited progress. Although special education students are seen as spending more time in the general education classroom, school personnel indicate that they need more support for this change not to be disruptive. Support in the form of training on differentiated instructional tools and classroom management tools was identified as a need. However, the AIR process seems to have increased collaboration between special education and general education teachers. The process has also contributed to higher implementation and better understanding of the 3-tier process.
The AIR Project has made some progress in transitioning teachers, administrators and parents toward a model of support that is based on the student’s instructional and behavioral needs and not a defined area of disability. However, considerable progress still needs to be made in reducing the paperwork and burden of both AIR and the 3-tier model on personnel, providing needed resources and generating a feeling of engagement among those most responsible for implementing the program and among parents.
Additionally, the survey results suggest the AIR process has made progress with students in diminishing the burden that a label appears to place on them emotionally and the associated low expectations according to survey respondents. Although the majority of the respondents did not think the AIR process has made students more self-confident or successful academically or behaviorally, at least half of two of the respondent groups reported that the process has reduced social stigma for special education students and engendered more positive interactions between general and special education students.
Lastly, analyses in this study reveal some higher, though statistically insignificant, gains in test scores for
AIR students in mathematics (both cohorts) and reading (Cohort 2 only). It is likely this finding may have
been affected by attrition, as there were 79 fewer students in 2011 for Cohort 1 and 33 fewer students in

APR Template – Part B (4) West Virginia.
State
Part B State Annual Performance Report for FFY2010 Page 60
2011, reducing the power of the tests. Including these students may have resulted in slightly different
outcome. It is possible these students moved out of the district, or they may have qualified for special
education in a non-AIR category. However, it is unclear whether their absence affected the gain
scores for the two groups. Regardless, it appears that AIR students have made only limited gains in test
scores compared to non-AIR students.
The complete AIR Evaluation Report will be made available online at the WVDE Office of Research link: https://sites.google.com/a/wvde.k12.wv.us/research-filecabinet/research-projects .
Response to Intervention (RTI)
The West Virginia Response to Intervention (RTI) initiative continued to expand during the 2010-2011 school year. State special education regulations phase in the implementation of RTI by programmatic levels. In accordance with timelines stated in Policy 2419: Regulations for the Education of Students with Exceptionalities, all elementary schools were required to establish three-tier instruction delivery models in the area of reading by July 1, 2009. By July 1, 2010, elementary schools were required to develop and implement tiered instruction and intervention in the area of mathematics. Middle schools were added July 2010. Please see the detailed narrative in West Virginia’s Indicator 3 for RTI activities implemented during the 2010-2011.
PBS
The initial Early Childhood Positive Behavior Supports (ECPBS) training has been provided to a total of 450 preschool, childcare and Head Start programs in the state. Two districts implementing ECPBS district-wide have provided the training to all kindergarten teachers and assistants this school year. The WVDE is offering this training to other districts interested in implementing ECPBS district-wide.
The School-Wide Positive Behavior Supports initiative is ongoing. Districts/schools must apply and go through a selection process outlined on the PBS website once administrative commitment is obtained. A total of 6 new school teams were trained this year.
Out-of-State Monitoring
The OSP continued to collaborate with Department of Health and Human Resources to bring awareness to the out-of-state placement issues for students with disabilities and to increase involvement of LEAs in ensuring all students with disabilities placed out-of-state receive protections required under IDEA. WVDE issued a memorandum to LEA special education directors and all out-of-state facilities serving students with disabilities in August of 2009 outlining and clarifying that an LEA representative should participate in IEP development.
Reports from WVEIS on out-of-state students are obtained on a monthly basis to ensure accuracy in billing. The WVDE requires out-of-state facilities submit IEPs with proof of LEA participation to the WVDE prior to reimbursement of funds and funds surrogate parents for students without parents. It is hoped increased involvement of the local district and other agencies in placement of these students will promote consideration of more inclusive in-state options and will result in improved transition when students placed out-of-state exit the facility.
Online IEP Development/Training
Development and implementation of the WVDE created Standards-Based Online IEP is a major initiative for the OSP. The online IEP is designed to support IEP Team members in writing standards-based IEPs for achievement in the general curriculum by providing access to the Content Standards and Objectives

APR Template – Part B (4) West Virginia.
State
Part B State Annual Performance Report for FFY2010 Page 61
(CSOs) within the system and supports for writing standards-based IEPs. Beginning January 2011, all LEAs were required to use the online IEP.
For the 2010/11 year the WVDE Online IEP continued to grow with additions and revision to the user interface that included new online forms and improved user friendliness. In addition to the revisions and updates to user perceived items, the infrastructure has also been upgraded to support periods of heavy usage.
User perceived updates and revisions include the design and addition of the Meeting Notice manager. The manager allows a user to create and track a meeting notice for each IEP in development. Also, the error messages users receive were streamlined to provide instructions for correction and reporting procedures which eliminated the unintelligible debugging codes.
The infrastructure updates include a software upgrade which handles multiple requests simultaneously and decreased the likelihood of slowdowns when heavy periods of use arise.
Total number of IEPs created up through 11/1/2011 – 81,378 Total number of SBIEP helpdesk inquiries fielded through 9/30/2011 - 1258 Total number of counties where SBIEP training took place through 9/30/2011 – All 8 RESAs twice
and central locations 6 times (all 57 districts have been trained) Total number of people trained on SBIEP through 9/30/2011 - 1050 Official Updates and communications -6 to the field including administrators and users. All districts are fully implementing the Online IEP
Revisions, with Justification, to Proposed Targets / Improvement Activities / Timelines /Resources for 2011-2012 (FFY 2011) No revisions are proposed at this time.

APR Template – Part B (4) West Virginia.
State
Part B State Annual Performance Report for FFY2010 Page 62
NO REPORTING REQUIRED FOR FFY 2010
Part B State Annual Performance Report (APR) for __________ (Insert FFY)
Overview of the Annual Performance Report Development:
Monitoring Priority: FAPE in the LRE
Indicator 6: Percent of children aged 3 through 5 with IEPs attending a:
A. Regular early childhood program and receiving the majority of special education and related services in the regular early childhood program; and
B. Separate special education class, separate school or residential facility.
(20 U.S.C. 1416(a)(3)(A))
Measurement:
A. Percent = [(# of children aged 3 through 5 with IEPs attending a regular early childhood program and receiving the majority of special education and related services in the regular early childhood program) divided by the (total # of children aged 3 through 5 with IEPs)] times 100.
B. Percent = [(# of children aged 3 through 5 with IEPs attending a separate special education class, separate school or residential facility) divided by the (total # of children aged 3 through 5 with IEPs)] times 100.

APR Template – Part B (4) West Virginia.
State
Part B State Annual Performance Report for FFY2010 Page 63
Part B State Annual Performance Report (APR) for FFY 2009 (2009-2010)
Overview of the Annual Performance Report Development:
See Indicator I
Monitoring Priority: FAPE in the LRE
Indicator 7: Percent of preschool children aged 3 through 5 with IEPs who demonstrate improved:
A. Positive social-emotional skills (including social relationships);
B. Acquisition and use of knowledge and skills (including early language/ communication and early literacy); and
C. Use of appropriate behaviors to meet their needs.
(20 U.S.C. 1416 (a)(3)(A))
Measurement:
Outcomes:
A. Positive social-emotional skills (including social relationships);
B. Acquisition and use of knowledge and skills (including early language/communication and early literacy); and
C. Use of appropriate behaviors to meet their needs.
Progress categories for A, B and C:
a. Percent of preschool children who did not improve functioning = [(# of preschool children who did not improve functioning) divided by (# of preschool children with IEPs assessed)] times 100.
b. Percent of preschool children who improved functioning but not sufficient to move nearer to functioning comparable to same-aged peers = [(# of preschool children who improved functioning but not sufficient to move nearer to functioning comparable to same-aged peers) divided by (# of preschool children with IEPs assessed)] times 100.
c. Percent of preschool children who improved functioning to a level nearer to same-aged peers but did not reach it = [(# of preschool children who improved functioning to a level nearer to same-aged peers but did not reach it) divided by (# of preschool children with IEPs assessed)] times 100.
d. Percent of preschool children who improved functioning to reach a level comparable to same-aged peers = [(# of preschool children who improved functioning to reach a level comparable to same-aged peers) divided by (# of preschool children with IEPs assessed)] times 100.
e. Percent of preschool children who maintained functioning at a level comparable to same-aged peers = [(# of preschool children who maintained functioning at a level comparable to same-aged peers) divided by (# of preschool children with IEPs assessed)] times 100.
Summary Statements for Each of the Three Outcomes (use for FFY 2008-2009 reporting):
Summary Statement 1: Of those preschool children who entered the preschool program below age expectations in each Outcome, the percent who substantially increased their rate of growth by the time they turned 6 years of age or exited the program.
Measurement for Summary Statement 1:
Percent = # of preschool children reported in progress category (c) plus # of preschool children reported in category (d) divided by [# of preschool children reported in progress category (a) plus # of

APR Template – Part B (4) West Virginia.
State
Part B State Annual Performance Report for FFY2010 Page 64
preschool children reported in progress category (b) plus # of preschool children reported in progress category (c) plus # of preschool children reported in progress category (d)] times 100.
Summary Statement 2: The percent of preschool children who were functioning within age expectations in each Outcome by the time they turned 6 years of age or exited the program.
Measurement for Summary Statement 2: Percent = # of preschool children reported in progress category (d) plus [# of preschool children reported in progress category (e) divided by the total # of preschool children reported in progress categories (a) + (b) + (c) + (d) + (e)] times 100.
Measurable and Rigorous Targets for FFY 2010
Summary Statements Outcome A Positive Social Emotional Skills
Outcome B Acquisition and Use of Knowledge and Skills
Outcome C Use of Appropriate Behaviors to Meet Needs
Of those children who entered or exited the program below age expectations, the percent who substantially increased their rate of growth by the time they turned 6 years of age or exited the program
75%
68%
73%
The percent of children who were functioning within age expectations by the time they turned 6 years of age or exited the program
83%
65%
84%
Actual Data for FFY 2010 (2010-2011)
Improvement data for all students with IEPs who met the entry and exit criteria for data collection are reported below. For Outcome A., the target was exceeded for item 1, but was not reached for item 2. Both measures met or exceeded the target for Outcome B. For Outcome C, item 1 exceeded the target, while the target for item 2 was not met.
Actual Target Data - Summary Statements – FFY 2010 (2010-2011) % of children
Outcome A: Positive social-emotional skills (including social relationships)
1. Of those children who entered or exited the program below age expectations in Outcome A, the percent who substantially increased their rate of growth by the time they turned 6 years of age or exited the program
77%
2. The percent of children who were functioning within age expectations in Outcome A by the time they turned 6 years of age or exited the program
82%
Outcome B: Acquisition and use of knowledge and skills (including early language/communication and early literacy)
1. Of those children who entered or exited the program below age expectations in Outcome B, the percent who substantially increased their rate of growth by the time they turned 6 years of age or exited the program
69%
2. The percent of children who were functioning within age expectations in Outcome B by the time they turned 6 years of age or exited the program
65%

APR Template – Part B (4) West Virginia.
State
Part B State Annual Performance Report for FFY2010 Page 65
Outcome C: Use of appropriate behaviors to meet their needs
1. Of those children who entered or exited the program below age expectations in each Outcome , the percent who substantially increased their rate of growth by the time they turned 6 years of age or exited the program
75%
2. The percent of children who were functioning within age expectations in each Outcome by the time they turned 6 years of age or exited the program
82%
Outcome A: Positive social-emotional skills (including social relationships)
OSEP Progress Categories Number of Children
Percent of Children
a) children who did not improve functioning 115 4%
b) children who improved functioning, but not sufficiently to move nearer to functioning comparable to same-aged peers
135 5%
c) children who improved functioning to a level nearer to same-aged peers but did not reach it
216 8%
d) children who improved functioning to reach a level comparable to same-aged peers
636
25%
e) children who maintained functioning at a level comparable to same-aged peers
1477 57%
Total with IEPs 2579 100%
Outcome B: Acquiring and using knowledge and skills
OSEP Progress Categories Number of Children
Percent of Children
a) children who did not improve functioning 188 7%
b) children who improved functioning, but not sufficiently to move nearer to functioning comparable to same-aged peers
313 12%
c) children who improved functioning to a level nearer to same-aged peers but did not reach it
405 16%
d) children who improved functioning to reach a level comparable to same-aged peers
706 27%
e) children who maintained functioning at a level comparable to same-aged peers
967 37%
Total with IEPs 2579 100%

APR Template – Part B (4) West Virginia.
State
Part B State Annual Performance Report for FFY2010 Page 66
Outcome C: Taking appropriate action to meet needs
OSEP Progress Categories Number of Children
Percent of Children
a) children who did not improve functioning 125 5%
b) children who improved functioning, but not sufficiently to move nearer to functioning comparable to same-aged peers
137 5%
c) children who improved functioning to a level nearer to same-aged peers but did not reach it
195 8%
d) children who improved functioning to reach a level comparable to same-aged peers
596 23%
e) children who maintained functioning at a level comparable to same-aged peers
1526 59%
Total with IEPs 2579 100%
The data collection includes children who entered 2007-2008, 2008-2009 and 2009-2010 and exited the program in 2010-2011. All children whose services were initiated during this time in the districts are included in the system, provided they remained in the program at least six months. .All students with disabilities in pre-k programs were assessed using the Creative Curriculum GOLD assessment, which was revised with new cut scores in 2009-2010. In 2010-2011, progress data were collected for 2,579 children; of that number 66% were males and 34% were females. The data incorporated 393 classrooms from 55 school districts. Eighteen percent were 3 – 4 years of age, and 82% were 4 – 5 years of age. Among the 2,579 assessed, the proportion of children reported with a Black race/ethnicity was 3%. This reflects a decrease of 104 children and an additional 3 classrooms from last year. Because this is the second year of using the GOLD assessment with the revised cut scores, comparison with last year’s scores may be made. The percentages of children in the progress categories demonstrated an increase. The data include children who received services for two or three years depending on the age of entry of the child. The data exclude those children who have been in program for fewer than six months.
The table below compares FFY 2009 against the actual data from FFY 2010. Progress was evident in all Outcome Areas for Summary Statement 1 and in Outcome B for Summary Statement 2. Slippage was noted in Outcome C for Summary Statement 2 and Outcome A remained at 82% for 2 consecutive years.
Comparison of FFY 2009 to FFY 2010 Data
Summary Statements Outcome A Positive Social Emotional Skills
Outcome B Acquisition and Use of Knowledge and Skills
Outcome C Use of Appropriate Behaviors to Meet Needs
Of those children who entered or exited the program below age expectations, the percent who substantially increased their rate of growth by the time they turned 6 years of age or exited the program
FFY 2009 74% 67% 72%
FFY 2010
77%
69%
75%
The percent of children who were functioning within age expectations by the time they turned 6 years of age or exited the program
FFY 2009 82% 64% 83%
FFY 2010
82%
65%
82%

APR Template – Part B (4) West Virginia.
State
Part B State Annual Performance Report for FFY2010 Page 67
Discussion of Improvement Activities Completed and Explanation of Progress or Slippage that occurred for FFY 2010:
Explanation of Slippage - Revisions to the Assessment Cut Scores and the Implementation of a new WV Pre-k Assessment System:
Over the past three years, states using the publishers’ system for reporting progress of young children have noted a larger than expected proportion of typically developing children. A review of the data found children rated a 6 or a 7 were performing below what would be considered typical development for their age. All states using the seven point scale were experiencing higher than expected numbers of children as performing at a typical level. Teaching Strategies and the Early Childhood Outcomes Center partnered to review the original process for converting student assessment data into the OSEP reporting categories within the online system. A set of methods were developed to revise and validate the new process for the cut-scores used for the conversion within the online assessment system. The data for 2010 show a slight increase in all three outcomes for those children for the Outcome Summary statement1. For the children in Outcomes Summary Statement 2 remains consistent for Outcome A, 1% decrease for Outcome 2 and 3.
The analysis of this process found children with and without disabilities were used in the sample from the original research. The assessment data we used to estimate age expected functioning for the children. The age-expected performance was used to benchmark either the seven or the nine points along a range of typical development for each age band. A sample of children with disabilities’ performance was compared to the benchmarks. The validation of the new scores was based on the previous research and the federally reported state data.
As a result of the new cut scores in the system, children must achieve higher scores to be rated as performing similar to same age peers within the system. The new cut scores ensure the data being reported are a more accurate representation of the status of the children. However, this changes the summary statements data that were used to establish targets. It does NOT reflect an actual decrease in the performance of the children; only a change in the measurement. The data for the progress categories indicate a better picture of the children falling within reporting categories. The majority of children are no longer falling into category e; however, West Virginia still has a higher percentage of children in this category compared to the other categories. The State is in the process of implementing The WV Pre-k Child Assessment System for Universal Pre-k and special education. The system is a unified system for all children. The partners in the early childhood system are Universal Pre-k, special education, Head Start and child care partners. The system was field tested in 2010 with full implementation in 2011. In 2010-2011, LEAs were requested to review the GOLD assessment data to clear up duplicate files and to complete entry and exit information for all children. This could account for the decrease in the number of children participating in the system.
Discussion of Improved Child Outcomes
As displayed in the above table (Actual Target Data - Summary Statements – FFY 2010), even with changes in the cut scores last year, a majority of children demonstrated improved outcomes positive social-emotional skills, acquisition and use of knowledge and skills and use of appropriate behaviors to meet their needs.
Summary Outcome Statement A: In the area of positive social-emotional skills (including social relationships), data indicate over 77% of the children are exiting the program with a sustained change in their rate of development, and over 82% exited within age expectations. Significant progress in this area is attributed to the state-wide Early Childhood Positive Behavior Support initiative. In the past five years, approximately 600 teachers and support staff have been trained. The goal is to scale-up this initiative to all districts and preschool classrooms over the next three - four years. West Virginia is working with the Technical Assistance Center on Social Emotional Intervention for Young Children (TACSEI) to better link the implementation of early childhood positive behavior supports data to determine the impacts and implications for early childhood outcomes. The scale –up of the system includes a Birth – Five system to

APR Template – Part B (4) West Virginia.
State
Part B State Annual Performance Report for FFY2010 Page 68
pull in the infant and toddler and home visiting components of the early childhood system for the TACSEI implementation. Summary Outcomes Statement B: In the area of acquisition and use of knowledge and skills (including early language/communication and early literacy) data indicate 69% of children entering below age level exited the program with a sustained change in their rate of development, and 65% exited the program within age expectations. The OSP has a implemented several early literacy activities directed toward this outcome. The Center for Early Learning and Language (CELL) has implemented several focused technical assistance trainings. The CELL training is also connected to Language Enhancement and Enrichment Program (LEEP) being provided for sustained professional development regarding oral language and literacy within the Bridges to Literacy General Supervision Enhancement Grant (See Indicator 3 for a detailed summary) CELL is also integrated as part of the TACSEI initiated with incorporation of the Language and Literacy skills as part of the training. Summary Outcome Statement C: In the area of use of appropriate behaviors to meet their needs, data indicate 75% of the children entered below age level and exited the program with a sustained change in their rate of development and 82% exited the program within age expectations. Children Functioning Comparable to Same-Aged Peers
As displayed below, progress data continues to demonstrate higher numbers and percentages in the OSEP category “e”, children who maintained functioning at a level comparable to same-aged peers. In 2007-2008, 2008-2009, and 2009 -2010 over half of the children for each of the three outcome areas are maintaining functioning at a level comparable to same-aged peers. In 2010-2011, with the revisions in the cut-scores, the data indicate higher numbers in category “e”. However, the numbers of children in the other categories have increased slightly, which would be linked with change in cut scores, not a change in performance for those children. The number of children in category e in outcome two decreased slightly this year. Even with the slight decrease, the trends are consistent and not indicating significant increases overall. A significant number of children with speech/language impairment receive early childhood services. If has been speculated the high number of children in category “e” may be associated with this group, however, data currently are not maintained to verify this hypothesis. The transition to a new online platform for assessment and clear up of the electronic portfolios may be attributed to the decrease in category e and overall participation in the system. The reporting for the other categories a – d appears to be consistent year to year (see table above for full display of OSEP Progress Categories data for 2010-2011).
Outcomes 1 -3 For category “e” (children who maintained functioning at a level comparable to same-aged peers)
Outcome A
Outcome B
Outcome C
2006-2007 71% (240)
72% (242)
77% (261)
2007-2008 70% ( 462)
67% (444)
75% (493)
2008-2009 71% (1081)
67% (444)
76% (1142)
2009-2010
60% (1599)
38% (1024)
63% (1686)
2009 - 2010 57% 1477
37% 967
59% 1526

APR Template – Part B (4) West Virginia.
State
Part B State Annual Performance Report for FFY2010 Page 69
Revisions, with Justification, to Proposed Targets / Improvement Activities / Timelines / Resources for FFY 2011:
Previously, all districts had been required to use the Creative Curriculum online system for their assessment. . In 2010-2011, WVDE developed a data platform to capture assessment data for the new WV Pre-k Assessment System. The data platform system is built within WV Education Information System (WVEIS). Although LEAs are no longer required to use the Creative Curriculum online assessment system. all are still required to use a framework curriculum (Creative Curriculum and/or High Scope). For students in universal pre-k, the anchor assessment is the Early Learning Scale (ELS), with additional approved assessments chosen by the LEA applicable to assessing progress of students with disabilities. Assessment data for the individual student then are summarized using the Child Outcomes Summary Form (COSF), for which a screen is provided within the online system. The system then compiles the data from the individual COSF for each participating student.
In FFY 2011, it is anticipated all children participating in universal preK programs will be administered the Early Learning Scale (ELS) rating three times per year. Additionally, the COSF will be completed three times a year for children with disabilities. The outcomes data for this indicator will be generated by the online system, based on the COSF. The OSP will collaborate with the Office of School Readiness and the early childhood technical assistance centers to ensure a smooth transition to the ELS from Teaching Strategies Gold.
Improvement Activity Timeline Resources Status
7.3 Redesign the early childhood assessment process for data collection of outcomes and coordinate with Universal Prek System. Design guidance information for using the online platform
2010-2013 WVDE OSP WVDE OSR
Active 2010 - 12
7.4 Provide Early Learning Scale (ELS) training to improve administration and trainers of ELS assessment and data collection and reporting for Early Childhood Outcomes.
2005-2013 WVDE OSP WVDE OSR
Active Revised 2011
7.5 Partner with Technical Assistance Center on Social Emotional Intervention for Young Children to access experts in the field.
2011-2013 WVDE OSP WVDHHR TACSEI
Completed 2011

APR Template – Part B (4) West Virginia.
State
Part B State Annual Performance Report for FFY2010 Page 70
Part B State Annual Performance Report (APR) for FFY 2010 (2010-2011)
Overview of the Annual Performance Report Development:
See Indicator I
Monitoring Priority: FAPE in the LRE
Indicator 8: Percent of parents with a child receiving special education services who report that schools facilitated parent involvement as a means of improving services and results for children with disabilities.
(20 U.S.C. 1416(a)(3)(A))
Measurement: Percent = [(# of respondent parents who report schools facilitated parent involvement as a means of improving services and results for children with disabilities) divided by the (total # of respondent parents of children with disabilities)] times 100.
FFY Measurable and Rigorous Target
2010
(2010-2011)
38% of parents report that schools facilitated parent involvement as a means of improving services and results for children with disabilities at or above the National Center for Special Education Accountability Monitoring (NCSEAM) Standard of 600.
Actual Target Data for 2010-2011 (FFY 2010):
28
32 32 32
36 34
0
10
20
30
40
50
2006 2007 2008 2009 2010 2011
Percent of
parents reporting
school
invovlement at
or above the 600
point NCSEAM
standard
Survey Administration Year
Parent-School Partnership Survey

APR Template – Part B (4) West Virginia.
State
Part B State Annual Performance Report for FFY2010 Page 71
West Virginia Parent Survey 2006-2010
Percent of parents agreeing that schools facilitated parent involvement as a means of improving services and results for children with disabilities at or above the NCSEAM Standard of 600.
West Virginia Parents
Percent At or Above Standard
# Valid
Responses
Mean SE of mean SD
2005-2006 28% 1145 542 1.3% 145
2006-2007 32% 813 546 1.6% 152
2007-2008 32% 907 545 1.5% 162
2008-2009 32% 777 547 1.7% 158
Target Data
2009-2010 36% 715 563 1.8% 153
Target Data
2010-2011 34% 593 567 1.8% 152
External Benchmark from NCSEAM Pilot
17% 2705 481 0.7% 135
In the 2010-2011 survey, 34% of parents reported that schools facilitated parent involvement as a means of improving services and results for children with disabilities.
To collect statewide and district-level data regarding parent partnership efforts, the West Virginia Department of Education conducted a survey developed by NCSEAM. Although NCSEAM developed four measurement scales, OSEP determined the School Efforts to Partner with Parents scale could be used to measure SPP Indicator 8, the percentage of parents with a child receiving special education services who report that schools facilitated parent involvement as a means of improving services and results for children with disabilities. Therefore, WVDE, with approval of West Virginia Advisory Council for the Education of Exceptional Children (WVACEEC), elected to implement this scale, with 25 questions selected from the NCSEAM item bank by WVDE staff.
WVDE contracted with Avatar International, Inc. to conduct the survey, using 25-item customized surveys for parents of both Section 619 and school age students. The Section 619 survey was customized for West Virginia to include approximately 25 questions addressing the Preschool Efforts to Partner with Parents and Quality of Services specific to Indicator 8. Dr. Batya Elbaum and Dr. William Fisher were consulted to ensure validity of the survey. All items for both surveys were selected from the item bank following the procedures originally established by the developers. Because all items selected for both surveys were scaled together, it is possible to combine the results of the surveys for school age and section 619 students in a manner producing a valid and reliable measure.
In April 2011, the Parent-School Partnership Survey was administered for the sixth time utilizing the NCSEAM-recommended Part B standard, which was established through a consensus process with a nationally representative stakeholder group convened by NCSEAM. The recommended standard is a

APR Template – Part B (4) West Virginia.
State
Part B State Annual Performance Report for FFY2010 Page 72
score of 600. For a reference point, 550 is the mean -or average value- in the Partnership Efforts scale. A score of approximately 550 indicates the respective survey item(s) has “been accomplished, and that the vast majority of parents consider their schools to be performing in these areas” Moreover, “items that calibrate just above the average measure, those that fall from about 550 to 600, are of special interest in the quality improvement context. These items are quantitatively nearest to the average measure, and so are the ones that could most easily target improvement” (Special Education Parent Survey Results for the State of West Virginia, 2011, p. 29).
Therefore, the annually reported percentage represents the percent of parents at or above the standard score of 600 with a .95 likelihood of a response of “ agree,” “strongly agree” or “very strongly agree” with item 131 on the NCSEAM survey’s Partnership Efforts scale: ‘The school explains what options parents have if they disagree with a decision of the school.” This means we can be 95% confident that 36 percent of the parent respondents in 2009-2010 reported agreement at 0.3 standard deviations above the established mean of 550 that the school explained options to parents, if parents disagree with a decision of the school.
Importantly, the survey uses Rasch measurement to determine the percentage (i.e., 34% in 2010-2011) of parent agreement based on their responses to a set of questions scaled according to the level of difficulty in obtaining agreement. The numbers, scaling, and statistical methodology used in calculating this percentage are complex and do not provide a simple numerator and denominator. Therefore, simple numerators and denominators are not able to be reported.
The above results of the Section 619 survey and the 25 question school-age survey relative to this indicator are based on the following returned surveys. The return rate of 10.68% (i.e., 593 surveys from a population of 5,551 parents) resulted in a 95 percent confidence level with a confidence interval of 3.8, according to the Sample Calculator (http://www.surveysystem.com/sscalc.htm). This indicates 95 percent confidence in the result that 34 percent agreed with standards, within a range of plus or minus 3.8 percent.
Representativeness of the Sample and Returned Surveys
Race/Ethnicity of Students with Disabilities (SWD) in Survey Sample and Retuned Surveys
Compared to SWD in West Virginia Districts
2010-2011
American
Indian/ Alaska Native
Asian Black Hispanic
Pacific Islander/ Native
Hawaiian
Two or More
Races
White (not Hispanic
Total
Sample 6 10 247 23 1 34 5,230 5,551
0.11% 0.18% 4.45% 0.41% 0.02% 0.61% 94.22% 100.00%
Returned Surveys
0 2 21 3 1 4 562 593
0.00% 0.34% 3.54% 0.51% 0.17% 0.67% 94.77% 100.00%
WV Child Count
ages 3-21
61 152 2270 432 3 322 41767 45007
0.14%
0.34%
5.04%
0.96%
0.01% 0.72%
92.80% 100.00%
The sample included ten districts. The sampling plan approved by OSEP in the SPP was followed. Part B surveys and Section 619 surveys were mailed to parents of children with disabilities in the selected districts who were enrolled in February 2011. Attrition in the sample versus mailed surveys is attributed to some families having more than one student with a disability as indicated by more surveys being mailed than unduplicated parents/addresses and inaccuracies in the parent and address information.
The demographics of the sample included two large (1200-1550 SWDs), four medium (700-920 SWDs) and four small districts (under 500 SWD). This exceeded the minimum requirement in the sampling plan

APR Template – Part B (4) West Virginia.
State
Part B State Annual Performance Report for FFY2010 Page 73
of one large, three medium and three small size districts. The percentage of 619 students (ages 3-5) represented compared to the percentage of preschool students in the child count was 8.8 percent in the returned sample as compared to 12.3 percent in the statewide child count. All eight regions of the state (RESAs) were represented in the sample. Among the returned surveys, all were within the limits set for the sampling plan (+ or – 2 percent of state percentage) for race/ethnicity representation.
Parents of Students with Disabilities in the Sample and Survey Returns and West Virginia Child Count Ages 3-21 2010-2011
Disability Sample Return State
Autism 160 2.9% 25 4.2% 1381 3.1%
Emotional/Behavior Disorders 141 2.5% 13 2.2% 1588 3.5%
Speech/Language Impairments 2004 36.1% 175 29.5% 14735 32.7%
Deafblindness 1 0.0% 0 0.0% 10 0.02%
Deafness and Hard of Hearing 45 0.8% 10 0.1% 447 1.00%
Specific Learning Disabilities 1374 24.8% 143 24.1% 12148 27.0%
Mental Impairments 925 16.6% 107 18.0% 7147 15.9%
Other Health Impairments 582 10.5% 83 14.0% 4995 11.1%
Orthopedic Impairments 21 0.4% 2 0.3% 138 0.3%
Developmental Delay 250 4.5% 26 4.4% 2026 4.5%
Traumatic Brain Injury 8 0.1% 0 0.0% 114 0.3%
Blindness and Low Vision 40 0.7% 9 1.5% 278 0.6%
Grand Total 5551 100.0% 593 100.0% 45,007 100.00%
According to the sampling plan, the four major disability categories (speech/language impairments, specific learning disabilities, mental impairment and other health impairment) must be represented as well as a combined low incidence group. Both the sample and the returned surveys met this criterion, although within the return speech/language impairments and specific learning disabilities were somewhat underrepresented in the returns compared to the sample and the state census. Families with children diagnosed with Mental Impairment and Other Health Impairments were somewhat overrepresented. All grade levels pre-kindergarten through grade twelve were represented.

APR Template – Part B (4) West Virginia.
State
Part B State Annual Performance Report for FFY2010 Page 74
Discussion of Improvement Activities Completed and Explanation of Progress or Slippage that occurred for FFY 2010 (2010-2011):
Explanation of Slippage
West Virginia failed to meet the 2010-2011 rigorous target of 38% of parents (at or above the NCSEAM standard of 600) reporting schools facilitated parent involvement as a means of improving services and results for children with disabilities. Rather, 34% of parents responding expressed agreement above the NCSEAM standard of 600 for the 2010-2011 school year, compared to the external benchmark for the original NCSEAM survey of 17%. Survey results have remained stable in all administrations, indicating that schools are doing a satisfactory job of providing parents information and assistance in participating in the required special education processes, but may be less inclined to be proactive in connecting parents with other parents or organizations or providing parent training opportunities, as represented by items on the survey scale above the level of agreement attained by this year’s survey.
Explaining slippage at the state level is difficult due to the rotating nature of the sample. The ten districts surveyed during the current school year were survey for the first time in the current SPP/APR cycle. However, the few parents who made additional comments above and beyond the closed ended items expressed 1) general dismay with the distance and bus time required to travel to school each day; 2) inadequate communication between the school and parents; and 3) perceived failure to implement IEPs in the general education classrooms despite successful partnerships with the special educators.

APR Template – Part B (4) West Virginia.
State
Part B State Annual Performance Report for FFY2010 Page 75
The table below illustrates the range of districts results. The district with the most parents reporting dissatisfaction was district 5 with only 23.8% of parents reporting agreement above the NCSEAM standard of 600. Parent respondents from districts 9 and 6 reported the highest levels of agreement at 40.8% and 39.7%, respectively. Both districts exceeded the state target of 38% above the NCSEAM standard of 600.
District Parent Partnership Percentage 1 30.51%
2 27.27%
3 26.58%
4 29.55%
5 23.81%
6 39.66%
7 31.82%
8 33.33%
9 40.79%
10 35.53%
Individual telephone calls were made to each district in the survey sample for 2010-2011 to discuss the survey and how to assist parents with the completion of the survey. Additionally, emails were sent out to PERCs and directors of special education to explain the process and to advise them on how to help parents with issues. Also, the special education directors again were reminded to give parents the state’s toll-free number when they have problems with the survey.
The surveys were mailed in May 2011 by Avatar International to ensure school and Parent Educator Resource Center (PERC) staff were available to assist parents as needed. Additionally, if parents could not reach the local PERC, they contacted the parent coordinator through the toll-free number for assistance with the survey. These measures were implemented in an effort to improve survey returns.
Improvement Activities Implemented:
Targeted Technical Assistance.
WVDE continues to support a state-level parent coordinator to provide technical assistance to PERCS and individual parents of SWDs through the toll-free telephone and e-mail and to address state policy issues related to parents. The state level parent coordinator provides rapid response to parents and IEP teams in crisis and through structured educational venues such as Camp Gizmo, Parent Involvement Seminars and Family Forums, including professional development opportunities provided in collaboration with WVDE Division of Student Services and Title I.
Dropout Prevention Project. The OSP has received a technical assistance grant from the National Dropout Prevention Center for Students with Disabilities as described more extensively in Indicators I, 2, 13 and 14. Stakeholders participated in a planning meeting in March 2011 and thirteen targeted district teams participated in the first round of training in June 2011. Parent involvement received significant attention during the initial training. Teams were trained to identify status variables associated with dropping out that cannot be altered, such as socioeconomic status, parent dropout status and race/ethnicity. District teams were then challenged to emphasize alterable variables (i.e., school climate, parenting skills, educational support in the home and school policies) which can increase .parent involvement and partnership and decrease a youth’s overall likelihood of dropping out of school. The thirteen teams are scheduled to receive additional professional development in the area of parent involvement in July 2011 and will be asked to develop and implement a district dropout prevention plan which includes an element targeting increased parent support

APR Template – Part B (4) West Virginia.
State
Part B State Annual Performance Report for FFY2010 Page 76
Information on Evidence-Based Practices.
Parent Resources. The WVDE develops and updates a variety of web resources for parents of children with exceptionalities:
The Office of Special Programs PERC website (http://wvde.state.wv.us/osp/perc.html) houses a general guide for parents of students with special needs; links to other agencies, procedural safeguards, state special education policy, and PERC specific information.
A Parenting and Education website (http://wvde.state.wv.us/21stparents/) is available for all parents of students in West Virginia and cross references several PERC resources and resources helpful to families with children with special needs.
Other initiative-specific information, such as the parent brochure entitled, Understanding the Response to Intervention Process: A Parent’s Guide was created and posted to inform parents about specific initiatives like the Response to Intervention (RtI) process.
Autism Support. An Autism Guidance Document has been developed and disseminated to special education directors, parents and other support agencies to assist with the education of students with autism
Parent Educator Resource Centers. WVDE continues to provide technical assistance and support for district Parent Educator Resource Centers.
Core team training was conducted during the 2010-11 school year for Parent-Professional teams. This training was mandatory for any LEA interested in starting a PERC or counties who have added new staff members to an established PERC.
The 3-day PERC Leadership Conference was conducted in June 2011 in Snowshoe, WV by the OSP. The conference is devoted to parent-professional team trainings, information on state and national issues, and local PERC annual reports. Twenty-seven PERC representatives attended.
PERC staff and Camp Gizmo for families with children who need assistive technology. Two hundred and sixty five children, siblings, parents and camp staff participated in the weeklong event.
Parent Partnerships. The State Personnel Development Grant, Bridges to Literacy, continued to support West Virginia Parent Training Information through a subgrant. The Parent Partnership Workgroup continued to serve as a stakeholder group for input into OSP initiatives. Special Education Leadership Conference. A training session on SPP/APR Indicator 8 and parent involvement for SWDs was presented in September of 2010 to approximately 100 special education administrators (56%) and other special education staff (44%) in Charleston WV. At the conclusion of the leadership conference, 81% percent of all participants reported gaining useful information and resources on the APR indicators for improving education outcomes for students with disabilities. Finally, OSP recognizes that activities targeted at increasing parent involvement are inherently activities which positively impact all other student specific indicators in the SPP/APR. Although the above activities are not specifically cross-referenced in the other SPP/APR indicators, these activities very much connect to graduation and dropout rates, achievement, placement, social-emotional outcomes and post school outcomes, as well as the compliance indicators
Revisions, with Justification, to Proposed Targets / Improvement Activities / Timelines / Resources for 2011
For the SPP/APR extension (school years 2011-2012 and 2012-2013), the following activities will be implemented to increase response rate for the parent survey:
Through a new vendor contract, the WVDE will increase the number of districts surveyed in each of the two remaining years and will require the contractor to send follow-up surveys to nonrespondents.

APR Template – Part B (4) West Virginia.
State
Part B State Annual Performance Report for FFY2010 Page 77
Part B State Annual Performance Report (APR) for FFY 2010 (2010-2011)
Overview of the Annual Performance Report Development:
See Indicator 1
Monitoring Priority: Disproportionality
Indicator 9: Percent of districts with disproportionate representation of racial and ethnic groups in special education and related services that is the result of inappropriate identification.
(20 U.S.C. 1416(a)(3)(C))
Measurement:
Percent = [(# of districts with disproportionate representation of racial and ethnic groups in special education and related services that is the result of inappropriate identification) divided by the (# of districts in the State)] times 100.
Definition of Disproportionate Representation
The state’s current definition of disproportionate representation is a weighted risk ratio of 2.0 or higher with a cell size of 20 for overrepresentation and a weighted risk ratio of .25 or below with a cell size of 50 for underrepresentation. Subsequently, in 2010, the WVDE added a test of statistical significance to the procedures for determining disproportionate representation after consulting with the OSEP state contact for West Virginia. Therefore, in the analysis of the December 1, 2009 child count data (for the February 1, 2011 APR submission), the WVDE applied the Z-Tests of Two Proportions and/or Chi-Square Tests to the data for any district identified in the initial analysis. Districts determined to be over or underrepresented must conduct a review of policies, practices and procedures to determine whether the disproportionate representation is a result of inappropriate identification. The process for the review of the districts’ policies, practices and procedures is described below.
Determining Inappropriate Identification
Beginning with the 2007-2008 school year, a checklist for conducting student file reviews was initiated for districts that emerged with disproportionate representation when the WWR and cell size criterion was applied. Each district with disproportionate overrepresentation is required to conduct file reviews for all students in the identified category(ies) utilizing the Disproportionality File Review Checklist contained in the Annual Desk Audit workbook. The checklist outlines the specific procedures delineated in Policy 2419 pertaining to the identification, referral, evaluation and eligibility of students for special education and is the method for determining whether inappropriate identification has occurred. Based on the summarized results of the file reviews and other relevant information, including its review for underrepresentation, if necessary, the district determines and defines its compliance status on the corresponding indicators. The WVDE verifies LEA reviews and determination status through a desk audit verification, and an on-site review, as necessary. An on-site review is conducted in the event that a district failed to conduct the review or the district’s review is insufficient.
FFY Measurable and Rigorous Target
2010
(2010-2011)
0% of districts with disproportionate representation of racial and ethnic groups in special education and related services that is the result of inappropriate
identification.

APR Template – Part B (4) West Virginia.
State
Part B State Annual Performance Report for FFY2010 Page 78
Actual Target Data for 2010-2011 (FFY 2010):
Districts with Disproportionate Representation of Racial and Ethnic Groups that was the Result of Inappropriate Identification
FFY Total Number of Districts
Number of Districts with Disproportionate Representation
Number of Districts with Disproportionate Representation of Racial and Ethnic Groups that was the Result of Inappropriate Identification
Percent of Districts with Disproportionate Representation
FFY 2010
(2010-2011)
57 2 0 0%
All Disabilities District WRR Number of Students Race/Ethnic Group
Compliance Status
Overrepresentation 0 districts with disproportionate overrepresentation
Underrepresentation Monongalia .17 335 Asian Compliant
Wood .20 116 Asian Compliant
All LEAs were included in the analyses. All LEAs had a white subgroup large enough for identification of both underrepresentation and overrepresentation while 18 of 57 districts met the minimum cell requirement for the African American/Black racial category and an additional 6 districts met the minimum cell size for underrepresentation only. All districts met the cell size requirement for the White race/ethnicity category. Ten LEAs met the minimum cell requirement for the Hispanic race/ethnicity and nine LEAs met the cell size requirement for the Asian category. Twelve LEAs met the minimum cell size requirements for the Two or More race/ethnicity category. No districts met the minimum cell requirement for the remaining two race/ethnicity categories.
When the weighted risk ratio and the test of statistical significance were applied to the FFY 2010 Child Count and enrollment data, no districts emerged with disproportionate overrepresentation based on the aforementioned definition.
In the analysis of the FFY 2010 data, two LEAs emerged with disproportionate underrepresentation in the Asian race/ethnic group. As part of the ADA Indicator 9 review of policies, procedures and practices for underrepresentation, the WVDE required the districts to conduct a review to examine district-wide procedures and practices that may contribute to underrepresentation. Moreover, the WVDE directed the districts to review schools with a higher percentage of students in the designated race/ethnic group and/or school(s) that have emerged with possible concerns in the areas of pre-referral, identification and/or eligibility in the past.
State Review of District’s Procedures
Upon completion of its review, the district compiled and submitted its data to the WVDE for verification. The WVDE reviewed the district’s data and policies, procedures and practices and determined the underrepresentation was not due to inappropriate policies, procedures and practices. Therefore, 0% of districts emerged with disproportionate representation that was a result of inappropriate identification.

APR Template – Part B (4) West Virginia.
State
Part B State Annual Performance Report for FFY2010 Page 79
Discussion of Improvement Activities Completed and Explanation of Progress or Slippage that occurred for FFY 2010:
For six consecutive years (i.e., 2005-2006 through 2010-2011 school years), three or fewer districts emerged with disproportionate over and/or underrepresentation. Each year the WVDE verified the districts’ disproportionality was not due to inappropriate policies, procedures and practices. The data remain highly stable, and districts have reported this is due to processes such as RTI implementation in the elementary schools and strong problem-solving teams wherein students are provided prereferral interventions to meet academic and behavioral needs.
The following improvement activities were implemented in the 2010-2011 school year to address disproportionality and promote appropriate identification.
Improvement Activity 9.1 and 10.1 - WVDE provided training and clarification on the state’s definition of under- and overrepresentation and the policy, procedure and practice review process for districts at the Special Education Leadership Conference in October 2010 and subsequently, through a webinar in March 2011, for the districts identified with disproportionate representation. Both of these sessions included an overview of the examination of enrollment and child count data, the review protocols and the state’s responsibility for the supervision and reporting for Indicators 9 and 10. Attendance at the leadership conference was approximately 120 and was comprised of district special education directors and other pertinent staff. The March 2011 webinar was accessed by personnel from all districts responsible for the reviews of policies, practices and procedures.
Improvement Activity 9.2 and 10.2 - Support the implementation of the following evidence based practices for the provision of primary academic and behavioral interventions:
RTI Technical Assistance SY 2010-2011: Professional development on RTI was delivered at the regional level by eight RTI specialists hired by the OSP through an OSEP funded grant. At the elementary level, technical assistance was centered around two main points: developing a structure and climate to support tiered instruction and filling the structure with great instruction. Technical assistance was provided to principals and county administrators regarding options for developing a schedule that best utilizes available staff and resources to maximize services for students. Guidance was provided to groups of teachers in how to examine benchmark assessment data to determine the basis of why a student is struggling and how to match this student need to the proper instruction. Teachers were trained to utilize instructional programs available through the WVDE, such as the WV Phonological Awareness Program, Explicit Phonics program, and Acuity to meet students’ instructional needs. For a detailed report of districts and participants receiving professional development in the area of RTI, please reference Indicator 3.
The initial Early Childhood Positive Behavior Supports (ECPBS) training has been provided to a total of 450 preschool, childcare and Head Start programs in the state. Two districts implementing ECPBS district-wide have provided the training to all kindergarten teachers and assistants this school year. The WVDE is offering this training to other districts interested in implementing ECPBS district-wide.
The School-Wide Positive Behavior Supports initiative is ongoing. Districts/schools must apply and go through a selection process outlined on the PBS website once administrative commitment is obtained. A total of 6 new school teams were trained this year.
Improvement Activity 9.5 and 10.5 - A guidance document for the implementation of speech-language services in West Virginia was developed and disseminated by the OSP Coordinator for Speech/Language Services in March through June 2011. The purpose of the guidance document is to provide a resource for SLPs working in the public schools that incorporate both state and federal regulations and best practice in the field of speech/language pathology. In addition to outlining the role of SLPs in the schools, the document specifically delineates the identification/referral, evaluation and eligibility procedures and the decision-making process for IEP development. The document is located on the OSP website at http://wvde.state.wv.us/osp/speechbestpractices.html.
Professional development was provided throughout the state in a variety of venues, including the WV Speech and Hearing Annual Convention (300 participants), the statewide Special Education Leadership

APR Template – Part B (4) West Virginia.
State
Part B State Annual Performance Report for FFY2010 Page 80
Spring Conference (200 participants), regional trainings at each one of the 8 RESAs (120 participants), the Parent-Educator Resource Centers Annual Meeting (30 participants) and to 6 individual districts (90 participants). The evaluation data from the professional development was positive and overwhelmingly supported the need for the document.
Improvement Activity 9.6 and 10.6 - Participate in professional development opportunities focused on improving results for at risk students to gain an increased awareness and understanding of effective strategies to address disproportionality in the state and individual districts. OSP staff accessed technical assistance related to Indicators 9 and 10 and at-risk students by attending relevant sessions at OSEPs Mega-Conference in August 2010 and 2011as well as Indicator specific webinars and SPP/APR monthly conference calls.
The WVDE has solicited questions from the districts pertaining to evaluation and eligibility in the categorical areas of Autism, Other Health Impairment, Sensory Impairments and Specific Learning Disabilities (SLD) for dissemination at the 2011 Fall Leadership Conference in September 2011. Evaluation results of the training for eligibility determination will be reported in the APR due February 1, 2013.
Improvement Activity 9.7 and 10.7 - The Office of Special Programs co-sponsored training on the Autism Diagnostic Observation Schedule (ADOS) with Marshall University School Psychology Program, the West Virginia School Psychologists Association and the Marshall University Autism Training Center. The ADOS training was provided in an effort to strengthen district capacity in the area of autism assessment in response to district need. The training was held on April 30 and May 1, 2011 at the Marshall University Graduate College in Charleston. The two-day training was well received by the 42 school psychologist and included:
an introduction to the ADOS, the “gold standard” tool for autism diagnosis; review of Modules 1, 2, 3 and 4; live administration of a module(s); review of administration and scoring; and a discussion on clinical use and implications of the ADOS.
Prior to the training, only one of every two participants reported they feel confident enough to make an initial autism diagnosis in the absence of a medical diagnosis, as permitted under WV Policy 2419. Moreover, the majority of school psychologist participants reported feeling only somewhat confident in their ability to provide strong psycho-educational recommendations for students with autism spectrum disorders.
Additional ADOS trainings and follow-up support in the area of autism assessment is planned for the 2011-2012 school year in response to evaluation data and district need. Eight ADOS kits were also purchased by the Office of Special Programs for district use. The kits are housed at the RESAs for lending purposes for districts without the financial resources or enrollment size to justify the local purchase.
Revisions, with Justification, to Proposed Targets / Improvement Activities / Timelines / Resources for FFY 2011:
There are no revisions proposed to the SPP targets, improvement activities or timelines at this time.

APR Template – Part B (4) West Virginia.
State
Part B State Annual Performance Report for FFY2010 Page 81
Part B State Annual Performance Report (APR) for FFY 2010 (2010-2011)
Overview of the Annual Performance Report Development:
See Indicator 1
Monitoring Priority: Disproportionality
Indicator 10: Percent of districts with disproportionate representation of racial and ethnic groups in specific disability categories that is the result of inappropriate identification.
(20 U.S.C. 1416(a)(3)(C))
Measurement:
Percent = [(# of districts with disproportionate representation of racial and ethnic groups in specific disability categories that is the result of inappropriate identification) divided by the (# of districts in the State)] times 100.
Definition of “Disproportionate Representation” and Methodology
The state’s current definition of disproportionate representation is a weighted risk ratio of 2.0 or higher with a cell size of 20 for overrepresentation, that is, at least 20 students with disabilities in a given disability category and in the given racial/ethnicity category; and a weighted risk ratio of .25 or below with a cell size of 50 for underrepresentation, that is, at least 50 students (with and without disabilities) in the total enrollment for a given race/ethnicity.
Subsequently, in 2010, the WVDE added a test of statistical significance to the procedures for determining disproportionate representation after consulting with the OSEP state contact for West Virginia. Therefore, in the analysis of the December 1, 2009 child count data (for the February 1, 2011 APR submission), the WVDE applied the Z-Tests of Two Proportions and/or Chi-Square Tests to the data for any district identified in the initial analysis. Districts determined to be over or underrepresented must conduct a review of policies, practices and procedures to determine whether the disproportionate representation is a result of inappropriate identification. The process for the review of the districts’ policies, practices and procedures is described below.
Determining Inappropriate Identification
Beginning with the 2007-2008 school year, a checklist for conducting student file reviews was initiated for districts that emerged with disproportionate representation when the WWR and cell size criterion was applied. Each district with disproportionate overrepresentation is required to conduct file reviews for all students in the identified category(ies) utilizing the Disproportionality File Review Checklist contained in the Annual Desk Audit workbook. The checklist outlines the specific procedures delineated in Policy 2419 pertaining to the identification, referral, evaluation and eligibility of students for special education and is the method for determining whether inappropriate identification has occurred. Based on the summarized results of the file reviews and other relevant information, including its review for underrepresentation, if necessary, the district determines and defines its compliance status on the corresponding indicators. The WVDE verifies LEA reviews and determination status through a desk audit verification, and an on-site review, as necessary. An on-site review is conducted in the event that a district failed to conduct the review or the district’s review is insufficient.
OSEP’s Response to the FFY2009 APR
Because the State reported less than 100% compliance for FFY 2009 (greater than 0% actual target data for this indicator), OSEP indicated the State must report on the status of correction of noncompliance reflected in the data the State reported for this indicator. The state must demonstrate, in the FFY 2010 APR, that the district identified in FFY 2009 with disproportionate representation of racial and ethnic groups in specific disability categories that was the result of inappropriate identification is in compliance with the requirements of 34 CFR §§300.111, 300.201, and 300.301 through 300.311, including that the

APR Template – Part B (4) West Virginia.
State
Part B State Annual Performance Report for FFY2010 Page 82
state verified that the one district with noncompliance: (1) is correctly implementing the specific regulatory requirements (i.e., achieved 100% compliance) based on a review of updated data such as data subsequently collected through on-site monitoring or a state data system; and (2) has corrected each individual case of noncompliance, unless the child is no longer within the jurisdiction of the district, consistent with OSEP Memorandum 09-02 dated October 17, 2008 (OSEP Memo 09-02). In the FFY 2010 APR, the state must describe the specific actions that were taken to verify the correction. Please see the section below, Correction of FFY 2009 Findings of Noncompliance, for West Virginia’s response.
FFY Measurable and Rigorous Target
FFY 2010 2010-2011
0% of districts with disproportionate representation of racial and ethnic groups in specific disability categories that is the result of inappropriate identification.
Actual Target Data for FFY 2010:
Districts with Disproportionate Representation of Racial and Ethnic Groups in Specific Disability categories that was the Result of Inappropriate Identification
FFY Total Number of Districts
Number of Districts with Disproportionate Representation
Number of Districts with Disproportionate Representation of Racial and Ethnic Groups that was the Result of Inappropriate Identification
Percent of Districts with Disproportionate Representation as a result of inappropriate identification
FFY 2010 (2010 -2011)
57
13
0 0%
Minimum Cell Requirement: All districts were included in the analyses for each disability category. All 57 districts met the minimum cell requirement of 50 for underrepresentation, while 56 of 57 districts met the minimum cell requirement of 20 for overrepresentation for at least one disability category (see table below). The one LEA not meeting the minimum cell requirement for overrepresentation was the WV Schools for the Deaf and Blind, which predominantly enrolls children with low incident sensory impairments. Data Include 7 race/ethnicities categories. Note: To meet the minimum cell requirement for underrepresentation, a district must have at least 50 students (with and without disabilities) in the total enrollment for a given race/ethnicity. To meet the minimum cell requirement for overrepresentation, a district must have at least 20 students with disabilities in a given disability category and in the given racial/ethnicity category.

APR Template – Part B (4) West Virginia.
State
Part B State Annual Performance Report for FFY2010 Page 83
Indicator 10 Number of Districts Meeting Minimum Cell Requirement*
Total Number
of Districts Meeting Cell Size
for at least One
Disability Area
Autism Communication Disorders
Emotional Behavioral Disorders
Other Health Impairments
Mental Impairments
Specific Learning Disabilities
Overrepresentation (Cell Size = 20)
IDEA Child Count by race/ethnicity categories
21 54 23 44 55 56 56
Underrepresentation (Cell Size = 50) Total Enrollment by race/ethnicity categories
57 57 57 57 57 57 57
Overrepresentation WWR ≥ 2.0 and Cell Size ≥ 20
Based on December 1, 2010 Child Count Data
Disability Category District Weighted Risk Ratio
Number of Students
Race/Ethnicity
Compliance Status
Speech Language Impairment (CD)
Greenbrier 2.77 201 White
Compliant
Mental Impairments Monongalia 2.01 162 White Compliant
Office of Institutional Education Programs (OIEP)
5.18 41 White Compliant
Specific Learning Disabilities (SLD)
McDowell 2.50 176 White Compliant
Underrepresentation WWR ≤ .25 and Cell Size ≥ 50
Based on Second Month Enrollment Data
Disability Category District Weighted Risk Ratio
Number of Students in Dec. 1, 2010 Child Count
Race/Ethnicity Compliance Status
Speech/Language Impairment (CD)
Greenbrier .22 2 Black Compliant
Mingo .18 5 or fewer Black Compliant
Wood .18 5 or fewer Asian Compliant
Emotional Behavior Disorders (EBD)
Jackson .24 40 White Compliant
Lewis .05 5 White Compliant
Mingo .13 7 White Compliant

APR Template – Part B (4) West Virginia.
State
Part B State Annual Performance Report for FFY2010 Page 84
Monongalia .00 0 Asian Compliant
Roane .04 7 White Compliant
Taylor .03 4 White Compliant
Mental Impairments OIEP .19 5 or fewer Black Compliant
Kanawha .11 5 or fewer Asian Complaint
.00 5 or fewer Hispanic Compliant
Monongalia .17 5 or fewer Asian Compliant
Other Health Impairments
Kanawha .15 5 or fewer Asian Compliant
Monongalia .19 5 or fewer Asian Compliant
.23 5 or fewer Hispanic Compliant
Specific Learning Disability
Berkeley .21 5 or fewer Asian
Jefferson .00 5 or fewer Asian Compliant
Monongalia .11 5 or fewer Asian Compliant
In FFY 2010, a total of 4 districts emerged with disproportionate overrepresentation and 12 with disproportionate underrepresentation.
In FFY 2010, a total of 13 districts were identified with disproportionate representation. One district emerged with a disproportionate overrepresentation of white students in the category of speech/language impairments when the criteria were applied. This district has experienced a recurrence of disproportionate overrepresentation and consequently, reviewed its policies, practices and procedures to determine its status on the ADA last year. Additionally, two districts had an overrepresentation of white students with mental impairments and one district had an overrepresentation of white students with specific learning disabilities. Each one of the districts conducted the required review and determined its status as Compliant as a result of the process.
For FFY 2010, no districts emerged with disproportionate underrepresentation in the category of autism when compared to four districts last year. In the emotional behavior disorders category, 6 districts exhibited underrepresentation, 5 of those districts for white students and 1 for Asian students. Three districts emerged with underrepresentation in the mental impairment category; one of those for black students, 1 for Asian students and 1 for Asian and Hispanic students. In the category of OHI, one district emerged in Asian and one with Asian and Hispanic. Finally, three districts emerged with underrepresentation in the specific learning disabilities category for Asian students. For the April 1, 2011 ADA submission, each district identified with disproportionate underrepresentation was directed to examine its data specific to the particular students in the racial/ethnic groups identified and in specific schools to determine whether the underrepresentation was a result of inappropriate procedures and/or practices pertaining to the identification, referral, evaluation and/or eligibility of students in the aforementioned racial/ethnic groups. Each of the 12 districts determined its status as compliant.
State’s Review of Districts’ Procedures
To verify the districts are appropriately conducting the reviews for both over and underrepresentation and subsequently, determining compliance status, the WVDE conducted desk audit reviews of the 13 districts. The results of the state’s reviews confirm the 13 districts have appropriate identification procedures and practices in place and the inappropriate identification is not a result of inappropriate policies, practices or procedures.
Correction of Noncompliance
In FFY 2009, one district was identified with disproportionate representation that was a result of inappropriate identification. The State notified the district on April 26, 2011 the State would conduct an

APR Template – Part B (4) West Virginia.
State
Part B State Annual Performance Report for FFY2010 Page 85
on-site visit to verify correction of the noncompliance. The WVDE conducted an on-site visit on May 16, 2011 to review student specific data to verify the district has corrected the noncompliance and collect the district’s updated data (10% of files for new transfer students in the district) to ensure the district is correctly implementing the requirements in 34 CRF §§300.111, 300.201 and 300.301 through 300.311. In addition, the district was required to submit its District Review of Policies, Practices and Procedures for Disproportionate Representation (Underrepresentation) to verify the district is correctly following the procedures for determining its compliance status. On May 23, 2011 the WVDE met with the on-site team to review the updated data. Upon review, the State verified the district has corrected each incidence of noncompliance and is correctly implementing the specific regulatory requirements in 34 CRF §§300.111, 300.201 and 300.301 through 300.311.
Discussion of Improvement Activities Completed and Explanation of Progress or Slippage that occurred for FFY 2010:
In FFY 2010 13 districts were identified with disproportionate under- or overrepresentation, as compared to 14 districts in FFY 2009. Moreover, none of the districts with disproportionate under- or overrepresentation was attributed to the inappropriate implementation of policies, procedures or practices as compared to one district in FFY 2009.
Year Number of Districts Identified with Disproportionate Representation
Number of Districts with Disproportionate Representation due to inappropriate implementation of policy, procedures or practices
FFY 2010 13 0
FFY 2009 14 1
FFY 2008 9 1
FFY 2007 21 0
FFY 2006 7 0
Districts have reported this low number is due to processes such as RTI implementation in the elementary schools and strong problem-solving teams wherein students are provided pre-referral interventions to meet academic and behavioral needs. One district identified with disproportionate overrepresentation of Black students with IEPs in the area of Behavior Disorders in 2006-2007 and 2007-2008 has implemented School-Wide Positive Behavior Supports with integrity. This district has not been identified with disproportionate representation in any category during 2008-2009 or 2009-2010 and reports implementation of School-Wide Positive Behavior Supports as the causal variable.
The following improvement activities were implemented in the 2010-2011 school year to address disproportionality and promote appropriate identification.
Improvement Activity 9.1 and 10.1 - WVDE provided training and clarification on the state’s definition of under- and overrepresentation and the policy, procedure and practice review process for districts at the Special Education Leadership Conference in October 2010 and subsequently, through a webinar in March 2011, for the districts identified with disproportionate representation. Both of these sessions included an overview of the examination of enrollment and child count data, the review protocols and the state’s responsibility for the supervision and reporting for Indicators 9 and 10. Attendance at the leadership conference was approximately 120 and was comprised of district special education directors and other pertinent staff. The March 2011 webinar was accessed by personnel from all districts responsible for the reviews of policies, practices and procedures.
Improvement Activity 9.2 and 10.2 - Support the implementation of the following evidence based practices for the provision of primary academic and behavioral interventions:
RTI Technical Assistance SY 2010-2011: Professional development on RTI was delivered at the regional level by eight RTI specialists hired by the OSP through an OSEP funded grant. At the elementary level, technical assistance was centered around two main points: developing a structure and climate to support tiered instruction and filling the structure with great instruction.

APR Template – Part B (4) West Virginia.
State
Part B State Annual Performance Report for FFY2010 Page 86
Technical assistance was provided to principals and county administrators regarding options for developing a schedule that best utilizes available staff and resources to maximize services for students. Guidance was provided to groups of teachers in how to examine benchmark assessment data to determine the basis of why a student is struggling and how to match this student need to the proper instruction. Teachers were trained to utilize instructional programs available through the WVDE, such as the WV Phonological Awareness Program, Explicit Phonics program, and Acuity to meet students’ instructional needs. For a detailed report of districts and participants receiving professional development in the area of RTI, please reference Indicator 3.
The initial Early Childhood Positive Behavior Supports (ECPBS) training has been provided to a total of 450 preschool, childcare and Head Start programs in the state. Two districts implementing ECPBS district-wide have provided the training to all kindergarten teachers and assistants this school year. The WVDE is offering this training to other districts interested in implementing ECPBS district-wide.
The School-Wide Positive Behavior Supports initiative is ongoing. Districts/schools must apply and go through a selection process outlined on the PBS website once administrative commitment is obtained. A total of 6 new school teams were trained this year.
Improvement Activity 9.5 and 10.5 - A guidance document for the implementation of speech-language services in West Virginia was developed and disseminated by the OSP Coordinator for Speech/Language Services in March through June 2011. The purpose of the guidance document is to provide a resource for SLPs working in the public schools that incorporate both state and federal regulations and best practice in the field of speech/language pathology. In addition to outlining the role of SLPs in the schools, the document specifically delineates the identification/referral, evaluation and eligibility procedures and the decision-making process for IEP development. The document is located on the OSP website at http://wvde.state.wv.us/osp/speechbestpractices.html.
Professional development was provided throughout the state in a variety of venues, including the WV Speech and Hearing Annual Convention (300 participants), the statewide Special Education Leadership Spring Conference (200 participants), regional trainings at each one of the 8 RESAs (120 participants), the Parent-Educator Resource Centers Annual Meeting (30 participants) and to 6 individual districts (90 participants). The evaluation data from the professional development was positive and overwhelmingly supported the need for the document.
Improvement Activity 9.6 and 10.6 - Participate in professional development opportunities focused on improving results for at risk students to gain an increased awareness and understanding of effective strategies to address disproportionality in the state and individual districts. OSP staff accessed technical assistance related to Indicators 9 and 10 and at-risk students by attending relevant sessions at OSEPs Mega-Conference in August 2010 and 2011as well as Indicator specific webinars and SPP/APR monthly conference calls.
The WVDE has solicited questions from the districts pertaining to evaluation and eligibility in the categorical areas of Autism, Other Health Impairment, Sensory Impairments and Specific Learning Disabilities (SLD) for dissemination at the 2011 Fall Leadership Conference in September 2011. Evaluation results of the training for eligibility determination will be reported in the APR due February 1, 2013.
Improvement Activity 9.7 and 10.7 - The Office of Special Programs co-sponsored training on the Autism Diagnostic Observation Schedule (ADOS) with Marshall University School Psychology Program, the West Virginia School Psychologists Association and the Marshall University Autism Training Center. The ADOS training was provided in an effort to strengthen district capacity in the area of autism assessment in response to district need. The training was held on April 30 and May 1, 2011 at the Marshall University Graduate College in Charleston. The two-day training was well received by the 42 school psychologist and included:
an introduction to the ADOS, the “gold standard” tool for autism diagnosis; review of Modules 1, 2, 3 and 4; live administration of a module(s);

APR Template – Part B (4) West Virginia.
State
Part B State Annual Performance Report for FFY2010 Page 87
review of administration and scoring; and a discussion on clinical use and implications of the ADOS.
Prior to the training, only one of every two participants reported they feel confident enough to make an initial autism diagnosis in the absence of a medical diagnosis, as permitted under WV Policy 2419. Moreover, the majority of school psychologist participants reported feeling only somewhat confident in their ability to provide strong psycho-educational recommendations for students with autism spectrum disorders.
Additional ADOS trainings and follow-up support in the area of autism assessment is planned for the 2011-2012 school year in response to evaluation data and district need. Eight ADOS kits were also purchased by the Office of Special Programs for district use. The kits are housed at the RESAs for lending purposes for districts without the financial resources or enrollment size to justify the local purchase.
Revisions, with Justification, to Proposed Targets / Improvement Activities / Timelines / Resources for FFY 2011:
WVDE reviewed the existing improvement activities per the FFY 2009 SPP/APR Response Table. However, there are no revisions proposed to the SPP targets, improvement activities or timelines at this time.

APR Template – Part B (4) West Virginia.
State
Part B State Annual Performance Report for FFY2010 Page 88
Part B State Annual Performance Report (APR) for 2010-2011 (FFY 2010)
Overview of the Annual Performance Report Development:
Monitoring Priority: Effective General Supervision Part B / Child Find
Indicator 11: Percent of children who were evaluated within 60 days of receiving parental consent for initial evaluation or, if the State establishes a timeframe within which the evaluation must be conducted, within that timeframe.
(20 U.S.C. 1416(a)(3)(B))
Measurement:
a. # of children for whom parental consent to evaluate was received. b. # of children whose evaluations were completed within 60 days (or State-established timeline).
Account for children included in a but not included in b. Indicate the range of days beyond the timeline when the evaluation was completed and any reasons for the delays.
Percent = [(b) divided by (a)] times 100.
FFY Measurable and Rigorous Target
FFY 2010 100% of students with parent consent for initial evaluations have evaluations completed within the 80-day timeframe established by West Virginia Policy 2419.
Actual Target Data for FFY 2010
Target Data for FFY 2010: 97.0%
6422+71+42=6535/6735=97.0
6535 students with parental consent for initial evaluation had evaluations completed within the 80-day timeframe established by West Virginia Policy 2419.
The 100% target was not met. A total of 200 individual findings of noncompliance across 40 districts were found.

APR Template – Part B (4) West Virginia.
State
Part B State Annual Performance Report for FFY2010 Page 89
Describe the method used to collect data
The West Virginia Education Information System special education record provides a screen for entering individual referral and evaluation information, including dates for tracking timelines for referral, consent, eligibility and individualized education program (IEP) development. Data entry is mandatory and is typically completed by the LEA special education office. Data were extracted from the records four times during the year and a file was provided to the Office of Special Programs (OSP). Upon receipt, the files were then analyzed to determine possible data entry errors. The OSP sent a formal letter to each district identifying specific student with missing and/or error data to be corrected. The final pull of the school year June 2011, was used for determination of compliance and reporting Indicator 11. The prior files served to promote accurate data entry throughout the year and were used to verify subsequent correction of noncompliance identified based on the prior year’s final data collection.
After error data were corrected by the districts and the final June 2011 file was obtained by WVDE, the data were filtered to remove the following: 1) duplicate entries; 2) entries outside the FFY 2010; 3) entries containing documented parental refusal to evaluate; 4) entries with no parental consent; 5) error data; and 6) students evaluated for the gifted program.
The data were then sorted based on the total number of days from parental consent to eligibility committee meeting. Those evaluations exceeding 80 days were sorted based on the reason entered by the district. Reason codes 4 and 8 (defined below) were removed as acceptable reasons for exceeding the 80-day timeframe. Results are summarized in the table below.
Evaluation Timeline Trend Data
Indicator 11 Measurement FFY 2005 Baseline
FFY 2006 FFY 2007 FFY 2008 FFY 2009 FFY 2010
# % # % # % # % # % # %
a. Students with consent for initial evaluation
8563 7868 9777 6969 6338 6735
b. Total with determinations within timelines Percent= b divided by a times 100
7067 82.5 7080 90.0 8965 91.7 6595 94.6 6015 94.9 6422 95.4
Total with determinations within timelines or provided acceptable reason for exceeding timelines.
Percent=(b+#4+#8 below/ a) X 100
9065 92.7 6676 95.8 6099 96.2 6535 97.0
Students not in b:
Students not in b due to missing data in student records
465 5.4 240 3.1 55 < 1 14 0.2 0 0 0 0
Students not in b due to exceeding timelines
1031 12.0 548 7.0 792 8.1 354 5.1 323 313 4.6
Students not in b due to error data 6 0.1 2 <0.1 0 0
Range of Days Timelines were Exceeded
1-99 1-176 1-302 1-386 1-303 1-445

APR Template – Part B (4) West Virginia.
State
Part B State Annual Performance Report for FFY2010 Page 90
Reasons for exceeding timelines:
Acceptable reasons ** (#4+#8) 100 81 84 113
1. Extenuating circumstances-disaster or inclement weather resulting in school closure
10 35 128 53 83 45
2. Excessive student absences 43 16 21 14 4 6
3. Student medical condition delayed evaluation
4 6 15 7 1 2
4. ** Parent failure to produce the student for evaluation during vacation or otherwise interrupting evaluation process
91 30 66 50 45 71
5. Eligibility committee meeting exceeded timelines due to documented parent request for rescheduling
96 56 100 41 30 14
6. Eligibility committee reconvened at parent request to consider additional evaluations
24 18 3 1 3
7. Student transferred into district during the evaluation process
39 2 5 3 3 2
8. **Student transferred out of district
17 2 34 31 39 42
9. WV BTT failed to provide notification 90 days or more before third birthday
1 1 0 0 1
10. WV BTT 90 day face-to-face meeting exceeded timeline or did not occur
3 1 1 1 0
11. 90 day face-to-face meeting exceeded timeline due to documented parent request to reschedule
3 0 1 0 0
12. IEP meeting exceeded timeline due to documented parent request to reschedule
6 10 2 1 2
13. District Error 99 272 128 84 82
Other (provide justification)
No longer an acceptable reason
15
No reason specified 716 265 121 20 31 31
TOTAL 1031 12.0 548 7.0 792 8.1 354 5.1 323 5.1 313 4.6

APR Template – Part B (4) West Virginia.
State
Part B State Annual Performance Report for FFY2010 Page 91
Percentage of Eligibility Determination within Timelines
Discussion of Improvement Activities Completed and Explanation of Progress or Slippage that occurred for (FFY 2009):
During 2010-2011, 97.0% of students received initial evaluations with in the 80 day timeline established by state policy. As a result of the improvement activities combined with improved efforts on the part of district personnel, the WVDE has shown consistent improved results for Indicator 11. From baseline data in 2005-2006 to current year, the WVDE has improved from 82.5% to 97.0% of initial evaluations being completed within the state-determined timeline. In addition, the number of students whose evaluations were not completed within the timeline declined from 239 in 2009-2010 to 200 in 2010-2011, while the percentage within timelines increased by 0.8 percentage points. Districts improved implementation of timelines despite an unusually snowy winter, which resulted in school closings and delays in completing evaluations.
Special education monitoring and data management staff completed the following professional development improvement activities to increase and maintain compliance with data entry and timelines requirements:
Training was provided regarding the Request for Evaluation/Reevaluation form, highlighting the date parent consent was received by any district personnel, thus initiating the 80-day timeline.
New district directors were provided training on Indicator 11 requirements and the WVEIS reports available to monitor initial evaluation timelines within the student record system.
WVDE staff addressed the subject of Indicator 11 at each statewide training in order to keep the importance of this indicator at the forefront of each district director’s and coordinator’s work tasks.
The OSP issues an official letter of findings to each district below 100% compliance on Indicator 11 as a result of the Annual Desk Audit (ADA) submission each April, requiring an improvement plan to include the use of the WVEIS data system for the purposes of self-monitoring. LEAs submit their improvement plans through the online ADA system, which are reviewed and approved with revisions as necessary by the OSP monitor assigned to the district. Additionally, the OSP will determine implementation of regulatory requirements by reviewing a subsequent data pull of all initial evaluation data for a two-month period. Correct implementation of regulatory requirements is verified when the LEA demonstrates 100% of initial evaluations within timelines within the two-month period.
Correction of FFY 2009 Findings of Noncompliance (if State reported less than 100% compliance):
Level of compliance (actual target data) State reported for FFY 2009 for this indicator: 96.2%
13. Number of findings of noncompliance the State made during FFY 2009 (the period from July 1, 2009 through June 30, 2010)
45
75
80
85
90
95
100
2005-2006 2006-2007 2007-2008 2008-2009 2009-2010 2010-2011

APR Template – Part B (4) West Virginia.
State
Part B State Annual Performance Report for FFY2010 Page 92
14. Number of FFY 2009 findings the State verified as timely corrected (corrected within one year from the date of notification to the LEA of the finding)
45
15. Number of FFY 2009 findings not verified as corrected within one year [(1) minus (2)]
0
One finding of noncompliance per LEA was issued, which may represent more than one individual student noncompliance.
Verification of Correction:
Forty-five LEAs received findings of noncompliance for one or more instances of individual student noncompliance based on data reported for 2009-2010 in the FFY2009 APR. At total of 239 individual findings of noncompliance were identified. Through the ADA process, districts submitted an improvement plan, which was reviewed and approved, or revised as necessary, by the special education monitor assigned to the district. Subsequent data pulled from individual student special education records within WVEIS were used to verify the districts: (1) had completed the evaluation, although late, for any child whose initial evaluation was not timely, unless the child is no longer within the jurisdiction of the LEA; and (2) were correctly implementing specific regulatory requirements, (i.e., achieved 100% compliance) based on updated data subsequently collected through the state data system. Subsequent data reviewed for all 45 LEAs verified all students whose initial evaluation had been out of timelines during 2009-2010 had received their evaluation, eligibility determination and IEPs as appropriate, although late, or the student was verified by WVDE as no longer within the jurisdiction of the LEA. Therefore, all instances of individual noncompliance were corrected. Furthermore, all 45 LEAs demonstrated correct implementation of regulatory compliance (100% compliance) by completing all initial evaluations within timelines for a two-month period, upon WVDE review of subsequent data pulled from WVEIS individual student records.
Revisions, with Justification, to Proposed Targets / Improvement Activities / Timelines / Resources for FFY 2011:
WVDE reviewed the existing improvement activities per OSEP’s measurement table requirement. However, there are no revisions proposed to the SPP targets, improvement activities or timelines at this time.

APR Template – Part B (4) West Virginia.
State
Part B State Annual Performance Report for FFY2010 Page 93
Part B State Annual Performance Report (APR) for FFY 2010 (2010-2011)
Overview of the Annual Performance Report Development:
See Indicator 1.
Monitoring Priority: Effective General Supervision Part B / Effective Transition
Indicator 12: Percent of children referred by Part C prior to age 3, who are found eligible for Part B, and who have an IEP developed and implemented by their third birthdays.
(20 U.S.C. 1416(a)(3)(B))
Measurement:
a. # of children who have been served in Part C and referred to Part B for Part B eligibility determination.
b. # of those referred determined to be NOT eligible and whose eligibility was determined prior to their third birthdays.
c. # of those found eligible who have an IEP developed and implemented by their third birthdays. d. # of children for whom parent refusal to provide consent caused delays in evaluation or initial
services or whom exceptions under 34 CFR §300.301(d) applied. e. # of children who were referred to Part C less than 90 days before their third birthdays.
Account for children included in a but not included in b, c, d or e. Indicate the range of days beyond the third birthday when eligibility was determined and the IEP developed and the reasons for the delays.
Percent = [(c) divided by (a - b - d - e)] times 100.
FFY Measurable and Rigorous Target
FFY 2010 100% percent of children referred by Part C prior to age 3 -who are found eligible for Part B have an IEP developed and implemented by their third birthdays.
OSEP’s FFY 2009 Response Table
Because West Virginia reported less than 100% compliance for FFY 2009, OSEP required the state to report on the status of correction of noncompliance reflected in the data reported for this indicator. The specific actions taken to verify correction of noncompliance may be found below under Correction of Findings Based upon 2009-2010 Data.

APR Template – Part B (4) West Virginia.
State
Part B State Annual Performance Report for FFY2010 Page 94
Actual Target Data for 2010-2011 (FFY 2010):
Trend Data and Target Data for Children Referred Prior to Age Three
from WV Birth to Three to Public School Districts
(a) (b) ( c) (d) (e) %
compliance
Number referred
Determined not eligible by third birthday
Determined eligible with IEPs prior to third birthday
Parents refused/declined evaluation or initial services
Referred to Part C less 90 days prior to third birthday
c/(a-b-d-e)*100
2004-2005 535 6 256 4 48.8%
2005-2006 526 77 338 75 90.4%
2006-2007 645 82 449 111 99.3%
2007-2008 670 83 501 73
97.3%
2008-2009 774 107 567 70 0 95.0%
2009-2010
719 108 516 77 0 96.6%
2010 -2011 678 87 537 50 0 99.26%
Referrals Not in Compliance for 2010 - 2011
4 students - IEPs developed and implemented after third birthday
2 students - 1 -39 days late
2 students - 159 -273 days late
Reasons for Delays:
IEPs developed and implemented after third birthday:
District staffing, personnel and leadership to complete process ( 4 children)

APR Template – Part B (4) West Virginia.
State
Part B State Annual Performance Report for FFY2010 Page 95
In 2010-2011, 99.26% of students referred by West Virginia Birth to Three (WV BTT) to Part B public school district who were found eligible had IEPs developed and implemented by the third birthday. This is a slight increase from 96.6% in 2009-2010. Of the 678 students referred, 537 were found eligible and received IEPs. The compliance target of 100 percent was not reached but remains at a very high level. The overall number of referrals shows a slight decrease from 719 to 678, and the number of parents declining evaluation showed a slight decrease this year.
Data provided credible documentation for 4 referrals, for which IEPs were completed and implemented, but not by the third birthday. The four IEPs not developed and implemented by the third birthday were due to staffing and personnel issues in the district that hindered the process. The IEPs developed after the third birthday ranged from 13 – 39 and 159 – 273 days late.
Discussion of Improvement Activities Completed and Explanation of Progress or Slippage that occurred for FFY 2011:
Transition Procedures. The lead agency for Part C, WV Birth to Three, is the Department of Health and Human Resources. As a result, the data system for each organization is distinct and separate. During 2010-2011, the effective data collection plan continued to be implemented by WVBTT, WVDE and local districts. WVDE continues to require districts to maintain referral dates, referral sources, eligibility status, exceptionality, eligibility dates and IEP dates for all students within the WVEIS electronic student record system. Districts are contacted individually to verify and complete missing information as needed. Data are extracted at least annually and examined to verify compliance with transition requirements.
Additionally, Child Notification Forms, containing the allowable demographic information, were sent to each school district six months prior to the child turning three. Procedures require the LEA representative to contact the family to discuss potential services. The LEA representative then completed the individual child forms and returned them to the WVDE for data entry, verification and follow-up. WV BTT and WVDE collaborated in data comparison and tracking to ensure all students referred by WVBTT were followed, and districts were in compliance with timelines.
Transition Procedures from C to B were implemented and are reviewed annually. All districts were requested to complete this process. The procedures are posted on the WV Birth to Three Web site. A Question and Answer document was revised and distributed regarding the Child Find Notification process. The document was distributed to WV Birth Three and county special education directors to clarify responsibilities regarding this process. Transition data also were reviewed at the Special Education Administrators’ meeting in fall 2010. Districts were contacted to investigate the reasons why timelines are not being met and to ascertain whether systemic issues were causing delays in timelines.
Professional Development and Technical Assistance. Training is offered on a quarterly basis in partnership with WV Birth to Three regarding transition from Part C to B. Transition training was provided for district collaborative teams when requested and/or identified as part of technical assistance. The training required core partners to participate. The core partners are local education agencies, WV Birth to Three, Head Start and a parent.
In the past, The Early Childhood Transition Steering Committee addressed transition issues for the early childhood community. This group has been rolled into the Continuous Quality Improvement (CQI) Council. This group is addressing transition into and out of preschool. The School Readiness group is in the process designing an umbrella approach to early childhood. The initiative is called Ready Set Go! WV Comprehensive Framework for School Readiness for the early childhood community. There are four components that include Ready Schools, Ready Communities, Ready Families and Ready Children. As part of this group the concept of seamless transition is part of the work. One area of concentration is the transition out of preschool into kindergarten. A transition summary form, a transition checklist and suggested strategies for all providers and new modules are being designed.
WV Training Connections and Resources assists with implementing the early childhood statewide collaborative conference; maintains a Web site; coordinates local interagency collaborative teams; agreements and processes to use at the local level; and published materials for parents, teachers and service providers, such as the Early Childhood Provider Quarterly, the twelve-month calendar with pull-

APR Template – Part B (4) West Virginia.
State
Part B State Annual Performance Report for FFY2010 Page 96
out milestone chart and the web-based interagency agreement template. The resources and products developed and implemented by the WV Steering Transition Committee continue to be used by higher education in courses, trainings and other providers in the early childhood community.
Three sessions at the Celebrating Connections Early Childhood Conference addressed transition process and resources available to local providers. The networking session for transition issues was continued in the conference format. A resource booth for transition is also available at the conference for participants. Information regarding the resources was also included in the Provider Quarterly magazine. The committee also utilizes a “newsflash” list serve. Information is disseminated to a mass number of early childhood representative on a variety of topics, including transition practices. The transition documents are accessible on several websites.
As part of the partnership with Institutes of Higher Education, representatives participate on the CQI group and use transition documents in the early childhood courses. The curriculum includes information for counties to address transition into and out of preschool services.
WVDE will continue to work collaboratively with early childhood partners, including WV Birth Three, to identify any potential systemic issues around transition and to assure supports and activities relating to transition practices are promoting positive transition outcomes for children and families.
Correction of Findings Based upon FFY 2009 (2009-2010) Data:
Level of compliance (actual target data) State reported for FFY 2009 for this indicator: __96.6_%
1. Number of findings based on FFY 2009 data (July 1, 2009 through June 30, 2010) for which findings were issued May 1, 2011, noted in OSEP’s June 2011 FFY 2009 APR response table for this indicator
18
2. Number of findings based on FFY 2009 data the state has verified as corrected 18
3. Number of remaining findings based on FFY 2009 data NOT verified as corrected within one year [(1) minus (2)].
0
WVDE monitoring procedures for 2010-2011 provided that letters of findings for noncompliance identified through the both APR and the district self-assessment, submitted April 1, were issued May 1. Therefore, findings based on FFY 2009 data, analyzed prior to the February 2011 APR, were issued May 1, 2011. The timeline for correction within one year is May 1, 2012.
Correction of every instance of identified noncompliance . As was reported in the FFY 2009 APR, all 18 IEPs had been developed and implemented prior to the February 1, 2011 report, although after the third birthday. Therefore, all individual noncompliaces were corrected. Verification and analysis of FFY 2009 data (for the period of July 1, 2009 through June 30, 2010) was completed in January 2011 for reporting in the FFY 2009 APR. WVDE verified eligibility was determined and IEPs were implemented – albeit late - by using the Part C to Part B collaborative tracking system, WVEIS initial timelines and child count data collections and district- provided documentation.
Correct Implementation of specific regulatory requirements. Implementation of specific regulatory requirements was verified by the OSP through a subsequent review of referral, initial evaluation and IEP data extracted from LEA’ individual student records. This review was completed in January 2012. Districts previously found out of compliance were verified as implementing IEPs by the third birthday for children subsequently referred by Part C.

APR Template – Part B (4) West Virginia.
State
Part B State Annual Performance Report for FFY2010 Page 97
Revisions, with Justification, to Proposed Targets / Improvement Activities / Timelines / Resources for FFY 2010 (if applicable):
To continue to improve and strengthen the transition process the between Part C and B and among all of our early childhood partners, additional activities will be implemented.
Collaborative team training will become a part of the Ready Set Go framework. The training will be offered to all early childhood teams. The training is based on the legal requirements and also based on effective transition practice including research from the National Childhood Transition Center. It will include transition to kindergarten. Each county is required to identify core partners to participate in the training. The training is a team approach with county and other representatives from that county participating to better address transition practices and implementation across the state. .
Improvement Activities Timelines Resources Status
12.5 Continue to participate on the WVDE Continuous Quality Improvement Council and Early Childhood Advisory Council and collaborate with other early childhood agency partners to disseminate PD and provide seamless transitions from Part C to Part B and into kindergarten.
2005-2013 WVDE Steering Transition Committee Training Connections WV Birth To Three
Active NEW Revised 2012

APR Template – Part B (4) West Virginia.
State
Part B State Annual Performance Report for FFY2010 Page 98
Part B State Annual Performance Report (APR) for FFY 2010 (2010-2011)
Overview of the Annual Performance Report Development:
See Indicator 1
Monitoring Priority: Effective General Supervision Part B / Effective Transition
Indicator 13: Percent of youth with IEPs aged 16 and above with an IEP that includes appropriate measurable postsecondary goals that are annually updated and based upon an age appropriate transition assessment, transition services, including courses of study, that will reasonably enable the student to meet those postsecondary goals, and annual IEP goals related to the student’s transition services needs. There also must be evidence that the student was invited to the IEP Team meeting where transition services are to be discussed and evidence that, if appropriate, a representative of any participating agency was invited to the IEP Team meeting with the prior consent of the parent or student who has reached the age of majority.
(20 U.S.C. 1416(a)(3)(B))
Measurement: Percent = [(# of youth with IEPs aged 16 and above with an IEP that includes appropriate measurable postsecondary goals that are annually updated and based upon an age appropriate transition assessment, transition services, including courses of study, that will reasonably enable the student to meet those postsecondary goals, and annual IEP goals related to the student’s transition services needs. There also must be evidence that the student was invited to the IEP Team meeting where transition services are to be discussed and evidence that, if appropriate, a representative of any participating agency was invited to the IEP Team meeting with the prior consent of the parent or student who has reached the age of majority) divided by the (# of youth with an IEP age 16 and above)] times 100.
FFY Measurable and Rigorous Target
2010
(2010-2011)
100% of IEPs reviewed in the sample will include appropriate measurable postsecondary goals that are annually updated and based upon an age appropriate transition assessment, transition services, including courses of study, that will reasonably enable the student to meet those postsecondary goals, and annual IEP goals related to the student’s transition services needs. There also must be evidence that the student was invited to the IEP Team meeting where transition services are to be discussed and evidence that, if appropriate, a representative of any participating agency was invited to the IEP Team meeting with the prior consent of the parent or student who has reached the age of majority.

APR Template – Part B (4) West Virginia.
State
Part B State Annual Performance Report for FFY2010 Page 99
OSEP FFY 2009 Response Table
In its Part B FFY 2009 SPP/APR response table for the APR submitted February 1, 2010, OSEP required WVDE to report on the status of correction of noncompliance reflected in Indicator 13 data, because WVDE reported less than 100% compliance for FFY 2009. WVDE was directed to report that it has verified that each LEA with noncompliance reflected in the FFY 2009 data is: (1)is correctly implementing regulatory requirements based on a review of updated data; and (2) has corrected each individual case of noncompliance, unless the child is no longer within the jurisdiction of the LEA, consistent with OSEP Memo 09-02. Additionally, WVDE was required to review improvement activities if 100% compliance is not reported in the FFY 2010 APR.
Correction of all noncompliance for FFY 2009 is discussed in the applicable section below, as well as the review of improvement activities.
Actual Target Data for FFY 2010:
Transition IEP Checklist Results
2010-2011
Yes,
Compliant
No,
Noncompliant
Are there appropriate measurable postsecondary goals that address education or training, employment, and (as needed) independent living?
783 1
Are the post secondary goals updated annually? 781 3
Is there evidence that the measurable postsecondary goals were based on age-appropriate transition assessment(s)?
775 9
Are there transition services in the IEP that will reasonably enable the student to meet his or her postsecondary goals?
782 2
Do the transition services include courses of study that will reasonably enable the student reach his/her postsecondary goals?
782 2
Is/are there annual IEP goals related to the student’s transition service needs?
783 1
Is there evidence that the student was invited to the IEP Team meeting where transition services were discussed?
783 1
Is there evidence that a representative of any participating agency(s) was invited to the IEP Team meeting with the prior consent of the parent or adult student (has reached the age of majority)?
779 5

APR Template – Part B (4) West Virginia.
State
Part B State Annual Performance Report for FFY2010 Page 100
Although WVDE failed to meet the one hundred percent target for Indicator 13, a high level of compliance (i.e., 98.1%) was revealed. Of the approximately 800 IEPs reviewed in the district self-assessment process described in WVDE’s SPP, only 15 were found to be noncompliant for Indicator 13. Two districts had noncompliant IEPs.
Trend Data
FFY Compliant IEPs
Noncompliant IEPs
Total IEPs Reviewed
2009
(2009-2010) 766 41 807
2010
(2010-2011) 769 15 784
Discussion of Improvement Activities Completed and Explanation of Progress or Slippage that occurred for FFY 2010 (2010-2011):
A three percentage increase was noted from FFY 2009 to FFY 2010. Significant professional development and targeted technical assistance in the area of transition has been delivered at the State, RESA and LEA level.
0.00%
20.00%
40.00%
60.00%
80.00%
100.00%
2009-2010 2010-2011
Indicator 13 Percent of IEPs for transition age youth in
compliance
Does the IEP meet the transition services requirements (i.e., meet each of the 8 components)?
769 (98.1%)
15 (1.9%)

APR Template – Part B (4) West Virginia.
State
Part B State Annual Performance Report for FFY2010 Page 101
Professional Development and Guidance Materials - Documenting Transition and Evidence-Based Transition Strategies
The WVDE OSP offers professional development for transition primarily through the Transition Collaborative Community of Practice (TCCoP) face-to-face meetings at least one to two times per year. Participants typically are district and school staff assigned to coordinate secondary transition services for students with disabilities and special education administrators. Attendance at each meeting ranges from 40 to 60. Topics for each meeting are generated from a variety of sources including exit and follow up surveys, IEP Checklist for Transition results, districts, leadership team input, agency council (Rehabilitation Services, Developmental Disabilities) participation and information from national technical assistance centers related to transition. A transition component is included in semi-annual special education administrator conferences. Approximately five (5) districts request face-to-face PD specific to transition early in the school year annually. The transition coordinator collaborates quarterly with career technical education (CTE) administrators and provides supplemental course support for CTE staff at the higher education level. Current publications, websites and books are a focus for periodic teleconferences. Book study participants average thirty per topic. Additional opportunities exist for presentations to targeted groups of staff, agencies, parents, adult clients, students and others.
Showcase for Transition on WVDE Website
The transition coordinator presented ideas and possible projects for development of student, family and district stories for creation of a showcase section on the transition web pages during the May, 2010, TCCoP meeting. The parent chair of the state Developmental Disabilities Council (DDC) volunteered to tell the story of her son from her perspective. The story was developed with the transition coordinator and presented at the West Virginia Board of Education meeting October, 2010, in conjunction with a discussion about autism and later at the December meeting of the TCCoP. The story has been published to the WVDE Transition web pages at http://wvde.state.wv.us/osp/Transition/TransitionIntro.html.
NDPC SD Intensive TA Grant 2011-2013
The WVDE OSP was awarded a grant (January, 2011) for intensive technical assistance (TA) from the National Dropout Prevention Center for Students with Disabilities (NDPC SD) through 2013. A teleconference call with NDPC SD staff and internal WVDE team for the grant was held (February, 2011) to develop the timeline for year one and to provide details of expectations from the NDPC SD. Twelve districts originally applied to participate in the intensive TA opportunity, and a thirteenth was added in June, 2011. Seven of those districts were also identified for TA and receive intensive intervention because of OSP compliance issues. Stakeholder members from advocacy agencies, Rehabilitation Services and the WV Developmental Disabilities Council were obtained as was a large and diverse WVDE team with membership of twenty-two (22) staff from various offices to assure coordination for dropout.
During March (2011) twenty-eight (28) participating WVDE staff and representatives of the twelve participating districts attended an initial two-day meeting with NDPC SD staff. Participants were guided to examine existing WV data and develop an understanding of the TA grant and goals. During June (69 participants) and July (57 participants) of 2011, district teams and WVDE staff worked intensively for four days with NDPC SD staff to understand the research, examine interventions and strategies, make decisions based on data and develop action and implementation plans. The WVDE OSP disseminated The Last Dropout: Stop the Epidemic to all TA Grant members, including all district team members and encouraged to conduct a book study. TA Grant members communicate primarily via email to stay current

APR Template – Part B (4) West Virginia.
State
Part B State Annual Performance Report for FFY2010 Page 102
on new materials (i.e. Dissemination of Reentry Programs for Out-of-School Youth with Disabilities NDPC SD publication), submit action plans and obtain notice for important events (i.e. WV Student Success Summit and Regional Truancy meetings).
West Virginia’s Four-Year Adjusted Cohort Graduation Rate: Questions & Answer Guide was developed to assist districts in understanding of the graduation cohort. Input from the TA grant districts was obtained at each meeting. This document was one of three goals for the intensive TA grant application. A second goal for West Virginia has been to raise awareness and develop a deep understanding of various data sources regarding dropout prevention, intervention and recovery. Discussion and development of an early warning system reflects a direct link to this goal. The final component of the plan involves the development of a dropout prevention tool for use by an LEA to assist with creating a customized dropout prevention intervention program specifically for students with disabilities.
TA grant participants had the opportunity to be involved in multiple opportunities for professional development and collaboration through financial grants from OSP to each district for each of the three years of participation. The second Student Success Summit and announcement of Innovation Zone grant opportunities for dropout prevention were offered by the WVDE. WV Senate Bill 228 was passed in March of 2011, where WV code was changed to address dropout prevention. Requirements in the Bill included implementation of an electronic system for early warning indicators, a separate category of innovation zones for dropout prevention and recovery, opportunities for collaboration, requirement for district school attendance assistants, GED Option program development. The mandatory school attendance age for the state is now at 17.
Truancy meetings sponsored by the WV Supreme Court of Appeals occurred throughout the state where the public was informed about the establishment of partnerships between the judiciary and education system to address attendance issues at all programmatic levels. Attendance directors statewide and special education administrators from the thirteen grant districts collaborated to examine district attendance policies for alignment with the state attendance policy and to identify barriers in October, 2011. Documents and other information are posted at https://sites.google.com/site/ospdropoutprevention/.
WV Transition Collaborative Community of Practice (TCCoP) and Leadership Team
The WVDE maintains a leadership team for the WV TCCoP to assist in identification of needs and to plan professional development and guidance for all components of transition services for LEA and school level staff for implementing transition services. Representatives from selected LEAs and agency staff collaborate with the transition coordinator at the WVDE and participate in the annual State Planning Institute sponsored by the National Secondary Transition Techical Assistance Center (NSTTAC), the National Post School Outcomes Center and (NPSO) and NDPC SD. Members of the leadership team developed a guide for transition in WV and presented the draft to WV TCCoP participants at the May 2011 statewide meeting. Documents for meetings are posted at https://sites.google.com/a/wvde.k12.wv.us/wv-tccop/l.
The WV TCCoP meets at least annually to provide statewide professional development opportunities for LEAs regarding implementation of all components of transition services. Two meetings of the WV TCCoP were held during 2010-2011 (December, May). The two day December professional development opportunity targeted transition topics in six areas: 1) secondary literacy, 2) transition planning for students with significant disabilities, 3) jigsaw book study for graduation and dropout: Helping Students Graduate, 4) Showcase, stories of success from former students with disabilities, 5) policy and procedures for transition services, and 6) collaboration and linkages with WV Department of Rehabilitation Services. Participants received and participated in a jigsaw version of a book study for

APR Template – Part B (4) West Virginia.
State
Part B State Annual Performance Report for FFY2010 Page 103
Helping Students Graduate and studied graduation/dropout data for students with disabilities. The purpose was for participants to return to their LEA to initiate discussions and to begin the process of understanding the particular challenge in the State for students with disabilities and to begin to blend knowledge gained from the NDPC SD Intensive TA Grant activities. At this same meeting and in a follow up email individuals and RS staff had the opportunity to volunteer for an intensive book study using A Guide to Vocational Assessment. Twenty-two participants volunteered for a series of eight one-hour teleconferences and a commitment of reading approximately fifty pages per call from January through April. The result of the study was development of a deep understanding of vocational assessment as well as transition assessment for school-age students.
The subsequent two-day meeting of the TCCoP in May focused primarily on post secondary goals and development of the Summary of Performance (SOP) where guidance from Dr. James Patton of Austin, TX, was provided. Additional topics included: 1) Developmental Disabilities Council coordination, 2) Showcase, stories of success from districts, 3) review of the developing WVDE OSP guidance document for transition, 4) guided website exploration, 5) understanding graduation and dropout calculations, 6) exit and Follow Up Surveys results, and 7) linking transition assessments to transition services. The format for professional development at the WV TCCoP meetings involves active engagement of participants with minimal lecture style presentations.
The WVDE OSP maintains an electronic listserv for the TCCoP for communications of all types. Participants of the WV TCCoP have the opportunity to collaborate quarterly with Rehabilitation Services (RS), Community Rehabilitation Program (CRP) providers and other agency partners in the six WV RS District Transition Teams that have been established for regions of the state (see below). The annual WV Council for Exceptional Children Conference was held during November 2010 where the topic was Transitions.
Agency Collaboration and Transition Teams
The transition coordinator collaborates at least monthly with RS and WV Developmental Disabilities Council (DDC). Both agencies are existing members of the WV TCCoP. Established RS District Transition Teams bring together RS staff, CRP providers and LEA staff. Teams meet quarterly with a focus on development of relationships and to broaden understanding of services. At least four LEAs have partnered with Transition Team members to present informational fairs for students and parents for 2010-2011. SEA and RS staffs attend some district meetings to promote further development. The RS school counselor coordinator and transition coordinator participated in the Mid Atlantic Transition Leadership Council for 2010-2011. RS and the SEA partnered to conduct district level discussion and guidance for improving services to students and families. The WVDE transition coordinator met with the RS supervisor and district Employment Specialists for each district to discuss and plan supports to district special education staff. Additionally, the DDC sponsored a Wills/Trusts presentation for interested parties that was attended by approximately 10 educators and parents from the districts.
The DDC administered a grant for 2010-2011 and beyond to support development of transition services through coordination of activities with the WVDE OSP. The first grant to a CRP helped the transition coordinator to identify non-typical students with disabilities for a pilot CTE program for direct instruction in the general education setting to teach occupational skills in the student’s preferred area of interest. The grant assisted the WVDE OSP in identification of student characteristics and contributed to a guidance document for program implementation for 2012-2013. A second grant supported development of new CRP providers comprised of school personnel to support exiting students in a supported work setting in local businesses the summer following graduation/exit. The program has been successful in districts not previously considered positive for job development. The transition coordinator serves as the state representative on the DDC at quarterly meetings.

APR Template – Part B (4) West Virginia.
State
Part B State Annual Performance Report for FFY2010 Page 104
Online IEP: The WVDE Online IEP supports for transition services were developed and posted within the online IEP during the 2010-2011 school year along with verification checklist for transition. Each of the transition checklist questions is linked to embedded help boxes in the WV Online IEP. Additionally, a compliance checklist for transition is supported in the finalization of the Online IEP process.
IEP Checklist: As a result of intensive and multi-year professional development and technical assistance for documenting transition in the IEP, only five (5) districts continued to experience documentation issues with at least one item on at least one IEP for multiple years, comprising 59% of noncompliant IEPs. This significant reduction of noncompliance reflects multidimensional effort both at the state and district level to assure that all staff responsible for IEPs of transition age students are proficient and knowledgeable. Notification of noncompliance and required actions for intensive technical assistance to support systemic and individual correction was provided to the five district administrators, RESA special education directors and OSP coordinators assigned. The timeline for actions relating to these districts follows. The remaining districts corrected noncompliant IEPs and reviewed district level procedures to determine further PD needs for Indicator 13 internally.
Correction of FFY 2009 Findings of Noncompliance:
Level of compliance (actual target data) State reported for FFY 2009 for this indicator: 95%
1. Number of findings of noncompliance the State made during FFY 2009 (the period from July 1, 2009 through June 30, 2010)
41
2. Number of FFY 2009 findings the State verified as timely corrected (corrected within one year from the date of notification to the LEA of the finding)
41
3. Number of FFY 2009 findings not verified as corrected within one year [(1) minus (2)]
0
Correction of FFY 2009 Findings of Noncompliance Not Timely Corrected (corrected more than one year from identification of the noncompliance):
4. Number of FFY 2009 findings not timely corrected (same as the number from (3) above)
0
5. Number of FFY 2009 findings the State has verified as corrected beyond the one-year timeline (“subsequent correction”)
0
6. Number of FFY 2009 findings not yet verified as corrected [(4) minus (5)] 0
Please note the above data do not directly correspond to noncompliances reported for Indicator 13 in the Part B Indicator 15 Worksheet, because additional noncompliances identified for related requirements are included in B15.

APR Template – Part B (4) West Virginia.
State
Part B State Annual Performance Report for FFY2010 Page 105
Verification of Correction for FFY 2009:
Baseline data were collected in April 1, 2010 for this indicator and were reported in the FFY 2009 SPP in February 2011. Districts self reviewed a random sample of transition IEPs, selected by the OSP, and reported their findings of noncompliance through the CSADA/ADA online submission process. Ten districts reported a total of 41 noncompliant IEPs. On May 1, 2010 districts were formally notified of noncompliance and directed to submit corrected IEPs to the West Virginia Department of Education, OSP, to verify correction of the individual noncompliances in accordance with the OSEP Memorandum 09-02. Noncompliant transition IEPs were to be corrected through anew IEP Team meeting or an IEP amendment. Documentation verifying the correction was to be submitted by July 1, 2010.
During the summer and first semester of the 2010-2011 school year, the OSP monitors reviewed the submitted documentation and collected additional documentation, including on-site visits as needed, to verify correction of individual noncompliance for the 41 noncompliant IEPs representing ten LEAs. In addition to verification of correction of individual noncompliance, verification that the district is correctly implementing requirements was accomplished through a review of an additional random sample of transition IEPs from each identified LEA. Reviews were conducted by one or more monitoring team members through onsite reviews and/or submission of documentation by the district. Districts were determined to be meeting requirements when the sample demonstrated compliant IEPs. To facilitate the review process, compliance monitors utilized transition guidance documents provided by the transition coordinator to create a concise compliance checklist (Attachment C) Transition questions were reordered to match the order the items appeared in the IEP. Important criteria were highlighted and information reduced to reflect only compliant examples.
While five districts were determined to have corrected all individual IEPs as well as to have achieved 100% compliance on a newly selected sample of IEPs, five districts initially did not demonstrate correction. Therefore, in February 2011, based on the updated sample review and prior history of noncompliance on this indicator, the five districts that demonstrated continued noncompliance for Indicator 13 received an enforcement letter from the OSP Executive Director specifying required procedures for correcting individual IEPs and systemic issues.
During February and March, 2011, direct and intensive technical assistance occurred through teleconferencing or face-to-face meetings with four of the five districts. Three districts had been directed to participate in TA in their enforcement letters, while one district voluntarily opted for technical assistance. The technical assistance components included discussion of general transition IEP components and checklist requirements, specific correction for district identified noncompliant IEPs and action planning for systemic correction. Participants included special educators and administrators from each district high school, RESA special education administrators and WVDE compliance coordinators. Follow up email to WVDE OSP administrators provided notification for completion of this step.
In April 2011, the five districts submitted corrected IEPs, and the OSP coordinator for transition verified correction and notified administrators of approval for all corrections required. Each file was reviewed using the IEP Checklist for Transition. Concurrently, compliance coordinators assigned to each district then verified systemic correction through follow-up IEP reviews for each district with a specific focus on IEP Checklist for Transition questions that were noncompliant. As a result of this process, all five districts corrected all remaining individual noncompliances and correct implementation of regulatory requirements was verified. All verification was completed within one year, that is, prior to May 1, 2011.

APR Template – Part B (4) West Virginia.
State
Part B State Annual Performance Report for FFY2010 Page 106
Revisions, with Justification, to Proposed Targets / Improvement Activities / Timelines / Resources for FFY 2010 (2010-2011):
Review of Improvement Activities
Because 100% compliance was not achieved in FY2010, the WVDE has reviewed its improvement activities, as required by the OSEP response table for FY2009. Although 100% compliance was not achieved, a high level of compliance was demonstrated. Therefore, the improvement activities have been determined effective and will continue. Additionally, as a result of review and revision of the OSP monitoring procedures, data collection and monitoring procedures for this indicator have been revised. While a high level of compliance was demonstrated through the annual District Self-Assessment (CSADA), it was determined a more rigorous review of transition IEPS conducted through cyclical onsite monitoring by OSP staff would further increase the compliance of transition IEPs.
Under the new monitoring procedures, the OSP will change the data collection process for Indicator 13 during the 2011-2012 school year. OSP will collect and report the transition age IEPs reviewed during cyclical monitoring visits for the 13-15 districts monitored each year. This will ensure all LEAs are reviewed and reported for Indicator 13 at least once during each four-year monitoring cycle. However, OSP will continue to mandate the annual self-assessment process which includes Indicator 13 to ensure continual improvement for all districts. Change to the data collection process emerged in tandem with improvement to the overall monitoring system and a revised file review process supported through technical assistance from the Mid-South Regional Resource Center.
Improvement Activity Timelines Resources
13.1 Collect and review data annually from file reviews of transition IEPs conducted through on-site monitoring of districts.
2011-2013 WVDE staff

APR Template – Part B (4) West Virginia.
State
Part B State Annual Performance Report for FFY2010 Page 107
Part B State Annual Performance Report (APR) for FFY 2010
Overview of the Annual Performance Report Development:
See Indicator 1
Monitoring Priority: Effective General Supervision Part B / Effective Transition
Indicator 14: Percent of youth who are no longer in secondary school, had IEPs in effect at the time they left school, and were:
A. Enrolled in higher education within one year of leaving high school.
B. Enrolled in higher education or competitively employed within one year of leaving high school.
C. Enrolled in higher education or in some other postsecondary education or training program; or competitively employed or in some other employment within one year of leaving high school.
(20 U.S.C. 1416(a)(3)(B))
Measurement:
A. Percent enrolled in higher education = [(# of youth who are no longer in secondary school, had IEPs in effect at the time they left school and were enrolled in higher education within one year of leaving high school) divided by the (# of respondent youth who are no longer in secondary school and had IEPs in effect at the time they left school)] times 100.
B. Percent enrolled in higher education or competitively employed within one year of leaving high school = [(# of youth who are no longer in secondary school, had IEPs in effect at the time they left school and were enrolled in higher education or competitively employed within one year of leaving high school) divided by the (# of respondent youth who are no longer in secondary school and had IEPs in effect at the time they left school)] times 100.
C. Percent enrolled in higher education, or in some other postsecondary education or training program; or competitively employed or in some other employment = [(# of youth who are no longer in secondary school, had IEPs in effect at the time they left school and were enrolled in higher education, or in some other postsecondary education or training program; or competitively employed or in some other employment) divided by the (# of respondent youth who are no longer in secondary school and had IEPs in effect at the time they left school)] times 100.

APR Template – Part B (4) West Virginia.
State
Part B State Annual Performance Report for FFY2010 Page 108
FFY Measurable and Rigorous Target
2010
(2010-2011)
A. Percent of youth who are no longer in secondary school, had IEPs in effect at the time they left school, and were enrolled in higher education within one year of leaving high school will increase to:
B. Percent of youth who are no longer in secondary school, had IEPs in effect at the time they left school, and were enrolled in higher education or competitively employed within one year of leaving high school will increase to:
C. Percent of youth who are no longer in secondary school, had IEPs in effect at the time they left school, and were enrolled in higher education or in some other postsecondary education or training program; or competitively employed or in some other employment within one year of leaving high school will increase to:
21.0%
50.3%
65.1%
Actual Target Data for FFY 2010:
2010
(2010-2011)
A. Percent of youth who are no longer in secondary school, had IEPs in effect at the time they left school, and were enrolled in higher education within one year of leaving high school will increase to:
B. Percent of youth who are no longer in secondary school, had IEPs in effect at the time they left school, and were enrolled in higher education or competitively employed within one year of leaving high school will increase to:
C. Percent of youth who are no longer in secondary school, had IEPs in effect at the time they left school, and were enrolled in higher education or in some other postsecondary education or training program; or competitively employed or in some other employment within one year of leaving high school will increase to:
12.2% 129 /1060 = 12.2%
(-8.8% below target)
44.6% (129 + 344)/1060 = 44.6%
(-5.7% below target)
64.4% (129 + 344 + 128 + 82)/1060
= 64.4%
(-0.7% below target)

APR Template – Part B (4) West Virginia.
State
Part B State Annual Performance Report for FFY2010 Page 109
Students Exiting in
2008-2009
One-Year Follow-Up Surveys Conducted May-September
2010
Students Exiting in
2009-2010
One-Year Follow-Up Surveys Conducted May-September 2011
A. Percent enrolled in higher education 19.49% 12.2%
B. Percent enrolled in higher education or competitively employed within one year of leaving high school
48.84%
44.6%
C. Percent enrolled in higher education, or in some other postsecondary education or training program; or competitively employed or in some other employment
63.57% 64.4%
Number of students returning surveys: 862 1060
Number students exiting 3208 2829
Response rate (Number of students returning surveys / Number students exiting *100)
26.9% 37.5%
Enrolled in higher education, 12.2%
Competitively employed, 32.5%
Enrolled in other type of postsecondary
education / training or engaged in "some other employment",
19.8%
Not enrolled in postsecondary education or
employed, 35.6%
One year follow up for youth who exited school in 2009-2010 with an IEP in effect:

APR Template – Part B (4) West Virginia.
State
Part B State Annual Performance Report for FFY2010 Page 110
There were 862 total respondents.
1 = 168 respondent leavers were enrolled in “higher education”.
2 = 253 respondent leavers were engaged in “competitive employment” (and not counted in 1 above).
3 = 69 of respondent leavers were enrolled in “some other postsecondary education or training” (and not counted in 1 or 2 above).
4 = 58 of respondent leavers were engaged in “some other employment” (and not counted in 1, 2, or 3 above).
Thus,
A = 168 (#1) divided by 862 (total respondents) = 19.49%
B = 168 (#1) + 253 (#2) divided by 862 (total respondents) = 48.84%
C = 168 (#1) + 253 (#2) + 69 (#3) + 58 (#4) divided by 862 (total respondents) = 63.57%
There were 1060 total respondents.
1 = 129 respondent leavers were enrolled in “higher education”.
2 = 344 respondent leavers were engaged in “competitive employment” (and not counted in 1 above).
3 = 128 of respondent leavers were enrolled in “some other postsecondary education or training” (and not counted in 1 or 2 above).
4 = 82 of respondent leavers were engaged in “some other employment” (and not counted in 1, 2, or 3 above).
Thus,
A = 129 (#1) divided by 1060 (total respondents) = 12.2%
B = 129 (#1) + 344 (#2) divided by 1060 (total respondents) = 44.6%
C = 129 (#1) + 344 (#2) + 128 (#3) + 82 (#4) divided by 1060 (total respondents) = 64.4%
Students with Disabilities Exiting School 2009-2010 by Basis of Exit
Students with Disabilities Exiting School 2008-2009 by Basis of Exit
Exiting Students Surveys Received
Exiting Students Surveys Received
Graduated with regular high school diploma
1893 66.91% 881 83.11% 2122 66.15% 693 80.39%
Received a certificate 235 8.31% 86 8.11% 260 8.10% 68 7.89%
Reached maximum age
4 0.14% 0 0.00% 5 0.16% 1 0.12%
Dropped out 697 24.64% 93 8.77% 822 25.62% 100 11.60%
Total 2829 100.00% 1060 99.99% 3208 100.00% 862 100.00%

APR Template – Part B (4) West Virginia.
State
Part B State Annual Performance Report for FFY2010 Page 111
Students with Disabilities Exiting
School 2009-2010 by Race/Ethnicity Students with Disabilities Exiting
School 2008-2009 by Race/Ethnicity
Ex
itin
g
Stu
de
nts
% o
f
Ex
itin
g
Stu
de
nts
Su
rve
ys
Re
ce
ived
% o
f
Su
rve
ys
Re
ce
ived
Ex
itin
g
Stu
de
nts
% o
f
Ex
itin
g
Stu
de
nts
Su
rve
ys
Re
ce
ived
% o
f
Su
rve
ys
Re
ce
ived
Hispanic/Latino 18 0.64% 6 0.57% 15 0.47% 3 0.93%
American Indian or Alaska Native
2 0.07%
0 0.00% 7 0.22% 0 0.00%
Asian 5 0.18% 1 0.09% 6 0.19% 0 0.00%
Black or African American
165 5.83% 56 5.28% 141 4.39% 27 3.13%
Native Hawaii and Pacific Islander (Did not report this category in 2008-2009)
0
0.00% 0 0.00% 0 0.00% 0 0.00%
White 2637 93.21% 997 94.06% 3039 94.73% 832 96.52%
Two or More Races (Did not report this category in 2008-2009)
2 0.07% 0 0.00% 0 0.00% 0 0.00%
Total 2829 100.00% 1060 100.00% 3208 100.00% 862 100.00%
Students with Disabilities Exiting School 2009-2010
by Specific Disability
Students with Disabilities Exiting School 2008-2009
by Specific Disability
Ex
itin
g
Stu
de
nts
% o
f
Ex
itin
g
Stu
de
nts
Su
rve
ys
Rec
eiv
ed
% o
f
Su
rve
ys
Rec
eiv
ed
Ex
itin
g
Stu
de
nts
% o
f
Ex
itin
g
Stu
de
nts
Su
rve
ys
Rec
eiv
ed
% o
f
Su
rve
ys
Rec
eiv
ed
Autism 45 1.59% 19 1.79% 42 1.31% 15 1.74%
Emotional/Behavior Disorders 158 5.59% 34 3.21% 187 5.83% 31 3.60%
Blind/partially sighted 19 0.67% 11 1.04% 22 0.69% 5 0.58%
DeafBlind 1 0.04% 0 0.00% 1 0.03% 1 0.12%

APR Template – Part B (4) West Virginia.
State
Part B State Annual Performance Report for FFY2010 Page 112
Deaf/Hard of Hearing 31 1.10% 14 1.32% 33 1.03% 8 0.93%
Intellectual Disabilities* 703 24.85% 290 27.36% 815 25.41% 227 26.33%
Orthopedic Impairment 5 0.18% 2 0.19% 10 0.31% 6 0.70%
Other Health Impairment 380 13.43% 142 13.40% 408 12.72% 121 14.04%
Specific Learning Disability 1466 51.82% 540 50.94% 1658 51.68% 443 51.39%
Speech/language impairment 6 0.21% 4 0.38% 11 0.34% 1 0.12%
Traumatic Brain Injury 15 0.53% 4 0.38% 21 0.65% 4 0.46%
All 2829 100.01% 1060 100.01% 3208 0.00% 862 100.00%
* Formerly mental impairment
Of those surveyed, 37.5 percent responded, which was a substantial increase over last year. The return of 1060 with a population of 2,829 yields a confidence level of 95 percent plus or minus 2.38 percent using the Sample Size Calculator at http://www.surveysystem.com/sscalc.htm. The respondents’ race/ethnicity well represented the race/ethnicity of the 2009-2010 exiters. Youth previously eligible with Intellectual Disabilities were slightly overrepresented while youth previously eligible with Behavior Disorders were slightly underrepresented. As in previous years, graduates were overrepresented and dropouts were underrepresented.
In addition to the federally required questions, LEAs also obtain other vital statistics that help gauge post school outcomes and the needs for former students with IEPs. The following is a sample of such data obtained from the 2009-2010 school year exiters:
Of the 257 exiters enrolled in higher education or some other type of postsecondary education /
training, 142 (55.2%) and 61 (23.7%) exiters, receive financial aid or scholarship monies,
respectively.
Thirteen percent receive accommodations under the Americans with Disabilities Act / Section
504.
Of the 425 exiters competitively employed or engaged in some other type of employment, 35.1%
(149 exiters) report receiving some type of health/insurance benefits.
One-hundred sixty-eight respondents reported that getting to and from work is a problem.
Just over half (56.4%) of all respondents reported having a valid driver’s license (not a permit).
Thirteen respondents have active military status.
Sixty-two percent (659) of all exiters reported that they are not engaged in any leisure activity
(e.g., sports, hunting, community activity or church) one year after high school.
Seventy-two percent (766 exiters) of respondents reported that school had challenged them,
while a commensurate number reported that school prepared them for daily living.
Six percent of all respondents reported being married at the time of the survey, while 91%
reported a single status. Two respondents were divorced and the remaining 3% opted not to
report marital status.
Approximately seventy percent of all respondents reported living at home with parents or other
family. Twenty percent reported living independently and the remaining ten percent noted a
variety of living arrangements (e.g., dormitory, military base).

APR Template – Part B (4) West Virginia.
State
Part B State Annual Performance Report for FFY2010 Page 113
Discussion of Improvement Activities Completed and Explanation of Progress or Slippage that occurred for FFY 2010 (2010-2011):
Both progress and slippage were evidenced in parts A, B and C of Indicator 14. Although targets were not met, improvement was seen in all measures except higher education attendance. The most significant reductions were observed in higher education (A) and the combined higher education and competitive employment (B) wherein 8 and 5 percentage point reductions were noted as compared to the FFY 2009 baseline. However, this slippage in B was entirely the result of the reduction in students enrolled in higher education. Competitive employment actually increased from 29% last year to 32.5% in the most recent survey. Part C of the Indicator which includes all former students engaged in postsecondary education and employment demonstrated the most stability across FFY 2009 (63.6%) and 2010 (64.4%) with a 0.8% increase evident. Although the targets were not met, given the economic conditions, the slippage in higher education balanced by an increase in other categories is better than might have been expected.
Several potential factors may contribute to the progress/slippage:
The economic recession, which was ongoing when the 2009-2010 exiters were available to enter postsecondary education and/or the workforce, apparently resulted in fewer students enrolling in higher education. Potentially less funding was available to the families of exiters to help support access to higher education for their children, given the general economic conditions during the spring of 2010. Fortunately, a higher number and percentage reported they were competitively employed and engaged in other postsecondary education/employment than in the 2010 survey. Therefore, the slippage in both A and B are attributed to fewer students attending higher education.
The percentage enrolled in some other type of postsecondary education/ training or engaged in some type of employment increased by almost 5 percentage points. Again, it is encouraging that respondents report engagement in productive post school activities
While the overall percentage of former students enrolled in higher education or in some other postsecondary education or training program; or competitively employed or in some other employment within one year of leaving high school missed the target by less 0.7%, the percentage increased over the previous year.
Improvement Activities Completed in FFY 2010 (2010-2011)
Survey Returns: The return rate for the FFY 2010 One-Year Follow-up survey exceeded the previous by 10.6 percentage points. New activities targeting increased response rates during FFY 2010 included 1) including the Indicator 14 response rate as a variable accessed in the LEAs’ Annual Desk Audit and 2) more frequent updates to LEAs regarding response rate.
Professional Development and Guidance Materials - Documenting Transition and Evidence-Based Transition Strategies: The WVDE OSP offers professional development for transition primarily through the WV Transition Collaborative Community of Practice (TCCoP) face-to-face meetings at least one to two times per year. Participants typically are district and school staff assigned to coordinate secondary transition services for students with disabilities and special education administrators. Attendance at each meeting ranges from 40 to 60. Topics for each meeting are generated from a variety of sources including exit and follow up surveys, IEP Checklist for Transition results, districts, leadership team input, agency council (Rehabilitation Services, Developmental Disabilities) participation and information from national technical assistance centers related to transition. A transition component is included in semi-annual special education administrator conferences. Approximately five (5) districts request face-to-face PD specific to transition early in the school year annually. The transition coordinator collaborates quarterly with career technical education (CTE) administrators and provides supplemental course support for CTE staff at the higher education level. Current publications, websites and books are a focus for periodic teleconferences. Book study participants average thirty per topic. Additional opportunities exist for presentations to targeted groups of staff, agencies, parents, adult clients, students and others.
APR Template – Part B (4) West Virginia.
State
Part B State Annual Performance Report for FFY2010 Page 114
Showcase for Transition on WVDE Website: The transition coordinator presented ideas and possible projects for development of student, family and district stories for creation of a showcase section on the transition web pages during the May, 2010, TCCoP meeting. The parent chair of the state Developmental Disabilities Council (DDC) volunteered to tell the story of her son from her perspective. The story was developed with the transition coordinator and presented at the West Virginia Board of Education meeting October, 2010, in conjunction with a discussion about autism and later at the December meeting of the WV TCCoP. The story has been published to the WVDE Transition web pages at http://wvde.state.wv.us/osp/Transition/TransitionIntro.html.
NDPC SD Intensive TA Grant 2011-2013: The WVDE OSP was awarded a grant (January, 2011) for intensive technical assistance (TA) from the National Dropout Prevention Center for Students with Disabilities (NDPC SD) through 2013. A teleconference call with NDPC SD staff and internal WVDE team for the grant was held (February, 2011) to develop the timeline for year one and to provide details of expectations from the NDPC SD. Twelve districts originally applied to participate in the intensive TA opportunity, and a thirteenth was added in June, 2011. Seven of those districts were also identified for TA and receive intensive intervention because of OSP compliance issues. Stakeholder members from advocacy agencies, Rehabilitation Services and the West Virginia Developmental Disabilities Council were obtained as was a large and diverse WVDE team with membership of twenty-two (22) staff from various offices to assure coordination for dropout.
During March (2011) twenty-eight (28) participating WVDE staff and representatives of the twelve participating districts attended an initial two-day meeting with NDPC SD staff. Participants were guided to examine existing state data and develop an understanding of the TA grant and goals. During June (69 participants) and July (57 participants) of 2011, district teams and WVDE staff worked intensively for four days with NDPC SD staff to understand the research, examine interventions and strategies, make decisions based on data and develop action and implementation plans. The WVDE OSP disseminated The Last Dropout: Stop the Epidemic to all TA Grant members, including all district team members and encouraged to conduct a book study. TA Grant members communicate primarily via email to stay current on new materials (i.e. Dissemination of Reentry Programs for Out-of-School Youth with Disabilities NDPC SD publication), submit action plans and obtain notice for important events (i.e. WV Student Success Summit and Regional Truancy meetings).
West Virginia’s Four-Year Adjusted Cohort Graduation Rate: Questions & Answer Guide was developed to assist districts in understanding of the graduation cohort. Input from the TA grant districts was obtained at each meeting. This document was one of three goals for the state’s intensive TA grant application. A second state goal has been to raise awareness and develop a deep understanding of various data sources regarding dropout prevention, intervention and recovery. Discussion and development of an early warning system reflects a direct link to this goal. The final component of the plan involves the development of a dropout prevention tool for use by an LEA to assist with creating a customized dropout prevention intervention program specifically for students with disabilities.
TA grant participants had the opportunity to be involved in multiple opportunities for professional development and collaboration through financial grants from OSP to each district for each of the three years of participation. The second West Virginia Student Success Summit and announcement of Innovation Zone grant opportunities for dropout prevention were offered by the WVDE. WV Senate Bill 228 was passed in March of 2011, wherein state code was changed to address dropout prevention. Requirements in the Bill included implementation of an electronic system for early warning indicators, a separate category of innovation zones for dropout prevention and recovery, opportunities for collaboration, requirement for district school attendance assistants and GED Option program development. The mandatory school attendance age for the state is now at 17.

APR Template – Part B (4) West Virginia.
State
Part B State Annual Performance Report for FFY2010 Page 115
Truancy meetings sponsored by the State Supreme Court of Appeals occurred throughout the state where the public was informed about the establishment of partnerships between the judiciary and education system to address attendance issues at all programmatic levels. Attendance directors statewide and special education administrators from the thirteen grant districts collaborated to examine district attendance policies for alignment with the state attendance policy and to identify barriers in October, 2011. Documents and other information are posted at https://sites.google.com/site/ospdropoutprevention/.
WV Transition Collaborative Community of Practice (TCCoP) and Leadership Team: The WVDE maintains a leadership team for the WV TCCoP to assist in identification of needs and to plan professional development and guidance for all components of transition services for LEA and school level staff for implementing transition services. Representatives from selected LEAs and agency staff collaborate with the transition coordinator at the WVDE and participate in the annual State Planning Institute sponsored by the National Secondary Transition Techical Assistance Center (NSTTAC), the National Post School Outcomes Center and (NPSO) and NDPC SD. Members of the leadership team developed a guide for transition in WV and presented the draft to WV TCCoP participants at the May 2011 statewide meeting. Documents for meetings are posted at https://sites.google.com/a/wvde.k12.wv.us/wv-tccop/l.
The WV TCCoP meets at least annually to provide statewide professional development opportunities for LEAs regarding implementation of all components of transition services. Two meetings of the WV TCCoP were held during 2010-2011 (December, May). The two day December professional development opportunity targeted transition topics in six areas: 1) secondary literacy, 2) transition planning for students with significant disabilities, 3) jigsaw book study for graduation and dropout: Helping Students Graduate, 4) Showcase, stories of success from former students with disabilities, 5) policy and procedures for transition services, and 6) collaboration and linkages with WV Department of Rehabilitation Services. Participants received and participated in a jigsaw version of a book study for Helping Students Graduate and studied graduation/dropout data for students with disabilities. The purpose was for participants to return to their LEA to initiate discussions and to begin the process of understanding the particular challenge in WV for students with disabilities and to begin to blend knowledge gained from the NDPC SD Intensive TA Grant activities. At this same meeting and in a follow up email individuals and RS staff had the opportunity to volunteer for an intensive book study using A Guide to Vocational Assessment. Twenty-two participants volunteered for a series of eight one-hour teleconferences and a commitment of reading approximately fifty pages per call from January through April. The result of the study was development of a deep understanding of vocational assessment as well as transition assessment for school-age students.
The subsequent two-day meeting of the TCCoP in May focused primarily on post secondary goals and development of the Summary of Performance (SOP) where guidance from Dr. James Patton of Austin, TX, was provided. Additional topics included: 1) Developmental Disabilities Council coordination, 2) Showcase, stories of success from districts, 3) review of the developing WVDE OSP guidance document for transition, 4) guided website exploration, 5) understanding graduation and dropout calculations, 6) exit and Follow Up Surveys results, and 7) linking transition assessments to transition services. The format for professional development at the WV TCCoP meetings involves active engagement of participants with minimal lecture style presentations.
The WVDE OSP maintains an electronic listserv for the WV TCCoP for communications of all types. Participants of the WV TCCoP have the opportunity to collaborate quarterly with Rehabilitation Services (RS), Community Rehabilitation Program (CRP) providers and other agency partners in the six WV RS District Transition Teams that have been established for regions of the state (see below). The annual WV Council for Exceptional Children Conference was held during November 2010 where the topic was Transitions.

APR Template – Part B (4) West Virginia.
State
Part B State Annual Performance Report for FFY2010 Page 116
Agency Collaboration and Transition Teams: The transition coordinator collaborates at least monthly with RS and WV Developmental Disabilities Council (DDC). Both agencies are existing members of the WV TCCoP. Established RS District Transition Teams bring together RS staff, CRP providers and LEA staff. Teams meet quarterly with a focus on development of relationships and to broaden understanding of services. At least four LEAs have partnered with Transition Team members to present informational fairs for students and parents for 2010-2011. SEA and RS staffs attend some district meetings to promote further development. The RS school counselor coordinator and transition coordinator participated in the Mid Atlantic Transition Leadership Council for 2010-2011. RS and the SEA partnered to conduct district level discussion and guidance for improving services to students and families. The WVDE transition coordinator met with the RS supervisor and district Employment Specialists for each district to discuss and plan supports to district special education staff. Additionally, the DDC sponsored a Wills/Trusts presentation for interested parties that was attended by approximately 10 educators and parents from the districts.
The DDC administered a grant for 2010-2011 and beyond to support development of transition services through coordination of activities with the WVDE OSP. The first grant to a CRP helped the transition coordinator to identify non-typical students with disabilities for a pilot CTE program for direct instruction in the general education setting to teach occupational skills in the student’s preferred area of interest. The grant assisted the WVDE OSP in identification of student characteristics and contributed to a guidance document for program implementation for 2012-2013. A second grant supported development of new CRP providers comprised of school personnel to support exiting students in a supported work setting in local businesses the summer following graduation/exit. The program has been successful in districts not previously considered positive for job development. The transition coordinator serves as the state representative on the DDC at quarterly meetings.
Exit Survey: In 2010-2011, the transition specialist coordinated the distribution, analysis and reporting of Exit Surveys and One-year Follow-up Surveys in West Virginia. The Exit Survey conducted each year at the time students leave school (see below) provides insight into factors affecting graduation rates. During 2010-2011, 1,987 students with disabilities in grades 9 through 12 participated in the exit survey. Return rate of the exit survey was 68.4% (i.e., 1,987 respondents divided by 2,904 total graduates with standard or modified diploma, total drop-outs and total number of students reaching maximum age).
2009-2010 Exit Survey Findings
Fifteen, nineteen and sixty percent of SWD reported entry, professional, and skilled career pathways, respectively.
Thirty-nine percent of SWD maintained they earned a certificate in a Career and Technical program concentration.
Twenty-five percent of SWD reported earning the industry credential from a Career and Technical program concentration.
Approximately 1 out of every 4 SWD (i.e., 26.1%) indicated he or she failed to obtain job experience while in high school.
Eighteen and sixteen percent of SWD purported they intend to pursue a 4-year and 2-year degree program, respectively.
Nineteen and fourteen percent of SWD purported they intend to pursue a career and technical/vocational program or on-the-job training/apprenticeship, respectively.
Forty-one percent of SWD indicated they have a current driver’s license (not a learner’s permit), which will allow them increased access to employment or postsecondary education.
One in three SWD (i.e., 32.5%) intend to live independently or with friends immediately after high school.

APR Template – Part B (4) West Virginia.
State
Part B State Annual Performance Report for FFY2010 Page 117
SWD indicate high levels of self-advocacy. Seventy-seven percent of SWD reported their own ideas and suggestions were incorporated into their most recent IEP meeting, while more than eight out of ten SWD are comfortable discussing their special needs and asking for assistance.
Between 85 and 90 percent of SWD purported schools were helpful 1) connecting them to further education; 2) developing work related skills (e.g., self-initiative, teamwork, use of technology); and 3) developing confidence to continue in education.
Three in every four SWD (i.e., 75.5%) reported that the school staff helped them talk about their disabilities.
Dislike of school of the school environment and the lack of interest and motivation were the most frequently cited deterrents to graduating (see Indicator 2 APR discussion).
Data Collection for ESEA and Section 618. Exit data are collected by WVEIS and submitted through EDEN. Both the EDFacts coordinator and data manager identified discrepancies in school and special education exit data and worked with districts to resolve discrepancies and ensure accurate individual student data files and federal reporting for both ESEA and Section 618.
Revisions, with Justification, to Proposed Targets / Improvement Activities / Timelines / Resources for FFY 2011
No revisions are proposed at this time.

APR Template – Part B (4) West Virginia.
State
Part B State Annual Performance Report for FFY2010 Page 118
Part B State Annual Performance Report (APR) for FFY 2009 (2009-2010)
Overview of the Annual Performance Report Development:
Monitoring Priority: Effective General Supervision Part B / General Supervision
Indicator 15: General supervision system (including monitoring, complaints, hearings, etc.) identifies and corrects noncompliance as soon as possible but in no case later than one year from identification.
(20 U.S.C. 1416 (a)(3)(B))
Measurement:
Percent of noncompliance corrected within one year of identification:
a. # of findings of noncompliance. b. # of corrections completed as soon as possible but in no case later than one year from
identification.
Percent = [(b) divided by (a)] times 100.
States are required to use the “Indicator 15 Worksheet” to report data for this indicator
(see Attachment A).
FFY Measurable and Rigorous Target
2010
(2010-2011)
100% Compliance – General supervision system (including monitoring, complaints, hearings) identifies and corrects noncompliance as soon as possible but in no case later than one year from identification.
Actual Target Data for FFY 2010:
Baseline Actual Target Data
2004-2005 (FFY 2004)
2005-2006 (FFY 2005)
2006-2007 (FFY 2006)
2007-2008 (FFY 2007)
2008-2009 (FFY 2008)
2009-2010 (FFY 2009)
2010-2011 (FFY 2010)
Number of Non-compliances Identified in Previous Year
188 249 287 102 1249 1524 595
Number of Non-compliances Corrected within One Year
170 153 274 102 1248 1465 582
Percentage Non-compliances Corrected in One Year
90.43 % 61.69 % 95.47% 100% 99.9% 96.1%
97.8%
There were 582 findings of noncompliance corrected within one year/595 findings of noncompliance
identified in 2009-2010 = 97.8%

APR Template – Part B (4) West Virginia.
State
Part B State Annual Performance Report for FFY2010 Page 119
Describe the process for selecting LEAs for Monitoring:
Indicator 15 addresses findings of noncompliance identified during 2009-2010, through all monitoring and compliance processes, that were corrected within one year of identification, that is, during 2010-2011.
The special education compliance unit has the responsibility to monitor local educational agencies (LEAs) for compliance with requirements of IDEA 2004 and Policy 2419: Regulations for the Education of Students with Exceptionalities. The process for selecting LEAs for monitoring falls within the authority of WVDE general supervision and the West Virginia State Code §18-20-7 Exceptional Children Program Compliance Review Teams. New monitoring procedures were implemented in 2009-2010. To establish a baseline, all 55 school districts, the West Virginia Schools for the Deaf and the Blind, and Office of Institutional Education Programs (OIEP) received an on-site visit to review the validity of the Comprehensive Self-Assessment Desk Audit (CSADA) during 2009-2010. Additionally, the WVDE conducted an on-site monitoring of Preston County, as it was a take-over district controlled by the WVDE, and OIEP received an on-site monitoring for four facilities. Findings of noncompliance corrected during 2010-11 were identified using the above process.
Discussion of Improvement Activities Completed and Explanation of Progress or Slippage that Occurred for FFY 2010:
The percentage of correction for the FFY 2010 APR was 97.7% compared to 96.1% for the FFY 2009 APR, representing an increase of 1.6%. This improvement in the percentage of noncompliance corrected for districts may be attributed to a strong focus on monitoring with the implementation of the two-pronged correction requirement set forth in the OSEP Memorandum 09-02.
Additionally, it should be noted that the total number of findings of noncompliance identified in 2008-2009 far exceeded the number identified in 2009-2010. This is primarily because in 2008-2009, districts submitted the lengthy CSADA (district self assessment), which contained many compliance indicators. In 2009-2010, districts were required to submit a revised self-assessment, the Annual Desk Audit, which focused on indicators corresponding to the State Performance Plan. Therefore, the number of indicators for which compliance data were submitted was greatly reduced. Also during this year, each district received an onsite verification visit.
Improvement Activities
Several activities during 2010-2011 contributed to broader understanding of compliance issues. At the Special Education Administrators’ Fall Conference in September 2010, each APR indicator was reviewed, including the compliance requirements and data issues. New Directors’ Conferences provided additional professional development, which contributed to district leadership’s understanding of compliance issues. The Office of Special Education Programs (OSEP) verification visit in fall 2010 provided a thorough review of compliance requirements, which in part served as training for new monitoring staff. Beginning in 2011, the OSP monitoring team and other staff as appropriate have worked with Mid-South Regional Resource Center (MSRRC) to revise monitoring procedures and data collection regarding noncompliance and correction of noncompliance. This process continues to increase capacity of staff and consistency of implementation of monitoring procedures. The OSP continues to address improvement activities as described in the SPP/APR, the OSP provided professional development and other forms of technical assistance to LEAs to address systemic and student specific issues to ensure improved results for students with exceptionalities. This professional development was offered in a variety of ways, including, but not limited to:
Sponsoring quarterly New Special Education Directors’ Conferences;
Sponsoring the Annual Special Education Administrators’ Conference;
Supporting other major conferences such as PATHS, Celebrating Connections and West Virginia Council of Exceptional Children;

APR Template – Part B (4) West Virginia.
State
Part B State Annual Performance Report for FFY2010 Page 120
Accessing the national technical assistance centers, such as National Secondary Transition Technical Assistance Center (NSTTAC) and Consortium for Appropriate Dispute Resolution in Special Education (CADRE);
Participating in Office of Special Education Programs (OSEP) monthly technical assistance calls;
Providing a summary of findings of noncompliance to district special education directors through a weekly listserv;
Providing training to districts to ensure access to the necessary tools and knowledge to monitor compliance;
Providing annual monitoring training to districts selected for a Compliance On-Site Review;
Presenting at the annual West Virginia Educational Information System Conference;
Utilizing the Department website to post special education information, policy clarifications, PowerPoint presentations and workshops with corresponding training materials, Tech 21, and State IEP form;
Implementing transition activities to address indicator #1, #2, #13, and #14; and
Collaborating with the Office of Informational Systems to improve the capacity of districts to access data in an accurate and timely manner.
The Part B Indicator 15 Worksheet, (attached), provides an overview of the timely correction of findings of noncompliance in relation to the SPP Monitoring Priorities and state-specific indicators.
Timely Correction of FFY 2009 Findings of Noncompliance (corrected within one year from identification of the noncompliance):
Number of findings of noncompliance the State made during FFY 2009 (the period from July 1, 2009 through June 30, 2010) (Sum of Column a on the Indicator B15 Worksheet)
595
Number of findings the State verified as timely corrected (corrected within one year from the date of notification to the LEA of the finding) (Sum of Column b on the Indicator B15 Worksheet)
582
Number of findings not verified as corrected within one year [(1) minus (2)] 13
Corrections of Individual Findings of Noncompliance Identified in FFY 2009 and Verification of Implementation of Regulatory Requirements
Findings of noncompliance identified in 2009-2010 through the CSADA on-site monitoring visits, Annual Desk Audit (ADA), Complaint Letters of Findings and Due Process Hearing Decisions were verified as corrected by the special education compliance unit staff. The special education compliance unit utilizes various methods with updated data to verify correction of noncompliance (i.e. desk audit, on-site visit, state database).
For the CSADA/ADA compliance indicators the self-assessment workbook indicates the targets to be met. For more complex indicators such as IEP reviews, discipline reviews and disproportionality reviews, checklists and protocols are utilized indicating specific items that must be present for compliance.
At the time the districts submit the ADA/CSADA, compliance indicators with a “not met” status require an improvement plan to be entered by the districts. The improvement/corrective activities are submitted along with the self-assessment by May each year. Monitoring staff review the plans and districts are notified within 30 days of submission of the self-assessment indicating the specific indicators of noncompliance and also notified whether the improvement plan submitted is accepted. If needed, the district will be given additional technical assistance prior to acceptance of the plan.

APR Template – Part B (4) West Virginia.
State
Part B State Annual Performance Report for FFY2010 Page 121
Correction of noncompliance was verified using multiple measures to include at a minimum: 1) a CSADA progress report with data supporting the completion of the accepted improvement activities was submitted and reviewed by monitoring staff, 2) subsequent data pulls including the full CSADA/ADA submission in the following year, and 3) evidence to document student specific corrections. While monitoring districts’ completion of improvement activities was critical to the improvement process, a district’s failure to implement these activities did not negate correction if both prongs of OSEP Memorandum 09-02 were met. When compliance was verified, both individual and regulatory, districts were notified of verification of correction in writing, typically in the subsequent CSADA letter in May.
For the CSADA/ADA, noncompliance was identified through a review of district data for Indicators 4, 9, 10, 11, 12 and 13 were and posted on the ADA website. For Indicators 4, 9, 10 and 13, correction of noncompliance was verified by a state level review of up-data district data through on-site reviews and desk audits of documentation submitted by the district. For Indicators 11 and 12, a subsequent pull of data from the state database was utilized to verify correction of noncompliance.
For noncompliance identified through on-site Data Verification Visits for which written notification of noncompliance was issued, the districts were required to submit an improvement plan delineating corrective action to ensure correction as soon as possible but in no case later than one year from written notification. Correction of noncompliance was verified utilizing multiple measure similar to the verification above, including: 1) review and approval of districts’ submitted documentation with data supporting the completion of the approved corrective activities by the district and reviewed by monitoring staff; 2) subsequent data pulls and collection of updated data samples (i.e. initial evaluation timelines, corrected IEPs), which were reviewed by monitoring staff to verify implementation of specific regulatory requirements; 3) on-site visits to validate correction of noncompliance through additional or up-dated file reviews, interviews and SEA review of LEA policies, practices and procedures as appropriate to the noncompliance and 4) evidence to document student-specific correction. Typically follow-up verification visits were scheduled 90 days prior to the anniversary date of notification of all monitoring reports to verify correction of noncompliance.
For comprehensive on-site monitoring, staff reviews documentation to ensure individual noncompliance is corrected. Following and on-site monitoring, the lead coordinator tracks the submission of required documentation to meet the two-prong requirements of the OSEP Memorandum 09-02 and follows the district through closure of the monitoring process. As technical assistance is required through the monitoring or requested by the district, the lead coordinator either provides the technical assistance or coordinates the provision of such technical assistance.
FFY 2009 Findings of Noncompliance Not Timely Corrected (corrected more than one year from identification of the noncompliance and/or not corrected):
Number of FFY 2009 findings not timely corrected (same as the number from (3) above)
13
Number of FFY 2009 findings the State has verified as corrected beyond the one-year timeline (“subsequent correction”)
13
Number of FFY 2009 findings not yet verified as corrected [(4) minus (5)] 0
Findings corrected more than one year from identification of noncompliance were verified as corrected, both for individual noncompliance and implementation of specific regulatory requirements, following the procedures described above.

APR Template – Part B (4) West Virginia.
State
Part B State Annual Performance Report for FFY2010 Page 122
FFY 2008 Findings of Noncompliance Not Timely Corrected (corrected more than one year from identification of the noncompliance and/or not corrected):
Number of FFY 2008 findings not timely corrected 16
Number of FFY 2008 findings the State has verified as corrected beyond the one-year timeline (“subsequent correction”)
16
Number of FFY 2008 findings not yet verified as corrected 0
In the FFY 2009 APR, the state reported 59 findings of noncompliance had not been verified as timely corrected within one year. Of these 59 findings of noncompliance, the state reported as of February 2011, 43 had been verified as corrected beyond the one-year timeline, and 16 had not yet been verified as corrected. The following actions were taken to ensure correction of the continued noncompliance:
The West Virginia Schools for the Deaf and the Blind received notice of Level One enforcement sanctions and effectively acquired technical assistance to correct their findings of noncompliance. Technical assistance was provided by WVDE staff as well as external consultants. Additionally, new staff were employed at the schools. The OSP verified WVSDB corrected the two (2) remaining findings of noncompliance reported as uncorrected in the APR 2009-2010 by 1) correcting all individual findings of noncompliance and 2) through subsequent onsite review demonstrating implementation of specific regulatory requirements.
The WVDE OSP has issued Mason County a written notice of Level One enforcement sanctions. The district received technical assistance from OSP staff and from the Statewide System of Support (SSOS) team, initiated as a result of an accreditation report issued by the Office of Education Performance Audits (OEPA). This team includes the OSP lead monitor assigned to the district. Three onsite visits by OSP staff were conducted April 2011 through January 2012 to verify correction of noncompliance. The OSP verified the districted has corrected remaining findings of noncompliance reported as uncorrected in the APR 2009-2010 by 1) correcting all individual findings of noncompliance and 2) by demonstrating through subsequent onsite review implementation of specific regulatory requirements.
Revisions, with Justification, to Proposed Targets / Improvement Activities / Timelines / Resources for FFY 2011 (if applicable):
Continuous Improvement and Focused Monitoring Process
In FFY 2010, the OSP began a review and revision of monitoring procedures, with technical assistance from Mid South Regional Resource Center, to more closely reflect West Virginia Code §18-20-7, which requires compliance review teams conduct random unannounced on-site reviews of districts at least every four years (approximately 14 districts per year) for the purpose of reviewing identification procedures, complying with any or all applicable laws and policies, delivering services and verifying enrollment and attendance reports. Districts are selected each July on a cyclical schedule to ensure each district receives an on-site visit within a four-year cycle.
In addition to the cyclical monitoring process, districts may receive a focused monitoring visit. Focused Monitoring is an on-site monitoring process where an LEA may receive a visit based on an identified need or other data source (i.e. an LEA receiving a large number of complaints on a specific issue) brought to the attention of the OSP. In addition, the OSP may resolve a complaint regarding alleged violations that occurred outside the one-year timeline through the focus monitoring process. This process may occur concurrently with a Compliance On-Site Monitoring or independently. A Focused Monitoring will drill down within the LEA’s data to identify root causes and solutions to an on-going issue of compliance, performance or both. Each Focused Monitoring is individualized to the district and the situation.

APR Template – Part B (4) West Virginia.
State
Part B State Annual Performance Report for FFY2010 Page 123
Previously, Indicator 13 data was collected through the annual CSADA/ADA submission based on each district’s review of student files selected by the SEA. The SEA then issued findings of noncompliance based on the district’s review. Districts have demonstrated consistent improvements in meeting secondary transition requirements. The SEA has strengthened the process for obtaining Indicator 13 data by sampling transition services and files during the on-site monitoring visits rather than relying on self-assessment data. Districts will continue the self-assessment process to review files however, the OSP will now collect Indicator 13 data through a sampling process during the on-site visits. This process is outlined in the Indicator 13 narrative.
The General Supervision System continues to identify and verify correction of district noncompliance as soon as possible but in no case later than one year from written notification, to conduct on-going professional development and to provide technical assistance to LEAs and RESAs. Professional development provided to LEAs includes annual training regarding the monitoring procedures, analysis of district data for the ADA and other areas as determined by the OSP staff regarding compliance.

APR Template – Part B (4) West Virginia.
State
Part B State Annual Performance Report for FFY2010 Page 124
ATTACHMENT
PART B INDICATOR 15 WORKSHEET
Please note, this worksheet displays may display a different number of findings of noncompliance identified under Indicators 4A, 4B, 12 and 13 than the number reported in the APR for each individual indicator, because WVDE reviews and identifies findings of noncompliance for related requirements in these areas. These additional findings are aggregated and reported in the worksheet;.
PART B INDICATOR 15 WORKSHEET
In completing the worksheet, the number recorded in column (b) cannot exceed the number recorded
in column (a). If the number in column (b) exceeds column (a) the column (b) cell will turn red.
This worksheet calculates the percent of noncompliance corrected within one year of identification.
The self-calculating cells are highlighted in gray. Be careful not to enter data into these cells because
the calculations will not work properly.
Indicator/Indicator Clusters
General Supervision System Components
# of LEAs Issued Findings in FFY 2009 (7/1/09 to 6/30/10)
(a) # of Findings of noncompliance identified in FFY 2009 (7/1/09 to 6/30/10)
(b) # of Findings of noncompliance from (a) for which correction was verified no later than one year from identification
1. Percent of youth with IEPs graduating from high school with a regular diploma.
Monitoring Activities: Self-Assessment/ Local APR, Data Review, Desk Audit, On-Site Visits, or Other
0 0 0
2. Percent of youth with IEPs dropping out of high school.
14. Percent of youth who had IEPs, are no longer in secondary school and who have been competitively employed, enrolled in some type of postsecondary school or training program, or both, within one year of leaving high school.
Dispute Resolution: Complaints, Hearings
0 0 0
3. Participation and performance of children with disabilities on statewide assessments.
Monitoring Activities: Self-Assessment/ Local APR, Data Review, Desk Audit, On-Site Visits, or Other 0 0 0
7. Percent of preschool children with IEPs who demonstrated improved outcomes.
Dispute Resolution: Complaints, Hearings
0 0 0

APR Template – Part B (4) West Virginia.
State
Part B State Annual Performance Report for FFY2010 Page 125
4A. Percent of districts identified as having a significant discrepancy in the rates of suspensions and expulsions of children with disabilities for greater than 10 days in a school year.
Monitoring Activities: Self-Assessment/ Local APR, Data Review, Desk Audit, On-Site Visits, or Other
1 1 1
4B. Percent of districts that have: (a) a significant discrepancy, by race or ethnicity, in the rate of suspensions and expulsions of greater than 10 days in a school year for children with IEPs; and (b) policies, procedures or practices that contribute to the significant discrepancy and do not comply with requirements relating to the development and implementation of IEPs, the use of positive behavioral interventions and supports, and procedural safeguards.
Monitoring Activities: Self-Assessment/ Local APR, Data Review, Desk Audit, On-Site Visits, or Other
12 18 17
Dispute Resolution: Complaints, Hearings
2 5 5
5. Percent of children with IEPs aged 6 through 21 -educational placements.
Monitoring Activities: Self-Assessment/ Local APR, Data Review, Desk Audit, On-Site Visits, or Other
0 0 0
6. Percent of preschool children aged 3 through 5 – early childhood placement.
Dispute Resolution: Complaints, Hearings 0 0 0
8. Percent of parents with a child receiving special education services who report that schools facilitated parent involvement as a means of improving services and results for children with disabilities.
Monitoring Activities: Self-Assessment/ Local APR, Data Review, Desk Audit, On-Site Visits, or Other
0 0 0
Dispute Resolution: Complaints, Hearings
1 1 1
9. Percent of districts with disproportionate representation of racial and ethnic groups in special education that is the result of inappropriate identification.
Monitoring Activities: Self-Assessment/ Local APR, Data Review, Desk Audit, On-Site Visits, or Other
1 1 1

APR Template – Part B (4) West Virginia.
State
Part B State Annual Performance Report for FFY2010 Page 126
10. Percent of districts with disproportionate representation of racial and ethnic groups in specific disability categories that is the result of inappropriate identification.
Dispute Resolution: Complaints, Hearings
0 0 0
11. Percent of children who were evaluated within 60 days of receiving parental consent for initial evaluation or, if the State establishes a timeframe within which the evaluation must be conducted, within that timeframe.
Monitoring Activities: Self-Assessment/ Local APR, Data Review, Desk Audit, On-Site Visits, or Other
40 240 240
Dispute Resolution: Complaints, Hearings
7 8 8
12. Percent of children referred by Part C prior to age 3, who are found eligible for Part B, and who have an IEP developed and implemented by their third birthdays.
Monitoring Activities: Self-Assessment/ Local APR, Data Review, Desk Audit, On-Site Visits, or Other
28 38 38
Dispute Resolution: Complaints, Hearings 0 0 0
13. Percent of youth aged 16 and above with IEP that includes appropriate measurable postsecondary goals that are annually updated and based upon an age appropriate transition assessment, transition services, including courses of study, that will reasonably enable the student to meet those postsecondary goals, and annual IEP goals related to the student’s transition service needs.
Monitoring Activities: Self-Assessment/ Local APR, Data Review, Desk Audit, On-Site Visits, or Other
12 45 45
Dispute Resolution: Complaints, Hearings
0 0 0
Other areas of noncompliance: Parents of students with exceptionalities are appropriately informed about parental rights and responsibilities. Prior written notice.
Monitoring Activities: Self-Assessment/ Local APR, Data Review, Desk Audit, On-Site Visits, or Other
13 15 15
Dispute Resolution: Complaints, Hearings 2 2 2
Other areas of noncompliance: When determining eligibility, the EC shall consider documented information from a variety of sources,
Monitoring Activities: Self-Assessment/ Local APR, Data Review, Desk Audit, On-Site Visits, or Other 3 4 4

APR Template – Part B (4) West Virginia.
State
Part B State Annual Performance Report for FFY2010 Page 127
such as ability and achievement tests, parent input, teacher recommendations, physical condition, social, cultural or ethnic background and adaptive skills.
Dispute Resolution: Complaints, Hearings
1 1 1
Other areas of noncompliance: The district maintains required caseload limits. The district provides highly qualified personnel who are appropriately trained for the area(s) of exceptionality in which they have primary responsibility to implement the IEP of each eligible student.
Monitoring Activities: Self-Assessment/ Local APR, Data Review, Desk Audit, On-Site Visits, or Other
21 24 23
Dispute Resolution: Complaints, Hearings
2 2 2
Other areas of noncompliance: IEPs are written to include all required components.IEPs must be reviewed at least annually.Reevaluations conducted at least every three years.
Monitoring Activities: Self-Assessment/ Local APR, Data Review, Desk Audit, On-Site Visits, or Other
30 47 39
Dispute Resolution: Complaints, Hearings 7 18 18
Other areas of noncompliance: Audit findings
Monitoring Activities: Self-Assessment/ Local APR, Data Review, Desk Audit, On-Site Visits, or Other
8 8 8
Dispute Resolution: Complaints, Hearings
0 0 0
Other areas of noncompliance: Collect, maintain and disclose personally identifiable student data in accordance with state and federal confidentiality requirements.
Monitoring Activities: Self-Assessment/ Local APR, Data Review, Desk Audit, On-Site Visits, or Other
2 3 3
Dispute Resolution: Complaints, Hearings 0 0 0
It is the responsibility of each public agency to collect and maintain current and accurate student data, which verifies the delivery of
Monitoring Activities: Self-Assessment/ Local APR, Data Review, Desk Audit, On-Site Visits, or Other
0 0 0

APR Template – Part B (4) West Virginia.
State
Part B State Annual Performance Report for FFY2010 Page 128
a free appropriate public education and report data as required.
Dispute Resolution: Complaints, Hearings
1 1 1
Documentation of time and effort
Monitoring Activities: Self-Assessment/ Local APR, Data Review, Desk Audit, On-Site Visits, or Other
52 52 52
Dispute Resolution: Complaints, Hearings 0 0 0
Each public agency must provide special education and related services to a student with an exceptionality in accordance with an individualized education program. Provide eligible exceptional students an instructional day, a school day and school calendar at least equivalent to that established for non-exceptional students of the same chronological age in the same setting.
Monitoring Activities: Self-Assessment/ Local APR, Data Review, Desk Audit, On-Site Visits, or Other
37 51 48
Dispute Resolution: Complaints, Hearings
10 10 10
Sum the numbers down Column a and Column b 595 582
Percent of noncompliance corrected within one year of identification = (b) / (a) X 100 = 97.82%
(column (b) sum divided by column (a) sum) times 100.

APR Template – Part B (4) West Virginia.
State
Part B State Annual Performance Report for FFY2010 Page 129
Part B State Annual Performance Report (APR) for FFY 2010 (2010-2011)
Overview of the Annual Performance Report Development:
See Indicator 1.
Monitoring Priority: Effective General Supervision Part B / General Supervision
Indicator 16: Percent of signed written complaints with reports issued that were resolved within 60-day timeline or a timeline extended for exceptional circumstances with respect to a particular complaint, or because the parent (or individual or organization) and the public agency agree to extend the time to engage in mediation or other alternative means of dispute resolution, if available in the State
(20 U.S.C. 1416(a)(3)(B))
Measurement: Percent = [(1.1(b) + 1.1(c)) divided by 1.1] times 100
FFY Measurable and Rigorous Target
2010
2010-2011
100% of signed written complaints with reports issued that were resolved within 60-day timeline or a timeline extended for exceptional circumstances with respect to a particular complaint, or because the parent (or individual or organization) and the public agency agree to extend the time to engage in mediation or other alternative means of dispute resolution, if available in the State.
Information Required by OSEP’s Response Table for FFY 2009
OSEP’s January 24, 2011 verification letter found that the State was extending the timeline for State complaint decisions in a manner that was inconsistent with the requirements in 34 CFR §300.152(b). To complete corrective actions for this finding, in the FFY 2009 Response Table, OSEP required the state to provide an assurance with its FFY 2010 APR that it did not routinely extend the 60-day timeline for complaints received in November or December of 2011.
WVDE hereby provides an assurance that it did not routinely extend the 60-day timeline for complaints received in November or December of 2011.
Actual Target Data for 2010-2011 (FFY 2010):
Percent of signed, written complaints completed within 60-day timeline or a timeline extended for exceptional circumstances.
[(20 + 1) divided by 22 times 100] = 95.4%

APR Template – Part B (4) West Virginia.
State
Part B State Annual Performance Report for FFY2010 Page 130
The table below provides detailed data pertaining to complaint investigations. Table 7, Report of Dispute Resolution, attached, also provides complaint data.
Reporting Period FFY 2005 2005-2006
Reporting Period FFY 2006 2006-2007
Reporting Period FFY 2007 2007-2008
Reporting Period FFY 2008 2008-2009
Reporting Period FFY 2009 2009-2010
Reporting Period FFY 2010 2010-2011
Complaints Filed 46 48 47 37 39 41
Complaints Investigated (1.1)
31 67% 24 50% 26 55% 19 51% 17 44% 22 54%
Complaints with Violations (1.1(a))
24 77% 21 87% 21 81% 14 74% 12 71% 18 82%
Complaints with no Violations
7 23 3 13% 5 19% 5 26% 5 29%
4 18%
Complaints withdrawn/dismissed
15
48% 24 50% 21 45% 18 49% 22 56% 19 46%
Investigations Completed Within Timeline
31 100% 24 100% 24 92% 19 100%
14 82.4% 21 95.4%
LOF issued within 60- day timeline (1.1(b)) LOF issued within extended timeline (1.1(c))
17 57% 11 46% 12
50%
10
53% 12 70.6% 20 90.9%
14 43% 13 54% 12 50% 9 47% 2 11.7%
1 4.54%
Investigations Exceeding 60-Day Timeline or an Extended Timeline
0 0 2 8% 0 3 17.6% 1 4.54%
Number of Complaints Deferred
0 0 0 0 0 0
Discussion of Improvement Activities Completed and Explanation of Progress or Slippage that occurred for FFY 2009:
A total of 41 letters of complaint were submitted to the West Virginia Department of Education (WVDE) from July 1, 2010 through June 30, 2011 compared to a total of 39 submitted during FFY 2009. Of the 41 letters received, 19 complaints were withdrawn or dismissed. Specifically, 17 complaints were resolved and subsequently withdrawn through the State’s early resolution process, 3 were resolved through formal mediation and 2 were dismissed for insufficiency. A total of 22 complaints were investigated and resulted in letters of findings. Of the 22, 18 letters of findings included violations requiring corrective activities to be submitted to the WVDE. Data for FFY 2010 indicate 21 complaints investigated were completed within the 60-day timeline or a timeline extended for exceptional circumstances with respect to a particular complaint consistent with 34 CFR §300.152. (b), resulting in 95.4% compliance, which denotes progress from FFY 2009.
During FFY 2010, one complaint investigation had been extended routinely in October in anticipation of the Thanksgiving break prior to the OSEP verification visit, which was immediately following Thanksgiving. Although the OSP revised complaint procedures after the OSEP exit conference on December 3, 2010 to prevent such extensions, one letter of findings was issued the following week, reflecting an extension not consistent with the timeline requirements for complaint decisions in 34 CFR §300.152(a) and (b)(1). No additional routine extensions have been granted since that time. The WVDE immediately revised its complaint procedures and practices to ensure complaint timelines are extended

APR Template – Part B (4) West Virginia.
State
Part B State Annual Performance Report for FFY2010 Page 131
only because exceptional circumstances exist with respect to a particular complaint or the parties agree to extend the time to engage in mediation or other alternative dispute resolution.
In June 2011, the complaint investigators attended professional development training provided by the WVDE for hearing officers and complaint investigators. In addition, both investigators attended complaint investigators’ training in July 2011, which was sponsored by the Kentucky Department of Education and presented by the Deputy Attorney General for the Indiana State Attorney General’s Office.
TABLE 7 SECTION A: WRITTEN, SIGNED COMPLAINTS
(1) Written, Signed Complaints Total 41
(1.1) Complaints with reports issued 22
(a) Reports with findings of noncompliance 18
(b) Reports within timelines 20
(c) Reports within extended timelines 1
(1.2) Complaints pending 0
(a) Complaint(s) pending a due process hearing 0
(1.3) Complaints withdrawn or dismissed 19
Revisions, with Justification, to Proposed Targets / Improvement Activities / Timelines / Resources for FYY 2010:
The State reviewed its improvement activities per the FFY 2009 SPP/APR Response Table. There are no proposed revisions at this time.

APR Template – Part B (4) West Virginia.
State
Part B State Annual Performance Report for FFY2010 Page 132
Part B State Annual Performance Report (APR) for FFY 2010 (2010-2011)
Overview of the Annual Performance Report Development:
See Indicator 1.
Monitoring Priority: Effective General Supervision Part B / General Supervision
Indicator 17: Percent of fully adjudicated due process hearing requests that were fully adjudicated within the 45-day timeline or a timeline that is properly extended by the hearing officer at the request of either party or in the case of an expedited hearing, within the required timelines.
.
(20 U.S.C. 1416(a)(3)(B))
Measurement: Percent = [(3.2(a) + 3.2(b)) divided by 3.2] times 100. (Refer to Table 7 attached.)
FFY Measurable and Rigorous Target
2010 (2010-2011)
100% of fully adjudicated due process hearing requests are within the 45-day timeline or a timeline that is properly extended and documented by the hearing officer at the request of either party of the hearing or in the case of an expedited hearing, within the required timelines.
.
Actual Target Data (FFY 2010):
Due Process Hearings 2004-2010
Hearings Requested C. *
Hearings Fully Adjudicated 3.2
Decisions Within 45 Day Timeline 3.2(a)
Decisions Within Extended Timeline 3.2(b)
% Within Timelines
Baseline 2004-2005
18 6 1 5 100%
2005-2006 13 1 0 1 100%
2006-2007 14 1 0 1 100%
2007-2008 20 3 0 3 100%
2008-2009
20 3 1 2 100%
2009-2010 12 2 0 2 100%
2010-2011 13 3 0 3 100%

APR Template – Part B (4) West Virginia.
State
Part B State Annual Performance Report for FFY2010 Page 133
*References are to Table 7 Section C Hearing Requests below.
The target of 100 percent compliance with due process hearing timelines was met.
Thirteen (13) due process complaints were filed from July 1, 2010 – June 30, 2011 (FFY 10). Of the 13 due process complaints filed, three (3) due process hearings were fully adjudicated. The three (3) fully adjudicated due process hearings were rendered within extended timelines, which were extended by the hearing officer at the request of a party and documented as required to the parties of the hearing and the West Virginia Department of Education (WVDE). No expedited hearings were filed during FFY 10. Therefore, the target of 100 percent compliance was met.
Discussion of Improvement Activities Completed and Explanation of Progress or Slippage that occurred for FFY 2010 (2010-2011):
The WVDE is committed to meeting the rigorous target of 100 percent of due process hearing requests being fully adjudicated within the 45-day timeline or within extended timelines only when necessary and properly extended and documented by the hearing officer at the request of either party of the hearing. The WVDE conducted annual due process hearing training June 2011, which provided information regarding the knowledge and ability to understand the provisions of the Individuals with Disabilities Education Improvement Act of 2004 (IDEA), federal and state regulations, legal interpretations of IDEA 2004 by federal and state courts and the ability to conduct hearings in accordance with appropriate, standard legal practice. The WVDE supported one (1) hearing officer’s attending LRP’s 32
th Annual
National Institute for Legal Issues in Special Education, including the pre-conference hearing officer training. A subscription to the LRP Special Education Connection was supported for all of the hearing officers, which provides online access to all IDEA 2004 statues, regulations, interpretations and case law.
The ongoing improvement activities as stated in the State Performance Plan were implemented during 2010-2011.
TABLE 7 REPORT OF DISPUTE RESOLUTION UNDER PART B, OF THE
INDIVIDUALS WITH DISABILITIES EDUCATION ACT 2009-10
SECTION C: DUE PROCESS COMPLAINTS
(3) Total number of due process complaints filed 13
(3.1) Resolution meetings 3
(a) Written Settlement agreements reached through resolution meetings 3
(3.2) Hearings fully adjudicated 3
(a) Decisions within timeline (include expedited) 0
(b) Decisions within extended timeline 3
(3.3) Due process complaints pending 1
(3.4) Due process complaints withdrawn or dismissed (including resolved without a hearing) 9

APR Template – Part B (4) West Virginia.
State
Part B State Annual Performance Report for FFY2010 Page 134
SECTION D: EXPEDITED DUE PROCESS COMPLAINTS (RELATED TO DISCIPLINARY DECISION)
(4) Total number of expedited due process complaints filed 0
(4.1) Resolution meetings 0
(a) Written settlement agreements 0
(4.2) Expedited hearings fully adjudicated 0
(a) Change of placement ordered 0
(4.3) Expedited due process complaints pending 0
(4.4) Expedited due process complaints withdrawn or dismissed 0
Revisions, with Justification, to Proposed Targets / Improvement Activities / Timelines / Resources for FFY 2010:
No revisions are proposed at this time.

APR Template – Part B (4) West Virginia.
State
Part B State Annual Performance Report for FFY2010 Page 135
Part B State Annual Performance Report (APR) for FFY 2010 (2010-2011)
Overview of the Annual Performance Report Development:
See Indicator 1.
Monitoring Priority: Effective General Supervision Part B / General Supervision
Indicator 18: Percent of hearing requests that went to resolution sessions that were resolved through resolution session settlement agreements.
(20 U.S.C. 1416(a)(3(B))
Measurement: Percent = (3.1(a) divided by 3.1) times 100.
FFY Measurable and Rigorous Target
2010 (2010-2011)
Fewer than 10 resolution sessions.
Actual Target Data for FFY 2010 (2010-2011)
Resolution Session Data for 2005-2011
FFY Resolution Sessions Held
3.1
Settlement Agreements
3.1(a)
% Sessions with Resolution
(3.1(a) divided by 3.1) times 100.
2006 (2006-2007)
2 2 100%
2007 (2007-2008)
7 7 100%
2008 (2008-2009)
4 4 100%
2009 (2009-2010)
8 8 100%
2010 (2010-2011)
3 3 100%
A review of the resolution session data collected during the 2010-2011 reveals 13 due process complaints received and three (3) resolution sessions held resulting in three (3) settlement agreements. Three hearings were fully adjudicated, while the remaining due process hearing complaints were withdrawn or resolved through mediation. Parents and districts in West Virginia have demonstrated a willingness to use alternatives to due process hearings to resolve complaints in an efficient and effective manner.

APR Template – Part B (4) West Virginia.
State
Part B State Annual Performance Report for FFY2010 Page 136
Discussion of Improvement Activities Completed and Explanation of Progress or Slippage that occurred for 2010-2011 (FFY 2010):
West Virginia had fewer than 10 resolution sessions, therefore, no targets or improvement activities are required at this time.
Table 7 REPORT OF DISPUTE RESOLUTION UNDER PART B, OF THE
INDIVIDUALS WITH DISABILITIES EDUCATION ACT 2010-2011
SECTION C: DUE PROCESS COMPLAINTS
(3) Total number of due process complaints filed 13
(3.1) Resolution meetings 3
(a) Written Settlement agreements reached through resolution meetings 3
(3.2) Hearings fully adjudicated 3
(a) Decisions within timeline (include expedited) 0
(b) Decisions within extended timeline 3
(3.3) Due process complaints pending 1
(3.4) Due process complaints withdrawn or dismissed (including resolved without a hearing) 9
Revisions, with Justification, to Proposed Targets / Improvement Activities / Timelines / Resources for FFY 2010:
No revisions are proposed at this time.

APR Template – Part B (4) West Virginia.
State
Part B State Annual Performance Report for FFY2010 Page 137
Part B State Annual Performance Report (APR) for FFY 2010 (2010-2011)
Overview of the Annual Performance Report Development:
See Indicator 1
Monitoring Priority: Effective General Supervision Part B / General Supervision
Indicator 19: Percent of mediations held that resulted in mediation agreements.
(20 U.S.C. 1416(a)(3)(B))
Measurement:
Percent = [(2.1(a)(i) + 2.1(b)(i)) divided by 2.1] times 100.
FFY Measurable and Rigorous Target
2010 (2010-2011)
85% of mediations held result in mediation agreements.
Actual Target Data for FFY 2010 (2010-2011)
Percent mediations resulting in agreements
[(3 + 7) / 17*100] = 58.8%
All Mediations 2004-2010
2004-2005
2005-2006
2006-2007
2007-2008
2008-2009
2009-2010
2010-2011
Mediation Requests
28 9 6 9 17 10
18
2.1 Mediations Conducted (Total)
24 6 4 9 16 7
17
Mediations Resulting in
17 (71%)
4 (66.7%)
2 (50%)
6 (67%)
10 (62.5%)
6 (85.7%)
10 (58.8%)

APR Template – Part B (4) West Virginia.
State
Part B State Annual Performance Report for FFY2010 Page 138
Agreements
Hearing- Related Mediations
2004-2005
2005-2006
2006-2007
2007-2008
2008-2009
2009-2010
2010-2011
Mediations Conducted
4 4 2 3 3 1
4
2.1.(a)(i) Mediations Resulting in Agreements
2
(50%)
3
(75%) 0
2
(67%)
1
(33%)
0
3
(75%)
Mediations Not Related to Hearing Requests
2004-2005
2005-2006
2006-2007
2007-2008
2008-2009
2009-2010
2010-2011
Mediations Conducted 20 2 2 6 14 6
13
2.1.(b)(i) Mediations Resulting in Agreements
15
1 2 4
9
6
7
Mediations Not Held (Withdrawn or Pending)
4 3 2 0 1 3
1
Percentage Resulting in Agreement
71% 67% 50% 46% 63% 100%
53.8%
Discussion of Improvement Activities Completed and Explanation of Progress or Slippage that Occurred for FFY 2011:
The proposed activities in the SPP for 2010-2011 have been implemented as stated. The mediation brochure is disseminated to the districts and the public and is included with each mediation request. The

APR Template – Part B (4) West Virginia.
State
Part B State Annual Performance Report for FFY2010 Page 139
toll-free number for parents’ access to technical assistance remains in operation, and the due process/mediation data base is being maintained.
The West Virginia Department of Education (WVDE) received a total of eighteen (18) mediation requests during the FFY 2010-2011. Seventeen (17) mediations were conducted, and ten, or 58.8%, resulted in mediation agreements. Of the seventeen (17) mediations conducted, four (4) were related to due process complaints, which resulted in three (3) mediation agreements. Thirteen (13) mediations held were not related to due process complaints and resulted in ten (10) mediation agreements. The target for 2010-2011 was 75% of the mediations held would result in mediation agreements, however, the target was not met. West Virginia historically has a low number due process hearings and mediation requests. The improvement activities and the districts commitment to students with exceptionalities have resulted in the majority of disagreements resolved through IEP process and West Virginia will continue to work with districts to resolve disagreements through mediation process.
Table 7
REPORT OF DISPUTE RESOLUTION UNDER PART B, OF THE INDIVIDUALS WITH DISABILITIES EDUCATION ACT
2010-11
SECTION B: MEDIATION REQUESTS
(2) Total number of mediation requests received through all dispute resolution processes 18
(2.1) Mediations held 17
(a) Mediations held related to due process complaints 4
(i) Mediation agreements related to due process complaints 3
(b) Mediations held not related to due process complaints 13
(i) Mediation agreements not related to due process complaints 7
(2.2) Mediations pending 0
(2.3) Mediations withdrawn or not held 1
Revisions, with Justification, to Proposed Targets / Improvement Activities / Timelines /
Resources for FFY 2011:
No revisions are proposed at this time.

APR Template – Part B (4) West Virginia.
State
Part B State Annual Performance Report for FFY2010 Page 140
Part B State Annual Performance Report (APR) for 2010-2011 (FFY 2010)
Overview of the Annual Performance Report Development:
See Indicator 1.
Monitoring Priority: Effective General Supervision Part B / General Supervision
Indicator 20: State reported data (618 and State Performance Plan and Annual Performance Report) are timely and accurate.
(20 U.S.C. 1416(a)(3)(B))
Measurement: State reported data, including 618 data and annual performance reports, are:
a. Submitted on or before due dates (February 1 for child count, including race and ethnicity; placement; November 1 for exiting, discipline, personnel; and February 1 for Annual Performance Reports); and
b. Accurate (describe mechanisms for ensuring error free, consistent, valid and reliable data and evidence that these standards are met).
FFY Measurable and Rigorous Target
2010 2010-2011
100% of reports submitted accurately and by the established due date.
Actual Target Data for FFY 2010:
Indicator #20 Calculation
A. APR Grand Total 45.00
B. 618 Grand Total 40.91
C. APR Grand Total (A) + 618 Grand Total (B) = 85.91
Total N/A in APR 0
Total N/A in 618 4.0908
Base 85.91
D. Subtotal (C divided by Base*) = 1.000
E. Indicator Score (Subtotal D x 100) = 100.00

APR Template – Part B (4) West Virginia.
State
Part B State Annual Performance Report for FFY2010 Page 141
The target of 100% was met.
SPP/APR Data - Indicator 20
APR Indicator Valid and Reliable
Correct Calculation
Total
1 1 1
2 1 1
3A 1 1 2
3B 1 1 2
3C 1 1 2
4A 1 1 2
4B 1 1 2
5 1 1 2
7 1 1 2
8 1 1 2
9 1 1 2
10 1 1 2
11 1 1 2
12 1 1 2
13 1 1 2
14 1 1 2
15 1 1 2
16 1 1 2
17 1 1 2
18 1 1 2
19 1 1 2
Subtotal 40
APR Score Calculation
Timely Submission Points - If the FFY 2010 APR was submitted on-time, place the number 5 in the cell on the right.
5
Grand Total - (Sum of subtotal and Timely Submission Points) =
45.00

APR Template – Part B (4) West Virginia.
State
Part B State Annual Performance Report for FFY2010 Page 142
618 Data - Indicator 20
Table Timely Complete Data Passed Edit Check Responded to
Data Note Requests
Total
Table 1 - Child Count Due Date: 2/2/11
1 1 1 N/A 3
Table 2 - Personnel Due Date: 11/2/11
1 1 1 N/A 3
Table 3 - Ed. Environments
Due Date: 2/2/11 1 1 1 N/A 3
Table 4 - Exiting Due Date: 11/2/11
1 1 1 N/A 3
Table 5 - Discipline Due Date: 11/2/11
1 1 1 N/A 3
Table 6 - State Assessment
Due Date: 12/15/11 1 N/A N/A N/A 1
Table 7 - Dispute Resolution
Due Date: 11/2/11 1 1 1 N/A 3
Table 8 - MOE/CEIS Due Date: 5/1/11
1 N/A N/A N/A 1
Subtotal 20
618 Score Calculation Grand Total (Subtotal X 2.045) = 40.91
Discussion of Improvement Activities Completed and Explanation of Progress or Slippage that occurred for 2010-2011 (FFY 2010):
The timeliness and accuracy of data measured using the Indicator 20 rubric provided by OSEP is 100 percent for 2010-2011. The rubric calculation is displayed above for the 2010-2011 Annual Performance Report submitted by February 1, 2012. The Section 618 reports submitted by their due dates were as follows:
Table 1 – December 1, 2010 Child Count, submitted through the Education Data Exchange Network (EDEN) by February 1, 2011
Data notes were not requested.
Table 2 – Personnel, submitted to EDEN by November 1, 2011
Data notes were not requested.
Table 3 – Educational Environments, submitted through EDEN by February 1, 2011
Data notes were not requested.

APR Template – Part B (4) West Virginia.
State
Part B State Annual Performance Report for FFY2010 Page 143
Table 4 – Exiting, submitted through EDEN by November 1, 2011
Data notes were not requested.
Table 5 – Discipline, submitted to EDEN by November 1, 2011
Data notes were not requested.
Table 6 – State Assessment, submitted to EDEN by December 15, 2011.
Table 7 – Dispute Resolution, submitted to OSEP and DANS by November 1, 2011
Data notes were not requested.
Table 8 – MOE/CEIS, submitted to OSEP and DANS by May 1, 2011.
Data notes were not requested.
All data for the FFY 2010 State Performance Plan and Annual Performance Report indicators due February 1, 2012 are valid and reliable, that is, all data are for the correct time period, consistent with the measurement required by the measurement table and consistent with data submitted for Section 618 reports where applicable. Calculations are correct and completed following the instructions for each indicator.
State Improvement Plan activities completed during 2010-2011 included the following:
The WV SPP/APR submitted in February 2011 was made publicly available at the following links: http://wvde.state.wv.us/osp/wvapr2011b.pdf and http://wvde.state.wv.us/osp/wvspprev2011b.pdf .
District performance on state targets for the required Annual Performance Report indicators were reported publicly: http://wveis.k12.wv.us/nclb/OSEcf/Data/replist1.cfm .
The WVEIS support link provides detailed information (i.e., definitions, codes for data entry, and report instructions) for LEAs use and is regularly updated to assist in WVDE and LEA level trainings.
WVDE staff attended the Overlapping EDFact/Data Managers’ Meeting in June 2010, the EIMAC fall and spring meetings, and the OSEP Leadership Conference. Additional technical assistance on APR calculations and reporting requirements was accessed via communications with OSEP’s WV state contact and DAC, as well as monthly SPP/TA Conference Calls.
Data audits and verification were conducted for all reports.
A data collection schedule was developed and disseminated to LEAs for the 2010-2011 school year. The schedule included preliminary collections of the initial timeline file which documents district adherence to child find timelines. The preliminary collections were planned to increase data accuracy and WVDE feedback to districts regarding timeline adherence.
OSP collaborated with other WVDE offices, district personnel and the National Dropout Prevention Center for Students with Disabilities to develop West Virginia’s Four-Year Adjusted Cohort Graduation Rate: Questions and Answer Guide. The guide was released to districts with AYP results in August 2011 and is currently available online http://wveis.k12.wv.us/wveis2004/documents/WVFour-YearAdjustedCohortGraduationRate.pdf . Preliminary training around the guide and the cohort graduation rate was conducted at the WV Transition Collaborative Community of Practice and the WVEIS State Data Conference in June 2011 for nearly 60 participants. WVDE intends to release a second edition of the guide for the 2012-2013 school year with additional information for alternate graduation pathways, military families and extended cohort information.
Two regional Special Education WVEIS trainings were held in September 2010 at RESA III and RESA VII, respectively. These trainings targeted Special Education Administrators and

APR Template – Part B (4) West Virginia.
State
Part B State Annual Performance Report for FFY2010 Page 144
Support Staff. Topics included basic WVEIS data entry, district edit/audit reports, and federal reporting requirements including definitions/codes. Approximately 40 participants attended these sessions.
Significant Disproportionality and Coordinated Early Intervention Services training was held at the Fall Leadership Conference in September 2010 for invited districts. Significant Disproportionality data were distributed to districts and reviewed during the training. The Significant Disproportionality and CEIS link to the WVDE webpage was also developed: http://wvde.state.wv.us/osp/SignificantDisproportionality-CEIS.html .
Moreover, West Virginia’s SPP and APR was the primary focus of the Fall Leadership Conference in September 2010 for special education administrators. Clusters of indicators were presented with the measurement, data source and ongoing statewide activities.
Two webinars were held in September 2010 on the federal PreK LRE changes. Districts were required to revise the PreK LRE codes for children ages 3-5 to align with the new federal codes by December 1, 2010. Additionally, a revision was made to WV’s Online IEP to update the PreK LRE codes.
As reported in Indicator 3, targeted technical assistance was provided to districts identified as most in need of improvement through data analysis, LEA determinations and compliance monitoring. During 2010-2011, the OSP invited 14 districts to participate in this process, in which WVDE and RESA staff conducted sessions to lead the districts through a process of data analysis/root cause analysis, improvement planning, implementation and performance measurement, employing logic modeling and evidence-based practices. Professional development on the IT Guide – Thinking Through Improvement by North Central Regional Resource Center staff at the Special Education Administrators’ Fall Conference for all districts. More in depth assistance then was provided to the 14 selected districts to lead them through the planning process and to evaluate and analyze activity effectiveness.
OSP funded a half-time researcher from the Office of Research to evaluate activity effectiveness during the 2010-2011 school year. The researcher primarily focused on development and evaluation of the AIR Project, RTI, and the three academies (Autism, Mathematics and Literacy) during the school year 2010-2011. Results of the AIR evaluation are summarized in Indicator 3.
OSP was notified by Avatar, the contractor for the Parent Partnership Survey, that Avatar would no longer be administering the NCSEAM survey for States. WV has released an RFQ to obtain another contractor to complete the survey for the remainder of the extended SPP/APR cycle.
Revisions, with Justification, to Proposed Targets / Improvement Activities / Timelines / Resources for FFY 2011:
No revisions are necessary at this time.