Food Security, Livelihoods and Markets Report For Ali Addeh ...
45
1 Food Security, Livelihoods and Markets Report For Ali Addeh and Holl Holl – Djibouti Refugees and Host Community November 2013
-
Upload
khangminh22 -
Category
Documents
-
view
0 -
download
0
Transcript of Food Security, Livelihoods and Markets Report For Ali Addeh ...
1
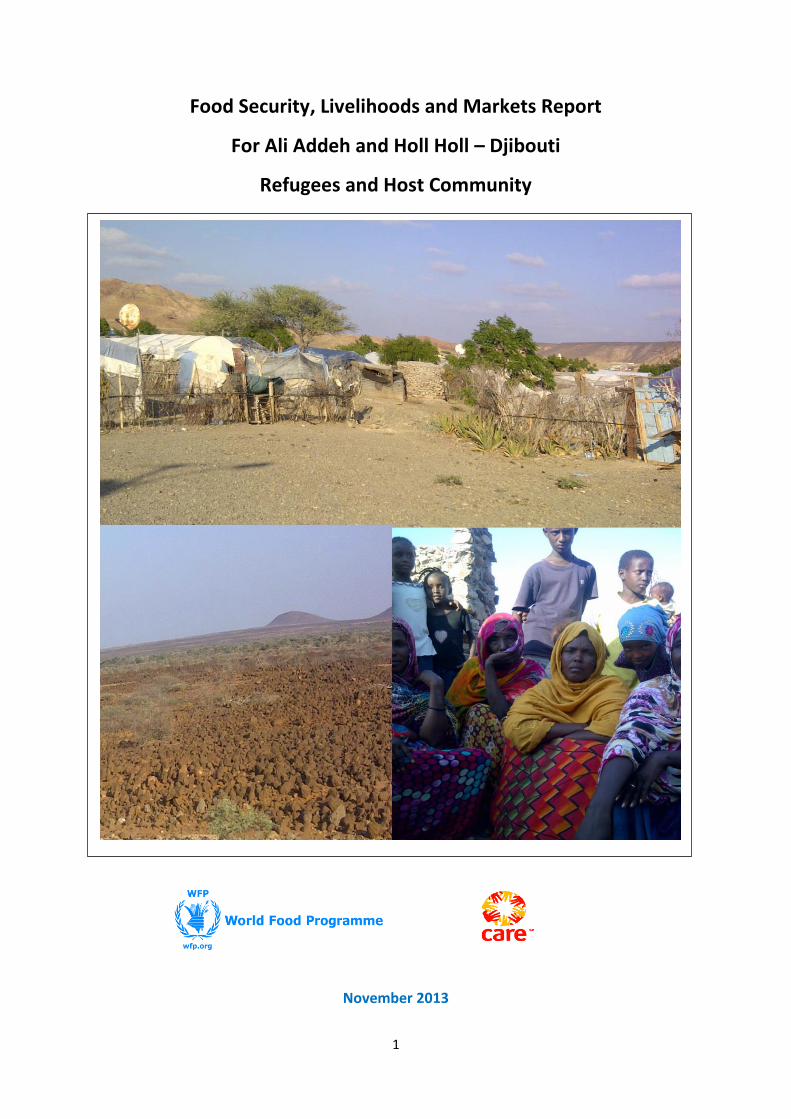
Food Security, Livelihoods and Markets Report
For Ali Addeh and Holl Holl – Djibouti
Refugees and Host Community
November 2013

2
Aknowledgement This study was conducted by the World Food Programme Regional and Djibouti Country
Office. The report was produced by Elliot Vhurumuku – Senior Regional VAM Officer, Simon
Dradri – Senior Regional Markets Officer, Sergio Regi – Regional Food Security Analyst. The
report was reviewed by Imed Khanfir- WFP Djibouti Head of Programme. The field work was
supervised by Houmed Gaba Mohamed, Nasrin Kayad, Awo Ahmed Guedi, Badri Said
Houssein and Halima Abdirahman Ibrahim WFP Djibouti Country Office. The survey was
carried out with support from the DISED who provided the enumerators and support from
representative from Ali Sabieh district. Finally, our thanks go to CARE Canada and Ms.
Fatouma Zara Soumara for her valuable contribution during the field work and the focus
group discussions especially to all the gender and protection related issues.
For additional information contact:
Jacques Higgins: [email protected]; or Imed Khanfir: [email protected];
Elliot Vhurumuku: [email protected]; or Simon Dradri: [email protected];
3
TABLE OF CONTENTS
Acknowledgement ................................................................................................................................... 2
1. Summary.......................................................................................................................................... 4
2. Introduction ..................................................................................................................................... 7
3. Food security situation .................................................................................................................... 9
3.1. Current Food Security................................................................................................................... 9
3.1. The number of households food insecure .............................................................................. 9
3.2. Characterization of the Food Insecure .................................................................................. 10
3.3. Food Consumption ................................................................................................................ 12
3.4. Expenditure ........................................................................................................................... 15
3.5. Remittances ........................................................................................................................... 17
3.6. Coping with food insecurity................................................................................................... 18
4. Food Assistance ............................................................................................................................. 20
4.1. Beneficiaries .......................................................................................................................... 20
4.2. Assistance Received .............................................................................................................. 20
4.3. Members responsible for collecting the ration ..................................................................... 21
4.4. Utilization of assistance ......................................................................................................... 21
5. Livelihoods and sources of income ............................................................................................... 22
5.1. Livelihoods ............................................................................................................................. 22
5.2. Asset and Livestock Ownership ............................................................................................. 23
5.3. Housing .................................................................................................................................. 25
5.4. Cooking fuel sources and lighting .......................................................................................... 25
5.5. Water ..................................................................................................................................... 27
5.6 Access to toilet facilities .............................................................................................................. 28
5.7. Education ............................................................................................................................... 28
5.8. Health .................................................................................................................................... 29
6. Protection ...................................................................................................................................... 30
7. Markets.......................................................................................................................................... 31
7.1. Type of Traders ........................................................................................................................... 31
7.2. Main commodities traded .......................................................................................................... 32
7.3. Availability of commodities and price seasonality ..................................................................... 32
7.4. Number of customers and sales ................................................................................................. 34
7.5. Credit, storage and transport capacities .................................................................................... 35
7.6. Commodity Price Trends ............................................................................................................ 37
8. Shocks and Preferences ................................................................................................................. 39
8.1. Shocks household face ............................................................................................................... 39
8.2. Household Priorities ................................................................................................................... 39
8.3. Preferred Assistance ................................................................................................................... 40
9. Recommendations......................................................................................................................... 41
ANNEX 1: Sampling methodology ......................................................................................................... 43

4
1. Summary The livelihoods and market study was carried out for the two refugee camps and host community of Ali Addeh
and Holl Holl in Ali Sabieh region in November 2013. In this study a total of 576 households were surveyed, 90
traders were interviewed and 15 focus group discussions were conducted.
Status of food security: A total of 3,400 refugee households out of an estimated 8,176 are food insecure, of
which 42 percent of the households in Ali Addeh and 36 percent of households in Holl Holl camp are
considered food insecure. On the other hand, an estimated 62 percent of the households in Ali Addeh rural and
44 percent in Holl Holl rural, of the 7,500 households in the rural host community are food insecure. Food
security status in refugee camps is better than that of the rural areas because all the refugees living in the camp
have access to a monthly food basket composed of wheat flour, cooking oil, split beans, sugar, salt and corn
soya blend. In addition the pregnant and lactating mothers and the children under five years are provided with
supplementary food.
Causes of food insecurity: In the camps food insecurity is largely due to sales of the food ration to meet other
non-food needs, sharing of the food and repayment of loans using food rations. The food rations provided on
average last for 17 to 23 days; this is a result of repayment of borrowed food, sharing of rations and sale of part
of the rations to meet non-food needs and other foods not provided in the basket. Furthermore, refugees have
limited access to other income sources to supplement the rations. Food insecurity in the rural host community
is driven by limited number of persons accessing food assistance, as only 77 and 36 percent of the Ali Addeh
and Holl Holl host community households respectively benefit from it. Furthermore, there is low asset holding
including livestock within the camp and host community as the latter (host community) lost most of their
camels and goats over the last 6 consecutive years of droughts. Most of the households in the camp and host
community depend on unreliable income sources, mainly from charcoal and wood sales, non-agricultural
wages such as domestic labour, and from gifts and remittances.
Dietary diversity: On average households consume 6 to 7 days of cereals and tubers; over 6 days of oil and fats
and about 5 to 6 days of sugar and condiments across all areas. The consumption of pulses, vegetables,
meat/fish, fruits and dairy across the refugees and the host population marks the difference in dietary diversity
and quality between the food secure and insecure.
Main food sources: Despite the food ration, refugees purchase relatively large quantities of rice, pasta, sugar,
tubers and milk from the market compared to other commodities such as vegetables. The refugees also
purchase other commodities such as vegetables, fruits, and meat though in small quantities. Most households
in the rural host community purchase a range of commodities from the market. A proportion of households
mainly in Ali Addeh host community source eggs, milk and dairy products from own production.
Expenditure: In both the refugee camps and the host communities, most of the household budget is used to
buy food. An estimated 80 and 65 percent of the total expenditure in Ali Addeh and Holl Holl rural is on food
respectively compared to around 55 percent in the refugee camps. Most of the food expenditure is on non-
cereal foods, but cereals and tubers take up close to 50 percent of the total food expenditure. For both
refugees and the host communities, cereal expenditure is mainly on rice and pasta. The largest proportion of
the non-food expenditure goes to clothes, soap, khat and transport.
Vulnerable population to food insecurity: Households with more children under five years, large households
with more than 8 members and those with less than 2 members tend to be more food insecure. The female
headed households are more likely to be food insecure compared to the male counterparts. Households
headed by those 46 years and above tend to be slightly worse off than the younger headed probably due to
better mobility and risk taking of the younger headed households. The divorced headed households tend to be
more food insecure compared to the other groups. Poverty has a clear effect on food security, with food
insecurity declining with an increase in the asset holding of the household. The most vulnerable households to
5
food insecurity in the refugee camps are those dependent on production and sale of animals; cattle herding;
fishing, and pensions.
Coping with food insecurity: More refugees (43 percent in Ali Addeh and 47 percent in Holl Holl) use high
consumption coping mechanisms compared to 30 and 23 percent in Ali Addeh and Holl Holl rural host
community. For non-consumption coping mechanisms, about 13 percent of the households reported applying
some coping in the camps and the proportion increases to 19 and 36 percent in Holl Holl and Ali Addeh rural
host communities respectively. The minimum use of this coping could be explained by the households’ limited
income generating opportunities. A small proportion of households in both rural and camps employ crisis and
emergency coping mechanisms particularly in Ali Addeh and Holl Holl rural.
Food assistance: Majority (over 98 percent) of the households are registered beneficiaries in the camps and it
was expected that all refugees in the camps should be registered. Of those registered as beneficiaries, 55 and
60 percent of the households indicated they had received the right entitlement during the last distribution in
Ali Addeh and Holl Holl refugee camps respectively. The reasons for not getting the right entitlement were
mainly the inadequate amount received by the household, followed by the incorrect weights used. The food
rations were reported to last between 17 and 23 days for wheat flour and this was mainly due to sale of food
commodities to buy other foods and non-food items, as well as the repayment of loans.
Non-food assistance: A limited proportion of households reported benefitting from non-food assistance such
as kerosene, wood/charcoal, water and health services in both camps.
Livelihoods sources: About a third of the households in Ali Addeh and Holl Holl rural areas rely on informal
trade that include charcoal, daily non-agricultural labour and domestic wage respectively. In the refugee
camps, no particular income sources seem to be prominent, the most common being daily and seasonal wage
with about 20 percent depending on it.
Household asset holding: The number of domestic and productive assets among households is very low. The
mean general household assets score (number of asset per household) is 3.1, with highest values among rural
communities (4.4 in Holl Holl and 3.3 in Ali Addeh) and 2.5 on average among refugees. There is a significant
difference in livestock holding between the host communities and the refugee camps, with an average goat
holding of 9.8 and 8.7 in Ali Addeh and Holl Holl rural respectively. Livestock production in both the host
population and refugees is dogged by lack of pasture and fodder reported by 37 percent of household;
parasites and diseases by 32 percent; and scarcity of water by 15 percent.
Housing: In the rural host community and Holl Holl refugee camp, over two thirds of the households live in
overcrowded conditions with 3 or more persons sharing one room. Holl Holl refugees are the most
overcrowded (80 percent) of the two refugee camps. The overcrowding is due to the nature and type of
housing. This also affects the privacy of the some families, forcing some of the children to sleep outside.
Cooking fuel: Firewood and charcoal are the most widely used source of fuel for cooking in both the host
communities and camps. The main source of fire wood and charcoal for host communities are markets, whilst
for the refugees is collecting from the bush. The utilization of bush for firewood creates pressure on the
environment around the camps thereby contributing to land degradation already highly challenged by adverse
climatic conditions.
Water availability: Availability and access to fresh water is of great concern among both refugee camps and
host communities. The increasing population pressure contributes to the reduction of fresh water availability
per-capita in the camps, posing high risks of pollution of groundwater reserves.
Education: The highest proportion (83 percent) of children above six years of age regularly attending lessons
was reported in Ali Addeh refugee camp, followed by 74 percent in both Holl Holl refugee camp and rural area.

6
The least proportion of 58 percent was recorded in Ali Addeh rural. The lack of interest, the long distance to
the closest school and economic activities to generate household income are the most frequent reasons
inhibiting regular attendance and leading to drop outs from school.
Health: Over 20 percent of the households in the refugee camps reported that one child aged under-five
suffered from a disease, mainly fever, diarrhoea and respiratory tract infections over the last three months,
with significantly higher rates of 29 percent in Holl Holl and 23 percent in Ali Addeh refugee camps compared
to 15 percent in both host communities. The long distance to health facilities, high cost and unavailability of
drugs were the main reasons why households did not seek medical treatment in both rural and refugee camps.
Markets: Across different markets, in Ali Addeh, the top traded commodities were rice, followed by pasta and
tomato paste. In Ali Sabieh, the main commodities were rice, pasta and sugar in that order. Rice was also the
main commodity in Holl Holl, followed by pasta and wheat flour. However, traders encounter supply challenges
for rice, pasta and wheat flour during the months of June, July and August. More than half of the traders in key
commodities (rice, wheat flour, pasta, sugar and oils) declared to have capacity to increase supplies if demand
increased by 25 to 50 percent. Majority of them would do so within one week to one month. For fresh fruits
and vegetables such as potatoes, onions, oranges and bananas, etc. 20 to 40 percent of the traders have
capacity to increase supplies within one week to one month. Transport was the major constraint identified by
traders in Ali Addeh and Holl Holl, followed by limited storage capacity.
Shocks: The main shocks most households experienced in both rural and refugee camps and between female
and male headed households include lack of food, and soaring of food and non-food prices. In Ali Addeh, other
shocks reported by households include drought and death of animals due to diseases and drought.
Household Priorities: The main priorities for most of the households include access to food products, money,
health services and medicines across the rural and refugee camps and for both female and male headed
households. Additionally, most male headed households indicated job opportunities as a priority in both the
host community and the camps. The women headed households mentioned increased access to water for
livestock as a priority. On the ideal form of assistance, most households declare that they would prefer a mix of
food and money support, followed by only money, across all the areas in rural and refugee camps, and for both
female and male headed households.
Recommendations: Food insecurity in the camps and rural host community needs to be addressed through
integrated measures that include the stimulation of markets and livelihoods; ensure dietary diversity; and
review the food distribution mechanism in the camp to ensure delivery of the right entitlement. The provision
of non-food entitlements to refugees’ households need to also be looked into so that refugees residing in the
camps minimize the monetization of the monthly food ration to meet non-food needs. Measures are required
to protect the environment through ensuring provision of sustainable renewable energy for both host and
refugee committee in addition to reforestation. Provision of adequate clean water is needed for both the host
community and refugees. Feasibility studies on livelihoods options for durable solutions and also on cash and
voucher needs to be carried out.

7
2. Introduction Extreme weather conditions and scarce water resources and biomass are key problems for Djibouti.
Traditionally these challenges have been addressed by rural communities through nomadic and semi-
sedentary pastoralist livelihoods. However, as adequately captured in WFP – rural EFSA1 2013, the
increasing scarcity of such resources and chronic drought over the last six years have fuelled
urbanization and increasing sedentarization, resulting into a rapid evolution of people’s livelihoods,
adapting traditional mechanisms and sources of income.
Djibouti imports around 90 percent of all of its food commodities requirements through the port of
Djibouti. The main commodities (rice, pasta, wheat flour, sugar, cooking oil, etc.) are imported in bulk
by 3-4 large importers who supply nearly two dozen large wholesalers. These large wholesalers in
turn supply smaller wholesalers and retailers. The availability of these commodities are generally not
subject to seasonal variations that usually associated with other countries that produce part or most
of their food, and are routinely affected by domestic production conditions. Djibouti also imports
most of its fresh foods (vegetables) from Ethiopia, where availability can be subject to seasonal
production conditions.
The latest food security assessments conducted by WFP in Djibouti (EFSA urban November 2012,
EFSA rural May-Aug 2013 and the food security monitoring system (FSMS) September 2013), show
that the food security situation in Djibouti remains very critical. An estimated 32,500 people in urban
area and around 82,500 people in the rural areas and 22,500 refugees remain severely to
moderately food insecure and therefore in need of humanitarian assistance. The rural EFSA 2013
estimated that 67 percent of the assessed population in the rural areas in Djibouti is severely to
moderately food insecure. Ali Sabieh region, one of the five regions in the country (where Ali Addeh
and Holl Holl refugee camps are located), has the highest rate of severe to moderate food insecure
households estimated at 84.9 percent. Food insecurity is a result of combined factors that include
chronic poverty, drought that killed most of the livestock, (main productive resource for rural
population), lack of economic opportunity, unemployment and refugee pressure.
Despite the adverse environment and high food insecurity levels, over the last twenty years, Djibouti
has experienced continuous influx of refugees from neighbouring countries (mainly Somalia and
Ethiopia) due to recurrent climatic constraints, conflicts and political unrests in these countries.
Djibouti is now home to over 24,500 refugees living in the two camps of Holl Holl and Ali Addeh (Ali
Sabieh region), and in Djibouti town.
In October and November 2013 WFP conducted a comprehensive markets and livelihoods
assessment targeting refugees living in Ali Addeh and Holl Holl camps as key input to the November
2013 Joint Assessment Mission (JAM) with UNHCR. The assessment also covered the host population
living in Ali Addeh and Holl Holl rural areas. The JAM is intended to review and better target needs
and assistance modality to the refugees and host communities. This report intends to give a general
overview of the current livelihoods and food security situation, and make recommendations among
others on the feasibility of using cash and/or voucher modality in the refugee camps.
1 EFSA – Emergency Food Security Assessment
8
Figure 1: Proportion of household members by age group
19% 19% 15% 26%
23% 23% 21%
23%
25% 27% 28%
29%
18% 19% 24%
17%
15% 13% 12% 6%
Ali Addeh rural Holl Holl camp de Ali Addeh camp de Holl Holl
Under 5 years 6 to 14 years 15 to 29 years 30 to 49 years Above 50 years
This assessment report looks at: food security; use of food assistance; livelihoods; protection;
markets and preference of assistance. The report then makes recommendations for programme
decision.
As expected, the vast majority of the population in host communities has Djiboutian nationality (86
percent in Holl Holl and 91 percent in Ali Addeh); the remainder is mainly represented by Somalis.
Most of the refugees living in the camp are Somalis (98 percent in Holl Holl and 90 percent in Ali
Addeh). In Ali Addeh camp, Ethiopian refugees’ presence is also quite relevant (6 percent, against
only 1 percent in Holl Holl camp). Most refugees settled in Djibouti after 2005 (72 percent in Holl Holl
and 52 percent in Ali Addeh). This proportion of refugees who were born in Djibouti is higher in Ali
Addeh camp (26 percent) compared to the more recently opened Holl Holl (18 percent).
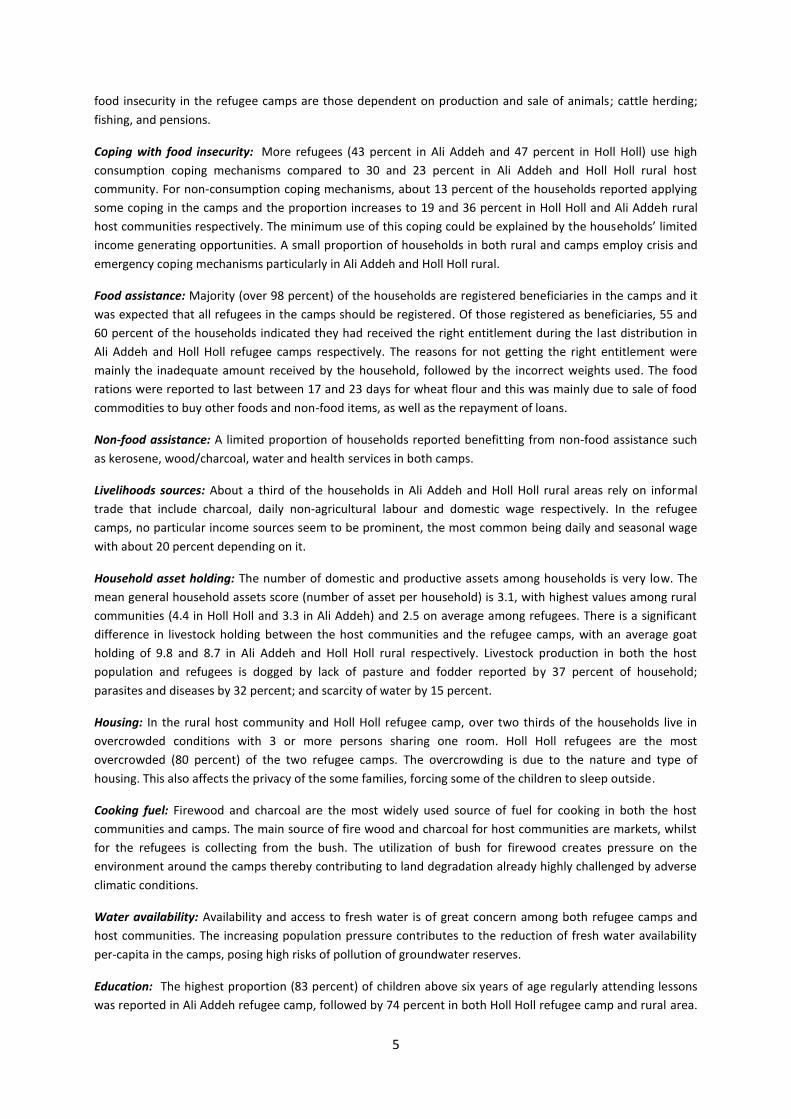
Overall, Holl Holl refugee camp, had the highest average number of children under five years of age
(26 percent of the population) compared to 15 percent in Ali Addeh camp. The level of adolescents
aged between 6 and 14 years of age, is almost similar across all areas for the host community and the
refugees. In Holl HOll camp amost 50 percent of the population is aged below 15 years. This could be
due to the 118 large families of refugees that were recently relocated from Ali Addeh to Holl Holl
camp. Finally, Ali Addeh and Holl Holl rural register the highest proportion of individuals aged 50 or
more (Figure 1).
9
Figure 2: Food Security Refugees and Host
Community – (% of households)
18% 2% 6% 3%
44%
42% 36% 34%
37% 52% 56% 61%
1% 4% 2% 2%
0%
20%
40%
60%
80%
100%
Ali Addehrural
Holl Hollrural
camp deAli Addeh
camp deHoll Holl
% o
f h
ou
seh
old
s
Severe food insecure Moderate food insecure
Mild food insecure Food secure
Figure 3: Food Insecurity Population groups
(Number of households)
30
1,390 1,640
680
160
1,940 1,590 60
190
4,340
2,840
450 10 220 120 10
0
1,000
2,000
3,000
4,000
5,000
Food secure Mild foodinsecure
Moderatefood insecure
Severe foodinsecure
Ali Addeh rural Holl Holl rural
camp de Ali Addeh camp de Holl Holl
3. Food security situation
3.1. Current Food Security
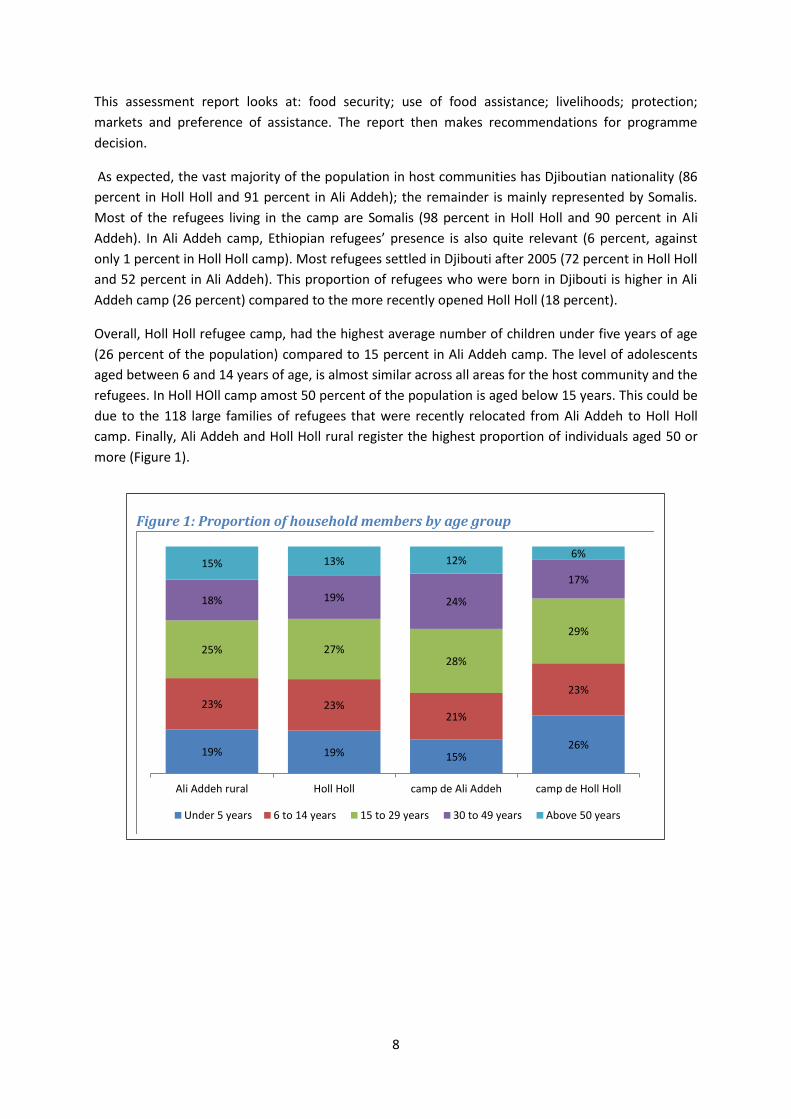
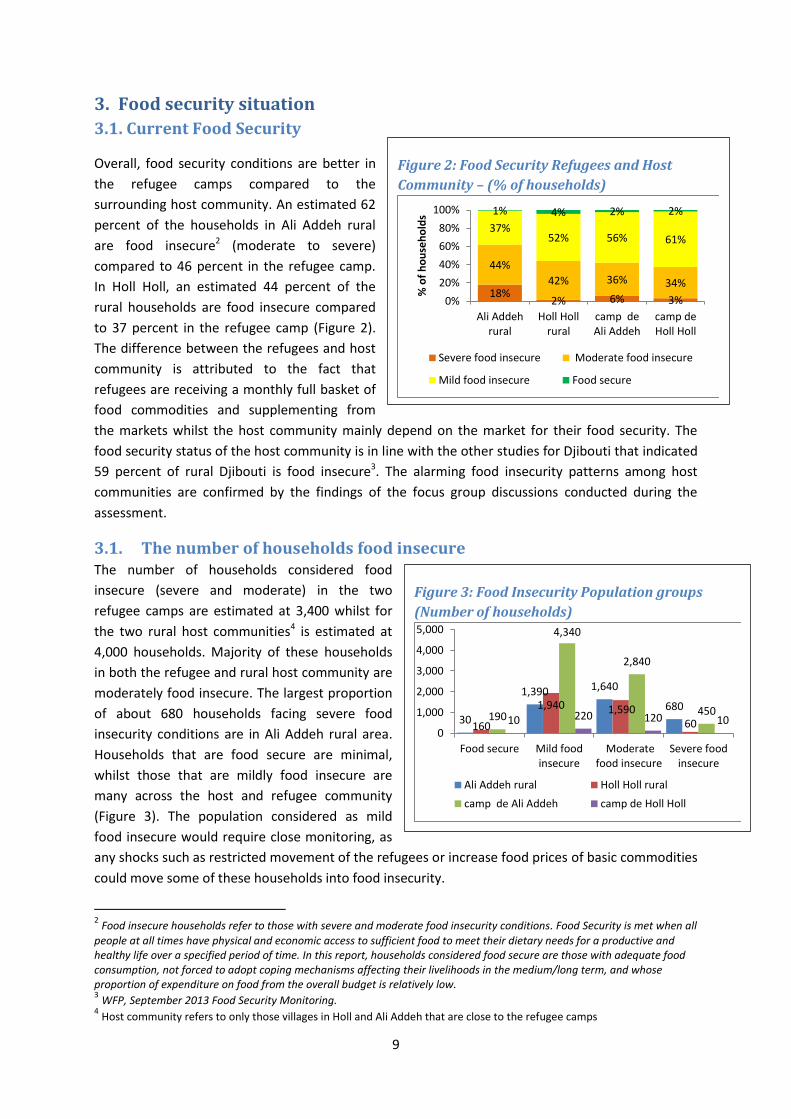
Overall, food security conditions are better in
the refugee camps compared to the
surrounding host community. An estimated 62
percent of the households in Ali Addeh rural
are food insecure2 (moderate to severe)
compared to 46 percent in the refugee camp.
In Holl Holl, an estimated 44 percent of the
rural households are food insecure compared
to 37 percent in the refugee camp (Figure 2).
The difference between the refugees and host
community is attributed to the fact that
refugees are receiving a monthly full basket of
food commodities and supplementing from
the markets whilst the host community mainly depend on the market for their food security. The
food security status of the host community is in line with the other studies for Djibouti that indicated
59 percent of rural Djibouti is food insecure3. The alarming food insecurity patterns among host
communities are confirmed by the findings of the focus group discussions conducted during the
assessment.
3.1. The number of households food insecure The number of households considered food
insecure (severe and moderate) in the two
refugee camps are estimated at 3,400 whilst for
the two rural host communities4 is estimated at
4,000 households. Majority of these households
in both the refugee and rural host community are
moderately food insecure. The largest proportion
of about 680 households facing severe food
insecurity conditions are in Ali Addeh rural area.
Households that are food secure are minimal,
whilst those that are mildly food insecure are
many across the host and refugee community
(Figure 3). The population considered as mild
food insecure would require close monitoring, as
any shocks such as restricted movement of the refugees or increase food prices of basic commodities
could move some of these households into food insecurity.
2 Food insecure households refer to those with severe and moderate food insecurity conditions. Food Security is met when all
people at all times have physical and economic access to sufficient food to meet their dietary needs for a productive and healthy life over a specified period of time. In this report, households considered food secure are those with adequate food consumption, not forced to adopt coping mechanisms affecting their livelihoods in the medium/long term, and whose proportion of expenditure on food from the overall budget is relatively low. 3 WFP, September 2013 Food Security Monitoring.
4 Host community refers to only those villages in Holl and Ali Addeh that are close to the refugee camps
10
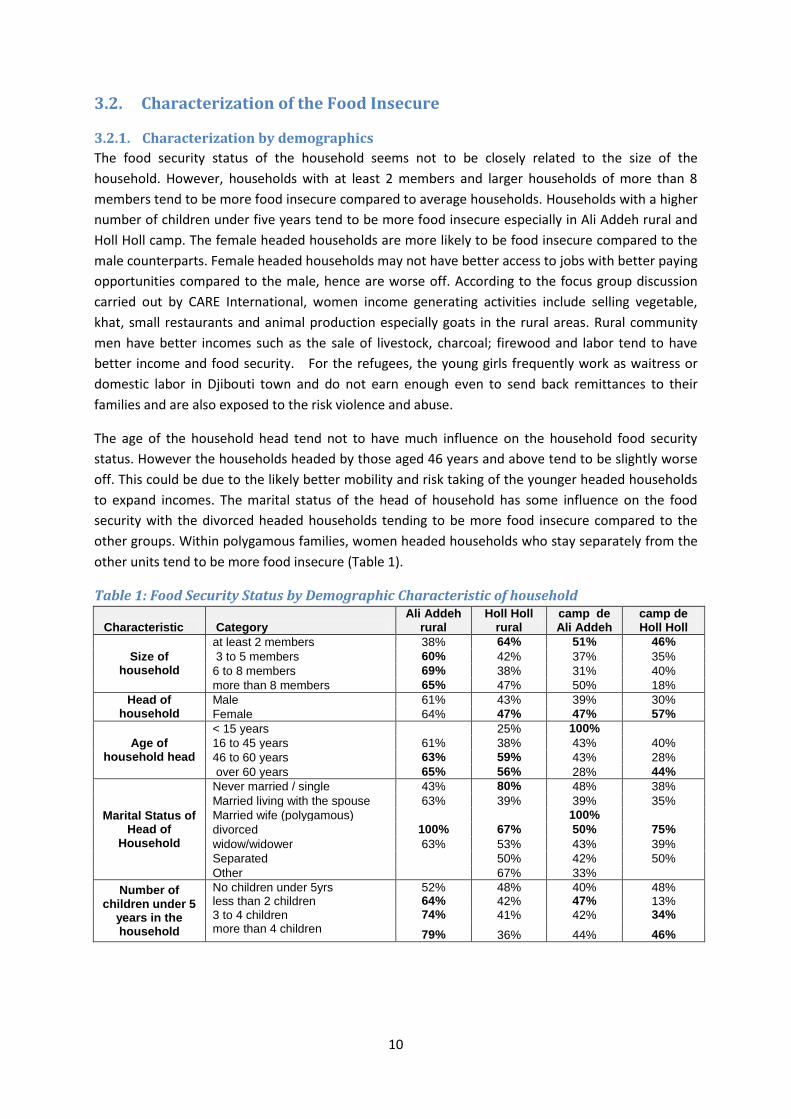
3.2. Characterization of the Food Insecure
3.2.1. Characterization by demographics
The food security status of the household seems not to be closely related to the size of the
household. However, households with at least 2 members and larger households of more than 8
members tend to be more food insecure compared to average households. Households with a higher
number of children under five years tend to be more food insecure especially in Ali Addeh rural and
Holl Holl camp. The female headed households are more likely to be food insecure compared to the
male counterparts. Female headed households may not have better access to jobs with better paying
opportunities compared to the male, hence are worse off. According to the focus group discussion
carried out by CARE International, women income generating activities include selling vegetable,
khat, small restaurants and animal production especially goats in the rural areas. Rural community
men have better incomes such as the sale of livestock, charcoal; firewood and labor tend to have
better income and food security. For the refugees, the young girls frequently work as waitress or
domestic labor in Djibouti town and do not earn enough even to send back remittances to their
families and are also exposed to the risk violence and abuse.
The age of the household head tend not to have much influence on the household food security
status. However the households headed by those aged 46 years and above tend to be slightly worse
off. This could be due to the likely better mobility and risk taking of the younger headed households
to expand incomes. The marital status of the head of household has some influence on the food
security with the divorced headed households tending to be more food insecure compared to the
other groups. Within polygamous families, women headed households who stay separately from the
other units tend to be more food insecure (Table 1).
Table 1: Food Security Status by Demographic Characteristic of household
Characteristic Category Ali Addeh
rural Holl Holl
rural camp de Ali Addeh
camp de Holl Holl
Size of household
at least 2 members 38% 64% 51% 46%
3 to 5 members 60% 42% 37% 35%
6 to 8 members 69% 38% 31% 40%
more than 8 members 65% 47% 50% 18%
Head of household
Male 61% 43% 39% 30%
Female 64% 47% 47% 57%
Age of household head
< 15 years
25% 100%
16 to 45 years 61% 38% 43% 40%
46 to 60 years 63% 59% 43% 28%
over 60 years 65% 56% 28% 44%
Marital Status of Head of
Household
Never married / single 43% 80% 48% 38%
Married living with the spouse 63% 39% 39% 35%
Married wife (polygamous) 100%
divorced 100% 67% 50% 75%
widow/widower 63% 53% 43% 39%
Separated 50% 42% 50%
Other 67% 33% Number of
children under 5 years in the household
No children under 5yrs 52% 48% 40% 48% less than 2 children 64% 42% 47% 13% 3 to 4 children 74% 41% 42% 34%
more than 4 children 79% 36% 44% 46%
11
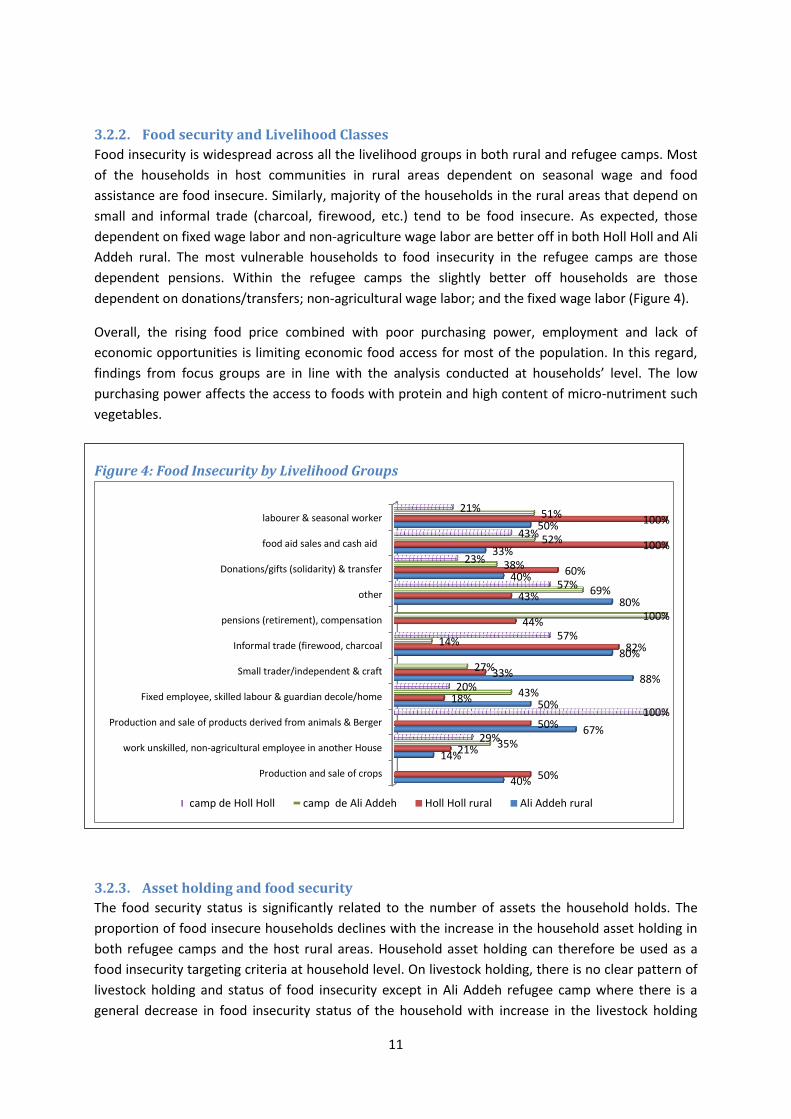
3.2.2. Food security and Livelihood Classes
Food insecurity is widespread across all the livelihood groups in both rural and refugee camps. Most
of the households in host communities in rural areas dependent on seasonal wage and food
assistance are food insecure. Similarly, majority of the households in the rural areas that depend on
small and informal trade (charcoal, firewood, etc.) tend to be food insecure. As expected, those
dependent on fixed wage labor and non-agriculture wage labor are better off in both Holl Holl and Ali
Addeh rural. The most vulnerable households to food insecurity in the refugee camps are those
dependent pensions. Within the refugee camps the slightly better off households are those
dependent on donations/transfers; non-agricultural wage labor; and the fixed wage labor (Figure 4).
Overall, the rising food price combined with poor purchasing power, employment and lack of
economic opportunities is limiting economic food access for most of the population. In this regard,
findings from focus groups are in line with the analysis conducted at households’ level. The low
purchasing power affects the access to foods with protein and high content of micro-nutriment such
vegetables.
3.2.3. Asset holding and food security
The food security status is significantly related to the number of assets the household holds. The
proportion of food insecure households declines with the increase in the household asset holding in
both refugee camps and the host rural areas. Household asset holding can therefore be used as a
food insecurity targeting criteria at household level. On livestock holding, there is no clear pattern of
livestock holding and status of food insecurity except in Ali Addeh refugee camp where there is a
general decrease in food insecurity status of the household with increase in the livestock holding
Figure 4: Food Insecurity by Livelihood Groups
Production and sale of crops
work unskilled, non-agricultural employee in another House
Production and sale of products derived from animals & Berger
Fixed employee, skilled labour & guardian decole/home
Small trader/independent & craft
Informal trade (firewood, charcoal
pensions (retirement), compensation
other
Donations/gifts (solidarity) & transfer
food aid sales and cash aid
labourer & seasonal worker
40%
14%
67%
50%
88%
80%
80%
40%
33%
50%
50%
21%
50%
18%
33%
82%
44%
43%
60%
100%
100%
35%
43%
27%
14%
100%
69%
38%
52%
51%
29%
100%
20%
57%
57%
23%
43%
21%
camp de Holl Holl camp de Ali Addeh Holl Holl rural Ali Addeh rural

12
(Table 2). Given that livestock holding in these areas is predominantly goats and that not much
livestock ownership exists in the camps, this characteristic may not be applied in refugee camps.
However, for the rural areas, the fact that livestock holding is not well related to food security status
is not surprising as livestock is taken as a social capital in most of the pastoral communities. In rural
areas it is expected that food security conditions should improve with more livestock holding, as
households utilize livestock products. The low livestock holding may explain lack of such relationship.
3.3. Food Consumption
3.3.1. Food Consumption score
In general most household members consumed at least three meals a day before the survey across
all areas. Across the areas, very rarely do members consume more than three meals per day more so
for the adults and children between 6 to 12 years (Table 3). Though the recall for this analysis was 24
hours prior to the survey, there is clear indication that most household members consumed between
2 and 3 meals irrespective whether the household had poor or acceptable consumption.
Table 2: Food Insecure households by Asset holding (percent of households)
Category Ali Addeh
rural Holl Holl
rural camp de Ali Addeh
camp de Holl Holl
Number of Type of Assets per household
No assets 75% 100% 100% Low (1 to 2 assets) 72% 74% 51% 40%
Medium (3 to 4 assets) 59% 39% 35% 36%
High (more 4 assets) 30% 19% 17%
Number of Livestock holding per household
No livestock
40% 67% 42%
Negligle holding (<0.5TLU) 63% 33% 38% 42%
Low livestock holding (<1TLU) 70% 68% 14%
Slightly high holding (2 to 4 TLU) 61% 29% 50%
High Livestock (> 5 TLU) 63% 67%
Table 3: Proportion of household members and number of meals in the last 24 hours
Ali Addeh rural Holl Holl rural camp de Ali Addeh camp de Holl Holl
Number of meals poor
borderline
acceptable poor
borderline
acceptable poor
borderline
acceptable poor
borderline
acceptable
Children 6 to 12 years
No meals - 44% 34% - - 2% 12% 2% 2% 29% 10% -
One meal - - 5% - - - 6% - - - - -
2 meals 47% 13% 14% 53% 36% 11% 35% 49% 15% 29% 60% 29%
3 meals 50% 44% 48% 47% 64% 85% 47% 49% 83% 43% 31% 71%
> 3 meals 3% - - - - 2% - - - - - -
Other members older than 12 years
No meals 2% - - 3% - 1% 3% 1% - - 2% -
One meal 4% 5% 13% - - - 8% 7% 4% - 2% -
2 meals 54% 32% 31% 66% 24% 8% 32% 46% 24% 67% 53% 27%
3 meals 41% 63% 56% 31% 76% 90% 58% 46% 72% 33% 43% 71%
> 3 meals - - - - - - - - - - - 2%
13
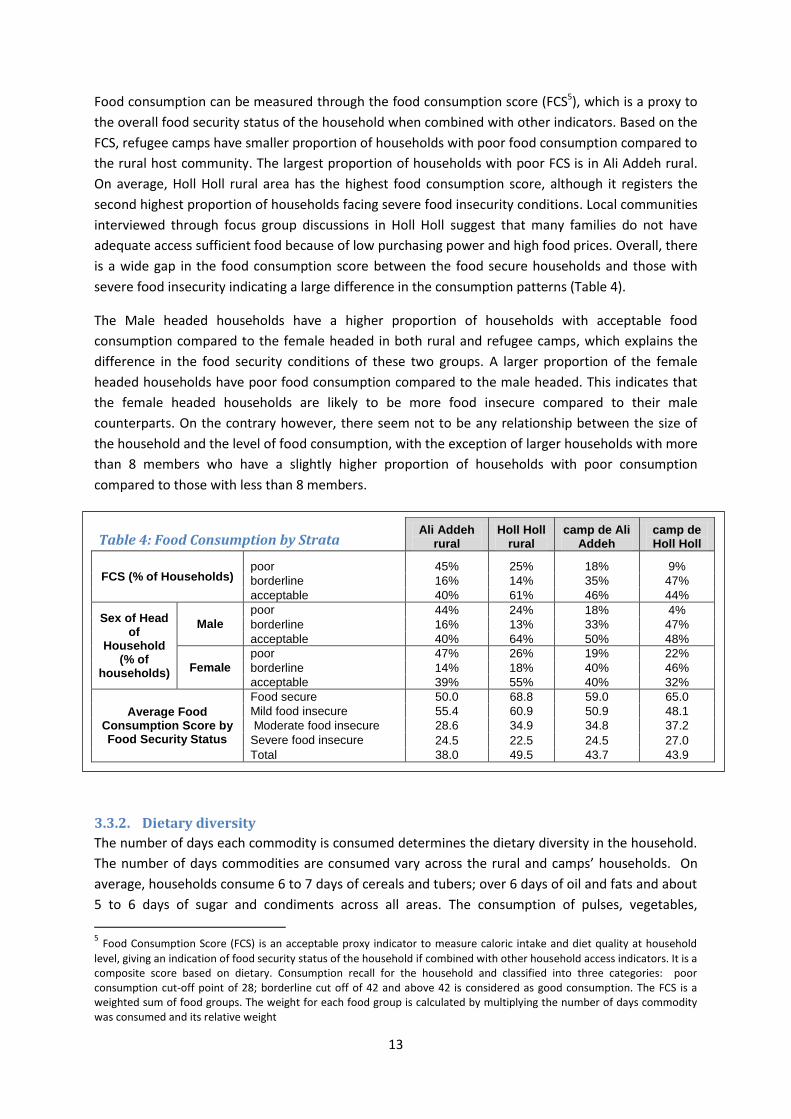
Food consumption can be measured through the food consumption score (FCS5), which is a proxy to
the overall food security status of the household when combined with other indicators. Based on the
FCS, refugee camps have smaller proportion of households with poor food consumption compared to
the rural host community. The largest proportion of households with poor FCS is in Ali Addeh rural.
On average, Holl Holl rural area has the highest food consumption score, although it registers the
second highest proportion of households facing severe food insecurity conditions. Local communities
interviewed through focus group discussions in Holl Holl suggest that many families do not have
adequate access sufficient food because of low purchasing power and high food prices. Overall, there
is a wide gap in the food consumption score between the food secure households and those with
severe food insecurity indicating a large difference in the consumption patterns (Table 4).
The Male headed households have a higher proportion of households with acceptable food
consumption compared to the female headed in both rural and refugee camps, which explains the
difference in the food security conditions of these two groups. A larger proportion of the female
headed households have poor food consumption compared to the male headed. This indicates that
the female headed households are likely to be more food insecure compared to their male
counterparts. On the contrary however, there seem not to be any relationship between the size of
the household and the level of food consumption, with the exception of larger households with more
than 8 members who have a slightly higher proportion of households with poor consumption
compared to those with less than 8 members.
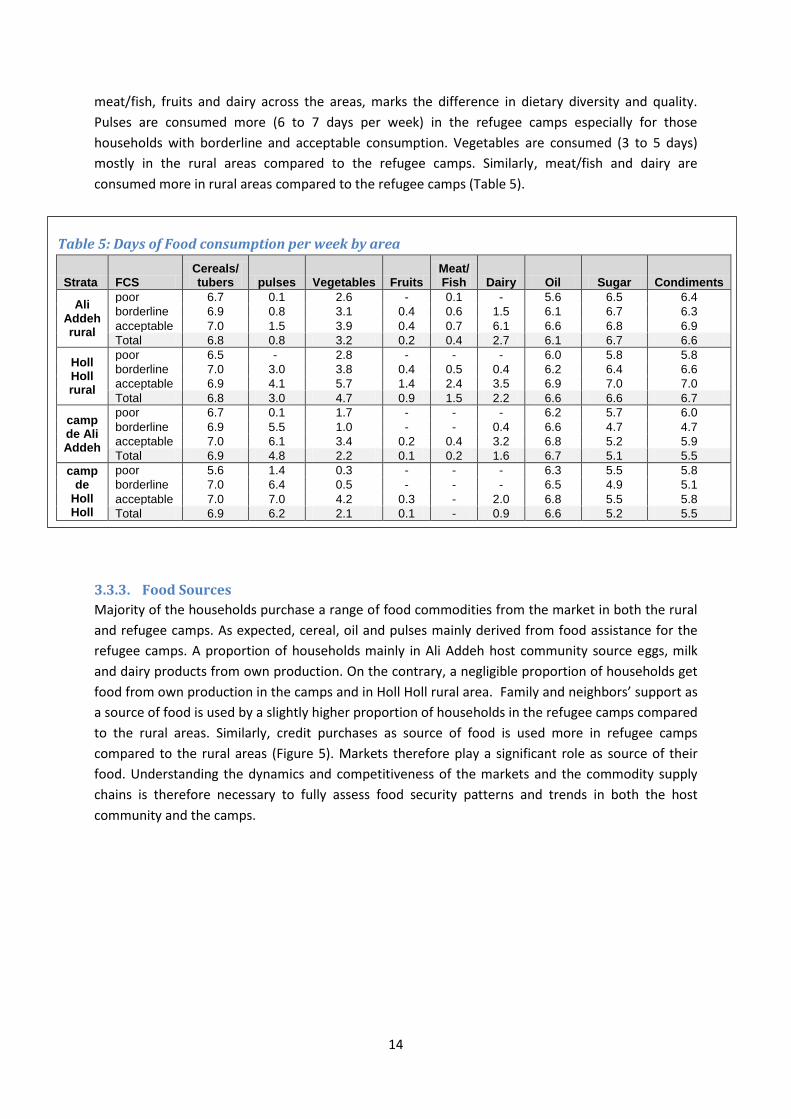
3.3.2. Dietary diversity
The number of days each commodity is consumed determines the dietary diversity in the household.
The number of days commodities are consumed vary across the rural and camps’ households. On
average, households consume 6 to 7 days of cereals and tubers; over 6 days of oil and fats and about
5 to 6 days of sugar and condiments across all areas. The consumption of pulses, vegetables,
5 Food Consumption Score (FCS) is an acceptable proxy indicator to measure caloric intake and diet quality at household
level, giving an indication of food security status of the household if combined with other household access indicators. It is a composite score based on dietary. Consumption recall for the household and classified into three categories: poor consumption cut-off point of 28; borderline cut off of 42 and above 42 is considered as good consumption. The FCS is a weighted sum of food groups. The weight for each food group is calculated by multiplying the number of days commodity was consumed and its relative weight
Table 4: Food Consumption by Strata Ali Addeh
rural Holl Holl
rural camp de Ali
Addeh camp de Holl Holl
FCS (% of Households) poor 45% 25% 18% 9%
borderline 16% 14% 35% 47%
acceptable 40% 61% 46% 44%
Sex of Head of
Household (% of
households)
Male
poor 44% 24% 18% 4%
borderline 16% 13% 33% 47%
acceptable 40% 64% 50% 48%
Female
poor 47% 26% 19% 22%
borderline 14% 18% 40% 46%
acceptable 39% 55% 40% 32%
Average Food Consumption Score by Food Security Status
Food secure 50.0 68.8 59.0 65.0
Mild food insecure 55.4 60.9 50.9 48.1
Moderate food insecure 28.6 34.9 34.8 37.2
Severe food insecure 24.5 22.5 24.5 27.0
Total 38.0 49.5 43.7 43.9
14
meat/fish, fruits and dairy across the areas, marks the difference in dietary diversity and quality.
Pulses are consumed more (6 to 7 days per week) in the refugee camps especially for those
households with borderline and acceptable consumption. Vegetables are consumed (3 to 5 days)
mostly in the rural areas compared to the refugee camps. Similarly, meat/fish and dairy are
consumed more in rural areas compared to the refugee camps (Table 5).
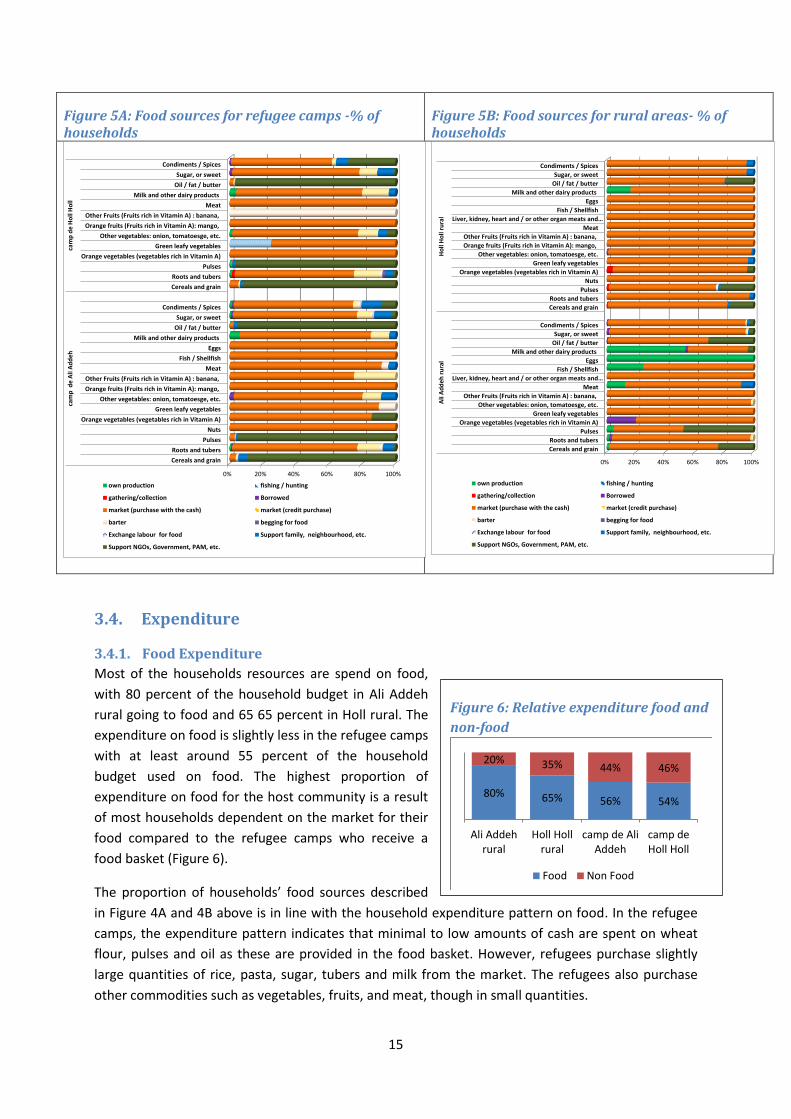
3.3.3. Food Sources
Majority of the households purchase a range of food commodities from the market in both the rural
and refugee camps. As expected, cereal, oil and pulses mainly derived from food assistance for the
refugee camps. A proportion of households mainly in Ali Addeh host community source eggs, milk
and dairy products from own production. On the contrary, a negligible proportion of households get
food from own production in the camps and in Holl Holl rural area. Family and neighbors’ support as
a source of food is used by a slightly higher proportion of households in the refugee camps compared
to the rural areas. Similarly, credit purchases as source of food is used more in refugee camps
compared to the rural areas (Figure 5). Markets therefore play a significant role as source of their
food. Understanding the dynamics and competitiveness of the markets and the commodity supply
chains is therefore necessary to fully assess food security patterns and trends in both the host
community and the camps.
Table 5: Days of Food consumption per week by area
Strata FCS Cereals/ tubers pulses Vegetables Fruits
Meat/ Fish Dairy Oil Sugar Condiments
Ali Addeh rural
poor 6.7 0.1 2.6 - 0.1 - 5.6 6.5 6.4
borderline 6.9 0.8 3.1 0.4 0.6 1.5 6.1 6.7 6.3
acceptable 7.0 1.5 3.9 0.4 0.7 6.1 6.6 6.8 6.9
Total 6.8 0.8 3.2 0.2 0.4 2.7 6.1 6.7 6.6
Holl Holl rural
poor 6.5 - 2.8 - - - 6.0 5.8 5.8
borderline 7.0 3.0 3.8 0.4 0.5 0.4 6.2 6.4 6.6
acceptable 6.9 4.1 5.7 1.4 2.4 3.5 6.9 7.0 7.0
Total 6.8 3.0 4.7 0.9 1.5 2.2 6.6 6.6 6.7
camp de Ali Addeh
poor 6.7 0.1 1.7 - - - 6.2 5.7 6.0
borderline 6.9 5.5 1.0 - - 0.4 6.6 4.7 4.7
acceptable 7.0 6.1 3.4 0.2 0.4 3.2 6.8 5.2 5.9
Total 6.9 4.8 2.2 0.1 0.2 1.6 6.7 5.1 5.5
camp de
Holl Holl
poor 5.6 1.4 0.3 - - - 6.3 5.5 5.8
borderline 7.0 6.4 0.5 - - - 6.5 4.9 5.1
acceptable 7.0 7.0 4.2 0.3 - 2.0 6.8 5.5 5.8
Total 6.9 6.2 2.1 0.1 - 0.9 6.6 5.2 5.5
15
Figure 6: Relative expenditure food and
non-food
80% 65% 56% 54%
20% 35% 44% 46%
Ali Addehrural
Holl Hollrural
camp de AliAddeh
camp deHoll Holl
Food Non Food
Figure 5A: Food sources for refugee camps -% of households
Figure 5B: Food sources for rural areas- % of households
3.4. Expenditure
3.4.1. Food Expenditure
Most of the households resources are spend on food,
with 80 percent of the household budget in Ali Addeh
rural going to food and 65 65 percent in Holl rural. The
expenditure on food is slightly less in the refugee camps
with at least around 55 percent of the household
budget used on food. The highest proportion of
expenditure on food for the host community is a result
of most households dependent on the market for their
food compared to the refugee camps who receive a
food basket (Figure 6).
The proportion of households’ food sources described
in Figure 4A and 4B above is in line with the household expenditure pattern on food. In the refugee
camps, the expenditure pattern indicates that minimal to low amounts of cash are spent on wheat
flour, pulses and oil as these are provided in the food basket. However, refugees purchase slightly
large quantities of rice, pasta, sugar, tubers and milk from the market. The refugees also purchase
other commodities such as vegetables, fruits, and meat, though in small quantities.
0% 20% 40% 60% 80% 100%
Cereals and grain
Roots and tubers
Pulses
Nuts
Orange vegetables (vegetables rich in Vitamin A)
Green leafy vegetables
Other vegetables: onion, tomatoesge, etc.
Orange fruits (Fruits rich in Vitamin A): mango,
Other Fruits (Fruits rich in Vitamin A) : banana,
Meat
Fish / Shellfish
Eggs
Milk and other dairy products
Oil / fat / butter
Sugar, or sweet
Condiments / Spices
Cereals and grain
Roots and tubers
Pulses
Orange vegetables (vegetables rich in Vitamin A)
Green leafy vegetables
Other vegetables: onion, tomatoesge, etc.
Orange fruits (Fruits rich in Vitamin A): mango,
Other Fruits (Fruits rich in Vitamin A) : banana,
Meat
Milk and other dairy products
Oil / fat / butter
Sugar, or sweet
Condiments / Spices
cam
p d
e A
li A
dd
eh
cam
p d
e H
oll
Ho
ll
own production fishing / hunting
gathering/collection Borrowed
market (purchase with the cash) market (credit purchase)
barter begging for food
Exchange labour for food Support family, neighbourhood, etc.
Support NGOs, Government, PAM, etc.
0% 20% 40% 60% 80% 100%
Cereals and grain
Roots and tubers
Pulses
Orange vegetables (vegetables rich in Vitamin A)
Green leafy vegetables
Other vegetables: onion, tomatoesge, etc.
Other Fruits (Fruits rich in Vitamin A) : banana,
Meat
Liver, kidney, heart and / or other organ meats and…
Fish / Shellfish
Eggs
Milk and other dairy products
Oil / fat / butter
Sugar, or sweet
Condiments / Spices
Cereals and grain
Roots and tubers
Pulses
Nuts
Orange vegetables (vegetables rich in Vitamin A)
Green leafy vegetables
Other vegetables: onion, tomatoesge, etc.
Orange fruits (Fruits rich in Vitamin A): mango,
Other Fruits (Fruits rich in Vitamin A) : banana,
Meat
Liver, kidney, heart and / or other organ meats and…
Fish / Shellfish
Eggs
Milk and other dairy products
Oil / fat / butter
Sugar, or sweet
Condiments / Spices
Ali
Ad
de
h r
ura
lH
oll
Ho
ll ru
ral
own production fishing / hunting
gathering/collection Borrowed
market (purchase with the cash) market (credit purchase)
barter begging for food
Exchange labour for food Support family, neighbourhood, etc.
Support NGOs, Government, PAM, etc.
16
Table 7: Household average monthly cash expenditure on food
and non-food (FDJ) Item Ali
Addeh rural
Holl Holl rural
camp de Ali Addeh
camp de Holl Holl
Per Capita Expenditure 2,692 5,309 2,036 1,671
Cereal and tubers 4,582 6,492 1,891 1,690
Non Cereal food 4,657 8,492 1,967 1,840
Average Total Food 9,239 14,984 3,858 3,530
Non Food (Regular) 3,098 9,550 3,291 2,746
Non Food Other(House rent/repairs) 62 1,437 144 103
Average Total Non-Food 3,152 10,938 3,423 2,842
Average Total Monthly Expenditure 12,391 25,922 7,281 6,371
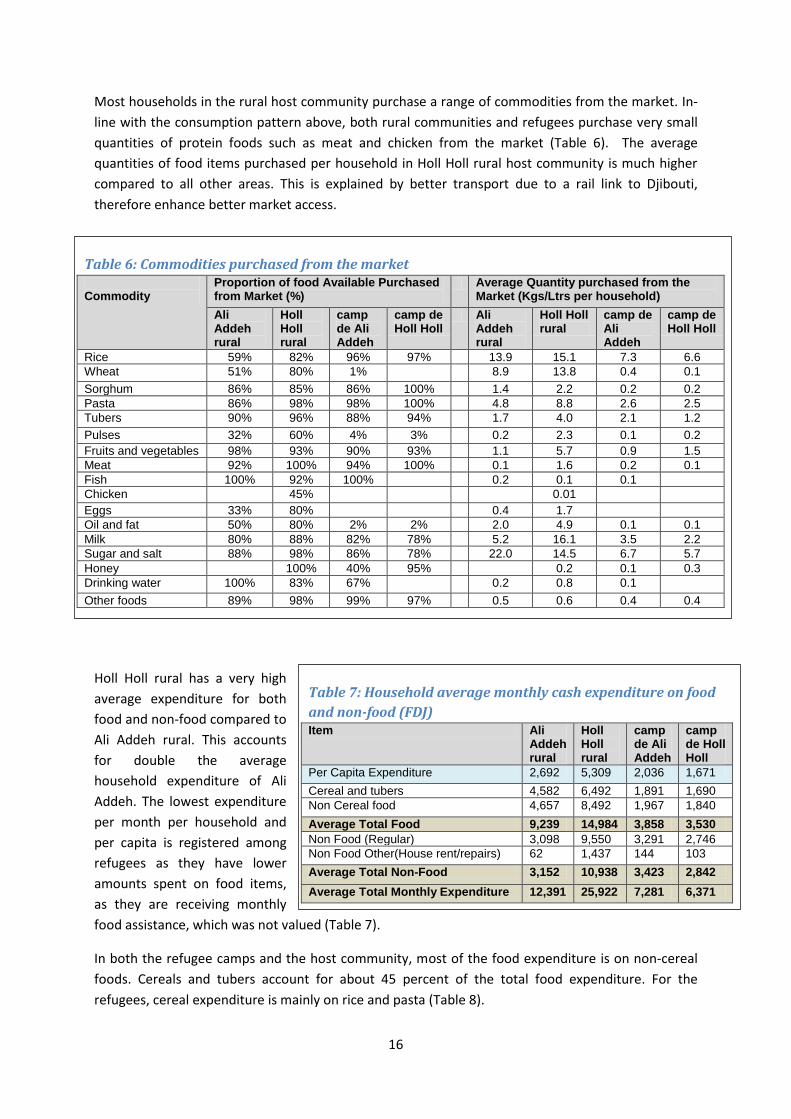
Most households in the rural host community purchase a range of commodities from the market. In-
line with the consumption pattern above, both rural communities and refugees purchase very small
quantities of protein foods such as meat and chicken from the market (Table 6). The average
quantities of food items purchased per household in Holl Holl rural host community is much higher
compared to all other areas. This is explained by better transport due to a rail link to Djibouti,
therefore enhance better market access.
Holl Holl rural has a very high
average expenditure for both
food and non-food compared to
Ali Addeh rural. This accounts
for double the average
household expenditure of Ali
Addeh. The lowest expenditure
per month per household and
per capita is registered among
refugees as they have lower
amounts spent on food items,
as they are receiving monthly
food assistance, which was not valued (Table 7).
In both the refugee camps and the host community, most of the food expenditure is on non-cereal
foods. Cereals and tubers account for about 45 percent of the total food expenditure. For the
refugees, cereal expenditure is mainly on rice and pasta (Table 8).
Table 6: Commodities purchased from the market Commodity
Proportion of food Available Purchased from Market (%)
Average Quantity purchased from the Market (Kgs/Ltrs per household)
Ali Addeh rural
Holl Holl rural
camp de Ali Addeh
camp de Holl Holl
Ali Addeh rural
Holl Holl rural
camp de Ali Addeh
camp de Holl Holl
Rice 59% 82% 96% 97% 13.9 15.1 7.3 6.6
Wheat 51% 80% 1% 8.9 13.8 0.4 0.1
Sorghum 86% 85% 86% 100% 1.4 2.2 0.2 0.2
Pasta 86% 98% 98% 100% 4.8 8.8 2.6 2.5
Tubers 90% 96% 88% 94% 1.7 4.0 2.1 1.2
Pulses 32% 60% 4% 3% 0.2 2.3 0.1 0.2
Fruits and vegetables 98% 93% 90% 93% 1.1 5.7 0.9 1.5
Meat 92% 100% 94% 100% 0.1 1.6 0.2 0.1
Fish 100% 92% 100% 0.2 0.1 0.1
Chicken 45% 0.01
Eggs 33% 80% 0.4 1.7
Oil and fat 50% 80% 2% 2% 2.0 4.9 0.1 0.1
Milk 80% 88% 82% 78% 5.2 16.1 3.5 2.2
Sugar and salt 88% 98% 86% 78% 22.0 14.5 6.7 5.7
Honey 100% 40% 95% 0.2 0.1 0.3
Drinking water 100% 83% 67% 0.2 0.8 0.1
Other foods 89% 98% 99% 97% 0.5 0.6 0.4 0.4
17
Table 8: % Cash expenditure by food commodity group
Commodity
Ali Addeh rural
Holl Holl rural
camp de Ali
Addeh camp de Holl Holl
Rice 21% 17% 25% 28% Wheat flour 11% 11% 0.3% 0.5% Tubers 3% 5% 9% 6% Pasta 9% 12% 11% 11% maize, sorghum 1% 1% 1% 0.4%
cereals and tubers 46% 46% 46% 45% pulses 0.3% 1% 1% 1% fruits and vegetables 2% 7% 6% 7% meat, chicken, fish/ egg 2% 8% 3% 1% sugar, salt and honey 36% 24% 30% 33% Oil, fat butter 6% 6% 1% 0.3% Milk cheese yorghut 4% 5% 6% 5% water and other foods 4% 4% 8% 8%
Share of expenditure on food
< 50% 12% 21% 37% 39%
>=50 to 65% 10% 22% 18% 22%
>=65 to 75% 15% 14% 18% 13%
>=75% 63% 43% 26% 26%
Table 9: Proportion of nonfood expenditure
Non Food Item
Ali Addeh rural
Holl Holl rural
camp de Ali Addeh
camp de Holl Holl
Clothes 31% 32% 24% 29% Soap 30% 16% 27% 31% Khat 18% 11% 7% 6% Transport 3% 4% 16% 13%
Electricty 5% 4% 7% 6% Education 4% 7% 5% 6% house rent/repairs 1% 12% 3% 2% Fossil fuel 3% 6% 2% 1%
Alcohol - 2% 2% 1% communication 1% 1% 2% 1% Medical 2% 2% 1% 2%
Debt repayment - 1% 1% - Savings 1% 1% 1% - Water - 1% 1% 1% Agriculture - 1% - - Social events - 1% - - Veterinary - - - -
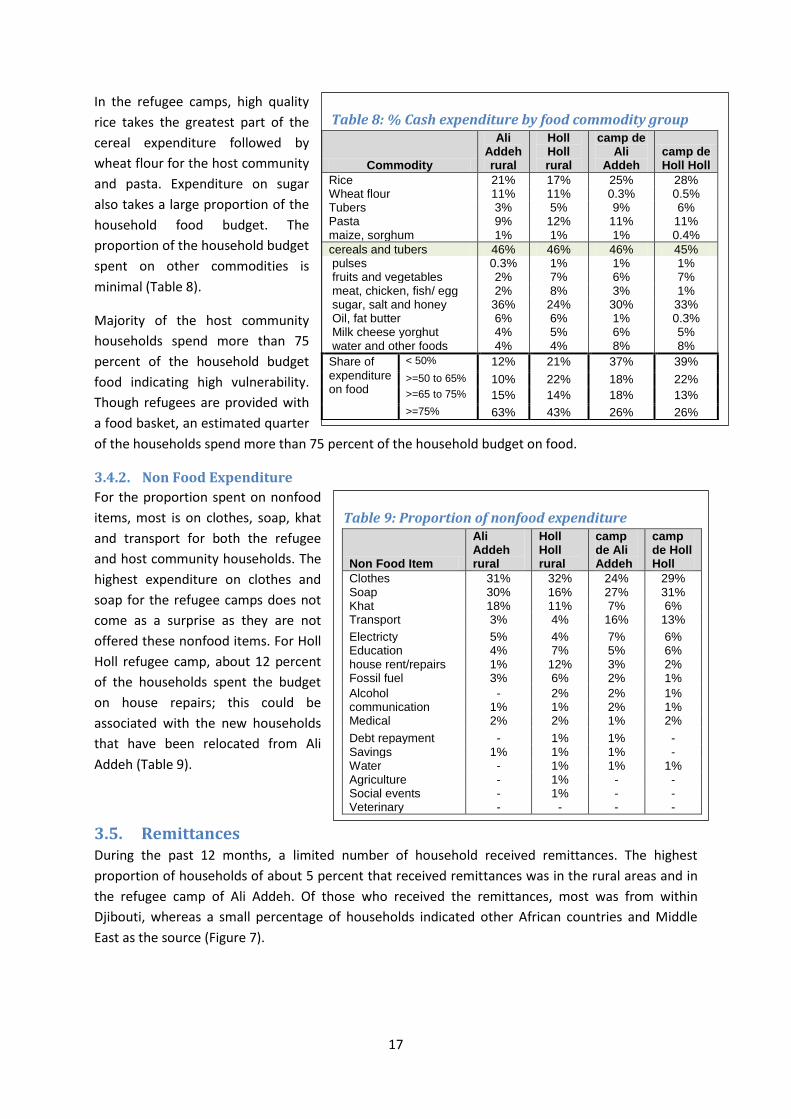
In the refugee camps, high quality
rice takes the greatest part of the
cereal expenditure followed by
wheat flour for the host community
and pasta. Expenditure on sugar
also takes a large proportion of the
household food budget. The
proportion of the household budget
spent on other commodities is
minimal (Table 8).
Majority of the host community
households spend more than 75
percent of the household budget
food indicating high vulnerability.
Though refugees are provided with
a food basket, an estimated quarter
of the households spend more than 75 percent of the household budget on food.
3.4.2. Non Food Expenditure
For the proportion spent on nonfood
items, most is on clothes, soap, khat
and transport for both the refugee
and host community households. The
highest expenditure on clothes and
soap for the refugee camps does not
come as a surprise as they are not
offered these nonfood items. For Holl
Holl refugee camp, about 12 percent
of the households spent the budget
on house repairs; this could be
associated with the new households
that have been relocated from Ali
Addeh (Table 9).
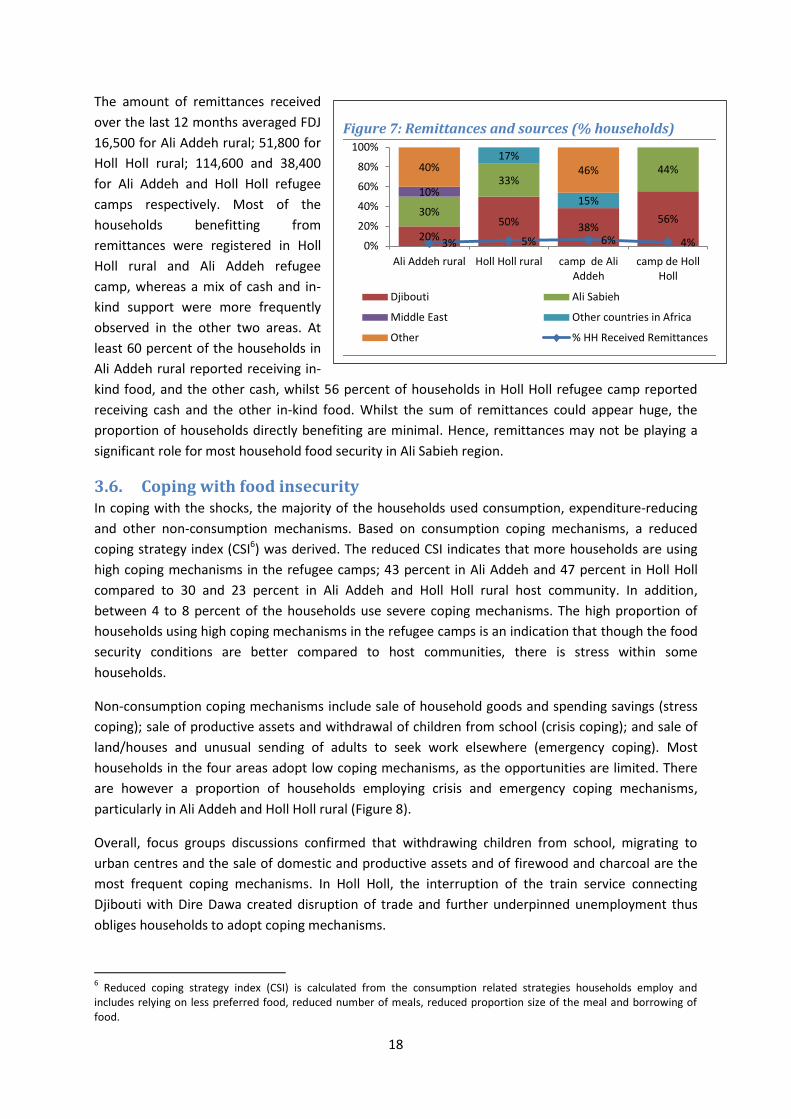
3.5. Remittances During the past 12 months, a limited number of household received remittances. The highest
proportion of households of about 5 percent that received remittances was in the rural areas and in
the refugee camp of Ali Addeh. Of those who received the remittances, most was from within
Djibouti, whereas a small percentage of households indicated other African countries and Middle
East as the source (Figure 7).
18
Figure 7: Remittances and sources (% households)
20% 50% 38%
56% 30%
33% 44%
10%
17%
15%
40% 46%
3% 5% 6% 4% 0%
20%
40%
60%
80%
100%
Ali Addeh rural Holl Holl rural camp de AliAddeh
camp de HollHoll
Djibouti Ali Sabieh
Middle East Other countries in Africa
Other % HH Received Remittances
The amount of remittances received
over the last 12 months averaged FDJ
16,500 for Ali Addeh rural; 51,800 for
Holl Holl rural; 114,600 and 38,400
for Ali Addeh and Holl Holl refugee
camps respectively. Most of the
households benefitting from
remittances were registered in Holl
Holl rural and Ali Addeh refugee
camp, whereas a mix of cash and in-
kind support were more frequently
observed in the other two areas. At
least 60 percent of the households in
Ali Addeh rural reported receiving in-
kind food, and the other cash, whilst 56 percent of households in Holl Holl refugee camp reported
receiving cash and the other in-kind food. Whilst the sum of remittances could appear huge, the
proportion of households directly benefiting are minimal. Hence, remittances may not be playing a
significant role for most household food security in Ali Sabieh region.
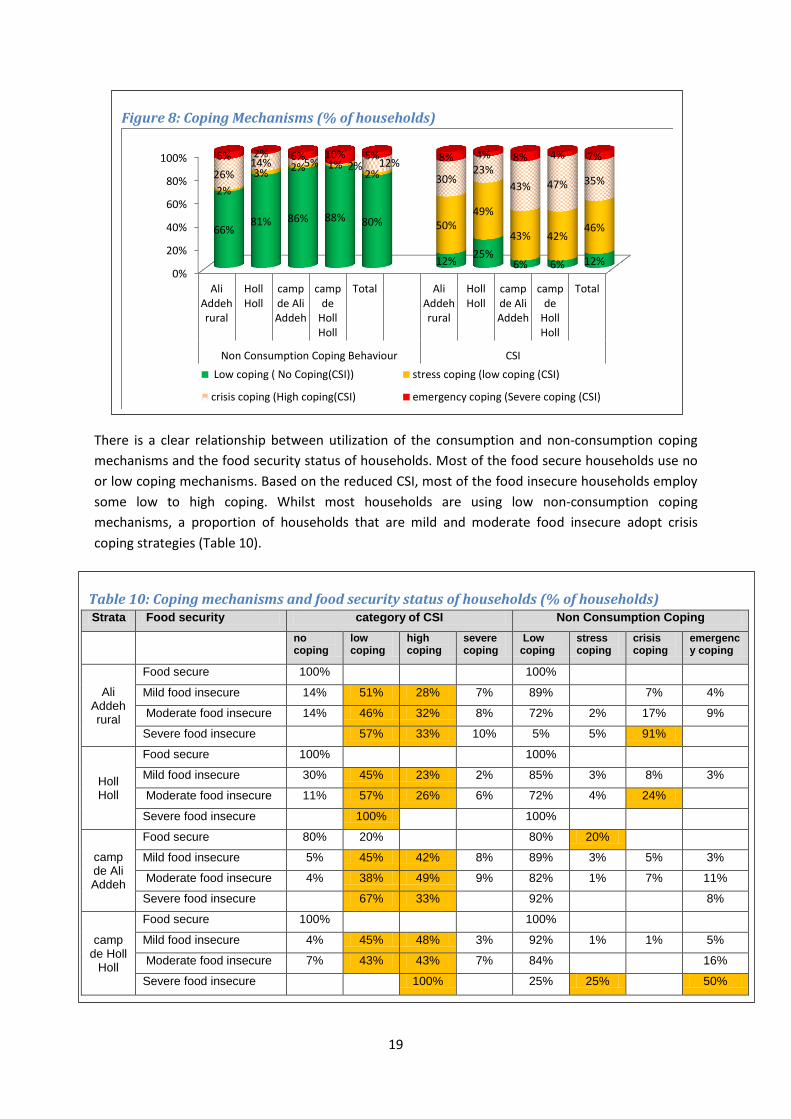
3.6. Coping with food insecurity In coping with the shocks, the majority of the households used consumption, expenditure-reducing
and other non-consumption mechanisms. Based on consumption coping mechanisms, a reduced
coping strategy index (CSI6) was derived. The reduced CSI indicates that more households are using
high coping mechanisms in the refugee camps; 43 percent in Ali Addeh and 47 percent in Holl Holl
compared to 30 and 23 percent in Ali Addeh and Holl Holl rural host community. In addition,
between 4 to 8 percent of the households use severe coping mechanisms. The high proportion of
households using high coping mechanisms in the refugee camps is an indication that though the food
security conditions are better compared to host communities, there is stress within some
households.
Non-consumption coping mechanisms include sale of household goods and spending savings (stress
coping); sale of productive assets and withdrawal of children from school (crisis coping); and sale of
land/houses and unusual sending of adults to seek work elsewhere (emergency coping). Most
households in the four areas adopt low coping mechanisms, as the opportunities are limited. There
are however a proportion of households employing crisis and emergency coping mechanisms,
particularly in Ali Addeh and Holl Holl rural (Figure 8).
Overall, focus groups discussions confirmed that withdrawing children from school, migrating to
urban centres and the sale of domestic and productive assets and of firewood and charcoal are the
most frequent coping mechanisms. In Holl Holl, the interruption of the train service connecting
Djibouti with Dire Dawa created disruption of trade and further underpinned unemployment thus
obliges households to adopt coping mechanisms.
6 Reduced coping strategy index (CSI) is calculated from the consumption related strategies households employ and
includes relying on less preferred food, reduced number of meals, reduced proportion size of the meal and borrowing of food.
19
There is a clear relationship between utilization of the consumption and non-consumption coping
mechanisms and the food security status of households. Most of the food secure households use no
or low coping mechanisms. Based on the reduced CSI, most of the food insecure households employ
some low to high coping. Whilst most households are using low non-consumption coping
mechanisms, a proportion of households that are mild and moderate food insecure adopt crisis
coping strategies (Table 10).
Figure 8: Coping Mechanisms (% of households)
0%
20%
40%
60%
80%
100%
AliAddehrural
HollHoll
campde AliAddeh
campde
HollHoll
Total AliAddehrural
HollHoll
campde AliAddeh
campde
HollHoll
Total
Non Consumption Coping Behaviour CSI
66% 81% 86% 88% 80%
12% 25%
6% 6% 12%
2%
3% 2% 2% 2%
50% 49%
43% 42% 46%
26% 14% 5% 1% 12%
30% 23%
43% 47% 35%
6% 2% 6% 10% 5% 8% 4% 8% 4% 7%
Low coping ( No Coping(CSI)) stress coping (low coping (CSI)
crisis coping (High coping(CSI) emergency coping (Severe coping (CSI)
Table 10: Coping mechanisms and food security status of households (% of households) Strata Food security category of CSI Non Consumption Coping
no coping
low coping
high coping
severe coping
Low coping
stress coping
crisis coping
emergency coping
Ali Addeh rural
Food secure 100% 100%
Mild food insecure 14% 51% 28% 7% 89% 7% 4%
Moderate food insecure 14% 46% 32% 8% 72% 2% 17% 9%
Severe food insecure 57% 33% 10% 5% 5% 91%
Holl Holl
Food secure 100% 100%
Mild food insecure 30% 45% 23% 2% 85% 3% 8% 3%
Moderate food insecure 11% 57% 26% 6% 72% 4% 24%
Severe food insecure 100% 100%
camp de Ali Addeh
Food secure 80% 20% 80% 20%
Mild food insecure 5% 45% 42% 8% 89% 3% 5% 3%
Moderate food insecure 4% 38% 49% 9% 82% 1% 7% 11%
Severe food insecure 67% 33% 92% 8%
camp de Holl
Holl
Food secure 100% 100%
Mild food insecure 4% 45% 48% 3% 92% 1% 1% 5%
Moderate food insecure 7% 43% 43% 7% 84% 16%
Severe food insecure 100% 25% 25% 50%
20
Table 11: Type of Assistance received (% of households)
Assistance Ali Addeh rural
Holl Holl rural
camp de Ali Addeh
camp de Holl Holl
General food distribution 99% 96% 98% 91% money 1%
food for malnourished children 11% 19% 22% foods to pregnant/breastfeeding women 1% 15% 16% live work 3%
wood heating/charcoal 8% 1% 1% Water 1% 7% 7% 9% Health (medicine, etc.) 0% 2% 4% 6%
4. Food Assistance
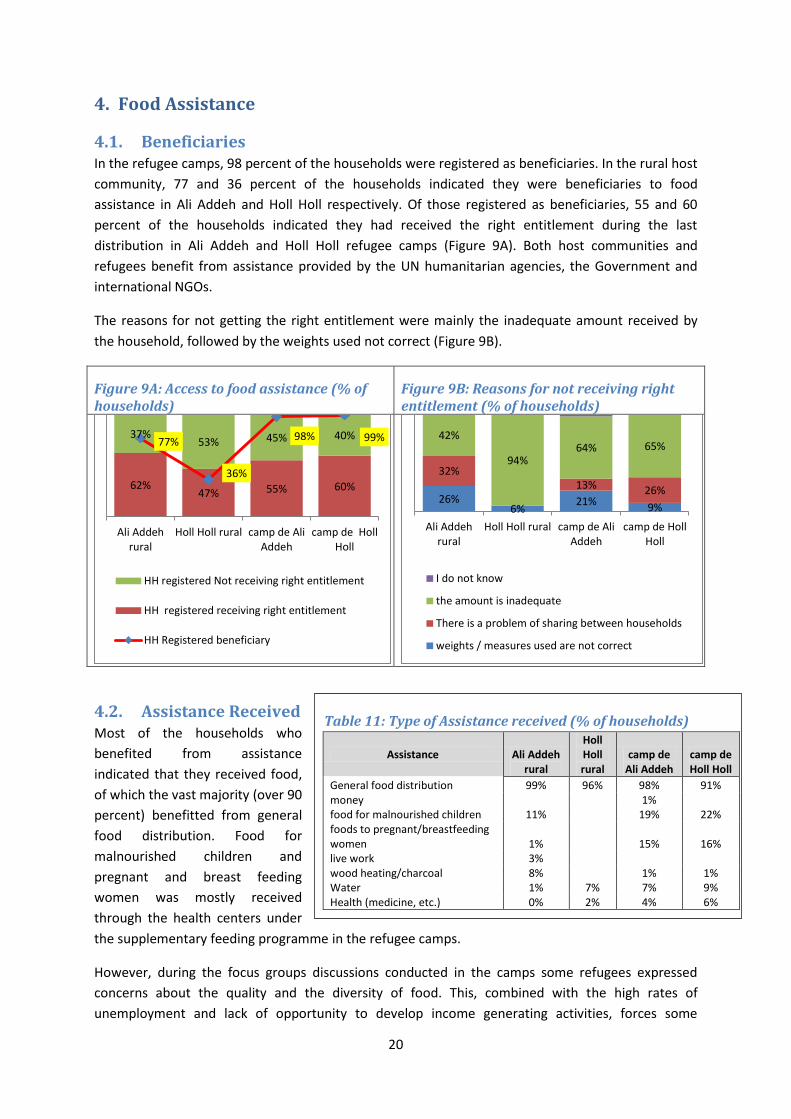
4.1. Beneficiaries In the refugee camps, 98 percent of the households were registered as beneficiaries. In the rural host
community, 77 and 36 percent of the households indicated they were beneficiaries to food
assistance in Ali Addeh and Holl Holl respectively. Of those registered as beneficiaries, 55 and 60
percent of the households indicated they had received the right entitlement during the last
distribution in Ali Addeh and Holl Holl refugee camps (Figure 9A). Both host communities and
refugees benefit from assistance provided by the UN humanitarian agencies, the Government and
international NGOs.
The reasons for not getting the right entitlement were mainly the inadequate amount received by
the household, followed by the weights used not correct (Figure 9B).
Figure 9A: Access to food assistance (% of households)
Figure 9B: Reasons for not receiving right entitlement (% of households)
4.2. Assistance Received Most of the households who
benefited from assistance
indicated that they received food,
of which the vast majority (over 90
percent) benefitted from general
food distribution. Food for
malnourished children and
pregnant and breast feeding
women was mostly received
through the health centers under
the supplementary feeding programme in the refugee camps.
However, during the focus groups discussions conducted in the camps some refugees expressed
concerns about the quality and the diversity of food. This, combined with the high rates of
unemployment and lack of opportunity to develop income generating activities, forces some
62% 47% 55% 60%
37% 53% 45% 40%
77%
36%
98% 99%
Ali Addehrural
Holl Holl rural camp de AliAddeh
camp de HollHoll
HH registered Not receiving right entitlement
HH registered receiving right entitlement
HH Registered beneficiary
26% 6%
21% 9%
32% 13% 26%
42%
94% 64% 65%
Ali Addehrural
Holl Holl rural camp de AliAddeh
camp de HollHoll
I do not know
the amount is inadequate
There is a problem of sharing between households
weights / measures used are not correct
21
Table 12: Utilization of Commodities % of
commodity sold
Ali Addeh rural
Holl Holl rural
camp de Ali
Addeh
camp de Holl
Holl
Wheat flour
0.8 0.8
rice 1.0 oil 0.5 0.4
legumes 1.1 CSB 1.0 0.4
salt 0.2 sugar
Average Number of Days the Ration last
17 18 21 23
Table 13: Reasons for selling the food ration
Reasons for selling food (% of households)
Holl Holl rural
camp de Ali
Addeh
camp de Holl
Holl
to buy non-foods - 40% 11%
money for health/education 50% 3% -
to buy other food products which do not form part of the diet 50% 52% 89%
do not like distributed food - 2% -
the food is of poor quality - 3% -
Estimated Number of Households selling ration 63 2,320 75
Figure 10: House member responsible for
collecting the ration
32% 41% 18% 19%
51% 54%
63% 69%
4% 5% 10% 11% 6%
Ali Addehrural
Holl Holl camp de AliAddeh
camp de HollHoll
husband wife child other member of the family other
refugees to sell part of the food ration to buy other type of food such as pasta and rice. The sale is
done mostly through loans and/or in kind exchange with local merchants.
A limited proportion of households reported benefited from wood, charcoal, water and health (Table
11). Most households indicated they purchased the firewood and had limited access to non-food
items (including kerosene distributed by UNHCR in the camps).
The level of satisfaction towards food assistance is relatively high. Among host communities, 46
percent of households benefitting from food assistance in Holl Holl and 63 percent in Ali Addeh are
satisfied with the food aid received; similar proportions (55 percent in Ali Addeh and 60 percent in
Holl Holl) were observed among refugees.
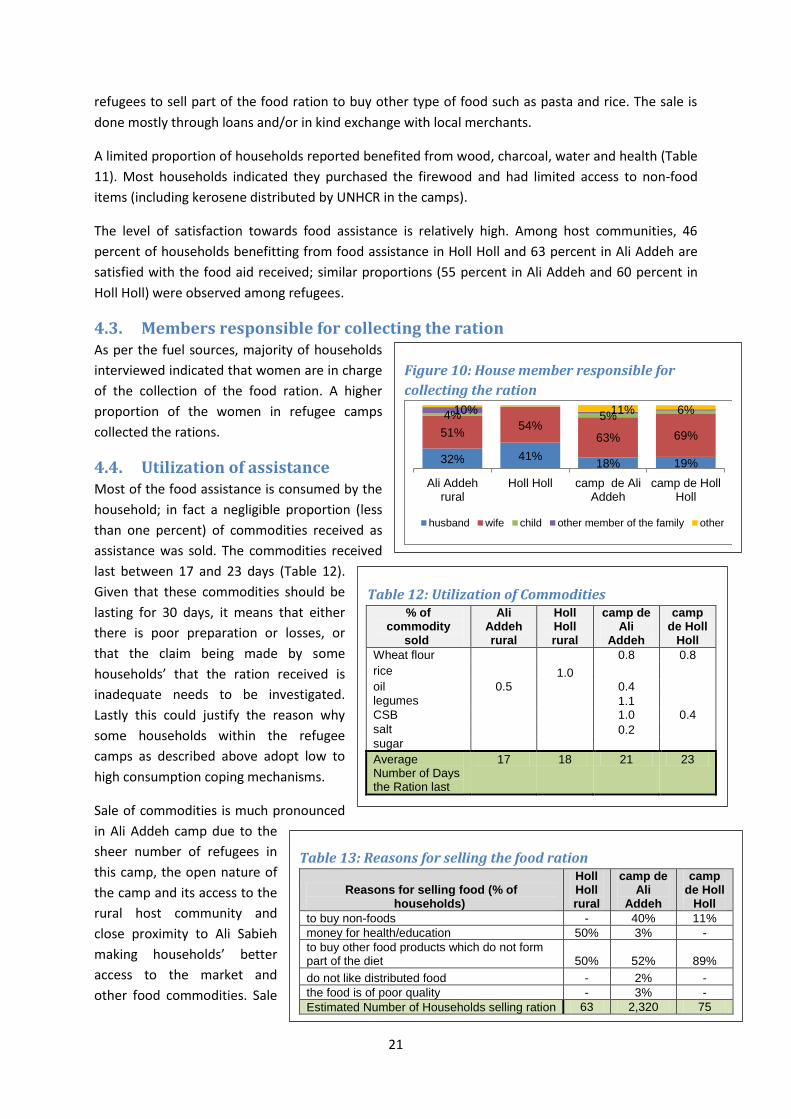
4.3. Members responsible for collecting the ration As per the fuel sources, majority of households
interviewed indicated that women are in charge
of the collection of the food ration. A higher
proportion of the women in refugee camps
collected the rations.
4.4. Utilization of assistance Most of the food assistance is consumed by the
household; in fact a negligible proportion (less
than one percent) of commodities received as
assistance was sold. The commodities received
last between 17 and 23 days (Table 12).
Given that these commodities should be
lasting for 30 days, it means that either
there is poor preparation or losses, or
that the claim being made by some
households’ that the ration received is
inadequate needs to be investigated.
Lastly this could justify the reason why
some households within the refugee
camps as described above adopt low to
high consumption coping mechanisms.
Sale of commodities is much pronounced
in Ali Addeh camp due to the
sheer number of refugees in
this camp, the open nature of
the camp and its access to the
rural host community and
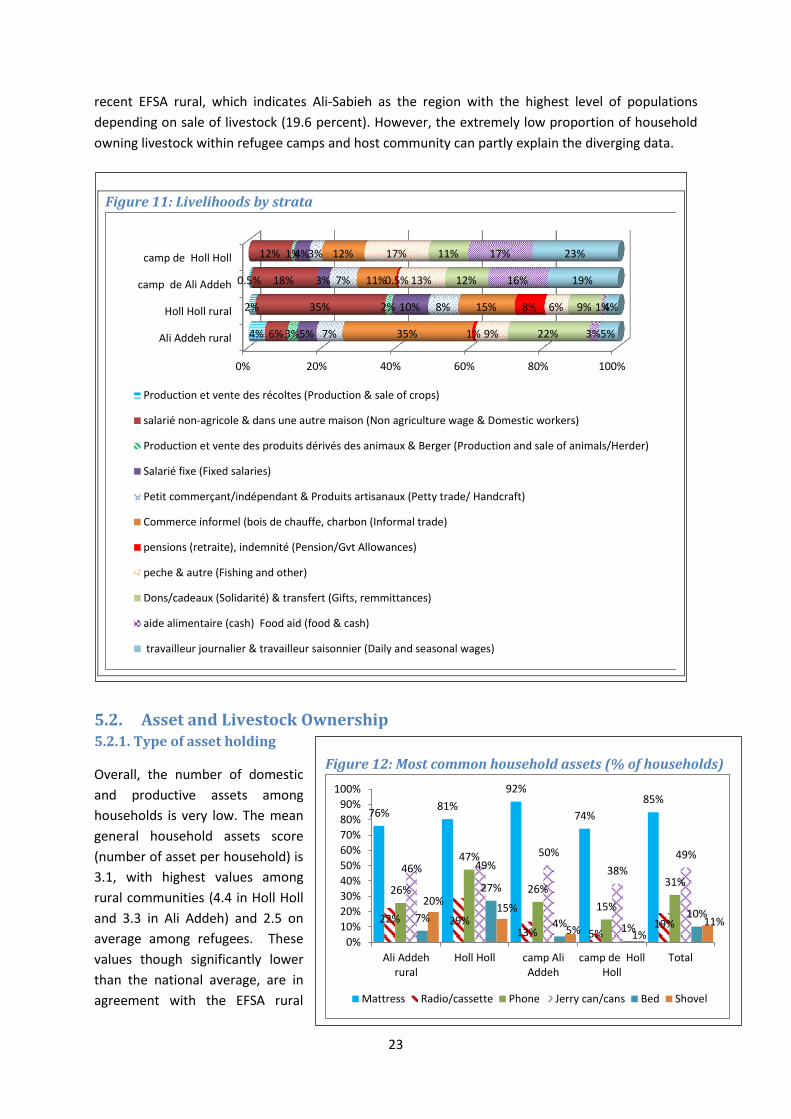
close proximity to Ali Sabieh
making households’ better
access to the market and
other food commodities. Sale
22
of food assistance is much lower in Holl Holl refugee camp, where there is a clear separation of the
refugee area from the village.
The sale of the commodities in the camps can be mainly attributed to purchase of commodities not
provided through the food ration and some households sell to buy non-food items (Table 13).
5. Livelihoods and sources of income
5.1. Livelihoods Different households in the four strata adopt different livelihoods, with majority relying on one major
source of income. About a third of the households in Ali Addeh and Holl Holl rural areas rely on
informal trade that include charcoal; and daily non-agricultural labour and domestic wage
respectively. In the refugee camps, no particular income sources seem to be prominent, the most
common is daily and seasonal wage with about 20 percent depending on it. The proportion of daily
workers is higher in the refugee camps compared to the host communities, estimated at 5 percent.
The more vibrant economy linked to the camps compared to the less diverse livelihoods of the host
communities could in part explain such difference.
In the two camps, about 17 percent of the households depend on food assistance as main source of
income and another 12 percent on gifts and remittances. As expected, food aid as source of income
is more prominent in the camps than amongst host communities were only 1 to 3 percent of
households indicated this as a main source. An estimated 13 and 17 percent rely on fishing and other
sources in Ali Addeh and Holl Holl refugee camps respectively. The other prominent income sources
for refugee camps is non-agricultural wages including domestic workers that is dependent on 18 and
12 percent of the households in Ali Addeh and Holl Holl refugee camps respectively. An estimated 12
percent depend on charcoal. Unfortunately, the high demand of fossil fuels due to the increasing
demographic pressure around the camps is affecting dramatically the natural resources (water, trees,
soils, etc.). The remainder of the households in the camps depend on other sources as indicated on
Figure 11.
In the rural areas, the second most prominent income sources are 22 percent of the households
relying on gifts and remittances in Ali Addeh and 15 percent on informal trade (mainly firewood and
charcoal) in Holl Holl rural. Though the population relying on selling charcoal and firewood is low in
Holl Holl rural, this in line with the rural national figure of 20.6 percent dependent on this source
(EFSA rural 2013). The EFSA study shows how the trade of natural resources shifted from a mere
coping strategy adopted to face the impact of drought on traditional economic activities, to common
livelihoods for most rural families; this is also evident in Ali Sabieh region, as a result of the chronic
connotations assumed by drought in recent years. Charcoal and fire wood, alongside food, are the
main goods that can be traded in the camps of Ali Addeh and Holl Holl and their surroundings. The
third important source of income is 9 percent that depend on fishing and other income in Ali Addeh
and 10 percent on fixed salaries in Holl Holl rural. The remainder of the households depend on a
range of other sources as in Figure 11. Fixed income is quite low in the host community, hence
making the incomes unreliable.
Surprisingly, households’ whose main income source is sale of livestock and animal products both in
the camps and among host communities is very low. This partly contradicts the information from the
23
Figure 12: Most common household assets (% of households)
76% 81%
92%
74%
85%
22% 29% 13% 5%
19%
26%
47%
26%
15%
31% 46% 49%
50%
38%
49%
7%
27%
4% 1% 10%
20% 15%
5% 1% 11%
0%
10%
20%
30%
40%
50%
60%
70%
80%
90%
100%
Ali Addehrural
Holl Holl camp AliAddeh
camp de HollHoll
Total
Mattress Radio/cassette Phone Jerry can/cans Bed Shovel
recent EFSA rural, which indicates Ali-Sabieh as the region with the highest level of populations
depending on sale of livestock (19.6 percent). However, the extremely low proportion of household
owning livestock within refugee camps and host community can partly explain the diverging data.
5.2. Asset and Livestock Ownership 5.2.1. Type of asset holding
Overall, the number of domestic
and productive assets among
households is very low. The mean
general household assets score
(number of asset per household) is
3.1, with highest values among
rural communities (4.4 in Holl Holl
and 3.3 in Ali Addeh) and 2.5 on
average among refugees. These
values though significantly lower
than the national average, are in
agreement with the EFSA rural
Figure 11: Livelihoods by strata
0% 20% 40% 60% 80% 100%
Ali Addeh rural
Holl Holl rural
camp de Ali Addeh
camp de Holl Holl
4%
2%
0.5%
6%
35%
18%
12%
3%
2%
1%
5%
10%
3%
4%
7%
8%
7%
3%
35%
15%
11%
12%
1%
8%
0.5%
9%
6%
13%
17%
22%
9%
12%
11%
3%
1%
16%
17%
5%
4%
19%
23%
Production et vente des récoltes (Production & sale of crops)
salarié non-agricole & dans une autre maison (Non agriculture wage & Domestic workers)
Production et vente des produits dérivés des animaux & Berger (Production and sale of animals/Herder)
Salarié fixe (Fixed salaries)
Petit commerçant/indépendant & Produits artisanaux (Petty trade/ Handcraft)
Commerce informel (bois de chauffe, charbon (Informal trade)
pensions (retraite), indemnité (Pension/Gvt Allowances)
peche & autre (Fishing and other)
Dons/cadeaux (Solidarité) & transfert (Gifts, remmittances)
aide alimentaire (cash) Food aid (food & cash)
travailleur journalier & travailleur saisonnier (Daily and seasonal wages)
24
2013 study that found Ali Sabieh and Obock regions having the lowest household asset score.
Overall, host communities own a wider range of domestic and productive assets than refugees. The
most common assets are mattresses (85 percent of households own at least one) followed by jerry
cans (49 percent) and telephones (30 percent).
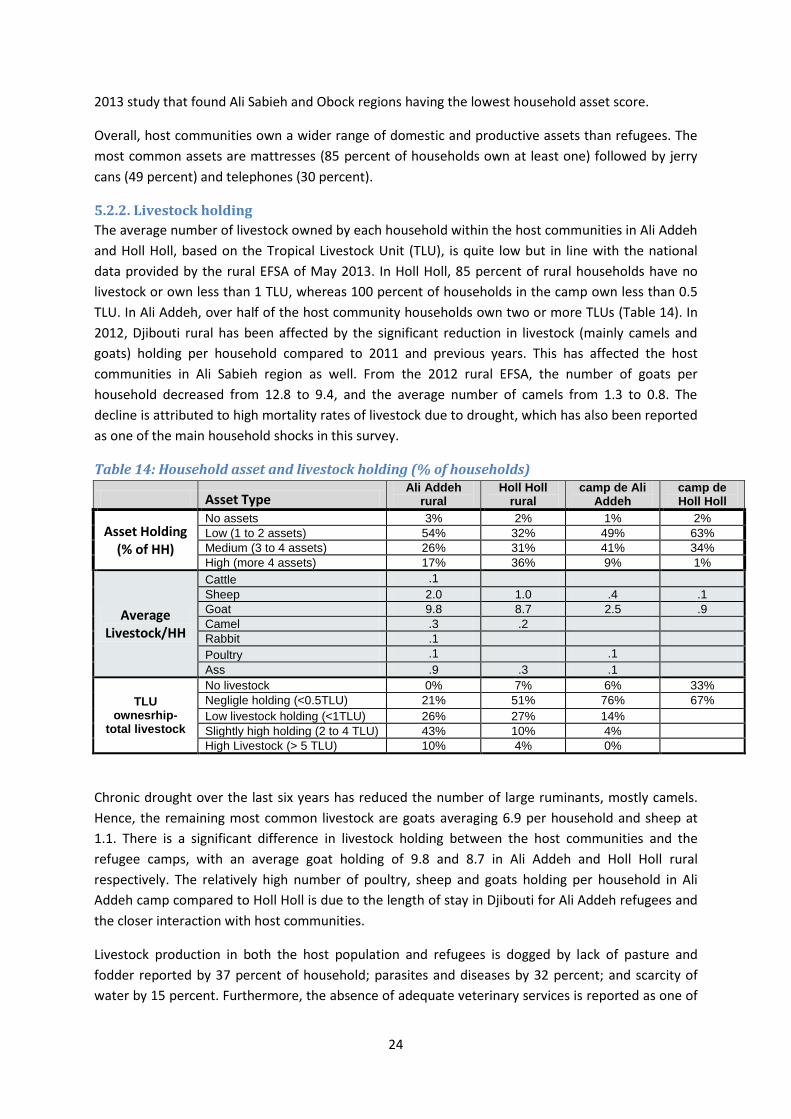
5.2.2. Livestock holding
The average number of livestock owned by each household within the host communities in Ali Addeh
and Holl Holl, based on the Tropical Livestock Unit (TLU), is quite low but in line with the national
data provided by the rural EFSA of May 2013. In Holl Holl, 85 percent of rural households have no
livestock or own less than 1 TLU, whereas 100 percent of households in the camp own less than 0.5
TLU. In Ali Addeh, over half of the host community households own two or more TLUs (Table 14). In
2012, Djibouti rural has been affected by the significant reduction in livestock (mainly camels and
goats) holding per household compared to 2011 and previous years. This has affected the host
communities in Ali Sabieh region as well. From the 2012 rural EFSA, the number of goats per
household decreased from 12.8 to 9.4, and the average number of camels from 1.3 to 0.8. The
decline is attributed to high mortality rates of livestock due to drought, which has also been reported
as one of the main household shocks in this survey.
Table 14: Household asset and livestock holding (% of households)
Asset Type Ali Addeh
rural Holl Holl
rural camp de Ali
Addeh camp de Holl Holl
Asset Holding (% of HH)
No assets 3% 2% 1% 2%
Low (1 to 2 assets) 54% 32% 49% 63%
Medium (3 to 4 assets) 26% 31% 41% 34%
High (more 4 assets) 17% 36% 9% 1%
Average Livestock/HH
Cattle .1
Sheep 2.0 1.0 .4 .1
Goat 9.8 8.7 2.5 .9
Camel .3 .2
Rabbit .1
Poultry .1 .1
Ass .9 .3 .1
TLU ownesrhip-
total livestock
No livestock 0% 7% 6% 33%
Negligle holding (<0.5TLU) 21% 51% 76% 67%
Low livestock holding (<1TLU) 26% 27% 14%
Slightly high holding (2 to 4 TLU) 43% 10% 4%
High Livestock (> 5 TLU) 10% 4% 0%
Chronic drought over the last six years has reduced the number of large ruminants, mostly camels.
Hence, the remaining most common livestock are goats averaging 6.9 per household and sheep at
1.1. There is a significant difference in livestock holding between the host communities and the
refugee camps, with an average goat holding of 9.8 and 8.7 in Ali Addeh and Holl Holl rural
respectively. The relatively high number of poultry, sheep and goats holding per household in Ali
Addeh camp compared to Holl Holl is due to the length of stay in Djibouti for Ali Addeh refugees and
the closer interaction with host communities.
Livestock production in both the host population and refugees is dogged by lack of pasture and
fodder reported by 37 percent of household; parasites and diseases by 32 percent; and scarcity of
water by 15 percent. Furthermore, the absence of adequate veterinary services is reported as one of
25
Figure 13: Crowding (% of households)
0% 20% 40% 60% 80% 100%
Ali Addeh rural
Holl Holl
camp de Ali Addeh
camp de Holl Holl
Total
8%
12%
22%
11%
15%
9%
23%
27%
9%
18%
46%
38%
28%
28%
33%
37%
27%
23%
52%
33%
one person/room 2 persons
3 to4 personsper room over 4 persons per room
the main constraints by 17 and 12 percent of the households in Holl Holl and Ali Addeh rural
respectively.
5.3. Housing Housing conditions are generally poor to very poor in the four strata, with slightly more precarious
living standards observed in the refugee camps compared to host communities. The most common
building materials for houses (walls and roofing) are plastic sheets, fabrics, dry grass and palm tree
leaves. The most common flooring is soil. Plastic and natural elements are the main components of
tents in refugee camps and toukouls used by the nomadic and semi-sedentary population within host
communities.
Over 80 percent of the refugees in both camps live in registered houses/shelters, whilst around 50
percent of the host community households own properly structured houses, and these could be
those living in Holl Holl and Ali Sabieh. Holl Holl rural reported a high proportion of households (23
percent) paying rentals for the houses they live in. For both refugee camps and Ali Addeh rural over
98 percent of the households
do not pay house rent.
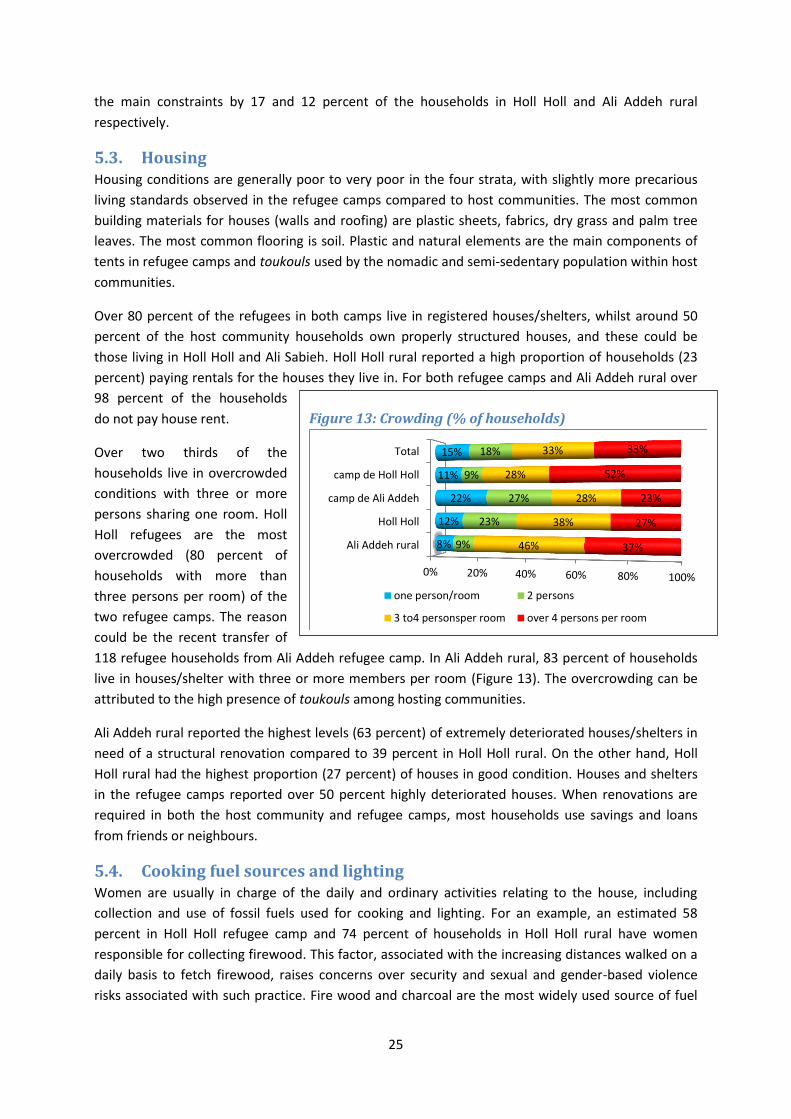
Over two thirds of the
households live in overcrowded
conditions with three or more
persons sharing one room. Holl
Holl refugees are the most
overcrowded (80 percent of
households with more than
three persons per room) of the
two refugee camps. The reason
could be the recent transfer of
118 refugee households from Ali Addeh refugee camp. In Ali Addeh rural, 83 percent of households
live in houses/shelter with three or more members per room (Figure 13). The overcrowding can be
attributed to the high presence of toukouls among hosting communities.
Ali Addeh rural reported the highest levels (63 percent) of extremely deteriorated houses/shelters in
need of a structural renovation compared to 39 percent in Holl Holl rural. On the other hand, Holl
Holl rural had the highest proportion (27 percent) of houses in good condition. Houses and shelters
in the refugee camps reported over 50 percent highly deteriorated houses. When renovations are
required in both the host community and refugee camps, most households use savings and loans
from friends or neighbours.
5.4. Cooking fuel sources and lighting Women are usually in charge of the daily and ordinary activities relating to the house, including
collection and use of fossil fuels used for cooking and lighting. For an example, an estimated 58
percent in Holl Holl refugee camp and 74 percent of households in Holl Holl rural have women
responsible for collecting firewood. This factor, associated with the increasing distances walked on a
daily basis to fetch firewood, raises concerns over security and sexual and gender-based violence
risks associated with such practice. Fire wood and charcoal are the most widely used source of fuel
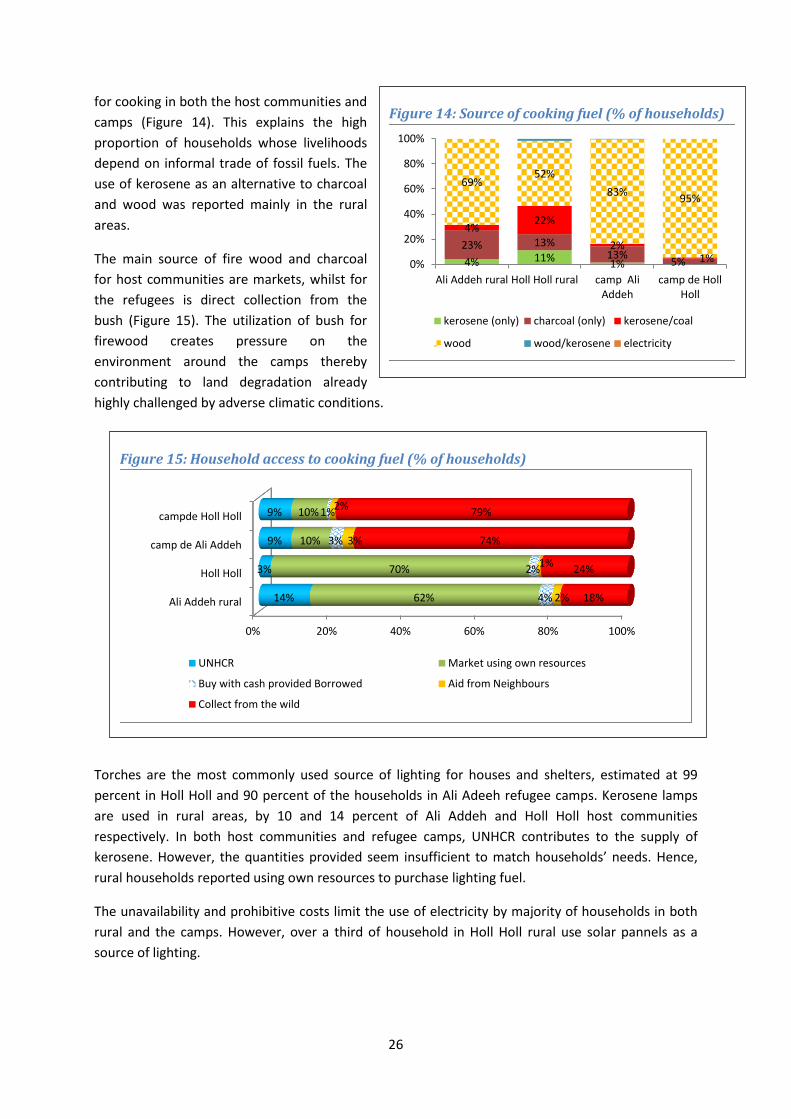
26
Figure 14: Source of cooking fuel (% of households)
4% 11% 1%
23% 13% 13%
5%
4% 22%
2% 1%
69% 52%
83% 95%
0%
20%
40%
60%
80%
100%
Ali Addeh rural Holl Holl rural camp AliAddeh
camp de HollHoll
kerosene (only) charcoal (only) kerosene/coal
wood wood/kerosene electricity
for cooking in both the host communities and
camps (Figure 14). This explains the high
proportion of households whose livelihoods
depend on informal trade of fossil fuels. The
use of kerosene as an alternative to charcoal
and wood was reported mainly in the rural
areas.
The main source of fire wood and charcoal
for host communities are markets, whilst for
the refugees is direct collection from the
bush (Figure 15). The utilization of bush for
firewood creates pressure on the
environment around the camps thereby
contributing to land degradation already
highly challenged by adverse climatic conditions.
Torches are the most commonly used source of lighting for houses and shelters, estimated at 99
percent in Holl Holl and 90 percent of the households in Ali Adeeh refugee camps. Kerosene lamps
are used in rural areas, by 10 and 14 percent of Ali Addeh and Holl Holl host communities
respectively. In both host communities and refugee camps, UNHCR contributes to the supply of
kerosene. However, the quantities provided seem insufficient to match households’ needs. Hence,
rural households reported using own resources to purchase lighting fuel.
The unavailability and prohibitive costs limit the use of electricity by majority of households in both
rural and the camps. However, over a third of household in Holl Holl rural use solar pannels as a
source of lighting.
Figure 15: Household access to cooking fuel (% of households)
0% 20% 40% 60% 80% 100%
Ali Addeh rural
Holl Holl
camp de Ali Addeh
campde Holl Holl
14%
3%
9%
9%
62%
70%
10%
10%
4%
2%
3%
1%
2%
1%
3%
2%
18%
24%
74%
79%
UNHCR Market using own resources
Buy with cash provided Borrowed Aid from Neighbours
Collect from the wild
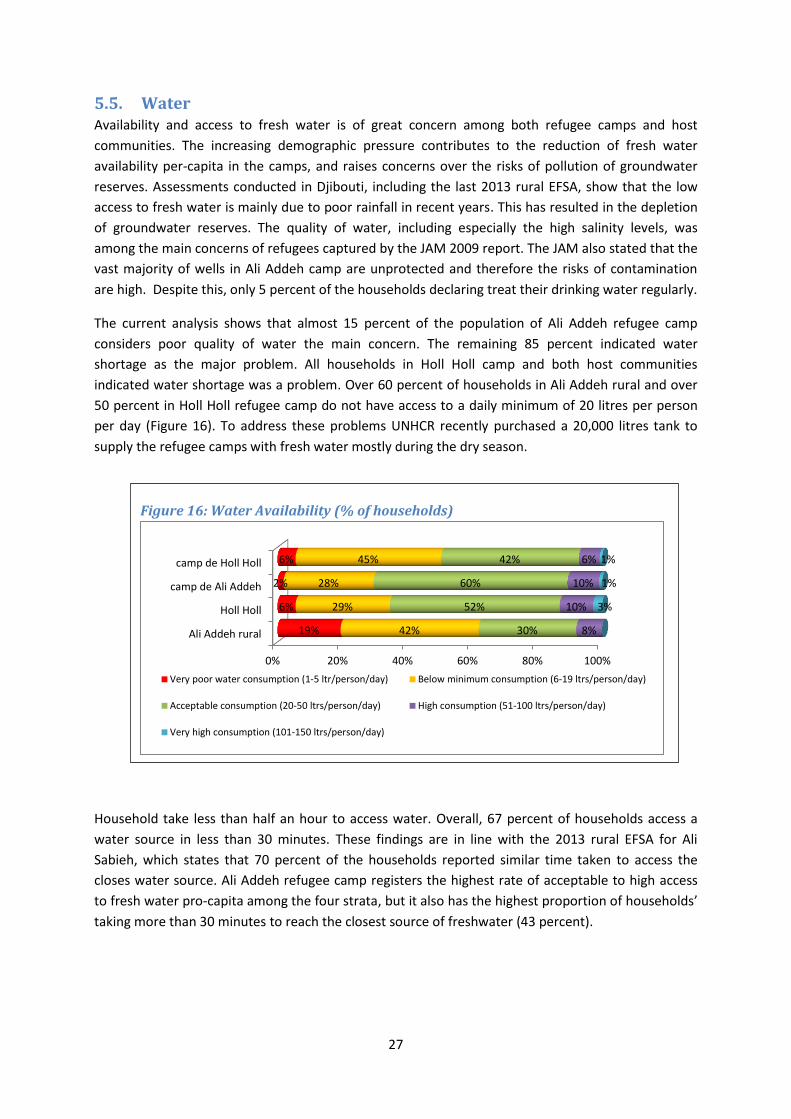
27
5.5. Water Availability and access to fresh water is of great concern among both refugee camps and host
communities. The increasing demographic pressure contributes to the reduction of fresh water
availability per-capita in the camps, and raises concerns over the risks of pollution of groundwater
reserves. Assessments conducted in Djibouti, including the last 2013 rural EFSA, show that the low
access to fresh water is mainly due to poor rainfall in recent years. This has resulted in the depletion
of groundwater reserves. The quality of water, including especially the high salinity levels, was
among the main concerns of refugees captured by the JAM 2009 report. The JAM also stated that the
vast majority of wells in Ali Addeh camp are unprotected and therefore the risks of contamination
are high. Despite this, only 5 percent of the households declaring treat their drinking water regularly.
The current analysis shows that almost 15 percent of the population of Ali Addeh refugee camp
considers poor quality of water the main concern. The remaining 85 percent indicated water
shortage as the major problem. All households in Holl Holl camp and both host communities
indicated water shortage was a problem. Over 60 percent of households in Ali Addeh rural and over
50 percent in Holl Holl refugee camp do not have access to a daily minimum of 20 litres per person
per day (Figure 16). To address these problems UNHCR recently purchased a 20,000 litres tank to
supply the refugee camps with fresh water mostly during the dry season.
Household take less than half an hour to access water. Overall, 67 percent of households access a
water source in less than 30 minutes. These findings are in line with the 2013 rural EFSA for Ali
Sabieh, which states that 70 percent of the households reported similar time taken to access the
closes water source. Ali Addeh refugee camp registers the highest rate of acceptable to high access
to fresh water pro-capita among the four strata, but it also has the highest proportion of households’
taking more than 30 minutes to reach the closest source of freshwater (43 percent).
Figure 16: Water Availability (% of households)
0% 20% 40% 60% 80% 100%
Ali Addeh rural
Holl Holl
camp de Ali Addeh
camp de Holl Holl
19%
6%
2%
6%
42%
29%
28%
45%
30%
52%
60%
42%
8%
10%
10%
6%
3%
1%
1%
Very poor water consumption (1-5 ltr/person/day) Below minimum consumption (6-19 ltrs/person/day)
Acceptable consumption (20-50 ltrs/person/day) High consumption (51-100 ltrs/person/day)
Very high consumption (101-150 ltrs/person/day)
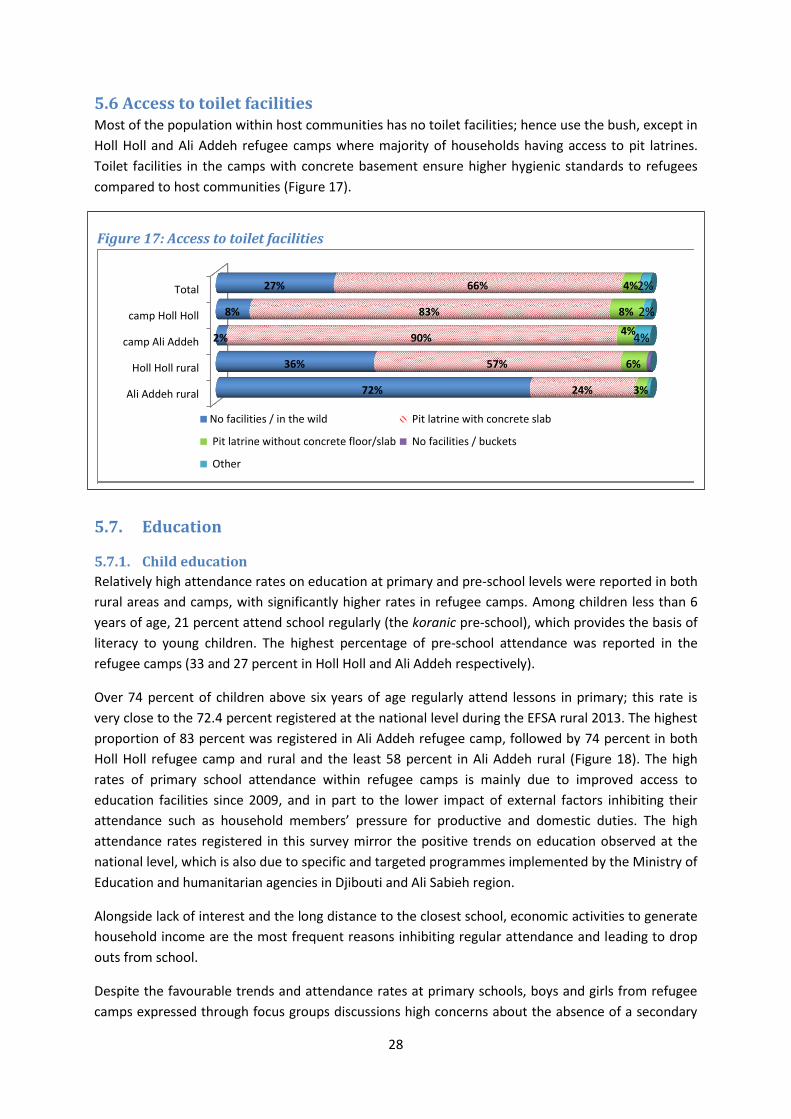
28
5.6 Access to toilet facilities Most of the population within host communities has no toilet facilities; hence use the bush, except in
Holl Holl and Ali Addeh refugee camps where majority of households having access to pit latrines.
Toilet facilities in the camps with concrete basement ensure higher hygienic standards to refugees
compared to host communities (Figure 17).
5.7. Education
5.7.1. Child education
Relatively high attendance rates on education at primary and pre-school levels were reported in both
rural areas and camps, with significantly higher rates in refugee camps. Among children less than 6
years of age, 21 percent attend school regularly (the koranic pre-school), which provides the basis of
literacy to young children. The highest percentage of pre-school attendance was reported in the
refugee camps (33 and 27 percent in Holl Holl and Ali Addeh respectively).
Over 74 percent of children above six years of age regularly attend lessons in primary; this rate is
very close to the 72.4 percent registered at the national level during the EFSA rural 2013. The highest
proportion of 83 percent was registered in Ali Addeh refugee camp, followed by 74 percent in both
Holl Holl refugee camp and rural and the least 58 percent in Ali Addeh rural (Figure 18). The high
rates of primary school attendance within refugee camps is mainly due to improved access to
education facilities since 2009, and in part to the lower impact of external factors inhibiting their
attendance such as household members’ pressure for productive and domestic duties. The high
attendance rates registered in this survey mirror the positive trends on education observed at the
national level, which is also due to specific and targeted programmes implemented by the Ministry of
Education and humanitarian agencies in Djibouti and Ali Sabieh region.
Alongside lack of interest and the long distance to the closest school, economic activities to generate
household income are the most frequent reasons inhibiting regular attendance and leading to drop
outs from school.
Despite the favourable trends and attendance rates at primary schools, boys and girls from refugee
camps expressed through focus groups discussions high concerns about the absence of a secondary
Figure 17: Access to toilet facilities
Ali Addeh rural
Holl Holl rural
camp Ali Addeh
camp Holl Holl
Total
72%
36%
2%
8%
27%
24%
57%
90%
83%
66%
3%
6%
4%
8%
4%
4%
2%
2%
No facilities / in the wild Pit latrine with concrete slab
Pit latrine without concrete floor/slab No facilities / buckets
Other
0% 20% 40% 60% 80% 100%
Ali Addehrural
Holl Hollrural
camp AliAddeh
camp HollHoll
Total
72%
36%
2%
8%
27%
24%
57%
90%
83%
66%
6%
4%
8%
4%
1%
4%
No facilities / in thewild
Pit latrine withconcrete slab
Pit latrine withoutfloor/lab
No facilities /buckets
Other

29
school in the camps’ premises. Unfortunately, most children cannot attend local secondary school
because of the different curricula and language used. This aspect is the main factor inhibiting the
attendance of young refugees to secondary school and determining the interruption of their
scholastic career.
5.7.2. Vocational training
Vocational trainings attendance among adults is less encouraging than rates registered for children
attending ordinary pre-school and primary school. Among the few who attended some training, most
of these focused on health and technical skills, such as welding techniques and carpentry. All
technical trainings were organized in Ali Addeh refugee camp, whereas the training on health took
place mainly among host communities in Ali Addeh and Holl Holl.
5.8. Health At least 19 percent of the households reported that one child aged under-five suffered from a
disease over the last three months, with significantly higher rates of 29 percent in Holl Holl and 23
percent in Ali Addeh refugee camps compared to 15 percent in both host communities. Over 87
percent of the cases of diseases among children were attributed to fever, diarrhoea and respiratory
tract infections (Figure 19). These results are in line with the findings from the EFSA rural 2013 in the
region of Ali Sabieh, which indicated high prevalence of common diseases such as fever, diarrhoea
and respiratory tract infections among children under five years of age.
Figure 18: Reasons for children not attending school
Ali Addeh rural
Holl Holl
camp de Ali Addeh
camp de Holl Holl
39%
40%
32%
31%
29%
19%
11%
16%
25%
5%
16%
6%
5%
5%
6%
5%
11%
60%
26%
13%
Not Interested School too far
The girl has to help with domestic duties Boys to help with income generation
Education poor Education costs too expensive
Handicapped child Other
Figure 19: Prevalence of main diseases of children under five years
0% 20% 40% 60% 80% 100%
Ali Addeh rural
Holl Holl rural
Ali Addeh camp
Holl Holl camp
31%
36%
43%
15% 3%
44%
64%
33%
30%
13%
12%
13%
7%
9%
13%
3%
30%
Diarrhea Measles Fever/malaria
respiratory tract infections Malnutrition Accident
Other
30
High concerns over infant and children’s malnutrition were also raised during focus group discussions
in the camps, and by women’s group in Holl Holl village. In this regard, when asked about the most
urgent needs during focus groups discussions, groups of women in Holl Holl camp reported the need
of distributing higher nutritional value foods (e.g. milk) for children. Furthermore, men requested a
nutrition screening of the overall population to identify the prevalence of acute malnutrition among
children and older persons.
For family members aged above five years of age, almost 30 percent of the household reported that
at least one member had fallen ill over the past three months. The highest prevalence diseases were
fever (22 percent), measles (14 percent) and diarrheic diseases (10 percent of households reporting).
Malnutrition was reported as the major problem by 22 percent of the households.
A higher prevalence of measles and respiratory tract diseases among individuals over five years of
age was reported in the host communities. The low rates in camps are probably a result of high
vaccination campaigns conducted in the camps compared to host communities.
Only 41 percent of all individuals affected by a disease over the last three months sought for some
treatment. Higher percentages compared to host communities were reported in the refugee camps,
57 percent in Holl Holl and 52 percent in Ali Addeh. Most (93 percent) of those who received
treatment obtained it from the nearest hospital or health centre. The refugees mainly relied on the
health centres and clinics close to or within the camp, whilst the host community mostly on the
closest referral hospitals.
Households indicated that the main reasons for not seeking for treatment were the long distance
from the closest health centre; unavailability of drugs; and the prohibitive costs (Table 15).
Table 15: Main constraints inhibiting access of patients to health facilities
Constraints Ali Addeh
rural Holl Holl
rural Ali Addeh
camp Holl Holl
camp
Lack of financial resources 23% 20% 33% 21%
Long distance from referral hospital/health centre 44% 24% 30% 34%
Drugs not available in the health centre 25% 40% 29% 33%
Other 8% 16% 7% 12%
6. Protection The long presence of refugees in the Ali Addeh camp has enhanced a gradual integration into the
local socio-economic architecture, whereas some minor frictions seem to arise in the newly
populated area of Holl Holl. Despite some pockets of scepticism still remain within the host
population over the presence of refugees, the camps seem to offer an opportunity to improve local
communities’ livelihoods through an expansion of their businesses and increased access to relevant
basic social services and facilities.
As confirmed by the focus group discussions, the co-existence of refugees and host communities in
the same area does not seem to cause friction and tension between the two communities. Overall,
the local community tends to have a favourable perception of their refugees neighbours. In fact, 89
percent of households interviewed within host communities have a favourable perception of
31
Table 16: Survey location and number of traders Location Retail Wholesale Total Percent
Ali Addeh 21 6 27 30%
Ali Sabieh 9 6 15 17%
Djibouti 20 10 30 33%
Holl Holl 14 4 18 20%
Total 64 26 90 100%
refugees and more than four out of five households affirm to be able to relate peacefully with them.
Likewise, the refugees’ communities have a favourable perception of local host communities both in
Holl Holl (99 percent) and in Ali Addeh (98 percent) of the local communities. Both sides indicated
that their favourable attitude and relations has remained unchanged in recent years.
When asked about the relationship between refugees and local authorities, almost all the refugees
indicated a very favourable relationship. Only 8 percent of the households within host communities
in Holl Holl and 4 percent in Ali Addeh indicated there was some tension with the refugees.
Finally, some diverging figures arise between host communities and refugees when interviewees
were asked to provide opinions on overall safety of their household and the capacity to meet basic
needs. Over 90 percent of the refugees thought they are in a position to meet their basic needs, such
as health, education and access to food. For the host community, 58 and 75 percent of the
households in Holl Holl and Ali Addeh host communities respectively thought they are in a position to
meet needs.
On safety of the households, 98 percent of the refugees in Ali Addeh and 99 percent in Holl Holl are
confident about the safety of their households within the camps. In rural areas, almost 20 percent in
Holl Holl and 10 percent in Ali Addeh indicated they faced some security concerns.
7. Markets
7.1. Type of Traders In order to understand the trade flows, a trader survey was administered to a total of 90 traders in the four key locations, notably Djibouti City (33 percent), Ali Addeh refugee camp and host community (30 percent), Holl-Holl refugee camp and host community (20 percent) and Ali Sabieh town (17 percent) (Table 16). The sample was composed of 71 percent retailers and 29 percent wholesalers operating from varying types of structures. Djibouti imports most of its food requirements. National level availability of key food commodities is stable, evidenced in the stable price trends. The trader survey has established that main food commodities (rice, pasta, wheat flour, sugar, cooking oil, etc.) are traded through a marketing chain consisting of 3 to 4 large importers who supply about two dozen large wholesalers. These wholesalers in turn supply large wholesalers that serve smaller wholesalers and retailers. The country also imports most of its fresh foods (vegetables) from Ethiopia, but their availability is subject to seasonal variations. Markets are vibrant in the two main urban areas that serve. The marketing chains for main traded commodities are well established and reasonably well linked with the few wholesale and wider variety of retail outlets in the camps and surrounding in host community areas that deal in a variety of groceries (rice, pasta, canned foods) as well as fresh vegetables and fruits.
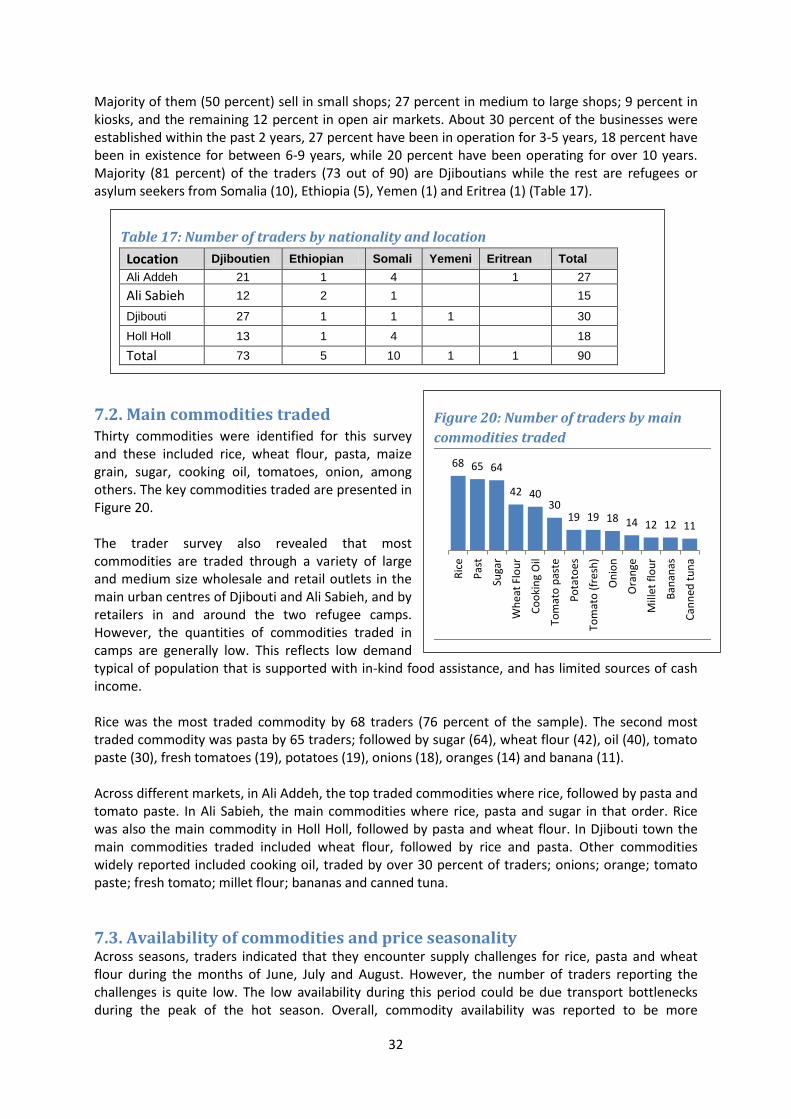
32
Figure 20: Number of traders by main
commodities traded
68 65 64
42 40 30
19 19 18 14 12 12 11
Ric
e
Pas
t
Suga
r
Wh
eat
Flo
ur
Co
oki
ng
Oil
Tom
ato
pas
te
Po
tato
es
Tom
ato
(fr
esh
)
On
ion
Ora
nge
Mill
et f
lou
r
Ban
anas
Can
ned
tu
na
Majority of them (50 percent) sell in small shops; 27 percent in medium to large shops; 9 percent in kiosks, and the remaining 12 percent in open air markets. About 30 percent of the businesses were established within the past 2 years, 27 percent have been in operation for 3-5 years, 18 percent have been in existence for between 6-9 years, while 20 percent have been operating for over 10 years. Majority (81 percent) of the traders (73 out of 90) are Djiboutians while the rest are refugees or asylum seekers from Somalia (10), Ethiopia (5), Yemen (1) and Eritrea (1) (Table 17).
7.2. Main commodities traded Thirty commodities were identified for this survey and these included rice, wheat flour, pasta, maize grain, sugar, cooking oil, tomatoes, onion, among others. The key commodities traded are presented in Figure 20. The trader survey also revealed that most commodities are traded through a variety of large and medium size wholesale and retail outlets in the main urban centres of Djibouti and Ali Sabieh, and by retailers in and around the two refugee camps. However, the quantities of commodities traded in camps are generally low. This reflects low demand typical of population that is supported with in-kind food assistance, and has limited sources of cash income. Rice was the most traded commodity by 68 traders (76 percent of the sample). The second most traded commodity was pasta by 65 traders; followed by sugar (64), wheat flour (42), oil (40), tomato paste (30), fresh tomatoes (19), potatoes (19), onions (18), oranges (14) and banana (11). Across different markets, in Ali Addeh, the top traded commodities where rice, followed by pasta and tomato paste. In Ali Sabieh, the main commodities where rice, pasta and sugar in that order. Rice was also the main commodity in Holl Holl, followed by pasta and wheat flour. In Djibouti town the main commodities traded included wheat flour, followed by rice and pasta. Other commodities widely reported included cooking oil, traded by over 30 percent of traders; onions; orange; tomato paste; fresh tomato; millet flour; bananas and canned tuna.
7.3. Availability of commodities and price seasonality Across seasons, traders indicated that they encounter supply challenges for rice, pasta and wheat flour during the months of June, July and August. However, the number of traders reporting the challenges is quite low. The low availability during this period could be due transport bottlenecks during the peak of the hot season. Overall, commodity availability was reported to be more
Table 17: Number of traders by nationality and location
Location Djiboutien Ethiopian Somali Yemeni Eritrean Total
Ali Addeh 21 1 4 1 27
Ali Sabieh 12 2 1 15
Djibouti 27 1 1 1 30
Holl Holl 13 1 4
18
Total 73 5 10 1 1 90
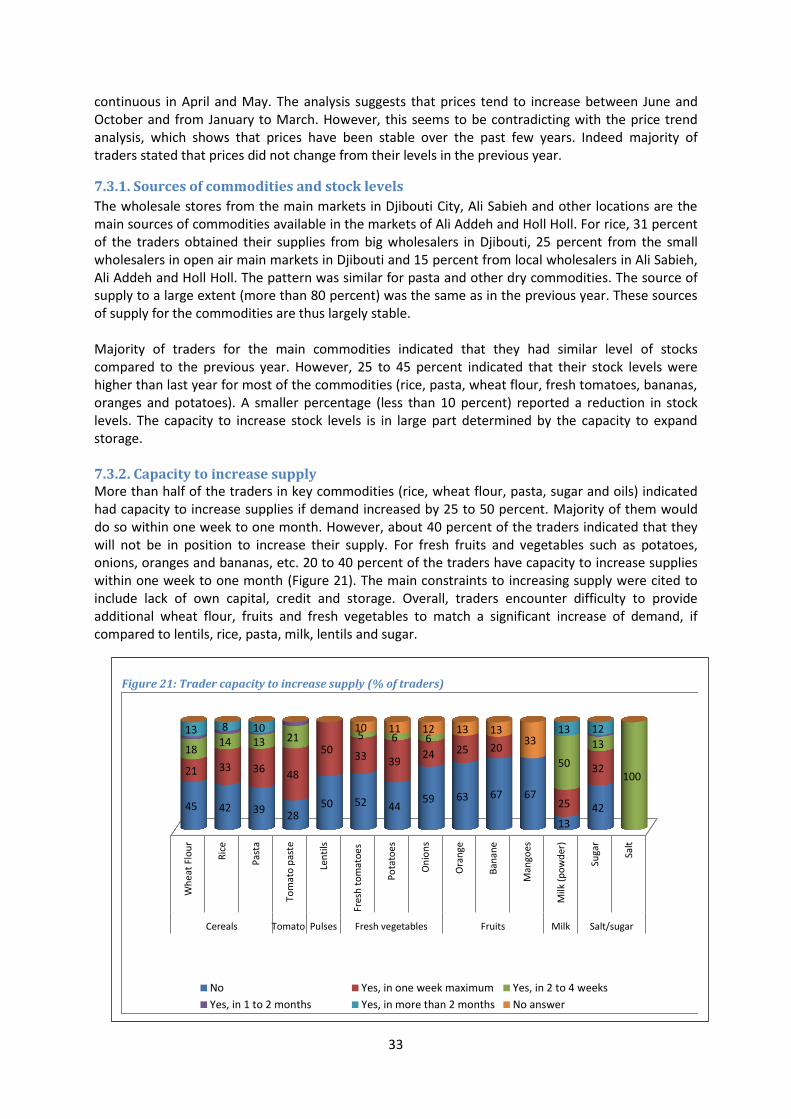
33
continuous in April and May. The analysis suggests that prices tend to increase between June and October and from January to March. However, this seems to be contradicting with the price trend analysis, which shows that prices have been stable over the past few years. Indeed majority of traders stated that prices did not change from their levels in the previous year.
7.3.1. Sources of commodities and stock levels
The wholesale stores from the main markets in Djibouti City, Ali Sabieh and other locations are the main sources of commodities available in the markets of Ali Addeh and Holl Holl. For rice, 31 percent of the traders obtained their supplies from big wholesalers in Djibouti, 25 percent from the small wholesalers in open air main markets in Djibouti and 15 percent from local wholesalers in Ali Sabieh, Ali Addeh and Holl Holl. The pattern was similar for pasta and other dry commodities. The source of supply to a large extent (more than 80 percent) was the same as in the previous year. These sources of supply for the commodities are thus largely stable. Majority of traders for the main commodities indicated that they had similar level of stocks compared to the previous year. However, 25 to 45 percent indicated that their stock levels were higher than last year for most of the commodities (rice, pasta, wheat flour, fresh tomatoes, bananas, oranges and potatoes). A smaller percentage (less than 10 percent) reported a reduction in stock levels. The capacity to increase stock levels is in large part determined by the capacity to expand storage. 7.3.2. Capacity to increase supply More than half of the traders in key commodities (rice, wheat flour, pasta, sugar and oils) indicated had capacity to increase supplies if demand increased by 25 to 50 percent. Majority of them would do so within one week to one month. However, about 40 percent of the traders indicated that they will not be in position to increase their supply. For fresh fruits and vegetables such as potatoes, onions, oranges and bananas, etc. 20 to 40 percent of the traders have capacity to increase supplies within one week to one month (Figure 21). The main constraints to increasing supply were cited to include lack of own capital, credit and storage. Overall, traders encounter difficulty to provide additional wheat flour, fruits and fresh vegetables to match a significant increase of demand, if compared to lentils, rice, pasta, milk, lentils and sugar.
Figure 21: Trader capacity to increase supply (% of traders)
Wh
eat
Flo
ur
Ric
e
Pas
ta
Tom
ato
pas
te
Len
tils
Fres
h t
om
ato
es
Po
tato
es
On
ion
s
Ora
nge
Ban
ane
Man
goes
Milk
(p
ow
der
)
Suga
r
Salt
Cereals Tomato Pulses Fresh vegetables Fruits Milk Salt/sugar
45 42 39 28
50 52 44 59 63 67 67
13
42
21 33 36 48
50 33 39
24 25 20
25
32
18 14 13 21 5 6 6
50
13
100
13 8 10 13 12 10 11 12 13 13 33
No Yes, in one week maximum Yes, in 2 to 4 weeks
Yes, in 1 to 2 months Yes, in more than 2 months No answer

34
Figure 23: Access to functional market
and bank (% of households)
80% 87% 88% 82%
4% 12% 5% 5%
Ali Addehrural
Holl Hollrural
camp de AliAddeh
camp de HollHoll
HH indicating nearest market accessible
HH with bank account
7.3.3. Expectations of price changes
More than half of the traders believe that a 25 to 50 percent increase in demand of most of the commodities would not lead to change in the prices. However, 9 to 14 percent believed prices would increase for rice, pasta, wheat flour, sugar and cooking oil. About 25 to 31 percent believed prices of fresh produce (tomatoes, potatoes and oranges) would increase (Figure 22). Majority of the traders (over 70 percent) believed such increases would be temporary. Despite the traders’ perception, in general prices are expected to rise if demand increases. However, the change will depend on the supply response, which in turn depends on the capacity of traders to expand business and new traders entry into the market and therefore on competition.
7.4. Number of customers and sales
7.4.1. Number of customers
The survey revealed that the average number of customers served by traders during the previous seven days averaged between 15 and 20 per day for the main commodities (19 for rice, 17 for pasta, and 18 for sugar). Compared to the similar year in the previous year, majority of traders (i.e. 50 to 70 percent for wheat flour, rice, pasta, sugar and cooking oil) indicated that they served similar number of customers. Only 15 to 40 percent of traders reported an increase in the number of their customers for the same period. An estimated 40 to 80 percent of tomato paste, fresh tomatoes, potatoes and onions traders reported large increase in number of customers over the previous year.
7.4.2. Access to market by the household perspective
Majority of the households indicated that all commodities
are readily available in the market except for chicken in
Ali Addeh rural areas. More than 80 percent of the
households indicated that they have access to the nearest
functional market. The average distance to the nearest
functional market was less than one and 12 km and Ali
Addeh rural indicated the furthest average distance to the
functional market. Majority of the households accessed
the market on foot and the remainder by bicycle.
However, most households did not have a bank account
or cash card. Given that most households purchase
Figure 22: Trader expectation of price changes
0%
20%
40%
60%
80%
100%
Wh
eat
Flo
ur
Ric
e
Pas
ta
Tom
ato
pas
te
Len
tils
Fres
h t
om
ato
es
Po
tato
es
On
ion
s
Ora
nge
Ban
ane
Man
goe
s
Milk
(p
ow
de
r)
Suga
r
Co
oki
ng
oil
Salt
Cereals Pulses Fresh vegetables Fruits MilkSugar, salt, cooking oil
83% 68% 72% 64%
50% 65% 61% 63%
44% 53% 67% 75% 72% 76%
100%
18% 19% 16% 50% 10% 11% 6%
19% 13%
12% 16% 14% 13% 9% 20% 25% 28% 31% 38% 33% 33% 25% 16% 8% 0%
No Change Prices decrease Prices increase
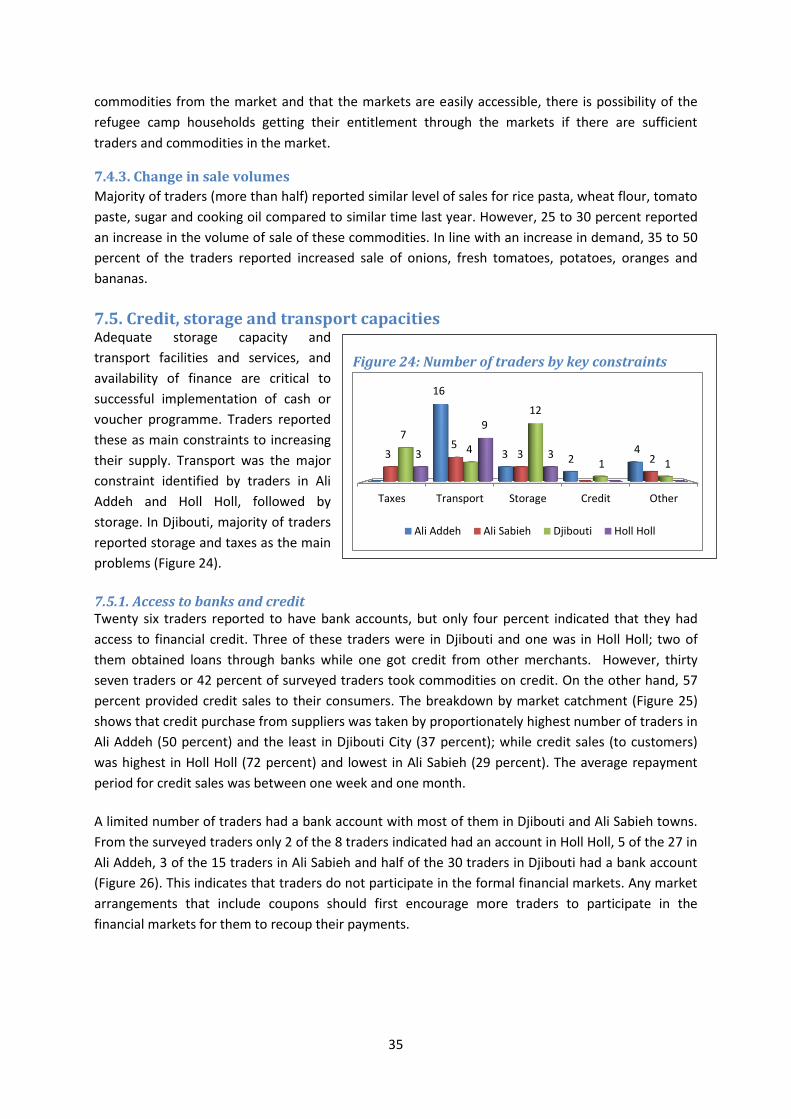
35
Figure 24: Number of traders by key constraints
Taxes Transport Storage Credit Other
16
3 2 4 3
5 3 2
7 4
12
1 1 3
9
3
Ali Addeh Ali Sabieh Djibouti Holl Holl
commodities from the market and that the markets are easily accessible, there is possibility of the
refugee camp households getting their entitlement through the markets if there are sufficient
traders and commodities in the market.
7.4.3. Change in sale volumes
Majority of traders (more than half) reported similar level of sales for rice pasta, wheat flour, tomato
paste, sugar and cooking oil compared to similar time last year. However, 25 to 30 percent reported
an increase in the volume of sale of these commodities. In line with an increase in demand, 35 to 50
percent of the traders reported increased sale of onions, fresh tomatoes, potatoes, oranges and
bananas.
7.5. Credit, storage and transport capacities Adequate storage capacity and
transport facilities and services, and
availability of finance are critical to
successful implementation of cash or
voucher programme. Traders reported
these as main constraints to increasing
their supply. Transport was the major
constraint identified by traders in Ali
Addeh and Holl Holl, followed by
storage. In Djibouti, majority of traders
reported storage and taxes as the main
problems (Figure 24).
7.5.1. Access to banks and credit Twenty six traders reported to have bank accounts, but only four percent indicated that they had
access to financial credit. Three of these traders were in Djibouti and one was in Holl Holl; two of
them obtained loans through banks while one got credit from other merchants. However, thirty
seven traders or 42 percent of surveyed traders took commodities on credit. On the other hand, 57
percent provided credit sales to their consumers. The breakdown by market catchment (Figure 25)
shows that credit purchase from suppliers was taken by proportionately highest number of traders in
Ali Addeh (50 percent) and the least in Djibouti City (37 percent); while credit sales (to customers)
was highest in Holl Holl (72 percent) and lowest in Ali Sabieh (29 percent). The average repayment
period for credit sales was between one week and one month.
A limited number of traders had a bank account with most of them in Djibouti and Ali Sabieh towns.
From the surveyed traders only 2 of the 8 traders indicated had an account in Holl Holl, 5 of the 27 in
Ali Addeh, 3 of the 15 traders in Ali Sabieh and half of the 30 traders in Djibouti had a bank account
(Figure 26). This indicates that traders do not participate in the formal financial markets. Any market
arrangements that include coupons should first encourage more traders to participate in the
financial markets for them to recoup their payments.
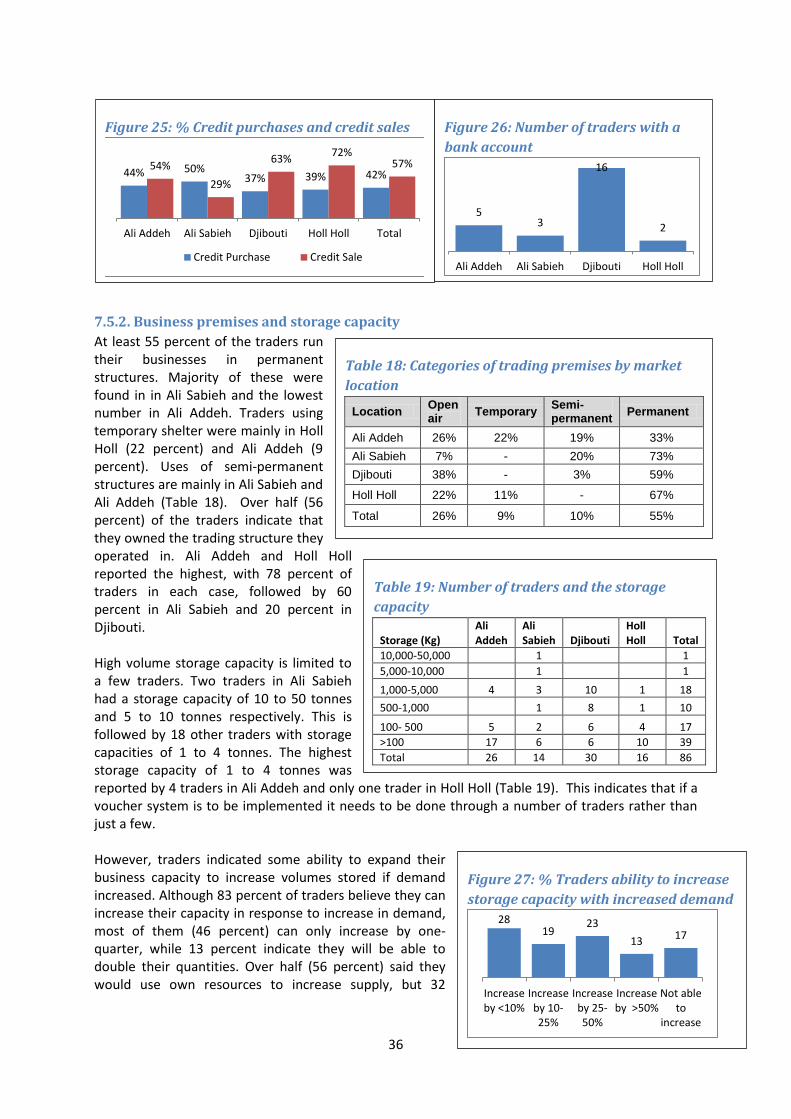
36
Figure 26: Number of traders with a
bank account
5 3
16
2
Ali Addeh Ali Sabieh Djibouti Holl Holl
Table 18: Categories of trading premises by market
location
Location Open air
Temporary Semi-permanent
Permanent
Ali Addeh 26% 22% 19% 33%
Ali Sabieh 7% - 20% 73%
Djibouti 38% - 3% 59%
Holl Holl 22% 11% - 67%
Total 26% 9% 10% 55%
Table 19: Number of traders and the storage
capacity
Storage (Kg) Ali Addeh
Ali Sabieh Djibouti
Holl Holl Total
10,000-50,000 1 1
5,000-10,000 1 1
1,000-5,000 4 3 10 1 18
500-1,000
1 8 1 10
100- 500 5 2 6 4 17
>100 17 6 6 10 39
Total 26 14 30 16 86
Figure 27: % Traders ability to increase
storage capacity with increased demand
28 19
23
13 17
Increaseby <10%
Increaseby 10-25%
Increaseby 25-50%
Increaseby >50%
Not ableto
increase
7.5.2. Business premises and storage capacity
At least 55 percent of the traders run their businesses in permanent structures. Majority of these were found in in Ali Sabieh and the lowest number in Ali Addeh. Traders using temporary shelter were mainly in Holl Holl (22 percent) and Ali Addeh (9 percent). Uses of semi-permanent structures are mainly in Ali Sabieh and Ali Addeh (Table 18). Over half (56 percent) of the traders indicate that they owned the trading structure they operated in. Ali Addeh and Holl Holl reported the highest, with 78 percent of traders in each case, followed by 60 percent in Ali Sabieh and 20 percent in Djibouti. High volume storage capacity is limited to a few traders. Two traders in Ali Sabieh had a storage capacity of 10 to 50 tonnes and 5 to 10 tonnes respectively. This is followed by 18 other traders with storage capacities of 1 to 4 tonnes. The highest storage capacity of 1 to 4 tonnes was reported by 4 traders in Ali Addeh and only one trader in Holl Holl (Table 19). This indicates that if a voucher system is to be implemented it needs to be done through a number of traders rather than just a few. However, traders indicated some ability to expand their business capacity to increase volumes stored if demand increased. Although 83 percent of traders believe they can increase their capacity in response to increase in demand, most of them (46 percent) can only increase by one-quarter, while 13 percent indicate they will be able to double their quantities. Over half (56 percent) said they would use own resources to increase supply, but 32
Figure 25: % Credit purchases and credit sales
44% 50% 37% 39% 42%
54%
29%
63% 72%
57%
Ali Addeh Ali Sabieh Djibouti Holl Holl Total
Credit Purchase Credit Sale
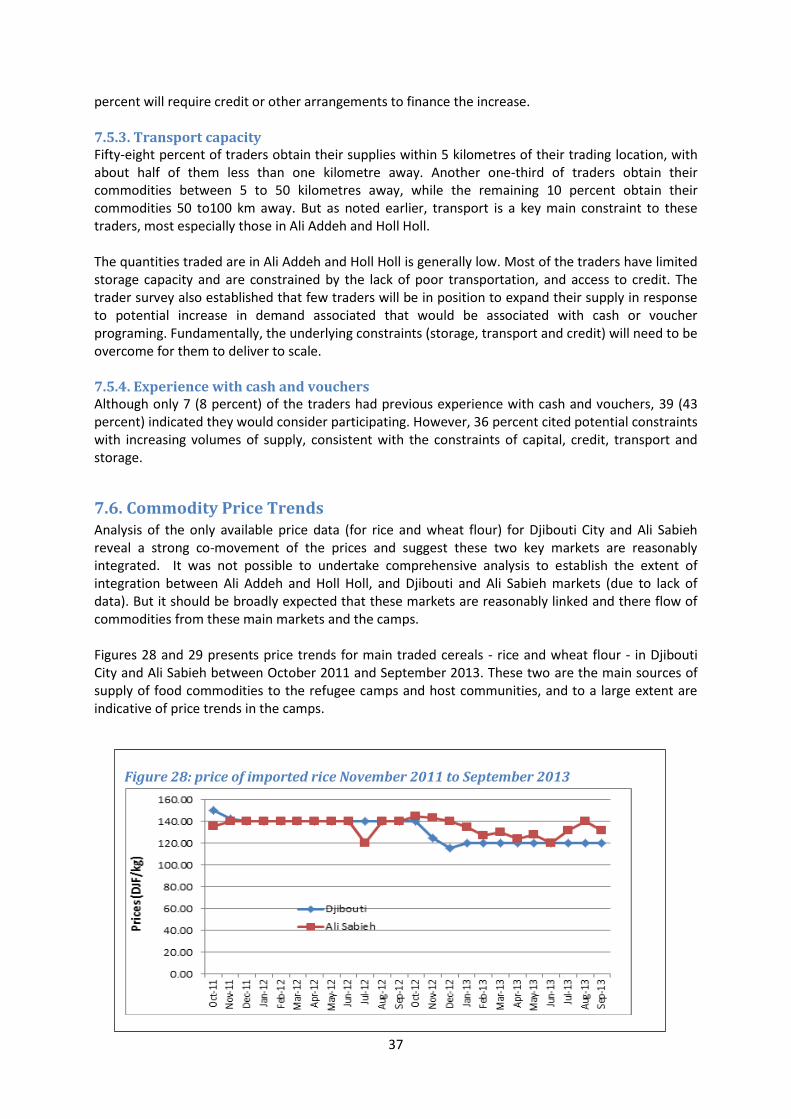
37
percent will require credit or other arrangements to finance the increase. 7.5.3. Transport capacity Fifty-eight percent of traders obtain their supplies within 5 kilometres of their trading location, with about half of them less than one kilometre away. Another one-third of traders obtain their commodities between 5 to 50 kilometres away, while the remaining 10 percent obtain their commodities 50 to100 km away. But as noted earlier, transport is a key main constraint to these traders, most especially those in Ali Addeh and Holl Holl. The quantities traded are in Ali Addeh and Holl Holl is generally low. Most of the traders have limited storage capacity and are constrained by the lack of poor transportation, and access to credit. The trader survey also established that few traders will be in position to expand their supply in response to potential increase in demand associated that would be associated with cash or voucher programing. Fundamentally, the underlying constraints (storage, transport and credit) will need to be overcome for them to deliver to scale. 7.5.4. Experience with cash and vouchers Although only 7 (8 percent) of the traders had previous experience with cash and vouchers, 39 (43 percent) indicated they would consider participating. However, 36 percent cited potential constraints with increasing volumes of supply, consistent with the constraints of capital, credit, transport and storage.
7.6. Commodity Price Trends Analysis of the only available price data (for rice and wheat flour) for Djibouti City and Ali Sabieh reveal a strong co-movement of the prices and suggest these two key markets are reasonably integrated. It was not possible to undertake comprehensive analysis to establish the extent of integration between Ali Addeh and Holl Holl, and Djibouti and Ali Sabieh markets (due to lack of data). But it should be broadly expected that these markets are reasonably linked and there flow of commodities from these main markets and the camps. Figures 28 and 29 presents price trends for main traded cereals - rice and wheat flour - in Djibouti City and Ali Sabieh between October 2011 and September 2013. These two are the main sources of supply of food commodities to the refugee camps and host communities, and to a large extent are indicative of price trends in the camps.
Figure 28: price of imported rice November 2011 to September 2013
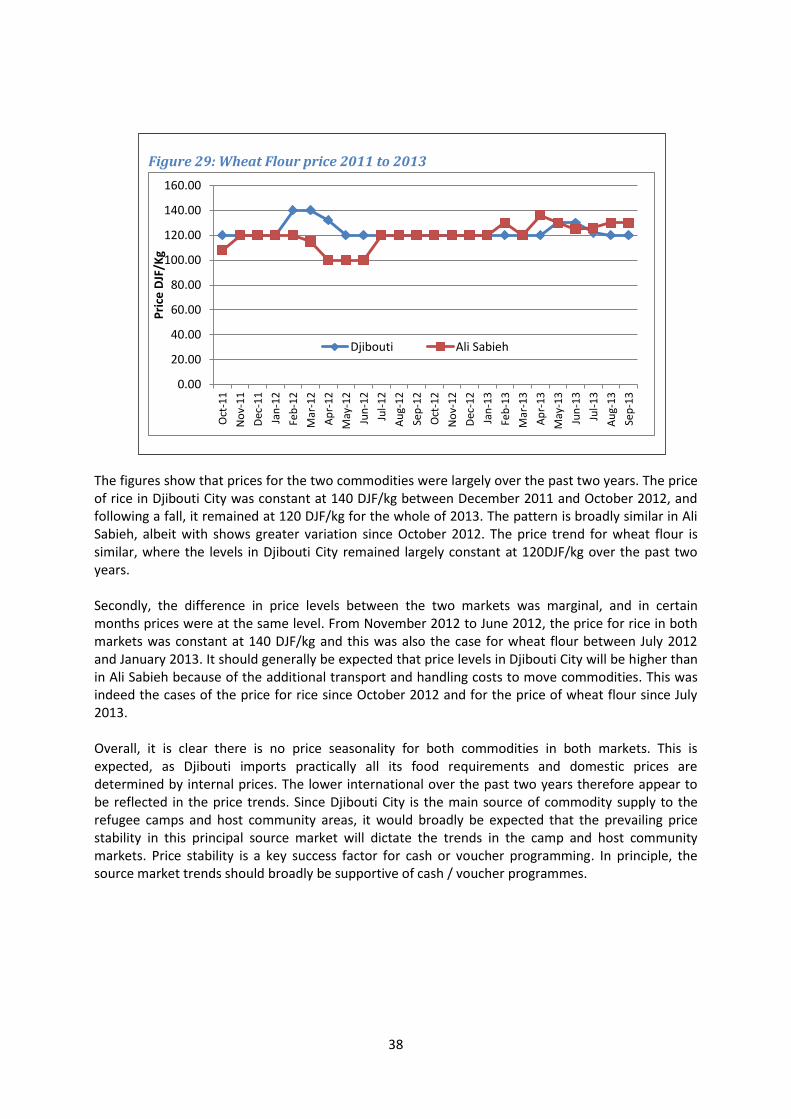
38
The figures show that prices for the two commodities were largely over the past two years. The price of rice in Djibouti City was constant at 140 DJF/kg between December 2011 and October 2012, and following a fall, it remained at 120 DJF/kg for the whole of 2013. The pattern is broadly similar in Ali Sabieh, albeit with shows greater variation since October 2012. The price trend for wheat flour is similar, where the levels in Djibouti City remained largely constant at 120DJF/kg over the past two years. Secondly, the difference in price levels between the two markets was marginal, and in certain months prices were at the same level. From November 2012 to June 2012, the price for rice in both markets was constant at 140 DJF/kg and this was also the case for wheat flour between July 2012 and January 2013. It should generally be expected that price levels in Djibouti City will be higher than in Ali Sabieh because of the additional transport and handling costs to move commodities. This was indeed the cases of the price for rice since October 2012 and for the price of wheat flour since July 2013. Overall, it is clear there is no price seasonality for both commodities in both markets. This is expected, as Djibouti imports practically all its food requirements and domestic prices are determined by internal prices. The lower international over the past two years therefore appear to be reflected in the price trends. Since Djibouti City is the main source of commodity supply to the refugee camps and host community areas, it would broadly be expected that the prevailing price stability in this principal source market will dictate the trends in the camp and host community markets. Price stability is a key success factor for cash or voucher programming. In principle, the source market trends should broadly be supportive of cash / voucher programmes.
Figure 29: Wheat Flour price 2011 to 2013
0.00
20.00
40.00
60.00
80.00
100.00
120.00
140.00
160.00
Oct
-11
No
v-1
1
Dec
-11
Jan
-12
Feb
-12
Mar
-12
Ap
r-1
2
May
-12
Jun
-12
Jul-
12
Au
g-1
2
Sep
-12
Oct
-12
No
v-1
2
Dec
-12
Jan
-13
Feb
-13
Mar
-13
Ap
r-1
3
May
-13
Jun
-13
Jul-
13
Au
g-1
3
Sep
-13
Pri
ce D
JF/K
g
Djibouti Ali Sabieh
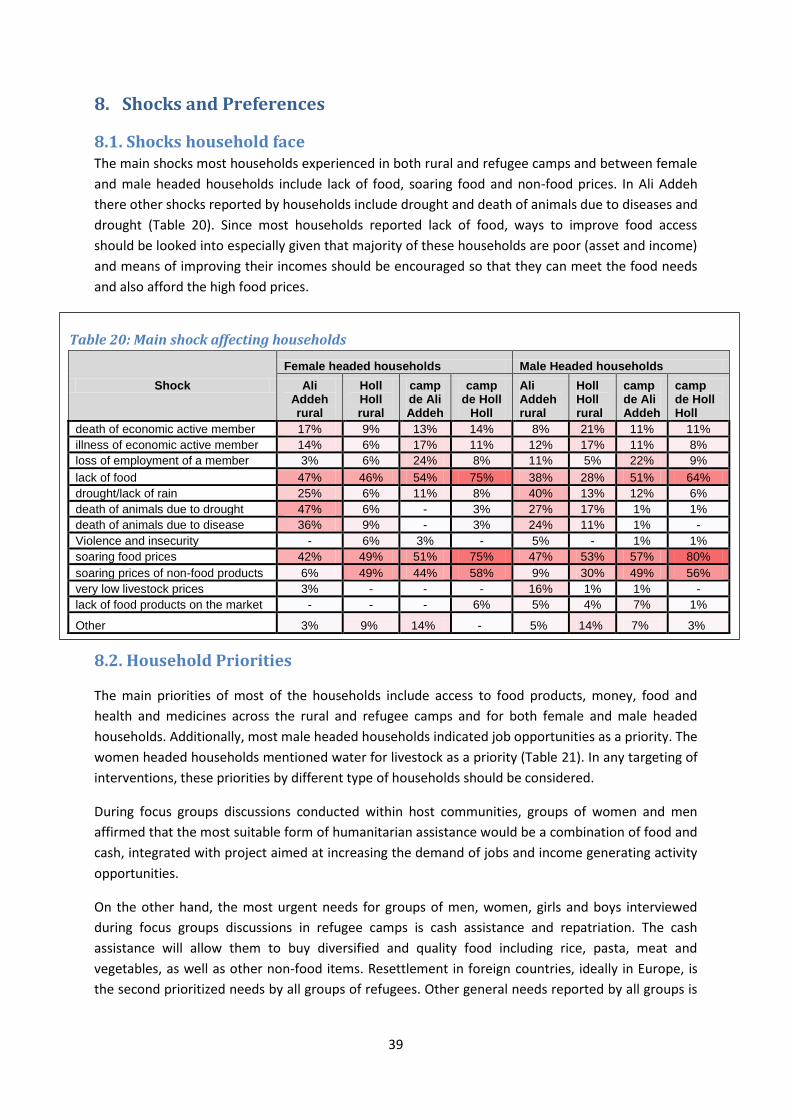
39
8. Shocks and Preferences
8.1. Shocks household face The main shocks most households experienced in both rural and refugee camps and between female
and male headed households include lack of food, soaring food and non-food prices. In Ali Addeh
there other shocks reported by households include drought and death of animals due to diseases and
drought (Table 20). Since most households reported lack of food, ways to improve food access
should be looked into especially given that majority of these households are poor (asset and income)
and means of improving their incomes should be encouraged so that they can meet the food needs
and also afford the high food prices.
8.2. Household Priorities
The main priorities of most of the households include access to food products, money, food and
health and medicines across the rural and refugee camps and for both female and male headed
households. Additionally, most male headed households indicated job opportunities as a priority. The
women headed households mentioned water for livestock as a priority (Table 21). In any targeting of
interventions, these priorities by different type of households should be considered.
During focus groups discussions conducted within host communities, groups of women and men
affirmed that the most suitable form of humanitarian assistance would be a combination of food and
cash, integrated with project aimed at increasing the demand of jobs and income generating activity
opportunities.
On the other hand, the most urgent needs for groups of men, women, girls and boys interviewed
during focus groups discussions in refugee camps is cash assistance and repatriation. The cash
assistance will allow them to buy diversified and quality food including rice, pasta, meat and
vegetables, as well as other non-food items. Resettlement in foreign countries, ideally in Europe, is
the second prioritized needs by all groups of refugees. Other general needs reported by all groups is
Table 20: Main shock affecting households
Shock
Female headed households Male Headed households
Ali Addeh rural
Holl Holl rural
camp de Ali Addeh
camp de Holl
Holl
Ali Addeh rural
Holl Holl rural
camp de Ali Addeh
camp de Holl Holl
death of economic active member 17% 9% 13% 14% 8% 21% 11% 11%
illness of economic active member 14% 6% 17% 11% 12% 17% 11% 8%
loss of employment of a member 3% 6% 24% 8% 11% 5% 22% 9%
lack of food 47% 46% 54% 75% 38% 28% 51% 64%
drought/lack of rain 25% 6% 11% 8% 40% 13% 12% 6%
death of animals due to drought 47% 6% - 3% 27% 17% 1% 1%
death of animals due to disease 36% 9% - 3% 24% 11% 1% -
Violence and insecurity - 6% 3% - 5% - 1% 1%
soaring food prices 42% 49% 51% 75% 47% 53% 57% 80%
soaring prices of non-food products 6% 49% 44% 58% 9% 30% 49% 56%
very low livestock prices 3% - - - 16% 1% 1% -
lack of food products on the market - - - 6% 5% 4% 7% 1%
Other 3% 9% 14% - 5% 14% 7% 3%
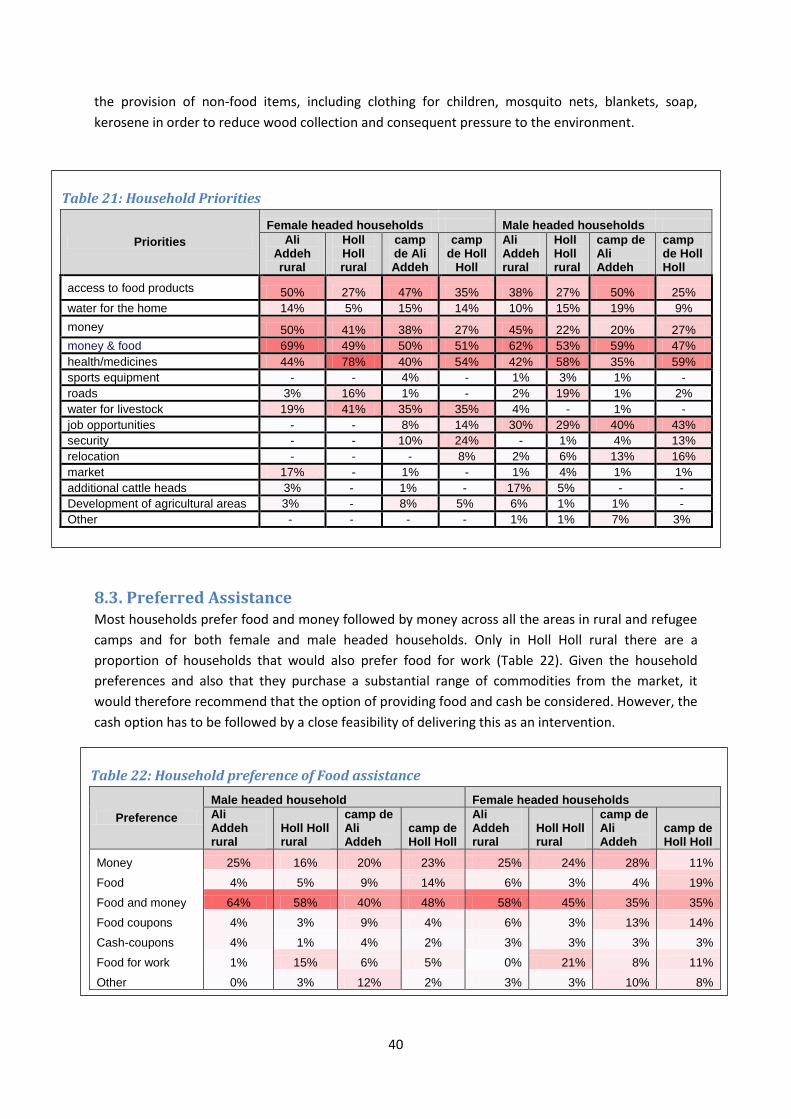
40
the provision of non-food items, including clothing for children, mosquito nets, blankets, soap,
kerosene in order to reduce wood collection and consequent pressure to the environment.
8.3. Preferred Assistance Most households prefer food and money followed by money across all the areas in rural and refugee
camps and for both female and male headed households. Only in Holl Holl rural there are a
proportion of households that would also prefer food for work (Table 22). Given the household
preferences and also that they purchase a substantial range of commodities from the market, it
would therefore recommend that the option of providing food and cash be considered. However, the
cash option has to be followed by a close feasibility of delivering this as an intervention.
Table 21: Household Priorities
Priorities
Female headed households Male headed households
Ali Addeh rural
Holl Holl rural
camp de Ali Addeh
camp de Holl
Holl
Ali Addeh rural
Holl Holl rural
camp de Ali Addeh
camp de Holl Holl
access to food products 50% 27% 47% 35% 38% 27% 50% 25%
water for the home 14% 5% 15% 14% 10% 15% 19% 9%
money 50% 41% 38% 27% 45% 22% 20% 27%
money & food 69% 49% 50% 51% 62% 53% 59% 47%
health/medicines 44% 78% 40% 54% 42% 58% 35% 59%
sports equipment - - 4% - 1% 3% 1% -
roads 3% 16% 1% - 2% 19% 1% 2%
water for livestock 19% 41% 35% 35% 4% - 1% -
job opportunities - - 8% 14% 30% 29% 40% 43%
security - - 10% 24% - 1% 4% 13%
relocation - - - 8% 2% 6% 13% 16%
market 17% - 1% - 1% 4% 1% 1%
additional cattle heads 3% - 1% - 17% 5% - -
Development of agricultural areas 3% - 8% 5% 6% 1% 1% -
Other - - - - 1% 1% 7% 3%
Table 22: Household preference of Food assistance
Preference
Male headed household Female headed households
Ali Addeh rural
Holl Holl rural
camp de Ali Addeh
camp de Holl Holl
Ali Addeh rural
Holl Holl rural
camp de Ali Addeh
camp de Holl Holl
Money 25% 16% 20% 23% 25% 24% 28% 11%
Food 4% 5% 9% 14% 6% 3% 4% 19%
Food and money 64% 58% 40% 48% 58% 45% 35% 35%
Food coupons 4% 3% 9% 4% 6% 3% 13% 14%
Cash-coupons 4% 1% 4% 2% 3% 3% 3% 3%
Food for work 1% 15% 6% 5% 0% 21% 8% 11%
Other 0% 3% 12% 2% 3% 3% 10% 8%
41
9. Recommendations Food security: Food insecurity in the camps and rural host community can only be improved through
a series of integrated measures that have to be put in place. To reduce the food insecurity in the
camps, there is need to ensure that a) non-food items entitlements to refugees are provided to
avoid monetization of the monthly ration (or part of the monthly ration) by the refugees; b) clothing
should also be provided that the food ration is not monetized to purchase them and c) look into the
some of the refugees’ claim of missing entitlements; d) the monotonous food basket is addressed
through strengthening refugees income generating activities so that they can supplement the ration;
this can be ensured by access to some income earning activities without overcrowding the job
market; providing vegetables through micro gardens; and e) converting part of their in-kind rations
to cash/voucher so that they can buy the foods that are not in the ration basket to increase food
variety and improve household nutrition. For the rural host community, food security can be
improved by increasing the livestock type and numbers per household accompanied by improved
veterinary services; and also ensuring access to skills development for the youths so that they can
become competitive in the job market and supplement pastoral incomes.
Meeting special needs of the most vulnerable: Attention to the food needs of the most vulnerable
population groups especially the chronically sick should be met. This can be done by ensuring
provision of nutritious foods as additional basket.
Measurement of rations: Improve on the scooping material and also provide measuring scales to
ensure that the distribution centres and households can check the ration entitlements and minimize
distribution errors. The review of the distribution systems will ensure improvement in food ration
entitlements of the households. Sensitization and reinforcement of the food committees is required,
as well as strengthening the monitoring of the distribution system.
Registration of beneficiaries: Whilst contacting the survey, 50 percent of the sampled households
could not be found in the camps especially in Section 5 of Ali Addeh. It is recommended that the
distribution list for the refugees be reviewed so that the actual number of existing refugees in the
camps is regularized to ensure efficient distribution and utilization of resources.
Stimulate market growth: Both refugees and host community purchase a variety of commodities
from the market to the tune of about 4,000 DJF, albeit at higher prices than in Djibouti City. Providing
part of the food ration (monetization) in the refugee camp would lead to expansion of the purchasing
power in the refugee camps and contribute to market development in both Holl Holl and Ali Addeh.
It is recommended that coupons/vouchers or cash transfer values equivalent to at least 50 percent of
the value of the food basket already being purchased from the market by the refugees should be
provided. This means on average at least 2,000 FDJ should be provided per refugee household per
month to purchase other preferred foods and the value should be reviewed as the markets develop.
It is expected this would improve their diet and nutritional outcomes. The voucher/cash is also
expected will increase effective demand in the market. The market development would in the
medium to long-term help to mitigate some of the major shocks raised by households – such as lack
of food and soaring food and non-food prices. The 2,000 DJF recommended will be a small fraction,
which effectively maintains the larger proportion of the in kind food distributions. However, it
recommended that exclusive in-kind food distribution be maintained during peak hot season (in June
to August) when commodity supply in the market is limited and the portion of the cash/voucher
42
assistance implemented from September to May. It is further recommended that the monetization of
part of the basket should put in an agreement with the refugees.
Carryout feasibility study of voucher or cash distribution: Given that majority of refugees and host
communities indicated that they would prefer cash and vouchers, it is recommended that a
feasibility study of delivery mechanisms of cash or vouchers be carried out prior to implementation
of these modalities.
Constant provision of other non-food items: As household monetize part of their in kind food ration
to meet other non-food needs, it is recommended that households are provided with their
entitlements for kerosene, soap and hygienic materials. Clothing and school materials for children
will help to minimize the diversion of the food rations to meet these needs.
Provision of safe drinking water: As water is a critical problem, it is recommended that adequate
safe drinking water be improved in the refugee and host communities in both Holl Holl and Ali
Addeh.
Protection of the environment: Given that both refugees and the host community are using
firewood for cooking, this has led to deforestation. It is recommended that community woodlots of
right species such as acacia be developed along the water catchments as contribution to
reforestation and this can provide fodder and firewood. Promotion and provision of solar lanterns for
lighting and solar cooking stoves to easy pressure on relying on firewood and charcoal should be
considered.
Potential livelihoods sources: Given the minimal vocational training conducted in both the refugee
and host community, there is need to carry-out a feasibility study of potential livelihoods for the
refugees as part of the durable solutions.
Improvement of houses: With over two thirds of the households living in overcrowded conditions in
both refugee and host community and that most houses are made out of non-durable materials, it is
recommend that better houses be promoted built out of the stones, expanding on the project that
has been initiated.
Provide adequate incentives to attend school: The lack of interest and the long distance to the
closest school, children engagement in economic activities to generate household income are the
most frequent reasons inhibiting regular attendance and leading to drop outs from school. There is
need to provide incentives for children to remain in school and also provision of secondary schools is
a prerequisite in the camps.
Provision of drugs in health centres: Given that household did not seek medical treatment due to
long distances, unavailability of drugs and the high cost, it is recommended that the essential and
relevant drugs be made available in the health centres within the reach of the refugee and host
community.
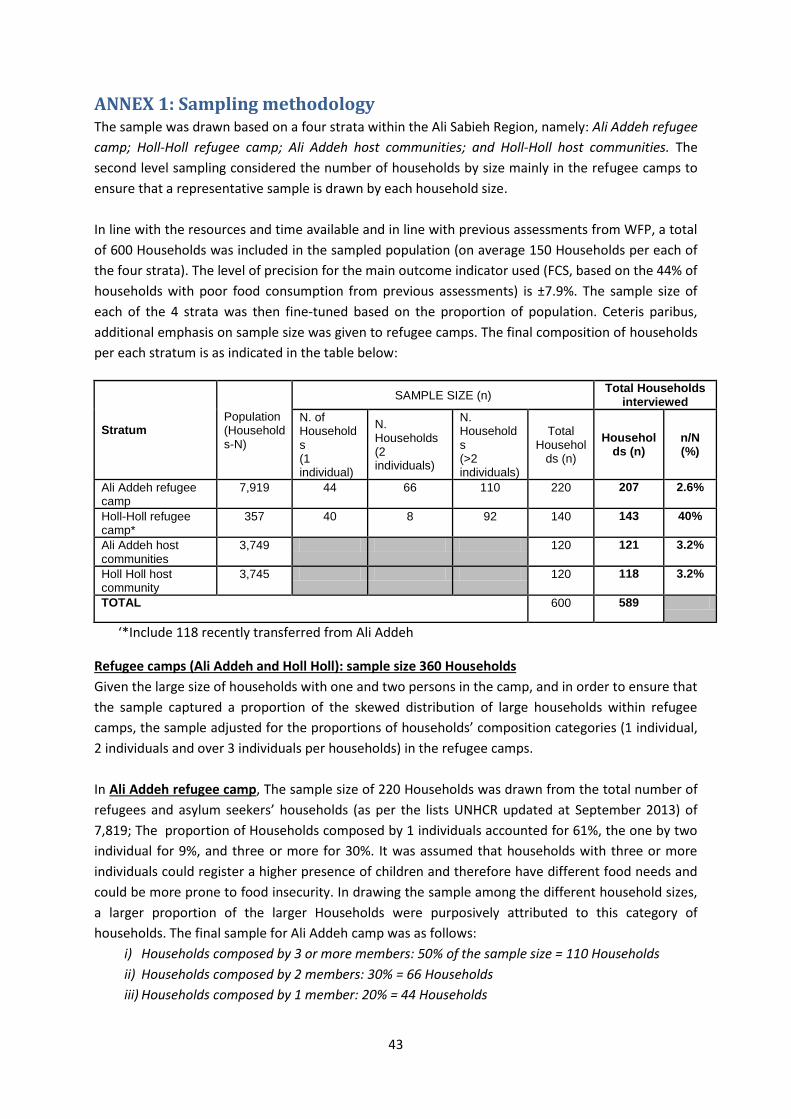
43
ANNEX 1: Sampling methodology The sample was drawn based on a four strata within the Ali Sabieh Region, namely: Ali Addeh refugee
camp; Holl-Holl refugee camp; Ali Addeh host communities; and Holl-Holl host communities. The
second level sampling considered the number of households by size mainly in the refugee camps to
ensure that a representative sample is drawn by each household size.
In line with the resources and time available and in line with previous assessments from WFP, a total
of 600 Households was included in the sampled population (on average 150 Households per each of
the four strata). The level of precision for the main outcome indicator used (FCS, based on the 44% of
households with poor food consumption from previous assessments) is ±7.9%. The sample size of
each of the 4 strata was then fine-tuned based on the proportion of population. Ceteris paribus,
additional emphasis on sample size was given to refugee camps. The final composition of households
per each stratum is as indicated in the table below:
Stratum Population (Households-N)
SAMPLE SIZE (n) Total Households
interviewed
N. of Households (1 individual)
N. Households (2 individuals)
N. Households (>2 individuals)
Total Househol
ds (n)
Households (n)
n/N (%)
Ali Addeh refugee camp
7,919 44 66 110 220 207 2.6%
Holl-Holl refugee camp*
357 40 8 92 140 143 40%
Ali Addeh host communities
3,749 120 121 3.2%
Holl Holl host community
3,745 120 118 3.2%
TOTAL 600 589
‘*Include 118 recently transferred from Ali Addeh
Refugee camps (Ali Addeh and Holl Holl): sample size 360 Households
Given the large size of households with one and two persons in the camp, and in order to ensure that
the sample captured a proportion of the skewed distribution of large households within refugee
camps, the sample adjusted for the proportions of households’ composition categories (1 individual,
2 individuals and over 3 individuals per households) in the refugee camps.
In Ali Addeh refugee camp, The sample size of 220 Households was drawn from the total number of
refugees and asylum seekers’ households (as per the lists UNHCR updated at September 2013) of
7,819; The proportion of Households composed by 1 individuals accounted for 61%, the one by two
individual for 9%, and three or more for 30%. It was assumed that households with three or more
individuals could register a higher presence of children and therefore have different food needs and
could be more prone to food insecurity. In drawing the sample among the different household sizes,
a larger proportion of the larger Households were purposively attributed to this category of
households. The final sample for Ali Addeh camp was as follows:
i) Households composed by 3 or more members: 50% of the sample size = 110 Households
ii) Households composed by 2 members: 30% = 66 Households
iii) Households composed by 1 member: 20% = 44 Households
44
The final list of 220 sampled households in Ali Addeh camps was drawn from the lists provided by
UNHCR through a systematic sampling. An equal number of replacements for the selected number of
Households in each category were also identified following the same method. The final lists of
selected Households and replacements were then organized per section within the camp for ease of
access and monitoring of the teams and their supervisors.
Whilst collecting data in Ali Addeh refugee camp, a high number of absent HOUSEHOLDS and empty
tents was registered, notably in the highly populated Section 5 of the camp. As the use of
replacements’ lists alone would not allow getting the desired sample size expected for that section,
alternative randomization techniques such as the ‘steps counting’ were adopted to finalize the data
collection. However, as a result of these constraints only 207 Households out if the total 220 sample
sizes, were interviewed. The Households selected at the field level through these techniques
provided their UNHCR registration number and were given a specific numerical code for this
assessment.
In Holl Holl camp, a 140 Households sample was drawn through a simple randomization applied to
the population of reference included in the UNHCR list of October 2013. This list includes the 118
Households that were transferred from Ali Addeh during September and October 2013. Overall, the
questionnaire was administered to 143 Households.
Overall, the total sampled households in the two refugee camps amounts to 350 units (207 in Ali
Addeh, 2.6% of the camp population and 143 in Holl-Holl, 40% of the total population), to ensure
large enough sample for analysis and comparison across the camps. As already mentioned, the final
sampling methodology that was used also takes into account fine-tuning adjustments due to the on-
going resettlement of 118 households from Ali Addeh to Holl-Holl camp that was concluded in
October 2013.
All the sampled tents in Ali Addeh were marked with a code from 01-001 to 01-220 preceded by the
acronym AMME (‘Analyze des Marchés et des Moyens d’Existence). All sampled tents in Holl Holl
were marked with a code from 02-001 to 02-143. The complete lists of Households including UNHCR
registration numbers and AMME codes will be circulated shortly.
Host communities:
120 Households in each of the two host communities selected (Ali Addeh and Holl Holl) were
identified through systematic sampling of population lists (were available) or random sampling
following focus group discussions and key informants with local elders and sous-prefects for nomadic
populations where lists were not available. In total, 240 Households were selected and included in
the sample.
45
The Trader Survey
The trader survey questionnaire was administered to a total of ninety traders in the four key locations. The locations and percentage of traders are presented in Table 1 and include: Djibouti City (33 percent), Ali Addeh refugee camp and host community (30 percent), Holl-Holl refugee camp and host community (17 percent) and Ali Sabieh town (17 percent). The composition was 71 percent retailers and 29 percent wholesalers and they operated from varying types of structures, the majority of them (50 percent) selling in small shops, 26.7 percent were selling in medium to large shops, 9 percent were selling in kiosks, and remaining 12 percent were selling in open air markets. About 30 percent of the traders started their business within the past 2 years, 27 percent have been in operation for 3-5 years, 18 percent have their business between 6-9 years; and 20 percent have been operating for over 10 years. Majority 81 percent of the traders (73 out of 90) are Djiboutians. The rest consists of refugees or asylum seekers who are Somalis (11 percent), Ethiopians (5.6 percent), and a Yemeni and an Eritrean.