Food losses and waste in primary production - Nordic Council ...
219
Food losses and waste in primary production Case studies on carrots, onions, peas, cereals and farmed fish
-
Upload
khangminh22 -
Category
Documents
-
view
0 -
download
0
Transcript of Food losses and waste in primary production - Nordic Council ...
Food losses and waste in primary productionCase studies on carrots, onions, peas, cereals and farmed fish
This report presents the results from six case studies of food losses and waste in primary production in the Nordic region. The product groups studied were carrots, onions, cereal (wheat or rye), green peas, field peas, and cultivated fish (rainbow trout or char). We used different methods to study the side flows: questionnaires, in-field measurements and interviews. Instead of the term “food losses and waste” we use the term “side flows”.
The side flow ranged from 4 % to 31 % for vegetables, cereals and pulses and most of the side flow for occurs after harvest, e.g. when sorting and storing the products. The main reason for side flow is quality issues. Weather conditions and diseases have a major impact on the quality of the products. We cannot draw many conclusions on side flow amounts for fish based on the results. The reasons for fish side flow are mainly diseases and predators.
Food losses and waste in primary production
Nordic Council of MinistersVed Stranden 18DK-1061 Copenhagen Kwww.norden.org
TemaN
ord 2016:557 Food losses and waste in prim
ary production

Food losses and waste in primary production
Case studies on carrots, onions, peas, cereals and farmed fish
Hanna Hartikainen, Erik Svanes, Ulrika Franke, Lisbeth Mogensen, Staffan Andersson, Rebekka Bond, Camilla Burman, Elin Einarsson, Patrik Eklöf Katri Joensuu, Marie E. Olsson, Raija Räikkönen, Taija Sinkko, Erling Stubhaug, Annelie Rosell and Sofi Sundin
Edited by Hanna Hartikainen
TemaNord 2016:557
Food losses and waste in primary production Case studies on carrots, onions, peas, cereals and farmed fish Hanna Hartikainen, Erik Svanes, Ulrika Franke, Lisbeth Mogensen, Staffan Andersson, Rebekka Bond, Camilla Burman, Elin Einarsson, Patrik Eklöf Katri Joensuu, Marie E. Olsson, Raija Räikkönen, Taija Sinkko, Er-ling Stubhaug, Annelie Rosell and Sofi Sundin. ISBN 978-92-893-4766-2 (PRINT) ISBN 978-92-893-4767-9 (PDF) ISBN 978-92-893-4768-6 (EPUB) http://dx.doi.org/10.6027/TN2016-557 TemaNord 2016:557 ISSN 0908-6692 Standard: PDF/UA-1 ISO 14289-1 © Nordic Council of Ministers 2017 Layout: NMR Cover photo: Scanpix Print: Rosendahls-Schultz Grafisk Printed in Denmark
Although the Nordic Council of Ministers funded this publication, the contents do not necessarily reflect its views, policies or recommendations.
Nordic co-operation Nordic co-operation is one of the world’s most extensive forms of regional collaboration, involving Denmark, Finland, Iceland, Norway, Sweden, the Faroe Islands, Greenland, and Åland.
Nordic co-operation has firm traditions in politics, the economy, and culture. It plays an important role in European and international collaboration, and aims at creating a strong Nordic community in a strong Europe.
Nordic co-operation seeks to safeguard Nordic and regional interests and principles in the global community. Shared Nordic values help the region solidify its position as one of the world’s most innovative and competitive.

Food losses and waste in primary production 3
Contents
Preface ..................................................................................................................................... 5 Summary .................................................................................................................................. 7
Introducing the new term “side flow” ................................................................................... 7 Case studies ....................................................................................................................... 8 Results ............................................................................................................................... 8 Discussion .......................................................................................................................... 9
Reading instructions ................................................................................................................ 11 1. Carrot side flow ................................................................................................................. 13
1.1 Carrot side flow in Finland ....................................................................................... 15 1.2 Carrot side flow in Sweden ..................................................................................... 29 1.3 Carrot side flow in Norway ..................................................................................... 48 1.4 Carrot side flow in Denmark ................................................................................... 68
2. Onion side flow .................................................................................................................. 75 2.1 Onion side flow in Finland ....................................................................................... 77 2.2 Onion side flow in Sweden ...................................................................................... 81 2.3 Onion side flow in Norway .................................................................................... 107 2.4 Onion side flow in Denmark .................................................................................. 117
3. Green pea side flow ......................................................................................................... 123 3.1 Green pea side flow in Finland ............................................................................... 125 3.2 Green pea side flow in Sweden .............................................................................. 127 3.3 Green pea side flow in Norway .............................................................................. 131 3.4 Green and field pea side flow in Denmark .............................................................. 133
4. Field pea side flow ........................................................................................................... 139 4.1 Field pea side flow in Finland ................................................................................. 140 4.2 Field pea side flow in Sweden ................................................................................ 151 4.3 Field pea side flow in Denmark .............................................................................. 160
5. Cereal side flow ............................................................................................................... 161 5.1 Wheat and rye side flow in Finland ........................................................................ 163 5.2 Wheat side flow in Sweden ................................................................................... 168 5.3 Wheat side flow in Norway .................................................................................... 177 5.4 Wheat side flow in Denmark ................................................................................. 186
6. Cultivated fish side flow ................................................................................................... 189 6.1 Rainbow trout side flow in Finland ......................................................................... 190 6.2 Rainbow trout and char side flow in Sweden ......................................................... 194 6.3 Rainbow trout side flow in Denmark ..................................................................... 204
References ........................................................................................................................... 209

4 Food losses and waste in primary production
Sammanfattning ................................................................................................................... 213 Introduktion av nya begreppet “sidoflöde” ...................................................................... 213 Fallstudier ....................................................................................................................... 214 Resultat .......................................................................................................................... 214 Diskussion ....................................................................................................................... 215
Food losses and waste in primary production 5
Preface
This is a technical report on the case studies from the Nordic project “Food losses and waste in primary production” (Franke et al. 2016). The project is financed by the Nordic Council of Ministers through the Nordic Green Growth Programme.
One purpose of the project was to test data collection methods on food losses and waste from primary producers in the Nordic countries. Another purpose was to estimate the amount of losses and waste. Case studies were carried out for six product groups in Finland, Sweden, Norway and Denmark to test the methods and to give us a better understanding of the losses and waste.
The project group consisted of Ulrika Franke from the Swedish Board of Agriculture, Hanna Hartikainen from the National Resources Institute Finland, Luke, Erik Svanes from Ostfold Research in Norway and Jesper Sørensen from the Danish Agrifish Agency. Researchers Marie Olsson and Staffan Andersson from the Swedish University of Agricultural Sciences, Lisbeth Mogensen from Aarhus University in Denmark, Erling Stubhaug from Ostfold Research in Norway and Raija Räikkönen from the National Resources Institute in Finland also contributed to the project. Ulrika Franke Project manager, Swedish Board of Agriculture

6 Food losses and waste in primary production
Food losses and waste in primary production 7
Summary
This is a technical report on case studies from the Nordic project “Food losses and waste in primary production” (Franke et al. 2016). The case studies were carried out for six products to develop and test side flow quantification methods and to obtain results for relative side flow amounts for the products in the Nordic countries.
Introducing the new term “side flow”
The project focused on primary production in the Nordic countries of Denmark, Finland, Norway and Sweden. In the project we introduced a new term – side flow – to capture the flows of food waste and production losses in primary production. By side flow we mean:
Primary products that are intended to be consumed by humans but never enter the food chain.
Planned feed production for animals is therefore excluded, whereas food that ends up as feed is included.
Only edible parts of the products are included, thus peels and bones are excluded. Primary production in this context refers to the production of agricultural and horticultural products as well as wild fruits and berries, wild game, fishery and aquaculture. The chosen system boundaries in this project are:
When cultivated crops, fruit and berries are ripe for harvest, wild fruit and berries are harvested, domesticated animals are born and farmed fish are hatched, wild animals or fish are caught, milk when it is drawn from animals, and eggs when laid.
Before the primary products enter the next step of the food chain (slaughter, retail or processing).

8 Food losses and waste in primary production
Case studies
To create a comprehensive picture of side flows and food waste in primary production, we conducted a literature study and several case studies (Franke et al. 2016). These case studies are presented in this report. In total we carried out case studies for six product groups: carrots, onions, cereal (wheat or rye), green peas, field peas, and cultivated fish (rainbow trout or char). The case studies took place in Finland, Sweden, Norway and Denmark. We used different methods to study the side flows. These methods included questionnaires, direct in-field measurements and interviews. Since we carried out case studies in four different countries, for seven different products, and used three types of methods, the number of case studies was 35 in total (Table 1).
Table 1: Overview of the case studies in the project: case products, applied methods and country (D=Denmark, F=Finland, N=Norway, S=Sweden).
Products Methods applied
Carrots Questionnaires (D, F, N, S), Field studies (F, N), Interviews (F, N) Onions Questionnaires (D, F, N, S), Field studies (S), Interviews (S, F) Green peas Questionnaires (D*, F, N, S), Interviews (S, F) Field peas Questionnaires (D*, F, S), Field study (F), Interviews (F) Wheat, Rye Questionnaires (Wheat) (D, N, S), Questionnaires (Rye) (F), Field study (Wheat) (F) , Interviews (Wheat) (F) Rainbow trout, Char Questionnaires (Rainbow trout) (D, F, S**), Questionnaires (Char) (S**), Interviews (F)
Note 1: Note 2:
The study results are presented in a combined national study report. The study results are presented in a combined national study report.
Results
The results from the questionnaires, the field studies and the interviews are presented in detail in Chapters 1–6. Here is a brief overview:
The carrot side flow results show that there is a lot of carrot side flow across all countries. The side flow ranged from 13% to 31%, and most of this side flow occurs after harvest, e.g. when sorting and storing carrots. The main reason for carrot side flow is quality issues, such as faults in appearance and spoilage. Weather conditions and diseases in particular have a major impact on the quality of carrots.
The onion side flow results show that there is quite a lot of onion side flow across all countries, ranging from 8% to 17%, and most of this side flow occurs after harvest, e.g. when sorting and storing onions. Similar to carrot side flows, onion side flows are especially due to weather conditions and diseases that have a major impact on the quality of onions.
Food losses and waste in primary production 9
The green pea side flow results show that there is a lot of green pea side flow across all countries, ranging from 18% to 21%. The main reasons for side flow was unharvested fields, but also related to the quality of the peas. The field pea side flow results show that there is quite a lot of field pea side flow across all countries, ranging from 17% to 18%, and most of this side flow occurs after harvest, e.g. when sorting and storing field peas. Besides weather conditions and diseases, green pea and field pea side flows also arise due to harsh harvest practices.
The cereal side flow results show that there is some cereal side flow in each country, and the range is quite wide, ranging from 4% to 23%. Most of this side flow occurs after harvest, e.g. when sorting and storing cereals. The main reason for wheat side flow is low protein content.
Of the three studies of cultivated fish side flow, only one study presents an estimate of the side flow of cultivated fish (rainbow trout). Therefore one cannot draw many conclusions on side flow amounts based on the results. The reasons for fish side flow are mainly diseases and predators.
The reasons behind side flows cover several topics and different levels of explanation. Apparent reasons (e.g. appearance), causal reasons (e.g. bad weather, diseases and pests) and underlying reasons (e.g. low price, overproduction) were given by the farmers. Inferior quality is one major reason, and this may be based only on appearance (‘cosmetic quality’) or on other reasons, such as inferior protein quality. The studies indicate that the most common, and probably the most important, factors behind side flows are the causal reasons, like weather, diseases and pests. When studying the side flows in detail, the underlying reasons such as price and the supply/demand relationship are also fairly important.
Vegetable and pulse side flows are used mainly for animal feed where possible. Onions are not suitable for animal feed and are often composted. A significant portion of vegetables and pulses are not harvested, but are left in the field to rot and serve as fertilizer. A part of the side flow is used for energy purposes, mostly dead fish but also some pulses. Wheat and rye side flows are mostly used for animal feed. A small proportion is used for energy purposes. For all product groups there is a proportion that is ‘not used’ thus is, for instance, landfilled.
Discussion
The case study results give an indication of the side flow amounts, but since the studies were somewhat different in each country it is not possible to compare data between the countries. The case studies varied in study design, execution and data management
10 Food losses and waste in primary production
and interpretation. Additionally, the sample sizes in all cases were relatively small, and some case studies do not show any results for the representativeness of the sample. Another problem was that the questions were misunderstood by some of the respondents, resulting in illogical or conflicting answers, e.g. when numbers in a mass balance did not add up to 100%. We also assume that most data are based on estimates.
The case study results indicate a large variation in side flow amounts from year to year, across geographical areas and between individual producers. The latter is indicated by a rather large standard deviation in the questionnaire and field study results. It is not clear how much of this variation is “real” variation, how much is related to the uncertainty of farmers not knowing exactly how much side flow they have (farmers do not generally keep records of the amounts of side flows, end-uses of the side flows or reasons for the side flows) and how much stems from the methods used to gather and process information. Most likely, all three impact on the results.
All in all, the results of the case studies are indicative of the magnitude of the side flows for these products, and more in-depth studies are needed.
Food losses and waste in primary production 11
Reading instructions
In this technical report we have collected all case studies carried out in the project “Food losses and waste in primary production” (Franke et al. 2016). Further information on the project, the results and the study methods used are presented in the project report by Franke et al. 2016.
The case studies include 21 questionnaires (the Danish study on field pea and green pea is a joint study, as is the Swedish study on rainbow trout and char is a joint national study) and 5 field studies. Additionally, there are 9 supplementary interview studies that were part of the questionnaires or field studies. In total there are 35 case studies (including the supplementary interview studies) which are presented in the following chapters (1–6).
Each chapter represents one case product group: Chapter 1 represents carrot side flow, Chapter 2 represents onion side flow, Chapter 3 represents green pea side flow, Chapter 4 represents field pea side flow, Chapter 5 represents cereal side flow (wheat or rye), and Chapter 6 represents side flow of cultivated fish (rainbow trout or char).
Each chapter contains subchapters that are divided up by the four countries: Finland, Sweden, Norway, and Denmark. Each country-specific subchapter contains one or more methods, i.e. questionnaires, field studies and interviews, to study product-specific side flows in the country.
We have also summarised the results for each case study product at the beginning of each chapter.
While our objective was to use a common reporting structure for the results of the questionnaires (no common reporting structure was established for field studies or interviews), the reports are independent studies and are therefore somewhat different from each other. For instance, the terminology used and the extensiveness of the results can vary.
However, there are common elements in the presentation of case studies: each study presents the materials and methods used, and gives information on the sample. Additionally, there is a results section on side flows (amount, type, stage at which the side flow occurred, current uses of the side flow, reasons for the side flow, etc.), and in most cases there is a discussion section on the results and possible further recommendations.

12 Food losses and waste in primary production

Food losses and waste in primary production 13
1. Carrot side flow
Carrot side flow amounts in primary production as well as side flow treatments, causes and measures to reduce these side flows are summarised in Tables 1 and 2. The results show that there is generally a high amount of carrot side flow in each country, ranging from 13% to 31% of produced amount, and most of this side flow occurs after harvest, e.g. when sorting and storing carrots.
It should be noted that the case studies in Subchapters 1.1.–1.4. are independent case studies that vary in study design, execution and data management and interpretation. Additionally, the sample sizes in all cases are relatively small, and some case studies do not show any results for the representativeness of the sample. For these reasons, the results contain a high degree of uncertainty and the results from different countries cannot be compared to each other. All in all, the results should be regarded as indicative and more comprehensive studies are needed to address the uncertainties.

14 Food losses and waste in primary production
Table 1: Questionnaire results from case studies in carrot production
Country Response rate (of all who received the questionnaire)
Side flow amount (standard deviation)
Side flow treatment (of total side flow)
Reasons for side flow Side flow reduction and measures for better side flow utilisation
Denmark 32% 20.8% 10% left in the field, 61% used for animal feed, 25% composted, 4% other.
Quality issues, pests, plant diseases, harvesting methods.
No answers.
Finland 10% 25.8% (15%) Three major usages: Composted, animal feed, left in field.
Most important: After harvest: Quality (appearance, size), plant diseases and damage. During harvest: Weather conditions, plant diseases and harvesting procedures.
Finding ways to overcome small-scale problems, finding new markets, feeding side flow to animals (no impact on side flow amount).
Norway 23% 17.6% (4.6%) 25.5% left in the field, 66% used for animal feed, 8.5% other.
Pests, plant diseases and quality issues are the main reasons.
Improved agronomical techniques and quality/better utilisation/better sorting.
Sweden 35% 13–31% (different
storage time and storage
practice)
51% animal feed, 16% bioenergy or deposited, 15% brought back to the field, 9% not harvested, 9% other use.
Main harvest side flow reasons: Unacceptable size and shape, damage during harvest and handling, insect or animal damage. Main post-harvest side flow reasons: Unacceptable size and shape, unacceptable appearance, damage during handling.
Less demanding quality standards, improved plant protection, and changes in consumers’ and retailers’ attitudes towards acceptable quality.

Food losses and waste in primary production 15
Table 2: Field study results from case studies of carrot harvest losses (including only losses that occur in field: sorted out during harvest/left in field)
Country Side flow amount
Standard deviation
Number of farmers/individual fields
Side flow reasons Possible reduction measures
Norway 4.2% 2.5% 8/12 Harvester adjustment and manoeuvring, cultivar choice, size of field, size of headland.
Better adjustment of harvesters, optimal driving speed, better cultivars.
Finland 6.2% 2.0% 3/6 Plant diseases and moulds during storage because of weather, crop rotation, storage conditions and cultivar. Minor quality deficiencies were also mentioned as major reasons for post-harvest losses.
1.1 Carrot side flow in Finland
Luke (Luke’s statistics unit, formerly Tike Statistics Finland) collects data on carrot production annually and the annual survey is conducted as a complete enumeration. According to Luke’s data collection, there were over 350 farms that cultivated carrots in Finland in 2013. The production area was close to 1,600 hectares and the net yield (sold amount) was up to 70.8 million kilos. Carrots are the most cultivated open field vegetable in Finland. In 2013, the second most cultivated open field vegetable was onions, with a net yield of less than 23 million kilos.
Carrots are sown from April to May (Voipio 2001). Fertilisation is mainly split into two applications, one during sowing, and one during the growing period. Insects and plant diseases are controlled by spraying plant protection products during the summer. The earliest cultivars for fresh consumption are harvested during the summer. Stored carrots are harvested in September–November. The harvested carrots are stored in one cubic metre crates at 0°C. After storage, carrots are commonly washed, sorted and packed. Sorting and packing can take place at the farm or at a separate (possibly farmer owned) packing company. Carrots can also be further processed within the food industry. Carrot losses can occur at all stages of the production chain.

16 Food losses and waste in primary production
During the growing period carrots can be infected by several, mainly fungal, storage diseases. The symptoms are often not visible during harvest or directly afterwards, but appear later during the winter and the spring. Unfavourable weather conditions, such as drought or excessive precipitation, can also cause malformation of the roots, which affects shelf life. Healthy, ripe carrots can be stored for up to 8 months at 0°C and in 97–99% humidity.
1.1.1 Questionnaire
Author(s): Hanna Hartikainen, Katri Joensuu, Luke
Materials and methods, Sample We conducted the questionnaire as an online questionnaire so that data management and analysis would be more efficient. We received the producer contacts from Tike Statistics Finland. The contacts included all Finnish carrot producer contacts: 379 producer contacts in total (of which only 140 had over 100 acres of carrot production fields). Moreover, 293 producers shared their e-mail details, and we therefore sent the questionnaire to all of the 293 producers.
We sent the questionnaire 11 April 2014, with a response time of until 22 April. We sent one reminder on 17 April.
The results were analysed in Excel and basic analyses were carried out. For the most part, we calculated (weighted) averages and standard deviations. We also compared the sample to Finnish averages.
The questionnaire was sent to 293 carrot producers, of which only 31 producers responded to the questionnaire and 27 completed the questionnaire successfully. Thus, the response rate was low – only 10%. Of the 27 carrot producers, two were organic producers and the rest were conventional producers.
Of the 27 carrot producers, all cultivated the crop, 63% stored the crop, 56% sorted the crop, 56% packed the crop, 19% processed the crop, and 30% transported the crop to the buyer. Furthermore, 52% produced “early carrot”, 64% produced “storage carrot”, and 16% produced “industrial carrot”.
When comparing the sample to all carrot producers in Finland, it was found that the sample represented around 7–8% of carrot production in Finland. (The total yield of the producers in the sample was over 5 million kilos per year, whereas the total yield of carrot production is around 70 million kilos per year.) The geographical representativeness of the sample was fairly good since there were producers from 13 of the 16 provinces that have carrot production (see Figure 1). Additionally, the average
Food losses and waste in primary production 17
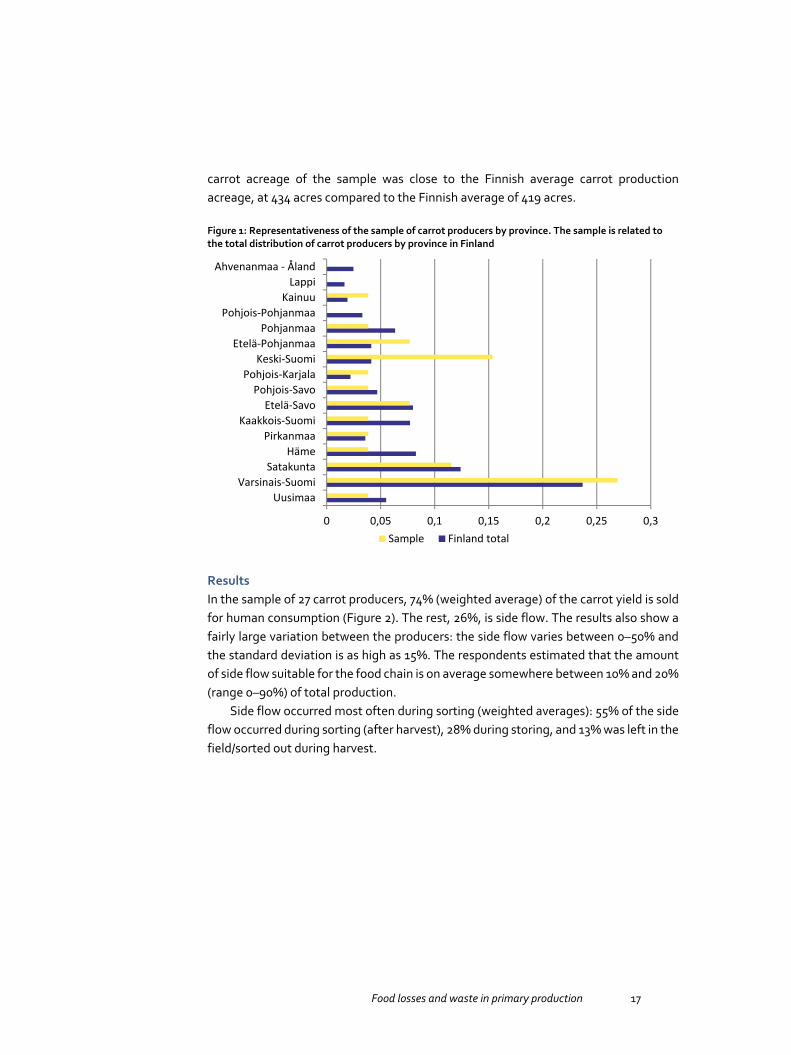
carrot acreage of the sample was close to the Finnish average carrot production acreage, at 434 acres compared to the Finnish average of 419 acres.
Figure 1: Representativeness of the sample of carrot producers by province. The sample is related to the total distribution of carrot producers by province in Finland
Results In the sample of 27 carrot producers, 74% (weighted average) of the carrot yield is sold for human consumption (Figure 2). The rest, 26%, is side flow. The results also show a fairly large variation between the producers: the side flow varies between 0–50% and the standard deviation is as high as 15%. The respondents estimated that the amount of side flow suitable for the food chain is on average somewhere between 10% and 20% (range 0–90%) of total production.
Side flow occurred most often during sorting (weighted averages): 55% of the side flow occurred during sorting (after harvest), 28% during storing, and 13% was left in the field/sorted out during harvest.
0 0,05 0,1 0,15 0,2 0,25 0,3
UusimaaVarsinais-Suomi
SatakuntaHäme
PirkanmaaKaakkois-Suomi
Etelä-SavoPohjois-Savo
Pohjois-KarjalaKeski-Suomi
Etelä-PohjanmaaPohjanmaa
Pohjois-PohjanmaaKainuu
LappiAhvenanmaa - Åland
Sample Finland total
18 Food losses and waste in primary production
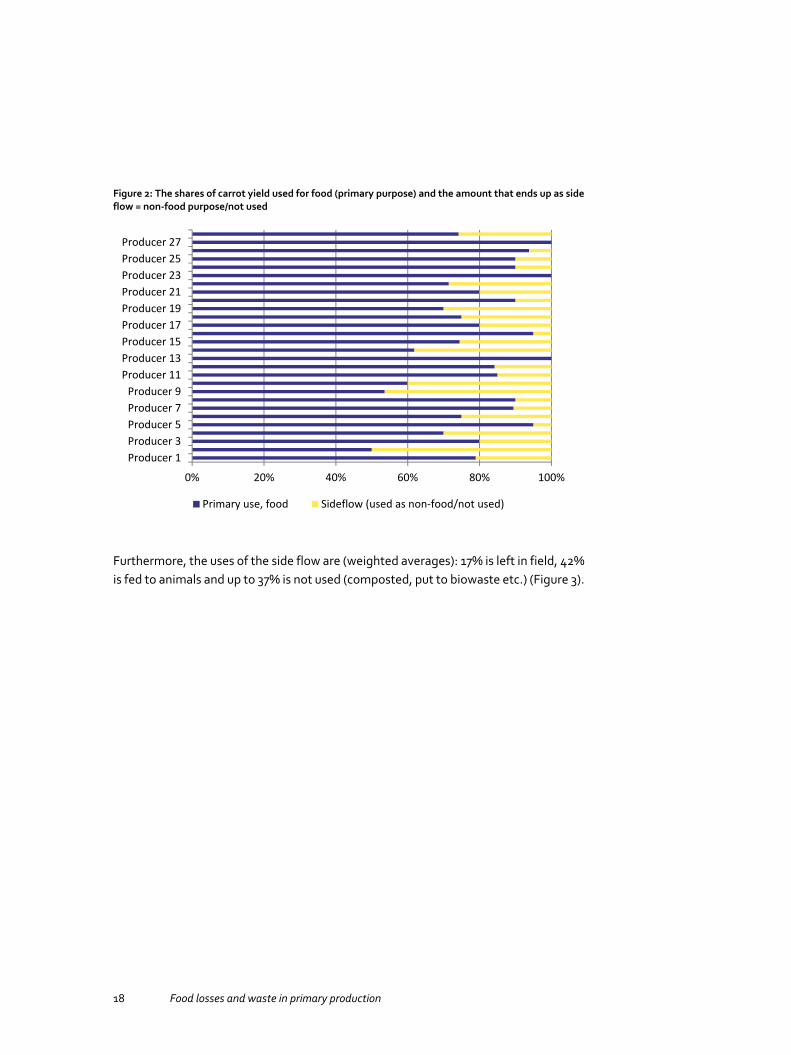
Figure 2: The shares of carrot yield used for food (primary purpose) and the amount that ends up as side flow = non-food purpose/not used
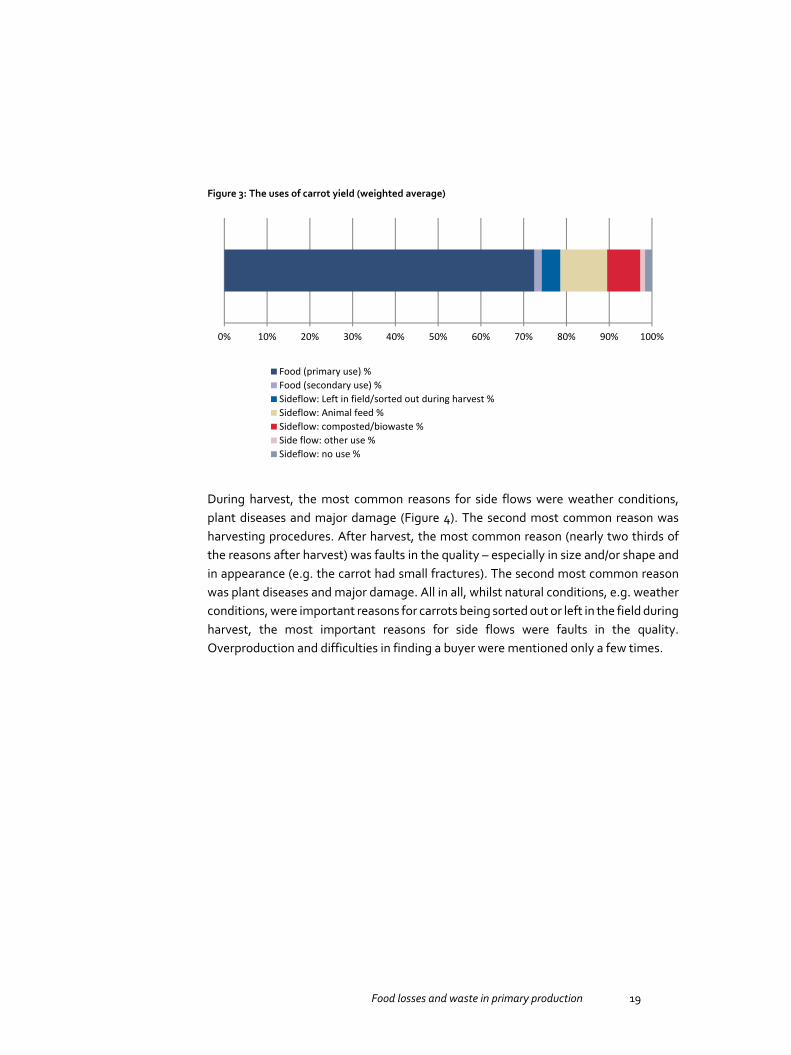
Furthermore, the uses of the side flow are (weighted averages): 17% is left in field, 42% is fed to animals and up to 37% is not used (composted, put to biowaste etc.) (Figure 3).
0% 20% 40% 60% 80% 100%
Producer 1Producer 3Producer 5Producer 7Producer 9
Producer 11Producer 13Producer 15Producer 17Producer 19Producer 21Producer 23Producer 25Producer 27
Primary use, food Sideflow (used as non-food/not used)
Food losses and waste in primary production 19
Figure 3: The uses of carrot yield (weighted average)
During harvest, the most common reasons for side flows were weather conditions, plant diseases and major damage (Figure 4). The second most common reason was harvesting procedures. After harvest, the most common reason (nearly two thirds of the reasons after harvest) was faults in the quality – especially in size and/or shape and in appearance (e.g. the carrot had small fractures). The second most common reason was plant diseases and major damage. All in all, whilst natural conditions, e.g. weather conditions, were important reasons for carrots being sorted out or left in the field during harvest, the most important reasons for side flows were faults in the quality. Overproduction and difficulties in finding a buyer were mentioned only a few times.
0% 10% 20% 30% 40% 50% 60% 70% 80% 90% 100%
Food (primary use) %Food (secondary use) %Sideflow: Left in field/sorted out during harvest %Sideflow: Animal feed %Sideflow: composted/biowaste %Side flow: other use %Sideflow: no use %

20 Food losses and waste in primary production
Figure 4: Reasons for the side flow (weighted averages), 26% of the carrot production was side flow
We also asked the respondents whether they would be interested in better utilisation of the side flows of their carrot production and finding solutions for making better use of these side flows (Yes/Maybe/No). Only 4 out of 24 who replied to the question were willing to find better utilisation for their side flows, and 10 were hesitant. Thus, 10 out of 24 were not interested in finding better uses for their side flows. However, these 10 uninterested producers had significantly smaller farms on average, and thus the conclusion is that most of the bigger carrot producers were somewhat interested in finding solutions for better utilisation of their side flows.
1.1.2 Field study
Author(s): Katri Joensuu, Raija Räikkönen, Hanna Hartikainen, Luke
Materials and methods, Sample The field study was performed at three farms, on one field per grower. The farms were selected from the same geographical area for practical reasons. We received the producers’ contacts from Tike Statistics Finland. One of the farmers had answered the questionnaire for Sub-project 1 sent in the spring. All of the farms were conventional farms. The farms had more carrot cultivation area than carrot farms on
0%1%2%3%4%5%6%7%8%
At harvest After harvest
Food losses and waste in primary production 21
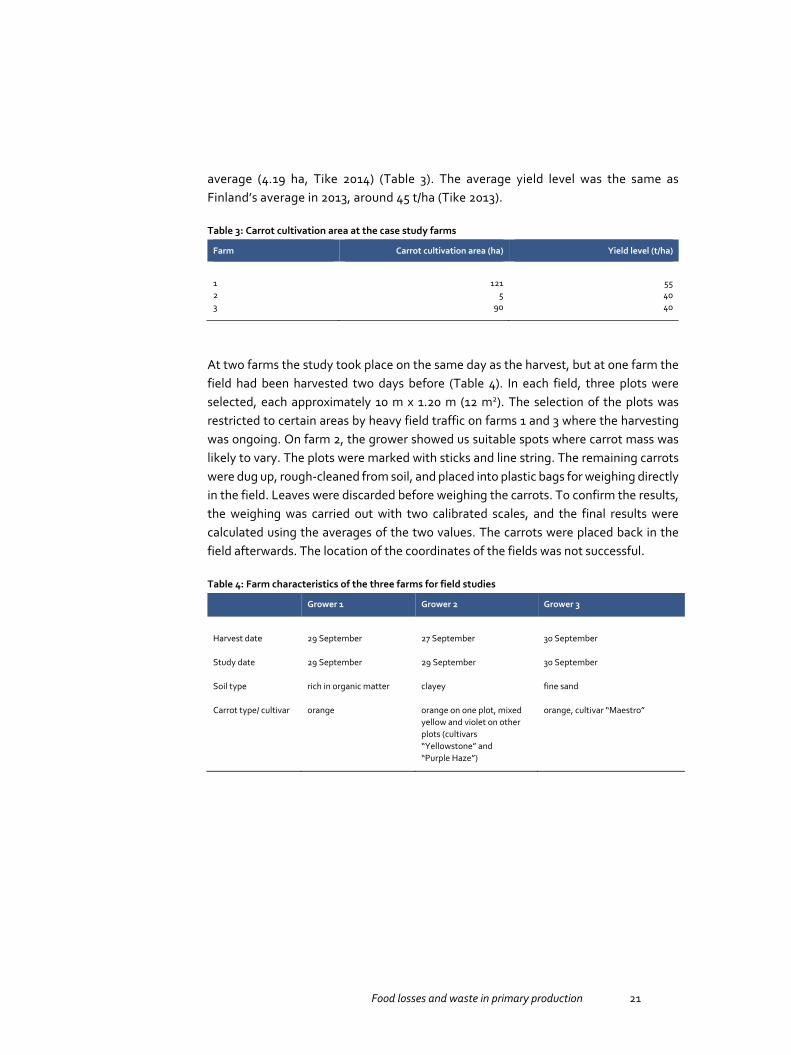
average (4.19 ha, Tike 2014) (Table 3). The average yield level was the same as Finland’s average in 2013, around 45 t/ha (Tike 2013).
Table 3: Carrot cultivation area at the case study farms
Farm Carrot cultivation area (ha) Yield level (t/ha)
1 121 55 2 5 40 3 90 40
At two farms the study took place on the same day as the harvest, but at one farm the field had been harvested two days before (Table 4). In each field, three plots were selected, each approximately 10 m x 1.20 m (12 m2). The selection of the plots was restricted to certain areas by heavy field traffic on farms 1 and 3 where the harvesting was ongoing. On farm 2, the grower showed us suitable spots where carrot mass was likely to vary. The plots were marked with sticks and line string. The remaining carrots were dug up, rough-cleaned from soil, and placed into plastic bags for weighing directly in the field. Leaves were discarded before weighing the carrots. To confirm the results, the weighing was carried out with two calibrated scales, and the final results were calculated using the averages of the two values. The carrots were placed back in the field afterwards. The location of the coordinates of the fields was not successful.
Table 4: Farm characteristics of the three farms for field studies
Grower 1 Grower 2 Grower 3
Harvest date 29 September
27 September 30 September
Study date 29 September
29 September 30 September
Soil type rich in organic matter
clayey fine sand
Carrot type/ cultivar orange orange on one plot, mixed yellow and violet on other plots (cultivars “Yellowstone” and “Purple Haze”)
orange, cultivar “Maestro”

22 Food losses and waste in primary production
Figure 5: Carrots are packed in one cubic metre sized crates in the field by the harvesting machine
Figure 6: The area of the studied plots was marked with sticks and line string

Food losses and waste in primary production 23
Figure 7: The carrots were dug up from the marked area with a spade

24 Food losses and waste in primary production
Figure 8: The carrots were rough-cleaned from soil and weighed directly in the field in plastic bags
All of the farms had packing and storing activities.1 However, due to the hectic harvesting season, it was not possible to visit the packing and storing rooms. Also, the harvesting was still unfinished, and thus due to the busy time the farmers were not able to answer questions about the total mass and quality of yield directly in the field, and they were therefore interviewed later.
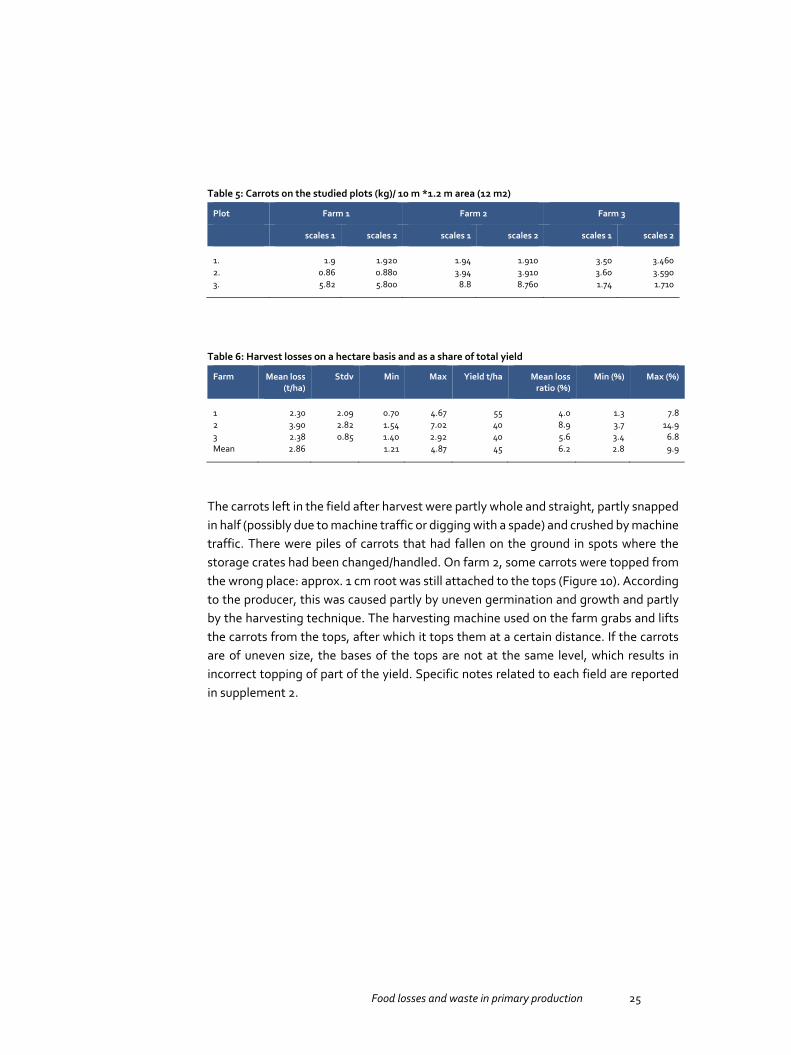
Results The results of the field study show that the mass of carrots left in the field after harvest varies considerably between farms and even within one field parcel. The field measurement data for individual plots is shown in Table 5, and the results on a hectare basis and as a share of the total yield are shown in Table 6. The mean harvest loss on the studied farms was 2.9 t/ha, varying from 0.7 to 4.7 t per ha. The greatest mean value and standard deviation occurred on farm 2, while the standard deviation was smallest on farm 3. A relatively small share of the produced carrot yield is left in the field or sorted in the field: on average 6.2%,2 varying from 1.3% to 14.9%.
1 One of the farmers processed the raw material, while the others only packed it before delivery. One of the producers was also beginning to produce some food products from the carrots with minor faults that did not affect edibility. 2 A weighted average was not calculated, because the representativeness of the studied plots was not linked to the individual farms, but to carrot cultivation in general.
Food losses and waste in primary production 25
Table 5: Carrots on the studied plots (kg)/ 10 m *1.2 m area (12 m2)
Plot Farm 1 Farm 2 Farm 3
scales 1 scales 2 scales 1 scales 2 scales 1 scales 2
1. 1.9 1.920 1.94 1.910 3.50 3.460 2. 0.86 0.880 3.94 3.910 3.60 3.590 3. 5.82 5.800 8.8 8.760 1.74 1.710
Table 6: Harvest losses on a hectare basis and as a share of total yield
Farm Mean loss (t/ha)
Stdv Min Max Yield t/ha Mean loss ratio (%)
Min (%) Max (%)
1 2.30 2.09 0.70 4.67 55 4.0 1.3 7.8 2 3.90 2.82 1.54 7.02 40 8.9 3.7 14.9 3 2.38 0.85 1.40 2.92 40 5.6 3.4 6.8 Mean 2.86
1.21 4.87 45 6.2 2.8 9.9
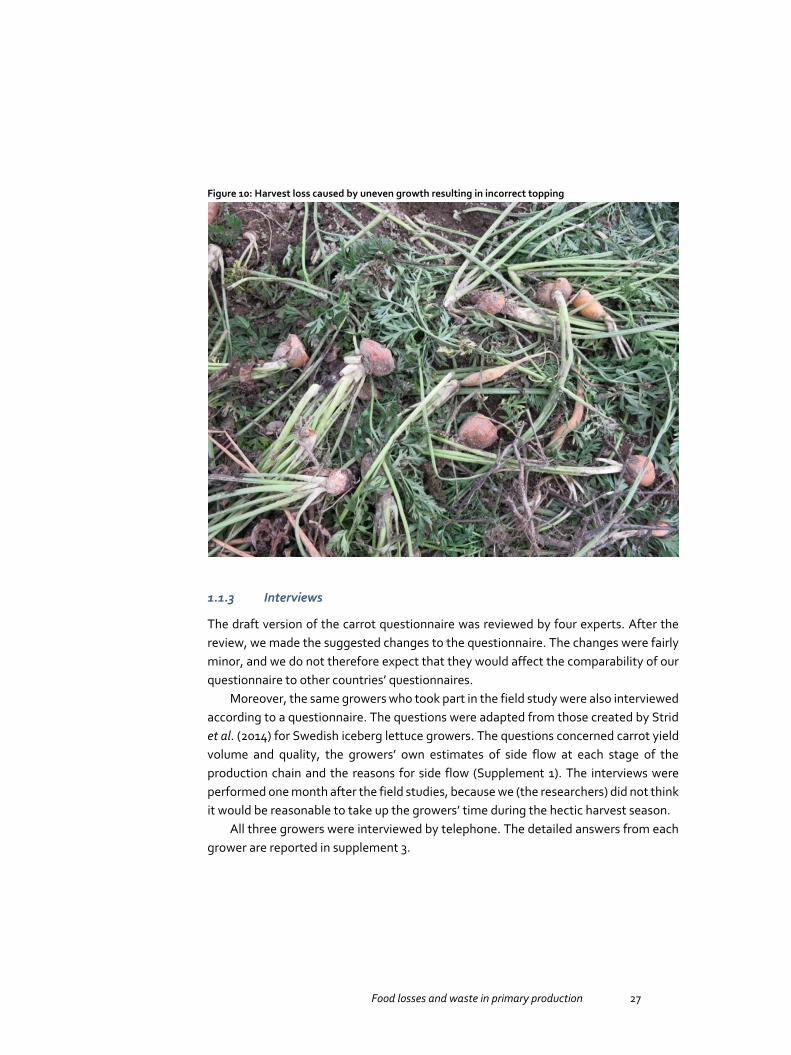
The carrots left in the field after harvest were partly whole and straight, partly snapped in half (possibly due to machine traffic or digging with a spade) and crushed by machine traffic. There were piles of carrots that had fallen on the ground in spots where the storage crates had been changed/handled. On farm 2, some carrots were topped from the wrong place: approx. 1 cm root was still attached to the tops (Figure 10). According to the producer, this was caused partly by uneven germination and growth and partly by the harvesting technique. The harvesting machine used on the farm grabs and lifts the carrots from the tops, after which it tops them at a certain distance. If the carrots are of uneven size, the bases of the tops are not at the same level, which results in incorrect topping of part of the yield. Specific notes related to each field are reported in supplement 2.

26 Food losses and waste in primary production
Figure 9: The carrots dug up were mainly whole and straight or snapped in half, possibly due to machine traffic or digging with a spade
Food losses and waste in primary production 27
Figure 10: Harvest loss caused by uneven growth resulting in incorrect topping
1.1.3 Interviews
The draft version of the carrot questionnaire was reviewed by four experts. After the review, we made the suggested changes to the questionnaire. The changes were fairly minor, and we do not therefore expect that they would affect the comparability of our questionnaire to other countries’ questionnaires.
Moreover, the same growers who took part in the field study were also interviewed according to a questionnaire. The questions were adapted from those created by Strid et al. (2014) for Swedish iceberg lettuce growers. The questions concerned carrot yield volume and quality, the growers’ own estimates of side flow at each stage of the production chain and the reasons for side flow (Supplement 1). The interviews were performed one month after the field studies, because we (the researchers) did not think it would be reasonable to take up the growers’ time during the hectic harvest season.
All three growers were interviewed by telephone. The detailed answers from each grower are reported in supplement 3.
28 Food losses and waste in primary production
The interviewed producers produced between approx. 0.2 and 6.7 million kg carrots per year on between 5 and more than 121 hectares. The yield level was 40–55 t/ha. This year’s yield was estimated to be an average yield, in terms of both quantity and quality. All of the interviewed producers store, sort and pack their whole yield during the winter. The producers’ estimates of the share of yield that does not go to human consumption varied from 15% to 50% (mean value 30%).
Two producers named plant diseases and moulds occurring during storage as the most important reason for the carrot losses. On one farm this comprised more than one third of the total loss, on the other the majority of the loss: 5% to almost 25% of the total yield. Weather conditions, cultivar, crop rotation and storage technology were said to play a role in the occurrence and severity of storage diseases. On the other hand, one producer named minor faults in quality (not affecting edibility, e.g. wrong size) as the most important reason for the side flow (approx. 48% of the total yield). They commented that overproduction has led to overly strict quality requirements.
Only one producer was able to estimate the share of yield that was left in the field after harvest this year: 2%, equivalent to 0.8 t/ha. Another producer estimated that the yield left unharvested (due to wet conditions and poor quality caused by wet conditions) can be up to 15% in some years.
One of the producers reported the yearly variation in side flow to be minimal. On the other hand, another producer reported that the share of side flow varied from a few percent to around 28% depending on the year. One producer reported that the share of side flow varied greatly from year to year, but was not able to estimate percentages. The share and reasons for side flow were said to vary greatly between field parcels, cultivars, etc.
According to all producers, it is possible for an entire field parcel not to be harvested due to quality faults or weather conditions. Possible reasons include plant diseases, insect pests, drought and wetness. Two producers reported that the autumn of 2012 was exceptionally wet and not all of the field area could be harvested, because the field could not withstand the heavy machines.
None of the producers saw the carrots left in the field during harvest as side flow, because it is impossible to harvest 100% of the yield with the current machinery. Also, as the carrots decompose, the nutrients are left in the field. The farmers did not think the carrots left in the field could be used profitably for other purposes.
On all the studied farms, the carrots that are discarded after harvest in the later stages of the production chain are used as forage, mainly for horses and game.

Food losses and waste in primary production 29
1.2 Carrot side flow in Sweden
The production of carrots in Sweden during the past 13 years (2002–2014) has showed an increase from 84,784 tonnes in 2002 to 119,021 tonnes in 2014, equal to an increase of about 40% (Figure 11) (Swedish Board of Agriculture 2015). During the same period of time, the area used for carrot production in Sweden has been relatively static, at between 1,474 and 2,135 ha. The yield (production/area) during this period has showed an increase from around 47 tonnes/ha (2002) to 61 tonnes/ha (2014), equal to an increase of about 32%. The number of producing companies during this time has decreased by about one quarter, from 453 in 2002 to 312 in 2014, indicating a trend of larger producers (data not presented).
The consumption of carrots in Sweden during the period 1984 to 2013 has showed an increasing trend from 54,900 tonnes per year in 1984 to 102,800 tonnes per year in 2013, which is equal to an increase from 6.6 kg/person per year to 10.7 kg/person per year (Figure 12). The differential from consumption and production of carrots from 2002 to 2014 shows a relatively static trend, with a surplus in domestic production within a span of 8,500 to 37,700 tonnes per year.
Figure 11:Swedish production, areas, yield and domestic surplus of carrots during the years 2002 to 2014. The domestic surplus was calculated as direct consumption minus total production

30 Food losses and waste in primary production
Figure 12: Consumption of carrots in Sweden during the years 1984–2013. The figure for 2013 is a preliminary estimate
From available statistics, only the production numbers are known and the waste in primary production is hidden in these figures or not considered at all, making yields (weight per area) and other important statistics unreliable. Besides statistics, is important to quantify the waste in primary production and to identify the causes of this waste, as well investigating the possibilities for alternative produce from discarded carrots, in order to reduce waste in the future. The reasons for reducing waste are both environmental considerations to move towards sustainable production and economic incentives. Therefore, this investigation gives us important new information about the production and handling of carrots.
1.2.1 Questionnaire
Authors: Marie E. Olsson and Staffan Andersson, Dept. of Plant Breeding, Swedish University of Agricultural Sciences
Materials and methods, Sample The questionnaire was sent to all Swedish companies which were known to have cultivated at least 0.5 ha of carrots during the years 2011, 2012 or 2013. Of the 197 questionnaires that were sent out, 108 companies responded, giving a response frequency of 55%. Of the 108 answers, 71 of these responded that they had been

Food losses and waste in primary production 31
involved in carrot cultivation or handling/distribution during 2013, while the remaining 37 responding companies had not. Of these 71 answers, 70 companies had cultivated carrots, 49 had harvested carrots, 6 had stored carrots covered by straw in the fields, 19 had stored carrots indoors for a short time (less than two months), 27 had stored carrots indoors for a long time in bins and 2 had stored loose carrots for a long time (more than two months). 28 had sorted carrots, 21 had packed carrots, 18 had bunched fresh carrots and 7 had processed carrots. Of the responding 71 companies, 27 only practised one or two of the production steps, most often cultivation and harvesting.
The companies that are currently cultivating carrots seem to have a higher tendency to answer the questionnaire than non-active growers. Non-responding companies only have older records of harvest yields more frequently than responding companies (48.3% and 36.1% respectively). Nothing implies that the responding and non-responding companies should be different in the size of acreage for carrot cultivation or total yield of carrots, however. The responding companies had an average acreage of 9.9 ± 25.7 ha, and an average harvest of 674 ± 1,791 tonnes, whereas the non-responding companies had an average acreage of 8.1 ± 16.0 ha and an average harvest of 474 ± 1,024 tonnes (calculated from previous years’ statistics).
In this section the replies from the carrot cultivating/handling companies are summarised in different figures. The questionnaire included ten questions regarding carrot cultivation, handling and processing in Sweden during 2013. All questions except the first question (The first question classifies the respondents in the categories companies involved in some kind of carrot handling and others) are included in the analysis in this section. The results shown in this section are based on the total number of replies from 71 companies involved in carrot handling. The response frequencies are presented as an average of the positive respondents, i.e. those that had some kind of carrot cultivation or handling (71 companies in total). The results for each question are presented, when appropriate, as an average of the responding companies for each question, or in some cases, where appropriate, as a percentage only of those who in question no. 2 had answered that they did the special production step in question. In some cases (questions 4 and 5), the average values of only those companies who responded that they had discarded products are also presented (not including those who responded with a zero value).
In the text below, the companies that responded yes to the question of whether they did some kind of carrot cultivation, handling or processing (71 in total) are called “carrot companies”.
32 Food losses and waste in primary production
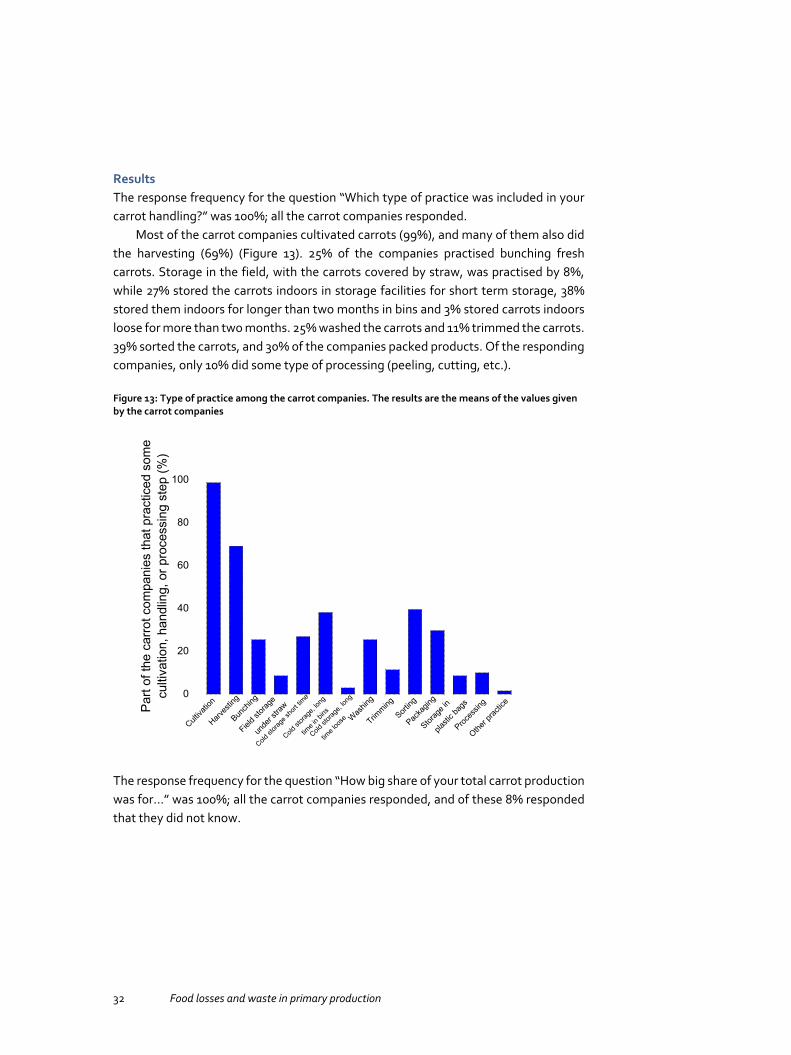
Results The response frequency for the question “Which type of practice was included in your carrot handling?” was 100%; all the carrot companies responded.
Most of the carrot companies cultivated carrots (99%), and many of them also did the harvesting (69%) (Figure 13). 25% of the companies practised bunching fresh carrots. Storage in the field, with the carrots covered by straw, was practised by 8%, while 27% stored the carrots indoors in storage facilities for short term storage, 38% stored them indoors for longer than two months in bins and 3% stored carrots indoors loose for more than two months. 25% washed the carrots and 11% trimmed the carrots. 39% sorted the carrots, and 30% of the companies packed products. Of the responding companies, only 10% did some type of processing (peeling, cutting, etc.).
Figure 13: Type of practice among the carrot companies. The results are the means of the values given by the carrot companies
0
20
40
60
80
100
Part
of th
e ca
rrot c
ompa
nies
that
pra
ctic
ed s
ome
culti
vatio
n, h
andl
ing,
or p
roce
ssin
g st
ep (%
)
Cultiva
tion
Harves
ting
Bunch
ing
Field s
torag
e
un
der s
traw
Cold st
orage
short
time
Cold st
orage
, long
time i
n bins
Cold st
orage
, long
tim
e loo
se Washin
g
Trimming
Sorting
Packa
ging
Storag
e in
plas
tic ba
gs
Proces
sing
Other p
ractic
e
The response frequency for the question “How big share of your total carrot production was for…” was 100%; all the carrot companies responded, and of these 8% responded that they did not know.
Food losses and waste in primary production 33
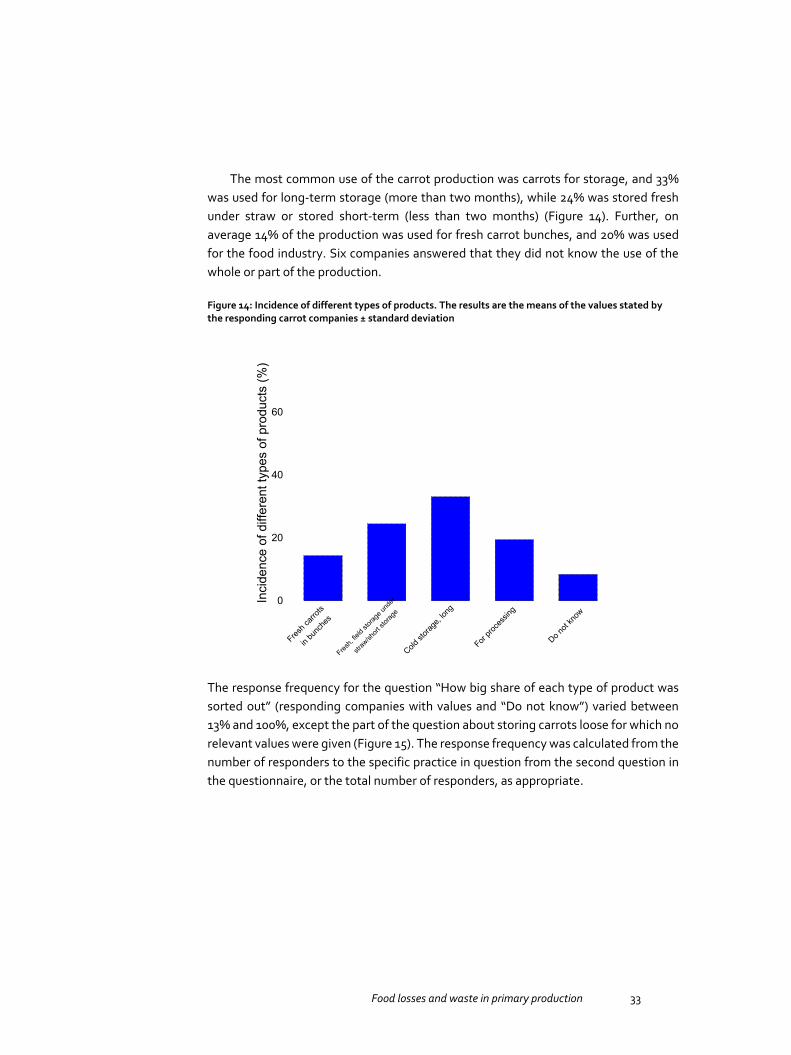
The most common use of the carrot production was carrots for storage, and 33% was used for long-term storage (more than two months), while 24% was stored fresh under straw or stored short-term (less than two months) (Figure 14). Further, on average 14% of the production was used for fresh carrot bunches, and 20% was used for the food industry. Six companies answered that they did not know the use of the whole or part of the production.
Figure 14: Incidence of different types of products. The results are the means of the values stated by the responding carrot companies ± standard deviation
0
20
40
60
Inci
denc
e of
diff
eren
t typ
es o
f pro
duct
s (%
)
Fresh c
arrots
in b
unch
es
Fresh,
field
storag
e und
er
s
traw/sh
ort st
orage
Cold st
orage
, long
For pro
cess
ing
Do not
know
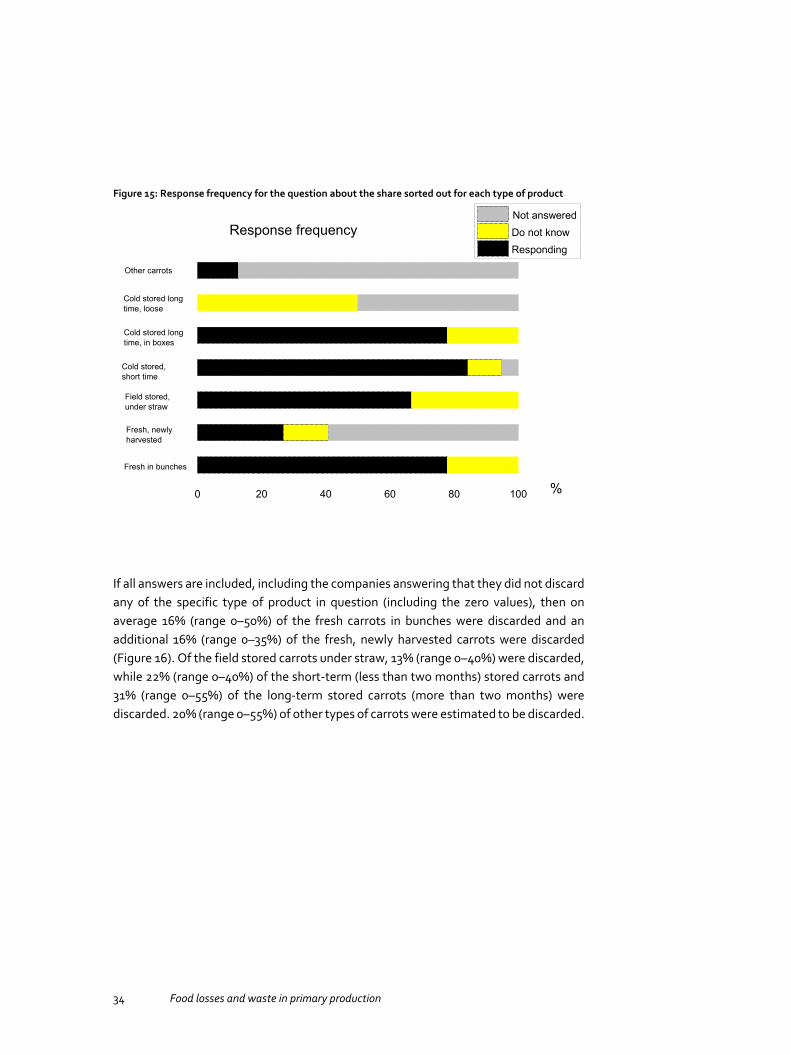
The response frequency for the question “How big share of each type of product was sorted out” (responding companies with values and “Do not know”) varied between 13% and 100%, except the part of the question about storing carrots loose for which no relevant values were given (Figure 15). The response frequency was calculated from the number of responders to the specific practice in question from the second question in the questionnaire, or the total number of responders, as appropriate.
34 Food losses and waste in primary production
Figure 15: Response frequency for the question about the share sorted out for each type of product
123
0 20 40 60 80 100
Not answered Do not know Responding
Response frequency
%
Other carrots
Cold stored long time, loose
Cold stored long time, in boxes
Cold stored, short time
Field stored, under straw
Fresh, newly harvested
Fresh in bunches
If all answers are included, including the companies answering that they did not discard any of the specific type of product in question (including the zero values), then on average 16% (range 0–50%) of the fresh carrots in bunches were discarded and an additional 16% (range 0–35%) of the fresh, newly harvested carrots were discarded (Figure 16). Of the field stored carrots under straw, 13% (range 0–40%) were discarded, while 22% (range 0–40%) of the short-term (less than two months) stored carrots and 31% (range 0–55%) of the long-term stored carrots (more than two months) were discarded. 20% (range 0–55%) of other types of carrots were estimated to be discarded.
Food losses and waste in primary production 35
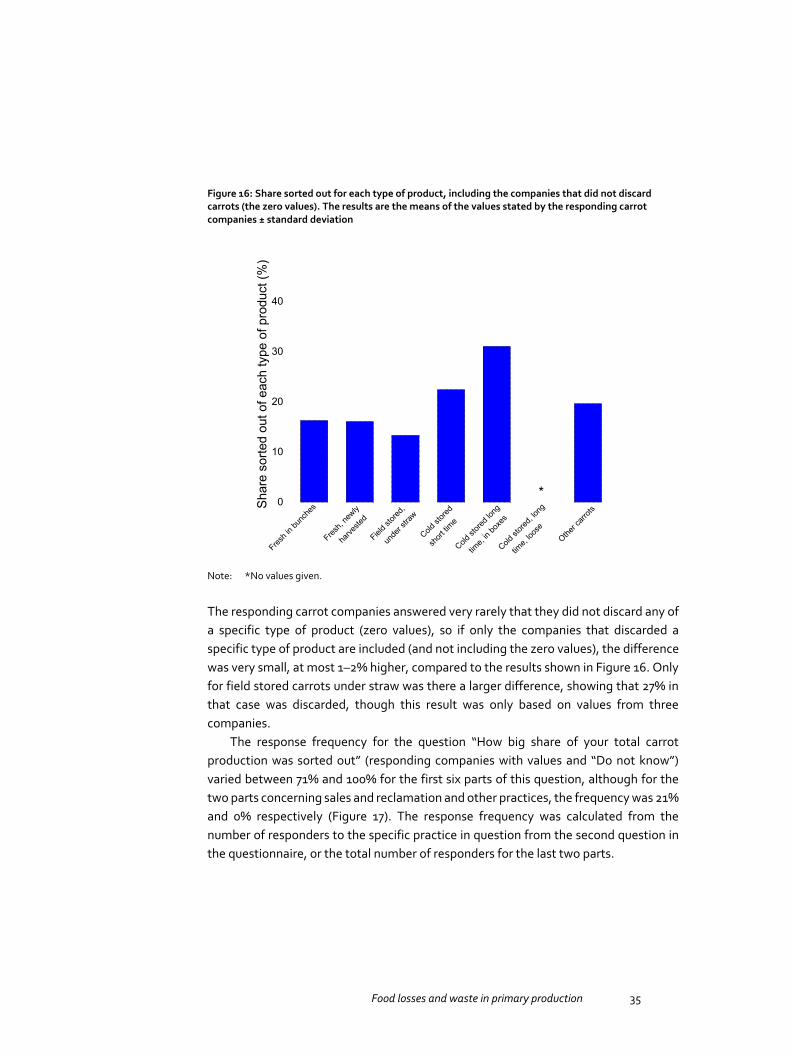
Figure 16: Share sorted out for each type of product, including the companies that did not discard carrots (the zero values). The results are the means of the values stated by the responding carrot companies ± standard deviation
1 20
10
20
30
40
Shar
e so
rted
out o
f eac
h ty
pe o
f pro
duct
(%)
Fresh i
n bun
ches
Fresh,
newly
ha
rveste
d
Field s
tored
,
und
er str
aw
Cold st
ored
short
time
Cold st
ored l
ong
tim
e, in
boxe
s
Cold st
ored,
long
tim
e, loo
se
*
Other c
arrots
Note: *No values given.
The responding carrot companies answered very rarely that they did not discard any of a specific type of product (zero values), so if only the companies that discarded a specific type of product are included (and not including the zero values), the difference was very small, at most 1–2% higher, compared to the results shown in Figure 16. Only for field stored carrots under straw was there a larger difference, showing that 27% in that case was discarded, though this result was only based on values from three companies.
The response frequency for the question “How big share of your total carrot production was sorted out” (responding companies with values and “Do not know”) varied between 71% and 100% for the first six parts of this question, although for the two parts concerning sales and reclamation and other practices, the frequency was 21% and 0% respectively (Figure 17). The response frequency was calculated from the number of responders to the specific practice in question from the second question in the questionnaire, or the total number of responders for the last two parts.

36 Food losses and waste in primary production
Figure 17:Response frequency for the question about the share sorted out of the total production, at the different steps of production
0 20 40 60 80 100
Not answered Do not know Respondning
Response frequency
Was not harvested
At harvest (only freshcarrots for bunches)
At washing, trimmingor sorting
At packaging
At processing
At storage after packaging
At sales or reclamation
At other practice
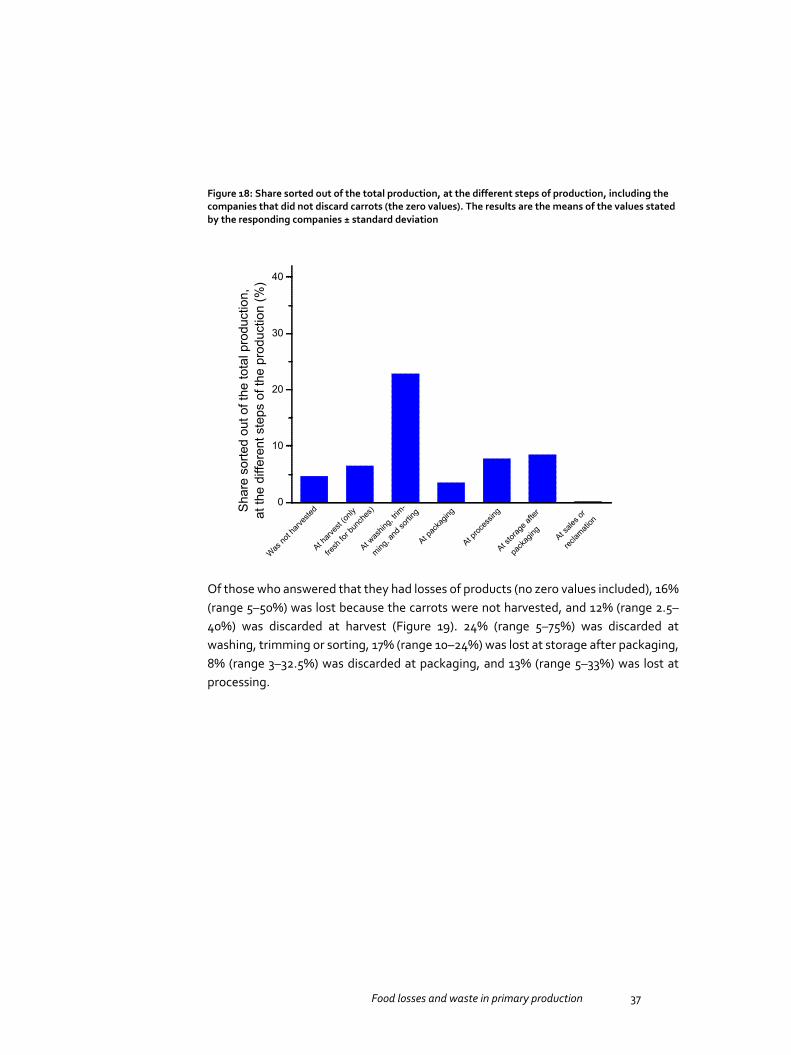
Of the total carrot production, and including the companies that did not discard carrots in the specific practice in question (the zero values), the highest share was sorted out at washing, trimming or sorting (23%; range 0–67%), at storage after packaging (9%; range 0–24%), or at processing (8%; range 0–33%) (Figure 18). 5% (range 0–50%) of the carrot production was not harvested, 6% (range 0–40%) of the production was estimated to be lost at harvesting, and 4% (range 0–35%) was discarded at packaging. At sales or reclamation, only 0.2% was discarded.
Food losses and waste in primary production 37
Figure 18: Share sorted out of the total production, at the different steps of production, including the companies that did not discard carrots (the zero values). The results are the means of the values stated by the responding companies ± standard deviation
0
10
20
30
40
Shar
e so
rted
out o
f the
tota
l pro
duct
ion,
at th
e di
ffere
nt s
teps
of t
he p
rodu
ctio
n (%
)
Was no
t harv
ested
At harv
est (o
nly
fres
h for
bunc
hes)
At was
hing,
trim-
ming
, and
sortin
g
At pac
kagin
g
At proc
essin
g
At stor
age a
fter
pac
kagin
gAt s
ales o
r
reclam
ation
Of those who answered that they had losses of products (no zero values included), 16% (range 5–50%) was lost because the carrots were not harvested, and 12% (range 2.5–40%) was discarded at harvest (Figure 19). 24% (range 5–75%) was discarded at washing, trimming or sorting, 17% (range 10–24%) was lost at storage after packaging, 8% (range 3–32.5%) was discarded at packaging, and 13% (range 5–33%) was lost at processing.

38 Food losses and waste in primary production
Figure 19: Share sorted out of the total production, different steps of production, including only the companies that discarded the specific types of product in question (not including zero values). The results are the means of the values stated by the responding carrot companies ± standard deviation
0
10
20
30
40
Shar
e of
the
tota
l pro
duct
ion
sorte
d ou
t,at
the
diffe
rent
pro
duct
ion
step
s (%
)
**
Was no
t harv
ested
At harv
est (o
nly
fres
h for
bunc
hes)
At was
hing,
trim-
ming
,and s
orting
At pac
kagin
g
At proc
essin
g
At stor
age a
fter
pac
kagin
gAt s
ales o
r
reclam
ation
*
Note 1: Note 2:
*At storage after packaging: only one value given, 1%. **At sales and reclamation: only two values given, on average 17% ±10.
The response frequency for the question “How big share of the discarding of the products at harvest was due to: Shall be in total either 0% (no discarded products) or 100% (if some kind of discarding of products has taken place)” was relatively high, and similar in all parts of this question, and was in the range between 61% and 63% responding with a value, and 37% to 39% that they did not know.
Including all the answers from the companies giving a value for a specific cause (and the zero values), the cause that gave the highest value was unacceptable shape or size, on average 34% (range 0–100%) (Figure 20). Disease occurring in the field (9%; range 0–100%), damage occurring at harvest or handling (19%; range 0–100%), and damage from insects or animals in the fields (12%; range 0–50%) were also major reasons for discarding products. Technical problems at cultivation (2%; range 0–20%) and weather conditions (6%; range 0–100%) were considered to be minor causes. Other causes were only considered to be important by three companies.

Food losses and waste in primary production 39
Figure 20: Reasons for discarding products at harvest, including the companies that stated that they did not have any loss for a specific cause in question (the zero values). The results are the means of the values stated by the responding carrot companies ± standard deviation
0
20
40
60
Rea
sons
for l
osse
s at
har
vest
(%)
Diseas
es in
the f
ield
Insec
t or a
nimal
dam
age
Weathe
r con
dition
s
Techn
ical p
roblem
s
a
t cult
ivatio
n
Damag
e at h
arves
t
a
nd ha
ndlin
g
Unacc
eptab
le sh
ape
or siz
e Other c
ause
Including only the answers from the companies that considered a specific cause of the reason for discarding products (not the zero values for a specific cause), the cause that gave the highest value was unacceptable shape or size, on average 54% (range 18–100%) (Figure 21). Disease occurring in the field (32%; range 5–100%), damage occurring at harvest or handling (30%; range 3–100%), weather conditions (29%; range 5–100%) and damage from insects or animals in the fields (26%; range 5–50%) were also major reasons for discarding products. Technical problems at cultivation (11%; range 5–20%) were considered to be a minor cause.

40 Food losses and waste in primary production
Figure 21: Reasons for discarding products, including only the companies that answered that they discarded products for the specific reasons (not including zero values). The results are the means of the values stated by the responding carrot companies ± standard deviation
0
20
40
60
80
Rea
sons
for l
osse
s at
har
vest
(%)
Diseas
es in
the f
ield
Insec
t or a
nimal
da
mage
Weathe
r con
dition
s
Techn
ical p
roblem
s
i
n cult
ivatio
n
Damag
e at h
arves
t
or
hand
ling
Unacc
eptab
le sh
ape
or
size
Other c
ause
*
Note: *Only two values, both 100%.
The response frequency for the question “How big share of the discarding of the products after harvest was due to: Shall be in total either 0% (no discarded products) or 100% (if some kind of discarding of products has taken place)” was in the range of 59% to 65% for the companies stating a value, and 35% to 41% answered that they did not know, in all parts of this question, with one exception. In the part concerning losses at processing, 46% responded with a value, while 54% answered that they did not know.
For all companies answering with a value for the different reasons for discarding products, including the companies that stated that they did not have any loss for a specific reasons (the zero values), the most common reasons for discarding products were unacceptable appearance (27%), unacceptable shape (22%), unacceptable size (18%) and damage at handling (11%) (Figure 22). Minor reasons were waste at processing (4%), no market (1%) and other reasons (1%).

Food losses and waste in primary production 41
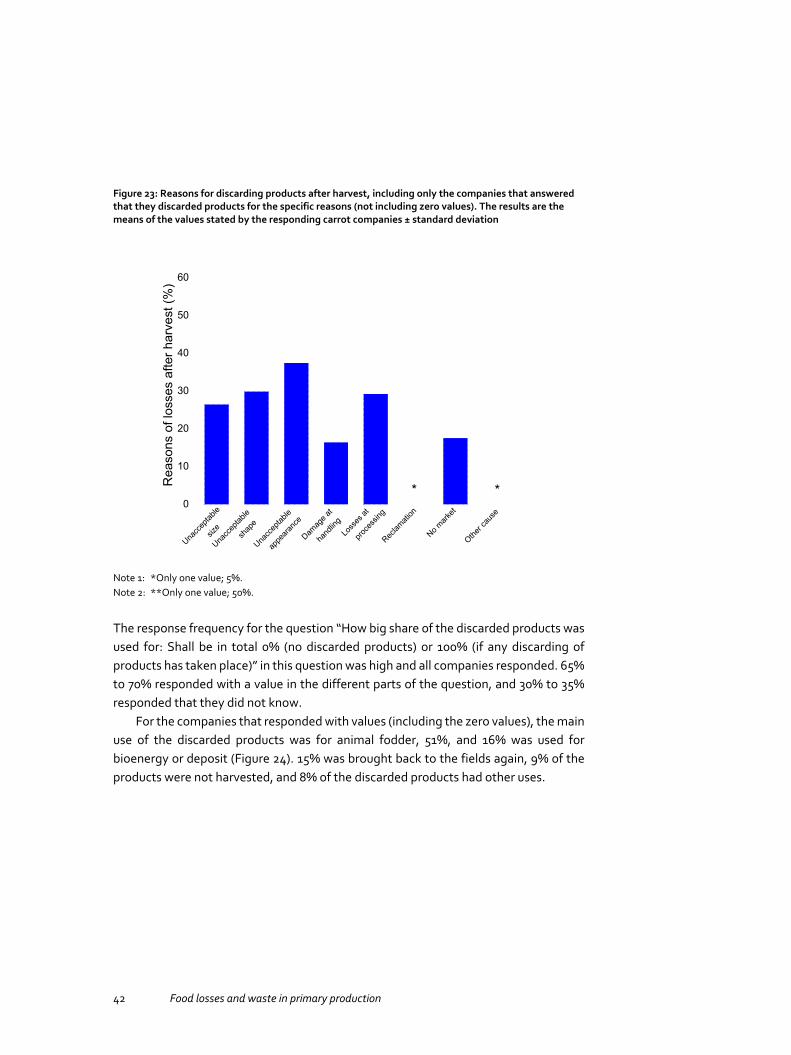
Figure 22: Reasons for discarding products after harvest, including the companies that stated that they did not have any loss for a specific reason (the zero values). The results are the means of the values stated by the responding carrot companies ± standard deviation
0
10
20
30
40
50
60
Rea
sons
for l
osse
s af
ter h
arve
st (%
)
Unacc
eptab
le
size
Unacc
eptab
le
sha
pe
Unacc
eptab
le
a
ppea
rance
Damag
e at
ha
ndlin
g
Loss
es at
pro
cess
ing
Reclam
ation
No mark
et
Other c
ause
Including only the answers from the companies that considered a specific reason for discarding products after harvest (not the zero values for a specific cause), the reasons that gave the highest results were unacceptable appearance (37%), unacceptable shape (30%), unacceptable size (26%), waste from processing (29%), no market (17%) and damage at handling (16%) (Figure 23). For reclamation as well as for other reasons, only one value was given.
42 Food losses and waste in primary production
Figure 23: Reasons for discarding products after harvest, including only the companies that answered that they discarded products for the specific reasons (not including zero values). The results are the means of the values stated by the responding carrot companies ± standard deviation
0
10
20
30
40
50
60
*
Rea
sons
of l
osse
s af
ter h
arve
st (%
)
Unacc
eptab
le
size
Unacc
eptab
le
sha
pe
Unacc
eptab
le
ap
peara
nce
Damag
e at
ha
ndlin
gLo
sses
at
proc
essin
g
Reclam
ation
No mark
et
Other c
ause
*
Note 1: Note 2:
*Only one value; 5%. **Only one value; 50%.
The response frequency for the question “How big share of the discarded products was used for: Shall be in total 0% (no discarded products) or 100% (if any discarding of products has taken place)” in this question was high and all companies responded. 65% to 70% responded with a value in the different parts of the question, and 30% to 35% responded that they did not know.
For the companies that responded with values (including the zero values), the main use of the discarded products was for animal fodder, 51%, and 16% was used for bioenergy or deposit (Figure 24). 15% was brought back to the fields again, 9% of the products were not harvested, and 8% of the discarded products had other uses.
Food losses and waste in primary production 43
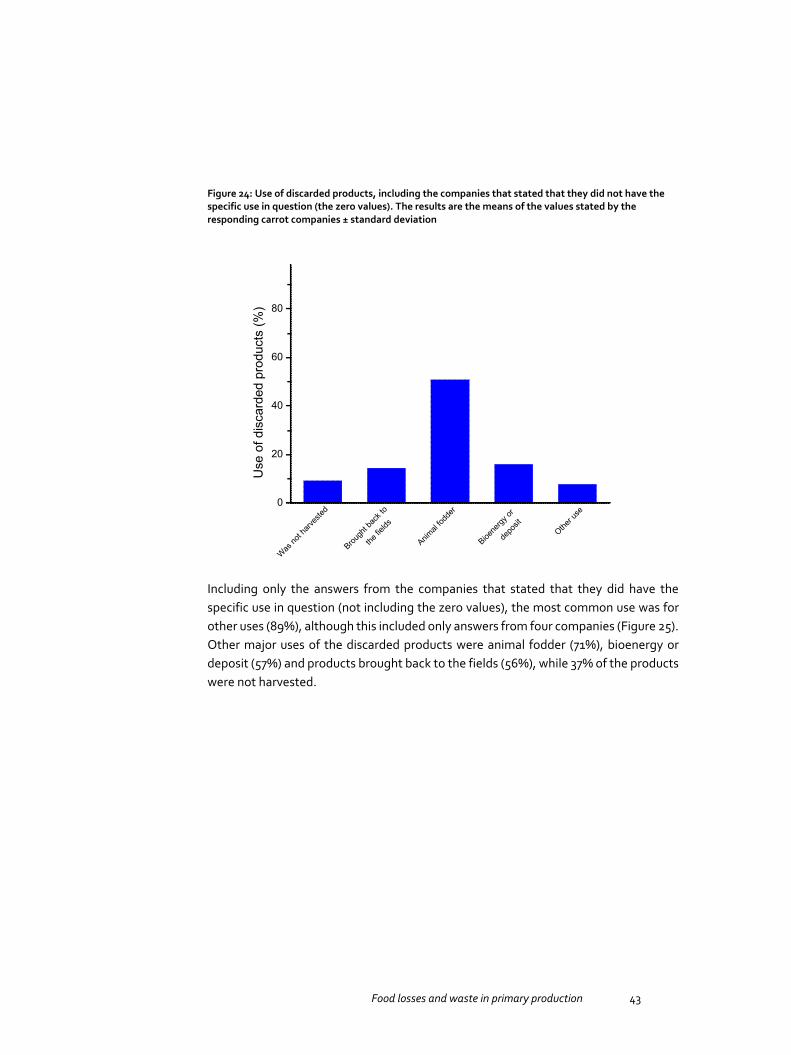
Figure 24: Use of discarded products, including the companies that stated that they did not have the specific use in question (the zero values). The results are the means of the values stated by the responding carrot companies ± standard deviation
0
20
40
60
80
Use
of d
isca
rded
pro
duct
s (%
)
Was no
t harv
ested
Brough
t bac
k to
the fie
lds
Animal
fodde
r
Bioene
rgy or
depo
sitOthe
r use
Including only the answers from the companies that stated that they did have the specific use in question (not including the zero values), the most common use was for other uses (89%), although this included only answers from four companies (Figure 25). Other major uses of the discarded products were animal fodder (71%), bioenergy or deposit (57%) and products brought back to the fields (56%), while 37% of the products were not harvested.

44 Food losses and waste in primary production
Figure 25: Use of discarded products, not including the companies that stated that they did not have the specific use in question (not including the zero values). The results are the means of the values stated by the responding carrot companies ± standard deviation
0
20
40
60
80
100
Use
of d
isca
rded
pro
duct
s (%
)
*
Was no
t harv
ested
Brough
t bac
k to
th
e fiel
ds
Animal
fodde
r
Bioene
rgy or
depo
sit
Other u
se
Note: *Only four values.
All carrot companies responded to the question “How big share of the discarded carrots do you think was edible?”. The response frequency was 63% of the companies responding with a value, while 37% responded that they did not know.
The average minimum value given for the question of how large a share of the discarded products they would consider to be edible was 48% (range 0.70%), and the maximum value was 63% (range 20–100%) (Figure 26).

Food losses and waste in primary production 45
Figure 26: Share of the products that were considered edible. The results are the means of the values stated by the responding carrot companies ± standard deviation
0
20
40
60
80
100
Shar
e of
the
disc
arde
d pr
oduc
ts th
at
wer
e co
nsid
ered
edi
ble
(%)
Minimum value
Maximum value
The response frequency to the question “How do you think the share of the carrots that are used for food could be increased?” was 48% that gave an answer, 52% answered “Do not know” and 0% did not respond.
To categorise the answers given, 16 answers concerned quality standards (market standards or EU standards), which the companies considered to be too high, 5 answers concerned plant protection issues, sometimes in relation to EU regulations, and 5 answers concerned consumers’ attitudes to quality demands.
Several companies suggested that a changed view of acceptable quality concerning appearance, shape and size would lead to less waste in the production of carrots. This was suggested both as a general view within society by consumers and in relation to what wholesalers accepted as acceptable quality. Some companies suggested that better knowledge among consumers about production could lead to higher acceptance of imperfect carrots.
Plant protection was suggested as something that could be improved to reduce product waste. Better protection against insect pathogens could lower the proportion of discarded carrots, but fungal carrot diseases were also considered to be a problem

46 Food losses and waste in primary production
that leads to waste in the production. Better carrot cultivars with higher resistance to pathogens could be an option.
Other suggestions for lowering waste in production included using more of the edible part of what is currently wasted for other processed products. Another solution to lower waste that was suggested was to have better storage facilities, to be able to maintain quality for longer.
Discussion The aim of this investigation was to quantify the losses of carrots in primary production in Sweden, including the handling and processing that is directly linked to this. In addition, the aim was also to understand the different reasons behind the losses during the different steps. Through the choice of a survey questionnaire sent to the Swedish growers’ companies that were previously known to cultivate and/or handle carrots, a method was used which is cost-effective in reaching many carrot companies, although it also has the disadvantage that the results are only based on estimates by the growers. For some of these questions, it is more likely that the growers are basing their answers on their own statistics, such as share discarded at washing, trimming and sorting, or at storage after packaging, since there are economic reasons for growers to keep their own statistics for these steps.
The response frequency varied significantly between the different questions as well as between the different parts of each question. In the evaluation of the answers, it could sometimes be difficult to determine whether a zero value was given because the company did not perform this step in the production/did not discard any product for a specific reason/did not know, or whether the zero value was actually meant to be zero. Therefore, in the results for some of the questions, the zero values have been both included and excluded, to illustrate how big a difference this uncertainty about the results represents, and also to show how important a specific reason for discarding products is for those who actually have losses for a specific reason.
Of the 99% of the carrot companies that cultivated carrots, many of them also stored the carrots, and only 14% on average was used for carrots sold fresh (not stored). However, including all types of storage, it seems that some of the companies did not store the carrots themselves, but had them stored and sorted at other companies’ facilities. This is also supported by the fact that of the responding 71 carrot companies, 27 only practised one or two of the production steps, most often cultivation and harvesting. Storing the products in larger facilities probably gives better conditions for having sufficiently good finances for making investments in modern storage equipment and more efficient storage, and thereby reducing waste. One drawback with several companies storing products together could be an increased risk of spreading carrot
Food losses and waste in primary production 47
diseases from different areas via the wooden storage bins. If the bins are not disinfected properly before returning to each company, this could lead to more infected carrots, causing more waste, although this is probably of minor importance compared to having efficient storage. A previous investigation showed that fungal diseases could be spread through wooden boxes, and 60% of the fungi that could colonise the wood caused lesions upon contact with intact carrots in cold storage (Kora et al. 2005).
A larger proportion of stored carrots seems to be discarded compared with carrots sold fresh, with the exception of the carrots that are stored under straw in the fields. Comparing field stored carrots under straw, with 13% of carrots estimated to be discarded, and the indoor stored carrots, with 22–31% of carrots estimated to be discarded, the former seems to be a method which could possibly reduce waste. Since it is common practice to wash and sort the carrots after storage, some of the quality traits lacking in the discarded products are likely to be present at harvest, although some, such as the development of storage diseases, are contributing to higher amounts of discarded products, especially after long-term storage. In recent years a new fungal disease in carrots, Acrothecium carotae, has appeared in Sweden, Denmark, the Netherlands and Canada, and in Sweden has become a major cause of quality problems occurring during storage. In a recent Swedish investigation, 80% of all carrot fields were infected, and 40% of the carrots had lesions which could cause the carrots to be discarded (Wikström et al. 2009). A changing climate with possibly higher temperatures and higher humidity during the autumn at harvest time has raised concerns that storage diseases caused by plant pathogens may increase, although the effects of different plant pathogens can be difficult to predict (Chakraborty and Newton 2011; Luck et al. 2011).
When comparing at which step in the overall production process products are discarded, the highest amounts were estimated to be discarded at sorting, trimming and washing, with 23–24% of carrots discarded (zero values included or excluded). 9–17% were lost at storage after packaging (zero values included or excluded), while 8–13% were lost at processing (zero values included or excluded). Surprisingly high amounts of the carrots were lost because the carrots were not harvested; 5–16% (zero values included or excluded).
With the exception of the sorting, trimming and washing step, question no. 5 (concerning waste for the different steps for the overall production process) resulted in bigger differences between the average values if all answers were included (including the zero values) or if only those who answered that they discarded products at a specific step were included (not including the zero values), than question no. 4 (concerning waste for each product) did. The reason why the step sorting, trimming and washing had lower discrepancy between the average values whether or not the zero values were included could be that the companies base their estimates here on their own statistics,

48 Food losses and waste in primary production
while it is more difficult to give estimates for the other steps, which could lead to more companies answering with zero values. It is probably also more difficult to estimate the losses for each step in the overall production process (question no. 5) than to estimate the losses for each product (question no. 4).
The discarded carrots were most commonly used for animal fodder (51–71%, zero values included or excluded) or for bioenergy or deposit (16–57%, zero values included or excluded), or were placed back into the fields. The latter is an easy way to dispose of the waste and probably also contributes mineral nutrients to the soil structure, although there is also a risk of spreading plant diseases to the fields.
The carrot companies regarded the main reason for discarding products at harvest to be unacceptable shape or size: 34–54% (zero values included or excluded). Other major causes were damage occurring at harvest or handling (19–30%, zero values included or excluded), damage from insects and animals in the fields (12–26%, zero values included or excluded) and disease occurring in the fields (9–32%, zero values included or excluded).
The main reasons for discarding products after harvest were similar to those for discarding products at harvest: unacceptable appearance (27–37%, zero values included or excluded), unacceptable shape (22–30%, zero values included or excluded), unacceptable size (18–26%, zero values included or excluded) and damage at handling (11–16%, zero values included or excluded). Some companies considered waste at processing to be a major cause of waste after harvest (29%, zero values excluded), while some considered no market to cause more than only minor losses (17%, zero values excluded). Both at harvest and after harvest, the main reasons for discarding products are also in accordance with the answers given by the companies when suggesting how to increase the share of carrots used for food. Several companies suggested a changed view of acceptable quality concerning appearance, shape and size as an approach that could reduce waste. In addition, as the companies considered a large share of the carrots to be edible (48–63%, average minimum and maximum values), it seems that a relatively large proportion of the waste in carrot production is caused by quality standards set by the EU or wholesalers. Some companies also suggest that better knowledge among consumers about production could lead to higher degree of acceptance for quality that is currently regarded to be below standards.
1.3 Carrot side flow in Norway
Carrot is an important horticultural crop in Norway. In 2014, 52,000 tonnes were produced, accounting for 84% of national consumption. Carrots are grown on contract for processing or consumption. Carrot is the main vegetable grown in Norway

Food losses and waste in primary production 49
(excluding potatoes), and is grown on about 15,000 dekar, with about 52,000 tonnes produced (SSB 2016). Carrots have been cultivated in Norway since the 17th century (Balvoll 1999) and have a strong position in traditional Norwegian food consumption (Vittersø et al. 2005). According to “Totaloversikten” (2014), the average Norwegian consumes 7.9 kg carrots a year (2014). Carrots account for 10% of vegetables (excluding potatoes) sold in Norway. Prices for carrots are somewhat stable, averaging NOK 7.18 per kg in 2014 (NILF 2015).
Norway’s natural resources do not allow carrot production on a large scale all over the country, and some regions have a higher concentration of carrot production. Production occurs in a range of soil types (sand, “other minerals” and clay) and within different rainfall areas (low, moderate and high).
1.3.1 Questionnaire
Authors: Erik Svanes, Østfoldforskning
Materials and methods, Sample A questionnaire was sent to 142 farmers of carrots in Norway. The survey was conducted during the period 8 April to 1 May 2014. Of the 142 recipients, 133 had an e-mail address and 9 had postal addresses. Addresses were received from the four main producer organisations: Norgesgrønt, Nordgrønt, Gartnerhallen and PF 1909.
84 recipients gave no answer, 21 answered some of the questions and 37 answered all the questions. This gives a response rate of 42% for partial or full response. Of these 58, only 52 grew crops in 2012.
The questionnaire included 23 questions on quantity wasted, handling of the wastage, reasons for wastage, quality of wastage and possible reduction options, as well as a number of supporting questions such as yield.
This section summarises the responses from 52 farmers who grew carrots for human consumption in Norway in 2013. The questionnaire consisted of 23 questions. Figure 27 shows the origin of respondents divided up by Norwegian counties (“fylker”).

50 Food losses and waste in primary production
Figure 27: County of origin for respondents, number of replies
The total growing area for the farms is shown in figure 28. This includes the area used for carrots and all other products grown on the farm.
Figure 28: Total farm size
0 2 4 6 8 10 12
BuskerudSogn og Fjordane
NordlandSør-Trøndelag
Nord-TrøndelagTrøndelag
Møre og RomsdalVestfold
HedmarkAkershus
Aust-AgderTelemarkRogaland
Repondent’s county of origin
Numberof replies
0 5 10 15 20 25
0-10 10-20 20-30 30-40 40-50 50-60 60-70 70-80 80-90
90-100 > 100
Total farm size (ha)
Number of replies
Food losses and waste in primary production 51
Of the total number, 84% answered that farming was their main income, 9% said it was not their main income and 7% did not answer. No respondents answered that their main income was some other agriculture-related activity, e.g. farm tourism.
All respondents replied that they carried out conventional production. One respondent carried out organic farming in addition to conventional farming.
67% of the respondents deliver the product to one specific customer, 15% answered “Partly”, 13% answered “No” and 5% did not answer.
We received 50 answers on cultivars. The average reported was 2.7 cultivars per grower. Namdal, Romance and Nominator were the most widely used cultivars, with about one third of the respondents saying that they used each of them. All but one respondents replied that they used crop rotation.
Of the total number of crop growers, 51% said that they rent farmland in the local area, 27% rent land further away and switch to new areas every year to avoid pests, insects and similar, and 13% said that they only farm their own soil. 9% did not answer.
The survey was mainly aimed at all those who had a role in the primary production of carrots, but the questionnaire was sent to all those whose details were provided by the producers’ organisations, which included some who did not grow carrots that year or who did not grow crops, e.g. packing house employees.
Between 31 and 53 recipients answered the sub-questions about roles. This means that 31 answered “Yes” or “No” to all, while the rest answered “Y” only to the roles they had but left the other questions unanswered. We have assumed that if a grower does not answer “Yes” or “No” to whether he carried out e.g. sorting of carrots, it means that he does not carry out sorting. The results (Figure 29) show that many store the products. The share of respondents who carry out processing (washing, polishing, sorting and packing) and transportation is high: 35–40%.
41 growers stored carrots. The ones who stored carrots report that an average of 74% of the total harvest was stored.
The average answer was to the question “How much time do you use for carrot production” 53 man-months.
The question related to the income that came from farming carrots and the share of carrot income in relation to total income. The average income from carrots was NOK 1,357,000. The average share of the income coming from carrot production was 43%.
Altogether, between 27 and 44 answered the questions. In the analyses we have added those who did not answer and those that answered “No”.
The average yield was 41.4 tonnes, the average carrot production area was 9.0 ha and the average yield per hectare was 4.21 tonnes. The standard deviation of the yield per ha was 1.8 tonnes. This may be due to the fact that some may have given net yield instead of gross yield.
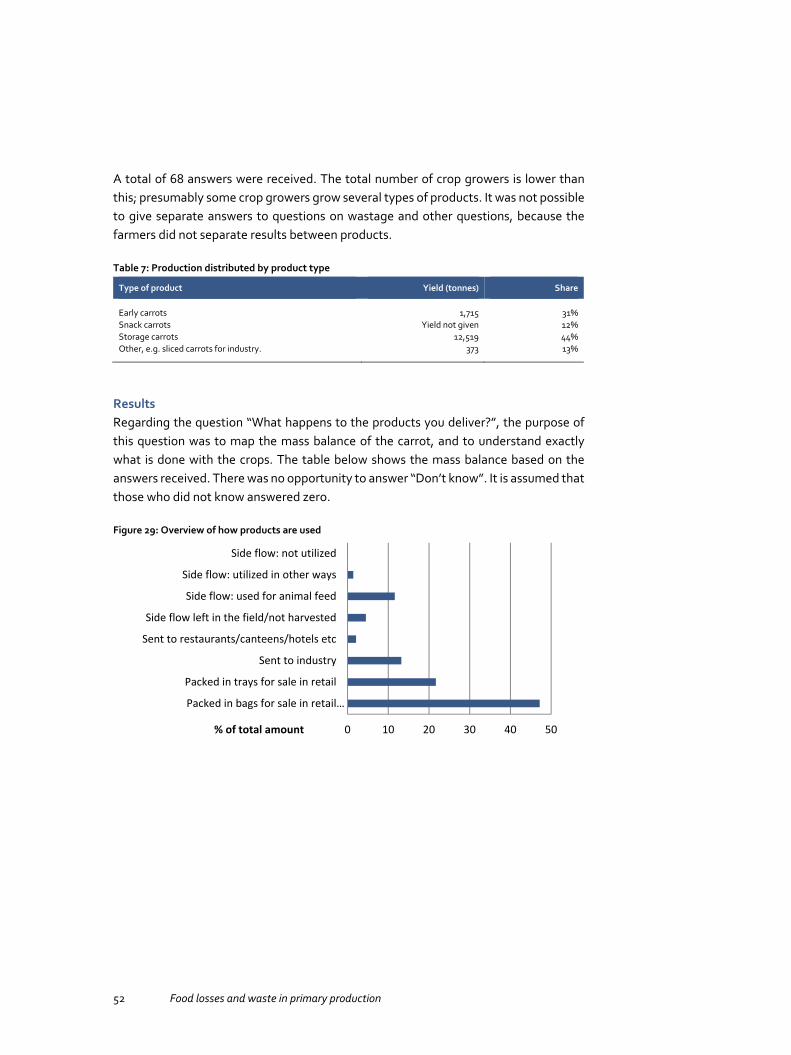
52 Food losses and waste in primary production
A total of 68 answers were received. The total number of crop growers is lower than this; presumably some crop growers grow several types of products. It was not possible to give separate answers to questions on wastage and other questions, because the farmers did not separate results between products.
Table 7: Production distributed by product type
Type of product Yield (tonnes) Share
Early carrots 1,715 31% Snack carrots Yield not given 12% Storage carrots 12,519 44% Other, e.g. sliced carrots for industry. 373 13%
Results Regarding the question “What happens to the products you deliver?”, the purpose of this question was to map the mass balance of the carrot, and to understand exactly what is done with the crops. The table below shows the mass balance based on the answers received. There was no opportunity to answer “Don’t know”. It is assumed that those who did not know answered zero.
Figure 29: Overview of how products are used
0 10 20 30 40 50
Packed in bags for sale in retail…
Packed in trays for sale in retail
Sent to industry
Sent to restaurants/canteens/hotels etc
Side flow left in the field/not harvested
Side flow: used for animal feed
Side flow: utilized in other ways
Side flow: not utilized
% of total amount
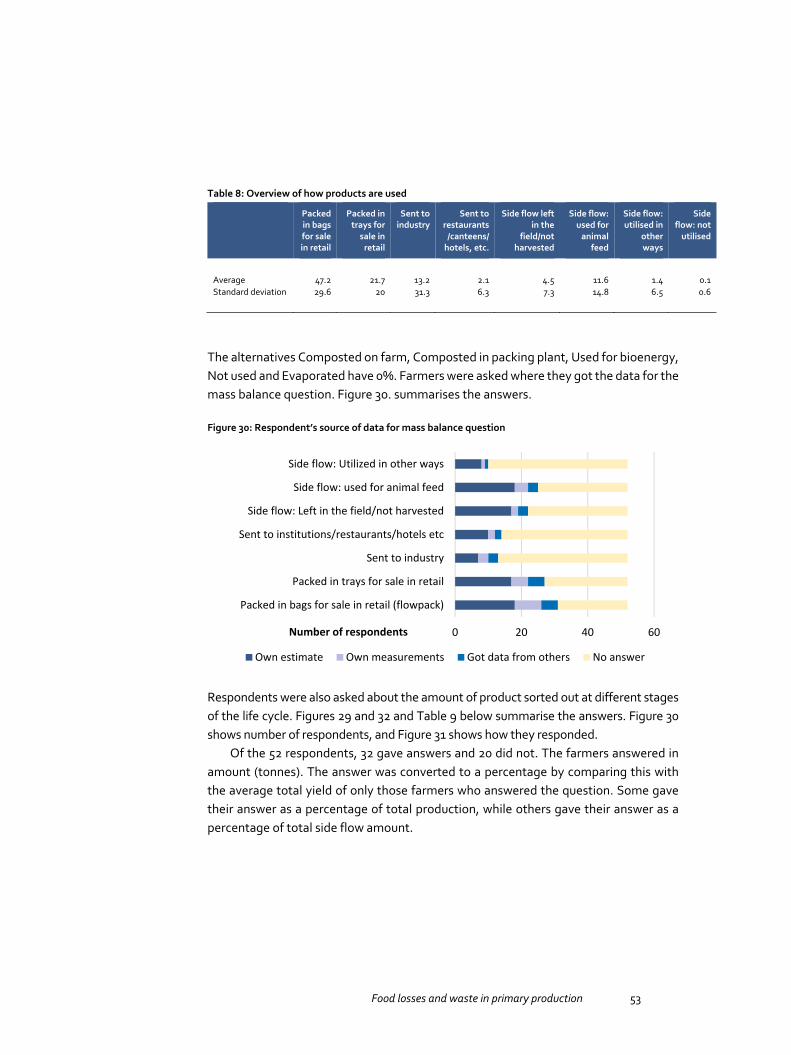
Food losses and waste in primary production 53
Table 8: Overview of how products are used
Packed in bags for sale in retail
Packed in trays for
sale in retail
Sent to industry
Sent to restaurants
/canteens/ hotels, etc.
Side flow left in the
field/not harvested
Side flow: used for
animal feed
Side flow: utilised in
other ways
Side flow: not
utilised
Average 47.2 21.7 13.2 2.1 4.5 11.6 1.4 0.1 Standard deviation 29.6 20 31.3 6.3 7.3 14.8 6.5 0.6
The alternatives Composted on farm, Composted in packing plant, Used for bioenergy, Not used and Evaporated have 0%. Farmers were asked where they got the data for the mass balance question. Figure 30. summarises the answers.
Figure 30: Respondent’s source of data for mass balance question
Respondents were also asked about the amount of product sorted out at different stages of the life cycle. Figures 29 and 32 and Table 9 below summarise the answers. Figure 30 shows number of respondents, and Figure 31 shows how they responded.
Of the 52 respondents, 32 gave answers and 20 did not. The farmers answered in amount (tonnes). The answer was converted to a percentage by comparing this with the average total yield of only those farmers who answered the question. Some gave their answer as a percentage of total production, while others gave their answer as a percentage of total side flow amount.
0 20 40 60
Packed in bags for sale in retail (flowpack)
Packed in trays for sale in retail
Sent to industry
Sent to institutions/restaurants/hotels etc
Side flow: Left in the field/not harvested
Side flow: used for animal feed
Side flow: Utilized in other ways
Number of respondents
Own estimate Own measurements Got data from others No answer

54 Food losses and waste in primary production
The answers show that most of the carrots were sorted out in the packing plant, while some were left in the field. Small amounts were sorted at the farm after harvest. Very little was sorted at the storage facility or other places or returned to the farmer.
Figure 31: Amount of product sorted out, as a % of total production
Table 9: Percentage of side flow amount sorted out at different part of the life cycle
Left in the field
Sorted out at the farm after
harvest
Sorted out at the storage
facility
Sorted out at the packing
plant
Returned to the farmer
Sorted out at other
places
Average 17.1 6.8 1.6 69.4 1.6 3.5 Standard deviation 22.3 24.2 8.7 35.0 8.7 17.5
Figure 32: Number of respondents who reported that some product had been sorted out
0,0 10,0 20,0 30,0 40,0 50,0 60,0 70,0 80,0
Left in the field
Sorted out at the farm after harvest
Sorted out at the storage facility
Sortd out at the packing plant
Returned to me
Sorted out other places
% of total amount of carrot
0 20 40 60
Left in the field
Sorted at farm after harvest
Sorted at storage
Sorted at the packing plant
Returned to farmer
Sorted other places
Number of respondentsAnswer No answer
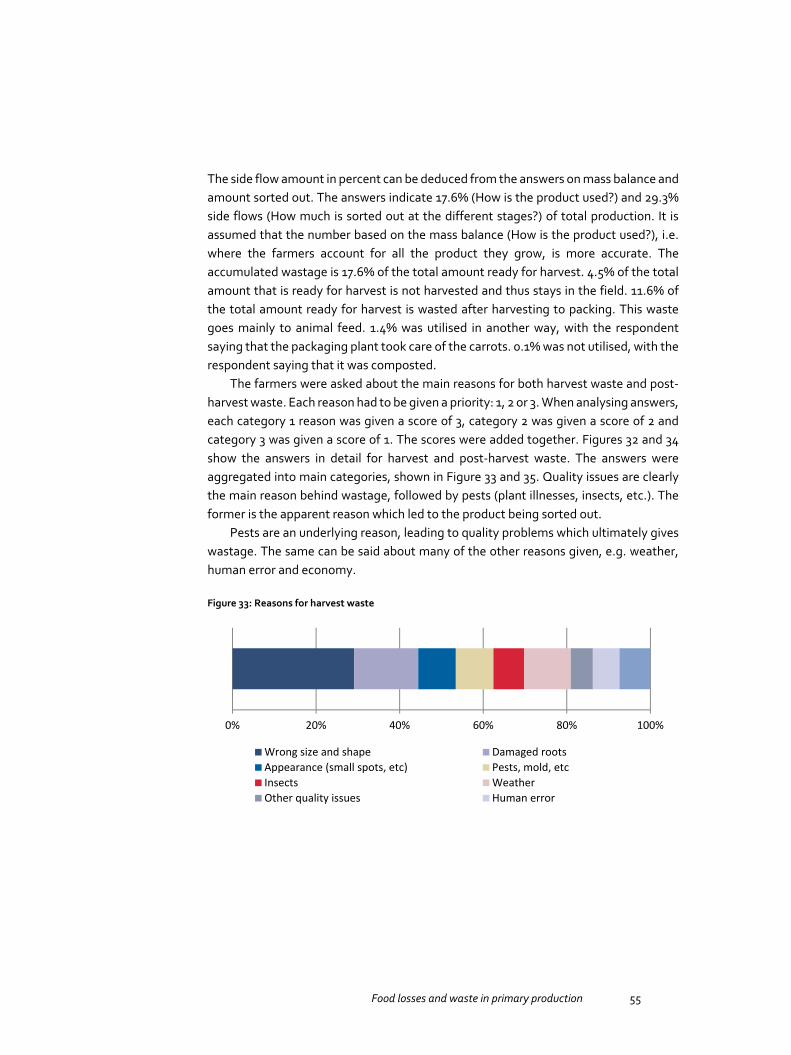
Food losses and waste in primary production 55
The side flow amount in percent can be deduced from the answers on mass balance and amount sorted out. The answers indicate 17.6% (How is the product used?) and 29.3% side flows (How much is sorted out at the different stages?) of total production. It is assumed that the number based on the mass balance (How is the product used?), i.e. where the farmers account for all the product they grow, is more accurate. The accumulated wastage is 17.6% of the total amount ready for harvest. 4.5% of the total amount that is ready for harvest is not harvested and thus stays in the field. 11.6% of the total amount ready for harvest is wasted after harvesting to packing. This waste goes mainly to animal feed. 1.4% was utilised in another way, with the respondent saying that the packaging plant took care of the carrots. 0.1% was not utilised, with the respondent saying that it was composted.
The farmers were asked about the main reasons for both harvest waste and post-harvest waste. Each reason had to be given a priority: 1, 2 or 3. When analysing answers, each category 1 reason was given a score of 3, category 2 was given a score of 2 and category 3 was given a score of 1. The scores were added together. Figures 32 and 34 show the answers in detail for harvest and post-harvest waste. The answers were aggregated into main categories, shown in Figure 33 and 35. Quality issues are clearly the main reason behind wastage, followed by pests (plant illnesses, insects, etc.). The former is the apparent reason which led to the product being sorted out.
Pests are an underlying reason, leading to quality problems which ultimately gives wastage. The same can be said about many of the other reasons given, e.g. weather, human error and economy.
Figure 33: Reasons for harvest waste
0% 20% 40% 60% 80% 100%
Wrong size and shape Damaged rootsAppearance (small spots, etc) Pests, mold, etcInsects WeatherOther quality issues Human error
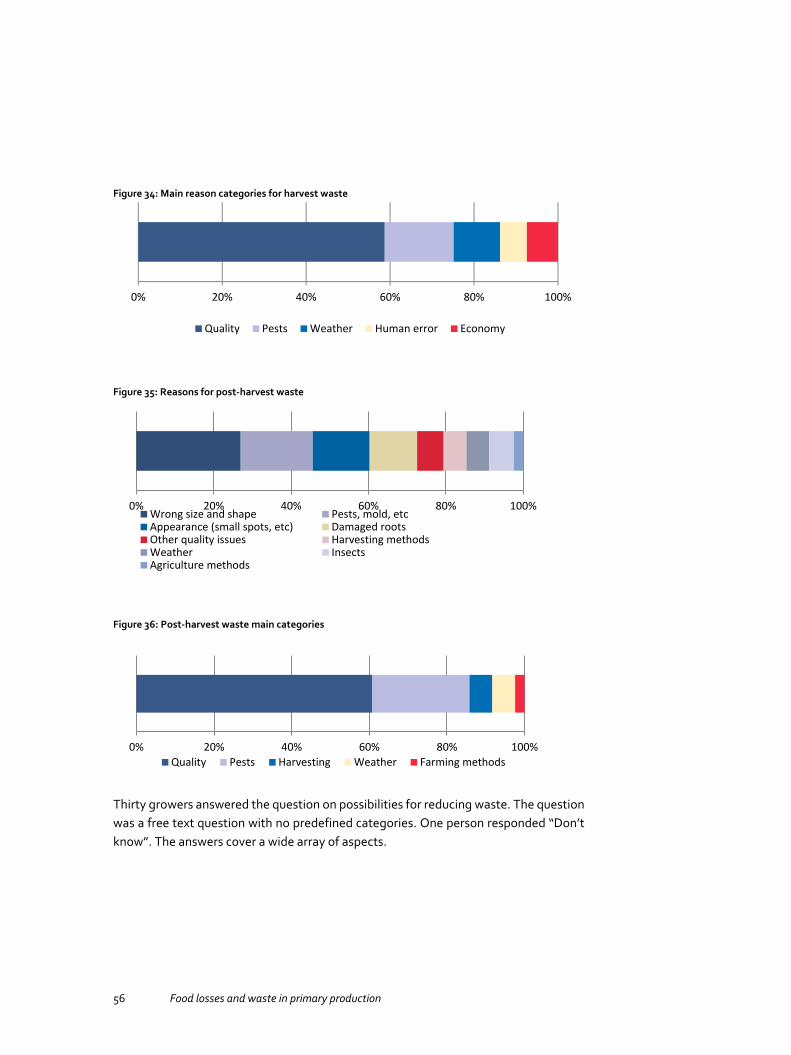
56 Food losses and waste in primary production
Figure 34: Main reason categories for harvest waste
Figure 35: Reasons for post-harvest waste
Figure 36: Post-harvest waste main categories
Thirty growers answered the question on possibilities for reducing waste. The question was a free text question with no predefined categories. One person responded “Don’t know”. The answers cover a wide array of aspects.
0% 20% 40% 60% 80% 100%
Quality Pests Weather Human error Economy
0% 20% 40% 60% 80% 100%Wrong size and shape Pests, mold, etcAppearance (small spots, etc) Damaged rootsOther quality issues Harvesting methodsWeather InsectsAgriculture methods
0% 20% 40% 60% 80% 100%Quality Pests Harvesting Weather Farming methods
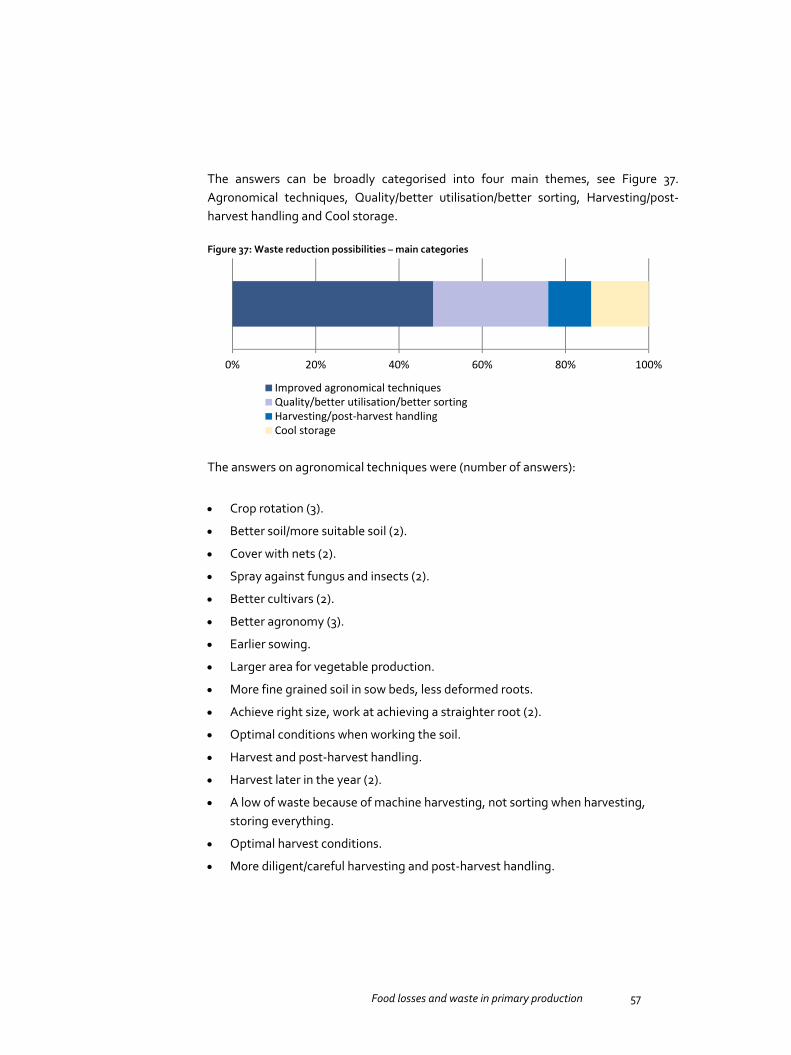
Food losses and waste in primary production 57
The answers can be broadly categorised into four main themes, see Figure 37. Agronomical techniques, Quality/better utilisation/better sorting, Harvesting/post-harvest handling and Cool storage.
Figure 37: Waste reduction possibilities – main categories
The answers on agronomical techniques were (number of answers):
Crop rotation (3).
Better soil/more suitable soil (2).
Cover with nets (2).
Spray against fungus and insects (2).
Better cultivars (2).
Better agronomy (3).
Earlier sowing.
Larger area for vegetable production.
More fine grained soil in sow beds, less deformed roots.
Achieve right size, work at achieving a straighter root (2).
Optimal conditions when working the soil.
Harvest and post-harvest handling.
Harvest later in the year (2).
A low of waste because of machine harvesting, not sorting when harvesting, storing everything.
Optimal harvest conditions.
More diligent/careful harvesting and post-harvest handling.
0% 20% 40% 60% 80% 100%
Improved agronomical techniquesQuality/better utilisation/better sortingHarvesting/post-harvest handlingCool storage

58 Food losses and waste in primary production
Cool storage.
Better storage.
Storage climate.
New cool storage.
Upgrade cool storage.
Quality/better utilisation/better sorting.
Accept different shaped product.
Utilise a larger share of the product.
Bent and short roots are also food.
Sharp focus on cosmetically perfect products.
Better utilisation of product, e.g. by cutting off the damaged part.
Utilise product with what is currently considered the wrong shape; the taste is just good as those with the right shape.
The current quality requirements are good.
Better sorting at packing plant. Thirty-three people responded to the question of “Could the product that was sorted out have been used for human consumption?”. The average minimum answer was 32% (standard deviation 25.0), and the average maximum answer was 45% (standard deviation 32.1).
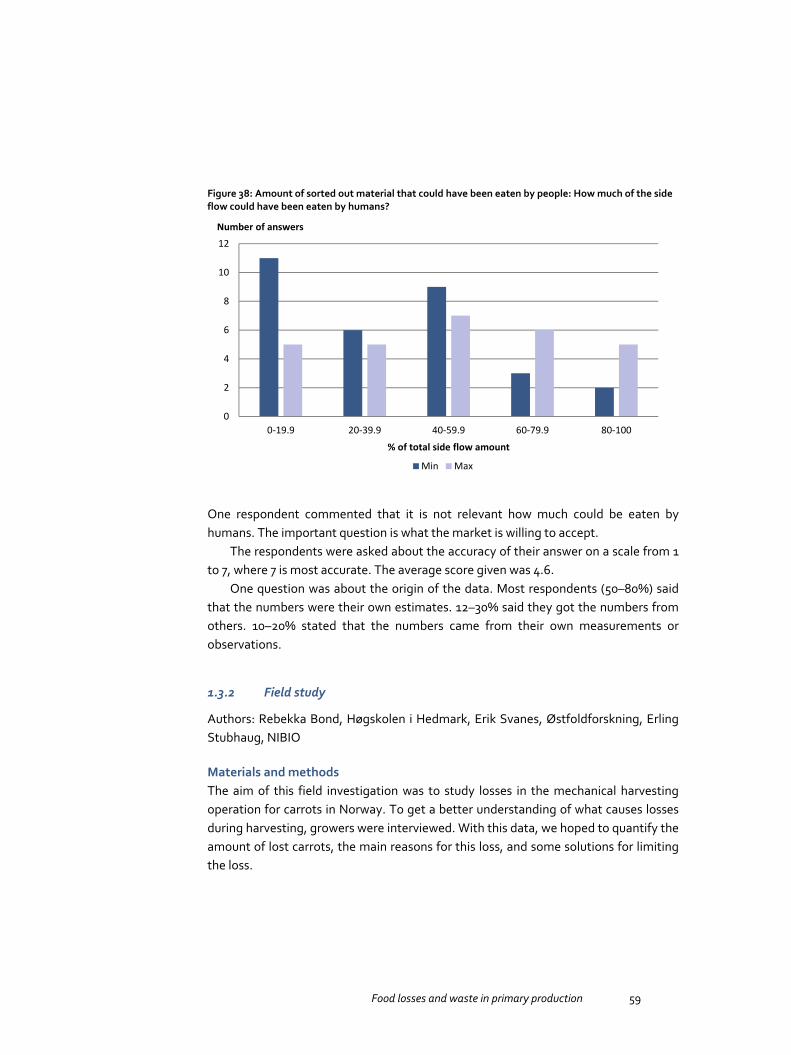
Food losses and waste in primary production 59
Figure 38: Amount of sorted out material that could have been eaten by people: How much of the side flow could have been eaten by humans?
One respondent commented that it is not relevant how much could be eaten by humans. The important question is what the market is willing to accept.
The respondents were asked about the accuracy of their answer on a scale from 1 to 7, where 7 is most accurate. The average score given was 4.6.
One question was about the origin of the data. Most respondents (50–80%) said that the numbers were their own estimates. 12–30% said they got the numbers from others. 10–20% stated that the numbers came from their own measurements or observations.
1.3.2 Field study
Authors: Rebekka Bond, Høgskolen i Hedmark, Erik Svanes, Østfoldforskning, Erling Stubhaug, NIBIO
Materials and methods The aim of this field investigation was to study losses in the mechanical harvesting operation for carrots in Norway. To get a better understanding of what causes losses during harvesting, growers were interviewed. With this data, we hoped to quantify the amount of lost carrots, the main reasons for this loss, and some solutions for limiting the loss.
0
2
4
6
8
10
12
0-19.9 20-39.9 40-59.9 60-79.9 80-100
% of total side flow amount
Min Max
Number of answers

60 Food losses and waste in primary production
The data collection was conducted during the 2015 harvest season at 12 different carrot field locations in the eastern part of Norway (more detailed description in Table 10). In the period from 21 September to 14 October 2015, the 12 fields were investigated for waste of carrots in the field after mechanical harvesting.
Table 10: Field locations and further agricultural information
Field Place Date Soil Condition Variety Machine
1 Romedal 13 Oct Moraine Dry Triton 130 D 2 Stange 13 Oct Muck soil Dry Romance Standard 3 Romedal 30 Sep Muck soil Dry Romance Standard 4 Ridabu 25 Sep Muck soil Wet Romance Standard 5 Stange 28 Sep Moraine Dry Panter T250 6 Stange 28 Sep Moraine Dry Rainbow T250 7 Lågendalen 21 Sep Silty sand Very wet Romance T250 8 Romedal 14 Oct Moraine Dry Nominator Standard 9 Ridabu 13 Oct Moraine Dry Namdal Standard 10 Lågendalen 22 Sep Silt Very wet Nominator T250 11 Oppakermoen 21 Sep Silty clay loam Wet Romance T250 12 Oppakermoen 21 Sep Silty clay loam Wet Romance T250
Figure 39: The harvester machine, Asa-Lift harvester T250
Photo: E. Stubhaug.

Food losses and waste in primary production 61
Mechanical harvesting was performed using different “Asa-Lift” harvesting machines with three different models performing top lift harvesting, Asa-Lift A/S Dianalund, Denmark. The two main differences between the models were the automation of several devices (Table 11).
Table 11: Some specifications in the different top-lifter models
Model T250 Standard D130 T140B
Two row lifter Yes No Yes no Manual out grading at sorting table No Yes No no Automatic gathering belt speed Yes No Yes Yes Automatic steering of torpedoes Yes No Yes Yes Automatic share depth Yes No Yes Yes
The harvesting process involves numerous operating procedures. The location, functions, movement and controls of these segments are not easy. It takes time to master this. These segments require continuous monitoring to obtain a high degree of efficiency during harvesting. The machines have a variety of settings and adjustments to accommodate a variety of crops, soils and moisture conditions. The settings require adjustment according to the operating conditions in the field (ASA-Lift A/S).
In cases where many carrots are left on the ground, it is our experience from direct observation that the main cause is that the equipment has not been properly adjusted to the conditions in the field. Examples of important adjustments include share depth and width. Different soil conditions require different settings. The foliage gathering belt and the torpedo width and angle adjustments also need specific adjustments according to the conditions in the field (ASA-Lift A/S).
Ground speed and gathering belt speed adjustments are important points for reducing loss in the field. The best results are obtained when the gathering belts are set to move 10% faster than the ground speed. This allows the belt to clamp onto the foliage just as the share loosens the soil and lifts the carrots out of the ground. If the belts run faster, they can break the foliage from the carrot before the soil has been loosened and the carrot will not be picked up. If the belts run too slowly, some foliage will slip through the belts and be missed or grabbed too high and go through the topers without being topped. The digging depth of the share can also affect the loss. If it is set too shallow, it cuts off the tips and parts of carrots are left in the field (ASA-Lift A/S).

62 Food losses and waste in primary production
Figure 40: Foliage gathering belt and share. Torpedoes
Photo: ASA LIFT A/S.
Baskets for collecting carrots, tape measure, rope and sticks for marking the area and a digging fork, ensuring digging without further damage of the roots, scale with two digits.
The fields were harvested the same day or the day before the investigation was conducted. First, three random areas of the field were selected, each measuring 6 m x 1.5 m. Ideally, the location was on the last harvested row, to prevent the location from being compacted by field machines. The area was dug with a digging fork to a depth of 30–40 cm (the depth of the share). All carrots within the plot were collected in plastic baskets. The carrots were counted and weighed. Yield samples were collected in an unharvested row, preferably next to the location where the loss sample was measured by registering the weight of carrots in a 1 metre row, and this was repeated 3 times. In both cases, leaves and soil were removed before weighing. Notes were made on harvester model, soil type and soil water content during harvest, grower and crop variety. See attachment no. 1.
Statistical analyses were performed using Excel.
Figure 41: From the investigation work in the field
Photo: E. Stubhaug.

Food losses and waste in primary production 63
Figure 42: Yield sample, loss sample area, counting and overview of loss sample
Results The carrots left in the field revealed variations within each field, as shown in Table 12. There was a large variation in terms of loss within individual fields (1.5–9.1%). The average loss was 4.6 percent (±0.7%), representing 390 kg/dekar (± 53 kg). A dekar is a unit often used in Norway, which equals 0.1 hectare. Our numbers for average loss in the field have been estimated as the percentage of carrots left in the field compared to gross yield. The measured gross yield was found to be about 8 tonnes per dekar. No correlation could be found between parameters such as harvester model, soil type and soil conditions during harvest, grower or crop variety. We found no P-values under 0.21.
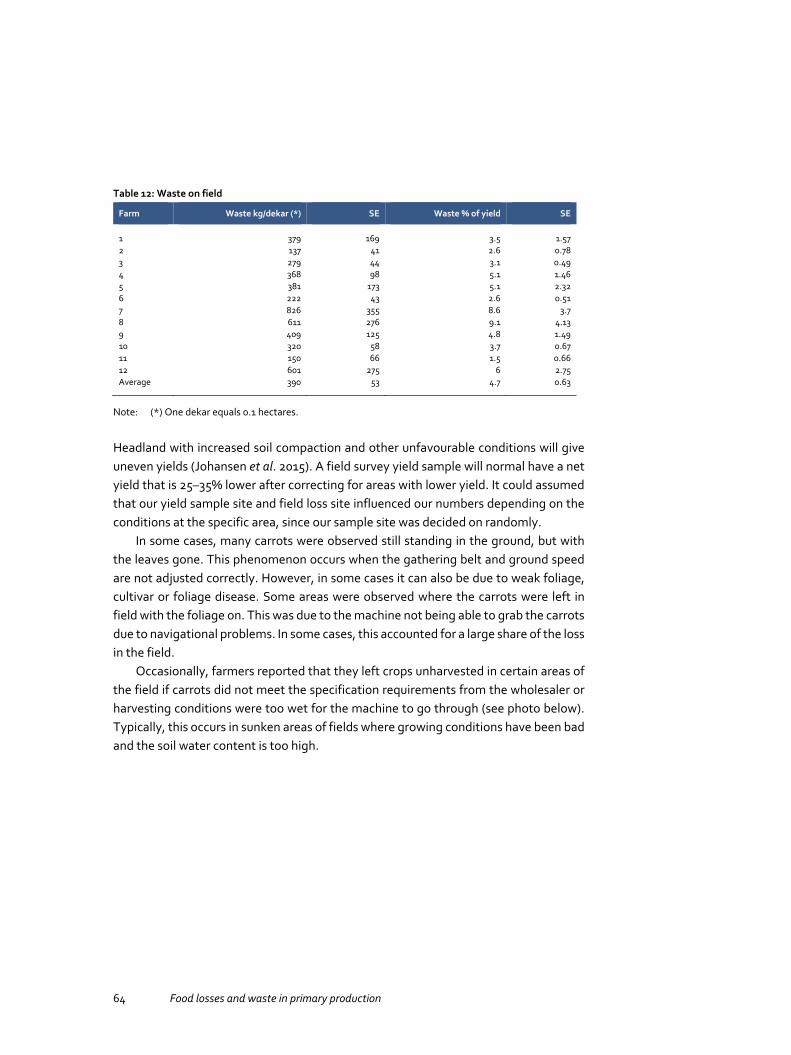
64 Food losses and waste in primary production
Table 12: Waste on field
Farm Waste kg/dekar (*) SE Waste % of yield SE
1 379 169 3.5 1.57 2 137 41 2.6 0.78 3 279 44 3.1 0.49 4 368 98 5.1 1.46 5 381 173 5.1 2.32 6 222 43 2.6 0.51 7 826 355 8.6 3.7 8 611 276 9.1 4.13 9 409 125 4.8 1.49 10 320 58 3.7 0.67 11 150 66 1.5 0.66 12 601 275 6 2.75 Average 390 53 4.7 0.63
Note: (*) One dekar equals 0.1 hectares.
Headland with increased soil compaction and other unfavourable conditions will give uneven yields (Johansen et al. 2015). A field survey yield sample will normal have a net yield that is 25–35% lower after correcting for areas with lower yield. It could assumed that our yield sample site and field loss site influenced our numbers depending on the conditions at the specific area, since our sample site was decided on randomly.
In some cases, many carrots were observed still standing in the ground, but with the leaves gone. This phenomenon occurs when the gathering belt and ground speed are not adjusted correctly. However, in some cases it can also be due to weak foliage, cultivar or foliage disease. Some areas were observed where the carrots were left in field with the foliage on. This was due to the machine not being able to grab the carrots due to navigational problems. In some cases, this accounted for a large share of the loss in the field.
Occasionally, farmers reported that they left crops unharvested in certain areas of the field if carrots did not meet the specification requirements from the wholesaler or harvesting conditions were too wet for the machine to go through (see photo below). Typically, this occurs in sunken areas of fields where growing conditions have been bad and the soil water content is too high.

Food losses and waste in primary production 65
Figure 43: Unharvested areas – the conditions are too wet for the machine
Photos: E. Stubhaug.
Discussion The average amount of carrots left in the field after harvest was 4.6 percent (390 kg/dekar). This study did not consider piles of carrots due to problems with filling the boxes, or rows and parts of fields that remained unharvested due to difficult soil condition. In our experience, this amount of carrots does not normally represent a significant proportion of total losses. The farmers also did not consider this to be a major problem. However, this means that the registered loss has probably been underestimated in this study.
A major problem in this kind of investigation is that we had to use a lot of resources to carry it out, especially in the form of man-hours. The number of fields was also very low in comparison with the total area used for carrot growing in Norway. This means that the harvest loss result probably is very uncertain.
The fact that large variations were found between farmers and fields and that important external factors (e.g. weather, especially precipitation) can vary substantially from year to year adds to the already high degree of uncertainty. The result indicates a much higher loss than that estimated by farmers in a previous study (Franke et al. 2013). This indicates that farmers systematically underestimate the amount of carrots lost during harvesting.
The interviews and direct observations in the field gave a good insight into the reasons for harvest losses. Without investigating further, it is hard to determine how much waste is caused by each reason, but some main reasons could be identified. Adjustment and operation of harvesters and strength of carrot foliage are the most important reasons, and the occurrence of weed is another. Weather conditions during harvesting can also cause carrot loss, and sometimes entire fields must be left unharvested because the machines cannot operate in very wet conditions.

66 Food losses and waste in primary production
The interviews and observations pointed to several possible options for reducing carrot harvest loss. However, some solutions for reducing waste in the field are more important than others. Improved maintenance and adjustments to the harvester are important reasons. Choosing the right cultivar and keeping diseases and weeds at a minimum level are also important and well-known strategies for minimising field waste.
The growers want to obtain a high yield, and as the growing season in many places in Norway and in particular in some years may be very short, the farmers want to extend the season as much as possible. This means that the start of harvesting is often a little too late. This increases the risk of wet and difficult conditions for the heavy machinery. The recommendation is that growers should not be so optimistic about conditions late in the season and should instead start harvesting a little earlier than what they consider the optimal time.
One way of reducing the amount left is to commence harvesting earlier in the autumn. Several farmers have taken losses into account and have adopted a strategy to grow more carrots than needed in contracts to be sure of having enough to deliver.
Close monitoring of the harvester and choosing a cultivar with strong foliage are the most effective measures for reducing field waste. One major potential for improvement identified was more careful manoeuvring of the harvester. It should be noted that the sometimes large variations within a field means that adjustment should ideally be done several times in order to reduce losses. The farmers reported that hiring an additional person or spending more time adjusting and monitoring the machine could cost more than the value of reducing carrot loss in field.
1.3.3 Interviews
In addition talking to the farmers on site during the field investigations, primary data was also gathered through informal semi-structured interviews held with the farmers. These interviews were conducted either face to face or by telephone after the harvest season had ended. Semi-structured informal interviews were chosen as a method of research to avoid restricting interviewees to answering questions within a strict format.
Secondary data was gathered via desktop research and communication with industry experts.
In general, growers were aware of the many choices that could affect losses during harvesting. For instance, optimal manoeuvring of the harvester was the most common reason given. This can be more difficult when the machine is bigger and the field is too small for good manoeuvring. This means that more of the field will remain unharvested.
The variations within a field due to different growing and harvesting conditions in general were mentioned by many farmers as a major disadvantage. For instance,

Food losses and waste in primary production 67
carrots can vary in size and shape because of differences in soil and water conditions within the field. This can make adjustment choices even more difficult. Where there are large field variations, adjustments can force the farmer to make some compromises in trying to find an optimal medium.
Choosing the right cultivar was also an important aspect for the farmer, and choosing a cultivar with strong foliage reduced the risk of waste in the field. Farmers were satisfied with the cultivars available on the market.
Weed problems was mentioned by most farmers as a significant problem regarding harvest loss. This was due to the weeds becoming tangled up in the harvester and requiring additional stops to remove the weeds. Every stop was mentioned as a risk of increasing the loss. After a stop, the machine requires several metres before functioning optimally. This was also the case in stony fields whenever big rocks struck the shear and manual adjustments were needed. Additional stops are also costly due to extra time spent.
Having additional workers on the machine during the harvest helps reduce wastage. In those cases where the harvester had a sorting table with workers present, this also functioned as a guard to prevent anything happening with the harvester. They recognised what was wrong and alerted the driver so the harvester could stop and deal with the problem. Several farmers who had changed from a smaller machine to a larger one without a sorting table mentioned that not having a person paying attention at the back is a disadvantage. Some growers solved this problem by having a worker walking alongside the machine to check that everything was adjusted correctly. However, this was not easy to do often enough to prevent every problem from occurring.
The interviews showed that, in general, the farmers were not concerned about the loss of carrot yield during mechanical harvest. However, the farmers who had recently changed to new harvesters were more concerned about loss in the field and ensuring good routines and making sure that the harvester’s adjustments were right. When the growers were familiar with their own machines, they became less concerned. The farmers were aware that losses occur during harvest. They considered this when estimating the amount to sow in the spring. Some farmers plan to grow far more carrots than needed, some up to 30–50% more than the contracted amount, to ensure supply in the event of a bad season with a high amount of carrot loss during harvesting and storage.

68 Food losses and waste in primary production
1.4 Carrot side flow in Denmark
1.4.1 Questionnaire
Author(s): The Danish Agrifish Agency
Materials and methods, Sample The questionnaire was generally relatively unclear and suffered due to a poor translation into Danish. There were multiple examples of words and phrases that were difficult for the respondents to understand. For example the word “sidestrømning” (side flows) was used to mean carrots which ended up being used as non-foods. The word is not a Danish word and is not self-explanatory.
Responses have been removed from further reporting if the respondent did not grow the crop in question.
There has been no altering of responses. This would require knowledge of the correct answer, which we do not have.
Responses which were marked as “answered” but which did not contain any information (i.e. empty responses) have also been removed. Thus the number of answers are the answers that contained information.
The response frequency for the questionnaire is presented in Table 13.
Table 13: Response frequency
Response
No. of distributed questionnaires 53 No. of answers 17 Response frequency 32% Frequency of producers among answers 100%
The questionnaire included the following questions about the farms (Tables 14–24). The tables show the distribution of producers in absolute numbers (“no. Of producers”) and as percentage of the total number of producers who completed the questionnaire (“frequency of producers”).
There are very few respondents in this questionnaire, which gives low statistical validity, especially when considering groupings and the fact that all of the questions have a response rate < 100%, i.e. Not all producers completed all parts of the questionnaire.
There is a fundamental problem with this question in that the possible answer categories are neither mutually exclusive nor exhaustive.

Food losses and waste in primary production 69
Figure 44: Distribution of producer’s total farmland
Table 14: Is agriculture your main source of income?
No. Of producers Frequency of producers
Yes 13 76% No 4 24%
Table 15: Is your carrot production conventional or organic?
No. Of producers Frequency of producers
Conventional 10 59% Organic 7 41%
Table 16: Are your carrots produced for one specific buyer (e.g. a specific company)?
No. Of producers Frequency of producers
Yes 8 47% No 9 53%
43
10
10 0 0
10
2
0
5
No. of CG

70 Food losses and waste in primary production
Table 17: Do you use crop rotation?
No. Of producers Frequency of producers
Yes 14 82% No 2 12%
Table 18: Do you rent fields from other farms?
No. Of producers Frequency of producers
Yes, I use new fields every year to avoid carrot fleas (Trioza apicalis) or for other reasons.
4
24%
Yes, I rent some fields but only in the local area. 7
41%
No, I only use my own fields. 5
29%
Figure 45: Frequency of producers who perform cultivation/handling step
Note: *Other was specified as “sale to farm shops, markets or others” and “sale of subscription boxes”.
The average response frequency was 78%.
94%
71%
41%
12%
47%
41%
6%
24%
35%
12%
Cultivation
Storage
Washing
Polishing
Sorting
Packing
Processing (e.g. peeling)
Transport
Direct sale (farm shop)
Other*

Food losses and waste in primary production 71
Table 19: Other questions related to production
Average Response frequency
Amount of total harvest stored by producer (%)
45.5% 65%
Average business turnover per year on producer’s farm (subsidies and taxes not included)
DKK 9.5 million 71%
Average business turnover per year from carrot production on producer’s farm (subsidies and taxes not included)
22.8% 71%
Note: There was a question on how much time per year the producer spent on his/her carrot production. The question was poorly worded and the answers were inconsistent, one major problem being the use of “full time months per year” as a measurement, which is not a readily available number for most employers/farmers. The question was therefore not included in this report.
Figure 46: Frequency of producers who send carrots for a given purpose
Note: *Specified as “own consumption”.
When farmers were asked about the amount of food carrots produced, producers were asked to base their answers on the past five years if possible. This presents a problem in the evaluation of the answers, since there is no indication of whether the answer relates to the total for the past five years, the average for the past five years, the average for 2, 3 or 4 past years, or just the most recent year. Different lengths of time will make the answers incomparable, since different market and harvest conditions must be assumed for different lengths of time.
29%
18%
12%
18%
29%
24%
12%
6%
Packing
Directly to wholesale
Directly to retail shops
Market places
Farm shops/directly to consumers
Directly to industry
Online sale
Other*
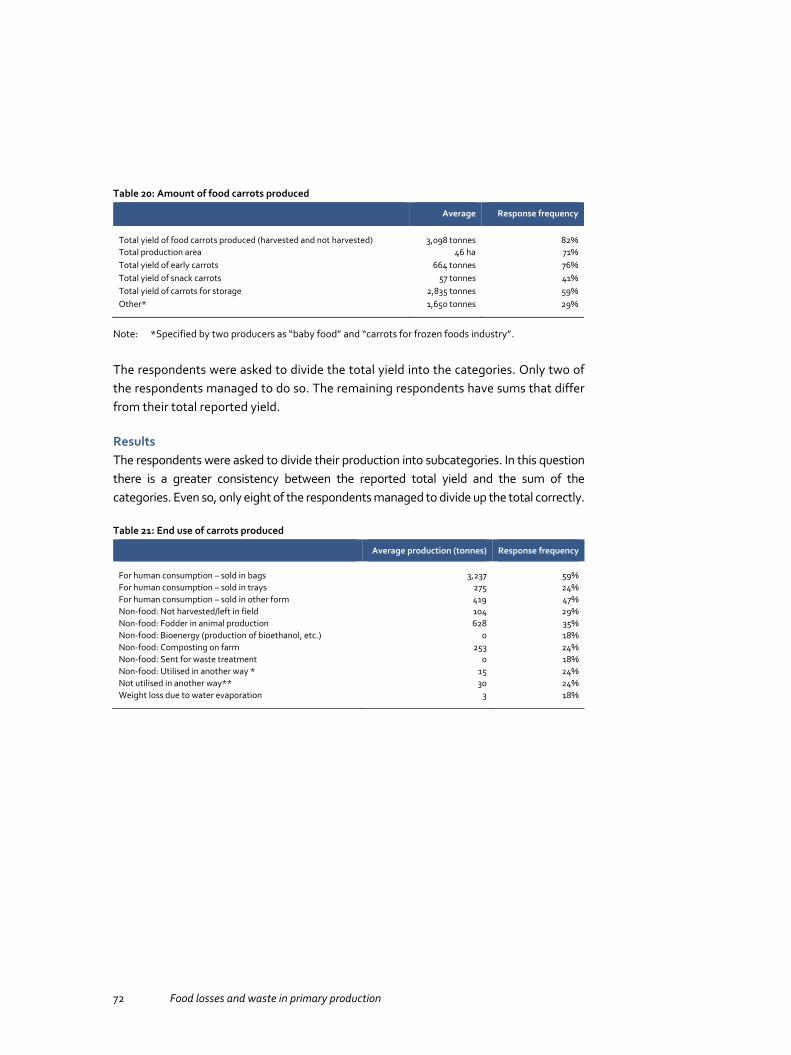
72 Food losses and waste in primary production
Table 20: Amount of food carrots produced
Average Response frequency
Total yield of food carrots produced (harvested and not harvested) 3,098 tonnes 82% Total production area 46 ha 71% Total yield of early carrots 664 tonnes 76% Total yield of snack carrots 57 tonnes 41% Total yield of carrots for storage 2,835 tonnes 59% Other* 1,650 tonnes 29%
Note: *Specified by two producers as “baby food” and “carrots for frozen foods industry”.
The respondents were asked to divide the total yield into the categories. Only two of the respondents managed to do so. The remaining respondents have sums that differ from their total reported yield.
Results The respondents were asked to divide their production into subcategories. In this question there is a greater consistency between the reported total yield and the sum of the categories. Even so, only eight of the respondents managed to divide up the total correctly.
Table 21: End use of carrots produced
Average production (tonnes) Response frequency
For human consumption – sold in bags 3,237 59% For human consumption – sold in trays 275 24% For human consumption – sold in other form 419 47% Non-food: Not harvested/left in field 104 29% Non-food: Fodder in animal production 628 35% Non-food: Bioenergy (production of bioethanol, etc.) 0 18% Non-food: Composting on farm 253 24% Non-food: Sent for waste treatment 0 18% Non-food: Utilised in another way * 15 24% Not utilised in another way** 30 24% Weight loss due to water evaporation 3 18%

Food losses and waste in primary production 73
Table 22: More questions on non-food carrots
Average Response frequency
Estimated fraction of non-food carrots which could have been used for food at the time when they were taken out of the food chain
17% 41%
Estimate uncertainty of answers on non-food carrots (scale 1–7, 1 meaning “poor estimate” and 7 meaning “very good estimate”)
4 53%
Estimate uncertainty of answers on non-food carrots which could have been used for food 4 53%
Table 23: During which cultivation/handling step were carrots produced for human food, but not used for human food, sorted out?
Average % of total non-food carrot production Response frequency
In field 9 41% During sorting 54 41% Storage 6 18% Washing 8 24% Packing (own carrots) 2 24% Transport/logistics 1 12% Refund and marketing 1 18% Other* 33 18%
Note: This question was very poorly worded and seemed to give rise to confusion among the respondents.
Table 24: Producer’s carrot production in 2012
Average Response frequency
Total yield 2,292 tonnes 65% Total cultivated land 38 ha 59% Amount of non-foods of total yield 5% 35%
Producers were asked to choose three main reasons for loss during harvest. The numbers indicate how any producers made the given prioritisation.

74 Food losses and waste in primary production
Table 25: Three main reasons for loss during harvest
Most important
Second most important
Third most important
Response frequency
Plant diseases, mould, germinated, injured 2 0 1 18% Pests (insects, birds, etc.) 2 3 1 35% Weather conditions 1 1 1 24% Cultivation method and crop protection 1 0 1 12% Harvest method 2 2 1 29% Processing processes 1 0 0 6% Wrong size/carrot shape 6 1 1 47% Appearance (small spots, etc.) 2 3 1 35% Other quality errors 1 0 1 12% Surplus production 0 0 2 12% Human error 1 0 0 6% No buyers 1 0 0 6% Not economically profitable 0 0 1 6% Other reasons 0 0 0 0%
Producers were asked which challenges, obstacles and opportunities existed for utilising non-food carrots on their farms. One producer answered. The answer was “Spread it on the field to give fertiliser value”.
Food losses and waste in primary production 75
2. Onion side flow
Onion side flow amounts in primary production and flow treatments, causes and measures to reduce these side flows are summarised in Tables 26 and 27. The results show that there is quite a lot of onion side flow in each country, ranging from 8% to 17%, and most of this side flow occurs after harvest, e.g. when sorting and storing onions.
It should be noted that the case studies, Subchapters 2.1.–2.4., are independent studies that vary in study design, execution, data management and data interpretation. Additionally, the sample sizes in all cases are relatively small, and some case studies do not show any results for the representativeness of the sample. For these reasons, the results are rather vague (they contain a high degree of uncertainty) and countries cannot be compared with each other. All in all, the results should be regarded as indicative and more comprehensive studies are needed to address the uncertainties.
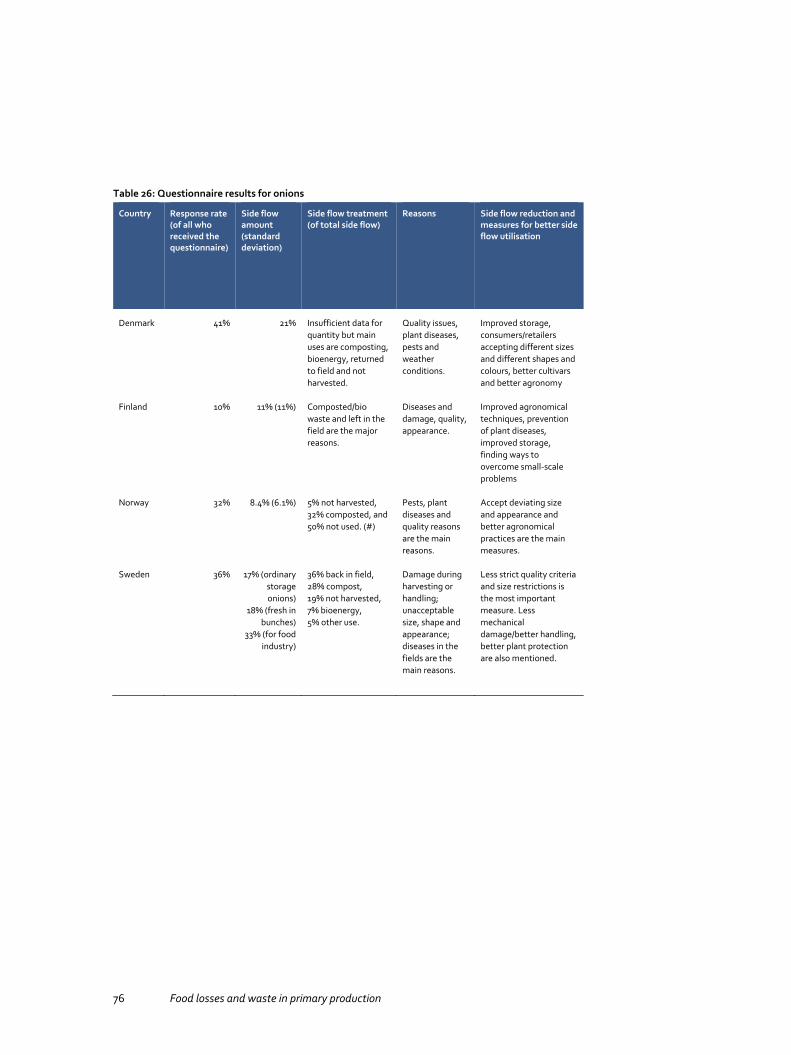
76 Food losses and waste in primary production
Table 26: Questionnaire results for onions
Country Response rate (of all who received the questionnaire)
Side flow amount (standard deviation)
Side flow treatment (of total side flow)
Reasons Side flow reduction and measures for better side flow utilisation
Denmark 41% 21% Insufficient data for quantity but main uses are composting, bioenergy, returned to field and not harvested.
Quality issues, plant diseases, pests and weather conditions.
Improved storage, consumers/retailers accepting different sizes and different shapes and colours, better cultivars and better agronomy
Finland 10% 11% (11%) Composted/bio waste and left in the field are the major reasons.
Diseases and damage, quality, appearance.
Improved agronomical techniques, prevention of plant diseases, improved storage, finding ways to overcome small-scale problems
Norway 32% 8.4% (6.1%) 5% not harvested, 32% composted, and 50% not used. (#)
Pests, plant diseases and quality reasons are the main reasons.
Accept deviating size and appearance and better agronomical practices are the main measures.
Sweden 36% 17% (ordinary storage onions)
18% (fresh in bunches)
33% (for food industry)
36% back in field, 28% compost, 19% not harvested, 7% bioenergy, 5% other use.
Damage during harvesting or handling; unacceptable size, shape and appearance; diseases in the fields are the main reasons.
Less strict quality criteria and size restrictions is the most important measure. Less mechanical damage/better handling, better plant protection are also mentioned.
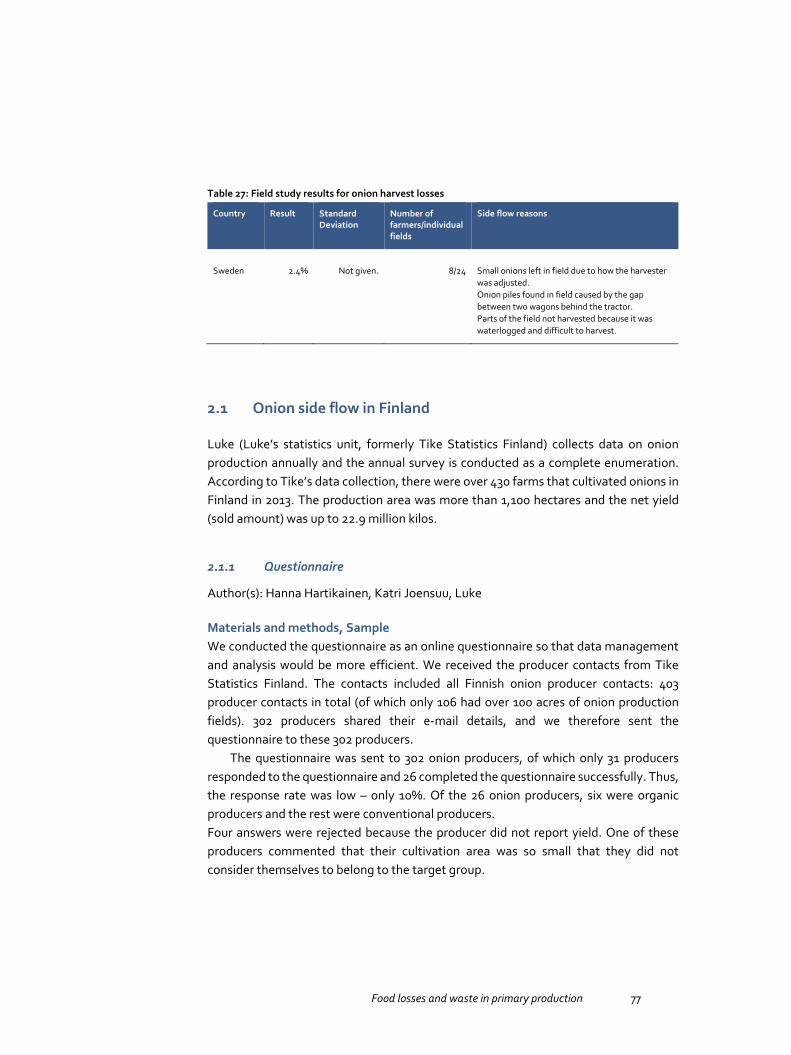
Food losses and waste in primary production 77
Table 27: Field study results for onion harvest losses
Country Result Standard Deviation
Number of farmers/individual fields
Side flow reasons
Sweden 2.4% Not given. 8/24 Small onions left in field due to how the harvester was adjusted. Onion piles found in field caused by the gap between two wagons behind the tractor. Parts of the field not harvested because it was waterlogged and difficult to harvest.
2.1 Onion side flow in Finland
Luke (Luke’s statistics unit, formerly Tike Statistics Finland) collects data on onion production annually and the annual survey is conducted as a complete enumeration. According to Tike’s data collection, there were over 430 farms that cultivated onions in Finland in 2013. The production area was more than 1,100 hectares and the net yield (sold amount) was up to 22.9 million kilos.
2.1.1 Questionnaire
Author(s): Hanna Hartikainen, Katri Joensuu, Luke
Materials and methods, Sample We conducted the questionnaire as an online questionnaire so that data management and analysis would be more efficient. We received the producer contacts from Tike Statistics Finland. The contacts included all Finnish onion producer contacts: 403 producer contacts in total (of which only 106 had over 100 acres of onion production fields). 302 producers shared their e-mail details, and we therefore sent the questionnaire to these 302 producers.
The questionnaire was sent to 302 onion producers, of which only 31 producers responded to the questionnaire and 26 completed the questionnaire successfully. Thus, the response rate was low – only 10%. Of the 26 onion producers, six were organic producers and the rest were conventional producers. Four answers were rejected because the producer did not report yield. One of these producers commented that their cultivation area was so small that they did not consider themselves to belong to the target group.

78 Food losses and waste in primary production
When comparing the sample to all onion producers in Finland, it was found out that the sample represents around 16.5% of the onion production in Finland (the total yield of the producers in the sample was almost 3.8 million kilos per year). The geographical representativeness of the sample was fairly good since there were producers from 12 of the 16 provinces that have onion production (see Figure 47). Additionally, the average onion acreage of the sample was higher than the Finnish average onion production acreage, at 736 acres compared to the Finnish average of 333 acres.
Figure 47: The geographical representativeness of the sample
Results For the sample of 26 onion producers, 89% (weighted average) of the onion yield is sold for human consumption (Figure 47). The rest, 11%, is side flow. The results also show a fairly significant variation between the producers: the side flow varies between 0% and 50%, and the standard deviation is as high as 11% (Figure 48). The respondents estimated that the side flow suitable for the food chain is on average somewhere between 2% and 5% of total production (range 0–15%). Side flow occurred most often during sorting (weighted averages): 59% of the side flow occurred during sorting (after harvest), 14% during storing, and around 18% was left in the field/sorted out during harvest.
0,00 0,10 0,20 0,30 0,40 0,50
UusimaaVarsinais-Suomi
SatakuntaHäme
PirkanmaaKaakkois-Suomi
Etelä-SavoPohjois-Savo
Pohjois-KarjalaKeski-Suomi
Etelä-PohjanmaaPohjanmaa
Pohjois-PohjanmaaKainuu
LappiAhvenanmaa - Åland
Sample Finland total

Food losses and waste in primary production 79
Figure 48: The shares of onion yield used for food (primary purpose) and the amount that ends up as side flow = non-food purpose/not used
Furthermore, the uses of the side flow are (weighted averages): 18% is left in the field and 64% is composted/ends up in biowaste (Figure 49).
0% 10% 20% 30% 40% 50% 60% 70% 80% 90% 100%
Farmer 1
Farmer 3
Farmer 5
Farmer 7
Farmer 9
Farmer 11
Farmer 13
Farmer 15
Farmer 17
Farmer 19
Farmer 21
Farmer 23
Farmer 25
Average (weighted)
Primary use, food Sideflow (used as non-food/not used)
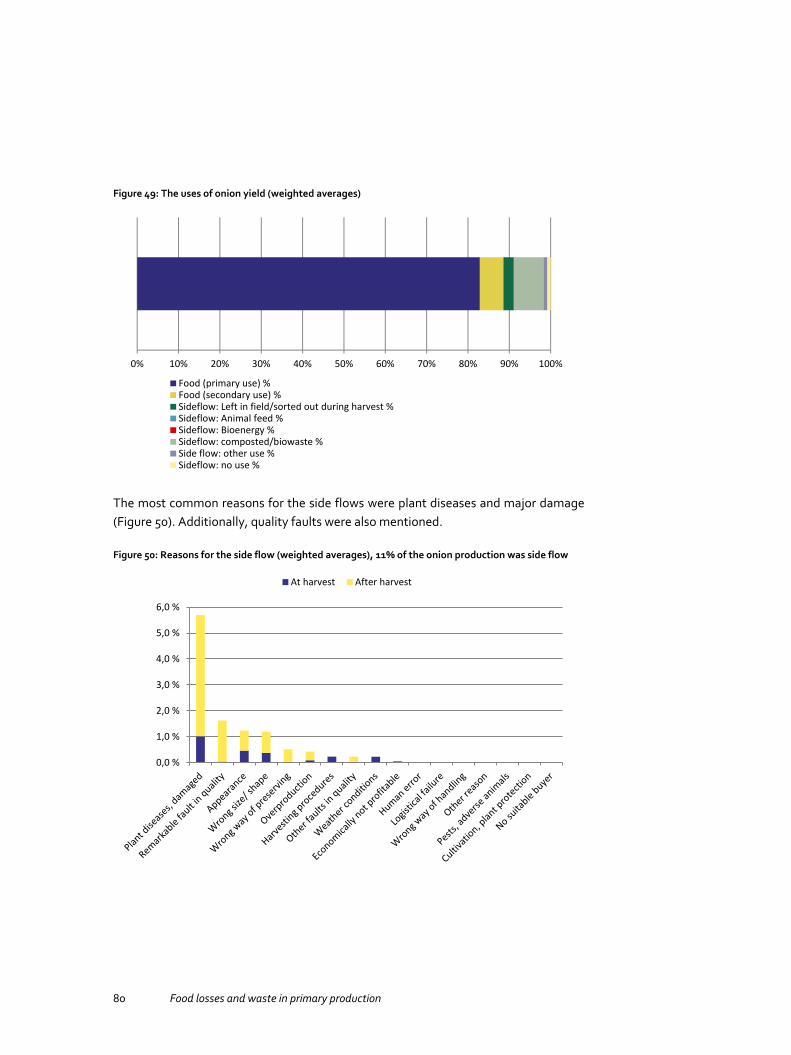
80 Food losses and waste in primary production
Figure 49: The uses of onion yield (weighted averages)
The most common reasons for the side flows were plant diseases and major damage (Figure 50). Additionally, quality faults were also mentioned.
Figure 50: Reasons for the side flow (weighted averages), 11% of the onion production was side flow
0% 10% 20% 30% 40% 50% 60% 70% 80% 90% 100%
Food (primary use) %Food (secondary use) %Sideflow: Left in field/sorted out during harvest %Sideflow: Animal feed %Sideflow: Bioenergy %Sideflow: composted/biowaste %Side flow: other use %Sideflow: no use %
0,0 %
1,0 %
2,0 %
3,0 %
4,0 %
5,0 %
6,0 %
At harvest After harvest

Food losses and waste in primary production 81
We also asked the respondents whether they would be interested in better utilisation of the side flows of their carrot production and finding solutions for making better use of these side flows (Yes/Maybe/No). Only 6 out of 24 who replied to the question were willing to find better utilisation for their side flows and 10 were hesitant. Thus, 8 out of 24 were not interested in finding better uses for their side flows.
2.1.2 Interviews
The draft version of the onion questionnaire was reviewed by four experts. After the review, we made the suggested changes to the questionnaire. The changes were fairly minor, and we therefore do not expect that they would affect the comparability of our questionnaire with other countries’ questionnaires.
2.2 Onion side flow in Sweden
The production of onions in Sweden during the past 13 years (2002–2014) shows an increasing trend from slightly above 23,000 tonnes to 53,000 tonnes, equal to an increase of approximately 130 percent (Figure 51) (Swedish Board of Agriculture 2015). During the same period, the area for cultivation of onions in Sweden grew from roughly 700–800 ha to over 1,100 ha. Alongside the increase in area, the yield (production/area) has also increased during the period from around 30 tonnes/ha to almost 50 tonnes/ha. The number of companies has decreased by approximately one third during this period, from 311 companies in 2002 to 225 in 2014, indicating a trend of producers with higher production (data not presented).
The consumption of onions in Sweden during 1984 to 2013 shows an increase from 34,400 tonnes to 77,000 tonnes per year, which is equal to consumption increasing from 4.1 to 8.1 kg per person per year, with a maximum level in 2012 of 85,200 tonnes and 9 kg per person per year (Figure 52). The differential from consumption and production of onions from 2002 to 2014 shows a more static trend with a shortage in domestic production within a range of 25,000–34,800 tonnes per year.

82 Food losses and waste in primary production
Figure 51: Swedish production, area, yield and domestic shortage of onions during the period 2002 to 2014. The domestic shortage was calculated as direct consumption minus total production

Food losses and waste in primary production 83
Figure 52: Consumption of onions in Sweden during the period 1984–2013. The figure for 2013 is a preliminary estimate
2.2.1 Questionnaire
Authors: Marie E. Olsson and Staffan Andersson, Dept. of Plant Breeding. Swedish University of Agricultural Sciences
Materials and methods, Sample The questionnaire was sent to all Swedish companies which were known to have cultivated onions on at least 0.5 ha during the years 2011, 2012 or 2013. The questions concerned the products from Allium cepa, and also included products from this species that are sold fresh in bunches (Swedish name: “knipplök”, “buntlök”). No questions were asked about other types of onions, such as Allium fistulosum (spring onions) or Allium porrum (leeks). Of the 120 questionnaires that were sent out, 68 companies responded, which was a response frequency of 57%. Of the 68 answers, 45 responded that they had been involved in onion cultivation, handling or processing during 2013. Of these 45 answers, 43 companies cultivated onions, 22 had stored onions, and 11 had sorted onions, while no company had processed onions for
84 Food losses and waste in primary production
industry, although two companies responded to another question that they had produced their own processed products.
The companies were currently cultivating onions seemed to have a higher tendency to answer the questionnaire than non-active growers. Non-responding companies only had older records of harvest yields more frequently than responding companies (28% and 35% respectively). Nothing suggested that the responding and non-responding companies should be different in terms of the size of acreage for onion cultivation or the total yield of onion, however.
In this section, the replies from the active onion companies are summarised in different figures. The questionnaire included nine questions regarding onion cultivation, handling and processing in Sweden during 2013. All questions except the first question are included in the analysis in this section. The results shown in this section are based on the total number of replies from 45 companies involved in onion handling. The response frequencies are presented as an average of the positive respondents, i.e. those that had some kind of onion cultivation or handling (45 companies in total) or, when a particular question is only relevant to some of a companies, only the relevant companies. The results for each question are presented, when appropriate, as an average of the responding companies for each question. In some cases (question 4 and 5), the average values of only those companies who responded that they had discarded products are also presented (not including those who responded with a zero value).
In the text below, the companies that responded yes to the question of whether they carried out some kind of onion cultivation, handling, or processing (45 in total) are called “onion companies”.
In response to the question “Which type of practice was included in your onion handling?”, most of the onion companies cultivated onions (96%), and many of them also did the harvesting (84%) (Figure 53). Among the onion companies, field drying was practised by 60%, while 53% dried onions in storage facilities. 31% of the companies practised bunching onions, 18% practised peeling onions before bunching, while only 4% stored onion bunches in cold storage, and no one stored onion bunches packed in plastic bags. 11% of the companies washed products, 24% sorted onions, and 27% packed products. No company practised any kind of processing for the food industry, but 4% processed onions for their own products.

Food losses and waste in primary production 85
Figure 53: Type of practice among the onion companies
10
20
40
60
80
100
Part
of th
e on
ion
com
pani
es th
at p
ract
iced
a c
erta
in
culti
vatio
n, h
andl
ing,
or p
roce
ssin
g st
ep (%
)
Cultiva
tion
Harves
ting
Bunch
ing
Storag
e, bu
nche
s
Field d
rying
Drying
in st
orage
Storag
e
Washin
g
Peelin
g, bu
nche
d
Sorting
Packin
g
Storag
e, bu
nche
d
Proces
sing,
indus
tryProc
essin
g,
own p
roduc
ts
0 0
Regarding the question “How big share of your total onion production was for…”, the most common use of the onion production was onions for storage (64% of all companies) (Figure 54). Further, on average 25% of the production was used for fresh onion bunches, while 9% was used for the food industry and no one answered that they used onions for their own processed products. Two companies answered that they did not know the use of all or part of their production.
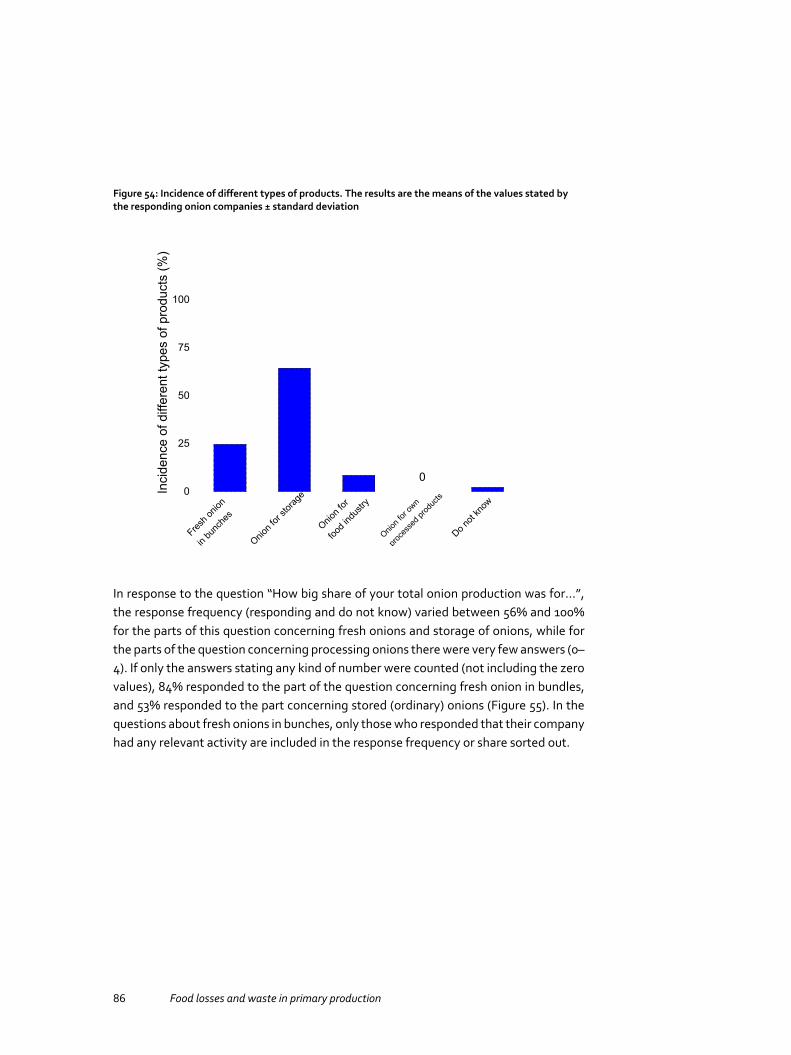
86 Food losses and waste in primary production
Figure 54: Incidence of different types of products. The results are the means of the values stated by the responding onion companies ± standard deviation
0
25
50
75
100
Inci
denc
e of
diff
eren
t typ
es o
f pro
duct
s (%
)
Fresh o
nion
in bu
nche
s
Onion f
or sto
rage
Onion f
or
food i
ndus
try
Onion f
or ow
n
proce
ssed
prod
ucts
0
Do not
know
In response to the question “How big share of your total onion production was for…”, the response frequency (responding and do not know) varied between 56% and 100% for the parts of this question concerning fresh onions and storage of onions, while for the parts of the question concerning processing onions there were very few answers (0–4). If only the answers stating any kind of number were counted (not including the zero values), 84% responded to the part of the question concerning fresh onion in bundles, and 53% responded to the part concerning stored (ordinary) onions (Figure 55). In the questions about fresh onions in bunches, only those who responded that their company had any relevant activity are included in the response frequency or share sorted out.

Food losses and waste in primary production 87
Figure 55: Response frequency for the question about the share sorted out for each type of product
123
0 20 40 60 80 100
Not answered Do not know Responding
Response frequency
Was not harvested
At harvest of freshonion for bunches
At harvest and field drying
At packaging or sto-rage of bunched onion
At storage or packa-ging of ordinary onion
At processing
At delivery to pro-ducer organisation
At sales and reclamation
At other activity
Results If all answers are included, including the companies answering that they did not discard any of the specific type of product in question, then on average 18% of the fresh onions in bunches were discarded, and an additional 0.5% of these products during storage (Figure 56). Just below 17% of the (ordinary) onions which had been stored were discarded, and 33% of the onions for the food industry were discarded, although the latter value was based on only four responding companies (range 0% to 100%). No values were given for either onions for own processing or other types of onion.

88 Food losses and waste in primary production
Figure 56: Share sorted out of each type of product, including the companies that did not discard onions (the zero values). The values are the means of the values stated by the responding onion companies ± standard deviation
0
20
40
60
80
Shar
e th
at is
sor
ted
out o
f eac
h ty
pe o
f pro
duct
(%)
Fresh o
nion
in bu
nche
s
Fresh o
nion i
n
bunc
hes,
stored
Onion (
ordina
ry)
a
fter s
torag
e
Onion f
or
food i
ndus
try
Onion f
or ow
n
proc
essin
g
Other ty
pe
of on
ion
0 0
If only those companies who discarded products for the specific types of products in question are included (not including the zero values), then the result is somewhat different, although the same trend is still seen for two of the parts of this question. Of those who discarded fresh onions in bunches (no zero values included), on average 22% of the products were wasted (11 answering companies), and on average just above 17% of the ordinary onions were estimated to be discarded after storage (24 answering companies) (Figure 57).

Food losses and waste in primary production 89
Figure 57: Share sorted out of each type of product, including only those companies that discarded the specific types of products in question (not including zero values). The results are the means of the values stated by the responding onion companies ± standard deviation
0
10
20
30
40
50
Sh
are
sorte
d ou
t (%
)
Fresh o
nion
in bu
nche
s
Fresh o
nion i
n
bunc
hes,
stored
Onion (
ordina
ry)
aft
er sto
rage
Onion f
or
food i
ndus
try
Onion f
or
proce
ssing
Other ty
pe
of o
nion
* *
** ***
Note 1: Note 2: Note 3:
*No answers were given. **Fresh onions in bunches, stored: only one value given: 6%. ***Onions for the food industry: only two values given; average of those 28%, SD 16%.
Regarding the question “How big share of your total onion production was sorted out”, the response frequency varied significantly in the different parts of this question, and varied between 7% and 100% (responding and do not know) (Figure 58). In the questions about fresh onions in bunches, only those who responded that their company had any relevant activity are included in the response frequency or share sorted out.

90 Food losses and waste in primary production
Figure 58: Response frequency for the question about the share sorted out of the total production at the different production steps
123
0 20 40 60 80 100
Not answered Do not know Responding
Response frequency
Other reason
Insects or animals in the field
No market
Reclamation
Losses at processing
Unacceptable form or appearance
Unacceptable size
Damage at harvestand handling
Technical problemsat cultivationClimate
Diseases in the field
Of the total onion production, including the companies that did not discard onions in the specific practice in question (the zero values), the highest share was sorted out on delivery to a producer organisation (co-operative) (10%), during some other activity (9%), or during storage and packaging of (ordinary) onions (8%) (Figure 59.). 4% of the onion production was not harvested, 1% of the production was lost during field drying and harvesting of onions, and 2% was lost during processing. For fresh onions in bunches, 5% was lost during harvesting and 0.5% was lost during packaging or storage. During sales or reclamation, 1% was discarded.

Food losses and waste in primary production 91
Figure 59: Share sorted out of the total production and reasons for discarding, including the companies that did not discard onions (the zero values). The results are the means of the values stated by the responding onion companies ± standard deviation
1 20
5
10
15
20
Shar
e of
the
tota
l pro
duct
ion
sorte
d ou
t,an
d re
sons
for d
isca
rdin
g (%
)
Was no
t harv
ested
Harves
t of fr
esh
onio
n in b
unch
es
Field d
rying
and
harv
est o
f onio
n
Packa
ging a
nd
storag
e of fr
esh
on
ion in
bunc
hes
Storag
e or p
acka
-
gi
ng of
onion
Proces
sing
Delive
ry pro
-
duce
r org.
Sales a
nd re
cla-
mation
Other a
ctivit
y
Of those who answered that they had losses of products (no zero values included), 19% of the onions were estimated to be lost because the onions were not harvested (9 answers), 12% were discarded on delivery to producer organisation (co-operative) (6 answers), 11% was lost during storage or packaging (18 answers), 8% was lost during harvesting fresh onions in bunches (6 answers), and 5% was lost during field drying and harvesting (6 answers) (Figure 60).
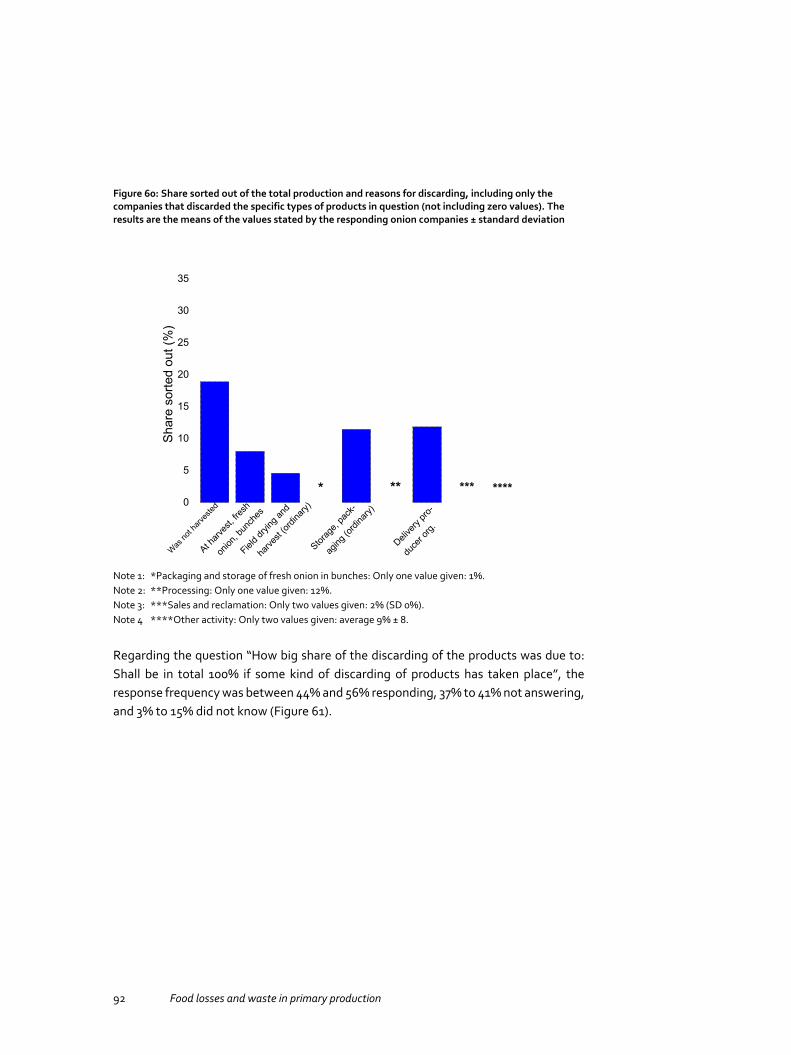
92 Food losses and waste in primary production
Figure 60: Share sorted out of the total production and reasons for discarding, including only the companies that discarded the specific types of products in question (not including zero values). The results are the means of the values stated by the responding onion companies ± standard deviation
0
5
10
15
20
25
30
35
*********
Shar
e so
rted
out (
%)
*
Was no
t harv
ested
At harv
est, f
resh
on
ion, b
unch
es
Field d
rying
and
ha
rvest
(ordin
ary)
Storag
e, pa
ck-
agin
g (ord
inary)
Delive
ry pro
-
duce
r org.
Note 1: Note 2: Note 3: Note 4
*Packaging and storage of fresh onion in bunches: Only one value given: 1%. **Processing: Only one value given: 12%. ***Sales and reclamation: Only two values given: 2% (SD 0%). ****Other activity: Only two values given: average 9% ± 8.
Regarding the question “How big share of the discarding of the products was due to: Shall be in total 100% if some kind of discarding of products has taken place”, the response frequency was between 44% and 56% responding, 37% to 41% not answering, and 3% to 15% did not know (Figure 61).

Food losses and waste in primary production 93
Figure 61: Response frequency for the question about the reasons for discarding products
123
0 20 40 60 80 100
Not answered Do not know Responding
Response frequency
Other reason
Insects or animals in the field
No market
Reclamation
Losses at processing
Unacceptable form or appearance
Unacceptable size
Damage at harvestand handling
Technical problemsat cultivationClimate
Diseases in the field
For all the answers, including those who answered that they discarded zero percent of onions for a specific reason, the reason that gave the highest value was damage at harvest or handling, on average 22% (range 0–100%) (Figure 62). Disease occurring in the field, unacceptable size or unacceptable shape/appearance were also major reasons for discarding products, and all gave values around 17% (range 0–60%; 0–80%; 0–97% respectively). Damage from insects or animals in the field as well as weather conditions were considered on average to be minor reasons, and contributed 7% (range 0–100%) and 5% (range 0–100%) respectively. The other reasons contributed on average less than 5%.
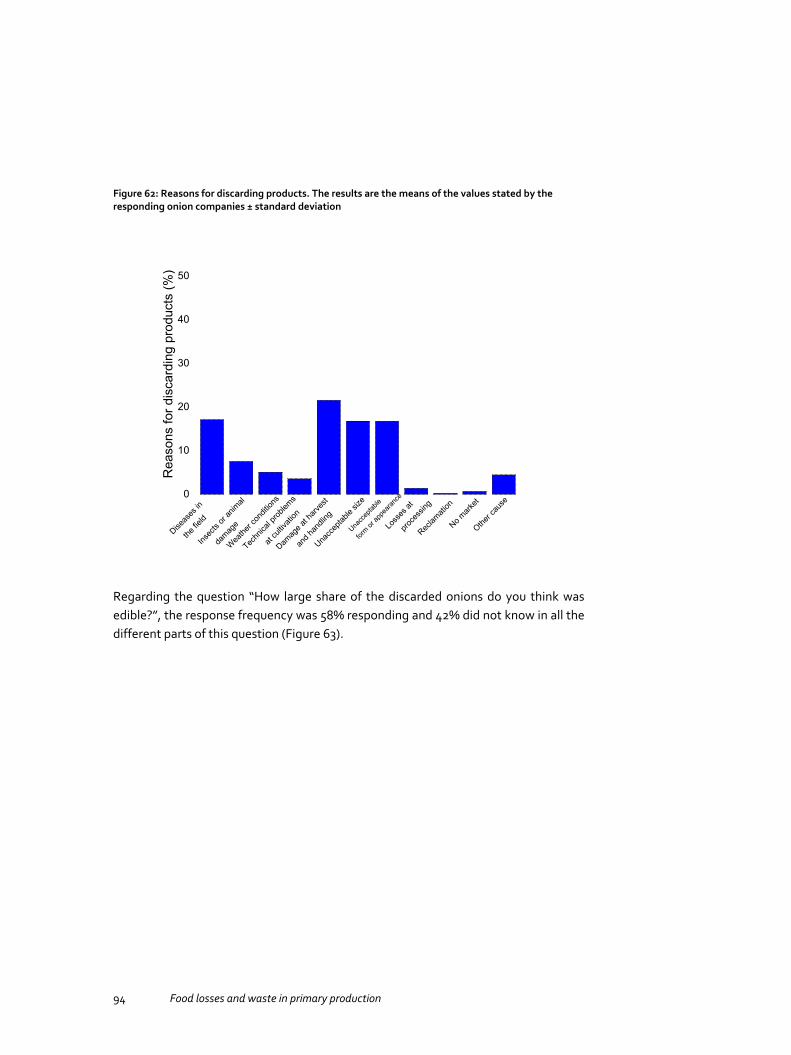
94 Food losses and waste in primary production
Figure 62: Reasons for discarding products. The results are the means of the values stated by the responding onion companies ± standard deviation
1 20
10
20
30
40
50
Rea
sons
for d
isca
rdin
g pr
oduc
ts (%
)
Diseas
es in
the
field
Insec
ts or
anim
al
da
mage
Weathe
r con
dition
s
Techn
ical p
roblem
s
at cu
ltivati
on
Damag
e at h
arves
t
a
nd ha
ndlin
g
Unacc
eptab
le siz
e
Unacc
eptab
le
form or
appe
aranc
e
Loss
es at
pro
cess
ing
Reclam
ation
No mark
et
Other c
ause
Regarding the question “How large share of the discarded onions do you think was edible?”, the response frequency was 58% responding and 42% did not know in all the different parts of this question (Figure 63).

Food losses and waste in primary production 95
Figure 63: Response frequency to the question of the share of the discarded products that were considered edible
0 10 20 30 40 50 60 70 80 90 100
Not answered Do not know Responding
Response frequency
%
Maximum value
Minimum value
The average minimum value given for the question of how large a share of the discarded products they would consider to be edible was 29% (range 0–70%), and maximum value was 44% (range 8–80%) (Figure 64).

96 Food losses and waste in primary production
Figure 64: Share of the discarded products that were considered edible. The results are the means of the values stated by the responding onion companies ± standard deviation
0
10
20
30
40
50
60
70
80
Estim
ated
sha
re o
f the
dis
card
ed
prod
ucts
that
are
edi
ble
(%)
Minimum value
Maximum value
Regarding the question “How large a proportion of the discarded products was used for…”, the response frequency was very high; 89% responded with values for different types of use, and 11% responded that they did not know.

Food losses and waste in primary production 97
Figure 65: Use of discarded products. The values are the means of the values stated by the responding onion companies ± standard deviation
1 20
20
40
60
80U
se o
f dis
card
ed p
rodu
cts
(5)
Were no
t
harv
ested
Placed
in th
e fiel
ds
Bioene
rgy
Compo
st
Other u
se
The most common use for the discarded products was to place them back in the field (36%; range 0–100%). 28% of the onions were composted (range 0–100%), 19% were not harvested and left in the fields (range 0–100%), 7% were used for bioenergy (range 0–100%) and 5% had other uses (range 0–100%).
Regarding the question “How would you think the share of the onions which are used for food could be increased?”, the response frequency was 31%. 67% answered “Do not know” and 2% did not respond.
To categorise the answers given, four onion companies mentioned issues related to cultivation, three mentioned issues related to sorting, storage and distribution, one mentioned processing, and six mentioned issues related to the market, mostly to the quality standards demanded by the market.
The cultivation-related answers mentioned problems with onion diseases reducing quality, and one mentioned the lack of pesticides against these disease presently allowed in Sweden. Mechanical damage at harvest was considered to be an important issue by two of the companies, and problems with weeds by another.
98 Food losses and waste in primary production
Reduction of mechanical damage, and especially during sorting after harvest, was suggested as a measure to reduce the loss of produced onions, and better storage as another. Better handling throughout the whole chain from producers to retail and better logistics were other measures suggested to reduce losses. One company suggested that the onions with unacceptable peels could be used for large-scale catering establishments and the food industry.
The highest number of answers concerned market-related issues. Two suggestions for reducing losses were reducing the delivery demands for certain sizes and lowering the quality demands that could be considered to be of minor importance. As example of quality demands that could be lowered, it was mentioned that the onions could be allowed not to have the whole outer surface covered with peel, or some onions could be allowed not to be completely clean.
Discussion The intention of this study was primarily to quantify the losses of onion production in Sweden at the primary production, including the handling and processing that are linked to this. The intention was also to understand the reasons behind the losses at the different steps. The method used, a questionnaire sent to Swedish growers’ companies that were previously known to cultivate and/or handle onions, has the advantage that many companies can be included in the investigation using limited resources. However, the disadvantage is that the values stated by the companies are their own estimates, and the basis for these estimates cannot be clearly defined. Some companies may base the estimates on their own statistics, while others may not. In the case of losses during storage and packaging as well as delivery to the producer organisation (co-operative), it seems more likely that the estimates from the onion companies are based on their own statistics, since it is common practice to measure volumes during sorting for economic reasons.
The response frequency varied significantly between the different questions, and also between different parts of a question. The evaluation of the results contains the possibility that some companies might have answered “zero” when they actually meant “Do not know” or “Not relevant for my company” for some of the questions, therefore constituting an uncertainty in the results.
The results of this investigation show that most of the companies cultivate the onions, and they usually also carry out the harvesting themselves. It seems to be less common to bunch fresh onions, which about one third of the companies did. Drying onions indoors before storage and storing them had been done by about half of the responding companies, suggesting that some companies store their onions at other companies’ storage facilities, or at the producer organisation’s (co-operative) facilities.

Food losses and waste in primary production 99
18–22% of the fresh onions in bunches were estimated to be discarded, if the zero values were included or excluded. For the stored (ordinary) onions, about 17% of the products were estimated to be sorted out. Of the onions for the food industry, 33% were estimated to be discarded, although this result was based on only a few responding companies with great disparities between the answers.
Evaluating the losses at the different production steps, 4–19% of the onions were not harvested, 1–5% were lost during harvesting or field drying, and 8–11% was lost during storage and packaging (zero values included or excluded). 10–12% were estimated to be lost on delivery to the producer organisation (co-operative). For the fresh onions in bunches, 5–8% were estimated to be lost during harvesting, while 0.5% or possibly up to 6%, were lost during packaging and storage (zero values included or excluded). Summarising the losses at the different steps, a total of 13–35% of the ordinary onions were lost, while less was lost for the fresh onions in bunches, around 6–14% (zero values included or excluded). Since the losses on delivery to the producer organisation (co-operative) include the same steps as in the storage and packaging part of this question, these values were not included in the summary of losses for ordinary onions. A previous report summarising the sorting results from a producer organisation (co-operative) for onion growers showed that on average, for all growers over five years, between 11.4% and 15.8% of yellow onions and between 16.7% and 29.7% of red onions were sorted out at delivery to this producer organisation (co-operative), without considering the onions left in the fields or growers’ own sorting before delivery (Olsson et al. 2011). The results from the previous investigation, based on measured sorting values, would then indicate that the growers in the present investigation tend to somewhat underestimate the size of losses in the different steps of the onion production and handling chain, although the results from the two investigations are still in the same range. Only a few studies that actually measure food losses in primary production are available, although one recent investigation about losses of iceberg lettuces in primary production indicated that the losses are bigger than previous estimates have concluded (Stridh et al. 2014).
Damage during harvesting or handling was given as one of the main reasons for discarding products, along with disease occurring in the field and unacceptable size or shape/appearance. Since the responding onion companies considered 29% to 44% of the discarded onions to be edible, this might indicate that there is the potential to use the products that do not meet the quality demands from wholesalers for other products. Another possibility is that the quality demands can be reconsidered. Some of the onions that are currently discarded but are still edible could be sold as other product types, such as those that are considered too small or lacking dry peel on the whole onion. Today, it seems that a very low percentage of the discarded onions are used for other purposes, and the most common practice is to place them back in the fields or

100 Food losses and waste in primary production
use them for compost. The suggestions given by the growers in the last question of the questionnaire indicate that the losses can be reduced with better practice in cultivation and handling, but also by changed practice for the quality criteria, which currently include traits related to food safety as well as traits related purely to appearance.
2.2.2 Field study
Authors: Marie E. Olsson and Staffan Andersson, Dept. of Plant Breeding, Swedish University of Agricultural Sciences, Alnarp, Sweden
Sample, Materials and methods Field studies were performed during autumn 2015, on three occasions: 19 August, 30 September and 29 October. On the first and third occasions fields of one commercial onion company were investigated, while on the second occasion two companies were investigated. The investigated sites were all located in the southern part of Sweden, within a 30 km radius of Malmö. The investigated fields had all been harvested on the same day that the investigation was performed. The onions were all of Allium cepa species, and both red and yellow onions were included. The red and yellow onion types could occupy different parts of the same field. The fields were large, ranging from about 60 x 180 m (the measured part, in this case the total area of the field was larger), 70 x 300 m and 150 x 400 m to 175 x 400 m.
Each large field was divided into two parts, and in each part three squares measuring 1.80 m (the width of the row) x 10 m were investigated, so a total of six squares were investigated for each field. In the first investigated field, the soil in some of the squares was turned with a spade to see if any remaining onions were found below the surface of the soil, but since no additional onions could be found, only onions visible above the ground were collected in the further investigations. The placement of the squares was decided by positioning the first square about three rows in from the right-hand edge of the field and 50 metres forward, the next square two rows further to the left and 50 metres forward, and the third by the same method. Thereby it could not be predicted beforehand if there were more or fewer onions remaining where the squares were placed, and at the same time the squares were fairly evenly distributed across the field. In the event that abnormalities such as waterlogging were found close to the scoring plot, it was planned to move two or more rows further to the left to avoid non-representative sampling. All the onions in each square were collected, and in some cases also the onion peels remaining on the ground. In some especially windy fields, there were hardy any peels still remaining in the fields. The collected onions and peels were placed in plastic bags and weighed, using a field balance.
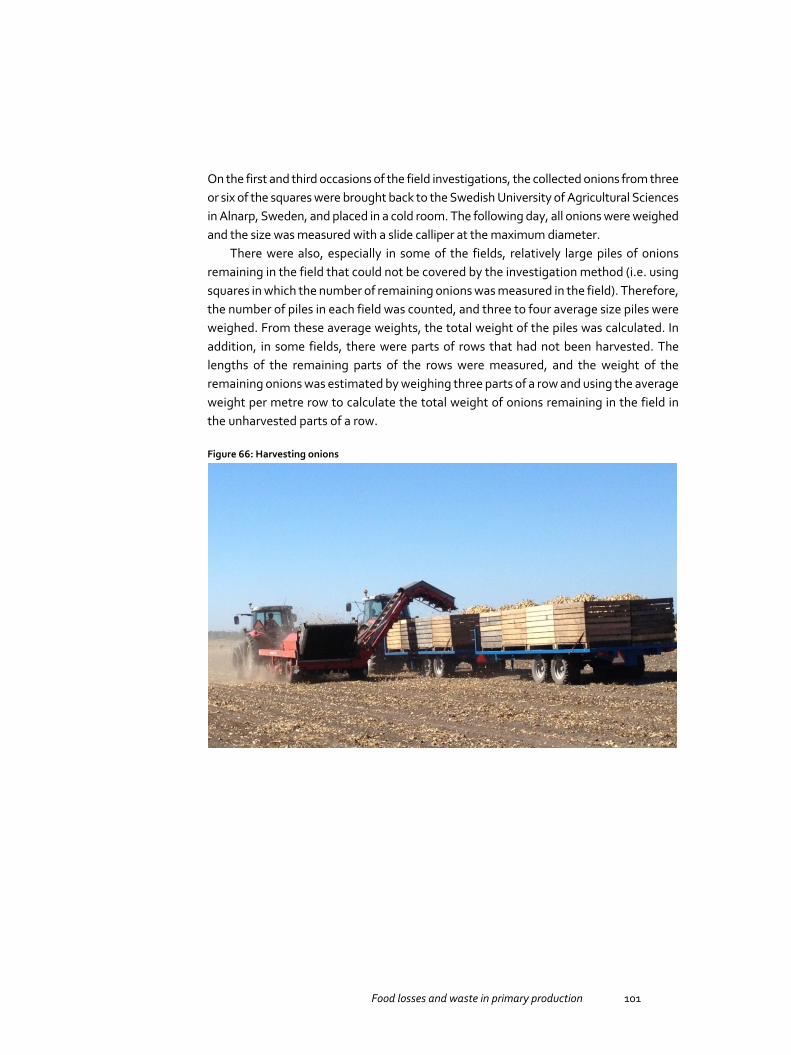
Food losses and waste in primary production 101
On the first and third occasions of the field investigations, the collected onions from three or six of the squares were brought back to the Swedish University of Agricultural Sciences in Alnarp, Sweden, and placed in a cold room. The following day, all onions were weighed and the size was measured with a slide calliper at the maximum diameter.
There were also, especially in some of the fields, relatively large piles of onions remaining in the field that could not be covered by the investigation method (i.e. using squares in which the number of remaining onions was measured in the field). Therefore, the number of piles in each field was counted, and three to four average size piles were weighed. From these average weights, the total weight of the piles was calculated. In addition, in some fields, there were parts of rows that had not been harvested. The lengths of the remaining parts of the rows were measured, and the weight of the remaining onions was estimated by weighing three parts of a row and using the average weight per metre row to calculate the total weight of onions remaining in the field in the unharvested parts of a row.
Figure 66: Harvesting onions

102 Food losses and waste in primary production
Figure 67: (left): Remaining piles of onions after harvesting. (right): Unevenly distributed onions and peels remaining in the field after harvesting
Results The investigated fields were relatively different in terms of how the onions remaining in the fields were distributed. In some fields, the majority of the remaining onions were small. This was, according to the grower, due to how the harvester was adjusted and because onions below a certain size could not be sold and were therefore not harvested. In some fields, there seemed to be relatively large numbers of piles of onions remaining. At one location, the reason for the onion piles seemed to be primarily caused by the gap between the two wagons behind the tractor, so when the first wagon was full, the harvesting machine was directed towards the second, but then a number of onions fell on the ground, causing piles of onion. However, in one field no piles of onions were found at all.
The amount of onions remaining in the field, and measured in the squares, varied between 0.05 and 0.20 kg/m2, which is equivalent to a range between 0.37 and 1.56 tonnes per ha and an average of 0.80 tonnes per ha, if 20% of the land is considered to be unproductive (edges of the fields, turning points for the tractors etc.) (Figure 68). The average weight of the onions remaining in the fields for the two measured locations was 30 ± 36 g and 68 ± 44 g, making a total average weight of each onion of 49 ± 40 g.
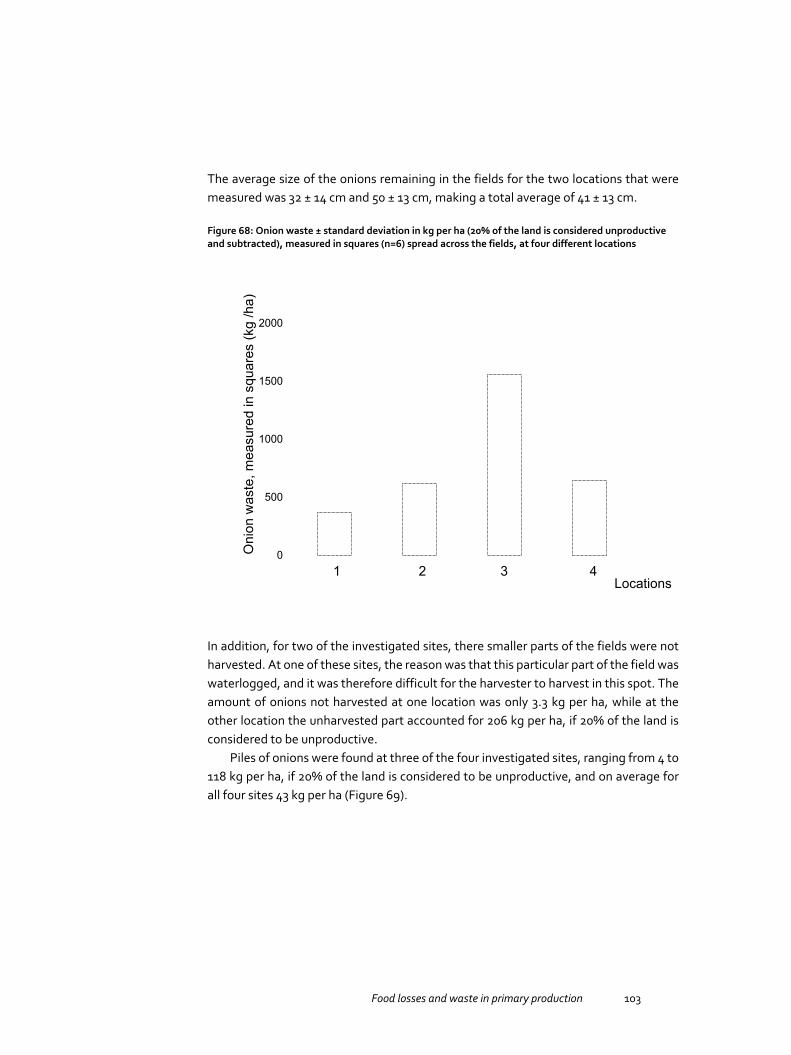
Food losses and waste in primary production 103
The average size of the onions remaining in the fields for the two locations that were measured was 32 ± 14 cm and 50 ± 13 cm, making a total average of 41 ± 13 cm.
Figure 68: Onion waste ± standard deviation in kg per ha (20% of the land is considered unproductive and subtracted), measured in squares (n=6) spread across the fields, at four different locations
0
500
1000
1500
2000
Oni
on w
aste
, mea
sure
d in
squ
ares
(kg
/ha)
Locations 1 2 3 4
In addition, for two of the investigated sites, there smaller parts of the fields were not harvested. At one of these sites, the reason was that this particular part of the field was waterlogged, and it was therefore difficult for the harvester to harvest in this spot. The amount of onions not harvested at one location was only 3.3 kg per ha, while at the other location the unharvested part accounted for 206 kg per ha, if 20% of the land is considered to be unproductive.
Piles of onions were found at three of the four investigated sites, ranging from 4 to 118 kg per ha, if 20% of the land is considered to be unproductive, and on average for all four sites 43 kg per ha (Figure 69).
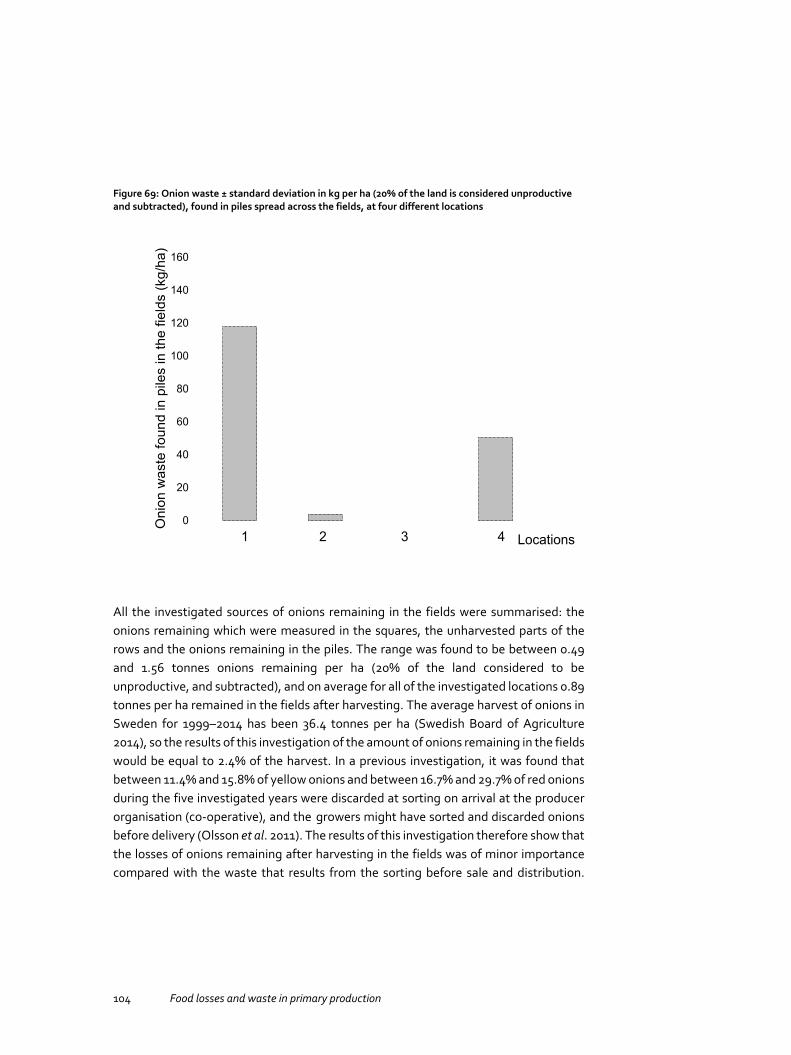
104 Food losses and waste in primary production
Figure 69: Onion waste ± standard deviation in kg per ha (20% of the land is considered unproductive and subtracted), found in piles spread across the fields, at four different locations
0
20
40
60
80
100
120
140
160
Oni
on w
aste
foun
d in
pile
s in
the
field
s (k
g/ha
)
1 2 3 4 Locations
All the investigated sources of onions remaining in the fields were summarised: the onions remaining which were measured in the squares, the unharvested parts of the rows and the onions remaining in the piles. The range was found to be between 0.49 and 1.56 tonnes onions remaining per ha (20% of the land considered to be unproductive, and subtracted), and on average for all of the investigated locations 0.89 tonnes per ha remained in the fields after harvesting. The average harvest of onions in Sweden for 1999–2014 has been 36.4 tonnes per ha (Swedish Board of Agriculture 2014), so the results of this investigation of the amount of onions remaining in the fields would be equal to 2.4% of the harvest. In a previous investigation, it was found that between 11.4% and 15.8% of yellow onions and between 16.7% and 29.7% of red onions during the five investigated years were discarded at sorting on arrival at the producer organisation (co-operative), and the growers might have sorted and discarded onions before delivery (Olsson et al. 2011). The results of this investigation therefore show that the losses of onions remaining after harvesting in the fields was of minor importance compared with the waste that results from the sorting before sale and distribution.
Food losses and waste in primary production 105
However, if the losses in the fields could be reduced, this would be beneficial both in terms of the economy of the onion companies and in relation to the environment and climate change. In some cases, it would appear to be possible to reduce the losses, for instance by also harvesting the small onions, or by improving harvesting techniques so that onions are not dropped back on the fields. The majority of the losses of onions in the field was found in the investigated squares, so even though the piles of onions remaining in some of the fields were very conspicuous, they only accounted for 5–6% of the onions found all over the fields after the harvest.
Field investigations of waste in the primary production of horticultural edible crops are scarce. In recent years, a new study of waste in the primary production of iceberg lettuces was published, which showed that 31.5 tonnes/ha of lettuce residues remained in the fields, giving a total of approximately 65% that was lost in production, including 15% of the fields that were not harvested (Stridh et al. 2014). The results of this investigation show that only a minority of the crop remains in the fields. Two major differences between these two crops are the harvesting technique and where the sorting of the crop is performed. While iceberg lettuce is hand harvested, and at the same time sorted so only products that meet the quality demands from the wholesalers are included, onions are mechanically harvested, and most sorting takes place later. Some sorting can also take place during onion harvesting if the harvester is set so the smaller onions are not harvested, thereby deliberately discarding these onions in the fields. No conclusions can be drawn from this study on whether whole fields or larger parts of onion fields are not harvested, which would increase the amount of waste in the primary production of onions.

106 Food losses and waste in primary production
Figure 70: Onion waste ± standard deviation in kg per ha, sum of onions remaining which were measured in the squares, the unharvested parts of the rows, and the onions remaining in the piles (20% of the land is considered unproductive and subtracted), at four different locations
0
500
1000
1500
2000
Oni
on w
aste
, tot
al (k
g/ha
)
1 2 3 4 Locations
This investigation had also the purpose of developing methods for field studies in the primary production of horticultural crops. The onions remaining in the field were very unevenly distributed, making it more difficult to obtain representative samples, which could also be seen in the sometimes large standard deviations in the results. Another difficulty in this study was the large and varying size of the fields, which makes it more difficult to choose the areas randomly for the investigations (the squares) and also to get a reliable estimation of the size of the fields. For future studies, we would recommend a higher number of smaller investigated squares, since this would make it easier to obtain representative samples.
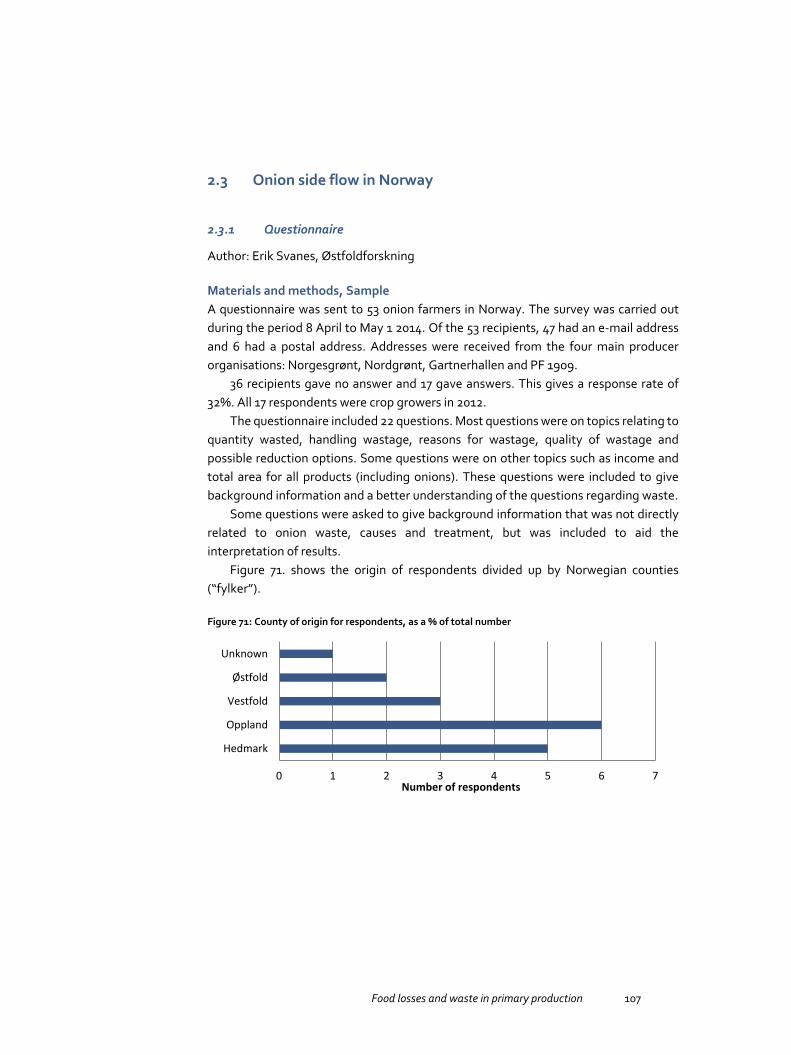
Food losses and waste in primary production 107
2.3 Onion side flow in Norway
2.3.1 Questionnaire
Author: Erik Svanes, Østfoldforskning
Materials and methods, Sample A questionnaire was sent to 53 onion farmers in Norway. The survey was carried out during the period 8 April to May 1 2014. Of the 53 recipients, 47 had an e-mail address and 6 had a postal address. Addresses were received from the four main producer organisations: Norgesgrønt, Nordgrønt, Gartnerhallen and PF 1909.
36 recipients gave no answer and 17 gave answers. This gives a response rate of 32%. All 17 respondents were crop growers in 2012.
The questionnaire included 22 questions. Most questions were on topics relating to quantity wasted, handling wastage, reasons for wastage, quality of wastage and possible reduction options. Some questions were on other topics such as income and total area for all products (including onions). These questions were included to give background information and a better understanding of the questions regarding waste.
Some questions were asked to give background information that was not directly related to onion waste, causes and treatment, but was included to aid the interpretation of results.
Figure 71. shows the origin of respondents divided up by Norwegian counties (“fylker”).
Figure 71: County of origin for respondents, as a % of total number
0 1 2 3 4 5 6 7
Hedmark
Oppland
Vestfold
Østfold
Unknown
Number of respondents

108 Food losses and waste in primary production
Figure 72: Total farm size in hectares
The total growing area for the farms is shown in Figure 72. This includes the area used for onions and all other product grown on the farm.
Of the total number, 82% answered that farming was their main income, 12% said it was not and 4% did not answer. No respondent answered that their main income was some other agriculture-related activity, e.g. farm tourism.
All 17 respondents replied that they carried out conventional production. One respondent carried out organic farming in addition to conventional production.
71% of the respondents deliver the product to one specific customer, 23% answered “Partly”, 6% did not answer.
We received 14 answers on cultivars. Most answered just the kind of onion they produced but six respondents gave details of cultivars. Figure 73. shows the distribution of answers. Most respondents grow yellow onion.
0 1 2 3 4 5
No answer0-10
10-20 20-3030-4040-5050-6060-90
100-150> 150
Number of respondents
Area
for c
rop
grow
ing
(ha)
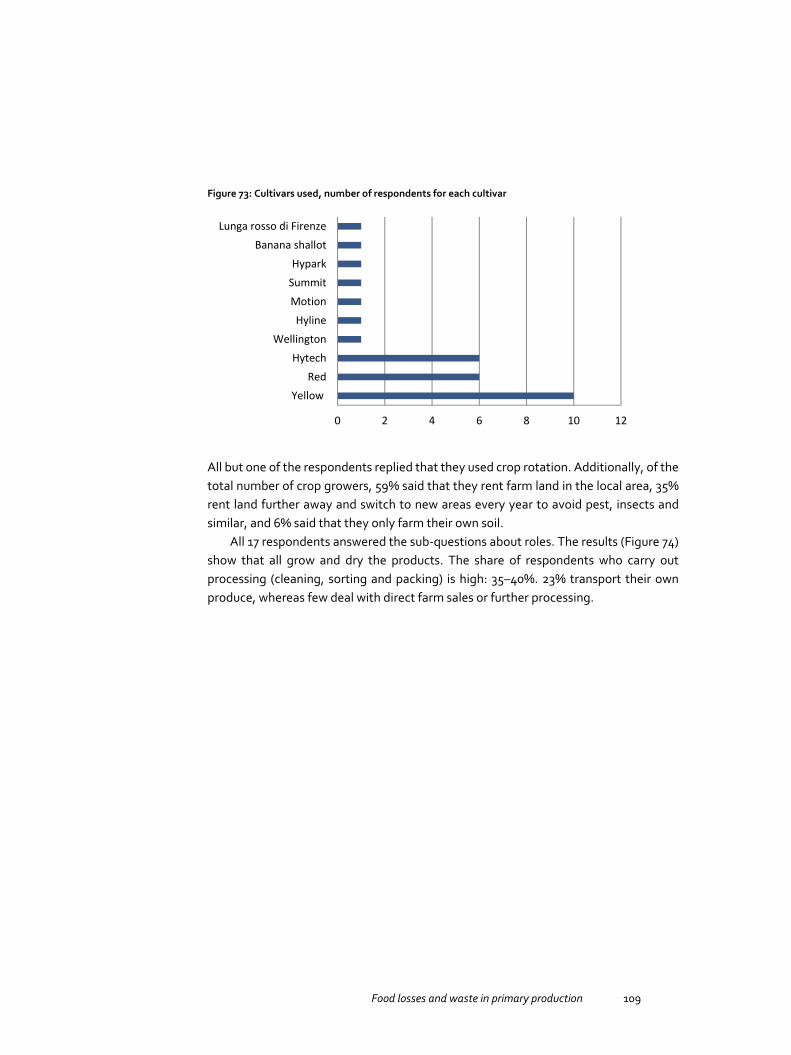
Food losses and waste in primary production 109
Figure 73: Cultivars used, number of respondents for each cultivar
All but one of the respondents replied that they used crop rotation. Additionally, of the total number of crop growers, 59% said that they rent farm land in the local area, 35% rent land further away and switch to new areas every year to avoid pest, insects and similar, and 6% said that they only farm their own soil.
All 17 respondents answered the sub-questions about roles. The results (Figure 74) show that all grow and dry the products. The share of respondents who carry out processing (cleaning, sorting and packing) is high: 35–40%. 23% transport their own produce, whereas few deal with direct farm sales or further processing.
0 2 4 6 8 10 12
YellowRed
HytechWellington
HylineMotionSummitHypark
Banana shallot Lunga rosso di Firenze

110 Food losses and waste in primary production
Figure 74: Which production steps the respondents carry out
All but one respondents stored onions. The ones who stored onions report that an average of 84% of their total harvest was stored. Almost half of the respondents (8 of 17) store all their produce.
The average answer to the question “How much time do you use for onion production” was 9.8 man-months.
The question addressed the income that came from farming onions and the share of the onion income compared to the total income. Only one respondent gave the answer in kroner. All but one respondent gave an average share of the income coming from onion production. The average answer was 51%.
Between 7 and 17 answered the questions on “Where is the product delivered?”. Most send their products to a packing house, while a few send their products to a wholesaler or industry.
0 5 10 15 20
Growing
Drying
Cleaning
Sorting
Packing
Processing
Transport
Direct sales from farm
Other
Number of respondents
Yes No No answer

Food losses and waste in primary production 111
Figure 75: Overview of who receives the products, as a % of total yield
The average yield was 338 tonnes, and the average onion production area was 8.3 ha. The average yield per hectare was 2.92 tonnes for those who answered the questions on both area and yield. The standard deviation of the yield per ha was 0.69 tonnes.
If the average onion growing area for those who gave an answer to that question is representative for all 17 who responded to most questions in the questionnaire, this means that the 17 respondents account for 165 ha of onion-growing area. This accounts for 18.7% of the 880 ha that is used for growing onions in Norway.
Six respondents grow red onions, and 12 grow yellow onions. Five respondents did not give an answer. Six grow both red and yellow onions. The total amount of yellow onions produced is 75% of the 17 respondents’ total onion yield, and the corresponding number for red onions was 25%.
Results The purpose of the question “What happens to the products you deliver?” was to map the mass balance of the onions, and to understand exactly what is done with the crops. The table below shows the mass balance based on the answers received.
0 5 10 15 20
Pack house
Wholesaler
Direct to retail
Farmers market or similar
Farm shop
Industry
Food service
Internet sales
Other
Number of respondents
Yes No No answer

112 Food losses and waste in primary production
Figure 76: Overview of how the product is used, %
Table 28: Material balance for onions. Average and standard deviation
Packed in bags for
retail
Packed in nets
for retail
For industry
Food service
Not harvested
Composted at packing
plant
Not used
Average (% of total yield)
39.9 47.3 3.8 0.2 0.4 2.6 4.2
Standard deviation (of % of total yield)
36.7 34.8 3.8 0.7 0.7 4.9 10.6
The alternatives “Composted on farm”, “Used for bioenergy”, “Used in some other way” and “Evaporation” were not chosen by the respondents and are thus not displayed in the diagram.
Farmers were asked where they got the data for the mass balance question. Figure 77 summarises the answers. The majority of those who answered stated that they used their own estimates, as opposed to getting the information from others or carrying out their own measurements.
0,0 10,0 20,0 30,0 40,0 50,0
Packed in bags for retail
Packed in nets for retail
For industry
Food service
Not harvested
Composted at packing plant
Not used
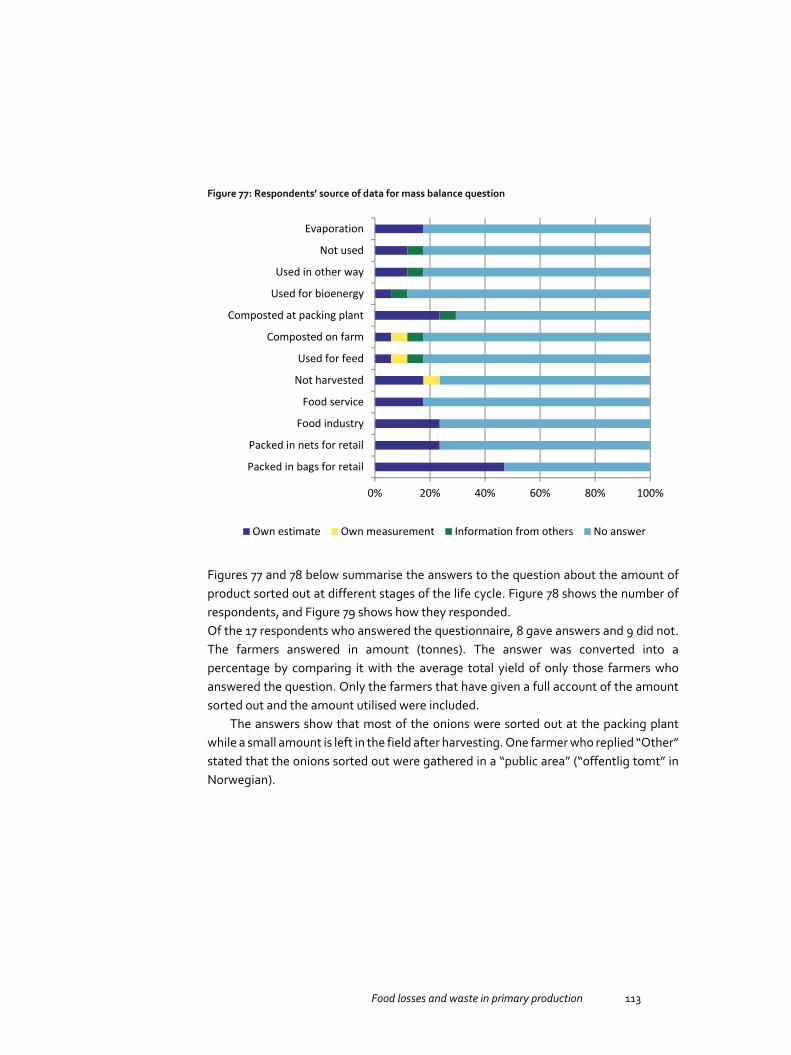
Food losses and waste in primary production 113
Figure 77: Respondents’ source of data for mass balance question
Figures 77 and 78 below summarise the answers to the question about the amount of product sorted out at different stages of the life cycle. Figure 78 shows the number of respondents, and Figure 79 shows how they responded. Of the 17 respondents who answered the questionnaire, 8 gave answers and 9 did not. The farmers answered in amount (tonnes). The answer was converted into a percentage by comparing it with the average total yield of only those farmers who answered the question. Only the farmers that have given a full account of the amount sorted out and the amount utilised were included.
The answers show that most of the onions were sorted out at the packing plant while a small amount is left in the field after harvesting. One farmer who replied “Other” stated that the onions sorted out were gathered in a “public area” (“offentlig tomt” in Norwegian).
0% 20% 40% 60% 80% 100%
Packed in bags for retail
Packed in nets for retail
Food industry
Food service
Not harvested
Used for feed
Composted on farm
Composted at packing plant
Used for bioenergy
Used in other way
Not used
Evaporation
Own estimate Own measurement Information from others No answer
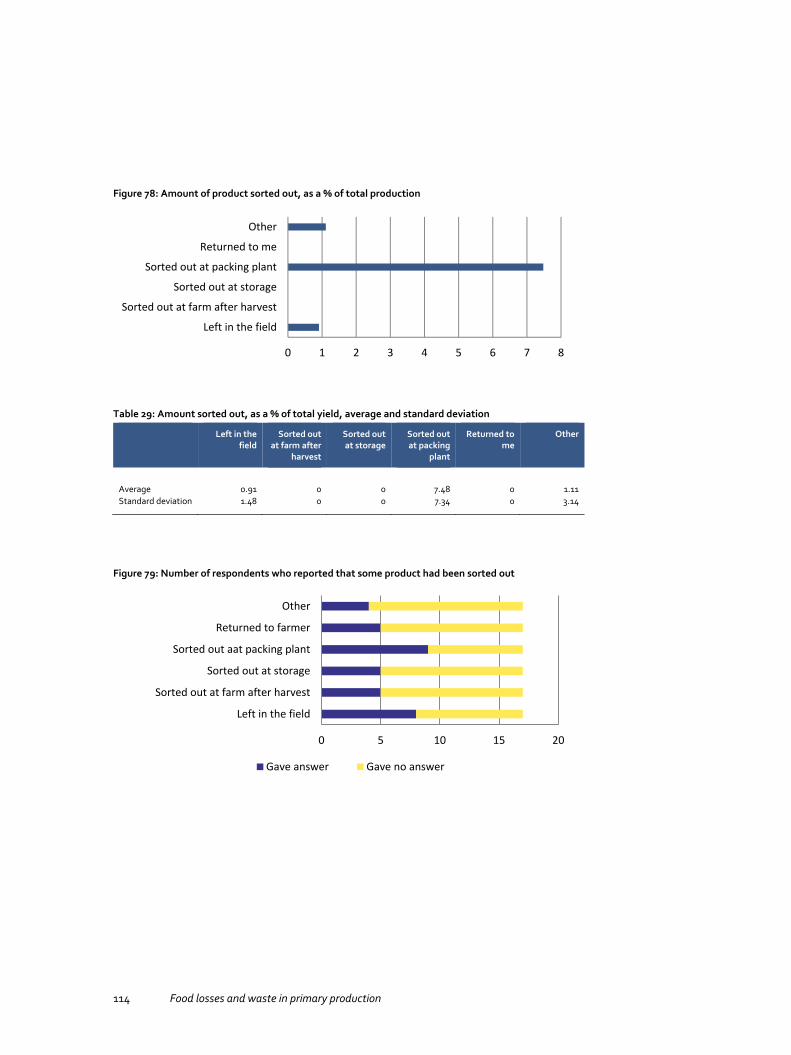
114 Food losses and waste in primary production
Figure 78: Amount of product sorted out, as a % of total production
Table 29: Amount sorted out, as a % of total yield, average and standard deviation
Left in the field
Sorted out at farm after
harvest
Sorted out at storage
Sorted out at packing
plant
Returned to me
Other
Average 0.91 0 0 7.48 0 1.11 Standard deviation 1.48 0 0 7.34 0 3.14
Figure 79: Number of respondents who reported that some product had been sorted out
0 1 2 3 4 5 6 7 8
Left in the field
Sorted out at farm after harvest
Sorted out at storage
Sorted out at packing plant
Returned to me
Other
0 5 10 15 20
Left in the field
Sorted out at farm after harvest
Sorted out at storage
Sorted out aat packing plant
Returned to farmer
Other
Gave answer Gave no answer

Food losses and waste in primary production 115
The wastage in percent can be deduced from the answers on mass balance and amount sorted out. The answers indicate 7.2% (how is the product used (mass balance)) and 9.5% wastage (how much is sorted out at the different stages) of total production. The amount sorted out contains an uncertainty: 1.1% is registered under “Other”. The respondent stated that the onions were deposited in a public area (“offentlig tomt”). It is difficult to ascertain which number is most correct, hence an average is used: 8.4%. The majority of the onion side flow is sorted out at the packing plant and composted. A small part is left in the field.
The farmers were asked about the main reasons for both harvest waste and post-harvest waste. Each reason had to be given a priority: 1, 2 or 3. When analysing the answers, each category 1 reason was given a score of 3, category 2 was given a score of 2 and category 3 was given a score of 1. The scores were added together. Figures 80 and 81 show the answers in the main categories for harvest and post-harvest waste. Quality issues are clearly the main reason for wastage, followed by pests (plant illnesses, insects, etc.) and weather. Harvesting methods is the fourth most important reason for harvest waste, and post-harvest treatment is the fourth most important reason for post-harvest waste. Human error is another reason mentioned.
Pests are an underlying reason, leading to quality problems which ultimately gives wastage. The same can be said about many of the other reasons given, e.g. weather, human error and economy.
Figure 80: Reasons for harvest waste
0% 20% 40% 60% 80% 100%
Quality Pests WeatherHarvesting methods Human error Farming methodsOther Economy

116 Food losses and waste in primary production
Figure 81: Reasons for post-harvest waste
Nine growers answered the question on possibilities for reducing waste. The question was a free text question with no predefined categories. The answers can be categorised into four main themes (see Figure 82): Agronomical techniques, accept deviating shape and size, improve plant protection and two replied that nothing could be done.
Figure 82: Waste reduction possibilities – main categories
Seven to nine people responded to the question “Could the product that was sorted out have been used for human consumption?”. The average minimum answer was 26% (standard deviation 20), and the average maximum answer was 42% (standard deviation 30).
0% 20% 40% 60% 80% 100%
Quality Pests Weather Post-harvest treatment Human error
0% 20% 40% 60% 80% 100%
Nothing Better protect the crops
Accept deviating shape and size Agronomical practices

Food losses and waste in primary production 117
The respondents were asked about the accuracy of their answer on a scale from 1 to 7, where 7 is most accurate. The average score given was 3.3.
Discussion The number of growers that answered all or a majority of the questions is low, but they still represent 19% of all farmland devoted to onion production. The questions on material balance and amount sorted out give contradictory results on side flow amounts. The answer based on amount sorted out seems more credible, compared to interviews (result 13%) in a previous project (Franke et al. 2013) and answers from other products produced in a similar way (e.g. carrots in this project).
The reasons for food waste are on different levels. The main apparent reason relates to quality, e.g. wrong size, small spots and discolouration. The reasons for these quality deficiencies can both be factors outside of the farmer’s control (e.g. weather), within the farmer’s control (e.g. harvesting technique) or a combination of both (e.g. pests). This is reflected in the answers to the question on possible waste reduction options. Most refer to better acceptance of deviating size and appearance.
The number of respondents falls from the start to the end of the questionnaire. This indicates that the number of questions was too high for the target group.
2.4 Onion side flow in Denmark
2.4.1 Questionnaire
Author(s): The Danish Agrifish Agency
Materials and methods, Sample Response frequencies and representativeness of the sample are given in Table 30.
Table 30: Response frequencies and representativeness of the sample
Response
No. of distributed questionnaires 41 No. of answers 18 Response frequency 43% No. Of answer by producer 17 Frequency of producer among total answers 94%
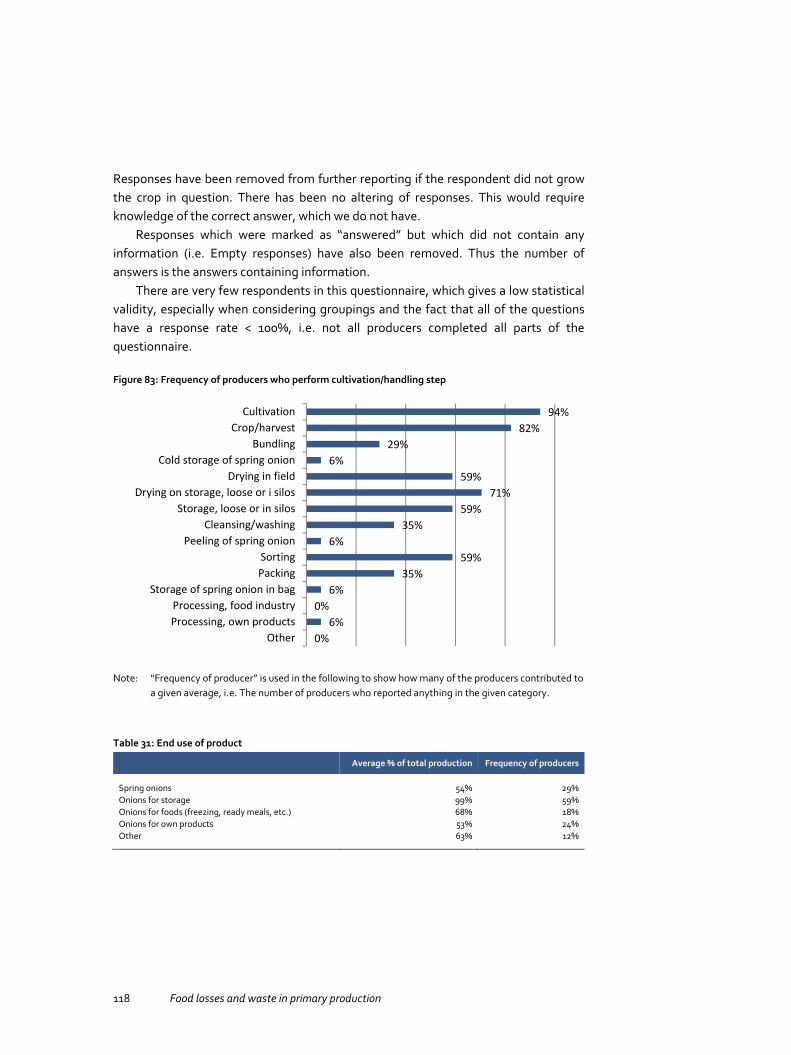
118 Food losses and waste in primary production
Responses have been removed from further reporting if the respondent did not grow the crop in question. There has been no altering of responses. This would require knowledge of the correct answer, which we do not have.
Responses which were marked as “answered” but which did not contain any information (i.e. Empty responses) have also been removed. Thus the number of answers is the answers containing information.
There are very few respondents in this questionnaire, which gives a low statistical validity, especially when considering groupings and the fact that all of the questions have a response rate < 100%, i.e. not all producers completed all parts of the questionnaire.
Figure 83: Frequency of producers who perform cultivation/handling step
Note: “Frequency of producer” is used in the following to show how many of the producers contributed to
a given average, i.e. The number of producers who reported anything in the given category.
Table 31: End use of product
Average % of total production Frequency of producers
Spring onions 54% 29% Onions for storage 99% 59% Onions for foods (freezing, ready meals, etc.) 68% 18% Onions for own products 53% 24% Other 63% 12%
94%82%
29%6%
59%71%
59%35%
6%59%
35%6%
0%6%
0%
CultivationCrop/harvest
BundlingCold storage of spring onion
Drying in fieldDrying on storage, loose or i silos
Storage, loose or in silosCleansing/washing
Peeling of spring onionSortingPacking
Storage of spring onion in bagProcessing, food industryProcessing, own products
Other

Food losses and waste in primary production 119
Results The respondents were asked to divide up the total production between the above categories. Only one respondent did not manage to do this, which indicates that most understood the question. Across all categories, the total average sorted out was 21% of production. Two producers reported a sorting out of 100% in the “Other” category, i.e. A total loss of production.
Table 32: Product sorted out
Average Frequency of producers
Frequency of producers who answered “Don’t know”
Spring onions 5% 12% 18% Stored spring onions 25% 12% 6% Regular onions after storage 10% 59% 6% Onion for foods 0% 0% 6% Onions for own products 0% 0% 6% Other 100% 12% 6%
Table 33: How much of the total production was sorted out at which cultivation/handling step?
Average Frequency of producers
Frequency of producers who answered “Don’t know”
Not harvested 43% 29% 6% During harvesting of spring onions 9% 18% 6% During field drying and harvesting of regular onions 2% 29% 6% During packing and storage of spring onions 5% 12% 6% During packing and storage of regular onions 12% 47% 6% During processing 0% 0% 6% During delivery to food shops or similar 9% 12% 6% During sale or advertisement 5% 18% 6% Other 0% 0% 12%
When comparing the reported totals from the questions on how much of the total products were sorted out and how much was sorted out at which cultivation/handling step, it is unclear whether the combined totals should be identical, i.e. If both questions relate to how much of the total production was sorted out divided up by either product categories or cultivation/handling steps. When checking, seven of the respondents report a different total sorted out in the question regarding cultivation/handling than in the question about product types, while nine respondents report the same total.
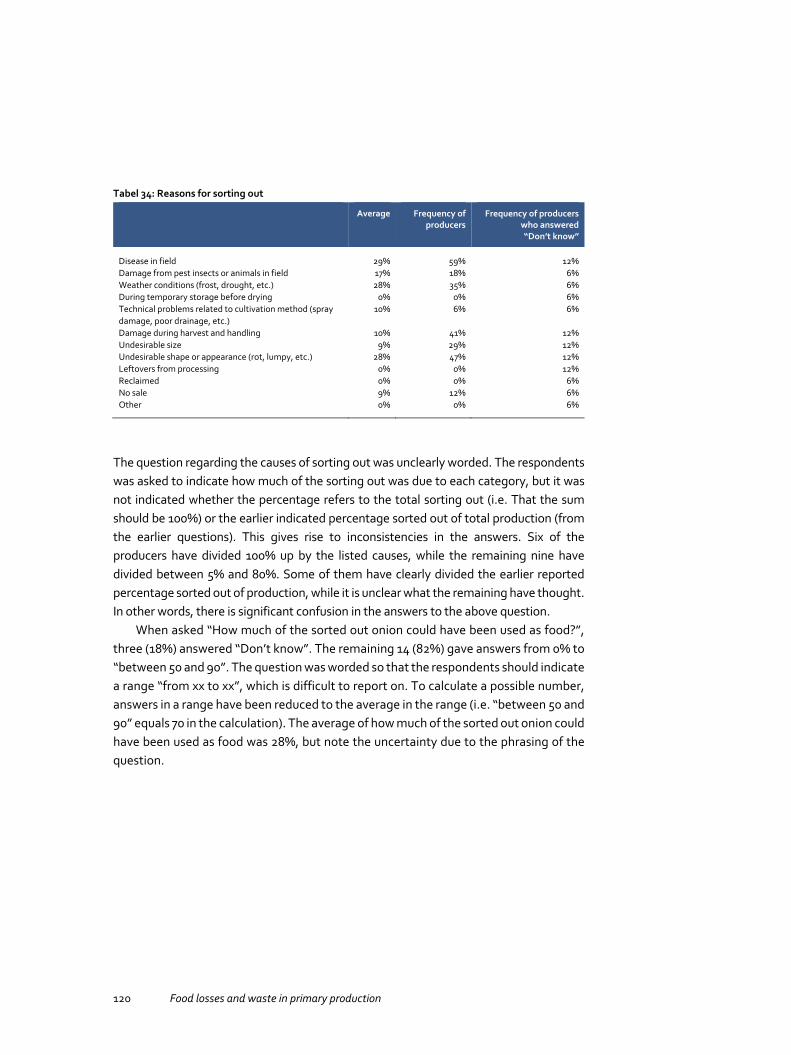
120 Food losses and waste in primary production
Tabel 34: Reasons for sorting out
Average Frequency of producers
Frequency of producers who answered “Don’t know”
Disease in field 29% 59% 12% Damage from pest insects or animals in field 17% 18% 6% Weather conditions (frost, drought, etc.) 28% 35% 6% During temporary storage before drying 0% 0% 6% Technical problems related to cultivation method (spray damage, poor drainage, etc.)
10% 6% 6%
Damage during harvest and handling 10% 41% 12% Undesirable size 9% 29% 12% Undesirable shape or appearance (rot, lumpy, etc.) 28% 47% 12% Leftovers from processing 0% 0% 12% Reclaimed 0% 0% 6% No sale 9% 12% 6% Other 0% 0% 6%
The question regarding the causes of sorting out was unclearly worded. The respondents was asked to indicate how much of the sorting out was due to each category, but it was not indicated whether the percentage refers to the total sorting out (i.e. That the sum should be 100%) or the earlier indicated percentage sorted out of total production (from the earlier questions). This gives rise to inconsistencies in the answers. Six of the producers have divided 100% up by the listed causes, while the remaining nine have divided between 5% and 80%. Some of them have clearly divided the earlier reported percentage sorted out of production, while it is unclear what the remaining have thought. In other words, there is significant confusion in the answers to the above question.
When asked “How much of the sorted out onion could have been used as food?”, three (18%) answered “Don’t know”. The remaining 14 (82%) gave answers from 0% to “between 50 and 90”. The question was worded so that the respondents should indicate a range “from xx to xx”, which is difficult to report on. To calculate a possible number, answers in a range have been reduced to the average in the range (i.e. “between 50 and 90” equals 70 in the calculation). The average of how much of the sorted out onion could have been used as food was 28%, but note the uncertainty due to the phrasing of the question.

Food losses and waste in primary production 121
Table 35: End use of the sorted out products
Average Frequency of producers Frequency of producers who answered “Don’t know”
Not harvested 78 18% 12% Returned to field 82 47% 12% Bioenergy 100 6% 6% Composting 100 6% 6% Other* 100 12% 6%
Note: *Specified as “animal fodder” and “composting”.
The total in the above question should be 100, and 11 of the respondents have managed this, while the remaining three respondents give answers which add up to something other than 100.
Free answers from the crop growers on how to reduce the food waste:
10 answered (59%).
2 suggested improved storage conditions.
2 suggested more flexible/less picky consumers.
1 answered “greater care during harvest and handling, better technology, new product codes e.g. Including undersized onions”.
1 answered “disease resistant organic onions”.
1 answered “retail shops hold the key to accepting different sizes and different shapes and colours”.
1 answered “better management”.
2 answered “don’t know”.

122 Food losses and waste in primary production

Food losses and waste in primary production 123
3. Green pea side flow
Green pea side flow amounts in primary production as well as side flow treatments, causes and measures to reduce these side flows are summarised in Table 36. The results show that there is a lot of green pea side flow in each country, ranging from 18% to 21%. The main reasons for side flow was unharvested fields, but also related to the quality of the peas.
It should be noted that the case studies, Subchapters 3.1.–3.4., are independent studies that vary in study design, execution and data management and interpretation. Additionally, the sample sizes in all cases are relatively small, and some case studies do not show any results for the representativeness of the sample. For these reasons, the results are rather vague (they contain a high degree of uncertainty) and countries cannot be compared to each other. All in all, the results should be regarded as indicative and more comprehensive study is needed to address the uncertainties.

124 Food losses and waste in primary production
Table 36: Questionnaire results for peas
Country Response rate (of all who received the questionnaire)
Side flow amount (standard deviation)
Side flow treatment (of total side flow)
Reasons Side flow reduction and measures for better side flow utilisation
Denmark (Green and field peas)
25% 18% Not harvested (59%), bioenergy (30%), compost (25%), returned to field (8%), other (25%) (#).
Damage during harvest and handling, no sale/overproduction, weather conditions, other quality parameters and damage from animals are the main reasons given.
Main reasons given: Higher sales/better prices, improved agronomy, e.g. new pesticides, better harvest techniques, not possible, better weather.
Finland (Green peas)
11% 17.6% (22.7%)
Mostly left in the field, some used for animal feed.
Diseases and weather conditions.
Finding ways to overcome small scale problem, finding new markets.
Sweden (Green peas)
67% 21. 4% (standard deviation between farmers not known)
Except for the unharvested part, which was left in the field, side flows were used to produce bioenergy.
Major reasons are harvesting and handling and did not have enough time to harvest all. Other reasons include weather conditions, wrong size and appearance, agricultural problems.
Better harvesting and processing machinery, better cultivars, better (more environmentally friendly) pesticides and better market prices.
Norway (Green peas)
One processor representing several farmers.
20.1% (standard deviation between farmers not known)
Animal feed: 75%. Compost: 20%. Not harvested: 5%.
Major reason was weather. Colour or appearance also important. Other reasons: insect/animal, damage and agronomical issues.
Better pesticides against aphids.
Food losses and waste in primary production 125
3.1 Green pea side flow in Finland
Luke (Luke’s statistics unit, formerly Tike Statistics Finland) collects data on green pea production annually and the annual survey is conducted as a complete enumeration. According to Tike’s data collection, there were 609 farms that cultivated green peas in Finland in 2013. The production area for green peas was almost 2,800 hectares and the net yield (sold amount) was up to 6.2 million kilos.
3.1.1 Questionnaire
Author(s): Hanna Hartikainen, Katri Joensuu, Luke
Materials and methods, Sample We conducted the questionnaire as an online questionnaire so that data management and analysis would be more efficient. We received the producer contacts from Tike Statistics Finland. The contacts included all Finnish pea producer contacts: 1,198 producer contacts in total (of which 549 had over 100 acres of pea production fields). 964 producers shared their e-mail details, and we therefore sent the questionnaire to these 964 producers.
The questionnaire was sent to 964 pea producers, of which only 114 producers responded to the questionnaire and 65 completed the questionnaire successfully. A large proportion of the responses – 49 responses – were rejected because the producers reported that they did not produce for human consumption (16), reported nothing for the uses of peas (23), reported 0 kg yield (3 cases) and/or did not report yield at all (15 cases). Therefore, when only complete answers are counted the final response rate was low – only 7%. 28 produced field peas and 37 produced green peas. Two of the field pea producers and one of the green pea producers were organic producers and the rest were conventional producers.
Of the 37 green pea producers, all cultivated the crop and 46% sold the peas straight to the buyer. Only one producer stored, sorted, packed and transported the peas, and one producer packed and transported the peas. The rest of the producers did not store, sort, pack or transport their peas.
When comparing the sample to all pea producers in Finland, it was found that the sample represents around 7% of the green peas produced (the total yield of the producers in the sample was 460 tonnes). The geographical representativeness of the sample was fairly good since there were producers from 12 different provinces of the 16 provinces that have green pea production. Additionally, the average pea acreage of the
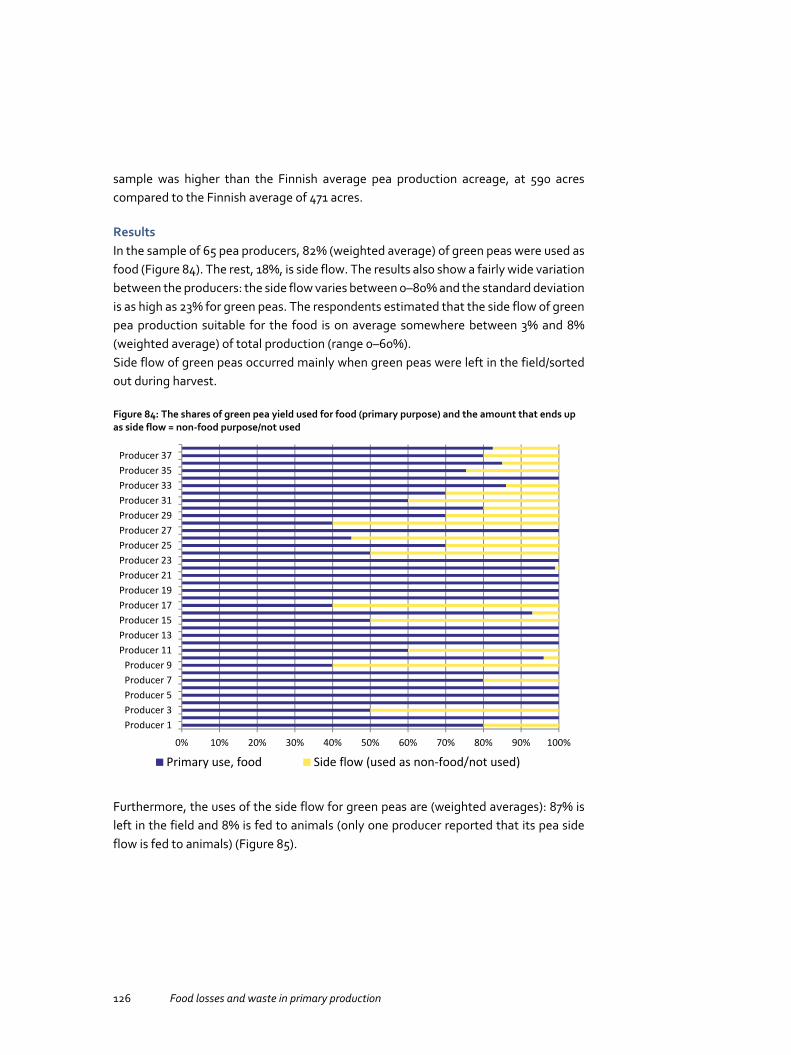
126 Food losses and waste in primary production
sample was higher than the Finnish average pea production acreage, at 590 acres compared to the Finnish average of 471 acres.
Results In the sample of 65 pea producers, 82% (weighted average) of green peas were used as food (Figure 84). The rest, 18%, is side flow. The results also show a fairly wide variation between the producers: the side flow varies between 0–80% and the standard deviation is as high as 23% for green peas. The respondents estimated that the side flow of green pea production suitable for the food is on average somewhere between 3% and 8% (weighted average) of total production (range 0–60%). Side flow of green peas occurred mainly when green peas were left in the field/sorted out during harvest.
Figure 84: The shares of green pea yield used for food (primary purpose) and the amount that ends up as side flow = non-food purpose/not used
Furthermore, the uses of the side flow for green peas are (weighted averages): 87% is left in the field and 8% is fed to animals (only one producer reported that its pea side flow is fed to animals) (Figure 85).
0% 10% 20% 30% 40% 50% 60% 70% 80% 90% 100%
Producer 1Producer 3Producer 5Producer 7Producer 9
Producer 11Producer 13Producer 15Producer 17Producer 19Producer 21Producer 23Producer 25Producer 27Producer 29Producer 31Producer 33Producer 35Producer 37
Primary use, food Side flow (used as non-food/not used)
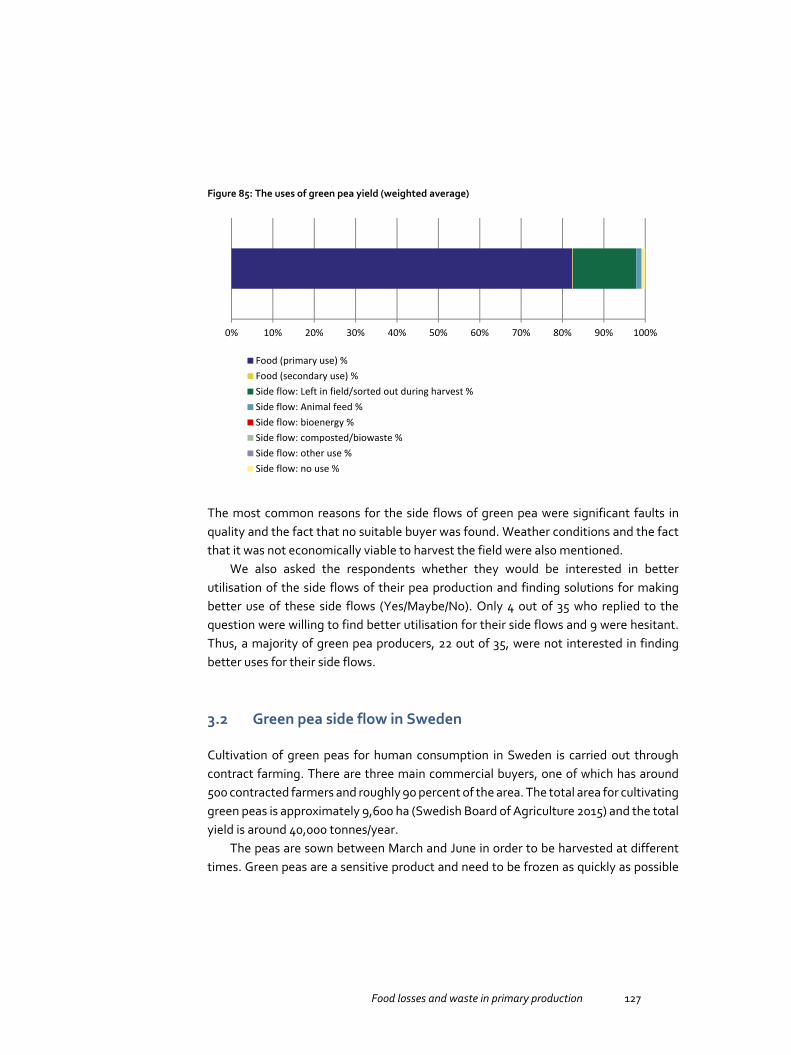
Food losses and waste in primary production 127
Figure 85: The uses of green pea yield (weighted average)
The most common reasons for the side flows of green pea were significant faults in quality and the fact that no suitable buyer was found. Weather conditions and the fact that it was not economically viable to harvest the field were also mentioned.
We also asked the respondents whether they would be interested in better utilisation of the side flows of their pea production and finding solutions for making better use of these side flows (Yes/Maybe/No). Only 4 out of 35 who replied to the question were willing to find better utilisation for their side flows and 9 were hesitant. Thus, a majority of green pea producers, 22 out of 35, were not interested in finding better uses for their side flows.
3.2 Green pea side flow in Sweden
Cultivation of green peas for human consumption in Sweden is carried out through contract farming. There are three main commercial buyers, one of which has around 500 contracted farmers and roughly 90 percent of the area. The total area for cultivating green peas is approximately 9,600 ha (Swedish Board of Agriculture 2015) and the total yield is around 40,000 tonnes/year.
The peas are sown between March and June in order to be harvested at different times. Green peas are a sensitive product and need to be frozen as quickly as possible
0% 10% 20% 30% 40% 50% 60% 70% 80% 90% 100%
Food (primary use) %Food (secondary use) %Side flow: Left in field/sorted out during harvest %Side flow: Animal feed %Side flow: bioenergy %Side flow: composted/biowaste %Side flow: other use %Side flow: no use %
128 Food losses and waste in primary production
after harvesting otherwise there is a risk that their quality will suffer. Approximately three hours after harvesting the peas are cleaned, washed, sorted by size, blanched and refrigerated.
Swedes eats approximately 1 kg of peas per person per year. Almost half of the green pea production is exported to other countries, mainly Italy.
3.2.1 Questionnaire
Author: Marie E. Olsson, Dept. of Plant Breeding, Swedish University of Agricultural Sciences, Alnarp
Materials and methods, Sample A questionnaire composed by the Swedish Board of Agriculture was sent during 2014 to the three Swedish commercial buyers of green peas. Two companies responded to the survey. There were seven questions in the questionnaire, all of which concerned production during 2013. The two responding companies had answered all the questions, and had added some of their own comments. In addition, further questions were asked during telephone interviews with the two companies, mainly concerning the reasons for the losses in production.
The two responding companies both produced only green peas and not field peas. Both companies performed all of the following steps: harvesting, cleaning, washing, size sorting, blanching, freezing and packaging. No company responded that they performed any other production step.
Results The losses in the different production steps were estimated by the companies (Figure 86). On average, of the two companies’ total production, 3.3% was not harvested, 1% was lost during harvesting, 7.8% was lost during cleaning and washing, 8.6% was lost during blanching and freezing, 0.7% was lost during colour sorting and 0% was lost during sales and reclamation. No company responded that there were losses at any other step.

Food losses and waste in primary production 129
Figure 86: Losses from total production at the different production steps (% of total production). The values are the means of the two responding companies ± standard deviation
0
2
4
6
8
10
12%
Losses at differentproduction steps
Was
not h
arves
ted
At harv
est
At clea
ning
At blan
ching
and f
reezin
g
At colo
ur so
rting
At sale
s and
reclam
ation
There were various reasons for the losses during production (Figure 87). One company responded that 90% of the losses during production were due to unharvested fields, and this was partly due to the fact that too many fields were ready to harvest at the same time, and the harvesting capacity was insufficient for these quantities. This cause of losses is probably highly variable from year to year. Even though the production is planned with different pea varieties having different harvesting times, the weather can affect the maturity rate, so too much can be ready to harvest at the same time. The company commented that to guarantee supply for the processing factory and production, there must also be a certain degree of overcapacity.
Another reason, estimated to account for 46% for the other company, was damage during harvesting and handling. Losses during processing were estimated to account for 33.5% of losses. Weather conditions were estimated to account for 5–7% of losses, while cultivation techniques accounted for 5–7% of losses for the two companies. If

130 Food losses and waste in primary production
drought occurs after the growth of the peas has been completed, this might cause the peas to crack and thereby cause losses. One company estimated that unwanted colour or appearance accounted for 6.5%, while neither of the companies considered damage from insects or animals in the fields to cause any significant losses. Plant diseases in the field were not considered to cause any losses in the field by one company, while the other responded that they did not know. Both companies responded that they did not consider reclamation, market demand or excessive production to cause any losses.
Figure 87: Reasons for the losses during production. The values are the means of the two responding companies ± standard deviation
0
20
40
60
80
100 **
%
Diseas
es in
t
he fie
ld
Damag
e from
insec
ts or
anim
als
Weathe
r con
dition
s
Cultiva
tion
techn
iques
Damag
e at h
arves
t
and
hand
ling
Unwan
ted co
lour
or a
ppea
rance
Reclam
ation
no m
arket,
too
large
prod
uctio
n
Other c
ause
s*
Causes for thelosses in the production
Note 1: *Only one company responded, and the other company answered that they did not know. Note 2: **The other reasons given were from one company losses during processing, and from the other company that they did not have enough time to harvest everything.
The companies regarded the losses during harvesting to be of minor importance, although both mentioned that major losses occurred during cleaning and washing, which could be due to imperfect peas or damage during handling after harvesting. One company also mentioned that during cleaning, some of the green material sorted out
Food losses and waste in primary production 131
was not peas, but other plant parts. Large losses occurred when blanching and freezing of peas, and the companies mentioned that the peas could crack during processing.
Both of the companies had arranged utilisation of the losses from production, so the waste was used for bioenergy. One company also estimated the losses in the unharvested fields to be 25% of the end usage. There was no other usage of the losses. One company estimated that 4–5% of the losses could have been used as food, while the other company did not respond to this question. Both of the companies considered alternative uses for waste other than for bioenergy to be favourable in the future.
Apart from unharvested fields, the sorting of the peas at the cleaning and washing steps as well as after blanching accounted for a significant proportion of the losses. There could be several reasons for the imperfect quality of the peas, although the quality standards set the limit for what is sorted out. The market quality includes factors such as texture, size, flavour and colour (Jute et al. 1998), and alcohol insoluble solids (AIS), size and colour uniformity are also important quality traits (Edelenbos et al. 2001). For this particular product, the losses in the fields seem to be of minor importance, apart from the unharvested fields. Finding new use for the losses appearing during processing in the factory seems to be easier and faster to achieve than changing the established quality traits and the sorting techniques arranged according to the quality standards. Recent interest in usage of food waste as a valuable resource for new types of products or for products produced by new technology creates future opportunities to reduce food waste (Mirabella et al. 2014).
3.3 Green pea side flow in Norway
3.3.1 Questionnaire
Authors: Erik Svanes, Østfoldforskning
Materials and methods, Sample The questionnaire on green pea production was answered by one processing company. Originally, a list of green pea growers was obtained from one producer’s organisation: Gartnerhallen. The organisation “Produktregisteret” that sold us the address list for wheat producers did have further growers’ addresses, but it was decided to send the questionnaire to the processing company. The reason was that this company was responsible for most activities in the pea value chain: harvesting, sorting out soil and other non-pea materials, washing, blanching, freezing and packing. The farmers perform all activities up to the time of harvesting. It is assumed that the processing

132 Food losses and waste in primary production
company has more knowledge of amounts sorted out, the reasons for this and opportunities for improvements.
Results Table 37 gives an overview of the pea side flows and where the side flows occur. The total side flow is 20%. The largest side flow occurs during processing, in particular during sorting out soil and other non-pea materials, washing, blanching, freezing and colour sorting.
Table 37: Overview of green pea side flows, as a % of total amount grown
Side flow Amount
Not harvested 1% Lost during harvesting 2% Lost when separating peas from soil and other non-pea material 5% Lost during blanching and freezing 5% Lost during colour sorting 6% Lost during sale to consumer or because of complaints 1%
Table 38 shows that, even though the side flow is discovered during processing, the reasons for the side flow can often be found in the growing phase. Weather conditions are by far the most important single factor, but insects, pests and agronomical reasons also play a role. In addition, incorrect colour and appearance are important factors.
Table 38: Reasons for green pea side flows
Reason Assumed importance
Damage from insects and animals in the field 10% Weather conditions 60% Agronomical problems 10% Unwanted colour or appearance 20%
The fact that a proportion of the peas is designated as side flow does not automatically mean that it is not suitable for human consumption. The producer assumed that between 40% and 60% of the side flow had sufficient quality to be used for human consumption at the time of sorting out.
Table 39 shows how the side flow was used. Most of it is used in some way or another. Most goes to animal feed, some is composted and even that which is not harvested gives a benefit as fertiliser for future crops.

Food losses and waste in primary production 133
Table 39: Utilisation of pea side flows
Utilisation Amount
Not harvested 5% Composted 20% Animal feed 75%
The only answer to the question of opportunities for reducing the side flows was: “better pesticides against aphids”.
3.4 Green and field pea side flow in Denmark
3.4.1 Questionnaire
Author(s): The Danish Agrifish Agency The results of both green and field pea side flow are presented here.
Materials and methods, Sample Response frequencies and representativeness of the sample are given in Tables 40–42.
Table 40: Response frequencies and representativeness of the sample
Response
No. Of distributed questionnaires 252 No. Of answers 64 Response frequency 25% Frequency of producers among answers 100%
Table 41: Frequency of producers who produce and/or process peas
Frequency of producers
Produce peas 92% Process peas 2% Produce and process peas 5% Response frequency 98%
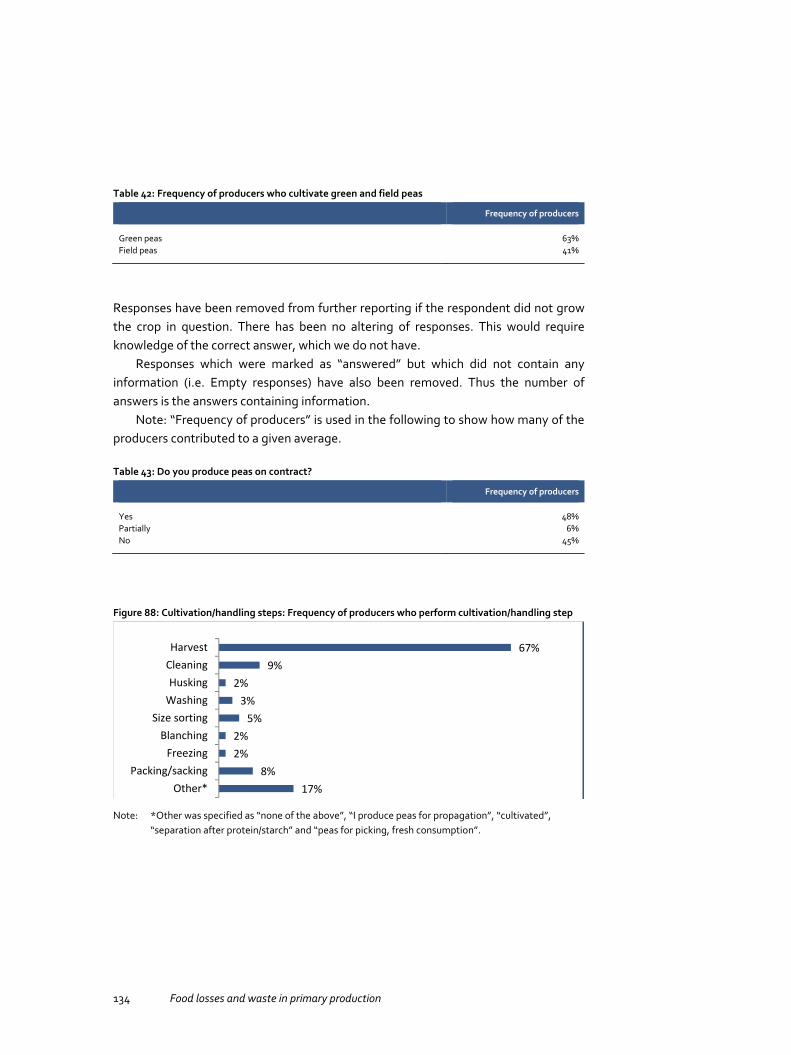
134 Food losses and waste in primary production
Table 42: Frequency of producers who cultivate green and field peas
Frequency of producers
Green peas 63% Field peas 41%
Responses have been removed from further reporting if the respondent did not grow the crop in question. There has been no altering of responses. This would require knowledge of the correct answer, which we do not have.
Responses which were marked as “answered” but which did not contain any information (i.e. Empty responses) have also been removed. Thus the number of answers is the answers containing information.
Note: “Frequency of producers” is used in the following to show how many of the producers contributed to a given average.
Table 43: Do you produce peas on contract?
Frequency of producers
Yes 48% Partially 6% No 45%
Figure 88: Cultivation/handling steps: Frequency of producers who perform cultivation/handling step
Note: *Other was specified as “none of the above”, “I produce peas for propagation”, “cultivated”,
“separation after protein/starch” and “peas for picking, fresh consumption”.
67%9%
2%3%
5%2%2%
8%17%
HarvestCleaningHusking
WashingSize sorting
BlanchingFreezing
Packing/sackingOther*

Food losses and waste in primary production 135
Results The average total loss (among the producers who reported a loss) was 18% in total over all the categories.
Table 44: Loss of product: How much of the peas was lost? However, not all producers wrote a number. Some only wrote a comment. “Frequency of producers” includes those that only made comments. Comments were: “40% supply and demand”, “Many were not harvested, grew too big”, “Waste is necessary because you cannot plan sowing according to how warm it will be six weeks later”, “Most was lost this year due to poor germination and weeds”, “We cultivate the peas. All other handling is carried out by Ardo”, “Not relevant for green peas for consumption”, “17% for the whole process”
Average Frequency of
producers
Frequency of producers who answered “Don’t know”
In field 14% 47% 36% During harvesting 5% 44% 27% During cleaning 2% 9% 30% During husking 5% 5% 27% During blanching and freezing 0% 3% 28% During colour sorting 8% 5% 27% During sale and reclaim 17% 5% 30% Other* 14% 14% 22%
Table 45: How much of the loss was due to…?
Average Frequency of producers
Frequency of producers who answered “Don’t know”
Disease in field 5% 22% 23% Damage from animals 20% 34% 19% Weather conditions (rain, flooding, etc.) 38% 30% 19% Technical problems related to cultivation method (spray damage or similar)
5% 16% 22%
Damage during harvest and handling 51% 27% 25% Other quality parameters 23% 8% 23% Reclaims 0% 6% 22% No sale or overproduction 35% 19% 23% Other* 13% 11% 20%
Note: *Not all producers wrote a number. Some only wrote a comment. “Frequency of producers” includes those that only made comments. Comments were: “Organic production, rooks the biggest problem”, “The questions did not seem relevant for propagation”, “Drought”.
The sum of the reasons for loss should be 100 for each respondent (this was clearly indicated in the question), however not all producers have understood this. 23 of the producers correctly divided up the full loss (100%) among the different categories, while 14 divided up less than 100% of the loss.

136 Food losses and waste in primary production
Table 46: How much of the lost/sorted out peas were edible?
Edible fraction of lost/sorted out peas Frequency of producers
1–5% 34% 5–10% 5% 10–15% 2% 15–20% 3% 20% or more 36%
Table 47: End use of the lost/sorted out products
Average Frequency of producer Frequency of producers who answered “Don’t know”
Not harvested 59 47% 19% Returned to field 8 11% 22% Bioenergy 30 6% 23% Compost 25 6% 23% Other* 25 14% 23%
Note: *Other was specified as “to own chicken”.
Again, the respondents were clearly asked to divide up the full end use of the lost/sorted out product (i.e. The sum of the reported numbers should be = 100). 18 producers managed to do this correctly, while 11 of the respondents failed to do this correctly and divided up a sum of less than 100.
The producers were asked how the proportion of peas which goes to food can be increased. 40 (63%) answered:
8 suggested higher sales, higher prices or VAT exemption.
6 suggested improved agriculture management, e.g. new pesticides, better harvesting techniques, etc.
4 did not think it was possible (some specified at least not in their part of the production).
2 wished for better weather.
1 asked for more lenient pesticide regulation.
1 answered “10”.
1 answered “I don’t think they are lost. It’s just green fertiliser. We just need enough for the market.”

Food losses and waste in primary production 137
1 answered “Buy Ardo frozen peas. Very strange questionnaire.”
1 suggested fewer foreign peas in the Danish market.
1 answered “Advertisement (New Nordic Kitchen, increase focus on protein in humanitarian aid rations, product development.”
1 answered “The sale is sick, we can’t sell anything which does not look like it’s been made by a machine, e.g. completely round.”
6 said the question was irrelevant as they produced peas for propagation or fodder
6 indicated that they did not know.

138 Food losses and waste in primary production

Food losses and waste in primary production 139
4. Field pea side flow
Field pea side flow amounts in primary production as well as side flow treatments, causes and measures to reduce these side flows are summarised in Tables 48 and 49 The results show that there is quite a lot of field pea side flow in each country, ranging from 17% to 18%, and most of this side flow occurs after harvesting, e.g. during sorting and storing of field peas.
It should be noted that the case studies, Subchapters 4.1–4.2, are independent studies that vary in study design, execution and data management and interpretation. Additionally, the sample sizes in all cases are relatively small, and some case studies do not show any results for the representativeness of the sample. For these reasons, the results are rather vague (they contain a high degree of uncertainty) and countries cannot be compared to each other. All in all, the results should be regarded as indicative and more comprehensive study is needed to address the uncertainties.
Table 48: Questionnaire results for peas
Country Response rate (of all who received the questionnaire)
Side flow amount (standard deviation)
Side flow treatment (of total side flow)
Reasons Side flow reduction and measures for better side flow utilisation
Finland (Field peas)
11% 17.7% (16.7%) Mostly used for animal feed, some left in field, “other use”.
Diseases and weather conditions.
Improved agronomical techniques, finding ways to overcome small scale problems, finding new markets, feeding side flow to animals (no impact on side flow amount)
Sweden (Field peas)
39% 16.5% (average of two buyers:
8% and 25%). Standard deviation between
farmers not known.
Used for animal feed, left in field and used for bioenergy and compost.
Damage during harvest or handling, insect/wildlife damage, quality (bad colour/appearance).
Better varieties, better agronomical techniques or equipment, decrease effect of wildlife.
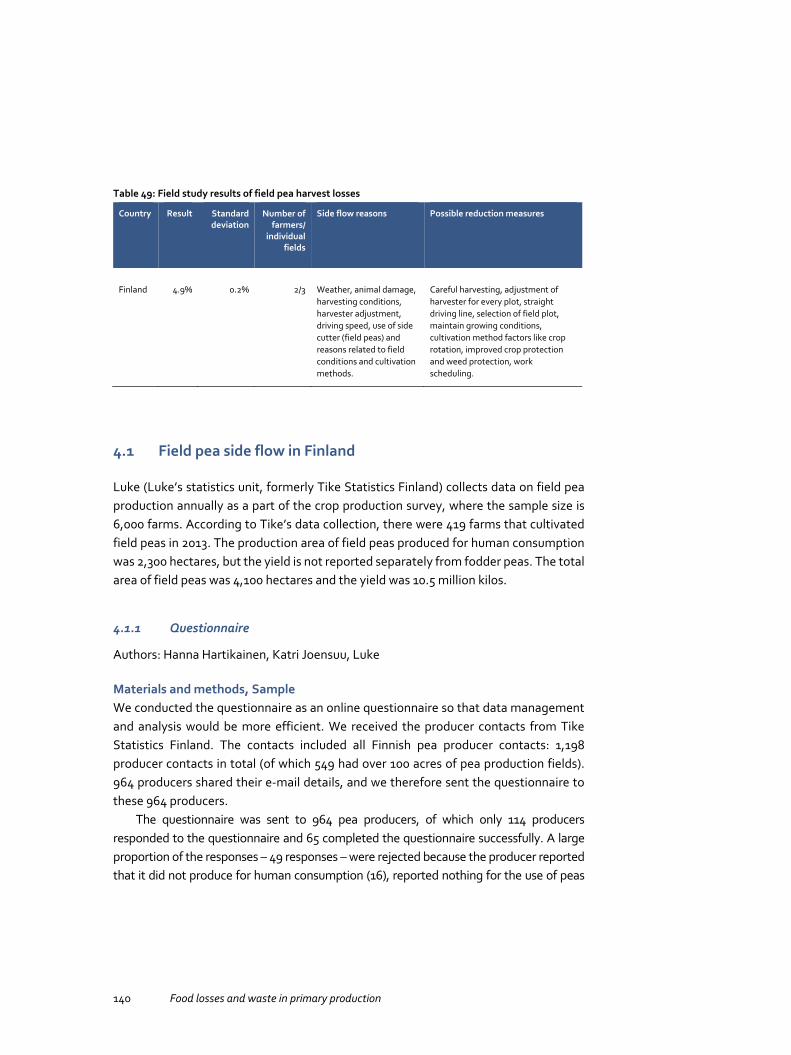
140 Food losses and waste in primary production
Table 49: Field study results of field pea harvest losses
Country Result Standard deviation
Number of farmers/
individual fields
Side flow reasons Possible reduction measures
Finland 4.9% 0.2% 2/3 Weather, animal damage, harvesting conditions, harvester adjustment, driving speed, use of side cutter (field peas) and reasons related to field conditions and cultivation methods.
Careful harvesting, adjustment of harvester for every plot, straight driving line, selection of field plot, maintain growing conditions, cultivation method factors like crop rotation, improved crop protection and weed protection, work scheduling.
4.1 Field pea side flow in Finland
Luke (Luke’s statistics unit, formerly Tike Statistics Finland) collects data on field pea production annually as a part of the crop production survey, where the sample size is 6,000 farms. According to Tike’s data collection, there were 419 farms that cultivated field peas in 2013. The production area of field peas produced for human consumption was 2,300 hectares, but the yield is not reported separately from fodder peas. The total area of field peas was 4,100 hectares and the yield was 10.5 million kilos.
4.1.1 Questionnaire
Authors: Hanna Hartikainen, Katri Joensuu, Luke
Materials and methods, Sample We conducted the questionnaire as an online questionnaire so that data management and analysis would be more efficient. We received the producer contacts from Tike Statistics Finland. The contacts included all Finnish pea producer contacts: 1,198 producer contacts in total (of which 549 had over 100 acres of pea production fields). 964 producers shared their e-mail details, and we therefore sent the questionnaire to these 964 producers.
The questionnaire was sent to 964 pea producers, of which only 114 producers responded to the questionnaire and 65 completed the questionnaire successfully. A large proportion of the responses – 49 responses – were rejected because the producer reported that it did not produce for human consumption (16), reported nothing for the use of peas

Food losses and waste in primary production 141
(23), reported 0 kg yield (3 cases), and/or did not report yield at all (15 cases). Therefore, when only complete answers are counted the final response rate was low – only 7%. 28 produced field peas and 37 produced green peas. Two field pea producers and one green pea producer were organic producers, and the rest were conventional producers.
Of the 28 field pea producers, all cultivated the crop, 61% stored the peas, 36% sorted out the peas, 14% packed the crop and 14% transported the crop to the buyer. The total yield of field peas produced for human consumption in Finland is not reported in the agricultural statistics. The sample represents 12% of the total Finnish cultivation area (the total cultivation area of the producers in the sample was 280 hectares). The geographical representativeness of the sample was fairly good since there were producers from 8 provinces of the 14 provinces that have field pea production. Additionally, the average pea acreage of the sample was higher than the Finnish average pea production acreage, at 804 acres compared to the Finnish average of 552.
Results In the sample of 65 pea producers, 82% of the field pea yield is sold for human consumption (Figure 89). The rest, 18%, is side flow. The results also show a fairly wide variation between the producers: the side flow varies between 0% and 80%, and the standard deviation is as high as 17% for field peas (Figure 89). The respondents estimated that the side flow of field pea production suitable for the food chain is 2–3% (weighted average) of total production (range 0–50%).
Side flow of field peas occurred most often when field peas were used for other uses (probably as seed), left in the field/sorted out during harvesting and sorted out pre-harvesting.

142 Food losses and waste in primary production
Figure 89: The shares of field pea yield used for food (primary purpose) and the amount that ends up as side flow = non-food purpose/not used
The uses of the side flow for field pea are (weighted averages): 19% is left in the field, 47% is fed to animals and 31% goes to “other use”. We were not able to ascertain what the “other use” is, but in at least some cases it is “pea used as seed”, which is not considered as side flow (Figure 90). Thus, if we assume that the 31% that goes to “other use” is used as seed, the side flow of field pea would reduce from 18% to 12%. In any case, we assume that the weighted average side flow of field peas is between 12% and 18%.
0% 10% 20% 30% 40% 50% 60% 70% 80% 90% 100%
Producer 1
Producer 3
Producer 5
Producer 7
Producer 9
Producer 11
Producer 13
Producer 15
Producer 17
Producer 19
Producer 21
Producer 23
Producer 25
Producer 27
Average (weighted)
Primary use, food Side flow (used as non-food/not used)
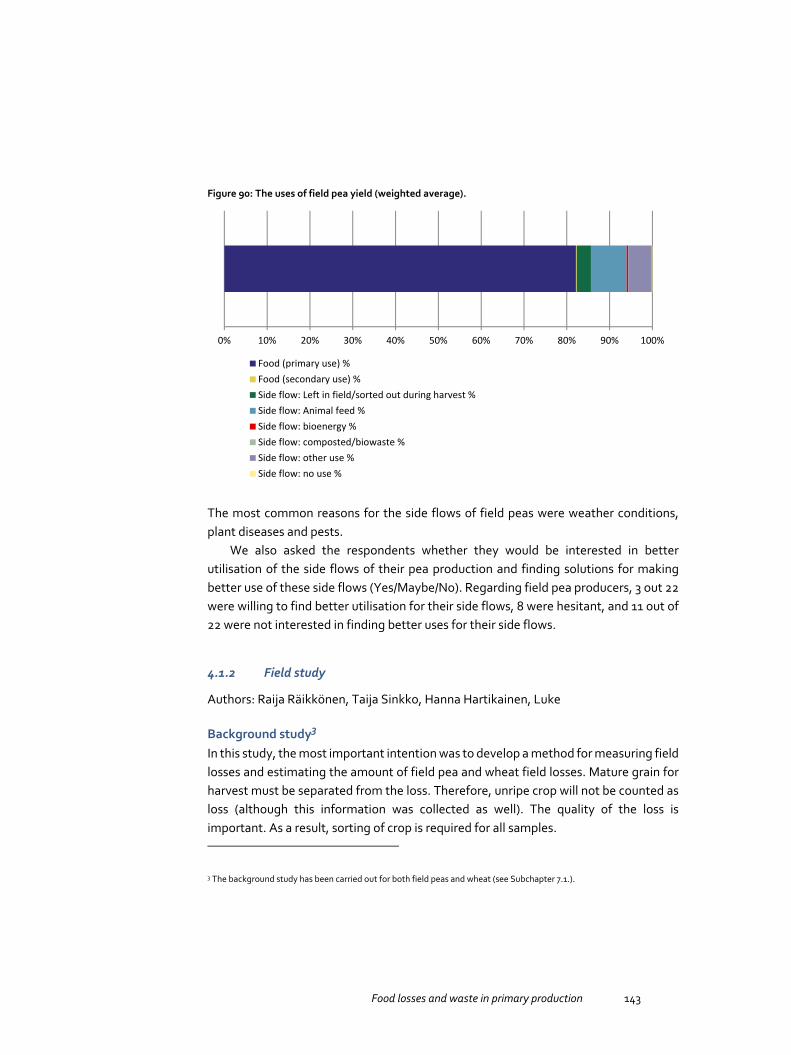
Food losses and waste in primary production 143
Figure 90: The uses of field pea yield (weighted average).
The most common reasons for the side flows of field peas were weather conditions, plant diseases and pests.
We also asked the respondents whether they would be interested in better utilisation of the side flows of their pea production and finding solutions for making better use of these side flows (Yes/Maybe/No). Regarding field pea producers, 3 out 22 were willing to find better utilisation for their side flows, 8 were hesitant, and 11 out of 22 were not interested in finding better uses for their side flows.
4.1.2 Field study
Authors: Raija Räikkönen, Taija Sinkko, Hanna Hartikainen, Luke
Background study3 In this study, the most important intention was to develop a method for measuring field losses and estimating the amount of field pea and wheat field losses. Mature grain for harvest must be separated from the loss. Therefore, unripe crop will not be counted as loss (although this information was collected as well). The quality of the loss is important. As a result, sorting of crop is required for all samples.
3 The background study has been carried out for both field peas and wheat (see Subchapter 7.1.).
0% 10% 20% 30% 40% 50% 60% 70% 80% 90% 100%
Food (primary use) %Food (secondary use) %Side flow: Left in field/sorted out during harvest %Side flow: Animal feed %Side flow: bioenergy %Side flow: composted/biowaste %Side flow: other use %Side flow: no use %
144 Food losses and waste in primary production
Sumner and Williams (2009) have measured field losses from grain and pea production. They separated loss from corn head, cylinder loss, ears lost and total machine loss. They also divided field losses into pre-harvest losses, which are caused by shattering and lodging, and loss of dry matter due to wildlife, birds, weather and other natural causes. Harvest losses are caused by the combine. Field losses can be determined by counting the seeds or spikes left in the field after harvest. This is normally done by counting the seeds in a 10 square foot area across the swath width of the combine. Sumner and Williams (2009) recommended measuring the pre-harvest losses in a 10 square foot area in the standing crop ahead of the combine. The header losses can be measured immediately ahead of the machine, and total losses behind the machine. Pre-harvest losses subtracted from total losses gives machine loss. They also planned the model of the form for what added information and other observations should be documented when losses are checked.
Huitink and Walker from the University of Arkansas, Agriculture and Natural Resources Harvesting have studied gathering losses of grain sorghum. The methodology includes five phases (Figure 91):
Step 1) Total field loss is determined by counting kernels in a 10 square foot area across the cutting width behind the combine.
Step 2) Pre-harvest loss is determined by counting kernels in a 10 square foot area in standing grain (ahead of the combine).
Step 3) Combine shall be backed at least 5 feet away from the standing crop and a 10 square foot area ahead of the cutterbar should be marked to count grain.
Step 4) To determine gathering loss, the pre-harvest loss shall be subtracted from the loss value counted across the width of the combine in Step 3.
Step 5) Threshing and separation loss is the portion of the total field loss not attributable to gathering or pre-harvest loss. Both pre-harvest and gathering loss (Step 3) shall be subtracted from total field loss (Step 1).

Food losses and waste in primary production 145
Figure 91: Measuring grain sorghum field loss at the University of Arkansas (Huitink & Walker)
In the study by Price et al. (1996), measurements were carried out on winter and spring sown rape to determine losses by natural shedding from standing crop and ripening swaths and from the machine operations for a swathed crop and a direct cut crop. Combine threshing and separation losses were not measured in the study. Measurements were made in 30 randomised 8 m wide x 14 m long plots. Trays placed in the crop beneath working machines collected losses from direct cutting, swathing and picking up by swaths by undercutting or the use of a draper (tined conveyor) pick-up. During direct cutting and swathing, groups of trays in carefully selected locations collected seed shed by the side knife, the cutterbar and the central area of the headers where the crop is brought together before entering the elevator or forming the swath.
In the study by Hobson and Bruce (2002), seed loss of oilseed rape with two types of combine harvester header (two different designs of header fitted to the combine harvester) were compared: a standard header and a header with a conveyor fitted behind the cutterbar, which was claimed to assist crop flow into the auger. They carried out six experiments with both techniques. They used same method as Price et al. (1996), whereby trays were placed in the standing crop to catch samples of seed falling from the crop itself and from the combine harvester. The tray size was 640 mm x 66 mm, and they used groups of 4–8 trays.
In Finland, the University of Helsinki’s Department of Agricultural Engineering conducted studies of header losses in 1986–1988 (Pehkonen & Varis 1989). In these studies, the objectives were to determine combine harvesting header loss level, distribution and variables influencing the header loss. Shedded seed or spikes should measure differently and count off the total field loss in order to get gathering loss (Figure 92).

146 Food losses and waste in primary production
Figure 92: Shedded seed or spikes should measure differently and count off the total field loss in order to get gathering loss (Pehkonen & Varis 1989)
Note: 1. Pre-harvest loss, 2. Header loss, 3. Field loss.
There are several definitions of harvesting loss:
1) Total harvesting loss is the sum of pre-harvest, gathering and processing losses (Dawelbeit 2000).
2) Total field loss is seed or spikes left in the field after harvest (Sumner & Williams 2009).
3) Total field loss is pre-harvest loss and gathering loss counted together (Huitink & Walker).
According to these previous studies, it has been decided to divide field loss into the following in this study (NMR 2015):
1) Pre-harvest losses, which are caused by shattering and lodging, and loss of dry matter due to wildlife, birds, weather and other natural causes.
2) Harvest/machine losses, which are caused by the combine and harvesting.
3) Total field loss by counting seeds and spikes behind the combine. The reasons behind field losses can vary depending on the stage at which the loss occurs, i.e. if it is pre-harvest loss or gathering loss (Figure 93).
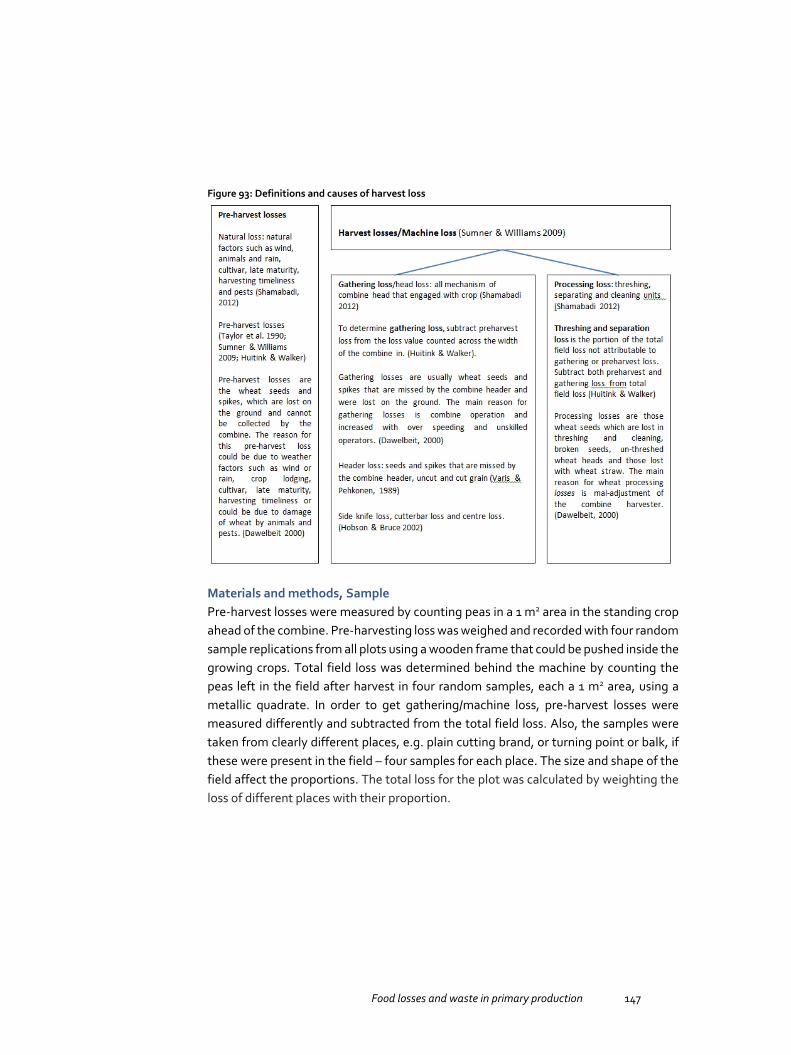
Food losses and waste in primary production 147
Figure 93: Definitions and causes of harvest loss
Materials and methods, Sample Pre-harvest losses were measured by counting peas in a 1 m2 area in the standing crop ahead of the combine. Pre-harvesting loss was weighed and recorded with four random sample replications from all plots using a wooden frame that could be pushed inside the growing crops. Total field loss was determined behind the machine by counting the peas left in the field after harvest in four random samples, each a 1 m2 area, using a metallic quadrate. In order to get gathering/machine loss, pre-harvest losses were measured differently and subtracted from the total field loss. Also, the samples were taken from clearly different places, e.g. plain cutting brand, or turning point or balk, if these were present in the field – four samples for each place. The size and shape of the field affect the proportions. The total loss for the plot was calculated by weighting the loss of different places with their proportion.
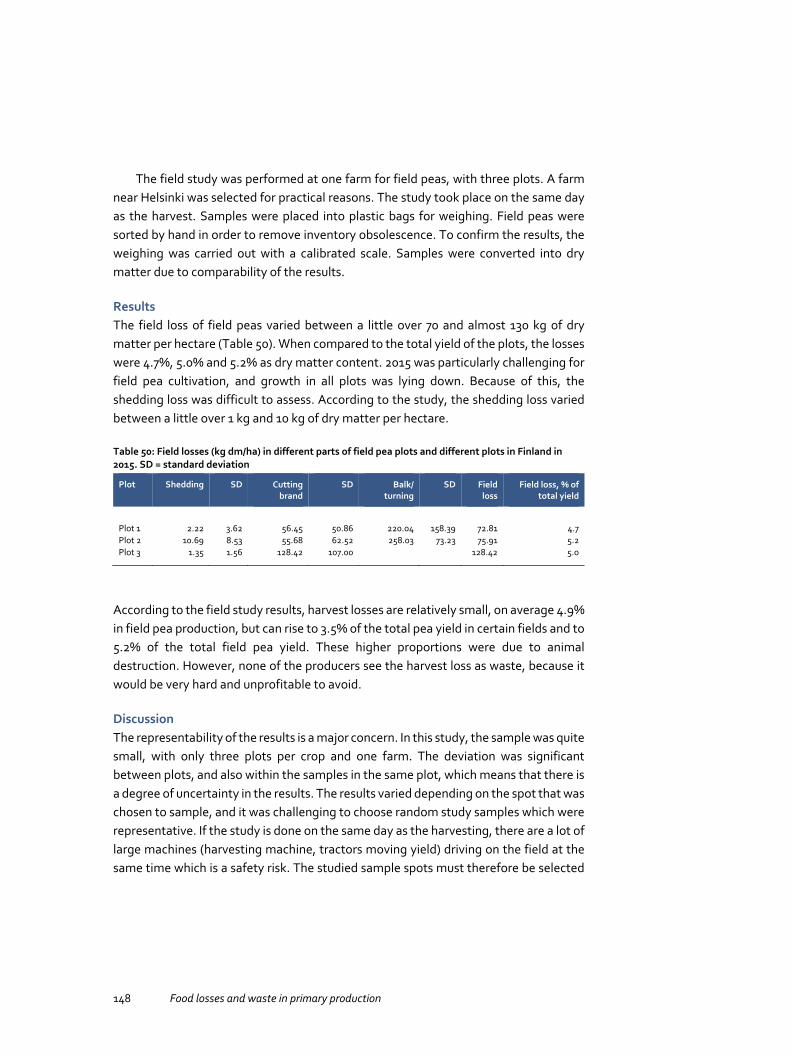
148 Food losses and waste in primary production
The field study was performed at one farm for field peas, with three plots. A farm near Helsinki was selected for practical reasons. The study took place on the same day as the harvest. Samples were placed into plastic bags for weighing. Field peas were sorted by hand in order to remove inventory obsolescence. To confirm the results, the weighing was carried out with a calibrated scale. Samples were converted into dry matter due to comparability of the results.
Results The field loss of field peas varied between a little over 70 and almost 130 kg of dry matter per hectare (Table 50). When compared to the total yield of the plots, the losses were 4.7%, 5.0% and 5.2% as dry matter content. 2015 was particularly challenging for field pea cultivation, and growth in all plots was lying down. Because of this, the shedding loss was difficult to assess. According to the study, the shedding loss varied between a little over 1 kg and 10 kg of dry matter per hectare.
Table 50: Field losses (kg dm/ha) in different parts of field pea plots and different plots in Finland in 2015. SD = standard deviation
Plot Shedding SD Cutting brand
SD Balk/ turning
SD Field loss
Field loss, % of total yield
Plot 1 2.22 3.62 56.45 50.86 220.04 158.39 72.81 4.7 Plot 2 10.69 8.53 55.68 62.52 258.03 73.23 75.91 5.2 Plot 3 1.35 1.56 128.42 107.00 128.42 5.0
According to the field study results, harvest losses are relatively small, on average 4.9% in field pea production, but can rise to 3.5% of the total pea yield in certain fields and to 5.2% of the total field pea yield. These higher proportions were due to animal destruction. However, none of the producers see the harvest loss as waste, because it would be very hard and unprofitable to avoid.
Discussion The representability of the results is a major concern. In this study, the sample was quite small, with only three plots per crop and one farm. The deviation was significant between plots, and also within the samples in the same plot, which means that there is a degree of uncertainty in the results. The results varied depending on the spot that was chosen to sample, and it was challenging to choose random study samples which were representative. If the study is done on the same day as the harvesting, there are a lot of large machines (harvesting machine, tractors moving yield) driving on the field at the same time which is a safety risk. The studied sample spots must therefore be selected

Food losses and waste in primary production 149
in areas where there is the least traffic. Due to this, the results probably do not represent the whole field evenly, so the results will not necessarily give reliable coverage. The study should however be performed on the harvesting day, because losses could differ. Also, the plots could contain places with animal destruction. Animals’ eating and sleeping places and the resulting loss of arable land were impossible to estimate from one end of the field, and were not usually discovered until calculating total loss. In order to obtain a reliable result, more samples should be taken from one plot.
Samplers in the field were able to explore the plots of the different resolution and quality of samples. Sample handlers work differently, which added variation to the results. Also, the measurement can cause losses if care is not taken. In this study, all the fallen grains – including halves, light and sprouted grains – which had not been intended to be harvested were collected. On the other hand, it was possible to verify eligibility for food with the laboratory analysis.
These results represent field loss for only one growing season. There is a considerable variation between growing seasons in Finland, which means that field loss could also be significantly different in other years. For example, the beginning of summer 2015 was exceptionally rainy in Finland.
There is a great variation in field losses between different farms, but also between different plots on the same farm and between different samples in the same plot. For field peas, the field loss varied between a little over 70 kg of dry matter per hectare and almost 130 kg of dry matter per hectare, corresponding to 4.7% and 5.2% of the total yield. In the case of field peas, the crops were lying down and there were also sprouted peas inside the pod, which is not normal. Consequently, there are differences between years, and the results for one year do not represent the average field loss sufficiently. However, measuring losses on arable land was challenging and time-consuming, with loose grains and cobs being collected from the soil by hand, so it may not make sense to implement the same study again. Also, the timing of the field study was challenging. Planning the study date is also limited by the unpredictability of the weather. The field study requires relatively dry weather conditions.
It is not easy to define which parts are food loss and which are not, because for example quality requirements at mills and stores vary from year to year, so similar crops may be accepted for food in one year but not another. Also, if the crop is lying down on the ground, it may not be possible to harvest that part. This causes field loss, but on the other hand, it may no longer be edible by the time of harvesting. Also, some losses are necessary so that the whole harvest could meet the criteria for food. E.g. small and light seeds are commonly left in the field causing losses, but if these were to be harvested,

150 Food losses and waste in primary production
the whole harvest may end up as animal feed because of low quality. In this way, part of the losses is due to the nature of operations.
4.1.3 Interviews
As part of the field studies, two farmers and four experts were interviewed in order to get information and alternatives to find appropriate methods for measuring field pea loss on farms. Semi-structured interviews were conducted in order to get some information about the reasons behind the losses in primary production. The purpose was also to find out some measures to avoid losses. The questions used in this interview were:
What things are affecting field loss in field peas?
Is it possible to reduce crop loss, and if so how?
They were also given some examples to describe reasons that could affect field losses and what reasons could be taken into account when thinking about solutions to reduce field losses:
Weather conditions.
Field etc. conditions.
Harvest losses.
Machine loss/the work, which was during the growing season.
Other. The interviews were conducted with all farmers participating in the field study (four farmers). Farmers were very busy at the time of harvesting, so the interviews were conducted later.
According to the interviews with the farmers, they do not usually measure losses in fields, but the total amount of the yield in each field. This will allow them to compare the current yield with the calculated average yield. Farmers check losses behind their combines in order to determine what adjustments need to be made. Before that they have set the initial combine adjustments according to the operator’s manual, which assumes only average conditions. Final adjustments have to be made in the field, because operating the combine is affected by grain moisture, stalk condition, variety and yield. Some losses are unavoidable.
Food losses and waste in primary production 151
According to expert interviews, field and weather conditions are important factors influencing when to begin harvesting. Varietal differences and time of year affect the probable plant-drying rate. Grain loss monitors are helpful for fine tuning operating adjustments and combine forward speed. There are still some opportunities to reduce field losses. According to semi-structured interviews, these include maintenance of growing conditions, using crop rotation, work scheduling and being careful when harvesting. Also, it is important to adjust the harvester for every plot. In addition, some new techniques could be used for harvesters that give continuous information about yield and moisture. New technologies could also be developed to measure field losses and to asses damaged areas inside the plots.
4.2 Field pea side flow in Sweden
The cultivation of field peas for human consumption in Sweden is carried out through contract farming. There are two commercial buyers, both located in the southern part of the country. There are a total of around 90–100 farms where field peas for human consumption are grown. The cultivation of field peas is associated with a degree of risk, since the yield varies considerably from year to year. Therefore, the proportion of land used for pea production at farm level is normally quite low.
There is no statistical data (cultivated area, number of holdings, yield) exclusively on field peas for human consumption in the Swedish Board of Agriculture’s database. Instead, the data presented for field peas includes peas for human consumption as well as for feed. According to the commercial buyers, the total area used for cultivation of field peas each year is approximately 1,250 hectares.
One of the two commercial buyers contracts around 40 farmers in the Kalmar/Öland region and delivers the peas to the food industry. The total area used for the cultivation of field peas in this area is approximately 350 hectares. We have no data for the yield. The total losses in the buyer’s processing chain were 8% in 2013. Approximately 20–30% of the losses were suitable for human consumption. Crop that is downgraded by the buyer is used as animal feed.
The other buyer currently contracts around 50–60 farmers in Östergötland County. The number has increased in the last few years. The peas are sold under the brand “Go green” in smaller (grocery stores) and larger (canteens/catering facilities) volumes. The buyer also exports about 400 tonnes/year to a company that produces canned field pea soup. The total area used for the cultivation of field peas in Östergötland is around 800–1,000 hectares. The average yield is 3 tonnes/hectare and the total yield is 8,500–9,500 tonnes per year. About 15% is organically grown. The total losses in the buyer’s

152 Food losses and waste in primary production
processing chain are 25%. Approximately 10–20% of the losses were suitable for human consumption. About 98% of the degraded crop goes to animal feed and the remaining 2% to bioenergy.
4.2.1 Questionnaire
Author: Sofi Sundin, Swedish Board of Agriculture
Materials and methods, Sample A questionnaire was sent to 41 farmers and the two commercial buyers of field peas for human consumption in Sweden. The commercial buyers were also contacted during the analysis of the results. The results from the commercial buyers are not graphically presented but are used as background information.
This section summarises responses from 16 farmers that grew field peas for human consumption in Sweden in 2013.
The questionnaire consisted of seven questions. Question one singled out the respondents that grew field peas for human consumption in 2013 (16 farmers). The results from questions two to seven were:
Q2. Production steps at holdings, %.
Q3. Size of loss at different production steps (chosen intervals reflects the responses).
Q4. Size of loss due to different factors (chosen intervals reflects the responses).
Q5. Share of loss appropriate for human consumption.
Q6. Use of losses/downgraded field peas (chosen intervals reflects the responses).
Q7. Suggestions to reduce losses in pea production. The questionnaire included multiple-choice questions but also permitted more elaborate answers in text. In Figures 94–99, blue bars show a specified answer, yellow bars show “Don’t know” answers and green bars show the number of blanks.
All farmers harvested their crop and 38% of them also stated that they cleaned their crop (Figure 94).

Food losses and waste in primary production 153
Figure 94: Total number of answers: 16 (16)
Results Losses occurred mostly during harvesting. More than 80% of the respondents to Q3 had losses during harvesting. All farmers that stated that they clean their crop (38%) also had losses during cleaning. To the remaining response options, farmers answered “Don’t know” or left blanks (Figure 95). Losses during harvesting averaged around 4% of total production and losses during cleaning averaged around 6% of total production (Figure 96). The proportion of crop losses was bigger in the production step “cleaning” than in the production step “harvesting”.
0% 20% 40% 60% 80% 100%
Other
Packing
Drying
Sorting (size)
Cleaning
Harvest
Q2. Production steps at holdings, %

154 Food losses and waste in primary production
Figure 95: Total number of answers: 13 (16). Blue bars show a specified answer, yellow bars show “Don’t know” answers and green bars show the number of blanks
Figure 96: Total number of answers: 13 (16)
In-field losses also occur. The most common reasons for losses, 38% (6 farmers), were crop damage during harvesting or handling and in-field damage from insects or other wildlife (Figure 97). There were also losses due to weather conditions and undesired size and appearance of the crop. Two farmers ticked the alternative “Other” and specified the reason to be “Normal losses at threshing” (which could also fit in the category
0% 20% 40% 60% 80% 100%
Other
Sales and complaints
Sorting
Cleaning
Harvest
Unharvested
Q3. Where losses occur, share of total answers
Loss, % Don't know, % No answer, %
0
1
2
3
4
5
6
7
Unharvested Harvest Cleaning Sorting Sales andcomplaints
Other
% Q3. Average loss at different production steps

Food losses and waste in primary production 155
“Damage during harvesting and handling”) and “Bad straw strength”. These two farmers indicated that 100% of their losses were due to this specific factor (Figure 98). Farmers losing crop due to damage during harvesting and handling attributed, on average, almost 60% of their losses to this. Farmers losing crop due to wildlife damage marked attributed, on average, just over 30% of losses to this.
Figure 97: Total number of answers: 8 (16). Blue bars show a specified answer, yellow bars show “Don’t know” answers and green bars show the number of blanks
Out of the farmers that answered Q5, 45% (5 respondents) suggested that at least 1–20% of their losses were appropriate for human consumption. Almost 30% (3 respondents) suggested that at least 80–100% of losses were appropriate for human consumption. In Q6, 31% of the respondents reported that the downgraded crop (losses) was used for animal feed. Another reported use was to return it to the field. Some was also left in the field at harvesting (unharvested crop).
0% 20% 40% 60% 80% 100%
Other reasonNo market demand
ComplaintsUndesired color or appearance
Undesired sizeDamage during harvest or handling
Cultivation techniqe (e.g. damage from spraying)Weather conditions
In-field damage from insects/other wildlifeIn-field deseases
Q4. Reasons for losses, share of total answers
Loss, % Don't know, % No answer, %

156 Food losses and waste in primary production
Figure 98: Total number of answers: 11 (16)
Figure 99: Total number of answers: 8 (16). Blue bars show a specified answer, yellow bars show “Don’t know” answers and green bars show the number of blanks
Nine farmers answered Q7 in text. Four ticked the box “Don’t know”. Some of the text answers included more than one suggestion. Therefore, these answers were separated into more than one suggestion. In this way, 12 different suggestions were given in total. Figure 100 shows a compilation of the suggestions grouped under seven headings. The suggestions could be grouped into even more thematic categories as shown in Figure 101 where 2/3 of the suggestions concern the crop’s ability to stand (as opposed to lodging), 1/6 concerns less wildlife interference and 1/6 concerns improved quality of threshing equipment.
0%10%20%30%40%50%60%70%80%90%
100%
1-20 % 21-40 % 41-60 % 61-80 % 81-100 %
Q5. Share of loss appropriate for human consumption
min max
0% 20% 40% 60% 80% 100%
OtherCompost
BioenergyFeed
Returned to fieldUnharvested
Q6. Downgraded field peas, share of total answers
Loss, % Don't know, % No answer, %
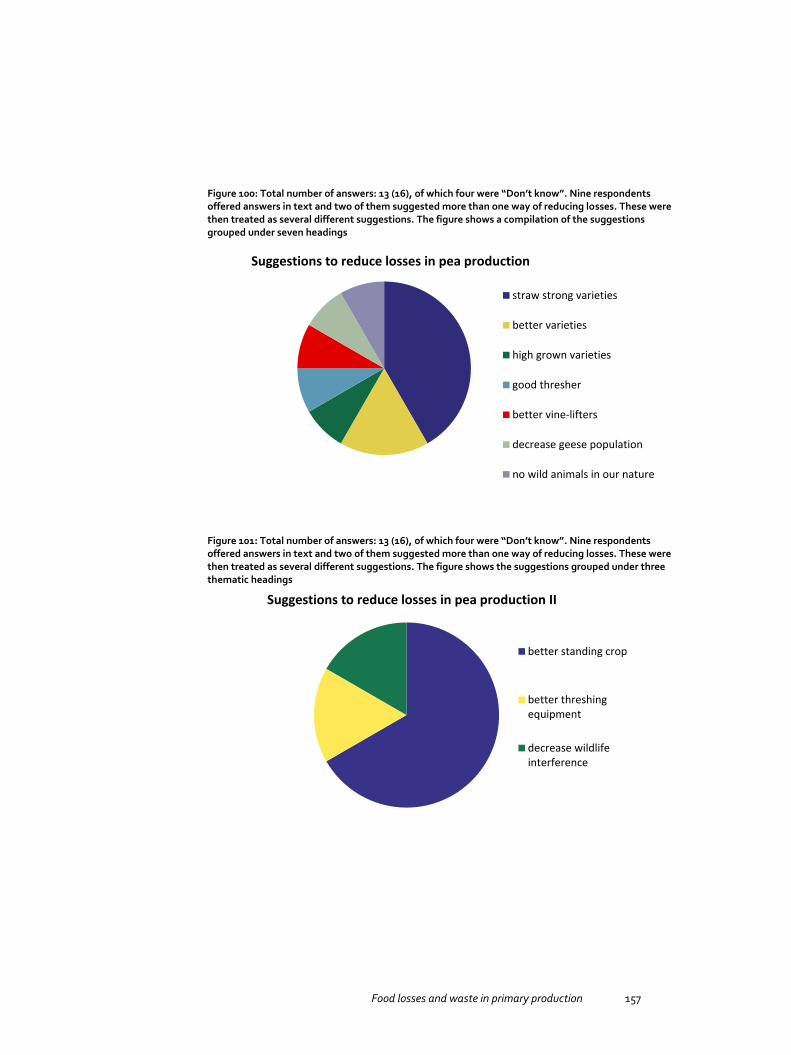
Food losses and waste in primary production 157
Figure 100: Total number of answers: 13 (16), of which four were “Don’t know”. Nine respondents offered answers in text and two of them suggested more than one way of reducing losses. These were then treated as several different suggestions. The figure shows a compilation of the suggestions grouped under seven headings
Figure 101: Total number of answers: 13 (16), of which four were “Don’t know”. Nine respondents offered answers in text and two of them suggested more than one way of reducing losses. These were then treated as several different suggestions. The figure shows the suggestions grouped under three thematic headings
Suggestions to reduce losses in pea production
straw strong varieties
better varieties
high grown varieties
good thresher
better vine-lifters
decrease geese population
no wild animals in our nature
Suggestions to reduce losses in pea production II
better standing crop
better threshingequipment
decrease wildlifeinterference
158 Food losses and waste in primary production
The questionnaire was first sent out to one of the commercial buyers. After receiving the response, one question was altered to improve the questionnaire. The outline of the questions stayed the same but the alternatives were amended. The terms used in the questionnaires for farmers and commercial buyers are the same. However, the analysis showed that the same term, e.g. “cleaning”, may mean different things in the different contexts.
The results from Q2 tell us that the only production steps that occur at the farms in the survey are harvesting and cleaning. However, in Q3 several farmers entered that they do not know the amount of loss that occurs at production steps other than harvesting and cleaning, suggesting that there are losses at these steps. This may be due to a misunderstanding when reading the question. A plausible explanation is that some of the respondents here refer to steps in the buyer’s production chain instead of production at the farm. In Q6, some farmers entered that they had losses due to “unharvested crop”, although this does not correspond to the answers in Q3, where nobody entered any losses at the production step “unharvested crop” (Figures 95, 96 and 99). The explanation for this is probably that some crops were left unharvested at the production step “harvesting” rather than the production step before harvesting.
The questionnaire was sent to 41 farmers in the Kalmar/Öland region. 19 replied, which makes the response rate 46%. Of these, 16 (84%) stated that they grew field peas for human consumption in 2013. Three (16%) stated that they did not grow field peas for human consumption in 2013. The survey did not include farmers in Östergötland County. The survey results may therefore not be representative for farmers of field peas for human consumption in Sweden, but rather for farmers of field peas for human consumption in the Kalmar/Öland region.
Of the 16 answers that were received, 69% needed to be corrected or supplemented. In Q2 (definition of production steps within the company), all 16 respondents stated “harvesting” exclusively. However, in Q3 (where losses occur), six respondents had ticked the box “during cleaning”. The assumption was then made that “cleaning” should also occur as a production step within the company (Q2). The answers to Q2 were therefore adjusted according to this assumption.
In Q4 and Q6, corrections were made so that the total sum of ratios in these questions should equal 100%. Corrections were also made when it became apparent that the respondent had misunderstood the question. When it was impossible to interpret what the respondent meant, data was removed.
Thirteen farmers answered Q3 (where losses occur). Three farmers did not answer Q3 or answered that they did not know. Of the 13 farmers who answered Q3, eight answered Q4 (reasons for losses). Five of these eight also answered Q5 (proportion of waste suitable for human consumption). Five respondents who did not answer Q4

Food losses and waste in primary production 159
(reasons for losses) answered Q5 and/or Q6. Due to the generally low response frequency, these answers were used in the analysis of Q5 and Q6.
Three farmers answered Q5 but not Q4. These answers were used in the analysis of Q5. Four out of the eight who answered Q4 and Q5 also answered Q6 (use of losses). Four farmers who did not answer Q4 and Q5 answered Q6. These answers were used in the analysis of Q6.
The overall response rate was less than 50%. The selection of farmers that the questionnaire was sent to comes from one of two regions where field peas are grown. In that respect, they are not representative of farmers of field peas for human consumption in Sweden. However, these two regions are both located in the southeast and therefore the difference in pea production should not be large between the regions.
The results from Q2 and Q3 may be misleading, since interpretations leading to corrections of data represent a risk of processing errors.
The low response rate to Q4 and Q6 (50% of respondents) and corrections in Q4 and Q6 represent a risk of processing errors. Therefore, these results may be misleading.
The interpretation of text answers in Q7 may be wrong and therefore the results may be misleading.
Discussion The following conclusions can be drawn from the results from this study: The most common reasons for losses, 38% (6 farmers), were crop damage during harvesting or handling and in-field damage from insects or other wildlife. The production step where losses occur most commonly was during harvesting. However, the proportion of losses was greater in the production step “cleaning” than in the production step “harvesting”. Most of the downgraded crop is used as animal feed. Both producers and buyers are of the opinion that part of the losses is suitable for human consumption. Most suggestions to reduce losses in pea production focused on crop characteristics (ability to stay erect). Threshing equipment and wildlife density were also mentioned.
Suggestions for future improvements were to:
Include farmers in Östergötland County for better representativeness of growers of field peas for human consumption.
Add questions about the cultivated area, size of holding etc. to the questionnaire, since there is little background information about field peas for human consumption to be found in statistical data.
160 Food losses and waste in primary production
More preparations before sending out a questionnaire are recommended. This could include:
Background check on available statistical data.
More in-depth interviews with professionals and experts to further map procedures and to define the specific meaning of terminology.
Send out the questionnaire to a few farmers first to test the questionnaire questions.
4.3 Field pea side flow in Denmark
The results of the field pea side flow in Denmark are presented in chapter 3.4.

Food losses and waste in primary production 161
5. Cereal side flow
Cereal (wheat/rye) side flow amounts in primary production as well as side flow treatments, causes and measures to reduce these side flows are summarised in Tables 51. and 52. The results show that there is some cereal side flow in each country, and the range is fairly large, ranging from 4 to 23%. Most of this side flow occurs after harvesting, e.g. when sorting and storing cereal. The main reason for side flow is quality requirements.
It should be noted that the case studies, Subchapters 5.1.–5.4., are independent studies that vary in study design, execution and data management and interpretation. Additionally, the sample sizes in all cases are relatively small, and some case studies do not show any results for the representativeness of the sample. For these reasons the results are rather vague (they contain a high degree of uncertainty) and countries cannot be compared to each other. All in all, the results should be regarded as indicative and more comprehensive study is needed to address the uncertainties.
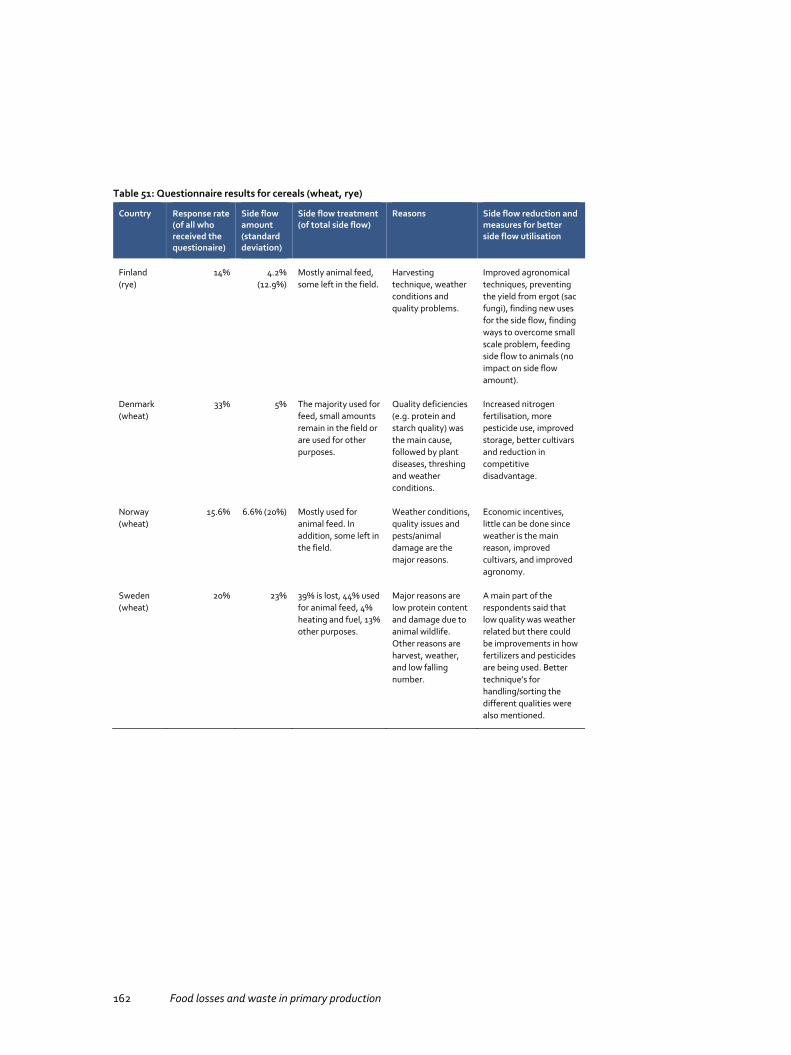
162 Food losses and waste in primary production
Table 51: Questionnaire results for cereals (wheat, rye)
Country Response rate (of all who received the questionaire)
Side flow amount (standard deviation)
Side flow treatment (of total side flow)
Reasons Side flow reduction and measures for better side flow utilisation
Finland (rye)
14% 4.2% (12.9%)
Mostly animal feed, some left in the field.
Harvesting technique, weather conditions and quality problems.
Improved agronomical techniques, preventing the yield from ergot (sac fungi), finding new uses for the side flow, finding ways to overcome small scale problem, feeding side flow to animals (no impact on side flow amount).
Denmark (wheat)
33% 5% The majority used for feed, small amounts remain in the field or are used for other purposes.
Quality deficiencies (e.g. protein and starch quality) was the main cause, followed by plant diseases, threshing and weather conditions.
Increased nitrogen fertilisation, more pesticide use, improved storage, better cultivars and reduction in competitive disadvantage.
Norway (wheat)
15.6% 6.6% (20%) Mostly used for animal feed. In addition, some left in the field.
Weather conditions, quality issues and pests/animal damage are the major reasons.
Economic incentives, little can be done since weather is the main reason, improved cultivars, and improved agronomy.
Sweden (wheat)
20% 23% 39% is lost, 44% used for animal feed, 4% heating and fuel, 13% other purposes.
Major reasons are low protein content and damage due to animal wildlife. Other reasons are harvest, weather, and low falling number.
A main part of the respondents said that low quality was weather related but there could be improvements in how fertilizers and pesticides are being used. Better technique’s for handling/sorting the different qualities were also mentioned.

Food losses and waste in primary production 163
Table 52: Field study results of wheat harvest losses
Country Result Standard deviation
Number of farmers/
individual fields
Side flow reasons Possible reduction measures
Finland 1.4% 1.5% 3/5 Weather, animal damage, harvesting conditions, harvester adjustment, driving speed, use of side cutter (field pea) and reasons related to field conditions and cultivation methods.
Careful harvesting, adjustment of harvester for every plot, straight driving line, selection of field plot, maintain growing conditions, cultivation method factors like crop rotation, improved crop protection and weed protection, work scheduling.
5.1 Wheat and rye side flow in Finland
Luke (Luke’s statistics unit, formerly Tike Statistics Finland) collects data on rye production annually as a part of the crop production survey, where the sample size is 6,000 farms. According to Tike’s data collection there were over 1,769 farms that cultivated rye in Finland in 2013. The production area was 12,300 hectares and the net yield (sold amount) up to 25.7 million kilos.
5.1.1 Questionnaire (rye)
Authors: Hanna Hartikainen, Katri Joensuu, Luke
Materials and methods We conducted the questionnaire as an online questionnaire so that data management and analysis would be more efficient. We received the producer contacts from Tike Statistics Finland. The contacts included all Finnish rye producer contacts: 1,820 producer contacts in total (of which 1,615 had over 100 acres of rye production fields). 1,429 producers shared their e-mail details, and we therefore sent the questionnaire to those 1,429 producers.
Sample The questionnaire was sent to 1,429 rye producers of which only 251 producers responded to the questionnaire and 206 completed the questionnaire successfully. Thus, the response rate was higher than with the other crops – around 14%. Of the 206
164 Food losses and waste in primary production
rye producers, 58 produced organic rye and 148 produced conventional rye. Winter rye was produced more frequently (183 farms) than spring rye (23 farms).
45 answers were rejected because the producer did not report the amount of rye produced for human consumption (31 cases) or yield (8 cases) or any estimate for side flow (6 cases). Two of these 14 producers commented that their cultivation area was so small that they did not consider themselves to belong to the target group. One producer commented that they had sown their first rye crop in the previous autumn (2013) and thus had not harvested any yield yet.
Of the producers that completed the questionnaire successfully, 15 commented that the current price level of Finnish rye is not high enough in view of the high quality requirements and risks related to rye cultivation (e.g. failure of overwintering). These concerns might be one reason for the relatively high response rate.
Of the 206 rye producers, all cultivated the crop, 67% dried the crop, 20% sorted out the crop, 61% stored the crop and 12% transported the crop to the buyer.
When comparing the sample to all rye producers in Finland, it was found out that the sample represents around 11% of the rye production in Finland. (The total yield of the producers in the sample was over 3 million kilos per year.) The geographical representativeness of the sample was fairly good since there were producers from 13 different provinces of the 15 provinces that have rye production. Additionally, the average rye acreage of the sample was higher than the Finnish average rye production acreage, at 797 acres compared to the Finnish average of 701 acres.
Results In the sample of 206 rye producers, 92% (weighted average) of the rye yield that is intended for human consumption is sold for human consumption and 3% is used as seed (Figure 102). The rest, 5%, is side flow. The results also show a fairly wide variation between the producers: the side flow varies between 0–100% and the standard deviation is as high as 15%. The respondents estimated that the side flow of rye production suitable for the food chain is on average somewhere between 1% and 3% (weighted average) of total production.
Side flow of rye occurred when the rye was sorted out during the pre-harvesting stage and to a lesser extent when the crop was left in the field/sorted out during harvesting.

Food losses and waste in primary production 165
Figure 102: The shares of rye yield used for food (primary purpose) and seed, and the amount that ends up as side flow = non-food purpose/not used
The uses of the side flow of rye (weighted averages) are: 16% is left in the field and 68% is fed to animals (Figure 103).
Figure 103: The uses of rye side flows (weighted averages)
The most common reasons for the side flows of rye during harvesting were weather conditions and harvesting procedure. After harvesting, side flow occurred mostly due to quality deficiencies.
We also asked the respondents whether they would be interested in better utilisation of the side flows of their rye production and finding solutions for making better use of these side flows (Yes/Maybe/No). Only 18 out of 173 who replied to the question were willing to find better utilisation for their side flows and 67 were hesitant. Thus, a majority of rye producers, 88 out of 173, were not interested in finding better uses for their side flows.
0% 10% 20% 30% 40% 50% 60% 70% 80% 90% 100%
Primary use, food Used as seed Sideflow (used as non-food/not used)
0% 10% 20% 30% 40% 50% 60% 70% 80% 90% 100%
Side flow: Left in field/sorted out during harvest%Side flow: Animal feed %Side flow: bioenergy %Side flow: composted/biowaste %Side flow: other use %Side flow: no use %

166 Food losses and waste in primary production
5.1.2 Field study (wheat)
Authors: Raija Räikkönen, Taija Sinkko, Hanna Hartikainen, Luke The background study for the wheat field study is presented in Subchapter
4.1.2. (field study on field peas), which was a joint background study for both field peas and wheat.
Materials and methods Pre-harvest losses were measured by counting seeds and spikes in a 1 m2 area in the standing crop/grain ahead of the combine. Pre-harvesting loss was weighed and recorded with four random sample replications from all plots using a wooden frame that could be pushed inside the growing crops. The total field loss was determined behind the machine by counting the seeds or spikes left in the field after harvest in four random samples, each a 1 m2 area, using a metallic quadrate. In order to calculate gathering/machine loss, pre-harvest losses/shedded seed or spikes were measured differently and counted off the total field loss. Also, the samples were taken from clearly different places, e.g. plain cutting brand, turning point or balk, or from spreading channel, if these were present in the field, four samples for each place. According to the measurements, there were 10% of balks, 3.75% of spreading channels and 86.25% plain cutting brands in the field. However, when there were no spreading channels in the field, the proportions were 10% for balks and 90% for plain cutting brands. Nonetheless, the size and shape of the field affects the proportions. The total loss of the plot was calculated by weighting the loss of different places with their proportion.
The field study was performed at four farms (two farms for winter wheat, one farm for spring wheat and one farm for field peas), with 1–3 plots per farm. Farms near Helsinki and Vihti were selected for practical reasons. On all farms the study took place on the same day as the harvest, except for one farm where the field had been harvested some days before. Samples were placed into plastic bags for weighing. Wheat samples were sorted with a 2 mm sieve, and field peas were sorted by hand in order to remove inventory obsolescence. To confirm the results, the weighing was done with a calibrated scale. Samples were converted into a dry matter due to comparability of the results.
Results The field loss varied between almost 30 and a little over 100 kg of dry matter per hectare in winter wheat plots included in the study, which means 0.6% to2.4% of the total yield (as dry matter content) of the field plot. Larger losses were partly due to single grains remaining inside the cobs. For spring wheat, the field loss varied between about 3 kg and 60 kg per hectare in the plots included in the study. The loss in two plots was only
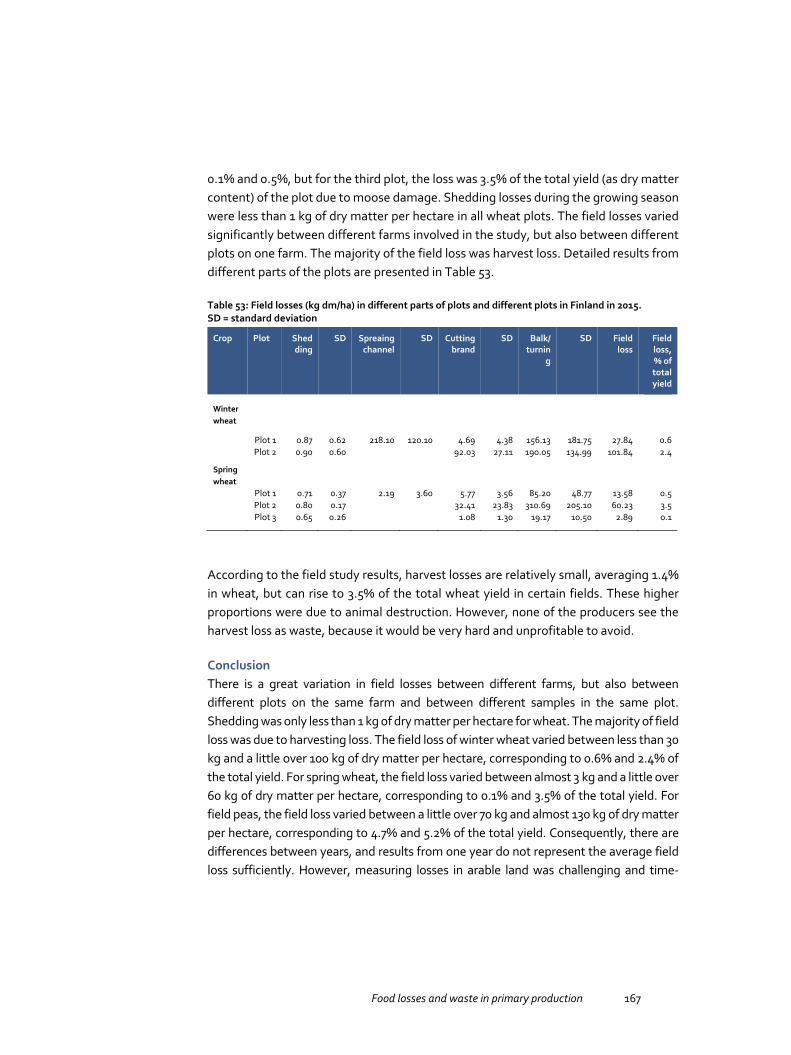
Food losses and waste in primary production 167
0.1% and 0.5%, but for the third plot, the loss was 3.5% of the total yield (as dry matter content) of the plot due to moose damage. Shedding losses during the growing season were less than 1 kg of dry matter per hectare in all wheat plots. The field losses varied significantly between different farms involved in the study, but also between different plots on one farm. The majority of the field loss was harvest loss. Detailed results from different parts of the plots are presented in Table 53.
Table 53: Field losses (kg dm/ha) in different parts of plots and different plots in Finland in 2015. SD = standard deviation
Crop Plot Shedding
SD Spreaing channel
SD Cutting brand
SD Balk/ turnin
g
SD Field loss
Field loss, % of total yield
Winter wheat
Plot 1 0.87 0.62 218.10 120.10 4.69 4.38 156.13 181.75 27.84 0.6 Plot 2 0.90 0.60 92.03 27.11 190.05 134.99 101.84 2.4
Spring wheat
Plot 1 0.71 0.37 2.19 3.60 5.77 3.56 85.20 48.77 13.58 0.5 Plot 2 0.80 0.17 32.41 23.83 310.69 205.10 60.23 3.5 Plot 3 0.65 0.26 1.08 1.30 19.17 10.50 2.89 0.1
According to the field study results, harvest losses are relatively small, averaging 1.4% in wheat, but can rise to 3.5% of the total wheat yield in certain fields. These higher proportions were due to animal destruction. However, none of the producers see the harvest loss as waste, because it would be very hard and unprofitable to avoid.
Conclusion There is a great variation in field losses between different farms, but also between different plots on the same farm and between different samples in the same plot. Shedding was only less than 1 kg of dry matter per hectare for wheat. The majority of field loss was due to harvesting loss. The field loss of winter wheat varied between less than 30 kg and a little over 100 kg of dry matter per hectare, corresponding to 0.6% and 2.4% of the total yield. For spring wheat, the field loss varied between almost 3 kg and a little over 60 kg of dry matter per hectare, corresponding to 0.1% and 3.5% of the total yield. For field peas, the field loss varied between a little over 70 kg and almost 130 kg of dry matter per hectare, corresponding to 4.7% and 5.2% of the total yield. Consequently, there are differences between years, and results from one year do not represent the average field loss sufficiently. However, measuring losses in arable land was challenging and time-

168 Food losses and waste in primary production
consuming when loose grains and cobs were collected from the soil by hand, so it may not make sense to implement the same study again. Also, the timing of the field study was found to be challenging. Planning the study date is also limited by the unpredictability of the weather. The field study requires relatively dry weather conditions.
It is not easy to define which parts are food loss and which are not, because for example quality requirements at mills and stores vary in from year to year, so similar crops may be accepted for food in one year but not another. Also, if the crop is lying down on the ground, it may not be possible to harvest that part. This causes field loss, but on the other hand, it may no longer be edible at the time of harvesting. Also, some losses are necessary so that the whole harvest can meet the criteria for food. E.g. small and light seeds are commonly left in the field causing losses, but if these were to be harvested, the whole harvest may end up as animal feed because of low quality. In this way, part of the losses is due to the nature of operations.
Interview The same growers who took part in the field study were also interviewed. There are still some opportunities to reduce field losses. According to semi-structured interviews, these include maintenance of growing conditions, using crop rotation, work scheduling and being careful when harvesting. Also, it is important to adjust the harvester for every plot. In addition, some new techniques could be used for harvesters that give continuous information about yield and moisture. New technologies could also be developed to measure field losses and to asses damaged areas inside the plots.
5.2 Wheat side flow in Sweden
The long-term average production of cereals in Sweden is approximately 5 million tonnes (Swedish Board of Agriculture 2015). In recent years, cultivation of the high yielding crop winter wheat has increased mainly at the expense of the cultivation of spring barley, spring wheat and oats. Since 1995, the average share of the total production has been 37 percent for winter wheat, 5 percent for spring wheat and 31 percent for spring barley. Sweden is self-sufficient in cereals and exports a regular surplus mainly to trading partners within the EU. The self-sufficiency level is on average 120 percent, and the bulk of the exported cereals are wheat.
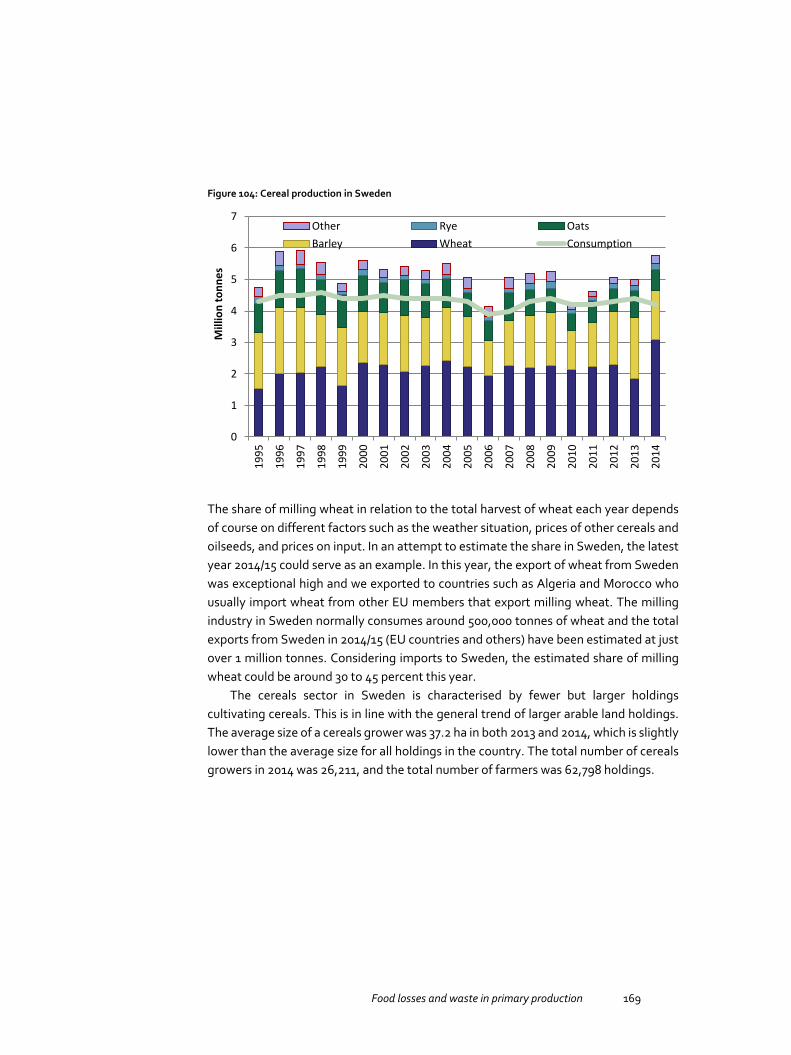
Food losses and waste in primary production 169
Figure 104: Cereal production in Sweden
The share of milling wheat in relation to the total harvest of wheat each year depends of course on different factors such as the weather situation, prices of other cereals and oilseeds, and prices on input. In an attempt to estimate the share in Sweden, the latest year 2014/15 could serve as an example. In this year, the export of wheat from Sweden was exceptional high and we exported to countries such as Algeria and Morocco who usually import wheat from other EU members that export milling wheat. The milling industry in Sweden normally consumes around 500,000 tonnes of wheat and the total exports from Sweden in 2014/15 (EU countries and others) have been estimated at just over 1 million tonnes. Considering imports to Sweden, the estimated share of milling wheat could be around 30 to 45 percent this year.
The cereals sector in Sweden is characterised by fewer but larger holdings cultivating cereals. This is in line with the general trend of larger arable land holdings. The average size of a cereals grower was 37.2 ha in both 2013 and 2014, which is slightly lower than the average size for all holdings in the country. The total number of cereals growers in 2014 was 26,211, and the total number of farmers was 62,798 holdings.
0
1
2
3
4
5
6
7
1995
1996
1997
1998
1999
2000
2001
2002
2003
2004
2005
2006
2007
2008
2009
2010
2011
2012
2013
2014
Mill
ion
tonn
esOther Rye OatsBarley Wheat Consumption
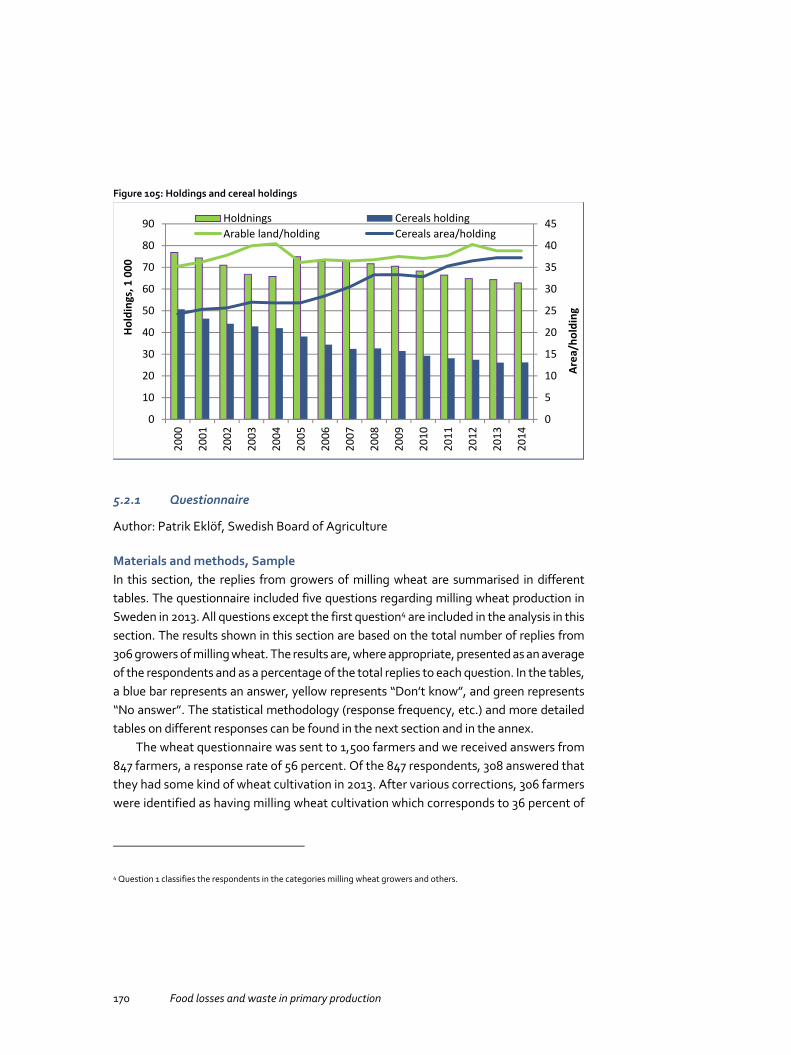
170 Food losses and waste in primary production
Figure 105: Holdings and cereal holdings
5.2.1 Questionnaire
Author: Patrik Eklöf, Swedish Board of Agriculture
Materials and methods, Sample In this section, the replies from growers of milling wheat are summarised in different tables. The questionnaire included five questions regarding milling wheat production in Sweden in 2013. All questions except the first question4 are included in the analysis in this section. The results shown in this section are based on the total number of replies from 306 growers of milling wheat. The results are, where appropriate, presented as an average of the respondents and as a percentage of the total replies to each question. In the tables, a blue bar represents an answer, yellow represents “Don’t know”, and green represents “No answer”. The statistical methodology (response frequency, etc.) and more detailed tables on different responses can be found in the next section and in the annex.
The wheat questionnaire was sent to 1,500 farmers and we received answers from 847 farmers, a response rate of 56 percent. Of the 847 respondents, 308 answered that they had some kind of wheat cultivation in 2013. After various corrections, 306 farmers were identified as having milling wheat cultivation which corresponds to 36 percent of
4 Question 1 classifies the respondents in the categories milling wheat growers and others.
0
5
10
15
20
25
30
35
40
45
0
10
20
30
40
50
60
70
80
90
2000
2001
2002
2003
2004
2005
2006
2007
2008
2009
2010
2011
2012
2013
2014
Area
/hol
ding
Hol
ding
s, 1
000
Holdnings Cereals holdingArable land/holding Cereals area/holding

Food losses and waste in primary production 171
the responses received. Calculated for the whole sample, the response rate was 20 percent. This is obviously a very low rate.
The distribution of the different production steps (Q2 below) among the milling wheat growers in this sample shows that 5 percent did not succeed in harvesting the crop and more than 50 percent of growers both dry and store the crop at the farm for future sale. Around 40 percent of the farmers sell the crop almost immediately after harvest.
Figure 106: Production steps at holdings
Results Not surprisingly, field losses and losses during harvesting are the most common production steps where losses occur (Q3). Losses are less common when the production steps are further away from the time of harvesting. More than 30 percent of the growers answered that losses happened in the field and/or during harvesting (threshing). The average size of field loss (calculated as a share of total milling wheat production) was as high as 19 percent and 2 percent during harvesting. If a field loss of around 20 percent is applied to the total wheat harvest in 2013, this would mean that approximately 370,000 tonnes of wheat had gone missing or could not be used for milling purposes. This amount would then be more than the total spring wheat production in Sweden in 2012 and 2014. According to official statistics on unharvested areas and yield in Sweden in 2013, the unharvested quantity could be estimated at 0.1–0.2 percent of the total wheat production in that year. This indicates that “field loss” in this survey has been interpreted by the respondents as a wider term.
0 10 20 30 40 50 60 70 80 90 100
OtherStorage before drying
Storage at farmDrying
LoadingHarvest
Cultivation
Q2. Production steps at holdings, %
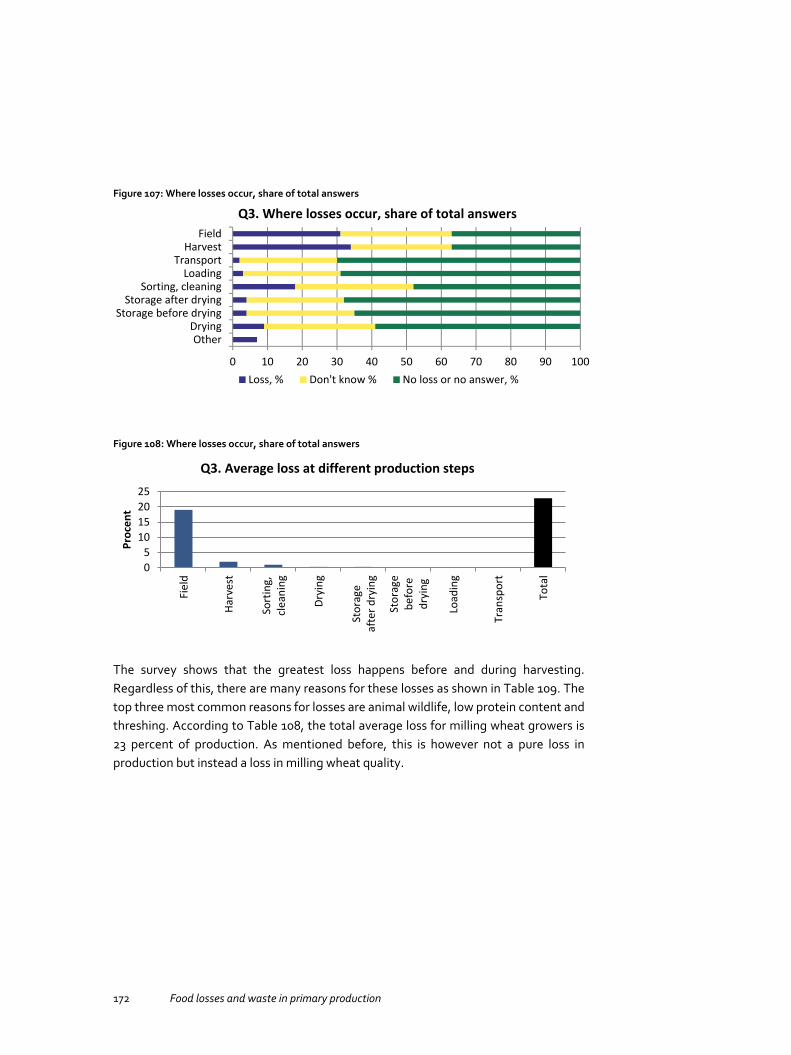
172 Food losses and waste in primary production
Figure 107: Where losses occur, share of total answers
Figure 108: Where losses occur, share of total answers
The survey shows that the greatest loss happens before and during harvesting. Regardless of this, there are many reasons for these losses as shown in Table 109. The top three most common reasons for losses are animal wildlife, low protein content and threshing. According to Table 108, the total average loss for milling wheat growers is 23 percent of production. As mentioned before, this is however not a pure loss in production but instead a loss in milling wheat quality.
0 10 20 30 40 50 60 70 80 90 100
OtherDrying
Storage before dryingStorage after drying
Sorting, cleaningLoading
TransportHarvest
Field
Q3. Where losses occur, share of total answers
Loss, % Don't know % No loss or no answer, %
05
10152025
Fiel
d
Harv
est
Sort
ing,
clea
ning
Dryi
ng
Stor
age
afte
r dry
ing
Stor
age
befo
redr
ying
Load
ing
Tran
spor
t
Tota
l
Proc
ent
Q3. Average loss at different production steps
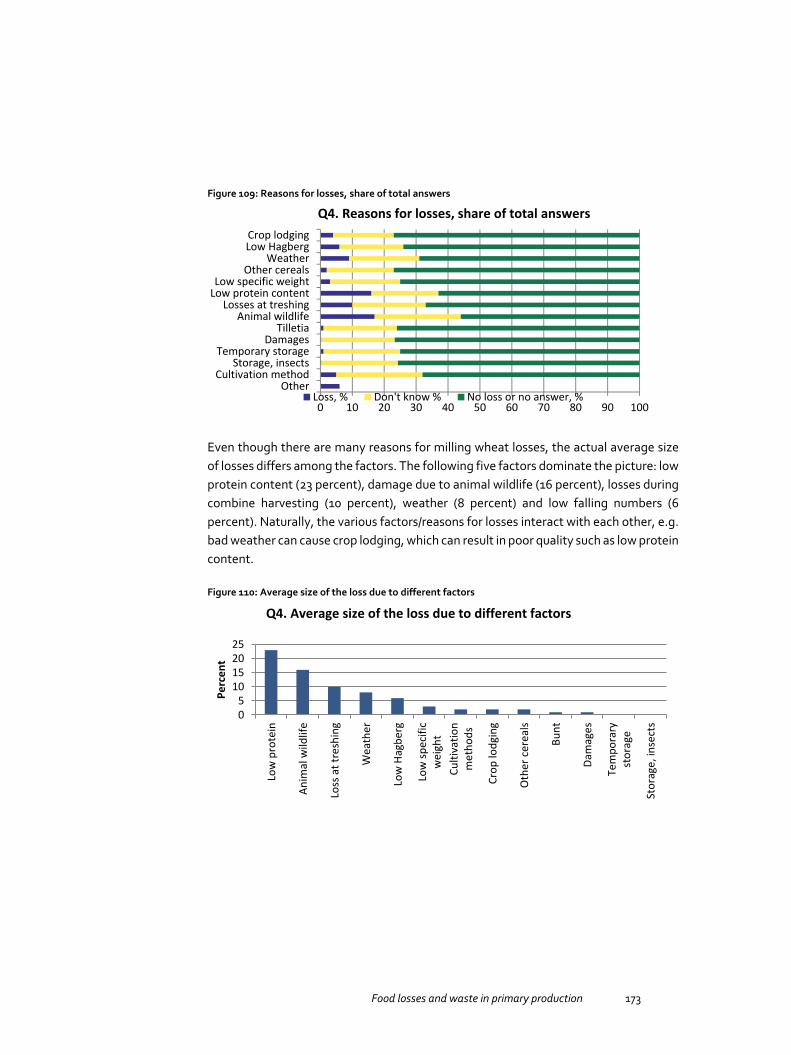
Food losses and waste in primary production 173
Figure 109: Reasons for losses, share of total answers
Even though there are many reasons for milling wheat losses, the actual average size of losses differs among the factors. The following five factors dominate the picture: low protein content (23 percent), damage due to animal wildlife (16 percent), losses during combine harvesting (10 percent), weather (8 percent) and low falling numbers (6 percent). Naturally, the various factors/reasons for losses interact with each other, e.g. bad weather can cause crop lodging, which can result in poor quality such as low protein content.
Figure 110: Average size of the loss due to different factors
0 10 20 30 40 50 60 70 80 90 100
OtherCultivation method
Storage, insectsTemporary storage
DamagesTilletia
Animal wildlifeLosses at treshing
Low protein contentLow specific weight
Other cerealsWeather
Low HagbergCrop lodging
Q4. Reasons for losses, share of total answers
Loss, % Don't know % No loss or no answer, %
05
10152025
Low
pro
tein
Anim
al w
ildlif
e
Loss
at t
resh
ing
Wea
ther
Low
Hag
berg
Low
spec
ific
wei
ght
Culti
vatio
nm
etho
ds
Crop
lodg
ing
Oth
er c
erea
ls
Bunt
Dam
ages
Tem
pora
ryst
orag
e
Stor
age,
inse
cts
Perc
ent
Q4. Average size of the loss due to different factors
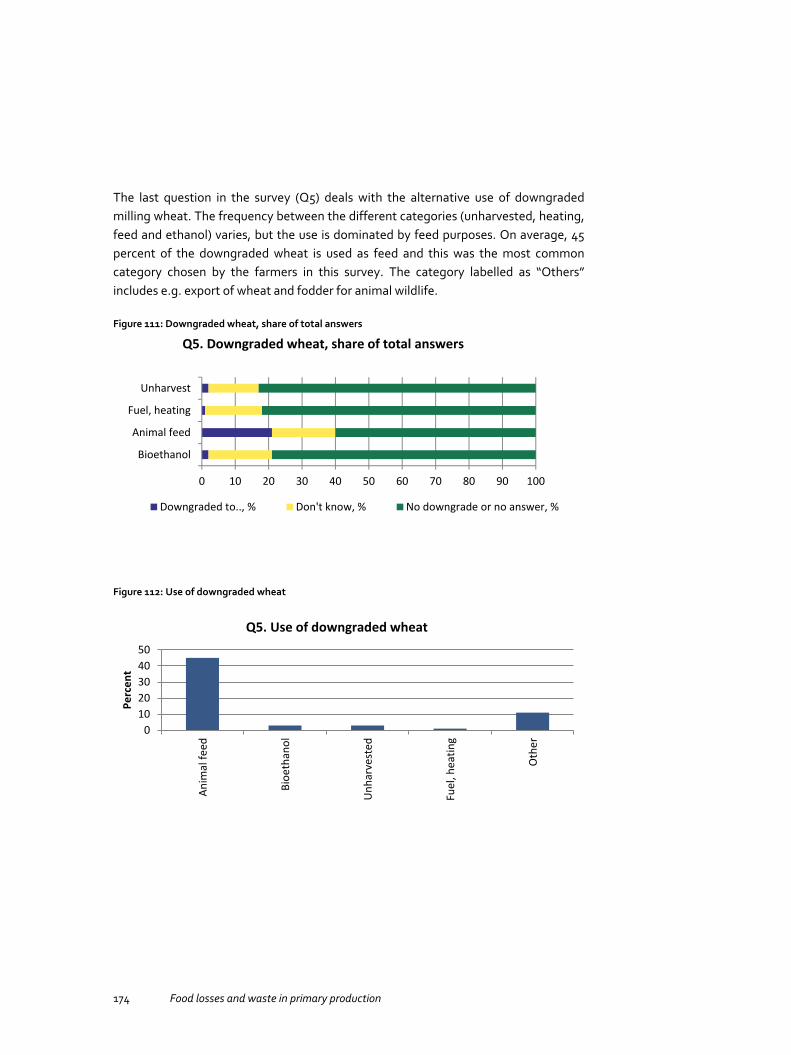
174 Food losses and waste in primary production
The last question in the survey (Q5) deals with the alternative use of downgraded milling wheat. The frequency between the different categories (unharvested, heating, feed and ethanol) varies, but the use is dominated by feed purposes. On average, 45 percent of the downgraded wheat is used as feed and this was the most common category chosen by the farmers in this survey. The category labelled as “Others” includes e.g. export of wheat and fodder for animal wildlife.
Figure 111: Downgraded wheat, share of total answers
Figure 112: Use of downgraded wheat
0 10 20 30 40 50 60 70 80 90 100
Bioethanol
Animal feed
Fuel, heating
Unharvest
Q5. Downgraded wheat, share of total answers
Downgraded to.., % Don't know, % No downgrade or no answer, %
01020304050
Anim
al fe
ed
Bioe
than
ol
Unh
arve
sted
Fuel
, hea
ting
Oth
er
Perc
ent
Q5. Use of downgraded wheat
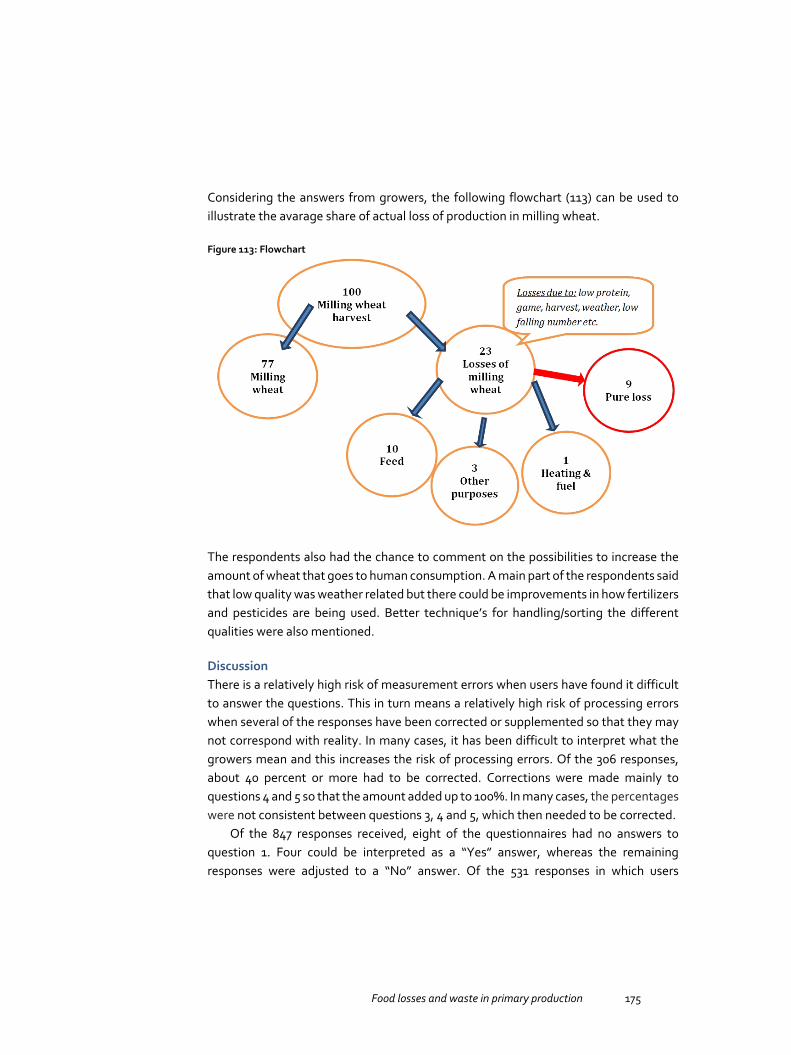
Food losses and waste in primary production 175
Considering the answers from growers, the following flowchart (113) can be used to illustrate the avarage share of actual loss of production in milling wheat.
Figure 113: Flowchart
The respondents also had the chance to comment on the possibilities to increase the amount of wheat that goes to human consumption. A main part of the respondents said that low quality was weather related but there could be improvements in how fertilizers and pesticides are being used. Better technique’s for handling/sorting the different qualities were also mentioned.
Discussion There is a relatively high risk of measurement errors when users have found it difficult to answer the questions. This in turn means a relatively high risk of processing errors when several of the responses have been corrected or supplemented so that they may not correspond with reality. In many cases, it has been difficult to interpret what the growers mean and this increases the risk of processing errors. Of the 306 responses, about 40 percent or more had to be corrected. Corrections were made mainly to questions 4 and 5 so that the amount added up to 100%. In many cases, the percentages were not consistent between questions 3, 4 and 5, which then needed to be corrected.
Of the 847 responses received, eight of the questionnaires had no answers to question 1. Four could be interpreted as a “Yes” answer, whereas the remaining responses were adjusted to a “No” answer. Of the 531 responses in which users

176 Food losses and waste in primary production
indicated that they did not cultivate wheat for milling purposes, two answers could be still be interpreted as implying that they have actually grown wheat for milling purposes. The interpretation was based on the grower’s answers to questions 2 to 5.
In several cases where the grower did not reply to question 3 but filled in a percentage under question 4 and/or question 5, an interpretation could be made about what the percentage would be under question 3. Imputation of value has then taken place. This represents a relatively high risk of processing errors as the interpretation may not be correct. If an interpretation of the response was not possible, the value in question 4 and or 5 was removed. After correction and imputation of question 3, about 60% of the 306 respondents had stated that any share had actually been lost. More than half of these had been corrected in one way or another.
Because of the low rate of response, there is a high risk of non-representative data which in turn leads to difficulties in drawing clear conclusions from the population. The selection of growers could instead have been based on a stratified sample by using information from traders and industry buying and using milling wheat.
Before sending out the questionnaire to the sample population; it should be tested on a smaller sample first. The high variation in the survey also makes it difficult to draw clear conclusions on various factors/relationships.
Some questions contain alternatives that are closely related, e.g. weather and protein content, which makes the analysis more difficult.
A question regarding the size of the holding (area, production of milling wheat, region) could be useful when classifying growers in different categories and when calculating the actual quantity of losses or alternative uses of downgraded milling wheat.
Before drawing any conclusions from this survey, data for a longer period of time is needed and methodology for the questionnaire must be changed.
All in all, the following conclusion could be drawn from the results:
Most of the milling wheat losses happen before and during harvesting.
Low protein content and damage due to animal wildlife account for most of the losses.
The actual losses are smaller since alternative use such as animal feed exists.
The pure loss of milling wheat according to this survey is as high as 9 percent.
If the loss according to the survey were to be applied the total loss, this would have been approximately 50,000–65,000 tonnes in Sweden in 2013.
The pure loss is not in line with actual losses in Sweden, and any conclusion based on this result should not be drawn regarding losses in Swedish milling wheat production.
Food losses and waste in primary production 177
5.3 Wheat side flow in Norway
5.3.1 Questionnaire
Authors: Erik Svanes, Østfoldforskning
Materials and methods, Sample A questionnaire was sent to 1,553 receivers on the address list of people who were in some way connected to growing and handling wheat in Norway. The survey was conducted in August 2014. Addresses were bought from the company “Produktregisteret”. 659 people responded, which gives a response frequency of 42%. 614 of the respondents (39%) had grown crops in 2013. These are hereafter called “crop growers”, abbreviated as producer. The analysis in this study is based on the producer responses. About 200 people (13% of all on the address list) answered virtually all the questions, and the rest gave partial answers.
The questionnaire included questions on the following themes: “if wheat had been grown in 2013”, “which roles the respondent performs”, “amount that was not used for food (side flows)”, “reasons for side flows”, “side flow treatment” and “possibility for reducing waste”.
This section summarises responses from the 614 producers who responded to the questionnaire.
The questionnaire consisted of seven questions, but some questions contained many sub-questions, i.e. the question on where the product was sorted out contained a sub-question for each possible stage where side flow could have occurred.
Figure 114 Shows the origin of respondents divided up by norwegian counties (“fylker”). The majority of respondents come from the southeast of norway, especially the counties surrounding the oslo fjord: østfold, vestfold and akershus. Hedmark county, situated north of oslo, is also well represented.

178 Food losses and waste in primary production
Figure 114: County of origin for respondents, as a % of the total number
All producers answered the sub-questions about roles. The results (figure 115) Show that almost all producers harvest their own crops. A large share (60–75%) of the producers store, dry and transport the wheat. A few carry out other activities. The most common such activity is seed production. Other activities include education and forestry.
Figure 115: What production steps the respondents do
0 20 40 60 80 100 120 140 160 180
HedmarkOslo
AkershusBuskerudOpplandVestfold
Nord-TrøndelagTelemark
Sør-TrøndelagAust-Agder
Østfold
Number of respondents
0 100 200 300 400 500 600 700
Growing
Harvesting
Storage before drying
Drying
On-farm storage
Transport
Other activity
Number of respondents

Food losses and waste in primary production 179
Results The question was: How much of your yield was not used for food, as a percentage of net wheat yield? A number of alternatives were given. The question intended to find out how much side flow was created in each unit operation of the wheat value chain.
The answers are summarised in Figure 116 and Table 54, shown below. Most of the side flows occur in the field or during harvesting. In comparison, very little side flow is created after the harvested wheat is stored.
Figure 116: Amount of product side flow, as a % of total production
Table 54: Amount of product sorted out, average and standard deviation
In the field/not specified
Harvesting Transport Germination
Storage before drying
Drying Transport
after drying
Storage after
drying
Total
Average 4.4 0.7 0.0 0.7 0.0 0.3 0.3 0.2 6.6 Standard deviation
18.1 4.2 0.3 5.1 0.3 4.1 4.6 4.0
The question on reasons for side flows aimed to give a quantitative picture of side flow reasons, rather than just a qualitative view. The question was: How much of your total side flow amount is caused by the following reasons? Thus, respondents were asked to indicate an amount, as a percentage of total yield, going to side flow for each possible reason. The most important reasons given were: Weather, pests, harvest and quality requirements.
0,0 1,0 2,0 3,0 4,0 5,0
In the field/not specifiedHarvestingTransport
GerminationStorage before drying
DryingTransport after drying
Storage after drying
% of total production

180 Food losses and waste in primary production
Figure 117: Reasons for wheat side flows
Table 55: Reasons for wheat waste, average, standard deviation and “don’t know” answers
Pests in field
Laydown Animal damage
Weather conditions
Storage before drying
Harvesting
Storage Insect damage during storage
Other quality requirements
Low starch quality
Low protein content
Density requirement
Don’t know
Average (% of total)
8.5 1.9 3.3 29.2 0.7 13.3 3.2 0.4 5.6 11.3 11.9 7.5 1.6
Standard deviation (% of total)
16.0 5.1 9.3 35.1 4.3 28.2 12.0 1.6 19.9 21.1 24.6 21.8 10.5
Number of “don’t know” answers
19 10 13 8 15 10 14 13 11 11 9 14 16
0,0 5,0 10,0 15,0 20,0 25,0 30,0 35,0
Pests in fieldLaydown
Animal damageWeather conditions
Storage before dryingHarvesting
StorageInsect damage during storage
Other quality requirementsLow starch quality
Low protein contentDensity requirement
Do not know
% of total side flow amount

Food losses and waste in primary production 181
The answer to the question “How much of the wheat you produced that was not used as food was treated in the following way?” was supposed to be given as a percentage of the total yield. Several alternatives were given, e.g. not harvested, used as fuel, animal feed, etc. Figure 118 below summarises the answers given. The number of respondents who answered “don’t know” was 36–42 for the different questions. This means that the majority of producers simply did not answer or wrote zero for this question.
The majority of wheat side flow is used as animal feed, but the amount left in the field is also significant. Small amounts are used for production of bioethanol or for unknown purposes, while very little is used directly as fuel.
Figure 118: Overview of how the side flows are treated
Table 56: Reasons for side flows, average, standard deviation and number of “Don’t knows
Not harvested – left in the field
Used directly as fuel
Animal feed
Bioethanol Unknown treatment
Average (% of total) 5.1 0.1 19.0 1.2 1.2 Standard deviation (% of total) 22 1 37 11 11 Number of “Don’t know” answers 1 1 1 1 2
0,0 5,0 10,0 15,0 20,0
Not harvested - left in the field
Used directly as fuel
Animal feed
Bioethanol
Unknown treatment
% of total side flow amount

182 Food losses and waste in primary production
250 producers (40% of all producers) answered the question on possibilities for reducing waste. The question was a free text question with no predefined categories.
The answers are summarised below. Table 57 gives detailed answers, while Figure 119 gives answers grouped in main categories. The most important possibility indicated is better agronomy (41% of all answers), meaning better agricultural techniques such as fertilisation and plant protection. The second most important reduction measure is improved cultivars (“Sorts”, 28% of all answers).
Many producers (17% of all answers) have pointed to economy as an important means for reducing side flow amount. The general idea seems to be that if the production had been more profitable, the farmers would be more motivated to take better care of their crops with the result being less side flows. Another significant segment (18%) stated that the main reason for side flows was the weather, which of course they cannot control, implying that little could be done to reduce side flow amounts. Several others (9%) stated that making the quality requirements less strict would reduce the side flow amounts.
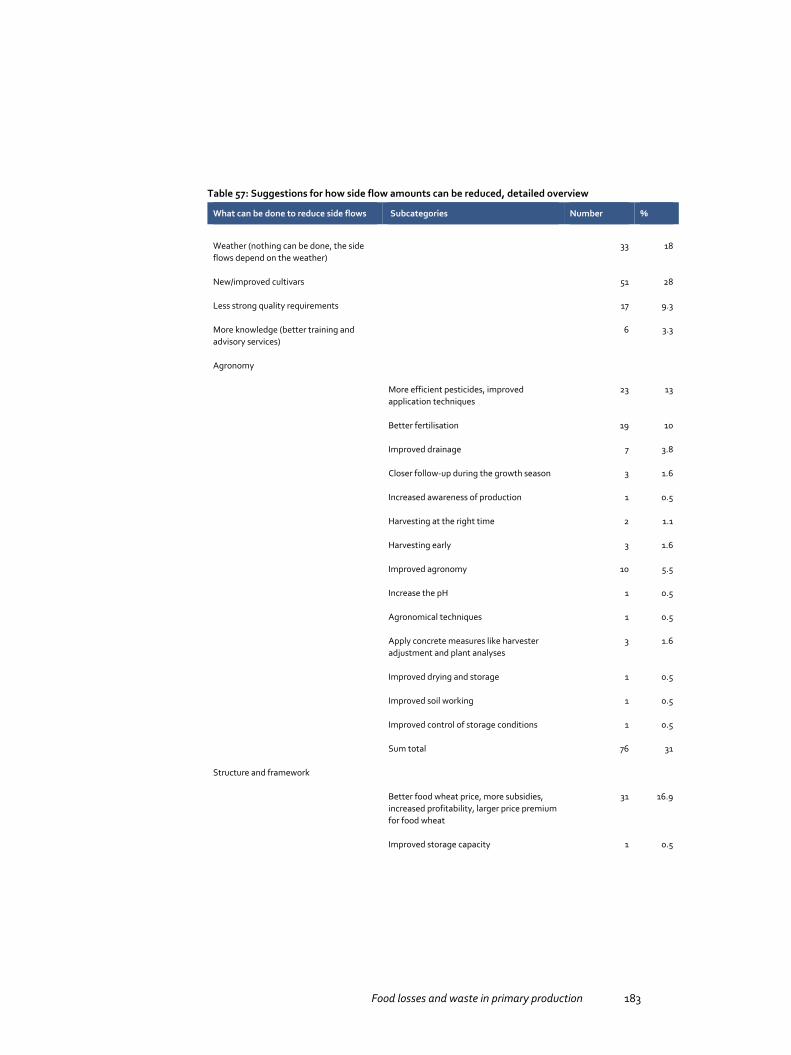
Food losses and waste in primary production 183
Table 57: Suggestions for how side flow amounts can be reduced, detailed overview
What can be done to reduce side flows Subcategories Number %
Weather (nothing can be done, the side flows depend on the weather)
33 18
New/improved cultivars
51 28
Less strong quality requirements
17 9.3
More knowledge (better training and advisory services)
6 3.3
Agronomy
More efficient pesticides, improved application techniques
23 13
Better fertilisation
19 10
Improved drainage
7 3.8
Closer follow-up during the growth season
3 1.6
Increased awareness of production
1 0.5
Harvesting at the right time
2 1.1
Harvesting early
3 1.6
Improved agronomy
10 5.5
Increase the pH
1 0.5
Agronomical techniques
1 0.5
Apply concrete measures like harvester adjustment and plant analyses
3 1.6
Improved drying and storage
1 0.5
Improved soil working
1 0.5
Improved control of storage conditions
1 0.5
Sum total
76 31
Structure and framework
Better food wheat price, more subsidies, increased profitability, larger price premium for food wheat
31 16.9
Improved storage capacity
1 0.5
What can be done to reduce side flows Subcategories Number %
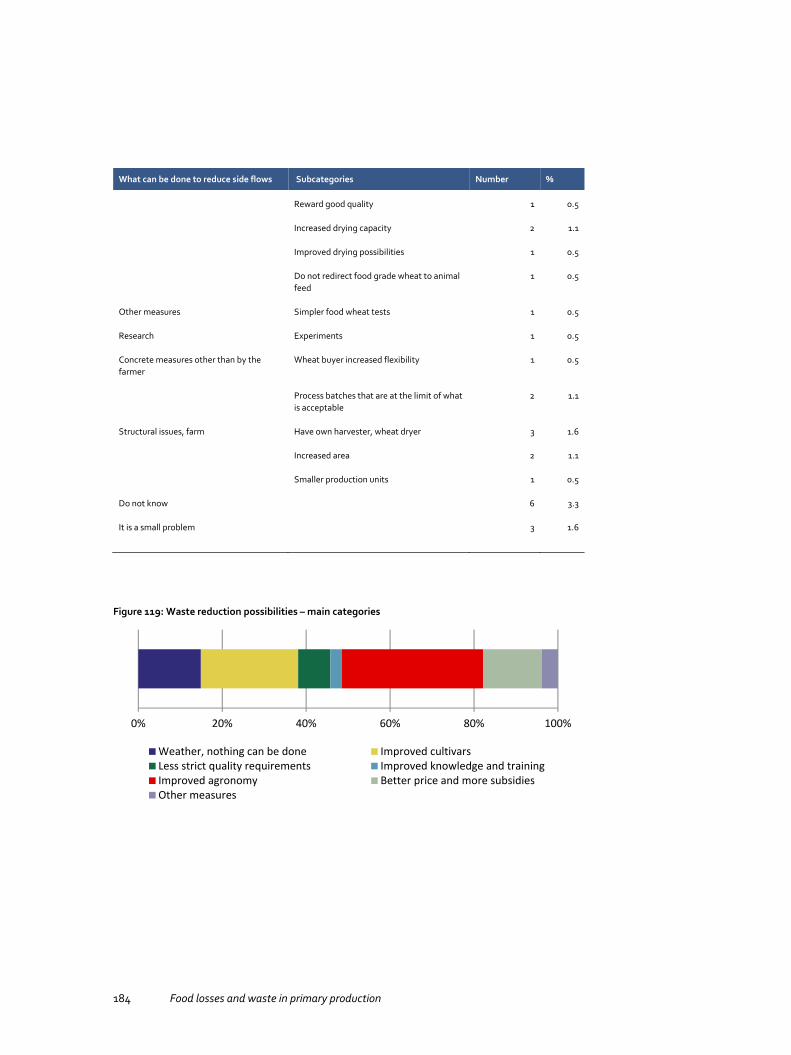
184 Food losses and waste in primary production
What can be done to reduce side flows Subcategories Number %
Reward good quality
1 0.5
Increased drying capacity
2 1.1
Improved drying possibilities
1 0.5
Do not redirect food grade wheat to animal feed
1 0.5
Other measures Simpler food wheat tests
1 0.5
Research Experiments
1 0.5
Concrete measures other than by the farmer
Wheat buyer increased flexibility 1 0.5
Process batches that are at the limit of what is acceptable
2 1.1
Structural issues, farm Have own harvester, wheat dryer
3 1.6
Increased area
2 1.1
Smaller production units
1 0.5
Do not know
6 3.3
It is a small problem
3 1.6
Figure 119: Waste reduction possibilities – main categories
0% 20% 40% 60% 80% 100%
Weather, nothing can be done Improved cultivarsLess strict quality requirements Improved knowledge and trainingImproved agronomy Better price and more subsidiesOther measures

Food losses and waste in primary production 185
Discussion The percentage of growers that answered all or the majority of the questions was 13%. This number is much lower than the total number of crop growers (40%) who responded to some questions. This indicates that the growers found the questions hard to answer.
The total side flow amount was very low, only 2.7%. The intention of the question was to find out how much side flows actually took place at the given stage. For the category “In the field”, this could be estimated by looking at e.g. the area that could not be harvested. For harvesting, the amount left in the field would be what we were looking for. For transport and storage, it would be the amount that is damaged or in some other way rendered unusable for human consumption in these stages. However, this was probably misunderstood by the growers. The most common side flow is animal feed. The decision is based on quality test results, economy, farmer’s opinions, etc., and can take place at several different points in time. However, the reason behind low quality can often be found in the growing stage – see the answers on reasons and reduction possibilities. This may be the reason why several producers have written 100% in the “Field” category. This is a very understandable misunderstanding. In future surveys, it is recommended that a clearer distinction should be made between the reasons for side flows and the stage at which side flows are removed.
The reasons for side flows give a detailed account, but a mix-up of levels of explanation is evident. The categories include both the stage at which side flows originate and apparent reasons. The answers regarding reduction possibilities give more insight into the underlying reasons. While the reason answers state that low quality can be an important reason and that the weather is an important factor behind this and other problems, the reduction possibility answers indicate that agronomical practices, cultivars, too strict quality requirements, profitability and even farmers’ skills and knowledge play important parts. This is a deeper, more fundamental level of side flow reasons.
This shows that open questions are an important addition to quantitative surveys like this one.
The answers on side flow treatment are dominated by two categories, “Used for animal feed” and “Left in the field”. Unfortunately, it is not known where the farmers get their information from. A question on data sources should be added to forthcoming questionnaires, especially for side flows outside the economic system, such as wheat left in the field.
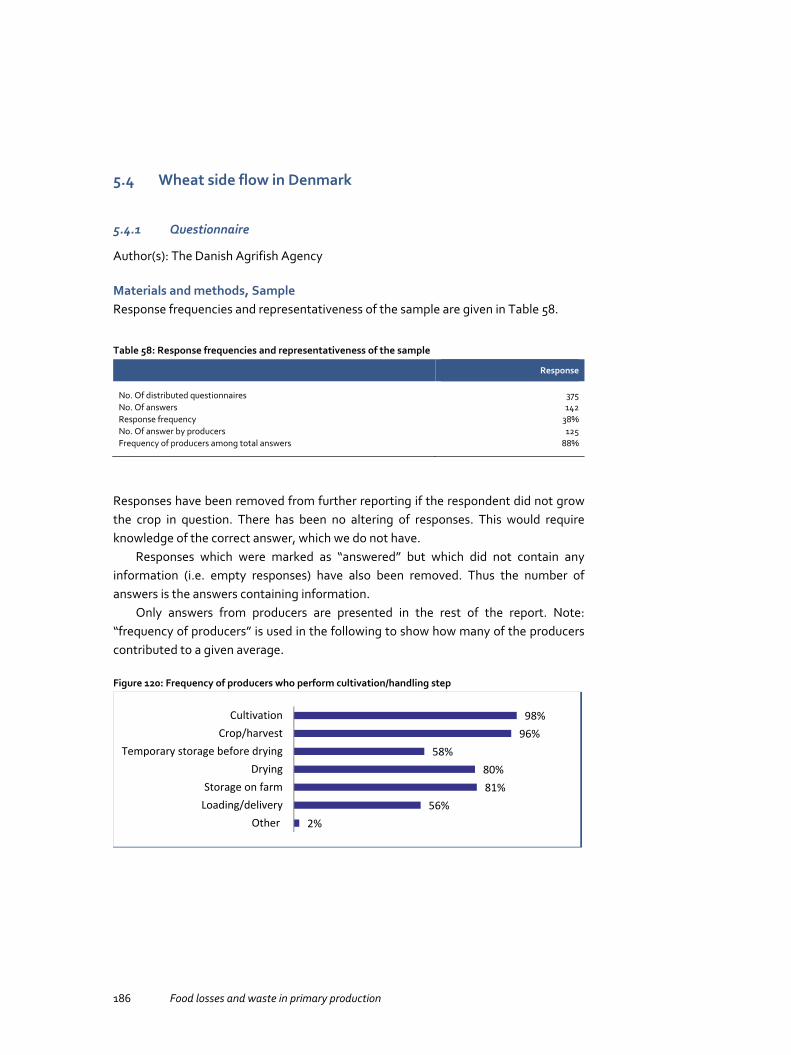
186 Food losses and waste in primary production
5.4 Wheat side flow in Denmark
5.4.1 Questionnaire
Author(s): The Danish Agrifish Agency
Materials and methods, Sample Response frequencies and representativeness of the sample are given in Table 58.
Table 58: Response frequencies and representativeness of the sample
Response
No. Of distributed questionnaires 375 No. Of answers 142 Response frequency 38% No. Of answer by producers 125 Frequency of producers among total answers 88%
Responses have been removed from further reporting if the respondent did not grow the crop in question. There has been no altering of responses. This would require knowledge of the correct answer, which we do not have.
Responses which were marked as “answered” but which did not contain any information (i.e. empty responses) have also been removed. Thus the number of answers is the answers containing information.
Only answers from producers are presented in the rest of the report. Note: “frequency of producers” is used in the following to show how many of the producers contributed to a given average.
Figure 120: Frequency of producers who perform cultivation/handling step
98%96%
58%80%81%
56%2%
CultivationCrop/harvest
Temporary storage before dryingDrying
Storage on farmLoading/delivery
Other

Food losses and waste in primary production 187
Results In total, the average loss of wheat production was estimated at around 5% for all causes. None of the respondents reported total losses of more than 100%. (The highest total is 99%.)
Table 59: How much of total wheat production was lost?
Average (%) Frequency of producer
Frequency of producers who answered “Don't
know”
In the field 1.7 59% 33% During threshing 1.0 64% 26% During transport 0.2 60% 26% At germination 0.2 61% 22% During temporary storage before drying
0.1 58% 23%
During drying 0.9 60% 26% During loading 0.1 57% 25% During storage after drying 0.3 53% 29% Other 7.2 22% 30%
Table 60: How much of the total lost wheat can be attributed to a given cause?
Average (%) Frequency of producers
Frequency of producers who answered “Don’t know”
Disease in the field 6.3 38% 34% Lodging (e.g. Caused by heavy rain) 2.4 43% 28% Pest damage 2.8 40% 29% Weather conditions (rain, floods, etc.) 3.7 40% 30% During temporary storage before drying 0.6 35% 29% Technical problems related to cultivation practices (damage caused by spraying, etc.)
0.3 33% 32%
Threshing 3.8 38% 30% Pest damage during storage 0.2 35% 31% Other quality parameters (foreign seeds, damaged seeds, etc.)
0.6 37% 29%
Falling number 1.3 33% 30% Protein content 8.9 38% 29% Test weight 4.7 36% 28% Other 13.1 17% 28%

188 Food losses and waste in primary production
The respondents were asked to allocate the total loss to several subcategories. Thus the sum of the categories should be 100% (= total loss). However, none of the respondents manage to do this. The sums range from 1% to 99%, but none manage to allocate 100 to the categories. Thus the quality of the answers to this question is fairly poor.
If the questionnaire is repeated, it should be considered whether the system should have a restriction, so the sum of the answers must be equal to 100.
Table 61: How much of total sorted out wheat was used for the given purpose?
Average (%) Frequency of producers Frequency of producers who answered “Don’t know”
Not harvested 0.8 33% 25% Fuel 0.0 29% 27% Fodder 28.5 42% 24% Bioethanol 0.0 28% 25% Other 0.3 12% 23%
The respondents were asked to allocate the total sorted out wheat (=100%) to subcategories according to purpose. It was clearly stated that the sum of the categories must be equal to 100. However, only one respondent managed to allocate the total correctly so that the total was equal to 100. The remaining respondents all have sums below 100%.
The producers were asked how the fraction of wheat used for food can be increased. 76 answered:
56 expressed a need for increased levels of nitrogen fertilisation.
8 answers concerned other cultivation practices, e.g. “Use more pesticides” or “Improve storage”.
8 answers expressed a need for improved regulation in general, e.g. “Reduce competitive disadvantages compared to other EU countries”.
8 answered “Don’t know” or “Not relevant”.
5 answers fall outside the aforementioned categories, e.g. “Cheaper pesticides” or “Improved wheat varieties”.

Food losses and waste in primary production 189
6. Cultivated fish side flow
Cultivated fish (trout/char) side flow amounts in primary production as well as side flow treatments, causes and measures to reduce these side flows are summarised in Table 8.1. Whilst there are three case studies, only one study presents the estimate for the side flow of cultivated fish (rainbow trout). It is not therefore possible to draw many conclusions based on the results.
It should be noted that the case studies, Subchapters 6.1–6.3., are independent studies that vary in study design, execution and data management and interpretation. Additionally, the sample sizes in all cases are relatively small, and some case studies do not show any results for the representativeness of the sample. For these reasons, the results are rather vague (they contain a high degree of uncertainty). All in all, the results should be regarded as indicative and more comprehensive study is needed to address the uncertainties.

190 Food losses and waste in primary production
Table 62: Questionnaire results for cultivated fish (trout, char)
Country Response rate (of all who received the questionnaire)
Side flow amount (standard deviation)
Side flow treatment (of total side flow)
Reasons Side flow reduction and measures for better side flow utilisation
Denmark Not given Not given Mostly used for biogas production, small amount for biodiesel.
Illnesses and poor water quality are main reasons.
Most mentioned more research on diseases as main possible reduction measure.
Finland 32.5% 5.6% (3.2%) Mainly waste treatment, buried in the ground and biogas production.
Diseases and predators are main reasons. Air and water quality also common reasons.
Finding ways to overcome small scale problem (especially problem due to long distances), utilising fish oil, more counselling, additional oxidation, more resistant varieties, better control of water temperature and water flows.
Sweden (Rainbow trout and char)
84% Not given Mainly buried in the ground, used for bioenergy or destroyed.
‘Predators’ was the most important reason. Escapes and external environmental factors were two other major reasons.
Measures for protection against predators, secure power supply, welfare and handling measures, better vaccination and disease control.
6.1 Rainbow trout side flow in Finland
According to Tike Statistics Finland, there were 122 rainbow trout producers in 2014 of which the majority had several production sites. The amount of rainbow trout production in Finland in 2013 was 12.2 million kilograms (Finnish Game and Fisheries Research Institute 2014). In addition to food fish, the industry produces fish fry for stocking and further rearing. The production of rainbow trout fry was about 22 million individuals, supplied almost exclusively for food fish production.

Food losses and waste in primary production 191
6.1.1 Questionnaire
Author(s): Hanna Hartikainen, Raija Räikkönen, Taija Sinkko, Luke
Materials and methods, Sample The draft version of the rainbow trout questionnaire was reviewed by six experts and piloted with four rainbow trout producers. After the review and pilot phase we made the suggested changes to the questionnaire, e.g. some questions were excluded because they were not relevant and the reasons for discards had to be adjusted to be suitable for Finland.
The questionnaire was an online questionnaire so that data management and analysis would be more efficient. We received the producer contacts from Tike Statistics Finland (now Luke’s statistics unit). The contacts included 122 rainbow trout producer contacts (69 e-mail addresses). However, some e-mail addresses were duplicated (i.e. the same contact person for different brands) or they were no longer in use, and in the end, the questionnaire was sent to 40 producers. Some producers have multiple production sites, and they were given the opportunity to decide if they wanted to answer on behalf of one of the production sites or on behalf of all their production sites.
The questionnaire was sent to 40 rainbow trout producers, some of which could have multiple production sites. 15 producers responded to the questionnaire, of which 13 completed the questionnaire successfully. Thus the response rate was 32.5% and therefore higher compared to other questionnaires. Two answers were rejected (two out of 15) because one respondent did not carry out fry production or further rearing anymore, and the other reported a fish accretion rate (yearly rate) that was a significant outlier.
Of the 13 rainbow trout producers, four answers comprised one production site and nine comprised several production sites. Furthermore, eight producers had fry production and further rearing (62%), three had only fry production (23%), and two had only further rearing (15%).
When comparing the sample to all rainbow trout producers in Finland, it was found out that the sample represents around 11% of rainbow trout producers. When comparing the sample to the amount of rainbow trout produced in Finland, the representativeness is around 18% (assuming that the contacts from Tike Statistics Finland cover Finnish production).
Rainbow trout producers are located in different parts of Finland, but the majority are located in the southwest and Lapland. The answers to the questionnaire were received from different parts of Finland, including southwest Finland, Lapland and central Finland, so the sample has good geographical representativeness.

192 Food losses and waste in primary production
Results In the sample of 13 rainbow trout producers, about 94% (weighted average) of the rainbow trout is sold for human consumption (Figure 121). The remaining 6% is side flow. The results show quite a wide variation between the producers: the side flow varies from 0.5% to 11%, and the standard deviation is 3.2%.
Figure 121: The shares of rainbow trout used for food (primary purpose) and the amount that ends up as side flows (= non-food purpose/not used)
The main reasons for rainbow trout side flows depend on the size of the fish. For small fish (0–49 g), the main reason is diseases (more than 40%), but for bigger ones (from 1,000 to over 2,000 g), the main reason is predators, e.g. seals, predator fish (27–33%) (Figure 122). Also, air and water temperature is quite a common reason; for instance, long heat waves can cause fish deaths. “Other reasons” include elimination of low-growing fish in separation.
0% 10% 20% 30% 40% 50% 60% 70% 80% 90% 100%
Producer 13Producer 12Producer 11Producer 10
Producer 9Producer 8Producer 7Producer 6Producer 5Producer 4Producer 3Producer 2Producer 1
Average (weighted)
Primary use, food Sideflow (used as non-food/not used)

Food losses and waste in primary production 193
Figure 122: Reasons for rainbow trout side flows for different fish-sizes
The majority of side flows (weighted average) end up at waste treatment plants (66%) (Figure 123). Other popular end-uses are “Burial in the ground” (18%) and “Biogas production” (12%). Only 2% is used for animal feed.
Figure 123: End use of rainbow trout side flows
0% 20% 40% 60% 80% 100%
0-19g
20-49g
50-149g
500-999g
1000-1499g
1500-2000g
>2000g
Environmental reasons 1: Temperature of air and waterEnvironmental reasons 2: Lack of oxygen, excessive flow, otherMechanical impact (physical damage in pond, transportation, transfer)Predators (e.g. seals)Deseases (yersinia, flavo, furunculosis, other)Other reason
0% 10% 20% 30% 40% 50% 60% 70% 80% 90% 100%
Biogas production Used for fur animal feed Waste treatment plantComposting Buried in the ground Other utilizationOther non-utilization

194 Food losses and waste in primary production
The challenges that limit the use of side flows are “small amounts of side flows” (small scale) (four respondents), long transportation distances (two respondents) and short shelf life of fish (one respondent). Also, it is not possible to influence the weather conditions which are one reason for losses (one respondent). Only two out of 13 fish farmers were interested in finding better uses for their side flows. Seven were hesitant and four out of 13 were not interested in finding better uses for their side flows.
The results of the survey differed significantly, because several fish production methods and fish production locations are used in Finland, the conditions and predators vary in different parts of the country. For this reason, the results of the survey were reviewed by four fish breeders, trade unions and two researchers. According to the expert interviews, the results show correctly that fish production in Finland is not a homogenous business and especially production inland and at sea should be separated in future questionnaires. In addition, the overall response rate needs to be higher.
6.2 Rainbow trout and char side flow in Sweden
Aquaculture is a small industry in Sweden, where six to eight companies account for more than 90% of fish production. Rainbow trout and Arctic char are the most common fish species produced for human consumption in Swedish aquaculture. In 2013, these two species accounted for 99% of the total Swedish fish production for consumption.
6.2.1 Questionnaire
Authors: Annelie Rosell and Camilla Burman, Swedish Board of Agriculture
Materials and methods, Sample In this section, we describe the results obtained in a survey sent out to all fish production locations that produced Arctic char and rainbow trout in 2013 and were listed in the Swedish Board of Agriculture’s central aquaculture register KTR 1429 (CVR_ANL001_20140612).
The received responses corresponded to approximately 90%5 of the production volume in 2013. Of the 57 production locations that responded to the questionnaire (in writing or by telephone), 49 were engaged in fish production in 2013. 71% (35 sites) of the fish production locations that were involved in fish production in 2013 farmed only rainbow trout, 16% (four
5 Estimated value. See last paragraph in the section “Response frequency and representativeness” for further information.
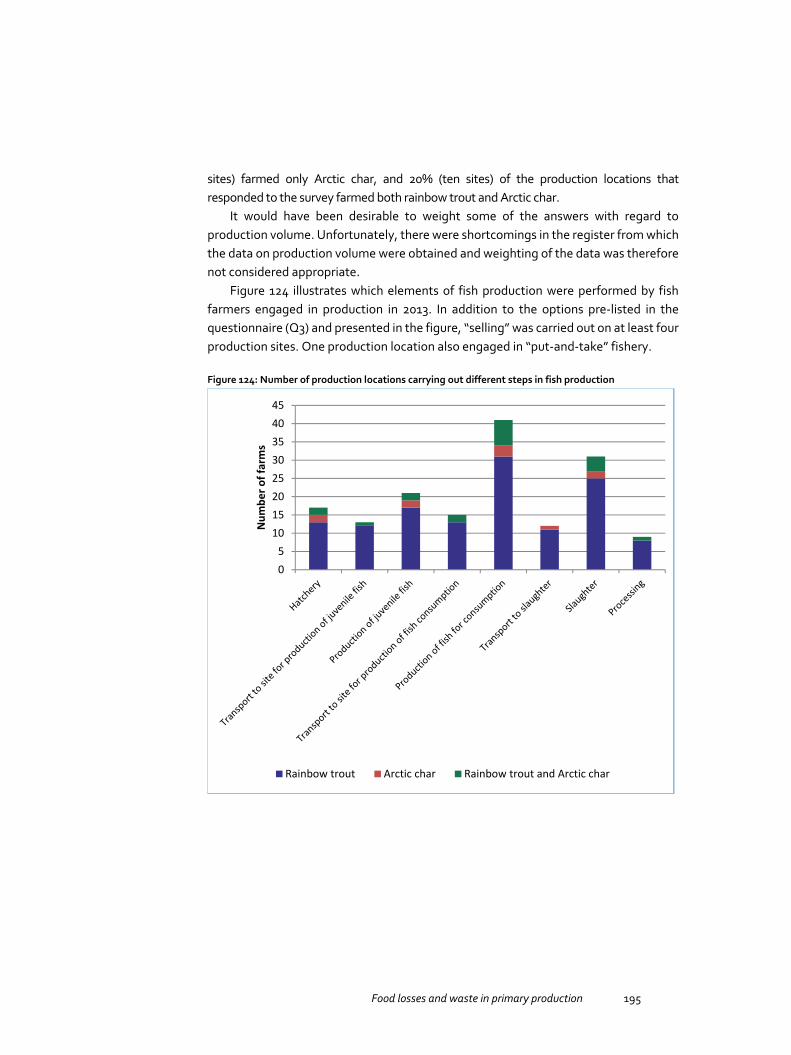
Food losses and waste in primary production 195
sites) farmed only Arctic char, and 20% (ten sites) of the production locations that responded to the survey farmed both rainbow trout and Arctic char.
It would have been desirable to weight some of the answers with regard to production volume. Unfortunately, there were shortcomings in the register from which the data on production volume were obtained and weighting of the data was therefore not considered appropriate.
Figure 124 illustrates which elements of fish production were performed by fish farmers engaged in production in 2013. In addition to the options pre-listed in the questionnaire (Q3) and presented in the figure, “selling” was carried out on at least four production sites. One production location also engaged in “put-and-take” fishery.
Figure 124: Number of production locations carrying out different steps in fish production
05
1015202530354045
Num
ber o
f far
ms
Rainbow trout Arctic char Rainbow trout and Arctic char

196 Food losses and waste in primary production
The survey was exclusively addressed to producers of rainbow trout and Arctic char, and was limited to the fish that were bred and slaughtered in 2013. The questions in the survey covered the whole production chain from breeding to slaughter. The survey design was based on a Norwegian questionnaire developed for salmon production, but adapted to Swedish conditions.
The questionnaire was sent out to 68 fish production locations in late August 2014. The response rate at the deadline was 26%. (No reminder was sent out.) Of the 18 production locations that responded to the survey on this occasion, six (33%) stated that they did not engage in fish production in 2013. The responses could not be considered representative of Swedish commercial fish production locations due to the low response rate. In February 2015, the questionnaire was sent out again to the addressees that had not replied on the first occasion. The response rate after the deadline was then 63%. This still could not be considered representative, since several large production locations were missing.
The second round of e-mails was followed up by telephone interviews with the missing addressees, and the response rate then rose to 84%, which corresponds to 57 companies. However, since the second round of mailing of the questionnaire took place in February 2015, it is possible that those answers concerned production in 2014, not 2013.
It would have been desirable to report the proportion of the received responses represented by rainbow trout and Arctic char production, respectively. The intention was to obtain information on production volumes from the annual reports – answered by fish farmers – that are found in the Swedish Board of Agriculture’s central aquaculture register (KTR-1429). Unfortunately, there were shortcomings in this register, which may be partly due to the fact that 2013 was the first year the annual report was submitted. The analysis showed that the total production entered into the registry for the responding production locations in the survey exceeded the production that Statistics Sweden, on behalf of the Swedish Board of Agriculture, reported6 for 2013. The reason for this discrepancy is not known. Reliable data on how much of the production is covered by the received responses cannot therefore be presented. The Board of Agriculture estimates that the responses received corresponds to roughly 90% of the production volume. This applies to both rainbow trout and Arctic char.
6 JO SM 1401, Vattenbruk 2013.

Food losses and waste in primary production 197
Results The respondents were asked to state the proportion of fish that died or were discarded for various pre-listed reasons (Q4). Predators were the most important reason for losses and caused losses at both smaller and bigger production locations. Two other important reasons for losses were escapes (often due to sabotage) and external environmental factors. In comparison with predators, these causes resulted in a far lower proportion of losses. Table 63 summarises the estimated proportions of fish that died or were discarded during the production process. The largest number of farm sites responding that they did not know the percentage of loss was noted for the production steps hatchery, smoltification,7 set aside for sampling for diseases and slaughter processing line or before transport to the processing site (Table 63).
7 Physiological process whereby the fish is adapted to living in saltwater.
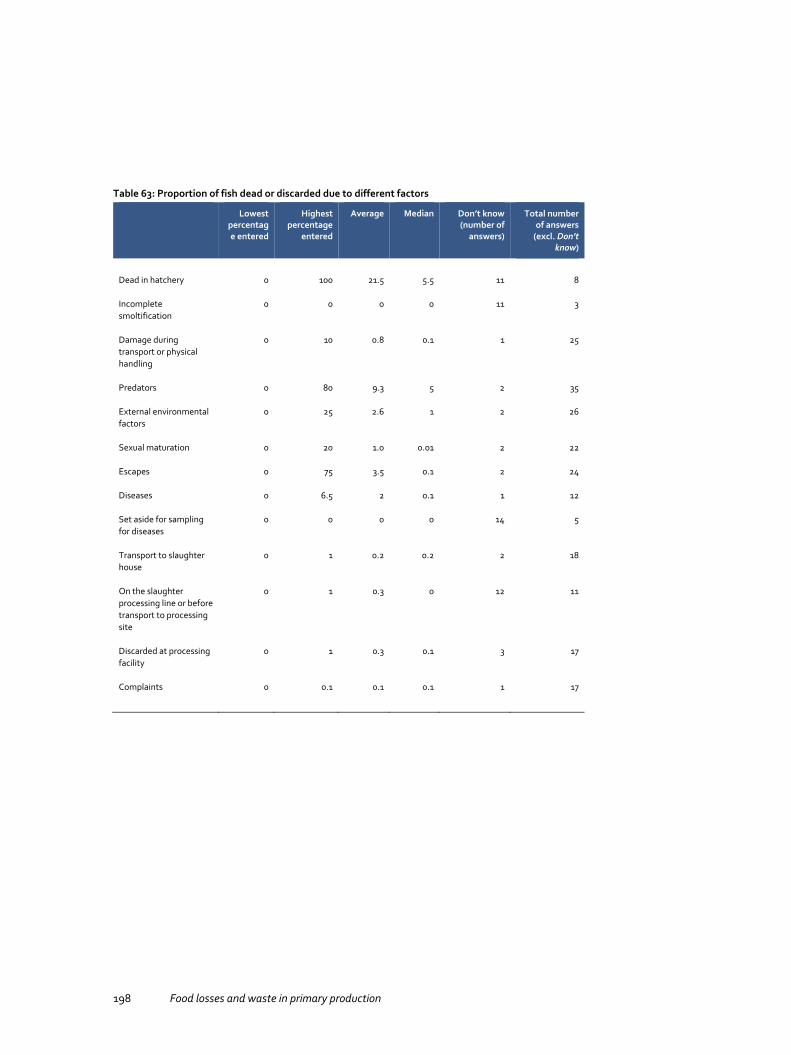
198 Food losses and waste in primary production
Table 63: Proportion of fish dead or discarded due to different factors
Lowest percentage entered
Highest percentage
entered
Average Median Don’t know (number of
answers)
Total number of answers
(excl. Don’t know)
Dead in hatchery 0
100 21.5 5.5 11 8
Incomplete smoltification
0
0 0 0 11 3
Damage during transport or physical handling
0
10 0.8 0.1 1 25
Predators 0
80 9.3 5 2 35
External environmental factors
0
25 2.6 1 2 26
Sexual maturation 0
20 1.0 0.01 2 22
Escapes 0
75 3.5 0.1 2 24
Diseases 0
6.5 2 0.1 1 12
Set aside for sampling for diseases
0
0 0 0 14 5
Transport to slaughter house
0
1 0.2 0.2 2 18
On the slaughter processing line or before transport to processing site
0
1 0.3 0 12 11
Discarded at processing facility
0
1 0.3 0.1 3 17
Complaints 0
0.1 0.1 0.1 1 17
Food losses and waste in primary production 199
The results indicated that some production locations had inadequate knowledge about the proportion of fish that died or were discarded during the various stages of production. One reason for this may be that most production locations carry out very small-scale production and lack procedures for reporting and monitoring losses. Telephone interviews revealed that several large production locations had very good knowledge of losses, and how discarded fish were used or disposed. We therefore make the assumption that data from big companies generally reflects reality better. The high percentage entered in column two in table 1–100% dead or discarded fish in hatchery – is related to one single occasion where the power to the farm site was accidently cut off.
Answers concerning certain production steps have a large spread when it comes to the proportion of losses. In several cases there are extreme values caused by a temporary “exceptional event”, such as an escape (possibly caused by sabotage) or a power failure. It is not possible to distinguish a difference in the causes of loss depending on production volume. The proportion of losses – out of the total production – also varies among production locations that produce larger volumes. For these production locations too, exceptional events such as outbreaks of diseases or external environmental factors seem to affect the size of the losses in certain years.
In some responses, losses were specified as “natural death”, “stressed fish” or “damaged fish”. It is not known how they have been classified. Without more information it is difficult to detect the cause-effect relationship in these cases.
Figure 125 shows the estimated proportion of dead or discarded fish, according to the respondents, that would have been suitable for human consumption (Q5). Among the production locations that responded to the question, ten stated that no fish that died or were discarded were suitable for human consumption, while seven facilities reported that all the fish that died or had been discarded were suitable for human consumption. The reason for some production locations stating that no fish could be used for consumption may be that the fish had already been eaten by predators or were too small to be consumed when discarded. Difficulty in understanding the purpose of the question may be the reason for several respondents choosing not to answer or stating that they did not know the answer.
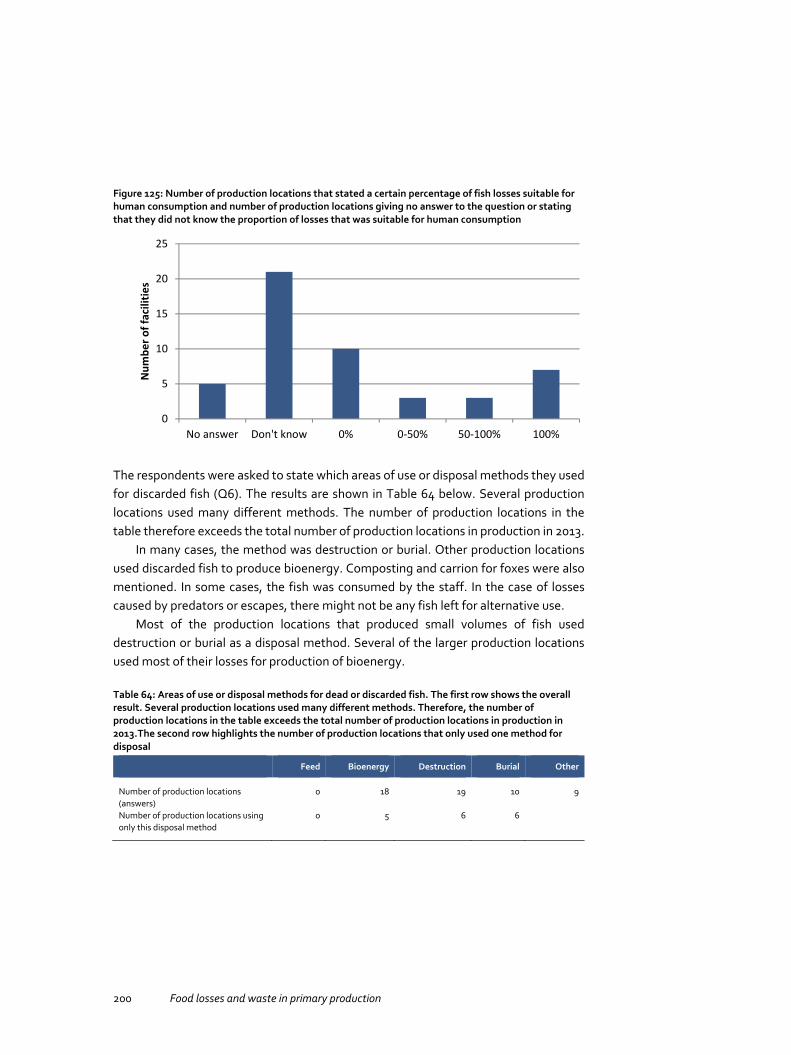
200 Food losses and waste in primary production
Figure 125: Number of production locations that stated a certain percentage of fish losses suitable for human consumption and number of production locations giving no answer to the question or stating that they did not know the proportion of losses that was suitable for human consumption
The respondents were asked to state which areas of use or disposal methods they used for discarded fish (Q6). The results are shown in Table 64 below. Several production locations used many different methods. The number of production locations in the table therefore exceeds the total number of production locations in production in 2013.
In many cases, the method was destruction or burial. Other production locations used discarded fish to produce bioenergy. Composting and carrion for foxes were also mentioned. In some cases, the fish was consumed by the staff. In the case of losses caused by predators or escapes, there might not be any fish left for alternative use.
Most of the production locations that produced small volumes of fish used destruction or burial as a disposal method. Several of the larger production locations used most of their losses for production of bioenergy.
Table 64: Areas of use or disposal methods for dead or discarded fish. The first row shows the overall result. Several production locations used many different methods. Therefore, the number of production locations in the table exceeds the total number of production locations in production in 2013.The second row highlights the number of production locations that only used one method for disposal
Feed Bioenergy Destruction Burial Other
Number of production locations (answers)
0 18 19 10 9
Number of production locations using only this disposal method
0 5 6 6
0
5
10
15
20
25
No answer Don't know 0% 0-50% 50-100% 100%
Num
ber o
f fac
ilitie
s
Food losses and waste in primary production 201
The respondents were given the opportunity to leave comments on how the amount of fish that died or were discarded could be decreased (Q7). The received proposals and comments have been grouped under subheadings depending on which cause of losses they wanted to address. Many of the proposed measures are intended to protect the fish from predators. Several other proposed measures aimed at improving management and thereby reducing stress and injury to the fish. The comments were as follows:
Measures to reduce damage caused by predators:
Durable nets protecting against seals and birds.
Mink traps.
Electric wire for protection against herons.
Protective hunting of seals.
Protective hunting of heron.
Giving aquaculture equal footing with commercial fishing in terms of the possibility of getting support for preventive measures for protection against seals.
Measures related to operational safety:
Avoid power outages.
Installation of cameras/lights/surveillance to prevent sabotage.
Measures to reduce losses caused by disease outbreaks.
Research into new medicines and disease progression.
Vaccine against flavobacterios (Flavobacterium psychrophilum).
Measures related to welfare/handling (reducing stress and damage):
Reduced number of fish in tanks and cages.
Increased amount of water in tanks.
Pump colder water from the bottom in summer.
Perform handling of fish at the right temperature.
Take into account the age and size of the fish when handling.
Improved equipment.
Measures related to breeding:
Improve breeding.

202 Food losses and waste in primary production
Discussion The submitted responses show that some of the production locations encountered “exceptional events” in 2013 which, for instance, impacted on production volumes and the level of losses. To obtain more representative data it would have been more appropriate to have average values or data from a longer time period.
The survey includes a question (Q3) about which elements are included in the company’s fish processing where slaughter is listed as an option. However, the telephone interviews revealed that there was uncertainty about the definition of this concept. At several production sites the fish was bled8 after which it was sent to another unit to be gutted. The respondents we talked to were not sure if bleeding counted as slaughter or not.
In the question about what proportion of fish died or were discarded during production (Q4), a number of reasons for loss or steps in the production process where loss may occur were given. Some of these can be interpreted as alternative descriptions of the same production step/sub-stage. This represents a risk of error and means that no clear conclusions can be drawn. For example, predators or escapes caused by sabotage could be considered “external environmental factors”. Another problem in the compilation of results was that some companies entered a zero value in certain boxes, while other companies (in accordance with the instruction) left blanks if the cause was not considered relevant to their company. The question is what actually was intended: Is a zero value comparable with a blank space? This is relevant when the average and median values are calculated. To ensure uniformity, even clearer instructions in the questionnaire would have been desirable.
The question about what amount of the losses could have been used for human consumption (Q5) turned out to be difficult to interpret. It is unclear if the intention was to find out what proportion of losses could have been avoided or whether the intention was to find out if a proportion of fish that go to waste (losses) could be used for human consumption, even if this does not happen. The question also gives the impression that all fish that died during production or were discarded could have been used for consumption. But there are several reasons why the fish is not consumed. Had the fish grown to a size that made it possible to consume, or was it too small to be consumed? Fish eaten by predators are not available for human consumption, since they have already been consumed. Based on the question (Q5), it is impossible to determine the extent to which food waste could be reduced. Therefore, the question is formulated incorrectly. A clearly designed survey or clearer instructions could remedy this problem.
8 The fish is sedated and then bled by throat cutting.
Food losses and waste in primary production 203
Finally, space should be added to the questionnaire to give respondents the opportunity to submit further comments. In the telephone interviews, comments were submitted by the farmers who wanted to inform the authority and add supplementary information.
Altogether, the current survey was not optimally designed and no clear conclusions can therefore be drawn from it. A questionnaire can serve as a method of investigation, but mailing will probably need to be backed up with subsequent reminders and phone calls to achieve an acceptable response rate.
When data is collected for a single year and the numbers of investigated objects and submitted answers are few, occasional events will have a major impact on the answers.
Weighing of data with regard to production volumes and data on what proportion of the total fish production for consumption is covered by the received responses cannot be presented due to a lack of reliable data on production volumes. The following conclusions can be drawn from the results of this study: Predator attacks are the most important reason for losses of fish in both smaller and bigger production sites. Two other important causes of loss are escapes and external environmental factors. In comparison with predators, these causes account for a far lower proportion of losses. It is not possible to differentiate between the causes of loss depending on the company’s production volume. Several companies lack knowledge about the proportion of fish that die or are discarded at various production stages. Fish that die or are discarded at the production location are most often destroyed or buried. Some production locations use discarded fish to produce bioenergy. Most suggestions to reduce losses in the production of fish for consumption concerned protection against predators. Several measures aimed at improving management and thereby reduce stress and injury to the fish were also suggested.
There are several suggestions for future studies: Any survey used to measure losses in aquaculture must be thoroughly designed, analysed by experts and ideally also tested by a panel of professionals before use. Also, if the intention is to combine the results with additional information from another source, it is important to examine the quality of that information and the possibility to integrate it with the results from the survey in advance. If it is important to quantify the degree of losses in Swedish aquaculture more accurately, as well as the proportion of losses caused by various reasons, the respondents could be asked in advance to measure their losses for a specified period of time. Additionally, if the intention is to obtain information on the main causes of the majority of the losses in Swedish aquaculture, it would have been more efficient to make a targeted effort and carry out phone interviews exclusively with the few companies that account for the large production volumes. Moreover, to avoid
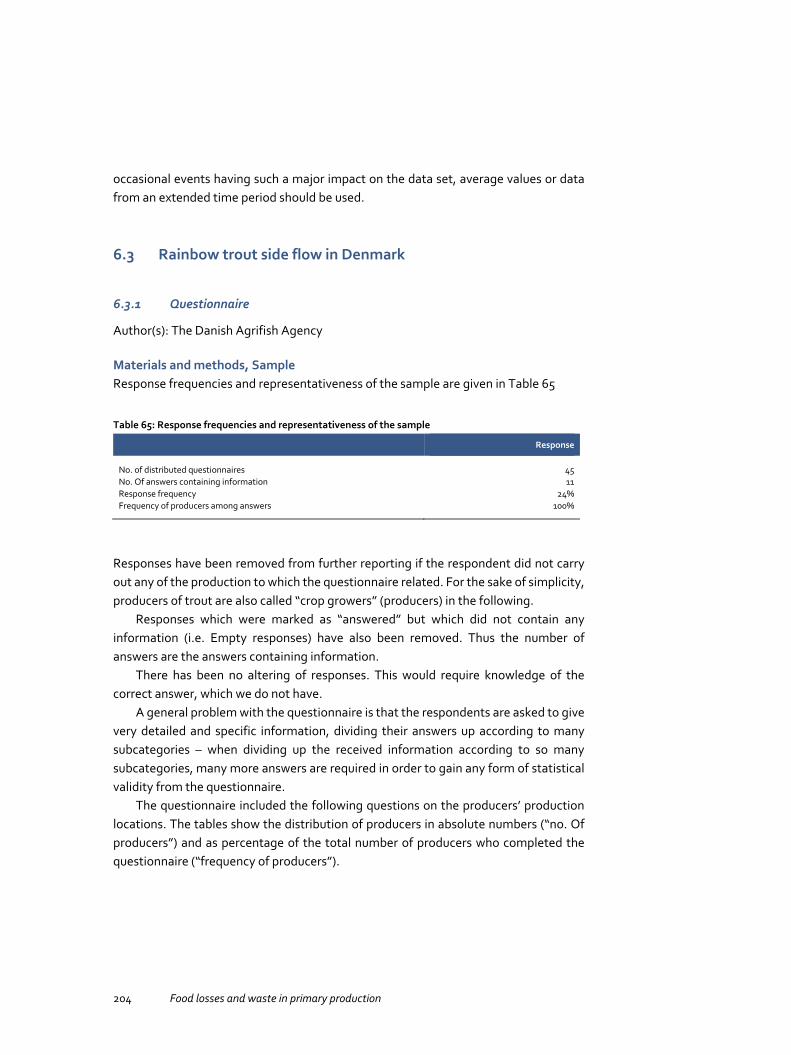
204 Food losses and waste in primary production
occasional events having such a major impact on the data set, average values or data from an extended time period should be used.
6.3 Rainbow trout side flow in Denmark
6.3.1 Questionnaire
Author(s): The Danish Agrifish Agency
Materials and methods, Sample Response frequencies and representativeness of the sample are given in Table 65
Table 65: Response frequencies and representativeness of the sample
Response
No. of distributed questionnaires 45 No. Of answers containing information 11 Response frequency 24% Frequency of producers among answers 100%
Responses have been removed from further reporting if the respondent did not carry out any of the production to which the questionnaire related. For the sake of simplicity, producers of trout are also called “crop growers” (producers) in the following.
Responses which were marked as “answered” but which did not contain any information (i.e. Empty responses) have also been removed. Thus the number of answers are the answers containing information.
There has been no altering of responses. This would require knowledge of the correct answer, which we do not have.
A general problem with the questionnaire is that the respondents are asked to give very detailed and specific information, dividing their answers up according to many subcategories – when dividing up the received information according to so many subcategories, many more answers are required in order to gain any form of statistical validity from the questionnaire.
The questionnaire included the following questions on the producers’ production locations. The tables show the distribution of producers in absolute numbers (“no. Of producers”) and as percentage of the total number of producers who completed the questionnaire (“frequency of producers”).

Food losses and waste in primary production 205
There are very few respondents in this questionnaire, which gives a low statistical validity, especially when considering groupings and the fact that all the questions have response rate < 100%, i.e. Not all producers completed all parts of the questionnaire.
Table 66: Production location types
No. of producers Frequency of producers
Traditional 8 73% Model 1 2 18% Model 3 1 9% Marine production location 0 0%
Table 67: Veterinary status
No. of producers Frequency of producers
IPN 7 64% BKD 7 64%
Table 68: Number of fish/egg deliveries to production location
No. of producers Frequency of producers
0–3 times per year 6 55% 3–6 times per year 3 27% More than 6 times per year 2 18%
Table 69: Vaccinations used on fish production location
No. of producers Frequency of producers
Dripping vaccine against enteric redmouth disease 10 91% Dripping vaccine against vibriose 0 0% Needle vaccine against enteric redmouth disease 0 0% Needle vaccine against vibriose 0 0%

206 Food losses and waste in primary production
Results
Table 70: Loss of fish: Dead, discarded or escaped fish
Average (tonnes) No. of producers
Total dead 757,9 8 Death by disease 720,8 7 Death by other causes 145,0 7 Discarded 2,6 4 Escaped 0,0 4
As a quality check, the total was compared to the sum of the causes. If correctly divided, the numbers should be identical. Three of the nine respondents have reported a total that is different from the total obtained by adding together the reported numbers under each cause.
The answers given are reported below, but it should be noted that due to the very low number of answers in each category, the quality of the information gained is quite poor and statistically insignificant.
Table 71: Reasons for loss of fish: Average loss of annual net production for different size groups
Died due to disease (%)
No. Of producers
Died due to poor water quality (%)
No. Of producers
Discarded (%)
No. Of producers
Escaped (%)
No. Of producers
Hatched-5 g 10.8 5 1.0 2 2.5 3 0.0 1 5–50 g 8.3 6 1.5 2 1.0 1 0.0 1 50–500 g 16.7 8 5.7 4 0.0 0 0.0 1 > 500 g 9.0 3 12.5 2 0.0 0 0.0 1 Breeding fish 8.1 4 0.0 1 0.0 0 0.0 1 Marine fish 0.0 0 0.0 1 0.0 0 0.0 1
Producers were asked to mark the three most important causes of death (+, ++, and +++) for different groups of fish. The numbers show the number of producers who made the given prioritisation.
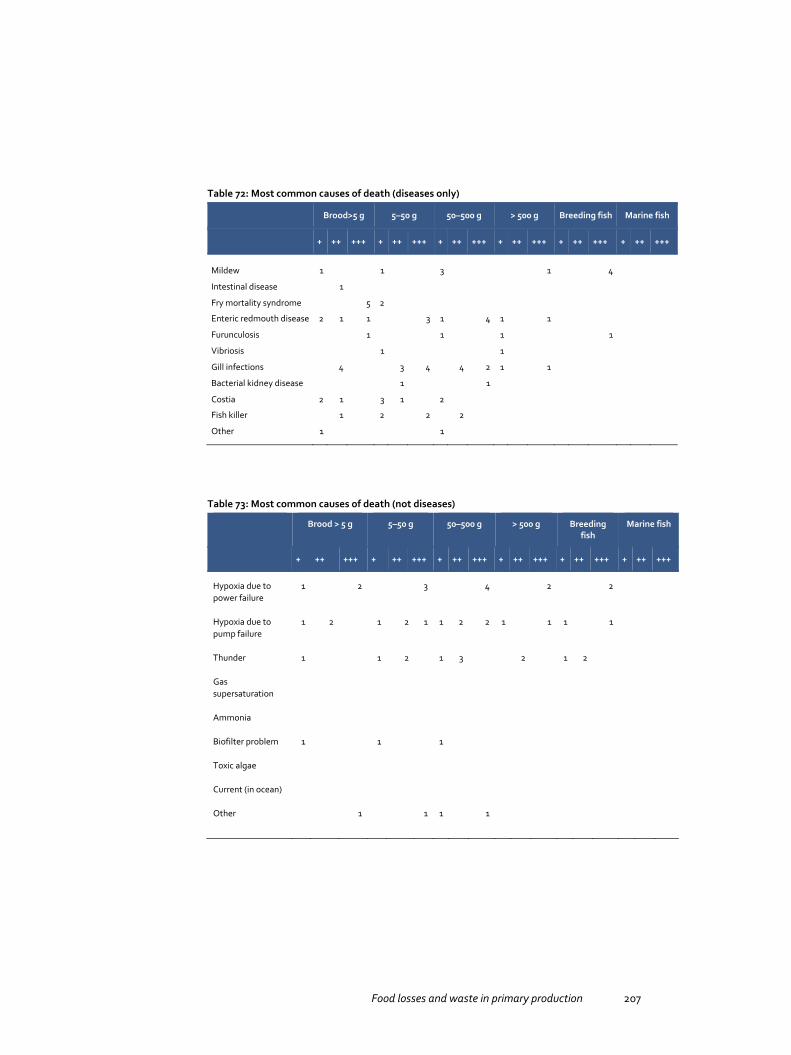
Food losses and waste in primary production 207
Table 72: Most common causes of death (diseases only)
Brood>5 g 5–50 g 50–500 g > 500 g Breeding fish Marine fish
+ ++ +++ + ++ +++ + ++ +++ + ++ +++ + ++ +++ + ++ +++
Mildew 1 1 3 1 4
Intestinal disease 1
Fry mortality syndrome 5 2
Enteric redmouth disease 2 1 1 3 1 4 1 1
Furunculosis 1 1 1 1
Vibriosis 1 1
Gill infections 4 3 4 4 2 1 1
Bacterial kidney disease 1 1
Costia 2 1 3 1 2
Fish killer 1 2 2 2
Other 1 1
Table 73: Most common causes of death (not diseases)
Brood > 5 g 5–50 g 50–500 g > 500 g Breeding fish
Marine fish
+ ++ +++ + ++ +++ + ++ +++ + ++ +++ + ++ +++ + ++ +++
Hypoxia due to power failure
1
2 3 4 2 2
Hypoxia due to pump failure
1
2 1 2 1 1 2 2 1 1 1 1
Thunder 1
1 2 1 3 2 1 2
Gas supersaturation
Ammonia
Biofilter problem 1
1 1
Toxic algae
Current (in ocean)
Other
1 1 1 1
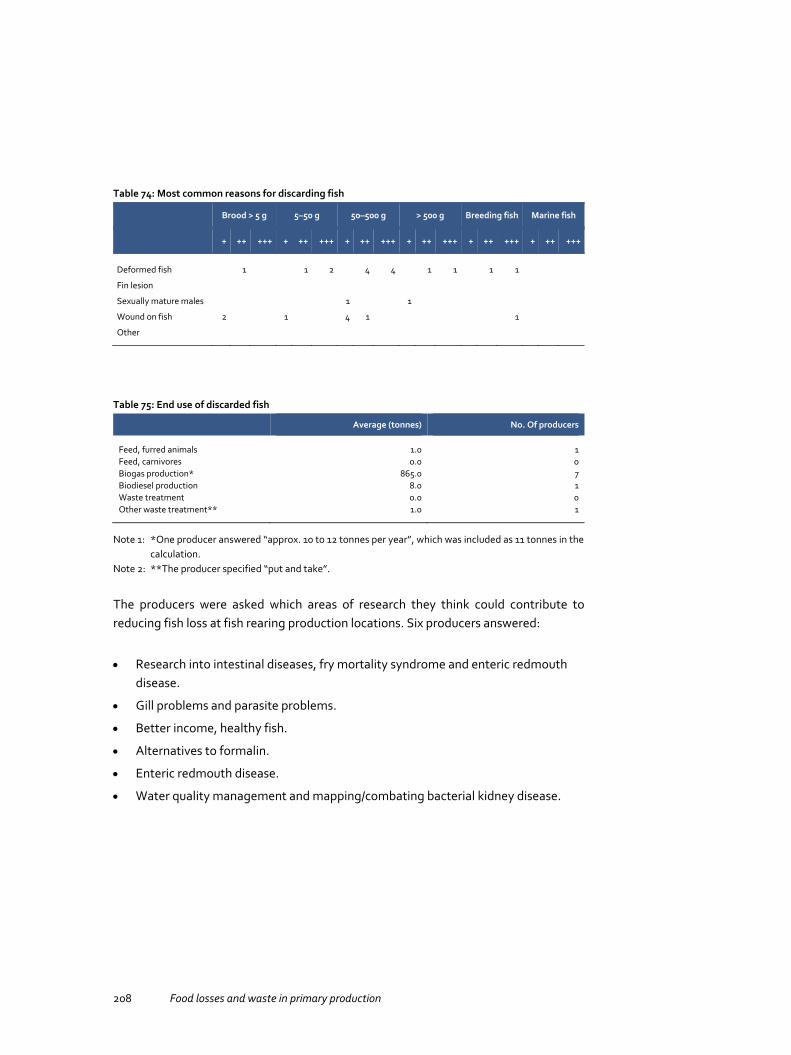
208 Food losses and waste in primary production
Table 74: Most common reasons for discarding fish
Brood > 5 g 5–50 g 50–500 g > 500 g Breeding fish Marine fish
+ ++ +++ + ++ +++ + ++ +++ + ++ +++ + ++ +++ + ++ +++
Deformed fish 1 1 2 4 4 1 1 1 1
Fin lesion
Sexually mature males 1 1
Wound on fish 2 1 4 1 1
Other
Table 75: End use of discarded fish
Average (tonnes) No. Of producers
Feed, furred animals 1.0 1 Feed, carnivores 0.0 0 Biogas production* 865.0 7 Biodiesel production 8.0 1 Waste treatment 0.0 0 Other waste treatment** 1.0 1
Note 1: Note 2:
*One producer answered “approx. 10 to 12 tonnes per year”, which was included as 11 tonnes in the calculation. **The producer specified “put and take”.
The producers were asked which areas of research they think could contribute to reducing fish loss at fish rearing production locations. Six producers answered:
Research into intestinal diseases, fry mortality syndrome and enteric redmouth disease.
Gill problems and parasite problems.
Better income, healthy fish.
Alternatives to formalin.
Enteric redmouth disease.
Water quality management and mapping/combating bacterial kidney disease.
Food losses and waste in primary production 209
References
ASA-Lift A/S. CM 1000 Operator’s manual. DK 4180 Sorø Balvoll, G. 1999. Grønnsakdyrking på friland. 6. utg. Landbruksforlaget, Oslo Cantwell, M., Gordon, G., Rubatzky, V. & Chen, P. (1991) EUCARPIA CARROT 91- Test to
monitor carrot cracking and breaking susceptibility. INRA, 91–103 Colbert, E. & Stuart, T. (2015). Food waste in Kenya. Feedback Global Cantwell, M., Morden, G., Rubatzky, V., & Chen, P. (1991) Test to monitor carrot cracking and
breaking susceptibility. INRA, Dept. Vegetable Crops, Univ, EUCARPIA carrot, pp. 91– 103. California, Davis.
Dawelbeit, M.I. 2000. Reducing mechanical harvesting losses of wheat under large-scale production in the gezira scheme, Sudan. The Eleventh Regional Wheat Workshop for Eastern, Central and Southern Africa. Addis Ababa, Ethiopia 18–22 September 2000.
Chakraborty, S., and Newton, A.C. 2011. Plant Pathology. Special Issue: Climate Change and Plant Diseases. Climate change, plant diseases and food security: an overview. 60, 2–14.
DEFRA (2006). Cutting Costs: adding value in organics, Food Chain Centre, Institute of Grocery Distribution. OFO344.
FAO 2011. Global food losses and food waste – Extent, causes and prevention. Rome. 29 pages. Franke, U., Einarson, E., Andrésen, N., Svanes, E., Hartikainen, H. & Mogensen, L. (2013)
Kartläggning av matsvinnet i primärproduktionen. TemaNord 2013:581, Nordiska ministerrådet, Köpenhamn. https://doi.org/10.6027/tn2013-581
Franke U., Hartikainen H., Mogensen L., Svanes E. (2016) Food losses and waste in primary production: Data collection in the Nordic countries. Nordic Council of Ministers, Nordic Council of Ministers Secretariat, Nordisk Ministerråd, 2016. , 90 p. TemaNord, ISSN 0908-6692; 2016:529 Available at: https://doi.org/10.6027/tn2016-529
Gustavsson, J., Cederberg, C. &, Sonesson, U. (2011) Global food losses and food waste, Food and Agricultural Organization of the United Nations (FAO), Rome
Hobson, R.N. & Bruce, R.N. 2002. Seed Loss when Cutting a Standing Crop of Oilseed Rape with Two Types of Combine Harvester Header. Biosystems Engineering (2002) 81 (3), 281–286. https://doi.org/10.1006/bioe.2001.0011
Hole, C. C., Drew, R. L. K., Smith, B. M. & Gray, D. (1999). Tissue properties and propensity for damage in carrot (Daucus carota L.) storage roots. Journal of Horticultural Science & Biotechnology 74 (5) pp 651–657. https://doi.org/10.1080/14620316.1999.11511168
Huitink, G. & Walker, J. Harvesting Grain Sorghum. University of Arkansas, Agriculture and Natural Resources Harvesting. University of Arkansas Cooperative Extension Service Printing Services.
Johansen, T. J., Thomsen, M. G., Løes, A-K. & Riley, H. (2015) Root development in potato and carrot crops – influences of soil compaction. Acta Agriculturae Scandinavica, Section B — Soil & Plant Science, 65 (2) 182–192. https://doi.org/10.1080/09064710.2014.977942
210 Food losses and waste in primary production
Jordbruksverkets statistikdatabas, Sveriges officiella statistik, (Swedish Board of Agriculture, Statistical Database), 2015: http://statistik.sjv.se/PXWeb/pxweb/sv/Jordbruksverkets%20statistikdatabas/?rxid=5adf4929-f548-4f27-9bc9-78e127837625
Kahala, M., Blasco, L., & Joutsjoki, V. (2012). Molecular Characterization of Spoilage Bacteria as a Means to Observe the Microbiological Quality of Carrot. Journal of Food Protection, 75(3), 523–532. https://doi.org/10.4315/0362-028X.JFP-11-185
Katajajuuri, J. M., Silvennoinen, K., Hartikainen, H., Heikkilä, L., & Reinikainen, A. (2014). Food waste in the Finnish food chain. Journal of Cleaner Production, 73, 322–329. https://doi.org/10.1016/j.jclepro.2013.12.057
Kora, C., McDonald, M. R. and Boland, G. J. 2005. Occurrence of fungal pathogens of carrots on wooden boxes used for storage. Plant Pathology, 54, 665–670. https://doi.org/10.1111/j.1365-3059.2005.01189.x
Lehto, M., Kuisma, R., Kymäläinen, H.-R., Suojala-Ahlfors, T., Laamanen, T.-L., Sipilä, I., Pienmunne, E. & Mäki, M. 2013. Tuorevihannesten tuotantoketjun tavoitteena turvallinen tuote (The improvement of the production chain of fresh-cut vegetables). MTT Raportti 86. Jokioinen. 63 pages.
Luck, J., Spackman, M., Freeman, A., Tre˛bicki, P., Griffiths, W., Finlay K. and Chakraborty, S. 2011. Climate change and diseases of food crops. Plant Pathology. Special Issue: Climate Change and Plant Diseases, 60, 113–121.
Meld. St. 9 (2011–2012) Landbruks- og maktpolitikken. https://www.regjeringen.no/contentassets/adb6bd7b2dd84c299aa9bd540569e836/no/pdfs/stm201120120009000dddpdfs.pdf
NILF (2015) Budsjettnemnda for jordbruket. Located http://nilf.no/statistikk/totalkalkylen/2015/NNposter/Totalkalkylen-Post0404-Gulrot
Olsson, M., Andersson, S., Ekelund, L., Larsson, G. 2011. Kvalitet och tillväxt för lökprodukter (‘Quality and Growth for Onion Produce’, with an English summary), Sveriges lantbruksuniversitet (Swedish University of Agricultural Sciences), Fakulteten för landskapsplanering, trädgårds- och jordbruksvetenskap, Rapport 2011:45, ISBN 978-91-86373-96-2.
Parfitt, J., Barthel, M. & Macnaughton, S. 2010. Food waste within food supply chains: quantification and potential for change to 2050, Phil. Trans. R. Soc., vol. 365, pp. 3065-3081. https://doi.org/10.1098/rstb.2010.0126
Pehkonen, A. & Varis, R. 1989. Header losses of combine harvesting. University of Helsinki, Department of Agricultural Engineering. Käytännön Maamies 7/1989.
Price, J.S., Hobson, R.N., Neale, M.A. & Bruce, D.M. 1996. Seed Losses in Commercial Harvesting of Oilseed Rape. Journal of Agricultural Engineering Research (1996) 65, 183–191. https://doi.org/10.1006/jaer.1996.0091
Räsänen, K., Saarinen, M., Kurppa, S., Silvenius, F., Riipi, I., Nousiainen, R., Erälinna, L., Mattinen, L., Jaakkola, S., Lento, S. & Mäkinen-Hankamäki, S. 2014. Lähiruuan ekologisten vaikutusten selvitys (Ecological impacts of local food). MTT Raportti 145. MTT Jokioinen. Available on the internet: http://www.mtt.fi/mttraportti/pdf/mttraportti145.pdf
Shamabadi, Z. 2012. Measurement the wheat losses in harvesting stage. International Journal of Agriculture and Crop Sciences. IJACS/2012/1797–1802.
Food losses and waste in primary production 211
Silvennoinen, K., Koivupuro, H.-K., Katajajuuri, J.-M., Jalkanen, L. & Reinikainen, A. 2012. Ruokahävikki suomalaisessa ruokaketjussa: Foodspill 2010–2012 -hankkeen loppuraportti (Food Waste Volume and Composition in Finnish Food Chain: Final report of the Foodspill project). MTT Raportti 41, 65 pages.
Silvennoinen, K., Pinolehto, M., Korhonen, O., Riipi, I. & Katajajuuri, J.-M. 2013. Kauppakassista kaatopaikalle, ruokahävikki kotitalouksissa : Kuru 2011–2013 -hankkeen loppuraportti. MTT Raportti 104, 58 pages.
SSB (2014). Tabell: 10507: Avling og areal av ymse hagebruksvekstar. https://www.ssb.no/statistikkbanken/selectvarval/Define.asp?subjectcode=&ProductId=&MainTable=Veksthus12&nvl=&PLanguage=0&nyTmpVar=true&CMSSubjectArea=jord-skog-jakt-og-fiskeri&KortNavnWeb=hagebruk&StatVariant=&checked=true
Strid, I., Eriksson, M., Andersson, S. & Olsson, M. 2014. Svinn av isbergssallat i primärproduktionen och grossistledet i Sverige. Jordbruksverkets rapport 2014:06. http://webbutiken.jordbruksverket.se/sv/artiklar/svinn-av-isbergssallat-i-primarproduktionen-och-grossistledet-i-sverige.html
Sumner, P.E. & Williams, E.J. 2009. Measuring Field Losses from grain combines. The University of Georgia and Ft. Valley State University, the U.S. Department of Agriculture and counties of the state cooperating. Cooperative Extension, the University of Georgia College of Agricultural and Environmental Sciences. Bulletin 973. Reviewed May 2009.
Suojala-Ahlfors, T. & Laamanen, T.-L. 2014. Effect of calcium amendment on the calcium content and storage quality of carrot (Daucus carota L.). European Journal of Horticultural Science 79: 278–282.
Swedish Board of Agriculture; Trädgårdsundersökningen 2014. Sveriges Officiella Statistik, Statistiska Meddelanden JO 28 SM 1501, Jordbruksverket, 2014. Swedish Board of Agriculture: http://statistik.sjv.se/PXWeb/pxweb/sv/Jordbruksverkets%20statistikdatabas/?rxid=5adf4929-f548-4f27-9bc9-78e127837625
Swedish Board of Agriculture, 2015: http://statistik.sjv.se/PXWeb/pxweb/sv/Jordbruksverkets%20statistikdatabas/?rxid=5adf4929-f548-4f27-9bc9-78e127837625
Tietohaarukka 2014. Tike 2013. Horticultural Statistics. Vegetables grown in the open by ELY Centres/total
production 2013. Tike (agricultural statistics) 2014. Contact information of Finnish carrot farms 2013. Voipio, I. 2001. Vihannekset – lajit, viljely ja sato (Vegetables – species, cultivation and yield, in
Finnish). Puutarhaliiton julkaisuja nro 316. Helsinki. 351 pages. Varis, R. & Pehkonen, A. 1989. Leikkuupuimurin pöytätappiot. Yhteenveto vuosien 1986-1988
pöytätappiotutkimuksista. Helsingin yliopisto. Maatalousteknologian laitos. ISBN 951-45-4983-X.
Vittersø, G., Rødbotten, M., Olsen, N. V. & Dragland, S. (2005) Gulrot og kålrot. SIFO, rapport. 12:2005
Wikström, M., Jönsson, B., Persson, L., 2009. Final report to The Swedish Farmers' Foundation for Agricultural Research: Black spots at stored carrots – new disease in Sweden caused by Acrothecium carotae (in Swedish). Retrieved at 2015-10-12: http://www.lantbruksforskning.se/?id=8746&cid=8941&pid=H0556131&tid=projekts

212 Food losses and waste in primary production

Food losses and waste in primary production 213
Sammanfattning
Detta är en teknisk rapport över de fallstudier vi gjorde inom det nordiska projektet ”Food waste and losses in primary production” (Franke et al. 2016). Vi genomförde fallstudier för sex produktgrupper för att testa olika mätmetoder och för att få siffror på det procentuella sidoflödet för produkterna i de nordiska länderna.
Introduktion av nya begreppet “sidoflöde”
Projektet har fokuserat på primärproduktionen i de nordiska länderna Danmark, Finland, Norge och Sverige. För att få ett grepp om de flöden av svinn och förluster som uppkommer i primärproduktionen har vi introducerat ett nytt begrepp – sidoflöde. Med sidoflöde menar vi:
Primärprodukter som var menade att bli mat, men som inte gick in livsmedelskedjan.
Planerad foderproduktion ingår alltså inte i begreppet, men däremot ingår produkter tänkta till mat, som i stället går till foder.
Endast den del av produkten som äts ingår. Oätliga delar såsom skal och ben ingår inte i begreppet.
Med primärproduktion menar vi jordbrukets produktion av djur, växtodling, trädgårdsodling, vattenbruk, vilda frukter och bär, jakt och fiske. De valda systemgränserna är:
När odlade grödor och trädgårdsprodukter är mogna för skörd, vilda frukter och bär plockats, tamdjur och odlad fisk fötts, vilda djur och fisk fångats, mjölken mjölkats och ägg är värpta.
Innan primärprodukterna går in I nästa led av livsmedelskedjan (slakt, detaljhandel eller livsmedelsindustrin).

214 Food losses and waste in primary production
Fallstudier
För att skapa en heltäckande bild av sidoflöden och matavfall i primärproduktionen, genomförde vi en litteraturstudie och flera fallstudier (Franke et al. 2016). Fallstudierna finns presenterade i denna rapport. Totalt genomförde vi fallstudier för sex produktgrupper: morot, lök, spannmål (vete eller råg), gröna ärtor, foderärter och odlad fisk (regnbåge eller röding). Fallstudierna genomfördes i Finland, Sverige, Norge och Danmark. Vi använde olika metoder för att studera sidoflöden, nämligen enkätundersökning, fältmätningar och intervjuer. Eftersom vi genomförde fallstudierna i fyra olika länder, för sju olika produkter och använde tre olika metoder, blev det totala antalet fallstudier 35 stycken (tabell 1).
Tabell 1: Översikt över fallstudierna I projektet: produkt, metod som användes och land (D=Danmark, F=Finland, N=Norge, S=Sverige)
Produkt Metod
Morot Enkätstudie (D, F, N, S), Fältmätning (F, N), Intervju (F, N) Lök Enkätstudie (D, F, N, S), Fältmätning (S), Intervju (S, F) Gröna ärtor Enkätstudie (D*, F, N, S), Intervju (S, F) Gula ärtor Enkätstudie (D*, F, S), Fältmätning (F), Intervju (F) Vete, Råg Enkätstudie (Vete) (D, N, S), enkätstudie (Råg) (F), Fältstudie (Wheat) (F) , Intervju (Vete) (F) Regnbåge, Röding Enkätstudie (Regnbåge) (D, F, S**), Enkätstudie (Röding) (S**), Intervju (F)
Note 1: Note 2:
*Resultaten presenteras i en kombinerad nationell rapport. ** Resultaten presenteras i en kombinerad nationell rapport.
Resultat
Resultaten från enkäterna, fältstudierna och intervjuerna presenteras i detalj i kapitel 3–8. Här är en kort översikt:
Resultaten för morot visar att det finns en hel del sidoflöde i alla länder, mellan 13% och 31%, och att det mesta av sidoflödet sker efter skörd, t.ex. vid sortering och lagring. Den främsta orsaken till sidoflöde är kopplade till kvalitet, såsom utseende eller angrepp. Väderförhållanden och sjukdomar har särskilt stor inverkan på kvaliteten på morötterna. Sidoflödet för lök varierar mellan 8% och 17% för de nordiska länderna och även här sker det mesta efter skörd, t.ex. vid sortering och lagring. Liksom för morötterna har väderförhållanden och sjukdomar stor påverkan på kvaliteten.
För gröna ärtor varierar sidoflödet mellan 18% till 21%. Sidoflödet berodde främst på oskördade fält, men även kvaliteten på ärtorna.
Sidoflödet för gula ärtor varierar från 17% till 18% mellan länderna. Det mesta uppkommer efter skörd och även här sker det ofta vid sortering och lagring. Förutom
Food losses and waste in primary production 215
väderförhållanden och sjukdomar så uppkommer en del sidoflöde till följd av hanteringen vid skörd.
Sidoflödet för spannmål skiljer sig ganska mycket mellan länderna och varierar från 4% till 23%. Det mesta uppstår efter skörd. Den främsta orsaken till sidoflöde är kvalitetskrav på vete (låg proteinhalt).
Av de tre studierna som gjordes på odlad fisk är det endast en av studierna som har presenterat en uppskattning av sidoflödet. Därför går det inte att dra några slutsatser på sidoflödet för odlad fisk. De främsta anledningarna till sidoflöde är sjukdomar och rovdjur.
Orsakerna till sidoflöden är många och varierar mellan produkt och led i produktionskedjan. Synliga skäl (t.ex. storlek och form), odlingsrelaterade orsaker (t.ex. dåligt väder, sjukdomar och skadedjur) och underliggande orsaker (t.ex. lågt pris och överproduktion) gavs av bönderna. Låg kvalitet är en viktig orsak till svinn, och detta kan handla om utseende (”kosmetisk” kvalitet) eller andra skäl, såsom låg proteinhalt hos vete. Studierna tyder på att de vanligaste, och förmodligen viktigaste faktorerna bakom sidoflöden är de odlingsrelaterade, som väder, sjukdomar och skadedjur. När man studerar sidoflödena i detalj är underliggande skäl t.ex. pris och förhållandet mellan utbud och efterfrågan också ganska viktigt.
Sidoflöden från grönsaker och baljväxter används främst som djurfoder om så är möjligt. Lök är inte lämpligt som foder och komposteras i stället. En betydande andel grönsaker och baljväxter skördas inte alls, utan lämnas kvar i fältet och får tjäna som gödning. En del av sidoflödet från framför allt fisk, men även baljväxter används för energiändamål. Sidoflöden från vete och råg används mestadels som djurfoder. En liten del används för energiändamål. För alla produktgrupper som det finns en liten andel som inte används alls, d.v.s. deponeras.
Diskussion
Resultaten från fallstudierna ger en indikation på storleksordningen för sidoflödet, men eftersom studierna genomfördes på lite olika sätt i de nordiska länderna går det inte att jämföra resultaten mellan länderna. Fallstudierna varierar i design, utförande, databehandling och tolkning av data. Dessutom var urvalet relativt litet och i några fall finns heller inga uppgifter på representativitet. Ett annat problem var att respondenterna i vissa fall missuppfattade frågan, vilket kunde resultera i ologiska svar och att summan av andelarna inte alltid blev 100%. Vi antar också att många svar baseras på uppskattningar snarare än faktiska mätningar.
Fallstudierna visar trots allt på stora variationer i sidoflöde mellan år, geografiska områden och enskilda producenter. Hög standardavvikelse i enkäterna och
216 Food losses and waste in primary production
fältstudierna visar på stora skillnader mellan producenterna. Vi vet dock inte hur mycket av detta som är en verklig skillnad och hur mycket som beror på osäkra uppskattningar eller hur mycket som beror på val av metod som användes för att samla in och bearbeta uppgifterna. Troligtvis spelar alla tre delarna in.
Resultaten är således indikativa och fler djupgående studier skulle behövas för att få en bättre uppskattning av sidoflöden i primärproduktionen.

Food losses and waste in primary productionCase studies on carrots, onions, peas, cereals and farmed fish
This report presents the results from six case studies of food losses and waste in primary production in the Nordic region. The product groups studied were carrots, onions, cereal (wheat or rye), green peas, field peas, and cultivated fish (rainbow trout or char). We used different methods to study the side flows: questionnaires, in-field measurements and interviews. Instead of the term “food losses and waste” we use the term “side flows”.
The side flow ranged from 4 % to 31 % for vegetables, cereals and pulses and most of the side flow for occurs after harvest, e.g. when sorting and storing the products. The main reason for side flow is quality issues. Weather conditions and diseases have a major impact on the quality of the products. We cannot draw many conclusions on side flow amounts for fish based on the results. The reasons for fish side flow are mainly diseases and predators.
Food losses and waste in primary production
Nordic Council of MinistersVed Stranden 18DK-1061 Copenhagen Kwww.norden.org
TemaN
ord 2016:557 Food losses and waste in prim
ary production