FOAM, a new simple benthic degradative module for the LAMP3D model: an application to a...
14
FOAM, a new simple benthic degradative module for the LAMP3D model: an application to a Mediterranean fish farm Patrizia De Gaetano 1 , Andrea M Doglioli 2 , Marcello G Magaldi 3 , Paolo Vassallo 4 & Mauro Fabiano 4 1 DIFI, Dipartimento di Fisica, Universita di Genova, Genoa, Italy 2 Laboratoire d’ Oce¤ anographie Physique et Bioge¤ ochimique, LOPB-UMR 6535, CNRS, OSU/Centre d’ Oceanologie de Marseille, Aix-Marselle Universite, Marseille, France 3 Division of Meteorology and Physical Oceanography (MPO), Rosenstiel School of Marine and Atmospheric Science (RSMAS), University of Miami, FL, USA 4 DIPTERIS, Dipartimento per lo Studio del Territorio e delle sue Risorse, Universita di Genova, Genoa, Italy Correspondence: P De Gaetano, DIFI, Dipartimento di Fisica, Universita di Genova,Via Dodecaneso 33,16146 Genova, Italy. E-mail: degaetano@¢sica.unige.it Abstract The modelling framework already introduced by Do- glioli, Magaldi, Vezzulli and Tucci to predict the potential impact of a marine ¢sh farm is improved following di¡erent directions, namely (1) real historic current-metre data are used to force the simulations, (2) settling velocity values speci¢cally targeting Mediterranean ¢sh species are used, and (3) a new benthic degradative module, the Finite Organic Accu- mulation Module, is added to the modelling frame- work. The Finite Organic Accumulation Module uses the output of the other functional units of the model- ling framework to calculate the organic load on the seabed. The Finite Organic Accumulation Module considers the natural capability of the sea£oor in ab- sorbing part of the organic load. Di¡erent reminerali- zation rates re£ect the sediment stress level according to the work of Findlay and Watling. Organic degrada- tion for both uneaten feed and faeces is evaluated by changing the release modality (continuous and peri- odical) and by varying the settling velocities. It is found that the maximum impact on the benthic community is observed either for quickly sinking un- eaten feed released twice a day, or for less intense near-bottom current conditions. If both the above- mentioned scenarios coexist, a high stress level is established in the sediment. The model also suggests that the use of self-feeders in cages can reduce farm impacts signi¢cantly. These results show how the new and more complete modelling framework pre- sented here is able to improve the objectivity in the decision-making processes and how it may be successfully used for planning and monitoring purposes. Keywords: biodegradation modelling, aquacul- ture impact, Mediterranean Sea, husbandry, net-pen, organic matter Introduction The increase in global ¢sh consumption and the decrease in wild ¢sh stocks are the main reasons behind the continuous development of marine aquaculture (FAO Fisheries Division, 2006, http:// www.fao.org/docrep/009/a0874e/a0874e00.htm). The worldwide expansion of marine ¢sh farms, how- ever, has always generated concern regarding the possible impacts on coastal ecosystems. Already in 1995, the Food and Agriculture Organization (FAO) of the United Nations adopted a Code of Conduct for Responsible Fisheries. The Code provided the neces- sary framework for national and international e¡orts to ensure sustainable exploitation of aquatic living resources. Particular attention was paid to the aqua- culture growth in accord with the sustainable and integrated use of the environment, taking into Aquaculture Research, 2008, 39, 1229^1242 doi: 10.1111/j.1365-2109.2008.01990.x r 2008 The Authors Journal Compilation r 2008 Blackwell Publishing Ltd 1229
Transcript of FOAM, a new simple benthic degradative module for the LAMP3D model: an application to a...

FOAM, a new simple benthic degradative module for
the LAMP3D model: an application to a Mediterranean
fish farm
Patrizia De Gaetano1, Andrea M Doglioli2, Marcello G Magaldi3, PaoloVassallo4 & Mauro Fabiano4
1DIFI, Dipartimento di Fisica, Universita di Genova, Genoa, Italy2Laboratoire d’Oce¤ anographie Physique et Bioge¤ ochimique, LOPB-UMR 6535, CNRS, OSU/Centre d’Oceanologie de Marseille,
Aix-Marselle Universite, Marseille, France3Division of Meteorologyand Physical Oceanography (MPO), Rosenstiel School of Marine and Atmospheric Science (RSMAS),
University of Miami, FL, USA4DIPTERIS, Dipartimento per lo Studio del Territorio e delle sue Risorse, Universita di Genova, Genoa, Italy
Correspondence: P De Gaetano, DIFI, Dipartimento di Fisica, Universita di Genova,Via Dodecaneso 33,16146 Genova, Italy. E-mail:
degaetano@¢sica.unige.it
Abstract
The modelling framework already introduced by Do-glioli, Magaldi, Vezzulli and Tucci to predict thepotential impact of a marine ¢sh farm is improvedfollowing di¡erent directions, namely (1) real historiccurrent-metre data are used to force the simulations,(2) settling velocity values speci¢cally targetingMediterranean ¢sh species are used, and (3) a newbenthic degradativemodule, the Finite OrganicAccu-mulation Module, is added to the modelling frame-work. The Finite Organic Accumulation Module usesthe output of the other functional units of the model-ling framework to calculate the organic load on theseabed. The Finite Organic Accumulation Moduleconsiders the natural capability of the sea£oor in ab-sorbing part of the organic load. Di¡erent reminerali-zation rates re£ect the sediment stress level accordingto the work of Findlay andWatling. Organic degrada-tion for both uneaten feed and faeces is evaluated bychanging the release modality (continuous and peri-odical) and by varying the settling velocities. It isfound that the maximum impact on the benthiccommunity is observed either for quickly sinking un-eaten feed released twice a day, or for less intensenear-bottom current conditions. If both the above-mentioned scenarios coexist, a high stress level isestablished in the sediment. The model also suggeststhat the use of self-feeders in cages can reduce farmimpacts signi¢cantly. These results show how the
new and more complete modelling framework pre-sented here is able to improve the objectivity inthe decision-making processes and how it may besuccessfully used for planning and monitoringpurposes.
Keywords: biodegradation modelling, aquacul-ture impact, Mediterranean Sea, husbandry,net-pen, organic matter
Introduction
The increase in global ¢sh consumption and thedecrease in wild ¢sh stocks are the main reasonsbehind the continuous development of marineaquaculture (FAO Fisheries Division, 2006, http://www.fao.org/docrep/009/a0874e/a0874e00.htm).The worldwide expansion of marine ¢sh farms, how-ever, has always generated concern regarding thepossible impacts on coastal ecosystems. Already in1995, the Food and Agriculture Organization (FAO)of the United Nations adopted a Code of Conduct forResponsible Fisheries. The Code provided the neces-sary framework for national and international e¡ortsto ensure sustainable exploitation of aquatic livingresources. Particular attention was paid to the aqua-culture growth in accord with the sustainable andintegrated use of the environment, taking into
Aquaculture Research, 2008, 39, 1229^1242 doi:10.1111/j.1365-2109.2008.01990.x
r 2008 TheAuthorsJournal Compilationr 2008 Blackwell Publishing Ltd 1229

account the fragility of coastal ecosystems, the ¢nitenature of their natural resources and the needs ofcoastal communities. In 2001, following the same di-rection, the European Union started to set up a strat-egy for sustainable aquaculture development withthe Biodiversity Action Plan for Fisheries (COM2001a) and the European Strategy for SustainableDevelopment (COM 2001b). These two documentsled to the more recent and speci¢c Strategy for theSustainable Development of European Aquaculture(COM 2002).Marine aquaculture operations are still very ex-
pensive, and the only means by which pro¢tabilitycan be sustained is to intensify ¢sh production. Un-fortunately, this intensi¢cation increases the alreadyexisting concerns about reaching and surpassing thenatural capability of the environment. The scienti¢cliterature has identi¢ed the main environmental im-pact from ¢sh farms to be the release of particulatewaste products (Hall, Anderson, Holby, Kollberg &Samuelsson 1990; Holmer & Kristensen 1992; Kara-kassis, Tsapakis, Hatziyanni, Papadopoulou & Plaiti2000). Particulate wastes increase the organic loadon the benthic environment and might determinechanges in the community structure and in the bio-diversity of the benthic assemblages (Tsutsumi, Kiku-chi,Tanaka, Higashi, Imasaka & Miyazaki 1991;Wu,Lam, MacKay, Lau & Yam 1994; Vezzulli, Chelossi,Riccardi & Fabiano 2002;Vezzulli, Marrale, Moreno &Fabiano 2003).Therefore, we are in need of predictivetools able to assess whether or not the establishmentof a new farm (or the permission for an increase inproduction of an already existing one) can result in apotential impact on the surrounding environment.Numerical models can be used to perform environ-
mental impact predictions and test di¡erent scenar-ios. The interest in tracking aquaculture wastes withmathematical models has been rapidly increasing intime as a consequence (Henderson, Gamito, Karakas-sis, Pederson & Smaal 2001). In the past, we havemoved from using analytical models describing over-simpli¢ed dispersion patterns in a constant £ow intime and space (Gowen, Bradbury & Brown1989), toimplementing equations with too many simplifyingassumptions about hydrodynamics (Gillibrand &Turrell 1997). Others have developed particle-track-ing models using hydrographic data and were there-fore limited in their simulations by the sparse data intime and in space (Cromey, Nickell & Black 2002).Ocean dynamics, instead, are usually very complex,and ocean ecosystems are likely to experiencecurrent reversals and £ow variability. Pioneering
numerical studies used circulation models focusingon strong tidally driven systems. In this case, the £owcould have been considered obeying two-dimen-sional (2D) vertically averaged dynamics (Panchang,Cheng & Newell 1997; Dudley, Panchang & Newell2000). Unfortunately, the 2D approximation can beinappropriate in more complex and dynamical sys-tems where vertical phenomena a¡ect the dispersionof di¡erent particles. Keeping this inmind, some of uswere the ¢rst ones to directly take into account thethree-dimensional (3D) ocean circulation and itsvariability in tracking di¡erent aquaculture wastes(Doglioli, Magaldi,Vezzulli & Tucci 2004; hereinafterreferred to as DMVT04). Nevertheless, to our knowl-edge, DMVT04 still represents the only application ofa 3D hydrodynamical model for aquaculturepurposes.The present study takes place following the contin-
uous e¡ort in improving the framework initially setup by DMVT04. The improvements and the assess-ment of their relative importance have been carriedout mainly in three areas and represent the core andthe original intent of this work. Namely, in this study,we (a) improved our hydrodynamics using real his-toric current-metre data to force the simulations, (b)improved our dispersion using a larger number ofparticles and updating the settling velocity valuesspeci¢cally for Mediterranean ¢sh species and fortheir feed, and (c) added a new coupled benthic mod-ule to consider the environmental response to theorganic load from the cages.In DMVT04, some of us used idealized winds to
force simulations. The choice of the winds was basedon a statistical treatment of 34 years of wind data,and it allowed us to carry out a complete 12-day hy-drodynamic simulation during whichwind directionand speed were changing according to a typical localmeteorological sequence. In a later paper, however,some of us successfully used historical current-metredata to study the hydrodynamic characteristics of thearea under examination (Doglioli, Gri¡a & Magaldi2004). Because the focus of this study is to move to-wards a more realistic scenario, we decided to imple-ment the already validated forcing set-up used inDoglioli, Gri¡a et al. (2004). This mainly implies thatthe open boundary conditions and the forcing eva-luation are improved by applying realistic currentmeasurements.On the other hand, settling velocity values for
uneaten feed and faeces represent key parametersfor aquaculture waste dispersion models. Due to thelack of values speci¢cally targeting Mediterranean
FOAM, Finite Organic Accumulation Module P De Gaetano et al. Aquaculture Research, 2008, 39, 1229^1242
r 2008 TheAuthors1230 Journal Compilationr 2008 Blackwell Publishing Ltd, Aquaculture Research, 39, 1229^1242

¢sh and their feeds, DMVT04 had to use the only va-lues available in the literature, i.e. the ones measuredfor salmonids (Chen, Beveridge & Telfer 1999a, b).However, two recent works ¢lled this importantgap. On the onehand, some of us, inVassallo, Doglioli,Rinaldi and Beiso (2006), presented the settlingvelocities of a feed usually utilized in Mediterraneanfarms (the ‘Marico Seabass and Seabream’ pelletsproduced by Coppens International), while on theother, Magill, Thetmeyer and Cromey (2006) mea-sured the settling velocities of gilthead sea breamand sea bass faecal particles collected in sedimentcores in a Greek ¢sh farm.The second original aspectof this study is that it uses these new values, payingparticular attention to the role they play in the over-all results.Finally, we recognize that following only the fate of
the particles, as we did in DMVT04, is not su⁄cient tocorrectly assess the organic load on the sea bottom.Themodelling e¡ort should consider the natural cap-ability of the benthic environment in reacting andabsorbing £uctuations in the organic load. Ourmodelframework is integrated with an additional newnumerical benthic degradative module, the FiniteOrganic Accumulation Module (FOAM). Finite Or-ganic Accumulation Module is mainly based onthe ideas expressed in the work of Findlay and Wa-tling (1997) (hereinafter referred to as FW97). Theyproposed an index of impact based on the ratio be-tween the quantity of oxygen supplied to the sedi-ment and the quantity of oxygen required by thesediment. The oxygen supply is a function of thenear-bottom £ow velocities and is calculated usingthe empirical relation put forth by FW97.The oxygendemand is based on the organic load from the cages,and it is strongly related to the microbial benthic me-tabolism rate. As pointed out by the same authors,the equations proposed by FW97 can be easilyexploited by numerical modellers, because the onlyneeded input variables are the bottom £ow velocitiesand the organic £ux towards the seabed. Because ourmodel does consider the vertical dimension, it is alsoable to provide these important, required data.Furthermore, its intrinsic Lagrangian nature allowsa simple numerical implementation of the ideas pro-posed in FW97.The rest of this paper is organized as follows: in
‘Methods’, a description of the study area and the de-tails of the modelling e¡ort are provided. The resultsof the numerical experiments are presented in ‘Re-sults’ and discussed in ‘Discussion’. Finally, the con-clusions are given in‘Conclusions’.
Methods
The simulations are carried out for the o¡shore ¢shfarm located in the Ligurian Sea already describedin DMVT04 (Fig.1).The sea cages are located at about1.5 km from the coast, and they cover an area of0.2 km2. The bottom depth ranges between 38 and41m.The farm is composed of eight ¢sh cages with acapacity of 2000m3 each. The reared biomass is20 kgm�3 for an annual mean production of about200 tonne year�1. The ¢sh in the cages are giltheadsea bream (Sparus aurata) and sea bass (Dicentrarchuslabrax).The modelling framework consists of di¡erent
models that are coupled together into a single func-tional unit (Fig. 2). The hydrodynamic model is thePrincetonOceanModel (POM), and it is used to derivespace and time information of the circulation of thecoastal area. Princeton Ocean Model is coupled on-line with the three-dimensional Lagrangian Assess-ment for Marine Pollution Model (LAMP3D).Three-dimensional Lagrangian Assessment forMarine Pollution Model is used to track the particlepositions in time and space.The Finite Organic Accu-mulation Model represents the biochemical compo-nent of the modelling system, and it uses POM andLAMP3D outputs to estimate the potential environ-mental impact due to the organic load from the cages.Princeton Ocean Model and LAMP3D calculate thebottom velocities and the particle £uxes to the bot-tom, and these values are then used by FOAM tocalculate the ¢nal organic load in each mesh of itsnumerical domain.The following part of this section gives a more de-
tailed description of the entire modelling framework.
The advective and dispersive models: POM andLAMP3D
Some historical measurements of the coastal currentin the area are available in terms of current-metretime series and hydrographic surveys, covering atotal of 10 months during 1978^1979 (Astraldi &Manzella 1983). Data are archived in the SIAMdatabase (http://www.santateresa.enea.it/wwwste/banchedati/bd_ambmar.html), and they have beenkindly provided to us by the Italian National Agencyfor New Technologies, Energy and Environment(ENEA) and the National Research Council (CNR). Inthis study, we concentrate on the winter^spring per-iod, when the currents are stronger and better de-¢ned and the strati¢cation is being formed.We select
Aquaculture Research, 2008, 39, 1229^1242 FOAM, Finite Organic Accumulation Module PDe Gaetano et al.
r 2008 TheAuthorsJournal Compilationr 2008 Blackwell Publishing Ltd, Aquaculture Research, 39, 1229^1242 1231
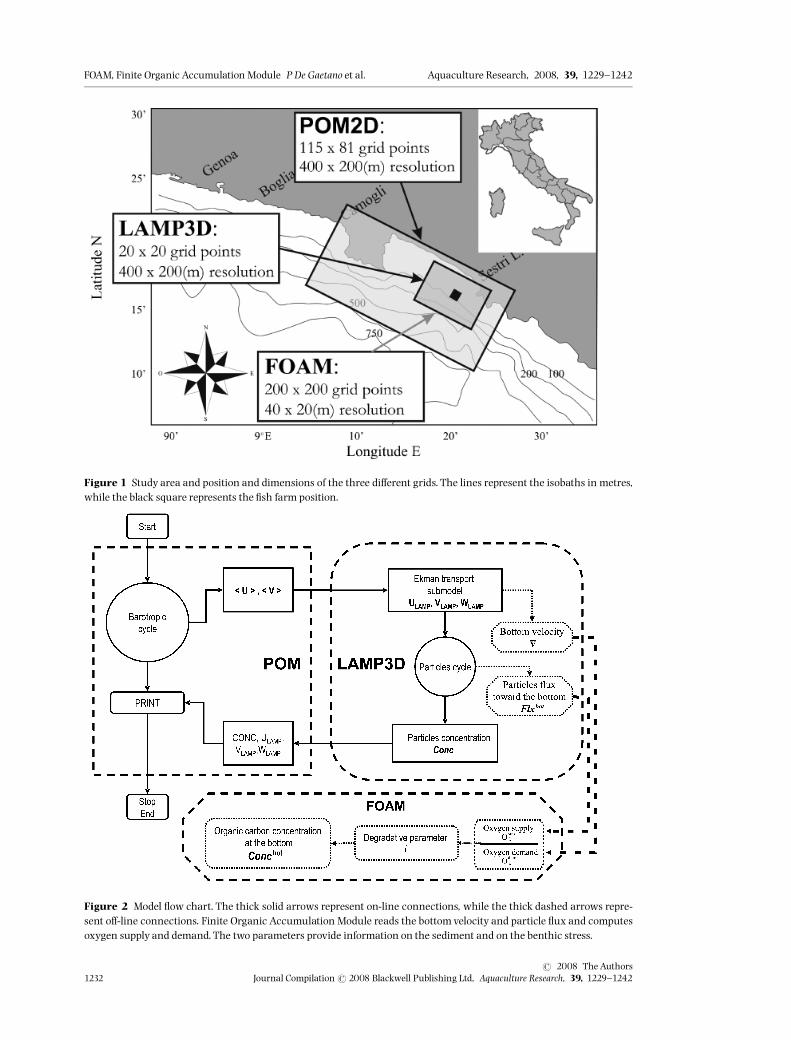
Figure 1 Study area and position and dimensions of the three di¡erent grids. The lines represent the isobaths in metres,while the black square represents the ¢sh farm position.
Figure 2 Model £ow chart. The thick solid arrows represent on-line connections, while the thick dashed arrows repre-sent o¡-line connections. Finite Organic Accumulation Module reads the bottom velocity and particle £ux and computesoxygen supply and demand. The two parameters provide information on the sediment and on the benthic stress.
FOAM, Finite Organic Accumulation Module P De Gaetano et al. Aquaculture Research, 2008, 39, 1229^1242
r 2008 TheAuthors1232 Journal Compilationr 2008 Blackwell Publishing Ltd, Aquaculture Research, 39, 1229^1242

the period from 8 February1979 to 30 June1979, andwe force the model on the eastern boundary. At thewestern boundary, a radiation condition is imposed.The set-up described is the same as that used and va-lidated in Doglioli, Gri¡a et al. (2004). The reader isreferred to this paper for a more detailed descriptionof the boundary conditions and for their validation.Here, complete 4-month simulations are carried out,obtaining current data necessary for the dispersion^degradation runs. The ¢rst velocity value (U5
�0.19m s�1), measured on 8 February 1979, isprovided on the whole domain as an initial conditionfor all the simulations. Because the objective of thiswork is simulating longer time periods, we cyclicallyrepeat the real current-metre data as boundary con-ditions to force the runs. Consequently, the organicmatter accumulation on the seabed can be estimatedfor longer time periods and the dependence of themodel results on the initial condition can be reduced.Moreover, because the primary focus of this study
is the organic load on the sea£oor and not the fate ofthe dissolved nutrients, we adopt a new set-up withrespect to that used in DMVT04 for the hydro-dyna-mical model POM and the dispersive model LAMP3D(see Fig.1).The POM grid has115 � 80meshes with aspatial resolution of 400m along the x-direction and200m along the y-direction. This resolution re£ectsthe best available bathymetric data in the area. TheLAMP3D numerical domain, instead, is smaller(8 km � 4 km), and it is nested in the POM grid withthe same spatial resolution (400m � 200m).The other dispersive parameters are unchanged
with respect to DMVT04, with the exception of theLagrangian particle number, whichwas increased to620000 for greater precision and better rendering.DMVT04’s assumptions on the organic carbon con-centration in feed and faecal waste are adopted. Inparticular, the value of 5% for the feed loss was re-cently con¢rmed by results of the MERAMED project(http://www.meramed.com). Nevertheless, becausethe number of particles is increased with respect toDMVT04, we calculate new conversion factors foruneaten feed and faecal waste (Table 1).We also keepcalculating nitrogen-loading rates for validation pur-poses (see ‘Results’) using the same conversion fac-tors as that used in DMVT04 for nitrogen.Due to the lack of data for Mediterranean species,
in DMVT04, we used the values proposed by Chenet al. (1999a, b) for salmonids. Recently, Magill et al.(2006) have measured the settling rates of faecalmaterial of gilthead sea bream and sea bass, while,under laboratory conditions reproducing the Medi-
terranean seawater, Vassallo et al. (2006) haveprovided the settling velocity values of a typicalgrowing sequence of feed pellets for the same species.We therefore used the values of these recent works inour simulations.All the parameters used in the hydrodynamic and
dispersive models are summarized in the upper partof Table 1, while the di¡erent settling velocity valuesare reported inTable 2.
The benthic module: FOAM
A new bottom boundary condition is implemented inour model. When a numerical particle touches theseabed, it is considered to be biodegradable settledmatter and is treated by the benthic module FOAM.
Table 1 Input parameters for POM^LAMP3D and FOAM
Value
POM–LAMP3D parameters
POM physical domain (km) 46 � 16
LAMP3D physical domain (km) 8 � 4
Horizontal resolution (m) 400 � 200
Vertical resolution (m) 10
Barotropic cycle time step (s) 1
Smagorinsky diffusivity coefficient 0.1
Asselin filter coefficient 0.05
Ekman depth, DE (m) 50
Wind drag coefficient, Cd 0.001
Horizontal standard deviation, s (m) 3.46
Particle cycle time step (s) 60
Number of particles 620 000
Feed conversion factor for organic carbon, wfeed C
(mmol C particle�1)
308.6
Faeces conversion factor for organic carbon, wfaeces C
(mmol C particle�1)
5.8
Feed conversion factor for nitrogen, wfeed N
(mmol N particle�1)
167.8
Faeces conversion factor for nitrogen, wfaeces N
(mmol N particle�1)
66.4
FOAM parameters
Physical domain (km) 8 � 4
Horizontal resolution (m) 40 � 20
O2 supply parameter A (mmol O2 m� 2 day� 1) 736.3
O2 supply parameter B (mmol O2 s� 1 m� 3 day� 1) 672.5
O2 demand parameter C (mmol O2 mmol C� 1) 1.07
O2 demand parameter D (mmol O2 m�2 day� 1) � 32.6
Settled matter non-stress, Ns (mmol C m� 2 day� 1) 27.53
Settled matter intermediate-stress, Is
(mmol C m�2 day�1)
57.50
Settled matter hyper-stress, Hs (mmol C m�2 day� 1) 30.59
Range amplitude parameter, Dfw 0.5
FOAM, Finite Organic Accumulation Module; LAMP3D, three-dimensional Lagrangian Assessment for Marine PollutionModel; POM, Princeton Ocean Model.
Aquaculture Research, 2008, 39, 1229^1242 FOAM, Finite Organic Accumulation Module PDe Gaetano et al.
r 2008 TheAuthorsJournal Compilationr 2008 Blackwell Publishing Ltd, Aquaculture Research, 39, 1229^1242 1233

Finite Organic Accumulation Module covers thesame area of the dispersive model, but its resolutionis 10 times higher, namely 40m � 20m (Fig.1). Thisresolution adequately represents the known pro-cesses of degradation and is acceptable in terms ofcomputational time. In the case of FOAM, a higherresolution is feasible, because its calculations are per-formed o¡-line.According to FW97, the organic accumulation at
the bottom leads to di¡erent rates of mineralizationin relation to the level of stress that the seabed is ex-posed to. In order to simulate the biological reactionof the microbial benthic community to the variationsin the organic enrichment, we assign the status of thesediment in each grid mesh according to the ratiobetween the benthic oxygen supply and the demand.In FOAM, the same equations and constants pro-
posed by FW97 are used.The oxygen supply is a func-tion of the near-bottom velocities and can becalculated using simple Fickian di¡usion argumentsand expressed by the empirical relation
Osup2 ¼ Aþ B logð�vÞ ð1Þ
whereA and B are constants (seeTable1) and �v is thetime-averaged current velocity taken at1m from thebottom. It is important to note that �v is just the nu-merical value of the bottom £ow velocity when it isexpressed in centimetre per second. In our model,this value is obtained by linear interpolation of thevelocity in the deepest vertical grid cell and by usingan average time interval of Dt52 h. This choice wasalready made by FW97 to describe oxygen supply tothe benthos. Moreover, this time interval seems to becritical, because a 2-h exposure to reduced oxygenand elevated hydrogen sulphide concentrationscauses permanent damage to the gill tissues of sensi-
tive infauna (Theede, Ponat, Hiroki & Schlieper1969).The same choice of Dt52 h is also supported by themore recent work by Morrisey, Gibbs, Pickmere andCole (2000).The oxygen demand, instead, is a function of the
organic carbon £ux towards the sea bottom FlxBot ac-cording to the relation
Odem2 ¼ CFlxBot þ D ð2Þ
where, again, C and D are just constants (Table 1; formore details refer to Figs 2 and 3 in FW97). If i and jare the grid mesh indexes in the x and y directions,respectively, the carbon £ux FlxBot in each grid mesh(i, j) at the instant k is calculated on the basis of thenumber of particles reaching the bottom, ni,j
Bot, duringan integration time interval dt, i.e.
FlxBotk ¼nBoti;j w
C
dtDxDyð3Þ
In Eqn (3), Dx and Dy are the horizontal grid sizes,while wC stands for the adopted organic carbon con-version factor. The value of wC varies if we considerfeed or faeces, and the di¡erent values are listed inTable1.Once themodel providesOsup
2 andOdem2 for eachgrid
mesh, we can calculate the index of impact I as sug-gested by FW97 as
Ii;j ¼Osup2
Odem2
ð4Þ
Based on I, we can identify three di¡erent levels ofstress: non-stressed sediments, intermediatelystressed sediments and highly stressed sediments.FW97 suggested that when I41, the supply of oxy-gen is in excess of the demand and therefore the im-pact is minimal. When I � 1, the impact can bemoderate, while when Io1, the sediment exhibitsthe azoic sediment endpoint and the resulting impactis high. In our model, the discrete FW97 criterion forthe di¡erent levels becomes
no stress; if Ii;j > 1þ Dfw;medium stress; if ð1� DfwÞ < ; Ii;j < ; ð1þ DfwÞ;high stress; if Ii;j < ;1� Dfw:
Sensitivity tests on the Dfw parameter are per-formed in a range varying from Dfw 50.05 to 0.5.Weobserve no meaningful di¡erences, and hence, forprecautionary reasons, the value of Dfw 50.5 isadopted.When the level of stress is decided according to the
value of Ii,j, di¡erent rates of mineralization are usedin each grid mesh. In our code, this is obtainedby subtracting di¡erent quantities from the already
Table 2 Settling velocity values for feed (Vassallo et al.2006) and for faecal pellets (Magill et al. 2006)
Feed pellets Faecal pellets
Diameter(mm)
Vsed
(ms� 1) Fish species [size (g)]Vsed
(ms� 1)
3 0.087 # Sparus aurata (380) 0.004 #3.5 0.118 S. aurata (60) 0.005
4.5 0.103 Dicentrarchus labrax
(280)
0.006
5 0.144 # # D. labrax (80) 0.007 # #6 0.088
Arrows indicate the values used in the experiments: slowly ( # )and quickly ( # # ) sinking particles.
FOAM, Finite Organic Accumulation Module P De Gaetano et al. Aquaculture Research, 2008, 39, 1229^1242
r 2008 TheAuthors1234 Journal Compilationr 2008 Blackwell Publishing Ltd, Aquaculture Research, 39, 1229^1242
calculated organic carbon concentration £uxes. Thesubtracted amounts are the same as FW97 and aregiven in the lower part of Table 1. On the basis of theobtained £uxes, the organic carbon concentrationConcBot in each grid mesh (i, j) is calculated as
ConcBot ¼XNT
k¼1FlxBotk dt ð5Þ
whereNT is the number of time intervals of the simu-lation.All the parameters used in the benthic module are
summarized in the lower part of Table1.
Results
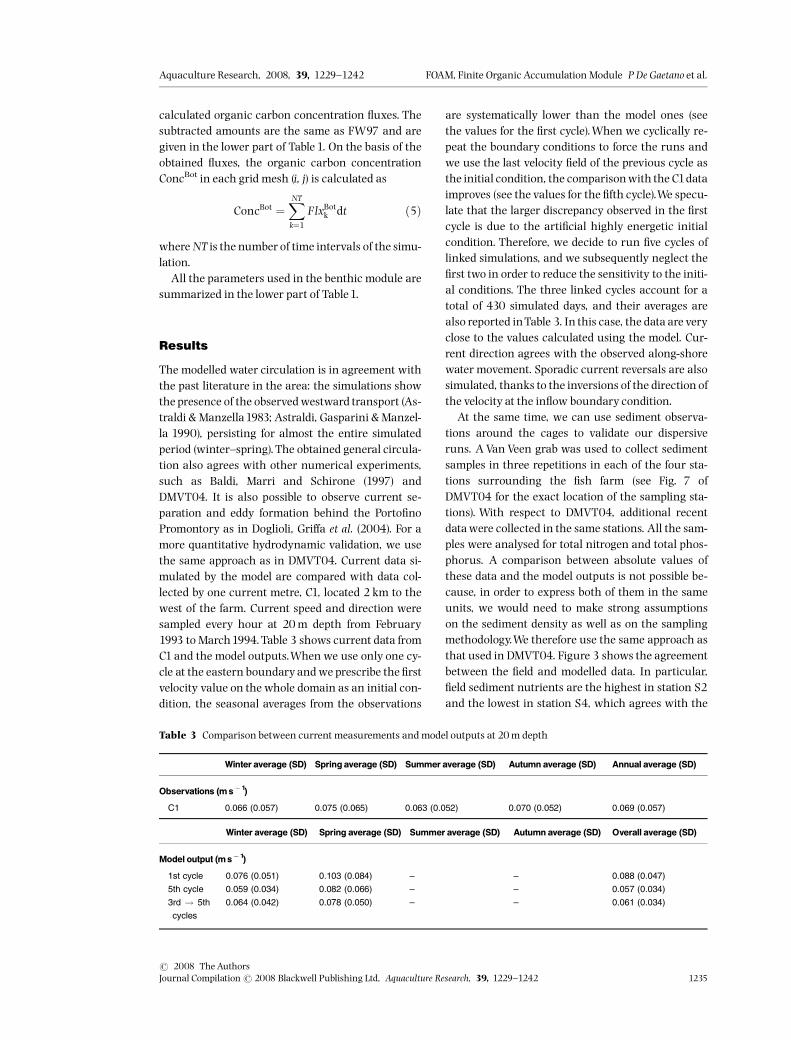
The modelled water circulation is in agreement withthe past literature in the area: the simulations showthe presence of the observedwestward transport (As-traldi & Manzella1983; Astraldi, Gasparini & Manzel-la 1990), persisting for almost the entire simulatedperiod (winter^spring). The obtained general circula-tion also agrees with other numerical experiments,such as Baldi, Marri and Schirone (1997) andDMVT04. It is also possible to observe current se-paration and eddy formation behind the Porto¢noPromontory as in Doglioli, Gri¡a et al. (2004). For amore quantitative hydrodynamic validation, we usethe same approach as in DMVT04. Current data si-mulated by the model are compared with data col-lected by one current metre, C1, located 2 km to thewest of the farm. Current speed and direction weresampled every hour at 20m depth from February1993 to March1994.Table 3 shows current data fromC1and the model outputs.When we use only one cy-cle at the eastern boundaryandwe prescribe the ¢rstvelocity value on the whole domain as an initial con-dition, the seasonal averages from the observations
are systematically lower than the model ones (seethe values for the ¢rst cycle).When we cyclically re-peat the boundary conditions to force the runs andwe use the last velocity ¢eld of the previous cycle asthe initial condition, the comparisonwith the C1dataimproves (see the values for the ¢fth cycle).We specu-late that the larger discrepancy observed in the ¢rstcycle is due to the arti¢cial highly energetic initialcondition. Therefore, we decide to run ¢ve cycles oflinked simulations, and we subsequently neglect the¢rst two in order to reduce the sensitivity to the initi-al conditions. The three linked cycles account for atotal of 430 simulated days, and their averages arealso reported inTable 3. In this case, the data are veryclose to the values calculated using the model. Cur-rent direction agrees with the observed along-shorewater movement. Sporadic current reversals are alsosimulated, thanks to the inversions of the direction ofthe velocity at the in£ow boundary condition.At the same time, we can use sediment observa-
tions around the cages to validate our dispersiveruns. A Van Veen grab was used to collect sedimentsamples in three repetitions in each of the four sta-tions surrounding the ¢sh farm (see Fig. 7 ofDMVT04 for the exact location of the sampling sta-tions). With respect to DMVT04, additional recentdatawere collected in the same stations. All the sam-ples were analysed for total nitrogen and total phos-phorus. A comparison between absolute values ofthese data and the model outputs is not possible be-cause, in order to express both of them in the sameunits, we would need to make strong assumptionson the sediment density as well as on the samplingmethodology.We therefore use the same approach asthat used in DMVT04. Figure 3 shows the agreementbetween the ¢eld and modelled data. In particular,¢eld sediment nutrients are the highest in station S2and the lowest in station S4, which agrees with the
Table 3 Comparison between current measurements and model outputs at 20m depth
Winter average (SD) Springaverage (SD) Summeraverage (SD) Autumn average (SD) Annual average (SD)
Observations (ms� 1)
C1 0.066 (0.057) 0.075 (0.065) 0.063 (0.052) 0.070 (0.052) 0.069 (0.057)
Winter average (SD) Spring average (SD) Summeraverage (SD) Autumn average (SD) Overall average (SD)
Model output (ms� 1)
1st cycle 0.076 (0.051) 0.103 (0.084) – – 0.088 (0.047)
5th cycle 0.059 (0.034) 0.082 (0.066) – – 0.057 (0.034)
3rd ! 5th
cycles
0.064 (0.042) 0.078 (0.050) – – 0.061 (0.034)
Aquaculture Research, 2008, 39, 1229^1242 FOAM, Finite Organic Accumulation Module PDe Gaetano et al.
r 2008 TheAuthorsJournal Compilationr 2008 Blackwell Publishing Ltd, Aquaculture Research, 39, 1229^1242 1235
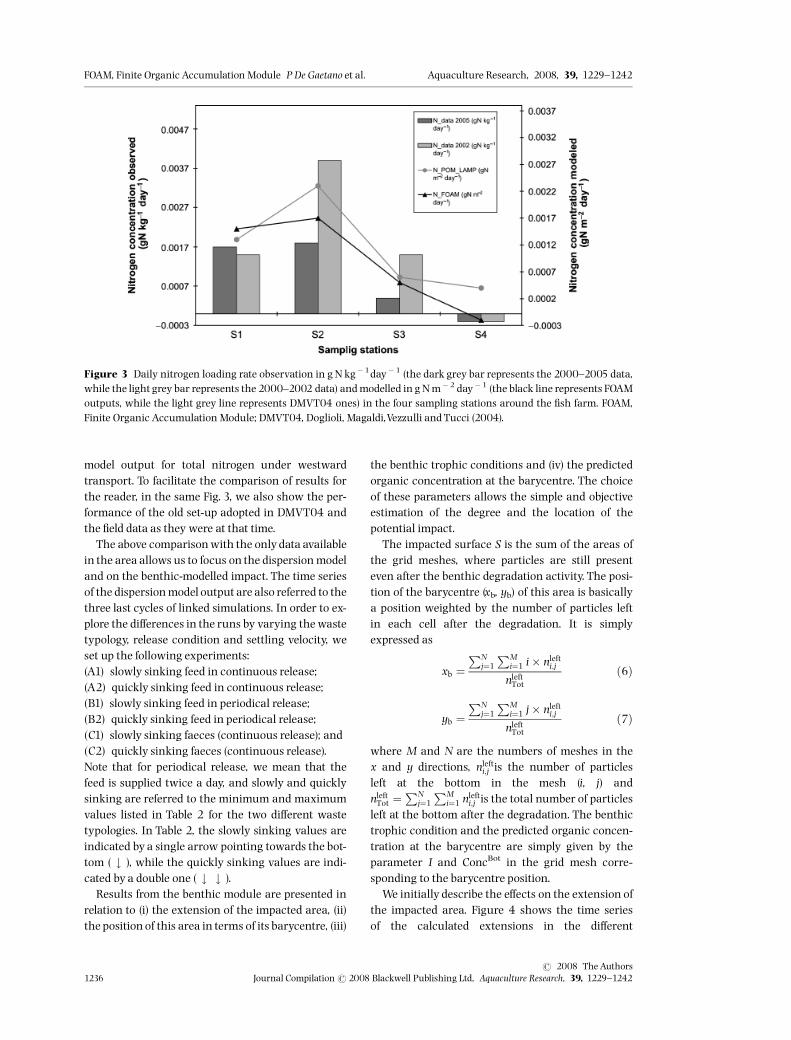
model output for total nitrogen under westwardtransport. To facilitate the comparison of results forthe reader, in the same Fig. 3, we also show the per-formance of the old set-up adopted in DMVT04 andthe ¢eld data as they were at that time.The above comparisonwith the only data available
in the area allows us to focus on the dispersionmodeland on the benthic-modelled impact. The time seriesof the dispersionmodel output are also referred to thethree last cycles of linked simulations. In order to ex-plore the di¡erences in the runs by varying the wastetypology, release condition and settling velocity, weset up the following experiments:(A1) slowly sinking feed in continuous release;(A2) quickly sinking feed in continuous release;(B1) slowly sinking feed in periodical release;(B2) quickly sinking feed in periodical release;(C1) slowly sinking faeces (continuous release); and(C2) quickly sinking faeces (continuous release).Note that for periodical release, we mean that thefeed is supplied twice a day, and slowly and quicklysinking are referred to the minimum and maximumvalues listed in Table 2 for the two di¡erent wastetypologies. In Table 2, the slowly sinking values areindicated by a single arrow pointing towards the bot-tom ( # ), while the quickly sinking values are indi-cated by a double one ( # # ).Results from the benthic module are presented in
relation to (i) the extension of the impacted area, (ii)the position of this area in terms of its barycentre, (iii)
the benthic trophic conditions and (iv) the predictedorganic concentration at the barycentre. The choiceof these parameters allows the simple and objectiveestimation of the degree and the location of thepotential impact.The impacted surface S is the sum of the areas of
the grid meshes, where particles are still presenteven after the benthic degradation activity. The posi-tion of the barycentre (xb, yb) of this area is basicallya position weighted by the number of particles leftin each cell after the degradation. It is simplyexpressed as
xb ¼PN
j¼1PM
i¼1 i� nlefti;j
nleftTot
ð6Þ
yb ¼PN
j¼1PM
i¼1 j� nlefti;j
nleftTot
ð7Þ
where M and N are the numbers of meshes in thex and y directions, nlefti;j is the number of particlesleft at the bottom in the mesh (i, j) andnleftTot ¼
PNj¼1PM
i¼1 nlefti;j is the total number of particles
left at the bottom after the degradation. The benthictrophic condition and the predicted organic concen-tration at the barycentre are simply given by theparameter I and ConcBot in the grid mesh corre-sponding to the barycentre position.We initially describe the e¡ects on the extension of
the impacted area. Figure 4 shows the time seriesof the calculated extensions in the di¡erent
Figure 3 Daily nitrogen loading rate observation in gN kg�1day�1 (the dark grey bar represents the 2000^2005 data,while the light grey bar represents the 2000^2002 data) andmodelled in g Nm�2 day�1 (the black line represents FOAMoutputs, while the light grey line represents DMVT04 ones) in the four sampling stations around the ¢sh farm. FOAM,Finite Organic Accumulation Module; DMVT04, Doglioli, Magaldi,Vezzulli andTucci (2004).
FOAM, Finite Organic Accumulation Module P De Gaetano et al. Aquaculture Research, 2008, 39, 1229^1242
r 2008 TheAuthors1236 Journal Compilationr 2008 Blackwell Publishing Ltd, Aquaculture Research, 39, 1229^1242

experiments and the temporal variations of the mod-elled current velocity near the cages (Fig. 4d). Theslowly sinking feed particles released continuously(Fig. 4a; solid black line) are dispersed by the currentslightly more than the quickly sinking ones (dashedgrey line). This is also con¢rmed by the time averagesand the standard deviations for experiments (A1) and(A2) (see Table 4). The situation changes when weconsider periodical release (Fig.4b). In this case, bothslowly and quickly sinking particles are dispersed ona larger area than that in the continuous case. How-ever, while for slowly sinking particles this area ismuch larger and less variable in time than that inthe continuous release, for quickly sinking ones, thearea is just slightly larger andmore variable (seeTable4). The variability of the dispersion is therefore asso-ciated with the current velocity, and it increases bothwith periodical release and with decreasing settlingvelocity values. For faecal pellets (Fig. 4c), the im-pacted area is smaller than that in the previous cases.Moreover, faecal wastes showgreater time variabilitythan the uneaten feed, no matter what the feed
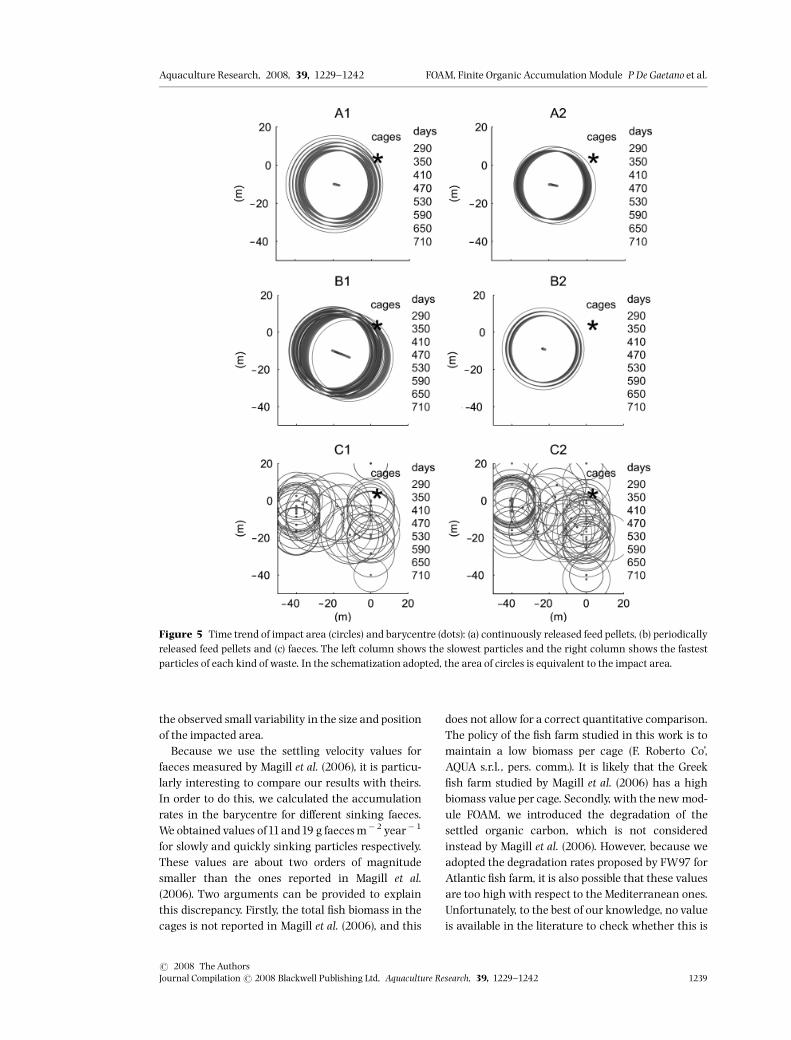
release is. The slowly sinking faecal particles impactsmaller areas with respect to the quickly sinkingones, and also the variability is smaller than thequickly sinking ones (Table 4).Figure 5 gives a better visualization of what has
been stated so far and, at the same time, it shows theposition of the barycentre of the impacted area. Inthis ¢gure, we schematize the extension of the im-pacted area with a circle centred in the barycentreand having an area equivalent to the one already cal-culated. The grey scale represents the time evolutionof the results every 60 days, while a circle is drawnevery10 days. In the case of feed, for both continuousand periodical releases, the barycentre of the im-pacted area is found at approximately 25m south-westward from the cages. For the same simulations,a less signi¢cant time variability is observed (Fig.5a1, a2, b1and b2), and this means that the impactedarea is always larger and that higher stress levels areexpected. In the case of faecal wastes, instead, thebarycentre shows greater time variability, accordingto changes in current directionand intensity (Fig.5c1
Figure 4 Time series of impact area for (a) continuously released feed pellets, (b) periodically released feed pellets,(c) faeces and (d) computed current velocity near cages. The solid black line represents slowly sinking wastes, while thedotted grey line represents quickly sinking ones.
Aquaculture Research, 2008, 39, 1229^1242 FOAM, Finite Organic Accumulation Module PDe Gaetano et al.
r 2008 TheAuthorsJournal Compilationr 2008 Blackwell Publishing Ltd, Aquaculture Research, 39, 1229^1242 1237

and c2). This variability results in a dispersion of thefaecal particles in di¡erent areas and therefore lowerstress levels are expected.To better emphasize these results, we can look at
the scatter diagramof the parameter Iat the barycen-tre position in time (Fig. 6). For clarity, all values 42are arti¢cially assigned to 2 in this ¢gure. For feedparticles continuously released (Fig.6a), I mainly re-mains in the non-stressed range (i.e. I41.5) andsometimes goes up to the intermediately stressedrange, but the highly stressed level is rarely reached.There is a slight tendency for quickly sinking parti-cles to remain more in the intermediate regime thanthe slowones (Table 4). For periodical release (Fig.6b),1 is often in the non-stressed range, very rarely in theintermediately stressed range, but it reaches thehighly stressed level more frequently than before.An easy and quick check shows that the highlystressed values are registered, in this case, in the per-iod going from 2 to 4 h after the release. No signi¢-cant di¡erence can be observed between slowly andquickly sinking particles. For faecal wastes (Fig. 6c),the parameter I is practically always 42 (for thisreason, in the plot, all dots are squeezed in the top)for both slowly and quickly sinking particles.Finally, the mean values of the computed organic
matter concentration ConcBot remaining on theseabed at the barycentre position after the degrada-tion are reported in the last column of Table 4. Theorganic carbon amount due to feed waste increaseswith time almost linearly, and the maximum valuesare reached in the case of the most quickly sinkingfeed particles in periodical release. The faecal wasteinstead seems to be completely degraded, and it doesnot contribute to organic carbon concentrationat thebottom.All the results are summarized inTable 4.
Discussion
The new model set-up is shown to better reproduceboth the hydrodynamics and the dispersion in the in-vestigated area. This is mainly due to the new forcingthat is based on current-metre data and leads to morerealistic results. As already remarked in previousworks, current direction and intensity strongly in£u-ence the position of the impacted area and the degra-dation of the settled matter (FW97; Morrisey et al.2000). Nevertheless, the processes involved arestrongly non-linear and it is di⁄cult to assess the roleplayed by each parameter in the model.When particles sink relatively quickly (settling ve-
locities are one order of magnitude less than the cur-rent velocity, as a lower limit), the impacted area doesnot vary and the barycentre position depends on themain direction of the current. Instead, for relativelyslowly sinking particles, the variability of the currentstarts to playamajor role.This di¡erent behaviour ex-plains why the barycentre of the uneaten feed re-mains practically motionless, while the one for thefaeces is very mobile.At the same time, current intensity reduces bottom
degradation, thanks to two di¡erent processes. Onthe one hand, a stronger current brings more oxygento the sediment and makes degradation more e⁄-cient. On the other hand, the same stronger currentincreases waste dispersion, resulting in a wider im-pacted area and in lower waste concentrations atthe bottom. Faeces do not contain much organic car-bon and the strong degradation is able to remove al-most all the settled matter. Uneaten feed containsmore organic carbon and sinks more rapidly thanfaeces. As a result, much more carbon accumulateson the sea £oor, and it is only partially degraded evenin the presence of strong currents. This also explains
Table 4 Time-averaged impacted area, benthic trophic conditions and organic concentrations at the barycentre position forthe di¡erent experiments
ExperimentSimulation typology(release)
S, impactedarea(mean � SD; m2)
Parameter I
Organic concentration(mean � SD; gCm� 2)
No stress(% days)
Mediumstress (% days)
High stress(% days)
A1 Slow feed (continuous) 3576 � 582 74 22 4 1450 � 404
A2 Quick feed (continuous) 3202 � 41 71 27 2 1490 � 453
B1 Slow feed (periodical) 4513 � 563 87 4 9 895 � 380
B2 Quick feed (periodical) 3277 � 266 88 4 8 1590 � 387
C1 Slow faeces 377 � 656 99 0 1 o1
C2 Quick faeces 941 � 962 99 0 1 o1
FOAM, Finite Organic Accumulation Module P De Gaetano et al. Aquaculture Research, 2008, 39, 1229^1242
r 2008 TheAuthors1238 Journal Compilationr 2008 Blackwell Publishing Ltd, Aquaculture Research, 39, 1229^1242
the observed small variability in the size and positionof the impacted area.Because we use the settling velocity values for
faeces measured by Magill et al. (2006), it is particu-larly interesting to compare our results with theirs.In order to do this, we calculated the accumulationrates in the barycentre for di¡erent sinking faeces.We obtained values of11and19 g faecesm�2 year�1
for slowly and quickly sinking particles respectively.These values are about two orders of magnitudesmaller than the ones reported in Magill et al.(2006). Two arguments can be provided to explainthis discrepancy. Firstly, the total ¢sh biomass in thecages is not reported in Magill et al. (2006), and this
does not allow for a correct quantitative comparison.The policy of the ¢sh farm studied in this work is tomaintain a low biomass per cage (F. Roberto Co’,AQUA s.r.l., pers. comm.). It is likely that the Greek¢sh farm studied by Magill et al. (2006) has a highbiomass value per cage. Secondly, with the newmod-ule FOAM, we introduced the degradation of thesettled organic carbon, which is not consideredinstead by Magill et al. (2006). However, because weadopted the degradation rates proposed by FW97 forAtlantic ¢sh farm, it is also possible that these valuesare too high with respect to the Mediterranean ones.Unfortunately, to the best of our knowledge, no valueis available in the literature to check whether this is
Figure 5 Time trend of impact area (circles) and barycentre (dots): (a) continuously released feed pellets, (b) periodicallyreleased feed pellets and (c) faeces. The left column shows the slowest particles and the right column shows the fastestparticles of each kind of waste. In the schematization adopted, the area of circles is equivalent to the impact area.
Aquaculture Research, 2008, 39, 1229^1242 FOAM, Finite Organic Accumulation Module PDe Gaetano et al.
r 2008 TheAuthorsJournal Compilationr 2008 Blackwell Publishing Ltd, Aquaculture Research, 39, 1229^1242 1239

really the case. On the other hand, our results agreewith the work of Magill et al. (2006) in predicting agreater impact for the faeces of D. labrax respect to S.aurata ones near the cages. The same results alsoagree with previous studies and con¢rm the uneatenfeed to be the primary cause of ecological impact onthe benthos community (Beveridge, Phillips & Clarke1991;Vezzulli et al. 2003). For this reason, we studiedthe feed release conditions in more detail.We foundthat a release occurring twice a day results in (i) morefrequent conditions of highly stressed sediments and(ii) larger impacted areas than a continuous release.These results support the idea already proposed inprevious studies of using self-feeders to reduce theuneaten feed loss without a¡ecting ¢sh growth rates
(Azzaydi, Madrid, Zamora, Snchez-vzquez & Martnez1998; and references therein).
Conclusions
Aquaculture is the food-related activity with themost rapid growth in the world. Because this growthproduces an immediate concern, it is necessaryto develop tools to predict the environmental impactsarising from intensive marine ¢sh farms.In this study, we improved the capability of the
POM^LAMP3Dmodel already proposed ina previouswork (DMVT04).We developed both a more realisticadvection^dispersion setup and a new benthic
Figure 6 Spread diagram of the parameter I at the barycentre position. All values 42 are ¢xed to 2: (a) continuouslyreleased feed pellets, (b) periodically released feed pellets, (c) faeces and (d) current velocity near cages. The black dotsrepresent the slowest particles, while the grey ones represent the fastest particles of each kind of waste. The dashed linesrepresent the stress-level thresholds.
FOAM, Finite Organic Accumulation Module P De Gaetano et al. Aquaculture Research, 2008, 39, 1229^1242
r 2008 TheAuthors1240 Journal Compilationr 2008 Blackwell Publishing Ltd, Aquaculture Research, 39, 1229^1242

model, FOAM. Using the empirical relations put forthby FW97, FOAM calculates the organic carbon degra-dation for three di¡erent levels of sediment stress.Weperformed several runs to simulate di¡erent scenar-ios by varying the waste typology (faecal or feed),the settling velocity of particles (on the basis of feeddimensions, ¢sh size and reared species) and therelease conditions of feed (periodical or continuous).At the same time, the same runs allowed us to testthe stability of the model that appears to be verysatisfactory.We obtained more satisfactory results for the
hydrodynamics and dispersion than that inDMVT04. Moreover, FOAM revealed its ability tosimulate di¡erent scenarios by switching suitableparameters.The results presented in relation to the extensionof
the impacted area and the position of its barycentreshow that the continuously released feed settleswithin a narrow area near the cages (impact areamaximum 6500m2, barycentre shifting amplitude10m, cages maximum distance 25m), while the feedreleased twice a day spreads on a larger area centrednear the cages (maximum area 8500m2, barycentreshifting amplitude 15m, cages maximum distance25m). Faecal pellets accumulate on a smaller areawithin a greater and more variable range from thecages (maximum area 4000m2, barycentre shiftingamplitude 100m, cage’s maximum distance morethan 50m) with respect to uneaten feed. Maximumimpacts, in terms of both stress parameter I andorganic carbon concentration, are due to the quicklysettling feed, released in periodical mode and duringslow current periods. Some mitigation of the impactis observed if the feed is released continuously. Theuse of self-feeders has therefore been suggested tothe farmers.Further investigations may be necessary to verify
the impact of combined feed and faeces settling,while mineralization rates for Mediterranean condi-tions and validation with speci¢c in situ measure-ments are required.
Acknowledgments
The authors warmly thank Roberto Festa for hisuseful advice and Corrado Ratto for his assistanceand his interest in our research. Thanks are also dueto the Physics of theAtmosphere and Ocean Group ofGenoa for their support. We also thank MaurizioCosta for the environmental data and Roberto Co’and the sta¡ of AQUA s.r.l. for their collaboration.We
also thank Mandy Karnauskas for her helpful criti-cism and for revising the ¢nal version of the manu-script. CINFAI (National Consortium of ItalianUniversities for Physics of Atmospheres and Hydro-sphere) is gratefully acknowledged for supportingthe activities of the Physics of the Atmosphere andOcean Group, Department of Physics, University ofGenoa, Italy. We ¢nally thank the anonymous re-viewer for the constructive criticism and support tothe original manuscript.
References
Astraldi M. & Manzella G. (1983) Some observations on cur-rent measurements on the East Ligurian Shelf, Mediterra-nean Sea. Continental Shelf Research 2,183^193.
Astraldi M., Gasparini G. & Manzella G. (1990) Temporalvariability of currents in the Eastern Ligurian Sea. Journalof Geophysical Research 95,1515^1522.
Azzaydi M., Madrid J.A., Zamora S., Snchez-Vzquez F.J. &Martnez F.J. (1998) E¡ect of three feeding strategies (auto-matic, ad libitum demand-feeding and time-restricteddemand-feeding) on feeding rhythms and growth in Eur-opean sea bass (Dicentrarchus labrax, L.). Aquaculture163,285^296.
Baldi A., Marri P. & Schirone A. (1997). Applicazione di unmodello per la simulazione del trasporto e della diluizione diinquinanti nelle acque costiere. Technical report, ENEA,RTI/AMB/GEM-MAR/97/04/RL2/A1.4.
Beveridge M., Phillips M. & Clarke R. (1991) A quantitativeand qualitative assessment of wastes fromaquatic animalproduction. In:Advances inWorld Aquaculture,Vol.3 (ed. byD.E. Brune & J.R. Tomasso), pp. 506^533.World Aquacul-ture Society, Baton-Rouge, LA,USA.
ChenY., Beveridge M. & Telfer T. (1999a) Physical character-istics of commercial pelleted atlantic salmon feeds andconsideration of implications for modeling of waste dis-persion through sedimentation. Aquaculture International7,89^100.
ChenY., Beveridge M. & Telfer T. (1999b) Settling rate char-acteristics and nutrient content of the faeces of Atlanticsalmon, Salmo salar L., and the implications for modellingof solid waste dispersion. Aquaculture Research 30,395^398.
Commission of the European Communities (COM) (2001a)Biodiversity action plan for ¢sheries. COM, Brussels, 2001,p.162.
Commission of the European Communities (COM) (2001b).A sustainable Europe for a better world: a European Unionstrategy for sustainable development. COM, Brussels, 2001,p. 264.
Commission of the European Communities (COM) (2002) AStrategy for the Sustainable Development of European Aqua-culture. COM, Brussels, 2002, p.511.
Aquaculture Research, 2008, 39, 1229^1242 FOAM, Finite Organic Accumulation Module PDe Gaetano et al.
r 2008 TheAuthorsJournal Compilationr 2008 Blackwell Publishing Ltd, Aquaculture Research, 39, 1229^1242 1241

Cromey C., Nickell T. & Black K. (2002) DEPOMOD ^ model-ling the deposition and the biological e¡ects of wastessolids frommarine cage farms.Aquaculture214,211^239.
Doglioli A.M., Gri¡a A. & Magaldi M.G. (2004) Numericalstudy of a coastal current on a steep slope in presence ofa cape: the case of the Promontorio di Porto¢no. Journal ofGeophysical Research 109, C12033, Doi: 10.1029/2004JC002422.
Doglioli A.M., Magaldi M.G., Vezzulli L. & Tucci S. (2004)Development of a numerical model to study the disper-sion of wastes coming from a marine ¢sh farm in theLigurian Sea (Western Mediterranean). Aquaculture 231,215^235.
Dudley R., PanchangV. & Newell C. (2000) Application of acomprehensive modeling strategy for the management ofnet-pen aquaculture waste transport. Aquaculture 187,319^349.
Findlay R. & Watling L. (1997) Prediction of benthic impactfor salmon netpens based on the balance of benthic oxy-gen supply and demand. Marine Ecology Progress Series155,147^157.
Gillibrand P. & TurrellW. (1997) The use of simple models inthe regulation of the impact of ¢sh farms onwater qualityin Scottish sea lochs. Aquaculture159,33^46.
Gowen R., Bradbury N. & Brown J. (1989) The use of simplemodels in assessing two of the interactions between ¢shfarming and marine environment. In: Aquaculture ^ ABiotechnology in Progress (ed. by N. DePauw, E. Jaspers, H.Ackefors &N.Wilkins), pp.1071^1080. EuropeanAquacul-ture Society, Bredene, Belgium.
Hall P.O.J., Anderson L.G., Holby O., Kollberg S. & Samuels-son M. (1990) Chemical £uxes and mass balances in amarine ¢sh cage farm. I. Carbon.Marine Ecology ProgressSeries 61,61^73.
Henderson A., Gamito S., Karakassis I., Pederson P. & SmaalA. (2001) Use of hydrodynamic and benthic models formanaging environmental impacts of marine aquacul-ture. Journal of Applied Ichthyology17,163^172.
HolmerM. & Kristensen E. (1992) Impact of marine ¢sh cagefarming on sediment metabolism and sulfate reduction ofunderlying sediments.Marine Ecology Progress Series 80,191^201.
Karakassis I.,TsapakisM., Hatziyanni E., Papadopoulou K. &Plaiti W. (2000) Impact of cage farming of ¢sh on theseabed in threeMediterranean coastal areas. ICES Journalof Marine Science 57,1462^1471.
Magill S.H., Thetmeyer H. & Cromey C.J. (2006) Settlingvelocity of faecal pellets of gilthead sea bream (Sparus aur-ata L.) and sea bass (Dicentrarchus labrax L.) and sensitivityanalysis using measured data in a deposition model.Aquaculture 251, 295^305.
Morrisey D.J., Gibbs M.M., Pickmere S.E. & Cole R.G. (2000)Predicting impacts and recovery of marine-farm sites inStewart Island, New Zealand, from the Findlay^Watlingmodel. Aquaculture185, 257^271.
PanchangV., Cheng G. & Newell C. (1997)Modeling hydrody-namics and aquaculture waste transport in coastalMaine. Estuaries 20,14^41.
Theede H., Ponat A., Hiroki K. & Schlieper C. (1969) Studieson the resistance of marine bottom invertebrates to oxy-gen-de¢ciency and hydrogen sulphide. Marine Biology 2,325^337.
Tsutsumi H., KikuchiT.,TanakaM., HigashiT., Imasaka K. &Miyazaki M. (1991) Benthic faunal succession in a coveorganically polluted by ¢sh farming. Marine PollutionBulletin 23, 233^238.
Vassallo P., Doglioli A.M., Rinaldi F. & Beiso I. (2006)Determination of physical behaviour of feed pelletsin Mediterranean water. Aquaculture Research 37,119^126.
Vezzulli L., Chelossi E., Riccardi G. & Fabiano M. (2002) Bac-terial community structure and activity in ¢sh farm sedi-ment of the Ligurian Sea (Western Mediterrenean).Aquaculture International10,123^141.
Vezzulli L., Marrale D., MorenoM. & Fabiano M. (2003) Sedi-ment organic matter and meiofauna community re-sponse to long-term ¢sh-farm impact in the LigurianSea (Western Mediterranean). Chemistry in Ecology 19,431^440.
Wu R., Lam K., MacKay D.W., Lau T.C. & Yam V. (1994)Impact of marine ¢sh farming on water quality andbottom sediment: a case study in the sub tropicalenvironment. Marine Environmental Research 38,115^145.
FOAM, Finite Organic Accumulation Module P De Gaetano et al. Aquaculture Research, 2008, 39, 1229^1242
r 2008 TheAuthors1242 Journal Compilationr 2008 Blackwell Publishing Ltd, Aquaculture Research, 39, 1229^1242