FN-444 Chapter 11
18
Solutions to Questions - Chapter 11 Investment Analysis and Taxation of Income Properties Question 11-1 What are the primary benefits of investing in real estate income property? Net Income: Dollars left over after collecting rent and paying expenses but before considering taxes and financing costs. Property Sale: Expecting a price increase over a specified holding period increases investor return. Diversification: Reduces overall risk to hold many types of investments. Taxes: Preferential tax benefits. Taxable income is often less than before- tax cash flow. Question 11-2 What factors affect a property’s projected NOI? Expected market rents and vacancy rates Expenses associated with operating the property Nature of any leases on the property Question 11-3 What factors would result in a property increasing in value over a holding period? Inflation: This causes rents as well as the final sale price to be higher. Demand: Increased demand for space may increase value if the supply of space doesn’t increase as well. Question 11-4 How do you think expense stops and CPI adjustments in leases affect the riskiness of the lease from the lessor’s point of view? There is less risk for the lessor with expense stops and CPI adjustments in leases. CPI Adjustments: The risk of unexpected inflation is shifted to the lessee. Expense Stops: The risk of increases in expenses is shifted to the lessee while allowing the lessor to retain the benefit of any decrease in expenses. Question 11-5 Why should investors be concerned about market rents if they are purchasing a property subject to leases? Even if the investment is an existing building that has already been leased, the income can be affected when the existing leases expire and are renewed at the market rent at the time. Question 11-6 What is meant by equity? The investor’s initial equity in the project is equal to the purchase price less the amount borrowed. The amount of equity an investor has in a property may change over time if the property value and loan balance changes. E.g., if the property value increases and the loan balance is reduced through amortization, the investor’s equity increases. 11-1
-
Upload
independent -
Category
Documents
-
view
0 -
download
0
Transcript of FN-444 Chapter 11
Solutions to Questions - Chapter 11Investment Analysis and Taxation of Income Properties
Question 11-1What are the primary benefits of investing in real estate income property?Net Income: Dollars left over after collecting rent and paying expenses but
before considering taxes and financing costs.Property Sale: Expecting a price increase over a specified holding period
increases investor return.Diversification: Reduces overall risk to hold many types of investments.Taxes: Preferential tax benefits. Taxable income is often less than before-
tax cash flow.
Question 11-2What factors affect a property’s projected NOI?Expected market rents and vacancy ratesExpenses associated with operating the propertyNature of any leases on the property
Question 11-3
What factors would result in a property increasing in value over a holding period?Inflation: This causes rents as well as the final sale price to be higher.Demand: Increased demand for space may increase value if the supply of space
doesn’t increase as well.
Question 11-4How do you think expense stops and CPI adjustments in leases affect the riskiness of the lease from the
lessor’s point of view?There is less risk for the lessor with expense stops and CPI adjustments in
leases.CPI Adjustments: The risk of unexpected inflation is shifted to the lessee.Expense Stops: The risk of increases in expenses is shifted to the lessee
while allowing the lessor to retain the benefit of any decrease in expenses.
Question 11-5Why should investors be concerned about market rents if they are purchasing a property subject to
leases?Even if the investment is an existing building that has already been leased,
the income can be affected when the existing leases expire and are renewed at the market rent at the time.
Question 11-6What is meant by equity?The investor’s initial equity in the project is equal to the purchase price less the amount borrowed. The amount of equity an investor has in a property may change over time if the property value and loan balance changes. E.g., ifthe property value increases and the loan balance is reduced through amortization, the investor’s equity increases.
11-1
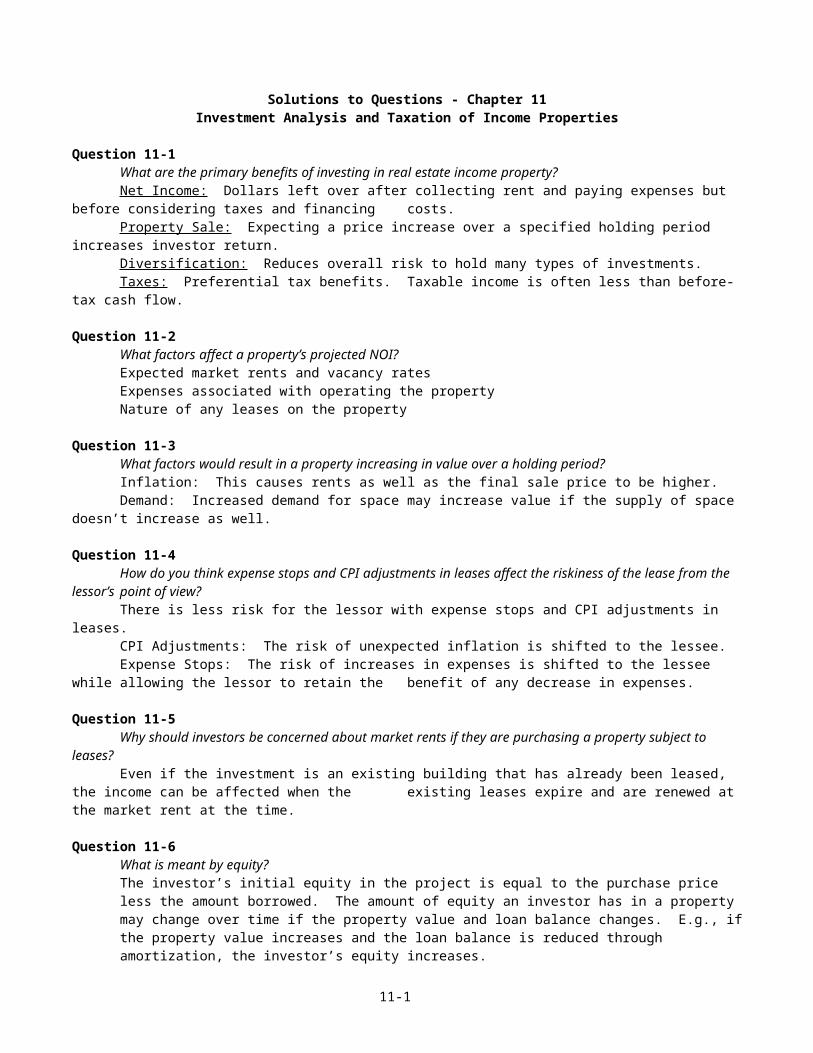
Question 11-7What are the similarities and differences between an overall rate and an equity dividend rate?Difference: The overall rate relates the entire NOI to the value of the
property. The equity dividend rate relates the BTCF (or equity dividend) in thefirst year to the initial equity investment.
Similarity: Neither one of these is a measure of investment yield because they do not take into account future income from operations or resale of the property at the end of the holding period. Both are based on a single year, usually the first year.
Question 11-8What is the significance of a debt coverage ratio?It is a ratio of the NOI to the mortgage payment that indicates the riskiness
of a loan. It is the degree to which the NOI from the property is expected toexceed the mortgage payment. Lenders typically want a debt coverage ratio (DCR) to be at least 1.2.
11-2
Question 11-9What is meant by tax shelter?The term “tax shelter” refers to an investment that allows a taxpayer to reduce taxable income. Although most of the tax shelter benefits of real estate were removed by the Tax Reform Act of 1986, depreciation deductions still provide some “shelter” in that they are non-cash deductions that reduce taxable income. Interest deductions on the mortgage also serve to reduce and in a sense shelter taxable income.
Question 11-10How is the gain from the sale of real estate taxed?The entire taxable gain from the sale of real estate is taxed at the same rate
as ordinary income.It is still important to keep track of capital gains/losses and ordinary
income gains/losses. This is due to TRA rules for passive investors and propertiesacquired prior to 1986.
Question 11-11What is meant by an effective tax rate? What does it measure?An effective tax rate is a tax rate that takes into account the effects of
depreciation and time value of money.It measures the actual difference between the BTIRR and the ATIRR. This
difference is the effective tax rate and can be less than the actual marginal tax rate.
This difference is also due to the fact that the interest on the mortgage loanis deductible.
Question 11-12Do you think taxes affect the value of real estate versus other investments?Yes. Not all investments are treated alike when it comes to federal income taxes. Thus, taxes must be considered when comparing returns for investments which are not taxed in the same manner. Investments that have the same before-tax return may have quite different after-tax returns.
Question 11-13What is the significance of the passive activity loss limitation (PALL) rules for real estate investors?The PALL rules are important because, in general, passive losses cannot be used to offset income from another category. Because any tax loss from real estate is usually considered a passive loss, it can not be used to offset income from other sources such as active income from salaries and wages or portfolio income from interest or dividends.
11-3
Solutions to Problems - Chapter 11Investment Analysis and Taxation of Income Properties
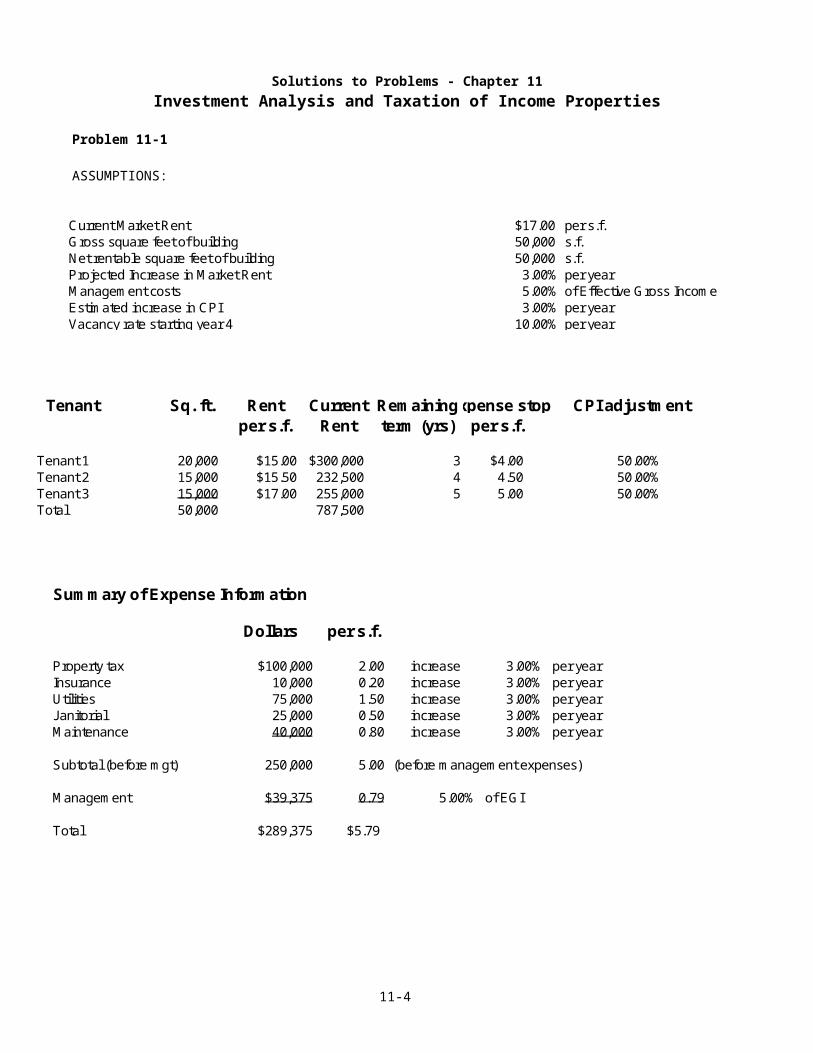
Problem 11-1
ASSUMPTIONS:
11-4
Current M arket Rent $17.00 per s.f.Gross square feet of building 50,000 s.f.Net rentable square feet of building 50,000 s.f.Projected Increase in M arket Rent 3.00% per yearM anagem ent costs 5.00% of Effective Gross Incom eEstim ated increase in CPI 3.00% per yearVacancy rate starting year 4 10.00% per year
Tenant Sq. ft. Rent Current Rem aining Expense stop CPI adjustm entper s.f. Rent term (yrs) per s.f.
Tenant 1 20,000 $15.00 $300,000 3 $4.00 50.00%Tenant 2 15,000 $15.50 232,500 4 4.50 50.00%Tenant 3 15,000 $17.00 255,000 5 5.00 50.00%Total 50,000 787,500
Sum m ary of Expense Inform ation
Dollars per s.f.
Property tax $100,000 2.00 increase 3.00% per yearInsurance 10,000 0.20 increase 3.00% per yearUtilities 75,000 1.50 increase 3.00% per yearJanitorial 25,000 0.50 increase 3.00% per yearM aintenance 40,000 0.80 increase 3.00% per year
Subtotal (before m gt) 250,000 5.00 (before m anagem ent expenses)
M anagem ent $39,375 0.79 5.00% of EGI
Total $289,375 $5.79

11-5
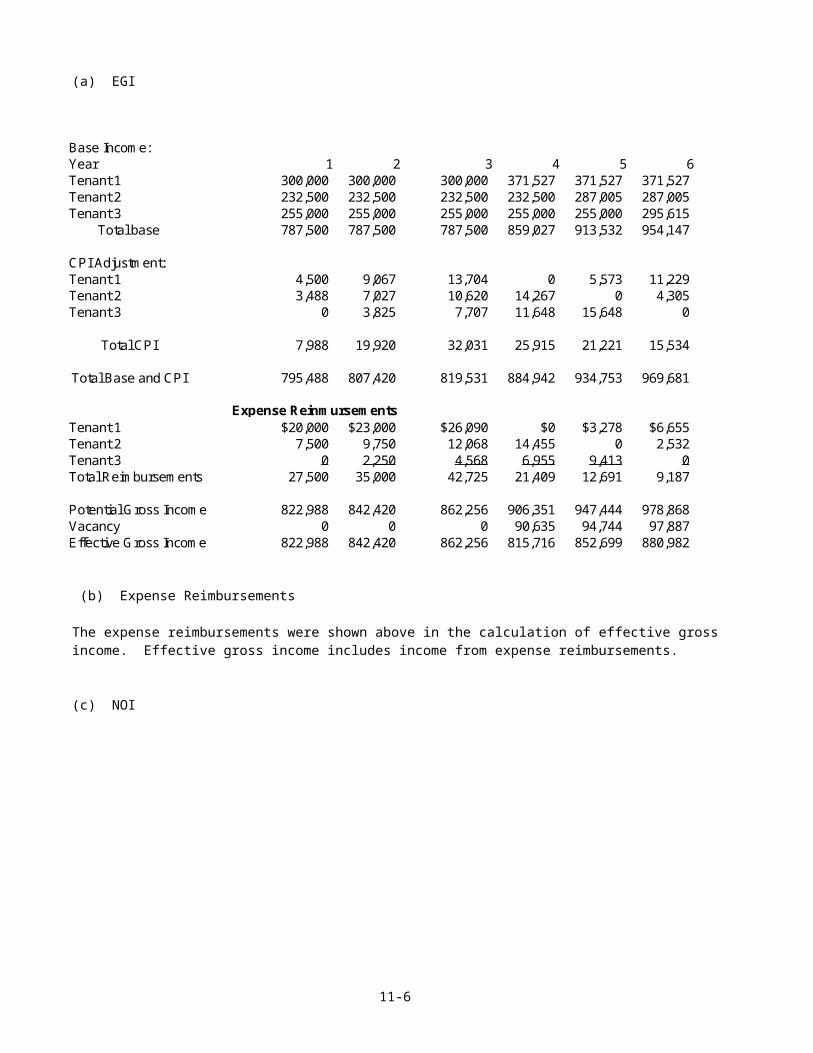
(a) EGI
(b) Expense Reimbursements
The expense reimbursements were shown above in the calculation of effective gross income. Effective gross income includes income from expense reimbursements.
(c) NOI
11-6
Base Incom e:Year 1 2 3 4 5 6Tenant 1 300,000 300,000 300,000 371,527 371,527 371,527Tenant 2 232,500 232,500 232,500 232,500 287,005 287,005Tenant 3 255,000 255,000 255,000 255,000 255,000 295,615
Total base 787,500 787,500 787,500 859,027 913,532 954,147
CPI Adjustm ent:Tenant 1 4,500 9,067 13,704 0 5,573 11,229Tenant 2 3,488 7,027 10,620 14,267 0 4,305Tenant 3 0 3,825 7,707 11,648 15,648 0
Total CPI 7,988 19,920 32,031 25,915 21,221 15,534
Total Base and CPI 795,488 807,420 819,531 884,942 934,753 969,681
Tenant 1 $20,000 $23,000 $26,090 $0 $3,278 $6,655Tenant 2 7,500 9,750 12,068 14,455 0 2,532Tenant 3 0 2,250 4,568 6,955 9,413 0Total Reim bursem ents 27,500 35,000 42,725 21,409 12,691 9,187
Potential Gross Incom e 822,988 842,420 862,256 906,351 947,444 978,868Vacancy 0 0 0 90,635 94,744 97,887Effective Gross Incom e 822,988 842,420 862,256 815,716 852,699 880,982
Expense Reinm ursem ents
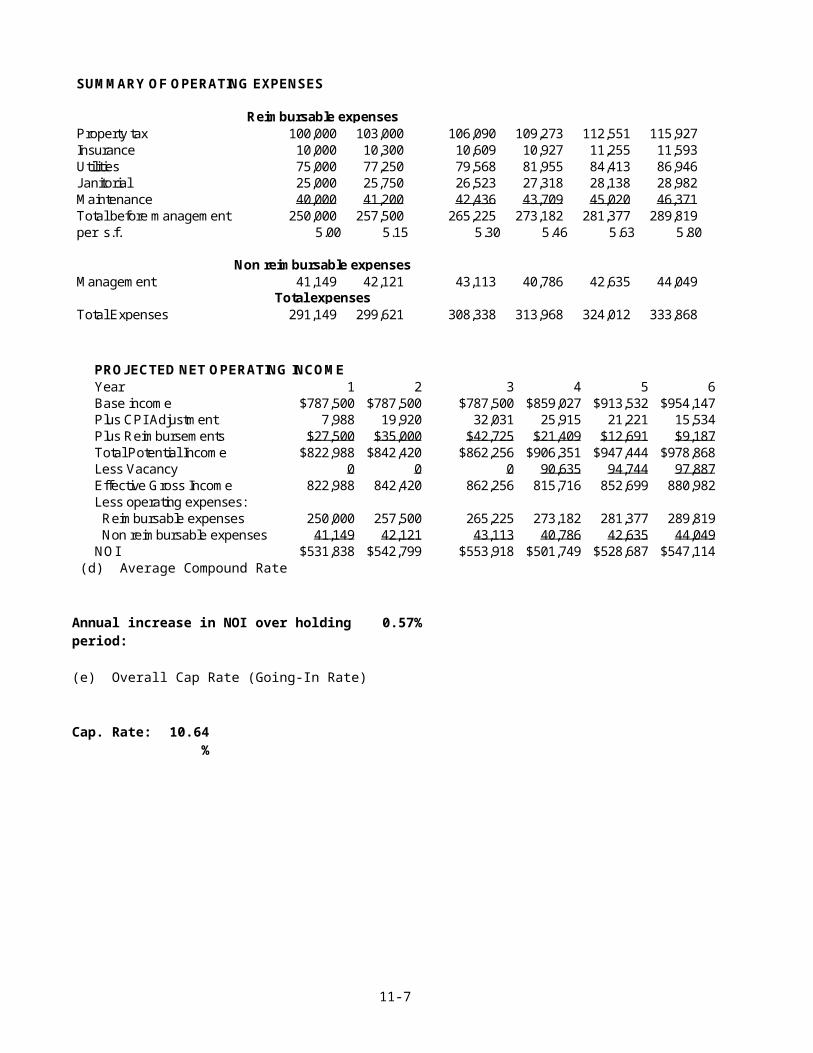
(d) Average Compound Rate
Annual increase in NOI over holding period:
0.57%
(e) Overall Cap Rate (Going-In Rate)
Cap. Rate: 10.64%
11-7
Property tax 100,000 103,000 106,090 109,273 112,551 115,927Insurance 10,000 10,300 10,609 10,927 11,255 11,593Utilities 75,000 77,250 79,568 81,955 84,413 86,946Janitorial 25,000 25,750 26,523 27,318 28,138 28,982M aintenance 40,000 41,200 42,436 43,709 45,020 46,371Total before m anagem ent 250,000 257,500 265,225 273,182 281,377 289,819per s.f. 5.00 5.15 5.30 5.46 5.63 5.80
M anagem ent 41,149 42,121 43,113 40,786 42,635 44,049
Total Expenses 291,149 299,621 308,338 313,968 324,012 333,868
Non reim bursable expenses
Total expenses
SUM M ARY OF OPERATING EXPENSES
Reim bursable expenses
PROJECTED NET OPERATING INCOM EYear 1 2 3 4 5 6Base incom e $787,500 $787,500 $787,500 $859,027 $913,532 $954,147Plus CPI Adjustm ent 7,988 19,920 32,031 25,915 21,221 15,534Plus Reim bursem ents $27,500 $35,000 $42,725 $21,409 $12,691 $9,187Total Potential Incom e $822,988 $842,420 $862,256 $906,351 $947,444 $978,868Less Vacancy 0 0 0 90,635 94,744 97,887Effective Gross Incom e 822,988 842,420 862,256 815,716 852,699 880,982Less operating expenses: Reim bursable expenses 250,000 257,500 265,225 273,182 281,377 289,819 Non reim bursable expenses 41,149 42,121 43,113 40,786 42,635 44,049NOI $531,838 $542,799 $553,918 $501,749 $528,687 $547,114
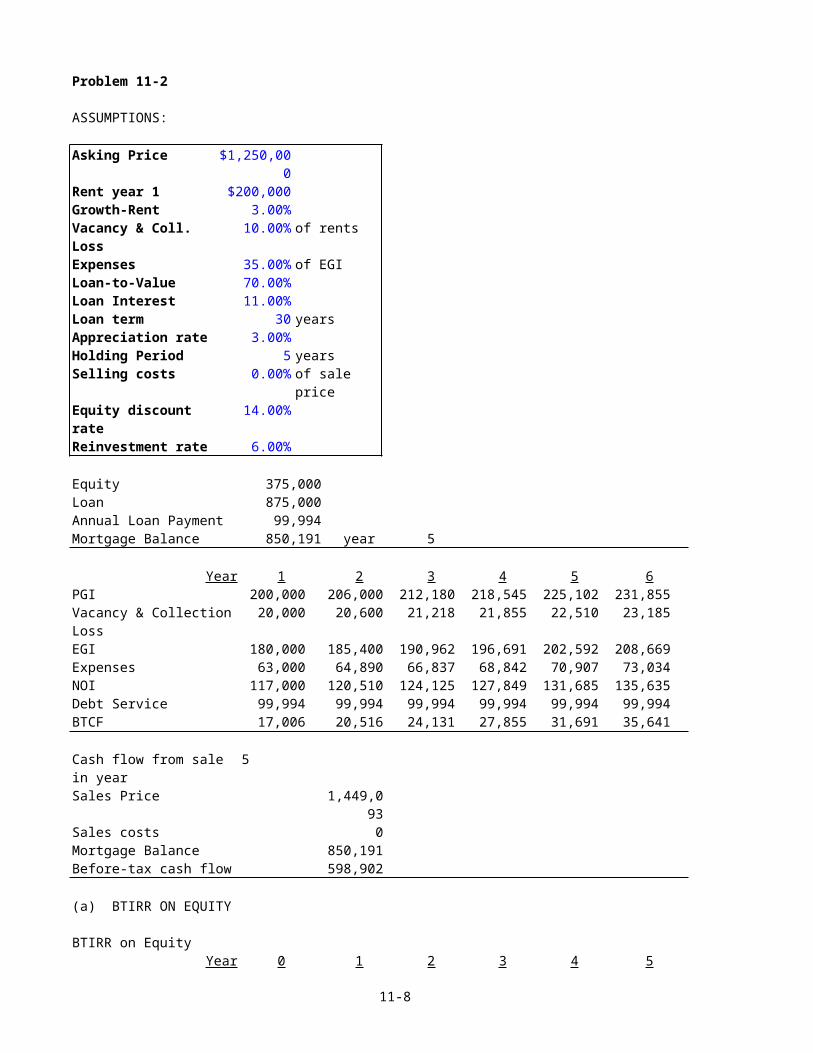
Problem 11-2
ASSUMPTIONS:
Asking Price $1,250,000
Rent year 1 $200,000 Growth-Rent 3.00%Vacancy & Coll. Loss
10.00% of rents
Expenses 35.00% of EGILoan-to-Value 70.00%Loan Interest 11.00%Loan term 30 yearsAppreciation rate 3.00%Holding Period 5 yearsSelling costs 0.00% of sale
priceEquity discount rate
14.00%
Reinvestment rate 6.00%
Equity 375,000 Loan 875,000 Annual Loan Payment 99,994 Mortgage Balance 850,191 year 5
Year 1 2 3 4 5 6PGI 200,000 206,000 212,180 218,545 225,102 231,855Vacancy & CollectionLoss
20,000 20,600 21,218 21,855 22,510 23,185
EGI 180,000 185,400 190,962 196,691 202,592 208,669Expenses 63,000 64,890 66,837 68,842 70,907 73,034 NOI 117,000 120,510 124,125 127,849 131,685 135,635Debt Service 99,994 99,994 99,994 99,994 99,994 99,994BTCF 17,006 20,516 24,131 27,855 31,691 35,641
Cash flow from sale in year
5
Sales Price 1,449,093
Sales costs 0Mortgage Balance 850,191Before-tax cash flow 598,902
(a) BTIRR ON EQUITY
BTIRR on EquityYear 0 1 2 3 4 5
11-8
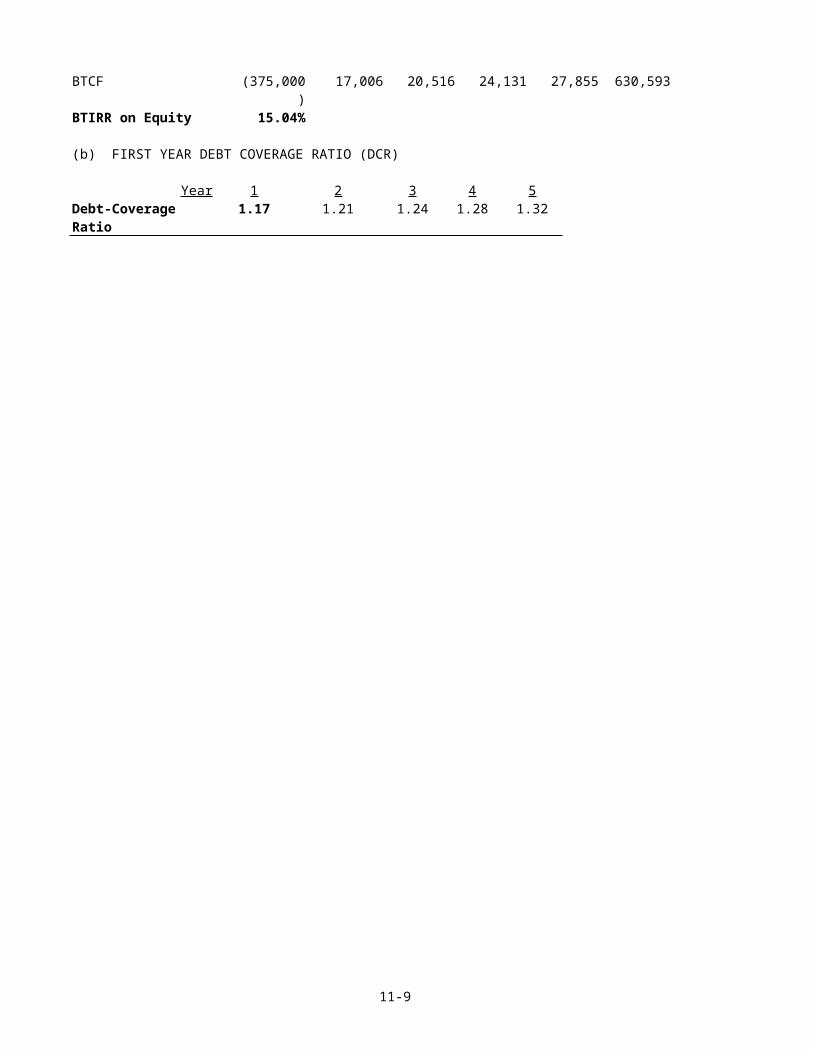
BTCF (375,000)
17,006 20,516 24,131 27,855 630,593
BTIRR on Equity 15.04%
(b) FIRST YEAR DEBT COVERAGE RATIO (DCR)
Year 1 2 3 4 5Debt-Coverage Ratio
1.17 1.21 1.24 1.28 1.32
11-9
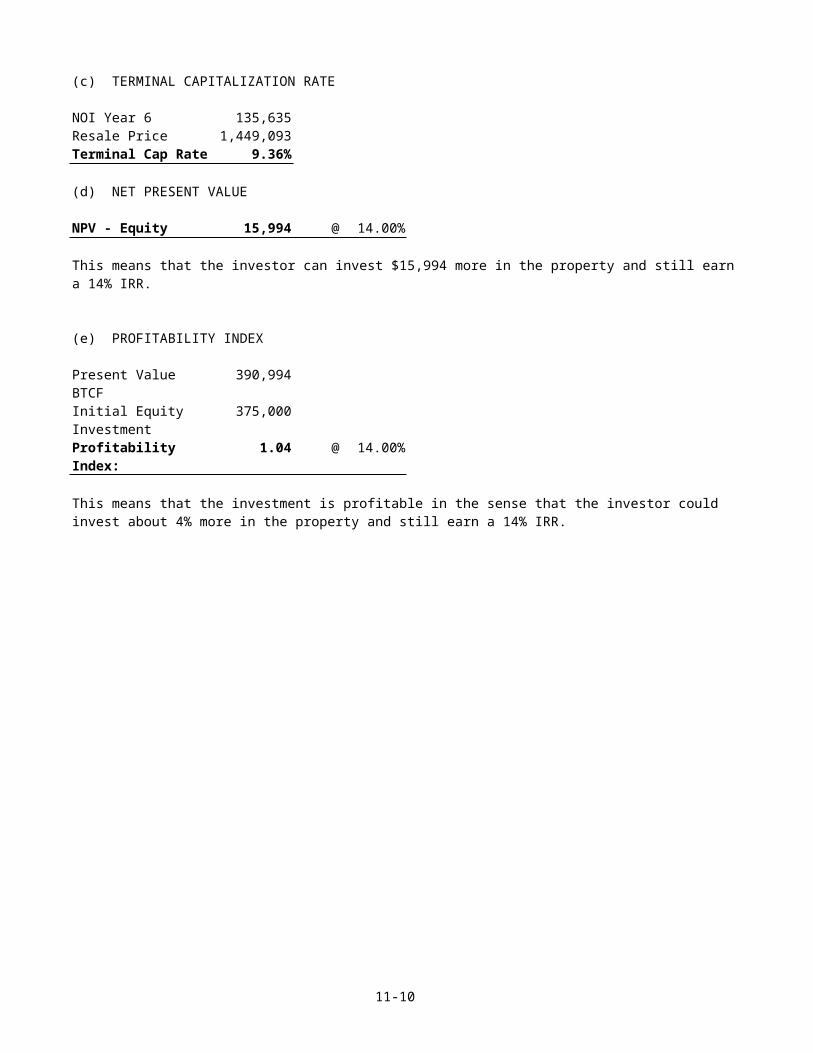
(c) TERMINAL CAPITALIZATION RATE
NOI Year 6 135,635 Resale Price 1,449,093 Terminal Cap Rate 9.36%
(d) NET PRESENT VALUE
NPV - Equity 15,994 @ 14.00%
This means that the investor can invest $15,994 more in the property and still earn a 14% IRR.
(e) PROFITABILITY INDEX
Present Value BTCF
390,994
Initial Equity Investment
375,000
Profitability Index:
1.04 @ 14.00%
This means that the investment is profitable in the sense that the investor could invest about 4% more in the property and still earn a 14% IRR.
11-10
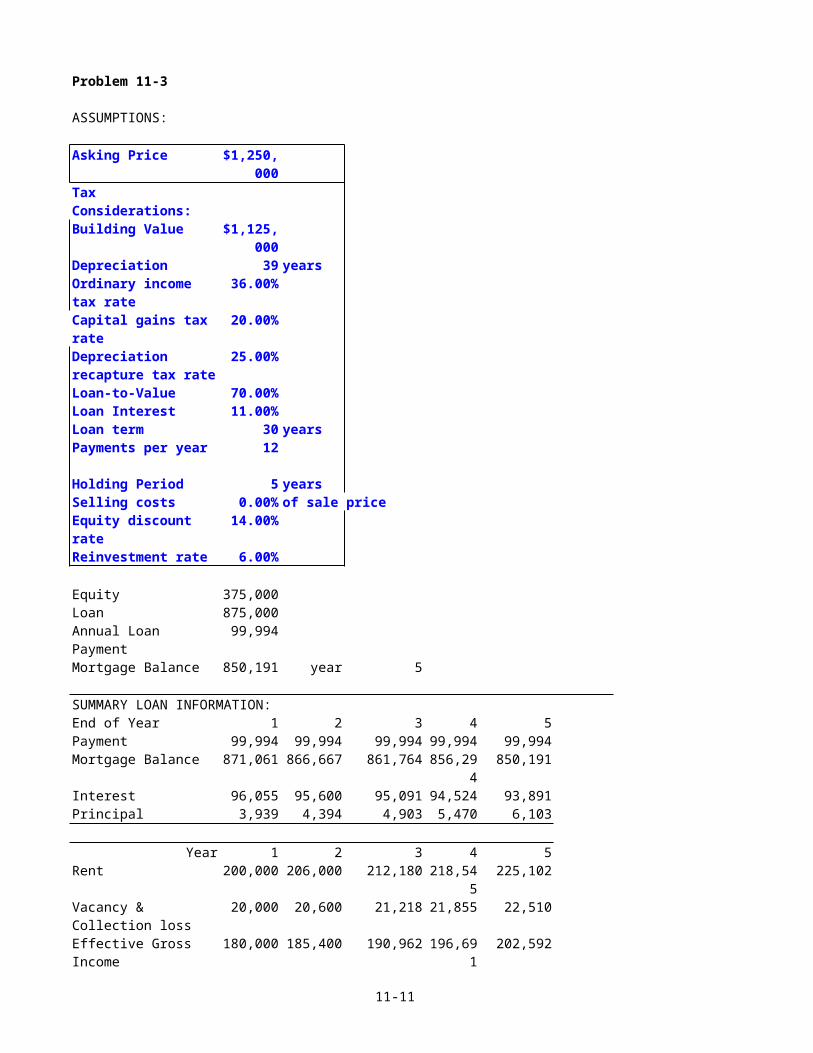
Problem 11-3
ASSUMPTIONS:
Asking Price $1,250,000
Tax Considerations:Building Value $1,125,
000 Depreciation 39 yearsOrdinary income tax rate
36.00%
Capital gains tax rate
20.00%
Depreciation recapture tax rate
25.00%
Loan-to-Value 70.00%Loan Interest 11.00%Loan term 30 yearsPayments per year 12
Holding Period 5 yearsSelling costs 0.00% of sale priceEquity discount rate
14.00%
Reinvestment rate 6.00%
Equity 375,000 Loan 875,000 Annual Loan Payment
99,994
Mortgage Balance 850,191 year 5
SUMMARY LOAN INFORMATION:End of Year 1 2 3 4 5Payment 99,994 99,994 99,994 99,994 99,994 Mortgage Balance 871,061 866,667 861,764 856,29
4 850,191
Interest 96,055 95,600 95,091 94,524 93,891 Principal 3,939 4,394 4,903 5,470 6,103
Year 1 2 3 4 5 Rent 200,000 206,000 212,180 218,54
5 225,102
Vacancy & Collection loss
20,000 20,600 21,218 21,855 22,510
Effective Gross Income
180,000 185,400 190,962 196,691
202,592
11-11
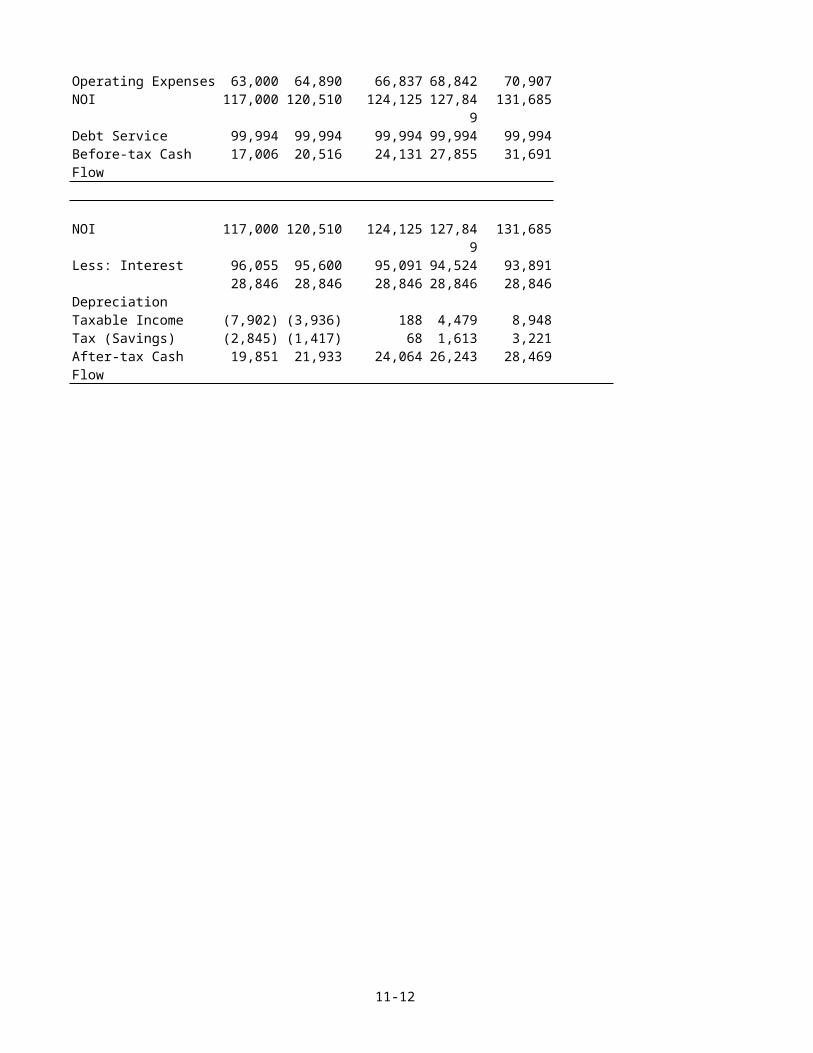
Operating Expenses 63,000 64,890 66,837 68,842 70,907 NOI 117,000 120,510 124,125 127,84
9 131,685
Debt Service 99,994 99,994 99,994 99,994 99,994 Before-tax Cash Flow
17,006 20,516 24,131 27,855 31,691
NOI 117,000 120,510 124,125 127,849
131,685
Less: Interest 96,055 95,600 95,091 94,524 93,891 Depreciation
28,846 28,846 28,846 28,846 28,846
Taxable Income (7,902) (3,936) 188 4,479 8,948 Tax (Savings) (2,845) (1,417) 68 1,613 3,221 After-tax Cash Flow
19,851 21,933 24,064 26,243 28,469
11-12
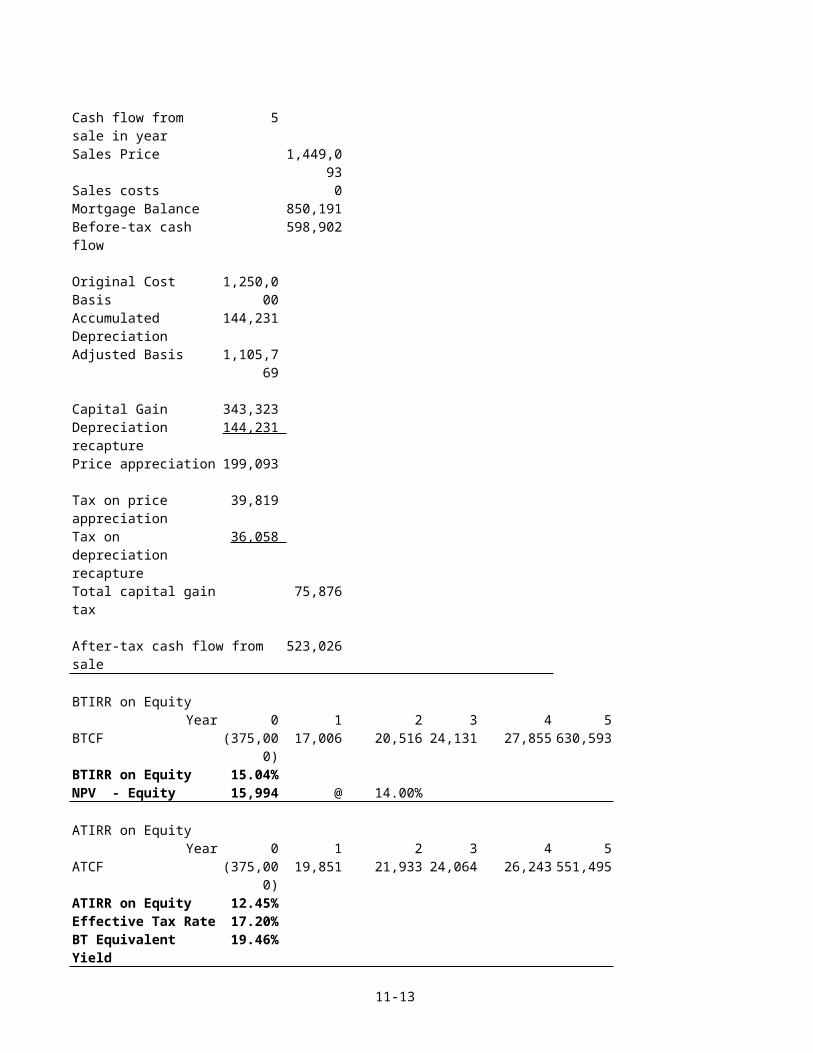
Cash flow from sale in year
5
Sales Price 1,449,093
Sales costs 0 Mortgage Balance 850,191 Before-tax cash flow
598,902
Original Cost Basis
1,250,000
Accumulated Depreciation
144,231
Adjusted Basis 1,105,769
Capital Gain 343,323 Depreciation recapture
144,231
Price appreciation 199,093
Tax on price appreciation
39,819
Tax on depreciation recapture
36,058
Total capital gaintax
75,876
After-tax cash flow from sale
523,026
BTIRR on EquityYear 0 1 2 3 4 5
BTCF (375,000)
17,006 20,516 24,131 27,855 630,593
BTIRR on Equity 15.04%NPV - Equity 15,994 @ 14.00%
ATIRR on EquityYear 0 1 2 3 4 5
ATCF (375,000)
19,851 21,933 24,064 26,243 551,495
ATIRR on Equity 12.45%Effective Tax Rate 17.20%BT Equivalent Yield
19.46%
11-13
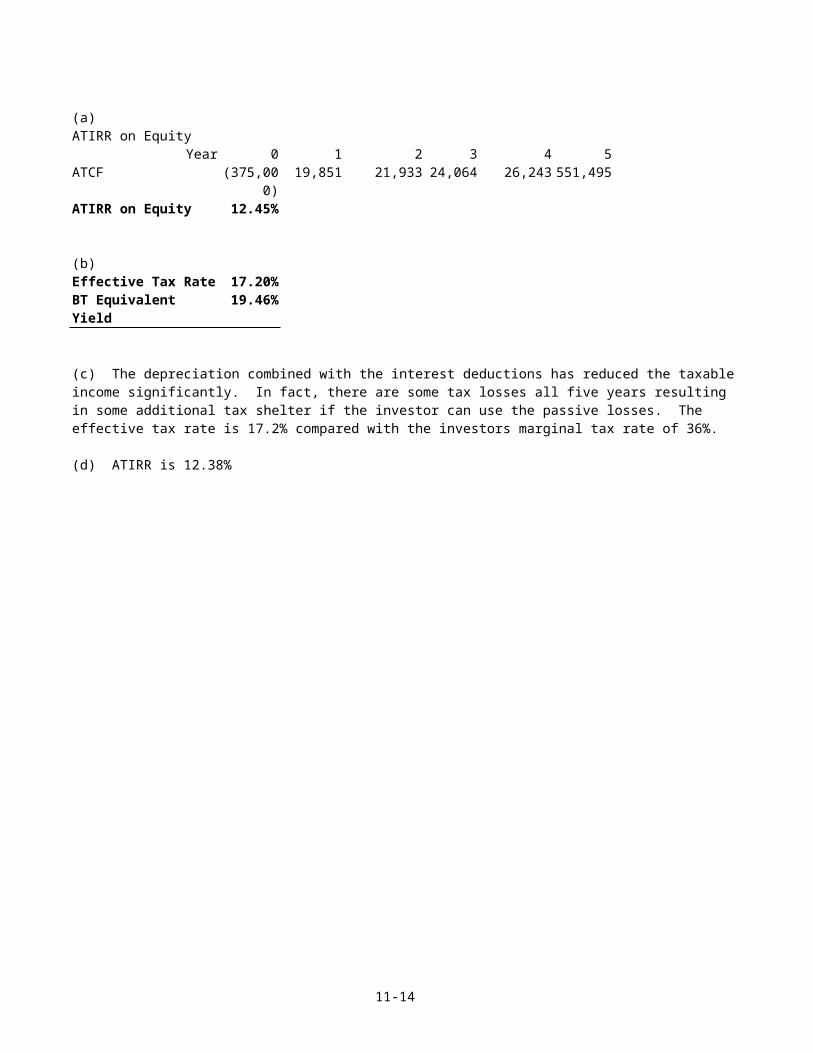
(a)ATIRR on Equity
Year 0 1 2 3 4 5ATCF (375,00
0)19,851 21,933 24,064 26,243 551,495
ATIRR on Equity 12.45%
(b)Effective Tax Rate 17.20%BT Equivalent Yield
19.46%
(c) The depreciation combined with the interest deductions has reduced the taxable income significantly. In fact, there are some tax losses all five years resulting in some additional tax shelter if the investor can use the passive losses. The effective tax rate is 17.2% compared with the investors marginal tax rate of 36%.
(d) ATIRR is 12.38%
11-14
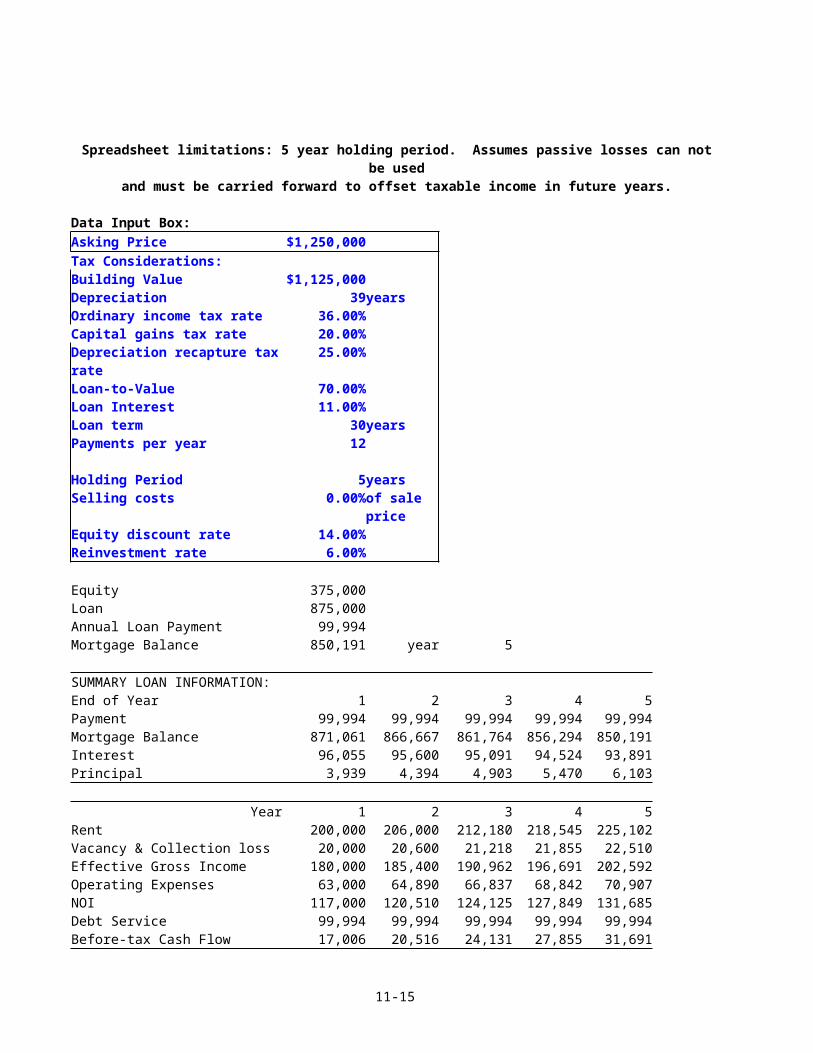
Spreadsheet limitations: 5 year holding period. Assumes passive losses can notbe used
and must be carried forward to offset taxable income in future years.
Data Input Box:Asking Price $1,250,000 Tax Considerations: Building Value $1,125,000 Depreciation 39yearsOrdinary income tax rate 36.00% Capital gains tax rate 20.00% Depreciation recapture taxrate
25.00%
Loan-to-Value 70.00% Loan Interest 11.00% Loan term 30yearsPayments per year 12 Holding Period 5yearsSelling costs 0.00%of sale
priceEquity discount rate 14.00% Reinvestment rate 6.00%
Equity 375,000 Loan 875,000 Annual Loan Payment 99,994 Mortgage Balance 850,191 year 5
SUMMARY LOAN INFORMATION: End of Year 1 2 3 4 5Payment 99,994 99,994 99,994 99,994 99,994 Mortgage Balance 871,061 866,667 861,764 856,294 850,191 Interest 96,055 95,600 95,091 94,524 93,891 Principal 3,939 4,394 4,903 5,470 6,103
Year 1 2 3 4 5 Rent 200,000 206,000 212,180 218,545 225,102 Vacancy & Collection loss 20,000 20,600 21,218 21,855 22,510 Effective Gross Income 180,000 185,400 190,962 196,691 202,592 Operating Expenses 63,000 64,890 66,837 68,842 70,907 NOI 117,000 120,510 124,125 127,849 131,685 Debt Service 99,994 99,994 99,994 99,994 99,994 Before-tax Cash Flow 17,006 20,516 24,131 27,855 31,691
11-15

11-16
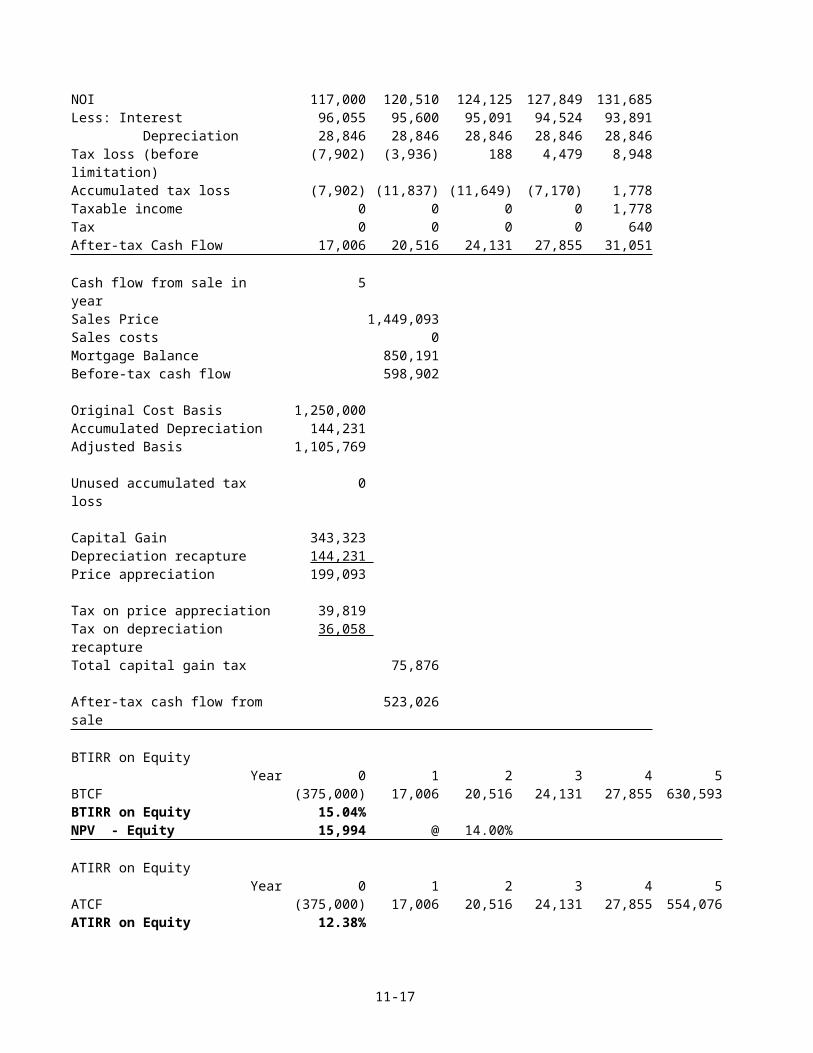
NOI 117,000 120,510 124,125 127,849 131,685 Less: Interest 96,055 95,600 95,091 94,524 93,891 Depreciation 28,846 28,846 28,846 28,846 28,846 Tax loss (before limitation)
(7,902) (3,936) 188 4,479 8,948
Accumulated tax loss (7,902) (11,837) (11,649) (7,170) 1,778 Taxable income 0 0 0 0 1,778 Tax 0 0 0 0 640 After-tax Cash Flow 17,006 20,516 24,131 27,855 31,051
Cash flow from sale in year
5
Sales Price 1,449,093 Sales costs 0 Mortgage Balance 850,191 Before-tax cash flow 598,902
Original Cost Basis 1,250,000 Accumulated Depreciation 144,231 Adjusted Basis 1,105,769
Unused accumulated tax loss
0
Capital Gain 343,323 Depreciation recapture 144,231 Price appreciation 199,093
Tax on price appreciation 39,819 Tax on depreciation recapture
36,058
Total capital gain tax 75,876
After-tax cash flow from sale
523,026
BTIRR on EquityYear 0 1 2 3 4 5
BTCF (375,000) 17,006 20,516 24,131 27,855 630,593 BTIRR on Equity 15.04%NPV - Equity 15,994 @ 14.00%
ATIRR on EquityYear 0 1 2 3 4 5
ATCF (375,000) 17,006 20,516 24,131 27,855 554,076 ATIRR on Equity 12.38%
11-17
PROBLEM 11-4
The after tax IRR increases to 17.21% from 15.45%.
PROBLEM 11-5
The return drops to 12.98% from 13.46%. To have market rents equal to zero you mustput a zero (not a blank) in the market rent inflation entry for each year. The general inflation rate should still be 4%.
11-18


![(1.7) Fn+1(c)= D /'[V] - The Fibonacci Quarterly](https://static.fdokumen.com/doc/165x107/632456c0f021b67e74087f49/17-fn1c-d-v-the-fibonacci-quarterly.jpg)