fMRI of parents of children with Asperger Syndrome: a pilot study
9
Brain and Cognition 61 (2006) 122–130 www.elsevier.com/locate/b&c 0278-2626/$ - see front matter © 2006 Elsevier Inc. All rights reserved. doi:10.1016/j.bandc.2005.12.011 fMRI of parents of children with Asperger Syndrome: A pilot study Simon Baron-Cohen a,¤ , Howard Ring a , Xavier Chitnis b , Sally Wheelwright a , Lloyd Gregory d , Steve Williams b , Mick Brammer b , Ed Bullmore c a Autism Research Centre, Department of Psychiatry, University of Cambridge, Douglas House, 18b Trumpington Road, Cambridge CB2 2AH, UK b Institute of Psychiatry, University of London, MRI Unit, Denmark Hill, London SE5 8AF, UK c Brain Mapping Unit, Department of Psychiatry, University of Cambridge, The Clinical School, Addenbrooke’s Hospital, Cambridge CB2 2QQ, UK d Translational Imaging Unit, Hope Hospital, Stott Lane, Salford M6 8HD, UK Accepted 9 December 2005 Available online 7 February 2006 Abstract Background: People with autism or Asperger Syndrome (AS) show altered patterns of brain activity during visual search and emotion recognition tasks. Autism and AS are genetic conditions and parents may show the ‘broader autism phenotype.’ Aims: (1) To test if parents of children with AS show atypical brain activity during a visual search and an empathy task; (2) to test for sex diVerences during these tasks at the neural level; (3) to test if parents of children with autism are hyper-masculinized, as might be pre- dicted by the ‘extreme male brain’ theory. Method: We used fMRI during a visual search task (the Embedded Figures Test (EFT)) and an emotion recognition test (the ‘Read- ing the Mind in the Eyes’ (or Eyes) test). Sample: Twelve parents of children with AS, vs. 12 sex-matched controls. Design: Factorial analysis was used to map main eVects of sex, group (parents vs. controls), and sex £ group interaction on brain function. An ordinal ANOVA also tested for regions of brain activity where females > males > fathers D mothers, to test for parental hyper-masculinization. Results on EFT task: Female controls showed more activity in extrastriate cortex than male controls, and both mothers and fathers showed even less activity in this area than sex-matched controls. There were no diVerences in group activation between mothers and fathers of children with AS. The ordinal ANOVA identiWed two speciWc regions in visual cortex (right and left, respectively) that showed the pattern Females > Males > Fathers D Mothers, both in BA 19. Results on Eyes task: Male controls showed more activity in the left inferior frontal gyrus than female controls, and both mothers and fathers showed even more activity in this area compared to sex-matched controls. Female controls showed greater bilateral inferior fron- tal activation than males. This was not seen when comparing mothers to males, or mothers to fathers. The ordinal ANOVA identiWed two speciWc regions that showed the pattern Females > Males > Mothers D Fathers: left medial temporal gyrus (BA 21) and left dorsolateral prefrontal cortex (BA 44). Conclusions: Parents of children with AS show atypical brain function during both visual search and emotion recognition, in the direction of hyper-masculinization of the brain. Because of the small sample size, and lack of age-matching between parents and controls, such results constitute a pilot study that needs replicating with larger samples. © 2006 Elsevier Inc. All rights reserved. Keywords: Autism; Asperger Syndrome; fMRI parents; Sex diVerences 1. Introduction The genetic theory of autism (Bailey, Bolton, & Rutter, 1998; Bailey et al., 1995) proposes that autism is strongly heritable, and that Wrst-degree relatives of children with * Corresponding author. Fax: +44 1223 333564. E-mail address: [email protected] (S. Baron-Cohen).
Transcript of fMRI of parents of children with Asperger Syndrome: a pilot study
Brain and Cognition 61 (2006) 122–130
www.elsevier.com/locate/b&c
fMRI of parents of children with Asperger Syndrome: A pilot study
Simon Baron-Cohen a,¤, Howard Ring a, Xavier Chitnis b, Sally Wheelwright a, Lloyd Gregory d, Steve Williams b, Mick Brammer b, Ed Bullmore c
a Autism Research Centre, Department of Psychiatry, University of Cambridge, Douglas House, 18b Trumpington Road, Cambridge CB2 2AH, UKb Institute of Psychiatry, University of London, MRI Unit, Denmark Hill, London SE5 8AF, UK
c Brain Mapping Unit, Department of Psychiatry, University of Cambridge, The Clinical School, Addenbrooke’s Hospital, Cambridge CB2 2QQ, UKd Translational Imaging Unit, Hope Hospital, Stott Lane, Salford M6 8HD, UK
Accepted 9 December 2005Available online 7 February 2006
Abstract
Background: People with autism or Asperger Syndrome (AS) show altered patterns of brain activity during visual search and emotionrecognition tasks. Autism and AS are genetic conditions and parents may show the ‘broader autism phenotype.’
Aims: (1) To test if parents of children with AS show atypical brain activity during a visual search and an empathy task; (2) to test forsex diVerences during these tasks at the neural level; (3) to test if parents of children with autism are hyper-masculinized, as might be pre-dicted by the ‘extreme male brain’ theory.
Method: We used fMRI during a visual search task (the Embedded Figures Test (EFT)) and an emotion recognition test (the ‘Read-ing the Mind in the Eyes’ (or Eyes) test).
Sample: Twelve parents of children with AS, vs. 12 sex-matched controls.Design: Factorial analysis was used to map main eVects of sex, group (parents vs. controls), and sex£ group interaction on brain
function. An ordinal ANOVA also tested for regions of brain activity where females > males > fathersDmothers, to test for parentalhyper-masculinization.
Results on EFT task: Female controls showed more activity in extrastriate cortex than male controls, and both mothers and fathersshowed even less activity in this area than sex-matched controls. There were no diVerences in group activation between mothers andfathers of children with AS. The ordinal ANOVA identiWed two speciWc regions in visual cortex (right and left, respectively) that showedthe pattern Females > Males > FathersDMothers, both in BA 19.
Results on Eyes task: Male controls showed more activity in the left inferior frontal gyrus than female controls, and both mothers andfathers showed even more activity in this area compared to sex-matched controls. Female controls showed greater bilateral inferior fron-tal activation than males. This was not seen when comparing mothers to males, or mothers to fathers. The ordinal ANOVA identiWed twospeciWc regions that showed the pattern Females > Males > MothersDFathers: left medial temporal gyrus (BA 21) and left dorsolateralprefrontal cortex (BA 44).
Conclusions: Parents of children with AS show atypical brain function during both visual search and emotion recognition, in thedirection of hyper-masculinization of the brain. Because of the small sample size, and lack of age-matching between parents and controls,such results constitute a pilot study that needs replicating with larger samples.© 2006 Elsevier Inc. All rights reserved.
Keywords: Autism; Asperger Syndrome; fMRI parents; Sex diVerences
* Corresponding author. Fax: +44 1223 333564.E-mail address: [email protected] (S. Baron-Cohen).
0278-2626/$ - see front matter © 2006 Elsevier Inc. All rights reserved.doi:10.1016/j.bandc.2005.12.011
1. Introduction
The genetic theory of autism (Bailey, Bolton, & Rutter,1998; Bailey et al., 1995) proposes that autism is stronglyheritable, and that Wrst-degree relatives of children with
S. Baron-Cohen et al. / Brain and Cognition 61 (2006) 122–130 123
autism possess the ‘broader autism phenotype’ (BAP). Her-itability of autism has been estimated to be above 90%, andthe BAP has been conWrmed among parents of childrenwith autism. For example, parents of children with autismscore higher on some of the subscales of the Autism Spec-trum Quotient (AQ), compared to controls (Baron-Cohen,Wheelwright, Skinner, Martin, & Clubley, 2001; Bishopet al., 2004).
To date there have been no fMRI studies of parents ofchildren with autism or AS to test for the BAP at the neurallevel. Since people with autism and AS show atypical brainfunction during fMRI, using tasks such as the EmbeddedFigures Test (EFT) (a visual search task) (Ring et al., 1999)and the ‘Reading the Mind in the Eyes’ (or Eyes) task (anadvanced emotion recognition task) (Baron-Cohen et al.,1999), it is important to see if on the same tasks, Wrst-degreerelatives of children with autism or AS also show atypicalbrain function. Such a result would implicate these mea-sures as assays for neurocognitive endophenotypes.
The use of the EFT and Eyes tests during fMRI is alsorelevant to the question of sex diVerences in brain function,since males in the general population often score higherthan females on the EFT (JolliVe & Baron-Cohen, 1997;Witkin, Dyk, Faterson, Goodenough, & Karp, 1962) andfemales in the general population often score higher thanmales on the Eyes test (Baron-Cohen, JolliVe, Mortimore,& Robertson, 1997; Baron-Cohen, Wheelwright, Hill,Raste, & Plumb, 2001). The study below is a preliminaryexploration testing for sex diVerences in brain function dur-ing these two tasks. It is preliminary because only six malesare tested, against six females.
1.1. The extreme male brain theory of autism
If sex diVerences are found, then these tasks also allowa preliminary test of the ‘extreme male brain’ (EMB) the-ory of autism (Baron-Cohen, 2002). It has been shownthat people with AS are faster than sex-matched controlson the EFT (JolliVe & Baron-Cohen, 1997), and scorebelow average on the Eyes test. In the study below, wealso test if parents of people with AS show such hyper-masculinization. The fact that parents score in a hyper-masculinized direction on both of these tasks in terms ofperformance is consistent with the EMB theory. Thus,parents of children with autism spectrum conditions(ASC) are faster than sex-matched controls on the EFT,and show lower scores on the Eyes test (Baron-Cohen &Hammer, 1997). In the study reported here we test if par-ents of children with AS show atypical brain functionwhilst performing these two tests. A preliminary clue thathyper-masculinization might be found in such parents isthat mothers of children with ASC show a masculinizedsecond-to-fourth digit (2D:4D) ratio (Manning, Baron-Cohen, Wheelwright, & Sanders, 2001). Here, we report apilot test of the EMB theory at the level of the brain.Again, this is a pilot study simply because only six moth-ers and six fathers are included.
In the earlier behavioural studies, sex diVerences weredetected when the sample size comprised 25 males and 25females (Baron-Cohen & Hammer, 1997). It is unclear ifsex diVerences in brain activity would be revealed in a rel-atively small sample as reported below. It is, however,possible that, even if at the behavioural level sex diVer-ences in performance are not apparent with just six malesand six females, it may be at the neural level that sexdiVerences will be seen. This is because in behaviouralstudies what is being measured is performance (speed oraccuracy) and the eVect size may be quite small. At theneural level, sex diVerences may exist in how the brainapproaches the task. If the two sexes (on average) areemploying very diVerent neural strategies to solve thetasks, this may be detectable even with small samples. Onthis view, the power to detect sex diVerences may begreater using fMRI than when using behavioural mea-sures. The same arguments apply to comparing parents ofchildren with AS with sex-matched controls. Even if per-formance diVerences are not seen at the level of behav-iour, diVerences may be detectable at the level of brainfunction.
1.2. Predictions
In the present study, we tested three predictions: (1) par-ents of children with autism would show atypical brainactivity during both the EFT and the Eyes tasks. (2) Maleand female controls would show diVerent patterns of brainactivity on each of these tasks. (3) On both of these tasks,parents of children with AS would show hyper-masculin-ized brain activation.
2. The experiment
2.1. Sample
Twelve adult controls (six males, six females) from thegeneral population and 12 parents (six mothers, sixfathers) of children with AS took part. The latter wererecruited from the volunteer database held by the AutismResearch Centre in Cambridge University. All partici-pants were right-handed and came from a mix of occupa-tions and social classes. All were free of any medicationuse, and had no history of neurological or psychiatricconditions. All gave written consent to participate in scan-ning. Exclusion criteria for subject selection were myopia(the tasks involved being able to see a screen without theoption of wearing spectacles in the scanner), claustropho-bia (the procedure required staying still in the scanner forup to 1 h), and metal implants in the body (due to theforce of the magnetic Weld in MRI). The two groups wereequated for socio-economic status (ascertained by years ineducation and occupation), and IQ (as measured by theWeschsler Abbreviated Scale of Intelligence [WASI]).They were not equated for age, which is why this studycan only be considered preliminary.
124 S. Baron-Cohen et al. / Brain and Cognition 61 (2006) 122–130
2.2. Method
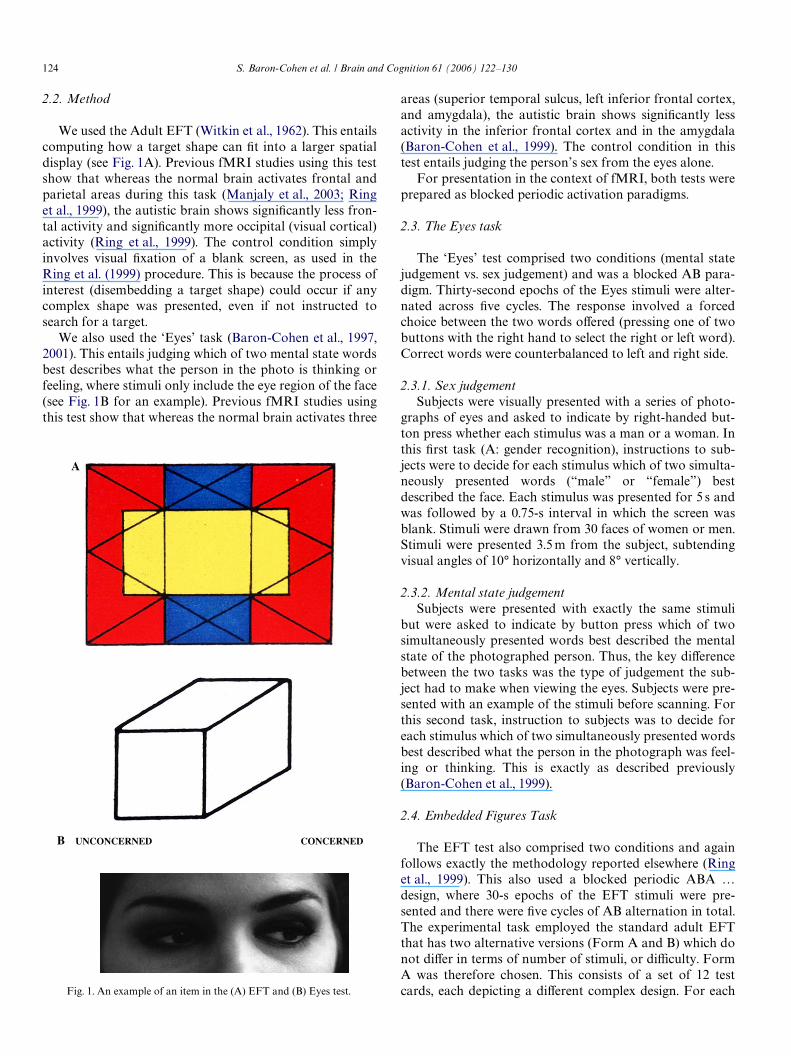
We used the Adult EFT (Witkin et al., 1962). This entailscomputing how a target shape can Wt into a larger spatialdisplay (see Fig. 1A). Previous fMRI studies using this testshow that whereas the normal brain activates frontal andparietal areas during this task (Manjaly et al., 2003; Ringet al., 1999), the autistic brain shows signiWcantly less fron-tal activity and signiWcantly more occipital (visual cortical)activity (Ring et al., 1999). The control condition simplyinvolves visual Wxation of a blank screen, as used in theRing et al. (1999) procedure. This is because the process ofinterest (disembedding a target shape) could occur if anycomplex shape was presented, even if not instructed tosearch for a target.
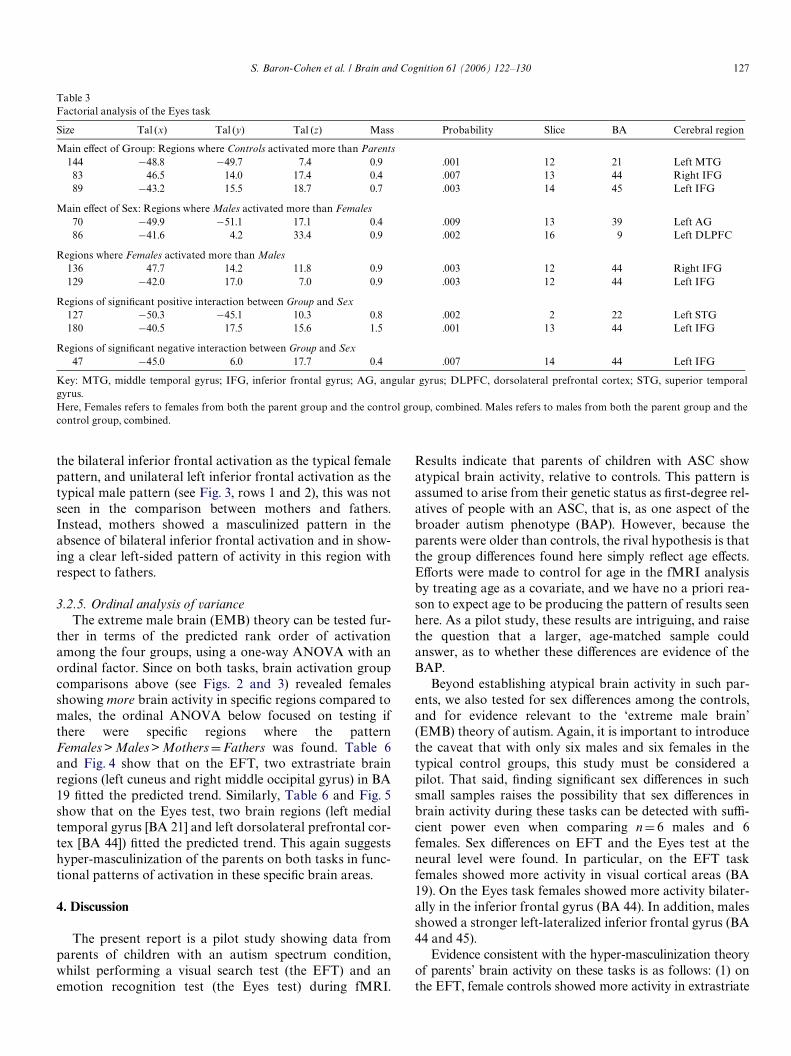
We also used the ‘Eyes’ task (Baron-Cohen et al., 1997,2001). This entails judging which of two mental state wordsbest describes what the person in the photo is thinking orfeeling, where stimuli only include the eye region of the face(see Fig. 1B for an example). Previous fMRI studies usingthis test show that whereas the normal brain activates three
Fig. 1. An example of an item in the (A) EFT and (B) Eyes test.
B UNCONCERNED CONCERNED
areas (superior temporal sulcus, left inferior frontal cortex,and amygdala), the autistic brain shows signiWcantly lessactivity in the inferior frontal cortex and in the amygdala(Baron-Cohen et al., 1999). The control condition in thistest entails judging the person’s sex from the eyes alone.
For presentation in the context of fMRI, both tests wereprepared as blocked periodic activation paradigms.
2.3. The Eyes task
The ‘Eyes’ test comprised two conditions (mental statejudgement vs. sex judgement) and was a blocked AB para-digm. Thirty-second epochs of the Eyes stimuli were alter-nated across Wve cycles. The response involved a forcedchoice between the two words oVered (pressing one of twobuttons with the right hand to select the right or left word).Correct words were counterbalanced to left and right side.
2.3.1. Sex judgementSubjects were visually presented with a series of photo-
graphs of eyes and asked to indicate by right-handed but-ton press whether each stimulus was a man or a woman. Inthis Wrst task (A: gender recognition), instructions to sub-jects were to decide for each stimulus which of two simulta-neously presented words (“male” or “female”) bestdescribed the face. Each stimulus was presented for 5 s andwas followed by a 0.75-s interval in which the screen wasblank. Stimuli were drawn from 30 faces of women or men.Stimuli were presented 3.5 m from the subject, subtendingvisual angles of 10° horizontally and 8° vertically.
2.3.2. Mental state judgementSubjects were presented with exactly the same stimuli
but were asked to indicate by button press which of twosimultaneously presented words best described the mentalstate of the photographed person. Thus, the key diVerencebetween the two tasks was the type of judgement the sub-ject had to make when viewing the eyes. Subjects were pre-sented with an example of the stimuli before scanning. Forthis second task, instruction to subjects was to decide foreach stimulus which of two simultaneously presented wordsbest described what the person in the photograph was feel-ing or thinking. This is exactly as described previously(Baron-Cohen et al., 1999).
2.4. Embedded Figures Task
The EFT test also comprised two conditions and againfollows exactly the methodology reported elsewhere (Ringet al., 1999). This also used a blocked periodic ABA ƒdesign, where 30-s epochs of the EFT stimuli were pre-sented and there were Wve cycles of AB alternation in total.The experimental task employed the standard adult EFTthat has two alternative versions (Form A and B) which donot diVer in terms of number of stimuli, or diYculty. FormA was therefore chosen. This consists of a set of 12 testcards, each depicting a diVerent complex design. For each
S. Baron-Cohen et al. / Brain and Cognition 61 (2006) 122–130 125
complex design there is a simple shape hidden somewherewithin it. In fact, there are just eight diVerent simple shapes,because some of these are common to several complexdesigns. In the current study, the administration of the EFTwas adapted for use in the scanner. Ten complex designswere chosen at random for testing in the scanner. Beforesubjects went into the scanner, they were given an addi-tional practice item to ensure that they fully understood thetask.
The task was introduced with the following instructions:“You will see a colourful design with a simple shape next toit. You have to look for the simple shape in the largerdesign. The shape you Wnd in the colourful design willalways be exactly the same as the simple shape, so it will bethe same size and proportions and the same way up.” Thepractice item was then shown. After the practice item, thesubject was settled in to the scanner and was reminded ofthe task using the same instructions with this addition: “Assoon as you’ve found the simple shape, press the buttonwith your right hand index Wnger. After you have foundone example of the simple shape, keep looking in case youcan Wnd any other examples, but you don’t have to pressthe button again until the next design comes up. Go asquickly and as accurately as you can.”
We used a blocked periodic ABAƒ design involvingrepeated contrasts between a baseline condition and anactivation condition. Each condition was visually pre-sented for an epoch of 30 s, and the cycle of alternationbetween epochs was repeated Wve times in the course ofeach 5-min experiment. During each activation epoch,subjects were presented with two randomly selecteddesigns from form A of the EFT task. Each complexdesign was shown for 15 s simultaneously and side by sidewith a simple shape that the subject was asked to identifyin the complex design. Stimuli were presented on a videomonitor approximately 8 ft from the subjects’ head. Dur-ing each baseline epoch, the subjects were asked simply toWxate on a blank screen.
The Eyes and EFT tasks were presented in a counterbal-anced order, half the subjects taking the Eyes test Wrst andhalf the subjects taking the EFT test Wrst. There was a shortbreak between tasks but the subjects did not leave the scan-ner or move position between tasks.
2.5. fMRI data acquisition
Gradient echo echoplanar imaging (EPI) data wereacquired on a GE Signa 1.5 T system (General Electric, Mil-waukee, WI, USA). A quadrature birdcage headcoil wasused for RF transmission and reception. One hundred T2¤-weighted images depicting BOLD contrast (Ogawa, Lee,Kay, & Tank, 1990) were acquired over 5 min (for eachtask) at each of 14 near-axial non-contiguous 7 mm thickplanes parallel to the inter-commissural (AC-PC) line: TE40 ms, TR 3 s, in-plane resolution 7 mm, inter-slice gap0.7 mm. This EPI dataset provided almost complete braincoverage.
2.6. fMRI data analysis
The data were Wrst realigned to minimize motion-relatedartefacts and smoothed using a Gaussian Wlter (FWHM7.2 mm). Responses to the experimental paradigms werethen estimated by general linear modelling using two Pois-son kernels (�D4 and 8 s) to model a locally variable hemo-dynamic response function. At each intracerebral voxel, agoodness-of-Wt statistic was computed from the ratio of thesum of squares of deviations of image intensity (from themean over all time points) due to the model divided by thesum of squares of deviations due to the residuals. This ratio(subsequently called the SSQ ratio) can easily be shown tobe functionally equivalent to F under permutation testingas the conversion to F would assume constant factors(degrees of freedom) in the numerator and denominator.Individual SSQ ratio maps were coregistered in the stan-dard space of Talairach and Tournoux (1988) prior to sec-ond-level analysis of variance using permutation tests onspatially informed cluster-level statistics for inference (Bull-more, Brammer, et al., 1999; Bullmore, Suckling, et al.,1999; Suckling & Bullmore, 2004).
We tested main eVects of group, sex, and group£ sex ina two-way ANOVA model and then tested hypotheticallypredicted rank orders of activation among the four groupsby one-way ANOVA with an ordinal factor. For all sec-ond-level analyses, the cluster-level threshold for statisticalsigniWcance p < .005 was speciWed so that the expected num-ber of false positive clusters was less than one per map.
3. Results
3.1. Participants and task performance
The age and IQ of the participants together with theresults of their task performance are given in Table 1.Inspection of age of the two groups showed that the par-ents were older than controls, so in the MRI data analysisage was entered as a covariate. For the EFT, a 2£ 2ANOVA was performed with group and sex as thebetween subject factors, and IQ as a covariate. Thedependent measure for both tasks was the percent correctscore. In the case of the EFT, participants pushed the
Table 1Group characteristics and task performance (percent scores): Means (SD)
Group Age IQ Eyes task (control)
Eyes task (emotions)
EFT
Fathers 39.1 114.8 85.6 80.6 66.7(6.0) (4.0) (4.6) (4.9) (26.6)
Mothers 37.3 115.3 84.4 82.2 66.7(5.9) (5.5) (6.2) (6.2) (27.3)
Male controls 23.1 120.0 86.7 83.3 76.7(0.6) (1.6) (3.0) (7.6) (22.5)
Female controls 21.6 118.0 86.7 87.2 76.7(0.8) (4.2) (3.0) (7.7) (19.7)
126 S. Baron-Cohen et al. / Brain and Cognition 61 (2006) 122–130
button whilst in the scanner when they had identiWed theshape, and this was checked after the scanning session byasking them to trace it out. Both the main eVects andinteraction were non-signiWcant. Although the parents’score appears lower than controls, it is important to notethat this was not a signiWcant diVerence so they can beregarded as equal to controls. For the Eyes test, arepeated measures ANOVA was conducted with judge-ment type (sex recognition vs. emotion judgement) as thewithin subject factor, group (parents vs. controls) and sex(males vs. females) as the between subject factors, and IQas the covariate. There were no signiWcant main eVects orinteractions. In a sample size of this magnitude, sex diVer-ences in performance would not necessarily be expected.As discussed earlier, absence of signiWcant sex diVerencesin performance in such small samples does not precludedetecting sex diVerences at the neural level, examinednext.
3.2. fMRI results
3.2.1. Factorial analysisOn each task, we used an ANOVA design. This design
mirrors the analysis of the performance data. On bothtasks, there was a signiWcant main eVect of Group, of Sex,and a signiWcant Group by Sex interaction. All compari-sons were thresholded at less than one false positive peranalysis. All between-group analyses were two-tailed tests.The coordinates quoted are in ‘Talairach space’ (Talairach& Tournoux, 1988), and in each case represents the 3D clus-ter centre.
3.2.2. EFTThere was a main eVect of Group, with two regions
showing greater activity in controls compared to parents.These were both in visual cortex (middle occipital and lin-gual gyrii) (BA 18). There was also a main eVect of Sex,with two regions activated more strongly in females com-pared to males. These were also in V2 and V3 (BA 18).Finally, there was a signiWcant Group by Sex interaction,again in the region of the middle occipital gyrus (BA 19).These results are shown in Table 2.
3.2.3. Eyes taskThere was a main eVect of Group, controls activating
three regions more than parents, in the mid temporal gyrus(BA 21), and the inferior frontal gyrus (BA 44 and 45).There was also a main eVect of Sex, males activating tworegions more than females, in the angular gyrus (BA 39)and the dorsolateral prefrontal cortex (BA 9), and femalesactivating two regions more than males, in the inferiorfrontal gyrus (BA 44, bilaterally). There was also a signiW-cant Group by Sex interaction in two regions: The superiortemporal gyrus (BA 22) and the inferior frontal gyrus (BA44). These results are shown in Table 3.
3.2.4. Group comparisonsThe results of the group comparisons are shown in
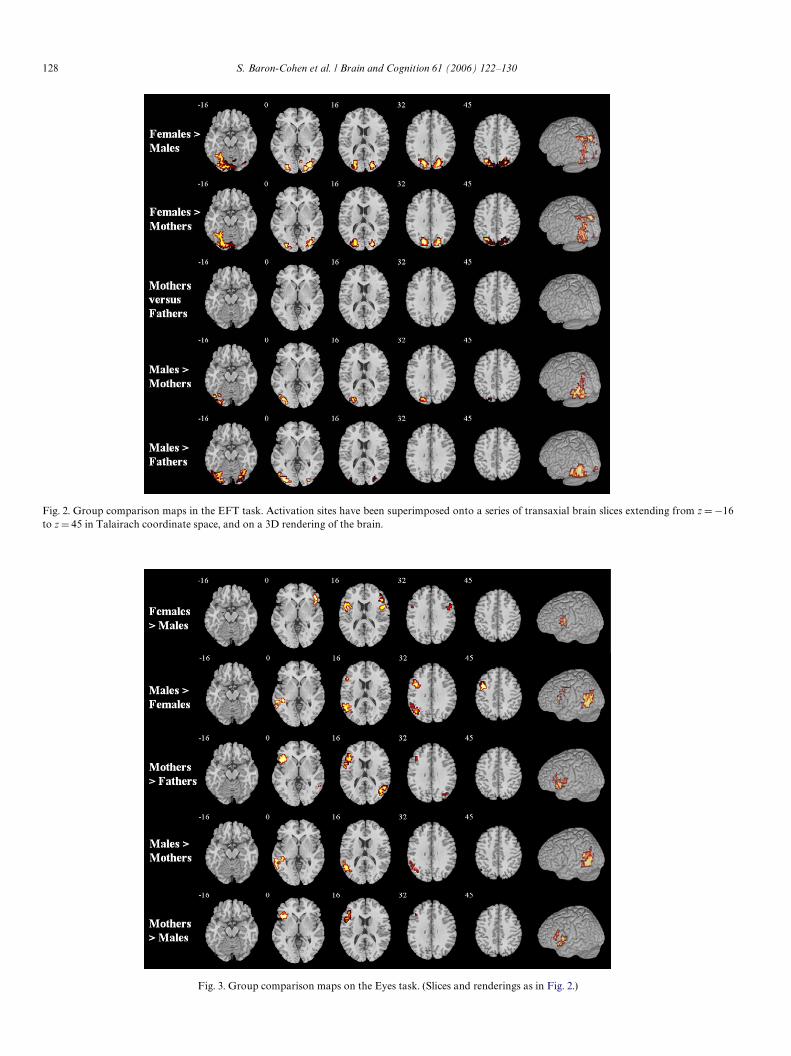
Figs. 2 and 3, and in Tables 4 and 5. On the EFT (Fig. 2,rows 1 and 2), typical females showed greater activitythan typical males in the left fusiform gyrus, and bilater-ally in the extrastriate cortices. There were no regionsthat were more active in males relative to females. Thefemale–male comparison was similar to the female–mother comparison. In both comparisons, the femalecontrols show more activity bilaterally in extrastriate cor-tex (BA 18 and 19), relative to the group they are beingcompared to. This suggests that the mothers have beenmasculinized. From Fig. 2, one can also see that there areno diVerences between the mothers and fathers. FromFig. 2 we can see the mothers show even less activity thantypical males in the left-sided primary visual cortices, sug-gesting the mothers have an extreme male pattern.Fathers showed less activity than typical males in theright middle occipital gyrus and particularly in the leftfusiform gyrus. This suggests they too have an extrememale pattern.
Group comparisons on the Eyes task are shown inFig. 3: Regarding normal sex diVerences, females activatedleft and right inferior frontal regions (BA 44 and 45) morestrongly than males did. Males also activated left superiortemporal (BA 22) and a superior part of the left inferiorfrontal gyrus (BA 44) more strongly than females did. Ason the EFT, the comparison between mothers and fathersdid not show the normal sex diVerence. Thus, if we regard
Table 2Factorial analysis of the EFT task
Key: MOG, middle occipital gyrus; LG, lingual gyrus; IOG, inferior occipital gyrus.Here, Females refers to females from both the parent group and the control group, combined. Males refers to males from both the parent group and thecontrol group, combined.
Size (x) (y) (z) Mass Probability Slice BA Cerebral region
Main eVect of Group: Regions where Controls activated more than Parents161 25.1 ¡75.1 5.5 4.5 .002 11 18 Right MOG322 ¡21.2 ¡72.2 ¡0.1 8.0 .001 10 18 Left LG
Main eVect of Sex: Regions where Females activated more than Males100 25.0 ¡78.5 2.0 2.7 .002 11 18 Right MOG
67 ¡22.7 ¡80.5 ¡2.1 1.7 .009 10 18 Left IOG
Regions of signiWcant interaction between Group and Sex102 ¡20.0 ¡71.9 29.1 3.0 .008 16 19 Left MOG
S. Baron-Cohen et al. / Brain and Cognition 61 (2006) 122–130 127
the bilateral inferior frontal activation as the typical femalepattern, and unilateral left inferior frontal activation as thetypical male pattern (see Fig. 3, rows 1 and 2), this was notseen in the comparison between mothers and fathers.Instead, mothers showed a masculinized pattern in theabsence of bilateral inferior frontal activation and in show-ing a clear left-sided pattern of activity in this region withrespect to fathers.
3.2.5. Ordinal analysis of varianceThe extreme male brain (EMB) theory can be tested fur-
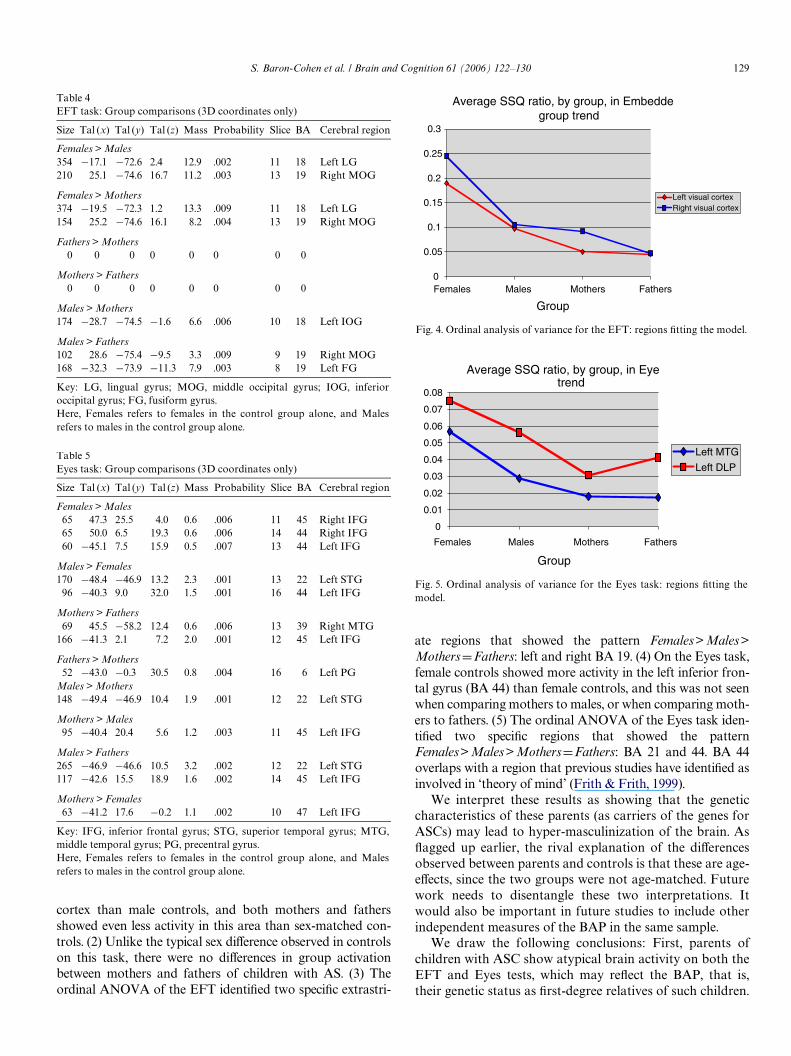
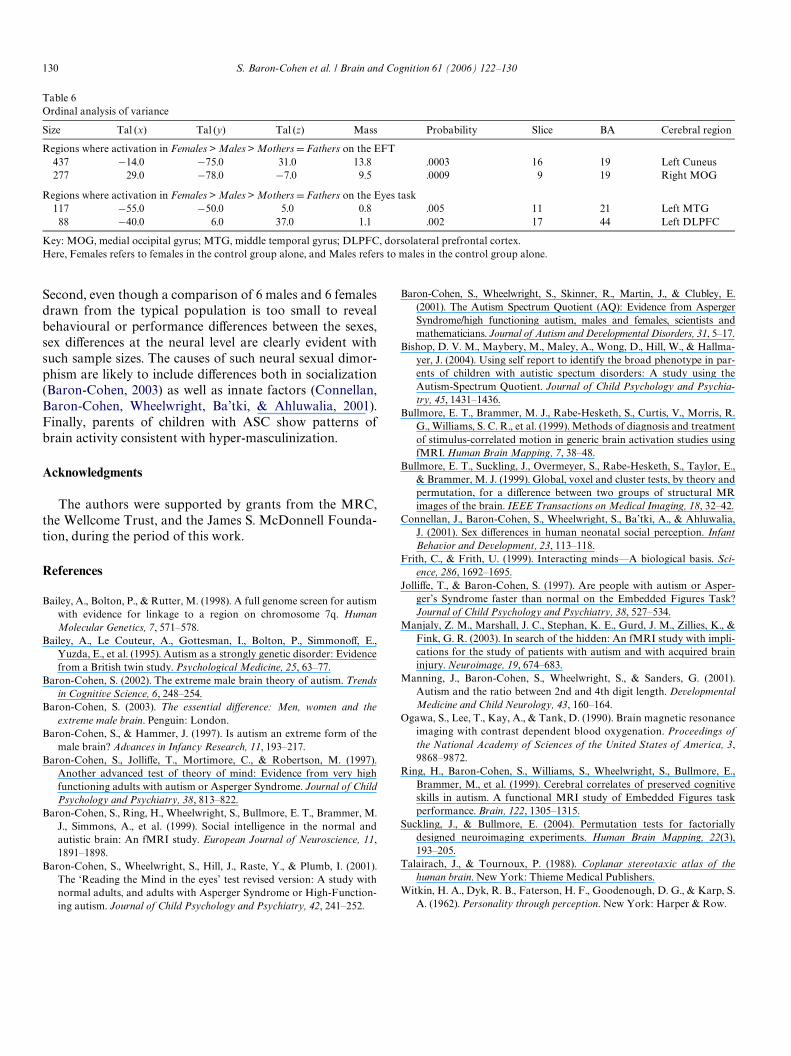
ther in terms of the predicted rank order of activationamong the four groups, using a one-way ANOVA with anordinal factor. Since on both tasks, brain activation groupcomparisons above (see Figs. 2 and 3) revealed femalesshowing more brain activity in speciWc regions compared tomales, the ordinal ANOVA below focused on testing ifthere were speciWc regions where the patternFemales > Males > MothersDFathers was found. Table 6and Fig. 4 show that on the EFT, two extrastriate brainregions (left cuneus and right middle occipital gyrus) in BA19 Wtted the predicted trend. Similarly, Table 6 and Fig. 5show that on the Eyes test, two brain regions (left medialtemporal gyrus [BA 21] and left dorsolateral prefrontal cor-tex [BA 44]) Wtted the predicted trend. This again suggestshyper-masculinization of the parents on both tasks in func-tional patterns of activation in these speciWc brain areas.
4. Discussion
The present report is a pilot study showing data fromparents of children with an autism spectrum condition,whilst performing a visual search test (the EFT) and anemotion recognition test (the Eyes test) during fMRI.
Results indicate that parents of children with ASC showatypical brain activity, relative to controls. This pattern isassumed to arise from their genetic status as Wrst-degree rel-atives of people with an ASC, that is, as one aspect of thebroader autism phenotype (BAP). However, because theparents were older than controls, the rival hypothesis is thatthe group diVerences found here simply reXect age eVects.EVorts were made to control for age in the fMRI analysisby treating age as a covariate, and we have no a priori rea-son to expect age to be producing the pattern of results seenhere. As a pilot study, these results are intriguing, and raisethe question that a larger, age-matched sample couldanswer, as to whether these diVerences are evidence of theBAP.
Beyond establishing atypical brain activity in such par-ents, we also tested for sex diVerences among the controls,and for evidence relevant to the ‘extreme male brain’(EMB) theory of autism. Again, it is important to introducethe caveat that with only six males and six females in thetypical control groups, this study must be considered apilot. That said, Wnding signiWcant sex diVerences in suchsmall samples raises the possibility that sex diVerences inbrain activity during these tasks can be detected with suY-cient power even when comparing nD 6 males and 6females. Sex diVerences on EFT and the Eyes test at theneural level were found. In particular, on the EFT taskfemales showed more activity in visual cortical areas (BA19). On the Eyes task females showed more activity bilater-ally in the inferior frontal gyrus (BA 44). In addition, malesshowed a stronger left-lateralized inferior frontal gyrus (BA44 and 45).
Evidence consistent with the hyper-masculinization theoryof parents’ brain activity on these tasks is as follows: (1) onthe EFT, female controls showed more activity in extrastriate
Table 3Factorial analysis of the Eyes task
Key: MTG, middle temporal gyrus; IFG, inferior frontal gyrus; AG, angular gyrus; DLPFC, dorsolateral prefrontal cortex; STG, superior temporalgyrus.Here, Females refers to females from both the parent group and the control group, combined. Males refers to males from both the parent group and thecontrol group, combined.
Size Tal (x) Tal (y) Tal (z) Mass Probability Slice BA Cerebral region
Main eVect of Group: Regions where Controls activated more than Parents144 ¡48.8 ¡49.7 7.4 0.9 .001 12 21 Left MTG
83 46.5 14.0 17.4 0.4 .007 13 44 Right IFG89 ¡43.2 15.5 18.7 0.7 .003 14 45 Left IFG
Main eVect of Sex: Regions where Males activated more than Females70 ¡49.9 ¡51.1 17.1 0.4 .009 13 39 Left AG86 ¡41.6 4.2 33.4 0.9 .002 16 9 Left DLPFC
Regions where Females activated more than Males136 47.7 14.2 11.8 0.9 .003 12 44 Right IFG129 ¡42.0 17.0 7.0 0.9 .003 12 44 Left IFG
Regions of signiWcant positive interaction between Group and Sex127 ¡50.3 ¡45.1 10.3 0.8 .002 2 22 Left STG180 ¡40.5 17.5 15.6 1.5 .001 13 44 Left IFG
Regions of signiWcant negative interaction between Group and Sex47 ¡45.0 6.0 17.7 0.4 .007 14 44 Left IFG
128 S. Baron-Cohen et al. / Brain and Cognition 61 (2006) 122–130
Fig. 3. Group comparison maps on the Eye
s task. (Slices and renderings as in Fig. 2.)Fig. 2. Group comparison maps in the EFT task. Activation sites have been superimposed onto a series of transaxial brain slices extending from z D¡16to z D 45 in Talairach coordinate space, and on a 3D rendering of the brain.
S. Baron-Cohen et al. / Brain and Cognition 61 (2006) 122–130 129
cortex than male controls, and both mothers and fathersshowed even less activity in this area than sex-matched con-trols. (2) Unlike the typical sex diVerence observed in controlson this task, there were no diVerences in group activationbetween mothers and fathers of children with AS. (3) Theordinal ANOVA of the EFT identiWed two speciWc extrastri-
Table 4EFT task: Group comparisons (3D coordinates only)
Key: LG, lingual gyrus; MOG, middle occipital gyrus; IOG, inferioroccipital gyrus; FG, fusiform gyrus.Here, Females refers to females in the control group alone, and Malesrefers to males in the control group alone.
Size Tal (x) Tal (y) Tal (z) Mass Probability Slice BA Cerebral region
Females > Males354 ¡17.1 ¡72.6 2.4 12.9 .002 11 18 Left LG210 25.1 ¡74.6 16.7 11.2 .003 13 19 Right MOG
Females > Mothers374 ¡19.5 ¡72.3 1.2 13.3 .009 11 18 Left LG154 25.2 ¡74.6 16.1 8.2 .004 13 19 Right MOG
Fathers > Mothers0 0 0 0 0 0 0 0
Mothers > Fathers0 0 0 0 0 0 0 0
Males > Mothers174 ¡28.7 ¡74.5 ¡1.6 6.6 .006 10 18 Left IOG
Males > Fathers102 28.6 ¡75.4 ¡9.5 3.3 .009 9 19 Right MOG168 ¡32.3 ¡73.9 ¡11.3 7.9 .003 8 19 Left FG
Table 5Eyes task: Group comparisons (3D coordinates only)
Key: IFG, inferior frontal gyrus; STG, superior temporal gyrus; MTG,middle temporal gyrus; PG, precentral gyrus.Here, Females refers to females in the control group alone, and Malesrefers to males in the control group alone.
Size Tal (x) Tal (y) Tal (z) Mass Probability Slice BA Cerebral region
Females > Males65 47.3 25.5 4.0 0.6 .006 11 45 Right IFG65 50.0 6.5 19.3 0.6 .006 14 44 Right IFG60 ¡45.1 7.5 15.9 0.5 .007 13 44 Left IFG
Males > Females170 ¡48.4 ¡46.9 13.2 2.3 .001 13 22 Left STG
96 ¡40.3 9.0 32.0 1.5 .001 16 44 Left IFG
Mothers > Fathers69 45.5 ¡58.2 12.4 0.6 .006 13 39 Right MTG
166 ¡41.3 2.1 7.2 2.0 .001 12 45 Left IFG
Fathers > Mothers52 ¡43.0 ¡0.3 30.5 0.8 .004 16 6 Left PG
Males > Mothers148 ¡49.4 ¡46.9 10.4 1.9 .001 12 22 Left STG
Mothers > Males95 ¡40.4 20.4 5.6 1.2 .003 11 45 Left IFG
Males > Fathers265 ¡46.9 ¡46.6 10.5 3.2 .002 12 22 Left STG117 ¡42.6 15.5 18.9 1.6 .002 14 45 Left IFG
Mothers > Females63 ¡41.2 17.6 ¡0.2 1.1 .002 10 47 Left IFG
ate regions that showed the pattern Females>Males>MothersDFathers: left and right BA 19. (4) On the Eyes task,female controls showed more activity in the left inferior fron-tal gyrus (BA 44) than female controls, and this was not seenwhen comparing mothers to males, or when comparing moth-ers to fathers. (5) The ordinal ANOVA of the Eyes task iden-tiWed two speciWc regions that showed the patternFemales>Males>MothersDFathers: BA 21 and 44. BA 44overlaps with a region that previous studies have identiWed asinvolved in ‘theory of mind’ (Frith & Frith, 1999).
We interpret these results as showing that the geneticcharacteristics of these parents (as carriers of the genes forASCs) may lead to hyper-masculinization of the brain. AsXagged up earlier, the rival explanation of the diVerencesobserved between parents and controls is that these are age-eVects, since the two groups were not age-matched. Futurework needs to disentangle these two interpretations. Itwould also be important in future studies to include otherindependent measures of the BAP in the same sample.
We draw the following conclusions: First, parents ofchildren with ASC show atypical brain activity on both theEFT and Eyes tests, which may reXect the BAP, that is,their genetic status as Wrst-degree relatives of such children.
Fig. 4. Ordinal analysis of variance for the EFT: regions Wtting the model.
Average SSQ ratio, by group, in Embeddegroup trend
0
0.05
0.1
0.15
0.2
0.25
0.3
Females Males Mothers Fathers
Group
Left visual cortexRight visual cortex
Fig. 5. Ordinal analysis of variance for the Eyes task: regions Wtting themodel.
Average SSQ ratio, by group, in Eyetrend
0
0.01
0.02
0.03
0.04
0.05
0.06
0.07
0.08
Females Males Mothers Fathers
Group
Left MTG
Left DLP
130 S. Baron-Cohen et al. / Brain and Cognition 61 (2006) 122–130
Second, even though a comparison of 6 males and 6 femalesdrawn from the typical population is too small to revealbehavioural or performance diVerences between the sexes,sex diVerences at the neural level are clearly evident withsuch sample sizes. The causes of such neural sexual dimor-phism are likely to include diVerences both in socialization(Baron-Cohen, 2003) as well as innate factors (Connellan,Baron-Cohen, Wheelwright, Ba’tki, & Ahluwalia, 2001).Finally, parents of children with ASC show patterns ofbrain activity consistent with hyper-masculinization.
Acknowledgments
The authors were supported by grants from the MRC,the Wellcome Trust, and the James S. McDonnell Founda-tion, during the period of this work.
References
Bailey, A., Bolton, P., & Rutter, M. (1998). A full genome screen for autismwith evidence for linkage to a region on chromosome 7q. HumanMolecular Genetics, 7, 571–578.
Bailey, A., Le Couteur, A., Gottesman, I., Bolton, P., SimmonoV, E.,Yuzda, E., et al. (1995). Autism as a strongly genetic disorder: Evidencefrom a British twin study. Psychological Medicine, 25, 63–77.
Baron-Cohen, S. (2002). The extreme male brain theory of autism. Trendsin Cognitive Science, 6, 248–254.
Baron-Cohen, S. (2003). The essential diVerence: Men, women and theextreme male brain. Penguin: London.
Baron-Cohen, S., & Hammer, J. (1997). Is autism an extreme form of themale brain? Advances in Infancy Research, 11, 193–217.
Baron-Cohen, S., JolliVe, T., Mortimore, C., & Robertson, M. (1997).Another advanced test of theory of mind: Evidence from very highfunctioning adults with autism or Asperger Syndrome. Journal of ChildPsychology and Psychiatry, 38, 813–822.
Baron-Cohen, S., Ring, H., Wheelwright, S., Bullmore, E. T., Brammer, M.J., Simmons, A., et al. (1999). Social intelligence in the normal andautistic brain: An fMRI study. European Journal of Neuroscience, 11,1891–1898.
Baron-Cohen, S., Wheelwright, S., Hill, J., Raste, Y., & Plumb, I. (2001).The ‘Reading the Mind in the eyes’ test revised version: A study withnormal adults, and adults with Asperger Syndrome or High-Function-ing autism. Journal of Child Psychology and Psychiatry, 42, 241–252.
Baron-Cohen, S., Wheelwright, S., Skinner, R., Martin, J., & Clubley, E.(2001). The Autism Spectrum Quotient (AQ): Evidence from AspergerSyndrome/high functioning autism, males and females, scientists andmathematicians. Journal of Autism and Developmental Disorders, 31, 5–17.
Bishop, D. V. M., Maybery, M., Maley, A., Wong, D., Hill, W., & Hallma-yer, J. (2004). Using self report to identify the broad phenotype in par-ents of children with autistic spectum disorders: A study using theAutism-Spectrum Quotient. Journal of Child Psychology and Psychia-try, 45, 1431–1436.
Bullmore, E. T., Brammer, M. J., Rabe-Hesketh, S., Curtis, V., Morris, R.G., Williams, S. C. R., et al. (1999). Methods of diagnosis and treatmentof stimulus-correlated motion in generic brain activation studies usingfMRI. Human Brain Mapping, 7, 38–48.
Bullmore, E. T., Suckling, J., Overmeyer, S., Rabe-Hesketh, S., Taylor, E.,& Brammer, M. J. (1999). Global, voxel and cluster tests, by theory andpermutation, for a diVerence between two groups of structural MRimages of the brain. IEEE Transactions on Medical Imaging, 18, 32–42.
Connellan, J., Baron-Cohen, S., Wheelwright, S., Ba’tki, A., & Ahluwalia,J. (2001). Sex diVerences in human neonatal social perception. InfantBehavior and Development, 23, 113–118.
Frith, C., & Frith, U. (1999). Interacting minds—A biological basis. Sci-ence, 286, 1692–1695.
JolliVe, T., & Baron-Cohen, S. (1997). Are people with autism or Asper-ger’s Syndrome faster than normal on the Embedded Figures Task?Journal of Child Psychology and Psychiatry, 38, 527–534.
Manjaly, Z. M., Marshall, J. C., Stephan, K. E., Gurd, J. M., Zillies, K., &Fink, G. R. (2003). In search of the hidden: An fMRI study with impli-cations for the study of patients with autism and with acquired braininjury. Neuroimage, 19, 674–683.
Manning, J., Baron-Cohen, S., Wheelwright, S., & Sanders, G. (2001).Autism and the ratio between 2nd and 4th digit length. DevelopmentalMedicine and Child Neurology, 43, 160–164.
Ogawa, S., Lee, T., Kay, A., & Tank, D. (1990). Brain magnetic resonanceimaging with contrast dependent blood oxygenation. Proceedings ofthe National Academy of Sciences of the United States of America, 3,9868–9872.
Ring, H., Baron-Cohen, S., Williams, S., Wheelwright, S., Bullmore, E.,Brammer, M., et al. (1999). Cerebral correlates of preserved cognitiveskills in autism. A functional MRI study of Embedded Figures taskperformance. Brain, 122, 1305–1315.
Suckling, J., & Bullmore, E. (2004). Permutation tests for factoriallydesigned neuroimaging experiments. Human Brain Mapping, 22(3),193–205.
Talairach, J., & Tournoux, P. (1988). Coplanar stereotaxic atlas of thehuman brain. New York: Thieme Medical Publishers.
Witkin, H. A., Dyk, R. B., Faterson, H. F., Goodenough, D. G., & Karp, S.A. (1962). Personality through perception. New York: Harper & Row.
Table 6Ordinal analysis of variance
Key: MOG, medial occipital gyrus; MTG, middle temporal gyrus; DLPFC, dorsolateral prefrontal cortex.Here, Females refers to females in the control group alone, and Males refers to males in the control group alone.
Size Tal (x) Tal (y) Tal (z) Mass Probability Slice BA Cerebral region
Regions where activation in Females > Males > Mothers D Fathers on the EFT437 ¡14.0 ¡75.0 31.0 13.8 .0003 16 19 Left Cuneus277 29.0 ¡78.0 ¡7.0 9.5 .0009 9 19 Right MOG
Regions where activation in Females > Males > Mothers D Fathers on the Eyes task117 ¡55.0 ¡50.0 5.0 0.8 .005 11 21 Left MTG
88 ¡40.0 6.0 37.0 1.1 .002 17 44 Left DLPFC