Flying high above the social radar: Coronal stop deletion in modern Appalachia
33
Flying high above the social radar: Coronal stop deletion in modern Appalachia K IRK H AZEN West Virginia University ABSTRACT In this paper I examine how a classic feature of variationist research, coronal stop deletion (CSD), operates at the end of the 20th century in one of the most renowned vernacular dialects in the United States, English in Appalachia. Through examination of CSD in a corpus of Appalachian speech, this paper also focuses on the methodological choices available. Several methodological questions are reviewed, such as the choices concerning voicing of the codas (wind vs. went vs. west). The corpus comprises interviews with 67 Appalachian speakers, yielding 17,694 tokens of potential CSD. These were analyzed using quantitative variationist methodology to reveal that morphological categories are less influential than even the preceding phonological environment. This finding is in stark contrast with some other vernacular varieties and suggests that apparent morphological influences are actually phonological influences that present themselves as morphological trends. Overall, the following phonological environment is overwhelmingly the most influential linguistic factor on the rate of CSD. These Appalachian speakers maintain relatively high rates, in effect constraining the social distinctions within Appalachia that could possibly be made using CSD, but marking them as vernacular speakers for those outside Appalachia. In general, we will find that consonant cluster simplification is a phonological process which intersects with grammatical processes, operating on a number of surface formatives to produce highly reduced surface forms, and the general rule which governs simplification can only be written when these grammatical forms are accurately known. —Labov, Cohen, Robins, & Lewis (1968:124) What was once seen as a vernacular feature of African American Vernacular English (AAVE) has now been investigated as a common feature in varieties of English around the world. As Schneider (2004:1126) summarized, deleting the final consonant of a consonant cluster “is the norm in the Caribbean, in ethnic dialects and contact forms in Am[erican] E[nglish], in L[iberean] S[ettler] The author greatly appreciates the National Science Foundation for supporting this research (BCS- 0743489). The author would like to thank the research assistants of the West Virginia Dialect Project for their work with this project, especially Paige Butcher, Sarah Vacovsky, Jaime Wagner, Ashley King, Erin Simmons, Courey DeGeorge, Kyle Vass, and Elizabeth Spinelli. The author would also like to thank Ralph Fasold and Walt Wolfram for their comments on consonant clusters. 105 Language Variation and Change, 23 (2011), 105–137. © Cambridge University Press, 2011 0954-3945/11 $16.00 doi:10.1017/S0954394510000220
Transcript of Flying high above the social radar: Coronal stop deletion in modern Appalachia

Flying high above the social radar:Coronal stop deletion in modern Appalachia
K I R K HA Z E N
West Virginia University
A B S T R AC T
In this paper I examine how a classic feature of variationist research, coronal stopdeletion (CSD), operates at the end of the 20th century in one of the mostrenowned vernacular dialects in the United States, English in Appalachia. Throughexamination of CSD in a corpus of Appalachian speech, this paper also focuses onthe methodological choices available. Several methodological questions arereviewed, such as the choices concerning voicing of the codas (wind vs. went vs.west). The corpus comprises interviews with 67 Appalachian speakers, yielding17,694 tokens of potential CSD. These were analyzed using quantitativevariationist methodology to reveal that morphological categories are less influentialthan even the preceding phonological environment. This finding is in stark contrastwith some other vernacular varieties and suggests that apparent morphologicalinfluences are actually phonological influences that present themselves asmorphological trends. Overall, the following phonological environment isoverwhelmingly the most influential linguistic factor on the rate of CSD. TheseAppalachian speakers maintain relatively high rates, in effect constraining thesocial distinctions within Appalachia that could possibly be made using CSD, butmarking them as vernacular speakers for those outside Appalachia.
In general, wewill find that consonant cluster simplification is a phonological processwhich intersects with grammatical processes, operating on a number of surfaceformatives to produce highly reduced surface forms, and the general rule whichgoverns simplification can only be written when these grammatical forms areaccurately known. —Labov, Cohen, Robins, & Lewis (1968:124)
What was once seen as a vernacular feature of African American VernacularEnglish (AAVE) has now been investigated as a common feature in varieties ofEnglish around the world. As Schneider (2004:1126) summarized, deleting thefinal consonant of a consonant cluster “is the norm in the Caribbean, in ethnicdialects and contact forms in Am[erican] E[nglish], in L[iberean] S[ettler]
The author greatly appreciates the National Science Foundation for supporting this research (BCS-0743489). The author would like to thank the research assistants of the West Virginia Dialect Projectfor their work with this project, especially Paige Butcher, Sarah Vacovsky, Jaime Wagner, AshleyKing, Erin Simmons, Courey DeGeorge, Kyle Vass, and Elizabeth Spinelli. The author would alsolike to thank Ralph Fasold and Walt Wolfram for their comments on consonant clusters.
105
Language Variation and Change, 23 (2011), 105–137.© Cambridge University Press, 2011 0954-3945/11 $16.00doi:10.1017/S0954394510000220

E[nglish] and Cameroon, and in South-East Asia, and it also occurs variably in alldialects of Am[erican] E[nglish], all non-white dialects of S[outh] A[frican] E[nglish], and also in northern England.”
This paper focuses on how coronal stop deletion (CSD) (e.g., best ! bes’) hasdeveloped in the variety of English found in theWest Virginia region of Appalachiaat the end of the twentieth century, exploring primarily its linguistic patternsthrough quantitative variationist analysis. As an often-studied variable, CSD, inits many guises, provides an excellent opportunity to make comparisons acrossthe linguistic and social factor groups of vernacular communities. Taking uptraditional methodological assumptions as a point of study, this paper fullyexamines the language variation patterns for the speakers, including lexical rates,morphological subdivisions, and phonological hierarchies.
A S U RV E Y O F CO RO N A L S TO P D E L E T I O N
Some sociolinguistic variables have several decades of research on their innerworkings, and CSD is a variable with such a rich literature of study. Given thislineage, it is important to review what methodological issues have arisen in thestudy of CSD. One of the first order concerns is about what constitutes thevariable itself. Three names are generally used. The name t/d deletion appears inmost of the literature of the 1970s and 1980s, and CSD is a rebranding of thatvariable. Consonant cluster reduction (CCR) is a slightly different variable.Rather than standardizing the names from the different sources, I have kept thenames used originally. From these early days of cluster analysis, it should benoted that three different sets of possible tokens were being analyzed by variousresearchers: final, single consonant deletion (e.g., bad ! ba’); CCR with final/t,d,p,k/; and CSD (a.k.a. /t,d/ deletion). Note that CSD and CCR are not thesame variable, and their names are not interchangeable.
Romaine (1984:221) argued that consonant cluster deletion has been operatingin its modern form since at least the beginning of the Middle English period, citingexamples in The Peterborough Chronicle, but that “the rule of t/d deletion was‘open-ended’; and that it reaches back to Proto-Germanic … ” (Romaine,1984:243). She identified the morphological constraint as most historicallyinfluential, because morphemic boundaries tend to inhibit reduction ofconsonant clusters. This finding is of interest because, regularly, the followingphonological environment most greatly affects the rate of CSD. Romaine alsoargued that the t/d deletion rule was “spread fairly widely through the socialcontinuum” (1984:244), and that even in the highest classes, the prohibitionsagainst t/d deletion went unheeded.
Labov, Cohen, and Robins (1965) and Labov and Cohen (1967) were the first inthe variationist era of linguistics to systematically examine CSD. Labov andCohen’s focus was the effects of CSD for literacy, a theme to which Labov(2001) returned. Wolfram (1969:50) also took up consonant clusters but added/sp/ and /sk/ clusters to the /t, d/ clusters. This choice remains the standard for
106 K I R K H A Z E N

Wolfram’s work (e.g., Mallinson & Wolfram, 2002; Wolfram, Childs, & Torbert,2000).1 Labov et al. (1968) considered postvocalic /t,d/ deletion to be part of thesame variable rule that produced /t,d/ cluster deletion, however Wolfram(1969:57, 95) defined CCR and postvocalic /d/ deletion as separate rules. Inanother study, Wolfram (1973b:83) argued for keeping the rules separatebecause they have different ordering of influential constraints. For a comparisonof these approaches, see the elucidating discussion of Fasold (1972:58–60).
In those previous works, the voicing of the cluster became a point ofmethodological concern. Wolfram (1969:51) wrote, “Clusters in which voicingor voicelessness is not a defining characteristic of the entire cluster such as[mp] (e.g., jump), [nt] (e.g., count), [lt] (e.g., colt), [!k] (e.g., crank), and [lp] (e.g.,gulp) are not included in this analysis since they do not function in the sameway… .” Subsequently, several early studies discussed the nature of voicing withfinal clusters. Wolfram and Fasold (1974:130) argued for a voicing constraintwhere the consonant clusters would be either both voiced or both voiceless: “thereduction rule only operates … when both members of the cluster are eithervoiced or voiceless.” Accordingly, several studies excluded clusters such as ltand nt from their potential tokens. In the current corpus, it was consideredworthwhile to assess patterns of variation of heterovoiced clusters.
Several general findings emerged from these early studies. First, consonantclusters were reduced more often before other consonants. For example,preconsonantal clusters showed deletion between 79% and 97% of the time forAfrican Americans in Detroit (Wolfram, 1969:62); for the same speakers, therates fell between 23% and 72% for following nonconsonants. In New York,Labov et al. (1968:128) found that working-class adults had rates that rangedbetween 47% and 86% for preconsonantal clusters. Second, clusters inmonomorphemic forms had higher rates of deletion than did clusters inbimorphemic forms. For prevocalic consonant clusters, Labov et al. (1968:128)found that working-class adults had rates of 49% for monomorphemic forms butrates of only 18% for bimorphemic forms. Third, the preceding phonologicalenvironment influences deletion, but it is seen as tertiary in comparison to theother two constraints.2
Guy (1980) enhanced the concept of the variable rule and ushered in the modernera of CSD study with an examination of individuals and groups in Philadelphia.He found that the linguistic constraints apply not only to the groups asconglomerates but also to individuals. Guy (1991) examined monomorphemicwords, semiweak verbs, and regular past tense verbs to test a model of lexicalphonology. Part of Guy’s (1991) analysis hinged on the idea that the final /t/ or/d/ is cut free from the coda cluster and is therefore available for resyllabificationwith the following word. At face value, this deduction aligns well with thegeneral finding that following consonants favor deletion and following vowelsinhibit it.
However, Labov (1997) argued against resyllabification of the final consonantas the explanation for the following phonological environment effect. He noted thatearlier studies (Fasold, 1972; Labov et al., 1968; Wolfram, 1969) found that “in all
C O RO N A L S TO P D E L E T I O N I N MOD E R N A P PA L AC H I A 107

English dialects, (t,d) deletion was favored by the sonority of the followingenvironment, by the presence of two preceding consonants, by absence of stress,by homogeneity of voicing in the cluster, and by the absence of any grammaticalfunction of the deleted segment.” Here the ordering falls from least sonorant—with the highest rates of CSD—to most sonorant—with the lowest rates of CSD.The categorization is, however, made by manner of articulation (stops, fricatives,liquids, glides, vowels), and differentiation within categories is rarely made.After recognizing the broad application for CSD research, Labov (1997) arguedthat resyllabification does not account for CSD because in order for thedesyllabified final consonant to be considered part of the next syllable, it wouldbe realized phonetically as an onset (e.g., /t/ would be aspirated word initially).Labov (1997) argued that this is not the case, and he also cast doubt on theusefulness of sonority as an explanation. Guy and Boberg (1997) revamped theargument over phonological structure when they evaluated CSD in terms of theobligatory contour principle, which has the general effect of differentiallydisallowing adjacent segments with similarities: the more different, the better.
Tagliamonte and Temple (2005) examined CSD in York English to provide aBritish perspective. Their study provides the most recent methodological basisfor the remainder of the current paper. Their important and surprising finding isthat the morphological constraint does not operate for York English speakers.For their speakers, CSD is strictly a phonological process. Tagliamonte andTemple (2005:283) reiterated the importance of the sonority of the precedingphonological environment but acknowledged that there are exceptions. Theyworked from Labov’s (1989) hierarchy: /s/. stops. nasals. other fricatives.liquids. Their results showed that preceding phonological segments stronglyaffect CSD, considerably more so than morphological constraints. Followingphonological environment is still the strongest constraint and patterns similarlyto other varieties.
Raymond, Dautricourt, and Hume (2006) took a new track in the linguisticanalysis of /t,d/ deletion with a thorough analysis of deletion word-internally,where clusters could be either onsets (e.g., still) or codas (e.g., holds). Clustersin the two different positions were found to undergo different deletion processes.For the internal codas, which parallel the context of the current study, Raymondet al. (2006) noted two influential linguistic factors: following phonologicalenvironment and preceding phonological environment. Nevertheless, they wrote(2006:89), “No features defining natural classes of consonants that followedword-internal alveolar stops predicted deletion of the preceding stop, althoughdifferent consonants were associated with different rates of /t,d/ deletion.” Theydid not (2006:75) find an effect of word frequency. For their model of speechproduction, they argued, “deletion results from cluster simplification to achievegestural economy and is introduced during segment planning” (Raymond et al.,2006:55).
Related to the acquisition of variable patterns is the storage of CSDconstraints in the mental grammar. From a different linguistic methodologicalperspective, Gahl and Garnsey (2004) used /t,d/-deletion to argue for the
108 K I R K H A Z E N

inclusion of probabilities in the syntactic knowledge of the mental grammar.This argument is based on the observation that “Frequent words tend toshorten (see, e.g., Schuchardt 1885, Hooper 1976), as do words that have ahigh probability of occurrence given a neighboring word (Jurafsky et al.2001).” Gahl and Garnsey (2004) reported that a word’s frequency and itslikelihood of having a reduced CC are proportional to each other. Accordingto Gahl and Garnsey (2004), this situation is especially true for word pairssuch as supreme court. Like Jurafsky, Bell, Gregory, and Raymond (2001),Gahl and Garnsey (2006) suggested that word frequency be considered as anindependent variable in /t,d/-deletion, because high frequency content wordsyield higher rates of word final /t,d/-deletion. For the current paper, corpus-internal probabilities of highly frequent words are considered.
Following from Schreier (2003), Schreier (2005) is a thorough book-lengthstudy of consonant changes in English, within which final cluster reduction,especially CCR, plays a large role. After reviewing the methodological choicesmade in many studies—whether to include tokens with more than twoconsonants, whether to include heterovoiced clusters, whether to include clustersending in a nonalveolar—Schreier compares constraints on CCR in NewZealand and the Englishes of the South Atlantic. He finds that for precedingenvironments, Pakeha New Zealand English adheres to the patterns familiar inU.S. varieties, in that laterals and nasals favor deletion more than most fricativesand plosives (2005:150). For Maori New Zealand English, preceding fricativesfavor deletion more than other factors. St. Helenian English and Tristan daCunha English invert the pattern of Pakeha speakers with plosives as the mostfavoring environment and laterals as the least favoring environment for CCR.For following phonological environment and morphological context, the NewZealand Englishes pattern as expected with consonants favoring reduction overpauses and vowels, whereas bimorphemic forms disfavor reduction of the finalconsonant (2005:151). Maori English is differentiated from Pakeha English byits notably higher rates (higher by 30 to 40 percentage points depending on theenvironment). For the South Atlantic Englishes, the following environments arenot ordered in familiar patterns. The average rates of 86.5% for St. HelenianEnglish and 87.8% for Tristan da Cunha English are distributed so that thebimorphemic tokens have higher rates than those for monomorphemic words,although the following phonological constraint appears to be the same as othervarieties. In the prevocalic environment, the bimorphemic tokens have rates of89.7% for St. Helenian English, whereas the monomorphemic forms have ratesof 72.5%. In the same phonological environment, Tristan da Cunha Englishspeakers have a rate of deletion of 93.8% for bimorphemic words but 81.4% formonomorphemic environments. Clearly, the South Atlantic English speakershave different constraint hierarchies for CCR. Schreier (2009) took thoseobservations further when he investigated CCR worldwide to assess the claim ofvernacular universals. He concluded that “there exist individual and dialect-specific differences as to the frequency and conditioning of CCR in Englishvarieties around the world” (2009:67). From the many studies he surveyed, he
CO RO NA L S TO P D E L E T I O N I N MOD E R N A P PA L AC H I A 109

found that in the United States, CCR is quantitatively significant for differentiatinglanguage variation patterns of English.
The literature on consonant reduction is vast and can be found in linguisticstudies and strictly social studies of ethnicity, language contact, and many othersocial examinations. Researchers have disagreed about how to delimit theenvelope of variation in which they were most interested, with variousresearchers defining the variable as all word-final consonant clusters and othersnarrowing the scope of consonant deletion. Some have restricted the variable toclusters with word-final coronal stops, and others have opted to restrict theconsonant-cluster pair to the same voicing (e.g., [sp] and [nd] but not [nt]).From the studies reviewed here and many more, researchers have found thevariable processes of deletion to be socially diagnostic and an efficient means ofassessing the mental grammar.
Previous research on Consonant Cluster Reduction in Appalachia
Wolfram and Christian (1976:33), in their summary of phonological aspects ofAppalachian English, examined CCR and found that Appalachians follow thenormal phonological constraint of higher rates of deletion before a consonantthan a vowel and lower rates in the bimorphemic context. As with otherWolfram studies, only heterovoiced clusters were examined. Table 1 is areplication of their findings (1976:36, Tables 10 and 11).
Wolfram and Christian (1976:35) also found that the rate of deletion beforepauses for the six speakers was 24.5%, which aligns pauses more closely with,yet still above, vowels, which averaged a rate of 11% (37 of 352). In terms ofwhat the deletion of consonant clusters can reveal about Appalachian society,Wolfram and Christian (1976:37) wrote, “On the whole, consonant clusterreduction in A[ppalachian] E[nglish] does not appear to be particularly sociallydiagnostic and speakers from different age and social group levels do not differsignificantly from each other in terms of the extent of simplification.”
Luhman (1990) used CCR in a matched guise study of attitudes about English inAppalachia, based on the identification of CCR by outsiders as an Appalachianfeature. He (1990:334) noted that consonant cluster simplification was one ofthe least predictable of the sociolinguistic variables analyzed in the speechsamples of the four speakers used to construct the matched guise samples.
Mallinson and Wolfram (2002) studied a small Appalachian, African Americancommunity in Beech Bottom, North Carolina, as part of the quest to understand theorigins of AAVE. In most U.S. Southern communities during the last third of the20th century, African American youth were moving away from local norms andtoward an external norm for AAVE. Within their rural community, however,Mallinson and Wolfram (2002) found accommodation to the local non–AfricanAmerican norms with several variables. Age was not included as a factor groupin their multivariate analysis, but in contrast to other AAVE features that werereceding, CCR did not show reduced rates through the generations. As withother studies, AAVE has been found to have considerably elevated rates of CCR.
110 K I R K H A Z E N

Mallinson and Wolfram (2002:757) argued that for African Americans in BeechBottom, CCR is a highly diagnostic variable, especially in comparison withother varieties of European-American Appalachian English. Their CCR resultsare displayed in Table 2, along with those from Childs and Mallinson (2004).Mallinson and Wolfram (2002:759) found that African Americans had a rate of28% for prevocalic monomorphemic forms, in comparison with 5% forEuropean Americans.
Childs and Mallinson (2004) examined the biethnic community of Texana,North Carolina, another small community in the Smoky Mountain region ofAppalachia. They took the same analytical strategy and contrasted the prevocalic
TABLE 1. CCR findings for six speakers from Wolfram and Christian (1976)
Preconsonant Prevowel
Age/Sex Monomorphemic Bimorphemic Monomorphemic Bimorphemic Total
27/F 81.0% 68.8% 10.0% 6.4% 32%17/21 11/16 2/20 3/47 33/104
67/M 77.7% 70.6% 21.4% 5.1% 43%35/45 12/17 6/28 2/39 55/129
13/M 80.6% 66.7% 28.6% 6.3% 52%29/36 8/12 6/21 1/16 44/85
15/F 68.4% 55.6% 22.7% 5.9% 43%26/38 5/9 5/22 1/17 37/86
9/M 78.6% 68.8% 8.8% 5.7% 24%11/14 11/16 3/34 3/52 28/116
11/F 65.2% 64.3% 16.0% 3.2% 38%30/46 9/14 4/25 1/31 44/116
Total 74% 67% 17% 5% 38%148/200 56/84 26/150 11/202 241/636
TABLE 2. CCR rates from Mallinson and Wolfram (2002:759) and Childs and Mallinson(2004:39)
Monomorphemic Bimorphemic
Prevowel Prepause Preconsonant Prevowel Prepause Preconsonant
Beech Bottom 27.8% 39.0% 76.5% 11.1% 20.0% 72.7%African Americans 15/54 16/41 62/81 8/72 2/10 16/22
Beech Bottom 5.0% 11.8% 51.4% 5.8% 0% 35.0%European Americans 2/50 4/34 36/70 4/69 0/15 14/40
Texana 26.0% 68.0%a 7.5% 41.2%African Americans 44/169 264/388 13/173 68/165
Texana 3.8% 30.2% 5.3% 19.7%European Americans 2/52 39/129 4/76 14/71
aThese combined columns are reconstructed from Childs and Mallinson (2004:39, Table 6).
C O RO N A L S TO P D E L E T I O N I N MOD E R N A P PA L AC H I A 111

environment for CCR in the two ethnic groups. Their data shows that their speakershave significantly lower rates of CCR in bimorphemic tokens (2004:39), therebydemonstrating that ethnic groups do not diverge in terms of the variable’smorphological constraints. For prevocalic, monomorphemic forms, AfricanAmericans have rates of 26% versus 4% for European Americans, as shown inTable 2.
The data from Appalachia indicate that the patterns found elsewhere in theUnited States also operate in this vernacular dialect region. Phonologicalconstraints, at least between consonants and vowels, affect rates of consonantdeletion, and morphological constraints also have an effect, albeit they are lessinfluential than the phonological factors. Socially, consonant deletion operatesacross Appalachian communities in all ethnic groups and generations. Fromthese previous investigations into CCR, the most straightforward hypothesis forthe current examination of CSD is that its vernacular status will be reduced andthat both phonological and morphological factors will influence the frequency ofdeletion.
M E T H O D S
For the investigation of sociolinguistic variation in Appalachia, the West VirginiaDialect Project (WVDP) has conducted sociolinguistic interviews with 151 nativeAppalachians. From these interviews, 67 speakers,3 born between 1919 and 1989,form the basis for the West Virginia Corpus of English in Appalachia (WVCEA),as shown in Table 3. Most of these interviews include word lists and readingpassages besides casual conversation. These speakers were chosen because ofthe quality of their interviews,4 their social distribution in terms of geography,age, and sex, and, lastly, the status of their parents as natives of Appalachia.5
TABLE 3. Social divisions for the West Virginia Corpus of English in Appalachia (WVCEA)
Group Subgroup Number of People
Age Group 2: 1919–1947 23Group 3: 1950–1979 23Group 4: 1980–1989 21
Sex F 32M 35
Region North 33South 34
College experience College (some) 44No college 23
Ethnicity African American 6European American 61
Social class Working 16Lower middle 32Upper middle 19
112 K I R K H A Z E N

These speakers are divided into three age groups, each of which is fairly evenlydivided by region and sex.6 Those three social categories were the major designgoal of the corpus. Of the 67 speakers, 6 are African American. Most speakerswere born and raised in West Virginia (64), although a few were born near theWest Virginia border in Ohio (2) and Pennsylvania (1).
Two social factors require explicit definition: regional division and educationallevel. The regional division between North and South was designated with alatitudinal line running through the middle of West Virginia from east to west,following Kurath’s (1949:27) division between northern and southern WestVirginia. It also echoes the divisions made by Carver (1987) and Labov, Ash,and Boberg (2006). The regional decision was also supported by speakers’ ownobservations. Most people assured us that Braxton County, WV, is where theSouthern–Northern division is found in the state. The second social factor is thecategory of college/no college. The differentiation rests between those speakerswith no college experience versus those with some, which could be as slight as asingle community-college class. A wide range exists in the corpus. Somespeakers do not have a high school degree and others have only a high schooldegree; some of the college speakers started postsecondary education but neverfinished; some finished with a bachelor’s degree, and one finished with amaster’s degree. The “college” speakers, defined as those who have orientedthemselves with postsecondary education in some fashion, could be any of thethree social classes in the corpus. The corpus contains working-class speakerswho have taken college classes and upper-middle-class speakers who are in the“no-college” category. In this way, the social factor group of college/no collegeis not a level of educational attainment but a category of identity and orientationto social institutions (Hazen, 2002). It is also a category of social orientation,which provides a check on our designations of social class and has shown strongcorrelations with language variation patterns in previous studies of this corpus(Hazen, 2008; Hazen, Hamilton, & Vacovsky, 2011).
For social class itself, the categories presented here are designed withtraditional indicators such as occupation and social-class environment in whichthe speaker was raised (Labov, 2001). For this study, the WVDP designatedsocial class based on occupation (or occupation of the parents if the subjectwas a minor), housing conditions (as known), self-discussion of high-schoolcliques, and living conditions (whether they had to work in high school; theirhobbies). These categories were used in addition to other factors, including thespeakers’ perceptions of their social class standings, their extracurricularactivity choices, and their explanations of their belongings. The previous resultsfrom this corpus (Hazen, 2008:128) strongly support the legitimacy of thesesocial class divisions.
The interviews were transcribed orthographically, and the WVDP researchersused those transcripts as maps to help guide them through the audio interviews.Each token was coded with the linguistic and social categories. All coders weretrained and their success rate was evaluated before starting on CSD coding.Difficult cases were evaluated using spectrograms to gather different clues for
C O RO N A L S TO P D E L E T I O N I N MOD E R N A P PA L AC H I A 113

making a judgment. Unclear instances were not kept as part of the data set, andoverall, the coding was a group effort, with several coders checking the moredifficult tokens.
The data were analyzed using Goldvarb X (Sankoff, Tagliamonte, & Smith,2005). Tables 10 and 13 are arranged to emphasize the constraint ranking withineach factor group and the relative strength of each factor group. Tagliamonte(2006:237) wrote, “Constraint ranking … provides a detailed model of thestructure of the relationship between variant and linguistic context, or the‘grammar’ underlying the variable surface manifestations.” The relative strengthof each factor group indicates which factor groups are most influential for thatdependent variable (Tagliamonte, 2006:242).
As noted previously, a distinction should be made between what numerousresearchers refer to as consonant cluster reduction (CCR) and coronal stopdeletion (CSD). For researchers such as Wolfram, Childs, and Torbert (2000)and Torbert (2001), the possible set of clusters to be examined includesinstances of /sk/ and /sp/. Obviously, those are not available to the samemorphological constraints as the other clusters, because /sk/ and /sp/ will onlyhave monomorphemic tokens. That distribution creates two concerns for thestatistical analysis. First, the potential for skewing the morphological hierarchywill arise, because the monomorphemic forms will have phonologicalconditioning that the bimorphemic tokens will not have. Second, the potentialforms have /s/ as a preceding sound, which has been found to be the precedingenvironment that most favors deletion. Conversely, when CCR studies report onthe preceding /s/ environment, it will have a higher proportion ofmonomorphemic forms, which will also skew the results. Accordingly, to avoidan imbalance and possible interactions of the linguistic constraint categories, thisstudy examines only coda clusters with coronal stops (i.e., CSD).
The dependent variable was coded for six variants, although [!], [p], and [k]were rare. The variants were thus reduced to [t], [d], and zero for the analysis.The tokens were coded for factor groups of underlying representation (/t/ or /d/),morphological context, and preceding and following phonological environment.For following phonological environments, vowels were coded as a single factor,and for both phonological environments, consonants were coded individually toallow for subsequent grouping as needed. Morphemic status was coded for eightdivisions: monomorphemic nonverb (e.g., the past), monomorphemic verb (e.g.,bust), bimorphemic preterit (e.g., I passed), semiweak verb (e.g., swept), regularpast participle (e.g., I have walked), semiweak past participle (e.g., I have swept),bimorphemic adjective (e.g., the burnt porch), and semiweak adjective (e.g., theswept porch). These morphemic categories were condensed throughout theanalysis.
Numerous combinations of factor groups and factors within each group wereexplored as part of coding the 17,694 tokens. Both phonological and phoneticenvironments were assessed, although the differences between them werenegligible in the end. Other methodological choices are revealed in the resultssection, where subsets of tokens are peeled away one by one to reveal certain
114 K I R K H A Z E N

language variation patterns. This paring down of the token set allows the mainresults to be comparable with the largest swath of studies.
R E S U LT S
This section provides results within two areas. First, the analysis of CSD isdiscussed in light of several linguistic constraints. Second, the correspondinganalysis of social constraints is presented, following the approach ofTagliamonte and Temple (2005). All percentages are the rates of zero formsdivided by the total number of tokens for that category.
Linguistic results
In analyzing many sociolinguistic variables, a wide variety of contexts arise thatmight influence the assessment of the linguistic processes. With this variable,the most abetting context to be considered is before alveolar consonants. Forboth homovoiced and heterovoiced clusters, prealveolar positions foster CSDrates above 93%, as seen in Figure 1 (/t/ [1416 of 1473]; /d/ [473 of 490]; /s/[727 of 788]; /n/ [238 of 246]). Clearly, following phonological environmentheavily influences CSD for these Appalachian speakers, and the lynchpinelement is the place of articulation because the wide range of sonorancy,manner, or voicing does not affect the rates. With this phonological influence inmind, these environments are removed for the remainder of the analysis.
Additionally, Tagliamonte and Temple (2005) developed a comprehensive setof contexts in which not to code CSD. For example, they exclude tokens ininterrogative and negated contexts. It is not exactly clear from that article whythose contexts would be excluded, although potential phonological stresspatterns might be altered within interrogative contexts. For this study, the tokenswere collected and the following results were found, as shown in Tables 4 and 5.At this point in the analysis, both homovoiced (e.g., /nd/, /st/) and heterovoiced(i.e., /rt/, /lt/, /nt/) tokens are included.
Neither negative contexts nor inverted question contexts were found to havesignificant effects on the rate of CSD in preliminary Goldvarb analysis. Inverted
FIGURE 1. Rates of CSD with following alveolar phonological environments.
C O RO N A L S TO P D E L E T I O N I N MOD E R N A P PA L AC H I A 115

questions in either homovoiced or heterovoiced contexts did not have a dramaticeffect, and inverted questions were a small fraction of the overall token count.For negative constructions, the rates were even more comparable with theirpositive counterparts. Future studies, in the search for sufficient tokens, shouldbe able to take these contexts as viable options. However, from this pointforward in this paper, these tokens will be excluded for the sake of comparability.
Another possible constraint for the consideration of CSD is that of stylisticcontext. In Table 6, within both homovoiced and heterovoiced clusters, the rates
TABLE 5. Rates of CSD in negative polarity contexts
Percentage of CSD
Homovoiced Negative contexts 58%385/659
Positive contexts 59%6312/10,717
Heterovoiced Negative contexts 91%176/194
Positive contexts 86%2374/2769
FIGURE 2. Rates of CSD within interviews, reading passages, and word lists.
TABLE 4. Rates of CSD in inverted question contexts
Percentage of CSD
Homovoiced Inverted questions 67%80/119
Declarative 59%6617/11,257
Heterovoiced Inverted questions 83%59/71
Declarative 86%2491/2892
116 K I R K H A Z E N

of CSD drop dramatically from the interview to theword list to the reading passage.For the heterovoiced, however, the decline between the interview and the readingpassage is not nearly as sharp, only a 6-percentage point drop. The overall impact ofthe stylistic contexts may be a result of social stigma about CSD, but it may also beattention to speech or the articulatory effects of the speech rate. Labov (2001:196)argued that -t,d deletion involves minimal style shifting and social awareness. Theword list and reading passage are frequently produced more slowly, or carefully,than the interviews. If it is not a social influence from stigmatization, then wecan conclude that articulatory effects contribute to these rates. This conclusionwould lend credibility to the interpretation of this variable being predominantlyphonological in nature. After the analysis of social factor groups, the potentialinfluence from stylistic context will be reconsidered. From this point forward inthis analysis, given the wide discrepancy between the three stylistic contexts, theinterview tokens are the only ones examined.
As noted by Tagliamonte and Temple (2005), among others, one of the basicexclusions in the study of CSD is the word and, because its rate of deletion isoften nearly categorical. It is not included in this study. Guy (2009) argued thatits reduced form has been lexicalized, as in the phrase rock ’n’ roll. Followingthis line of thought, three decisions were made regarding lexical items. First, alexical factor group would track frequently used lexical items, with 67 lexicalitems under observation. This tracking of individual lexical items allowed foranalysis of which lexical items might yield high rates of CSD, indicatingpossible lexical conditioning. Second, it was decided not to adopt the five-token-per-type sampling method established by Wolfram (1969:58, 1993:214). Theprimary rationale for establishing that sampling procedure was to limit thepotential effect of any one lexical item; for CSD specifically, the concern wasthat some words might be stored in the lexicon as a reduced form, and henceCSD could not apply as a variable rule. In the present study, by tracking lexicaleffects, the research team could guard against undue lexical influence without
TABLE 6. The effect of different stylistic contexts on rates of CSD
Cluster Voicing Percentage of CSD
Homovoiced Interview 61%6303/10,393
Reading passage 40%394/983
Word list 19%34/180
Heterovoiced Interview 86%2420/2801
Reading passage 80%130/162
Word list 21%38/178
C O RO N A L S TO P D E L E T I O N I N MOD E R N A P PA L AC H I A 117

restricting the number of tokens overall. Third, during analysis, it was decided toexclude the lexical items with deletion rates around or above 90%. That set oflexical items is displayed in Table 7. These high frequency lexical items withrates above 87% are excluded from the analysis for the remainder of this paper.Phonologically, five of these lexical items are [nt] combinations and two containvoiceless fricatives and one a voiceless stop. Although these phonologicalcontexts are not determinative in producing the associated high rates of deletion,they do lend themselves to higher rates in many studies.
One lexical item that is occasionally excluded before coding potential tokens ofcluster simplification is just. This one word had an overall rate of deletion of 82%(1455 of 1783). Although this rate is high, it was not excluded because it was stillvariably produced. Additionally, other words with preceding alveolars had a rate of77%, in line with that of the alveolar /s/ of just.
In reviewing the individual lexical items, an unexpected result appeared. Somelexical items had a noticeably lower rate of reduction than expected. In Table 8, thelexical items with the lowest rates of CSD are listed. The first column is the lexicalitem itself. The second column is the rate of CSD for that lexical item. The thirdcolumn is the percentage of tokens of that lexical item that fall before vowels,and the fourth column is the rate of reduction for that prevowel subset. Vowelsin almost all studies of CSD strongly disfavor deletion. Table 8 displays anunusually large percentage of these lexical items that come before vowels anddo, indeed, have considerably lower rates of deletion (cf. Bybee, 2002).
In this corpus, the 3830 tokens in the prevowel environment constitute 34% ofall the tokens. Given that these lexical items show up before vowels more often thanthat average, their lower rates of CSD would be best seen not as a lexical exceptionbut as a phonological effect. That these lexical items do show up before vowelsmore often is a matter of historical happenstance (e.g., many of these vowels are
TABLE 7. Lexical items removed from further analysis
Lexical Item Percentage of CSD
Front 98%44/45
Finished 96%49/51
West 96%300/314
Different 95%222/234
Went 95%460/486
Keep (kept) 92%57/62
Want 91%61/67
Tent 88%7/8
118 K I R K H A Z E N
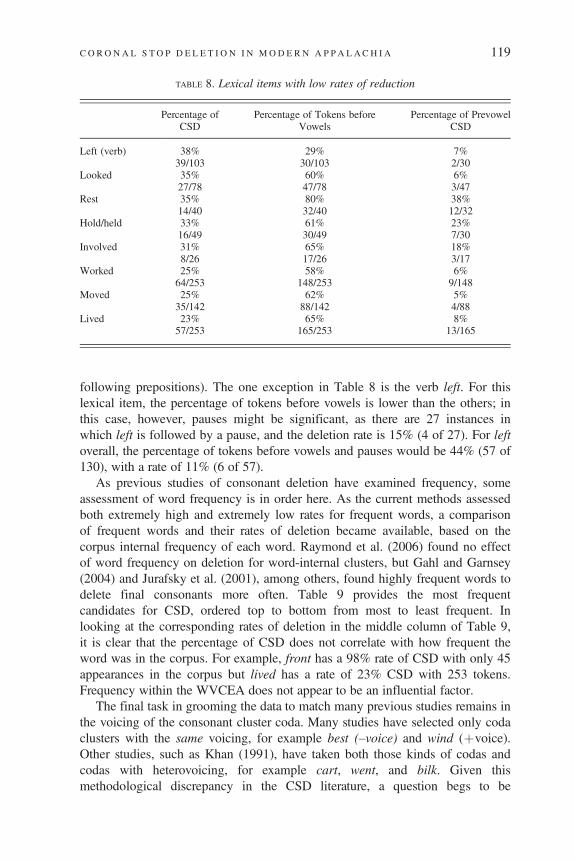
following prepositions). The one exception in Table 8 is the verb left. For thislexical item, the percentage of tokens before vowels is lower than the others; inthis case, however, pauses might be significant, as there are 27 instances inwhich left is followed by a pause, and the deletion rate is 15% (4 of 27). For leftoverall, the percentage of tokens before vowels and pauses would be 44% (57 of130), with a rate of 11% (6 of 57).
As previous studies of consonant deletion have examined frequency, someassessment of word frequency is in order here. As the current methods assessedboth extremely high and extremely low rates for frequent words, a comparisonof frequent words and their rates of deletion became available, based on thecorpus internal frequency of each word. Raymond et al. (2006) found no effectof word frequency on deletion for word-internal clusters, but Gahl and Garnsey(2004) and Jurafsky et al. (2001), among others, found highly frequent words todelete final consonants more often. Table 9 provides the most frequentcandidates for CSD, ordered top to bottom from most to least frequent. Inlooking at the corresponding rates of deletion in the middle column of Table 9,it is clear that the percentage of CSD does not correlate with how frequent theword was in the corpus. For example, front has a 98% rate of CSD with only 45appearances in the corpus but lived has a rate of 23% CSD with 253 tokens.Frequency within the WVCEA does not appear to be an influential factor.
The final task in grooming the data to match many previous studies remains inthe voicing of the consonant cluster coda. Many studies have selected only codaclusters with the same voicing, for example best (–voice) and wind (!voice).Other studies, such as Khan (1991), have taken both those kinds of codas andcodas with heterovoicing, for example cart, went, and bilk. Given thismethodological discrepancy in the CSD literature, a question begs to be
TABLE 8. Lexical items with low rates of reduction
Percentage ofCSD
Percentage of Tokens beforeVowels
Percentage of PrevowelCSD
Left (verb) 38% 29% 7%39/103 30/103 2/30
Looked 35% 60% 6%27/78 47/78 3/47
Rest 35% 80% 38%14/40 32/40 12/32
Hold/held 33% 61% 23%16/49 30/49 7/30
Involved 31% 65% 18%8/26 17/26 3/17
Worked 25% 58% 6%64/253 148/253 9/148
Moved 25% 62% 5%35/142 88/142 4/88
Lived 23% 65% 8%57/253 165/253 13/165
C O RO N A L S TO P D E L E T I O N I N MOD E R N A P PA L AC H I A 119

answered. Does the voicing harmony of the coda make a difference in the rate ofCSD? To answer this question, a factor group was established to mark voicelesscodas, voiced codas, and heterovoiced codas. As a factor group, the voicing ofthe coda was found to be significant in all subsequent Goldvarb analyses.Importantly, even between the homovoiced codas, a difference in the rate ofdeletion was found (see Table 10). The heterovoiced clusters (a voiced !voiceless consonant) were the most strongly correlated with deletion, with a rateof 86%. This higher rate primarily is a result of the preceding consonants of theclusters being /n/, /s/, and /l/, all of which favor deletion in any coda cluster.7 Forthe voiceless clusters, the rate falls to 64%. The rate for the voiced clusters dropsagain to 56%. This factor group was originally part of the Goldvarb analysis. Inthat examination, the factor group for the voice of the consonant cluster wassecond most influential with a range between the lowest and highest factor of 38.Considering that most studies do not consider this factor group, it was a surprisethat its effect was so strong. With this finding, future researchers shouldinvestigate how the voicing of the coda affects CSD in different communities.
However, as a regular factor group in the following analysis, statisticalanomalies arose. With the preceding phonological environment also a factorgroup, not all heterovoiced tokens could fully participate in the variation of thepreceding phonological environment. For the sake of comparability withprevious studies, and to avoid interactions in the following tables, the tokens willbe restricted to homovoiced codas. For all of the following findings, it is safe to
TABLE 9. Most frequent words, ordered by N
Word Percentage of CSD N
Just 82% 1783Went 95% 486Around 78% 424West 96% 314Most 59% 254Live 23% 253Work 25% 253First 73% 237Different 95% 234Tell 67% 211Call 54% 172Move 25% 142Find 54% 137End 52% 126Last 83% 120Left (verb) 38% 103Almost 59% 95Look 35% 78Want 91% 67Keep (kept) 92% 62Finish 96% 51Hold 33% 49Front 98% 45
120 K I R K H A Z E N

assume that heterovoiced codas would yield higher rates for any categoryexamined.
To summarize the analysis up until this point, tokens from the followingcontexts and categories have been removed from the subsequent analysis:following alveolars, inverted questions, negative constructions, reading passages,word lists, lexical items with unusually high rates of CSD, and heterovoicedcodas. The analysis now turns to consideration of the remaining significantlinguistic influences on CSD.
TABLE 10. Rates of CSD in three different types of consonant clusters
Percentage of CSD
Heterovoiced coda 86%2189/2541
Voiceless coda 64%3450/5363
Voiced coda 56%2398/4304
Total 66%8037/12,208
TABLE 11. Linguistic factors influencing CSD (Goldvarb analysis)
Input: .667 Chi-square/cell = 1.5281
Total N: 9554 Log likelihood =!4341.043
FW % N
Following phonological environmentConsonants (and /l/) .84 90% 3780Glides (and /r/) .57 74% 892Pause .28 46% 1154/h/ .23 38% 512Vowel .18 30% 3216
Range 66
Preceding phonological environmentAlveolar (/s/ and /n/) .59 72% 5684Voiced consonants (including liquids) .42 48% 2498Voiceless consonants .30 36% 1372
Range 29
Morphological typeMonomorphemic nonverbs .57 71% 5637Bimorphemic adjectives .47 57% 356Semiweak verbs and monomorphemic verbs .44 54% 853Bimorphemic verbs .37 39% 2708
Range 20
Note: Other factor groups included in analysis: ethnicity, age, social class, sex, region, collegeexperience (see Table 14).
C O RO N A L S TO P D E L E T I O N I N MOD E R N A P PA L AC H I A 121

In Table 11, three potential linguistic factor groups were investigated, and allthree were found to significantly affect its rate. As expected from previousstudies, the most influential factor group is that of the following phonologicalsegment. The factor groups themselves are ordered from most influential to leastinfluential, and internal to each factor group, the factors are ordered again frommost to least favorable (Tagliamonte, 2006). The range between the highest andlowest factor in each group indicates the relative strength of influence from thatgroup.
The factor group for the following phonological environment was mostsignificant with a range of 66. The difference between this range and the rangesof the other two factor groups should be kept in mind. It is evident that CSD forthese speakers is mainly a phonological process controlled by the followingphonological environment. In this environment, the CSD rate for consonants was90%, and the percentage for vowels was 30%. Those two factors, themselvescollections of various sounds, constituted the majority (73%) of the tokens. Thefull range of sounds is given in Figure 3.
The following environment of /l/ was found to have rates equal to otherconsonants, but following /r/ behaved differently. Following /l/ had a rate of92% (416 of 453), and following /r/ had a rate of 72% (105 of 145). As withpreceding environments, the status of /l/ as a lateral liquid with alveolar tonguecontact appears to be the deciding factor; for many West Virginians, /r/ isproduced as a bunched velar liquid. Following glides correlated with the nexthighest rate of CSD at 74%. The glides /j/ (81%, 174 of 216) and /w/ (72%,384 of 531) are grouped with the following environment of /r/, all of which hadcomparable rates. The rates of glides and other consonants were distinct enoughthat when combined, the larger grouping did not improve the model withinGoldvarb, and these categories were kept as separate factors. Following pausesdemonstrated a differential influence on CSD, with a rate of 46%. The followingenvironment of /h/ was a separate conundrum. One would expect that word-initially and as an onset, /h/ would maintain its consonantal qualities and matchthe rates of deletion found with the other fricatives in the consonant group. It
FIGURE 3. The rates of CSD for following phonological environment.
122 K I R K H A Z E N

clearly does not, correlating with deletion 38% of the time. Even though there areonly 512 tokens, the addition of these /h/ tokens to the consonant category did notimprove the model. For the factor group as a whole, exactly what linguistic qualityis the triggering influence is unclear: The following phonological environmentprovides hints of the effect of sonorancy, but it is not a foregone conclusion thatsonorancy is the actual triggering mechanism. The possible phonologicalworkings will be explored further in the discussion section.
The factor group for preceding phonological environment was next mostinfluential, with a range of 29 between the highest and the lowest ranked factors,as shown in Table 11. Contrary to many studies, this factor group outranked themorphological context in terms of its strength of influence. Although this factorgroup was originally coded as individual sounds, different natural classes weresubsequently tested with Goldvarb to assess which classification had the moststriking influence and provided the best model. The individual factors weretested in groups by sonorancy, by manner, by voice, and by place. Of thosecombinations, the place of articulation and voicing provided the best fit. Asnoted for other studies, preceding alveolars strongly correlate with CSD, with arate of 72%. Of the permutations of the other sounds, place of articulation wasnot clearly relatable to the rate of CSD. For example with velars, /g/ had a rate of56% but /k/ only had a rate of 32%. The most applicable natural class for theremainder of the factor group appears to be voicing. The sounds /r/ and /l/ hadcomparable rates, 44% (206 of 474) and 56% (634 of 1131), respectively. Giventheir multiple places of articulation and other phonological similarities, theywere grouped together in this factor group with the voiced consonants. A graphof the individual factors is given in Figure 4. As Tagliamonte and Temple(2005:283) noted of Labov (1989), the hierarchy /s/. stops . nasals . otherfricatives. liquids has been viewed as the normal ordering of influence frompreceding phonological contexts. According to Figure 4, that hierarchy does notfully match these data.
After the alveolars, the preceding environment demonstrates a gradual declineacross voiced consonants to voiceless consonants. The one anomaly is /v/, avoiced consonant with the lowest corresponding rate of CSD. This case is a
FIGURE 4. The rates of CSD for preceding phonological environment.
C O RO N A L S TO P D E L E T I O N I N MOD E R N A P PA L AC H I A 123

good example of a factor reflecting a separate linguistic influence. Throughhistorical happenstance, 518 of the 532 /v/ tokens are bimorphemic preterits,which have a lower rate of CSD: 138 of those 518 tokens (27%) had CSD. Theother 14 tokens of /v/ correlate with a 50% rate of CSD, which would put itfirmly in the voiced consonant range of rates. With that anomaly accounted for,the nonalveolar factors were grouped into voiced and voiceless categories. Theresulting Goldvarb analysis aligned well with the percentage distribution.
The least influential, yet significant, linguistic factor group was themorphological context, with a range of only 20, less than one-third of thefollowing phonological environment (and a smaller range than ethnicity inTable 14). This factor group began with more finely grained distinctionsbetween actively conjugated past tense forms and past participles and betweenadjectives and verbs. After winnowing these down, they were grouped togetherinto the categories in Table 11. The end points on this range of factors are theexpected candidates. The vast majority of the monomorphemic forms have thehighest rate at 71%. There is a subset of monomorphemic forms,the monomorphemic verbs such as rest (verb), which fit neither the pattern ofthe monomorphemic nonverbs nor the bimorphemic verbs. Semiweak verbs,be they adjectives or participles or actively conjugated, all patterned similarly,with a total rate of 55% (204 of 368). Monomorphemic verbs fell in line withthe semiweak verbs with a rate of 53% (257 of 485). Bimorphemic forms haddiffering rates within their subset. The bimorphemic verbs had the lowest rate at39% deletion (either as participles or not). The bimorphemic forms used asadjectives (e.g., the trapped miners) were found to have higher rates ofreduction, 57%, than bimorphemic verbs. Unlike Tagliamonte and Temple’s(2005) York corpus, the WVCEA demonstrates a morphological influence,although its internal categories are not as tidy as that found in other studies.
The cross tabulation between the following phonological environment and themorphological context reveals a fairly regular set of implicational tendencies inTable 12. Clearly, in looking across Table 12, the phonological environment hasthe strongest influence. Even the morphological category with the mostdampening effect, bimorphemic verbs, had a rate of deletion at 81% before afollowing consonant, although only a 15% rate before following vowels. Itshould be noted that for bimorphemic verbs, following vowels constitute 52%(1329 of 2564) of the instances, which is more than any other morphologicalcategory. Monomorphemic nonverbs had following vowels 28% of the time(1488 of 5379); bimorphemic adjectives had following vowels 34% of the time(121 of 352); and the combined monomorphemic and semiweak verb categoryhad following vowels 37% of the time (278 of 747). The rates do vary accordingto morphological category, as can be seen even in the vowel column inTable 12, but having one-half of the bimorphemic verbs come before vowelsyields lower CSD rates for that category. The morphological context with thehighest rates of deletion, monomorphemic nonverbs, drops from 94% beforeconsonants to 43% before vowels. This phonological influence is strongest withfollowing consonants, which clearly override other constraints and maintain rates
124 K I R K H A Z E N

above 80% for all the morphological categories. The monomorphemic nonverbshave the highest percentage of tokens that come before consonants with 46%(2456 of 5379). Bimorphemic verbs on the other hand have only 34% (863 of2564) of their tokens before consonants. The phonological influence from bothends of the spectrum reaches into the full range of morphological categories.
With the cross tabulation of the morphological and following phonologicalcategories, some cells are somewhat out of alignment. The preglides andprepauses contain most of the discrepancies. Semiweak verbs and bimorphemicadjectives overall have lower numbers of tokens than the other morphologicalcategories, and these lower numbers may have affected the order of rates.
For the cross tabulation of the following and preceding phonologicalenvironment, no cells are out of alignment. As these two are the most influentiallinguistic categories, their importance can be seen in the strict ordering ofTable 13. The range in this table is extremely wide, with rates as high as 95%for CSD after an alveolar and before a consonant and as low as 9% for CSDafter a voiceless consonant and before a vowel. Both the wider range of rates andthe stricter ordering provides more evidence for CSD’s nature as a phonologicalprocess for these Appalachian speakers.
TABLE 13. Cross tabulation between preceding and following phonological environments
Following Phonological Environment
Preceding Phonological Environment Consonant Glide Pause Vowel
Alveolar (/s/ and /n/) 95% 84% 53% 41%2407/2531 520/619 335/638 667/1630
Voiced 81% 61% 41% 24%644/797 115/187 152/372 228/962
Voiceless 78% 33% 28% 9%354/452 28/86 41/144 57/624
TABLE 12. Cross tabulation between morphology and phonology
Following Phonological Environment
Morphological Context Consonant Glide Pause Vowel
Monomorphemic nonverb 94% 82% 52% 43%2301/2456 525/639 417/796 643/1488
Bimorphemic adjective 86% 71% 33% 35%112/130 24/34 22/67 42/121
Monomorphemic verb and semiweak verb(all types)
88% 80% 29% 23%292/331 48/60 23/78 65/278
Bimorphemic verb (past tense and participle) 81% 42% 31% 15%700/863 66/159 66/213 202/1329
C O RO N A L S TO P D E L E T I O N I N MOD E R N A P PA L AC H I A 125

Social results
This section provides the results for possible social constraints on CSD as theypotentially affect language variation patterns. These social results includedivisions in age, sex, educational orientation, social class, region, and ethnicity.
As shown in Table 14, the differences between the social groups are slight, andtwo social categories—region and college experience—were not found to besignificant at all in the step-up/step-down procedure in Goldvarb. They wereremoved from the final Goldvarb analysis. Given these small differences, itwould be difficult to argue that the large differences (Table 6) found betweenthe stylistic contexts of interview, reading passage, and word list are a result ofsocial stigma. Only ethnicity illustrates a sizable difference in rates of CSD, withAfrican Americans holding a 13-percentage point higher rate than EuropeanAmericans.
TABLE 14. Social factors influencing CSD (Goldvarb analysis)
Input: .667 Chi-square/cell = 1.5281
Total N: 9554 Log likelihood =!4341.043
FW % N
EthnicityAfrican American .71 72% 820European American .48 59% 8734
Range 23
AgeGroup 4 .57 66% 3012Group 2 .54 58% 3337Group 3 .39 57% 3205
Range 18
Social classLower middle .53 60% 4331Working .51 60% 2648Upper middle .44 61% 2575
Range 9
SexFemale .53 63% 4577Male .47 57% 4977
Range 6
RegionNorth {NS} 60% 5167South {NS} 60% 4387
College experienceSome college {NS} 61% 6183No college {NS} 59% 3371
Note: Other factor groups included in analysis: following phonological environment, precedingphonological environment, and morphological type (see Table 11).
126 K I R K H A Z E N

The range between the factor weights is wider for ethnicity than formorphological context, one of the linguistic factors, but no social factor is moreinfluential than the phonological constraints. The African American populationof Appalachia is small (3.6% for West Virginia), and it is unclear how stronglyassociated CSD is with African Americans in the West Virginia region.
The social class results do not mirror those found for other variables in thiscorpus. For (ING) (Hazen, 2008), the rate of alveolar –in was found to bestrongly correlated with social class, with a decline from 73% for the workingclass to 50% for the lower-middle class to 38% for the upper-middle class. InTable 14, the rates for the three social classes are nearly identical. The collegeexperience category is also an indication of this lack of social stigma, because itoften times strongly correlates with social class differences. In these results,there is little difference between those with some college experience and thosewith none. If CSD were heavily stigmatized for these speakers, social differencesmatching the wide range of stylistic context differences would arise (Preston,1991). None do. Therefore, it would be best to conclude that the stylisticdifferences are the result of articulatory effects of speed or attention paid tospeech. This finding confirms Labov’s (2001) assertion that CSD offers onlymoderate style shifting opportunities for communities.
Coronal stop deletion does not appear to be undergoing a change in progress inAppalachia, as would be expected given what we know from previous studies. Therates for the three age groups are similar, and it is the youngest age group that hasthe highest rates. Unlike sociolinguistic variables such as a-prefixing (Hazen,Butcher, & King, 2010; Wolfram & Christian, 1976), CSD is maintaining itslinguistic and social patterns.
Lastly, for this small social examination, a look at individual variation is inorder. The rates for each individual are displayed in Figure 5, with the meanaverage line displayed. These rates are ordered from highest to lowest to allow aperspective of whether there are important breaks between speakers. Given thesmooth cline from the top speaker (85%) to the bottom speaker (36%), it isapparent that this sociolinguistic variable follows a pattern of gradient
FIGURE 5. Rates of CSD for individuals.
C O RO N A L S TO P D E L E T I O N I N MOD E R N A P PA L AC H I A 127

stratification, a typical scenario for a phonological variable. Given Romaine’s(1984) assumption that this linguistic process is quite old, it should be nosurprise that large gaps do not appear across the speech community despite thewide range of interspeaker variation. Unlike the distributions for individualsfound for (ING) by Trudgill (1974) and Hazen (2008), the upper and lowerlimits are not as distinct. That lack of distinction again reflects the low degree ofsocial marking this variable provides.
D I S C U S S I O N
The linguistic constraints on CSD fall into two basic categories—phonologicalconstraints and morphological constraints—as analyzed in this paper. Thephonological constraints themselves are divided into preceding and followingenvironments and are considered as segmental influences. As a generalassessment for this set of speakers, analysis has revealed that CSD is primarily aphonological process.
From the first CSD study to the present, the following phonologicalenvironment has been the most significant factor group for English. For theseAppalachian speakers, the effect of the following phonological environment isvastly stronger than that of other constraints. The ordering of influence withinthat factor group has been open to debate for some time, although clearly sometrends hold between communities. Following alveolars contribute the most tohigher rates of deletion. Following vowels do not favor deletion relative tofollowing consonants. This relative ordering is to be expected given previousresults. The full hierarchy for this study is: consonants. glides . pause . /h/ . vowel. Schreier (2005:169) presented this following hierarchy as fitting thefindings of Tagliamonte and Temple (2005), Fasold (1972), Guy (1991), andLabov (1997) for the effect of the following segment: “plosive. glide .liquids . vowel . pause.” This study’s hierarchy is not disharmonious withSchreier’s hierarchy, in that plosives fall in with all consonants, liquids dividebetween consonants (/l/) and glides (/r/) for this study, and pauses vary betweencommunities. Like Philadelphia and the Southern United States, theseAppalachian speakers’ CSD rates before a pause more closely align with vowelsthan they do with following consonants. Relatedly, Schreier (2005:169) notedthat some varieties, such as English in Philadelphia (Guy, 1991) showed moredeletion with following /l/. For most speakers in this region of Appalachia, theAmerican /r/ is produced as bunched, with most of the body of the tonguegrouped toward the velar region. In contrast, light /l/ in onset position will havean alveolar tongue tip placement. This contrast explains the difference between/l/ with 92% deletion and /r/ with 72% deletion.
Sonorancy has been an open question as a factor for following segments.Vowels, being the most sonorant elements, have always disfavored deletion.However, within the consonants, the following environments do not align withthe most sonorant elements favoring deletion more than the less sonorant
128 K I R K H A Z E N

elements. For example, in Figure 3, the rates for interdental fricatives and bilabialstops are inverted fromwhat their voicing would predict were the sonority hierarchystrictly enforced. Labov (1997) noted, “The auxiliary notion of the sonorityhierarchy has no more likely chance of success, since as we have seen, thebehavior of /w/ is not predicted by this principle any more than byresyllabification.”
One anomaly in the current results is the behavior of /h/ as a following segment.It should pattern like other voiceless fricatives and have rates somewhere between80% (/f/) and 96% (/!/). Instead, CSD before /h/ had a rate of 38%, second only tovowels (30%) for its inhibiting effect on CSD. In other words, neither followingvowels nor following /h/ encroached upon the preceding consonant clustersenough to cause higher rates of deletion. The possible reason for this /h/-scenario is that its qualities as a voiceless fricative may be waning in areas ofAppalachia. It is not uncommon for native West Virginians to say ’uge for hugeor ’umid for humid. At this point, the process seems to be lexically constrained.This /h/ dropping is not a feature remarked on by outsiders and has not becomepart of common stereotypes of Appalachian speech. It does appear for natives inour study, however, and it certainly provides an explanation for the exceptionallylow rate of CSD before /h/.
Given the changing nature of initial /h/ and the strong effects from consonants,we are able to reassess resyllabification. Labov (1997) provided a convincingargument against resyllabification as the motivation for the low rate of CSDbefore vowels. The idea of resyllabification follows from word final (t,d) beingreconfigured as the onset of the following word. As the onset, the (t,d) escapesthe deletion rule, which can no longer operate on that form. For resyllabificationto be a factor, it assumes that CSD occurs because a rule operates proactively.The data from this analysis present a different picture. The word-final (t,d)appears to be deleted most prominently when the following consonantencroaches upon it. When articulation for the following consonant is beingprocessed psycholinguistically, the final consonant of the preceding word has adramatically lower chance of being articulated. Two different constraints or rulesmay be operating here: (1) a (phonological) rule or constraint operating on allword-final CC clusters to reduce them to C codas approximately 50% of thetime, and (2) then an additional (articulatory) rule or constraint operating on allcodas followed by an encroaching consonant.
For CSD, following pause has varied from dialect to dialect, sometimesinhibiting deletion, sometimes correlating strongly with deletion. Schreier(2005:206) developed an analysis across many varieties to assess how theygroup according to rates before pauses. The varieties where following pausesinhibit deletion are those that have been long established and have been withoutcontact with substrate languages using only simple codas (CVC) (e.g., YorkEnglish, England; Pakeha English, New Zealand; European American English,North Carolina). The varieties where following pauses correlate with higher ratesof CSD have histories of language contact (Hyde County AAVE; BlackBahamian English). Schreier wrote (2005:207), “One could make a case in point
C O RO N A L S TO P D E L E T I O N I N MOD E R N A P PA L AC H I A 129

TABLE 15. The ethnic division for following phonological environment and morphemic status
Preconsonant Prepause Prevowel
Variety Monomorphemic Bimorphemic Monomorphemic Bimorphemic Monomorphemic Bimorphemic
WVCEA 93% 77% 75% 38% 61% 19%African Americans 319/343 69/90 58/77 8/21 104/170 18/96WVCEA 87% 69% 49% 31% 39% 17%European Americans 2835/3257 858/1244 369/753 80/259 594/1522 226/1354
Note: Semiweak tokens are excluded from this table.
130KIR
KHAZEN

that this is phonotactically motivated, namely that contact-derived varieties have astrong tendency to reduce complex final clusters with the aim of modifying thesyllable structure to CVC in saliently pre-P{ause} environments.” Within theWVCEA data, the ethnic divide does reveal a divide in the prepausalenvironment. In Table 15, the monomorphemic forms before pauses have aconsiderably higher rate for African Americans than do those for EuropeanAmericans. This finding aligns these Appalachian African Americans with thosefrom Hyde County, North Carolina, and supports Schreier’s claim aboutdiachronic effects on syllable structure from contact varieties.
Moving away from the following environment, the preceding phonologicalenvironment was second most influential on the rates of CSD, a surprisingfinding. As Tagliamonte and Temple (2005:283) noted, Labov’s (1989:90)constraint of /s/. stops. nasals . other fricatives. liquids is a “relativelyweak constraint.” For these data, the overall process of CSD appears to be morethoroughly a phonological process than a morphophonological process. Guy andBoberg (1997) argued within the autosegmental framework that the obligatorycontour principle constrains the final consonant in the CC coda, disfavoringsimilar adjacent forms. The data for these Appalachian speakers indicates thatpreceding phonological environment has this hierarchy: s. voicedconsonants . voiceless consonants. Because the alveolar place of articulationcontributes greatly to deletion, Guy and Boberg’s hypothesis is substantiated tosome degree. Yet no one quality appears to rule the preceding phonologicalenvironment’s effect on CSD, because a voiced segment favors deletion,regardless of the place of articulation. No clear alignment appears for manner ofarticulation either. Many studies have appealed to sonority for an explanation forthe preceding phonological environment effect. Tagliamonte (2006:115)summarized, “For preceding phonological context, variable (t,d) varies roughlyin proportion to the sonority of the preceding segment: less sonorous segments(stops and fricatives) tend to favour deletion, while more sonorous segmentsdisfavour deletion.” Raymond et al. (2006:84) found that for coda /t,d/ deletion,the preceding consonant class worked in the following way: nonhomorganicnonapproximant . homorganic nonapproximant . approximant. The results inthis analysis for word-final CSD do not match either of these findings,indicating a different set of constraints.
With the morphological analysis of these data, a few avenues of linguisticenquiry are revealed. The ordering of morphological context, from those thatcorrelate with higher rates to those that correlate with lower rates, is thefollowing: monomorphemic nonverbs . bimorphemic adjectives. semiweakverbs and monomorphemic verbs. bimorphemic verbs. The normal ordering,as noted by Tagliamonte and Temple (2005:285), is monomorphemes . pasttense semiweak verbs. past tense regular verbs. Two anomalies appear in thecurrent data, namely that neither monomorphemic nor bimorphemic formsbehave as a single group. It would be accurate to describe these category resultsfor CSD as nonverbs versus verbs, regardless of whether they aremonomorphemic or bimorphemic. Future studies could assess whether syntax
CO RO NA L S TO P D E L E T I O N I N MOD E R N A P PA L AC H I A 131

could play a role, but it seems more likely that the phonological prominence withincertain phrases is influential. Within the verb phrase, it appears that the verb wouldreceive more phrasal stress than a predicate adjective or an adjective embedded in anoun phrase. This alone would explain the differences between themonomorphemic nonverbs and the monomorphemic verbs. Alternatively, if onewere to adopt the lexical phonology path of Guy (1991), the bimorphemicadjectives might be stored as complete adjective forms, but the verbs might beactively constructed (and thereby be subjected to fewer opportunities fordeletion). However, the lexical phonology approach does not have much to sayabout the difference between the monomorphemic forms.
Furthermore, this study demonstrates that the voicing of the cluster—voiceless,voiced, or heterovoiced—can be a significant factor influencing the languagevariation pattern of CSD. Labov (1989:90) posited a hierarchy ofhomovoiced. heterovoiced, as drawn from (t,d) deletion studies of the 1960sand 1970s, and others have claimed that heterovoiced consonant clusters rarelyundergo deletion. In contrast to previous scholars’ claims, the heterovoicedcontext not only demonstrates CSD but also had the highest rate of deletion.Because this factor has been shown to be significant for other English varietiesaround the world (e.g., Khan, 1991), it should become a regular part of the CSDinvestigation.
For the field of language variation analysis, one of the advantages in havingmultiple CSD studies is the opportunity for comparing language variationpatterns for many communities. The caveat about comparing the overall rateremains. Tagliamonte and Temple (2005:288) wrote, “As is well known, theinput rate to the rule varies across dialects and even across individuals (e.g.,Guy, 1980).” The rate for the speakers in this study is higher than what has beenfound for other studies of Appalachia. This finding is probably related to thedecision to not limit the tokens to a small set per speaker or to limit the tokens-per-type ratio. Monitoring the rates of frequent lexical items was a crucial part ofthat choice, as certain lexical items could have skewed the variable resultsotherwise. This methodological change also yielded a more robust set of dataand allowed for a fuller statistical analysis.
Table 16 and Figure 6 compare rates from several U.S. varieties. OnlyAppalachian studies are included in Figure 6, whereas Table 16 also containsstudies of different ethnic varieties in the North and the South (United States).As a collection, a solid assertion can be made that these varieties operate withthe same language variation patterns for CSD and CCR.
The phonological constraint is evident across all varieties, and themorphological constraint shows effects for at least some cells. For theAppalachian varieties, they are most similar in that they have their lowest rateswith bimorphemic prevowel environments, between 5% and 19% deletion. Thiscomparability is remarkable because their rates diverge widely formonomorphemic prevowel environments, between 4% and 61%. The input ratefor these Appalachian speakers is not the same for each of the studies, but theinternal linguistic constraints are exceedingly similar.
132 K I R K H A Z E N

TABLE 16. A cross-lectal comparison of rates of CSD and CCR in U.S. varieties
Preconsonant Prepause Prevowel
Variety Monomorphemic Bimorphemic Monomorphemic Bimorphemic Monomorphemic Bimorphemic
African Americans, NY, working-class adults, Labov et al.(1968:128)
86 49 47 18
Northern African American, lower-working class,Wolfram (1969:62, 68)a
97 76 72 34
Northern U.S. European American middle class, Wolfram(1969:62, 68)a
66 36 12 3
Hyde County African Americans, Wolfram & Thomas(2002:136)
83 83 80 78 52 30
Hyde County European Americans, Wolfram & Thomas(2002:136)
59 41 33 6 10 4
Appalachian European Americans, Wolfram & Christian(1976:35,36)
74 67 25 17 5
Beech Bottom African Americans, Mallinson & Wolfram(2002:759)
77 73 39 20 28 11
Beech Bottom European Americans, Mallinson &Wolfram (2002:759)
51 35 11 0 5 6
Texana African Americans, Childs & Mallinson (2004:39) 68 41 26 8Texana European Americans, Childs & Mallinson(2004:39)
30 20 4 5
WVCEA African Americans 93 77 75 38 61 19WVCEA European Americans 87 69 49 31 39 17
aIn this study, the division was between consonants and nonconsonants.
CORONAL
STOP
DELETIO
NIN
MODERN
APPALACHIA
133

CO N C L U S I O N S
This paper examines CSD at the end of the 20th century in the English ofAppalachia, exploring both its linguistic and social patterns through quantitativevariationist analysis. From sociolinguistic interviews with 67 Appalachianspeakers and 17,694 of their coded tokens, the variationist analysis workedthrough different subsets of data to reach a data set comparable with otherstudies. From this investigation, it is clear that CSD plays a role in the languagevariation patterns of Appalachia. Yet even though it has been a regular part ofEnglish in Appalachia throughout the 20th century, internal to Appalachiancommunities, CSD has not been developed as a social marker. The lack of socialdifferentiation may well result from the high rates throughout the corpus. Somesocial factors, ethnicity and sex, for example, do significantly affect CSD rates,but the difference between ethnic groups and social classes does not parallelthose gaps found in other communities. For CSD to be used as a social markerinside Appalachia, the high rates of these Appalachians would most likely needto drop down into lower frequencies.
This study of CSD for English in Appalachia reveals that the majority oflinguistic constraints are similar to other U.S. varieties. The following andpreceding phonological segmental environments affect variation as well as themorphological category of the word containing the consonant cluster.Differences, or at least phenomena that are newly accounted for, do arise in thelanguage variation patterns of this corpus. A major distinction for this group ofAppalachian speakers is that the preceding phonological environment more
FIGURE 6. A comparison of Appalachian rates of CCR and CSD.
134 K I R K H A Z E N

significantly affects rates of CSD than do morphological categories. Anotherdistinction is that within the morphology factor group significant differenceswere found between different types of monomorphemic and bimorphemic forms:monomorphemic verbs had lower rates than monomorphemic nonverbs;bimorphemic verbs had lower rates than bimorphemic adjectives. Lexicalinfluences were also discovered, with some lexical items having extremely highrates of deletion and some lexical items having extremely low rates of deletion.To probe the lexical patterns, the methodological choice was made to avoid thefive tokens-per-type collection technique, and consequently more tokens becameavailable to analyze. On another methodological front, neither inverted questioncontexts nor negative contexts influenced rates of CSD, opening up otherlanguage corners where researchers can find tokens of CSD. The lastmethodological corner illuminated in this CSD study was that of the variablevoicing of the coda consonant cluster. This factor group included three factors—heterovoiced, voiced, and voiceless—and it was found to be strongly significant.
In the end, this investigation has revealed that even in the most inhibitingenvironments, the CSD rates are relatively high, marking these speakers asvernacular in the ears of listeners from other parts of the country. However, it isquestionable how vernacular CSD seems for Appalachians themselves. Despiteits high rates, the scant social divisions reveal that for the West Virginia area ofAppalachia, CSD is not a socially defining feature. The variable patterns of CSDdo not appear to be changing over time, and accordingly, it seems that it will bea stable feature for West Virginia in the 21st century.
With its relatively high rates for so many speakers, the social factors associatedwith CSD in other regions do not strongly correlate with it in this corpus. Somesocial factors, such as ethnicity, are found to be statistically significantinfluences on the rates of CSD, but the results clearly indicate that its powers ofsocial differentiation are underwhelming. From these findings, it can be said thatfor Appalachians at the turn of the century, their rates of CSD are flying highabove the social radar.
N O T E S
1. Wolfram (1973a:113) did, however, analyze syllable-final, postvocalic /t,d/ deletion in a study ofPuerto Rican English of New York City.2. Preceding phonological environment is configured in different ways for different dialects. For theAfrican American speakers studied in Labov et al. (1968), there were no voiced monomorphemicclusters, because various phonological processes (e.g., /r/-vocalization) were disrupting those clustersor making the tabulation of CSD impossible.3. There are 67, instead of more transparent 60, because some interviews were shorter. When there wasa dearth of material (e.g., an interview ran only 40minutes), another speaker was added to the category tobalance out theword total for age-sex-region subgroup. For example, Group 3 Southern males spoke lessthan other subgroups. For these interviews, the corpus contains 631,519 words (including all interviewparticipants).4. The selected interviews had predominantly free-flowing conversation rather than question andanswer formats. Regardless of which variables would eventually be studied in the WVCEA, thespeakers produced a lot of data in these interviews.5. In most cases, the grandparents and previous generations were also natives to Appalachia.
C O RO N A L S TO P D E L E T I O N I N MOD E R N A P PA L AC H I A 135

6. There is a Group 1, not accounted for in this paper, with speakers born between 1871 and 1918.Although balanced for region, it is not evenly balanced for sex, with a total of 16 speakers, only 2 ofwhom are female. The audio quality of some the interviews is also questionable.7. As shown later, the rate for preceding /r/ is not as high as for /s/, /n/, and /l/. Most likely, thisdifference results from a more bunched, velar /r/.
R E F E R E N C E S
Bybee, Joan. (2002). Word frequency and context of use in the lexical diffusion of phoneticallyconditioned sound change. Language Variation and Change 14:261–290.
Carver, Craig. (1987). American regional dialects: A word geography. Ann Arbor: University ofMichigan Press.
Childs, Becky, & Mallinson, Christine. (2004). African American English in Appalachia: Dialectaccommodation and substrate influence. English World-Wide 25(1):27–50.
Fasold, RalphW. (1972). Tense marking in Black English: A linguistic and social analysis. Washington,D.C: Center for Applied Linguistics.
Gahl, Susanne, & Garnsey, Susan. (2004). Knowledge of grammar, knowledge of usage: Syntacticprobabilities affect pronunciation variation. Language 80(4):748–775.
. (2006). Knowledge of grammar includes knowledge of syntactic probabilities. Language 82(2):405–410.
Guy, Gregory R. (1980). Variation in the group and the individual: The case of final stop deletion. InW. Labov (ed.), Locating language in time and space. New York: Academic Press. 1–36.
. (1991). Contextual conditioning in variable lexical phonology. Language Variation andChange 3:223–239.
. (2009). Unique lexical representations or multiple exemplars? A presentation at the annualmeeting of the Linguistic Society of America.
Guy, Gregory R., & Boberg, Charles. (1997). Inherent variability and the obligatory contour principle.Language Variation and Change 9(2):149–164.
Hazen, Kirk. (2002). Identity and language variation in a rural community. Language 78:240–257.. (2008). (ING): A vernacular baseline for English in Appalachia. American Speech 83(2):
116–140.Hazen, Kirk, Butcher, Paige, & King, Ashley. (2010). Unvernacular Appalachia. English Today 24(4):13–22.
Hazen, Kirk, Hamilton, Sarah, & Vacovsky, Sarah. (2011). The fall of demonstrative them: Evidencefrom Appalachia. English World-Wide 32(1):74–103.
Hooper, Joan Bybee. (1976). Word frequency in lexical diffusion and the source of morpho-phonological change. In W. Christie (ed.), Current progress in historical linguistics. Amsterdam:North Holland. 96–105.
Jurafsky, Daniel, Bell, Allan, Gregory, Michelle, & Raymond, William. (2001). Probabilistic relationsbetween words: Evidence from reduction in lexical production. In J. Bybee & P. Hopper (eds.),Frequency and the emergence of linguistic structure. Amsterdam: John Benjamins PublishingCompany. 229–254.
Khan, Farhat. (1991). Final consonant cluster simplification in a variety of Indian English. In J. Cheshire(ed.), English around the world: Sociolinguistic perspectives. Cambridge: Cambridge UniversityPress. 288–298.
Kurath, Hans. (1949). A word geography of the Eastern United States. Ann Arbor: University ofMichigan Press.
Labov, William. (1989). The child as linguistic historian. Language Variation and Change 1:85–97.. (1997). Resyllabification. In F. Hinskens, R. van Hout, & L.Wetzels (eds.), Language variation
and phonological theory. Amsterdam: Benjamins. 145–180.. (2001). Applying our knowledge of African-American English to the problem of raising
reading levels in inner-city schools. In S. Lanehart (ed.), Sociocultural and historical contexts ofAfrican American English. Philadelphia: John Benjamins. 299–330.
Labov, William, Ash, Sharon, & Boberg, Charles. (2006). Atlas of North American English. Hague:Mouton de Gruyter.
Labov, William, & Cohen, Paul. (1967). Systematic relations of standard and non-standard rules in thegrammars of Negro speakers. Project Literacy Reports No. 8. Ithaca, NY: Cornell University. 66–84.
Labov, William, Cohen, Paul, & Robins, Clarence. (1965). A preliminary study of the structure ofEnglish used by Negro and Puerto Rican speakers in New York City. Final report, CooperativeResearch Project 3091 [ERIC ED003819].
136 K I R K H A Z E N

Labov, William, Cohen, Paul, Robins, Clarence, & Lewis, John. (1968). A study of the Non-StandardEnglish of Negro and Puerto Rican speakers in New York City, Vols. 1 & 2. United States Office ofEducation Final Report, Research Project 3288 [ERIC ED028423 and ED028424].
Luhman, Reid. (1990). Appalachian English stereotypes: Language attitudes in Kentucky. Language inSociety 19:331–348.
Mallinson, Christine, &Wolfram,Walt. (2002). Dialect accommodation in a bi-ethnic mountain enclavecommunity: More evidence on the development of African American English. Language in Society31(5):743–775.
Preston, Dennis. (1991). Sorting out the variables in sociolinguistic theory. American Speech 66:33–56.Raymond, William D., Dautricourt, Robin, & Hume, Elizabeth. (2006). Word-internal /t,d/ deletion inspontaneous speech: Modeling the effects of extra-linguistic, lexical, and phonological factors.Language Variation and Change 18:55–97.
Romaine, Suzanne. (1984). The sociolinguistic history of t/d deletion. Folio Linguistica Historia 2:221–255.
Sankoff, David, Tagliamonte, Sali, & Smith, Eric. (2005). Goldvarb X: A variable rule application forMacintosh and Windows. Department of Linguistics, University of Toronto.
Schneider, Edgar W. (2004). Global synopsis: Phonetic and phonological variation in English world-wide. In E. W. Schneider, K. Burridge, B. Kortmann, R. Mesthrie, & C. Upton (eds.), A handbookof varieties of English. New York: Mouton de Gruyter. 1111–1138.
Schreier, Daniel. (2003). Convergence and language shift in New Zealand: Consonant cluster reductionin 19th century Maori English. Journal of Sociolinguistics 7(3):378–414.
. (2005). Consonant change in English worldwide: Synchrony meets diachrony. New York:Palgrave MacMillan.
. (2009). How diagnostic are English universals? In M. Flippula, J. Klemola, & H. Paulasto(eds.), Vernacular universals and language contacts: Evidence from varieties of English andbeyond. New York: Routledge.
Schuchardt, Hugo. (1885). Über die Lautgesetze: Gegen die Junggrammatiker. Berlin: R. Oppenheim.Tagliamonte, Sali. (2006). Analysing sociolinguistic variation. New York. Cambridge University Press.Tagliamonte, Sali, & Temple, Rosalind. (2005). New perspectives on an ol’ variable: (t,d) in BritishEnglish. Language Variation and Change 17(3):281–302.
Torbert, Benjamin. (2001). Tracing Native American English history through consonant clusterreduction: The case of Lumbee English. American Speech 76(4):361–387.
Trudgill, Peter. (1974). The social differentiation of English in Norwich. Cambridge: CambridgeUniversity Press.
Wolfram, Walter A. (1969). A sociolinguistic description of Detroit Negro speech. Washington, DC:Center for Applied Linguistics.
. (1973a). Sociolinguistic aspects of assimilation: Puerto Rican English in New York City.Arlington, VA: Center for Applied Linguistics.
. (1973b). Variable constraints and rule relations. In R.W. Fasold (ed.), Variation in the form anduse of language. Washington, DC: Georgetown University Press.
. (1993). Identifying and interpreting variables. In D. Preston (ed.), American dialect research.Amsterdam: Benjamins. 193–221.
Wolfram, Walter A., Childs, Becky, & Torbert, Benjamin. (2000). Tracing language history throughconsonant cluster reduction: Comparative evidence from isolated dialects. Southern Journal ofLinguistics 24(1):17–40.
Wolfram,Walter A., & Christian, Donna. (1976). Appalachian speech. Washington, DC: The Center forApplied Linguistics.
Wolfram, Walter A., & Fasold, Ralph W. (1974). The study of social dialects in American English.Englewood Cliffs, NJ: Prentice-Hall.
Wolfram,Walter A., & Thomas, Erik R. (2002). The development of African American English. Oxford:Blackwell.
C O RO N A L S TO P D E L E T I O N I N MOD E R N A P PA L AC H I A 137