Flow of winter-transformed Pacific water into the Western Arctic
24
Deep-Sea Research II 52 (2005) 3175–3198 Flow of winter-transformed Pacific water into the Western Arctic Robert S. Pickart a, , Thomas J. Weingartner b , Lawrence J. Pratt a , Sarah Zimmermann c , Daniel J. Torres a a Woods Hole Oceanographic Institution, Woods Hole, MA 02543, USA b University of Alaska, Fairbanks, Alaska, 99775, USA c Institute of Ocean Sciences, USA Accepted 16 September 2005 Abstract The dynamics of the flow of dense water through Barrow Canyon is investigated using data from a hydrographic survey in summer 2002. The focus is on the winter-transformed Bering water—the highest volumetric mode of winter water in the Chukchi Sea—which drains northward through the canyon in spring and summer. The transport of this water mass during the time of the survey was 0.2–0.3 Sv. As the layer flowed from the head of the canyon to the mouth, it sank, decelerated, and stretched. Strong cyclonic relative vorticity was generated on the seaward side of the jet, which compensated for the stretching. This adjustment was incomplete, however, in that it did not extend across the entire current, possibly because of internal mixing due to shear instabilities. The resulting vorticity structure of the flow at the canyon mouth was conducive for baroclinic instability and eddy formation. Multiple eddies of winter-transformed Bering water were observed along the Chukchi–Beaufort shelfbreak. Those to the west of Barrow Canyon were in the process of being spawned by the eastward- flowing shelfbreak current emanating from Herald Canyon, while the single eddy observed to the east originated from the Barrow Canyon outflow. It is argued that such an eddy formation is a major source of the ubiquitous cold-core anti- cyclones observed historically throughout the Canada Basin. Implications for the ventilation of the upper halocline of the Western Arctic are discussed. r 2005 Elsevier Ltd. All rights reserved. Keywords: Ocean circulation; Ocean currents; Oceanic eddies; Ventilation 1. Introduction Pacific-origin water flows through Bering Strait into the Chukchi Sea as a result of the large-scale sea-level difference between the Arctic and Pacific (Coachman et al., 1975). While the mean volume flux of 0.8 Sv is well-documented (Roach et al., 1995), north of the strait the exact pathways by which this water reaches the edge of the Chukchi shelf are still uncertain. One route is the Alaskan Coastal Current in the Eastern Chukchi Sea (Paquette and Bourke, 1974; Mountain, 1974), while another branch extends to the west through Hope Valley (Weingartner et al., 1998). Recently a third branch has been postulated in the central ARTICLE IN PRESS www.elsevier.com/locate/dsr2 0967-0645/$ - see front matter r 2005 Elsevier Ltd. All rights reserved. doi:10.1016/j.dsr2.2005.10.009 Corresponding author. E-mail address: [email protected] (R.S. Pickart).
-
Upload
uniatlantico -
Category
Documents
-
view
3 -
download
0
Transcript of Flow of winter-transformed Pacific water into the Western Arctic

ARTICLE IN PRESS
0967-0645/$ - see
doi:10.1016/j.ds
�CorrespondiE-mail addre
Deep-Sea Research II 52 (2005) 3175–3198
www.elsevier.com/locate/dsr2
Flow of winter-transformed Pacific water intothe Western Arctic
Robert S. Pickarta,�, Thomas J. Weingartnerb, Lawrence J. Pratta,Sarah Zimmermannc, Daniel J. Torresa
aWoods Hole Oceanographic Institution, Woods Hole, MA 02543, USAbUniversity of Alaska, Fairbanks, Alaska, 99775, USA
cInstitute of Ocean Sciences, USA
Accepted 16 September 2005
Abstract
The dynamics of the flow of dense water through Barrow Canyon is investigated using data from a hydrographic survey
in summer 2002. The focus is on the winter-transformed Bering water—the highest volumetric mode of winter water in the
Chukchi Sea—which drains northward through the canyon in spring and summer. The transport of this water mass during
the time of the survey was 0.2–0.3 Sv. As the layer flowed from the head of the canyon to the mouth, it sank, decelerated,
and stretched. Strong cyclonic relative vorticity was generated on the seaward side of the jet, which compensated for the
stretching. This adjustment was incomplete, however, in that it did not extend across the entire current, possibly because of
internal mixing due to shear instabilities. The resulting vorticity structure of the flow at the canyon mouth was conducive
for baroclinic instability and eddy formation. Multiple eddies of winter-transformed Bering water were observed along the
Chukchi–Beaufort shelfbreak. Those to the west of Barrow Canyon were in the process of being spawned by the eastward-
flowing shelfbreak current emanating from Herald Canyon, while the single eddy observed to the east originated from the
Barrow Canyon outflow. It is argued that such an eddy formation is a major source of the ubiquitous cold-core anti-
cyclones observed historically throughout the Canada Basin. Implications for the ventilation of the upper halocline of the
Western Arctic are discussed.
r 2005 Elsevier Ltd. All rights reserved.
Keywords: Ocean circulation; Ocean currents; Oceanic eddies; Ventilation
1. Introduction
Pacific-origin water flows through Bering Straitinto the Chukchi Sea as a result of the large-scalesea-level difference between the Arctic and Pacific(Coachman et al., 1975). While the mean volume
front matter r 2005 Elsevier Ltd. All rights reserved
r2.2005.10.009
ng author.
ss: [email protected] (R.S. Pickart).
flux of 0.8 Sv is well-documented (Roach et al.,1995), north of the strait the exact pathways bywhich this water reaches the edge of the Chukchishelf are still uncertain. One route is the AlaskanCoastal Current in the Eastern Chukchi Sea(Paquette and Bourke, 1974; Mountain, 1974),while another branch extends to the west throughHope Valley (Weingartner et al., 1998). Recently athird branch has been postulated in the central
.

ARTICLE IN PRESSR.S. Pickart et al. / Deep-Sea Research II 52 (2005) 3175–31983176
Chukchi, through the gap between Herald andHanna Shoals (Weingartner et al., 2005, see Fig. 1).However, recent modeling results suggest that, to alarge degree, the northward-flowing water fans outacross the entire Chukchi shelf, with little tendencytoward forming distinct branches (Winsor andChapman, 2004). One thing is certain, however,the two major canyons that cut into the Chukchishelfbreak—Herald Canyon in the west, and Bar-row Canyon in the east—play an important role inthe channeling of Pacific-origin water toward theopen Arctic.
Strong, persistent northward flow has beenobserved in both Herald and Barrow Canyon(Aagaard and Roach, 1990; Woodgate et al.,2005), although relatively little is known about thecirculation near Herald Canyon. This is largelybecause it is located in Russian territorial waters,which has limited the accessibility of this region.Barrow Canyon, on the other hand, has been thesubject of numerous field programs over the years.Early studies documented the seasonality of thenorthward flow through this canyon. In summer-time the buoyant Alaskan Coastal Current carrieswarm, fresh Bering summertime water into thecanyon as a surface-intensified jet (Paquette andBourke, 1974; Mountain et al., 1976; Munchow andCarmack, 1997). In fall and winter the windsintensify out of the northeast (Furey, 1996), whichtends to retard the flow, or block it altogether(Weingartner et al., 1998). During this period,cooling and ice formation over the Chukchi Seaform various classes of winter waters. These havebeen given a variety of names by different investi-gators, but in general there are two main classes thatwe will refer to as winter-transformed Bering water,and hypersaline water. The former is the largestvolumetric mode on the Chukchi shelf (see Aagaardand Roach, 1990; Weingartner et al., 1998), withsalinities between 32.5 and 33.5 and potentialtemperatures between �1.4 and �1.8 1C.1 The latteris the result of enhanced brine-enrichment due tocoastal polynyas that form adjacent to the AlaskanCoast (Cavalieri and Martin, 1994; Winsor andChapman, 2002), with salinities X34.0 and poten-tial temperatures near the freezing point (seeWeingartner et al., 1998). The winter-transformed
1This encompasses winter Chukchi water (Coachman et al.,
1975; Garrison and Becker, 1976; Aagaard and Roach, 1990),
Bering Sea winter water (Munchow and Carmack, 1997), and
Intermediate Chukchi water (Weingartner et al., 1998).
Bering water ventilates primarily the upper halo-cline (see Pickart, 2004), while the hypersaline wateris dense enough to ventilate the lower halocline(Weingartner et al., 1998).
In springtime, after the northeasterly winds sub-side, the recently formed dense water flows throughBarrow Canyon as a subsurface current. This flowlasts for several months (Mountain et al., 1976), andcan even persist beneath the buoyant AlaskanCoastal Current during the late summer (Paquetteand Bourke, 1974; Munchow and Carmack, 1997).It is primarily composed of the winter-transformedBering water. Northward flow of hypersaline waterthrough Barrow Canyon appears to be relativelyrare (Garrison and Becker, 1976; Aagaard andRoach, 1990; Munchow and Carmack, 1997),although plumes of it have been observed (Wein-gartner et al., 1998).
Aside from the seasonal transition in BarrowCanyon from dense winter-transformed Beringwater to buoyant Alaskan Coastal Current water,the dominant variability in the canyon is due toupwelling events. Warm deep water of Atlanticorigin is often transported a fair distance up thecanyon during episodic events, typically lastingfrom several days to a week (Aagaard and Roach,1990). Several mechanisms have been put forth toexplain such events. These include response tovariations in the sea level pressure differencebetween the Chukchi Sea and the Arctic (Mountainet al., 1976; Garrison and Becker, 1976), propaga-tion of large-scale coastally trapped waves (Aagaardand Roach, 1990), forcing by local winds (Moun-tain, 1974), and non-linear rectification due tovariations in the northward flowing waters throughBarrow Canyon (Signorini et al., 1997). At times theupwelled Atlantic water can extend far onto theChukchi shelf (Bourke and Paquette, 1976).
The mean speed of the northward-flowing winter-transformed Bering water through Barrow Canyonis O(15–20) cm/s (Aagaard and Roach, 1990).Instantaneously, however, the flow can be muchgreater than this. The surface-intensified flow of theAlaskan Coastal Current through the canyon iseven stronger, with synoptic measurements as largeas 75–100 cm/s (Mountain, 1974; Munchow andCarmack, 1997). To date there have been no long-term measurements of the near-surface waterthrough the canyon (due to ice constraints).Synoptic estimates of volume transport throughthe canyon vary significantly, and can exceed 1 Sv(Munchow and Carmack, 1997). The partitioning of

ARTICLE IN PRESSR.S. Pickart et al. / Deep-Sea Research II 52 (2005) 3175–3198 3177
the transport between the summertime and winter-transformed Bering waters—which can flowthrough the canyon simultaneously—has yet to bedone.
Some aspects of the dynamics of the flow throughBarrow Canyon have been addressed previously.Munchow and Carmack (1997) were the first toobtain a high-resolution two-dimensional (2-D)section of the velocity field, using a towed AcousticDoppler Current Profiler (ADCP). This revealed astrong, deep-reaching jet (carrying Alaskan CoastalCurrent water in the upper layer and winter-transformed Bering water at depth) in approximategeostrophic balance (see Signorini et al., 1997).However, relative vorticities as strong as 6f (where f
is the local Coriolis parameter) were measured onthe offshore side of the jet. This suggests thelikelihood of non-negligible ageostrophic effects,and in fact Signorini et al. (1997) demonstrated thata significant secondary (cross-canyon) circulationexists.
Downstream of Barrow Canyon there is someuncertainty as to the fate of the Pacific-origin water.One notion is that the majority of the water (bothlight and dense) continues eastward along theshelfbreak/upper-slope of the Beaufort Sea as aboundary current (Mountain, 1974; Chapman,2000; Pickart, 2004). Another suggestion is thatthe dense winter water sinks down the canyon andenters the deep basin directly (Garrison and Becker,1976). Either way, there is suggestion that the flowof both warm and cold water exiting the canyonbecomes ‘‘ill-behaved’’ and subsequently formseddies. The southern Canada Basin is populatedwith small-scale eddies (Manley and Hunkins, 1985;Plueddemann et al., 1999) that contain Pacific-origin shelf water (Muench et al., 2000). The vicinityof Barrow Canyon has been postulated as a sourceregion for some of these eddies. Modeling studies ofthe flow through the canyon have investigated thespawning of eddies from the Alaskan CoastalCurrent (D’Asaro, 1988) as well as from thewinter-transformed water (Shaw and Chao, 2003;Chao and Shaw, 2003; Cenedese and Whitehead,2000). Direct observation of this process, however,has yet to occur.
The purpose of the present study is to elucidatefurther the dynamics of the flow of dense waterthrough Barrow Canyon, with an eye towardsunderstanding why this might lead to eddy forma-tion. We focus on the winter-transformed Beringwater, and use data from a hydrographic survey
conducted in July–August 2002 to investigate theadjustment of the dense water as it flows down thecanyon. We begin with a presentation of the data,followed by a kinematic description of the flow. Thepotential vorticity dynamics are then investigated tounderstand the impact of the stretching of the layeras it progresses northward. Several cold-core, anti-cyclonic eddies were observed along the shelfbreak;these are described and related to the flow throughthe two Chukchi Sea canyons. Finally, the ramifica-tions of such eddies on the ventilation of theWestern Arctic halocline are considered.
2. Data and methods
2.1. Hydrographic variables
In July–August, 2002 a hydrographic survey wascarried out in the Eastern Chukchi/Western Beau-fort Seas, as part of the Western Arctic Shelf–BasinInteractions (SBI) program. SBI is a multi-institu-tional, interdisciplinary project studying the mannerin which the Arctic shelves communicate with andinfluence the adjacent Canada Basin (see Grebmeierand Harvey, 2005). The hydrographic survey inquestion was carried out aboard the USCGC PolarStar, during which an array of moorings was alsoset. (A second SBI cruise on the USCGC Healyoccurred at the same time, consisting mostly ofbiological and chemical measurements; see thearticles in this special issue). Fig. 1 shows thestation locations, consisting mainly of a set ofsections crossing the Chukchi/Beaufort shelf-slopeboundary. This survey represents the first time thatdensely spaced measurements have been carried outacross the shelfbreak in the Western Arctic. Thestation spacing for all sections (excluding the centralshelf section) was p5 km, which is smaller than theRossby radius of deformation at this latitude(8–10 km).
The instrument package consisted of a Seabird9+ conductivity/temperature/depth (CTD) unitmounted on a 24-position frame with 10-l Niskinbottles. A laboratory calibration of the temperaturesensors was done before and after the cruise, and anin situ calibration of the conductivity sensors wascarried out during the cruise via bottle salinitymeasurements. Accuracies were determined to be.001 1C for temperature and .002 for salinity(practical salinity scale). Included on the CTDpackage was a Wetlabs light scattering sensorto measure turbidity, a Seapoint chlorophyll

ARTICLE IN PRESS
10
10
20 203030
40
40
40
40
40
40
40
50
50
5050
50
50
60
60
60
60
60
70
70
70
70
70
80
80
80
8080
9090
90
90
100
100
100
100
150
150
150
150
200
200
200
500
500
500
1000
1000
1000
2000
2000
2000
3000
3000
Alaska
Chukchi Sea
Beaufort Sea
1
2
3
4
5
6
Barrow Canyon
Hanna Shoal
Herald Shoal
52
42
78
90
Scicex 97
CTD Stations July-August 2002
72
(A)
(B)
ο
ο
ο
ο
ο
οοοοο
ο
ο
ο
ο
ο
Fig. 1. (A) Study area in the Eastern Chukchi and Western Beaufort Seas. (B) Enlarged view of study area, showing the hydrographic
stations occupied by USCGC Polar Star in summer 2002. The survey consisted of six sections. Station numbers are included on the two
Barrow Canyon sections: the head of the canyon (stations 42–52) and the mouth of the canyon (stations 78–90). The location of the eddy
observed during the 1997 Scicex expedition is indicated by the triangle.
R.S. Pickart et al. / Deep-Sea Research II 52 (2005) 3175–31983178
fluorometer, and an RD Instruments dual-work-horse lowered ADCP. Phosphate, nitrate, silicate,and nitrite samples were collected as well, althoughnot at every station due to the fast pace of thesurvey. Nonetheless, slightly coarser nutrient sec-tions were obtained for all but the last section (nowater samples were taken on Section 6 because of apylon malfunction late in the cruise). Stations were
regularly occupied to within 1–2m above thebottom in order to sample the bottom boundarylayer. Standard CTD quality control and pressureaveraging were performed to produce 1-db-aver-aged downcast temperature and salinity profiles,from which potential temperature (y) and potentialdensity (sy), referenced to the sea surface, werecomputed.

ARTICLE IN PRESSR.S. Pickart et al. / Deep-Sea Research II 52 (2005) 3175–3198 3179
2.2. Winds
Wind data were obtained using the Polar Star’smeteorological sensor suite, mounted 21m abovethe sea surface. An average wind vector wascomputed for each CTD station (while the shipwas stopped). Winds throughout the cruise werelight; the overall average wind speed was3.471.8m/s out of the northwest. Hence, atno time during the month-long survey was therean upwelling event in Barrow Canyon (such eventsare more common during the fall season, corre-sponding to the passage of Aleutian low-pressuresystems).
The two hydrographic sections of particularinterest for this study are the lines across the headand mouth of Barrow Canyon (Sections 4 and 6,respectively, Fig. 1). Although these lines were notoccupied sequentially, they were separated by only 3days. This is less than the time for a parcel of densewater to travel the length of Barrow Canyon (order150 km), so in this regard the two sections can beconsidered synoptic.2 Winds during the first cross-ing (head of the canyon) averaged 3.672.7m/s outof the west/southwest, and during the secondcrossing (mouth of canyon) the winds averaged2.971.4m/s out of the northwest.
2.3. Absolute velocity
2.3.1. Estimation of surface velocity
Unfortunately, our lowered-ADCP data are oflimited use in Barrow Canyon due to an inap-propriate setting in the software for the shallowdepth of the canyon (the deep-water lowered-ADCPdata are fine). Therefore, we were faced with usinggeostrophic velocities for our analysis, and, inparticular, determining a method of making themabsolute. To do this we relied on ship drift.
As it happens, the Polar Star shuts down itspropulsion system during the occupation of CTDstations in the presence of ice. In the case of our2002 survey, the standard procedure was to wait10–15min after the screws were disengaged beforedeploying the CTD, to allow the ship to adjust to
2Munchow and Carmack (1997) found large variations in the
flow field within Barrow Canyon on time scales shorter than this.
It is worth pointing out, however, that their sections were
collected during the fall season when winds are generally
stronger. Furthermore, their sections were taken just a few days
after an upwelling event occurred in the canyon (Signorini et al.,
1997).
the environmental conditions. The movement of theship during the cast—i.e. the ship drift—was due toa combination of wind, surface-current, and icestresses. We used the navigational data to calculatethe ship drift during each CTD cast of the twoBarrow Canyon crossings. The GPS unit on thePolar Star has a stated accuracy of 5m. When this islocated on the mast of a rolling ship the accuracyfor computing ship drift will be less. However, thesea state was flat during both Barrow Canyoncrossings (due to the presence of ice and the lightwinds), so the GPS unit was likely quite stable. Toquantify the accuracy, a dock test was conductedafter the cruise when the ship was tied to the pier.Over the 90-min period of the test the RMS scatterin the GPS position was 73.1m (this included theeffects of small rolls due to the passage of nearbyvessels in the harbor). For a 10-min CTD cast (theaverage duration during the Barrow Canyonstations) this gives a maximum random error of1 cm/s. Hence the ship-drift calculation is deemedaccurate.
The next step is to determine what portion of thedrift is due to the surface current. Because the windswere light during the two transects of the canyon,and because during each transect we crossed theswift Alaskan Coastal Current, we assume that theship drift during each CTD station was duepredominantly to the surface current. In otherwords, we neglect wind drift and ice effects on themovement of the vessel. Ice stresses were likely not aproblem because there was a significant amount ofopen water in the area. This was verified byphotographs taken during the cruise, as well as byinspection of the ship’s logs. Visual estimates of iceconcentration were recorded hourly by the person-nel on the bridge, and the average concentrationduring the two crossings was 0.470.2.
As an attempt to quantify the error associatedwith neglecting the wind drift, we note that thestandard rule used by the Coast Guard and othermariners is that vessels drift at roughly 3% of thewind speed and 201 to the right of the wind. Thiscan be derived by considering the steady-state forcebalance on the ship due to the wind and current(J. Trowbridge, pers. comm., 2005). Keep in mindthat we waited 10–15min before estimating the shipdrift, during which time the vessel would swingbeam into the wind. Under these conditions thedrag coefficients in air and water are roughlythe same and equal to unity. With this assumption,the difference between the ship drift and surface

ARTICLE IN PRESSR.S. Pickart et al. / Deep-Sea Research II 52 (2005) 3175–31983180
current can be written as
jU s�!� Uw�!j ¼
raAa
rwAw
� �1=2
ðjUa�!� U s�!jjUa�!jÞ1=2,
(1)
where U!
is velocity, r is density, A is the cross-sectional area on which the fluid acts, and thesubscripts a, w, and s denote the air, water, andship. Assuming Aa ¼ Aw and j~Uajbjj~U sj, andtaking ra=rw ¼ 10�3, (1) reduces tojU s�!� Uw�!j ¼ :03jUa
�!j, which is the standard esti-
mate noted above. In our case, using a diagram ofthe ship, Aa=Aw was estimated to be 1.3 (B. Toney,pers. comm., 2005), and since the winds were lightwe did not implement the assumption thatj~Uajbjj~U sj. These two factors tend to offset eachother, such that the resulting scale factor for thewind remains nearly the same (.031).
Using the measured wind speeds noted above,this results in an error of 10 cm/s for the assumptionthat the surface current equals the ship drift. This ison the order of 10% based on the observed shipdrift of 2 knots in the Alaskan Coastal Current. Theerror, however, is likely smaller than this. Considerthat during the first crossing (head of the canyon)the wind was variable over a range of 601 yet theship drift in the Alaskan Coastal Current stayedconstant to within 81 (mean direction ¼ 65 1T).Then, despite the fact that the wind shifted 551 tothe right prior to the second crossing (mouth of thecanyon), the ship drift direction remained the same(within 31). In fact, the predicted wind drift for thesecond crossing was nearly perpendicular to theobserved ship drift. Finally, there was no station-to-station correlation between the wind and ship-driftvectors for either crossing.
Therefore, we are confident that the calculatedship drift is an accurate measure of the surfacevelocity. We note that there is a nice correspondenceof the surface flow of the Alaskan Coastal Current,so computed, and its hydrographic front. Also, theconsistency of the volume transport between thetwo transects (see below) gives us confidence thatour method of referencing the geostrophic velocitiesis sound.
2.3.2. Referencing the geostrophic velocity
To compute the absolute geostrophic velocitieswe first interpolated the temperature and salinitysections onto a regular grid using a Laplacian-splineobjective interpolator. The grid spacing was 1 or
2 km in the horizontal and 5m in the vertical (notethat the CTD station spacing was approximately2.5 km within the jet). Geostrophic velocities werecomputed on this grid (using the same objectiveroutine to extrapolate into the bottom triangles),then the component of the surface current normal tothe hydrographic section was used to reference thevelocities. We define x, u as the distance, velocitynormal to the section (positive northeastward), andy, v as the distance, velocity along the section(positive offshore). For the section across the mouthof the canyon, the velocity calculation revealedstrong northward flow in the upper layer (theAlaskan Coastal Current), and alternating bandsof northward and southward flow at depth (notshown). Such bands of alternating flow are remi-niscent of topographic Rossby waves propagatingalong a sloping bottom, such as those commonlyobserved beneath Gulf Stream north of CapeHatteras (Johns and Watts, 1986; Pickart andSmethie, 1993). Signorini et al. (1997) found wave-like features (both topographic Rossby waves andKelvin waves) in their model of the flow throughBarrow Canyon.
For the purpose of this study we are interested inthe seasonal flow of dense water through thecanyon, so we applied a filtering technique toremove the high-wavenumber signal from thevelocity sections. The technique is similar to thatemployed by Pickart and Smethie (1993) to removethe topographic wave signal from sections acrossthe Deep Western Boundary Current near CapeHatteras. Since such waves are bottom-trapped, itmakes sense to consider them in a topographicframework. With this in mind we applied a spatiallow-pass filter to our gridded velocity data, wherethe filter is implemented not along lines of constantdepth, but along lines of constant height above thebottom (every 5m). A filter width of 35 km waschosen, which was effective in removing much of thevariance of the deep wave signal. The resulting low-passed velocity field was smoothed once more usinga 2-D Laplacian filter (to remove noise in the upperportion of the Alaskan Coastal Current, where thebottom-following low-pass filter was less effective).The final filtered absolute geostrophic velocity at themouth of the Canyon is shown in Fig. 2, along withthe high-passed signal that was removed. It reveals awell-behaved, deep-reaching jet flowing northwardthrough the canyon.
The velocity section across the head of the canyondid not show as much spatial variability (for

ARTICLE IN PRESS
0
50
100
150
200
250
Dep
th (
m)
0
50
100
150
200
250
Dep
th (
m)
0 10 20 30
0
10
10
10
10
10
10
10 10
20
2020
20
2020 20
20
30
30
30
30
30
40
40
40
40
40
40
50
50
50
60
||||||||||c81c82c83c84c85c87c90
Velocity (cm/s)
Low Pass
0
50
100
150
200
250
Dep
th (
m)
0
50
100
150
200
250
Dep
th (
m)
0 10 20 30
Distance (km)
-30-20
-20
-20
-20
-20
-20
-20
-20
-20
-20
-10
-10
-10
-10
-10
-10
-10
-10
-10-1
0
-10
-10
-10
-10
0
00
00
0
0
0
0
0
0
0
00
0
0
0
0
0
0
0
0
0
0
10
10
10
10
10
10
10
10
1010
10
10
20
20
20
20
30
||||||||||c81c82c83c84c85c87c90
Velocity (cm/s)
High Pass
(A)
(B)
Fig. 2. (A) Filtered absolute geostrophic velocity (cm/s) at the mouth of Barrow Canyon (see text for a description of the filtering
technique). Positive velocities (solid contours) are out of the canyon, negative velocities (dashed contours) are into the canyon. (B) High-
passed residual velocity (same sign convention for positive and negative velocities).
R.S. Pickart et al. / Deep-Sea Research II 52 (2005) 3175–3198 3181
instance, no flow reversals), but to be consistentwith the northern section we applied the samefiltering procedure. Since tides are weak in Barrow
Canyon (2–3 cm/s, Danielson, 1996), their contribu-tion is assumed negligible compared to the AlaskanCoastal Current.

ARTICLE IN PRESS
Fig. 3. Vertical sections of filtered velocity (contours, cm/s) overlaid on potential temperature (color, 1C). The white dashed line is the
�1.74 1C isotherm. (A) Head of Barrow Canyon and (B) mouth of Barrow Canyon.
R.S. Pickart et al. / Deep-Sea Research II 52 (2005) 3175–31983182
3. Kinematics and hydrographic properties
The two absolute geostrophic velocity sectionsare shown in Fig. 3, overlaid on potential tempera-ture. At the head of the canyon (Fig. 3A) one seesthe Alaskan Coastal Current flowing northward at480 cm/s, advecting warm Bering summertimewater 43.5 1C (the section does not extend far
enough onshore to capture the entire current). Thebottom boundary layer in the current is roughly40m thick, as seen by the vertically uniformtemperature and potential density (Fig. 4A). Thetemperature color bar used throughout the paperwas chosen so that the winter-transformed Beringwater corresponds to the magenta shades. Note theuniform layer of winter-transformed water adjacent

ARTICLE IN PRESS
Fig. 4. Vertical sections of potential density (contours, kg/m3) overlaid on potential temperature (color, 1C). (A) Head of Barrow Canyon
and (B) mouth of Barrow Canyon.
R.S. Pickart et al. / Deep-Sea Research II 52 (2005) 3175–3198 3183
to the Alaskan Coastal Current at the head of thecanyon, also flowing northward (Figs. 3A and 4A).We are particularly interested in the adjustment andfate of this dense water as it flows down the canyon.Its origin is likely the central Chukchi shelf; this isconsistent with current meter data from the south-ern flank of Hanna Shoal (Fig. 1) showing agenerally steady eastward flow toward the canyon(Weingartner et al., 2005).
At the end of the winter season, this dense waterrepresents a reservoir at the top of Barrow Canyon.It is also a source of high silicate for the Arctic(Fig. 5A), likely due to the re-suspension ofnutrients from the bottom sediments on theChukchi shelf. This is consistent with the eleva-ted turbidity in the lower part of the water column(Fig. 5B). We note that this contradicts thetraditional view that the sole source of high-nutrient

ARTICLE IN PRESS
Fig. 5. Vertical sections at the head of Barrow Canyon. The contours are potential density (kg/m3): (A) Silicate (color, mM/l); Water
sample locations are indicated by the circles, (B) turbidity (color, volts) and (C) fluorescence (color, mg/l).
R.S. Pickart et al. / Deep-Sea Research II 52 (2005) 3175–31983184
Chukchi shelf water into the Arctic is throughHerald Canyon in the west. The fluorescence signalat the head of Barrow Canyon is also intriguing
(Fig. 5C), indicating elevated values of chlorophyllon the Chukchi shelf within the main pycnocline(near 25m) at this time of year. This signal follows

ARTICLE IN PRESSR.S. Pickart et al. / Deep-Sea Research II 52 (2005) 3175–3198 3185
the nutricline, while the surface waters seem to benitrogen-limited. Near the seaward edge of theAlaskan Coastal Current the high fluorescenceextends vertically into the bottom boundary layer,right to the seafloor (near y ¼ 15 km). This may bedue to a combination of convergence/downwellingin the coastal current as well as the sinking of thephytoplankton mass. It is unlikely that localproduction is occurring near the bottom, based onmeasurements conducted in Barrow Canyon duringthe concurrent SBI cruise aboard the USCGCHealy. The CTD package on the Healy included aPAR sensor, and primary production experimentswere carried out. These indicate that the 1% lightlevel extended only to 50m and that production didnot occur deeper than this (Hill and Cota, 2005).Due to such a distribution of fluorescence in thecanyon, some of the signal readily diffuses into thelayer of winter-transformed Bering water (Fig. 5C).The ramifications of this are discussed later in thepaper in the discussion on eddy formation.
The adjustment of the flow from the head of thecanyon to its mouth—a distance of roughly150 km—is striking. At the head of the canyon,the Alaskan Coastal Current and the winter-transformed water flow side by side (Fig. 3A). Atthe downstream section (Fig. 3B) these two featureshave re-arranged themselves into a narrow, deep-reaching jet in which the winter-transformed wateris now essentially beneath the Alaskan CoastalCurrent water. (Atlantic-origin water occupies thedeepest part of the canyon.) Using an advectivespeed of 30 cm/s for the dense water and a netvertical displacement of 70m (within the down-stream jet), this gives a vertical velocity of 12m/day.Note that the winter-transformed water warms as itsinks. This is likely due to diffusion more thanentrainment, since the water occupies roughly thesame density class at the two sections,26:4osyo26:85, and the volume transport isessentially conserved within this layer. In particular,the transport at the upstream section is 0.29 Sv,while at the downstream section it is 0.24 Sv. In lightof the uncertainty noted above in the surfacecurrents used to reference the geostrophic velocities,these transport values are probably indistinguish-able. This suggests that an isopycnal framework isappropriate for studying the dynamics of the flowthrough the canyon. In Figs. 3 and 4 the �1.74 1Cisotherm has been contoured (white dashed line),delimiting the coldest winter-transformed water. Atthe mouth of the canyon (Fig. 3B) the offshore edge
of this water coincides with the offshore edge of thedeep jet (the 10 cm/s isotach). Hence, during theadjustment, the coldest water has moved toward theshoreward side of the canyon.
4. Dynamics of adjustment in the Canyon
4.1. Potential vorticity
Using the gridded velocity and hydrographicsections, we computed fields of the potentialvorticity. Because of the strongly sloped isopycnalsat both the head and the mouth of the canyon (forinstance in the bottom boundary layer of theAlaskan Coastal Current at the head of the canyon),it was necessary to consider the Ertel potentialvorticity,
P ¼�f
r0
qsyqzþ
1
r0
qu
qy
qsyqz�
g
r20fqsyqy
� �2
, (2)
where f is the (constant) Coriolis parameter(1.38� 10�4 s�1), r0 is the reference density(1.027� 103 kgm�3), and g is the gravitationalacceleration. The first two terms in (2) are theplanetary stretching and the relative vorticity, whichare present in a quasi-geostrophic framework (notethat since vx5uy in Barrow Canyon, the relativevorticity is due primarily to the cross-canyongradient of the along-canyon velocity). The thirdterm in (2) is the tilting vorticity, a non-quasi-geostrophic term that arises because of the strongcross-canyon gradients in density. Hall (1994)presents a thorough derivation and discussion ofthe Ertel potential vorticity for a similar case in theGulf Stream.
In weak or large-scale flows, the stretching termin (2) is generally dominant. However, as seen inFigs. 6 and 7, both the relative vorticity and thestretching vorticity were significant in parts ofBarrow Canyon during our hydrographic survey.In particular, the deep-reaching jet at the mouth ofthe canyon is characterized by significant relativevorticity of both signs (Fig. 6B): cyclonic vorticityon the seaward side of the jet, strongest at mid-depth; and anti-cyclonic vorticity on the shorewardside, strongest near the surface in the AlaskanCoastal Current. In both instances values exceeded0.5f, which is consistent with the values Munchowand Carmack (1997) observed previously in BarrowCanyon. At the head of the canyon relativevorticities were generally weak (Fig. 6A).

ARTICLE IN PRESS
0
50
100
Dep
th (
m)
0 5 10 15 20 25 30 35
-0.1
0
0
0 0.1
| | | | | | | | | | |
c42 c43 c44 c45 c46 c47 c48 c49 c50 c51c52
Head of Canyon
relative vorticity / stretching vorticity
0
50
100
150
200
250
Dep
th (
m)
0 5 10 15 20 25 30 35 40 45
Distance (km)
-0.4
-0.3-0.2
-0.2
-0.1
-0.1
-0.1
-0.1
0
0
0
0
0
0
0.1
0.1
0.1
0.1
0.1
0.2
0.2
0.2
0.2
0.3
0.3
.3
0.30.4
0.40.4
0.5
|||||||||||||
c78c79c80c81c82c83c84c85c87c90
Mouth of Canyon
relative vorticity / stretching vorticity
(A)
(B)
Fig. 6. Vertical sections of the ratio of relative vorticity to
stretching vorticity (see Eq. (2)). Solid contours are cyclonic
vorticity, dashed contours are anti-cyclonic. The thick gray lines
show the density layer chosen for the vorticity analysis
(sy ¼ 26:6226:75). (A) Head of Barrow Canyon and (B) mouth
of Barrow Canyon.
0
50
100
Dep
th (
m)
0 5 10 15 20 25 30 35
0.10.2
0.30.4
0.51
1.522.53
44.5
| | | | | | | | | | |
c42 c43 c44 c45 c46 c47 c48c49 c50 c51 c52
Head of Canyon
tilting vorticity / stretching vorticity
0
50
100
150
200
250
Dep
th (
m)
0 5 10 15 20 25 30 35 40 45
Distance (km)
0.1
0.1
0.1
0.2
0.2
0.2
0.3
|||||||||||||
c78c79c80c81c82c83c84c85c87c90
Mouth of Canyon
tilting vorticity / stretching vorticity
(A)
(B)
Fig. 7. Vertical sections of the ratio of tilting vorticity to
stretching vorticity. The thick gray lines are as in Fig. 6. (A) Head
of Barrow Canyon and (B) mouth of Barrow Canyon.
R.S. Pickart et al. / Deep-Sea Research II 52 (2005) 3175–31983186
By contrast, the tilting vorticity is the dominantterm in the bottom boundary layer of the AlaskanCoastal Current at the head of Barrow Canyon(Fig. 7A), with values 3–4 times greater than thestretching vorticity. Even at the mouth of thecanyon the tilting term can be significant, withvalues 40% as strong as the stretching vorticity inthe center of the deep-reaching jet (Fig. 7B). For thepurposes of this study we are interested in theevolution of the dense winter-transformed Beringwater as it flows down the canyon. Accordingly, weconsidered the potential vorticity balance within thedensity layer 26.6–26.75. This layer does not quiteencompass the entire winter-transformed water
mass (Fig. 4), but this was done to avoid ‘‘edgeeffects’’ (near the bounding water masses) whencomputing the vorticity terms. The upper and lowerbounds of the density layer are shown in Figs. 6 and7. We confine ourselves to the broad part of thelayer at the head of the canyon (18 kmoyo28 km,where the layer is bounded below by the topogra-phy), and the onshore part of the layer at the mouthof the canyon (yo25 km). The transport is virtuallyidentical in these two regions, so we are indeedconsidering the part of the flow that undergoes theadjustment.
As seen in Figs. 6A and 7A, both the relativevorticity and tilting vorticity are small in the winter-transformed layer at the head of Barrow Canyon(10–15% of the stretching vorticity). However,during the adjustment through the canyon both of

ARTICLE IN PRESS
-10
0
10
20
30
40
50
60
70
80
90
Vor
ticity
((m
s)-1
x 1
0-11 )
5 10 15 20 25Distance (km)
Ertel Vorticity for σθ = 26.6-26.75
relative
stretching
tilting
total
center of jet
Fig. 8. Terms of the Ertel vorticity at the mouth of Barrow
Canyon, averaged over the density layer sy ¼ 26:6226:75 (see
Eq. (2)). The center of the deep jet is marked by the arrow.
-2
0
2
4
6
8
10
Vor
ticity
((m
s)-1
x 1
0-6)
5 10 15 20 25Distance (km)
Shallow Water Vorticity for σθ = 26.6-26.75
relative
stretching
upst
ream
val
ue
total
center of jet
Fig. 9. Terms of the shallow-water vorticity at the mouth of
Barrow Canyon, averaged over the density layer sy ¼ 26:6226:75(see Eq. (3)). The center of the deep jet is marked by the arrow.
The average value of Q at the head of the canyon
(18 kmoyo28 km) is shown by the thick dashed line (standard
deviation indicated by the bar).
R.S. Pickart et al. / Deep-Sea Research II 52 (2005) 3175–3198 3187
these terms become important (40% as large as thestretching term at the downstream section). Theramifications of this can be seen in Fig. 8, whichshows the layer-averaged cross-stream distributionof vorticity at the mouth of the canyon. On theoffshore side of the jet the large cyclonic relativevorticity causes P to deviate substantially from thestretching value, and in the center of the jet thetilting vorticity does the same. Note that thecyclonic side of the jet is broader than the anti-cyclonic side (this is evident in Fig. 6B as well), andthat the anti-cyclonic relative vorticity is negligible.
Therefore, from the top of Barrow Canyon to itsmouth, the layer of winter-transformed waterdecelerates, undergoes significant stretching (seeFig. 4), and, as a result, generates significantcyclonic relative vorticity. Does the value of relativevorticity so attained make sense? To answer this oneneeds to compute the analogous layer-averages forthe section across the head of Barrow Canyon.Unfortunately however, the sharp pycnocline at thetop of the layer in this region makes this calculationproblematic. In particular, the large value of qsy=qz
near the upper edge dominates the layer average(and choosing a thin enough layer to avoid thismakes the result too uncertain). Note, however, thatthe tilting term is not relevant in this discussion,since it is negligible where the cyclonic vorticity islarge (Fig. 8). Hence, we can answer the abovequestion by considering the shallow water potentialvorticity,
Q ¼ðf þ zÞ
h, (3)
where z ¼ uy; and h is the layer thickness. Thisquantity is straightforward to calculate from thegridded sections, and it is not subject to the edgeeffects encountered above. At the head of BarrowCanyon Q is dominated by f =h, with an averagevalue of 6.570.8 (ms)�1� 10�6. Fig. 9 shows thecross-stream distribution of Q, and its two consti-tuents, at the mouth of the canyon. One sees thatthe stretching and the relative vorticity distributions

ARTICLE IN PRESS
0
50
100
150
200
250
Dep
th (
m)
0 5 10 15 20 25 30 35 40 45
Distance (km)
0.2
0.2
0.2
0.4
0.6
0.6
0.8
0.8
1
1
1.2
1.2
|||||||||||||c78c79c80c81c82c83c84c85c87c90
Mouth of Canyon
0
50
100
150
200
2500 5 10 15 20 25 30 35 40
Froude Number
Fig. 10. Vertical section of Froude number (see text for
definition) at the mouth of Barrow Canyon. The thick gray lines
are as in Fig. 6. The vertical black lines denote the artificial edges
of the canyon used to solve Eq. (4).
R.S. Pickart et al. / Deep-Sea Research II 52 (2005) 3175–31983188
are essentially the same as for the Ertel formula-tion.3 However, it is now clear that the cyclonicvorticity which is generated during the adjustmentcompensates exactly the stretching of the watercolumn, so as to conserve the upstream value of Q.This in turn causes a plateau in Q (and P) todevelop within the seaward part of the jet (Figs. 8and 9). The question now is, why doesn’t thispotential vorticity adjustment extend across theentire jet?
4.2. Mixing and hydraulics
One possible explanation for the non-conserva-tion of the potential vorticity on the shoreward sideof the jet is that it is due to sidewall friction. Thelowered-ADCP velocity data from multiple SBIcruises provide the opportunity to investigate thehigh-wavenumber signal and the importance ofmixing. This will hopefully shed light on the issueat hand, but at present the analysis is not far enoughalong to be definitive. We can, however, do a simplescale analysis to see if lateral mixing is a possibility.The length over which frictional effects extend isgiven by the Munk boundary layer thickness, dm ¼ðAHb0Þ
1=3; where AH is the lateral viscosity and b0 ¼sf =H is topographic beta. Using a bottom slope s of.012 for Barrow Canyon and a layer thickness H of50m, this gives b0 ¼ 3� 10�8ðmsÞ�1. In order fordm to extend into the shoreward part of the jet(order 5 km), this would require AH to be of theorder 103m2s�1, which is not unreasonable (Ped-losky, 1979).
A second possible reason why P may not beconserved onshore is due to internal mixing result-ing from shear instabilities. For this to be the case,the vertical shear in velocity must generally bestrong enough to make the Richardson numberRi ¼ ðN=uzÞ
2 less than unity, where u is the down-stream velocity and N is the buoyancy frequency.Approximating uz by u=H where H is the verticallength scale, yields a bulk form of the Richardsonnumber, Ri ¼ 1=F2; where F ¼ u=NH is an internalFroude number. Choosing H ¼ 50m as above, weused the gridded sections of N and u to compute avertical section of F, which is shown in Fig. 10. Forthe density layer in question, the combination ofstrongly sloped isopycnals in the center of the jet(which translates to weak vertical stratification) and
3Note that the magnitude of P and Q differ by a factor of
Dr=r0; which for the density layer in question is O(10�4).
the strong flow, leads to a sharp enhancement of theFroude number (values 41). Note that F attainsthese large values (Ri falls below unity) at thelocation where the conservation of potential vorti-city breaks down, near y ¼ 16 km (Fig. 8).
The fact that the internal Froude number gets aslarge as unity suggests that the deep-reaching jetmay be supercritical and that hydraulic processesmay be important in Barrow Canyon. A similarsituation has been shown to exist in the Faroe Bankchannel of the North Atlantic, where the flow isbelieved to be hydraulically controlled (Borenas andLundberg, 1988). If a subcritical-to-supercriticaltransition takes place in Barrow Canyon, a hydrau-lic jump or strong lee wave might result. Either ofthese could be responsible for altering the potentialvorticity of the dense winter-transformed waterflowing down the canyon. Hydraulic control in thecanyon could have strong implications for theupstream dynamics in the Chukchi Sea, since itwould imply limits on how rapidly fluid could bedrained from the shelf. The limiting factor wouldinvolve the width of the canyon.
A thorough hydraulic analysis is beyond thescope of our data. However, we can get a betterindication of whether or not hydraulic effects are

ARTICLE IN PRESS
0.0
0.2
0.4
0.6
0.8
1.0
Nor
mal
ized
Hei
ght
-1.0 -0.8 -0.6 -0.4 -0.2 -0.0 0.2 0.4 0.6 0.8 1.0
Modal Amplitude
Eigenfunctions
1
32
-1.5
-1.0
-0.5
0.0
0.5
1.0
1.5
Nor
mal
ized
Wav
e S
peed
1 2 3Mode Number
Eigenvalues
(A)
(B)
Fig. 11. Solution to the modified Taylor-Goldstein equation for
the mouth of Barrow Canyon: (A) vertical structure of the first
three dynamical modes and (B) wave speeds of the first three
modes (symbols the same as in (A)).
R.S. Pickart et al. / Deep-Sea Research II 52 (2005) 3175–3198 3189
present by calculating the long, internal gravitywave speeds of the system. Hydraulic processes canact when the flow is strong enough to arrestupstream propagation of long waves (i.e. it issupercritical). We are therefore interested in thepropagation speeds of, say, the first few internalmodes. In order to determine these speeds properlyone must take the effects of stratification andvertical shear into account. Speeds for given profilesof NðzÞ and uðzÞ are calculated by solving theTaylor–Goldstein equation. Recently Pratt et al.(2000) extended this equation to account for non-uniformities in the cross-sectional topography of thechannel. The method of solution assumes, however,that the velocity and density are uniform across thechannel. Following Pratt et al. (2000), we dividedthe water column into 15 discrete layers andcomputed canyon-averaged profiles of buoyancy,frequency and velocity from our gridded fields. Tocompute these averages, the sides of the canyonwere artificially extended to the surface as depictedin Fig. 10. The governing equation is
ðu� cÞd2w
dz2þ
N2
u� c�
d2u
dz2
� �wþ
d
dz½ðu� cÞTw� ¼ 0,
(4)
where w is the amplitude of the vertical velocity ofthe internal gravity wave, c is the wave speed, u isthe background jet velocity, and T ¼ b�1 db=dz;where bðzÞ is the width of the canyon as a functionof depth. The boundary conditions are that w
vanishes at the surface and at the deepest depth,z ¼ D of the channel:
wð0Þ ¼ wðDÞ ¼ 0. (5)
The eigenvalues of (4) and (5) are the discretedynamical, long-wave modes of the flow. When theRichardson number is everywhere greater than 1
4
there are an infinite number of modes. Each mode isassociated with two waves: one that propagates withthe flow (positive), and the other that usuallypropagates counter to the flow towards the ChukchiSea (negative). We are primarily interested in thelatter. If the speed of this wave is in fact positive(indicating propagation out of the Chukchi Sea) ornegative but of a magnitude much less than thespeed of its sister mode, then hydraulic behavior isstrongly indicated.
The solution to (4) and (5) for the observed deepjet in Barrow Canyon is shown in Fig. 11. Only thefirst three dynamical modes are included. The toppanel shows the vertical structure of the upstream
propagating mode (which is similar in character tothe downstream propagating mode), and the bot-tom panel shows the wave speeds of each modalpair. A mode is supercritical if both of these wavespeeds are positive (i.e. propagating towards theArctic). While none of the Barrow Canyon modesare strictly supercritical, the results nonethelesssuggest that the flow may be hydraulic in character.This is due to the strong asymmetry in the wavespeeds of the modes; namely, that the negativephase speeds approach zero with higher modenumber. For mode 3, the upstream propagatingwave is essentially stationary. This is significant

ARTICLE IN PRESS
4The concept of a deep-reaching Beaufort Undercurrent has
recently been called into question, see Pickart (2004).
R.S. Pickart et al. / Deep-Sea Research II 52 (2005) 3175–31983190
because it is this mode which is the most relevant forthe Barrow Canyon dense water case. To wit, thewinter-transformed Bering water is flowing out atmid-depth (below the Alaskan Coastal Currentwater and above the Atlantic water), which isconsistent with the vertical structure of mode 3(Fig. 11A). We conclude that hydraulic control maybe active in Barrow Canyon, and that small-scalemixing may contribute to the non-conservation ofpotential vorticity during the adjustment of thedense water as it flows down the canyon. Clearly,more detailed study of the hydraulics is required.For instance, an analysis using directly measured(non-smoothed) velocity, over a period of severaldays, would be enlightening.
5. Shelfbreak eddies
5.1. Formation mechanisms
It is well documented that the Canada Basincontains a large number of ubiquitous eddies(Manley and Hunkins, 1985) that are filled withPacific-origin water (Muench et al., 2000). They aretypically 15–25 km in diameter, and are locatedpredominantly in the depth range 50–150m (Man-ley and Hunkins, 1985; Krishfield and Pluedde-mann, 2002). To date, their place of origin, as wellas the manner in which they are formed, have notbeen determined. However, the Chukchi Sea isclearly the ultimate source of water in these features.Both warm-core and cold-core eddies have beenobserved, and most spin anti-cyclonically.
Various mechanisms have been put forth toexplain the generation of the eddies. The explana-tions fall into two general classes: current-topogra-phy interactions, and hydrodynamic instability.Most of the explanations in the former class applyexplicitly to Barrow Canyon. For instance, D’Asaro(1988) proposed that frictional torque, generatedwhen the Alaskan Coastal Current flows against theside of Barrow Canyon, leads to eddy formation.However, it is unlikely that such strong anti-cyclonic vorticity exists in the canyon (see Fig. 6,as well as Munchow and Carmack, 1997). Morerelevant to the discussion at hand, Cenedese andWhitehead (2000) investigated dense water flowingthrough Barrow Canyon in a laboratory setting.They found that the sharp change in coastline at thecanyon mouth, in conjunction with the steepeningof the continental slope, led to the generation ofanti-cyclones. Most recently, Shaw and Chao (2003)
and Chao and Shaw (2003) did a numerical study ofeddy formation due to dense water flowing down anArctic canyon, with application to Barrow Canyon.Anti-cyclones were spawned by the sinking current,and this process was enhanced by the presence ofambient flow farther offshore.
Our vorticity analysis in the previous section doesnot explicitly support nor contradict the Cenedeseand Whitehead (2000) hypothesis, or the mechan-isms put forth by Shaw and Chao (2003) and Chaoand Shaw (2003). We note, however, that theorientation of the continental slope does not changebetween our two hydrographic lines (Sections 4 and6, Fig. 1), so the change in curvature investigated byCenedese and Whitehead (2000) does not apply toour case. Furthermore, the westward-flowing Beau-fort Gyre as well as Aagaard’s (1984) eastward-flowing Beaufort Undercurrent—the two ambientflows investigated by Shaw and Chao (2003) andChao and Shaw (2003)—are located offshore of ourdownstream hydrographic section.4 Hence thesefeatures also do not apply to the present situation.
Are there any aspects of the potential vorticityadjustment described above that could facilitateeddy formation? Two factors are worth mentioning.Note in Fig. 8 that, onshore of the plateau in p, thedecrease in relative vorticity along with the genera-tion of tilting vorticity cause a precipitous drop inthe value of the potential vorticity. This not onlyproduces a sharp front, but creates an abruptchange in sign of dP=dy at the center of the jet.This change in sign is a necessary condition forbaroclinic instability of the current (Pedlosky,1979), which is conducive for eddy formation.Furthermore, the potential vorticity front in Fig. 8is analogous to that found in the Gulf Stream (Hall,1985). Pratt and Stern (1986) have demonstratedthat such a feature can lead to eddy formation vianon-linear steepening of the path of the current atfinite amplitude. Hence, our results suggest that aninitial disturbance arising from baroclinic instabilityof the flow of dense water through Barrow Canyoncould quickly become enhanced and pinch off ananti-cyclone (see Fig. 22 in Pratt and Stern, 1986).
The second general type of eddy formation doesnot involve anomalous topography such as acanyon, but instead is due to ‘‘generic’’ hydrody-namic instability of the flow. Manley and Hunkins(1985) proposed that eddies would likely be formed

ARTICLE IN PRESS
5The 3-D structure of such a boundary current eddy was
mapped out during the fall 2004 SBI cruise.
R.S. Pickart et al. / Deep-Sea Research II 52 (2005) 3175–3198 3191
via baroclinic instability of the boundary currentalong the southern Canada Basin. They identifiedthe Alaskan Coastal Current (downstream ofBarrow Canyon) as a possible source of theobserved warm-core eddies. Instability of such asurface-intensified flow leads to eddy formation inother areas of the world ocean, such as theshelfbreak jet of the Middle Atlantic Bight (Garvineet al., 1988). However, in order for the AlaskanCoastal Current to be source of the Canada Basineddies described above, this would require amechanism for transforming the eddies into subsur-face features after they are formed. Manley andHunkins (1985) hypothesized that friction exertedby the pack ice in the central basin mightaccomplish this, and Ou and Gordon (1986)modeled this process numerically. However, whilethe Alaskan Coastal Current does indeed formeddies, they are likely not the subsurface featuresobserved by Manley and Hunkins (1985) in theinterior (see below).
A second flavor of baroclinic instability in thesouthern Canada Basin boundary current has beensuggested recently by Pickart (2004). Using histor-ical data from the Alaskan Beaufort Sea, he showedthat when the shelfbreak jet advects winter-trans-formed Bering water in late spring and summer, itspotential vorticity structure is conducive for bar-oclinic instability (in a manner distinct from thatdescribed above for Barrow Canyon). It wasspeculated that the Canada Basin cold-core anti-cyclonic eddies could be formed from this seasonalcurrent. We now verify this, using our hydrographicdata from the shelfedge.
5.2. Observed anti-cyclones
As seen in Fig. 1, our survey included fourhydrographic sections across the shelfbreak andupper slope (the outer portion of Section 6constitutes one of the crossings). The sections tothe west of Barrow Canyon revealed that winter-transformed Bering water, likely originating fromHerald Canyon, flows eastward as a boundarycurrent centered near the shelfbreak—just as it doesto the east of Barrow Canyon (Pickart, 2004).Hence, the concept of the ‘‘Beaufort shelfbreak jet’’put forth by Pickart (2004) should be extended toinclude the Chukchi shelfbreak as well. Strikingly,at each of our cross-slope sections we observedeither an eddy being formed from this boundarycurrent, or a fully detached eddy just offshore of it
(Fig. 12). This represents strong evidence that theshelfbreak jet is a source of the Canada Basin cold-core eddies.
In Fig. 12A, to the west of Barrow Canyon(Section 5 in Fig. 1), the downward-slopingisopycnals near the edge of the shelf correspond tothe sub-surface intensified eastward shelfbreak jet.Offshore of this, centered at stations 61 and 64, aretwo lenses of boundary current water that are likelyanti-cyclonic eddies being spawned from the cur-rent, in a manner similar to that seen in thenumerical studies of Spall (1995) and Bush et al.(1996). We note that since our section is a 2-D snapshot, we could instead have sampled a meander ofthe current. However, the ‘‘pinching’’ of the coldwater at station 59 suggests that eddy formation wasimminent.5 One sees that these features are carryingwith them high sediment loads (Fig. 12A) as well aselevated values of fluorescence and silicate (notshown). A similar pinching was observed as well atthe other two sections west of Barrow Canyon,indicating that this process is very active, and,presumably very efficient at transporting propertiesfrom the shelf to the basin.
The section to the east of Barrow Canyon alsoshows an anti-cyclonic cold-core eddy filled withwinter-transformed Bering water (Fig. 12B). Thedifference here is that this eddy seems to be fullydetached from the boundary current—note theabsence of cold boundary current water near theshelfbreak. This could be due to a temporarydisruption of the current due to the eddy-formationprocess, or it might be that the boundary current isstarting to ‘‘disintegrate’’ at this location and time(see Pickart, 2004 for a description of the seasonalevolution of the shelfbreak jet). The latter may bemore likely. During the cruise we deployed an arrayof moorings along Section 3, and the first year ofdata indicated that the winter-transformed Beringwater was nearly depleted by August of 2002. Henceour survey sampled the tail end of the previouswinter’s Chukchi Sea water mass product.
The detached eddy at Section 3 is also character-ized by high values of turbidity (Fig. 12B) as well asfluorescence and silicate (not shown). The otherinteresting feature in Fig. 12B is the lens of warmwater in the upper 40m of the water columnseaward of the shelfbreak (stations 30–33 inFig. 12B). This is a surface-intensified anti-cyclonic

ARTICLE IN PRESS
Fig. 12. Vertical sections of properties overlaid on potential density (kg/m3). The top panel shows potential temperature (color, 1C); the
bottom panel shows turbidity (color, volts). (A) Section 5, west of Barrow Canyon and (B) Section 3, east of Barrow Canyon.
R.S. Pickart et al. / Deep-Sea Research II 52 (2005) 3175–31983192
ARTICLE IN PRESS
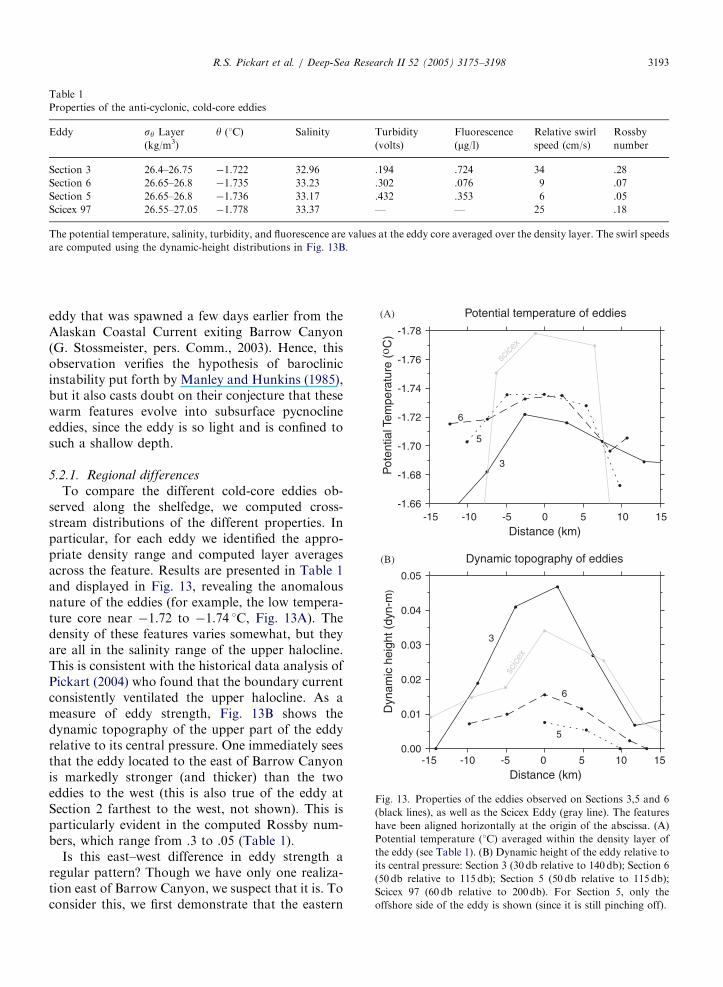
Table 1
Properties of the anti-cyclonic, cold-core eddies
Eddy sy Layer
(kg/m3)
y (1C) Salinity Turbidity
(volts)
Fluorescence
(mg/l)Relative swirl
speed (cm/s)
Rossby
number
Section 3 26.4–26.75 �1.722 32.96 .194 .724 34 .28
Section 6 26.65–26.8 �1.735 33.23 .302 .076 9 .07
Section 5 26.65–26.8 �1.736 33.17 .432 .353 6 .05
Scicex 97 26.55–27.05 �1.778 33.37 — — 25 .18
The potential temperature, salinity, turbidity, and fluorescence are values at the eddy core averaged over the density layer. The swirl speeds
are computed using the dynamic-height distributions in Fig. 13B.
-1.78
-1.76
-1.74
-1.72
-1.70
-1.68
-1.66
Pot
entia
l Tem
pera
ture
(ο C
)
-15 -10 -5 0 5 10 15Distance (km)
Potential temperature of eddies
3
5
6
scice
x
0.00
0.01
0.02
0.03
0.04
0.05
Dyn
amic
hei
ght (
dyn-
m)
-15 -10 -5 0 5 10 15Distance (km)
Dynamic topography of eddies
scic
ex
3
6
5
(A)
(B)
Fig. 13. Properties of the eddies observed on Sections 3,5 and 6
(black lines), as well as the Scicex Eddy (gray line). The features
have been aligned horizontally at the origin of the abscissa. (A)
Potential temperature (1C) averaged within the density layer of
the eddy (see Table 1). (B) Dynamic height of the eddy relative to
its central pressure: Section 3 (30 db relative to 140 db); Section 6
(50 db relative to 115 db); Section 5 (50 db relative to 115 db);
Scicex 97 (60 db relative to 200 db). For Section 5, only the
offshore side of the eddy is shown (since it is still pinching off).
R.S. Pickart et al. / Deep-Sea Research II 52 (2005) 3175–3198 3193
eddy that was spawned a few days earlier from theAlaskan Coastal Current exiting Barrow Canyon(G. Stossmeister, pers. Comm., 2003). Hence, thisobservation verifies the hypothesis of baroclinicinstability put forth by Manley and Hunkins (1985),but it also casts doubt on their conjecture that thesewarm features evolve into subsurface pycnoclineeddies, since the eddy is so light and is confined tosuch a shallow depth.
5.2.1. Regional differences
To compare the different cold-core eddies ob-served along the shelfedge, we computed cross-stream distributions of the different properties. Inparticular, for each eddy we identified the appro-priate density range and computed layer averagesacross the feature. Results are presented in Table 1and displayed in Fig. 13, revealing the anomalousnature of the eddies (for example, the low tempera-ture core near �1.72 to �1.74 1C, Fig. 13A). Thedensity of these features varies somewhat, but theyare all in the salinity range of the upper halocline.This is consistent with the historical data analysis ofPickart (2004) who found that the boundary currentconsistently ventilated the upper halocline. As ameasure of eddy strength, Fig. 13B shows thedynamic topography of the upper part of the eddyrelative to its central pressure. One immediately seesthat the eddy located to the east of Barrow Canyonis markedly stronger (and thicker) than the twoeddies to the west (this is also true of the eddy atSection 2 farthest to the west, not shown). This isparticularly evident in the computed Rossby num-bers, which range from .3 to .05 (Table 1).
Is this east–west difference in eddy strength aregular pattern? Though we have only one realiza-tion east of Barrow Canyon, we suspect that it is. Toconsider this, we first demonstrate that the eastern

ARTICLE IN PRESS
-1.76
-1.74
-1.72
Pot
entia
l Tem
pera
ture
(C
)
300 400 500 600 700 800
Distance from Herald Canyon (km)
Pot. Temp.
Eddy Pot. Temp.
0.2
0.3
0.4
0.5
0.6
Turb
idity
(vo
lts)
300 400 500 600 700 800
Turbidity
Eddy Turbidity
300 400 500 600 700 800
Bar
row
Can
yon
Mou
th
Obs
erve
d E
ddy
166W
Fluoro.
Eddy Fluoro.
Evolution of Boundary Current Properties
0.2
0.4
0.6
0.8
1.0
Flu
oroe
senc
e (µ
g/l)
Fig. 14. Downstream evolution of boundary current properties, averaged within the density layer sy ¼ 26:65226:8. Also shown are the
properties at the core of the eastern eddy (see Table 1).
R.S. Pickart et al. / Deep-Sea Research II 52 (2005) 3175–31983194
eddy originated from the dense water exitingBarrow Canyon, and not from the dense waterexiting Herald Canyon from farther west. Fig. 14shows the downstream evolution in properties of theboundary current from west to east, compared withthose of the eddy east of Barrow Canyon. Note thatall of the boundary current properties moderate asone progresses eastward from the Herald Canyonsource (presumably from diffusion and eddy for-mation). This trend changes, however, at the mouthof Barrow Canyon where the current suddenly getscolder and higher in fluorescence (Fig. 14). This isconsistent with the scenario described above where-by the reservoir of cold water at the head of BarrowCanyon feeds the current exiting the canyon—henceoverpowering any dense water trying to enter thewestern end of the canyon from offshore. Recallthat the high-fluorescence signal diffuses into thewinter-transformed water at the head of BarrowCanyon (Fig. 5C); this is likely the source of themarked increase in fluorescence in Fig. 14. Essen-tially, the eastern eddy has values of temperatureand fluorescence that are too extreme to haveoriginated from the water west of the canyon (Fig.14), but consistent with the water exiting throughthe canyon (after modification by mixing during theeddy-formation process).
Now consider the east–west differences in bound-ary current strength. We used the lowered-ADCPvelocity data to reference the thermal wind shear inSection 5 (Fig. 12A) to quantify the eastward-flowing shelfbreak jet. Because the vertical structureof the lowered-ADCP velocity profiles agrees wellwith the geostrophic shear, this implies that tides areminimal at this location as in Barrow Canyon. Theabsolutely referenced boundary current core speedat this location (not shown) is 14 cm/s. By contrast,the winter-transformed water flows out of BarrowCanyon at speeds of up to 30 cm/s (keep in mindalso that this velocity field has been smoothed, Fig.3). This difference in current strength is consistentwith the discrepancy in eddy swirl speeds observedon either side of the canyon (Table 1), implying thateddies formed from the Barrow Canyon outflowshould be stronger than those originating from theHerald Canyon outflow.
5.2.2. Comparison to interior eddy
Muench et al. (2000) did a detailed survey of acold-core, anti-cyclonic eddy in the interior of theCanada Basin, using data collected during theScicex expedition in August 1997. The eddy waslocated roughly 175 km north of our easternmosthydrographic section (Fig. 1), and was similar in

ARTICLE IN PRESSR.S. Pickart et al. / Deep-Sea Research II 52 (2005) 3175–3198 3195
character to the eddies found in our data set.Muench et al. (2000) argued that the Scicex Eddylikely originated from densified polynya water onthe northeast Chukchi shelf (south of BarrowCanyon, see Cavalieri and Martin, 1994), andevolved into an eddy via the processes studied byGawarkiewicz and Chapman (1995) and Chapmanand Gawarkiewicz (1995). These authors demon-strated, in a numerical modeling framework, thatdense water formed within a polynya is fluxedlaterally away from the region of forcing byturbulent eddies. The eddies arise due to baroclinicinstability of the frontal edge surrounding thepolynya.
While this process may be happening on the shelf,such ‘‘polynya eddies’’ are probably not whatMuench et al. (2000) observed in the middle of theCanada Basin. Gawarkiewicz (2000) extended thenumerical modeling work to include shelfbreaktopography, and showed that, in the absence ofbackground flow, the polynya eddies tend tocoalesce at the shelfedge and form a gravity current.Very little dense water is fluxed offshore, which ledGawarkiewicz (2000) to suggest that other mechan-isms are necessary to transport the polynya water tothe open basin. We argue that the Scicex Eddy wasformed instead by instability of the shelfbreak jet ina similar manner to that observed in Fig. 12A.Furthermore, we suggest that the Scicex Eddy didnot contain polynya water, but was filled with themore generic winter-transformed Bering water. Thecharacteristics of the Scicex Eddy are included inTable 1 and displayed in Fig. 13. While it is colderand denser than any of the eddies we observed, thiscould be due to seasonal or interannual variability.(The temperature anomaly is greater because theScicex Eddy was observed in mid-basin, surroundedby warmer water.) In terms of y, S, and sy theScicex Eddy corresponds to Weingartner et al.’s(1998) intermediate winter mode water, not theircold hypersaline mode water (i.e. not the polynyawater). Hence, like the eddies observed in oursurvey, the Scicex Eddy contains the genericwintertime water mass of the Chukchi Sea, and isof the correct density to ventilate the upperhalocline of the Canada Basin.
Muench et al. (2000) also believed that the ScicexEddy was over a year old, based in part on itscalculated tritium–helium age. Fig. 13B shows thatthe eddy was in fact still quite strong. This suggestsfirstly that it was formed by the Barrow Canyonoutflow, and secondly that it may not be very old.
Assuming that the winter-transformed Bering wateris exiting the Chukchi Sea by early May of each year(consistent with the newly obtained mooring data),this gives a transit speed of 2.1 cm/s for the eddy if itwere formed earlier that year (instead of theprevious year, as suggested by Muench et al.,2000). One must also keep in mind that thetritium–helium age of a newly formed water massoften overestimates the true age. A particularlypertinent example of this is seen in Pickart et al.(1996), who sampled a newly formed subsurfaceanti-cyclone in the Labrador Sea, likely spawned bya similar instability process from the Labradorcurrent (Pickart et al., 1997). The calculated tracerage was several years, whereas the eddy was formedonly months earlier. Pickart et al. (1996) showedthat this discrepancy arose because of incompleteatmospheric equilibration during the wintertimeoverturning of the water column. This same effectcould be happening during the formation of thewinter water in the Chukchi and Bering Seas.
6. Discussion
Our results demonstrate that the ubiquitouseddies of winter-transformed Bering water foundthroughout the Canada Basin are readily formedfrom the Chukchi/Beaufort shelfbreak current—likely from baroclinic instability. While the adjust-ment of the dense water through Barrow Canyonleads to a potential vorticity distribution which isconducive for such instability, we cannot say at thispoint how close to the mouth of the canyon eddiesactually form. We can say, however, that eddies arespawned from both the Barrow Canyon outflow aswell as the Herald Canyon outflow. The number ofeddies we observed during our month-long hydro-graphic survey suggests that this process is anefficient, and perhaps even dominant, means offluxing newly formed water offshore.
An obvious question to ask is, how many eddieswould be required to ventilate the entire upperhalocline of the Canada Basin? We estimate this asfollows. Assuming that the average eddy is a rightcircular cylinder with radius ¼ 10 km andthickness ¼ 75m, this gives a volume of 25 km3
for a single eddy. The area of the Canada Basin istaken to be 106 km2, and the thickness of the upperhalocline to be 50m. This means that the volume ofwinter-transformed Bering water in the CanadaBasin is roughly 5� 104 km3. It is believed that therenewal time of the upper halocline is on the order

ARTICLE IN PRESSR.S. Pickart et al. / Deep-Sea Research II 52 (2005) 3175–31983196
of 10 years (Aagaard et al., 1981; Carmack, 1990). Ifwe assume 10–20 years, this gives an annual renewalrate of .08–.16 Sv. If we now assume that thisrenewal is due completely to eddies, it means thatroughly 100–200 eddies are formed each year. Howreasonable is this number? Based on historicalobservations of eddies from ice camps and driftingbuoys, it is believed that at any one time the CanadaBasin is filled with 100–200 such features (A.Plueddemann, pers. Comm., 2004). Hence, if anaverage eddy lifetime is on the order of a year, theestimated eddy population is consistent with ourestimated formation rate. This calculation of coursehas significant uncertainties (as does the populationestimate). For example, if the area of the CanadaBasin and the thickness of the upper halocline areboth increased by 20%, this implies a renewal rateof .11–.23 Sv, and hence 144–288 eddies formed peryear. Also, we are assuming that all of the eddyvolume is winter-transformed water (i.e. minimalentrainment from above or below).
What does this mean in terms of the fate of thePacific water flowing through Bering Strait? In themean, 0.8 Sv pass through the strait, but not all ofthis is winter-transformed water (or what willbecome winter-transformed water in the ChukchiSea). As an upper estimate we assume that thewinter water transport is 0.3 Sv (the synoptic valuecalculated above, which likely does not persist yearround). This implies that somewhere between30–75% of this water is fluxed offshore by eddies.What happens to the rest of the water? At least partof the shelfbreak jet is able to pass into theCanadian Arctic Archipelago (limited to about theupper 120–150m of the water column). Usingnitrate–phosphate ratios, Jones et al. (2003a, b)show that a high percentage of Pacific water ispresent in the major passages of the archipelago(Barrow Strait, Jones Sound, Nares Strait, andSmith Sound). In the salinity range of the upperhalocline (approximately 33.0–33.5) the percentageof Pacific-origin water ranges from 60% to 100%.
Some of the winter-transformed Bering water alsocontinues eastward along the edge of the Arctic intothe Lincoln Sea north of Greenland. Hydrographicsections collected there during the early 1990s(Newton and Sotirin, 1997) reveal the presence ofthis water near the shelfedge. The structure of theboundary current reported by Newton and Sotirin(1997) is somewhat different than that found in ourstudy (and also reported by Pickart, 2004). North ofGreenland the strongest flow occurs in the Atlantic
layer, beneath the winter-transformed water. This,together with the relatively weak geostrophic shearseen by Newton and Sotirin (1997), seems to suggestthat the majority of the Pacific-origin water passesinto the archipelago. However, the shelfbreak in theLincoln Sea is quite deep, and Newton and Sotirin’s(1997) current meter array may have missed themajority of the Pacific water. Also, their hydro-graphic sections were occupied in April, too soon tosee the seasonal presence of the winter-transformedBering water.
A non-trivial amount of winter-transformedwater almost certainly does pass through theLincoln Sea and into Fram Strait, as evidenced byhydrographic surveys done in the strait. Jones et al.(2003c) measured a high percentage of Pacific-originwater using the nitrate–phosphate ratio technique.Taylor et al. (2003) reported similar findings using adifferent data set. Also, both papers presentedvertical sections of silicate, clearly indicating thepresence of winter-transformed Bering water in thesame density range (i.e. upper halocline) as thatreported here (Fig. 5A). Hence, while much of thewinter-transformed water is seemingly fluxed intothe interior Canada Basin by eddies, a significantfraction is transported directly out of the Arctic viathe boundary current system, both through theCanadian Arctic Archipelago and through FramStrait. The precise partitioning of the flux betweenthese three different routes, however, remains to besorted out.
Acknowledgments
The authors are indebted to the crew of theUSCGC Polar Star, who worked tirelessly—bothbefore and during the cruise—to help us accomplishour scientific objectives. John Trowbridge helped uswith the ship-drift analysis, and David MacKenzie,Bruce Toney, and Matt Walker provided valuableinput for this calculation. We thank Robin Muenchand Terry Whitledge for use of the Scicex 97 data.Dean Stockwell and Jackie Grebmeier helped withthe interpretation of the fluorescence data. Wethank Gratia Montgomery for all her supportthroughout the experiment, as well as Chris Linderfor his hard work putting together the outreachprogram. Support for this project was provided bythe Office of Naval Research through GrantsN00014-02-1-0317 (RP, DT); N00014-93-1-0930(TW); and by the National Science Foundationthrough Grant OPP0125395 (SZ).
ARTICLE IN PRESSR.S. Pickart et al. / Deep-Sea Research II 52 (2005) 3175–3198 3197
References
Aagaard, K., 1984. The Beaufort Undercurrent. The Alaskan
Beaufort Sea: Ecosystems and Environments. Academic
Press, New york, pp. 47–71.
Aagaard, K., Roach, A.T., 1990. Arctic Ocean-shelf exchange:
measurements in Barrow Canyon. Journal of Geophysical
Research 95, 18,163–18,175.
Aagaard, K., Coachman, L.K., Carmack, E.C., 1981. On the
halocline of the Arctic Ocean. Deep-Sea Research I 28,
529–545.
Borenas, K.M., Lundberg, P.A., 1988. On deep water flow
through the Faroe Bank Channel. Journal of Geophysical
Research 93, 1281–1292.
Bourke, R.H., Paquette, R.G., 1976. Atlantic water on the
Chukchi Shelf. Geophysical Research Letters 3, 629–632.
Bush, A.B.G., McWilliams, J.C., Peltier, W.R., 1996. The
formation of oceanic eddies in symmetric and asymmetric
jets. Part II: late time evolution and coherent vortex
formation. Journal of Physical Oceanography 26, 1825–1848.
Carmack, E.C., 1990. Large-scale physical oceanography of polar
Oceans. In: Smith, Jr., W.O. (Ed.), Polar Oceanography, Part
A: Physical Science. Academic Press, San Diego (406pp).
Cavalieri, D.J., Martin, S., 1994. The contribution of Alaskan,
Siberian, and Canadian coastal polynyas to the cold halocline
of the Arctic Ocean. Journal of Geophysical Research 99,
18,343–18,362.
Cenedese, C., Whitehead, J., 2000. Eddy formation at the
shelfbreak. In: Proceedings of the shelf–basin interactions
Pan-Arctic Meeting. SBI Project Office, 15–17.
Chao, S.-Y., Shaw, P.-T., 2003. Heton shedding from submarine-
canyon plumes in an Arctic boundary current system:
sensitivity to the undercurrent. Journal of Physical Oceano-
graphy 33, 2032–2044.
Chapman, D.C., 2000. The influence of an alongshelf current on
the formation and offshore transport of dense water from a
coastal polynya. Journal of Geophysical Research 105,
24,007–24,019.
Chapman, D.C., Gawarkiewicz, G.G., 1995. Offshore transport
of dense shelf water in the presence of a submarine canyon.
Journal of Geophysical Research 100, 13,373–13,387.
Coachman, L.K., Aagaard, K., Tripp, R.B., 1975. Bering Strait:
The Regional Physical Oceanography. University of Wa-
shington Press, Seattle (172pp).
Danielson, S., 1996. The Chukchi Sea tides. M.Sc. Thesis,
University of Alaska, Fairbanks, 51pp.
D’Asaro, E.A., 1988. Observations of small eddies in the
Beaufort Sea. Journal of Geophysical Research 93,
6669–6684.
Furey, P.W., 1996. The large-scale surface wind field over the
Western Arctic Ocean, 1981–1993. Masters Thesis, University
of Alaska, Fairbanks, AK, 121pp.
Garrison, G.R., Becker, P., 1976. The Barrow submarine canyon:
A drain for the Chukchi Sea. Journal of Geophysical
Research 81, 4445–4453.
Garvine, R.W., Wong, K.C., Gawarkiewicz, G.G., McCarthy,
R.K., Houghton, R.W., AikmanIII, F., 1988. The morphol-
ogy of shelfbreak eddies. Journal of Geophysical Research 93,
15,593–15,607.
Gawarkiewicz, G.G., 2000. Effects of ambient stratification and
shelfbreak topography on offshore transport of dense water
on continental shelves. Journal of Geophysical Research 105,
3307–3324.
Gawarkiewicz, G.G., Chapman, D.C., 1995. A numerical study
of dense water formation and transport on shallow, sloping
continental shelves. Journal of Geophysical Research 100,
4489–4507.
Grebmeier, J.M., Harvey, R., 2005. The Western Arctic
Shelf–Basin Interactions (SBI) project: an introduction.
Deep-Sea Research II, this issue [doi:10.1016/j.dsr2.
2005.10.004].
Hall, M.M., 1985. Horizontal and vertical structure of velocity,
potential vorticity, and energy in the Gulf Stream. Ph.D.
Thesis, Massachusetts Institute of Technology, 165pp.
Hall, M.M., 1994. Synthesizing the Gulf Stream thermal
structure from XBT data. Journal of Physical Oceanography
24, 2278–2287.
Hill, V., Cota, G., 2005. Spatial patterns of primary production
in the Chukchi Sea in the spring and summer of 2002. Deep-
Sea Research II, this issue [doi:10.1016/j.dsr2.2005.10.001].
Johns, W.E., Watts, D.R., 1986. Time Scales and structure of
topographic Rossby waves and meanders in the deep Gulf
Stream. Journal of Marine Research 44, 267–290.
Jones, E.P., Swift, E.P., Anderson, L.G., Lipizer, M., Civitarese,
G., Falkner, K.K., Kattner, G., McLaughlin, F., 2003a.
Tracing Pacific water in the North Atlantic Ocean. Journal of
Geophysical Research 108.
Jones, E. P., Rudels, B., Eert, A.J., Anderson, L.G., Azetsu-
Scott, K., 2003b. Waters of Nares Strait in the Canadian
Arctic Archipelago. In: Proceedings, ACSYS Final Science
Conference, St. Petersburg, 11–14 November 2003.
Jones, E.P., Anderson, L.G., Jutterstrom, S., Swift, J.H., 2003c.
Identifying sources of fresh water in the east greenland
current. Eos Transactions, AGU 84 (46) Fall Meeting, Suppl.,
Abstract OS21C-1137.
Krishfield, R.A., Plueddemann, A.J., 2002. Eddys in the Arctic
Ocean from IOEB ADCP data. Woods Hole Oceanographic
Institution Technical Report WHOI-2002-09, 144pp.
Manley, T.O., Hunkins, K., 1985. Mesoscale eddies of the Arctic
Ocean. Journal of Geophysical Research 90, 4911–4930.
Mountain, D.G., 1974. Bering Sea Water on the north Alaskan
Shelf. Ph.D. Thesis, University of Washington, Seattle, WA,
153pp.
Mountain, D.G., Coachman, L.K., Aagaard, K., 1976. On the
flow through Barrow Canyon. Journal of Physical Oceano-
graphy 6, 461–470.
Muench, R.D., Gunn, J.T., Whitledge, T.E., Schlosser, P.,
Smethie Jr., W., 2000. An Arctic Ocean cold core eddy.
Journal of Geophysical Research 105, 23,997–24,006.
Munchow, A., Carmack, E.C., 1997. Synoptic flow and density
observations near an Arctic shelfbreak. Journal of Physical
Oceanography 27, 1402–1419.
Newton, J.L., Sotirin, B.J., 1997. Boundary undercurrent and
water mass changes in the Lincoln Sea. Journal of Geophy-
sical Research 102, 3393–3403.
Ou, H.W., Gordon, A.L., 1986. Spin-down of baroclinic eddies
under sea ice. Journal of Geophysical Research 91,
7623–7630.
Paquette, R.G., Bourke, R.H., 1974. Observations on the coastal
current of Arctic Alaska. Journal of Marine Research 32,
195–207.
Pedlosky, J., 1979. Geophysical Fluid Dynamics. Springer, New
York (624pp).

ARTICLE IN PRESSR.S. Pickart et al. / Deep-Sea Research II 52 (2005) 3175–31983198
Pickart, R.S., 2004. Shelfbreak circulation in the Alaskan
Beaufort Sea: mean structure and variability. Journal of
Geophysical Research 109.
Pickart, R.S., Smethie Jr., W.M., 1993. How does the deep
Western Boundary Current cross the Gulf Stream? Journal of
Physical Oceanography 23, 2602–2616.
Pickart, R.S., Smethie Jr., W.M., Lazier, J.R.N., Jones, E.P.,
Jenkins, W.J., 1996. Eddies of newly formed upper Labrador
Sea water. Journal of Geophysical Research 101,
20,711–20,726.
Pickart, R.S., Spall, M.A., Lazier, J.R.N., 1997. Mid-
depth ventilation in the Western Boundary Current
system of the sub-polar gyre. Deep-Sea Research I 44,
1025–1054.
Plueddemann, A., Krishfield, R., Edwards, C., 1999. Eddies in
the Beaufort Gyre, Ocean–Atmosphere–Ice Interactions
(OAII) All Hands Meeting, 20–22 October, 1999, Virginia
Beach, VA.
Pratt, L.J., Stern, M.E., 1986. Dynamics of potential vorticity
fronts and eddy detachment. Journal of Physical Oceano-
graphy 16, 1101–1120.
Pratt, L.J., Deese, H.E., Murray, S.P., Johns, W., 2000.
Continuous dynamical modes in straits having arbitrary cross
sections, with applications to the Bab al Mandab. Journal of
Physical Oceanography 30, 2525–2534.
Roach, A.T., Aagaard, K., Pease, C.H., Salo, S.A., Weingartner,
T., Pavlov, V., Kulakov, M., 1995. Direct measure-
ments of transport and water properties through the
Bering Strait. Journal of Geophysical Research 100,
18,443–18,457.
Shaw, P.-T., Chao, S.-Y., 2003. Effects of a baroclinic current on
a sinking dense water plume from a submarine canyon and
heton shedding. Deep-Sea Research I 50, 357–370.
Signorini, S.R., Munchow, A., Haidvogel, D., 1997. Flow
dynamics of a wide Arctic canyon. Journal of Geophysical
Research 102, 18,661–18,680.
Spall, M.A., 1995. Frontogenesis, subduction, and cross-front
exchange at upper ocean fronts. Journal of Geophysical
Research 100, 2543–2557.
Taylor, J.R., Falkner, K.K., Schauer, U., Meredith, M., 2003.
Quantitative considerations of dissolved barium as a tracer in
the Arctic Ocean. Journal of Geophysical Research 108.
Weingartner, T.J., Cavalieri, D.J., Aagaard, K., Sasaki, Y., 1998.
Circulation, dense water formation, and outflow on the
northeast Chukchi shelf. Journal of Geophysical Research
103, 7647–7661.
Weingartner, T., Aagaard, K., Woodgate, R., Danielson, S.,
Sasaki, Y., Cavalieri, D., 2005. Circulation on the north
central Chukchi Sea shelf. Deep-Sea Research II, this issue
[doi:10.1016/j.dsr2.2005.10.015].
Winsor, P., Chapman, D.C., 2002. Distribution and interannual
variability of dense water production from coastal polynyas
on the Chukchi shelf. Journal of Geophysical Research 107.
Winsor, P., Chapman, D.C., 2004. Pathways of Pacific water
across the Chukchi Sea: A numerical model study. Journal of
Geophysical Research 109, C03002.
Woodgate, R.A., Aagaard, K., Weingartner, T.J., 2005. A year in
the physical oceanography of the Chukchi Sea: Moored
measurements from autumn 1990–1991. Deep-Sea Research
II, this issue [doi:10.1016/j.dsr2.2005.10.016].