
Mechanisms and evolution of oxidative sulfur metabolism in green sulfur bacteria
Upload
khangminh22Category
view
1download
0
Flow Impairment by DepositedSulfur - A Review of 50 Years of Research
Bruce E. Roberts
Rock Isle Consulting Services Ltd., Calgary, Alberta, Canada
Received March 30, 2017; Accepted May 11, 2017
Abstract: Sulfur deposition in the reservoir formation and its impact on wellproductivity and ultimate recovery has been investigated for close to 50years. Experimental measurements and numerical modeling studies havefocused on the phase behavior of the sulfur-sour gas mixture system andthe flow of sulfur and natural gas through the formation. The key resultsfrom these investigations are reviewed in this paper. The implementationof the insights gained over these 50 years of research into the fielddevelopment planning and operation of sour gas fields is described.
Keywords: Sulfur deposition, sour gas, hydrogen sulfide, formation damage
1 Introduction
Elemental sulfur is often present in significant quantities in sour gas at reser-voir pressure and temperature conditions. The equilibrium sulfur content ofreservoir fluids decreases with pressure and temperature. Deposition of sulfurwill occur in the reservoir, well tubulars, or surface equipment when the equili-brium solubility of sulfur becomes less than the sulfur content of the fluid.
Although sulfur deposition in the well and surface equipment is a signifi-cant operational problem, it is deposition in the formation that most signifi-cantly impacts well productivity and ultimate recovery. Estimation of theperformance of wells producing reservoir fluid containing elemental sulfurrequires an understanding of the phase behavior of sulfur in sour gas mixturescoupled with aspects of the flow of sulfur and gas through the formation. Inthis review, the development of our current understanding of the deposition
Corresponding author(s): [email protected]
DOI: 10.7569/JNGE.2017.692504
J. Natural Gas Eng., Vol. 2, No. 1, June 2017 84
Flow Impairment by DepositedSulfur - A Review of 50 Years of Research
Bruce E. Roberts
Rock Isle Consulting Services Ltd., Calgary, Alberta, Canada
Received March 30, 2017; Accepted May 11, 2017
Abstract: Sulfur deposition in the reservoir formation and its impact on wellproductivity and ultimate recovery has been investigated for close to 50years. Experimental measurements and numerical modeling studies havefocused on the phase behavior of the sulfur-sour gas mixture system andthe flow of sulfur and natural gas through the formation. The key resultsfrom these investigations are reviewed in this paper. The implementationof the insights gained over these 50 years of research into the fielddevelopment planning and operation of sour gas fields is described.
Keywords: Sulfur deposition, sour gas, hydrogen sulfide, formation damage
1 Introduction
Elemental sulfur is often present in significant quantities in sour gas at reser-voir pressure and temperature conditions. The equilibrium sulfur content ofreservoir fluids decreases with pressure and temperature. Deposition of sulfurwill occur in the reservoir, well tubulars, or surface equipment when the equili-brium solubility of sulfur becomes less than the sulfur content of the fluid.
Although sulfur deposition in the well and surface equipment is a signifi-cant operational problem, it is deposition in the formation that most signifi-cantly impacts well productivity and ultimate recovery. Estimation of theperformance of wells producing reservoir fluid containing elemental sulfurrequires an understanding of the phase behavior of sulfur in sour gas mixturescoupled with aspects of the flow of sulfur and gas through the formation. Inthis review, the development of our current understanding of the deposition
Corresponding author(s): [email protected]
DOI: 10.7569/JNGE.2017.692504
J. Natural Gas Eng., Vol. 2, No. 1, June 2017 © 2017 Scrivener Publishing LLC 84
process within the formation and its impact on gas well productivity over thelast 50 years of study is outlined. An objective of this review is to demonstratehow advances in this understanding may be implemented into the field devel-opment planning and subsequent management of sour gas containing elemen-tal sulfur.
2 Field Experience
The early insights into the nature of sulfur deposition and the resulting opera-tional issues may be attributed to the studies by J.B. Hyne and co-workers atAlberta Sulfur Research Ltd. Hyne [1] surveyed more than 100 sour gas wellsworld-wide and determined that a combination of high bottomhole pressureand well temperature with low wellhead pressure provided a favorable set ofconditions for deposition in the well. However, the study focused on deposi-tion in the well and surface equipment, with relatively little attention given tothe deposition within the formation.
Deposition of solid sulfur in the formation has significantly impacted wellperformance during production of Shell Canada’s dry, sour gas from deep,fractured, carbonate reservoirs located in southwest Alberta, Canada. The H2Sconcentration of the reservoir fluid ranges from 15 to 30%, with initial pressurefrom 30 to 40 MPa, and temperature from 80 to 100 ˚C. In a case described byRoberts [2], well production dropped rapidly from an initial rate of 320 � 103
to 100 � 103 m3/d in 42 days. The well skin, as determined by a pressurebuildup test, increased from slightly negative before production to about +17following this flow period. Hands et al. [3] noted that well life of the order ofonly 2–3 years has been experienced for these gas pools. In a specific case, ahorizontal well had become quickly plugged with sulfur and required side-tracking just beyond 50 m from the original well. Field experience also showedthat solvent treatments can remove deposition within natural fractures, butonce the fracture has been allowed to bridge with sulfur, solvent treatmentsbecome ineffective.
Deposition of sulfur is generally absent when the composition of the reser-voir fluid is high in heavier hydrocarbons (Hyne [1]). Sulfur which precipitatesfrom the gas phase will dissolve into any hydrocarbon liquids which havedropped out due to retrograde condensation.
The most detailed account of sulfur deposition within the formation is pro-vided by Chernik and Williams [4] and Williams and Milligan [5] in theirdescription of production testing of Shell Canada’s ultra-sour (90% H2S) Bear-berry gas reservoir. The reservoir fluid was determined to contain approxi-mately 65 g/m3 (standard conditions) at a reservoir pressure of 37 MPa and118 ˚C. At these conditions, sulfur would deposit in the formation as a liquidphase. The project consisted of production from two wells. Production throughone well was via a large (88 m) perforated interval and was used to obtain
Bruce E. Roberts: Flow Impairment by Deposited Sulfur - A Review of 50 Years of Research
DOI:10.7569/JNGE.2017.692504
J. Natural Gas Eng., Vol. 2, No. 1, June 2017 85
data on the productivity of a commercial Bearberry well. For the second well,only one meter of pay was perforated to generate a large pressure differentialat the well to accelerate sulfur deposition. However, impairment of gas flow bythe near-well bore accumulation of liquid elemental sulfur was not observed. Itshould be noted that the Bearberry formation is highly permeable – the draw-down at the large perforated interval well was less than 1 MPa at 180 x 103
m3/d. The results for Bearberry may not be completely applicable to muchtighter formations.
3 Phase Behavior of Sulfur/Sour-Gas Systems
The following describe the main aspects of the phase behavior of sulfur-sourgas mixtures that govern the sulfur deposition process within the reservoir.
3.1 Sulfur Solubility in H2S and Sour Gas - Experimental Data
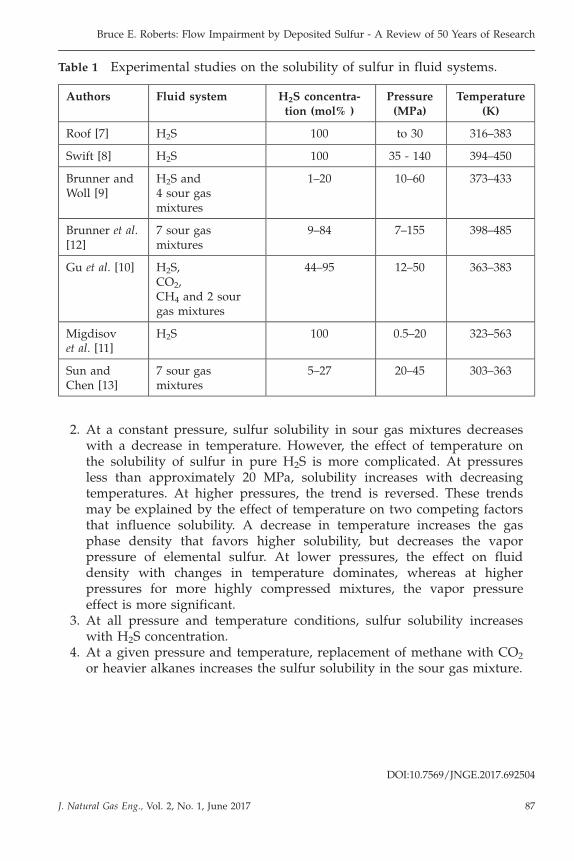
Kennedy and Wieland [6] provided the first data set on the solubility of sulfurin sour gas mixtures at pressures to 40 MPa and temperatures to 394 K. How-ever, their results have been found not to be consistent with studies that fol-lowed. Solubility measurements in pure H2S have been reported by Roof [7],Swift [8], Brunner and Woll [9], Gu et al. [10] and Migdisov et al. [11]. Brunnerand Woll [9] also measured sulfur solubility in four gas mixtures, with H2Sconcentrations ranging from 1 to 20%. Brunner et al. [12] followed up thisstudy with additional measurements in seven gas mixtures that included a spe-cific examination of the impact of ethane and butane components on sulfur sol-ubility. Gu et al. [10] measured the solubility of two sour gas mixtures of highH2S concentration (44 and 95%). To facilitate the evaluation of equation of statebinary interaction parameters, Gu et al. [10] also determined the solubility ofsulfur in pure CO2 and CH4. Sun and Chen [13] determined sulfur solubility inseven sour gas mixtures, with a focus on the low temperature range from 30 to90 ˚C. A summary of the experimental studies reported to date is shown inTable 1.
3.2 Sulfur Solubility Trends
Analysis of the experimental sulfur solubility data reveals several key trendsthat are relevant to an analysis of the sulfur deposition process:
1. At a constant temperature, sulfur solubility in H2S and sour gasmixtures decreases with declining pressure. As noted previously, such adecrease in solubility in a saturated reservoir fluid will result indeposition of sulfur in the formation.
Bruce E. Roberts: Flow Impairment by Deposited Sulfur - A Review of 50 Years of Research
DOI:10.7569/JNGE.2017.692504
J. Natural Gas Eng., Vol. 2, No. 1, June 201786
2. At a constant pressure, sulfur solubility in sour gas mixtures decreaseswith a decrease in temperature. However, the effect of temperature onthe solubility of sulfur in pure H2S is more complicated. At pressuresless than approximately 20 MPa, solubility increases with decreasingtemperatures. At higher pressures, the trend is reversed. These trendsmay be explained by the effect of temperature on two competing factorsthat influence solubility. A decrease in temperature increases the gasphase density that favors higher solubility, but decreases the vaporpressure of elemental sulfur. At lower pressures, the effect on fluiddensity with changes in temperature dominates, whereas at higherpressures for more highly compressed mixtures, the vapor pressureeffect is more significant.
3. At all pressure and temperature conditions, sulfur solubility increaseswith H2S concentration.
4. At a given pressure and temperature, replacement of methane with CO2
or heavier alkanes increases the sulfur solubility in the sour gas mixture.
Table 1 Experimental studies on the solubility of sulfur in fluid systems.
Authors Fluid system H2S concentra-tion (mol% )
Pressure(MPa)
Temperature(K)
Roof [7] H2S 100 to 30 316–383
Swift [8] H2S 100 35 - 140 394–450
Brunner andWoll [9]
H2S and4 sour gasmixtures
1–20 10–60 373–433
Brunner et al.[12]
7 sour gasmixtures
9–84 7–155 398–485
Gu et al. [10] H2S,CO2,CH4 and 2 sourgas mixtures
44–95 12–50 363–383
Migdisovet al. [11]
H2S 100 0.5–20 323–563
Sun andChen [13]
7 sour gasmixtures
5–27 20–45 303–363
Bruce E. Roberts: Flow Impairment by Deposited Sulfur - A Review of 50 Years of Research
DOI:10.7569/JNGE.2017.692504
J. Natural Gas Eng., Vol. 2, No. 1, June 2017 © 2017 Scrivener Publishing LLC 87
2. At a constant pressure, sulfur solubility in sour gas mixtures decreaseswith a decrease in temperature. However, the effect of temperature onthe solubility of sulfur in pure H2S is more complicated. At pressuresless than approximately 20 MPa, solubility increases with decreasingtemperatures. At higher pressures, the trend is reversed. These trendsmay be explained by the effect of temperature on two competing factorsthat influence solubility. A decrease in temperature increases the gasphase density that favors higher solubility, but decreases the vaporpressure of elemental sulfur. At lower pressures, the effect on fluiddensity with changes in temperature dominates, whereas at higherpressures for more highly compressed mixtures, the vapor pressureeffect is more significant.
3. At all pressure and temperature conditions, sulfur solubility increaseswith H2S concentration.
4. At a given pressure and temperature, replacement of methane with CO2
or heavier alkanes increases the sulfur solubility in the sour gas mixture.
Table 1 Experimental studies on the solubility of sulfur in fluid systems.
Authors Fluid system H2S concentra-tion (mol% )
Pressure(MPa)
Temperature(K)
Roof [7] H2S 100 to 30 316–383
Swift [8] H2S 100 35 - 140 394–450
Brunner andWoll [9]
H2S and4 sour gasmixtures
1–20 10–60 373–433
Brunner et al.[12]
7 sour gasmixtures
9–84 7–155 398–485
Gu et al. [10] H2S,CO2,CH4 and 2 sourgas mixtures
44–95 12–50 363–383
Migdisovet al. [11]
H2S 100 0.5–20 323–563
Sun andChen [13]
7 sour gasmixtures
5–27 20–45 303–363
Bruce E. Roberts: Flow Impairment by Deposited Sulfur - A Review of 50 Years of Research
DOI:10.7569/JNGE.2017.692504
J. Natural Gas Eng., Vol. 2, No. 1, June 2017 87
3.3 Sulfur Solubility in the Gas Phase: Chemical vs. PhysicalSolubility
The solubility of sulfur in sour gas at reservoir conditions is orders of magni-tude greater than would be expected assuming ideal gas behavior. Chemicalreaction and physical solubility mechanisms have been proposed to explainthis high solubility.
Hyne [14, 15] proposed that a chemical reaction between sulfur and H2Soccurs in the gas phase to form hydrogen polysulfides (H2Sx):
H2Sþ Sx ¼ H2Sx (1)
High H2S partial pressure and temperatures favor polysulfide formation.Hyne concluded that a reduction in pressure and temperature would alter thechemical reaction equilibrium leading to a reduction in solubility and deposi-tion of sulfur.
A second mechanism to explain the high solubility of sulfur in sour gas is aphysical solvation process in which strong interactions between H2S and ele-mental sulfur result in highly nonideal gas behavior. High solubilities havealso been reported for other solid/compressed gas systems, and form the basisof many industrial supercritical fluid separation processes (Brenecke andEckert [16]).
As noted by Roberts [2], the nature of sulfur solubility is important in theevaluation of the deposition process. Sulfur held physically in a sulfur-satu-rated gas phase will deposit immediately upon a reduction of pressure or tem-perature. However, if sulfur exists as a polysulfide species, the kinetics of thechemical reactions will govern the deposition process.
Reported studies have provided evidence that the polysulfide reactionmechanism is relatively unimportant at temperatures generally encountered inthe natural gas industry. Hydrogen polysulfides were not detected in liquidH2S saturated with elemental sulfur to 100 ˚C (Smith et al. [17]). A study byMigdisov et al. [11] on the stability of polysulfides in gaseous H2S concludedthat sulfur solubility is dominated by physical solubility at 125 to 170 ˚C, andpolysulfide formation at 200 to 290 ˚C. The polysulfide formation mechanismsalso cannot account for the reduction of sulfur solubility in H2S with increasingtemperature as noted previously.
3.4 Freezing Point of Elemental Sulfur
Formation flow impairment by sulfur deposition may be manageable whensulfur deposits as a liquid phase as shown by the field results for the Bearberryproject. The freezing point of elemental sulfur at atmospheric pressure is115–119 ˚C. A study by Woll [18] provided data on depression of the freezing
Bruce E. Roberts: Flow Impairment by Deposited Sulfur - A Review of 50 Years of Research
DOI:10.7569/JNGE.2017.692504
J. Natural Gas Eng., Vol. 2, No. 1, June 201788
point due to dissolution of H2S into the liquid phase. The magnitude of thedepression increases with increasing H2S concentration. The minimum freezingtemperature is observed at 94 ˚C for pure H2S at approximately 7.5 MPa. Fur-ther increases in pressure increases the freezing temperature.
4 Modeling of Sulfur Solubility
Two main approaches to the modeling of sulfur solubility in H2S and sour gasmixtures have been reported in the literature – equation of state modeling, andthe use of analytical expressions, incorporating empirical constants. In additionto these two approaches, the application of an artificial neural network to theprediction of sulfur solubility has been described. Details on these methods areoutlined below.
4.1 Thermodynamic Modeling with an Equation of State
At equilibrium, the fugacity of sulfur is equal in all phases:
f ss ¼ f ls ¼ fvs (2)
For the solid phase, assuming a constant molar volume of sulfur, vs, thefugacity of sulfur may be given by the following expression, where Ps
s is thevapor pressure of sulfur, and the exponential term is the Poynting correctionfactor:
f ss ¼ Pssexp vs P� Ps
s
� �=RT
� �(3)
An equation of state may be used to determine the fugacity of sulfur in theliquid or vapor phases. Studies reported to date have all used the Peng-Robin-son equation of state for the fugacity calculation with different approachesbeing used to determine the equation parameters and in the incorporation ofchemical reactions.
An application of the Peng-Robinson equation of state to calculate sulfur sol-ubility in a fluid phase was first reported by Tomcej et al. [19]. The model wasapplied to a range of possible cases in which sulfur (in solid or liquid phase)distributes between a single-phase vapor, single-phase liquid, or two-phaseliquid. The experimental sulfur melting data of Woll [18] was used to deter-mine if the sulfur fugacity calculation was to apply equation (3) for the solidsulfur case, or the equation of state for the liquid phase equilibrium. Thisapproach resulted in a slight discontinuity in the solubility curves at the sulfurmelting temperature. Solid sulfur vapor pressure and sulfur critical tempera-ture used to calculate the EOS parameters were adjusted to provide the best
Bruce E. Roberts: Flow Impairment by Deposited Sulfur - A Review of 50 Years of Research
DOI:10.7569/JNGE.2017.692504
J. Natural Gas Eng., Vol. 2, No. 1, June 2017 © 2017 Scrivener Publishing LLC 89
3.3 Sulfur Solubility in the Gas Phase: Chemical vs. PhysicalSolubility
The solubility of sulfur in sour gas at reservoir conditions is orders of magni-tude greater than would be expected assuming ideal gas behavior. Chemicalreaction and physical solubility mechanisms have been proposed to explainthis high solubility.
Hyne [14, 15] proposed that a chemical reaction between sulfur and H2Soccurs in the gas phase to form hydrogen polysulfides (H2Sx):
H2Sþ Sx ¼ H2Sx (1)
High H2S partial pressure and temperatures favor polysulfide formation.Hyne concluded that a reduction in pressure and temperature would alter thechemical reaction equilibrium leading to a reduction in solubility and deposi-tion of sulfur.
A second mechanism to explain the high solubility of sulfur in sour gas is aphysical solvation process in which strong interactions between H2S and ele-mental sulfur result in highly nonideal gas behavior. High solubilities havealso been reported for other solid/compressed gas systems, and form the basisof many industrial supercritical fluid separation processes (Brenecke andEckert [16]).
As noted by Roberts [2], the nature of sulfur solubility is important in theevaluation of the deposition process. Sulfur held physically in a sulfur-satu-rated gas phase will deposit immediately upon a reduction of pressure or tem-perature. However, if sulfur exists as a polysulfide species, the kinetics of thechemical reactions will govern the deposition process.
Reported studies have provided evidence that the polysulfide reactionmechanism is relatively unimportant at temperatures generally encountered inthe natural gas industry. Hydrogen polysulfides were not detected in liquidH2S saturated with elemental sulfur to 100 ˚C (Smith et al. [17]). A study byMigdisov et al. [11] on the stability of polysulfides in gaseous H2S concludedthat sulfur solubility is dominated by physical solubility at 125 to 170 ˚C, andpolysulfide formation at 200 to 290 ˚C. The polysulfide formation mechanismsalso cannot account for the reduction of sulfur solubility in H2S with increasingtemperature as noted previously.
3.4 Freezing Point of Elemental Sulfur
Formation flow impairment by sulfur deposition may be manageable whensulfur deposits as a liquid phase as shown by the field results for the Bearberryproject. The freezing point of elemental sulfur at atmospheric pressure is115–119 ˚C. A study by Woll [18] provided data on depression of the freezing
Bruce E. Roberts: Flow Impairment by Deposited Sulfur - A Review of 50 Years of Research
DOI:10.7569/JNGE.2017.692504
J. Natural Gas Eng., Vol. 2, No. 1, June 2017 © 2017 Scrivener Publishing LLC88
point due to dissolution of H2S into the liquid phase. The magnitude of thedepression increases with increasing H2S concentration. The minimum freezingtemperature is observed at 94 ˚C for pure H2S at approximately 7.5 MPa. Fur-ther increases in pressure increases the freezing temperature.
4 Modeling of Sulfur Solubility
Two main approaches to the modeling of sulfur solubility in H2S and sour gasmixtures have been reported in the literature – equation of state modeling, andthe use of analytical expressions, incorporating empirical constants. In additionto these two approaches, the application of an artificial neural network to theprediction of sulfur solubility has been described. Details on these methods areoutlined below.
4.1 Thermodynamic Modeling with an Equation of State
At equilibrium, the fugacity of sulfur is equal in all phases:
f ss ¼ f ls ¼ fvs (2)
For the solid phase, assuming a constant molar volume of sulfur, vs, thefugacity of sulfur may be given by the following expression, where Ps
s is thevapor pressure of sulfur, and the exponential term is the Poynting correctionfactor:
f ss ¼ Pssexp vs P� Ps
s
� �=RT
� �(3)
An equation of state may be used to determine the fugacity of sulfur in theliquid or vapor phases. Studies reported to date have all used the Peng-Robin-son equation of state for the fugacity calculation with different approachesbeing used to determine the equation parameters and in the incorporation ofchemical reactions.
An application of the Peng-Robinson equation of state to calculate sulfur sol-ubility in a fluid phase was first reported by Tomcej et al. [19]. The model wasapplied to a range of possible cases in which sulfur (in solid or liquid phase)distributes between a single-phase vapor, single-phase liquid, or two-phaseliquid. The experimental sulfur melting data of Woll [18] was used to deter-mine if the sulfur fugacity calculation was to apply equation (3) for the solidsulfur case, or the equation of state for the liquid phase equilibrium. Thisapproach resulted in a slight discontinuity in the solubility curves at the sulfurmelting temperature. Solid sulfur vapor pressure and sulfur critical tempera-ture used to calculate the EOS parameters were adjusted to provide the best
Bruce E. Roberts: Flow Impairment by Deposited Sulfur - A Review of 50 Years of Research
DOI:10.7569/JNGE.2017.692504
J. Natural Gas Eng., Vol. 2, No. 1, June 2017 89
match to the available experimental data. A reasonable fit to the experimentaldata of Roof [7], Brunner and Woll [9] and Brunner et al. [12] was obtained.
The Peng-Robinson equation of state was also used by Karan et al. [20] butwith a different approach to the calculation of the equation parameters. For theliquid and vapor phases, the a and b parameters of the equation of state wereadjusted to provide the best match to the vapor pressure and liquid density.The solid sulfur fugacity was calculated by an empirical function of tempera-ture and pressure with the parameters adjusted to fit experimental solubilitydata. In addition, binary interaction parameters were determined from avail-able experimental data. The match obtained between predicted and experimen-tal solubility for the data of Roof [7], Brunner and Woll [9], and Brunner et al.[12] was similar to that reported by Tomcej et al. [19], as based on a visualcomparison of the paper figures.
A much more complicated model was developed by Heidemann et al. [21],by the incorporation of chemical reactions. Sulfur was modeled as a mixture ofeight species, S1 to S8, with each available to react with H2S:
H2Sþ n� 1
8S8 ¼ H2Sn;n ¼ 2; . . . ::9 (4)
A method to estimate the equation of state parameters for all the specieswas described. The calculation of the equation of state parameters for pure S8,and estimation of the binary interaction parameters followed the approach ofKaran et al. [20] Despite the added complexity of the model, the matchbetween predicted and the experimental data was similar to the model ofKaran et al. [20].
Gu et al. [10] used the Peng-Robinson equation of state to determine sulfursolubility at temperatures less than the melting point. A correction functionincorporating two temperature-dependent interaction parameters were intro-duced to modify the mixing rule for the b parameter of the Peng-Robinsonequation of state. These new interaction parameters, plus the usual interactionparameter to calculate the a parameter were determined by fitting to the avail-able experimental data. The average absolute deviation between experimentaland predicted solubility for two sour gas mixtures of 44 and 95% H2S wasapproximately 7%. Sun and Chen [13] used a similar approach, but consideredthe interaction parameters to be temperature independent. An average absolutedeviation between experimental and predicted solubility of 6.5% was deter-mined for seven gas mixtures of H2S content of approximately 5 to 27%.
The Peng-Robinson equation of state model by Cézac et al. [22] was devel-oped specifically to investigate sulfur deposition in natural gas transmissionnetworks. An approach similar to Heidemann et al. [21] was used with theincorporation of reactions between the eight sulfur species and H2S to formpolysulfanes. The pressure and temperature conditions studied were outside
Bruce E. Roberts: Flow Impairment by Deposited Sulfur - A Review of 50 Years of Research
DOI:10.7569/JNGE.2017.692504
J. Natural Gas Eng., Vol. 2, No. 1, June 201790
the range of available experimental data, so no conclusions could be drawnregarding the accuracy of the prediction.
In summary, an equation of state is generally able to provide an estimate ofsulfur solubility in sour gas of sufficient accuracy for screening calculations.Development of more complex models incorporating chemical reactions doesnot improve the predictive capability.
4.2 Analytical Models
A simple correlation developed by Chrastil [23] for predicting the solubility ofsolids in fluids at high pressure was first applied by Roberts [2] to the sulfur-sour gas system:
cr ¼ �kexpa
Tþ B
� �(5)
where cr (g/m3), is the concentration of the solid component at reservoirtemperature and pressure, � is the fluid density (kg/m3), and T is the fluidtemperature (K). The parameters, k, a, and B are empirical constants deter-mined by matching experimental solubility measurements.
As this equation has been used extensively in subsequent studies on the sul-fur deposition process, it is useful to note the key aspects of its application andparameter determination. Roberts [2] used solubility data for two sour gas mix-tures comprised of 20% H2S and 6% H2S reported by Brunner and Woll [9] toestimate the correlation parameters. These mixtures were selected as the H2Sconcentration bounded the H2S concentration of the reservoir fluid understudy (16% H2S). The parameter, k, was estimated by plotting ln cr versus ln �at a constant temperature (100, 120, 140 and 160 ˚C) for both gas mixtures. Val-ues for k for the four temperatures studied varied from 3.7 to 4.1. The parame-ters a and B were determined by plotting ln cr versus 1/T at a constant densityequal to the value for the reservoir fluid at reservoir pressure (36.6 MPa) andtemperature (81 ˚C). The linear trend observed in the plot was determined tocoincide with the sulfur content of the reservoir fluid as measured in a bottom-hole sample. This analysis of the Brunner and Woll [9] data for the two mix-tures thus yielded the following expression for the sulfur solubility of thefluid:
cr ¼ �4exp�4666
T� 4:5711
� �(6)
The solubility as predicted by eq. (6) is expressed for fluid at reservoir tem-perature and pressure. Recent papers by Hu et al. [24] and Guo and Wang [25]have incorrectly assumed solubility prediction by eq. (6) is expressed for fluid
Bruce E. Roberts: Flow Impairment by Deposited Sulfur - A Review of 50 Years of Research
DOI:10.7569/JNGE.2017.692504
J. Natural Gas Eng., Vol. 2, No. 1, June 2017 © 2017 Scrivener Publishing LLC 91
match to the available experimental data. A reasonable fit to the experimentaldata of Roof [7], Brunner and Woll [9] and Brunner et al. [12] was obtained.
The Peng-Robinson equation of state was also used by Karan et al. [20] butwith a different approach to the calculation of the equation parameters. For theliquid and vapor phases, the a and b parameters of the equation of state wereadjusted to provide the best match to the vapor pressure and liquid density.The solid sulfur fugacity was calculated by an empirical function of tempera-ture and pressure with the parameters adjusted to fit experimental solubilitydata. In addition, binary interaction parameters were determined from avail-able experimental data. The match obtained between predicted and experimen-tal solubility for the data of Roof [7], Brunner and Woll [9], and Brunner et al.[12] was similar to that reported by Tomcej et al. [19], as based on a visualcomparison of the paper figures.
A much more complicated model was developed by Heidemann et al. [21],by the incorporation of chemical reactions. Sulfur was modeled as a mixture ofeight species, S1 to S8, with each available to react with H2S:
H2Sþ n� 1
8S8 ¼ H2Sn;n ¼ 2; . . . ::9 (4)
A method to estimate the equation of state parameters for all the specieswas described. The calculation of the equation of state parameters for pure S8,and estimation of the binary interaction parameters followed the approach ofKaran et al. [20] Despite the added complexity of the model, the matchbetween predicted and the experimental data was similar to the model ofKaran et al. [20].
Gu et al. [10] used the Peng-Robinson equation of state to determine sulfursolubility at temperatures less than the melting point. A correction functionincorporating two temperature-dependent interaction parameters were intro-duced to modify the mixing rule for the b parameter of the Peng-Robinsonequation of state. These new interaction parameters, plus the usual interactionparameter to calculate the a parameter were determined by fitting to the avail-able experimental data. The average absolute deviation between experimentaland predicted solubility for two sour gas mixtures of 44 and 95% H2S wasapproximately 7%. Sun and Chen [13] used a similar approach, but consideredthe interaction parameters to be temperature independent. An average absolutedeviation between experimental and predicted solubility of 6.5% was deter-mined for seven gas mixtures of H2S content of approximately 5 to 27%.
The Peng-Robinson equation of state model by Cézac et al. [22] was devel-oped specifically to investigate sulfur deposition in natural gas transmissionnetworks. An approach similar to Heidemann et al. [21] was used with theincorporation of reactions between the eight sulfur species and H2S to formpolysulfanes. The pressure and temperature conditions studied were outside
Bruce E. Roberts: Flow Impairment by Deposited Sulfur - A Review of 50 Years of Research
DOI:10.7569/JNGE.2017.692504
J. Natural Gas Eng., Vol. 2, No. 1, June 2017 © 2017 Scrivener Publishing LLC90
the range of available experimental data, so no conclusions could be drawnregarding the accuracy of the prediction.
In summary, an equation of state is generally able to provide an estimate ofsulfur solubility in sour gas of sufficient accuracy for screening calculations.Development of more complex models incorporating chemical reactions doesnot improve the predictive capability.
4.2 Analytical Models
A simple correlation developed by Chrastil [23] for predicting the solubility ofsolids in fluids at high pressure was first applied by Roberts [2] to the sulfur-sour gas system:
cr ¼ �kexpa
Tþ B
� �(5)
where cr (g/m3), is the concentration of the solid component at reservoirtemperature and pressure, � is the fluid density (kg/m3), and T is the fluidtemperature (K). The parameters, k, a, and B are empirical constants deter-mined by matching experimental solubility measurements.
As this equation has been used extensively in subsequent studies on the sul-fur deposition process, it is useful to note the key aspects of its application andparameter determination. Roberts [2] used solubility data for two sour gas mix-tures comprised of 20% H2S and 6% H2S reported by Brunner and Woll [9] toestimate the correlation parameters. These mixtures were selected as the H2Sconcentration bounded the H2S concentration of the reservoir fluid understudy (16% H2S). The parameter, k, was estimated by plotting ln cr versus ln �at a constant temperature (100, 120, 140 and 160 ˚C) for both gas mixtures. Val-ues for k for the four temperatures studied varied from 3.7 to 4.1. The parame-ters a and B were determined by plotting ln cr versus 1/T at a constant densityequal to the value for the reservoir fluid at reservoir pressure (36.6 MPa) andtemperature (81 ˚C). The linear trend observed in the plot was determined tocoincide with the sulfur content of the reservoir fluid as measured in a bottom-hole sample. This analysis of the Brunner and Woll [9] data for the two mix-tures thus yielded the following expression for the sulfur solubility of thefluid:
cr ¼ �4exp�4666
T� 4:5711
� �(6)
The solubility as predicted by eq. (6) is expressed for fluid at reservoir tem-perature and pressure. Recent papers by Hu et al. [24] and Guo and Wang [25]have incorrectly assumed solubility prediction by eq. (6) is expressed for fluid
Bruce E. Roberts: Flow Impairment by Deposited Sulfur - A Review of 50 Years of Research
DOI:10.7569/JNGE.2017.692504
J. Natural Gas Eng., Vol. 2, No. 1, June 2017 91
at standard temperature and pressure conditions. It is also important to stressthat this equation was developed based on data for a narrow range of H2S con-centrations (6 to 20%) and should not be applied outside of this range. Arecent study by Wang et al. [26] proposed an improved method to estimate theparameters for the Chrastil equation.
A modified approach to the application of the Chrastil equation was pro-vided by Carroll [27] by expressing the solubility in equation (5) in terms ofmass of solute per unit volume of solvent at standard conditions. Carroll [27]evaluated the equation parameters by fitting experimental data by least squaresregression for pure H2S grouped in three categories: solid sulfur in high den-sity fluid, liquid sulfur in high density fluid, and liquid sulfur in low densityfluid. The model predictions were generally with +/-20% of the experimentalvalues. Model parameters were determined for 20 sour gas mixtures studiedby Brunner and Woll [9], Brunner et al. [12], Gu et al. [10], and Sun and Chen[13]. For each mixture, parameters for the solubility of solid sulfur and liquidsulfur were determined. The average absolute error for each gas mixtureranged from approximately 4 to 35%, with average for all mixtures equal to15%. In general, the correlation was significantly more accurate in the high-pressure region.
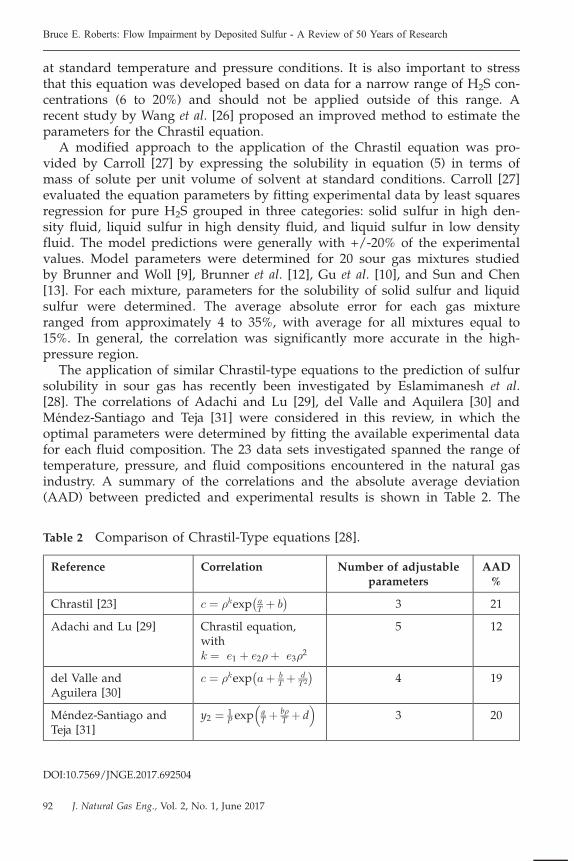
The application of similar Chrastil-type equations to the prediction of sulfursolubility in sour gas has recently been investigated by Eslamimanesh et al.[28]. The correlations of Adachi and Lu [29], del Valle and Aquilera [30] andMéndez-Santiago and Teja [31] were considered in this review, in which theoptimal parameters were determined by fitting the available experimental datafor each fluid composition. The 23 data sets investigated spanned the range oftemperature, pressure, and fluid compositions encountered in the natural gasindustry. A summary of the correlations and the absolute average deviation(AAD) between predicted and experimental results is shown in Table 2. The
Table 2 Comparison of Chrastil-Type equations [28].
Reference Correlation Number of adjustableparameters
AAD%
Chrastil [23] c ¼ �kexp aT þ b� �
3 21
Adachi and Lu [29] Chrastil equation,withk ¼ e1 þ e2�þ e3�
2
5 12
del Valle andAguilera [30]
c ¼ �kexp aþ bT þ d
T 2
� �4 19
Méndez-Santiago andTeja [31]
y2 ¼ 1P exp
aT þ b�
T þ d� �
3 20
Bruce E. Roberts: Flow Impairment by Deposited Sulfur - A Review of 50 Years of Research
DOI:10.7569/JNGE.2017.692504
J. Natural Gas Eng., Vol. 2, No. 1, June 201792
Adachi and Lu equation in which the k parameter is determined as a functionof density was determined to provide the best fit to the experimental data, asmay be expected given the incorporation of more adjustable parameters in thecorrelation. Improvements in the match for the solubility of sulfur in pure H2Swere obtained by eliminating thermodynamically inconsistent data as identi-fied by Eslamimanesh et al. [32].
4.3 Artificial Neural Network
An artificial neural network (ANN) is a compositional model loosely based onthe structure of the brain. It does not require a mathematical description of thephysical process. Mohammadi and Richon [33] developed an ANN algorithmfor estimating sulfur content in H2S. The algorithm was extended to sour gasmixtures by Mehrpooya et al. [34]. A subset of available experimental data wasused to train the ANN model prior to a validation step in which deviationsbetween the experimental and predicted values were determined. Inputs to themodel were temperature, pressure, gas gravity (acid-gas free basis) and molefraction of H2S. Mehrpooya et al. [34] reported a 17% average absolute devia-tion between experimental and predicted data.
5. Formation Damage by Sulfur Deposition – Experimental Studies
Several studies have attempted to experimentally assess the degree to whichsolid sulfur deposition will impact fluid flow in the formation. Guo et al. [35]flowed sulfur-saturated gas containing 19% H2S through carbonate core sam-ples and measured the distribution of sulfur deposited within the core using aScanning Electron Microscope. A buildup of deposited sulfur near the core exitwas attributed to a significant reduction in pressure in this region of the core.A core flow experiment by Guo et al. [36] in which the pressure of a sulfur-saturated gas containing 7% H2S was reduced from 19 to 10 MPa resulted in a16% reduction in core permeability. In a follow-up study, Guo et al. [37] con-ducted a series of coreflow experiments and illustrated that the impact of sul-fur deposition on formation permeability increased significantly withincreasing H2S content of the reservoir fluid. Hu et al. [38] conducted depletionexperiments by reducing saturated sour gas containing 7% H2S from 40 to8 MPa and observed approximately a 13% reduction in core permeability.Higher reduction in permeability was reported by Xuefeng et al. [39] for similarreservoir fluid composition – a decline of pressure from 45 to 8 MPa resultedin a 45% loss in permeability.
Abou-Kassem [40] conducted a series of tests involving the flow of nitrogensaturated with sulfur through limestone cores at relatively low pressure (3 to6 MPa) and approximately 90 ˚C. A 15% reduction in permeability wasobserved which was attributed to adsorption of elemental sulfur onto the rock
Bruce E. Roberts: Flow Impairment by Deposited Sulfur - A Review of 50 Years of Research
DOI:10.7569/JNGE.2017.692504
J. Natural Gas Eng., Vol. 2, No. 1, June 2017 © 2017 Scrivener Publishing LLC 93
at standard temperature and pressure conditions. It is also important to stressthat this equation was developed based on data for a narrow range of H2S con-centrations (6 to 20%) and should not be applied outside of this range. Arecent study by Wang et al. [26] proposed an improved method to estimate theparameters for the Chrastil equation.
A modified approach to the application of the Chrastil equation was pro-vided by Carroll [27] by expressing the solubility in equation (5) in terms ofmass of solute per unit volume of solvent at standard conditions. Carroll [27]evaluated the equation parameters by fitting experimental data by least squaresregression for pure H2S grouped in three categories: solid sulfur in high den-sity fluid, liquid sulfur in high density fluid, and liquid sulfur in low densityfluid. The model predictions were generally with +/-20% of the experimentalvalues. Model parameters were determined for 20 sour gas mixtures studiedby Brunner and Woll [9], Brunner et al. [12], Gu et al. [10], and Sun and Chen[13]. For each mixture, parameters for the solubility of solid sulfur and liquidsulfur were determined. The average absolute error for each gas mixtureranged from approximately 4 to 35%, with average for all mixtures equal to15%. In general, the correlation was significantly more accurate in the high-pressure region.
The application of similar Chrastil-type equations to the prediction of sulfursolubility in sour gas has recently been investigated by Eslamimanesh et al.[28]. The correlations of Adachi and Lu [29], del Valle and Aquilera [30] andMéndez-Santiago and Teja [31] were considered in this review, in which theoptimal parameters were determined by fitting the available experimental datafor each fluid composition. The 23 data sets investigated spanned the range oftemperature, pressure, and fluid compositions encountered in the natural gasindustry. A summary of the correlations and the absolute average deviation(AAD) between predicted and experimental results is shown in Table 2. The
Table 2 Comparison of Chrastil-Type equations [28].
Reference Correlation Number of adjustableparameters
AAD%
Chrastil [23] c ¼ �kexp aT þ b� �
3 21
Adachi and Lu [29] Chrastil equation,withk ¼ e1 þ e2�þ e3�
2
5 12
del Valle andAguilera [30]
c ¼ �kexp aþ bT þ d
T 2
� �4 19
Méndez-Santiago andTeja [31]
y2 ¼ 1P exp
aT þ b�
T þ d� �
3 20
Bruce E. Roberts: Flow Impairment by Deposited Sulfur - A Review of 50 Years of Research
DOI:10.7569/JNGE.2017.692504
J. Natural Gas Eng., Vol. 2, No. 1, June 2017 © 2017 Scrivener Publishing LLC92
Adachi and Lu equation in which the k parameter is determined as a functionof density was determined to provide the best fit to the experimental data, asmay be expected given the incorporation of more adjustable parameters in thecorrelation. Improvements in the match for the solubility of sulfur in pure H2Swere obtained by eliminating thermodynamically inconsistent data as identi-fied by Eslamimanesh et al. [32].
4.3 Artificial Neural Network
An artificial neural network (ANN) is a compositional model loosely based onthe structure of the brain. It does not require a mathematical description of thephysical process. Mohammadi and Richon [33] developed an ANN algorithmfor estimating sulfur content in H2S. The algorithm was extended to sour gasmixtures by Mehrpooya et al. [34]. A subset of available experimental data wasused to train the ANN model prior to a validation step in which deviationsbetween the experimental and predicted values were determined. Inputs to themodel were temperature, pressure, gas gravity (acid-gas free basis) and molefraction of H2S. Mehrpooya et al. [34] reported a 17% average absolute devia-tion between experimental and predicted data.
5. Formation Damage by Sulfur Deposition – Experimental Studies
Several studies have attempted to experimentally assess the degree to whichsolid sulfur deposition will impact fluid flow in the formation. Guo et al. [35]flowed sulfur-saturated gas containing 19% H2S through carbonate core sam-ples and measured the distribution of sulfur deposited within the core using aScanning Electron Microscope. A buildup of deposited sulfur near the core exitwas attributed to a significant reduction in pressure in this region of the core.A core flow experiment by Guo et al. [36] in which the pressure of a sulfur-saturated gas containing 7% H2S was reduced from 19 to 10 MPa resulted in a16% reduction in core permeability. In a follow-up study, Guo et al. [37] con-ducted a series of coreflow experiments and illustrated that the impact of sul-fur deposition on formation permeability increased significantly withincreasing H2S content of the reservoir fluid. Hu et al. [38] conducted depletionexperiments by reducing saturated sour gas containing 7% H2S from 40 to8 MPa and observed approximately a 13% reduction in core permeability.Higher reduction in permeability was reported by Xuefeng et al. [39] for similarreservoir fluid composition – a decline of pressure from 45 to 8 MPa resultedin a 45% loss in permeability.
Abou-Kassem [40] conducted a series of tests involving the flow of nitrogensaturated with sulfur through limestone cores at relatively low pressure (3 to6 MPa) and approximately 90 ˚C. A 15% reduction in permeability wasobserved which was attributed to adsorption of elemental sulfur onto the rock
Bruce E. Roberts: Flow Impairment by Deposited Sulfur - A Review of 50 Years of Research
DOI:10.7569/JNGE.2017.692504
J. Natural Gas Eng., Vol. 2, No. 1, June 2017 93
surface. Mahmoud [41] conducted a flow experiment by injecting liquid sulfurat 150 ˚C into an outcrop limestone core saturated initially with fresh water. Apressure drop across the core was greater than would be expected based onlyon the difference in viscosity between fresh water and elemental sulfur, whichMahmoud [4] attributed to the adsorption of sulfur onto the rock surface.However, Mahmoud assumed that sulfur displaced all the water after 1 pore-volume was injected. A second explanation for the higher than expected pres-sure drop is the presence of a residual water phase.
The above noted studies all investigated the impact of deposited sulfur inthe solid phase. The impact of liquid sulfur deposition was investigated byCoskuner [42] by conducting a unique set of experiments using glass micromo-dels. The studies attempted to qualitatively explain the field results for theBearberry Demonstration Project previously noted. Flow of reservoir fluid con-taining 90% H2S, liquid sulfur, and water was visualized under reservoir con-ditions of 31 MPa and 120 ˚C. It was observed that the gas wets the sulfur/water interface and flows relatively easily through the pore network. It wasconcluded the deposition of liquid sulfur in the formation would not signifi-cantly impair the flow of gas as observed in field for the Bearberry project.
In summary, the experimental studies, even for the deposition of solid sulfurhave shown only modest decreases in formation permeability which wouldunlikely lead to serious production problems. However, the coreflow tests areunable to replicate the transport of elemental sulfur from the bulk of the reser-voir to the near-wellbore region where deposition occurs.
6 Formation Damage Modeling
A number of numerical models which incorporate phase behavior and fluidflow elements have been derived to assess the impact of sulfur deposition onreservoir inflow performance. These models range from relatively simple ana-lytical equations to more complex expressions incorporating velocity effectsand flow through natural fractures.
6.1 Initial Models
The first attempt to model the impact of sulfur deposition on fluid flow wasreported by Kuo and Closmann [43], with a follow-up paper by Kuo [44]. Con-tinuity equations based on the isothermal, one-dimensional form of Darcy’slaw for the fluid phase and sulfur components were derived and solvednumerically. The deposited sulfur phase was assumed to be immobile. Thefluid density and viscosity and sulfur solubility were considered to be func-tions of pressure. An expression based on the data reported by Archie [45] wasderived for fluid permeability as a function of porosity, which is reduced dueto the deposition of sulfur. The example reservoir chosen for study represented
Bruce E. Roberts: Flow Impairment by Deposited Sulfur - A Review of 50 Years of Research
DOI:10.7569/JNGE.2017.692504
J. Natural Gas Eng., Vol. 2, No. 1, June 201794
an extreme case for sulfur deposition – reservoir pressure set at approximately100 MPa and reservoir temperature at 200 ˚C. Solubility data of Roof [7] forpure H2S was extrapolated to these reservoir conditions. The reservoir fluidwas determined to be undersaturated, with a saturation pressure of 38 MPa.Modeling results demonstrated that sulfur deposition may completely plug theformation near the wellbore. Flow rate reduction, decreased well spacing, oran increase in effective wellbore radius were determined to reduce the impactof sulfur deposition.
6.2 Analytical Approaches
An alternate approach was taken by Roberts [2] by deriving an analytical equa-tion to describe the rate of sulfur buildup in the formation. Instead of applyingthe transient flow equations of Kuo [44], one-dimensional, semi-steady stateradial flow was assumed. The rate of sulfur-saturation buildup, dSs=dt; wasderived as shown in eq. (7):
dSsdt
¼q2 dc
dp
� �Bu
4p2kakrh2f 1� Swið Þr2 (7)
An approximate expression for the sulfur saturation (as a fraction of thehydrocarbon pore volume) as a function of time may be derived by integratingeq. (7) assuming constant values for B, m, and dc/dp and an expression for kr.The relationship for relative permeability, kr, was taken from the study by Kuo[44]:
lnkr ¼ ASs (8)
Equation (7) may be integrated to yield:
Ss ¼ln
A q2Bm dcdp
� �t
4p2kah2f 1�Swið Þr2 þ 1
24
35
A(9)
Based on equation (7) and (8), Roberts [2] identified four key factors whichgovern the rate of buildup of deposited sulfur and the magnitude of flowimpairment:
1. Transport of elemental sulfur to the region in which sulfur is depositedis required. Dropout of sulfur in the bulk of the reservoir due to
Bruce E. Roberts: Flow Impairment by Deposited Sulfur - A Review of 50 Years of Research
DOI:10.7569/JNGE.2017.692504
J. Natural Gas Eng., Vol. 2, No. 1, June 2017 © 2017 Scrivener Publishing LLC 95
surface. Mahmoud [41] conducted a flow experiment by injecting liquid sulfurat 150 ˚C into an outcrop limestone core saturated initially with fresh water. Apressure drop across the core was greater than would be expected based onlyon the difference in viscosity between fresh water and elemental sulfur, whichMahmoud [4] attributed to the adsorption of sulfur onto the rock surface.However, Mahmoud assumed that sulfur displaced all the water after 1 pore-volume was injected. A second explanation for the higher than expected pres-sure drop is the presence of a residual water phase.
The above noted studies all investigated the impact of deposited sulfur inthe solid phase. The impact of liquid sulfur deposition was investigated byCoskuner [42] by conducting a unique set of experiments using glass micromo-dels. The studies attempted to qualitatively explain the field results for theBearberry Demonstration Project previously noted. Flow of reservoir fluid con-taining 90% H2S, liquid sulfur, and water was visualized under reservoir con-ditions of 31 MPa and 120 ˚C. It was observed that the gas wets the sulfur/water interface and flows relatively easily through the pore network. It wasconcluded the deposition of liquid sulfur in the formation would not signifi-cantly impair the flow of gas as observed in field for the Bearberry project.
In summary, the experimental studies, even for the deposition of solid sulfurhave shown only modest decreases in formation permeability which wouldunlikely lead to serious production problems. However, the coreflow tests areunable to replicate the transport of elemental sulfur from the bulk of the reser-voir to the near-wellbore region where deposition occurs.
6 Formation Damage Modeling
A number of numerical models which incorporate phase behavior and fluidflow elements have been derived to assess the impact of sulfur deposition onreservoir inflow performance. These models range from relatively simple ana-lytical equations to more complex expressions incorporating velocity effectsand flow through natural fractures.
6.1 Initial Models
The first attempt to model the impact of sulfur deposition on fluid flow wasreported by Kuo and Closmann [43], with a follow-up paper by Kuo [44]. Con-tinuity equations based on the isothermal, one-dimensional form of Darcy’slaw for the fluid phase and sulfur components were derived and solvednumerically. The deposited sulfur phase was assumed to be immobile. Thefluid density and viscosity and sulfur solubility were considered to be func-tions of pressure. An expression based on the data reported by Archie [45] wasderived for fluid permeability as a function of porosity, which is reduced dueto the deposition of sulfur. The example reservoir chosen for study represented
Bruce E. Roberts: Flow Impairment by Deposited Sulfur - A Review of 50 Years of Research
DOI:10.7569/JNGE.2017.692504
J. Natural Gas Eng., Vol. 2, No. 1, June 2017 © 2017 Scrivener Publishing LLC94
an extreme case for sulfur deposition – reservoir pressure set at approximately100 MPa and reservoir temperature at 200 ˚C. Solubility data of Roof [7] forpure H2S was extrapolated to these reservoir conditions. The reservoir fluidwas determined to be undersaturated, with a saturation pressure of 38 MPa.Modeling results demonstrated that sulfur deposition may completely plug theformation near the wellbore. Flow rate reduction, decreased well spacing, oran increase in effective wellbore radius were determined to reduce the impactof sulfur deposition.
6.2 Analytical Approaches
An alternate approach was taken by Roberts [2] by deriving an analytical equa-tion to describe the rate of sulfur buildup in the formation. Instead of applyingthe transient flow equations of Kuo [44], one-dimensional, semi-steady stateradial flow was assumed. The rate of sulfur-saturation buildup, dSs=dt; wasderived as shown in eq. (7):
dSsdt
¼q2 dc
dp
� �Bu
4p2kakrh2f 1� Swið Þr2 (7)
An approximate expression for the sulfur saturation (as a fraction of thehydrocarbon pore volume) as a function of time may be derived by integratingeq. (7) assuming constant values for B, m, and dc/dp and an expression for kr.The relationship for relative permeability, kr, was taken from the study by Kuo[44]:
lnkr ¼ ASs (8)
Equation (7) may be integrated to yield:
Ss ¼ln
A q2Bm dcdp
� �t
4p2kah2f 1�Swið Þr2 þ 1
24
35
A(9)
Based on equation (7) and (8), Roberts [2] identified four key factors whichgovern the rate of buildup of deposited sulfur and the magnitude of flowimpairment:
1. Transport of elemental sulfur to the region in which sulfur is depositedis required. Dropout of sulfur in the bulk of the reservoir due to
Bruce E. Roberts: Flow Impairment by Deposited Sulfur - A Review of 50 Years of Research
DOI:10.7569/JNGE.2017.692504
J. Natural Gas Eng., Vol. 2, No. 1, June 2017 95
pressure depletion would have little impact on formation porosity orgas permeability.
2. Pressure drop near the well results in reduced solubility of sulfur of thesulfur-saturated sour gas. The greater the pressure gradient, due to highflow rates or low permeability, the greater the deposition rate.
3. The volume of pore space in which sulfur deposits influences the rate ofsulfur buildup. The buildup rate will be less in formations of highporosity and pay thickness or in cases in which deposition is spread outwithin a large volume, such as flow to a horizontal well or to hydraulicfractures.
4. Flow impairment is controlled by the relative permeability of the gasphase in the presence of the deposited phase.
Follow-up studies have subsequently used the analytical model derived byRoberts to further quantify the impact of sulfur deposition. Mei et al. [46] usedeq. (7) to determine gas deliverability in terms of the AOF potential. Impair-ment of gas flow due to sulfur deposition as reflected in the AOF was shownto be more severe during the early time of production. Mahmoud andAl-Majeb [47] used eq. (9) and the relative permeability expression given byeq. (8) to investigate the deposition process and reached similar conclusions asoutlined in the Roberts [2] study. Adesina et al. [48] incorporated a slightly dif-ferent expression for the impact of deposition of elemental sulfur on gas flowinto eq. (7) which resulted in a higher rate of sulfur buildup near the wellborethan predicted by Roberts [2].
The model of Roberts [2] has been extended to include the additional pres-sure drop due to non-Darcy flow by Hu et al. [49–51]. Guo et al. [52] includedboth the impact of non-Darcy flow and compaction in their model and allowedfor variation of gas properties and dc/dp with pressure. They compared the rateof sulfur buildup with the Roberts [2] model to show that including these ele-ments into the model resulted in a significantly higher rate of sulfur buildup.
Hu et al. [53] investigated the impact of sulfur deposition on horizontal wellproductivity by incorporation of the expression for gas relative permeabilitygiven by eq. (8) into common equations for horizontal well productivity. Itshould be noted that although these equations illustrate that sulfur buildupnear horizontal wells will reduce productivity, the time to reach a given sulfursaturation may be orders of magnitude greater than for vertical wells, giventhe lower pressure gradient near the well and the larger pore volume over thelength of the horizontal wells.
Mahmoud [41] derived an expression for near-wellbore sulfur saturationthat accounts for adsorption of sulfur onto the carbonate formation surface. Atthe temperature conditions of this study (150 ˚C), elemental sulfur exists as aliquid phase. An expression for the added increase in sulfur saturation due to
Bruce E. Roberts: Flow Impairment by Deposited Sulfur - A Review of 50 Years of Research
DOI:10.7569/JNGE.2017.692504
J. Natural Gas Eng., Vol. 2, No. 1, June 201796
adsorption was added to the Roberts [2] derived expression given by eq. (9).However, eq. (9) is specifically derived for the deposition of solid sulfur andassumes no mobility of the phase. Predictions by the Mahmoud [41] expressionresults in complete plugging of the formation (Ss equal to one). However, thisresult for the deposition of sulfur in the liquid phase would not be expected,as the liquid sulfur saturation would begin to flow once the critical saturationhas been obtained. Field evidence given by the Bearberry project shows rela-tively little impairment by liquid sulfur deposition.
6.3 Incorporation of Non-Equilibrium Effects
The main limitation of the Roberts [2] model and other variations cited aboveis that the location of sulfur precipitation and deposition are assumed to be thesame. However, it is likely that precipitated sulfur particles would be carriedwith the gas stream for a distance before deposition. Civan [54] developed ananalytical model applicable to any precipitate to account for the delay in thedeposition which resulted in less deposit relative to the equilibrium case. Anumerical model to account for non-equilibrium effects specifically for sulfurdeposition was derived by Du et al. [55]. An expression for the velocity of car-ried sulfur was introduced into the partial differential equation describing theflow of components through the formation. An equation was derived for thecritical velocity of the gas stream, below which any suspended particles woulddeposit in the formation. However, the equation is a function of highly uncer-tain parameters, such as particle mass, pore diameter, and friction coefficients.Du et al. [55] did not explain how these values may be determined, or providethe values used in their example analysis. The model predictions were com-pared with the results of Roberts [2] for the simulation of the impact of sulfurdeposition on the performance of a sour gas well. Incorporating the effect ofcarried sulfur in the gas stream was shown to slightly increase the productivelife of the well. The model of Du et al. [55] predicted complete plugging after320 days, whereas Roberts [2] predicted a productive life of 270 days.
6.4 Modeling Deposition in Naturally Fractured Reservoirs
The deposition of elemental sulfur in naturally fractured reservoirs will be sig-nificantly different than for reservoirs in which fluid flow is mainly throughthe rock matrix. Often gas productivity is governed by number and conductiv-ity of open natural fractures that intersect the wellbore. A model for depositionof solid elemental sulfur in natural fractures was first described by Hands et al.[3] to aid in the design of sulfur solvent treatments for Shell Canada’s wells intheir dry sour gas fields. An equation for the pressure profile within a naturalfracture was derived as a function of gas flow rate and fracture properties. Thetemperature profile was incorporated into the model to account for Joule-
Bruce E. Roberts: Flow Impairment by Deposited Sulfur - A Review of 50 Years of Research
DOI:10.7569/JNGE.2017.692504
J. Natural Gas Eng., Vol. 2, No. 1, June 2017 © 2017 Scrivener Publishing LLC 97
pressure depletion would have little impact on formation porosity orgas permeability.
2. Pressure drop near the well results in reduced solubility of sulfur of thesulfur-saturated sour gas. The greater the pressure gradient, due to highflow rates or low permeability, the greater the deposition rate.
3. The volume of pore space in which sulfur deposits influences the rate ofsulfur buildup. The buildup rate will be less in formations of highporosity and pay thickness or in cases in which deposition is spread outwithin a large volume, such as flow to a horizontal well or to hydraulicfractures.
4. Flow impairment is controlled by the relative permeability of the gasphase in the presence of the deposited phase.
Follow-up studies have subsequently used the analytical model derived byRoberts to further quantify the impact of sulfur deposition. Mei et al. [46] usedeq. (7) to determine gas deliverability in terms of the AOF potential. Impair-ment of gas flow due to sulfur deposition as reflected in the AOF was shownto be more severe during the early time of production. Mahmoud andAl-Majeb [47] used eq. (9) and the relative permeability expression given byeq. (8) to investigate the deposition process and reached similar conclusions asoutlined in the Roberts [2] study. Adesina et al. [48] incorporated a slightly dif-ferent expression for the impact of deposition of elemental sulfur on gas flowinto eq. (7) which resulted in a higher rate of sulfur buildup near the wellborethan predicted by Roberts [2].
The model of Roberts [2] has been extended to include the additional pres-sure drop due to non-Darcy flow by Hu et al. [49–51]. Guo et al. [52] includedboth the impact of non-Darcy flow and compaction in their model and allowedfor variation of gas properties and dc/dp with pressure. They compared the rateof sulfur buildup with the Roberts [2] model to show that including these ele-ments into the model resulted in a significantly higher rate of sulfur buildup.
Hu et al. [53] investigated the impact of sulfur deposition on horizontal wellproductivity by incorporation of the expression for gas relative permeabilitygiven by eq. (8) into common equations for horizontal well productivity. Itshould be noted that although these equations illustrate that sulfur buildupnear horizontal wells will reduce productivity, the time to reach a given sulfursaturation may be orders of magnitude greater than for vertical wells, giventhe lower pressure gradient near the well and the larger pore volume over thelength of the horizontal wells.
Mahmoud [41] derived an expression for near-wellbore sulfur saturationthat accounts for adsorption of sulfur onto the carbonate formation surface. Atthe temperature conditions of this study (150 ˚C), elemental sulfur exists as aliquid phase. An expression for the added increase in sulfur saturation due to
Bruce E. Roberts: Flow Impairment by Deposited Sulfur - A Review of 50 Years of Research
DOI:10.7569/JNGE.2017.692504
J. Natural Gas Eng., Vol. 2, No. 1, June 2017 © 2017 Scrivener Publishing LLC96
adsorption was added to the Roberts [2] derived expression given by eq. (9).However, eq. (9) is specifically derived for the deposition of solid sulfur andassumes no mobility of the phase. Predictions by the Mahmoud [41] expressionresults in complete plugging of the formation (Ss equal to one). However, thisresult for the deposition of sulfur in the liquid phase would not be expected,as the liquid sulfur saturation would begin to flow once the critical saturationhas been obtained. Field evidence given by the Bearberry project shows rela-tively little impairment by liquid sulfur deposition.
6.3 Incorporation of Non-Equilibrium Effects
The main limitation of the Roberts [2] model and other variations cited aboveis that the location of sulfur precipitation and deposition are assumed to be thesame. However, it is likely that precipitated sulfur particles would be carriedwith the gas stream for a distance before deposition. Civan [54] developed ananalytical model applicable to any precipitate to account for the delay in thedeposition which resulted in less deposit relative to the equilibrium case. Anumerical model to account for non-equilibrium effects specifically for sulfurdeposition was derived by Du et al. [55]. An expression for the velocity of car-ried sulfur was introduced into the partial differential equation describing theflow of components through the formation. An equation was derived for thecritical velocity of the gas stream, below which any suspended particles woulddeposit in the formation. However, the equation is a function of highly uncer-tain parameters, such as particle mass, pore diameter, and friction coefficients.Du et al. [55] did not explain how these values may be determined, or providethe values used in their example analysis. The model predictions were com-pared with the results of Roberts [2] for the simulation of the impact of sulfurdeposition on the performance of a sour gas well. Incorporating the effect ofcarried sulfur in the gas stream was shown to slightly increase the productivelife of the well. The model of Du et al. [55] predicted complete plugging after320 days, whereas Roberts [2] predicted a productive life of 270 days.
6.4 Modeling Deposition in Naturally Fractured Reservoirs
The deposition of elemental sulfur in naturally fractured reservoirs will be sig-nificantly different than for reservoirs in which fluid flow is mainly throughthe rock matrix. Often gas productivity is governed by number and conductiv-ity of open natural fractures that intersect the wellbore. A model for depositionof solid elemental sulfur in natural fractures was first described by Hands et al.[3] to aid in the design of sulfur solvent treatments for Shell Canada’s wells intheir dry sour gas fields. An equation for the pressure profile within a naturalfracture was derived as a function of gas flow rate and fracture properties. Thetemperature profile was incorporated into the model to account for Joule-
Bruce E. Roberts: Flow Impairment by Deposited Sulfur - A Review of 50 Years of Research
DOI:10.7569/JNGE.2017.692504
J. Natural Gas Eng., Vol. 2, No. 1, June 2017 97
Thomson cooling which would impact sulfur solubility. The model requiresspecification of a critical velocity, below which precipitated sulfur is allowed todeposit. To be useful as a tool to manage sulfur solvent treatments, a calibra-tion process was implemented, in which reservoir and performance data forone representative well within a field was used to estimate fracture propertiesand critical velocity. The calibrated model was subsequently used to determinethe schedule for solvent treatments, and to estimate productive life and ulti-mate recovery for each well of interest.
The field calibrated modeling results of Hands et al. [3] identified three spe-cific zones of sulfur deposition within the natural fracture: (1) a zone nearestthe well in which sulfur deposition has been reduced due to dynamic effects(gas velocity exceeds the critical value), (2) a zone of deposition which can beremoved by solvent treatments, and (3) a zone of permanent plugging whichcannot be reached by conventional solvent injection. The model indicated thatthis deep deposition may occur 15 to 30 m into the formation, a distance muchgreater than would be expected for deposition in a non-fractured reservoir.Reducing the gas flow rate was shown to bring the deposition closer to thewellbore, thus making solvent treatment more effective. The model and fieldevidence also confirmed that high flow rates are to be avoided to prevent“uncontrollable” deposition – for a given set of reservoir and wellbore proper-ties, an optimum production rate may be calculated which maximizes the eco-nomic value of the well.
More recently, models for sulfur deposition in natural fractures have beenreported by Hu et al. [56] and He and Guo [57]. However, unlike the model ofHands et al. [3] these models do not take into account transport of sulfur par-ticles within the gas phase, nor incorporation of a temperature profile alongthe fracture.
6.5 Use of Conventional Reservoir Simulators
The above-described numerical models for predicting the impact of sulfur dep-osition on inflow performance into gas wells have all used homogeneous prop-erties. For example, the models have assumed one value for formationporosity, pay thickness, permeability, etc. To model deposition within an actualreservoir requires a more detailed and realistic reservoir description. Suchmodeling will generally require the use of conventional reservoir simulators.Roberts [2] used a black-oil simulator in which the deposited sulfur is repre-sented by the “oil” phase. The phase behavior is specified in terms of a con-densate (sulfur)/gas ratio. For the deposition of solid sulfur, the relativepermeability of the “oil” is set to 0 for all saturations. Although not reported inthe paper, flow of liquid sulfur may be also modeled, by using properties forliquid sulfur for the “oil” phase, and specifying a relative permeability curvefor sulfur. Mahmoud et al. [41] stated that this application of a reservoir
Bruce E. Roberts: Flow Impairment by Deposited Sulfur - A Review of 50 Years of Research
DOI:10.7569/JNGE.2017.692504
J. Natural Gas Eng., Vol. 2, No. 1, June 201798
simulator would not give an accurate prediction of the sulfur damage in gasreservoirs as hydrocarbon condensate properties were being used. However, inthe Roberts [2] study, hydrocarbon condensate properties were not used, butinstead well-established literature values for liquid sulfur.
It should be noted that conventional simulation models may not be able tomodel non-equilibrium deposition. Results from such simulation modelsshould be considered a “worst-case” since sulfur that is carried in the gasphase may not deposit in the reservoir but be carried through to the well.Neglecting non-equilibrium effects may be offset by adjustment of reservoirparameters by calibration with field or analogue performance data.
The key benefit of a reservoir simulation model over the analytical modelsis that the effect of formation heterogeneities near the wellbore may be investi-gated. A two-layer system consisting of a 22 m thick, 0.2 mD layer in commu-nication with a 8 m 2.0 mD layer was modeled. Sulfur plugging was found tooccur rapidly in the small-volume, high permeability streak because most ofthe flow is through this layer. This layer is subsequently plugged off, and flowto the well must take place through the low permeability layer resulting in arapid reduction in gas flow rate. Further simulations of a highly layered sys-tem demonstrated that formation impairment by deposited sulfur becomesmore severe as the degree of heterogeneity increases. Field performance of theWaterton gas well noted earlier in this paper was simulated. A match betweensimulated and actual performance and the following pressure buildup wasobtained by adjusting the effective wellbore radius of a layered system, toreflect differing degrees of stimulation for each of the model layers.
7 Reservoir Engineering Applications - Development of Sour GasReservoirs
Development of a newly discovered sour gas reservoir will generally requirean assessment of well productivity and ultimate recovery, determination ofwell type (vertical, horizontal, slant) and spacing, and specific requirements forwell stimulation such as hydraulic fracturing. A production forecast will beneeded for the design of surface processing facilities and gas marketing. Thepotential for sulfur deposition in the formation will increase the level of uncer-tainty for many of these key reservoir performance parameters, and increasethe risk of uneconomic performance. Based on the investigations reviewed inthis study, the following factors will increase development risk:
1. high H2S content2. high reservoir pressure3. at or near saturated solubility conditions
Bruce E. Roberts: Flow Impairment by Deposited Sulfur - A Review of 50 Years of Research
DOI:10.7569/JNGE.2017.692504
J. Natural Gas Eng., Vol. 2, No. 1, June 2017 © 2017 Scrivener Publishing LLC 99
Thomson cooling which would impact sulfur solubility. The model requiresspecification of a critical velocity, below which precipitated sulfur is allowed todeposit. To be useful as a tool to manage sulfur solvent treatments, a calibra-tion process was implemented, in which reservoir and performance data forone representative well within a field was used to estimate fracture propertiesand critical velocity. The calibrated model was subsequently used to determinethe schedule for solvent treatments, and to estimate productive life and ulti-mate recovery for each well of interest.
The field calibrated modeling results of Hands et al. [3] identified three spe-cific zones of sulfur deposition within the natural fracture: (1) a zone nearestthe well in which sulfur deposition has been reduced due to dynamic effects(gas velocity exceeds the critical value), (2) a zone of deposition which can beremoved by solvent treatments, and (3) a zone of permanent plugging whichcannot be reached by conventional solvent injection. The model indicated thatthis deep deposition may occur 15 to 30 m into the formation, a distance muchgreater than would be expected for deposition in a non-fractured reservoir.Reducing the gas flow rate was shown to bring the deposition closer to thewellbore, thus making solvent treatment more effective. The model and fieldevidence also confirmed that high flow rates are to be avoided to prevent“uncontrollable” deposition – for a given set of reservoir and wellbore proper-ties, an optimum production rate may be calculated which maximizes the eco-nomic value of the well.
More recently, models for sulfur deposition in natural fractures have beenreported by Hu et al. [56] and He and Guo [57]. However, unlike the model ofHands et al. [3] these models do not take into account transport of sulfur par-ticles within the gas phase, nor incorporation of a temperature profile alongthe fracture.
6.5 Use of Conventional Reservoir Simulators
The above-described numerical models for predicting the impact of sulfur dep-osition on inflow performance into gas wells have all used homogeneous prop-erties. For example, the models have assumed one value for formationporosity, pay thickness, permeability, etc. To model deposition within an actualreservoir requires a more detailed and realistic reservoir description. Suchmodeling will generally require the use of conventional reservoir simulators.Roberts [2] used a black-oil simulator in which the deposited sulfur is repre-sented by the “oil” phase. The phase behavior is specified in terms of a con-densate (sulfur)/gas ratio. For the deposition of solid sulfur, the relativepermeability of the “oil” is set to 0 for all saturations. Although not reported inthe paper, flow of liquid sulfur may be also modeled, by using properties forliquid sulfur for the “oil” phase, and specifying a relative permeability curvefor sulfur. Mahmoud et al. [41] stated that this application of a reservoir
Bruce E. Roberts: Flow Impairment by Deposited Sulfur - A Review of 50 Years of Research
DOI:10.7569/JNGE.2017.692504
J. Natural Gas Eng., Vol. 2, No. 1, June 2017 © 2017 Scrivener Publishing LLC98
simulator would not give an accurate prediction of the sulfur damage in gasreservoirs as hydrocarbon condensate properties were being used. However, inthe Roberts [2] study, hydrocarbon condensate properties were not used, butinstead well-established literature values for liquid sulfur.
It should be noted that conventional simulation models may not be able tomodel non-equilibrium deposition. Results from such simulation modelsshould be considered a “worst-case” since sulfur that is carried in the gasphase may not deposit in the reservoir but be carried through to the well.Neglecting non-equilibrium effects may be offset by adjustment of reservoirparameters by calibration with field or analogue performance data.
The key benefit of a reservoir simulation model over the analytical modelsis that the effect of formation heterogeneities near the wellbore may be investi-gated. A two-layer system consisting of a 22 m thick, 0.2 mD layer in commu-nication with a 8 m 2.0 mD layer was modeled. Sulfur plugging was found tooccur rapidly in the small-volume, high permeability streak because most ofthe flow is through this layer. This layer is subsequently plugged off, and flowto the well must take place through the low permeability layer resulting in arapid reduction in gas flow rate. Further simulations of a highly layered sys-tem demonstrated that formation impairment by deposited sulfur becomesmore severe as the degree of heterogeneity increases. Field performance of theWaterton gas well noted earlier in this paper was simulated. A match betweensimulated and actual performance and the following pressure buildup wasobtained by adjusting the effective wellbore radius of a layered system, toreflect differing degrees of stimulation for each of the model layers.
7 Reservoir Engineering Applications - Development of Sour GasReservoirs
Development of a newly discovered sour gas reservoir will generally requirean assessment of well productivity and ultimate recovery, determination ofwell type (vertical, horizontal, slant) and spacing, and specific requirements forwell stimulation such as hydraulic fracturing. A production forecast will beneeded for the design of surface processing facilities and gas marketing. Thepotential for sulfur deposition in the formation will increase the level of uncer-tainty for many of these key reservoir performance parameters, and increasethe risk of uneconomic performance. Based on the investigations reviewed inthis study, the following factors will increase development risk:
1. high H2S content2. high reservoir pressure3. at or near saturated solubility conditions
Bruce E. Roberts: Flow Impairment by Deposited Sulfur - A Review of 50 Years of Research
DOI:10.7569/JNGE.2017.692504
J. Natural Gas Eng., Vol. 2, No. 1, June 2017 99
4. dry gas composition (absence of hydrocarbon condensate in theformation)
5. low permeability, porosity, and pay thickness6. high level of reservoir heterogeneity (layering at the well)7. reservoir temperature below sulfur melting point.
Given the above risk assessment, additional data gathering will be requiredover and above what is typically needed for gas reservoir development. Theadditional data should include:
1. Bottomhole sampling and analysis to determine sulfur content atreservoir conditions.
2. Determination of sulfur solubility as a function of pressure at reservoirtemperature.
3. If reservoir temperature is between approximately 100 and 120 ˚C,measurement of sulfur melting point at reservoir pressure. The data ofWoll [18] may be used as a guide to determine if measurements arerequired.
Given the above risk assessment and reservoir data, low-mid-high produc-tion forecasts for individual wells may be generated using simple single wellsimulation models. A range of forecasts may be obtained by varying the mostuncertain parameter (e.g. level of sulfur saturation, or gas relative permeabil-ity). Production forecasts which include the impact with sulfur depositionshould be compared with any available analogue data. A range of forecasts forthe reservoir may be determined by considering a set of scenarios. For exam-ple, the scenarios may consider varying the number of wells which experienceextensive plugging and low ultimate recovery. Given both field observationsand the results of the modeling studies, scenarios should include constrainingthe well rate to prolong well life and ultimate recovery.
The development plan should also include additional surveillance require-ments. These may include the installation of permanent downhole gauges andthe scheduling of pressure buildup tests to monitor any changes in the wellskin. The single well simulation models may also be updated based on produc-tion and pressure data as a tool to guide future operation of the wells, schedul-ing of any solvent treatments, or the need for hydraulic fracturing.
Bruce E. Roberts: Flow Impairment by Deposited Sulfur - A Review of 50 Years of Research
DOI:10.7569/JNGE.2017.692504
J. Natural Gas Eng., Vol. 2, No. 1, June 2017100
8 Conclusions
1. Sulphur deposition has been established as a near-wellbore process thatmay lead to significant loss in well productivity, production life andultimate recovery.
2. Key reservoir properties that govern the deposition process are:(a) Rate of sulfur precipitation per unit pressure drop(b) Absolute permeability and gas relative permeability (control near-well
pressure gradient)(c) Formation porosity and pay thickness (sets the total pore volume
available for deposition)3. Field experience combined with laboratory investigations indicate that
the impact of the deposition of liquid elemental sulfur in the formationmay not be important for high permeability formations. The impact ofliquid deposition in tighter formations has yet to be established.
4. The following operational considerations have been identified from fieldexperience and modeling results:(a) Constraining the production rate may lengthen the well life and yield
a higher ultimate recovery.(b) Monitoring flow and downhole pressure data, combined with
periodic pressure transient testing should be implementeted into thesurveillance plan, as rapid plugging of the formation may occur oncedeposition has initiated.
(c) Sulfur deposition will become less a factor later in the life of thereservoir as the reservoir pressure declines due to gas depletion.
Acknowledgement
Discussions with John Carroll on aspects of sour gas development were veryhelpful and appreciated. Thanks also to Erin Roberts for her help with the liter-ature search.
Nomenclature
a empirical constant in eq. (5)A empirical constant in eq. (8)B gas formation volume factorB empirical constant in eq. (5)cr concentration of sulfur in gas phase at reservoir conditions, g/m3
fss fugacity of sulfur in the solid phase, Pafls fugacity of sulfur in the liquid phase, Pafvs fugacity of sulfur in the vapor phase, Pah pay thickness, m
Bruce E. Roberts: Flow Impairment by Deposited Sulfur - A Review of 50 Years of Research
DOI:10.7569/JNGE.2017.692504
J. Natural Gas Eng., Vol. 2, No. 1, June 2017 © 2017 Scrivener Publishing LLC 101
4. dry gas composition (absence of hydrocarbon condensate in theformation)
5. low permeability, porosity, and pay thickness6. high level of reservoir heterogeneity (layering at the well)7. reservoir temperature below sulfur melting point.
Given the above risk assessment, additional data gathering will be requiredover and above what is typically needed for gas reservoir development. Theadditional data should include:
1. Bottomhole sampling and analysis to determine sulfur content atreservoir conditions.
2. Determination of sulfur solubility as a function of pressure at reservoirtemperature.
3. If reservoir temperature is between approximately 100 and 120 ˚C,measurement of sulfur melting point at reservoir pressure. The data ofWoll [18] may be used as a guide to determine if measurements arerequired.
Given the above risk assessment and reservoir data, low-mid-high produc-tion forecasts for individual wells may be generated using simple single wellsimulation models. A range of forecasts may be obtained by varying the mostuncertain parameter (e.g. level of sulfur saturation, or gas relative permeabil-ity). Production forecasts which include the impact with sulfur depositionshould be compared with any available analogue data. A range of forecasts forthe reservoir may be determined by considering a set of scenarios. For exam-ple, the scenarios may consider varying the number of wells which experienceextensive plugging and low ultimate recovery. Given both field observationsand the results of the modeling studies, scenarios should include constrainingthe well rate to prolong well life and ultimate recovery.
The development plan should also include additional surveillance require-ments. These may include the installation of permanent downhole gauges andthe scheduling of pressure buildup tests to monitor any changes in the wellskin. The single well simulation models may also be updated based on produc-tion and pressure data as a tool to guide future operation of the wells, schedul-ing of any solvent treatments, or the need for hydraulic fracturing.
Bruce E. Roberts: Flow Impairment by Deposited Sulfur - A Review of 50 Years of Research
DOI:10.7569/JNGE.2017.692504
J. Natural Gas Eng., Vol. 2, No. 1, June 2017 © 2017 Scrivener Publishing LLC100
8 Conclusions
1. Sulphur deposition has been established as a near-wellbore process thatmay lead to significant loss in well productivity, production life andultimate recovery.
2. Key reservoir properties that govern the deposition process are:(a) Rate of sulfur precipitation per unit pressure drop(b) Absolute permeability and gas relative permeability (control near-well
pressure gradient)(c) Formation porosity and pay thickness (sets the total pore volume
available for deposition)3. Field experience combined with laboratory investigations indicate that
the impact of the deposition of liquid elemental sulfur in the formationmay not be important for high permeability formations. The impact ofliquid deposition in tighter formations has yet to be established.
4. The following operational considerations have been identified from fieldexperience and modeling results:(a) Constraining the production rate may lengthen the well life and yield
a higher ultimate recovery.(b) Monitoring flow and downhole pressure data, combined with
periodic pressure transient testing should be implementeted into thesurveillance plan, as rapid plugging of the formation may occur oncedeposition has initiated.
(c) Sulfur deposition will become less a factor later in the life of thereservoir as the reservoir pressure declines due to gas depletion.
Acknowledgement
Discussions with John Carroll on aspects of sour gas development were veryhelpful and appreciated. Thanks also to Erin Roberts for her help with the liter-ature search.
Nomenclature
a empirical constant in eq. (5)A empirical constant in eq. (8)B gas formation volume factorB empirical constant in eq. (5)cr concentration of sulfur in gas phase at reservoir conditions, g/m3
fss fugacity of sulfur in the solid phase, Pafls fugacity of sulfur in the liquid phase, Pafvs fugacity of sulfur in the vapor phase, Pah pay thickness, m
Bruce E. Roberts: Flow Impairment by Deposited Sulfur - A Review of 50 Years of Research
DOI:10.7569/JNGE.2017.692504
J. Natural Gas Eng., Vol. 2, No. 1, June 2017 101
k empirical constant in eq. (5)ka absolute permeability, m2
kr relative permeabilityn stoichiometric coefficients in eq. (4)P pressure, PaPss vapor pressure of sulfur, Pa
q gas flow rate, m3/sR gas constant, J K–1 mol–1
Ss sulfur saturation as a fraction of the hydrocarbon pore volume.Swi initial water saturationr radial distance from well, mt time, sT temperature, Kv specific molar volume of sulfur, m3/molf porositym gas viscosity, Pa.s� gas density, kg/m3
References
1. J.B. Hyne, Study aids prediction of sulfur deposition in sour gas wells. Oil and Gas J.12, 107–113 (1968).
2. B.E. Roberts, The effect of sulfur deposition on gaswell inflow performance. SPE Res.Eng. 12(2), 118–123 (1997).
3. N. Hands, B. Oz, B. Roberts, P. Davis, and M. Minchau, Advances in the predictionand management of elemental sulfur deposition associated with sour gas productionfrom fractured carbonate reservoirs. SPE paper 77332 presented at the SPE AnnualTechnical Conference and Exhibition held in San Antonio, Texas, USA, September29–October 3, 2002.
4. P.S. Chernik and P.J. Williams, Extended production testing of the Bearberry ultra-sour gas resource. SPE paper 26190 presented at the 1993 SPE Gas TechnologySymposium, Calgary, Alberta, Canada, June 28–30, 1980.
5. P. J. Williams and M. R. Milligan, Completion design for production of Bearberryultra-sour gas. Paper presented at the Annual Technical Meeting of the PetroleumSociety of Canada, Calgary, Alberta, Canada, June 7–10, 1992.
6. H.T. Kennedy and D.R. Wieland, Equilibrium in the methane/carbon dioxide/hydrogen sulfide-sulfur system. Pet. Trans., AIME 219, 166–169 (1960).
7. J.G. Roof, Solubility of sulfur in hydrogen sulfide and in carbon disulfide at elevatedtemperature and pressure. Soc. Pet. Eng. J. 11(3), 272–276 (1971).
8. S.C. Swift, Sulfur-bearing capacity of hydrogen sulfide gas. Soc. Pet. Eng. J. 16(2),57–64 (1976).
9. E. Brunner and W. Woll, Solubility of sulfur in hydrogen sulfide and sour gases. Soc.Pet. Eng. J. 20(5), 377–384 (1980).
10. M-X. Gu, Q. Li, S-Y. Zhou, W-D. Chen, and T-M. Guo, Experimental and modelingstudies on the phase behavior of the high H2S-content natural gas mixtures. FluidPhase Equilibria 82, 173–182 (1993).
Bruce E. Roberts: Flow Impairment by Deposited Sulfur - A Review of 50 Years of Research
DOI:10.7569/JNGE.2017.692504
J. Natural Gas Eng., Vol. 2, No. 1, June 2017102
11. A.A. Migdisov, O.M. Suleimenov, and Y.V. Alekhin, Experimental study ofpolysulfane stability in gaseous hydrogen sulfide. Geochim. et Cosmochim. Acta 62(15),2627–2635 (1998).
12. E. Brunner, M.C. Place Jr., and W. H. Woll, Sulfur solubility in sour gases. J. Pet.Tech. 40(12), 1587–1592 (1988).
13. C.-Y. Sun and G.-J. Chen, Experimental and modeling studies on sulfur solubility insour gas. Fluid Phase Equilibria 214(2), 187–195 (2003).
14. J.B. Hyne, Controlling sulfur deposition in sour gas wells. World Oil (August), 35–46(1983).
15. J.B. Hyne and G. Derdall, Sulfur deposition in reservoirs and production equipment:Sources and solutions. Paper presented at the 1980 Annual Gas ConditioningConference, U. of Oklahoma, Norman, Oklahoma, USA, March 3–5, 1980.
16. J.F. Brenecke and C.A. Eckert, Phase equilibria for supercritical fluid process design.AIChE J. 35(9), 1409–1427 (1989).
17. J.J. Smith, D. Jensen, and B. Meyer, Liquid hydrogen sulfide in contact with sulfur.J. Chem. Eng. Data 15(1), 144–146 (1970).
18. W. Woll, The effect of sour gases on the pressure-melting point curve of sulfur.Erdoel, Erdgas Z. 9, 297–300 (1983).
19. R.A. Tomcej, H. Kalra, and B.E. Hunter, Prediction of sulfur solubility in sour gasmixtures. Paper presented at the 39th Annual Laurance Reid Gas ConditioningConference, Norman, Oklahoma, USA, March 6–9, 1989.
20. K. Karan, R.A. Heidemann, and L.A. Behie, Sulfur solubility in sour gas: Predictionswith an equation of state model. Ind. Eng. Chem. Res. 37(5), 1679–1684 (1998).
21. R.A. Heidemann, A.V. Phoenix, K. Karan, and L.A. Behie, A chemical equilibriumequation of state for elemental sulfur-containing fluids. Ind. Eng. Chem. Res. 40(9),2160–2167 (2001).
22. P. Cézac, J.P. Serin, J.M. Reneaume, J. Mercadier, and G. Mouton, Elemental sulfurdeposition in natural gas transmission and distribution networks. J. of SupercriticalFluids 44(2), 115–122 (2008).
23. J. Chrastil, Solubility of solids and liquids in supercritical gases. J. Phys. Chem. 86(15), 3016–3021 (1982).
24. J-H. Hu, J-Z. Zhao, L. Wang, L-Y. Meng, and Y.M. Li, Prediction model of elementalsulfur solubility in sour gas mixtures. J. of Nat. Gas Sci. and Eng. 18, 31–38 (2014).
25. X. Guo and Q. Wang, A new prediction model of elemental sulfur solubility in sourgas mixtures. J. of Nat. Gas Sci., and Eng. 31, 98–107 (2016).
26. Q. Wang, X. Guo, and R. Leng, In-depth study on the solubility of elemental sulfurin sour gas mixtures based on the Chrastil’s Association Model. Petroleum 2(4),425–434 (2016).
27. J.J. Carroll, Solubility of sulfur in sour gas mixtures. Advances in Gas Processing 1,276–285 (2009).
28. A. Eslamimanesh, A. Mohammadi, and D. Richon, Determination of sulfur contentof various gases using Chrastil-type equations. Ind. Eng. Chem. Res. 50(12), 7682–7687(2011).
29. Y. Adachi and C.-Y. Lu, Supercritical fluid extraction with carbon dioxide andethylene. Fluid Phase Equilibria 14, 147–156 (1983).
Bruce E. Roberts: Flow Impairment by Deposited Sulfur - A Review of 50 Years of Research
DOI:10.7569/JNGE.2017.692504
J. Natural Gas Eng., Vol. 2, No. 1, June 2017 © 2017 Scrivener Publishing LLC 103
k empirical constant in eq. (5)ka absolute permeability, m2
kr relative permeabilityn stoichiometric coefficients in eq. (4)P pressure, PaPss vapor pressure of sulfur, Pa
q gas flow rate, m3/sR gas constant, J K–1 mol–1
Ss sulfur saturation as a fraction of the hydrocarbon pore volume.Swi initial water saturationr radial distance from well, mt time, sT temperature, Kv specific molar volume of sulfur, m3/molf porositym gas viscosity, Pa.s� gas density, kg/m3
References
1. J.B. Hyne, Study aids prediction of sulfur deposition in sour gas wells. Oil and Gas J.12, 107–113 (1968).
2. B.E. Roberts, The effect of sulfur deposition on gaswell inflow performance. SPE Res.Eng. 12(2), 118–123 (1997).
3. N. Hands, B. Oz, B. Roberts, P. Davis, and M. Minchau, Advances in the predictionand management of elemental sulfur deposition associated with sour gas productionfrom fractured carbonate reservoirs. SPE paper 77332 presented at the SPE AnnualTechnical Conference and Exhibition held in San Antonio, Texas, USA, September29–October 3, 2002.
4. P.S. Chernik and P.J. Williams, Extended production testing of the Bearberry ultra-sour gas resource. SPE paper 26190 presented at the 1993 SPE Gas TechnologySymposium, Calgary, Alberta, Canada, June 28–30, 1980.
5. P. J. Williams and M. R. Milligan, Completion design for production of Bearberryultra-sour gas. Paper presented at the Annual Technical Meeting of the PetroleumSociety of Canada, Calgary, Alberta, Canada, June 7–10, 1992.
6. H.T. Kennedy and D.R. Wieland, Equilibrium in the methane/carbon dioxide/hydrogen sulfide-sulfur system. Pet. Trans., AIME 219, 166–169 (1960).
7. J.G. Roof, Solubility of sulfur in hydrogen sulfide and in carbon disulfide at elevatedtemperature and pressure. Soc. Pet. Eng. J. 11(3), 272–276 (1971).
8. S.C. Swift, Sulfur-bearing capacity of hydrogen sulfide gas. Soc. Pet. Eng. J. 16(2),57–64 (1976).
9. E. Brunner and W. Woll, Solubility of sulfur in hydrogen sulfide and sour gases. Soc.Pet. Eng. J. 20(5), 377–384 (1980).
10. M-X. Gu, Q. Li, S-Y. Zhou, W-D. Chen, and T-M. Guo, Experimental and modelingstudies on the phase behavior of the high H2S-content natural gas mixtures. FluidPhase Equilibria 82, 173–182 (1993).
Bruce E. Roberts: Flow Impairment by Deposited Sulfur - A Review of 50 Years of Research
DOI:10.7569/JNGE.2017.692504
J. Natural Gas Eng., Vol. 2, No. 1, June 2017 © 2017 Scrivener Publishing LLC102
11. A.A. Migdisov, O.M. Suleimenov, and Y.V. Alekhin, Experimental study ofpolysulfane stability in gaseous hydrogen sulfide. Geochim. et Cosmochim. Acta 62(15),2627–2635 (1998).
12. E. Brunner, M.C. Place Jr., and W. H. Woll, Sulfur solubility in sour gases. J. Pet.Tech. 40(12), 1587–1592 (1988).
13. C.-Y. Sun and G.-J. Chen, Experimental and modeling studies on sulfur solubility insour gas. Fluid Phase Equilibria 214(2), 187–195 (2003).
14. J.B. Hyne, Controlling sulfur deposition in sour gas wells. World Oil (August), 35–46(1983).
15. J.B. Hyne and G. Derdall, Sulfur deposition in reservoirs and production equipment:Sources and solutions. Paper presented at the 1980 Annual Gas ConditioningConference, U. of Oklahoma, Norman, Oklahoma, USA, March 3–5, 1980.
16. J.F. Brenecke and C.A. Eckert, Phase equilibria for supercritical fluid process design.AIChE J. 35(9), 1409–1427 (1989).
17. J.J. Smith, D. Jensen, and B. Meyer, Liquid hydrogen sulfide in contact with sulfur.J. Chem. Eng. Data 15(1), 144–146 (1970).
18. W. Woll, The effect of sour gases on the pressure-melting point curve of sulfur.Erdoel, Erdgas Z. 9, 297–300 (1983).
19. R.A. Tomcej, H. Kalra, and B.E. Hunter, Prediction of sulfur solubility in sour gasmixtures. Paper presented at the 39th Annual Laurance Reid Gas ConditioningConference, Norman, Oklahoma, USA, March 6–9, 1989.
20. K. Karan, R.A. Heidemann, and L.A. Behie, Sulfur solubility in sour gas: Predictionswith an equation of state model. Ind. Eng. Chem. Res. 37(5), 1679–1684 (1998).
21. R.A. Heidemann, A.V. Phoenix, K. Karan, and L.A. Behie, A chemical equilibriumequation of state for elemental sulfur-containing fluids. Ind. Eng. Chem. Res. 40(9),2160–2167 (2001).
22. P. Cézac, J.P. Serin, J.M. Reneaume, J. Mercadier, and G. Mouton, Elemental sulfurdeposition in natural gas transmission and distribution networks. J. of SupercriticalFluids 44(2), 115–122 (2008).
23. J. Chrastil, Solubility of solids and liquids in supercritical gases. J. Phys. Chem. 86(15), 3016–3021 (1982).
24. J-H. Hu, J-Z. Zhao, L. Wang, L-Y. Meng, and Y.M. Li, Prediction model of elementalsulfur solubility in sour gas mixtures. J. of Nat. Gas Sci. and Eng. 18, 31–38 (2014).
25. X. Guo and Q. Wang, A new prediction model of elemental sulfur solubility in sourgas mixtures. J. of Nat. Gas Sci., and Eng. 31, 98–107 (2016).
26. Q. Wang, X. Guo, and R. Leng, In-depth study on the solubility of elemental sulfurin sour gas mixtures based on the Chrastil’s Association Model. Petroleum 2(4),425–434 (2016).
27. J.J. Carroll, Solubility of sulfur in sour gas mixtures. Advances in Gas Processing 1,276–285 (2009).
28. A. Eslamimanesh, A. Mohammadi, and D. Richon, Determination of sulfur contentof various gases using Chrastil-type equations. Ind. Eng. Chem. Res. 50(12), 7682–7687(2011).
29. Y. Adachi and C.-Y. Lu, Supercritical fluid extraction with carbon dioxide andethylene. Fluid Phase Equilibria 14, 147–156 (1983).
Bruce E. Roberts: Flow Impairment by Deposited Sulfur - A Review of 50 Years of Research
DOI:10.7569/JNGE.2017.692504
J. Natural Gas Eng., Vol. 2, No. 1, June 2017 103
30. J. M. Del Valle and J.M. Aguilera, An improved equation for predicting thesolubility of vegetable oils in supercritical CO2. Ind. Eng. Chem. Res. 27, 1551–1559(1988).
31. J. Méndez-Santiago and A.S. Teja, The solubilities of solids in supercritical fluids.Fluid Phase Equilibria 158, 501–510 (1999).
32. A. Eslamimanesh, A. Mohammadi, and D. Richon, Thermodynamic consistency testfor experimental data of sulfur content of hydrogen sulfide. Ind. Eng. Chem. Res.50(6), 3555–3563 (2011).
33. A. Mohammadi and D. Richon, Estimating sulfur content of hydrogen sulfide atelevated temperatures and pressures using an artificial neural network algorithm.Ind. Eng. Chem. Res. 47(12), 8499–8504 (2008).
34. M. Mehrpooya, A. Mohammadi, and D. Richon, Extension of an artificial neuralnetwork algorithm for estimating sulfur content of sour gases at elevatedtemperatures and pressures. Ind. Eng. Chem. Res. 49(1), 439–442 (2010).
35. X. Guo, Z. Du, Y. Zhang, and L. Wang, Laboratory and simulation investigation ofsulfur deposition in sour gas reservoir. SPE paper 1031810 presented at theInternational Oil and Gas Conference and Exhibition in China held in Beijing, China,December 5–7, 2006.
36. X. Guo, Z. Du, X. Yang, Y. Zhang, and D. Fu, Sulfur deposition in sour gasreservoirs: Laboratory and simulation study. Pet. Sci. 6(4), 404–414 (2009).
37. X. Guo, Z. Du, and L. Wang, Effect of sulfur deposition on rock permeability in sourgas reservoir. SPE paper 136979 presented at the 34th Annual SPE InternationalConference and Exhibition held in Tinapa-Calabar, Nigeria, July 31–August 7, 2010.
38. J.-H. Hu, S.-L. He, J.-Z. Zhao, Y.-M. Li, and X.-F. Yang, Sulfur deposition experimentin the presence of non-movable water. J. of Pet, Sci. and Eng. 100, 37–40 (2012).
39. Y. Xuefeng, H. Yong, Z. Bing, Y. Hongzhi, and W. Songxia, The damage appraisal onelemental sulfur deposition in high sulfur content gas reservoirs. Paper IPTC 17199presented at the International Petroleum Technology Conference held in Beijing,China, March 26–28, 2013.
40. J.H. Abou-Kassem, Experimental and numerical modeling of sulfur plugging incarbonate reservoirs. J. of Pet. Sci. and Eng. 26, 91–103 (2000).
41. M.A. Mahmoud, Effect of elemental-sulfur deposition on the rock petrophysicalproperties in sour-gas reservoirs. SPE J. 19(4), 703–715 (2014).
42. G. Coskuner, Flow of sour gas, liquid sulfur, and water in porous media. J. of Colloidand Interface Science 165(2), 526–531 (1994).
43. C.H. Kuo and P.J. Closmann, Theoretical study of the fluid flow accompanied bysolid precipitation in porous media. AIChE J. 12(5), 995–998 (1966).
44. C.H. Kuo, On the production of hydrogen sulfide-sulfur mixtures from deepformations. J. Pet. Tech. 24(9), 1142–1146 (1972).
45. G.E. Archie, Bull. Am. Assoc. of Pet. Geol. 34(15), 943–961 (1950).46. H. Mei, M. Zhang, and X. Yang, Effect of sulfur deposition on gas deliverability. SPE
paper 99700 presented at the 2006 SPE Gas Technology Symposium held in Calgary,Alberta, Canada, May 15–17, 2006.
47. M. A. Mahmoud and A.A. Al-Majed, New model to predict formation damage dueto sulfur deposition in sour gas wells. SPE paper 149535 presented at the North
Bruce E. Roberts: Flow Impairment by Deposited Sulfur - A Review of 50 Years of Research
DOI:10.7569/JNGE.2017.692504
J. Natural Gas Eng., Vol. 2, No. 1, June 2017104
Africa Technical Conference and Exhibition held in Cairo, Egypt, February 20–22,2012.
48. F. Adesina, A. Churchill, and F. Olugbenga, Elemental sulfur induced formationdamage management in gas reservoir. SPE paper 154980 presented at the SPEInternational Conference and Exhibition on Oilfield Scale held in Aberdeen, UK,May 30–31, 2012.
49. J-H. Hu, S-L. He, J-Z. Zhao, Y-M. Li, and Y. Deng, Modeling of sulfur depositiondamage in the presence of irreducible water. Pet. Sci. and Tech. 29(5), 499–505 (2011).
50. J. Hu, S. He, J. Zhao, and Y. Li, Modeling of sulfur plugging in a sour gas reservoir.J. of Nat. Gas Sci. and Eng. 11, 18–22 (2013).
51. J-H. Hu, S. He, J-Z. Zhao, Y-M. Li, and X. Wang, A deliverability equation in thepresence of sulfur deposition. Pet. Sci. and Tech. 32(4), 402–408 (2013).
52. X. Guo, X. Zhou, and B. Zhou, Prediction model of sulfur saturation considering theeffects of non-darcy flow and reservoir compaction. J. of Natural Gas Science andEngineering 22, 371–376 (2015).
53. J. Hu, J. Zhao, and Y. Li, Productivity model of horizontal wells in a sour gasreservoir. Particulate Science and Technology 34(1), 112–117 (2016).
54. Z. Du and X. Guo, Gas-liquid-solid coupled flow modeling in fractured carbonategas reservoir with high H2S-content. SPE paper 103946 presented at the FirstInternational Oil Conference and Exhibition in Mexico held in Cancun, Mexico,August 31–September 2, 2006.
55. F. Civan, Modeling well performance under nonequilbrium deposition conditions.SPE paper 67234 presented at the SPE Production and Operations Symposium,Oklahoma City, Oklahoma, USA, March 24-27, 2001.
56. J-H. Hu, S-L. He, X-D. Wang, J.Z. Zhao, and K. Dong, The modeling of sulfurdeposition damage in the presences of natural fracture. Pet. Sci. and Tech. 31(1),80–87 (2013).
57. L. He and X. Guo, Study on sulfur deposition damage model of fractured gasreservoirs with high content H2S. Petroleum. Article in press (2016).
Bruce E. Roberts: Flow Impairment by Deposited Sulfur - A Review of 50 Years of Research
DOI:10.7569/JNGE.2017.692504
J. Natural Gas Eng., Vol. 2, No. 1, June 2017 © 2017 Scrivener Publishing LLC 105
30. J. M. Del Valle and J.M. Aguilera, An improved equation for predicting thesolubility of vegetable oils in supercritical CO2. Ind. Eng. Chem. Res. 27, 1551–1559(1988).
31. J. Méndez-Santiago and A.S. Teja, The solubilities of solids in supercritical fluids.Fluid Phase Equilibria 158, 501–510 (1999).
32. A. Eslamimanesh, A. Mohammadi, and D. Richon, Thermodynamic consistency testfor experimental data of sulfur content of hydrogen sulfide. Ind. Eng. Chem. Res.50(6), 3555–3563 (2011).
33. A. Mohammadi and D. Richon, Estimating sulfur content of hydrogen sulfide atelevated temperatures and pressures using an artificial neural network algorithm.Ind. Eng. Chem. Res. 47(12), 8499–8504 (2008).
34. M. Mehrpooya, A. Mohammadi, and D. Richon, Extension of an artificial neuralnetwork algorithm for estimating sulfur content of sour gases at elevatedtemperatures and pressures. Ind. Eng. Chem. Res. 49(1), 439–442 (2010).
35. X. Guo, Z. Du, Y. Zhang, and L. Wang, Laboratory and simulation investigation ofsulfur deposition in sour gas reservoir. SPE paper 1031810 presented at theInternational Oil and Gas Conference and Exhibition in China held in Beijing, China,December 5–7, 2006.
36. X. Guo, Z. Du, X. Yang, Y. Zhang, and D. Fu, Sulfur deposition in sour gasreservoirs: Laboratory and simulation study. Pet. Sci. 6(4), 404–414 (2009).
37. X. Guo, Z. Du, and L. Wang, Effect of sulfur deposition on rock permeability in sourgas reservoir. SPE paper 136979 presented at the 34th Annual SPE InternationalConference and Exhibition held in Tinapa-Calabar, Nigeria, July 31–August 7, 2010.
38. J.-H. Hu, S.-L. He, J.-Z. Zhao, Y.-M. Li, and X.-F. Yang, Sulfur deposition experimentin the presence of non-movable water. J. of Pet, Sci. and Eng. 100, 37–40 (2012).
39. Y. Xuefeng, H. Yong, Z. Bing, Y. Hongzhi, and W. Songxia, The damage appraisal onelemental sulfur deposition in high sulfur content gas reservoirs. Paper IPTC 17199presented at the International Petroleum Technology Conference held in Beijing,China, March 26–28, 2013.
40. J.H. Abou-Kassem, Experimental and numerical modeling of sulfur plugging incarbonate reservoirs. J. of Pet. Sci. and Eng. 26, 91–103 (2000).
41. M.A. Mahmoud, Effect of elemental-sulfur deposition on the rock petrophysicalproperties in sour-gas reservoirs. SPE J. 19(4), 703–715 (2014).
42. G. Coskuner, Flow of sour gas, liquid sulfur, and water in porous media. J. of Colloidand Interface Science 165(2), 526–531 (1994).
43. C.H. Kuo and P.J. Closmann, Theoretical study of the fluid flow accompanied bysolid precipitation in porous media. AIChE J. 12(5), 995–998 (1966).
44. C.H. Kuo, On the production of hydrogen sulfide-sulfur mixtures from deepformations. J. Pet. Tech. 24(9), 1142–1146 (1972).
45. G.E. Archie, Bull. Am. Assoc. of Pet. Geol. 34(15), 943–961 (1950).46. H. Mei, M. Zhang, and X. Yang, Effect of sulfur deposition on gas deliverability. SPE
paper 99700 presented at the 2006 SPE Gas Technology Symposium held in Calgary,Alberta, Canada, May 15–17, 2006.
47. M. A. Mahmoud and A.A. Al-Majed, New model to predict formation damage dueto sulfur deposition in sour gas wells. SPE paper 149535 presented at the North
Bruce E. Roberts: Flow Impairment by Deposited Sulfur - A Review of 50 Years of Research
DOI:10.7569/JNGE.2017.692504
J. Natural Gas Eng., Vol. 2, No. 1, June 2017 © 2017 Scrivener Publishing LLC104
Africa Technical Conference and Exhibition held in Cairo, Egypt, February 20–22,2012.
48. F. Adesina, A. Churchill, and F. Olugbenga, Elemental sulfur induced formationdamage management in gas reservoir. SPE paper 154980 presented at the SPEInternational Conference and Exhibition on Oilfield Scale held in Aberdeen, UK,May 30–31, 2012.
49. J-H. Hu, S-L. He, J-Z. Zhao, Y-M. Li, and Y. Deng, Modeling of sulfur depositiondamage in the presence of irreducible water. Pet. Sci. and Tech. 29(5), 499–505 (2011).
50. J. Hu, S. He, J. Zhao, and Y. Li, Modeling of sulfur plugging in a sour gas reservoir.J. of Nat. Gas Sci. and Eng. 11, 18–22 (2013).
51. J-H. Hu, S. He, J-Z. Zhao, Y-M. Li, and X. Wang, A deliverability equation in thepresence of sulfur deposition. Pet. Sci. and Tech. 32(4), 402–408 (2013).
52. X. Guo, X. Zhou, and B. Zhou, Prediction model of sulfur saturation considering theeffects of non-darcy flow and reservoir compaction. J. of Natural Gas Science andEngineering 22, 371–376 (2015).
53. J. Hu, J. Zhao, and Y. Li, Productivity model of horizontal wells in a sour gasreservoir. Particulate Science and Technology 34(1), 112–117 (2016).
54. Z. Du and X. Guo, Gas-liquid-solid coupled flow modeling in fractured carbonategas reservoir with high H2S-content. SPE paper 103946 presented at the FirstInternational Oil Conference and Exhibition in Mexico held in Cancun, Mexico,August 31–September 2, 2006.
55. F. Civan, Modeling well performance under nonequilbrium deposition conditions.SPE paper 67234 presented at the SPE Production and Operations Symposium,Oklahoma City, Oklahoma, USA, March 24-27, 2001.
56. J-H. Hu, S-L. He, X-D. Wang, J.Z. Zhao, and K. Dong, The modeling of sulfurdeposition damage in the presences of natural fracture. Pet. Sci. and Tech. 31(1),80–87 (2013).
57. L. He and X. Guo, Study on sulfur deposition damage model of fractured gasreservoirs with high content H2S. Petroleum. Article in press (2016).
Bruce E. Roberts: Flow Impairment by Deposited Sulfur - A Review of 50 Years of Research
DOI:10.7569/JNGE.2017.692504
J. Natural Gas Eng., Vol. 2, No. 1, June 2017 105
Copyright © 2022 FDOKUMEN