Flight Test Safety Fact - helping you communicate better
11
April Issue 20-04 Flight Test Safety Fact Published for the Flight Test Safety Committee In This Issue Chairman’s Corner – COVID Cancels Flight Test Safety Workshop Long Reads – Should we trust our gut? The (big) data suggests we may not be able to. Listen to the Podcast – If you walk for 20 minutes, you have time to listen to it. COVID Cancels FTSW: Chairman’s Corner Tom Huff Fellow testers, I hope this edition of the FTSF finds you healthy. What a difference a month makes! Seems our world has changed in major ways and there is still uncertainty as to the extent of the COVID-19 impact. As we scramble to procure sufficient Personal Protective Equipment (PPE) for our medical community heroes, I note with interest some comments made in the media regarding the predictability of such an outbreak. The more I thought about the contention that the current pandemic was unpredictable, the more it inspired me to open the Pandora’s Box about black swan events. But first, a few comments about our Workshops: The decision to cancel the Flight Test Safety Workshop (FTSW) in Denver this May was a no-brainer. However, it took some negotiating with the hotel to concede to a no-cost deferral to 2021. The SETP/SFTE headquarters staff did a great job making that happen. The Flight Test Safety Committee is currently looking into one or more remote sessions and the topics that might be of interest for a stay-at-home workshop. For now, we’re still full speed ahead on European FTSW in Oct (London). Hopefully we’ll see restoration of safe travel and social interaction by this fall, and we can resume the Workshops. Back to forecasting the predictability of adverse events. Clearly, we’ve had other [deadly] highly contagious global infections, and so, I question being ill-prepared with an excuse of unpredictability. Also, we certainly know enough about transmission, but will we change our habits? One of our Flight Test Safety Committee members asked if we’d stop shaking hands, as a cultural shift. Food for thought on re-learning lessons! Moving away from medical black swans: I recently read a couple of articles in a prominent air safety investigation journal regarding such “rare” events. I didn’t necessarily agree with the authors that the events (crashes or close calls) fell into a category of being so obscure or improbable that they are unable to be predicted. In one case, the wires/connectors were reversed to the inceptor control box for the pilot’s control stick and resulted in reversed roll control. Thankfully, the pilot transferred control to the pilot monitoring and the commercial aircraft recovered uneventfully. Perhaps the system safety assessment yielded probabilities beyond the service life of the aircraft, or we simply overlooked a potential design flaw. A savvy engineer (or
-
Upload
khangminh22 -
Category
Documents
-
view
2 -
download
0
Transcript of Flight Test Safety Fact - helping you communicate better

April Issue 20-04
Flight Test Safety Fact Published for the Flight Test Safety Committee In This Issue Chairman’s Corner – COVID Cancels Flight Test Safety Workshop Long Reads – Should we trust our gut? The (big) data suggests we may not be able to. Listen to the Podcast – If you walk for 20 minutes, you have time to listen to it.
COVID Cancels FTSW: Chairman’s Corner Tom Huff Fellow testers, I hope this edition of the FTSF finds you healthy. What a difference a month makes! Seems our world has changed in major ways and there is still uncertainty as to the extent of the COVID-19 impact. As we scramble to procure sufficient Personal Protective Equipment (PPE) for our medical community heroes, I note with interest some comments made in the media regarding the predictability of such an outbreak. The more I thought about the contention that the current pandemic was unpredictable, the more it inspired me to open the Pandora’s Box about black swan events. But first, a few comments about our Workshops: The decision to cancel the Flight Test Safety Workshop (FTSW) in Denver this May was a no-brainer. However, it took some negotiating with the hotel to concede to a no-cost deferral to 2021. The SETP/SFTE headquarters staff did a great job making that happen. The Flight Test Safety Committee is currently looking into one or more remote sessions and the topics that might be of interest for a stay-at-home workshop. For now, we’re still full speed ahead on European FTSW in Oct (London). Hopefully we’ll see restoration of safe travel and social interaction by this fall, and we can resume the Workshops. Back to forecasting the predictability of adverse events. Clearly, we’ve had other [deadly] highly contagious global infections, and so, I question being ill-prepared with an excuse of unpredictability. Also, we certainly know enough about transmission, but will we change our habits? One of our Flight Test Safety Committee members asked if we’d stop shaking hands, as a cultural shift. Food for thought on re-learning lessons! Moving away from medical black swans: I recently read a couple of articles in a prominent air safety investigation journal regarding such “rare” events. I didn’t necessarily agree with the authors that the events (crashes or close calls) fell into a category of being so obscure or improbable that they are unable to be predicted. In one case, the wires/connectors were reversed to the inceptor control box for the pilot’s control stick and resulted in reversed roll control. Thankfully, the pilot transferred control to the pilot monitoring and the commercial aircraft recovered uneventfully. Perhaps the system safety assessment yielded probabilities beyond the service life of the aircraft, or we simply overlooked a potential design flaw. A savvy engineer (or

April Issue 20-04
operator) that understands suitability might have a different view of the design. For critical systems, design assurance should accommodate the potential for errors. There was not discussion on the ability of technicians or pilots to determine proper operation based on functional test or synoptic display. Apparently, that has been rectified. One of the other articles discussed system complexity and the response of the aircrew. A favorite accident analysis to cite is AF447, as it relates to crew response to misleading/confusing information and system faults following probe icing on an A330. With a near-asymptotic growth of software code in our air vehicle systems, we face a real challenge in predicting potential faults and how the crew will respond. This was a principal discussion in the Joint Authority Technical Review (JATR) related to the 737 MAX. Complicated systems become complex in the presence of humans. A recommendation in the JATR was to evaluate new systems against a wider variance in pilot competency and expected response. Over to the human factors experts to figure that out! Really does beg the question as to how much we educate and train crews for failure conditions and cascading/compounding faults. Unfortunately, our component reliability-based risk assessment processes fall short on predicting reality. This was a principal motivator for Dr. Nancy Leveson to develop her systems theoretic body of work. While you are social distancing at home, perhaps explore Systems Theoretic Process Analysis (STPA) further on our website resources tab at flighttestsafety.org. Why is all this important to flight testers? Hopefully not a lot of explanation needed… As the last hurdle to civilian certification or Initial Operational Capability (IOC) for defense, testers must maintain an independent/unbiased “critical eye” regarding product safety. I like this litmus test: “Would you put your family in the airplane?” or “Would you send your son or daughter into combat in that aircraft?” I’d venture a guess that most seasoned testers have a war story of something that was discovered by an operator and not revealed in test. I took one of those calls where a fleet FA-18 Hornet operator claimed he landed with 2,000lbs less gas than what the new performance widget we implemented said he would. His profile was a long cross country – all legs in the same direction. I asked about his return trip; 2,000lbs more than predicted. Sounded like a sign error in winds. Sure enough, we tested by flying a round robin which washed out the error. Embarrassing, and thankfully didn’t cause a major safety event. Interestingly, the JATR highlighted that fight testers don’t represent operation line pilots. Nice to know who the cream-of-the-crop is, but test organizations should embrace the unique responsibility to test the system for safety, not just compliance or minimum operational requirements. Finally, we seek your suggestions and feedback on this newsletter, the podcast and the workshops. We want to make this forum useful and continue to reach as many as possible. Please help us by sharing and discussing the topics. On behalf of the Flight Test Safety Committee, please accept wishes for health and safety during these uncertain times. Launch an air mail to [email protected]. In your service, Tom Huff

April Issue 20-04
Long Reads Mark Jones Jr. Editor’s note: “Long reads” are longer than usual. The term is legitimately part of the vernacular (e.g., here). That what’s this is. It’s part of the ongoing safety conversation that includes words like uncertainty and complexity. Let me know what you think. Introduction Several years ago, I had just completed a temperature survey test flight and wanted to review the data. The three hour flight had collected temperature data during a one hour heat soak on the ramp at Yuma, followed by startup, taxi, takeoff, and climb to our max altitude. We cruised at max altitude until all of the temperature parameters had stabilized. There were forty-three parameters of interest, which seemed like a reasonable number. After we landed I wanted to do a spot check of the data, just to be sure that no data parameters had failed and that the data were reasonable. I sub-sampled the original data file at 1 Hz and exported the forty-three parameters of interest. Once I settled on the couch at my hotel, I imported the csv file into Microsoft Excel for a quick review. One way of verifying data is to plot a time history. Invalid data would appear as gaps or spikes in the time history. Using Excel to plot these data resulted in numerous failure messages and a blue spinning wheel that ultimately preceded the program crashing, again and again. With only forty-three parameters and approximately five hours of data, I had exceeded the ability of Excel or Windows or my laptop—I don’t know which—to render the line charts. In this case, these data were big—big enough to crash my computer. What’s the Big Deal about Big Data? One of the most profound implications of big data is the ability of technology to give incredible results from seemingly unrelated data. Some of these results delight us, seeming to work like magic, while others are creepy or spooky. In this article I will present examples of both kinds of results and attempt to describe big data. Big data has resisted attempts at definition by many experts, so instead of reducing its meaning to a pithy phrase, I will point out several landmarks that define various dimensions of big data’s landscape. In the end, I hope that all of these things—the anecdotes and the explanations—will provide the reader with a map to be used as he or she encounters big data, navigates uncertainty, and avoids technological pitfalls. Ultimately, I want to see big data used effectively in flight test engineering, and perhaps this map will help us reach that destination. Warning! Our journey through the fields of big data begins with a warning. The incredible results promised by big data come at a cost. Big data’s complexity attempts to camouflage the pitfalls created by the technology. It turns out that digital, computational technology is especially susceptible to results that are unbelievable…unbelievably wrong. Dr. John Cook, a colleague, recently published an example that highlights one of these blunders and has allowed FTN to reprint his article.

April Issue 20-04
I compared three methods of computing sample variance: Welford's method; what I'll call the sum of squares method, using the formula
and what I'll call the direct method, the method that first computes the sample mean then sums the squares of the samples minus the mean[directly from the definition of variance]. I generated 106 (1,000,000) samples from a uniform U(0,1) distribution and added 109 (1,000,000,000) to each sample. I did this so the variance in the samples would be small relative to the mean. This is the case that causes accuracy problems. Welford's method and the direct method were correct to 8 significant figures: 0.083226511. The sum of squares method gave the impossible result -37154.734.1
(Variance must be less than 1. This is off by 5 orders of magnitude.) He continues the example using the normal distribution and several other variations, but the result is still astounding. When we perform seemingly routine computations with big data, we must be aware of the limitations of the technology. This error is caused by floating point arithmetic, the ability of the computer to handle only a finite number of decimal places. In this simple example, the error is obvious. Often the error in our results will not be as obvious, or the model will be more complex and less intuitive, both of which may mask the errors. Awareness of big data’s weaknesses is one of the most compelling reasons to understand what it can and can’t do, but it does not help us understand what it is. So what is big data? Long before the term “big data” was popular, scientists had described a scenario that clearly falls into the big data paradigm. It involves a monkey (or chimpanzee) typing on a keyboard at random for infinity. Most of what we see on the screen (or paper), if we happened to be observing such a monkey, is gibberish, nothing more than gobbledy-gook. The surprising fact is that such a monkey will type out the complete SFTE Technical Handbook, and it will do so without any errors. The manuscript typed by such a monkey would also contain the complete works of William Shakespeare. We can demonstrate with mathematical certainty that these events will
April Issue 20-04
happen with probability = 1.2 In this case, we have the data we need and many things that we don’t—a set so large most of us can’t imagine it. This example, first postulated in the early 1900s, defines one end of the spectrum of big data, a major landmark that helps us see one of the boundaries in the geography of this science and its associated technology. We could exploit this hypothetical situation by adding a room full of such monkeys and then allowing the room to extend to infinity. (I’ll resist all but one urge to make any mention of pilots here.) These monkeys, and the output of their keyboards, clearly stake a claim in the new territory of big data, but the promises of big data do not arise from such a theoretical room, because it is impossible to construct. Thus we must find the other end of the spectrum that describes big data as we continue to explore its borders. When does small data get big? At what size data set have we passed from “data” to “big data”? This question is more difficult to answer. One can research this question and find a variety of marketing materials from computing companies and even a useful article describing Hadoop, a common big data computational tool, which sets the threshold for big data at 5 TB. I’m not certain, however, that this last answer, though definitive and simple, tells the whole story, so I’ll revisit the example given in the introduction. I repeat it here, its entirety, so you can estimate the (rather small) volume of the data. Several years ago, I had just completed a temperature survey test flight and wanted to review the data. The three hour flight had collected temperature data during a one hour heat soak on the ramp at Yuma, followed by startup, taxi, takeoff, and climb to our max altitude. We cruised at max altitude until all of the temperature parameters had stabilized. There were forty-three parameters of interest, which seemed like a reasonable number. As mentioned, after we landed I wanted to do a spot check of the data, just to be sure that no data parameters had failed and that the data were reasonable. I sub-sampled the original data file at 1 Hz and exported the forty-three parameters of interest. Once I settled on the couch at my hotel, I imported the csv file into Microsoft Excel for a quick review. One way of verifying data is to plot a time history. Invalid data would appear as gaps or spikes in the time history. Using Excel to plot these data resulted in numerous failure messages and a blue spinning wheel that ultimately preceded the program crashing, again and again. With only forty-three parameters and approximately five hours of data, I had exceeded the ability of Excel or Windows or my laptop—I don’t know which—to render the line charts. In this case, these data were big—big enough to crash my computer. I call this big data, since it was bigger than the capability of my hardware and software. In other words: We measure data size relative to the computational capacity available.

April Issue 20-04
This partially answers the question, “When does data get big?” but just as we would need three points to triangulate our position on a map, we will need another example to find our place in the big data landscape. Usually, we look at the size of large data sets encountered casually or accidentally. Instead of doing that, the next anecdote describes a very large theoretical computer. This thought experiment will examine the capacity of the computer and then define the size of the big data problem that such a computer can handle. The author describes it this way: …a “perfect” parallel computer the size of the universe, given the time of the universe, might compute. In this parallel computer, the processors are as small as protons, they operate at the speed of light, and they are packed densely into the volume of our universe. Each processor is assigned a distinct engagement to calculate, can compute the outcome instantaneously, and can fetch a new engagement in 10–23 seconds, an approximation of the time it takes light to go the diameter of a proton. Given 1045 processors per cubic meter, 1081 cubic meters in the universe, 1023 calculations per second, and 10 seconds as an epoch a bit longer than the age of the universe, this computer could perform 10168 calculations, or about 2558.3 The author of this anecdote further demonstrates that this very large number, 2558, is equivalent to a small, two-sided war game with only twelve personnel on each side. In other words, very big data can come from small problems. The author provides context for this by describing the simple game “Rock, Paper, Scissors.” This simple game that even a child can play is a two-sided wargame with three “factors” on each side, the rock, the paper, and the scissors. If such a simple scenario can create such big data… I can easily concoct a flight test scenario with twelve factors. For example, we might consider the interaction of rudder, elevator, left and right ailerons, airspeed, altitude, pitch angle, heading, and roll angle…include the rates in three axes, and we have a problem that saturates the universe’s most powerful, theoretical computer. Attempting to analyze the correlations between these twelve factors in a static condition crashes our universal-super-computer. The reader should be able to see that this radically reduces the scope of problems to which we can apply the promises of computational technology and big data. Thus this second example describes the landscape of big data from a different perspective, demonstrating how quickly small problems can create big data. (At this point, the arguments are diverse and potentially exhausting, so I’ll insert this hilarious tweet I encountered—it’s like a coffee break for your brain.) Now back to our regular programming…

April Issue 20-04
So what’s the big deal? Based on what we have examined thus far, one begins to wonder what caused all the hoopla to begin with., so a final example seems appropriate, one that demonstrates the mystical powers of big data. In 2012, Forbes published an account of a widely repeated story: Target’s big data had identified a teen girl and selected her for a particular kind of direct mail advertisement.4
The advert in question included coupons for a variety of prenatal and infant care products. Accounts vary, but it’s also possible that the mail acknowledged that she was pregnant and included a personal note of congratulations. The father called Target, enraged at the kind of mail his daughter had received. (Later when the father discovered that his
daughter was, in fact, pregnant, he did apologize.) It’s this kind of correlation—using seemingly random shopping habits to identify something important—that most imagine when they proclaim big data’s power. (We too might be able to use seemingly random data to predict something important, but what?) While amazing, the example does not illustrate how we ought to apply big data technology in our specific field of engineering. Perhaps the next, a personal anecdote, hits closer to the bullseye. As you can see below, my two youngest sons found toy guns under the Christmas tree one year. As a result, I was trying to explain how a gun sight works, and in the process I mentally compared the distance bullets drop on their flight to the target. In particular, we were talking about the arc of an airsoft BB and a Nerf dart. If I were to fire my SIG P226 pistol at short range, it would appear that the 9mm bullet did not drop at all. On the other hand, when my youngest son fires a suction cup dart at the Nerf target, it drops a significant distance. The physical principle behind the trajectory is the law of universal gravitation which says that all of the bullets aforementioned—the BBs, the darts, and the 9mm projectile—will fall towards the center of the earth at the same rate. (Apollo 15 astronauts proved this on the moon by dropping a hammer and a feather.) For my two little boys, their empirical observations seem to contradict this universal law. In the distance between muzzle and target, one type of bullet seemed to drop further.

April Issue 20-04
The contradiction lies in the unit of measure for the data we correlate. Each of us, including me, tends to compare the vertical distance travelled by the Nerf dart to the horizontal distance travelled. Instead, we should have correlated vertical distance and time. In the latter, which is more difficult to visualize physically, we find equality, just as we expected, as predicted by Isaac Newton. Here’s the takeaway: We’ve probably all seen a manager who measured the wrong thing and reported the wrong metrics. “You shouldn’t correlate X with Y,” we think from the back of the room when we see the PowerPoint slides, but most of us fail to realize when we ourselves fall into this trap. Complex problems make it even harder to detect our own errors, but big data is renowned for its ability to detect significant correlations when we cannot. A relationship may exist that we cannot visualize, but big data can. The greatest benefit of big data and the computational technology that powers it is the ability to create multiple plots, evaluate many correlations, and present the information in a way that we can detect significance. This is something we don’t usually do well when we rely on our intuition, a fact illustrated clearly by both the angry father in the Target example and the confused, seven-year old sniper with a Nerf gun. As humans, we trust our intuition and our judgment more than we should. No example is more popular and poignant than Moneyball. In 2003, Michael Lewis published a book of the same title, an account of the Oakland A’s baseball team and the statistical methods that allowed them to recruit winning talent. The team’s managers used statistics to choose players for their team, but they ignored the popular statistics that their scouts focused on. They also ignored scouts’ opinions. Instead, they built a rigorous model from the data-rich field of baseball, incorporating a variety of secondary performance metrics. Using this model, they choose players with the skills that really mattered for winning the game, not the skills that attracted the most attention from crowds and scouts, and this strategy led the team to the playoffs. In his book, Lewis argues that the judgment of experts is often wrong, like the baseball scouts. He further demonstrates that a rigorous analytical model can reveal not only the flaws in their subjective opinions but also the true characteristics that contribute to success. Moneyball forces everyone, including us, to ask hard questions: “Are we using data properly to make objective decisions, or are we using subjective data to confirm cognitive biases?” (I’ve seen the way some engineers explain away unusual test results. I think you will agree that once you start looking for confirmation bias, you find it everywhere.) In a subsequent book, The Undoing Project, he refines the findings of Moneyball, explaining that the book is not just about a sabermetrics fad but about a timeless, well documented phenomenon: It is about “...the ways in which any expert’s judgment might be warped by the expert’s own mind.” Lewis’s book and baseball’s big data reinforce

April Issue 20-04
the conclusion that we need big data to continually challenge our assumptions, but Lewis does not ignore or discount the role of the expert: “The trick wasn’t just to build a model. It was to listen to it and the scouts at the same time.”5 This is also the conclusion we must draw when presented with the potential benefits and shortcomings of big data. To this point, we have surveyed the landscape of big data and described its geography, including the peaks and pitfalls, but “are we there yet?” Before we arrive at an understanding of big data’s utility for us and for flight test, one more question remains. What can big data do? Big data can do all the things that small data can do better. Therefore, I think it would benefit us to review the things small data can do, as organized in the following six categories of data analysis.5 1. Descriptive – summarize data (quantitatively or qualitatively) How many? Min and max? Average? 2 Exploratory – attempt to find patterns in data. For example: The pilot reported what appeared to be a brake failure. After stopping the aircraft, it was found that the right tire was shredded. What happened? Was there some malfunction of the anti-skid brakes? Did it occur on landing? Did a normal blowout appear on takeoff and was exacerbated by the landing? The tree splits into two major trunks here: deterministic (3.1) versus random (3.2). 3.1 Deterministic – Determines what happens to one dependent (deterministic) variable if we change an independent variable 3.2 Causal – Determines what happens to one dependent (random) variable if we change an independent variable. 4.1 Inferential – Do the patterns that we see in the data apply to a larger class of data? We can tell a relationship exists, but inference does not tell us anything about why the relationship exists. 4.2 Predictive – The patterns in the data will help us predict patterns in a larger class. However, there is no attempt to discern causation. To fully explore these six areas will require more column space than this edition will allow—that adventure will have to wait for another time. I will close with two examples of the use of “big data” in flight test. Two Examples Example 1. Several years ago, I was part of a team that asked the engine manufacturer to data mine about a particular characteristic of engine performance during takeoff. (I think we can agree that engine manufacturers lead our industry in the collection and analysis of big data.) The engineering team did conduct a search and sifted through countless terabytes of data, eventually finding what we asked for and providing it to the flight sciences team to update their models. They also found something else. They discovered that some aircrews were taking off before certain engine BIT checks were
April Issue 20-04
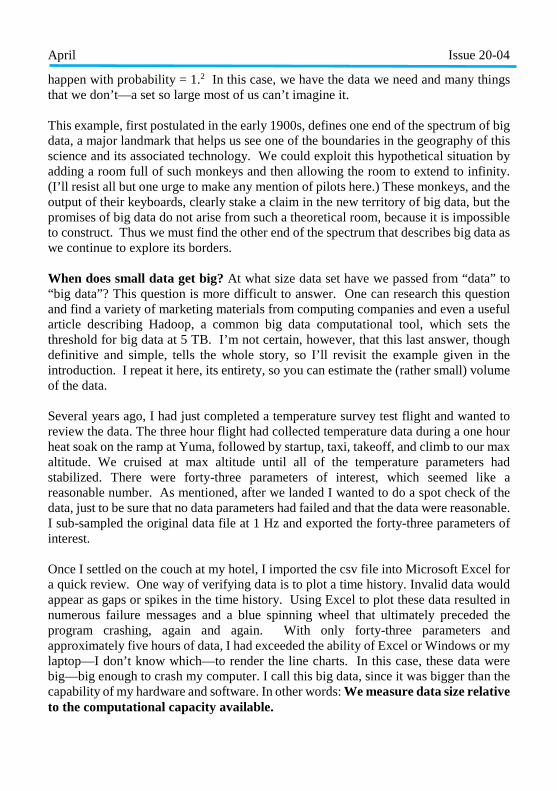
complete. The “early” takeoff would have resulted in reduced performance during normal takeoff, and it would have reduced margins during continued takeoff with engine failure. Their find allowed us to develop procedures to prevent such a catastrophe. I think that was a “big data win.” Example 2. Once when I was a safety officer, we were investigating the root cause of an engine anomaly. The engine manufacturer thought they understood how to predict the anomaly after review of a lot of data on the incident engine. They used this information to predict the next engine they thought would fail, and as the safety officer I impounded the aircraft and authorized removal of the suspect part. What they found was a component that was working perfectly. This time, big data did not “win.” What’s the punch line? I think it’s this: We haven’t mastered big data yet. Hopefully, though, the reader now has a map and some rudimentary navigation skills for making their way through the landscape of big data and finding ways to apply it to flight test engineering and aerospace applications. We’ve taken some big strides in this quick survey of big data. Here is a summary: 1. Warning - Big data can create absurd results due to computational limits. 2. So what is big data? A room full of monkeys typing randomly for infinity creates the biggest data, and we are certain (probability = 1) it creates the data and the answers we need. That scenario would drive us bananas. 3. When does data get big? a) Data becomes big data when it exceeds the limits of our hardware or software. b) Very big data can come from small problems. 4. So what’s the big deal? Big data really is magic, but it’s somewhere between delightful and creepy, as demonstrated by Target’s advertising. A relationship may exist that we cannot visualize, but big data can. Comparing the Nerf gun and the 9mm illustrates this in the physical domain. Remember that a bullet drops the same amount as a Nerf dart (per unit of time!). Big data allows us to see this when we create multiple plots and present the information in a way that we can detect significance. It also reminds us that sometimes we shouldn’t trust our judgment, and sometimes we shouldn’t trust the model. Big data can be just as dangerous as a gun. So can “experts,” but when skilled expertise complements rigorous models and thorough analysis, big data hits the mark. 5. What can big data do? Remember the six kinds of questions data (of any size) can answer. Big data can do what small data can do (better) by revealing unexpected correlations, so experts can detect either significance or bias. Endnotes 1. Cook, John. “Comparing Three Methods of Computing Standard Deviation.” https://www.johndcook.com/blog/2008/09/26/comparing-three-methods-of-computing-standard-deviation/

April Issue 20-04
2. Burger, Edward B and Michael Starbird. The Heart of Mathematics: An Invitation to Effective Thinking. 3. Hanley, John. "Changing DOD's Analysis Paradigm: The Science of War Gaming and Combat/Campaign Simulation," Naval War College Review. 4. Hill, Kashmir. “How Target Figured out a Teen Girl Was Pregnant before Her Father Did.” https://www.forbes.com/sites/kashmirhill/2012/02/16/how-target-figured-out-a-teen-girl-was-pregnant-before-her-father-did/#1f966e5a6668 5. Lewis, Michael. The Undoing Project. 6. Peng, Roger. The Art of Data Science. https://bookdown.org/rdpeng/artofdatascience/types-of-questions.html
Subscribe to our Podcast Please subscribe to the new Flight Test Safety Podcast on the Apple or Google podcast app. You can also navigate directly to the recording in a web browser.
Contact Flight Test Safety Committee Tom Huff, Chairman [email protected] Susan Bennett, FTSC Administrator [email protected] Society of Flight Test Engineers [email protected] Society of Experimental Test Pilots [email protected] AIAA Flight Test Group [email protected] Contact Flight Test Safety Fact Mark Jones Jr, Editor [email protected] Website: flighttestsafety.org Podcast: ftscchannel.podbean.com/