
Flexible Enabling Technology for Variable Renewable Energy ...
20
Article Ocean Thermal Energy Conversion – Flexible Enabling Technology for Variable Renewable Energy Integration in the Caribbean R. J. Brecha 1,2,3,4,* , Katherine Schoenenberger 4 , Masaō Ashtine 5 , Randy Koon Koon 6 1 Climate Analytics, Ritterstr. 3, 10969 Berlin, Germany 2 Hanley Sustainability Institute, University of Dayton, Dayton, OH, USA 45469 3 Renewable and Clean Energy Program, University of Dayton, Dayton, OH, USA 45469 4 Physics Dept., University of Dayton, Dayton, OH, USA 45469 5 Department of Engineering, University of Oxford, United Kingdom. 6 Department of Physics, University of the West Indies, Mona Campus, Jamaica, W.I. * Correspondence: [email protected] Abstract: Many Caribbean island nations have historically been heavily dependent on imported fossil fuels for both power and transportation, while at the same time being at an enhanced risk from the impacts of climate change, although their emissions represent a very tiny fraction of the global total responsible for climate change. Small island devel- oping states (SIDS) are among the leaders in advocating for the ambitious 1.5°C Paris Agreement target and the transition to 100% sustainable, renewable energy systems. In this work we present three central results. First, we show through GIS mapping of all Caribbean islands the potential for near-coastal deep-water as a resource for Ocean Thermal Energy Conversion (OTEC) and couple these results with an estimate of the countries for which OTEC would be most advantageous due to a lack of other dispatch- able renewable power options. Second, hourly data have been utilized to explicitly show the trade-offs between battery storage needs and dispatchable renewable sources such as OTEC in 100% renewable electricity systems, both in technological and economic terms. Finally, the utility of near-shore, open-cycle OTEC with accompanying desalination is shown to enable a higher penetration of renewable energy and lead to lower system levelized costs than those of a conventional fossil fuel system. Keywords: Ocean thermal energy conversion, OTEC, seawater air conditioning, SWAC, desalination, variable renewable energy, wind power, solar PV, 100% renewable energy, Caribbean 1. Introduction Although responsible for a negligible fraction of historic emissions, Small Island Developing States (SIDS), including those in the Caribbean, have committed to fulfilling ratified obligations outlined in the Paris Agreement. Critical reasons for the strong regional support for the 1.5°C (rise) temperature target are the dire threat from sea-level rise, temperature changes, and tropical cyclones that are already increasing measurably and will do so even more in a world beyond 1.5°C [1]. One of the key findings of the IPCC Special Report on Global Warming of 1.5°C [2], [3] is that the world needs to be carbon-emissions neutral by mid-century or shortly thereafter. If this target is taken as a guiding concept, roughly thirty years remain for most, if not all, countries to decarbonize their energy systems; in a world largely free of fossil fuels, it will be critical for SIDS to accelerate this transition. Preprints (www.preprints.org) | NOT PEER-REVIEWED | Posted: 25 February 2021 doi:10.20944/preprints202102.0585.v1 © 2021 by the author(s). Distributed under a Creative Commons CC BY license.
-
Upload
khangminh22 -
Category
Documents
-
view
1 -
download
0
Transcript of Flexible Enabling Technology for Variable Renewable Energy ...
Article
Ocean Thermal Energy Conversion – Flexible Enabling Technology
for Variable Renewable Energy Integration in the Caribbean
R. J. Brecha1,2,3,4,*, Katherine Schoenenberger4, Masaō Ashtine5, Randy Koon Koon6
1Climate Analytics, Ritterstr. 3, 10969 Berlin, Germany
2Hanley Sustainability Institute, University of Dayton, Dayton, OH, USA 45469
3Renewable and Clean Energy Program, University of Dayton, Dayton, OH, USA 45469
4Physics Dept., University of Dayton, Dayton, OH, USA 45469
5Department of Engineering, University of Oxford, United Kingdom.
6Department of Physics, University of the West Indies, Mona Campus, Jamaica, W.I.
*Correspondence: [email protected]
Abstract: Many Caribbean island nations have historically been heavily dependent on
imported fossil fuels for both power and transportation, while at the same time being at an
enhanced risk from the impacts of climate change, although their emissions represent a
very tiny fraction of the global total responsible for climate change. Small island devel-
oping states (SIDS) are among the leaders in advocating for the ambitious 1.5°C Paris
Agreement target and the transition to 100% sustainable, renewable energy systems. In
this work we present three central results. First, we show through GIS mapping of all
Caribbean islands the potential for near-coastal deep-water as a resource for Ocean
Thermal Energy Conversion (OTEC) and couple these results with an estimate of the
countries for which OTEC would be most advantageous due to a lack of other dispatch-
able renewable power options. Second, hourly data have been utilized to explicitly show
the trade-offs between battery storage needs and dispatchable renewable sources such as
OTEC in 100% renewable electricity systems, both in technological and economic terms.
Finally, the utility of near-shore, open-cycle OTEC with accompanying desalination is
shown to enable a higher penetration of renewable energy and lead to lower system
levelized costs than those of a conventional fossil fuel system.
Keywords: Ocean thermal energy conversion, OTEC, seawater air conditioning, SWAC,
desalination, variable renewable energy, wind power, solar PV, 100% renewable energy,
Caribbean
1. Introduction
Although responsible for a negligible fraction of historic emissions, Small Island Developing States (SIDS),
including those in the Caribbean, have committed to fulfilling ratified obligations outlined in the Paris Agreement.
Critical reasons for the strong regional support for the 1.5°C (rise) temperature target are the dire threat from sea-level
rise, temperature changes, and tropical cyclones that are already increasing measurably and will do so even more in a
world beyond 1.5°C [1]. One of the key findings of the IPCC Special Report on Global Warming of 1.5°C [2], [3] is that
the world needs to be carbon-emissions neutral by mid-century or shortly thereafter. If this target is taken as a
guiding concept, roughly thirty years remain for most, if not all, countries to decarbonize their energy systems; in a
world largely free of fossil fuels, it will be critical for SIDS to accelerate this transition.
Preprints (www.preprints.org) | NOT PEER-REVIEWED | Posted: 25 February 2021 doi:10.20944/preprints202102.0585.v1
© 2021 by the author(s). Distributed under a Creative Commons CC BY license.

Ocean energy technologies can help play a role in enabling island states to reach targets of energy self-sufficiency
[3], [4]. Three basic, but linked ideas are behind the continued interest in Ocean Thermal Energy Conversion (OTEC)
as an enabling technology in particular [5]–[8]. First, as shares of increasingly economical variable renewable energy
(VRE) sources such as wind and solar photovoltaics are incorporated into the energy mix, there will still be a need for
dispatchable electricity sources to complement variability [9]. Second, much as with sun and wind, ocean energy as a
primary resource is essentially infinite and not depletable. Third, OTEC can also provide extra services beyond the
generation of electricity, such as desalination of water, cooling of buildings and aquaculture [10].
In spite of these important driving factors and some continued interest in OTEC by research groups and
commercial ventures around the world, uptake has thus far been slow. Predictably, one of the valid reasons for the
lack of adoption has been the relatively high up-front cost that is expected for any emerging technology. In general,
technologies follow an experience learning curve, described by decreasing costs per installed unit or per unit of
generated electricity, expressed as a function of total cumulative installed capacity [11]–[13]. Solar photovoltaics (PV)
represent a classic example with installation costs dropping by about 25% for each doubling of installed capacity,
following this trend for the past four decades [14]. Technology such as OTEC, largely still within a demonstration
phase, will inevitably be comparatively costly when factoring in more mature systems.
Another factor that can also lead to hesitation on the part of developers of potential OTEC projects is the relatively
limited geographical area over which OTEC can be a viable technology [7], [8], [15]. In fact, compared to wind and
solar energy, it is likely that the decreases in cost for OTEC projects may not show dramatic declines beyond those
seen in moving from experimental projects to more standardized technology implementation. For OTEC and
accompanying desalination and perhaps Sea Water Air Conditioning (SWAC) to be implemented, developers require
(a) a viable coastline resource (including the absence of Marine Protected Areas or sensitive wetlands, for example), (b)
bathymetry that allows for relatively deep ocean waters (~1000 m or more) within reasonable proximity (~5 km or
less), and finally, (c) towns or fairly urbanized developments with electricity transmission infrastructure near these
coastal areas.
While not likely to become a worldwide mass-market technology, we show that OTEC and desalination can play
a limited but important role in complementing variable renewables in certain cases. Therefore, bathymetric data for all
island countries and overseas territories in the Caribbean have been examined to determine which are the most likely
candidates using the three proximity criteria above, together with a fourth criterion that sufficient, less expensive or
more developed dispatchable renewable resources (e.g. hydropower or geothermal) are not readily available. Most
crucially, this research shows at least two reasons that OTEC should not be judged as a technology in isolation, for
example in terms of the levelized cost of electricity (LCOE) generated.
The first argument for OTEC is focused on applications where the power systems are heavily dependent on
variable renewables, as such the value of a dispatchable source goes beyond the actual electrical energy generated, but
in the ancillary services that can be provided to the system in terms of stability. While batteries are increasingly an
economically viable option for backup [16], [17], a balance between storage and dispatchable power will be necessary,
with consideration of the overall system-wide LCOE, not that of each technology individually, being a more prudent
way to view planning toward a 100% renewable energy (RE) future. This is especially true in the context of SIDS in
the Caribbean, many of which are just beginning transitions from a nearly complete reliance on oil and gas for power
generation, and thus have the opportunity for taking a longer-term systemic view of power system transformation.
The second strand of the economic argument is that the combination of OTEC with auxiliary desalination as a
combined system provides multiple services; another potential benefit is the further combination of OTEC and
desalination with SWAC as an additional output that is of great value-added on many islands which continue to face
increasing pressures owing to climate change.
Preprints (www.preprints.org) | NOT PEER-REVIEWED | Posted: 25 February 2021 doi:10.20944/preprints202102.0585.v1

The following subsections present a brief overview of the energy landscape in the Caribbean region, linking
resource and economic factors (Section 1.1). In Section 1.2, a summary of various regional dispatchable RE resources is
given, with an eye toward a transition to 100% RE. OTEC as a specific technology is presented in terms of both
physical and economic factors, including considerations of desalination and sea-water air conditioning as by-products
(Section 1.3). These considerations lead to the filtering criteria that are used in Section 4 for a preliminary selection of
potential Caribbean sites for OTEC based on GIS mapping of bathymetry, and in Section 5 some economic parameters
related to OTEC are presented. In Section 6 the representative hourly demand, wind and solar data are used to gain
an understanding of the challenges of integrating high levels of VRE sources into the power system, leading therefore
to the necessity of complementary technologies such as OTEC. Section 7 is a discussion of the results and provides an
outlook for the adoption of OTEC for Caribbean SIDS.
1.1. Status of renewables across the Caribbean
The abundance of unexploited renewable resources across the Caribbean positions the region to become a leader
in sustainable development. An overview of RE potential across Caribbean Community (CARICOM) member states
can be seen in Figure 1. It should be noted that SIDS are, in addition to their energy needs, acutely focused on
climate adaptation measures that can be supported by ambitious RE integration plans. In the Caribbean, the primary
focus will be on increasing penetration rates of solar photovoltaics and wind energy. The variable nature of wind
and solar power mandates that there be an additional source of energy or storage of energy to complement these two
resources. Battery storage is an increasingly integrated option for storing energy whereby utilities operate load
shifting methods to ‘transfer’ energy from times of plentiful sun and wind to those times without [18]. The other
available avenue to complement variable renewable power generation is through the use of a dispatchable
(controllable) source of power. If fossil fuel sources and nuclear energy are not considered, a limited number of
technologies are available (e.g. hydropower, geothermal, biomass, waste, tidal, wave, and OTEC).
Figure 1 - Renewable energy distribution across the CARICOM Caribbean nations (Ochs et al., 2015).
Preprints (www.preprints.org) | NOT PEER-REVIEWED | Posted: 25 February 2021 doi:10.20944/preprints202102.0585.v1

Whereas worldwide hydropower has long been the dominant renewable electricity source, hydropower plays a
fairly insignificant role in the region (with few exceptions such as Suriname and Belize). As shown in the summary in
Table 1 as well as in Figure 1, some countries have hydropower resources that may be either very small (Grenada) or
already at maximum capacity (Dominica and St. Vincent and the Grenadines). In very few cases in the region,
pumped hydropower storage, and the increasingly viable conversion of renewable electricity to hydrogen through
hydrolysis are also being explored. Hydrogène de France (HDF) for instance has recently invested in developing a 55
MW/140 MWh hydrogen-based solar-plus-storage plant in French Guiana in 2018 [19] with work expected to begin in
2020.
Another potential energy source, biomass use for power generation, can largely come in two forms, either using
waste from crops, such as sugar cane, or from purpose-grown bioenergy crops. Biomass electricity can therefore play
a niche role in some countries, but especially on some of the smaller islands, a large biomass to electricity capacity is
not to be expected due to environmental concerns and climatic risks posed to already strained agricultural systems.
These limitations are further compounded by resource competition as most agri-based biomass systems need a
constant supply of by-products which are often more valuable on international markets than being converted into
ethanol or burned for electricity.
Finally, waste-to-power generation could play a marginal role in some countries, either from solid waste
combustion or capture of landfill methane; although countries in the region do have waste disposal challenges, the
overall amount of waste generated in 2010 was ~1 kg/person/day) [20] with estimates of the combustion value and the
resulting electricity generation from municipal solid waste [21] leading to an energy production of approximately 90
kWh/capita/year; a relatively small contribution compared to typical island electricity consumption of ~2,000
kWh/capita/year.
Figure 1 shows estimates for several renewable technologies based upon the 2027 energy capacity projections
outlined by the Caribbean Sustainable Energy Roadmap and Strategy [22]. For example, the CARICOM subset of
Eastern Caribbean islands from St. Kitts & Nevis to Grenada collectively accounts for a potential of 6,280 MW of
exploitable geothermal power [22]. Interestingly, and although not currently planned, a collective approach to
exploit this resource could further increase its efficacy, for example, between the islands of St. Kitts and Nevis
(approximately 3.5 km from coast to coast), or between Dominica, Guadeloupe and Martinique through inter-island
grid connectivity [23]. On the other hand, geothermal resources have been widely explored but often run into
implementation difficulties and delays (e.g. Grenada, Saint Lucia).
Beyond the critical issue of carbon emissions reductions, there are other reasons for Caribbean SIDS to transform
their energy systems to domestic renewable resources. Caribbean member states are vulnerable to the volatile nature
of the oil and gas industry, hence a continued reliance on fossil fuel imports hinders energy diversification and
economic security. Collectively, the average price of the domestic retail rate of electricity across Caribbean islands
states is ~US$0.30/kWh [24]. Therefore, there is a continued need for RE integration to mitigate trade imbalances due
to fossil fuel imports. In addition, Caribbean countries tend to rank in the middle of the Notre Dame Global
Adaptation Initiative [25] Index, a measure of a country’s vulnerability to climate change and its readiness to improve
its resilience. The combination of vulnerability, economic stress and climate change mitigation commitments motivate
the present work.
One technology not represented in Figure 1 is OTEC. In the next subsection we explore in more detail the
available dispatchable RE technologies in the region, assuming that solar PV and wind will form the backbone of the
power system.
Preprints (www.preprints.org) | NOT PEER-REVIEWED | Posted: 25 February 2021 doi:10.20944/preprints202102.0585.v1

1.2. Summary of dispatchable renewable technologies and OTEC potential
The analysis presented in this paper is multi-faceted, looking at OTEC resource potential in all Caribbean island states,
some ancillary advantages of OTEC as both a supporting technology for variable renewable systems as well as in
terms of sea-water desalination as an additional adaptation and resilience measure, and finally, at the economics of
OTEC as part of a 100% RE system. The International Renewable Energy Agency (IRENA) surveyed ocean energy
resources around the world [4] and for the Caribbean region, both tidal and wave power are poor resources due to
limited tidal channels to harness energy, and are therefore not considered within this study. Table 1 gives a summary
of potential resources for hydropower, geothermal and OTEC, summarizing the discussion in the previous section
and with the latter based on the results to be shown in Section 3; here we use the comparison to motivate the results of
this paper and look in more detail at OTEC as a potentially viable and alternative complementary power source for
high VRE penetration, and as a technology that can also provide other co-benefits for those regions in which it is
viable. Geothermal and OTEC as listed are really either available or not, depending on geological conditions.
Hydropower in some cases may be available on a small scale, either in absolute terms or relative to system size. In
addition, peak demand for each of the islands is listed to provide a sense of the system size [24]. This will become
more relevant in the discussion below on complementing VRE with dispatchable renewables.
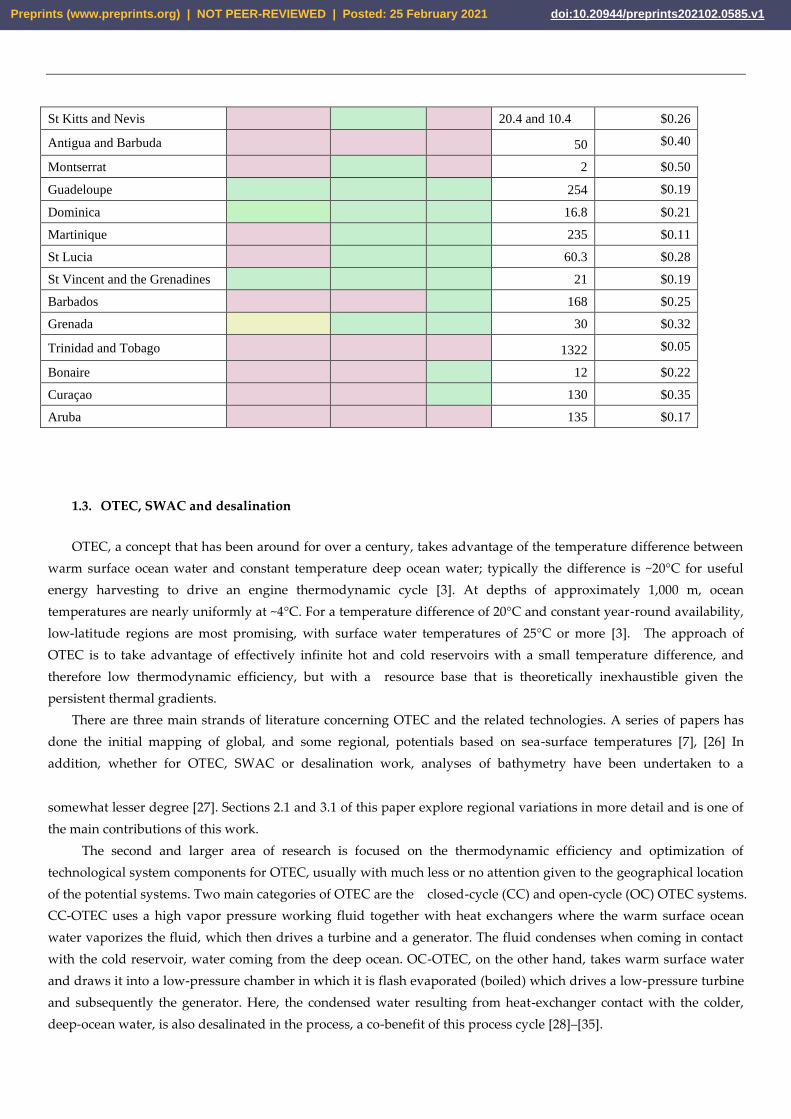
Table 1 - List of Caribbean countries with yes (green) or no (light red) filters for potential hydropower, geothermal and OTEC
technologies as dispatchable renewable energy. For OTEC in this table, no filtering has been done for resources to determine
proximity to population centers or other infrastructure. In some cases (yellow) hydropower resources may be small, either in
absolute terms or in comparison to the overall system capacity. Additional information for reference purposes on peak demand and
electricity price by country, based on Ref. [24]
Country Hydropower Geothermal OTEC
Peak
demand
[MW]
Residential
electricity
price
[US$/kWh]
Bahamas 308 $0.32
Cuba
Turks and Caicos 34.7 $0.26
Jamaica 644 $0.28
Haiti 500 $0.13
Dominican Republic 2506 $0.13
Puerto Rico 3685 $0.22
British Virgin Islands 32 $0.24
US Virgin Islands - St Thomas
and St John
88
$0.40
US Virgin Islands - St Croix 55 $0.40
Anguilla 14 $0.23
Sint-Maarten/Saint-Martin 42.6/32 $0.30
Preprints (www.preprints.org) | NOT PEER-REVIEWED | Posted: 25 February 2021 doi:10.20944/preprints202102.0585.v1
St Kitts and Nevis 20.4 and 10.4 $0.26
Antigua and Barbuda 50 $0.40
Montserrat 2 $0.50
Guadeloupe 254 $0.19
Dominica 16.8 $0.21
Martinique 235 $0.11
St Lucia 60.3 $0.28
St Vincent and the Grenadines 21 $0.19
Barbados 168 $0.25
Grenada 30 $0.32
Trinidad and Tobago 1322 $0.05
Bonaire 12 $0.22
Curaçao 130 $0.35
Aruba 135 $0.17
1.3. OTEC, SWAC and desalination
OTEC, a concept that has been around for over a century, takes advantage of the temperature difference between
warm surface ocean water and constant temperature deep ocean water; typically the difference is ~20°C for useful
energy harvesting to drive an engine thermodynamic cycle [3]. At depths of approximately 1,000 m, ocean
temperatures are nearly uniformly at ~4°C. For a temperature difference of 20°C and constant year-round availability,
low-latitude regions are most promising, with surface water temperatures of 25°C or more [3]. The approach of
OTEC is to take advantage of effectively infinite hot and cold reservoirs with a small temperature difference, and
therefore low thermodynamic efficiency, but with a resource base that is theoretically inexhaustible given the
persistent thermal gradients.
There are three main strands of literature concerning OTEC and the related technologies. A series of papers has
done the initial mapping of global, and some regional, potentials based on sea-surface temperatures [7], [26] In
addition, whether for OTEC, SWAC or desalination work, analyses of bathymetry have been undertaken to a
somewhat lesser degree [27]. Sections 2.1 and 3.1 of this paper explore regional variations in more detail and is one of
the main contributions of this work.
The second and larger area of research is focused on the thermodynamic efficiency and optimization of
technological system components for OTEC, usually with much less or no attention given to the geographical location
of the potential systems. Two main categories of OTEC are the closed-cycle (CC) and open-cycle (OC) OTEC systems.
CC-OTEC uses a high vapor pressure working fluid together with heat exchangers where the warm surface ocean
water vaporizes the fluid, which then drives a turbine and a generator. The fluid condenses when coming in contact
with the cold reservoir, water coming from the deep ocean. OC-OTEC, on the other hand, takes warm surface water
and draws it into a low-pressure chamber in which it is flash evaporated (boiled) which drives a low-pressure turbine
and subsequently the generator. Here, the condensed water resulting from heat-exchanger contact with the colder,
deep-ocean water, is also desalinated in the process, a co-benefit of this process cycle [28]–[35].
Figure - Schematic diagrams of closed-cycle OTEC (CC-OTEC) and open-cycle OTEC (OC-OTEC) systems
(Images courtesy of Wikimedia Commons:
https://commons.wikimedia.org/wiki/File:Otec_Open_Diagram_in_English.JPG
https://commons.wikimedia.org/wiki/File:Otec_Closed_Diagram_in_English.JPG
Preprints (www.preprints.org) | NOT PEER-REVIEWED | Posted: 25 February 2021 doi:10.20944/preprints202102.0585.v1

For both processes there is potential for using the circulating cold water for SWAC, essentially a low-carbon and
low-cost replacement for utility-scaled and chiller-based cooling. However, in all of these technologies, two of the
most critical and expensive components are the heat exchangers and the necessary piping to reach deep, cold ocean
water, and subsequently, coastlines. Having both warm and cold-water reservoirs near the generation facility and for
SWAC, near-demand for cooling becomes one of the most important criteria for site selection [27].
The third area of research, usually in conjunction with one of the first two is to analyze the economic feasibility, or
at least, the system costs of OTEC, desalination, and accompanying SWAC outputs. Sections 2.2 and 3.2 explore these
aspects in more detail, highlighting the main economic considerations where the emphasis is placed on the economics
of both OC- and CC-OTEC, showing that costs decrease when moving to the CC-OTEC technology due in part to the
overall larger size (>10 MW) of these systems compared to smaller OC-OTEC plants [6], [8], [10], [28], [36], [37].
2. Materials and Methods
We present in the following three sections the methodologies used in this paper. Bathymetry mapping of all
Caribbean Island states is used to determine the most promising sites for OTEC (Sec. 2.1). A summary of economic
parameters and approaches is given in Sec. 2.2. The description of residual loads and the hourly modeling of RE
generation and battery storage is provided in Sec. 2.3.
2.1. GIS bathymetry mapping of the Caribbean region
Previous low-resolution mapping of potential OTEC resources that looked at sites with a temperature difference
~20 °C and within 200 miles of coastlines [15] is expanded upon in the present work. Suitable locations within the
Caribbean region, with an emphasis on SWAC, have also been previously investigated [36].
The main requirements applied in what follows are having a depth of 1,000 m, for consistent ~4°C temperature,
and that potential OTEC sites be near coastal areas to minimize piping lengths and allow land-based infrastructure for
the OTEC power plant. Coastlines were defined using the NOAA high-resolution shoreline database, and then
extended out to a distance of 10 km. The primary bathymetry dataset used was the General Bathymetric Chart of the
Oceans (GEBCO) [38] which covers the complete extent of the study area at a 15 arc-second resolution. Information on
bathymetric source data types is provided with the downloaded grid, with examples including single and multibeam
bathymetry, and seismic and sounding surveys. The 10 km study area extending from coastlines was further refined
with 2.5 km shoreline buffer increments symbolized to emphasize proximity to the coast. Particular areas of interest
within the study area were located by identifying the gridded areas of the GEBCO bathymetry dataset at depths
greater than 1,000 m. Over the extent of the study area, the horizontal resolution of the GEBCO 15 arc second depth
data was approximately 400 m (range 385-460 m).
For purposes of organization, we consider two sub-regions within the Caribbean region (Figure 1). The Greater
Antilles consisting of larger islands such as Cuba, Jamaica, Hispaniola (Haiti and the Dominican Republic), and
Puerto Rico; The Bahamas and Turks and Caicos Islands are also taken as part of this group. The Lesser Antilles are
the islands ranging from the U.S. and the British Virgin Islands and Anguilla southward to Trinidad and Tobago,
including Barbados and islands near the coast of South America (Aruba, Curaçao, Bonaire and Isla de los Roques). We
examine each of these, in turn, identifying candidate areas within these regions for OTEC implementation based on
our chosen criteria. Detailed maps of the bathymetry and distances to the coast for all islands are shown statically in
the Supplementary Information online as well as being available as an interactive mapping tool at
https://arcg.is/1LfKff.
Preprints (www.preprints.org) | NOT PEER-REVIEWED | Posted: 25 February 2021 doi:10.20944/preprints202102.0585.v1
2.2. Summary of economic parameters for OTEC and desalination
As referenced above, a number of studies have attempted to determine the costs for coupled OTEC and
desalination and /SWAC systems. The typical view as been that a) these technologies are not yet ripe, (both
technologically and economically), being only in the pilot-project stage, but that b) with enough research and
deployment, economies of scale will drive costs down with one of the reasons for examining the feasibility of these
coupled systems stems from the hope for better energy economics through the use of these dual-use technologies.
However, as shown by the specific cases highlighted here with the filtering of likely areas for OTEC, the feasible sites
dwindle in number to a very few.
Relatively few detailed economic estimates are available in the literature. The most complete recent accounting
for costs is for a CC-OTEC system [28]. A detailed study of both CC and OC systems was carried out in Ref. [8]. In this
paper, we recognize the large degree of uncertainty in OTEC cost estimates but bridge the cited literature for our
analysis. Earlier work assumed an offshore platform for hosting the OTEC system, with the platform, moorings and
undersea power cable representing a significant fraction of the total cost. These previous analyses also assumed a
relatively large, generically-placed (geographically) OTEC plant of 50 MW capacity, having determined that a strong
cost advantage arises in moving from plants of 10 MW or less to this larger size due to scale effects [8]. For our
proposed application, smaller plants or units on the order of 5 - 10 MW capacity are more appropriate. Based on Ref.
[8] the specific (i.e. per kW of capacity) capital cost of a 5-10 MW plant would be approximately three times that of a
50 MW plant [8]. One key point we use for our assumptions, following Ref. [8], is that overall component costs for the
CC and OC plants will be approximately equal [8]. Using these scaling factors and assumptions, the capital cost for a 5
MW OC-OTEC plant would be approximately $13,500/kW (also converting 2009 US$ to 2018 US$ with a producer
price index factor of 1.2).
A more recent analysis examines an OC-OTEC plant with a net capacity of 2.3 MW (after self-consumption is
taken into consideration) in which multiple such units could be combined for a power plant of larger total capacity
[28]. Those authors estimate a levelized cost of electricity of €269/MWh (~USD 300/MWh or $0.30/kWh) in their base
case with a capital cost of €16,000/kW (€14,000/kW in a low-cost case). This result is somewhat higher than that of the
earlier work [8], but within any reasonable estimate of uncertainty and will be used as a best-estimate baseline in our
analysis, with sensitivity tests for lower and higher costs being applied.
As far as the production of desalinated water and electricity is concerned, an estimate gives daily production of
118,000 m3 and an annual output of electricity (assuming an overall 92% capacity factor) of 414,415 MWh [8]. For
operation of a smaller system with 0.5 MW net capacity and 80% capacity factor a freshwater production of 1,175
m3/day was found in Ref. [31], in very good agreement with Ref. [8]. More realistically, especially given the grid
integration potential we want to consider here, a capacity factor of ~70% should be taken if sized reasonably for the
system, which increases the LCOE. This co-benefit of desalinated water will be considered in our analysis as well.
Estimating the cost of water from regional water agencies we take a value of US $2/m3 and test sensitivities for lower
and higher water prices.
2.3. Load, residual load and system benefits of dispatchable renewable energy
According to the best available science as summarized by the Intergovernmental Panel on Climate Change
(IPCC)) compliance with the Paris Agreement will require a near-total phase-out of fossil fuels by about mid-century
globally [2]. In support of the need to understand this transition, modeling integrated systems of 100% RE has
become an increasingly active field of research [39]–[42]. The strong decrease in the past decade in the cost of solar
Preprints (www.preprints.org) | NOT PEER-REVIEWED | Posted: 25 February 2021 doi:10.20944/preprints202102.0585.v1

PV, wind power and batteries, and in the near future, of electric vehicles, makes the outlines of a pathway forward to
elimination of fossil fuels and reliance on sustainable, renewable sources of energy [16], [43]–[45].
In general, there is a trade-off between the possibility of integrating high percentages of variable renewables and
the use of either storage or a dispatchable power source. As we shall show, adding a relatively small amount of
dispatchable capacity, even if expensive when considered in isolation, can enable a significantly increased uptake in
much cheaper wind and solar energy. Thus, when one considers an overall system LCOE there can still be a benefit of
the apparently expensive technology [46], [47].
To investigate trade-offs, we construct a Python-based model (available at
https://github.com/RJBrecha/OTEC-Caribbean) and assume a fictitious but representative Caribbean island with a
yearly electricity generation of 250 GWh and a peak demand of 37 MW. Here we have used proprietary hourly
demand data but scaled it from an actual country to the total generation for this fictitious island. Load curves tend to
be very similar for smaller Caribbean islands except for the overall amplitude, and at the level needed for this
demonstration of principle, these data will suffice. Hourly demand data can alternatively be taken from data available
for synthetic demand curves generated as part of 100% RE modeling efforts [48]; comparison with real data shows a
somewhat exaggerated secondary evening peak for the synthetic data.
To a first approximation, solar and wind energy generation at an hourly time resolution for a given modeled
installed capacity can be obtained from https://www.renewables.ninja/ based on reanalysis data [49], [50]; before
embarking on a large-scale transformation it would be necessary to undertake actual in situ measurements. With these
three datasets, each of which can be scaled in amplitude to represent different levels of production of wind and solar
power, as well as for different overall demand, an hourly time series can be constructed that shows the residual load
after VRE has been taken into account, i.e. load minus solar and wind power. For an assumed installed capacity of a
dispatchable source (OTEC is the assumed technology in this case, but this could be made up of different sources), if
the residual load from VRE is positive, i.e. demand is not satisfied, then the dispatchable source is used to fill in the
gap up to its maximum capacity. In the model, the dispatchable source is also assumed to have a minimum output
that is chosen to be 25% of the maximum capacity. Finally, storage is integrated into the model with a given capacity
(MWh) and power output (MW) (batteries, either at utility-scale or in an integrated grid with electric vehicles, or
perhaps hydrogen with fuel cells) such that an oversupply of VRE can charge the storage, or undersupply of VRE
with dispatchable source results in discharge of the storage; the dispatchable renewable source can also be used to
charge the battery up to its maximum capacity as needed. This process is modeled for each hour of the year with the
goal of satisfying demand at each hour while keeping track as well of the capacity factor of the dispatchable source,
the state of charge of the storage, and the total curtailed amount of VRE during the year. A convenient way to
visualize the various trade-offs that arise, including that of meeting demand versus curtailing VRE (which can in
some cases be part of an optimal solution) is through the use of residual load duration curves [51]; this approach is
presented in the Supplementary Information online.
A variety of combinations of dispatchable renewable source, storage capacity and VRE (wind + solar PV) can
meet the demand for all hours of the year. Using this model, it is possible to find the amount of storage (in MWh)
needed for a given combination of wind, solar PV and dispatchable renewable power (e.g. OTEC) capacities such that
demand for all hours of the year is met. Table 2 summarizes input parameters and assumptions used for the scenarios
and to determine the total system levelized cost of electricity (sLCOE). Whereas the exact nature of the dispatchable
source is of less importance here, one part of our argument is that for several of the Caribbean islands under
consideration, OTEC may be the best or only dispatchable renewable technology potentially available.
Preprints (www.preprints.org) | NOT PEER-REVIEWED | Posted: 25 February 2021 doi:10.20944/preprints202102.0585.v1
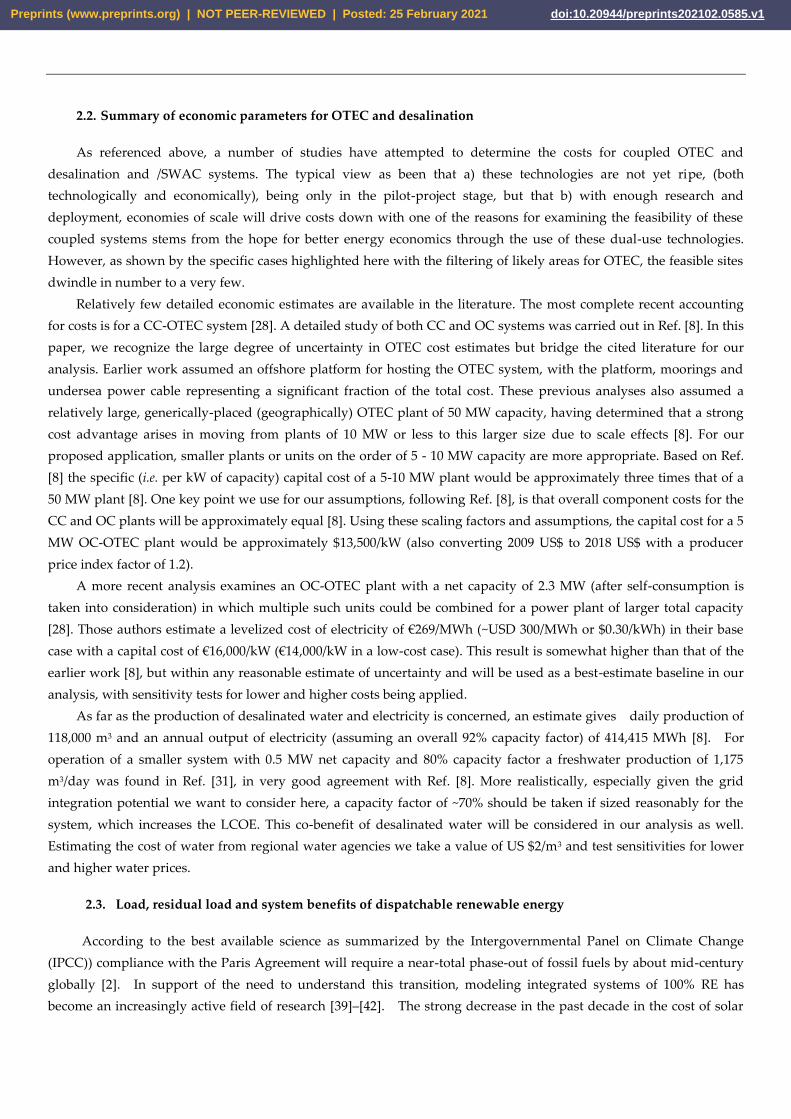
Table 2 - Parameters for the evaluation of system levelized costs of electricity (sLCOE) for different combinations of solar PV, wind,
dispatchable renewable and storage
Peak power 37.2 MW
Yearly energy 250 GWh
Levelized cost of wind $100 /MWh
Levelized cost of solar PV $100 /MWh
Levelized cost of dispatchable $300 /MWh
Levelized cost of storage $300 /MWh
Lifetime of storage 15 years
Lifetime of system 20 years
With these data and parameters as background, we now turn to the main results of this paper.
3. Results
Results are presented in the following three subsections. First, examples of the results of GIS mapping for near-shore
OTEC potential are given in Sec. 3.1, with more details in the Supplementary Information. System integration of
variable and dispatchable renewables with battery storage are shown in Sec. 3.2, and example system LCOE results
are given in Sec. 3.3, showing estimated costs both with and without the inclusion of desalination.
3.1. GIS mapping of deep water at different distances from the coast
Example results of GIS bathymetry and coastal distance mapping are shown in the following two sections for the
Greater and Lesser Antilles; a summary of promising locations for OTEC near towns or other facilities is shown in the
final subsection.
3.1.1. Greater Antilles (with The Bahamas and Turks and Caicos)
As an example of our analysis we show a map of Jamaica in Figure 3. On this map, the blue area shows the
regions of > 1,000 m depth and the gray area those with depth < 1,000 m. The additional contours are for distances of
2.5 km (green), 5.0 km (yellow), 7.5 km (orange) and 10 km (red) from the coast. The interpretation of the map is that
any area for which the blue 1,000 m depth contour closer to the coast is than a given distance contour will represent
cold, deep water at a constant temperature. For the sake of evaluation, the most promising locations are those closer
than 5 km (yellow line) and preferably (in the sense of the cost of construction) closer. In the case of Jamaica, the best
locations from the point of view of a near-coastal resource for OTEC would be near Negril, Lucea, southeast of
Kingston and near Port Maria and Port Antonio in the northeast. A more detailed list of potential sites in the Greater
Antilles is given in Table 2.
Preprints (www.preprints.org) | NOT PEER-REVIEWED | Posted: 25 February 2021 doi:10.20944/preprints202102.0585.v1

Figure 3 - Map of Jamaica with a bathymetry contour (blue) representing the boundary between depths of greater than
1,000m (blue) and less than 1,000 m (gray). Other contours are equidistant from the coast at 2.5 km (green), 5.0 km (yellow),
7.5 km (orange) and 10 km (red).
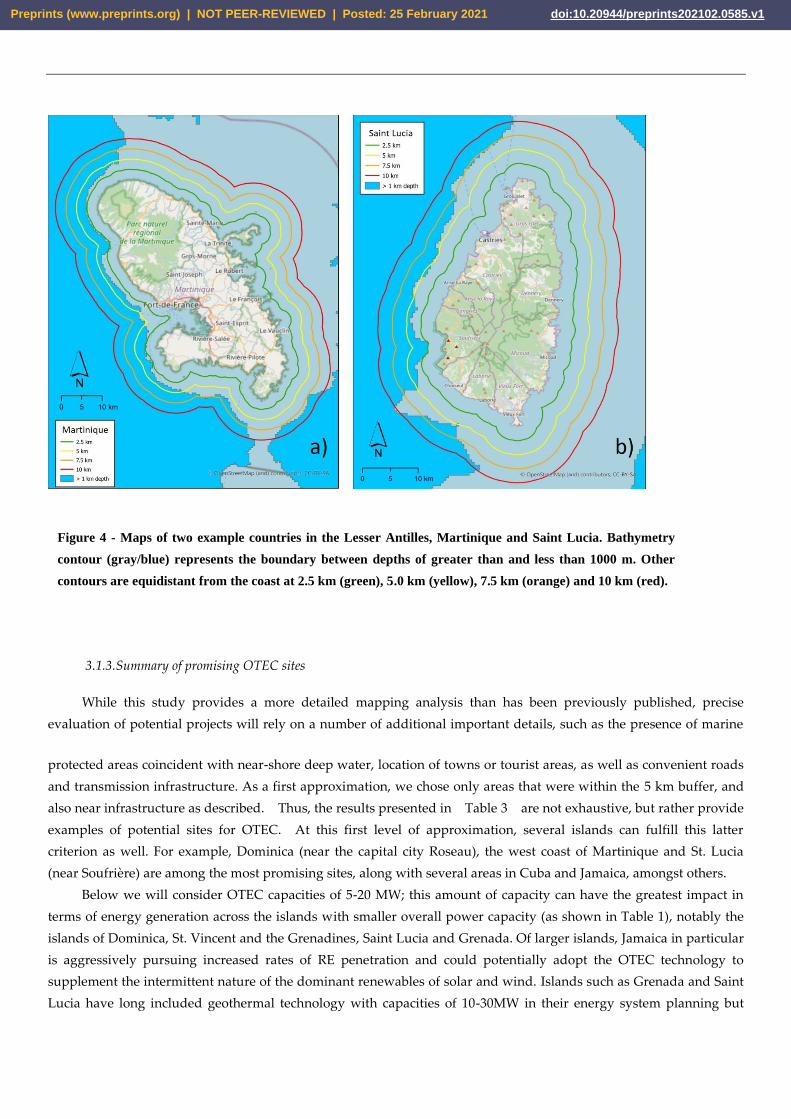
3.1.2. Lesser Antilles
Two examples of islands with promising OTEC locations for the Lesser Antilles are shown as examples in
Figure 4, for Martinique and for Saint Lucia. Several of the Eastern Caribbean islands have deep water within 10 km of
the coast. Again, the areas enclosed in red are distances of 10 km and distances from the coast of 5 km are shown in
yellow. Depths of 1,000 m and greater are outside (i.e. farther from the coast than) the gray area and represented in
blue. It can be quickly seen that several areas off the coasts of islands appear to be viable sites for OTEC, with deep,
cold ocean water at distances of 2.5 km - 5 km or less. A more detailed summary of mapping and potential sites is
shown in the SI online, but also includes explicitly those islands with no likely OTEC potential according to these
criteria, for example, St. Kitts and Nevis, Antigua and Barbuda, Aruba and Trinidad and Tobago.
Preprints (www.preprints.org) | NOT PEER-REVIEWED | Posted: 25 February 2021 doi:10.20944/preprints202102.0585.v1
3.1.3. Summary of promising OTEC sites
While this study provides a more detailed mapping analysis than has been previously published, precise
evaluation of potential projects will rely on a number of additional important details, such as the presence of marine
protected areas coincident with near-shore deep water, location of towns or tourist areas, as well as convenient roads
and transmission infrastructure. As a first approximation, we chose only areas that were within the 5 km buffer, and
also near infrastructure as described. Thus, the results presented in Table 3 are not exhaustive, but rather provide
examples of potential sites for OTEC. At this first level of approximation, several islands can fulfill this latter
criterion as well. For example, Dominica (near the capital city Roseau), the west coast of Martinique and St. Lucia
(near Soufrière) are among the most promising sites, along with several areas in Cuba and Jamaica, amongst others.
Below we will consider OTEC capacities of 5-20 MW; this amount of capacity can have the greatest impact in
terms of energy generation across the islands with smaller overall power capacity (as shown in Table 1), notably the
islands of Dominica, St. Vincent and the Grenadines, Saint Lucia and Grenada. Of larger islands, Jamaica in particular
is aggressively pursuing increased rates of RE penetration and could potentially adopt the OTEC technology to
supplement the intermittent nature of the dominant renewables of solar and wind. Islands such as Grenada and Saint
Lucia have long included geothermal technology with capacities of 10-30MW in their energy system planning but
Figure 4 - Maps of two example countries in the Lesser Antilles, Martinique and Saint Lucia. Bathymetry
contour (gray/blue) represents the boundary between depths of greater than and less than 1000 m. Other
contours are equidistant from the coast at 2.5 km (green), 5.0 km (yellow), 7.5 km (orange) and 10 km (red).
Preprints (www.preprints.org) | NOT PEER-REVIEWED | Posted: 25 February 2021 doi:10.20944/preprints202102.0585.v1
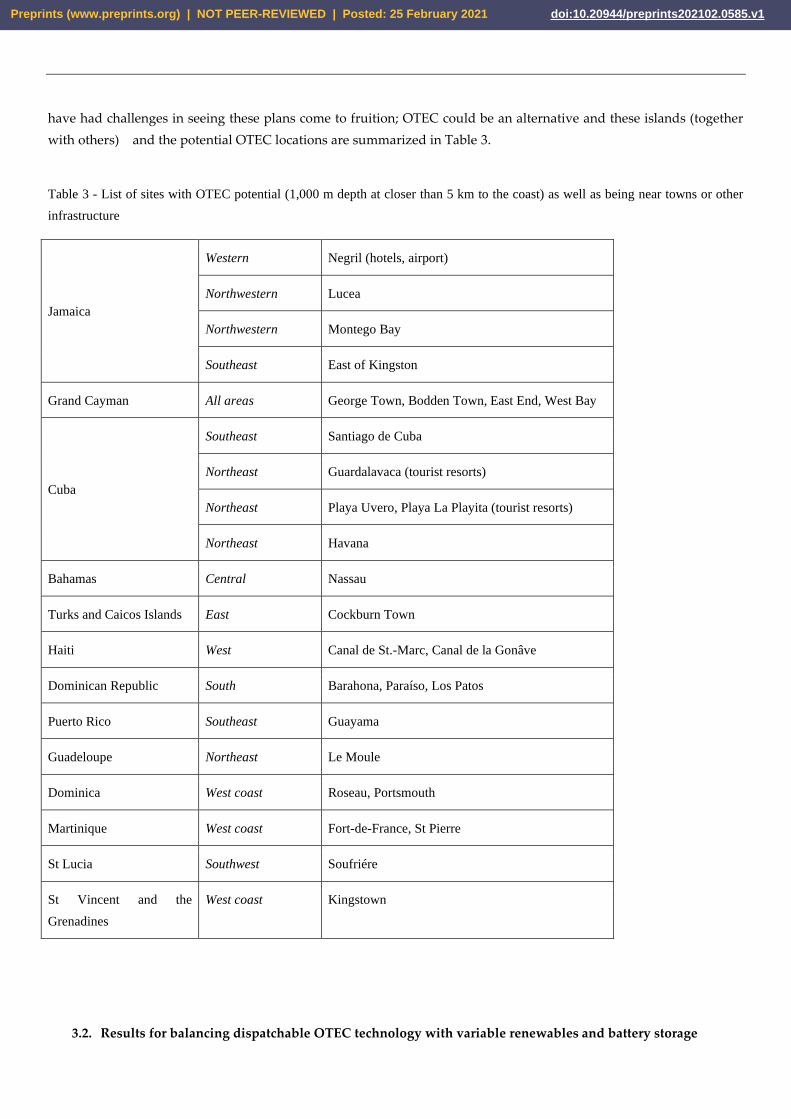
have had challenges in seeing these plans come to fruition; OTEC could be an alternative and these islands (together
with others) and the potential OTEC locations are summarized in Table 3.
Table 3 - List of sites with OTEC potential (1,000 m depth at closer than 5 km to the coast) as well as being near towns or other
infrastructure
Jamaica
Western Negril (hotels, airport)
Northwestern Lucea
Northwestern Montego Bay
Southeast East of Kingston
Grand Cayman All areas George Town, Bodden Town, East End, West Bay
Cuba
Southeast Santiago de Cuba
Northeast Guardalavaca (tourist resorts)
Northeast Playa Uvero, Playa La Playita (tourist resorts)
Northeast Havana
Bahamas Central Nassau
Turks and Caicos Islands East Cockburn Town
Haiti West Canal de St.-Marc, Canal de la Gonâve
Dominican Republic South Barahona, Paraíso, Los Patos
Puerto Rico Southeast Guayama
Guadeloupe Northeast Le Moule
Dominica West coast Roseau, Portsmouth
Martinique West coast Fort-de-France, St Pierre
St Lucia Southwest Soufriére
St Vincent and the
Grenadines
West coast Kingstown
3.2. Results for balancing dispatchable OTEC technology with variable renewables and battery storage
Preprints (www.preprints.org) | NOT PEER-REVIEWED | Posted: 25 February 2021 doi:10.20944/preprints202102.0585.v1
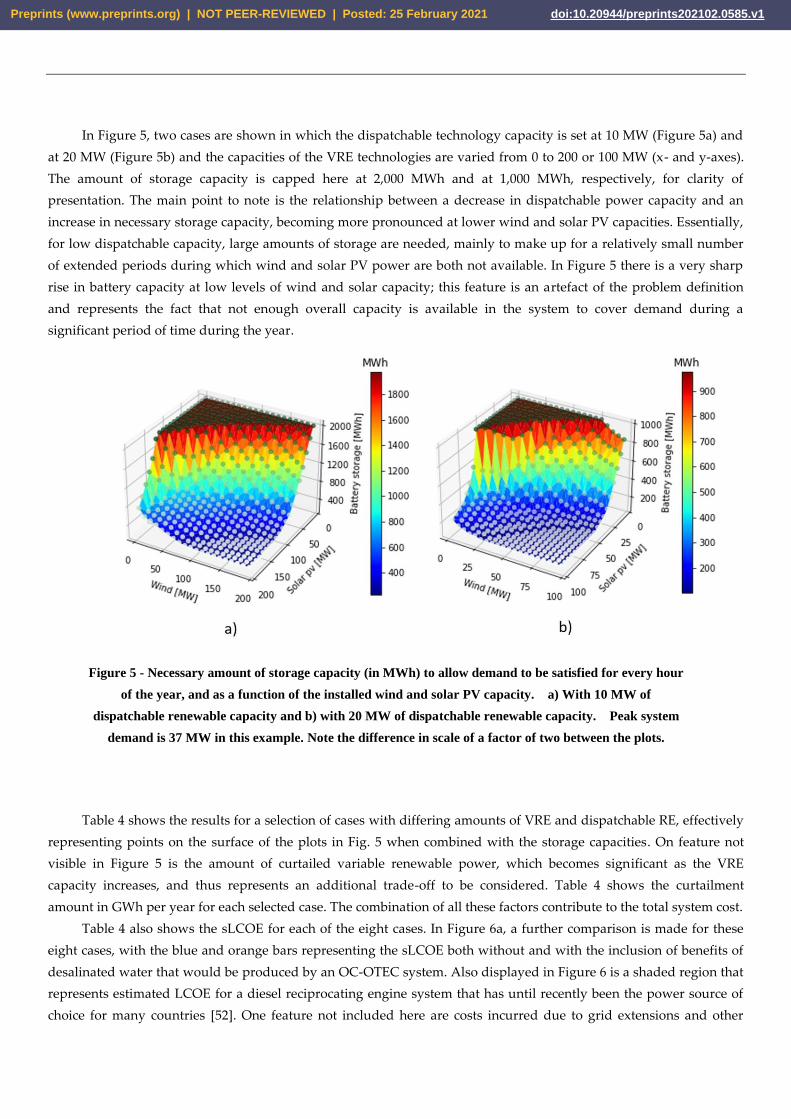
In Figure 5, two cases are shown in which the dispatchable technology capacity is set at 10 MW (Figure 5a) and
at 20 MW (Figure 5b) and the capacities of the VRE technologies are varied from 0 to 200 or 100 MW (x- and y-axes).
The amount of storage capacity is capped here at 2,000 MWh and at 1,000 MWh, respectively, for clarity of
presentation. The main point to note is the relationship between a decrease in dispatchable power capacity and an
increase in necessary storage capacity, becoming more pronounced at lower wind and solar PV capacities. Essentially,
for low dispatchable capacity, large amounts of storage are needed, mainly to make up for a relatively small number
of extended periods during which wind and solar PV power are both not available. In Figure 5 there is a very sharp
rise in battery capacity at low levels of wind and solar capacity; this feature is an artefact of the problem definition
and represents the fact that not enough overall capacity is available in the system to cover demand during a
significant period of time during the year.
Table 4 shows the results for a selection of cases with differing amounts of VRE and dispatchable RE, effectively
representing points on the surface of the plots in Fig. 5 when combined with the storage capacities. On feature not
visible in Figure 5 is the amount of curtailed variable renewable power, which becomes significant as the VRE
capacity increases, and thus represents an additional trade-off to be considered. Table 4 shows the curtailment
amount in GWh per year for each selected case. The combination of all these factors contribute to the total system cost.
Table 4 also shows the sLCOE for each of the eight cases. In Figure 6a, a further comparison is made for these
eight cases, with the blue and orange bars representing the sLCOE both without and with the inclusion of benefits of
desalinated water that would be produced by an OC-OTEC system. Also displayed in Figure 6 is a shaded region that
represents estimated LCOE for a diesel reciprocating engine system that has until recently been the power source of
choice for many countries [52]. One feature not included here are costs incurred due to grid extensions and other
Figure 5 - Necessary amount of storage capacity (in MWh) to allow demand to be satisfied for every hour
of the year, and as a function of the installed wind and solar PV capacity. a) With 10 MW of
dispatchable renewable capacity and b) with 20 MW of dispatchable renewable capacity. Peak system
demand is 37 MW in this example. Note the difference in scale of a factor of two between the plots.
Preprints (www.preprints.org) | NOT PEER-REVIEWED | Posted: 25 February 2021 doi:10.20944/preprints202102.0585.v1

system costs often associated with the higher penetration of renewables [53]. These costs will be very dependent on
individual system configurations and would require further investigation within the context of a given country.
Table 4 - Sample results for sLCOE (USD/MWh) for different system configurations (solar PV, wind, dispatchable renewable,
storage). Comparison is made with and without including the co-benefit of desalination. Dispatchable (Disp.); Desalination (desal.);
Curtailment (Curtaill.)
Case
Solar
[MW]
Solar
[GWh]
Wind
[MW]
Wind
[GWh]
Disp.
RE
[MW]
Disp. RE
[GWh]
Storage
capacity
[MWh]
Energy
from
storage
[GWh]
Curtail.
[%]
sLCOE
[$/MWh]
With desal.
water
[$/MWh]
1 200 335 73 204 0 0 2000 42.5 53 375 375
2 140 234 73 204 10 40 1000 17.8 48 294 267
3 120 201 53 150 10 46 1500 24.5 37 329 298
4 100 167 44 122 15 71 1000 15.8 30 293 244
5 90 151 34 95 15 79 1500 20.3 23 344 291
6 80 134 17 48 20 117 1000 15.7 16 325 245
7 90 151 24 68 20 108 500 11.3 23 270 197
8 60 100 29 82 25 115 200 2.37 16 237 159
There are several points to note about these summary results. First, costs for solar and wind have been set at
$100/MWh; our estimates are conservative in that there are many examples around the world of far lower LCOEs for
these technologies, and in fact in more mature markets, power purchase agreements have been tendered with costs of
only $30-40/MWh for systems of solar PV or wind energy, even including battery storage in some cases. On the other
hand, Caribbean islands have not yet shown the cost decreases to these lowest levels yet. A second point is to
emphasize that we use $300/MWh to represent the relatively untested OTEC costs; with other technologies such as
geothermal or hydropower the dispatchable source would be expected to have significantly lower LCOE, thus
lowering the sLCOE cost with respect to those shown here, even without the added benefit of desalinated water, as
illustrated in Figure 6. Even with these caveats and relatively conservative assumptions, the system LCOE for OTEC
with the co-benefit of desalinated water, and in some scenarios even without this advantage, is less than it would be
for diesel power generation.
To represent some potential and likely future developments, we show in Figure 6b the same analysis but with
an assumed cost of solar PV and wind each of $50/MWh, and storage costs of $150/kWh, keeping the uncertain cost of
the dispatchable OTEC source constant at $300/MWh. This situation might represent expected costs by 2030, which is
Preprints (www.preprints.org) | NOT PEER-REVIEWED | Posted: 25 February 2021 doi:10.20944/preprints202102.0585.v1

when many Caribbean islands will have increased implementation of variable renewables and will be looking at
options for complementing variable renewables with a dispatchable source of RE. It is seen that with these costs
decreasing, even with the relatively expensive OTEC technology as a backstop, the total system cost of electricity is in
nearly all cases less than what would be expected for diesel generators. Taking into account the added benefit of
desalinated water, the difference is even larger.
4. Discussion
Sea-based OTEC technologies by their very nature of operation are susceptible to both short- and long-term
changes in weather and climate patterns. Their open-water functioning presents many challenges, mostly
infrastructural, and Caribbean systems are particularly vulnerable to extremes in weather owing to the pronounced
hurricane season and deep convective atmospheric conditions that often result in storm surges and inclement weather
during the rainy seasons.
OTEC systems are governed by basic principles of vertical ocean thermal gradients and are relatively simple in
their operation, excluding more advanced hybrid and electrolysis complementary operations. Both floating and shelf-
or land-based systems involve extensive lengths of piping which can be easily disrupted by turbulent ocean surfaces.
Though having these systems at some distance near/offshore provides the advantage of tapping into greater and less
variable thermal gradients, they come at a greater infrastructural cost and capital risk. The Caribbean basin is already
seeing more weather extremes in recent years and meteorologists have shown through extensive climate models that
climate change is making hurricanes more frequent and powerful over the Atlantic Ocean, where they eventually
cross the Caribbean Sea via various paths. In a recent extreme example, the 2017 hurricane season cost Caribbean
countries and the United States USD $200 billion with Harvey, Irma, María and José leaving islands like Barbuda,
Figure 6 - Comparison of the sLCOE for eight example cases as described in the text and in Table 4. A) with estimated
current costs of each technology and b) with estimated costs in 2030, when deep renewable energy penetration will
likely be starting to make dispatchable technologies a necessity to complement variable renewable energy sources.
Preprints (www.preprints.org) | NOT PEER-REVIEWED | Posted: 25 February 2021 doi:10.20944/preprints202102.0585.v1

Dominica and Puerto Rico completely incapacitated by their passage (Bang et al., 2019) Thus, sea-based OTEC systems
are considerably more vulnerable to these climatic changes given their operation and offshore siting. The increased
variability in the tracks of hurricanes is also adding new challenges for the region when viewed in the light that new
countries and economies, once at low risk to these systems (Guyana and Trinidad and Tobago for instance), may
become increasingly vulnerable to these weather extremes.
5. Conclusions
We have presented a set of observations about achieving the challenging goal of 100% renewable energy
systems in the Caribbean Island States. By their very nature, these countries and territories have limitations in both
resources and interconnections that would otherwise ease the transition to fossil-free energy systems.
The positive side of this scenario of transformation is that Caribbean Islands are wealthy in the inexhaustible
natural resources of solar and wind power; however, dispatchable RE resources are more unevenly distributed among
islands, even within a small region. While there has been a dramatic reduction in the cost of wind turbines and solar
PV panels over the past decade, bringing the cost of these technologies to a level competitive with the existing
fossil-fuel generation used by most Caribbean islands, the same is not necessarily true for other renewable resources
such as geothermal power and ocean technologies such as OTEC and wave power. In power systems dominated by
variable renewable sources, complementary technologies are necessary to ensure grid reliability. As we have shown
here, there is a significant tradeoff in islanded systems between the availability of storage and dispatchable renewable
resources. A useful perspective, presented in this work, is to consider the sLCOE, including inexpensive variable
renewables, battery storage, and potentially a more expensive (if viewed in a standalone case) dispatchable renewable
power such as OTEC that can enable higher penetration of wind and solar power and decrease the reliance on only
energy storage that would be underutilized. OTEC itself is unique in that it can actually provide more than just
electricity services, such as desalination and sea-water air-conditioning (only mentioned here), each of which can help
make the system costs more favorable.
There remains the crucial question of up-front capital costs, which would be relevant one way or another as
fossil-fuel generation capacity will be either replaced or phased out with increasing pressure in the coming decade.
Oil-based power generation will certainly remain as one option; however, given the cost advantages of RE, there is
also the increasing risk of new investments either becoming stranded assets or that they will block investment in RE.
As we have shown, there are various options on different islands for complementing the wealth of solar and wind
potential with other technologies, including OTEC. In the end, a tradeoff exists between the relatively higher capital
costs of wind and solar, followed by near-zero operating costs, versus the lower and more familiar cost of purchasing
diesel engines that are then accompanied by high yearly fuel and operating costs. Detailed energy system planning
will be necessary to demonstrate the lifecycle benefits of renewables, but financial resources must also be then made
available to set countries down the pathway to renewables.
Long-term system planning will also be necessary for each island to take advantage of its domestic resources; as
we have shown here, 100% RE systems are feasible but having some fraction of the system capacity in the form of a
dispatchable resource is advantageous. Some of the islands, as shown here, are strong candidates for the
implementation of OTEC as a supporting technology. There are challenges to rebuilding energy systems, whether in
the Caribbean or elsewhere. Islands in tropical regions offer both large hurdles, but also significant advantages and
the opportunity to serve as models for how to diverge from a business-as-usual path of fossil-fuel dependence and
move toward a sustainable, renewable energy future.
Preprints (www.preprints.org) | NOT PEER-REVIEWED | Posted: 25 February 2021 doi:10.20944/preprints202102.0585.v1

Supplementary Materials: The following are available as supplementary material online at www.mdpi.com/xxx/,
Part I - GIS mapping details and procedure outline; Part II – Additional results of mapping and preliminary site
selection; Part III – Residual load duration curves for visualization of hourly supply and demand
Author Contributions: RJB conceptualized the research and developed the hourly demand and supply model. KS did
the GIS mapping. MA and RKK provided regional expertise and input to the framing of the manuscript. RJB drafted
the manuscript, RJB, MA and RKK edited and revised the manuscript.
Funding: This research was funded for RJB by EU Horizon2020 Marie-Curie Fellowship Program
(H2020-MSCA-IF-2018, proposal number 838667 – INTERACTION
Data Availability Statement: Mapping results can be found at https://arcg.is/1SmOeK. Python code for results in
Sec. 3.2 are found at https://github.com/RJBrecha/OTEC-Caribbean.
Conflicts of Interest: The authors declare no conflict of interest.
References
[1] A. Thomas, C. F. Schleussner, and M. Kumar, “Small island developing states and 1.5 °C,” Reg. Environ. Chang., vol. 18, no.
8, pp. 2197–2200, 2018.
[2] IPCC, Global Warming of 1.5°C. An IPCC Special Report on the impacts of global warming of 1.5°C above pre-industrial levels and
related global greenhouse gas emission pathways. Switzerland: Intergovernmental Panel on Climate Change, 2018.
[3] A. Lewis, S. Estefen, J. Huckerby, W. Musial, T. Pontes, and J. Torres-Martinez, “Ocean Energy,” in IPCC Special Report on
Renewable Energy Sources and Climate Change Mitigation, 2011.
[4] IRENA (International Renewable Energy Agency), “Ocean Energy - Technology Readiness, Patent, Deployment Status and
Outlook,” 2014.
[5] A. D. Watt, F. S. Mathews, and R. E. Hathaway, “Open Cycle Ocean Thermal Energy Conversion. A Preliminary
Engineering Evaluation,” 1977.
[6] L. A. Vega, “Economics of ocean thermal energy conversion (OTEC),” Ocean Energy Recover. - State Art, pp. 152–181, 1992.
[7] D. E. Lennard, “The viability and best locations for ocean thermal energy conversion systems around the world,” Renew.
Energy, vol. 6, no. 3, pp. 359–365, 1995.
[8] L. A. Vega, “Economies of ocean thermal energy conversion (OTEC): An update,” Proc. Annu. Offshore Technol. Conf., vol. 4,
pp. 3239–3256, 2010.
[9] M. Yekini Suberu, M. Wazir Mustafa, and N. Bashir, “Energy storage systems for renewable energy power sector
integration and mitigation of intermittency,” Renew. Sustain. Energy Rev., vol. 35, pp. 499–514, 2014.
[10] R. Fujita et al., “Revisiting ocean thermal energy conversion,” Mar. Policy, vol. 36, no. 2, pp. 463–465, 2012.
[11] K. J. Arrow, “The Economic Implications of Learning by Doing,” Rev. Econ. Stud., vol. 29, no. 3, p. 155, 1962.
[12] A. Grübler, N. Nakićenović, and D. G. Victor, “Dynamics of energy technologies and global change,” Energy Policy, vol. 27,
no. 5, pp. 247–280, 1999.
[13] G. F. Nemet, “Beyond the learning curve: factors influencing cost reductions in photovoltaics,” Energy Policy, vol. 34, no. 17,
pp. 3218–3232, 2006.
[14] F. Creutzig, P. Agoston, J. C. Goldschmidt, G. Luderer, G. Nemet, and R. C. Pietzcker, “The underestimated potential of
solar energy to mitigate climate change,” Nat. Energy, vol. 2, no. 9, p. 17140, 2017.
[15] G. C. Nihous, “A preliminary assessment of ocean thermal energy conversion resources,” J. Energy Resour. Technol. Trans.
ASME, vol. 129, no. 1, pp. 10–17, 2007.
Preprints (www.preprints.org) | NOT PEER-REVIEWED | Posted: 25 February 2021 doi:10.20944/preprints202102.0585.v1

[16] Lazard, “Lazard’s Levelized Cost of Storage 4.0,” 2018.
[17] (International Renewable Energy Agency) IRENA, IRENA: ELECTRICITY STORAGE AND RENEWABLES: COSTS AND
MARKETS TO 2030 ELECTRICITY STORAGE AND RENEWABLES: COSTS AND MARKETS TO 2030 About IRENA, no.
October. 2017.
[18] A. A. Chen, A. J. Stephens, R. K. Koon, M. Ashtine, and K. M. Koon, “Pathways to climate change mitigation and stable
energy by 100 % renewable for a small island : Jamaica as an example,” Renew. Sustain. Energy Rev., vol. 121, no. March
2019, p. 109671, 2020.
[19] E. Bellini, “Hydrogen based solar-plus-storage project launched in French Guiana,” PV Magazine, 2018. .
[20] P. Espinoza, E. Arce, D. Daza, M. Faure, and H. Terraza, “Regional Evaluation on Urban Solid Waste Management in Latin
America and the Caribbean,” 2010.
[21] U. Arena, F. Ardolino, and F. Di Gregorio, “A life cycle assessment of environmental performances of two combustion- and
gasification-based waste-to-energy technologies,” Waste Manag., vol. 41, pp. 60–74, 2015.
[22] A. Ochs, M. Konold, K. Auth, E. Musolino, and P. Killeen, “Caribbean Sustainable Energy Roadmap and Strategy,”
Washington D.C., USA, 2015.
[23] R. Koon Koon, S. Marshall, D. Morna, R. McCallum, and M. Ashtine, “A Review of Caribbean Geothermal Energy
Resource Potential,” West Indian J. Eng., vol. 42, no. 2, pp. 37–43, 2020.
[24] National Renewable Energy Laboratory (NREL)., “Island Energy Snapshots,” 2021. .
[25] ND-GAIN, “Notre Dame Global Adaptation Index,” 2021. [Online]. Available: https://gain.nd.edu/.
[26] G. C. Nihous, “Mapping available Ocean Thermal Energy Conversion resources around the main Hawaiian Islands with
state-of-the-art tools,” J. Renew. Sustain. Energy, vol. 2, no. 4, pp. 2–11, 2010.
[27] CAF - Latin America Development Bank, “A Pre-Feasibility Study for Deep Seawater Air Conditioning Systems in the
Caribbean,” no. October, p. 76, 2015.
[28] C. Bernardoni, M. Binotti, and A. Giostri, “Techno-economic analysis of closed OTEC cycles for power generation,” Renew.
Energy, vol. 132, pp. 1018–1033, 2019.
[29] M. Wang, R. Jing, H. Zhang, C. Meng, N. Li, and Y. Zhao, “An innovative Organic Rankine Cycle (ORC) based Ocean
Thermal Energy Conversion (OTEC) system with performance simulation and multi-objective optimization,” Appl. Therm.
Eng., vol. 145, no. August, pp. 743–754, 2018.
[30] S. Park, W. Chun, and N. Kim, “Simulated production of electric power and desalination using Solar-OTEC hybrid
system,” Int. J. Energy Res., vol. 41, no. 5, pp. 637–649, 2017.
[31] A. S. Kim, H. Kim, H. Lee, and S. Cha, “Dual-use open cycle ocean thermal energy conversion ( OC-OTEC ) using multiple
condensers for adjustable power generation and seawater desalination,” Renew. Energy, vol. 85, pp. 344–358, 2016.
[32] F. Chen, L. Liu, J. Peng, Y. Ge, H. Wu, and W. Liu, “Theoretical and experimental research on the thermal performance of
ocean thermal energy conversion system using the rankine cycle mode,” Energy, vol. 183, pp. 497–503, 2019.
[33] Y. Ikegami, T. Yasunaga, and T. Morisaki, “Ocean Thermal Energy Conversion using double-stage Rankine Cycle,” J. Mar.
Sci. Eng., vol. 6, no. 1, 2018.
[34] S. Mutair and Y. Ikegami, “Design optimization of shore-based low temperature thermal desalination system utilizing the
ocean thermal energy,” J. Sol. Energy Eng. Trans. ASME, vol. 136, no. 4, pp. 1–8, 2014.
[35] R. H. Yeh, T. Z. Su, and M. S. Yang, “Maximum output of an OTEC power plant,” Ocean Eng., vol. 32, no. 5–6, pp. 685–700,
2005.
[36] J. D. Hunt, E. Byers, and A. S. Sánchez, “Technical potential and cost estimates for seawater air conditioning,” Energy, vol.
166, pp. 979–988, 2019.
[37] A. Devis-Morales, R. A. Montoya-Sánchez, A. F. Osorio, and L. J. Otero-Díaz, “Ocean thermal energy resources in
Colombia,” Renew. Energy, vol. 66, no. 2014, pp. 759–769, 2014.
Preprints (www.preprints.org) | NOT PEER-REVIEWED | Posted: 25 February 2021 doi:10.20944/preprints202102.0585.v1
[38] International Hydrographic Organization, UNESCO, and Intergovernmental Oceanographic Commission, “General
Bathymetric Chart of the Oceans,” 2021. [Online]. Available: https://www.gebco.net/. [Accessed: 18-Feb-2021].
[39] M. Ram et al., “Global Energy System based on 100% Renewable Energy - Power, Heat, Transport and Desalination
Sectors.Study by Lappeenranta University of Technology and Energy Watch Group, Lappeenranta, Berlin, March 2019.,”
Energy Watch Group, 2019. [Online]. Available:
http://energywatchgroup.org/new-study-global-energy-system-based-100-renewable-energy.
[40] K. Löffler, K. Hainsch, T. Burandt, P.-Y. Oei, C. Kemfert, and C. von Hirschhausen, “Designing a Model for the Global
Energy System—GENeSYS-MOD: An Application of the Open-Source Energy Modeling System (OSeMOSYS),” Energies,
vol. 10, no. 10, p. 1468, 2017.
[41] M. Z. Jacobson et al., “100% Clean and Renewable Wind, Water, and Sunlight All-Sector Energy Roadmaps for 139
Countries of the World,” Joule, vol. 1, no. 1, pp. 108–121, 2017.
[42] M. Z. Jacobson, M. A. Delucchi, M. A. Cameron, and B. V. Mathiesen, “Matching demand with supply at low cost in 139
countries among 20 world regions with 100% intermittent wind, water, and sunlight (WWS) for all purposes,” Renew.
Energy, vol. 123, pp. 236–248, 2018.
[43] IRENA, Global Renewables Outlook: Energy transformation 2050. International Renewable Energy Agency, Abu Dhabi, UAE. 2020.
[44] IRENA, Renewable Power Generation Costs in 2018. 2019.
[45] Lazard, “Lazard’s Levelized Cost of Energy Analysis—Version 14.0,” 2020.
[46] F. Ueckerdt, L. Hirth, G. Luderer, and O. Edenhofer, “System LCOE: What are the costs of variable renewables?,” Energy,
vol. 63, pp. 61–75, 2013.
[47] Y. Yang, S. Bremner, C. Menictas, and M. Kay, “Battery energy storage system size determination in renewable energy
systems: A review,” Renew. Sustain. Energy Rev., vol. 91, no. March, pp. 109–125, 2018.
[48] A. Toktarova, L. Gruber, M. Hlusiak, D. Bogdanov, and C. Breyer, “Long term load projection in high resolution for all
countries globally,” Int. J. Electr. Power Energy Syst., vol. 111, no. November 2018, pp. 160–181, 2019.
[49] S. Pfenninger and I. Staffell, “Long-term patterns of European PV output using 30 years of validated hourly reanalysis and
satellite data,” Energy, vol. 114, pp. 1251–1265, 2016.
[50] I. Staffell and S. Pfenninger, “Using bias-corrected reanalysis to simulate current and future wind power output,” Energy,
vol. 114, pp. 1224–1239, 2016.
[51] F. Ueckerdt, R. Brecha, and G. Luderer, “Analyzing major challenges of wind and solar variability in power systems,”
Renew. Energy, vol. 81, 2015.
[52] Lazard, “Lazard’s levelized cost of energy analysis — version 13.0,” 2019.
[53] L. Hirth, F. Ueckerdt, and O. Edenhofer, “Integration costs revisited - An economic framework for wind and solar
variability,” Renew. Energy, vol. 74, pp. 925–939, 2015.
Preprints (www.preprints.org) | NOT PEER-REVIEWED | Posted: 25 February 2021 doi:10.20944/preprints202102.0585.v1