Response of ventilatory and lactate thresholds to continuous ...

Article No. bu980041Bulletin of Mathematical Biology(1998)60, 753–807
Fixed Response Thresholds and the Regulation of Divisionof Labor in Insect Societies
ERIC BONABEAUSanta Fe Institute,1399 Hyde Park Road,Santa Fe, NM 87501, U.S.A.E-mail: [email protected]
GUY THERAULAZLaboratoire d’Ethologie et de Psychologie Animale,CNRS-UMR 5550,Universite Paul Sabatier,118 route de Narbonne,31062 Toulouse Cedex, France
JEAN-LOUIS DENEUBOURGUnit of Theoretical Behavioural Ecology,Service de Chimie-Physique,CP 231, Universit´e Libre de Bruxelles,Boulevard du triomphe,1050 Brussels, Belgium
We introduce a simple mathematical model of regulation of division of labor in insectsocieties based on fixed-response thresholds. Individuals with different thresholdsrespond differently to task-associated stimuli. Low-threshold individuals becomeinvolved at a lower level of stimulus than high-threshold individuals. We showthat this simple model can account for experimental observations of Wilson (1984),extend the model to more complicated situations, explore its properties, and studyunder what conditions it can account for temporal polyethism.
c© 1998 Society for Mathematical Biology
1. INTRODUCTION
A key factor contributing to the impressive ecological success of social insects istheir social organization, and particularly their division of labor (Oster and Wilson,1978; Robinson, 1992). It is widely accepted that dividing tasks among mem-bers of a colony, so that individuals tend to become specialized in certain roles,enhances colony efficiency (here, reproductive output), either because workers de-velop task-specific skills through practice, or because spatial fidelity, whereby indi-viduals become more and more spatially localized to perform specific tasks, reducesthe need for time- and energy-consuming movements between different locations
0092-8240/98/040753 + 55 $30.00/0 c© 1998 Society for Mathematical Biology

754 E. Bonabeauet al.
(Wilson, 1976; Oster and Wilson, 1978; Seeley, 1982; Jeanne, 1986; Sendova-Franks and Franks, 1993). Genotype, physiology, morphology, age, experience,social and external environments have been shown to influence patterns of taskallocation (Lenoir, 1987; Jeanne, 1991) in such a way that division of labor is notonly efficient (i.e., allows more work to be done for the same energy expense), butalso flexible. A colony can, in many cases, respond to internal needs and externalperturbations in a flexible and robust way. Colony-level flexibility is attained overshort time scales [see, for example, Wilson (1984)] mostly through the workers’behavioral flexibility. Over longer time scales, the colony may, for example, adjustcaste ratios in response to a threatening environment (Passeraet al., 1996), but thisappears to be relatively uncommon (Wilson and H¨olldobler, 1988).
How are colony-level robustness and individual flexibility connected? In a previ-ous work (Bonabeauet al., 1996), we have shown that a simple response thresholdmodel (Wilson, 1985; Robinson, 1987a, 1987b, 1992; Robinson and Page, 1988;Calabi, 1988; Detrainet al., 1988; Detrain and Pasteels, 1991, 1992; Page and Robin-son, 1991) can account for the workers’ behavioral flexibility. The model assumesthat workers are able to assess needs through particular stimuli triggering task per-formance (the nature of these stimuli and how they are perceived are issues notaddressed by the model), and that response thresholds do not vary over time. Thismodel is able to account for experimental observations by Wilson (1984), who ar-tificially varied the ratio of majors to minors in several polymorphic ant species(Pheidole) and observed a dramatic increase in task performance by previously in-active majors as the ratio exceeded some value; the involvement of majors occurredwithin an hour of the removal of the minors. When individuals that are character-ized by low response thresholds with respect to stimuli related to a given task arewithdrawn (for example, minors), the associated demand increases, as does the in-tensity of the stimulus, until it eventually reaches the higher characteristic responsethresholds of the remaining individuals that are not initially specialized into thattask (for example, majors); the increase of stimulus intensity beyond threshold hasthe effect of stimulating these individuals into performing the task (Calabi, 1988).
Two aspects of division of labor can be discussed: (1) How is information gatheredby workers? (2) How are decisions made on the basis of such information? Althoughthese two aspects are certainly not unrelated, they should not be confused in themodeling process. Some models of flexible task allocation are aimed at describingeither one of the two aspects, and make simplifying assumptions about the other.For example, in the threshold model, it is assumed that each task to be performedis associated with a demand expressed under the form of a stimulus. The focus ofthe model is not the nature of such stimuli, but rather how an individual engagesin task performance, given exposure to the associated stimulus (here, when thelevel of the stimulus exceeds the individual’s threshold). Another example is theforaging-for-work (FFW) model, introduced by Tofts and Franks (1992); Tofts(1993); Franks and Tofts (1994); Frankset al. (1997), where individuals seek workand engage in task performance when they encounter a stimulus. How tasks are
Fixed Response Thresholds 755
allocated is modeled by FFW, using the basis of perceived stimuli and not that of thedetailed nature of the evaluation of colony needs, which could rely on interactionsamong individuals as well as on nest patrolling, or any other relevant mechanism.The relation of our model to the FFW model will be discussed in detail in Section5.1.1.
We shall not address the first question in this paper, and assume that each task isassociated with a stimulus or set of stimuli (signals and cues strongly and reliablycorrelated with specific labor requirements). The respective intensities of thesevarious stimuli that individual insects can sense, contain enough information. In-dividuals can therefore ‘evaluate’ the demand for one particular task when they arein contact with the associated stimulus. We assume that each insect encounters allstimuli with some probability within some period of time, and can in principle re-spond to these stimuli. For simplicity, we shall first neglect the fact that performinga given task may promote contacts with specific stimuli, and prevent other stimulifrom being encountered, but this aspect will be dealt with in Section 4. Let usgive a simple example: if the task is larval feeding, the associated demand is larvaldemand, which is expressed, for instance, through the emission of pheromones.The nature of task-related stimuli may vary greatly from one task to another, and socan information sampling techniques, which may involve direct interactions amongworkers (trophallaxis, antennation, etc.) (Gordon, 1996; Huang and Robinson,1992), nest ‘patrolling’ (Lindauer, 1952), or more or less random exposure to task-related stimuli. Another way of obtaining information is through waiting times,when a complex task requires the coordination of several task groups. For example,Seeley (1989) showed that the time it takes for a forager to unload her nectar toa storer bee depends on the availability of such bees in the unloading area, whichitself depends on whether or not more nectar is needed. Jeanne (1996) showed thatthe same type of process is taking place in the regulation of nest construction in thetropical waspPolybia occidentalis, where three different groups of workers, pulpforagers, water foragers and builders, are involved and interdependent. The timetaken to unload water or pulp to a builder gives an indication about whether foragersare needed or not, or if more foragers are needed, while the stimulus that initiallytriggers foraging can be the number of waiting builders in the unloading area.
The focus of the present paper is the second question, which can be studiedwith the help of the fixed-threshold model (Robinson, 1987a, 1987b, 1992; Calabi,1988; Bonabeauet al., 1996), where it is assumed that individuals are characterizedby (genetically determined) fixed-response thresholds to the various stimuli. Amathematical framework is presented for this model, some exact results are given,and the behavior of the model is explored in detail. The model is also extended toinclude spatial ‘fidelity’ or specialization by workers, so that task-associated stimuliare encountered with differential probabilities. An explicit age dependence of theprobabilities of encountering task-associated stimuli leads to a strong pattern ofage polyethism. If, instead of being explicitly age based, differential probabilitiesof encountering the various task-associated stimuli are combined with an inflow

756 E. Bonabeauet al.
of newly born individuals emerging in the nest and an outflow of older individualsdriven out of the nest, the model can generate temporal polyethism [in a way similarto Tofts and Franks (1992) and Tofts (1993)], but in a weaker and more unstableform. Finally, the influence of genetic diversity on temporal polyethism, colonyefficiency and colony flexibility is studied. In the present context, genetic diversityis represented by distributions of response thresholds (corresponding, for example,to patrilines).
2. EXPERIMENTAL EVIDENCE FOR THE THRESHOLD MODEL
The first question that we have to answer is: What is a response threshold?Let s be the intensity of a stimulus associated with a particular task;s can be anumber of encounters, a chemical concentration, or any quantitative cue sensedby individuals. A response thresholdθ , expressed in units of stimulus intensity,is an internal variable that determines the tendency of an individual to respond tothe stimuluss and perform the associated task. More precisely,θ is such that theprobability of response is low fors � θ and high fors � θ . One family ofresponse functionsTθ (s) that can be parametrized with thresholds that satisfy thisrequirement is given by
Tθ (s) = sn
sn + θn, (1)
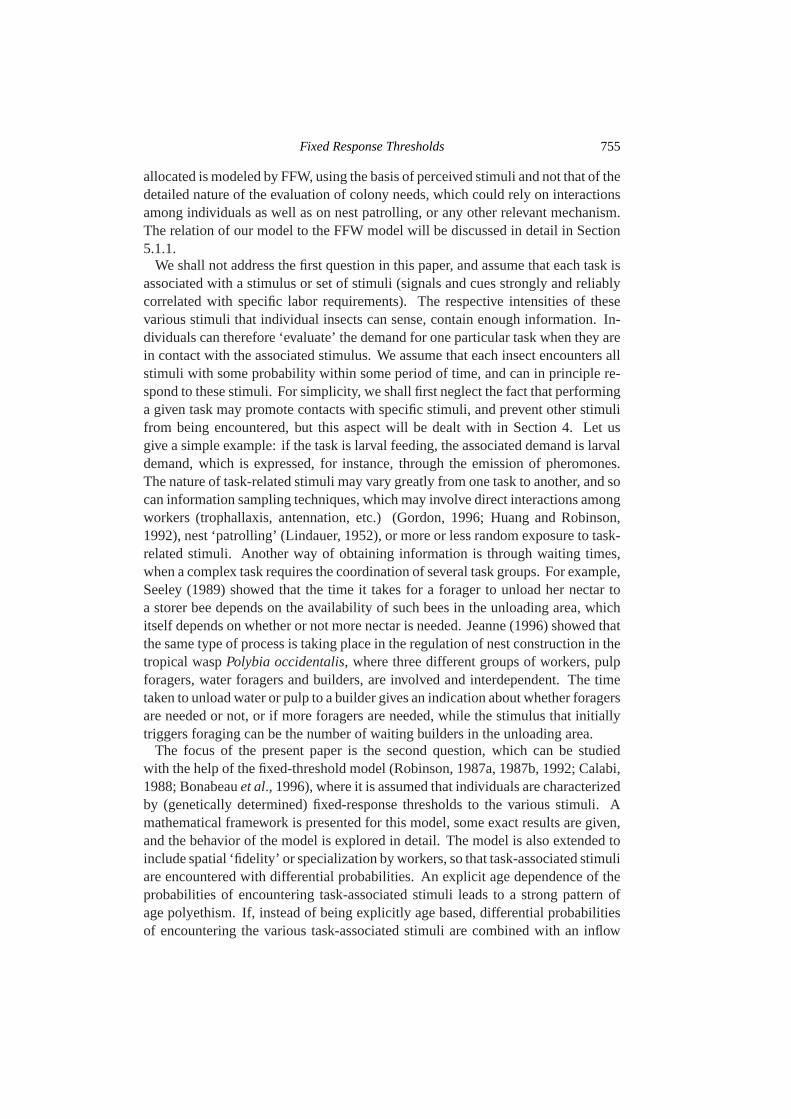
wheren > 1 determines the steepness of the threshold. In the rest of the paperwe will be concerned with the casen = 2, but similar results can be obtained withother values ofn > 1. Figure 1(a) shows several such response curves, withn = 2,for different values ofθ . The meaning ofθ is clear: fors� θ , the probability ofengaging task performance is close to 0, and fors� θ , this probability is close to1; ats= θ , this probability is exactly12. Therefore, individuals with a lower valueof θ are likely to respond to a lower level of stimulus. The notion of a threshold isoften associated with a change in concavity in the response curve, as is the case, forexample, for response curves given by equation (1) withn > 1, where the inflectionpoint is given bys= θ((n−1)/(n+1))1/n. But the definition of a threshold givenabove does not require a change in concavity. One example is whenn = 1. Anotherimportant example is when the response function is exponential, rather than givenby equation (1). [Plowright and Plowright (1988) use this type of response functionin their model of the emergence of specialization.] In that case,
Tθ (s) = 1− e−s/θ (2)
Figure 1(b) showsTθ (s) given by equation (2) for different values ofθ . We see,here again, that the probability of engaging task performance is small fors � θ ,and is close to 1 fors� θ . Although there is no change in concavity in the curve,this response function produces behaviors which are comparable to those produced
Fixed Response Thresholds 757
0.10.010
0.1
0.2
0.3
0.4
0.5
T (
s)
0.6
0.7
0.8
0.9
1
1 10
s
100
θ = 1θ = 5
θ = 10θ = 20θ = 50
(a)
00
0.2
0.4
0.6
T (
s)
0.8
1
1 2 3 4 5
s
6 7 8 9 10
θ = 0.1θ = 0.25
θ = 0.5
θ = 1θ = 5
(b)
0.010
0.2
0.4
0.6
T (
s)
0.8
1
0.1 1
s
10 100
θ = 0.1θ = 0.25θ = 0.5
θ = 1θ = 5
(c)
Figure 1. (a) Semi-logarithmic plot of threshold response curves (n = 2) with differentthresholds (θ = 1, 5, 10, 20, 50). (b) Exponential response curves with different thresholds(θ = 0.1, 0.25, 0.5, 1, 5). (c) Semi-logarithmic plot of exponential response curves withdifferent thresholds (θ = 0.1, 0.25, 0.5, 1, 5).
758 E. Bonabeauet al.
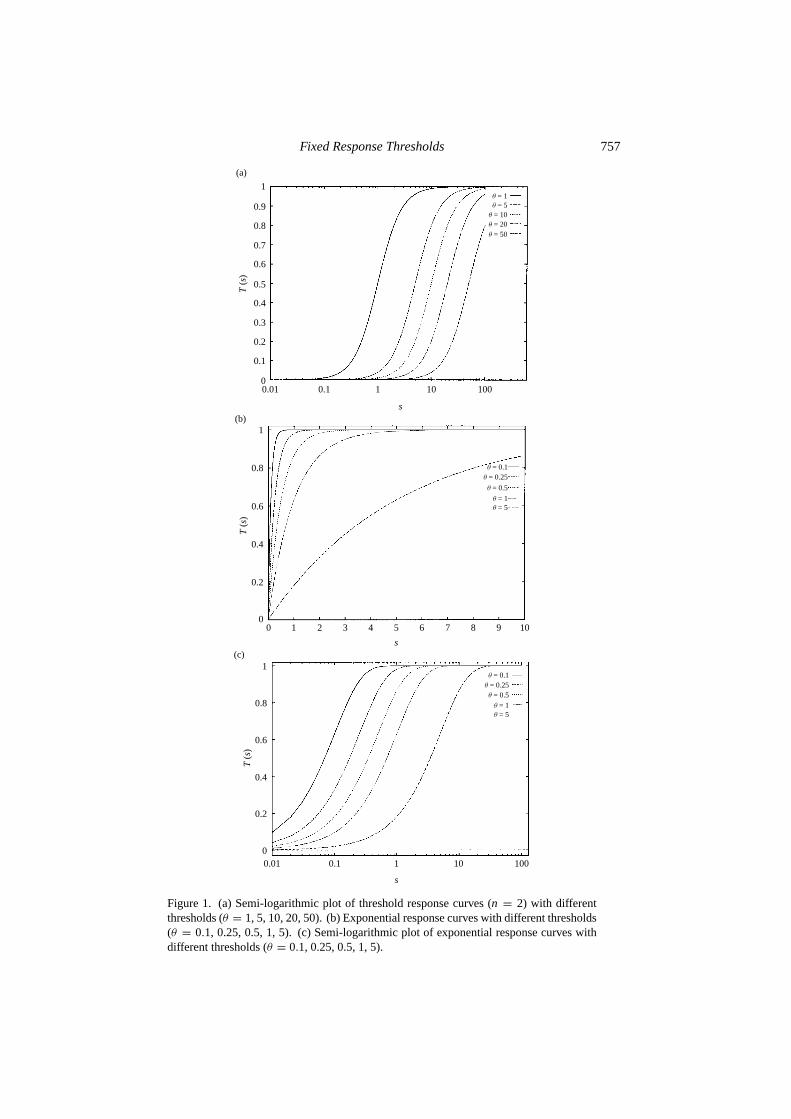
by response functions based on equation (1) (see, for example, Fig. 4 below).Figure 1(c) also shows that a semilogarithmic plot ofTθ (s) given by equation (2)exhibits a change in concavity, and Fig. 1(c) is actually very similar to Fig. 1(a).In most of this paper, we make use of equation (1) withn = 2 rather than equation(2), simply because analytical results are possible for equation (1) withn = 2.But it is important to emphasize that threshold models encompass exponentialresponse functions: the important ingredient is the existence of a characteristicθ . Exponential response functions are particularly important because they maybe encountered quite frequently (although, as discussed below, there are not manyexperiments studying response functions in social insects). For example, imagine astimulus that consists of a series of encounters with, say, items to process. If, at eachencounter with an item, an individual has a fixed probability of processing the item,then the probability that the individual will not respond to the firstN encountereditems is given by(1− ρ)N . Therefore, the probabilityP(N) that there will be aresponse within theN encounters is given byP(N) = 1−(1−ρ)N = 1−eN ln(1−ρ),which is exactly equation (2) withs= N andθ = −1/ ln(1−ρ). For example, theorganization of cemeteries in ants provides a good illustration of this process. Theprobability of dropping a dead body (or a dead item, i.e., a thorax or an abdomen)has been studied experimentally by Chr´etien (1996) in the antLasius niger: theprobability that a laden ant drops an item next to anN cluster can be approximatedby P(N) = 1 − (1 − p)N = 1 − eN ln(1−p), for N up to 30, wherep ≈ 0.2[Fig. 2(a)]. Here, the intensity of the stimulus is the number of encountered deadbodies, and the associated response is dropping an item. Another situation in whichexponential response functions may be observed is when there are waiting timesinvolved, although it may not always be the case. Let us assume that Tasks A and Bare causally related in the sense that a worker performing Task A has to wait for aworker performing Task B to unload nectar or pulp, say, or any kind of material. Ifa Task A worker has a fixed probabilityp per unit waiting time of giving up Task Aperformance, the probability that this worker will still be waiting aftert time unitsis given byP(t) = 1− (1− p)t = 1− et ln(1−p). In conclusion, threshold responsefunctions, such as the one given by equation (1), or exponential response functions,such as the one given by equation (2), can be encountered in various situations, and,as will be shown below, yield similar results.
Viewed from the perspective of response thresholds, castes may correspond topossible physical differences, but also to innate differences in response thresholdswithout any visible physical difference. Note that differences in response thresholdsmay either reflect actual differences in behavioral responses, or differences in theway task-related stimuli are perceived.
Let us further discuss the experimental basis of the model. Only a few experimen-tal results support the idea of thresholds, but very few experiments have been aimedat showing the existence of response thresholds in social insects. Such experimentsrequire controlling (or at least being able to vary and measure) the intensity of thestimuli workers are responsive to, a task that can be very difficult. Most experi-
Fixed Response Thresholds 759
00
0.25
0.5
P (
N)
0.75
1
10 20N
30
Observed P (N)
Fit
0
0
0.25
0.5
Prob
abilt
iy o
f be
havi
or 0.75
1
50 100
Search time (s)
150
Waggle dance
Tremble dance
No dance
0.0001
10
20
30
40
Dur
atio
n of
rea
ctio
n 50
60
0.001 0.01
IPA concentration
0.1 1 02
3
4
5
Num
ber
of s
tinge
rs
6
7
8
100 200
Number of prey
300 400
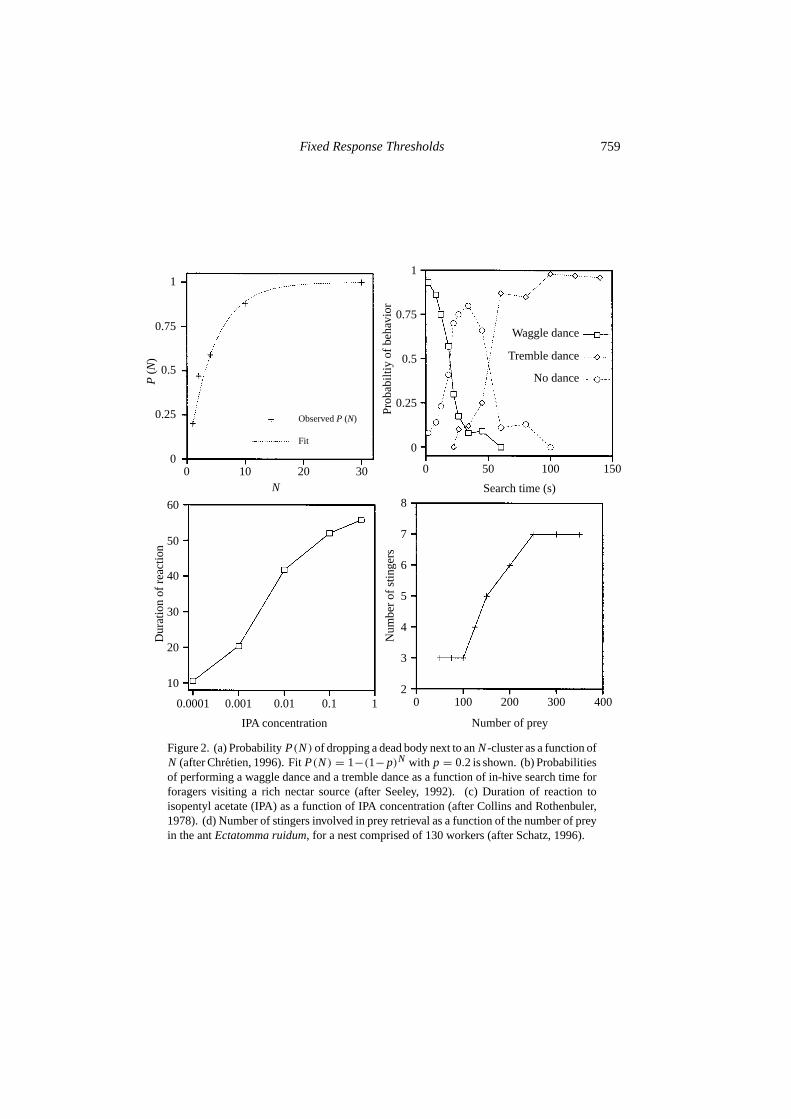
Figure 2. (a) ProbabilityP(N) of dropping a dead body next to anN-cluster as a function ofN (after Chretien, 1996). FitP(N) = 1−(1− p)N with p = 0.2 is shown. (b) Probabilitiesof performing a waggle dance and a tremble dance as a function of in-hive search time forforagers visiting a rich nectar source (after Seeley, 1992). (c) Duration of reaction toisopentyl acetate (IPA) as a function of IPA concentration (after Collins and Rothenbuler,1978). (d) Number of stingers involved in prey retrieval as a function of the number of preyin the antEctatomma ruidum, for a nest comprised of 130 workers (after Schatz, 1996).
760 E. Bonabeauet al.
mental curves show the probability of response of an individual as a function of itssize, or weight, etc., atfixed stimulusintensity. Although these curves can teach alot, they cannot prove the existence or lack of response thresholds.
Robinson (1987a, 1992) and Breedet al. (1990) showed the existence of hormon-ally regulated behavioral response thresholds to alarm pheromones in honeybees(Apis mellifera). Treatment of young worker honeybees with a juvenile hormone(JH) analog increases their sensitivity to alarm pheromones, which play a role in nestdefense. The corpora allata glands produce JH, and are known to grow with age.Robinson (1987a) also showed that JH treatment of bees stimulates their productionof alarm pheromone. He further noted that isolated JH-treated bees do not respondto presented alarm pheromones, but do respond when in a group. This may be dueto the fact that increased production of alarm pheromones by treated bees allows athreshold to be reached when several such bees are put together. Robinson and Page(1988) and Page and Robinson (1991) have shown that honeybee workers belong-ing to different Patrilines may have different response thresholds. For example,assume for simplicity that workers of Patriline A engage in nest guarding as soon asthere are less than 20 guards, whereas workers of Patriline B start performing thistask when there are less than 10 workers guarding the hive’s entrance: workers ofPatriline B have a higher response threshold to perform this task. More generally,in a series of papers, these authors have shown that response thresholds are partlydetermined by genes.
We mentioned Seeley’s (1989) work in the previous section. If it takes a foragertoo long to unload her nectar to a storer bee, she gives up foraging with a probabilitythat depends on her search time in the unloading area. She will then start a ‘trembledance’ (Seeley, 1992) to recruit storer bees (the tremble dance also inhibits waggledancing). If, on the other hand, her in-hive waiting or search time is very small,she starts recruiting other foragers with a waggle dance. If her in-hive waiting orsearch time lies within a given window, she is likely not to dance at all and return tothe food source. If one plots the probability of either waggle or tremble dancing asa function of search time, a clear threshold function can be observed [Fig. 2(b)]. Itis also interesting to note that search time is correlated with the spatial distributionof nectar unloadings: nectar foragers have to go deeper into the hive in order tofind an available storer bee when the influx of foragers is high than when it is low.This means that nectar foragers may use spatial (location of unloading) as well astemporal (search time) information to make decisions.
Collins and Rothenbuler (1978) performed laboratory experiments onApis mellif-era to measure the duration of reactions to a particular chemical, isopentyl acetate,(IPA), the major component of the sting alarm pheromone (Bochet al., 1962). Usingparaffin oil IPA diluted in volume, and reactions were tested for different dilutions.Figure 2(c) shows the duration of the reaction as a function of IPA concentration.We can see that the response function is an exponential-like response function.
A series of experiments by Detrainet al. (1988) and Detrain and Pasteels (1991,1992) clearly indicate the existence of differential response thresholds in the ant

Fixed Response Thresholds 761
Pheidole pallidulain at least two activities, foraging and nest defense. The in-tensity of behavioral stimuli (measured by trail concentration and the number oftactile invitations in the case of foraging, supplemented by the number of intrudersin the case of defense) required to induce the effective recruitment of majors isgreater than for minors for both tasks, indicating that majors have higher responsethresholds. An interesting discussion of the adaptive significance of these findingsis given by Detrain and Pasteels (1991, 1992). They also hypothesize that JH titers(Wheeler and Nijhout, 1981) or the volume and number of cells of corpora allatacould affect behavioral thresholds.
Finally, Schatz (1997) presents convincing evidence of response thresholds inthe antEctatomma ruidum. When presented with an increasing number of prey,specialized ‘stinger ants’ (or killer ants) start to become involved in the retrievalprocess (in addition to transporters, to which dead prey are transferred), the numberof such ants being dependent on the number of prey in a characteristic sigmoid-likemanner [Fig. 2(d)]. This suggests that within-caste specialization among huntersis indeed based on response thresholds.
3. EQUIPROBABLE EXPOSURE TO TASK-ASSOCIATED STIMULI
3.1. One task. Let us assume for the moment that one task only has to be per-formed, and that this task is associated with a stimulus or demand, the level of whichincreases if it is not satisfied (because the task is not performed by enough indi-viduals, or not performed with enough efficiency). We first consider two types ofworkers, Types 1 and 2, or Groups 1 and 2. In what follows, we may sometimes callworkers of Type 1 ‘majors’ and workers of Type 2 ‘minors’ in reference to physicalcastes, but Types 1 and 2 workers could as well represent different behavioral orage castes, or individuals belonging to different patrilines. Majors often (but notalways) are characterized by a lower probability of becoming active than minors.Let n1 andn2 be the respective numbers of workers of Types 1 and 2 in the colony,N the total number of workers in the colony(n1+n2 = N), f = n1/N the fractionof workers of Type 1 in the colony,N1 andN2 the respective numbers of workers ofTypes 1 and 2 engaged in task performance, andx1 andx2 the corresponding frac-tions(x1 = Ni /ni ). The average deterministic equations describing the dynamicsof x1 andx2 are given by:
∂t x1 = Tθ1(s)(1− x1)− px1, (3)
∂t x2 = Tθ2(s)(1− x2)− px2, (4)
whereθi is the response threshold of Typei workers, ands the integrated intensity oftask-associated stimuli. The first term on the rhs of equations (3) and (4) describeshow the(1−xi ) fraction of inactive Typei workers responds to the stimulus intensity
762 E. Bonabeauet al.
or demands, with a threshold functionTθi (s)
Tθi (s) =s2
s2+ θ2i
. (5)
We assume that individuals can assess the demand for a particular task when theyare in contact with the associated stimulus. A critical assumption of this section isthat each insect encounters all stimuli with equal probability per time unit, and canrespond to these stimuli. Let us definez = θ2
1/θ22 : here,z > 1, i.e., workers of
Type 1 are less responsive than workers of Type 2 to task-associated stimuli. Thesecond rhs term in equations (3) and (4) expresses the fact that an active individualgives up task performance and becomes inactive with probabilityp per unit time(that we take identical for both types of workers). The average time spent by anindividual in task performance before giving up this task is 1/p. It is assumed thatp is fixed, and independent of any stimulus. Therefore, individuals involved in taskperformance spend 1/p time units working even if their work is no longer necessary.Such a behavior has been reported in several cases [e.g., building behavior; seeDeneubourg and Franks (1995)]. Individuals give up task performance after 1/p,but may become engaged again immediately if the stimulus is still large. Thedynamics of the demand is described by:
∂t s= δ − α
N(N1+ N2), (6)
i.e., since(N1+ N2)/N = f x1+ (1− f )x2,
∂t s= δ − α f x1− α(1− f )x2, (7)
whereδ is the (fixed) increase in stimulus intensity per unit time, andα is a scalefactor measuring the efficiency of task performance. Identical efficiencies in taskperformance are assumed for Types 1 and 2 individuals. That efficiencies do notvary significantly is a plausible assumption provided the time scales of experimentsare sufficiently short, whereas learning may take place over longer time scales. Theamount of work performed by active individuals is scaled byN, as can be seenby equation (6), to reflect the idea that the demand is an increasing function ofN, that we take to be linear here. For example, the brood should be divided by2 when colony size is divided by 2 [see experiments by Wilson (1984)]. In otherwords, colony requirements scale (more or less) linearly with colony size. Underthis assumption, our results should be independent of colony size. In the stationarystate, where all∂ts are equal to 0, one has:
pθ21 x1
1− (p+ 1)x1= pθ2
2 x2
1− (p+ 1)x2, (8)
x2 = 1
1− f
(δ
α− f x1
). (9)

Fixed Response Thresholds 763
0
0.05
0
0.1
0.15
0.2
0.25
0.3
0.35
0.4
0.2 0.4 0.6
Proportion of majors in the colony
0.8 1
Social behavior
Self-groomingFr
actio
n of
act
ive
maj
ors
or r
ate
of a
ctiv
ity p
er m
ajor
Figure 3. Fraction of active majors given by equation (11) as a function of the proportionfof majors in the colony, forθ1 = 8, θ2 = 1, α = 3, δ = 1, p = 0.2. Comparison with theresults of Wilson (1984) (scaled so that curves of the model and the experiments lie withinthe same range): number of acts of social behavior and self-grooming per major within thetime of experiments inPheidole guilelmimuelleri.
The stationary valuexs1 of x1 can then be easily found. Let us define for convenience
χ = (z− 1)
(f + (p+ 1)
δ
α
)− z (10)
Then,
xs1 =
χ + (χ2+ 4 f (p+ 1)(z− 1)(δ/α))1/2
2 f (p+ 1)(z− 1). (11)
Numerical integration of equations (3) and (4) and Monte Carlo simulations(Bonabeauet al., 1996) are in very good agreement with this expression ofxs
1.Moreover, values ofxs
1 obtained in simulations are independent of initial condi-tions, indicating thatxs
1 given by equation (11) is a global attractor of the dynamics.Figure 3 shows howxs
1 varies as a function off , for z = 64, p = 0.2, δ = 1, andα = 3, and are comparable with Wilson’s (1984) results (who measured, amongother things, the number of acts of social behavior and self grooming per major inPheidole guilelmimuelleri). When individuals performing a given task are with-drawn (they have low response thresholds with respect to stimuli related to thistask)—here, Type 1 workers—the associated demand increases until it eventuallyreaches the higher characteristic response thresholds of the remaining individuals—here Type 2 workers—that are not initially specialized into that task. The increaseof stimulus intensity beyond threshold has the effect of stimulating Type 2 work-ers into performing the task. Figure 4 illustrates the fact that it is possible to find

764 E. Bonabeauet al.
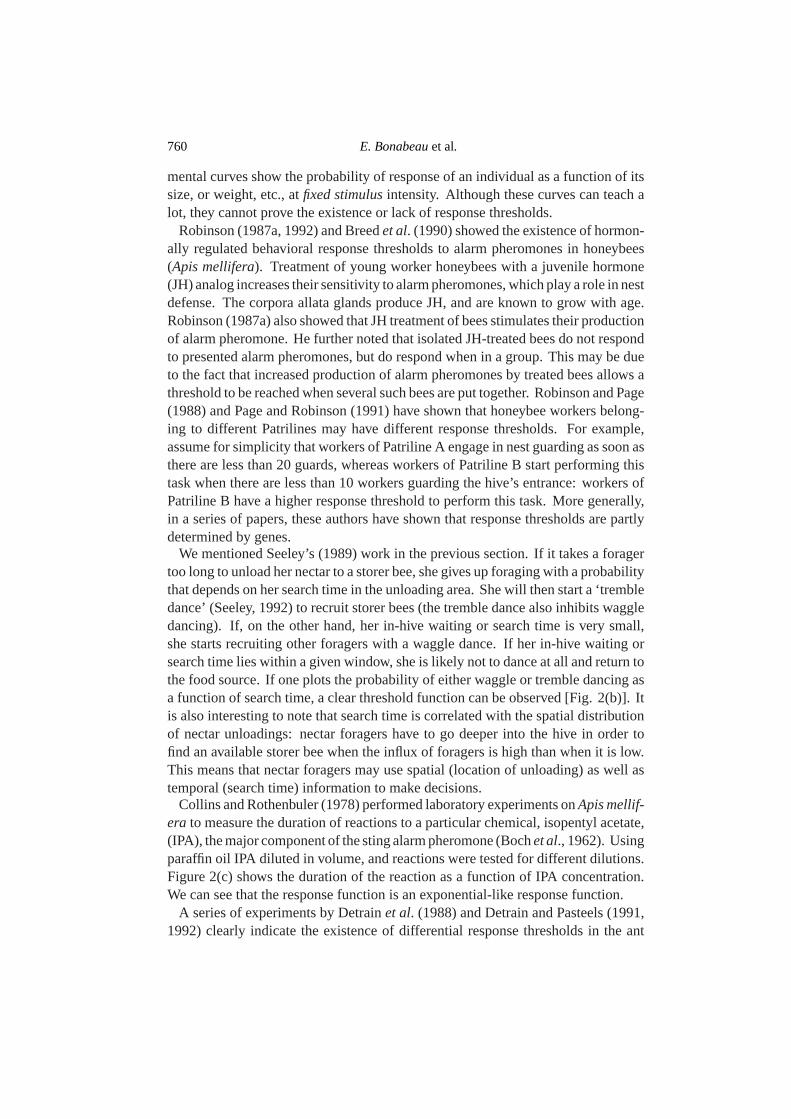
appropriate parameters (here,θ1 = 0.1, θ2 = 1, α = 3, δ = 1, p = 0.2) withan exponential response function(Tθ (s) = 1− e−s/θ ) such that it reproduces thesame results as the threshold response function. As can be seen from equations (10)and (11), there are only three parameters influencing the shape ofxs
1( f ) : δ/α, z,and p. Figures 5–7 show how thexs
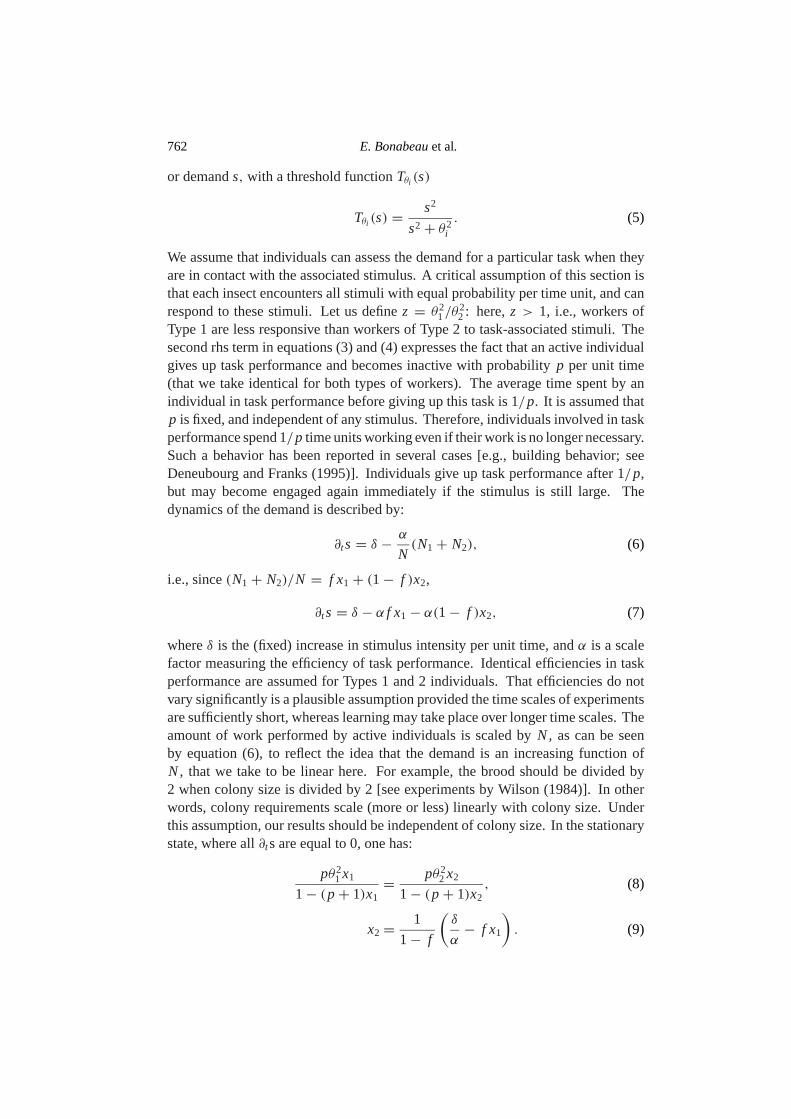
1( f ) relationship varies with these parameters.When individuals are very efficient at performing the task (δ/α small), the valueof f above which an important fraction of majors is performing the task is largerand the crossover becomes smoother; conversely, a decrease in efficiency leads toan earlier and more abrupt modification of the number of majors engaged in taskperformance (Fig. 5:δ = 1, α varying). This result is relatively natural, as moreefficient task performances by individuals which have a low response thresholdprevent task-related stimuli from growing large, and therefore from eliciting taskperformances by individuals that have larger response thresholds. The crossoverbecomes more abrupt asz increases, and the point at which the crossover is ob-served decreases; whenz is close to 1, the proportion of majors engaged in taskperformance starts from a larger value (Fig. 6). When the probability of giving uptask performance becomes small, the involvement of majors in task performancebecomes less progressive, and starts at a larger value off (Fig. 7). This is dueto the fact that task performers, mostly minors for low values off , spend moretime on average in task performance, so that less majors are required. However,when majors have to engage in task performance, they must do so more massivelybecause missing minors were performing a lot of work. Finally, it is important tonote that in Figs 5–7, there is always a fraction of active majors asf comes closeto 0 [this property may be difficult to see directly in equation (11)].
Besides the nine species ofPheidolestudied by Wilson (1984), there are otherexamples of flexibility, whereby individuals perform tasks that do not belong tothe normal repertoire of their physical or age caste, that the threshold model cancertainly explain (Calabi, 1988). Wilson (1980, 1983a, 1983b) studied flexibility inthe antsAtta cephalotesandA. sexdens, in which there is a continuum of size classesrather than simply two physical castes, as is the case inPheidole. He showed that theexperimental removal of a size class stimulates individuals belonging to adjacentsize classes into performing the tasks of the missing size class. Lenoir (1979)found that young workers of the antTapinoma erraticumtend to be stimulated intoforaging activities when the ratio of old to young workers<1. Calabi (1986) foundthat young workers of the antPheidole dentata, when raised in the absence of olderminors, forage significantly earlier than when older minors are present; conversely,old minors in colonies without young minors perform brood care, a behavior thatis not observed when young minors are present. Carlin and H¨olldobler (1983),cited in Calabi (1988), found interesting interspecific differences, possibly relatedto differences in response thresholds, in mixed-species colonies ofCamponotusants. Camponotus pennsylvanicusperforms brood care and works inside the nestwhen raised withC. americanusor C. noveboracensis, but works outside the nestwhen raised withC. ferrugineus. This suggests, within the context of the threshold
Fixed Response Thresholds 765
00
0.05
0.1
0.15
0.2
Frac
tion
of a
ctiv
e m
ajor
s
0.25
0.3
0.35
0.1 0.2 0.3 0.4 0.5
Proportion of majors in the colony
0.6 0.7 0.8 0.9 1
Threshold responseExponential response
Figure 4. Comparison between the fraction of active majors as a function of the proportionof majors in the colony obtained with an exponential response function (θ1 = 0.1, θ2 = 1,α = 3, δ = 1, p = 0.2) and a threshold response function (θ1 = 8, θ2 = 1, α = 3, δ = 1,p = 0.2).
00
0.1
0.2
0.3
0.4
Frac
tion
of a
ctiv
e m
ajor
s
0.5
0.6
0.7
0.2 0.4 0.6
Proportion of majors in the colony
0.8 1
α = 1.5α = 2
α = 3α = 5
Figure 5. Fraction of active majors given by equation (11) as a function of the proportionf of majors in the colony, forz= 64,δ = 1, p = 0.2,α = 1.5, 2, 3, 5.

766 E. Bonabeauet al.
00
0.05
0.1
0.15
0.2
Frac
tion
of a
ctiv
e m
ajor
s 0.25
0.3
0.35
0.2 0.4 0.6
Proportion of majors in the colony
0.8 1
z = 4z = 9
z = 16
z = 25
z = 36
z = 49
z = 64
Figure 6. Fraction of active majors given by equation (11) as a function of the proportionf of majors in the colony, forα = 3, δ = 1, p = 0.2, z= 4, 9, 16, 25, 36, 49 and 64.
00
0.05
0.1
0.15
0.2
Frac
tion
of a
ctiv
e m
ajor
s
0.25
0.3
0.35
0.2 0.4 0.6
Proportion of majors in the colony
0.8 1
p = 0
p = 0.05p = 0.1
p = 0.2p = 0.5
p = 0.8
p = 1
Figure 7. Fraction of active majors given by equation (11) as a function of the proportionfof majors in the colony, forα = 3, δ = 1, z= 64, andp = 0, 0.05, 0.1, 0.2, 0.5, 0.8 and 1.
Fixed Response Thresholds 767
model, thatC. pennsylvanicushas a lower response threshold to brood care thanC. americanusor C. noveboracensis, but higher thanC. ferrugineus. More studieswould be welcome, however, since other factors could play a role in this unusualexample of interspecific task allocation.
3.2. A note on between-caste aversion.In order to explain the increased involve-ment of majors in minor-related tasks when the fraction of majors in the colonyincreases (Wilson, 1984), Wilson (1985) introduced the notion of between-casteaversion, a phenomenon that he apparently observed inPheidole pubiventris. Hestudied the case of brood care, and noticed that majors pay a greater attention tothe brood when less minors are present, which is due, according to him, to thefact that majors actively avoid minors while in the vicinity of the immature stages.He further noticed that majors did not avoid minors in any other part of the nest(which in passing casts doubt on the generality of between-caste aversion as a basisfor division of labor). Wilson (1985) presented this hypothesis as an alternative toresponse thresholds, which had rarely been evidenced (but a good reason for thissituation, is discussed in Section 2). However, all of Wilson’s (1985) observationscan be explained by a threshold model. Moreover, making the assumption thatresponse thresholds exist does not make any further assumption about the asso-ciated stimuli: in particular, majors could use contacts with minors orwith othermajorsin the vicinity of the brood as a stimulus to assess indirectly the degree ofsatisfaction of the brood. It is hard to determine whether majorsavoidminors, orrespond to a brood-specific chemical (or other) cues carried by minors. Indeed,Wilson (1985) reports that majors showed the clearest responses after making di-rect antennal contacts with minors: this suggests that instead of identifying minors,they may be sensitive to cues carried by minors from the brood area. It is also per-fectly possible that majors have higher response thresholds to brood stimuli, so thatbrood care by minors maintains larval demand below threshold. In summary, theresponse-threshold approach explains Wilson’s (1985) observations qualitativelyand quantitatively, and does not raise the same issues as between-caste aversion.In effect, between-caste aversion does not seem to be an efficient way of dividinglabor among workers (notwithstanding its lack of generality): if larvae are satiated,less minors will take care of the brood, so that more majors will access the broodarea and take over brood care, which is not necessary; if larvae are hungry, manyminors are present, preventing majors from reaching the brood, where they couldbe useful. All these remarks make the threshold hypothesis far more likely.
3.3. Several tasks.Let us now proceed to the case ofm tasks. By analogywith the previous case, let us defineNi j the number of workers of Typei engagedin Task j performance,xi j the corresponding fraction(xi j = Ni j /ni ), andθi j theassociated response threshold. Alternatively,xi j can be interpreted as the probabilityof finding a worker of Groupi performing Taskj . The average deterministic

768 E. Bonabeauet al.
equations describing the dynamics of thexi j s are given by:
∂t xi j = (qi j sj )2
(qi j sj )2+ θ2i j
(1−
m∑k=1
xik
)− pxi j , (12)
whereqi j is the probability that workers of Typei encounter stimuli associatedwith Task j (∀i,∑m
j=1 qi j = 1), andsj the integrated intensity of Taskj -associatedstimuli. Again, we here assume thatqi j = q = 1/m, i.e., stimuli associated withall tasks are equally likely to be encountered by all types of workers. Finally, letus assume for simplicity thatm = 2 andi = 1,2. Results for other cases canreadily be inferred from those obtained with these parameters. The dynamics of thedemandsj associated with Taskj is given by:
∂t sj = δ − α f x1 j − α(1− f )x2 j . (13)
Here again, we assume that efficiency in task performance, measured byα, isidentical for workers of both types. Furthermore,α is the same for all tasks. Let usnow distinguish two cases.
CASE 1. θ11 > θ21 andθ12 > θ22: workers of Type 2 are more responsive totask-associated stimuli for both tasks. Introducingzj = θ2
1 j /θ22 j , we can study,
without loss of generality, the case where, for example,z1 > z2.CASE 2. θ11 > θ21 but θ12 < θ22: workers of Type 1 (respectively, Type 2) are
more responsive than workers of Type 2 (respectively, Type 1) to stimuli associatedwith Task 1 (respectively, Task 2). We can study the symmetric case, i.e., wherez1z2 = 1.
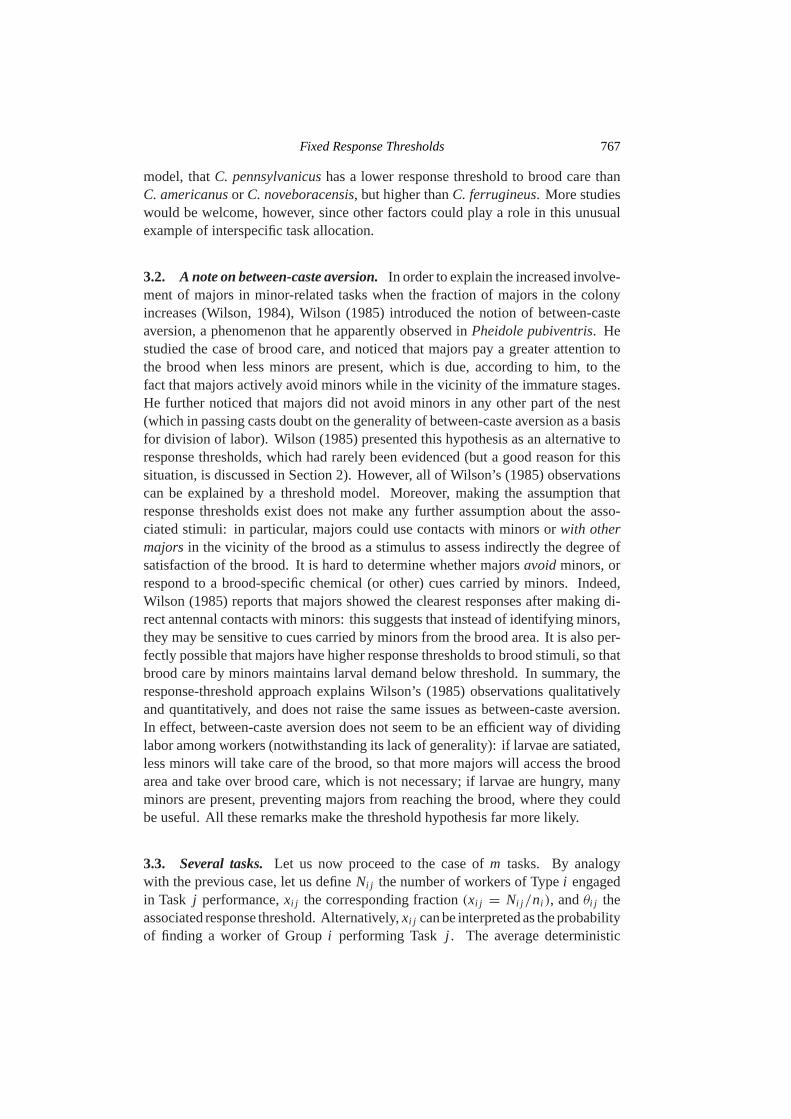
The stationary state of equation (13) cannot be easily calculated: numerical inte-gration has been used to find the stationary values ofxi j as a function off . Figures 8and 9 show thexi j vs. f relationships in Case 1 [xi j vs. f ( j = 1,2), z1 = 64andz2 = 25] and Case 2 [xi j vs. f (i = 1,2 and j = 1,2), z1 = 64 = 1/z2]for p = 0.2, δ = 1, andα = 3. In Case 1, when workers of Type 1 have lowerresponse thresholds to both tasks, we obtain twoxi j vs. f curves that are qualita-tively similar to those observed on Fig. 3. Thex11 vs. f andx12 vs. f curves are,however, quantitatively different becausez1 andz2 are different. Wilson (1984)measured the number of acts per major for social behavior and self grooming inPheidole megacephala. There is a reasonably good agreement between Wilson’sobservations and the curves of the model. In Case 2, when a caste is specialized inone of the two tasks, and the other caste in the other task, behavioral flexibility isobserved on both sides: workers of Type 1 can replace workers of Type 2, and viceversa (Fig. 9). Since minors cannot always be induced to perform major-specifictasks (while majors can always be induced to perform tasks usually performed byminors) [e.g., Wilson (1984)], this example may not apply to the case of physicalcastes, but can certainly apply to less rigid castes, or to intracaste behavioral flexi-bility. One can model such an observation by assuming that minors have very large
Fixed Response Thresholds 769
0 0.10
0.1
0.2
0.3
Frac
tion
of a
ctiv
e in
divi
dual
s
0.4
0.5
0.6
0.2 0.3 0.4 0.5
f
0.6 0.7 0.8 0.9 1
x11x12x21x22
Figure 8. Fractions of minors and majors performing Tasks 1 and 2 as a function ofthe proportionf of majors in the colony, obtained by numerical integration of equations(12) and (13). qi j = 1
2, θ11 = 5, θ12 = 10, θ21 = 1, θ22 = 1, α1 = 1, α2 = 3,δ1 = δ2 = 1, p1 = p2 = 0.2.
(virtually infinite) response thresholds for stimuli associated with majors’ tasks,although in principle any finite threshold will elicit task performance once stimulusintensity becomes large enough. But if minors lack perceptual tools for stimuliassociated with tasks usually performed by majors, we are in the case where, in-deed, the response threshold is infinite, since differences in response thresholds mayeither reflect actual differences in behavioral responses, or differences in the waytask-related stimuli are perceived.
3.4. Succession of tasks.It is possible, with fixed response thresholds, to observea simulated colony perform some tasks in succession in situations that are notuncommon. There are two possible models. Model 1 assumes that individuals allhave identical response thresholds, but these thresholds are different for the varioustasks to be performed, and, moreover, the success rate in task performance alsovaries with the task. This model can describe the dynamics of brood sorting inLeptothoraxants (Franks and Sendova-Franks, 1992) or seed piling in harvesterants. Model 2 assumes that performing a given task increases the demand foranother task. For example, excavation, by creating a refuse pile just at the entranceof the nest, generates a need for cleaning (Chr´etien, 1996). Both models will givethe impression that individuals have decided to perform the tasks in sequence.
MODEL 1. Let us assume thatm different types of items have to be processed.Let Li be the number of workers loaded with item typei , U the number of unloadedworkers,si the number of items that still need to be processed,ri the number of

770 E. Bonabeauet al.
0
0.1
0.2
0.4
0.6
Frac
tion
of a
ctiv
e in
divi
dual
s0.8
1
0.1 0.2 0.3 0.4 0.5
f
0.6 0.7 0.8 0.9 1
x11x12x21x22
Figure 9. Fractions of minors and majors performing Tasks 1 and 2 as a function of theproportion f of majors in the colony, obtained by numerical integration of equations (12)and (13). qi j = 1
2, θ11 = 8, θ12 = 1, θ21 = 1, θ22 = 8, α1 = α2 = 3, δ1 = δ2 = 1,p1 = p2 = 0.2.
items that have been successfully processed, andτi the time it takes to process anitem of Typei (for example, to carry a larva or seed to the appropriate location),and fi = e−τi /τ , whereτ is a characteristic time, the probability of success of thetask (the longer it takes to carry a larva or seed to the appropriate location, the lesslikely the individual is to succeed). The idea behind this model is that, for example,heavier items or items that are harder to work with will be processed after lighteror easier items have been processed. Heavier items are naturally associated with alower probability of success. The dynamics ofU andLi are given by
∂tU =m∑
i=1
(Li
τi− αi Usi
), (14)
∂t Li = αi Usi − Li
τi(15)
whereαi is a threshold function
αi = pis2i
θ2i + s2
i
(16)

Fixed Response Thresholds 771
weighted by the probabilitypi of finding an item of Typei , that we approximatesimply by
Pi = sim∑
j=1
sj
(17)
Equation (14) expresses the fact that laden individuals deposit their loads everyτi (either successfully or not) and that unloaded workers pick up items with aprobability that combines the probability of encountering an item of Typei (whichis proportional topi si ) and that of responding to such an item [equation (16)].Equation (15) also expresses how laden workers become unladen, and vice versa,but with signs opposite to those of equation (14), as it describes the dynamics of thenumber of laden workers. The thresholdθi in equation (16) is such that ifsi � θi ,few workers will be stimulated to carry an item of Typei , and, in constrast, ifsi � θi , workers will be stimulated to process items of Typei . The dynamics ofri
andsi are given by
∂t si =−αi Usi + (1− fi )Li
τi, (18)
∂t r i = fiLi
τi. (19)
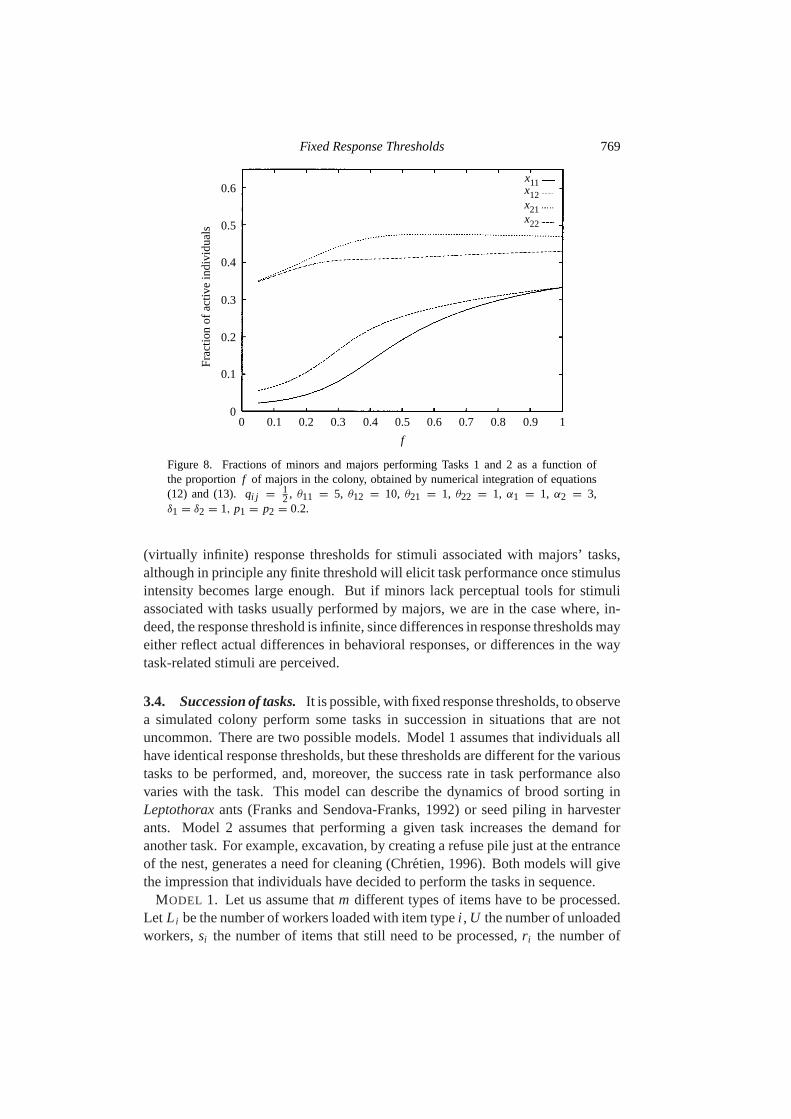
Equation (18) expresses that the number of items that can be processed decreaseswhen an item is picked up, but increases when a laden worker deposits an item at awrong location (unsuccessful deposition), which happens with probability 1− fi .Equations (14)–(19) have been integrated numerically for three types of items.Figure 10(a) shows the respective numbers of workers performing Tasks 1, 2 and 3as a function of time. Figure 10(b) shows the fraction of processed items of Types1, 2 and 3 as a function of time. Clearly, workers tend to process items of Type 1,then items of Type 2, and eventually items of Type 3.
MODEL 2. Let us now assume that there arem potential tasks to be performedby the workers. Letxi be the fraction of workers engaged in performing Taski ,si be the demand (stimulus intensity) associated with Taski , θi be the thresholdassociated with Taski (similar to Model 1),pi be the probability of encounteringstimuli associated with Taski , p be the probability of stopping performing Taski(the average time spent performing a task before task switching or before becominginactive is given by 1/p), andα be the efficiency of task performance, which wealso take to be the rate of stimulus production per unit working time for the nexttask. The dynamics ofxi andsi are described by
∂t xi = pis2i
θ2i + s2
i
(1−
m∑k=1
xk
)− pxi , (20)
∂t si = α(xi−1− xi ) with xi−1 = 0 if i = 1. (21)
772 E. Bonabeauet al.
00
2
4
6
8
Num
ber
of w
orke
rs
10
12
14
16
50 100 150
Time
200 250 300
Workers performing Task 1
Workers performing Task 2
Workers performing Task 3
00
0.2
0.4
0.6
Frac
tion
of p
roce
ssed
item
s
0.8
1
1.2
50 100 150
Time
200 250 300
Items of type 1
Items of type 2
Items of type 3
Figure 10. (a) Respective numbers of workers performing Tasks 1, 2 and 3 as a functionof time. Dynamics given by equations (14)–(19), with three types of items.θ1 = 10,θ2 = 40, θ3 = 80, τ = 5, τ1 = 2, τ2 = 5, τ3 = 8, T1(t = 0) = 120,T2(t = 0) = 70,T3(t = 0) = 50. (b) Respective fractions of processed items of Types 1, 2 and 3 as afunction of time for the same simulation as (a).

Fixed Response Thresholds 773
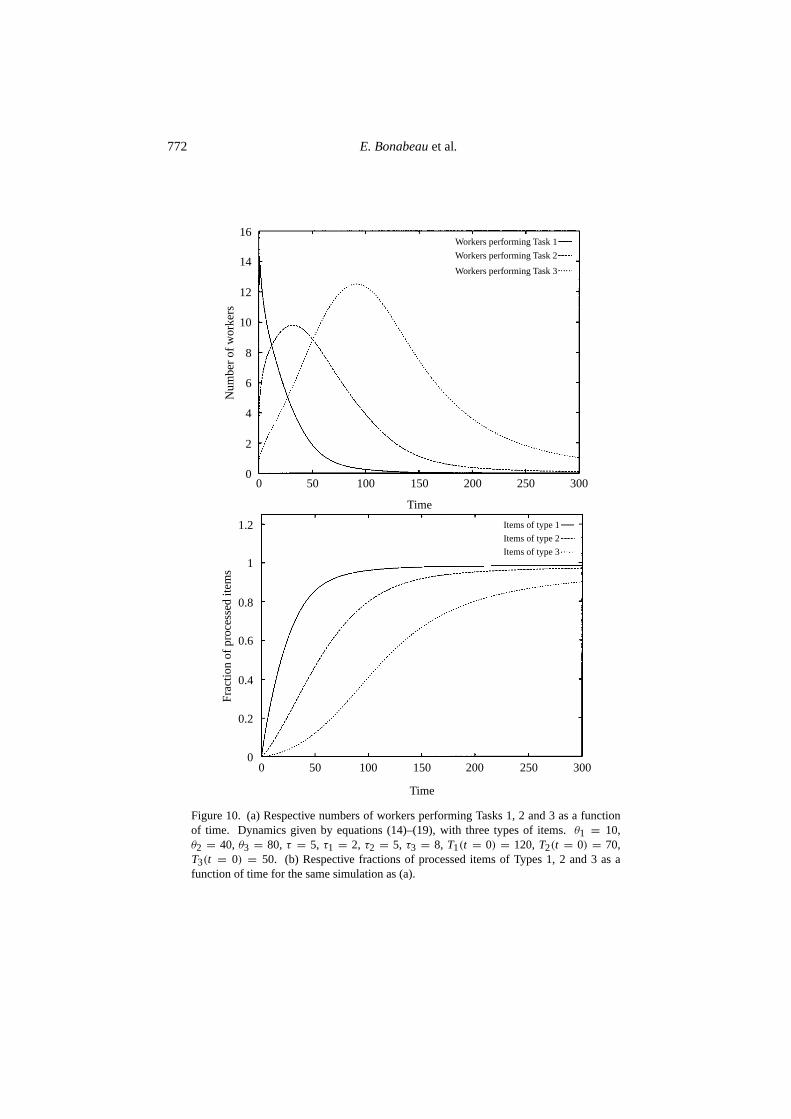
Equation (20) is similar to equation (12), and equation (21) expresses the fact thatperforming Taski − 1 increasessi , which in turn decreases when Taski is beingperformed. Numerical integration of equations (20) and (21) has been performedfor three tasks (i = 1, 2, 3). Figure 11(a) shows the respective numbers of workersperforming Tasks 1, 2 and 3 as a function of time. Figure 11(b) shows the dynamicsof stimulus intensities associated with Tasks 1, 2 and 3, respectively. It can beseen that workers first tend to perform Task 1, then Task 2 and finally Task 3. Ifperforming Task 3 increased the demand associated with Task 1, a cyclical activitywould be observed.
4. EXPOSURE TO TASK-ASSOCIATED STIMULI DEPENDS ON THE
CURRENT TASK
4.1. Introduction. Until now, we have been able to observe a global flexibilityobtained at the colony level with fixed response thresholds. One question thatarises is: Can we also observe specialization with the same model? For example,as we allow no learning, it seems difficult under the form of a reinforcement ofresponse thresholds (Deneubourget al., 1987; Plowright and Plowright, 1988;Theraulazet al., 1991). However, with fixed response thresholds, another typeof specialization is possible in this model if stimulus perception is allowed to varyas a function of the probability of task performance. Introducing this assumptionwill allow us to introduce an additional type of specialization by workers, such as,for instance, spatial specialization, where workers of a certain type are more likelyto encounter stimuli associated with tasks of a certain kind. For example, in somespecies foragers are more likely to respond to alarm signals and start to defend thecolony, although defensive behavior can also be induced in non-foragers [see, forinstance, Jeanneet al. (1992) on the tropical social waspPolybia occidentalis]. Wecan imagine that this correlation between foraging and probability of response toalarm signals is due to the fact that foragers are more easily in contact with potentialsources of danger and alarm signals. More generally, performing a task may eitherpromote or reduce direct exposure to stimuli associated with other tasks, or maypromote or prevent encounters with workers performing other tasks (antennations,trophallaxis, etc.). Such encounters can be stimulatory (recruitment) or inhibitory.Gordon (1996) advocates that encounter rates may be regulated to allow workersto assess how many workers are performing a task. In the absence of regulation, astoo many encounters with individuals performing a task inhibit task performanceby other individuals, the number of task performers would be fixed regardless ofcolony size.
Further support of this idea that exposure to stimuli depends on what task isbeing performed comes from experiments showing that tasks are sometimes spa-tially organized (not only in the absolute sense, but also relative to each other)(Wilson, 1976; Seeley, 1982; Sendova-Franks and Franks, 1994, 1995a, 1995b;
774 E. Bonabeauet al.
00
0.1
0.2
0.3
Num
ber
of w
orke
rs 0.4
0.5
0.6
20 40 60 80 100
Time
120 140 160 180 200
Workers performing Task 1
Workers performing Task 2
Workers performing Task 3
00
10
20
30
40
50
Stim
ulus
inte
nsity
60
70
80
90
100
20 40 60 80 100
Time
120 140 160 180 200
Stimulus 1Stimulus 2Stimulus 3
Figure 11. (a) Respective numbers of workers performing Tasks 1, 2 and 3 as a functionof time. Dynamics given by equations (20) and (21) with three tasks.D1(t = 0) = 100,D2(t = 0) = D3(t = 0) = 0, D1 → D2 → D3, α = 3, θ1 = θ2 = θ3 = 20,p1 = p2 = p3 = 0.3, p = 0.2. (b) Respective stimulus intensities associated with Tasks1, 2 and 3 as a function of time for the same simulation as (a).
Fixed Response Thresholds 775
Franks and Sendova-Franks, 1992). When this is the case, it is clear that theprobability of being exposed to stimuli (either directly or through worker inter-actions) associated with Task B when performing Task A depends on the spatialrelationships between both tasks. Interesting quantitative information reported bySendova-Franks and Franks (1995a), who have shown the existence of individual-specific ‘spatial fidelity zones’ (SFZ) in the antLeptothorax unifasciatus, is thatthe frequency of brood care by a given worker is directly related to the amount ofoverlap between her SFZ and the spatial distribution of the brood: this suggeststhat the probability of responding to a particular stimulus depends on the perceivedintensity of that stimulus; stimulus perception is influenced by the individual’s SFZ.
Spatial relationships among tasks is usually thought to be a factor of efficiency,if workers tend to perform a set of spatially localized tasks, so that mean free pathsbetween tasks are minimized and tasks are more easily located (Wilson, 1976;Seeley, 1982). In cases where temporal polyethism has been evidenced, age andspatial location are often correlated [see, for example, Seeley (1982); Sendova-Franks and Franks (1995a) did not observe any significant correlation between ageand spatial location]. Roughly speaking, in such cases younger individuals tend tobe located within the nest, close to its centre, whereas older individuals are morelikely to perform tasks outside the nest, such as nest defense or foraging. Theprevailing ultimate explanation for this age-location correlation is West-Eberhard’s(1981) hypothesis of centrifugal polyethism: younger workers, because they canreproduce, tend to stay in the nest where they can lay eggs, while older workers areless likely to be able to reproduce and can therefore perform more dangerous tasksoutside the nest.
The idea that task-associated stimuli are encountered differentially can be gen-eralized to tasks which are not simply spatially related, but are causally connectedor logically close. For example, in honeybees, foragers are in contact with foodstorers, to whom they deliver nectar, which is then stored in the combs by the food-storer bees (Seeley, 1989). It has been observed that food-storer bees (12–18 daysold) are older than nurses but younger than foragers; food-storer bees then becomeforagers, an observation which is consistent with the notion of task connectivity.Tofts and Franks (1992) and Tofts (1993) often use a one-dimensional array of log-ically/spatially connected tasks because it is easy to visualize, but more complexarrays or graphs can also be used as a substrate for their model. In summary, theset of ‘topological’ relationships among tasks, which can be relatively complicatedas it includes spatial, causal and other links, defines the conditional probabilities ofbeing exposed to specific stimuli when performing a given task. We will show that,within the fixed-response threshold model, differential exposure to task-associatedstimuli is sufficient to induce specialization and, under specific conditions, temporalpolyethism.
4.2. Specialization. The simplest and most natural choice is to considerqi j = xi j ,i.e., the probability of Groupi to perceive stimuli associated with Taskj directly

776 E. Bonabeauet al.
depends on the involvement of Groupi in Task j . But then, the null state, whereno worker of Groupi performs Taskj may be a stable attractor of the dynamicsif the intensitysj of the stimuli associated withj is too low (in effect, assuming aconstant stationary levels for sj , a necessary condition for the stationary value ofxi j to be different from 0 iss2 > 4p(p+1)θi j ). If xi j reaches 0, workers of Groupiwill no longer be performing Taskj , no matter how largesj may grow. We wouldtherefore observe specialization (a specialist of Taskj being defined byxi j closeto 1), but also a complete loss of flexibility in certain cases, when specializationbecomes exclusive. This result may explain in part why minors do not do some ofthe majors’ tasks: they do not perceive the corresponding stimuli, not necessarilyfor lack of the appropriate sensors, but because they do not encounter the stimuli.One way of restoring flexibility is to allow workers performing a given Taskk toencounter stimuli associated with another Taskj , even if they currently have aprobability equal to zero of performing Taskj . Of course, one would still liketo retain the idea that performing Taskj enhances the probability of encounteringstimuli associated with Taskj . If we define
qi j − pexi j + [(1− pe)/(m− 1)]m∑
k=1,k 6= j
xik (22)
(so that normalization is satisfied), wherepe is the probability of encounteringstimuli associated with Taskj while performing Taskj , and(1− pe)/(m−1) is theprobability of encountering stimuli associated with Taskj while performing anyother task, we obtain the desired property, provided thatpe� (1−pe)/(m−1) > 0.We assume here thatpe is task-independent, and that the probability of encounteringstimuli associated with Taskj while performing another task is identical for any taskdifferent from j , which are obviously oversimplifications. However, we still havethe main ingredients to generate a colony of flexible specialists. The generalizationof the model toN individuals andm tasks requires a description of how task-associated demands vary. We generalize equation (6):
∂t sj = δ − α
N
( N∑i=1
xi j
). (23)
Note that here again,sj is scaled byN. Figure 12 shows an example of specializa-tion (with two tasks), starting with groups of individuals with identical thresholds:although the thresholds do not vary in time, the probability of task performanceevolves to match task-associated demands [xik (k = Task 1, Task 2) shown for twoGroupsi and j out of 10]. Figure 13 shows the evolution of the demand associatedwith Task 1: it oscillates before stabilizing above the individuals’ threshold (θ = 5),at sj = 8. That the stationary value ofsj lies well aboveθ is not surprising, forindividuals are not stimulated ifsj lies at or below their response thresholds.

Fixed Response Thresholds 777
00.1
0.2
0.3
0.4
0.5
0.6
10 20 30 40 50
Time
60 70 80 90 100
xi1xi2xi3xi4
Prob
abili
ty o
f ta
sk p
erfo
rman
ce
Figure 12. Frequency of task performancexik for two Tasks 1 and 2, and two individualsrandomly selected out of 10, obtained by numerical integration of equations (12) and (15),with qi j given by equation (14).θ = 5 for both tasks and all individuals,α1 = α2 = 3,δ1 = δ2 = 1, p1 = p2 = 0.2.
05
5.5
6
6.5
7
7.5
Stim
ulus
s1 8
8.5
9
9.5
10
10 20 30 40 50
Time
60 70 80 90 100
Figure 13. Dynamics of the demand associated with Task 1 for the example of Fig. 12.

778 E. Bonabeauet al.
0
0
0.1
0.2
0.3
Prob
abili
ty o
f ta
sk p
erfo
rman
ce
0.4
0.5
0.6
10 20 30 40 50
Time
60 70 80 90 100
xi1xi2xi1xi2
Figure 14. Same as Fig. 12 forp1 = p2 = 0.5.
00
20
40
60
Dem
and
80
100
120
10 20 30 40 50
Time
60 70 80 90 100
Figure 15. Dynamics of the demand associated with Task 1 for the example of Fig. 14.

Fixed Response Thresholds 779
Expression (12) forqi j , neglecting the probability of an individual of Groupi‘spontaneously’ (i.e., while performing no task in particular) encountering a stim-ulus associated with Taskj , can lead to another null state: one where there exists aGroupi characterized byxi j = 0 for all Tasksj , i.e., a completely idle group. Thissituation occurs frequently whenp is large, or in other words, when the time spentperforming a task before giving it up is small. Figure 14 shows a typical case, whereGroupi becomes completely inactive with respect to all tasks, while the other groupspends 40% of its time performing each task, the rest of the time being lost in taskswitching (remember thatp is large here:p = 0.5). Once, again, this state is anattractor of the dynamics. The demand associated with Task 1 is shown by Fig. 15,and can be seen to be divergent; despite this divergence, workers of Groupi do notbecome active. It seems necessary, therefore, to introduce the probabilityps (thatwe take to be identical for all tasks and groups) of an individual to find a stimuluseven when performing no task. Equation (14) is then transformed into
qi j = (1+ ps)−1
{ps+ pexi j + [(1− pe)/(m− 1)]
m∑k=1,k 6= j
xik
}. (24)
Expression (22) satisfies the normalization condition of theqi j . As can be seen inFig. 16 (p = 0.5, ps = 0.001), the null state for a group is no longer an absorbingstate: Groupi first becomes completely lazy, and then becomes involved in taskperformance again, because the demands have increased. This indicates that thespecialization is weak (which permits it to be flexible), in the sense that a decrease insj can inducej specialists to perform other tasks or becoming lazy, and an increasein sj can induce non-j specialists to performj . Figure 17 shows that non-specialistsof a task can become specialists when colony requirements with respect to that taskincrease (p = 0.2, ps = 0.0001, att = 75, task performance efficiencyα changesfrom 4 to 2). We see that the two groups of workers switch fromx = 0.25 tox = 0.45 (frequency of Task 1 performance).
4.3. Temporal polyethism. If we now add time to the previous model with spe-cialization, for example by defining
qi j = qi j (t) = gj (t)(1+ ps)−1
{ps+ pexi j +[(1− pe)/(m−1)]
m∑k=1,k 6= j
xik
}, (25)
wheret is the age of an individual,gj (t)(1 ≤ gj (t) ≤ 1) is a function that defineshow the probability of encountering stimuli associated with Taskj varies in time,we can account for temporal polyethism, with specific sets{gj (t)}. Here, we caninclude implicitly the outward motion of individuals as they age by (1) assumingthat task-associated stimuli are more likely to be found in specific locations, and (2)by usinggj (t) to explicitly describe in what general order locations will be visitedand stimuli be encountered. Such a model is certainly less ‘emergent’ than the

780 E. Bonabeauet al.
0 10
0
0.1
0.2
0.3
Prob
ality
of
task
per
form
ance
0.4
0.5
0.6
0.7
20 30 40 50Time
60 70 80 90 100
xi1xi2xi1xi2
Figure 16. Same as Fig. 14, withps = 0.001.
00.1
0.15
0.2
0.25
0.3
0.35
0.4
Prob
abili
ty o
f ta
sk p
erfo
rman
ce
0.45
0.5
0.55
0.6
0.65
50 100 150
Time
200 250
xi1xi2xi3xi4
Figure 17. Same as Fig. 16, withp = 0.2, ps = 0.0001. At t = 75, task performanceefficiencyα changes from 4 to 2.

Fixed Response Thresholds 781
FFW model (Tofts and Franks, 1992; Tofts, 1993), but is also more robust and morestable, and still flexible.Our model does not assume time-varying thresholds butdoes assume an explicit time dependence of the probability of becoming engagedin performing a task. The functionsgj (t) could represent or include physiologicalageing, although it is not exactly in the spirit of the model. We rather assume thatgj (t)expresses an age-location correlation. For example, it could be physiologicallynecessary for newly emerged individuals to stay in the center of the nest for a certainamount of time, or alternatively, physiology again could stimulate older workersto exit the nest more often. Robinson (1987a) showed that JH is involved in thetransition from intranidal to extranidal activities in honeybees, and that the onset offoraging is characterized by a rise in JH titers, but it is still not clear whether thisfeature is a cause or an effect of behavior. We have performed simulations withthree tasks, characterized by three functionsgj (t):
gj (t) = e(t−t j /T)2 (26)
wheret j is the time when stimuli associated withj are most likely to be encountered,andT is the duration of the ‘Taskj period’. From now on, we consider the casewherem = 3 (m is the number of tasks). Figure 18 shows the three functionsgj (t). We now assume that each Groupi is in fact limited to one individual: acolony of N individuals is described byN equations similar to equation (12), andxi j describes the frequency of Taskj performance by an individuali . The lifespanof an individual is 2T , andt1 = 0, t2 = T andt3 = 2T . There is an inflow ofN/2Tnewly born individuals per time unit, so that colony sizeC is stable atN individuals(in the simulations reported below,T = 50, N = 100):
∂tC = 1
2T(N − C). (27)
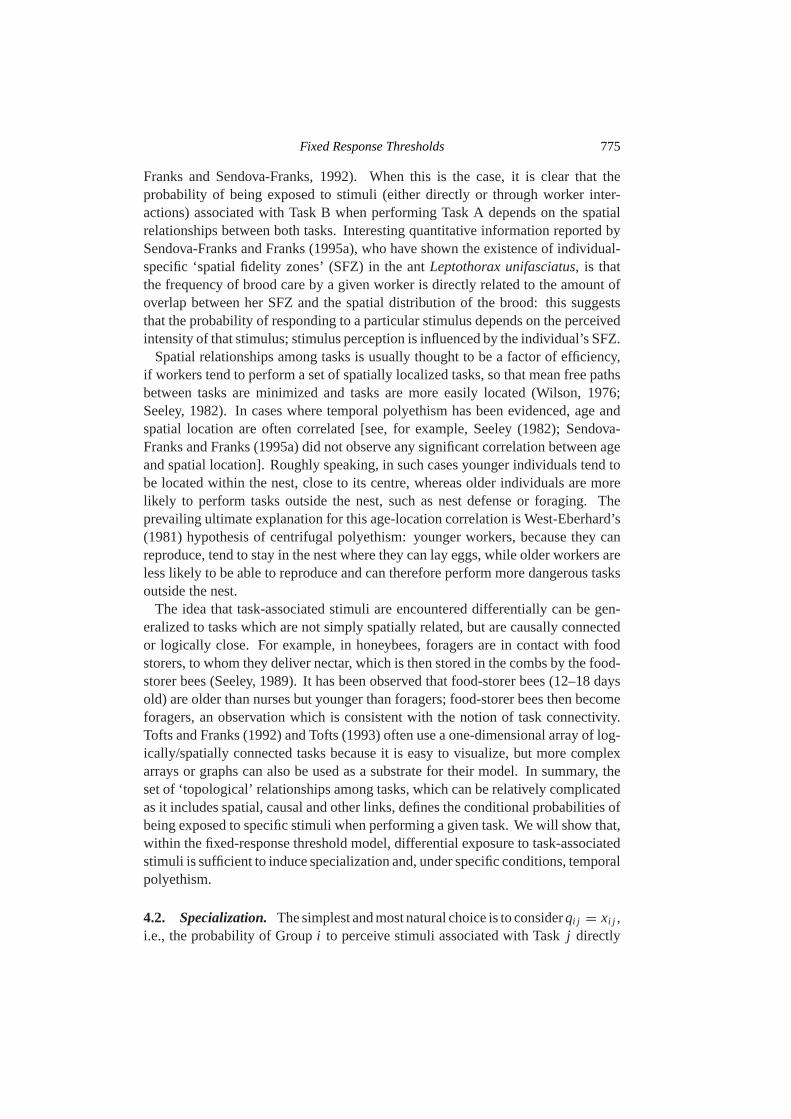
Figure 19 shows the age–xi j relationship for an individual taken at random in thecolony, from t = 5000 tot = 5100. Figure 20 shows the age–xi j relationshipfor a snapshot of the whole colony taken att = 5000. The simulation startedwith N individuals having identical thresholds(θi j = θ = 5) and an initiallyrandom probability of performing each task{xi j (t = 0) distributed uniformly in[0,1/m]}. New individuals are generated with the same thresholds but randominitial frequencies of task performance (again, distributed uniformly in[0,1/m]).We see that there is a strong correlation between age and probability of performingcertain tasks: younger individuals perform mostly Task 1, intermediate individualsperform mostly Task 2 and older individuals perform mostly Task 3. There is alsoa striking similarity between the lifetime evolution of one individual and snapshotsof the colony age–task distribution, except for young individuals, where the randominitial distribution ofxi j induces fluctuations.
Behavioral reversion (Seeley, 1982; Lenoir, 1987; Robinson, 1992) can also beobtained in the same model if younger individuals are removed. Figures 21 and 22

782 E. Bonabeauet al.
00
0.1
0.2
0.3
0.4
0.5g
0.6
0.7
0.8
0.9
1
10 20 30 40 50
Age
60 70 80 90 100
‘g1’‘g2’‘g3’
Figure 18.gj (t) = e(t−t j /T)2, j = 1, 2, 3. t1 = 0, t2 = T , t3 = 2T, T = 50.
00
0.1
0.2
0.3
0.4
Freq
uenc
y of
task
per
form
ance
0.5
0.6
0.7
10 20 30 40 50
Age
60 70 80 90 100
xi1xi2xi3
Figure 19. Frequencies of Taskj performance for one individuali as a function of age. Onehundred individuals with identical thresholdsθi j = θ = 5 for all tasks. Initially randomprobability of performing each task (xi j (t = 0) distributed uniformly in[0,1/m]). Newindividuals are generated with the same thresholds but random initial frequencies of taskperformance (again, distributed uniformly in[0,1/m]).
Fixed Response Thresholds 783
show how older individuals increase their probability of performing tasks usuallyperformed by younger individuals, when the latter are removed. Figure 21 showsthe age–xi j curve of one individual before the removal of young individuals, andFig. 22 shows the same curve for another typical individual after the removal ofyoung individuals (all individuals of age less than 30 time units are removed; theindividual represented in Fig. 22 was 40 time units old when the removal tookplace). This simulation can apply, for example, to the case of swarm-foundedcolonies in honeybees (Robinson, 1992), where over-aged nurses can be observedcaring for the brood and the queen, as no young individuals are available to performthat task. The same mechanism can induce younger individuals to perform tasksusually performed by older individuals if those are removed (as can occur naturallybecause of predation, competition, or other factors that tend to increase the deathrate of older workers). Seeley’s (1982) observation that the probability of behavioralreversion from foraging to nursing in honeybees depends on the amount of timespent foraging, cannot be explained in a robust way with this model. It would requirethe inclusion of a learning or task-fixation process (the probability of behavioralreversion in the present model depends weakly on the time spent performing thetask, because specialization is weak). Note, however, that because the probabilityof reversion indirectly depends onxi j , older individuals strongly involved in Task3 are less likely to revert to Tasks 2 or 1.
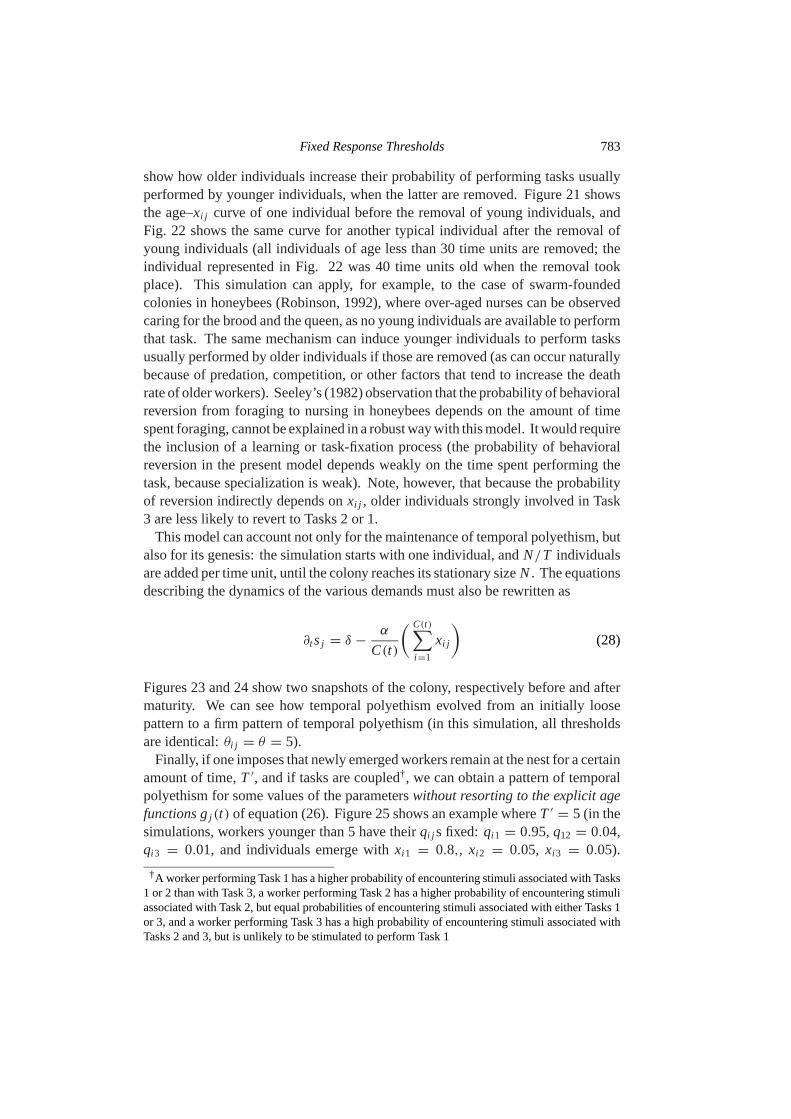
This model can account not only for the maintenance of temporal polyethism, butalso for its genesis: the simulation starts with one individual, andN/T individualsare added per time unit, until the colony reaches its stationary sizeN. The equationsdescribing the dynamics of the various demands must also be rewritten as
∂t sj = δ − α
C(t)
( C(t)∑i=1
xi j
)(28)
Figures 23 and 24 show two snapshots of the colony, respectively before and aftermaturity. We can see how temporal polyethism evolved from an initially loosepattern to a firm pattern of temporal polyethism (in this simulation, all thresholdsare identical:θi j = θ = 5).
Finally, if one imposes that newly emerged workers remain at the nest for a certainamount of time,T ′, and if tasks are coupled†, we can obtain a pattern of temporalpolyethism for some values of the parameterswithout resorting to the explicit agefunctions gj (t) of equation (26). Figure 25 shows an example whereT ′ = 5 (in thesimulations, workers younger than 5 have theirqi j s fixed: qi 1 = 0.95,q12 = 0.04,qi 3 = 0.01, and individuals emerge withxi 1 = 0.8,, xi 2 = 0.05, xi 3 = 0.05).
†A worker performing Task 1 has a higher probability of encountering stimuli associated with Tasks1 or 2 than with Task 3, a worker performing Task 2 has a higher probability of encountering stimuliassociated with Task 2, but equal probabilities of encountering stimuli associated with either Tasks 1or 3, and a worker performing Task 3 has a high probability of encountering stimuli associated withTasks 2 and 3, but is unlikely to be stimulated to perform Task 1

784 E. Bonabeauet al.
00
0.1
0.2
0.3
Freq
uenc
y of
task
per
form
ance
0.4
0.5
0.6
10 20 30 40 50
Age
60 70 80 90 100
Task 1Task 2
Task 3
Figure 20. Snapshot of the whole colony taken att = 5000 for the same simulation as inFig. 19.
0 100
0.1
0.2
0.3
0.4
0.5
Freq
uenc
y of
task
per
form
ance
0.6
0.7
0.8
20 30 40 50
Age
60 70 80 90 100
xi1xi2xi3
Figure 21. Age-xi j curve of one individual before the removal of young individuals. Sameparameters as in Fig. 19.

Fixed Response Thresholds 785
00
0.1
0.2
0.3
0.3
Freq
uenc
y of
task
per
form
ance
0.5
0.6
0.7
10 20 30 40 50
Age
60 70 80 90 100
xi1xi2xi3
Figure 22. Same as Fig. 21 after the removal of individuals of age less than 30 time units.The individual represented in Fig. 18 was 40 time units old at the time of removal.
00
0.1
0.2
0.3
Freq
uncy
of
task
per
form
ance
0.4
0.5
0.6
5 10 15 20 25
Age
30 35 40 45 50
Task 1Task 2Task 3
Figure 23. Snapshot of the age–task distribution in a simulated colony at half its time ofmaturity (the colony contains only individuals of age less than 50 time units). All individualshave identical thresholdsθi j = θ = 5 for all tasks.

786 E. Bonabeauet al.
00
0.1
0.2
Freq
uenc
y of
task
per
form
ance
0.4
0.3
0.5
0.6
0.7
10 20 30 40 50
Age
60 70 80 90 100
Task 1
Task 2
Task 3
Figure 24. Same as Fig. 23, but after the colony has reached its stationary size.
This period of time spent in the nest by newly emerged individuals drasticallylowers the demand for Task 1 and stimulates older workers to perform other tasks,the demands of which increase. From the snapshot presented by Fig. 25, wesee that workers aged 0–30 perform mostly Task 1, workers aged 30–50 performmostly Task 2 and workers aged 50–100 perform mostly Task 3. Notice that thismore-emergent pattern of temporal polyethism can be obtained only for specificvalues of the parameters, and does not appear to be robust with respect to parametervariations. In particular,T ′ has to be sufficiently large, and new individuals haveto be initialized with specific values ofqi j andxi j .
4.4. Genotypic diversity (1): temporal polyethism.We have treated the case ofidentical thresholds, but it might be interesting to study the effect of genetic diver-sity, i.e., of distributions of thresholds. The fact that some individuals have lowthresholds and others high thresholds means that there exist intrinsic specialists of agiven task. Individuals with close genotypic characteristics (for example, belongingto the same patriline) may have similar response thresholds and are therefore predis-posed to perform the same tasks. There is now convincing evidence that there is agenetic component to division of labor in honeybees and ants (Calderone and Page,1988; Frumhoff and Baker, 1988; Robinson and Page, 1988; Breedet al., 1990;Page and Robinson, 1991; Stuart and Page, 1991). It is generally believed (Jeanne,1986) that the existence of specialists in a colony is a favorable trait, underlyingmost evolutionary explanations of division of labor: this is due to the fact special-ists may be more efficient, either because they are better at performing the task, orbecause they do not waste time switching tasks. If specialization is a good thing,

Fixed Response Thresholds 787
00
0.1
0.2
0.3
0.4
Freq
uenc
y of
task
per
form
ance
0.5
0.6
0.7
0.8
10 20 30 40 50
Age
60 70 80 90 100
Task 1Task 2
Task 3
Figure 25. Snapshot of the age–task distribution in a simulated colony att = 10 000.Workers younger than 5 have theirqi j s fixed: qi 1 = 0.95,qi 2 = 0.04,qi 3 = 0.01, andindividuals emerge withxi 1 = 0.8, xi 2 = 0.05, xi 3 = 0.05. qi j s for older individuals aregiven by: qi 1 = 0.97x1 + (0.03/(m− 1))(1.95x2 + 0.05x3); qi 2 = 0.9x2 + (0.1/(m−1))(1.8x2 + 0.2x3); qi 3 = 0.97x3 + (0.03/(m− 1))(0.05x2 + 1.95x3). All individualshave identical thresholdsθi j = θ = 5 for all tasks,p = 0.2, ps = 0.0001,α = 4, δ = 1.
and if genotypic variability provides a basis for behavioral differentiation, then, forexample, high levels of polyandry may be favoured, as is the case in honeybees.The same reasoning applies to polygyny: it is striking that there is a strong negativecorrelation between polygyny and physical polymorphism among workers in ants(Keller, 1995); if genetic diversity, due for example to the presence of workers pro-duced by different queens, endows the colony with a variety of response thresholds,and therefore specialization, physical polymorphism may not be necessary.
We study here how genotypic variability influences patterns of temporal poly-ethism in the context of the fixed-threshold model. Response thresholds constituteonly one possible difference between individuals from different genotypes. Noticethat genetic diversity can induce a bias not only in the pattern of temporal polyethism,but more fundamentally in the probabilities that individuals perform tasks, leadingto patterns of genetically based specialization.
In a genetically diverse colony, some individuals may have an ‘accelerated devel-opment’ because they have a lower threshold with respect to tasks that are usuallyperformed by older individuals, and other individuals may exhibit ‘retarded de-velopment’, as they are not very responsive to these tasks (Calderone and Page,1988; Frumhoff and Baker, 1988). According to Calderone and Page (1988, 1991,1996) genes may have effects on (1) the rate of behavioral ontogeny, and (2) theprobability of task performance independent of the rate of behavioral ontogeny.
788 E. Bonabeauet al.
00.1
0.15
0.2
0.25
0.3
Freq
uenc
y of
task
per
form
ance
0.35
0.4
0.45
10 20 30 40 50
Age
60 70 80 90 100
Task 1
Task 2
Task 3
Figure 26. Snapshot of thexi j –age relationship att = 5000 for individuals of Group 1:θ11 = 1, θ12 = 5 andθ13 = 10.
00
0.1
0.15
0.2
0.25
Freq
uenc
y of
task
per
form
ance
0.3
0.35
0.4
0.45
10 20 30 40 50
Age
60 70 80 90 100
Task 1
Task 2
Task 3
Figure 27. Same as Fig. 19 for Group 2:θ21 = 5, θ22 = 1, θ23 = 5.

Fixed Response Thresholds 789
00
0.1
0.2
0.3
Freq
uenc
y of
task
per
form
nce
0.4
0.5
0.6
10 20 30 40 50
Age
60 70 80 90 100
Task 1
Task 2
Task 3
Figure 28. Same as Fig. 19 for Group 3:θ31 = 10,θ32 = 5, θ33 = 1.
Our model suggests that the rate of behavioral ontogeny itself may be influenced byhow sensitive individuals are to the various task-sensitive stimuli, provided there is a‘driving force’ that promotes temporal polyethism, such as the emergent centrifugalflow observed under certain conditions in the FFW model. Figures 26–28 show theage–xi j relationship for a snapshot of the colony for three groups of workers char-acterized by different response thresholds to the various tasks (Group 1: θ11 = 1,θ12 = 5 andθ13 = 10; Group 2: θ21 = 5, θ22 = 1 andθ23 = 5; Group 3: θ31 = 10,θ32 = 5 andθ33 = 1). Although all three groups exhibit the same global trend intemporal polyethism (Task 1 first, then Task 2, and eventually Task 3), they differquantitatively in the way this temporal polyethism occurs. Groupj is biased to-ward Task j , but age modulates this bias.These results indicate that the rate ofbehavioral ontogeny can be influenced by response thresholds. Figure 29 shows asnapshot of the age–task distribution in a simulated colony where all members (in-cluding newly emerged individuals) have randomly generated thresholds (uniformdistribution in[0,10]). The general structure of temporal polyethism is conserved,but is highly fluctuating. By contrast, the lifetime evolution of a single worker’sbehavioral profile is smoother, but only loosely follows the expected pattern of tem-poral polyethism, as it is influenced by its own pattern of response thresholds. Forthe individual whose profile is shown on Fig. 30, we haveθ11 = 3, θ12 = 9 andθ13 = 1. Individuals with different patterns of temporal polyethism can be found,for example, in honeybees, where different patrilines have different genotypes andtherefore probably different responses with respect to the various tasks.

790 E. Bonabeauet al.
00
0.1
0.2
0.3
Freq
uenc
y of
task
per
form
ance
0.5
0.4
0.6
0.7
10 20 30 40 50
Age
60 70 80 90 100
Task 1Task 2
Task 3
Figure 29. Snapshot att = 5000 of the age–task distribution in a simulated colony where allmembers, including newly emerged individuals, are characterized by randomly generatedthresholds (uniform distribution in[0,10]).
00.05
0.1
0.15
0.2
0.25
0.3
Freq
uenc
y of
task
per
form
ance
0.35
0.4
0.45
0.5
10 20 30 40 50
Age
60 70 80 90 100
xi1xi2xi3
Figure 30.xi j –age relationship of a single worker characterized byθ11 = 3, θ12 = 9 andθ13 = 1.

Fixed Response Thresholds 791
4.5. Genotypic diversity (2): modulation of individual response vs collectivemodulation. An interesting theoretical question related to genotypic diversity iswhether the collective response of a colony is as efficient when the modulation ofthe response results from a distribution of thresholds as to when it results fromindividual modulation. Let us illustrate this rather abstract question in the contextof the choice of food sources in ants. Let us assume thatN foragers are exploitingm food sources. The quality or richness of sourcei is given byri . Trails to thevarious food sources are reinforced by pheromone deposited by foragers. At theexit of the nest, an ant has to choose among all possible trails. We assume that thechoice of a trail to Sourcei is probabilistic: the probability of selecting Traili isgiven by (Deneubourget al., 1989; Deneubourg and Goss, 1989)
Pi = (k+ Ci )2
m∑j=1
(k+ Cj )2
, (29)
whereCi is the pheromone concentration on Traili andk is a threshold-like pa-rameter. We assume for simplicity that pheromone concentration does not decayover the time scale of the experiment. A forager coming back from Sourcei adds aquantity Q(i) of pheromone to Traili . This deposition behavior can be modulatedas a function ofri . Such a modulation can be implemented in either one of twoways (other alternatives will not be considered here).
MODEL 3. The amount of pheromone deposited per individual is a direct functionof ri . For example, it can be given by
Q(i ) = r 2i
r 2i + ρ2
, (30)
whereρ is, once again, a deposition threshold. Here, all individuals have the samethreshold, but are able to modulate their own trail as a function of source quality(resource quality may vary between food sources; also, the quality of a source canvary as a function of how many foragers are already present at the source, but, forthe sake of simplicity, we do not consider this possibility). This is an example ofindividual modulation.
MODEL 4. A forager, j , deposits 1 unit of pheromone ifri > θ j , whereθ j isan all-or-nothing deposition threshold. Individuals are characterized by differentvalues ofθ j . In order for this collective modulation to be compared to individualmodulation, the distributionP(θ) of θ in the colony must be such that the fraction ofindividuals that deposit pheromone for a source of richnessri be given byr 2
1/(r2i +
ρ2). Therefore,
P(θ) = ∂
∂θ
(θ2
θ2+ ρ2
)= θρ2
(θ2+ ρ2)2. (31)

792 E. Bonabeauet al.
This is obviously an example of collective modulation, for no individual is capableof fine tuning the amount of pheromone it deposits as a function of source quality.
Two situations can be tested in order to compare individual and collective mod-ulation of trail laying (we consider for simplicity the case of two food sources:m= 2):
QUESTION 1. Two sources of identical quality are offered to the colonysimultaneously at the same distance from the nest. It is known that, in speciesthat resort exclusively to trail laying and trail following [as modeled, forexample, by equations (29) and (30) or (31)], one of the sources is eventuallyfar more exploited than the other source (Beckerset al., 1990). How rapidlyis the winning source selected over the other?QUESTION 2. A single poor-quality source (Source 1) is presented to thecolony, and, after a certain amount of time, a second, better-quality source(Source 2) is presented to the colony at the same distance from the nest.When the second source is presented, the colony is actively exploiting thefirst source, and a well-marked pheromone trail leads to Source 1. What isthe probability that the colony be able to switch to the better source?
It is clear that differences between the two modes of trail laying will disappearas N becomes large: in effect, the theoretical distribution given by equation (31)is better and better approximated asN grows. Figure 31 shows the theoreticaldistribution and its simulated approximation for different values ofN. We seethat significant deviations from the theoretical distribution occur forN up to 2000.Results presented below correspond toN = 200, where deviations are visible, butthe distribution is nevertheless reasonably well approximated.
The answer to the first question is that both Models 3 and 4 yield undistinguishablebehaviors. Lett1 andt2 be the time it takes in Model 3 and Model 4, respectively,to reach a state where one source attracts 80% of the foragers. Variablest1 andt2 are random, the values of which depend on particular realizations of the food-source selection stochastic process. The question one is interested in is whethert1 is greater thant2 or vice versa. Applying a two-tailed Mann–Whitney U-testto a set of 100 values oft1 and 100 values oft2 obtained from 200 simulationswith identical food sources presented simultaneously to the colony (and parametersr1 = r2 = 15,k = 10,ρ = 10, N = 200,C1(t = 0) = C2(t = 0) = 0.2), we findthat P > 0.5, which means that Models 3 and 4 yield similar convergence times.In other words, individual or collective modulation has no significant influence onhow fast the colony selects a food source.
In the context of the second question, Models 3 and 4 have different behaviors.Notice that Question 1 deals, in some sense, with efficiency, while Question 2 hasto do with flexibility. Figure 32 shows the proportion of simulations where thesecond, richer food source is eventually selected although it has been presentedafter the first, poorer source (withr1 = 5, r2 = 15, k = 10, ρ = 10, N = 200,C1(t = 0) = 10–60,C2(t = 0) = 0.2). Model 3 curve lies below Model 4
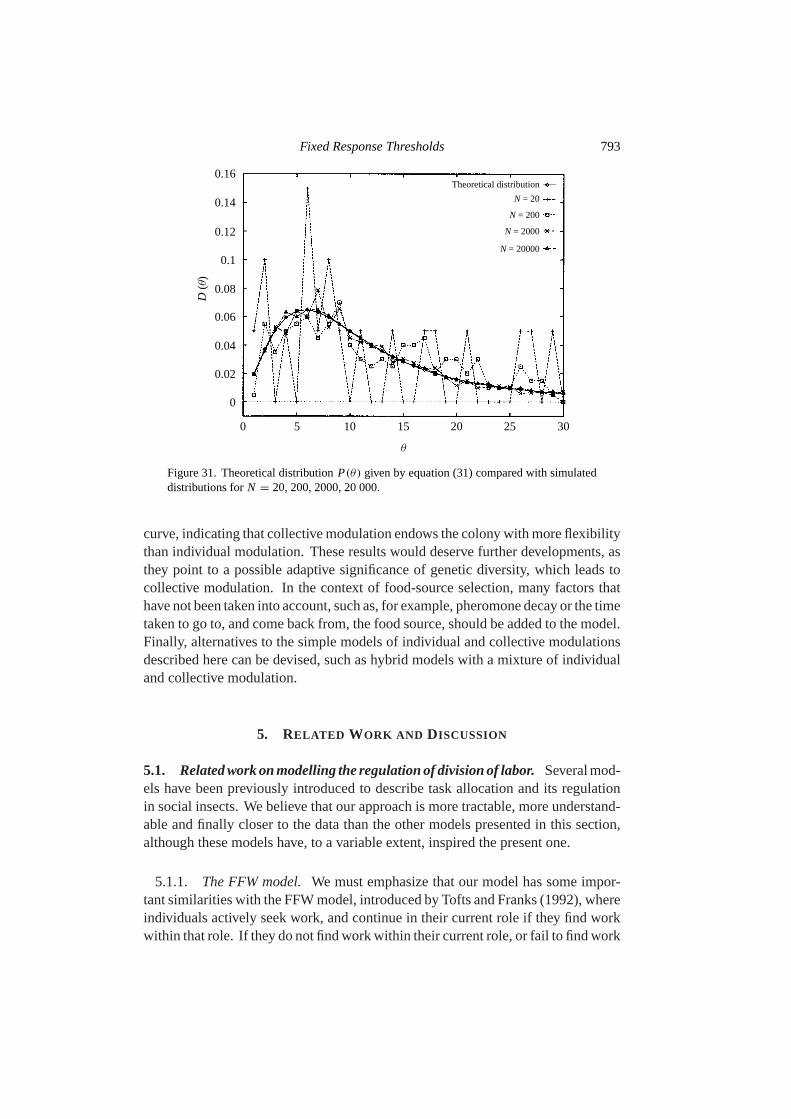
Fixed Response Thresholds 793
0
0
0.02
0.04
0.06
0.08
D (θ)
0.1
0.12
0.14
0.16
5 10 15
θ
20 25 30
Theoretical distribution
N = 20
N = 200
N = 2000
N = 20000
Figure 31. Theoretical distributionP(θ) given by equation (31) compared with simulateddistributions forN = 20, 200, 2000, 20 000.
curve, indicating that collective modulation endows the colony with more flexibilitythan individual modulation. These results would deserve further developments, asthey point to a possible adaptive significance of genetic diversity, which leads tocollective modulation. In the context of food-source selection, many factors thathave not been taken into account, such as, for example, pheromone decay or the timetaken to go to, and come back from, the food source, should be added to the model.Finally, alternatives to the simple models of individual and collective modulationsdescribed here can be devised, such as hybrid models with a mixture of individualand collective modulation.
5. RELATED WORK AND DISCUSSION
5.1. Related work on modelling the regulation of division of labor.Several mod-els have been previously introduced to describe task allocation and its regulationin social insects. We believe that our approach is more tractable, more understand-able and finally closer to the data than the other models presented in this section,although these models have, to a variable extent, inspired the present one.
5.1.1. The FFW model.We must emphasize that our model has some impor-tant similarities with the FFW model, introduced by Tofts and Franks (1992), whereindividuals actively seek work, and continue in their current role if they find workwithin that role. If they do not find work within their current role, or fail to find work
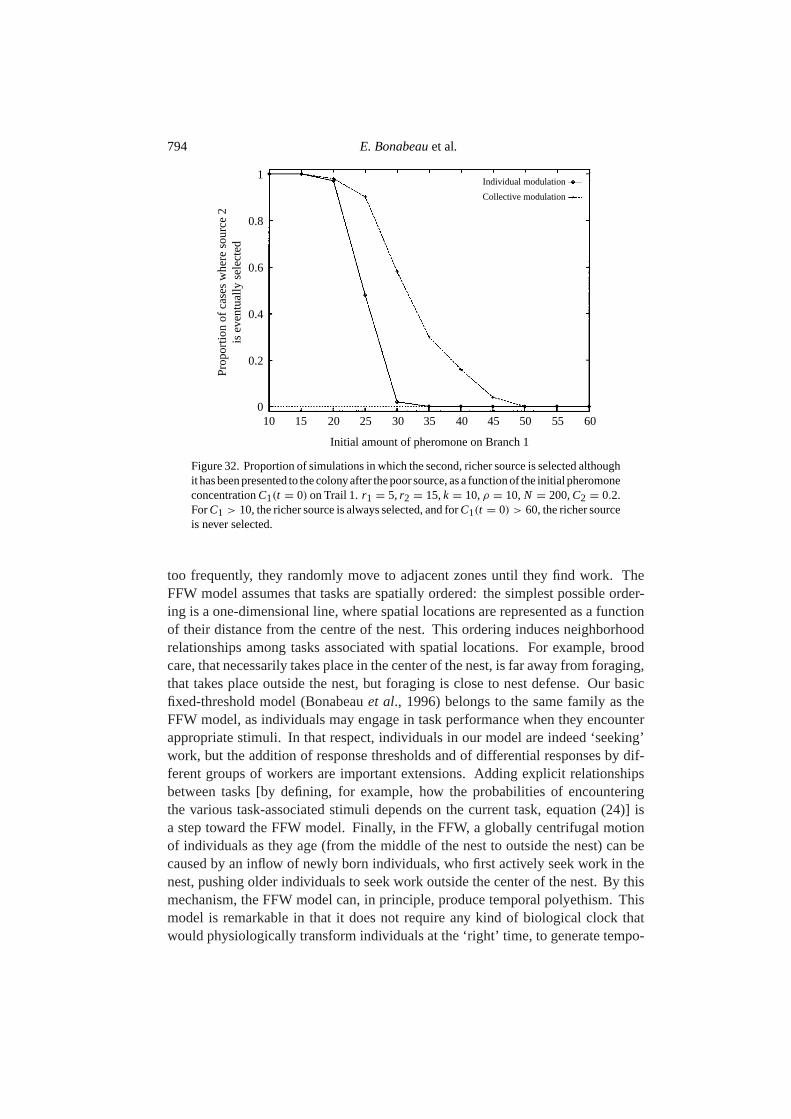
794 E. Bonabeauet al.
100
0.2
0.4
0.6
Prop
ortio
n of
cas
es w
here
sou
rce
2is
eve
ntua
lly s
elec
ted
0.8
1
15 20 25 30 35
Initial amount of pheromone on Branch 1
40 45 50 55 60
Individual modulation
Collective modulation
Figure 32. Proportion of simulations in which the second, richer source is selected althoughit has been presented to the colony after the poor source, as a function of the initial pheromoneconcentrationC1(t = 0) on Trail 1. r1 = 5,r2 = 15,k = 10,ρ = 10,N = 200,C2 = 0.2.ForC1 > 10, the richer source is always selected, and forC1(t = 0) > 60, the richer sourceis never selected.
too frequently, they randomly move to adjacent zones until they find work. TheFFW model assumes that tasks are spatially ordered: the simplest possible order-ing is a one-dimensional line, where spatial locations are represented as a functionof their distance from the centre of the nest. This ordering induces neighborhoodrelationships among tasks associated with spatial locations. For example, broodcare, that necessarily takes place in the center of the nest, is far away from foraging,that takes place outside the nest, but foraging is close to nest defense. Our basicfixed-threshold model (Bonabeauet al., 1996) belongs to the same family as theFFW model, as individuals may engage in task performance when they encounterappropriate stimuli. In that respect, individuals in our model are indeed ‘seeking’work, but the addition of response thresholds and of differential responses by dif-ferent groups of workers are important extensions. Adding explicit relationshipsbetween tasks [by defining, for example, how the probabilities of encounteringthe various task-associated stimuli depends on the current task, equation (24)] isa step toward the FFW model. Finally, in the FFW, a globally centrifugal motionof individuals as they age (from the middle of the nest to outside the nest) can becaused by an inflow of newly born individuals, who first actively seek work in thenest, pushing older individuals to seek work outside the center of the nest. By thismechanism, the FFW model can, in principle, produce temporal polyethism. Thismodel is remarkable in that it does not require any kind of biological clock thatwould physiologically transform individuals at the ‘right’ time, to generate tempo-

Fixed Response Thresholds 795
ral polyethism. Sendova-Franks and Franks (1993) argue that the FFW model isfully consistent with their observations of Leptothorax ants, which are characterizedby weak temporal polyethism. Their argument is further supported by more recentexperiments (Sendova-Franks and Franks, 1995a), in which they showed the exis-tence of individual-specific SFZ, (see Section 4.1), which appear to be independentof the individual’s age: workers tend to perform tasks within their SFZ, irrespectiveof their age. In view of recent experimental evidence [e.g., Calderone and Page(1996); Robinsonet al. (1994)], however, it is almost certain that other mechanisms(such as ageing, under one form or another, including learning) play a role in tem-poral polyethism in some species of social insects, including honeybees. The FFWmodel could be supplemented with a learning mechanism to account for strongerpatterns of age polyethism.
Our mechanism is similar to that of the FFW algorithm (Tofts and Franks, 1992;Franks and Tofts, 1994), except that we use a direct dependence of spatial special-ization on age (by spatial specialization, we mean that workers are more likely to befound in some region of space). Our model allows for behavioral reversion whenrequired, but is less flexible than FFW. On the other hand, temporal polyethism ismore stable than in the pure FFW case. When we tried to set up the parameters ofour model so that it reproduces exactly the FFW model (although with a slightlydifferent formulation), we were unable to generate temporal polyethism solely withspatial relationships between task-associated stimuli, which indicates that the ‘pure’FFW model generates a somewhat unstable form of temporal polyethism. We could,however, generate a less ‘emergent’ pattern of temporal polyethism in our model bycoupling spatial relationships between tasks with the assumption that the youngerworkers tend to remain a certain time in the nest, where they perform local tasks.This constraint, if it is sufficiently strong, i.e., if the time that newly emerged work-ers spend in the center of the nest is sufficiently long, can effectively force olderworkers to find tasks associated with stimuli which are not found at the center of thenest. Finally, while we owe a conceptual debt to the FFW model, we believe thatour model is formulated in such a way that it will be more understandable than thetheory of the FFW model (Tofts, 1993), which was based on a probabilistic exten-sion of Milner’s (1990) process algebra. In such a formalism, initially introducedin the context of theoretical computer science to study general concurrent systemscomprised of interacting individuals, ants correspond to probabilistic processescomposed in parallel. The language of Tofts’ (1993) paper, being most unfamiliarto ethologists, obscured rather than clarified the scope of the FFW model.
5.1.2. Modelling division of labor in social insects.Given a recent set of com-mentaries (Traniello and Rosengaus, 1997; Robson and Beshers, 1997) ‘against’modeling in general, modeling division of labor in particular, and even more specif-ically the FFW model [see also the reply by Frankset al. (1997)], we feel that it isuseful to justify our own modeling approach, all the more as it is related to FFW.First, as clearly explained by Frankset al. (1997), a modeling approach implies that

796 E. Bonabeauet al.
only a (usually small) fraction of reality be studied and formalized; furthermore,any scientific enterprise—stamp collecting not being considered scientific here—is aimed at finding at least some degree of regularity in the world, and scientificexplanation is explanation (by virtue of necessarily simplifying models) of suchregularity. Physicists, obsessed as they are about universality, are responsible fora global tendency to seek common underlying theories for virtually all phenomena[see Bak (1997) for an extreme, provocative, but inspiring version of this tendency],which may not always be justified. Any good theory should be characterized bywhat it cannot explain and what it cannot explain, and both sides are equally im-portant. For instance, in the context of division of labor, finding a potential generalmechanism, such as FFW, is an honorable quest provided one understands that whatTraniello and Rosengaus (1997) call species-specific traits are not part of this theo-retical framework, the aim of which is precisely to point to common features ratherthan to differences. Such differences are not explained by FFW, but suggests thatthere may be common underlying mechanisms responsible for division of labor,including observed patterns of temporal polyethism. This approach is particularlyimportant if one is seeking ancestral mechanisms that allowed for the emergence ofeusociality (for example, mechanisms upon which an efficient division of labor canbe based): evolution may have refined and perhaps sometimes substantially mod-ified such ancestral mechanisms, but finding common features is essential as theypoint to possible common ancestral features that were important for the appearanceof eusociality. The threshold model is also a general model of task allocation, whichcan be useful not only to explain observed behavior, but also, perhaps, to point topotential common ancestral mechanisms. Finally, the assumptions of the basicmodel presented in this paper are based on experimental evidence (Detrain and Pas-teels, 1991, 1992), and can account for other experimental results [Wilson (1984)for example]. This gives more weight to the extensions of the model, and at thesame time the model allows us to test what is and what is not possible within itsframework. For example, we have indicated several times that only a weak formof temporal polyethism can be obtained in this model, with highly specific valuesof the parameters, which suggests that other ingredients are required to account forsome observed patterns of temporal polyethism.
5.1.3. Boolean network model.Page and Mitchell (1990) and Page and Robin-son (1991) have developed a model of task allocation in honeybees based on thethreshold principle, where individuals are represented as boolean automata embed-ded within a network. They did not try, however, to relate quantitatively their resultsto any specific experimental observation. In their model, each worker bee is a binaryswitching element (that can either be 1 or 0: performing or not performing a giventask), connected toK other elements. An element switches on and off dependingon how many 0s and 1s it perceives from theK elements it is connected to. Theidea is that individuals receive information from other individuals (in particular,they can perceive the current task of theK individuals they encounter per unit time)

Fixed Response Thresholds 797
in the colony and decide to become engaged or to give up task performance de-pending on this information. There is also an external input to each element, whichrepresents task-associated stimuli. This external ‘field’ is decreased by one unit byunit time for each individual performing the task, and is regularly incremented torepresent the dynamics of colony needs irrespective of task performance. Whenthe combined input to a given inactive element (state 0) exceeds a threshold, thisindividual becomes engaged in task performance (state 1), and vice versa. Themagnitude of the external field has a positive effect on task performance, whilethe number of workers already performing the task acts as a negative feedback.This model is obviously very similar in spirit to the model described in the presentpaper. Page and Mitchell (1990) found that a boolean network following theserules converges to a steady state, where the proportion of active elements dependson the value of the threshold. They also studied the effect of the variance of thethreshold distribution on the properties of the network, and found that responses todisturbances drive the stimulus back to its predisturbance level for highly peakeddistributions, while the regulation of stimulus level was not as good in wider dis-tributions, although the number of active elements did change in response to theperturbation. These findings show that a network of simple interconnected elementscan exhibit remarkable homeostatic properties, but they are not clearly related toquantitative experimental results. Note that our model shows that the same typeof properties can be obtained without any explicit interaction among individuals(although such interactions certainly do play a role in evaluating colony needs), asthe magnitude of the stimulus alone is sufficient to determine approximately thenumber of individuals involved in task performance. Therefore, in principle it isnot necessary for individuals to know how many other colony members are active.A combination of task-associated stimuli and interactions with other workers is,however, likely to be the relevant information acquisition mechanism.
5.1.4. Connectionist model of task allocation.In an attempt to account for thefield observations of Gordon (1986, 1987, 1989) on the dynamics of task allocationin harvester ants, Gordonet al. (1992) have developed a model based on a con-nectionist (neural net) model, which can be seen as a more complex (and a moreexperiment-driven) version of Page and Mitchell’s (1990) boolean network, whereunits correspond to ants, possible states of a given unit to tasks that can be performedby the ant, and patterns of connections to observed patterns of interaction amongindividuals. They modeled eight categories of ants. Antk is represented by a setof three binary values(ak = ±1,bk = ±1, ck = ±1), so that all eight categoriescan be represented: inactive patrollers(−1,1,1), active patrollers (1,1,1), inactiveforagers(−1,1,−1), active foragers(1,1,−1), inactive nest maintenance workers(−1,−1,1), active nest maintenance workers(1,−1,1), inactive midden workers(−1,−1,−1), and active midden workers(1,−1,−1). Matrices of interactionsα jk , β jk andγ jk , and between Antj and Antk are defined forak, bk, andck respec-tively. One specific feature of this model is that the set of interactions of a given unit

798 E. Bonabeauet al.
with other units changes when the unit changes state. The dynamics of the fullyconnected system proceeds by elementary moves (changingak, bk, or ck) at eachdiscrete time step, depending on the signs of
∑k α jkak,
∑k β jkbk, and
∑k γ jkck:
ak(t + 1) = 2
[(2∑
k
α jkak(t)
)− 1
2
], (32.1)
bk(t + 1) = 2
[(2∑
k
β jkbk(t)
)− 1
2
], (32.2)
ck(t + 1) = 2
[(2∑
k
γ jkck(t)
)− 1
2
], (32.3)
where2(x) = 1 if x > 0, and2(x) = 0 otherwise. Notice that these conditionsare deterministic threshold conditions: when some weighted input exceeds, or goesbelow, some threshold (here, 0), an individual switches tasks or becomes (in)active.Their model is therefore fundamentally a threshold model, where stimulus intensityis a weighted sum of inputs from other individuals. They showed that, dependingon the pattern of interactions among individuals, the system can have one or severalattractors, and that perturbations of one activity propagates to others. One importantassumption of their model is that the evaluation of colony needs by an individualis performed only through interactions with other members of the colony, i.e., onlynumbers of workers engaged in the different tasks are used by an individual to decidewhat task to perform next (depending also on its current state). The magnitude oftask-associated stimuli are not taken into account, which makes the functioning ofthe system rely solely on an internal dynamics. Gordonet al. (1992) were able toreproduce some experimental results qualitatively, but other results are unlikely tobe explained, as the model cannot be robust with respect to certain perturbations(for example, because it is insensitive to colony needs).
5.1.5. A general model of task allocation.Pacalaet al. (1996) have recentlydeveloped a rather general, simple model of task allocation. LetQ be the numberof different tasks to be performed,N the total number of individuals,xi the numberof workers engaged in taski , σi the probability that individuals performing Taskiare successful (an individual that views the environment as profitable (respectively,unprofitable) is in the successful (respectively, unsuccessful) state),ρi j the meanlocal density of Taskj individuals about a Taski individual, ρI i the mean localdensity of Taski individuals about a inactive individual,q the probability perunit time that an unsuccessful individual becomes inactive. Interactions amongindividuals are modeled as simple collisions. The rate at which an individualengaged in Taski encounters individuals engaged in Taskj is proportional toρi j .An inactive individual is recruited to perform Taski if it interacts with a successful

Fixed Response Thresholds 799
Taski individual: the rate of activation into Taski is therefore proportional toρI i .The dynamics ofxi is given by
∂t xi = −xi (1− σi )q +Q∑
j=1
[xiσiρi j (1− σ j )− xjσ jρ j i (1− σi )] + xiσiρI i . (33)
Equation (33) is similar in spirit to equation (12), where stimulus intensitysi hasbeen replaced byσi , and where the response function depends linearly onσi and alsoon a recruitment process [in equation (33), two mistakes present in Pacalaet al.’s(1996) equation (1) have been corrected]. The dynamics ofσi must be specified inorder for the model to be complete. Pacalaet al. (1996) assume that a successfulindividual switches to the unsuccessful state with a probabilityτ−1 per unit time,and that processing a unit of resource within a time unit increasesσ1. Letϕi be theresource density (per unit area) andk a parameter affecting the rate of increase ofσi . The dynamics ofσi is given by
∂tσi = −σi
τ+ kϕi (1− σi ). (34)
If crowding avoidance is taken into account, equation (34) has to be supplementedwith a new term:
∂tσi = −σi
τ+ kϕi (1− σi )− ξ xi
αiσi , (35)
whereξ is a constant of proportionality andαi is the area over which Taski is beingperformed. Clearly,ϕi can change over time, because resources get depleted. Thedynamics ofϕi is then given by
∂tϕi = 0i − µϕi − kϕi xi , (36)
where0i is the rate of creation of the resource (for example seeds that fall to theground), andµ is the ‘natural’ rate of disappearance of the resource (wind, othercolonies, and so forth). Pacalaet al. (1996) considered three cases forσi andϕi : (1) there is no crowding avoidance andϕi does not vary with time (resourcesare abundant), (2) there is no crowding avoidance butϕi varies because resourcesget depleted, and (3) there is crowding avoidance andϕi varies because resourcesget depleted. In all three cases, Pacalaet al. (1996) assumed that the dynamicsof σi and ϕi are fast with respect to variations inxi . Curiously, they did notconsider the case where there are increasing returns for increasingxi , which canbe the case when, for example, allocating a lot of workers to a given task is safer.More importantly, they did not consider how variations in colony needs resultingfrom task performance, which obviously have an influence onσi , could influencepatterns of task allocation. Their model is therefore aimed at describing short-termtask allocation, or, alternatively, can be seen as a general model of recruitment.

800 E. Bonabeauet al.
In equation (33), Pacalaet al. (1996) assumed thatρi j is given byxj I (N)/N,whereI (N) is the ‘per capitarate of social interaction as a function of group size’.They studied the influence ofI (N) on patterns of task allocation. They showedthat some parameter values allow individual- or colony-level evolutionarily stablestrategies to be implemented by means of simple individual behavior. Although theypresented simulations of their model withI (N) proportional toN, they showed thatI (N) should be tuned to maximize fitness. Larger groups may be more efficientthan smaller ones at tracking a changing environment when rates of interactionsper individual increase with group size, but there may be an overload of socialinformation in very large groups, that can become trapped in suboptimal states.Pacalaet al. (1996) predict that, in order to balance optimally, the flows of infor-mation from environmental stimuli and social exchanges (antennation, mandibularcontacts, trophallaxis, etc.) across a range of group sizes, ants should regulate theirper capitarates of social interaction.
5.2. Predictions of the model and connection to experimental work.The fixedthreshold model is arguably the simplest model that connects flexibility at the workerlevel with the resiliency observed at the colony level, in a way that is consistent withexperimental data. In that respect, this model makes an important prediction: thatfixed response thresholds are sufficient to reproduce and possibly explain numerousaspects of task allocation in social insects. An important task is now to study re-sponse curves and show the existence of response thresholds in experiments. Severalexperiments, some results of which are briefly described in Section 2, have shownthe existence of response thresholds, but they do not allow us to connect individualand colonial levels. It would be extremely valuable to find empirical evidence fordifferential response thresholds in minors and majors in the polymorphic speciesstudied by Wilson (1984). Our model generates results that are consistent with theseexperiments, which indicates that differential response curves at the individual levelmight be the underlying mechanism of colony-level flexibility. Preliminary experi-ments onLasius niger(Deneubourget al., in prep.) indicate that different responsethresholds to different seed sizes might be responsible for the fact that small seedsare processed first, followed by medium-sized and large seeds, thereby suggestingthat Model 1 may be valid. Finally, we also believe that our model will be usefulto students of social insects when interpreting results of experiments on divisionof labor. Before looking for complex mechanisms, it may make more sense to askwhether an empirical result could be explained by the fixed-threshold model.
5.3. Limitations of the fixed threshold and future modeling directions.Thefixed threshold model can account, at least partly, for the behavioral flexibility ob-served in ants, when manipulations such as those reported by Wilson (1984) onseveral species ofPheidoleare carried out (Bonabeauet al., 1996). Because thismodel is also biologically plausible, our aim in this paper was to explore whatcould be expected from the model. Clearly, it can explain some aspects of division
Fixed Response Thresholds 801
of labor, including colony-level flexibility in polymorphic species, within-‘caste’flexibility and task switching, spatial fidelity, weak temporal polyethism, or tasksuccession, but it is not always consistent with experimental observations, especiallywhen ‘long’ time scales are involved. Until recently the ‘classical’ view of divisionof labor (Oster and Wilson, 1978) was that it was a relatively static phenomenon,with caste ratios, or more generally ‘class ratios’ (Calabi, 1988), determined byergonomic and energetic considerations. Although within- and between-caste taskswitching and flexibility are observed (Wilson, 1984; Lenoir, 1987; Calabi, 1988;Gordon, 1989), such considerations do appear to be important, and observed (age,physical or behavioral) class ratios have certainly been selected for in the courseof evolution on the basis of these factors. For example, Wilson (1983b) observedflexibility in Atta cephalotesants when one class of workers is removed; replace-ment workers perform similarly to ‘specialized’ workers in terms of frequency andeffectiveness of task performance, but are 30% less efficient with respect to oxygenconsumption (Calabi, 1988). It is therefore tempting to think, following Calabi(1988), that ‘optimal’ caste ratios predicted on the basis of energetic factors (Osterand Wilson, 1978) are relevant over evolutionary time scales, and that observed casteratios have been shaped more or less accordingly, but on short time scales, chang-ing ecological conditions make flexibility an absolute necessity—flexibility has alsobeen selected for. ‘Where colony survival is at issue, considerations of behavioraland/or metabolic efficiency should be secondary. By this reasoning, the caste distri-bution function only approximately reflects long-term selective pressures, becauseflexibility among classes allows short-term compensation for any ‘slop’ or inappro-priateness in caste ratios’ (Calabi, 1988). The same argument applies in support ofWest-Eberhard’s (1981) hypothesis of centrifugal task allocation (see Section 4.1):selection acting at the level of the individual exerts a long-term pressure leading to amore or less marked centrifugal pattern of temporal task allocation, and short-termflexibility, driven by immediate colony requirements, tends to blur this pattern. Thethreshold model is able to reconcile both views, i.e., both time scales. For exam-ple, in polymorphic species, response thresholds may be determined by physicalcaste, with caste ratios being determined (at least partly) by energetic factors. In‘normal’ conditions, i.e., when all individuals belonging to all physical castes arepresent and when there is no particular stress on the colony (such conditions mayin fact be quite abnormal!), task allocation should follow exactly caste distribution.When, however, a large portion of a given caste is missing, individuals belonging toother castes may replace missing workers, through the mechanism developed in thispaper. The understanding of ‘age-based’ task allocation and within-age-class flex-ibility might, however, require a little more than the simple fixed threshold model,although flexibility alone can in principle be understood with this model on shorttime scales, using the same argument as for physical castes.
Although it has been argued several times by Franks and colleagues (Franks and Tofts,1994; Frankset al., 1997) that one should not confuse causality with correlation, andspecifically correlation between age and task with an age-based division of labor,
802 E. Bonabeauet al.
recent experiments (Robinsonet al., 1994; Calderone and Page, 1996) suggest thatresponse thresholds, if they play a role in task allocation, are unlikely to be fixed.Variability in response thresholds may result from two, somewhat complementary,mechanisms; ageing and learning.
(1) In the context of response thresholds, ageing would involve the modificationof thresholds with time, so that, for example, a young individual would havea naturally high response threshold with respect to nest defense, but thatthreshold would progressively become lower as the individual ages, until theprobability of response to a defense-related stimulus becomes significant.
(2) Learning would involve, for example, reduction of a response thresholdwhen the associated task is being performed (task ‘fixation’), and increase ofthe response threshold when the task is not being performed (‘unlearning’)(Deneubourget al., 1987; Plowright and Plowright, 1988; Theraulazet al.,1991).
Both mechanisms seem to be involved; in particular, the role of learning hasbeen evidenced. Witherset al. (1993) have shown that important changes in someregions of the brain are associated with ageing: foragers (> 20 days old) are char-acterized by a smaller volume of Kenyon cells (neurons of the mushroom bodies)and a significantly larger neuropil volume (where synaptic connections are located)than 1-day-old bees, suggesting a high synapse-to-neuron ratio in older bees. Nursebees, intermediate in age, have intermediate volumes of Kenyon cells and neuropil.These observations could result from absolute ageing, but further experiments, car-ried out on artificial colonies comprising a single age cohort of 1-day-old bees,where worker bees start foraging as early as 4 days old, showed that precocious for-agers had similar mushroom bodies as normal foragers, and that nurses were againintermediate. This suggests that behavior influences brain organization, which inturn certainly influences under what conditions tasks are performed. Therefore, age-ing alone cannot explain Witherset al.’s (1993) observations. Calderone and Page(1996) showed that deprived bees (raised in isolation in wire cages with a queen)exhibit precocious foraging, suggesting that the lack of certain stimuli may influ-ence the rate of behavioral ontogeny [a possibility that Calderone and Page (1996)did not rule out; see also Huang and Robinson (1992)]. More generally, relativeage (i.e., age relative to the rest of the colony) is often a more relevant parameterthan absolute age (Lenoir, 1979; Jaissonet al., 1988; Calabi, 1988; Van der Blom,1993; Sendova-Franks and Franks, 1994), which means that stimuli provided bythe environment and other colony members are likely to play an important rolein shaping behavioral ontogeny. These studies suggest that individual experienceshapes behavioral ontogeny, and that response thresholds may be dynamic, ratherthan static. But whether behavior is a cause or an effect of ageing remains anunsolved question.
As emphasized by Sendova-Franks and Franks (1993, 1994), the FFW modelor threshold models can readily be supplemented with learning or reinforcement,
Fixed Response Thresholds 803
leading to stronger specialization and, under the appropriate conditions, strongerpatterns of temporal polyethism: ‘ants become increasingly entrained on certaintasks they practice, and seek out such tasks in preference to others’ (Sendova-Franks and Franks, 1993), leading to the phenomenon of strong ‘task fixation’(Wilson, 1976). Theraulazet al. (1991) developed a model of regulation of divisionof labor combined with hierarchical differentiation based on variable thresholds. Intheir model, a threshold is lowered when the corresponding task is performed, andincreased when the corresponding task is not performed [see also Deneubourget al.(1987) and Plowright and Plowright (1988)]. But, although their model is able togenerate sociogenesis, it is still necessary to compare its behavior with experimentsand to determine what it can explain and what it cannot explain.
There are other limitations inherent to the model presented in this paper: it doesnot really take into account complex networks of interactions among individuals, itassumes a single way of getting information about a given task or about differenttasks, and does not deal accurately with spatial heterogeneities. It is in a sense amean-field model. But all these limitations can be overcome in future works, whileretaining the essence of the concept of response threshold.
Finally, our study has been aimed at clarifying the mechanisms underlying theregulation of division of labor in social insects. We did not discuss the adap-tive significance of such patterns. We believe, however, that understanding themechanisms that allow social insects to perform complex tasks collectively, is anecessary step towards understanding the evolution of social behavior (Mangel,1995; Bonabeauet al., 1997).
ACKNOWLEDGEMENTS
We thank Claire Detrain and Jacques M. Pasteels for fruitful discussions. EB issupported by the Interval Research Postdoctoral Fellowship at the Santa Fe Institute.GT is supported in part by a grant from the Conseil R´egional Midi-Pyrenees. Thiswork was supported in part by a grant from the GIS (Groupe d’Int´eret Scientifique)Sciences de la Cognition to EB and GT.
REFERENCES
}}Bak, P. (1997).How Nature Works, New York: Copernicus.}}Beckers, R., J.-L. Deneubourg, S. Goss and J. M. Pasteels (1990). Collective decision
making through food recruitment.Insectes Soc.37, 258–267.}}Boch, R., D. A. Shearer and B. C. Stone (1962). Identification of iso-amyl acetate as an
active component in the sting pheromone of the honey bee.Nature195, 1018–1020.

804 E. Bonabeauet al.
}}Bonabeau, E., G. Theraulaz and J.-L. Deneubourg (1996). Quantitative study of the fixedthreshold model for the regulation of division of labour in insect societies.Proc. Roy.Soc. Lond.B263, 1565–1569.
}}Bonabeau, E., G. Theraulaz, J.-L. Deneubourg, S. Aron and S. Camazine (1997). Self-organization in social insects.Trends Ecol. Evol.12, 188–193.
}}Breed, M. D., G. E. Robinson and R. E. Page (1990). Division of labour during honey beecolony defense.Behav. Ecol. Sociobiol.27, 395–401.
}}Calabi, P. (1986).Division of labor in the antPheidole dentata: the role of colony de-mography and behavioral flexibility, PhD dissertation, Boston University, Boston, MA,U.S.A.
}}Calabi, P. (1988). Behavioral flexibility in Hymenoptera: a re-examination of the concept ofcaste, inAdvances in Myrmecology, J. C. Trager (Ed.), Leiden: Brill Press, pp. 237–258.
}}Calderone, N. W. and R. E. Page (1988). Genotypic variability in age polyethism and taskspecialization in the honey beeApis mellifera(Hymenoptera: Apidae).Behav. Ecol.Sociobiol.22, 17–25.
}}Calderone, N. W. and R. E. Page. 1991. The evolutionary genetics of division of labor incolonies of the honey bee(Apis mellifera). Amer. Nat.138, 69–92.
}}Calderone, N. W. and R. E. Page (1996). Temporal polyethism and behavioral canalizationin the honey bee,Apis mellifera. Anim. Behav.51, 631–643.
}}Carlin, N. F. and B. H¨olldobler (1983). Nestmate and kin recognition in interspecific mixedcolonies of ants.Science222, 1027–1029.
}}Chretien, L. (1996).Organisation spatiale du materiel provenant de l’excavation du nidchezMessor barbaruset des cadavres d’ouvrieres chezLasius niger(Hymenopterae:Formicidae).PhD Thesis, D´epartement de Biologie Animale, Universit´e Libre de Brux-elles, Belgium.
}}Collins, A. M. and W. C. Rothenbuler (1978). Laboratory test of the response to an alarmchemical, isopentyl acetate, by Apis mellifera.Ann. Ent. Soc. Am.71, 906–909.
}}Deneubourg, J.-L., S. Aron, S. Goss and J. M. Pasteels (1989). The self-organizing ex-ploratory pattern of the Argentine ant.J. Insect Behav.2, 719–725.
}}Deneubourg, J.-L. and N. R. Franks (1995). Collective control without explicit coding: thecase of communal nest excavation.J. Insect Behav.8, 417–432.
}}Deneubourg, J.-L. and S. Goss (1989). Collective patterns and decision-making.Ethol.Ecol. Evol.1, 295–311.
}}Deneubourg, J.-L., S. Goss, J. M. Pasteels, D. Fresneau and J.-P. Lachaud (1987). Self-organization mechanisms in ant societies (II): learning in foraging and division of labour,in From Individual to Collective Behaviour in Social Insects, J. M. Pasteels and J.-L.Deneubourg (Eds),Experientia Supplementum54, 177–196.
}}Detrain, C. and J. M. Pasteels (1991). Caste differences in behavioral thresholds as a basis forpolyethism during food recruitment in the antPheidole pallidula(Nyl.) (Hymenoptera:Myrmicinae).J. Insect Behav.4, 157–176.
}}Detrain, C. and J. M. Pasteels (1992). Caste polyethism and collective defense in the antPheidole pallidula: the outcome of quantitative differences in recruitment.Behav. Ecol.Sociobiol.29, 405–412.
}}Detrain, C., J. M. Pasteels and J.-L. Deneubourg (1988). Poly´ethisme dans le trac´e et lesuivi de la piste chez Pheidole pallidula (Formicidae).Actes Coll. Ins. Soc.4, 87–94.
}}Franks, N. R. and A. B. Sendova-Franks (1992). Brood sorting by ants: distributing theworkload over the work surface.Behav. Ecol. Sociobiol.30, 109–123.
}}Franks, N. R. and C. M. N. Tofts (1994). Foraging for work: how tasks allocate workers.

Fixed Response Thresholds 805
Anim. Behav.48, 470–472.}}Franks, N. R., C. M. N. Tofts and A. B. Sendova-Franks (1997). Studies of division of
labour: neither physics nor stamp collecting.Anim. Behav.53, 219–224.}}Frumhoff, P. C. and J. Baker (1988). A genetic component to division of labour within
honey bee colonies.Nature333, 358–361.}}Gordon, D. M. (1986). The dynamics of the daily round of the harvester ant colony.Anim.
Behav.34, 1402–1419.}}Gordon, D. M. (1987). Group-level dynamics in harvester ants: young colonies and the role
of patrolling.Anim. Behav.35, 833–834.}}Gordon, D. M. (1989). Dynamics of task-switching in harvester ants.Anim. Behav.38,
194–204.}}Gordon, D. M. (1996). The organization of work in social insect colonies.Nature 380,
121–124.}}Gordon, D. M., B. C. Goodwin and L. E. H. Trainor (1992). A parallel distributed model
of the behaviour of ant colonies.J. Theor. Biol.156, 293–307.}}Huang, Z. Y. and G. E. Robinson (1992). Honeybee colony integration: worker-worker
interactions mediate hormonally regulated plasticity.Proc. Natl. Acad. Sci. USA89,11726–11729.
}}Jaisson, P., D. Fresneau and J.-P. Lachaud (1988). Individual traits of social behaviour inants. InInterindividual Behavioral Variability in Social Insects, R. L. Jeanne (Ed.), pp.1–51. Boulder, CO, Westview Press.
}}Jeanne, R. L. (1986). The evolution of the organization of work in social insects.Monit.Zool. Ital.20, 119–133.
}}Jeanne, R. L. (1991). Polyethism, inThe Social Biology of Wasps, K. G. Ross and R. W.Matthews (Eds), Cornell, Ithaca, NY: Comstock, pp. 389-425.
}}Jeanne, R. L. (1996). Regulation of nest construction behaviour in Polybia occidentalis.Anim. Behav.52, 473–488.
}}Jeanne, R. L., N. M. Williams and B. S. Yandell (1992). Age polyethism and defense in atropical social wasp (Hymenoptera: Vespidae).J. Insect Behav.5, 211–227.
}}Keller, L. (1995). Parasites, worker polymorphism, and queen number in social insects.Am.Nat.145, 842–847.
}}Lenoir, A. (1979). Le comportement alimentaire et la division du travail chez la fourmiLasius niger.Bull. Biol. France and Belgique113, 79–314.
}}Lenoir, A. (1987). Factors determining polyethism in social insects, inFrom Individualto Collective Behaviour in Social Insects, J. M. Pasteels and J.-L. Deneubourg (Eds),Experientia Supplementum54, 219–241.
}}Lindauer, M. (1952). Ein Beitrag zur Frage der Arbeitsteilung im Bienenstaat.Z. Vgl.Physiol.34, 299–345.
}}Mangel, M. (1995). Social interactions, nonlinear dynamics and task allocation in groups.Trends Ecol. Evol.10, 347.
}}Milner, R. (1990).Communication and Concurrency, New York: Prentice Hall.}}Oster, G. and E. O. Wilson (1978).Caste and Ecology in the Social Insects, Princeton, NJ:
Princeton University Press.}}Pacala, S. W., D. M. Gordon and H. C. J. Godfray (1996). Effects of social group size on
information transfer and task allocation.Evol. Ecol.10, 127–165.}}Page, R. E. and S. D. Mitchell (1990). Self-organization and adaptation in insect societies.
A. Fine, M. Forbes and L. Wessels (Eds),Phil. Sci. Assoc., 2, 289–298.}}Page, R. E. and G. E. Robinson (1991). The genetics of division of labour in honey bee

806 E. Bonabeauet al.
colonies.Adv. Ins. Physiol.23, 117–169.}}Passera, L., E. Roncin, B. Kaufmann and L. Keller (1996). Increased soldier production in
ant colonies exposed to intraspecific competition.Nature379, 630–631.}}Plowright, R. C. and C. M. S. Plowright (1988). Elitism in social insects: a positive feedback
model, inInterindividual Behavioral Variability in Social Insects, R. L. Jeanne (Ed),Boulder, CO: Westview Press, pp. 419–431..
}}Robinson, G. E. (1987a). Modulation of alarm pheromone perception in the honey bee:evidence for division of labour based on hormonally regulated response thresholds.J.Comp. Physiol.A160, 613–619.
}}Robinson, G. E. (1987b). Regulation of honey bee age polyethism by juvenile hormone.Behav. Ecol. Sociobiol.20, 329-338.
}}Robinson, G. E. (1992). Regulation of division of labour in insect societies.Ann. Rev.Entomol.37, 637–665.
}}Robinson, G. E. and R. E. Page (1988). Genetic determination of guarding and undertakingin honey-bee colonies.Nature333, 356–358.
}}Robinson, G. E., R. E. Page and Z.-Y. Huang (1994). Temporal polyethism in social insectsis a developmental process.Anim. Behav.48, 467–469.
}}Robson, S. K. and S. N. Beshers (1997). Division of labour and ‘foraging for work’:simulating reality versus the reality of simulations.Anim. Behav.53, 214–218.
}}Schatz, B. (1997).Modalites de la recherche et de la recolte alimentaire chez la fourmiEctatomma ruidumRoger: flexibilites individuelle et collective, PhD dissertation, Uni-versite Paul Sabatier, Toulouse, France.
}}Seeley, T. D. (1982). Adaptive significance of the age polyethism schedule in honeybeecolonies.Behav. Ecol. Sociobiol.11, 287–293.
}}Seeley, T. D. (1989). Social foraging in honey bees: how nectar foragers assess their colony’snutritional status.Behav. Ecol. Sociobiol.24, 181–199.
}}Seeley, T. D. (1992). The tremble dance of the honey bee: message and meanings.Behav.Ecol. Sociobiol.31, 375–383.
}}Sendova-Franks, A. B. and N. R. Franks (1993). Task allocation in ant colonies withinvariable environments (a study of temporal polyethism: experimental).Bull. Math.Biol. 55, 75–96.
}}Sendova-Franks, A. B. and N. R. Franks (1994). Social resilience in individual worker antsand its role in division of labour.Proc. Roy. Soc. Lond.B256, 305–309.
}}Sendova-Franks, A. B. and N. R. Franks (1995a). Spatial relationships within the nests ofthe ant Leptothorax unifasciatus (Latr.) and their implications for the division of labour.Anim. Behav.50, 121–136.
}}Sendova-Franks, A. B. and N. R. Franks (1995b). Division of labour in a crisis: taskallocation during colony emigration in the ant Leptothorax unifasciatus (Latr.).Behav.Ecol. Sociobiol.36, 269–282.
}}Stuart, R. J. and R. E. Page (1991). Genetic component to division of labor among workersof a leptothoracine ants.Naturwiss.78, 375–377.
}}Theraulaz G., S. Goss, J. Gervet and J.-L. Deneubourg (1991). Task differentiation inPolistes wasp colonies: a model for self-organizing groups of robots, inFrom Animalsto Animats, J.-A. Meyer and S. W. Wilson (Eds), Cambridge, MA: MIT Press/BradfordBooks, pp. 346–355.
}}Tofts, C. (1993). Algorithms for task allocation in ants (A study of temporal polyethism:theory).Bull. Math. Biol.55, 891–918.
}}Tofts, C. and N. R. Franks (1992). Doing the right thing: ants, honeybees and naked mole-

Fixed Response Thresholds 807
rats.Trends Ecol. Evol.7, 346–349.}}Traniello, J. F. A. and R. B. Rosengaus (1997). Ecology, evolution and division of labour
in social insects.Anim. Behav.53, 209–213.}}Van der Blom, J. (1993). Individual differentiation in behaviour of honey bee workers (Apis
mellifera L.).Insectes Soc.40, 345–361.}}West-Eberhard, M.-J. (1981). Intragroup selection and the evolution of insect societies, in
Natural Selection and Social Behaviour, R. D. Alexander and D. W. Tinkle (Eds), NewYork: Chiron Press, pp. 3-17.
}}Wheeler, D. E. and H. F. Nijhout (1981). Soldier determination in ants: new role for juvenilehormone.Science213, 361–363.
}}Wilson, E. O. (1976). Behavioral discretization and the number of castes in an ant species.Behav. Ecol. Sociobiol.1, 141–154.
}}Wilson, E. O. (1980). Caste and division of labor in leaf-cutter ants (Hymenoptera: Formi-cidae: Atta). I. The overall pattern in A. sexdens.Behav. Ecol. Sociobiol.7, 143–156.
}}Wilson, E. O. (1983a). Caste and division of labor in leaf-cutter ants (Hymenoptera: Formi-cidae: Atta). III. Ergonomic resiliency in foraging by A. cephalotes.Behav. Ecol. So-ciobiol. 14, 47–54.
}}Wilson, E. O. (1983b). Caste and division of labor in leaf-cutter ants (Hymenoptera: Formi-cidae: Atta). IV. Colony ontogeny of A. cephalotes.Behav. Ecol. Sociobiol.14, 55–60.
}}Wilson, E. O. (1984). The relation between caste ratios and division of labour in the antgenus Pheidole (Hymenoptera: Formicidae).Behav. Ecol. Sociobiol.16, 89–98.
}}Wilson, E. O. (1985). Between-caste aversion as a basis for division of labour in the antPheidole pubiventris (Hymenoptera: Formicidae).Behav. Ecol. Sociobiol.17, 35–37.
}}Wilson, E. O. and B. H¨olldobler (1988). Dense heterarchies and mass communications asthe basis of organization in ant colonies.Trends Ecol. Evol.3, 65–68.
}}Withers, G. S., S. E. Fahrbach and G. E. Robinson (1993). Selective neuroanatomicalplasticity and division of labour in the honeybee.Nature364, 238–240.
Received 29 September 1997 and accepted 13 January 1998
Copyright © 2022 FDOKUMEN