
Five-Dimensional Optical Data Storage Based on Ellipse ...
9
micromachines Article Five-Dimensional Optical Data Storage Based on Ellipse Orientation and Fluorescence Intensity in a Silver-Sensitized Commercial Glass Chang-Hyun Park 1,2 , Yannick Petit 2,3, *, Lionel Canioni 2 and Seung-Han Park 1, * 1 Department of Physics, Yonsei University, Seoul 03722, Korea; [email protected] 2 University of Bordeaux, CNRS, CEA, CELIA, UMR 5107, 351 Cours de la Libération, 33405 Talence CEDEX, France; [email protected] 3 University of Bordeaux, CNRS, ICMCB, UMR 5026, 87 Avenue du Dr. A. Schweitzer, 33608 Pessac, France * Correspondence: [email protected] (Y.P.); [email protected] (S.-H.P.) Received: 21 October 2020; Accepted: 18 November 2020; Published: 24 November 2020 Abstract: Five-dimensional (5D) recording and decoding is demonstrated by using femtosecond direct laser writing in a silver-containing commercial glass. In particular, laser intensities and ellipse orientations generated by anamorphic focusing are employed to produce 5D data storage unit (3D for XYZ, 1D for the orientation of the elliptically-shaped data storage unit and 1D for its fluorescence intensity). In the recording process, two different images of a 4-bit bitmap format were simultaneously embedded in the medium by multiplexing the elliptical orientation of the laser focus and its intensity so as to access oriented elliptical patterns with independent fluorescence intensity. In the decoding process, two merged original images were successfully reconstructed by comparing each data storage unit with a fabricated calibration matrix of 16 × 16 levels for elliptic orientations and fluorescence intensities. We believe this technique can be applied to semi-permanent high-density data storage device. Keywords: multi-dimensional optical data storage; direct laser writing; phase shaping; femtosecond phenomena; specialty glasses; silver clusters 1. Introduction High-density optical data storage (ODS) techniques have been actively investigated to overcome storage-capacity and life-time limitations of conventional storage media such as CDs and DVDs [1,2]. Multilayered 3D data storage was demonstrated by using two-photon excitation in photopolymer [3,4]. The polarization–multiplexed optical memory technique in urethane–urea copolymers was also presented [5]. To increase the data storage capacity, 5D optical recording was proposed by using three different wavelengths and two polarizations of an incident laser [6]. Pearson et. al. fabricated bow-tie nanoscale fuses on graphene for permanent write-once-read-many applications [7]. Zhang et al. achieved semi-permanent 5D optical recording and decoding of digital information by femtosecond (fs) laser nanostructuring in fused quartz [8,9]. Recently, polychromatic and polarized multilevel multiplexing in glass containing gold nanorods (GNRs) was also demonstrated [10]. In general, nano and micro-scale ODS units created in glass (mostly fused silica) result from type I or type II index modifications produced by direct laser writing (DLW) [11,12], corresponding either to an isotropic refractive index change or to the creation of self-organized form-birefringent nano-gratings, respectively. High laser intensities are required for both of these DLW techniques. In contrast, the recently reported type Argentum (type A) index modification can be performed in silver-containing glass with relatively low incident laser irradiation around 10 TW/cm 2 [13], taking advantage of tailored Micromachines 2020, 11, 1026; doi:10.3390/mi11121026 www.mdpi.com/journal/micromachines
-
Upload
khangminh22 -
Category
Documents
-
view
0 -
download
0
Transcript of Five-Dimensional Optical Data Storage Based on Ellipse ...

micromachines
Article
Five-Dimensional Optical Data Storage Based onEllipse Orientation and Fluorescence Intensity in aSilver-Sensitized Commercial Glass
Chang-Hyun Park 1,2, Yannick Petit 2,3,*, Lionel Canioni 2 and Seung-Han Park 1,*1 Department of Physics, Yonsei University, Seoul 03722, Korea; [email protected] University of Bordeaux, CNRS, CEA, CELIA, UMR 5107, 351 Cours de la Libération,
33405 Talence CEDEX, France; [email protected] University of Bordeaux, CNRS, ICMCB, UMR 5026, 87 Avenue du Dr. A. Schweitzer, 33608 Pessac, France* Correspondence: [email protected] (Y.P.); [email protected] (S.-H.P.)
Received: 21 October 2020; Accepted: 18 November 2020; Published: 24 November 2020 �����������������
Abstract: Five-dimensional (5D) recording and decoding is demonstrated by using femtoseconddirect laser writing in a silver-containing commercial glass. In particular, laser intensities andellipse orientations generated by anamorphic focusing are employed to produce 5D data storageunit (3D for XYZ, 1D for the orientation of the elliptically-shaped data storage unit and 1D for itsfluorescence intensity). In the recording process, two different images of a 4-bit bitmap format weresimultaneously embedded in the medium by multiplexing the elliptical orientation of the laser focusand its intensity so as to access oriented elliptical patterns with independent fluorescence intensity.In the decoding process, two merged original images were successfully reconstructed by comparingeach data storage unit with a fabricated calibration matrix of 16 × 16 levels for elliptic orientations andfluorescence intensities. We believe this technique can be applied to semi-permanent high-densitydata storage device.
Keywords: multi-dimensional optical data storage; direct laser writing; phase shaping; femtosecondphenomena; specialty glasses; silver clusters
1. Introduction
High-density optical data storage (ODS) techniques have been actively investigated to overcomestorage-capacity and life-time limitations of conventional storage media such as CDs and DVDs [1,2].Multilayered 3D data storage was demonstrated by using two-photon excitation in photopolymer [3,4].The polarization–multiplexed optical memory technique in urethane–urea copolymers was alsopresented [5]. To increase the data storage capacity, 5D optical recording was proposed by usingthree different wavelengths and two polarizations of an incident laser [6]. Pearson et. al. fabricatedbow-tie nanoscale fuses on graphene for permanent write-once-read-many applications [7]. Zhang et al.achieved semi-permanent 5D optical recording and decoding of digital information by femtosecond(fs) laser nanostructuring in fused quartz [8,9]. Recently, polychromatic and polarized multilevelmultiplexing in glass containing gold nanorods (GNRs) was also demonstrated [10].
In general, nano and micro-scale ODS units created in glass (mostly fused silica) result from type Ior type II index modifications produced by direct laser writing (DLW) [11,12], corresponding either toan isotropic refractive index change or to the creation of self-organized form-birefringent nano-gratings,respectively. High laser intensities are required for both of these DLW techniques. In contrast,the recently reported type Argentum (type A) index modification can be performed in silver-containingglass with relatively low incident laser irradiation around 10 TW/cm2 [13], taking advantage of tailored
Micromachines 2020, 11, 1026; doi:10.3390/mi11121026 www.mdpi.com/journal/micromachines

Micromachines 2020, 11, 1026 2 of 9
materials with sensitizing agents [14]. Type A DLW of fluorescent hollow cylindrical structureswas demonstrated, which has been intensively investigated in terms of spatial 3D distributions ofassociated linear (absorption, excitation, emission, and lifetime, index modification) and nonlinear(SHG and THG) micro-spectrocopies, as well as in terms of silver element redistribution (electronchemical microprobe, near-field optical scanning microscopy) and of detailed numerical modelingunder many-pulse laser-glass interactions, as reviewed by Petit et al. [15,16]. Indeed, these fluorescenthollow cylindrical structures show an increasing readout fluorescence emission while DLW intensityincreases [15]. An accelerated aging test, carried out in a climatic test chamber at 100 ◦C for 3100 h,revealed long-term storage capability of this type A approach, with unmodified optical performanceand fluorescence spectrum changes less than 1% [17]. The three-layer images, inscribed by fromRoyon et al. ten years ago, are still perfectly observable [18].
In this letter, we report on the 5D ODS technique based on fluorescence intensity and ellipseorientation of data storage units by using Type A DLW in silver-containing commercial glass.Fluorescence intensity modulation, obtained by controlling the incident laser irradiance, was usedto provide one dimension to ODS, in addition to the three spatial coordinates. In order to increasethe experimental degrees of freedom, the hollow cylindrical structure was transformed into a hollowellipse structure by anamorphic focusing of the fs laser. We demonstrate that two different 4-bit bitmapimages of 100 × 100 pixels can be embedded into one single image in such glasses by multiplexing16 levels of the laser intensity and 16 levels of the ellipse orientation. We also show that the originalimages could be successively decoded and retrieved.
2. Materials and Methods
2.1. Commercial Glass Sample
The sample used in our 5D ODS experiments was a silver-containing commercial glass (AG01®,from ArgoLight Company, Pessac, France). Fluorescent clusters were created in AG01® with anear-infrared fs laser, enabling the type A DLW. As detailed elsewhere, silver-sensitized glassesand laser-activated photochemistry can lead to the fabrication of innovative integrated or surfacewaveguides, directional couplers both in bulk or ribbon fiber-shaped samples [15]. In the present work,laser inscription were conducted in fixed point-by-point positions, leading to localized patterns withcontrolled orientations and fluorescence intensities, as detailed hereafter.
2.2. Formation and Observation of Oriented Elliptical Fluorescent Patterns
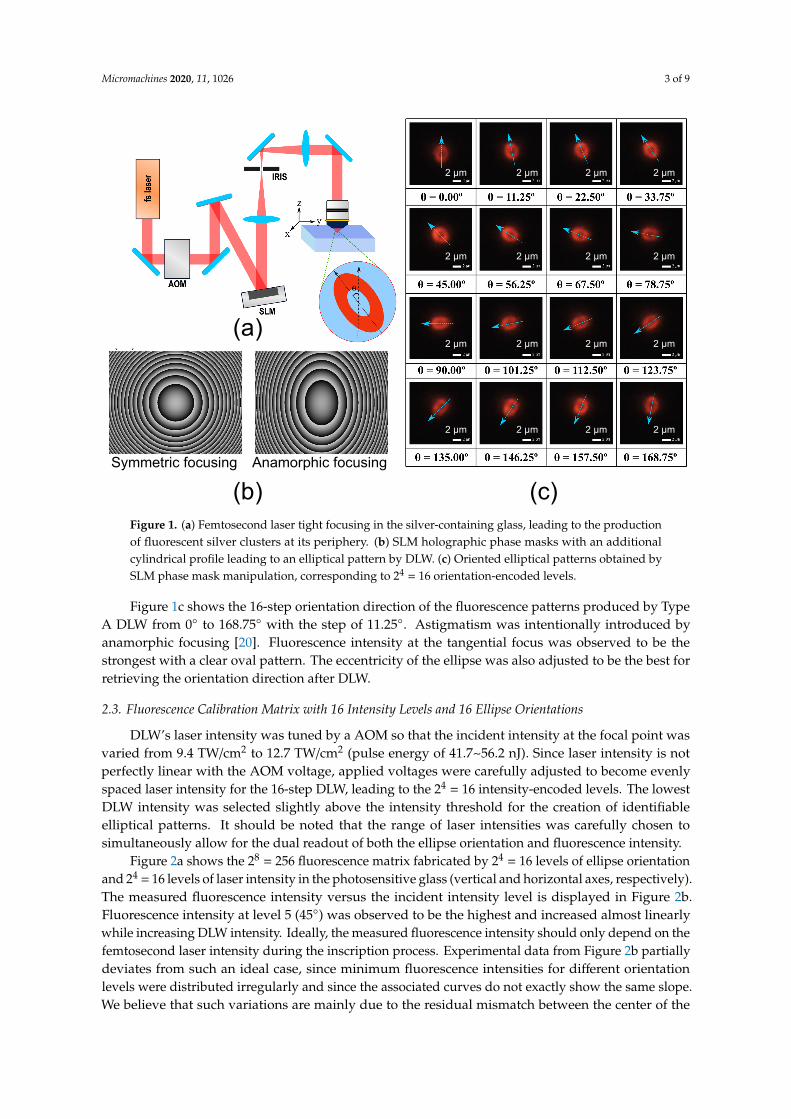
Figure 1a shows our experimental setup for recording 4-bit bitmap images. The light source forType A DLW was an Yb:KGW fs laser (Amplitude system, 9.8 MHz repetition rate, 390 fs pulse FWHMduration and operating at 1030 nm). An Acousto-Optic Modulator (AOM) was used to generate the16-step incident laser intensities. The phase of the laser beam was adjusted by a liquid-crystal-siliconspatial light modulator (SLM; LCOS, X10468-03, 800 × 600 pixel, Hamamatsu Photonics, Higashi-ku,Japan). The beam was focused by an objective lens (Zeiss, Oberkochen, Germany, 20×, 0.75 NA).
Laser-induced fluorescent patterns, composed of fluorescent molecular silver clusters, were imagedwith a scanning confocal microscope (Leica, Wetzlar, Germany, DM6 CFS TCS SP8) with 1 Airy diskpinhole (defined for a central wavelength of 500 nm) and a Leica microscope objective (20×, NA = 0.75),integrating the 450–550 nm spectral fluorescence emission under excitation with a 405 nm laser.The limited UV illumination time of each pattern during the scanning imaging process did lead to anyfluorescence intensity decay nor to any permanent fluorescence bleaching.
Figure 1b shows the SLM holographic phase masks with a circular profile (left) and a cylindricalprofile (right). Indeed, we introduce an SLM phase mask with the cylindrical profile to generate anelliptical fluorescent pattern at the tangential focus, to control the orientation encoding direction [19].The 16-step orientations of the elliptical pattern at the tangential focus were created by graduallyrotating the SLM mask while maintaining the cylindrical profile.
Micromachines 2020, 11, 1026 3 of 9
Micromachines 2020, 11, x 3 of 9
[19]. The 16-step orientations of the elliptical pattern at the tangential focus were created by gradually rotating the SLM mask while maintaining the cylindrical profile.
Figure 1c shows the 16-step orientation direction of the fluorescence patterns produced by Type A DLW from 0° to 168.75° with the step of 11.25°. Astigmatism was intentionally introduced by anamorphic focusing [20]. Fluorescence intensity at the tangential focus was observed to be the strongest with a clear oval pattern. The eccentricity of the ellipse was also adjusted to be the best for retrieving the orientation direction after DLW.
Figure 1. (a) Femtosecond laser tight focusing in the silver-containing glass, leading to the production of fluorescent silver clusters at its periphery. (b) SLM holographic phase masks with an additional cylindrical profile leading to an elliptical pattern by DLW. (c) Oriented elliptical patterns obtained by SLM phase mask manipulation, corresponding to 24 = 16 orientation-encoded levels.
2.3. Fluorescence Calibration Matrix with 16 Intensity Levels and 16 Ellipse Orientations
DLW’s laser intensity was tuned by a AOM so that the incident intensity at the focal point was varied from 9.4 TW/cm2 to 12.7 TW/cm2 (pulse energy of 41.7~56.2 nJ). Since laser intensity is not perfectly linear with the AOM voltage, applied voltages were carefully adjusted to become evenly spaced laser intensity for the 16-step DLW, leading to the 24 = 16 intensity-encoded levels. The lowest DLW intensity was selected slightly above the intensity threshold for the creation of identifiable elliptical patterns. It should be noted that the range of laser intensities was carefully chosen to simultaneously allow for the dual readout of both the ellipse orientation and fluorescence intensity.
Figure 2a shows the 28 = 256 fluorescence matrix fabricated by 24 = 16 levels of ellipse orientation and 24 = 16 levels of laser intensity in the photosensitive glass (vertical and horizontal axes, respectively). The measured fluorescence intensity versus the incident intensity level is displayed in Figure 2b. Fluorescence intensity at level 5 (45°) was observed to be the highest and increased almost linearly while increasing DLW intensity. Ideally, the measured fluorescence intensity should only depend on the femtosecond laser intensity during the inscription process. Experimental data from Figure 2b partially deviates from such an ideal case, since minimum fluorescence intensities for different orientation levels were distributed irregularly and since the associated curves do not
Symmetric focusing Anamorphic focusing
2 µm 2 µm 2 µm2 µm
2 µm 2 µm 2 µm2 µm
2 µm 2 µm 2 µm2 µm
2 µm 2 µm 2 µm2 µm
(a)
(b) (c)Figure 1. (a) Femtosecond laser tight focusing in the silver-containing glass, leading to the productionof fluorescent silver clusters at its periphery. (b) SLM holographic phase masks with an additionalcylindrical profile leading to an elliptical pattern by DLW. (c) Oriented elliptical patterns obtained bySLM phase mask manipulation, corresponding to 24 = 16 orientation-encoded levels.
Figure 1c shows the 16-step orientation direction of the fluorescence patterns produced by TypeA DLW from 0◦ to 168.75◦ with the step of 11.25◦. Astigmatism was intentionally introduced byanamorphic focusing [20]. Fluorescence intensity at the tangential focus was observed to be thestrongest with a clear oval pattern. The eccentricity of the ellipse was also adjusted to be the best forretrieving the orientation direction after DLW.
2.3. Fluorescence Calibration Matrix with 16 Intensity Levels and 16 Ellipse Orientations
DLW’s laser intensity was tuned by a AOM so that the incident intensity at the focal point wasvaried from 9.4 TW/cm2 to 12.7 TW/cm2 (pulse energy of 41.7~56.2 nJ). Since laser intensity is notperfectly linear with the AOM voltage, applied voltages were carefully adjusted to become evenlyspaced laser intensity for the 16-step DLW, leading to the 24 = 16 intensity-encoded levels. The lowestDLW intensity was selected slightly above the intensity threshold for the creation of identifiableelliptical patterns. It should be noted that the range of laser intensities was carefully chosen tosimultaneously allow for the dual readout of both the ellipse orientation and fluorescence intensity.
Figure 2a shows the 28 = 256 fluorescence matrix fabricated by 24 = 16 levels of ellipse orientationand 24 = 16 levels of laser intensity in the photosensitive glass (vertical and horizontal axes, respectively).The measured fluorescence intensity versus the incident intensity level is displayed in Figure 2b.Fluorescence intensity at level 5 (45◦) was observed to be the highest and increased almost linearlywhile increasing DLW intensity. Ideally, the measured fluorescence intensity should only depend on thefemtosecond laser intensity during the inscription process. Experimental data from Figure 2b partiallydeviates from such an ideal case, since minimum fluorescence intensities for different orientationlevels were distributed irregularly and since the associated curves do not exactly show the same slope.We believe that such variations are mainly due to the residual mismatch between the center of the

Micromachines 2020, 11, 1026 4 of 9
laser beam and the center of the SLM mask for anamorphic focusing, in combination with a residualintrinsic astigmatism of the incident laser beam. Nonetheless, the linearity with the increase of DLWintensity was mostly maintained. Such a calibration matrix was further used to retrieve 5D stored datain the decoding process.
Micromachines 2020, 11, x 4 of 9
exactly show the same slope. We believe that such variations are mainly due to the residual
mismatch between the center of the laser beam and the center of the SLM mask for anamorphic
focusing, in combination with a residual intrinsic astigmatism of the incident laser beam.
Nonetheless, the linearity with the increase of DLW intensity was mostly maintained. Such a
calibration matrix was further used to retrieve 5D stored data in the decoding process.
Figure 2. Fabricated fluorescence calibration matrix. (a) Confocal image of all basic storage units
composed by 16 intensity levels and 16 orientation levels. (b) Measured fluorescence intensity versus
incident DLW intensity for the 5D decoding process.
3. Results
3.1. Laser Writing Process with 256 Levels: 16 Fluorescence Intensity Levels and 16 Ellipse
Orientation Levels
Images of two French Nobel Prize winners in physics were selected for simultaneous DLW
using both incident intensity and ellipse orientation direction. Each image, consisting of 100 × 100
pixels, was converted to 4-bit bitmap format based on 24 = 16 ellipse orientation levels (Figure 3a)
and 24 = 16 intensity levels (Figure 3b), respectively. Figure 3c shows the resulting entangled image
at the focal plane inscribed by Type A DLW with 256 = 24 × 24 levels. Each ellipse pattern of 7 μm
spacing was produced by irradiating 106 laser pulses. The total size of the recorded image was 700 ×
700 μm since the image has 100 × 100 storage units.
As shown in Figure 3c, the image recorded using laser irradiance is visually distinguished in
the entangled 5D ODS image. In contrast, the image recorded by the ellipse orientation was barely
visible due to the irregular fluorescent intensities for the different orientation levels, as mentioned
above. Therefore, a fluorescence calibration matrix was required to retrieve the ellipse orientation of
each pattern. Figure 3d displays a fluorescence calibration matrix with 16 × 16 intensity and
orientation levels. The matrix was simultaneously fabricated in a separate region near the embedded
DLW image in order to minimize the decoding errors.
Orientation levels
Flu
ore
scen
ce inte
nsity
(A.U
)
161514131211109
87664321
Orien
tation
le
vel
Intensity level
1 2 3 4 5 6 7 8 9 10 11 12 13 14 15 16
Intensity level1 2 3 4 5 6 7 8 9 10 11 12 13 14 15 16
(0°)
(11.25°)
(33.75°)
(22.5°)
(56.25°)
(67.5°)
(45°)
(90°)
(101.25°)
(123.75°)
(112.5°)
(146.25°)
(157.5°)
(135°)
(168.75°)
(78.75°)
(a) (b)
Figure 2. Fabricated fluorescence calibration matrix. (a) Confocal image of all basic storage unitscomposed by 16 intensity levels and 16 orientation levels. (b) Measured fluorescence intensity versusincident DLW intensity for the 5D decoding process.
3. Results
3.1. Laser Writing Process with 256 Levels: 16 Fluorescence Intensity Levels and 16 Ellipse Orientation Levels
Images of two French Nobel Prize winners in physics were selected for simultaneous DLW usingboth incident intensity and ellipse orientation direction. Each image, consisting of 100 × 100 pixels,was converted to 4-bit bitmap format based on 24 = 16 ellipse orientation levels (Figure 3a) and 24 = 16intensity levels (Figure 3b), respectively. Figure 3c shows the resulting entangled image at the focalplane inscribed by Type A DLW with 256 = 24
× 24 levels. Each ellipse pattern of 7 µm spacing wasproduced by irradiating 106 laser pulses. The total size of the recorded image was 700 × 700 µm sincethe image has 100 × 100 storage units.
As shown in Figure 3c, the image recorded using laser irradiance is visually distinguished in theentangled 5D ODS image. In contrast, the image recorded by the ellipse orientation was barely visibledue to the irregular fluorescent intensities for the different orientation levels, as mentioned above.Therefore, a fluorescence calibration matrix was required to retrieve the ellipse orientation of eachpattern. Figure 3d displays a fluorescence calibration matrix with 16 × 16 intensity and orientationlevels. The matrix was simultaneously fabricated in a separate region near the embedded DLW imagein order to minimize the decoding errors.

Micromachines 2020, 11, 1026 5 of 9Micromachines 2020, 11, x 5 of 9
Figure 3. (a,b) are the encoded images of two Nobel laureates in 16 orientation levels and 16 intensity levels, respectively. (c) 100 × 100 entangled patterns among 16 × 16 intensity and orientation levels. (d) The fluorescence calibration matrix was fabricated for decoding (fluorescence excitation at 405 nm).
3.2. Reading Process with 256 Levels: 16 Fluorescence Intensity Levels and 16 Ellipse Orientation Levels
In the readout process, we carefully adjusted the z-position of the maximal fluorescence intensity, which corresponds to the tangential focus during inscription. The field-of-view non-uniformity of the scanning confocal fluorescence microscope was also reduced by selecting a rather small area of interest (124.67 × 124.67 μm, 4096 × 4096 numerical pixels, 300 ns pixel dwell time, 4 frame average). The imaging process was repeated at different selected regions to cover the full 5D ODS image.
Each of the 100 × 100 entangled patterns of Figure 3c, namely 10 × 10 entangled patterns successively recorded in 10 × 10 selected regions, was systematically compared to the 256 patterns of the calibration matrix for decoding. Comparisons were made by calculating the root-mean-square value between the confocal image of each storage unit of Figure 3a with each pattern of the calibration matrix. Such numerical comparison was required to successively restrict both the images in Figure 3c,d to a region of interest being carefully centered in at the centroid of each of the compared patterns (each pattern of Figure 3c being compared to each of the Figure 3d patterns). By performing these automatic one-to-one comparisons using the least squares method, the most similar pattern in the calibration matrix was selected as the pattern corresponding to the minimal root-mean-square value. Note that, taking into account the fact that the reference matrix itself shows deviations from the ideal expected intensity dependence (as discussed with Figure 2b), the reported numerical decoding method is the approach that led to the best readout results with the present data, showing better fidelity than that obtained while trying to independently retrieve the intensity levels on the one hand and orientation levels on the other hand. As a consequence, the reported
10 20 30 40 50 60 70 80 90 100 10 20 30 40 50 60 70 80 90 100
10
20
30
40
50
60
70
80
90
100
10
20
30
40
50
60
70
80
90
100
1213141516
789
1011
23456
1
123.75°135.00°
146.25°157.50°168.75°
67.50°78.75°
90.00°101.25°112.50°
11.25°22.50°
33.75°
45.00°56.25°
0.00°
100 µm 10 µm
(a)
Figure 3. (a,b) are the encoded images of two Nobel laureates in 16 orientation levels and 16 intensitylevels, respectively. (c) 100 × 100 entangled patterns among 16 × 16 intensity and orientation levels.(d) The fluorescence calibration matrix was fabricated for decoding (fluorescence excitation at 405 nm).
3.2. Reading Process with 256 Levels: 16 Fluorescence Intensity Levels and 16 Ellipse Orientation Levels
In the readout process, we carefully adjusted the z-position of the maximal fluorescence intensity,which corresponds to the tangential focus during inscription. The field-of-view non-uniformity ofthe scanning confocal fluorescence microscope was also reduced by selecting a rather small area ofinterest (124.67 × 124.67 µm, 4096 × 4096 numerical pixels, 300 ns pixel dwell time, 4 frame average).The imaging process was repeated at different selected regions to cover the full 5D ODS image.
Each of the 100 × 100 entangled patterns of Figure 3c, namely 10 × 10 entangled patternssuccessively recorded in 10 × 10 selected regions, was systematically compared to the 256 patterns ofthe calibration matrix for decoding. Comparisons were made by calculating the root-mean-squarevalue between the confocal image of each storage unit of Figure 3a with each pattern of the calibrationmatrix. Such numerical comparison was required to successively restrict both the images in Figure 3c,dto a region of interest being carefully centered in at the centroid of each of the compared patterns(each pattern of Figure 3c being compared to each of the Figure 3d patterns). By performing theseautomatic one-to-one comparisons using the least squares method, the most similar pattern in thecalibration matrix was selected as the pattern corresponding to the minimal root-mean-square value.Note that, taking into account the fact that the reference matrix itself shows deviations from the idealexpected intensity dependence (as discussed with Figure 2b), the reported numerical decoding methodis the approach that led to the best readout results with the present data, showing better fidelity thanthat obtained while trying to independently retrieve the intensity levels on the one hand and orientationlevels on the other hand. As a consequence, the reported readout approach allowed us to determine

Micromachines 2020, 11, 1026 6 of 9
at once the entangled orientation level and intensity level simultaneously for each of the 100 × 100entangled image patterns. Based on such a direct decoding process, the merged laser-engraved imagewas successfully split into two decoded images.
The retrieved images were decoded over 16 orientation levels and 16 intensity levels, as shownin Figure 4a,b. In addition, Figure 4a,b faintly show that consecutive adjacent images were obtainedafter dividing the entangled image into 10 × 10 square regions. Detailed error analysis was performedto quantify the fidelity of the readout process. Comparing each of the two decoded images withthe original images, it was found that the orientation and intensity readout fidelities were 61% and25%, respectively. The orientation readout errors showed 34% 1-level error and 5% 2-level error.The intensity readout errors showed 43% 1-level error and 32% 2-level (or more) error. The readoutfidelity of the intensity level was lower than that of the elliptical orientation level.
Micromachines 2020, 11, x 6 of 9
readout approach allowed us to determine at once the entangled orientation level and intensity level simultaneously for each of the 100 × 100 entangled image patterns. Based on such a direct decoding process, the merged laser-engraved image was successfully split into two decoded images.
The retrieved images were decoded over 16 orientation levels and 16 intensity levels, as shown in Figure 4a,b. In addition, Figure 4a,b faintly show that consecutive adjacent images were obtained after dividing the entangled image into 10 × 10 square regions. Detailed error analysis was performed to quantify the fidelity of the readout process. Comparing each of the two decoded images with the original images, it was found that the orientation and intensity readout fidelities were 61% and 25%, respectively. The orientation readout errors showed 34% 1-level error and 5% 2-level error. The intensity readout errors showed 43% 1-level error and 32% 2-level (or more) error. The readout fidelity of the intensity level was lower than that of the elliptical orientation level.
Figure 4. (a,b) Retrieved images from the initial images of Figure 3a,b, respectively. (c,d) Histograms of the level difference between original and decoded levels for the orientation direction and the fluorescence intensity, respectively.
4. Discussion
The experimental demonstration of 5D ODS based on oriented elliptical fluorescent patterns is demonstrated. Fidelity is not yet mature to achieve transfer technology for commercial applications. However, we believe that the writing process is robust as well as the readout process while the imaging part itself showed technological limitations. Indeed, the difference in terms of orientation or intensity fidelities is mainly due to the field-of-view non-uniformity of the scanning confocal fluorescence microscope in the decoding process. A minor contribution to fidelity loss is still possible from the residual mismatch between the center of the laser beam and the center of the SLM mask for anamorphic focusing in the process of writing. A minor residual intrinsic astigmatism of the laser beam itself may also affect the inscription process and mix the orientation/intensity information supported by the storage data units and the reference patterns. Possible improvements are thus expected, especially after performing a fine intensity calibration of the field of view of the confocal microscope used for the imaging part, so as to correct sensitivity inhomogeneities. Such sensitivity inhomogeneity of the imaging system field of view affects not only the image to be decoded but also the imaging of the reference matrix itself, which can further introduce additional
10 20 30 40 50 60 70 80 90 100 10 20 30 40 50 60 70 80 90 100
10
20
30
40
50
60
70
80
90
100
10
20
30
40
50
60
70
80
90
100
1213141516
789
1011
23456
1
123.75°135.00°
146.25°
157.50°168.75°
67.50°78.75°
90.00°
101.25°112.50°
11.25°22.50°
33.75°
45.00°56.25°
0.00°
(a)
10002000
3000400050006000
7000
-4 -3 -2 -1 0 1 2 3 40
-7 -6 -5 -4 -3 -2 -1 0 1 2 3 4 5 6 70
50
100
150
200
250
300∆O=0
∆O=+1
∆O=-1
∆I=0∆I=+1
∆I=-1
Figure 4. (a,b) Retrieved images from the initial images of Figure 3a,b, respectively. (c,d) Histogramsof the level difference between original and decoded levels for the orientation direction and thefluorescence intensity, respectively.
4. Discussion
The experimental demonstration of 5D ODS based on oriented elliptical fluorescent patterns isdemonstrated. Fidelity is not yet mature to achieve transfer technology for commercial applications.However, we believe that the writing process is robust as well as the readout process while the imagingpart itself showed technological limitations. Indeed, the difference in terms of orientation or intensityfidelities is mainly due to the field-of-view non-uniformity of the scanning confocal fluorescencemicroscope in the decoding process. A minor contribution to fidelity loss is still possible from theresidual mismatch between the center of the laser beam and the center of the SLM mask for anamorphicfocusing in the process of writing. A minor residual intrinsic astigmatism of the laser beam itselfmay also affect the inscription process and mix the orientation/intensity information supported by thestorage data units and the reference patterns. Possible improvements are thus expected, especiallyafter performing a fine intensity calibration of the field of view of the confocal microscope used forthe imaging part, so as to correct sensitivity inhomogeneities. Such sensitivity inhomogeneity of the

Micromachines 2020, 11, 1026 7 of 9
imaging system field of view affects not only the image to be decoded but also the imaging of thereference matrix itself, which can further introduce additional errors leading to the degradation ofthe overall process fidelity. Indeed, the non homogeneous sensitivity of the field of view of the usedcommercial confocal microscope introduces a quasi-random deviation in the readout and decodingprocess because optical data storage units are almost never observed at the same positions in the fieldof view for the reference image of the calibration matrix and for each of the 10 × 10 selected regions toreconstruct the full entangled image. Such critical aspects and error sources in the readout fidelity isthus considered to result mostly from the confocal imaging of the entangle image.
Beyond the readout errors that result from the experimental deviations, one can also mentionpotential error sources in the numerical process of pattern identification. The developed algorithm toquantify the root-mean-square error is a fully deterministic process. However, it may be sensitive toinitial conditions. Indeed, for each given data storage unit to be compared to each of the 256 referencepatterns, one needs to define relevant associated regions of interest in order to estimate the associatedpositions of the centroids. A moderate deviation of the centroid positions can affect the numericaloverlapping the regions of interest to compare, which can in turn affect the least square method thatdrives the decision-making process of pattern identification. The estimation of such a numericalsensitivity of the decoding process would require further computation effort and readout computationtime, which is beyond the scope of proof-of-concept demonstration.
The storage capacity of the proposed ODS was estimated by measuring the intensity profile of thestorage unit. Figure 5a shows the fluorescence top-view image of a ODS unit measured for an areaof 7.6 × 7.6 µm. Figure 5b represents the intensity cross-section profiles of basic storage units alongthe y and x axes. From these two profiles, we can find that at least a 5 × 5µm space is required toprevent overlapping from adjacent patterns. Figure 5c shows an intensity profile measured at 500 nmintervals on the z axis near the tangential focal plane. The fluorescence intensity depth distribution hasa Gaussian distribution and shows the strongest signal at the focal plane. It indicates that a 20 µm gapis required between successive layers to prevent in-depth crosstalk. Optical data storage capacity canbe estimated by taking into account the minimum volume of storage unit and 8-bits format (4-bits forintensity, 4-bits for orientation). Thus, a storage density of greater than 10 Gb/cm3 can be reasonablyexpected with the current experimental conditions.
Micromachines 2020, 11, x 7 of 9
errors leading to the degradation of the overall process fidelity. Indeed, the non homogeneous sensitivity of the field of view of the used commercial confocal microscope introduces a quasi-random deviation in the readout and decoding process because optical data storage units are almost never observed at the same positions in the field of view for the reference image of the calibration matrix and for each of the 10 × 10 selected regions to reconstruct the full entangled image. Such critical aspects and error sources in the readout fidelity is thus considered to result mostly from the confocal imaging of the entangle image.
Beyond the readout errors that result from the experimental deviations, one can also mention potential error sources in the numerical process of pattern identification. The developed algorithm to quantify the root-mean-square error is a fully deterministic process. However, it may be sensitive to initial conditions. Indeed, for each given data storage unit to be compared to each of the 256 reference patterns, one needs to define relevant associated regions of interest in order to estimate the associated positions of the centroids. A moderate deviation of the centroid positions can affect the numerical overlapping the regions of interest to compare, which can in turn affect the least square method that drives the decision-making process of pattern identification. The estimation of such a numerical sensitivity of the decoding process would require further computation effort and readout computation time, which is beyond the scope of proof-of-concept demonstration.
The storage capacity of the proposed ODS was estimated by measuring the intensity profile of the storage unit. Figure 5a shows the fluorescence top-view image of a ODS unit measured for an area of 7.6 × 7.6 μm. Figure 5b represents the intensity cross-section profiles of basic storage units along the y and x axes. From these two profiles, we can find that at least a 5 × 5μm space is required to prevent overlapping from adjacent patterns. Figure 5c shows an intensity profile measured at 500 nm intervals on the z axis near the tangential focal plane. The fluorescence intensity depth distribution has a Gaussian distribution and shows the strongest signal at the focal plane. It indicates that a 20 μm gap is required between successive layers to prevent in-depth crosstalk. Optical data storage capacity can be estimated by taking into account the minimum volume of storage unit and 8-bits format (4-bits for intensity, 4-bits for orientation). Thus, a storage density of greater than 10 Gb/cm3 can be reasonably expected with the current experimental conditions.
Figure 5. (a) Confocal top-view image of one single elliptically-shaped storage unit fabricated by using type A DLW. (b) Fluorescence intensity profile along the horizontal and vertical cross section at focal plane. (c) Fluorescence intensity profile and Gaussian fitting along the z-axis (depth).
5. Conclusions
We have demonstrated 5D optical data storage encoded in orientated type A DLW modifications in the silver-containing commercial glass by using a relatively low laser intensity (with very high number of pulses with sub-100 nJ pulse energies) compared to conventional DLW (that usually relies on low number of pulses at the μJ pulse energy level). Five dimensions were achieved by introducing the 3D distribution of oriented elliptically-shaped fluorescent patterns inscribed by an fs laser. The ellipse pattern was created by anamorphic focusing, and the orientation
-7 -3 -2 -1 0 1 2 3 4Cross section axis (µm)
-10 -5 0 5 10Z-axis (µm)
1 µm 0
20
40
60
80
Hor
izon
tal p
rofil
e (A
.U.)
100
0
20
40
60
80
Ver
tical
pro
file
(A.U
.)
100800
600
400
200
0Inte
nsity
prof
ile (A
.U.)
(a) (b) (c)Figure 5. (a) Confocal top-view image of one single elliptically-shaped storage unit fabricated by usingtype A DLW. (b) Fluorescence intensity profile along the horizontal and vertical cross section at focalplane. (c) Fluorescence intensity profile and Gaussian fitting along the z-axis (depth).
5. Conclusions
We have demonstrated 5D optical data storage encoded in orientated type A DLW modificationsin the silver-containing commercial glass by using a relatively low laser intensity (with very highnumber of pulses with sub-100 nJ pulse energies) compared to conventional DLW (that usually relies onlow number of pulses at the µJ pulse energy level). Five dimensions were achieved by introducing the3D distribution of oriented elliptically-shaped fluorescent patterns inscribed by an fs laser. The ellipse
Micromachines 2020, 11, 1026 8 of 9
pattern was created by anamorphic focusing, and the orientation was adjusted to 16 levels by employingan SLM. In addition, an AOM device was used to adjust the fs laser intensity of 16 levels.
Two different images were embedded simultaneously at the same plane of a silver-containingcommercial glass, by performing type A DLW. In particular, a 100 × 100 pixel 4-bit bitmap formatimage was produced for 5D recording by employing 16 ellipse orientation levels and 16 intensitylevels. A calibration matrix with 16 × 16 intensity and orientation levels was also fabricated nearthe DLW image for the readout process. The two different original images of 4-bit bitmap formatwere successfully restored. The corresponding reading fidelities of 60.5% and 25.1% were obtainedfor the orientation direction and fluorescence intensity levels, respectively. While higher fidelities areneeded while considering reliable hexadecimal information management, these results demonstratethe proof-of-concept of the proposed approach to 5-dimension multi-level ODS. Therefore, we believethat our proposed technique can be used for the next-generation optical permanent recording.
Author Contributions: Conceptualization, Y.P.; methodology, C.-H.P., Y.P. and L.C.; validation, C.-H.P. and Y.P.;formal analysis, C.-H.P. and Y.P.; investigation, C.-H.P. and Y.P.; resources, Y.P., L.C. and S.-H.P.; data curation,C.-H.P., Y.P., L.C. and S.-H.P.; writing—review and editing, C.-H.P., Y.P., L.C. and S.-H.P.; supervision, projectadministration and funding acquisition, Y.P., L.C. and S.-H.P. All authors have read and agreed to the publishedversion of the manuscript.
Funding: This study has been carried out with financial support from French National Research Agency (ANR) inthe frame of “the investments for the future” Programme IdEx Bordeaux—LAPHIA (ANR-10-IDEX-03-02) andANR-19-CE08-0021-01, from the European Union’s Horizon 2020 research and innovation programme under theMarie Sklodowska-Curie grant agreement No 82394, and from Pioneer Research Center Program (2013-004613)through the Ministry of Science, ICT and Future Planning, Korea.
Conflicts of Interest: The authors declare no conflict of interest.
References
1. Ródenas, A.; Li, X.; Cao, Y. Optical storage arrays: A perspective for future big data storage. Light Sci. Appl.2014, 3, e177. [CrossRef]
2. Zhang, J.; Drevinskas, R.; Patel, A.; Beresna, M.; Kazansky, P.; Cerkauskaite, A.; Beresna, R.; Drevinskas, A.;Patel, J.Z.; Gecevicius, M. Laser-Based Micro-and Nanoprocessing X. Int. Soc. Opt. Photonics 2016,9736, 97360U.
3. Strickler, J.H.; Webb, W.W. Three-dimensional optical data storage in refractive media by two-photon pointexcitation. Opt. Lett. 1991, 16, 1780. [CrossRef] [PubMed]
4. Li, X.; Bullen, C.; Chon, J.W.M.; Evans, R.A.; Gu, M. Two-photon-induced three-dimensional optical datastorage in CdS quantum-dot doped photopolymer. Appl. Phys. Lett. 2007, 90, 161116. [CrossRef]
5. Alasfar, S.; Ishikawa, M.; Kawata, Y.; Egami, C.; Sugihara, O.; Okamoto, N.; Tsuchimori, M.; Watanabe, O.Polarization-multiplexed optical memory with urethane–urea copolymers. Appl. Opt. 1999, 38, 6201–6204.[CrossRef]
6. Zijlstra, P.; Chon, J.W.M.; Gu, M. Five-dimensional optical recording mediated by surface plasmons in goldnanorods. Nat. Cell Biol. 2009, 459, 410–413. [CrossRef]
7. Pearson, A.C.; Jamieson, S.; Linford, M.R.; Lunt, B.M.; Davis, R.C. Oxidation of graphene ‘bow tie’ nanofusesfor permanent, write-once-read-many data storage devices. Nanotechnol. 2013, 24, 135202. [CrossRef]
8. Zhang, J.; Gecevicius, M.; Beresna, M.; Kazansky, P.G. Seemingly Unlimited Lifetime Data Storage inNanostructured Glass. Phys. Rev. Lett. 2014, 112, 033901. [CrossRef]
9. Beresna, M.; Gecevicius, M.; Kazansky, P.; Taylor, T.; Kavokin, A. Exciton mediated self-organization in glassdriven by ultrashort light pulses. Appl. Phys. Lett. 2012, 101, 53120. [CrossRef]
10. Ouyang, X.; Xu, Y.; Feng, Z.; Tang, W.; Cao, Y.; Li, X. Polychromatic and polarized multilevel optical datastorage. Nanoscale 2019, 11, 2447–2452. [CrossRef]
11. Eaton, S.M.; Cerullo, G.; Osellame, R. Photonic and Microfluidic Devices in Transparent Materials.In Femtosecond Laser Micromachining; Osellame, R., Cerullo, G., Ramponi, R., Eds.; Springler: Berlin/Heidelberg,Germany, 2012; Volume 3, pp. 3–18.
12. Sohn, I.-B.; Lee, M.-S.; Woo, J.-S.; Lee, S.-M.; Chung, J.-Y. Femtosecond Laser Application to Optical Memoryand Microfluidics. J. Opt. Soc. Korea 2005, 9, 92–94. [CrossRef]
Micromachines 2020, 11, 1026 9 of 9
13. Khalil, A.A.; Bérubé, J.-P.; Danto, S.; Cardinal, T.; Petit, Y.; Canioni, L.; Vallée, R. Comparative study betweenthe standard type I and the type A femtosecond laser induced refractive index change in silver containingglasses. Opt. Mater. Express 2019, 9, 2640–2651. [CrossRef]
14. Royon, A.; Petit, Y.; Papon, G.; Richardson, M.; Canioni, L. Femtosecond laser induced photochemistry inmaterials tailored with photosensitive agents [Invited]. Opt. Mater. Express 2011, 1, 866. [CrossRef]
15. Petit, Y.; Danto, S.; Guérineau, T.; Khalil, A.A.; Le Camus, A.; Fargin, E.; Duchateau, G.; Bérubé, J.-P.;Vallée, R.; Messaddeq, Y.; et al. On the femtosecond laser-induced photochemistry in silver-containingoxide glasses: Mechanisms, related optical and physico-chemical properties, and technological applications.Adv. Opt. Technol. 2018, 7, 291–309. [CrossRef]
16. Petit, Y.; Park, C.-H.; Mok, J.-M.; Smetanina, E.; Chimier, B.; Duchateau, G.; Cardinal, T.; Canioni, L.; Park, S.Ultrashort laser induced spatial redistribution of silver species and nano-patterning of etching selectivity insilver-containing glasses. Opt. Express 2019, 27, 13675–13680. [CrossRef] [PubMed]
17. Royon, A.; Bourhis, K.; Bechou, L.; Cardinal, T.; Canioni, L.; Deshayes, Y. Durability study of a fluorescentoptical memory in glass studied by luminescence spectroscopy. Microelectron. Reliab. 2013, 53, 1514–1518.[CrossRef]
18. Royon, A.; Bourhis, K.; Bellec, M.; Papon, G.; Bousquet, B.; Deshayes, Y.; Cardinal, T.; Canioni, L. Silver ClustersEmbedded in Glass as a Perennial High Capacity Optical Recording Medium. Adv. Mater. 2010, 22, 5282–5286.[CrossRef] [PubMed]
19. Davis, J.A.; Schley-Seebold, H.M.; Cottrell, D.M. Anamorphic optical systems using programmable spatiallight modulators. Appl. Opt. 1992, 31, 6185–6186. [CrossRef] [PubMed]
20. Carcolé, E.; Davis, J.A.; Cottrell, D.M. Astigmatic phase correction for the magneto-optic spatial lightmodulator. Appl. Opt. 1995, 34, 5118–5120. [CrossRef] [PubMed]
Publisher’s Note: MDPI stays neutral with regard to jurisdictional claims in published maps and institutionalaffiliations.
© 2020 by the authors. Licensee MDPI, Basel, Switzerland. This article is an open accessarticle distributed under the terms and conditions of the Creative Commons Attribution(CC BY) license (http://creativecommons.org/licenses/by/4.0/).