Fisheries and oceanography off Galicia, NW Spain: Mesoscale spatial and temporal changes in physical...
24
JOURNAL OF GEOPHYSICAL RESEARCH, VOL. 100, NO. C6, PAGES 10,943-10,966, JUNE 15, 1995 Fisheries and oceanography off Galicia, NW Spain: Mesoscale spatial and temporal changesin physical processes and resultant patterns of biologicalproductivity K. R. Tenore, • M. Alonso-Noval, 2 M. Alvarez-Ossorio, 2 L. P. Atkinson, 3 J. M. Cabanas 4R. M Cal, 4H J Campos, 2 F Castillejo 5 E. J. Chesney 6 N. Gonzalez, 2 R. B. Hanson, 7 C. R. McClain,• A. Miranda, 4 M. R. Roman, J. Sanchez, 4 G. Santiago, 1ø L. Valdes, 2 M. Varela, 2 and J. Yoder TM Abstract. The Galician shelfoff NW Spain(43Nø 9Wø) exhibits mesoscale spatial and temporal changes in biological productivity associated with upwelling. Spatialheteroge- neity results from local geomorphic and land-sea interactions superimposed on the large scale atmospheric processes that produce upwelling. Wind-induced upwellingevents, commonly of short (i.e., week) duration,are more common in the summer than in the winter. A series of cruises, including some time series sampling, and satellite imagery analysis showed that surface upwellingwas more commonand persistent on the northern coast compared with the western coast off the coastal embayments, the Rias Bajas. Nearshore off the rias, coastal runoff, which is greater in the rainy winter/spring versus the dry summer,affected upwelling. In early summer, upwellinglessoften reaches the surface because of increased water column stratification associated with lower surface salinities and thus upwelling is not detected by satellite imagery. Conversely, in late summer, upwellingmore often reaches the surface because coastal runoff is reduced duringthe dry summer months and the water columntends to be lessstratified. Plankton biomass and rate processes alongthe Galician shelf reflected both ambient hydrographic conditions aswell asprior history of upwelling or downwelling.Phyto- plankton and bacterioplankton were in greatest abundance duringupwelling conditions (June through August); in contrast, both zooplankton and fish larvae exhibited highest abundances in March, when there were upwellingconditions prior to our cruise. Spatial differences in the duration and frequency of upwelling events,in combination with advection of water masses, are critical to the patterns of water columnproductivity and sardine fisheries production off the Galiciancoast. More persistent upwelling at this NW cornerof the Iberianpeninsula supports large sardine fisheries because zooplankton and larval fish populations have time to respond to the higherprimary production. Fartherdown the western Galiciancoast,the episodic upwellingand resultant intermit- tentprimaryproduction does not support a stable food supply needed to support fisheries. Times series sampling revealed meanresponse timesof bacteria, phytoplank- ton, and zooplankton to be on the order of a day, days, and weeks, respectively. Sardines showed no spawning response in the relativelyshort time series sampling. The observed distributional patterns of fish eggs and larvae showed some offshore transport of fish larvaethatwere spawned inshore during upwelling periods and aggregation of larvae in a convergence zone northwest of Cabo Villano. Introduction The Galician (NW Spain) continental shelf with its northern (Rias Altas) and western (Rias Bajas) coastal embayments (Figure 1) supportssignificant pelagic and demersal fisheries because of upwelling enrichment. In the rias, high primary productivity from the intrusion of up- welled oceanic water supports an intense mussel raft culture [Tenore et al., 1982; Blanton et al., 1987]. The Ria de Copyright 1995by theAmerican Geophysical Union. Paper number95JC00529. 0148-0227/95/95JC-00529505.00 •Chesapeake Biological Laboratory, CEES, University of Maryland,Solomons. 2Instituto Espafiol deOceanografia, LaCoruna, Spain. 3Department of Oceanography, Old Dominion University, Norfolk, Virginia. 4Instituto Espafiol deOceanografia, Vigo,Spain. 5Instituto Espafiol deOceanografia, Fuengirola, Spain. 6Louisiana Universities Marine Consortium, Chauvin. 7Skidaway Institute of Oceanography, Savannah, Georgia. SLaboratory for Oceans, NASA Goddard Space Flight Center, Greenbelt, Maryland. 9Horn Point Environmental Laboratory, CEES, University of Maryland, Cambridge. •øInstituto Espafiol de Oceanography, Madrid, Spain. •Graduate School of Oceanography, University of Rhode Island, Kingston. 10,943
-
Upload
independent -
Category
Documents
-
view
0 -
download
0
Transcript of Fisheries and oceanography off Galicia, NW Spain: Mesoscale spatial and temporal changes in physical...

JOURNAL OF GEOPHYSICAL RESEARCH, VOL. 100, NO. C6, PAGES 10,943-10,966, JUNE 15, 1995
Fisheries and oceanography off Galicia, NW Spain: Mesoscale spatial and temporal changes in physical processes and resultant patterns of biological productivity
K. R. Tenore, • M. Alonso-Noval, 2 M. Alvarez-Ossorio, 2 L. P. Atkinson, 3 J. M. Cabanas 4 R. M Cal, 4 H J Campos, 2 F Castillejo 5 E. J. Chesney 6 N. Gonzalez, 2 R. B. Hanson, 7 C. R. McClain, • A. Miranda, 4 M. R. Roman, J. Sanchez, 4 G. Santiago, 1ø L. Valdes, 2 M. Varela, 2 and J. Yoder TM
Abstract. The Galician shelf off NW Spain (43N ø 9W ø) exhibits mesoscale spatial and temporal changes in biological productivity associated with upwelling. Spatial heteroge- neity results from local geomorphic and land-sea interactions superimposed on the large scale atmospheric processes that produce upwelling. Wind-induced upwelling events, commonly of short (i.e., week) duration, are more common in the summer than in the winter. A series of cruises, including some time series sampling, and satellite imagery analysis showed that surface upwelling was more common and persistent on the northern coast compared with the western coast off the coastal embayments, the Rias Bajas. Nearshore off the rias, coastal runoff, which is greater in the rainy winter/spring versus the dry summer, affected upwelling. In early summer, upwelling less often reaches the surface because of increased water column stratification associated with lower surface
salinities and thus upwelling is not detected by satellite imagery. Conversely, in late summer, upwelling more often reaches the surface because coastal runoff is reduced during the dry summer months and the water column tends to be less stratified. Plankton biomass and rate processes along the Galician shelf reflected both ambient hydrographic conditions as well as prior history of upwelling or downwelling. Phyto- plankton and bacterioplankton were in greatest abundance during upwelling conditions (June through August); in contrast, both zooplankton and fish larvae exhibited highest abundances in March, when there were upwelling conditions prior to our cruise. Spatial differences in the duration and frequency of upwelling events, in combination with advection of water masses, are critical to the patterns of water column productivity and sardine fisheries production off the Galician coast. More persistent upwelling at this NW corner of the Iberian peninsula supports large sardine fisheries because zooplankton and larval fish populations have time to respond to the higher primary production. Farther down the western Galician coast, the episodic upwelling and resultant intermit- tent primary production does not support a stable food supply needed to support fisheries. Times series sampling revealed mean response times of bacteria, phytoplank- ton, and zooplankton to be on the order of a day, days, and weeks, respectively. Sardines showed no spawning response in the relatively short time series sampling. The observed distributional patterns of fish eggs and larvae showed some offshore transport of fish larvae that were spawned inshore during upwelling periods and aggregation of larvae in a convergence zone northwest of Cabo Villano.
Introduction
The Galician (NW Spain) continental shelf with its northern (Rias Altas) and western (Rias Bajas) coastal embayments (Figure 1) supports significant pelagic and demersal fisheries because of upwelling enrichment. In the rias, high primary productivity from the intrusion of up- welled oceanic water supports an intense mussel raft culture [Tenore et al., 1982; Blanton et al., 1987]. The Ria de
Copyright 1995 by the American Geophysical Union.
Paper number 95JC00529. 0148-0227/95/95JC-00529505.00
•Chesapeake Biological Laboratory, CEES, University of Maryland, Solomons.
2Instituto Espafiol de Oceanografia, LaCoruna, Spain. 3Department of Oceanography, Old Dominion University,
Norfolk, Virginia. 4Instituto Espafiol de Oceanografia, Vigo, Spain. 5Instituto Espafiol de Oceanografia, Fuengirola, Spain. 6Louisiana Universities Marine Consortium, Chauvin. 7Skidaway Institute of Oceanography, Savannah, Georgia. SLaboratory for Oceans, NASA Goddard Space Flight Center,
Greenbelt, Maryland. 9Horn Point Environmental Laboratory, CEES, University of
Maryland, Cambridge. •øInstituto Espafiol de Oceanography, Madrid, Spain. •Graduate School of Oceanography, University of Rhode Island,
Kingston.
10,943

10,944 TENORE ET AL.' OCEANOGRAPHY OFF GALICIA, NW SPAIN
cv1 ß
cv3 ©
cv3 •
; cv4 ©
I
/ !
ß
%
iV•t• M3 ',,
ß A1 /
I
;v,v
de Arosa
ß ß
A4•, Ria de Pontevedra
•, c•e Vigo :: -. 0 25 50
•IGO • i • km
lO 9
Figure 1. The Galician coast of NW Spain showing sam- pling stations along transects off the western (V indicating off the Ria de Vigo, A, off the Ria de Arosa; and M, off the Ria de Muros) and northern (CV indicating off Cape Villano, C, off La Coruna; and O, off Cape Ortegal) coasts occupied during the series of Fisheries and Oceanography off Galicia (FOG) cruises.
Arosa annually produces approximately 100,000 t of mussels [Perez and Roman, 1979]. Along the coast, purse seine fisheries for sardines, Sardina pilchardus, typically yields 100,000 t annually. Important demersal fisheries exist for hake, Merluccius merluccius, and blue-whiting, Micro- mesistius poutassou.
Coastal upwelling is fundamentally driven by large-scale atmospheric processes, but localized geomorphology and wind patterns can form complex temporal and spatial patterns [Barber, 1988; Parrish et al. , 1983; Jury, 1988]. A seasonal north-south migration of the Azores High results typically in alongshore winds in summer (April through September) that, combined with Ekman transport, uplifts subsurface North Atlamic Cemral Water (NACW) oreo the shelf; during wimer, typical onshore winds favor down- welling. However, in either season, shifting wind patterns cause upwelling and downwelling episodes [Wooster et al., 1976; Fraga, 1981; Blanton et al., 1984; McClain et al., 1986].
A diffuse frontal zone extending northwest from Cape Finisterre dominates the general oceanic circulation pattern off Galicia [Fraga, 1981; Fraga et al. , 1982; McClain et al., 1986]. The from forms at the convergence between the anticyclonic gyre in the Bay of Biscay and the weak north- ward flowing currein west of Spain and Portugal [Swallow et al., 1977]. Because of the abrupt change in coastal direction at Cape Finisterre, upwelling will occur some- where along the Galician coast throughout 270 ø of wind direction [McClain et al., 1986). In comrast to conditions off
the western U.S. coast, meteorological evems propagating from west to east are not affected by any meridionally continuous land mass north of Cape Ortegal.
The indemed coastline formed by the Rias Bajas produces significant orographic steering in the winds, resulting in a complex oceanic circulation over the narrow western Galician continental shelf [Blanton et al., 1984; McClain et al., 1986]. These effects include both local wind steering and current-bathymetry interactions. The winds in the rias are usually intensified, resulting in a wind stress curl that can cause a flow reversal offshore of the shelf break. The
bathymetry causes additional complexity. During upwelling, high-velocity and southward flowing jets are established and may be deflected offshore by the topographic features extending across the shelf [Blanton et al., 1984; McClain et al., 1986]. To even further complicate the situation, local flow patterns respond within a day to changes in wind forcing.
Freshwater runoff varies geographically, being highest, though seasonal, along the western Rias Bajas but minimal along the northern Rias Altas. When ranoff accumulates along the western coast, as during northeastward winds, an alongshore gradient sets up that drives a northward coastal current. The runoff discharge can influence the strength of upwelling [Blanton et al., 1984; McClain et al., 1986]. During periods of high discharge from the Rias Bajas a freshwater lens extends onto the shelf and caps upwelled water. Solar insulation contributes to stratification in the
spring and may also mask upwelled water. Thus upwelling along the rias coast is complex both
spatially and temporally because of irregular coastline, variable wind fields, and varying distributions of runoff. Fisheries and Oceanography off Galicia (FOG), a joim research program of Spanish and U.S. scientists, focused on oceanographic processes that would lead to mesoscale spatial and temporal differences in biological productivity and food chain patterns along the Galician shelf. The present paper emphasizes the following three themes that emerged from this work: (1)Upwelling is more persistent off Cape Finisterre and along the northern versus the western shelf. (2) Outwelling from the Rias Bajas, both of freshwater and biogenic materials, influences coastal upwelling and related primary production along the western shelf. (3) The biologi- cal components of the shelf ecosystem respond on different timescales to short-term episodic upwelling events and seasonal changes in upwelling.
Materials and Methods
We carried out four cruises aboard the R/V Cornide de
Saavedra as follows: June 16-26, 1984, September 27 to October 2, 1984, July 27 to August 8, 1985, and March 22 to April 2, 1986. We established the following series of transects: on the northern coast off Cape Ortegal (O), La Coruna (C), Cape Villano (CV), and on the western coast off the Rias Bajas off the Ria de Muros (M), the Ria de Arosa (A), and the Ria de Vigo (V) (Figure 1). Individu- al stations along these transects were numbered from 1 to 4 beginning offshore. We measured water column hydrog- raphy, phytoplankton biomass and productivity, micro- and macrozooplankton biomass and species composition, and macrozooplankton grazing rates, bacterial abundance, and production, and ichthyoplankton species composition and

TENORE ET AL.: OCEANOGRAPHY OFF GALICIA, NW SPAIN 10,945
abundance. The sampling strategy of the first two cruises differed from cruises three and four. On the first two
cruises all the transects were sampled only once to get a spatial distribution of hydrographic and biological properties. On the third cruise, transects A and CV were sampled multiple times to study short-term temporal responses in hydrography and biological parameters to upwelling events. For the fourth cruise we added transect C to increase areal
coverage.
Hydrography, Meteorology, and Satellite Imagery Temperature and salinity measurements were made with
a Neil Brown Mark III conductivitiy-temperature-depth (CTD) profiler. Water samples from Niskin bottles were analyzed for nutrients using methods described by Glibert and Loder [1977] and Strickland and Parsons [1972]. Wind data derived from pressure field maps were used to compute upwelling indices as described by Blanton et al. [1984].
NOAA 7 advanced very high resolution (AVHRR) satellite data were used to calculate sea surface temperatures using Strong and McClain's [1984] algorithm. Nimbus 7 coastal zone color scanner (CZCS) satellite data were used to calculate chlorophyll pigment data using the atmospheric correction and bio-optical algorithms of Gordon et al. [1983].
Phytoplankton
Water samples were collected with Niskin bottles at isolume depths of 100, 50, 25, 10, and 1% light penetration determined with an underwater photometer (Kahl Instru- ments, model 268 WA 310, first two cruises) or Secchi disc (last two cruises). Incident irradiance was continuously monitored during cruises with a LI-COR LI-190S quantum sensor and LI-550 integrator.
Chlorophyll a (chl a) and phaeopigments were determined using the fluorometric method of Yentsch and Menzel [ 1963] as described by Strickland and Parsons [1972]. Water samples were filtered through Gelman type A glass fiber filters (total size fractions) or, alternatively, were first filtered through 12-/xm Nucleopore polycarbonate filters and then the filtrate was filtered through Whatman GF/C filters (< 12-/•m size fraction). Phytoplankton species were enumerated using the Utermohl [1958] technique with 100-mL settling chambers and 250 or 400x magnification.
Primary production (carbon uptake) was determined by incubating surface seawater with 14C bicarbonate in 125-mL Pyrex bottles placed into bags made of varying layers of screen to simulate in situ irradiance levels at different
depths. Two light and one dark bottle for each water depth were incubated for 4 hours on ship deck in running surface seawater. Size fractionation was the same as described for
chl a and phaeopigments but using 0.8/•m Millipore filters. Nitrate uptake was determined using the stable isotope
method (15NO3-) of Dugdale and Goering [1967]. Polycar- bonate bottles containing 500-mL samples were inoculated with 0.2 •tm of 15NO3-, incubated for 4 hours, and then the contents of the bottles were filtered through previously combusted Gelman glass fiber filters (type A). Isotope ratios were determined with a Jasco emission spectrometer. Equations given by Yoder et al. [1983] were used to calcu- late NO3-N uptake.
Microbiology
Rates of tritiated thymidine incorporation into trichloro- acitic acid (TCA) precipitable material were determined by the method of Fuhrman and Azam [1982]. Two replicate and one TCA-killed control (to measure abiotic adsorption of label) 30-mL seawater samples were inoculated with 0.1 /xCi mL -1 3H-methyl thymidine and incubated on board ship in the dark for 1 hour at surface water temperatures. Bacterial growth rates were estimated from sample dilution experiments [Kirchman et al., 1982]. Bacterial abundance was determined by counting preserved samples stained with acridine orange [Hobble et al., 1977]. These data were used to convert in situ thymidine uptake data (picomoles per liter per day to cells per liter per day [Kirchman et al., 1982]).
Zooplankton and Fish Larvae
Macrozooplankton and ichthyoplankton were sampled during the day with a paired opening-closing net frame (60 cm diameter) fitted with 202- and 333-/xm mesh nets. Distance during each tow was estimated with General Oceanics flowmeters. Two depth intervals, the surface mixed layer (30-50 m) and below the mixed layer to 100 m, were sampled at each station. The samples were preserved in 5 % formalin for later analysis.
Zooplankton biomass caught in the 202-/xm mesh was determined from displacement volumes measured at least 6 weeks after preservation to avoid bias due to variable sample shrinkage [Wiebe et al., 1975]. Biomass was calcu- lated from displacement volumes by log C (milligrams of carbon per cubic meter) = log displacement volume (cubic centimeter per cubic meter) q- 2.2092/1.069 [Roman et al., 19851.
Fish eggs and larvae were sorted and identified to species when possible. Eggs of sardines, Sardina pilchardus, were separated into three stages of development and classified as living or dead. Sardina pilchardus larvae were measured to the nearest 0.1-mm standard length (SL) for length-frequen- cy analysis.
Microzooplankton were collected by a submersible pump and hose (5-cm diameter) system. Seawater flowed at 22 L min -• through shipboard sensors for measuring temperature, conductivity, and fluorescence and was concentrated through a submerged 20-/•m mesh net on deck to collect microzoo- plankton. Microzooplankton were collected from below the mixed layer and above as indicated by the temperature profile of water collected on the pump's descent. Microzoo- plankton were preserved in 4 % buffered formalin and later enumerated to taxonomic groups.
Zooplankton grazing was estimated by the uptake rate of •4C labeled particulate matter [Daro, 1978; Roman and Rublee, 1981]. Water collected from the mixed layer was dispensed into 1-L polycarbonate bottles and inoculated with •4C-bicarbonate (50/•C L'I). The bottles were incubated for 1 hour at 60% light on board in flowing surface seawater. Macrozooplankton collected by short tows in the mixed layer were added to the bottles after ! hour incubation with 14C.
After 30, 60, and 90 min, replicate bottles were removed, the zooplankton were concentrated on 200-/•m mesh, filtered onto 12-/•m preweighed filters, washed with 10% HC1 and water, dry weight (DW) determined, and isotope content of the zooplankton measured. The < 200-•tm particulate frac- tion was filtered, and the isotope activity was measured.

10,946 TENORE ET AL.' OCEANOGRAPHY OFF GALICIA, NW SPAIN
6000 1984 Upwelling Index- West Coast ] 2500[ 1984 Upwelling I -600 4000r •. _.
/il . I I ooo -oo t AI ,, • -800
- • • " o, ,soo•/• / ,ooo -1000
I L/ , , , , Oh , , ", , , -1200 Jan Feb Mar Apr May June July Aug Sept' Oct Nov Dec 16 18 20 22 24 26 •7 •8 •9 •0 1 2
J•e Sept Oct
20O0 x
..• o
• -2000
6000 1984 Upwelling Index- North Coast
4000 -•.
Jh, I ..
•,, I I tl
-4000
-6000 t -80001
• • , , , • i 'Sept' ' ' Jan Feb Mar Apr May June July Aug Oct Nov Dec
1984 Upwelling
_
200
x
-200 c
.__c
-400 •
-600 I
-800
16 1• •0 2'2 2•4 2• •7 •8' 2•9 3•0 • •-1000 June Sept Oct
Figure 2. Calculated upwelling indices for the (top) west and (bottom) north coasts of NW Spain during 1984 and, specifically, during the summer 1984 and fall 1984 cruises.
Zooplankton grazing rates were calculated by disintegrations per minute (dpm) zooplankton milligram of DW per liter equals liters filtered milligram zooplankton DW per weight per hour. Weight-specific filtration rates were multiplied by the zooplankton biomass to estimate in situ grazing rate equals liters filtered per cubic meter per hour.
Results
Summer 1984 (Cruise dates, June 16-26): Prevailing Upwelling Conditions
Physical oceanography. Winds were generally upwelling favorable along both the northern and western coasts during the cruise and were mainly from the NE up to 13 ms -i (Figure 2). Winds had been upwelling favorable along both coasts since June 7, increasing steadily in strength until subsiding on June 22-23. Satellite surface temperatures showed upwelling localized off Cape Ortegal and Cape Finisterre, with upwelling at the surface visible west of Cape Finisterre (Plates la and lb). Water column temperature data collected during the cruise rendered a slightly different interpretation. Uplifted isotherms occurred off Rias de Arosa (Figure 3) and de Vigo, indicating subsurface up- welling along the more western portion of the shelf. Nitrate values at 50 m depth on June 18 in the Rias Bajas and adjacent shelf exceeded 8 rim, but were 5 to 8 rim at other areas on the shelf. By June 28 nitrate concentrations at 50 m were greater than 15 tzm near the Rias de Arosa and de Vigo and were generally between 10 and 15 rim else- where, indicating that upwelling had intensified. Surface
and subsurface temperatures were highest off the Rias Bajas; temperatures at 50 m depth were the same or lower than at 50 m off the Rias Altas. Low oxygen values observed off the Ria de Arosa suggest considerable outwelling from that ria, which could help to explain why the upwelling was not manifest at the surface. On June 18 the surface pigment concentrations exceeded 3 mg m -3 off Cape Finisterre and were greater than 1.5 mg rn -3 off the Rias de Arosa and de Vigo. The high concentrations off Finisterre corresponded with the area of low surface temperatures. Isopycnals indicated upwelling on three occupations along transects off the Arosa (June 18, 20, and 28).
Phytoplankton. Vertical distributions along the western shelf at nearshore stations V4 and M4 show the effects of
outwelled waters on nutrients, chl a, and primary production (Figures 4a-4d). Nitrate concentrations were relatively low in the near-surface layer compared to the coastal stations farther north (CV4, Figure 4d). Furthermore, vertical distribution of primary production was bimodal at stations V4 and M4, suggesting a high light-adapted phytoplankton population in the layer of outwelled water. At all coastal stations, concentrations of NO-3-N generally exceeded 5 rim near the base of the euphotic zone (30-40 m deep).
Depth-integrated primary production and chl a were generally higher near the coast (V4, A4, M4, and CV4) than near the shelf break (A2, M2, and CV2) (Table 1 and Figure 5). Mean chl a and primary production were 90 mg m -2 and 1.23 gC m '2 d 'l, respectively, at the four coastal stations compared with 33 mg m -2 and 0.78 gC m -2 d 'l at the three offshore stations.

TENORE ET AL.. OCEANOGRAPHY OFF GALICIA, NW SPAIN 10,947
CAPE FINISTERRE
CAPE ORTEGAL
.•:-•. '•" R I A d ß MUROS
•'•'"m . •m• • RIA •l AROSA
R IA •le PONTEVEBRA
RIA •le VIGO
N.W. SPA IN
SEA SURFACE TEMPERATURE
NASA GSFC
6 1884
Plate la. Satellite photograph of sea surface temperatures along the coast of NW Spain on June 18, 1984. The following are the color definitions for surface water temperatures- dark blue, 12 to 13"C' purple, 14øC; light blue, 15øC; yellow, 16øC; amber, 17øC ß orange, 18"C; and red, 22øC. Black indicates land while white is cloud cover.
Phytoplankton passing through a 12-/xm filter were a relatively small proportion of chl a (28%) and primary production (32%) at the four coastal stations but accounted for two thirds of both chl a and primary production at the three offshore stations (Table 1). Net phytoplankton were dominated by the following diatoms: Chaetoceras com- pressus, C. decipiens, C. lauderi, Rhizosolenia alata, R. imbricata, R. shrubsolei, Schroederella delicatula, Stephano- pyxis turris, Nitzchia seriata, and Lauderia borealis. Most nanophytoplankton were either small flagellates with a mean diameter of 3 to 6 ttm or small naked dinoflagellates (Gymnodinium and Amphidinium types) with a diameter of 8to 10/xm.
Microbiology. Bacterioplankton cell numbers varied vertically and horizontally on the northern and western shelves (Figure 6). On the western shelf, bacterioplankton
numbers increased from about 3 x l0 s mL -I on transect V to over 7 x l0 s mL -• on transect M. Numbers nearshore were
about twice those at the shelf break. At the shelf break, numbers found near the bottom of the water column were similar to those measured at the surface. On the northern
shelf, at transect CV, numbers decreased from 4 x 10⁵ mL -• at the nearshore station to 3 x 10⁵ mL -• in deep waters near the shelf break. Highest numbers of bacterioplankton occurred on the northern shelf on transects C and O. Along transect C, bacterioplankton numbers reached concentrations of 1.4 x 10⁵ mL -•.
We compared bacterioplankton biomass estimated from bacterial cell numbers (using a conversion of 20 /xgC per cell) from Figure 6 to phytoplankton chl a biomass (using 50/xgC per microgram chl a) from Figure 5. Bacterio- plankton near the coast were only 5 to 20%, but at the shelf

10,948 TENORE ET AL.' OCEANOGRAPHY OFF GALICIA, NW SPAIN
CAPE FIHISTERRE
CAPE ORTEGAL
R I A •1 MUROS
RIA •te AROSA
RIA • PONTEVEDRA
RIA ae VIGO
N.W. SPAIN
SEA SURFACE TEMPERATURE
NASA GSFC
6 25 84
Plate lb. Same as Plate l a, but for June 25, 1984.
break were 40 to 70% of the phytoplankton biomass. Size- fractionation data of the phytoplankton community showed that in nearshore waters, net plankton dominated and bacteri- al biomass was a small percentage of the phytoplankton biomass, whereas in offshore waters, nanoplankton dominat- ed and bacterial biomass equaled phytoplankton biomass.
Zooplankton. Zooplankton biomass ranged from 0.9 at station C3 (50 to 100 m) to 72.5 mgC m -3 at station C2 (0 to 50 m) (Figure 7). The ratio of zooplankton biomass in the surface 50 m versus 50 to 100 m ranged from 1.2 to 16.2 and averaged 5 mgC m -3. Thus most of the zooplank- ton were concentrated in the surface mixed layer.
Copepod nauplii ranged from 2 to 12 individuals (ind) L -• (Figure 8a). On the northern shelf, where upwelling reached the surface, nauplii abundances in the water column between 0 to 15 m were higher than between 15 to 35 m. In contrast, on the western shelf on transect A, where there was an upwelling-related subsurface nitrate maximum and
temperature minimum, nauplii abundances in the water column between 15 to 35 m were higher than between 0 to 15 m. Bivalve larvae ranged from 0.3 to a maximum of 13 ind L -• and crustacean larvae showed a maximum of 12 ind L '• at station A3.
Weight-specific zooplankton grazing rates ranged from 118 to 531 mL mgC -• h '• (Figure 8b). When these weight- specific rates are multiplied by the zooplankton biomass, we can estimate the grazing impact of the zooplankton commu- nity. The two highest grazing rates were found on transects A and C, where zooplankton removed an estimated 77 % of phytoplankton standing stock per day.
Ichthyoplankton. The five most abundant fish larvae composed 75% of the total catch. They included the sardine, Sardina pilchardus (49%), the dragonet, Cal- lionymus lyra (14%), labridae (12%), the scad, Trachurus (8 %), and the scaldfish, Arnoglossus laterna (6 %). Mean abundances of fish larvae were 29 ind 100 m -3. Densities

TENORE ET AL.. OCEANOGRAPHY OFF GALICIA, NW SPAIN 10,949
Surface (Om) Water Temperature June 1984 Cruise
" 14.0 ß
13.6 --' • ...'
La Coruna
Finnistera
Rla de Muros
Rla de Arosa
Rla de Pontevedra
,./J • Rla de Vigo •' Vigo
50m Water Temperature June 1984 Cruise
_.• /' 12.4
13'2'•"•I•' ••'-"• La Coruna 12.8/" 12;4 •
: / Cabo Villano
'i i i Cabo Finnistera ,
? [ Ria de Muros ,
12.8
"" Rla de Arosa 13.2 '-• \\
,..,.• I -' / I
Rla de Pontevedra
Ria de Vigo
v'.•o
Figure 3. (left) Surface and (mi. ddle) 50-m water temperatures (degrees Celsius) along the coast of NW Spain and (right) vertical temperature profiles off the Ria de Arosa during the June 1984 cruise.
were greatest nearshore on transects V, CV, and C and lowest off transect M (Figure 9).
Sardine larvae were more abundant and significantly larger offshore (V2, A2, C2, and CV2) from transect CV west down to transect V (Mann-Whitney U-test, probability (p)=0.05). North of Cabo Villano, sardine larvae were more abundant offshore but were not significantly different in length than those collected at nearshore stations [Chesney and Alonso-Noval, 1989]. Sardine egg abundances (data not shown), in contrast to larvae, were distributed close to shore and were abundant at stations C4, CV4, and A4.
Sardine larval densities were significantly greater (Mann-- Whitney U-test, p=0.02) on the northern transects (x=20.0 100 m -3) than on the western transects (x=7.8 100 m-3). Similarly, densities and distribution of other fish larvae showed distinct distribution differences between the northern
and western coasts. The scad Trachurus was significantly more abundant (Mann-Whitney U-test, p=0.05) in the northern shelf, while the labrid Ctenolabrus rupestris was more abundant on the western shelf off the Rias Bajas, but those differences were not statistically significant.
For every cruise where the data were available an attempt was made to look at the distribution and abundance of fish
larvae in relation to microzooplankton and abundance of sardine eggs in relation to concentrations chl a. There were no significant correlations with either of these variables.
Fall 1984 (Cruise dates, September 27 to October 2): Prevailing Upwelling Conditions
Physical oceanography. Winds prior to and during the cruise were from the southwest and downwelling favorable along both north and west coasts (Figure 2), but the down- welling was relatively weak. Satellite sea surface tempera- ture (SST) (Plates 2a and 2b) and subsurface hydrography (Figure 10) both indicated weak upwelling to the south off the Rias Bajas and downwelling north of Cape Finisterre. Apparently, the wind had a sufficient southward component to force some upwelling south of Cabo Finisterre. The upwelling indices and the upward trend in nearshore iso-
therms on the Vigo (V) transect do not correlate well. The CZCS data on September 24 (not shown) indicate highest sea surface pigment concentrations were nearshore south of Ria de Vigo, with a diffuse enhancement in a broad area from La Coruna to the Portuguese border. Minimum surface temperatures of less than 14øC were observed at the nearshore stations along transect V and, according to the satellite data, were colder farther west. Moderately cool water extended around Cabo Finisterre to La Coruna and
coincided with the region of slightly enhanced pigment concentrations observed with CZCS. The coastal SSTs from
the AVHRR and ship observations decreased in the region between Cabo Ortegal and Ria de Vigo from September 25 to October 2. This drop indicates that upwelling had intensi- fied and that the general area of colder temperatures and enhanced pigment concentration circumscribing Cabo Finisterre had increased in size. A second CZCS image on September 29 confirms this interpretation. However, the pigment concentrations were low compared with previous observations made in this area [McClain et al., 1986]. At 50 m, minimum temperatures were found off the Ria de Vigo. Surface nitrate concentrations were highest (> 5 ttm) off the Rias Bajas. Thus the AVHRR SST and CZCS pigment images show similar patterns and trends: surface temperatures dropping and pigment concentrations increasing with time.
Phytoplankton. As in June 1984, NO-a concentrations at all coastal stations generally exceeded 5/tm near the base of the euphotic zone (1% surface light) at 30 to 40 m deep (Figures 4a-4d). There were no consistent differences within coastal or offshore stations. A mean chl a concentra-
tion of 47 mg chl a m-: and primary production of 0.46 gC m-: d 4 at the four coastal stations compared with 36 mg chl a m-: and 0.78 gC m-: d 4 for the two offshore stations (Figure 5 and Table 1).
Phytoplankton passing through a 12-/tm filter accounted for a relatively high proportion, averaging 60%, of chl a and primary production at the coastal stations (Table 1). The < 12-/tm fraction accounted for virtually all of the chl a

10,950 TENORE ET AL.' OCEANOGRAPHY OFF GALICIA, NW SPAIN
A June
NO 3 0 10 20 L I
NH 4 0 2.5 5.0 ! i i
PO 4 0 2
40 a [I
0 2.5 5.0
_ø t E
--E 20
4O
STATION V4
Sej3tember
0 10 20 I i I
0 2.5 5.0 i •1 ,!
0 1 2
NO 3 NH 4 !"1 po 4
Chl a
0 2.5 5.0
$ nano O net
Primary Production 0 2.5 5.0 0 2.5 5.0
0 - I...u I I I
20
.J O net r
40
STATION M2 NO 3 S<?13tember
lO o 5 10
NH 4 0 2.5 5• 0 2.5 5.0 I I J I I I
1304 0 I 2 0 I 2
0 ; J
ß NO 3 O NH 4
40 1:3 PO 4 Chl&
0 I 2 0 I 2 0 I , I I
! t • 20
¾'ø7' I, !•o
40J; ••Pr t' 0 I 2 0 I 2
0 i
20 i i / nano 40
C STATION M4 June September
NO 3 0 10 2O 0 10 20 I ,I I I I I
•H 4 0 2.5 5;0 0 2.5 5.0 I I I I, I
PO,• o !.o 2.o o !.o 2.0
40 -J ß NO 3
j aPO,• Chl a
0 2.5 5.0 0 2.5 5.0 ß
0 •; •1
ß ' 20 / [• , C3 nano
net
40 Primary Production
02..55.0 02.55.0
2ø1; //
-•' •" '1' o 40 J J
STATION CV4 June September
NO 3 5• lO o 5 lO I I I f
NH 4 2.5 5.0 0 2.5 5.0
I I I I I
PO 4 0 1 2 0 I 2
Chl a
0 I 2 0 I 2
0 net
4o
Prtmnry Prod.clion O ,5 IO 0 5 IO
o 20 ? ,• I• O not
40 J [3I:
Figure 4. Vertical profiles of nutrients (NO3, NH4, and PO4, in micrometer), chlorophyll a (micrograms per liter), and primary production (micrograms of Carbon per cubic meter per hour) during the June 1984 and September 1984 cruises at stations (a) V4, (b) M2, (c) M4, (d) CV4 along the coast of NW Spain. See Figure ! for station locations.

TENORE ET AL.' OCEANOGRAPHY OFF GALICIA, NW SPAIN 10,951
Table 1. Chlorophyll a and Primary Production, and the < 12-ttm Size Fraction Percentage Contribution at Coastal and Offshore Stations for the June 1984 and September 1984 Cruises
Chlorophyll a Primary Production ß
mg m -2 Percent < 12 ttm gC m -2 d '• Percent < 12 ttm
Station June Sept. June Sept. June Sept. June Sept.
Coastal
V4 144 49 - 45 0.57 0.32 35 35 A4 60 70 29 62 0.64 0.74 68 67 M4 107 44 30 59 1.79 0.48 19 56 CV4 48 24 24 86 1.92 0.30 7 90 Mean 90 47 28 63 1.23 0.46 32 62 Standard 44 19 3 17 0.72 0.20 26 23 deviation
Offshore
A2 17 30 67 98 0.47 0.39 86 98 M2 30 41 88 99 0.32 1.16 80 91 CV2 53 - 13 - 1.54 - 12 - Mean 33 36 56 99 0.78 0.78 59 95 Standard 18 - 39 - 0.67 - 4 - deviation
and primary production at the offshore stations (Table 1). Microflagellates ranging from 2 to 5 /zm in diameter dominated the nanoplankton. Net phytoplankton were dominated by the following diatoms' Rhizosolenia delicatula, R. stolterfothii, R. shrubsolei, and Thalassiosira subtilis.
Microbiology. During this cruise, estimates of in situ growth rates of bacterioplankton varied between the northern (CV and O transects) and western (V and A transects) coasts
(Figure 11). Two estimates of bacterial growth in the water column, one based on initial rates of thyroidinc incorporation and cell number and one based on in situ cell dilution
experiments and change in cell abundance over time, were generally within a factor of 1 or 2 of each other. However, along transect V, in situ bacterioplankton populations appeared to be active from initial growth rate estimates (thymidine incorporation), but they did not appear to
150 June 1984 A
100
50
0 432 432 432 4'32 432
v A M CV C
150
100
50
September 1984 c
432 432 432 432 432 432
V A M CV C O
100
50
o
Or
July-August 1985 B
42 A
42 CV
March-April 1986 D
42 42 42 A CV C
Figure 5. Phytoplankton biomass as chlorophyll a at stations along the coast of NW Spain during the four FOG cruises in (a) June 1984, (b) July/August 1985, (c) September 1984, and (d) March/April 1986. Data are given as mean with bars representing 1 standard deviation. See Figure 1 for transect and station loca- tions.

10,952 TENORE ET AL.' OCEANOGRAPHY OFF GALICIA, NW SPAIN
14
12
10
June 1984
432 432 432 234 234
V A M CV C
Figure 6. Bacteria counts for surface and bottom water at stations along the coast of NW Spain during the June 1984 cruise. See Figure 1 for transect and station locations.
increase significantly over time in the dilution experiments. On the basis of these experiments and measurements, bacterioplankton on the northern shelf were active and dividing, whereas those on the western shelf were growing slowly. Interestingly, highest bacterioplankton growth rates were found in a region where 70 to 90% of the phytoplank- ton were nanoplankton.
Zooplankton. Zooplankton biomass ranged from 6 at station 02 to 107 mgC m -3 at station M2 (Figure 7b).
Highest concentrations or' zooplankton were found on transect CV and on the western shelf transects M and A.
Similar to June, there were more zooplankton in the surface (0 to 50 m) compared with the subsurface (50 to 100 m) water column, an average ratio of 2.6 (range 1.7 to 5.0).
Copepod nauplii ranged from < 1 to 8 ind L 'l with highest abundances at stations M4 and 04 (Figure 8a). The highest abundances (3 ind L -1) of bivalve larvae were found off the Ria de Arosa at station A4.
Weight-specific zooplankton grazing ranged from 21 to 355 mL mgC -1 h 'l (Figure 8b). Water column clearance rates (weight-specific rates multiplied by biomass) were lower than June values. The average for all stations, 3.1 L m -3 h -1, extrapolates to approximately 6% of the phytoplank- ton standing crop grazed per day.
Ichthyoplankton. Mean density of fish larvae was 3.5 100 m -3, reflecting the low period of annual spawning in the area. No derailed analysis of the fish larvae data was made, and graphics of the abundance data were not included because species diversity and abundance of fish larvae were low, indicating low spawning activity. A total of only a few hundred larvae were taken in all the samples. The larvae collected were almost exclusively one species, the goby, Crystallogobius linearis.
Summer 1985 (Cruise dates, July 27 to August 8): Prevailing Upwelling Conditions
Physical oceanography. The calculated upwelling index indicated that weak upwelling conditions persisted during most of July (Figure 12). During the cruise, winds were initially strongly downwelling favorable (SW) along the west
120 June 1984
60
0 432 432 v A
_September 1984 A B
432 432 432 432 432 432 432 432
M CV C V A M CV C O
July/August 1985
120 -
60
432
A
c
March/April 1986
432 4321
CV C 4321 4321
A M
D
Figure 7. Zooplankton biomass concentrations (milligrams Carbon per cubic meter) in the surface 50 m at stations along the coast of NW Spain during the four FOG cruises in (a) June 1984, (b) September 1984, (c) July/August 1985, and (d) March/April 1986. Data are given as single values or means, with bars representing the standard deviation of the mean. See Figure 1 for transect and station locations.

TENORE ET AL.' OCEANOGRAPHY OFF GALICIA, NW SPAIN 10,953
Ai June 1984
15- 8-
10
V4 A3 M3 CV3 03
15 July 1985
1 E] o-15 rn
i r,, o- A4 A2. OV40V2
40
20
0
September 1984
V4 A4 M4 CV3 04
March 1986
A4 A2 CV4 CV2 C4 C2
el 600
40O
cn 200 E
E u) 0 • v3 • 600
.__.
(..o 400
200
o A4
June 1984
A4 M4 CV2 C2
July 1985
A2 CV4 CV2
September 1984
A4 A3 04 03 04 03
March 1986
A4 A2 CV4 CV2 C4 02
3O
lO E ß
0
-10
Io Figure 8. (a) Copepod nauplii densities (per liter) in the surface 15 m (dotted) and 15 to 30 m (stippled) water depths and (b) weight-specific zooplankton grazing rates (milliliters per milligram Carbon per hour) (dotted) and community water column clearance rates (liters filtered per cubit meter per hour) (stippled) in the surface 50 m at transect stations along the coast of NW Spain during the four FOG cruises in June 1984, September 1984, July/August 1985, and March/April 1986. Data are plotted as either single values or means, with bars representing the standard deviation of the mean. See Figure 1 for transect and station locations.
coast, shifting midway, and remaining weakly upwelling favorable for the remainder of the cruise. However, winds were upwelling favorable off the northern coast, with a strong sustained event beginning on July 29. The CZCS imagery (not shown) indicated a broad area of enhanced surface pigment extending offshore of Cabo Finisterre, reflecting the weak upwelling situation along the north coast during July. The hydrography on transects V and A showed weak upwelling (Figure 13). Subsurface isotherms (e.g., 12øC) rose with time west of Finisterre but remained fairly constant to the north, although the Villano section (CV) on
July 30 and August 3 did indicate brief upwelling in re- sponse to the wind event on July 31. Note the abrupt decrease in nitrate distribution on transect V between July 30 and August 3 and the increase on transect A from July 29 to August 6. A strong thermocline was present at most stations because of surface heating, with highest surface water temperatures observed offshore.
Phytoplankton. At nearshore stations off Villano (CV4) and Arosa (A4) temporal changes in mean euphotic zone chl a and primary production showed opposite trends (Fig- ure 14b). On the northern shelf station CV4, both chl a and

10,954 TENORE ET AL.' OCEANOGRAPHY OFF GALICIA, NW SPAIN
50 • Sardine E] Other larvae 0
Scale - per 100 rn •
, ! 10 ø
I
\
LA CORUNA
!Cabo ;•illano ß
ß ß ,
ß ß
Finisterre ß .
,
ß
ß ,
ß ß .
..
r= Ria •e Uuros ?.:.'."'. 'RIAS BAJAS'
ß .
:. Ria de Arosa
• • f Ri•. de Pontevedra ..
.
• Ri• •; Vigo • " 0 25
VIGO km 9•
Ortegal
5O
Figure 9. Densities of fish larvae at stations along the coast of NW Spain during the June 1984 cruise.
primary production decreased with time. On July 28, chl a was 6 mg m -3 but was < 1 mg m -3 on August 7, 10 days later. A CZCS image from July 30 showed that the highest pigment concentrations were centered between La Coruna (C) and Ria de Muros (M), with the highest values (> 2 mg m -3) off Cape Villano (CV). Primary production was not measured on July 28 on transect CV. However, primary production generally decreased from July 30 to August 7. In sharp contrast to the northern shelf, on transect A on the
western shelf, primary production and chl a increased from July 29 to August 8. On July 29, primary production and chl a were <2 mg m -3 h -1 and 2 mg m -3, respectivelyß On August 8, primary production was 7 mgC m -3 h -1, and chl a was almost 5 mg m -3. Increasing rates of primary produc- tion and concentrations of chl a from July 28 to August 8 coincided with decreasing surface temperatures and increas- ing nitrate levels associated with coastal upwellingß
At the offshore stations on both transects CV and A there
40
80
120
160
2OO
24O
28O
\
I I I 40 20 0
VIGO TRANSECT
Temperature September 1984
I I 10
o
40
80
20
60
:oo
•4o
- "'" '--' - 14•' •,- -.- ....
'--' 13 .-,,,•
-'- ø 1• ..,,, --
--
ORTEGAL TRANSEC
_ Temperature
September 1984 I /I I
•0 15 10 5 0
Distance (kin) Distance (krn)
Figure 10. Vertical temperature (degrees Celsius) profiles with distance from coast on the transects off (left) Vigo and (right) Ortegal (see Figure 1 for locations of these transects) in September 1984.

TENORE ET AL.' OCEANOGRAPHY OFF GALICIA, NW SPAIN 10,955
CAPE ORTEGAL
CAPE FINISTERRE
R A d MUROS
R ! A d AROS ß
RIA ß PONTEVEI)RA
RIA 4 VIGO
N.W. SPAIN
SEA SURFACE TEMPERATURE
NASA GSFC
9 5 8
Plate 2a. Satellite photographs of sea surface temperatures along the coast of NW Spain on September 25, 1984. The following are color definitions for surface water temperatures: dark blue, 12 to 13øC; purple, 14"C; light blue, 15øC; yellow, 16øC; amber, 17øC; orange, 18"C; and red, 22"C. Black indicates land, while white is cloud cover.
were no clear trends in primary production and chl a during the time series, except that chl a concentrations offshore on transect CV decreased from approximately 3.0 to 0.5 mg m -3. These changes cooccurred with an approximate 3"C rise in surface temperature (14a).
Microbiology. In 1985, time series study showed short- term changes (days) in thymidine incorporation and bacterio- plankton numbers in surface waters on the northern and western shelves (Figure 15). Rates on the western shelf were higher but more variable than rates on the northern shelf (Table 2). During the 10-day time series, rates in- creased on the northern transect CV, whereas rates cycled through a minimum value on the western transect.
Bacterioplankton abundance covaried with thymidine incorporation on the short-term (days) on both shelves (Figure 15). Bacterioplankton abundance in bottom waters remained constant over the time series. Average bacteriopl- ankton abundance on the western and northern shelves was
not significantly different (Table 2).
To compare bacterioplankton to phytoplankton produc- tion, rates of thymidine incorporation were converted to bacterioplankton production using 2 x 1048 cells mole -• of thymidine incorporation and 1 x 10 -•4 gC cell 4. Or/' the western shelf, bacterioplankton production decreased as a percentage of phytoplankton production from 10 to 3%, whereas on the northern shelf, bacterioplankton production increased from 5 to 30%. Bacterioplankton were 25 % of the phytoplankton on the western shelf but nearly equaled phytoplankton biomass on the northern shelf by the end of the time series. Phytoplankton biomass decreased over time on the northern shelf.
Zooplankton. The variability and amount of zooplankton were greatest at station A4, nearshore off the Ria de Arosa (Figure 16a). At station A4 (0-30 m), zooplankton biomass decreased from 120 to 48 mgC m -3 during the time series sampling but then increased on the last sampling day. On transect CV the biomass decreased only slightly, with a slight increase at station CV4 on the last sampling day. The

10,956 TENORE ET AL.' OCEANOGRAPHY OFF GALICIA, NW SPAIN
C-PE ORTEGAL
CAPE FINISTERRE
R I A •1 MUROS
RIA 4 AROS'
RIA •i PONTEVEDRA
RIA • VIGO
N.. SPAIN
SEA SURFACE TEMPERATURE
NASA GSF C
1028
Plate 2b. Same as Plate 2a, but on October 2, 1984.
changes in zooplankton biomass were similar to the patterns of bacterial abundance and productivity on both transects A and CV.
Nauplii abundances were higher at inshore compared with offshore stations (Figure 16b). Nauplii abundances exhibited a similar trend as zooplankton biomass on transect CV. At station CV2 the nauplii remained fairly constant over the time series sampling, whereas there was a strong increase in nauplii (3 to 12 ind L -1) at station CV4.
Weight-specific zooplankton grazing ranged from 26 to 894 mL mgC-' h 4. Grazing rates were highest at the inshore stations. Similar to biomass changes, water column clear- ance rates (Figure 16a) showed the greatest increase over time at station A4, little change at stations A2 and CV2, and a slight increase toward the end of the time series sampling at station CV4. Expressed as a daily consumption of phytoplankton biomass, maximum rates at station A4 were approximately 100 % and at CV4, approximately 26 %.
Ichthyoplankton. The six most abundant fish larvae composed 82% of the total catch. They included Gobiidae (32 %), the sardine, Sardina pilchardus (18 %), the dragonet, Callionymus lyra (12 %), the scaldfish, Arnoglossus laterna (10 %), Labridae (6 %), and the anchovy, Engraulis en- crasicholis (4 %). Mean abundances of fish larvae were 20 100 m -3, reflecting the summer spawning activity in the area. Transects were repeated every 2 or 3 days to determine temporal variability in response to upwelling and/or trans- port. Minimal temporal variability was evident in the fish larvae samples, partly because of high inherent sampling variability and partly because the timescale required for detectable changes in the composition and abundance of fish larvae is longer than for bacteria, phytoplankton, and zooplankton, which have relatively short response times to changes in the ecosystem. Temporal responses to changes in upwelling would have been most evident for egg stages of ichthyoplankton, but no sardine eggs were taken.

TENORE ET AL.- OCEANOGRAPHY OFF GALICIA, NW SPAIN 10,957
0.14
0,12
0.10
0.08
0.08
0.04
0.02
0.00
...:E Thymidine Incorporation _ Bacterial Abundance
September 1984
=.
_1-1 Vigo Arosa Villano Ortegal
Figure 11. Bacterial growth rates estimated by instanta- neous thymidine incorporation (1- to 2-hour incubations) and by dilution culture (change in bacterial abundance over 0 to 24 hours) techniques. Values are averages of all stations across each transect (see Figure 1 for transect locations) during the September 1984 cruise.
Although there were only two transects during this cruise there were distinct differences in species composition of larval fish of the northern versus the western transects
(Figure 17). T. trachurus and E. encrasicholis were significantly more abundant and mostly taken on the Villano transect, and gobies were significantly more abundant on the Arosa transect. Sardine and labrids were abundant on both transects.
Lengths of larval sardine were significantly longer offshore on the Villano (CV) and inshore on the Arosa (A) transects [see Chesney and Alonso-Noval, 1989]. Demities of fish larvae were highest inshore on the Arosa transect, decreasing to near zero at the seaward station, but densities remained high or even increased offshore on the Villano transect, indicating offshore transport of fish larvae off Cabo Villano.
Distinct species-specific onshore-offshore patterns occurred as well. On the Villano transect sardines, gobies, and labrids were all most abundant at the outermost station
of the transect (Figure 17). On the Arosa transect these species were most abundant at the inshore station of the transect (Figure 17).
Spring 1986 (Cruise dates, March 22-April 2): Prevailing Downwelling Conditions
Physical Oceanography. Strong SW winds (Figure 18) created moderately strong downwelling-favorable conditions for most of the cruise. Hydrography indicated 12 to 13øC surface temperatures throughout the areas. We detected little thermal structure with depth and conditions did not suggest any upwelling in the area (Figure 19). This is supported by CZCS imagery (not shown) on April 3 which shows a narrow band of enhanced pigment concentrations along the entire coast south of Finisterre similar to the pattern of lower-salinity water along the same west coast
(Figure 20). This pattern of surface pigments contrasts with the image on July 30, 1985, when the winds were upwelling favorable and the region of enhanced pigment concentration was quite broad. The Arosa transect temperature section on March 23 (Figure 19) suggests upwelling in the layers below 80 m.
Salinity profiles indicate a low-salinity layer off the Rias Bajas extending 20 to 30 km offshore and reaching depths of 40 m. The source of this water must have been the rivers
of the Rias Bajas. The SW winds, which would induce a southward flow, appeared to constrain this water south of Cape Finisterre. The surface salinity map (Figure 20) suggests there was a southward flow in the upper water column layers. The extent and depth of this low-salinity layer suggests mixing related to the strong southwest winds was intense. The salinity distribution also correlates well with surface pigment distribution from the CZCS.
Phytoplankton. Some measurements were made at stations C2, C4, CV2, CV4, A2, and A4. Highest rates of primary production were at A4 and CV2, showing no clear trend between coastal and offshore stations. At eight stations along either the Coruna or Cabo Villano transects, chl a and primary production averaged (n = 8 stations) 41 mg m -2 and 0.48 gC m -2 d 4, respectively (Figure 5). The < 12-/zm phytoplankton fraction averaged 73 % of the chl a and 70% of primary production.
Along the Arosa transect, chl a and primary production averaged 75 mg rn -2 and 1.1 gC m -2 d 4, respectively. The < 12-/zm size fraction contributed most of the phytoplankton biomass and productivity.
Microbiology. Thymidine incorporation and bacterio- plankton abundance on both northern and western shelves varied over time and space. Only bacterioplankton abun- dance was significantly :different overall between western versus northern shelves (Table 3). During this cruise, bacterioplankton abundance and rates of incorporation were about twice those measured in July 1985. Comparing bacterioplankton to phytoplankton biomass, on the western shelf, bacterioplankton biomass was 15 to 46%, and on the northern shelf, 70% of phytoplankton biomass values. Phytoplankton biomass on the northern shelf was low during this time series. In terms of production, bacterioplankton production was only 1 to 10% of phytoplankton production above 15 m and equaled phytoplankton production below 15 m water depth.
Zooplankton. Zooplankton biomass was the highest of all the cruises (Figure 7). Zooplankton biomass did not show any pattern of increase or decrease during the cruise. On the western shelf there was a nearshore band of lower-
salinity water that had high chl a concentrations relative to the shelf waters; for stations on the various transects in this zone the ratio of zooplankton at 0- to 50-m and 50- to 100-m water depths averaged 4.6 at station A4, 2.2 at station CV4, and 1.9 at station C4.
Total microzooplankton abundances were at least twofold higher than on all the other cruises. The abundances of copepod nauplii ranged from 3 to 47 nauplii L 4, with the highest abundances found at station A2 (Figure 8a). Bivalve larvae were most abundant (maximum of 6 ind L 4) at station A4 in surface waters nearshore the mouth of the Ria de Arosa.
Zooplankton grazing rates were similar over all transects. Weight-specific grazing rates ranged from 10 to 118 mL

10,958 TENORE ET AL.' OCEANOGRAPHY OFF GALICIA, NW SPAIN
4000
2000
c• .-2ooo
-4000
1985 Upwelling Index - West Coast
-6øøø'"Jan 'Feb'Mar'Apr'May' Jun 'Jul 'Aug'Sep'Oct'Nov'Dec' 4000
1985 Upwelling Index - North Coast
,ooo I I
-2o0o
• -4000
-6000
-8000 an 'Feb'Mar'Apr'May' Jun' Jul 'Aug'Sep'Oct'Nov'Dec'
500j Upwelling Index - 1985/• O' West Coa••,••/ ••/./•.•
-500
-1000
-1500
-2000 • • • • i • • 27 29 31 2 4 6 8
1200
I / North Coast //
4OO
-20027 29 3! 2 4 6 8 Jul I Aug
Figure 12. Calculated upwelling indices for the (top) west and (bottom) north coasts of NW Spain during 1985 and specifically during the summer 1985 cruise.
mgC -i h -1, with the highest grazing rates at CV4 (Figure 8b). Water column clearance rates were low compared with the other cruises (1 to 6 L m -3 h-i). Thus the maximum zoo- plankton grazing rate was equivalem to a daily removal rate of approximately 14 To of the phytoplankton standing crop.
Ichthyoplankton. Transects were repeatedly sampled every 2 or 3 days to determine temporal variability in response to upwelling and/or transport. Again, no clear-cut pattern of temporal variability was evident in fish eggs and larvae. The six most abundant fish larvae composed 81% of the total catch. They included Gadidae (47%), Gobiidae (14 %), the sardine, $ardina pilchardus (11%), Labridae (6%), Blennidae (4%), and Ammodytes marinus (3 %). Mean abundances of fish larvae were 35 100 m -3, reflecting a peak spawning time for several species in the area. Nearshore-offshore density distributions clearly indicated highest concentrations of fish larvae inshore and decreasing significantly seaward (Mann-Whitney U test, p=0.05) on
transects A and C (Figure 21). Comparing just nearshore stations, fish larval densities were highest on transect V.
Relatively few sardine eggs and larvae were taken [Chesney and Alonso-Noval, 1989], especially considering that February through May is the peak spawning time for sardines in this region. Nevertheless, sardine eggs were more abundant than on any of the other cruises but were found primarily on inshore stations on transect C. Sardine larvae averaged 4.9 mm SL and were small compared with those taken on other cruises.
Discussion
Timescales of Biotic Responses to Episodic Upwelling Events
It is well known that bacteria, phytoplankton, and zooplankton generally respond to the physical and chemical changes, especially nutrient enrichment, associated with

TENORE ET AL.. OCEANOGRAPHY OFF GALICIA, NW SPAIN 10,959
o
lOO
•oo -
300 - 400 -
500
11.5 -- -- '"
I 30 July 1985 _ II Tempersturel i I - Nitrate I
I I I I
100 -" '• 200 t _-. --11,5 ...• ___ 300 I WL_LANO4__ • / 3 August 1985
4001 _-11 -/ 500• 45 30 15 0
Distance (krn)
ß 11,5 -
AROSA 1
29 July 1985
12
.-.11,5 - o
AROSA 5
6 Aug 1985
45 30 15
Distance (krn)
Figure 13. Changes in temperature (degrees Celsius) and nitrate (-NO3) distributions along the coast of NW Spain off (left) Villano and (right) Arosa during the summer 1985 cruise. See Figure 1 for transect and station locations.
A Cabo Villano Transeot Arosa Transeot N, Coast off Finisterre W, Coast off Rlas BaJas
18
17
16
G' 15
E 17
8hell Break 8tatIon CV2 I I I I I I
Coastal Station CV4
8hell Break 8tatIon A2 I I I I I I
36.0
Coastal Station A4 ' ' 35,0
6 8hell Break 8tatIon CV2 8hell Break 8tatIon A2
.c • Primary production • 4
• o ............... • • •, Coastal 8tatIon CV4
.e-
0 / i i ! i i i 27 •9 :•1 • •, • • 29 31 2 4 6 8 July Aug ust July Aug ust
episodic upwelling events on timescales varying from hours to days to weeks. For example, the time series sampling off the Galician shelf showed that bacterioplankton demities and production increased two to three times within 10 days of the onset of an upwelling event, but zooplankton and fish 36,0
larvae showed little change. Because of these different 35.5 response times, a set of observations collected on cruises
such as these FOG studies are, in reality, a point-of-time 35.o • "snapshot" of the planktonic community structure and rate
:_• functions at a given point of time in a dynamic continuum. • Thus preceding hydrographic conditions and biotic fluxes are
0.10
Cabo Villano Transect N. Coast off Finisterra
Arosa Transeot
W. Coast off Rias BaJas
0,08
0,06
0,04
0,02
0
0.80
0,60 0.40
0,20
Shelf Break Station CV2
0 27 29 31
July
/
I I I I
Coastal Station CV4
[ H Bacteria l ß Production I I I
4 6 8
August
Shelf Break Statio•
I I I I I
Coastal Station A4
July August
4 •
Figure 14. Time series changes in (a) temperature and salinity and (b) chlorophyll a and primary production at sta- tions A2, A4, V2, and V4 along the coast of NW Spain. See Figure 1 for transect and station locations.
Figure 15. Time series changes in bacterial numbers and thymidine incorporation rates along the north and west coasts of NW Spain during the summer 1985 cruise. See Figure 1 for transect and station locations.

10,960 TENORE ET AL.' OCEANOGRAPHY OFF GALICIA, NW SPAIN
Table 2. Thymidine Incorporation and Bacterioplankton Counts Under Upwelling Conditions During the Summer 1985 Cruise off Northwest Spain
Thymidine, pmol L '• h '• Bacteria, 108 cells L -•
Minimum Maximum Mean Standard Minimum Maximum Mean Standard Deviation Deviation
Shelf
Northern 0.10 6.20 2.73 1.49 1.7 8.5 4.8 1.8 Western 1.10 10.10 5.78 2.79 1.0 10.2 4.6 2.3
Section
Arosa 1.10 10.10 5.78 2.79 1.0 10.2 4.6 2.3 Villano 0.10 6.20 2.73 1.49 1.7 8.5 4.8 1.8
Area
Nearshore 1.70 10.10 5.08 2.92 2.1 7.5 4.4 1.4 Midshelf ND ND ND ND 1.0 9.4 4.5 2.3 Outershelf 0.10 9.00 3.69 2.43 1.4 10.2 5.0 2.3
All "shelf" values are averaged over entire shelf. All "section" values are averaged across each section. Mean values are for each area for both sides. ND indicates no data.
Shelf Break Stations Coastal Stations
A, 120 N. Coast off Finisterre W. Coast off Riss Betjam Shelf Break Station CV2 Shelf Break Station A2
I• o '.• Coastal Station CV4 Station A4 ; •' •o -- , •o :• water masses. -• Biornassl "%. ,
I- "• GraZing I
m m ..-' '....o.; . II- 0 - 'm a...•_• •. -0 0 Others /--' 27 29 31 2 4 (5 8 29 31 2 4 (5 8 •__• July August July August Scale - ;•f 100 m 3
B, 21 "/
• A2 • •,1 , •_+-,--,---{-i-'r"',-• A2, ,I S ,•%.•,Finisterre
cv ; ' 'i: "' • \ Ria de Muros
• 'de Arosa
July August ---
needed to understand the nutrient and standing stock levels described by a set of cruise data taken from any given point
in time and to interpret physiological and biomass responses of plankton in areas such as the NW coast of Spain that exhibit episodic upwelling. Furthermore, observed spatial changes reflect not only biotic fluctuations, but also distri- butional changes caused by vertical/horizontal water mass movements. Even spatial time series sampling is difficult to interpret because of water mass movement and because more
intensive studies follow plankton dynamics occurring in
'RIAS BAJAS'
Ria do Pontevedra
Figure 16. (a) Time series changes in zooplankton biomass (milligrams Carbon per cubic meter, solid lines) and water column clearance rates (liters filtered per cubic meter per hour, dotted lines) in surface waters at stations A2, A4, V2, and V4 along the coast of NW Spain during the July/August 1985 cruise, (b) Time series changes in nauplii abundance (individuals per liter) in surface waters.
/ :;. Summer 1gas
VIGO ß
F:'.'-' ' de Vigo
o 25 50 I ! i
km
LA CORUNA
Figure 17. Larval fish densities on transects A and V along the coast of NW Spain during the summer 1985 cruise.
',abo Ortega]
ß .
ß .
ß
.. ß

TENORE ET AL.' OCEANOGRAPHY OFF GALICIA, NW SPAIN 10,961
1986 Upwelling Index - West Coast
,,,, i ,._ k.
I • I I
I
I
I I I I I I
- I I I I
...........
4000
i
E
• 0
x
.c_ -4000
-8000
10000r 1986 Upwelling Index - North Coast
5000
c•-5000 ._c_
21
- 10000 I - 15000 •, Jan 'Feb'Mar' Apr 'May' Jun' Jul 'Aug'Sep'Oct' Nov'Dec'
2001 West Coast
-2000 I -4000•.-
-6000 -
--
-8000
-ooo
4000
2000
-20OO
-4000
I I I I I
I 23 25 27 29 31
I
Upwelling Index - 1986
North Coast
--
_ •
--
--
-6000 i • • • • • 21 23 25 27 29 31 2
Mar i Apr
Figure 18. Calculated upwelling indices for the (top) west and (bottom) north coast of NW Spain during 1986 and specifically during the spring 1986 cruise.
Upwelling conditions prior to and during the June 1984 cruise resulted in high phytoplankton biomass and productiv- ity. For example, chl a and primary production in the Galician upwelling system attained levels comparable to those observed in the northwest Africa upwelling system [Huntsman and Barber, 1977]. However, both zooplankton biomass and fish larvae were low during this cruise. In contrast, downwelling conditions prior to and during the March/April 1986 cruise resulted in low phytoplankton biomass. However, we found the highest demities of zooplankton and fish larvae. This mismatch of autotroph and heterotroph can result from both advection as well as differences in response times to upwelling events.
The time series sampling during the July/August 1985 cruise can be used to unravel some of these phenomena. Prior to the cruise, upwelling conditions existed on both the northern and western coasts (Figure 12). Downwelling conditions existed during the beginning of the cruise; a strong upwelling event occurred on July 31 off the northern coast and a weak upwelling event occurred on August 3 off
the western coast. Nitrate and phytoplankton decreased and temperature increased off the northern coast; nitrate and phytoplankton increased and temperature decreased off the western coast. In contrast, bacterial abundance and produc- tion increased off both northern and western coasts. These results could be variously interpreted: (1)off the western coast, as a response to enhanced phytoplankton production; (2) off the northern coast, as a response to increased temperature; or (3) as due to different bacterial populations associated with different water masses. Similarly, zooplank- ton data from this time series sampling illustrate the classic response to episodic upwelling enrichment to tile water column planktonic community. The weak upwelling event off the western coast brought newly upwelled water to the surface and resulted in decreased zooplankton biomass. However, within 1 week, in response to enhanced phyto- plankton biomass and production (Figure 15), increased zooplankton grazing (Figure 16), and production (as evi- denced by higher nauplii abundances) had resulted in increased zooplankton biomass.

10,962 TENORE ET AL.' OCEANOGRAPHY OFF GALICIA, NW SPAIN
• -120
-160
O (:::)
I I ../ I I I I.._ I ..... ... 12.7 ---- __
/--' H ! I / /'"'--"'" ß -. // lP.g /t i / / /•-'""'
\ ! _--.
\ • / •,.-'-'-' ._._,.•, //
\ \ / / / .,-"' _,-
....• '•.......•"-•//';'"/ / /
.. -."... • • -- x / / / x /- Temperature '-- ,. '" --- - -- '- •///_• / Arosa Transect
x -,. •.• "•//, •" / 23 Mar 1986
r• -120 -
-160 -
'"-..•,, •---"/ /,.--- 35.•"--• .......
\ • [ •x • I /------"--,. '"'"--"'' \ • •,-•5.4 / / I x -.,... ""-• / I I \ --"
! /
I '- _ _ _ .. /'• Salinity
/ • 23 Mar 198e I
-20 -10 0 -200 ;
-50 -40 -30
Distance (km)
Figure 19. (top) Temperature and (bottom) salinity depth profiles on the Arosa transect on March 23, 1986, during the spring 1986 cruise. See Figure 1 for transect and station locations.
Surface Salinity April 1986
Ortegal
ß .
35.6-"-'-..
35.5 ""-' 35.4 ....
/ I i
,.
;abo •illano ß
ß ß
ß
Finisterre
CORUNA
I%t Ria •e Muros .'.
.'
Ri•'de Arosa I •',1 ,'.. '.
"RIA$ BAJA$'
ß • de Pontevedra
ci• woo 35i4• ::.. I
VIGO !
IO
Figure 20. Surface salinity contours along the coast of NW Spain during the spring 1986 cruise.
During upwelling conditions (summers of 1984 and 1985), phytoplankton biomass and productivity were high in response to the nitrate input in the euphotic zone. Size fractionation studies suggest that new nitrogen supported the growth of netplankton (> 12/zm, primarily diatoms) in early summer 1984. In early fall 1984, when upwelling was weak following a strong downwelling period, phytoplankton biomass decreased from that measured in the summers of
1984 and 1985, and the size structure of the plankton shifted from netplankton to nanoplankton (< 12 /zm). This shift suggests a change to alternate nitrogen sources, e.g.,
Table 3. Thymidine Incorporation and Bacteria Counts Under Downwelling Conditions During the Spring 1986 Cruise off Northwest Spain
Thymidine, pmol L -• h '• Bacteria, 108 cells L -I
Minimum Maximum Mean Standard Minimum Maximum Mean Standard Deviation Deviation
Shelf
Northern 0.90 18.20 6.57 4.11 5.1 10.2 7.2* 1.3 Western 0.84 58.82 9.00 9.88 5.9 14.5 9.5* 2.2
Section
Arosa 0.84 59.82 9.00 9.88 5.9 14.5 9.5 2.2 La Coruna 1.10 14.96 6.18 3.71 5.1 10.2 7.6 1.3 Villano 0.90 18.20 7.02 4.55 5.2 8.5 6.6 1.0
Area
Nearshore 1.59 18.13 6.49 3.55 5.8 12.1 7.8 1.6 Midshelf 0.84 18.07 6.89 4.53 5.5 11.1 8.2 1.7 Outer Shelf 0.90 59.82 9.34 10.90 5.1 14.5 8.2 2.7
All "shelf" values are averaged over the entire shelf. All "section" values are averaged across each section. Mean values are for each area for both sides.
*Significant differences are at the 99% confidence level (student t test) between means.

TENORE ET AL.. OCEANOGRAPHY OFF GALICIA, NW SPAIN 10,963
fo LACORUNA
- 50 I• sardine • Gadidae ., I--I other larvae Scale - per 50 m 3 • ..//
ß
ß ' •:' ß. .
( 'Cabo '•iilano • ,.',
• .... . [ Finisterre !
! :.". t I ' -
• ... ß
( Ria ;:le Muros .'.
ß :.. %• ..
• de Arosa
• '.. -. •2',, I• . .
r=_ ] • Ria de Pontevedra
/ •, •ia de vigo .'. 0 25
Spring 1986 WGO km
'RIAS BAJAS'
Ortegal
50
Figure 21. Fish larval densities along the coast of NW Spain during the spring 1986 cruise.
ammonium from nitrogen regeneration, was supporting continued phytoplankton growth. During this weak upwel- ling period in the fall 1984 cruise, zooplankton biomass exceeded phytoplankton biomass. During downwelling conditions in the spring 1986 cruise we also found low phytoplankton and high zooplankton biomass.
On the other hand, the effect of preceding and current hydrographic conditions on the bacterioplankton was not at all obvious from these studies of short duration because
bacteria can correlate with both related changes in phytopla- nkton and zooplankton. High bacterioplankton occurred along with high phytoplankton biomass in the summer 1984 cruise but not in the summer 1985 cruise. Because of their
short generation times, bacteria can respond rapidly to increases in both phytoplankton and zooplankton. Enhanced phytoplankton production, with accompanying leakage of dissolved organic substrates, can result in increased bacterial production and biomass [e.g., Duursma, 1961]. Increases in bacterial biomass and production can also result from a greater release of dissolved organics associated with in- creased zooplankton grazing [Roman et al., 1988].
Mesoscale Spatial and Temporal Patterns in the Galician Shelf Coastal Systems
Superimposed on macroscale atmospheric and oceano- graphic patterns are mesoscale upwelling/downwelling due to coastal topography and outwelling from the rias (Fig- ure 22). Surface salinities nearshore the rias during the June campaign were less than expected from T/S relations of North Atlantic Central Water (NACW). Seaward advection of low-salinity waters from the rias is a likely explanation for the reduced salinities nearshore off the Rias Bajas.
Previous work [Blanton et al., 1984] showed that surface waters in the rias advect seaward when NACW intrudes into
the rias as a subsurface layer. These intrusions occur throughout the upwelling season and are a primary source of nutrients sustaining the high production off the rias [Campos and Gonzalez, 1975]. However, Alvarez-Salgado et al. [1993] discuss the potential contribution of mineralization of organic matter outwelling from the rias contributing to the nutrient pool of the shelf waters. Mixing of intruded NACW with the lower-salinity waters in the rias occurs in the middle and inner Ria de Arosa [Hanson et al., 1986]. This mixing of nutrient-rich intruded water into the photic zone results in high primary production. The resultant phytoplankton biomass of typically estuarine species in the rias is advected seaward. Both zooplankton and fish fauna near Arosa are more typical of the rias than species found on the northern transects. Fish species more typical of classic upwelling systems are seen in the north, while in the south, large numbers of gobies and labrids indicate more coastal estuarine influence. Similarly, the zooplankton community on the western shelf contains several species of invertebrate larvae which are outwelled from the rias.
Effects on Fisheries Along the Galician Shelf
Temporal distribution and abundance of fish eggs during the four cruises reflected seasonal spawning patterns; spatial distribution of sardine eggs and larvae reflected the distribu- tion of the spawning adults and the pattern of oceanographic currents which dispersed the eggs and larvae. Acoustical surveys of sardines have shown that adults generally distrib- ute themselves and spawn close inshore along the Galician shelf [see Garcia et al. 1988, and references therein]. However, in our study the sardine larvae tended to be just as abundant and larger offshore as inshore (Figure 23). This suggests that during upwelling-favorable periods, larvae were transported offshore from inshore spawning sites. Sardine abundances, length frequencies, and the likely pattern of coastal flow [McClain et al., 1986) suggest that larvae were dispersed westward and offshore north of Cape Finisterre. South of Cape Finisterre, fish larvae appeared to be dispersed to the south and offshore.
The highly productive convergence zone of two water masses just north of Cape Finisterre occurs offshore from the coastal upwelling [Fraga, 1981; Fraga et al., 1982; Estrada, 1984; McClain et al., 1986). Adult sardines are known to concentrate inshore, so the observed higher concentrations of sardines and other ichthyoplankton off- shore in June 1984 and July 1985 (Figures 9 and 18) must have been due to offshore transport and concentration caused by the frontal convergence. The fish larvae collected offshore also tended to be larger/older larvae. In contrast, in March 1986, when downwelling conditions prevailed, no sardine, but other fish larvae, were observed at the offshore stations near the convergence zone (Figure 21). Winds in March 1986 were strong and variable, shifting from down- welling to upwelling favorable during the cruise, and the water column was mixed. Strong turbulent mixing is generally believed to be detrimental to survival of early stage fish larvae [Lasker, 1981; Peterman and Bradford, 1987; Cury and Roy, 1989]. Given that March is one of the peak spawning periods for sardines, there were surprisingly low numbers of sardine eggs and larvae along the Galician

10,964 TENORE ET AL.' OCEANOGRAPHY OFF GALICIA, NW SPAIN
TYPICAL SPRING-EARLY SUMMER
UPWELLINGPATTERN WITH NE WINDS
OUTWELLING ESTUARINE WATER OVERLAYS SUBSURFACE UPWELLED WATER UNLESS SUBSEQUENT STRONG SE WINDS OFF THE RIAS BAJAS ENHANCE NORTHWARD
MOVEMENT OF FRESHWATER.
e.g. JUNE 1984 and MARCH 1986 SURVEY
TYPICAL LATE SUMMER-EARLY FALL UPWELLING PATTERN.
SURFACE UPWELLING OCCURS ALSO ALONG THE COAST OFF THE RIAS BAJAS WHEN LOWER PRECIPITATION RATES RESULT IN LOWER OUTWELLING
OF ESTUARINE WATER.
e.g. SEPTEMBER-OCTOBER 1984 SURVEY
Figure 22. Diagram illustrating the effects of coastal outwelling on upwelling along the inshore western coast of Galicia, NW Spain off the Rias Bajas.
coast at that time; this absence suggests that either little sardine reproduction had occurred or sardine egg and larval survival in the area prior to the March cruise was poor, perhaps as a result of strong mrbulem mixing. In either case there would have been little opportunity for advection of sardines and other larvae offshore as was observed during periods of moderate upwelling.
The Iberian stock of sardines has not shown wide fluctua-
tions in catch nor apparem steep population declines typical of many upwelling fisheries. Of course, sardine and anchovy catches from this Galician fisheries are 2 orders of magnitude lower than that of Peru. Annual catch data from the Atlantic Spanish coast (FAO area 27) since 1980 have ranged for anchovies between 0.01 to 0.12 and for sardines
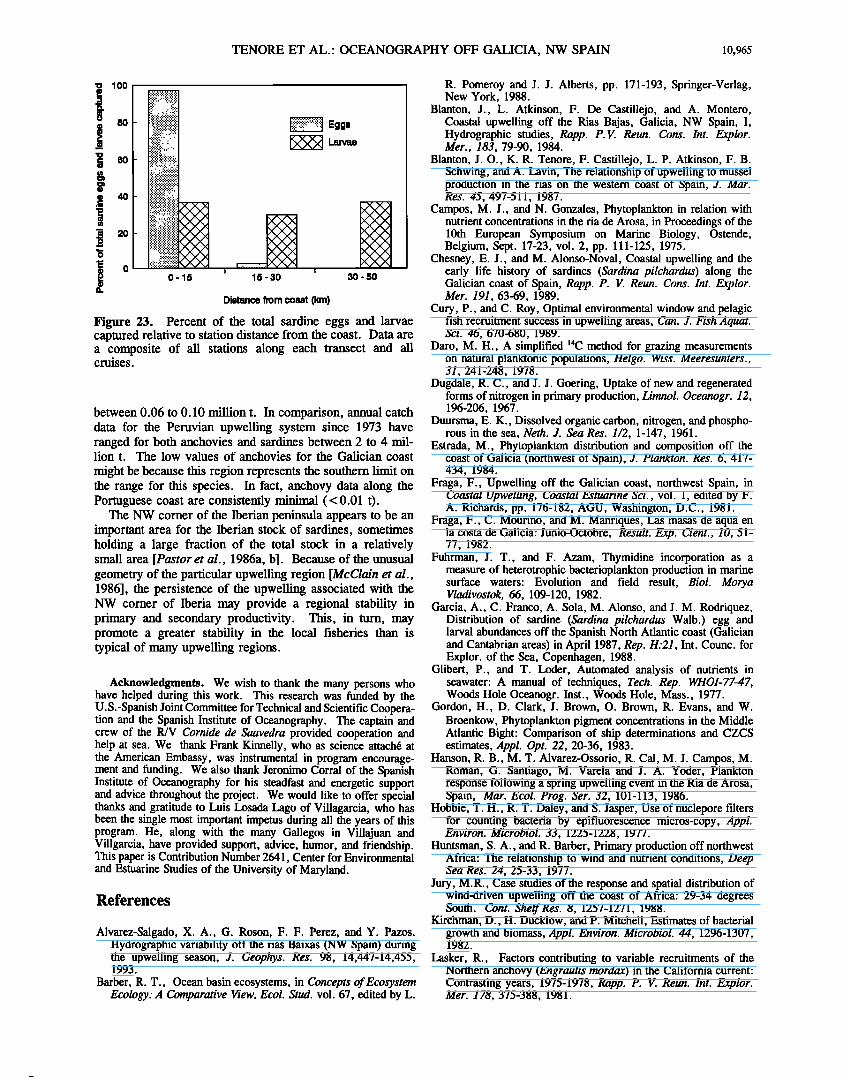
TENORE ET AL.' OCEANOGRAPHY OFF GALICIA, NW SPAIN 10,965
lOO
80
õ oo
ß 40 .=_
=o
.:.:.:.:.:.:.:.:.:.:.: :::::::::::::::::::::: >;.:.:.:.:.:.:.:.:.:.
' '"'""'"':• Eggs •L•rvae
...........
0.15 • 15 - 30 I 30 - 50
Distance from coast (km)
Figure 23. Percent of the total sardine eggs and larvae captured relative to station distance from the coast. Data are a composite of all stations along each transect and all cruises.
between 0.06 to 0.10 million t. In comparison, annual catch data for the Peruvian upwelling system since 1973 have ranged for both anchovies and sardines between 2 to 4 mil- lion t. The low values of anchovies for the Galician coast
might be because this region represents the southern limit on the range for this species. In fact, anchovy data along the Portuguese coast are consistently minimal (<0.01 t).
The NW corner of the Iberian peninsula appears to be an important area for the Iberian stock of sardines, sometimes holding a large fraction of the total stock in a relatively small area [Pastor et al., 1986a, b]. Because of the unusual geometry of the particular upwelling region [McClain et al., 1986], the persistence of the upwelling associated with the NW corner of Iberia may provide a regional stability in primary and secondary productivity. This, in turn, may promote a greater stability in the local fisheries than is typical of many upwelling regions.
Acknowledgments. We wish to thank the many persons who have helped during this work. This research was funded by the U.S.-Spanish Joint Committee for Technical and Scientific Coopera- tion and the Spanish Institute of Oceanography. The captain and crew of the R/V Cornide de Saavedra provided cooperation and help at sea. We thank Frank Kinnelly, who as science attach6 at the American Embassy, was instrumental in program encourage- ment and funding. We also thank Jeronimo Corral of the Spanish Institute of Oceanography for his steadfast and energetic support and advice throughout the project. We would like to offer special thanks and gratitude to Luis Losada Lago of Villagarcia, who has been the single most important impetus during all the years of this program. He, along with the many Gallegos in Villajuan and Viiigarcia, have provided support, advice, humor, and f{iendship. This paper is Contribution Number 2641, Center for Environmental and Estuarine Studies of the University of Maryland.
References
Alvarez-Salgado, X. A., G. Roson, F. F. Perez, and Y. Pazos. Hydrographic variability off the rias Baixas (NW Spain) during the upwelling season, J. Geophys. Res. 98, 14,447-14,455, 1993.
Barber, R. T., Ocean basin ecosystems, in Concepts of Ecosystem Ecology: A Comparative View. Ecol. Stud. vol. 67, edited by L.
R. Pomeroy and J. J. Alberts, pp. 171-193, Springer-Verlag, New York, 1988.
Blanton, J., L. Atkinson, F. De Castillejo, and A. Montero, Coastal upwelling off the Rias Bajas, Galicia, NW Spain, I, Hydrographic studies, Rapp. P.V. Reun. Cons. lnt. Explor. Mer., 183, 79-90, 1984.
Blanton, J. O., K. R. Tenore, F. Castillejo, L. P. Atkinson, F. B. Schwing, and A. Lavin, The relationship of upwelling to mussel production in the rias on the western coast of Spain, J. Mar. Res. 45, 497-511, 1987.
Campos, M. J., and N. Gonzales, Phytoplankton in relation with nutrient concentrations in the ria de Arosa, in Proceedings of the 10th European Symposium on Marine Biology, Ostende, Belgium, Sept. 17-23, vol. 2, pp. 111-125, 1975.
Chesney, E. J., and M. Alonso-Noval, Coastal upwelling and the early life history of sardines (Sardina pilchardus) along the Galician coast of Spain, Rapp. P. V. Reun. Cons. Int. Explor. Mer. 191, 63-69, 1989.
Cury, P., and C. Roy, Optimal environmental window and pelagic fish recruitment success in upwelling areas, Can. J. Fish Aquat. Sci. 46, 670-680, 1989.
Daro, M. H., A simplified 14C method for grazing measurements on natural planktonic populations, Helgo. Wiss. Meeresunters., 31, 241-248, 1978.
Dugdale, R. C., and J. J. Goering, Uptake of new and regenerated forms of nitrogen in primary production, Limnol. Oceanogr. 12, 196-206, 1967.
Duursma, E. K., Dissolved organic carbon, nitrogen, and phospho- rous in the sea, Neth. J. Sea Res. 1/2, 1-147, 1961.
Estrada, M., Phytoplankton distribution and composition off the coast of Galicia (northwest of Spain), J. Plankton. Res. 6, 417- 434, 1984.
Fraga, F., Upwelling off the Galician coast, noahwest Spain, in Coastal Upwelling, Coastal Estuarine Sci., vol. 1, edited by F. A. Richards, pp. 176-182, AGU, Washington, D.C., 1981.
Fraga, F., C. Mourino, and M. Manriques, Las masas de aqua en la costa de Galicia: Junio-Octobre, Result. Exp. Cient., 10, 51- 77, 1982.
Fuhrman, J. T., and F. Azam, Thymidine incorporation as a measure of heterotrophic bacterioplankton production in marine surface waters: Evolution and field result, Biol. Morya Vladivostok, 66, 109-120, 1982.
Garcia, A., C. Franco, A. Sola, M. Alonso, and J. M. Rodriquez, Distribution of sardine (Sardina pilchardus Walb.) egg and larval abundances off the Spanish North Atlantic coast (Galician and Cantabrian areas) in April 1987, Rep. H:21, Int. Counc. for Explor. of the Sea, Copenhagen, 1988.
Glibert, P., and T. Loder, Automated analysis of nutrients in seawater: A manual of techniques, Tech. Rep. WH01-77-47, Woods Hole Oceanogr. Inst., Woods Hole, Mass., 1977.
Gordon, H., D. Clark, J. Brown, O. Brown, R. Evans, and W. Broenkow, Phytoplankton pigment concentrations in the Middle Atlantic Bight: Comparison of ship determinations and CZCS estimates, Appl. Opt. 22, 20-36, 1983.
Hanson, R. B., M. T. Alvarez-Ossorio, R. Cal, M. J. Campos, M. Roman, G. Santiago, M. Varela and J. A. Yoder, Plankton response following a spring upwelling event in the Ria de Arosa, Spain, Mar. Ecol. Prog. Ser. 32, 101-113, 1986.
Hobbie, T. H., R. T. Daley, and S. Jasper, Use of nuclepore filters for counting bacteria by epifluorescence micros-copy, Appl. Environ. Microbiol. 33, 1225-1228, 1977.
Huntsman, S. A., and R. Barber, Primary production off northwest Africa: The relationship to wind and nutrient conditions, Deep Sea Res. 24, 25-33, 1977.
Jury, M.R., Case studies of the response and spatial distribution of wind-driven upwelling off the coast of Africa: 29-34 degrees South. Cont. Shelf Res. 8, 1257-1271, 1988.
Kirchman, D., H. Ducklow, and P. Mitchell, Estimates of bacterial growth and biomass, Appl. Environ. Microbiol. 44, 1296-1307, 1982.
Lasker, R., Factors contributing to variable recruitments of the Northern anchovy (Engraulis mordax) in the California current: Contrasting years, 1975-1978, Rapp. P. V. Reun. lnt. Explor. Mer. 178, 375-388, 1981.

10,966 TENORE ET AL.' OCEANOGRAPHY OFF GALICIA, NW SPAIN
McClain, C. R., S. Chao, L. P. Atkinson, J. O. Blanton. and F. Castillejo, Wind-driven upwelling in the vicinity of Cape Finnisterre, Spain, J. Geophys. Res. 91, 8470-8486, 1986.
Parrish, R.H., A. Bakun, D.M. Husby, and C.S. Nelson, Compar- ative climatology of selected environmental processes in relation to eastern boundary current pelagic fish reproduction, in Proceedings of the Expert Consultation to Examine Changes in Abundance and Species Composition of Neritic Fish Resources, San Jose, Costa Rica, 18-29 April 1983, edited by G. D. Sharp and J. Csirke, Fish. Rep. 291, vol. 3, pp. 731-778, Food and Agric. Organ., Rome, 1983.
Pastor, X., F. Alvarez, C. Porteiro, and A. Astudillo, Acoustic abundance estimation of sardine (Sardina pilchardus Walb.) off Cantabric and Galician waters, August 1985. Rep. H.'21, Int. Counc. for Exlor. of the Sea, Copenhagen, 1986a.
Pastor, X., C. Porteiro, F. Alvarez, and J. Miquel, Acoustic abundance estimation of sardine (Sardina pilchardus Walb.) off Cantabric and Galician waters, March 1986. Rep. H.'20, Int. Counc. for Explor. of the Sea, Copenhagen, 1986b.
Perez, A., and G. Roman, Estudio del mejillon y de su epifauna en los cultivos flotantes de la Ria de Arosa, II, Crecimiento, mortalidad y produccion del mejillon, Bol. Inst. Esp. Oceanogr. 5(267), 23-41, 1979.
Peterman, M. R., and M. J. Bradford, Wind speed and mortality rate of a marine fish, the northern anchovy (Engraulis mordax), Science 235, 354-356, 1987.
Petersen, W. T., D. F. Arcos, G. B. McManus, H. Dam, D. Bellantoni, T. Johnson, and P. Tiselius, The nearshore zone during coastal upwelling: Daily variability and coupling between primary and secondary production off central Chile, Prog. Oceanog. 20, 1-40, 1988.
Roman, M. R., H. W. Ducklow, J. A. Fuhrman, C. Garside, P. M. Glibert, T. C. Malone, and G. B. McManus, Production, consumption, and nutrient cycling in a laboratory mesocosm, Mar. Ecol. Prog. Ser. 42, 39-52, 1988.
Roman, M. R., A. L. Gauzens, and T. J. Cowles, Temporal and spatial changes in epipelagic microzooplankton and mesozoo- plankton biomass in warm-core Gulf Stream Ring 82-B, Deep Sea Res., Part A, 32, 1007-1022, 1985.
Roman, M. R., and P. A. Rublee, A method to determine in situ zooplankton grazing rates on natural particle assemblages, Biol. Morya Vladivostok, 65, 303-309, 1981.
Strickland, J., and T. Parsons, A practical handbook of seawater analysis, Bull. Fish. Res. Board Can., 167, 1972.
Strong, A., and P. McClain, Improved ocean surface temperatures from space Comparisons with drifting buoys, Bull. Am. Meteorol. Soc., 65, 138-142, 1984.
Swallow, J., W. Gould, and P. Saunders, Evidence for a poleward eastern boundary current in the North Atlantic Ocean, Rep C.'32,
21 pp., Hydrogr. Comm., Int. Counc. for the Explor. of the Sea, Copenhagen, 1977.
Tenore, K. R., et al., Coastal upwelling in the Rias Bajas, N.W. Spain: Contrasting the benthic regimes of the Rias de Arosa and de Muros. J. Mar. Res. 40, 701-772, 1982.
Utermohl, H., Zur Vervollkornnmung der quantitativen Phyto- plankton-methodik, Mitt. Int. Ver. Theor. Angew. Limnol., 9, 1- 38, 1958.
Wiebe, P. H., S. H. Boyd, and J. L. Cox, Relationships between zooplankton displacement volume, wet weight, dry weight, and carbon, Fish. Bull. 73, 777-786, 1975.
Wooster, W. S., A. Bakun, and D. R. McClain, The seasonal upwelling cycle along the eastern boundary of the North Atlantic, J. Mar. Res. 34, 131-141, 1976.
Yentsch, C., and D. M. Menzel, A method for the determination of phytoplankton, chlorophyll, and phaeophiton by fluoresence. Deep Sea Res. 10, 221-231, 1963.
Yoder, J. A., L. P. Atkinson, S.S. Bishop, E. E. Hofmann, and T. N. Lee, The effect of upwelling on phytoplankton production of the outer southeastern U.S. continental shelf. Cont. Shelf Res. 1,385-404, 1983.
M. Alonso-Noval, M. Alvarez-Ossorio, H.J. Campos, N. Gonzalez, L. Valdez, and M. Varela, Instituto Espanol de Oceanografia, Box 130, LaCoruna, Spain.
L.P. Atkinson, Department of Oceanography, Old Dominion University, Norfolk, VA 23508.
J.M. Cabanas, R.M. Cal, A. Miranda, and J. Sanchez, Instituto Espanol de Oceanografia, Vigo, Spain.
F. Castillejo, Instituto Espanol de Oceanografia, Fuengirola, Spain.
E.J. Chesney, Louisiana Universities Marine Consortium, Chauvin, LA 70344.
R.B. Hanson, Skidaway Institute of Oceanography, Box 13687, Savannah, GA 31416.
C.R. McClain, Laboratory for Oceans, NASA Goddard Space Flight Center, Mail Code 971, Greenbelt, MD 20771.
M.R. Roman, Horn Point Environmental Laboratory, CEES, University of Maryland, P.O. Box 775, Cambridge, MD 21613- 0775. (e-mail: [email protected])
G. Santiago, Instituto Espanol de Oceanografia, Madrid, Spain. K.R. Tenore, Chesapeake Biological Laboratory, CEES,
University of Maryland, P.O. Box 38, Solmons, MD 20688-0038. (e-mail: [email protected])
J. Yoder, Graduate School of Oceanography, University of Rhode Island, Kingston, RI 02882.
(Received May 28, 1993' revised January 27, 1995' accepted February 2, 1995)
All in-text references underlined in blue are linked to publications on ResearchGate, letting you access and read them immediately.