FISCHER-TROPSCH SYNTHESIS FIXED BED REACTOR ...
221
FISCHER-TROPSCH SYNTHESIS FIXED BED REACTOR INTENSIFICATION JIANQI SHEN PhD Thesis 2021
-
Upload
khangminh22 -
Category
Documents
-
view
1 -
download
0
Transcript of FISCHER-TROPSCH SYNTHESIS FIXED BED REACTOR ...

FISCHER-TROPSCH SYNTHESIS FIXED BED REACTOR
INTENSIFICATION
JIANQI SHEN
PhD Thesis
2021

Fischer-Tropsch Synthesis Fixed Bed Reactor Intensification
by
Jianqi Shen
A thesis submitted to Institute of the Development of Energy for Africa
Sustainability (IDEAS), University of South Africa, Roodepoort, in fulfilment
of the requirements for the degree of Doctor of Philosophy.
Florida, 2021

I
DECLARATION
I declare that this thesis is my own, unaided work under the supervision of Professor Diane
Hildebrandt, Professor Xinying Liu and Professor Wei Hua Ho. It is being submitted for the
Degree of Doctor Philosophy to the University of South Africa. It has not been submitted
before for any degree or examination in any other university.
Signature of candidate
Signed this 14 day of 12 month 2021 year

II
ABSTRACT
A 2D pseudo-homogeneous fixed bed reactor model was developed using ANSYS Fluent,
based on an actual bench-scale Fischer-Tropsch reactor. The single-tube reactor had a
diameter of 0.05m, which is representative of the diameters used in industrial applications.
Using a specially-designed temperature measurement, the detailed temperature distribution in
the bench-scale reactor was reported for the first time. A position-dependent heat transfer
coefficient, which is considered more accurate for temperature predictions, was applied. The
model was validated against the experimental data, including both the reaction results and the
measured temperatures, which obtained with a Co-based catalyst under conditions of 2MPa
and 458K at various syngas partial pressures and space velocities. The model was qualified to
carry out temperature-prediction related simulations, for example the following studies of
Fischer-Tropsch reactor intensification approaches. The changes in the maximum temperature
in the bed and hot spot region are discussed in terms of different N2 flowrates and gas hourly
space velocity rates. The inferred properties within the reactor were analysed to obtain insight
into how to increase the production capacity of the reactor.
One Fischer-Tropsch reactor intensification approach proposed was tubular reactor internals
with a simple structure and easy installation, in order to suppress hot spot formation in the
catalyst bed. The reactor internals were designed to adjust the effective inner diameter in the
front region of the catalyst bed where the hot spot was most likely to form. A bench-scale
CFD reactor model was employed to verify the performance of the reactor internals under
Fischer-Tropsch reaction conditions and to optimize its key parameters: neck diameter and
frustum cavity height. The simulation results for the optimised reactor internals showed that:

III
the maximum temperature rise decreased by as much as 22.6%; the change in the rate of CO
conversion was less than 2.13%; the C3+ product selectivity increased slightly.
The design of reactors for small scale Fischer-Tropsch Synthesis (FTS) plants needs a
different approach to that used for mega plants, because of the drivers from environmental,
economic and social aspects. A novel reactor design approach for small-scale FTS reactors
was proposed, in which the reactor diameter was optimised for the maximum productivity of
heavy hydrocarbon products at a given temperature rise limit. The catalyst activity and the
space velocity were varied so as to keep the maximum temperature in the catalyst bed at a
specified value. Using a multi-tube fixed bed reactor of given dimensions as an example,
CFD simulation was carried out to verify the proposed design approach. According to the
simulation results for a single tube, the highest productivity was achieved with the reactor
tube with the largest diameter. However, when looking at the multi-tube fixed bed reactor
itself, because fewer tubes could be fitted into the reactor as the reactor tube diameter
increased, the results for maximum productivity became more complicated. According to the
simulation results, a maximum heavy hydrocarbon productivity of 15.3kg/h can be achieved
in a multi-tube reactor fitted into a commercial container when using: an optimal tube
diameter of 3/4’; a SV of 300h-1; a required catalyst activity of 695% of that of the base case.
The multi-plate reactor, of which the spaces between the plates were used for thermal fluid
and catalyst alternately, integrates the fixed bed reactor with the plate heat exchanger. The
proposed reactor design approach was applied in the optimization of the plate pitch of a
multi-plate reactor with the same aforementioned given dimension for maximum productivity
at the same temperature rise limit. Similarly, the catalyst activity and the space velocity were

IV
set as parameters to adjust the temperature peak in the catalyst bed. The simulation results
showed that a maximum productivity of 21.3kg/h can be obtained in the multi-plate reactor
that meets the specification requirements of a containerized FT application with a 0.5 inch
plate distance and 300 h-1, while the required catalyst activity is 582% of that of the base
case.

V
ACKNOWLEDGEMENTS
It’s my honor to study and work at Institute for the Development of Energy for Africa
Sustainability (IDEAS) at University of South Africa (UNISA), and I am grateful to my
supervisor, Professor Diane Hildebrandt, for the support and supervision provided with my
PhD research. Her rigorous approach, but approachable personality has impressed me deeply,
which encouraged me to be a professional researcher.
I owe a debt of gratitude to my co-supervisor, Professor Xinying Liu, and his family for the
support and guidance provided during my PhD study, as well as their care and concern about
my living in South Africa. Without all his help and effort, I would have not been able to finish
my thesis. I would like to express my gratitude to Professor Wei Hua Ho for agreeing to be
my co-supervisor and for all the input he provided to my research into fluid dynamics and
CFD simulation. Our discussions on my PhD project were really enjoyable and inspiring. I
also want to recognize the support from Dr Yali Yao, Dr Baraka Celestin Sempuga, Dr
Xiaojun Lu and Dr Xiaowei Zhu - I appreciate their help and encouragement with this study.
My sincere thanks also go to my lovely friends at Institute for the Development of Energy for
African Sustainability (IDEAS), especially Yusheng Zhang, Jianli Chang, Shahid Ansari,
George Okoye-Chine, Pascal Simba, Kabir Otun, et al.
My special thanks go to IDEAS, University of South Africa (UNISA) and National Research
Foundation (NRF) for the financial support and the use of the research facilities.
Finally, I would like to thank my parents, my fiancée and my younger sister for their
unconditional love and endless support.

VI
LIST OF PUBLICATIONS AND PRESENTATIONS
Publications:
1. Jianqi Shen, Yunchao Li, Wei Hua Ho, Xinying Liu, Diane Hildebrandt, Experimental and
simulation study of the temperature distribution in a bench-Scale fixed bed
Fischer-Tropsch reactor, AIChE Journal, 2021, 67(5): e17145.
2. Jianqi Shen, Wei Hua Ho, Xinying Liu, Diane Hildebrandt, Tubular reactor internals for
suppressing hot spot formation applied to the Fischer-Tropsch reaction, Chemical
Engineering and Process: Process Intensification, 2021, 161: 108309.
3. Jianqi Shen, Wei Hua Ho, Yusheng Zhang, Xinying Liu, Diane Hildebrandt, Design of a
Fischer-Tropsch multi-tube reactor fitted in a container: A novel design approach for
small scale application, Journal of cleaner production, in progress.
Patent:
1. Jianqi Shen, Xinying Liu, Diane Hildebrandt, Tubular Reactor Internals, UK Patent
Application No. 2013769.1
International conference proceedings:
1. Shen, J., Liu, X., Hildebrandt, D., Ho, W. H., CFD Simulation of a bench scale fixed bed
Fischer-Tropsch Synthesis reactor (conference proceeding), American Institute of
Chemical Engineers (AICHE) 2018 Annual Meeting, Pittsburgh, US, October
31-November 4, 2018
2. Jianqi Shen, Xinying Liu, Wei Hua Ho, CFD simulation of a fluidized bed as a solar
receiver (conference proceeding), 24th SolarPACES International Conference, Casablanca,
Morocco, October 2-5, 2018

VII
3. Jianqi Shen, Yali Yao, Xinying Liu, Low temperature solar-driven biogas stream
reforming in membrane reactor (conference proceeding), 2020 5th International
Conference on Advances in Energy and Environment Research, Shanghai, China,
September 18-20, 2020
4. Jianqi Shen, Xinying Liu, ASPEN simulation of solar-driven membrane steam methane
reforming for hydrogen production (poster presentation), 26th SolarPACES International
Conference, online conference, September 28 – October 2, 2020
Local conference proceedings:
1. Jianqi Shen, Xinying Liu, Wei Hua Ho, Diane Hildebrandt, A fixed bed reactor modelling
study for BTL process, CATSA 2019 Conference (Catalyst Society of South Africa),
Langebaan, South Africa, Nov 11~13, 2019, poster presentation.
2. Jianqi Shen, Wei Hua Ho, Xinying Liu, Diane Hildebrandt, CFD simulation of a bench
scale fixed bed Fischer-Tropsch reactor, CATSA 2018 Conference (Catalyst Society of
South Africa), Mokopane, South Africa, Nov 11~14, oral presentation.
3. Jianqi Shen, Xinying Liu, Wei Hua Ho, Diane Hildebrandt, Modelling and simulation of
methanation from syngas to synthetic natural gas, CATSA 2017 Conference (Catalyst
Society of South Africa), Pilanesberg, South Africa, Nov 11~14, oral presentation.
4. Jianqi Shen, Xinying Liu, Wei Hua Ho, Diane Hildebrandt, Modelling and simulation of
methanation reaction, Engineering Simulation Conference 2017, Pretoria, South Africa,
Aug. 17, 2017, oral presentation.

VIII
CONTENT
DECLARATION........................................................................................................................ I
ABSTRACT. ............................................................................................................................. II
ACKNOWLEDGEMENTS ...................................................................................................... V
LIST OF PUBLICATIONS AND PRESENTATIONS ............................................................ VI
CONTENT…. ...................................................................................................................... .VIII
LIST OF FIGURES .............................................................................................................. XIII
LIST OF TABLES ............................................................................................................. XVIII
ABBREVIATIONS AND ACRONYMS .............................................................................. XXI
CHAPTER 1 INTRODUCTION ............................................................................................... 1
1.1 Background .............................................................................................................. 1
1.2 Motivation ................................................................................................................ 4
1.3 Objectives ................................................................................................................ 7
1.4 Thesis overview ....................................................................................................... 7
References ........................................................................................................................ 10
CHAPTER 2 LITERATURE REVIEW................................................................................... 15
2.1 Introduction ............................................................................................................ 15
2.2 Fixed bed reactor modelling .................................................................................. 16
2.2.1 Modelling methodology ............................................................................... 16
2.2.2 FTS reaction kinetics ................................................................................... 22
2.2.3 Characteristics of modelling ........................................................................ 25
2.2.4 Scientific and engineering applications ....................................................... 29

IX
2.3 Process intensification technology ......................................................................... 32
2.4 Summary ................................................................................................................ 34
References ........................................................................................................................ 37
CHAPTER 3 MODELLING AND SIMULATION STUDY OF A BENCH-SCALE FIXED
BED FISCHER-TROPSCH REACTOR ............................................................ 47
3.1 Introduction ............................................................................................................ 47
3.2 Experimental .......................................................................................................... 51
3.2.1 Experimental apparatus ................................................................................ 51
3.2.2 Operating parameters and procedure ........................................................... 52
3.3 Reactor Model ........................................................................................................ 53
3.3.1 Simulation strategy ...................................................................................... 53
3.3.2 Reaction kinetics .......................................................................................... 56
3.4 Results and Discussion .......................................................................................... 57
3.4.1 Experimental results..................................................................................... 57
3.4.2 Model validation .......................................................................................... 63
3.4.3 Simulation results......................................................................................... 66
3.5 Conclusions ............................................................................................................ 72
References ........................................................................................................................ 74
CHAPTER 4 TUBULAR REACTOR INTERNALS FOR SUPPRESSING HOT SPOT
FORMATION APPLIED TO THE FISCHER-TROPSCH REACTION ........... 80
4.1 Introduction ............................................................................................................ 80
4.2 Design of ring & tube type internals ...................................................................... 84

X
4.3 Reactor model and validation ................................................................................ 88
4.3.1 Reactor model .............................................................................................. 88
4.3.2 Model validation .......................................................................................... 91
4.4. Results and discussion ........................................................................................... 93
4.4.1 Predicted performance of internals of different geometries......................... 93
4.4.2 Mechanism ................................................................................................... 99
4.5 Conclusions .......................................................................................................... 100
References ...................................................................................................................... 103
CHAPTER 5 DESIGN OF A FISCHER-TROPSCH MULTI-TUBE REACTOR FITTED IN
A CONTAINER: A NOVEL DESIGN APPROACH FOR SMALL SCALE
APPLICATION ................................................................................................. 109
5.1 Introduction .......................................................................................................... 109
5.2 Reactor model ...................................................................................................... 116
5.2.1 Reactor model and validation .................................................................... 116
5.2.2 Simulation strategy .................................................................................... 121
5.2.2.1 Maximum Temperature Constraint (Tconst) ......................................... 121
5.2.2.2 Catalyst activity coefficient ................................................................ 123
5.3 Results and discussion ......................................................................................... 123
5.3.1 Operating pressure ..................................................................................... 123
5.3.2 Optimisation of a single reactor tube ......................................................... 125
5.3.3 Design results for a multi-tube reactor with a fixed shell diameter ........... 130
5.3.4 Productivity of the multi-tubular reactor ................................................... 132

XI
5.4 Conclusions .......................................................................................................... 134
References ...................................................................................................................... 137
CHAPTER 6 A SIMULATION OPTIMIZATION APPROACH FOR A SIZE-SPECIFIED
MULTI-PLATE REACTOR IN FISCHER-TROPSCH SYNTHESIS PROCESS
........................................................................................................................... 147
6.1 Introduction .......................................................................................................... 147
6.2 Reactor model ...................................................................................................... 152
6.2.1 Model setup and validation ........................................................................ 152
6.2.2 Simulation strategy .................................................................................... 156
6.2.2.1 Maximum temperature constraint ...................................................... 157
6.2.2.2 Catalyst activity coefficient ................................................................ 158
6.3. Results and discussion ......................................................................................... 159
6.3.1 Optimization of a single-layer plate reactor............................................... 159
6.3.2 Design results for a multi-plate reactor with fixed outer specifications .... 162
6.4 Conclusions .......................................................................................................... 165
References ...................................................................................................................... 167
CHAPTER 7 OVERALL CONCLUSIONS .......................................................................... 174
7.1 Modelling and validation of a bench scale fixed bed reactor .............................. 174
7.2 Design and verification of a tubular reactor internals .......................................... 175
7.3 Design approach for a multi-tube reactor fitted in a containerized FTS plant..... 176
7.4 Design approach for a multi-plate reactor fitted in a containerized FTS plant .... 177
7.5 Summary .................................................................................................................. 178

XII
APPENDIX 181
A-1 Drawbacks of different types of reactors by comparison .................................... 181
A-2 Description of the Bench-scale Fixed bed reactor ............................................... 182
A-3 Physical properties of the ceramic ball and catalyst particles .............................. 184
A-4 Dimensionless criterion for inter-phase heat transfer resistance ......................... 185
A-5 Reynold’s Number calculation ............................................................................. 186
A-6 Pressure drop estimation ...................................................................................... 187
A-7 Equations of the thermal conductivity for different species ................................ 188
A-8 summary of boundary conditions in simulation................................................... 189
A-9 Kinetics parameters .............................................................................................. 190
A-10 The structure of the FTS section in modular portable FTS plant ......................... 191
A-11 Predicted temperature distributions along the axis of symmetry of the single-layer
plate reactor for different plate pitch.............................................................................. 192
A-12 Predicted axial temperature distributions along the axis of the single-layer plate
reactor for R3 with different SV .................................................................................... 193
References ...................................................................................................................... 194

XIII
LIST OF FIGURES
Figure 3.1: Temperature measuring points at the reactor cross-section ................................... 52
Figure 3.2: Geometry of the fixed bed reactor model .............................................................. 54
Figure 3.3: Axial and radial temperature distribution in the reactor in Exp1. The dashed lines
indicate the position of the catalyst bed and the dotted line indicates the position
of the radial temperature distribution. (GHSV = 300 h-1 and N2 Flowrate = 0
l/min at standard conditions; the position of the thermocouples T1 to T4 are as
shown in Figure 3.2.) .......................................................................................... 59
Figure 3.4: Axial and radial temperature distribution in the reactor in Exp2. The dashed lines
indicate the position of the catalyst bed and the dotted line indicates the position
of the radial temperature distribution. (GHSV = 300 h-1 and N2 Flowrate = 1.50
l/min at standard conditions; the position of the thermocouples T1 to T4 are as
shown in Figure 3.2.) .......................................................................................... 59
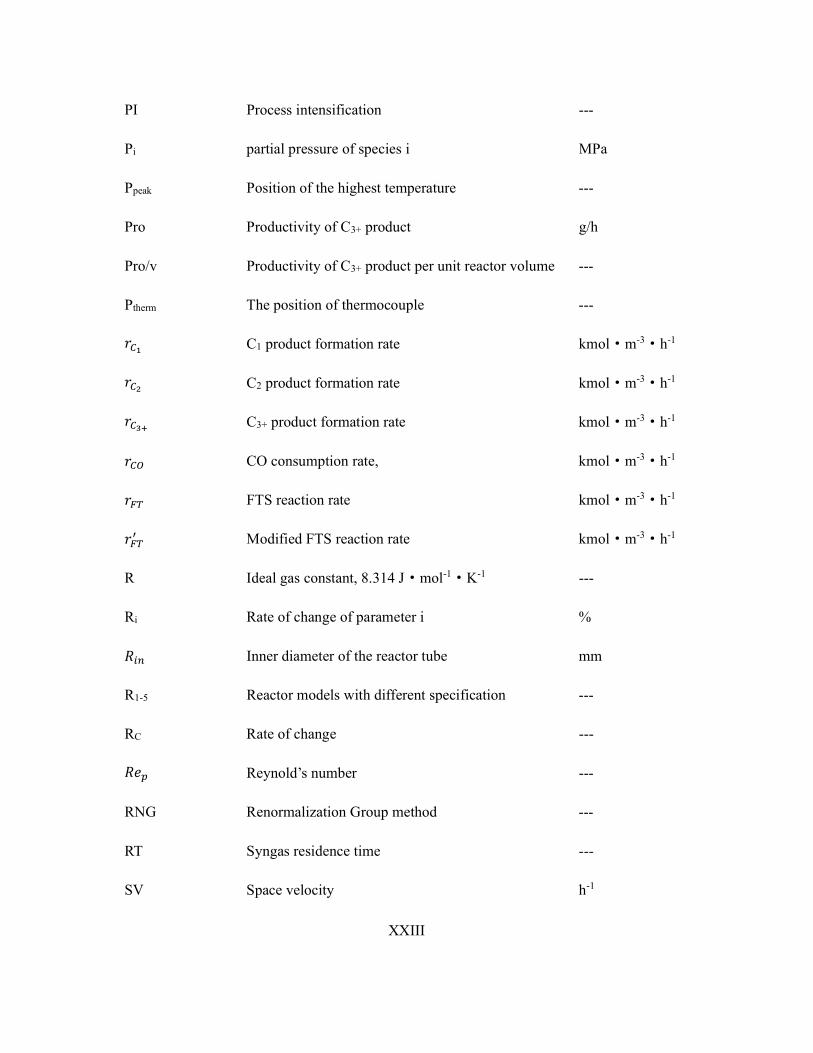
Figure 3.5: Axial and radial temperature distribution in the reactor in Exp3. The dashed lines
indicate the position of the catalyst bed and the dotted line indicates the position
of the radial temperature distribution. (GHSV = 300 h-1 and N2 Flowrate = 4.50
l/min at standard conditions; the position of the thermocouples T1 to T4 are as
shown in Figure 3.2.) .......................................................................................... 60
Figure 3.6: Axial and radial temperature distribution along the reactor in Exp4. The dashed
lines indicate the position of the catalyst bed and the dotted line indicates the
position of the radial temperature distribution. (GHSV = 150 h-1 and N2 Flowrate

XIV
= 0.75 l/min at standard conditions; the position of the thermocouples T1 to T4
are as shown in Figure 3.2.) ................................................................................ 61
Figure 3.7: Axial and radial temperature distribution in the reactor in Exp5. The dashed lines
indicate the position of the catalyst bed and the dotted line indicates the position
of the radial temperature distribution. (GHSV = 75 h-1 and N2 Flowrate = 0.38
l/min at standard conditions; the position of the thermocouples T1 to T4 are as
shown in Figure 3.2.) .......................................................................................... 61
Figure 3.8: Temperature contours and (a) comparison of measured and predicted axial
temperatures (b) with decreasing nitrogen flowrate. (Details of operating
conditions for Exp1 to Exp3 are given in Table 3.1.) ........................................... 65
Figure 3.9: Temperature contours and (a) and comparison of the measured and predicted axial
temperatures (b) with increasing GHSV. (Details of operating conditions for
Exp2, Exp4 and Exp5 are given in Table 3.1.) ...................................................... 66
Figure 3.10: The plot of CO conversion verse maximum temperature in the T2 position ....... 67
Figure 3.11: Integral results (a) and (b) and differential results (c) and (d) for the radially
average CO conversion in catalyst bed based on the inlet. The N2 flowrate
changes in experiments 1-3, while GHSV changes in experiments 2, 4 and 5. .. 69
Figure 3.12: Integral results (a) and (b) and differential results (c) and (d) of STY in the
catalyst bed based on the inlet. The flowrate of N2 changes in experiments 1-3,
while GHSV changes in experiments 2, 4 and 5. ............................................... 71
Figure 4.1: Drawing of the assembled internals (a) and a sectional view (b) of ring & tube type
internals ............................................................................................................... 86

XV
Figure 4.2: Geometry of the fixed bed reactor models with (a) and without (b) internals ...... 88
Figure 4.3: Temperature contour (a) and comparison of measured and predicted temperatures
(b) ........................................................................................................................ 92
Figure 4.4: The plot of CO conversion verse temperature rise in catalyst bed ........................ 94
Figure 4.5: Comparison of the temperature contours in the catalyst bed in C1 to C4 ............. 95
Figure 4.6: Comparison of temperature contours in the catalyst bed in C1, C3, C5 and C6 ... 97
Figure 4.7: Comparison of CO consumption rates in the centre of the reactor for C1 and C3
........................................................................................................................... 100
Figure 5.1: Geometry of the reactor model ............................................................................ 118
Figure 5.2: Simulation results for CO conversion XCO (bar chart) and catalyst activity
coefficient A (line chart) in different single tube reactor models (feed
temperature 458K, 10bar, Tconst=468K; the catalyst mixture that contains 25 vol%
of 15% Co-SiO2 catalyst and balanced ceramic balls corresponds to A=100%;
reactant syngas volumetric composition of 22.68% CO, 49.90% H2, 18.36%
CO2, and 9.06% N2; R1 to R4 are defined in Table 2). ..................................... 126
Figure 5.3: Simulation results for C3+ product selectivity SC3+ (bar chart) and average
temperature in the catalyst bed TAVE (line chart) in different single tube reactor
models (feed temperature 458K, 10bar, Tconst=468K; the catalyst mixture that
contains 25 vol% of 15% Co-SiO2 catalyst and balanced ceramic balls
corresponds to A=100%; reactant syngas volumetric composition of 22.68% CO,
49.90% H2,18.36% CO2, and 9.06% N2; R1 to R4 are defined in Table 2). ..... 127
Figure 5.4 Axial temperature distribution along the centre of a reactor tube for different

XVI
diameters (feed temperature 458 K, 10 bar, Tconst=468 K, SV=300; the catalyst
mixture that contains 25 vol% of 15% Co-SiO2 catalyst and balanced ceramic
balls corresponds to A=100%; reactant syngas volumetric composition of 22.68%
CO, 49.90% H2, 18.36% CO2, and 9.06% N2; R1 to R4 are defined in Table 5.2).
........................................................................................................................... 129
Figure 5.5 Axial temperature distribution along the centre of reactor tube when using model
R2 with different SV (feed temperature 458 K, 10 bar, Tconst=468 K; the catalyst
mixture that contains 25 vol% of 15% Co-SiO2 catalyst and balanced ceramic
balls corresponds to A=100%; reactant syngas volumetric composition of 22.68%
CO, 49.90% H2, 18.36% CO2, and 9.06% N2; R1 to R4 are defined in Table 5.2).
........................................................................................................................... 130
Figure 5.6: Triangular pattern of the tube arrangement ......................................................... 131
Figure 6.1: Structure of the plate reactor ............................................................................... 153
Figure 6.2: Simulation results of CO conversion XCO (bar chart) and catalyst activity
acceleration coefficient A (line chart) in different single-layer plate reactor
models (458K, 10bar, temperature rise constrain of 10K, Co-SiO2 catalyst,
reactant syngas volumetric compositions of 22.68% CO, 49.90% H2, 18.36%
CO2, and 9.06% N2) ......................................................................................... 160
Figure 6.3: Simulation results of C3+ product selectivity SC3+ (bar chart) and average
temperature in the catalyst bed TAVE (line chart) in different single-layer plate
reactor models (458K, 10bar, temperature rise constraint of 10K, Co-SiO2
catalyst, reactant syngas volumetric composition of 22.68% CO, 49.90% H2,

XVII
18.36% CO2, and 9.06% N2) ............................................................................. 161
Figure 6.4: Simulation results of the space-time yield (bar chart) and total Pro per reactor
mass (line chart) in different single- plate reactor models (458K, 10bar,
temperature rise constraint of 10K, Co-SiO2 catalyst, reactant syngas volumetric
composition of 22.68% CO, 49.90% H2, 18.36% CO2, and 9.06% N2) ........... 164
Figure A2 The structure of the FTS section of modular portable FTS plant ......................... 191
Figure A3 Axial temperature distribution along the axis of symmetry of a single-layer plate
reactor for different plate pitches (feed temperature 458 K, 10 bar, Tconst=468 K,
SV=300 /h; the catalyst mixture contains 25 vol% of 15% Co-SiO2 catalyst and
balanced ceramic balls corresponds to A=100%; reactant syngas volumetric
composition of 22.68% CO, 49.90% H2, 18.36% CO2, and 9.06% N2; R1 to R5
are defined in Table 6.1). .................................................................................. 192
Fig. A4 Axial temperature distribution along the axis of symmetry of single-layer reactor
model R3 with different SVs (feed temperature 458 K, 10 bar, Tconst=468 K,
SV=300 /h; the catalyst mixture that contains 25 vol% of 15% Co-SiO2 catalyst
and balanced ceramic balls corresponds to A=100%; reactant syngas volumetric
composition of 22.68% CO, 49.90% H2, 18.36% CO2, and 9.06% N2; R1 to R5
are defined in Table 6.1). .................................................................................. 193

XVIII
LIST OF TABLES
Table 3.1: Summary of experimental conditions ..................................................................... 53
Table 3.2: FTS reaction scheme ............................................................................................... 57
Table 3.3: Effect of the N2 flowrate on conversion and selectivity ......................................... 58
Table 3.4: Effect of GHSV on conversion and selectivity ....................................................... 58
Table 3.5: Feed partial pressures, average catalyst bed temperature and syngas residence time
............................................................................................................................. 61
Table 3.6: Comparison of the experimental results and simulation data ................................. 64
Table 3.7: Simulated position of the maximum temperature Ppeak and the value of the
maximum temperature Tmax in the T2 position; Tmax is the maximum difference
and MAE (mean absolute error) between the measured and simulated
temperature profiles ............................................................................................ 66
Table 4.1: Summary of specifications for the different simulations ........................................ 87
Table 4.2: Physical properties of the layers of ceramic ball and the catalyst bed .................... 89
Table 4.3: FTS reaction scheme ............................................................................................... 90
Table 4.4: Kinetics parameters used in this study .................................................................... 91
Table 4.5: Comparison of the experimental results and simulation data for the blank case (C1)
............................................................................................................................. 92
Table 4.6: Performance of internals with different neck diameters ......................................... 96
Table 4.7: Performance of internals with different proportions of catalyst being replaced ..... 97
Table 4.8: Summary of the total catalyst height (Htot) in different cases and the corresponding
rate of change (R𝐻𝑡𝑜𝑡) in different cases ........................................................... 98

XIX
Table 4.9: Temperature of thermal conductive oil at inlet and outlet, and temperature
difference ............................................................................................................ 99
Table 5.1: Comparison of productivity per unit reactor volume from different reactors .... 113
Table 5.2: Reactor model specifications ................................................................................ 117
Table 5.3: Physical properties of the ceramic ball layers and catalyst bed ............................ 119
Table 5.4: FTS reaction scheme ............................................................................................. 119
Table 5.5: Kinetics parameters used in this study .................................................................. 120
Table 5.6: Simulation results for different operating pressure levels .................................... 125
Table 5.7: Productivity of C3+products(Pro) in single reactor tubes with different diameters
........................................................................................................................... 130
Table 5.8: Specifications for standard stainless steel seamless tube bundles ........................ 132
Table 5.9: Total productivity of C3+ products (Pro),in a TFBR with reactor tubes of different
diameters ........................................................................................................... 132
Table 5.10: Productivity of C3+products per unit reactor volume (Pro/m) in single reactor
tubes with different diameters ........................................................................... 134
Table 6.1: Specifications for the plate reactor models ........................................................... 154
Table 6.2: Characteristics of the porous zones ....................................................................... 154
Table 6.3: FTS reaction scheme ............................................................................................. 155
Table 6.4: List of kinetics parameters used in this study ....................................................... 155
Table 6.5: Productivity of C3+ in different single-layer plate reactor models ........................ 162
Table 6.6: Multi-plate reactor with different plate pitches ..................................................... 163
Table 6.7: Productivity of C3+ (kg/h) in different multi-plate reactor models ....................... 163

XX
Table A1: Drawbacks of different types of reactors by comparison ...................................... 181
Table A2: Physical properties of the ceramic ball layer and catalyst bed .............................. 184
Table A3: Thermal conductivity as a function of temperature ............................................... 188
Table A4 Summary of boundary conditions in simulation .................................................... 189
Table A5: List of kinetic parameters used in this study ......................................................... 190

XXI
ABBREVIATIONS AND ACRONYMS
A catalyst activity coefficient ---
𝐴 The total area of the cross-section m2
𝐴 Facet area of the individual mesh cell m2
ASF the theory for Anderson-Schulz-Flory distribution ---
C molar concentration kmol·m-3
C1-6 Simulation case of 1-6 ---
C5+ Hydrocarbons with carbon number more than 5 ---
CFB Circulating fluidized bed reactor ---
CFD Computational Fluid Dynamics ---
dt Tube diameter m
Dneck The neck diameter mm
Dp Equivalent spherical particle diameter m
E Energy kJ
Ei Activation energy kJ·mol-1
Expi Experiment set of i ---
F External body force N
F’ Constant factor ---
FBR Fixed bed reactor ---
FFB Fixed fluidized bed reactor ---

XXII
FTS Fischer-Tropsch Synthesis ---
g Acceleration of gravity m/s2
GC Gas chromatograph ---
GHSV Gas hourly space velocity h-1
h Length of the cavity of the conical frustum mm
hj Enthalpy of species j kJ
H Length of replaced cylindrically shaped catalyst bed mm
Htot Total height of catalyst bed mm
i substance ---
Jj Diffusion flux of species j mol/(m2*s)
ki pre-exponential factor ---
keff Effective conductivity W/(m*K)
MAE Mean absolute error ---
𝑀𝐹 C3+ product mass flowrate at the ith cross-section in
the axial direction
mg·min-1
MR Microchannel reactor ---
n Number of carbon atom ---
𝑛 Number of measurement points ---
𝑛 CO molar flowrate at the ith cross-section in axial
direction
mol·s-1
P operating pressure bar
XXIII
PI Process intensification ---
Pi partial pressure of species i MPa
Ppeak Position of the highest temperature ---
Pro Productivity of C3+ product g/h
Pro/v Productivity of C3+ product per unit reactor volume ---
Ptherm The position of thermocouple ---
𝑟 C1 product formation rate kmol·m-3·h-1
𝑟 C2 product formation rate kmol·m-3·h-1
𝑟 C3+ product formation rate kmol·m-3·h-1
𝑟 CO consumption rate, kmol·m-3·h-1
𝑟 FTS reaction rate kmol·m-3·h-1
𝑟 Modified FTS reaction rate kmol·m-3·h-1
R Ideal gas constant, 8.314 J·mol-1·K-1 ---
Ri Rate of change of parameter i %
𝑅 Inner diameter of the reactor tube mm
R1-5 Reactor models with different specification ---
RC Rate of change ---
𝑅𝑒 Reynold’s number ---
RNG Renormalization Group method ---
RT Syngas residence time ---
SV Space velocity h-1

XXIV
STY Space-time yield ---
Si selectivity for component i %
Sh Heat source term ---
Sm Mass source term ---
SPR Slurry phase reactor ---
T temperature K
t time s
T1-4 Four thermocouple sheath ---
Ta Adiabatic temperature K
TAVE average temperature of catalyst bed K
Text experimental temperature K
Tmax maximum temperature in catalyst bed K
Tconst maximum temperature constraint in catalyst bed, K
Tsim simulation temperature K
Tw Wall temperature K
TFBR Tubular fixed bed reactor ---
U Total heat transfer coefficient W/(m2*K)
v conical frustum cavity volume proportion of the total catalyst bed
%
→ velocity m/s
𝑉 The catalyst volume between the ith and (i-1)th
cross-section
ml

XXV
Vcon Volume of the cavity of the conical frustum mm3
v Physical gas velocity m/s
Vcyl Volume of the cylinder mm3
WGS Water gas shift reaction ---
XCO CO conversion %
∆𝐻 Reaction heat kJ
∆𝑃 Pressure drop Pa
∆𝑇 Maximum temperature deviation K
Greek symbols:
𝛼 Chain growth probability factor ----
𝜀 The rate of dissipation of turbulent kinetic energy ---
𝜀′ Void fraction of catalyst bed ---
κ The turbulent kinetic energy ---
𝜆 Thermal conductivity W/(m*K)
µ Dynamic viscosity of gas Pa*s
𝜌 Density kg/m3
𝜏 Stress tensor N/m2

1
CHAPTER 1
INTRODUCTION
1.1 Background
Fischer-Tropsch Synthesis (FTS) is a heterogeneous catalytic process that converts syngas (a
mixture of CO and H2) into hydrocarbons with a low range of carbon numbers [1–3]. These
hydrocarbons include paraffins, olefins and alcohols. Since its discovery in 1922, FTS has
received widespread attention because it provides an alternative route for producing clean
fuels from coal, biomass, natural gas and solid municipal waste [4,5].
Because of the strong exothermic nature of FTS, there are stringent temperature control
requirements for the reactor (especially in commercial applications) to avoid the negative
consequences of local temperature increases in the reactor. These negative consequences
include decreased selectivity to heavy hydrocarbon products, catalyst deactivation, and
system temperature runaway (in extreme situations) [6,7].
Many types of FTS reactors have been proposed and applied in practice, for example, the
fixed bed reactor (FBR), the fluidized bed reactor, the slurry bed reactor and the monolith bed
reactor [8–10]. Each type of reactor has particular drawbacks. The fluidized bed reactor is
complex to operate and is not recommended for wax production processes, even though
isothermal operation, good mass transfer and online catalyst removal/addition can be
achieved in the fluidization zone [6,11]. In slurry bed reactor applications, an additional
procedure is needed to separate the net wax produced from the suspended catalyst particles
[12]. Monolith bed reactors have a relatively low catalyst loading volume and require a

2
complicated catalyst bed preparation process, etc. [13]. The FBR system is a good option
because of the following characteristics: high catalyst loading volume and potential
productivity; easy installation and operation; easy scale-up.
The major challenge with FBR in practice is its relatively low heat removal capacity, which
results in hot spots forming in the catalyst bed, especially in larger-scale applications [14]. In
detail, it was reported that a hot spot formed near the inlet of an FTS FBR in both
experimental and modelling studies[11]. Zhuang et al. [15] reported on a simulation study of
an FBR for the exothermic process of preparing olefins from methanol. The simulation
results also showed a hot spot near the reactor inlet. There are many factors that could lead to
the formation of a hot spot in the catalyst bed, for example, the temperature at the hot spot
increases with increasing FBR diameter, because the burden of removing heat per unit length
of the reactor tube increases with increasing diameter [16,17].
Process intensification (PI) is defined as a “radically innovative principle” or a “paradigm
shift” in terms of process and equipment design. According to the European Roadmap of
Process Intensification, it can deliver improvements (often by a factor of two or more) in
process and chain efficiency, capital and operating expenses, quality, waste production,
process safety and more [18–20]. Given these “innovative principles", PI applications were
typically realized by novel or unusual approaches to designing or modifying equipment to
strengthen different functions in the chemical process. For example, the solvent process used
for post-combustion CO2 capture is the most mature technology for carbon capture and
storage, while its two main drawbacks (high capital investment and high energy consumption

3
during solvent regeneration) still limit its commercial deployment. Wang et al. reviewed the
current status of PI approaches for the post-combustion CO2 capture process and concluded
that PI technology could significantly reduce the capital cost of the process without reducing
the production capacity or increasing the difficulty of operation and process control [21]. In
terms of applying FBRs in FTS, PI technology is a potential solution to intensify heat transfer
in the catalyst bed in an FBR.
In practical applications, the lack of an effective measure to strengthen heat transfer means
that the actual FTS reaction rate is generally restricted by: using a catalyst with a much lower
activity level than a catalyst used in laboratory research; or diluting catalyst particles (often
with inert materials) in order to suppress the temperature increase in the catalyst bed [22].
Therefore, a higher FTS reaction rate could be achieved if the heat transfer behavior of an
FBR could be improved; this would lead (at least theoretically) to enhanced productivity in
the FBR. It is possible that a higher reactor efficiency, safer operating conditions and lower
capital cost could be realized by applying PI technologies in the design and modification of
FBRs.
In addition to the theoretical and experimental studies on FTS reactors, numerical simulation
is considered a powerful “virtual laboratory” that provides reliable solutions based on certain
theoretical equations and experimental results that are used for validation [23]. Reactor
modelling is particularly important for scientists and engineers to test novel reactor designs
before building the actual reactor. Results and solutions can be compared without performing
experiments, thereby allowing new solutions to be proposed and leading to a better

4
understanding of the mass and heat transfer behavior inside the reactor. Simulation allows a
proposed solution to be provided in less time and with less capital outlay than the
conventional method of building an actual or pilot reactor [24].
Computational Fluid Dynamics (CFD) is a branch of simulation studies used in chemical and
engineering research and development; it is governed by the Navier-Stokes equations and
additional conservation equations for a specified geometrical model [25]. The CFD modelling
strategy is dependent on detailed model geometry and can provide better spatial information
in terms of heat transfer, mass transfer, flow hydrodynamics, etc., compared to conventional
mathematical simulations. Therefore, CFD simulation has many competitive advantages,
including giving more insight into what occurs inside the reactor; more accurate predictions
about new reactor designs; more reliable heat / mass transfer estimates for scaling up existing
reactors; identifying the cause of any previously identified problems encountered in practice
[26].
Currently, the heat transfer limitations of FBRs affect both the implementation and safe
operation of FBRs, and in particular, the use of FBRs in the production of heavy hydrocarbon
products in FTS. Integration of PI technologies that intensify the heat transfer process in
FBRs offers a promising solution in terms of this knowledge gap. The CFD simulation is also
the most suitable and efficient method to verify any proposed PI approach for an FTS process.
This thesis considers several approaches to FTS FBR intensification using CFD simulation.
1.2 Motivation
The FBR still has an important position in both academic research and industrial FTS

5
applications. However, due to the strong exothermicity of FTS, the intrinsic limitation of an
FBR in terms of heat removal may lead to certain undesired or even disastrous consequences,
including an increase in methane selectivity, acceleration of catalyst deactivation, temperature
runaway, etc.
Current studies show that FTS catalyst activity has advanced during the last few decades, and
these show far greater efficiency than what is seen in industrial applications [27]. In practice,
only catalysts with limited activity have been employed in FBR plant applications to ensure
that the FTS reaction rate in the catalyst bed is contained and that no hot spot forms.
Furthermore, catalyst particles are typically diluted by inert materials in larger-scale catalyst
beds so that the intensity of the FTS reaction is reduced, which further inhibits a temperature
rise [28]. Briefly, both the FTS reaction rate and the FTS reaction intensity in the catalyst bed
have to be suppressed because of the lack of an efficient solution to increase the heat transfer
capability in an FBR. Consequently, the productivity of fuel in the FTS FBR is constrained,
which means that the economic efficiency of the whole process is affected negatively. The
interaction between temperature control in an FBR and the achievable FTS catalyst activity
has received increasing attention in the current era of rapidly developing economies.
PI technology can provide solutions to intensify heat transfer in FTS FBRs and thereby
increase the volumetric efficiency of the catalyst bed, productivity and process economics
when modifying an existing FBR or designing a new reactor. The CFD simulation study is
now used as an efficient method to conduct and verify a PI approach. Compared to other
types of simulations, the distinct advantage of CFD modelling is the detailed results obtained

6
for the processes inside the model geometry domain (including pressure drop, species
distribution, flow pattern and temperature gradient).
A comprehensive understanding of temperature gradients in FTS FBRs (especially in
larger-scale applications such as a bench-scale or industrial-scale FBR) is particularly
important for better understanding of heat transfer in the catalyst bed and improving the
reactor temperature control [29]. Thus, CFD simulation is the most suitable tool for verifying
different PI approaches that aim to improve the performance of FBRs. Factors that affect
temperature distribution in FBRs include: the FTS reaction; the practical conditions relating
to FBR, such as heat conductivity of the catalyst bed, heat convection of the fluid in the
reaction region, the coolant conditions and the reactor specifications [30].
In terms of an FTS FBR intensification study, the catalyst bed temperature distribution is
considered as important as FTS performance. The FTS reactor model can be validated by
comparing the predicted and measured FTS reaction results and temperature distribution in
the catalyst bed. Unfortunately, modelling validation of temperature predictions is often
neglected or inadequate in currently-reported studies. For example, some simulations were
validated against FTS reaction results, while other studies verified the predicted temperature
profile using a few measured data points [15, 31]. In Park’s analysis, the temperature profiles
measured at three fixed positions on the axis were used for model validation; however, the
actual temperature distributions in both the axial and radial directions were not reflected [32].
Therefore, sufficient validation of both FTS reaction results and temperature profiles in CFD
reactor modelling studies is strongly recommended.

7
1.3 Objectives
The major objectives of this thesis were: to build a reliable CFD modelling methodology that
can accurately predict the temperature distribution and FTS reaction results in an FBR when
using typical low-temperature FTS conditions; and to demonstrate PI technology approaches
that will improve heat transfer in an FBR or enhance the productivity of heavy hydrocarbons.
The CFD reactor model was based on an actual bench-scale tubular FBR apparatus that was
validated using corresponding experimental results obtained under low-temperature FTS
conditions. Model verification was performed using two experimental data categories: the
measured temperature profile in both the axial and radial direction and the FTS reaction
results. This ensured that the model is suitable and provides reliable predictions in terms of
these two variables.
Two PI technology approaches were proposed and verified using CFD simulation. Firstly, a
tubular reactor internal mechanism with a ring-and-tube type structure was designed to
suppress hot spot formation by intensifying local heat transfer in the front region of the
catalyst bed. Secondly, a novel reactor design approach was used, in which the reactor design
was integrated with a suggested catalyst design. This was applied to the design of both a
multi-tube and a multi-plate reactor in a portable FTS plant.
1.4 Thesis overview
This thesis contains seven chapters. Most of the chapters were written in scientific journal
article style, since they were prepared for publication or have already been published as part
of the academic output of this study. Thus, a small amount of repetition will be seen in the

8
sections on modelling and validation, since the same modelling methodology was used. The
repetition is necessary and makes the affected chapters more readable because each chapter
was prepared as a stand-alone, independent scientific article. The introduction to this PhD
research study is provided in this chapter.
An overview of the remainder of this thesis is as follows:
Chapter 2 briefly reviews the literature on FTS reactor simulations and PI technologies
applied to reactors. In this chapter, the methodology and applicability of different FBR
modelling approaches are reviewed. A summary is provided of the current status of
approaches to using PI technology in reactors.
Chapter 3 gives details of the simulation study done on a bench-scale FBR under typical
low-temperature FTS conditions. The reactor modeling was based on an actual bench-scale
tubular FBR, and the methodology is explained in detail. The FTS reaction results obtained
using different SV conditions, inlet compositions, and corresponding measured temperature
profiles were used to validate the model. The simulation results obtained from the
bench-scale tubular FBR model could provide better insight into the processes that occur in
the catalyst bed. The study focused on the effects of the operating conditions (including the
GHSV and N2 flowrate) on CO conversion, space-time yield of C5+ products, and some
parameters that are difficult to measure in experiments (such as the value and position of
maximum temperature).
Chapter 4 reports on the innovative tubular reactor internals, namely a tube-and-ring
structure, used to suppress the maximum temperature in the reactor bed. The novel reactor

9
internals intensifies local heat transfer in the upstream region of the catalyst bed. The reactor
internals can easily be installed in an existing tubular FBR without any extra modifications
having to be made to the body of the FBR. The internals contribute to temperature control in
the reactor. The improvements to the reactor performance were verified and analyzed by CFD
simulation.
Chapter 5 explains a new multi-tube reactor design approach applied in a portable module
FTS plant. The diameter of the single reactor tube was optimized for heavy hydrocarbon
productivity at similar thermal conditions of the catalyst bed. It was proposed that the catalyst
activity would be modified for different SV conditions.
Chapter 6 presents an alternative design of a portable module FTS plant using a multi-plate
reactor. The proposed multi-plate reactor was designed with a simple plate structure. The
plate pitch was optimized to maximize total productivity for the given volume of the reactor
using similar thermal conditions for the catalyst bed.
Chapter 7 summarizes the conclusions obtained in this research study.

10
References
[1] S.S. Ail, S. Dasappa, Biomass to liquid transportation fuel via Fischer Tropsch synthesis
- Technology review and current scenario, Renew. Sustain. Energy Rev. 58 (2016) 267–
286. doi:10.1016/j.rser.2015.12.143.
[2] S. Abelló, D. Montané, Exploring iron-based multifunctional catalysts for
Fischer-Tropsch synthesis: A review, ChemSusChem. 4 (2011) 1538–1556.
doi:10.1002/cssc.201100189.
[3] J. Yang, W. Ma, D. Chen, A. Holmen, B.H. Davis, Fischer-Tropsch synthesis: A review
of the effect of CO conversion on methane selectivity, Appl. Catal. A Gen. 470 (2014)
250–260. doi:10.1016/j.apcata.2013.10.061.
[4] H. Jahangiri, J. Bennett, P. Mahjoubi, K. Wilson, S. Gu, A review of advanced catalyst
development for Fischer-Tropsch synthesis of hydrocarbons from biomass derived
syn-gas, Catal. Sci. Technol. 4 (2014) 2210–2229. doi:10.1039/c4cy00327f.
[5] A.K. Dalai, B.H. Davis, Fischer-Tropsch synthesis: A review of water effects on the
performances of unsupported and supported Co catalysts, Appl. Catal. A Gen. 348
(2008) 1–15. doi:10.1016/j.apcata.2008.06.021.
[6] M.E. Dry, High quality diesel via the Fischer-Tropsch process - A review, J. Chem.
Technol. Biotechnol. 77 (2002) 43–50. doi:10.1002/jctb.527.
[7] X. Zhu, D. Hildebrandt, D. Glasser, A study of radial heat transfer in a tubular
Fischer-Tropsch synthesis reactor, 10th Top. Conf. Gas Util. 2010 - Top. Conf. 2010
AIChE Spring Meet. 6th Glob. Congr. Process Saf. (2010) 22–24.

11
[8] R. Guettel, U. Kunz, T. Turek, Reactors for Fischer-Tropsch synthesis, Chem. Eng.
Technol. 31 (2008) 746–754. doi:10.1002/ceat.200800023.
[9] H. Schulz, Short history and present trends of Fischer-Tropsch synthesis, Appl. Catal. A
Gen. 186 (1999) 3–12. doi:10.1016/S0926-860X(99)00160-X.
[10] S.T. Sie, R. Krishna, Fundamentals and selection of advanced Fischer-Tropsch reactors,
Appl. Catal. A Gen. 186 (1999) 55–70. doi:10.1016/S0926-860X(99)00164-7.
[11] M.E. Dry, Practical and theoretical aspects of the catalytic Fischer-Tropsch process,
Appl. Catal. A Gen. 138 (1996) 319–344. doi:10.1016/0926-860X(95)00306-1.
[12] O.M. Basha, L. Sehabiague, A. Abdel-Wahab, B.I. Morsi, Fischer-Tropsch Synthesis in
slurry bubble column reactors : Experimental investigations and modeling – A Review,
Int. J. Chem. React. Eng. 13 (2015) 201–288. doi:10.1515/ijcre-2014-0146.
[13] V. Tomašić, F. Jović, State-of-the-art in the monolithic catalysts / reactors, Appl. Catal.
A Gen. 311 (2006) 112–121. doi:10.1016/j.apcata.2006.06.013.
[14] B.H. Davis, Fischer-Tropsch synthesis: Overview of reactor development and future
potentialities, Top. Catal. 32 (2005) 143–168. doi:10.1007/s11244-005-2886-5.
[15] Y. Zhuang, X. Gao, Y. Zhu, Z. Luo, CFD modeling of methanol to olefins process in a
fixed-bed reactor, Powder Technol. 221 (2012) 419–430.
doi:10.1016/j.powtec.2012.01.041.
[16] M.H. Rafiq, H.A. Jakobsen, R. Schmid, J.E. Hustad, Experimental studies and modeling
of a fixed bed reactor for Fischer-Tropsch synthesis using biosyngas, Fuel Process.
Technol. 92 (2011) 893–907. doi:10.1016/j.fuproc.2010.12.008.

12
[17] G. Chabot, R. Guilet, P. Cognet, C. Gourdon, A mathematical modeling of catalytic
milli-fixed bed reactor for Fischer-Tropsch synthesis: Influence of tube diameter on
Fischer Tropsch selectivity and thermal behavior, Chem. Eng. Sci. 127 (2015) 72–83.
doi:10.1016/j.ces.2015.01.015.
[18] M. Baldea, From process integration to process intensification, Comput. Chem. Eng. 81
(2015) 104–114. doi:10.1016/j.compchemeng.2015.03.011.
[19] G. Christophe, E. Sébastien, P. Laurent, What are the needs for process intensification?,
Oil Gas Sci. Technol. – Rev. 70 (2015) 463–473. doi:10.2516/ogst/2014051.
[20] J. Bielenberg, M. Bryner, Realize the potential of process intensification, Chem. Eng.
Prog. (2018) 41–45.
doi:https://www.aiche.org/resources/publications/cep/2018/march/realize-potential-pro
cess-intensification.
[21] M. Wang, A.S. Joel, C. Ramshaw, D. Eimer, N.M. Musa, Process intensification for
post-combustion CO2 capture with chemical absorption : A critical review, Appl.
Energy. 158 (2015) 275–291. doi:10.1016/j.apenergy.2015.08.083.
[22] S. Saeidi, K. Nikoo, Maryam, A. Mirvakili, S. Bahrani, E. Al, Recent advances in
reactors for low-temperature Fischer-Tropsch synthesis: Process intensification
perspective, Rev Chem Eng. 31 (2015) 209–238. doi:10.1515/revce-2014-0042.
[23] L. Raynal, F. Augier, Y. Haroun, C.P. Fonte, CFD applied to process development in the
oil and gas industry – A review, Oil Gas Sci. Technol. – Rev. 71 (2016) 1–24.
doi:10.2516/ogst/2015019.

13
[24] H. Pan, X. Chen, X. Liang, L. Zhu, Z. Luo, CFD simulations of gas-liquid-solid flow in
fluidized bed reactors — A review, Powder Technol. 299 (2016) 235–258.
doi:10.1016/j.powtec.2016.05.024.
[25] A. Jafari, P. Zamankhan, S.M. Mousavi, K. Pietarinen, Modeling and CFD simulation of
flow behavior and dispersivity through randomly packed bed reactors, Chem. Eng. J.
144 (2008) 476–482. doi:10.1016/j.cej.2008.07.033.
[26] C.K. Harris, D.R.F.J.J. Rosendal, F.G.J. Buitendijk, P. Daskopoulos, A.J.N. Vreenegoor,
H. Wang, K. Sheli-laboratorium, Computational Fluid Dynamics for Chemical Reactor
Engineering, Chem. Eng. Sci. 51 (1996) 1569–1594.
[27] R. Guettel, T. Turek, Comparison of different reactor types for low temperature
Fischer-Tropsch synthesis: A simulation study, Chem. Eng. Sci. 64 (2009) 955–964.
doi:10.1016/j.ces.2008.10.059.
[28] M. Irani, Investigating the production of liquid fuels from synthesis gas (CO+H2) in a
bench-scale packed-bed reactor based on Fe-Cu-La/SiO2 catalyst: Experimental and
CFD modeling, Int. J. Ind. Chem. 5 (2014) 1–9. doi:10.1007/s40090-014-0011-y.
[29] X. Zhu, X. Lu, X. Liu, D. Hildebrandt, D. Glasser, Study of radial heat transfer in a
tubular Fischer-Tropsch synthesis reactor, Ind. Eng. Chem. Res. 49 (2010) 10682–
10688. doi:10.1021/ie1004527.
[30] D. Merino, O. Sanz, M. Montes, Effect of the thermal conductivity and catalyst layer
thickness on the Fischer-Tropsch synthesis selectivity using structured catalysts, Chem.
Eng. J. 327 (2017) 1033–1042. doi:10.1016/j.cej.2017.07.003.

14
[31] S.J.P. Romkes, F.M. Dautzenberg, C.M. Van den Bleek, H.P.A. Calis, CFD modelling
and experimental validation of particle-to-fluid mass and heat transfer in a packed bed at
very low channel to particle diameter ratio, Chem. Eng. J. 96 (2003) 3–13.
doi:10.1016/j.cej.2003.08.026.
[32] J.-S. Park, Y.-J. Lee, G. Kwak, K.-W. Jun, M.-J. Park, CFD modeling of a thermally
efficient modular reactor for Fischer−Tropsch synthesis: Determination of the optimal
size for each module, Ind. Eng. Chem. Res. 55 (2016) 9416–9425.
doi:10.1021/acs.iecr.6b02359.

15
CHAPTER 2
LITERATURE REVIEW
2.1 Introduction
The fixed bed reactor (FBR) is still significant in multi-scale applications of Fischer-Tropsch
synthesis (FTS) because each of its competitors, for example the fluidized bed reactor and
slurry bed reactor, has certain unique drawbacks [1]. Studies done to improve the
applicability of FBR in FTS are important in terms of both academics and industrial-use
prospects. Simulation is an efficient method that is widely used in reactor related studies,
including novel reactor concept design, optimization of operating conditions, reactor
modification approach verification, etc. [2]. However, the accuracy of the reactor model is
dependent on the feasibility and precision of the modelling method used, while its reliability
is tested by means of validation. Because of the various scientific aims, many different types
of FBR models have been built (using various methodologies) and various validation
methods have been employed for different requirements.
A popular development trend in chemical engineering is process intensification (PI)
technology, which makes the apparatus smaller: the process is therefore cleaner, safer and
more energy-efficient [3]. In terms of FBR, novel designs and modifications that are
consistent with the principle of PI technology have been proposed to improve performance in
different applications, such as the FTS process. Scientists and engineers have already
reported many successful trials that focus on enhancing the applicability and performance of
FBR. However, it is difficult to interpret the mechanisms behind these reported approaches,

16
because a change to any parameter must be dealt with carefully as it may contribute to
improved performance of FBR in FTS.
In this chapter, various studies on FBR simulations are reviewed and compared briefly. This
allowed the appropriateness of the employed modelling approach for the FTS process in this
thesis to be highlighted. The studies based on this model explained in subsequent chapters in
this thesis are regarded as precise and convincible. PI technology from open resources that
has been applied to FBR is introduced and the corresponding mechanisms that relate to mass
transfer, heat transfer, fluid dynamics, etc. are summarized. The discussion of PI applications
can provide guidance in terms of improving FBRs used for FTS.
2.2 Fixed bed reactor modelling
The applicability and market potential of the syngas conversion process is highly dependent
on its capital cost and average product price [4]. Studies on high efficiency and high
economic value of FTS have been of interest to researchers and engineers since the first FTS
industrial application [5]. Driven by the same motivation, optimization of the FTS reactor is
considered as another important area of FTS reactions studies compared to the FTS
mechanism and catalyst improvement. Therefore, it is important to establish an accurate
Fischer-Tropsch FBR model, from which quantitative predictions can be obtained for: CO
conversion and product selectivity; optimization of reactor configuration and operating
conditions; thermal management of the catalyst bed; scale-up. An extensive literature review
on FBR modelling for different research objectives was done. This is summarized below.
2.2.1 Modelling methodology

17
The FBR modelling process uses mathematic equations and correlations to describe the
physical and chemical behavior inside the FBR under FTS conditions. The development of
FBR modelling methodologies - from the simple to the complicated - are in consistent with
the history of knowing the catalytic FTS process. Moazami et al. reported a 1D
pseudo-homogeneous modelling approach to investigate the effect of operating conditions on
CO conversion and product selectivity [6]. In this study, the model was a mini-scale
laboratory FBR with a Co-based catalyst. Certain assumptions were made, including no axial
species dispersion and no interphase and intraparticle mass transport. It should be noted that
the isothermal condition was implemented in the catalyst bed because of the predictable
inapparent temperature distribution in such small scale of reactor dimension and catalyst
loading amount. A MATLAB program was used to solve the governing equations. Wang et al.
developed a 1D heterogeneous FBR mathematical model using FTS operating conditions
with detailed kinetics [7]. The phase equilibrium between the bulk gaseous mixture and liquid
wax was correlated using a modified SRK equation of state. The modelling approach was
solved using FORTRAN program. However, since the research aims for these one-dimension
models were simple, the validity of these models was generally tested by comparing only the
FTS reaction results (CO conversion, product selectivity, etc.).
These assumptions, including isothermal conditions in Moazami’s study or no radial
temperature gradient and no radial mass transfer in Wang’s study, were considered reasonable
for 1D modelling under certain circumstances, while in other modelling applications they are
considered over-simplified, especially with larger-diameter FBR modelling applications. To

18
validate the feasibility of 1D model, the Mears criterion (shown in Equation 2-1) is normally
used to check the existence of radial temperature gradient in the catalyst bed [8].
(1 − 𝜀′) ∙ 𝑟 ∙ |∆𝐻| ∙ 𝑇 ∙ 𝑑 4𝜆 ∙ 𝑇 ∙ (1 + 8 ∙ 𝜆 𝑈 ∙ 𝑑⁄ ) < 0.4 2-1
Where: 𝜀′ is the void fraction of catalyst bed; ∆𝐻 is the reaction heat; 𝑇 and 𝑇 are the
adiabatic temperature and wall temperature, respectively; 𝑑 is the tube diameter; 𝜆 is the
thermal conductivity; U is the total heat transfer coefficient.
As long as the Mears criterion equation is not verified, the radial temperature gradient is
considered non-negligible and the 2D model is strongly recommended. The development of
the FBR modelling approach from 1D to 2D means not only the extension of model geometry,
but, from the mathematical aspect, the use of vector parameters in governing equations. Jess
and Kern developed a 2D pseudo-homogeneous multi-tubular reactor model operated at FTS
conditions; and parameters relating to the heat balance in catalyst bed (including the internal
and external convection heat transfer coefficient and the radial effective heat conductivity)
were carefully discussed [9]. By comparing the predictions of thermal runaway behavior in
the catalyst bed to that from a conventional 1D FBR model, Jess and Kern concluded that the
2D modelling approach could provide a more accurate prediction of the temperature profile
in the catalyst bed and the critical cooling temperature conditions for safe operation. Due to
the intense correlation between temperature and the FTS reaction mechanism, it could be
deduced that the precision of FTS simulation results was improved distinctly. Philippe et al.
reported on a 2D pseudo-homogeneous, non-isobaric and non-isothermal modelling approach
used to study the effect of operating conditions, reactor diameter, and thermal properties of

19
catalysts on the FTS reaction [10]. Simulations were even carried out under predicted
industrial conditions in their study, namely a low superficial velocity field; the results indicate
that the thermal conductivity of the catalyst support plays an important role in heat transfer in
the catalyst bed.
2D FBR models have been reported in many simulations done for different research aims,
because it is regarded as providing a compromise between the prediction accuracy and the
modelling complexity. Mendez et al. summed up the different FBR models in the literature
and developed a generalized mathematic model in which all the modelling considerations
were taken into account, including: phase equilibrium, fluid dynamics, mass/heat transfer, etc.
[11]. Their 2D model was considered a comprehensive model, even though the solution
procedure was complex and the parameter settings required in-depth acknowledgement.
However, researchers still pay little or no attention to the validation of temperature
distribution in their simulation studies. Abusrafa et al. developed a 2D reactor model to test
their approach for alleviating hot spot formation in a packed bed by using supercritical fluid
as the medium [12]. The simulation results confirmed an exceptional reduction in
temperature rise in the catalyst bed compared to the conventional gas phase FTS process [12].
While their model was only validated by reaction results, including CO conversion, product
selectivity, etc. Irani [13] developed a 2D FBR model with an axial symmetric geometry for
general studies of the FTS process, including the effects of operating conditions on FTS
reaction performance. Irani’s model was successfully validated from both the reaction results
and the temperature distribution in the catalyst bed; but sufficient thermal validation is still

20
required, as only temperature data on three points on reactor axis was used for validation.
To fulfill the requirements of increasing the diversity of research projects, 3D simulations
emerged and were rapidly applied in chemical engineering, especially in model
geometry-dependent studies, for example for a reactor design with a novel structure,
heat/mass transfer at the particle scale level in the catalyst bed, etc. FBR related 3D
simulation normally belong to computational fluid dynamics (CFD) simulation, which could
be regard as a hybrid branch of mathematics and fluid mechanics [14]. The CFD modelling
implements a series of governing equations, including equations of fluid motion (mass,
momentum and energy) and subsidiary equations for specific problems of interested, to
describe physical and chemical process in the geometry of objective [15,16]. The mass
conservation equation is in the general form as follows [17]:
𝜕𝜌 𝜕𝑡⁄ + ∇ ∙ (𝜌𝑣) = 𝑆 2-2
Where 𝜌, t and �⃗� indicate the density, time and velocity, respectively. 𝑆 is the mass
source term.
The momentum conservation equation is written as [17]:
𝜕(𝜌�⃗�) 𝜕𝑡⁄ + ∇ ∙ (𝜌�⃗��⃗�) = −∇P + ∇ ∙ 𝜏̿ + 𝜌�⃗� + �⃗� 2-3
Where P is the static pressure, 𝜏̿ indicates the stress tensor, 𝜌�⃗� and �⃗� represent the gravity
and external body force on the inertial reference frame system respectively.
The energy balance is governed by [17]:
𝜕(𝜌𝐸) 𝜕𝑡⁄ + ∇ ∙ (𝜌𝐸 + 𝑃)�⃗� = ∇ ∙ 𝑘 ∇𝑇 − ∑ ℎ 𝐽⃗ + 𝜏̿ ∙ �⃗� + 𝑆 2-4
Where E and T are total energy and temperature; 𝑘 is the effective conductivity; ℎ and

21
𝐽⃗ are the enthalpy and the diffusion flux of species j respectively; 𝑆 is the heat source term,
like chemical reaction heat.
Pertaining to the FTS reactor modelling, subsidiary equations implemented include 1)
equations for describing species dispersion in chemical process; 2) equations for predicting
the dynamics of solid particles in flow; 3) equations for more reliable turbulence in the
domain of reactor.
3D CFD simulation differs from conventional mathematical approaches in its use of the finite
element method, i.e. the geometry of the modelling object is divided into a number of small
cells; within each cell, the governing equations are solved by certain algorithms, and the
calculated results are then transferred to the adjacent cells [18]. Apparently, CFD modelling
of FBR could provide more detailed but more intuitionistic results for the temperature field,
velocity field, species changes, etc., in model geometry, compared to conventional
mathematical solutions.
Arzamendi et al. did a 3D simulation to study heat transfer in a microchannel reactor block
containing 80 square microchannels (1 mm wide and 21mm long). Its good isothermicity was
verified by their simulation results under low temperature FTS conditions [19]. Guardo et al.
used 3D simulations to compare the heat transfer parameters and pressure drop of a catalyst
bed consisting of 44 catalyst particles by using different turbulence models [20]. Thanks to
the well-constructed model geometry in Guardo’s study, the difference in near-wall treatment
in the turbulence models could be identified. CFD simulation has been widely developed so
that either commercial software (like ANSYS Fluent, CFX, etc.) or open source code (like

22
OpenFOAM) can be used as the simulator. Ariza et al. developed and compared the 3D
annular reactor models established by OpenFOAM and ANSYS Fluent respectively [18]. The
obtained comparable simulation results proved that both are reliable tools for CFD simulation
[21].
However, these “fancy” results are at the expense of computer capacity and are time
consuming. Taking the packed bed model with only 44 particles in Guardo’s study as an
example, each simulation run may require more than 12h to reach the convergence of
residuals. Besides, the validity of the 3D CFD model becomes more difficult as there are
various objective factors. The temperature distribution in the microchannel reactor block was
one of the most interesting results in Arzamendi’s study, although direct comparison between
the simulation data and experimental results is very difficult because of the technical barrier
in terms of temperature measurement in reactor cavities with such a small dimension. Even
though certain quantitative results from 3D simulation are without sufficient validation and
lacking in accuracy, the qualitative analysis results still have scientific and engineering
meaning.
In this thesis, a 2D FBR model was built to study novel reactor internals tests and new reactor
design verifications; particularly the gap in terms of the lack of sufficient model validation in
current research studies was fulfilled in this proposed modelling approach that was based on a
bench scale FTS FBR with a specially-designed 2D temperature measurement system.
2.2.2 FTS reaction kinetics
Due to the complexity of the FTS reaction scheme, studying the kinetic mechanism is an

23
interesting though controversial area for scientists [22]. The same applies to FTS reaction
kinetics modelling. Various kinetics models that use different fundamentals have been
reported, and there are three main approaches: 1) the mechanistic kinetics model with a
sequence of elementary reaction rate equations; 2) the empirical kinetics model of general
power law expressions; 3) the semi-empirical kinetics model that is based on a simplified
chain-growth mechanism [23–25]. The first approach is rarely reported to be employed in
recent studies due to its imaginable complexity.
The rate equation in power law form is one of the widely accepted empirical kinetics models.
Moazami et al. reported a study on modelling a 1D fixed bed reactor for the FTS process, in
which the FTS reaction scheme was presented by eight power law reaction rate equations
(shown in Equation 2-5) [6, 22].
𝑟 = 𝑘 ∙ 𝑒𝑥𝑝(−𝐸 𝑅𝑇⁄ ) ∙ 𝑃 ∙ 𝑃 2-5
Where: 𝑟 is the FTS reaction rate; 𝐸 is the activation energy; 𝑘 , m and n are the
constant parameters. Each product formation rate was solved independently; the
pre-exponential factor 𝑘 and the partial orders (m, n) in each product formation rate
equation were computed according to the corresponding experimental results. Thus, the
reaction network and the kinetics model is a complex that requires much effort. Guettel
employed the power law reaction rate (shown as Equation 2-6) in a study, without
considering the product distribution [27]. The constant factor F’ was used to simulate
different activities for different catalysts.
𝑟 = 𝐹′ ∙ 𝑘 ∙ 𝑒𝑥𝑝(−𝐸 𝑅𝑇⁄ ) ∙ 𝐶 2-6

24
Guettel’s kinetics model was based on a simple strategy, while it was only suggested to be
used for FTS applications with CO conversion no higher than 60%.
The so-called semi-empirical kinetics, which is based on the Langmuir–Hinselwood–
Hougen-Watson model equations, is considered a good compromise between the FTS
mechanism, mathematical tractability and experimental feasibility [28]. Compared to
iron-based catalyst for FTS process, the cobalt-based catalyst is superior in terms of FTS
catalytic activity and heavy hydrocarbon selectivity; in particular, the water-gas shift reaction
in the FTS process is negligible with the presence of Co-based catalyst [18, 26]. In this study,
only the FTS reaction kinetics models that use a cobalt catalyst were included in discussion
that follows [30].
The widely accepted kinetics model consists of two parts: the CO consumption rate (shown
as Equation 2-7); and the product formation rate (shown as Equation 2-8, 2-9, 2-10) [10, 28–
31].
𝑟 = −𝑟 = −𝑘 ∙ 𝑒𝑥𝑝(−𝐸 𝑅𝑇⁄ ) ∙ 𝐶 ∙ 𝐶 (1 + 𝑘 ∙ 𝑒𝑥𝑝(−𝐸 𝑅𝑇⁄ ) ∙ 𝐶 )⁄ 2-7
For the sake of simplification, the modelling approach normally assumes that the FTS
products only contain paraffins, while olefins and oxygenate products are not taken into
account. The product distribution is then described by the methane and ethane formation rates
and the chain growth possibility, i.e. α value in ASF theory, as follows [35]:
𝑟 = 𝑘 ∙ 𝑒𝑥𝑝(−𝐸 𝑅𝑇⁄ ) ∙ 𝑟 2-8
𝑟 = 𝑘 ∙ 𝑒𝑥𝑝(−𝐸 𝑅𝑇⁄ ) ∙ 𝑟 2-9
𝑟 = 𝛼 ∙ 𝑟 (𝑛 ≥ 3) 2-10

25
The α value is generally an average value taken from the experimental results. Theoretically,
all the formation rates of FTS hydrocarbon products with different carbon atoms can be
formulated using equations 2-8 to 2-10. To simplify the reaction scheme, products with 5 or
more carbon atoms are grouped together as C5+ products in most of the reported simulation
studies, and represented by pentane.
Chabot et al. [36] developed a pseudo-homogeneous FBR model using a semi-empirical
reaction kinetics model, using the aforementioned assumptions for the simplification of FTS
products. It is apparent that the FTS reaction scheme and the kinetics model are much simpler
than the empirical model. Rafiq et al. [37] implemented the same reaction kinetics model
when building an FBR model of a lab-scale apparatus for the FTS process using bio-syngas.
The reaction kinetics model showed that it could provide accurate predictions of the FTS
reaction results, because satisfactory agreement between the predictions and the experimental
data was obtained.
Even though the FTS kinetics mechanism is still not conclusive, the developed FTS kinetics
models reported in open published studies has been proven to predict FTS reactions with
acceptable results. The FTS kinetics model used in this thesis was developed based on the
semi-empirical kinetics model.
2.2.3 Characteristics of modelling
It is never too much to simulate more details of actual FTS reactor, including fluid dynamics,
species phase change, reactor geometry, etc., in modelling to ensure accurate simulation
results. However, a proper FBR model application should be a good compromise of the

26
requirements determined by the research objectives, the practical feasibility and the
computation efficiency. Thus, in different simulation studies, different modelling
characteristics are emphasized.
The intrinsic exothermicity of the FTS process dictates the need for efficient heat removal
capability by FBR. Otherwise, an undesired hot spot may form, which has a negative effect
on product selectivity and results in rapid deactivation of the catalyst bed, and sometimes
even dangerous thermal runaway. Therefore, thermal behavior is a crucial issue that must be
dealt with carefully by researchers when modelling reactors. Tremendous reaction heat can be
removed by heat conduction as well as by simultaneous convection heat transfer. Ozgumus et
al. [38] did an extensive review of experimental and simulation work done on thermal
dispersion in a packed bed. According to their report summary, the relations for effective
thermal conductivity were determined by both fluid and particle parameters, including the
Reynolds number, Peclet number, porosity of bed, particle shape and material, etc. In addition,
radial effective thermal conductivity played a more important role in heat transfer than axial
effective thermal conductivity in most of the studies reviewed. Todic et al. [39] paid special
attention to thermal management of the catalyst bed in their 2D pseudo-homogeneous FBR
model for the FTS process. Excluding the radial effective thermal conductivity, the heat
transfer coefficient at the wall was carefully investigated in Todic’s study, and a correlation
was proposed that consisted of a stagnant part and a convective part.
Apart from these studies on mathematical correlations for heat transfer parameters, factors
relating the temperature distribution in catalyst bed, including operating conditions, catalyst

27
particle physical properties and specifications, etc., were widely investigated in publications.
Dong et al. [40] developed a 3D heterogeneous FBR model with a random packed catalyst
bed to investigate heat transfer behavior. The catalyst particles, which are in the shape of
spheres and steatite rings, were performed by the discrete element method and packed
randomly by free-fall from the top of the reactor. High-quality validation between the
predicted and the measured radial temperature profiles was obtained at different packing
heights and flow rates.
Local fluid dynamics in the catalyst bed is a critical aspect when predicting the velocity field,
the mass transfer, the pressure drop, and especially the heat transfer behavior [41]. Many
researchers have done studies to correlate the heat transfer behavior and the fluid flow, using
different assumptions and simplifications. Lee and Chung [42] reported on a 2D numerical
simulation of a packed bed reactor using FTS conditions. In their study, the packed catalyst
bed was assumed to be a conglomerate of porous material, in which the fluid dynamics was
governed by the Eulerian-Eulerian mixture model and the momentum balance by the
momentum sink term. The simulation was performed under two phase flow using a porous
medium, and it was validated as showing satisfactory agreement. Using a porous medium to
represent the packed bed is only considered suitable when the tubular reactor in the
applications has a relatively larger tube-to-particle diameter ratio (no less than 10). Otherwise,
the wall effect from the reactor tube and the catalyst particle surface is negligible and it
affects the fluid dynamics in the catalyst bed. Thermal behavior is also influenced because the
heat transfer resistance in the near-wall region increases markedly. Nijemeisland and Dixon

28
[43] performed a CFD simulation of a FBR model with specific geometry that being identical
to actual experiment setup and containing 44 sphere catalyst particles, in order to
investigating the fluid dynamics in the catalyst bed and the heat transfer behavior. In their
study: the tube-to-particle diameter ratio was as low as 2; the temperature gradients were
obviously influenced by the fluid properties in the catalyst bed [40]. It is also claimed that
CFD simulations with detailed model geometry could provide useful solutions for
understanding flow and thermal principles. Zhou et al. [44] developed a 3D FBR model with
a packed bed of spherical particles inside, to investigate the effect of inlet velocity and
particle diameter on thermal behavior and reaction performance.
Given that liquid wax products are generated in catalyst pellet pores at FTS production
conditions, the pore diffusion may affect species dispersion strongly, and the mass transfer
resistance in both the axial and radial directions will not be negligible [47, 48]. Chabot et al.
[36] proposed a 2D pseudo-homogeneous FBR model to study the effect of reactor diameter
on the low-temperature FTS reaction results and temperature profile in the catalyst bed. In
Chabot’s study on the mass balance: the tortuosity and porosity of the catalyst pellets were
taken into account when calculating the effective diffusion coefficient for the pores; the CO
consumption rate was correlated with the internal mass transfer parameters, i.e. Thiele’s
modulus and effective diffusion coefficient, as the catalyst pores were filled with liquid wax.
Wehinger et al. [47] carried out simulations using different pore models to predict the
temperature profile in a catalyst bed and to study the effect of local flow on reaction kinetics.
Normally, the wall effect is lumped into the heat transfer coefficient. Romkes et al. [48]

29
performed a CFD simulation of a packed bed reactor to investigate the mass and heat transfer
characteristics in a system with a strong wall effect. By fitting their simulated mass/heat
transfer rate to different Reynolds number conditions, a simple engineering correlation for
mass and heat transfer prediction was concluded. However, Behnam et al. [49] proposed a
heat transfer equation with local position-dependent velocity components, instead of using
thermal conductivity and the heat transfer coefficient: a particle-resolved packed-bed
geometry was used in their CFD simulation. Dixon et al. [50] suggested that, for complex
fluid flow, especially the flow impacted by a strong wall effect in FBR, the Renormalization
Group (RNG) κ − ε model is more suitable, because the additional source term in ε
balance is dependent on strain and streamline curvature.
There has also been research interest in detailing the physical properties of species in the
reactor. Irani [51] claimed that the non-ideality of a gaseous mixture in a catalyst bed should
be taken into account, since the compression factor could be as low as 9, owing to the
formation of the heavy hydrocarbons. In Irani’s study, the Peng-Robinson equation of state
proved to be efficient and reliable with an error of less than 4%.
Modelling characteristics vary according to the research aims and experimental set-up on
which the FBR models are based. However, assumptions or simplifications, which ignore
certain practical details, are normally indispensable so as to balance the model complexity
and simulation accuracy.
2.2.4 Scientific and engineering applications
Simulation studies are considered to provide a connection between scientific knowledge,

30
which is the foundation used to build a model, and the practical applications, which reflect
the actual value of the theoretical research. The FBR used in the FTS process still has merits
in reactor applications, although the drawbacks are quite clear. Approaches that contribute to
improving the efficiency and safety of FBRs can be tested under FTS conditions by means of
mathematical experiments using an appropriate model. Therefore, the scientific and
engineering applications of FBR modelling are broad and worth considering.
The FBR model could be used as an engineering tool to design and optimize an FTS catalyst.
Mazidi et al. [52] carried out a heterogeneous FBR model to compare the performance of
different catalysts, including both uniform and non-uniform catalysts (e.g. egg-shell catalyst,
egg-yolk catalyst, surface-layered catalyst, mid-layered catalyst, center-layered catalyst).
When modelling, the catalytic activity distribution of different catalyst pellets is described by
the parameters of an integral characteristic variable of the pellet geometry and a
dimensionless pellet length. Based on the simulation results, non-uniform catalysts are
strongly recommended, because of the superior performance in improving the C5+ product
yield and suppressing temperature run away.
Reactor design and modification are the major applications of reactor modelling. Guettel and
Turek [27] conducted a mathematical simulation study to compare the FBR, slurry bed
reactor, micro reactor and monolith reactor, under the same low temperature FTS conditions.
The comparison was based on certain general assumptions, including no radial mass transfer,
isothermal conditions in both the axial and radial directions and non-compressible ideal gas.
The scientists employed specific settings for each reactor model, which meant that different

31
heat/mass transfer resistance and hydrodynamic statistics were used. The analysis of the
results showed that FBR still out-performs its competitors in terms of complexity of post
process and productivity per reactor volume.
The FBR and monolith bed reactor were compared using the pseudo-homogeneous modelling
approach with typical low temperature FTS conditions in Majidian and Soltanali’s study [53].
Their simulations were conducted to investigate the effects of various operating conditions
(including pressure, temperature and H2/CO ratio) and structure parameters (including the
diameter of the pellets used in a tubular reactor model and the thickness of the coated catalyst
used with a monolith reactor).
Simulation of different scales of FBR in the FTS process could supply sufficient information
in a scale-up process. A 2D mathematical model based on a pilot-scale FBR was reported by
Park et al. [51]. It was employed to study temperature profile and reaction performance when
changing the tube diameters in the reactor [54]. The analysis suggests that the optimal tube
diameter in their study was 40mm, in order to obtain the maximum CO conversion and C5+
yield at guaranteed safe operating conditions. They also suggested that their model could
provide valuable information for commercial-scale reactor designs. Wang et al. [7] performed
a simulation study of reactor tube diameter with a heterogeneous FBR model. The study
results indicated that the optimized tube diameter of the reactor should be less than 60mm.
The recycle operation of the FTS process was simulated and its superior ability to
once-through operation of FTS process in terms of maintaining thermal stability and
enhancing the heavy product yield was noted.

32
2.3 Process intensification technology
Process intensification technology (PI) was first proposed by Ramshaw and Mallinson in
their study on a rotation packed bed reactor [55]. PI has been broadly defined as: any
engineering development that leads to a substantially smaller, cleaner, safer and more
energy-efficient technology [52, 53]. The general aims in terms of PI technology can be
summarized as: to reduce the geometric or structural size of equipment; to integrate a
multiple process into one step; to enhance the efficiency of equipment [55].
PI technology development is considered a systematic engineering process that involves
multi-disciplinary collaboration in terms of physical and chemical processes and fluid
dynamics, etc. PI studies have been reported involving various applications in different areas
or different functional mechanisms [58]. In terms of the fixed bed FTS reactor that is the
focus of this thesis, PI technology approaches that increase heat removal, intensify mass
transfer and boost productivity are considered valuable to improve the feasibility and
applicability of Fischer-Tropsch FBR. Recent studies have indicated that innovative reactors
(including the microchannel reactor and plate reactor) are consistent with the core of PI
technology and attractive to FTS process [2].
It has also been reported that the microchannel reactor has shown advantages such as a short
diffusion distance, and lower heat and mass transfer resistance, which makes it suitable for
use in the FTS process [59]. Kshetrimayum et al. [59] developed a 3D CFD microchannel
reactor operated at low temperature FTS conditions. Myrstad et al. [60] carried out an
experimental study using a self-manufactured micro-structure packed bed reactor and FTS

33
conditions with a cobalt-based catalyst. The results of Myrstad’s study showed that the heat
transfer behavior in the micro-structure reactor improved dramatically and it was suggested
that catalysts with a higher activation were considered containable and that there was no
temperature runaway risk. However, the limited efficiency per reactor volume is a major
obstacle to plant scale microchannel reactor applications and few commercial applications of
the microchannel reactor are reported in published sources.
The plate reactor integrates the high performance heat exchanger and the catalytic reactor,
and is regarded as a promising option for improving the FTS reaction. Zanÿr and Gavriilidis
[61] developed a 2D mathematical model of a catalytic plate reactor in which the methane
steam reforming reaction and methane catalytic combustion were carried out in adjacent plate
spaces. The simulation results verified the superior thermal control performance of the plate
reactor and indicated that the parameters were significant for temperature control, including
the specifications for the channels between the plates, reactant flowrates and catalysts
properties.
Several types of tubular reactor internals have been proposed for the purpose of mass/heat
intensification in an existing tubular reactor. Porta proposed a bent and folded structure for
reactor internals to intensify heat conduction in the packed bed and to distribute the reaction
heat rapidly to the wall [62]. Verbist [63] employed a novel rector insert for the exothermic
process that functioned as a heat conductor in a catalyst bed, and the isothermal condition
was achieved. It was also reported that good thermal management was realized in a plant
scale FBR using the FTS process by increasing the heat transfer area using Hartvigsen’s

34
fin-type internals [64]. In Narataruksa’s study, a commercialized static mixer was employed
to intensify the mass transfer in a tubular FBR at FTS conditions [62]. Surprisingly, a much
better FTS reaction performance was obtained and hot spot formation was suppressed [65].
The concept of PI technology provides the core principles to improve the main drawbacks of
the FBR. The application of PI technology in FBR has wide relevance, even though its major
objective is to intensify the mass/heat transfer behavior in catalyst bed. Any approaches that
make the FTS process more volumetrically efficient and safer are considered as realizing PI
technology.
2.4 Summary
Although problems such as insufficient heat removal capacity, high drop in pressure and
diffusion limitations remain, the FBR is still viable for use in the FTS process at different
scales of scientific and engineering applications. FBR modelling is considered an efficient
and reliable method for making progress with existing reactor modifications and new reactor
designs.
The FBR modelling methodology has developed from a simple 1D simulation to a
comprehensive 2/3D simulation for different research objectives and interests. Owning to the
powerful modern computer industry, CFD simulation, which requires high computational
capacity, provides an effective way to build a geometry-dependent model to obtain more
detailed intrinsic information, including fluid dynamics, velocity field and temperature profile.
Therefore, it takes FBR simulation to a higher level. However, no universal modelling
approach is suitable for all research objectives. Each simulation study is developed using

35
unique characteristics, and effort should be paid to ensuring more detailed descriptions of
heat conduction in the catalyst bed, the specified pore diffusion rate, the modified equation of
state, etc. The complexity of the modelling approach is dependent on the computation
efficiency and the requirements in terms of accuracy of simulation results.
Even though the FTS reaction mechanism is still unclear, its reaction kinetics model have
been widely studied. Semi-empirical reaction kinetics has been verified in different FBR
modelling studies and it is considered an acceptable compromise of the FTS mechanism
description, mathematical tractability and experimental feasibility. FBR modelling offers
significant guidance on its practical applications in both scientific and engineering areas. In
this chapter, examples of applications in terms of catalyst optimization, reactor design and
FBR scale-up were presented. PI technology is a recently developed concept that has a range
of uses in practice and provides suggestions for new FTS reactor designs and modifications
for existing FBRs.
In this thesis, a 2D bench scale FBR CFD model with axisymmetric geometry was developed
for use with the low temperature FTS process. The modelling approach was built with
consideration being given to both the accuracy requirements of the research objectives and
the computational efficiency required to solve the model. Sufficient validation was conducted
on two aspects: FTS reaction results and 2D temperature distribution in the catalyst bed.
Based on the model, the FTS FBR intensification was illustrated with two different
approaches, i.e. the invention of novel tubular reactor internals for existing FBR and the
reactor design approach, which intensifies reactor productivity and volumetric efficiency for

36
both the multi-tube reactor and the multi-plate reactor.

37
References
[1] R. Krishna, S.T. Sie, Design and scale-up of the Fischer – Tropsch bubble column slurry
reactor, Fuel Process. Technol. 64 (2000) 73–105.
doi:10.1016/S0378-3820(99)00128-9.
[2] B.H. Davis, Fischer-Tropsch synthesis: Overview of reactor development and future
potentialities, Top. Catal. 32 (2005) 143–168. doi:10.1007/s11244-005-2886-5.
[3] A. Jess, R. Popp, K. Hedden, Fischer - Tropsch-synthesis with nitrogen-rich syngas
Fundamentals and reactor design aspects, Appl. Catal. A Gen. 186 (1999) 321–342.
doi:https://doi.org/10.1016/S0926-860X(99)00152-0.
[4] M.E. Dry, Practical and theoretical aspects of the catalytic Fischer-Tropsch process,
Appl. Catal. A Gen. 138 (1996) 319–344. doi:10.1016/0926-860X(95)00306-1.
[5] M.E. Dry, Fischer-Tropsch reactions and the environment, Appl. Catal. A Gen. 189
(1999) 185–190. doi:10.1016/S0926-860X(99)00275-6.
[6] N. Moazami, M.L. Wyszynski, H. Mahmoudi, A. Tsolakis, Z. Zou, P. Panahifar, K.
Rahbar, Modelling of a fixed bed reactor for Fischer-Tropsch synthesis of simulated
N2-rich syngas over Co/SiO2: Hydrocarbon production, Fuel. 154 (2015) 140–151.
doi:10.1016/j.fuel.2015.03.049.
[7] Y.N. Wang, Y.Y. Xu, Y.W. Li, Y.L. Zhao, B.J. Zhang, Heterogeneous modeling for
fixed-bed Fischer-Tropsch synthesis: Reactor model and its applications, Chem. Eng.
Sci. 58 (2003) 867–875. doi:10.1016/S0009-2509(02)00618-8.
[8] D.E. Mears, Diagnostic criteria for heat transport limitations in fixed bed reactors, J.

38
Catal. 20 (1971) 127–131. doi:10.1016/0021-9517(71)90073-X.
[9] A. Jess, C. Kern, Modeling of multi-tubular reactors for Fischer-Tropsch synthesis,
Chem. Eng. Technol. 32 (2009) 1164–1175. doi:10.1002/ceat.200900131.
[10] R. Philippe, M. Lacroix, L. Dreibine, C. Pham-Huu, D. Edouard, S. Savin, F. Luck, D.
Schweich, Effect of structure and thermal properties of a Fischer–Tropsch catalyst in a
fixed bed, Catal. Today. 147 (2009) S305–S312. doi:10.1016/j.cattod.2009.07.058.
[11] C. Mendez, J. Ancheyta, F. Trejo, Modeling of catalytic fixed-bed reactors for fuels
production by Fischer−Tropsch Synthesis, Energy & Fuels. 31 (2017) 13011–13042.
doi:10.1021/acs.energyfuels.7b01431.
[12] A.E. Abusrafa, M.S. Challiwala, H.A. Choudhury, B.A. Wilhite, N.O. Elbashir,
Experimental Verification of 2-Dimensional Computational Fluid Dynamics Modeling
of Supercritical Fluids Fischer Tropsch Reactor Bed, Catal. Today. 343 (2020) 165–175.
doi:10.1016/j.cattod.2019.05.027.
[13] M. Irani, Investigating the production of liquid fuels from synthesis gas (CO+H2) in a
bench-scale packed-bed reactor based on Fe-Cu-La/SiO2 catalyst: Experimental and
CFD modeling, Int. J. Ind. Chem. 5 (2014) 1–9. doi:10.1007/s40090-014-0011-y.
[14] A.A. Troshko, F. Zdravistch, CFD modeling of slurry bubble column reactors for
Fisher-Tropsch synthesis, Chem. Eng. Sci. 64 (2009) 892–903.
doi:10.1016/j.ces.2008.10.022.
[15] J.A.M. Kuipers, W.P.M. Van Swaiij, Application of computational fluid dynamics to
chemical reaction engineering, Rev. Chem. Eng. 13 (1997) 1–118.

39
doi:10.1515/REVCE.1997.13.3.1.
[16] C.K. Harris, D.R.F.J.J. Rosendal, F.G.J. Buitendijk, P. Daskopoulos, a J.N.
Vreenegoor, H. Wang, K. Sheli-laboratorium, Computational Fluid Dynamics for
Chemical Reactor Engineering, Chem. Eng. Sci. 51 (1996) 1569–1594.
[17] Ansys.Inc, Ansys Fluent Theory Guide, Ansys Website. (2009).
www.afs.enea.it/project/neptunius/docs/fluent/html/th/node1.htm.
[18] Y. Zhuang, X. Gao, Y. Zhu, Z. Luo, CFD modeling of methanol to olefins process in a
fixed-bed reactor, Powder Technol. 221 (2012) 419–430.
doi:10.1016/j.powtec.2012.01.041.
[19] G. Arzamendi, P.M. Dieguez, M. Montes, J.A. Odriozola, E.F. Sousa-Aguiar, L.M.
Gandia, Computational fluid dynamics study of heat transfer in a microchannel reactor
for low-temperature Fischer-Tropsch synthesis, Chem. Eng. J. 160 (2010) 915–922.
doi:10.1016/j.cej.2009.12.028.
[20] A. Guardo, M. Coussirat, M.A. Larrayoz, F. Recasens, E. Egusquiza, Influence of the
turbulence model in CFD modeling of wall-to-fluid heat transfer in packed beds, Chem.
Eng. Sci. 60 (2005) 1733–1742. doi:10.1016/j.ces.2004.10.034.
[21] C. Ariza, C. Casado, R. Wang, E.E. Adams, J. Marugán, Comparative evaluation of
OpenFOAM and ANSYS Fluent for the modeling of annular reactors, Chem. Eng.
Technol. 41 (2018) 1473–1483. doi:https://doi.org/10.1002/ceat.201700455.
[22] J.J.C. Geerlings, J.H. Wilson, G.J. Kramer, H.P.C.E. Kuipers, A. Hoek, H.M. Huisman,
Fischer-Tropsch technology-from active site to commercial process, Appl. Catal. A Gen.

40
186 (1999) 27–40. doi:https://doi.org/10.1016/S0926-860X(99)00162-3.
[23] M.J. Keyser, R.C. Everson, R.L. Espinoza, Fischer - Tropsch kinetic studies with
cobalt-manganese oxide catalysts, Ind. Eng. Chem. Res. 39 (2000) 48–54.
doi:https://doi.org/10.1021/ie990236f.
[24] H.E. Atwood, C. Bennett, Kinetics of the Fischer-Tropsch reaction over iron, Ind. Eng.
Chem. Process Des. Dev. 18 (1979) 163–170. doi:10.1021/i260069a023.
[25] M. Sadeqzadeh, J. Hong, P. Fongarland, D. Curulla-ferre, F. Luck, J. Bousquet, D.
Schweich, A.Y. Khodakov, Mechanistic modeling of cobalt based catalyst sintering in a
fixed bed reactor under different conditions of Fischer-Tropsch synthesis, Ind. Eng.
Chem. Res. 51 (2012) 11955–11964. doi:https://doi.org/10.1021/ie3006929.
[26] M.. Post, A.. van Hoog, J.. Minderhoud, S.T. Sie, Diffusion limitations in
Fischer-Tropsch catalysts, AIChE J. 35 (1989).
doi:https://doi.org/10.1002/aic.690350706.
[27] R. Guettel, T. Turek, Comparison of different reactor types for low temperature
Fischer-Tropsch synthesis: A simulation study, Chem. Eng. Sci. 64 (2009) 955–964.
doi:10.1016/j.ces.2008.10.059.
[28] B. Sarup, B.W. Wojciechowski, Studies of the Fischer-Tropsch synthesis on a cobalt
catalyst II. Kinetics of carbon monoxide conversion to methane and to higher
hydrocarbons, Can. J. Chem. Eng. 67 (1989) 62–74.
doi:https://doi.org/10.1002/cjce.5450670110.
[29] D.S. Newsome, P. Kellogg, The water-gas shift reaction conditions, Catal. Rev. Sci. Eng.

41
21 (1980) 275–318. doi:http://dx.doi.org/10.1080/03602458008067535.
[30] P.F. Andrei Y. Khodakov, Wei Chu, Advances in the development of novel cobalt
Fischer−Tropsch catalysts for synthesis of long-chain hydrocarbons and clean fuels,
Chem. Eng. Technol. 107 (2007) 1692–1744. doi:https://doi.org/10.1021/cr050972v.
[31] I.C. Yates, C.N. Satterfield, Intrinsic kinetics of the Fischer-Tropsch synthesis on a
cobalt catalyst, Energy & Fuels. 5 (1991) 168–173.
doi:https://doi.org/10.1021/ef00025a029.
[32] R.B. Anderson, R.A. Friedel, H.H. Storch, Fischer-Tropsch reaction mechanism
involving stepwise growth of carbon chain, J. Chem. Phys. 19 (1951) 313–319.
doi:10.1063/1.1748201.
[33] D.B.B. Zimmerman, William H., Joseph A. Rossin, Effect of particle size on the activity
of a fused iron Fischer-Tropsch cata1yst, Ind. Eng. Chem. Res. 28 (1989) 406–413.
doi:https://doi.org/10.1021/ie00088a005.
[34] S. Storsæter, D. Chen, A. Holmen, Microkinetic modelling of the formation of C1 and
C2 products in the Fischer-Tropsch synthesis over cobalt catalysts, Surf. Sci. 600 (2006)
2051–2063. doi:10.1016/j.susc.2006.02.048.
[35] A.N. Pour, M.R. Housaindokht, S.F. Tayyari, J. Zarkesh, Effect of nano-particle size on
product distribution and kinetic parameters of Fe/Cu/La catalyst in Fischer-Tropsch
synthesis, J. Nat. Gas Chem. 19 (2010) 107–116. doi:10.1016/S1003-9953(09)60041-4.
[36] G. Chabot, R. Guilet, P. Cognet, C. Gourdon, A mathematical modeling of catalytic
milli-fixed bed reactor for Fischer-Tropsch synthesis: Influence of tube diameter on

42
Fischer Tropsch selectivity and thermal behavior, Chem. Eng. Sci. 127 (2015) 72–83.
doi:10.1016/j.ces.2015.01.015.
[37] M.H. Rafiq, H.A. Jakobsen, R. Schmid, J.E. Hustad, Experimental studies and modeling
of a fixed bed reactor for Fischer-Tropsch synthesis using biosyngas, Fuel Process.
Technol. 92 (2011) 893–907. doi:10.1016/j.fuproc.2010.12.008.
[38] T. Özgümüš, M. Mobedi, Ü. Özkol, A. Nakayama, Thermal dispersion in porous media
- a review on the experimental studies for packed beds, Appl. Mech. Rev. 65 (2013) 1–
19. doi:10.1115/1.4024351.
[39] B. Todic, M. Mandic, N. Nikacevic, D.B. Bukur, Effects of process and design
parameters on heat management in fixed bed Fischer-Tropsch synthesis reactor, Ko. 35
(2018) 1–15. doi:10.1007/s11814-017-0335-3.
[40] Y. Dong, B. Sosna, O. Korup, F. Rosowski, R. Horn, Investigation of radial heat transfer
in a fixed-bed reactor CFD simulations and profile measurements, Chem. Eng. J. 3 (2017)
204–214. doi:https://doi.org/10.1016/j.cej.2017.02.063.
[41] Z.F. Tian, J.Y. Tu, G.H. Yeoh, Numerical modelling and validation of gas-particle flow
in an in-line tube bank, Comput. Chem. Eng. 31 (2007) 1064–1072.
doi:10.1016/j.compchemeng.2006.09.008.
[42] T.S. Lee, J.N. Chung, Mathematical modeling and numerical simulation of a
Fischer−Tropsch packed bed reactor and its thermal management for liquid
hydrocarbon fuel production using biomass syngas, Energy & Fuels. 26 (2012)
1363−1379. doi:dx.doi.org/10.1021/ef201667a |.

43
[43] M. Nijemeisland, A.G. Dixon, Comparison of CFD simulations to experiment for
convective heat transfer in a gas-solid fixed bed, Chem. Eng. J. 82 (2001) 231–246.
doi:https://doi.org/10.1016/S1385-8947(00)00360-0.
[44] X. Zhou, Y. Duan, X. Huai, X. Li, 3D CFD modeling of acetone hydrogenation in fixed
bed reactor with spherical particles, Particuology. 11 (2013) 715–722.
doi:10.1016/j.partic.2012.10.009.
[45] S.T. Sie, R. Krishna, Fundamentals and selection of advanced Fischer-Tropsch reactors,
Appl. Catal. A Gen. 186 (1999) 55–70. doi:10.1016/S0926-860X(99)00164-7.
[46] R.J. Madon, E. Iglesia, Hydrogen and CO intrapellet diffusion effects in
ruthenium-catalyzed hydrocarbon synthesis, J. Catal. 149 (1994) 428–437.
doi:https://doi.org/10.1016/S0926-860X(99)00152-0.
[47] G.D. Wehinger, F. Klippel, M. Kraume, Modeling pore processes for particle-resolved
CFD simulations of catalytic fixed-bed reactors, Comput. Chem. Eng. 101 (2017) 11–22.
doi:https://doi.org/10.1016/j.compchemeng.2017.02.029.
[48] S.J.P. Romkes, F.M. Dautzenberg, C.M. Van den Bleek, H.P.A. Calis, CFD modelling
and experimental validation of particle-to-fluid mass and heat transfer in a packed bed at
very low channel to particle diameter ratio, Chem. Eng. J. 96 (2003) 3–13.
doi:10.1016/j.cej.2003.08.026.
[49] M. Behnam, A.G. Dixon, M. Nijemeisland, E.H. Stitt, A new approach to fixed bed
radial heat transfer modeling using velocity fields from computational fluid dynamics
simulations, Ind. Eng. Chem. Res. 52 (2013) 15244−15261.

44
doi:dx.doi.org/10.1021/ie4000568 |.
[50] A.G. Dixon, M. Nijemeisland, H. Stitt, CFD simulation of reaction and heat transfer
near the wall of a fixed bed, Int. J. Chem. React. Eng. 1 (2003) 1–18.
[51] M. Irani, Experimental and CFD modeling of a bench-scale GTL packed-bed reactor
based on FE/CU catalyst, Pet. Coal. 56 (2014) 62–73.
[52] S.K. Mazidi, M.T. Sadeghi, M.A. Marvast, Optimization of Fischer-Tropsch process in
a fixed-bed reactor using non-uniform catalysts, Chem Eng. Technol. 36 (2013) 62–72.
doi:10.1002/ceat.201200268.
[53] N. Majidian, S. Soltanali, Comparison of Fischer-Tropsch fixed and monolith bed
reactors using pseudo-homogeneous 2D model, J. Japan Pet. Inst. 59 (2016) 126–139.
doi:10.1627/jpi.59.126.
[54] N. Park, J.R. Kim, Y. Yoo, J. Lee, M.J. Park, Modeling of a pilot-scale fixed-bed reactor
for iron-based Fischer-Tropsch synthesis: Two-dimensional approach for optimal tube
diameter, Fuel. 122 (2014) 229–235. doi:10.1016/j.fuel.2014.01.044.
[55] M. Wang, A. Lawal, P. Stephenson, J. Sidders, C. Ramshaw, Post-combustion CO2
capture with chemical absorption: A state-of-the-art review, Chem. Eng. Res. Des. 89
(2011) 1609–1624. doi:10.1016/j.cherd.2010.11.005.
[56] D. Reay, The role of process intensification in cutting greenhouse gas emissions, Appl.
Therm. Eng. 28 (2008) 2011–2019. doi:10.1016/j.applthermaleng.2008.01.004.
[57] C. Ramshaw, R.H. Mallinson, Mass transfer process, 4283255, 1970.
doi:10.11470/oubutsu1932.39.119.

45
[58] M. Wang, A.S. Joel, C. Ramshaw, D. Eimer, N.M. Musa, Process intensification for
post-combustion CO2 capture with chemical absorption: A critical review, Appl.
Energy. 158 (2015) 275–291. doi:10.1016/j.apenergy.2015.08.083.
[59] Krishnadash S. Kshetrimayum, I. Jung, J. Na, S. Park, Y. Lee, S. Park, C.-J. Lee, C. Han,
CFD simulation of microchannel reactor block for Fischer−Tropsch synthesis: Effect of
coolant type and wall boiling condition on reactor temperature, Ind. Eng. Chem. Res.Nd.
Eng. Chem. Res. 55 (2015) 543–554. doi:https://doi.org/10.1021/acs.iecr.5b03283.
[60] R. Myrstad, S. Eri, P. Pfeifer, E. Rytter, A. Holmen, Fischer-Tropsch synthesis in a
microstructured reactor, Catal. Today. 147 (2009) 3–6.
doi:10.1016/j.cattod.2009.07.011.
[61] M. Zanÿr, A. Gavriilidis, Catalytic combustion assisted methane steam reforming in a
catalytic plate reactor, Chem. Eng. Sci. 58 (2003) 3947–3960.
doi:10.1016/S0009-2509(03)00279-3.
[62] P. della Porta, T.A. Giorgi, A. Cantaluppi, B. Ferrario, P. Montalenti, Catalyst cartridge,
3,857,680, 1974. doi:https://patents.google.com/patent/US3441382A/en.
[63] M. Verbist, Tubular reactor with packing, US 2007/0299148A1, 2007.
doi:https://patents.google.com/patent/US20070299148A1/en?oq=US+2007%2f029914
8A1.
[64] J.J. Hartvigsen, Fixed bed reactor heat transfer structure, US 2014/0134067 A1, 2014.
doi:https://patents.google.com/patent/US9157689B2/en.
[65] P. Narataruksa, S. Tungkamani, K. Pana-Suppamassadu, P. Keeratiwintakorn, S.

46
Nivitchanyong, P. Hunpinyo, H. Sukkathanyawat, P. Jiamrittiwong, V. Nopparat,
Conversion enhancement of tubular fixed-bed reactor for Fischer-Tropsch synthesis
using static mixer, J. Nat. Gas Chem. 21 (2012) 435–444.
doi:10.1016/S1003-9953(11)60388-5.

47
CHAPTER 3
MODELLING AND SIMULATION STUDY OF A
BENCH-SCALE FIXED BED
FISCHER-TROPSCH REACTOR
3.1 Introduction
Fischer-Tropsch synthesis (FTS), which converts syngas into a complex multi-component
mixture including liquid fuel, since its discovery in the 1920s, continuously receives a great
deal of attention from researchers [1]. This is because it offers potential solutions to current
concerns, such as: protecting the natural environment from harmful industrial emissions and
effluents; finding sustainable sources of energy and fuel to support the development of
society; and ensuring the energy and electricity security of nations [2]. There has been much
research into the different sub-fields of FTS, such as the intrinsic reaction mechanism,
catalyst preparation and improvement, engineering optimisation, etc. [3]. But there is less
(published) research on the interaction between the catalyst and the reactor itself.
FTS is a strongly exothermic process, which has an adiabatic temperature rise of
approximately 1750K [4]. However, excessively high temperatures in the catalyst bed should
be avoided for the sake of system safety and FTS reaction performance [5]. Temperature
runaway, which is a serious issue in practice, was observed in Mazidi’s research [6] when the
reaction heat was not removed immediately. Dry states that higher temperatures will result in
higher selectivity towards undesired methane; while it was also found that the probability of
chain growth decreases when the temperature increases [7,8]. Moreover, higher temperatures

48
may increase the catalyst deactivation rate by coking and sintering. Therefore, controlling the
temperature rise in an FTS reactor is critical to ensure effective performance of the process.
Fixed bed reactors (FBR) are widely used in multi-scale FTS research, because of the various
benefits, including: 1) simple installation and operation; 2) high catalyst loading volume; 3)
high potential productivity; 4) easy to scale up [9]. However, hot spots may form easily in an
FBR because of its relatively low heat transfer rate. To improve this situation, many other
types of reactors, such as fluidized bed reactor, slurry bed reactor, monolith bed reactor, etc.,
are utilized in different scale of applications. Despite the increased usage of these alternative
reactors, FBRs are not being completely replaced by these newer reactors because they too
have drawbacks (briefly summarized in Table A1 in Appendix A-1). Nonetheless, the
operability and stability of the FBR would dramatically improve if its heat transfer rate were
enhanced, thereby reducing the high temperatures that occur at the hotspot [10].
Heat transfer behaviour in FBRs depends on operational conditions, such as reaction rate,
flowrate within the reactor, physical properties of the catalyst bed, the cooling system, etc. A
better understanding of the heat transfer behaviour and hot spot formation in FBRs can be
gained from knowledge of the temperature distribution in the catalyst bed. Unfortunately,
current studies of temperature distributions in fixed bed FT reactors have limitations or
deficiencies. For example, only axial temperatures were measured in much of the published
literature, even though radial heat transfer plays a more important role in heat removal [11].
Dong et al. reported setting up an FBR (0.021m inner diameter) with a radially-placed fused
silica capillary containing thermocouples to measure the radial temperatures [12]. However,

49
they were unable to measure the axial temperature distribution because the silica capillary
was fixed at a given axial position. Zhu et al. performed a series of experiments to determine
the heat transfer characteristics of a lab-scale FBR by employing a specially designed
two-dimensional temperature distribution measuring arrangement [4,13]. But the reactor
diameter was only 0.023m and the catalyst bed height was only 0.027m, which is far from
that in industrial practice. Sie and Krishna reported that fluid dynamics in an FBR is an
important factor in heat transfer and that the heat transfer coefficient increases strongly with
the Reynold’s number [14]. Therefore the fluid dynamics may be strongly affected, resulting
in the heat transfer coefficient being over-estimated, when internal structures are installed in a
relatively small diameter reactor such as that used in Zhu’s experimental design. In this study,
a bench-scale FBR, which more closely approximates the dimensions of an industrial FBR
(i.e. larger diameter and longer reactor tube length), was used to improve the accuracy of the
measurements and more closely approximate the properties of industrial FBRs.
Computational fluid dynamic (CFD) techniques have been applied to more real-world
situations, for example certain unit designs, predictions of the reaction rate and complex fluid
dynamic research [15–18]. However, a drawback of some of the current CFD modelling
research in FTS is not being able to validate the simulation against experimental
measurements such as temperature. Since the heat transfer behaviour is complex and some
related parameters are determined by theoretical or empirical data, the predicted temperature
profiles may not be credible without verification. The temperature distribution in some
reported simulations may not be accurate, as the models were only validated against overall

50
reaction results, such as overall CO conversion, methane selectivity, C5+ product selectivity,
etc., instead of taking experimentally measured temperature profiles into account [19,20]. In
other recent research, the models were fitted to measured temperatures, although the amount
of experimental data used was far from satisfactory, in that the temperature was measured at 3
points along the centre axis only [21,22]. The calculation of the heat transfer coefficient is
complicated and the boundary condition at the wall of an FBR model is normally set as either
adiabatic or isothermal, which leads to the wall heat flux being under-estimated or
over-estimated, respectively. Behnam et al. developed a FBR modelling approach with
convection/conduction heat transfer being calculated according to local flow physical
phenomena. The corresponding temperature distribution was predicted precisely without a
detailed model geometry containing full bed of sphere particles [23]. Motivated by this
approach, the heat transfer coefficient in this study will be predicted using the characteristics
of the gaseous reactants locally and the thermal oil.
The authors believe that the special designed temperature measurement system is reported for
the first time to be employed in a bench-scale Fischer-Tropsch FBR with a diameter
representative of those in industrial reactors. Accordingly, the obtained 2D temperature
distribution is novel and of interest to researchers in the field, especially to engineers in
industrial fields. The experiments were conducted under low-temperature FTS conditions at
different inert gas flowrates and GHSVs respectively. The corresponding axial and radial
temperature profiles along the catalyst bed were measured in each of the experiments, as well
as the overall conversion and selectivity. The effects of inert gas flowrates and GHSVs on

51
temperature distribution and FTS reaction are discussed in this chapter. A CFD model with
position-dependent heat transfer coefficient on reactor wall was developed refer to the actual
experiment setup. The model was validated by respectively comparing with the measured
reaction results (conversion and selectivity) and temperature profiles. The axial variation in
predicted properties, such as CO conversion and space-time yield (STY) of C3+ products, was
analysed, which gives not only a better understanding of the phenomenon inside of reactor
but a guidance study for FBR design and modification. Furthermore, this validated model is
of great practical use for further research, such as optimising and modifying FTS FBR design
to increase reactor efficiency and productivity.
3.2 Experimental
3.2.1 Experimental apparatus
A bench-scale FBR of 0.05m inner diameter and 1m length was designed and built for this
experimental study. The reactor is a tube-shell structure, which were under counter current
operation, consisting of a reaction zone on the tube side and an oil-cooled shell side (see
more details in the Appendix A-2). In this study, the effects of operating conditions on the
temperature distribution in the reactor tube are of interest. In order to record as many
temperature measurements as possible, four spatially isolated thermocouple sheaths (T1, T2,
T3 and T4) were placed at radii of 0m, 0.0085mm, 0.017m and 0.021m, respectively, as
shown in Figure 3.1). The diameter of the thermocouple sheaths T2-T4 is 0.0025m such that
a single point thermocouple fits perfectly and slides smoothly inside each sheath to measure
the temperature in the axial direction. A thermocouple sheath of 0.006m diameter (T1) was

52
inserted in the centre axis of the bed. A multi-point thermocouple, which was easily broken
when sliding in the sheath, was used to measure the temperature at four points at fixed
positions simultaneously.
Figure 3.1: Temperature measuring points at the reactor cross-section
3.2.2 Operating parameters and procedure
As the stability and activity of the catalyst are two critical issues for commercial applications,
a 15% Co-SiO2 catalyst prepared using the incipient wetness method was used in this study
[24,25]. The preparation procedure was as follows: the required quantity of support (SiO2)
was measured, and an aqueous solution of cobalt nitrate with a volume equal to that of the
volume of the pores in the support was absorbed onto the support material. The raw catalyst
was dried at 363K for three hours and calcined at 673K for five hours. For safe operation, the
catalyst was diluted with ceramic balls. The reactor was packed vertically with three layers
from the bottom to the top, namely: 200ml ceramic ball; 1.200ml catalyst mixture (made up
of 300ml catalyst and the balance ceramic balls); 800ml ceramic ball.
Before carrying out the experiment, the catalyst was reduced by hydrogen at a flowrate of
3l/min at 593K under atmospheric pressure. After 24 hours, hydrogen was replaced by
nitrogen and the bed was cooled until the bed temperature reached experimental conditions

53
(458K). Two different sets of experiments were performed. In the first, the flowrate of the
inert gas (nitrogen) (0~4.5l/min at standard conditions) was varied while keeping the
flowrates of CO and H2 constant. In the second, the gas composition (mole ratio of CO:H2:N2)
was kept constant and the GHSV (from 75 to 300h-1) was varied. The operating pressure and
temperature were kept constant for all experiments. The operating conditions of each
experiment are summarized in Table 3.1.
Table 3.1: Summary of experimental conditions
Exp1 Exp2 Exp3 Exp4 Exp5
Mole ratio of CO:H2:N2 1:2:0 1:2:3 1:2:9 1:2:3 1:2:3
CO flowrate/(l·min-1) 0.50 0.50 0.50 0.25 0.13
H2 flowrate/(l·min-1) 1.00 1.00 1.00 0.50 0.25
N2 flowrate/(l·min-1) 0 1.50 4.50 0.75 0.38
GHSV/h-1 300 300 300 150 75
The experimental conditions were kept constant at 458K. 2MPa, 300 ml Co-SiO2 catalyst. The
volumetric flowrate was under standard conditions.
The product composition of FTS is complex and usually analysed by gas chromatograph
(GC). In this study, the inorganic components (CO, CO2, etc.) and organic components were
analysed using a thermal conductivity detector and a flame ionization detector installed on
the same online GC, respectively.
3.3 Reactor Model
3.3.1 Simulation strategy
A 2D axisymmetric FBR model consisting of a tubular reactor and an annular oil bath was
developed using ANSYS Fluent 18.1. The model layout is shown in Figure 3.2. Mesh
independence was conducted and a uniform structured grid with 173 600 cells was chosen.
The physical properties of the ceramic ball and catalyst particles are summarized in Table A2
in Appendix A-3. Because the ratio of the diameter of the tube to that of the particles is larger

54
than 10, it was reasonable to assume that the mean bed void is constant [25]. Three uniform
solid porous zones were utilized to represent the layers of ceramic balls and catalyst bed. The
“physical velocity” was chosen in Porous Formulation of ANSYS Fluent such that the
porosity was taken into account when calculating the gas velocity in the porous region. The
significance of inter-phase heat transfer resistance was studied by the dimensionless criterion
from Mears’ study [26](demonstrated in Appendix A-4). The results validated that the
inter-phase heat transfer resistance was negligible and, thereby, thermal equilibrium between
the solid catalyst bed and the reactant flow can be assumed.
Figure 3.2: Geometry of the fixed bed reactor model
The Reynold’s number can be calculated by the Equation A1 in Appendix A-5. Thus the flow
pattern of the gaseous mixture in the reactor was determined to be laminar (𝑅𝑒 < 10) and the
Laminar Model was applied. The pressure drop across the reactor, which is estimated by
means of the Ergun equation (Equation A2 in Appendix A-6), was considered to be negligible
compared to the operating pressure of 2MPa; therefore, the reacting gas was assumed to be an

55
incompressible ideal gas. The equations were fitted to the data for the thermal conductivity of
different species at different temperatures, and these are summarized in Table A3 in Appendix
A-7 [27]. The boundary conditions for the inlet velocity and outlet pressure were set for both
the reaction and cooling oil regions. By setting the boundary condition between the gaseous
mixture on the tube side and the cooling oil flow on the shell side as coupled walls, the local
surface heat transfer coefficient can be calculated according to the fluid properties at the
corresponding positions. The conventional approaches for heat transfer modelling on the
reactor wall, including setting the reactor wall to a constant temperature, isothermal condition
or constant heat transfer coefficient, may provide acceptable temperature prediction only in
lab scale FBR. However, in bench scale FBR, the axial changes of the heat transfer
coefficient are much more obvious and cannot be described well using these conventional
approaches. Therefore, the approach of using a position-dependent heat transfer coefficient
was considered relatively accurate. The other boundaries adjacent to the atmosphere were
implemented as adiabatic walls, by setting the heat flux to 0 W/m2. A no-slip condition was
set, namely that the fluid at the walls has no relative momentum. A summary all the boundary
conditions were given in Table A4 in Appendix A-8. Moreover, only the products were
assumed to be gas and three reactions were used to describe the FTS reaction scheme for
simplicity. This is discussed later in this chapter.
The mass and momentum conservations that based on the Navier-Stokes equations and
additional equations for energy and species balances were calculated according to the built-in
governing equations in Fluent. The SIMPLE algorithm was selected for the Pressure-Velocity

56
Coupling scheme. The simulation results are considered converged when the scaled residuals
are smaller than the absolute criteria (10-5 for continuity and x/y-velocity, 10-6 for the others).
3.3.2 Reaction kinetics
The complexity of the actual FTS mechanism and the large number of species involved make
detailed kinetics modelling difficult [10, 27–29]. The semi-empirical kinetics model was
developed, which is considered to keep a good balance between the FTS mechanism,
mathematical tractability and experimental limitations [31].
The water gas shift reaction (WGS) was ignored in this work because of the weak WGS
reaction activity observed in the Co-supported catalyst FTS system [32]. Moreover, to
simplify the model, the olefin and oxygenate products were lumped with the paraffin product
distribution. No liquid phase product was considered in this model and the diffusivity of the
gas mixture was assumed as a constant 2.88x10⁻⁵ m2/s. According to the semi-empirical
kinetic model, the equation reported by Yates and Satterfield (Equation 3-1) was used to
describe the FTS reaction rate (r ), which is a function of temperature (T) and the
concentration of carbon monoxide (CCO) and hydrogen (𝐶 ) [33]:
r = k ∙ exp(−E RT⁄ ) ∙ C ∙ C (1 + k ∙ exp(−E RT⁄ ) ∙ C )⁄ 3-1
Therefore, the CO consumption rate (r ) is as shown in Equation 3-2:
r = −r 3-2
Conventionally, in term of the FTS product distribution, methane and ethane formation rates
were specified, whereas the formation rates of the rest hydrocarbon products can be described
by using the chain growth probability (α value). However, due to the α value varies according

57
to the operating conditions, including GHSV and inert flowrate, it is difficult to build a
universal model accordingly. Therefore, in this study, we used three reactions (shown in
Table 3.2) to represent the FTS reaction scheme, with pentane representing the lumped C3+
product. The methane and ethane formation rates were calculated using Arrhenius law
expressions (Equation 3-3 and Equation 3-4) [34]. The formation rate of the lumped C3+
product was constrained by the carbon balance and calculated according to Equation 3-5.
Table 3.2: FTS reaction scheme
Reaction
Reaction1 CO + 3𝐻 ↔ 𝐶𝐻 + 𝐻 𝑂
Reaction2 2CO + 5𝐻 ↔ 𝐶 𝐻 + 2𝐻 𝑂
Reaction3 5CO + 11𝐻 ↔ 𝐶 𝐻 + 5𝐻 𝑂
r = k ∙ exp(−E RT⁄ ) ∙ r 3-3
r = k ∙ exp(−E RT⁄ ) ∙ r 3-4
r = [1 − k ∙ exp(−E RT⁄ ) − 2 × k ∙ exp(−E RT⁄ )] ∙ r /5 3-5
There are eight (constant) parameters in the kinetic model, as listed in Table A5 in Appendix
A-9.
3.4 Results and Discussion
3.4.1 Experimental results
Two sets of experiments were conducted to investigate the influence of firstly nitrogen
flowrate and secondly GHSV (or reacting gas velocity) on the FTS reaction and the
temperature distribution in the catalyst bed. The main results are summarised in Tables 3.3
and 3.4 (XCO and S donate the CO conversion and selectivity, respectively). CO2 was not
detected in any of the experiments, which confirms that the water-gas shift reaction rate is
negligible. The selectivity and reaction (production) rate of the products containing three or

58
more carbon atoms were lumped together, and designated as SC3+% and Pro, respectively,
because the longer chain products respond in similar ways to changes in operating conditions.
Table 3.3: Effect of the N2 flowrate on conversion and selectivity N2 flowrate /l·min-1 XCO/% SCH4/% SC2/% SC3+/% Pro/g·h-1
Exp1 0 48.3 7.04 0.68 92.28 8.62
Exp2 1.5 36.5 6.38 0.63 92.99 6.56
Exp3 4.5 28.7 5.83 0.61 93.56 5.19
Note: Experimental conditions used were: 2MPa, 458K, 300ml Co-SiO2 catalyst, CO:H2=1:2,
GHSV=300 h-1, which corresponds to a CO flowrate of 0.5 l·min-1. The conditions for Expi are
defined in Table 3.1.The volumetric flowrate was under standard conditions.
Table 3.4: Effect of GHSV on conversion and selectivity GHSV/h-1 XCO/% SCH4/% SC2/% SC3+/% Pro/g·h-1
Exp2 300 36.5 6.38 0.63 92.99 6.56
Exp4 150 55.3 5.92 0.62 93.46 4.99
Exp5 75 70.9 5.83 0.59 93.58 3.34
Note: Experimental conditions used were: 2MPa, 458K, 300ml Co-SiO2 catalyst, CO: H2:
N2=1:2:3. The conditions for Expi are defined in Table 3.1. The volumetric flowrate was
under standard conditions.
The axial temperature profiles for thermocouples T1 to T4 were also recorded. Since the
thermocouples T1 to T4 were located at different radii in the reactor tube, the temperature
plot of both the axial and radial temperature distributions in the reactor could be obtained.
The radial temperature distributions at an axial dimensionless position of 0.4 from the inlet
and the axial temperature distributions are shown in Figures 3.3-3.7. Note that the x-axis was
normalized according to the actual axial position and total reactor length, and the block
denoted by dashed-lines indicates the position of the catalyst bed. The partial pressure of each
species in the feed, the arithmetically average measured bed temperature (TAVE) and the
syngas residence time (RT) for each experiment are listed in Table 3.5. Although the TAVE
may not describe the average catalyst bed temperature accurately, the trend in TAVE under

59
different operating conditions is still informative.
Figure 3.3: Axial and radial temperature distribution in the reactor in Exp1. The dashed lines indicate the
position of the catalyst bed and the dotted line indicates the position of the radial temperature distribution.
(GHSV = 300 h-1 and N2 Flowrate = 0 l/min at standard conditions; the position of the thermocouples T1 to T4
are as shown in Figure 3.2.)
Figure 3.4: Axial and radial temperature distribution in the reactor in Exp2. The dashed lines indicate the
position of the catalyst bed and the dotted line indicates the position of the radial temperature distribution.
60
(GHSV = 300 h-1 and N2 Flowrate = 1.50 l/min at standard conditions; the position of the thermocouples T1 to
T4 are as shown in Figure 3.2.)
Figure 3.5: Axial and radial temperature distribution in the reactor in Exp3. The dashed lines indicate the
position of the catalyst bed and the dotted line indicates the position of the radial temperature distribution.
(GHSV = 300 h-1 and N2 Flowrate = 4.50 l/min at standard conditions; the position of the thermocouples T1 to
T4 are as shown in Figure 3.2.)

61
Figure 3.6: Axial and radial temperature distribution along the reactor in Exp4. The dashed lines indicate the
position of the catalyst bed and the dotted line indicates the position of the radial temperature distribution.
(GHSV = 150 h-1 and N2 Flowrate = 0.75 l/min at standard conditions; the position of the thermocouples T1 to
T4 are as shown in Figure 3.2.)
Figure 3.7: Axial and radial temperature distribution in the reactor in Exp5. The dashed lines indicate the position
of the catalyst bed and the dotted line indicates the position of the radial temperature distribution. (GHSV = 75
h-1 and N2 Flowrate = 0.38 l/min at standard conditions; the position of the thermocouples T1 to T4 are as shown
in Figure 3.2.)
Table 3.5: Feed partial pressures, average catalyst bed temperature and syngas residence time
Exp1 Exp2 Exp3 Exp4 Exp5
PCO/MPa 0.7 0.3 0.2 0.3 0.3
PH2/MPa 1.3 0.7 0.3 0.7 0.7
PN2/MPa 0 1.0 1.5 1.0 1.0
TAVE/K 463.3 461.4 460.3 461.8 460.6
RT/min 0.8 0.8 0.8 1.5 3.0
Note: The conditions for Expi are defined in Table 3.1
The experimental data presented in Table 3.3 indicates that the CO conversion decreases with
the increase in N2 flowrate. Since Jess et al. concluded that nitrogen has no effect on the
intrinsic kinetics of FTS, except for diluting the feeding syngas, we believe that the decrease

62
in the partial pressure of CO and H2 (shown in Table 3.5) is the main reason for the observed
lower reaction rate, which results in a lower CO conversion [11]. A lower reaction rates
results in less heat being released, therefore, TAVE also decreases, which in turn leads to the
reaction rate dropping. Moreover, it is reported that the selectivity of methane and C2
increases with temperature, and thus the observed decrease in methane and C2 selectivity seen
in Table 3.3 could be caused by the decrease in TAVE [35]. Although the SC3+ increases slightly,
the Pro decreases from 8.62 to 5.19 g/h with an increase in the N2 flowrate.
The measured temperature profiles for a changing N2 flowrate are plotted in Figures 3.3 to
3.5. The maximum temperature dropped from 472K with no N2 flow to 465K for the highest
N2 flowrate, which is similar to the trend in TAVE: the position of the maximum temperature
moved axially in the direction of the gas flow, from a dimensionless reactor length of 0.40 in
Figure 3.3 (no N2 flow) to 0.47 in Figure 3.5 (highest N2 flowrate). It is believed that the
increased inert gas flowrate was conductive to decrease the generated reaction heat and
intensify the axial convection heat removal and radial heat transfer, consequently resulting in
the movement of maximum temperature in the direction of flow [36,37].
According to the data in Table 3.4, there is a significant rise in XCO with the decrease in
GHSV, while SC3+ increases slightly. As the partial pressure of the reactants in the feed to the
reactor is kept constant in these experiments, and TAVE only changes slightly (as shown in
Table 3.5), the increase in conversion can be attributed to the increase in RT (corresponding
to a lower GHSV), which leads to a higher extent of reaction. However, the productivity of
C3+ products decreases from 6.56 to 3.34 g/h, when the feed flowrate of CO drops from 0.5 to
0.13 L/min.
In all five temperature profiles, the position of the maximum temperature is usually located in

63
the catalyst bed region closest to the inlet, which could be explained by the comparably
higher reaction rate due to the higher reactant concentration [14]. Strangely, the peak
temperature in the T1 curve does not always correspond to the maximum temperature in the
bed; however, the outer diameter of the thermocouple sheath for T1 is 0.006m as opposed to
0.0025m for the other thermocouple sheaths. Therefore, axial heat conduction along the
central thermocouple sheath should be higher than along the other thermocouple sheaths,
which leads to a greater error in the measurement of T1, especially when the axial
temperature gradients are high.
This result emphasizes an easily neglected conclusion, namely that the thermocouple sheath
is itself a heat conductor, which results in unavoidable measurement error and the
measurement accuracy is worse with an increase in the diameter and thickness of the
thermocouple sheath. Furthermore, as the multi-point thermocouple T1 could not slide inside
the sheath for operational reasons, resulting in temperatures being measured at only four
points along the central axis, the T1 thermocouple provides limited information compared to
the other thermocouples. Consequently, validation of the model is limited to fitting the T2-T4
temperature profiles only.
3.4.2 Model validation
The CFD FBR model was validated in two respects, namely reaction performance and
temperature profile, as per the experimental data presented above. Table 3.6 provides a
comparison of the measured and predicted CO conversion, CH4 selectivity, C2 selectivity and
C3+ selectivity for the five sets of experiments. As shown in Table 3.6, the absolute relative

64
error in CO conversion is less than 9%, while that of product selectivity is smaller than 4%.
Therefore, the simulation results show good agreement with the experimental data, and the
FTS reaction kinetic model utilized in this research is considered reliable under the operating
conditions employed.
Table 3.6: Comparison of the experimental results and simulation data Exp1 Exp2 Exp3 Exp4 Exp5
XCO/% ext 48.3 36.5 28.7 55.3 70.9
sim 52.4 38.5 29.3 54.5 68.5
Relative error/% -8.5 -5.5 -2.2 1.5 3.3
SCH4/% ext 7.04 6.38 5.83 5.92 5.83
sim 6.93 6.30 5.86 5.94 5.60
Relative error/% 1.56 1.25 -0.51 -0.34 3.95
SC2/% ext 0.68 0.63 0.61 0.62 0.59
sim 0.68 0.64 0.62 0.62 0.60
Relative error/% 0 -1.59 -1.64 0 -1.69
SC3+/% ext 92.28 92.99 93.56 93.46 93.58
sim 91.72 93.48 93.49 93.75 93.71
Relative error/% 0.61 -0.53 0.07 -0.31 -0.14
ext and sim refer to the experimental results and simulation data respectively.
Figures 3.8 and 3.9 show the predicted and measured axial temperature profiles in the reactor.
The deviation between the measured and predicted temperature decreases towards the tube
wall, i.e. from T2 to T4. This error was larger at higher reaction rates. This suggests that the
conduction along the metal walls of the thermocouple sheaths leads to the measured
temperature being less than what it would have been without conduction occurring axially. To
facilitate the discussion of the results, Table 3.7 summarises the temperature information for
position T2, namely, the position of the highest temperature (Ppeak), the value of the highest
temperature (Tmax), the maximum deviation (∆𝑇 ) and the mean absolute error (MAE)
between the measured and predicted temperature profiles. Equation 3-6 was used to calculate

65
MAE, where 𝑛 denotes the number of measurement points.
MAE = ∑|𝑇 − 𝑇 | 𝑛⁄ 3-6
(a)
Exp1 (0 l/min) Exp2 (1.5 l/min) Exp3 (4.5 l/min)
Temperature/K
Dimensionless reactor length
(b)
Figure 3.8: Temperature contours and (a) comparison of measured and predicted axial temperatures (b) with
decreasing nitrogen flowrate. (Details of operating conditions for Exp1 to Exp3 are given in Table 3.1.)

66
(a)
Exp2 (300 h-1) Exp4 (150 h-1) Exp5 (75 h-1)
Temperature/K
Dimensionless reactor length
(b)
Figure 3.9: Temperature contours and (a) and comparison of the measured and predicted axial temperatures (b)
with increasing GHSV. (Details of operating conditions for Exp2, Exp4 and Exp5 are given in Table 3.1.)
Table 3.7: Simulated position of the maximum temperature Ppeak and the value of the maximum temperature
Tmax in the T2 position; Tmax is the maximum difference and MAE (mean absolute error) between the measured
and simulated temperature profiles Exp1 Exp2 Exp3 Exp4 Exp5
Ppeak 0.408 0.412 0.431 0.399 0.392
Tmax/K 474.1 468.9 465.2 467.1 464.9
∆𝑇 /K 5.5 4.6 3.1 3.2 2.6
MAE 3.2 2.8 1.3 0.7 0.9
3.4.3 Simulation results

67
The predicted temperature fits the measured data and the calculated ∆𝑇 and MAE are no
larger than 5.5K and 3.2K, respectively, for all experiments. The calculated ∆𝑇 and
MAE are acceptable, because: firstly the intrinsic experimental error caused by heat
conduction in the thermocouple sheath is unavoidable and the magnitude of this effect is not
known; secondly, although the heat transfer between the gas on the reactor side and the
cooling oil is quite complicated to predict in practice, this simple model describes the
phenomena adequately. Therefore, we have confidence that the CFD model is validated and
can be regarded as reliable and accurate.
The CO conversion and the maximum temperature in the T2 position have been plotted in
Figure 3.10. It can be clearly observed according to Figure 3.10 that both the CO conversion
and maximum temperature decreased with the increasing inert gas flowrate; while when
increasing GHSV, the peak temperature was dropped but the CO conversion showed an
upward trend.
Figure 3.10: The plot of CO conversion verse maximum temperature in the T2 position
Modelling has become an efficient and important method for reactor design, analysis and
optimisation. In this section, a series of radially average properties, including temperature,

68
gas density, mass flowrate and mass fraction of each species, was calculated at equidistant
cross-sections in the axial direction in the catalyst bed and plotted. The radially average
results were calculated as an area-weighted average (shown in Equation 3-7) and exported
using ANSYS Fluent.
Radially average result = 1 𝐴⁄ ∙ ∫ 𝜑 ∙ 𝑑𝐴 = 1 𝐴⁄ ∙ ∑ 𝜑 ∙ |𝐴 | 3-7
Where: φ and 𝐴 denote the variable (density, flowrate, concentration, etc.) and the total
area of the cross-section (m2) respectively; 𝜑 and Ai denote the variable and facet area of
the individual mesh cell (m2). These results can provide insight into the phenomena in the
catalyst bed, which helps to understand what the limiting factors are in the FT reactor with a
view to improving the operation and design.
The STY, which is defined in this work as the mass of C3+ product formed per unit volume
catalyst per minute, is an important criterion that indicates reactor efficiency [38–40]. The
integral results were calculated based on the difference between the conditions at the inlet and
the axial position (shown in Equation 3-8 and Equation 3-9). The differential results were
calculated as the difference between two adjacent axial positions (shown in Equation 3-10
and Equation 3-11).
Integral 𝑋 = 𝑛 − 𝑛 𝑛⁄ × 100% 3-8
𝐼𝑛𝑡𝑒𝑔𝑟𝑎𝑙 STY = 𝑀𝐹 ∑ 𝑉⁄ 3-9
𝐷𝑖𝑓𝑓𝑒𝑟𝑒𝑛𝑡𝑖𝑎𝑙 𝑋 = 𝑛 − 𝑛 𝑛⁄ × 100% 3-10
𝐷𝑖𝑓𝑓𝑒𝑟𝑒𝑛𝑡𝑖𝑎𝑙 STY = 𝑀𝐹 − 𝑀𝐹 𝑉⁄ 3-11
Where: 𝑛 and 𝑛 donate the CO molar flowrate at the reactor inlet and at the ith

69
cross-section in the axial direction respectively; mol·s-1; 𝑀𝐹 donates the mass flowrate
of the C3+ product at the ith cross-section in the axial direction; mg·min-1; 𝑉 is the
catalyst volume between the ith and (i-1)th cross-section, ml. Figures 3.11 and 3.12 show the
axial variation in the radially average CO conversion and the radially average space-time
yield (STY) of C3+ products, respectively.
(a) (b)
Integral Results
(c) (d) Differential Results
Figure 3.11: Integral results (a) and (b) and differential results (c) and (d) for the radially average CO conversion
in catalyst bed based on the inlet. The N2 flowrate changes in experiments 1-3, while GHSV changes in
experiments 2, 4 and 5.
According to Figure 3.11, the integral CO conversion shows an increase in the axial direction
for all examples (that is for both increases in nitrogen flowrate and GHSV), which is
expected because of the continuous consumption of CO. The differential result for the local
CO conversion at a given axial position in the catalyst bed is proportional to the local volume
average reaction rate, and shows the opposite trend. When the GHSV is constant (Figure

70
3.11(c)), the decrease in the differential CO conversion in the axial direction is due to both
the decrease in the temperature axially as well as the decrease in reactant concentration due to
N2 dilution. However, when the GHSV is varied (Figure 3.11(d)), the local CO conversion is
also affected by the increase in the supply of reagents, which leads to a higher reaction rate.
The local CO conversion (or reaction rate) is mainly dependent on the partial pressure of the
reactants, which decreases axially. Although it is desirable to achieve a high conversion of
CO in a single pass, these results show how the reaction rate in the latter part of the tube is
lower than that in the beginning of the tube, and as such productivity is sacrificed in the latter
half of the catalyst bed. On the other hand, high local CO conversion rates result in high heat
production rates and this heat needs to be removed efficiently.
In summary, the plots of differential CO conversion, suggest that efforts should be made to
enhance the reaction rate in the latter part of the catalyst bed so that a higher total CO
conversion can be obtained. Meanwhile the reaction rate at the tube entrance should be
controlled carefully to ensure that the local reaction heat release rate is acceptable.
In general, the plot of the integral STY can be interpreted as how the overall product reaction
rate varies with catalyst bed length, while a plot of differential STY shows the axial change in
local catalyst bed efficiency. As shown in Figure 3.12(a) and (b), the integral STY, decreases
monotonically along the reactor bed, when either increasing N2 flowrate or decreasing GHSV;
this results is supported by Deckwer’s research and is caused by both the decreasing
temperature profile and reactant concentration [41–43].

71
(a) (b)
Integral Results
(c) (d) Differential Results
Figure 3.12: Integral results (a) and (b) and differential results (c) and (d) of STY in the catalyst bed based on
the inlet. The flowrate of N2 changes in experiments 1-3, while GHSV changes in experiments 2, 4 and 5.
Since the differential STY was calculated based on equal volumes of catalyst, it is
proportional to the local C3+ product formation rate. From this perspective, the differential
STY in Exp1 dropped faster in the first part of the catalyst bed due to the higher temperature
gradient in this experiment, as shown in Figure 3.12(c). The decrease in STY when changing
the GHSV (Figure 3.12(d)) is more constant due to the smaller temperature gradient and the
drop in the concentration of the reactants. Therefore, even though a longer catalyst bed can
result in a higher single-pass conversion, the loss of reactor efficiency should also be taken
into account when designing a reactor.
These integral and differential simulation results provide a guidance study for obtaining
higher reactor efficiency and productivity in new FBR designs and modifications to existing

72
reactors. For example, the enhancement of reaction rate in the latter part of the catalyst bed
benefits not only the CO conversion but also the overall STY. In this regard, to apply an
axially increasing catalytic activity gradient in catalyst bed is considered one of the feasible
approaches to enhance the efficiency of FBR. The required catalytic activity gradient can be
realized by dividing the catalyst bed into several layers with different catalysts or different
catalyst dilution ratios [44]. Dilution of the catalyst with inert solid particles is normally used
in large scale applications, in order to avoid reaction heat overloading per unit volume of
catalyst bed. Besides, to operate the latter part of the catalyst bed at a higher temperature is
another approach that can be used. The use of a sectional heating system, instead of a
conventional uniform heating system, may significantly increase the reaction rate in latter
part of the catalyst bed and increase the CO conversion and the overall reactor efficiency.
3.5 Conclusions
In this study, a bench-scale fixed bed reactor which has a diameter close to those used in
industry, was used for FTS. A novel temperature measurement system was used to measure
four axial temperature profiles at different radial positions inside the bench-scale reactor
under different GHSV’s and nitrogen flowrates. The exit CO conversion and product
selectivity were also measured. The results show that the CO conversion decreased with
increasing nitrogen flowrate or increasing GHSV. The position of the maximum temperature
moved axially in the direction of gas flow with increasing total reactant flow. The maximum
temperature decreased when increasing the N2 flowrate and the hot spot became longer in
axial direction and narrower in radial direction. The size and position of the hot spot was

73
insensitive when decreasing the GHSV from 300h-1 to 150h-1, but it shrank significantly
when the GHSV was reduced to 75h-1. A full-scale CFD reactor model with semi-empirical
FTS kinetics was implemented by ANSYS Fluent. The heat transfer coefficient on reactor
wall was calculated according to local fluid properties in order to predict the temperature
distributions precisely. Good agreement between predicted and experimental CO conversions
and product selectivity was obtained with absolute relative errors less than 9% and 4%
respectively. Furthermore, the model was also validated by comparing the simulated and
measured temperature distributions with the MAE no larger than 3.2 K and the maximum
temperature deviation was less than 5.5K over all five experiments.
By analysing the integral and differential CO conversion, design modifications to enhance the
local CO conversion in the later parts of the catalyst bed were recommended for future
reactor design and catalyst development research, in order to achieve a higher total CO
conversion while maintaining an acceptable reaction heat released rate. The decrease of the
integral STY of C3+ products in the axial direction demonstrates that the efficiency of the
catalyst bed is reduced with the increasing catalyst bed length, which should be addressed
when designing or modifying future (innovative) FBR’s.

74
References
[1] M.E. Dry, Fischer – Tropsch reactions and the environment, Appl. Catal. 189 (1999)
185–190. doi:10.1016/S0926-860X(99)00275-6.
[2] J. Cheng, P. Hu, P. Ellis, S. French, G. Kelly, C.M. Lok, Some understanding of
fischer-tropsch synthesis from density functional theory calculations, in: Top. Catal.,
2010: pp. 326–337. doi:10.1007/s11244-010-9450-7.
[3] M.E. Dry, High quality diesel via the Fischer-Tropsch process - a review, J. Chem.
Technol. Biotechnol. 77 (2002) 43–50. doi:10.1002/jctb.527.
[4] X. Zhu, X. Lu, X. Liu, D. Hildebrandt, D. Glasser, Study of radial heat transfer in a
tubular Fischer-Tropsch synthesis reactor, in: Ind. Eng. Chem. Res., 2010: pp. 10682–
10688. doi:10.1021/ie1004527.
[5] B.H. Davis, Fischer-Tropsch synthesis: overview of reactor development and future
potentialities, Top. Catal. 32 (2005) 143–168. doi:10.1007/s11244-005-2886-5.
[6] S.K. Mazidi, M.T. Sadeghi, M.A. Marvast, Optimization of Fischer-Tropsch process in
a fixed-bed reactor using non-uniform catalysts, Chem. Eng. Technol. 36 (2013) 62–72.
doi:10.1002/ceat.201200268.
[7] M.E. Dry, Practical and theoretical aspects of the Fischer-Tropsch process, J. Appl.
Catal. A Gen. 138 (1996) 319–344. doi:10.1016/0926-860X(95)00306-1.
[8] E.S. Lox, G.F. Froment, Kinetics of the Fischer-Tropsch reaction on a precipitated
promoted iron catalyst. 1. Experimental procedure and results, Ind. Eng. Chem. Res. 32
(1993) 61–70. doi:10.1021/ie00013a010.

75
[9] H. Schulz, Short history and present trends of Fischer–Tropsch synthesis, Appl. Catal. A
Gen. 186 (1999) 3–12. doi:10.1016/S0926-860X(99)00160-X.
[10] R.L. Espinoza, A.P. Steynberg, B. Jager, A.C. Vosloo, Low temperature Fischer –
Tropsch synthesis from a Sasol perspective, Appl. Catal. A Gen. 186 (1999) 13–26.
doi:10.1016/S0926-860X(99)00161-1.
[11] A. Jess, R. Popp, K. Hedden, Fischer–Tropsch-synthesis with nitrogen-rich syngas:
fundamentals and reactor design aspects, Appl. Catal. A Gen. 186 (1999) 321–342.
doi:10.1016/S0926-860X(99)00152-0.
[12] Y. Dong, B. Sosna, O. Korup, F. Rosowski, R. Horn, Investigation of radial heat transfer
in a fixed-bed reactor: CFD simulations and profile measurements, Chem. Eng. J. 317
(2017) 204–214. doi:10.1016/j.cej.2017.02.063.
[13] X. Zhu, X. Lu, X. Liu, D. Hildebrandt, D. Glasser, Heat transfer study with and without
Fischer-Tropsch reaction in a fixed bed reactor with TiO2, SiO2, and SiC supported
cobalt catalysts, Chem. Eng. J. 247 (2014) 75–84. doi:10.1016/j.cej.2014.02.089.
[14] S.T. Sie, R. Krishna, Fundamentals and selection of advanced Fischer–Tropsch reactors,
Appl. Catal. A Gen. 186 (1999) 55–70. doi:10.1016/S0926-860X(99)00164-7.
[15] K.S. Kshetrimayum, I. Jung, J. Na, S. Park, Y. Lee, S. Park, C.-J. Lee, C. Han, CFD
simulation of microchannel reactor block for Fischer–Tropsch Synthesis: Effect of
coolant type and wall boiling condition on reactor temperature, Ind. Eng. Chem. Res. 55
(2016) 543–554. doi:10.1021/acs.iecr.5b03283.
[16] J.M. van Baten, R. Krishna, Eulerian simulation strategy for scaling up a bubble column

76
slurry reactor for Fischer−Tropsch Synthesis, Ind. Eng. Chem. Res. 43 (2004) 4483–
4493. doi:10.1021/ie0340286.
[17] M.R. Rampure, A.A. Kulkarni, V. V Ranade, Hydrodynamics of bubble column
reactors at high gas velocity: experiments and computational fluid dynamics (CFD)
simulations, Ind. Eng. Chem. Res. 46 (2007) 8431–8447. doi:10.1021/ie070079h.
[18] S. Zimmermann, F. Taghipour, CFD modeling of the hydrodynamics and reaction
kinetics of FCC fluidized-bed reactors sebastian, Ind. Eng. Chem. Res. 44 (2005) 9818–
9827. doi:10.1021/ie050490+.
[19] Y.Q. Zhuang, X. Gao, Y. ping Zhu, Z. hong Luo, CFD modeling of methanol to olefins
process in a fixed-bed reactor, Powder Technol. 221 (2012) 419–430.
doi:10.1016/j.powtec.2012.01.041.
[20] M.R. Rahimpour, M.H. Khademi, A.M. Bahmanpour, A comparison of conventional
and optimized thermally coupled reactors for Fischer-Tropsch synthesis in GTL
technology, Chem. Eng. Sci. 65 (2010) 6206–6214. doi:10.1016/j.ces.2010.09.002.
[21] M. Irani, Investigating the production of liquid fuels from synthesis gas (CO+H2) in a
bench-scale packed-bed reactor based on Fe–Cu–La/SiO2 catalyst: Experimental and
CFD modeling, Int. J. Ind. Chem. 5 (2014) 1–9. doi:10.1007/s40090-014-0011-y.
[22] J.-S. Park, D.-E. Kim, Y.-J. Lee, G. Kwak, K.-W. Jun, M.-J. Park, CFD Modeling of a
Thermally Efficient Modular Reactor for Fischer–Tropsch Synthesis: Determination of
the Optimal Size for Each Module, Ind. Eng. Chem. Res. 55 (2016) 9416–9425.
doi:10.1021/acs.iecr.6b02359.

77
[23] M. Behnam, A.G. Dixon, M. Nijemeisland, E.H. Stitt, A new approach to fixed bed
radial heat transfer modeling using velocity fields from cmputational fluid dynamics
simulations, Ind. Eng. Chem. Res. 52 (2013) 15244–15261. doi:10.1021/ie4000568.
[24] A.Y. Khodakov, W. Chu, P. Fongarland, Advances in the development of novel cobalt
Fischer−Tropsch catalysts for synthesis of long-chain hydrocarbons and clean fuels,
Chem. Rev. 107 (2007) 1692–1744. doi:10.1021/cr050972v.
[25] E.A. Foumeny, F. Benyahia, Predictive characterization of mean voidage in packed
beds, Heat Recover. Syst. CHP. 11 (1991) 127–130.
doi:10.1016/0890-4332(91)90126-O.
[26] D.E. Mears, Diagnostic criteria for heat transport limitations in fixed bed reactors, J.
Catal. 20 (1971) 127–131. doi:10.1016/0021-9517(71)90073-X.
[27] A.C. Herald, Thermal Conductivity of Gases, Sch. Sci. Math. 60 (1960) 636–638.
doi:10.1111/j.1949-8594.1960.tb08458.x.
[28] H.E. Atwood, C. Bennett, Kinetics of the Fischer-Tropsch Reaction over Iron, 18 (1979)
163–170. doi:0019-7882/79.
[29] R.B. Anderson, R.A. Friedel, H.H. Storch, Fischer‐Tropsch Reaction Mechanism
Involving Stepwise Growth of Carbon Chain, J. Chem. Phys. 19 (1951) 313–319.
doi:10.1063/1.1748201.
[30] M. Irani, Experimental and CFD modeling of a bench-scale GTL packed-bed reactor
based on Fe/Cu catalyst, Pet. Coal. 56 (2014) 62–73.
http://www.vurup.sk/wp-content/uploads/dlm_uploads/2017/07/pc_1_2014_irani_250

78
_0.pdf.
[31] R. Philippe, M. Lacroix, L. Dreibine, C. Pham-Huu, D. Edouard, S. Savin, F. Luck, D.
Schweich, Effect of structure and thermal properties of a Fischer–Tropsch catalyst in a
fixed bed, Catal. Today. 147 (2009) S305–S312. doi:10.1016/j.cattod.2009.07.058.
[32] G. Chabot, R. Guilet, P. Cognet, C. Gourdon, A mathematical modeling of catalytic
milli-fixed bed reactor for Fischer-Tropsch synthesis: Influence of tube diameter on
Fischer Tropsch selectivity and thermal behavior, Chem. Eng. Sci. 127 (2015) 72–83.
doi:10.1016/j.ces.2015.01.015.
[33] I.C. Yates, C.N. Satterfield, Intrinsic kinetics of the Fischer-Tropsch synthesis on a
cobalt catalyst, Energy & Fuels. 5 (1991) 168–173. doi:10.1021/ef00025a029.
[34] M. Sadeqzadeh, J. Hong, P. Fongarland, D. Curulla-Ferré, F. Luck, J. Bousquet, D.
Schweich, A.Y. Khodakov, Mechanistic modeling of cobalt based catalyst sintering in a
fixed bed reactor under different conditions of Fischer-Tropsch synthesis, Ind. Eng.
Chem. Res. 51 (2012) 11955–11964. doi:10.1021/ie3006929.
[35] B. Jager, R. Espinoza, Advances in low temperature Fischer-Tropsch synthesis, Catal.
Today. 23 (1995) 17–28. doi:10.1016/0920-5861(94)00136-P.
[36] A. Jess, R. Popp, K. Hedden, Fischer-Tropsch-synthesis with nitrogen-rich syngas:
Fundamentals and reactor design aspects, Appl. Catal. A Gen. 186 (1999) 321–342.
doi:10.1016/S0926-860X(99)00152-0.
[37] B. Todic, M. Mandic, N. Nikacevic, D.B. Bukur, Effects of process and design
parameters on heat management in fixed bed Fischer-Tropsch synthesis reactor, Korean

79
J. Chem. Eng. 35 (2018) 1–15. doi:10.1007/s11814-017-0335-3.
[38] G.J. Janz, S.C. Wait, Space‐time yield and reaction rate, J. Chem. Phys. 23 (1955) 1550–
1551. doi:10.1063/1.1742359.
[39] D. Tristantini, S. Lögdberg, B. Gevert, Ø. Borg, A. Holmen, The effect of synthesis gas
composition on the Fischer–Tropsch synthesis over Co/γ-Al2O3 and Co–Re/γ-Al2O3
catalysts, Fuel Process. Technol. 88 (2007) 643–649. doi:10.1016/j.fuproc.2007.01.012.
[40] S. Kodama, K. Fukui, A. Mazume, Relation of space velocity and space time yield, Ind.
Eng. Chem. 45 (1953) 1644–1648. doi:10.1021/ie50524a022.
[41] W.D. Deckwer, Y. Serpemen, M. Ralek, B. Schmidt, Modeling the Fischer-Tropsch
synthesis in the slurry phase, Ind. Eng. Chem. Process Des. Dev. 21 (1982) 231–241.
doi:10.1021/i200017a006.
[42] T. Inoue, O. Okuma, K. Masuda, M. Yasumuro, K. Miura, Hydrothermal treatment of
brown coal to improve the space time yield of a direct liquefaction reactor, Energy &
Fuels. 26 (2012) 2198–2203. doi:10.1021/ef300095s.
[43] S. Qian, W. Li, J. Tang, Factors f or the eff ect of methanol synthesis catalyst on
methanol space - time yield, (2002). doi:1004-9932( 2002) 01-0001-05.
[44] M. Irani, Investigating the production of liquid fuels from synthesis gas (CO + H2) in a
bench-scale packed-bed reactor based on Fe–Cu–La/SiO2 catalyst: Experimental and
CFD modeling, Int. J. Ind. Chem. 5 (2014) 11. doi:10.1007/s40090-014-0011-y.

80
CHAPTER 4
TUBULAR REACTOR INTERNALS FOR
SUPPRESSING HOT SPOT FORMATION
APPLIED TO THE FISCHER-TROPSCH
REACTION
4.1 Introduction
The tubular fixed bed reactor (TFBR) is considered to be one of the most successful types of
reactors and it is widely used in multi-scale applications in academia and industry. Its merits
include simple installation and operation; high catalyst loading volume; high potential
productivity; and easy scale up [1]. However, its shortcomings (including low heat transfer
capacity, high pressure drop and high capital investment) cannot be ignored when considering
it for applications [2]. In strongly exothermic processes, such as Fischer-Tropsch synthesis
(FTS), its intrinsic poor heat removal ability may result in a hot spot forming in the catalyst
bed. FTS converts syngas into liquid fuels, but releases a large amount of reaction heat
(standard heat of the reaction is -165 kJ/mol CO), and the adiabatic temperature rise is in the
order of 1750 K [3,4]. An undesirable temperature rise may lead to catalyst deactivation, and
has a negative effect on product selectivity and even temperature runaway, which can easily
occur in a TFBR during FTS [5]. However, the TFBR still has a significant role in multi-scale
FTS applications, since its successors – the fluidized bed reactor, the slurry bed reactor, etc. –
all have their own limitations.
Many strategies to improve heat transfer during the FTS reaction in TFBRs have been

81
proposed, with the aim of reducing or eliminating temperature gradients in the catalyst bed.
Structured catalysts have a superior heat removal capacity compared to a conventional pellet
or powdered catalyst bed, and also offer advantages such as a lower pressure drop and better
mass transfer [6,7]. A structured catalyst normally consists of pre-shaped ceramic or metallic
supports with active components that are coated or deposited on the support, for example
honeycomb monolith catalysts and metal foam catalysts [8,9]. Merino and his colleagues
prepared a metallic monolith catalyst by coating a Co-Re/Al2O3 catalyst on foils of different
alloys and testing it under typical low temperature FTS conditions [10]. The results obtained
indicate that, although the temperature inside the aluminum monolith catalyst was difficult to
measure, it could be inferred that isothermal operation had been achieved, since the adverse
effects on methane selectivity caused by temperature rise were not significant under the
various operating conditions used for testing. The use of an open-cell aluminum foam catalyst
loaded with Co-Pt/Al2O3 was employed in a tubular FT reactor by Fratalocchi [11]. The
performance of the reactor was outstanding, even under the most severe operating conditions.
However, disadvantages have been widely reported in the literature, including: a) loading of
catalyst per reactor volume is lower than that in a randomly packed catalyst bed; b) preparing
a structured catalyst is complex and costly; c) dispersion of the active component is difficult
to control; d) pilot scale and even larger scale applications are not well reported, thus there is
a lack of practical operational experience [9,12,13].
Another approach used to intensify heat transfer across the tubular reactor wall is to increase
the heat exchange area by constructing projecting fins [14,15]. Bhouri et al. investigated the

82
effects of the geometric properties of the fins (such as the number of fins, the thickness and
the tip clearance), on the hydrogen charging rate, using a multi-tubular sodium alanate
hydride reactor [16]. In their simulation results, the temperature distribution was significantly
improved with an optimized fin configuration, and an increase of 41% in the hydrogen
loading rate was achieved. However, the total mass increase and the loss of volumetric
efficiency of the multi-tube reactor, due to the presence of fins, should not be ignored. Thus,
although isothermal operation can be achieved by fabricating fins on the reactor wall, some
sacrifices have to be made in terms of reactor performance. For instance, the loading volume
of the catalyst and the potential productivity declined due to the presence of fins in a catalyst
bed. Consequently there was a significant loss in the volumetric efficiency of a multi-tube
reactor when fins were used on the outer wall of the reactor tube in Bhouri’s study.
Reactor internals are mechanical parts that are assembled or placed inside a reactor in order
to achieve certain functions or improve the performance of the reactor. In the present study, in
order to intensify the heat transfer rate in a conventional catalyst bed, the use of reactor
internals on the inside of reactor tube was considered a good compromise between attempting
to improve heat transfer in a fixed bed reactor and avoiding new problems, as detailed in
literature cited above. Porta reported on catalytic reactor internals with a bent and folded
structure, which functioned as a thermal conductor between the catalyst bed and the heat sink,
in order to maintain the isothermal operation in an exothermic reaction system [17].
Hartvigsen proposed reactor internals that consist of a plurality of fins with catalyst particles
packed amongst them [18]. Outstanding performance in controlling temperature in both the

83
radial and axial directions was verified in a 3/2” diameter FTS reactor. Verbist reported that
an “insert”, which is type of reactor internal, can act as a conductor in the FTS reactor tube
and remove the reaction heat directly [19]. Other researchers proposed other kinds of reactor
internals that help control temperature, although they were originally designed for different
purposes, i.e. intensifying mass transfer, improving fluid flow, etc. [20]. Anton et al. reviewed
different fixed bed reactor internals applied in the hydrogenation process for oil fractions, and
concluded that the internal hardware of the reactor (the distributor tray, the quench box, etc.)
can promote the reactant flow distribution, as well as reduce the temperature gradient in the
catalyst bed [21]. Narataruksa et al. [22] employed the KenicsTM static mixer insert
(commercialized reactor internals) in a tubular FTS reactor for the purpose of overcoming
heat and mass transfer limitations. The results of the experiments showed that hot spot
formation in the catalyst bed was suppressed and chain growth probability increased from
0.89 to 0.92 because the temperature in the catalyst bed was better controlled.
Although these studies have shown that reactor internals in TFBRs can improve temperature
control, limited progress has been made with developing and optimizing the design of such
reactor internals. Related reports on studies on reactor internals, especially those that focus on
heat transfer, are rather limited. Thus, there is still a great deal of interest in innovating and
designing reactor internals, which could reduce the temperature gradient in the catalyst bed in
FTS process, especially if it can be used directly and easily in existing TFBR applications.
In this study, ring & tube type internals were investigated to see if this could enhance heat
removal capacity in the upstream section of the catalyst bed, which is where hot spots are

84
normally formed in an FTS tubular reactor. A bench-scale fixed bed reactor model was built
and validated using the experimental data provided in previous studies. The simulation results
for the reactor model with and without the ring & tube type reactor internals were used to
compare the efficiency of the inserts in terms of improving reaction heat removal. Various
specifications of ring & tube type inserts were simulated and the effect of the various
geometries on temperature control and reaction results (including reaction rate, CO
conversion and selectivity) were compared, in order to determine the optimal specifications
for temperature control in catalyst bed.
4.2 Design of ring & tube type internals
Since the concentration of reactants decreases in the direction of flow in a fixed bed reactor,
the reaction rate is relatively high at the entrance to the catalyst bed. In addition, a higher
reaction rate results in an increase in the rate of release of the reaction heat, which in turn
increases the local temperature, and consequently accelerates the reaction rate. Usually a hot
spot first forms in the front part of the catalyst bed, because the rate of reaction heat release
exceeds the heat removal capacity of the reactor [2,23]. Therefore, it is reasonable to suggest
that either enhancing the heat transfer rate or decreasing the intensity of the release of
reaction heat in this “critical” region would effectively suppress the formation of the hot spot
[24]. For example, Taniewski [25] proved that in oxidative coupling of the methane process,
diluting the catalyst bed with quartz chips or α-Al2O3 effectively decreased the amount of
reaction heat released and in this way the isothermal operation was maintained.
This study was also inspired by the observation that the maximum temperature difference in

85
the catalyst bed in FTS increases with an increase in the tube diameter; therefore, methods
used to adjust the effective inner diameter of the reactor tubes were considered to be a
potential approach for controlling the maximum temperature in a TFBR [26–28]. Ring &
tube type internals were designed to be placed in the inlet section of the catalyst bed, so as to
partially change the effective inner diameter of the bed along the axial direction [2,29,30].
Figure 4.1(a) is a drawing of the assembled ring & tube type internals, while Figure 4.1(b) is
an axial section view. As can be seen in Figure 4.1, the proposed reactor internals
compromise a ring & tube type structure, with the outer diameter designed to fit perfectly
inside the reactor tube, while the inner diameter varies in the axial direction. The neck
position, where the inner diameter is the smallest, is at the top boundary of the catalyst bed,
and divides the internals into two parts, namely: the outer part, which works as a draft tube
for the gaseous reactants; and the inner part, which is the functional part. The configurations
of the “draft tube” part, although not discussed in detail in this study, need further study in
terms of practical implementation, since it affects the flow dynamics and pressure drop. In the
functional part, the inner diameter increases linearly in the axial direction, which indicating
that the effective reactor tube diameter is adjusted. Since the desired characteristics of the
ring & tube type internals should include good thermal stability, high thermal conductivity,
and being cheap and easy to manufacture. The available material for manufacturing the
prototype could be aluminum, steel or copper (which was used in the simulation).
Figure 4.1(a) shows that it is easy to assemble the ring & tube type internals. The process is:
firstly remove the layer of ceramic ball on the upper side of the catalyst bed (if applicable);

86
then remove a volume of catalyst particles equal to the volume of the cavity of the internals;
put the internals inside the tube; lastly, fill the internal cavity with catalyst particles and
re-load the ceramic balls (if used) above the insert. Obviously, if it is required to keep the
total volume of the catalyst in the reactor tube constant, the total length of the catalyst bed
will be longer after the internals are installed. However, given that both ends of the catalyst
bed are normally packed with inert solid particles, there is typically some flexibility to pack
the reactor tube fully, and the required increase in catalyst bed height should be containable.
Thus, no additional modification to the original reactor or additional operational procedure is
needed to install the internals.
Figure 4.1: Drawing of the assembled internals (a) and a sectional view (b) of ring & tube type internals
As shown in Figure 4.1(b), the effective inner diameter of the reactor tube is directly
influenced by the neck diameter (Dneck), while its rate of increase is dependent on the length
of the cavity of the conical frustum (h). In order to compare reaction performance with and

87
without the internals, the total amount of catalyst loaded should be maintained, i.e. the
volume of the cavity of the conical frustum should be equal to the volume of the replaced
cylindrical shaped catalyst bed.
The equations for the volume of the cavity of the conical frustum (Equation 4-1) and the
volume of cylinder (Equations 4-2) are as follows:
𝑉 = 𝜋ℎ 𝐷 + 𝑅 + 𝐷 𝑅 4-1
𝑉 = 𝜋𝑅 𝐻 4-2
Where Vcon and Vcyl represent the volume of the cavity of the conical frustum and the
cylinder, respectively - mm3; H is the length of the replaced cylindrically shaped catalyst bed
- mm; and 𝑅 is the inner diameter of the reactor tube, mm.
Table 4.1: Summary of specifications for the different simulations
NO. C1 C2 C3 C4 C5 C6
v/% - 20 20 20 15 25
𝐷 /mm - 13 25 38 25 25
h/mm - 264 201 150 150 251
Note: v represents the conical frustum cavity volume proportion of the total
catalyst bed.
The length of the cavity of the conical frustum cavity height (h) is greater than H, because the
total amount of catalyst is kept constant, namely Vcon=Vcyl. It is more convenient to use the
volumetric proportion of the replaced cylindrically shaped catalyst bed v as the configuration
variable of the reactor internals. Since both the h or H are proportional to Vcyl, the
configuration of either the conical frustum cavity or the replaced cylindrically shaped catalyst
bed can be determined in terms of the same variable. The proportion v was varied from 15%
to 25% in this study. The values of the variables used for the different simulations (C1 to C6)
are summarized in Table 4.1. In the table, C1 indicates the blank case, in which no ring &

88
tube type internals were used.
4.3 Reactor model and validation
4.3.1 Reactor model
The fixed bed reactor model considered in this paper was based on the author’s previous
research, involving a 2D axisymmetric model developed using ANSYS Fluent 18.1. The
reactor model was built based on a practical bench scale TFBR, which was 50 mm in
diameter and 1000 mm in height.
(a) no internals installed (b) with internals installed
Figure 4.2: Geometry of the fixed bed reactor models with (a) and without (b) internals
Its geometry is shown in Figure 4.2(a), and it can be seen that it consists of two parts: a
catalyst bed on the tube side; and an annular oil bath on the shell side. When simulating the
reactor with the ring & tube type internals installed, only the geometry of the model was
changed. Figure 4.2(b) shows a schematic of the reactor model with the internals installed.
The individual geometry is different for C2 to C6, since the specifications for the internals is
different in each case, but the configuration of the reactor was kept constant. Assuming the

89
mean bed void is constant, three solid porous zones were considered, namely a layer of
ceramic balls, the catalyst bed, and another layer of ceramic balls [31]. When applying
different ring & tube type internals, the length of the first layer of ceramic balls was kept as
constant by using the empty space of near the inlet. The physical properties of the layers of
ceramic balls and the catalyst bed are listed in Table 4.2.
Table 4.2: Physical properties of the layers of ceramic ball and the catalyst bed
Ceramic ball Catalyst
Diameter/mm 3.6±0.3 1.8±0.2
Thermal conductivity/(W·m-1·K-1) 1.2 1.4
Pecking density/(g·ml-1) 1.35 0.69
Bed void/% 46 49.4
According to the Reynolds number, the flow in the bed was in laminar; hence a laminar flow
model was applied in the model. The boundary between the reaction region and the oil bath
region was set as a coupled wall, so that the corresponding heat transfer coefficients at
different axial positions could be calculated based on the local fluid properties. When the
reactor internals were included, the same method was used to predict the position-dependent
heat transfer coefficients on the boundary between the reaction region and the metal reactor
internals. As mentioned in the previous section, copper was chosen as the material for the
reactor internals, thus the heat conductivity of copper was used in the simulation.
Furthermore, the reactor internals were assumed to fit perfectly along the reactor wall, or in
other words, it was assumed that there was no gap between the reactor internals and the wall.
The other walls adjacent to the atmosphere were set as adiabatic walls, since the experimental
apparatus was covered by a layer of insulating material. The simulation software calculated
the built-in governing equations, including the Navier-Stokes equation, energy balance,

90
species balance, etc., in each individual cell of the model [32,33]. The SIMPLE algorithm
was chosen for the Pressure-Velocity Couple scheme. The simulation results were regarded as
convergent only when the calculated residuals were smaller than the absolute criterion of
10-6.
Table 4.3: FTS reaction scheme
Reaction
R1 CO + 3𝐻 ↔ 𝐶𝐻 + 𝐻 𝑂
R2 2CO + 5𝐻 ↔ 𝐶 𝐻 + 2𝐻 𝑂
R3 5CO + 11𝐻 ↔ 𝐶 𝐻 + 5𝐻 𝑂
Pertaining to a Co-supported catalyst FTS system, side reactions (for example the water-gas
shift reaction), can be neglected. The FTS products were assumed to be only alkanes, and
methane and ethane were used to represent the C1 and C2 products, respectively. Normally,
due to the complexity of the FTS product spectrum, the formation rate of the C3+ products
(hydrocarbons with a carbon number bigger than 3) are specified by the C2 formation rate and
the average chain growth probability (α value). In this simulation, the detailed product
distribution was not that important, as the formation rate for the lumped C3+ products follows
the same trend as the heavy hydrocarbon selectivity with different reactor internals. Pentane
was used to represent the C3+ products for the purpose of simplifying the reaction kinetics.
All the reactants and products were considered to be in the gas phase. The semi-empirical
kinetics employed in this investigation were the same as that used in the previous study
[34,35]. The reaction scheme is summarized in Table 4.3, and the equations for the CO
consumption rate (Equation 4-4) and product formation rate are listed in Equations 4-5 to 4-7.
𝑟 = 𝑘 ∙ 𝑒𝑥𝑝(−𝐸 𝑅𝑇⁄ ) ∙ 𝐶 ∙ 𝐶 (1 + 𝑘 ∙ 𝑒𝑥𝑝(−ΔH 𝑅𝑇⁄ ) ∙ 𝐶 )⁄ 4-3
𝑟 = −𝑟 4-4

91
𝑟 = 𝑘 ∙ 𝑒𝑥𝑝(−𝐸 𝑅𝑇⁄ ) ∙ 𝑟 4-5
𝑟 = 𝑘 ∙ 𝑒𝑥𝑝(−𝐸 𝑅𝑇⁄ ) ∙ 𝑟 4-6
𝑟 = [1 − 𝑘 ∙ 𝑒𝑥𝑝(−𝐸 𝑅𝑇⁄ ) − 2 × 𝑘 ∙ 𝑒𝑥𝑝(−𝐸 𝑅𝑇⁄ )] ∙ 𝑟 /5 4-7
Where 𝑟 is the FTS reaction rate, 𝑘𝑚𝑜𝑙 (𝑚 ∙ 𝑠)⁄ ; 𝑟 is the CO consumption rate,
𝑘𝑚𝑜𝑙 (𝑚 ∙ 𝑠)⁄ ; 𝑟 , 𝑟 and 𝑟 are the formation rates of methane, ethane and pentane,
respectively; 𝐶 and 𝐶 are the concentrations of CO and hydrogen. The mass balance of
the model was checked, and the values of the eight constant coefficients used in the model
are listed in Table 4.4. The four pre-exponential factors (k1-k4) were adjusted according to the
FTS experimental results, while the activation energy (E1-E3) and adsorption heat (ΔH) were
taken from the literature, respectively [36–38].
Table 4.4: Kinetics parameters used in this study
parameters k1 k2 k3 k4 E1(kJ/mol) ΔH (kJ/mol) E2(kJ/mol) E3(kJ/mol) 4.94x10⁹ 4.68 8.58x10⁷ 1.08x10³ 100 20 81 49
All the simulations were conducted under the same conditions, namely: 1200ml of combined
catalyst and ceramic (made up of 300ml 15% Co-SiO2 catalyst and the balance being ceramic
balls); 458K operating temperature; 20bar operating pressure; a flowrate of 1.5Nl/min
reactant mixture (H2/CO =2).
4.3.2 Model validation
The model validation was done by comparing the simulation results obtained from the blank
case (C1) to the experimental results. The comparison of the CO conversion and product
selectivity are given in Table 4.5. As can be seen, the relative error in the CO conversion is
only 8.5%, and the predicted selectivity is even more accurate; therefore it was concluded
that the reaction kinetics are reliable and are suitable for describing the actual FTS reaction.

92
More importantly, the heat transfer behaviour in the catalyst bed was also validated by
comparing the predicted and measured temperature profiles.
Table 4.5: Comparison of the experimental results and simulation data for the blank case (C1)
Experimental result Simulation data Relative error/%
CO conversion/% 48.3 52.4 -8.5
SCH4/% 7.04 6.93 1.56
SC2/% 0.68 0.68 0
SC3+/% 92.3 91.7 0.61
(a) Temperature contour
P=8.5mm P=17mm P=21mm
Tem
perature/K
Distance from inlet/m (b) Comparison of the temperature plots at different radial positions
Figure 4.3: Temperature contour (a) and comparison of measured and predicted temperatures (b)
A specially designed temperature measurement system was implemented in the experiment
set-up, where axial temperature was measured at different radial positions in the reactor,
corresponding to radii of 8.5 mm, 17 mm and 21 mm. Figure 4.3(a) shows the predicted
temperature contour in the reactor. The position of the catalyst bed is denoted by the region
inside the dashed-lines, and the positions of the thermocouple are also indicated
455
460
465
470
475
0.3 0.4 0.5 0.6 0.7 0.8 0.9
Experiment
Simulation
455
460
465
470
475
0.3 0.4 0.5 0.6 0.7 0.8 0.9
Experiment
Simulation
455
460
465
470
475
0.3 0.4 0.5 0.6 0.7 0.8 0.9
Experiment
Simulation

93
(Ptherm=8.5mm; Ptherm =17mm; Ptherm =21mm). The comparison of the experimental and the
predicted temperature profiles, at corresponding positions, are shown in Figure 4.3(b). The
maximum mean absolute error of all the temperature data is only 3.2 K, which is considered
acceptable when compared to the operating temperature of 458 K. Thus, it is reasonable to
assume that the heat transfer behaviour is well described. As mentioned above, only the
geometry changes in the different simulation cases of C2 to C6, and it is believed that the use
of the reactor internals does not affect the simulation methodology. Therefore, it can be
claimed that the simulations described in this study are reliable.
4.4. Results and discussion
4.4.1 Predicted performance of internals of different geometries
Various neck diameter and frustum cavity height options were investigated cetaris paribus. The
simulation results are summarized in Table 4.6 and Table 4.7. In order to evaluate the
performance of different ring & tube type internals, the rate of change (RC) was defined as:
𝑅 = 𝐴 −𝐴 𝐴 × 100% 4-8
Where: A can be maximum temperature increase ΔTMAX, CO conversion XCO, selectivity of
methane SC1 or selectivity of C3+ products SC3+ - depending on its use; the subscripts org and
int indicate whether the parameter A refers to the original (org) tubular reactor (also known as
the blank case C1) or the tubular reactor with the ring & tube type internals (int) installed (C2
to C6), respectively; A negative value of RC indicates that the parameter decreases when ring
& tube type internals are used.
A comprehensive comparison of the simulation results for the blank case (C1) to those with

94
ring & tube type internals installed (C2 to C6) is summarized in Figure 4.4, while the detail
simulation results are given in Figure 4.5 and 4.6, and Table 4.6 and 4.7. The Figure 4.4 plot
the CO conversion and the temperature rise in catalyst bed. The data for the same controlled
key specification was presented in the same colour. According to the Figure 4.4, it shows that:
the TMAX in C2 to C6 dropped apparently, and the RC for temperature rise is negative,
reaching as low as -22.6% in C6; however, the CO conversion was varied slightly in a small
range, as the rate of change is no more than 2.1%. Thus, we can conclude that: the
temperature rise was inhibited by applying the ring & tube type internals, while the CO
conversion was not significantly affected; the average temperature of the catalyst bed (TAVE)
decreased in the case of C2-C6; the methane selectivity declined slightly; SC3+ increased
compared to C1.
Figure 4.4: The plot of CO conversion verse temperature rise in catalyst bed

95
Figure 4.5: Comparison of the temperature contours in the catalyst bed in C1 to C4
Figure 4.5 shows the temperature contours of the catalyst bed in the cases of C1 to C4. The
hot spot is in the shape of a water drop in C1, while it changes to a spindle shape when the
designed internals are applied in C2 to C4. Compared to the hot spot in C1, the temperature
peaks in C2 to C4 obviously dropped, and the “red zone” in the temperature contour is
smaller. Thus, it can be concluded that the temperature distribution in the catalyst bed became
milder when the ring & tube type internals were used. It should also be noticed that the hot
spots in all case of C2 to C4 were located at the end of the catalyst bed where the reactor
internals were installed. This can be explained by the function of the ring & tube type
internals to delay and suppress the formation of a hot spot by increasing the heat transfer.
Furthermore, when decreasing the neck diameter from C2 to C4: the catalyst bed became
higher so that the total loading volume of the catalyst was kept constant; the range of the “red
zone” decreased at firstly and then increased in the C4 case, which means that there is an
optimal neck diameter for suppressing the hot spot.
Table 4.6 shows that when increasing the neck diameter from 13 to 38 mm, both ΔTMAX and
TAVE showed a minimum value. The lowest value of ΔTMAX was obtained in case C3 with
C1
C2
C3
C4

96
Dneck of 25 mm. The reaction performance of FTS is directly related to the temperature of the
catalyst bed, thus SC1 increased with an increase in TAVE, while SC3+ showed the opposite
trend. In addition, although the values of RC-XCO RC-SC1 and RC-SC3+ were quite small, the
changes were obvious when decreasing Dneck from 38 mm to 25 mm. This means that the FTS
results were more sensitive in this range.
Table 4.6: Performance of internals with different neck diameters original internals
NO. C1 C2 C3 C4
Dneck/mm - 13 25 38
ΔTMAX /K 16.9 14.5 14.0 14.7
RC-ΔTmax /% - -14.1 -16.9 -12.8
TAVE/K 463.4 463.2 463.1 463.4
XCO /% 51.8 51.2 51.1 51.7
RC-Xco/% - -1.19 -1.34 -0.12
SC1/% 6.83 6.58 6.55 6.74
RC-SC1/% - -3.65 -4.09 -1.35
SC3+/% 92.5 92.8 92.7 92.6
RC-SC3+/% - 0.29 0.25 0.10
Figure 4.6 shows the temperature contours of the catalyst bed for C1, C3, C5 and C6. In this
section, the neck diameter of the ring & tube type internals was fixed, while its height was
increased. Apparently, both the maximum of the temperature and the range of the hot spot
declined when the designed ring & tube type internals was installed. Furthermore, when
enhancing the proportion (v) from 15% to 25%, the “red zone” in the catalyst bed obviously
shrank and it almost vanished in the case of C6. Therefore, an increase in the ring & tube type
internals height has a strong, positive effect on inhibiting hot spot formation. However, there
is a limitation in catalyst bed height, which also restricting the height of the designed
internals, especially in terms of modifying an existing reactor. For example, the catalyst bed
height should be less than the height of the oil bath.

97
Figure 4.6: Comparison of temperature contours in the catalyst bed in C1, C3, C5 and C6
Table 4.7: Performance of internals with different proportions of catalyst being
replaced Original Internals
NO. C1 C5 C3 C6
v/% - 15 20 25
ΔTMAX /K 16.9 14.8 14.0 13.1
RC-ΔTmax /% - -12.3 -16.9 -22.6
Tave/K 463.4 463.2 463.1 462.9
XCO /% 51.8 51.3 51.1 50.7
RC-Xco/% - -0.99 -1.34 -2.13
SC1/% 6.83 6.63 6.55 6.46
RC-SC1/% - -3.03 -4.09 -5.41
SC3+/% 92.5 92.6 92.7 93.0
RC-SC3+/% - 0.20 0.25 0.48
As indicated in Table 4.7, TAVE declined gradually as the proportion of the original cylinder
shape catalyst bed was changed from 15% to 25%, while the ΔTMAX dropped as low as 13.1
K with the changing rate of -22.6% for C6. The results demonstrate that a longer frustum
cavity results in a lower peak temperature within the catalyst, as well as better product
distribution for longer chain hydrocarbons. Table 4.7 shows that the methane selectivity
decreased from 6.63% to 6.46%, while the C3+ product selectivity rose slightly from 92.6% to
C1
C5
C3
C6

98
93.0%. However: the CO conversion dropped slightly from 51.3% to 50.7%, which was
caused by the lower average catalyst bed temperature, and the maximum changing rate was
only -2.13%.
Table 4.8: Summary of the total catalyst height (Htot) in different cases and the corresponding rate
of change (R ) in different cases
NO. C1 C2 C3 C4 C5 C6
Htot /mm 585 732 669 618 647 690
R /% - 25.1 14.4 5.6 10.6 17.9
When the ring & tube type internals was applied to an existing TFBR, the packed catalyst
volume was usually kept constant to maintain the reactor productivity at the same level.
Therefore, there was a slight increase in the catalyst bed height. The total height of the catalyst
bed (Htot) in the different cases and the corresponding rate of change for each (R ) are
listed in Table 4.8. We can see that H increased with decreasing neck diameter Dneck or when
enlarging the proportion of replaced original cylinder shape catalyst bed (v). Normally, there
is extra space at both ends of the catalyst bed for the layers of inert solid supports. Thus, the
fixed bed reactor may be designed to 1.5 times longer at most than its catalyst bed. However,
actual TFBR design varies from case to case, and the available extra space in the TFBR for
the application of the ring & tube type reactor internals cannot be determined in general. For
example, for our experimental set-up, inserting the ring & tube type reactor internals
increased the bed height by 20% of the total catalyst bed height at most, which is acceptable.
The results suggest that: when designing ring & tube type internals for a new tubular reactor
or when modifying an existing reactor, the neck diameter Dneck should be optimized; while a
bigger proportion of replaced original cylinder catalyst bed is preferred, the actual value
should be determined according to the available tube length.

99
4.4.2 Mechanism
There are two mechanisms that reduce the maximum temperature when using ring & tube
type internals. The simulation results for C1 and C3 can be used as examples for comparison
purposes. The axial CO consumption rate along the centre of the catalyst bed in C1 and C3 is
shown in Figure 4.7. The ring & tube type internals increase the heat removal capacity by
partially reducing the effective reactor diameter, and it is widely reported that a smaller
reactor diameter favours temperature control in a TFBR [27,39].
Table 4.9: Temperature of thermal conductive oil at inlet and
outlet, and temperature difference C1 C3
TinlSt/K 458.00 458.00
ToutlSt/K 458.06 458.07
ΔT/K 0.0623 0.0704
A comparison of the temperature increase in the thermal oil between the inlet and the outlet in
C1 and C3 supports the notion that there is an increase in heat removal (see Table 4.9). The
initial inlet temperature for the thermal oil is the same in both cases; therefore, a higher
temperature in the thermal oil at the outlet indicates that more reaction heat is removed. The
temperature difference increased slightly from 0.0623 K (C1) to 0.0704 K (C3), therefore,
inserting the internals resulted in more reaction heat being removed, even though the total
amount of reaction heat released in C3 is lower than that in C1, since CO conversion in C3
decreased by 1.34%. See Table 4.7.

100
Figure 4.7: Comparison of CO consumption rates in the centre of the reactor for C1 and C3
Meanwhile, the reaction intensity at the “critical” zone was dispersed over a longer axial
distance (see Figure 4.7), as the original cylindrical shaped catalyst bed (in C1) was replaced
with a longer conical shaped bed in C3. It is inevitable that a large amount of heat is released
in the FTS process, as the reaction is extremely exothermic. An acceptable method to control
the temperature of the hot spot is to reduce the rate of release of the reaction heat in the initial
part of the catalyst bed by distributing the reaction heat over a longer axial distance. Although
the volume of the cavity of the conical frustum was the same as that of the replaced
cylindrical shaped catalyst bed, the catalyst bed packed in C3 had a longer and narrower
shape to that in C1; that is to say, the reaction rate and the reaction heat release rate per
volume of reactor will be lower in the initial part of the catalyst bed, thereby reducing the
undesirable temperature rise.
4.5 Conclusions
In this study, an innovative type of reactor internal, namely the ring & tube type internals,
was proposed to inhibit hot spot formation in a catalyst bed in the exothermic reaction, i.e.
FTS. A CFD model showed that modifying the reactor tube with this insert reduced the
0.0000
0.0001
0.0002
0.0003
0.0004
0.0005
0.0006
0.0007
0.0008
0.0009
0.25 0.35 0.45 0.55 0.65 0.75 0.85 0.95
reac
tion
rate
/(km
ol/m
3 /s)
Dimensionless reactor length
C1
C3

101
maximum temperature of the hot spot and improved the selectivity for C3+ products. The
reactor model was based on an actual bench-scale TFBR with a 50mm diameter and 1000mm
length. It was validated by choosing parameters so as to fit both the measured reaction
conversions and selectivity. A good agreement from the comparison of the measured
temperature profiles from the experiments conducted under typical low temperature FTS
conditions with a cobalt catalyst and the predicted profiles. The model was considered to
predicte reliable temperature profiles on both the axial and radial directions.
Using a blank case (corresponding to no reactor internals) for comparison purposes, it was
shown that the internals inhibited hot spot formation in the catalyst bed, while having little
effect on the overall FTS reaction rate, i.e.: the maximum temperature in the catalyst bed
dropped 22.6% when using internals (Case 6), while the rate of change in CO conversion was
less than 2.13%. Furthermore, because of the reduced maximum temperature in the bed, the
C3+ product selectivity increased slightly when using internals. The effect of the
specifications of the internals, namely the diameter at the neck position Dneck and the conical
frustum cavity height (h) was investigated. For purposes of comparison, the amount of
catalyst used was kept constant in all the simulations and this resulted in the length of the
catalyst bed varying for the different cases. The maximum temperature ΔTMAX in the bed
showed a minimum value when varying the diameter of the neck of the insert Dneck and an
increasing trend with an increase in the length of the cavity of the conical frustum h. The
overall reaction rate was not overly sensitive to the presence of the reactor insert. The
internals essentially reduced the effective inner diameter of the reactor tube, which enhanced

102
the heat removal capacity and dispersed the heat release over the hot spot region over a
longer axial distance. Given the design of the ring & tube type internals, other benefits could
include ease of manufacturing, simple assembling and disassembling.

103
References
[1] H. Schulz, Short history and present trends of Fischer–Tropsch synthesis, Appl. Catal. A
Gen. 186 (1999) 3–12. doi:10.1016/S0926-860X(99)00160-X.
[2] B.H. Davis, Fischer-Tropsch synthesis: Overview of reactor development and future
potentialities, Top. Catal. 32 (2005) 143–168. doi:10.1007/s11244-005-2886-5.
[3] D. Glasser, D. Hildebrandt, X. Liu, X. Lu, C.M. Masuku, Recent advances in
understanding the Fischer-Tropsch synthesis (FTS) reaction, Curr. Opin. Chem. Eng. 1
(2012) 296–302. doi:10.1016/j.coche.2012.02.001.
[4] X. Zhu, X. Lu, X. Liu, D. Hildebrandt, D. Glasser, Heat transfer study with and without
Fischer-Tropsch reaction in a fixed bed reactor with TiO2, SiO2, and SiC supported
cobalt catalysts, Chem. Eng. J. 247 (2014) 75–84. doi:10.1016/j.cej.2014.02.089.
[5] D. Merino, O. Sanz, M. Montes, Effect of catalyst layer macroporosity in
high-thermal-conductivity monolithic Fischer-Tropsch catalysts, Fuel. 210 (2017) 49–
57. doi:10.1016/j.fuel.2017.08.040.
[6] S. Govender, H.B. Friedrich, Monoliths: A review of the basics, preparation methods
and their relevance to oxidation, Catalysts. 7 (2017). doi:10.3390/catal7020062.
[7] T.A. Nijhuis, A.E.W. Beers, T. Vergunst, I. Hoek, F. Kapteijn, J.A. Moulijn,
Preparation of monolithic catalysts, Catal. Rev. - Sci. Eng. 43 (2001) 345–380.
doi:10.1081/CR-120001807.
[8] Y.H. Chin, J. Hu, C. Cao, Y. Gao, Y. Wang, Preparation of a novel structured catalyst
based on aligned carbon nanotube arrays for a microchannel Fischer-Tropsch synthesis

104
reactor, Catal. Today. 110 (2005) 47–52. doi:10.1016/j.cattod.2005.09.007.
[9] E. Tronconi, G. Groppi, C.G. Visconti, Structured catalysts for non-adiabatic
applications, Curr. Opin. Chem. Eng. 5 (2014) 55–67. doi:10.1016/j.coche.2014.04.003.
[10] D. Merino, O. Sanz, M. Montes, Effect of the thermal conductivity and catalyst layer
thickness on the Fischer-Tropsch synthesis selectivity using structured catalysts, Chem.
Eng. J. 327 (2017) 1033–1042. doi:https://doi.org/10.1016/j.cej.2017.07.003.
[11] L. Fratalocchi, C.G. Visconti, G. Groppi, L. Lietti, E. Tronconi, Intensifying heat
transfer in Fischer-Tropsch tubular reactors through the adoption of conductive packed
foams, Chem. Eng. J. 349 (2018) 829–837. doi:10.1016/j.cej.2018.05.108.
[12] V. Tomašić, F. Jović, State-of-the-art in the monolithic catalysts / reactors, Appl. Catal.
A Gen. 311 (2006) 112–121. doi:10.1016/j.apcata.2006.06.013.
[13] J. Lefevere, S. Mullens, V. Meynen, J. Van Noyen, Structured catalysts for
methanol-to-olefins conversion: A review, Chem. Pap. 68 (2014) 1143–1153.
doi:10.2478/s11696-014-0568-0.
[14] V.N. Le, High Heat Transfer Tubular Reactor, 7018591 B2, 2013.
doi:https://patents.google.com/patent/US7018591B2/en.
[15] E. Bruegger, Catalyst finned tubing and method of making, 2,778,610, 1957.
doi:https://patents.google.com/patent/US2778610A/en.
[16] M. Bhouri, J. Goyette, B.J. Hardy, D.L. Anton, Numerical modeling and performance
evaluation of multi-tubular sodium alanate hydride finned reactor, Int. J. Hydrogen
Energy. 37 (2012) 1551–1567. doi:10.1016/j.ijhydene.2011.10.044.

105
[17] P. della Porta, T.A. Giorgi, A. Cantaluppi, B. Ferrario, P. Montalenti, Catalyst cartridge,
3,857,680, 1974. doi:https://patents.google.com/patent/US3441382A/en.
[18] J.J. Hartvigsen, Fixed bed reactor heat transfer structure, US 2014/0134067 A1, 2014.
doi:https://patents.google.com/patent/US9157689B2/en.
[19] M. Verbist, Tubular reactor with packing, US 2007/0299148A1, 2007.
doi:https://patents.google.com/patent/US20070299148A1/en?oq=US+2007%2f029914
8A1.
[20] B. Jin, R.R. Broekhuis, X. He, S. Nataraj, W.R. Licht, D. Garg, Tubular reactor with jet
impingement heat transfer, EP 2 514 523 A1, 2012.
doi:https://patents.google.com/patent/US8409521B2/en.
[21] A. Alvarez, S. Ramírez, J. Ancheyta, L.M. Rodríguez, Key role of reactor internals in
hydroprocessing of oil fractions, Energy and Fuels. 21 (2007) 1731–1740.
doi:10.1021/ef060650+.
[22] P. Narataruksa, S. Tungkamani, K. Pana-Suppamassadu, P. Keeratiwintakorn, S.
Nivitchanyong, P. Hunpinyo, H. Sukkathanyawat, P. Jiamrittiwong, V. Nopparat,
Conversion enhancement of tubular fixed-bed reactor for Fischer-Tropsch synthesis
using static mixer, J. Nat. Gas Chem. 21 (2012) 435–444.
doi:10.1016/S1003-9953(11)60388-5.
[23] A. Jess, R. Popp, K. Hedden, Fischer–Tropsch-synthesis with nitrogen-rich syngas:
fundamentals and reactor design aspects, Appl. Catal. A Gen. 186 (1999) 321–342.
doi:10.1016/S0926-860X(99)00152-0.

106
[24] M. Irani, Investigating the production of liquid fuels from synthesis gas (CO + H2) in a
bench-scale packed-bed reactor based on Fe–Cu–La/SiO2 catalyst: Experimental and
CFD modeling, Int. J. Ind. Chem. 5 (2014) 1–9. doi:10.1007/s40090-014-0011-y.
[25] M. Taniewski, A. Lachowicz, K. Skutil, D. Czechowicz, Heat-Transfer Characteristics
in Oxidative, Chem. Eng. Sci. 51 (1996) 4271–4278.
doi:https://doi.org/10.1016/0009-2509(96)00266-7.
[26] G. Chabot, R. Guilet, P. Cognet, C. Gourdon, A mathematical modeling of catalytic
milli-fixed bed reactor for Fischer-Tropsch synthesis: Influence of tube diameter on
Fischer Tropsch selectivity and thermal behavior, Chem. Eng. Sci. 127 (2015) 72–83.
doi:10.1016/j.ces.2015.01.015.
[27] B. Todic, M. Mandic, N. Nikacevic, D.B. Bukur, Effects of process and design
parameters on heat management in fixed bed Fischer-Tropsch synthesis reactor, Korean
J. Chem. Eng. 35 (2018) 1–15. doi:10.1007/s11814-017-0335-3.
[28] Y.N. Wang, Y.Y. Xu, Y.W. Li, Y.L. Zhao, B.J. Zhang, Heterogeneous modeling for
fixed-bed Fischer-Tropsch synthesis: Reactor model and its applications, Chem. Eng.
Sci. 58 (2003) 867–875. doi:10.1016/S0009-2509(02)00618-8.
[29] K.S. Kshetrimayum, I. Jung, J. Na, S. Park, Y. Lee, S. Park, C.-J. Lee, C. Han, CFD
Simulation of Microchannel Reactor Block for Fischer−Tropsch Synthesis: Effect of
coolant type and wall Boiling Condition on Reactor Temperature, Ind. Eng. Chem. Res.
55 (2016) 543–554. doi:DOI: 10.1021/acs.iecr.5b03283.
[30] A. Jess, C. Kern, Modeling of Multi-Tubular Reactors for Fischer-Tropsch Synthesis,

107
Chem. Eng. Technol. 32 (2009) 1164–1175. doi:10.1002/ceat.200900131.
[31] E.A. Foumeny, F. Benyahia, Predictive characterization of mean voidage in packed
beds, Heat Recover. Syst. CHP. 11 (1991) 127–130.
doi:10.1016/0890-4332(91)90126-O.
[32] K.S. Kshetrimayum, I. Jung, J. Na, S. Park, Y. Lee, S. Park, C.-J. Lee, C. Han, CFD
simulation of microchannel reactor block for Fischer–Tropsch Synthesis: Effect of
coolant type and wall boiling condition on reactor temperature, Ind. Eng. Chem. Res. 55
(2016) 543–554. doi:10.1021/acs.iecr.5b03283.
[33] ANSYS Inc., ANSYS FLUENT 12.0 User’s Guide, 2009.
http://www.afs.enea.it/project/neptunius/docs/fluent/html/ug/main_pre.htm.
[34] R. Philippe, M. Lacroix, L. Dreibine, C. Pham-Huu, D. Edouard, S. Savin, F. Luck, D.
Schweich, Effect of structure and thermal properties of a Fischer–Tropsch catalyst in a
fixed bed, Catal. Today. 147 (2009) S305–S312. doi:10.1016/j.cattod.2009.07.058.
[35] I.C. Yates, C.N. Satterfield, Intrinsic kinetics of the Fischer-Tropsch synthesis on a
cobalt catalyst, Energy & Fuels. 5 (1991) 168–173. doi:10.1021/ef00025a029.
[36] M. Sadeqzadeh, J. Hong, P. Fongarland, D. Curulla-Ferré, F. Luck, J. Bousquet, D.
Schweich, A.Y. Khodakov, Mechanistic modeling of cobalt based catalyst sintering in a
fixed bed reactor under different conditions of Fischer-Tropsch synthesis, Ind. Eng.
Chem. Res. 51 (2012) 11955–11964. doi:10.1021/ie3006929.
[37] M.H. Rafiq, H.A. Jakobsen, R. Schmid, J.E. Hustad, Experimental studies and modeling
of a fixed bed reactor for Fischer–Tropsch synthesis using biosyngas, Fuel Process.

108
Technol. 92 (2011) 893–907. doi:10.1016/j.fuproc.2010.12.008.
[38] N. Majidian, S. Soltanali, Comparison of Fischer-Tropsch fixed and monolith bed
reactors using pseudo-homogeneous 2D model, J. Japan Pet. Inst. 59 (2016) 126–139.
doi:10.1627/jpi.59.126.
[39] A. Montebelli, C. Giorgio, G. Groppi, E. Tronconi, S. Kohler, Optimization of compact
multitubular fixed-bed reactors for the methanol synthesis loaded with highly
conductive structured catalysts, Chem. Eng. J. 255 (2014) 257–265.
doi:10.1016/j.cej.2014.06.050.

109
CHAPTER 5
DESIGN OF A FISCHER-TROPSCH
MULTI-TUBE REACTOR FITTED IN A
CONTAINER: A NOVEL DESIGN APPROACH
FOR SMALL SCALE APPLICATION
5.1 Introduction
Fischer-Tropsch synthesis (FTS) is a process whereby syngas is converted into a complex
mixture of hydrocarbons, including ultra-clean fuel, bulk chemicals, etc. [1,2]. It provides not
only a source of renewable and sustainable energy but an environment friendly solution to
solid waste treatment, when using biomass and solid municipal waste to generate syngas by
gasification. Biomass is considered a CO2 neutral resource and conducive to the control of
Green House Gas emission; while it is reported that in South Africa only 35% of organic
biomass were re-used instead of burning or disposing on landfills [3,4]. Recyclable municipal
waste in South Africa was reported about 31-41% [5]. Development on recycle use such
considerable quantity of solid municipal waste is beneficial to the pressure of municipal
waste management and the increasing energy crisis.
Large scale FTS-based processes are reported to be economically robust; however, the
investment risk is proportional to scale, which negatively affects the decision to develop and
invest in new mega FTS plants [6]. Apart from the lower overall capital investment
requirement, small scale FTS plants have logistical and environmental advantages compared
to mega scale applications, because they are flexible enough to use a wider range of

110
carbon-contained resources as feed, such as municipal waste and biomass [7]. A unavoidable
fact is that feeds such as solid municipal waste in urban areas or biomass, agriculture waste in
rural areas, are normally more widely distributed in lower concentrations than traditional
fossil fuel resources; therefore, there feed either needs to be transported to a centralised mega
plant or small-scale FTS process equipment needs to be installed near the feed source, in
order to reduce transportation cost [8]. Thus, small-scale FTS plants are appropriate under
some circumstances, and the implementation of a small scale plant results in reduced
investment cost per plant, lower running cost and increased flexibility for utilising different
types of feedstock.
The concept of process intensification (PI) can be used to design small scale, compact FTS
plants that provide all the process steps and functionality of a big plant. PI can be used to
develop small scale FTS applications that are both environmentally sustainable and cost
competitive. Additionally, a more comprehensive PI approach may also include a strategy that
significantly enhances the production capacity of certain equipment of a given size, or reduces
the energy consumption per unit of product, or even dramatically decreases the output of waste
or by-product formation. [9] A novel design of a multi-tube reactor for small-scale FTS plants,
which qualifies under the broader PI definition, was proposed in order to maximize the overall
productivity within the limited volume of the reactor.
A containerised small-scale FTS plant is an interesting approach that demonstrates the
application of PI. The design of a modular, portable FTS plant, proposed by the research
group headed by Prof. Hildebrandt, was used as the example in this study. The containerised

111
plant contains the entire process, from taking in a solid carbon containing material to
producing crude synthetic fuel and electricity [8,9]. The plant is built in a standard
commercial shipping container, with the container accommodating all the equipment,
including the plasma gasifier, wet quench and scrubber, FTS reactor, product coolers and
separators. It is important to optimise the volumetric efficiency of the equipment used in the
various process steps in order to ensure the best use of the limited space available in a
container. The requirement for the FTS reactor in such an application is high productivity of
liquid fuel, so that the small-scale FTS plant can be competitive overall in terms of cost and
profit.
In the traditional approach used to design mega FTS reactor plants, there is usually no (strict)
space limitation on the reactor, and the design is therefore based on data that is
experimentally measured in the laboratory, including catalyst activity and performance,
pressure, temperature, etc. In effect, the final design of the commercial reactor is scaled up
from laboratory reactors, using the optimal experimental conditions determined in the
laboratory. However, space utilization is very important when designing small-scale FTS
plants. Thus, different approaches need to be considered when designing space-constrained
small-scale reactor plants, such as the aforementioned modular portable FTS containerised
plant, as opposed to mega plants, as there are different drivers for the design. In particular,
issues such as maximum productivity for a given space constraint need to be addressed.
Many types of FTS reactors, including tubular fixed bed reactor (TFBR), circulating fluidized
bed reactor (CFB), fixed fluidized bed reactor (FFB), slurry phase reactor (SPR),

112
microchannel reactor (MR), etc., have been developed since the discovery of FTS in the
1920s [12]. However, each type of reactor suffers from certain drawbacks, thus there is no
“optimal” FTS reactor type, and the choice of reactor depends on the application and
situation [13]. Multi-tubular reactors, which consist of a TFBR bundle in a cooling system,
are widely agreed to have the following advantages: 1) simple installation and robust
operation; 2) high catalyst loading volume; and 3) high potential productivity [14–16]. The
productivities per unit reactor volume, which indicating the volumetric reactor efficiency,
from reported industrial/pilot scale FTS applications of TFBR, SPR, CFB, FFB and MR were
summarized in Table 5.1. As seen, productivities per reactor volume from TFBR applications,
i.e. ARGE reactor and Shell’s Bintulu reactor, were at upper medium level, which makes
TFBR fairly feasible to space-limited small scale FTS applications, i.e. the containerized
modular, portable FTS plant. Even though MR has distinct advantage in productivity per
reactor volume, it still currently required to improve on aspects of intricate catalyst
manufacture, high blank activity, high manufactory cost, etc. [17]. Besides, modular portable
FTS plants have additional constraints, in that the properties of the syngas - including flow
rate, CO/H2 ratio, impurities, etc. - could be variable because of the changing properties of
the carbon-contained resource, for example biomass, solid municipal waste, etc. Thus, these
plants would need to be able to run flexibly under non-steady state conditions. For this reason,
the TFBR is considered the most appropriate reactor, as it has a wider tolerance to
non-uniformity of the feed compared to its competitors. Additionally, considering that the
direct user or operator of the modular portable FTS plant may be unskilled, the TFBR’s

113
features of simple operation and robustness make it an excellent choice for small-scale
processes. In the following sections, a different approach is provided for the design of a
TFBR for modular portable plant applications.
The FT reaction is strongly exothermic and the adiabatic temperature rise may climb as high
as 1750K [18]; however, the heat removal capacity of a TFBR is relatively low compared to
other types of reactors [19]. Therefore, temperature control in an TFBR FT reactor has to be
considered carefully, as an extreme rise in temperature may lead to serious consequences,
including catalyst deactivation, a decrease in heavy hydrocarbon product selectivity,
temperature runaway, etc. [20,21]. Thus, the stability and long term performance of a TFBR
depends on good temperature control in the catalyst bed.
Table 5.1: Comparison of productivity per unit reactor volume from different reactors
Reactor Type size productivity Reactor efficiency Gas recycle
ratio bb/day bbl/day/m3
ARGE reactor
[14,22,23] TFBR Φ2.95x12.8m 700 8.0 moderate
Bintulu reactor from
Shell [24–26] TFBR Φ7x12.2m 3,000 6.4 moderate
Sasol's SPR [27] SPR Φ5x22m 2,500 5.8 low
Rheinpreussen‘s
reactor [27] SPR Φ1.3x7.5m 80 8.0 Once-though
Exxon's bubble
column [27] SPR Φ1.2x21m 200 8.4 low
Oryx GTL reactor
[28,29] SPR Φ10x60m 17,000 3.6 low
Velocys’s reactor
[30] MR Φ1.37x3.96m 200 34.3 low
Synthol reactor in
Sasolburg [13,14] CFB Φ2.3x46m 1,500 7.9 high
Brownsville's
reactor [31] FFB Φ4x18m 3,102 13.7 -
Sasol Advance
Synthol [13] FFB Φ10x60m 20,000 3.7 low

114
The heat transfer between the catalyst bed and the surrounding coolant is strongly dependant
on the diameter of the reactor tubes and this, in turn, influences the heavy hydrocarbon
product selectivity through the temperature distribution in the tubes [14]. The effect of reactor
diameter on the temperature profile in a reactor tube when using the same operating
conditions has been widely reported. The observed maximum temperature in the catalyst bed
increases with increasing reactor diameter; as a result, TFBRs with a smaller tube diameter
favour higher selectivity to heavy hydrocarbons [32–34]. Thus, a TFBR with a smaller tube
diameter exhibits superior temperature control, resulting in improved heavy hydrocarbon
selectivity compared to a reactor with a larger tube diameter (when using the same catalyst).
However, even though both the operational safety and process productivity are critical to the
success and profitability of commercial FTS plants, few studies have reported on the effect of
the reactor diameter on reactor productivity when using the same or a similar operating
temperature in the catalyst bed. In principle, the designer could use a catalyst with lower
activity with reactor tubes with a larger diameter, in order to improve the temperature control
in the catalyst bed. Thus, by varying the catalyst activity so as to maintain the same
maximum temperature in the catalyst bed, the achievable reaction rates and the heavy
hydrocarbon product selectivity can be optimised while ensuring safe operation of the reactor.
In this study, the catalyst activity and space velocity (SV) of the gas in the tube were
manipulated to adjust the temperature rise in the catalyst bed so that the maximum
temperature in the catalyst bed did not exceed the stipulated safe operating temperature
constraint.

115
The FT catalyst activity depends on factors such as active metal type, active metal particle
size, catalyst support and metal loading. Changing these parameters causes the activity of the
catalyst to vary by orders of magnitude. It is reported that the cobalt catalyst activity changed
some 7 times when increasing the cobalt particle size from 2 nm to 27 nm, while the turn
over frequency of the catalyst varied from 2.3x10⁻³ s-1 to 200x10-3 s-1 [35]. Atashi et al. [36]
reported on a high-performance cobalt-manganese catalyst tested in a fixed bed reactor.
According to their experimental results, the CO consumption rate can reach as high as 1.419
mmol/(g cat*min). However, it is not always possible to use a catalyst with high activity in an
industrial FTS reactor, as the requirement to control the temperature in an industrial reactor
means that the achievable FTS reaction rate is limited by the heat removal rate of the reactor.
The reported performance of FTS catalysts measured in a laboratory is often much higher
than what can be safely accommodated in industrial reactors. Even in many laboratory
experiments, the catalysts are diluted (for example, with glass beads), so that the temperature
in the laboratory reactor does not exceed the temperature at which the reaction rate starts
declining (due to catalyst deactivation, sintering or carbon depositing, for example) [13,37].
Compared to a typical FTS mega plant, a small-scale plant, such as the proposed modular
portable FTS plant, offers more flexibility in terms of reactor design, as a wider range of
reactor tube diameters could be considered, with a correspondingly wider range of catalyst
activity that could be utilised.
When using similar thermal conditions in the catalyst bed, the FTS reaction performance of
TFBRs with different tube diameters can be compared, where the corresponding heat removal

116
capacity of the reactor matches the reaction rate. The more traditional approach is to design
the reactor for a catalyst with a performance that has been “optimised” in the lab. This author
suggests that with a small-scale plant, the catalyst performance should be based on optimising
the performance of the catalyst-reactor system. Once the catalyst specifications and the
associated reactor tube diameter that optimises the reactor performance have been determined,
a catalyst that matches these specifications can be engineered in the laboratory. We have not
found any study reports on this design approach in the literature, i.e. determining the optimal
catalyst-reactor properties and then using these specifications to design a suitable catalyst.
In this study, we propose a novel design approach for a reactor for small-scale FTS
applications. The design approach was applied in a FTS multi-tube reactor that was to be
installed in a containerised modular mobile plant, to find its highest possible production
capacity, and then find the operational conditions and the catalyst fit for it. In other words, the
strategy for this design approach is to intensify the total heavy hydrocarbon production rate
for a volume-limited reactor; to achieve that, the single tube diameter was optimized by
varying the catalyst activity and SV so as to adjust the peak temperature in the catalyst bed
such that it would meet but not exceed the maximum temperature constraint. CFD
simulations of the reactor performance and temperature profile in the catalyst bed were used
to find the optimal combinations of tube diameter and catalyst activity.
5.2 Reactor model
5.2.1 Reactor model and validation
To simplify the modelling of the multi-tube reactor, the overall dimensions of the TFBR

117
(length and diameter of the tube bundle) were fixed, and only the reactor tube diameter was
varied. Thermal oil was used as the cooling medium.
The specifications used for the TFBR were based on the modular portable plant mentioned
previously (Φ1916 x 2030mm) and this was used to set the reactor tube length at 2030mm.
The structure of the FTS section in modular portable FTS plant was illustrated in Figure A2
in Appendix A-10. Four different tube diameters were considered (from DN 3/4” to DN 2”).
The other dimensions and properties were taken from the specifications for commercial
Grade 304L stainless steel tubes [38]. Four different models (R1-R4) that corresponded to
each of the four tube diameters considered were developed in this design using ANSYS
Fluent 19.1. The details of the reactor configurations are provided in Table 5.2.
Table 5.2: Reactor model specifications
Category Name R1 R2 R3 R4
DN 3/4” 1” 3/2” 2”
Inner diameter/mm 23.4 27.9 42.7 52.5
Total length/mm 2030 2030 2030 2030
Catalyst bed height/mm 1600 1600 1600 1600
Wall thickness/mm 1.65 2.77 2.77 3.91
Weight/(kg/m) 1.02 2.09 3.11 5.45
The height of the catalyst bed in all the reactor models was fixed at 1600mm. The universal
geometry of an axial section view of the reactor model is shown in Figure 5.1, including the
reactor tube and the annular flow of oil around the tube. Three uniform, solid, porous zones
on the tube side were utilized to represent the ceramic ball layer, the catalyst bed and a
second ceramic ball layer. Vertically parallel to the reactor tube are two zones that were used
to simulate the annular oil bath around the tube. The flow of the reactant gases and the
thermal oil were taken as counter-current. The uniform structured grids that were used in the

118
modelling are also shown in Figure 5.1.
Figure 5.1: Geometry of the reactor model
The catalyst employed in the base case simulation was one that the authors had previously
tested in the lab and reported on in another study [39]. The catalyst reported on previously
was a 15% Co-SiO2 catalyst, which was prepared using the incipient wetness method [40]. In
the previously reported experiments, the catalyst bed was diluted with ceramic balls, in order
to lower the overall reaction rate and so avoid the formation of hot spots[41].
In the base case, every 100ml of catalyst mixture contained 25ml of catalyst particles, with
the balance being ceramic balls. The physical properties of the ceramic ball layer and catalyst
bed are listed in Table 5.3. The reactant syngas composition (22.68% CO, 49.90% H2, 18.36%
CO2, and 9.06% N2 in volume) was obtained according to the experimentally-measured gas
composition for catalytic gasification of municipal solid waste in modular portable FTS
project. This syngas was then reacted in following section of the containerised FTS plant and
its composition was representative for syngas from gasification. Thus this syngas
composition was used in this study. The gas space velocity (SV) was varied between 70 to

119
1000h-1, and was used as a variable operating parameter in each reactor model.
Table 5.3: Physical properties of the ceramic ball layers and catalyst bed
Ceramic ball layer Catalyst bed
Thermal conductivity/(W·m-1·K-1) 1.2 1.4
Packing density/(g·ml-1) 1.35 0.69
Bed void/% 46 62
The water gas shift reaction was not considered, as this reaction does not typically occur on
Co catalysts [42]. To simplify the complex FTS mechanism, it was assumed that all species
involved in this process were in the gas phase and that only paraffin products would be
produced. Methane and ethane were used to represent the C1 and C2 products respectively;
while the balance of the hydrocarbon products (i.e. those with a carbon number of 3 or higher)
were lumped together as C3+ products and represented by pentane.
Table 5.4: FTS reaction scheme
Reaction
Reaction 1 CO + 3𝐻 ↔ 𝐶𝐻 + 𝐻 𝑂
Reaction 2 2CO + 5𝐻 ↔ 𝐶 𝐻 + 2𝐻 𝑂
Reaction 3 5CO + 11𝐻 ↔ 𝐶 𝐻 + 5𝐻 𝑂
Three reactions were used to represent the FTS reaction scheme – see Table 5.4. A
widely-used semi-empirical kinetic model, based on the CO consumption rate equation (𝑟 )
was used in this model, and the product formation rates (𝑟 , 𝑟 and 𝑟 ) indicated
below[43,44].
𝑟 = 𝑘 ∙ 𝑒𝑥𝑝(−𝐸 𝑅𝑇⁄ ) ∙ 𝐶 ∙ 𝐶 (1 + 𝑘 ∙ 𝑒𝑥𝑝(−𝐸 𝑅𝑇⁄ ) ∙ 𝐶 )⁄ 5-1
𝑟 = −𝑟 5-2
𝑟 = 𝑘 ∙ 𝑒𝑥𝑝(−𝐸 𝑅𝑇⁄ ) ∙ 𝑟 5-3
𝑟 = 𝑘 ∙ 𝑒𝑥𝑝(−𝐸 𝑅𝑇⁄ ) ∙ 𝑟 5-4
𝑟 = [1 − 𝑘 ∙ 𝑒𝑥𝑝(−𝐸 𝑅𝑇⁄ ) − 2 × 𝑘 ∙ 𝑒𝑥𝑝(−𝐸 𝑅𝑇⁄ )] ∙ 𝑟 /5 5-5

120
The parameters, including the four pre-exponential factors (k1–k4), were adjusted to fit the
experimental results, as reported previously [45]. The values of the four activation energies
(E1–E4) were based on data in the literature [46–48]. These are listed in Table 5.5.
Table 5.5: Kinetics parameters used in this study
parameter k1 k2 k3 k4 E1(kJ/mol) E2(kJ/mol) E3(kJ/mol) E4(kJ/mol) 4.76x10⁹ 4.68 8.58x10⁷ 1.08x10³ 100 20 81 49
The Reynold’s number in this design was less than 6.84 in all instances, which means that the
flow in the tubes is laminar. Thus, the “Laminar Model” in ANSYS Fluent 19.1 was used for
the modelling. The heat transfer coefficient at the boundary between the reactor tube and the
oil was calculated based on the local fluid properties by setting the boundary as a coupled
wall. The other boundaries of the model were set as adiabatic walls. The built-in governing
equations, including the Navier-Stokes equation, energy balance, species balance, etc., were
calculated using the Pressure-Velocity Couple algorithm in ANSYS Fluent [49,50]. The
simulation results were regarded as having converged only when the calculated residuals
were smaller than the absolute criterion of 10-6.
The validation of the model was reported in a previous study, in which both the experimental
reaction results and the 2D temperature distribution in the catalyst bed were compared to the
results from bench-scale experiments [39]. In this design, only the model geometries were
changed, while the modelling methodology and parameters (including reaction kinetics, heat
transfer and fluid dynamics settings) were kept exactly the same as those used in the previous
study [39]. Therefore, it is believed that the simulation results (including the predicted FTS
reaction rates and temperature distributions) are reliable and accurate enough to use for
extrapolation purposes and to draw conclusions in terms of the current study.

121
5.2.2 Simulation strategy
In order to optimize the tube diameter for the multi-tube reactor, two factors should be
considered: firstly, how the productivity in a single tube varies with tube diameter; secondly,
how the productivity of the overall TFBR varies with tube diameter, because the total number
of tubes that can be fitted into a given reactor shell of fixed diameter depends on the diameter
of the reactor tubes. The potential maximum productivity of C3+ products in a single tube
depends on the catalyst activity and the temperature distribution in the tube. The maximum
temperature (Tmax) that is realised in a reactor tube depends on the interaction between the
catalyst activity and the rate of heat removal. In order to compare the overall productivity of
the catalyst in reactor tubes with different diameters, the comparison should be done using
similar temperature conditions in the tube. For this study, the maximum temperature in the
catalyst bed (Tmax) was set as the constraint, and the activity of the catalyst was adjusted so
that this maximum specific temperature was reached in the catalyst bed but not exceeded.
5.2.2.1 Maximum Temperature Constraint (Tconst)
As explained above, even though CFD simulation is capable to provide detailed temperature
distributions in catalyst bed, the aim was to limit the maximum temperature in catalyst bed so
as to ensure the safety operation. However, there is limited research literature on a suitable
limit for Tmax for safe and stable operation of a reactor, and the empirical rule-of-thumb used
typically depends on the experimental conditions. Thus, setting a credible Tconst is difficult,
and it basically needs to be conservative enough to avoid any negative effect on both system
safety and the long term FTS reaction rate.

122
Previous experiments performed by our research group, indicate that the critical value of the
temperature rise that will ensure there is no temperature runaway is 14K, when using a bench
scale TFBR under the typical low temperature FTS conditions. However, this critical
temperature rise may vary with reactor specifications, catalyst and operating conditions. For
example, Jess states that a “safe temperature rise” is 35K, based on his 40mm diameter
reactor model. [51] Mazidi [52]set up a comprehensive mathematical reactor model and
claimed that the reactor can be operated safely by controlling the maximum temperature rise
below 50K.
Even though the deactivation mechanism of the cobalt catalyst in FTS is complex, the
consensus among researchers and engineers is that an excessively high temperature can result
in sintering of cobalt crystallites and bulk carbide formation, which leads to a loss of catalyst
activity [53,54]. Bertole et al. [55] reported that the activity of a cobalt catalyst was reduced
permanently because of catalyst sintering at temperatures of 483K with the addition of vapour.
Van Steen et al. claimed that under realistic Fischer-Tropsch conditions (P P⁄ < 1.5,
523K), cobalt crystallites with a diameter of less than 4.3nm will not be stable [56]. Carbide
can be detected on the catalyst at a temperature of 493K and it is widely accepted that carbide
formation results in a decrease in catalyst activity [57]. In addition, FTS product distribution
is sensitive to temperature, and higher temperatures favour the production of undesired
methane [58]. After considering all these facts, the maximum permissible temperature
increase in the catalyst bed was set at 10K for this study. The feed temperature was set at
458K, hence Tconst was set at 468K in all the simulations.

123
5.2.2.2 Catalyst activity coefficient
As discussed above, the productivity of a single reactor tube was compared and optimised by
varying the catalyst activity, so as to ensure that Tmax did not exceed 468K. The assumption
used was that the catalyst was ideal, which means that the activity is adjustable and that
changing the activity does not influence the product selectivity. A constant parameter, i.e.
catalyst activity coefficient A, was defined, in order to indicate the proportion of FTS reaction
rate in current modified case (𝑟 ) to that in base case (𝑟 , ) in a previous study [39]. The
𝑟 used in current research was thus expressed as:
𝑟 = 𝐴 ∙ 𝑟 , 5-6
Combining Equations 5-1 and 5-6 gives:
𝑟 = 𝐴 ∙ 𝑘 ∙ 𝑒𝑥𝑝(−𝐸 𝑅𝑇⁄ ) ∙ 𝐶 ∙ 𝐶 (1 + 𝑘 ∙ 𝑒𝑥𝑝(−𝐸 𝑅𝑇⁄ ) ∙ 𝐶 )⁄ 5-7
According to the experiment data in base case in previous study, the CO consumption rate
was only as low as 0.023 mmol/(g cat*min), while the reported CO consumption rates that
could be reached in practice were distributed in a wide range [39]. The value obtained in a
fixed bed reactor in Atashi’s study as mentioned in introduction section was as high as 1.419
mmol/(g cat*min) [36]. This indicates that the catalyst activity could be significantly
improved and it could be considered physicochemical reliable even the catalyst activity
coefficient A in Equation 5-7 potentially increased up to 6170%.
5.3 Results and discussion
5.3.1 Operating pressure
The resulting temperature distribution in the catalyst bed is a result of many interacting

124
factors, including the catalyst activity and the operating conditions, such as pressure and SV.
The reactor pressure is a key parameter that impacts the performance of the FTS process.
However, reported studies on the influence of operating pressure on FTS are normally
conducted under the same operating (feed) temperature and do not take into account the
effect of the temperature distribution in the catalyst bed with varying operating pressure [59].
Zheng [60] reported that CO conversion increased, while the methane selectivity decreased
with increasing pressure. Changing the pressure in the reactor will result in different reaction
rates and therefore different temperature profiles in the catalyst bed. It could therefore be
expected that the observed Tmax in the catalyst bed would vary in the experiments reported in
Zheng’s study. Furthermore, once the Tmax reaches the specifications for safe operation (Tmax
= Tconst), increasing the reactor pressure further will only cause Tmax to increase further,
resulting in unsafe operational conditions and increased capital and operating costs. Therefore,
because of the differences in thermal conditions, i.e. a different Tmax figure, the results
obtained in Zheng’s study do not necessarily reflect the actual capacity of the catalyst bed at
different operating pressures.
In this chapter, it was proposed that the effect of operating pressure on actual productivity
should be compared at a condition of Tmax = Tconst. To investigate the effect of operating
pressure on FTS performance with Tconst = 468K, simulations were conducted by varying the
operating pressure from 3 bar to 30 bar, and A was adjusted so that Tmax = Tconst. The other
conditions were kept constant, including: operating (feed) temperature of 458K; space
velocity (SV) of 500h-1; reactor diameter of 1 inch, etc. The results are listed in Table 5.6.

125
Table 5.6: Simulation results for different operating pressure levels
P/bar A/% TAVE/K XCO/% SC3+/%
3 3013 461.3 55.66 93.34
10 314 461.3 55.78 93.33
30 53.0 461.3 55.80 93.33
458K, SV=500h-1, H2/CO=2, the reactor diameter=1inch
As indicated in Table 6, in order to ensure Tmax = Tconst = 468K, the value of the coefficient A
changed from 3013% (in the case of 3 bar) to 53.0% (in the case of 30 bar). This shows that
in order to ensure a reasonable reaction rate at a low operating pressure, very active catalysts
are needed, i.e. only 3013% of that in base case; while, on the other hand, the reaction rate
was distinctly supressed at the pressure of 30 bar, i.e. only 53% of that in base case. This
conclusion is consistent with research studies that report that the FTS reaction rate increases
with increasing pressure in the same catalyst bed [60].
The average temperatures of the catalyst bed (TAVE), which was calculated as the
area-weighted average of the temperature integral of the cells in the catalyst bed domain,
were exported and listed in Table 5.6. Its mathematical definition is as follows:
𝑇 = 𝐴 ∙ ∫ 𝑇 ∙ 𝑑𝐴 5-8
Table 5.6 shows that TAVE was independent of pressure, when Tmax was controlled in these
simulations. In addition, the simulated CO conversion (XCO) and the selectivity of the C3+
products (SC3+) were almost constant across the range of operating pressure levels tested.
Thus, the operating pressure was chosen as 10 bar for all the simulations in following work of
this chapter, which was a compromise between the catalyst activity and the size of the
equipment.
5.3.2 Optimisation of a single reactor tube

126
To compare the potential maximum productivity of the reactor tubes with different diameters,
simulations were conducted with Tconst = 468 K, which was realized by modifying A and SV.
The results are summarized in Figure 5.2, Figure 5.3 and Table 5.7. Figure 5.2 and Figure 5.3
show the CO conversion (XCO) and the selectivity of the C3+ products (SC3+), respectively, as
bar charts. The A and TAVE are shown as curves on the same graphs. A higher single pass
conversion favours a higher efficiency for a simple once-through FT process, such as that
proposed for the modular portable plant. An auxiliary line corresponding to XCO = 80% is
indicated by the dashed line in Figure 5.2.
Figure 5.2: Simulation results for CO conversion XCO (bar chart) and catalyst activity coefficient A (line chart)
in different single tube reactor models (feed temperature 458K, 10bar, Tconst=468K; the catalyst mixture that
contains 25 vol% of 15% Co-SiO2 catalyst and balanced ceramic balls corresponds to A=100%; reactant syngas
volumetric composition of 22.68% CO, 49.90% H2, 18.36% CO2, and 9.06% N2; R1 to R4 are defined in Table
2).
Figure 5.2 shows that XCO decreases with an increase in tube diameter under the same SV
conditions. This is particularly obvious at high SV conditions (300h-1 and above). For
example, when increasing the reactor diameter from R1 to R4, XCO decreased from 96.8% to
0
100
200
300
400
500
600
700
800
900
1000
1100
1200
1300
0
10
20
30
40
50
60
70
80
90
100
70 100 200 300 400 500 1000
A/%
in li
ne c
hart
XC
O/%
in b
ar c
hart
SV/h-1
R1R2R3R4

127
80.1% at a SV of 70 h-1, while XCO decreased from 47.2% to 13.3% at a SV of 1000h-1. It has
been widely reported that a decrease in the reactor tube diameter improves the heat removal
capacity of the reactor [32–34]. Thus, for the same Tconst, A can be much larger with reactor
tubes of a smaller diameter, which results in a higher XCO. Figure 5.2 shows that, under the
same SV conditions, A increases with a decrease in the reactor tube diameter, i.e. from R4 to
R1. However, XCO decreases with an increase in SV from 70 to 1000h-1. The SV affects the
reaction extent and the residence time of the reactants, resulting in a decrease in conversion.
Figure 5.3: Simulation results for C3+ product selectivity SC3+ (bar chart) and average temperature in the catalyst
bed TAVE (line chart) in different single tube reactor models (feed temperature 458K, 10bar, Tconst=468K; the
catalyst mixture that contains 25 vol% of 15% Co-SiO2 catalyst and balanced ceramic balls corresponds to
A=100%; reactant syngas volumetric composition of 22.68% CO, 49.90% H2,18.36% CO2, and 9.06% N2; R1 to
R4 are defined in Table 2).
As seen in Figure 5.3, the TAVE decreased with decreasing tube diameter from R4 to R1 under
the same SV condition. On one hand, a reactor tube with a smaller diameter has better
temperature control; while on the other hand, due to the higher catalyst activity in a reactor tube
with a smaller diameter, the syngas concentration reduces sharply in the axial direction, which
458
459
460
461
462
463
464
465
80
82
84
86
88
90
92
94
96
98
100
70 100 200 300 400 500 1000T
AV
E/K
in l
ine
char
t
S C3+
/% in
bar
cha
rt
SV/(1/h)
R1R2R3R4

128
leads to a marked decrease in reaction rate in the direction of flow. Consequently, the axial
temperature distribution along the centre of a reactor tube with smaller diameter is steeper in
the front part of catalyst bed and flatter in the later part (shown in Figure 5.4). Figure 5.3 also
shows that TAVE increases with an increase in SV, even though, by definition, Tmax is the same.
This can be explained by the local reaction rate, which is directly related to local temperature,
in the front part of the catalyst bed being mainly determined by the (optimized) catalyst
activity, while that in the later part of the tube controlled by the (low) syngas concentration.
Considering reactor R2 for example, the axial temperature distribution along centre of R2 at
different SV is presented in Figure 5.5. It has been reported that temperature influences the FT
product distribution and that a lower temperature normally favours heavy products [58].
Generally, seen as the bar chart in Figure 5.3, the SC3+ was stable at the same level in all
simulation runs; while the detailed value of SC3+ decreases slightly with an increase in TAVE,
which is consistent with reported regulation.
The productivity of the C3+ products (Pro) in each simulation is summarized in Table 5.7. It
shows that Pro is proportional to the SV and the reactor tube diameter. However, in practical
applications of TFBRs, a minimum single pass XCO is normally specified. In the discussion
that follows, it was assumed that XCO>80%. In Figure 5.2, the operating conditions that
satisfy the specification that XCO> 80% (indicated by the dash line) are indicated. The Pro for
the C3+ products, which also satisfy XCO>80%, are shown in bold in Table 5.7. The maximum
Pro products increase from 5.4g/h at a SV of 300h-1 for the smallest reactor tube
(corresponding to R1), to 8.6g/h at a SV of 70 h-1 in the reactor tube with the largest diameter

129
(R4). Thus, perhaps contrary to our initial assumptions, the largest tube diameter shows the
highest value of Pro. This is because the catalyst used has the lowest A of all the cases
considered, which, in turn, results in TAVE being the highest of all the cases considered, even
though the heat transfer rate is better in smaller tubes.
Figure 5.4 Axial temperature distribution along the centre of a reactor tube for different diameters (feed
temperature 458 K, 10 bar, Tconst=468 K, SV=300; the catalyst mixture that contains 25 vol% of 15% Co-SiO2
catalyst and balanced ceramic balls corresponds to A=100%; reactant syngas volumetric composition of 22.68%
CO, 49.90% H2, 18.36% CO2, and 9.06% N2; R1 to R4 are defined in Table 5.2).
456
458
460
462
464
466
468
4700.
180.
210.
240.
270.
300.
330.
360.
390.
430.
460.
490.
520.
550.
580.
610.
640.
670.
700.
730.
770.
800.
830.
860.
890.
920.
95
Tem
pera
ture
/K
Normalized reactor length
R1R2R3R4

130
Figure 5.5 Axial temperature distribution along the centre of reactor tube when using model R2 with different SV
(feed temperature 458 K, 10 bar, Tconst=468 K; the catalyst mixture that contains 25 vol% of 15% Co-SiO2
catalyst and balanced ceramic balls corresponds to A=100%; reactant syngas volumetric composition of 22.68%
CO, 49.90% H2, 18.36% CO2, and 9.06% N2; R1 to R4 are defined in Table 5.2).
Table 5.7: Productivity of C3+products(Pro) in single reactor tubes with
different diameters
Model
SV/h-1 Pro/(g/h) R1 R2 R3 R4
70 1.5 2.5 5.3 8.6
100 2.0 3.5 7.1 10.8
200 3.9 6.3 11.1 15.0
300 5.4 8.2 13.2 16.9
400 6.6 9.6 14.5 17.9
500 7.5 10.6 15.3 18.6
1000 10.1 13.0 17.3 20.3
5.3.3 Design results for a multi-tube reactor with a fixed shell diameter
The space available for the reactor is limited by space constraints in the design of small,
modular FT plants; therefore, it was assumed that the diameter of the shell of the TFBR is
fixed by the available space in the container. In the example used in this paper, the available
space for the TFBR was taken to be 1916 mm in diameter and 2030 mm in height. As the
456
458
460
462
464
466
468
470
0.18
0.21
0.24
0.27
0.30
0.33
0.36
0.39
0.43
0.46
0.49
0.52
0.55
0.58
0.61
0.64
0.67
0.70
0.73
0.77
0.80
0.83
0.86
0.89
0.92
0.95
Tem
pera
ture
/K
Normalized reactor length
SV=70SV=100SV=200SV=300SV=400SV=500SV=1000

131
diameter of the reactor tube varies, so the number of tubes that can be fitted in the reactor
shell in the design changes. The single reactor bundle layout was arranged in a triangular
pattern (shown in Figure 5.6), which is widely used in practice. The tube pitch chosen was
the minimum value (i.e. 1.25 times the outer diameter of the tube), for the purpose of packing
the tube bundle closely and accommodating as many single tubes as possible [55,61–63].
However, it can be seen that as the tube diameter increases, so the distance between the tubes
also increases, which means that fewer tubes can be fitted into the reactor shell. Given this
geometry, we can then ask what reactor tube diameter and what corresponding operating
parameters maximize the productivity of C3+ products in the reactor?
Figure 5.6: Triangular pattern of the tube arrangement
The tube pitch and the number of tubes that can be fitted in the tube bundles for the different
reactor tube diameters are listed in Table 5.8. This clearly shows that as the tube diameter
increases, so the number of reactor tubes in the tube bundle decrease. It is not clear if the
increase in Pro with the larger reactor tubes compensates for the decrease in the number of
tubes in the reactor. We can thus look at how the Pro varies with reactor tube diameter for the
reactor as a whole.

132
Table 5.8: Specifications for standard stainless steel seamless tube bundles R1 R2 R3 R4
Tube pitch/mm 33.34 41.75 60.33 75.40
Number of tubes 2857 1801 847 531
5.3.4 Productivity of the multi-tubular reactor
Assuming that the behaviour of each single reactor tube in the tube bundle is the same in
terms of reaction and heat transfer, the total C3+ productivity for a multi-tube reactor with a
given reactor tube diameter can be calculated as the product of the Pro of a single tube and
the number of tubes in the tube bundle. The resulting value of Pro for the overall reactor,
when using a different tube diameter, is given in Table 9. The values in bold again correspond
to the conditions with XCO>80% and these are therefore the cases that would meet the
requirement of the once through conversion.
Table 5.9: Total productivity of C3+ products (Pro),in a TFBR with reactor tubes of
different diameters
Model
SV/h-1 Pro/(kg/h) R1 R2 R3 R4
70 4.2 4.6 4.5 4.5
100 5.9 6.3 6.0 5.7
200 11.0 11.3 9.4 7.9
300 15.3 14.8 11.2 9.0
400 18.7 17.3 12.3 9.5
500 21.4 19.1 13.0 9.9
1000 28.8 23.4 14.6 10.8
According to Table 5.9, Pro for a multi-tube reactor when using a fixed tube diameter
increases with increasing SV. However, for a given SV between 70 and 200 h-1, Pro goes
through a maximum with increasing tube diameter. For SV ≥300 h-1, the overall Pro of the
reactor decreases with an increase in the diameter of the reactor tube, although XCO <80% for
all but one point. This means that these operating points are probably not economically viable

133
for a single pass FT process operation. The result seen may be caused by the opposing trends
with the increasing tube diameter, i.e. the increase of the potential maximum productivity in
single TFBR and the decrease of the number of tubes that can be contained in the tube bundle
of the TFBR.
Considering the requirement that XCO >80% (the maximum Pro, independent of SV)
decreases with an increase in the tube diameter, i.e. from 15.3kg/h for R1 to 4.5kg/h for R4,
while the overall theoretical maximum Pro (given Tmax = 468 K and XCO >80%) is 15.3kg/h.
This is achieved when using reactor tubes with a DN3/4” diameter, a SV of 300h-1 and a
catalyst activity coefficient A of 695% of that used in the base case. According to the
simulation results in this optimized case, the average CO consumption rate for the whole
catalyst bed is only 0.0840mmol/(g cat*min), while the predicted peak CO consumption rate
in catalyst bed is 0.7107mmol/(g cat*min). This catalyst activity is achievable according to
current FTS catalyst research, for example the CO consumption rate with the Co/SiC catalyst
reported in Liu’s study was 0.8333 mmol/(g cat*min) and with Xiong’s Co/N-CSs catalyst it
reached 2.3333 mmol/(g cat*min) [64,65].
For a further comparison of reactor volumetric efficiency in above proposed reactors, the
productivity of C3+ hydrocarbons per unit reactor volume (Pro/v) was calculated and
summarized in Table 5.10. Since the reactor volume was constant, the trends of Pro/v were
consistent with that of Pro in Table 5.9. As seen, the Pro/v varied in the range from 0.11 to
0.74 bbl/(d*m3); similarly, considering the restriction of once-through CO conversion, the
available values of Pro/v (varied from 0.11 to 0.39 bbl/(d*m3) were in bold format.

134
Table 5.10: Productivity of C3+products per unit reactor volume (Pro/m) in
single reactor tubes with different diameters
Model
SV/h-1 Pro/v ( bbl/day/m3) R1 R2 R3 R4
70 0.11 0.12 0.12 0.12
100 0.15 0.16 0.15 0.15
200 0.28 0.29 0.24 0.20
300 0.39 0.38 0.29 0.23
400 0.48 0.45 0.32 0.25
500 0.55 0.49 0.34 0.26
1000 0.74 0.60 0.38 0.28
The available range of Pro/v from the designed multi-tube reactor for containerized FTS plant
was relative lower than that from neither Arge reactor in Sasol nor Bintulu reactor in Shell
(shown in Table 5.1) [22]. The most possible reason for this observation is that the industrial
TFBRs were operated at a high space velocity and with recycling the unreacted tail gas to
feeding flow for a fair overall CO conversion. Exactly because the different conditions from
the industrial applications, the proposed design approach of TFBR for small scale FTS plant
was extremely required, which was exactly the starting point of our research.
Except the economic efficiency of small-scale FTS application, the environmental interest
also benefits from the optimization of heavy hydrocarbons productivity on reactor diameter.
Taking the optimised case (Pro=15.3 kg/h at 300 h-1 in R1) for example, the required syngas
from upstream process, i.e. the gasification of biomass or municipal solid waste, is around
97.7 Nm3/h. Thus, the optimised containerized FTS plant may consume approximately 2.2
tons of municipal solid waste or 2.0 tons of wood chips per day, when estimated by the
reported syngas yield from gasification [66,67].
5.4 Conclusions

135
The extensive use of small-scale FTS process from biomass and municipal solid waste is
conductive to reduce the CO2 emission and environment-friendly treatment of solid waste. A
different approach to that traditionally used for the design of multi-tube reactors for mega
plants was proposed for the design of a multi-tube reactor in a small-scale FTS plant, in order
to intensify the total productivity of C3+ products (Pro) and the multi-tube reactor efficiency.
The maximum allowable temperature in the catalyst bed was fixed at Tconst= 468K; the
activity of the catalyst and the SV were varied to ensure that the maximum temperature in
catalyst bed would meet but not exceeded the given temperature rise limit. Thus, the catalysts
selection and reactor design was related by optimising the catalyst activity and the SV for a
given reactor tube diameter, rather than optimising the reactor for a given catalyst, which is
the more classical approach.
A validated CFD model using ANSYS Fluent in an earlier study was employed to verify the
proposed design approach [39]. Firstly, using an operating pressure of 10 bar as an economic
compromise, the Pro for the reactor tubes with different diameters for a given Tconst (and
matching catalyst activity and SV) was simulated. The Pro increased with both an increase in
tube diameter and SV. Secondly, the Pro in a multi-tube reactor of given diameter was
considered. As the shell diameter of the multi-tube reactor was fixed according to the portable
modular plant, under the same tube bundle design method, the number of reactor tubes that
could be fitted in the multi-tube reactor decreased along with the increase in tube diameter.
Assuming that each reactor tube in the multi-tube reactor behaved in the same way, the Pro
for the multi-tube reactor was estimated by multiplying the Pro for a single tube reactor and

136
the number of corresponding tubes fitted in the multi-tube reactor. When varying the reactor
tube diameter at a low fixed SV (i.e. between 70~200h-1), Pro exhibited a maximum with a
reactor tube with an intermediate diameter; at a higher SV (i.e. 300~1000h-1), Pro increased
with an increase in the diameter of the reactor tube. Therefore, considering the economic
efficiency of a portable modular plant (with a single pass CO conversion greater than 80%),
the optimal heavy hydrocarbon productivity was 15.3kg/h with a reactor tube reactor
diameter of 3/4” operated at a SV of 300h-1 and catalyst activity of 695% of that of the base
case. Under the conditions of optimized case, the daily consumption of feedstock of
municipal solid waste or biomass (wood chip) for the containerized FTS plant was estimated
2.2 ton or 2.0 ton, respectively.

137
References
[1] S. Luo, Y. Zhou, C. Yi, Syngas production by catalytic steam gasification of municipal
solid waste in fixed-bed reactor, Energy. 44 (2012) 391–395.
doi:10.1016/j.energy.2012.06.016.
[2] M.E. Dry, Fischer–Tropsch reactions and the environment, Appl. Catal. A Gen. 189
(1999) 185–190. doi:10.1016/S0926-860X(99)00275-6.
[3] P.C. Badger, P. Fransham, Use of mobile fast pyrolysis plants to densify biomass and
reduce biomass handling costs — a preliminary assessment, Biomass and Bioenergy. 30
(2006) 321–325. doi:10.1016/j.biombioe.2005.07.011.
[4] P.T. Sekoai, E.B.G. Kana, Semi-pilot scale production of hydrogen from Organic
Fraction of Solid Municipal Waste and electricity generation from process effluents,
Biomass and Bioenergy. 60 (2013) 156–163. doi:10.1016/j.biombioe.2013.11.008.
[5] E. Friedrich, C. Trois, GHG emission factors developed for the recycling and
composting of municipal waste in South African municipalities, Waste Manag. 33 (2013)
2520–2531. doi:10.1016/j.wasman.2013.05.010.
[6] D.A. Wood, C. Nwaoha, B.F. Towler, Gas-to-liquids(GTL): A review of an industry
offering several routes for monetizing natural gas, J. Nat. Gas Sci. Eng. 9 (2012) 196–
208. doi:10.1016/j.jngse.2012.07.001.
[7] H.J. Venvik, J. Yang, Catalysis in microstructured reactors: Short review on small-scale
syngas production and further conversion into methanol, DME and Fischer-Tropsch

138
products, Catal. Today. (2017) 1–12. doi:10.1016/j.cattod.2017.02.014.
[8] F. You, B. Wang, Life cycle optimization of biomass-to-liquid supply chains with
distributed- centralized processing networks, Ind. Eng. Chem. Res. 50 (2011) 10102–
10127. doi:10.1021/ie200850t.
[9] A.C. Dimian, C.S. Bildea, A.A. Kiss, Process intensification: Transforming chemical
engineering, Comput. Aided Chem. Eng. 35 (2014) 22–34.
doi:10.1016/B978-0-444-62700-1.00010-3.
[10] D. Hildebrandt, Portable plant makes fuel from waste, (2011).
https://www.brandsouthafrica.com/investments-immigration/science-technology/beauti
fuel-231111.
[11] D. Hildebrandt, BeauTiFuel project to convert waste to fuel debuts at COP 17 - Wits
University, (2012).
[12] S.T. Sie, R. Krishna, Fundamentals and selection of advanced Fischer-Tropsch reactors,
Appl. Catal. A Gen. 186 (1999) 55–70. doi:10.1016/S0926-860X(99)00164-7.
[13] A.P. Steynberg, M.E. Dry, B.H. Davis, B.B. Breman, Fischer-Tropsch reactors, Elsevier
B.V., 2004. doi:10.1016/s0167-2991(04)80459-2.
[14] R. Guettel, U. Kunz, T. Turek, Reactors for Fischer-Tropsch synthesis, Chem. Eng.
Technol. 31 (2008) 746–754. doi:10.1002/ceat.200800023.
[15] H. Schulz, Short history and present trends of Fischer–Tropsch synthesis, Appl. Catal. A
Gen. 186 (1999) 3–12. doi:10.1016/S0926-860X(99)00160-X.
[16] R.M. De Deugd, F. Kapteijn, J.A. Moulijn, Trends in Fischer-Tropsch reactor

139
technology - opportunities for structured reactors, Top. Catal. 26 (2003) 29–39.
doi:10.1023/B:TOCA.0000012985.60691.67.
[17] S. Walter, S. Malmberg, B. Schmidt, M.A. Liauw, Comparison of microchannel and
fixed bed reactors for selective oxidation reactions isoprene to citraconic anhydride,
Chem. Eng. R. 83 (2005) 1019–1029. doi:10.1205/cherd.04066.
[18] X. Zhu, X. Lu, X. Liu, D. Hildebrandt, D. Glasser, Heat transfer study with and without
Fischer-Tropsch reaction in a fixed bed reactor with TiO2, SiO2, and SiC supported
cobalt catalysts, Chem. Eng. J. 247 (2014) 75–84. doi:10.1016/j.cej.2014.02.089.
[19] X. Zhu, X. Lu, X. Liu, D. Hildebrandt, D. Glasser, Study of radial heat transfer in a
tubular Fischer-Tropsch synthesis reactor, in: Ind. Eng. Chem. Res., 2010: pp. 10682–
10688. doi:10.1021/ie1004527.
[20] D. Merino, O. Sanz, M. Montes, Effect of catalyst layer macroporosity in
high-thermal-conductivity monolithic Fischer-Tropsch catalysts, Fuel. 210 (2017) 49–
57. doi:10.1016/j.fuel.2017.08.040.
[21] D. Glasser, D. Hildebrandt, X. Liu, X. Lu, C.M. Masuku, Recent advances in
understanding the Fischer-Tropsch synthesis (FTS) reaction, Curr. Opin. Chem. Eng. 1
(2012) 296–302. doi:10.1016/j.coche.2012.02.001.
[22] R.L. Espinoza, A.P. Steynberg, B. Jager, A.C. Vosloo, Low temperature Fischer –
Tropsch synthesis from a Sasol perspective, Appl. Catal. A Gen. 186 (1999) 13–26.
[23] B. Jager, Development in Fischer-Tropsch technology, Stud. Surf. Sci. Catal. 107 (1997)
219–224. doi:10.1016/S0167-2991(97)80338-2.

140
[24] R. Overtoom, N. Fabricius, W. Leenhouts, Shell GTL, from Bench scale to World scale,
in: Proc. 1st Annu. Gas Process. Symp., First Edit, Elsevier B.V., 2009: pp. 378–386.
doi:10.1016/b978-0-444-53292-3.50046-8.
[25] L. Carlsson, N. Fabricius, From Bintulu Shell MDS to Pearl GTL in Qatar applying the
lessons of eleven years of commercial GTL experience to develop a world scale plant,
Manager. (2005).
[26] B.H. Davis, Fischer-Tropsch synthesis: Overview of reactor development and future
potentialities, Top. Catal. 32 (2005) 143–168. doi:10.1007/s11244-005-2886-5.
[27] R. Krishna, S.T. Sie, Design and scale-up of the Fischer – Tropsch bubble column slurry
reactor, Fuel Process. Technol. 64 (2000) 73–105.
doi:10.1016/S0378-3820(99)00128-9.
[28] L.P. Dancuart, A.P. Steynberg, Fischer-Tropsch based GTL Technology : a New
Process ?, Stud. Surf. Sci. Catal. 163 (2007) 379–399.
doi:10.1016/S0167-2991(07)80490-3.
[29] B. Bao, M.M. El-halwagi, N.O. Elbashir, Simulation , integration , and economic
analysis of gas-to-liquid processes, Fuel Process. Technol. 91 (2010) 703–713.
doi:10.1016/j.fuproc.2010.02.001.
[30] G. Jacobs, B.H. Davis, Industrial applications of multiphase reactors, 2016.
[31] S.T. Sie, R. Krishna, Fundamentals and selection of advanced Fischer–Tropsch reactors,
Appl. Catal. A Gen. 186 (1999) 55–70. doi:10.1016/S0926-860X(99)00164-7.
[32] G. Chabot, R. Guilet, P. Cognet, C. Gourdon, A mathematical modeling of catalytic

141
milli-fixed bed reactor for Fischer-Tropsch synthesis: Influence of tube diameter on
Fischer Tropsch selectivity and thermal behavior, Chem. Eng. Sci. 127 (2015) 72–83.
doi:10.1016/j.ces.2015.01.015.
[33] B. Todic, M. Mandic, N. Nikacevic, D.B. Bukur, Effects of process and design
parameters on heat management in fixed bed Fischer-Tropsch synthesis reactor, Korean
J. Chem. Eng. 35 (2018) 1–15. doi:10.1007/s11814-017-0335-3.
[34] Y.N. Wang, Y.Y. Xu, Y.W. Li, Y.L. Zhao, B.J. Zhang, Heterogeneous modeling for
fixed-bed Fischer-Tropsch synthesis: Reactor model and its applications, Chem. Eng.
Sci. 58 (2003) 867–875. doi:10.1016/S0009-2509(02)00618-8.
[35] A.C. Ghogia, A. Nzihou, P. Serp, K. Soulantica, D.P. Minh, Cobalt catalysts on
carbon-based materials for Fischer-Tropsch synthesis: a review, Appl. Catal. A, Gen.
(2020). doi:doi.org/10.1016/j.apcata.2020.117906.
[36] H. Atashi, F. Siami, A.A. Mirzaei, M. Sarkari, Kinetic study of Fischer – Tropsch
process on titania-supported cobalt-manganese catalyst, J. Ind. Eng. Chem. 16 (2010)
952–961. doi:10.1016/j.jiec.2010.04.005.
[37] R.M. Malek Abbaslou, J.S. Soltan Mohammadzadeh, A.K. Dalai, Review on
Fischer-Tropsch synthesis in supercritical media, Fuel Process. Technol. 90 (2009) 849–
856. doi:10.1016/j.fuproc.2009.03.018.
[38] AtlasSteels, Atlas Steels Australia - the leading supplier of specialty metals, (n.d.).
https://www.atlassteels.com.au.
[39] J. Shen, Y.-C. Li, W.H. Ho, X. Liu, D. Hildebrandt, Experimental and simulation study

142
of the temperature distribution in a bench-scale fixed bed Fischer-Tropsch reactor,
AIChE J. Early View (2021). doi:https://doi.org/10.1002/aic.17145.
[40] A.Y. Khodakov, W. Chu, P. Fongarland, Advances in the development of novel cobalt
Fischer−Tropsch catalysts for synthesis of long-chain hydrocarbons and clean fuels,
Chem. Rev. 107 (2007) 1692–1744. doi:10.1021/cr050972v.
[41] M. Irani, Investigating the production of liquid fuels from synthesis gas (CO+H2) in a
bench-scale packed-bed reactor based on Fe–Cu–La/SiO2 catalyst: Experimental and
CFD modeling, Int. J. Ind. Chem. 5 (2014) 1–9. doi:10.1007/s40090-014-0011-y.
[42] G. Chabot, R. Guilet, P. Cognet, C. Gourdon, A mathematical modeling of catalytic
milli-fixed bed reactor for Fischer-Tropsch synthesis: Influence of tube diameter on
Fischer Tropsch selectivity and thermal behavior, Chem. Eng. Sci. 127 (2015) 72–83.
doi:10.1016/j.ces.2015.01.015.
[43] R. Philippe, M. Lacroix, L. Dreibine, C. Pham-Huu, D. Edouard, S. Savin, F. Luck, D.
Schweich, Effect of structure and thermal properties of a Fischer–Tropsch catalyst in a
fixed bed, Catal. Today. 147 (2009) S305–S312. doi:10.1016/j.cattod.2009.07.058.
[44] I.C. Yates, C.N. Satterfield, Intrinsic kinetics of the Fischer-Tropsch synthesis on a
cobalt catalyst, Energy & Fuels. 5 (1991) 168–173. doi:10.1021/ef00025a029.
[45] J. Shen, Y. Li, W.H. Ho, X. Liu, D. Hildebrandt, Experimental and simulation study of
the temperature distribution in a bench-scale fixed bed Fischer – Tropsch reactor,
AIChE J. 67 (2021) 1–14. doi:10.1002/aic.17145.
[46] M. Sadeqzadeh, J. Hong, P. Fongarland, D. Curulla-Ferré, F. Luck, J. Bousquet, D.

143
Schweich, A.Y. Khodakov, Mechanistic modeling of cobalt based catalyst sintering in a
fixed bed reactor under different conditions of Fischer-Tropsch synthesis, Ind. Eng.
Chem. Res. 51 (2012) 11955–11964. doi:10.1021/ie3006929.
[47] M.H. Rafiq, H.A. Jakobsen, R. Schmid, J.E. Hustad, Experimental studies and modeling
of a fixed bed reactor for Fischer–Tropsch synthesis using biosyngas, Fuel Process.
Technol. 92 (2011) 893–907. doi:10.1016/j.fuproc.2010.12.008.
[48] N. Majidian, S. Soltanali, Comparison of Fischer-Tropsch fixed and monolith bed
reactors using pseudo-homogeneous 2D model, J. Japan Pet. Inst. 59 (2016) 126–139.
doi:10.1627/jpi.59.126.
[49] K.S. Kshetrimayum, I. Jung, J. Na, S. Park, Y. Lee, S. Park, C.-J. Lee, C. Han, CFD
simulation of microchannel reactor block for Fischer–Tropsch Synthesis: Effect of
coolant type and wall boiling condition on reactor temperature, Ind. Eng. Chem. Res. 55
(2016) 543–554. doi:10.1021/acs.iecr.5b03283.
[50] ANSYS Inc., ANSYS FLUENT 12.0 User’s Guide, 2009.
http://www.afs.enea.it/project/neptunius/docs/fluent/html/ug/main_pre.htm.
[51] A. Jess, C. Kern, Influence of particle size and single-tube diameter on thermal behavior
of Fischer-Tropsch reactors, Chem. Eng. Technol. 35 (2012) 369–378.
doi:10.1002/ceat.201100615.
[52] M.A.M. Sajad Karimi Mazidi, Mohammad Taghi Sadeghi, Optimization of
Fischer-Tropsch process in a fixed-bed reactor using non-uniform catalysts, Chem. Eng.
Technol. 36 (2013) 62–72. doi:10.1002/ceat.201200268.

144
[53] N.E. Tsakoumis, M. Rønning, O. Borg, E. Rytter, A. Holmen, Deactivation of cobalt
based Fischer-Tropsch catalysts : A review, Catal. Today. 154 (2010) 162–182.
doi:10.1016/j.cattod.2010.02.077.
[54] J. van De Loosdrecht, B. Balzhinimaev, J. Dalmon, J.W. Niemantsverdriet, Cobalt
Fischer-Tropsch synthesis : Deactivation by oxidation?, Catal. Today. 123 (2007) 293–
302. doi:10.1016/j.cattod.2007.02.032.
[55] C.J. Bertole, C.A. Mims, G. Kiss, The effect of water on the cobalt-catalyzed Fischer-
Tropsch synthesis, J. Catal. 96 (2002) 84–96. doi:10.1006/jcat.2002.3666.
[56] E. van Steen, M. Claeys, M.E. Dry, J. van De Loosdrecht, E.L. Viljoen, J.L. Visagie,
Stability of nanocrystals: Thermodynamic analysis of oxidation and re-reduction of
cobalt in water/hydrogen mixtures, J. Phys. Chem. 109 (2005) 3575–3577.
doi:10.1021/jp045136o.
[57] A. Tavasoli, R.M. Malek, A.K. Dalai, Deactivation behavior of ruthenium promoted
Co/g-Al2O3 catalysts in Fischer–Tropsch synthesis, Appl. Catal. A Gen. 346 (2008)
58–64. doi:10.1016/j.apcata.2008.05.001.
[58] M.E. Dry, High quality diesel via the Fischer-Tropsch process - A review, J. Chem.
Technol. Biotechnol. 77 (2002) 43–50. doi:10.1002/jctb.527.
[59] R.W. Dorner, D.R. Hardy, F.W. Williams, B.H. Davis, H.D. Willauer, Influence of Gas
Feed Composition and Pressure on the Catalytic Conversion of CO 2 to Hydrocarbons
Using a Traditional Cobalt-Based Fischer - Tropsch Catalyst, Energy & Fuels. 23 (2009)
4190–4195.

145
[60] S. Zheng, Y. Liu, J. Li, B. Shi, Deuterium tracer study of pressure effect on product
distribution in the cobalt-catalyzed Fischer–Tropsch synthesis, Appl. Catal. A Gen. 330
(2007) 63–68. doi:10.1016/j.apcata.2007.07.010.
[61] B. Todic, L. Nowicki, N. Nikacevic, D.B. Bukur, Fischer-Tropsch synthesis product
selectivity over an industrial iron-based catalyst : Effect of process conditions, Catal.
Today. 261 (2016) 28–39. doi:10.1016/j.cattod.2015.09.005.
[62] A.R. De Osa, A. De Lucas, A. Romero, J.L. Valverde, P. Sánchez, Fischer-Tropsch
diesel production over calcium-promoted Co/alumina catalyst: Effect of reaction
conditions, Fuel. 90 (2011) 1935–1945. doi:10.1016/j.fuel.2010.12.024.
[63] S. Fettaka, J. Thibault, Y. Gupta, Design of shell-and-tube heat exchangers using
multiobjective optimization, Int. J. Heat Mass Transf. 60 (2013) 343–354.
doi:10.1016/j.ijheatmasstransfer.2012.12.047.
[64] Y. Liu, D. Edouard, L.D. Nguyen, D. Begin, P. Nguyen, C. Pham, C. Pham-huu, High
performance structured platelet milli-reactor filled with supported cobalt open cell SiC
foam catalyst for the Fischer-Tropsch synthesis, Chem. Eng. J. 222 (2013) 265–273.
doi:10.1016/j.cej.2013.02.066.
[65] H. Xiong, M. Moyo, M.K. Rayner, L.L. Jewell, D.G. Billing, Autoreduction and
catalytic performance of a cobalt Fischer-Tropsch synthesis catalyst supported on
nitrogen-doped carbon spheres, ChemCatChem. 2 (2010) 514–518.
doi:10.1002/cctc.200900309.
[66] Q. Zhang, L. Dor, D. Fenigshtein, W. Yang, W. Blasiak, Gasification of municipal solid
146
waste in the plasma gasification melting process, Appl. Energy. 90 (2012) 106–112.
doi:10.1016/j.apenergy.2011.01.041.
[67] S. Vineet Singh, M. Zhao, P. Clough, J. Yao, X. Zhong, M. Zaki, N. Shal, E. Anthony, P.
Fennell, An overview of advances in biomass gasification, Energy Environ. Sci. 1 (2016)
1–43. doi:10.1039/C6EE00935B.

147
CHAPTER 6
A SIMULATION OPTIMIZATION APPROACH
FOR A SIZE-SPECIFIED MULTI-PLATE
REACTOR IN FISCHER-TROPSCH SYNTHESIS
PROCESS
6.1 Introduction
The Fischer-Tropsch synthesis (FTS) process, which converts syngas (a mixture of carbon
monoxide and hydrogen) into a large spectrum of hydrocarbons, provides a viable route for
the production of low-sulfur synthetic fuel [1,2]. Since its discovery in the 1920s, it has
received significant attention from researchers worldwide because of the increasing demand
for fossil fuel from modern society and the increasing pressure on the environmental crisis.
FTS is a strong exothermic process and the theoretical adiabatic temperature rise could be as
high as 1750K [3]. Special attention has been paid to temperature control in the reactor,
because an adverse temperature rise may result in catalyst deactivation, a decrease in heavy
hydrocarbon product selectivity, system temperature runaway, etc. [4,5].
Along with the development of the FTS industry, many other types of reactors have also been
employed in practical applications, including the fixed bed reactor, fluidized bed reactor and
slurry bed reactor [6]. However, the most suitable reactor for the FTS process is still under
debate, because each of these reactors has certain drawbacks [7]. Generally, the fixed bed
reactor still has a competitive position in multi-scales of FTS applications, because it offers: 1)
simple installation and robust operation; 2) high catalyst loading volume; 3) high potential

148
productivity [8–10].
FBR normally contains an indirect heat exchange structure between the reaction region and
the cooling medium. Tubular FBR has been widely implemented in applications from
lab-scale to industrial scale, and its efficiency relies heavily on its tube specification and
layout arrangement, as discussed in the previous chapter.
The plate reactor, in which the catalyst and the cooling medium are alternatively packed in
adjacent channels between the plates, is another type of widely accepted FBR [11,12]. It
draws much interest from scientists in terms of applications for different chemical processes,
especially strong exothermic processes. Haugwitz et al. [13] developed a so-called Open
Plate Reactor from a plate heat exchanger for the purpose of superior mixing of reactants and
high heat removal capacity. They claimed that, according to their simulation results, the
system control of the plate reactor is similar to an ideal tubular FBR, while its design
flexibility in terms of the reactor plates, cooling plates, multiple injections, etc., offers more
possibilities for improved control of the exothermic chemical process.
Schodel et al. [14] invented a type of plate reactor in which parallel plates were provided with
grooves or ribs, with these flat channels containing the catalyst bed and process fluid
alternatively. Lim et al. [15] employed a plate-type reactor for the methane steam reforming
process. The reactivity proved to correspond to that obtained from a conventional tubular
FBR, and it benefitted from the high heat transfer rate of the plate reactor. Zanfir and
Gavriilidis [16] did a simulation study on a catalytic plate reactor involving the methane
combustion process and the methane steam reforming process in adjacent channels.

149
According to their simulation results, more distinct heat transfer efficiency was observed than
with a conventional reformer, due to the short distance between the heat source and the heat
sink.
Thus, the plate reactor could be approximated as an ideal tubular FBR from both the structure
and functional aspects, and it enjoy more advantages than those of conventional FBR
mentioned above. Compared to a tubular FBR, the heat transfer capability of the plate reactor
was efficiently improved due to its flexibility in terms of plate specifications. Similar to the
multi-tube reactor, the multi-plate reactor can be scaled-up for commercial applications by
simply adding more plates from a lab setup or a smaller scale setup. However, while the
tubular form of FBR has been used in various FTS application scales, few studies have been
reported on applying the plate reactor to commercial FTS processes.
This chapter reports on the study involving a plate reactor that was employed in a project for
a modular portable Fischer-Tropsch plant [17, 18]. This was developed by Prof. Hildebrandt’s
research group, as a potential substitute for the multi-tube reactor [17,18]. The modular
portable FTS plant involves the same process for synthesising fuel from carbon-containing
raw material in a mega plant. However, the portable plant was designed to be compact
enough to fit into a commercial shipping container. This typical small-scale FTS project has
significance for FTS applications with widely distributed but low concentration feeds,
including biomass, agriculture waste and solid municipal waste, or with applications
involving syngas from small scale of catalytic methane reforming.
To take full advantage of the limited space in the container, special attention should be paid to

150
the volumetric efficiency of all the equipment required for the plasma gasification, wet
quench and scrubber, FTS reaction and product separation steps of the process. In particular,
the plate reactor used in the FTS reaction step was also expected to be high productivity of
synthesis fuel, in order to enhance the capital competitiveness of the proposed containerised
project. This requirement is consistent with the concept of process intensification (PI), which
aims to make the equipment smaller but increase its efficiency. The applicability of the
FTS-based process is highly dependent on its capital cost and the average product price [19].
Thus, to achieve high applicability, high efficiency and high economics of the FTS reactor are
investigated by researchers and engineers, as this is both a scientific and an engineering
research project [20]. In this study, the design strategy used in a multi-tube reactor in the
previous chapter was used to design a plate reactor.
The plate pitch, which corresponds to the tube diameter in a tubular FBR, is the key design
parameter that affects the heat transfer rate directly [21]. The heat transfer capability benefits
from a short heat transfer distance in a plate reactor with a small plate pitch, as the
temperature rise in catalyst bed will reduce accordingly. It has been widely reported that the
low average temperature in a catalyst bed favours higher selectivity to long chain
hydrocarbons [22]. Therefore, attention was paid to optimizing the plate pitch performance in
the FTS reaction. However, FTS catalysts, especially cobalt-based catalyst, are likely to be
deactivated at high temperature. Thus, it is critical to control the maximum temperature in the
catalyst bed, so that it does not exceed the safety operation range, which will enable
maintaining a stable, long term run. Theoretically, the temperature control in the catalyst bed
151
can be improved by changing the catalyst activity; but the FTS process is normally scaled-up
with using conditions determined in lab-scale experiments, including the catalyst activity. It is
possible to compare the reaction rate and FTS reaction results under the same maximum
temperature in the plate reactor. In this chapter, the catalyst activity and space velocity (SV)
of the reactants was set as the parameters to maintain the same temperature peak in the plate
reactors with different plate distances used to ensure safe operation.
The theoretical support for adjusting the maximum temperature in the plate reactor by
changing the catalyst activity is that the reported catalyst activity in the lab experiment is
more sufficient than could safely be applied in a plant [7,23,24]. The FTS catalyst was
reported to be varied by orders of magnitude with different active metal types, active metal
particle sizes and loading amount, catalyst support, etc. However, the requirement for safety
operation may limit the use of catalysts with high activity in commercial scale FTS
applications. Consequently the catalyst particles may be diluted by adding inert ceramic balls,
in order to reduce the reaction intensity in the catalyst bed, and so control the temperature
distribution in the catalyst bed [25]. In contrast to a mega commercial FTS plant, the
containerized FTS plant is more flexible in terms of the design of the plate reactor and
selection of a proper catalyst.
The intrinsic relationship between the plate pitch and the FTS reaction in the plate reactor is
revealed when the catalyst beds are operating under the similar thermal condition, i.e. same
temperature rise constraint. According to the proposed design approach outlined in the last
chapter, the catalyst specification was designed for a plate reactor with an optimized plate

152
pitch in a small-scale FTS application (i.e. the containerized FTS plant), instead of
implementing the catalyst specifications determined in the lab experiment.
This chapter reports on the design approach proposed in the previous chapter being
implemented with a plate reactor to apply the PI in modular portable Fischer-Tropsch plant.
CFD simulation of a simple structure plate reactor was conducted to predict the FTS reaction
performance, including the CO conversion, selectivity, productivity, et al, and the maximum
temperature in plate reactor. The plate pitch was optimized for a determined temperature rise
constraint in the catalyst bed, in order to maintain safe operations and, importantly, maximize
the overall heavy hydrocarbon production of the plate reactor. To control the temperature
peak at the determined constraint, the catalyst activity and SV were adjusted for different
plate pitches in the reactor.
6.2 Reactor model
6.2.1 Model setup and validation
This chapter reports on a plate reactor model with flat plates in a parallel arrangement that
was built. The flat channels were alternatively used for the reaction region and thermal oil
flow. Due to the oil bath settings has been proved to be sufficient, each individual channel
containing a reaction region was assumed to be independent of the others. Thus the modelling
objective could be simplified to one rectangular chamber for the catalytic reaction inside and
two layers of empty chambers for thermal oil flow. The chamber for the reaction region was
sandwiched by two thermal oil bath chambers, as shown as Figure 6.1. In the modular
portable plant project, the available space for the FTS reactor is 1916x1916x 2030mm. The

153
plate pitch of the reaction region was studied as a design parameter. Each plate was 1916 x
2030mm and the number of chambers accommodated in the multi-plate reactor was restricted
by the width of 1916mm. The details of the modelling process are provided below.
Figure 6.1: Structure of the plate reactor
Figure 6.1 shows the three layers of particles that were packed sequentially in the reaction
region: ceramic balls, catalyst particles and ceramic balls. The height of the catalyst bed was
set as a constant value of 1600mm. The counter current operation was set for the reactive gas
mixture and the thermal oil flow. Five reactor models with different plate distances, i.e. from
1/2 inch to 2 inch, were developed using ANSYS Fluent 19.1. The specifications for the
model geometries are summarized in Table 6.1. The studied range of the plate pitch is
distinctly larger than the catalyst particle diameter; therefore, the three layers of packing beds
in the chamber can be regard as three uniform porous zones. The model geometry was

154
meshed with uniform structured grids.
Table 6.1: Specifications for the plate reactor models
R1 R2 R3 R4 R5
Plate pitch/mm 1/2 3/4 1 3/2 2
Total length/mm 2030 2030 2030 2030 2030
Catalyst bed height/mm 1600 1600 1600 1600 1600
Note: The width of plate reactor was fixed as 1916 mm.
A Co-SiO2 catalyst prepared by the incipient wetness method was used in this study [26]. The
catalyst bed implemented in the base case was a mixture of catalyst particles and ceramic
balls used to suppress the hot spot formation [27]. The fraction of the catalyst particles was
25ml per 100ml ceramic balls. The characteristics of these porous zones are provided in Table
6.2.
Table 6.2: Characteristics of the porous zones
Ceramic ball layer Catalyst bed
Thermal conductivity/(W·m-1·K-1) 1.2 1.4
Pecking density/(g·ml-1) 1.35 0.69
Bed void/% 46 62
According to an unopened study of catalytic gasification of municipal solid waste performed
in our group, the syngas with a composition of 22.68% CO, 49.90% H2, 18.36% CO2, and
9.06% N2 in volume was employed in the simulation. The simulations of the FTS reaction
were performed at a temperature of 458K and an inlet pressure of 10bar. SV in the range of
100 to 500 h-1 was tested as an operational parameter.
Due to the complexity of FTS, its reaction mechanism is still uncertain, which makes the FTS
reaction kinetics model difficult to be detailed described. To simplify the modelling, the FTS
products were assumed to be only paraffins and it was assumed that no oxidants and olefins
were produced. The hydrocarbon products with 3 or more carbon atoms were lumped
together as the C3+ product and represented by pentane. All species were assumed as ideal

155
incompressible gas. The activation of the water gas shift reaction in cobalt catalyst was
negligible [28]. Thus, the formation reactions of methane, ethane and pentane were used to
represent the FTS reaction scheme (See Table 6.3).
Table 6.3: FTS reaction scheme
Reaction Reaction1 𝐂𝐎 + 𝟑𝑯𝟐 ↔ 𝑪𝑯𝟒 + 𝑯𝟐𝑶 Reaction2 𝟐𝐂𝐎 + 𝟓𝑯𝟐 ↔ 𝑪𝟐𝑯𝟔 + 𝟐𝑯𝟐𝑶 Reaction3 𝟓𝐂𝐎 + 𝟏𝟏𝑯𝟐 ↔ 𝑪𝟓𝑯𝟏𝟐 + 𝟓𝑯𝟐𝑶
In this study, a widely accepted semi-empirical approach using the Langmuir-Hinshelwood
equation was implemented. The kinetics (listed as follows) included the FTS reaction rate and
three product formation rate expressions (𝑟 , 𝑟 and 𝑟 ) [29,30].
𝑟 = 𝑘 ∙ 𝑒𝑥𝑝(−𝐸 𝑅𝑇⁄ ) ∙ 𝐶 ∙ 𝐶 (1 + 𝑘 ∙ 𝑒𝑥𝑝(−𝐸 𝑅𝑇⁄ ) ∙ 𝐶 )⁄ 6-1
𝑟 = −𝑟 6-2
𝑟 = 𝑘 ∙ 𝑒𝑥𝑝(−𝐸 𝑅𝑇⁄ ) ∙ 𝑟 6-3
𝑟 = 𝑘 ∙ 𝑒𝑥𝑝(−𝐸 𝑅𝑇⁄ ) ∙ 𝑟 6-4
𝑟 = [1 − 𝑘 ∙ 𝑒𝑥𝑝(−𝐸 𝑅𝑇⁄ ) − 2 × 𝑘 ∙ 𝑒𝑥𝑝(−𝐸 𝑅𝑇⁄ )] ∙ 𝑟 /5 6-5
The four activation energy parameters (E1–E4) were cited from the literature, while the four
pre-exponential factors (k1–k4) were adjustable and obtained from the experimental results
[31–33]. The parameters are listed in Table 6.4.
Table 6.4: List of kinetics parameters used in this study
parameters k1 k2 k3 k4 E1(kJ/mol) E2(kJ/mol) E3(kJ/mol) E4(kJ/mol) 4.76x10⁹ 4.68 8.58x10⁷ 1.08x10³ 100 20 81 49
Given the SV range to be investigated, the flow pattern was determined as laminar flow. Thus
the Laminar Model was selected with respect to the flow mode settings. Thermal equilibrium
was assumed between the gas phase and the solid porous zones. The overall heat transfer

156
coefficient was evaluated according to local fluid properties, while the boundaries making
direct contact with the atmospheric environment were set as adiabatic walls. The physical
properties of stainless steel Grade 304 were cited for the plate wall settings [34]. The solver
of ANSYS Fluent was employed for the governing equations of the Navier-Stokes equation,
energy balance, species balance, etc. [35,36]. The details of the modelling methodology and
the validation were indicated in the researcher previously published study [22].
The simulated catalyst bed was changed from cylindrical shape (used in the previous study)
to a brick shape. The model geometry was the only difference to the previous study, as the
other simulation settings and conditions for reaction kinetics, heat transfer, fluid dynamics,
etc., were kept the same. Therefore, the simulation methodology is acceptable and
corresponding predictions of FTS reaction performance, temperature distribution, etc. were
considered valuable.
6.2.2 Simulation strategy
With practical FTS applications, the biggest concern is achieving high CO conversion and
productivity under safe operating conditions. This chapter reports on the simulation
optimization of a plate pitch for a multi-plate reactor installed in a portable modular plant,
which was carried out for this purpose. Due to the strong exothermic reaction of FTS, the
reaction intensity is normally limited by the heat removal rate of the reactor, which is
considered to be directly related to the plate pitch with a multi-plate reactor. Thus, a
reasonable temperature rise limit for the catalyst bed was required, so that the safety
operation could be ensured and the reaction performances with different plate pitches could

157
be compared when using same thermal condition. In order to adjust the maximum
temperature in the catalyst bed, catalyst activation and the SV of the reactants (the control
parameters) were modified. This allowed for the FTS reaction performance, including CO
conversion and productivity from the plate reactors with different plate distances to be
evaluated when using the same catalyst bed thermal condition.
6.2.2.1 Maximum temperature constraint
The undesired temperature rise in the catalyst bed may lead to a decrease in heavy
hydrocarbon product selectivity, acceleration of catalyst deactivation and temperature
runaway. A safety limit for temperature rise is difficult to determine, owing to the
complicated interactions between reactions and heat/mass transfer. Few studies have been
reported on this topic and the experimental critical value of temperature runaway in the
literature varies from case to case. However, in terms of the temperature rise constraint in this
study, it was required to be conservative enough, but without causing any of the mentioned
negative effects.
According to the experimental experience during conducting in the bench scale fixed bed
reactor in our previous study, the critical temperature rise for temperature runaway was 14K.
However, the critical value for temperature runaway varied in different studies reported in the
literature. Jess [37] reported that an FTS reactor with a diameter of 40mm can be operated
safely with a temperature rise of 35K, according to their simulation. Mazidi [38] claimed that
the safety of the FTS reactor can be assured by controlling the temperature rise to below 50K.
Furthermore, the sintering of cobalt crystallites and the formation of bulk carbide - which

158
leads to the deactivation of the cobalt catalyst - can be efficiently avoided by controlling the
temperature rise [39,40]. Bertole et al. [41] reported that, due to the deterioration of sintering
on a cobalt catalyst at 483K with the presence of vapour, the deactivation was accelerated
permanently. Van Steen et al. [42] studied the stability of cobalt crystallites under the realistic
FTS condition of 523K. The results showed that the cobalt crystallite was very active and
sintering happened easily [42]. Carbide formation on the cobalt catalyst was reportedly at a
temperature of 493K [43]. Further, the FTS reaction was considered to be sensitive to
temperature distribution in the catalyst bed, and a flatter temperature distribution in the
catalyst bed was preferred [44].
In this chapter, the temperature rise constraint in the catalyst bed was set at 10K (i.e. 468K)
after considering all the above information.
6.2.2.2 Catalyst activity coefficient
The catalyst particles are normally diluted in practical applications, and this was done in the
base case. In addition, catalysts with orders of magnitude higher activity have widely
reported in lab studies than that used in plant scale applications. The use of high performance
catalyst was restricted by the temperature rise limit for safety operation [24]. Thus the
catalyst activity could be considered to be an adjustable parameter, to ensure that the
maximum temperature in the catalyst bed reached the determined maximum temperature
constraint.
The modified FTS reaction rate (𝑟 ) was defined by the expression for the FTS reaction rate
𝑟 (Equation 6-6) and a constant of catalyst activity coefficient A, shown as follows:

159
𝑟 = 𝐴 ∙ 𝑟 6-6
The CO consumption rate was modified accordingly:
𝑟 = −𝑟 6-7
6.3. Results and discussion
6.3.1 Optimization of a single-layer plate reactor
The FTS reaction performance of the different plate reactor models were then studied at
different SVs. Figure 6.2 shows the CO conversion and the catalyst activity coefficient used
in each simulation run; Figure 6.3 exhibits the selectivity of the C3+ product and the average
temperature of the catalyst bed. Considering the economic efficiency of the modular portable
plant, a higher once through CO conversion is always favoured. The auxiliary line for the
scale of 80% in CO conversion is indicated by the dash line in Figure 6.2.
The line chart in Figure 6.2 shows that the catalyst activation coefficient decreased with an
increase in plate distance (i.e. from model R1 to model R5), at all SV conditions. In model
R5, the catalyst activation coefficient fell below zero, which means that the containable
catalyst activity in R5 is lower than that in the base case. This trend implies that, under the
same temperature rise constraint, the plate reactor with the largest plate distance allows lower
catalytic activation for safe operation; in other words, the hot spot is more easily formed in a
plate reactor with a larger plate distance. Similar to the effect of reactor diameter on heat
transfer, namely the shorter heat transfer distance contributes to a higher heat transfer rate,
the same mechanism can be account for this observation in this study [45–47]. This can
explain the trend of CO conversion decreasing when increasing the plate distance: for

160
example, the XCO decreased from 95.1% to 49.5% at an SV of 100h-1, as shown in the bar
chat.
Figure 6.2: Simulation results of CO conversion XCO (bar chart) and catalyst activity acceleration coefficient A
(line chart) in different single-layer plate reactor models (458K, 10bar, temperature rise constrain of 10K,
Co-SiO2 catalyst, reactant syngas volumetric compositions of 22.68% CO, 49.90% H2, 18.36% CO2, and 9.06%
N2)
In terms of the influence of the SV increasing from 100 to 300h-1, the XCO showed the
opposite trend in the plate reactor simulations, with the same thermal condition used in the
catalyst bed. This was expected, because both the reaction extent and the resident time of the
gas mixture in the catalyst bed declined with an increase in SV [48,49]. Another interesting
discovery is that the drop in the catalyst activation coefficient is more pronounced in plate
reactors with a smaller plate distance: for instance, A declined from 946 to 480 in R1, while
R5 declined from -35 to -41. This indicates that, when increasing the SV, the FTS process
was controlled by the safety constraint for temperature in the plate reactor with a large plate
distance, while it was controlled by reaction kinetics in the plate reactor with a small plate
distance.
01002003004005006007008009001000110012001300
0
10
20
30
40
50
60
70
80
90
100
100 300 500
A/%
in li
ne c
hart
XC
O/%
in b
ar c
hart
SV /h-1
R1R2R3R4R5

161
Figure 6.3: Simulation results of C3+ product selectivity SC3+ (bar chart) and average temperature in the catalyst
bed TAVE (line chart) in different single-layer plate reactor models (458K, 10bar, temperature rise constraint of
10K, Co-SiO2 catalyst, reactant syngas volumetric composition of 22.68% CO, 49.90% H2, 18.36% CO2, and
9.06% N2)
It has been widely acknowledged that the formation of a hot spot in the catalyst bed results in
a decline in C3+ product selectivity [44]. The same relation between the average catalyst bed
temperature TAVE and SC3+ is observed in Figure 6.3, even though both the TAVE and the SC3+
changed in a relatively small range. When enlarging the plate distance at a constant SV
condition, the TAVE increased slightly due to the heat transfer rate decreasing, while the SC3+
declined accordingly. When enhancing the SV from 100 to 300h-1, the TAVE increased, while
the SC3+ decreased in all plate reactor models. The predicted temperature distribution along the
axis of symmetry of the single-layer plate reactor with different plate pitches at a SV of 300 /h
are presented in Figure A3 in the Appendix A-11; while the predicted temperature distribution
along the axis of symmetry of R3 at different SVs are presented in Figure A4 of Appendix
A-12.
The productivity of C3+ products (Pro) of each plate reactor model was directly proportional
458
459
460
461
462
463
464
465
80
82
84
86
88
90
92
94
96
98
100
100 300 500
TA
VE
in li
ne c
hart
S C3+
/% in
bar
cha
rt
SV /h-1
R1 R2R3 R4R5

162
to its corresponding catalyst loading volume, SV, XCO and SC3+. Table 6.5 summarizes the Pro
for each simulation run. As seen in Table 6.5, the Pro varies from 174.1 up to 636.5g/h at the
determined conditions. But, because of the economic considerations with an actual FTS
process, the XCO is normally required to reach as high as possible. In this study, the minimum
value for XCO was assumed to be 80% for a single pass operation. An auxiliary dash line for
XCO =80% was drawn in Figure 6.2. Thus, only the operating conditions under which XCO
was at least 80% were considered feasible for actual applications. Accordingly, the potential
achievable Pro in the range of 174.1 to 443.4g/h, is indicated in bold font in Table 6.5.
Table 6.5: Productivity of C3+ in different single-layer plate reactor models
Pro/(g/h) R1 R2 R3 R4 R5 SV=100 174.1 246.5 300.7 354.3 361.1 SV=300 443.4 523.7 541.1 510.4 462.8 SV=500 604.1 636.5 618.5 553.2 492.0
6.3.2 Design results for a multi-plate reactor with fixed outer specifications
The FTS reactor with an outer specification of 1916mm X 1916mm X 2030mm in the
modular portable plant project indicated the space limit for the design of a multi-plate reactor.
The multi-plate reactors were designed with a simple structure of piling up the plates
(1916mm X 2030mm) using the aforementioned plate pitch specifications. A wall thickness
of 4.5mm was considered sufficient for the determined operating conditions. In this way, a
multi-plate reactor with different plate pitches can be designed, and the total catalyst loading
volume set. Capital investment is also an important consideration with reactor applications.
The reactor mass can be used to evaluate the cost of reactor manufacture with the “half labour
work and half material cost” regulation. In this study, the stainless steel Grand 304 was used
for reactor manufacture and the corresponding density was cited for the reactor mass

163
calculation. The specifications of the designed multi-plate reactor are summarized in Table
6.6.
Table 6.6 shows that with an increase in the plate distance, the amount of channels for
reaction accommodated in the size-specified FTS multi-plate reactor decreased, as did the
reactor mass. However, the total catalyst loading volume showed a peak-shape trend, i.e. the
maximum total catalyst loading volume was 554.8l with a plate pitch of 3/2inches.
Table 6.6: Multi-plate reactor with different plate pitches R1 R2 R3 R4 R5
Plate pitch/inch 1/2 3/4 1 3/2 2 Reaction channel
amount 48 35 27 19 14
Total catalyst volume/l 467.2 511 525.6 554.8 545.1 Total mass for
multi-plate reactor/kg 6889 5023.3 3875.1 2726.9 2009.3
Assuming that the reaction performance in reaction channel was independent, the total
productivity of the multi-plate reactor could be predicted by multiplying the corresponding
results from single-layer plate reactor and the number of reaction channel. The total Pros of
the multi-plate reactors are shown in Table 6.7, and the space-time yield of the C3+ products
(STY) and total Pro per reactor mass are shown in Figure 6.4.
Table 6.7: Productivity of C3+ (kg/h) in different multi-plate reactor models R1 R2 R3 R4 R5
SV=100 8.4 8.6 8.1 6.7 5.1 SV=300 21.3 18.3 14.6 9.7 6.5 SV=500 29 22.3 16.7 10.5 6.9
Table 6.7 shows that the total Pro increased with an increase in the SVs, while it decreased
with an increase in plate pitch at SV conditions of 300 and 500. At the SV condition of 100,
the total Pro increased to 8.6 kg/h from the model R2, then decreased from R2 to R5. As

164
shown in Figure 6.4, the STY increased with an increase in the SV in each multi-plate reactor,
while it declined when enlarging the plate pitch at a constant SV. Thus, to pursue a high STY,
which regard as the volumetric efficiency of total catalyst bed, small plate distance and high
SV are recommended.
Figure 6.4: Simulation results of the space-time yield (bar chart) and total Pro per reactor mass (line chart) in
different single- plate reactor models (458K, 10bar, temperature rise constraint of 10K, Co-SiO2 catalyst,
reactant syngas volumetric composition of 22.68% CO, 49.90% H2, 18.36% CO2, and 9.06% N2)
However, the total Pro per reactor mass showed an upward trend with an increase in SV in
each multi-plate reactor. More specifically, the change in total Pro per reactor mass is more
obvious in a multi-plate reactor with a small plate pitch. With an increase in plate distance,
the total Pro per reactor mass exhibits different trends with different SV conditions. The total
Pro per reactor mass increased from 1.22 up to 2.54g/(h ∙ kg reactor) for the multi-plate
reactor models from R1 to R5 at the condition of SV=100ℎ . It first increased and then
decreased under the SV condition of either 300 or 500ℎ , and the peaks of total Pro per
reactor mass were 3.77 g/(h ∙ kg reactor) at SV=300ℎ and 4.44 g/(h ∙ kg reactor) at
SV=500ℎ . These observations are considered the integral results of the FTS results and the
0.0
1.0
2.0
3.0
4.0
5.0
0.0
10.0
20.0
30.0
40.0
50.0
60.0
70.0
100 300 500
Tot
al P
ro p
er r
eact
or m
ass
-(g/
h/kg
) in
li
ne c
hart
ST
Y /(
g/h/
l cat
) in
bar
cha
rt
SV /h-1
R1R2R3R4R5

165
specifications for the multi-plate reactors.
Considering the practical requirement of CO conversion with a single pass operation, the
available total Pros in Table 6.7 are indicated in bold fort. The selected STYs were in the
range of 15.41 to 45.59 g/(h ∙ l cat) and the qualified total Pro per reactor mass was in the
range of 1.22 to 3.09g/(h ∙ kg reactor) (See Figure 6.4). Consequently, the theoretical
maximum Pro for this size-specific multi-plate reactor is 21.3kg/h at the SV condition of
300ℎ and a plate pitch of 0.5 inch. The corresponding STY and total Pro per reactor mass
were 45.59 g/(h ∙ l cat) and 3.09 g/(h ∙ kg reactor), respectively.
6.4 Conclusions
The plate reactor, which is integral of high performance plate heat exchanger and packed bed
reactor, is considered as a competitor to the conventional tubular fixed bed reactor. This
chapter reports on a plate reactor employed as a substitute for the tubular FBR in a portable
modular plant. The same design approach as that detailed the previous chapter was used to
optimize the plate pitch for maximum productivity. The modelling and validation of the plate
reactor were based on a previous study on the tubular fixed bed reactor model, and only the
model geometry was changed.
A temperature rise constraint was assumed, so that the plate reactor models with different
plate distances were operated safely and at the same thermal condition. To achieve that, the
catalyst activity and SV were set as operational parameters. The effect of plate pitch on a
single-layer plate reactor was studied. When increasing the plate distance or the SV, both the
XCO and the SC3+ decreased. The multi-plate reactor was designed according to the

166
requirements of the portable modular plant project. Assuming that each layer of the catalyst
bed was independent, the results of multi-plate reactor could be obtained by multiplying those
from the single-layer plate reactor model and the amount of the reaction channels.
As the outer size of the multi-plate reactor was determined, when enlarging the plate pitch,
both the amount of reaction channels and the total reactor mass were decreased, while the
catalyst loading volume showed first an increase and then a decrease. When increasing the
plate distance, i.e. from R1 to R5, the total Pro showed a downward trend at SV conditions of
300 h-1 and 500 h-1; while it showed a peak-shape trend at the SV condition of 100 h-1. The
STY of the catalyst bed increased when increasing the SV, while it showed the opposite trend
for models R1 to R5. The total Pro per reactor mass showed an inverted U-shape trend at SV
conditions of 300 and 500, while it showed an increasing trend when enlarging the plate pitch.
Considering the practical requirement of no less than 80% of single pass CO conversion, a
plate pitch of 0.5 inch was suggested, and the potential maximum Pro, STY and total Pro per
reactor mass were 21.3kg/h, 45.59 g/(h ∙ l cat) and 3.09 g/(h ∙ kg reactor), respectively. A
practical consideration for a FTS application is to obtain the maximum productivity with an
acceptable CO conversion for once-through operation. Therefore, the performance of
multi-plate reactor weights out than that of multi-tube reactor, by comparing the predicted
maximum total productivity for a multi-tube reactor was 15.3 kg/h in Chapter 5 to above
reported result.

167
References
[1] S. Luo, Y. Zhou, C. Yi, Syngas production by catalytic steam gasification of municipal
solid waste in fixed-bed reactor, Energy. 44 (2012) 391–395.
doi:10.1016/j.energy.2012.06.016.
[2] M.E. Dry, Fischer–Tropsch reactions and the environment, Appl. Catal. A Gen. 189
(1999) 185–190. doi:10.1016/S0926-860X(99)00275-6.
[3] X. Zhu, X. Lu, X. Liu, D. Hildebrandt, D. Glasser, Heat transfer study with and without
Fischer-Tropsch reaction in a fixed bed reactor with TiO2, SiO2, and SiC supported
cobalt catalysts, Chem. Eng. J. 247 (2014) 75–84. doi:10.1016/j.cej.2014.02.089.
[4] D. Merino, O. Sanz, M. Montes, Effect of catalyst layer macroporosity in
high-thermal-conductivity monolithic Fischer-Tropsch catalysts, Fuel. 210 (2017) 49–
57. doi:10.1016/j.fuel.2017.08.040.
[5] D. Glasser, D. Hildebrandt, X. Liu, X. Lu, C.M. Masuku, Recent advances in
understanding the Fischer-Tropsch synthesis (FTS) reaction, Curr. Opin. Chem. Eng. 1
(2012) 296–302. doi:10.1016/j.coche.2012.02.001.
[6] S.T. Sie, R. Krishna, Fundamentals and selection of advanced Fischer-Tropsch reactors,
Appl. Catal. A Gen. 186 (1999) 55–70. doi:10.1016/S0926-860X(99)00164-7.
[7] A.P. Steynberg, M.E. Dry, B.H. Davis, B.B. Breman, Fischer-Tropsch reactors, Elsevier
B.V., 2004. doi:10.1016/s0167-2991(04)80459-2.
[8] R. Guettel, U. Kunz, T. Turek, Reactors for Fischer-Tropsch synthesis, Chem. Eng.

168
Technol. 31 (2008) 746–754. doi:10.1002/ceat.200800023.
[9] H. Schulz, Short history and present trends of Fischer–Tropsch synthesis, Appl. Catal. A
Gen. 186 (1999) 3–12. doi:10.1016/S0926-860X(99)00160-X.
[10] R.M. De Deugd, F. Kapteijn, J.A. Moulijn, Trends in Fischer-Tropsch reactor
technology - opportunities for structured reactors, Top. Catal. 26 (2003) 29–39.
doi:10.1023/B:TOCA.0000012985.60691.67.
[11] J. Romatier, Riverwoods, Simplified plate chennel reactor arrangement, 2001.
doi:US006190624B1.
[12] B.H. Davis, Fischer–Tropsch synthesis: Overview of reactor development and future
potentialities, Top. Catal. 32 (2005) 143–168. doi:10.1007/s11244-005-2886-5.
[13] S. Haugwitz, P. Hagander, T. Noren, Modeling and control of a novel heat exchange
reactor, the open plate reactor, Control Eng. Pract. 15 (2007) 779–792.
doi:10.1016/j.conengprac.2006.02.019.
[14] N. Schodel, M. Sotzek, W. Sussmann, R. Walzl, Reactor for performing a strongly
heat-conditioned catalytic reaction, 2002. doi:US 2002/0048541 A1.
[15] M.S. Lim, M.R. Kim, J. Noh, S.I. Woo, A plate-type reactor coated with zirconia-sol
and catalyst mixture for methanol steam-reforming, J. OfPower Sources. 140 (2005)
66–71. doi:10.1016/j.jpowsour.2004.08.005.
[16] M. Zanfir, A. Gavriilidis, Catalytic combustion assisted methane steam reforming in a
catalytic plate reactor, Chem. Eng. Sci. 58 (2003) 3947–3960.
doi:10.1016/S0009-2509(03)00279-3.

169
[17] D. Hildebrandt, Portable plant makes fuel from waste, (2011).
https://www.brandsouthafrica.com/investments-immigration/science-technology/beauti
fuel-231111.
[18] D. Hildebrandt, BeauTiFuel project to convert waste to fuel debuts at COP 17 - Wits
University, (2012).
[19] M.E. Dry, Practical and theoretical aspects of the catalytic Fischer-Tropsch process,
Appl. Catal. A Gen. 138 (1996) 319–344. doi:10.1016/0926-860X(95)00306-1.
[20] M.E. Dry, Fischer-Tropsch reactions and the environment, Appl. Catal. A Gen. 189
(1999) 185–190. doi:10.1016/S0926-860X(99)00275-6.
[21] C.H. Phillips, G. Lauschket, H. Peerhossainiz, Intensification of batch chemical
processes by using integrated chemical reactor-heat exchangers, Appl. Therm. Eng. 17
(1997) 809–824. doi:https://doi.org/10.1016/S1359-4311(96)00061-0.
[22] J. Shen, Y.-C. Li, W.H. Ho, X. Liu, D. Hildebrandt, Experimental and simulation study
of the temperature distribution in a bench-scale fixed bed Fischer-Tropsch reactor,
AIChE J. Early View (2021). doi:https://doi.org/10.1002/aic.17145.
[23] R.M. Malek Abbaslou, J.S. Soltan Mohammadzadeh, A.K. Dalai, Review on
Fischer-Tropsch synthesis in supercritical media, Fuel Process. Technol. 90 (2009) 849–
856. doi:10.1016/j.fuproc.2009.03.018.
[24] R. Guettel, T. Turek, Comparison of different reactor types for low temperature
Fischer-Tropsch synthesis: A simulation study, Chem. Eng. Sci. 64 (2009) 955–964.
doi:10.1016/j.ces.2008.10.059.

170
[25] M. Irani, Investigating the production of liquid fuels from synthesis gas (CO+H2) in a
bench-scale packed-bed reactor based on Fe-Cu-La/SiO2 catalyst: Experimental and
CFD modeling, Int. J. Ind. Chem. 5 (2014) 1–9. doi:10.1007/s40090-014-0011-y.
[26] A.Y. Khodakov, W. Chu, P. Fongarland, Advances in the development of novel cobalt
Fischer−Tropsch catalysts for synthesis of long-chain hydrocarbons and clean fuels,
Chem. Rev. 107 (2007) 1692–1744. doi:10.1021/cr050972v.
[27] M. Irani, Investigating the production of liquid fuels from synthesis gas (CO+H2) in a
bench-scale packed-bed reactor based on Fe–Cu–La/SiO2 catalyst: Experimental and
CFD modeling, Int. J. Ind. Chem. 5 (2014) 1–9. doi:10.1007/s40090-014-0011-y.
[28] G. Chabot, R. Guilet, P. Cognet, C. Gourdon, A mathematical modeling of catalytic
milli-fixed bed reactor for Fischer-Tropsch synthesis: Influence of tube diameter on
Fischer Tropsch selectivity and thermal behavior, Chem. Eng. Sci. 127 (2015) 72–83.
doi:10.1016/j.ces.2015.01.015.
[29] R. Philippe, M. Lacroix, L. Dreibine, C. Pham-Huu, D. Edouard, S. Savin, F. Luck, D.
Schweich, Effect of structure and thermal properties of a Fischer–Tropsch catalyst in a
fixed bed, Catal. Today. 147 (2009) S305–S312. doi:10.1016/j.cattod.2009.07.058.
[30] I.C. Yates, C.N. Satterfield, Intrinsic kinetics of the Fischer-Tropsch synthesis on a
cobalt catalyst, Energy & Fuels. 5 (1991) 168–173. doi:10.1021/ef00025a029.
[31] M. Sadeqzadeh, J. Hong, P. Fongarland, D. Curulla-Ferré, F. Luck, J. Bousquet, D.
Schweich, A.Y. Khodakov, Mechanistic modeling of cobalt based catalyst sintering in a
fixed bed reactor under different conditions of Fischer-Tropsch synthesis, Ind. Eng.

171
Chem. Res. 51 (2012) 11955–11964. doi:10.1021/ie3006929.
[32] M.H. Rafiq, H.A. Jakobsen, R. Schmid, J.E. Hustad, Experimental studies and modeling
of a fixed bed reactor for Fischer–Tropsch synthesis using biosyngas, Fuel Process.
Technol. 92 (2011) 893–907. doi:10.1016/j.fuproc.2010.12.008.
[33] N. Majidian, S. Soltanali, Comparison of Fischer-Tropsch fixed and monolith bed
reactors using pseudo-homogeneous 2D model, J. Japan Pet. Inst. 59 (2016) 126–139.
doi:10.1627/jpi.59.126.
[34] AtlasSteels, Atlas Steels Australia - the leading supplier of specialty metals, (n.d.).
https://www.atlassteels.com.au.
[35] K.S. Kshetrimayum, I. Jung, J. Na, S. Park, Y. Lee, S. Park, C.-J. Lee, C. Han, CFD
simulation of microchannel reactor block for Fischer–Tropsch Synthesis: Effect of
coolant type and wall boiling condition on reactor temperature, Ind. Eng. Chem. Res. 55
(2016) 543–554. doi:10.1021/acs.iecr.5b03283.
[36] ANSYS Inc., ANSYS FLUENT 12.0 User’s Guide, 2009.
http://www.afs.enea.it/project/neptunius/docs/fluent/html/ug/main_pre.htm.
[37] A. Jess, C. Kern, Influence of particle size and single-tube diameter on thermal behavior
of Fischer-Tropsch reactors, Chem. Eng. Technol. 35 (2012) 369–378.
doi:10.1002/ceat.201100615.
[38] M.A.M. Sajad Karimi Mazidi, Mohammad Taghi Sadeghi, Optimization of
Fischer-Tropsch process in a fixed-bed reactor using non-uniform catalysts, Chem. Eng.
Technol. 36 (2013) 62–72. doi:10.1002/ceat.201200268.

172
[39] N.E. Tsakoumis, M. Rønning, O. Borg, E. Rytter, A. Holmen, Deactivation of cobalt
based Fischer-Tropsch catalysts : A review, Catal. Today. 154 (2010) 162–182.
doi:10.1016/j.cattod.2010.02.077.
[40] J. van De Loosdrecht, B. Balzhinimaev, J. Dalmon, J.W. Niemantsverdriet, Cobalt
Fischer-Tropsch synthesis : Deactivation by oxidation?, Catal. Today. 123 (2007) 293–
302. doi:10.1016/j.cattod.2007.02.032.
[41] C.J. Bertole, C.A. Mims, G. Kiss, The effect of water on the cobalt-catalyzed Fischer-
Tropsch synthesis, J. Catal. 96 (2002) 84–96. doi:10.1006/jcat.2002.3666.
[42] E. van Steen, M. Claeys, M.E. Dry, J. van De Loosdrecht, E.L. Viljoen, J.L. Visagie,
Stability of nanocrystals: Thermodynamic analysis of oxidation and re-reduction of
cobalt in water/hydrogen mixtures, J. Phys. Chem. 109 (2005) 3575–3577.
doi:10.1021/jp045136o.
[43] A. Tavasoli, R.M. Malek, A.K. Dalai, Deactivation behavior of ruthenium promoted
Co/g-Al2O3 catalysts in Fischer–Tropsch synthesis, Appl. Catal. A Gen. 346 (2008)
58–64. doi:10.1016/j.apcata.2008.05.001.
[44] M.E. Dry, High quality diesel via the Fischer-Tropsch process - A review, J. Chem.
Technol. Biotechnol. 77 (2002) 43–50. doi:10.1002/jctb.527.
[45] G. Chabot, R. Guilet, P. Cognet, C. Gourdon, A mathematical modeling of catalytic
milli-fixed bed reactor for Fischer-Tropsch synthesis: Influence of tube diameter on
Fischer Tropsch selectivity and thermal behavior, Chem. Eng. Sci. 127 (2015) 72–83.
doi:10.1016/j.ces.2015.01.015.

173
[46] B. Todic, M. Mandic, N. Nikacevic, D.B. Bukur, Effects of process and design
parameters on heat management in fixed bed Fischer-Tropsch synthesis reactor, Korean
J. Chem. Eng. 35 (2018) 1–15. doi:10.1007/s11814-017-0335-3.
[47] Y.N. Wang, Y.Y. Xu, Y.W. Li, Y.L. Zhao, B.J. Zhang, Heterogeneous modeling for
fixed-bed Fischer-Tropsch synthesis: Reactor model and its applications, Chem. Eng.
Sci. 58 (2003) 867–875. doi:10.1016/S0009-2509(02)00618-8.
[48] B. Todic, L. Nowicki, N. Nikacevic, D.B. Bukur, Fischer-Tropsch synthesis product
selectivity over an industrial iron-based catalyst : Effect of process conditions, Catal.
Today. 261 (2016) 28–39. doi:10.1016/j.cattod.2015.09.005.
[49] A.R. De Osa, A. De Lucas, A. Romero, J.L. Valverde, P. Sánchez, Fischer-Tropsch
diesel production over calcium-promoted Co/alumina catalyst: Effect of reaction
conditions, Fuel. 90 (2011) 1935–1945. doi:10.1016/j.fuel.2010.12.024.

174
CHAPTER 7
OVERALL CONCLUSIONS
The main objectives of this thesis were to design a CFD fixed bed reactor model validated by
both the FTS reaction results and the temperature distribution in the catalyst bed, and to then
employ it in actual PI applications, for example the existing FTS reactor modification and the
design approach for new FTS reactors. Three practical PI applications were proposed in this
thesis: a tubular reactor internals to intensify the heat transfer was proposed and verified by
simulation; optimization of key specification parameter (i.e. tube diameter or plate pitch) for
maximum productivity of heavy hydrocarbon products in the multi-tubular reactor or the
multi-plate reactor, respectively, were carried out for an actual commercial scale application.
In each study, the simulation results were carefully calculated and analyzed, in order to reveal
the intrinsic regulation and interactions inside the fixed bed reactor. The major conclusions
from the series of simulation studies and the guidance for further research are provided below.
7.1 Modelling and validation of a bench scale fixed bed reactor
The temperature distribution in a bench-scale fixed bed Fischer-Tropsch reactor using a
Co-based catalyst was investigated under conditions of 2MPa and 458K using various syngas
partial pressure and space velocity values. The implemented single-tube reactor has a
diameter of 0.05m, which could be dimensionally representative of a tubular reactor used in
industrial applications. Using a specially designed temperature measurement containing four
axial thermocouple wells at different radial positions inside the catalyst bed, the detailed 2D
temperature distributions were measured under different GHSVs and nitrogen flowrates.

175
A full-scale 2D CFD reactor model with semi-empirical FTS kinetics was developed by
ANSYS Fluent. The local heat transfer coefficient on the reactor wall was predicted by the
local fluid properties in the near-wall region. Acceptable agreement between the predicted
FTS reaction performance, including CO conversion and product selectivity, and the
experimental results was achieved with an absolute relative error of less than 9% and 4%,
respectively. In addition, the temperature distributions from simulations at different
conditions were compared with the measured data, and the comparison showed that the MAE
was no larger than 3.2 K and the maximum temperature deviation was less than 5.5K for all
five experiments. Therefore, the temperature prediction was considered precise enough for
related study.
Both the integral and differential CO conversion along the axis were calculated and plotted.
The trend shows that CO mainly converted at the front part, while the reaction rate at the later
part of the reactor is relatively low. Furthermore, according to the integral STY of C3+
products in the axial direction, the efficiency of the catalyst bed decreases with an increase in
catalyst bed length. These conclusions provide guidance and motivation for applying PI in
order to enhance reactor efficiency and productivity in new FBR designs or an existing
reactor The inferred integral and differential simulation results along the reactor axis were
analysed to give insight as to how to intensify the reactor production capacity.
7.2 Design and verification of a tubular reactor internals
A tubular reactor internals was proposed in order to suppress hot spot formation in the
catalyst bed. The reactor internals possesses a ring & tube type structure, in which the outer

176
diameter is designed to fit perfectly into the reactor tube chamber, while the inner diameter
varies in the axial direction. The reactor internals functions in the front region of the catalyst
bed where the hot spot is most likely to form.
The proposed reactor internals was verified by a bench-scale CFD reactor model with
specifications of 50mm in diameter and 1000mm in height under Fischer-Tropsch reaction
conditions. Compared to the blank case, the formation of a hot spot in catalyst bed was
efficiently inhibited, while the overall FTS reaction results were barely affected in the
catalyst bed with the reactor internals installed: the temperature peak in the catalyst bed
dropped 22.6% when using internals; while the changing rate in CO conversion was less than
2.13%.
The key parameters of the reactor internals, i.e. neck diameter and frustum cavity height,
were optimized. The maximum temperature rise in the catalyst bed showed a U-shape trend
when increasing the neck diameter, while it increased with the increase in frustum cavity
height. Besides, other benefits of implementing the ring & tube type internals include ease of
manufacturing, and simple assembly and disassembly.
7.3 Design approach for a multi-tube reactor fitted in a
containerized FTS plant
Since space utilization for a small-scale plant is extremely significant, and a different design
approach is required for the modular portable FTS plant than for the design of a mega plant.
The strategy of the new design approach was to optimize the single tube diameter on the total
productivity for the overall multi-tube reactor at a determined temperature rise constraint in

177
the catalyst bed. The optimization study was conducted with the CFD model coupled with
semi-empirical FTS reaction kinetics in ANSYS Fluent.
A temperature rise constraint was assumed for all simulation runs, so that the comparison of
the reactor models with different tube diameters was conducted at a similar catalyst bed
thermal condition. To realize this, the catalyst activity and the SV were set as operational
parameters. The operating pressure was found to have less impact on the productivity of C3+
products, while it increased with an increase in SV. When increasing the tube diameter, the
productivity of C3+ products was boosted. Further, the size-specific multi-tube reactors with
different single tubes were designed with the same tube layout. Thus, the performance of
different multi-tube reactors could be evaluated by simply multiplying the amount of the
accommodated tubes in the tube layout and the FTS results from the individual reactor tube,
while assuming that each individual reactor tube was independent. According to the predicted
productivity, when decreasing the reactor tube diameter, the total productivity had a peak
value in an SV range of 70~200h-1, while it declined in an SV range of 300~1000h-1.
Considering the economic efficiency for a commercial plant, a minimum CO conversion of
80% was required for once-through pass operation. Thus the optimal heavy hydrocarbon
productivity was 15.3kg/h when employing 3/4” single tubes at the SV condition of 300h-1.
7.4 Design approach for a multi-plate reactor fitted in a
containerized FTS plant
A multi-plate reactor with a simple structure was implemented for the modular portable FTS
plant, as a substitute for the multi-tube reactor. The proposed design approach detailed in the

178
chapter 5 was used to optimize the plate pitch for the total productivity of heavy
hydrocarbons.
The catalyst activity and SV were assumed to be adjustable, so that the thermal condition of
the catalyst beds with different plate pitch values could be kept similar. The CO conversion
decreased with either an increase in plate distance or an increase in SV. Total productivity
decreased with an increase in plate pitch at the SV condition of 300 h-1 and 500 h-1, while it
first increased and then decreased at a low SV condition, i.e. 100 h-1.
In order to evaluate the efficiency and economy of the multi-plate reactor, the volumetric
STY and the total productivity per reactor mass were calculated. The STY increased with an
increase in SV, while the opposite trend was observed when increasing the plate pitch.
However, the total productivity per reactor mass showed a peak-shape trend at SV conditions
of 300 and 500, while it increased when enlarging the plate pitch. Consequently, at the
optimized conditions, i.e. the SV was 300h-1 and the plate pitch was 0.5inch, the CO
conversion was 80.8%, while the potential maximum productivity, the STY and total
productivity per reactor mass were 21.3kg/h, 45.59 g/(h ∙ l cat) and 3.09 g/(h ∙ kg reactor),
respectively.
7.5 Summary
This thesis mainly presents a CFD bench-scale FBR model with reliable modelling approach
and sufficient validation, and three PI applications with considerable practical value for either
existing FBR or designing FBR. The proposed FBR model in this thesis was based on an
actual experimental setup with a diameter representative of those in industrial reactors. The

179
modelling approach was come up with on the fundamental of adequate literature study in
order to predict the temperature distributions in catalyst bed precisely and efficiently. The
modified semi-empirical FTS reaction kinetics was applied. The validation was highlighted
by performing on the aspects of not only reaction results but the 2D temperature profiles with
a specially designed temperature measurement. Even though the applied temperature
measurement system was still imperfect, it opens up a novel way to verify the model
adequately.
With the help of the established CFD model, in which reliable temperature distributions in
catalyst bed can be obtained, the PI applications that related to temperature control can be
verified by simulation study. The ring & tube type reactor internals, which designed for an
existing large-scale FBR that suffering apparent hot spot, has been proved to be effective to
intensify the heat transfer and prohibit the temperature rise while the reaction results were
barely affected. A reactor design approach, in which the optimization of key specification
(single tube diameter, plate pitch, etc.) and the design of catalyst were integrated to maximize
the overall productivity at a suggested temperature rise constraint, was proposed; and it was
applied into the designs of multi-tube reactor and multi-plate reactor for the modular portable
containerized FTS plant respectively. A simple comparison from the practical consideration
of getting more product with an acceptable once-through conversion shows that the potential
maximum productivity for multi-plate reactor (21.3 kg/h) higher than that for multi-tube
reactor (15.3 kg/h). However, both two types of reactors possess more merits and
shortcomings that need to be considered for an actual use, for example multi-tube reactor

180
technology is more mature, the “dead zone” for fluid is more easily formed in multi-plate
reactor, the multi-plate reactor can be integrated with high performance heat exchanger
technology, etc..

181
APPENDIX
A-1 Drawbacks of different types of reactors by comparison
The drawbacks of different types of reactors were briefly summarized in Table A1.
Table A1: Drawbacks of different types of reactors by comparison
Reactor type Drawbacks
Fluidized bed reactor[1] An extra procedure or facility is needed to separate the catalysts from
the gaseous products.
Fluidization of the catalyst may be hampered because of heavy
product deposit on catalyst particles, thus it is only suitable for high
temperature FTS.
Its scale-up is much more complicated.
Slurry bed reactor[1] An extra procedure or facility is needed to separate the catalysts from
the liquid products.
Gas-liquid separation may be needed due to foam formation.
Suspension of the catalyst may be hampered because of catalyst
particles settling or agglomeration.
Its scale-up is much more complicated.
Monolith bed reactor[2] The catalyst loading volume is relatively lower.
Catalyst preparation is complex and costly.
Uniform dispersion of the active component on the catalyst is
difficult to achieve.
It lacks practical operation experience, since few pilot studies and
even fewer larger scale applications have been reported.

182
A-2 Description of the Bench-scale Fixed bed reactor
A bench-scale FBR of 0.05m inner diameter and 1m length was designed and built for this
experimental study. The design capacity is 0.1kg liquid hydrocarbon per day. Figure A1
shows the structure of the reactor. The reactor is a tube-shell structure consisting of a reaction
zone on the tube side and an oil-cooled shell side. The reactor is operated with
counter-current flow between the gas flow (fed in at the top at N1 and flowing out at the
bottom) and the cooling oil (pumped in at N4 at the bottom and recycled back to the oil bath
from N5). Orifice N2 is used to load the catalyst before the reaction. The outside of the
reactor shell is covered by 0.1m of insulation, in order to minimise the heat loss to the
environment.
Because of the intrinsic characteristics of FTS, both the axial and radial temperature gradients
develop in the reactor tube. Another three single point thermocouples (T5, T6 and T7) were
installed vertically to monitor the temperature of the thermal oil.

183
Figure A1: The structure of the bench-scale reactor

184
A-3 Physical properties of the ceramic ball and catalyst particles
The physical properties of the ceramic ball and catalyst particles are summarized in this table.
Table A2: Physical properties of the ceramic ball layer and catalyst bed
Ceramic ball Catalyst
Diameter/m 0.0036±0.0003 0.0018±0.002
Thermal conductivity/(W·m-1·K-1) 1.2 1.4
Pecking density/(g·ml-1) 1.35 0.69
Bed void/% 46 49.4
Viscous resistance/(1/m2) 64210000 26394000
Inertial resistance/(1/m) 5393.69 4750.069

185
A-4 Dimensionless criterion for inter-phase heat transfer
resistance
According to Mears’ study, the inter-phase heat transfer resistance was considered negligible
when the following dimensionless criterion is satisfied:
∆𝐻 ∙ 𝑟 ∙ 𝐷 2ℎ ∙ 𝑇⁄ < 0.15 𝑅 ∙ 𝑇 𝐸⁄
(1)
Where: DP is the spherical particle diameter; 𝐸 is the active energy for the FTS reaction
rate; 𝑟 is the FTS reaction rate; ∆H denotes the absolute value of the reaction heat; ℎ is
the heat transfer coefficient calculated by the correlation of De Acetis and Thodos [13].
Considering Exp2 for example, the value for the term on the left of the criterion is 2.77x10⁻¹¹,
which is smaller than the value of 5.70x10⁻³ for the right term of the criterion. Consequently,
the criterion was validated, and the inter-phase heat transfer resistance can be assumed to be
negligible.

186
A-5 Reynold’s Number calculation
The Reynold’s number Rep of the packed bed was calculated using Equation A1 [4]:
𝑅𝑒 = 𝐷 ∙ 𝑣 ∙ 𝜌 [𝜇 ∙ (1 − 𝜀)]⁄ (A1)
Where: DP is the equivalent spherical particle diameter; 𝑣 is the physical gas velocity; ρ is
the gaseous species density; µ denotes the dynamic viscosity of gas; is the void fraction of
the packing in the bed. In this study, the maximum 𝑅𝑒 obtained under the experimental
conditions was 6.50, as indicated in Table 3-2.

187
A-6 Pressure drop estimation
The pressure drop ∆P through the packed bed can be estimated using the Ergun equation given
below:
∆P 𝐿⁄ = 150𝜇 ∙ 𝑣 ∙ (1 − 𝜀′) 𝐷 ∙ 𝜀′ + 1.75𝑣 ∙ 𝜌 ∙ (1 − 𝜀′) 𝐷 ∙ 𝜀 (A2)
Where 𝐿 represents the length of packed bed. The predicted maximum ∆P in this study was
only 4.32Pa.

188
A-7 Equations of the thermal conductivity for different species
The equations used to calculate the thermal conductivity at different temperatures is in this
table.
Table A3: Thermal conductivity as a function of temperature
Species Thermal conductivity (W·m-1·K-1) with temperature (T/K)
Hydrogen 3.26 x 10⁻¹⁶ T4 - 4.41 x 10⁻¹² T3 + 1.07 x 10⁻⁸ T2 + 3.56 x 10⁻⁴ T + 8.26 x 10⁻¹
Carbon monoxide -5.00 x 10⁻¹³ T3 - 0.20 T2 + 7.90 T + 17.3
Water (g) 6.17 x 10⁻¹⁶ T4 - 9.10 x 10⁻¹² T3 + 4.49 x 10⁻⁸ T2 + 6.88 x 10⁻⁵ T - 7.98 x 10⁻³
Methane -0.05 T4 + 0.33 T3 + 0.95 T2 + 7.17 T + 14.10
Ethane -4.20 x 10⁻³ T4 - 0.14 T3 + 2.85 T2 + 2.80 T + 5.50
Pentane (g) -6.67 x 10⁻² T3 + 1.60 T2 + 6.17 T + 6.70
Nitrogen 7.78 x 10⁻¹⁷ T4 + 1.45 x 10⁻¹² T3 - 1.12 x 10⁻⁸ T2 + 7.27 x 10⁻⁵ T + 4.74 x 10⁻³

189
A-8 summary of boundary conditions in simulation
The settings for the boundary conditions of the reactor model were summarized in Table A4.
Table A4 Summary of boundary conditions in simulation
Boundary Type Quantity Thermal condition
Inlet for gas Velocity-inlet Velocity depending on
the experiment setting 423 K
Inlet for oil Velocity-inlet 0.07 m/s 458 K
Outlet for gas Pressure-outlet 0 Pa 458 K
Outlet for oil Pressure-outlet 0 Pa 458 K
Wall for empty inlet zone Wall 8 mm for thickness Heat Flux
0 W/m2
Wall for inlet zone with
ceramic ball layer Wall 8 mm for thickness Coupled
Wall for catalyst bed Wall 8 mm for thickness Coupled
Wall for outlet zone with
ceramic ball layer Wall 8 mm for thickness Coupled
Wall for oil bath Wall 8 mm for thickness Heat Flux
0 W/m2

190
A-9 Kinetics parameters
The eight (constant) parameters in the kinetic model are listed in Table A4. The four
pre-exponential factors (k1–k4) were adjusted so that the model fitted the experimental data,
while the activation energies (E1–E4) were taken from the literature [5,6].
Table A5: List of kinetic parameters used in this study
parameters k1 k2 k3 k4 E1(kJ/mol) E2(kJ/mol) E3(kJ/mol) E4(kJ/mol) 4.94x10⁹ 4.68 8.58x10⁷ 1.08x10³ 100 20 81 49

191
A-10 The structure of the FTS section in modular portable FTS
plant
Fig. A2 shows the structure of the FTS section of modular portable FTS plant was illustrated
in Figure A2 in Appendix.
Figure A2 The structure of the FTS section of modular portable FTS plant

192
A-11 Predicted temperature distributions along the axis of
symmetry of the single-layer plate reactor for different plate
pitch
Fig. A3 shows the simulated axial temperature distributions along the axis of symmetry of a
single-layer plate reactor for different plate pitch. The temperature profiles in Figure A3 were
presented at normalized reactor lengths under the same operating conditions.
Figure A3 Axial temperature distribution along the axis of symmetry of a single-layer plate reactor for different
plate pitches (feed temperature 458 K, 10 bar, Tconst=468 K, SV=300 /h; the catalyst mixture contains 25 vol%
of 15% Co-SiO2 catalyst and balanced ceramic balls corresponds to A=100%; reactant syngas volumetric
composition of 22.68% CO, 49.90% H2, 18.36% CO2, and 9.06% N2; R1 to R5 are defined in Table 6.1).
456
458
460
462
464
466
468
470
0.18
0.21
0.24
0.27
0.30
0.33
0.36
0.39
0.43
0.46
0.49
0.52
0.55
0.58
0.61
0.64
0.67
0.70
0.73
0.77
0.80
0.83
0.86
0.89
0.92
0.95
Tem
pera
ture
/K
Normalized reactor length
R1R2R3R4R5

193
A-12 Predicted axial temperature distributions along the axis of
the single-layer plate reactor for R3 with different SV
Using reactor model R3 for example, Fig. A4 shows the simulated axial temperature
distributions along the axis of symmetry of reactor model at different SV. The temperature
profiles in Figure A4 were presented at normalized reactor lengths of R3.
Fig. A4 Axial temperature distribution along the axis of symmetry of single-layer reactor model R3 with
different SVs (feed temperature 458 K, 10 bar, Tconst=468 K, SV=300 /h; the catalyst mixture that contains 25
vol% of 15% Co-SiO2 catalyst and balanced ceramic balls corresponds to A=100%; reactant syngas volumetric
composition of 22.68% CO, 49.90% H2, 18.36% CO2, and 9.06% N2; R1 to R5 are defined in Table 6.1).
456
458
460
462
464
466
468
470
0.18
0.21
0.24
0.27
0.30
0.33
0.36
0.39
0.43
0.46
0.49
0.52
0.55
0.58
0.61
0.64
0.67
0.70
0.73
0.77
0.80
0.83
0.86
0.89
0.92
0.95
Tem
pera
ture
/K
Normalized reactor length
SV=100
SV=300
SV=500

194
References
[1] S.T. Sie, R. Krishna, Fundamentals and selection of advanced Fischer–Tropsch reactors,
Appl. Catal. A Gen. 186 (1999) 55–70. doi:10.1016/S0926-860X(99)00164-7.
[2] V. Tomašić, F. Jović, State-of-the-art in the monolithic catalysts / reactors, Appl. Catal.
A Gen. 311 (2006) 112–121. doi:10.1016/j.apcata.2006.06.013.
[3] J.D.E. Acetis, G. Thodos, Flow of Gases Through Sperical Packings, Ind. Eng. Chem.
52 (1960) 1003–1006. doi:10.1021/ie50612a026.
[4] W.L. Mccabe, J.C. Smith, P. Harriott, Unit Operations of Chemical Engineering, Fifth,
McGraw-Hill, Inc., 1993.
[5] M.H. Rafiq, H.A. Jakobsen, R. Schmid, J.E. Hustad, Experimental studies and modeling
of a fixed bed reactor for Fischer–Tropsch synthesis using biosyngas, Fuel Process.
Technol. 92 (2011) 893–907. doi:10.1016/j.fuproc.2010.12.008.
[6] N. Majidian, S. Soltanali, Comparison of Fischer-Tropsch fixed and monolith bed
reactors using pseudo-homogeneous 2D model, J. Japan Pet. Inst. 59 (2016) 126–139.
doi:10.1627/jpi.59.126.