NEBOSH Annual Report and Financial Statements for the year ...
Upload
khangminh22Category
view
0download
0
First Women Bank Limited
First Women Bank Limited
Financial Statements For the year ended 31 December 2017
First Women Bank Limited
Page 1 of 10
DIRECTORS’ REPORT FOR THE YEAR ENDED 31 DECEMBER 2017
On behalf of the Board of Directors, I am pleased to present the 28th Annual Report of First Women Bank
Limited (the Bank) for the year ended 31 December 2017.
Economic Review
Comprehensive economic reform agenda as well as the continuity and consistency in economic policies
aimed at achieving a higher growth momentum, ongoing structural reforms, lower commodity prices
and improved law & order conditions are the key contributors towards growth. GDP growth is expected
to strengthen to 6% over the medium term on the back of stepped-up China Pakistan Economic Corridor
investments, improved availability of energy, and growth-supporting structural reforms. Industry grew
mainly on a rebound growth in large-scale manufacturing. Improvement was particularly observed in
sectors like Automobile, Cement, Fertilizer and Steel.
Headline CPI inflation was recorded at 4.6 percent on a year-on-year basis in December 2017.
Devaluation of Rupee during recent months and the rising international oil prices are likely to increase
inflation in the coming months which is expected to be in the range of 4.5% to 5.5%; end of fiscal year
YoY inflation is likely to inch towards the annual target of 6%.
Pakistan’s economy has performed well during FY17. While GDP growth is estimated at 5.3%, LSM
achieved a 5.7% growth; per capita income increased to $1,629 and remittances rose to $19.3 billion,
however, fiscal deficit rose to 5.8 percent of the GDP (against the target of 3.8 percent, and 4.6 percent
in FY16). Pakistan’s economy has now become 42nd largest in terms of the gross domestic product
(GDP) while 25th largest in the world in terms of purchasing power parity.
The country’s trade deficit deteriorated during H1 FY’18 to around USD 18.0 billion, up 24.5% on a year
on year basis. During H1 FY’18, exports picked up by 11.2% year on year while imports were up by
19.1%. Thus, the current account deficit for H1 FY’18 increased substantially to USD 7.4 billion as
compared to USD 4.7 billion for the same period last year. Despite weaker current account performance,
the financial account supported the country’s reserves position during H1 FY’18.
Given the inflation upsurge during recent months, State Bank of Pakistan seems to have started taking
control measures by increasing, for the first time since 2013, the discount rate by 25 bps. This, in return
is also expected to result in some growth in net interest margin of the Banking industry. Given the
increased liquidity and stable discount rates, opportunities exist for the Banking industry to secure
further growth in near future. Operating environment seems stable as economic growth will accelerate
driven by infrastructure investment as CPEC projects gain momentum, attracting foreign direct
investment as well as local demand for credit.
Four key factors of Pakistan’s economy have witnessed important changes since November 2017
impinging upon the policy rate decision. Firstly, PKR has depreciated by around 5 percent. Secondly, oil
prices are hovering near USD 70 per barrel. Thirdly, a numbers of central banks have started to adjust
their policy rates upwards adversely affecting PKR interest-rate differentials vis-à-vis their currencies.
Fourthly, multiple indicators show that the output gap has significantly narrowed indicating a buildup of
demand pressures.
These positive developments also supported FWBL but due to low volumes and execution capacity the
positivity is overshadowed due to absorption of deferred tax asset, additional provisioning and loss of
markup income on bad debts. FWBL is deprived of agility to respond to the market dynamics and
benefiting out of the available opportunities, due to low levels of capital and human resource
constraints despite of increase in deposit base and overall investment portfolio.
First Women Bank Limited
Page 2 of 10
Financial Highlights
Financial Performance
On the gross markup income side, the Bank reported an increase of Rs. 114.47 million (9.85%) whereas on
the interest expense side, the Bank registered an increase of Rs. 79.33 million over last year. To supplement
its net interest margins, the Bank remained focused on increasing its low cost deposit base and venture in
higher-yielding assets. On the non-markup income front, the Bank reported a base of Rs. 121.98 million with
the decrease of 50.12% over last year mainly due to significant capital market volatility in the later half of the
year. During 2017, as the spreads further squeezed, business margins were challenged, hence, the bank
booked loss before tax for the year of Rs. 115.94 million. The bank has registered a slight growth in volumes –
Yet the The management is focusing to reduce its funding cost further; thereby improving its spreads.
Meanwhile, given recent capital compliance with reduced MCR, bank still needs higher level of Capital to
compete in the market with rising compliance standards & technology innovations
Asset base of the bank has reached to Rs. 24.829 billion from Rs. 18.52 billion, reflecting a health
increase of 34.06% over December 2016. Analysis of asset mix highlights that net investments increased
by 69.15%, net advances have shown an increase of 8.06% while deposit portfolio register an increase of
18.61% over 31 December 2016.
Bank has always encouraged providing financial support to women for promoting this important
component of the economy. During the year 2017, Bank has disbursed Rs. 137.565 million to female
individuals and entities run by female entrepreneurs.
Key Business Developments
FWBL is constantly striving for keeping pace with changing market dynamics and customer needs. In the
year 2017 the main focus of the management remained on improvement and facilitation of SME and
consumer sector. Three SBP’s SME concessional schemes namely Prime Minister National Health
Program –PMNHP, Refinance and Credit Guarantee Scheme for Women Entrepreneur –WERS,
Corporate Guarantee Scheme – CGS have been launched. Number of SME loan and consumer loan have
also increased considerably as compared to 2016.
Rupees in '000
Profit & Loss Account for the Year Ended, Statement of Financial Position As at,
December
2017
December
2016
Change (%) 31 December
2017
31 December
2016
Change
(%)
Mark-up / return / interest earned 1,276,336 1,161,864 9.85%
Mark-up / return / interest expensed (601,824) (522,492) 15.18% Advances - Net 8,875,631 8,213,247 8.06%
Net mark-up / interest income 674,512 639,372 5.50% Investments - Net 13,587,722 8,032,819 69.15%
Non Mark-up Income 121,978 244,555 -50.12% Deposits 16,259,737 13,708,791 18.61%
Total income 796,490 883,927 -9.89% Total Assets 24,828,931 18,520,564 34.06%
Administrative expenses (893,021) (879,190) 1.57% Total Liabilities 21,096,220 15,040,042 40.27%
Other provisions and charges (7,050) (18,351) -61.58% Borrowings 3,903,832 743,909 424.77%
(Loss) before reversal/provisions (103,581) (13,614) 660.84% Share Capital 3,994,113 3,494,113 14.31%
(Provisions) / Reversals (12,354) 17,667 169.93% Reserves 307,717 307,717 0.00%
Loss before taxation (115,935) 4,053 (2.96 times) Accumulated loss (695,455) (463,975) 49.89%
Taxation (122,103) 7,269 (1.78 times)
(Loss) / profit after taxation (238,038) 11,322 (2.20 times)
Earnings per share (rupees) (0.61) 0.03 (2.13 times)
First Women Bank Limited
Page 3 of 10
In an attempt to expand outreach in Baluchistan under SBP Baluchistan Action point, to serve the people
of under-served province opening of two booths in two girls colleges of Quetta are underway. Another
mile stone achieved last year was enabling SMS alert services across the board for customers, although
it’s a very small step but for the management it’s a big achievement keeping in view of a number of
constrains bank has been facing since long.
In the year 2017 the main focus of the management remained on strategy formulation, improving
regulatory compliance, governance, enhancement of core banking platform to newer version and
improve policies, processes & internal controls. Its business focus remained on low cost Deposit
mobilization and recovery of bad loans. Cash recoveries worth Rs. 190 million from classified borrowers
were managed during the year.
Alternate Delivery Channels (ADCs) are effective mediums for providing banking services directly to
customers. ADCs have proven their ability to meet customers’ expectations by ensuring accuracy,
convenience and timeliness in service 24/7. FWBL signed agreements with 1Link, MasterCard, and
Avanza to offer debits cards and internet banking services to it’s customers. These initiatives will take
FWBL a step forward in providing Fintech services to their existing and future customer base.
Gender Equity Program Grant
The First Women Bank Limited has been awarded a grant of Rs. 27.5 million for developing three new
financial products for (GEP) Home based Workers and Small Scale Women Entrepreneurs and Capacity
Building of FWBL including Senior management and core banking staff on the new financial products,
leadership development and service quality under Gender Equity Program (GEP) of Aurat Foundation
(AF) by the support of the American People through United States Agency for International
Development (USAID).
The overall Project objective is to enhance the Financial Inclusion of Women, thus leading to poverty
alleviation, access to much needed finance, increasing the habit of saving, and provision of other bank
services. These asset based/liability oriented/ risk mitigating and insurance covered financial products
will be targeted to women clusters, 17 AF affiliated Universities, beneficiaries of GEP and small scale
female entrepreneurs.
FWBL will organize a market survey to find out what financial products do Home Based Workers and
Small Scale Entrepreneurs want. The sample for this survey on Research and Development of products
will be taken from previous trainees (640) and GEP implementing partners of grant cycle 7A and 12
districts of Pakistan consisting approximately 1750 direct beneficiaries. FWBL will develop at least three
(3) new banking products / services that it will pretest, pilot and launch through a marketing campaign
and three road shows. FWBL will conduct trainings of its senior management as well as its core banking
staff on the new developed products as well as impart soft skills trainings on Team Building, Leadership,
Customer Service and Sales Management.
FWBL will also utilize GEP’s “Pakistan Gender Coalition” (PGC) platform for marketing its products to
GEP sub guarantees so that NGOs and CSOs working on women’s empowerment and development can
access FWBL’s services.
First Women Bank Limited
Page 4 of 10
FWBL will also engage and develop interventions with 17 GEP affiliated Universities in the close
proximity of its branch network to introduce banking services to young women.
It is envisioned that through these campaigns and three road shows financial inclusion of women will be
increased and improved leading to women economic empowerment and emancipation.
National Financial Inclusion Strategy
FWBL aims to support women's financial inclusion by taking a holistic and integrated approach and
undertaking research and developing products & services based on needs of un-served women markets.
Further, it is also planned to participate in schemes of Government aimed to Economic Empowerment of
women at all three MACRO, MEZZO and MICRO levels. We aim to build tie ups with organization that
are providing financial assistance to low income groups to facilitate and promote SME sector by focusing
particularly on S of SME. Management is also planning to develop variety of affordable products for the
end users that enhance economic activity & financial inclusion and identify women target markets and
clusters which are financially excluded. Even if we aim to target 1% of the total Financial Inclusion target
for Pakistan, we would be undertaking a paradigm shift in our existing product mix structures and
services mix for the end user. We aim to utilize the GEP project as corner stone in the foundation to
achieve the National Financial Inclusion target.
Key IT Developments
Subsequent to strengthening of Information Technology infrastructure in prior year, FWBL management
took initiatives to roll out customer centric solutions via alternate delivery channels. During the year
2017, FWBL team began working on Pay-Pak debit card, MasterCard debit card, 24/7 Call Center with
IVR, and Internet Banking.
Cyber Security was one of the major discussion points during the year. FWBL Information security
department conducted sessions with human resources across the nation to inform them about the basic
tools to prevent cyber-attacks. In addition to these sessions, Information Security department
coordinated with IT network and systems engineering teams to implement controls within the existing
network to minimize the chances of cyber-attack.
During the year, FWBL conducted BCP and IT Disaster Recovery drills to ensure business continuity and
availability of business applications to manage customer needs. These drills included drills for Core
Banking Solution, ATM services, RTGS, and CDC applications.
Minimum Capital Requirement
Minimum Capital Requirements (MCR) has been reset for the Bank by SBP, upon recommendation from
Government of Pakistan (GoP), as disclosed in note 1.2 to the financial statements. Under the revised
requirements, the Bank is required to maintain paid-up capital (net of losses) of Rs. 3 billion and Capital
Adequacy Ratio (CAR) of 18% at all times. However, till the year ended 31 December 2017 the paid up
capital net of accumulated losses stood at Rs. 3.299 billion. Whereas bank risk profile remain quite
satisfactory as reflected through its CAR of 53.86%.
Additional Equity Injection by GoP.
During the year 2017 MOF injected Rs. 500 million towards the paid up capital of the Bank thus the paid
up share capital of the Bank stands at Rs. 3.994 billion as at the close of the year. GoP through MoF now
owns 82.64% of the shareholding of the Bank.
First Women Bank Limited
Page 5 of 10
Credit Rating
The Bank has a long-term entity rating of “A-” while the short-term entity rating is “A2”. Bank’s rating
denotes that there is currently a low expectation of credit risk and the capacity for timely payment of
financial commitments is considered strong.
Statement under clause xvii of the Public Sector Companies Code of Corporate Governance
The Board of Directors is committed to ensure that the relevant principles of Corporate Governance are
complied with. However, the non-compliances, if any (as mentioned in statement of compliance) have
been identified and have been recorded along with the reasons. The Directors are pleased to report
that;
• The financial statements present fairly the state of affairs of the Bank, the result of its operations,
cash flows and changes in equity;
• Proper books of account of the Bank have been maintained;
• Appropriate accounting policies have been consistently applied in the preparation of the financial
statements, & Accounting estimates are based on reasonable and prudent judgment;
• International Financial Reporting standards, as applicable to Banks in Pakistan, have been followed
in the preparation of financial statements and departure(s), (if any) there from have been
adequately disclosed in the Annual Financial Statements.
• The system of internal control in the Bank is sound in design, and has been effectively implemented
and monitored;
• The appointment of Chairman Board & other Members, the terms of their appointment & the
remuneration Policy (Director’s fee) adopted are in the best interest of the Bank as well as in line
with the best practices.
• The disclosure of the remuneration of the Chief Executive and the Directors is covered under Note
35 of the attached financial statements.
• There are no significant doubts regarding the Bank’s ability to continue as a going concern;
• There has been no material departure from the best practices of Corporate Governance;
• The Board has formed the following four committees with defined terms of reference:
- Board Risk Management Committee (BRMC); met 3 times during the year;
- Board Human Resource & Compensation Committee (BHRCC); met 4 times during the year;
- Board Audit Committee (BAC); met 4 times during the year and
- Board Business Strategy Committee- met 3 times during the year and.
Further, the Board has also formed Board Nomination Committee in 2017.
Board & Sub Committee Meetings
Total 7 Board Meetings, 4 BAC meetings, 4 BHRCC meetings,3 BRMC meetings and 3 BBSC meetings
were held during 2017. The number of meetings attended by each of the Director during his/ her tenure
is as follows;

First Women Bank Limited
Page 6 of 10
Change in the Directors
There have been following changes in the Board:
• Mr. Mudassir H Khan (Nominee – NBP) resigned on August 11, 2017.
• Ms. Naheed Ishaq (Nominee-MoF) retired from the Board on July 26, 2017. Ms. Sumaira K Aslam
joined the Board on 18th September 2017 (in place of retiring Director from MoF1) after FPT
clearance from SBP.
Directors Training Program
In compliance with clause 11(2) of Public Sector Companies Code of Corporate Governance 2013, three
Directors completed certification in Director Training Program during 2017 from certified training
institution. Out of seven Directors, 5 Directors are now certified. Whereas, Certification for one Director
would also be completed in February 2018. The nomination process of the remaining Director is in
finalization.
Directors’ Remuneration
With changes in the corporate governance norms, the role of the Non-Executive Directors (NED) and the
degree and quality of their engagement with the Board and the Company has undergone significant
changes over a period of time. Therefore considering the enhanced roles of the Non-Executive Directors
and to attract, retain and motivate them, the Board of Directors in their 151st Board of Directors
meeting held on 27th October, 2017 recommended increase in Director’s fee (for Non-Executive and
Independent Directors) from 25,000 per Board & Sub Committee meeting to Rs. 90,000 per meeting.
The same would be submitted to shareholders for consideration and approval in upcoming AGM in
March 2018.
Moreover, travelling and accommodation is also allowed to out stationed Non-Executive Directors as
per the criteria approved by the Shareholders in their 27th Annual General Meeting held on 30th March,
2016.
Ms. Tahira Raza FWBL 7 7 2 2 3 3 3 3
Mr. Mudassir H. Khan* NBP 4 4 2 2
Ms. Naheed Ishaq** MoF 4 4 2 2 1 -
Ms. Nausheen Ahmed HBL 7 3 3 1 4 4 1 -
Mr. Muhtashim Ahmed Ashai MCB 7 6 4 3 3 3
Ms. Rukhsana Shah ID 7 5 2 1 2 1 3 2
Ms. Huma Baqai ID 7 6 4 4 3 2 3 2
Mr. Gholam Kazim Hosein ID 7 7 4 4 3 3
Ms. Sumaira K Aslam** MoF 3 3 1 1 1 1 1 1
* Nominee Directors from NBP resigned from the Board on August 11, 2017
N/A
N/AN/A
N/A
N/A
N/A
N/A
N/A
BRMC
Meetings
Held
During
Tenur
Attendance
Meetings
Held
During
Tenur
Attendance
Meetings
Held During
Tenur
Attendance
N/A
N/A
** Nominee Directors from MoF retired from the Board on July 26, 2017. Ms. Sumaira K Aslam joined the Board on 18th September 2017 in her place after FPT clearance from
SBP
BBSC
Meetings
Held
During
Tenur
Attendance
N/AN/A
N/A
Name of Directors Org.
Meetings
Held
During
Tenur
Attendance
BAC BHRCCBoard Meeting
First Women Bank Limited
Page 7 of 10
Performance Evaluation of the Directors
The purpose of the performance evaluation of the Directors is to identify the factors that would act as
change agent and to help Board (as an entity) to be more successful in assessing its areas of strength
and weakness and also to provide a yardstick by which the Board can identify and prioritize its goals for
the future in the interest of the Organization. The performance evaluation takes into account the
international broad corporate governance norms as well as the responsibilities of the Board as approved
by the Board under the FWBL Board Charter (BC) and Board approved Policy on Self Evaluation
(BE). Further the Guidelines on the performance evaluation of Board of Directors issued by SBP vide
BPRD Circular No. 11 of 2016 dated 22nd August, 2016 were also taken into account and the
questionnaires for performance evaluation were developed on line with the said guidelines. Currently
the in-house approach for performance evaluation has been adopted; however, as required under the
guidelines, the performance evaluation from third party would be undertaken once in three years.
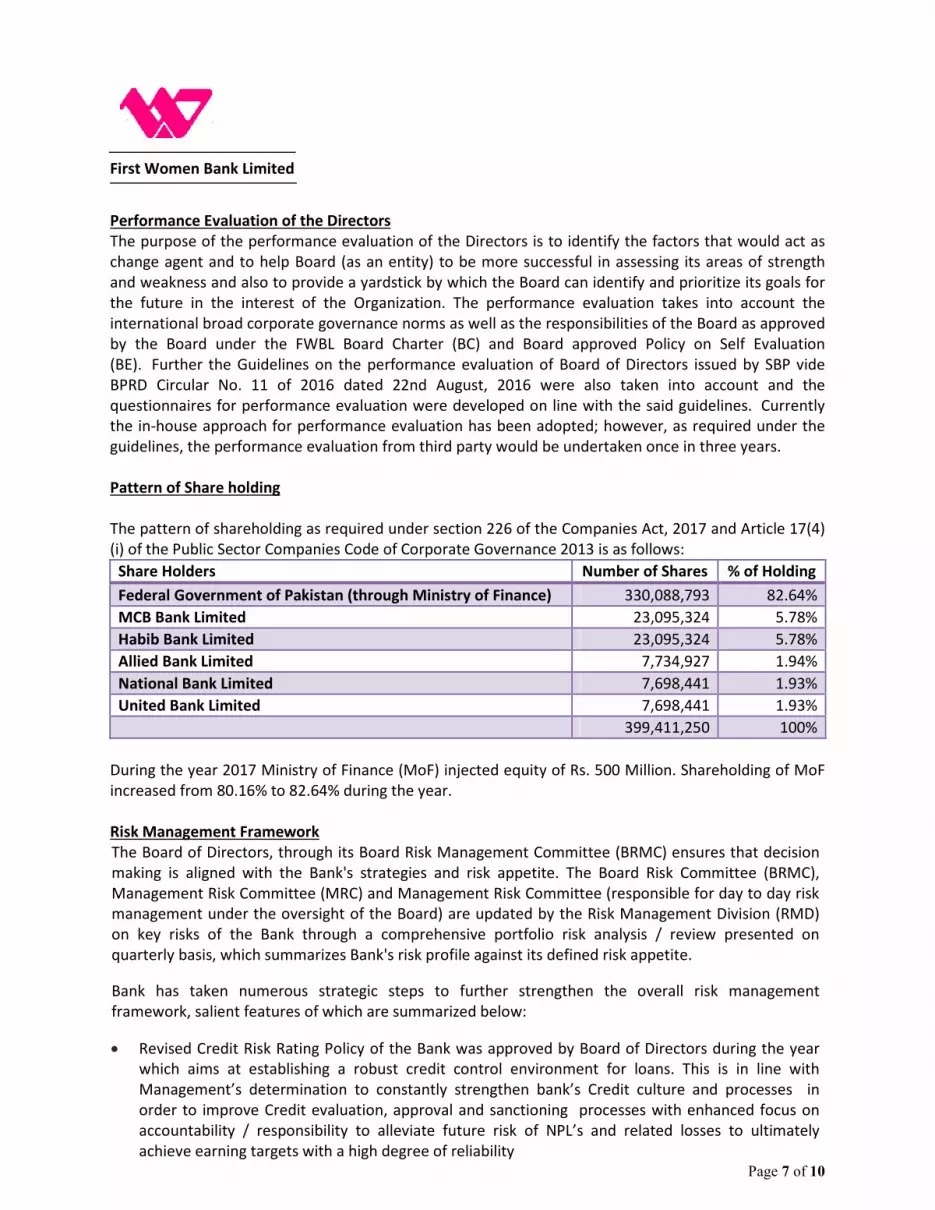
Pattern of Share holding
The pattern of shareholding as required under section 226 of the Companies Act, 2017 and Article 17(4)
(i) of the Public Sector Companies Code of Corporate Governance 2013 is as follows:
Share Holders Number of Shares % of Holding
Federal Government of Pakistan (through Ministry of Finance) 330,088,793 82.64%
MCB Bank Limited 23,095,324 5.78%
Habib Bank Limited 23,095,324 5.78%
Allied Bank Limited 7,734,927 1.94%
National Bank Limited 7,698,441 1.93%
United Bank Limited 7,698,441 1.93%
399,411,250 100%
During the year 2017 Ministry of Finance (MoF) injected equity of Rs. 500 Million. Shareholding of MoF
increased from 80.16% to 82.64% during the year.
Risk Management Framework
The Board of Directors, through its Board Risk Management Committee (BRMC) ensures that decision
making is aligned with the Bank's strategies and risk appetite. The Board Risk Committee (BRMC),
Management Risk Committee (MRC) and Management Risk Committee (responsible for day to day risk
management under the oversight of the Board) are updated by the Risk Management Division (RMD)
on key risks of the Bank through a comprehensive portfolio risk analysis / review presented on
quarterly basis, which summarizes Bank's risk profile against its defined risk appetite.
Bank has taken numerous strategic steps to further strengthen the overall risk management
framework, salient features of which are summarized below:
• Revised Credit Risk Rating Policy of the Bank was approved by Board of Directors during the year
which aims at establishing a robust credit control environment for loans. This is in line with
Management’s determination to constantly strengthen bank’s Credit culture and processes in
order to improve Credit evaluation, approval and sanctioning processes with enhanced focus on
accountability / responsibility to alleviate future risk of NPL’s and related losses to ultimately
achieve earning targets with a high degree of reliability

First Women Bank Limited
Page 8 of 10
• SBP had extended special relaxation to FWBL for Minimum Capital requirement in December 2013
wherein Bank is required to maintain a minimum paid up capital (net of losses) of Rs. 3 Billion
instead of Rs. 10 Billion as applicable to other banks. As on date, the Bank complies with the special
MCR criteria.
• The Bank also successfully meets the Capital Adequacy Ratio (CAR) & Leverage Ratio requirements
under Basel III standards. The Bank has been able to maintain its CAR much above the approved
threshold of 18 % as set by SBP which is over and above the required benchmark for other banks.
• The Market Risk and Treasury Middle Office under the umbrella of Risk Management Division are
responsible to monitor Bank’s market risk exposures remains within approved policy parameters
(i.e risk appetite and tolerance levels). During the year, continuous efforts were made to further
enhancement/strengthen risk management techniques and tools for effective monitoring of Bank’s
Market Risk exposure
• During the year, FWBL consistently remained above the regulatory requirement for Liquidity
Coverage Ratio (LCR) and Net Stable Funding Ratio (NSFR). This is an evidence of Bank’s
comfortable Liquidity position.
• Adequate mechanism is in place for regularly monitoring of liquidity indicators and escalation of
early warning signals(if any) well in time to Senior Management along with defined Management
Action Plans(MAP)
• Operational risk is the risk of direct or indirect losses resulting from inadequate or failed
internal processes or systems, human factors or from external events. The Bank’s businesses are
dependent on the ability to process a large number of transactions efficiently and accurately.
Operational risks and losses originate from business / operational process failure, IT security failure,
natural disasters, dependence on key suppliers, fraud, service quality compromises, regulatory
noncompliance, loss of key staff and social and environmental impacts. The Operational Risk
Management function is primarily responsible for the oversight of operational risk management
across the Bank. The operational risk management framework of the Bank is governed by the
Operational Risk Management Policy and Procedures. The framework is in line with international
best practices, flexible enough to implement in stages and permits the overall approach to evolve in
response to organizational learning and future requirements.
• The Bank has implemented an effective Operational Risk Management (ORM) framework for
managing operational risk. Operational loss data is collected through a well-defined program
implemented across the Bank. Periodic workshops are conducted for Risk & Control Self-Assessment
and key risk exposures are identified and assessed against existing controls to evaluate
improvement opportunities. Key Risk Indicators are also defined for monitoring of risk exposures.
New products, systems, activities and processes, are comprehensively assessed by operational risk
before implementation. Regular updates on operational risk status is presented to Management
Risk Committee (MRC) and the Board of Directors through the Board Risk Management Committee
(BRMC)
The Bank’s management is committed to allocate considerable efforts and resources in managing the
material risks to which it is exposed. The momentum attained so far will be continued in identifying,
controlling and managing risk through significant investments in experienced human resource,
innovative technology and required trainings.
First Women Bank Limited
Page 9 of 10
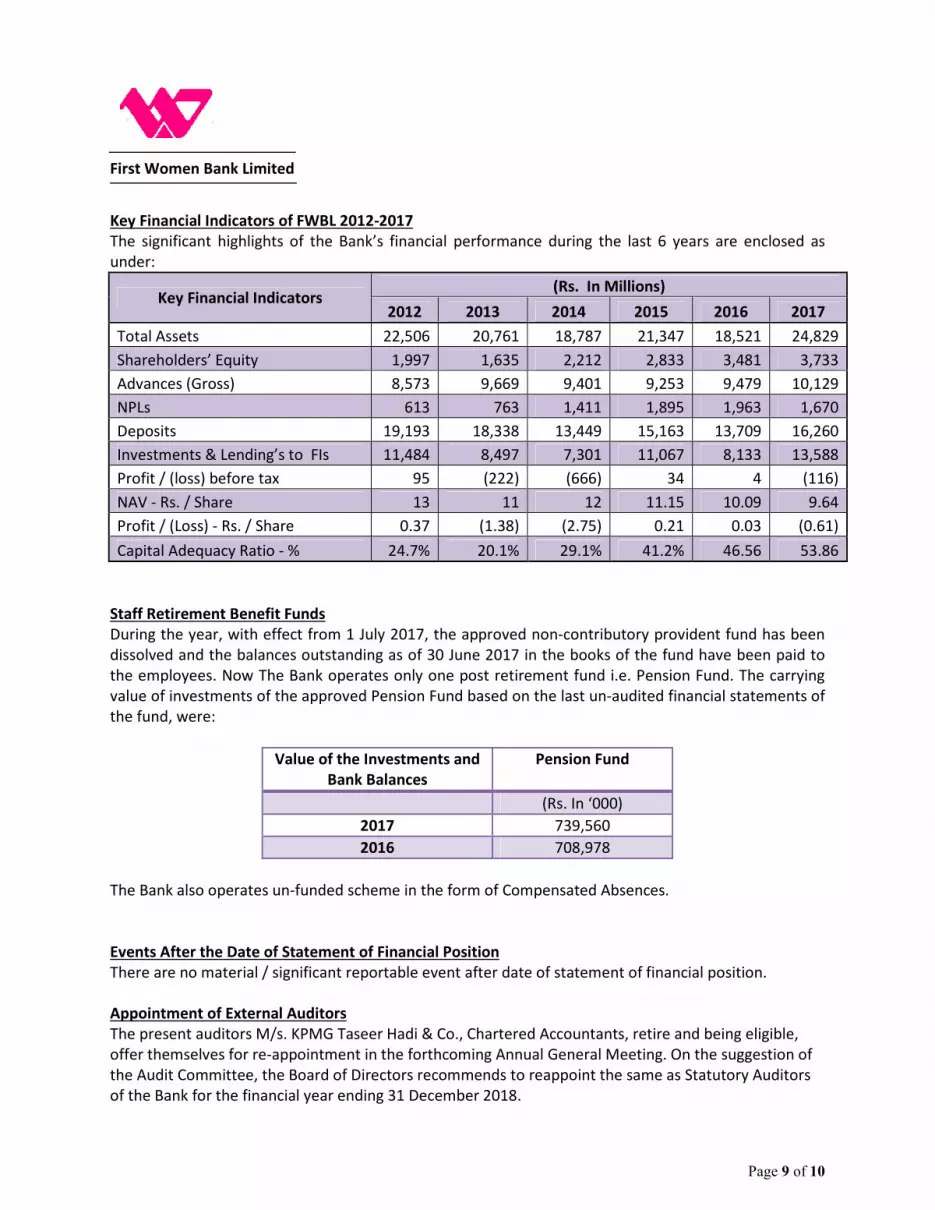
Key Financial Indicators of FWBL 2012-2017
The significant highlights of the Bank’s financial performance during the last 6 years are enclosed as
under:
Key Financial Indicators (Rs. In Millions)
2012 2013 2014 2015 2016 2017
Total Assets 22,506 20,761 18,787 21,347 18,521 24,829
Shareholders’ Equity 1,997 1,635 2,212 2,833 3,481 3,733
Advances (Gross) 8,573 9,669 9,401 9,253 9,479 10,129
NPLs 613 763 1,411 1,895 1,963 1,670
Deposits 19,193 18,338 13,449 15,163 13,709 16,260
Investments & Lending’s to FIs 11,484 8,497 7,301 11,067 8,133 13,588
Profit / (loss) before tax 95 (222) (666) 34 4 (116)
NAV - Rs. / Share 13 11 12 11.15 10.09 9.64
Profit / (Loss) - Rs. / Share 0.37 (1.38) (2.75) 0.21 0.03 (0.61)
Capital Adequacy Ratio - % 24.7% 20.1% 29.1% 41.2% 46.56 53.86
Staff Retirement Benefit Funds
During the year, with effect from 1 July 2017, the approved non-contributory provident fund has been
dissolved and the balances outstanding as of 30 June 2017 in the books of the fund have been paid to
the employees. Now The Bank operates only one post retirement fund i.e. Pension Fund. The carrying
value of investments of the approved Pension Fund based on the last un-audited financial statements of
the fund, were:
Value of the Investments and
Bank Balances
Pension Fund
(Rs. In ‘000)
2017 739,560
2016 708,978
The Bank also operates un-funded scheme in the form of Compensated Absences.
Events After the Date of Statement of Financial Position
There are no material / significant reportable event after date of statement of financial position.
Appointment of External Auditors
The present auditors M/s. KPMG Taseer Hadi & Co., Chartered Accountants, retire and being eligible,
offer themselves for re-appointment in the forthcoming Annual General Meeting. On the suggestion of
the Audit Committee, the Board of Directors recommends to reappoint the same as Statutory Auditors
of the Bank for the financial year ending 31 December 2018.
First Women Bank Limited
Page 10 of 10
Corporate Social Responsibility
We aim to conduct our business that creates value for our customers, clients, partners, shareholders
and mostly important our society. We understand that being a good corporate citizen starts with serving
responsibly. We have engrained this philosophy in our business operation, in our culture and in our
business decisions.
Looking Ahead
Our long term strategy is to evolve our leading segments resulting in deeper market access and creating
opportunities through new product development. We believe in further expanding the scope of banking
services in Pakistan in future. It is our objective to actively contribute to the development of the
economy that is seeking its true potential. With ever changing industry and customer outlook, The Bank
is focusing on development of new research based products to address the needs of different market
segments, branch network transformation, branding and reshaping its processes. Focus on women
empowerment through alliances and linkages with different women oriented forums is also the main
pillar of the long term strategy of the Bank.
For the Bank, asset quality will remain a focus area while revitalizing its lending within the selected
segments. Further, the management will continue to pursue the major shareholder for an equity
injection that address the issue of the minimum paid up capital in line with the regulatory directives
strengthening the financial base of the Bank.
Appreciation and Acknowledgement
On behalf of the Board, I wish to place on record their sincere gratitude to the Government of Pakistan,
Ministry of Finance, State Bank of Pakistan and Securities & Exchange Commission of Pakistan for their
support and continued guidance. We also like to thank our outgoing Directors for the support and
insights they had shared to allow us to move ahead and improve the overall governance structure of the
bank.
The Directors also thank and appreciate the support and confidence of our valued customers and
business partners for their continued trust and patronage. We also have high expectations from the
bank’s management and staff to turn this Bank around as quickly as possible.
For and on behalf of the Board of Directors
Tahira Raza
President
Karachi
Date: 21 March 2018
First Women Bank Limited
STATEMENT OF INTERNAL CONTROLS
REPORTING OF INTERNAL CONTROL SYSTEM
The Bank’s management is primarily responsible for the establishment and maintenance of an
adequate and effective system of internal control that could help in the Bank’s endeavor to attain a
professional and efficient working environment throughout the Bank. The Internal Control System
comprises of control procedures, practices and control environment.
The management ensures the efficiency and effectiveness of the Internal Control System by
identifying control objectives, reviewing pertinent policies / procedures and establishing relevant
control procedures. The Board has approved significant policies / manuals of the Bank, while some
policies and procedures are being compared with existing practices and necessary amendments /
updates and preparation of additional new policies / manuals are in progress. On the overall basis
twenty six new policies are developed, fifteen are updated, seven new procedure manuals are
developed and four existing manuals are updated.
Further, the management is conscious of appropriate authentication of transactions, strengthening
of control environment, identifying areas requiring improvement in Internal Control System and
ensuring relevant appropriate follow-ups / corrective actions, on timely basis. Internal Control
System in the Bank is designed to manage, rather than eliminating, the risk of failure to achieve the
business objectives and can only provide reasonable and not absolute assurance against material
misstatement or loss.
In compliance with the SBP’s directives, the Bank is striving to complete the implementation of
Roadmap regarding Internal Controls over Financial Reporting (“ICFR”). In this regard, Bank has
completed detailed documentation of the existing processes, comprehensive evaluation of controls,
development of detailed remedial action plans for the gaps identified as a result of such evaluation
and devising comprehensive testing plans of the controls of all processes. Whole documentation is
currently under review by the external auditors and Long Form Report (“LFR”) shall be issued for the
year ended 31 December 2017.
The Bank is actively working towards completing the remaining stages of the ICFR program. The
management is under process of appointing a consultant to provide end to end services to the Bank
to comply with the regulatory requirements of State Bank of Pakistan for completion of ICFR
roadmap. The tender notice of the same has been published and the proposal submission deadline is
26th
March 2018.
EVALUATION OF EXISTING INTERNAL CONTROL SYSTEM
The Bank strived during the year 2017 to ensure that an effective and efficient internal control
system is implemented, any material compromise is not made in implementing the desired control
procedures and a suitable environment is maintained in general. However, it is an ongoing process
that includes identification, evaluation and management of significant risks being faced by the Bank.
The significant observations and weaknesses found / identified, both internal and external, have
taken care of largely and necessary steps were taken by the management, to minimize recurrence of
those exceptions and elimination of such weaknesses, as far as possible. First time in the history of
First Women Bank Limited
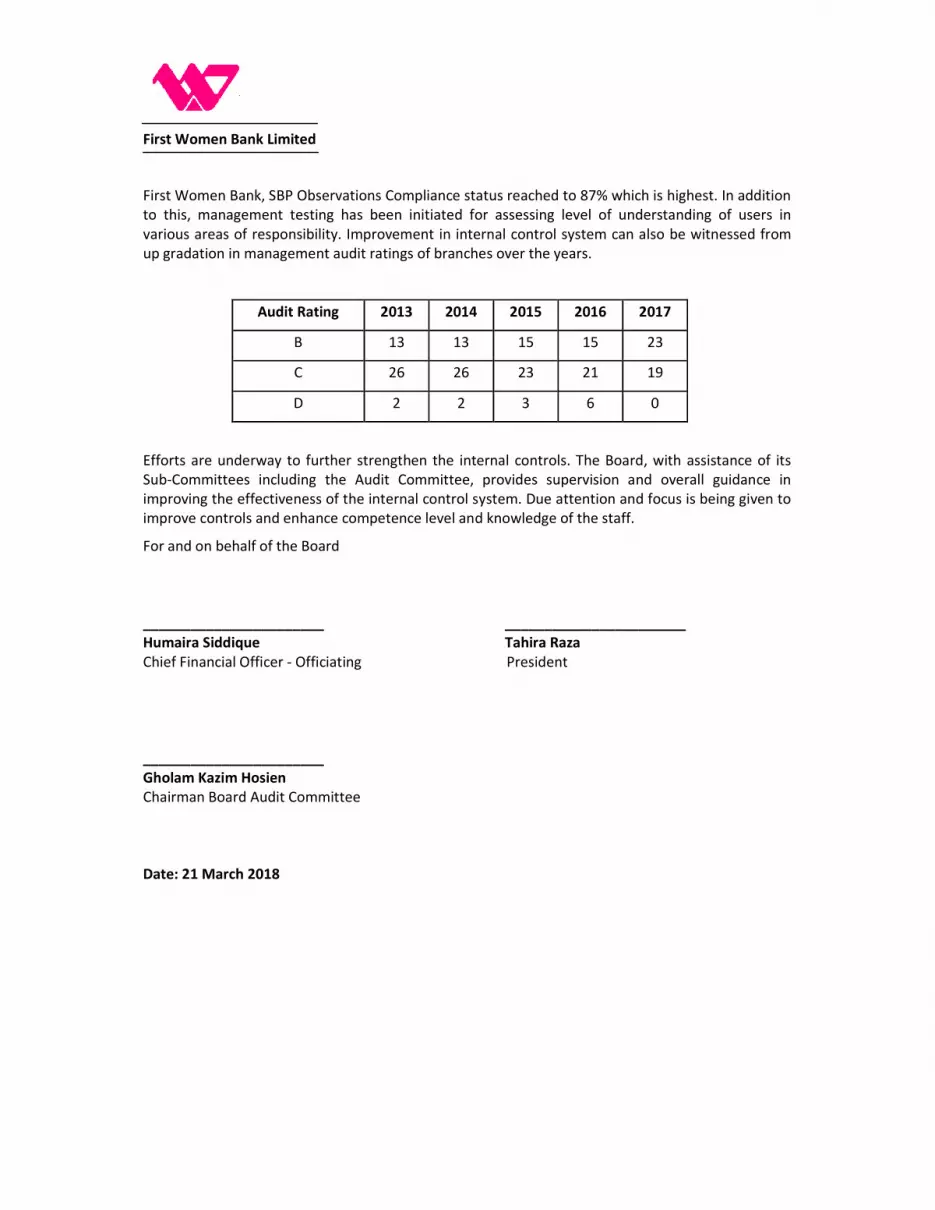
First Women Bank, SBP Observations Compliance status reached to 87% which is highest. In addition
to this, management testing has been initiated for assessing level of understanding of users in
various areas of responsibility. Improvement in internal control system can also be witnessed from
up gradation in management audit ratings of branches over the years.
Audit Rating 2013 2014 2015 2016 2017
B 13 13 15 15 23
C 26 26 23 21 19
D 2 2 3 6 0
Efforts are underway to further strengthen the internal controls. The Board, with assistance of its
Sub-Committees including the Audit Committee, provides supervision and overall guidance in
improving the effectiveness of the internal control system. Due attention and focus is being given to
improve controls and enhance competence level and knowledge of the staff.
For and on behalf of the Board
_______________________ _______________________
Humaira Siddique Tahira Raza
Chief Financial Officer - Officiating President
_______________________
Gholam Kazim Hosien
Chairman Board Audit Committee
Date: 21 March 2018
Review Report to the Members On the Statements of Compliance with the Code of
Corporate Governance and Public Sector Companies (Corporate Governance) Rules, 2013
We have reviewed the enclosed Statement of Compliance with the best practices contained in
the Public Sector Companies (Corporate Governance) Rules, 2013 (herein referred to as 'the
Code') prepared by the Board of Directors of First Women Bank Limited (“the Bank”) for the
year ended 31 December 2017 to comply with the provisions of Public Sector Companies
(Corporate Governance) Rules, 2013.
The responsibility for compliance with the Code is that of the Board of Directors of the Bank.
Our responsibility is to review, to the extent where such compliance can be objectively verified,
whether the Statement of Compliance reflects the status of the Bank's compliance with the
provisions of the Code and report if it does not and to highlight any non-compliance with the
requirements of the Code. A review is limited primarily to inquiries of the Bank's personnel and
review of various documents prepared by the Bank to comply with the Code.
As a part of our audit of the financial statements we are required to obtain an understanding of
the accounting and internal control systems sufficient to plan the audit and develop an effective
audit approach. We are not required to consider whether the Board of Directors' statement on
internal control covers all risks and controls or to form an opinion on the effectiveness of such
internal controls, the Bank's corporate governance procedures and risks.
The Code require the Bank to place before the Audit Committee, and upon recommendation of
the Audit Committee, place before the Board of Directors for their review and approval its
related party transactions distinguishing between transactions carried out on terms equivalent to
those that prevail in arm's length transactions and transactions which are not executed at arm's
length price and recording proper justification for using such alternate pricing mechanism. We
are only required and have ensured compliance of this requirement to the extent of the approval
of the related party transactions by the Board of Directors upon recommendation of the Audit
Committee. We have not carried out any procedures to determine whether the related party
transactions were undertaken at arm's length price or not.
Based on our review, nothing has come to our attention which causes us to believe that the
'Statement of Compliance' does not appropriately reflect the Bank's compliance, in all material
respects, with the best practices contained in the Code as applicable to the Bank for the year
ended 31 December 2017.
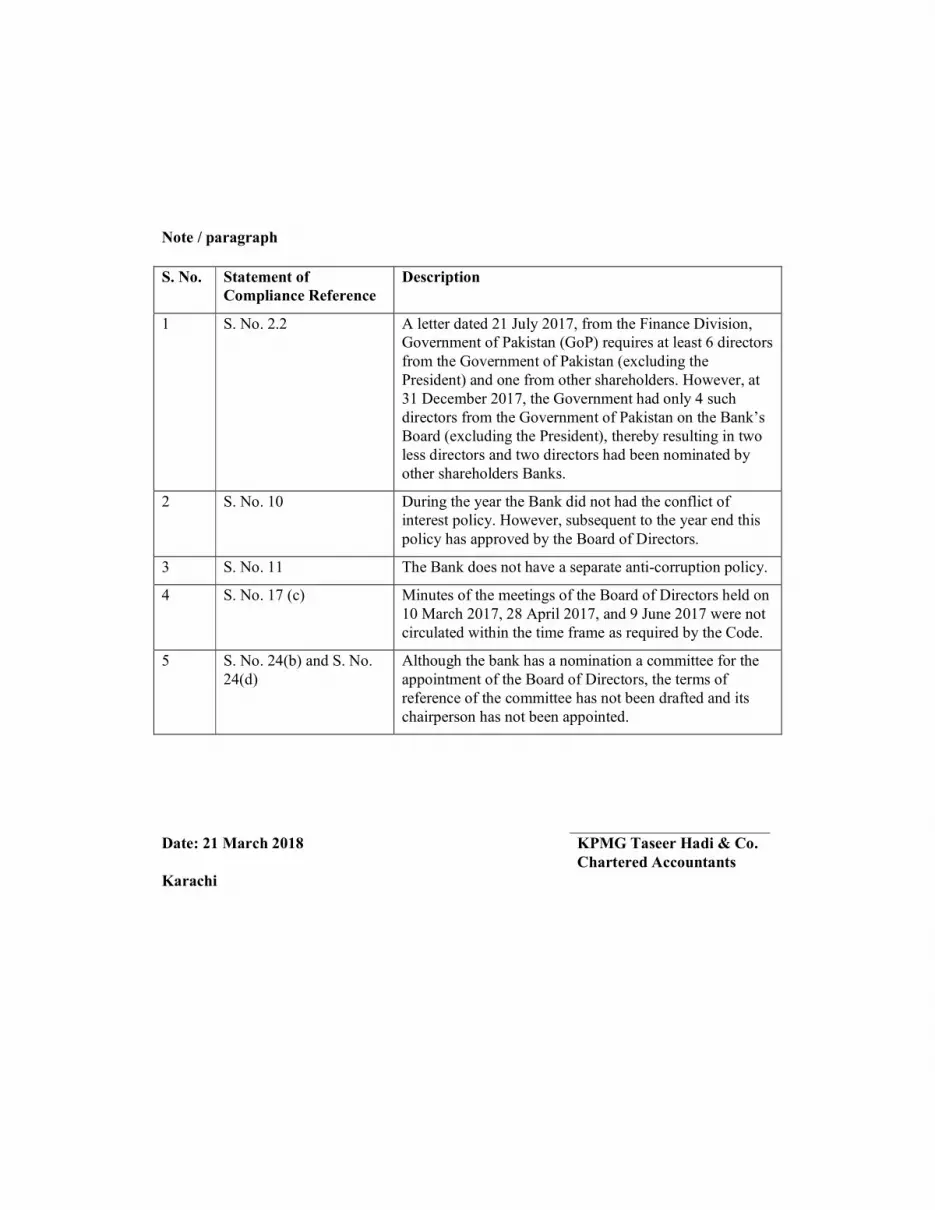
Further, we highlight below instances of non-compliance with the requirements of the Code as
reflected in the notes / paragraph references where these are stated in the Statement of
Compliance:
Note / paragraph
S. No. Statement of
Compliance Reference
Description
1 S. No. 2.2 A letter dated 21 July 2017, from the Finance Division,
Government of Pakistan (GoP) requires at least 6 directors
from the Government of Pakistan (excluding the
President) and one from other shareholders. However, at
31 December 2017, the Government had only 4 such
directors from the Government of Pakistan on the Bank’s
Board (excluding the President), thereby resulting in two
less directors and two directors had been nominated by
other shareholders Banks.
2 S. No. 10 During the year the Bank did not had the conflict of
interest policy. However, subsequent to the year end this
policy has approved by the Board of Directors.
3 S. No. 11 The Bank does not have a separate anti-corruption policy.
4 S. No. 17 (c) Minutes of the meetings of the Board of Directors held on
10 March 2017, 28 April 2017, and 9 June 2017 were not
circulated within the time frame as required by the Code.
5 S. No. 24(b) and S. No.
24(d)
Although the bank has a nomination a committee for the
appointment of the Board of Directors, the terms of
reference of the committee has not been drafted and its
chairperson has not been appointed.
Date: 21 March 2018 KPMG Taseer Hadi & Co.
Chartered Accountants
Karachi
1 of 11
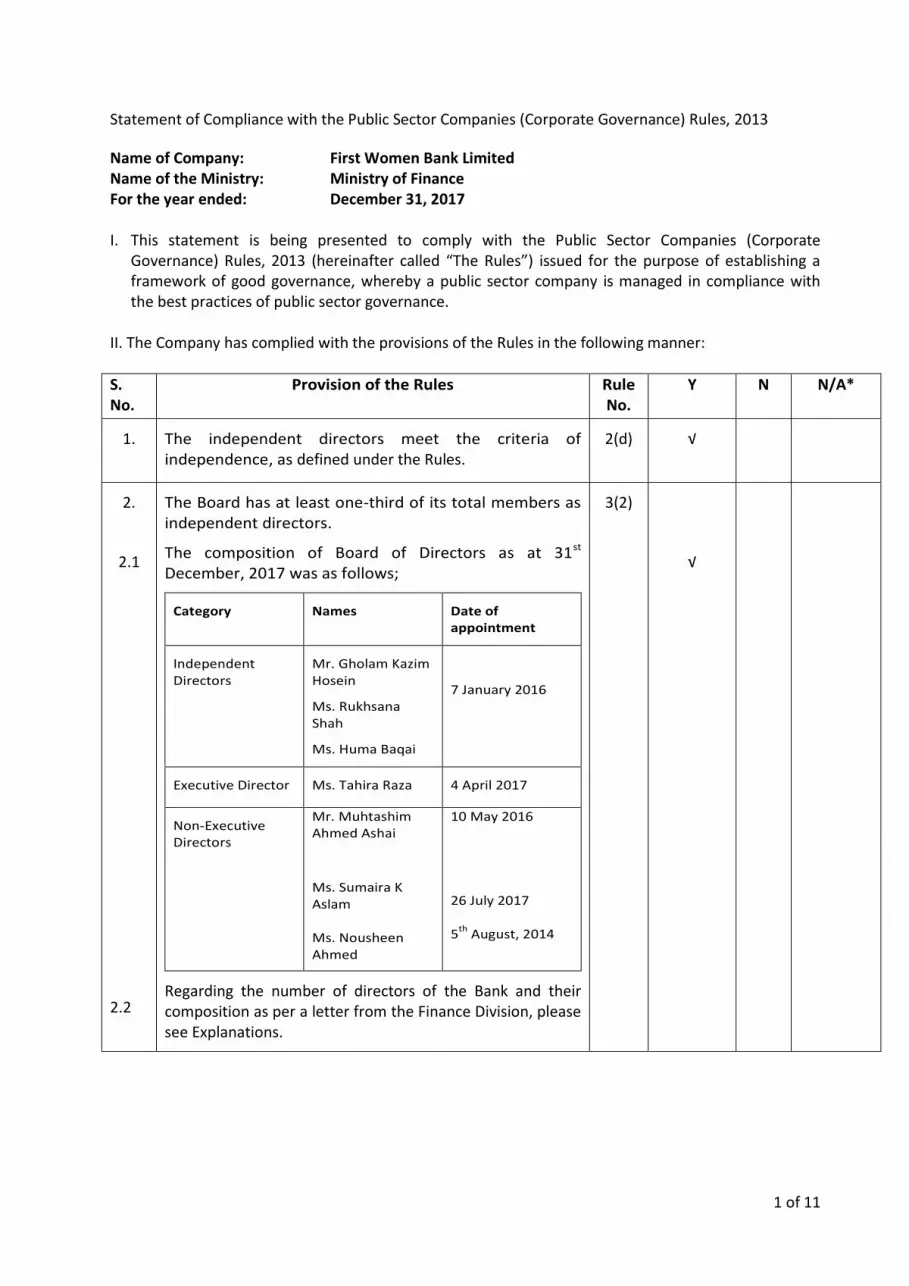
Statement of Compliance with the Public Sector Companies (Corporate Governance) Rules, 2013
Name of Company: First Women Bank Limited Name of the Ministry: Ministry of Finance For the year ended: December 31, 2017 I. This statement is being presented to comply with the Public Sector Companies (Corporate
Governance) Rules, 2013 (hereinafter called “The Rules”) issued for the purpose of establishing a framework of good governance, whereby a public sector company is managed in compliance with the best practices of public sector governance.
II. The Company has complied with the provisions of the Rules in the following manner:
S. No.
Provision of the Rules Rule No.
Y
N N/A*
1. The independent directors meet the criteria of independence, as defined under the Rules.
2(d) √
2.
2.1
2.2
The Board has at least one-third of its total members as independent directors.
The composition of Board of Directors as at 31st December, 2017 was as follows;
Category Names Date of appointment
Independent Directors
Mr. Gholam Kazim Hosein
Ms. Rukhsana Shah
Ms. Huma Baqai
7 January 2016
Executive Director Ms. Tahira Raza 4 April 2017
Non-Executive Directors
Mr. Muhtashim Ahmed Ashai
Ms. Sumaira K Aslam Ms. Nousheen Ahmed
10 May 2016 26 July 2017 5
th August, 2014
Regarding the number of directors of the Bank and their composition as per a letter from the Finance Division, please see Explanations.
3(2)
√
2 of 11
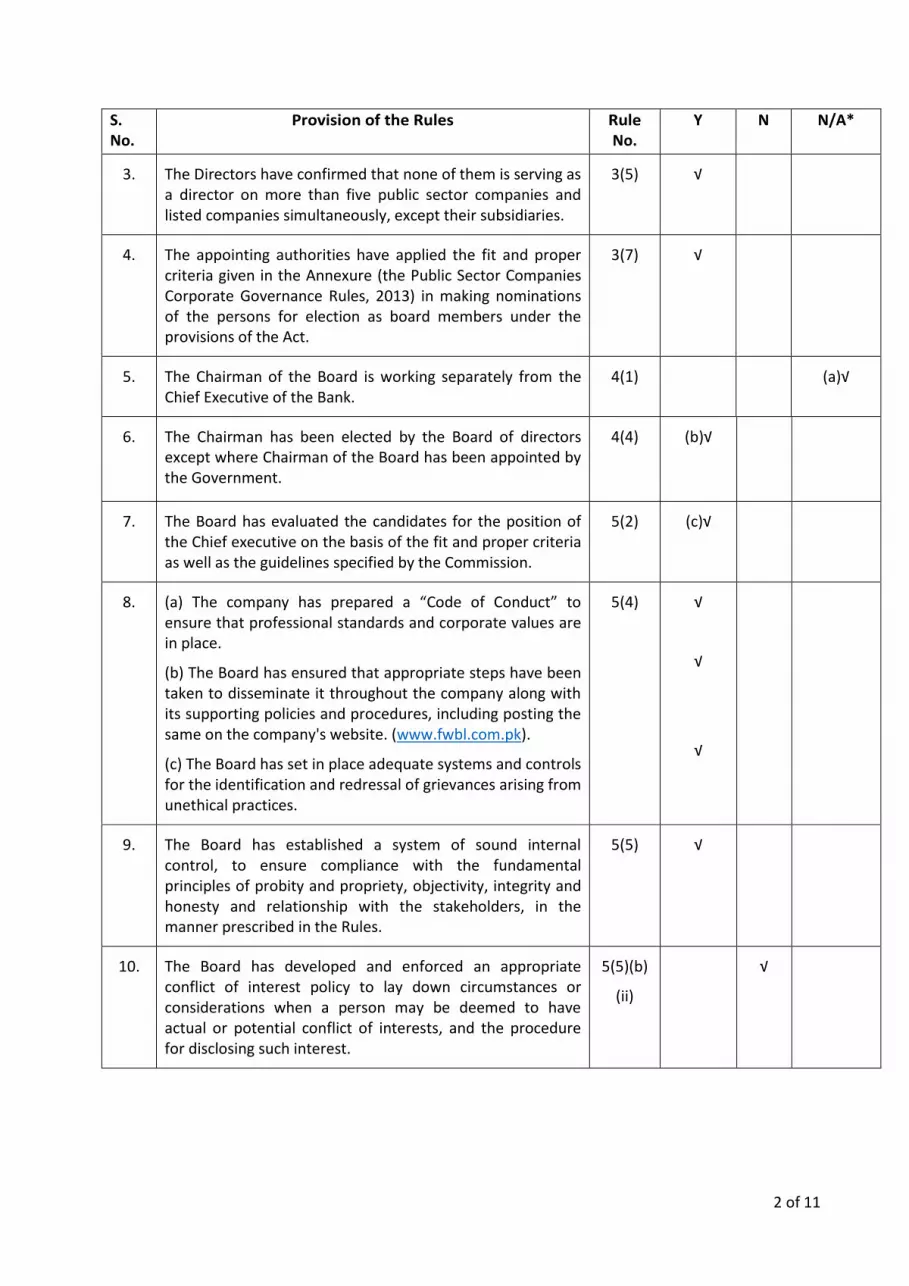
S. No.
Provision of the Rules Rule No.
Y
N N/A*
3. The Directors have confirmed that none of them is serving as a director on more than five public sector companies and listed companies simultaneously, except their subsidiaries.
3(5) √
4. The appointing authorities have applied the fit and proper criteria given in the Annexure (the Public Sector Companies Corporate Governance Rules, 2013) in making nominations of the persons for election as board members under the provisions of the Act.
3(7) √
5. The Chairman of the Board is working separately from the Chief Executive of the Bank.
4(1) (a)√
6. The Chairman has been elected by the Board of directors except where Chairman of the Board has been appointed by the Government.
4(4) (b)√
7. The Board has evaluated the candidates for the position of the Chief executive on the basis of the fit and proper criteria as well as the guidelines specified by the Commission.
5(2) (c)√
8. (a) The company has prepared a “Code of Conduct” to ensure that professional standards and corporate values are in place.
(b) The Board has ensured that appropriate steps have been taken to disseminate it throughout the company along with its supporting policies and procedures, including posting the same on the company's website. (www.fwbl.com.pk).
(c) The Board has set in place adequate systems and controls for the identification and redressal of grievances arising from unethical practices.
5(4) √
√
√
9. The Board has established a system of sound internal control, to ensure compliance with the fundamental principles of probity and propriety, objectivity, integrity and honesty and relationship with the stakeholders, in the manner prescribed in the Rules.
5(5) √
10. The Board has developed and enforced an appropriate conflict of interest policy to lay down circumstances or considerations when a person may be deemed to have actual or potential conflict of interests, and the procedure for disclosing such interest.
5(5)(b)
(ii)
√
3 of 11
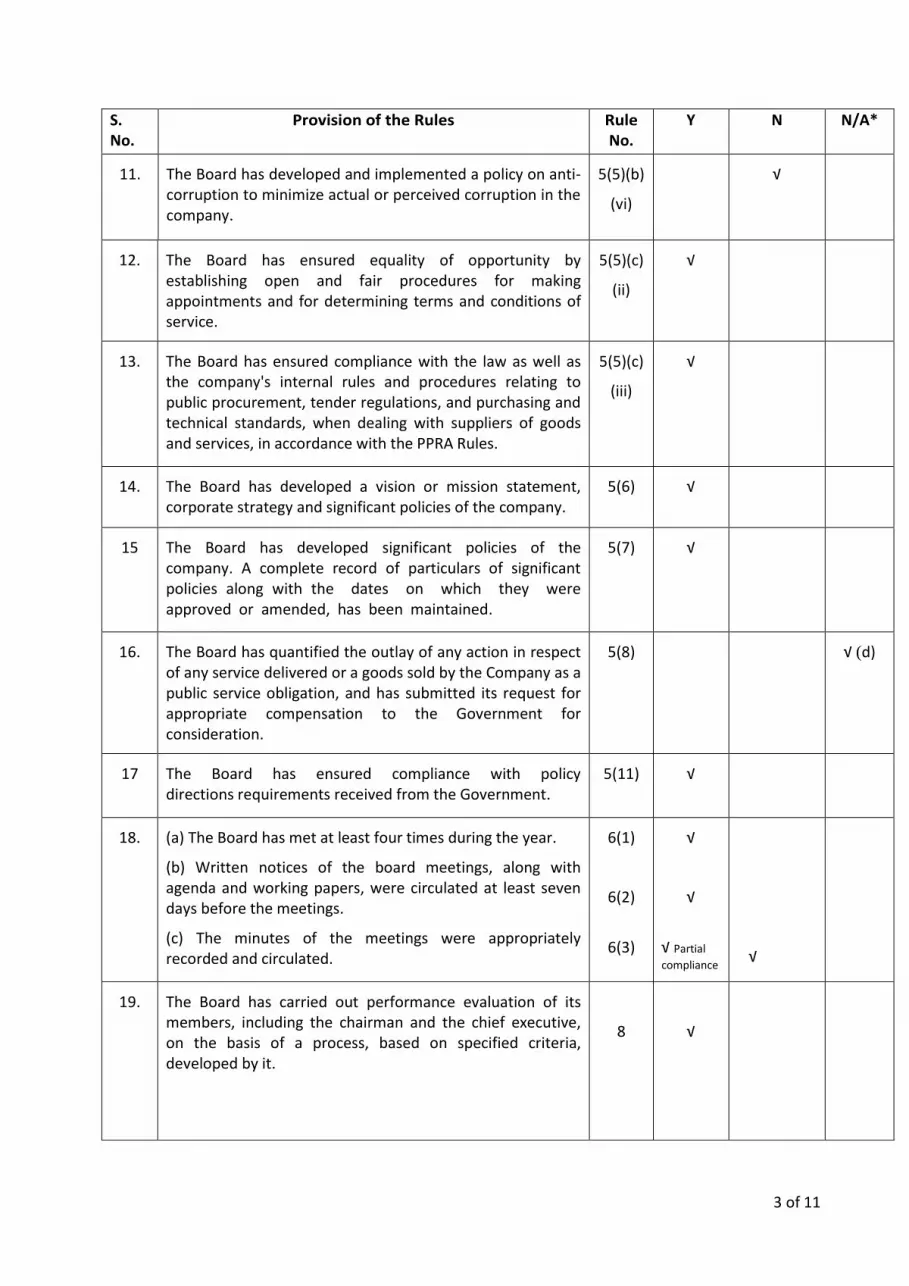
S. No.
Provision of the Rules Rule No.
Y
N N/A*
11. The Board has developed and implemented a policy on anti-corruption to minimize actual or perceived corruption in the company.
5(5)(b)
(vi)
√
12. The Board has ensured equality of opportunity by establishing open and fair procedures for making appointments and for determining terms and conditions of service.
5(5)(c)
(ii)
√
13. The Board has ensured compliance with the law as well as the company's internal rules and procedures relating to public procurement, tender regulations, and purchasing and technical standards, when dealing with suppliers of goods and services, in accordance with the PPRA Rules.
5(5)(c)
(iii)
√
14. The Board has developed a vision or mission statement, corporate strategy and significant policies of the company.
5(6) √
15 The Board has developed significant policies of the company. A complete record of particulars of significant policies along with the dates on which they were approved or amended, has been maintained.
5(7) √
16. The Board has quantified the outlay of any action in respect of any service delivered or a goods sold by the Company as a public service obligation, and has submitted its request for appropriate compensation to the Government for consideration.
5(8) √ (d)
17 The Board has ensured compliance with policy directions requirements received from the Government.
5(11) √
18. (a) The Board has met at least four times during the year.
(b) Written notices of the board meetings, along with agenda and working papers, were circulated at least seven days before the meetings.
(c) The minutes of the meetings were appropriately recorded and circulated.
6(1)
6(2)
6(3)
√
√
√ Partial
compliance
√
19.
The Board has carried out performance evaluation of its members, including the chairman and the chief executive, on the basis of a process, based on specified criteria, developed by it.
8
√
4 of 11
S. No.
Provision of the Rules Rule No.
Y
N N/A*
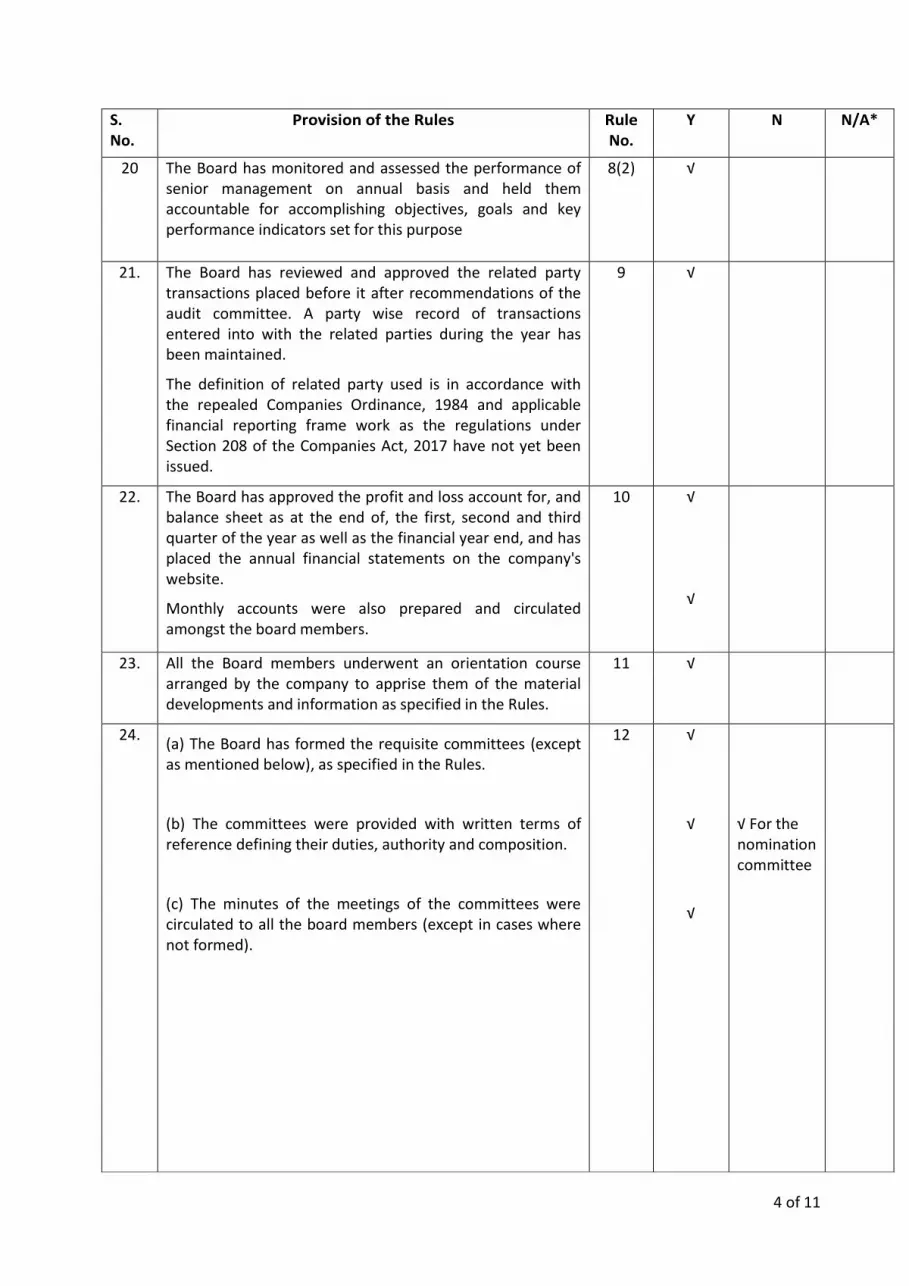
20 The Board has monitored and assessed the performance of senior management on annual basis and held them accountable for accomplishing objectives, goals and key performance indicators set for this purpose
8(2) √
21. The Board has reviewed and approved the related party transactions placed before it after recommendations of the audit committee. A party wise record of transactions entered into with the related parties during the year has been maintained.
The definition of related party used is in accordance with the repealed Companies Ordinance, 1984 and applicable financial reporting frame work as the regulations under Section 208 of the Companies Act, 2017 have not yet been issued.
9 √
22. The Board has approved the profit and loss account for, and balance sheet as at the end of, the first, second and third quarter of the year as well as the financial year end, and has placed the annual financial statements on the company's website.
Monthly accounts were also prepared and circulated amongst the board members.
10 √
√
23. All the Board members underwent an orientation course arranged by the company to apprise them of the material developments and information as specified in the Rules.
11 √
24. (a) The Board has formed the requisite committees (except as mentioned below), as specified in the Rules.
(b) The committees were provided with written terms of reference defining their duties, authority and composition.
(c) The minutes of the meetings of the committees were circulated to all the board members (except in cases where not formed).
12 √
√
√
√ For the nomination committee
5 of 11
S. No.
Provision of the Rules Rule No.
Y
N N/A*
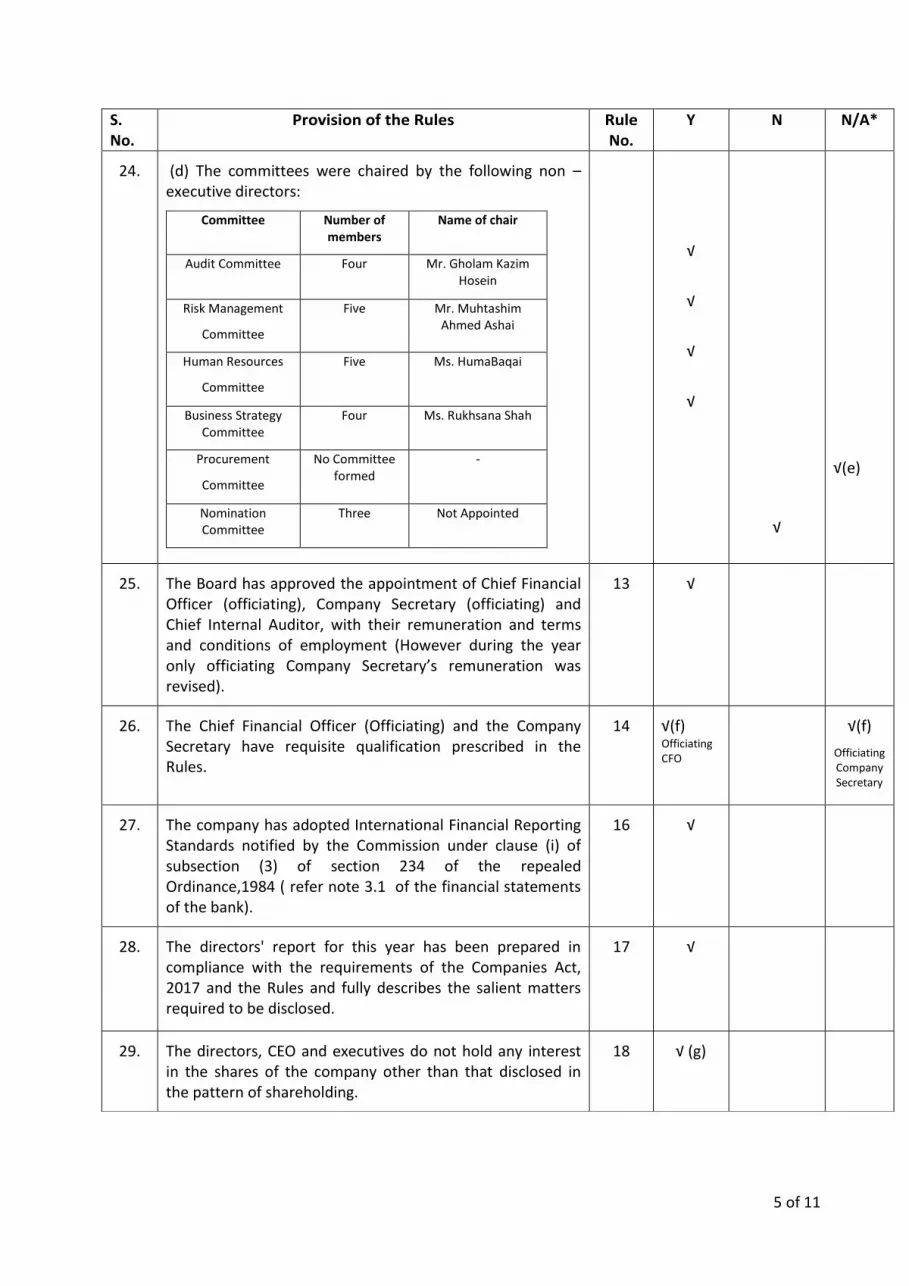
24. (d) The committees were chaired by the following non –executive directors:
Committee Number of members
Name of chair
Audit Committee Four Mr. Gholam Kazim Hosein
Risk Management
Committee
Five Mr. Muhtashim Ahmed Ashai
Human Resources
Committee
Five Ms. HumaBaqai
Business Strategy Committee
Four Ms. Rukhsana Shah
Procurement
Committee
No Committee formed
-
Nomination Committee
Three Not Appointed
√
√
√
√
√
√(e)
25.
The Board has approved the appointment of Chief Financial Officer (officiating), Company Secretary (officiating) and Chief Internal Auditor, with their remuneration and terms and conditions of employment (However during the year only officiating Company Secretary’s remuneration was revised).
13 √
26. The Chief Financial Officer (Officiating) and the Company Secretary have requisite qualification prescribed in the Rules.
14 √(f) Officiating CFO
√(f)
Officiating Company Secretary
27. The company has adopted International Financial Reporting Standards notified by the Commission under clause (i) of subsection (3) of section 234 of the repealed Ordinance,1984 ( refer note 3.1 of the financial statements of the bank).
16 √
28. The directors' report for this year has been prepared in compliance with the requirements of the Companies Act, 2017 and the Rules and fully describes the salient matters required to be disclosed.
17 √
29. The directors, CEO and executives do not hold any interest in the shares of the company other than that disclosed in the pattern of shareholding.
18 √ (g)
6 of 11
S. No.
Provision of the Rules Rule No.
Y
N N/A*
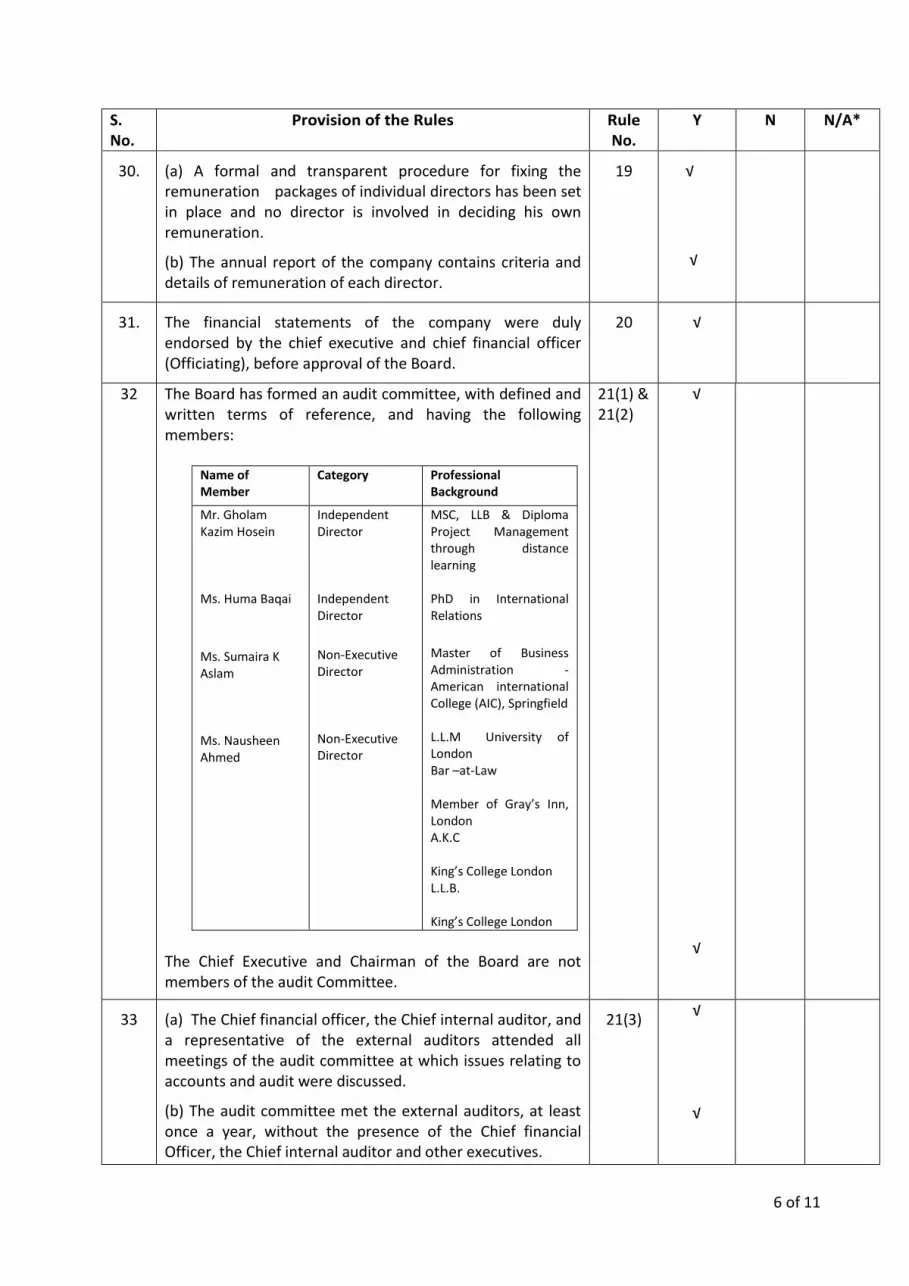
30. (a) A formal and transparent procedure for fixing the remuneration packages of individual directors has been set in place and no director is involved in deciding his own remuneration.
(b) The annual report of the company contains criteria and details of remuneration of each director.
19 √
√
31. The financial statements of the company were duly endorsed by the chief executive and chief financial officer (Officiating), before approval of the Board.
20 √
32
The Board has formed an audit committee, with defined and written terms of reference, and having the following members:
Name of Member
Category Professional Background
Mr. Gholam Kazim Hosein Ms. Huma Baqai
Ms. Sumaira K Aslam Ms. Nausheen Ahmed
Independent Director Independent Director
Non-Executive Director Non-Executive Director
MSC, LLB & Diploma Project Management through distance learning PhD in International Relations
Master of Business Administration -American international College (AIC), Springfield L.L.M University of London Bar –at-Law Member of Gray’s Inn, London A.K.C King’s College London L.L.B. King’s College London
The Chief Executive and Chairman of the Board are not members of the audit Committee.
21(1) & 21(2)
√
√
33 (a) The Chief financial officer, the Chief internal auditor, and a representative of the external auditors attended all meetings of the audit committee at which issues relating to accounts and audit were discussed.
(b) The audit committee met the external auditors, at least once a year, without the presence of the Chief financial Officer, the Chief internal auditor and other executives.
21(3) √
√

7 of 11
(c) The audit committee met the Chief internal auditor and other members of the internal audit function, at least once a year, without the presence of Chief Financial Officer and the External auditors
√
34 (a) The Board has set up an effective internal audit function, which has an audit charter, duly approved by the audit committee.
(b) The Chief internal auditor has requisite qualification and experience prescribed in the Rules.
(c) The internal audit reports have been provided to the external auditors for their review.
22 √
√
√
35. The external auditors of the company have confirmed that the firm and all its partners are in compliance with International Federation of Accountants (IFAC) guidelines on Code of Ethics as applicable in Pakistan.
23(4) √
36. The auditors have confirmed that they have observed applicable guidelines issued by IFAC with regard to provision of non-audit services.
23(5) √

8 of 11
*Reasons for Non-applicability:
The Public Sector Companies (Corporate Governance) Rules 2013 promulgated by the Securities and
Exchange Commission of Pakistan (SECP) has laid down certain provisions which are not considered
applicable to the extent of overriding provisions of The Banks (Nationalization) Act, 1974 and
Regulation G-1 of Prudential Regulations issued by State Bank of Pakistan.
Explanations:
(a)Currently the bank do not have Chairman of the Board. Under Sections 11(2) & (3) of the Banking
Nationalization Act, 1974 (BNA), the Federal Government may, if it deems necessary, appoint a
Chairman of the Board in respect of a Bank. Further, the Chairman shall be appointed by the Federal
Government in consultation with SBP. Under Section 11(8) of the BNA, in case the Federal Government
has appointed a Chairman, he shall preside over the meetings of the Board, and in case a Chairman has
not been appointed then the President shall preside over the meetings of Board. In the absence of the
Chairman or the President, as the case maybe the Directors may elect one of its members to preside
over the meetings. However, the bank has written to the Government of Pakistan.
(b)Since the Chairman Board has not been appointed by the Board, therefore in compliance with
Section 11(8) of BNA (as mentioned above), President was elected to chair the meetings.
(c) In compliance of section 11(3) of BNA, the President has been appointed by the Federal
Government.
(d) However, the Bank provides subsidized Prime Minister Youth Business Loans for which quarterly
repayments of the subsidized interest are being claimed from the Government (State bank of Pakistan).
(e) The Code is for all Public Sector Companies be it a Bank or otherwise, however, some clauses
including the formation of Procurement Committee could not be as such applicable on the bank
because as per the SBP regulations, the Board could not be involved in the day to day operations of the
Bank. The Procurement Committee's function is to approve the regular procurements of the Bank. We
have a Procurement Committee at the management level which oversees the procurement at the Bank
level in line with the PPRA Rules. Hence the formation of the Committee could not be applicable on the
bank.
(f) The earlier Chief Financial Officer (CFO) had resigned with effect 15 December 2017. The Board has
appointed an officiating Chief Financial Officer with effect from 1 January 2018 for a period of six
months. State Bank of Pakistan vide its letter dated 05 March 2018, has given its approval for the
appointment up to 30 June 2018. Regarding the Company Secretary, since she did not met the
qualification criteria for the position of the Company Secretary, the bank had requested for an
exemption from the Securities and Exchange Commission of Pakistan, who vide its letter dated 23 June
2017 has given a relaxation from compliance for one year with effect from 01 July 2017. State Bank of
Pakistan vide its letter dated 11 August 2017 has also allowed to assign the acting charge of Company
Secretary up to 30 June 2018 with a condition to complete her qualification of Chartered Secretary
within the allowed time period.

9 of 11
(g)None of the Directors (whose appointment has been approved by the State Bank of Pakistan) holds
any interest in the shares of the bank. However, by virtue of the position of CEO, President, holds 2
shares of the Bank.
Signature
(Names in Block Letters)
CEO & Chairman\Independent
Director
10 of 11
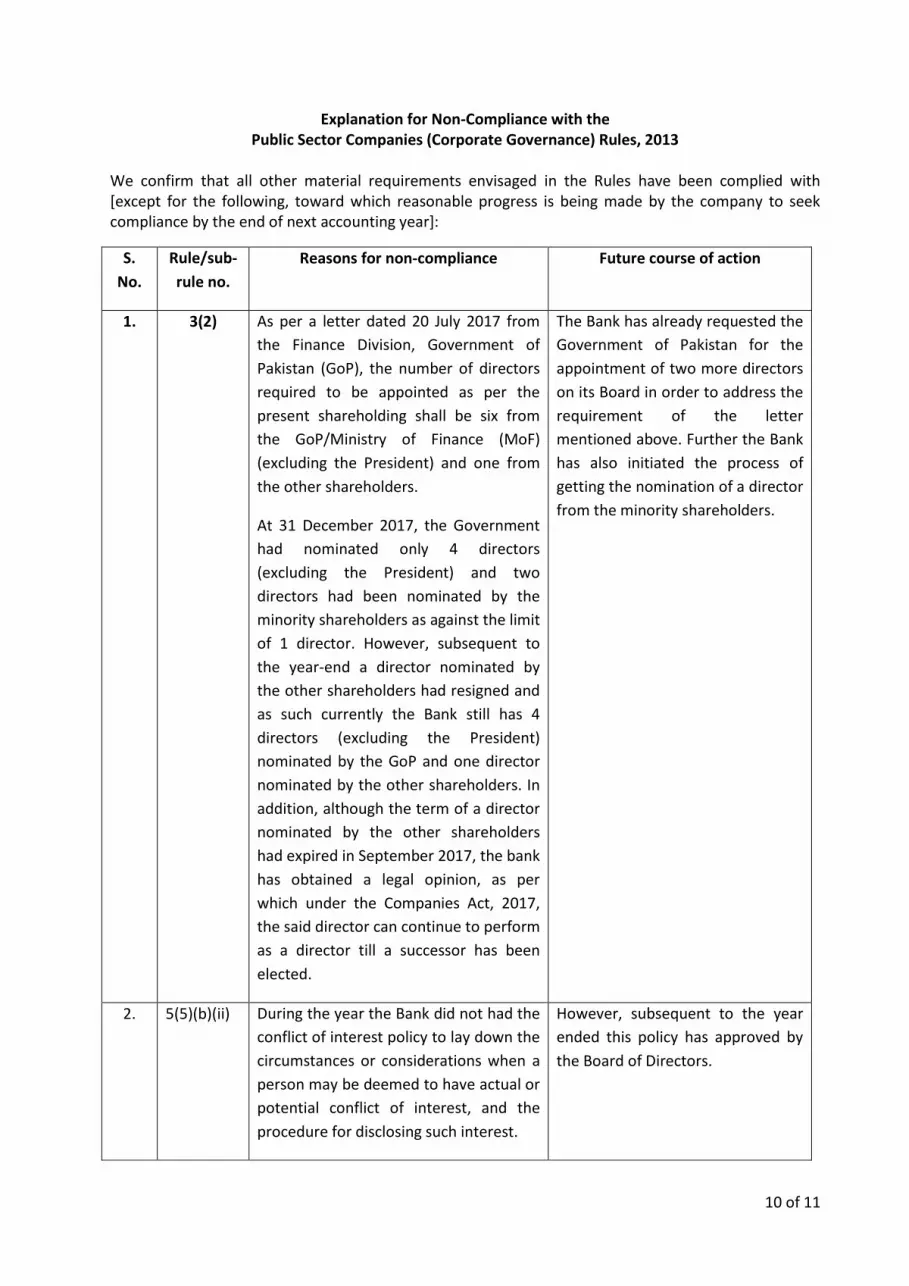
Explanation for Non-Compliance with the Public Sector Companies (Corporate Governance) Rules, 2013
We confirm that all other material requirements envisaged in the Rules have been complied with [except for the following, toward which reasonable progress is being made by the company to seek compliance by the end of next accounting year]:
S.
No.
Rule/sub-
rule no.
Reasons for non-compliance Future course of action
1. 3(2) As per a letter dated 20 July 2017 from
the Finance Division, Government of
Pakistan (GoP), the number of directors
required to be appointed as per the
present shareholding shall be six from
the GoP/Ministry of Finance (MoF)
(excluding the President) and one from
the other shareholders.
At 31 December 2017, the Government
had nominated only 4 directors
(excluding the President) and two
directors had been nominated by the
minority shareholders as against the limit
of 1 director. However, subsequent to
the year-end a director nominated by
the other shareholders had resigned and
as such currently the Bank still has 4
directors (excluding the President)
nominated by the GoP and one director
nominated by the other shareholders. In
addition, although the term of a director
nominated by the other shareholders
had expired in September 2017, the bank
has obtained a legal opinion, as per
which under the Companies Act, 2017,
the said director can continue to perform
as a director till a successor has been
elected.
The Bank has already requested the
Government of Pakistan for the
appointment of two more directors
on its Board in order to address the
requirement of the letter
mentioned above. Further the Bank
has also initiated the process of
getting the nomination of a director
from the minority shareholders.
2. 5(5)(b)(ii) During the year the Bank did not had the
conflict of interest policy to lay down the
circumstances or considerations when a
person may be deemed to have actual or
potential conflict of interest, and the
procedure for disclosing such interest.
However, subsequent to the year
ended this policy has approved by
the Board of Directors.
11 of 11
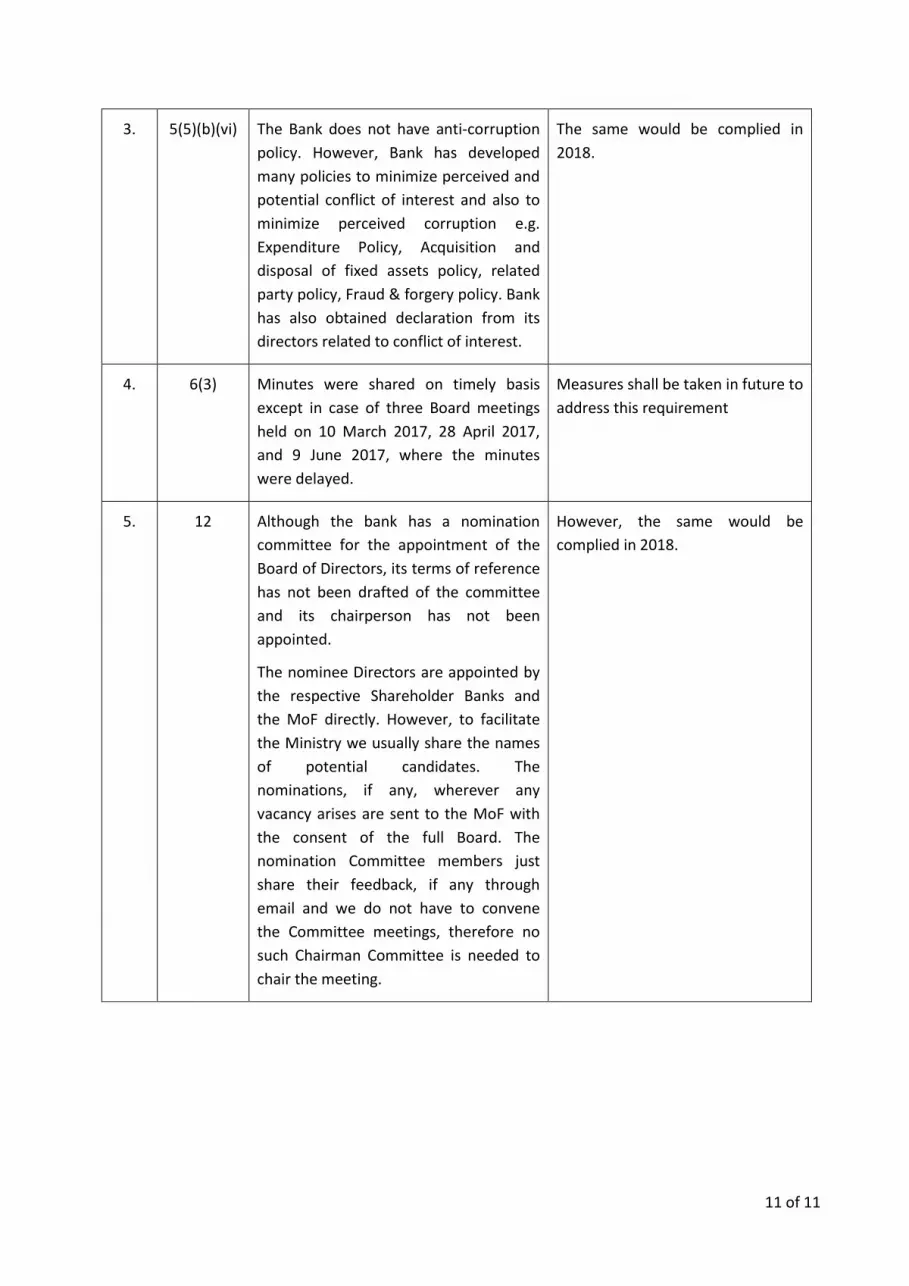
3. 5(5)(b)(vi) The Bank does not have anti-corruption
policy. However, Bank has developed
many policies to minimize perceived and
potential conflict of interest and also to
minimize perceived corruption e.g.
Expenditure Policy, Acquisition and
disposal of fixed assets policy, related
party policy, Fraud & forgery policy. Bank
has also obtained declaration from its
directors related to conflict of interest.
The same would be complied in
2018.
4. 6(3) Minutes were shared on timely basis
except in case of three Board meetings
held on 10 March 2017, 28 April 2017,
and 9 June 2017, where the minutes
were delayed.
Measures shall be taken in future to
address this requirement
5. 12 Although the bank has a nomination
committee for the appointment of the
Board of Directors, its terms of reference
has not been drafted of the committee
and its chairperson has not been
appointed.
The nominee Directors are appointed by
the respective Shareholder Banks and
the MoF directly. However, to facilitate
the Ministry we usually share the names
of potential candidates. The
nominations, if any, wherever any
vacancy arises are sent to the MoF with
the consent of the full Board. The
nomination Committee members just
share their feedback, if any through
email and we do not have to convene
the Committee meetings, therefore no
such Chairman Committee is needed to
chair the meeting.
However, the same would be
complied in 2018.

Auditors’ Report to the Members
We have audited the annexed statement of financial position of First Women Bank Limited
(“the Bank”) as at 31 December 2017 and the related profit and loss account, statement of
comprehensive income, cash flow statement and statement of changes in equity together with
the notes forming part thereof (here-in-after referred to as the ‘financial statements’) for the year
then ended, in which are incorporated the unaudited certified returns from the branches except
for 16 branches which have been audited by us and we state that we have obtained all the
information and explanations which, to the best of our knowledge and belief, were necessary for
the purposes of our audit.
It is the responsibility of the Bank’s Board of Directors to establish and maintain a system of
internal control, and prepare and present the financial statements in conformity with the
approved accounting standards and the requirements of the Banking Companies Ordinance,
1962 (LVII of 1962), and the repealed Companies Ordinance, 1984 (XLVII of 1984). Our
responsibility is to express an opinion on these statements based on our audit.
We conducted our audit in accordance with the International Standards on Auditing as
applicable in Pakistan. These standards require that we plan and perform the audit to obtain
reasonable assurance about whether the financial statements are free of any material
misstatement. An audit includes examining, on a test basis, evidence supporting the amounts
and disclosures in the financial statements. An audit also includes assessing the accounting
policies and significant estimates made by management, as well as, evaluating the overall
presentation of the financial statements. We believe that our audit provides a reasonable basis
for our opinion and, after due verification, which in case of loans and advances covered more
than sixty percent of the total loans and advances of the Bank, we report that:
a) in our opinion, proper books of account have been kept by the Bank as required by the
repealed Companies Ordinance, 1984 (XLVII of 1984), and the returns referred to above
received from the branches have been found adequate for the purposes of our audit;
b) in our opinion:
i) the statement of financial position and the profit and loss account together with the
notes thereon have been drawn up in conformity with the Banking Companies
Ordinance, 1962 (LVII of 1962), and the repealed Companies Ordinance, 1984
(XLVII of 1984), and are in agreement with the books of accounts and are further in
accordance with the accounting policies consistently applied;
ii) the expenditure incurred during the year was for the purpose of the Bank’s business;
and
iii) the business conducted, investments made and the expenditure incurred during the
year were in accordance with the objects of the Bank and the transactions of the
Bank which have come to our notice have been within the powers of the Bank;
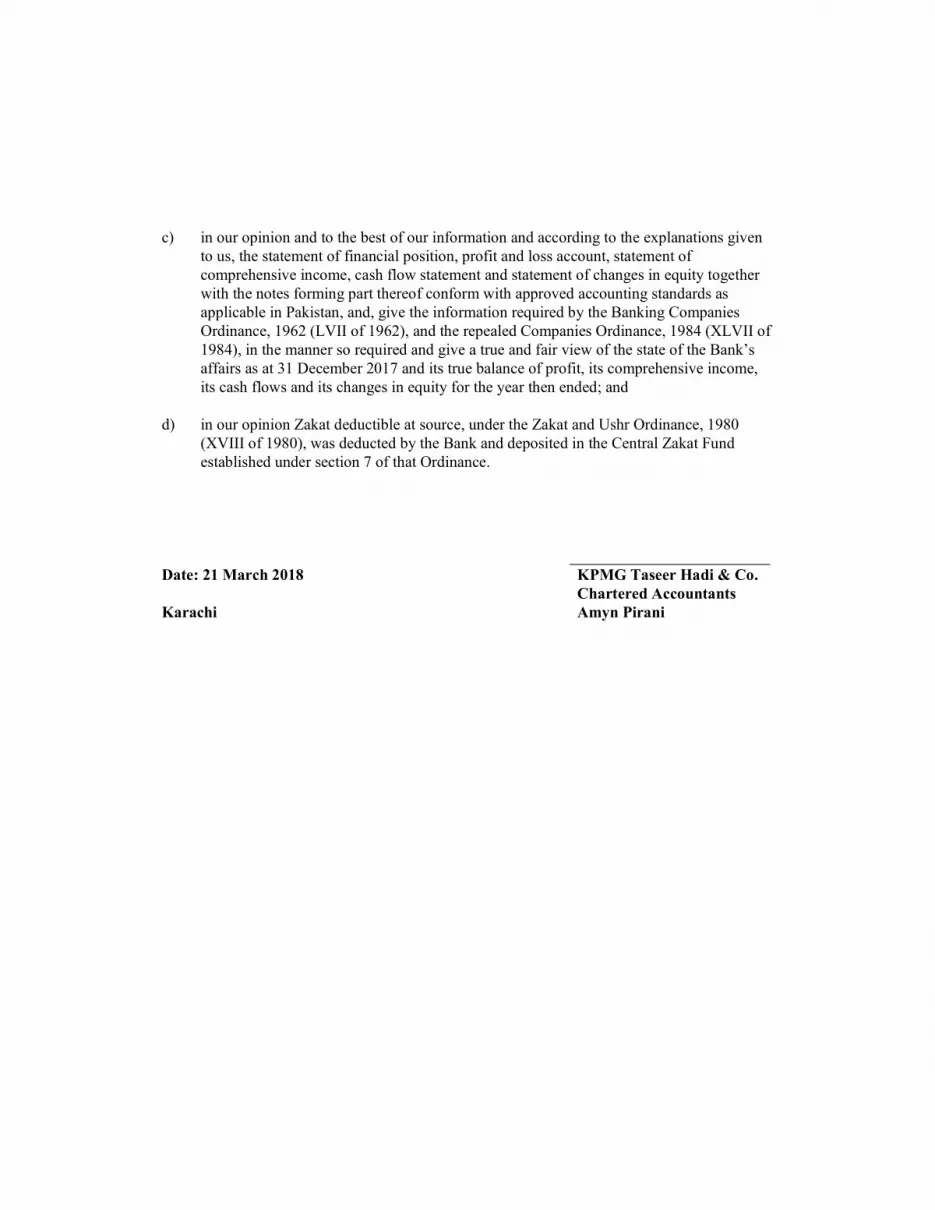
c) in our opinion and to the best of our information and according to the explanations given
to us, the statement of financial position, profit and loss account, statement of
comprehensive income, cash flow statement and statement of changes in equity together
with the notes forming part thereof conform with approved accounting standards as
applicable in Pakistan, and, give the information required by the Banking Companies
Ordinance, 1962 (LVII of 1962), and the repealed Companies Ordinance, 1984 (XLVII of
1984), in the manner so required and give a true and fair view of the state of the Bank’s
affairs as at 31 December 2017 and its true balance of profit, its comprehensive income,
its cash flows and its changes in equity for the year then ended; and
d) in our opinion Zakat deductible at source, under the Zakat and Ushr Ordinance, 1980
(XVIII of 1980), was deducted by the Bank and deposited in the Central Zakat Fund
established under section 7 of that Ordinance.
Date: 21 March 2018 KPMG Taseer Hadi & Co.
Chartered Accountants
Karachi Amyn Pirani
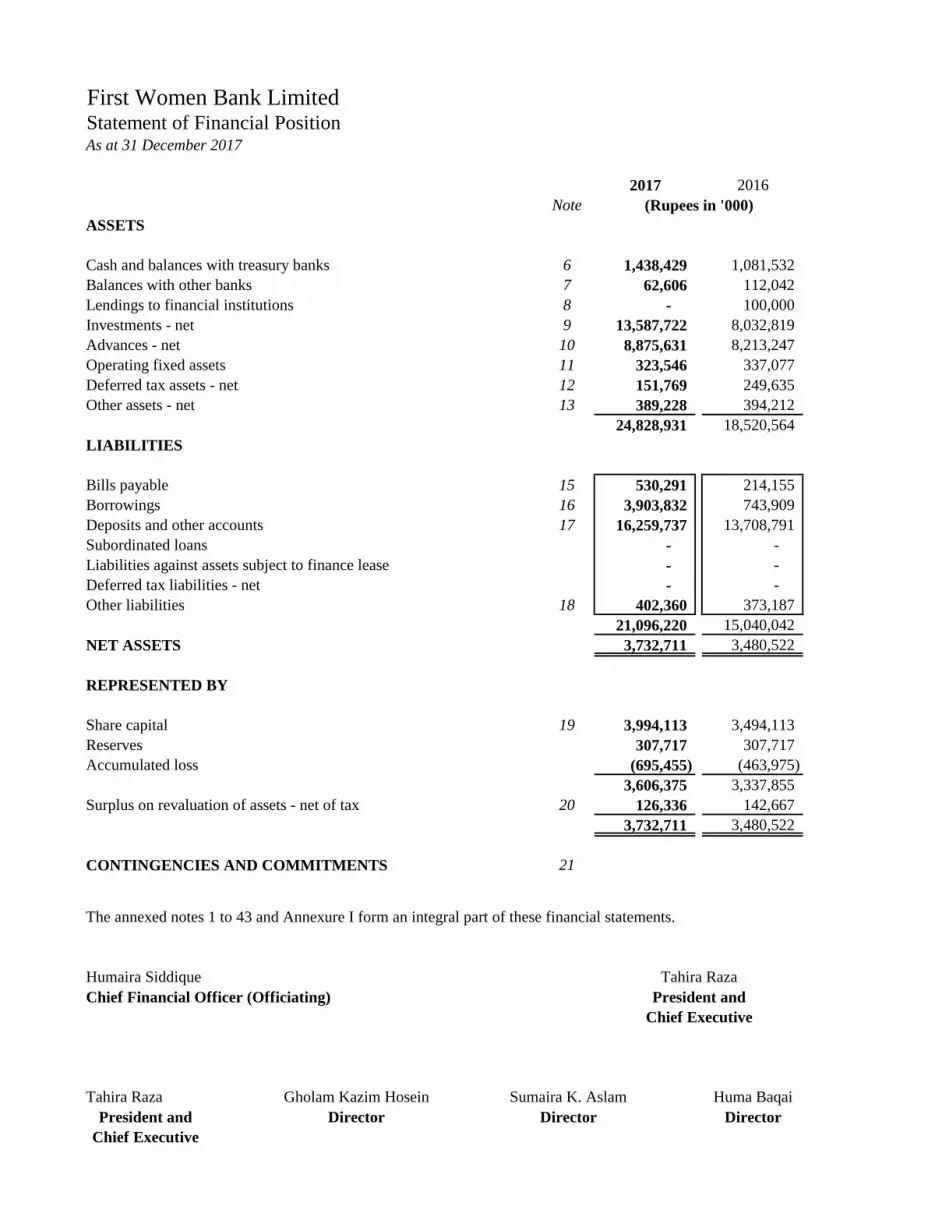
First Women Bank LimitedStatement of Financial PositionAs at 31 December 2017
2017 2016
Note
ASSETS
Cash and balances with treasury banks 6 1,438,429 1,081,532
Balances with other banks 7 62,606 112,042
Lendings to financial institutions 8 - 100,000
Investments - net 9 13,587,722 8,032,819
Advances - net 10 8,875,631 8,213,247
Operating fixed assets 11 323,546 337,077
Deferred tax assets - net 12 151,769 249,635
Other assets - net 13 389,228 394,212
24,828,931 18,520,564
LIABILITIES
Bills payable 15 530,291 214,155
Borrowings 16 3,903,832 743,909
Deposits and other accounts 17 16,259,737 13,708,791
Subordinated loans - -
Liabilities against assets subject to finance lease - -
Deferred tax liabilities - net - -
Other liabilities 18 402,360 373,187
21,096,220 15,040,042
NET ASSETS 3,732,711 3,480,522
REPRESENTED BY
Share capital 19 3,994,113 3,494,113
Reserves 307,717 307,717
Accumulated loss (695,455) (463,975)
3,606,375 3,337,855
Surplus on revaluation of assets - net of tax 20 126,336 142,667
3,732,711 3,480,522
CONTINGENCIES AND COMMITMENTS 21
The annexed notes 1 to 43 and Annexure I form an integral part of these financial statements.
Humaira Siddique Tahira Raza
Chief Financial Officer (Officiating) President and
Chief Executive
Tahira Raza Gholam Kazim Hosein Sumaira K. Aslam Huma Baqai
President and Director Director Director
Chief Executive
(Rupees in '000)

First Women Bank LimitedProfit and Loss AccountFor the year ended 31 December 2017
2017 2016
Note (Rupees in '000)
Mark-up / return / interest earned 23 1,276,336 1,161,864
Mark-up / return / interest expensed 24 601,824 522,492
Net mark-up / interest income 674,512 639,372
Provision / (reversal of provision) against non-performing loans
and advances - net 10.3.2 12,354 (17,667)
Provision for diminution in the value of investments - -
Bad debts written off directly - -
12,354 (17,667)
Net mark-up / interest income after provisions 662,158 657,039
NON-MARK-UP / INTEREST INCOME
Fee, commission and brokerage income 66,218 81,419
Dividend income 8,640 24,812
Income from dealing in foreign currencies 20,375 13,757
Gain on sale of securities - net 25 6,193 94,086
Unrealized loss on revaluation of investments
classified as held for trading - -
Other income - net 26 20,552 30,481
Total non-mark-up / interest income 121,978 244,555
784,136 901,594
NON-MARK-UP / INTEREST EXPENSES
Administrative expenses 27 893,021 879,190
Other provisions 3,212 6,767
Other charges 28 3,838 11,584
Total non-mark-up / interest expenses 900,071 897,541
Extra ordinary / unusual items - -
(Loss) / profit before taxation (115,935) 4,053
Taxation - current year 17,478 13,927
- prior year - -
- deferred 104,625 (21,196)
29 122,103 (7,269)
(Loss) / profit after taxation (238,038) 11,322
(Rupees)
Basic and diluted earnings per share 30 (0.61) 0.03
The annexed notes 1 to 43 and Annexure I form an integral part of these financial statements.
Humaira Siddique Tahira Raza
Chief Financial Officer (Officiating) President and
Chief Executive
Tahira Raza Gholam Kazim Hosein Sumaira K. Aslam Huma Baqai
President and Director Director Director
Chief Executive

First Women Bank LimitedStatement of Comprehensive IncomeFor the year ended 31 December 2017
2017 2016
Note (Rupees in '000)
(Loss) / Profit after taxation for the year (238,038) 11,322
Other comprehensive income
Items not to be reclassified to profit and loss account in
subsequent periods
Remeasurement of post retirement benefits obligations 33.1.7.2 2,780 52,924
Related deferred tax 12.2 - (28,669)
2,780 24,255
Comprehensive income transferred to equity (235,258) 35,577
Components of comprehensive income not reflected in equity
Items to be reclassified to profit and loss account in
subsequent periods
Net change in fair value of available-for-sale securities (19,312) (14,173)
Related deferred tax 12.2 6,759 4,961
(12,553) (9,212)
Total comprehensive income for the year (247,811) 26,365
The annexed notes 1 to 43 and Annexure I form an integral part of these financial statements.
Humaira Siddique Tahira Raza
Chief Financial Officer (Officiating) President and
Chief Executive
Tahira Raza Gholam Kazim Hosein Sumaira K. Aslam Huma Baqai
President and Director Director Director
Chief Executive
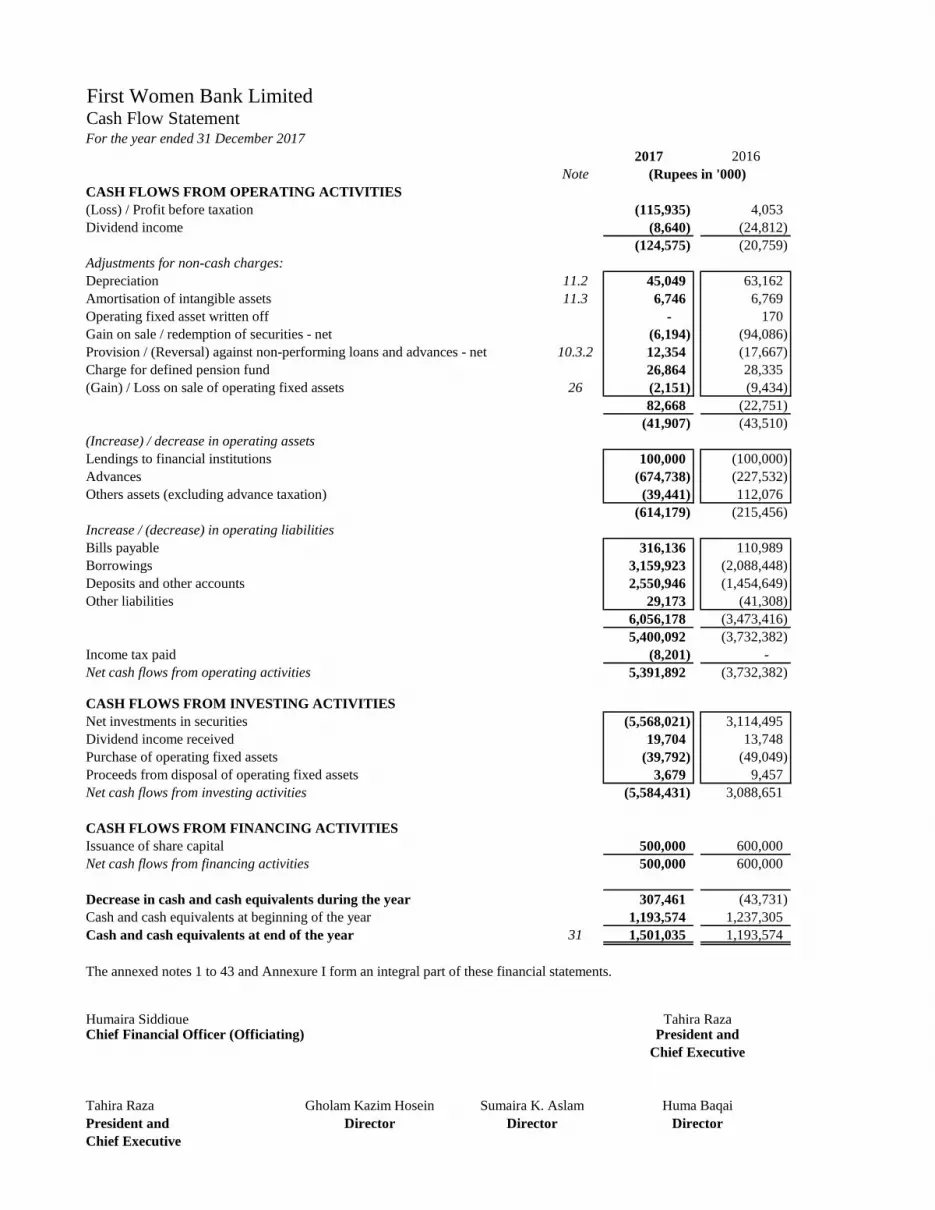
First Women Bank LimitedCash Flow StatementFor the year ended 31 December 2017
2017 2016
Note (Rupees in '000)
CASH FLOWS FROM OPERATING ACTIVITIES
(Loss) / Profit before taxation (115,935) 4,053
Dividend income (8,640) (24,812)
(124,575) (20,759)
Adjustments for non-cash charges:
Depreciation 11.2 45,049 63,162
Amortisation of intangible assets 11.3 6,746 6,769
Operating fixed asset written off - 170
Gain on sale / redemption of securities - net (6,194) (94,086)
Provision / (Reversal) against non-performing loans and advances - net 10.3.2 12,354 (17,667)
Charge for defined pension fund 26,864 28,335
(Gain) / Loss on sale of operating fixed assets 26 (2,151) (9,434)
82,668 (22,751)
(41,907) (43,510)
(Increase) / decrease in operating assets
Lendings to financial institutions 100,000 (100,000)
Advances (674,738) (227,532)
Others assets (excluding advance taxation) (39,441) 112,076
(614,179) (215,456)
Increase / (decrease) in operating liabilities
Bills payable 316,136 110,989
Borrowings 3,159,923 (2,088,448)
Deposits and other accounts 2,550,946 (1,454,649)
Other liabilities 29,173 (41,308)
6,056,178 (3,473,416)
5,400,092 (3,732,382)
Income tax paid (8,201) -
Net cash flows from operating activities 5,391,892 (3,732,382)
CASH FLOWS FROM INVESTING ACTIVITIES
Net investments in securities (5,568,021) 3,114,495
Dividend income received 19,704 13,748
Purchase of operating fixed assets (39,792) (49,049)
Proceeds from disposal of operating fixed assets 3,679 9,457
Net cash flows from investing activities (5,584,431) 3,088,651
CASH FLOWS FROM FINANCING ACTIVITIES
Issuance of share capital 500,000 600,000
Net cash flows from financing activities 500,000 600,000
Decrease in cash and cash equivalents during the year 307,461 (43,731)
Cash and cash equivalents at beginning of the year 1,193,574 1,237,305
Cash and cash equivalents at end of the year 31 1,501,035 1,193,574
The annexed notes 1 to 43 and Annexure I form an integral part of these financial statements.
Humaira Siddique Tahira RazaChief Financial Officer (Officiating) President and
Chief Executive
Tahira Raza Gholam Kazim Hosein Sumaira K. Aslam Huma Baqai
President and Director Director Director
Chief Executive
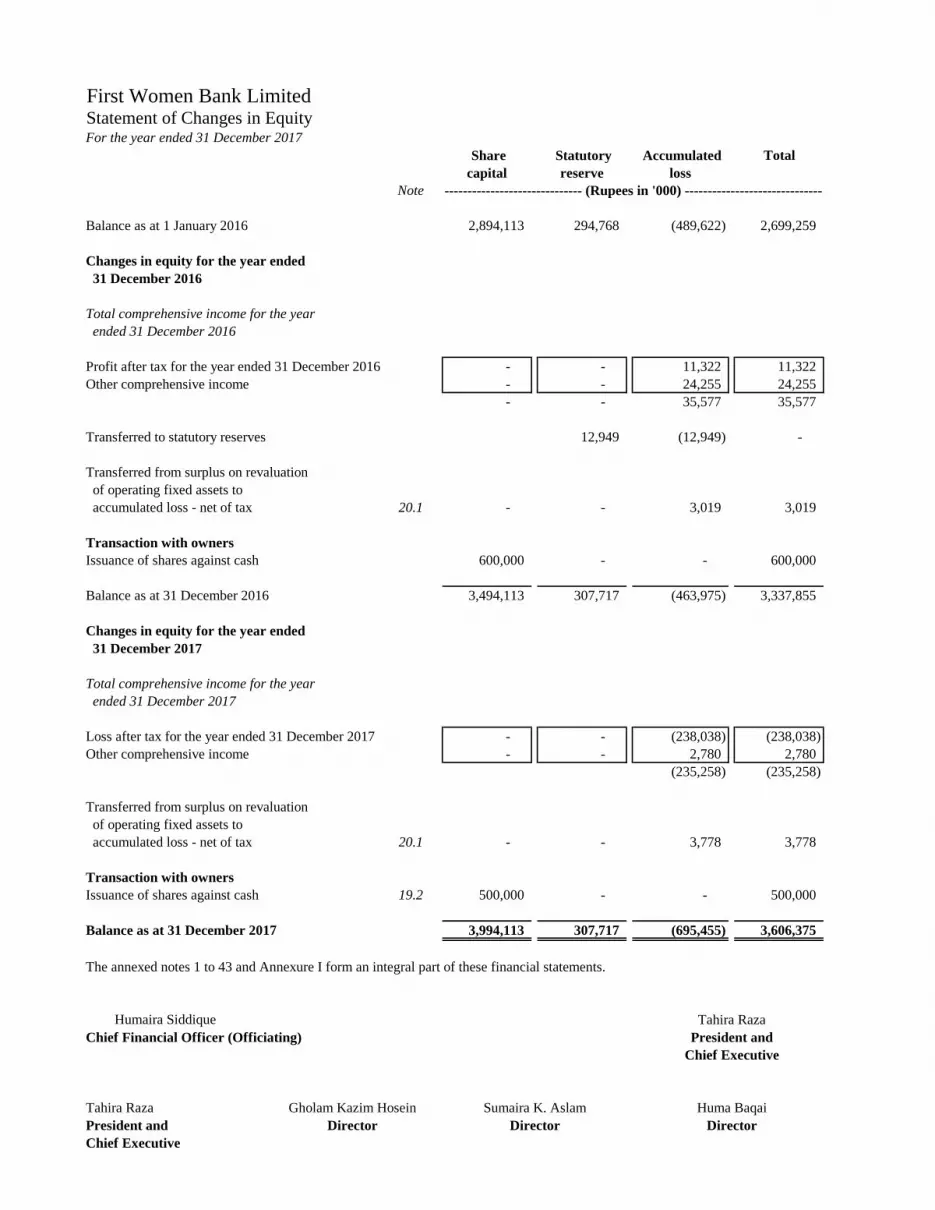
First Women Bank LimitedStatement of Changes in EquityFor the year ended 31 December 2017
Note
Balance as at 1 January 2016 2,894,113 294,768 (489,622) 2,699,259
Changes in equity for the year ended
31 December 2016
Total comprehensive income for the year
ended 31 December 2016
Profit after tax for the year ended 31 December 2016 - - 11,322 11,322
Other comprehensive income - - 24,255 24,255
- - 35,577 35,577
Transferred to statutory reserves 12,949 (12,949) -
Transferred from surplus on revaluation
of operating fixed assets to
accumulated loss - net of tax 20.1 - - 3,019 3,019
Transaction with owners
Issuance of shares against cash 600,000 - - 600,000
Balance as at 31 December 2016 3,494,113 307,717 (463,975) 3,337,855
Changes in equity for the year ended
31 December 2017
Total comprehensive income for the year
ended 31 December 2017
Loss after tax for the year ended 31 December 2017 - - (238,038) (238,038)
Other comprehensive income - - 2,780 2,780
(235,258) (235,258)
Transferred from surplus on revaluation
of operating fixed assets to
accumulated loss - net of tax 20.1 - - 3,778 3,778
Transaction with owners
Issuance of shares against cash 19.2 500,000 - - 500,000
Balance as at 31 December 2017 3,994,113 307,717 (695,455) 3,606,375
The annexed notes 1 to 43 and Annexure I form an integral part of these financial statements.
Humaira Siddique Tahira Raza
Chief Financial Officer (Officiating) President and
Chief Executive
Tahira Raza Gholam Kazim Hosein Sumaira K. Aslam Huma Baqai
President and Director Director Director
Chief Executive
------------------------------ (Rupees in '000) ------------------------------
Accumulated
loss
Share
capital
Statutory
reserve
Total
First Women Bank LimitedNotes to the Financial StatementsFor the year ended 31 December 2017
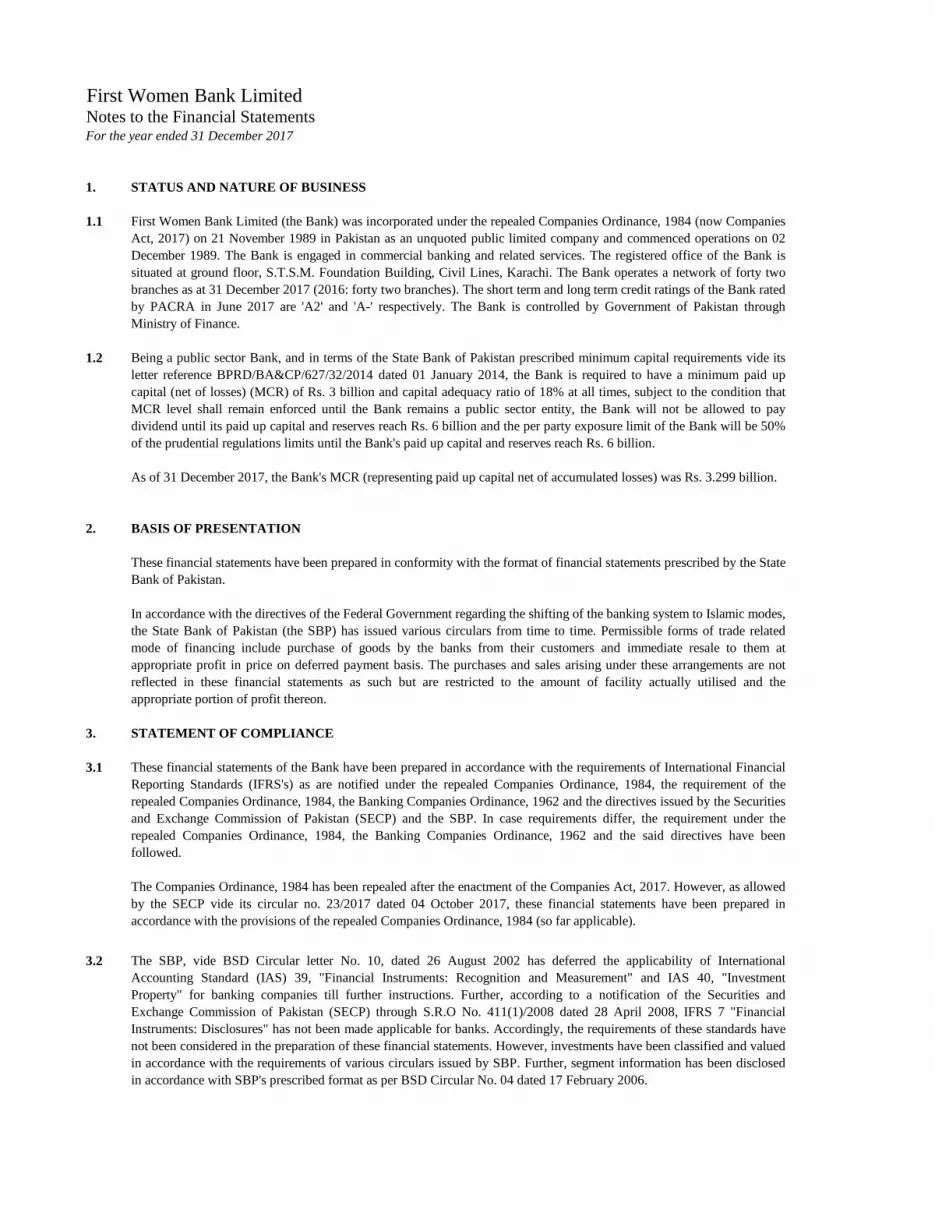
1. STATUS AND NATURE OF BUSINESS
1.1
1.2
2. BASIS OF PRESENTATION
3. STATEMENT OF COMPLIANCE
3.1
3.2
Being a public sector Bank, and in terms of the State Bank of Pakistan prescribed minimum capital requirements vide its
letter reference BPRD/BA&CP/627/32/2014 dated 01 January 2014, the Bank is required to have a minimum paid up
capital (net of losses) (MCR) of Rs. 3 billion and capital adequacy ratio of 18% at all times, subject to the condition that
MCR level shall remain enforced until the Bank remains a public sector entity, the Bank will not be allowed to pay
dividend until its paid up capital and reserves reach Rs. 6 billion and the per party exposure limit of the Bank will be 50%
of the prudential regulations limits until the Bank's paid up capital and reserves reach Rs. 6 billion.
As of 31 December 2017, the Bank's MCR (representing paid up capital net of accumulated losses) was Rs. 3.299 billion.
These financial statements have been prepared in conformity with the format of financial statements prescribed by the State
Bank of Pakistan.
First Women Bank Limited (the Bank) was incorporated under the repealed Companies Ordinance, 1984 (now Companies
Act, 2017) on 21 November 1989 in Pakistan as an unquoted public limited company and commenced operations on 02
December 1989. The Bank is engaged in commercial banking and related services. The registered office of the Bank is
situated at ground floor, S.T.S.M. Foundation Building, Civil Lines, Karachi. The Bank operates a network of forty two
branches as at 31 December 2017 (2016: forty two branches). The short term and long term credit ratings of the Bank rated
by PACRA in June 2017 are 'A2' and 'A-' respectively. The Bank is controlled by Government of Pakistan through
Ministry of Finance.
In accordance with the directives of the Federal Government regarding the shifting of the banking system to Islamic modes,
the State Bank of Pakistan (the SBP) has issued various circulars from time to time. Permissible forms of trade related
mode of financing include purchase of goods by the banks from their customers and immediate resale to them at
appropriate profit in price on deferred payment basis. The purchases and sales arising under these arrangements are not
reflected in these financial statements as such but are restricted to the amount of facility actually utilised and the
appropriate portion of profit thereon.
The SBP, vide BSD Circular letter No. 10, dated 26 August 2002 has deferred the applicability of International
Accounting Standard (IAS) 39, "Financial Instruments: Recognition and Measurement" and IAS 40, "Investment
Property" for banking companies till further instructions. Further, according to a notification of the Securities and
Exchange Commission of Pakistan (SECP) through S.R.O No. 411(1)/2008 dated 28 April 2008, IFRS 7 "Financial
Instruments: Disclosures" has not been made applicable for banks. Accordingly, the requirements of these standards have
not been considered in the preparation of these financial statements. However, investments have been classified and valued
in accordance with the requirements of various circulars issued by SBP. Further, segment information has been disclosed
in accordance with SBP's prescribed format as per BSD Circular No. 04 dated 17 February 2006.
These financial statements of the Bank have been prepared in accordance with the requirements of International Financial
Reporting Standards (IFRS's) as are notified under the repealed Companies Ordinance, 1984, the requirement of the
repealed Companies Ordinance, 1984, the Banking Companies Ordinance, 1962 and the directives issued by the Securities
and Exchange Commission of Pakistan (SECP) and the SBP. In case requirements differ, the requirement under the
repealed Companies Ordinance, 1984, the Banking Companies Ordinance, 1962 and the said directives have been
followed.
The Companies Ordinance, 1984 has been repealed after the enactment of the Companies Act, 2017. However, as allowed
by the SECP vide its circular no. 23/2017 dated 04 October 2017, these financial statements have been prepared in
accordance with the provisions of the repealed Companies Ordinance, 1984 (so far applicable).

3.3
3.4 Standards, interpretations and amendments to published approved accounting standards
that are not yet effective
-
-
-
-
-
-
IFRIC 23 „Uncertainty over Income Tax Treatments‟ (effective for annual periods beginning on or after 1 January 2019)
clarifies the accounting for income tax when there is uncertainty over income tax treatments under IAS 12. The
interpretation requires the uncertainty over tax treatment be reflected in the measurement of current and deferred tax. The
application of interpretation is not likely to have impact on Bank's financial statements.
The following standards, amendments and interpretations of Approved Accounting Standards will be effective for
accounting periods on or after 1 January 2018:
IFRS 9 „Financial Instruments‟ and amendment - Prepayment Features with Negative Compensation (effective for annual
periods beginning on or after 1 July 2018 and 1 January 2019 respectively). IFRS 9 replaces the existing guidance in IAS
39 Financial Instruments: Recognition and Measurement. IFRS 9 includes revised guidance on the classification and
measurement of financial instruments, a new expected credit loss model for calculating impairment on financial assets, and
new general hedge accounting requirements. It also carries forward the guidance on recognition and derecognition of
financial instruments from IAS 39. The Bank is currently awaiting instructions from SBP as applicability of IAS 39 was
deferred by SBP till further instructions.
The SBP vide BPRD circular no 2 dataed 25 January 2018, has specified the new reporting format for the financial
statements of banking companies. The new format has revised the disclosure requirement and will become applicable for
the financial statement of th bank for the year ending 31 December 2018.
Classification and measurement of Share Based Payment transactions amendments to IFRS 2 - Share-based Payment
clarify the accounting for certain types of arrangements and are effective for annual periods beginning on or after 1 January
2018. The amendments cover three accounting areas (a) measurement of cash-settled share-based payments; (b)
classification of share-based payments settled net of tax withholdings; and (c) accounting for a modification of a share-
based payment from cash-settled to equity-settled. The new requirements could affect the classification and/or
measurement of these arrangements and potentially the timing and amount of expense recognized for new and outstanding
awards. The amendments are not likely to have an impact on Bank‟s financial statements.
Annual Improvements to IFRSs 2014-2016 Cycle [Amendments to IAS 28 „Investments in Associates and Joint
Ventures‟] (effective for annual periods beginning on or after 1 January 2018) clarifies that a venture capital organization
and other similar entities may elect to measure investments in associates and joint ventures at fair value through profit or
loss, for each associate or joint venture separately at the time of initial recognition of investment. Furthermore, similar
election is available to non-investment entity that has an interest in an associate or joint venture that is an investment entity,
when applying the equity method, to retain the fair value measurement applied by that investment entity associate or joint
venture to the investment entity associate's or joint venture's interests in subsidiaries. This election is made separately for
each investment entity associate or joint venture. The amendments are not likely to have an impact on Bank‟s financial
statements.
IFRIC 22 „Foreign Currency Transactions and Advance Consideration‟ (effective for annual periods beginning on or after
1 January 2018) clarifies which date should be used for translation when a foreign currency transaction involves payment
or receipt in advance of the item it relates to. The related item is translated using the exchange rate on the date the advance
foreign currency is received or paid and the prepayment or deferred income is recognized. The date of the transaction for
the purpose of determining the exchange rate to use on initial recognition of the related asset, expense or income (or part of
it) would remain the date on which receipt of payment from advance consideration was recognized. If there are multiple
payments or receipts in advance, the entity shall determine a date of the transaction for each payment or receipt of advance
consideration. The application of interpretation is not likely to have an impact on Bank's financial statements.
IFRS 15 „Revenue from contracts with customers‟ (effective for annual periods beginning on or after 1 July 2018). IFRS
15 establishes a comprehensive framework for determining whether, how much and when revenue is recognized. It
replaces existing revenue recognition guidance, including IAS 18 „Revenue‟, IAS 11 „Construction Contracts‟ and IFRIC
13 „Customer Loyalty Programmes‟. The Bank is currently in the process of analyzing the potential impact of changes
required in revenue recognition policies on adoption of the standard.
-
-
-
-
-
-
3.5 Standards, interpretations and amendments to approved accounting standards
that are effective in the current year
4. BASIS OF MEASUREMENT
4.1 Accounting convention
4.2 Functional and Presentation Currency
IFRS 3 Business Combinations and IFRS 11 Joint Arrangements the amendment aims to clarify the accounting
treatment when a company increases its interest in a joint operation that meets the definition of a business. A
company remeasures its previously held interest in a joint operation when it obtains control of the business. A
company does not remeasure its previously held interest in a joint operation when it obtains joint control of the
business.
IAS 12 Income Taxes - the amendment clarify that all income tax consequences of dividends (including payments on
financial instruments classified as equity) are recognized consistently with the transaction that generates the
distributable profits.
There are certain new and amended standards, interpretations and amendments that are mandatory for the Bank's
accounting periods beginning on or after 1 January 2017 but are considered not to be relevant or do not have any
significant effect on the Bank's operations and therefore not detailed in these financial statements.
The financial statements are presented in Pakistan Rupees, which is also the Bank's functional currency. Except as
indicated, financial information presented in Pakistan Rupees has been rounded to nearest thousand.
Amendment to IAS 28 „Investments in Associates and Joint Ventures‟ - Long term interests in Associates and Joint
Ventures (effective for annual periods beginning on or after 1 January 2019). An amendment to IAS 28 Investments in
Associates and Joint Ventures will affect companies that finance such entities with preference shares or with loans for
which repayment is not expected in the foreseeable future (referred to as long-term interests or „LTI‟). The amendment and
accompanying example state that LTI are in the scope of both IFRS 9 and IAS 28 and explain the annual sequence in
which both standards are to be applied. The amendment is not likely to have an impact on the Bank's financial statements.
These financial statements have been prepared under the historical cost convention except that certain operating fixed
assets are stated at revalued amounts less accumulated depreciation, available- for-sale and held-for-trading investments
and derivative financial instruments are measured at fair values.
Annual Improvements to IFRS Standards 2015–2017 Cycle. The improvements address amendments to following
approved accounting standards:
IFRS 3 Business Combinations and IFRS 11 Joint Arrangements the amendment aims to clarify the accounting
treatment when a company increases its interest in a joint operation that meets the definition of a business. A
company remeasures its previously held interest in a joint operation when it obtains control of the business. A
company does not remeasure its previously held interest in a joint operation when it obtains joint control of the
business.
The above amendments are not likely to have an impact on the Bank's financial statements.
IAS 23 Borrowing Costs, the amendment clarifies that a company treats as part of general borrowings any borrowing
originally made to develop an asset when the asset is ready for its intended use or sale.
In addition the Companies Act, 2017 was enacted on 30 May 2017 and according to circular referred to in note 3.1, for
financial statements purposes would be applicable to financial statements for periods after 1 January 2018. Furthermore,
SBI' has also notified a new format of financial statements which would be effective from the accounting year ending 31
December 2018. The Companies Act, 2017 and the revised format would result in additional disclosures and certain
changes in the financial statements presentation.

4.3 Critical accounting judgments and key sources of estimation of uncertainty
a)
-
-
-
b) Valuation and impairment of available-for-sale equity investments
c) Provision against non-performing loans and advances and debt securities classified as investments
d) Income taxes
e) Operating fixed assets, depreciation, amortisation and revaluation
The investments which are not classified as 'held-for-trading' or 'held-to-maturity' are classified as 'available-for-sale'.
The preparation of these financial statements is in conformity with approved accounting standards as applicable in
Pakistan requires management to make judgements, estimates and assumptions that affect the reported amounts of assets
and liabilities and income and expenses. It also requires management to exercise judgement in application of its accounting
policies. The estimates and associated assumptions are based on historical experience and various other factors that are
believed to be reasonable under the circumstances. These estimates and assumptions are reviewed on an ongoing basis.
Revisions to accounting estimates are recognised in the period in which the estimate is revised, if the revision affects only
that period, or in the period of revision and in future periods if the revision affects both current and future periods.
Significant accounting estimates and areas where judgements were made by management in the application of accounting
policies are as follows :
The Bank estimates the revalued amount of land and buildings on a regular basis. The estimates are based on
valuations carried out by independent professional valuers and such valuations are carried out with sufficient
regulatory so that the valuation at the year end is close to their fair values. In making estimates of the depreciation /
amortisation method, the management uses the method which reflects the pattern in which economic benefits are
expected to be consumed by the Bank. The estimates made are reviewed at each financial year end and if there is a
change in the expected pattern of consumption of the future economic benefits embodied in the assets, the estimates
are changed to reflect the changed pattern. Such a change is accounted for as change in accounting estimates in
accordance with International Accounting Standard - 8, 'Accounting Policies, Changes in Accounting Estimates and
Errors'.
Classification of investments
These are investments with fixed or determinable payments and fixed maturities and the Bank has the positive intent
and ability to hold them till maturity.
The Bank determines that 'available-for-sale' equity investments are impaired when there has been a significant or
prolonged decline in the fair value below its cost. This determination of what is significant or prolonged requires
judgment. In making this judgment, the Bank evaluates among other factors, the normal volatility in share price. In
addition, the impairment may be appropriate when there is an evidence of deterioration in the financial health of
investee, industry and sector performance, changes in technology and operational and financing cash flows.
In making the estimates for income taxes currently payable by the Bank, the management looks at the current income
tax laws and the decisions of appellate authorities on certain issues in the past. In making the provision for deferred
taxes, estimates of the Bank's future taxable profits are taken into account.
In classifying investments as 'held-for-trading', the Bank determines the securities which are acquired with the
intention to trade by taking advantage of short term market / interest rate movements.
The Bank reviews its loan portfolio and debt securities classified as investments to assess amount of non-performing
loans and advances and debt securities and provision required there against on a regular basis. While assessing this
requirement various factors including the delinquency in the account, financial position of the borrower, and the
requirements of the Prudential Regulations are considered. The Bank also maintains general provision against
consumer and small and medium enterprises advances in accordance with the requirements set out in Prudential
Regulations of the SBP. These provisions change due to changes in requirements.
f) Staff retirement benefits
g) Fair value hierarchy of assets and liabilities
i) Level 1
ii) Level 2
iii) Level 3
These are unobservable inputs for the asset or liability.
h) Impairment of non-financial assets (excluding deferred tax asset)
i) Compensated Absences
5. SUMMARY OF SIGNIFICANT ACCOUNTING POLICIES
5.1 Cash and cash equivalents
The principal accounting policies applied in the preparation of these financial statements are set out below. These have
been consistently applied to all the years presented.
The fair value of the assets and liabilities is the amount at which these could be exchanged in a current transaction
between willing parties, other than in a forced of liquidation sale. The Bank categorizes fair value measurements
within the following fair value hierarchy;
These are quoted prices (unadjusted) in active markets for identical assets or liabilities that the bank can access at the
measurement date.
Cash and cash equivalents comprise of cash in hand, balances with treasury banks, balances with other banks in current
and deposit accounts, national prize bonds, any overdrawn nostro accounts and call lendings having maturity of three
months or less.
Liability is determined on the basis of actuarial advice using the Projected Unit Credit Method. The actuarial
assumptions used to determine the liability and related expense are disclosed in note 33.1.2. Actuarial assumptions
are entity's best estimates of the variables that will determine the ultimate cost of providing post employment
benefits. Changes in these assumptions in future years may effect the liability / asset under these plans in those years.
Non-financial assets are subject to impairment review if there are events or changes in circumstances that indicate
that the carrying amount may not be recoverable. If any such indication exists, the Bank estimates the recoverable
amount of the asset and the impairment loss, if any. The recoverable amount of an asset is the higher of its fair value
less costs to sell and its value in use. Value in use is the present value of future cash flows from the asset discounted
at a rate that reflects market interest rates adjusted for risks specific to the asset. If the recoverable amount of an
intangible or tangible asset is less than its carrying value, an impairment loss is recognised immediately in the profit
and loss account and the carrying value of the asset is reduced by the amount of the loss. A reversal of an impairment
loss on intangible assets is recognised as it arises provided the increased carrying value does not exceed which it
would have been had no impairment loss been recognised.
The bank uses actuarial valuation for the determination of its compensated absences liability. This method makes
certain assumptions, which may change, there by effecting the profit and loss account of future period.
These are inputs other than quoted prices included within Level 1 inputs that are observable for asset or liability,
either directly or indirectly.
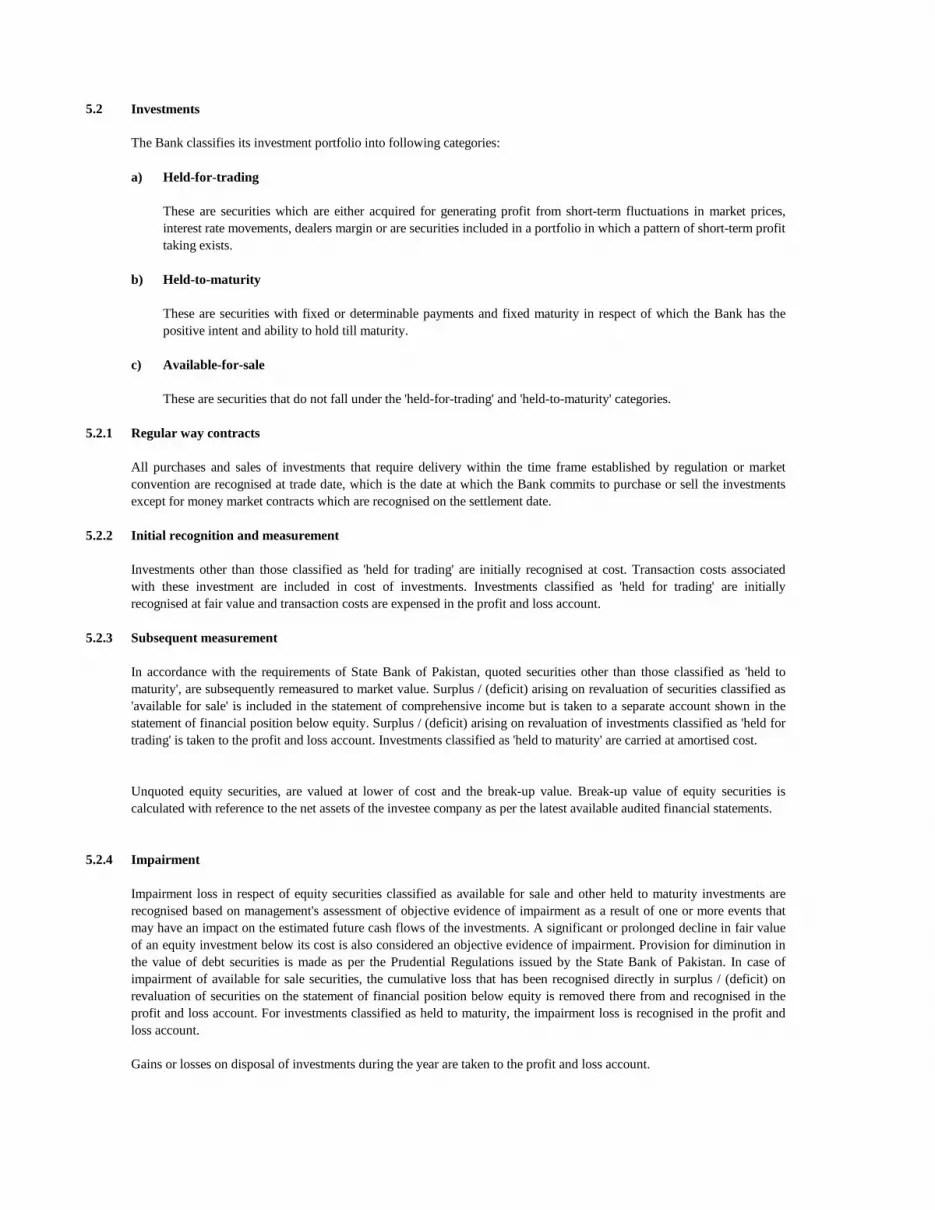
5.2
The Bank classifies its investment portfolio into following categories:
a) Held-for-trading
b) Held-to-maturity
c) Available-for-sale
5.2.1 Regular way contracts
5.2.2 Initial recognition and measurement
5.2.3 Subsequent measurement
5.2.4 Impairment
Gains or losses on disposal of investments during the year are taken to the profit and loss account.
In accordance with the requirements of State Bank of Pakistan, quoted securities other than those classified as 'held to
maturity', are subsequently remeasured to market value. Surplus / (deficit) arising on revaluation of securities classified as
'available for sale' is included in the statement of comprehensive income but is taken to a separate account shown in the
statement of financial position below equity. Surplus / (deficit) arising on revaluation of investments classified as 'held for
trading' is taken to the profit and loss account. Investments classified as 'held to maturity' are carried at amortised cost.
These are securities which are either acquired for generating profit from short-term fluctuations in market prices,
interest rate movements, dealers margin or are securities included in a portfolio in which a pattern of short-term profit
taking exists.
These are securities that do not fall under the 'held-for-trading' and 'held-to-maturity' categories.
Unquoted equity securities, are valued at lower of cost and the break-up value. Break-up value of equity securities is
calculated with reference to the net assets of the investee company as per the latest available audited financial statements.
Impairment loss in respect of equity securities classified as available for sale and other held to maturity investments are
recognised based on management's assessment of objective evidence of impairment as a result of one or more events that
may have an impact on the estimated future cash flows of the investments. A significant or prolonged decline in fair value
of an equity investment below its cost is also considered an objective evidence of impairment. Provision for diminution in
the value of debt securities is made as per the Prudential Regulations issued by the State Bank of Pakistan. In case of
impairment of available for sale securities, the cumulative loss that has been recognised directly in surplus / (deficit) on
revaluation of securities on the statement of financial position below equity is removed there from and recognised in the
profit and loss account. For investments classified as held to maturity, the impairment loss is recognised in the profit and
loss account.
All purchases and sales of investments that require delivery within the time frame established by regulation or market
convention are recognised at trade date, which is the date at which the Bank commits to purchase or sell the investments
except for money market contracts which are recognised on the settlement date.
These are securities with fixed or determinable payments and fixed maturity in respect of which the Bank has the
positive intent and ability to hold till maturity.
Investments
Investments other than those classified as 'held for trading' are initially recognised at cost. Transaction costs associated
with these investment are included in cost of investments. Investments classified as 'held for trading' are initially
recognised at fair value and transaction costs are expensed in the profit and loss account.

5.3 Lendings to / borrowings from financial institutions
Sale under repurchase obligation
Purchase under resale obligation
Other obligations
5.4
5.5 Operating fixed assets
5.5.1 Tangible assets
Depreciation is charged to the profit and loss account applying straight line method. The rates of depreciation are given in
note 11.2 to these financial statements. The residual values, useful lives and depreciation methods are reviewed and
changes, if any, are treated as change in accounting estimates, at each balance sheet date [also refer note 4.3(e)].
Depreciation on additions is charged from the month the assets are available for use, while no depreciation is charged in
the month in which the assets are disposed off.
The Bank enters into transactions of borrowing (repurchase) from and lending (reverse repurchase) to financial institutions,
at contracted rates for a specified period of time. These are recorded as under:
Advances
Advances are stated net of specific and general provisions. Specific and general provision is determined on the basis of the
Prudential Regulations and other directives issued by the SBP. The net provision made/reversed during the year is charged
to profit and loss account and accumulated provision is netted off against advances. Advances are written-off when there is
no realistic prospect of recovery.
An item of property and equipment is de-recognized upon disposal or when no future economic benefits are expected from
its use or disposal. Any gains or losses on sale of property and equipment are included in the profit and loss account in the
year the asset is de-recognized, except that the related surplus on revaluation of land and buildings (net of deferred tax) is
transferred directly to accumulated loss.
Subsequent costs are included in the asset's carrying amount or are recognized as a separate asset, as appropriate, only
when it is probable that future economic benefits associated with the item will flow to the Bank and the cost of the item
can be measured reliably. All other repairs and maintenance are charged to the profit and loss account.
Other borrowings including borrowings from SBP are recorded at the proceeds received. Mark-up on such borrowing is
charged to the profit and loss account on a time proportion basis.
Securities sold with a simultaneous commitment to repurchase at a specified future date (repo) continue to be recognized in
the balance sheet and are measured in accordance with accounting policies for investments and counter party liability is
included in borrowing from financial institutions. The difference between sale and repurchase price is accrued or a time
proportionate basis over the period of the contract and recorded as an expense.
Except for land and buildings, other items of property and equipment are stated at cost less accumulated depreciation and
accumulated impairment losses, if any. Land is stated at revalued amounts whereas the buildings are stated at revalued
amounts less subsequent accumulated depreciation and impairment losses, if any.
Surplus arising on revaluation of land and buildings is credited to the surplus on revaluation of fixed assets account.
Deficit arising on subsequent revaluation of fixed assets is adjusted against the balance in the above mentioned surplus
account as allowed under the provisions of the repealed Companies Ordinance, 1984. Revaluation is carried out with
sufficient regularity to ensure that the carrying amount of assets does not differ materially from the fair value. The surplus
on revaluation of fixed assets to the extent of incremental depreciation charged on the related assets, is transferred directly
to accumulated loss.
Securities purchased with a corresponding commitment to resell at a specified future date (reverse repo) are not recognized
in the balance sheet and instead amounts paid under these arrangements are included in lendings to financial institutions.
The difference between purchase and resale price is accrued on a time proportionate basis over the period of the contract
and recorded as income.

5.5.2 Intangible assets
5.5.3 Capital work-in-progress
5.6 Grants
5.7 Impairment - non financial assets
5.8 Taxation
5.8.1 Current
5.8.2 Deferred
Grants related to assets, including non-monetary grants at fair value, are presented in the statement of financial position by
setting up the grant as deferred income.
Capital work-in-progress is stated at cost less impairment losses, if any.
At each balance sheet date, the Bank reviews the carrying amount of its assets (other than deferred tax assets) to determine
whether there is an indication that those assets have suffered an impairment loss. If any such indication exists, the
recoverable amount of assets is estimated in order to determine the extent of the impairment loss, if any. Recoverable
amount is the greater of net selling price and value in use. If the recoverable amount of an asset is estimated to be less than
its carrying amount, the carrying amount of the assets is reduced to its recoverable amount. The resulting impairment loss
is recognized as an expense immediately, except that the impairment loss on revalued fixed assets is first adjusted against
the related revaluation surplus to the extent that the impairment loss does not exceed the surplus on revaluation of those
assets.
Provision for current taxation is based on taxable income for the year determined in accordance with the prevailing laws
for taxation on income earned. The charge for current tax is calculated using the prevailing tax rates or tax rates expected
to apply to the profits for the year. The charge for current tax also includes adjustments where considered necessary,
relating to prior years which arise from assessments finalized during the year for such years.
Income tax expense comprises current and deferred tax. Income tax expense is recognised in the profit and loss account
except to the extent that it relates to items recognised directly in other comprehensive income / surplus on revaluation of
assets in which case it is recognised in statement of comprehensive income / surplus on revaluation of assets.
Deferred tax is recognised using the balance sheet liability method on all major temporary differences as at the statement of
financial position date between the amounts attributed to assets and liabilities for financial reporting purposes and amounts
used for taxation purposes. The Bank records deferred tax assets / liabilities using tax rates, enacted or substantially
enacted at the statement of financial position date, that are expected to be applicable at the time of their reversal.
Intangible assets comprise of cost of computer software and are stated at cost less accumulated amortisation and
accumulated impairment losses, if any. The cost of intangible assets are amortized over their estimated useful lives using
the straight line method at the rates stated in note 11.3. Costs associated with maintaining the computer software are
recognized as expense in the profit and loss account as and when incurred. The useful lives of intangible assets are
reviewed and adjusted, if appropriate, at each balance sheet date.
Grants are assistances in the form of transfer of resources to the Bank in return for past or future compliance with certain
conditions relating to the operating activities of the Bank. They exclude those forms of assistances which cannot
reasonably have a value placed upon them.
Grants are recognized in the profit and loss account on a systematic basis over the periods in which the Bank recognizes as
expenses the related costs for which the grants are intended to compensate.

5.9 Provisions
5.10 Staff retirement benefits
Approved funded pension scheme (defined benefit plan)
Approved non contributory provident fund (defined contribution plan)
Unfunded gratuity scheme
5.11 Employees’ compensated absences
A deferred tax asset is recognised only to the extent that it is probable that future taxable profits will be available against
which the asset can be utilized. Deferred tax assets are reduced to the extent that it is no longer probable that the related tax
benefit will be realized.
The Bank recognizes a deferred tax asset / liability on deficit / surplus on revaluation of assets in accordance with the
requirements of IAS 12 "Income Taxes". The related deferred tax asset / liability is adjusted against the related deficit /
surplus.
The Bank operates an unfunded gratuity scheme for its President only. Liability and expense are recorded in accordance
with the terms of the scheme.
The Bank operates a funded pension scheme for its employees. The fund was granted approval by the Commissioner of
Income Tax on 6 March 2000 to take effect from 1 October 1999. Provision is made in these financial statements based on
the actuarial valuation (conducted at the balance sheet date - 31 December 2017) using the projected unit credit method.
The above benefits are payable to staff at the time of separation / retirement from the Bank's services subject to the
completion of qualifying period of service. Remeasurement component, which is the net of actuarial gains and losses is
recognized immediately in other comprehensive income whereas service cost and net interest income / expense are charged
to the profit and loss account.
Up to 30 June 2017, the Bank operated a non contributory provident fund in which monthly contributions were made by
employees at a rate of 12% of basic salary. However this scheme since then has been discontinued and the dues have been
fully settled.
The Bank recognizes liability in respect of compensated absences of its employees in the period in which these are earned
on the basis of actuarial valuation (conducted at the balance sheet date - 31 December 2017) carried out using the
Projected Unit Credit Method. Actuarial gains / losses are immediately recognised in the profit and loss account.
Above benefit is available to the employees who had joined the Bank by September 2013.
The Bank recognizes a deferred tax asset for the carry forward of unused tax losses and unused tax credits to the extent that
it is probable that future taxable profits will be available against which the unused tax losses and unused tax credits can be
utilized in accordance with the requirements of IAS 12 "Income Taxes".
Provisions are recognized when the Bank has a present obligation (legal or constructive) as a result of past events and it is
probable that an outflow of resources embodying economic benefits will be required to settle the obligation and a reliable
estimate of the amount can be made.
Provision against identified non-funded losses is recognized when intimated and reasonable certainty exists for the Bank to
settle the obligation. The loss is charged to the profit and loss account net of expected recovery and is classified under
other liabilities.
Provisions are reviewed at each balance sheet date and adjusted to reflect the current best estimates.
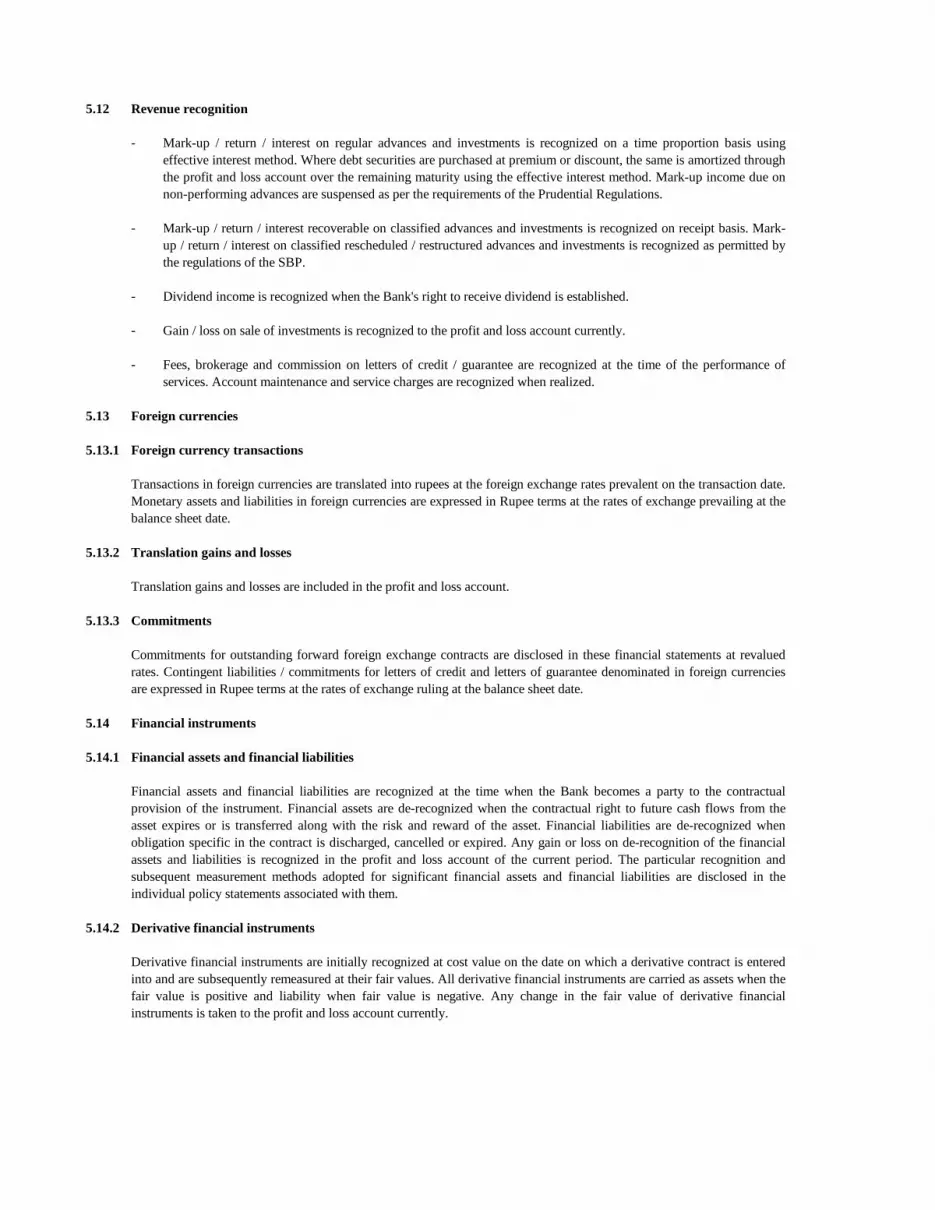
5.12 Revenue recognition
-
-
-
-
-
5.13 Foreign currencies
5.13.1 Foreign currency transactions
5.13.2 Translation gains and losses
5.13.3 Commitments
5.14 Financial instruments
5.14.1 Financial assets and financial liabilities
5.14.2 Derivative financial instruments
Dividend income is recognized when the Bank's right to receive dividend is established.
Transactions in foreign currencies are translated into rupees at the foreign exchange rates prevalent on the transaction date.
Monetary assets and liabilities in foreign currencies are expressed in Rupee terms at the rates of exchange prevailing at the
balance sheet date.
Gain / loss on sale of investments is recognized to the profit and loss account currently.
Fees, brokerage and commission on letters of credit / guarantee are recognized at the time of the performance of
services. Account maintenance and service charges are recognized when realized.
Translation gains and losses are included in the profit and loss account.
Mark-up / return / interest on regular advances and investments is recognized on a time proportion basis using
effective interest method. Where debt securities are purchased at premium or discount, the same is amortized through
the profit and loss account over the remaining maturity using the effective interest method. Mark-up income due on
non-performing advances are suspensed as per the requirements of the Prudential Regulations.
Mark-up / return / interest recoverable on classified advances and investments is recognized on receipt basis. Mark-
up / return / interest on classified rescheduled / restructured advances and investments is recognized as permitted by
the regulations of the SBP.
Commitments for outstanding forward foreign exchange contracts are disclosed in these financial statements at revalued
rates. Contingent liabilities / commitments for letters of credit and letters of guarantee denominated in foreign currencies
are expressed in Rupee terms at the rates of exchange ruling at the balance sheet date.
Financial assets and financial liabilities are recognized at the time when the Bank becomes a party to the contractual
provision of the instrument. Financial assets are de-recognized when the contractual right to future cash flows from the
asset expires or is transferred along with the risk and reward of the asset. Financial liabilities are de-recognized when
obligation specific in the contract is discharged, cancelled or expired. Any gain or loss on de-recognition of the financial
assets and liabilities is recognized in the profit and loss account of the current period. The particular recognition and
subsequent measurement methods adopted for significant financial assets and financial liabilities are disclosed in the
individual policy statements associated with them.
Derivative financial instruments are initially recognized at cost value on the date on which a derivative contract is entered
into and are subsequently remeasured at their fair values. All derivative financial instruments are carried as assets when the
fair value is positive and liability when fair value is negative. Any change in the fair value of derivative financial
instruments is taken to the profit and loss account currently.

5.15 Off-setting
5.16 Borrowing / Deposits and their cost
5.17 Dividend distribution and appropriations
5.18 Earnings per share
5.19 Segment reporting
5.19.1 Business segments
a) Corporate finance
Corporate finance includes syndications and advances to corporate enterprises.
b) Treasury
c) Retail and consumer banking
d) Commercial banking
It includes project finance, export finance, trade finance, other lendings, guarantees and bills of exchange.
5.19.2 Geographical segment
The Bank operates in Pakistan only.
It includes retail lending and deposits, banking services, private lending and deposits, retail offered to its retail
customers and small and medium enterprises.
The Bank presents basic and diluted earnings per share. Basic earning is calculated by dividing the profit or loss
attributable to ordinary shareholders of the Bank by the weighted average number of ordinary shares outstanding during
the year. Diluted EPS is determined by adjusting the profit or loss attributable to ordinary shareholders and the weighted
average number of ordinary shares outstanding for the effects of all dilutive potential ordinary shares, if any.
A segment is a distinguishable component of the Bank that is engaged in providing products or services (business segment)
or in providing products or services within a particular economic environment (geographical segment), which is subject to
risks and rewards that are different from those of other segments. Segment information is presented as per the Bank‟s
functional structure and guidance of the SBP. The Bank comprises of following main segments:
Bonus dividend, cash dividend and other appropriations (except for the appropriations required by law), declared /
approved subsequent to balance sheet date are considered as non-adjusting event and are not recorded in financial
statements of the current year. These are recognized in the period in which these are declared / approved.
It includes fixed income, equity, foreign exchange commodities, lendings to financial institutions and borrowings.
Borrowing / deposits are initially recorded at the amount of proceeds received. Mark-up accrued on deposits is recognized
separately as part of other liabilities and is charged to the profit and loss account on a time proportion basis.
Financial assets and financial liabilities are set off and the net amount is reported in the financial statements when there is a
legally enforceable right to set off and the Bank intends to either settle on net basis, or to realize the assets and to settle the
liabilities, simultaneously.
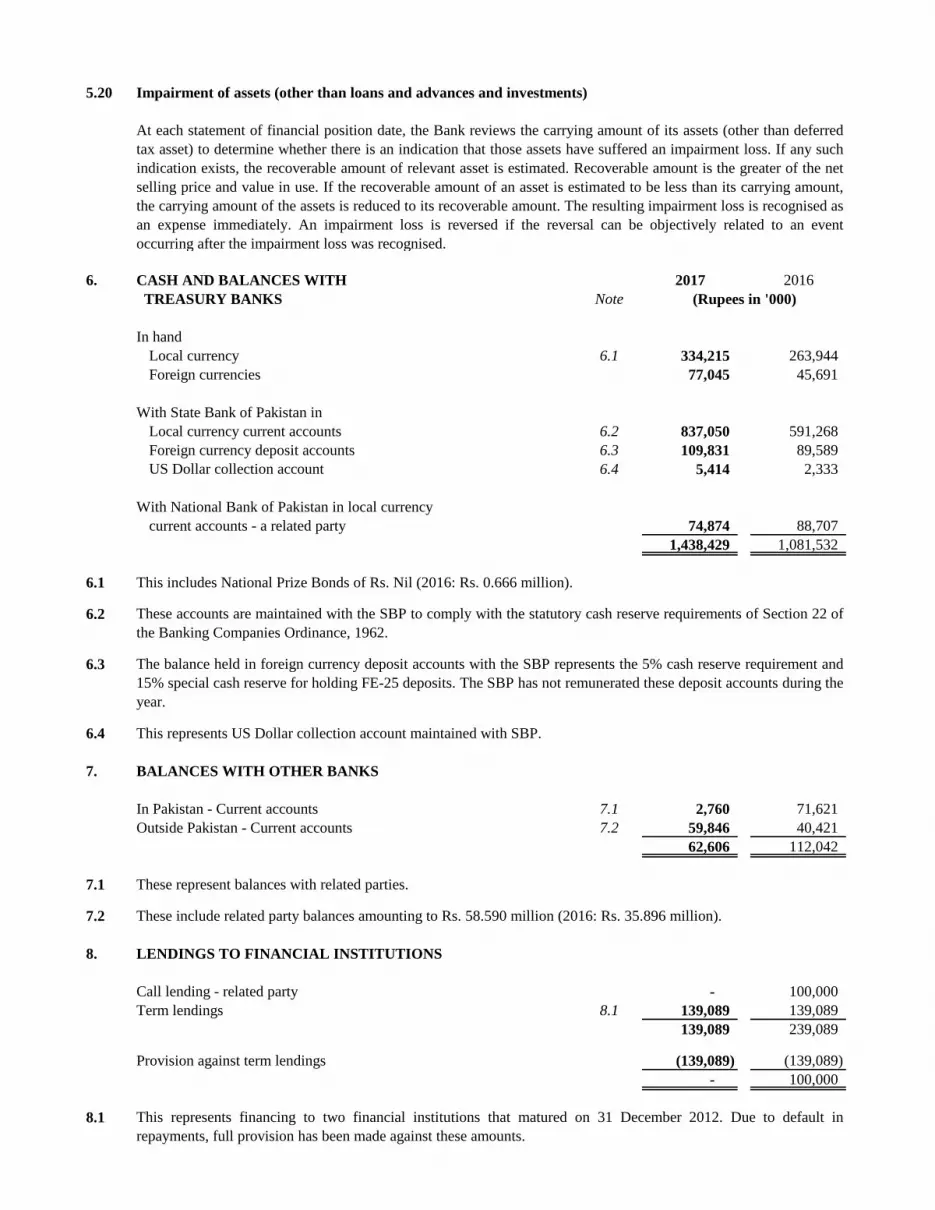
5.20 Impairment of assets (other than loans and advances and investments)
6. CASH AND BALANCES WITH 2017 2016
TREASURY BANKS Note
In hand
Local currency 6.1 334,215 263,944
Foreign currencies 77,045 45,691
With State Bank of Pakistan in
Local currency current accounts 6.2 837,050 591,268
Foreign currency deposit accounts 6.3 109,831 89,589
US Dollar collection account 6.4 5,414 2,333
With National Bank of Pakistan in local currency
current accounts - a related party 74,874 88,707
1,438,429 1,081,532
6.1 This includes National Prize Bonds of Rs. Nil (2016: Rs. 0.666 million).
6.2
6.3
6.4 This represents US Dollar collection account maintained with SBP.
7. BALANCES WITH OTHER BANKS
In Pakistan - Current accounts 7.1 2,760 71,621
Outside Pakistan - Current accounts 7.2 59,846 40,421
62,606 112,042
7.1 These represent balances with related parties.
7.2 These include related party balances amounting to Rs. 58.590 million (2016: Rs. 35.896 million).
8. LENDINGS TO FINANCIAL INSTITUTIONS
Call lending - related party - 100,000
Term lendings 8.1 139,089 139,089
139,089 239,089
Provision against term lendings (139,089) (139,089)
- 100,000
8.1
At each statement of financial position date, the Bank reviews the carrying amount of its assets (other than deferred
tax asset) to determine whether there is an indication that those assets have suffered an impairment loss. If any such
indication exists, the recoverable amount of relevant asset is estimated. Recoverable amount is the greater of the net
selling price and value in use. If the recoverable amount of an asset is estimated to be less than its carrying amount,
the carrying amount of the assets is reduced to its recoverable amount. The resulting impairment loss is recognised as
an expense immediately. An impairment loss is reversed if the reversal can be objectively related to an event
occurring after the impairment loss was recognised.
(Rupees in '000)
The balance held in foreign currency deposit accounts with the SBP represents the 5% cash reserve requirement and
15% special cash reserve for holding FE-25 deposits. The SBP has not remunerated these deposit accounts during the
year.
These accounts are maintained with the SBP to comply with the statutory cash reserve requirements of Section 22 of
the Banking Companies Ordinance, 1962.
This represents financing to two financial institutions that matured on 31 December 2012. Due to default in
repayments, full provision has been made against these amounts.
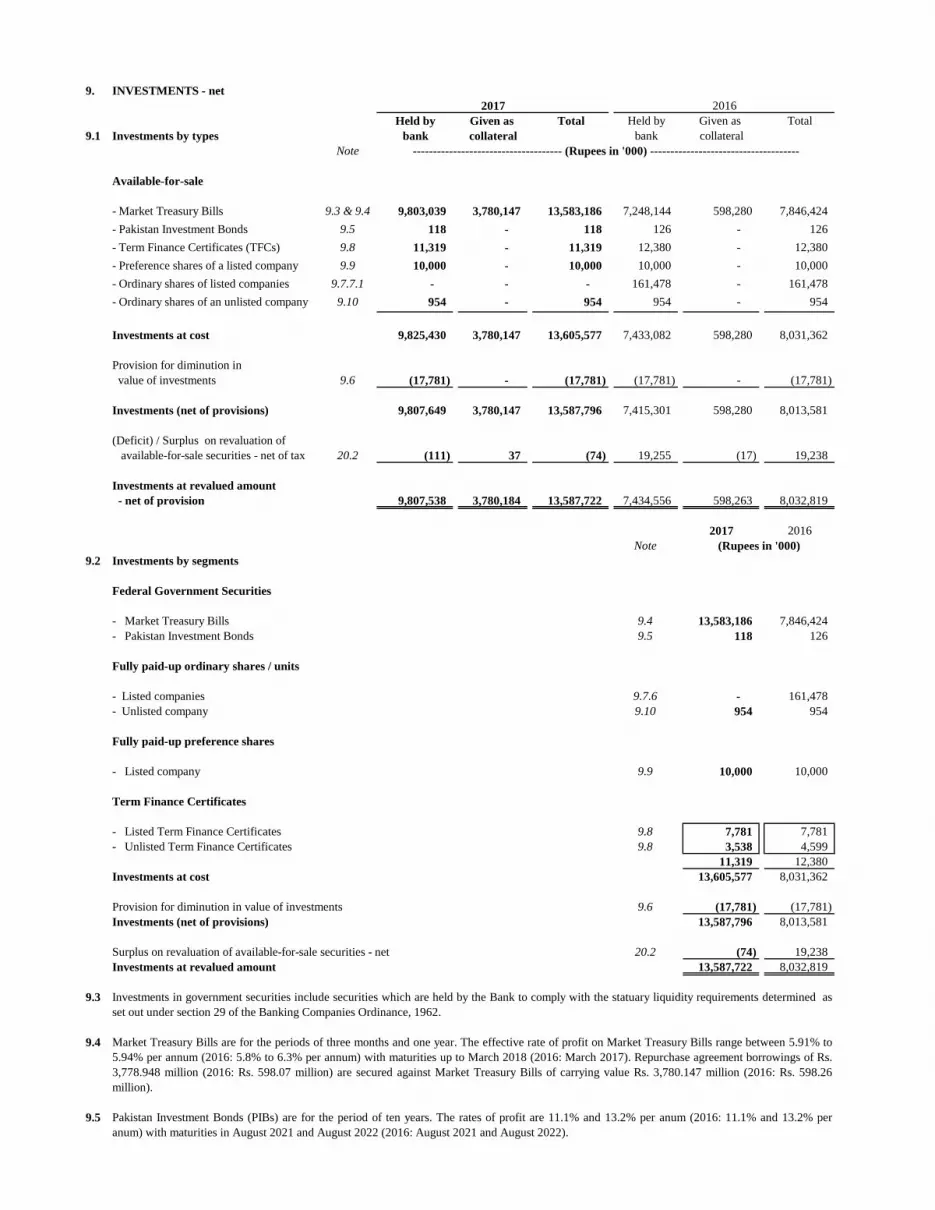
9. INVESTMENTS - net
Held by Given as Total Held by Given as Total
9.1 Investments by types bank collateral bank collateral
Note
Available-for-sale
- Market Treasury Bills 9.3 & 9.4 9,803,039 3,780,147 13,583,186 7,248,144 598,280 7,846,424
- Pakistan Investment Bonds 9.5 118 - 118 126 - 126
- Term Finance Certificates (TFCs) 9.8 11,319 - 11,319 12,380 - 12,380
- Preference shares of a listed company 9.9 10,000 - 10,000 10,000 - 10,000
- Ordinary shares of listed companies 9.7.7.1 - - - 161,478 - 161,478
- Ordinary shares of an unlisted company 9.10 954 - 954 954 - 954
Investments at cost 9,825,430 3,780,147 13,605,577 7,433,082 598,280 8,031,362
Provision for diminution in
value of investments 9.6 (17,781) - (17,781) (17,781) - (17,781)
Investments (net of provisions) 9,807,649 3,780,147 13,587,796 7,415,301 598,280 8,013,581
(Deficit) / Surplus on revaluation of
available-for-sale securities - net of tax 20.2 (111) 37 (74) 19,255 (17) 19,238
Investments at revalued amount
- net of provision 9,807,538 3,780,184 13,587,722 7,434,556 598,263 8,032,819
2017 2016
Note
9.2 Investments by segments
Federal Government Securities
- Market Treasury Bills 9.4 13,583,186 7,846,424
- Pakistan Investment Bonds 9.5 118 126
Fully paid-up ordinary shares / units
- Listed companies 9.7.6 - 161,478
- Unlisted company 9.10 954 954
Fully paid-up preference shares
- Listed company 9.9 10,000 10,000
Term Finance Certificates
- Listed Term Finance Certificates 9.8 7,781 7,781
- Unlisted Term Finance Certificates 9.8 3,538 4,599
11,319 12,380
Investments at cost 13,605,577 8,031,362
Provision for diminution in value of investments 9.6 (17,781) (17,781)
Investments (net of provisions) 13,587,796 8,013,581
Surplus on revaluation of available-for-sale securities - net 20.2 (74) 19,238
Investments at revalued amount 13,587,722 8,032,819
9.3
9.4
9.5
2017 2016
Investments in government securities include securities which are held by the Bank to comply with the statuary liquidity requirements determined as
set out under section 29 of the Banking Companies Ordinance, 1962.
Market Treasury Bills are for the periods of three months and one year. The effective rate of profit on Market Treasury Bills range between 5.91% to
5.94% per annum (2016: 5.8% to 6.3% per annum) with maturities up to March 2018 (2016: March 2017). Repurchase agreement borrowings of Rs.
3,778.948 million (2016: Rs. 598.07 million) are secured against Market Treasury Bills of carrying value Rs. 3,780.147 million (2016: Rs. 598.26
million).
Pakistan Investment Bonds (PIBs) are for the period of ten years. The rates of profit are 11.1% and 13.2% per anum (2016: 11.1% and 13.2% per
anum) with maturities in August 2021 and August 2022 (2016: August 2021 and August 2022).
------------------------------------- (Rupees in '000) -------------------------------------
(Rupees in '000)

9.6 Particulars of provision Note 2017 2016
9.6.1 Provision for diminution in value of investment by type - available-for-sale securities
- Term Finance Certificates (TFCs) 9.8 7,781 7,781
- Preference shares of a listed company 9.9 10,000 10,000
17,781 17,781
9.6.2 Provision for diminution in value of investment by segment - available-for-sale securities
Equity securities
- Preference shares of a listed company 9.9 10,000 10,000
Debt securities
- Term Finance Certificates (TFCs) 9.8 7,781 7,781
17,781 17,781
9.7 Quality of available-for-sale securities
Long Short Long Short
term term term term
(Rupees in '000) (Rupees in '000)
9.7.1 Market Treasury Bills 13,583,094 7,847,063
9.7.2 Pakistan Investment Bonds 136 148
9.7.3 Listed Term Finance Certificates
Telecard Limited - I - (Unrated) (Unrated) - (Unrated) (Unrated)
9.7.4 Un-listed Term Finance Certificates
Pakistan International Airlines Corporation 3,538 (Unrated) (Unrated) 4,599 (Unrated) (Unrated)
9.7.5 Preference shares of a listed company
Chenab Limited - preference shares - (Unrated) (Unrated) - (Unrated) (Unrated)
9.7.6 Ordinary shares of listed companies - at market value
Allied Bank Limited - - - 2,980.00 AA- A1+
Attock Petroleum Limited - - - 9,379 (Unrated) (Unrated)
Bank Al-Habib Limited - - - 885 AA+ A1+
D.G. Khan Cement Company Limited - - - 1,109 (Unrated) (Unrated)
Engro Corporation Limited - - - 2,529 AA A1+
Engro Fertilizer Limited - - - 4,759 AA- A1+
Fauji Cement Company Limited - - - 902 (Unrated) (Unrated)
Fauji Fertilizer Bin Qasim Limited - - - 1,997 (Unrated) (Unrated)
Fauji Fertilizer Company Limited - - - 13,746 AA A1+
Habib Bank Limited - - - 12,296 AAA A1+
The Hub Power Company Limited - - - 9,508 AA + A1+
Indus Motor Company Limited - - - 21,150 (Unrated) (Unrated)
Kot Addu Power Company Limited - - - 9,023 AA+ A1+
Lucky Cement Limited - - - 3,465 (Unrated) (Unrated)
MCB Bank Limited - - - 14,127 AAA A1+
National Bank of Pakistan - - - 7,526 AAA A1+
Nishat Chunian Power Limited - - - 2,497 (Unrated) (Unrated)
Nishat Power Limited - - - 1,827 A+ A1
Oil & Gas Development Company - - -
Limited - - - 9,094 AAA A1+
Pakistan Oilfields Limited - - - 35,016 (Unrated) (Unrated)
Pakistan Petroleum Limited - - - 2,448 (Unrated) (Unrated)
Pakistan State Oil Company Limited - - - 3,041 AA A1+
United Bank Limited - - - 10,751 AAA A1+
Investments at revalued amount - 180,055
9.7.7 Shares of unlisted company
National Institutional Facilitation
Technologies (Private) Limited 954 (Unrated) (Unrated) 954 (Unrated) (Unrated)
Available-for-sale investments at
revalued amount 13,587,722 8,032,819
9.7.7.1 Investments at cost - 161,478
Surplus / (deficit) on revaluation of
available-for-sale securities - net - 18,577
Investments at revalued amount - 180,055
9.7.8 Available-for-sale Market Treasury Bills and Pakistan Investment Bonds are eligible for rediscounting with the State Bank of Pakistan.
(Rupees in '000)
2017 2016
(Unrated - Government Securities)
(Unrated - Government Securities)
(Unrated - Government Securities)
(Unrated - Government Securities)
Market value/
carrying value
of investments
Credit rating Market value/
carrying value of
investments
Credit rating
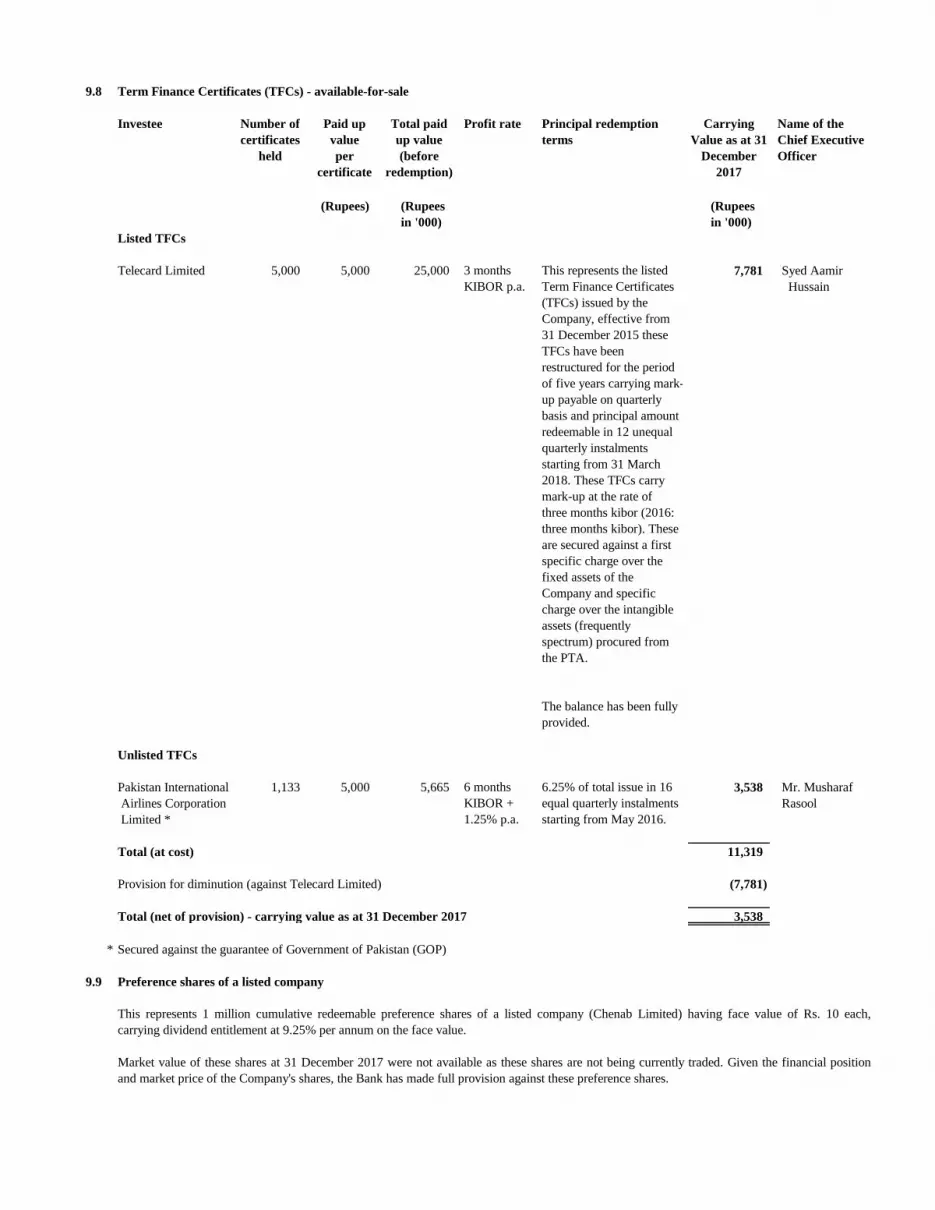
9.8 Term Finance Certificates (TFCs) - available-for-sale
Investee Number of
certificates
held
Paid up
value
per
certificate
Total paid
up value
(before
redemption)
Carrying
Value as at 31
December
2017
Name of the
Chief Executive
Officer
(Rupees) (Rupees (Rupees
in '000) in '000)
Listed TFCs
Telecard Limited 5,000 5,000 25,000 7,781 Syed Aamir
Hussain
Unlisted TFCs
Pakistan International 1,133 5,000 5,665 3,538 Mr. Musharaf
Airlines Corporation Rasool
Limited *
Total (at cost) 11,319
Provision for diminution (against Telecard Limited) (7,781)
Total (net of provision) - carrying value as at 31 December 2017 3,538
* Secured against the guarantee of Government of Pakistan (GOP)
9.9 Preference shares of a listed company
This represents 1 million cumulative redeemable preference shares of a listed company (Chenab Limited) having face value of Rs. 10 each,
carrying dividend entitlement at 9.25% per annum on the face value.
Market value of these shares at 31 December 2017 were not available as these shares are not being currently traded. Given the financial position
and market price of the Company's shares, the Bank has made full provision against these preference shares.
Profit rate Principal redemption
terms
3 months
KIBOR p.a.
6 months
KIBOR +
1.25% p.a.
This represents the listed
Term Finance Certificates
(TFCs) issued by the
Company, effective from
31 December 2015 these
TFCs have been
restructured for the period
of five years carrying mark-
up payable on quarterly
basis and principal amount
redeemable in 12 unequal
quarterly instalments
starting from 31 March
2018. These TFCs carry
mark-up at the rate of
three months kibor (2016:
three months kibor). These
are secured against a first
specific charge over the
fixed assets of the
Company and specific
charge over the intangible
assets (frequently
spectrum) procured from
the PTA.
6.25% of total issue in 16
equal quarterly instalments
starting from May 2016.
The balance has been fully
provided.
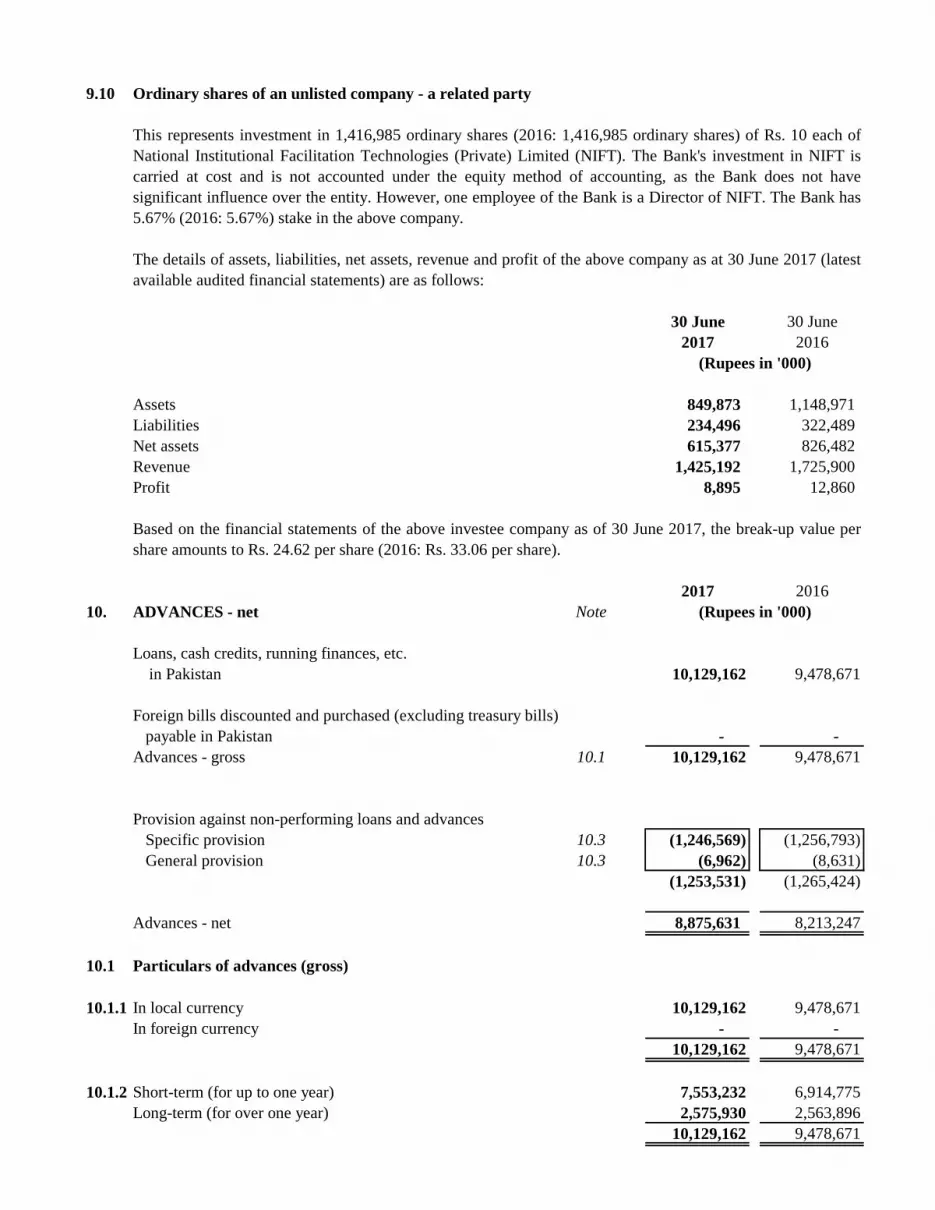
9.10 Ordinary shares of an unlisted company - a related party
30 June 30 June
2017 2016
Assets 849,873 1,148,971
Liabilities 234,496 322,489
Net assets 615,377 826,482
Revenue 1,425,192 1,725,900
Profit 8,895 12,860
2017 2016
10. ADVANCES - net Note
Loans, cash credits, running finances, etc.
in Pakistan 10,129,162 9,478,671
Foreign bills discounted and purchased (excluding treasury bills)
payable in Pakistan - -
Advances - gross 10.1 10,129,162 9,478,671
Provision against non-performing loans and advances
Specific provision 10.3 (1,246,569) (1,256,793)
General provision 10.3 (6,962) (8,631)
(1,253,531) (1,265,424)
Advances - net 8,875,631 8,213,247
10.1 Particulars of advances (gross)
10.1.1 In local currency 10,129,162 9,478,671
In foreign currency - -
10,129,162 9,478,671
10.1.2 Short-term (for up to one year) 7,553,232 6,914,775
Long-term (for over one year) 2,575,930 2,563,896
10,129,162 9,478,671
(Rupees in '000)
(Rupees in '000)
This represents investment in 1,416,985 ordinary shares (2016: 1,416,985 ordinary shares) of Rs. 10 each of
National Institutional Facilitation Technologies (Private) Limited (NIFT). The Bank's investment in NIFT is
carried at cost and is not accounted under the equity method of accounting, as the Bank does not have
significant influence over the entity. However, one employee of the Bank is a Director of NIFT. The Bank has
5.67% (2016: 5.67%) stake in the above company.
The details of assets, liabilities, net assets, revenue and profit of the above company as at 30 June 2017 (latest
available audited financial statements) are as follows:
Based on the financial statements of the above investee company as of 30 June 2017, the break-up value per
share amounts to Rs. 24.62 per share (2016: Rs. 33.06 per share).

10.2 Advances include Rs. 1,670.104 million (2016: Rs. 1,963.210 million) which have been placed under the non-performing status as detailed below:
Category of classification
Domestic Overseas Total Domestic Overseas Total Domestic Overseas Total
Other Assets
Especially Mentioned 1,261 - 1,261 - - - - - -
Substandard - - - - - - - - -
Doubtful 100,253 - 100,253 8,489 - 8,489 8,489 - 8,489
Loss 1,568,590 - 1,568,590 1,238,080 - 1,238,080 1,238,080 - 1,238,080
1,670,104 - 1,670,104 1,246,569 - 1,246,569 1,246,569 - 1,246,569
Category of classification
Domestic Overseas Total Domestic Overseas Total Domestic Overseas Total
Other Assets
Especially Mentioned 58 - 58 - - - - - -
Substandard 10,642 - 10,642 1,359 - 1,359 1,359 - 1,359
Doubtful 103,031 - 103,031 749 - 749 749 - 749
Loss 1,849,479 - 1,849,479 1,254,685 - 1,254,685 1,254,685 - 1,254,685
1,963,210 - 1,963,210 1,256,793 - 1,256,793 1,256,793 - 1,256,793
10.2.1
10.2.2
10.3 Particulars of provision against non-performing loans and advances
Note Specific General Total Specific General Total
Opening balance 1,256,793 8,631 1,265,424 1,277,954 5,152 1,283,106
Charge for the year 127,479 3,490 130,969 225,810 5,581 231,391
Reversals (113,456) (5,159) (118,615) (246,956) (2,102) (249,058)
10.3.2 14,023 (1,669) 12,354 (21,146) 3,479 (17,667)
Amounts written off against provision 10.4 (24,136) - (24,136) (15) - (15)
Reversal against provision as per court order (111) - (111) - - -
Closing balance 1,246,569 6,962 1,253,531 1,256,793 8,631 1,265,424
10.3.1 Particulars of provision against non-performing loans and advances
Specific General Total Specific General Total
In local currency 1,246,569 6,962 1,253,531 1,256,793 8,631 1,265,424
In foreign currencies - - - - - -
1,246,569 6,962 1,253,531 1,256,793 8,631 1,265,424
10.3.2 The following amounts have been (credited) / charged to the profit and loss account (net of recoveries): 2017 2016
Note
Specific provision 14,023 (21,146)
General provision 10.3.3 (1,669) 3,479
12,354 (17,667)
--------------------------------------- (Rupees in '000) ---------------------------------------
Specific provision required
2017 2016
Specific provision required Specific provision held
Specific provision held
In accordance with BSD Circular No. 1 dated 21 October 2011 issued by the State Bank of Pakistan, the Bank has availed the benefit of Forced Sale Value (FSV)
against the non-performing advances. During the year ended 31 December 2017, erosion in FSV benefit has resulted in increase in loss before tax of Rs. 274.594
million (31 December 2016: FSV benifit taken by the bank resulted in increase in profit of Rs. 475.592 million). Had the benefit under the said circular not been taken
by the Bank, specific provision against non - performing advances as of the year end would have been higher by Rs. 372.274 million (31 December 2016: Rs. 646.868
million). The FSV benefit recognized will not be available for the distribution of cash and stock dividend to shareholders.
As per the revised Prudential Regulations issued for the Corporate / Commercial Banking vide BPRD Circular No. 06 of 2014 dated 26 June 2014, the cumulative
FSV benefit recognized in respect of customers under Corporate / Commercial Banking is Rs. 192.847 million (31 December 2016: Rs. 459.5 million) and is not
available for distribution of cash or stock dividend / bonus to employees.
Classified advances
2017
--------------------------------------------------------------- (Rupees in '000) ---------------------------------------------------------------
--------------------------------------------------------------- (Rupees in '000) ---------------------------------------------------------------
2016
Classified advances
2017
--------------------------------------- (Rupees in '000) ---------------------------------------
(Rupees in '000)
2016
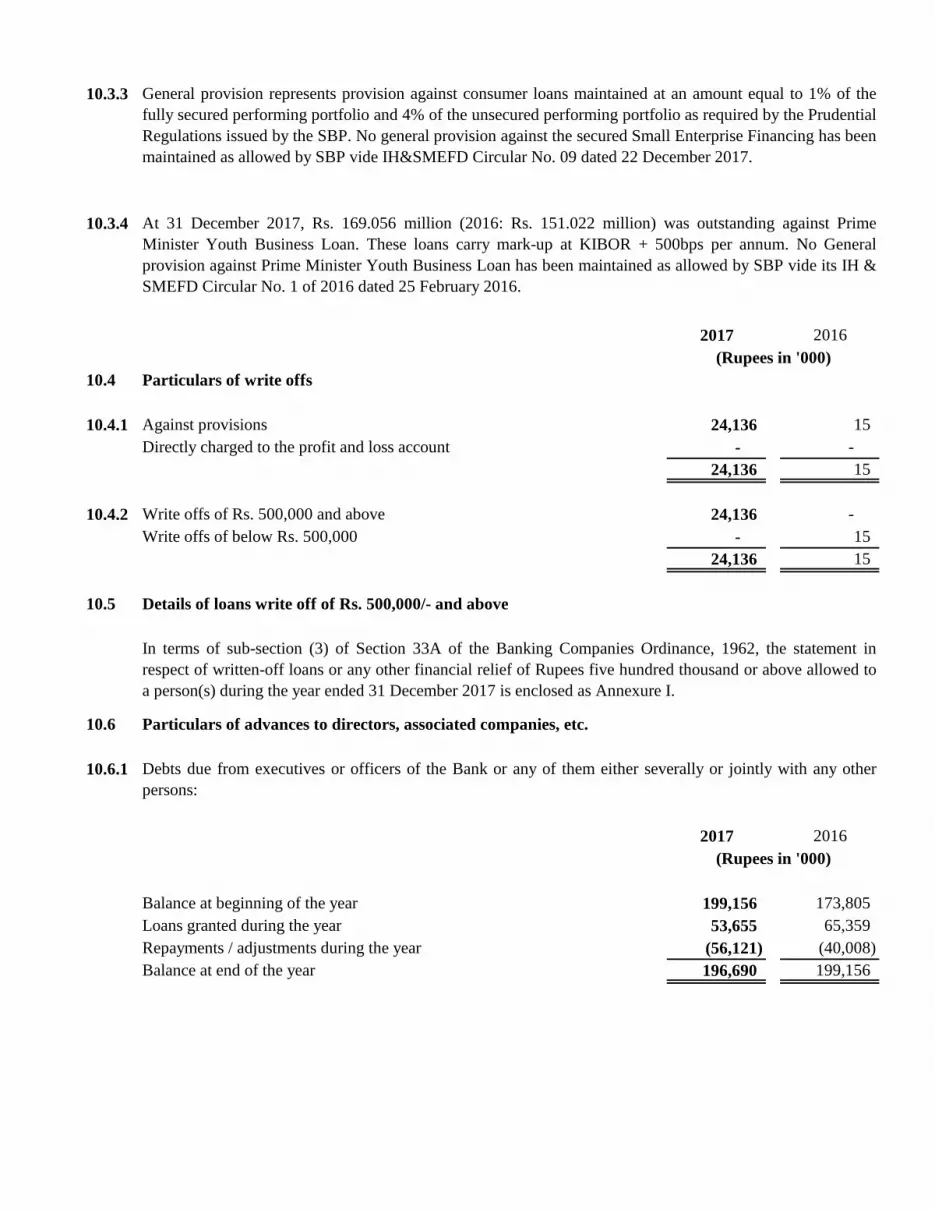
10.3.3
10.3.4
2017 2016
10.4 Particulars of write offs
10.4.1 Against provisions 24,136 15
Directly charged to the profit and loss account - -
24,136 15
10.4.2 Write offs of Rs. 500,000 and above 24,136 -
Write offs of below Rs. 500,000 - 15
24,136 15
10.5 Details of loans write off of Rs. 500,000/- and above
10.6 Particulars of advances to directors, associated companies, etc.
10.6.1
2017 2016
Balance at beginning of the year 199,156 173,805
Loans granted during the year 53,655 65,359
Repayments / adjustments during the year (56,121) (40,008)
Balance at end of the year 196,690 199,156
(Rupees in '000)
(Rupees in '000)
At 31 December 2017, Rs. 169.056 million (2016: Rs. 151.022 million) was outstanding against Prime
Minister Youth Business Loan. These loans carry mark-up at KIBOR + 500bps per annum. No General
provision against Prime Minister Youth Business Loan has been maintained as allowed by SBP vide its IH &
SMEFD Circular No. 1 of 2016 dated 25 February 2016.
In terms of sub-section (3) of Section 33A of the Banking Companies Ordinance, 1962, the statement in
respect of written-off loans or any other financial relief of Rupees five hundred thousand or above allowed to
a person(s) during the year ended 31 December 2017 is enclosed as Annexure I.
General provision represents provision against consumer loans maintained at an amount equal to 1% of the
fully secured performing portfolio and 4% of the unsecured performing portfolio as required by the Prudential
Regulations issued by the SBP. No general provision against the secured Small Enterprise Financing has been
maintained as allowed by SBP vide IH&SMEFD Circular No. 09 dated 22 December 2017.
Debts due from executives or officers of the Bank or any of them either severally or jointly with any other
persons:

11. OPERATING FIXED ASSETS 2017 2016
Note
Capital work-in-progress 11.1 4,993 21,305
Property and equipment 11.2 279,260 283,755
Intangible assets 11.3 39,293 32,017
323,546 337,077
11.1 Capital work-in-progress
Software up gradation (advance to the consultant) 2,515 7,585
Civil works 49 -
Payments to consultant for up gradation of IT setup 2,429 1,903
Equipments - 11,817
4,993 21,305
11.2 Property and equipment
Description Charge for
the year /
(deprecation on
on disposals) /
(written off*)
----------------------------------------------------------------------------(Rupees in '000)--------------------------------------------------------------------------- %
Leasehold lands 57,787 - - 57,787 - - - - 57,787 -
(note 11.2.3)
Buildings 172,462 - - 172,462 2,427 8,502 - 10,929 161,533 5
(note 11.2.3)
Building improvement
(rented premises) 45,884 1,959 - 47,843 29,446 6,614 - 36,060 11,783 20
Furniture and fixtures 69,786 2,623 - 69,199 54,147 6,361 - 57,881 11,318 20
(note 11.2.7) (3,210) (2,627)
Electrical, office and 225,086 36,766 - 260,959 204,455 22,673 - 226,235 34,724 33.33
computer equipment (893) (893)
(note 11.2.7)
Vehicles 18,234 735 - 13,275 15,009 899 - 11,160 2,115 20
(5,694) (4,748)
589,239 42,083 - 621,525 305,484 45,049 - 342,265 279,260
(9,797) - (8,268)
Description Charge for
the year /
(deprecation on
on disposals) /
(written off*)
----------------------------------------------------------------------------(Rupees in '000)--------------------------------------------------------------------------- %
Leasehold lands 58,025 2,080 57,787 - - - - 57,787 -
(2,318)
Buildings 155,739 - 16,723 172,462 10,701 7,666 (15,940) 2,427 170,035 5
Building improvement
(rented premises) 38,161 7,859 - 45,884 23,041 6,490 - 29,446 16,438 20
(136) (85)
Furniture and fixtures 66,229 5,768 - 69,786 50,232 6,013 - 54,147 15,639 20
(note 11.2.7) (1,045) (1,042)
(1,166) (1,056)
Electrical, office and 227,744 6,235 - 225,086 172,319 41,019 - 204,455 20,631 33.33
computer equipment (1,494) (1,493)
(note 11.2.7) (7,399) (7,390)
Vehicles 33,425 - - 18,234 28,207 1,974 - 15,009 3,225 20
(15,191) (15,172)
579,323 19,862 18,803 589,239 284,500 63,162 (15,940) 305,484 283,755
(17,730) (2,318) (17,707)
(8,701) (8,531)
2016
Cost / revalued amount
At 1
January
2016
Additions /
(disposals) /
(written off*)
Surplus on
revaluation
At 31
December
2016
At 1
January
2016
Adjustment due
to revaluation
At 31
December
2015
Net book
value at 31
December
2015
Annual rate
of
depreciation
Accumulated depreciation
(Rupees in '000)
Accumulated depreciation
2017
Cost / revalued amount
At 1
January
2017
Additions /
(disposals) /
(written off*)
Surplus on
revaluation /
(reversal*)
At 31
December
2017
At 1
January
2017
Net book
value at 31
December
2017
Annual rate
of
depreciation
Adjustment due
to revaluation
At 31
December
2017
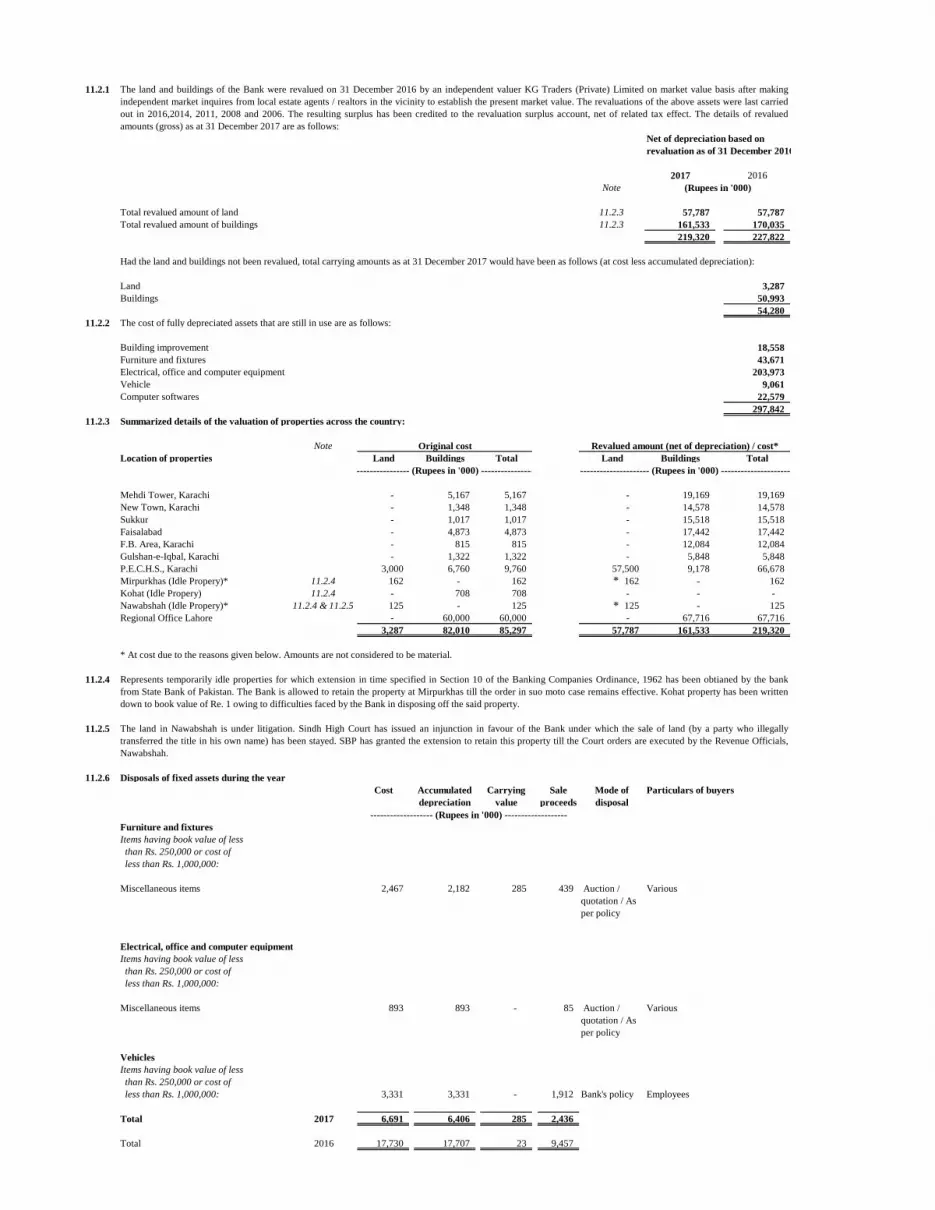
11.2.1
Net of depreciation based on
revaluation as of 31 December 2016
2017 2016
Note
Total revalued amount of land 11.2.3 57,787 57,787
Total revalued amount of buildings 11.2.3 161,533 170,035
219,320 227,822
Had the land and buildings not been revalued, total carrying amounts as at 31 December 2017 would have been as follows (at cost less accumulated depreciation):
Land 3,287
Buildings 50,993
54,280
11.2.2 The cost of fully depreciated assets that are still in use are as follows:
Building improvement 18,558
Furniture and fixtures 43,671
Electrical, office and computer equipment 203,973
Vehicle 9,061
Computer softwares 22,579
297,842
11.2.3 Summarized details of the valuation of properties across the country:
Note
Location of properties Land Buildings Total Land Buildings Total
Mehdi Tower, Karachi - 5,167 5,167 - 19,169 19,169
New Town, Karachi - 1,348 1,348 - 14,578 14,578
Sukkur - 1,017 1,017 - 15,518 15,518
Faisalabad - 4,873 4,873 - 17,442 17,442
F.B. Area, Karachi - 815 815 - 12,084 12,084
Gulshan-e-Iqbal, Karachi - 1,322 1,322 - 5,848 5,848
P.E.C.H.S., Karachi 3,000 6,760 9,760 57,500 9,178 66,678
Mirpurkhas (Idle Propery)* 11.2.4 162 - 162 162 - 162
Kohat (Idle Propery) 11.2.4 - 708 708 - - -
Nawabshah (Idle Propery)* 11.2.4 & 11.2.5 125 - 125 125 - 125
Regional Office Lahore - 60,000 60,000 - 67,716 67,716
3,287 82,010 85,297 57,787 161,533 219,320
* At cost due to the reasons given below. Amounts are not considered to be material.
11.2.4
11.2.5
11.2.6 Disposals of fixed assets during the year
Cost Accumulated
depreciation
Carrying
value
Sale
proceeds
Mode of
disposal
Particulars of buyers
Furniture and fixtures
Items having book value of less
than Rs. 250,000 or cost of
less than Rs. 1,000,000:
Miscellaneous items 2,467 2,182 285 439 Auction /
quotation / As
per policy
Various
Electrical, office and computer equipment
Items having book value of less
than Rs. 250,000 or cost of
less than Rs. 1,000,000:
Miscellaneous items 893 893 - 85 Auction /
quotation / As
per policy
Various
Vehicles
Items having book value of less
than Rs. 250,000 or cost of
less than Rs. 1,000,000: 3,331 3,331 - 1,912 Bank's policy Employees
Total 2017 6,691 6,406 285 2,436
Total 2016 17,730 17,707 23 9,457
The land and buildings of the Bank were revalued on 31 December 2016 by an independent valuer KG Traders (Private) Limited on market value basis after making
independent market inquires from local estate agents / realtors in the vicinity to establish the present market value. The revaluations of the above assets were last carried
out in 2016,2014, 2011, 2008 and 2006. The resulting surplus has been credited to the revaluation surplus account, net of related tax effect. The details of revalued
amounts (gross) as at 31 December 2017 are as follows:
--------------------- (Rupees in '000) ---------------------
------------------- (Rupees in '000) -------------------
--------------------- (Rupees in '000) ---------------------
Revalued amount (net of depreciation) / cost*Original cost
The land in Nawabshah is under litigation. Sindh High Court has issued an injunction in favour of the Bank under which the sale of land (by a party who illegally
transferred the title in his own name) has been stayed. SBP has granted the extension to retain this property till the Court orders are executed by the Revenue Officials,
Nawabshah.
Represents temporarily idle properties for which extension in time specified in Section 10 of the Banking Companies Ordinance, 1962 has been obtianed by the bank
from State Bank of Pakistan. The Bank is allowed to retain the property at Mirpurkhas till the order in suo moto case remains effective. Kohat property has been written
down to book value of Re. 1 owing to difficulties faced by the Bank in disposing off the said property.
(Rupees in '000)
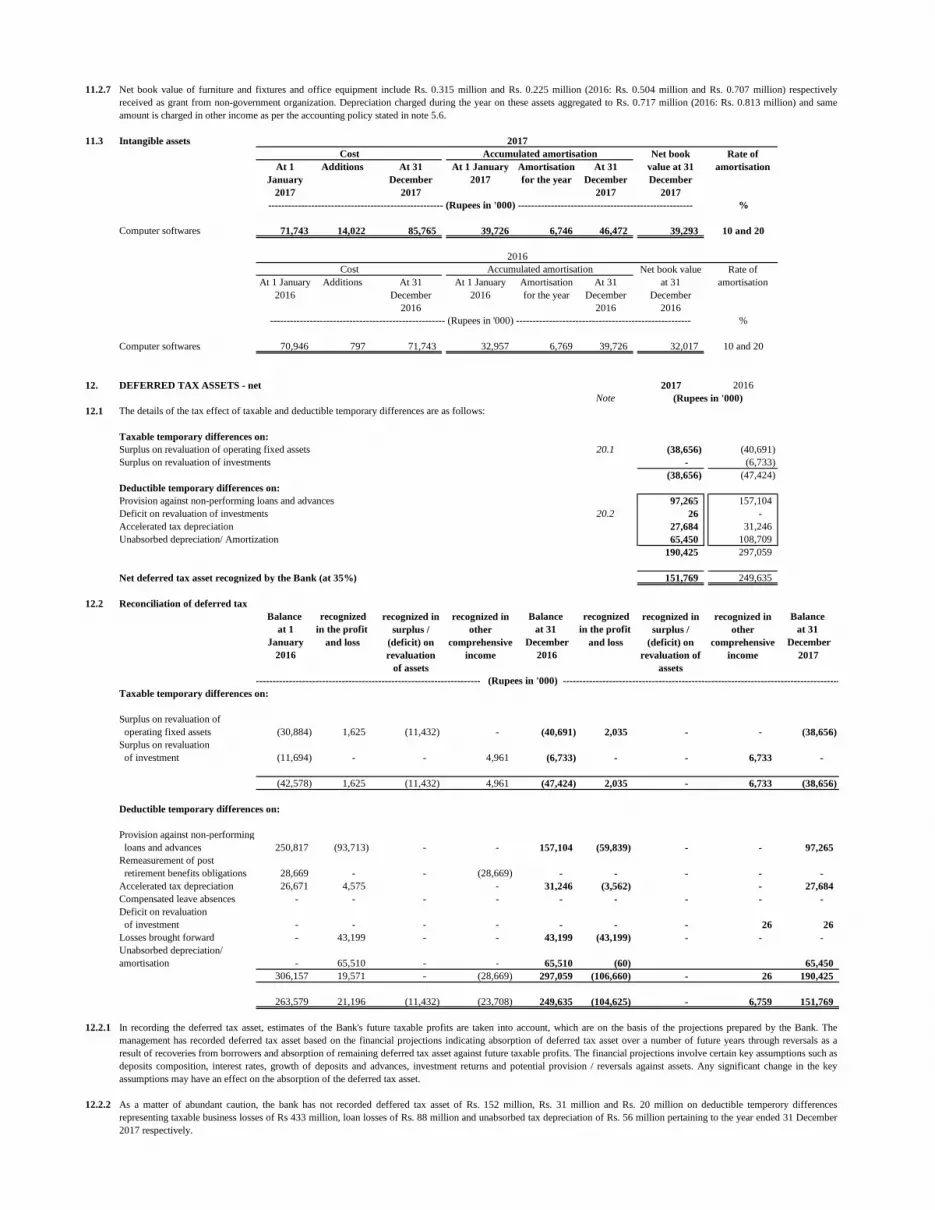
11.2.7
11.3 Intangible assets
%
Computer softwares 71,743 14,022 85,765 39,726 6,746 46,472 39,293 10 and 20
%
Computer softwares 70,946 797 71,743 32,957 6,769 39,726 32,017 10 and 20
12. DEFERRED TAX ASSETS - net 2017 2016
Note
12.1 The details of the tax effect of taxable and deductible temporary differences are as follows:
Taxable temporary differences on:
Surplus on revaluation of operating fixed assets 20.1 (38,656) (40,691)
Surplus on revaluation of investments - (6,733)
(38,656) (47,424)
Deductible temporary differences on:
Provision against non-performing loans and advances 97,265 157,104
Deficit on revaluation of investments 20.2 26 -
Accelerated tax depreciation 27,684 31,246
Unabsorbed depreciation/ Amortization 65,450 108,709
190,425 297,059
Net deferred tax asset recognized by the Bank (at 35%) 151,769 249,635
12.2 Reconciliation of deferred tax
Balance recognized Balance recognized Balance
at 1 in the profit at 31 in the profit at 31
January and loss December and loss December
2016 2016 2017
Taxable temporary differences on:
Surplus on revaluation of
operating fixed assets (30,884) 1,625 (11,432) - (40,691) 2,035 - - (38,656)
Surplus on revaluation
of investment (11,694) - - 4,961 (6,733) - - 6,733 -
(42,578) 1,625 (11,432) 4,961 (47,424) 2,035 - 6,733 (38,656)
Deductible temporary differences on:
Provision against non-performing
loans and advances 250,817 (93,713) - - 157,104 (59,839) - - 97,265
Remeasurement of post
retirement benefits obligations 28,669 - - (28,669) - - - - -
Accelerated tax depreciation 26,671 4,575 - 31,246 (3,562) - 27,684
Compensated leave absences - - - - - - - - -
Deficit on revaluation
of investment - - - - - - - 26 26
Losses brought forward - 43,199 - - 43,199 (43,199) - - -
Unabsorbed depreciation/
amortisation - 65,510 - - 65,510 (60) 65,450
306,157 19,571 - (28,669) 297,059 (106,660) - 26 190,425
263,579 21,196 (11,432) (23,708) 249,635 (104,625) - 6,759 151,769
12.2.1
12.2.2
In recording the deferred tax asset, estimates of the Bank's future taxable profits are taken into account, which are on the basis of the projections prepared by the Bank. The
management has recorded deferred tax asset based on the financial projections indicating absorption of deferred tax asset over a number of future years through reversals as a
result of recoveries from borrowers and absorption of remaining deferred tax asset against future taxable profits. The financial projections involve certain key assumptions such as
deposits composition, interest rates, growth of deposits and advances, investment returns and potential provision / reversals against assets. Any significant change in the key
assumptions may have an effect on the absorption of the deferred tax asset.
Cost
Cost
Net book value of furniture and fixtures and office equipment include Rs. 0.315 million and Rs. 0.225 million (2016: Rs. 0.504 million and Rs. 0.707 million) respectively
received as grant from non-government organization. Depreciation charged during the year on these assets aggregated to Rs. 0.717 million (2016: Rs. 0.813 million) and same
amount is charged in other income as per the accounting policy stated in note 5.6.
2017
----------------------------------------------------- (Rupees in '000) -----------------------------------------------------
Accumulated amortisation Net book value
at 31
December
2016
Rate of
amortisation At 1 January
2016
Amortisation
for the year
----------------------------------------------------- (Rupees in '000) -----------------------------------------------------
2016
Accumulated amortisation
At 31
December
2017
Rate of
amortisation Additions At 31
December
2017
At 1
January
2017
Net book
value at 31
December
2017
Additions At 31
December
2016
At 1 January
2016
Amortisation
for the year
At 1 January
2017
At 31
December
2016
-------------------------------------------------------------------- (Rupees in '000) ------------------------------------------------------------------------------------
recognized in
other
comprehensive
income
recognized in
surplus /
(deficit) on
revaluation of
assets
recognized in
surplus /
(deficit) on
revaluation
of assets
recognized in
other
comprehensive
income
(Rupees in '000)
As a matter of abundant caution, the bank has not recorded deffered tax asset of Rs. 152 million, Rs. 31 million and Rs. 20 million on deductible temperory differences
representing taxable business losses of Rs 433 million, loan losses of Rs. 88 million and unabsorbed tax depreciation of Rs. 56 million pertaining to the year ended 31 December
2017 respectively.
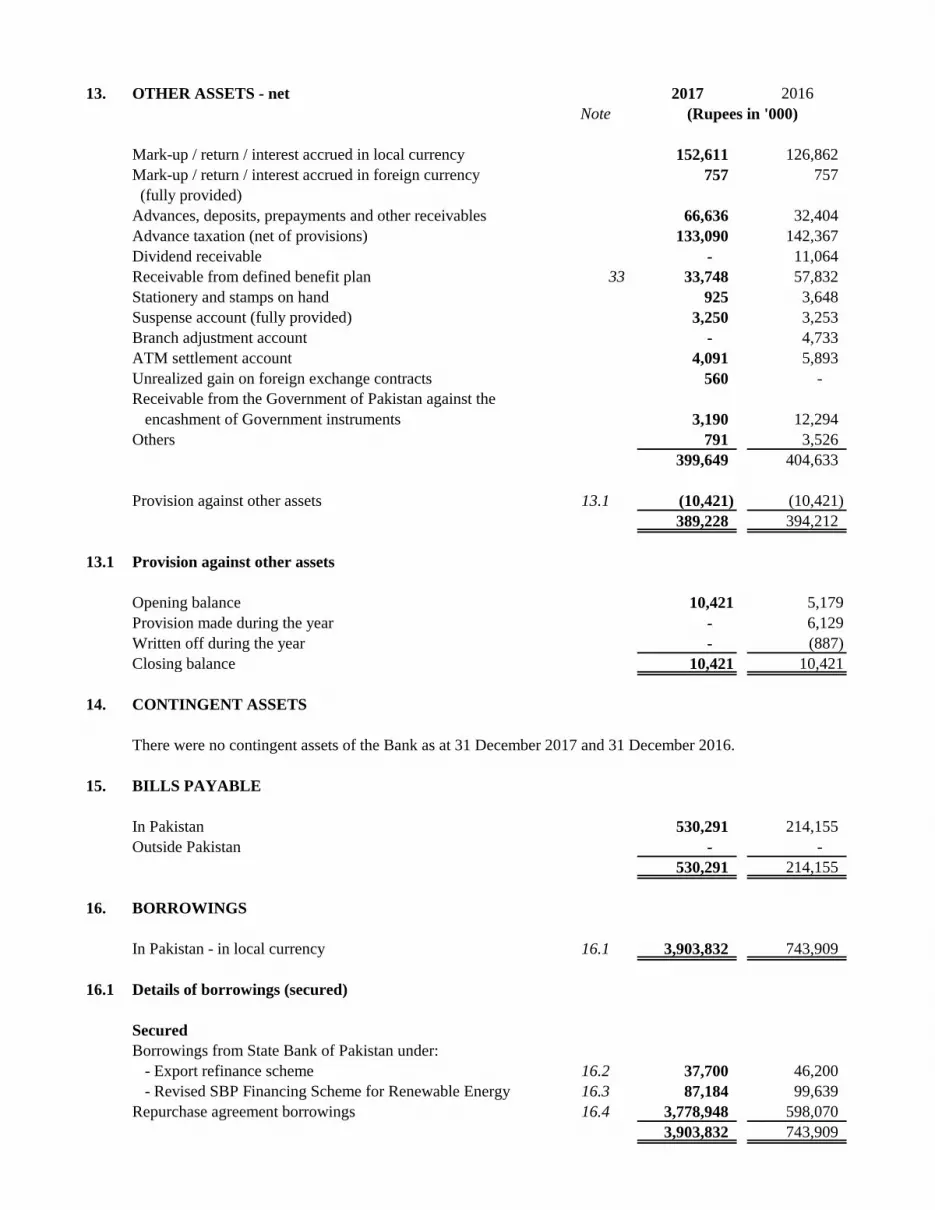
13. OTHER ASSETS - net 2017 2016
Note
Mark-up / return / interest accrued in local currency 152,611 126,862
Mark-up / return / interest accrued in foreign currency 757 757
(fully provided)
Advances, deposits, prepayments and other receivables 66,636 32,404
Advance taxation (net of provisions) 133,090 142,367
Dividend receivable - 11,064
Receivable from defined benefit plan 33 33,748 57,832
Stationery and stamps on hand 925 3,648
Suspense account (fully provided) 3,250 3,253
Branch adjustment account - 4,733
ATM settlement account 4,091 5,893
Unrealized gain on foreign exchange contracts 560 -
Receivable from the Government of Pakistan against the
encashment of Government instruments 3,190 12,294
Others 791 3,526
399,649 404,633
Provision against other assets 13.1 (10,421) (10,421)
389,228 394,212
13.1 Provision against other assets
Opening balance 10,421 5,179
Provision made during the year - 6,129
Written off during the year - (887)
Closing balance 10,421 10,421
14. CONTINGENT ASSETS
There were no contingent assets of the Bank as at 31 December 2017 and 31 December 2016.
15. BILLS PAYABLE
In Pakistan 530,291 214,155
Outside Pakistan - -
530,291 214,155
16. BORROWINGS
In Pakistan - in local currency 16.1 3,903,832 743,909
16.1 Details of borrowings (secured)
Secured
Borrowings from State Bank of Pakistan under:
- Export refinance scheme 16.2 37,700 46,200
- Revised SBP Financing Scheme for Renewable Energy 16.3 87,184 99,639
Repurchase agreement borrowings 16.4 3,778,948 598,070
3,903,832 743,909
(Rupees in '000)
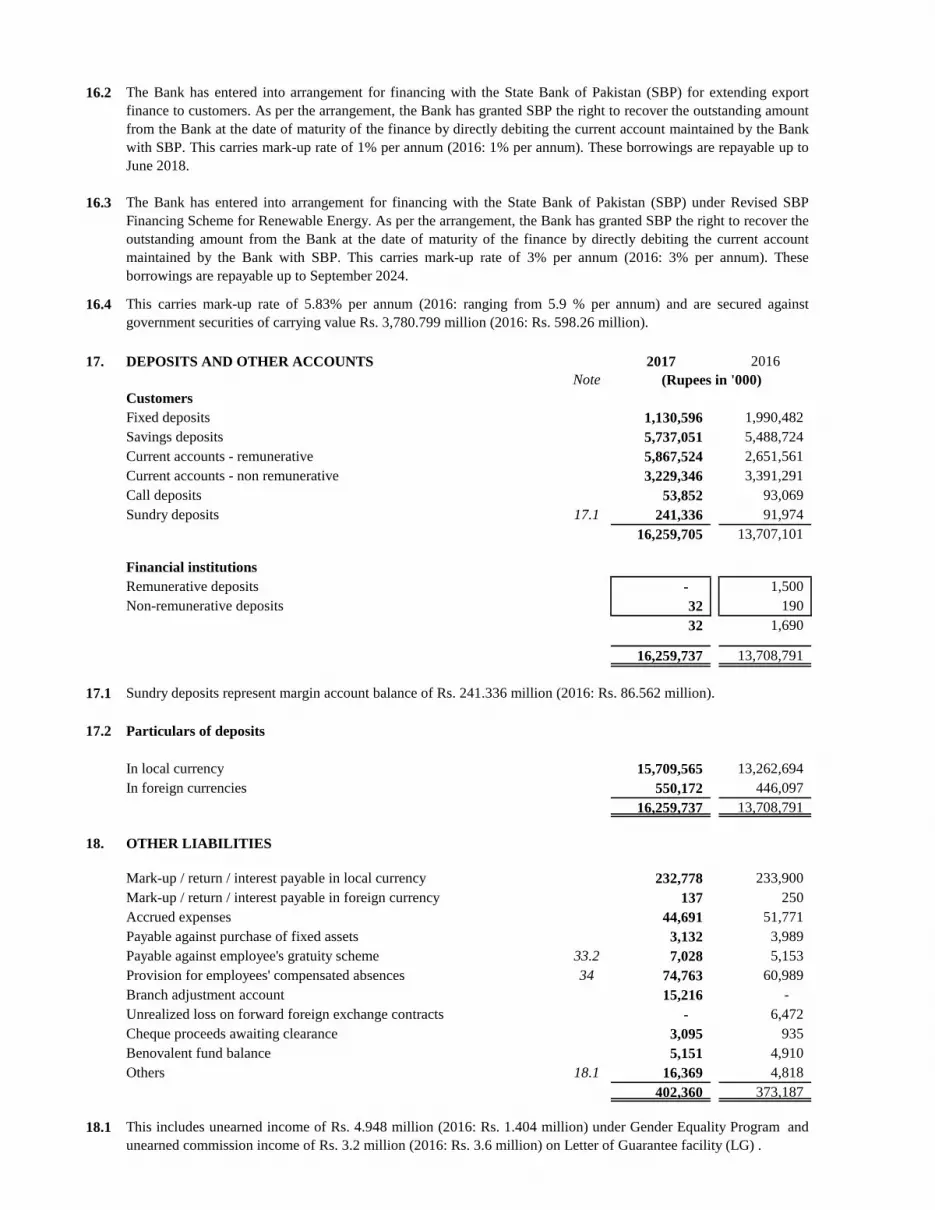
16.2
16.3
16.4
17. DEPOSITS AND OTHER ACCOUNTS 2017 2016
Note
Customers
Fixed deposits 1,130,596 1,990,482
Savings deposits 5,737,051 5,488,724
Current accounts - remunerative 5,867,524 2,651,561
Current accounts - non remunerative 3,229,346 3,391,291
Call deposits 53,852 93,069
Sundry deposits 17.1 241,336 91,974
16,259,705 13,707,101
Financial institutions
Remunerative deposits - 1,500
Non-remunerative deposits 32 190
32 1,690
16,259,737 13,708,791
17.1
17.2 Particulars of deposits
In local currency 15,709,565 13,262,694
In foreign currencies 550,172 446,097
16,259,737 13,708,791
18. OTHER LIABILITIES
Mark-up / return / interest payable in local currency 232,778 233,900
Mark-up / return / interest payable in foreign currency 137 250
Accrued expenses 44,691 51,771
Payable against purchase of fixed assets 3,132 3,989
Payable against employee's gratuity scheme 33.2 7,028 5,153
Provision for employees' compensated absences 34 74,763 60,989
Branch adjustment account 15,216 -
Unrealized loss on forward foreign exchange contracts - 6,472
Cheque proceeds awaiting clearance 3,095 935
Benovalent fund balance 5,151 4,910
Others 18.1 16,369 4,818
402,360 373,187
18.1
The Bank has entered into arrangement for financing with the State Bank of Pakistan (SBP) for extending export
finance to customers. As per the arrangement, the Bank has granted SBP the right to recover the outstanding amount
from the Bank at the date of maturity of the finance by directly debiting the current account maintained by the Bank
with SBP. This carries mark-up rate of 1% per annum (2016: 1% per annum). These borrowings are repayable up to
June 2018.
Sundry deposits represent margin account balance of Rs. 241.336 million (2016: Rs. 86.562 million).
This carries mark-up rate of 5.83% per annum (2016: ranging from 5.9 % per annum) and are secured against
government securities of carrying value Rs. 3,780.799 million (2016: Rs. 598.26 million).
(Rupees in '000)
The Bank has entered into arrangement for financing with the State Bank of Pakistan (SBP) under Revised SBP
Financing Scheme for Renewable Energy. As per the arrangement, the Bank has granted SBP the right to recover the
outstanding amount from the Bank at the date of maturity of the finance by directly debiting the current account
maintained by the Bank with SBP. This carries mark-up rate of 3% per annum (2016: 3% per annum). These
borrowings are repayable up to September 2024.
This includes unearned income of Rs. 4.948 million (2016: Rs. 1.404 million) under Gender Equality Program and
unearned commission income of Rs. 3.2 million (2016: Rs. 3.6 million) on Letter of Guarantee facility (LG) .
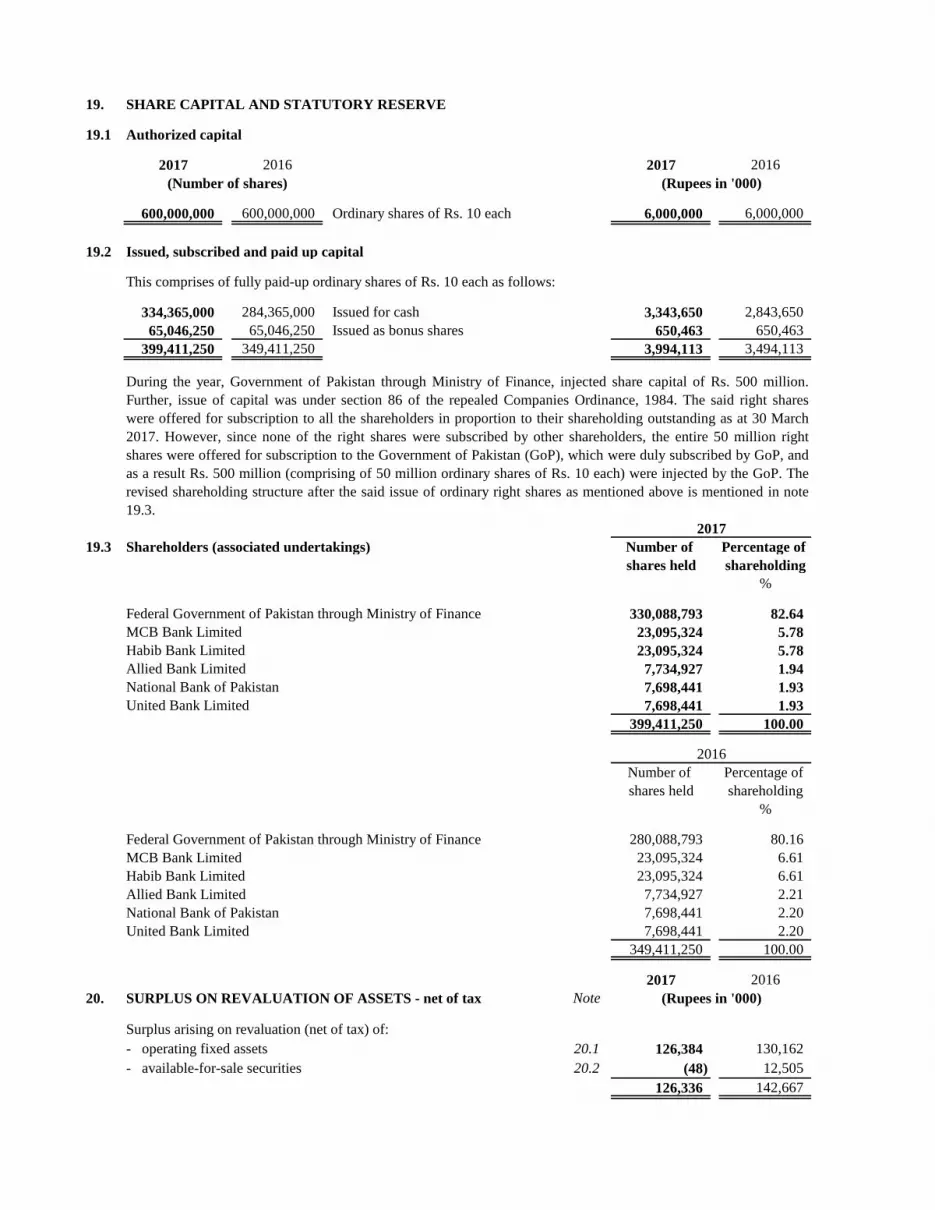
19. SHARE CAPITAL AND STATUTORY RESERVE
19.1 Authorized capital
2017 2016 2017 2016
(Number of shares)
600,000,000 600,000,000 Ordinary shares of Rs. 10 each 6,000,000 6,000,000
19.2 Issued, subscribed and paid up capital
This comprises of fully paid-up ordinary shares of Rs. 10 each as follows:
334,365,000 284,365,000 Issued for cash 3,343,650 2,843,650
65,046,250 65,046,250 Issued as bonus shares 650,463 650,463
399,411,250 349,411,250 3,994,113 3,494,113
19.3 Shareholders (associated undertakings) Number of Percentage of
shares held shareholding
%
Federal Government of Pakistan through Ministry of Finance 330,088,793 82.64
MCB Bank Limited 23,095,324 5.78
Habib Bank Limited 23,095,324 5.78
Allied Bank Limited 7,734,927 1.94
National Bank of Pakistan 7,698,441 1.93
United Bank Limited 7,698,441 1.93
399,411,250 100.00
Number of Percentage of
shares held shareholding
%
Federal Government of Pakistan through Ministry of Finance 280,088,793 80.16
MCB Bank Limited 23,095,324 6.61
Habib Bank Limited 23,095,324 6.61
Allied Bank Limited 7,734,927 2.21
National Bank of Pakistan 7,698,441 2.20
United Bank Limited 7,698,441 2.20
349,411,250 100.00
2017 2016
20. SURPLUS ON REVALUATION OF ASSETS - net of tax Note
Surplus arising on revaluation (net of tax) of:
- operating fixed assets 20.1 126,384 130,162
- available-for-sale securities 20.2 (48) 12,505
126,336 142,667
2017
(Rupees in '000)
2016
(Rupees in '000)
During the year, Government of Pakistan through Ministry of Finance, injected share capital of Rs. 500 million.
Further, issue of capital was under section 86 of the repealed Companies Ordinance, 1984. The said right shares
were offered for subscription to all the shareholders in proportion to their shareholding outstanding as at 30 March
2017. However, since none of the right shares were subscribed by other shareholders, the entire 50 million right
shares were offered for subscription to the Government of Pakistan (GoP), which were duly subscribed by GoP, and
as a result Rs. 500 million (comprising of 50 million ordinary shares of Rs. 10 each) were injected by the GoP. The
revised shareholding structure after the said issue of ordinary right shares as mentioned above is mentioned in note
19.3.
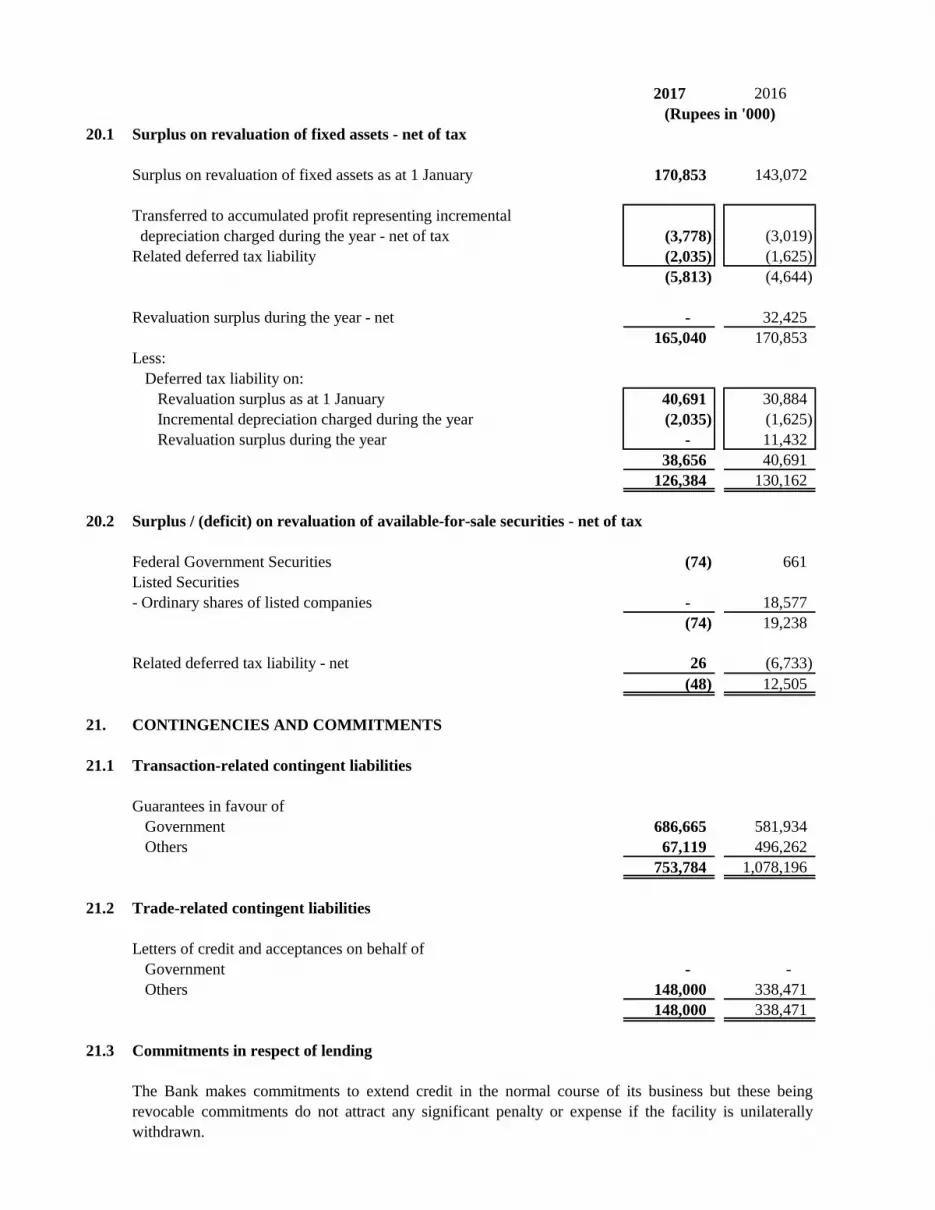
2017 2016
20.1 Surplus on revaluation of fixed assets - net of tax
Surplus on revaluation of fixed assets as at 1 January 170,853 143,072
Transferred to accumulated profit representing incremental
depreciation charged during the year - net of tax (3,778) (3,019)
Related deferred tax liability (2,035) (1,625)
(5,813) (4,644)
Revaluation surplus during the year - net - 32,425
165,040 170,853
Less:
Deferred tax liability on:
Revaluation surplus as at 1 January 40,691 30,884
Incremental depreciation charged during the year (2,035) (1,625)
Revaluation surplus during the year - 11,432
38,656 40,691
126,384 130,162
20.2 Surplus / (deficit) on revaluation of available-for-sale securities - net of tax
Federal Government Securities (74) 661
Listed Securities
- Ordinary shares of listed companies - 18,577
(74) 19,238
Related deferred tax liability - net 26 (6,733)
(48) 12,505
21. CONTINGENCIES AND COMMITMENTS
21.1 Transaction-related contingent liabilities
Guarantees in favour of
Government 686,665 581,934
Others 67,119 496,262
753,784 1,078,196
21.2 Trade-related contingent liabilities
Letters of credit and acceptances on behalf of
Government - -
Others 148,000 338,471
148,000 338,471
21.3 Commitments in respect of lending
(Rupees in '000)
The Bank makes commitments to extend credit in the normal course of its business but these being
revocable commitments do not attract any significant penalty or expense if the facility is unilaterally
withdrawn.

2017 2016
21.4 Commitments in respect of forward foreign exchange contracts
Purchase 309,781 -
Sale - 157,542
21.5 Commitments in respect of forward Swaps
Purchase 17,895 567,134
Sale 17,606 124,206
21.6 Commitment for the acquisition of operating fixed assets
Capital commitments for tangible assets 8,897 7,617
22. DERIVATIVE INSTRUMENTS
23. MARK-UP / RETURN / INTEREST EARNED
On loans and advances to:
Customers 658,384 638,273
Financial institutions - 3,205
658,384 641,478
On investments in:
Available-for-sale securities 612,389 513,671
On deposits with financial institutions (including lendings) 599 581
On securities purchased under resale agreements 4,964 6,134
1,276,336 1,161,864
24. MARK-UP / RETURN / INTEREST EXPENSED
On deposits 436,627 424,190
On securities sold under repurchase agreements 165,098 98,290
On other short-term borrowings 99 12
601,824 522,492
(Rupees in '000)
The Bank, as a policy does not enter into derivatives except for forward foreign exchange contracts and
foreign exchange currency swaps, which are primarily backed by trade finance related business of
customers.
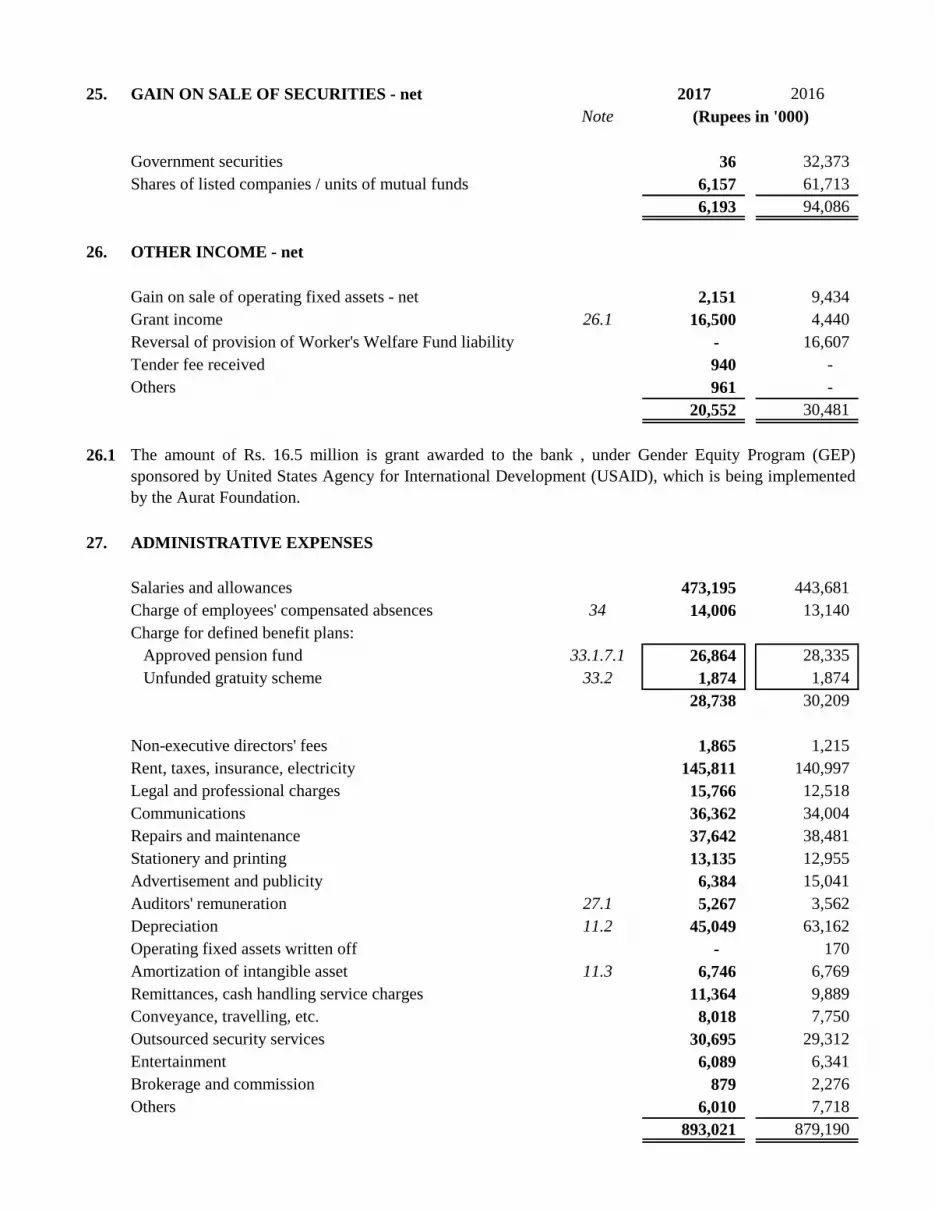
25. GAIN ON SALE OF SECURITIES - net 2017 2016
Note
Government securities 36 32,373
Shares of listed companies / units of mutual funds 6,157 61,713
6,193 94,086
26. OTHER INCOME - net
Gain on sale of operating fixed assets - net 2,151 9,434
Grant income 26.1 16,500 4,440
Reversal of provision of Worker's Welfare Fund liability - 16,607
Tender fee received 940 -
Others 961 -
20,552 30,481
26.1
27. ADMINISTRATIVE EXPENSES
Salaries and allowances 473,195 443,681
Charge of employees' compensated absences 34 14,006 13,140
Charge for defined benefit plans:
Approved pension fund 33.1.7.1 26,864 28,335
Unfunded gratuity scheme 33.2 1,874 1,874
28,738 30,209
Non-executive directors' fees 1,865 1,215
Rent, taxes, insurance, electricity 145,811 140,997
Legal and professional charges 15,766 12,518
Communications 36,362 34,004
Repairs and maintenance 37,642 38,481
Stationery and printing 13,135 12,955
Advertisement and publicity 6,384 15,041
Auditors' remuneration 27.1 5,267 3,562
Depreciation 11.2 45,049 63,162
Operating fixed assets written off - 170
Amortization of intangible asset 11.3 6,746 6,769
Remittances, cash handling service charges 11,364 9,889
Conveyance, travelling, etc. 8,018 7,750
Outsourced security services 30,695 29,312
Entertainment 6,089 6,341
Brokerage and commission 879 2,276
Others 6,010 7,718
893,021 879,190
(Rupees in '000)
The amount of Rs. 16.5 million is grant awarded to the bank , under Gender Equity Program (GEP)
sponsored by United States Agency for International Development (USAID), which is being implemented
by the Aurat Foundation.
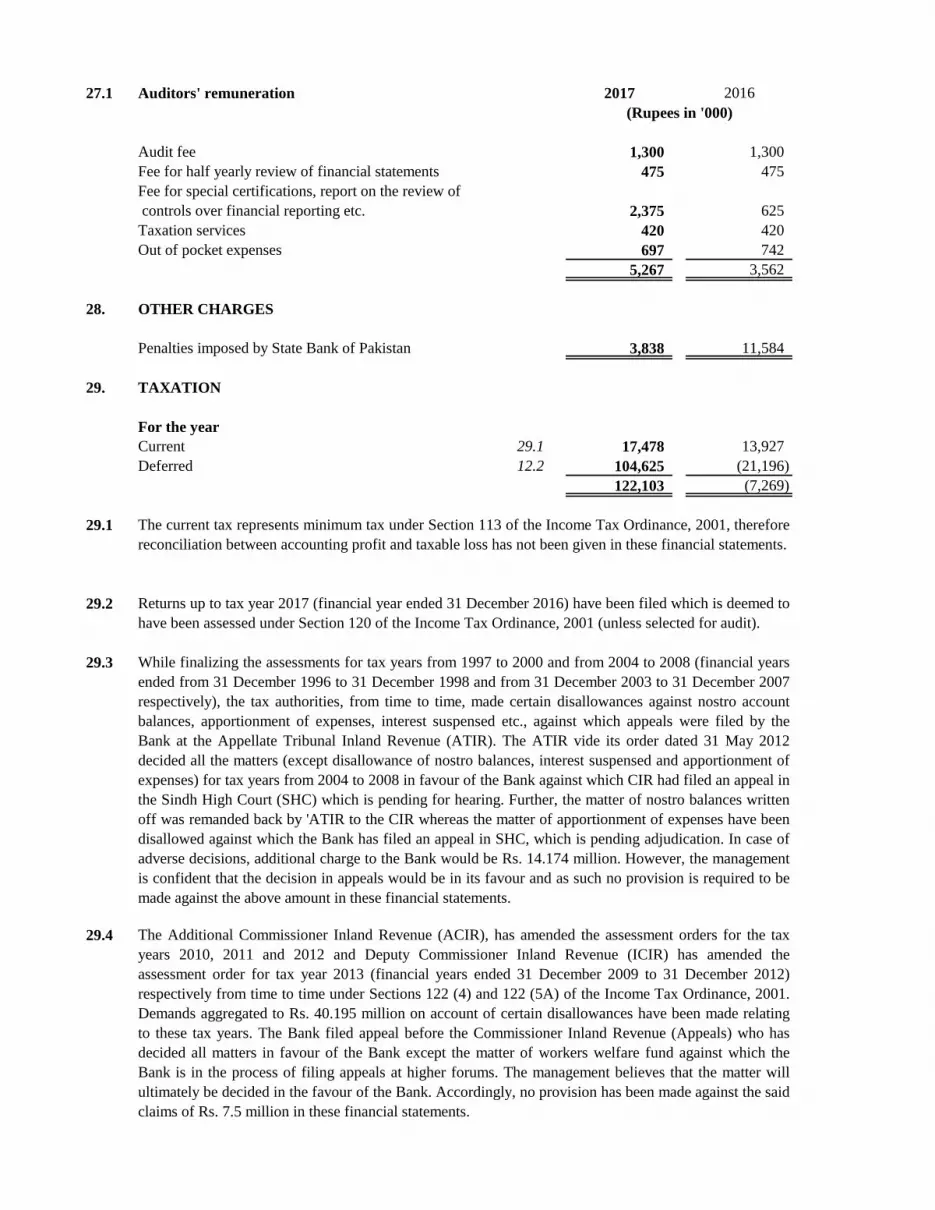
27.1 Auditors' remuneration 2017 2016
Audit fee 1,300 1,300
Fee for half yearly review of financial statements 475 475
Fee for special certifications, report on the review of
controls over financial reporting etc. 2,375 625
Taxation services 420 420
Out of pocket expenses 697 742
5,267 3,562
28. OTHER CHARGES
Penalties imposed by State Bank of Pakistan 3,838 11,584
29. TAXATION
For the year
Current 29.1 17,478 13,927
Deferred 12.2 104,625 (21,196)
122,103 (7,269)
29.1
29.2
29.3
29.4
(Rupees in '000)
The current tax represents minimum tax under Section 113 of the Income Tax Ordinance, 2001, therefore
reconciliation between accounting profit and taxable loss has not been given in these financial statements.
Returns up to tax year 2017 (financial year ended 31 December 2016) have been filed which is deemed to
have been assessed under Section 120 of the Income Tax Ordinance, 2001 (unless selected for audit).
While finalizing the assessments for tax years from 1997 to 2000 and from 2004 to 2008 (financial years
ended from 31 December 1996 to 31 December 1998 and from 31 December 2003 to 31 December 2007
respectively), the tax authorities, from time to time, made certain disallowances against nostro account
balances, apportionment of expenses, interest suspensed etc., against which appeals were filed by the
Bank at the Appellate Tribunal Inland Revenue (ATIR). The ATIR vide its order dated 31 May 2012
decided all the matters (except disallowance of nostro balances, interest suspensed and apportionment of
expenses) for tax years from 2004 to 2008 in favour of the Bank against which CIR had filed an appeal in
the Sindh High Court (SHC) which is pending for hearing. Further, the matter of nostro balances written
off was remanded back by 'ATIR to the CIR whereas the matter of apportionment of expenses have been
disallowed against which the Bank has filed an appeal in SHC, which is pending adjudication. In case of
adverse decisions, additional charge to the Bank would be Rs. 14.174 million. However, the management
is confident that the decision in appeals would be in its favour and as such no provision is required to be
made against the above amount in these financial statements.
The Additional Commissioner Inland Revenue (ACIR), has amended the assessment orders for the tax
years 2010, 2011 and 2012 and Deputy Commissioner Inland Revenue (ICIR) has amended the
assessment order for tax year 2013 (financial years ended 31 December 2009 to 31 December 2012)
respectively from time to time under Sections 122 (4) and 122 (5A) of the Income Tax Ordinance, 2001.
Demands aggregated to Rs. 40.195 million on account of certain disallowances have been made relating
to these tax years. The Bank filed appeal before the Commissioner Inland Revenue (Appeals) who has
decided all matters in favour of the Bank except the matter of workers welfare fund against which the
Bank is in the process of filing appeals at higher forums. The management believes that the matter will
ultimately be decided in the favour of the Bank. Accordingly, no provision has been made against the said
claims of Rs. 7.5 million in these financial statements.
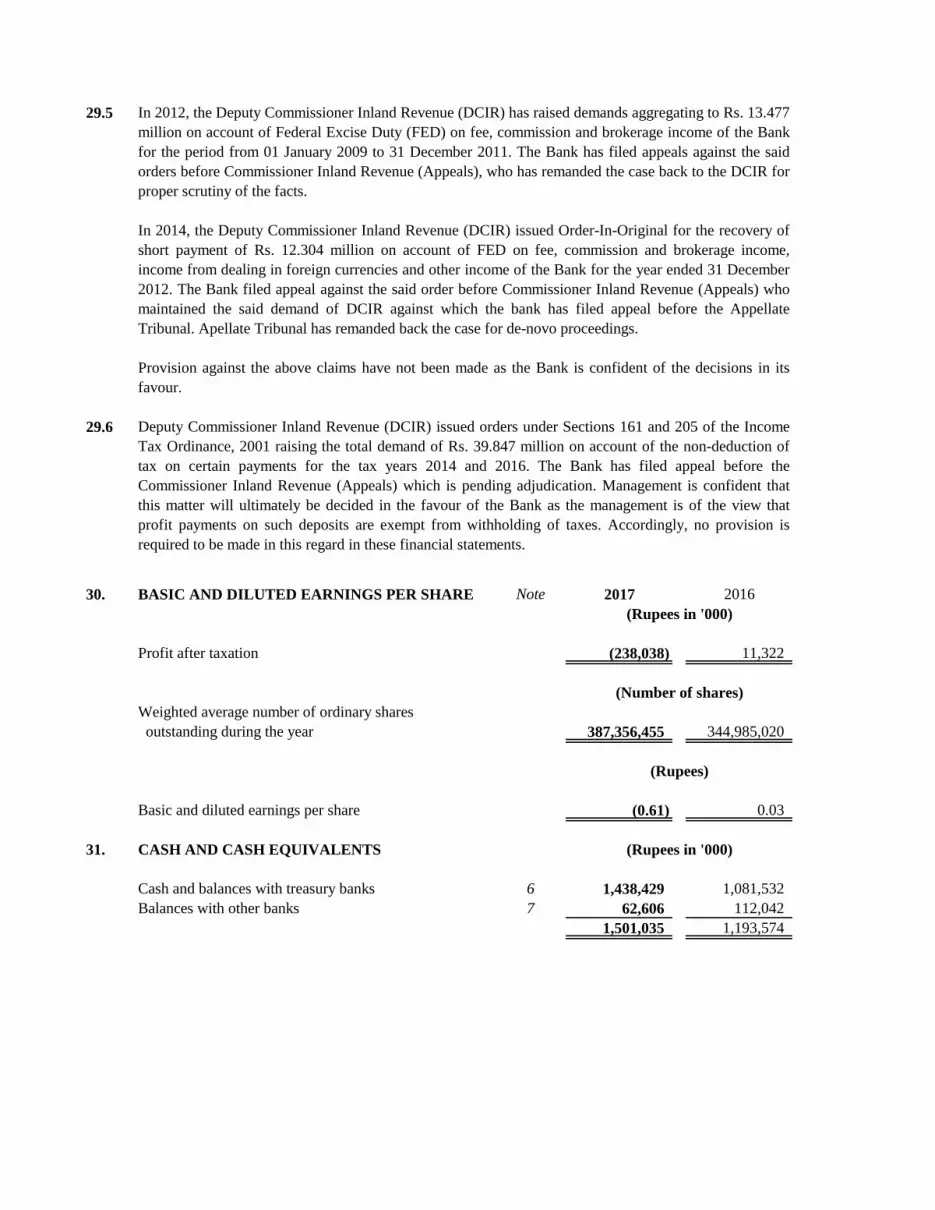
29.5
29.6
30. BASIC AND DILUTED EARNINGS PER SHARE Note 2017 2016
Profit after taxation (238,038) 11,322
Weighted average number of ordinary shares
outstanding during the year 387,356,455 344,985,020
Basic and diluted earnings per share (0.61) 0.03
31. CASH AND CASH EQUIVALENTS
Cash and balances with treasury banks 6 1,438,429 1,081,532
Balances with other banks 7 62,606 112,042
1,501,035 1,193,574
(Number of shares)
(Rupees in '000)
(Rupees)
(Rupees in '000)
In 2012, the Deputy Commissioner Inland Revenue (DCIR) has raised demands aggregating to Rs. 13.477
million on account of Federal Excise Duty (FED) on fee, commission and brokerage income of the Bank
for the period from 01 January 2009 to 31 December 2011. The Bank has filed appeals against the said
orders before Commissioner Inland Revenue (Appeals), who has remanded the case back to the DCIR for
proper scrutiny of the facts.
In 2014, the Deputy Commissioner Inland Revenue (DCIR) issued Order-In-Original for the recovery of
short payment of Rs. 12.304 million on account of FED on fee, commission and brokerage income,
income from dealing in foreign currencies and other income of the Bank for the year ended 31 December
2012. The Bank filed appeal against the said order before Commissioner Inland Revenue (Appeals) who
maintained the said demand of DCIR against which the bank has filed appeal before the Appellate
Tribunal. Apellate Tribunal has remanded back the case for de-novo proceedings.
Deputy Commissioner Inland Revenue (DCIR) issued orders under Sections 161 and 205 of the Income
Tax Ordinance, 2001 raising the total demand of Rs. 39.847 million on account of the non-deduction of
tax on certain payments for the tax years 2014 and 2016. The Bank has filed appeal before the
Commissioner Inland Revenue (Appeals) which is pending adjudication. Management is confident that
this matter will ultimately be decided in the favour of the Bank as the management is of the view that
profit payments on such deposits are exempt from withholding of taxes. Accordingly, no provision is
required to be made in this regard in these financial statements.
Provision against the above claims have not been made as the Bank is confident of the decisions in its
favour.
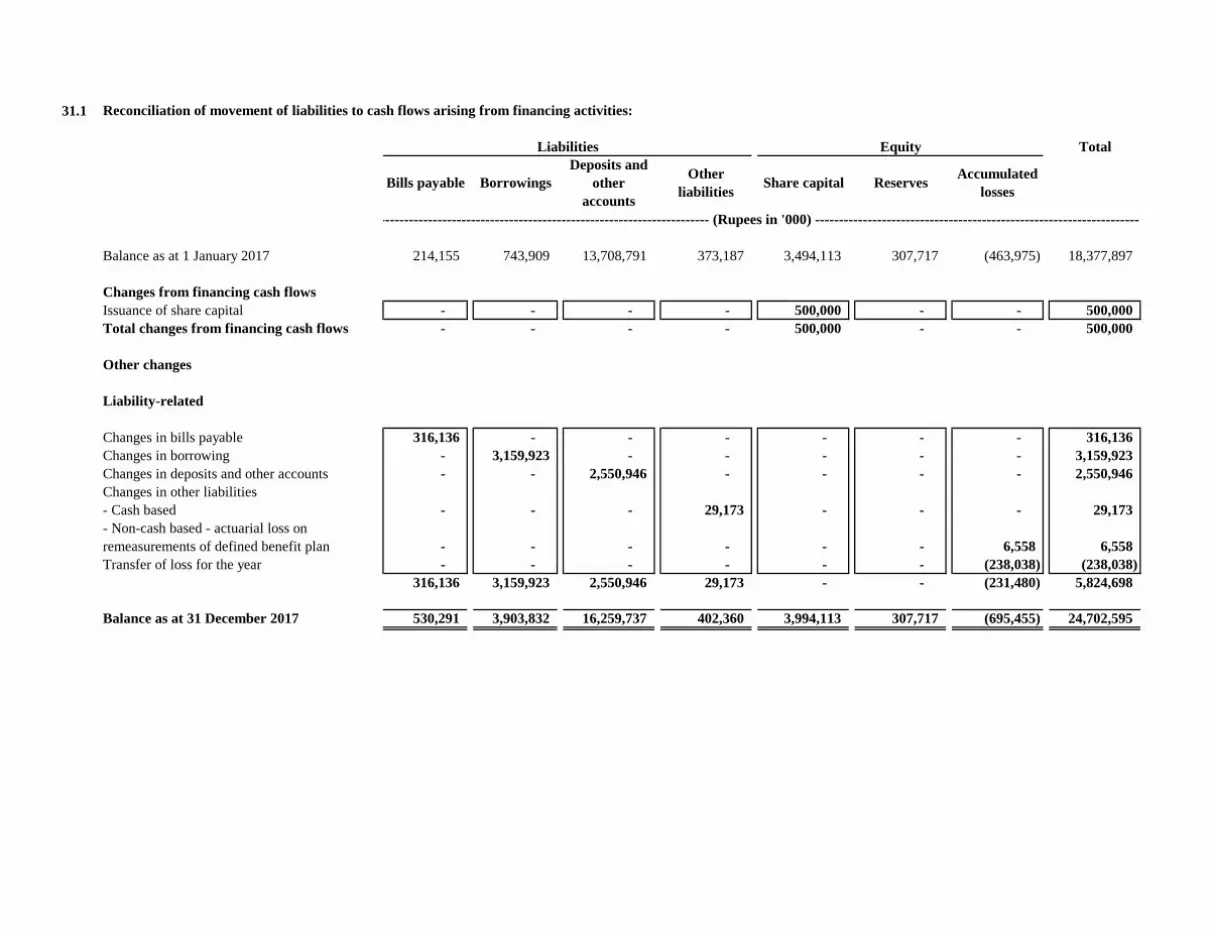
31.1 Reconciliation of movement of liabilities to cash flows arising from financing activities:
Total
Balance as at 1 January 2017 214,155 743,909 13,708,791 373,187 3,494,113 307,717 (463,975) 18,377,897
Changes from financing cash flows
Issuance of share capital - - - - 500,000 - - 500,000
Total changes from financing cash flows - - - - 500,000 - - 500,000
Other changes
Liability-related
Changes in bills payable 316,136 - - - - - - 316,136
Changes in borrowing - 3,159,923 - - - - - 3,159,923
Changes in deposits and other accounts - - 2,550,946 - - - - 2,550,946
Changes in other liabilities
- Cash based - - - 29,173 - - - 29,173
- Non-cash based - actuarial loss on
remeasurements of defined benefit plan - - - - - - 6,558 6,558
Transfer of loss for the year - - - - - - (238,038) (238,038)
316,136 3,159,923 2,550,946 29,173 - - (231,480) 5,824,698
Balance as at 31 December 2017 530,291 3,903,832 16,259,737 402,360 3,994,113 307,717 (695,455) 24,702,595
----------------------------------------------------------------------- (Rupees in '000) -----------------------------------------------------------------------
Liabilities Equity
Bills payable
Deposits and
other
accounts
Other
liabilitiesShare capital Reserves
Accumulated
lossesBorrowings
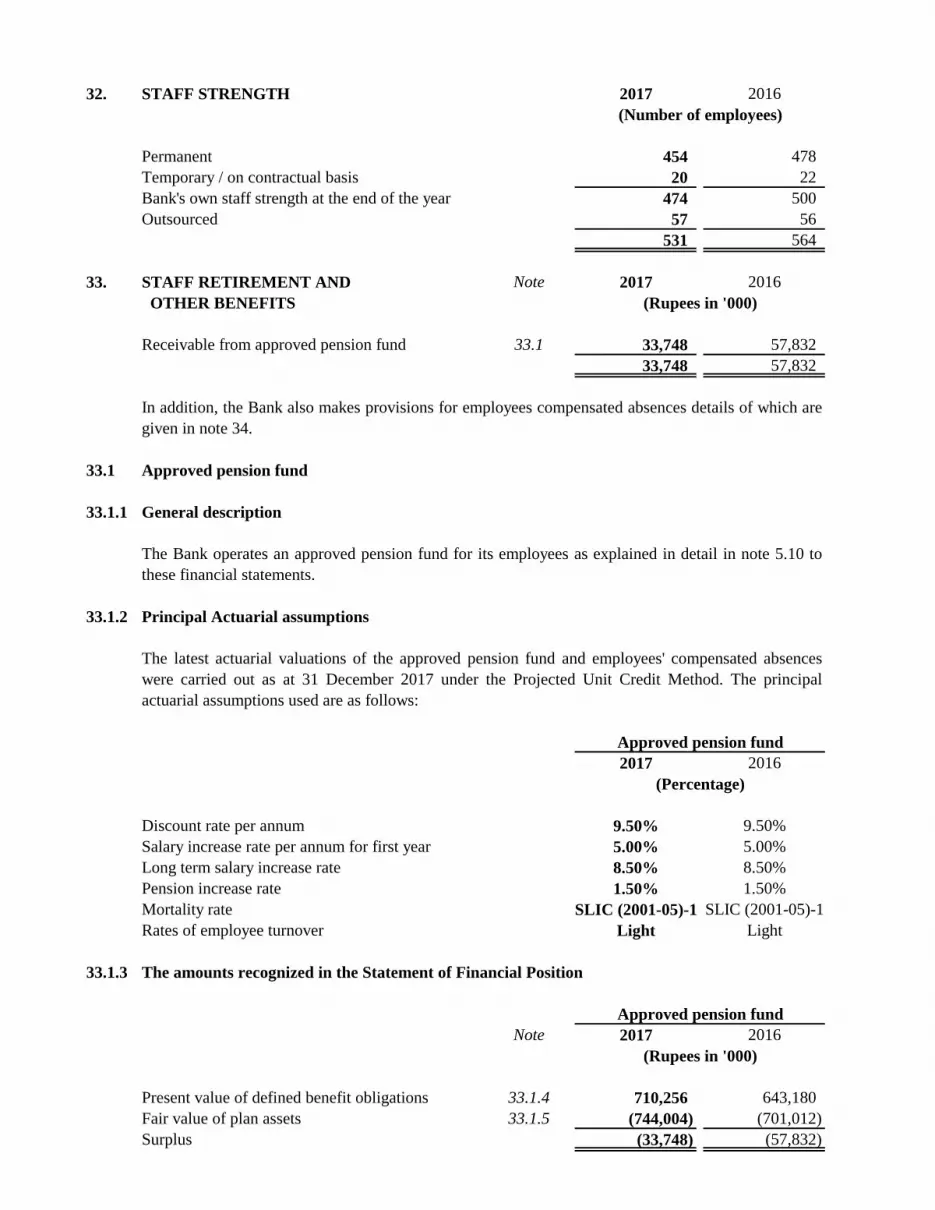
32. STAFF STRENGTH 2017 2016
Permanent 454 478
Temporary / on contractual basis 20 22
Bank's own staff strength at the end of the year 474 500
Outsourced 57 56
531 564
33. STAFF RETIREMENT AND Note 2017 2016
OTHER BENEFITS
Receivable from approved pension fund 33.1 33,748 57,832
33,748 57,832
33.1 Approved pension fund
33.1.1 General description
33.1.2 Principal Actuarial assumptions
2017 2016
Discount rate per annum 9.50% 9.50%
Salary increase rate per annum for first year 5.00% 5.00%
Long term salary increase rate 8.50% 8.50%
Pension increase rate 1.50% 1.50%
Mortality rate SLIC (2001-05)-1 SLIC (2001-05)-1
Rates of employee turnover Light Light
33.1.3 The amounts recognized in the Statement of Financial Position
Note 2017 2016
Present value of defined benefit obligations 33.1.4 710,256 643,180
Fair value of plan assets 33.1.5 (744,004) (701,012)
Surplus (33,748) (57,832)
(Rupees in '000)
(Number of employees)
Approved pension fund
Approved pension fund
(Percentage)
The Bank operates an approved pension fund for its employees as explained in detail in note 5.10 to
these financial statements.
In addition, the Bank also makes provisions for employees compensated absences details of which are
given in note 34.
The latest actuarial valuations of the approved pension fund and employees' compensated absences
were carried out as at 31 December 2017 under the Projected Unit Credit Method. The principal
actuarial assumptions used are as follows:
(Rupees in '000)
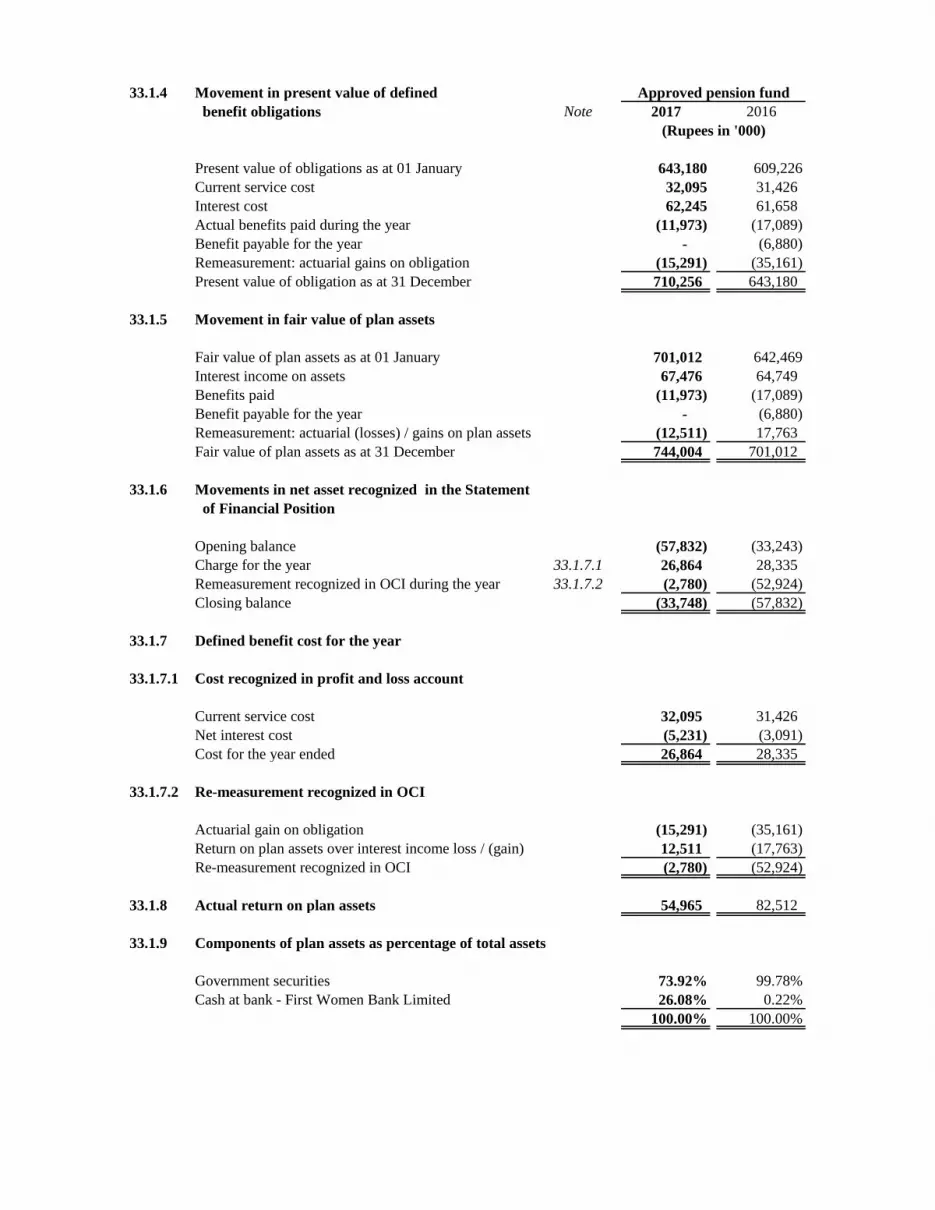
33.1.4 Movement in present value of defined
benefit obligations Note 2017 2016
Present value of obligations as at 01 January 643,180 609,226
Current service cost 32,095 31,426
Interest cost 62,245 61,658
Actual benefits paid during the year (11,973) (17,089)
Benefit payable for the year - (6,880)
Remeasurement: actuarial gains on obligation (15,291) (35,161)
Present value of obligation as at 31 December 710,256 643,180
33.1.5 Movement in fair value of plan assets
Fair value of plan assets as at 01 January 701,012 642,469
Interest income on assets 67,476 64,749
Benefits paid (11,973) (17,089)
Benefit payable for the year - (6,880)
Remeasurement: actuarial (losses) / gains on plan assets (12,511) 17,763
Fair value of plan assets as at 31 December 744,004 701,012
33.1.6 Movements in net asset recognized in the Statement
of Financial Position
Opening balance (57,832) (33,243)
Charge for the year 33.1.7.1 26,864 28,335
Remeasurement recognized in OCI during the year 33.1.7.2 (2,780) (52,924)
Closing balance (33,748) (57,832)
33.1.7 Defined benefit cost for the year
33.1.7.1 Cost recognized in profit and loss account
Current service cost 32,095 31,426
Net interest cost (5,231) (3,091)
Cost for the year ended 26,864 28,335
33.1.7.2 Re-measurement recognized in OCI
Actuarial gain on obligation (15,291) (35,161)
Return on plan assets over interest income loss / (gain) 12,511 (17,763)
Re-measurement recognized in OCI (2,780) (52,924)
33.1.8 Actual return on plan assets 54,965 82,512
33.1.9 Components of plan assets as percentage of total assets
Government securities 73.92% 99.78%
Cash at bank - First Women Bank Limited 26.08% 0.22%
100.00% 100.00%
Approved pension fund
(Rupees in '000)

33.1.10 Other relevant details of above funds are as follows:
33.1.10.1
33.1.10.2 Sensitivity analysis on significant actuarial assumptions: Pension Fund
2017 2016
Discount rate: +1% 629,107 566,693
Discount rate: -1% 807,393 735,128
Long term salary increase: +1% 773,788 704,465
Long term salary increase: -1% 653,312 588,557
Long term pension increase: +1% 740,350 670,580
Long term pension increase: -1% 683,943 619,223
33.1.10.3 Maturity profile of the defined benefit obligation 2017 2016
Weighted average duration of obligation in years 10.34 10.61
Distribution of timing of benefit payments (time in years)
1 12,196 7,486
2 12,061 15,807
3 26,841 15,048
4 17,753 29,274
5 47,715 16,761
6-10 484,647 348,297
11-15 892,380 945,336
16-20 - 853,817
20+ - 4,405,763
1,493,593 6,637,589
33.1.10.4 Total staff covered under the scheme at 31 December 2017 were 344 (2016: 371).
33.2 Unfunded gratuity scheme
34. EMPLOYEE COMPENSATED ABSENCES
(Rupees in '000)
The liability of the Bank in respect of employees compensated absences is determined based on
actuarial valuation carried out using Projected Unit Credit Method. The liability of the Bank as per
the latest actuarial valuation carried out as at 31 December 2017 amounted to Rs. 74.763 million
(2016: Rs. 60.989 million) which has been fully provided by the Bank. The charge for the year in
respect of these absences is Rs. 14.006 million (2016: Rs. 13.140 million) which is included in note
27 to these financial statements. Discount rate of 9.5% (2016: 9.5%) and salary increase of 5%
(2016: 5%) per annum have been used for the above valuation.
The Company operates an unfunded gratuity scheme for its President. The liability determined in
accordance with the terms of the Scheme as at 31 December 2017 was Rs. 7.028 million (2016: Rs
5.153 million). As the amount is not material in relation to the size of financial statements taken as a
whole, actuarial valuation has not been carried out.
The expected charge in respect of pension fund for the year ending 31 December 2018 is Rs. 2.120
million.
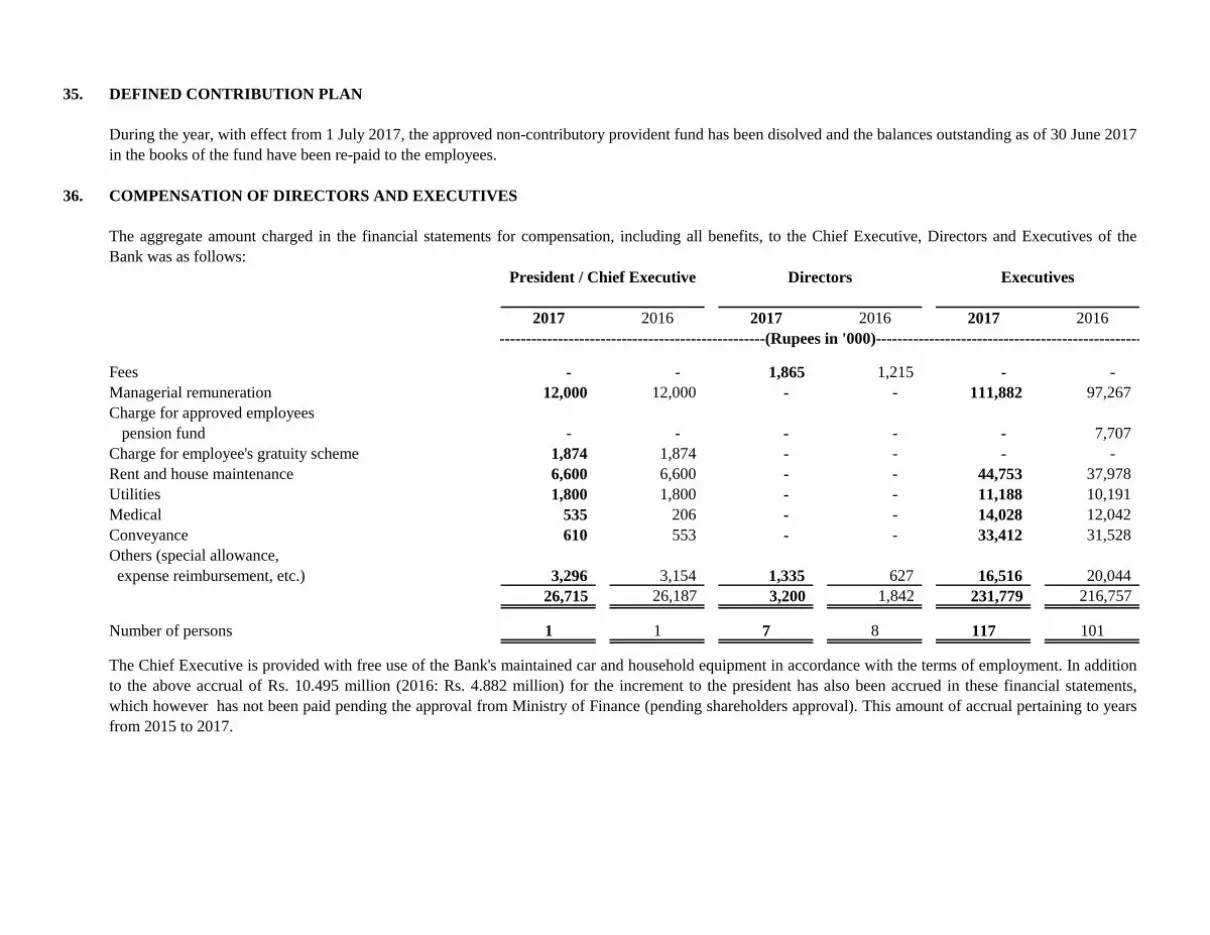
35. DEFINED CONTRIBUTION PLAN
36. COMPENSATION OF DIRECTORS AND EXECUTIVES
2017 2016 2017 2016 2017 2016
Fees - - 1,865 1,215 - -
Managerial remuneration 12,000 12,000 - - 111,882 97,267
Charge for approved employees
pension fund - - - - - 7,707
Charge for employee's gratuity scheme 1,874 1,874 - - - -
Rent and house maintenance 6,600 6,600 - - 44,753 37,978
Utilities 1,800 1,800 - - 11,188 10,191
Medical 535 206 - - 14,028 12,042
Conveyance 610 553 - - 33,412 31,528
Others (special allowance,
expense reimbursement, etc.) 3,296 3,154 1,335 627 16,516 20,044
26,715 26,187 3,200 1,842 231,779 216,757
Number of persons 1 1 7 8 117 101
DirectorsPresident / Chief Executive
--------------------------------------------------(Rupees in '000)--------------------------------------------------
Executives
The aggregate amount charged in the financial statements for compensation, including all benefits, to the Chief Executive, Directors and Executives of the
Bank was as follows:
During the year, with effect from 1 July 2017, the approved non-contributory provident fund has been disolved and the balances outstanding as of 30 June 2017
in the books of the fund have been re-paid to the employees.
The Chief Executive is provided with free use of the Bank's maintained car and household equipment in accordance with the terms of employment. In addition
to the above accrual of Rs. 10.495 million (2016: Rs. 4.882 million) for the increment to the president has also been accrued in these financial statements,
which however has not been paid pending the approval from Ministry of Finance (pending shareholders approval). This amount of accrual pertaining to years
from 2015 to 2017.
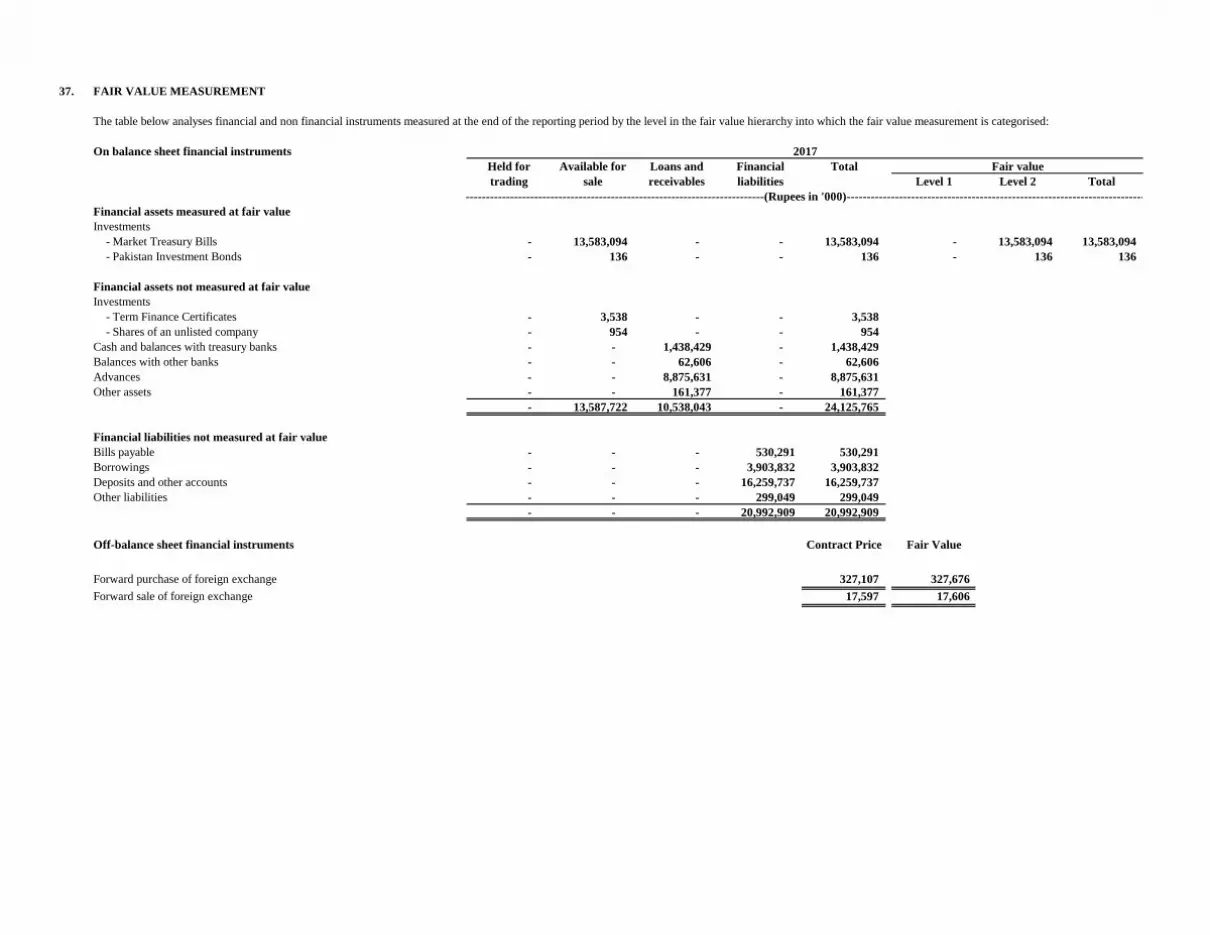
37. FAIR VALUE MEASUREMENT
The table below analyses financial and non financial instruments measured at the end of the reporting period by the level in the fair value hierarchy into which the fair value measurement is categorised:
On balance sheet financial instruments
Held for Available for Loans and Financial Total
trading sale receivables liabilities Level 1 Level 2 Total
Financial assets measured at fair value
Investments
- Market Treasury Bills - 13,583,094 - - 13,583,094 - 13,583,094 13,583,094
- Pakistan Investment Bonds - 136 - - 136 - 136 136
Financial assets not measured at fair value
Investments
- Term Finance Certificates - 3,538 - - 3,538
- Shares of an unlisted company - 954 - - 954
Cash and balances with treasury banks - - 1,438,429 - 1,438,429
Balances with other banks - - 62,606 - 62,606
Advances - - 8,875,631 - 8,875,631
Other assets - - 161,377 - 161,377
- 13,587,722 10,538,043 - 24,125,765
Financial liabilities not measured at fair value
Bills payable - - - 530,291 530,291
Borrowings - - - 3,903,832 3,903,832
Deposits and other accounts - - - 16,259,737 16,259,737
Other liabilities - - - 299,049 299,049
- - - 20,992,909 20,992,909
Off-balance sheet financial instruments Contract Price Fair Value
Forward purchase of foreign exchange 327,107 327,676
Forward sale of foreign exchange 17,597 17,606
2017
Fair value
-----------------------------------------------------------------------------------------------------------------(Rupees in '000)-----------------------------------------------------------------------------------------------------------------
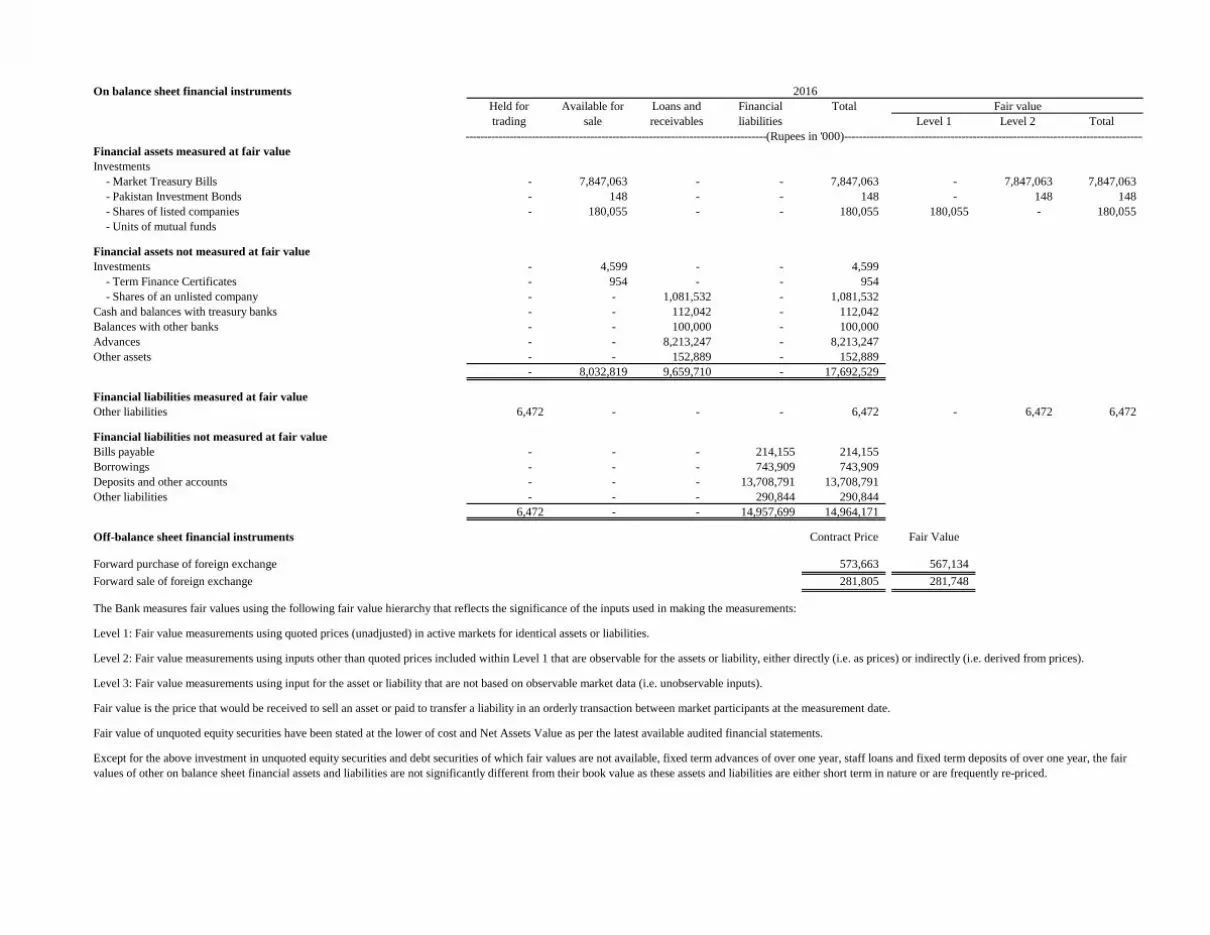
On balance sheet financial instruments
Held for Available for Loans and Financial Total
trading sale receivables liabilities Level 1 Level 2 Total
Financial assets measured at fair value
Investments
- Market Treasury Bills - 7,847,063 - - 7,847,063 - 7,847,063 7,847,063
- Pakistan Investment Bonds - 148 - - 148 - 148 148
- Shares of listed companies - 180,055 - - 180,055 180,055 - 180,055
- Units of mutual funds
Financial assets not measured at fair value
Investments - 4,599 - - 4,599
- Term Finance Certificates - 954 - - 954
- Shares of an unlisted company - - 1,081,532 - 1,081,532
Cash and balances with treasury banks - - 112,042 - 112,042
Balances with other banks - - 100,000 - 100,000
Advances - - 8,213,247 - 8,213,247
Other assets - - 152,889 - 152,889
- 8,032,819 9,659,710 - 17,692,529
Financial liabilities measured at fair value
Other liabilities 6,472 - - - 6,472 - 6,472 6,472
Financial liabilities not measured at fair value
Bills payable - - - 214,155 214,155
Borrowings - - - 743,909 743,909
Deposits and other accounts - - - 13,708,791 13,708,791
Other liabilities - - - 290,844 290,844
6,472 - - 14,957,699 14,964,171
Off-balance sheet financial instruments Contract Price Fair Value
Forward purchase of foreign exchange 573,663 567,134
Forward sale of foreign exchange 281,805 281,748
The Bank measures fair values using the following fair value hierarchy that reflects the significance of the inputs used in making the measurements:
Level 1: Fair value measurements using quoted prices (unadjusted) in active markets for identical assets or liabilities.
Level 2: Fair value measurements using inputs other than quoted prices included within Level 1 that are observable for the assets or liability, either directly (i.e. as prices) or indirectly (i.e. derived from prices).
Level 3: Fair value measurements using input for the asset or liability that are not based on observable market data (i.e. unobservable inputs).
Fair value is the price that would be received to sell an asset or paid to transfer a liability in an orderly transaction between market participants at the measurement date.
Fair value of unquoted equity securities have been stated at the lower of cost and Net Assets Value as per the latest available audited financial statements.
Except for the above investment in unquoted equity securities and debt securities of which fair values are not available, fixed term advances of over one year, staff loans and fixed term deposits of over one year, the fair
values of other on balance sheet financial assets and liabilities are not significantly different from their book value as these assets and liabilities are either short term in nature or are frequently re-priced.
-----------------------------------------------------------------------------------------------------------------(Rupees in '000)-----------------------------------------------------------------------------------------------------------------
2016
Fair value
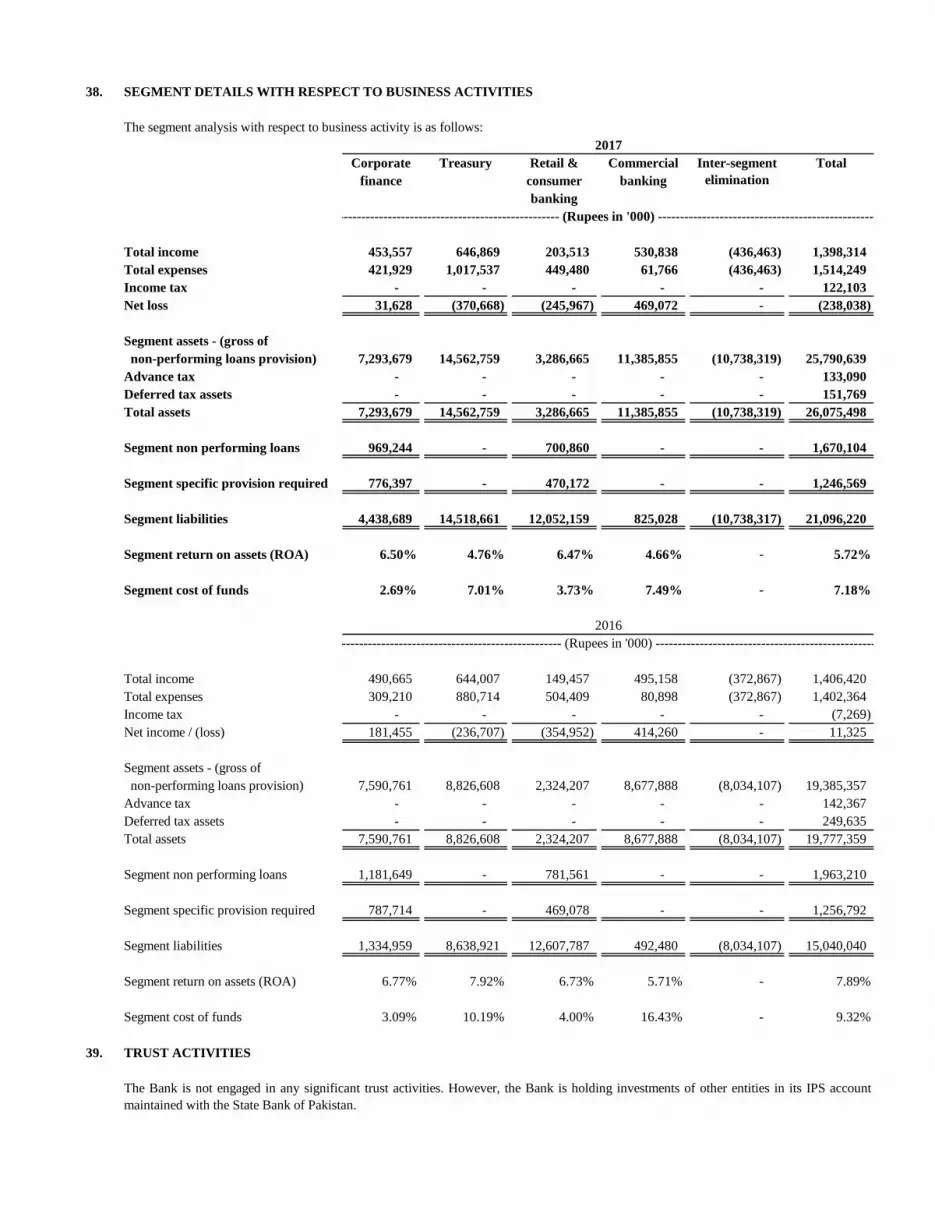
38. SEGMENT DETAILS WITH RESPECT TO BUSINESS ACTIVITIES
The segment analysis with respect to business activity is as follows:
Corporate Treasury Retail & Commercial Total
finance consumer banking
banking
Total income 453,557 646,869 203,513 530,838 (436,463) 1,398,314
Total expenses 421,929 1,017,537 449,480 61,766 (436,463) 1,514,249
Income tax - - - - - 122,103
Net loss 31,628 (370,668) (245,967) 469,072 - (238,038)
Segment assets - (gross of
non-performing loans provision) 7,293,679 14,562,759 3,286,665 11,385,855 (10,738,319) 25,790,639
Advance tax - - - - - 133,090
Deferred tax assets - - - - - 151,769
Total assets 7,293,679 14,562,759 3,286,665 11,385,855 (10,738,319) 26,075,498
Segment non performing loans 969,244 - 700,860 - - 1,670,104
Segment specific provision required 776,397 - 470,172 - - 1,246,569
Segment liabilities 4,438,689 14,518,661 12,052,159 825,028 (10,738,317) 21,096,220
Segment return on assets (ROA) 6.50% 4.76% 6.47% 4.66% - 5.72%
Segment cost of funds 2.69% 7.01% 3.73% 7.49% - 7.18%
Total income 490,665 644,007 149,457 495,158 (372,867) 1,406,420
Total expenses 309,210 880,714 504,409 80,898 (372,867) 1,402,364
Income tax - - - - - (7,269)
Net income / (loss) 181,455 (236,707) (354,952) 414,260 - 11,325
Segment assets - (gross of
non-performing loans provision) 7,590,761 8,826,608 2,324,207 8,677,888 (8,034,107) 19,385,357
Advance tax - - - - - 142,367
Deferred tax assets - - - - - 249,635
Total assets 7,590,761 8,826,608 2,324,207 8,677,888 (8,034,107) 19,777,359
Segment non performing loans 1,181,649 - 781,561 - - 1,963,210
Segment specific provision required 787,714 - 469,078 - - 1,256,792
Segment liabilities 1,334,959 8,638,921 12,607,787 492,480 (8,034,107) 15,040,040
Segment return on assets (ROA) 6.77% 7.92% 6.73% 5.71% - 7.89%
Segment cost of funds 3.09% 10.19% 4.00% 16.43% - 9.32%
39. TRUST ACTIVITIES
The Bank is not engaged in any significant trust activities. However, the Bank is holding investments of other entities in its IPS account
maintained with the State Bank of Pakistan.
2017
2016
Inter-segment
elimination
-------------------------------------------------- (Rupees in '000) --------------------------------------------------
-------------------------------------------------- (Rupees in '000) --------------------------------------------------
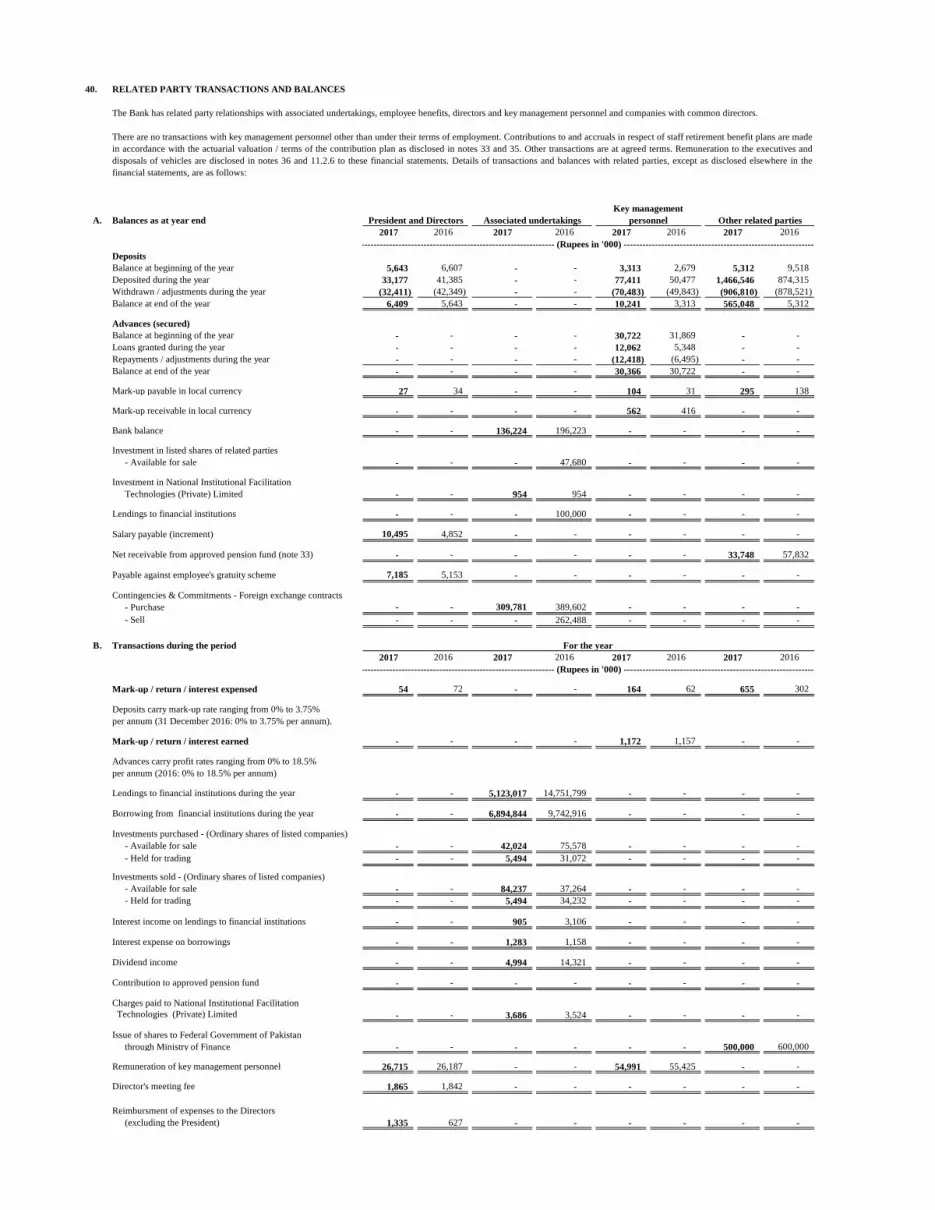
40. RELATED PARTY TRANSACTIONS AND BALANCES
A. Balances as at year end
2017 2016 2017 2016 2017 2016 2017 2016
Deposits
Balance at beginning of the year 5,643 6,607 - - 3,313 2,679 5,312 9,518
Deposited during the year 33,177 41,385 - - 77,411 50,477 1,466,546 874,315
Withdrawn / adjustments during the year (32,411) (42,349) - - (70,483) (49,843) (906,810) (878,521)
Balance at end of the year 6,409 5,643 - - 10,241 3,313 565,048 5,312
Advances (secured)
Balance at beginning of the year - - - - 30,722 31,869 - -
Loans granted during the year - - - - 12,062 5,348 - -
Repayments / adjustments during the year - - - - (12,418) (6,495) - -
Balance at end of the year - - - - 30,366 30,722 - -
Mark-up payable in local currency 27 34 - - 104 31 295 138
Mark-up receivable in local currency - - - - 562 416 - -
Bank balance - - 136,224 196,223 - - - -
Investment in listed shares of related parties
- Available for sale - - - 47,680 - - - -
Investment in National Institutional Facilitation
Technologies (Private) Limited - - 954 954 - - - -
Lendings to financial institutions - - - 100,000 - - - -
Salary payable (increment) 10,495 4,852 - - - - - -
Net receivable from approved pension fund (note 33) - - - - - - 33,748 57,832
Payable against employee's gratuity scheme 7,185 5,153 - - - - - -
Contingencies & Commitments - Foreign exchange contracts
- Purchase - - 309,781 389,602 - - - -
- Sell - - - 262,488 - - - -
B. Transactions during the period
2017 2016 2017 2016 2017 2016 2017 2016
Mark-up / return / interest expensed 54 72 - - 164 62 655 302
Deposits carry mark-up rate ranging from 0% to 3.75%
per annum (31 December 2016: 0% to 3.75% per annum).
Mark-up / return / interest earned - - - - 1,172 1,157 - -
Advances carry profit rates ranging from 0% to 18.5%
per annum (2016: 0% to 18.5% per annum)
Lendings to financial institutions during the year - - 5,123,017 14,751,799 - - - -
Borrowing from financial institutions during the year - - 6,894,844 9,742,916 - - - -
Investments purchased - (Ordinary shares of listed companies)
- Available for sale - - 42,024 75,578 - - - -
- Held for trading - - 5,494 31,072 - - - -
Investments sold - (Ordinary shares of listed companies)
- Available for sale - - 84,237 37,264 - - - -
- Held for trading - - 5,494 34,232 - - - -
Interest income on lendings to financial institutions - - 905 3,106 - - - -
Interest expense on borrowings - - 1,283 1,158 - - - -
Dividend income - - 4,994 14,321 - - - -
Contribution to approved pension fund - - - - - - - -
Charges paid to National Institutional Facilitation
Technologies (Private) Limited - - 3,686 3,524 - - - -
Issue of shares to Federal Government of Pakistan
through Ministry of Finance - - - - - - 500,000 600,000
Remuneration of key management personnel 26,715 26,187 - - 54,991 55,425 - -
Director's meeting fee 1,865 1,842 - - - - - -
Reimbursment of expenses to the Directors
(excluding the President) 1,335 627 - - - - - -
-------------------------------------------------------------- (Rupees in '000) --------------------------------------------------------------
-------------------------------------------------------------- (Rupees in '000) --------------------------------------------------------------
For the year
Key management
personnel
The Bank has related party relationships with associated undertakings, employee benefits, directors and key management personnel and companies with common directors.
There are no transactions with key management personnel other than under their terms of employment. Contributions to and accruals in respect of staff retirement benefit plans are made
in accordance with the actuarial valuation / terms of the contribution plan as disclosed in notes 33 and 35. Other transactions are at agreed terms. Remuneration to the executives and
disposals of vehicles are disclosed in notes 36 and 11.2.6 to these financial statements. Details of transactions and balances with related parties, except as disclosed elsewhere in the
financial statements, are as follows:
President and Directors Other related partiesAssociated undertakings
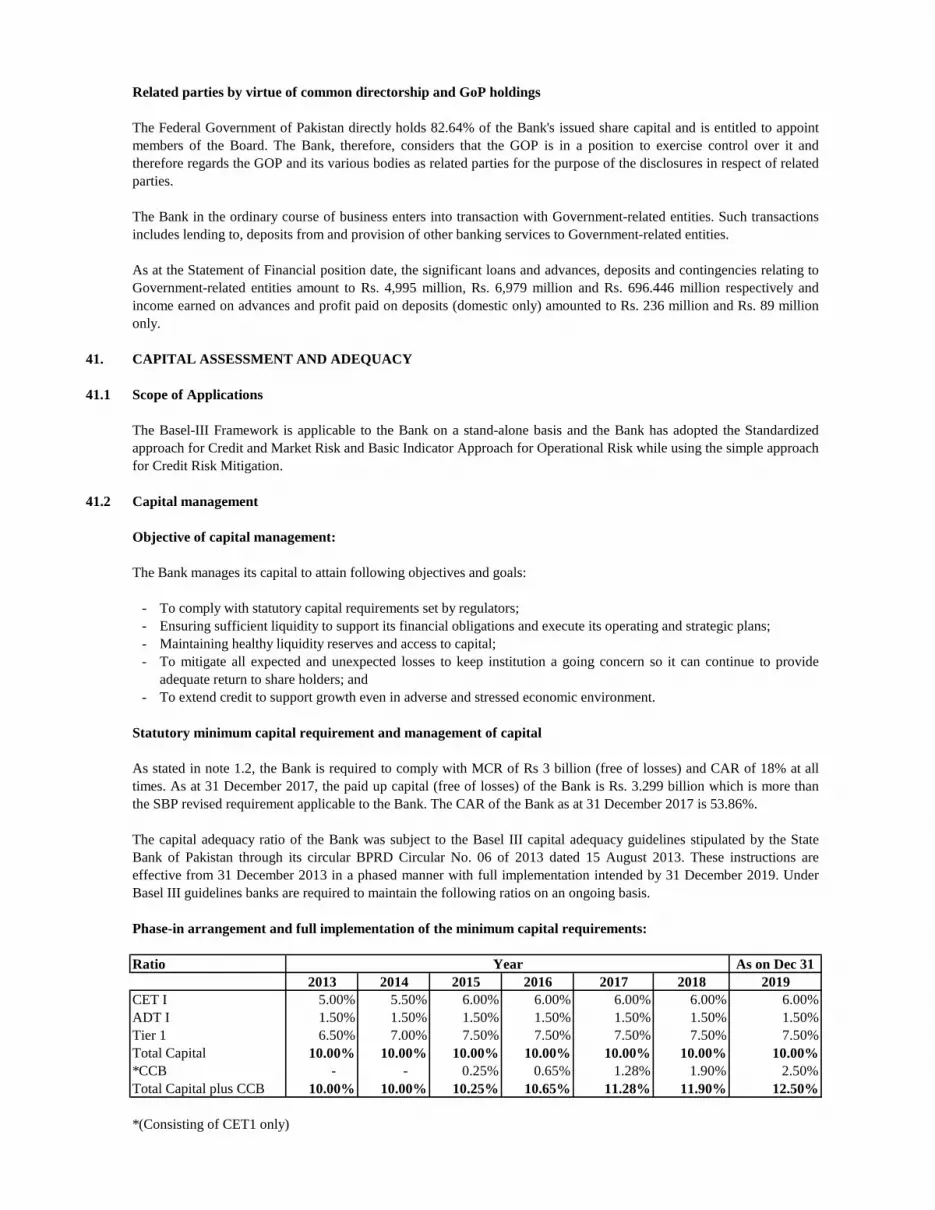
Related parties by virtue of common directorship and GoP holdings
41. CAPITAL ASSESSMENT AND ADEQUACY
41.1 Scope of Applications
41.2 Capital management
Objective of capital management:
The Bank manages its capital to attain following objectives and goals:
- To comply with statutory capital requirements set by regulators;
- Ensuring sufficient liquidity to support its financial obligations and execute its operating and strategic plans;
- Maintaining healthy liquidity reserves and access to capital;
-
- To extend credit to support growth even in adverse and stressed economic environment.
Statutory minimum capital requirement and management of capital
Phase-in arrangement and full implementation of the minimum capital requirements:
Ratio As on Dec 31
2013 2014 2015 2016 2017 2018 2019
5.00% 5.50% 6.00% 6.00% 6.00% 6.00% 6.00%
ADT I 1.50% 1.50% 1.50% 1.50% 1.50% 1.50% 1.50%
Tier 1 6.50% 7.00% 7.50% 7.50% 7.50% 7.50% 7.50%
Total Capital 10.00% 10.00% 10.00% 10.00% 10.00% 10.00% 10.00%
*CCB - - 0.25% 0.65% 1.28% 1.90% 2.50%
Total Capital plus CCB 10.00% 10.00% 10.25% 10.65% 11.28% 11.90% 12.50%
The Basel-III Framework is applicable to the Bank on a stand-alone basis and the Bank has adopted the Standardized
approach for Credit and Market Risk and Basic Indicator Approach for Operational Risk while using the simple approach
for Credit Risk Mitigation.
The Federal Government of Pakistan directly holds 82.64% of the Bank's issued share capital and is entitled to appoint
members of the Board. The Bank, therefore, considers that the GOP is in a position to exercise control over it and
therefore regards the GOP and its various bodies as related parties for the purpose of the disclosures in respect of related
parties.
The Bank in the ordinary course of business enters into transaction with Government-related entities. Such transactions
includes lending to, deposits from and provision of other banking services to Government-related entities.
As at the Statement of Financial position date, the significant loans and advances, deposits and contingencies relating to
Government-related entities amount to Rs. 4,995 million, Rs. 6,979 million and Rs. 696.446 million respectively and
income earned on advances and profit paid on deposits (domestic only) amounted to Rs. 236 million and Rs. 89 million
only.
To mitigate all expected and unexpected losses to keep institution a going concern so it can continue to provide
adequate return to share holders; and
CET I
*(Consisting of CET1 only)
As stated in note 1.2, the Bank is required to comply with MCR of Rs 3 billion (free of losses) and CAR of 18% at all
times. As at 31 December 2017, the paid up capital (free of losses) of the Bank is Rs. 3.299 billion which is more than
the SBP revised requirement applicable to the Bank. The CAR of the Bank as at 31 December 2017 is 53.86%.
The capital adequacy ratio of the Bank was subject to the Basel III capital adequacy guidelines stipulated by the State
Bank of Pakistan through its circular BPRD Circular No. 06 of 2013 dated 15 August 2013. These instructions are
effective from 31 December 2013 in a phased manner with full implementation intended by 31 December 2019. Under
Basel III guidelines banks are required to maintain the following ratios on an ongoing basis.
Year
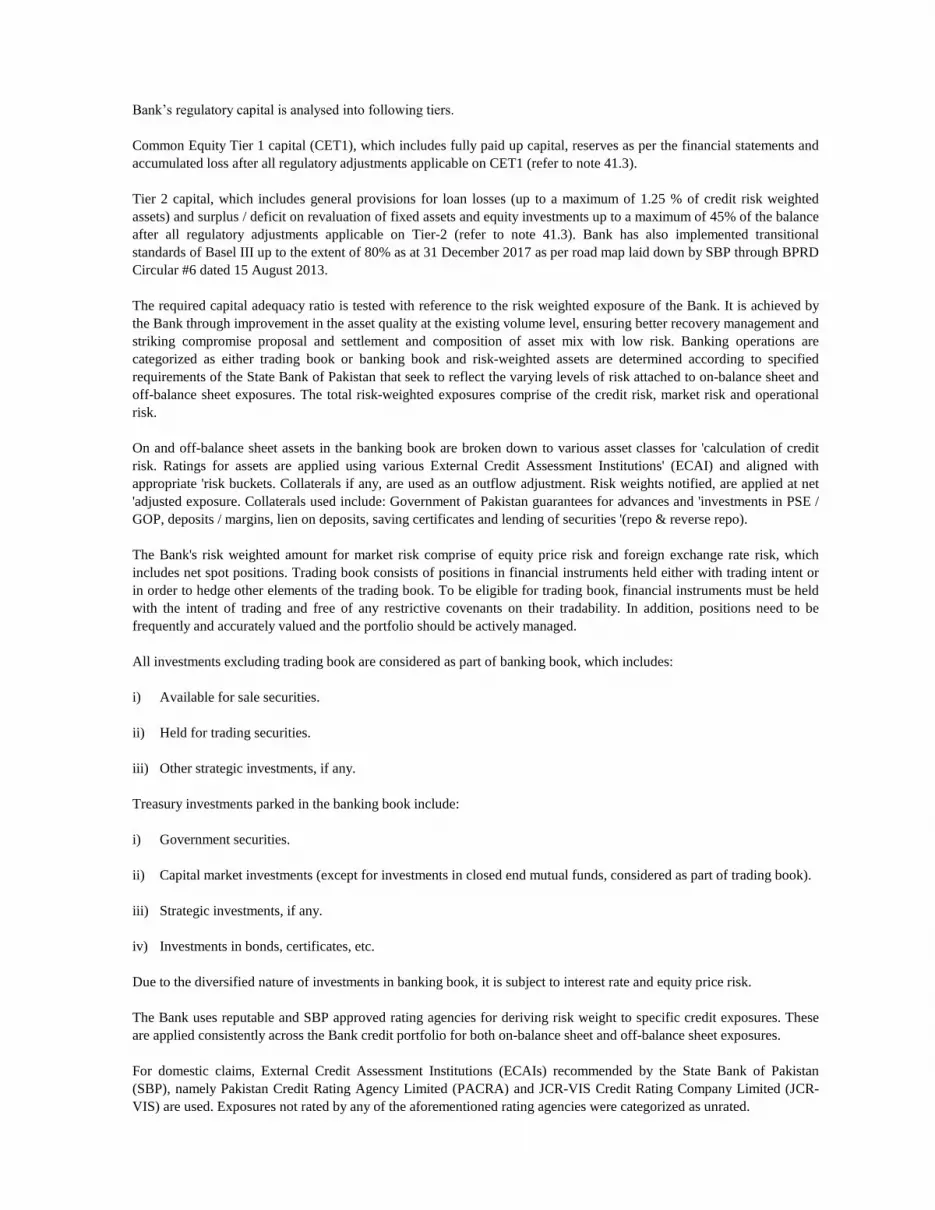
Bank‟s regulatory capital is analysed into following tiers.
All investments excluding trading book are considered as part of banking book, which includes:
i) Available for sale securities.
ii) Held for trading securities.
iii) Other strategic investments, if any.
Treasury investments parked in the banking book include:
i) Government securities.
ii) Capital market investments (except for investments in closed end mutual funds, considered as part of trading book).
iii) Strategic investments, if any.
iv) Investments in bonds, certificates, etc.
Due to the diversified nature of investments in banking book, it is subject to interest rate and equity price risk.
On and off-balance sheet assets in the banking book are broken down to various asset classes for 'calculation of credit
risk. Ratings for assets are applied using various External Credit Assessment Institutions' (ECAI) and aligned with
appropriate 'risk buckets. Collaterals if any, are used as an outflow adjustment. Risk weights notified, are applied at net
'adjusted exposure. Collaterals used include: Government of Pakistan guarantees for advances and 'investments in PSE /
GOP, deposits / margins, lien on deposits, saving certificates and lending of securities '(repo & reverse repo).
The Bank's risk weighted amount for market risk comprise of equity price risk and foreign exchange rate risk, which
includes net spot positions. Trading book consists of positions in financial instruments held either with trading intent or
in order to hedge other elements of the trading book. To be eligible for trading book, financial instruments must be held
with the intent of trading and free of any restrictive covenants on their tradability. In addition, positions need to be
frequently and accurately valued and the portfolio should be actively managed.
The Bank uses reputable and SBP approved rating agencies for deriving risk weight to specific credit exposures. These
are applied consistently across the Bank credit portfolio for both on-balance sheet and off-balance sheet exposures.
For domestic claims, External Credit Assessment Institutions (ECAIs) recommended by the State Bank of Pakistan
(SBP), namely Pakistan Credit Rating Agency Limited (PACRA) and JCR-VIS Credit Rating Company Limited (JCR-
VIS) are used. Exposures not rated by any of the aforementioned rating agencies were categorized as unrated.
The required capital adequacy ratio is tested with reference to the risk weighted exposure of the Bank. It is achieved by
the Bank through improvement in the asset quality at the existing volume level, ensuring better recovery management and
striking compromise proposal and settlement and composition of asset mix with low risk. Banking operations are
categorized as either trading book or banking book and risk-weighted assets are determined according to specified
requirements of the State Bank of Pakistan that seek to reflect the varying levels of risk attached to on-balance sheet and
off-balance sheet exposures. The total risk-weighted exposures comprise of the credit risk, market risk and operational
risk.
Common Equity Tier 1 capital (CET1), which includes fully paid up capital, reserves as per the financial statements and
accumulated loss after all regulatory adjustments applicable on CET1 (refer to note 41.3).
Tier 2 capital, which includes general provisions for loan losses (up to a maximum of 1.25 % of credit risk weighted
assets) and surplus / deficit on revaluation of fixed assets and equity investments up to a maximum of 45% of the balance
after all regulatory adjustments applicable on Tier-2 (refer to note 41.3). Bank has also implemented transitional
standards of Basel III up to the extent of 80% as at 31 December 2017 as per road map laid down by SBP through BPRD
Circular #6 dated 15 August 2013.
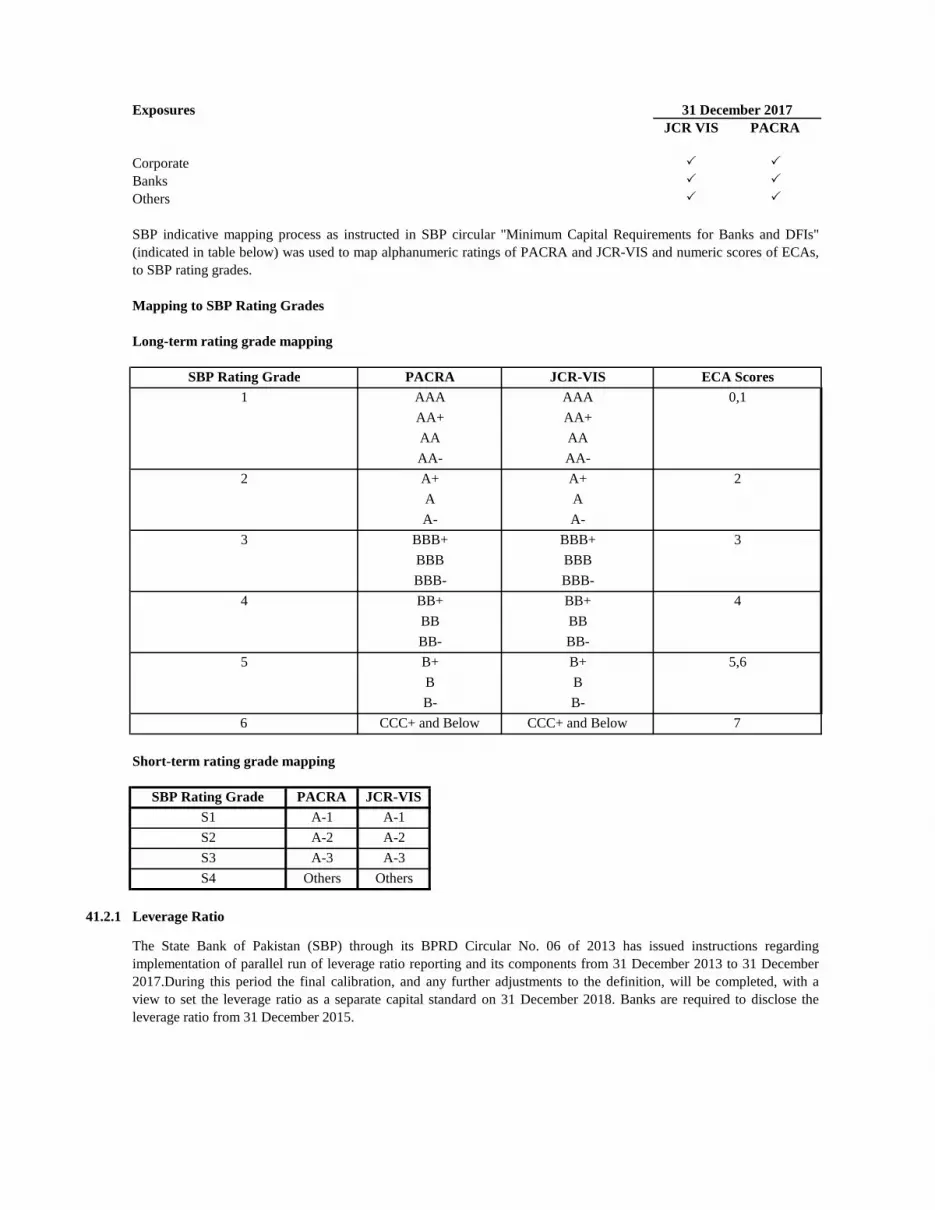
JCR VIS PACRA
Corporate P P
Banks P P
Others P P
Mapping to SBP Rating Grades
Long-term rating grade mapping
Short-term rating grade mapping
PACRA JCR-VIS
A-1 A-1
A-2 A-2
A-3 A-3
Others Others
41.2.1 Leverage Ratio
The State Bank of Pakistan (SBP) through its BPRD Circular No. 06 of 2013 has issued instructions regarding
implementation of parallel run of leverage ratio reporting and its components from 31 December 2013 to 31 December
2017.During this period the final calibration, and any further adjustments to the definition, will be completed, with a
view to set the leverage ratio as a separate capital standard on 31 December 2018. Banks are required to disclose the
leverage ratio from 31 December 2015.
5 B+ B+
S3
S4
S1
5,6
B B
B- B-
S2
4 BB+ BB+ 4
BB BB
BB- BB-
6 CCC+ and Below CCC+ and Below 7
SBP Rating Grade
3 BBB+ BBB+ 3
BBB BBB
BBB- BBB-
2 A+ A+ 2
A A
A- A-
1 AAA AAA 0,1
AA+ AA+
AA AA
AA- AA-
SBP indicative mapping process as instructed in SBP circular "Minimum Capital Requirements for Banks and DFIs"
(indicated in table below) was used to map alphanumeric ratings of PACRA and JCR-VIS and numeric scores of ECAs,
to SBP rating grades.
SBP Rating Grade PACRA JCR-VIS ECA Scores
Exposures 31 December 2017

Leverage Ratio = Tier 1 capital (after related deductions)
Total Exposure
2017 2016
On-Balance Sheet Assets
Cash and balances with treasury banks 1,438,429 1,081,532
Balances with other banks 62,606 112,042
Lendings to financial institutions - 100,000
Investments (including assets held for sale) 13,587,722 8,032,819
Advances 8,875,631 8,213,247
Operating fixed assets 323,546 337,077
Deferred tax assets 151,769 249,635
Other assets 389,228 394,212
Total Assets (A) 24,828,931 18,520,564
Derivatives (On-Balance Sheet)
Interest Rate - -
Equity - -
Foreign Exchange & gold - -
Precious Metals (except gold) - -
Commodities - -
Credit Derivatives (protection brought & sold) - -
Any other derivatives - -
Total Derivatives (A.1) - -
Off-Balance Sheet Items excluding derivatives
- 23,634
Performance-related Contingent Liabilities (i.e. Guarantees) 753,784 1,078,196
Trade-related Contingent Liabilities (i.e. Letter of Credits) 148,000 314,837
Lending of securities or posting of securities as collaterals - 598,070
Undrawn committed facilities (which are not cancellable) 1,678,476 972,348
Unconditionally cancellable commitments -
Commitments in respect of operating leases -
Commitments for the acquisition of operating fixed assets 8,897 7,617
Other commitments - -
Total Off-Balance Sheet Items excluding Derivatives (B) 2,589,157 2,994,702
Commitments in respect of Derivatives - Off Balance Sheet Items
(Derivatives having negative fair value are also included)
Interest Rate - -
Equity - -
Foreign Exchange & gold 3,271 8,306
Precious Metals (except gold) - -
Commodities - -
Credit Derivatives (protection sold and bought) - -
Other derivatives - -
Total Derivatives (C) 3,271 8,306
Tier-1 Capital 3,487,724 3,158,233
Total Exposures (sum of A,B and C) 27,421,359 21,523,571
Leverage Ratio 12.72% 14.67%
Direct Credit Substitutes (i.e.
The Basel III leverage ratio is defined as the capital measure (the numerator) divided by the exposure measure (the
denominator), with this ratio expressed as a percentage:
As at 31 December 2017, Bank‟s Leverage ratio stood at 12.72% which is above the minimum requirement of 3.0%.
---(Rupees in '000)--
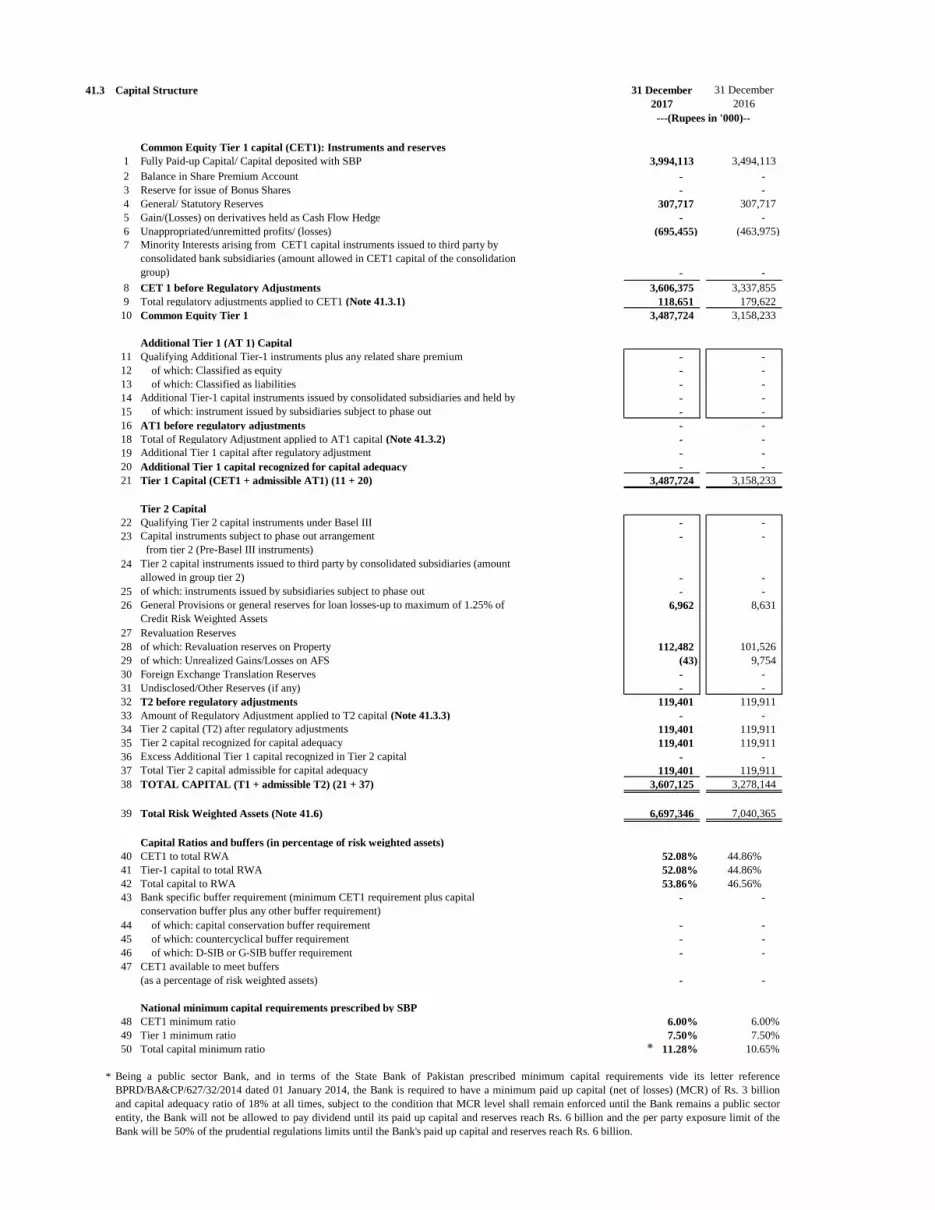
41.3 Capital Structure 31 December
2017
31 December
2016
Common Equity Tier 1 capital (CET1): Instruments and reserves
1 Fully Paid-up Capital/ Capital deposited with SBP 3,994,113 3,494,113
2 Balance in Share Premium Account - -
3 Reserve for issue of Bonus Shares - -
4 General/ Statutory Reserves 307,717 307,717
5 Gain/(Losses) on derivatives held as Cash Flow Hedge - -
6 Unappropriated/unremitted profits/ (losses) (695,455) (463,975)
7
- -
8 CET 1 before Regulatory Adjustments 3,606,375 3,337,855
9 Total regulatory adjustments applied to CET1 (Note 41.3.1) 118,651 179,622
10 Common Equity Tier 1 3,487,724 3,158,233
Additional Tier 1 (AT 1) Capital
11 Qualifying Additional Tier-1 instruments plus any related share premium - -
12 of which: Classified as equity - -
13 of which: Classified as liabilities - -
14 Additional Tier-1 capital instruments issued by consolidated subsidiaries and held by - -
15 of which: instrument issued by subsidiaries subject to phase out - -
16 AT1 before regulatory adjustments - -
18 Total of Regulatory Adjustment applied to AT1 capital (Note 41.3.2) - -
19 Additional Tier 1 capital after regulatory adjustment - -
20 Additional Tier 1 capital recognized for capital adequacy - -
21 Tier 1 Capital (CET1 + admissible AT1) (11 + 20) 3,487,724 3,158,233
Tier 2 Capital
22 Qualifying Tier 2 capital instruments under Basel III - -
23 Capital instruments subject to phase out arrangement
from tier 2 (Pre-Basel III instruments)
- -
24
- -
25 of which: instruments issued by subsidiaries subject to phase out - -
26 General Provisions or general reserves for loan losses-up to maximum of 1.25% of
Credit Risk Weighted Assets
6,962 8,631
27 Revaluation Reserves
28 of which: Revaluation reserves on Property 112,482 101,526
29 of which: Unrealized Gains/Losses on AFS (43) 9,754
30 Foreign Exchange Translation Reserves - -
31 Undisclosed/Other Reserves (if any) - -
32 T2 before regulatory adjustments 119,401 119,911
33 Amount of Regulatory Adjustment applied to T2 capital (Note 41.3.3) - -
34 Tier 2 capital (T2) after regulatory adjustments 119,401 119,911
35 Tier 2 capital recognized for capital adequacy 119,401 119,911
36 Excess Additional Tier 1 capital recognized in Tier 2 capital - -
37 Total Tier 2 capital admissible for capital adequacy 119,401 119,911
38 TOTAL CAPITAL (T1 + admissible T2) (21 + 37) 3,607,125 3,278,144
39 Total Risk Weighted Assets (Note 41.6) 6,697,346 7,040,365
Capital Ratios and buffers (in percentage of risk weighted assets)
40 CET1 to total RWA 52.08% 44.86%
41 Tier-1 capital to total RWA 52.08% 44.86%
42 Total capital to RWA 53.86% 46.56%
43 Bank specific buffer requirement (minimum CET1 requirement plus capital
conservation buffer plus any other buffer requirement)
- -
44 of which: capital conservation buffer requirement - -
45 of which: countercyclical buffer requirement - -
46 of which: D-SIB or G-SIB buffer requirement - -
47 CET1 available to meet buffers
(as a percentage of risk weighted assets) - -
National minimum capital requirements prescribed by SBP
48 CET1 minimum ratio 6.00% 6.00%
49 Tier 1 minimum ratio 7.50% 7.50%
50 Total capital minimum ratio 11.28% 10.65%
*
---(Rupees in '000)--
Minority Interests arising from CET1 capital instruments issued to third party by
consolidated bank subsidiaries (amount allowed in CET1 capital of the consolidation
group)
Tier 2 capital instruments issued to third party by consolidated subsidiaries (amount
allowed in group tier 2)
Being a public sector Bank, and in terms of the State Bank of Pakistan prescribed minimum capital requirements vide its letter reference
BPRD/BA&CP/627/32/2014 dated 01 January 2014, the Bank is required to have a minimum paid up capital (net of losses) (MCR) of Rs. 3 billion
and capital adequacy ratio of 18% at all times, subject to the condition that MCR level shall remain enforced until the Bank remains a public sector
entity, the Bank will not be allowed to pay dividend until its paid up capital and reserves reach Rs. 6 billion and the per party exposure limit of the
Bank will be 50% of the prudential regulations limits until the Bank's paid up capital and reserves reach Rs. 6 billion.
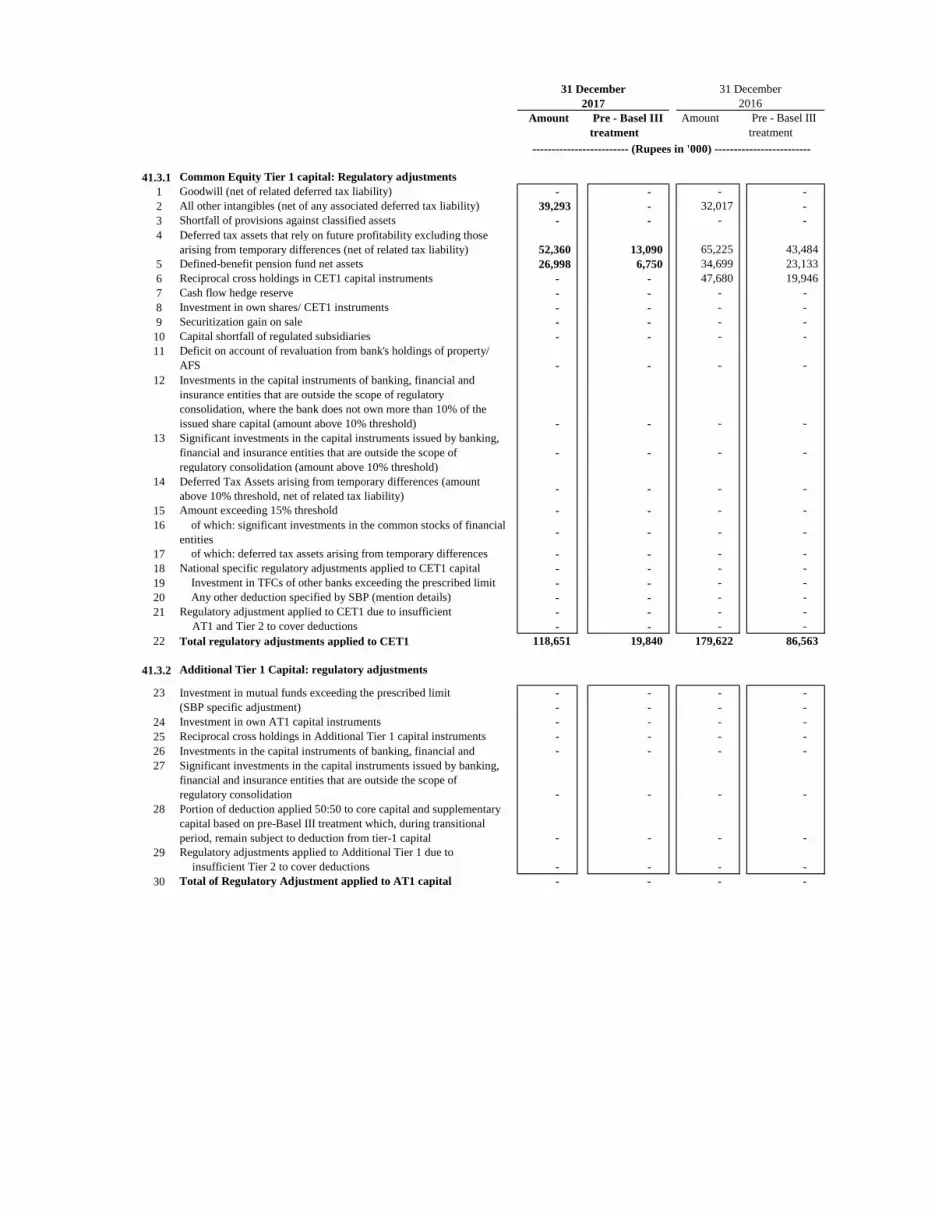
Amount Pre - Basel III
treatment
Amount Pre - Basel III
treatment
41.3.1 Common Equity Tier 1 capital: Regulatory adjustments
1 Goodwill (net of related deferred tax liability) - - - -
2 All other intangibles (net of any associated deferred tax liability) 39,293 - 32,017 -
3 Shortfall of provisions against classified assets - - - -
4 Deferred tax assets that rely on future profitability excluding those
arising from temporary differences (net of related tax liability) 52,360 13,090 65,225 43,484
5 Defined-benefit pension fund net assets 26,998 6,750 34,699 23,133
6 Reciprocal cross holdings in CET1 capital instruments - - 47,680 19,946
7 Cash flow hedge reserve - - - -
8 Investment in own shares/ CET1 instruments - - - -
9 Securitization gain on sale - - - -
10 Capital shortfall of regulated subsidiaries - - - -
11
- - - -
12
- - - -
13 Significant investments in the capital instruments issued by banking,
financial and insurance entities that are outside the scope of
regulatory consolidation (amount above 10% threshold)
- - - -
14 Deferred Tax Assets arising from temporary differences (amount
above 10% threshold, net of related tax liability)- - - -
15 Amount exceeding 15% threshold - - - -
16 of which: significant investments in the common stocks of financial
entities- - - -
17 of which: deferred tax assets arising from temporary differences - - - -
18 National specific regulatory adjustments applied to CET1 capital - - - -
19 Investment in TFCs of other banks exceeding the prescribed limit - - - -
20 Any other deduction specified by SBP (mention details) - - - -
21 Regulatory adjustment applied to CET1 due to insufficient - - - -
AT1 and Tier 2 to cover deductions - - - -
22 Total regulatory adjustments applied to CET1 118,651 19,840 179,622 86,563
41.3.2 Additional Tier 1 Capital: regulatory adjustments
23 Investment in mutual funds exceeding the prescribed limit - - - -
(SBP specific adjustment) - - - -
24 Investment in own AT1 capital instruments - - - -
25 Reciprocal cross holdings in Additional Tier 1 capital instruments - - - -
26 Investments in the capital instruments of banking, financial and - - - -
27
- - - -
28
- - - -
29 Regulatory adjustments applied to Additional Tier 1 due to
insufficient Tier 2 to cover deductions - - - -
30 Total of Regulatory Adjustment applied to AT1 capital - - - -
31 December
2016
31 December
2017
------------------------- (Rupees in '000) -------------------------
Investments in the capital instruments of banking, financial and
insurance entities that are outside the scope of regulatory
consolidation, where the bank does not own more than 10% of the
issued share capital (amount above 10% threshold)
Deficit on account of revaluation from bank's holdings of property/
AFS
Portion of deduction applied 50:50 to core capital and supplementary
capital based on pre-Basel III treatment which, during transitional
period, remain subject to deduction from tier-1 capital
Significant investments in the capital instruments issued by banking,
financial and insurance entities that are outside the scope of
regulatory consolidation
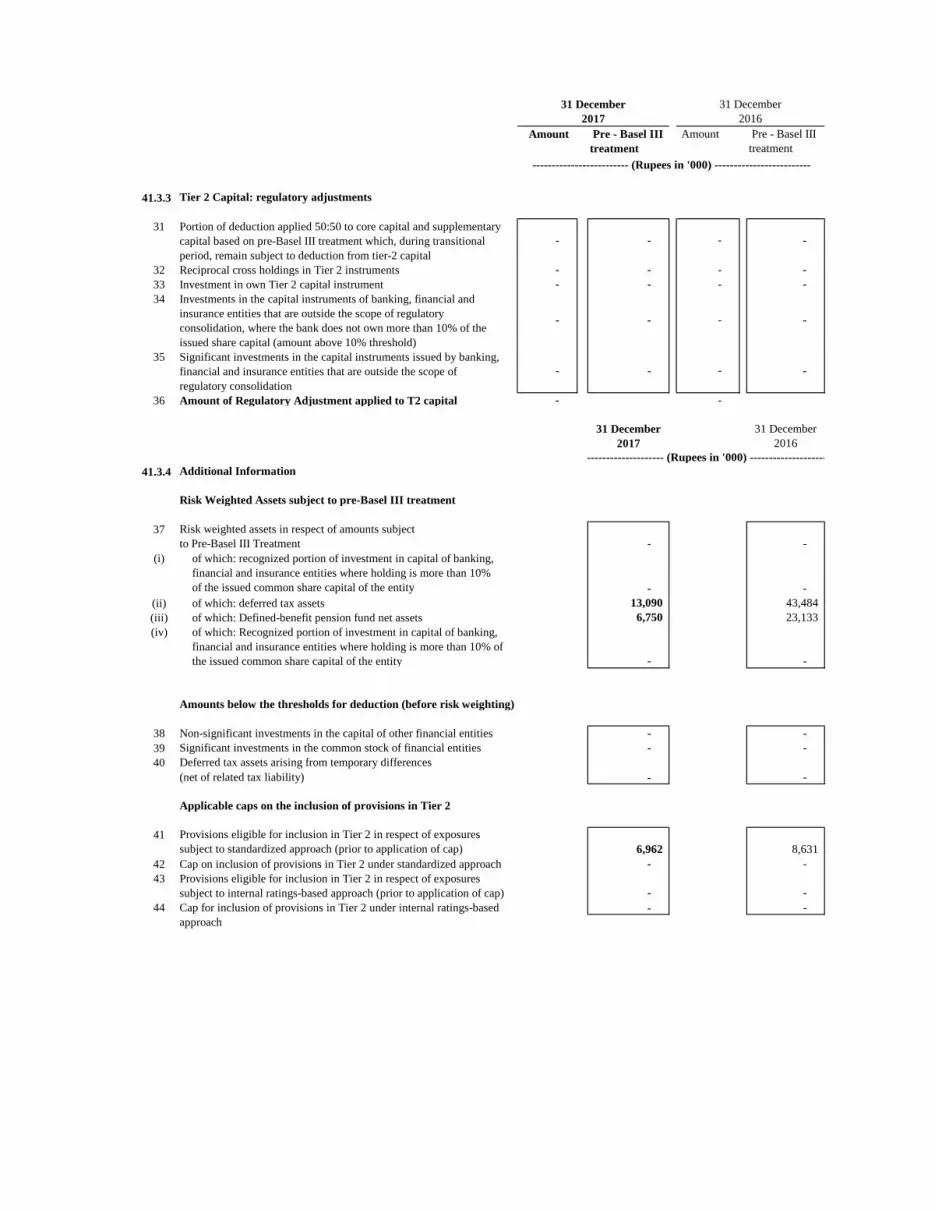
Amount Pre - Basel III
treatment
Amount Pre - Basel III
treatment
41.3.3 Tier 2 Capital: regulatory adjustments
31
32 Reciprocal cross holdings in Tier 2 instruments - - - -
33 Investment in own Tier 2 capital instrument - - - -
34
35
36 Amount of Regulatory Adjustment applied to T2 capital - -
31 December
2017
31 December
2016
41.3.4 Additional Information
Risk Weighted Assets subject to pre-Basel III treatment
37 Risk weighted assets in respect of amounts subject
to Pre-Basel III Treatment - -
(i)
- -
(ii) of which: deferred tax assets 13,090 43,484
(iii) of which: Defined-benefit pension fund net assets 6,750 23,133
(iv) of which: Recognized portion of investment in capital of banking,
financial and insurance entities where holding is more than 10% of
the issued common share capital of the entity - -
Amounts below the thresholds for deduction (before risk weighting)
38 Non-significant investments in the capital of other financial entities - -
39 Significant investments in the common stock of financial entities - -
40 Deferred tax assets arising from temporary differences
(net of related tax liability) - -
Applicable caps on the inclusion of provisions in Tier 2
41
6,962 8,631
42 - -
43
- -
44 - -
31 December
2017
31 December
2016
Significant investments in the capital instruments issued by banking,
financial and insurance entities that are outside the scope of
regulatory consolidation
- -
of which: recognized portion of investment in capital of banking,
financial and insurance entities where holding is more than 10%
of the issued common share capital of the entity
Provisions eligible for inclusion in Tier 2 in respect of exposures
subject to standardized approach (prior to application of cap)
Cap on inclusion of provisions in Tier 2 under standardized approach
Provisions eligible for inclusion in Tier 2 in respect of exposures
subject to internal ratings-based approach (prior to application of cap)
Cap for inclusion of provisions in Tier 2 under internal ratings-based
approach
------------------------- (Rupees in '000) -------------------------
- -
Investments in the capital instruments of banking, financial and
insurance entities that are outside the scope of regulatory
consolidation, where the bank does not own more than 10% of the
issued share capital (amount above 10% threshold)
- -
Portion of deduction applied 50:50 to core capital and supplementary
capital based on pre-Basel III treatment which, during transitional
period, remain subject to deduction from tier-2 capital
------------------------- (Rupees in '000) -------------------------
-
-
-
-
- -
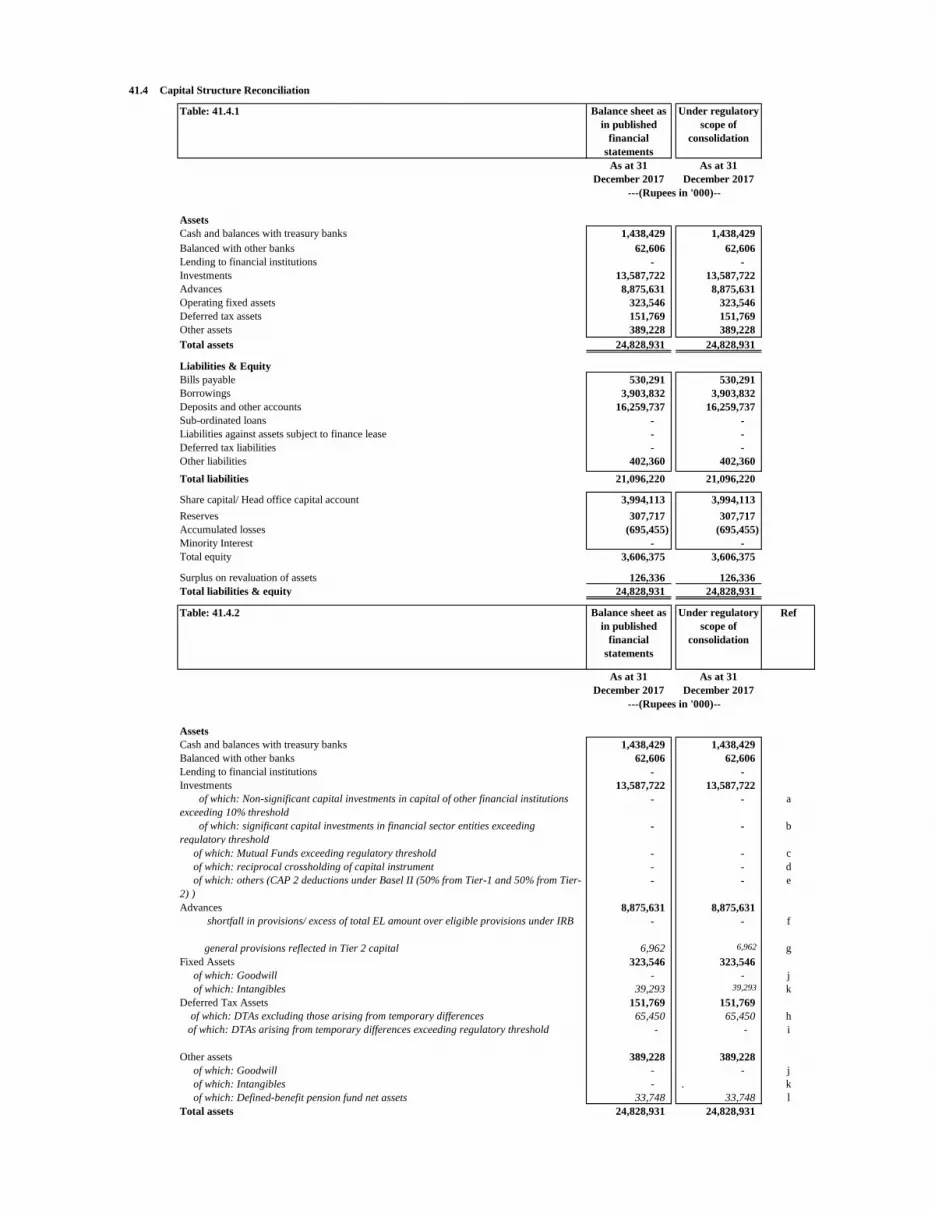
41.4 Capital Structure Reconciliation
Table: 41.4.1 Balance sheet as
in published
financial
statements
Under regulatory
scope of
consolidation
As at 31
December 2017
As at 31
December 2017
Assets
Cash and balances with treasury banks 1,438,429 1,438,429
Balanced with other banks 62,606 62,606
Lending to financial institutions - -
Investments 13,587,722 13,587,722
Advances 8,875,631 8,875,631
Operating fixed assets 323,546 323,546
Deferred tax assets 151,769 151,769
Other assets 389,228 389,228
Total assets 24,828,931 24,828,931
Liabilities & Equity
Bills payable 530,291 530,291
Borrowings 3,903,832 3,903,832
Deposits and other accounts 16,259,737 16,259,737
Sub-ordinated loans - -
Liabilities against assets subject to finance lease - -
Deferred tax liabilities - -
Other liabilities 402,360 402,360
Total liabilities 21,096,220 21,096,220
Share capital/ Head office capital account 3,994,113 3,994,113
Reserves 307,717 307,717
Accumulated losses (695,455) (695,455)
Minority Interest - -
Total equity 3,606,375 3,606,375
Surplus on revaluation of assets 126,336 126,336
Total liabilities & equity 24,828,931 24,828,931
Table: 41.4.2 Balance sheet as
in published
financial
statements
Under regulatory
scope of
consolidation
Ref
As at 31
December 2017
As at 31
December 2017
Assets
Cash and balances with treasury banks 1,438,429 1,438,429
Balanced with other banks 62,606 62,606
Lending to financial institutions - -
Investments 13,587,722 13,587,722
of which: Non-significant capital investments in capital of other financial institutions
exceeding 10% threshold
- - a
of which: significant capital investments in financial sector entities exceeding
regulatory threshold
- - b
of which: Mutual Funds exceeding regulatory threshold - - c
of which: reciprocal crossholding of capital instrument - - d
of which: others (CAP 2 deductions under Basel II (50% from Tier-1 and 50% from Tier-
2) )
- - e
Advances 8,875,631 8,875,631
shortfall in provisions/ excess of total EL amount over eligible provisions under IRB - - f
general provisions reflected in Tier 2 capital 6,962 6,962 g
Fixed Assets 323,546 323,546
of which: Goodwill - - j
of which: Intangibles 39,293 39,293 k
Deferred Tax Assets 151,769 151,769
of which: DTAs excluding those arising from temporary differences 65,450 65,450 h
i
Other assets 389,228 389,228
of which: Goodwill - - j
of which: Intangibles - . k
of which: Defined-benefit pension fund net assets 33,748 33,748 l
Total assets 24,828,931 24,828,931
---(Rupees in '000)--
---(Rupees in '000)--
of which: DTAs arising from temporary differences exceeding regulatory threshold - -
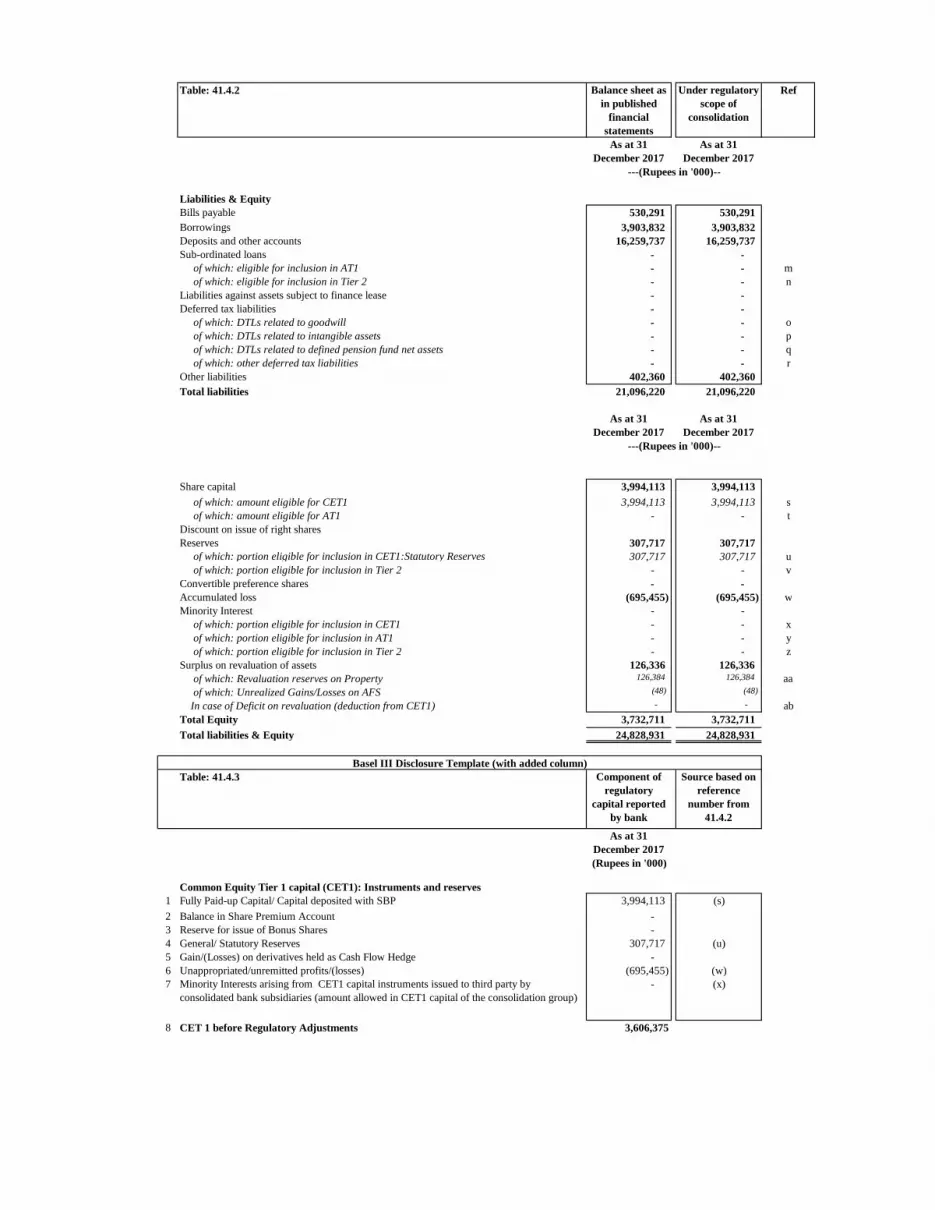
Table: 41.4.2 Balance sheet as
in published
financial
statements
Under regulatory
scope of
consolidation
Ref
As at 31
December 2017
As at 31
December 2017
Liabilities & Equity
Bills payable 530,291 530,291
Borrowings 3,903,832 3,903,832
Deposits and other accounts 16,259,737 16,259,737
Sub-ordinated loans - -
of which: eligible for inclusion in AT1 - - m
of which: eligible for inclusion in Tier 2 - - n
Liabilities against assets subject to finance lease - -
Deferred tax liabilities - -
of which: DTLs related to goodwill - - o
of which: DTLs related to intangible assets - - p
of which: DTLs related to defined pension fund net assets - - q
of which: other deferred tax liabilities - - r
Other liabilities 402,360 402,360
Total liabilities 21,096,220 21,096,220
As at 31
December 2017
As at 31
December 2017
Share capital 3,994,113 3,994,113
of which: amount eligible for CET1 3,994,113 3,994,113 s
of which: amount eligible for AT1 - - t
Discount on issue of right shares
Reserves 307,717 307,717
of which: portion eligible for inclusion in CET1:Statutory Reserves 307,717 307,717 u
of which: portion eligible for inclusion in Tier 2 - - v
Convertible preference shares - -
Accumulated loss (695,455) (695,455) w
Minority Interest - -
of which: portion eligible for inclusion in CET1 - - x
of which: portion eligible for inclusion in AT1 - - y
of which: portion eligible for inclusion in Tier 2 - - z
Surplus on revaluation of assets 126,336 126,336
of which: Revaluation reserves on Property 126,384 126,384
of which: Unrealized Gains/Losses on AFS (48) (48)
In case of Deficit on revaluation (deduction from CET1) - - ab
Total Equity 3,732,711 3,732,711
Total liabilities & Equity 24,828,931 24,828,931
Table: 41.4.3 Component of
regulatory
capital reported
by bank
Source based on
reference
number from
41.4.2
As at 31
December 2017
(Rupees in '000)
Common Equity Tier 1 capital (CET1): Instruments and reserves
1 Fully Paid-up Capital/ Capital deposited with SBP 3,994,113
2 Balance in Share Premium Account -
3 Reserve for issue of Bonus Shares -
4 General/ Statutory Reserves 307,717
5 Gain/(Losses) on derivatives held as Cash Flow Hedge -
6 Unappropriated/unremitted profits/(losses) (695,455) (w)
7
8 CET 1 before Regulatory Adjustments 3,606,375
---(Rupees in '000)--
---(Rupees in '000)--
(s)
(u)
aa
Basel III Disclosure Template (with added column)
Minority Interests arising from CET1 capital instruments issued to third party by
consolidated bank subsidiaries (amount allowed in CET1 capital of the consolidation group)
- (x)

Table: 41.4.3 Component of
regulatory
capital reported
by bank
Source based on
reference
number from
41.4.2
As at 31
December 2017
(Rupees in '000)
Common Equity Tier 1 capital: Regulatory adjustments
9 Goodwill (net of related deferred tax liability) - (j) - (o)
10 All other intangibles (net of any associated deferred tax liability) 39,293 (k) - (p)
11 Shortfall of provisions against classified assets - (f)
12
52,360 {(h) - (r} * 80%
13 Defined-benefit pension fund net assets 26,998 {(l) - (q)} * 80%
14 Reciprocal cross holdings in CET1 capital instruments - (d)
15 Cash flow hedge reserve -
16 Investment in own shares/ CET1 instruments -
17 Securitization gain on sale -
18 Capital shortfall of regulated subsidiaries -
19 Deficit on account of revaluation from bank's holdings of property/ AFS - (ab)
20
- (a) - (ac) - (ae)
21 - (b) - (ad) - (af)
22
- (i)
23 Amount exceeding 15% threshold -
24 of which: significant investments in the common stocks of financial entities -
25 of which: deferred tax assets arising from temporary differences -
26 National specific regulatory adjustments applied to CET1 capital -
27 Investment in TFCs of other banks exceeding the prescribed limit -
28 Any other deduction specified by SBP (mention details) -
29 Regulatory adjustment applied to CET1 due to insufficient AT1 and Tier 2 to cover
deductions
-
30 Total regulatory adjustments applied to CET1 (sum of 9 to 25) 118,651
Common Equity Tier 1 3,487,724
Additional Tier 1 (AT 1) Capital
31 Qualifying Additional Tier-1 instruments plus any related share premium -
32 of which: Classified as equity - (t)
33 of which: Classified as liabilities - (m)
34 Additional Tier-1 capital instruments issued by consolidated subsidiaries and held by third
parties (amount allowed in group AT 1)
- (y)
35 of which: instrument issued by subsidiaries subject to phase out -
36 AT1 before regulatory adjustments -
Significant investments in the capital instruments issued by banking, financial and insurance
entities that are outside the scope of regulatory consolidation (amount above 10% threshold)
Deferred Tax Assets arising from temporary differences (amount above 10% threshold, net
of related tax liability)
Basel III Disclosure Template (with added column)
Deferred tax assets that rely on future profitability excluding those arising from temporary
differences (net of related tax liability)
Investments in the capital instruments of banking, financial and insurance entities that are
outside the scope of regulatory consolidation, where the bank does not own more than 10%
of the issued share capital (amount above 10% threshold)
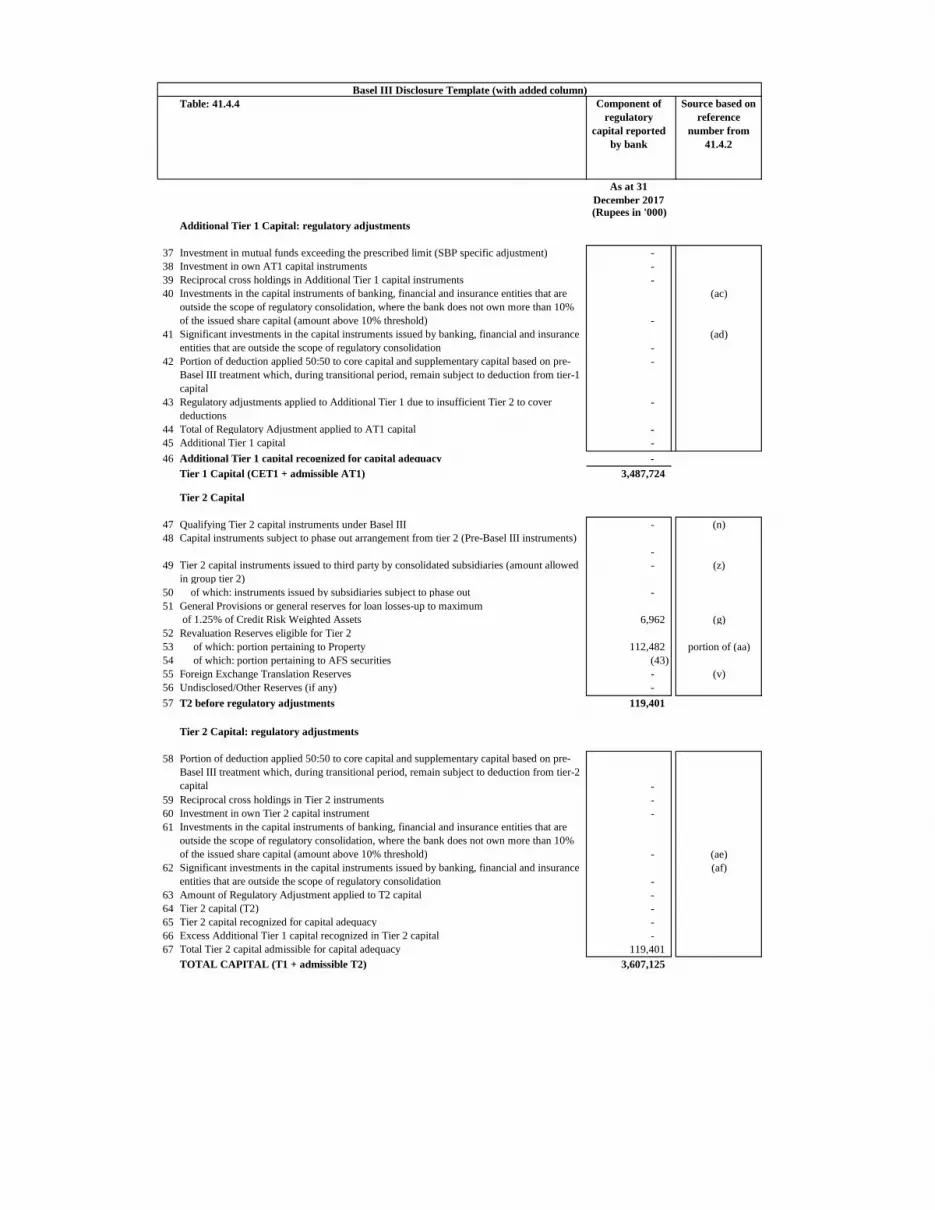
Table: 41.4.4 Component of
regulatory
capital reported
by bank
Source based on
reference
number from
41.4.2
As at 31
December 2017
(Rupees in '000)
Additional Tier 1 Capital: regulatory adjustments
37 Investment in mutual funds exceeding the prescribed limit (SBP specific adjustment) -
38 Investment in own AT1 capital instruments -
39 Reciprocal cross holdings in Additional Tier 1 capital instruments -
40
-
41
-
42
43
44 Total of Regulatory Adjustment applied to AT1 capital -
45 Additional Tier 1 capital -
46 Additional Tier 1 capital recognized for capital adequacy -
Tier 1 Capital (CET1 + admissible AT1) 3,487,724
Tier 2 Capital
47 Qualifying Tier 2 capital instruments under Basel III -
48
-
49 Tier 2 capital instruments issued to third party by consolidated subsidiaries (amount allowed
in group tier 2)
- (z)
50 of which: instruments issued by subsidiaries subject to phase out -
51 General Provisions or general reserves for loan losses-up to maximum
of 1.25% of Credit Risk Weighted Assets 6,962 (g)
52 Revaluation Reserves eligible for Tier 2
53 of which: portion pertaining to Property 112,482
54 of which: portion pertaining to AFS securities (43)
55 Foreign Exchange Translation Reserves - (v)
56 Undisclosed/Other Reserves (if any) -
57 T2 before regulatory adjustments 119,401
Tier 2 Capital: regulatory adjustments
58
-
59 Reciprocal cross holdings in Tier 2 instruments -
60 Investment in own Tier 2 capital instrument -
61
- (ae)
62 (af)
-
63 Amount of Regulatory Adjustment applied to T2 capital -
64 Tier 2 capital (T2) -
65 Tier 2 capital recognized for capital adequacy -
66 Excess Additional Tier 1 capital recognized in Tier 2 capital -
67 Total Tier 2 capital admissible for capital adequacy 119,401
TOTAL CAPITAL (T1 + admissible T2) 3,607,125
Regulatory adjustments applied to Additional Tier 1 due to insufficient Tier 2 to cover
deductions
-
(n)
Capital instruments subject to phase out arrangement from tier 2 (Pre-Basel III instruments)
portion of (aa)
Portion of deduction applied 50:50 to core capital and supplementary capital based on pre-
Basel III treatment which, during transitional period, remain subject to deduction from tier-2
capital
Portion of deduction applied 50:50 to core capital and supplementary capital based on pre-
Basel III treatment which, during transitional period, remain subject to deduction from tier-1
capital
-
Investments in the capital instruments of banking, financial and insurance entities that are
outside the scope of regulatory consolidation, where the bank does not own more than 10%
of the issued share capital (amount above 10% threshold)
Significant investments in the capital instruments issued by banking, financial and insurance
entities that are outside the scope of regulatory consolidation
Investments in the capital instruments of banking, financial and insurance entities that are
outside the scope of regulatory consolidation, where the bank does not own more than 10%
of the issued share capital (amount above 10% threshold)
(ac)
Significant investments in the capital instruments issued by banking, financial and insurance
entities that are outside the scope of regulatory consolidation
(ad)
Basel III Disclosure Template (with added column)
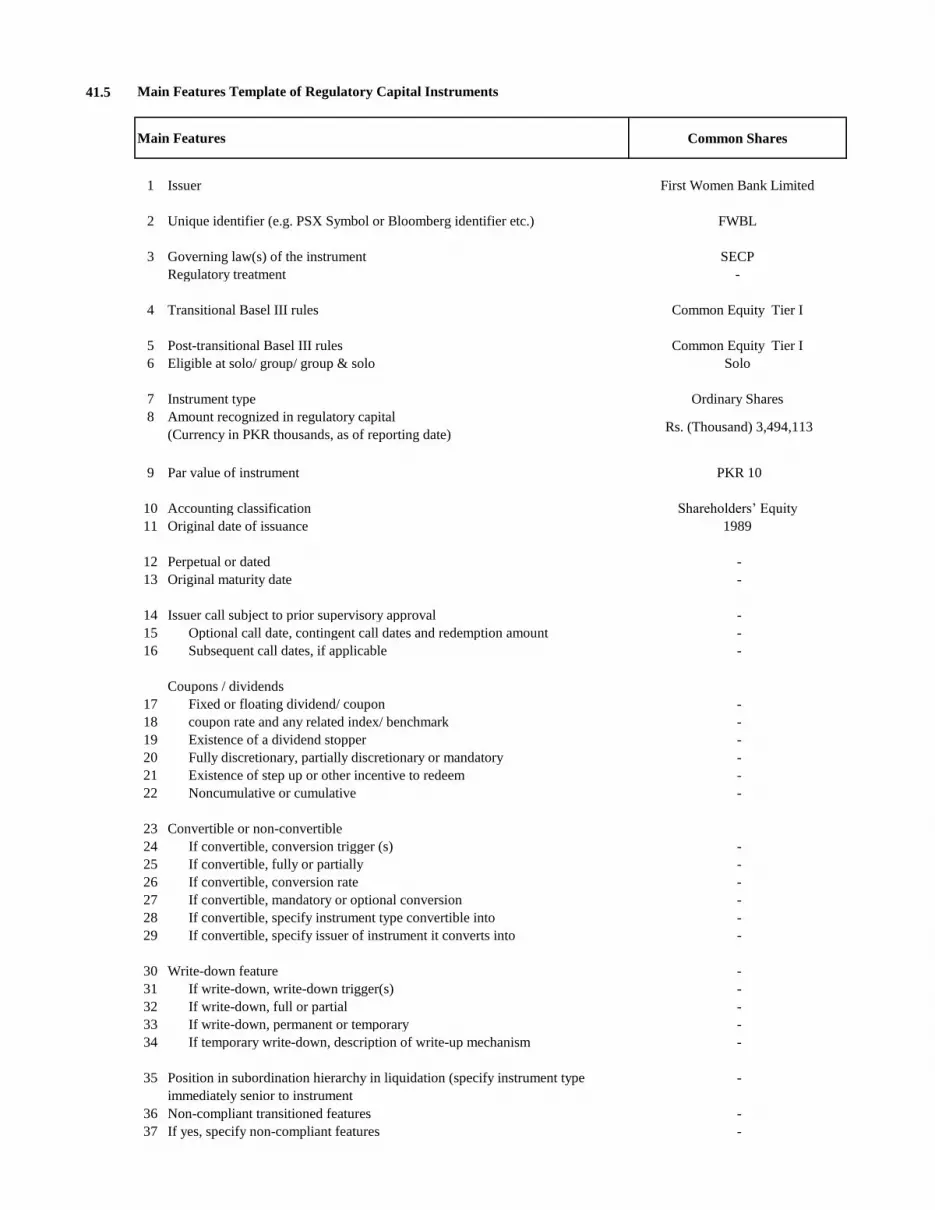
41.5 Main Features Template of Regulatory Capital Instruments
Main Features Common Shares
1 Issuer First Women Bank Limited
2 Unique identifier (e.g. PSX Symbol or Bloomberg identifier etc.) FWBL
3 Governing law(s) of the instrument SECP
Regulatory treatment -
4 Transitional Basel III rules Common Equity Tier I
5 Post-transitional Basel III rules Common Equity Tier I
6 Eligible at solo/ group/ group & solo Solo
7 Instrument type Ordinary Shares
8 Amount recognized in regulatory capital
(Currency in PKR thousands, as of reporting date) Rs. (Thousand) 3,494,113
9 Par value of instrument PKR 10
10 Accounting classification Shareholders‟ Equity
11 Original date of issuance 1989
12 Perpetual or dated -
13 Original maturity date -
14 Issuer call subject to prior supervisory approval -
15 Optional call date, contingent call dates and redemption amount -
16 Subsequent call dates, if applicable -
Coupons / dividends
17 Fixed or floating dividend/ coupon -
18 coupon rate and any related index/ benchmark -
19 Existence of a dividend stopper -
20 Fully discretionary, partially discretionary or mandatory -
21 Existence of step up or other incentive to redeem -
22 Noncumulative or cumulative -
23 Convertible or non-convertible
24 If convertible, conversion trigger (s) -
25 If convertible, fully or partially -
26 If convertible, conversion rate -
27 If convertible, mandatory or optional conversion -
28 If convertible, specify instrument type convertible into -
29 If convertible, specify issuer of instrument it converts into -
30 Write-down feature -
31 If write-down, write-down trigger(s) -
32 If write-down, full or partial -
33 If write-down, permanent or temporary -
34 If temporary write-down, description of write-up mechanism -
35 Position in subordination hierarchy in liquidation (specify instrument type
immediately senior to instrument
-
36 Non-compliant transitioned features -
37 If yes, specify non-compliant features -

41.6 Capital Adequacy
The risk weighted assets to capital ratio, calculated in accordance with the prescribed revised MCR limit for the Bank as stated in note 1.2 was as follows:
31 December
2017
31 December
2016
31 December
2017
31 December
2016
Credit Risk
Portfolios subject to standardized approach (Simple or Comprehensive)
Cash and Cash Equivalents - - -
Claims on Government of Pakistan - - -
Foreign Currency claims on SBP arising out of statutory obligations of banks in Pakistan - - -
Claims on other sovereigns and on Government of Pakistan or provincial governments
or SBP denominated in currencies other than PKR 975 420 5,414 2,333 -
Claims on Bank for International Settlements, International Monetary Fund,
European Central Bank, and European Community - - - -
Claims on Multilateral Development Banks - - - -
Claims on Public Sector Entities in Pakistan 338 442 1,878 2,453 -
Claims on Banks 2,795 5,772 15,527 32,066 -
Claims, denominated in foreign currency, on banks with original maturity of 3 months or less 2,154 1,455 11,969 8,084 -
Claims on banks with original maturity of 3 months or less denominated in PKR and
funded in PKR - 3,600 - 20,000 -
Claims on Corporates (excluding equity exposures) 521,053 481,025 2,894,741 2,672,361 -
Claims categorized as retail portfolio 70,144 52,622 389,687 292,344 -
Claims fully secured by residential property (Residential Mortgage Finance
as defined in Section 2.1) 9,351 9,149 51,952 50,825
Past Due loans: 86,983 172,001 483,237 955,562
Significant investment and DTA above threshold 38,844 63,417 215,798 352,316 -
-
Unlisted equity investments (other than that deducted from capital) held in banking book 258 258 1,431 1,431 -
Significant investment and DTAs above 15% threshold
Claims on all fixed assets under operating lease - -
Fixed Asset 51,166 - 284,255 305,060 -
All other assets (excluding mark-up receivables) 16,218 24,171 90,099 134,285 -
800,278 814,331 4,445,988 4,829,120
Off- Balance Sheet - Non Market related Exposures
Direct Credit Substitutes/ Lending of securities of securities as collateral 1,601 5,200 8,897 28,888
Performance related contingencies 43,083 38,895 239,350 216,081
Trade Related contingencies 54,014 35,782 300,077 198,791
Off- Balance Sheet - Non market related - -
98,698 79,877 548,323 443,760
Off- Balance Sheet -Market related Exposures 138 545 766 3,025
Total Credit Risk (A) 899,114 894,752 4,995,078 5,275,905
Market Risk
Capital Requirement for portfolios subject to Standardized Approach
Interest rate risk 35,288 2,104 196,043 11,688
Equity position risk - 47,655 - 264,750
Foreign Exchange risk 2,095 2,617 11,638 14,538
Operational Risk 269,026 265,227 1,494,588 1,473,484
TOTAL 1,205,522 1,212,355 6,697,346 7,040,365
Capital Adequacy Ratio Current Year Prior Year
Total eligible regulatory capital held 3,607,125 3,278,144
Total Risk Weighted Assets 6,697,346 7,040,365
Capital Adequacy Ratio 53.86% 46.56%
Listed Equity investments and regulatory capital instruments issued by other banks
(other than those deducted from capital) held in the banking book.
-
Risk Weighted Assets Capital Requirements
------------------------------------ (Rupees in '000) ------------------------------------
- - - -
- - -

42. RISK MANAGEMENT
42.1 Credit risk
Credit Risk Management Policy
Credit Risk Assessment
Credit Risk Rating
Credit Portfolio Management
Impaired financial assets
42.2 Concentration of credit and deposit
The following financial assets are guaranteed by the Federal / Provincial Government or the State Bank of Pakistan.
2017 2016
Advances 4,995,983 3,199,693
Investments 13,586,768 7,854,992
Mark-up receivable on Government guaranteed financial assets 84,478 135,747
Cash and balances with the State Bank of Pakistan 952,295 683,190
The Bank‟s activities expose it to a variety of financial risks. The management‟s aim is to achieve an appropriate balance between risk and return, and
minimize potential adverse effects on its financial performance. The Bank‟s risk management policies are designed to identify and analyse financial and non-
financial risks, to set appropriate risk limits and controls, and to monitor the risks and adherence to set limits by means of reliable and up-to-date information
systems. The Bank regularly reviews its risk management policies and systems to reflect changes in markets, products and emerging best practice.
Risk management is carried out by the Bank under policies approved by the Board of Directors. The principal risks associated with the banking business are
credit risk, market risk, liquidity risk and operational risk. The Bank is focused to further refine its risk management processes in line with the changing
economic scenario and Bank's business expansions. The Bank‟s management intends to review and assess its risk management methodology on continuous
basis and is determined to improve it on regular basis. The Bank has established a specialized division for risk management.
Concentrations of credit risk exist if clients are engaged in similar activities, or are located in the same geographical region, or have comparable economic
characteristics such that their ability to meet contractual obligations would be similarly affected by changes in economic, political or other conditions.
Currently, the Bank faces concentration of credit and deposit risks which are managed through prudent credit and liquidity risk management policies.
Credit risk is the possibility that a borrower or counter party will fail to meet its obligations in accordance with agreed terms. The Bank‟s credit policy and
manual contains detailed procedures and guidelines and define credit risk methodology for identifying, assessing, monitoring and mitigating risk factors.
Bank has established an appropriate credit risk environment which is operating under a sound credit-granting process; maintaining an appropriate credit
administration, measurement and monitoring process and ensuring adequate controls. For risk management reporting purposes the Bank considers and
consolidates all elements of credit risk exposures.
A sound credit risk management framework is fundamental for the overall business strategy and credit operations of the Bank. The Bank has recently
developed its credit risk policy . The principles for credit risk management have been laid down in detail in the Bank's credit policy. The policy has been
developed in accordance with the requirements of the State Bank of Pakistan and will be reviewed and updated (where required) on periodic basis. After
approval of the credit risk policy, the credit manual of the Bank will also be revised accordingly.
The Bank has a well established process of credit risk embedded in each credit transaction executed by the business units. The entire process broadly
encompasses gathering relevant information on the borrower, detailed credit appraisal, and credit risk assessment and measurement. There is a proper credit
delegation matrix for review and approving credit applications.
The credit risk rating system provides support for the assessment and measurement of credit risk against each obligor. The Bank has a BoD approved Obligor
Risk Rating (ORR) systems for corporate, small and medium enterprises and consumer finance obligors and also has BoD approved facility risk rating system
(FRR) for its borrowers.
Besides managing credit risk at transaction level, the Bank regularly monitors credit risk at portfolio level and ensures that no undue concentration of risk is
present in the overall credit exposure at Bank level. In addition to monitoring credit limits specified in the Prudential Regulations of the State Bank of Pakistan,
credit limit structure of the Bank includes internal limits as established by the senior management and the BoD. All these limits are monitored on regular basis
and any exceptions are reported to the relevant authorities for their timely action where necessary. Post-disbursement maintenance of accounts is done through
Credit Administration Department (“CAD”). The CAD has direct reporting line to the President.
Impaired financial assets including loans and debt instruments are those which the Bank determines that it is probable that it will not be able to collect all
principal and interest due according to the contractual terms of the agreement(s) underlying the financial assets.
(Rupees in '000)
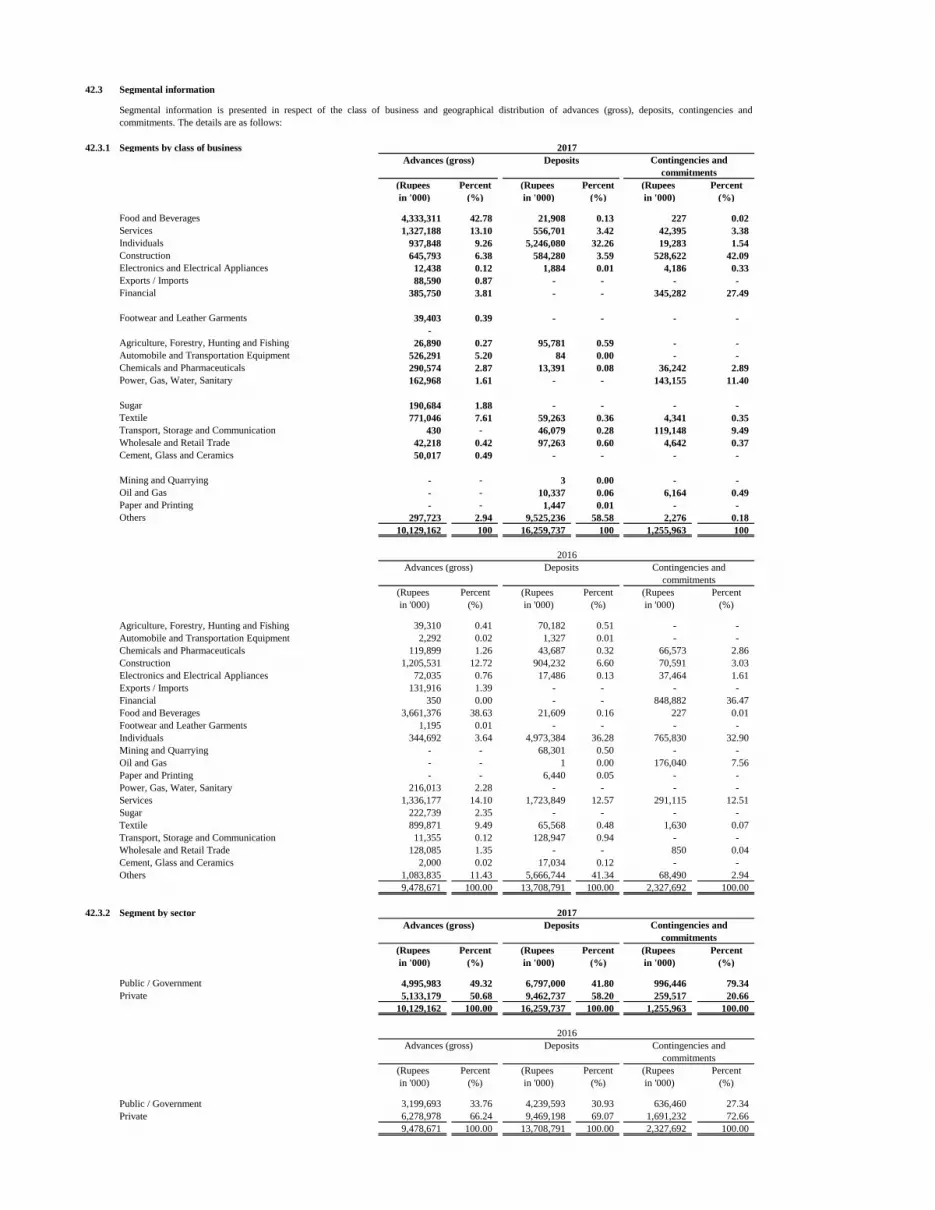
42.3 Segmental information
42.3.1 Segments by class of business
(Rupees Percent (Rupees Percent (Rupees Percent
in '000) (%) in '000) (%) in '000) (%)
Food and Beverages 4,333,311 42.78 21,908 0.13 227 0.02
Services 1,327,188 13.10 556,701 3.42 42,395 3.38
Individuals 937,848 9.26 5,246,080 32.26 19,283 1.54
Construction 645,793 6.38 584,280 3.59 528,622 42.09
Electronics and Electrical Appliances 12,438 0.12 1,884 0.01 4,186 0.33
Exports / Imports 88,590 0.87 - - - -
Financial 385,750 3.81 - - 345,282 27.49
Footwear and Leather Garments 39,403 0.39 - - - -
-
Agriculture, Forestry, Hunting and Fishing 26,890 0.27 95,781 0.59 - -
Automobile and Transportation Equipment 526,291 5.20 84 0.00 - -
Chemicals and Pharmaceuticals 290,574 2.87 13,391 0.08 36,242 2.89
Power, Gas, Water, Sanitary 162,968 1.61 - - 143,155 11.40
Sugar 190,684 1.88 - - - -
Textile 771,046 7.61 59,263 0.36 4,341 0.35
Transport, Storage and Communication 430 - 46,079 0.28 119,148 9.49
Wholesale and Retail Trade 42,218 0.42 97,263 0.60 4,642 0.37
Cement, Glass and Ceramics 50,017 0.49 - - - -
Mining and Quarrying - - 3 0.00 - -
Oil and Gas - - 10,337 0.06 6,164 0.49
Paper and Printing - - 1,447 0.01 - -
Others 297,723 2.94 9,525,236 58.58 2,276 0.18
10,129,162 100 16,259,737 100 1,255,963 100
(Rupees Percent (Rupees Percent (Rupees Percent
in '000) (%) in '000) (%) in '000) (%)
Agriculture, Forestry, Hunting and Fishing 39,310 0.41 70,182 0.51 - -
Automobile and Transportation Equipment 2,292 0.02 1,327 0.01 - -
Chemicals and Pharmaceuticals 119,899 1.26 43,687 0.32 66,573 2.86
Construction 1,205,531 12.72 904,232 6.60 70,591 3.03
Electronics and Electrical Appliances 72,035 0.76 17,486 0.13 37,464 1.61
Exports / Imports 131,916 1.39 - - - -
Financial 350 0.00 - - 848,882 36.47
Food and Beverages 3,661,376 38.63 21,609 0.16 227 0.01
Footwear and Leather Garments 1,195 0.01 - - - -
Individuals 344,692 3.64 4,973,384 36.28 765,830 32.90
Mining and Quarrying - - 68,301 0.50 - -
Oil and Gas - - 1 0.00 176,040 7.56
Paper and Printing - - 6,440 0.05 - -
Power, Gas, Water, Sanitary 216,013 2.28 - - - -
Services 1,336,177 14.10 1,723,849 12.57 291,115 12.51
Sugar 222,739 2.35 - - - -
Textile 899,871 9.49 65,568 0.48 1,630 0.07
Transport, Storage and Communication 11,355 0.12 128,947 0.94 - -
Wholesale and Retail Trade 128,085 1.35 - - 850 0.04
Cement, Glass and Ceramics 2,000 0.02 17,034 0.12 - -
Others 1,083,835 11.43 5,666,744 41.34 68,490 2.94
9,478,671 100.00 13,708,791 100.00 2,327,692 100.00
42.3.2 Segment by sector
(Rupees Percent (Rupees Percent (Rupees Percent
in '000) (%) in '000) (%) in '000) (%)
Public / Government 4,995,983 49.32 6,797,000 41.80 996,446 79.34
Private 5,133,179 50.68 9,462,737 58.20 259,517 20.66
10,129,162 100.00 16,259,737 100.00 1,255,963 100.00
(Rupees Percent (Rupees Percent (Rupees Percent
in '000) (%) in '000) (%) in '000) (%)
Public / Government 3,199,693 33.76 4,239,593 30.93 636,460 27.34
Private 6,278,978 66.24 9,469,198 69.07 1,691,232 72.66
9,478,671 100.00 13,708,791 100.00 2,327,692 100.00
2017
2016
Advances (gross) Deposits Contingencies and
commitments
Advances (gross) Deposits Contingencies and
commitments
2016
Advances (gross) Deposits Contingencies and
commitments
2017
Advances (gross) Deposits Contingencies and
commitments
Segmental information is presented in respect of the class of business and geographical distribution of advances (gross), deposits, contingencies and
commitments. The details are as follows:
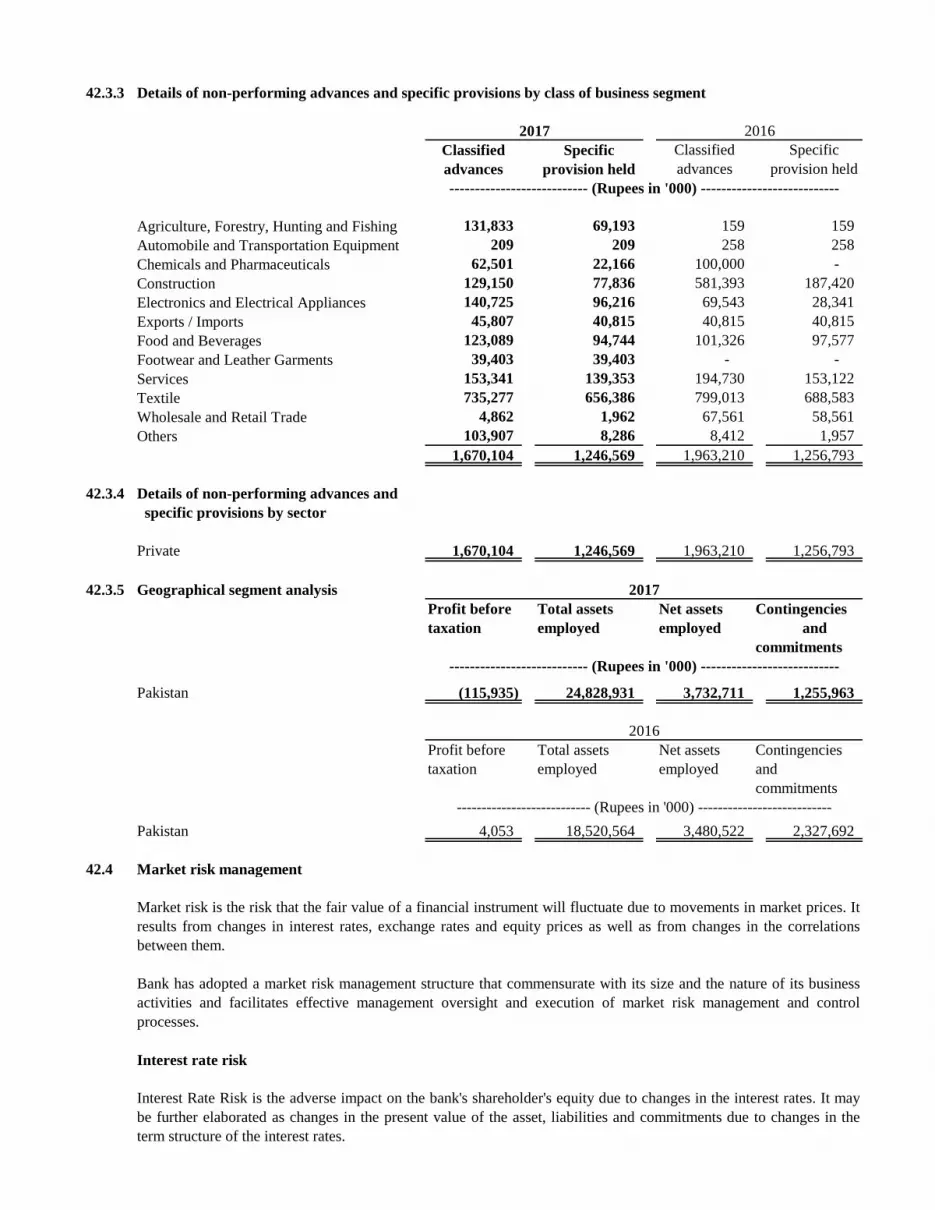
42.3.3 Details of non-performing advances and specific provisions by class of business segment
Agriculture, Forestry, Hunting and Fishing 131,833 69,193 159 159
Automobile and Transportation Equipment 209 209 258 258
Chemicals and Pharmaceuticals 62,501 22,166 100,000 -
Construction 129,150 77,836 581,393 187,420
Electronics and Electrical Appliances 140,725 96,216 69,543 28,341
Exports / Imports 45,807 40,815 40,815 40,815
Food and Beverages 123,089 94,744 101,326 97,577
Footwear and Leather Garments 39,403 39,403 - -
Services 153,341 139,353 194,730 153,122
Textile 735,277 656,386 799,013 688,583
Wholesale and Retail Trade 4,862 1,962 67,561 58,561
Others 103,907 8,286 8,412 1,957
1,670,104 1,246,569 1,963,210 1,256,793
42.3.4 Details of non-performing advances and
specific provisions by sector
Private 1,670,104 1,246,569 1,963,210 1,256,793
42.3.5 Geographical segment analysis
Profit before Total assets Net assets Contingencies
taxation employed employed and
commitments
Pakistan (115,935) 24,828,931 3,732,711 1,255,963
Profit before Total assets Net assets Contingencies
taxation employed employed and
commitments
Pakistan 4,053 18,520,564 3,480,522 2,327,692
42.4 Market risk management
Interest Rate Risk is the adverse impact on the bank's shareholder's equity due to changes in the interest rates. It may
be further elaborated as changes in the present value of the asset, liabilities and commitments due to changes in the
term structure of the interest rates.
Bank has adopted a market risk management structure that commensurate with its size and the nature of its business
activities and facilitates effective management oversight and execution of market risk management and control
processes.
Interest rate risk
2017 2016
Market risk is the risk that the fair value of a financial instrument will fluctuate due to movements in market prices. It
results from changes in interest rates, exchange rates and equity prices as well as from changes in the correlations
between them.
2017
2016
--------------------------- (Rupees in '000) ---------------------------
--------------------------- (Rupees in '000) ---------------------------
--------------------------- (Rupees in '000) ---------------------------
Classified
advances
Specific
provision held
Classified
advances
Specific
provision held
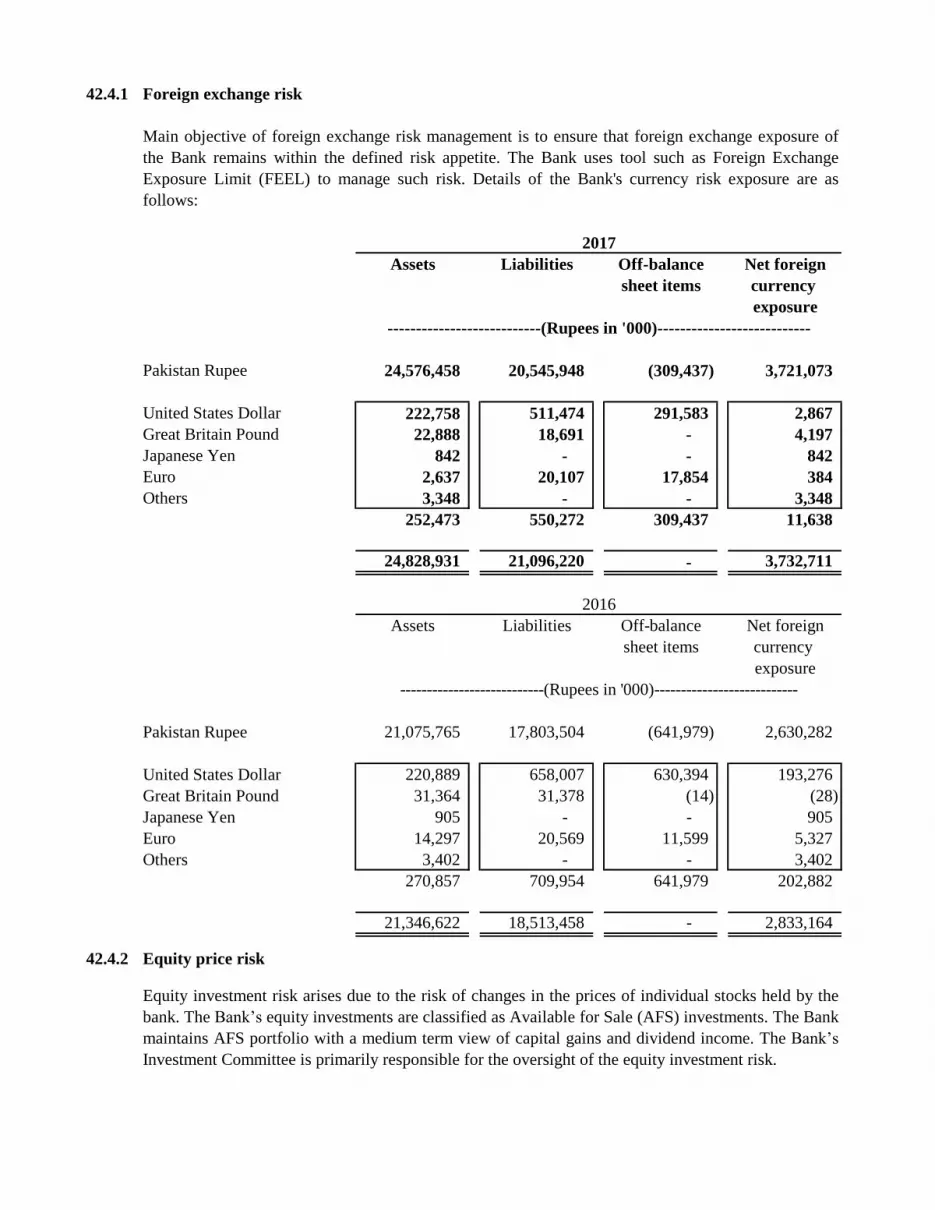
42.4.1 Foreign exchange risk
Assets Liabilities Off-balance Net foreign
sheet items currency
exposure
Pakistan Rupee 24,576,458 20,545,948 (309,437) 3,721,073
United States Dollar 222,758 511,474 291,583 2,867
Great Britain Pound 22,888 18,691 - 4,197
Japanese Yen 842 - - 842
Euro 2,637 20,107 17,854 384
Others 3,348 - - 3,348
252,473 550,272 309,437 11,638
24,828,931 21,096,220 - 3,732,711
2016
Assets Liabilities Off-balance Net foreign
sheet items currency
exposure
---------------------------(Rupees in '000)---------------------------
Pakistan Rupee 21,075,765 17,803,504 (641,979) 2,630,282
United States Dollar 220,889 658,007 630,394 193,276
Great Britain Pound 31,364 31,378 (14) (28)
Japanese Yen 905 - - 905
Euro 14,297 20,569 11,599 5,327
Others 3,402 - - 3,402
270,857 709,954 641,979 202,882
21,346,622 18,513,458 - 2,833,164
42.4.2 Equity price risk
---------------------------(Rupees in '000)---------------------------
2017
Main objective of foreign exchange risk management is to ensure that foreign exchange exposure of
the Bank remains within the defined risk appetite. The Bank uses tool such as Foreign Exchange
Exposure Limit (FEEL) to manage such risk. Details of the Bank's currency risk exposure are as
follows:
Equity investment risk arises due to the risk of changes in the prices of individual stocks held by the
bank. The Bank‟s equity investments are classified as Available for Sale (AFS) investments. The Bank
maintains AFS portfolio with a medium term view of capital gains and dividend income. The Bank‟s
Investment Committee is primarily responsible for the oversight of the equity investment risk.
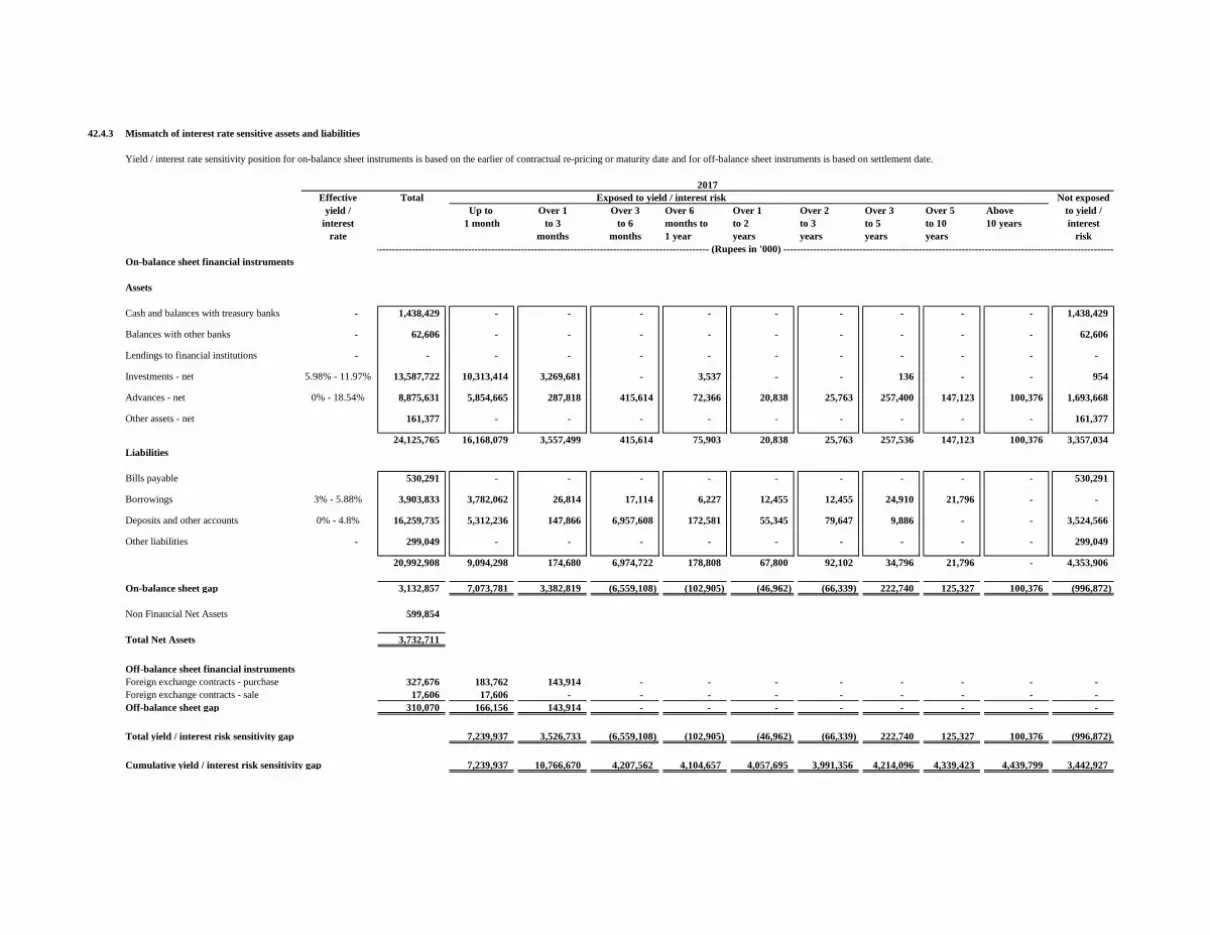
42.4.3 Mismatch of interest rate sensitive assets and liabilities
Yield / interest rate sensitivity position for on-balance sheet instruments is based on the earlier of contractual re-pricing or maturity date and for off-balance sheet instruments is based on settlement date.
Effective Total Exposed to yield / interest risk Not exposed
yield / Up to Over 1 Over 3 Over 6 Over 1 Over 2 Over 3 Over 5 Above to yield /
interest 1 month to 3 to 6 months to to 2 to 3 to 5 to 10 10 years interest
rate months months 1 year years years years years risk
On-balance sheet financial instruments
Assets
Cash and balances with treasury banks - 1,438,429 - - - - - - - - - 1,438,429
Balances with other banks - 62,606 - - - - - - - - - 62,606
Lendings to financial institutions - - - - - - - - - - - -
Investments - net 5.98% - 11.97% 13,587,722 10,313,414 3,269,681 - 3,537 - - 136 - - 954
Advances - net 0% - 18.54% 8,875,631 5,854,665 287,818 415,614 72,366 20,838 25,763 257,400 147,123 100,376 1,693,668
Other assets - net 161,377 - - - - - - - - - 161,377
24,125,765 16,168,079 3,557,499 415,614 75,903 20,838 25,763 257,536 147,123 100,376 3,357,034
Liabilities
Bills payable 530,291 - - - - - - - - - 530,291
Borrowings 3% - 5.88% 3,903,833 3,782,062 26,814 17,114 6,227 12,455 12,455 24,910 21,796 - -
Deposits and other accounts 0% - 4.8% 16,259,735 5,312,236 147,866 6,957,608 172,581 55,345 79,647 9,886 - - 3,524,566
Other liabilities - 299,049 - - - - - - - - - 299,049
20,992,908 9,094,298 174,680 6,974,722 178,808 67,800 92,102 34,796 21,796 - 4,353,906
On-balance sheet gap 3,132,857 7,073,781 3,382,819 (6,559,108) (102,905) (46,962) (66,339) 222,740 125,327 100,376 (996,872)
Non Financial Net Assets 599,854
Total Net Assets 3,732,711
Off-balance sheet financial instruments
Foreign exchange contracts - purchase 327,676 183,762 143,914 - - - - - - - -
Foreign exchange contracts - sale 17,606 17,606 - - - - - - - - -
Off-balance sheet gap 310,070 166,156 143,914 - - - - - - - -
Total yield / interest risk sensitivity gap 7,239,937 3,526,733 (6,559,108) (102,905) (46,962) (66,339) 222,740 125,327 100,376 (996,872)
Cumulative yield / interest risk sensitivity gap 7,239,937 10,766,670 4,207,562 4,104,657 4,057,695 3,991,356 4,214,096 4,339,423 4,439,799 3,442,927
2017
------------------------------------------------------------------------------------------------------ (Rupees in '000) ------------------------------------------------------------------------------------------------------
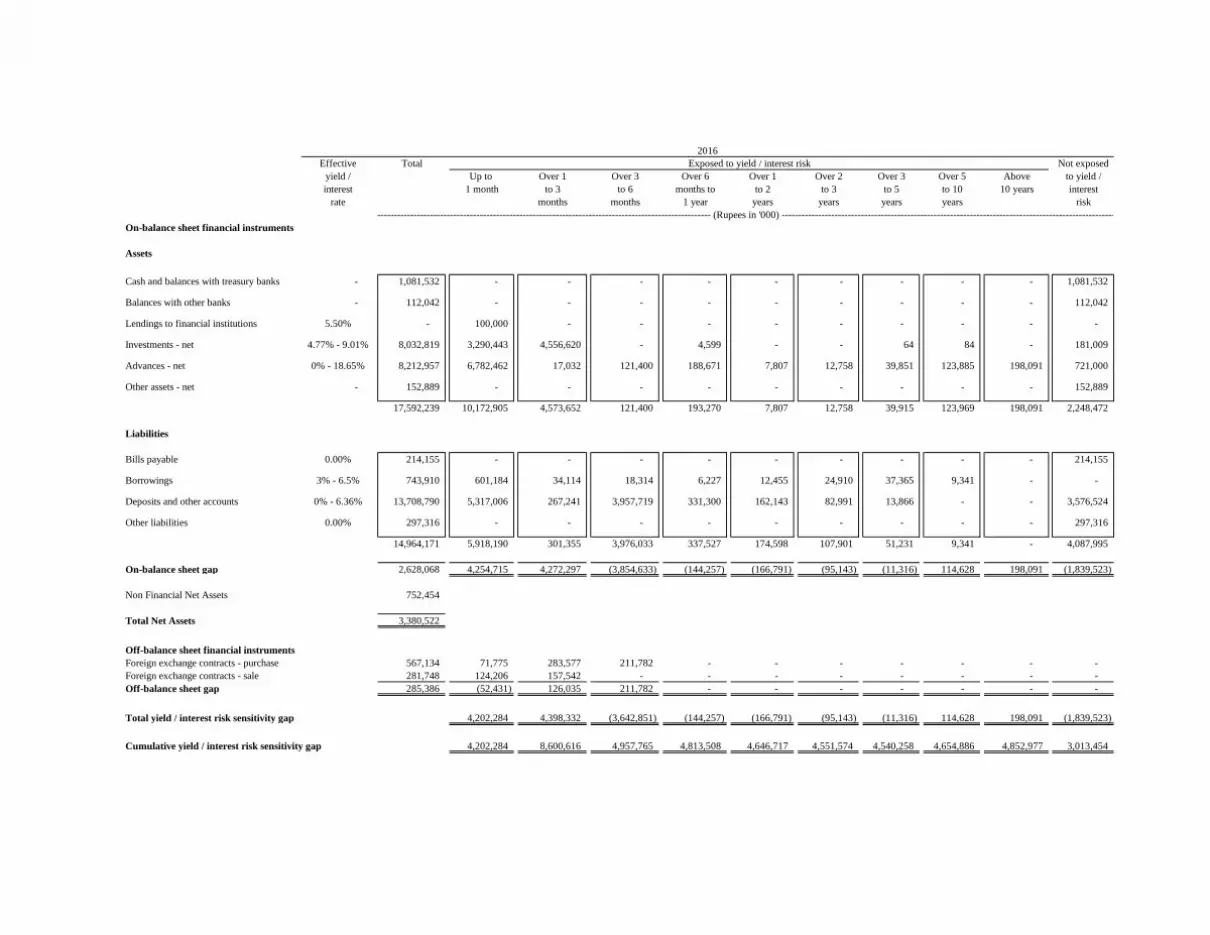
Effective Total Not exposed
yield / Up to Over 1 Over 3 Over 6 Over 1 Over 2 Over 3 Over 5 Above to yield /
interest 1 month to 3 to 6 months to to 2 to 3 to 5 to 10 10 years interest
rate months months 1 year years years years years risk
On-balance sheet financial instruments
Assets
Cash and balances with treasury banks - 1,081,532 - - - - - - - - - 1,081,532
Balances with other banks - 112,042 - - - - - - - - - 112,042
Lendings to financial institutions 5.50% - 100,000 - - - - - - - - -
Investments - net 4.77% - 9.01% 8,032,819 3,290,443 4,556,620 - 4,599 - - 64 84 - 181,009
Advances - net 0% - 18.65% 8,212,957 6,782,462 17,032 121,400 188,671 7,807 12,758 39,851 123,885 198,091 721,000
Other assets - net - 152,889 - - - - - - - - - 152,889
17,592,239 10,172,905 4,573,652 121,400 193,270 7,807 12,758 39,915 123,969 198,091 2,248,472
Liabilities
Bills payable 0.00% 214,155 - - - - - - - - - 214,155
Borrowings 3% - 6.5% 743,910 601,184 34,114 18,314 6,227 12,455 24,910 37,365 9,341 - -
Deposits and other accounts 0% - 6.36% 13,708,790 5,317,006 267,241 3,957,719 331,300 162,143 82,991 13,866 - - 3,576,524
Other liabilities 0.00% 297,316 - - - - - - - - - 297,316
14,964,171 5,918,190 301,355 3,976,033 337,527 174,598 107,901 51,231 9,341 - 4,087,995
On-balance sheet gap 2,628,068 4,254,715 4,272,297 (3,854,633) (144,257) (166,791) (95,143) (11,316) 114,628 198,091 (1,839,523)
Non Financial Net Assets 752,454
Total Net Assets 3,380,522
Off-balance sheet financial instruments
Foreign exchange contracts - purchase 567,134 71,775 283,577 211,782 - - - - - - -
Foreign exchange contracts - sale 281,748 124,206 157,542 - - - - - - - -
Off-balance sheet gap 285,386 (52,431) 126,035 211,782 - - - - - - -
Total yield / interest risk sensitivity gap 4,202,284 4,398,332 (3,642,851) (144,257) (166,791) (95,143) (11,316) 114,628 198,091 (1,839,523)
Cumulative yield / interest risk sensitivity gap 4,202,284 8,600,616 4,957,765 4,813,508 4,646,717 4,551,574 4,540,258 4,654,886 4,852,977 3,013,454
Exposed to yield / interest risk
------------------------------------------------------------------------------------------------------ (Rupees in '000) ------------------------------------------------------------------------------------------------------
2016
42.4.4 Liquidity Risk
Liquidity risk is the risk that the Bank will not be able to raise funds to meet its commitments.
Governance of Liquidity risk management
ALCO manages the liquidity position on a continuous basis.
Funding Strategy
Liquidity Risk Mitigation techniques
Liquidity Stress Testing
Contingency Funding Plan
LCR and NSFR results
Main drivers of LCR results
Composition of High Quality Liquid Assets (HQLA)
Main drivers of LCR Results are High Quality Liquid Assets and Net cash outflows. Outflows are mainly deposit outflows net of cash
inflows which consist of inflows from financing and money market placements up to 1 month. The inputs for calculation of LCR are as
prescribed by the SBP.
High Quality Liquid Assets composed of Level- l assets which can be included in the stock of liquid assets at 100% of their market
value. The Bank has taken cash & treasury balances, investments in government securities classified as „Available for Sale‟. Further,
Level 2-B asset category includes investment in qualifying corporate bonds and equity investments classified as available for sales.
Liquidity and related risks are managed through standardized processes established in the Bank. The management of liquidity risk
within the Bank is undertaken within limits and other parameters set by BoD under the relevant policies. The Bank's treasury function
has the primary responsibility for assessing, monitoring and managing the Bank's liquidity and funding strategy while overall
compliance is monitored by the ALCO. Board and Senior Management are apprised of Bank‟s liquidity profile to ensure proactive
liquidity management. Treasury Middle Office being part of the Risk Management Division is responsible for the identification,
monitoring and analysis of intrinsic risks of treasury business independently. The Bank has in place duly approved Treasury
investment policy and strategy along with liquidity risk management policy along with various defined tolerance/appetite levels that are
communicated at various levels so as to ensure effective liquidity management for the Bank.
The Bank‟s liquidity model is based on core funding sources of retail deposits from branch network. The Bank aims at diversification
of its deposit base. Further, the Bank can also generate liquidity from Interbank market against government securities to fund its short
term liquidity requirement, if any. The Bank as a policy invests significantly in HQLA that can be readily converted into cash to meet
unexpected liquidity requirements, besides yielding attractive returns. Furthermore, long term loan are very low relative to Bank's
capital base/reserves.
Various tools and techniques are used to measure and monitor the possible liquidity risk. These include monitoring of different liquidity
ratios which are monitored regularly against approved triggers and communicated to the Senior Management and ALCO. Further, Bank
also prepares the maturity profile of assets and liabilities to monitor the liquidity gaps over different time buckets. The Bank also
ensures that statutory cash and liquidity requirements are maintained at all times.
As per SBP BSD Circular No. 1 of 2012, Liquidity stress testing is being conducted under well-defined stress scenarios. Results of
same are escalated at the senior level so as to enable the Senior Management to take proactive actions to avoid liquidity crunch for the
Bank.
Contingency Funding Plan (CFP) is a part of liquidity management framework of the Bank which defines and identifies the factors that
can instigate a liquidity crisis and the actions to be taken to manage the crisis. The Bank has a comprehensive liquidity contingency
funding plan in place, which highlights liquidity management strategy to be followed under stress scenario. Parameters and
responsibilities are also incorporated in CFP in order to tackle the liquidity crisis. Moreover, CFP highlights possible funding sources,
in case of a liquidity crisis.
The Bank calculates the Liquidity Coverage Ratio (LCR) on monthly basis as per SBP Basel Ill Liquidity Standards issued under
BPRD circular no 08 dated 23 June 2016. The objective of LCR is to ensure the short-term resilience of the liquidity risk profile of the
Bank and requires banks to maintain sufficient High Quality Liquid Assets (HQLAs) to meet stressed cash outflows over a prospective
30 calendar-days period. As of 31 December 2017, the Bank's LCR stood at 237 % against the SBP's minimum requirement of 90%.
The objective of Net Stable Funding Ratio (NSFR) is to reduce funding risk over a longer time horizon by requiring banks to fund their
activities with sufficiently stable sources of funding in order to mitigate the risk of future funding stress. Banks are expected to meet the
NSFR requirement of at least 100% on an ongoing basis from 31 December 2017. As of 31 December 2017, the Bank's NSFR stood at
244%.
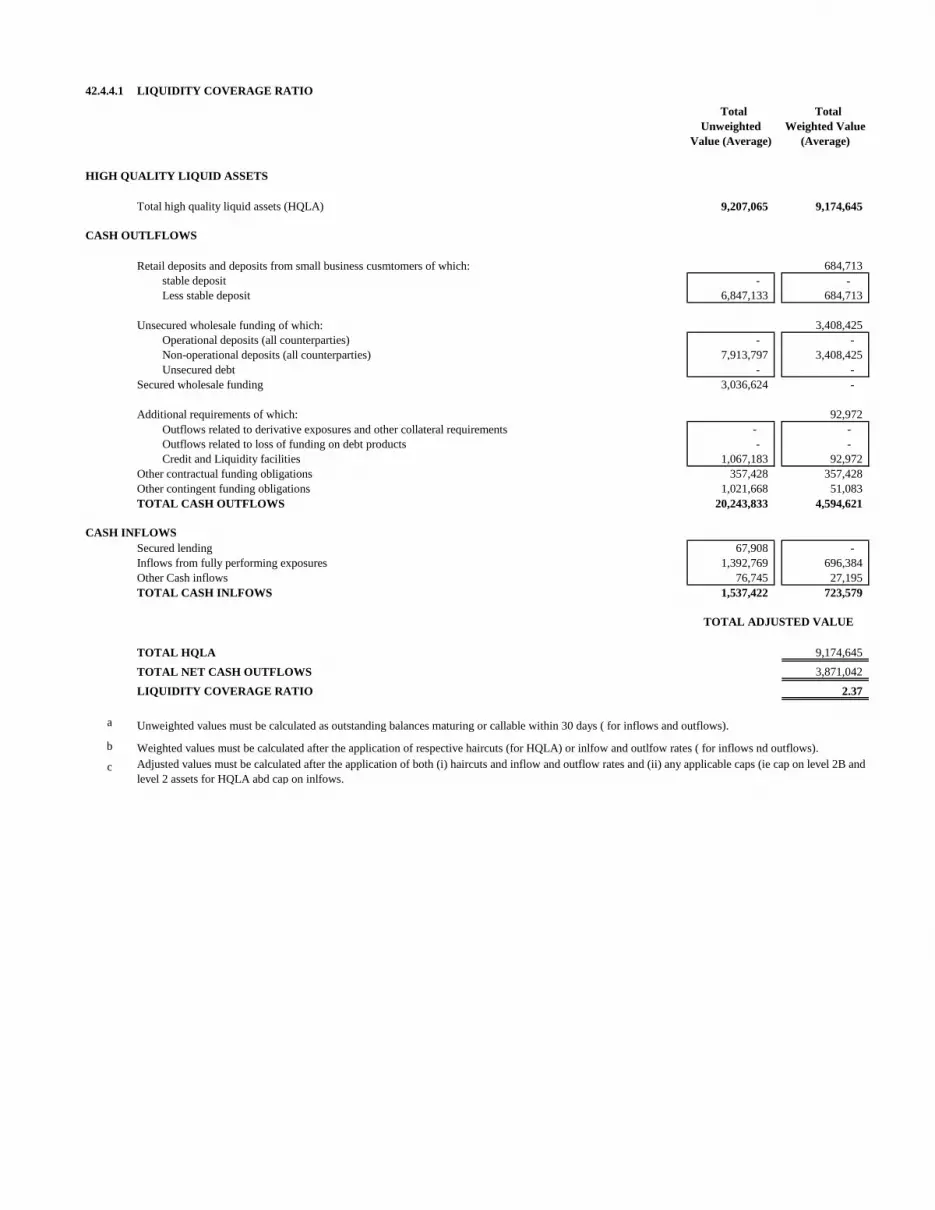
42.4.4.1 LIQUIDITY COVERAGE RATIO
Total
Unweighted
Value (Average)
Total
Weighted Value
(Average)
Total high quality liquid assets (HQLA) 9,207,065 9,174,645
Retail deposits and deposits from small business cusmtomers of which: 684,713
stable deposit - -
Less stable deposit 6,847,133 684,713
Unsecured wholesale funding of which: 3,408,425
Operational deposits (all counterparties) - -
Non-operational deposits (all counterparties) 7,913,797 3,408,425
Unsecured debt - -
Secured wholesale funding 3,036,624 -
Additional requirements of which: 92,972
Outflows related to derivative exposures and other collateral requirements - -
Outflows related to loss of funding on debt products - -
Credit and Liquidity facilities 1,067,183 92,972
Other contractual funding obligations 357,428 357,428
Other contingent funding obligations 1,021,668 51,083
TOTAL CASH OUTFLOWS 20,243,833 4,594,621
Secured lending 67,908 -
Inflows from fully performing exposures 1,392,769 696,384
Other Cash inflows 76,745 27,195
TOTAL CASH INLFOWS 1,537,422 723,579
TOTAL HQLA 9,174,645
TOTAL NET CASH OUTFLOWS 3,871,042
LIQUIDITY COVERAGE RATIO 2.37
a
b
c
Weighted values must be calculated after the application of respective haircuts (for HQLA) or inlfow and outlfow rates ( for inflows nd outflows).
Adjusted values must be calculated after the application of both (i) haircuts and inflow and outflow rates and (ii) any applicable caps (ie cap on level 2B and
level 2 assets for HQLA abd cap on inlfows.
HIGH QUALITY LIQUID ASSETS
CASH OUTLFLOWS
CASH INFLOWS
TOTAL ADJUSTED VALUE
Unweighted values must be calculated as outstanding balances maturing or callable within 30 days ( for inflows and outflows).
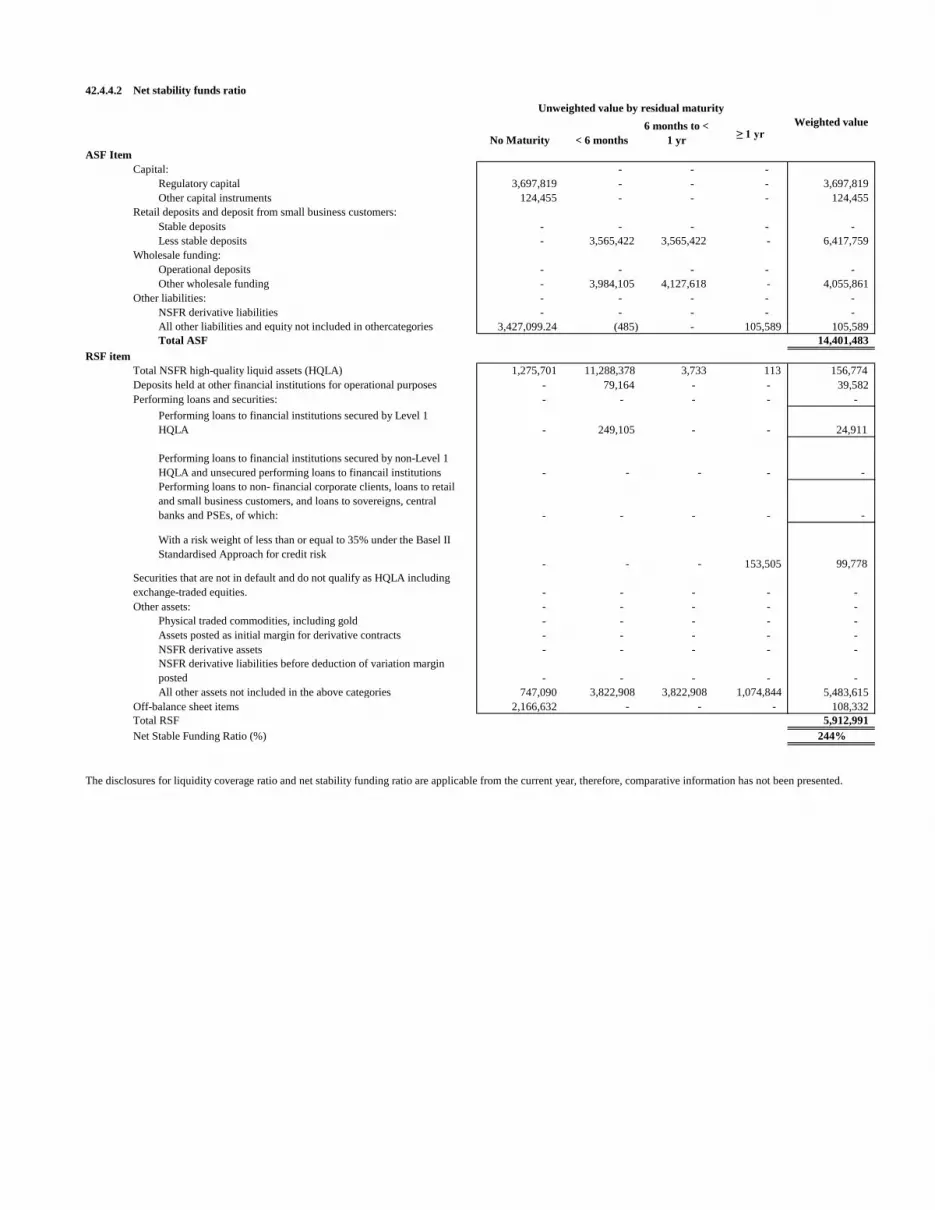
42.4.4.2 Net stability funds ratio
No Maturity < 6 months
6 months to <
1 yr≥ 1 yr
Capital: - - -
Regulatory capital 3,697,819 - - - 3,697,819
Other capital instruments 124,455 - - - 124,455
Retail deposits and deposit from small business customers:
Stable deposits - - - - -
Less stable deposits - 3,565,422 3,565,422 - 6,417,759
Wholesale funding:
Operational deposits - - - - -
Other wholesale funding - 3,984,105 4,127,618 - 4,055,861
Other liabilities: - - - - -
NSFR derivative liabilities - - - - -
All other liabilities and equity not included in othercategories 3,427,099.24 (485) - 105,589 105,589
Total ASF 14,401,483
Total NSFR high-quality liquid assets (HQLA) 1,275,701 11,288,378 3,733 113 156,774
Deposits held at other financial institutions for operational purposes - 79,164 - - 39,582
Performing loans and securities: - - - - -
Performing loans to financial institutions secured by Level 1
HQLA - 249,105 - - 24,911
Performing loans to financial institutions secured by non-Level 1
HQLA and unsecured performing loans to financail institutions - - - - -
Performing loans to non- financial corporate clients, loans to retail
and small business customers, and loans to sovereigns, central
banks and PSEs, of which: - - - - -
With a risk weight of less than or equal to 35% under the Basel II
Standardised Approach for credit risk- - - 153,505 99,778
Securities that are not in default and do not qualify as HQLA including
exchange-traded equities. - - - - -
Other assets: - - - - -
Physical traded commodities, including gold - - - - -
Assets posted as initial margin for derivative contracts - - - - -
NSFR derivative assets - - - - -
NSFR derivative liabilities before deduction of variation margin
posted - - - - -
All other assets not included in the above categories 747,090 3,822,908 3,822,908 1,074,844 5,483,615
Off-balance sheet items 2,166,632 - - - 108,332
Total RSF 5,912,991
Net Stable Funding Ratio (%) 244%
RSF item
The disclosures for liquidity coverage ratio and net stability funding ratio are applicable from the current year, therefore, comparative information has not been presented.
Unweighted value by residual maturity
Weighted value
ASF Item

42.4.5 Maturities of assets and liabilities
42.4.5.1 Maturities of assets and liabilities - Based on contractual maturity of the assets and liabilities of the Bank
Total Up to 1 Over 1 Over 3 Over 6 Over 1 Over 2 Over 3 Over 5 Above
month to 3 to 6 months to to 2 to 3 to 5 to 10 10 years
months months 1 year years years years years
Assets
Cash and balances with treasury banks 1,438,429 1,438,429 - - - - - - - -
Balances with other banks 62,606 62,606 - - - - - - - -
Lendings to financial institutions - - - - - - - - - -
Investments - net 13,587,722 10,313,413 3,269,681 4,492 - - - 136 - -
Advances - net 8,875,631 3,433,594 4,070,536 20,798 28,304 211,020 104,848 650,580 255,575 100,376
Operating fixed assets 323,546 2,711 5,425 13,131 16,276 32,552 32,556 41,958 40,384 138,553
Deferred tax assets - net 151,769 91 148 640 427 21,852 26,853 115,440 (6,211) (7,471)
Other assets - net 389,226 206,145 33,288 49,932 99,861 - - - - -
24,828,929 15,456,989 7,379,078 88,993 144,868 265,424 164,257 808,114 289,748 231,458
Liabilities
- -
Bills payable 530,291 530,291 - - - - - - - -
Borrowings 3,903,832 3,782,061 26,814 17,114 6,227 12,455 12,455 24,910 21,796 -
Deposits and other accounts 16,259,737 12,024,932 445,818 783,349 502,029 349,083 819,889 1,334,637 - -
Other liabilities 402,360 364,247 15,176 15,318 847 1,694 1,694 3,384 - -
21,096,220 16,701,531 487,808 815,781 509,103 363,232 834,038 1,362,931 21,796 -
Net assets 3,732,709 (1,244,542) 6,891,270 (726,788) (364,235) (97,808) (669,781) (554,817) 267,952 231,458
Share capital 3,994,113
Reserves 307,717
Accumulated loss (695,455)
Surplus on revaluation of assets - net of tax 126,336
3,732,711
2017
---------------------------------------------------------------------------------------- (Rupees in '000) ----------------------------------------------------------------------------------------

Total Up to 1 Over 1 Over 3 Over 6 Over 1 Over 2 Over 3 Over 5 Above
month to 3 to 6 months to to 2 to 3 to 5 to 10 10 years
months months 1 year years years years years
Assets
Cash and balances with treasury banks 1,081,532 1,081,532 - - - - - - - -
Balances with other banks 112,042 112,042 - - - - - - - -
Lendings to financial institutions 100,000 100,000 - - - - - - - -
Investments - net 8,032,819 3,290,443 4,556,620 - 185,608 - - 64 84 -
Advances - net 8,213,247 6,702,337 1,887 372 210,178 149,856 340,468 406,076 283,160 118,913
Operating fixed assets 337,077 2,403 4,807 28,515 14,421 28,842 28,844 43,931 42,509 142,805
Deferred tax assets - net 249,635 28,257 42,732 64,048 17,940 639 639 108,712 (6,223) (7,109)
Other assets - net 394,212 148,929 114,207 43,691 87,385 - - - - -
18,520,564 11,465,943 4,720,253 136,626 515,532 179,337 369,951 558,783 319,530 254,609
Liabilities
Bills payable 214,155 214,155 - - - - - - - -
Borrowings 743,909 601,184 34,113 18,314 6,227 12,455 24,910 37,365 9,341 -
Deposits and other accounts 13,708,791 10,455,851 402,688 995,727 486,491 305,214 434,099 628,721 - -
Other liabilities 373,187 331,499 15,495 20,899 588 1,176 1,176 2,354 - -
15,040,042 11,602,689 452,296 1,034,940 493,306 318,845 460,185 668,440 9,341 -
Net assets 3,480,522 (136,746) 4,267,957 (898,314) 22,226 (139,508) (90,234) (109,657) 310,189 254,609
Share capital 3,494,113
Reserves 307,717
Accumulated loss (463,975)
Surplus on revaluation of assets - net of tax 142,667
3,480,522
------------------------------------------------------------------------------------------- Restated -------------------------------------------------------------------------------------------
2016
---------------------------------------------------------------------------------------- (Rupees in '000) ----------------------------------------------------------------------------------------
The above maturity profile has been prepared in accordance with International Financial Reporting Standard 7, Financial Instruments: Disclosures, based on contractual maturities. Consequently, all demand
assets and liabilities such as running finance, current accounts and saving accounts are shown as having a maturity up to one month. However, based on historical behaviour, management is of the opinion that
the possibility of these inflows / outflows actually occurring entirely within one month is remote, as these flows normally occur over a longer period of time.
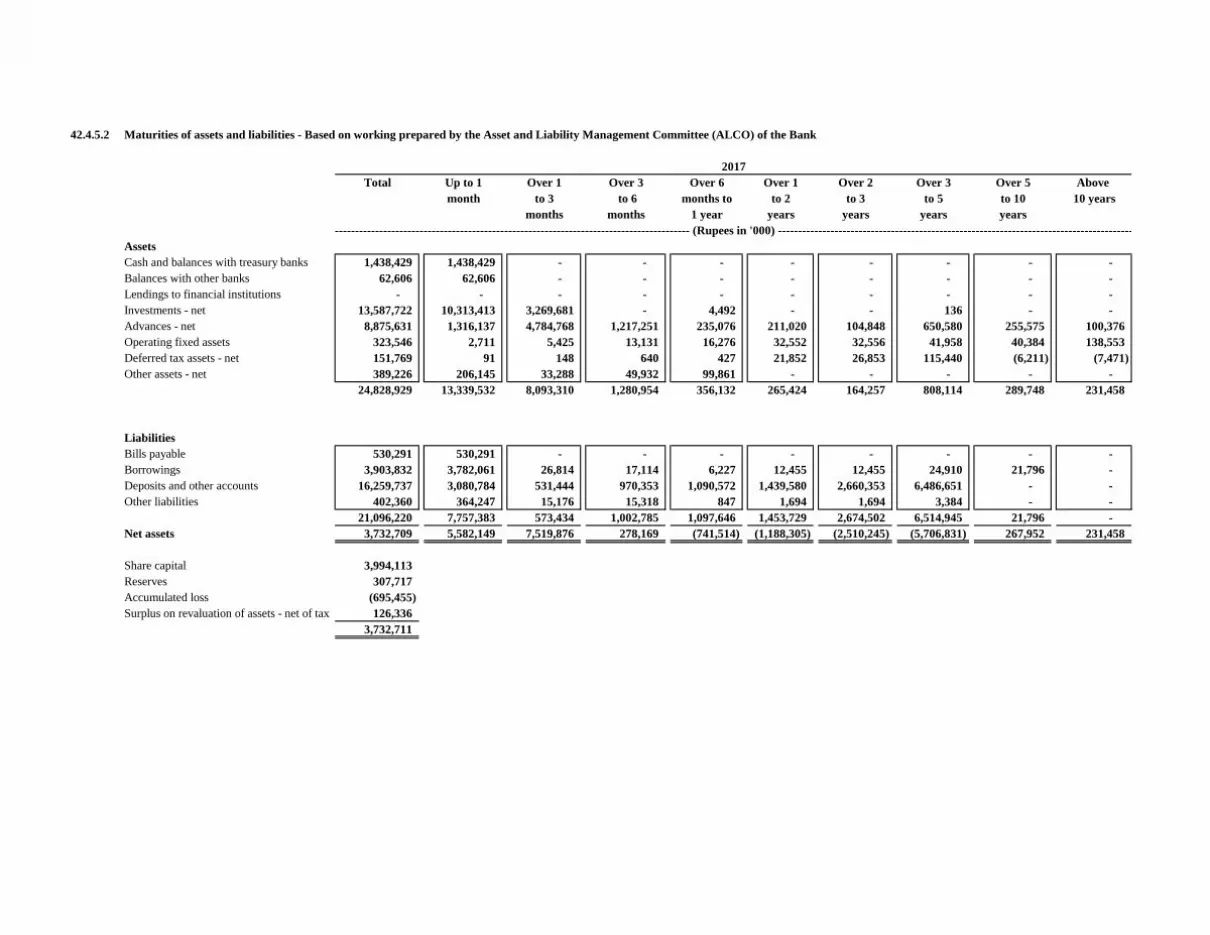
42.4.5.2 Maturities of assets and liabilities - Based on working prepared by the Asset and Liability Management Committee (ALCO) of the Bank
Total Up to 1 Over 1 Over 3 Over 6 Over 1 Over 2 Over 3 Over 5 Above
month to 3 to 6 months to to 2 to 3 to 5 to 10 10 years
months months 1 year years years years years
Assets
Cash and balances with treasury banks 1,438,429 1,438,429 - - - - - - - -
Balances with other banks 62,606 62,606 - - - - - - - -
Lendings to financial institutions - - - - - - - - - -
Investments - net 13,587,722 10,313,413 3,269,681 - 4,492 - - 136 - -
Advances - net 8,875,631 1,316,137 4,784,768 1,217,251 235,076 211,020 104,848 650,580 255,575 100,376
Operating fixed assets 323,546 2,711 5,425 13,131 16,276 32,552 32,556 41,958 40,384 138,553
Deferred tax assets - net 151,769 91 148 640 427 21,852 26,853 115,440 (6,211) (7,471)
Other assets - net 389,226 206,145 33,288 49,932 99,861 - - - - -
24,828,929 13,339,532 8,093,310 1,280,954 356,132 265,424 164,257 808,114 289,748 231,458
Liabilities
Bills payable 530,291 530,291 - - - - - - - -
Borrowings 3,903,832 3,782,061 26,814 17,114 6,227 12,455 12,455 24,910 21,796 -
Deposits and other accounts 16,259,737 3,080,784 531,444 970,353 1,090,572 1,439,580 2,660,353 6,486,651 - -
Other liabilities 402,360 364,247 15,176 15,318 847 1,694 1,694 3,384 - -
21,096,220 7,757,383 573,434 1,002,785 1,097,646 1,453,729 2,674,502 6,514,945 21,796 -
Net assets 3,732,709 5,582,149 7,519,876 278,169 (741,514) (1,188,305) (2,510,245) (5,706,831) 267,952 231,458
Share capital 3,994,113
Reserves 307,717
Accumulated loss (695,455)
Surplus on revaluation of assets - net of tax 126,336
3,732,711
---------------------------------------------------------------------------------------- (Rupees in '000) ----------------------------------------------------------------------------------------
2017
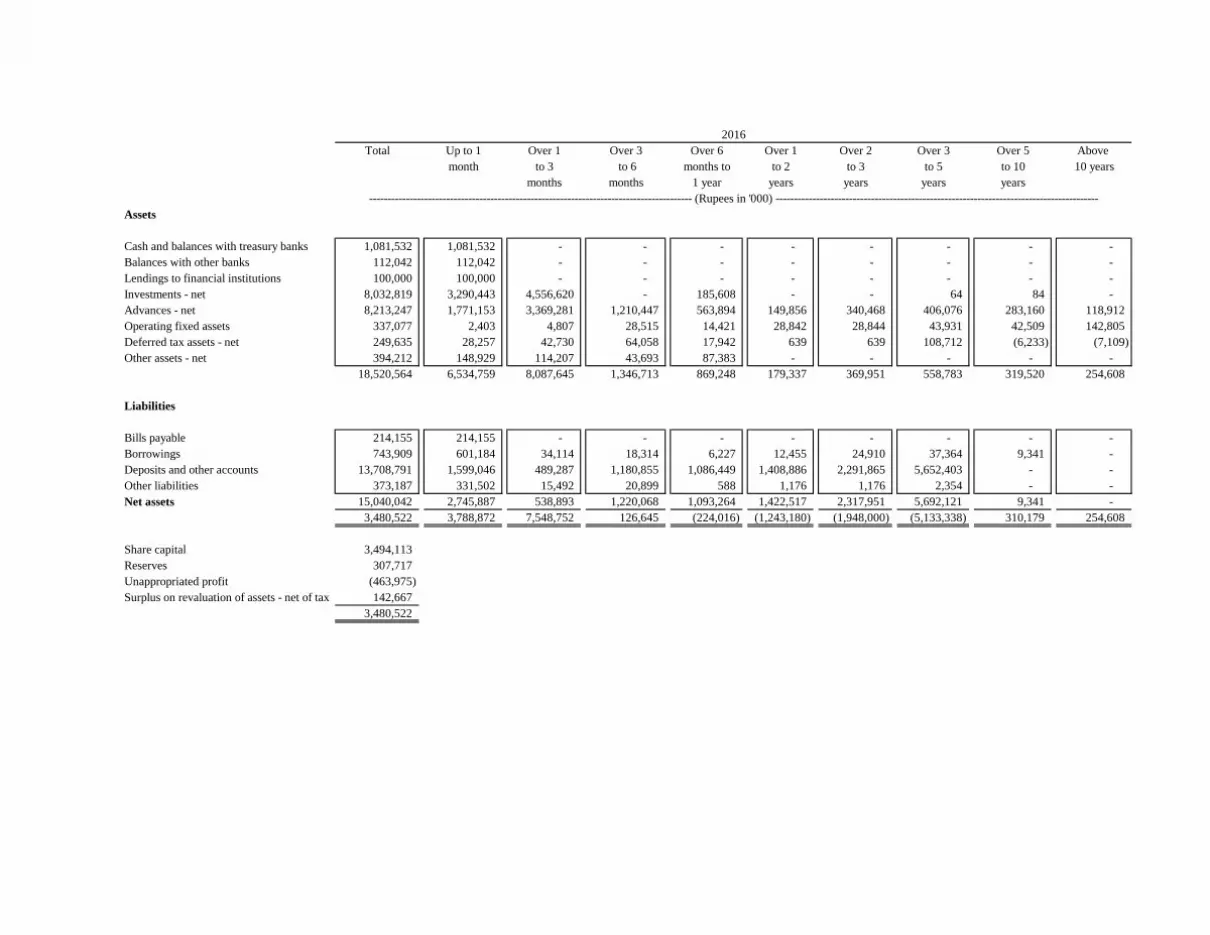
Total Up to 1 Over 1 Over 3 Over 6 Over 1 Over 2 Over 3 Over 5 Above
month to 3 to 6 months to to 2 to 3 to 5 to 10 10 years
months months 1 year years years years years
Assets
Cash and balances with treasury banks 1,081,532 1,081,532 - - - - - - - -
Balances with other banks 112,042 112,042 - - - - - - - -
Lendings to financial institutions 100,000 100,000 - - - - - - - -
Investments - net 8,032,819 3,290,443 4,556,620 - 185,608 - - 64 84 -
Advances - net 8,213,247 1,771,153 3,369,281 1,210,447 563,894 149,856 340,468 406,076 283,160 118,912
Operating fixed assets 337,077 2,403 4,807 28,515 14,421 28,842 28,844 43,931 42,509 142,805
Deferred tax assets - net 249,635 28,257 42,730 64,058 17,942 639 639 108,712 (6,233) (7,109)
Other assets - net 394,212 148,929 114,207 43,693 87,383 - - - - -
18,520,564 6,534,759 8,087,645 1,346,713 869,248 179,337 369,951 558,783 319,520 254,608
Liabilities
Bills payable 214,155 214,155 - - - - - - - -
Borrowings 743,909 601,184 34,114 18,314 6,227 12,455 24,910 37,364 9,341 -
Deposits and other accounts 13,708,791 1,599,046 489,287 1,180,855 1,086,449 1,408,886 2,291,865 5,652,403 - -
Other liabilities 373,187 331,502 15,492 20,899 588 1,176 1,176 2,354 - -
Net assets 15,040,042 2,745,887 538,893 1,220,068 1,093,264 1,422,517 2,317,951 5,692,121 9,341 -
3,480,522 3,788,872 7,548,752 126,645 (224,016) (1,243,180) (1,948,000) (5,133,338) 310,179 254,608
Share capital 3,494,113
Reserves 307,717
Unappropriated profit (463,975)
Surplus on revaluation of assets - net of tax 142,667
3,480,522
---------------------------------------------------------------------------------------- (Rupees in '000) ----------------------------------------------------------------------------------------
2016
42.4.6 Operational risk
43. DATE OF AUTHORIZATION FOR ISSUE
Humaira Siddique Tahira Raza
Chief Financial Officer President and
Chief Executive
Tahira Raza Gholam Kazim Hosein Sumaira K. Aslam Huma Baqai
President and Director Director Director
Chief Executive
These financial statements were authorized for issue by the Board of Directors of the Bank in their
meeting held on 21 March 2018.
Operational risk is the risk of loss resulting from inadequate or failed internal processes, people and
systems or from external events.
The Operational risk management policy of the Bank is duly approved by the Board and Operational
Risk Management Manual covers the processes, structure and functions of Operational risk
management and provides guidelines to identify, assess, monitor, control and report operational risk in
a consistent and transparent manner across the Bank.
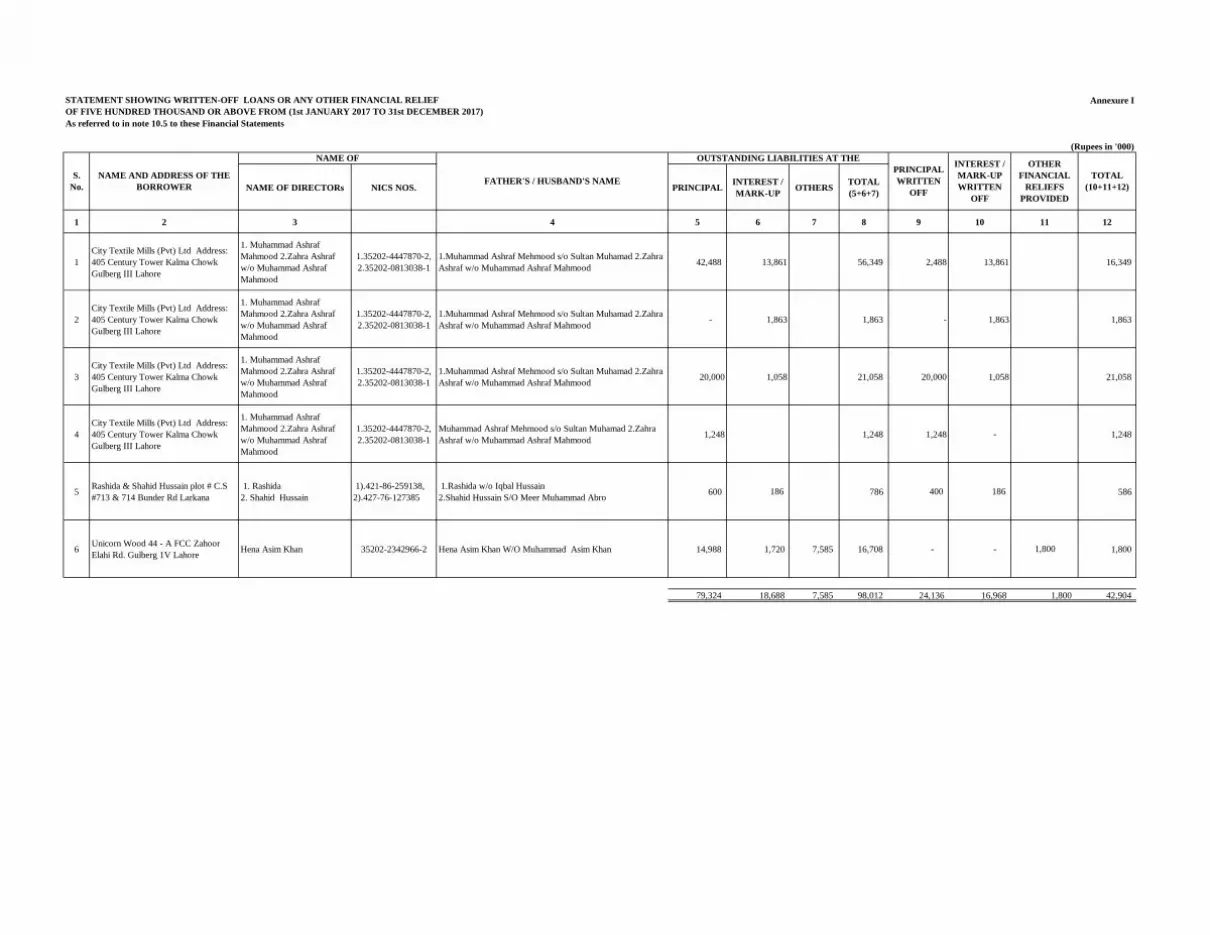
NAME OF DIRECTORs NICS NOS. PRINCIPALINTEREST /
MARK-UPOTHERS
TOTAL
(5+6+7)
1 2 3 4 5 6 7 8 9 10 11 12
1
City Textile Mills (Pvt) Ltd Address:
405 Century Tower Kalma Chowk
Gulberg III Lahore
1. Muhammad Ashraf
Mahmood 2.Zahra Ashraf
w/o Muhammad Ashraf
Mahmood
1.35202-4447870-2,
2.35202-0813038-1
1.Muhammad Ashraf Mehmood s/o Sultan Muhamad 2.Zahra
Ashraf w/o Muhammad Ashraf Mahmood 42,488 13,861 56,349 2,488 13,861 16,349
2
City Textile Mills (Pvt) Ltd Address:
405 Century Tower Kalma Chowk
Gulberg III Lahore
1. Muhammad Ashraf
Mahmood 2.Zahra Ashraf
w/o Muhammad Ashraf
Mahmood
1.35202-4447870-2,
2.35202-0813038-1
1.Muhammad Ashraf Mehmood s/o Sultan Muhamad 2.Zahra
Ashraf w/o Muhammad Ashraf Mahmood- 1,863 1,863 - 1,863 1,863
3
City Textile Mills (Pvt) Ltd Address:
405 Century Tower Kalma Chowk
Gulberg III Lahore
1. Muhammad Ashraf
Mahmood 2.Zahra Ashraf
w/o Muhammad Ashraf
Mahmood
1.35202-4447870-2,
2.35202-0813038-1
1.Muhammad Ashraf Mehmood s/o Sultan Muhamad 2.Zahra
Ashraf w/o Muhammad Ashraf Mahmood 20,000 1,058 21,058 20,000 1,058 21,058
4
City Textile Mills (Pvt) Ltd Address:
405 Century Tower Kalma Chowk
Gulberg III Lahore
1. Muhammad Ashraf
Mahmood 2.Zahra Ashraf
w/o Muhammad Ashraf
Mahmood
1.35202-4447870-2,
2.35202-0813038-1
Muhammad Ashraf Mehmood s/o Sultan Muhamad 2.Zahra
Ashraf w/o Muhammad Ashraf Mahmood 1,248 1,248 1,248 - 1,248
5Rashida & Shahid Hussain plot # C.S
#713 & 714 Bunder Rd Larkana
1. Rashida
2. Shahid Hussain
1).421-86-259138,
2).427-76-127385
1.Rashida w/o Iqbal Hussain
2.Shahid Hussain S/O Meer Muhammad Abro 600 186 786 400 186 586
6Unicorn Wood 44 - A FCC Zahoor
Elahi Rd. Gulberg 1V LahoreHena Asim Khan 35202-2342966-2 Hena Asim Khan W/O Muhammad Asim Khan 14,988 1,720 7,585 16,708 - - 1,800 1,800
79,324 18,688 7,585 98,012 24,136 16,968 1,800 42,904
PRINCIPAL
WRITTEN
OFF
INTEREST /
MARK-UP
WRITTEN
OFF
OTHER
FINANCIAL
RELIEFS
PROVIDED
TOTAL
(10+11+12)
STATEMENT SHOWING WRITTEN-OFF LOANS OR ANY OTHER FINANCIAL RELIEF Annexure I
OF FIVE HUNDRED THOUSAND OR ABOVE FROM (1st JANUARY 2017 TO 31st DECEMBER 2017)
As referred to in note 10.5 to these Financial Statements
(Rupees in '000)
S.
No.
NAME AND ADDRESS OF THE
BORROWER
NAME OF
FATHER'S / HUSBAND'S NAME
OUTSTANDING LIABILITIES AT THE
Copyright © 2022 FDOKUMEN