Annual Report and Financial Statements For the year ended ...
Upload
khangminh22Category
view
1download
0
Annual Report and Financial Statements for the year ended 30 September 2012Sasini Ltd and Subsidiaries
Annual Report and Financial Statements for the year ended 30 September 2012
Annual Report and Financial Statements for the year ended 30 September 2012Sasini Ltd and Subsidiaries Sasini Ltd and Subsidiaries
C o n t e n t s
F i n a n c i a l S t a t e m e n t s
P a g eDirectors and Statutory Information
Board of Directors
Management team
Notice of Annual General Meeting
Ilani ya Mkutano
Chairman’s Statement
Taarifa ya Mwenyekiti
Graphical Highlights
Report of the Directors
Ripoti ya Wakurugenzi
Corporate Governance
Corporate Social Investment
Statement of Directors’ Responsibilities
Report of the Independent Auditors
1 - 2
3 - 4
5
6
7 - 10
11 - 14
15
16
17
18 - 21
22
23
24
Consolidated Statement of Comprehensive Income
Company Statement of Comprehensive Income
Consolidated Statement of Financial Position
Company Statement of Financial Position
Consolidated Statement of Changes in Equity
Company Statement of Changes in Equity
Consolidated Statement of Cash Flows
Company Statement of Cash Flows
Notes to the financial statements
Five years comparative statements
Notes
Form of proxy /fomu ya uwakilishi
Directions to Kamundu Estate
25
26
27
28
29 - 30
31 - 32
33
34
35 - 75
77 - 78
79
Sasin
i
Sasin
i
Sasini
Tea
Sasini
Tea
Annual Report and Financial Statements for the year ended 30 September 2012
Annual Report and Financial Statements for the year ended 30 September 2012Sasini Ltd and Subsidiaries Sasini Ltd and Subsidiaries
D i r e c t o r s a n d S t a t u t o r y I n f o r m a t i o n
D i r e c t o r sDr. J.B. McFie, PhD, MBSDr. M.J.C Mwangi, PhDN. N. Merali, CBSA.H. Butt, CPA (K), FCCAS.N. Merali, MSc M.J. Ernest, BA (Hons), FCA (British)Mrs. L.W. Waithaka, MSc S.O. Mainda, EBSI. A. Timamy, LLB (Hons), CPS (K)P.W. Muthoka, BA (Hons), MA, MBS, FKIB, FKIM
S e c r e t a r yMary Rebecca Ekaya, LLB, CPS (K)P.O. Box 30151 – 00100NAIROBI
ChairmanManaging Director
(Appointed 21 September 2012)(Resigned 11 December 2012)
(Resigned 21 September 2012)
A d v o c a t e sShapley Barret & CompanyP.O. Box 40286 - 00100 NAIROBI
Hamilton Harrison and MathewsP.O. Box 30333 - 00100NAIROBI
Timamy and Company AdvocatesP.O. Box 87288 - 80100 MOMBASA
A u d i t o r sKPMG Kenya16th Floor, Lonrho HouseStandard StreetP.O. Box 40612 - 00100 NAIROBI
V i s i o n
“ To be the leading agribusiness in Africa.”
M i s s i o n
“ To focus on innovative and efficient business practices, quality products and commitment to all our stake holders.”
R e g i s t e r e d O f f i c e a n d P r i n c i p a l P l a c e o f B u s i n e s sSasini HouseLoita StreetP.O. Box 30151 - 00100 NAIROBI
Telephone(254-020) 342166/71/72
Mobile0722 200706, 0734 200706
Websitewww.sasini.co.ke
B a n k e r sBarclays Bank of Kenya LimitedBarclays PlazaP.O. Box 46661 - 00100 NAIROBI
Commercial Bank of Africa LimitedMara & Ragati Roads, Upper HillP.O. Box 30437 - 00100 NAIROBI
Equatorial Commercial Bank LimitedNyerere Road P.O. Box 52467 - 00200NAIROBI
Kenya Commercial Bank LimitedKiambu BranchP.O. Box 81KIAMBU
Standard Chartered Bank Kenya LimitedKiambu BranchP.O. Box 117-00900KIAMBU
UBA Kenya Bank LimitedRing Road, Vale Close WestlandsP.O. Box 34154 -00100NAIROBI
Annual Report and Financial Statements for the year ended 30 September 2012
Annual Report and Financial Statements for the year ended 30 September 2012Sasini Ltd and Subsidiaries Sasini Ltd and Subsidiaries
Sasin
i
Sasin
i
Sasini
Tea
Sasini
Tea
Sasin
i
Sasin
i
Sasini
Tea
Sasini
Tea
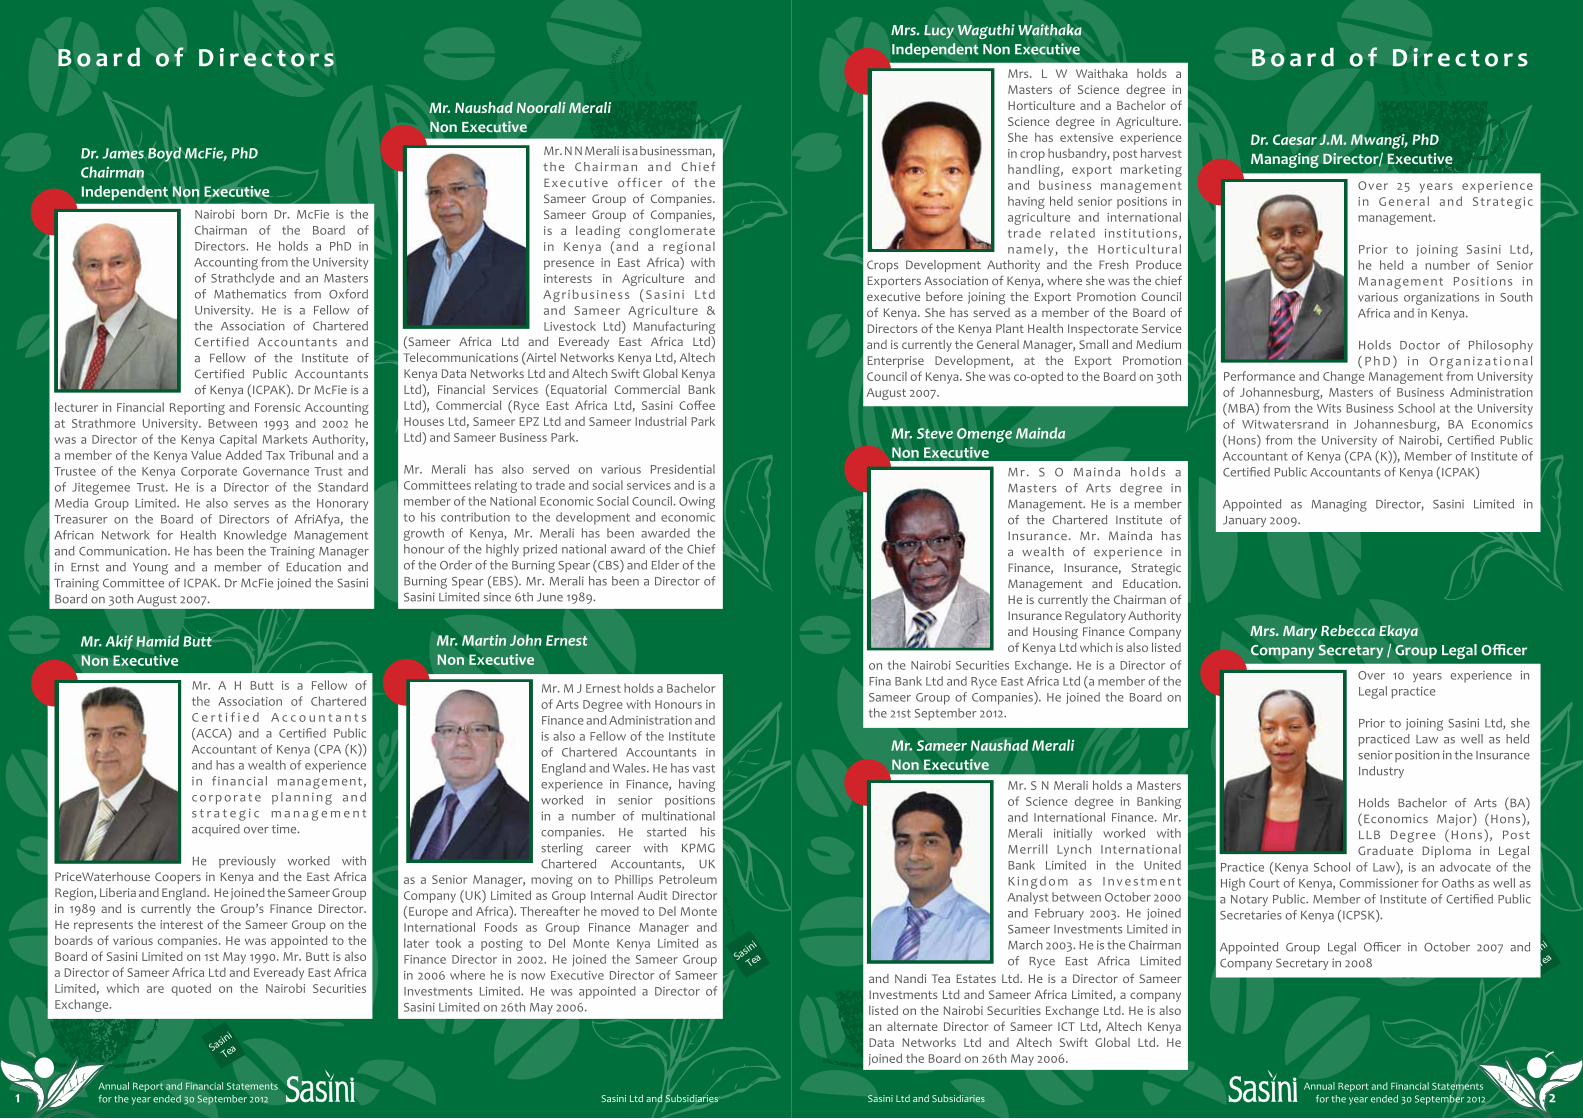
Dr. James Boyd McFie, PhD ChairmanIndependent Non Executive
Nairobi born Dr. McFie is the Chairman of the Board of Directors. He holds a PhD in Accounting from the University of Strathclyde and an Masters of Mathematics from Oxford University. He is a Fellow of the Association of Chartered Certified Accountants and a Fellow of the Institute of Certified Public Accountants of Kenya (ICPAK). Dr McFie is a
Mr. M J Ernest holds a Bachelor of Arts Degree with Honours in Finance and Administration and is also a Fellow of the Institute of Chartered Accountants in England and Wales. He has vast experience in Finance, having worked in senior positions in a number of multinational companies. He started his sterling career with KPMG Chartered Accountants, UK
Mr. Naushad Noorali Merali Non Executive
Mr. N N Merali is a businessman, t h e C ha i r m a n a nd C h i e f Execut ive off icer of the Sameer Group of Companies. Sameer Group of Companies, is a leading conglomerate in Kenya (and a regional presence in East Africa) with interests in Agriculture and Agr ibus iness (Sas in i Ltd and Sameer Agriculture & Livestock Ltd) Manufacturing
B o a r d o f D i r e c t o r s B o a r d o f D i r e c t o r s
(Sameer Africa Ltd and Eveready East Africa Ltd) Telecommunications (Airtel Networks Kenya Ltd, Altech Kenya Data Networks Ltd and Altech Swift Global Kenya Ltd), Financial Services (Equatorial Commercial Bank Ltd), Commercial (Ryce East Africa Ltd, Sasini Coffee Houses Ltd, Sameer EPZ Ltd and Sameer Industrial Park Ltd) and Sameer Business Park.
Mr. Merali has also served on various Presidential Committees relating to trade and social services and is a member of the National Economic Social Council. Owing to his contribution to the development and economic growth of Kenya, Mr. Merali has been awarded the honour of the highly prized national award of the Chief of the Order of the Burning Spear (CBS) and Elder of the Burning Spear (EBS). Mr. Merali has been a Director of Sasini Limited since 6th June 1989.
lecturer in Financial Reporting and Forensic Accounting at Strathmore University. Between 1993 and 2002 he was a Director of the Kenya Capital Markets Authority, a member of the Kenya Value Added Tax Tribunal and a Trustee of the Kenya Corporate Governance Trust and of Jitegemee Trust. He is a Director of the Standard Media Group Limited. He also serves as the Honorary Treasurer on the Board of Directors of AfriAfya, the African Network for Health Knowledge Management and Communication. He has been the Training Manager in Ernst and Young and a member of Education and Training Committee of ICPAK. Dr McFie joined the Sasini Board on 30th August 2007.
Mrs. Mary Rebecca Ekaya Company Secretary / Group Legal Officer
Over 10 years experience in Legal practice
Prior to joining Sasini Ltd, she practiced Law as well as held senior position in the Insurance Industry
Holds Bachelor of Arts (BA) (Economics Major) (Hons), LLB Degree (Hons), Post Graduate Diploma in Legal
Practice (Kenya School of Law), is an advocate of the High Court of Kenya, Commissioner for Oaths as well as a Notary Public. Member of Institute of Certified Public Secretaries of Kenya (ICPSK).
Appointed Group Legal Officer in October 2007 and Company Secretary in 2008
Mr. Martin John Ernest Non Executive
Mr. A H Butt is a Fellow of the Association of Chartered C e r t i f i e d A c c o u n t a n t s (ACCA) and a Certified Public Accountant of Kenya (CPA (K)) and has a wealth of experience in f inancial management, c o r p o r a t e p l a n n i n g a n d s t r a t e g i c m a n a g e m e n t acquired over time.
He previously worked with
Mr. Akif Hamid ButtNon Executive
as a Senior Manager, moving on to Phillips Petroleum Company (UK) Limited as Group Internal Audit Director (Europe and Africa). Thereafter he moved to Del Monte International Foods as Group Finance Manager and later took a posting to Del Monte Kenya Limited as Finance Director in 2002. He joined the Sameer Group in 2006 where he is now Executive Director of Sameer Investments Limited. He was appointed a Director of Sasini Limited on 26th May 2006.
PriceWaterhouse Coopers in Kenya and the East Africa Region, Liberia and England. He joined the Sameer Group in 1989 and is currently the Group’s Finance Director. He represents the interest of the Sameer Group on the boards of various companies. He was appointed to the Board of Sasini Limited on 1st May 1990. Mr. Butt is also a Director of Sameer Africa Ltd and Eveready East Africa Limited, which are quoted on the Nairobi Securities Exchange.
Dr. Caesar J.M. Mwangi, PhDiManaging Director/ Executive
Over 25 years experience in General and Strategic management.
Prior to joining Sasini Ltd, he held a number of Senior Management Posit ions in various organizations in South Africa and in Kenya.
Holds Doctor of Philosophy ( P h D ) i n O r g a n i z a t i o n a l
Performance and Change Management from University of Johannesburg, Masters of Business Administration (MBA) from the Wits Business School at the University of Witwatersrand in Johannesburg, BA Economics (Hons) from the University of Nairobi, Certified Public Accountant of Kenya (CPA (K)), Member of Institute of Certified Public Accountants of Kenya (ICPAK)
Appointed as Managing Director, Sasini Limited in January 2009.
Mrs. Lucy Waguthi Waithaka Independent Non Executive
Mrs. L W Waithaka holds a Masters of Science degree in Horticulture and a Bachelor of Science degree in Agriculture. She has extensive experience in crop husbandry, post harvest handling, export marketing and business management having held senior positions in agriculture and international trade related institutions, namely, the Horticultural
Crops Development Authority and the Fresh Produce Exporters Association of Kenya, where she was the chief executive before joining the Export Promotion Council of Kenya. She has served as a member of the Board of Directors of the Kenya Plant Health Inspectorate Service and is currently the General Manager, Small and Medium Enterprise Development, at the Export Promotion Council of Kenya. She was co-opted to the Board on 30th August 2007.
Mr. Sameer Naushad MeraliNon Executive
Mr. S N Merali holds a Masters of Science degree in Banking and International Finance. Mr. Merali initially worked with Merrill Lynch International Bank Limited in the United K i n g d o m a s I n v e s t m e n t Analyst between October 2000 and February 2003. He joined Sameer Investments Limited in March 2003. He is the Chairman of Ryce East Africa Limited
and Nandi Tea Estates Ltd. He is a Director of Sameer Investments Ltd and Sameer Africa Limited, a company listed on the Nairobi Securities Exchange Ltd. He is also an alternate Director of Sameer ICT Ltd, Altech Kenya Data Networks Ltd and Altech Swift Global Ltd. He joined the Board on 26th May 2006.
Mr. Steve Omenge MaindaNon Executive
Mr. S O Mainda holds a Masters of Arts degree in Management. He is a member of the Chartered Institute of Insurance. Mr. Mainda has a wealth of experience in Finance, Insurance, Strategic Management and Education. He is currently the Chairman of Insurance Regulatory Authority and Housing Finance Company of Kenya Ltd which is also listed
on the Nairobi Securities Exchange. He is a Director of Fina Bank Ltd and Ryce East Africa Ltd (a member of the Sameer Group of Companies). He joined the Board on the 21st September 2012.
Annual Report and Financial Statements for the year ended 30 September 2012
Annual Report and Financial Statements for the year ended 30 September 2012Sasini Ltd and Subsidiaries Sasini Ltd and Subsidiaries1 2
Annual Report and Financial Statements for the year ended 30 September 2012
Annual Report and Financial Statements for the year ended 30 September 2012Sasini Ltd and Subsidiaries Sasini Ltd and Subsidiaries
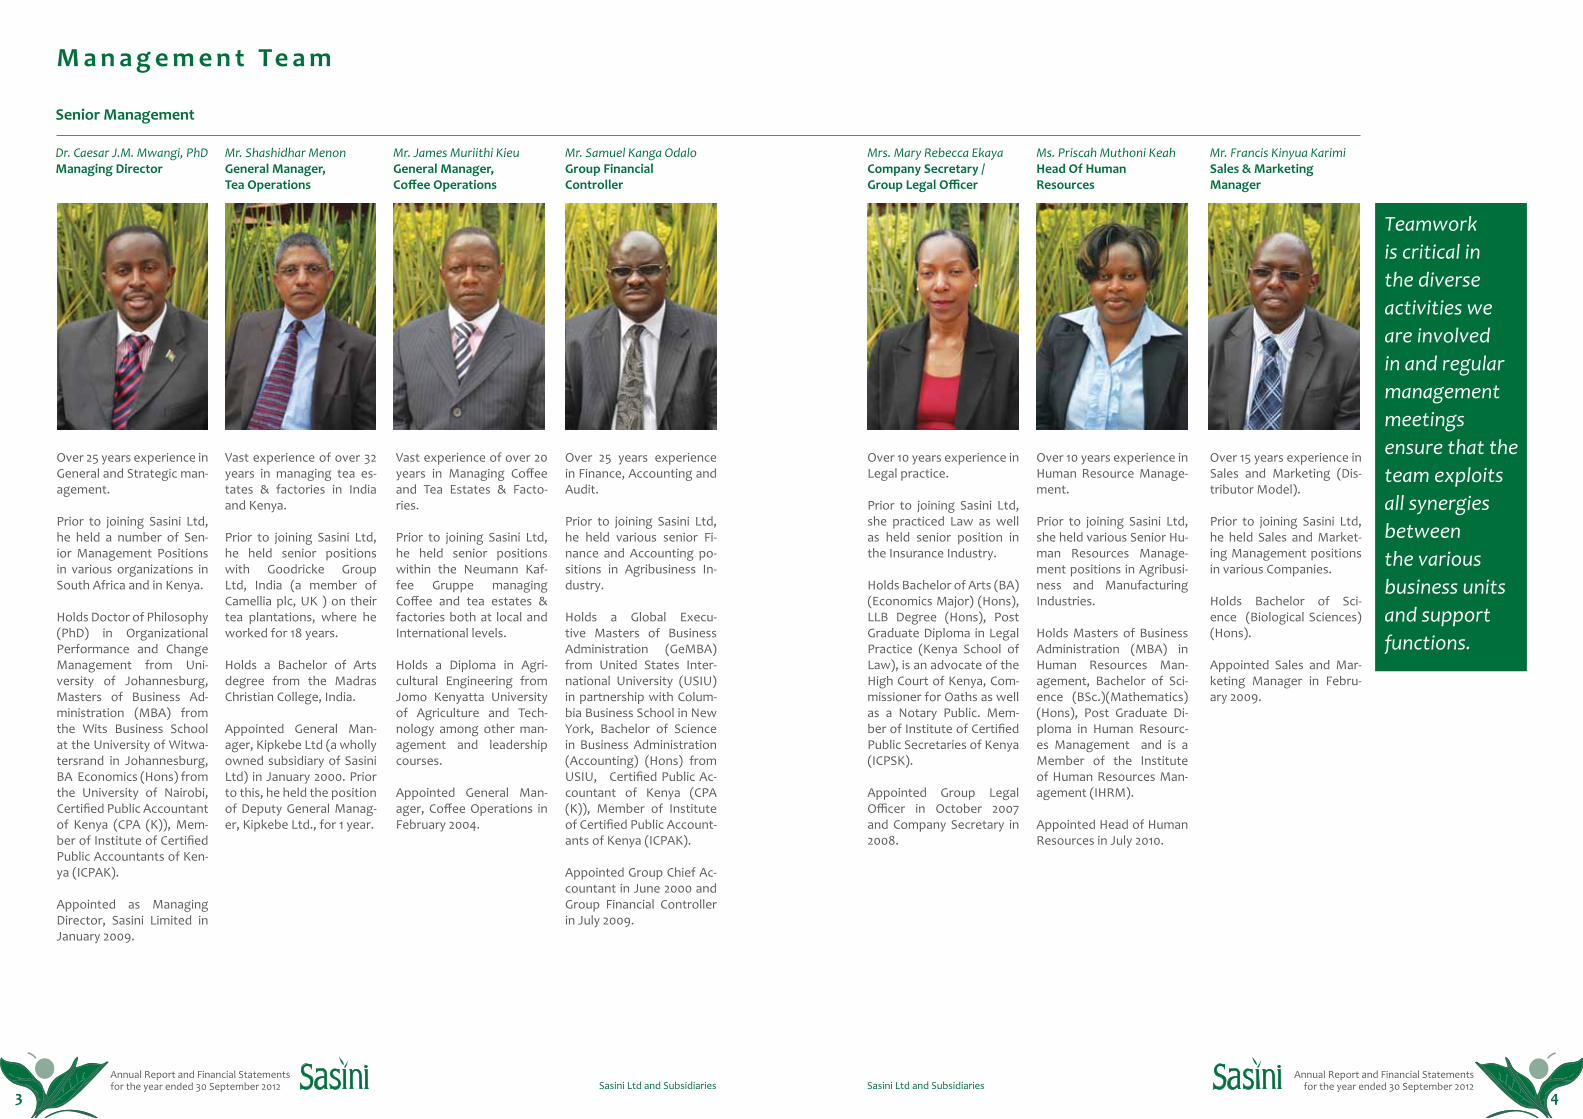
Senior Management
M a n a g e m e n t Te a m
Dr. Caesar J.M. Mwangi, PhDManaging Director
Mr. Shashidhar Menon General Manager, Tea Operations
Mr. James Muriithi Kieu General Manager, Coffee Operations
Mr. Samuel Kanga Odalo Group Financial Controller
Mrs. Mary Rebecca Ekaya Company Secretary / Group Legal Officer
Ms. Priscah Muthoni KeahHead Of Human Resources
Mr. Francis Kinyua Karimi Sales & Marketing Manager
Over 25 years experience in General and Strategic man-agement.
Prior to joining Sasini Ltd, he held a number of Sen-ior Management Positions in various organizations in South Africa and in Kenya.
Holds Doctor of Philosophy (PhD) in Organizational Performance and Change Management from Uni-versity of Johannesburg, Masters of Business Ad-ministration (MBA) from the Wits Business School at the University of Witwa-tersrand in Johannesburg, BA Economics (Hons) from the University of Nairobi, Certified Public Accountant of Kenya (CPA (K)), Mem-ber of Institute of Certified Public Accountants of Ken-ya (ICPAK).
Appointed as Managing Director, Sasini Limited in January 2009.
Vast experience of over 32 years in managing tea es-tates & factories in India and Kenya.
Prior to joining Sasini Ltd, he held senior positions with Goodricke Group Ltd, India (a member of Camellia plc, UK ) on their tea plantations, where he worked for 18 years.
Holds a Bachelor of Arts degree from the Madras Christian College, India.
Appointed General Man-ager, Kipkebe Ltd (a wholly owned subsidiary of Sasini Ltd) in January 2000. Prior to this, he held the position of Deputy General Manag-er, Kipkebe Ltd., for 1 year.
Vast experience of over 20 years in Managing Coffee and Tea Estates & Facto-ries.
Prior to joining Sasini Ltd, he held senior positions within the Neumann Kaf-fee Gruppe managing Coffee and tea estates & factories both at local and International levels.
Holds a Diploma in Agri-cultural Engineering from Jomo Kenyatta University of Agriculture and Tech-nology among other man-agement and leadership courses.
Appointed General Man-ager, Coffee Operations in February 2004.
Over 25 years experience in Finance, Accounting and Audit.
Prior to joining Sasini Ltd, he held various senior Fi-nance and Accounting po-sitions in Agribusiness In-dustry.
Holds a Global Execu-tive Masters of Business Administration (GeMBA) from United States Inter-national University (USIU) in partnership with Colum-bia Business School in New York, Bachelor of Science in Business Administration (Accounting) (Hons) from USIU, Certified Public Ac-countant of Kenya (CPA (K)), Member of Institute of Certified Public Account-ants of Kenya (ICPAK).
Appointed Group Chief Ac-countant in June 2000 and Group Financial Controller in July 2009.
Over 10 years experience in Legal practice.
Prior to joining Sasini Ltd, she practiced Law as well as held senior position in the Insurance Industry.
Holds Bachelor of Arts (BA) (Economics Major) (Hons), LLB Degree (Hons), Post Graduate Diploma in Legal Practice (Kenya School of Law), is an advocate of the High Court of Kenya, Com-missioner for Oaths as well as a Notary Public. Mem-ber of Institute of Certified Public Secretaries of Kenya (ICPSK).
Appointed Group Legal Officer in October 2007 and Company Secretary in 2008.
Over 10 years experience in Human Resource Manage-ment.
Prior to joining Sasini Ltd, she held various Senior Hu-man Resources Manage-ment positions in Agribusi-ness and Manufacturing Industries.
Holds Masters of Business Administration (MBA) in Human Resources Man-agement, Bachelor of Sci-ence (BSc.)(Mathematics) (Hons), Post Graduate Di-ploma in Human Resourc-es Management and is a Member of the Institute of Human Resources Man-agement (IHRM).
Appointed Head of Human Resources in July 2010.
Over 15 years experience in Sales and Marketing (Dis-tributor Model).
Prior to joining Sasini Ltd, he held Sales and Market-ing Management positions in various Companies.
Holds Bachelor of Sci-ence (Biological Sciences) (Hons).
Appointed Sales and Mar-keting Manager in Febru-ary 2009.
Teamwork is critical in the diverse activities we are involved in and regular management meetings ensure that the team exploits all synergies between the various business units and support functions.
3 4
Annual Report and Financial Statements for the year ended 30 September 2012
Annual Report and Financial Statements for the year ended 30 September 2012Sasini Ltd and Subsidiaries Sasini Ltd and Subsidiaries
N o t i c e o f A n n u a l G e n e r a l M e e t i n g I l a n i y a M k u t a n o M k u u w a K i l a M w a k a
Notice is hereby given that the Sixty-first (61st) ANNUAL GENERAL MEETING of the members will be held at Kamundu Estate, Kiambu, on Friday 22nd February 2013, at 11.30 a.m, for the following purposes:
1. To confirm the minutes of the Sixtieth (60th) Annual General Meeting held on 2nd March 2012.
2. To receive, consider and if deemed fit, adopt the Annual Report and Financial Statements for the year ended 30th September 2012 together with the reports thereon of the Directors and of the Auditors.
3. To confirm the interim dividend of 50% paid on 6th July 2012 and to declare a final dividend of 25%
4. To elect the following Directors: I. Dr. J. B. McFie, a Director retiring by rotation, who being eligible, offers himself for re-election. II. Mrs. L.W. Waithaka a Director retiring by rotation, who being eligible, offers herself for re-election. III. Mr. S. O. Mainda, who was appointed a Director on the 21st September 2012 to hold office until the conclusion of this Annual General Meeting, and who being eligible, offers himself for re-election.
5. To confirm the Directors’ emoluments.
6. To appoint KPMG Kenya as auditors for the ensuing year and authorize Directors to fix their remuneration.
7. To transact any other business which may be transacted at an Annual General Meeting.
By Order of the Board
Mrs. Mary Rebecca EkayaCompany Secretary
Nairobi18 December 2012
Notes.• A member entitled to attend and vote at this meeting may appoint a proxy to attend and vote on his/her behalf, and such a proxy need not be a member of the Company.
• The form of proxy is enclosed.
Ilani inatolewa hapa kuwa Mkutano Mkuu wa kila Mwaka wa sitini na moja (61) wa wanachama utafanyika katika shamba la Kamundu, Kiambu, Ijumaa, tarehe 22 Februari 2013, saa tano na nusu asubuhi kwa madhumuni yafuatayo:
1. Kuthibitisha matokeo ya Mkutano Mkuu wa Sitini (60) uliofanyika tarehe 2 Machi 2012.
2. Kupokea, kuchunguza na ikionekana sawa kuidhinisha Ripoti ya Mwaka na Taarifa za Kifedha za mwaka uliomalizikia tarehe 30 Septemba 2012, pamoja na taarifa za wakurugenzi na wakaguzi wa hesabu .
3. Kuthibitisha mgao wa faida wa muda wa asilimia 50 uliolipwa tarehe 6 Julai 2012 na kutangaza mgao wa mwisho wa faida wa asilimia 25.
4. Kuwachagua wakurugenzi wafuatao: I. Dkt. J. B. McFie, Mkurugenzi anayestaafu kwa zamu, ambaye kwa kuwa ana haki ya kuchaguliwa, anajitolea kuchaguliwa tena. II. Bi. L.W. Waithaka, Mkurugenzi anayestaafu kwa zamu, ambaye kwa kuwa ana haki ya kuchaguliwa, anajitolea kuchaguliwa tena. III. Bw. S. O. Mainda, Mkurugenzi aliyechaguliwa tarehe 21 Septemba 2012 kushikilia mamlaka mpaka kumalizika Mkutano Mkuu wa kila Mwaka, na ambaye kwa kuwa ana haki ya kuchaguliwa, anajitolea kuchaguliwa tena.
5. Kuidhinisha malipo ya Wakurugenzi.
6. Kuwachagua KPMG Kenya kama wakaguzi wa hesabu wa mwaka unaofuata na kuwaidhinisha wakurugenzi kuamua ujira wao.
7. Kushughulikia jambo lingine lolote linaloweza kushughulikiwa katika Mkutano Mkuu wa kila Mwaka.
Kwa Amri ya Halmashauri
Bi. Mary Rebecca EkayaKatibu wa Kampuni
NairobiTarehe 18 Desemba 2012
Maelezo• Mwanachama mwenye haki ya kuhudhuria na kupiga kura katika mkutano huu aweza kuchagua mwakilishi kuhudhuria na kupiga kura kwa niaba yake na mwakilishi huyo si lazima awe mwanachama wa Kampuni.
• Fomu ya uwakilishi imeshikanishwa.
5 6
Annual Report and Financial Statements for the year ended 30 September 2012
Annual Report and Financial Statements for the year ended 30 September 2012Sasini Ltd and Subsidiaries Sasini Ltd and Subsidiaries
C h a i r m a n ’ s S t a t e m e n t C h a i r m a n ’ s S t a t e m e n t
Economy and Business Environment
Global and National Economy
The world economy has changed somewhat since September 2011. European growth has slowed sharply, and many economies in Europe are now in, or close to, recession. In the Middle East and North Africa (MENA), unrest is still present in some countries, depressing the outlook for the region even as some economies rebuild after earlier conflicts. In other regions, however, developments have been more positive. The United States has seen a spate of encouraging economic news, with growth increasing and unemployment falling. Asia has weathered the global slowdown well and looks headed for a soft landing. Latin America has shown resilience to the swings flowing from European developments over recent months. Finally, sub-Saharan Africa (SSA) has been surprisingly resilient to the European slowdown, reflecting an ongoing redirection of its economic linkages toward Asia. While growth prospects in much of the world have been marked down since the September 2011 World Economic Outlook, there were expectations for improvement in 2012 and beyond as a result of the combined policy measures taken across developed and emerging market economies i.
In Kenya, there was a general slowdown in the economy between 2011 and 2012. This was reflected in reduced GDP growth as measured in the second quarter of 2012 and 2011. In 2012 the growth was 3.3 percent compared to 3.5 percent in 2011. This general slowdown was also reflected in comparisons with overall performance in earlier years where there was an overall declining trend between 2010 and 2011. In 2011 the economy grew by 4.4 percent while in 2010 it grew by 5.8 percent ii.
Inflation has declined since the highs of close to 20 percent in November 2011. By September 2012, inflation stood at 5.3 percent reflecting the impact of aggressive monetary policy decisions taken by the Monetary Policy Committee which raised the Central Bank Rate (CBR) to 7% on 17th September 2011, to 11 % on 5th October 2011 and to 18% in December 2011.
Global Tea Trends
According to global figures provided for 2012, black tea production has seen a considerable drop in the first three quarters of the year 2012. In major producing countries and from information from trade bodies around the world, black tea output fell by 2.85 percent compared to the same period in 2011. This represents a drop of almost 42 million kilograms to 1,427.49 million kilograms despite rising demand. Almost all black tea producing nations have seen declines, with Kenya being the hardest hit; its output dropped by almost 12 million kilograms, closely followed by India where there was a decline of almost 11 million kilograms. Uganda, Indonesia, Sri Lanka, Tanzania and Zimbabwe all saw declines; the only country that posted an increase in production during the period was Bangladesh.
The shortfall in supply is primarily attributed to erratic weather conditions across the globe. Kenya, the world’s largest exporter of black tea, experienced dry spells, poor rains and frosts in the early part of 2012; poor monsoon rains iii have reduced yields in Sri Lanka and India. Experts predict that this increase in a production-demand gap may continue, as production shortfalls squeeze the market and demand rises quickly in India and China.
The resultant decline in production volumes has seen the price of supermarket-quality tea increase dramatically during 2012. The wholesale price of black tea rose substantially from the beginning of the year, surpassing USD 4 a kilogram during the year. This is the highest price since late 2009, when prices reached USD 5.45 per kilogram.
Trends indicate that global black tea consumption is projected to rise 21% in the next 10 years. With reduced supplies from major producing countries like Kenya, Sri Lanka and India, there is likely to be upward pressure on prices given that tea plantation areas around the world remain the same, while demand continues to rise.
National Tea Trends
The year 2012 experienced a drop in national production volumes of tea. The production in 2011 was 377 million kg and this was expected to drop to 360 million kg in 2012. However prices improved in 2012 as indicated by the 2012 eight month performance report compiled by the Tea Board of Kenya which indicated an average growth of 4% in Kenya tea auction prices from USD 3.02 per Kg of made tea in 2011 to USD 3.15 in the 2012.
In terms of markets, Kenya is exporting to over 50 destinations. The top markets remain Egypt, Pakistan, the UK, Sudan and Afghanistan which collectively take
( C o n t i n u e d )
Future Prospects for Growth
“ We have embarked on a
diagnostic analysis of the nutrient
levels in our coffee farms aimed
at ultimately designing an
optimal soil nutrient application
plan to maximize the production
of coffee.”
about 70% of Kenya’s total exports. Significant growth has been witnessed in traditional markets such as Egypt and Pakistan and in emerging markets such as the U.A.E, Russia, Somalia, Iran, Ireland, Djibouti, the USA and Turkey. Growth is attributed to enhanced promotion activities. By the end of 2012, Kenya expected to earn marginally more export earnings from Kshs. 109 billion in 2011 to Kshs. 110 billion in 2012.
Global Coffee Trends
In the twelve months ending October 2012, world exports of Arabica coffee totalled 66.19 million bags compared to 67.5 million bags in the previous year; Robusta exports amounted to 43.05 million bags compared to 37.01 million bags. iv
World coffee prices fell during the nine month period to September 2012 and they slipped further in October 2012. Early indications are that world production will continue to increase in 2012/13. World consumption is expected to remain buoyant. If the record expected production for 2012/13 is confirmed, the coffee market will move into a surplus of supply, although any impact on prices is likely to be modest, given the need to replenish stocks.
National Coffee Trends
Kenya has established herself as an important supplier of high quality coffee over time. The country supplied coffee worth USD 224 million in 2011, which accounted for 1% of world demand. Coffee accounted for about 4% of Kenya’s total exports in 2011 placing it as the third largest export earner. The leading export products were tea, horticulture, coffee, apparels, iron and steel products, and tobacco products v.
However, the Country’s Coffee production has been on a worryingly downward trend. From a high of 65,167mt in 2001, production has declined to 43,096mt in 2010, 36,629mt in 2011 but improved to 49,003mt in 2012. Average prices at the Nairobi Coffee Exchange assumed a downward trend between 2011 and 2012. In 2011, the average price per kg was USD 6.73 and this declined by 32% in 2012 to USD 4.57 in 2012.
The declining national production situation is as a result of various factors, chief among them being the abandoning of growing of coffee by a large number of smallholder growers due to declining coffee prices during the period from 2001 to 2007; prices per kg were as low as USD 1.31 in 2003. Other factors include un-favourable weather conditions and the escalating land prices in some of the main coffee growing areas around Nairobi which are being transformed into real estate developments.
7 8
Annual Report and Financial Statements for the year ended 30 September 2012
Annual Report and Financial Statements for the year ended 30 September 2012Sasini Ltd and Subsidiaries Sasini Ltd and Subsidiaries
C h a i r m a n ’ s S t a t e m e n t C h a i r m a n ’ s S t a t e m e n t( C o n t i n u e d ) ( C o n t i n u e d )
Group Financial Results
Overview
The year 2011/12 has seen a decline in the financial performance of the Sasini Group in relation to the previous year despite an increase in turnover of 4% to Kshs 2.78 billion from Kshs 2.66 billion in the previous year. Operating profit after tax attributable to the members decreased by 51% from Kshs 384.7 million, to Kshs 186.9 million in 2011/2012. The decrease in the operating profitability was mainly due to a substantial drop in prices realized for coffee compared to the prior year. The results were also negatively impacted by rising costs of the main inputs particularly in relation to energy, farm inputs and labour. The drought experienced during the first three months of 2012 also resulted in a drop in the production of tea.After taking into account losses from changes in the fair value of biological assets, the loss for the year attributable to owners is Kshs 67.8 million compared to the prior year profit of Kshs 391.2 million. The reduction in the fair value of biological assets were driven mainly by the substantial drop in the value of coffee trees caused by the decline in the market prices.
Tea Production
During the year, our factories produced 8,826 Tons of made tea compared to 9,042 Tons in the previous year. The volume of tea produced was adversely affected by the drought experienced in the first three months of 2012. The average price realized for tea was USD 2.31/kg compared to USD 2.25/kg in the previous Financial Year.
Coffee Production
During the year, our estates produced 980 Tons of Coffee compared to 863 Tons in the previous year. This 13% increase is attributed to more favourable growing conditions for coffee and improved crop husbandry.
Our performance at the Nairobi Coffee Exchange was impressive. Our subsidiary company Aristocrats Coffee and Tea Exporters Ltd, which is our commercial marketing arm, presented for sale 7,252 Tons of coffee at the auction compared to 5,913 Tons during the previous coffee year 2010/2011. This represents 16.72% of the total coffee volume offered for sale at the Auction during the period and is equivalent to a 40% increase in volumes supplied. This volume was the second highest among the eight participating coffee millers in the country. The average price for the year 2011/2012 of USD 235.5 per 50kg (USD 4.71 per kg) was however substantially lower than the average price of USD 367.5 per 50kg (USD 7.35 per kg) the previous year.
Social Responsibility
Sasini realizes that it exists with different stakeholders and its sustainable progress to a large extent depends on its relationships with other stakeholders.
The Company thus pays attention to its employees, the environment and the communities in which it operates. The company employs in excess of 4,000 employees and these are mainly sourced from the surrounding communities where its plantations are located. In order to ensure sustainable lifestyles for its employees, it provides well maintained housing, health services, social amenities and education facilities on the plantations.
Through its international certification programs for its plantations in both the tea and coffee sectors, the Company pays close attention to maintaining a sustainable environment and its tea farms are Rainforest Alliance certified and its coffee is UTZ Certified. These certification standards require attention to the environment and also fair labour practices and employee welfare issues.
Within the wider community, Sasini has contributed to the national peace agenda as the country approaches the next general elections in March 2013 by making financial contribution to the Mkenya Daima National Peace campaign coordinated by the Kenya Private Sector Alliance (KEPSA). Sasini also contributed to the national hunger alleviation campaign, “Kenyans for Kenya”, coordinated by the Kenya Red Cross and the business sector through KEPSA.
The Company is totally committed to the ideals of Vision 2030 and continues to explore more ways to enhance its productivity and export earnings and to continue to be a responsible tax payer and employer of choice in its diverse locations.
Future Prospects for Growth
As part of our performance improvement initiatives, we have embarked on a diagnostic analysis of the nutrient levels in our coffee farms aimed at ultimately designing an optimal soil nutrient application plan to maximize the production of coffee at estate level.
We have also embarked on an uprooting and replanting program in our tea estates aimed at boosting productivity per hectare in the fields that have lower yields. In addition to the farm level yields, we are also improving our tea factories through machinery enhancements to boost factory efficiency and boost made tea quality and ultimately the prices we can command.
In order to enhance our sales margins and profitability, we continue to enhance our marketing activities with a view to increasing our direct sales volumes. We expect that all these initiatives will improve prospects for improved profitability in the future.
Acknowledgement
I wish to express my gratitude to the Sasini Management and staff for their commitment to the Company. I would also like to thank my colleagues on the Board for their continued unwavering support. In particular, I would like to thank two board members who resigned during 2012 to pursue other interests. These were Mr Peter Wanyaga Muthoka and Mr Issa Timamy. They both served diligently as Directors of Sasini for many years and I salute them for their exemplary service. Mr Steve Mainda was also appointed to the Board during 2012 and I would like to take this opportunity to welcome him.
Finally, on behalf of the Board, I wish to thank you, our esteemed shareholders for the trust bestowed upon us as your representatives. With your unwavering support, Sasini will continue to strive for sustainable growth for the benefit of all its stakeholders.
Dr J B McFIEChairman
18th December 2012
i RESILIENCE IN EMERGING MARKET AND DEVELOPING ECONOMIES: WILL IT LAST? World Economic Outlook, October 2012ii Economic Survey 2012, Kenya National Bureau of Statistics.iii A system of winds that influences the climate of a large area and that reverses direction with the seasonsiv ICO Trade Statistics for October 2012 on www.ico.orgv Economic Survey, Kenya National Bureau of Statistics (2012)
Sasini Ltd and Subsidiaries
Economy and Business Environment
Group Financial Results
Social Responsibility
Future Prospects for Growth
9 10
Annual Report and Financial Statements for the year ended 30 September 2012
Annual Report and Financial Statements for the year ended 30 September 2012Sasini Ltd and Subsidiaries Sasini Ltd and Subsidiaries
T a a r i f a Y a M w e n y e k i t i T a a r i f a Y a M w e n y e k i t i
11 12
Mazingira ya Uchumi na Biashara
Uchumi wa Kitaifa na Kilimwengu
Uchumi wa ulimwengu umebadilika kwa kiasi fulani kutokea mwezi Septemba 2011. Ukuaji wa Ulaya umepungua sana, na chumi nyingi katika eneo sasa ziko katika mdororo au zinakaribia hali hiyo.Katika Mashariki ya Kati na Afrika ya Kusini, hali ya kutokuwa na utulivu bado ipo katika baadhi ya nchi, ikichangia kukandamiza mtazamo wa eneo hilo hata ikiwa chumi nyingine zinajijenga baada ya migongano ya awali.Ijapokuwa katika maeneo mengine, maendeleo yamekuwa mazuri zaidi. Amerika imepata mfuriko wa habari za kutia moyo za kiuchumi, ukuaji ukiongezeka na ukosefu wa kazi ukipungua. Asia imekabili mpunguko wa kiuchumi vizuri na inaonekana inaelekea kwenye hali shwari. Amerika ya Kusini imeonyesha uthabiti katika mabadiliko haya kwa kukingwa na hatari kutokana na maendeleo ya Ulaya. Mwishowe, Afrika chini ya Sahara, kwa mastaajabu imenepa kwa mpunguo wa kiuchumi wa Ulaya, ikionyesha mgeuko wa mwelekeo unaoendelea wa mshikamano wao wa kiuchumi kuelekea Asia. Wakati kwingi ulimwenguni matarajio ya ukuaji yamekuwa chini kutokea Mtazamo wa Kiuchumi wa Ulimwengu mwezi Septemba 2011, kulikuwa na matarajio ya kuimarika katika mwaka 2012 na mbeleni kutokana na hatua za sera za pamoja zilizochukuliwa katika bei za soko za chumi zilizoendelea na zinazoanza.i
Kulikuwa na kupungua kwa ujumla katika uchumi nchini Kenya baina ya mwaka 2011 na mwaka 2012. Hili lilionyeshwa katika ukuaji wa jumla wa pato halisi la nchi kama lilivyopimwa katika robo ya pili ya mwaka 2012 na mwaka 2011. Katika mwaka 2012 ukuaji ulikuwa asilimia 3.3 ikilinganishwa na asilimia 3.5 ya mwaka 2011. Upunguaji huu wa kijumla pia ulionekana katika ulinganisho na utendaji wa jumla katika miaka ya awali ambapo kulikuwa na mwelekeo wa kupungua wa ujumla baina ya mwaka 2010 na mwaka 2011.Katika mwaka 2011 uchumi ulikua kwa asilimia 4.4 hali katika mwaka 2010 ulikua kwa asilimia 5.8.ii
Mfumko wa bei umepungua kutokea viwango vya juu vya kukaribia asilimia 20 katika mwezi Novemba 2011.Kufikia mwezi Septemba 2012, mfumko wa bei ulikuwa asilimia 5.3 ukionyesha athari ya hima ya maamuzi ya sera ya kifedha yaliochukuliwa na Kamati ya Sera ya Kifedha ambayo ilipandisha kiwango cha Benki Kuu kuwa asilimia 7 tarehe 17 Septemba 2011, kuwa asilimia 11 tarehe 5 Oktoba 2011 na kuwa asilimia 18 mwezi wa Desemba 2011.
Mielekeo ya Kilimwengu ya Majani Chai
Kulingana na hesabu za kilimwengu za mwaka 2012, uzalishaji wa chai nyeusi umepungua kwa kiasi kikubwa katika robo tatu za kwanza za mwaka 2012. Katika nchi muhimu zinazozalisha majani chai na taarifa kutoka mashirika ya kibiashara ulimwengu mzima, uzalishaji wa majani chai nyeusi umeanguka kwa asilimia 2.85 ikilinganishwa na wakati kama huo mwaka 2011.Hii inawakilisha anguko la karibu kilo milioni 42 kuwa kilo milioni 1427.49 dhidi ya ongezeko katika mahitaji.Karibu nchi zote zinazozalisha majani chai nyeusi zimepata upungufu, Kenya ikiwa ilioathirika zaidi,uzalishaji wake ukipungua kwa karibu kilo milioni 12, ikifuatwa kwa karibu na India ambako kulikuwa na upungufu wa karibu kilo milioni 11 za mazao.Uganda,Indonesia, Sri lanka, Tanzania na Zimbabwe zote zilipata upungufu, nchi pekee iliopata ongezeko katika uzalishaji katika kipindi hiki ilikuwa Bangladesh.
Upungufu katika ugavi umesababishwa hasa na hali za anga zisizotabirika kote ulimwenguni.Kenya msafirishaji mkuu kabisa wa majani chai nyeusi ulimwenguni,ilipata vipindi vya ukame, mvua chache na jalidi katika kipindi cha mapema cha mwaka 2012; mvua iii kidogo ya pepo za msimu zilipunguza mazao nchini Sri lanka na India. Wataalamu wanatabiri kuwa ongezeko hili katika pengo la uzalishaji na mahitaji linaweza kuendelea, wakati upungufu wa uzalishaji unakamua soko na mahitaji kuongezeka haraka nchini India na Uchina.
Upungufu uliotokea katika wingi wa uzalishaji umefanya bei ya majani chai ya ubora wa maduka makuu kuongezeka maradufu katika mwaka 2012. Bei ya jumla ya majani chai nyeusi imeongezeka kwa kiwango kikubwa kutokea mwanzoni mwa mwaka, ikizidi USD 4 kwa kilo katika mwaka. Hii ndiyo bei ya juu zaidi kutokea mwishoni mwa mwaka 2009, wakati bei zilifikia USD 5.45 kwa kilo.
Mielekeo inaashiria kuwa utumizi wa kilimwengu wa majani chai nyeusi umetazamiwa kuongezeka kwa asilimia 21 katika miaka 10 ijayo.Kukiwa na ugavi uliopungua kutoka nchi kuu zinazozalisha kama Kenya, Sri lanka na India,kuna uwezekano kuwa na mshinikizo wa juu kwenye bei ikitambulikana kuwa eneo la mashamba ya majani chai kote ulimwenguni linabakia lile lile, hali mahitaji yakiendelea kuongezeka.
Mielekeo ya Kitaifa ya Majani Chai
Mwaka 2012 ulipata upungufu katika wingi wa uzalishaji wa majani chai wa kitaifa.Uzalishaji ulikuwa kilo milioni 377 katika mwaka 2011 na huu ulitarajiwa kupungua kuwa kilo milioni 360 katika 2012.Hata hivyo, bei ziliongezeka katika mwaka 2012 kama inavyoonyeshwa na ripoti ya utendaji wa miezi minane ya mwaka 2012 iliyotayarishwa na Halmashauri ya Chai ya Kenya ambayo imeonyesha ukuaji wa wastani wa asilimia 4 katika bei za mnada wa majani chai ya Kenya kutoka USD 3.02 kwa kilo ya majani chai yaliyotayarishwa katika mwaka 2011 kuwa USD 3.15
Matarajio ya Ukuaji ya Siku za Usoni
“tumeanza uchunguzi wa kubainisha
viwango vya virutubishi katika
mashamba yetu ya kahawa
uliolengwa hatimaye kubuni mpango
wa utumizi wa hali bora kabisa ya
virutubishi vya mchanga kuongeza
hadi upeo uzalishaji wa kahawa katika
kiwango cha shamba.”
katika mwaka 2012.
Kulingana na masoko, Kenya inasafirisha majani chai kwa nchi zaidi ya 50. Masoko makuu yakisalia Misri, Pakistan, Uingereza, Sudan na Afghanistan ambayo kwa pamoja yanachukua karibu asilimia 70 ya jumla ya mahuruji . Ongezeko la maana limeshuhudiwa katika masoko ya kiasili kama vile Misri na Pakistan na masoko yanayoanza kama vile U.A.E.,Urusi,Somalia, Iran, Ireland,Djibouti,Amerika na Uturuki. Ongezeko hili linatokana na utengemano wa kisiasa na kijamii katika Mashariki ya Kati na shughuli za utangazaji zilizoongezwa. Kufikia mwisho wa mwaka 2012, Kenya ilitarajia kupata ziada ndogo ya mapato ya mahuruji kutoka Kshs. bilioni 109 katika mwaka 2011 hadi Kshs. bilioni 110 katika 2012.
Mielekeo ya Kahawa ya Kilimwengu
Katika miezi kumi na miwili inayoishia na mwezi Oktoba 2012, mahuruji ya ulimwengu ya kahawa ya Arabika yalijumlisha magunia milioni 66.19 ikilinganishwa na magunia milioni 67.5 katika mwaka uliopita.ivMahuruji ya Robusta yalijumlisha magunia milioni 43.05 ikilinganishwa na magunia 37.01. Mahuruji ya kahawa ya ulimwengu yalifikia magunia milioni 8.88 katika mwezi wa Oktoba 2012, ikilinganishwa na magunia milioni 7.57 katika mwezi wa Oktoba 2011.Mahuruji katika mwezi huu wa kwanza wa mwaka wa kahawa 2012/2013 (Oktoba 2012 hadi Septemba 2013) yameongezeka kwa asilimia 17.3 ikilinganishwa na mwezi wa kwanza wa mwaka wa kahawa uliopita.
Bei za kahawa za ulimwengu zilianguka katika kipindi cha miezi tisa kufikia Septemba mwaka 2012 na zilishuka zaidi katika mwezi wa Oktoba mwaka 2012.Dalili za awali ni kuwa uzalishaji wa ulimwengu utaendelea kuongezeka katika mwaka 2012/2013. Utumizi wa ulimwengu pia unatarajiwa kuendelea kuongezeka. Ikiwa uzalishaji wa rekodi unaotarajiwa wa mwaka 2012/2013 utathibitishwa, Soko la kahawa litapata ziada ya ugavi, ijapokuwa athari yoyote kwenye bei inawezekana kuwa ndogo, ikifikiriwa haja ya kusheheneza bidhaa.
Mielekeo Ya Kitaifa Ya Kahawa
Kenya imejithibitisha kama mgavi muhimu wa kahawa ya ubora wa juu kwa muda, Kenya ilitoa kahawa ya thamani ya USD milioni 224 katika mwaka 2011, ambayo ilijumuisha asilimia 1 ya mahitaji ya ulimwengu.Kahawa ilijumuisha karibu asilimia 4 ya jumla ya mahuruji ya Kenya katika mwaka 2011 ikiwekwa nambari tatu kati ya mapato ya mahuruji. Bidhaa za mahuruji zinazoongoza zilikuwa majani chai, kilimo cha bustani, kahawa, nguo, bidhaa za chuma na bidhaa za tumbaku. v
Ijapokuwa, uzalishaji wa kahawa wa nchi umekuwa na mwelekeo wa kupungua unaotia wasiwasi. Kutoka kwa kiwango cha juu cha tm 65,167 katika mwaka
Mielekeo ya Kitaifa ya Majani Chai (continued)
Annual Report and Financial Statements for the year ended 30 September 2012
Annual Report and Financial Statements for the year ended 30 September 2012Sasini Ltd and Subsidiaries Sasini Ltd and Subsidiaries
T a a r i f a Y a M w e n y e k i t i T a a r i f a Y a M w e n y e k i t i
13 14
( C o n t i n u e d ) ( C o n t i n u e d )
Sasini Ltd and Subsidiaries
Mazingira ya Uchumi na Biashara
Matokeo ya Kifedha ya Kundi
Wajibu wa Kijamii
Matarajio ya Ukuaji ya Siku za Usoni
2001,uzalishaji umeshuka kuwa tm 43,096 katika mwaka 2010, tm 36,629 mwaka 2011 lakini uliongezeka hadi tm 49,003 katika mwaka 2012. Bei za wastani katika Soko la Ubadilishaji kahawa la Nairobi zilichukua mwelekeo wa kupungua baina ya mwaka 2011 na mwaka 2012. Katika mwaka 2011, bei ya wastani kwa kilo ilikuwa USD 6.73 na hii ilipungua kwa asilimia 32 katika mwaka 2012 kuwa USD 4.57 katika mwaka 2012.
Hali ya upungufu wa uzalishaji wa kitaifa ni matokeo ya vipengele tofauti, kikuu kati yavyo ikiwa ni kuachwa kwa ukuzaji wa kahawa na idadi kubwa ya wakulima wadogo kutokana na kupungua kwa bei za kahawa katika kipindi baina ya mwaka 2001 na mwaka 2007; bei kwa kilo zilifikia kiwango cha chini sana cha USD 1.31 katika mwaka 2003. Vipengele vingine ni pamoja na hali za anga zisizofaa na bei za ardhi zinazoongezeka katika baadhi ya maeneo makuu ya ukuzaji wa kahawa karibu na Nairobi ambayo yanageuzwa kutumika katika ujenzi wa nyumba.
Matokeo ya Kifedha ya Kundi
Mtazamo
Mwaka 2011/2012 umeshuhudia upungufu katika utendaji wa kifedha wa Kundi la Sasini ukilinganishwa na mwaka uliotangulia dhidi ya ongezeko la mali iliyozalishwa ya asilimia 4 kuwa Kshs.bilioni 2.78 kutoka Kshs. bilioni 2.66 katika mwaka uliotangulia. Faida ya kuendeshea shughuli inayowaendea wanachama baada ya kodi ilipungua kwa asilimia 51 kutoka Kshs. milioni 384.7, kuwa Kshs. milioni 186.9 katika mwaka 2011/2012.
Upungufu katika faida ya kuendeshea shughuli ulitokana na kushuka kwa kiasi kikubwa kwa bei za kahawa zilizopatikana ikilinganishwa na mwaka uliotangulia.Matokeo pia yaliathiriwa kihasi na gharama zilizoongezeka za bidhaa muhimu hasa kuhusiana na nishati, pembejeo za ukulima na nguvukazi.Ukame uliokuwepo katika miezi mitatu ya kwanza ya mwaka 2012 pia ulisababisha upungufu katika uzalishaji wa majani chai. Baada ya kutilia maanani hasara zilizotokana na mabadiliko katika thamani ya haki ya rasilimali za biolojia, hasara ya mwaka inayowaendea wenye mali ni Kshs. milioni 67.8 ikilinganishwa na faida ya Kshs. milioni 391.2. Hasara zilizotokana na mabadiliko katika thamani ya haki ya rasilimali za kibiolojia zilitokana hasa na kupungua kwa kiasi kikubwa katika thamani ya miti ya kahawa kulikosababishwa na kupungua katika thamani ya usoni ya mauzo ya kahawa.
Uzalishaji wa Majani Chai
Katika mwaka, viwanda vyetu vilizalisha tani 8,826 za majani chai yaliotengenezwa ikilinganishwa na tani 9,042 katika mwaka uliotangulia.Wingi wa majani chai uliozalishwa uliathiriwa sana na ukame uliokuwepo katika miezi mitatu ya mwanzo wa mwaka 2012. Bei ya
wastani iliopatikana ya majani chai ilikuwa USD 2.31 kwa kilo ikilinganishwa na USD 2.25 kwa kilo katika Mwaka wa Kifedha uliopita.
Uzalishaji wa Kahawa
Katika mwaka, mashamba yetu yalizalisha tani 980 za kahawa ikilinganishwa na tani 863 zilizozalishwa katika mwaka uliotangulia. Ongezeko hili la asilimia 13 limetokana na hali nzuri zaidi za ukuzaji wa kahawa na uimarikaji wa ukulima wa mimea.
Utendaji wetu katika soko la ubadilishaji kahawa la Nairobi ulikuwa wa kuvutia.Kampuni yetu ndogo ya Aristocrats Coffee and Tea Exporters Ltd, ambayo ndio sehemu yetu ya kibiashara na mauzo,iliwasilisha tani 7,252 za kahawa kuuzwa katika mnada ikilinganishwa na tani 5,913 katika mwaka wa kahawa 2010/2011.Hii iliwakilisha asilima 16.72 ya jumla ya wingi wa kahawa iliyotolewa kuuzwa katika mnada katika kipindi hiki na ni sawa na ongezeko la asilimia 40 katika wingi wa kahawa iliyotolewa. Wingi huu ndio wa pili kwa idadi miongoni mwa wasagaji wanane wa kahawa wanaoshiriki nchini. Ijapokuwa, bei ya wastani ya mwaka 2011/2012 ya USD 235.5 kwa kilo 50 (USD 4.71 kwa kilo) ilikuwa ya chini kuliko ya wastani ya USD 367.5 kwa kilo 50 (USD 7.35 kwa kilo) katika mwaka uliotangulia.
Wajibu wa Kijamii
Sasini inatambua kuwa imo katika mfumo wa ikolojia wa washika dau na maendeleo yake ya kujiendeleza kwa kiwango kikubwa yanategemea uhusiano wake na washika dau wengine.Kwa hivyo Kampuni inatilia maanani wafanyikazi wake, mazingira na jamii ambapo inajishughulisha.Kampuni inaajiri zaidi ya wafanyikazi 4000 na hawa hasa wanachukuliwa kutoka jamii zilizoko ambako mashamba yake yanapatikana.Ili kuhakikisha hali za kimaisha zinazokubalika kwa wafanyikazi wake, inatoa makao yanayowekwa vizuri, huduma za afya, huduma za kijamii na vifaa vya elimu katika mashamba.
Kupitia kwa mipango ya kuthibitishwa kimataifa kwa mashamba yake ya zote sekta za chai na kahawa, Kampuni inatilia maanani kuhifadhi mazingira na mashamba yake ya chai yamethibitishwa na Muungano wa Msitu wa Mvua na kahawa yake imethibitishwa na UTZ. Viwango hivi vya uthibitishaji vinatilia maanani zaidi mazingira na pia matendo ya haki ya nguvu kazi na maswala ya ustawi wa wafanyikazi.
Katika jamii pana zaidi, Sasini imechangia katika ajenda ya amani ya kitaifa kwa kutoa mchango wa kifedha kwa kampeni ya Amani ya Kitaifa ya Mkenya Daima inayoratibishwa na Kenya Private Sector Alliance( KEPSA) vile nchi inavyokaribia uchaguzi mkuu ujao mwezi Machi 2013. Sasini pia imechangia katika kampeni ya kitaifa ya kuondoa njaa inayojulikana kama Wakenya kwa Kenya inayoratibishwa na Kenya Red Cross na sekta ya biashara kupitia KEPSA.
Kampuni imejitolea kabisa kwa mifano kamilifu ya mwono 2030 na inaendelea kutafuta njia zaidi kuendeleza uzalishaji wake, mapato ya mahuruji na inaendelea kuwa mlipaji ushuru mwaminifu na mwajiri wa kupendwa katika maeneo yake mbalimbali.
Matarajio ya Ukuaji ya Siku za Usoni
Kama sehemu ya juhudi za uimarishaji wa utendaji wetu, tumeanza uchunguzi wa kubainisha viwango vya virutubishi katika mashamba yetu ya kahawa uliolengwa hatimaye kubuni mpango wa utumizi wa hali bora kabisa ya virutubishi vya mchanga kuongeza hadi upeo uzalishaji wa kahawa katika kiwango cha shamba.
Pia tumeanzisha mpango wa kun’goa na kupanda upya katika mashamba yetu ya majani chai unaolenga katika kuzidisha uzalishaji kwa hekta katika mashamba yanayotoa mazao ya chini. Pamoja na mazao ya kiwango cha shamba ,tunaimarisha viwanda vyetu vya majani chai kupitia kuboresha mashine ili kuzidisha ufanisi na kuzidisha ubora wa majani chai yaliyotengenezwa na mwishowe bei tunazoweza kuuliza.
Ili kuimarisha mauzo yetu ya ziada na faida, tunaendelea kuimarisha shughuli zetu za soko kwa lengo la kuongeza wingi wa mauzo yetu ya moja kwa moja. Tunataraji kuwa juhudi hizi zote zitaongeza matarajio ya faida ilioongezeka katika siku za usoni.
Shukrani
Ningependa kutoa shukrani zangu kwa Usimamizi wa Sasini na wafanyikazi kwa kujitolea kwao kwa Kampuni.Ningependa pia kuwashukuru wenzangu katika Halmashauri ya Sasini kwa usaidizi wao usiotetereka unaoendelea. Hasa, ningependa kuwashukuru wanachama wawili wa halmashauri waliojiuzulu katika mwaka 2012 kufuatilia mambo yao mengine.Hawa walikuwa Bw. Peter Wanyaga Muthoka na Bw. Issa Timamy.Wote walifanya kazi kwa bidii kwa miaka mingi kama Wakurugenzi wa Sasini na ninawashukuru kwa huduma yao ya kupigia mfano.Bw. Steve Mainda pia aliteuliwa kwenye Halmashauri katika mwaka 2012 na ningependa kuchukua fursa hii kumkaribisha.
Mwishowe, kwa niaba ya Halmashauri, ningependa kuwashukuru,wanahisa wetu wataadhima kwa imani muliotupatia kama wawakilishi wenu.Kwa usaidizi wenu usiotetereka, Sasini itaendelea kujitahidi kupata ukuaji unaofululiza kwa faida ya washika dau wake wote.
Dkt. J B McFIE
Tarehe 18 Desemba 2012
i RESILIENCE IN EMERGING MARKET AND DEVELOPING ECONOMIES: WILL IT LAST? World Economic Outlook, October 2012ii Economic Survey 2012, Kenya National Bureau of Statistics.iii A system of winds that influences the climate of a large area and that reverses direction with the seasonsiv ICO Trade Statistics for October 2012 on www.ico.orgv Economic Survey, Kenya National Bureau of Statistics (2012)
Annual Report and Financial Statements for the year ended 30 September 2012
Annual Report and Financial Statements for the year ended 30 September 2012Sasini Ltd and Subsidiaries Sasini Ltd and Subsidiaries
G r a p h i c a l H i g h l i g h t s R e p o r t o f t h e D i r e c t o r s
-‐50,000
-‐
50,000
100,000
150,000
200,000
250,000
300,000
350,000
400,000
2008 2009
2010 2011
2012
Profit/(Loss) arising from operating activities (Kshs '000)
Years
0.00
0.20
0.40
0.60
0.80
1.00
1.20
2008 2009
2010 2011
2012
Dividend per share (Kshs '000)
Years
-‐0.20
0.00
0.20
0.40
0.60
0.80
1.00
1.20
1.40
1.60
1.80
2008 2009
2010 2011
2012
Earnings/(Loss) per share on operating activities (Kshs )
Years
0.00
0.50
1.00
1.50
2.00
2.50
3.00
3.50
2008 2009
2010 2011
2012
Dividend Cover (times covered)
The Directors have pleasure in submitting their report together with the consolidated and separate financial statements for the year ended 30 September 2012, which disclose the state of affairs of the Group and the Company.
1. Activities
The principal activities of the Company and its subsidiaries are the growing and processing of tea and coffee, commercial milling and marketing of coffee, value addition of related products, forestry, dairy operations, livestock and horticulture.
2. Results
The results of the Group and Company for the year are set out on pages 25 and 26, respectively.
3. Dividends
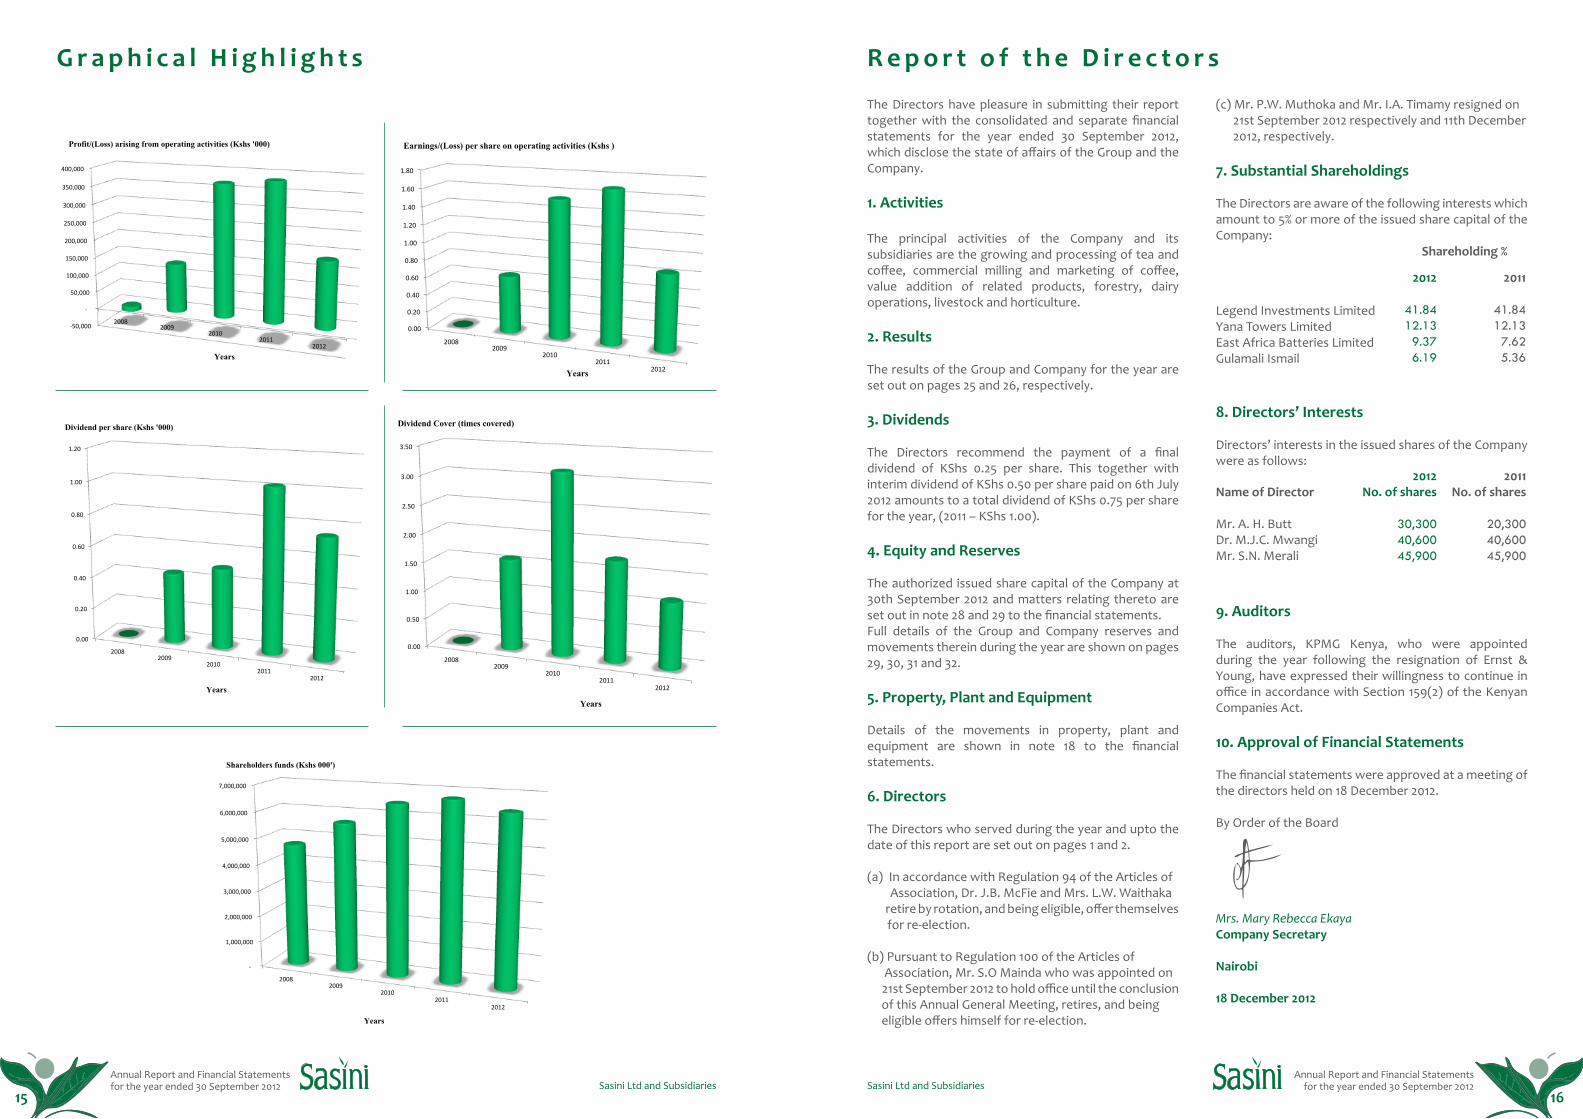
The Directors recommend the payment of a final dividend of KShs 0.25 per share. This together with interim dividend of KShs 0.50 per share paid on 6th July 2012 amounts to a total dividend of KShs 0.75 per share for the year, (2011 – KShs 1.00).
4. Equity and Reserves
The authorized issued share capital of the Company at 30th September 2012 and matters relating thereto are set out in note 28 and 29 to the financial statements.Full details of the Group and Company reserves and movements therein during the year are shown on pages 29, 30, 31 and 32.
5. Property, Plant and Equipment
Details of the movements in property, plant and equipment are shown in note 18 to the financial statements.
6. Directors
The Directors who served during the year and upto the date of this report are set out on pages 1 and 2.
(a) In accordance with Regulation 94 of the Articles of Association, Dr. J.B. McFie and Mrs. L.W. Waithaka retire by rotation, and being eligible, offer themselves for re-election.
(b) Pursuant to Regulation 100 of the Articles of Association, Mr. S.O Mainda who was appointed on 21st September 2012 to hold office until the conclusion of this Annual General Meeting, retires, and being eligible offers himself for re-election.
Legend Investments LimitedYana Towers LimitedEast Africa Batteries LimitedGulamali Ismail
2011
41.8412.13
7.62 5.36
2012
41.8412.13
9.376.19
2012No. of shares
30,30040,60045,900
2011No. of shares
20,30040,60045,900
(c) Mr. P.W. Muthoka and Mr. I.A. Timamy resigned on 21st September 2012 respectively and 11th December 2012, respectively.
7. Substantial Shareholdings
The Directors are aware of the following interests which amount to 5% or more of the issued share capital of the Company:
8. Directors’ Interests
Directors’ interests in the issued shares of the Company were as follows:
Name of Director
Mr. A. H. ButtDr. M.J.C. MwangiMr. S.N. Merali
Shareholding %
9. Auditors
The auditors, KPMG Kenya, who were appointed during the year following the resignation of Ernst & Young, have expressed their willingness to continue in office in accordance with Section 159(2) of the Kenyan Companies Act.
10. Approval of Financial Statements
The financial statements were approved at a meeting of the directors held on 18 December 2012.
By Order of the Board
Mrs. Mary Rebecca EkayaCompany Secretary
Nairobi
18 December 2012
15 16
-‐50,000
-‐
50,000
100,000
150,000
200,000
250,000
300,000
350,000
400,000
2008 2009
2010 2011
2012
Profit/(Loss) arising from operating activities (Kshs '000)
Years
0.00
0.20
0.40
0.60
0.80
1.00
1.20
1.40
1.60
1.80
2008 2009
2010 2011
2012
Earnings/(Loss) per share on operating activities (Kshs )
Years
0.00
0.20
0.40
0.60
0.80
1.00
1.20
2008 2009
2010 2011
2012
Dividend per share (Kshs '000)
Years
0.00
0.50
1.00
1.50
2.00
2.50
3.00
3.50
2008 2009
2010 2011
2012
Dividend Cover (times covered)
Years
-‐
1,000,000
2,000,000
3,000,000
4,000,000
5,000,000
6,000,000
7,000,000
2008 2009
2010 2011
2012
Shareholders funds (Kshs 000')
Years
Annual Report and Financial Statements for the year ended 30 September 2012
Annual Report and Financial Statements for the year ended 30 September 2012Sasini Ltd and Subsidiaries Sasini Ltd and Subsidiaries
R i p o t i y a W a k u r u g e n z i C o r p o r a t e G o v e r n a n c e
Wakurugenzi wanafuraha kuwakilisha ripoti yao pamoja na taarifa za hesabu zilizounganishwa na za kando za mwaka ulioishia tarehe 30 Septemba 2012 zinazoonyesha hali ilivyo ya Kundi na Kampuni.
1. Shughuli
Shughuli muhimu za Kampuni na kampuni zake tanzu ni ukuzaji na utengenezaji wa majani chai na kahawa, usagaji kahawa wa kibiashara na uuzaji, uongezaji thamani wa bidhaa zinazohusiana, biashara ya misitu, shughuli za maziwa na bidhaa zake, mifugo na kilimo cha bustani.
2. Matokeo
Matokeo ya mwaka ya Kundi na Kampuni yako katika ukurasa wa 25 na 26 mtawalia.
3. Mgao
Wakurugenzi wanapendekeza malipo ya mwisho ya Kshs 0.25 kwa kila hisa. Hii pamoja na mgao wa muda wa Kshs 0.50 kwa kila hisa uliolipwa tarehe 6 Julai 2012 unajumlisha kuwa mgao wa Kshs 0.75 kwa jumla kwa kila hisa kwa mwaka, (2011 – Kshs1.00).
4. Rasilimali ya Hisa na Akiba
Rasilimali ya hisa za Kampuni zilizoidhinishwa na kutolewa kufikia tarehe 30 Septemba 2012 na mambo yanayohusiana nazo yanaonyeshwa kwenye tanbihi 28 na 29 ya taarifa za kifedha.
Maelezo kamili ya Kundi na akiba ya Kampuni na mienendo yake katika mwaka yameonyeshwa katika kurasa 29, 30, 31 na 32.
5. Mali, Mtambo na Vifaa
Maelezo ya mienendo ya mali, mtambo na vifaa yanaonyeshwa katika tanbihi 18 ya taarifa za kifedha.
6. Wakurugenzi
Wakurugenzi waliohudumu katika mwaka na mpaka tarehe ya ripoti wameonyeshwa kwenye ukurasa wa 1 na 2.
(a) Kulingana na Sheria ya 94 ya Kanuni za Kampuni, Dr. J. B. McFie na Bi. L. W. Waithaka wanajiuzulu kwa zamu, na kwa kuwa wanastahiki, wanajitolea tena kuchaguliwa.
(b) Kufuatana na Sheria ya 100 ya Kanuni za Kampuni, Bw. S. O. Mainda aliyechaguliwa tarehe 21 Septemba 2012 kushikilia mamlaka mpaka mwisho
Corporate governance is the manner in which the power of, and the power over a company is exercised in the stewardship of its assets and resources so as to enhance and sustain shareholder value while at the same time satisfying the needs and interests of all its stakeholders.
The Group conducts its operations in accordance with recommended principles of good corporate governance as provided in the guidelines issued by the Capital Markets Authority and complies with the Capital Markets (Securities), (Public Offers, Listing and Disclosures) Regulations, 2002. In this regard, the Board has adopted a Corporate Governance Framework and a Board Charter consistent with the CMA guidelines.
In November 2011, Sasini was awarded a Champion of Governance Award in the agriculture sector by the Institute of Certified Public Secretaries of Kenya following an independent evaluation of the Company’s Governance practices and process. The award recognised that Sasini demonstrates excellence and integrity in its Governance systems, Leadership and Management practices.
Board of Directors
The composition of the Board is compliant with good corporate governance practices. The role of the Chairman and the Managing Director are segregated. The Managing Director is in charge of the day to day running of the business of the Group. A non-executive director acts as Chairman of the Board. The current Board is composed of one Executive Director and eight non-executive directors and it includes committed individuals with diverse and complementary skills to ensure that there is sufficient wealth of experience at Board level. All the directors’ appointments are vetted and recommended by the remuneration and nomination committee are subject to confirmation by shareholders at the Annual General Meeting. One third of the directors, except the Managing Director, retire by rotation annually and are eligible for re-election at the Annual General Meeting.
The directors are given appropriate and timely information to enable them to maintain full and effective control over all strategic, financial, operational and compliance issues.
Board of Directors Responsibilities
The Board of Directors is responsible for the long term strategic direction of the Group, to maintain a profitable growth and at the same time uphold high standards of corporate governance and business ethics. A summary of Board of Directors responsibilities is highlighted below:
• Formulation of Group strategy and ensuring there are adequate structures to implement it;• Monitoring the Group performance against strategy and budgets;• Approval for publication of Group financial statements in line with Capital Markets Authority (CMA) regulations;• The selection, appointment and appraisal of senior executives who are qualified to manage the Group affairs;• Review of the effectiveness of the structures put in place to guide the Group operations;• Ensuring there are adequate systems for monitoring compliance with laws and regulations; and,• Determining the terms of all Board Committees and ensuring that they carry out their functions effectively.
Board Meetings
Board Meetings are held every quarter and in exceptional circumstances as dictated by exigencies of Company operations. This financial year, a total of four (4) Board Meetings were held. During their meetings the Board reviews the Company performance against the planned strategies and also approves issues of strategic nature.
Board Committees
The Board has approved the delegation of certain authorities to Board Sub-Committees where applicable, and to the management.
The Board has two committees both of which are guided by clear terms of reference. The committees are instrumental in monitoring Group operations, conduct of business, systems and internal controls. The committees are as follows:
Legend Investments LimitedYana Towers LimitedEast Africa Batteries LimitedGulamali Ismail
2011
41.8412.13
7.62 5.36
2012
41.8412.139.376.19
2012Idadi ya Hisa
30,30040,60045,900
2011Idadi ya Hisa
20,30040,60045,900
wa Mkutano Mkuu wa kila Mwaka, anajiuzulu, na kwa kuwa anastahiki anajitolea kuchaguliwa tena.
(c) Bw. P.W. Muthoka na Bw. I. A. Timamy wamejiuzulu tarehe 21 Septemba 2012 na tarehe 11 Desemba 2012 mtawalia.
7. Umilikaji wa hisa nyingi
Wakurugenzi wanafahamu kuhusu umilikaji wa asilimia 5 au zaidi ya rasilimali ya hisa zilizotolewa za Kampuni kama ifuatavyo:
8.Ushirika wa Wakurugenzi
Ushirika wa wakurugenzi katika hisa zilizotolewa za Kampuni kufikia tarehe 30 Septemba 2012 ni kama ufuatao:
Jina la Mkurugenzi
Bw.A.H.ButtDkt. M.J.C. Mwangi Bw. S. N. Merali
Umilikaji wa hisa %
9. Wakaguzi
Wakaguzi, KPMG Kenya, waliochaguliwa katika mwaka kufuatia kustaafu kwa Ernst & Young, wameonyesha ridhaa yao ya kuendelea na wadhifa huo kwa kufuatana na sehemu 159(2) ya Sheria za Makampuni za Kenya.
10. Kuidhinishwa kwa taarifa za kifedha
Taaifa za kifedha ziliidhinishwa katika mkutano wa wakurugenzi uliofanywa tarehe 18 mwezi wa Desemba 2012.
Kwa Amri ya Halmashauri
Bi. Mary Rebecca EkayaKatibu wa Kampuni
Nairobi
18 Desemba 2012
17 18
Annual Report and Financial Statements for the year ended 30 September 2012
Annual Report and Financial Statements for the year ended 30 September 2012Sasini Ltd and Subsidiaries Sasini Ltd and Subsidiaries
Audit Committee
The members of this committee are all non-executive directors and professionals. All the members meet minimum financial literacy standards and have accounting or financial management expertise. The committee meets four times in a year and the Managing Director, the Group Financial Controller, the Internal Auditor and occasionally the External Auditors, attend meetings of the committee. The roles of the committee include:
(a) The review of interim and annual financial statements to ensure compliance with Accounting Standards and other disclosure requirements;(b) The maintenance and review of the Group’s system of accounting and internal controls;(c) Liaising with external auditors of the Group and effecting their recommendations; and(d) Defining the scope and responsibilities of the internal auditors.
The Committee is made up of the following Directors:
(a) Mrs. L.W. Waithaka (Chair)(b) Mr. M.J. Ernest(c) Mr. I. A. Timamy (Resigned 11 December 2012)(d) Mr S.N. Merali (Appointed 11 December 2012)
Remuneration and Nominations Committee
This Committee’s remit is to assist the Board in addressing issues pertaining to remuneration levels, employee development and motivation. It ensures that the appropriate reward mechanisms are in place at all levels of the organisation while maintaining principles of equity and appropriateness. The Committee also oversees the rigorous and transparent process for bringing new Directors on to the Board, and for appointing Directors to Board Committees, subject to approval by the full Board.
The members of the Committee are all non-executive directors and professionals who by reason of education and/or experience possess sufficient expertise to enable the Committee to execute its mandate.
The Committee meets at least four times in a year.
The Committee is made up of the following Directors:
(a) Dr. J.B. McFie(b) Mr. A.H Butt(c) Mr. S.O. Mainda (Appointed 21 September 2012)(d) Mr. P.W. Muthoka (Resigned 21 September 2012) Directors’ Remuneration
The remuneration for non-executive directors consists of fees and sitting allowances for their services in connection with Board and committee meetings.
The aggregate amount of emoluments paid to directors for services rendered during the financial year ended 30 September 2012 are contained in Note 14 to the financial statements in this annual report.
Neither at the end of the financial year, nor at any time during the year did there exist any arrangement to which the Group is party, whereby directors might acquire benefits by means of the acquisition of the Group’s shares. There were no directors’ loans at any time during the year.
Communication with Shareholders
The Group is committed to ensuring that shareholders and the financial markets are provided with timely information in regard to its performance. This is achieved by issuing notices directly to shareholders at their last known addresses and press announcements of its half-yearly and annual financial results and any information which could lead to substantial movement in the share price. The full annual report and financial statements are posted on the Group’s website and also distributed to all shareholders and to other parties who have an interest in the Group’s performance, on request.
( C o n t i n u e d ) ( C o n t i n u e d )C o r p o r a t e G o v e r n a n c e C o r p o r a t e G o v e r n a n c eCommunication with Shareholders (continued)
The Group responds to numerous letters and electronic mail from shareholders and interested parties on a wide range of issues.
The Group also invites shareholders to seek clarity on company performance in general meetings.
Social and Environmental Responsibilities
The Group is mindful of its responsibilities with regard to the social welfare of its employees, their families and the host communities. The Group, therefore, provides housing, health, educational and recreational facilities to meet the needs of its employee’s resident on its estates. Maintenance of the facilities is provided to the highest standards and success in this regard has been manifested by the good results achieved in primary schools situated in the Group’s estates.
The Group is also concerned with the maintenance of the environment and in this regard it maintains sections of indigenous and non-indigenous forests in its tea plantations and shade trees in its coffee plantations. The Group has maintained a continuous afforestation program in all areas with idle land. It also maintains natural vegetation in all water catchment areas.
The Group has attained the internationally recognized Rain Forest Alliance (RFA) Certification for its Tea estates and this certification confirms the attainment of minimum standards in relation to ecosystem conservation, wildlife protection, and fair treatment and good working conditions for workers.
In addition the group has attained the UTZ Certification for its coffee operations. This internationally recognized certification is given on fulfilling a code of conduct which tests coffee operations based on three criteria namely good agriculture and business practices, social responsibility and environmental considerations.
The Group not only earns substantial foreign exchange through the export of its produce, but also makes a significant contribution through the payment of taxes, cess and other levies to the Government and Local Authorities in the areas in which it operates.
Code of Conduct
The Group has a code of conduct which seek to guide employees in ethical conduct of business. All directors, management and employees are expected to observe high standards of integrity and ethical conduct when dealing with customers, staff, suppliers and regulators.
Internal Control
The effectiveness of the Group internal control is monitored on a regular basis by the Internal Audit function. The Internal Audit function reviews the Group compliance with the laid down polices and procedures as well as assessing the effectiveness of the internal control structures. The Internal Audit function focuses their attention to areas the Group could be exposed to greatest risks. The Internal Audit function reports to the Audit Committee of the Board.
The Group has established operational procedures and controls to facilitate proper safeguard of assets and accurate financial reporting.
Conflicts of Interest
All directors and management are under duty to avoid conflict of interest. The directors are required to disclose outside business interests which would conflict with the Group business.
Going Concern
The directors confirm that the Group has adequate resources to continue in business for the foreseeable future and therefore to continue to use the going concern basis when preparing the financial statements.
19 20
Annual Report and Financial Statements for the year ended 30 September 2012
Annual Report and Financial Statements for the year ended 30 September 2012Sasini Ltd and Subsidiaries Sasini Ltd and Subsidiaries
Significant Change in Shareholders
The Company discloses to the Nairobi Securities Exchange at the end of each calendar quarter, names of persons who hold or acquire 3% or more of the issued shares. The Company also files the foreign investors’ returns as required, on a monthly basis.
Board and Board Committees Attendance
The following table gives the record of attendance of the Sasini Board and its Committee meetings for the year ended 30 September 2012:
Sasini acknowledges that it operates within a larger eco system and its survival and sustainability depends on how well it interacts with its stakeholders and public. Given this fact, the Company has committed both its human and capital resources in various corporate social investment (CSI) initiatives in the fields of Education and training, Health and safety, Community partnership, Mentorship programs and joint initiatives.
As necessitated by the principle of corporate governance, Sasini is obliged to act responsibly as a key player in the society and embrace ethical business practices as outlined below.
Top ten shareholders at 30 September 2012
The ten largest shareholders of the Company as at 30 September 2012 were as follows:
Distribution of shareholders
Dr. J.B. McFieChairman
Date: 18 December 2012
Dr. M.J.C. MwangiManaging Director
Number of meetings held
Dr. J.B. McFieDr M.J.C MwangiN.N. MeraliI. A. TimamyA.H. ButtP.W. MuthokaS.N. MeraliM.J. ErnestMrs. L.W. Waithaka
Name of shareholder
Legend Investments LimitedYana Towers LimitedEast Africa Batteries LtdGulamali IsmailKarim JamalCFC Stanbic Nominees Kenya Ltd- A/C R48701Shardaben Vithaldas MorjariaJoseph SchwartzmanSwani Coffee Estate LimitedThe Jubilee Insurance Company of Kenya Ltd
Shareholding (No. of Shares)
Less than 500500 - 5,0005,001 - 10,00010,001 – 100,000100,001-1,000,000Above 1,000,000
Total
No.
12345678910
Main Board444443444
No. of shares
95,417,34527,673,34021,368,70014,109,6005,879,8415,400,0602,111,7801,971,0001,637,2701,475,900
No. of shares held
544,0376,206,7543,215,566
15,210,08921,854,378
181,024,676
228,055,500
No. of Shareholders
2,6813,962
43051984
13
7,689
% Shareholding
0.242.721.416.679.58
79.38
100.00
Meetings attended
Audit Committee
N/A4
N/A4
N/AN/AN/A
44
Remuneration and Nomination Committee
44
N/AN/A
43
N/AN/AN/A
% Shareholding
41.8412.139.376.192.582.370.930.860.720.65
( C o n t i n u e d )C o r p o r a t e G o v e r n a n c e C o r p o r a t e S o c i a l I n v e s t m e n t
21 22
Education and Training
The company presented a donation of books and tea products during the education/prize giving day functions at Menyenya Primary School in Borabu District and Ikonge Boys Secondary School in Nyamira District. The function was aimed at motivating staff and students to improve on educational accomplishments.
In addition to supporting this cause the company funded the construction of a double classroom at Nyamiranga secondary school and a toilet block at Nyamauro secondary school. This included overseeing the procedure of contract awarding. The construction was completed during the year.
The company also gave an insight of the company’s tea processing plant and equipments to students from Menyenya S.D.A High School and equipped them with knowledge on career opportunities available in the tea sector.
In addition to holding the coffee farmers day, the company was involved in training and enlightened the farmers on coffee growing, husbandry and issues of marketing.
In the spirit of supporting the girl child education due to gender imbalance in education, the company contributed to the development of the Graceland Girls School in Laikipia during the fundraising event. Further to this, the company donated teaching materials, sanitary towels for girls to a local primary school in Kiambu County.
Health and Safety
In a bid to promote the now popular mode of transport (boda boda) in the community living in the tea growing areas, the company organized training for the operators where the local police officers were invited to talk about the safety of the boda boda operators and donated reflective jackets in support.
Environment
The company has been promoting the growing of shade trees in coffee plantations to boost moisture
retention and also provide appropriate nutrients from foliage from the trees. This is aimed at improving coffee farming productivity. Sasini has also taken the initiative of providing farmers with appropriate indigenous tree seedlings to grow the shade trees in their farms mainly in the Kiambu area.
Mentorship Programs
The company encourages its staff to take part in Corporate Social Investment initiatives. In this regard Management team have been involved in carrying out career guidance talks as well as seminars in local universities. The Management team have made career guidance and people development presentations at the Unites States International University, University of Nairobi, Strathmore University, AKAD career guidance seminar, League of Young Professionals Leadership development seminars, ICPAK annual seminar and leadership retreat, Institute of Internal Auditors Annual conference among others.
Community Partnership
As a way of promoting the local consumption of tea the company participated in sponsoring the Kericho marathon 2012 organized by the Tea Board of Kenya.
Police officers play a vital role in ensuring security and development, Sasini recognized this cause by contributing to the welfare of the families of police officers who lost their lives in the line of duty. Moreover, the company committed its resources in erecting Cianda police patrol base which has effectively provided security within Cianda location and its neighbourhood.
Joint initiatives
Sasini partnered with the Kenya Private Sector Alliance (KEPSA) to support an initiative dubbed ‘My Kenya National Peace building Campaign’ with the aim of promoting peace as the country approaches the next general elections due in March 2013. The operations of the company were affected by the post election violence of 2007/2008 and Sasini is now committed to supporting peace building effort by KEPSA.
Annual Report and Financial Statements for the year ended 30 September 2012
Annual Report and Financial Statements for the year ended 30 September 2012Sasini Ltd and Subsidiaries Sasini Ltd and Subsidiaries
The Directors are responsible for the preparation and presentation of the company and consolidated financial statements of Sasini Limited and its subsidiaries set out on pages 25 to 75 which comprise the statements of financial positions of the group and of the company as at 30 September 2012, and the group and company statement of comprehensive income, the group and company statement of changes in equity and group and company statement of cash flows for the year then ended, and a summary of significant accounting policies and other explanatory notes.
The Directors’ responsibilities include: determining that the basis of accounting described in Note 2 is an acceptable basis for preparing and presenting the financial statements in the circumstances, preparation and presentation of financial statements in accordance with International Financial Reporting Standards and in the manner required by the Kenyan Companies Act and for such internal control as the directors determine is necessary to enable the preparation of financial statements that are free from material misstatements, whether due to fraud or error.
Under the Kenyan Companies Act, the Directors are required to prepare financial statements for each financial year which give a true and fair view of the state of affairs of the group and of the company as at the end of the financial year and of the operating results of the group for that year. It also requires the Directors to ensure the company and its subsidiary keep proper accounting records which disclose with reasonable accuracy the financial position of the group and the company.
The Directors accept responsibility for the annual financial statements, which have been prepared using appropriate accounting policies supported by reasonable and prudent judgements and estimates, in conformity with International Financial Reporting Standards and in the manner required by the Kenyan Companies Act. The Directors are of the opinion that the financial statements give a true and fair view of the state of the financial affairs of the group and the company and of the group operating results.
The Directors further accept responsibility for the maintenance of accounting records which may be relied upon in the preparation of financial statements, as well as adequate systems of internal financial control.
The Directors have made an assessment of the group and the company’s ability to continue as a going concern and have no reason to believe the company and its subsidiary will not be a going concern for at least the next twelve months from the date of this statement.
Approval of the financial statements
The financial statements, as indicated above, were approved by the Board of Directors on 18 December 2012and were signed on its behalf by:
S t a t e m e n t o f D i r e c t o r s ’ R e s p o n s i b i l i t i e s
Dr. J.B. McFieChairman
Dr. M.J.C. MwangiManaging Director
23 24
REPORT OF THE INDEPENDENT AUDITORS TO THE MEMBERS OF
Report on the financial statements
We have audited the consolidated financial statements of Sasini Limited set out on pages 25 to 75 which comprise the statements of financial position of the group and the company as at 30 September 2012, and the consolidated and company statement of comprehensive income, consolidated and company statement of changes in equity and consolidated and company statement of cash flows for the year then ended, and a summary of significant accounting policies and other explanatory notes.
Directors’ responsibility for the financial statements
As stated on page 23, the directors are responsible for the preparation and fair presentation of these financial statements in accordance with International Financial Reporting Standards and in the manner required by the Kenyan Companies Act and for such internal control as the directors determine is necessary to enable the preparation of financial statements that are free from material misstatements, whether due to fraud or error.
Auditors’ responsibility
Our responsibility is to express an opinion on these financial statements based on our audit. We conducted our audit in accordance with International Standards on Auditing. Those standards require that we comply with relevant ethical requirements and plan and perform the audit to obtain reasonable assurance whether the financial statements are free from material misstatement.
An audit involves performing procedures to obtain audit evidence about the amounts and disclosures in the financial statements. The procedures selected depend on our judgement, including the assessment of the risks of material misstatement of the financial statements, whether due to fraud or error. In making those risk assessments, we consider internal control relevant to the entity’s preparation and fair presentation of the financial statements in order to design audit procedures that are appropriate in the circumstances, but not for the purpose of expressing an opinion on the effectiveness of the entity’s internal control. An audit also includes evaluating the appropriateness of accounting policies used and the reasonableness of accounting estimates made by management, as well as evaluating the overall presentation of the financial statements.
We believe that the audit evidence we have obtained is sufficient and appropriate to provide a basis for our opinion.
Opinion
In our opinion, the financial statements give a true and fair view of the financial position of the group and the company at 30 September 2012, and the group and company financial performance and cash flows for the year then ended in accordance with International Financial Reporting Standards and the Kenyan Companies Act. Report on other legal requirements
As required by the Kenyan Companies Act we report to you, based on our audit, that:
(i) we have obtained all the information and explanations, which to the best of our knowledge and belief were necessary for the purpose of our audit;
(ii) in our opinion, proper books of account have been kept by the company, so far as appears from our examination of those books; and
(iii) the statement of financial position of the company is in agreement with the books of account.
KPMG Kenya is a Kenyan partnership and a member firm of the KPMG network of independent member firms affiliated with KPMG international Cooperative (‘KPMG International”), a Swiss entity
EE AholiPC Appleton*BC D’SouzaJM Gathecha
Partners
(British*)
PC MuemaJL MwauraRB Ndung’uAW Pringle*
KPMG KenyaCertified Public Accountants 16th Floor, Lonrho HouseStandard StreetPO Box 40612 00100 GPONairobi, Kenya
Telephone +254 20 2806000Fax +254 20 2215695Email [email protected] www.kpmg.com/eastafrica
Date: 18 December 2012
SASINI LIMITED AND SUBSIDIARIES
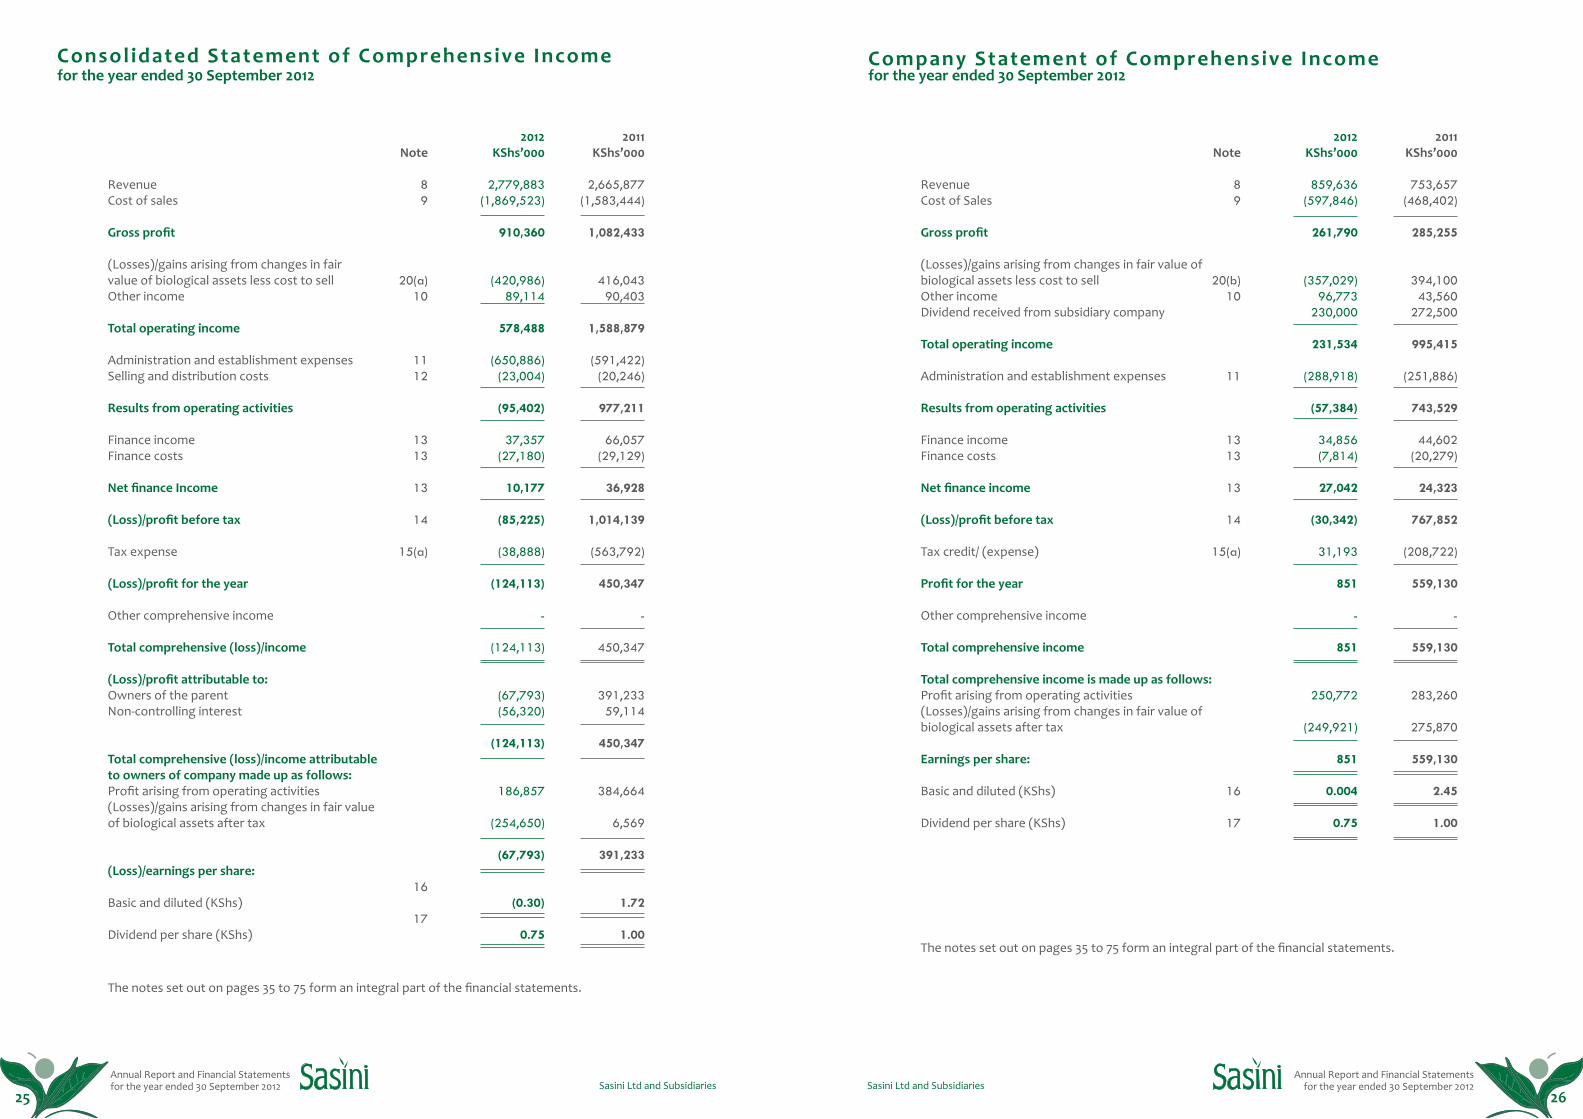
Annual Report and Financial Statements for the year ended 30 September 2012
Annual Report and Financial Statements for the year ended 30 September 2012Sasini Ltd and Subsidiaries Sasini Ltd and Subsidiaries
Consolidated Statement of Comprehensive Income
RevenueCost of sales
Gross profit
(Losses)/gains arising from changes in fair value of biological assets less cost to sellOther income
Total operating income
Administration and establishment expensesSelling and distribution costs
Results from operating activities
Finance incomeFinance costs
Net finance Income
(Loss)/profit before tax
Tax expense
(Loss)/profit for the year
Other comprehensive income
Total comprehensive (loss)/income
(Loss)/profit attributable to:Owners of the parentNon-controlling interest
Total comprehensive (loss)/income attributableto owners of company made up as follows:Profit arising from operating activities(Losses)/gains arising from changes in fair valueof biological assets after tax
(Loss)/earnings per share:
Basic and diluted (KShs)
Dividend per share (KShs)
Note
89
20(a)10
1112
1313
13
14
15(a)
16
17
2012KShs’000
2,779,883(1,869,523)
910,360
(420,986) 89,114
578,488
(650,886)(23,004)
(95,402)
37,357(27,180)
10,177
(85,225)
(38,888)
(124,113)
-
(124,113)
(67,793)(56,320)
(124,113)
186,857
(254,650)
(67,793)
(0.30)
0.75
2011KShs’000
2,665,877(1,583,444)
1,082,433
416,043 90,403
1,588,879
(591,422)(20,246)
977,211
66,057(29,129)
36,928
1,014,139
(563,792)
450,347
-
450,347
391,233 59,114
450,347
384,664
6,569
391,233
1.72
1.00
The notes set out on pages 35 to 75 form an integral part of the financial statements.
25 26
Company Statement of Comprehensive Income
RevenueCost of Sales
Gross profit
(Losses)/gains arising from changes in fair value of biological assets less cost to sellOther incomeDividend received from subsidiary company
Total operating income
Administration and establishment expenses
Results from operating activities
Finance incomeFinance costs
Net finance income
(Loss)/profit before tax
Tax credit/ (expense)
Profit for the year
Other comprehensive income
Total comprehensive income
Total comprehensive income is made up as follows:Profit arising from operating activities (Losses)/gains arising from changes in fair value of biological assets after tax
Earnings per share:
Basic and diluted (KShs)
Dividend per share (KShs)
Note
89
20(b)10
11
1313
13
14
15(a)
16
17
The notes set out on pages 35 to 75 form an integral part of the financial statements.
2011KShs’000
753,657(468,402)
285,255
394,100 43,560
272,500
995,415
(251,886)
743,529
44,602(20,279)
24,323
767,852
(208,722)
559,130
-
559,130
283,260
275,870
559,130
2.45
1.00
2012KShs’000
859,636(597,846)
261,790
(357,029) 96,773
230,000
231,534
(288,918)
(57,384)
34,856(7,814)
27,042
(30,342)
31,193
851
-
851
250,772
(249,921)
851
0.004
0.75
for the year ended 30 September 2012 for the year ended 30 September 2012

Annual Report and Financial Statements for the year ended 30 September 2012
Annual Report and Financial Statements for the year ended 30 September 2012Sasini Ltd and Subsidiaries Sasini Ltd and Subsidiaries
Consolidated Statement of Financial Posit ion
AssetsNon-Current AssetsProperty, plant and equipmentCapital work-in-progressIntangible assets Biological assetsPrepaid leases on leasehold landAvailable-for-sale financial asset
Current AssetsInventoriesTrade and other receivablesAmounts due from related companiesTax recoverableCash and cash equivalents
Total Assets
Equity and Liabilities
Capital and Reserves (Pages 29 & 30)Share capitalNon-distributable reservesDistributable reserves
Non-controlling interest
Total equity
Non-Current LiabilitiesDeferred taxBank loanPost employment benefits
Current LiabilitiesBank loanPost employment benefitsTrade and other payablesTax payable
Total Equity and Liabilities
Note
18(a)18(c)
1920(a)
2122
242526
15(b)27
282929
29
303132
313233
15(b)
2012KShs’000
2,411,97237,87719,887
5,322,29220,556
525
7,813,109
430,589409,383
1,418-
268,481
1,109,871
8,922,980
228,0554,825,7931,239,823
6,293,671 133,131
6,426,802
1,673,591-
236,959
1,910,550
55,70310,246
460,177 59,502
585,628
8,922,980
2011KShs’000
2,402,79121,64529,758
5,743,27820,797
525
8,218,794
385,614347,296
1,05120,169
489,103
1,243,233
9,462,027
228,0555,119,9731,225,026
6,573,054189,118
6,762,172
1,847,08156,837
212,502
2,116,420
131,68210,450
441,303-
583,435
9,462,027
The financial statements set out on pages 25 to 75 were approved by the Board of Directors on 18 December 2012 and signed on its behalf by:
The notes set out on pages 35 to 75 form an integral part of the financial statements.
Dr. J.B. McFieChairman
Dr. M.J.C. MwangiManaging Director
27 28
Company Statement of Financial Posit ion
AssetsNon-Current AssetsProperty, plant and equipmentIntangible assetsBiological assetsPrepaid leases on leasehold landInvestment in subsidiary companies
Current AssetsInventoriesTrade and other receivablesAmounts due from subsidiary companiesAmounts due from related companiesTax recoverableCash and cash equivalents
Total Assets
Equity and Liabilities
Capital and Reserves (Pages 31 & 32)Share capitalNon-distributable reservesDistributable reserves
Total equity
Non-Current LiabilitiesDeferred taxBank loanPost employment benefits
Current LiabilitiesBank loanPost employment benefitsAmounts due to subsidiary companiesTrade and other payablesTax payable
Total Equity and Liabilities
Note
18(b)19
20(b)2123
24252626
15(b)27
282929
303132
31322633
15(b)
2012KShs’000
1,522,0597,109
1,467,2058,016
172,697
3,177,086
116,520183,392162,728
111-
65,282
528,033
3,705,119
228,0552,114,047
438,246
2,780,348
529,445-
17,212
546,657
55,7031,678
-291,874
28,859
378,114
3,705,119
2011KShs’000
1,563,82610,457
1,824,2348,141
172,697
3,579,355
127,651121,619
7,8011,734
27,673224,765
511,243
4,090,598
228,0552,374,439
400,572
3,003,066
627,44056,83717,500
701,777
131,682880
80,871172,322
-
385,755
4,090,598
The financial statements set out on pages 25 to 75 were approved by the Board of Directors on 18 December 2012 and signed on its behalf by:
The notes set out on pages 35 to 75 form an integral part of the financial statements.
Dr. J.B. McFieChairman
Dr. M.J.C. MwangiManaging Director
as at 30 September 2012 as at 30 September 2012

Annual Report and Financial Statements for the year ended 30 September 2012
Annual Report and Financial Statements for the year ended 30 September 2012Sasini Ltd and Subsidiaries Sasini Ltd and Subsidiaries
Consolidated Statement of Changes in Equity
2011:
At 1 October 2010
Total comprehensive income for the yearProfit for the yearAppropriation of gains onbiological assetsExcess depreciation on revaluationDeferred tax on revaluationNon-controlling interest share of subsidiary dividends
Total comprehensive income for the year
Transactions with owners of the company recorded directly in equityFinal 2010 dividend paidInterim 2011 dividend paidProposed final 2011 dividend
Total distribution to ownersof the company
At 30 September 2011
Sharecapital
KShs’000
228,055
-
-
--
-
-
---
-
228,055
Capitalreserve
KShs’000
98,530
-
-
--
-
-
---
-
98,530
Revaluationreserve
KShs’000
1,959,230
-
-
(39,303)11,026
-
(28,277)
---
-
1,930,953
Biologicalassets fair
valueKShs’000
3,083,921
-
6,569
--
-
6,569
---
-
3,090,490
Retainedearnings
KShs’000
915,087
391,233
(6,569)
39,303-
-
423,967
-(114,028)(114,028)
(228,056)
1,110,998
Proposed dividendsKShs’000
68,417
-
-
--
-
-
(68,417)-
114,028
45,611
114,028
Total equityattributable
to ownersKShs’000
6,353,240
391,233
-
-11,026
-
402,259
(68,417)(114,028)
-
(182,445)
6,573,054
Non controlling
interestKShs’000
136,739
59,114
-
-765
(7,500)
52,379
---
-
189,118
Totalequity
KShs’000
6,489,979
450,347
-
-11,791
(7,500)
454,638
(68,417)(114,028)
-
(182,445)
6,762,172
The notes set out on pages 35 to 75 form an integral part of the financial statements.
29 30
( C o n t i n u e d )Consolidated Statement of Changes in Equity
2012:
At 1 October 2011
Total comprehensive income for the yearLoss for the yearAppropriation of losses onbiological assetsExcess depreciation on revaluationDeferred tax on revaluation
Total comprehensive income for the year
Transactions with owners of the company recorded directly in equityFinal 2011 dividend paidInterim 2012 dividend paidProposed final 2012 dividend
Total distribution to ownersof the company
At 30 September 2012
Sharecapital
KShs’000
228,055
-
-
--
-
---
-
228,055
Capitalreserve
KShs’000
98,530
-
-
--
-
---
-
98,530
Revaluationreserve
KShs’000
1,930,953
-
-
(55,996)16,466
(39,530)
---
-
1,891,423
Biologicalassets fair
valueKShs’000
3,090,490
-
(254,650)
--
(254,650)
---
-
2,835,840
Retainedearnings
KShs’000
1,110,998
(67,793)
254,650
55,996-
242,853
-(114,028)(57,014)
(171,042)
1,182,809
Proposed dividendsKShs’000
114,028
-
-
--
-
(114,028)-
57,014
(57,014)
57,014
Total equityattributable
to ownersKShs’000
6,573,054
(67,793)
-
-16,466
(51,327)
(114,028)(114,028)
-
(228,056)
6,293,671
Non controlling
interestKShs’000
189,118
(56,320)
-
-333
(55,987)
---
-
133,131
Totalequity
KShs’000
6,762,172
(124,113)
-
-16,799
(107,314)
(114,028)(114,028)
-
(228,056)
6,426,802
The notes set out on pages 35 to 75 form an integral part of the financial statements.
for the year ended 30 September 2012 for the year ended 30 September 2012
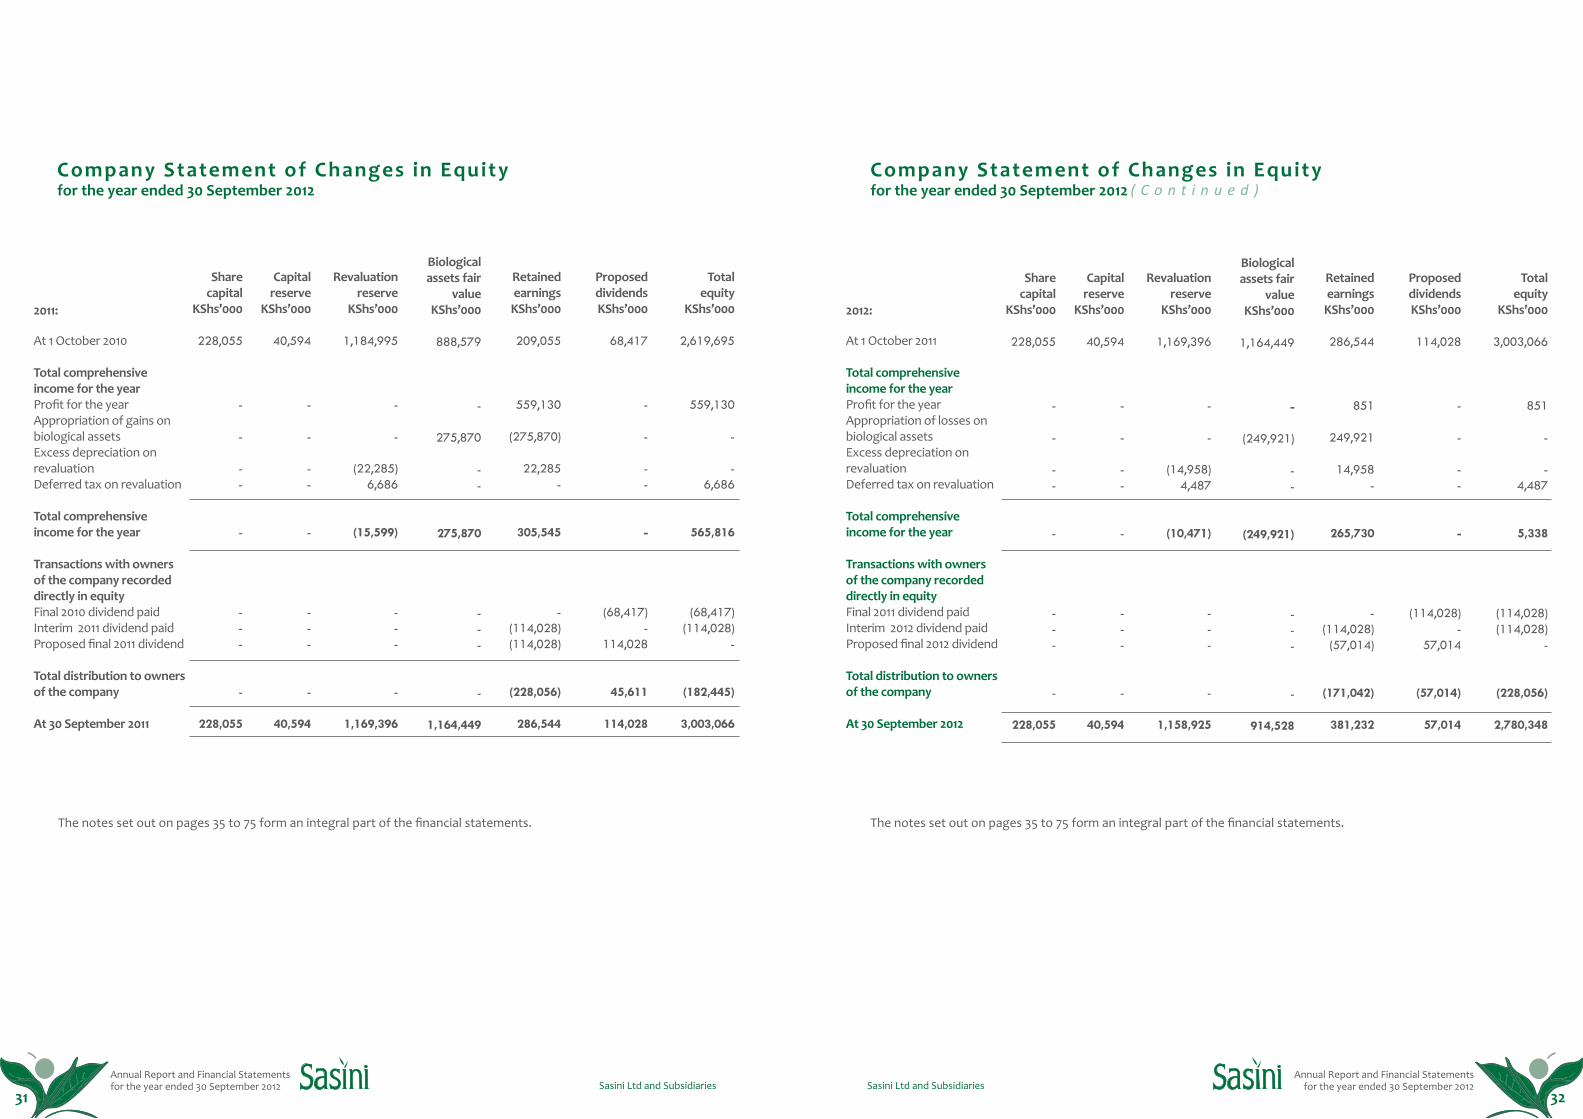
Annual Report and Financial Statements for the year ended 30 September 2012
Annual Report and Financial Statements for the year ended 30 September 2012Sasini Ltd and Subsidiaries Sasini Ltd and Subsidiaries
Company Statement of Changes in Equity
2011:
At 1 October 2010
Total comprehensive income for the yearProfit for the yearAppropriation of gains onbiological assetsExcess depreciation on revaluationDeferred tax on revaluation
Total comprehensive income for the year
Transactions with owners of the company recorded directly in equityFinal 2010 dividend paidInterim 2011 dividend paidProposed final 2011 dividend
Total distribution to ownersof the company
At 30 September 2011
Sharecapital
KShs’000
228,055
-
-
--
-
---
-
228,055
Capitalreserve
KShs’000
40,594
-
-
--
-
---
-
40,594
Revaluationreserve
KShs’000
1,184,995
-
-
(22,285)6,686
(15,599)
---
-
1,169,396
Biologicalassets fair
valueKShs’000
888,579
-
275,870
--
275,870
---
-
1,164,449
Retainedearnings
KShs’000
209,055
559,130
(275,870)
22,285-
305,545
-(114,028)(114,028)
(228,056)
286,544
Proposed dividendsKShs’000
68,417
-
-
--
-
(68,417)-
114,028
45,611
114,028
Totalequity
KShs’000
2,619,695
559,130
-
-6,686
565,816
(68,417)(114,028)
-
(182,445)
3,003,066
The notes set out on pages 35 to 75 form an integral part of the financial statements.
31 32
2012:
At 1 October 2011
Total comprehensive income for the yearProfit for the yearAppropriation of losses onbiological assetsExcess depreciation on revaluationDeferred tax on revaluation
Total comprehensive income for the year
Transactions with owners of the company recorded directly in equityFinal 2011 dividend paidInterim 2012 dividend paidProposed final 2012 dividend
Total distribution to ownersof the company
At 30 September 2012
The notes set out on pages 35 to 75 form an integral part of the financial statements.
( C o n t i n u e d )Company Statement of Changes in Equity
Sharecapital
KShs’000
228,055
-
-
--
-
---
-
228,055
Capitalreserve
KShs’000
40,594
-
-
--
-
---
-
40,594
Revaluationreserve
KShs’000
1,169,396
-
-
(14,958)4,487
(10,471)
---
-
1,158,925
Biologicalassets fair
valueKShs’000
1,164,449
-
(249,921)
--
(249,921)
---
-
914,528
Retainedearnings
KShs’000
286,544
851
249,921
14,958-
265,730
-(114,028)(57,014)
(171,042)
381,232
Proposed dividendsKShs’000
114,028
-
-
--
-
(114,028)-
57,014
(57,014)
57,014
Totalequity
KShs’000
3,003,066
851
-
-4,487
5,338
(114,028)(114,028)
-
(228,056)
2,780,348
for the year ended 30 September 2012 for the year ended 30 September 2012
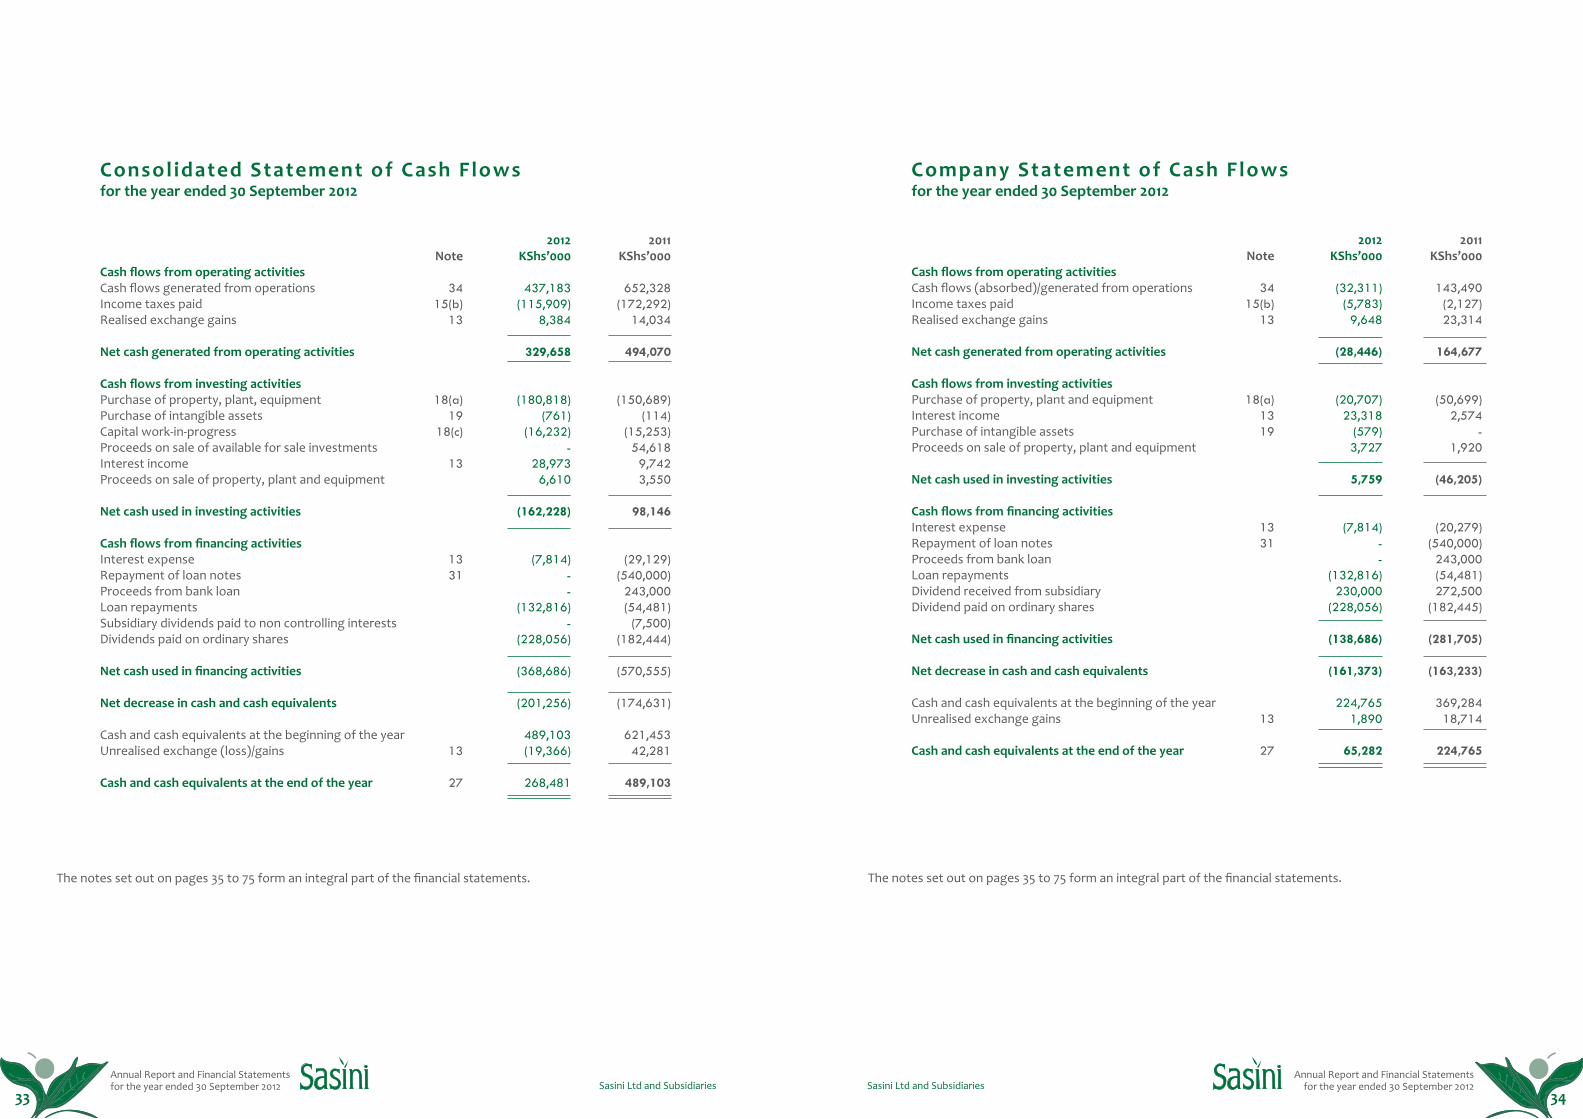
Annual Report and Financial Statements for the year ended 30 September 2012
Annual Report and Financial Statements for the year ended 30 September 2012Sasini Ltd and Subsidiaries Sasini Ltd and Subsidiaries
The notes set out on pages 35 to 75 form an integral part of the financial statements.
Consolidated Statement of Cash Flows
Cash flows from operating activitiesCash flows generated from operationsIncome taxes paidRealised exchange gains
Net cash generated from operating activities
Cash flows from investing activitiesPurchase of property, plant, equipmentPurchase of intangible assetsCapital work-in-progressProceeds on sale of available for sale investmentsInterest incomeProceeds on sale of property, plant and equipment
Net cash used in investing activities
Cash flows from financing activitiesInterest expenseRepayment of loan notes Proceeds from bank loan Loan repaymentsSubsidiary dividends paid to non controlling interestsDividends paid on ordinary shares
Net cash used in financing activities
Net decrease in cash and cash equivalents
Cash and cash equivalents at the beginning of the yearUnrealised exchange (loss)/gains
Cash and cash equivalents at the end of the year
Note
3415(b)
13
18(a)19
18(c)
13
1331
13
27
2012KShs’000
437,183(115,909)
8,384
329,658
(180,818)(761)
(16,232)-
28,9736,610
(162,228)
(7,814)--
(132,816)-
(228,056)
(368,686)
(201,256)
489,103(19,366)
268,481
2011KShs’000
652,328(172,292)
14,034
494,070
(150,689)(114)
(15,253)54,6189,742
3,550
98,146
(29,129)(540,000)243,000(54,481)(7,500)
(182,444)
(570,555)
(174,631)
621,45342,281
489,103
33 34
The notes set out on pages 35 to 75 form an integral part of the financial statements.
Company Statement of Cash Flows
Cash flows from operating activitiesCash flows (absorbed)/generated from operationsIncome taxes paidRealised exchange gains
Net cash generated from operating activities
Cash flows from investing activitiesPurchase of property, plant and equipmentInterest incomePurchase of intangible assetsProceeds on sale of property, plant and equipment
Net cash used in investing activities
Cash flows from financing activitiesInterest expenseRepayment of loan notes Proceeds from bank loan Loan repaymentsDividend received from subsidiaryDividend paid on ordinary shares
Net cash used in financing activities
Net decrease in cash and cash equivalents
Cash and cash equivalents at the beginning of the yearUnrealised exchange gains
Cash and cash equivalents at the end of the year
Note
3415(b)
13
18(a)1319
1331
13
27
2012KShs’000
(32,311)(5,783)
9,648
(28,446)
(20,707)23,318
(579) 3,727
5,759
(7,814)--
(132,816)230,000
(228,056)
(138,686)
(161,373)
224,7651,890
65,282
2011KShs’000
143,490(2,127)
23,314
164,677
(50,699)2,574
- 1,920
(46,205)
(20,279)(540,000)243,000(54,481)272,500
(182,445)
(281,705)
(163,233)
369,284 18,714
224,765
for the year ended 30 September 2012 for the year ended 30 September 2012
Annual Report and Financial Statements for the year ended 30 September 2012
Annual Report and Financial Statements for the year ended 30 September 2012Sasini Ltd and Subsidiaries Sasini Ltd and Subsidiaries
1. Reporting Entity
Sasini Limited (the “Company”) is a company incorporated in Kenya under the Kenyan Companies Act and is domiciled in Kenya. The consolidated financial statements comprise the Company and its subsidiaries (together referred to as the “Group” and individually referred to as “Group entities”).
The Group primarily is involved in growing and processing of tea and coffee, commercial milling and marketing of coffee, value addition of related products, forestry, dairy operations, livestock and horticulture.
The address of its registered office and principal place of business is as follows:
Sasini HouseLoita StreetP.O. Box 30151 - 00100 Nairobi
The shares of the Company are listed on the Nairobi Securities Exchange (NSE). The consolidated financial statements were authorised for issue by the Board of Directors on 18 December 2012.
For Kenyan Companies Act reporting purposes, the balance sheet is represented by the statement of financial position and the profit and loss account by the statement of comprehensive income in these financial statements.
2. Basis of Preparation
(a) Statement of compliance
The financial statements are prepared in compliance with International Financial Reporting Standards (IFRS).
(b) Basis of measurement
The financial statements are prepared under the historical cost basis of accounting except for biological assets and financial instruments that have been measured at fair value and property, plant and equipment that have been carried at revaluation amounts. The accounting policies adopted are consistent with those of the previous years.
(c) Functional and presentation currency
The financial statements are presented in Kenya shillings (KShs), which is the Group’s functional currency. Except as otherwise indicated, financial information presentation in Kenya shillings has been rounded to the nearest thousand (KShs‘000).
(d) Going concern
The Group’s and Company’s management has made an assessment of the Group and Company’s ability to continue as a going concern and is satisfied that the Group and Company has the resources to continue in business for the foreseeable future. Furthermore, the management is not aware of any material uncertainties that may cast significant doubt upon the Group’s ability to continue as a going concern. Therefore, the financial statements have been prepared on the going concern basis. (e) Use of estimates and judgments
The preparation of financial statements in conformity with IFRSs requires management to make judgments, estimates and assumptions that affect the application of accounting policies and reported amounts of assets and liabilities and disclosures of contingent assets and liabilities at the date of the financial statements and the reported amounts of revenues and expenses during the reporting period. The estimates and assumptions are based on the Directors’ best knowledge of current events, actions, historical experience and various other factors that are believed to be reasonable under the circumstances, the results of which form the basis of making the judgments about the carrying values of assets and liabilities that are not readily apparent from other sources. Actual results may differ from these estimates.
The estimates and underlying assumptions are reviewed on an ongoing basis. Revisions to accounting estimates are recognized in the period which the estimate is revised if the revision affects only that period or in the period of the revision and future periods if the revision affects both current and future periods.
In particular, information about significant areas of estimation and critical judgments in applying accounting policies that have the most significant effect on the amounts recognized in the financial statements are described in Note 4.
3. Significant Accounting Policies
(a) Basis of consolidation
(i) Subsidiaries
The consolidated financial statements comprise the financial statements of the Group and its subsidiaries as at 30 September 2012. The subsidiaries are shown in Note 23.
35 36
Subsidiaries are entities controlled by the Group. Control exists when the Group has the power to govern the financial and operating policies of an entity so as to obtain benefits from its activities. In assessing control, potential voting rights that presently are exercisable are taken into account. The financial statements of subsidiaries are included in the consolidated financial statements from the date that control commences until the date that control ceases. The financial statements have been prepared using uniform accounting policies for like transactions and other events in similar circumstances.
Losses within a subsidiary are attributed to the non-controlling interest even if that results in a deficit balance. A change in the ownership interest of a subsidiary, without a loss of control, is accounted for as an equity transaction. If the Group loses control over a subsidiary, it:
• Derecognises the assets (including goodwill) and liabilities of the subsidiary• Derecognises the carrying amount of any non-controlling interest• Derecognises the cumulative translation differences, recorded in equity• Recognises the fair value of the consideration received• Recognises the fair value of any investment retained. Subsequently, it is accounted as an equity accounted investee or as an available-for-sale financial asset depending on the level of influence retained• Recognises any surplus or deficit in profit or loss
(ii) Transactions eliminated on consolidation
Intra-group balances and income and expenses (except for foreign currency transaction gains or losses) arising from intra-group transactions, are eliminated in preparing the consolidated financial statements. Unrealized losses are eliminated in the same way as unrealized gains, but only to the extent that there is no evidence of impairment.
(b) Foreign currency transactions
Monetary assets and liabilities expressed in foreign currencies are translated into Kenya Shillings at the rate of exchange ruling at the reporting date. Transactions during the year in foreign currencies are translated at the rates ruling at the dates of the transactions. Gains and losses on exchange are recognised in profit or loss.
Non-monetary items that are measured in terms of historical cost in a foreign currency are translated using the exchange rates as at the dates of the initial transactions. Non-monetary items measured at fair value
in a foreign currency are translated using the exchange rates at the date when the fair value is determined.
(c) Revenue recognition
Revenue represents the fair value of the consideration receivable for sales of goods and services, and is stated net of value-added tax (VAT), rebates and discounts and after eliminating sales within the Group. Revenue is recognised as follows:
(i) Sales of goods are recognised when significant risk and rewards of ownership have been transferred to the buyer, recovery of the consideration is probable and when there is no continuing management involvement.
(ii) Sales of services are recognised in the period in which the services are rendered by reference to the completion of specific transactions assessed on the basis of actual service provided as a proportion of total services to be provided. Sales revenue can only be recognised when the associated costs can be estimated reliably and the amount of revenue can be estimated reliably.
(d) Taxation
(i) Current taxation
Current income tax assets and liabilities for the current and prior periods are measured at the amount expected to be recovered from or paid to the taxation authorities. The tax rates and tax laws used to compute the amount are those that are enacted or substantively enacted, by the reporting date. Current income tax relating to items recognised directly in other comprehensive income or equity is recognised in other comprehensive income or equity and not in profit or loss.
Management periodically evaluates positions taken in the tax returns with respect to situations in which applicable tax regulations are subject to interpretation and establishes provisions where appropriate. (ii) Deferred tax
Deferred tax is provided in respect of temporary differences at the reporting date between the tax bases of assets and liabilities and their carrying amounts for financial reporting purposes.
Deferred tax liabilities are recognised for all taxable temporary differences, except:
• Where the deferred tax liability arises from the initial
3. Significant Accounting Policies (continued) (a) Basis of consolidation (continued)
Notes to the Consolidated Financial Statements( C o n t i n u e d )for the year ended 30 September 2012
Notes to the Consolidated Financial Statementsfor the year ended 30 September 2012
Annual Report and Financial Statements for the year ended 30 September 2012
Annual Report and Financial Statements for the year ended 30 September 2012Sasini Ltd and Subsidiaries Sasini Ltd and Subsidiaries
recognition of goodwill or of an asset or liability in a transaction that is not a business combination and, at the time of the transaction, affects neither the accounting profit nor taxable profit or loss.
• In respect of taxable temporary differences associated with investments in subsidiaries where the timing of the reversal of the temporary differences can be controlled and it is probable that the temporary differences will not reverse in the foreseeable future.
Deferred tax assets are recognised for all deductible temporary differences, carry forward of unused tax credits and unused tax losses, to the extent that it is probable that taxable profit will be available against which the deductible temporary differences, and the carry forward of unused tax credits and unused tax losses can be utilised.
The carrying amount of deferred tax assets is reviewed at each reporting date and reduced to the extent that it is no longer probable that sufficient taxable profit will be available to allow all or part of the deferred tax asset to be utilised. Unrecognised deferred tax assets are reassessed at each reporting date and are recognised to the extent that it has become probable that future taxable profits will allow the deferred tax asset to be recovered. Deferred tax assets and liabilities are measured at the tax rates that are expected to apply in the year when the asset is realised or the liability is settled, based on tax rates (and tax laws) that have been enacted or substantively enacted at the reporting date.
Deferred tax relating to items recognised directly in other comprehensive income or equity is recognised in other comprehensive income or equity and not in profit or loss.
Deferred tax assets and deferred tax liabilities are offset, if a legally enforceable right exists to set off current tax assets against current income tax liabilities and the deferred taxes relate to the same taxable entity and the same taxation authority.
(e) Investments in subsidiary companies
The investments in subsidiary companies are accounted for at cost in the Company’s statement of financial position less any provisions for impairment losses. Where in the opinion of the directors, there has been an impairment of value of an investment; the loss is recognised as an expense in the period in which the impairment is identified.
(f) Financial instruments
Financial instruments are recognised in the Group and Company financial statements when, and only when, the Group and Company becomes a party to the contractual provisions of the instrument.
(i) Classification
A financial instrument is a contract that gives rise to both a financial asset of one enterprise and a financial liability of another enterprise. These are classified as follows: Financial assets at fair value through profit or loss: This category has two subcategories; financial assets held for trading, and those designated at fair value through profit or loss at inception. Financial instruments reclassified in this category are those that the Group holds principally for the purpose of short-term profit taking.
Loans and receivables are non-derivative financial assets with fixed or determinable payments that are not quoted in an active market other than those that the Group intends to sell in the short term or that it has designated as at fair value through profit or loss or available-for-sale. Loans and receivables comprise receivables and balances due from Group companies.
Held-to-maturity assets are financial assets with fixed or determinable payments and fixed maturity that the Group has positive intent and ability to hold to maturity. Were the Group to sell other than an insignificant amount of held-to-maturity assets, the entire category would be tainted and reclassified as available-for-sale.
Available-for-sale assets are the non-derivative financial assets that are designated as available for sale or are not classified as held for trading purposes, loans and receivables or held to maturity. These include short-term deposits and cash and cash equivalents. (ii) Recognition The Group recognises financial assets held for trading and available-for-sale assets on the date it commits to purchase the assets. From this date any gains and losses arising from changes in fair value of the assets are recognised in profit or loss and other comprehensive income respectively.
Held-to-maturity, loans and receivables are recognised on the date they are transferred to the Group.
3. Significant Accounting Policies (continued) (d) Taxation (continued)
37 38
(iii) Measurement Financial instruments are measured initially at fair value, including transaction costs.
Subsequent to initial recognition all trading instruments and all available-for-sale assets are measured at fair value, except that any instrument that does not have a quoted market price in an active market and whose fair value cannot be reliably measured is stated at cost, including transaction costs, less impairment losses. All non-trading financial liabilities, loans and receivables and held-to-maturity assets are measured at amortised cost less impairment losses. Amortised cost is calculated on the effective interest rate method. Premiums and discounts, including initial transaction costs, are included in the carrying amount of the related instrument and amortised based on the effective interest rate of the instrument.
Gains and losses arising from a change in the fair value of available-for-sale assets are recognised in other comprehensive income and presented within equity until the instrument is derecognised or impaired, at which time the cumulative gain or loss is recognised in profit or loss and trading instrument gains or losses are recognised in profit or loss in the period they arise.
The following explains how the various financial instruements are measured in the financial statements:
(i) Unquoted equity instruments
Investments in shares of other enterprises that give the Group a residual interest in the assets of that enterprise after deducting all of its liabilities are classified as equity instruments. For unquoted equity investments fair value is determined by reference to the market value of a similar investment, where applicable. For financial instruments not traded in an active market, the fair value is determined using appropriate valuation techniques. Such techniques may include recent arm’s length market transactions, reference to the current fair value of another instrument that is substantially the same, discounted cash flow analysis or other valuation models.
(ii) Trade and other receivables
Trade and other receivables are carried at their original invoiced amount less an estimate made for allowances for credit losses based on a review of all outstanding amounts, on an account by account and portfolio basis, at
3. Significant Accounting Policies (continued)(f) Financial Instruments (continued)
the year end. Allowances for credit losses are written off in the year in which they are identified as irrecoverable.
Allowances for credit losses are made when there is objective evidence (such as the probability of insolvency or significant financial difficulties of the debtor) that the Group will not be able to collect all of the amounts due under the original terms of the invoice. The carrying amount of the receivable is reduced through use of an allowance account. Impaired debts are derecognised when they are assessed as uncollectible. In determining the recoverability of trade receivables, the company considers any change in the credit quality of the trade receivable from the date credit was initially granted up to the reporting date.
(iii) Cash and cash equivalents
Cash and cash equivalents includes cash in hand, deposits held at call with banks, other short-term highly liquid investments with original maturities of three months or less, and for the purposes of the statement of cash flows, bank overdrafts.
Cash and cash equivalents are measured at amortised cost.
(iv) Trade and other payables
Trade and other payables are non interest bearing financial liabilities and are carried at amortised cost, which is measured at the contractual value of the consideration to be paid in future in respect of goods and services supplied by the suppliers, whether billed to the Group or not, less any payments made to the suppliers.
(v) Borrowings and loans
Interest bearing loans, overdrafts and bonds are initially recognised at fair value net of issue costs and any discount or premium on settlement. Subsequent to initial recognition, they are measured at amortised cost using the effective interest rate method. Impairment and uncollectibility of financial assets
The Group assesses at each reporting date whether there is any objective evidence that a financial asset or Group of financial assets is impaired.
If there is objective evidence that an impairment loss on loans and receivables carried at amortised cost has been incurred, the amount of the loss is measured as the
Notes to the Consolidated Financial Statements( C o n t i n u e d ) ( C o n t i n u e d )for the year ended 30 September 2012
Notes to the Consolidated Financial Statementsfor the year ended 30 September 2012
Annual Report and Financial Statements for the year ended 30 September 2012
Annual Report and Financial Statements for the year ended 30 September 2012Sasini Ltd and Subsidiaries Sasini Ltd and Subsidiaries
3. Significant Accounting Policies (continued) (f) Financial Instruments (continued)Impairment and Uncollectibility of financial assets (continued)
difference between the asset’s carrying amount and the present value of estimated future cash flows (excluding future credit losses that have not been incurred) discounted at the financial asset’s original effective interest rate (i.e. the effective interest rate computed at initial recognition).
The carrying amount of the asset is written down through the use of an allowance account. The amount of the loss is recognised in profit or loss.
If there is objective evidence that an impairment loss has been incurred on an unquoted equity instrument that is not carried at fair value because its fair value cannot be reliably measured, the amount of the impairment loss is measured as the difference between the carrying amount of the financial asset and the present value of estimated future cash flows discounted at the current market rate of return for a similar financial asset. Such impairment losses are not reversed.
When there is a decline in the fair value of an available-for-sale financial asset whose fair value gains and losses have been recognised in other comprehensive income and accumulated in equity and there is objective evidence that the asset is impaired, the cumulative loss that had been accumulated in equity is removed from equity and recognised through other comprehensive income into profit or loss even though the financial asset has not been derecognised. Impairment losses recognised in profit or loss for an investment in an equity instrument classified as available for sale are not reversed.
De-recognition
Financial assets (or a portion thereof) are de-recognised when the Group’s rights to the cash flows expire or when the Group transfers substantially all the risks and rewards related to the financial asset or when the Group loses control of the financial asset. Financial liabilities (or a portion thereof) are de-recognised when the obligation specified in the contract is discharged, cancelled or expires. On de-recognition, the difference between the carrying amount of the financial liability, including related un-amortised costs and amounts paid for it, are included in profit or loss.
(g) Property, plant & equipment and depreciation
Property, plant and equipment are measured at revalued amounts less accumulated depreciation and any impairment losses. Revaluation increases arising on the revaluations are recognised in other comprehensive
income and accumulated in the revaluation reserve in equity, except to the extent that it reverses a revaluation decrease for the same asset previously recognised as an expense, in which case the increase is credited to profit or loss to the extent of the decrease previously charged. A decrease in carrying amount arising out of revaluation is charged as an expense to the extent that it exceeds the balance, if any, held in the revaluation reserve relating to a previous revaluation of that asset.
An annual transfer from the asset revaluation reserve to retained earnings is made for the difference between depreciation based on the revalued amount of the asset and the original cost. Additionally, accumulated depreciation at the revaluation date is eliminated against the gross carrying amount of the asset and the net amount is restated to the revalued amount of the asset. Upon disposal, any surplus remaining in the revaluation reserve relating to the particular asset being sold is transferred to retained earnings.
Revaluations are done with sufficient regularity to ensure that the carrying amount does not differ materially from that which would be determined using fair value at the end of the reporting period.
Subsequent expenditure is capitalised only when it is probable that the future economic benefits associated with the expenditure will flow to the Group. Ongoing repairs and maintenance is expensed as incurred.
When parts of an item of property, plant and equipment have different useful lives, they are accounted for as separate items (major components) of property, plant and equipment.
No depreciation is provided on freehold land. Other items of property, plant and equipment are depreciated on the straight line basis to write down the cost or revalued amount of each asset to its residual value over its estimated useful life for current and comparative periods as follows:
Buildings and improvementsPlant, machinery and toolsRolling stockFarm implements and trailersFurniture, fittings and equipmentComputers
12 - 45 years12.5% p.a25.0% p.a12.5% p.a12.5% p.a33.3% p.a
Useful life, residual values and depreciation methods are reviewed on an annual basis and adjusted prospectively, if appropriate.
39 40
An item of property, plant and equipment is de-recognised upon disposal or when no future economic benefits are expected to arise from the continued use of the asset. Any gain or loss on de-recognition of the asset (calculated as the difference between the net disposal proceeds and the carrying amount of the item) is included in profit or loss in the year the item is de-recognised.
The carrying values of the property, plant and equipment are assessed annually and adjusted for impairment where it is considered necessary.
(h) Intangible assets
An intangible asset arises from the purchases of accounting software. Acquired intangible assets are measured on initial recognition at cost.The Group recognises an intangible asset at cost if, and only if, it is probable that the future economic benefits that are attributable to the asset will flow to the Group and the cost of the asset can be measured reliably. Following initial recognition, intangible assets are carried at cost less any accumulated amortisation and any accumulated impairment losses. The useful lives of intangible assets are assessed to be finite.
The intangible assets are amortised on a straight-line basis over their useful lives (5 years).
Amortisation method, useful lives and residual values are reviewed at each reporting date. (i) Biological assets
Biological assets are measured on initial recognition and at each reporting date at fair value less cost to sell. Any changes to the fair value are recognised in profit or loss in the period in which they arise. The fair value net of deferred tax is reserved in equity as a non-distributable reserve.
The fair value of livestock is determined based on the market prices of livestock of similar age, breed and sex. Where meaningful market determined prices do not exist to assess the fair value of the Group’s other biological assets, the fair value is determined based on the net present value of expected future cash flows, discounted at appropriate pre-tax rate.
All costs incurred relating to mature biological assets are recognised in profit or loss in the period in which they are incurred. Costs incurred relating to immature biological assets are factored in the fair value adjustment.
3. Significant Accounting Policies (continued) (g) Property, plant & equipment and depreciation (continued)
(j) Leases
The determination of whether an arrangement is, or contains a lease is based on the substance of the arrangement at inception date: whether fulfilment of the arrangement is dependent on the use of a specific asset or assets or the arrangement conveys a right to use the asset.
(i) Group as a lessee
Finance leases, which transfer to the Group substantially all the risks and benefits incidental to ownership of the leased item, are recognised at the commencement of the lease at the fair value of the leased property or, if lower, at the present value of the minimum lease payments. Lease payments are apportioned between finance charges and reduction of the lease liability so as to achieve a constant rate of interest on the remaining balance of the liability. Finance charges are recognised in profit or loss.
Leased assets are depreciated over the useful life of the asset. However, if there is no reasonable certainty that the Group will obtain ownership by the end of the lease term, the asset is depreciated over the shorter of the estimated useful life of the asset and the lease term.
Operating lease payments are recognised as an expense in the statement of comprehensive income on a straight line basis over the lease term.
Lease incentives received are recognised as an integral part of the total lease expense, over the lease term. (ii) Group as a lessor
Leases where the Group does not transfer substantially all the risks and benefits of ownership of the asset are classified as operating leases. Initial direct costs incurred in negotiating an operating lease are added to the carrying amount of the leased asset and recognised over the lease term on the same bases as rental income. Contingent rents are recognised as revenue in the period in which they are earned.
(k) Work-in-progress
Work-in-progress represents costs incurred in acquisition/installation of an item of property, plant and equipment which is not in use. Work-in-progress is not depreciated until the assets are completed and brought into use but tested for impairment when there is an indicator for impairment.
Notes to the Consolidated Financial Statements( C o n t i n u e d ) ( C o n t i n u e d )for the year ended 30 September 2012
Notes to the Consolidated Financial Statementsfor the year ended 30 September 2012
Annual Report and Financial Statements for the year ended 30 September 2012
Annual Report and Financial Statements for the year ended 30 September 2012Sasini Ltd and Subsidiaries Sasini Ltd and Subsidiaries
3. Significant Accounting Policies (continued)
(l) Inventories
Tea and coffee inventories are stated at the lower of cost and net realisable value. Cost is determined on the weighted average cost. Cost comprises expenditure incurred in the normal course of business, including direct material costs, labour and production overheads, where appropriate, that have been incurred in bringing the stocks to their present location and condition. Net realisable value is the price at which the inventory can be realised in the normal course of business after allowing for costs of realisation. Consumable stores are stated at the weighted average cost less provisions for obsolescence, slow moving and defective stores.
Agricultural produce is measured at fair value less cost to sell at the point of harvest. Any changes arising on initial recognition of agricultural produce at fair value less cost to sell are recognised in profit or loss. The cost of finished goods and work in progress comprise the fair value less cost to sell of agricultural produce at the point of harvest, raw materials, direct costs and related production overheads (based on normal operating capacity) but excludes borrowing costs.
(m) Impairment of non-financial assets
The carrying amounts of the Group’s non-financial assets, other than deferred tax assets and inventories, are reviewed at each reporting date to determine whether there is any indication of impairment. If any such indication exists then the asset’s recoverable amount is estimated.
An impairment loss is recognised if the carrying amount of an asset or its cash-generating unit exceeds its recoverable amount. A cash-generating unit is the smallest identifiable asset Group that generates cash flows that largely are independent from other assets and Groups. Impairment losses are recognised in profit or loss. Impairment losses recognised in respect of cash-generating units are allocated first to reduce the carrying amount of any goodwill allocated to the units and then to reduce the carrying amount of the other assets in the unit (group of units) on a pro-rata basis. The recoverable amount of an asset or cash-generating unit is the greater of its value in use and its fair value less costs to sell. In assessing value in use, the estimated future cash flows are discounted to their present value using a pre-tax discount rate that reflects current market assessments of the time value of money and the risks specific to the asset.
(n) Employee benefit
The Group operates a defined contribution retirement benefits scheme for its non-unionised employees. For the unionised employees, the Group operates a gratuity scheme.
(i) Defined contribution plan
A defined contribution plan is a post employment benefit plan which an entity pays fixed contribution into a separate entity and has no legal or constructive obligation to pay further amounts. The expense is recognised in profit or loss.
Contributions from the Group, at a rate of 12.5% of the basic salary of each employee, are expensed in the year the services are rendered and paid over to a separate trustee administered fund.
The Group also contributes to a statutory defined contribution pension scheme, the National Social Security Fund (NSSF). Contributions are determined by local statute and are limited to KShs 200 per employee per month. The Group’s contributions to the above schemes are charged to profit tor loss in the year to which they relate.
(ii) Gratuity
Employee entitlement to gratuity under the collective bargaining agreements with the trade unions and long service awards are recognised when they accrue to employees. A provision is made for the liability for such entitlements as a result of services rendered by employees up to the reporting date.
The liability recognised in the statement of financial position is the present value of the estimated future cash outflows, calculated by an independent actuary using the projected unit credit method. The increase or decrease in the provision is taken to profit or loss.
(iii) Accrued annual leave
The monetary liability for employees’ accrued annual leave entitlement at the reporting date is recognised as an expense accrual.
(o) Provisions
A provision is recognised in the statement of financial position when the Group has a legal or constructive obligation as a result of a past event and it is probable
41 42
that an outflow of economic benefits will be required to settle the obligation. If the effect is material, provisions are determined by discounting the expected future cash flows at a pre-tax rate that reflects current market assessments of the time value of money and, where appropriate, the risks specific to the liability. (p) Borrowing costs
Borrowing costs directly attributable to the acquisition, construction or production of an asset that necessarily takes a substantial period of time to get ready for its intended use or sale are capitalised as part of the cost of the respective assets. All other borrowing costs are expensed in the period they occur.
(q) Earnings per share
Basic and diluted earnings per share (EPS) data for ordinary shares are presented in the financial statements. Basic EPS is calculated by dividing the profit or loss attributable to ordinary shareholders of the Group by the weighted average number of ordinary shares outstanding during the period. Diluted EPS is determined by adjusting the profit or loss attributable to ordinary shareholders and the weighted average number of ordinary shares outstanding for the effects of all dilutive potential ordinary shares, if any.
(r) Finance income and expenses
Finance income comprises interest income on funds invested (including available-for-sale financial assets), dividend income, gains on the disposal of available-for-sale financial assets and changes in the fair value of financial assets at fair value through profit or loss. Interest income is recognised as it accrues in profit or loss, using the effective interest method. Dividend income is recognised in profit or loss on the date that the Group’s right to receive payment is established, which in the case of quoted securities is the ex-dividend date.
Finance costs comprise interest expense on borrowings, unwinding of the discount on provisions, changes in the fair value of financial assets at fair value through profit or loss, impairment losses recognised on financial assets. Borrowing costs that are not directly attributable to the acquisition, construction or production of a qualifying asset are recognised in profit or loss using the effective interest method.
Foreign currency gains and losses are reported on a net basis.
3. Significant Accounting Policies (continued) (o) Provisions (continued)
(s) Dividends
Dividends payable to the Company’s shareholders are recognised as a liability in the period in which they are declared. Proposed dividends are disclosed as a separate component of equity. (t) Related party transactions
The Group discloses the nature, volume and amounts outstanding at the end of each financial year from transactions with related parties, which include transactions with the directors, executive officers and Group or related companies. The related party transactions are at arms length.
(u) Operating segments
An operating segment is a component of the Group that engages in business activities from which it may earn revenues and incur expenses, including revenues and expenses that relate to transactions with any of the Group’s other components, whose operating results are reviewed regularly by the Group’s Management Committee (being the chief operating decision maker) to make decisions about resources allocated to each segment and assess its performance, and for which discrete financial information is available.
(v) Comparatives
Where necessary, comparative figures have been restated to conform with changes in presentation in the current year.
(w) New standards and interpretations not yet adopted
(i) Standards, amendments and interpretations to existing standards effective in 2012 but not relevant
Disclosures – Transfers of Financial Assets (Amendments to IFRS 7) - effective 1 July 2011. The amendments introduce new disclosure requirements about transfers of financial assets, including disclosures for:
• Financial assets that are not derecognised in their entirety; and• Financial assets that are derecognised in their entirety but for which the entity retains continuing involvement.
(ii) Standards, amendments and interpretations to existing standards that are not yet effective and have not been early adopted by the Group.
Notes to the Consolidated Financial Statements( C o n t i n u e d ) ( C o n t i n u e d )for the year ended 30 September 2012
Notes to the Consolidated Financial Statementsfor the year ended 30 September 2012
Annual Report and Financial Statements for the year ended 30 September 2012
Annual Report and Financial Statements for the year ended 30 September 2012Sasini Ltd and Subsidiaries Sasini Ltd and Subsidiaries
3. Significant Accounting Policies (continued) (w) New standards and interpretations not yet adopted (continued)(ii) Standards, amendments and interpretations to existing standards that are not yet effective and have not been early adopted by the Group (continued)
The Group’s and parent entity’s assessment of the impact of these new standards and interpretations is set out below:
• Amendments to IAS 1‘Presentation of Items of Other Comprehensive Income’ (effective 1 July 2012). The amendments require that an entity present separately the items of other comprehensive income that would be reclassified to profit or loss in the future if certain conditions are met from those that would never be reclassified to profit or loss. It however does not change the existing option to present profit or loss and other comprehensive income in two statements but changes the title of the statement of comprehensive income to the statement of profit or loss and other comprehensive income. However, an entity is still allowed to use other titles.
• IAS 27 Separate Financial Statements (effective 1 January 2013) contains accounting and disclosure requirements for investments in subsidiaries, joint ventures and associates when an entity prepares separate financial statements. The amendment carries forward the existing accounting and disclosure requirements for separate financial statements, with some minor clarifications.
• Deferred Tax - Recovery of Underlying Assets (Amendments to IAS 12) – effective 1 January 2012. The amendments introduce an exception to the general measurement requirements of IAS 12 Income Taxes in respect of investment properties measured at fair value. The measurement of deferred tax assets and liabilities, in this limited circumstance, is based on a rebuttable presumption that the carrying amount of the investment property will be recovered entirely through sale. The presumption can be rebutted only if the investment property is depreciable and held within a business model whose objective is to consume substantially all of the asset’s economic benefits over the life of the asset.
• IAS 19 ‘Employee Benefits’ – effective 1 January 2013. The amended IAS 19 requires that actuarial gains and losses are recognised immediately in other comprehensive income; this change will remove the corridor method and eliminate the ability for entities to recognise all changes in the defined benefit obligation and in plan assets in profit or loss, which currently is allowed under IAS 19. It also requires that expected return on plan assets recognised in profit or loss is calculated based on the rate used to discount the defined benefit obligation.
• IAS 28 Investments in Associates and Joint Ventures (effective 1 January 2013). IAS 28 prescribes the accounting for investments in associates and sets out the requirements for the application of the equity method when accounting for investments in associates and joint ventures. It carries forward the existing accounting and disclosure requirements with limited amendments.
• IFRS 10 ‘Consolidated Financial Statements’ (effective 1 January 2013). This standard replaces the requirements and guidance in IAS 27 relating to consolidated financial statements. The objective of this standard is to improve the usefulness of consolidated financial statements by developing a single basis for consolidation and robust guidance for applying that basis to situations where it has proved difficult to assess control in practice and divergence has evolved. The basis for consolidation is control and it is applied irrespective of the nature of the investee.
• IFRS 11 – ‘Joint arrangements’ (effective 1 January 2013). IFRS 11 supersedes IAS 31 and SIC-13 relating to Jointly Controlled Entities. The objective of this IFRS is to establish principles for financial reporting by entities that have an interest in arrangements that are controlled jointly. It focuses on the rights and obligations of joint arrangements, rather than the legal form (as is currently the case). It further distinguishes joint arrangements between joint operations and joint ventures; and requires the equity method for jointly controlled entities that are now called joint ventures.
• IFRS 12 – ‘Disclosure of interests in other entities’ (effective 1 January 2013). The objective of this IFRS is to require an entity to disclose information that enables users of its financial statements to evaluate: the nature of, and risks associated with, its interests in other entities; and the effects of those interests on its financial position, financial performance and cash flows.
• IFRS 13 – ‘Fair value measurement’ (effective 1 January 2013). IFRS 13 replaces the fair value measurement guidance contained in individual IFRSs with a single source of fair value measurement guidance. It defines fair value, establishes a framework for measuring fair value and sets out disclosure requirements for fair value measurements. It explains how to measure fair value when it is required or permitted by other IFRSs. It does not introduce new requirements to measure assets or liabilities at fair value, nor does it eliminate the practicability exceptions to fair value measurements that currently exist in certain standards.
43 44
• IFRS 9 ‘Financial Instruments’ (effective 1 January 2015) is a new standard on financial instruments that will eventually replace IAS 39. The published standard introduces changes to the current IAS 39 rules for classification and measurement of financial assets. Under IFRS 9 there will be two measurement bases for financial assets: amortised cost and fair value. Financial assets at fair value will be recorded at fair value through profit or loss with a limited opportunity to record changes in fair value of certain equity instruments through other comprehensive income. Financial liabilities are excluded from the scope of the standard.
The standard also differs from existing requirements for accounting for financial assets in various other areas, such as embedded derivatives and the recognition of fair value adjustments in other comprehensive income.
The standard will be applied retrospectively (subject to the standard’s transitional provisions).
The Group is currently in the process of evaluating the potential effect of these standards.
4. Use of Estimates and Judgements
(a) Critical accounting estimates and assumptions
In the process of applying the Group’s accounting policies, directors make certain estimates and assumptions about future events. In practice, the estimated and assumed results would differ from the actual results. Such estimates and assumptions, that have a significant risk of causing a material adjustment to the carrying amounts of assets and liabilities within the next financial year, are described below:
(i) Biological assets
In determining the fair value of biological assets, the Group uses the present value of expected future cash flows from the assets discounted at the current market determined pre tax rate. The objective of calculating the present value of expected cash flows is to determine the fair value of biological assets in their present location and condition. The Group considers this in determining an appropriate discount rate to be used and in estimating net cash flows. Management uses historical data relating to production and market prices of tea, coffee, livestock and trees. The methodology and assumptions used for estimating both
3. Significant Accounting Policies (continued) (w) New standards and interpretations not yet adopted (continued)(ii) Standards, amendments and interpretations to existing standards that are not yet effective and have not been early adopted by the Group (continued)
the amount and timing of future cash flows are reviewed to reduce any differences between estimates and actual experience. The significant assumptions are set out in Note 20 to the financial statements.
(ii) Property, plant and equipment
Directors make estimates in determining the depreciation rates for property, plant and equipment. The rates used are set out in the accounting policy for property, plant and equipment.
These estimates are continually evaluated and are based on historical experience and other factors, including expectations of future events that are believed to be reasonable under the prevailing circumstances.
The Group measures its property, plant and equipment at revalued amounts with changes in revaluation values being recognised in other comprehensive income. The Group engages independent valuers to determine fair values of property, plant and equipment. The valuation values are based on the prevailing market prices which are sensitive to economic conditions. The details of property, plant and equipment and the assumptions applied are disclosed in Note 3(g) and Note 18.
(iii) Income taxes and deferred tax
Significant judgement is required in determining the Group’s provision for deferred and income taxes. There are many transactions and calculations for which the ultimate tax determination is uncertain during the ordinary course of business. The Group recognises liabilities for anticipated tax audit issues based on estimates of whether additional taxes will be due. Where the final tax outcome of these matters is different from the amounts that were initially recorded, such differences will impact the current income tax and deferred income tax provisions in the year in which such determination is made. (iv) Post employment benefit obligation
The cost of the unfunded service gratuity is determined using actuarial valuations. The actuarial valuation involves making assumptions about discount rates, expected rates of return on scheme assets and future salary increases. Due to the long term nature of these plans, such estimates are subject to significant uncertainty. Details of post employment benefits and the assumptions applied are disclosed in Note 3(n) and Note 32.
Notes to the Consolidated Financial Statements( C o n t i n u e d ) ( C o n t i n u e d )for the year ended 30 September 2012
Notes to the Consolidated Financial Statementsfor the year ended 30 September 2012
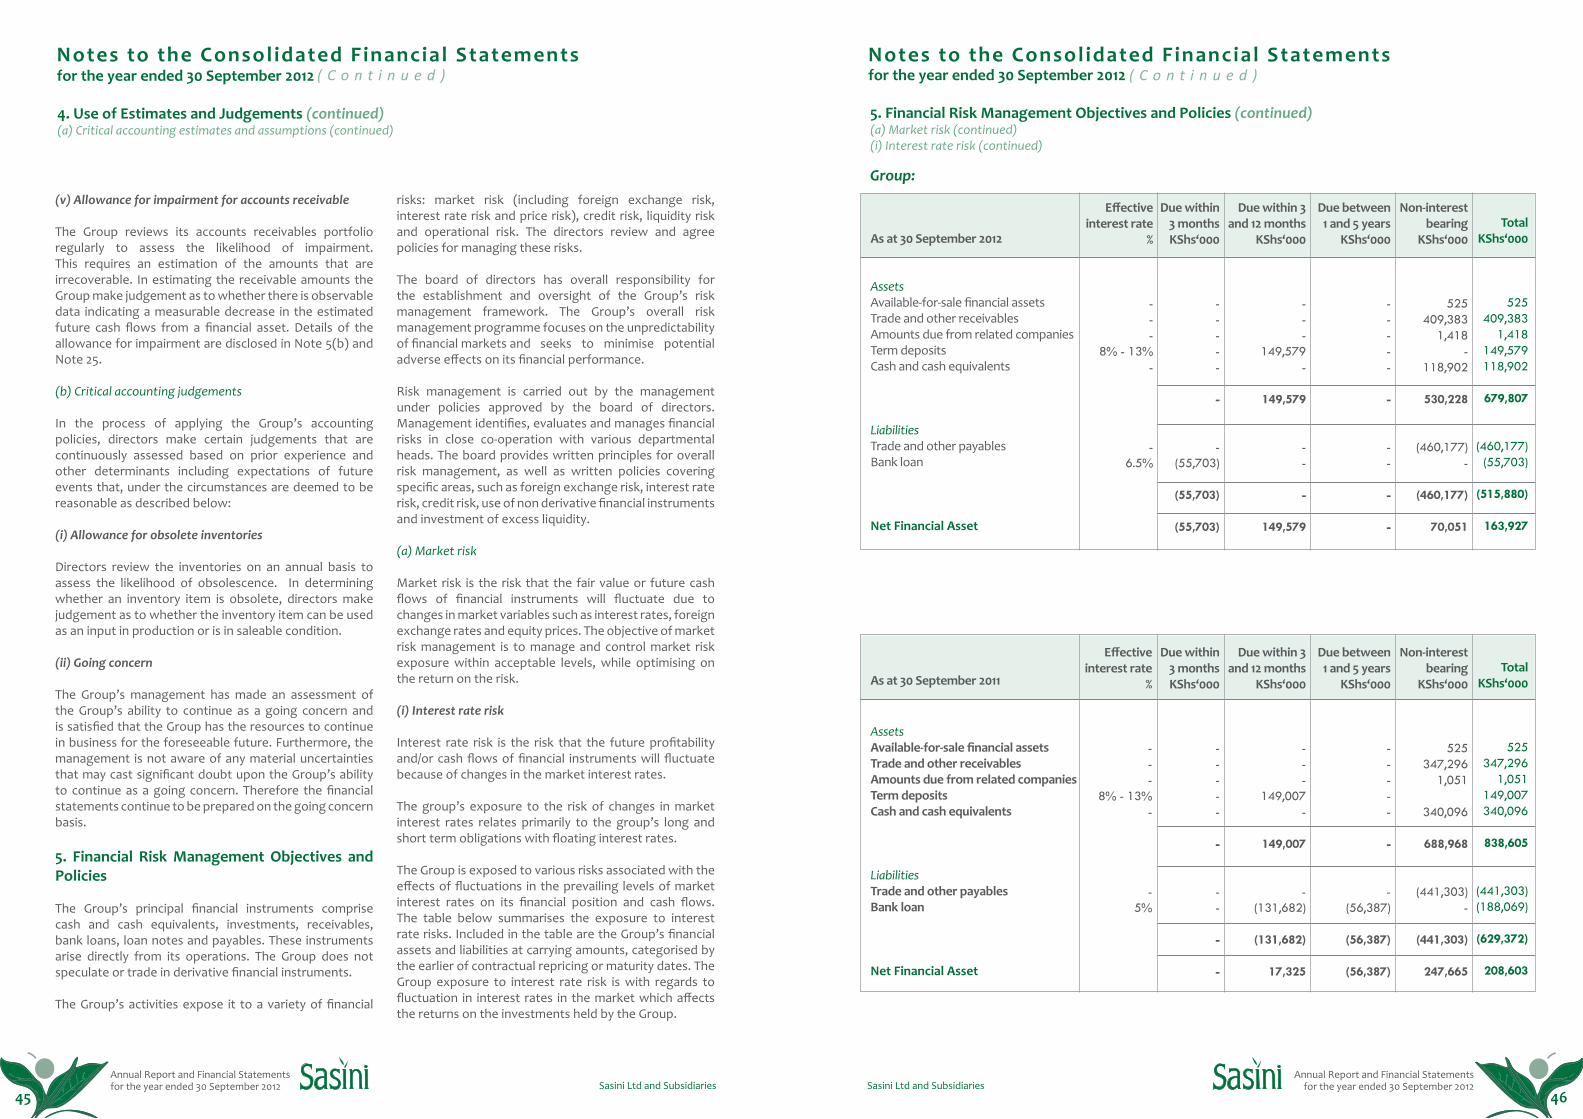
Annual Report and Financial Statements for the year ended 30 September 2012
Annual Report and Financial Statements for the year ended 30 September 2012Sasini Ltd and Subsidiaries Sasini Ltd and Subsidiaries
4. Use of Estimates and Judgements (continued)(a) Critical accounting estimates and assumptions (continued)
(v) Allowance for impairment for accounts receivable
The Group reviews its accounts receivables portfolio regularly to assess the likelihood of impairment. This requires an estimation of the amounts that are irrecoverable. In estimating the receivable amounts the Group make judgement as to whether there is observable data indicating a measurable decrease in the estimated future cash flows from a financial asset. Details of the allowance for impairment are disclosed in Note 5(b) and Note 25.
(b) Critical accounting judgements
In the process of applying the Group’s accounting policies, directors make certain judgements that are continuously assessed based on prior experience and other determinants including expectations of future events that, under the circumstances are deemed to be reasonable as described below:
(i) Allowance for obsolete inventories
Directors review the inventories on an annual basis to assess the likelihood of obsolescence. In determining whether an inventory item is obsolete, directors make judgement as to whether the inventory item can be used as an input in production or is in saleable condition.
(ii) Going concern
The Group’s management has made an assessment of the Group’s ability to continue as a going concern and is satisfied that the Group has the resources to continue in business for the foreseeable future. Furthermore, the management is not aware of any material uncertainties that may cast significant doubt upon the Group’s ability to continue as a going concern. Therefore the financial statements continue to be prepared on the going concern basis. 5. Financial Risk Management Objectives and Policies
The Group’s principal financial instruments comprise cash and cash equivalents, investments, receivables, bank loans, loan notes and payables. These instruments arise directly from its operations. The Group does not speculate or trade in derivative financial instruments.
The Group’s activities expose it to a variety of financial
risks: market risk (including foreign exchange risk, interest rate risk and price risk), credit risk, liquidity risk and operational risk. The directors review and agree policies for managing these risks.
The board of directors has overall responsibility for the establishment and oversight of the Group’s risk management framework. The Group’s overall risk management programme focuses on the unpredictability of financial markets and seeks to minimise potential adverse effects on its financial performance.
Risk management is carried out by the management under policies approved by the board of directors. Management identifies, evaluates and manages financial risks in close co-operation with various departmental heads. The board provides written principles for overall risk management, as well as written policies covering specific areas, such as foreign exchange risk, interest rate risk, credit risk, use of non derivative financial instruments and investment of excess liquidity.
(a) Market risk
Market risk is the risk that the fair value or future cash flows of financial instruments will fluctuate due to changes in market variables such as interest rates, foreign exchange rates and equity prices. The objective of market risk management is to manage and control market risk exposure within acceptable levels, while optimising on the return on the risk.
(i) Interest rate risk
Interest rate risk is the risk that the future profitability and/or cash flows of financial instruments will fluctuate because of changes in the market interest rates.
The group’s exposure to the risk of changes in market interest rates relates primarily to the group’s long and short term obligations with floating interest rates.
The Group is exposed to various risks associated with the effects of fluctuations in the prevailing levels of market interest rates on its financial position and cash flows. The table below summarises the exposure to interest rate risks. Included in the table are the Group’s financial assets and liabilities at carrying amounts, categorised by the earlier of contractual repricing or maturity dates. The Group exposure to interest rate risk is with regards to fluctuation in interest rates in the market which affects the returns on the investments held by the Group.
45 46
5. Financial Risk Management Objectives and Policies (continued) (a) Market risk (continued)(i) Interest rate risk (continued)
Group:
As at 30 September 2012
AssetsAvailable-for-sale financial assetsTrade and other receivablesAmounts due from related companiesTerm depositsCash and cash equivalents
LiabilitiesTrade and other payablesBank loan
Net Financial Asset
As at 30 September 2011
AssetsAvailable-for-sale financial assetsTrade and other receivablesAmounts due from related companiesTerm depositsCash and cash equivalents
LiabilitiesTrade and other payablesBank loan
Net Financial Asset
Effective interest rate
%
---
8% - 13%-
-6.5%
Effective interest rate
%
---
8% - 13%-
-5%
Due within 3 monthsKShs‘000
-----
-
-(55,703)
(55,703)
(55,703)
Due within 3 monthsKShs‘000
-----
-
--
-
-
Due within 3 and 12 months
KShs‘000
---
149,579-
149,579
--
-
149,579
Due within 3 and 12 months
KShs‘000
---
149,007-
149,007
-(131,682)
(131,682)
17,325
Due between 1 and 5 years
KShs‘000
-----
-
--
-
-
Due between 1 and 5 years
KShs‘000
-----
-
-(56,387)
(56,387)
(56,387)
Non-interest bearing
KShs‘000
525409,383
1,418-
118,902
530,228
(460,177)-
(460,177)
70,051
Non-interest bearing
KShs‘000
525347,296
1,051
340,096
688,968
(441,303)-
(441,303)
247,665
TotalKShs‘000
525409,383
1,418149,579118,902
679,807
(460,177)(55,703)
(515,880)
163,927
TotalKShs‘000
525347,296
1,051149,007340,096
838,605
(441,303)(188,069)
(629,372)
208,603
Notes to the Consolidated Financial Statements( C o n t i n u e d ) ( C o n t i n u e d )for the year ended 30 September 2012
Notes to the Consolidated Financial Statementsfor the year ended 30 September 2012
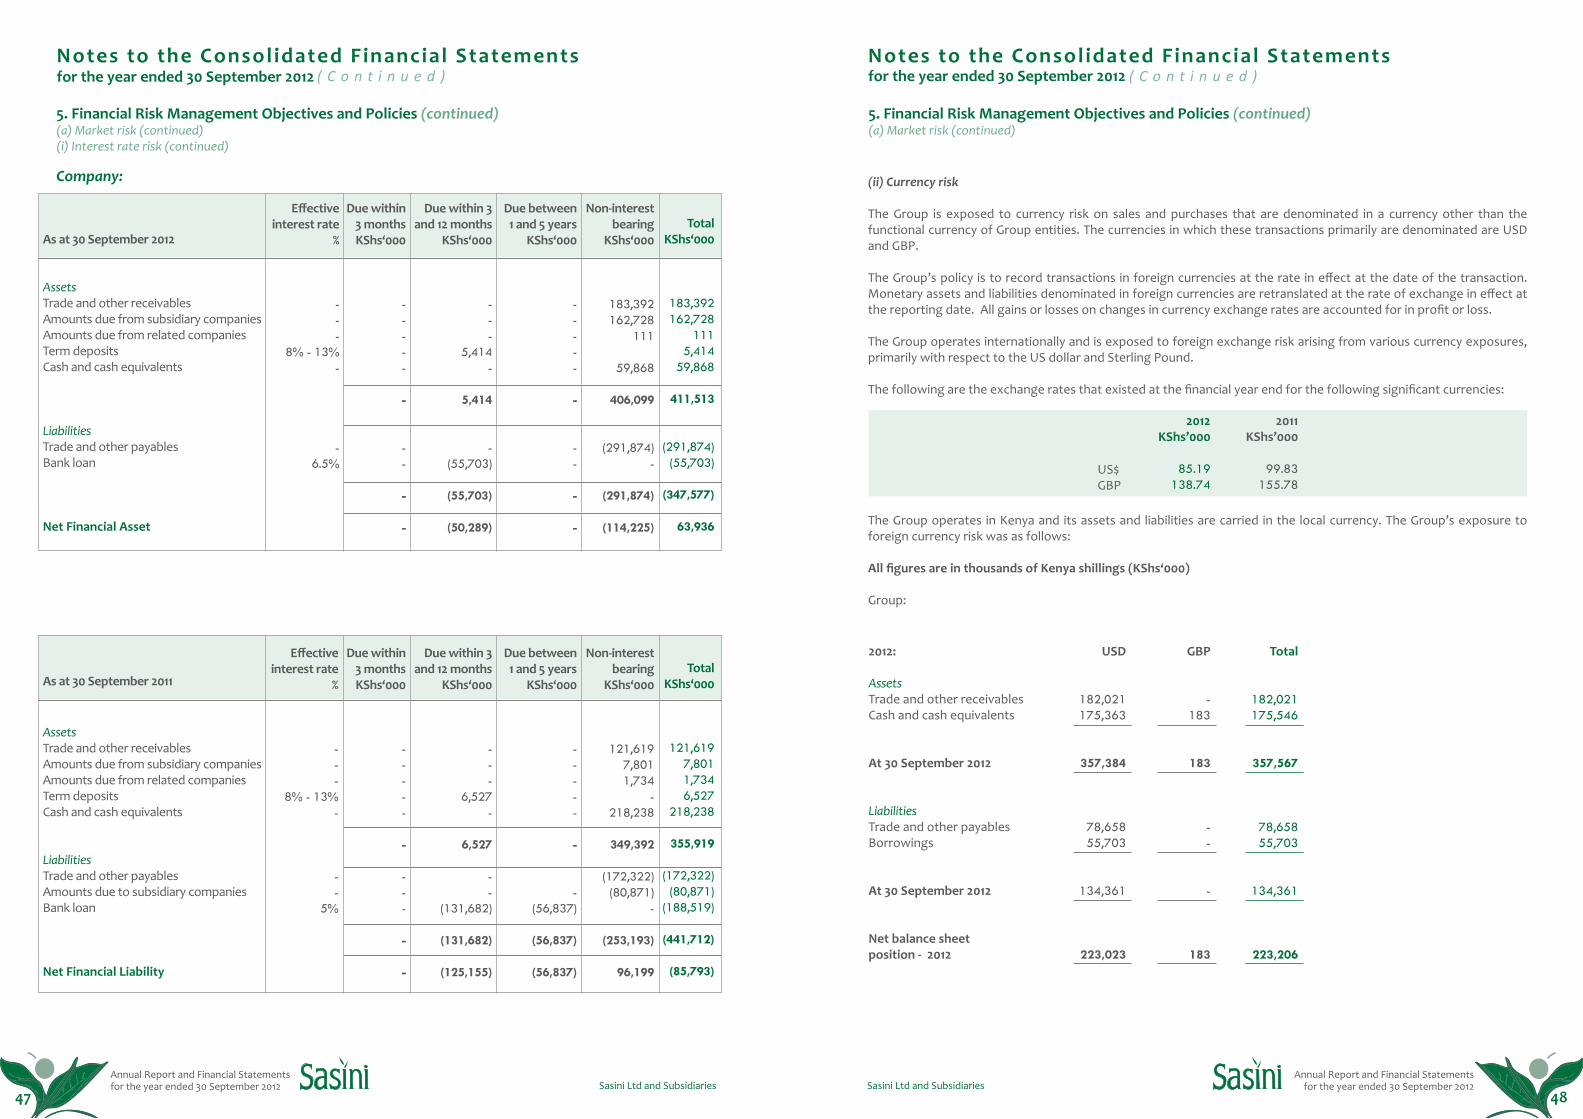
Annual Report and Financial Statements for the year ended 30 September 2012
Annual Report and Financial Statements for the year ended 30 September 2012Sasini Ltd and Subsidiaries Sasini Ltd and Subsidiaries
Company:
5. Financial Risk Management Objectives and Policies (continued) (a) Market risk (continued)(i) Interest rate risk (continued)
As at 30 September 2012
AssetsTrade and other receivablesAmounts due from subsidiary companiesAmounts due from related companiesTerm depositsCash and cash equivalents
LiabilitiesTrade and other payablesBank loan
Net Financial Asset
As at 30 September 2011
AssetsTrade and other receivablesAmounts due from subsidiary companiesAmounts due from related companiesTerm depositsCash and cash equivalents
LiabilitiesTrade and other payablesAmounts due to subsidiary companiesBank loan
Net Financial Liability
Effective interest rate
%
---
8% - 13%-
-6.5%
Effective interest rate
%
---
8% - 13%-
--
5%
Due within 3 monthsKShs‘000
-----
-
--
-
-
Due within 3 monthsKShs‘000
-----
-
---
-
-
Due within 3 and 12 months
KShs‘000
---
5,414-
5,414
-(55,703)
(55,703)
(50,289)
Due within 3 and 12 months
KShs‘000
---
6,527-
6,527
--
(131,682)
(131,682)
(125,155)
Due between 1 and 5 years
KShs‘000
-----
-
--
-
-
Due between 1 and 5 years
KShs‘000
-----
-
-(56,837)
(56,837)
(56,837)
Non-interest bearing
KShs‘000
183,392162,728
111
59,868
406,099
(291,874)-
(291,874)
(114,225)
Non-interest bearing
KShs‘000
121,6197,8011,734
-218,238
349,392
(172,322)(80,871)
-
(253,193)
96,199
TotalKShs‘000
183,392162,728
1115,414
59,868
411,513
(291,874)(55,703)
(347,577)
63,936
TotalKShs‘000
121,6197,8011,7346,527
218,238
355,919
(172,322)(80,871)
(188,519)
(441,712)
(85,793)
47 48
5. Financial Risk Management Objectives and Policies (continued) (a) Market risk (continued)
(ii) Currency risk
The Group is exposed to currency risk on sales and purchases that are denominated in a currency other than the functional currency of Group entities. The currencies in which these transactions primarily are denominated are USD and GBP.
The Group’s policy is to record transactions in foreign currencies at the rate in effect at the date of the transaction. Monetary assets and liabilities denominated in foreign currencies are retranslated at the rate of exchange in effect at the reporting date. All gains or losses on changes in currency exchange rates are accounted for in profit or loss.
The Group operates internationally and is exposed to foreign exchange risk arising from various currency exposures, primarily with respect to the US dollar and Sterling Pound.
The following are the exchange rates that existed at the financial year end for the following significant currencies:
The Group operates in Kenya and its assets and liabilities are carried in the local currency. The Group’s exposure to foreign currency risk was as follows:
All figures are in thousands of Kenya shillings (KShs‘000)
Group:
US$GBP
2012:
Assets Trade and other receivablesCash and cash equivalents
At 30 September 2012
LiabilitiesTrade and other payables Borrowings
At 30 September 2012
Net balance sheet position - 2012
2012KShs’000
85.19138.74
USD
182,021175,363
357,384
78,658 55,703
134,361
223,023
GBP
-183
183
- -
-
183
Total
182,021175,546
357,567
78,658 55,703
134,361
223,206
2011KShs’000
99.83155.78
Notes to the Consolidated Financial Statements( C o n t i n u e d ) ( C o n t i n u e d )for the year ended 30 September 2012
Notes to the Consolidated Financial Statementsfor the year ended 30 September 2012
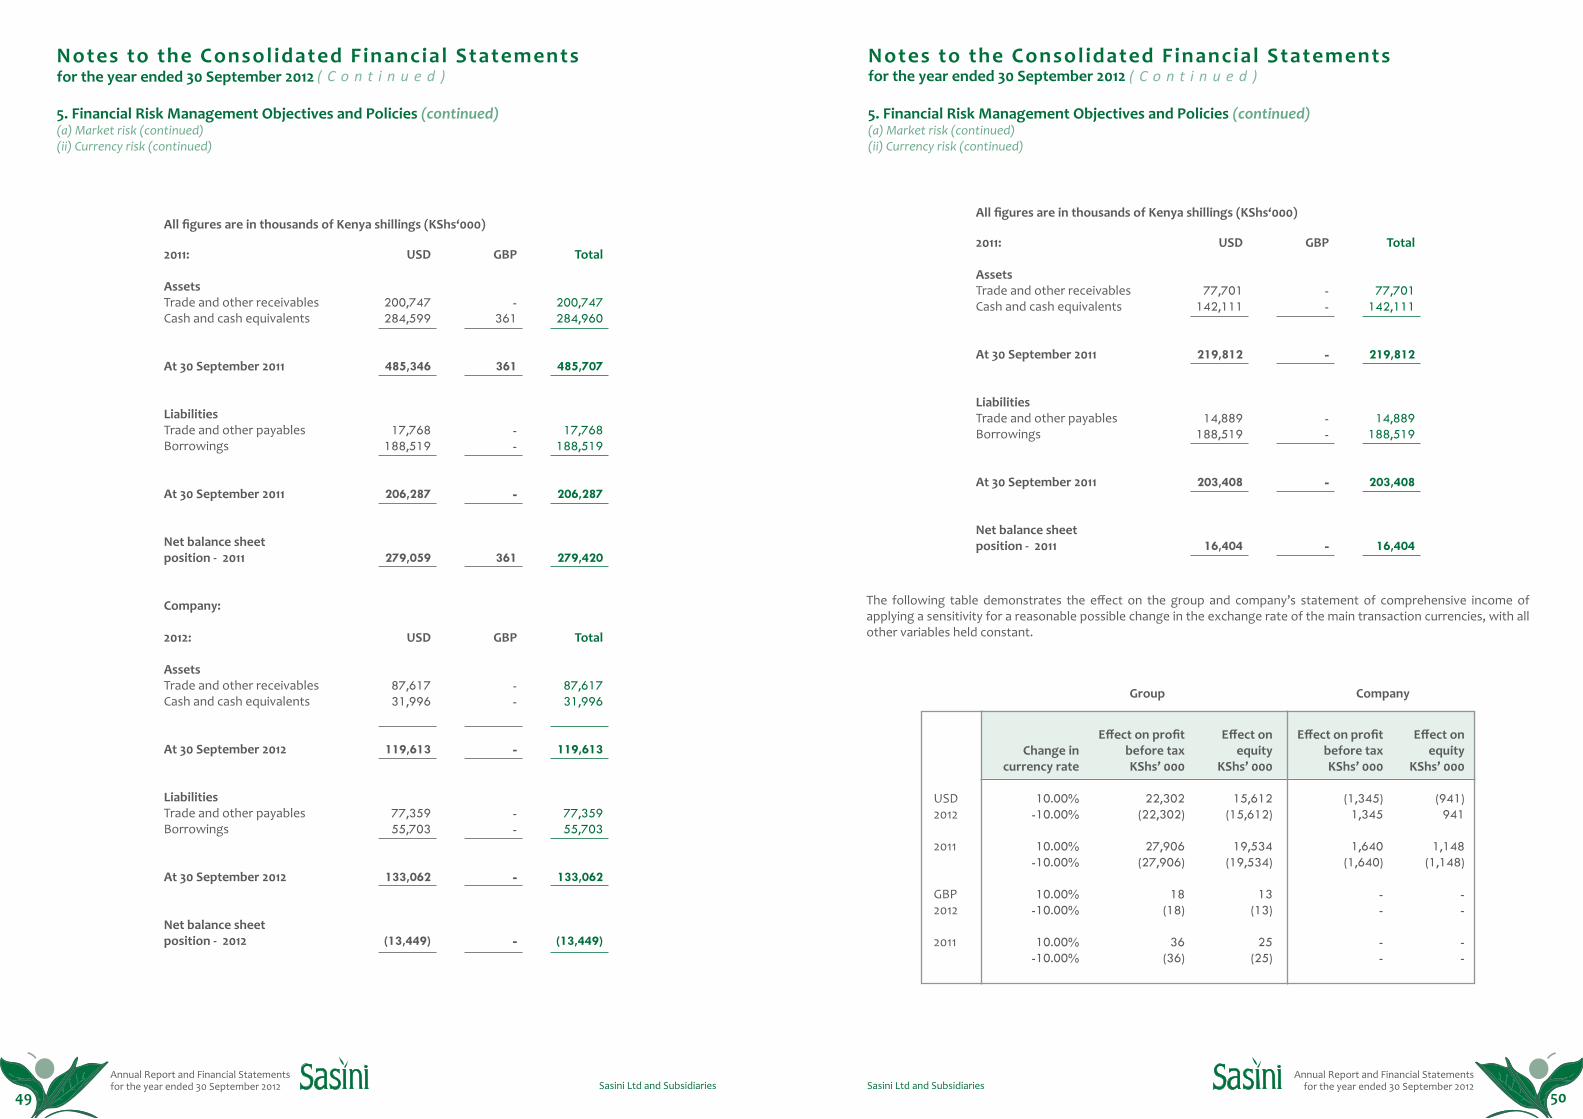
Annual Report and Financial Statements for the year ended 30 September 2012
Annual Report and Financial Statements for the year ended 30 September 2012Sasini Ltd and Subsidiaries Sasini Ltd and Subsidiaries
5. Financial Risk Management Objectives and Policies (continued) (a) Market risk (continued)(ii) Currency risk (continued)
All figures are in thousands of Kenya shillings (KShs‘000)
2011:
Assets Trade and other receivablesCash and cash equivalents
At 30 September 2011
LiabilitiesTrade and other payablesBorrowings
At 30 September 2011
Net balance sheetposition - 2011
Company:
2012:
AssetsTrade and other receivablesCash and cash equivalents
At 30 September 2012
LiabilitiesTrade and other payablesBorrowings
At 30 September 2012
Net balance sheetposition - 2012
USD
200,747284,599
485,346
17,768 188,519
206,287
279,059
USD
87,617 31,996
119,613
77,359 55,703
133,062
(13,449)
GBP
-361
361
- -
-
361
GBP
--
-
--
-
-
Total
200,747284,960
485,707
17,768 188,519
206,287
279,420
Total
87,617 31,996
119,613
77,359 55,703
133,062
(13,449)
49 50
5. Financial Risk Management Objectives and Policies (continued) (a) Market risk (continued)(ii) Currency risk (continued)
All figures are in thousands of Kenya shillings (KShs‘000)
The following table demonstrates the effect on the group and company’s statement of comprehensive income of applying a sensitivity for a reasonable possible change in the exchange rate of the main transaction currencies, with all other variables held constant.
2011:
Assets Trade and other receivablesCash and cash equivalents
At 30 September 2011
LiabilitiesTrade and other payablesBorrowings
At 30 September 2011
Net balance sheetposition - 2011
USD
77,701142,111
219,812
14,889188,519
203,408
16,404
GBP
--
-
- -
-
-
Total
77,701142,111
219,812
14,889 188,519
203,408
16,404
Group Company
USD2012
2011
GBP2012
2011
Change in currency rate
10.00%-10.00%
10.00%-10.00%
10.00%-10.00%
10.00%-10.00%
Effect on profit before taxKShs’ 000
22,302(22,302)
27,906(27,906)
18(18)
36(36)
Effect on equity
KShs’ 000
15,612(15,612)
19,534(19,534)
13(13)
25 (25)
Effect on profit before taxKShs’ 000
(1,345)1,345
1,640(1,640)
--
--
Effect on equity
KShs’ 000
(941)941
1,148(1,148)
--
--
Notes to the Consolidated Financial Statements( C o n t i n u e d ) ( C o n t i n u e d )for the year ended 30 September 2012
Notes to the Consolidated Financial Statementsfor the year ended 30 September 2012
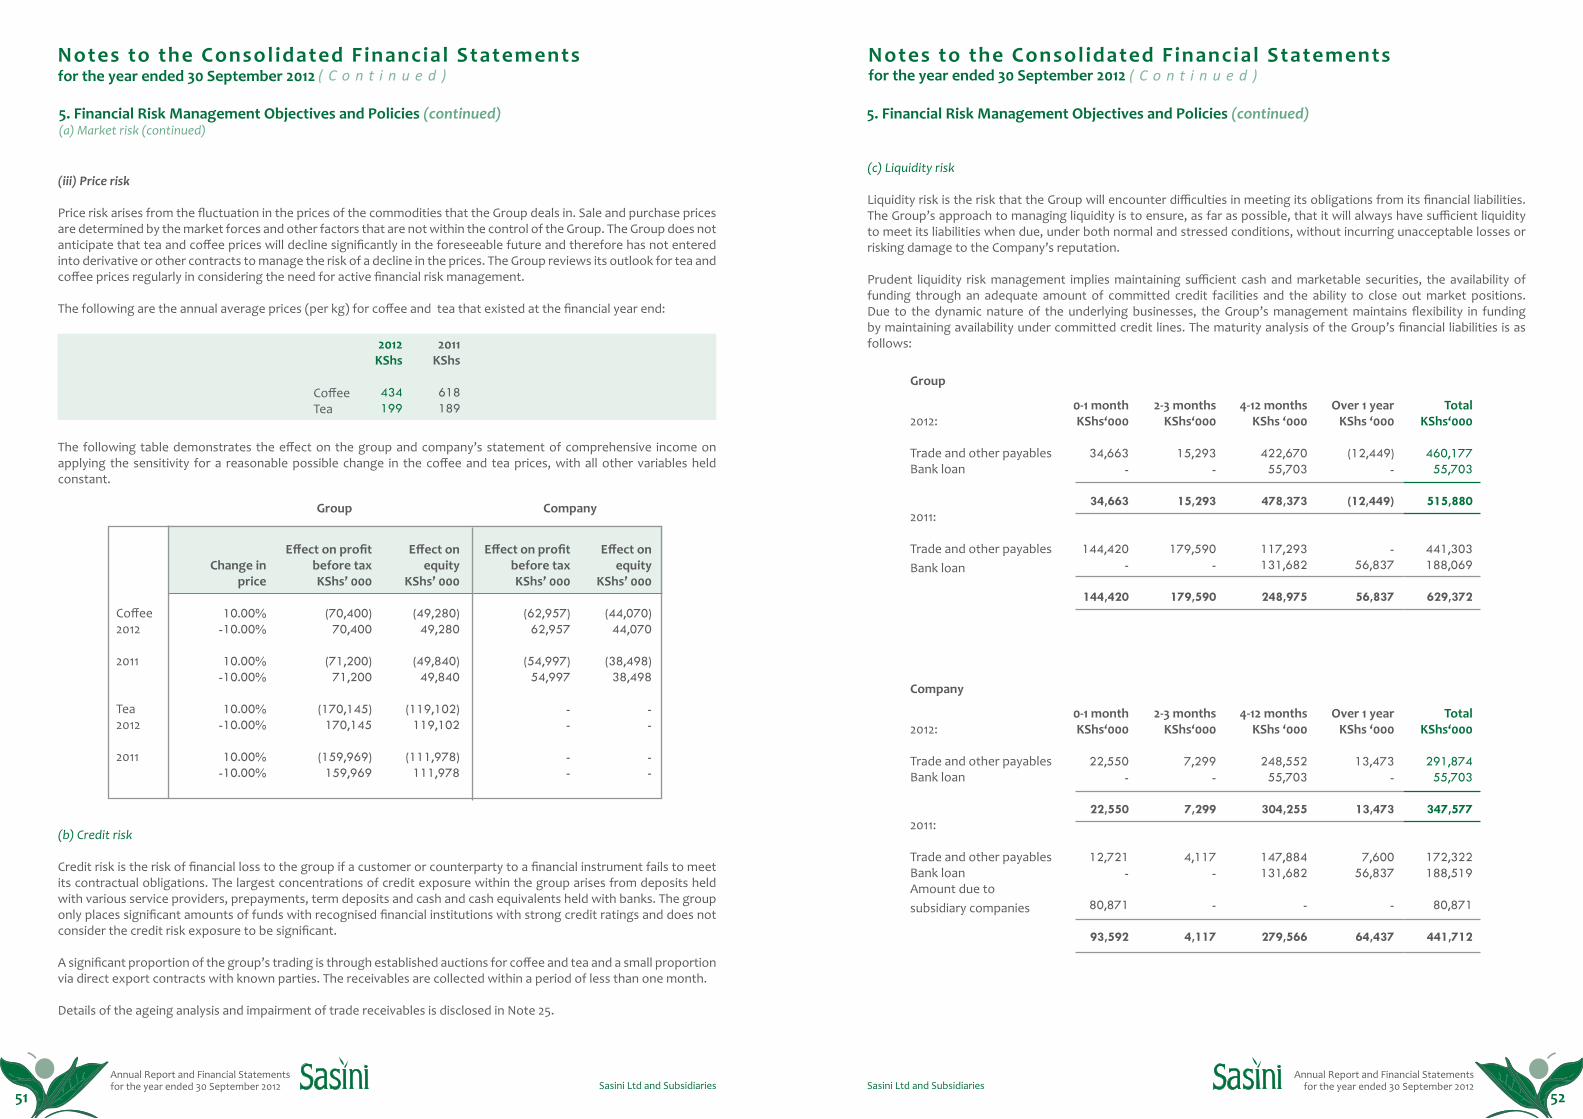
Annual Report and Financial Statements for the year ended 30 September 2012
Annual Report and Financial Statements for the year ended 30 September 2012Sasini Ltd and Subsidiaries Sasini Ltd and Subsidiaries
5. Financial Risk Management Objectives and Policies (continued) (a) Market risk (continued)
(iii) Price risk
Price risk arises from the fluctuation in the prices of the commodities that the Group deals in. Sale and purchase prices are determined by the market forces and other factors that are not within the control of the Group. The Group does not anticipate that tea and coffee prices will decline significantly in the foreseeable future and therefore has not entered into derivative or other contracts to manage the risk of a decline in the prices. The Group reviews its outlook for tea and coffee prices regularly in considering the need for active financial risk management.
The following are the annual average prices (per kg) for coffee and tea that existed at the financial year end:
(b) Credit risk
Credit risk is the risk of financial loss to the group if a customer or counterparty to a financial instrument fails to meet its contractual obligations. The largest concentrations of credit exposure within the group arises from deposits held with various service providers, prepayments, term deposits and cash and cash equivalents held with banks. The group only places significant amounts of funds with recognised financial institutions with strong credit ratings and does not consider the credit risk exposure to be significant.
A significant proportion of the group’s trading is through established auctions for coffee and tea and a small proportion via direct export contracts with known parties. The receivables are collected within a period of less than one month.
Details of the ageing analysis and impairment of trade receivables is disclosed in Note 25.
The following table demonstrates the effect on the group and company’s statement of comprehensive income on applying the sensitivity for a reasonable possible change in the coffee and tea prices, with all other variables held constant.
CoffeeTea
2012KShs
434199
2011KShs
618189
Group Company
Coffee2012
2011
Tea2012
2011
Change in price
10.00%-10.00%
10.00%-10.00%
10.00%-10.00%
10.00%-10.00%
Effect on profit before taxKShs’ 000
(70,400)70,400
(71,200)71,200
(170,145)170,145
(159,969)159,969
Effect on equity
KShs’ 000
(49,280)49,280
(49,840)49,840
(119,102)119,102
(111,978)111,978
Effect on profit before taxKShs’ 000
(62,957)62,957
(54,997)54,997
--
--
Effect on equity
KShs’ 000
(44,070)44,070
(38,498)38,498
--
--
51 52
(c) Liquidity risk
Liquidity risk is the risk that the Group will encounter difficulties in meeting its obligations from its financial liabilities. The Group’s approach to managing liquidity is to ensure, as far as possible, that it will always have sufficient liquidity to meet its liabilities when due, under both normal and stressed conditions, without incurring unacceptable losses or risking damage to the Company’s reputation.
Prudent liquidity risk management implies maintaining sufficient cash and marketable securities, the availability of funding through an adequate amount of committed credit facilities and the ability to close out market positions. Due to the dynamic nature of the underlying businesses, the Group’s management maintains flexibility in funding by maintaining availability under committed credit lines. The maturity analysis of the Group’s financial liabilities is as follows:
5. Financial Risk Management Objectives and Policies (continued)
Group
Company
2012:
Trade and other payablesBank loan
2011:
Trade and other payablesBank loan
2012:
Trade and other payablesBank loan
2011:
Trade and other payablesBank loanAmount due to subsidiary companies
0-1 monthKShs‘000
34,663 -
34,663
144,420 -
144,420
0-1 monthKShs‘000
22,550 -
22,550
12,721-
80,871
93,592
2-3 months KShs‘000
15,293 -
15,293
179,590 -
179,590
2-3 months KShs‘000
7,299 -
7,299
4,117-
-
4,117
4-12 monthsKShs ‘000
422,670 55,703
478,373
117,293131,682
248,975
4-12 monthsKShs ‘000
248,552 55,703
304,255
147,884131,682
-
279,566
Over 1 yearKShs ‘000
(12,449) -
(12,449)
-56,837
56,837
Over 1 yearKShs ‘000
13,473 -
13,473
7,60056,837
-
64,437
TotalKShs‘000
460,177 55,703
515,880
441,303188,069
629,372
TotalKShs‘000
291,874 55,703
347,577
172,322188,519
80,871
441,712
Notes to the Consolidated Financial Statements( C o n t i n u e d ) ( C o n t i n u e d )for the year ended 30 September 2012
Notes to the Consolidated Financial Statementsfor the year ended 30 September 2012
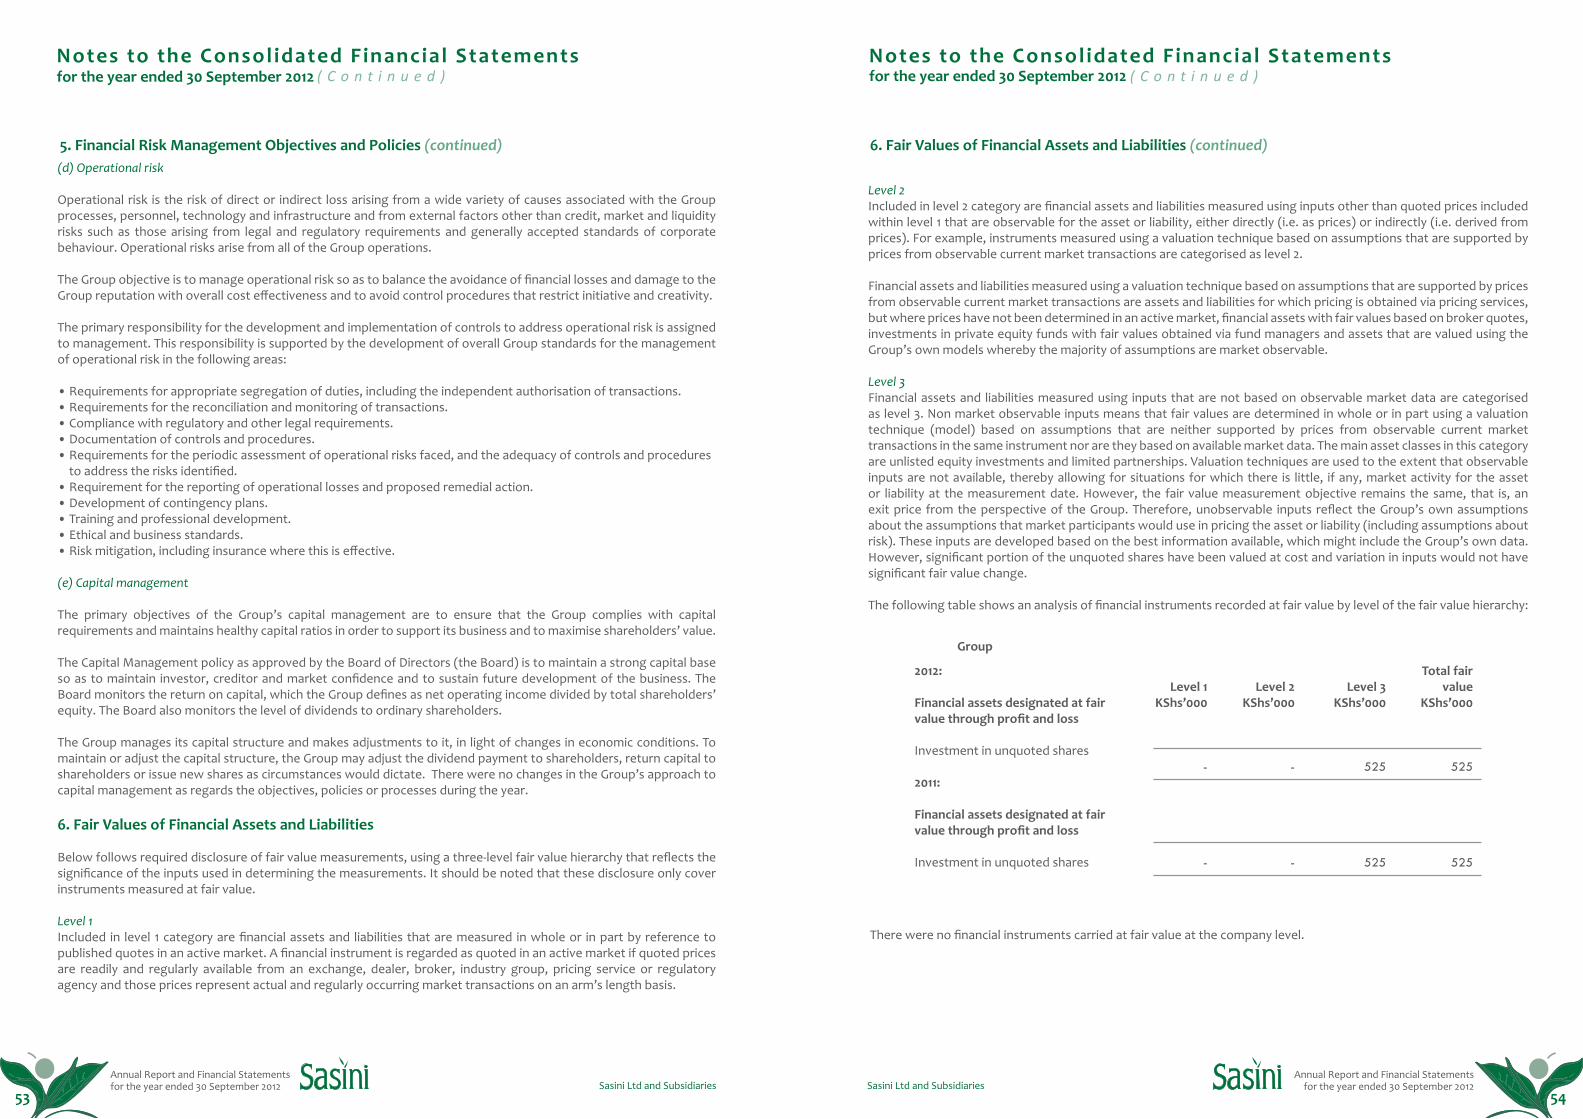
Annual Report and Financial Statements for the year ended 30 September 2012
Annual Report and Financial Statements for the year ended 30 September 2012Sasini Ltd and Subsidiaries Sasini Ltd and Subsidiaries
(d) Operational risk
Operational risk is the risk of direct or indirect loss arising from a wide variety of causes associated with the Group processes, personnel, technology and infrastructure and from external factors other than credit, market and liquidity risks such as those arising from legal and regulatory requirements and generally accepted standards of corporate behaviour. Operational risks arise from all of the Group operations.
The Group objective is to manage operational risk so as to balance the avoidance of financial losses and damage to the Group reputation with overall cost effectiveness and to avoid control procedures that restrict initiative and creativity.
The primary responsibility for the development and implementation of controls to address operational risk is assigned to management. This responsibility is supported by the development of overall Group standards for the management of operational risk in the following areas:
• Requirements for appropriate segregation of duties, including the independent authorisation of transactions.• Requirements for the reconciliation and monitoring of transactions.• Compliance with regulatory and other legal requirements.• Documentation of controls and procedures.• Requirements for the periodic assessment of operational risks faced, and the adequacy of controls and procedures to address the risks identified.• Requirement for the reporting of operational losses and proposed remedial action.• Development of contingency plans.• Training and professional development.• Ethical and business standards.• Risk mitigation, including insurance where this is effective. (e) Capital management
The primary objectives of the Group’s capital management are to ensure that the Group complies with capital requirements and maintains healthy capital ratios in order to support its business and to maximise shareholders’ value.
The Capital Management policy as approved by the Board of Directors (the Board) is to maintain a strong capital base so as to maintain investor, creditor and market confidence and to sustain future development of the business. The Board monitors the return on capital, which the Group defines as net operating income divided by total shareholders’ equity. The Board also monitors the level of dividends to ordinary shareholders.
The Group manages its capital structure and makes adjustments to it, in light of changes in economic conditions. To maintain or adjust the capital structure, the Group may adjust the dividend payment to shareholders, return capital to shareholders or issue new shares as circumstances would dictate. There were no changes in the Group’s approach to capital management as regards the objectives, policies or processes during the year.
6. Fair Values of Financial Assets and Liabilities
Below follows required disclosure of fair value measurements, using a three-level fair value hierarchy that reflects the significance of the inputs used in determining the measurements. It should be noted that these disclosure only cover instruments measured at fair value.
Level 1Included in level 1 category are financial assets and liabilities that are measured in whole or in part by reference to published quotes in an active market. A financial instrument is regarded as quoted in an active market if quoted prices are readily and regularly available from an exchange, dealer, broker, industry group, pricing service or regulatory agency and those prices represent actual and regularly occurring market transactions on an arm’s length basis.
5. Financial Risk Management Objectives and Policies (continued)
53 54
Level 2Included in level 2 category are financial assets and liabilities measured using inputs other than quoted prices included within level 1 that are observable for the asset or liability, either directly (i.e. as prices) or indirectly (i.e. derived from prices). For example, instruments measured using a valuation technique based on assumptions that are supported by prices from observable current market transactions are categorised as level 2.
Financial assets and liabilities measured using a valuation technique based on assumptions that are supported by prices from observable current market transactions are assets and liabilities for which pricing is obtained via pricing services, but where prices have not been determined in an active market, financial assets with fair values based on broker quotes, investments in private equity funds with fair values obtained via fund managers and assets that are valued using the Group’s own models whereby the majority of assumptions are market observable. Level 3Financial assets and liabilities measured using inputs that are not based on observable market data are categorised as level 3. Non market observable inputs means that fair values are determined in whole or in part using a valuation technique (model) based on assumptions that are neither supported by prices from observable current market transactions in the same instrument nor are they based on available market data. The main asset classes in this category are unlisted equity investments and limited partnerships. Valuation techniques are used to the extent that observable inputs are not available, thereby allowing for situations for which there is little, if any, market activity for the asset or liability at the measurement date. However, the fair value measurement objective remains the same, that is, an exit price from the perspective of the Group. Therefore, unobservable inputs reflect the Group’s own assumptions about the assumptions that market participants would use in pricing the asset or liability (including assumptions about risk). These inputs are developed based on the best information available, which might include the Group’s own data. However, significant portion of the unquoted shares have been valued at cost and variation in inputs would not have significant fair value change.
The following table shows an analysis of financial instruments recorded at fair value by level of the fair value hierarchy:
6. Fair Values of Financial Assets and Liabilities (continued)
Group
2012:
Financial assets designated at fair value through profit and loss
Investment in unquoted shares
2011:
Financial assets designated at fair value through profit and loss
Investment in unquoted shares
Level 1 KShs’000
-
-
Level 2
KShs’000
-
-
Level 3
KShs’000
525
525
Total fair value
KShs’000
525
525
There were no financial instruments carried at fair value at the company level.
Notes to the Consolidated Financial Statements( C o n t i n u e d ) ( C o n t i n u e d )for the year ended 30 September 2012
Notes to the Consolidated Financial Statementsfor the year ended 30 September 2012
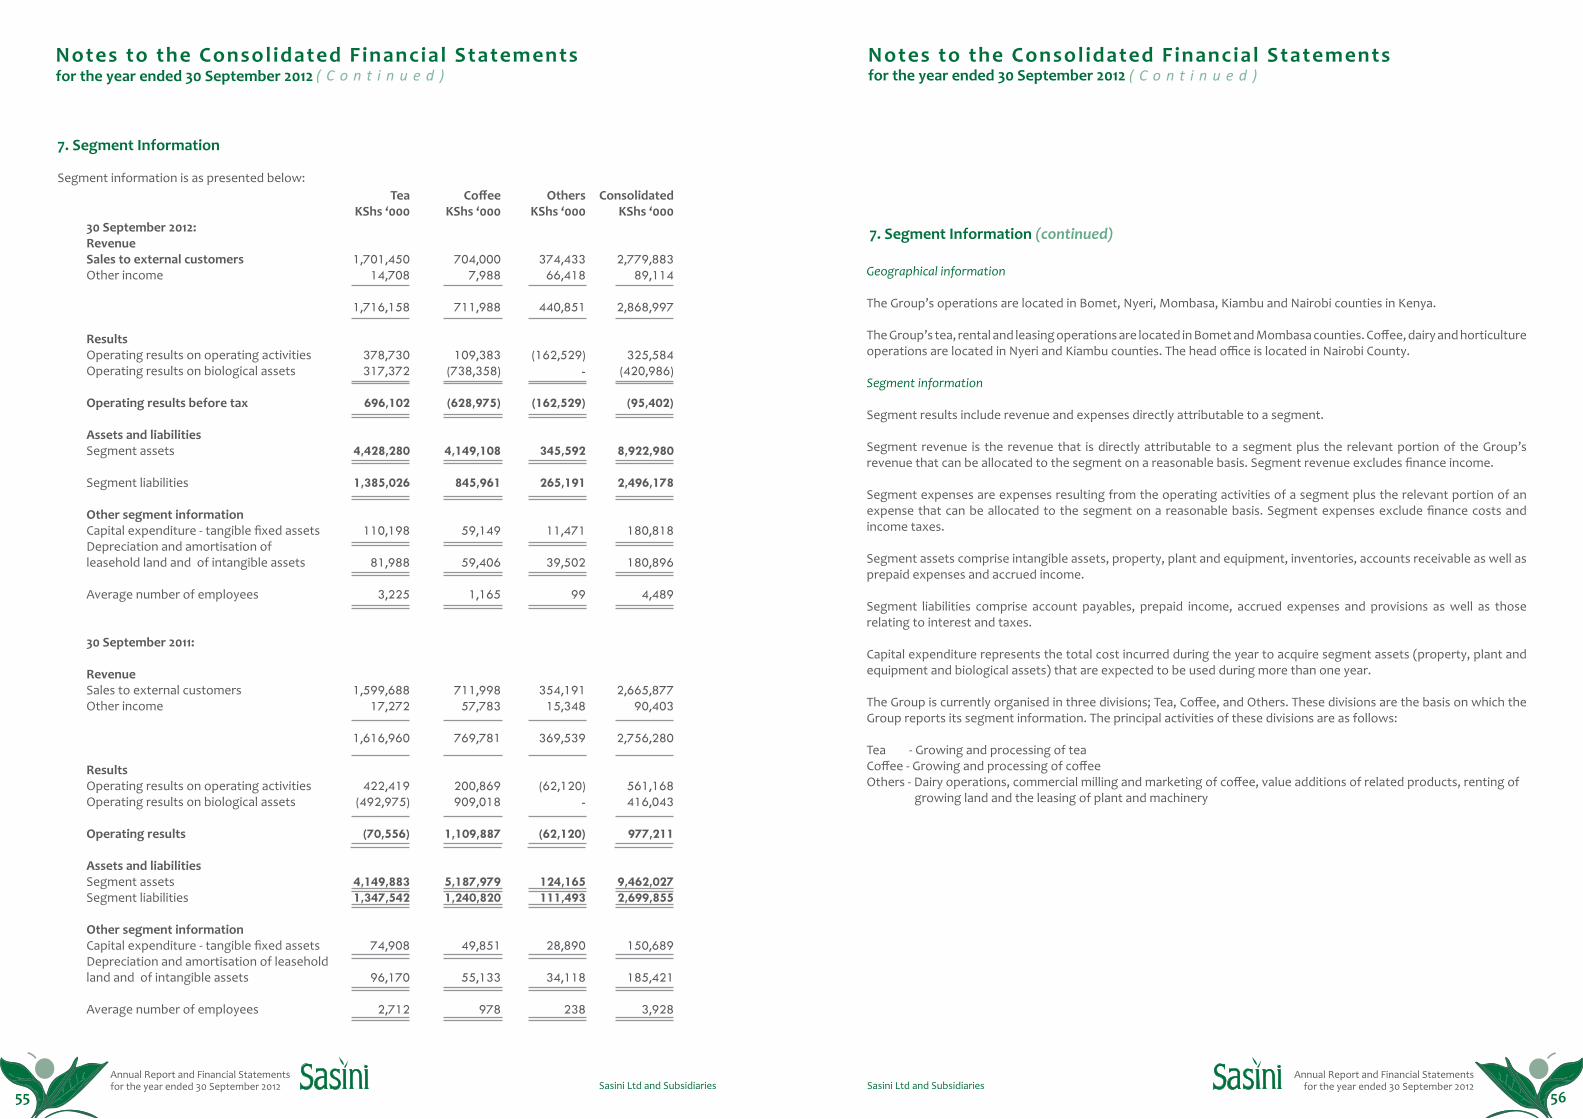
Annual Report and Financial Statements for the year ended 30 September 2012
Annual Report and Financial Statements for the year ended 30 September 2012Sasini Ltd and Subsidiaries Sasini Ltd and Subsidiaries
30 September 2012: RevenueSales to external customersOther income
ResultsOperating results on operating activitiesOperating results on biological assets
Operating results before tax
Assets and liabilitiesSegment assets
Segment liabilities
Other segment informationCapital expenditure - tangible fixed assetsDepreciation and amortisation ofleasehold land and of intangible assets
Average number of employees
30 September 2011:
RevenueSales to external customersOther income
ResultsOperating results on operating activitiesOperating results on biological assets
Operating results
Assets and liabilitiesSegment assetsSegment liabilities
Other segment informationCapital expenditure - tangible fixed assetsDepreciation and amortisation of leasehold land and of intangible assets
Average number of employees
TeaKShs ‘000
1,701,450 14,708
1,716,158
378,730 317,372
696,102
4,428,280
1,385,026
110,198
81,988
3,225
1,599,688 17,272
1,616,960
422,419(492,975)
(70,556)
4,149,8831,347,542
74,908
96,170
2,712
CoffeeKShs ‘000
704,000 7,988
711,988
109,383 (738,358)
(628,975)
4,149,108
845,961
59,149
59,406
1,165
711,998 57,783
769,781
200,869909,018
1,109,887
5,187,9791,240,820
49,851
55,133
978
OthersKShs ‘000
374,433 66,418
440,851
(162,529) -
(162,529)
345,592
265,191
11,471
39,502
99
354,191 15,348
369,539
(62,120) -
(62,120)
124,165111,493
28,890
34,118
238
ConsolidatedKShs ‘000
2,779,883 89,114
2,868,997
325,584 (420,986)
(95,402)
8,922,980
2,496,178
180,818
180,896
4,489
2,665,877 90,403
2,756,280
561,168416,043
977,211
9,462,0272,699,855
150,689
185,421
3,928
7. Segment Information
Segment information is as presented below:
55 56
7. Segment Information (continued)
Geographical information
The Group’s operations are located in Bomet, Nyeri, Mombasa, Kiambu and Nairobi counties in Kenya.
The Group’s tea, rental and leasing operations are located in Bomet and Mombasa counties. Coffee, dairy and horticulture operations are located in Nyeri and Kiambu counties. The head office is located in Nairobi County.
Segment information
Segment results include revenue and expenses directly attributable to a segment.
Segment revenue is the revenue that is directly attributable to a segment plus the relevant portion of the Group’s revenue that can be allocated to the segment on a reasonable basis. Segment revenue excludes finance income.
Segment expenses are expenses resulting from the operating activities of a segment plus the relevant portion of an expense that can be allocated to the segment on a reasonable basis. Segment expenses exclude finance costs and income taxes.
Segment assets comprise intangible assets, property, plant and equipment, inventories, accounts receivable as well as prepaid expenses and accrued income.
Segment liabilities comprise account payables, prepaid income, accrued expenses and provisions as well as those relating to interest and taxes.
Capital expenditure represents the total cost incurred during the year to acquire segment assets (property, plant and equipment and biological assets) that are expected to be used during more than one year.
The Group is currently organised in three divisions; Tea, Coffee, and Others. These divisions are the basis on which the Group reports its segment information. The principal activities of these divisions are as follows:
Tea - Growing and processing of teaCoffee - Growing and processing of coffeeOthers - Dairy operations, commercial milling and marketing of coffee, value additions of related products, renting of growing land and the leasing of plant and machinery
Notes to the Consolidated Financial Statements( C o n t i n u e d ) ( C o n t i n u e d )for the year ended 30 September 2012
Notes to the Consolidated Financial Statementsfor the year ended 30 September 2012

Annual Report and Financial Statements for the year ended 30 September 2012
Annual Report and Financial Statements for the year ended 30 September 2012Sasini Ltd and Subsidiaries Sasini Ltd and Subsidiaries
Group Company
8. Revenue
TeaCoffeeLivestockDairy produceHorticultureRetail and coffee loungeCoffee millRent receivableMarketing commission
9. Cost Of Sales
Stock movement General chargesEstates maintenanceProduction expensesGreen leaf purchasesCoffee house expensesCoffee purchases and other charges Livestock expensesHorticulture expensesRetail trading expensesCoffee mill expenses
10. Other Income
Gain/(loss) on disposal of property,plant and equipmentGain on disposal of investmentManagement feesOther income
2012 KShs’000
1,701,450 704,000
5,17724,76015,811
209,92080,0594,730
33,976
2,779,883
9,594235,150529,296394,372264,02440,607
244,59840,66718,34557,005
35,865
1,869,523
4,996--
84,118
89,114
2011KShs’000
1,599,689711,998
5,34520,94315,981
216,50659,4638,327
27,625
2,665,877
(61,690)204,162433,000407,781214,71340,357
189,78531,95314,07196,713 12,599
1,583,444
(3,035) 50,914
- 42,524
90,403
2012KShs’000
-629,566
2822,679
-97,38886,5739,172
33,976
859,636
10,49082,691
108,51953,545
--
244,5985,131
-57,00535,867
597,846
3,490-
27,300 65,983
96,773
2011KShs’000
-549,965
4484,133
-103,74659,4638,276
27,626
753,657
(37,912)65,37740,92095,914
--
189,7855,006
-96,713
12,599
468,402
(504)-
27,300 16,764
43,560
57 58
Group Company
(a) Administration andestablishment expenses
Staff costs (Note 11(b))Insurance and medical costsDepreciation of property, plant and equipmentAmortisation of intangible assetsAmortisation of leasehold landAuditors’ remunerationDirectors’ emolumentsLegal and professional feesSecretarial costsTravelling and accommodationCoffee house overheadsOffice expensesAdministration costsBank chargesOther expenses
(b) Staff costs
Salaries and wagesStaff leave accrualsPension costsNational Social Security Fund
Warehousing and storage charges
(a)
(b)
Finance incomeInterest incomeRealised foreign exchange gainUnrealised foreign exchange gain
Finance costInterest expenseUnrealised foreign exchange loss
Net finance income
11. Administration and Establishment Expenses
12. Selling and Distribution Expenses
13. Net Finance Income
2012 KShs’000
169,93825,297
170,02210,631
2414,178
14,8077,5553,0003,807
42,76727,375
153,5092,742
15,017
650,886
147,6925,036
13,295 3,915
169,938
23,004
28,9738,384
-
37,357
(7,814)(19,366)
(27,180)
10,177
-
23,3189,6481,890
34,856
(7,814) -
(7,814)
27,042
2011KShs’000
153,51524,413
175,03310,147
2413,755
14,2016,9973,0007,227
32,96646,535
105,4802,528
5,384
591,422
146,652(3,513)9,500
876
153,515
20,246
9,74214,034
42,281
66,057
(29,129)-
(29,129)
36,928
-
2,57423,31418,714
44,602
(20,279)-
(20,279)
24,323
2012KShs’000
71,4571,163
62,2373,927
1251,340
14,8072,958
-2,450
-25,25396,401
1,3735,868
288,918
57,1743,0407,5783,665
71,457
2011KShs’000
72,6981,561
55,0213,486
1251,155
14,2011,177
-3,969
-5,930
91,867696
-
251,886
70,381(2,386)4,088
615
72,698
Notes to the Consolidated Financial Statements( C o n t i n u e d ) ( C o n t i n u e d )for the year ended 30 September 2012
Notes to the Consolidated Financial Statementsfor the year ended 30 September 2012
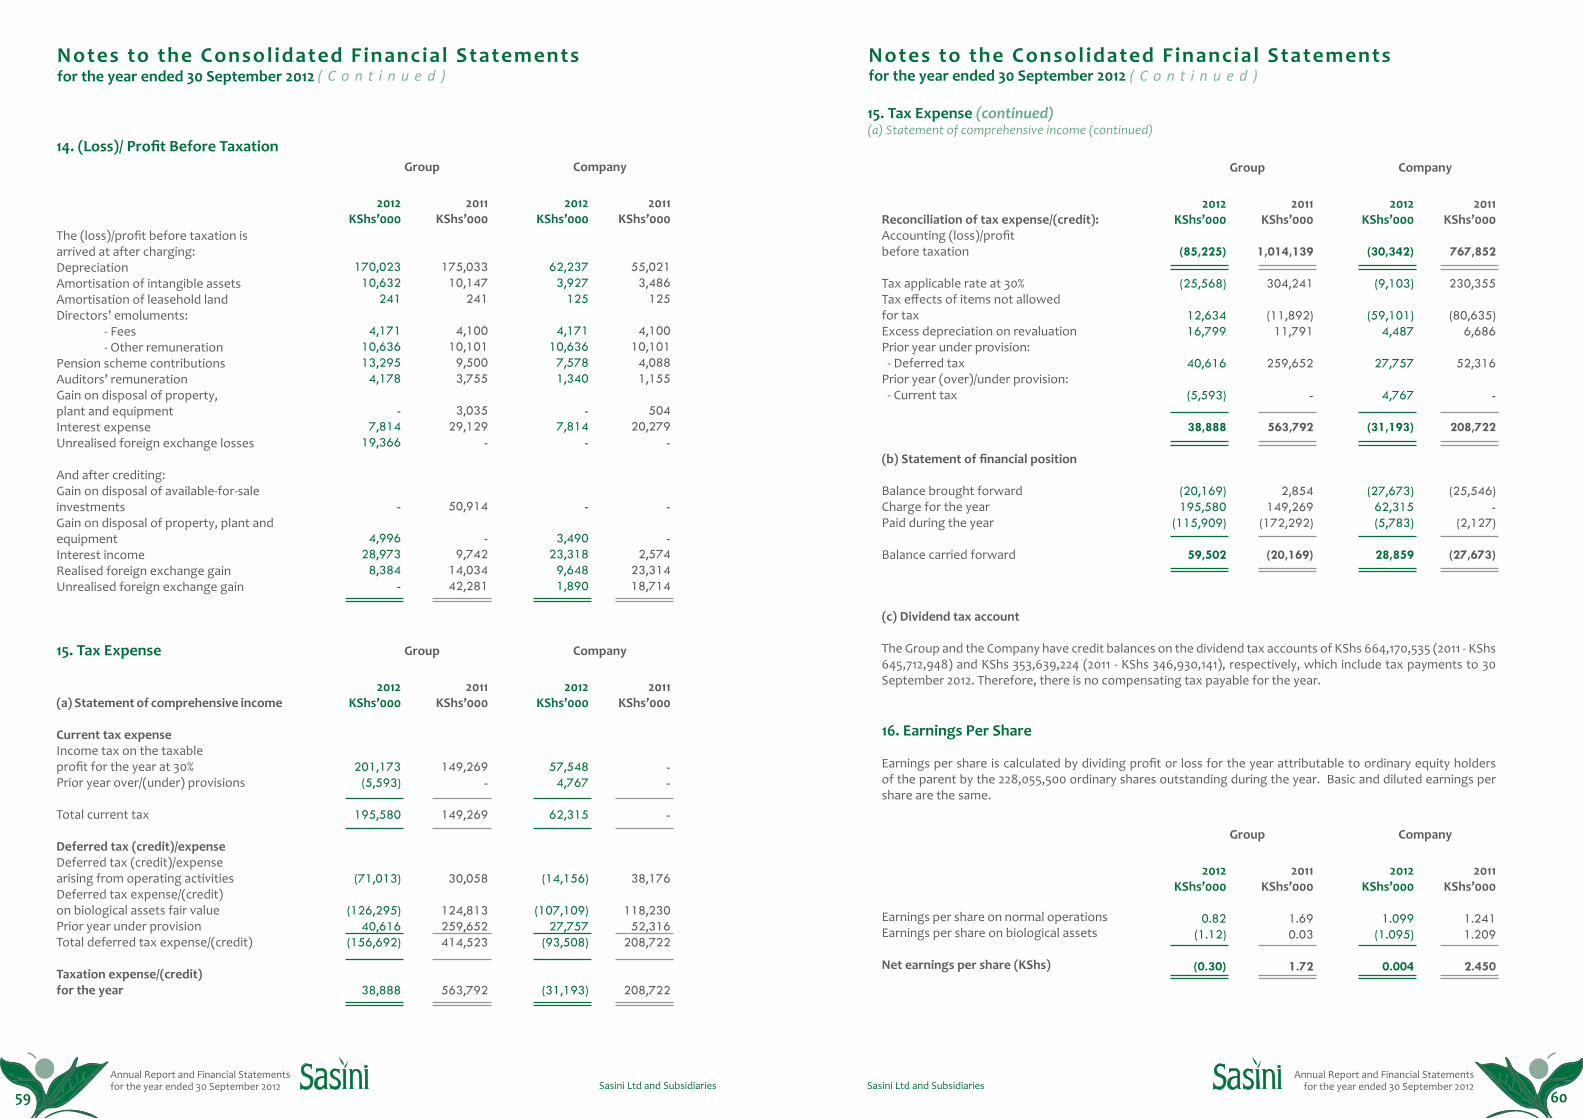
Annual Report and Financial Statements for the year ended 30 September 2012
Annual Report and Financial Statements for the year ended 30 September 2012Sasini Ltd and Subsidiaries Sasini Ltd and Subsidiaries
Group
Group
Company
Company
The (loss)/profit before taxation is arrived at after charging:DepreciationAmortisation of intangible assetsAmortisation of leasehold landDirectors’ emoluments: - Fees - Other remunerationPension scheme contributionsAuditors’ remunerationGain on disposal of property,plant and equipmentInterest expenseUnrealised foreign exchange losses
And after crediting:Gain on disposal of available-for-saleinvestmentsGain on disposal of property, plant andequipmentInterest incomeRealised foreign exchange gainUnrealised foreign exchange gain
(a) Statement of comprehensive income
Current tax expenseIncome tax on the taxableprofit for the year at 30%Prior year over/(under) provisions
Total current tax
Deferred tax (credit)/expenseDeferred tax (credit)/expensearising from operating activitiesDeferred tax expense/(credit)on biological assets fair valuePrior year under provisionTotal deferred tax expense/(credit)
Taxation expense/(credit)for the year
14. (Loss)/ Profit Before Taxation
15. Tax Expense
2012 KShs’000
170,02310,632
241
4,17110,63613,2954,178
-7,814
19,366
-
4,99628,9738,384
-
2012 KShs’000
201,173(5,593)
195,580
(71,013)
(126,295)40,616
(156,692)
38,888
2011KShs’000
175,03310,147
241
4,10010,1019,5003,755
3,03529,129
-
50,914
-9,742
14,03442,281
2011KShs’000
149,269-
149,269
30,058
124,813259,652414,523
563,792
2012KShs’000
62,2373,927
125
4,17110,6367,5781,340
-7,814
-
-
3,49023,3189,6481,890
2012KShs’000
57,548 4,767
62,315
(14,156)
(107,109) 27,757(93,508)
(31,193)
2011KShs’000
55,0213,486
125
4,10010,1014,0881,155
50420,279
-
-
-2,574
23,31418,714
2011KShs’000
--
-
38,176
118,23052,316
208,722
208,722
59 60
15. Tax Expense (continued)(a) Statement of comprehensive income (continued)
Group
Group
Company
Company
Reconciliation of tax expense/(credit):Accounting (loss)/profitbefore taxation
Tax applicable rate at 30% Tax effects of items not allowedfor tax Excess depreciation on revaluationPrior year under provision: - Deferred taxPrior year (over)/under provision: - Current tax
(b) Statement of financial position
Balance brought forwardCharge for the yearPaid during the year
Balance carried forward
Earnings per share on normal operationsEarnings per share on biological assets
Net earnings per share (KShs)
(c) Dividend tax account
The Group and the Company have credit balances on the dividend tax accounts of KShs 664,170,535 (2011 - KShs 645,712,948) and KShs 353,639,224 (2011 - KShs 346,930,141), respectively, which include tax payments to 30 September 2012. Therefore, there is no compensating tax payable for the year.
16. Earnings Per Share
Earnings per share is calculated by dividing profit or loss for the year attributable to ordinary equity holders of the parent by the 228,055,500 ordinary shares outstanding during the year. Basic and diluted earnings per share are the same.
2012 KShs’000
(85,225)
(25,568)
12,63416,799
40,616
(5,593)
38,888
(20,169)195,580
(115,909)
59,502
2012 KShs’000
0.82(1.12)
(0.30)
2011KShs’000
1,014,139
304,241
(11,892)11,791
259,652
-
563,792
2,854149,269
(172,292)
(20,169)
2011KShs’000
1.690.03
1.72
2012KShs’000
(30,342)
(9,103)
(59,101)4,487
27,757
4,767
(31,193)
(27,673)62,315(5,783)
28,859
2012KShs’000
1.099(1.095)
0.004
2011KShs’000
767,852
230,355
(80,635)6,686
52,316
-
208,722
(25,546)-
(2,127)
(27,673)
2011KShs’000
1.2411.209
2.450
Notes to the Consolidated Financial Statements( C o n t i n u e d ) ( C o n t i n u e d )for the year ended 30 September 2012
Notes to the Consolidated Financial Statementsfor the year ended 30 September 2012
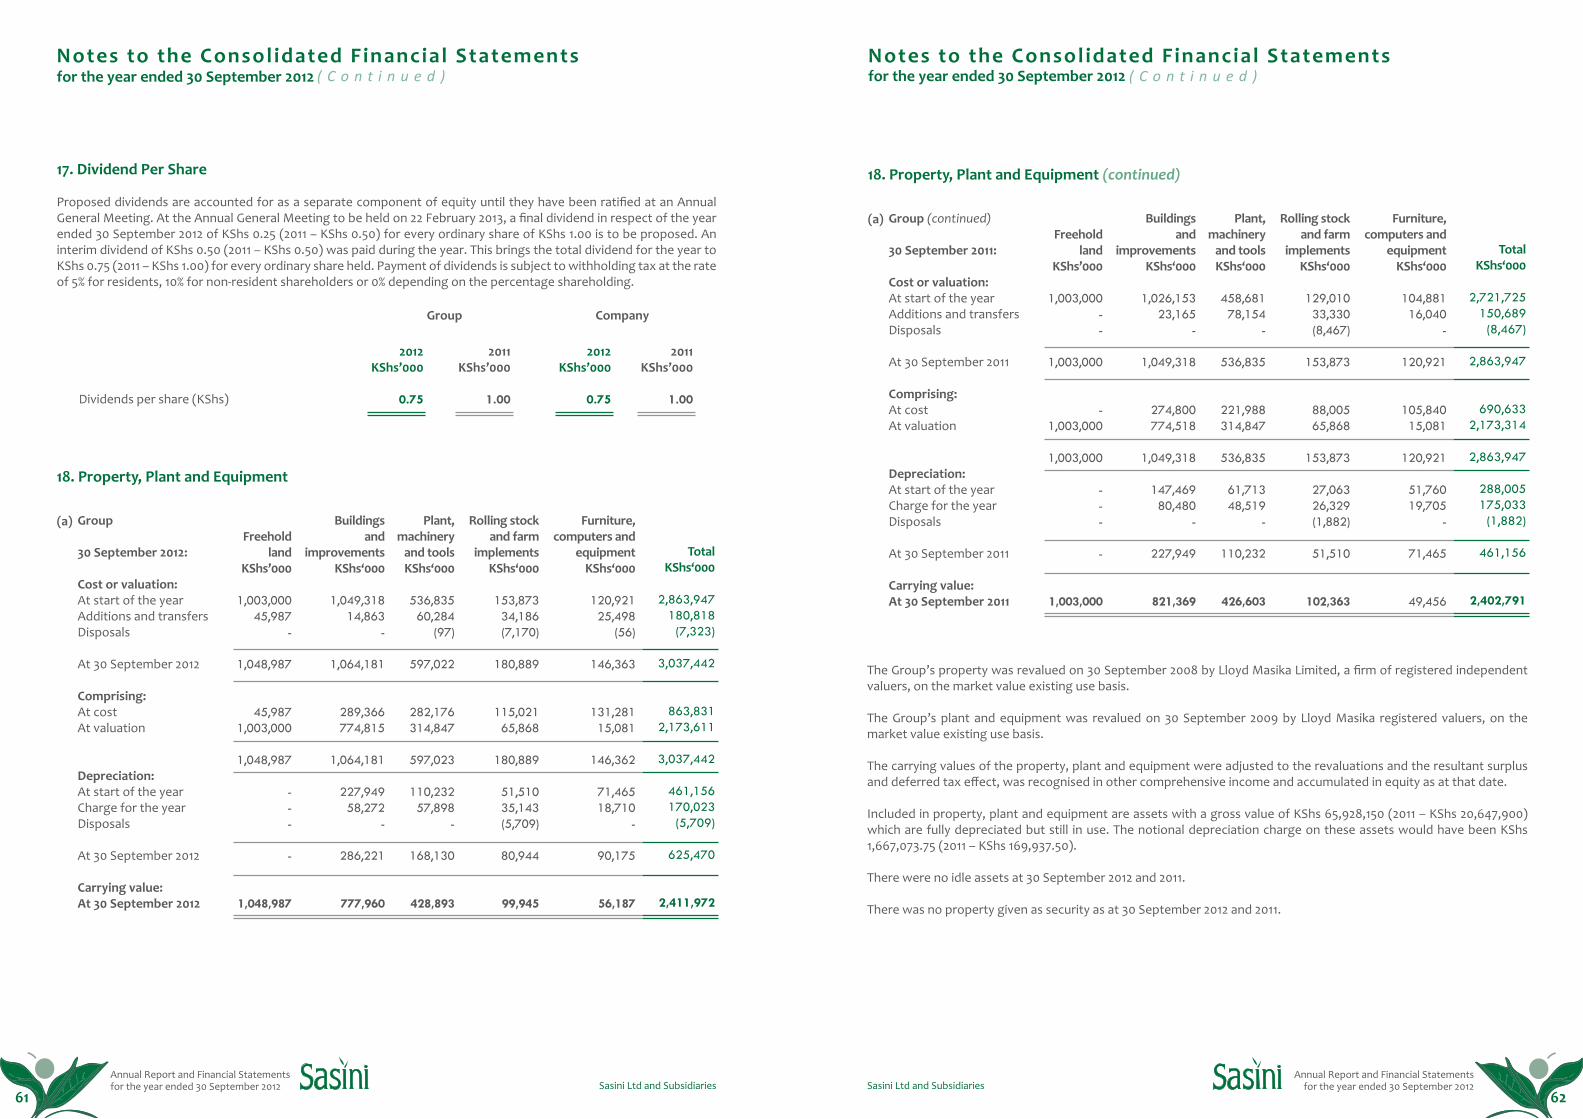
Annual Report and Financial Statements for the year ended 30 September 2012
Annual Report and Financial Statements for the year ended 30 September 2012Sasini Ltd and Subsidiaries Sasini Ltd and Subsidiaries
Group Company
Dividends per share (KShs)
17. Dividend Per Share
Proposed dividends are accounted for as a separate component of equity until they have been ratified at an Annual General Meeting. At the Annual General Meeting to be held on 22 February 2013, a final dividend in respect of the year ended 30 September 2012 of KShs 0.25 (2011 – KShs 0.50) for every ordinary share of KShs 1.00 is to be proposed. An interim dividend of KShs 0.50 (2011 – KShs 0.50) was paid during the year. This brings the total dividend for the year to KShs 0.75 (2011 – KShs 1.00) for every ordinary share held. Payment of dividends is subject to withholding tax at the rate of 5% for residents, 10% for non-resident shareholders or 0% depending on the percentage shareholding.
18. Property, Plant and Equipment
2012 KShs’000
0.75
2011KShs’000
1.00
2012KShs’000
0.75
2011KShs’000
1.00
Group
30 September 2012:
Cost or valuation:At start of the yearAdditions and transfersDisposals
At 30 September 2012
Comprising:At costAt valuation
Depreciation:At start of the yearCharge for the yearDisposals
At 30 September 2012
Carrying value:At 30 September 2012
Freehold land
KShs’000
1,003,00045,987
-
1,048,987
45,9871,003,000
1,048,987
---
-
1,048,987
Buildingsand
improvementsKShs‘000
1,049,31814,863
-
1,064,181
289,366774,815
1,064,181
227,94958,272
-
286,221
777,960
Plant, machinery
and toolsKShs‘000
536,83560,284
(97)
597,022
282,176314,847
597,023
110,23257,898
-
168,130
428,893
Rolling stock and farm
implementsKShs‘000
153,87334,186 (7,170)
180,889
115,02165,868
180,889
51,51035,143(5,709)
80,944
99,945
Furniture,computers and
equipmentKShs‘000
120,92125,498
(56)
146,363
131,28115,081
146,362
71,46518,710
-
90,175
56,187
TotalKShs‘000
2,863,947180,818
(7,323)
3,037,442
863,8312,173,611
3,037,442
461,156170,023
(5,709)
625,470
2,411,972
(a)
61 62
18. Property, Plant and Equipment (continued)
Group (continued)
30 September 2011:
Cost or valuation:At start of the yearAdditions and transfersDisposals
At 30 September 2011
Comprising:At costAt valuation
Depreciation:At start of the yearCharge for the yearDisposals
At 30 September 2011
Carrying value:At 30 September 2011
Freehold land
KShs’000
1,003,000--
1,003,000
-1,003,000
1,003,000
---
-
1,003,000
Buildingsand
improvementsKShs‘000
1,026,15323,165
-
1,049,318
274,800774,518
1,049,318
147,46980,480
-
227,949
821,369
Plant, machinery
and toolsKShs‘000
458,68178,154
-
536,835
221,988314,847
536,835
61,71348,519
-
110,232
426,603
Rolling stock and farm
implementsKShs‘000
129,01033,330
(8,467)
153,873
88,00565,868
153,873
27,06326,329(1,882)
51,510
102,363
Furniture,computers and
equipmentKShs‘000
104,88116,040
-
120,921
105,84015,081
120,921
51,76019,705
-
71,465
49,456
TotalKShs‘000
2,721,725150,689
(8,467)
2,863,947
690,6332,173,314
2,863,947
288,005175,033
(1,882)
461,156
2,402,791
(a)
The Group’s property was revalued on 30 September 2008 by Lloyd Masika Limited, a firm of registered independent valuers, on the market value existing use basis.
The Group’s plant and equipment was revalued on 30 September 2009 by Lloyd Masika registered valuers, on the market value existing use basis.
The carrying values of the property, plant and equipment were adjusted to the revaluations and the resultant surplus and deferred tax effect, was recognised in other comprehensive income and accumulated in equity as at that date.
Included in property, plant and equipment are assets with a gross value of KShs 65,928,150 (2011 – KShs 20,647,900) which are fully depreciated but still in use. The notional depreciation charge on these assets would have been KShs 1,667,073.75 (2011 – KShs 169,937.50).
There were no idle assets at 30 September 2012 and 2011.
There was no property given as security as at 30 September 2012 and 2011.
Notes to the Consolidated Financial Statements( C o n t i n u e d ) ( C o n t i n u e d )for the year ended 30 September 2012
Notes to the Consolidated Financial Statementsfor the year ended 30 September 2012
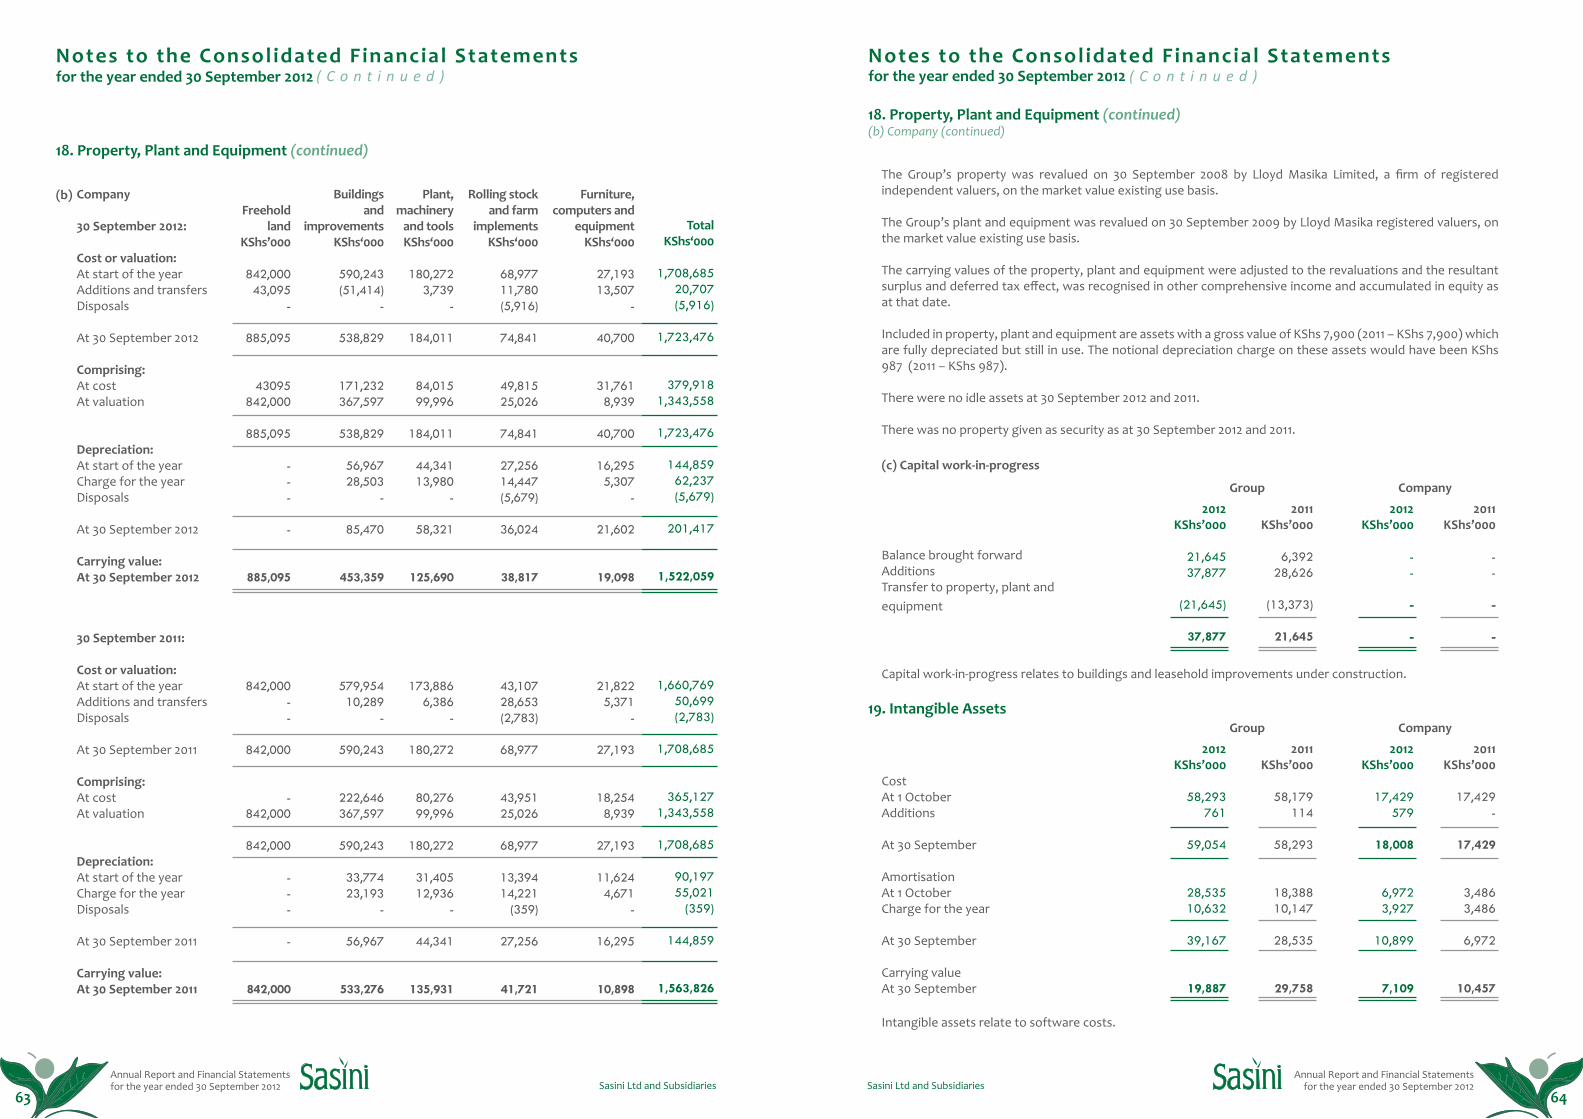
Annual Report and Financial Statements for the year ended 30 September 2012
Annual Report and Financial Statements for the year ended 30 September 2012Sasini Ltd and Subsidiaries Sasini Ltd and Subsidiaries
18. Property, Plant and Equipment (continued)
Company
30 September 2012:
Cost or valuation:At start of the yearAdditions and transfersDisposals
At 30 September 2012
Comprising:At costAt valuation
Depreciation:At start of the yearCharge for the yearDisposals
At 30 September 2012
Carrying value:At 30 September 2012
30 September 2011:
Cost or valuation:At start of the yearAdditions and transfersDisposals
At 30 September 2011
Comprising:At costAt valuation
Depreciation:At start of the yearCharge for the yearDisposals
At 30 September 2011
Carrying value:At 30 September 2011
Freehold land
KShs’000
842,00043,095
-
885,095
43095842,000
885,095
---
-
885,095
842,000--
842,000
-842,000
842,000
---
-
842,000
Buildingsand
improvementsKShs‘000
590,243(51,414)
-
538,829
171,232367,597
538,829
56,96728,503
-
85,470
453,359
579,95410,289
-
590,243
222,646367,597
590,243
33,77423,193
-
56,967
533,276
Plant, machinery
and toolsKShs‘000
180,2723,739
-
184,011
84,01599,996
184,011
44,34113,980
-
58,321
125,690
173,8866,386
-
180,272
80,27699,996
180,272
31,40512,936
-
44,341
135,931
Rolling stock and farm
implementsKShs‘000
68,97711,780
(5,916)
74,841
49,81525,026
74,841
27,25614,447(5,679)
36,024
38,817
43,10728,653(2,783)
68,977
43,95125,026
68,977
13,39414,221
(359)
27,256
41,721
Furniture,computers and
equipmentKShs‘000
27,19313,507
-
40,700
31,761 8,939
40,700
16,2955,307
-
21,602
19,098
21,8225,371
-
27,193
18,254 8,939
27,193
11,6244,671
-
16,295
10,898
TotalKShs‘000
1,708,68520,707(5,916)
1,723,476
379,9181,343,558
1,723,476
144,85962,237(5,679)
201,417
1,522,059
1,660,76950,699(2,783)
1,708,685
365,1271,343,558
1,708,685
90,19755,021 (359)
144,859
1,563,826
(b)
63 64
18. Property, Plant and Equipment (continued)(b) Company (continued)
The Group’s property was revalued on 30 September 2008 by Lloyd Masika Limited, a firm of registered independent valuers, on the market value existing use basis.
The Group’s plant and equipment was revalued on 30 September 2009 by Lloyd Masika registered valuers, on the market value existing use basis.
The carrying values of the property, plant and equipment were adjusted to the revaluations and the resultant surplus and deferred tax effect, was recognised in other comprehensive income and accumulated in equity as at that date.
Included in property, plant and equipment are assets with a gross value of KShs 7,900 (2011 – KShs 7,900) which are fully depreciated but still in use. The notional depreciation charge on these assets would have been KShs 987 (2011 – KShs 987).
There were no idle assets at 30 September 2012 and 2011.
There was no property given as security as at 30 September 2012 and 2011.
Capital work-in-progress relates to buildings and leasehold improvements under construction.
Intangible assets relate to software costs.
Group
Group
Company
Company
Balance brought forwardAdditionsTransfer to property, plant andequipment
CostAt 1 OctoberAdditions
At 30 September
AmortisationAt 1 OctoberCharge for the year
At 30 September
Carrying valueAt 30 September
(c) Capital work-in-progress
2012 KShs’000
21,64537,877
(21,645)
37,877
2012 KShs’000
58,293761
59,054
28,53510,632
39,167
19,887
2011KShs’000
6,39228,626
(13,373)
21,645
2011KShs’000
58,179 114
58,293
18,38810,147
28,535
29,758
2012KShs’000
--
-
-
2012KShs’000
17,429 579
18,008
6,9723,927
10,899
7,109
2011KShs’000
--
-
-
2011KShs’000
17,429-
17,429
3,4863,486
6,972
10,457
19. Intangible Assets
Notes to the Consolidated Financial Statements( C o n t i n u e d ) ( C o n t i n u e d )for the year ended 30 September 2012
Notes to the Consolidated Financial Statementsfor the year ended 30 September 2012
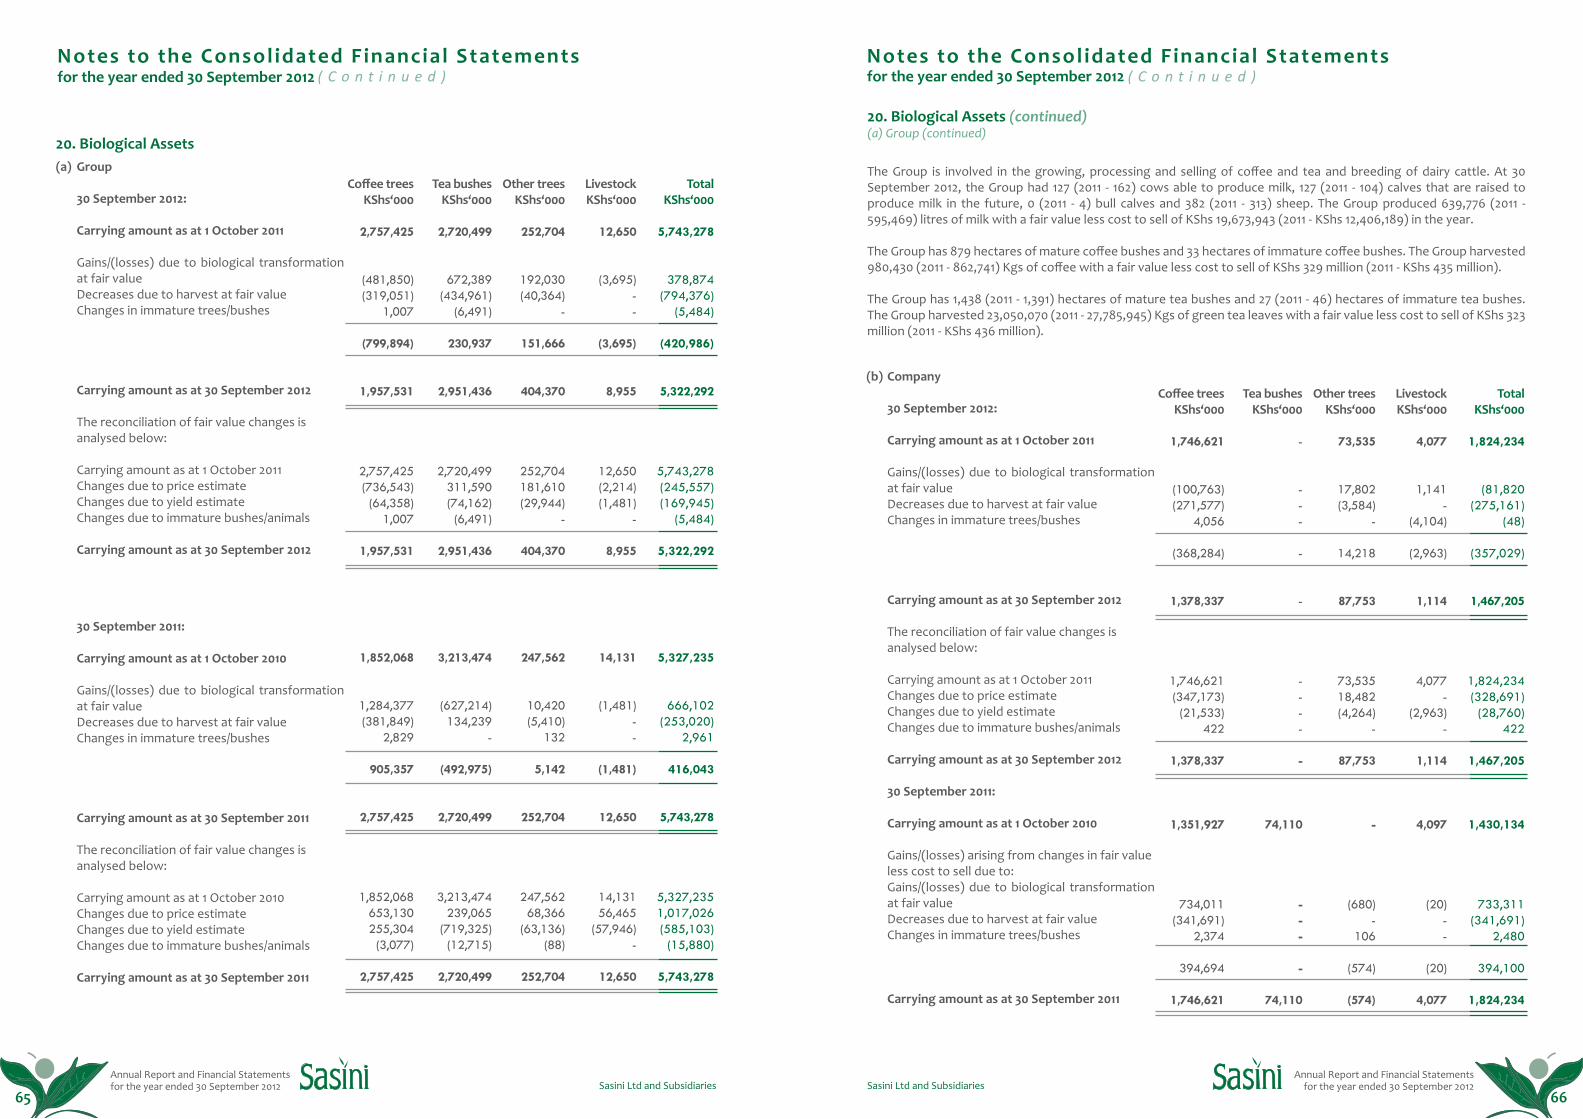
Annual Report and Financial Statements for the year ended 30 September 2012
Annual Report and Financial Statements for the year ended 30 September 2012Sasini Ltd and Subsidiaries Sasini Ltd and Subsidiaries
20. Biological AssetsGroup
30 September 2012:
Carrying amount as at 1 October 2011
Gains/(losses) due to biological transformation at fair valueDecreases due to harvest at fair valueChanges in immature trees/bushes
Carrying amount as at 30 September 2012
The reconciliation of fair value changes isanalysed below:
Carrying amount as at 1 October 2011Changes due to price estimate Changes due to yield estimateChanges due to immature bushes/animals
Carrying amount as at 30 September 2012
30 September 2011:
Carrying amount as at 1 October 2010
Gains/(losses) due to biological transformation at fair valueDecreases due to harvest at fair valueChanges in immature trees/bushes
Carrying amount as at 30 September 2011
The reconciliation of fair value changes isanalysed below:
Carrying amount as at 1 October 2010Changes due to price estimate Changes due to yield estimateChanges due to immature bushes/animals
Carrying amount as at 30 September 2011
Coffee treesKShs‘000
2,757,425
(481,850)(319,051) 1,007
(799,894)
1,957,531
2,757,425(736,543)(64,358)
1,007
1,957,531
1,852,068
1,284,377(381,849)
2,829
905,357
2,757,425
1,852,068653,130255,304
(3,077)
2,757,425
Tea bushesKShs‘000
2,720,499
672,389(434,961)
(6,491)
230,937
2,951,436
2,720,499311,590(74,162)(6,491)
2,951,436
3,213,474
(627,214)134,239
-
(492,975)
2,720,499
3,213,474239,065
(719,325)(12,715)
2,720,499
Other treesKShs‘000
252,704
192,030(40,364)
-
151,666
404,370
252,704181,610(29,944)
-
404,370
247,562
10,420(5,410)
132
5,142
252,704
247,56268,366
(63,136)(88)
252,704
LivestockKShs‘000
12,650
(3,695)--
(3,695)
8,955
12,650(2,214)(1,481)
-
8,955
14,131
(1,481)--
(1,481)
12,650
14,13156,465
(57,946)-
12,650
TotalKShs‘000
5,743,278
378,874(794,376)
(5,484)
(420,986)
5,322,292
5,743,278(245,557)(169,945)
(5,484)
5,322,292
5,327,235
666,102(253,020)
2,961
416,043
5,743,278
5,327,235 1,017,026(585,103)(15,880)
5,743,278
(a)
65 66
20. Biological Assets (continued)(a) Group (continued)
The Group is involved in the growing, processing and selling of coffee and tea and breeding of dairy cattle. At 30 September 2012, the Group had 127 (2011 - 162) cows able to produce milk, 127 (2011 - 104) calves that are raised to produce milk in the future, 0 (2011 - 4) bull calves and 382 (2011 - 313) sheep. The Group produced 639,776 (2011 - 595,469) litres of milk with a fair value less cost to sell of KShs 19,673,943 (2011 - KShs 12,406,189) in the year.
The Group has 879 hectares of mature coffee bushes and 33 hectares of immature coffee bushes. The Group harvested 980,430 (2011 - 862,741) Kgs of coffee with a fair value less cost to sell of KShs 329 million (2011 - KShs 435 million).
The Group has 1,438 (2011 - 1,391) hectares of mature tea bushes and 27 (2011 - 46) hectares of immature tea bushes. The Group harvested 23,050,070 (2011 - 27,785,945) Kgs of green tea leaves with a fair value less cost to sell of KShs 323 million (2011 - KShs 436 million).
Company
30 September 2012:
Carrying amount as at 1 October 2011
Gains/(losses) due to biological transformation at fair valueDecreases due to harvest at fair valueChanges in immature trees/bushes
Carrying amount as at 30 September 2012
The reconciliation of fair value changes isanalysed below:
Carrying amount as at 1 October 2011Changes due to price estimate Changes due to yield estimateChanges due to immature bushes/animals
Carrying amount as at 30 September 2012
30 September 2011:
Carrying amount as at 1 October 2010
Gains/(losses) arising from changes in fair valueless cost to sell due to:Gains/(losses) due to biological transformation at fair valueDecreases due to harvest at fair valueChanges in immature trees/bushes
Carrying amount as at 30 September 2011
Coffee treesKShs‘000
1,746,621
(100,763)(271,577) 4,056
(368,284)
1,378,337
1,746,621(347,173)(21,533)
422
1,378,337
1,351,927
734,011(341,691) 2,374
394,694
1,746,621
Tea bushesKShs‘000
-
---
-
-
----
-
74,110
---
-
74,110
Other treesKShs‘000
73,535
17,802(3,584)
-
14,218
87,753
73,53518,482(4,264)
-
87,753
-
(680)-
106
(574)
(574)
LivestockKShs‘000
4,077
1,141-
(4,104)
(2,963)
1,114
4,077-
(2,963)-
1,114
4,097
(20)--
(20)
4,077
TotalKShs‘000
1,824,234
(81,820(275,161)
(48)
(357,029)
1,467,205
1,824,234 (328,691)
(28,760)422
1,467,205
1,430,134
733,311(341,691)
2,480
394,100
1,824,234
(b)
Notes to the Consolidated Financial Statements( C o n t i n u e d ) ( C o n t i n u e d )for the year ended 30 September 2012
Notes to the Consolidated Financial Statementsfor the year ended 30 September 2012
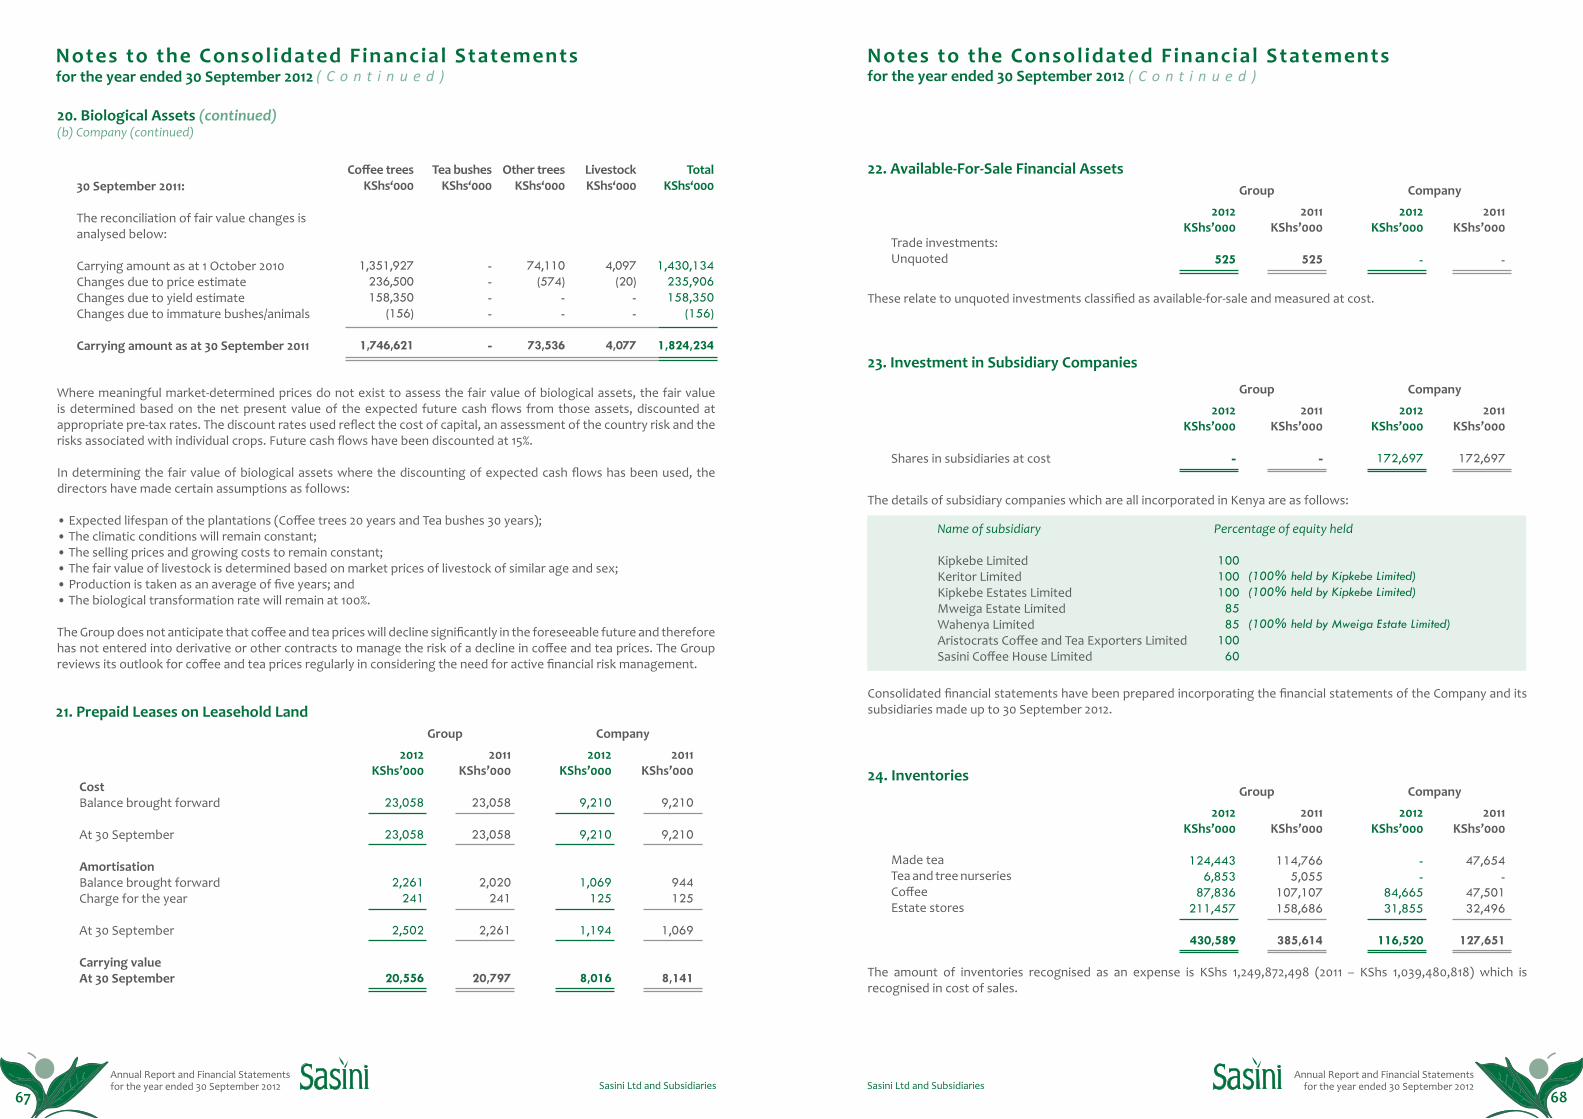
Annual Report and Financial Statements for the year ended 30 September 2012
Annual Report and Financial Statements for the year ended 30 September 2012Sasini Ltd and Subsidiaries Sasini Ltd and Subsidiaries
20. Biological Assets (continued)(b) Company (continued)
Where meaningful market-determined prices do not exist to assess the fair value of biological assets, the fair value is determined based on the net present value of the expected future cash flows from those assets, discounted at appropriate pre-tax rates. The discount rates used reflect the cost of capital, an assessment of the country risk and the risks associated with individual crops. Future cash flows have been discounted at 15%.
In determining the fair value of biological assets where the discounting of expected cash flows has been used, the directors have made certain assumptions as follows:
• Expected lifespan of the plantations (Coffee trees 20 years and Tea bushes 30 years);• The climatic conditions will remain constant;• The selling prices and growing costs to remain constant;• The fair value of livestock is determined based on market prices of livestock of similar age and sex;• Production is taken as an average of five years; and• The biological transformation rate will remain at 100%.
The Group does not anticipate that coffee and tea prices will decline significantly in the foreseeable future and therefore has not entered into derivative or other contracts to manage the risk of a decline in coffee and tea prices. The Group reviews its outlook for coffee and tea prices regularly in considering the need for active financial risk management.
30 September 2011:
The reconciliation of fair value changes is analysed below:
Carrying amount as at 1 October 2010Changes due to price estimateChanges due to yield estimateChanges due to immature bushes/animals
Carrying amount as at 30 September 2011
Coffee treesKShs‘000
1,351,927236,500158,350
(156)
1,746,621
Tea bushesKShs‘000
----
-
Other treesKShs‘000
74,110(574)
--
73,536
LivestockKShs‘000
4,097(20)
--
4,077
TotalKShs‘000
1,430,134235,906158,350
(156)
1,824,234
21. Prepaid Leases on Leasehold LandGroup Company
CostBalance brought forward
At 30 September
AmortisationBalance brought forwardCharge for the year
At 30 September
Carrying valueAt 30 September
2012 KShs’000
23,058
23,058
2,261241
2,502
20,556
2011KShs’000
23,058
23,058
2,020241
2,261
20,797
2012KShs’000
9,210
9,210
1,069125
1,194
8,016
2011KShs’000
9,210
9,210
944 125
1,069
8,141
Notes to the Consolidated Financial Statements( C o n t i n u e d ) ( C o n t i n u e d )for the year ended 30 September 2012
67 68
22. Available-For-Sale Financial Assets
23. Investment in Subsidiary Companies
24. Inventories
Group
Group
Group
Company
Company
Company
Trade investments:Unquoted
Shares in subsidiaries at cost
Made teaTea and tree nurseriesCoffeeEstate stores
2012 KShs’000
525
2012 KShs’000
-
2012 KShs’000
124,4436,853
87,836211,457
430,589
2011KShs’000
525
2011KShs’000
-
2011KShs’000
114,7665,055
107,107158,686
385,614
2012KShs’000
-
2012KShs’000
172,697
2012KShs’000
--
84,66531,855
116,520
2011KShs’000
-
2011KShs’000
172,697
2011KShs’000
47,654-
47,501 32,496
127,651
These relate to unquoted investments classified as available-for-sale and measured at cost.
The details of subsidiary companies which are all incorporated in Kenya are as follows:
Consolidated financial statements have been prepared incorporating the financial statements of the Company and its subsidiaries made up to 30 September 2012.
The amount of inventories recognised as an expense is KShs 1,249,872,498 (2011 – KShs 1,039,480,818) which is recognised in cost of sales.
Name of subsidiary
Kipkebe LimitedKeritor LimitedKipkebe Estates LimitedMweiga Estate LimitedWahenya LimitedAristocrats Coffee and Tea Exporters LimitedSasini Coffee House Limited
Percentage of equity held
(100% held by Kipkebe Limited)(100% held by Kipkebe Limited)
(100% held by Mweiga Estate Limited)
100100 100
8585
10060
Notes to the Consolidated Financial Statementsfor the year ended 30 September 2012
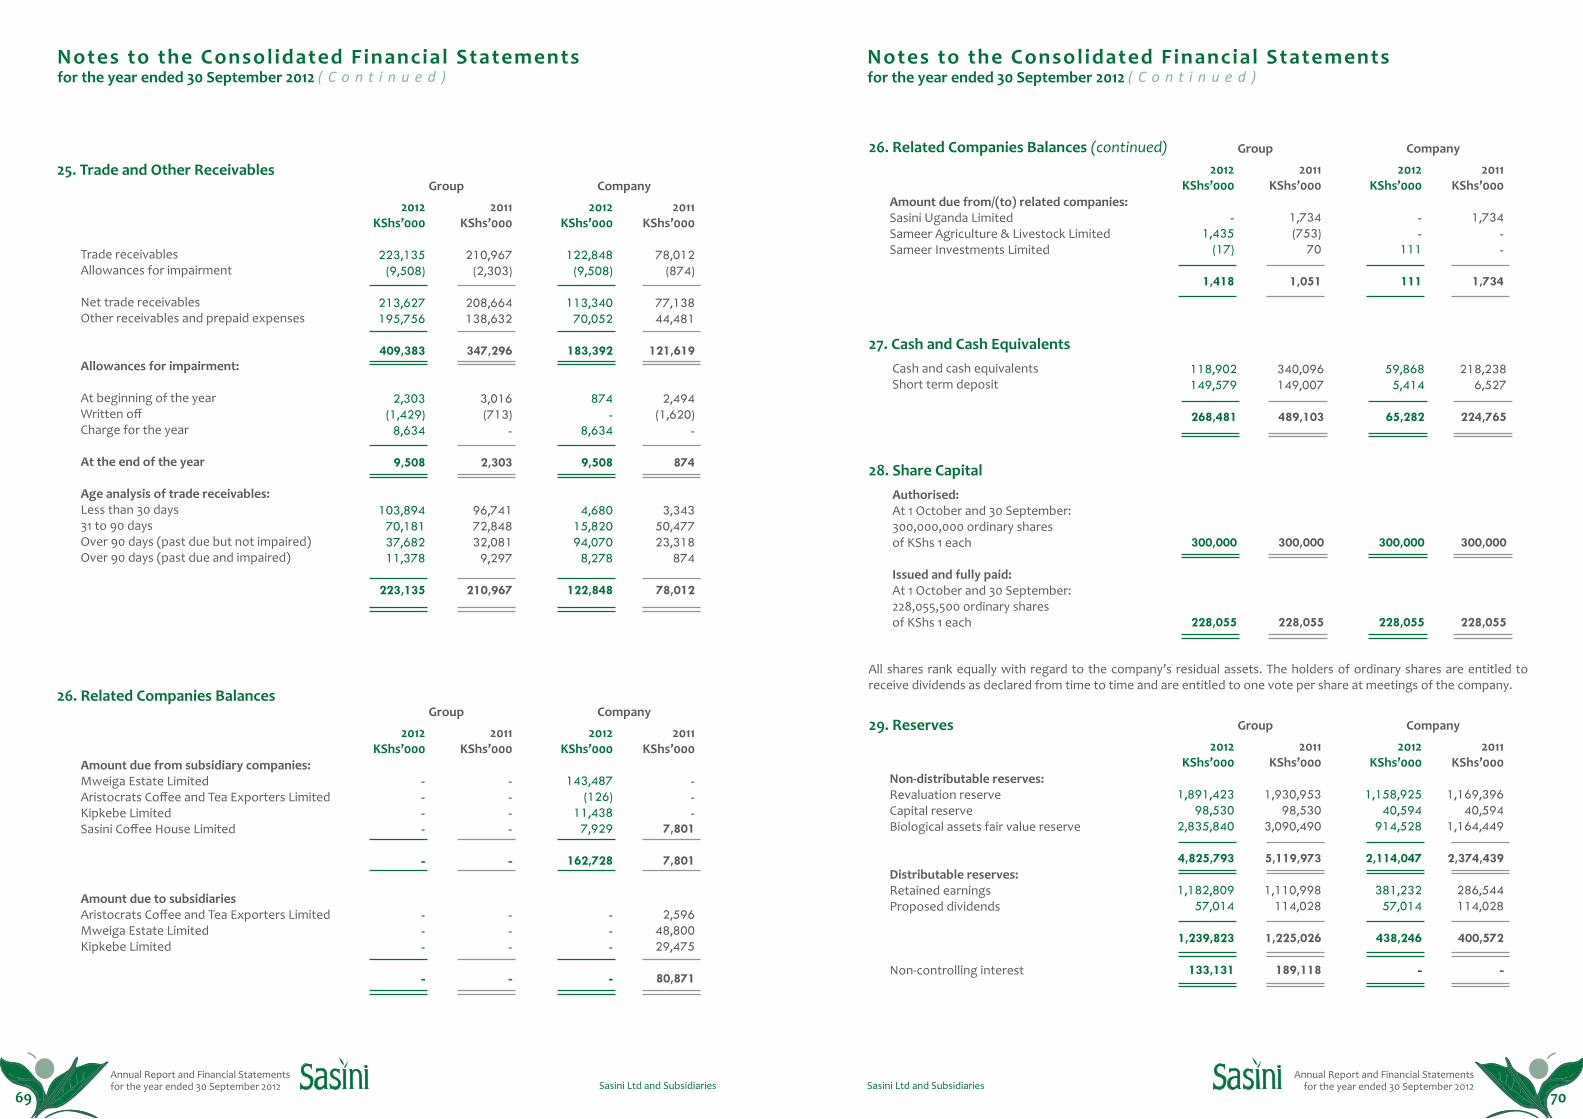
Annual Report and Financial Statements for the year ended 30 September 2012
Annual Report and Financial Statements for the year ended 30 September 2012Sasini Ltd and Subsidiaries Sasini Ltd and Subsidiaries
Group Company
Amount due from subsidiary companies:Mweiga Estate LimitedAristocrats Coffee and Tea Exporters LimitedKipkebe LimitedSasini Coffee House Limited
Amount due to subsidiariesAristocrats Coffee and Tea Exporters LimitedMweiga Estate LimitedKipkebe Limited
2012 KShs’000
----
-
---
-
2011KShs’000
----
-
---
-
2012KShs’000
143,487(126)
11,4387,929
162,728
---
-
2011KShs’000
---
7,801
7,801
2,59648,80029,475
80,871
25. Trade and Other Receivables
26. Related Companies Balances
Group Company
Trade receivablesAllowances for impairment
Net trade receivables Other receivables and prepaid expenses
Allowances for impairment:
At beginning of the yearWritten offCharge for the year
At the end of the year
Age analysis of trade receivables:Less than 30 days31 to 90 daysOver 90 days (past due but not impaired)Over 90 days (past due and impaired)
2012 KShs’000
223,135(9,508)
213,627195,756
409,383
2,303(1,429)
8,634
9,508
103,89470,18137,682
11,378
223,135
2011KShs’000
210,967 (2,303)
208,664138,632
347,296
3,016(713)
-
2,303
96,74172,84832,0819,297
210,967
2012KShs’000
122,848 (9,508)
113,34070,052
183,392
874-
8,634
9,508
4,68015,82094,0708,278
122,848
2011KShs’000
78,012 (874)
77,138 44,481
121,619
2,494(1,620)
-
874
3,34350,47723,318
874
78,012
Notes to the Consolidated Financial Statements( C o n t i n u e d ) ( C o n t i n u e d )for the year ended 30 September 2012
69 70
26. Related Companies Balances (continued) Group
Group
Company
Company
Amount due from/(to) related companies:Sasini Uganda LimitedSameer Agriculture & Livestock LimitedSameer Investments Limited
Non-distributable reserves:Revaluation reserveCapital reserveBiological assets fair value reserve
Distributable reserves:Retained earningsProposed dividends
Non-controlling interest
2012 KShs’000
-1,435
(17)
1,418
2012 KShs’000
1,891,42398,530
2,835,840
4,825,793
1,182,809 57,014
1,239,823
133,131
2011KShs’000
1,734(753) 70
1,051
2011KShs’000
1,930,95398,530
3,090,490
5,119,973
1,110,998114,028
1,225,026
189,118
2012KShs’000
--
111
111
2012KShs’000
1,158,92540,594
914,528
2,114,047
381,232 57,014
438,246
-
2011KShs’000
1,734--
1,734
2011KShs’000
1,169,39640,594
1,164,449
2,374,439
286,544114,028
400,572
-
Cash and cash equivalents Short term deposit
Authorised:At 1 October and 30 September:300,000,000 ordinary sharesof KShs 1 each
Issued and fully paid:At 1 October and 30 September:228,055,500 ordinary sharesof KShs 1 each
118,902149,579
268,481
300,000
228,055
300,000
228,055
340,096149,007
489,103
300,000
228,055
300,000
228,055
59,8685,414
65,282
218,2386,527
224,765
27. Cash and Cash Equivalents
28. Share Capital
All shares rank equally with regard to the company’s residual assets. The holders of ordinary shares are entitled to receive dividends as declared from time to time and are entitled to one vote per share at meetings of the company.
29. Reserves
Notes to the Consolidated Financial Statementsfor the year ended 30 September 2012
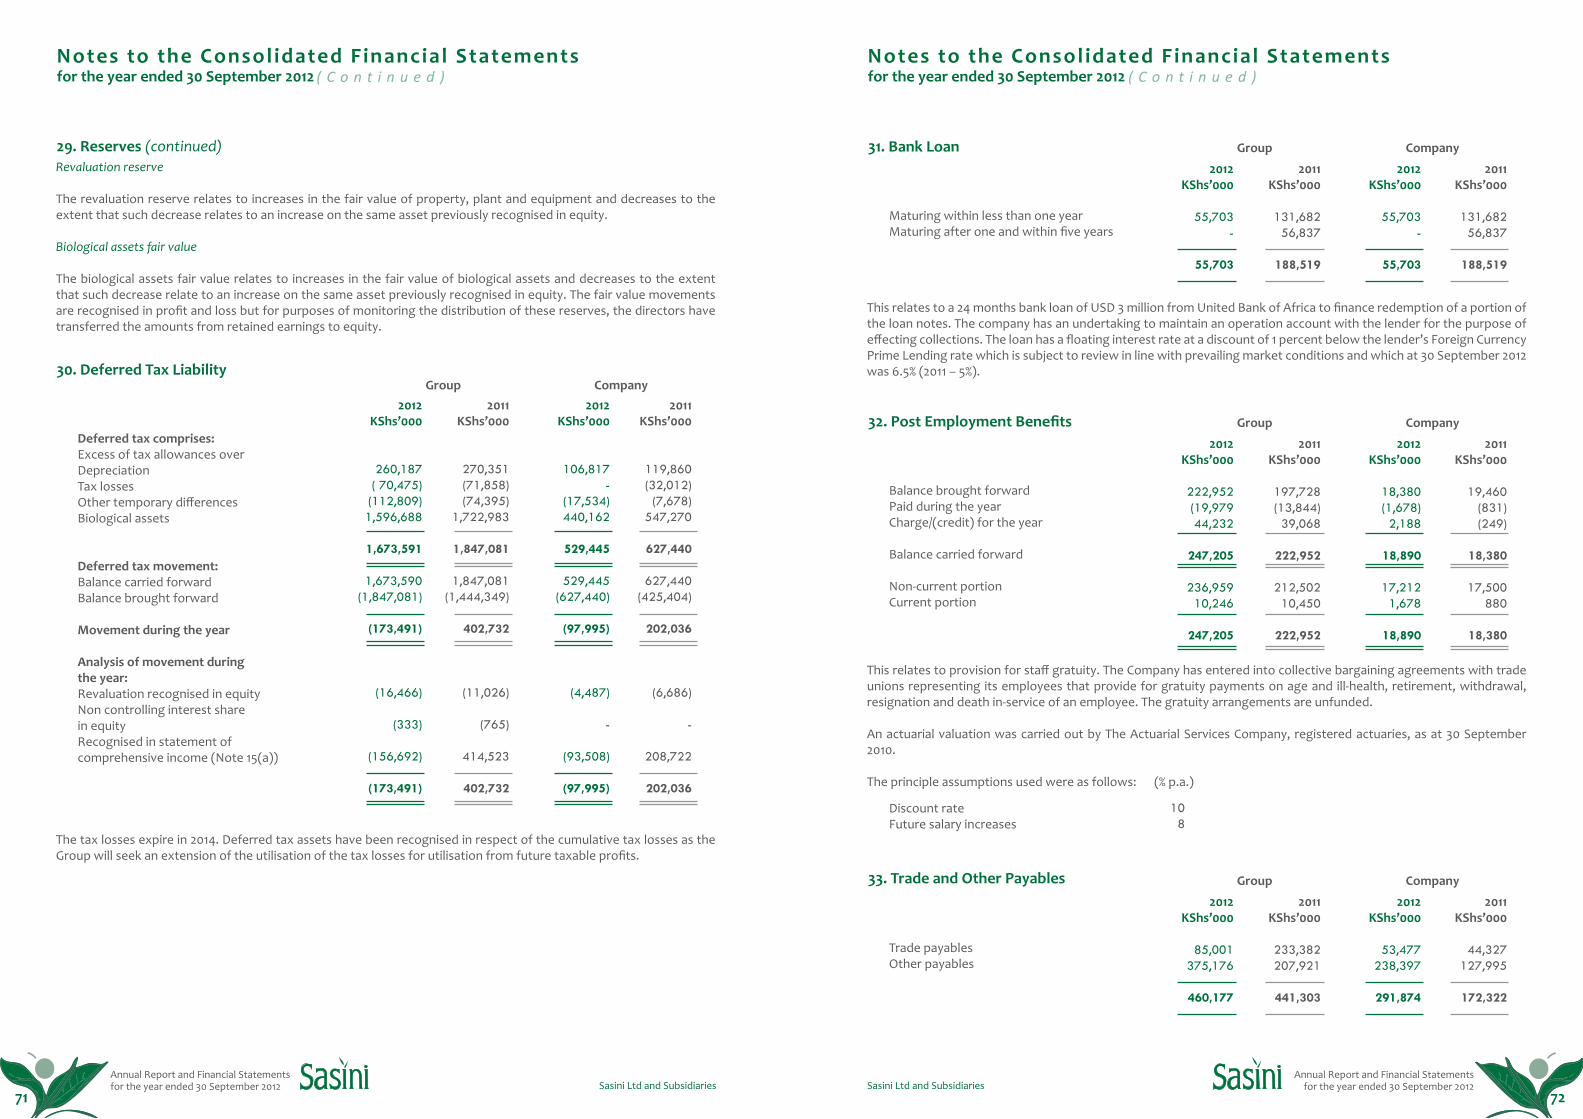
Annual Report and Financial Statements for the year ended 30 September 2012
Annual Report and Financial Statements for the year ended 30 September 2012Sasini Ltd and Subsidiaries Sasini Ltd and Subsidiaries
Group Company
Deferred tax comprises:Excess of tax allowances over DepreciationTax lossesOther temporary differencesBiological assets
Deferred tax movement:Balance carried forwardBalance brought forward
Movement during the year
Analysis of movement duringthe year:Revaluation recognised in equityNon controlling interest sharein equityRecognised in statement ofcomprehensive income (Note 15(a))
2012 KShs’000
260,187( 70,475)
(112,809)1,596,688
1,673,591
1,673,590(1,847,081)
(173,491)
(16,466)
(333)
(156,692)
(173,491)
2011KShs’000
270,351(71,858)(74,395)
1,722,983
1,847,081
1,847,081(1,444,349)
402,732
(11,026)
(765)
414,523
402,732
2012KShs’000
106,817-
(17,534)440,162
529,445
529,445(627,440)
(97,995)
(4,487)
-
(93,508)
(97,995)
2011KShs’000
119,860(32,012)(7,678)
547,270
627,440
627,440(425,404)
202,036
(6,686)
-
208,722
202,036
29. Reserves (continued)
30. Deferred Tax Liability
Revaluation reserve
The revaluation reserve relates to increases in the fair value of property, plant and equipment and decreases to the extent that such decrease relates to an increase on the same asset previously recognised in equity.
Biological assets fair value
The biological assets fair value relates to increases in the fair value of biological assets and decreases to the extent that such decrease relate to an increase on the same asset previously recognised in equity. The fair value movements are recognised in profit and loss but for purposes of monitoring the distribution of these reserves, the directors have transferred the amounts from retained earnings to equity.
The tax losses expire in 2014. Deferred tax assets have been recognised in respect of the cumulative tax losses as the Group will seek an extension of the utilisation of the tax losses for utilisation from future taxable profits.
Notes to the Consolidated Financial Statements( C o n t i n u e d )for the year ended 30 September 2012
71 72
31. Bank Loan
32. Post Employment Benefits
33. Trade and Other Payables
Group
Group
Group
Company
Company
Company
Maturing within less than one yearMaturing after one and within five years
Balance brought forwardPaid during the yearCharge/(credit) for the year
Balance carried forward
Non-current portionCurrent portion
Discount rateFuture salary increases
Trade payablesOther payables
108
2012 KShs’000
55,703-
55,703
2012 KShs’000
85,001375,176
460,177
2012 KShs’000
222,952(19,979 44,232
247,205
236,959 10,246
247,205
2012 KShs’000
55,703-
55,703
2012 KShs’000
53,477238,397
291,874
2012 KShs’000
18,380(1,678) 2,188
18,890
17,212 1,678
18,890
2011KShs’000
131,68256,837
188,519
2011KShs’000
233,382207,921
441,303
2011KShs’000
197,728(13,844) 39,068
222,952
212,50210,450
222,952
2011KShs’000
131,68256,837
188,519
2011KShs’000
44,327127,995
172,322
2011KShs’000
19,460(831)(249)
18,380
17,500880
18,380
This relates to a 24 months bank loan of USD 3 million from United Bank of Africa to finance redemption of a portion of the loan notes. The company has an undertaking to maintain an operation account with the lender for the purpose of effecting collections. The loan has a floating interest rate at a discount of 1 percent below the lender’s Foreign Currency Prime Lending rate which is subject to review in line with prevailing market conditions and which at 30 September 2012 was 6.5% (2011 – 5%).
This relates to provision for staff gratuity. The Company has entered into collective bargaining agreements with trade unions representing its employees that provide for gratuity payments on age and ill-health, retirement, withdrawal, resignation and death in-service of an employee. The gratuity arrangements are unfunded.
An actuarial valuation was carried out by The Actuarial Services Company, registered actuaries, as at 30 September 2010.
The principle assumptions used were as follows: (% p.a.)
Notes to the Consolidated Financial Statements( C o n t i n u e d )for the year ended 30 September 2012
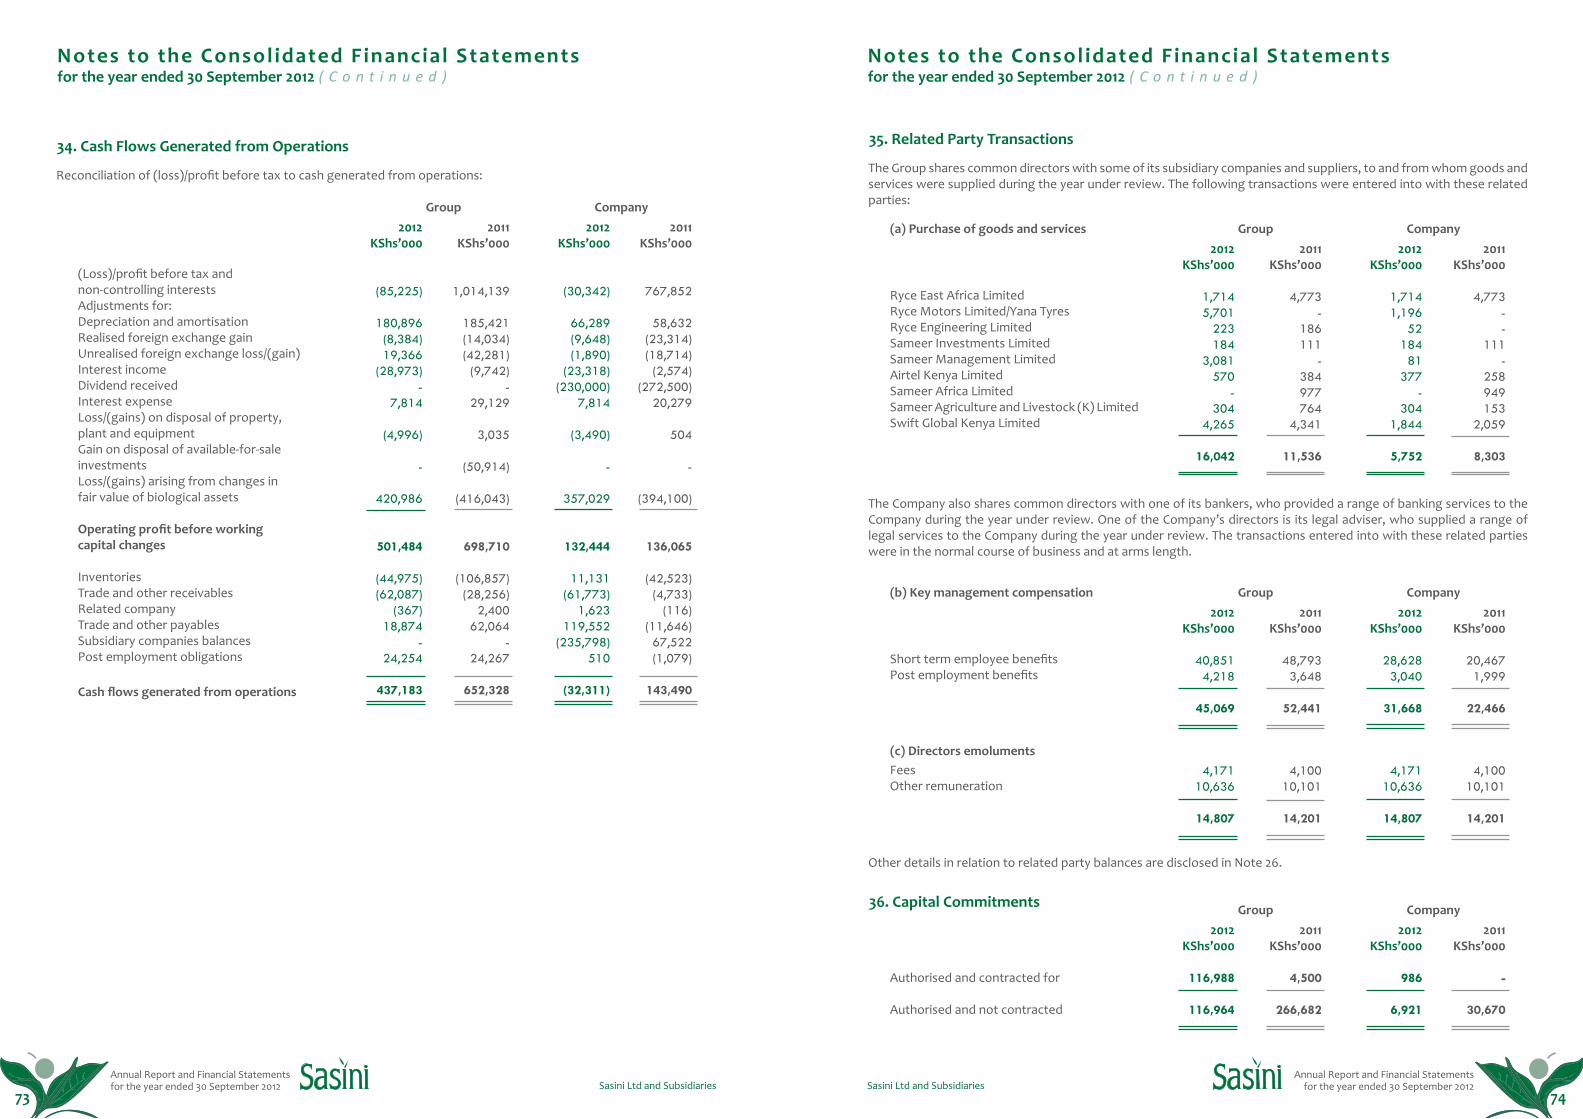
Annual Report and Financial Statements for the year ended 30 September 2012
Annual Report and Financial Statements for the year ended 30 September 2012Sasini Ltd and Subsidiaries Sasini Ltd and Subsidiaries
Group Company
(Loss)/profit before tax andnon-controlling interests Adjustments for:Depreciation and amortisationRealised foreign exchange gainUnrealised foreign exchange loss/(gain)Interest incomeDividend received Interest expenseLoss/(gains) on disposal of property,plant and equipmentGain on disposal of available-for-saleinvestmentsLoss/(gains) arising from changes in fair value of biological assets
Operating profit before workingcapital changes
InventoriesTrade and other receivablesRelated companyTrade and other payablesSubsidiary companies balancesPost employment obligations
Cash flows generated from operations
2012 KShs’000
(85,225)
180,896(8,384)19,366
(28,973)-
7,814
(4,996)
-
420,986
501,484
(44,975)(62,087)
(367)18,874
- 24,254
437,183
2011KShs’000
1,014,139
185,421(14,034)(42,281)(9,742)
-29,129
3,035
(50,914)
(416,043)
698,710
(106,857)(28,256)
2,40062,064
- 24,267
652,328
2012KShs’000
(30,342)
66,289(9,648)(1,890)
(23,318)(230,000)
7,814
(3,490)
-
357,029
132,444
11,131(61,773)
1,623119,552
(235,798) 510
(32,311)
2011KShs’000
767,852
58,632(23,314)(18,714)(2,574)
(272,500)20,279
504
-
(394,100)
136,065
(42,523)(4,733)
(116)(11,646)67,522(1,079)
143,490
34. Cash Flows Generated from Operations
Reconciliation of (loss)/profit before tax to cash generated from operations:
Notes to the Consolidated Financial Statements( C o n t i n u e d )for the year ended 30 September 2012
73 74
Notes to the Consolidated Financial Statements( C o n t i n u e d )
Group
Group
Group
(a) Purchase of goods and services
(b) Key management compensation
(c) Directors emoluments
Company
Company
Company
Ryce East Africa LimitedRyce Motors Limited/Yana TyresRyce Engineering LimitedSameer Investments LimitedSameer Management LimitedAirtel Kenya LimitedSameer Africa LimitedSameer Agriculture and Livestock (K) LimitedSwift Global Kenya Limited
Short term employee benefitsPost employment benefits
Fees Other remuneration
Authorised and contracted for
Authorised and not contracted
2012 KShs’000
1,7145,701
223184
3,081570
-304
4,265
16,042
2012 KShs’000
40,8514,218
45,069
2012 KShs’000
116,988
116,964
4,17110,636
14,807
4,17110,636
14,807
2011KShs’000
4,773-
186111
-384977764
4,341
11,536
2011KShs’000
48,793 3,648
52,441
2011KShs’000
4,500
266,682
4,100 10,101
14,201
4,100 10,101
14,201
2012KShs’000
1,7141,196
52184
81377
-304
1,844
5,752
2012KShs’000
28,6283,040
31,668
2012KShs’000
986
6,921
2011KShs’000
4,773--
111-
258949153
2,059
8,303
2011KShs’000
20,467 1,999
22,466
2011KShs’000
-
30,670
35. Related Party Transactions
36. Capital Commitments
The Group shares common directors with some of its subsidiary companies and suppliers, to and from whom goods and services were supplied during the year under review. The following transactions were entered into with these related parties:
The Company also shares common directors with one of its bankers, who provided a range of banking services to the Company during the year under review. One of the Company’s directors is its legal adviser, who supplied a range of legal services to the Company during the year under review. The transactions entered into with these related parties were in the normal course of business and at arms length.
Other details in relation to related party balances are disclosed in Note 26.
for the year ended 30 September 2012
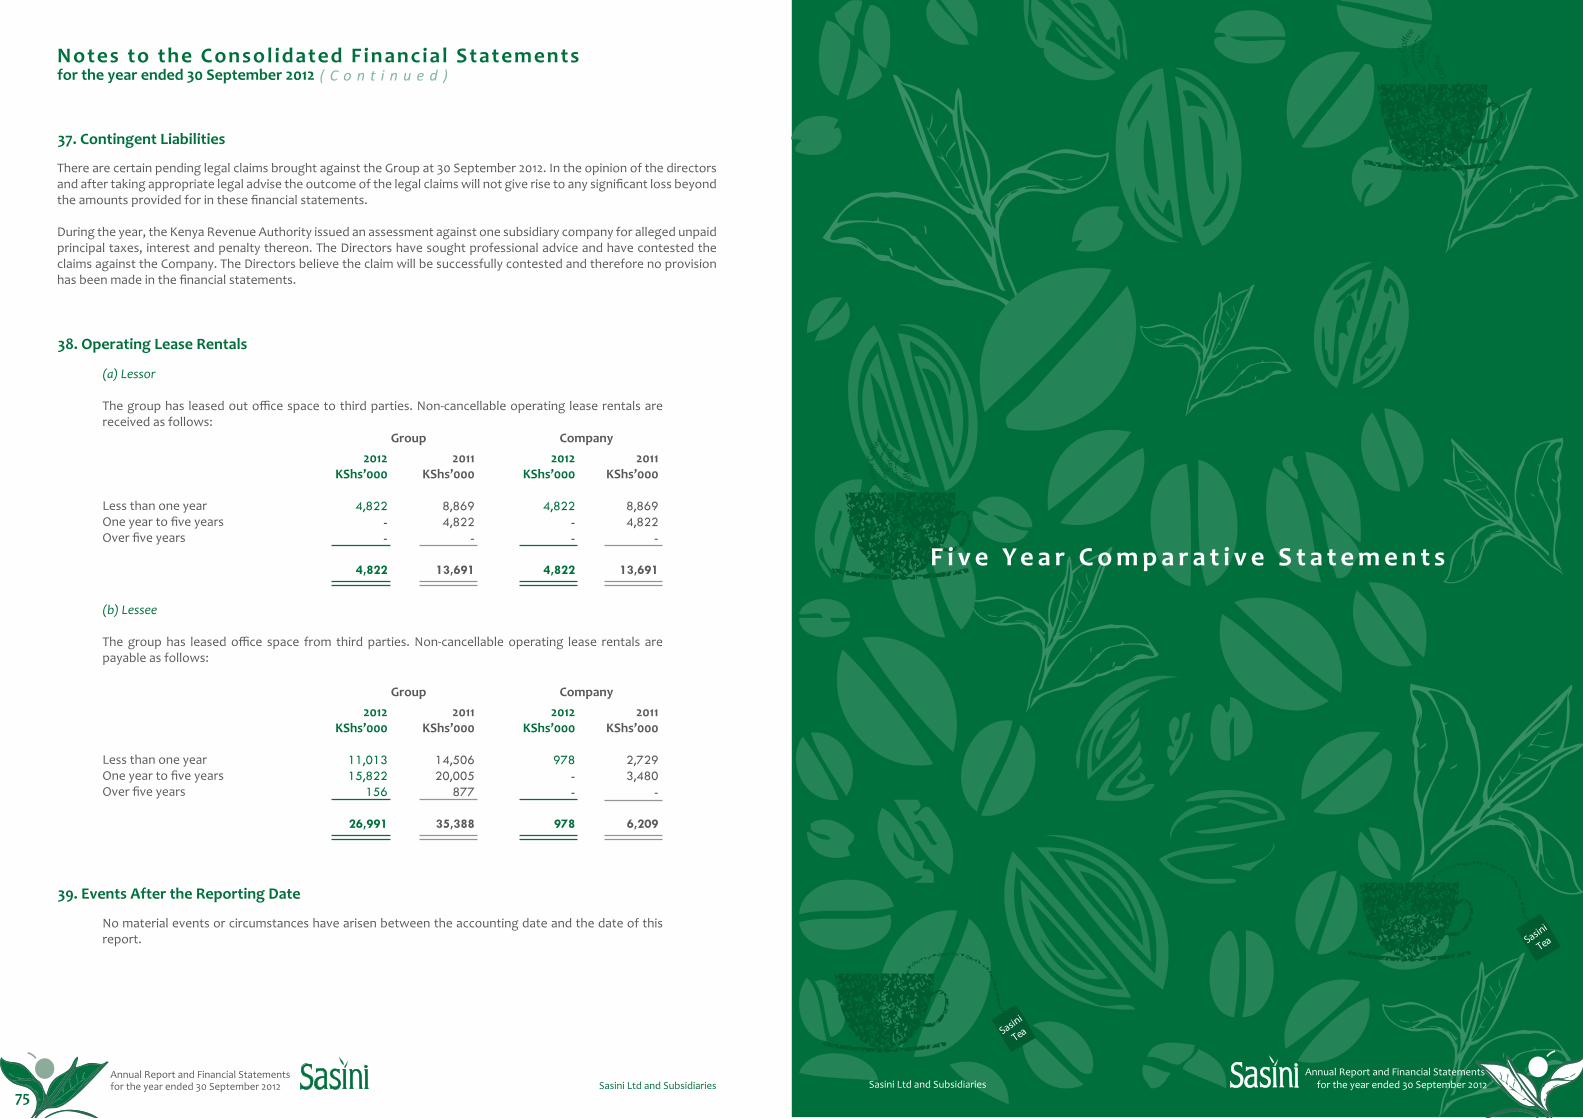
Annual Report and Financial Statements for the year ended 30 September 2012
Annual Report and Financial Statements for the year ended 30 September 2012Sasini Ltd and Subsidiaries Sasini Ltd and Subsidiaries
Notes to the Consolidated Financial Statements( C o n t i n u e d )
Less than one yearOne year to five yearsOver five years
Less than one yearOne year to five yearsOver five years
Group
Group
Company
Company
2012 KShs’000
4,822--
4,822
2012 KShs’000
11,01315,822 156
26,991
2012 KShs’000
4,822--
4,822
2012 KShs’000
978--
978
2011KShs’000
8,8694,822
-
13,691
2011KShs’000
14,506 20,005
877
35,388
2011KShs’000
8,8694,822
-
13,691
2011KShs’000
2,7293,480
-
6,209
37. Contingent Liabilities
38. Operating Lease Rentals
39. Events After the Reporting Date
There are certain pending legal claims brought against the Group at 30 September 2012. In the opinion of the directors and after taking appropriate legal advise the outcome of the legal claims will not give rise to any significant loss beyond the amounts provided for in these financial statements.
During the year, the Kenya Revenue Authority issued an assessment against one subsidiary company for alleged unpaid principal taxes, interest and penalty thereon. The Directors have sought professional advice and have contested the claims against the Company. The Directors believe the claim will be successfully contested and therefore no provision has been made in the financial statements.
(a) Lessor
The group has leased out office space to third parties. Non-cancellable operating lease rentals are received as follows:
No material events or circumstances have arisen between the accounting date and the date of this report.
(b) Lessee
The group has leased office space from third parties. Non-cancellable operating lease rentals are payable as follows:
for the year ended 30 September 2012
75 76
Sasin
i
Sasin
i
Sasini
Tea
Sasini
Tea
F i v e Y e a r C o m p a r a t i v e S t a t e m e n t s
Annual Report and Financial Statements for the year ended 30 September 2012Sasini Ltd and Subsidiaries
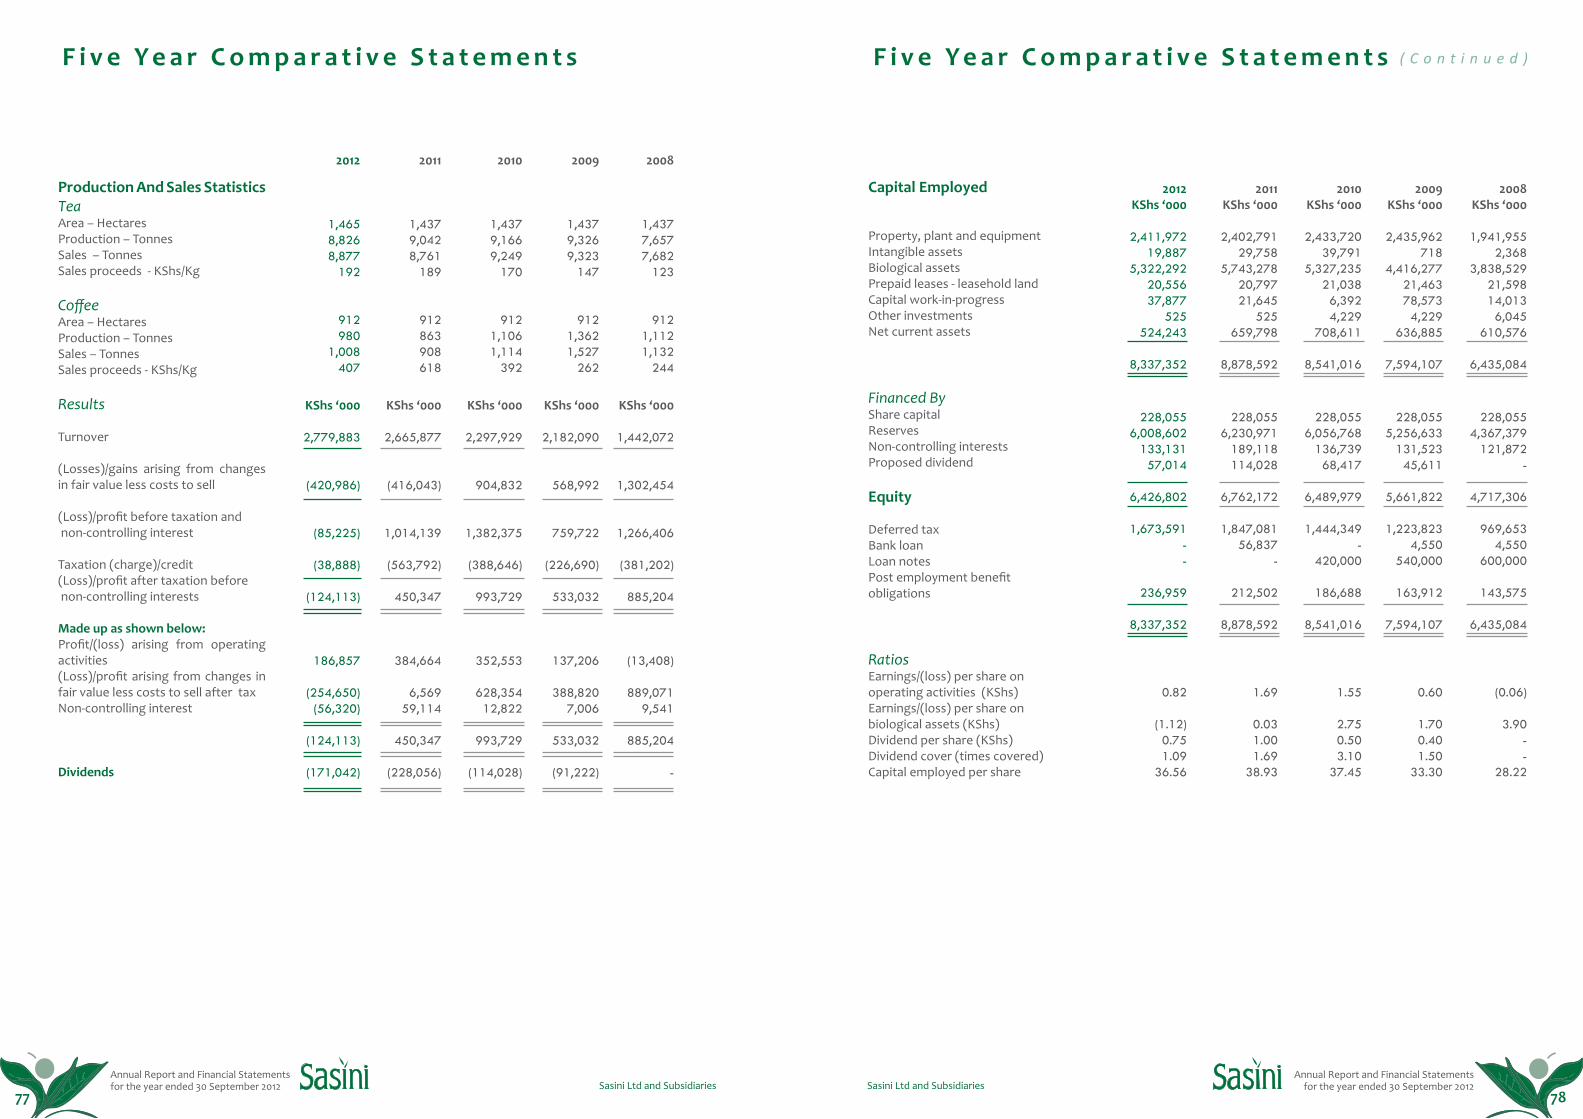
Annual Report and Financial Statements for the year ended 30 September 2012
Annual Report and Financial Statements for the year ended 30 September 2012Sasini Ltd and Subsidiaries Sasini Ltd and Subsidiaries
F i v e Y e a r C o m p a r a t i v e S t a t e m e n t s F i v e Y e a r C o m p a r a t i v e S t a t e m e n t s
Production And Sales StatisticsTeaArea – HectaresProduction – TonnesSales – TonnesSales proceeds - KShs/Kg
CoffeeArea – HectaresProduction – TonnesSales – TonnesSales proceeds - KShs/Kg
Results
Turnover
(Losses)/gains arising from changes in fair value less costs to sell
(Loss)/profit before taxation and non-controlling interest
Taxation (charge)/credit (Loss)/profit after taxation before non-controlling interests
Made up as shown below:Profit/(loss) arising from operating activities(Loss)/profit arising from changes in fair value less costs to sell after taxNon-controlling interest
Dividends
Capital Employed
Property, plant and equipmentIntangible assetsBiological assetsPrepaid leases - leasehold landCapital work-in-progressOther investmentsNet current assets
Financed ByShare capitalReservesNon-controlling interestsProposed dividend
Equity
Deferred taxBank loanLoan notesPost employment benefit obligations
RatiosEarnings/(loss) per share onoperating activities (KShs)Earnings/(loss) per share on biological assets (KShs)Dividend per share (KShs)Dividend cover (times covered)Capital employed per share
2012
1,4658,8268,877
192
912980
1,008407
2012KShs ‘000
2,411,97219,887
5,322,29220,55637,877
525 524,243
8,337,352
2011KShs ‘000
2,402,79129,758
5,743,27820,79721,645
525 659,798
8,878,592
2010KShs ‘000
2,433,72039,791
5,327,23521,038
6,3924,229
708,611
8,541,016
2009KShs ‘000
2,435,962718
4,416,27721,46378,573
4,229 636,885
7,594,107
2008KShs ‘000
1,941,9552,368
3,838,52921,59814,013
6,045 610,576
6,435,084
228,0556,008,602
133,131 57,014
6,426,802
1,673,591--
236,959
8,337,352
228,0556,230,971
189,118 114,028
6,762,172
1,847,08156,837
-
212,502
8,878,592
228,0556,056,768
136,739 68,417
6,489,979
1,444,349-
420,000
186,688
8,541,016
228,0555,256,633
131,523 45,611
5,661,822
1,223,8234,550
540,000
163,912
7,594,107
228,0554,367,379
121,872 -
4,717,306
969,6534,550
600,000
143,575
6,435,084
0.82
(1.12)0.751.09
36.56
1.69
0.031.001.69
38.93
1.55
2.750.503.10
37.45
0.60
1.70 0.40
1.5033.30
(0.06)
3.90--
28.22
2011
1,4379,0428,761
189
912863908618
2010
1,4379,1669,249
170
9121,1061,114
392
2009
1,4379,3269,323
147
9121,3621,527
262
2008
1,437 7,657 7,682
123
9121,1121,132
244
KShs ‘000
2,779,883
(420,986)
(85,225)
(38,888)
(124,113)
186,857
(254,650)(56,320)
(124,113)
(171,042)
KShs ‘000
2,665,877
(416,043)
1,014,139
(563,792)
450,347
384,664
6,56959,114
450,347
(228,056)
KShs ‘000
2,297,929
904,832
1,382,375
(388,646)
993,729
352,553
628,35412,822
993,729
(114,028)
KShs ‘000
2,182,090
568,992
759,722
(226,690)
533,032
137,206
388,8207,006
533,032
(91,222)
KShs ‘000
1,442,072
1,302,454
1,266,406
(381,202)
885,204
(13,408)
889,0719,541
885,204
-
( C o n t i n u e d )
77 78
Annual Report and Financial Statements for the year ended 30 September 2012
Annual Report and Financial Statements for the year ended 30 September 2012Sasini Ltd and Subsidiaries Sasini Ltd and Subsidiaries
I We
Of
bein
g a
mem
ber/
mem
bers
of S
asin
i Lim
ited,
do
here
by a
ppoi
nt
or fa
iling
him
/her
the
duly
app
oint
ed C
hairm
an o
f the
mee
ting
to b
e m
y/ o
ur p
roxy
, to
vote
for m
e/us
at t
he
Annu
al G
ener
al M
eetin
g of
the
Com
pany
to b
e he
ld a
t Kam
undu
Est
ate,
Kia
mbu
, Ken
ya
on F
riday
22n
d Fe
brua
ry 2
013
and
at a
ny a
djou
rnm
ent t
here
of.
As w
itnes
s m
y/ou
r han
d(s)
this
day
of
20
13
Sign
atur
e
Not
es:
•
To
be v
alid
, thi
s pr
oxy
mus
t be
depo
site
d at
the
Regi
ster
ed O
ffice
of t
he C
ompa
ny
no
t les
s th
an 4
8hou
rs b
efor
e th
e tim
e ap
poin
ted
for h
oldi
ng th
e m
eetin
g.
•
If th
e ap
poin
ter i
s a
corp
orat
ion,
the
prox
y m
ust b
e ex
ecut
ed u
nder
its
com
mon
Seal
or u
nder
the
hand
of a
n offi
cer o
r att
orne
y du
ly a
utho
rized
in w
ritin
g.
Form
of P
roxy
/ Fo
mu
ya U
wak
ilish
iM
imi/s
isi
wa
niki
wa/
tuki
wa
mw
anac
ham
a/w
anac
ham
a w
a Sa
sini
Lim
ited,
nam
chag
ua/t
wam
chag
ua
au a
kiko
sa y
eye
Mw
enye
kiti
aliy
echa
guliw
a w
a m
kuta
no k
uwa
kam
a m
wak
ilish
i wan
gu/w
etu,
kup
iga
kura
kwa
niab
a ya
ngu/
yetu
kw
enye
mku
tano
mku
u w
a m
wak
a w
a Ka
mpu
ni u
taka
ofan
yika
katik
a sh
amba
la K
amun
du,K
iam
bu,
Keny
a si
ku y
a Iju
maa
tar
ehe
22 F
ebru
ari 2
013
na
kwen
ye u
ahiri
shw
aji w
ake
wow
ote.
Kam
a us
hahi
di w
angu
/wet
u hi
i sik
u ya
Mw
ezi
wa
2013
Sahi
hi
Mae
lezo
:
• Il
i kuw
a ha
lali,
fom
u hi
i ya
uaki
lishi
lazi
ma
ifiki
shw
e kw
enye
afis
i iliy
oand
ikis
hwa
ya
kam
puni
kw
a m
uda
usio
pung
ua m
asaa
aro
bain
i na
nane
kab
la y
a w
akat
i
ulio
chag
uliw
a w
a ku
fany
a m
kuta
no.
• Ik
iwa
mw
anac
ham
a ni
shi
rika,
uak
ilish
i uw
e kw
enye
muh
uri w
a ka
wai
da a
u kw
a
idhi
ni y
a afi
saa
au m
wan
ashe
ria a
liyei
dhin
ishw
a kw
a m
aadi
shi.
Annu
al R
epor
t and
Fin
anci
al S
tate
men
ts
for t
he y
ear e
nded
30
Sept
embe
r 201
2An
nual
Rep
ort a
nd F
inan
cial
Sta
tem
ents
fo
r the
yea
r end
ed 3
0 Se
ptem
ber 2
012
Sasi
ni L
td a
nd S
ubsi
diar
ies
N o t e s :
79
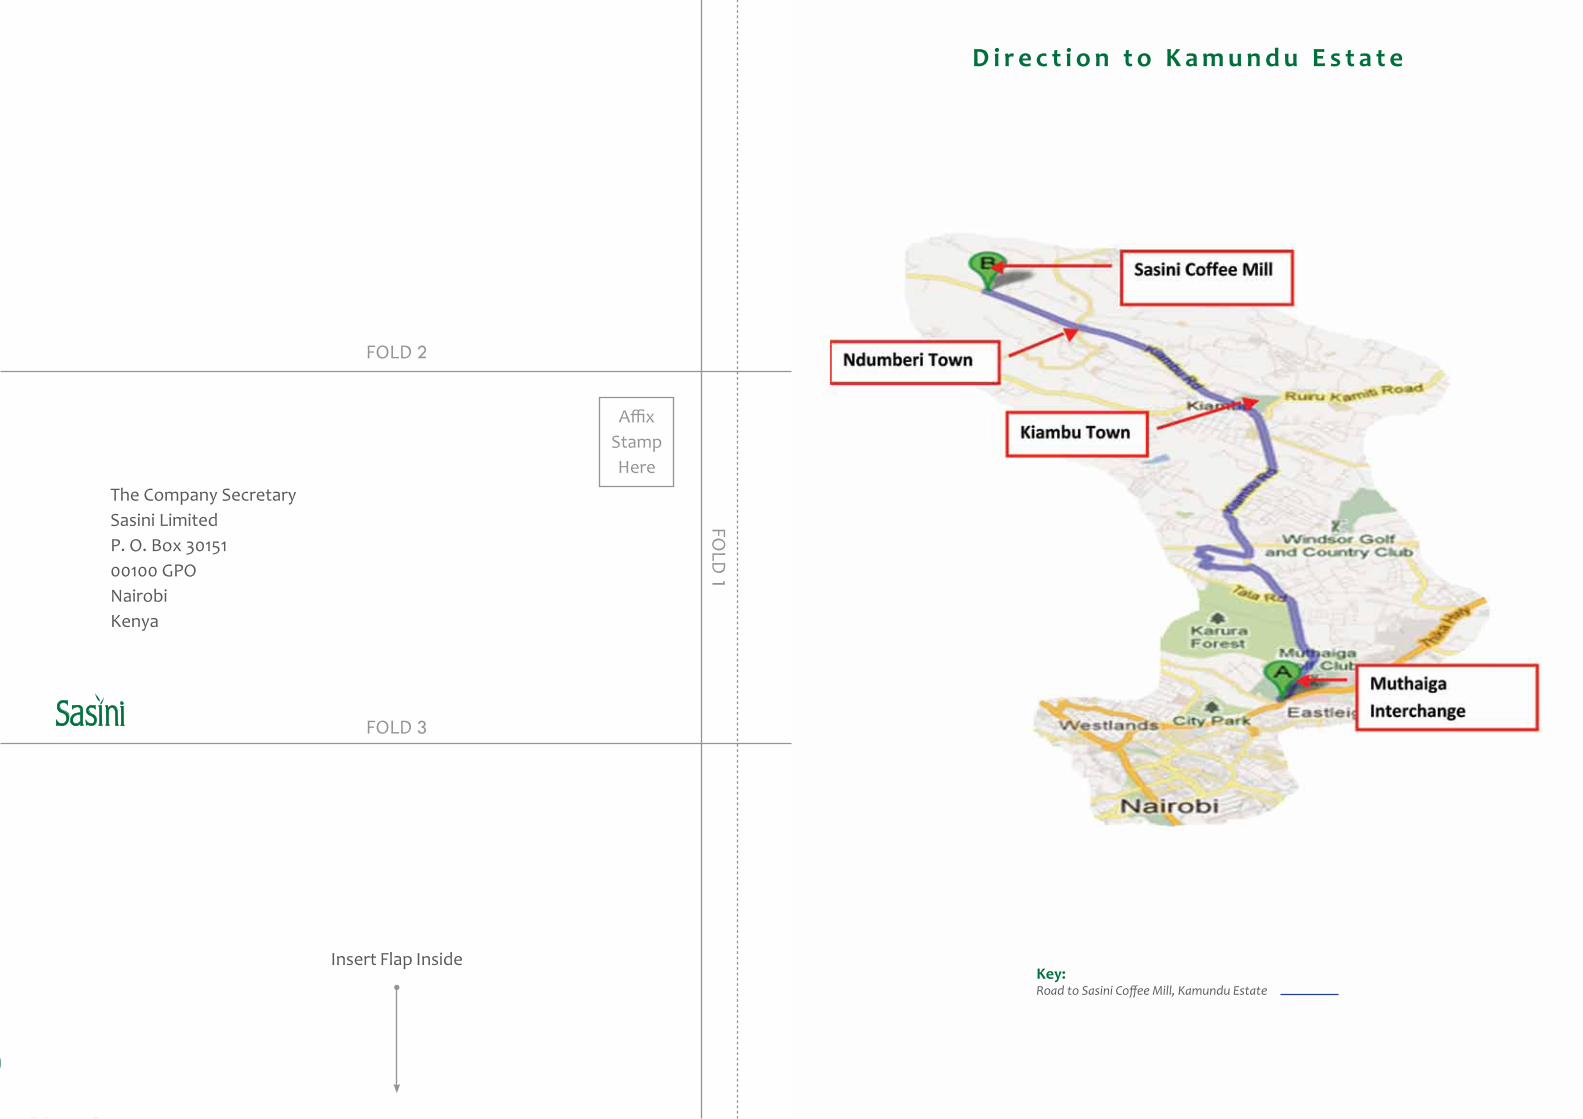
Annual Report and Financial Statements for the year ended 30 September 2012
Annual Report and Financial Statements for the year ended 30 September 2012Sasini Ltd and Subsidiaries Sasini Ltd and Subsidiaries
D i r e c t i o n t o K a m u n d u E s t a t e
Key:Road to Sasini Coffee Mill, Kamundu Estate
The Company SecretarySasini LimitedP. O. Box 3015100100 GPONairobiKenya
Insert Flap Inside
FOLD 3
FOLD 2
FOLD
1
AffixStamp Here

Annual Report and Financial Statements for the year ended 30 September 2012 Sasini Ltd and Subsidiaries
Copyright © 2022 FDOKUMEN