FIREWACh: high-throughput functional detection of transcriptional regulatory modules in mammalian...
12
ARTICLES NATURE METHODS | VOL.11 NO.5 | MAY 2014 | 559 Promoters and enhancers establish precise gene transcription patterns. The development of functional approaches for their identification in mammalian cells has been complicated by the size of these genomes. Here we report a high-throughput functional assay for directly identifying active promoter and enhancer elements called FIREWACh (Functional Identification of Regulatory Elements Within Accessible Chromatin), which we used to simultaneously assess over 80,000 DNA fragments derived from nucleosome-free regions within the chromatin of embryonic stem cells (ESCs) and identify 6,364 active regulatory elements. Many of these represent newly discovered ESC-specific enhancers, showing enriched binding-site motifs for ESC-specific transcription factors including SOX2, POU5F1 (OCT4) and KLF4. The application of FIREWACh to additional cultured cell types will facilitate functional annotation of the genome and expand our view of transcriptional network dynamics. Embryonic development relies on the establishment of precise temporally and spatially regulated gene expression patterns. A fundamental determinant of this is the interaction of tran- scription factors (TFs) with their DNA-binding sites within cis-regulatory modules (CRMs) of promoters and enhanc- ers, leading to the activation or repression of the associated gene. Understanding these regulatory mechanisms requires the global identification of differentially active CRMs within mammalian genomes. Traditional approaches for identifying active CRMs rely on functional assays of individually transfected reporter plasmids harboring putative regulatory regions for a gene of interest 1 , but these assays are not scalable for global identification of CRMs. Functional approaches for CRM discovery have largely been supplanted by surrogate genome-wide assays mapping protein- DNA interactions for, among others, specific TFs or histone modifications associated with active promoters and enhancers 2 . These studies have provided an expanded view of chromatin landscapes as well as insights into the relationship between gene expression and the dynamics of chromatin modification FIREWACh: high-throughput functional detection of transcriptional regulatory modules in mammalian cells Matthew Murtha 1 , Zeynep Tokcaer-Keskin 1 , Zuojian Tang 2 , Francesco Strino 3 , Xi Chen 4 , Yatong Wang 1 , Xiangmei Xi 1 , Claudio Basilico 1 , Stuart Brown 2 , Richard Bonneau 4,5 , Yuval Kluger 3 & Lisa Dailey 1 and remodeling. However, the genomic loci defined by these marks typically span several kilobases and are generally too broad to define the specific DNA sequences mediating pro- moter or enhancer function, and putative CRMs require further functional validation. Recently, several groups have developed massively parallel reporter assays (MPRAs) that permit the simultaneous analy- sis of hundreds of thousands of reporter plasmids and, thereby, functional assessment of transcriptional-activation properties of large numbers of genomic regions 3–6 . However, MPRAs have primarily been used as a way to dissect the functional components of previously identified transcriptional regulatory DNA elements rather than as a tool for the discovery of CRMs in mammalian cells. Even with these advances, the enormous size and complexity of mammalian genomes, and the concomitant number of required reporter plasmids, remain among the pri- mary challenges to using functional approaches for the de novo discovery of CRMs. We previously showed that the efficiency of identifying biologically relevant transcriptional regulatory elements can be dramatically increased by focusing the functional analysis on DNA isolated from nucleosome-free regions (NFRs) 7,8 , i.e., genomic regions in which nucleosomes are relatively depleted and/or highly destabilized 9 . Notably, NFRs are where active regu- latory elements reside and represent only 2% of chromatin. Thus, focusing a functional analysis on NFR-derived DNA reduces the search space to the most relevant portion of the genome and eliminates the need for a priori selection based on criteria such as phylogenetic sequence conservation or chromatin marks. We developed a high-throughput functional assay for the iden- tification of active CRMs, FIREWACh, and have applied the assay to murine ESCs. We report the identification of more than 6,000 previously unknown transcriptional regulatory modules for both promoters and enhancers, and provide evidence that genomic loci detected by FIREWACh correspond to elements that regulate endogenous gene expression in ESCs. Accordingly, analysis of ESC-specific enhancers discovered using FIREWACh can identify enriched binding-site motifs for key ESC transcription factors, 1 Department of Microbiology, New York University School of Medicine, New York, New York, USA. 2 Center for Health Informatics and Bioinformatics, New York University School of Medicine, New York, New York, USA. 3 Department of Biology and Biological Sciences, Yale University, New Haven, Connecticut, USA. 4 Department of Biology, New York University, New York, New York, USA. 5 Department of Computer Science, Courant Institute of Mathematical Sciences, New York, New York, USA. Correspondence should be addressed to L.D. ([email protected]). RECEIVED 3 SEPTEMBER 2013; ACCEPTED 28 JANUARY 2014; PUBLISHED ONLINE 23 MARCH 2014; DOI:10.1038/NMETH.2885 npg © 2014 Nature America, Inc. All rights reserved.
Transcript of FIREWACh: high-throughput functional detection of transcriptional regulatory modules in mammalian...
Articles
nAture methods | VOL.11 NO.5 | MAY 2014 | 559
Promoters and enhancers establish precise gene transcription patterns. the development of functional approaches for their identification in mammalian cells has been complicated by the size of these genomes. here we report a high-throughput functional assay for directly identifying active promoter and enhancer elements called FireWAch (Functional identification of regulatory elements Within Accessible chromatin), which we used to simultaneously assess over 80,000 dnA fragments derived from nucleosome-free regions within the chromatin of embryonic stem cells (escs) and identify 6,364 active regulatory elements. many of these represent newly discovered esc-specific enhancers, showing enriched binding-site motifs for esc-specific transcription factors including soX2, Pou5F1 (oct4) and KlF4. the application of FireWAch to additional cultured cell types will facilitate functional annotation of the genome and expand our view of transcriptional network dynamics.
Embryonic development relies on the establishment of precise temporally and spatially regulated gene expression patterns. A fundamental determinant of this is the interaction of tran-scription factors (TFs) with their DNA-binding sites within cis-regulatory modules (CRMs) of promoters and enhanc-ers, leading to the activation or repression of the associated gene. Understanding these regulatory mechanisms requires the global identification of differentially active CRMs within mammalian genomes.
Traditional approaches for identifying active CRMs rely on functional assays of individually transfected reporter plasmids harboring putative regulatory regions for a gene of interest1, but these assays are not scalable for global identification of CRMs. Functional approaches for CRM discovery have largely been supplanted by surrogate genome-wide assays mapping protein-DNA interactions for, among others, specific TFs or histone modifications associated with active promoters and enhancers2. These studies have provided an expanded view of chromatin landscapes as well as insights into the relationship between gene expression and the dynamics of chromatin modification
FireWAch: high-throughput functional detection of transcriptional regulatory modules in mammalian cellsMatthew Murtha1, Zeynep Tokcaer-Keskin1, Zuojian Tang2, Francesco Strino3, Xi Chen4, Yatong Wang1, Xiangmei Xi1, Claudio Basilico1, Stuart Brown2, Richard Bonneau4,5, Yuval Kluger3 & Lisa Dailey1
and remodeling. However, the genomic loci defined by these marks typically span several kilobases and are generally too broad to define the specific DNA sequences mediating pro-moter or enhancer function, and putative CRMs require further functional validation.
Recently, several groups have developed massively parallel reporter assays (MPRAs) that permit the simultaneous analy-sis of hundreds of thousands of reporter plasmids and, thereby, functional assessment of transcriptional-activation properties of large numbers of genomic regions3–6. However, MPRAs have primarily been used as a way to dissect the functional components of previously identified transcriptional regulatory DNA elements rather than as a tool for the discovery of CRMs in mammalian cells. Even with these advances, the enormous size and complexity of mammalian genomes, and the concomitant number of required reporter plasmids, remain among the pri-mary challenges to using functional approaches for the de novo discovery of CRMs.
We previously showed that the efficiency of identifying biologically relevant transcriptional regulatory elements can be dramatically increased by focusing the functional analysis on DNA isolated from nucleosome-free regions (NFRs)7,8, i.e., genomic regions in which nucleosomes are relatively depleted and/or highly destabilized9. Notably, NFRs are where active regu-latory elements reside and represent only 2% of chromatin. Thus, focusing a functional analysis on NFR-derived DNA reduces the search space to the most relevant portion of the genome and eliminates the need for a priori selection based on criteria such as phylogenetic sequence conservation or chromatin marks.
We developed a high-throughput functional assay for the iden-tification of active CRMs, FIREWACh, and have applied the assay to murine ESCs. We report the identification of more than 6,000 previously unknown transcriptional regulatory modules for both promoters and enhancers, and provide evidence that genomic loci detected by FIREWACh correspond to elements that regulate endogenous gene expression in ESCs. Accordingly, analysis of ESC-specific enhancers discovered using FIREWACh can identify enriched binding-site motifs for key ESC transcription factors,
1Department of Microbiology, New York University School of Medicine, New York, New York, USA. 2Center for Health Informatics and Bioinformatics, New York University School of Medicine, New York, New York, USA. 3Department of Biology and Biological Sciences, Yale University, New Haven, Connecticut, USA. 4Department of Biology, New York University, New York, New York, USA. 5Department of Computer Science, Courant Institute of Mathematical Sciences, New York, New York, USA. Correspondence should be addressed to L.D. ([email protected]).Received 3 SeptembeR 2013; accepted 28 JanuaRy 2014; publiShed online 23 maRch 2014; doi:10.1038/nmeth.2885
npg
© 2
014
Nat
ure
Am
eric
a, In
c. A
ll rig
hts
rese
rved
.
560 | VOL.11 NO.5 | MAY 2014 | nAture methods
Articles
further demonstrating the utility of FIREWACh to identify essen-tial components of transcriptional networks.
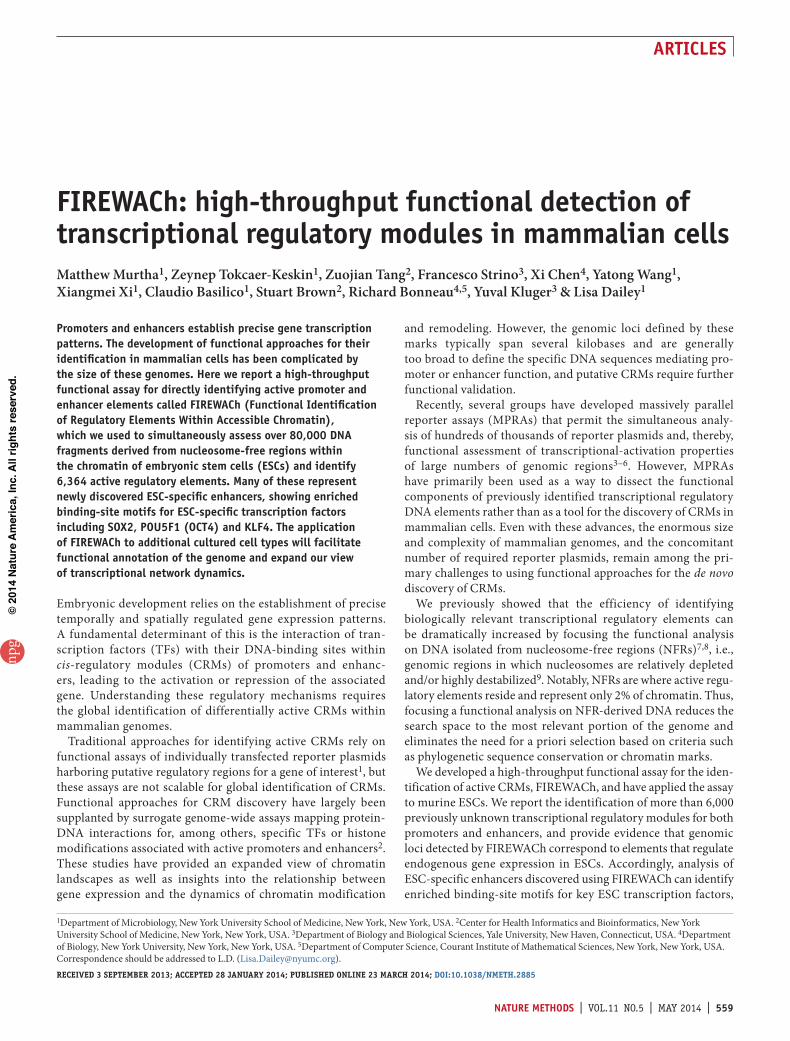
resultslentiviral reporter library preparation with esc nFr dnAsWe have previously shown that incubating permeabilized nuclei with restriction enzymes results in the selective digestion and release of DNA from NFRs and the diffusion of these molecules out of the nucleus into the surrounding buffer7,8. The resulting DNA population is enriched for regulatory regions in the virtual absence of background DNA, making it feasible to use reporter-based functional assays to interrogate the DNA population for elements capable of activating transcription (Fig. 1).
We used murine ESCs, as they have been the subject of a multitude of genome-wide chromatin immunoprecipitation (ChIP)10–13 and DNase studies, and, accordingly, these anno-tated chromatin features provide a valuable platform for the evaluation of putative CRMs identified using FIREWACh. ESC nuclei were exposed to either HaeIII or RsaI restriction enzymes, and the two separate NFR DNA populations were isolated. The HaeIII- or RsaI-generated NFR DNAs were amplified using ligation-mediated PCR and an oligonucleotide primer comple-mentary flanking adaptor DNA (Supplementary Table 1), and inserted within the lentiviral (LV) reporter plasmid FpG5 to create two distinct NFR-GFP-LV libraries. FpG5 is a derivative of the self-inactivating FUW lentivirus14 and contains a clon-ing site for insertion of the NFR DNAs immediately upstream of a minimal promoter and GFP-coding sequences, as well as
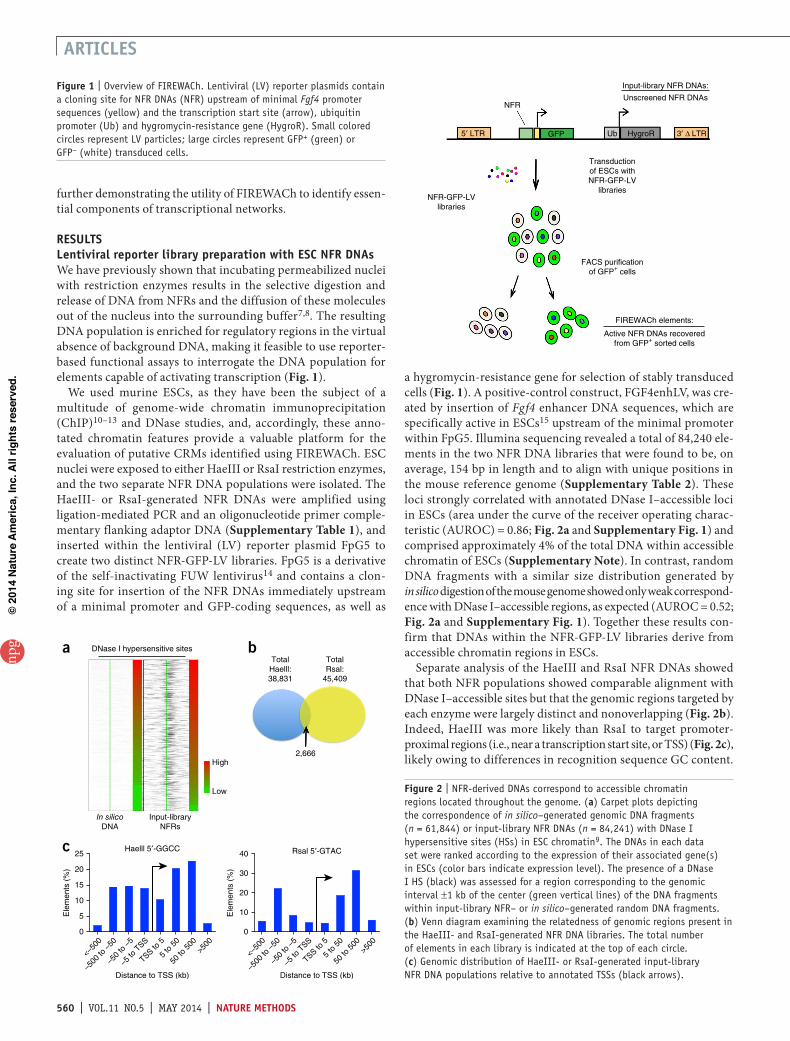
a hygromycin-resistance gene for selection of stably transduced cells (Fig. 1). A positive-control construct, FGF4enhLV, was cre-ated by insertion of Fgf4 enhancer DNA sequences, which are specifically active in ESCs15 upstream of the minimal promoter within FpG5. Illumina sequencing revealed a total of 84,240 ele-ments in the two NFR DNA libraries that were found to be, on average, 154 bp in length and to align with unique positions in the mouse reference genome (Supplementary Table 2). These loci strongly correlated with annotated DNase I–accessible loci in ESCs (area under the curve of the receiver operating charac-teristic (AUROC) = 0.86; Fig. 2a and Supplementary Fig. 1) and comprised approximately 4% of the total DNA within accessible chromatin of ESCs (Supplementary Note). In contrast, random DNA fragments with a similar size distribution generated by in silico digestion of the mouse genome showed only weak correspond-ence with DNase I–accessible regions, as expected (AUROC = 0.52; Fig. 2a and Supplementary Fig. 1). Together these results con-firm that DNAs within the NFR-GFP-LV libraries derive from accessible chromatin regions in ESCs.
Separate analysis of the HaeIII and RsaI NFR DNAs showed that both NFR populations showed comparable alignment with DNase I–accessible sites but that the genomic regions targeted by each enzyme were largely distinct and nonoverlapping (Fig. 2b). Indeed, HaeIII was more likely than RsaI to target promoter- proximal regions (i.e., near a transcription start site, or TSS) (Fig. 2c), likely owing to differences in recognition sequence GC content.
Input-library NFR DNAs:
FIREWACh elements:
Active NFR DNAs recoveredfrom GFP+ sorted cells
Unscreened NFR DNAsNFR
5′ LTR GFP
Transductionof ESCs withNFR-GFP-LV
libraries
FACS purificationof GFP+ cells
NFR-GFP-LVlibraries
Ub HygroR 3′ ∆ LTR
Figure 1 | Overview of FIREWACh. Lentiviral (LV) reporter plasmids contain a cloning site for NFR DNAs (NFR) upstream of minimal Fgf4 promoter sequences (yellow) and the transcription start site (arrow), ubiquitin promoter (Ub) and hygromycin-resistance gene (HygroR). Small colored circles represent LV particles; large circles represent GFP+ (green) or GFP− (white) transduced cells.
c Haelll 5′-GGCC
Distance to TSS (kb) Distance to TSS (kb)
<–50
0
–500
to –
50
–50
to –
5
–5 to
TSS
TSS to 5
5 to
50
50 to
500
>500
<–50
0
–500
to –
50
–50
to –
5
–5 to
TSS
TSS to 5
5 to
50
50 to
500
>500
Ele
men
ts (
%)
Ele
men
ts (
%)
25 40
30
20
10
0
20
15
10
5
0
Rsal 5′-GTAC
DNase I hypersensitive sitesa bTotalHaelll:38,831
TotalRsal:
45,409
2,666High
Low
Input-libraryNFRs
In silicoDNA
Figure 2 | NFR-derived DNAs correspond to accessible chromatin regions located throughout the genome. (a) Carpet plots depicting the correspondence of in silico–generated genomic DNA fragments (n = 61,844) or input-library NFR DNAs (n = 84,241) with DNase I hypersensitive sites (HSs) in ESC chromatin9. The DNAs in each data set were ranked according to the expression of their associated gene(s) in ESCs (color bars indicate expression level). The presence of a DNase I HS (black) was assessed for a region corresponding to the genomic interval ±1 kb of the center (green vertical lines) of the DNA fragments within input-library NFR– or in silico–generated random DNA fragments. (b) Venn diagram examining the relatedness of genomic regions present in the HaeIII- and RsaI-generated NFR DNA libraries. The total number of elements in each library is indicated at the top of each circle. (c) Genomic distribution of HaeIII- or RsaI-generated input-library NFR DNA populations relative to annotated TSSs (black arrows).
npg
© 2
014
Nat
ure
Am
eric
a, In
c. A
ll rig
hts
rese
rved
.
nAture methods | VOL.11 NO.5 | MAY 2014 | 561
Articles
Thus, the combined use of two enzymes with distinct recognition sequences increases genomic coverage and better captures the diversity of regulatory elements within ESC chromatin.
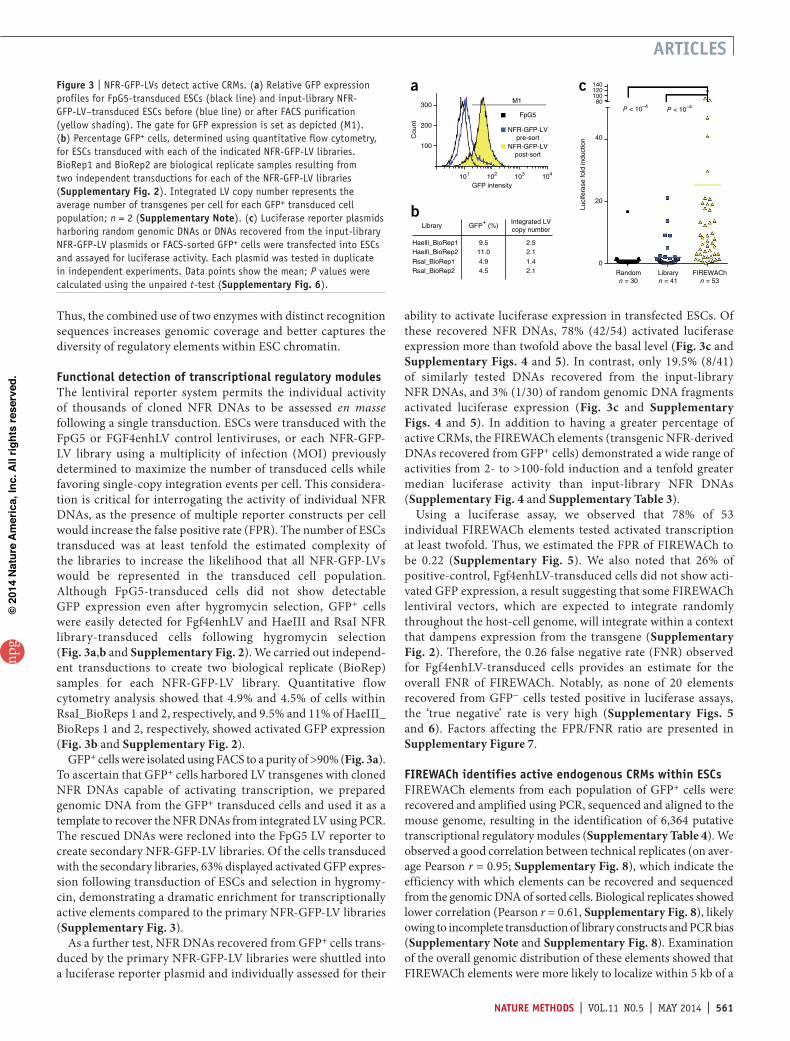
Functional detection of transcriptional regulatory modulesThe lentiviral reporter system permits the individual activity of thousands of cloned NFR DNAs to be assessed en masse following a single transduction. ESCs were transduced with the FpG5 or FGF4enhLV control lentiviruses, or each NFR-GFP-LV library using a multiplicity of infection (MOI) previously determined to maximize the number of transduced cells while favoring single-copy integration events per cell. This considera-tion is critical for interrogating the activity of individual NFR DNAs, as the presence of multiple reporter constructs per cell would increase the false positive rate (FPR). The number of ESCs transduced was at least tenfold the estimated complexity of the libraries to increase the likelihood that all NFR-GFP-LVs would be represented in the transduced cell population. Although FpG5-transduced cells did not show detectable GFP expression even after hygromycin selection, GFP+ cells were easily detected for Fgf4enhLV and HaeIII and RsaI NFR library-transduced cells following hygromycin selection (Fig. 3a,b and Supplementary Fig. 2). We carried out independ-ent transductions to create two biological replicate (BioRep) samples for each NFR-GFP-LV library. Quantitative flow cytometry analysis showed that 4.9% and 4.5% of cells within RsaI_BioReps 1 and 2, respectively, and 9.5% and 11% of HaeIII_BioReps 1 and 2, respectively, showed activated GFP expression (Fig. 3b and Supplementary Fig. 2).
GFP+ cells were isolated using FACS to a purity of >90% (Fig. 3a). To ascertain that GFP+ cells harbored LV transgenes with cloned NFR DNAs capable of activating transcription, we prepared genomic DNA from the GFP+ transduced cells and used it as a template to recover the NFR DNAs from integrated LV using PCR. The rescued DNAs were recloned into the FpG5 LV reporter to create secondary NFR-GFP-LV libraries. Of the cells transduced with the secondary libraries, 63% displayed activated GFP expres-sion following transduction of ESCs and selection in hygromy-cin, demonstrating a dramatic enrichment for transcriptionally active elements compared to the primary NFR-GFP-LV libraries (Supplementary Fig. 3).
As a further test, NFR DNAs recovered from GFP+ cells trans-duced by the primary NFR-GFP-LV libraries were shuttled into a luciferase reporter plasmid and individually assessed for their
ability to activate luciferase expression in transfected ESCs. Of these recovered NFR DNAs, 78% (42/54) activated luciferase expression more than twofold above the basal level (Fig. 3c and Supplementary Figs. 4 and 5). In contrast, only 19.5% (8/41) of similarly tested DNAs recovered from the input-library NFR DNAs, and 3% (1/30) of random genomic DNA fragments activated luciferase expression (Fig. 3c and Supplementary Figs. 4 and 5). In addition to having a greater percentage of active CRMs, the FIREWACh elements (transgenic NFR-derived DNAs recovered from GFP+ cells) demonstrated a wide range of activities from 2- to >100-fold induction and a tenfold greater median luciferase activity than input-library NFR DNAs (Supplementary Fig. 4 and Supplementary Table 3).
Using a luciferase assay, we observed that 78% of 53 individual FIREWACh elements tested activated transcription at least twofold. Thus, we estimated the FPR of FIREWACh to be 0.22 (Supplementary Fig. 5). We also noted that 26% of positive-control, Fgf4enhLV-transduced cells did not show acti-vated GFP expression, a result suggesting that some FIREWACh lentiviral vectors, which are expected to integrate randomly throughout the host-cell genome, will integrate within a context that dampens expression from the transgene (Supplementary Fig. 2). Therefore, the 0.26 false negative rate (FNR) observed for Fgf4enhLV-transduced cells provides an estimate for the overall FNR of FIREWACh. Notably, as none of 20 elements recovered from GFP− cells tested positive in luciferase assays, the ‘true negative’ rate is very high (Supplementary Figs. 5 and 6). Factors affecting the FPR/FNR ratio are presented in Supplementary Figure 7.
FireWAch identifies active endogenous crms within escsFIREWACh elements from each population of GFP+ cells were recovered and amplified using PCR, sequenced and aligned to the mouse genome, resulting in the identification of 6,364 putative transcriptional regulatory modules (Supplementary Table 4). We observed a good correlation between technical replicates (on aver-age Pearson r = 0.95; Supplementary Fig. 8), which indicate the efficiency with which elements can be recovered and sequenced from the genomic DNA of sorted cells. Biological replicates showed lower correlation (Pearson r = 0.61, Supplementary Fig. 8), likely owing to incomplete transduction of library constructs and PCR bias (Supplementary Note and Supplementary Fig. 8). Examination of the overall genomic distribution of these elements showed that FIREWACh elements were more likely to localize within 5 kb of a
c
Randomn = 30
Libraryn = 41
FIREWAChn = 53
P < 10–4
Luci
fera
se fo
ld in
duct
ion
140120100
80
40
20
0
P < 10–4300
a
b
200
Cou
nt
100
101 102 103 104
GFP intensity
Library
Haelll_BioRep1 9.511.04.94.5
2.52.11.42.1
Haelll_BioRep2Rsal_BioRep1Rsal_BioRep2
GFP+ (%)
Integrated LVcopy number
M1
FpG5
NFR-GFP-LVpre-sort
NFR-GFP-LVpost-sort
Figure 3 | NFR-GFP-LVs detect active CRMs. (a) Relative GFP expression profiles for FpG5-transduced ESCs (black line) and input-library NFR-GFP-LV–transduced ESCs before (blue line) or after FACS purification (yellow shading). The gate for GFP expression is set as depicted (M1). (b) Percentage GFP+ cells, determined using quantitative flow cytometry, for ESCs transduced with each of the indicated NFR-GFP-LV libraries. BioRep1 and BioRep2 are biological replicate samples resulting from two independent transductions for each of the NFR-GFP-LV libraries (supplementary Fig. 2). Integrated LV copy number represents the average number of transgenes per cell for each GFP+ transduced cell population; n = 2 (supplementary note). (c) Luciferase reporter plasmids harboring random genomic DNAs or DNAs recovered from the input-library NFR-GFP-LV plasmids or FACS-sorted GFP+ cells were transfected into ESCs and assayed for luciferase activity. Each plasmid was tested in duplicate in independent experiments. Data points show the mean; P values were calculated using the unpaired t-test (supplementary Fig. 6).
npg
© 2
014
Nat
ure
Am
eric
a, In
c. A
ll rig
hts
rese
rved
.
562 | VOL.11 NO.5 | MAY 2014 | nAture methods
Articles
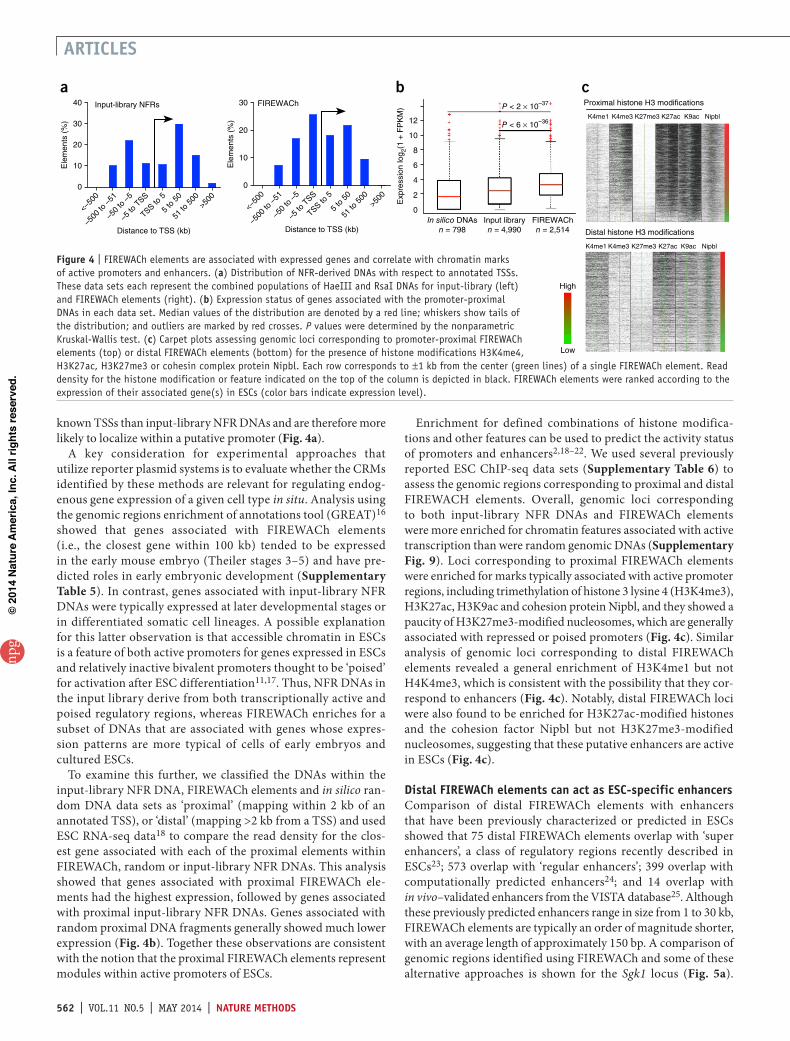
known TSSs than input-library NFR DNAs and are therefore more likely to localize within a putative promoter (Fig. 4a).
A key consideration for experimental approaches that utilize reporter plasmid systems is to evaluate whether the CRMs identified by these methods are relevant for regulating endog-enous gene expression of a given cell type in situ. Analysis using the genomic regions enrichment of annotations tool (GREAT)16 showed that genes associated with FIREWACh elements (i.e., the closest gene within 100 kb) tended to be expressed in the early mouse embryo (Theiler stages 3–5) and have pre-dicted roles in early embryonic development (Supplementary Table 5). In contrast, genes associated with input-library NFR DNAs were typically expressed at later developmental stages or in differentiated somatic cell lineages. A possible explanation for this latter observation is that accessible chromatin in ESCs is a feature of both active promoters for genes expressed in ESCs and relatively inactive bivalent promoters thought to be ‘poised’ for activation after ESC differentiation11,17. Thus, NFR DNAs in the input library derive from both transcriptionally active and poised regulatory regions, whereas FIREWACh enriches for a subset of DNAs that are associated with genes whose expres-sion patterns are more typical of cells of early embryos and cultured ESCs.
To examine this further, we classified the DNAs within the input-library NFR DNA, FIREWACh elements and in silico ran-dom DNA data sets as ‘proximal’ (mapping within 2 kb of an annotated TSS), or ‘distal’ (mapping >2 kb from a TSS) and used ESC RNA-seq data18 to compare the read density for the clos-est gene associated with each of the proximal elements within FIREWACh, random or input-library NFR DNAs. This analysis showed that genes associated with proximal FIREWACh ele-ments had the highest expression, followed by genes associated with proximal input-library NFR DNAs. Genes associated with random proximal DNA fragments generally showed much lower expression (Fig. 4b). Together these observations are consistent with the notion that the proximal FIREWACh elements represent modules within active promoters of ESCs.
Enrichment for defined combinations of histone modifica-tions and other features can be used to predict the activity status of promoters and enhancers2,18–22. We used several previously reported ESC ChIP-seq data sets (Supplementary Table 6) to assess the genomic regions corresponding to proximal and distal FIREWACH elements. Overall, genomic loci corresponding to both input-library NFR DNAs and FIREWACh elements were more enriched for chromatin features associated with active transcription than were random genomic DNAs (Supplementary Fig. 9). Loci corresponding to proximal FIREWACh elements were enriched for marks typically associated with active promoter regions, including trimethylation of histone 3 lysine 4 (H3K4me3), H3K27ac, H3K9ac and cohesion protein Nipbl, and they showed a paucity of H3K27me3-modified nucleosomes, which are generally associated with repressed or poised promoters (Fig. 4c). Similar analysis of genomic loci corresponding to distal FIREWACh elements revealed a general enrichment of H3K4me1 but not H4K4me3, which is consistent with the possibility that they cor-respond to enhancers (Fig. 4c). Notably, distal FIREWACh loci were also found to be enriched for H3K27ac-modified histones and the cohesion factor Nipbl but not H3K27me3-modified nucleosomes, suggesting that these putative enhancers are active in ESCs (Fig. 4c).
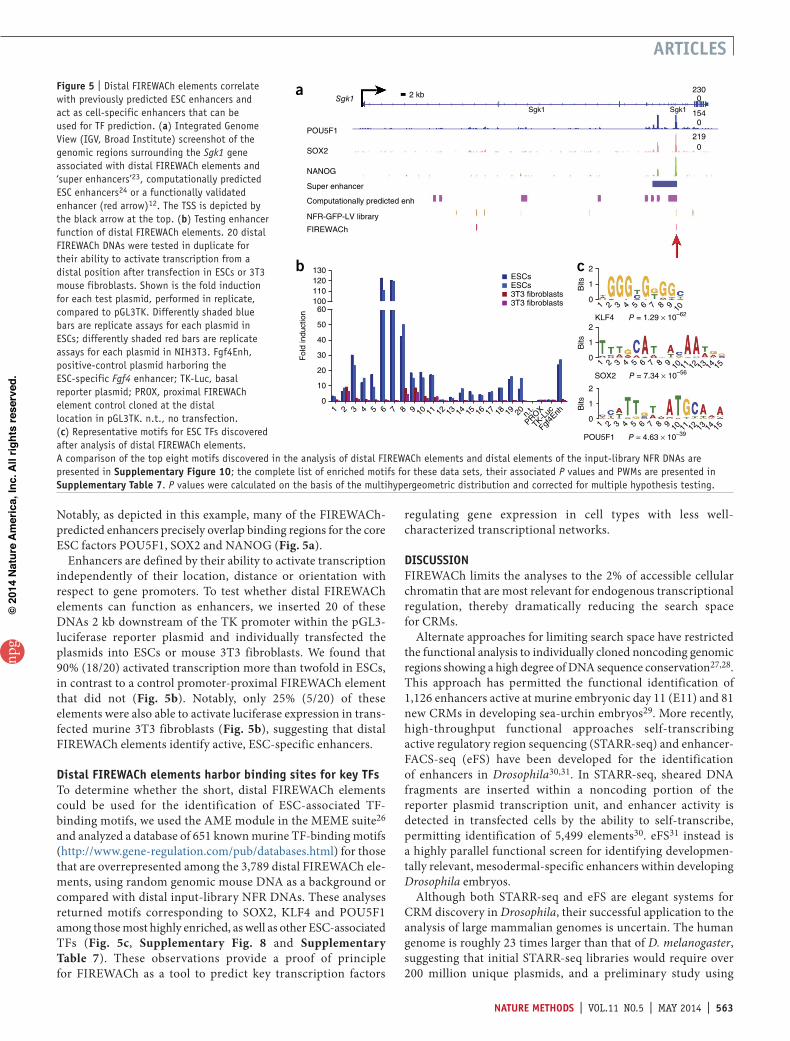
distal FireWAch elements can act as esc-specific enhancersComparison of distal FIREWACh elements with enhancers that have been previously characterized or predicted in ESCs showed that 75 distal FIREWACh elements overlap with ‘super enhancers’, a class of regulatory regions recently described in ESCs23; 573 overlap with ‘regular enhancers’; 399 overlap with computationally predicted enhancers24; and 14 overlap with in vivo–validated enhancers from the VISTA database25. Although these previously predicted enhancers range in size from 1 to 30 kb, FIREWACh elements are typically an order of magnitude shorter, with an average length of approximately 150 bp. A comparison of genomic regions identified using FIREWACh and some of these alternative approaches is shown for the Sgk1 locus (Fig. 5a).
High
Low
In silico DNAsn = 798
Input libraryn = 4,990
FIREWAChn = 2,514
12
P < 2 × 10–37
P < 6 × 10–36
10
8
6
4
2
0
Exp
ress
ion
log 2(
1 +
FP
KM
)
40 Input-library NFRs
Distance to TSS (kb)
Ele
men
ts (
%) 30
20
10
0
<–50
0
–500
to –
51
–50
to –
5
–5 to
TSS
TSS to 5
5 to
50
51 to
500
>500
Distance to TSS (kb)
a b cFIREWACh
Ele
men
ts (
%)
30
20
10
0
<–50
0
–500
to –
51
–50
to –
5
–5 to
TSS
TSS to 5
5 to
50
51 to
500
>500
Proximal histone H3 modifications
Distal histone H3 modifications
K4me1 K4me3 K27me3 K27ac K9ac Nipbl
K4me1 K4me3 K27me3 K27ac K9ac Nipbl
Figure 4 | FIREWACh elements are associated with expressed genes and correlate with chromatin marks of active promoters and enhancers. (a) Distribution of NFR-derived DNAs with respect to annotated TSSs. These data sets each represent the combined populations of HaeIII and RsaI DNAs for input-library (left) and FIREWACh elements (right). (b) Expression status of genes associated with the promoter-proximal DNAs in each data set. Median values of the distribution are denoted by a red line; whiskers show tails of the distribution; and outliers are marked by red crosses. P values were determined by the nonparametric Kruskal-Wallis test. (c) Carpet plots assessing genomic loci corresponding to promoter-proximal FIREWACh elements (top) or distal FIREWACh elements (bottom) for the presence of histone modifications H3K4me4, H3K27ac, H3K27me3 or cohesin complex protein Nipbl. Each row corresponds to ±1 kb from the center (green lines) of a single FIREWACh element. Read density for the histone modification or feature indicated on the top of the column is depicted in black. FIREWACh elements were ranked according to the expression of their associated gene(s) in ESCs (color bars indicate expression level).
npg
© 2
014
Nat
ure
Am
eric
a, In
c. A
ll rig
hts
rese
rved
.
nAture methods | VOL.11 NO.5 | MAY 2014 | 563
Articles
regulating gene expression in cell types with less well- characterized transcriptional networks.
discussionFIREWACh limits the analyses to the 2% of accessible cellular chromatin that are most relevant for endogenous transcriptional regulation, thereby dramatically reducing the search space for CRMs.
Alternate approaches for limiting search space have restricted the functional analysis to individually cloned noncoding genomic regions showing a high degree of DNA sequence conservation27,28. This approach has permitted the functional identification of 1,126 enhancers active at murine embryonic day 11 (E11) and 81 new CRMs in developing sea-urchin embryos29. More recently, high-throughput functional approaches self-transcribing active regulatory region sequencing (STARR-seq) and enhancer-FACS-seq (eFS) have been developed for the identification of enhancers in Drosophila30,31. In STARR-seq, sheared DNA fragments are inserted within a noncoding portion of the reporter plasmid transcription unit, and enhancer activity is detected in transfected cells by the ability to self-transcribe, permitting identification of 5,499 elements30. eFS31 instead is a highly parallel functional screen for identifying developmen-tally relevant, mesodermal-specific enhancers within developing Drosophila embryos.
Although both STARR-seq and eFS are elegant systems for CRM discovery in Drosophila, their successful application to the analysis of large mammalian genomes is uncertain. The human genome is roughly 23 times larger than that of D. melanogaster, suggesting that initial STARR-seq libraries would require over 200 million unique plasmids, and a preliminary study using
Notably, as depicted in this example, many of the FIREWACh- predicted enhancers precisely overlap binding regions for the core ESC factors POU5F1, SOX2 and NANOG (Fig. 5a).
Enhancers are defined by their ability to activate transcription independently of their location, distance or orientation with respect to gene promoters. To test whether distal FIREWACh elements can function as enhancers, we inserted 20 of these DNAs 2 kb downstream of the TK promoter within the pGL3- luciferase reporter plasmid and individually transfected the plasmids into ESCs or mouse 3T3 fibroblasts. We found that 90% (18/20) activated transcription more than twofold in ESCs, in contrast to a control promoter-proximal FIREWACh element that did not (Fig. 5b). Notably, only 25% (5/20) of these elements were also able to activate luciferase expression in trans-fected murine 3T3 fibroblasts (Fig. 5b), suggesting that distal FIREWACh elements identify active, ESC-specific enhancers.
distal FireWAch elements harbor binding sites for key tFsTo determine whether the short, distal FIREWACh elements could be used for the identification of ESC-associated TF- binding motifs, we used the AME module in the MEME suite26 and analyzed a database of 651 known murine TF-binding motifs (http://www.gene-regulation.com/pub/databases.html) for those that are overrepresented among the 3,789 distal FIREWACh ele-ments, using random genomic mouse DNA as a background or compared with distal input-library NFR DNAs. These analyses returned motifs corresponding to SOX2, KLF4 and POU5F1 among those most highly enriched, as well as other ESC-associated TFs (Fig. 5c, Supplementary Fig. 8 and Supplementary Table 7). These observations provide a proof of principle for FIREWACh as a tool to predict key transcription factors
b
Sgk1a
POU5F1
SOX2
NANOG
Super enhancer
Computationally predicted enh
NFR-GFP-LV library
FIREWACh
2 kb2300
154Sgk1Sgk1
0
2190
c 2
1
0
KLF4 P = 1.29 × 10–62
SOX2 P = 7.34 × 10–56
POU5F1 P = 4.63 × 10–39
1 2 3 4 5 6 7 8 9 10
1 2 3 4 5 6 7 8 9 10 11 12 13 14 15
1 2 3 4 5 6 7 8 9 10 11 12 13 14 15
Bits
2
1
0
Bits
2
1
0
Bits
130ESCsESCs3T3 fibroblasts3T3 fibroblasts
12011010060
50
40
Fol
d in
duct
ion
30
20
10
01 2 3 4 5 6 7 8 9 10 11 12 13 14 15 16 17 18 19 20 n.
t.
PROX
Fgf4E
nh
TK-Luc
Figure 5 | Distal FIREWACh elements correlate with previously predicted ESC enhancers and act as cell-specific enhancers that can be used for TF prediction. (a) Integrated Genome View (IGV, Broad Institute) screenshot of the genomic regions surrounding the Sgk1 gene associated with distal FIREWACh elements and ‘super enhancers’23, computationally predicted ESC enhancers24 or a functionally validated enhancer (red arrow)12. The TSS is depicted by the black arrow at the top. (b) Testing enhancer function of distal FIREWACh elements. 20 distal FIREWACh DNAs were tested in duplicate for their ability to activate transcription from a distal position after transfection in ESCs or 3T3 mouse fibroblasts. Shown is the fold induction for each test plasmid, performed in replicate, compared to pGL3TK. Differently shaded blue bars are replicate assays for each plasmid in ESCs; differently shaded red bars are replicate assays for each plasmid in NIH3T3. Fgf4Enh, positive-control plasmid harboring the ESC-specific Fgf4 enhancer; TK-Luc, basal reporter plasmid; PROX, proximal FIREWACh element control cloned at the distal location in pGL3TK. n.t., no transfection. (c) Representative motifs for ESC TFs discovered after analysis of distal FIREWACh elements. A comparison of the top eight motifs discovered in the analysis of distal FIREWACh elements and distal elements of the input-library NFR DNAs are presented in supplementary Figure 10; the complete list of enriched motifs for these data sets, their associated P values and PWMs are presented in supplementary table 7. P values were calculated on the basis of the multihypergeometric distribution and corrected for multiple hypothesis testing.
npg
© 2
014
Nat
ure
Am
eric
a, In
c. A
ll rig
hts
rese
rved
.
564 | VOL.11 NO.5 | MAY 2014 | nAture methods
Articles
STARR-seq analysis of human DNAs identified only six enhancers from a plasmid library consisting of 1.3-million unique genomic regions derived from 1 Mb of human DNA. In addition, the rel-evance of STARR-seq–identified enhancers to endogenous gene expression is less clear, as many correspond to closed chromatin regions30. eFS focuses on potentially relevant portions of the genome, but an eFS-like approach using transgenic mouse embryos for screening genomic segments would be prohibitively expensive for most researchers.
Although the performance of FIREWACh is generally robust, there are some limitations. FIREWACh does not provide a quanti-tative measure of CRM ‘strength’, primarily owing to the context-dependent effects of integration site noted above. In addition, issues of nonlinear amplification and PCR bias make the uniform recovery of these elements challenging. These considerations, as well as incomplete transduction, likely underlie the lower cor-relations noted between biological replicates (Supplementary Fig. 8). Future development of FIREWACh will be aimed at improving these features, perhaps by adopting strategies such as those employed by MPRAs3–6, reporter assays that have been used to study position effects or DNA sequence variants of several syn-thetic or previously identified mammalian or yeast transcriptional regulatory elements but have not yet been applied as tools for the discovery of new elements. Although a prohibitively large number of plasmid constructs would be required for analyzing sonicated or enzymatically digested mammalian genomic DNA, combining MPRAs with the focused analysis of NFRs could result in a power-ful adaptation of both approaches for CRM identification.
Genome coverage by FIREWACh is not comprehensive, nor is it intended to be. Rather than aspiring to the low-resolution predic-tion of ‘all’ potentially active genomic regions or TF-binding sites, FIREWACh identifies functionally validated active modules at high resolution. Most importantly, the short DNAs generated by FIREWACh permit the identification of enriched DNA sequence motifs and relevant TFs in the selected DNAs.
It is noteworthy that motifs for the insulator-binding protein CTCF32 were among those found to be enriched for elements in the input-library NFR DNA (Supplementary Fig. 10 and Supplementary Table 7), suggesting that additional types of regulatory elements within accessible chromatin regions are likely to be present in our NFR DNA libraries. These elements, which would include insulators, repressive elements or matrix attach-ment regions, could be functionally identified using alternate vectors and screening strategies.
The more general application of FIREWACh to a wider range of cell types or classes of regulatory elements will permit func-tional annotation of the genome, and inform the interpretation of histone modifications and other chromatin marks. Tracking changes to CRM function during the differentiation of ESCs will enable the identification of stage-specific elements and their cognate transcription factors, expanding our understanding of transcriptional network dynamics in development.
methodsMethods and any associated references are available in the online version of the paper.
Accession codes. NCBI Gene Expression Omnibus: sequencing data files have been deposited under accession number GSE54863.
Note: Any Supplementary Information and Source Data files are available in the online version of the paper.
AcKnoWledgmentsWe thank A. Heguy, E. Mazzoni, M. Stadtfeld, D. Smith and U. Basu-Roy for their critical reading of this manuscript. We also thank A. Mansukhani and members of the Skok laboratory for helpful discussions, and the Genome Technology Center and Flow Cytometry and Cell Sorting Center at New York University Langone Medical Center for technical assistance. This work was supported by an Empire State Stem Cell Board grant through the New York State Department of Health (NYSTEM Contract #CO24322) to L.D. and a postdoctoral fellowship from US National Institutes of Health NCI institutional training grant 1T32CA160002 awarded to M.M.
Author contriButionsL.D. conceived of and designed the study; Y.W. constructed the NFR-GFP-LV reporter libraries and viral stocks; M.M. developed the FIREWACh technology and generated all cell lines, FACS sorting and PCR rescue and analysis of FIREWACh elements; Z.T. performed all processing and genomic alignment of Illumina data; S.B. generated the in silico DNA data sets; Z.T.-K. and X.X. performed luciferase assays; C.B. contributed to critical discussions; X.C., F.S., Y.K. and R.B. provided bioinformatic support and analyses; and M.M. and L.D. wrote the manuscript with additional contributions from X.C. and R.B.
comPeting FinAnciAl interestsThe authors declare no competing financial interests.
reprints and permissions information is available online at http://www.nature.com/reprints/index.html.
1. Landolin, J.M. et al. Sequence features that drive human promoter function and tissue specificity. Genome Res. 20, 890–898 (2010).
2. Hardison, R.C. & Taylor, J. Genomic approaches towards finding cis-regulatory modules in animals. Nat. Rev. Genet. 13, 469–483 (2012).
3. Patwardhan, R.P. et al. Massively parallel functional dissection of mammalian enhancers in vivo. Nat. Biotechnol. 30, 265–270 (2012).
4. Melnikov, A. et al. Systematic dissection and optimization of inducible enhancers in human cells using a massively parallel reporter assay. Nat. Biotechnol. 30, 271–277 (2012).
5. Akhtar, W. et al. Chromatin position effects assayed by thousands of reporters integrated in parallel. Cell 154, 914–927 (2013).
6. Mogno, I., Kwasnieski, J.C. & Cohen, B.A. Massively parallel synthetic promoter assays reveal the in vivo effects of binding site variants. Genome Res. 23, 1908–1915 (2013).
7. Yaragatti, M., Basilico, C. & Dailey, L. Identification of active transcriptional regulatory modules by the functional assay of DNA from nucleosome-free regions. Genome Res. 18, 930–938 (2008).
8. Murtha, M., Wang, Y., Basilico, C. & Dailey, L. Isolation and analysis of DNA derived from nucleosome-free regions. Methods Mol. Biol. 977, 35–51 (2013).
9. Cockerill, P.N. Structure and function of active chromatin and DNase I hypersensitive sites. FEBS J. 278, 2182–2210 (2011).
10. Jaenisch, R. & Young, R. Stem cells, the molecular circuitry of pluripotency and nuclear reprogramming. Cell 132, 567–582 (2008).
11. Bernstein, B.E. et al. A bivalent chromatin structure marks key developmental genes in embryonic stem cells. Cell 125, 315–326 (2006).
12. Chen, X. et al. Integration of external signaling pathways with the core transcriptional network in embryonic stem cells. Cell 133, 1106–1117 (2008).
13. Shen, Y. et al. A map of the cis-regulatory sequences in the mouse genome. Nature 488, 116–120 (2012).
14. Lois, C., Hong, E.J., Pease, S., Brown, E.J. & Baltimore, D. Germline transmission and tissue-specific expression of transgenes delivered by lentiviral vectors. Science 295, 868–872 (2002).
15. Yuan, H., Corbi, N., Basilico, C. & Dailey, L. Developmental-specific activity of the FGF-4 enhancer requires the synergistic action of Sox2 and Oct-3. Genes Dev. 9, 2635–2645 (1995).
16. McLean, C.Y. et al. GREAT improves functional interpretation of cis-regulatory regions. Nat. Biotechnol. 28, 495–501 (2010).
17. Voigt, P., Tee, W.-W. & Reinberg, D. A double take on bivalent promoters. Genes Dev. 27, 1318–1338 (2013).
npg
© 2
014
Nat
ure
Am
eric
a, In
c. A
ll rig
hts
rese
rved
.
nAture methods | VOL.11 NO.5 | MAY 2014 | 565
Articles
18. Marks, H. et al. The transcriptional and epigenomic foundations of ground state pluripotency. Cell 149, 590–604 (2012).
19. Rada-Iglesias, A. et al. A unique chromatin signature uncovers early developmental enhancers in humans. Nature 470, 279–283 (2011).
20. Visel, A. et al. ChIP-seq accurately predicts tissue-specific activity of enhancers. Nature 457, 854–858 (2009).
21. Ernst, J. & Kellis, M. Discovery and characterization of chromatin states for systematic annotation of the human genome. Nat. Biotechnol. 28, 817–825 (2010).
22. Heintzman, N.D. et al. Distinct and predictive chromatin signatures of transcriptional promoters and enhancers in the human genome. Nat. Genet. 39, 311–318 (2007).
23. Whyte, W.A. et al. Master transcription factors and mediator establish super-enhancers at key cell identity genes. Cell 153, 307–319 (2013).
24. Chen, C.-Y., Morris, Q. & Mitchell, J.A. Enhancer identification in mouse embryonic stem cells using integrative modeling of chromatin and genomic features. BMC Genomics 13, 152 (2012).
25. Visel, A., Minovitsky, S., Dubchak, I. & Pennachio, L.A. VISTA Enhancer Browser—a database of tissue-specific human enhancers. Nucleic Acids Res. 35, D88–D92 (2007).
26. Bailey, T.L. et al. MEME SUITE: tools for motif discovery and searching. Nucleic Acids Res. 37, W202–W208 (2009).
27. Visel, A., Rubin, E.M. & Pennacchio, L.A. Genomic views of distant-acting enhancers. Nature 461, 199–205 (2009).
28. Pennacchio, L.A. et al. In vivo enhancer analysis of human conserved non-coding sequences. Nature 444, 499–502 (2006).
29. Nam, J., Dong, P., Tarpine, R., Istrail, S. & Davidson, E.H. Functional cis-regulatory genomics for systems biology. Proc. Natl. Acad. Sci. USA 107, 3930–3935 (2010).
30. Arnold, C.D. et al. Genome-wide quantitative enhancer activity maps identified by STARR-seq. Science 339, 1074–1077 (2013).
31. Gisselbrecht, S.S. et al. Highly parallel assays of tissue-specific enhancers in whole Drosophila embryos. Nat. Methods 10, 774–780 (2013).
32. Herold, M., Bartkuhn, M. & Renkawitz, R. CTCF: insights into insulator function during development. Development 139, 1045–1057 (2012).
npg
© 2
014
Nat
ure
Am
eric
a, In
c. A
ll rig
hts
rese
rved
.
doi:10.1038/nmeth.2885nAture methods
online methodsCell culture. E14 ESCs were obtained from ATCC (ES-E14TG2a, CRL-1821) and were maintained in 2i/LIF with the inhibitors CHIR99021 (3 µM), and PD0325901 (1 µM) (Axon Medchem BV) and 100 U/ml LIF in N2B27 or in stand-ard ESC medium (DMEM supplemented with 15% FCS (Stem Cell Technologies,“ES cult”), 0.1 mM non-essential amino acids, 0.1 mM β-mercaptoethanol, 1× GlutaMAX (Invitrogen), and 1,000 U/ml LIF on plates coated with 0.2% gelatin. NIH3T3 cells were maintained in DMEM (Invitrogen), 10% bovine calf serum and penicillin/streptomycin.
Preparation of NFR DNAs. A detailed protocol for the method of extracting DNA from the NFRs of formaldehyde-cross-linked permeabilized cell nuclei has been reported8. Briefly, cultures of E14 ESCs were plated in the absence of feeder cells on eight 15-cm gelatinized tissue culture plates, and grown to 70–80% confluency, (approximately 8 × 10⁷ cells). The cells were cross-linked using 1% formaldehyde in DMEM for 10 min at room temperature (RT), quenched using 0.125 M glycine at RT for 10 min, washed with cold PBS, and collected using 2 ml/plate of PBS into 15-ml conical polyethylene tubes on ice with cell scraper. The cells were pelleted by centrifugation and stored at −80 °C. Nuclei were permeabilized by resuspension in lysis buffer and incubation for 10 min on ice with occasional mixing. The suspension was then treated with ten strokes with a Dounce homogenizer (B pestle) and centrifuged at 2,000 r.p.m. (Sorvall H1000b rotor; 800g) at 4 °C for 10 min. The cells were resuspended in 6.4 ml Buffer 2, incubated for 10 min at room temperature on a platform rocker, and the nuclei were pelleted by centrifugation for 10 min at 2,000 r.p.m. (4 °C).
Pellets of permeabilized nuclei prepared from ~4 × 10⁷ cells were resuspended in 2.6 ml of NEB2 (New England BioLabs), and distributed as five 500-µl aliquots in Eppendorf tubes on ice. One-hundred units of HaeIII or RsaI restriction enzyme (New England BioLabs) were each added to the NFR DNA samples, two tubes for each enzyme. All samples were incubated at 30 °C for 1 h with gentle mixing every 15 min. The reaction was stopped with 20 mM EDTA and the samples centrifuged. The supernatants were transferred to new Eppendorf tubes and re-centrifuged at maximal speed for 20 s. NFR DNAs in the supernatants were either subjected directly to crosslink reversal or treated to two rounds of phenol-chloroform extraction before cross-link reversal.
Construction of lentiviral reporter plasmid FpG5 and positive-control plasmid Fgf4Enh-LV. The DNA plasmid for generation of the self-inactivating lentivirus FUW was obtained from Addgene (Addgene #14882)14. Coding sequences of the hygromycin-resistance gene were generated using PCR ampli-fication of plasmid pCEP4 using primers PR12 and PR13 (Supplementary Table 1). The amplification product, contain-ing BglII sites at each end, was inserted at the unique BamHI site immediately downstream of ubiquitin promoter DNA sequences within FUW, creating a hybrid BamHI/BglII site that is resist-ant to digestion by either enzyme. The resulting construct was named FUWH. A DNA cassette containing the Fgf4 minimal promoter upstream of GFP coding sequences and transcription stop/poly(A) signals was PCR amplified using primers PR10 and PR11 (Supplementary Table 1) with the -64GFP plasmid DNA as template7. In parallel, a cassette containing DNA sequences
of the Fgf4 enhancer, Fgf4 minimal promoter, and GFP coding sequences and transcription stop/poly(A) signals was PCR amplified using oligonucleotide primer sequences PR14 and PR11 (Supplementary Table 1) with enhGFP plasmid DNA as template7. Owing to the design of the primer sequences, these amplification products contain a PacI recognition site at both the 5′ and 3′ ends. Thus the promoter-GFP and enhancer- promoter-GFP cassettes were each cloned, in both orientations, into the single PacI site upstream of the ubiquitin promoter within FUWH. Assessment of GFP expression following the transduction of these lentiviruses into F9 cells indicated that plasmids containing the collinear orientation of the GFP and hygromycin units resulted in somewhat better GFP expression (data not shown). FpG5 has BamHI site proximal to the promoter that accepts BglII digested NFR/adaptor DNA oligos. All lentiviral construct are depicted in the Supplementary Note.
Preparation of NFR DNAs for cloning into LV reporter plasmids. The protocol for the preparation of the double-stranded adaptor DNAs and their ligation to NFR DNAs is detailed elsewhere8. Briefly, HaeIII NFR DNAs and RsaI NFR DNAs were each subjected to blunt-end ligation to distinct adaptor DNAs that, after ligation, permit the restoration of the HaeIII or RsaI sites, respectively, at the NFR/adaptor junction (Supplementary Table 1). The HaeIII and RsaI adaptors were generated by annealing equimolar amounts of the respective “Linker A” and “Linker B” oligos (Supplementary Table 1). The adaptor sequence contains a BglII site that used for cloning. Annealed linkers were ligated to NFR DNAs overnight at 16 °C using a reaction of 30 µl NFR-DNA supernatant, 10 µl 5× ligation buffer (Invitrogen), 6.7 µl of 15 µM annealed linker, 2.3 µl H2O and 1 µl (5 units) T4 DNA ligase (Invitrogen).
After ligation, the DNAs were purified using the QiagenMini-Elute PCR cleanup kit and eluted in 30 µl H2O. 25 µl of the eluted DNA were assembled in a 50 µl reaction for PCR ampli-fication using the appropriate “AMP” oligonucleotide primer (Supplementary Table 1) and the following PCR conditions: 55 °C for 2 min to melt the shorter “Linker B” oligo away from the NFR/adaptor and then 72 °C for 5 min, 95 °C for 1 min, followed by 15 cycles of 95 °C for 1 min, 60 °C for 1 min, and a final extension at 72 °C for 5 min. The amplified DNAs were purified using the Qiagen PCR cleanup kit and eluted in 50 µl H2O.
Cloning, bacterial transformation and isolation of input-library NFR DNA LV plasmids. Purified PCR-amplified NFR DNAs were digested with BglII restriction enzyme digestion over-night and purified using a Qiagen PCR cleanup column using 50 µl water for elution. The DNA concentration of the samples was determined using NanoDrop. Multiple ligation reactions were assembled containing 200 ng BamHI-digested and phos-phatase-treated FpG5 LV vector plus 40 ng of BglII-cut, LMPCR-amplified NFR DNAs in a 20 µl total ligation reaction using 5 U T4 DNA ligase (Invitrogen or Roche). Ligation was performed overnight at 16 °C.
Commercially available electrocompetent Stbl4 bacteria were used for high-efficiency transformation using electroporation according to the parameters suggested by the manufacturer (Invitrogen). After purification of the ligation reactions through QiagenMini-Elute columns and elution in 20 µl of water, 1–2 µl
npg
© 2
014
Nat
ure
Am
eric
a, In
c. A
ll rig
hts
rese
rved
.

doi:10.1038/nmeth.2885 nAture methods
of each reaction were used for the electroporation of 20 µl Stbl4. We added 700–900 SOC broth was added to the electroporated cells and, after 1 h recovery, the sample was divided in three and spread over three 15-cm agar plates containing 50 µg/ml ampicillin. This procedure generally yielded several thousand colonies per electroporated sample.
The ligation efficiency for each reaction was determined by transferring cells from 20 colonies into tubes containing PCR reaction components and primers PR2 and PR21 that are complementary to sequences flanking the LV BamHI cloning site. PCR amplification was performed for 25 cycles (95 °C for 30 s, 58 °C for 1 min, 72 °C for 30 s) and run in a 2% agarose gel in TAE buffer. The percentage of constructs containing insert was determined by the presence of a PCR product migrating slower than that amplified from FpG5 template. Generally, 80–90% of the constructs contained an NFR DNA insert.
These steps were repeated until approximately 5 × 10⁵ colo-nies each for the HaeIII and RsaI constructs were obtained. The ampicillin plates were stored at 4 °C until collection. To prepare input-library plasmids, we added 5 ml of cold LB containing 10% glycerol to the plate, and the colonies were collected without fur-ther amplification using a cell scraper across the plate surface. All colonies were collected into a single flask, mixed, and then divided into two portions. One tube was stored at −20 °C, and the other half used for preparing input-library plasmids.
To prepare library plasmids from the pooled colonies, we used a Qiagen maxiprep kit following standard protocols for plasmid DNA isolation.
Preparation and titer of lentivirus. Input NFR-GFP lentiviral libraries were prepared using ViraPower (Invitrogen) following the manufacturer’s protocol. Briefly, 5 × 10⁶ 293FT cells were plated to a poly(l-lysine)-coated 10-cm dish 1 d before transfection in 10% FCS DMEM without antibiotic. On the day of transfection, the medium was replaced with 5 ml of Opti-DMEM/10% FCS without antibiotic. For each input NFR-GFP lentiviral library and control lentivirus construct, DNA-Lipofectamine 2000 complexes were generated as follows. We diluted 9 µg of ViraPower Packaging Mix and 3 µg of lentiviral plasmid into 1.5 ml of Opti-MEM medium without serum. In a separate tube, 36 µl of Lipofectamine 2000 was diluted in 1.5 ml Opti-MEM and allowed to incubate at RT for 5 min. After incubation, diluted DNA and Lipofectamine 2000 solutions were combined with gentle mixing and allowed to incubate at RT for 20 min. The solution was then added dropwise to a single 10-cm dish of near confluent 293FT cells and incubated overnight at 37 °C. The next day, medium was changed to complete ESC medium without LIF. Virus-containing medium was collected at 48 h and 72 h post transfection and stored at −80 °C.
Prior to freezing, lentiviral titers were determined using p24 Antigen ELISA (ZeptoMetrix). Virus-containing medium was diluted 103- and 104-fold with DMEM in 450-µl aliquots. We added 50 µl of lysis buffer to each sample. A six-point p24 antigen standard curve was generated by successively diluting 125 pg/ml solution of p24 antigen 1:2 to a final concentration of 7.8 pg/ml. We added 200 µl of standard sample or lentiviral- containing medium to individual wells of the p24 ELISA micro-plate, covered it with plate sealer, and allowed it to incubate for 2 h at 37 °C. After incubation, the wells were aspirated and
washed five times with 300 µl wash buffer. Then 100 µl of HIV-1 p24 detector antibody were added to each and incubated at 37 °C for 1 h. Wells were washed as before, and 100 µl streptavidin- peroxidase working solution was added to each well and incu-bated for 30 min at 37 °C. Wells were washed, and 100 µl freshly prepared Substrate Working Solution was added to all wells and incubated uncovered at room temperature for 15 min. Then 100 µl of Stop Solution was added, and the optical density, OD, of each well was immediately measured at 450 nm using a Spectromax M5 plate reader. The slope, b, and intercept, m, of the standard curve were determined, and the final concentration of lentiviral particles per sample was inferred with the equation
Titer OD blank dilution factor= − − × ×( )/b m 100
Transduction and FACS of ESCs. ESCs were transduced at a MOI of 7 to ensure that the maximum number of cells was transduced while favoring single-copy integration. To increase the likelihood that any given NFR-lentiviral genome would be represented, the number of cells transduced was equivalent to more than ten times each library’s complexity. Thus, 5 × 10⁶ E14 ESCs were plated in complete ESC medium plus LIF in feeder-free conditions on a 10-cm gelatin-coated dish 1 d before transduction. The cells were then transduced overnight in 10 ml of complete ESC medium plus 8 µg/ml Polybrene, containing 3.5 × 10⁷ virus particles for a MOI of 7. The following day, the medium was replaced with fresh ESC medium plus LIF. Hygromycin selection was initiated 4 d post transduction in ESC medium/LIF containing 250 µg/ml hygromycin B. Cells were selected for hygromycin B resistance for 5 d, with medium changed daily. At least 56% of the input library NFR-GFP-LV constructs was estimated to have been transduced into the ESCs using these conditions (Supplementary Note). GFP+ cells were selected using FACS on an iCyt Reflection HAPS2 cell sorter. Cells were treated with propidium iodide at 2 µg/ml before sorting to counterselect dead cells. The gate was set relative to the profile of FpG5 transduced cells such that the number GFP+ cells observed was less than 0.5%. Cells transduced by NFR-GFP-LV and expressing GFP at a level higher than this set point were collected using FACS. Collected cells were returned to culture, expanded and subjected to an additional 1 or 2 rounds of FACS to obtain a population of greater than 90% GFP+ cells. A minimum of 106 GFP+ cells was collected from each sort so as to maintain complexity of the integrated transgene popula-tion. Post-sort FACS analysis was performed with a minimum 105 cells per 100 µl sort buffer on a FACSCalibur flow cytometer (BD Biosciences) and analyzed with FlowJo software.
For each NFR-GFP-LV library, that is, HaeIII- and RsaI-derived libraries, two independent transductions were performed to generate two biological replicates for each library. Each replicate was transduced, selected for hygromycin resistance, and sorted independently to generate cell lines (HaeIII_BioRep1, RsaI_BioRep2, etc.) comprised of pools of NFR-GFP-LV transduced cells. Each cell line was cultured and independently assayed for copy number and NFR sequences. Downstream informatics analysis was also largely done on independent lines before pooling end-result NFR sequence information and analysis.
Determination of transgene copy number. Average copy number of integrated lentivirus was estimated using an adapted qPCR approach33. Briefly, genomic DNA from each transduced cell
npg
© 2
014
Nat
ure
Am
eric
a, In
c. A
ll rig
hts
rese
rved
.
doi:10.1038/nmeth.2885nAture methods
line was obtained from 1 × 10⁶ cells with DNeasy (Qiagen). The number of lentiviral vector genomes per cell was determined by quantitative real-time PCR with primers recognizing the GFP transgene, whereas the number of mouse genomes was deter-mined using primers recognizing a unique noncoding region of the genome (Primers “Gen-F” and “Gen-R”). A six-point standard curve from 106 to 102 copies was generated by serial dilution of a single plasmid cloned to contain both the GFP and genomic DNA target elements. Amplification reactions contained 5 µl SYBR Green MasterMix, 2 µl genomic DNA (gDNA) (100 ng), 2 µl H2O, and 0.5 µl each of 5 µM forward and reverse primer. Reactions consisted of 40 cycles at 95 °C (15 s) then 60 °C (1 min) on a BioRad thermocycler. Data were plotted against and inter-preted in the linear portion of the standard curve where the regression coefficient was greater than 0.98. The average inte-grated copy number was determined by dividing the calculated number of lentiviral genomes by the total number of mouse genomes present in the DNA sample of each transduced line and measured in triplicates.
Luciferase assays. Reporter constructs. The pGL3 luciferase reporter plasmid was modified to contain the 162-bp minimal Fgf4 promoter (fgfprom-luc). This plasmid has a BglII site upstream of the Fgf4 promoter sequences used for inserting test DNAs. Oligonucleotide primers used to recover input-library NFR DNAs or FIREWACh elements from the lentiviral plasmids and prepare them for InFusion cloning into the fgfprom-luc plasmid were designed as follows: the 5′ portion consisted of 15 bases comple-mentary to the sequence flanking the fgf4prom-luc plasmid BglII site, and the 3′ portion contained sequences complementary to sequences flanking the NFR DNA cloning site within the lentiviral plasmid. PCR amplification was performed using either input-library NFR-GFP-LV plasmid DNA or the genomic DNA isolated from FACS-sorted GFP+ cells as template. The amplified fragments were used for In-Fusion (Clontech) directional cloning into the fgfprom-luc plasmid. Primers InFusionpGL3R, InFusResFA were used to clone into the proximal BglII site of fgfprom-luc while DisInFusResFA and DisInFuspGL3R were used at the distal BamHI site of TKluc (Supplementary Table 4). Recombinase reactions were assembled according to the manufacturer’s protocol.
For generation of luciferase reporter constructs to assay random genomic DNA fragments, 3 µg of purified gDNA were digested with either HaeIII or RsaI, and DNA fragments ranging from 100 to 300 bp were gel purified and cloned into the SmaI site of the fgfprom-luc plasmid.
Transfections and luciferase assays. E14 cells grown ESC medium with 1,000 U/ml LIF were seeded on 0.2% gelatin coated 96-well plates at 5 × 10⁴ cells/well. Cells were transfected using 250 ng plasmid DNA and 1.25 µl Lipofectamine 2000 (Invitrogen) and supplemented with OPTIMEM and LIF (1,000 U/ml) for a total volume of 150 µl/well. 4 h after transfection, the medium was changed to complete ESC medium plus 1,000 U/ml LIF. 24 h after transfection, lysates were prepared and luciferase assays were per-formed as instructed by the manufacturer (Promega). The protein concentration of the lysates was determined (Bio-Rad) and used to normalize the samples. The luciferase activities of all test con-structs were calculated relative to the activity displayed by the fgfprom luciferase construct containing only the minimal Fgf4 promoter upstream of the luciferase gene.
PCR rescue of functionally selected NFR DNAs and high-throughput sequencing. NFR DNAs were rescued from either the initial lentiviral plasmid libraries or gDNA of GFP+ selected cells using PCR in a method adapted from bacterial rRNA sequencing34. In this method, Illumina sequencing adaptors are included in the primers, permitting one-step amplification and sequencing library preparation34. Primers (termed FMS-F/R; Supplementary Table 1) were designed such that they contain recognition sequences complimentary to the lentiviral sequence flanking NFR DNA and Illumina adaptor sequence for paired-end sequencing in addition to a 6-bp Index sequence. Six PCR reac-tions (10 µl Phusion polymerase buffer, 1 µl 10 mM dNTP, 2.5 µl 10 µM forward and reverse primer, 1.5 µl DMSO, 0.5 µl (NEB) 50 ng DNA, 31 µl H2O; 16 cycles with 55 °C annealing tempera-ture) per plasmid library were pooled and sequenced to identify input library NFR DNAs.
FIREWACh elements were recovered from the genomic DNA of a least 1 × 10⁶ FACS-sorted GFP+ cells using PCR. In this case, 10 PCR reactions were performed using the same conditions as above, but with 100 ng gDNA and 23 cycles of amplification. The 10 reactions were then pooled.
Each sample was amplified with primers containing the Illumina adaptor sequence with 6-bp indexing sequence. This allowed us to pool up to six samples within a single lane on the MiSeq machine. Input-library NFR DNAs were sequenced together using three of the barcodes while FIREWACh elements—that is, NFR-derived DNAs rescued from GFP+ cells—were run with six samples per lane, each sample representing elements rescued from an inde-pendent biological replicate (i.e., HaeIII_BioRep1, etc.). Technical replicates consisting of independent PCR-rescued sequencing libraries were sequenced on separate days.
Samples were run on a miSeq sequencer with the miSeq cartridge version 2, as a 2 × 150-bases run, with a 50% PhiX library spiked in to compensate for potential low diversity in the libraries. In order to ensure efficient binding of sequencing primers, we designed and used custom Read 1, Index and Read 2 primers (sequences in Supplementary Table 1) of which 17 µl of custom primers at 100 µM were spiked into the Illumina Read 1, Read 2 and index reads positions in the cartridge.
Genomic alignment. Illumina MiSeq 2 × 151-bp data were pre-processed by demultiplexing and trimming of 7 bp from the 5′ end and 44 bp from the 3′ end, yielding a data set of 2 × 100-bp sequence reads. Paired-end sequences were aligned to the mouse reference genome (mm9) using BWA35 software with default set-tings. Read pairs were filtered from the final data set if either read failed to map to the genome, if both reads did not map in the proper orientation, if the mapping quality score of both reads was less than 25, or if neither read had a unique map location on the genome. Target sites were identified as loci where paired reads both aligned entirely within a 500-bp genomic region.
Each biological replicate sample was independently sequenced three times (i.e., three technical replicates), and all sequencing data for all samples were then merged to create the final list of FIREWACh genomic regions (6,364 elements). The final input-library NFR DNA data set was generated by merging the mapped loci from replicate samples of the individual library NFR DNAs created by each enzyme, as well as with all FIREWACh elements to generate a final list of 84,240 elements.
npg
© 2
014
Nat
ure
Am
eric
a, In
c. A
ll rig
hts
rese
rved
.
doi:10.1038/nmeth.2885 nAture methods
In silico generation of random genomic DNA fragments. To create a data set of random genomic DNA fragments, we generated a list of genomic loci corresponding to digestion of the murine reference genome (mm9) with HaeIII or RsaI. We used a script to scan chromosome 19 for pairs of each restric-tion sites as a regular expression separated by a variable region of DNA up to 500 bp in length so that the size distribution of the in silico fragments would be comparable to that of the enzymati-cally derived NFR libraries. The resulting in silico DNA frag-ment data set was comparable in number to the input-library NFR DNAs (61,844 random elements versus 84,240 NFR DNAs) and was then reformatted as genomic loci in a BED file. Random distribution of elements was confirmed in subsequent analysis as this list generated correlative scores expected of a randomly distributed set of loci (for example, in comparison to DNase I–HS, the random elements had an AUROC = 0.52, typical of random elements; Supplementary Fig. 1).
Bioinformatic data analysis. To investigate the chromatin status of FIREWACh elements, we used several publicly avail-able sequence files for ChIP-seq and DNase I–HS sequencing experiments. Data were obtained from the NIH’s sequence read archive (SRA) and the UCSC Genome Browser (for full list of data sets used, see Supplementary Table 6). In the case of the H3K4me1/3, H3K27me3/ac, and H3K9ac chromatin marks, reads were remapped using the mm9 genome as reference with Bowtie36 (version 2) with the options “-n 1 -k 1 -m 20 --best --strata -p 8 -- chunkmbs 1024.” TopHat (version 2.0.4) and Cufflinks (version 2.0.2) with default parameters were used to obtain fragments per kilobase of transcript per million mapped reads (FPKM) values for all genes from RNA-seq data.
GREAT analysis. BED files of the input-library NFR DNAs or FIREWACh elements were analyzed using the genomic regions enrichment of annotations tool (GREAT)16 with the following settings: mouse with NCBI build 37; whole-genome background; basal plus extension with proximal 5 kb upstream, 1 kb down-stream and plus distal up to 100 kb. Data sets were analyzed using both the “Significance by Both” and “Significance by Region-based Binomial” views.
Comparison with genomic regions of DNase I hypersensitivity in ESCs. The relation between DNase I hypersensitivity and the input-library NFR DNAs was investigated using receiver operat-ing characteristic (ROC) curves. In particular, we verified that open regions (that is, those with high DNase I HS coverage) could predict the location of genomic regions covered by input-library NFR DNA reads. For each data set (all library NFR DNAs, HaeIII NFR DNA library, RsaI NFR DNA library and in silico DNA library), the genome was divided into nonoverlapping bins of 1 kb, and the bin was classified as positive if it contained at least one NFR DNA read or negative if it did not intersect any element. The coverage of DNase I HS hotspots (ES-CJ7 Pk1, UCSC Genome Browser) for each bin was used as a classifier in order to build the ROC curve (DNase I HS coverage was used to predict whether a bin would contain any of the elements). The area under the curve of the receiver operating characteristic (AUCROC) was 0.8637 for the combined (All) input library NFR DNAs, 0.8780 for input RsaI-NFR DNAs, and 0.8539 for input HaeIII DNAs NFR DNAs. The AUCROC for the in silico reads (0.5267) was not significantly different from 0.5, which is the expected value
of random reads. The area under the curve was calculated and plotted in graph form as presented in Supplementary Figure 1.
RNA-seq analysis. For each unique read, we considered the expression of the nearest gene. The expression data for ESCs in 2i medium were obtained from Marks et al.18. TopHat (version 2.0.4) and Cufflinks (version 2.0.2) with default parameters were used to obtain FPKM values for all genes. To aid visualization and analy-sis, we scaled the FPKM values logarithmically as log2(1 + FPKM). The significance between different libraries was assessed using the nonparametric Kruskal-Wallis test37.
Carpet methods. High-density maps of coverage of chroma-tin marks around FIREWACh loci were visualized as previously described38. Each horizontal line represents the center of a unique FIREWACh element. The expression of the nearest gene was color coded from red (expressed) to green (not expressed), and the expression values were used to sort the horizontal values. The ChIP-seq signal in the ±1-kb region around each FIREWACh locus was determined for H3K4me1 H3K4me3, H3K27me3, H3K27ac, and DNase I HS. The ChIP-seq and DNase I HS signals were normalized by total number of reads. The gene expression data were quantile normalized over all genes. In case of identical, overlapping or nearby FIREWACh loci (<100 bp), the profile of only one read was used in the high-density map.
Correlation coefficients. The correlation coefficients (r) for technical or biological replicates were calculated by binning the genome into windows of 100 bp and computing the Pearson cor-relation of the genomic coverage between all pairs of the coverage vectors, which represent our sequencing data sets. The calcula-tion was done using an in-house Java code. Technical replicates consist of independent sequencing library preparations from a common template (for example, GFP+ cells transduced with input HaeIII NFR-GFP LV) and were generated to assess the reproduc-ibility of our sequencing library preparation protocol. All three independent technical replicates of each biological replicate were compared pairwise.
For measuring the correlation between biological replicates, the total reads from all three technical replicates of FIREWACh elements were combined into a single file. For example, HaeIII_BioRep1 contains three technical sequencing replicates gener-ated from the recovery of cloned NFR DNAs from the integrated LV vectors within HaeIII_BioRep1-transduced GFP+ ESCs. The HaeIII_BioRep1 sequences were combined with RsaI_BioRep1 sequences into a single file (Rep1). Rep2 was similarly gener-ated from HaeIII_BioRep2 and Rsa_BioRep2. Comparison of Rep1 and Rep2 generated the correlation between biological replicates (0.61).
Motif analysis. Motif enrichment analysis was performed for the distal FIREWACh elements using the AME module in the MEME suite26 with the following command line options: “--method mhg --scoring totalhits --length-correction.” Random gDNA elements from in silico digestions were used as background model. We also analyzed distal FIREWACh elements using distal input-library NFR DNAs as background. This allowed us to determine which motifs were enriched above those obtained from open chromatin alone. P values were calculated on the basis of the multihypergeo-metric distribution and corrected for multiple hypothesis test-ing. Analysis was performed using a database of known motifs that covers approximately 50% of mouse TFs (Supplementary Fig. 8 and Supplementary Table 7). This curated compendium
npg
© 2
014
Nat
ure
Am
eric
a, In
c. A
ll rig
hts
rese
rved
.
doi:10.1038/nmeth.2885nAture methods
of motifs can be accessed via the Timothy Hughes lab web page (http://cisbp2.ccbr.utoronto.ca/) and is derived from protein-binding microarray data, HT-SELEX and ChIP-seq. Most of the motifs used are also redundantly available in the JASPER and TRANSFAC databases39,40.
33. Charrier, S. et al. Quantification of lentiviral vector copy numbers in individual hematopoietic colony-forming cells shows vector dose-dependent effects on the frequency and level of transduction. Gene Ther. 18, 479–487 (2011).
34. Caporaso, J.G. et al. Global patterns of 16S rRNA diversity at a depth of millions of sequences per sample. Proc. Natl. Acad. Sci. USA 108 (suppl. 1), 4516–4522 (2011).
35. Li, H. & Durbin, R. Fast and accurate long-read alignment with Burrows-Wheeler transform. Bioinformatics 26, 589–595 (2010).
36. Langmead, B., Trapnell, C., Pop, M. & Salzberg, S.L. Ultrafast and memory-efficient alignment of short DNA sequences to the human genome. Genome Biol. 10, R25 (2009).
37. Kruskal, W.H. & Wallis, W.A. Use of ranks in one-criterion variance analysis. J. Am. Stat. Assoc. 47, 583–621 (1952).
38. Gao, Z. et al. PCGF homologs, CBX proteins, and RYBP define functionally distinct PRC1 family complexes. Mol. Cell 45, 344–356 (2012).
39. Mathelier, A. et al. JASPAR 2014: an extensively expanded and updated open-access database of transcription factor binding profiles. Nucleic Acids Res. 42, D142–D147 (2014).
40. Matys, V. et al. TRANSFAC and its module TRANSCompel: transcriptional gene regulation in eukaryotes. Nucleic Acids Res. 34, D108–D110 (2006).
npg
© 2
014
Nat
ure
Am
eric
a, In
c. A
ll rig
hts
rese
rved
.