Fire research and safety - Govinfo.gov
404
INST. OF A111D7 n?^t3 NBS PUBLICATIONS OF r O CO Q * NBS SPECIAL PUBLICATION 639 U.S. DEPARTMENT OF COMMERCE/Nationai Bureau of Standards Fire Research and Safety 100 .U57 639 C.2
-
Upload
khangminh22 -
Category
Documents
-
view
4 -
download
0
Transcript of Fire research and safety - Govinfo.gov
INST. OF
A111D7 n?^t3NBS
PUBLICATIONS
OF r
O
CO
Q*
NBS SPECIAL PUBLICATION 639
U.S. DEPARTMENT OF COMMERCE/Nationai Bureau of Standards
Fire Researchand
Safety
100
.U57
639
C.2

NATIONAL BUREAU OF STANDARDS
The National Bureau of Standards' was established by an act of Congress on March 3, 1901.
The Bureau's overall goal is to strengthen and advance the Nation's science and technology
and facilitate their effective application for public benefit. To this end, the Bureau conducts
research and provides: (1) a basis for the Nation's physical measurement system, (2) scientific
and technological services for industry and government, (3) a technical basis for equity in
trade, and (4) technical services to promote public safety. The Bureau's technical work is per-
formed by the National Measurement Laboratory, the National Engineering Laboratory, and
the Institute for Computer Sciences and Technology.
THE NATIONAL MEASUREMENT LABORATORY provides the national system of
physical and chemical and materials measurement; coordinates the system with measurement
systems of other nations and furnishes essential services leading to accurate and uniform
physical and chemical measurement throughout the Nation's scientific community, industry,
and commerce; conducts materials research leading to improved methods of measurement,
standards, and data on the properties of materials needed by industry, commerce, educational
institutions, and Government; provides advisory and research services to other Government
agencies; develops, produces, and distributes Standard Reference Materials; and provides
calibration services. The Laboratory consists of the following centers:
Absolute Physical Quantities2 — Radiation Research — Chemical Physics —Analytical Chemistry — Materials Science
THE NATIONAL ENGINEERING LABORATORY provides technology and technical ser-
vices to the public and private sectors to address national needs and to solve national
problems; conducts research in engineering and applied science in support of these efforts;
builds and maintains competence in the necessary disciplines required to carry out this
research and technical service; develops engineering data and measurement capabilities;
provides engineering measurement traceability services; develops test methods and proposes
engineering standards and code changes; develops and proposes new engineering practices;
and develops and improves mechanisms to transfer results of its research to the ultimate user.
The Laboratory consists of the following centers:
Applied Mathematics — Electronics and Electrical Engineering2 — Manufacturing
Engineering — Building Technology — Fire Research — Chemical Engineering2
THE INSTITUTE FOR COMPUTER SCIENCES AND TECHNOLOGY conducts
research and provides scientific and technical services to aid Federal agencies in the selection,
acquisition, application, and use of computer technology to improve effectiveness and
economy in Government operations in accordance with Public Law 89-306 (40 U.S.C. 759),
relevant Executive Orders, and other directives; carries out this mission by managing the
Federal Information Processing Standards Program, developing Federal ADP standards
guidelines, and managing Federal participation in ADP voluntary standardization activities;
provides scientific and technological advisory services and assistance to Federal agencies; and
provides the technical foundation for computer-related policies of the Federal Government.
The Institute consists of the following centers:
Programming Science and Technology — Computer Systems Engineering.
'Headquarters and Laboratories at Gaithersburg, MD, unless otherwise noted;
mailing address Washington, DC 20234.
'Some divisions within the center are located at Boulder, CO 80303.
Mationat Bureau of Stfsotosa
Fire Research and Safety O^T i 1982
<\&K O.CC CATC
Proceedings of the Fifth Joint Panel Meeting of the
U.S.-Japan Cooperative Program in Natural Resources held
October 15-24, 1980, at the National Bureau of Standards,
Gaithersburg, MD
Edited by:
Joyce E. Chidester
Center for Fire Research
National Engineering Laboratory
National Bureau of Standards
Washington, DC 20234
U.S. DEPARTMENT OF COMMERCE, Malcolm Baldrige, Secretary
NATIONAL BUREAU OF STANDARDS, Ernest Ambler, Director
Issued September 1982
f

Library of Congress Catalog Card Number: 82-600580
National Bureau of Standards Special Publication 639Natl. Bur. Stand. (U.S.), Spec. Publ. 639, 394 pages (Sept. 1982)
CODEN: XNBSAV
Papers in this volume, except those by National Bureau of
Standards authors, have not been edited or altered by the National
Bureau of Standards. Opinions expressed in non-NBS papers are
those of the authors, and not necessarily those of the National
Bureau of Standards. Non-NBS authors are solely responsible for
the content and quality of their submissions.
The mention of trade names in the volume is in no sense an
endorsement or recommendation by the National Bureau of
Standards.
U.S. GOVERNMENT PRINTING OFFICE
WASHINGTON: 1982
For sale by the Superintendent of Documents, U.S. Government Printing Office, Washington, D.C. 20402Price $9.50
(Add 25 percent for other than U.S. mailing)
TABLE OF CONTENTS
Page
ABSTRACT vi
AGENDA vii
LIST OF PARTICIPANTS ix
MINUTES xi
1. PROGRESS REPORTS 1
Recent Development of Fire Retardance 2
F. Saito
Recent Advances in Flame Retardance Research 11
F. Clarke
Building Systems and Smoke Control, T. Wakamatsu 17
and Y. Morishita
Detection in U.S.A. 1979-1980, I. Benjamin 22
Human Behavior, S. Horiuchi and T. Jin 26
Fire Detection and Smoke Property, J. Miyama 31
Discussion of Presentations on Progress Reports 39
2. ARSON AND FIRE INVESTIGATION 43
Early Intervention in Arson Epidemics: Developing a . . . 44
Motive-Based Intervention Strategy, C. Karchmer
Incendiary Fires in Japan, T. Kawamura 64
Discussion of Presentations on Arson 67
iii

Page
TOXICITY OF COMBUSTION PRODUCTS 71
Basic Concept of Toxic Hazards in Building Fires, 72
K. Kishitani, F. Saito and S. Yusa
Preliminary Comparison of Combustion Model in 88
Toxicity Test Method with a Large Scale Fire Scenario,M. Birky
Study of Toxic Gas Generated During Combustion — In ... 104Case of Natural and Artificial Lawn, Y. Nishimaru andY. Tsuda
Discussion of Presentations on Toxicology 116
ADVANCES IN SPRINKLER TECHNOLOGY 121
Life Safety Factors Involved in the Use of Sprinklers, . . 122
J. O'Neill
Sprinkler Technology and Design in Japan, J. Unoki .... 155
Advances in Residential Sprinklers, H. Kung 176
Discussion of Presentations on Sprinkler Technology .... 225
FIRE MODELING 230
Laminar Wake Flame Heights, C. Kinoshita and P. Pagni . . . 231
Mr. Hasemi presented a condensed review of manuscripts onrecent advances in fire research in Japan. These papers areincluded in the Bibliography Of Support Papers (page 379).
The Computer Fire Code, H. Emmons . 236
Recent U.S. Progress in Mathematical Modeling of Fire . . . 248Enclosures, R. Friedman
Discussion of Presentations on Modeling 260
iv

Page
6. SMOLDERING 265
Modeling of Smoldering Combustion Propagation, 266
T. Ohlemiller
Thermal Processes in the Smoldering of Wood, 308
T. Handa, S. Yoshizawa, M. Morita, M. Fukuoka,H. Tsushima, Y. Hashizume and T. Nakamura
Discussion of Presentations on Smoldering 365
FINAL SESSION REPORTS 367
Report on Progress Report Session, F. Clarke 368
Report on Technical Session on Arson and Fire 370Investigation, I. Benjamin
Report on Technical Session on Toxicity of 371Combustion Products, J. Bryan
Report on Technical Session on Advances in 373Sprinkler Technology, T. Jin
Report on Technical Session on Fire Modeling, 374
T. Handa
Report on Technical Session on Smoldering, 375
R. Friedman
RESOLUTIONS 376
SUPPORT PAPERS, Bibliography Of 379
v
ABSTRACT
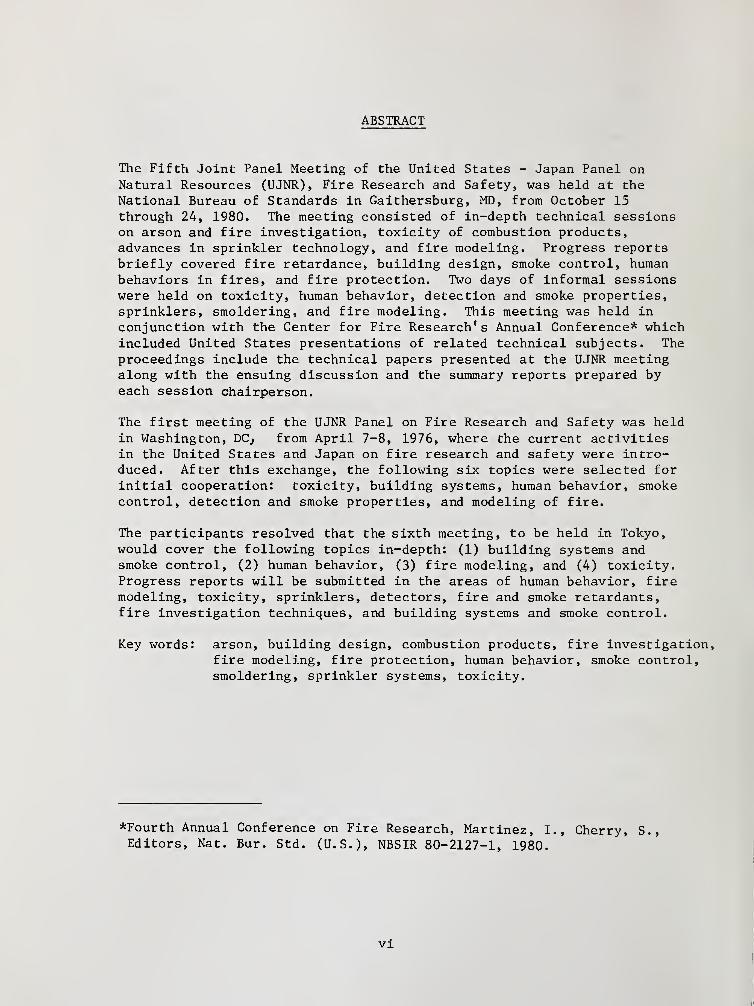
The Fifth Joint Panel Meeting of the United States - Japan Panel onNatural Resources (UJNR), Fire Research and Safety, was held at theNational Bureau of Standards in Gaithersburg, MD, from October 15through 24, 1980. The meeting consisted of in-depth technical sessionson arson and fire investigation, toxicity of combustion products,advances in sprinkler technology, and fire modeling. Progress reportsbriefly covered fire retardance, building design, smoke control, humanbehaviors in fires, and fire protection. Two days of informal sessionswere held on toxicity, human behavior, detection and smoke properties,sprinklers, smoldering, and fire modeling. This meeting was held in
conjunction with the Center for Fire Research's Annual Conference* whichincluded United States presentations of related technical subjects. The
proceedings include the technical papers presented at the UJNR meetingalong with the ensuing discussion and the summary reports prepared byeach session chairperson.
The first meeting of the UJNR Panel on Fire Research and Safety was heldin Washington, DC, from April 7-8, 1976, where the current activitiesin the United States and Japan on fire research and safety were intro-duced. After this exchange, the following six topics were selected for
initial cooperation: toxicity, building systems, human behavior, smokecontrol, detection and smoke properties, and modeling of fire.
The participants resolved that the sixth meeting, to be held in Tokyo,
would cover the following topics in-depth: (1) building systems andsmoke control, (2) human behavior, (3) fire modeling, and (4) toxicity.Progress reports will be submitted in the areas of human behavior, firemodeling, toxicity, sprinklers, detectors, fire and smoke retardants,fire investigation techniques, and building systems and smoke control.
Key words: arson, building design, combustion products, fire investigation,fire modeling, fire protection, human behavior, smoke control,smoldering, sprinkler systems, toxicity.
*Fourth Annual Conference on Fire Research, Martinez, I., Cherry, S.,Editors, Nat. Bur. Std. (U.S.), NBSIR 80-2127-1, 1980.
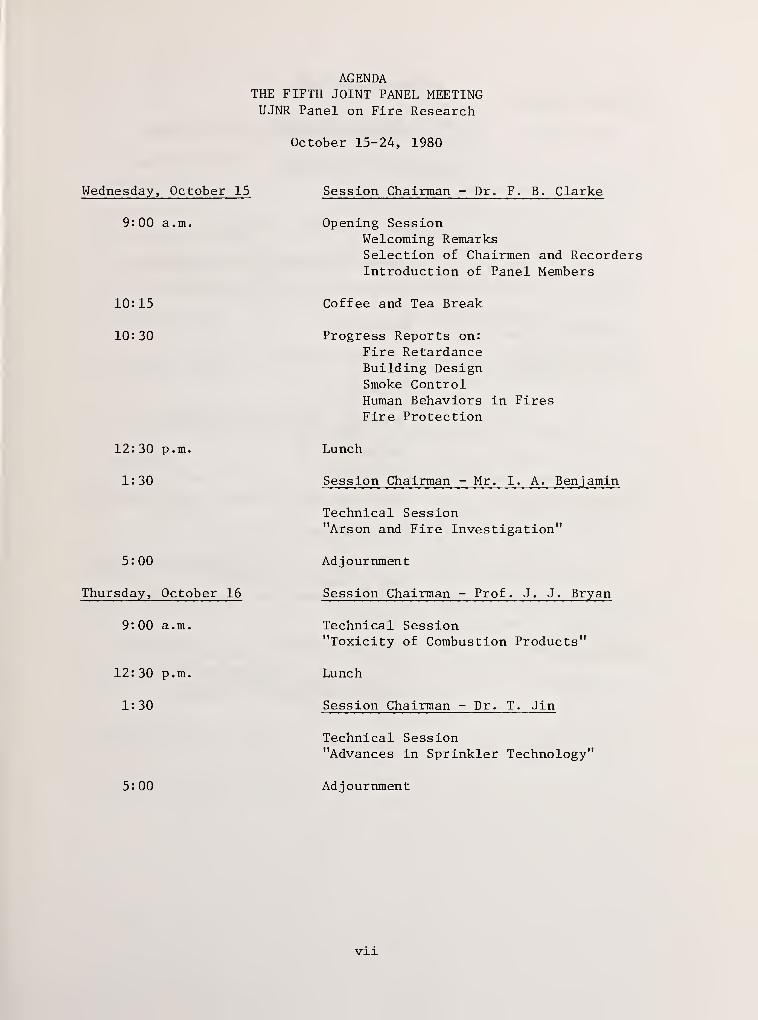
AGENDATHE FIFTH JOINT PANEL MEETINGUJNR Panel on Fire Research
October 15-24, 1980
Wednesday, October 15
9:00 a.m.
10:15
10:30
12:30 p.m.
1:30
5:00
Thursday, October 16
9:00 a.m.
12:30 p.m.
1:30
Session Chairman - Dr. F. B. Clarke
Opening SessionWelcoming RemarksSelection of Chairmen and RecordersIntroduction of Panel Members
Coffee and Tea Break
Progress Reports on:
Fire RetardanceBuilding DesignSmoke ControlHuman Behaviors in FiresFire Protection
Lunch
Session Chairman - Mr. I. A. Benjamin
Technical Session"Arson and Fire Investigation"
Adjournment
Session Chairman - Prof. J. J. Bryan
Technical Session"Toxicity of Combustion Products"
Lunch
Session Chairman - Dr. T. Jin
Technical Session"Advances in Sprinkler Technology"
5:00 Adjournment
vii
Friday, October 17
9:00 a.m.
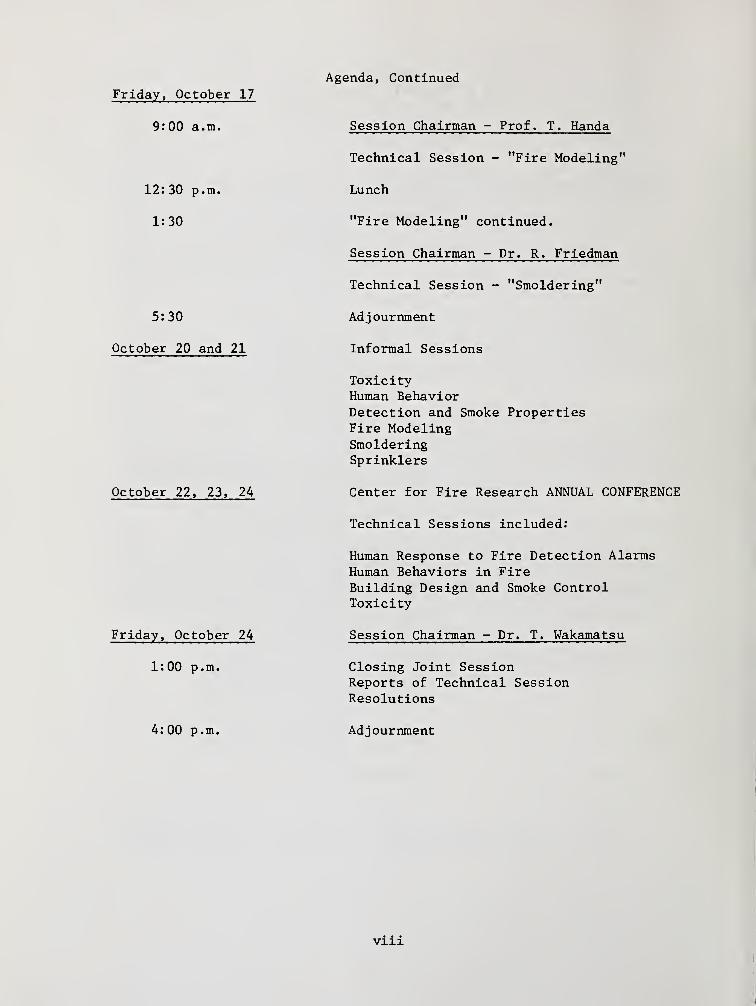
Agenda, Continued
Session Chairman - Prof. T. Handa
12:30 p.m.
1:30
5:30
October 20 and 21
October 22, 23, 24
Friday, October 24
1:00 p.m.
4:00 p.m.
Technical Session - "Fire Modeling"
Lunch
"Fire Modeling" continued.
Session Chairman - Dr. R. Friedman
Technical Session - "Smoldering"
Adjournment
Informal Sessions
ToxicityHuman BehaviorDetection and Smoke PropertiesFire ModelingSmolderingSprinklers
Center for Fire Research ANNUAL CONFERENCE
Technical Sessions included:
Human Response to Fire Detection AlarmsHuman Behaviors in FireBuilding Design and Smoke ControlToxicity
Session Chairman - Dr. T. Wakamatsu
Closing Joint SessionReports of Technical SessionResolutions
Adjournment
viii
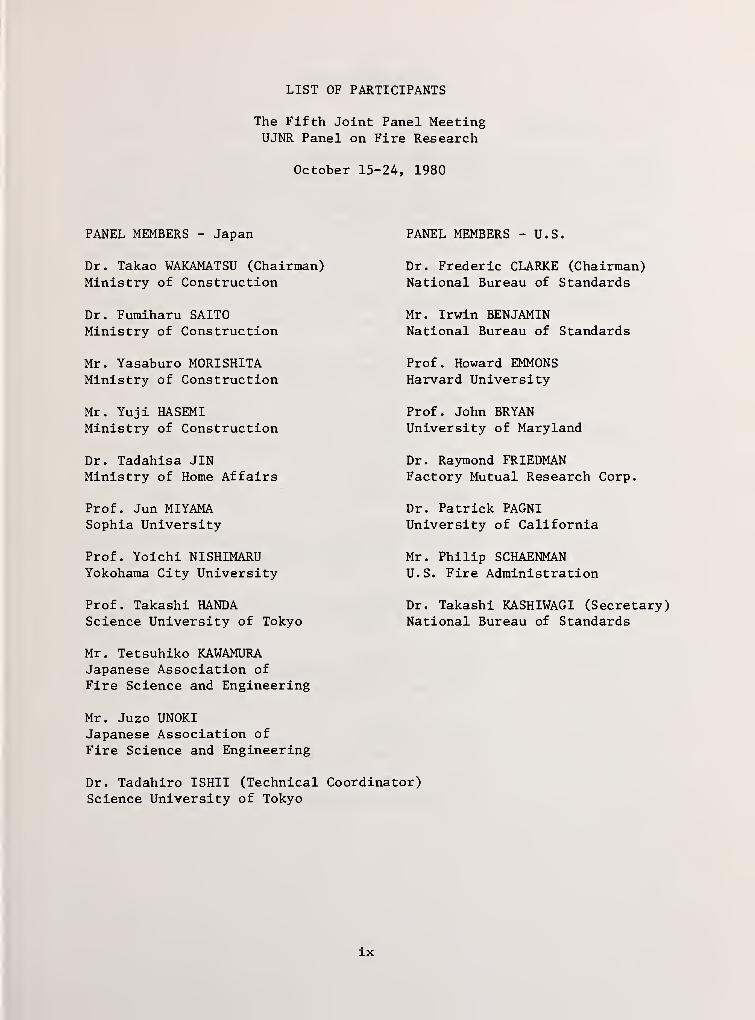
LIST OF PARTICIPANTS
The Fifth Joint Panel MeetingUJNR Panel on Fire Research
October 15-24, 1980
PANEL MEMBERS - Japan
Dr. Takao WAKAMATSU (Chairman)Ministry of Construction
PANEL MEMBERS - U.S.
Dr. Frederic CLARKE (Chairman)National Bureau of Standards
Dr. Fumiharu SAITOMinistry of Construction
Mr. Yasaburo MORI SHITAMinistry of Construction
Mr. Yuji HASEMIMinistry of Construction
Dr. Tadahisa JINMinistry of Home Affairs
Prof. Jun MIYAMASophia University
Prof. Yoichi NISHIMARUYokohama City University
Prof. Takashi HANDAScience University of Tokyo
Mr. Tetsuhiko KAWAMURAJapanese Association of
Fire Science and Engineering
Mr. Juzo UNOKIJapanese Association of
Fire Science and Engineering
Mr. Irwin BENJAMINNational Bureau of Standards
Prof. Howard EMMONSHarvard University
Prof. John BRYANUniversity of Maryland
Dr. Raymond FRIEDMANFactory Mutual Research Corp.
Dr. Patrick PAGNIUniversity of California
Mr. Philip SCHAENMANU.S. Fire Administration
Dr. Takashi KASHIWAGI (Secretary)National Bureau of Standards
Dr. Tadahiro ISHII (Technical Coordinator)Science University of Tokyo
ix
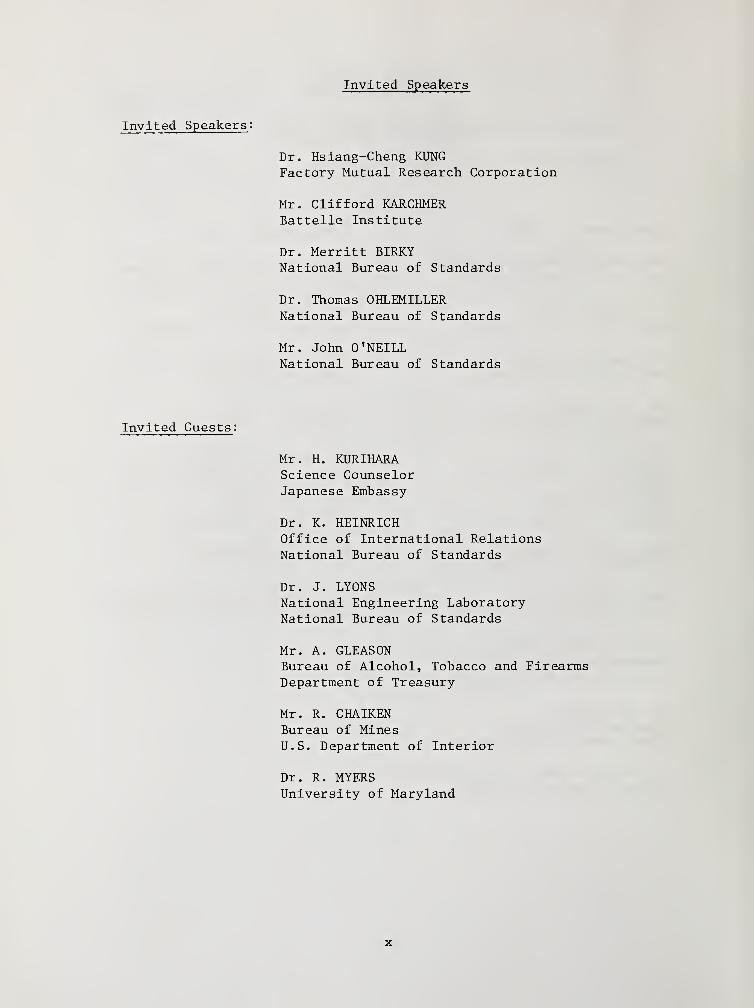
Invited Speakers
Invited Speakers :
Dr. Hsiang-Cheng KUNGFactory Mutual Research Corporation
Mr. Clifford KARCHMERBattelle Institute
Dr. Merritt BIRKYNational Bureau of Standards
Dr. Thomas OHLEMILLERNational Bureau of Standards
Mr. John O'NEILLNational Bureau of Standards
Invited Guests :
Mr. H. KURIHARAScience CounselorJapanese Embassy
Dr. K. HEINRICHOffice of International RelationsNational Bureau of Standards
Dr. J. LYONSNational Engineering LaboratoryNational Bureau of Standards
Mr. A. GLEASONBureau of Alcohol, Tobacco and FirearmsDepartment of Treasury
Mr. R. CHAIKENBureau of MinesU.S. Department of Interior
Dr. R. MYERSUniversity of Maryland
x
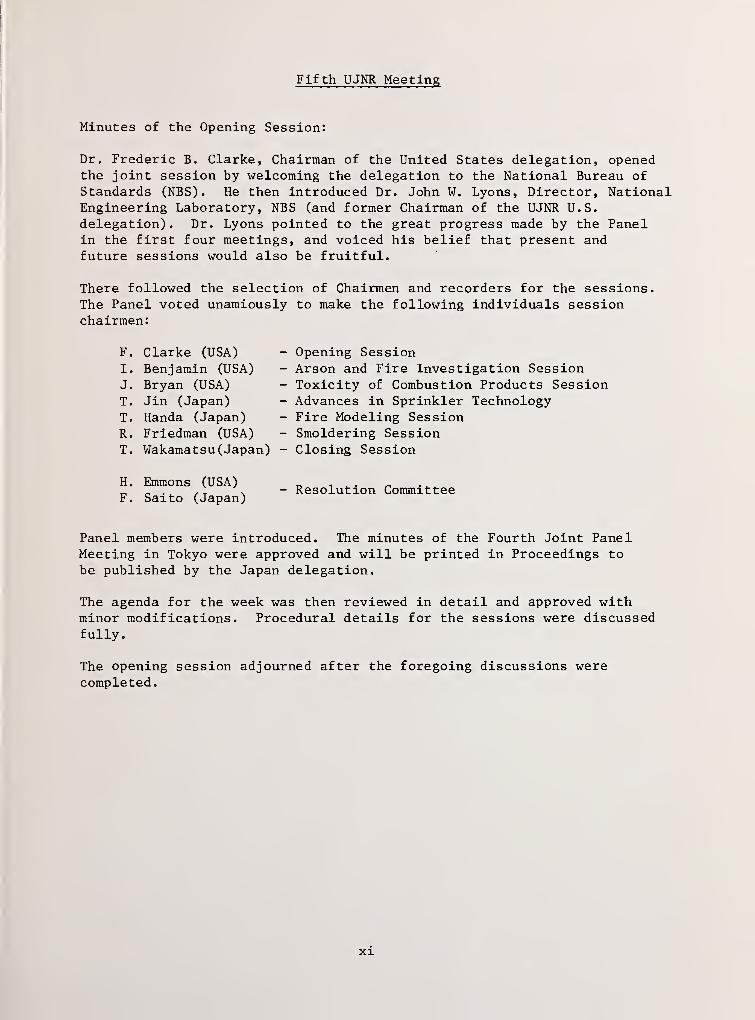
Fifth UJNR Meeting
Minutes of the Opening Session:
Dr. Frederic B. Clarke, Chairman of the United States delegation, openedthe joint session by welcoming the delegation to the National Bureau ofStandards (NBS). He then introduced Dr. John W. Lyons, Director, NationalEngineering Laboratory, NBS (and former Chairman of the UJNR U.S.
delegation). Dr. Lyons pointed to the great progress made by the Panelin the first four meetings, and voiced his belief that present andfuture sessions would also be fruitful.
There followed the selection of Chairmen and recorders for the sessions.The Panel voted unamiously to make the following individuals sessionchairmen:
F. Clarke (USA)
I. Benjamin (USA)
J. Bryan (USA)
T. Jin (Japan)
T. Handa (Japan)
R. Friedman (USA)
T. Wakamatsu (Japan)
Opening SessionArson and Fire Investigation SessionToxicity of Combustion Products SessionAdvances in Sprinkler TechnologyFire Modeling SessionSmoldering SessionClosing Session
H. Emmons (USA)
F. Saito (Japan)- Resolution Committee
Panel members were introduced. The minutes of the Fourth Joint PanelMeeting in Tokyo were approved and will be printed in Proceedings to
be published by the Japan delegation.
The agenda for the week was then reviewed in detail and approved withminor modifications. Procedural details for the sessions were discussedfully.
The opening session adjourned after the foregoing discussions werecompleted.
xi

1, PROGRESS REPORTS
i

PROGRESS REPORT
Recent Development of Fire Retardance
by F. Saito
To decrease the probability of fire-outbreaks and prevent
fires from developing are primarily important in the field of fire
prevention technology. Compartmentation of fire, smoke control and
evacuation are also important subjects to be studied.
In Japan, we have enforced the regulations so that interior
materials, such as linings, curtains and carpets applied in public
buildings or tall buildings, from which people will take a long time
to evacuate, should be resistant enough to fire, having a certain
level of flame retardancy or fire retardancy depending on the place
where the material is applied. The methods for evaluating flame and
fire retardancy of these materials have been already established.
Flame retardant materials: char area, after flame (curtains,
and carpets)
Fire retardant materials: heat release, smoke generation,
toxicity (linings)
The methods of flame and fire retardant treatment tc meet the
standards prescribed in the regulations are being developed. In this
paper, flame and fire retardant technology, their defects and profits
are briefly discussed.
1. Production of flame retardant chemicals
Table 1 shows a statistical data of the amounts of the retardant
chemicals used.
2. Technology for flame retardant treatment
It is needless to say that chemicals and treatment methods have
to be selected according to a material and performance level for fire
protection required.2
I
LOI method has been adopted in many research laboratories because
this method is easy to be applied and gives accurate values for evaluating
efficiency and synergistic action of chemicals.
A defect of this method, however, lies in the difficulty in
correlation between LOI values and the ones obtained by our national
standard method. Therefore it is difficult to decide the type and
the proper amount of chemicals to be used by LOI method.
Flame retardant: Cellulose-type curtains concerned, additive
type flame retardant in which phosphoric ester are dominant, are mainly
used and small amount of inorganic type chemicals, in spite of their
poor light durability but owing to their inexpenslveness , are also
found in market. As cleaning test is now enforced to evaluate curtains,
which are usually washed, after treatment is studied to pass the test.
Fire retardant: As legal regulations of fire protective materials
in Japan are considerably strict, it is very rare that organic materials
are made noncombustible only by the treatment of fire retardant chemicals.
Adding large amount of inorganics or treating surface material is a
common method to be taken in Japan. Fire retardant is often added in
adhesives, in case of bonding organic lamination on inorganic base
layer
.
For example, in case of wallpapers, a fire protective material
should be used as a base material. Wallpaper whose weight is designated
according to the classified fire protection properties required should
be applied on base material, using adhesive which contains fire retardant
from 1 to 3% in dry weight content
.
In this case the weight of phosphoric ester to be used should be
a dry weight of 10 to 20% of the weight against the original wallpaper.
3
3. Future work
1) Plastic foams
In 1978, a lot of firemen were wounded in a fire of warehouse
whose insulation was made of poly-urethane foam. The backfire caused
by poly-urethane insulation was a main reason for' such unfortunate
injury. The material was classified as a self-extinguish type by
ASTM test method.
The cause of the fire-outbreak is considered that high temperature
droplet of welding penetrated into the insulation layer and combustion
was taken place inside the plastic foam.
In this case, thermal insulating property of this material acted
as a negative factor. Backfire occured when the firemen opened the
door of the warehouse, because the building, which has little opening,
accumulated large amount of smoke and combustible gases.
After that, a method of evaluating plastic foams in view of such
danger has been established, but other insulation materials which will
be used in near future should be also studied.
2) Evaluation for fire retardant chemicals
The type and the proper quantity of fire retardant to be applied
depend on what kind of testing method is taken for evaluation.
The world-wide standard for evaluating fire retardant has not
yet been established. And how to apply the values obtained from a
test to a real fire has not been clarified.
There are so many ignition sources such as cigarettes, waste
baskets, electric appliances, and stoves in circumstance. From the view-
point of fire protection, probability of turning such substances into
primary ignition sources should be kept as low as possible.
However, intensity of thermal load that a material receives from
these various ignition sources has not been clarified.
4*
As shown in Figs 1 to 3 S thermal load that a material receives
from an ignition source depends on the size of the ignition source
and the distance from it. Therefore, it is necessary to know the
extent of fire retardant effectiveness expected, according to the
size of the ignition source and the distance from it.
To extinguish a fire on their way of developing, prevent a flash-
over or at least delay- a flash-over; these are most important in
preventing building fires. Duration from a fire-outbreak to a
flashover is not always proportional to the size of the ignition
source, even if the materials are the same as shown in Figs 4 and 5-
Although, researchers in other fields may give a fruitful solution,
researchers of fire retardant should be eager to solve these problems.
3. Durability of fire retardant materials
Materials, according to their end-use, are used under various
circumstances
.
It is needless to say that materials have to possess various
properties depending on their purposes. Besides that, fire protective
materials should possess fire protection properties.
It means that their own general characteristics should not be
degraded due to the treatment of chemicals and the fire protection
properties should not be reduced with time. At present, however, there
are few testing methods which require long lasting durability of fire
protecting efficiency. A proper method for evaluating such durability
should be developed.
At present, basic researches for evaluating durability are being
promoted in Japan, in such a manner that a material is exposed to light
under glass, or immerced in water.
5
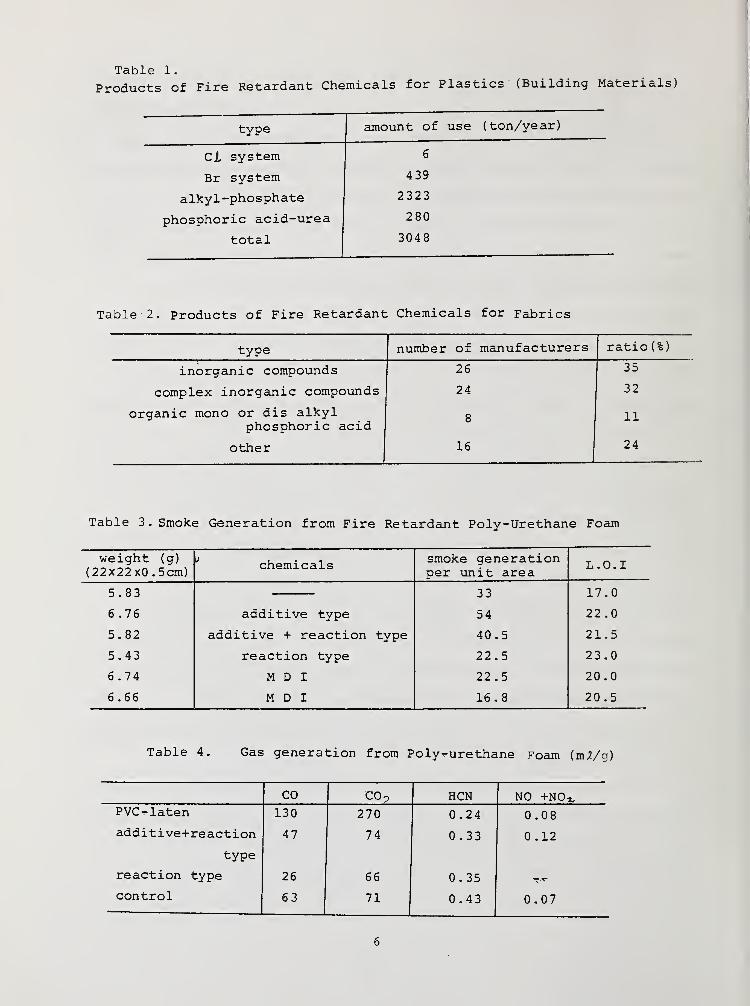
Table 1.
Products of Fire Retardant Chemicals for Plastics (Building Materials)
type amount of use (ton/year)
Cl system 6
Br system 439
alkyl-phosphate 2323
phosphoric acid-urea 280
total 3048
Table 2. Products of Fire Retardant Chemicals for Fabrics
type number of manufacturers ratio (%)
inorganic compounds 26 35
complex inorganic compounds 24 32
organic mono or dis alkylphosphoric acid
8 11
other 16 24
Table 3. Smoke Generation from Fire Retardant Poly-Urethane Foam
weight(22x22x0
.
(g)5 cm)
chemicals smoke generationper unit area
L.O.I
5. 83 33 17.0
6.76 additive type 54 22 .0
5.82 additive + reaction type 40.5 21.5
5.43 reaction type 22.5 23.0
6.74 M D I 22 .5 20 .0
6.66 M D I 16.8 20.5
Table 4. Gas generation from Poly-urethane Foam (mi/g)
CO CO? HCN NO +NO*,
PVC-laten 130 270 0.24 0.08
additive+reaction 47 74 0 . 33 0.12
type
reaction type 26 66 0.35
control 63 71 0.43 0.07
6

C T3O U•H "3
a, m
o o(oas • _uio/ibo>i) A-[ddns
7

Table 5. Smoke Generation from PVC (Ministry of Construction Method)
PVC film chemicals
thick (mm) type Ph Px C.A
0 .
2
45 . 0-60 .
0
0.25 epoxy 3 55
0.25 D 0 P 20 58 .
5
0.21 D 0 P 30 31.5
0 . 19 D 0 P 40 33.0
0 . 19 D H P 20 54 .
0
0.22 D I D P 20 49 .
0
0.24 Sb203 5 72 .
0
0.25 Sb*03 10 75 . 0
0 .
2
CaC03 xJ 39 .
3
0.25 CaC03 30 63.0
0.25 CaC03 30
Sb203 5 53.4
0.24 asbestos 20 73.5
0.23 Sb203 5
asbestos 20 51.0
D 0 P :Dioctyl phthalate C6H4 (COOC8H17)
2
D H P :Diheptyl phthalate ,-r-COOC7Hl5
^tOOC7Hl5D I D P :Diiasdecyl phthalate (CH2) 4 (COOC10H21)
2
5-
• FH : 3.0mnr
° PW : 5.5mm
8
*
K> 50 100
Burning Rate of Crib (g/min)
15
S 10
• oo
«•
».
O RHS Modele SHSA Modelx shl Model
'0 10 20 30 40 50
Volume of Model (m 3) / Burning Rate of Crib (g/min)
Fig. 2 Relation Between the time to reach F.0. andthe Burning Rate of Ignition Source
8
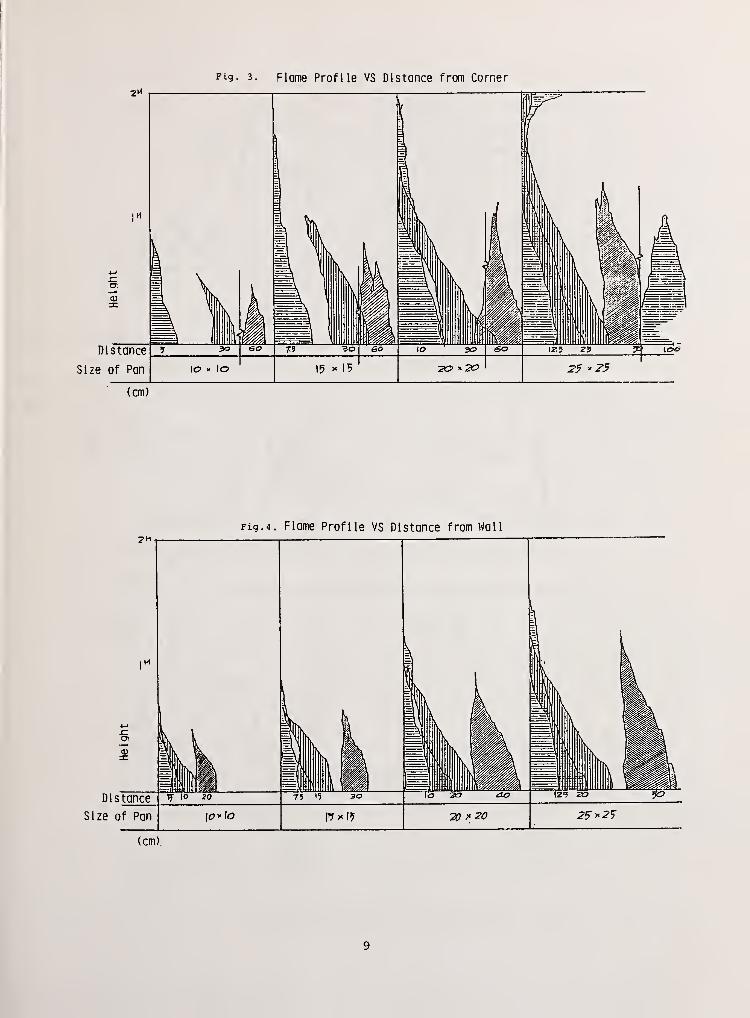
Fig
.
Flame Profile VS Distance from Corner
2*
(cm)
Fig. 4. Flame Profile VS Distance from Wall7M.
MO!
<U3:
|v L
l
i i
Distance 10 20 75 I? SO
Size of Pan 2? ^ 20
(cm).
9

Fig 7 CO Gas Concentration VS Time
10
PROGRESS REPORT
RECENT ADVANCES IN FLAME RETARDANCE RESEARCH
By Frederic B. Clarke
The purpose of this update is to comment upon some of the significant
developments in this field which have taken place since the last UJNR Panel
meeting
.
At that time, we surveyed some of the newly- emerging techniques which
dealt directly with the condensed fuel phase and the earliest stages of
flame chemistry. The past 18 months have shown that several of these
continue a great deal of promise for the elucidation of fire retardance.
1. New Instrumentation
A. Opposed-Flow Diffusion Flame
It has been shown that the opposed flow diffusion flame is a useful
tool for the better understanding of polymer combustion.
Sawyer and co-workers have studied the burning characteristics and the
flame structure of poly (ethylene) in an opposed flow diffusion flame near
extinction conditions. Using appropriately designed burners, sampling
perturbations can be minimized. Compositions and temperature profiles
can be made similar in the radial direction, which confirms predictions
and simplifies the modeling of the opposed flow diffusion flame.
Oxygen was found on the fuel side of the diffusion flame, and carbon
monoxide levels at the flame are above equilibrium. It means a departure
from collapsed flame model. Oxygen transport to the surface is important
because it can result in exothermic surface oxidation reactions and increases
the fuel pyrolysis. The difference between oxygen diffusion rate to the
surface and the rate at which oxygen is transported away from the surface
by the pyrolyzing polymer was calculated. The result of the energy
release calculation estimated that the surface oxidation could provide
11

at most twenty percent of the energy required for depolymerization.
This result suggests that heat transfer to the surface from the flame
rather than surface oxidation controls the pyrolysis, and therefore, burning
rate
.
B. Soot Formation
At the last UJNR meeting, we mentioned work about to begin on soot formation
in flames. The formation of soot in a combustion environment leads to
dramatic and important consequences. In large fires, the thermal radiation
from soot is the dominant energy transfer mode for pyrolysis and flame
spread. Inhalation of soot poses serious health hazards due to absorption
of toxic gases, and heavy smoke production in a fire hinders escape due
to visual obscuration. It is clear that a fundamental understanding
of soot formation processes would greatly aid in developing methods for
reducing the amount of soot produced and in controlling its properties.
One of our principal goals is to develop a detailed understanding of soot
formation processes in flames. The early chemistry is not well under-
stood, and several proposed models have yet to be validated or disproved.
We have recently discovered that in rich hydrocarbon flames, just on the
lean side of the first observable soot luminosity, a laser induced ionization
signal can be detected which is critically dependent upon the stoichiometry
and position. Further studies have indicated that we are observing surfaceo
heating and ionization of small soot particles (diameters of 10-20A) , which
are most difficult to detect by laser scattering methods. In our
experiments an electrode is immersed in a premixed or diffusion flame and
a pulsed laser induces an increase in ionization some distance away.
Under the influence of an applied electric field, the resulting positive
ions drift to the electrode; their average and differential velocities
can be measured with high accuracy as a function of the laser beam-to-
electrode distance. From these measurements the mobilities of the
ionized soot particles can be determined, and one can estimate the
corresponding molecular weight (~ 5000 amu) and size.
12
We are now able to readily track very small soot particles in a variety of
flames. Future work will concentrate on the effects of fuel structure and
the correlation of our observed ionization signals with scattering and
fluorescence measurements.
The Application of Existing Instrumental Techniques to Fire-Related Problems
A. Solid Phase Nuclear Magnetic Resonance:
For many years, nuclear magnetic resonance (NMR) of liquids and
solutions has been a powerful tool for chemical analysis. Until
recently NMR of solids has been of little use to chemists because
of poor signal to noise and broad resonance lines which obscure the
chemical information desired. The technique of cross polarization
improves the sensitivity of NMR of solids and the combination of high
power decoupling and magic angle sample spinning improves the resolution13
such that the C NMR linewidths of many organic materials are a few Hz.
13This approaches the resolution obtainable in C NMR of liquids.
Unfortunately, the inherent inhomogeneity of solids precludes obtaining
linewidths as narrow as are found in liquids where isotropic motion
provides averaging and consequent narrowing of NMR resonances.
Presently several studies are underway in the Center for Fire Research
aimed both at understanding the basic physics of NMR in solids and at
applying the technique to characterization of solid materials. A series13
of experiments have been completed on the identification of the C NMR
peaks in cellulose. These studies illustrate the sensitivity of NMR to
morphology and crystalline structure. More studies are planned to add
to our understanding of the physical structure of cellulose. Model
studies on various simple sugars have been started in an attempt to
quantify the chemical shift of the resonance lines due to hydrogen
bonding and conformational changes. The simple mono and disaccharides
are excellent model compounds because their solution NMR is well under-
stood and many of the crystal structures are known. Solid state NMR is
13

currently being used to observe the chars from pyrolysis of cellulose in
nitrogen and from smoldering of cellulosic loose fill insulation. These
studies are just starting, with the expectation that we will be able to
observe intermediate compounds in pyrolysis and that we will be able to
distinguish the smoldering of the cellulose from that of the lignin in
the smoldering of paper. It is already clear that the large number of
free radicals in the chars make these experiments somewhat difficult but
we are able to clearly see that a char generated by pyrolyzing cellulose
at 625K is primarily aromatic in chemical structure.
B. The Mechanism of Cellulose Smoldering Retardance by Sulfur
Molecular sulfur is known to retard smoldering in cellulose and cellulosic
materials. At present there is little commercial use of sulfur as a
smoldering inhibitor because of the odor and problems of application. An
understanding of the detailed chemical mechanism of this retardance would
provide a starting point for looking for other compounds which could be
used to retard smoldering in cellulose.
The approach to this problem involved multiple instrumental techniques
including: x-ray fluorescence, electron paramagnetic resonance, mass
spectrometry, thermal analyses and simple measurement of rates and
temperatures of smoldering. Using thermal analysis it was shown that
molecular sulfur is not simply acting as a heat sink through its various
phase transitions. The direct sampling mass spectrometric experiments
show that the sulfur is primarily oxidized in SC^ and COS and that oxygen
depletion by reaction with sulfur is not the mechanism of retardance.
Electron paramagnetic resonance with careful spin counting, showed a
large decrease in the number of free radicals in the char of material
treated with sulfur. The x-ray fluorescence measurement of sulfur
remaining in the char showed a significant amount of sulfur bound to
the carbon skeleton of the char. The quantity of bound sulfur is
comparable to the quantity of free radicals lost by sulfur treatment.
The conclusions from this work are: sulfur acts as a radical scavenger,
14

reacting with free radicals generated in the pyrolysis step of the
cellulose smoldering. This radical scavenging stops the free radicals
from further reaction thus reducing the amount of heat generated for
further pyrolysis. One of the important properties of sulfur is that
vaporization of the sulfur occurs between 490 and 650K so that it is
mobilized and available for reaction at temperatures where the pyrolysis
of cellulose is beginning to generate large numbers of free radicals.
C. Antimony-Halogen Interactions
Early organohalogen/antimony oxide research efforts were primarily
concerned with determining optimum antimony to halogen and antimony oxide/
organohalogen to polymer substrate ratios for specific flame retardant
applications. From these studies the concept of an antimony /halogen
synergistic effect was developed. While this concept has been accepted
for many years, we have only recently begun to understand some of the
mechanistic aspects of this interaction. More recently, mass spectrometric
techniques have been used to monitor the formation of volatile antimony
halide and oxyhalides as a function of temperature. Brauman, et. al.
,
studied a wide variety of antimony oxide/organohalogen combinations using
a wide variety of experimental techniques and concluded that the volatilized
antimony was the dominant retardant species in the gas phase. Yeh and
Drews used calorimetric techniques to measure the efficiencies of antimony
oxide/organohalogen finishes and additives. Their data show that while
the efficiencies of the antimony/halogen systems were greater than those
measured for the halogen alone, the calorimetric responses were similar.
While these data have shown that the concept of a antimony/halogen
synergism appears to be a valid one for many different organohalogen/
antimony oxide combinations, the solid state chemistry involved in the
generation of the volatile antimony species must be quite different.
Accordingly, research to determine the importance of the solid phase
15
interactions which occur among antimony oxide, organobromine additives
and polymer substrates in the solid phase to the overall system chemistry
in combustion is now in progress. The role of the polymer substrate
in the generation of the volatile antimony species is of particular
importance in this work.
For the future, research designed to increase our understanding of the
solid phase chemistry of these retardant systems can be expected to continue.
In addition, efforts to more completely elucidate the flame chemistry
of antimony/halogen inhibited flames will be necessary to answer some of
the questions posed by the calorimetric data of Drews.
16

Progress Report
on
Building Systems and Smoke Control
by
T.Wakamatsu and Y.Morishita
I. Building Systems
The interests on the subjects to develop the Total Evaluationand Design Systems of Fire Protections in Buildings are still moregrowing in Japan. At the consultative meeting on archtectual designand also at that on fire prevention which were held at the time ofthe Annual Meeting of Archtectual Institute of Japan, September 198 0,the necessity to solve this subject was emphasized from the viewpoint to make the fire safety regulations synthetic and clear,which are now only becoming complex and multiplex.
As reported at the U.J.N.R. 3rd Joint Meeting, the researcheson this subject are. conducted mainly at Fire Safety Systems Committeewhich was. founded in April 1977 by Japanese Association of FireScience and Engineering. tl]
The principal results of the researches which had been conductedin this committee until December 1979, were published as theOccasional Report No. 3 of Japanese Association Fire Science andEngineering.
The contents of this repot is attached as Appendix I.
The 10 studies out of 13 ones which were printed in this reportwere already reported at the U.J.N.R. Joint Meeting, so the summariesof unreported 3 studies are introduced -here. ( (a) -(c) )
Besides these studies which were printed in this occasionalreport, several studies have been done on this subject recently.They are also introduced in this paper. ( (d) - (g) )
(a) Concepts and Methods on Optimization of Fire Safety Planning( Y.Aoki ) [2]
The Concepts and methods on optimization of fire safety plan-nings are examined in this paper. First, fire losses are classifiedinto the reparable loss and the irreparable one by using the statetransition model, and the method to indicate these losses by thetwo dimensional vector is proposed. Further, the concepts on optimi-zation of fire safety planning is analyzed by dealing them as twodimensional optimization problem from the view point of the decisionthory, and the optimization method of fire safety planning isproposed.
(b) Some Discussions on Interior Finishing Materials and/or theirComponents for Building Fire Safety ( S.Sugawara ) [2]
The significance oi; interior fire protective methods shouldbe evaluated by the contributivity to the total systems for firesafety design. From such a point of view, it is necessary to accumu-
17
late the real fire data which will give useful informations aboutthe contributivity of interior finishing. In this paper, the estab-lishment of " International Fire Information Center " is proposedfor the purpose to develop a new automatic data processing system
,
etc. Further, some stochastic approaches are tried in order toestimate the contributivity for fire development.
(c) Engineering Design for Structural Fire Safety ( H.Saito ) [2]There are several proposals for the engineering design of
structural fire safety which are different in the setting of firecharacteristics or in the design method for fire resistive perfor-mance of structural elements. In this paper, after such recent statusof design for fire resistance is introduced, the optimum value offire resistance design is discussed. Further, the author refer tothe necessity to examine the factors which have the effects on thereliability of fire resistance design, such as the maintenanceconditions, the durability of fire resistance, etc.
(d) Development of Computer Programme for the Evaluation of FireProtection Performance of Dwelling Houses ( T.Tanaka ) [3] , [4]
In relation to the evaluation method for fire protectionperformance of dwelling houses which has already been reported atthe U.J.N.R. 4th Joint Meeting, the computer programmes for theevaluations were developed on the prevention performance againstinter-house -fire spread and on the evacuation performance. Theprogrammes were applied to some examples of dwelling houses, andsome problems on such evaluation method were discussed.
(e) Reliability Analysis of Network Systems ( M.Kobayashi ) [5]
Network systems can be applied to the examination of the func-tions and the configurations of evacuation routs in buildings, etc.In this paper, the computer algorithm is developed in order toestimate the reliability of a network system which is expressedby nodes and links, if the abilities between adjacent two nodes aregiven in probability. Using the methods developed here, importantlinks and optimum configurations of networks could be obtained aswell as reliabilities even though their structures are considerablycomplex.
(f ) Study on the Fire Protection Performance of a Fire PreventingZone with Two Glass Doors ( T.Tanaka ) [6]
In place of fire proof doors ordinarily used for preventing firespread in buildings, it is now planned to use "fire preventing zone"composed of two doors with large glass panes and fire resistance areabetween them, for the convenience of fire extinguishment activities,occupants* evacuation and prevention of smoke spread. In this paper,the performance of "fire preventing zone" is examined, by developingthe calculation method of thermal radiation heat transfer through it.
The results show that it is practically possisible for the zone toprevent the thermal radiation heat transfer caused by fire more eff-ectively than fire proof steel doors of Class A, provided that thezone is appropriately designed.
(g) Evaluation of Fire Extinguishment Devices by Paired ComparisonMethod ( Y.Morishita ) [7]
The questionnaire on the effect of the combination of three
18
/

kinds of fire extinguishment devices was made on the experts offire research in BRI, in which the paired comparison method wasused for the estimation. From this result, the main effect and theinteractions of these devices were estimated. Further, the differencesof judgements among evaluators were shown by analysing them with" Cluster Analysis " and " Principal Component Analysis "
. Suchresults of the analyses are expected to be useful informations whenthe evaluation method of such devices is determined by the discu-ssions of experts.
Literatures
[1] " Present Status of Research on Fire Safety Systems forBuildings ", Progress Report on Building Systems, The U.J.N.R.3rd Joint Meeting, March 1978
[2] " Evaluation of Fire Safety in Buildings ", Occasional ReportNo. 3 of Japanese Association of Fire Science and Engineering,Dec. 1979
[3] Tanaka,T. : " Protection performance against inter-house firespread "
( in Jaoanese ) . Internal report of Fire Safety SystemsCommittee, Dec. 197 9
[4] Tanaka,T. : " Appliacation of the evaluation system for evacu-ation safety performance to concrete examples " ( in Japanese )
,
Internal report of Fire Safety Systems Committee, Jan. 198 0
[5] Kobayashi,M. : " Reliability Analysis of Network Systems "( inJapanese ) , Papers of the 15th Scientific Reseach Meeting, Nov.198 0, City Planning Review, The City Planning Institute ofJapan, ( in printing )
[6] Tanaka,T. : " Study on the Fire Protection Performance of aFire Preventing Zone with Two Grass Doors - Theoretical Calcula-tion of the Thermal Radiation Heat Transfer through a FireZone "
( in Japanese ) , Transactions of Architectural Instituteof Japan, Number 28 0, June 197 9
[7] Morishita,Y. :" Evaluation of Fire Extinguishment Devices by
Paired Comparison Method " ( in Japanese ) , The Spring Meetingfor Presentation of Researches in BRI, May 1930
19
II. Smoke Control
The studies on smoke control in Japan have been developed forthe purpose of establishing the prediction method of smoke movementand the evaluation method of smoke control systems, by means ofwhich more rational design of smoke control systems will be possible.In these studies, a few field experiments to validate the theoryare included, but the theoretical approaches have been centered sofar.
Recently, the priority of the studies in this field is movingto the experimental approaches by the fact that the theoreticalapproaches have achieved an expected goal and that the new FullScale Fire Testing Laboratory for smoke movement and its controlwas built in BRI, Tsukuba. The main purpose of these experimentsis to validate the theory, to supplement it, to comfirm the effec-tiveness of various smoke control systems, etc.
1. Field Study in TsukubaThe laboratory for smoke test in Tsukuba has 7 stories and is
equipped with facilities and equipments for smoke control such asfans for air supply and smoke exhaust. The experiments using thislaboratory started from April last year. In last year, first, theflow resistances of the small openings of doors, windows, etc. andthe vertical shafts such as staircases were measured. Then, thepreliminary experiment was conducted, through which the experimentalvalues were compared with the theoretically caluculated ones concer-ning the pressures and the current velocities at the pointssignificant on smoke control. This year, the experiments on freespread of smoke are conducted on 80 cases combinating the conditionssuch as wind pressures ( controlable ) , the position of smokegeneration, flow path structures composed of opening and shuttingdoors, windows , vents , etc. In these experiments, smoke candles andmethyl alcohol are principally used for the smoke generation. Thecombustion of wood fuel and SF 6 as a tracer gas are now planned tobe used.
On and after next year, a series of experiments is planned inorder to examine and confirm the effectiveness of various smokecontrol systems.
2. Field Tests in New BuildingsThe design of smoke control systems of two high-rise buildings
recently constructed at Shinjuku, Tokyo, namely, Shinjuku NomuraBuilding ( completed June 198 0, with 50 stories and 5 basements )
and Shinjuku Center Building ( completed Nov. 1979, with 55 storiesand 5 basements ) , are made under the guidance of BRI , based on theresults of many case studies by computer simulation on smoke move-ments or the smoke control effectiveness. The field experiments forthe smoke control effectiveness were carried out on these twobuildings just after their completions. The main purpose of theseexperiments was to ascertain if the function of control works asexpected at the time of design, by operating smoke control systemsunder some possible fire situations. By the results of these experiments,the function of control was ascertained to work as expected as forShinjuku Center Building, but for Shinjuku Nomura Building, itcouldn't be enough ascertained since the measurement of the pressureand the current velocity was not conducted sufficiently.
20

Appendix I : " Evaluation of Fire Safety in BuildingsOccasional ReDort of Japanese Association ofFire Science and Engineering No. 3, Dec. 1979
CONTENTS
Concepts and Methods on Optimization of FireSafety Planning - Yoshitsugu AOKI 1
Basic Problems on Evaluating Fire Safety inBuildings - Yasaburo MORISHITA 10
On An Aquirement of Fire Safety in Buildings- Yoshio MIMURA " ' 23
Development of Evaluation Method for FireProtection Performance of Dwelling Houses- Takeyoshi TANAKA 41
Studies on Probabilistic Spread of Fire- Yoshitsugu AOKI 62
Evaluation of Flashover Criteria by UsingMathematical Fire Modelling - Yuji HASEMI 118
Some Discussions on Interior Finishing Materialsand/or Their Components for Building Fire Safety- Shin-ichi SUGAWARA ' 131
Investigation on The Compartmentation againstSmoke Spread in Office Buildings- Yuji HASEMI, Tomio SHIM-ADA 144
Efficiency of Fire Compartmentation- Tetsuo MORIWAKI, Toshio EDA 155
Effectiveness of Active Fire Protection Systems- Akio WATANABE 170
A Quantitative Assessment on Smoke Safety- Takao WAKAMATSU 182
A Methodology for Evaluating Fire/life SafetyPlanning. of Tall Buildings - Masami KOBAYASHI 203
Engineering Design for Structural Fire Safety- Hikaru SAITO 215
21
PROGRESS REPORT
Detection in U.S.A. 1979-1980
By Irwin A. "Benjamin
Current surveys indicate that about 50% of the U.S. homes now have smoke
detectors. However, the distribution of detectors varies according to socio-
economic groupings. About two-thirds of the homes with incomes of over $20,000
have detectors compared with about one-third of the homes with incomes less than
$20,000. However, in spite of this discrepancy there has been a real increase
in the number of detectors in both these groups over the 1979 to 1980 period.
The detector industry has begun a trend toward consolidation, with several small
manufacturers going out of the business. There have been no major technical
innovations in the detection industry during the last year. New development
activity has slowed down and the Underwriters Laboratories have indicated that
their applications for approvals of new models and new designs have dropped off
radically in the recent period. A couple of years ago a residential detector
combining ion chamber and photoelectric sensing units in the same head was put
on the market. This represents the only recent development in detector technology;
and there does not appear to be a substantial growth in the sales of this combined
unit, possibly because of the increase in price.
The Underwriters Laboratories Test Method 217 which was originally published
in October 1978 is now in effect, after an initial 18 month waiting period.
This test method, now includes a smoldering test based on heating small pine
sticks on a hot plate to meet a predetermined optical density curve. The smoke
level is measured both with a photoelectric beam and also with a MIC (measuring
ionization chamber). For the smoldering test a criteria of 7% per ft. OD isKj
the maximum for the response of the detector. This value is being disputed asI
being too high and has been subject to discussion.
22
Some technological development is being done for commercial installations. Some
of the manufacturers have been working on developing a remote sensitivity monitoring
system so that the detectors can be checked from a central panel. Also, methods
for the continuous monitoring of detectors are being investigated. In general,
fire detectors are being combined with the energy sensing devices into an integrated
system which attempts to address the total energy problem. Likewise, for residen-
tial systems combined fire and burglary systems are being promoted. However, these
more complex systems represent only a small share of the installations.
Much effort in the past period has gone into monitoring performance of fire
detectors. One of the major studies is being conducted by the Ontario Housing
Authority, Ontario, Canada. They installed 87,000 single station detectors in
apartment units in 1976 and 77 and are checking them yearly. There are seven models
of detectors, six ionization and one photoelectric. Six of the models are U.L.
listed and one is a Canadian listed detector. From the Spring of 1977 to the
Spring of 1979, 150,000 detectors have been tested and 3,244 have been found
defective—a 2.2% overall failure rate. This failure rate seems to be consistent
for all the six U.S. detectors in the study. Recent data from Ontario has
indicated that about 5% of the detectors have been disconnected by the tenants
because of their desire to eliminate false alarms. In general, the observations
of the Ontario Housing Authority are that the ion chamber seems to be giving a
slightly higher false alarm rate. This would not be unanticipated for these
apartments which are in the range of 50 sq. meters in size. In such a small
area the ionization detector would be subject to the effects of cooking vapors.
One other recent development in the U.S. has been the promotion of what is called
ARRAS (Automatic Residential Remote Alarm Systems). One such system is
installed in Woodland, Texas in a large number of residences. The system is being
run in conjunction with a cable T.V. system. Preliminary data is starting to
come in on the effectiveness of this system; but it is still too early to
draw any conclusions. One observation however does seem to be that the ion
chambers may be giving a slightly higher false alarm rate than the photoelectric
types. It is interesting to note that the preliminary data indicates that about
30% of the apartments have had false alarms. This again is associated with a
fairly small size apartment.
Detectors do appear to be effective. Recent statistics from NFIRS (National
Fire Information Reporting System) indicate that the death rate in fires in homes
without detectors appears to be double the rate for homes with detectors.
Although there may be socio -economic factors involved in this statistic
yet it is is a good indication that the detectors are effective. In a
study recently conducted by IAFC (International Association of Fire Chiefs) fires
were studied in ten cities around the country. Their data would indicate that
the first warning of a fire in hemes having detection was given by a detector
in 40% of the cases. This indicates a very substantial achievement for detection,
particularly if one takes into account the fact that many reported fires occur
during the day time with the person directly involved with the fire.
The overall statistical data on the fire loss rate in the U.S. has not yet
reflected the effect of detectors. It is believed however that such evidence may
be premature and that it will be several years before the gross fire statistics
will reflect the fact that 50% of the homes now have detectors.
24
In summary, the past period has been one of limited technological growth and
little new research. Studies are being initiated or conducted to determine
effectiveness of detectors and identify the magnitude of the false alarm
problem.
25

PROGRESS REPORT ON HUMAN BEHAVIOR
by
S . Horiuchi and T . Jin
We would like to introduce to the reader briefly two
lines of research we have been undertaking for the past year
and a half here in Japan on the subject of human behavior at
the time of a fire.
1. STUDY OF THE SAFETY SIGN FOR EMERGENCY EXIT1 *
The markings on safety sign of emergency exit must be
simple so as to be clearly visible even from a distance, and
the indication of emergency exits must possess a concreteness
that would be immediately understandable even by a foreigner.
We have commenced research in this area in order to modify
the characters presently used in Japan ( # WO. ) to a picto-
graph that fulfills the above stated conditions. We solicited
generally for such pictographs and made a selection from
3,334 entries based on the following evaluative processes.
First Process :
Employing video signal technics, we excluded those
pictographs which were hard for people with deficient eyesight
to distinguish.
26
Second Process :
We eliminated those which according to the designer
were considered inappropriate.
Third Process :
We ranked the entries according to what the general
public of about 15 0 persons would find both pleasing and
appropriate in a pictograph indicating an emergency exit.
Fourth Process :
After transferring the top ten pictographs , as determined
by the third process, to panels of actual luminaire devices
and then installing these devices in corridors, we measured
the visual distance of each pictograph under normal illumina-
tion conditions.
Fifth Process :
Using the same devices as in the above, we tested the
visibility of each under smoky conditions.
Comprehensive Judgement :
After tabulating the results of the above processes,
we determined which pictographs were most effective. These
are to be found in Figure 1. This research was carried out
27
under the leadership of the Fire Defense Agency of the Ministry
of Home Affairs.
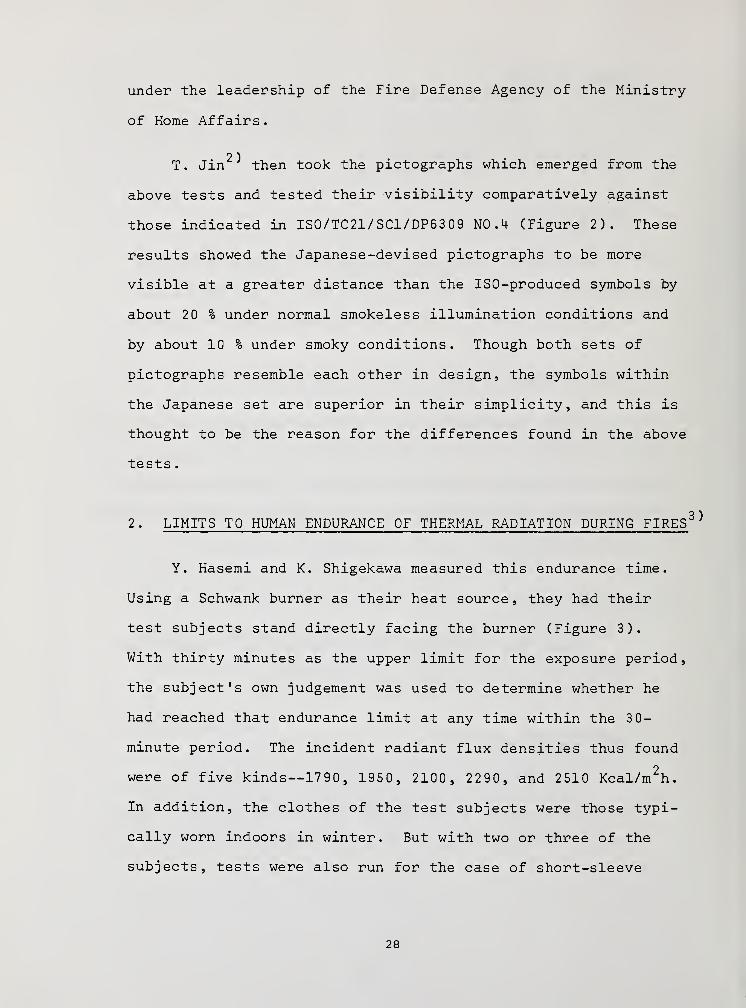
2)T . Jin then took the pictographs which emerged from the
above tests and tested their visibility comparatively against
those indicated in ISO/TC21/SC1/DP63 09 NO .4 (Figure 2). These
results showed the Japanese-devised pictographs to be more
visible at a greater distance than the ISO-produced symbols by
about 2 0 % under normal smokeless illumination conditions and
by about 10 % under smoky conditions. Though both sets of
pictographs resemble each other in design, the symbols within
the Japanese set are superior in their simplicity, and this is
thought to be the reason for the differences found in the above
tests
.
2. LIMITS TO HUMAN ENDURANCE OF THERMAL RADIATION DURING FIRES3
Y. Hasemi and K. Shigekawa measured this endurance time.
Using a Schwank burner as their heat source, they had their
test subjects stand directly facing the burner (Figure 3).
With thirty minutes as the upper limit for the exposure period,
the subject's own judgement was used to determine whether he
had reached that endurance limit at any time within the 3 0-
minute period. The incident radiant flux densities thus found
were of five kinds— 1790, 1950, 2100, 2290, and 2510 Kcal/m2h.
In addition, the clothes of the test subjects were those typi-
cally worn indoors in winter. But with two or three of the
subjects, tests were also run for the case of short-sleeve
28
garments
,
The relation between the incident radiant flux density
and the endurance time is given in Figure 4. It was found
2that if the density were below 18 0 0 Kcal/m h, the endurance
time of most of the subjects exceeded 30 minutes.
3. THE ADDITIONAL RESEARCHES CONCERNING HUMAN-
BEHAVIOR AT
THE TIME OF A FIRE.
Y. Watanabe has performed experiments using a continuous
4) .
maze . For subjects given only one chance in the maze, it
was found that, upon turning three corners, less than half of
the subjects could return to the starting point. However, a
large number of the subjects who had walked the same course
a number of times were found to be able to return to the
starting point even after turning seven or eight corners
.
S. Okazaki made a simulation model concerning walking in
the case where there are markers to lead the way^
.
Using questionnaires, Y. Murozaki surveyed residents
evacuated from a twelve -story apartment building which had
6
)
caught on fire . In this apartment building, fire occurred
two times for one year.
29
REFERENCES:
1) Research Committee on Fire Safety Systems for Buildings
(a part of the Fire Protection Equipment and Safety
center of Japan): "Research Report on Pictographs
Designs for Emergency Exits" (1980)
2) Tadahisa Jin: "Lecture Abstracts from the Annual Meeting
of the Architectural Institute of Japan" (Building Con-
struction Volume) p. 2119 (1980)
3) Yuji Hasemi and Kishie Shigekawa: "Research Report
Summaries from .the Meeting of the Japanese Association
of Fire Science and Engineering" p. 17 (1980)
4) Yuichi Watanabe: "Lecture Abstracts from the Annual
Meeting of the Architectural Institute of Japan" (Design
Volume) p. 763 (1979)
5) Shigeyuki Okazaki and Satoru Matsushita: "Lecture
Abstracts from the Annual Meeting of the Architectural
Institute of Japan" (Design Volume) p. 751 (1979)
6) Yoshiteru Murozaki and Akihiko Kokugo : "Lecture Abstracts
from the Annual Meeting of the Architectural Institute of
Japan" (Design Volume) p. 769 (1979).
30
The Progress Report
on
FIRE DETECTION and SMOKE PROPERTY
by
Dr. Jun Miyama
Professor Sophia University, Tokyo
Fumiharu Saito
Building Reseach Institute
Ministery of Construction
The progress report on Fire Detection and Smoke Property
summarizes researches, investigations, and developments in
both fields since the Fourth United State - Japan Panel on
Fire Research and Safety meeting in Tokyo during February,
1979 .
The report consists of two parts; i. e., Part I is concerned
with fire detection and was described by J. Miyama, and Part
II is concerned with smoke property and was described by
F. Saito, according to their respective specialty.
Part I
Part I consists of two reports on fire experiments in full-
scale houses, comparative study on the absorption of visible
and infrared ray in smoke, a report on the study of beam type
smoke detectors, and several recent developments on smoke
detectors and fire alarm systems.
1.1 A fire experiment in a full-scale house for the investi-
gation of detector's response time concerning feasibility of
extinction and refuge
The experiment was performed in a room of an evacuated tene-
ment house to investigate time allowable for the residents to
31
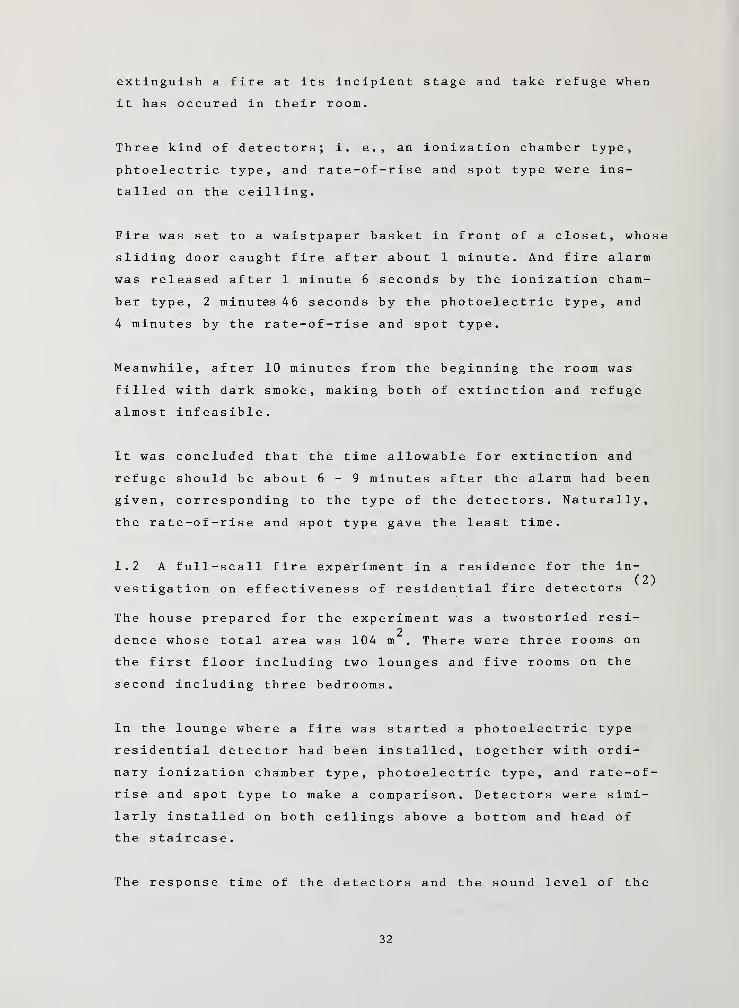
extinguish a fire
it has occured in
at its incipient
their room.
stage and take refuge when
Three kind of detectors; i. e., an ionization chamber type,
phtoelectric type, and rate-of-rise and spot type were ins-
talled on the ceilling.
Fire was set to a waistpaper basket in front of a closet, whose
sliding door caught fire after about 1 minute. And fire alarm
was released after 1 minute 6 seconds by the ionization cham-
ber type, 2 minutes 46 seconds by the photoelectric type, and
4 minutes by the rate-of-rise and spot type.
Meanwhile, after 10 minutes from the beginning the room was
filled with dark smoke, making both of extinction and refuge
almost infeasible.
It was concluded that the time allowable for extinction and
refuge should be about 6-9 minutes after the alarm had been
given, corresponding to the type of the detectors. Naturally,
the rate-of-rise and spot type gave the least time.
1.2 A full-scall fire experiment in a residence for the in-(2)vestigation on effectiveness of residential fire detectors
The house prepared for the experiment was a twostoried resi-2
dence whose total area was 104 m . There were three rooms on
the first floor including two lounges and five rooms on the
second including three bedrooms.
In the lounge where a fire was started a photoelectric type
residential detector had been installed, together with ordi-
nary ionization chamber type, photoelectric type, and rate-of-
rise and spot type to make a comparison. Detectors were simi-
larly installed on both ceilings above a bottom and head of
the staircase.
The response time of the detectors and the sound level of the
32
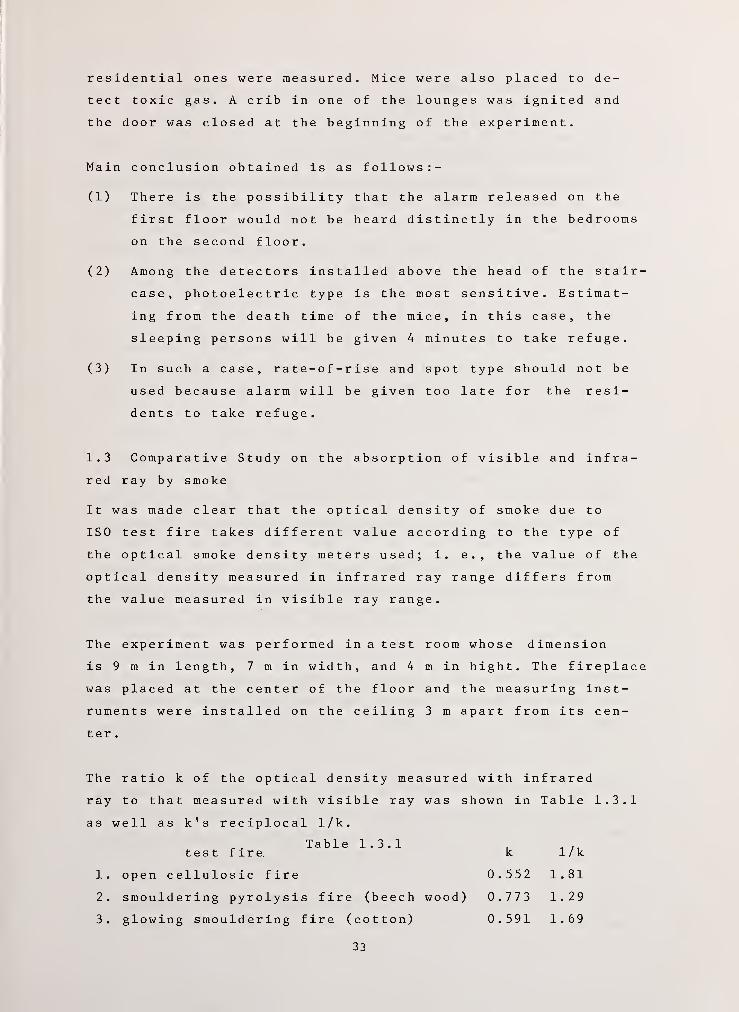
residential ones were measured. Mice were also placed to de-
tect toxic gas. A crib in one of the lounges was ignited and
the door was closed at the beginning of the experiment.
Main conclusion obtained is as follows :-
(1) There is the possibility that the alarm released on the
first floor would not be heard distinctly in the bedrooms
on the second floor.
(2) Among the detectors installed above the head of the stair-
case, photoelectric type is the most sensitive. Estimat-
ing from the death time of the mice, in this case, the
sleeping persons will be given 4 minutes to take refuge.
(3) In such a case, rate-of-rise and spot type should not be
used because alarm will be given too late for the resi-
dents to take refuge.
1.3 Comparative Study on the absorption of visible and infra-
red ray by smoke
It was made clear that the optical density of smoke due to
ISO test fire takes different value according to the type of
the optical smoke density meters used; i. e., the value of the
optical density measured in infrared ray range differs from
the value measured in visible ray range.
The experiment was performed in a test room whose dimension
is 9 m in length, 7 m in width, and 4 m in hight. The fireplace
was placed at the center of the floor and the measuring inst-
ruments were installed on the ceiling 3 m apart from its cen-
ter.
The ratio k of the optical density measured with infrared
ray to that measured with visible ray was shown in Table 1.3.1
as well as k's reciplocal 1/k.
Table 1.3.1, ,test fire k 1/k
1. open cellulosic fire 0.552 1.81
2. smouldering pyrolysis fire (beech wood) 0.773 1.29
3. glowing smouldering fire (cotton) 0.591 1.69
33

4. open plastic fire 0.689 1.45
5. liquid fire (n-heptane) 0.683 1.46
This table shows that visible ray is more intensely absorbed
by every kind of smoke from the test fire than infrared ray is.
Although in the present photoelectric smoke detectors infrared
ray is used as a light emitting source, from a point of view
of taking refuge from a fire, it should be appropriate to mea-
sure optical density with visible ray regarding the fire sen-
sitivity test under the test fire.
(4)1.4 Study on the beam type smoke detectors
Beam type smoke detectors are considered to have various kinds
of distinctive characteristics in comparison with spot type
smoke detectors due to differences in working principle and
construction.
For example, in buildings with a high ceiling such as ware-
house, aircraft hangers, theaters, museums, etc., smoke dif-
fuses during its rise on to their ceiling, decreasing too in-
tensly its density for spot type smoke detectors to operate.
On the other hand, beam type smoke detectors are considered
to be able to detect such thin smoke because they do detect
integral value of the diffused smoke over the span (length)
of the beam.
Furthermore, reguler maintenance of spot type scattered
throughout on the surface of high ceilings will be very diffi-
cult, while that of beam type will be easy because they can
be installed on the walls.
Even in an ordinary large building, in the corridors leading
to the kitchen area of a restaurant where it may likely pre-
sent locally smoke in higher concentration, use of the beam
type would be preferable to eliminate false alarm.
Under such
have began
conditions, recently in Japan,
to develop the beam type smoke
34
several companies
detectors and a re-

search and study group was organized in Sep., 1979, consisting
of the representatives from manufacturers and government person
concerned. The group has been studying and evaluating effectiveness,
sensitivity and location of the developed detectors and conducted
a fire test, making reference to the test fire proposed by
ISO/TC21/SC3
.
The results thus obtained are as follows:
(a) In flaming fire, large signal values was obtained due to
rapid rise and diffusion of smoke.
(b) In smouldering fire,* no special features of the beam type
as seen in flaming fire were observed.
(c) As an intermediate report, it can be said from this fire
test, that a suitable sensitivity level of beam type smoke
detectors spanned 30 meters is between 30 - 60% and a
beam pitch should be less than 14 meters.
1.5 Several recent development and improvement on fire detec-
tors and fire alarm systems
1) An ionization chamber type smoke detector was recently
developed which can operate with two classes of sensitivity;( 5
)
i.e., class II and class III which is less sensitive.
Thus, it has two output terminals; one is for releasing
fire alarm and another for starting related fire protection
facilities.
2) A photoelectric type smoke detector was recently developed
which will not be affected by incoming insects. ^) It is
making use of infrared ray radiated downwards into conical
space. When it is scattered by smoke, the scattered ray
is forcused on a solar cell by a lens.
3) A fire alarm system was developed, which can indicate the( 7 )exact location of the detector making response. It re-
leases fire signal in audio frequency, which is proper to
the respective detectors. So that it can be discriminated
to indicate the location of the detector operated.
4) A control board for complex use was recently developed
which will be utilized to give indication about fire alarm
35

system and fire protection facility on the same indicators.(8)Accordingly, it diminishes space occupied.
REFERENCES
1. Akio Takemoto, On the time allowable to extinguish a fireat its incipient stage and the time to take refuge afterthe alarm released by residential smoke detectors . The Com-mittee on Fire Alarm Systems, Report No. 80-4, June 1980,The Illuminating Engineering Institute of Japan.
2. Kazuo Kobayashi, Report on a full-scale fire experiment inHouse 55 to investigate the effectiveness of residentialfire detectors . Ibid. Report No. 79-8, Oct., 1979. Ibid.
3. Koichi Endo, Comparative study on the absorption of visi -
ble and infrared ray in smoke . Ibid. Repot No. 80-5, Aug.,1980, Ibid.
4. Study on the beam type smoke detectors . Beam Type SmokeDetectors Research and Study Group, Intermediate Report,Aug., 1980.
5. Isao Sonehara, On the smoke detectors with two classes ofsensitivity . The Committee on Fire Alarm Systems. ReportNo. 80-6, Aug., 1980, The Illuminating Engineering Insti-tute of Japan.
6. Yoshio Furukawa, The increased reliability smoke detectorswith conically radiated ray . Ibid. Report No. 80-7, Sept.,1980, Ibid.
7. Isao Sonehara, The new fire alarm system with proper firesignals attached to respective detector units . Ibid. ReportNo. 80-8, Sept., 1980, Ibid.
8. Yoshio Furukawa, The new complex control board serviciableboth for fire alarm system and fire protection facility .
Ibid. Report No. 80-9, Sept., 1980, Ibid.
36
Part II
The purpose of research into formation of smoke particles to apply
the result to the study of fire detection and escape from fires.
For the former, characteristic relation between size distribution of
particulates, including invisible particulates, and smoke detectors has
been pursued!"^
For the latter, relation between decrease of visibility by smoke particul-
ates and human activity in smoke has been pursued.
For a boundary study between physico-chemical and ecological surface area
of various kind of smoke particulates and artifical particles are measured
by means of Brunauer-Emmett-Teller (B.E.T.) method for getting a suggestion
. 2) 3)to toxicity. '
In the field of smoke control design, study on smoke load in fire rooms
and on control of the flow of smoke in building have been pursued.
Although characteristics of smoke production from many materials have been
pursued by many researchers, characteristics of smoke from composit materials
are difficult to predict in fire. This seems to disturb the further develop-
ment of smoke control system.
In the region of ventilation control fires, especially the stage of
developing fires, the ratio of ventilation factor to combustible materials
is more important factor than characteristics of smoke production from
materials.
For the study on smoke production, development of measurement method for
high temperature smoke in fire rooms, study on absorption of smoke particulates
on walls and coagulation during travelling in the building are also expected.
Measurement of attenuation of light intensity for the smoke density is
sueful at a low temperature atmosphere, but this method can't be useful at
37
a high temperature atmosphere as in a fire room.
Therefore, weight concentration method is substitutional for the
attenuation method in a fire room.
A linear relationship between optical density and weight concentration at
h)flaming and smoldering combustion has been reported by T. King.
However, any linear relationship between the two could not be obtained
when plastic and wooden materials were burnt under the temperatures between
5)
600 and 800°C.
It's reasonable that ther's no relation between the optical density
method and weight concentration method for smoke. Because the main factors
for the former are size distribution and shape and surface condition of the
particulates, but the mass of particulates for the latter.
Measurement of optical density of smoke and the flow rate of smoke in a
tube or in a corridor whose thermal property is known, which is connected
with a combustion chamber in which a fire condition can be simulated, and
where the temperature is low enough to measure the light attenuation, may
be useful
.
References
1) A. Watanabe and A. Takemoto : Bui of the Prevention Society of Japan,
Vol. 21, No. 2 Feb 1972
2) F. Saito : Research Work for the Period, Building Research Institute (1970
)
3) H. Suzuki : Annual Conference on Fire Research, P6U , May (1980)
h) T. King : NBS Special Publication kll, 1973
5) F. Saito : Unpublished
38

PROGRESS REPORTS - DISCUSSION
Saito Presentation on Fire Retardance
Benjamin: Could you briefly give us an idea of what method is nowbeing used to evaluate plastic foam?
Saito: The size of the sample is a slick shape of 10 cm square withabout 30 cm height (demonstrated on blackboard). The cross section of
the same is drawn on the board. Alcohol cup with about 2 cm diameteris installed. Burning of the sample starts from the inside in thisconfiguration.
Emmons: In Table 4, the first two columns are labeled CO, is this
correct?
Saito: No, the second column should be labeled C0 0
Clarke: For clarification in the fire in the warehouse involvingpolyurethane foam, you state that the combustion took place insidethe plastic foam. Was the plastic foam covered with a fire resistanceor non-combustible material? Was the surface exposed to air?
Saito: The material was not protected. It was exposed to the air.
Clarke: We have had similar trouble in the United States and one of
the results is that building codes have retroactively changed to requireall exposed foams be covered.
39

Clarke Presentation
"Recent Advances in Flame Retardant Research"
Handa: What is the temperature used for BC measurement — 200 °C?
Clarke: At the moment, most of our temperature measurements have beenwell below the combustion temperatures because of the difficulty offinding probe materials to withstand prolonged high temperatures. Athigher temperatures we need to conduct the experiment, stop it, and putthe material into the NMR sample probe. We cannot do the experimentin the NMR sample chamber, which would be most desirable.
Handa: Did you include pump procedure?
Clarke: No. I don't believe that works effectively for solids.
Chaiken: Regarding the amount of surface oxidation in the combustionof solids, the measurement that Dr. Clarke refers to here is poly-ethylene. I would strongly suspect that in charring combustion suchas wool, coal, the amount of surface oxidation is probably considerablygreater than 20%.
40
Morishita Presentation
"Building Design and Smoke Control"
Emmons: In which publication does the measurements of the flowresistancy of small openings of doors, windows, etc., appear?
Wakamatsu: This report has not been officially published.
Chaiken: In reference to smoke in high rise buildings and in yourlaboratory, is this smoke generated by an actual fire, a large heatsource, or is it strictly from a smoke generator?
Wakamatsu: Since the building was newly built and we could notmake a fire, we generated smoke using a smoke generator and burnedmethanol.
Chaiken: We are concerned with smoke in mine networks in two- andthree-dimensional configurations and how the affect of a large fireinfluences any ventilation system being used. There is a very strongcoupling between the smoke and where the smoke goes, and the generationof smoke and the fire itself. So that one designs a smoke protectionsystem and does not take into account the influence of fire on the airdynamic forces you have to work with. This could cause problems.
41
Jin Presentation
"Human Behavior in Fires"
Bryan: Relative to the 20% difference in visibility between the normalilluminating condition and 10% for smoking conditions, how smokey is
smokey conditions?
Jin: The concentration of smoke set below extinction coefficientwas 0.3 nrrl. The source of smoke was smoldering wood.
Emmons: Have you considered requiring the placement of such figuresnear the floor as well as near the ceiling?
Jin: The Japanese Fire Code requires that first emergency indicatorlights should be posted right above the emergency exit. Then the
blinking lights, or sirens, should be placed 20 meter intervals guidingtowards the exit. They must be posted within 1 meter from the floor.
Miyama Presentation
"Detection and Smoke Properties"
Friedman: In referring to the infrared attenuation of smoke that youmentioned relative to the visible attenuation, do you know the wave-length of infrared that was used in that test?
Miyama: I do not have the data but it is the same that appeared in
the International Standards Organization (ISO) material.
42
ARSON AND FIRE INVESTIGATION
43
Early Intervention in Arson Epidemics:
Developing a Motive-Based Intervention Strategy
Clifford L. Karchmer
Research Scientist
Battell e Law and Justice Study Center
Seattle, Washington
44
Introduction
The reported incidence of arson in the United States has been increasing
since 1975.^ Several observers cite arson, committed for economic gain as a major
factor in the nationwide growth, while other sources attribute the rise to non-
2economic problems that are related to deeply rooted stresses in society. According
to the latter interpretation, interpersonal and societ il strains give rise to a
variety of non-economic arson motives, with revenge and mindless vandalism being
cited most frequently.
The most logical explanation for the recent increase in arson centers on the
growth and accumulation of various stresses in society. These can increase, for
example, domestic disturbances and other interpersonal conflicts (affecting the
revenge motive for arson) and juvenile delinquency (influencing the vandalism
motive). Exacerbation of social, or personal problems which underly each of
these motives seems to have an impact on other motives as well. This may be so
because as the aggregate incidence of arson increases, more and more arsonsists
remain uncaught. This development may establish arson as an emotional or financial
inoutlet for a variety of stresses which ordinarily are discharged either/less harm-
ful or by other violent means. During such a progression, contagion builds and
arson epidemics may prevail for substantial periods of time. Three-to-five-
year spans over the past decade have been noted in such cities as Buffalo, Detroit,
Boston, New York and Seattle. However, the time series is too short to determine
whether these undulations are cyclical or random in nature.
The mix of arson motives seems to differ from one jurisdiction to another
because of variations in the types and relative frequencies of each of the various
stresses, and to differences in the size of populations which experience them.
Despite such variations, however, most of the commonly prescribed remedies treat
arson as though it were a monolithic phenomenon, unaffected by differences
45
in motives and the personal, social, and economic pressures which underly these
influences. In general, the criminal justice response is the most frequent form
of intervention. But, since it is primarily reactive (i.e., post fire) in nature,
its deterrent value is dubious.
A brief review of investigative and prosecutive responses to arson demon-
strates the difficulties inherent in designing more effective strategies to
combat this crime problem. To begin with, it is difficult to gauge the true
extent of arson because the fire's cause is often difficult to determine, and
many incendiary incidents are mistakenly labeled as suspicious, unknown, or of
accidental origin. Estimates of the actual incidence of arson fires range from
3twenty-five to fifty percent of all fires. Where an incendiary cause is sus-
pected, the shift in control of the fire scene from firefighters to fire or
police investigators can result in the loss of valuable time and in compromising
the integrity of the evidence at the scene.
Next, the transfer of the case from investigators to prosecutors often
results in diminished continuity. Most arson evidence is overwhelmingly circum-
4stantial and in most cases implicates the suspect only indirectly. Because of
prosecutors' desire to maximize conviction rates, they have an understandable
aversion to new or troublesome kinds of cases. Consequently, prosecutors have
been reported to avoid arson cases and to discourage investigators from pursuing
5them effectively. This in turn generates an understandable reluctance on the
part of investigators to try to interest a prosecutor the next time an arson case
develops. Consequently, many investigations languish for lack of momentum.
Overall .these impediments to enforcement have a debilitating affect on investigator
morale, which serves to undercut the rate of progress essential in arson investi-
gations.
Suspects who commit arson out of emotional impulses such as revenge and
pyromania appear to be those most likely to be caught, for the irrationality of
46
their actions diminishes caution and increases the likelihood that they will
leave behind incriminating evidence. For this reason, those who commit arson
out of strong emotional stimuli tend to be overly represented in arson arrest
and conviction statistics, while those who commit arson in a calculated and
planned manner stand to gain a de facto type of "informal immunity" as a result
of their ability to destroy or conceal evidence. Thus, the low arrest and even
lower conviction rates for arson substantially dilute the deterrent power of the
criminal sanction.^
Despite lingering questions about the impact of punitive sanctions, local
public officials have focused on prosecution and punishment as the most potent
deterrents. Two implications follow from this view. First, a broad range of
non-criminal justice prevention or early intervention strategies may either be
ruled out prematurely or identified too late to arrest a developing arson epidemic.
Second, strong reliance on criminal santions places considerable pressure on
investigators and prosecutors to "solve" arson cases and "punish" arsonists. Both
the pressure and the official response interact in a political environment which
focuses on those offenses that are most readily subject to solution. As noted
above, in cases of arson the most vulnerable population of offenders is likely to
consist of persons are emotionally motivated.
Focusing on Arson Through a "Motive-based" Strategy
To summarize the foregoing discussion, a primary reason for the difficulty
of enforcement agencies in combatting increases in arson is the highly reactive nature
of the law enforcement response. Traditionally, the objective of investigators
and prosecutors has been the arrest and conviction of persons who commit arson,
rather than some form of intervention to prevent future criminal acts. Since
relatively few arsonists are caught, and still fewer are convicted, the threat of
punishment is arguably not a very effective deterrent in this case, nor in
47
combatting most other forms of crime.
Early Warning Signs and Early Intervention Strategies
The most frequently cited motives for committing arson are revenge, pyromania
vandalism, concealment of another crime, intimidation, and arson-for-profi t. In
many cases, decisions to commit an incendiary act will be so impulsive--and therefo
unplanned--that the potential firesetters generate few noticeable warning signs
of criminal intent. For example, a family dispute may escalate so rapidly to an
act of arson that no one could have foreseen or forestalled the oncoming tragedy.
Unanticipated fi resetting may also stem from erratic or irrational behavior of
disturbed or psychotic persons. Conversely, arson for other motives such as
profit is usually planned in a rational manner over a relatively longer period
of time, and although executed in stealth often follows a known pattern that
permits trained investigators to detect the crime.
If arson motives are arranged along a continuum which ranges from "rational"
to "irrational," then arson for profit should be posted near the former, with
revenge near the latter, and other motives falling between. If a second vertical
dimension is added (see Figure II) which arranges the motives according to numbers
of prior warning signs, then motives can be further distinguished according to
their susceptibility to early intervention. For example, several prior warning
signs of revenge arson may exist, manifested in earlier disputes ranging from
moderately noisy to extremely violent.'7
The problem posed by revenge arson
however, is the absence of an effective monitoring apparatus to deter, and notify
authorities when early warning signs are observed. Usually, neither the disput-
ants nor witnesses, nor even experts, can as yet distinguish between conflicts
that will escalate into violent acts and those which will dissipate with the
passage of time. Although obviously desirable, intervention to stem the rise in
arson is still in its earliest stages and a long way from realization.
48
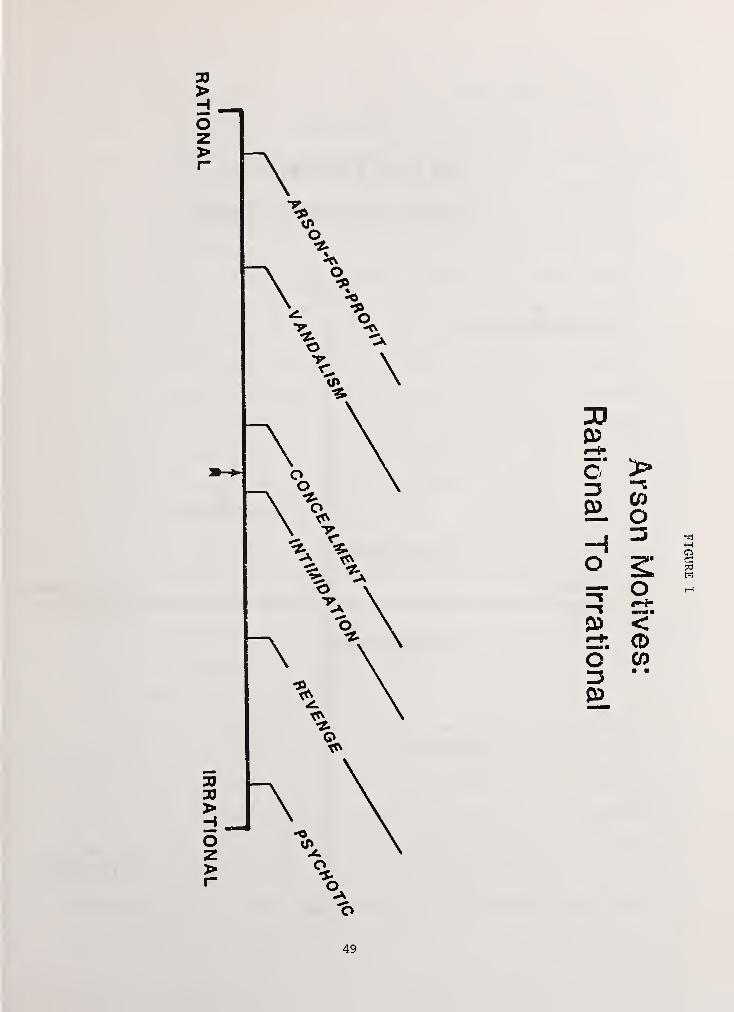
J305
c"
EL
Ho
05
c"
05
>05O
= o<CDCO
49
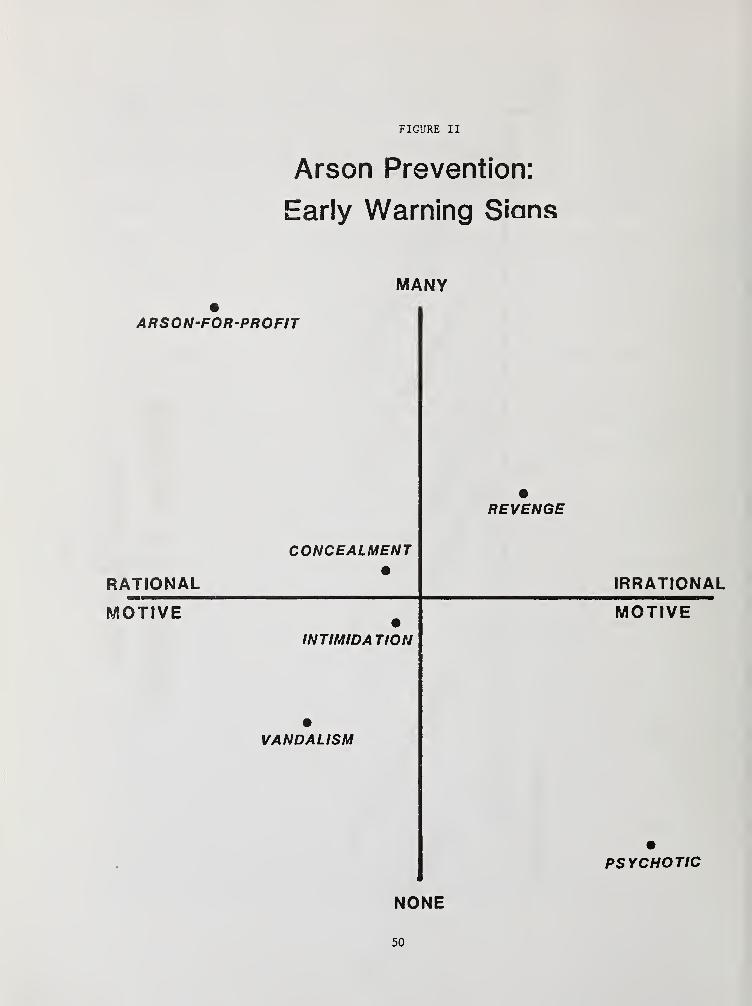
FIGURE II
Arson Prevention:
Early Warning Sians
MANY
ARSON-FOR-PROFIT
RATIONAL
CONCEALMENT
REVENGE
IRRATIONAL
MOTIVEINTIMIDA TION
VANDALISM
MOTIVE
PSYCHOTIC
NONE
50
In order to examine the range of arson motives from rational, to mixed, to
irrational, it is instructive to use the notion of "moral hazard" as it may
be applied to arson. A term drawn principally from the insurance lexicon, moral
hazard refers to specific factors in the decision processes of an individual
that identifies him/her as arson-prone, and therefore an imprudent risk to an
insurer. When applied to arson motives there are psychological, social, and
economic pressures which weigh, for example, on pyromaniacs, revenge arsonists,
and those who commit arson for monetary gain. The interplay of psychological
and perhaps social stresses are far more significant, if less subject to detection,
in the case of the revenge arsonist. In contrast, economic stress factors are
salient with respect to the profit-motivated arsonist. The distinction between
these two types of moral hazard, however, lies in the presence of identifiable
and easily traceable indicators of the antecedent stress situations influencing
the potential arsonist. The indicators of prior stress factors left by the
revenge arsonist are, in most instances, clear and identifiable after the fact.
But only a small proportion of cases that possess these characteristics actually
result in the commission of a crime, and the detection of relevent factors prior
to a crime would require the establishment of a surveillance system so pervasive
that it would present a civil liberties problem of enormous magnitude. Even then
it would still be necessary to identify which of the arson prone people would
actually commit the crime.
In the case of arson-for-profi t, the issues are markedly different. The
pressures which weigh on the arsonist, and his/her preparation for the arson,
leave two converging trails; (1) financial stress indicators, and (2) pre-arson
planning steps. Although these factors affect the condition of the arsonist's
moral hazard, the emphasis here is largely on economic components because the
general indicators of financial stress (such as business recession or impending
bankruptcy), and their affect on local economies, can be identified and measured
with a moderate degree of accuracy.51
In sum, economic stress situations profoundly affect the condition of moral
hazard. For arson prevention purposes therefore, it would be ideal to be able
to identify three categories of information, each with its own predictive
capabilities:
t Situation-based information, to focus on variable impacts
of economic conditions on different business sectors
(e.g., restaurants, home building, furniture, etc.)
t Location-based information, to focus on various types ofbuildings (e.g. , schools, single-family and multi-familyhousing, etc.) which are probable arson targets.
• People-based information, to focus on individuals whose indexof moral hazard indicated that they would be likely to commit(or cause to be committed) an act of arson.
Each of the seven Arson Information Management Systems (AIMS), supported by
the U.S. Fire Administration addresses one or more of the above categories of
information. In most cases, the projects deal with arson for profit, because of
the presence of prior warning signs and the frequent rationality of the perpetrators.
Certain AIM systems are purely preventive in nature. They seek to identify
financial stress and other causal factors early enough to enable official inter-
vention to prevent arson. Other AIM systems analyze information on multiple prior
fires and involved individuals, in the hope of determining whether groups of
people have conspired to set or to arrange to set fires. The following discussion
covers three representatives of the seven AIM systems that have established
methods of information gathering, analysis, and dissemination. The three cities
in which these systems are located are New Haven, Boston, and Phoenix.
There are several general similarities among the systems. They all use elec-
tronic data processing equipment, to some extent, in order to expedite the collec-
tion and analysis of fire and arson-related information. All three employ some form
of statistical or other type of information analysis to determine the correlation
between arson fires and other variables. Arson prevention measures are outlined
in each of the three jurisdictions based on the use of the arson information once
it is obtained.52
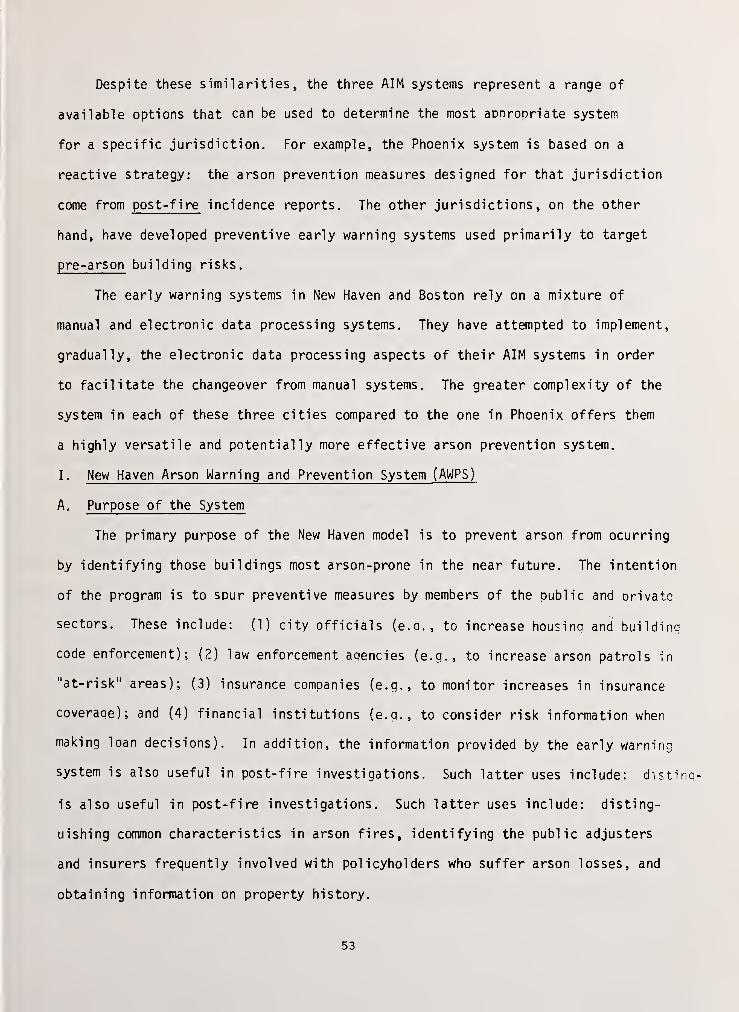
Despite these similarities, the three AIM systems represent a range of
available options that can be used to determine the most aooropriate system
for a specific jurisdiction. For example, the Phoenix system is based on a
reactive strategy: the arson prevention measures designed for that jurisdiction
come from post-fire incidence reports. The other jurisdictions, on the other
hand, have developed preventive early warning systems used primarily to target
pre-arson building risks.
The early warning systems in New Haven and Boston rely on a mixture of
manual and electronic data processing systems. They have attempted to implement,
gradually, the electronic data processing aspects of their AIM systems in order
to facilitate the changeover from manual systems. The greater complexity of the
system in each of these three cities compared to the one in Phoenix offers them
a highly versatile and potentially more effective arson prevention system.
I. New Haven Arson Warning and Prevention System (AWPS)
A. Purpose of the System
The primary purpose of the New Haven model is to prevent arson from ocurring
by identifying those buildings most arson-prone in the near future. The intention
of the program is to spur preventive measures by members of the public and orivate
sectors. These include: (1) city officials (e.q. , to increase housina and building
code enforcement); {?.) law enforcement aqencies (e.g., to increase arson patrols in
"at-risk" areas); (3) insurance companies (e.g., to monitor increases in insurance
coveraoe); and (4) financial institutions (e.g., to consider risk information when
making loan decisions). In addition, the information provided by the early warning
system is also useful in post-fire investigations. Such latter uses include: disting-
is also useful in post-fire investigations. Such latter uses include: disting-
uishing common characteristics in arson fires, identifying the public adjusters
and insurers frequently involved with policyholders who suffer arson losses, and
obtaining information on property history.
53
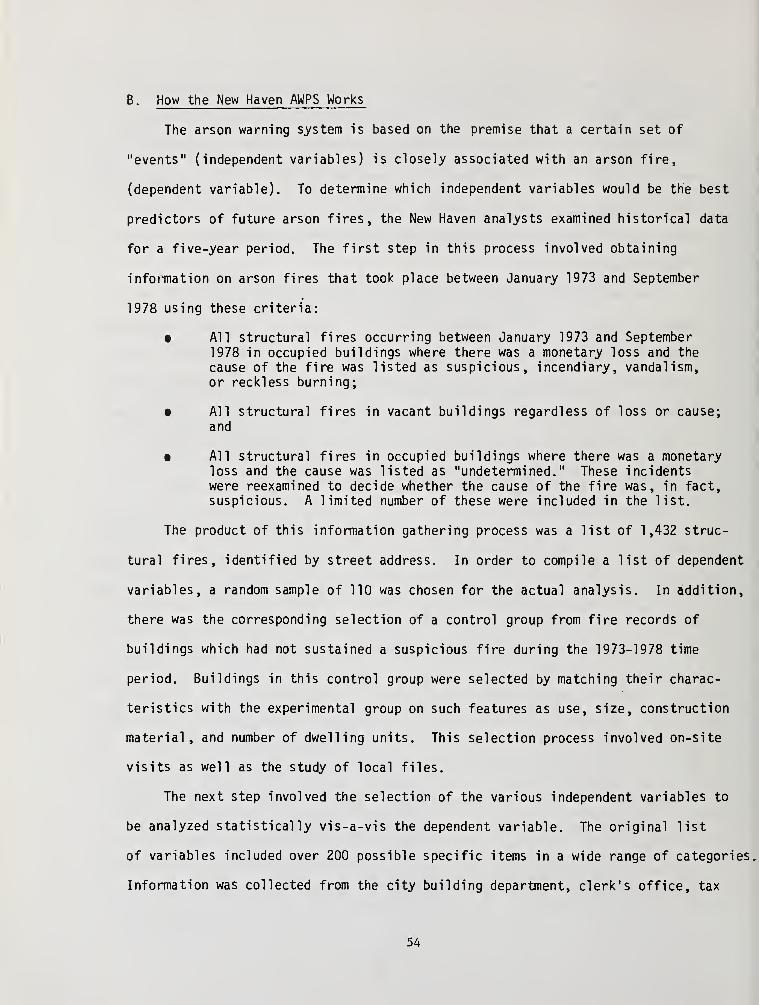
B. How the New Haven AWPS Works
The arson warning system is based on the premise that a certain set of
"events" (independent variables) is closely associated with an arson fire,
(dependent variable). To determine which independent variables would be the best
predictors of future arson fires, the New Haven analysts examined historical data
for a five-year period. The first step in this process involved obtaining
information on arson fires that took place between January 1973 and September
1978 using these criteria:
e All structural fires occurring between January 1973 and September1978 in occupied buildings where there was a monetary loss and the
cause of the fire was listed as suspicious, incendiary, vandalism,or reckless burning;
• All structural fires in vacant buildings regardless of loss or cause;and
• All structural fires in occupied buildings where there was a monetaryloss and the cause was listed as "undetermined." These incidentswere reexamined to decide whether the cause of the fire was, in fact,suspicious. A limited number of these were included in the list.
The product of this information gathering process was a list of 1,432 struc-
tural fires, identified by street address. In order to compile a list of dependent
variables, a random sample of 110 was chosen for the actual analysis. In addition,
there was the corresponding selection of a control group from fire records of
buildings which had not sustained a suspicious fire during the 1973-1978 time
period. Buildings in this control group were selected by matching their charac-
teristics with the experimental group on such features as use, size, construction
material, and number of dwelling units. This selection process involved on-site
visits as well as the study of local files.
The next step involved the selection of the various independent variables to
be analyzed statistically vis-a-vis the dependent variable. The original list
of variables included over 200 possible specific items in a wide range of categories,
Information was collected from the city building department, clerk's office, tax
54

collector's office, fire department, housing conservation and code enforcement
agency, and police department.
For each structural fire in the sample and for each control group item, the
information regarding the various independent variables was gathered, coded on
worksheets, and then keypunched and verified. A statistical package called SAS
(Statistical Analysis Systems) was used to determine the correlation between the
various independent variables and the arson fires. Through the use of frequency
procedures and a statistical regression model, the variable list was ultimately
reduced to four key indicators or "trigger" variables:
t Total amount and number of years of tax arrearage,
• Previous structural fires,
• Housing code violations cited by the New Haven Housing Conservationand Code Enforcement Agency, and
• Liens and other claims on the property.
Statistical analysis revealed that 78 percent of the variance in arson
incidence between the structural fire group and the control group could be
explained by these four variables.
Having determined the "trigger" varibles for an arson prediction system, the
New Haven staff has mounted a program to test the findings. A decision was made
to collect a two-year back history on each of the four trigger variables.
Information on structural fires, tax arrearages, housing code violations, and
liens which occurred or were issued in New Haven between January 1, 1977, and
December 30, 1979, was collected. This work was executed manually utilizing off-
duty firefighters, student interns, and the AWPS staff.
Once collected, the information was recorded and stored by address, on color
coded index cards. The cards were arranged alphabetically, and a master list of
each address and the trigger variables which are now available. These lists form
the basis of the at-risk group.
55
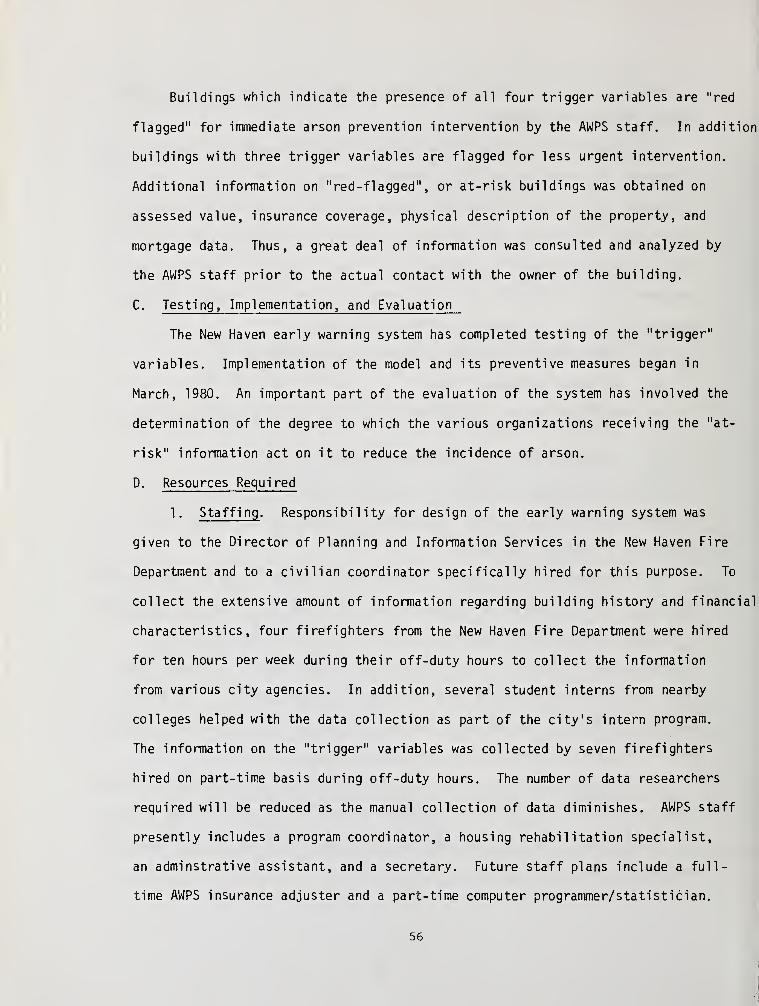
Buildings which indicate the presence of all four trigger variables are "red
flagged" for immediate arson prevention intervention by the AWPS staff. In addition
buildings with three trigger variables are flagged for less urgent intervention.
Additional information on "red-flagged", or at-risk buildings was obtained on
assessed value, insurance coverage, physical description of the property, and
mortgage data. Thus, a great deal of information was consulted and analyzed by
the AWPS staff prior to the actual contact with the owner of the building.
C. Testing, Implementation, and Evaluation
The New Haven early warning system has completed testing of the "trigger"
variables. Implementation of the model and its preventive measures began in
March, 1980. An important part of the evaluation of the system has involved the
determination of the degree to which the various organizations receiving the "at-
risk" information act on it to reduce the incidence of arson.
D. Resources Required
1. Staffing . Responsibility for design of the early warning system was
given to the Director of Planning and Information Services in the New Haven Fire
Department and to a civilian coordinator specifically hired for this purpose. To
collect the extensive amount of information regarding building history and financial
characteristics, four firefighters from the New Haven Fire Department were hired
for ten hours per week during their off-duty hours to collect the information
from various city agencies. In addition, several student interns from nearby
colleges helped with the data collection as part of the city's intern program.
The information on the "trigger" variables was collected by seven firefighters
hired on part-time basis during off-duty hours. The number of data researchers
required will be reduced as the manual collection of data diminishes. AWPS staff
presently includes a program coordinator, a housing rehabilitation specialist,
an adminstrati ve assistant, and a secretary. Future staff plans include a full-
time AWPS insurance adjuster and a part-time computer programmer/statistician.
56
i
•i
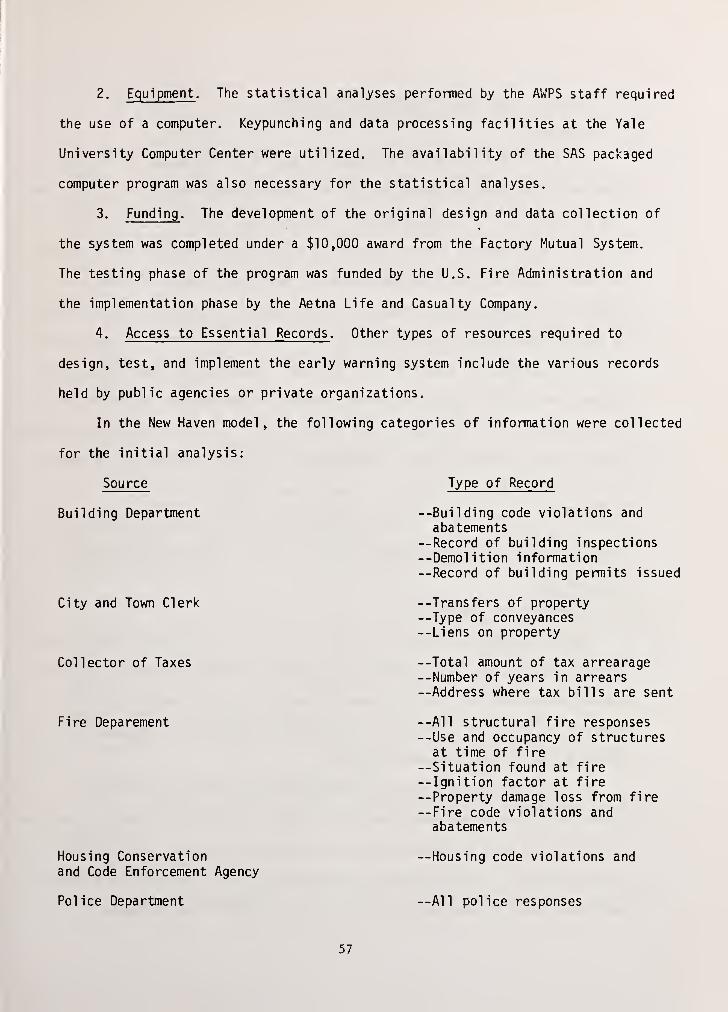
2. Equipment . The statistical analyses performed by the AWPS staff required
the use of a computer. Keypunching and data processing facilities at the Yale
University Computer Center were utilized. The availability of the SAS packaged
computer program was also necessary for the statistical analyses.
3. Funding . The development of the original design and data collection of
the system was completed under a $10,000 award from the Factory Mutual System.
The testing phase of the program was funded by the U.S. Fire Administration and
the implementation phase by the Aetna Life and Casualty Company.
4. Access to Essential Records . Other types of resources required to
design, test, and implement the early warning system include the various records
held by public agencies or private organizations.
In the New Haven model, the following categories of information were collected
for the initial analysis:
Source
Building Department
City and Town Clerk
Collector of Taxes
Fire Deparement
Housing Conservationand Code Enforcement Agency
Police Department
Type of Record
--Building code violations andabatements
—Record of building inspections--Demolition information--Record of building permits issued
--Transfers of property--Type of conveyances--Liens on property
--Total amount of tax arrearage—Number of years in arrears—Address where tax bills are sent
--All structural fire responses--Use and occupancy of structures
at time of fire—Situation found at fire— Ignition factor at fire--Property damage loss from fire—Fire code violations andabatements
--Housing code violations and
--All police responses
57
II. Boston: Arson Early Warning System (AEWS)
A. Background
The Boston AEW System was developed following an investigation into an
organized arson ring which operated in the Symphony Road area of that city. The
ring was involved in setting dozens of fires during the period 1974 to 1977.
Following the deaths of several tenants in arson fires within a short time, the
residents formed a group (Symphony Tenants Organizing Project) to combat the
problem. The symphony Road group felt that a prediction system could be created
to prevent arson because buildings that were ignited had similar characteristics.
A decision was made to undertake a pilot study, conducted by Urban Educational
Systems, Inc. (UES), of Boston, a firm created for the purpose of conducting
arson research. UES received a grant from the U.S. Fire Administration to develop
an arson early warning system. Three manuals have been produced by UES growing
out of their work on this Droject. These manuals Dublished by UES in 1979 and
available from them, are: (1) Arson Action Guide , (2) Research: A Manual for
Arson Analysis and Property Research , and (3) Tools: Anti-Arson Programs and
Legislation .
B. Purpose of the System
The arson prediction system is utilized to identify buildings that are most
prone to arson fires. This information is used to initiate a variety of arson
preventive measures such as enforcement of building codes, reduction in over-
insurance of property, promotion of neighborhood awareness, and proactive
investigation by law enforcement agencies.
As in the New Haven AIM system, the Boston AEWS serves as both a data
collection system and an arson prediction system. Information from city agencies
on building or owner characteristics can be collected and made accessible in an
efficient manner. This will aid in the investigation and prosecution efforts in
post-fire search for evidence, in the event that arson is not prevented.
58
C. How the System Works
The AEWS study selected 78 residential, absentee-owned, multi-unit rental
buildings in the Boston area in which a fire had occured between June 1, 1978 and
May 31, 1979 as their sample population. To meet the criteria, the fire had to
have caused a loss of more than $500 and had to be classified as incendiary, sus-
picious, or one that caused abandonment. The 78 sample buildings were matched
with a control sample of 78 buildings in which there had been no fire in the
same time period.
Historical differences between these two groups over a 10-year period were
determined on the basis of information on over 300 variables collected for each
building.
Results from the analysis suggest that combinations of as many as a dozen
variables will constitute the best indicators of high arson risk. Variables can
be assigned relative weights depending on their correlation with past arson fires.
The variables examined are divided into two categories: (1) economic
stress factors of the building, include such items as: vacancy rates, debt-to
equity ratio, sale and resale transactions, previous fire record, building code
violations, santiary code violations, tax arrearage, liens, attachments, rent
control data, and time lag between building citations and repairs; and (2) the
owner's characteristics include such factors as: previous fire record, owner's
other property, and the owner's financial status. In many cases a distinct
separation between economic stress factors and owner-characteristic factors is
not possible. For example, code violations and tax arrearage bear on both.
D. Implementation, Testing, and Evaluation
The process of collecting the building and ownership information has been
completed.
E. Resources Required
1. Staff and Equipment . The staffing required for this study is provided
59
by Urban Educational Systems, Inc. Three full time equivalent staff members have
been assigned to the AEWS study, including two computer specialists (one full-
time, one half-time), one researcher, and an administrative assistant (half-time).
2. Funding . Funding for the AEWS study was provided by a grant of $200,000
made to UES by the U.S. Fire Administration. Approximately one-half of this grant
is devoted to research purposes, and the other half to providing technical
assistance to other communities throughout the nation.
III. Phoenix; Arson Prevention and Analysis Unit (APAU )
A. Background
The Phoenix program is managed by the Arson Prevention and Analysis Unit
(APAU) in the Phoenix Fire Department. Data located and analyzed in separate
local agencies will be collected and studied by the Arson Prevention and Analysis
Project.
The APAU project serves three general purposes:
(1) Output from the analysis of data is distributed to local agencies, thus
providing each with information generated by the others.
(2) The data analysis indicates patterns of arson incidence in the Phoenix
area which can facilitate deployment of arson investigative personnel.
(3) Information provided through the data analysis assists in joint planning
of strategies among the various Phoenix agencies, including the police and fire
departments, insurance companies, county prosecutor's office, the arson task
force, city manager's office, city council, the chamber of commerce, and other
civic groups.
B. How the System Works
The Phoenix AIMS staff has developed special record-keeping forms for arson
investigations undertaken in the city. Arson investigations in Phoenix are
conducted by the Fire Department (Fire Investigation Squad) and the Police
Department (Bomb and Arson Squad). Both units are provided with the improved
60
data collection forms. These forms can be used to establish several files in-
cluding an "Arson Location" file, a" "A~son Suspect/Victim Investigation Lead"
file, a "Property Management" file, and a "Fire Dollar Loss Reported" file.
Additional information is collected from various insurance companies, from the
Property Insurance Loss Register (PILR), and from other city departments including
Zoning, Parks and Recreation, and Public Housing.
The information received from these sources can be programmed, coded, and
entered into a work processor to allow rapid retrieval of requested information.
Multiple listed information (e.g., an owner's name under "previous fires,"
"housing code violations" and "insurance claim files"). Unlike the New Haven and
Boston AIM systems, the Phoenix model does not attempt to predict the risk level
of specific owners or buildings, but instead focuses on geographic areas.
C. Implementation and Evaluation
The output of the Phoenix AIM system is distributed to a wide range of
potential users. Police and fire units utilize if for- arson investigations (e.g.
intelligence operations, surveillance decisions, property loss information
retrieval, etc.). The local Arson Task Force uses the information as a basis
for community outreach programs, legislative lobbying efforts, and as a means of
informing the media. Other recipients of the output include, when appropriate,
insurance companies, civic groups, the city council and mayor's office, and other
law enforcement agencies.
D. Resources Required
1. Staffing. Staff are drawn from existing personnel in the Fire Department
Arson Investigation Unit and Police Department Bomb and Arson Squad. Operation
of the AIM system is handled by a Loss Prevention Analyst in the Arson Prevention
and Analysis Unit.
2. Funding . The project has been funded by a U.S. Fire Administration
grant of $20,000, which is used to support the Lost Prevention Analyst.
61
3. Equipment . The word processor and other equipment necessary for the
information analysis are supplied by the Arson Investigation Unit of the Fire
Department.
Conclusion
The above discussion focused on those aspects of arson motives that render
certain motive patterns (and principally arson-for-profit) more susceptible to
prediction and early intervention than others. A most important finding that
emerges from a review of current arson control programs is that the number of
indicators of prior intent to commit arson, rather than the rationality or
irrationality of each motive, provides officials with arson reduction opportuni-
ties that are just becoming appreciated. Arson-for-profit is believed to con-
stitute the most costly motive, in that perpetrators routinely cause the
widespread destruction which they have planned. The discernible motive
pattern for this profit-motivated crime provides officials who are willing
to probe for background information on the financial distress that often can
be traced to distinct pre-arson planning steps, and frequently culminates in
arson. Consequently, it is likely that future arson control demonstration
programs will focus on profit-motivated arson. The considerable potential
to prevent acts of arson committed for other more irrational motives such as
revenge, remains to be tested.
62
ENDNOTES
1/ - John F. Boudreau, et a"!., Arson and Arso n Investigation: Survey and Assessmcn(Washington: U.S. Government Printing Office, 1977~T; National Fire Prevention and
Control Administration, Arson: America's Malignant Crime (Washington: National F
Prevention and Control Administration, 1976); U.S. General Accounting Office, Repoi
to Senator Charles Percy, "Federal Authority and Coordination for Arson-RelatedCrimes". No.B-171019 (Washington: Contoller General of the U.S., 1978); Internatit
Training, Research, and Evaluation Council, Workshop-Synopsis: N ew York Governor '.
Conferenc e on Ars on and Arson-for-Prof i
t
(Fairfax, Virginia: ITREC, 1978];Nicholas Borg and Leonard David, Arson: A Multi-Dimensional Problem (Boston:Society of Fire Protection Engineers, 1976).
2/ See Boudreau, supra, note 1, pp. 19-27; R. G. Vreeland and M. B. Waller,The Psychology of Firesettinq: A R eview and Ap praisal , Report No. NBS-GCR-79-157TWashington: National Bureau of Standards, 1 979) , and Bernard Levin, "psycho-logical Characteristics of Fi resetters ," in Fire Journal , March, 1976.
3/ Boudreau, supra , note 1, p. 1.
4/ Note. "Arson Fraud: Criminal Prosecution and Insurance Law. FordhamUrban Law Journal , 3 (19791.
5/ See Dale Tooley and Christopher Munch, "The Need for Prosecutor Involvementin Arson Cases," Firehouse Magazine , August, 1979. Mr-. Tooley is the DistrictAttorney in Denver, Colorado.
6/ See Boudreau, supra , note 1, pp. 29-31; and Robert McGann, "DA's are
Urged to Become Involved in Early Stage of Fire Investigations," in FireEngineering , August, 1978.
7/ See Marie Wilt and James Bannon, Domestic Violence and the Police (WashingtonPolice Foundation, 1977); and Morton Bard, Family Crisis Intervention: From
Concept to Implementation (Washington: Government Printing Office, 1973).
63
INCENDIARY FIRES IN JAPAN
by Tetsuhiko KawamuraJapanese Assocition of
Fire Science and Engineering
Incendiary Fires in Japan Today
Arson has been thought a rural type of offense until ratherrecently. There are as many arson fires in rural areas as urbanareas when compared with the number of occurrences per populationof the areas. It has also been said that since the beginning of
this century, arson has been on the decrease except in the periodsof depression.
However, this tendency has recently been changed a little andin cities, especially in Tokyo, Osaka and in other big cities arsonhas exceeded the fires with other causes. But when looking at thewhole country, from the classification as shown in the Fire Journal,March 1976, arson occupies not the top place but the fourth, both innumber of and loss by fires, as shown in Figs. 1 and 2.
Incidentally, little change has been found in the number of firesand amount of loss in Japan for the last few years. In 1978 Japanexperienced 70,423 fires and loss of ¥130,539 million (approximately$593 million).
Types of Incendiaries
Most malicious fires are started by individuals in secret. Manyfires are started for reason of revenge or spite, which are broughtabout by the feud between relatives, neighbors, or other acquaintances.Some fires are caused by persons who have a sort of enmity againstsociety, or by pyromaniacs whose motive is to obtain a sort of satis-faction from the fire and the accompanying events. Other types of
firesetters include thieves who want to destroy evidence or who startfires because of dissatisfaction over their spoils. And it is remarkablethat many fires are caused by incendiaries committing suicide nowadaysby setting fire to the fuel gas leaked intentionally or such flammableliquids as gasoline or kerosene. But incendiary fires motivated by"defrauding insurance companies" are very few as shown in the reports
by Yamaoka and Murakami.
64

What Insurance Companies Do to Prevent Fraud by Arson
As mentioned above, there are very few cases of arson for the
purpose of insurance fraud in Japan. Insurance companies have establishedorganizations some years ago to investigate suspicious cases related to
insurance fraud, but almost all the cases are related to automobileinsurance, whereas very few cases are involved in fire insurance — one
or two cases in a year.
Early in the sixties, we had several remarkable arson fraud cases —rubber-shoe manufacturers in Osaka, textile wholesaler in Kyushu. Sincethen insurance companies have exchanged information with each other,making their underwriting more cautious.
Summary
Except in Tokyo and other big cities, incendiarism is not taken as
a very grave problem today in Japan. And even insurance companies do not
pay much attention to it. There may be many reasons for this situation.The fact that economic conditions as a whole are not so bad may be citedas one of them, traditionally strong guilt feelings against playing withfire can be a second force to prevent the increase of incendiaries, the
high percentage of arsonist apprehension, which exceeds 30%, may beanother factor. And the fact that Japan is ethnically an almost uniformnation and consists of a very stable society is one of the effectivefactors, I should say.
Although these are the incendiary situations as of today in Japan,the following two facts are to be noted:
(1) Repetitive or serial incendiary fires by arsonists, whoare often mental defectives or people with low intelli-gence, are caused from time to time in big cities, moreoften in larger cities.
(2) Incendiary fires or sometimes explosions which are causedby firesetters who want to commit suicide setting fire to
fuel gas intentionally leaked by them, or flammable liquidssuch as gasoline and kerosene. There were 531 such peoplewho committed suicide in 1978, and in the case of leakedgas, these incidents tend to cause damage to other peopleand property, in such a densely built-up area as Tokyo.
65
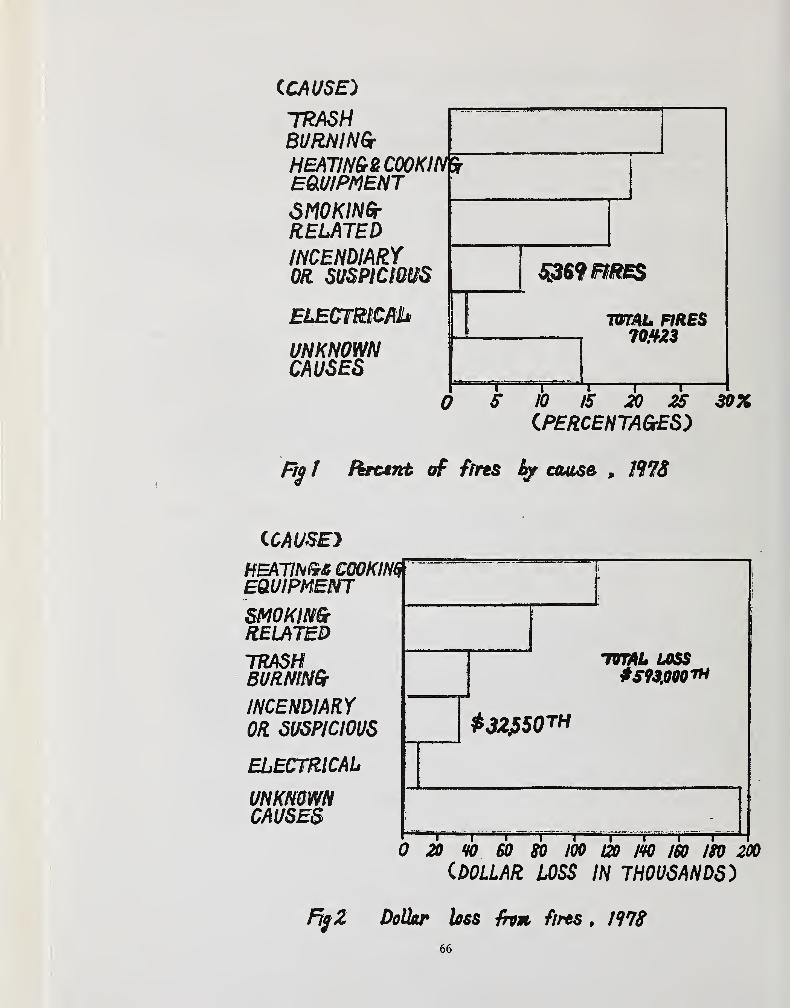
CCAUSE)
TRASHBURNINGrHEATINGrZ COOKINfyEQUIPMENT
SMOKING-RELATEDincendiaryor suspicious
ELECmtCAk
UNKNOWNCAUSES
5369me$
TOTAL FIRES
To & 20 25 mm(PERCENTAGES)
Frg 1 forctnt of ffres fy cause , I97S
UAUSE)HEATlNGrt CQOKINQEQUIPMENT
SMOKimRELATED
TRASHBURNING
INCENDIARYOR SUSPICIOUS
ELECTRICAL
UNKNOWNCAUSES
TOTAL LOSS^93.000™
*32J!50TH
20 % 60 80 100 120 IW 160 ISO 200
(DOLLAR LOSS IN THOUSANDS)
FtjZ Dollar loss from, fires , 1918
66
Discussion of Presentations on Arson
Karchmer Presentation
Handa: You mentioned several cities. I wonder whether the patternof each jurisdiction varies according to the city.
Karchmer: Each of the four cities I reported on had different typesof arson problems. New York and Boston were primarily multi-familyresidential housing. New Haven was primarily single-family housing.Arson for profit is a problem in both these cities. Phoenix wassingle-family housing with commercial arson as a problem. So, youhave at least three different kinds of arson problems to which theseAIMS systems were a response.
Furthermore, the New York and New Haven multi-family housingwas "absentee" owned by absentee landlords. That gives us a furtherdifference among the different programs.
All four AIMS projects are currently working on refining their
output and figuring ways to utilize that information. The issue of
the impact of its evaluated information is forthcoming, but is severalmonths away.
Handa: When business is bad and/or there is a death, is this oneindication of motivation for arson?
Karchmer: Yes, let me explain. A study was done several years agothat is reported in the Journal of Insurance. Between 50 and 75
variables were analyzed to determine what would predict deaths of
increases in arson in the U.S. Data from the U.S. Department of
Commerce and its various reports were utilized. The one variablethat correlated most closely with the increase in arson, was non-personal bankruptcy which included several different kinds of
bankruptcy under our laws: partnership, corporateship , as well as
corporateship reorganization. But the real value of the informationis that bankruptcy and arson statistics so closely followed each other.The problem with predicting commercial arson which includes industrialarson, in contrast to residential arson, is that the indicators of
residential arson all come from public sources of information: liens,
code violations, firefighters. The comparable stress indicators for
commerical or industrial arson are found in the business 's financial
books, its tax receipts and other private nonpublic sources of infor-mation. This means that it is next to impossible for a researcher to
use related financial stress information to attack commercial arson.
67
The indicators of commerical arson, therefore, are most usefulas indication of criminal intent. For example, insurance may beincreased drastically on the premises just prior to the fire. In manystates it is possible to obtain that information. Secondly, there maybe changes in inventory levels in that company; such that cheapinventory is substituted for expensive inventory prior to the fire.
In some cases, it is easy for an investigator to get that kind of
circumstantial evidence of a likely involvement of an owner in thearson. But it is difficult to prove the involvement.
Apart from that, the intervention strategies to combat commercialarson deal with the development of criminal intelligence programs to
gather criminal information about the kinds of people the businessowner may be dealing with, and they are very different from the
statistical and other kinds of records upon which the AIMS projectsare based.
I have just completed an enforcement manual on arson for profitfor the Justice Department which details that type of a program. I
would be happy to provide those who are interested in receiving a
copy. It is much better to do that than raise the discussion here.
Handa: Can you include the information of explosives used in arsoncases for revenge?
Karchmer: Presently apart from location and time of day, I do notbelieve any other kind of information is gathered by any of theseven AIMS systems which would help in predicting revenge arson.
Kawamura: I am interested in any figures and/or statistics. Whatis the rate of arresting arsonists? How many of them are convictedfrom trials?
Karchmer: I do not have that information. The personnel who work inthese AIMS systems developed better case tracking mechanisms. I canprovide you with the names and addresses of those people and theycan provide you that information.
68
Kawamura Presentation
Levine: Did you say that all fires in Tokyo are investigated?
Kawamura: We do investigate as many as possible, but the data in whichwe understand the motive of arson clearly are used in my Figure 1.
Levine: Can you investigate all fires, not just arson?
Kawamura: Not all of them.
Levine: That is a very important factor in this country. Thosecities which do little investigating of fires, do not report mucharson. The fires you describe as unknown causes, are about 15%of the fires. Is there a reason that the fires of unknown causeshave a much larger than 15% portion of the loss in yen?
Kawamura: We regret that we have no answer to this question. Thedata in this figure are based on the entire country, not just Tokyo.
Clarke: I'm amazed at the remarkably small number of cases to defraudinsurance companies in Japan, as compared to the very large number inthe United States. My question is whether a large fraction of com-mercial property in Japan is covered by casualty insurance? In the
United States virtually all commercial property is covered byinsurance.
Kawamura: It is true that people in Japan are less insurance mindedthan in U.S., but almost all commercial properties in Japan are
covered by insurance. The percentage of dwellings covered by insurance
is not as large as U.S.
Miyama: With respect to Figure 2, please explain why money for
unknown causes is high. In Japan, persons who cause accidental fire
can be criminally penalized.
Kawamura: I think that is not true. Person who pays damage does
not get penalized. However, business people who are in charge, (i.e.,
maintenance or building guards) if proven negligence on their part,
would be criminally charged.
The legal point of view is described above, but traditionally
there might be penalty from society.
Karchmer: In some cities one of the arson for profit problems involves
a building that is profitable that is destroyed for the purpose of
creating an even more profitable business on that location (some
types of urban renewal or urban development) . Do you have anything
comparable to that?
69
Kawamura: More specifically, do you mean to cause arson to make
profit in specified development area after demolition of the old site?
Karchmer: Yes, exactly.
Kawamura: There is no criminal penalty on hospitals. However if
patients are hurt or die during the fire, the hospital can be penalizedfor their negligence in not taking care of their patients.
Handa: I should like to speak concerning the number of cases ofunknown causes. Sometimes the agencies are unable to handle responsi-bility for all cases. For convenience, they are classified as unknowncauses without detailed investigation. I've found this to be truewhen I was asked to be a legal adviser.
Levine: A note of interest, for four years we've had a programat Johns Hopkins University to investigate the causes of all deaths infires in the state of Maryland. During that time about 3% of thepeople killed in fires were killed by self immolation, by pouring gaso-line over themselves. If we use that same percentage for the 8,000people in this country who are killed every year in fires, that wouldbe about 240 people which is not all that different from your statisticson suicide. Perhaps it is a little lower.
Kawamura: I think that the percentage of suicide arson in Japanis high, because total number of people who died in fire is a littleless than 2000 and the number of people who died in suicide arson is
about 530.
70
TOXICITY OF COMBUSTION PRODUCTS
71
BASIC CONCEPT OF TOXIC HAZARDS
IN BUILDING FIRES
by
Koichi Kishitani, Dr. Eng., Prof,
Fumiharu Saito, Dr. Eng.
Shyuitsu Yusa, Dr. Eng.
72
1. Introduction
Losses due to fire may be divided into material damage
and human losses. It may be said that material damage is
caused by heat and human losses by smoke and gas.
Consequently, with respect to fire protection measures,
the procedures of research will be dissimilar since there
are great differences between measures against heat which
cause structural damage to buildings and safety measures for
occupants of buildings in connection with the principal
factors causing damage and the concepts in making evaluations.
The first matter to be taken up usually when discussing
measures to secure safety of human lives during fire is the
problem of- smoke and gas, and there is not much said con-
cerning heat. This is because loss of human life attributed
to heat is due to burns as seen from fire statistics, and
-
countermeasures are heavily dependent on compartmentation
of fire and fire fighting activities.
In contrast, measures against smoke and gas in building
fires must be discussed based on the relations of the flow
characteristics of heat, smoke and gas from the room on fire
to the various parts of the building, the varieties and
quantities of the components emitting the above, and the
corresponding activities of humans. Obstructions to human
behavior must be considered first of all from the standpoint
of physiological obstructions. Accordingly, as impeding
73

factors, the types and quantities of combustion gases, the
thickness and humidity of smoke, and further, although
perhaps not of a degree to cause burns, the rise in atmos-
pheric temperature must be taken into consideration.
In other words, whereas many research works have been
only on compositions of gases in studies of gas toxicity,
for the problem of toxic hazards in fire, examinations must
be made not only of gas, but all combustion products includ-
ing the entire lot of factors mentioned above.
The varieties and quantities of combustion products
will differ according to the correlations between the
varieties and quantities of materials burned and the condi-
tions of the building, namely, the thermal properties and
geometrical sizes of constituent materials, ventilation, etc.
of the space on fire or in combustion.
Further, the method of evaluation and the level of
safety indicated will differ greatly depending on whether
toxicities of combustion products are to be evaluated as
acute or chronic, and still further, whether the toxicities
are to be evaluated on the basis of absolute or relative
degree
.
These interrelations and the governing factors are
shown in summarized form in Fig. 1.
That is, for acute toxicity, it is possible for the
limit to evacuation activity according to one's own will or
74
physiological death to be made the basis for evaluation, but
for chronic toxicity, it is necessary to consider a range
from a degree that light activity is possible to that where
the person will become a human vegetable due to complete
functional impediment.
With regard to the former in this case, It is possible
to proceed with research by animal experiments, but for the
latter, it will be unavoidable to rely on chemical analysis
employing instruments.
For evaluation of toxicity by chemical analysis, there
will be the extremely complex problem of making detailed
studies of progress made in analytical techniques and of the
type of gas and the degree of trouble, and further, establish-
ment of a plural number of mixed gas toxicity evaluation
formulae
.
Meanwhile, there are large amounts of high-polymer
materials being used in the forms of building materials,
furniture and daily necessities, and it is surmised that the
toxicity of gases is greatly increased by combustion of these
materials
.
It must be considered that it will be too late to estab-
lish a measure against gas waiting for research on toxicity
which includes chronic toxicity to be completed.
In view of the above, it is necessary in coping with
actual situations for combustion conditions to be those
75
under which prediction of combustion properties of materials
in a real fire will be possible, and for an evaluation method
considering acute toxicity to be established.
2. Analyses of Full-Size Fire Experiments
For evaluation of gas toxicity of a material, it is
necessary to be able to predict the combustion products to
be emitted by that material in a real fire, and for that
purpose it is necessary to set the conditions of heating to
which the material will be subjected in a real fire.
However, since buildings are of various configurations
depending on their uses while at the same time manifold objects
are placed indoors, .although fires may be caused by combustion
of identical materials, the combustion products coming from
the fires must be considered to be of differing compositions.
Consequently, it may be expected that there will be many
combinations of temperatures and supply of air in combustion
in real fires. It is difficult, and unrealistic, to attempt
to evaluate toxicity by heating a. material subjected to these
many different combinations. Therefore, it will be necessary
to find basic combustion conditions under which gross errors
will not result in evaluation of the gas toxicity of a
material by analyzing in detail the properties during fire.
As a method of solving such a problem, it will be
useful to make detailed investigations of buildings after
fires, but it is difficult to estimate dynamic behayiors of
76
fires. Accordingly, it becomes necessary for fire experiments
to be carried out with buildings of actual size to accumulate
and analyze data,
Many fire experiments have been conducted in Japan with
the purposes being various studies regarding fire. The
objectives of- these fire experiments have differed according
to the needs of the time, but may be broadly divided into the
five categories below.
1. Hazard of spread of fire to neighboring
building
2. Compartmentation of fire
3. Room temperature and duration of fire
^ . Properties of room on fire
5- Generation and control of smoke and gas
These experiments were carried out to verify the many
laboratory and theoretical studies and to gain rough concepts
of fires, and there were not a few which led to development
of new research fields through analyses of experimental
results. Consequently, the purposes of fire experiments
have close relations with the trend of research on fire.
That is, in fire experiments at the initial stage, there
were many which had the objective of safety of structures of
buildings, but as buildings became taller, large underground
shopping areas were developed, and fire statistics were
analyzed, more and more experiments in which studies of
77
smoke generation and gas toxicity were added came to be con-
ducted .
There were experiments in which buildings were newly
constructed for the purpose of fire tests, but since these
required considerable testing expenses and labor, many of the
experiments were carried out on modifying parts of buildings
planned to be demolished. Consequently, the testing condi-
tions did not coincide in many cases. The fire experiments
carried out in Japan up to this time which were concerned
with emission characteristics and toxicities of smoke and
gases are summarized in Table 1.
In these experiments, adequate measurements were made
on temperatures necessary for combustion conditions of
materials, but there were few in which measurements were made
of air supply which is an important factor in establishing
combustion conditions.
3. Hazards to Humans
3-1 Analysis of Victims of Fire
The classification of the present causes of fire fatali-
ties in Japan today consists of carbon monoxide poisoning,
burns, contusions and bone fractures, unknown, other and
suicide"1"^. It is surmised that among those classified as
deaths due to burns, there was a good proportion consisting
of those who initially (principally) were victims of toxic
78
gases. Reports of. the results of investigations on degrees
of carbon monoxide-hemoglobin saturation in persons killed
2
)
in fire substantiate this .
Many high polymer materials are located inside buildings
as interior finishing materials and articles ;accomodated , and
there is a possibility for gases of high toxicities .other
than carbon monoxide which are peculiar to these materials
to be emitted during fires.
As a result of investigating the degrees of CO-Hb
saturation and cyanide levels in serum of 30 cases of
fatalities in fire, it was reported that most of those killed
had cyanide in their blood, with some having reached minimum
lethal doses .
In the U.S.A. and elsewhere, the connections with alcohol
4)and illnesses have been pointed out and clinical studies
of casualties due to fire have become of increasing importance.
This is necessary also from the standpoint of studying uncon-
firmed toxic substances produced in decomposition and combus-
tion of high polymer materials. It is regrettable that cases
of study regarding this are few in number in Japan because
of various restrictions.
3.2 Criteria for Evaluation
At the present stage, checks by animal experiments are
indispensable when examining combustion toxicity. The corre-
lation between humans and test- animals;and selection of the
79

kind of test animal are the problems in such case, In
studies made in the past, with regard at least to lethal
limits among physiological effects of toxic gases on various
test animals, classifications could be made according to
those for which the limit of lethal concentration rose with
increase in body-weight and those for which body-weight was
of no concern and a more or less constant level was indicated.
It may be said that the latter is more desirable from the
standpoint of handling in experiments.
With respect to selection of the kind of test animal, it
may be said that bigger animals would be suitable in case of
carrying out biological analyses in detail, but otherwise, it
may be said that small animals are desirable from the stand-
points of availability, rearing and management, securing of
quantity, ease of handling, and number required for a single
test. At present, using mice and rats are mainstreams in
Japan and the U.S.A., respectively, and it is necessary at
least for the correlation between these two to be investigated.
Regarding evaluation of gas toxicity, there are the
problems of acute toxicity and chronic toxicity. In relation
to acute toxicity, it would suffice to consider impediment of
activity or fatality. In contrast, with regard to chronic
toxicity, further studies must be made on setting of period
of observation after exposure, items of observation after
exposure, and methods of observation.
80

In consideration of the above; it is thought suitable
for acute toxicity which considers observation for a short
period after exposure to be taken as the tentative criterion
for evaluation.
k. Method of Evaluating Gas Toxicity During Building Fire
4.1 Evaluations of Relative Degrees of Toxicity of Various
Materials
In Japan at present, the combustion toxicities of materi-
als generally are being evaluated through relative comparisons.
The methods of evaluating toxicities of combustion products
may be broadly divided into evaluations by chemical analyses
of products and evaluations' by biological analyses using test
animals. The former have the advantage that combustion con-
ditions can be readily set in large number, but problems
remain concerning appropriateness of overall evaluation and
oversights in detection of toxic components -With the latter,
there is the advantage that the physiological effects on
humans can be estimated to an extent by the "effects seen in
the test animals, but there is a slight drawback with respect
to reproducibility. From the standpoint of overall evalua^
tion it may be said animal tests are advantageous at present.
Evaluations using test animals may be broadly divided
into methods evaluating with sample weights and heated
surface areas constant and methods (LC 50 ) applying techniques
81
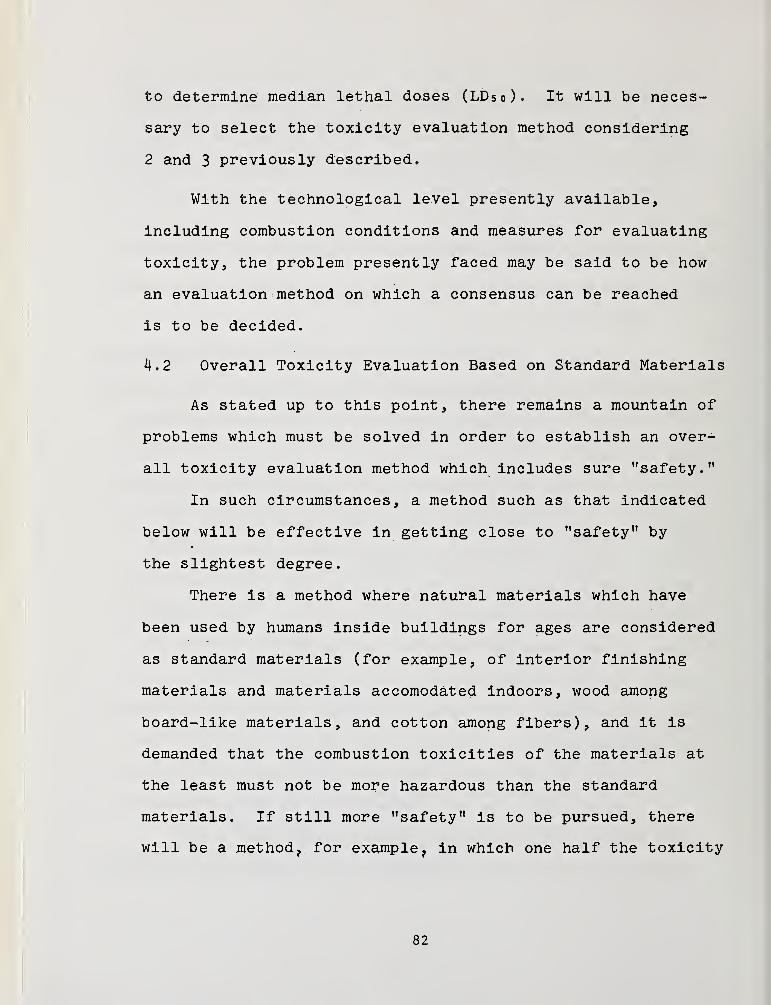
to determine median lethal doses (LD50). It will be neces-
sary to select the toxicity evaluation method considering
2 and 3 previously described.
With the technological level presently available,
including combustion conditions and measures for evaluating
toxicity, the problem presently faced may be said to be how
an evaluation method on which a consensus can be reached
is to be decided.
k.2 Overall Toxicity Evaluation Based on Standard Materials
As stated up to this point, there remains a mountain of
problems which must be solved in order to establish an over-
all toxicity evaluation method which includes sure "safety."
In such circumstances, a method such as that indicated
below will be effective in getting close to "safety" by
the slightest degree.
There is a method where natural materials which have
been used by humans inside buildings for ages are considered
as standard materials (for example, of interior finishing
materials and materials accomodated indoors, wood among
board-like materials, and cotton among fibers), and it is
demanded that the combustion toxicities of the materials at
the least must not be more hazardous than the standard
materials. If still more "safety" is to be pursued, there
will be a method, for example, in which one half the toxicity
82
of a standard material is sought of other materials.
In order tc secure "safety." it is necessary for the gas
concentration in the building during fire to be grasped, the
interior finishing materials restricted?and combustible
furniture and the like to be reduced for the allowable gas
concentration, but it will_ still be premature for a conclu-
sion to be drawn at the present stage *
References
7 1) Fire Defense Agency, "Fire Defense White Paper, n -
1978.
2) T.. Yamada, et al., "Causes of Deaths in Fires,"
Fire Science Laboratory Report, No. 11, 197^.
3) M. Fukui , "Cyanide in Serum of Persons Killed in
Fires Assessed by the Quantitative Colorimetri.c Method,
Report of the National Research Institute of Police Science,
Vol. 22, No. 1, Mar, 1969.
H) Berl, W. G.
, and Halpin, B. M. , "Human Fatalities
from Unwanted Fires," APL/JHU FPP TR 37, Dec'. 1978.
83
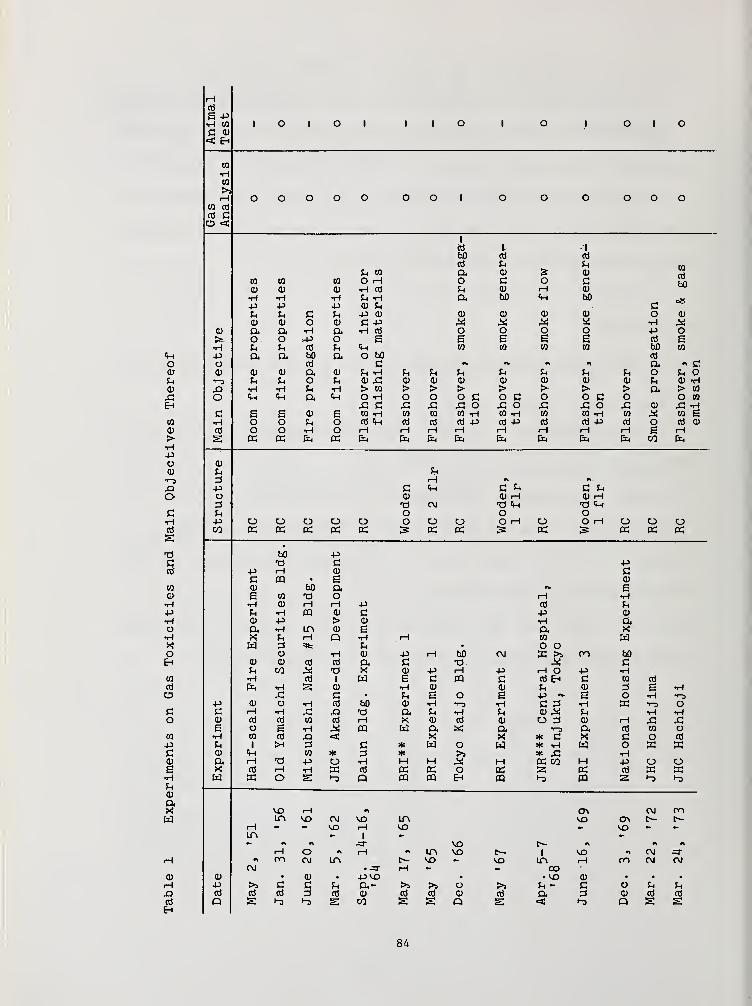
i—I
cd
E P•H CO 1 o I o 1 i 1 o 1 o i o I oC 0< Eh
CO
•Hw>3rH o o o o o o o 1 o o o O O o
CO Cd
cd Co <;
1
cd I 1
bO cd cd
cd u pgasP co a 0 % 0
CO CO CO O H o c o c0 0 0 •H cd p 0 rH 0H H •H Pi -H a bO Cm bO43 p p 0 Pi
P p P P 0 0 0 0 0 o VI/
0 0 o 0 C -P ^! •H(U a a •H a •H cd O o O O pf*- o o „P O E E E E E cd
H P Pi cd p Ch CO CO to CO faO CO
P Pi (X bO O bO cd
o o cd «v a0 0 0 0 a 0 P iH p p P P P p P o M op "i—
2
P Pi O p 0 xi 0 0 0 0 0 0 0 p fl 1 H0 X3 •H •H P •H > CO > > > > !> > a >> 09
,c o Cm «M a <m O iH o o o c o c o o c o r\ 09
Eh x: c xi X! O x: o xi X! O X! 0 •Hc e 6 0 E CO iH CO m CO «H CO tH CO CO iH to CO E
CO •H o o p, o Cd Cm cd cd cd p cd p cd cd p cd o frt 00 cd o o •H o rH rH rH rH rH H rH rH E ,
1
> g cd CC Ph PC Ph Ph Ph Ph fe Ph Ph CO FV.
•H1
1
O 00 P P
rH ft- ft-
X! P Cm C f* C Poon de CM
0 rHd Cm
0 rHT3 <M
P o o O•H -p o o O O O o O o O rH o O rH O ocd CO K « K 13 « czS
faO PC d c Pcd
nt Bl me en
10 0 bO a •V E0 E to "d o rH H•H •H 0 rH rH P cd Pit er tl CQ
ve en it De
o a •H LO 0 E a X•H X P rH Q •H rH CO inX w P . o oo o H 0 P rH bO CM K >» bOEh 0 0 cd cd a C ^! c
p CO •o 0 p H p rH O p •HCO •H cd 1 w E CQ cd Eh c CO cd
cd Ph •H 0 •H 0 0 p 0 E •HO X3 c P E o E -p - E o •Hp 0 o H cd to 0 •H "rj •H C 3 •H T~3 o
C c rH •H -d D. P •H P 0 ^! p •H •HO 0 cd cd CO cd rH X 0 cd 0 O 3 0 H Xi X!
s o E •H CQ H Q, a •rj a cd CO oCO •H co cd ,Q < X x * C c o cd
•p P >H C * W o w * tH w o WC 0 CO * >j * XI •H0 rH a .p o •H H H iij H K CO H p o Oe cd rH •H cd K o cc S K cd S3•H W o g Q CQ CQ Eh CQ »"3 CQ 1-3 •"3
P0a
vo rH ft CM mw in VD C\J vo LTi VO cr> f— c—
rH VO rH VO voLTV
•=r VO t~- r\ r\
rH o ft rH in VD C— 1 VD ft CMH
CMon CM
• -=r
t^rH
VD inCO
H m CM CM
d) 0 0 p vo • vo 0rH P >> C a p a- >> >5 O >J p - C o P PX> cd cd cd cd 0 cd cd 0 cd a 0 cd cd
cd Q g •"5 •-5 g CO g g Q g <c Q g gEh
84
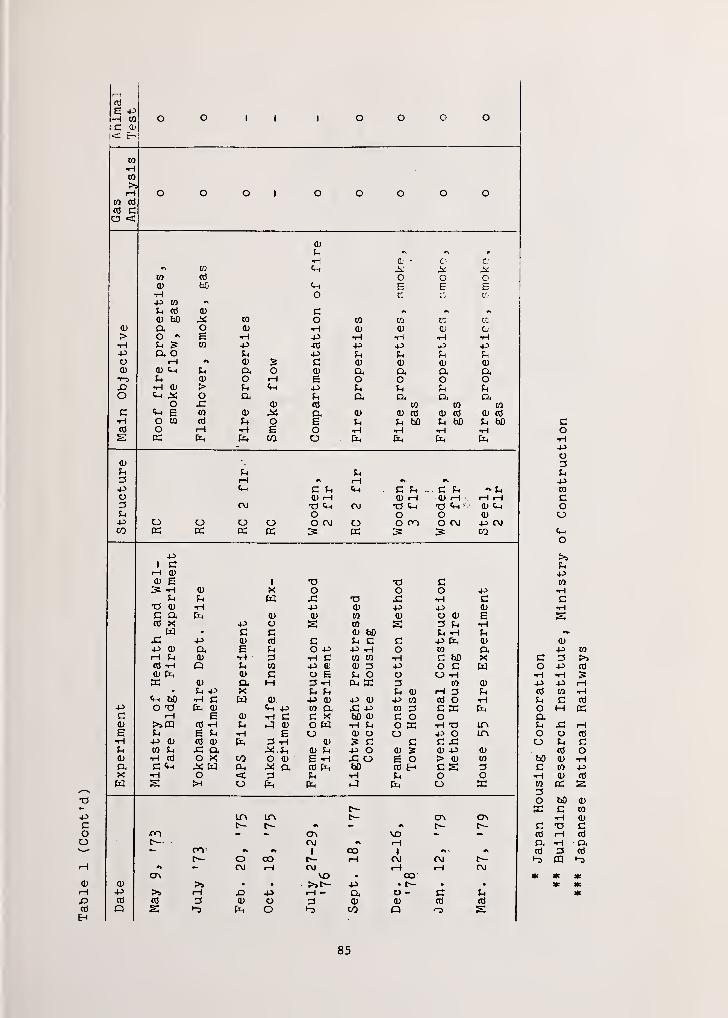
1—1
cd
E P•H CO O 0 1 1 1 0 0 O 0C CU
<: Eh
CO
HCO
>rH O O O 1 O 0 0 O 0
co cd
cO c
CD
M•H CD
•C' c
*" CO Cm ^ ^£CO TO O 0 0CD Cm E E E•H O 11 y..p cor MM CD CD Cft) bD CO O CO CO CO v.
CD CX CD •H CD CD 0 (v
i> 0 ** r- •H P •H H •H •H•H M 3 CO P cd P P P PP CX O m p M u Ch MO rH »\ CD C 0 CD CD CD
ft) CD Cm M CX O CD CX CX CX CXT"3 m CD O rH E 0 0 0 O,Q •H CD Cm p M u M Mf—
s
0 cx M CX CX CX CX0 CD cd CO CO CO
(—
•
M CQ IV r-V CX <D cd cd cd cd CD cdiH O CO CD £+ O E M m bO m bO m bOTO 1 "rH CI O •H •H •H •H
rvPhr_ co O Pm Cm
<D
M M urH rH **
-P Cm c u Cm C U ..Cm *>• MO d) rH CD rH CD rH rH rHmm C\J TJ Cm OJ TJ Cm "O *M ' CD CmM O O 0 CD+3 O 0 O OJ O O CI O OJ P OJCO K K K 15 K CO
p1 c
rH CD
CD fc 1 TJ cIS- iH CD X O O 0 P
m M w si 13 •H CCD •H p CD P P CD
C CX Cm 0) <D CO CD O CD Ecd X p 0 CO 3 M •Hw C c CD bD M iH M
-P CD cd c u c c P ft)
-P CD ft E u 0 p P -H 0 CO CXrH m CD •H 3 •H C CO CO •H C bO XCd *H Q M CO P ft) CD 3 p O C wCD Ph CD c 0 E M O 0 O -H
CD CX M 3"-H CO 0m P X M M m CD rH 3 M
M-t uu H C w . CD P ft) P CD P CQ cd O •Hp O TJ CD Cm p CO D< x: p CO 3 C Xc rH E CD •H C C X bO CD c 0 0ft) >>CQ cd tH m m! CD O W H M 0 w •H T3f—
»
E M E M •H E O CD O P O LP\•H P CD cd cd Cm 3 iH CD > C c C £m CO m X! CX X-4H CD U P O CD S CD P CDCD •H cd 0 X CO O CD E -H £ O E O > CD CO
CX C Cm ^ w Pm X CX cd bO cd E-i c s 3X •H 0 M -H M 0 0w >4 O i-J 0 X
ir\ <T\t
—
r~— t-—0-1 en
- f—.. - CVJ r-
i
co •» •» CO 1•% >. •»
r— 0 00 rH CVJ CM** OJ rH Oi rH rH OJ
CTN vo COCD >s P> * t—-P >» rH .Q P rH - CX O - MCtj cd 3 CD O d CD CD cd cdQ S •-5 Cm O •-0 CO P 0
p co
c 30 p cd
•HP p rHcd CO •HU C cd
0 H CCCXM rH0 O cd
M ccd 0
bO ft) •HC CO P•H ft) cdCO K3O faO ft)
tc c CO
•H ft)
C •0 Ccd rH cd
a H CXcd 3 cd•-3 CQ rO
** *
85
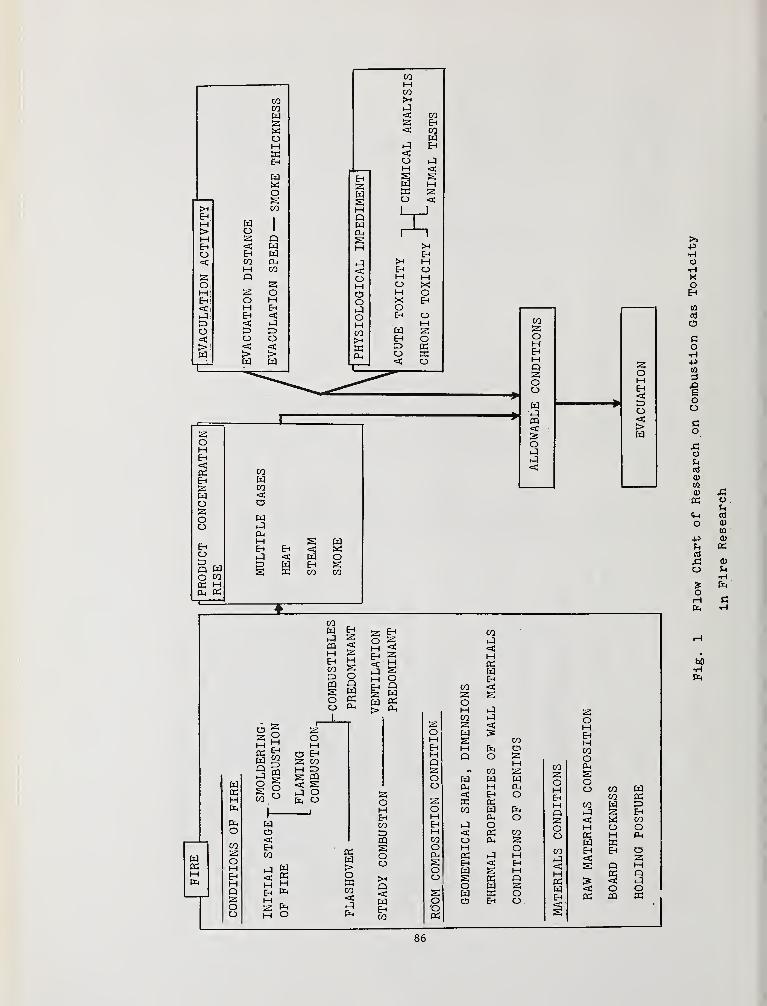
COCOmh
«oMaEh
Hos
>H CO£h
|H w>, o 1
H 55 QEh; < WU Eh W< CO Ph
H CO55 Qo 55
TIo
o M<i H Eh•^1 EH <t=>\o & £=>
<! o o< <& > >
1
2OHEh<KEh55Wosoo
EhOC3Q WO oo
K HPL, Ph
COHrn\/J
1—
1
coEh
< COWEh
<O k-1M <Cs SW M
s
EhX HEhM OO H
XM oX EhOEh O
HW 55Eh oI=> KO Ph"o
cowco<owPhH S wEh Eh <h-1 < W ot> W Eh ss K CO CO
cow EH
<2
co S!3 OCQ QS WO KO Ph
_L
EH
MsoQw
> p-l
Q n
co
ensoo
55oHEhCOt=>
CQSOO
[33
O<;EHCO
j w< KH HEh
55H O
pc;
w>owCO<Ph
55oHEhCOIz>
CQSOOtHQ<WEhCO
CO55OHCO55WSMQ
WPh<CO
<oMPHEhWSOwo
CO
<HPHWEh<CSiJ
PhOCOP3HEh
WPhOKPh
<JSPhP3wEh
CO&55H55wPhoPhoCO55O
Q55Oo
.
55oHEhHCOO(X,
so Wo COCO Ph
CO w 5355 EH
<c COM O OPi H PhwEh Eh O
55S Q M
PS Q5s <<C o OPH PQ
-p
oEh
Oco•H-Pco
•iOo
o
£ofnCO
CD
co
CD
«OhO
•Pucd
o&oHPh
^:OPiCTJ
CD
CO
0PS
CD
P.•HPh
C
bO
Ph
86
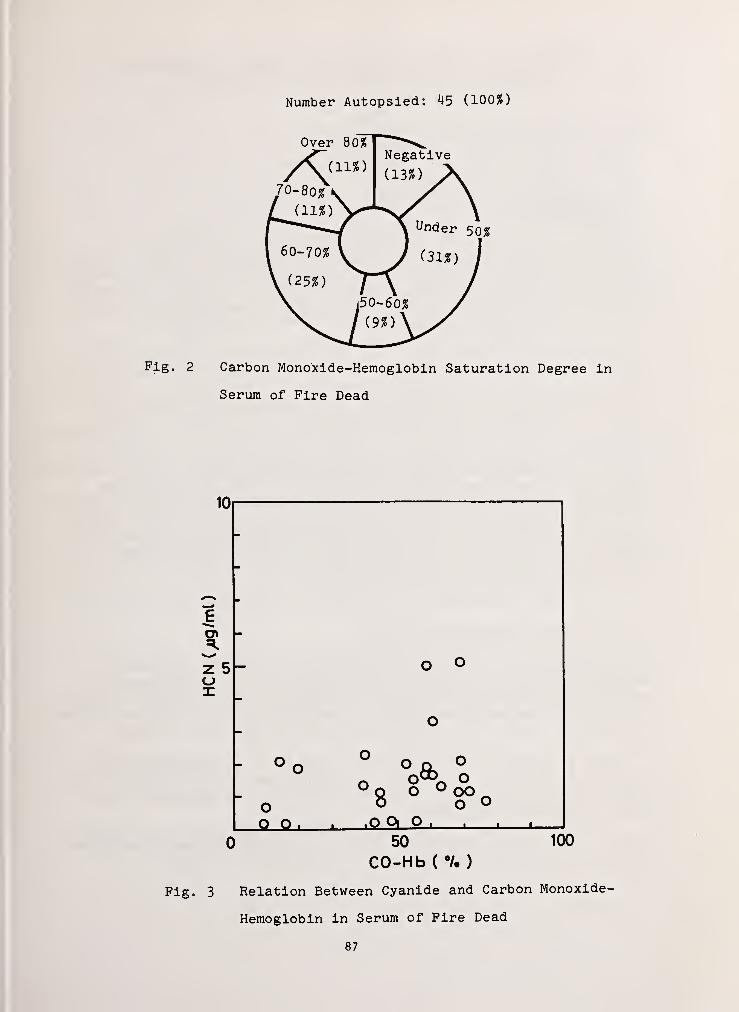
Number Autopsied; 45 (10055)
Fig. 2 Carbon Monoxide-Hemoglobin Saturation Degree in
Serum of Fire Dead
10
5
oX
o
ooQ 0
>fk°
o °oo no o,QO| O
. .
8
Fig. 3
50 100
CO-Hb ( °/. )
Relation Between Cyanide and Carbon Monoxide-
Hemoglobin in Serum of Fire Dead
87
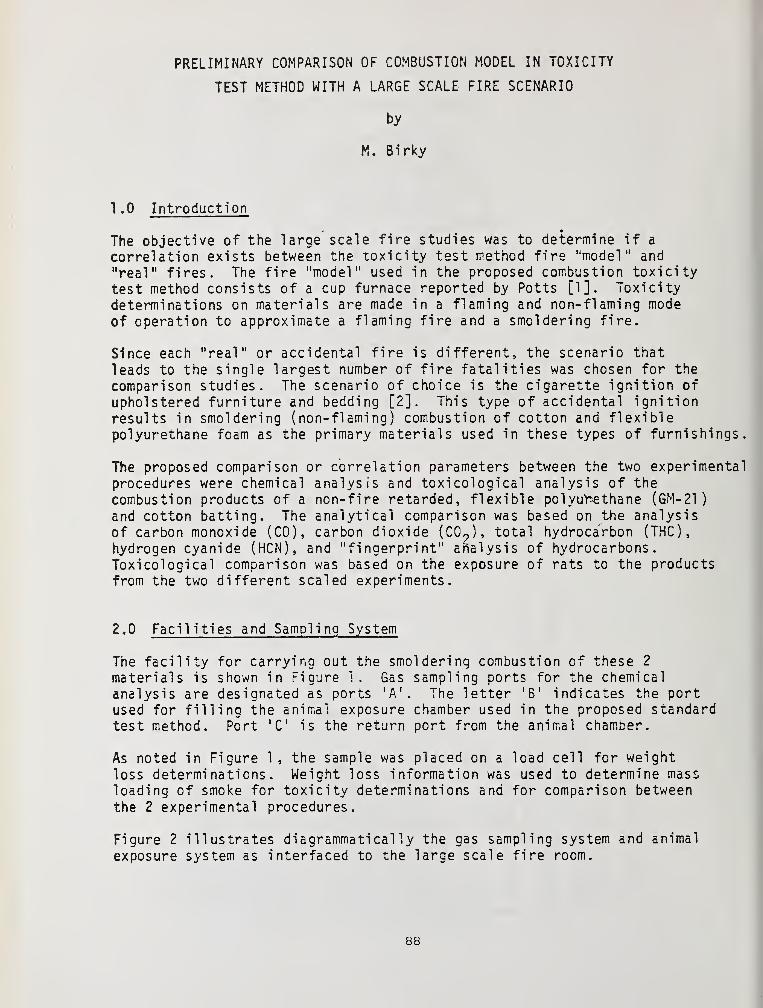
PRELIMINARY COMPARISON OF COMBUSTION MODEL IN TOXICITY
TEST METHOD WITH A LARGE SCALE FIRE SCENARIO
by
M. Birky
1 .0 Introduction
The objective of the large scale fire studies was to determine if a
correlation exists between the toxicity test method fire "model" and
"real" fires. The fire "model" used in the proposed combustion toxicitytest method consists of a cup furnace reported by Potts [1]. Toxicitydeterminations on materials are made in a flaming and non-flaming mode
of operation to approximate a flaming fire and a smoldering fire.
Since each "real" or accidental fire is different, the scenario that
leads to the single largest number of fire fatalities was chosen for the
comparison studies. The scenario of choice is the cigarette ignition ofupholstered furniture and bedding [2]. This type of accidental ignitionresults in smoldering (non-flaming) combustion of cotton and flexiblepolyurethane foam as the primary materials used in these types of furnishings.
The proposed comparison or correlation parameters between the two experimentalprocedures were chemical analysis and toxicological analysis of the
combustion products of a non-fire retarded, flexible polyurethane (GM-21
)
and cotton batting. The analytical comparison was based on the analysisof carbon monoxide (CO), carbon dioxide (CO,,), total hydrocarbon (THC),
hydrogen cyanide (HCN), and "fingerprint" analysis of hydrocarbons.Toxicological comparison was based on the exposure of rats to the productsfrom the two different scaled experiments.
2.0 Facilities and Sampling System
The facility for carrying out the smoldering combustion of these 2
materials is shown in Figure 1. Gas sampling ports for the chemical
analysis are designated as ports 'A'. The letter 'B' indicates the portused for filling the animal exposure chamber used in the proposed standardtest method. Port 1 C is the return port from the animal chamber.
As noted in Figure 1 , the sample was placed on a load cell for weightloss determinations. Weight loss information was used to determine massloading of smoke for toxicity determinations and for comparison betweenthe 2 experimental procedures.
Figure 2 illustrates diagrammati cally the gas sampling system and animal
exposure system as interfaced to the large scale fire room.
88
3.0 Polyurethane Results
3.1 Analytical
A summary of the preliminary analysis of the various gas species for the
large scale experiments and the test protocol on flexible polyurethaneat various concentrations is shown in Table 1. As noted in the tablethe HCN concentrations are higher in the large scale experiments by a
factor of 2 or 3 depending on size of sample decomposed* However, froma toxicological perspective this difference is not very significantsince the lethal level for HCN is about 200 ppm for a 30 minute exposure.
The THC (total hydrocarbon) concentrations are higher in the test protocolsystem than in the self smoldering large scale tests (Table 1). However,the "fingerprints" of the hydrocarbons as determined by gas chromatographyusing a flame detector (FID) are nearly identical.
As noted in Table 1, the CO and CO2 concentrations are very similar in
the 2 sets of experiments.
3.2 Toxicological Comparison
The LCcq for this polyurethane foam in the non- flaming model as determinedby the test protocol is about 16 mg/1 . The deaths are not due to HCN orCO. This fact was substantiated by environmental measurements of HCN,
CO, and blood chemistry. This conclusion is further verified by deaths thatoccur 3 to 1 5 days post-exposure. The cause of the deaths in terms ofchemical species has not been identified. However, death is attributedto lung damage due to a chemical irritant. TDI is a possible candidate.Analytical measurements for TDI are in progress to confirm this hypothesis.
Exposure of animals to the products generated in the room by self-smoldering combustion results in an LC
5Qof 35-40 mg/1. Death in this
case is due to CO.
As noted, the LC5Q
and the toxicological syndromes are different in the2 experimental set-ups. A factor of 2 difference in the LCr
Qvalues is
not too significant. However, the difference in toxicological syndromesuggests that the mode of combustion is not entirely the same eventhough the chemical analysis shows very little difference.
4.0 Cotton Results
4.1 Analytical
A summary of the analytical results on cotton is shown in Table II.
This work is still in progress.
89

Carbon monoxide and carbon dioxide are somewhat higher in the protocol
system. At 40 mg/1 the ratio of C0/C0« for protocol system is 0.17 and
for the large scale is 0.20. Total hyarocarbon concentrations in the
test system are approximately 2 times the concentrations produced in the
large scale self-smoldering case.
4.2 Toxicological Comparison
The LC50
for the cotton materials as determined by the test method in
the non-flaming mode is about 54 mg/1. Death was attributed to carbonmonoxide. Similar data from the large scale, although incomplete, gavean approximate LC,-q of 60 mg/1. Again the cause of death was attributedto carbon monoxide.
From the analytical and toxicological data on cotton, the test protocolapproximates a large scale self-smoldering fire very well.
REFERENCES
[1] Potts, W. J. and Lederer, T. S., "A Method for Comparative Testing ofSmoke Toxicity," Journal of Combustion Toxicity, Vol. 4, pp. 114-162(May 1977).
[2] Clarke, III, F. B. and Ottoson, J., Fire Death Scenario and Fire SafetyPlanning, Fire Journal, Volume 70, No. 3 (May 1976).
90
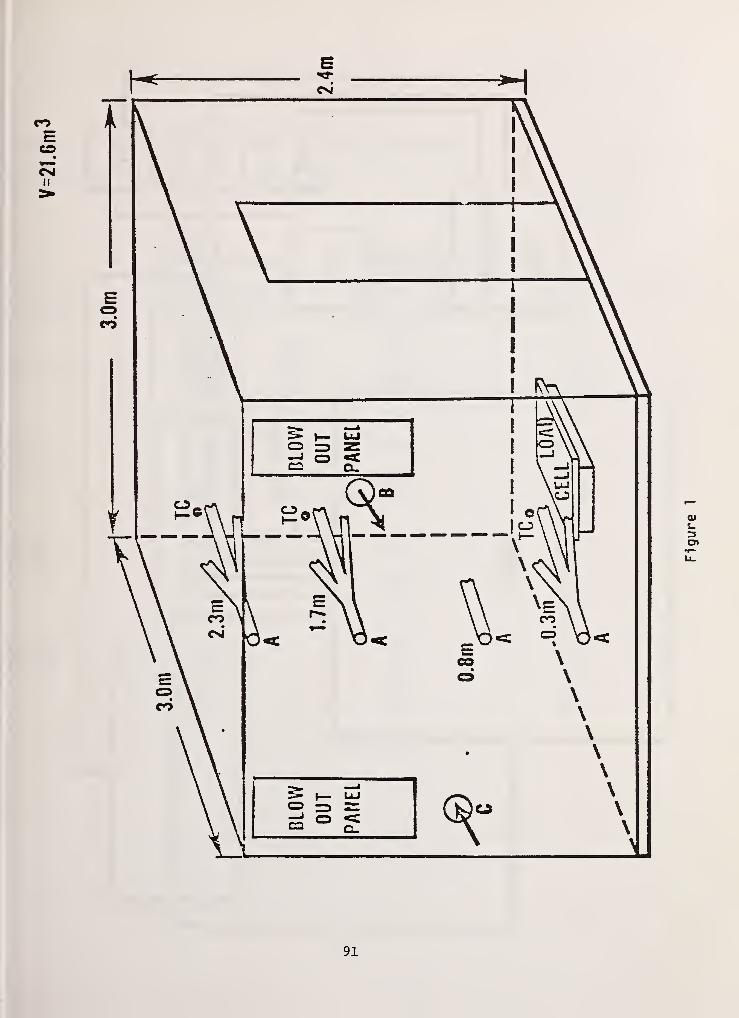
91

92
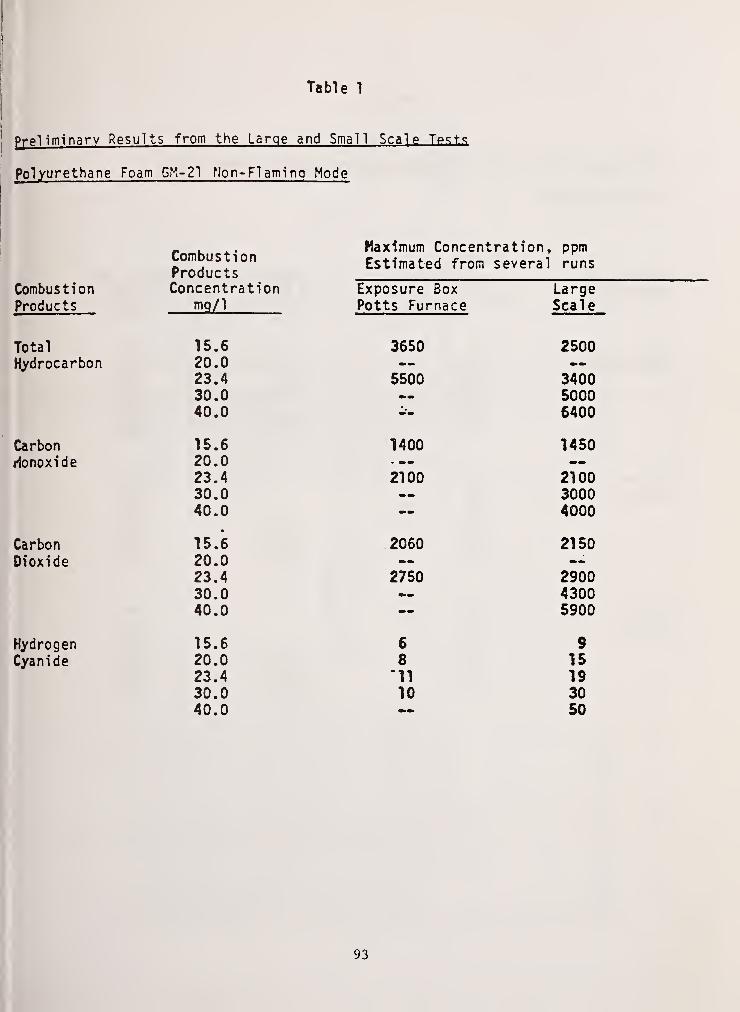
I Table 1
Preliminary Results from the Large and Small Scalp Tpst.s
Polyurethane Foam GM-21 Non-Flaming Mode
CombustionProducts
Maximum Concentration, ppmEstimated from several runs
Combustion Concentration Exoosure Box LargeProducts mo/1 Potts Furnace Scale
Total 15.6 3650 2500Hydrocarbon 20.0
23.4 5500 340030.0 500040.0 6400
Carbon 15.6 1400 1450rionoxide 20.0
23.4 2100 210030.0 300040.0 4000
Carbon 15.6 2060 2150Dioxide 20.0
23.4 2750 290030.0 430040.0 5900
Hydrogen 15.6 6 9
Cyanide 20.0 8 1523.4 "11 1930.0 10 3040.0 50
93
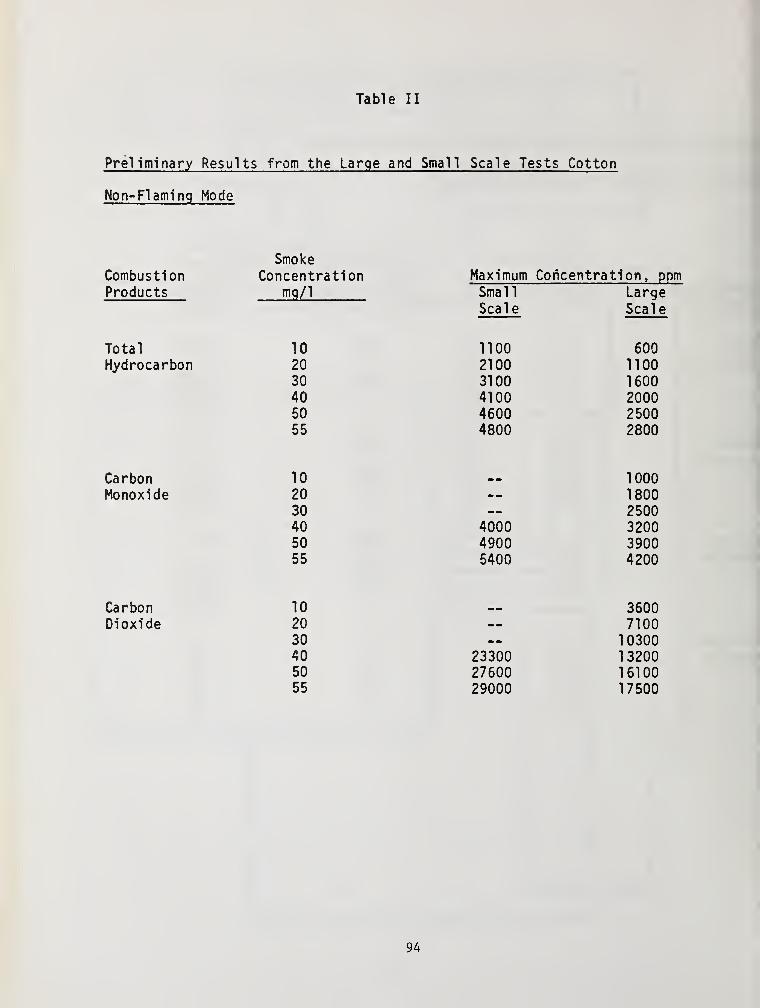
Table II
Preliminary Results from the Large and Small Scale Tests Cotton
Non- Flaming Mode
CombustionProducts
SmokeConcentration Maximum Concentration, ppm
Small LargeScale Scale
Total 10 1100 600Hydrocarbon 20 2100 1100
30 3100 160040 4100 200050 4600 250055 4800 2800
Carbon 10 — 1000Monoxide 20 1800
30 — 250040 4000 320050 4900 390055 5400 4200
CarbonDioxide
1020304050
55
233002760029000
36007100
10300132001610017500
94
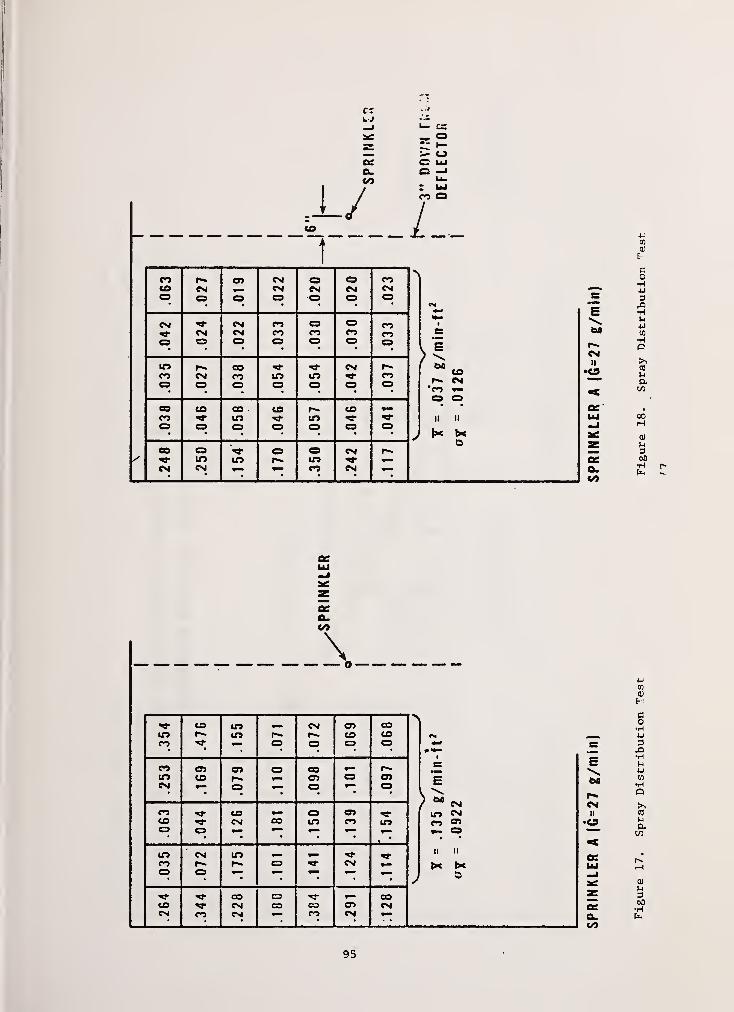
LJ ~
— i~ Oa. o —
"
95
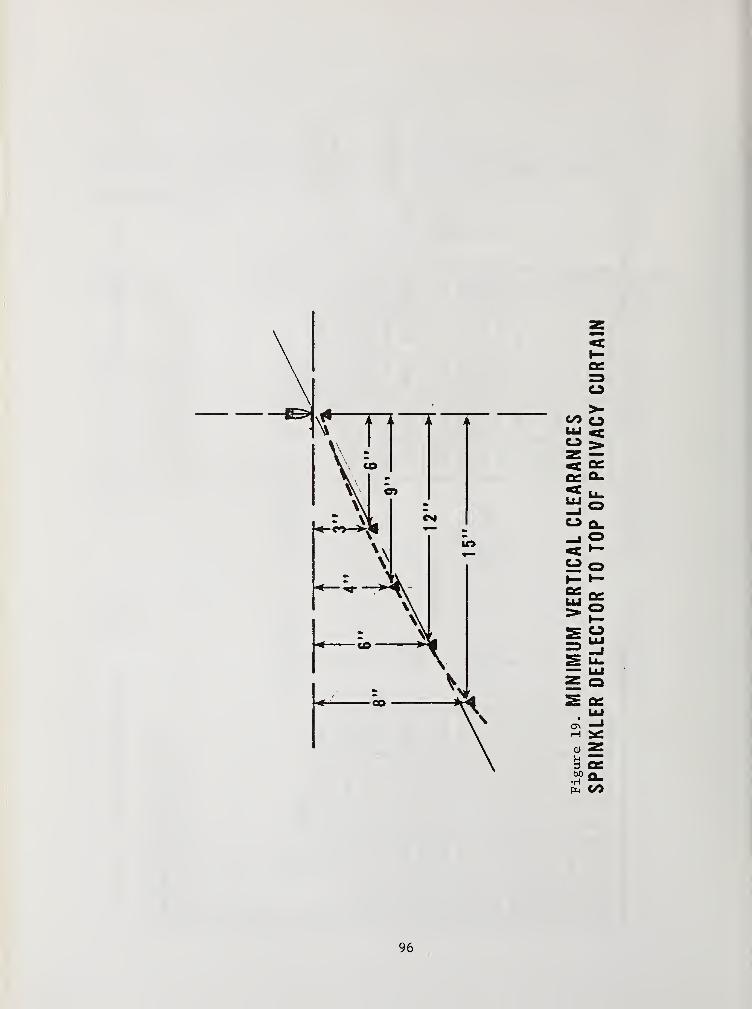
>-CO oUJ «f
Jjjo
o o._j o£2 o
oO
2 Q£UJ
r ££ CO
7 /
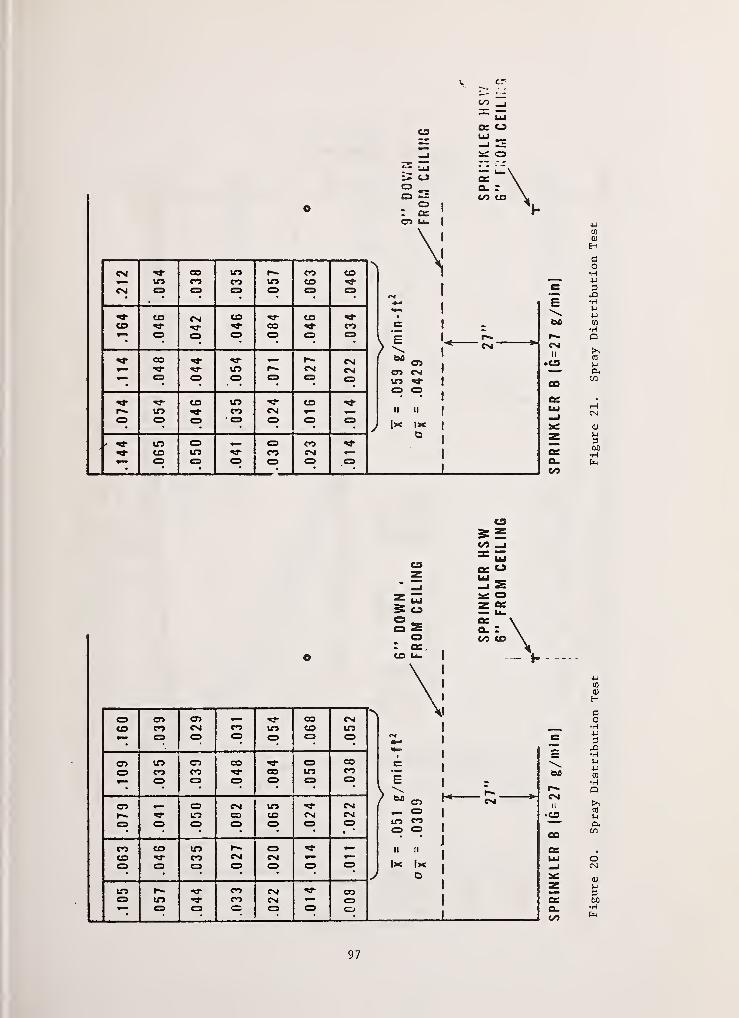
V
03
QJ
HCo•H
3rd•HS-l
r» P
U
CO
u360•H
as
C/5 _1
CD
5 CO
- ccCO u»
CO CO CO CO CMCO co CM CO CO LOo CO o CO CO CO
•-•c
ECD LTJ (75 CO CO GO C \O CO CO co in CO CM
r—CO CD CO o CO CO E
) M CMIIC7> O lO CM CO 1 CM
r-~ ««# L.O co CO CM CM CO 1
COCO 1
•cso CO CO C3 CO CO CO toCO
00
CO CO lf> r» CO ii II1
ccCO CO CM CM i
Ix IX|
0
uuco o CO CO CO CO o
)—Jac
in r~ CO CM coz
CD LO *J- CO CM CO ccCO c CO o a SP
OSo_ rCO CO\
0)
a)
HCO•H4-1
,C
CO
•HP>*
MP.
oCN
QJ
U300•H
Fx
97
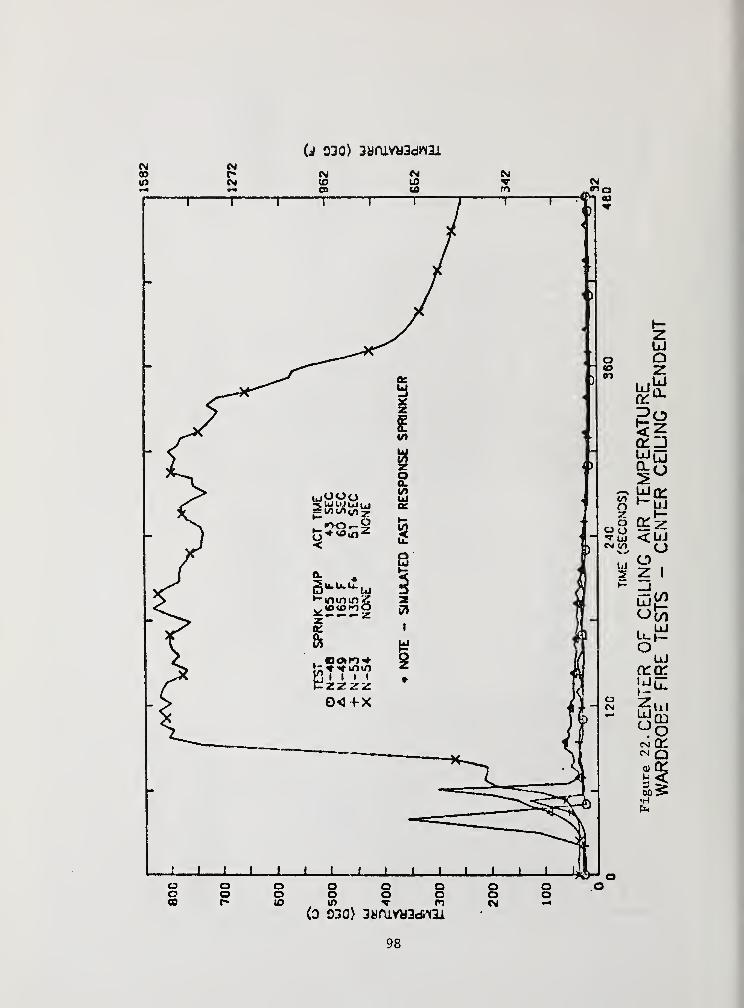
oooaoooo .ooooooooo(3 030) 3«fUVy3d«li
98
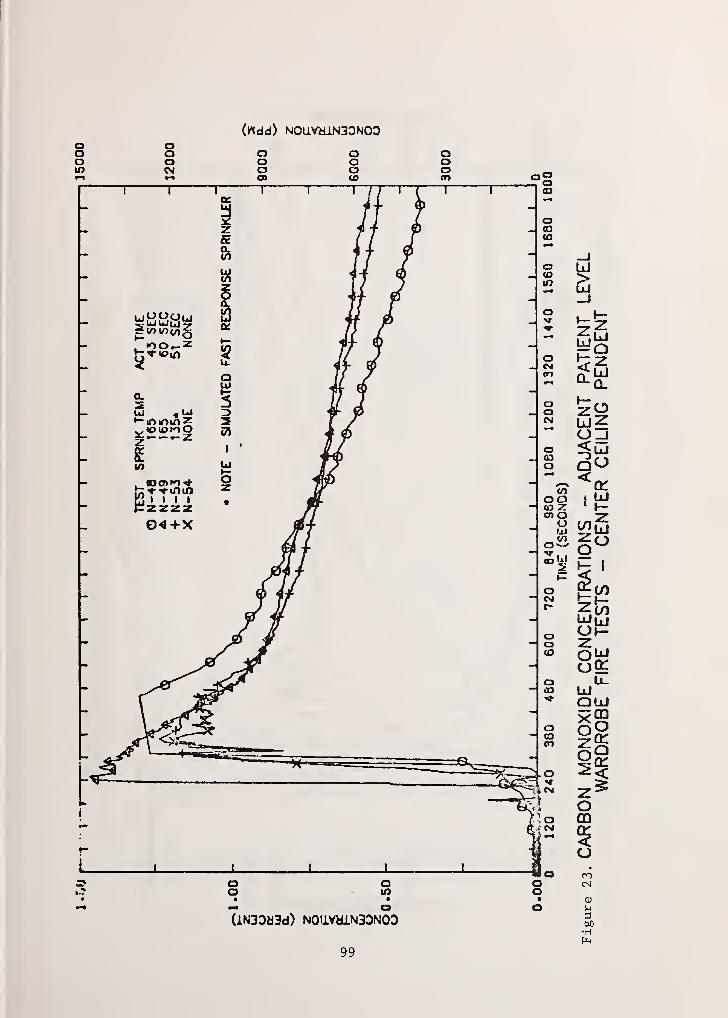

<Hdd) NOLLV«1N30N03
(lN3DH3d) NOU.VHLN3DNO0
100
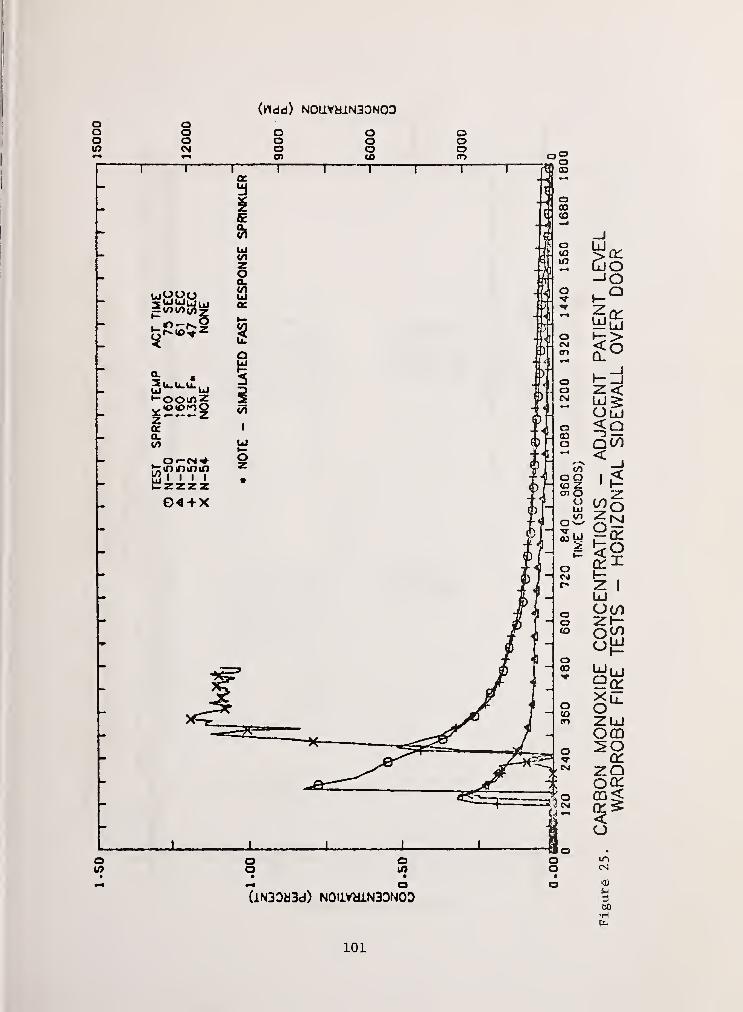
(rtdd) NOUVblN30NOD
(lN3DH3d) NOliVaiNBONOD 1-3
00•H
101

oooin
(ndd) NOLLVH1N30NODoooo
oaato
UlOUu•2 UJ UJ VxJ UJ
.in —
£
zo
a2 ,UJU.U.U.W
-,<0<OK>0
a
- $
O «- CN
I I I 1zzzzQ4+X
Q
I
UJ
Oz
oto
oo oin
(lN30S3d) N0U.VHJLN3DN0D
102
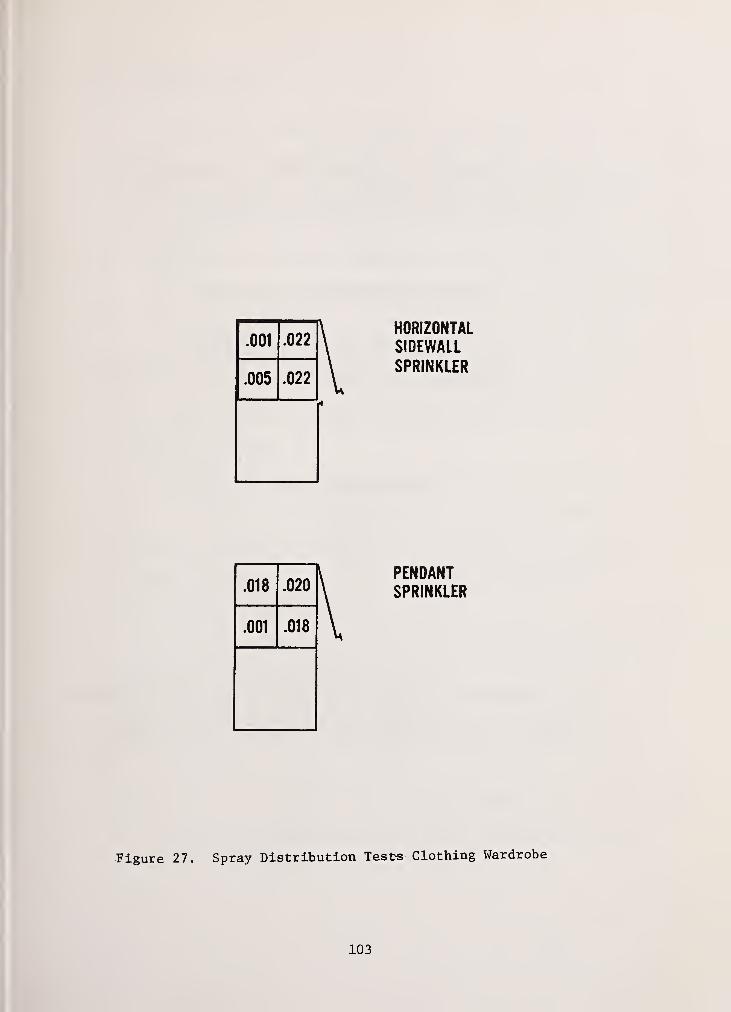
.001 .022
.005 .022
HORIZONTAL
SIDEWALL
SPRINKLER
.018 .020
.001 .018
PENDANTSPRINKLER
Figure 27. Spray Distribution Tests Clothing Wardrobe
103
Study of Toxic Gas Generated During Combustion
-- In Case of Natural & Artificial Lawn —
by
Yoichi NISHIMARU & Yukio TSUDA
Department of Legal Medicine
Yokohama City University, School of Medicine
October 16, 1980
For presentation at 5th UJNR Conference on Fire Research
( Japan - United States Panel on Natural Resources )
104
1. Introduction
In present Japan, the great interest and fear of
people's are strong earthquake attack. We, Japanese
people dwelling in those overpopulated cities and living
considers that if we encounter a strong earthquake,
damages and casualities must be beyond our expectations.
In such case, sufferers are supposed to seek refuge
at the public extensive refuge designated by each local
self-governing body. However, as refuges which require
certain extent are exceedingly limited in big cities,
Golfcourses, Baseball game studiams and so on are
designated actually.
Though Yokohama City which is the second biggest
city in Japan in its population, has a small mumber of
extensive refuges in a center of the city. Its typical
refuges are natural lawny golf courses or artficial
lawny baseball game studiam.
In case of a fire spread to those places, assuming
what sort of damages and casualities are occured, we
burnt artificial lawn and natural lawn in the experi-
mental facilities for combution based on the standard
of the Ministry of Construction and then test on living
animals in it for studing what type of toxic gases
generated during combustion and how to influent on them.
105
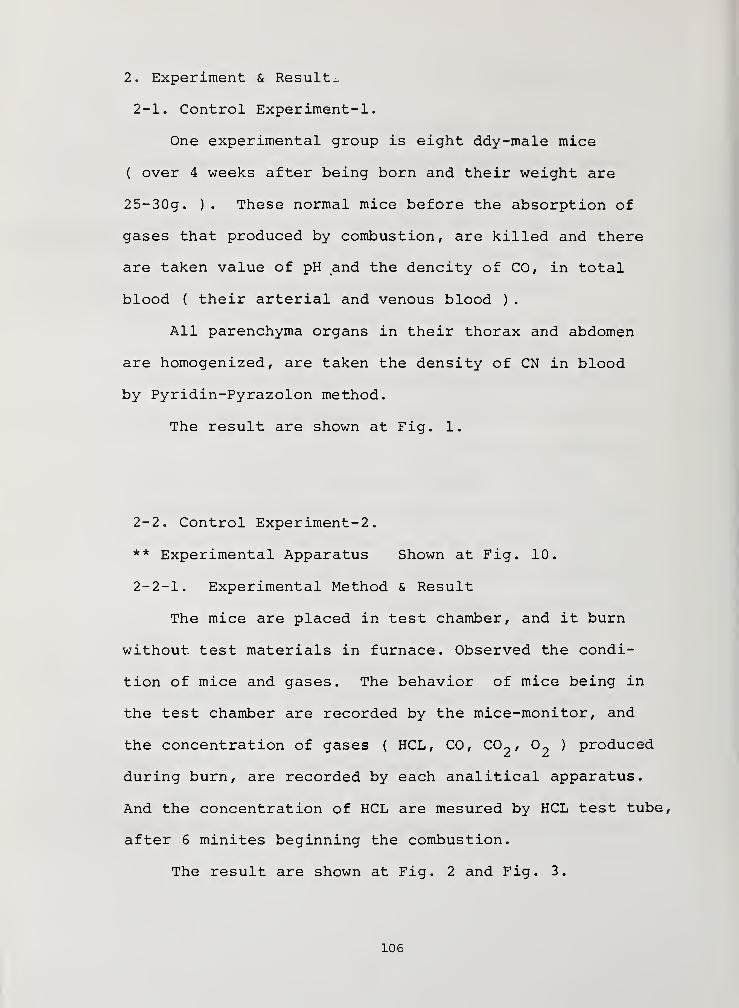
2. Experiment & Result-
2-1. Control Experiment-1
.
One experimental group is eight ddy-male mice
( over 4 weeks after being born and their weight are
25-30g. ) . These normal mice before the absorption of
gases that produced by combustion, are killed and there
are taken value of pH and the dencity of CO, in total
blood ( their arterial and venous blood )
.
All parenchyma organs in their thorax and abdomen
are homogenized, are taken the density of CN in blood
by Pyridin-Pyrazolon method.
The result are shown at Fig. 1.
2-2. Control Experiment-2
.
** Experimental Apparatus Shown at Fig. 10.
2-2-1. Experimental Method & Result
The mice are placed in test chamber, and it burn
without test materials in furnace. Observed the condi-
tion of mice and gases. The behavior of mice being in
the test chamber are recorded by the mice-monitor, and
the concentration of gases ( HCL, CO, C02 ,
02
) produced
during burn, are recorded by each analitical apparatus.
And the concentration of HCL are mesured by HCL test tube,
after 6 minites beginning the combustion.
The result are shown at Fig. 2 and Fig. 3.
106
** Combustion Method : When the appratus is switched
on, air ( 3 X/min. ) and propane-gas ( 350 mjl/min. ) are
automatically taken into the furnace. After this, the pro-
pane-gas is burned. After 3 minutes, electric heater ( 1.5
kw ) is switched on and after 6 minutes, switched off, in
automatically. Burn by propane-gas is put out after 10
minutes
.
2-3. Experiment-3 . ( Material : Natural lawn )
2-3-1. Experimental Method & Result.
The method and object are same the Control Experiment
-2. In this time, the test material in furnace is natural
dry lawn ( 9 0g. )
.
The result are shown at Fig. 4 and Fig. 5.
2-4. Experiment-4 . ( Material : Artificial lawn )
2-4-1. Experimental Method & Result.
In this experiment, we use the artificial lawn as
test material in furnace. This material is_90g. _in ; weight,
20x20cm. in width at one time.
The result are shown at Fig. 6 and Fig. 7.
107
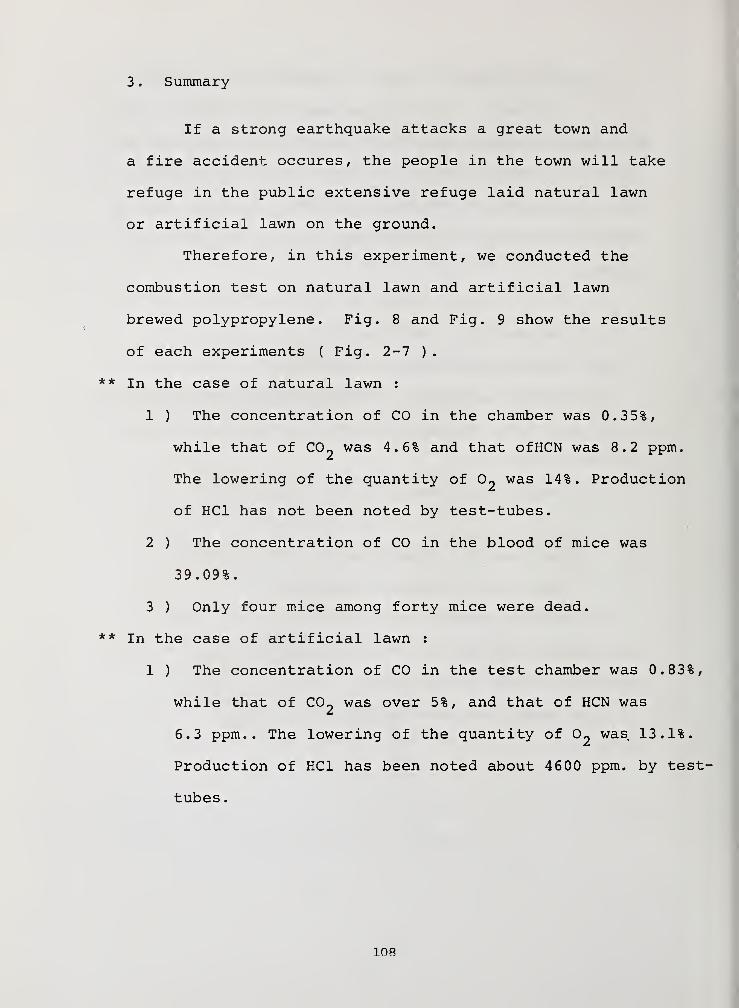
3 . Summary
If a strong earthquake attacks a great town and
a fire accident occures, the people in the town will take
refuge in the public extensive refuge laid natural lawn
or artificial lawn on the ground.
Therefore, in this experiment, we conducted the
combustion test on natural lawn and artificial lawn
brewed polypropylene. Fig. 8 and Fig. 9 show the results
of each experiments ( Fig. 2-7 ).
** In the case of natural lawn :
1 ) The concentration of CO in the chamber was 0.35%,
while that of C02was 4.6% and that ofHCN was 8.2 ppm.
The lowering of the quantity of 02was 14%. Production
of HC1 has not been noted by test-tubes.
2 ) The concentration of CO in the blood of mice was
39.09%.
3 ) Only four mice among forty mice were dead.
** In the case of artificial lawn :
1 ) The concentration of CO in the test chamber was 0.83%,
while that of C02was over 5%, and that of HCN was
6.3 ppm.. The lowering of the quantity of 02was 13.1%.
Production of HC1 has been noted about 4600 ppm. by test-
tubes .
108

2 ) The concentration of CO in the blood of the mice
was 39.54%.
3 ) The all mice were dead.
The results of this experiment have shown, that
a place laid artificial lawn on the ground was unfit
for a public extensive refuge.
109
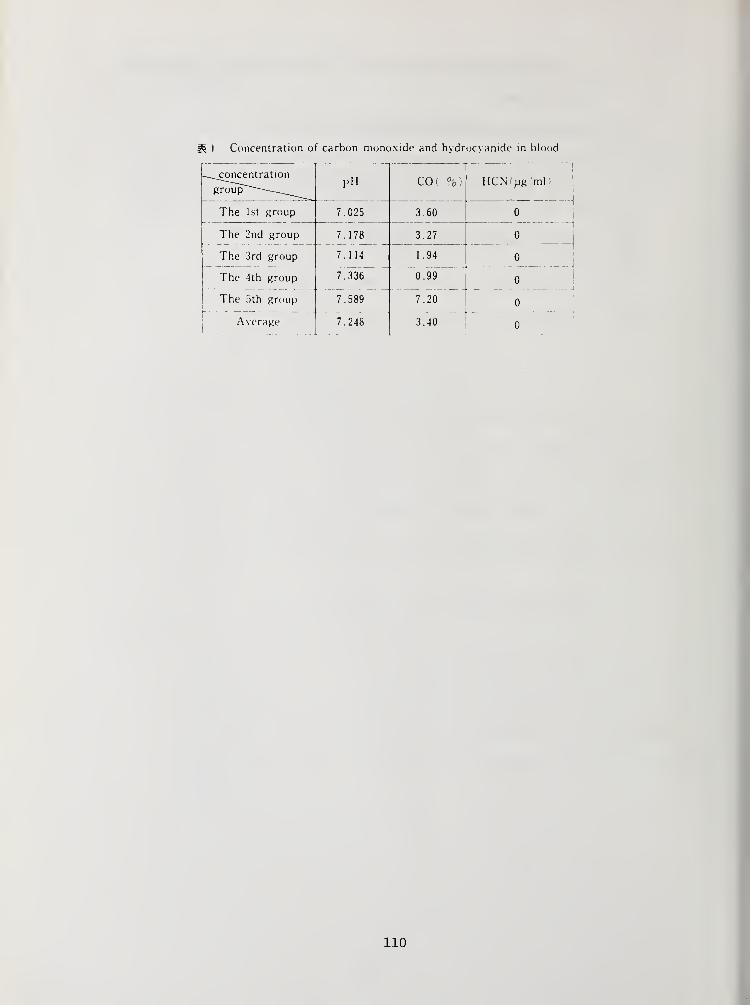
H I Concentration of carbon monoxide and hydrocyanide in blood
PHconcentration
group
The 1st group
The 2nd group
The 3rd group
The 4th group
The 5th group
Average
7.025
7.178
7.114
7. 336"
7.589
7.248
CO( %)
3.60
3.27
1.94
0.99"
7.20
3.40
HCN^g ml
110

2 Combustion on no test material in the furnace (Concentration of gases
Maximumtemperature
in
the furnace
concentration of poisonous
gases in the test chamberO2 minimumconcentration
in
the test chamber
17.2%
Number of
dead mice
0
CO CO 2 II CN HCL
Oppm500 t 150ppm 2.30 % Oppm
520 f
495 t
lOOppm 2.25 % Oppm Oppm 17.8% 0
150ppm 2.15% Oppm Oppm 17.8% 0
490 r ISOppm 18.0% Oppm Oppm 18.0% 0
580 °Q 150ppm 2.10% Oppm Oppm 17.4% 0
517 "C 140ppm 2.18% Oppm Oppm 17.6% 0
g 3 Combustion on no test material in the furnace (Concentration
of carbon monoxide and hydrocyanide in blood)
^^concentration
group"PH com HCN(ijg/ml)
The 1st group 7.098 0.00 0
The 2nd group 7.277 7.78 0
The 3rd group 7.196 3.99 0
The 4th group 7.154 3.59 0
The 5th group 7.073 13.91 0
Average 7.160 5.85 0
111
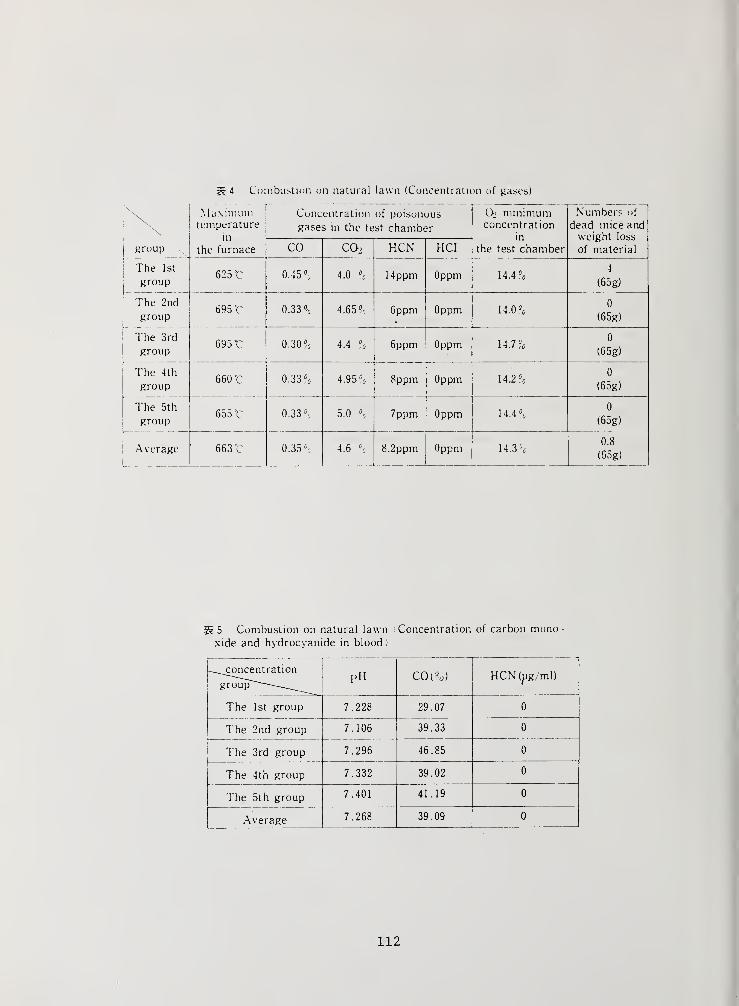
4 Combustion on natural lawn (Concentration of gases)
\\
Maximumtemperature
in
the furnace
Concentration of poisonous
gases in the test chamber
Oj minimumconcentration
in
the test chamber
Numbers of
dead mice andweight loss
of materialgroup CO co2 HCN HCI
The 1st
group625 °C 0.45°, 4.0 % 14ppm Oppm 14.4 °
0
4
(65g)
The 2nd
group695 r 0.33 % 4.65", 6ppm Oppm U.0%
0
(65g)
The 3rd
group695 r 0.30 % 4.4 % 6ppm Oppm 14.7?,
0
(65g)
The 4th
group660 °C 0.33 % 4.95 c
0 8ppm Oppm 14.2 ?5
0
(65g)
The 5th
group655 °C 0.33 °o 5.0 \ 7ppm Oppm 14.4 %
0
(65g)
Average 663
1
0.35 °0 4.6 °
c 8.2ppm Oppm 14.3 =c
0.8
(65g)
5 Combustion on natural lawn (Concentration of carbon mono-xide and hydrocyanide in blood)
L^concentration
group~~~~-
—
PH CO(?*) HCN(pg/ml)
The 1st group 7.228 29.07 0
The 2nd group 7.106 39.33 0
i The 3rd group 7.296 46.85 0
The 4th group 7.332 39.02 0
The 5th group 7.401 41.19 0
Average 7.268 39.09 0
112
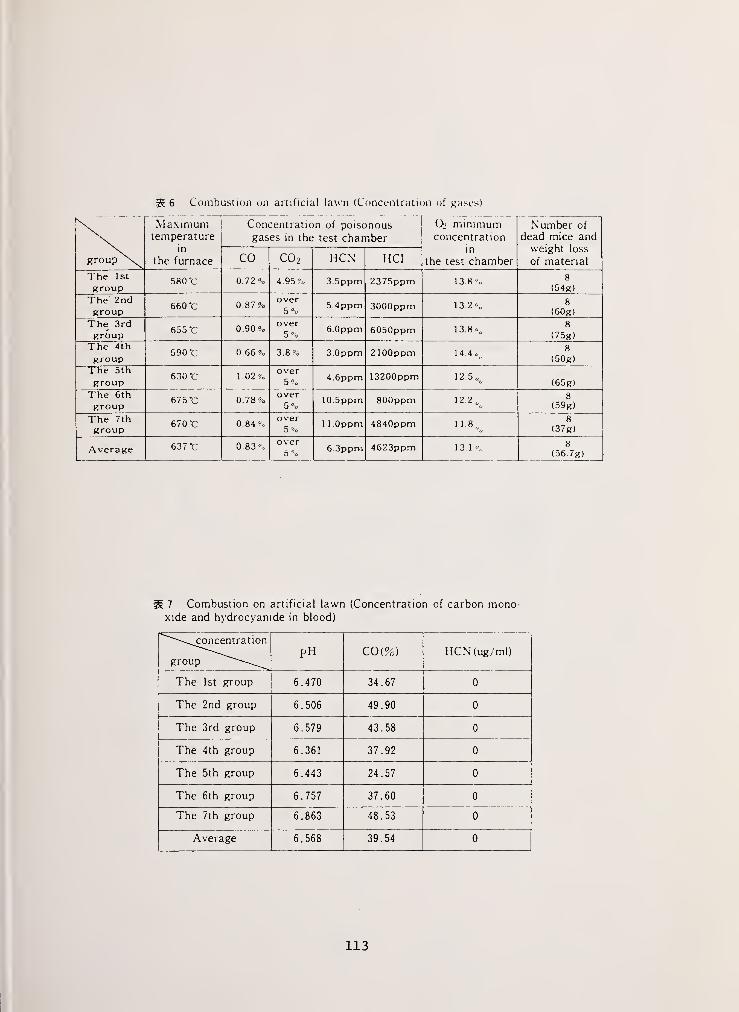
6 Combustion on artificial lawn (Concentration of gases)
\group \^
Maximumtemperature
in
the furnace
Concentration of poisonousgases in the test chamber
(J> minimumconcentration
in
the test chamber
Number of
dead mice andweight loss
of materialCO C0 2 HCN HCI
The 1st
group580
mc 0.72 % 4.95% 3.5ppm 2375ppm 13.8% 8
(54g)
The 2ndgroup
660 "C 0.87%over5% 5 4ppm 3000ppm 13.2% 8
(60g)
The 3rdgroup 655 "C 0.90%
over5% 6.0ppm 6050ppm 13.8%
8
(75g)
The 4th
group590 TC 0.66% 3.8% 3.0ppm 2100ppm 14.4 „,
8
(50g)
The 5th
group630
-C 1.02%over5% 4.6ppm 13200ppm 12 - 5 % (65g)
The 6th
group675 'C 0.78%
over5% 10.5ppm 800ppm 12.2 „
8(59g)
The 7thgroup
670 "C 0.84 % over5 % 1 l.Oppm 4840ppm 11.8,,
8
(37g)
Average 637 r 0.83%over5 % 6.3ppm 4623ppm 13.1 % 8
(56.7g)
H 7 Combustion on artificial lawn (Concentration of carbon mono-xide and hydrocyanide in blood)
^"\^concentration
groupPH COm HCN (ug/ml)
The 1st group 6.470 34 67 0
The 2nd group 6.506 49 90 0
The 3rd group 6.579 43 58 0
The 4th group 6.361 37 92 0
The 5th group 6.443 24 57 0
The 6th group 6.757 37 60 0
The 7th group 6.863 48 53 0
Average 6.568 39 54 0
113
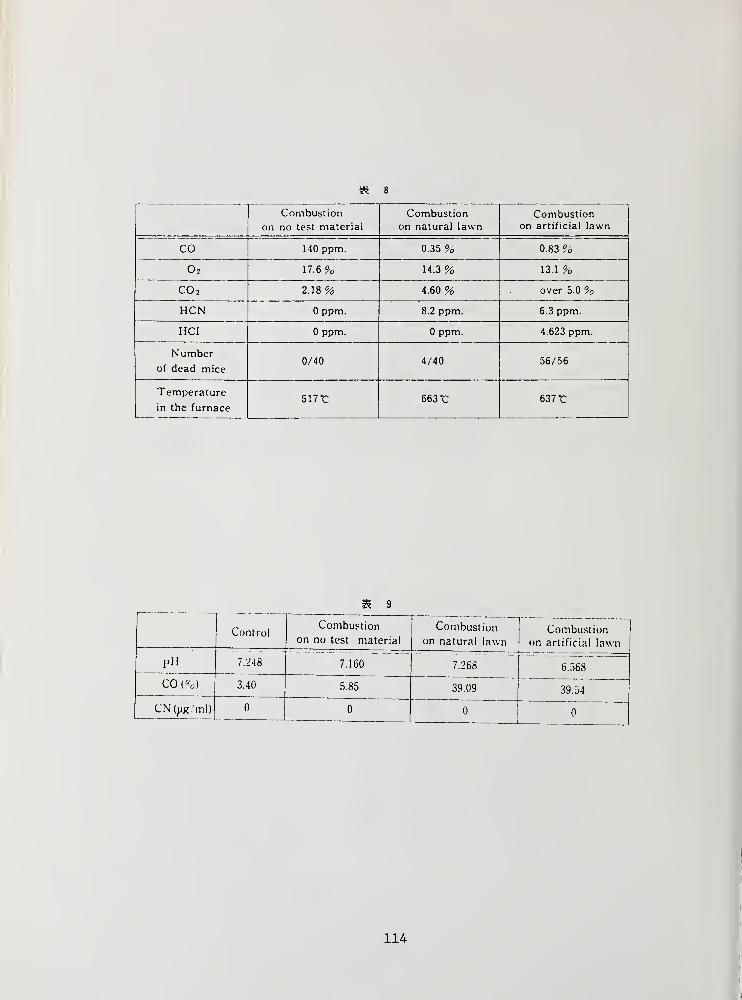
m. 8
Combustion
on no test material
Combustionon natural lawn
Pnm hnct 1 fi n\_ U 1 1 1 U Ll 0 1 1 u 1
1
on artificial lawn
CO 140 ppm. 0.35 % 0.83 %
02 17.6 % 14.3 % 13.1 %CO 2 2.18 % 4.60 % over 5.0 %HCN 0 ppm. 8.2 ppm. 6.3 ppm.
HCI 0 ppm. 0 ppm. 4.623 ppm.
N umberof dead mice
0/40 4/40 56/56
Temperature
in the furnace517 *C 663 r 637 r
8 9
ControlCombustion
on no test material
Combustion
on natural lawnCombustion
on artificial lawn
PH 7.248 7.160 7.268 6.568
CO(%) 3.40 5.85 39.09 39.54
CN (yg/ml) 0 0 0 0
114
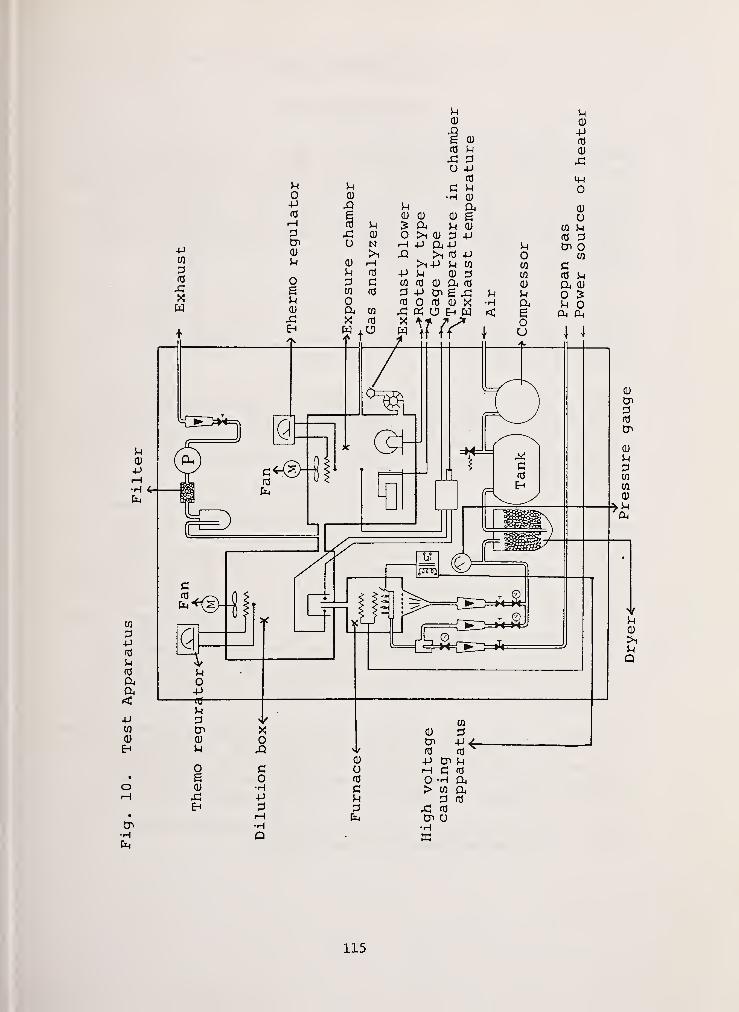
-PWP03
£1XH
O-Pf0
i—
I
PCPCD
5-1
Oe5-1
CD
xiEh
5-i
X!
ird
U
CD
UP
U +J
rd
rd
5-1
CD
N
CD
5-1 rd
P cW rd
O
a)
a.
c-H
CD
u
uCD
eCD
>i CD P +J-p a+j
>i rd P>i P 5-4 W5-1 CD prd CD a rd
P tn g jCO rd CD X« O BW\t ?/*
UH
UowwCD
UCueo
5-4
CD
Prd
CD
xi
<+-4
o
CD
O
rrj pC7> O
W
rd 5-1
a cd
5o
115
Discussion of Presentations on Toxicology
Saito Presentation
Benjamin: I have a question regarding Figure 2. We reported to thePanel a couple of years ago on the work done by Johns Hopkins Universityon a similar study of autoposies. The findings at that time indicatedthat over 80% of the deaths could be attributed to carboxyhemoglobin.Figure 2 would indicate that the conclusions that we had drawn—thatcarbon monoxide was the prime factor in deaths—may not be a correctconclusion. I would like to ask Dr. Saito if he has any ideas asto why we seem to be different.
Saito: In my opinion there is a difference in the availability ofautoposies for fire death between our two countries. In Japan, anautoposy only was done for the case if it was connected to a crime.However, in United States autoposies are done relatively easy. I
would like to confirm this with Prof. Nishimaru.
Nishimaru: In Figure 2, we believe that at least 50% of deaths werecaused by CO. I notice that recent Johns Hopkins data indicate thatthis rate changed from 80% to 60%. In my opinion, it is not clearwhether the availability of autopsy in Japan, as mentioned by Dr. Saito,or different materials used in Japan are the cause of different typesof toxicants.
Myers: Again in reference to Figure 2, we are looking at a smallnumber. I don't think there is that much variance from our ownclinical experiments. In our clinical experiments involving somework on a current report, we have been taking blood samples frompeople involved with fires—survivors in the field—and we have foundthat the blood caroxyhemoglobin HBCO level at the field is dramaticallyhigher than the indications in the hospital twenty minutes later;field level is 60 and hospital level is 40. In looking at your figure,it would appear that your people were dying with higher levels of
carbon monoxide. There are a great number above 50%, but Halpin andFisher's data are lower than that. It may be the materials of the
fire in the building that makes the difference, if there is a
difference.
Nishimaru: Your report on the different discrepancies between figures
of blood samples in the field and in the hospitals has been veryinformative. The Dr. Halpin that you mention, is he the MedicalExaminer in New York? We noticed some difference in data between
Halpin 's and ours. It might be due to the difference in materials.
Myers: Dr. Halpin was one of the people on the Hopkins grant. Dr.
Fisher is the Medical Examiner in Baltimore, Md.
116
Birky Presentation
Saito: I would like to ask two questions. Is there a significantdifference in gas concentration (mg/1) between the large scaleexperiment and the small scale one. I think there may be a significantloss of combustion products through the sampling line between thechamber to the detector instrument.
Birky: Yes, that is correct and may be part of the problem. Theother part of the problem is that in the large scale experiment, wetake about an hour and a half to generate the concentration requiredto expose the animals. So we have time for loss of reactive components.
Saito: The table showed mg/1 as units. Is a time factor includedin this figure.
Birky: The exposure of the animals takes place over thirty minutesin both cases. However, to generate the products takes longer in thelarge scale.
Saito: You described that the smoldering mode was used for the largescale experiment and the small scale one. Could we assume that the
smoldering condition is identical for both the scales?
Birky: No, in the small scale we have the sample decomposed in a
furnace that is preset at some temperature.
117

Nishimaru Presentation
Birky: Was exposure time three minutes?
Nishimaru: With which samples?
Birky: Didn't you test all the materials the same way?
Nishimaru: I will try to explain the burning condition used in thisstudy. 3 1/min of air and 350 ml/min propane, 1.5kw electric heaterwere turned on. Six minutes later, the electric heater was automat-ically turned off and the propane gas was turned off ten minutes later.Therefore, animals in the chamber were exposed to products for fifteenminutes
.
Birky: Does the concentration of the gases in the table representthe average over that 15 minute period?
Nishimaru: Yes.
Birky: In Table 1 does it concern you that the variation is fairlylarge from a biological point of view?
Nishimaru: Do you mean from 7.25 to 7.58?
Birky: Yes, are those control values?
Nishimaru: Yes, principally it is. The pH value shown in Figures 1
and 3, should be about the same because there are no effects of products.However, there are some scatter and we interpret this as a biologicaldifference among individual animals.
Birky: In terms of interpretation of Tables 6 and 7, how do youestablish a correlation between any of the factors in those two tables?For example, what is the cause of death and correlation to reduce pHto the highest P level?
Nishimaru: Since the amount of each toxicant is way beyond the
critical amount for the correlation, it is rather difficult to evaluate.I misunderstood the previous question. O2 and COo concentrations areautomatically recorded. Values shown in figures are maximum CO2 andminimum O2.
Huggett: We find that the toxic dangers being associated withmaterials depend on the toxicity as measured in laboratory tests, but
also on the quantity of material and the probability that it is likelyto be involved in a fire. We find that carpets, floor coverings,
118
ground covers are difficult to involve in a fire. They usually willburn only if they are preheated by radiation from a ceiling, from a hotgas in a large fire. I find it difficult that you could get a sub-stantial fire on a carpet (ground cover) in the open, such as a golf
course. I wonder if any tests have been run in determining the likeli-hood of a fire developing under the conditions that this material is
being used?
Nishimaru: I do not have any experience with that. I agree that
we do not worry about fire hazards for golf courses. It might be anextreme case, but I keep remembering what happened fifty years ago.
Japan had a very serious earthquake which caused extremely large firesand many deaths and included large buildings. We do not know whatcaused the deaths of the people in this extreme case. The Japanesegovernment suggests that we don't use any kind of potentially toxicmaterials. We should use safe materials. With this in mind, we testedthese materials. In crowded places such as a baseball stadium, it mighthappen as an extreme case. So, our point of view is just in case.
Saito: In Japanese building code, the floor materials are consideredto be less fire hazardous at early stage of fire and were not includedin the fire code. Prof. Nishimaru considered these materials as a
chemical compound instead of floor covering for artificial turf. Thefloor covering might get involved after flashover. Then, this studymight be useful.
Clarke: The issue raised here, expressing the evolution of hydrogenchloride, prompts me to ask a related question of a somewhat differentsubject of this paper. In the United States we have very little workgoing on in the treatment of fire victims who have inhaled hydrogenchloride and yet this is going to be a problem because of the increasingprevalence of chloride-containing polymers in the environment. Has
there been any research in Japan that Prof. Nishimaru and colleaguesknow of on the treatment of HCl (hydrogen chloride) inhalation?
Nishimaru: My personal opinion is that there is not much affectof these gases on plants, animals or humans. However, it is almostimpossible to remove all these gases or all materials which producethese gases from our present society. After this meeting, I willdiscuss with Dr. Saito how we will explore a new type of study to
determine if animals will survive without permanent damages after we
stop the test in the middle of experiment; rather than the present type
test in which we continue the test until the death of the animals.
119
Clarke: We have a few cases in the U.S. of people being injured wherethe symptons look very much like hydrogen chloride inhalation, althoughI know of no cases where it was definitely established that that was thecause of the problem. But I share the view that chloride containingmaterials are increasingly finding their way into the environment and wemay find this to be more of a problem in the future. The most likelyvictims of exposure to this kind of situation would probably be the
firefighters. How common is the use of breathing apparatus— independentair tank—by Japanese firefighters?
Jin: When firefighters go into a smoke filled area, they usuallybreathe from air tanks.
Benjamin: Dr. Jin mentioned that the firemen will wear their maskwhen there is visible smoke. Our experience has been, particularlywith PVC type fires, that the smoke was not visible and many of the
injuries have been the result of firemen who went into an atmospherewhere there was no visible smoke and they did not put their masks on.
Jin: When the smoke is visible, obviously, then it is mandatorythat they wear gas mask. Where you don't see any smoke, they have
to decide whether or not to wear the mask. If toxicants are expected,then they wear the mask; otherwise they just go in without masks.
I personally do not know any casualties caused by invisible toxic
atmosphere. Medical doctors of the laboratory of Tokyo Fire DefenseAgency are studying the toxic hazards of combustion products and they
recommend more awareness of the danger of these gases for firefighters
than used to be.
120
4. ADVANCES IN SPRINKLER TECHNOLOGY
121
LIFE SAFETY FACTORS INVOLVED IN THEUSE OF SPRINKLERS
John G. O'Neill
Center for Fire ResearchNational Engineering LaboratoryNational Bureau of Standards
Washington, D.C. 20234
122
LIFE SAFETY FACTORS INVOLVED INTHE USE OF SPRINKLERS
John G. O'Neill
1 . INTRODUCTION
The Center for Fire Research (CFR) at the National Bureau of Standards(NBS) has conducted an extensive research program into the use of automaticsprinklers in health care facilities. The purpose of this paper is to presentsome of the results of this project which may impact future installation criteriaand product design criteria for automatic sprinklers in health care facilities.These results may also apply to other occupancies where life safety is also theprimary purpose for installing automatic sprinklers.
The CFR project, which was originated in 1977 and then resumed in 1979,consisted of a series of full-scale tests to develop engineering design informa-tion concerning the use of automatic sprinklers to minimize life loss andinjury in the event of fire in health care facilities.
An interim report by O'Neill and Hay^s has been published and it coversthe first eight tests in this project [1] . A final report on phase II of the
project was published in July, 1980 [2].
2. OVERALL PROJECT OBJECTIVE
The overall project objective was to measure the performance of the sprinklein terms of:
a. Overall fire control.
b. Time available for evacuation of patients in the fire area.
c. Maintaining tolerable environmental conditions for patients whocannot be evacuated.
3. EXPERIMENTAL FACILITIES
3.1 Test Area and Instrumentation
The experimental approach used in this project was to conduct full-scalefire tests in a two patient sized room with an adjoining corridor and a remoteroom located at one end of the corridor, as shown in figure 1. The performance
Numbers in brackets refer to the literature references listed at the end of
this paper.
123
of the sprinklers in these tests was determined through the analysis of datarecorded with instrumentation installed in key locations throughout the testarea. The instruments measured temperatures, total heat flux, weight loss ofburning items, gas velocities, carbon monoxide (CO), oxygen and smoke obscura-tion. Measurements of gas temperature and velocities, CO and smoke obscurationwere made at different elevations in the doorway to the patient room and in thecorridor in order to obtain a profile of smoke movement and CO concentrationsduring the tests.
3.2 Automatic Sprinkler System
The automatic sprinkler system for this project provided use of either a
center ceiling pendant sprinkler in the patient room or a horizontal sidewallsprinkler located over the door opening in the patient room. Flow rates to thesprinklers were established prior to and maintained throughout each test bymeans of a control valve and flow meter located outside the test area. Generally,the water flow for the sprinkler in the patient room was set at 102 £/min (27
g/min) to provide the equivalent specified minimum flow resulting from onesprinkler head operating if the system was hydraulically designed in accordancewith the National Fire Protection Association (NFPA) Standard No. 13 [3]. The
standard requires a minimum average density of 4.1 mm/min (0.10 g/min/ft 2) for
this type of occupancy. The standard, however, states that for this type of
installation sprinklers outside the room must be considered in the calculation.This requirement resulted in an actual 6.9 mm/min (0.17 g/min/ft 2
) density withone sprinkler operating in the room.
Sprinklers "sed in the project included 13 mm (1/2 in) and 10 mm (3/8 in)
pendant sprinklers and 13 mm (1/2 in) horizontal sidewall sprinklers which meetthe requirements of UL 199 [4].
In addition to the "wet" sprinkler head, three dry sprinkler heads wereplaced at the center of the burn room ceiling. The purpose was to obtain dataon response times of other types of sprinkler heads in the full-scale fire
tests. The dry sprinkler heads were pressurized by nitrogen which was pumpedthrough copper tubing placed above the fire resistive ceiling. A pressureswitch was connected into the tubing which led to each sprinkler head and, whenthe sprinkler operated, the pressure switch activated a relay which stopped a
clock. Thus, response times relative to time of ignition were automaticallyrecorded. Dry sprinkler heads included the following fusible elements:
Rapid-response 57°C (135°F) (commercially available)
Fusible pellet 74°C (165°F)
Link-lever 75°C (165°F) duplicate of wet sprinkler head
3.3 Ventilation of Test Area
A simulated heating, venting and air conditioning (HVAC) system was installedin the burn room for the tests reported in this paper. The HVAC system consistedof a supply duct mounted high in the wall, and an exhaust duct in the lower
124
opposite wall as shown in figure 2. The air flow rate for the burn room wasbased on criteria contained in the Minimum Requirements of Construction andEquipment for Hospitals and Medical Facilit ies [5]. This standard requires aminimum ventilation rate of 2 air changes per hour for patient rooms with zeropressure difference between the patient room and corridor. For this sized roomthe flow rates for both supply and exhaust were established at 1.2 m 3 /rain (42
ft 3 /min) to give the minimum air change rate without creating an air flowbetween the patient room and corridor. A fan coil unit was installed to providerecirculated air in the room. A separate system provided conditioning for theburn room to maintain a limited range of temperature and relative humidityconditions in the burn room throughout the series of tests. The fan coil unitwas set at a low speed which recirculated air in the burn room at an approximaterate of 3.4 m 3 /min (120 f
t
3 /min)
.
4. ELEMENTS OF HAZARD ANALYSIS
Consistent with the overall project objectives the results of the firetests were measured in terms of the following:
Fire Spread
Heat Flux
Toxic Gases
Smoke Obscuration
Specific quantitative values for fire spread were not developed to measurethe performance of sprinklers. However, weight loss data as well as the recordof visual observations were analyzed to determine the relative performance ofsprinklers in limiting fire growth.
Quantitative values were selected as estimated limiting conditions for theother elements. These values based on previous studies, were as follows:
a. For the heat flux measured at the adjacent patient level a thresholdfor burn injury of 2.5 KW/m2 was selected as an upper limit prior to
one feeling pain [6].
b. A threshold of 25% carboxyhemoglobin was established as a limitingcondition for continuous exposure to CO [7]. A concentration of 1%
(10,000 ppm) CO was selected as a hazardous threshold for instanta-neous exposure to CO [8].
c. A minimum of oxygen concentration of 14% was selected as a lowerlimit for determining the impact of O2 depletion on occupants [9].
125
d. For smoke obscuration two limiting conditions were selected. The firstconcerned the rescue of a patient inside the room of fire origin. A smokeobscuration threshold of 0.5 OD/m was estimated as the level where rescueof a patient would be impaired. The second concerned egress in the
adjoining corridor. A threshold of 0.25 OD/m was estimated as the levelwhere movement in the corridor would be impaired [10, 11]
.
5. TEST PROCEDURES
The series of full-scale fire tests and sprinkler spray distribution testswas based on fire scenarios involving either bedding and mattresses or clothingwardrobes in a two patient room environment. These furnishings representedtypical contents in patient rooms of health care facilities and in the testprocedures they served as the principal burning items. The experimental pro-cedure for the sprinkler evaluation was limited to the flaming ignitions of
these items.
5.1 Mattress and Bedding Fires
In all fire tests where a mattress and bedding served as the burningitems, a hospital specified polyurethane innerspring mattress was used. Thebedding which consisted of various cotton and cotton polyester materials, wasalso specified for hospital use. In several tests a privacy curtain was installedaround the bed and located between the bed and the pendant ceiling sprinkler to
determine the effect on sprinkler performance.
The test was initiated when the contents of a small waste container nextto the bed were ignited with a match and the fire then spread to the beddingand then to the mattress. As discussed in the interim technical report, this
procedure was very repeatable [1].
5.2 Clothing Wardrobe Fires
The clothing wardrobe fire scenario was also included in the project inorder to assess the impact of sprinklers on what was estimated to be a verysevere (but also realistic) fire in a patient room.
In an effort to develop a reproducible test fire, the same loading wasinitially used in each test. The loading consisted of various fabrics whichrepresent materials found in present day clothing. The materials were placedon wire coat hangers and arranged loosely in the wardrobe to provide a clearspace between each hung fabric. This arrangement was chosen since it wasdesirable to have a fire which would develop rapidly inside the wardrobe. Acardboard box containing crumpled newspaper was placed on the floor of the
wardrobe and the newspaper served as the pilot flame inside the wardrobe. Each
126
wardrobe test started when the crumpled newspaper was ignited with a match.Following ignition the left hand door was closed tightly while the right handdoor was left partially opened resulting in a 7.6 cm (3 in) opening along thevertical edge of the door. The position of the wardrobe in the patient room isshown in figure 3.
6 . RESULTS
6.1 Mattress and Bedding Test Results
In tests where the mattress and bedding served as the burning items, theestimated limiting condition for smoke obscuration was exceeded with both thestandard pendant and horizontal sidewall sprinklers. The range of responsetimes for the 165°F (74°C) pendant sprinkler was from 330 to 388 sec. In onetest in which a standard 160°F (71°C) horizontal sidewall sprinkler was installed,the response time was 388 sec.
The estimated limiting conditions for smoke obscuration as measured at thepatient room doorway and in the corridor were exceeded before the sprinklersoperated. The smoke layer lowered to within .9 to 1.2 m (3 to 4 ft) from thefloor before sprinkler operation. Following sprinkler operation, there wasessentially total obscuration from floor to ceiling throughout the test area. It
should be noted that in previous tests involving the same type of mattress and in
which sprinklers were not installed, the smoke filled the corridor and also createdessentially total obscuration from floor to ceiling.
None of the other estimated limiting conditions outlined in paragraph 4 wereexceeded except for carboxyhemoglobin levels in the fires where the privacy curtainwas installed. These results are discussed in 6.2.1.
6.1.1 Movement of Smoke and CO - Analysis of Data
The impact on smoke movement by the sprinklers was significant, especiallyin the doorway where velocity measurements, smoke meters, and gas measurementsindicated a reversal of flow of smoke through the doorway and the shifting of
peak CO concentrations from ceiling to floor level. Figure 4 provides therecord of CO measurements in the burn room and doorway for Test N-37. Concen-trations of CO shifted after sprinkler actuation at 330 sec. The CO data fromthe corridor instrumentation tree indicated that the sprinkler acted to redis-tribute the smoke layer (represented by the CO measurements) away from theimmediate area of sprinkler actuation. Figure 5 gives the CO measurements atthe corridor tree. Following the initial sprinkler flow, higher concentrationswere recorded at 0.9 m (3 ft) and 1.5 m (5 ft) from the floor. The concentrationsmeasured near the ceiling were lower than those measured at the other elevationsfollowing sprinkler actuation.
The concentrations of CO measured at all locations were low and estimatedCOHb levels did not exceed a limiting condition of 25% in tests where theprivacy curtain was not installed. The increase in CO in the corridor and theredistribution of the CO throughout the test area, however, verified that, inthese types of fires, the sprinkler acted to lower the smoke layer throughout
127
the test area and to project the combustion products from the patient room intothe adjoining corridor at a more rapid rate than before the sprinkler operated.This resulted in the severe smoke obscuration recorded throughout the test areawhich in an actual health care facility could seriously hamper the movement ofstaff and patients in the adjoining corridor.
An analysis of the data revealed that the smoke filling rate in the testarea was roughly proportional to the fire growth rate as reflected in therecord of gas temperatures measured at the ceiling in the center of the burnroom. Figures 6 and 7 demonstrate this correlation where the depth of the smokelayer is defined as the time a smoke meter located in the doorway or in thecorridor measured an obscuration of 0.25 OD/m. This boundary value for thesmoke layer was arbitrarily established in this analysis in order to assess theimpact of sprinkler response time as a function of the estimated depth of thesmoke layer in the test area. (As mentioned in section 4, 0.25 OD/m was selectedas a hazardous threshold for visibility and personnel movement in the corridor.)
Figure 6 provides the results of Test N-37 in which a pendant automaticsprinkler was installed in the center of the room. Although the sprinkler hada temperature rating of 165°F (74°C), the thermal lag of the fusible element wassuch that the sprinkler finally operated at 330 sec. At this point the ceilinggas temperature had reached 200°C near the sprinkler and the smoke layer hadlowered to approximately 0.9 m (3 ft) from the floor.
This lag was even more significant in a test in which a horizontal sidewallautomatic sprinkler was located over the door. The sprinkler had a temperaturerating of 160°F (71°C) and at time of actuation. 388 sec, the smoke layer wasless than .9 m (3 ft) from the floor. See figure 7.
By plotting the smoke filling rate on the same time axis as the ceiling gas
temperatures, one can see that a fusible element operating at approximately135°F (57°C) would actuate the sprinkler when the volume of smoke in the patientroom and corridor was significantly less than when the standard 74°C sprinkleractually operated. Since the instrumentation as well as visual observationrevealed that the flowing sprinkler lowered and redistributed the smoke layer,it follows that if a sprinkler operated sufficiently early enough in the fire,
there would be significantly less smoke and toxic gases such as CO present to be
redistributed by the sprinkler. Based on this, the project focused on theinvestigation of sprinklers operating at an earlier stage of the fire develop-ment and their impact on smoke movement.
6.1.2 Simulated Rapid Response Sprinkler Tests
6.1.2.1 Preliminary Test
In Test N-37, a commercially available dry sprinkler which was rated for135 F (57 °C) operating temperature and designed for rapid response, responded at
285 sec. At this time, as shown in figure 6, the center ceiling gas temperaturewas approximately 120°C and the smoke layer in the corridor had lowered to
within 4 ft from the floor.
128
This suggested that a fusible element with a thermal inertia lower thanthat which exists for current technology sprinklers was necessary if the sprinklerwas expected to operate shortly after the gas temperature near the sprinklerreached its nominal temperature rating.
Initially, a test (No. N-38) was conducted to determine the feasibility of
preventing the smoke obscuration from reaching hazardous thresholds by actuatingthe sprinkler sufficiently early in the fire. This test included the samemattress, bedding, and waste container ignition sequence described earlier.The sprinkler system consisted of an open 10 mm (3/8 in) pendant sprinklerarranged to flow 64.3 £/min (17 g/min) which provided an average density of 4.1mm/min (.10 g/min/ft2
) in the burn room. The open sprinkler was fitted with a
resilient plug, and the system piping was primed with water downstream of a
closed control valve.
During the fire test the gas temperature measured near the sprinkler wascontinuously monitored. To simulate the rapid response, the sprinkler valvewas opened at 10 seconds after the time the center ceiling gas temperature at
the sprinkler reached 135°F (57°C). The sprinkler was opened at 105 secondsinto the test and the subsequent smoke obscuration was very low throughout the
test area. The maximum obscuration measured at 1.7 m (5 ft 8 in) in the burnroom doorway and at 1.5 m (5 ft) in the corridor were 0.10 and 0.086 OD/mrespectively. These levels were considerably below the estimated limitingconditions
.
The results of this test indicated that for this type of fire, the smokeobscuration problem both before and after sprinkler operation could be greatlyreduced by means of a sprinkler with a low thermal inertia fusible link whichwould operate soon after the ceiling gas temperature reached 57 °C.
6.1.3 Verification Tests
Following this preliminary test the investigation sought to quantify the
dynamic heating measurement of a successful fast response sprinkler in terms of
a dynamic heating test which was proposed by Factory Mutual Research (FM) andis discussed in the appendix [12] . The dynamic heating measurement of the
fusible element is expressed as a time constant "t". In order to model sprinklerswith a t less than standard sprinklers (i.e. fusible elements with a thermalinertia lower than standard sprinklers) , FM manufactured and furnished brassdiscs designed and verified for t factors of 9.0, 14.4 and 21.5 sec. Thetemperatures of these discs were measured and the data were used during the
tests to activate simulated fast response sprinklers.
The results of these tests verified that smoke obscuration was significantlydecreased with the use of fast response sprinklers with a time constant of
approximately 21.5 sec. Figures 8 thru 10 demonstrate that the use of a fast
129
response pendant or horizontal sidewall sprinklers (Tests N-40 and N-45) resultedin significantly lower smoke obscuration than in the tests with standard pendantand horizontal sidewall sprinklers (Tests N-37 and N-39)
.
6.1.4 Discussion
The tests discussed in this section were conducted in a limited volume testarea which represented a typical patient room and corridor arrangement but itdid not represent as great a volume as would likely be in a smoke zone in ahealth care facility. Thus, limited extrapolation could be made for othergeometries and larger volumes. Despite the limitations which prevent extensiveextrapolation to other building sizes, the experimental work reported hereclearly demonstrates that a lower thermal inertia or fast response sprinkler canreduce significantly the impact of smoke obscuration for a patient room mattressand bedding fire. Since the lowering of the heated gas layer and severe obscurationwas immediate in and near the patient room, where the conventional sprinkleroperated, this phenomenon suggests that the obscuration problem is severe nearthe room of fire origin regardless of the volume of the building or smoke zone.The impact of the fast response sprinkler, in reducing the smoke obscurationproblem in and near the room of fire origin, could increase the time availableto rescue the patients closest to the fire.
6.1.5 Impact on Sprinkler System and Hardware Design
In addition to these findings, the results of an ongoing residentialsprinkler test program have indicated that the dynamic heating characteristic ofa sprinkler is an important variable in the performance of a residential sprinklersystem. (This test program is being conducted by NFPA, Factory Mutual Researchand the Los Angeles City Fire Department and sponsored prinicpally by the U.S.Fire Administration.) In earlier tests FM determined that a sprinkler fusibleelement of a t = 21 sec was needed to insure that the sprinkler would operateearly enough in the fire to prevent flashover in a ventilated living room testfire [13].
The results of both of these programs, the residential sprinkler programand the CFR patient room sprinkler program strongly suggest that product testingcriteria should include a dynamic heating measurement. For life safety, theresults also suggest the need for a more rapidly responding sprinkler thanconventional sprinklers. It should, however, not be inferred that sprinklers,in general, should respond faster than a standard conventional sprinkler. Inindustrial and storage occupancies where it is desirable to limit the number of
operating sprinklers to prevent the overtaxing of the water supply, a high t
factor, (i.e. slow response) sprinkler may be more effective. In any case it
appears that a dynamic heating measurement of the sprinkler, in addition to the
temperature rating of the sprinkler, should be a primary design variable in futuresprinkler criteria.
130
6.2 Privacy Curtain Tests
6.2.1 Fire Tests
In several mattress and bedding tests a privacy curtain was placed aroundthe bed as shown in figure 2. The purpose of these tests was to determine theeffect of the privacy curtain on the sprinkler spray distribution and subsequentfire control by the sprinkler. The results of the tests indicated that thesprinkler cooled and controlled ceiling temperatures in the burn room. Theresults, however, also indicated that CO concentrations were higher throughoutthe test area when the privacy curtain was present. The differences in CO
concentrations are shown in figures 11 and 12 for Test N-25, without the privacycurtain and Test N-33 with the privacy curtain. In Test N-33, calculatedcarboxyhemoglobin levels at the adjacent patient level exceeded the estimatedlimiting condition of 25% approximately 20 minutes after ignition. After Test
N-33 was completed, it was noted that the mattress and bedding were totallyconsumed. (In tests without the privacy curtain, approximately 20% of the
bedding and mattress was consumed prior to final extinguishment by the sprinkler.)
It was clear that the position of the privacy curtain with respect to the
sprinkler as shown in figure 13 presented a serious obstacle to the sprinklerspray distribution. The higher concentrations of CO were apparently due to theposition of the privacy curtain which shielded the burning bed from the waterspray and adversely affected the extinguishing performance of the sprinkler.
6.2.2 Spray Distribution Tests
6.2.2.1 Test Plan and Procedure
Based on these findings an investigation was conducted to quantify theinterference of the privacy curtain in terms of spray distribution; and to
develop recommendations concerning the location and arrangement of the privacycurtain with respect to the sprinkler. A simple collection container array wasinstalled in the burn room at the location of the bed to obtain spray densitymeasurements over the horizontal plane of the bed, as shown in figure 14.
The results of these non-fire tests clearly indicated that the privacycurtain as installed in the previous fire tests severely blocked the waterspray from the sprinkler. Figures 15 and 16 provide a comparison of results of
one of the pendant sprinkler tests with and without the privacy curtain.Repeated tests with other models of pendant sprinklers and a horizontal side-
wall sprinkler provided similar results.
The investigation then proceeded to determine design information on the
placement of the privacy curtains with respect to the sprinkler to minimize the
impact of the curtain on the spray distribution of the sprinkler.
131

Initially criteria were established for the minimum spray density which wasnecessary to extinguish a fire involving a mattress and bedding. Kung et al.suggested a critical application density of 1.4 mm/min (0.033 g/min/ft 2
) for haltingfire spread underneath a urethane foam mattress [14].
To facilitate the experimental work, a plywood screen was fabricated and it
served in the place of the privacy curtain. As various tests were conductedwith sprinklers flowing at 102 £/min (27 g/min) the screen was raised andlowered and moved to various positions horizontally in an effort to determinethe position boundaries for the cases where the critical density could not beobtained. During the experimental work it was noted that variations existedamong standard pendant sprinklers of different manufacturers, such that, thespray from one tended to project more water directly parallel to the plane of
the deflector than others. Therefore, measurements were made for these differ-ent sprinklers in order to insure that recommendations developed from theexperimental work were not biased toward the most favorable spray pattern.
Spray distribution measurements were also conducted with the horizontalsidewall sprinkler to determine the impact on the sprinkler spray pattern. Thesimulated curtain was placed 40.6 cm (16 in) from the foot of the bed and 68.6cm (27 in) from the corridor wall, with the height of the curtain being variedfor each measurement. The flow from the sprinkler was also set for 102 Jl/min
(27 g/min) to provide an average density of 6.9 mm/min (.17 g/min/ft 2).
6.2.2.2 Results
In all of the spray distribution tests it was observed that the collectorswhich were placed along the wall collected most of the water which hit the wall.While the wetting of the wall may be an important benefit, the quantities of
water collected in these containers do not reflect the actual density for that
"slice" of the horizontal plane of the protected surface. Therefore, dataobtained from these containers were not included in the calculation of the
average density over the plane of the bed.
The results of the tests with pendant sprinklers verified that the effectivespray density reaching the bed was dependent on both the vertical distance of
the top of the privacy curtain from sprinkler deflector and, the horizontaldistance of the curtain from the sprinkler. With the screen placed directlybeneath the deflector of the sprinkler, there was no adverse effect on the
effective density reaching the bed. As it was moved from the sprinkler towardthe bed the screen was progressively lowered to achieve the minimum densitycriterion of .033 g/min/ft 2
. Data shown in figures 17 and 18 indicate some of
the results which served as the basis for the recommended installation criteria
shown in figure 19. These criteria include a vertical distance from the sprinkler
deflector to the top of the curtain as a function of the distance of the curtain
up to 15 inches away from the sprinkler. k linear approximation has beendeveloped as a guideline for the installation of privacy curtains installed
further than 15 inches from the sprinkler. The formula is as follows:
132

Y = 0.5x + 0.5
where x = horizontal distance of curtain from sprinklerY = vertical distance from top of curtain to sprinkler deflector
The horizontal sidewall sprinkler was found to project a high percentageof the discharged water toward the ceiling and in a radial direction horizontalto the center line of the orifice. This spray pattern reduced the effect ofthe privacy curtain on the horizontal sidewall sprinkler as compared to the *
pendant sprinkler. The results as shown in figures 20 and 21 indicated that aminimum average effective density could be achieved over the plane of the bedif the height of the privacy curtain was equal to or lower than the height ofthe horizontal sidewall sprinkler.
6.3.1 Nonsprinklered Wardrobe Fire
In order to obtain a baseline for evaluating the performance of sprinklerswhen exposed to combustible wardrobe fires, a fire test (No. N-54) withoutsprinklers was conducted.
The initial rate of fire growth was essentially the same as in the testswith sprinklers. With no other furnishings in the room, flashover occurred atapproximately 120 sec. into the test (see figure 22). At this time all limitingconditions were exceeded throughout the test area. Several smoke meters in thecorridor and in the doorway were damaged by heat and much of that data waslost. Measurements made at the key elevations in the doorway and in the corridor,however, indicated that limiting conditions had already been exceeded prior to
the instrument failures. The test was terminated at 480 sec. when an opensprinkler was activated.
6.3.2 Pendant Sprinkler Test
In the initial wardrobe test, No. N-48, a standard 160°F (71°C) pendantsprinkler was installed and arranged to provide the 6.9 mm/min (.17 g/min/ft 2
)
density. As expected the fire quickly enveloped the interior of the wardrobeand gas temperatures in the burn room rose rapidly. Following actuation of the
sprinkler, the ceiling gas temperatures were lowered as shown in figure 22;
however, the fire could still be seen burning inside the wardrobe for approxi-mately 60 sec. following the initial flow of the sprinkler. Eventually, thesmoke obscuration prevented any observations of the burn room from a window inthe corridor across from the burn room doorway.
Analysis of the data from this test indicated that concentrations of COwere very high throughout the test area. The instantaneous limiting conditionof 1% was exceeded not only in the patient room but also in the remote lobbyarea (figures 23 and 24) - Estimated COHb percentages also well exceeded thelimiting condition of 25%.
133

This test was repeated and the overall results were comparable. The firedeveloped rapidly inside the wardrobe and, although CO concentrations wereslightly less than in No. N-48 , limiting conditions were exceeded or approachedin the burn room at the adjacent patient level, at the 1.5 m (5 ft) elevationin the corridor as well as in the remote lobby area.
6.3.3 Horizontal Sidewall Sprinkler Tests
Using the same wardrobe fire scenario, a test was conducted using a standard160°F (71°C) horizontal sidewall sprinkler set to provide a 6.9 mm/min (.17
g/min/ft 2) density. The sprinkler was installed over the door as in the previous
mattress test (N-39)
.
The initial fire development was as rapid as in the previous tests andfollowing sprinkler actuation, the fire was visible for a brief time inside thewardrobe. As in the previous tests tbe visibility was limited soon aftersprinkler operation. A major difference, however, was noted in the CO con-centrations, compared to the previous tests with the pendant sprinkler. COconcentrations were significantly lower; the instantaneous threshold level of
1% was not reached, and the 25% COHb was exceeded only in the burn room at theadjacent patient level at approximately 17 minutes after ignition. The testwas repeated, (No. N-51) and approximately the same results were obtained.Figures 25 and 26 provide the record of CO.
The record of total weight losses of the combustible wardrobes for the fourtests tracked closely with CO data. In the pendant sprinkler tests the weightlosses and CO concentrations throughout the test area were much higher than in
the tests with the horizontal sidewall sprinklers. See table 1 and figures 23
thru 26. These measurements indicated that the horizontal sidewall sprinklerachieved better fire control than the pendant sprinkler.
In the initial analysis of the results, it was believed that the orientationof the partially open wardrobe door with respect to the direction of the sprayfrom the horizontal sidewall sprinkler allowed more water to penetrate the
interior of the wardrobe. Spray distribution measurements were made in nonfiretests for both the pendant and horizontal sidewall sprinklers operating at the
same flow rates as in the actual fire tests. The results of the tests areshown in figure 27. Tbe spray measurement tests indicated that no more waterpenetrated the wardrobe with the horizontal sidewall sprinkler than with the
pendant sprinkler.
6.3.4 Simulated Rapid Response
Analysis of the disc temperature data from the sprinklered wardrobe testsindicated that fast response sprinklers would have operated only 10 to 15 sec.
prior to the actual standard sprinklers. A review of the photographic recordof the test showed that at the time the discs reached 57°C the fire was justbeginning to issue from the wardrobe. Two tests were conducted each simulatinga fast response, x = 21 sec, 57°C fusible element; one test (N-53) with the
134
pendant sprinkler and the other (N-52) with a horizontal sidewall sprinkler.The purpose of the tests was to determine if the extinguishing performance ofthe sprinklers could be improved through the use of fast response sprinkler.As shown in figures 23 thru 26, and in table 1, no significant improvementswere noted for either sprinkler over the standard fusible element sprinklers.It appeared as though the fire growth rate inside the wardrobe had reached thepoint where the spray from the fast response pendant sprinkler could not extin-guish the fire any better than the standard fusible element sprinkler.
6.3.5 Discussion
The greater extinguishing performance of the horizontal sidewall sprinklerover the pendant sprinkler was apparently not due to a greater flow densityinside the wardrobe. At least two possibilities can be postulated for thedistinct differences:
a. The droplet size of the spray from the horizontal sidewall sprinklerwas such that they penetrated the intense fire plume from the ward-robe and acheived more rapid extinguishment. (To date the dropletsizes have not been measured for these sprinklers.)
b. The spray from the horizontal sidewall sprinkler located over thedoor was somewhat parallel to the flow of combustion air into thewardrobe. The spray may have been entrained in the combustion airstream.
6.3.6 Impact on Sprinkler System Design
The reasons for the differences between the two types of sprinklers arenot immediately clear and need further investigation. These differences aresignificant in terms of the impact of sprinklers on life safety and could havean effect on design recommendations. As the CO data, in particular demonstrate,the prevention of flashover by the sprinkler will not in itself assure life
safety outside the room of fire origin. Limiting the generation of toxic
gases, which in these fires was dependent upon the extinguishing performance of
the sprinkler must also be considered.
In terms of possible impact on future sprinkler system and hardward design,several points are offered based on these wardrobe tests:
a. The benefit of a fast response sprinkler for very rapid developing(and partially concealed) room fires may not be as significant as it
was for the mattress and bedding fires.
b. The droplet size and distribution may be an important performancevariable where sprinklers are used to reduce the life safety hazardsresulting from rapidly developing room fires.
135

c. The control of materials in the room such as the combustibility ofthe interior of the wardrobe (or a closet) may be the only practicalsolution for insuring life safety regardless of whether sprinklersare installed in the room.
7 . REFERENCES
[1] O'Neill, J. G. and Hayes, W. D., Full-scale fire tests with automaticsprinklers in a patient room, Nat. Bur. Stand. (U.S.), NBSIR 79-1749,(June 1970)
.
[2] O'Neill, J. G., Hayes, W. D., and Zile, R. H. , Full-scale fire tests withautomatic sprinklers in a patient room, phase II, Nat. Bur. Stand. (U.S.),NBSIR 80-2097 (July, 1980).
[3] Installation of sprinkler systems, Standard No. 13, National Fire ProtectionAssociation, Boston, MA (1978 Ed.)
.
[4] Automatic sprinklers for fire-protection service, UL 199, UnderwritersLaboratories, Inc., Northbrook, IL (6th edition with revisions up to Mar
19, 1979).
[5] Minimum requirements of construction and equipment for hospital and medicalfacilities, U.S. Department of Health, Education and Welfare, Washington,D.C., May 1975 Ed and Proposed Revision, May 1977.
[6] Dinman, B. D., Journal of American Medical Association, Vol. 235, 2874-5(June 28, 1976) .
[7] Kimmerle, G., Aspects and methodology for the evaluation of toxicologicalparameters during fire exposure, Journal of Fire and Flammability/CombustionToxicology, Vol. 1, 4-41 (Feb. 1974).
[8] Claudy, W. D., Respiratory hazards of the first service, National FireProtection Association, Boston, MA (1957)
.
[9] Pryor, A. J. and Yuill, C. H. , Mass fire life hazard, prepared for theOffice of Civil Defense under Contract N228 (62479) 68665, SouthwestResearch Institute, San Antonio, TX (1966).
[10] Jin, T., Visibility through fire smoke-, part 2, Report of the Fire ResearchInstitute of Japan, No. 33, 31-48 (1971). Part 5, Report of Fire ResearchInstitute of Japan, No. 42, 12-18 (1975).
[11] Jin, T., Visibility through fire smoke, main reports on production, movementand control of smoke in buildings, pp. 100-153, Japanese Association of
Fire Science and Engineering (1974)
.
136
[12] Heskestad, G. and Smith, H. F. , Investigation of a new sprinkler sensitivityapproval test: the plunge test, FMRC Serial No. 22485, Dec. 1976, FactoryMutual Research Corporation, Norwood, MA.
[13] Kung, H. C, Residential sprinkler test program, presentation at FactoryMutual Research, Norwood, MA, June 14, 1979.
[14] Kung, H. C, Haines, D. M. , and Greene, R. E., Jr., Development of low-costresidential sprinkler protection, prepared for the National Fire Protectionand Control Administration, Factory Mutual Research, Norwood, MA (Feb.
1978) .
137
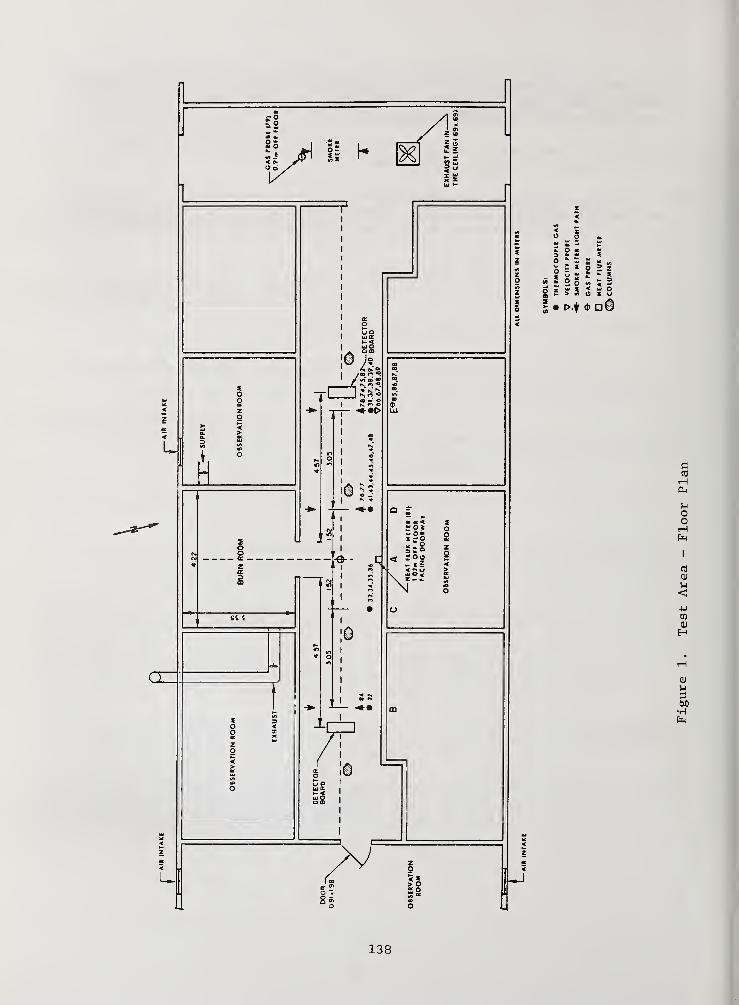
138
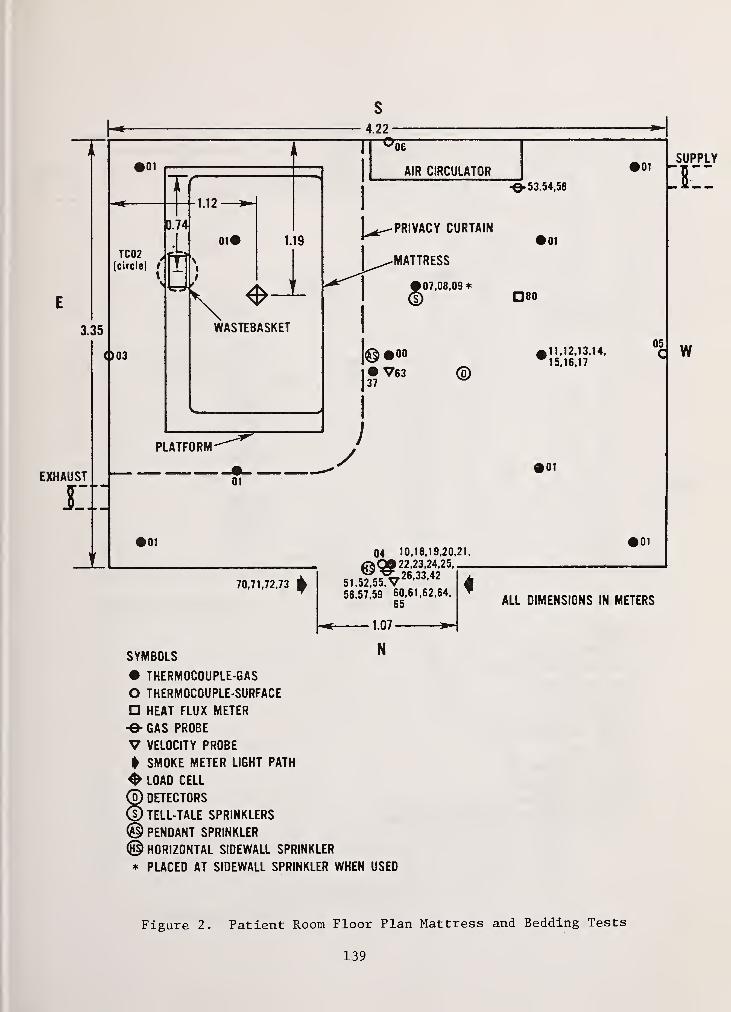
s
4.22
01
TC02,
(circle] /
0.74
3.35
O03
1.12
OK
WASTEBASKET
19
T '06
AIR CIRCULATOR 101
L^PRIVACY CURTAIN
-MATTRESS
(07,08,09*
-e- 53,54,58
»01
80
©•00• V6337
,11,12,13,14,
15,16,17
PLATFORM-
EXHAUST»01
r:::
01
SUPPLY
05
c w
01
04 10,18,19,20,21,
iOI
70,71,72,73
fl> 0022,23,24,25,
51,52,55,VZ6,33,4Z
56 57,59 60,61,62,64,
65
e 1.07-
SYMB0LS N
• THERMOCOUPLE-GAS
O THERMOCOUPLE-SURFACE
HEAT FLUX METER
-9- GAS PROBE
V VELOCITY PROBE
t SMOKE METER LIGHT PATH
LOAD CELL
(d) DETECTORS
© TELL-TALE SPRINKLERS
© PENDANT SPRINKLER
© HORIZONTAL SIDEWALL SPRINKLER
* PLACED AT SIDEWALL SPRINKLER WHEN USED
ALL DIMENSIONS IN METERS
Figure 2. Patient Room Floor Plan Mattress and Bedding Tests
139
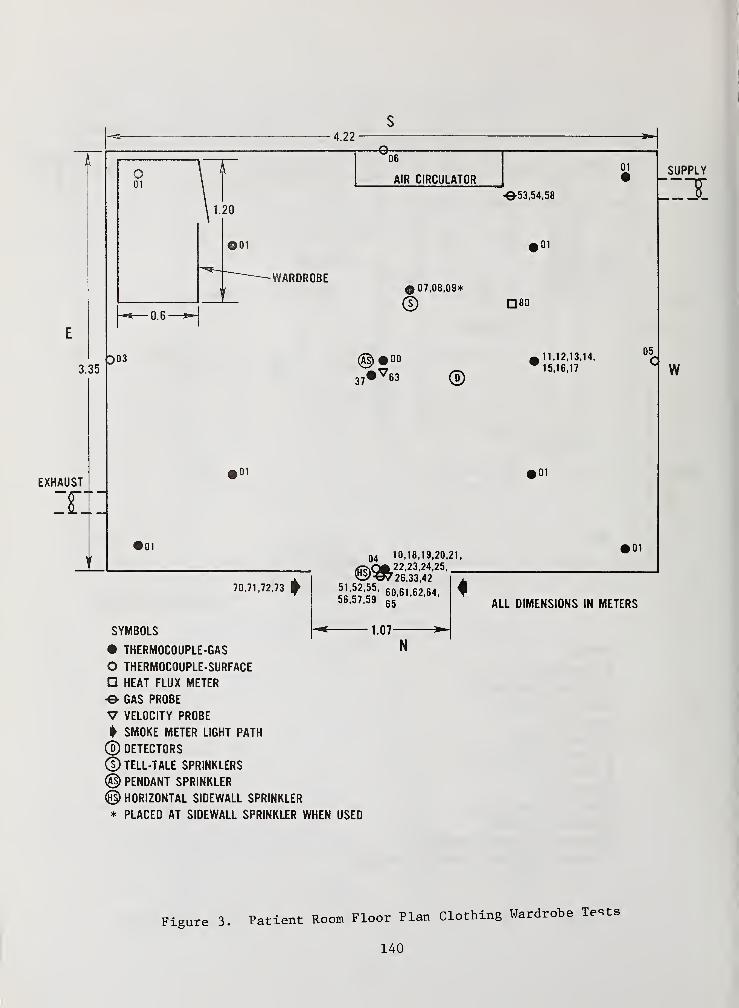
4.22
3.35
EXHAUST
x::
06
AIR CIRCULATOR01
-053,54,58
,01
SUPPLY
WARDROBE
0Q3
© 07,08,09*
©
©•oo37#V
63 ®
80
a 11,12,13,14,W15,16,17
05
0 w
• 01
• 01
04 10,18,19,20,21,(01
70,71,72,73
rfR.QiL22,23,24,25,^:W26,33,42
60,61,62,64,56,57,59
65
SYMBOLS
• THERMOCOUPLE-GAS
0 THERMOCOUPLE-SURFACE
HEAT FLUX METER
-e GAS PROBE
V VELOCITY PROBE
1 SMOKE METER LIGHT PATH
©DETECTORS
© TELL-TALE SPRINKLERS
© PENDANT SPRINKLER
© HORIZONTAL SIDEWALL SPRINKLER
* PLACED AT SIDEWALL SPRINKLER WHEN USED
1.07-
ALL DIMENSIONS IN METERS
Figure 3. Patient Room Floor Plan Clothing Wardrobe Tests
140
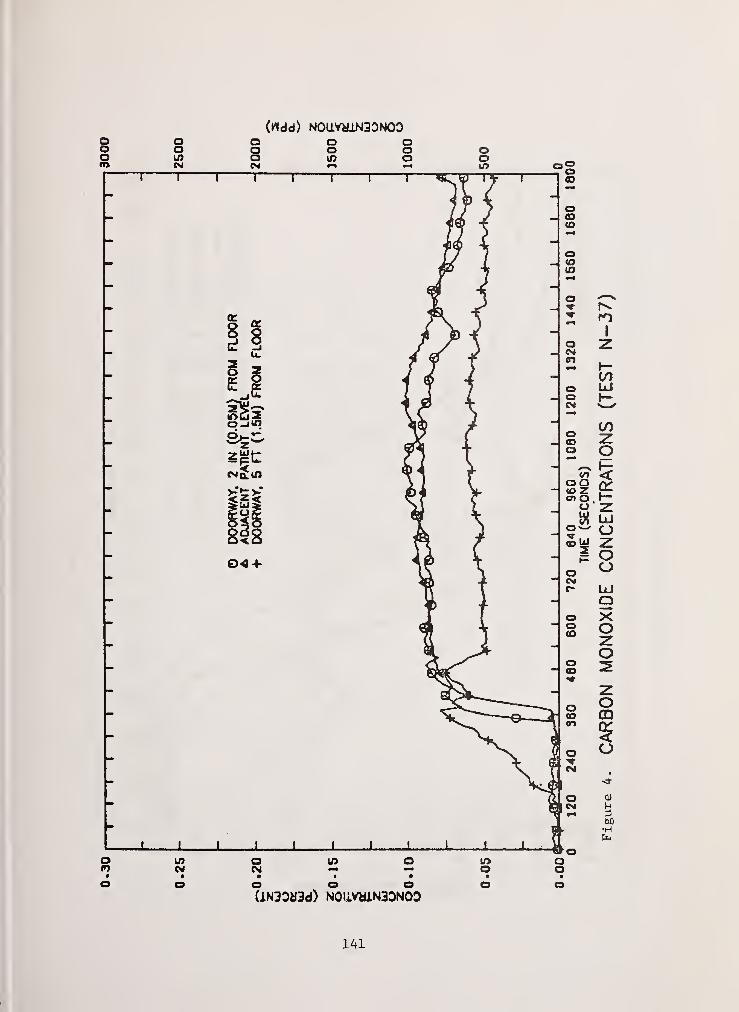
(Hdd) NOUVyiN33NOD
to
I
COLJ
COzo
ujoooLUQXo
oCD
CD
•H
(lN30b3d) N0liVHiN30NOD
141
i

j I i I i i I I L
o an oo to LO CO CMo o o o o o oo o o o e> o o o o(lN33H3d) N0SiVHlN30N03
I
142
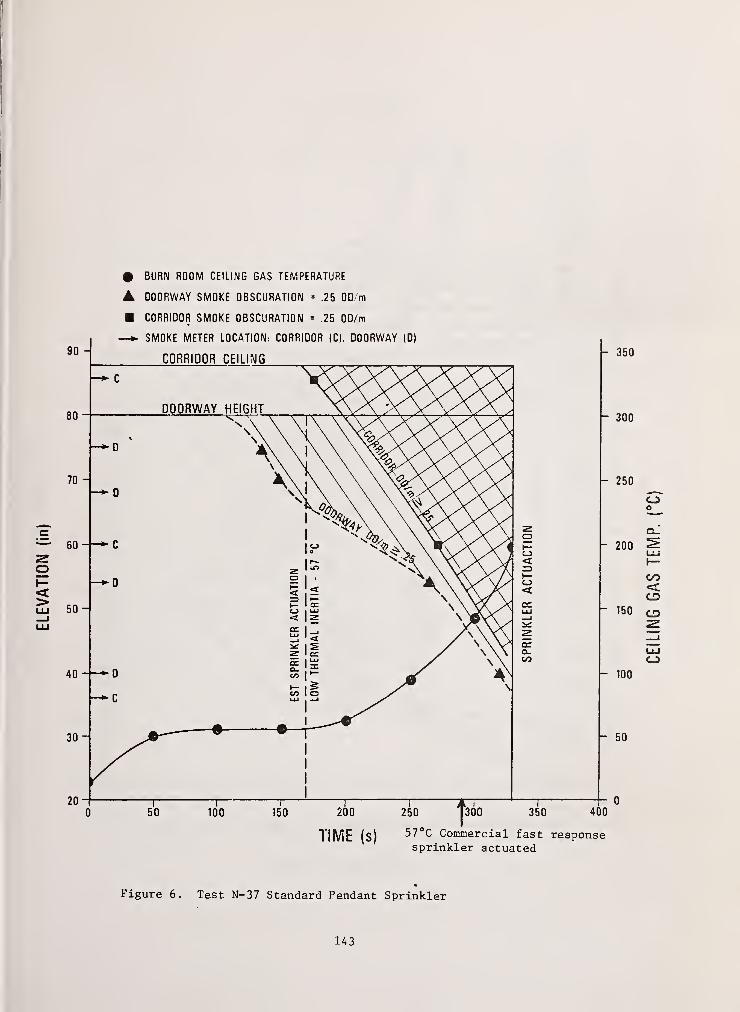
I
I
# BURN ROOM CEILING GAS TEMPERATURE
DOORWAY SMOKE OBSCURATION = .25 OD/m
CORRIDOR SMOKE OBSCURATION = .25 OD/m
—» SMOKE METER LOCATION: CORRIDOR (C|. DOORWAY (D)
CORRIDOR CEILING- 350
- 300
- 250
- 200
- 150
- 100
- 50
200
TIME (s)57 C Commercial fast responsesprinkler actuated
Figure 6. Test N-37 Standard Pendant Sprinkler
143

90 -
0 BURN ROOM CEILING GAS TEMPERATURES
A DOORWAY SMOKE OBSCURATION =25 OD/m
CORRIDOR SMOKE OBSCURATION = .25 QD/m
—* SMOKE METER LOCATION: CORRIDOR (C). DOORWAY (D)'
CORRIDOR CEILING
80
70-
CD 60
50-
40
30 -
20 -t
DOOR HEIGHT
200
TIME (s)
300
Figure 7. Test N-39 Standard Horizontal Sidewall Sprinkler
144
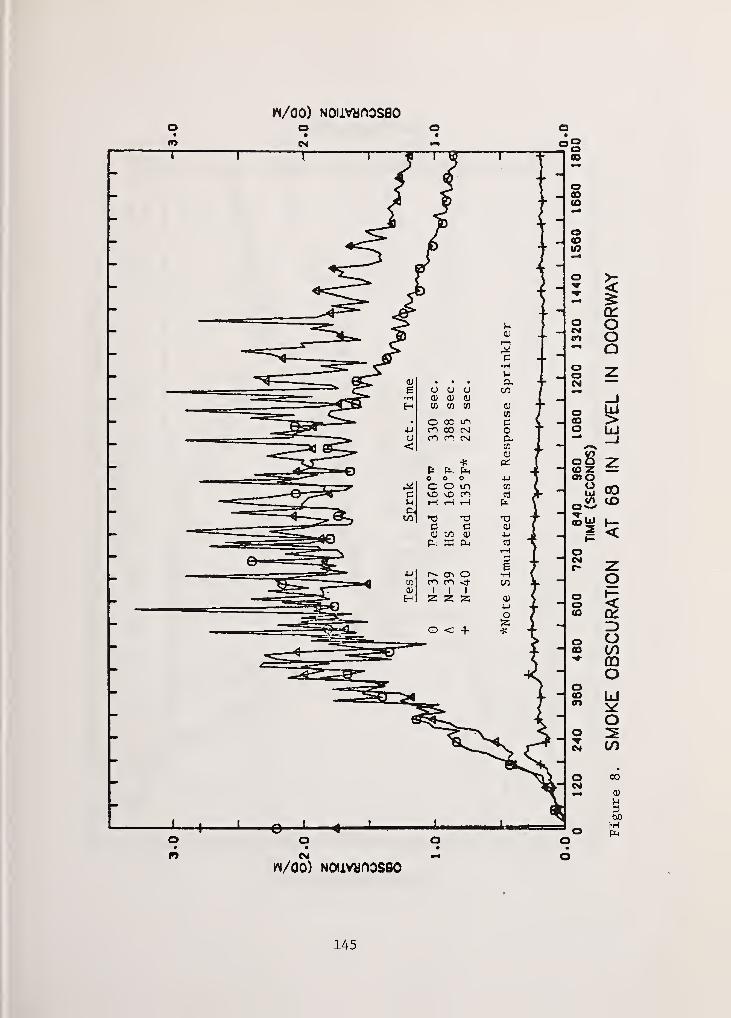
145

IN/00) NOIlVUnOSBO
ON
•H
146
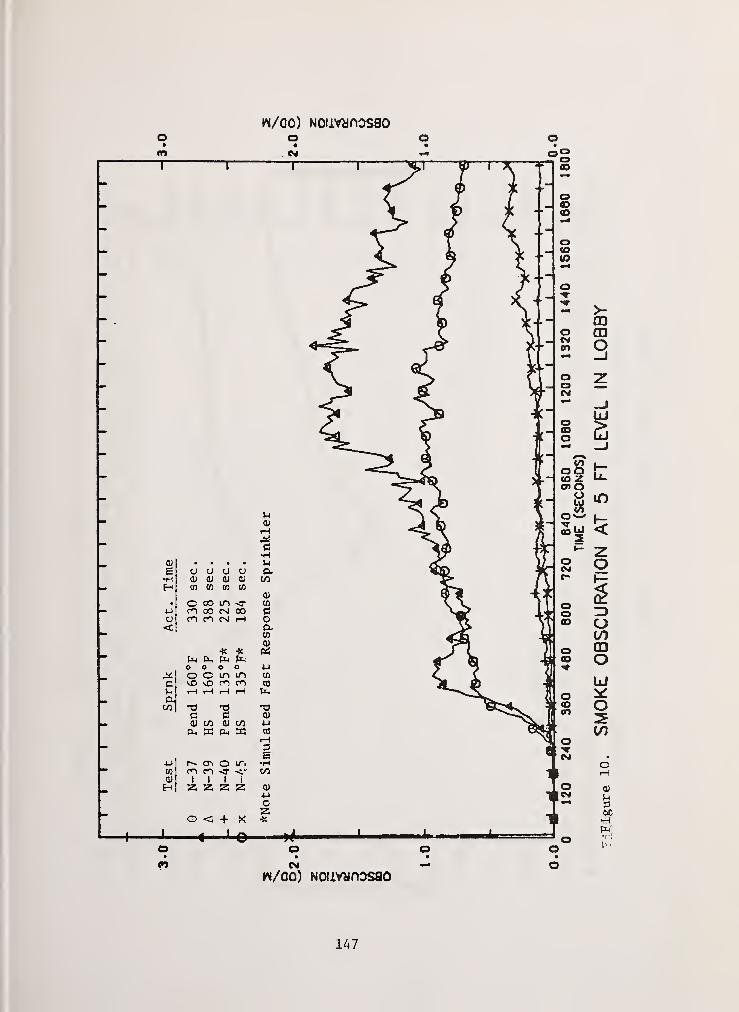
w/oo) Notivanosso
147
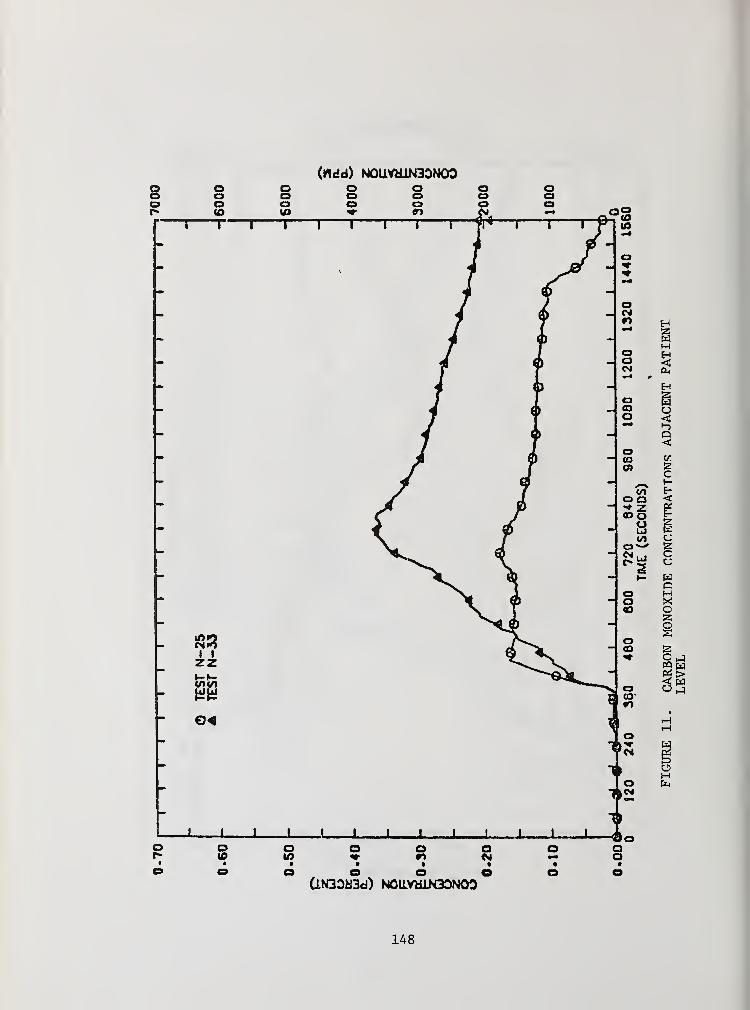
148
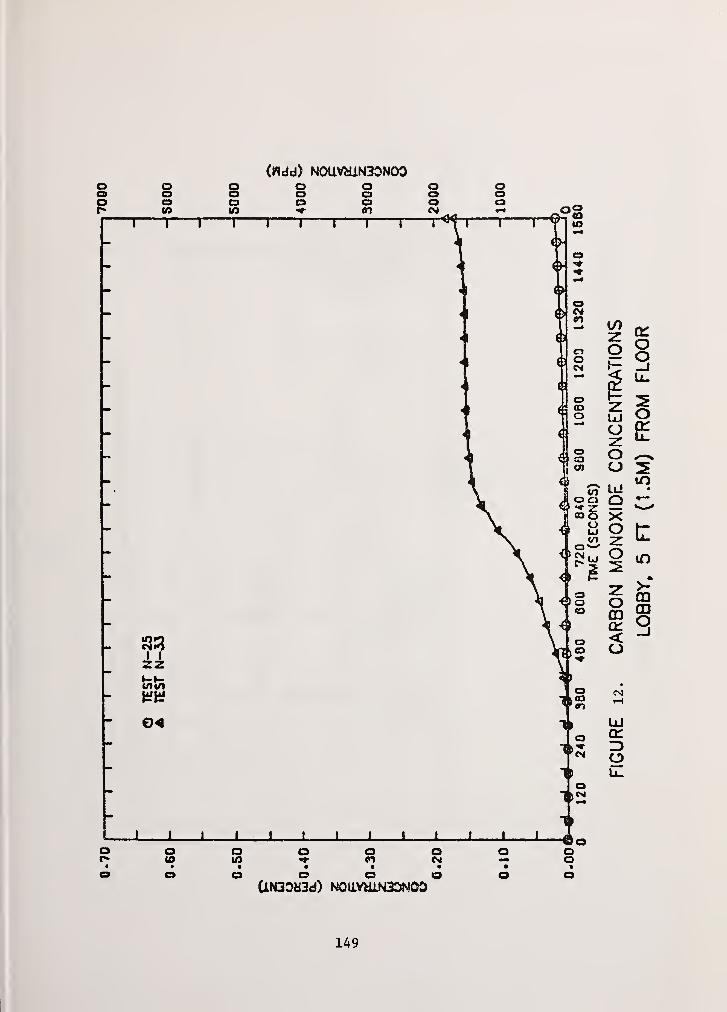
149
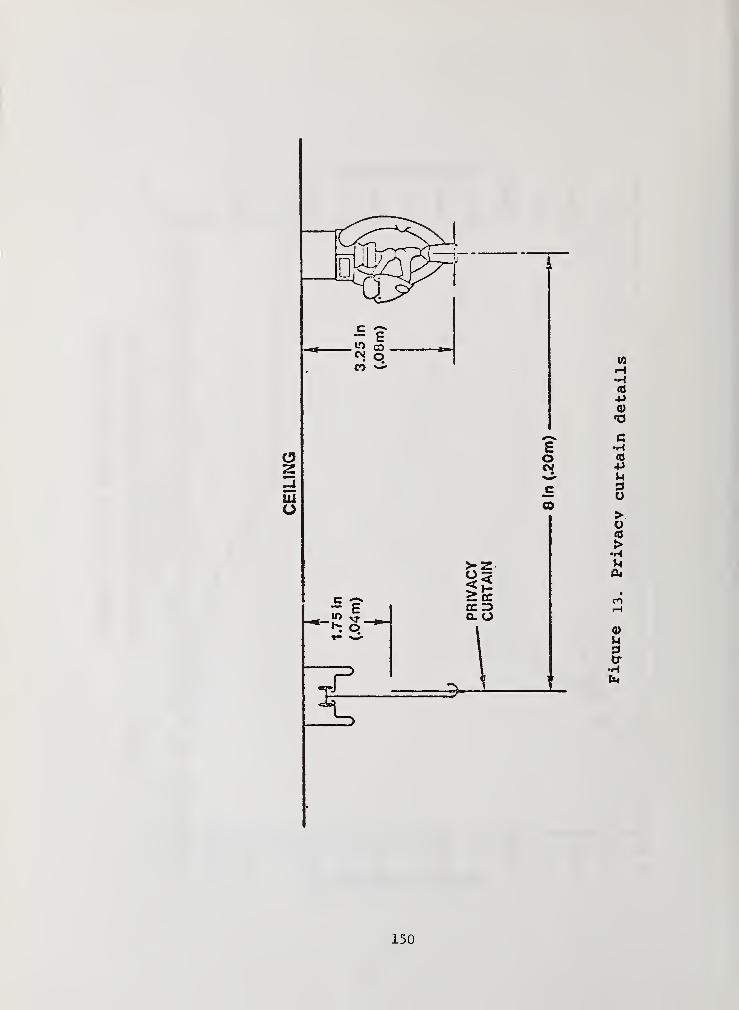
150
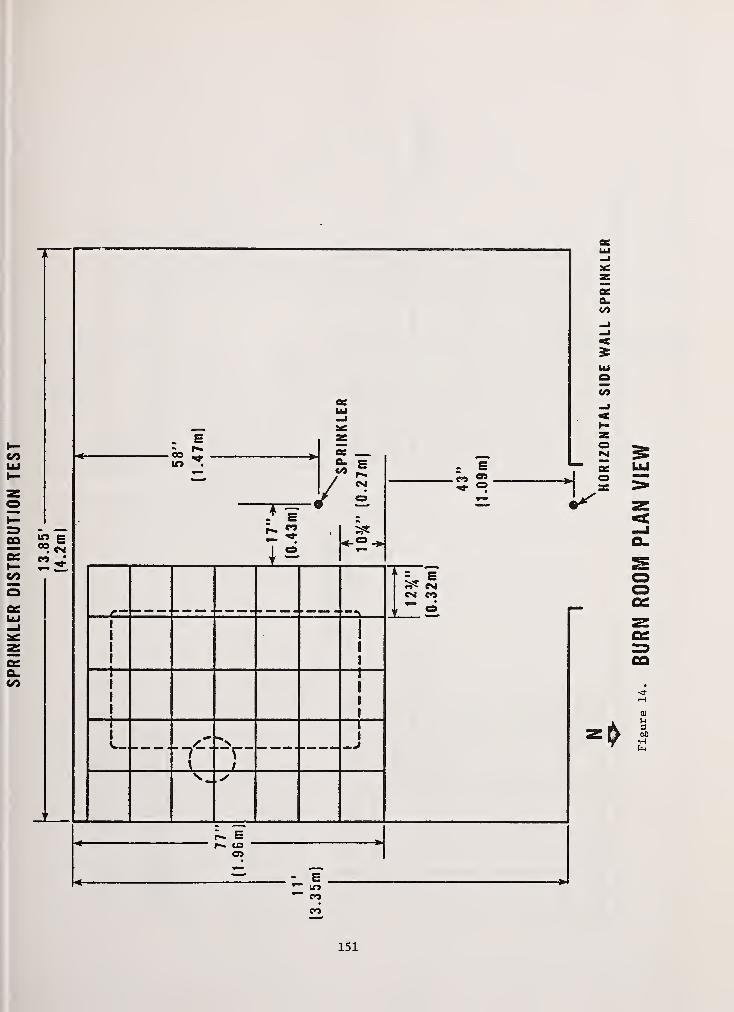
151
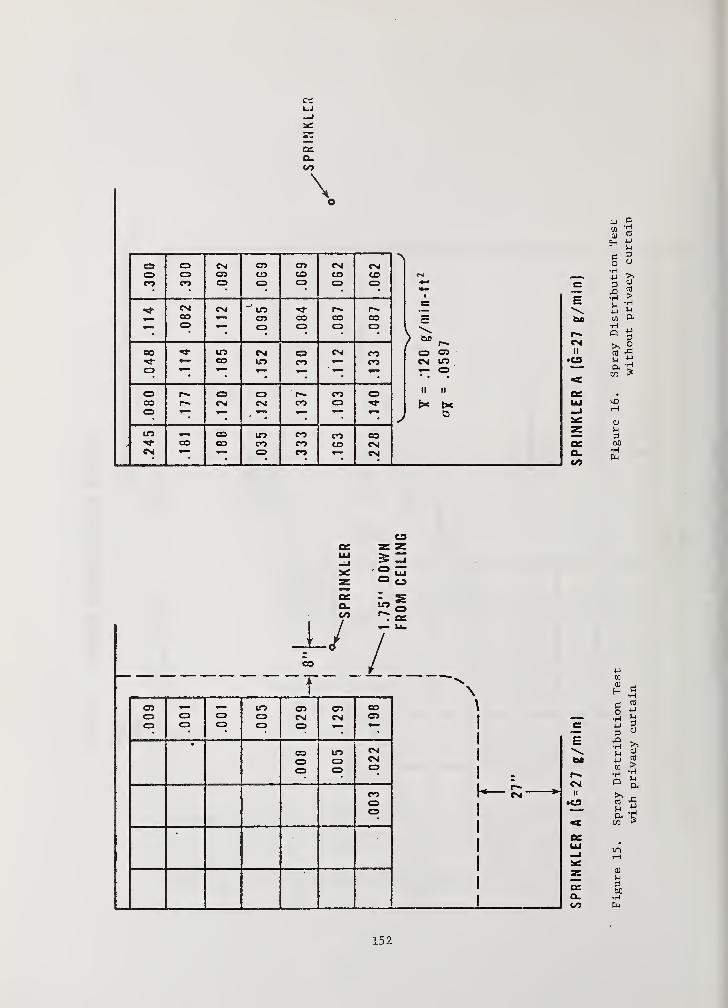
Q_oo
\
o o CM era CO CM CMCD co CO to CO to COCO CO CO CO CO CO CO *>
«*—t
CM ezCNI LT5 Tl- r— r
—
CO CO oo GO CO sCD CO CO o CO
) OJ
oo *r in CM o CM CO o«* oo WO CO CO CMoo r— o o ' r» CO o II
oo r>» CM CM CO COCD
)in CO IT> CO CO CO
co CO CO CO to CMCM CO CO CM
r-CMII
•ts
IXto
(3
•Htd
+jH
a
>>am>•HV-i
(1)
H3
Ci_
CD
152

Table 1. Total Weight Losses Combustible Wardrobe Tests
Sprinkler Type Test No. Weight Loss (lbs)
Pendant N-48 38.2Pendant N-49 17.4Pendant* N-53 40.7
Horiz Sidewall N-50 14.2Horiz Sidewall N-51 9.4Horiz Sidewall* N-52 9.2
*Simulated fast response sprinkler t = 21 sec.
153
APPENDIX
The dynamic heating measurements used in this presentation to characterizefast response sprinklers were based on a proposed test called the "plunge test"developed by Heskestad and Smith at FM. The test, which has been proposed todetermine the response time of sprinklers, is based on the assumption that in
actual fire situations, the sprinkler fusible element is primarily heated byconvection and the effect of radiation on the element is relatively small. Thedynamic heating measurement of the fusible element is expressed as the timeconstant x ; where
(AT - TT )t = g L
d(ATL)/dt
where AT^ is the increase in temperature of the fusible element (relative to
ambient or initial temperature) and AT is the excess temperature of the gas.
t, therefore, has units of time. Hesklstad and Smith found that selected stan-dard sprinklers when tested in a "plunge test apparatus" varied in terms of t
from 100 to 280 seconds at a reference velocity, y =5 ft/sec.
154
SPRINKLER TECHNOLOGY AND DESIGN IN JAPAN
by Juzo Unoki*
August 1980
ABSTRACT
In Japan installation of sprinklers is mandatory by law for buildings where
many and unspecified persons are accommodated, high-rise buildings, dangerous
material storages, etc. The records of fire suppression by sprinklers indicate
very efficient performance of these sprinkler systems.
The heads used in these systems are designed to meet the standards which are
characterized by the following : the water distribution test is to be conducted
using a single head, and the relationship between permanent and elastic elongation
is defined. The proposal on time constant as the requirement of heat response
of heads is also being discussed.
In these sprinkler systems it is not permitted to directly connect underground
supply pipe of the systems to a public water main due to the regulations, and
it is necessary to install a water reservior with fire pumps. The water
supply arrangements for the sprinkler systems in newly-constructed high-rise
buildings are shown.
Use of larger orifice sprinkler heads in dangerous material storages, etc., the
behavior of smoke and water vapor during fire suppression -by sprinklers,
prevention of water damage by interlocking with automatic fire alarm systems,
etc. are being studied in response to future needs.
* Director, Japanese Association of Fire Science and Engineering
155
. MANDATORY INSTALLATION OF SPRINKLERS
In buildings where many and unspecified persons are accommodated, e.g.,
department stores, theaters, hotels, hospitals, there is a great probability
that a lot of lives would be lost if a fire happens in the premises.
Especially, in high-rise buildings it is difficult to extinguish the fire
and rescue the occupants externally by use of Fire Department equipment
operating from ground level, and in underground shopping malls and windowless
floors hot gases and smoke from the fire could readily permeate the whole
premises. Besides these buildings rack storages and dangerous material
storages would have the greatest fire hazard. For these reasons installation
of sprinklers in these buildings over a certain floor area is mandatory by
the Fire Service Law and ordinances in Japan as summarized in Table 1.
In those buildings where many and unspecified persons are accommodated the
following premises are subjected to the codes requiring mandatory installation
of sprinklers: all floors above 11th floor; floors of l,000m2 or 1 ,500m2 or
more as classified by occupancies from 4th to 11th floors; basements . and
windowless floors of over l,000m2; buildings over 6,000m2 in total floor area
except those including different occupancies; underground shopping malls
over 1 ,000m2. In addition all floors above the 11th floor of all buildings,
rack storages over 10m in ceiling height and over 700m2 in total floor area
concurrently, buildings where dangerous materials or hazardous materials, etc.
are stored or handled in excess of the predetermined amount are subjected
to mandatory installation of sprinklers.
In Japan the mandatory installation of sprinklers is applied to those buildings
constructed before the regulations took effect, not to mention newly-constructed
buildings. The number of buildings where installation is mandatory is returned
as 7,551, of which 6,551 buildings have finished installation, and the completion1)2)
rate is 86% in the whole country as of March 31st 1979. '; Because there
are many cases in which persons concerned with the buildings must bear much
expenses when they install sprinklers in existing buildings, they are given
facilities for the reduction of taxes and the loan by financial institutions
associated with the government.
Sprinkler heads, alarm valves, etc. used in these buildings must be approved
by Japan Fire Equipment Inspection Corporation which has given official
approvals to 1,272 thousand sprinkler heads and 7 thousand alarm valves during
one year from April 1979 to March 1980.
156
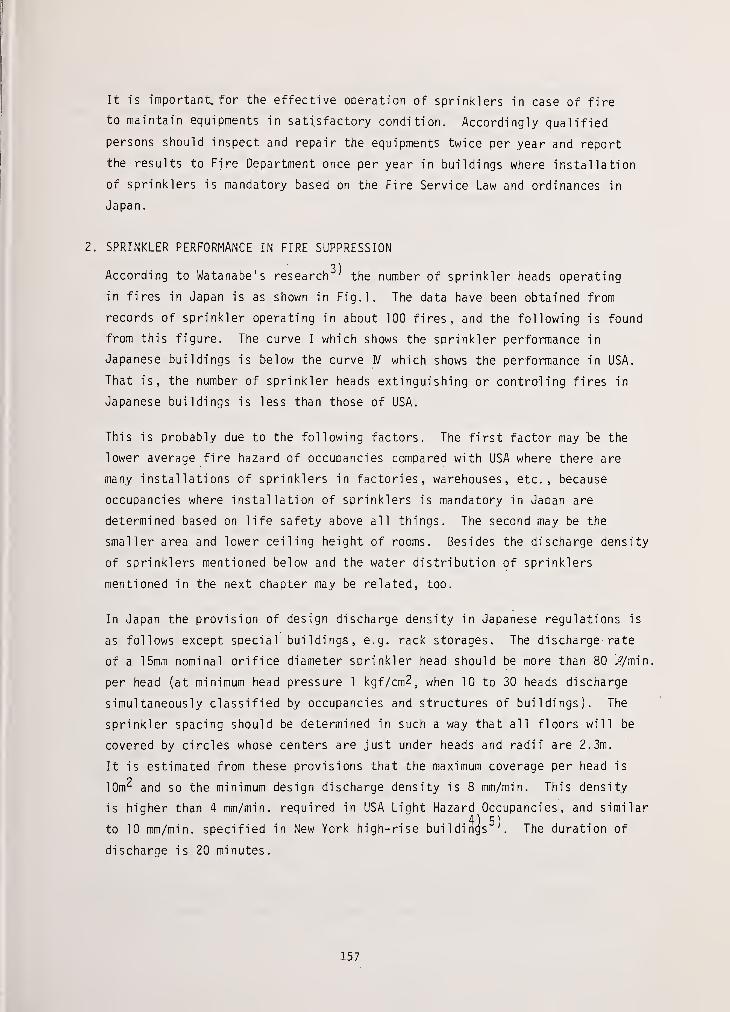
It is important, for the effective operation of sprinklers in case of fire
to maintain equipments in satisfactory condition. Accordingly qualified
persons should inspect and repair the equipments twice per year and report
the results to Fire Department once per year in buildings where installation
of sprinklers is mandatory based on the Fire Service Law and ordinances in
Japan
.
SPRINKLER PERFORMANCE IN FIRE SUPPRESSION
3)According to Watanabe's research ' the number of sprinkler heads operating
in fires in Japan is as shown in Fig. 1 . The data have been obtained from
records of sprinkler operating in about 100 fires, and the following is found
from this figure. The curve I which shows the sprinkler performance in
Japanese buildings is below the curve IV which shows the performance in USA.
That is, the number of sprinkler heads extinguishing or control ing fires in
Japanese buildings is less than those of USA.
This is probably due to the following factors. The first factor may 'be the
lower average fire hazard of occupancies compared with USA where there are
many installations of sprinklers in factories, warehouses, etc., because
occupancies where installation of sprinklers is mandatory in Japan are
determined based on life safety above all things. The second may be the
smaller area and lower ceiling height of rooms. Besides the discharge density
of sprinklers mentioned below and the water distribution of sprinklers
mentioned in the next chapter may be related, too.
In Japan the provision of design discharge density in Japanese regulations is
as follows except special buildings, e.g. rack storages. The discharge rate
of a 15mm nominal orifice diameter sprinkler head should be more than 80 J?/min.
per head (at minimum head pressure 1 kgf/cm2, when 10 to 30 heads discharge
simultaneously classified by occupancies and structures of buildings). The
sprinkler spacing should be determined in such a way that all floors will be
covered by circles whose centers are just under heads and radii are 2.3m.
It is estimated from these provisions that the maximum coverage per head is
10m^ and so the minimum design discharge density is 8 mm/min. This density
is higher than 4 mm/min. required in USA Light Hazard Occupancies, and similar4) 5)
to 10 mm/min. specified in New York high-rise buildings . The duration of
discharge is 20 minutes.
157
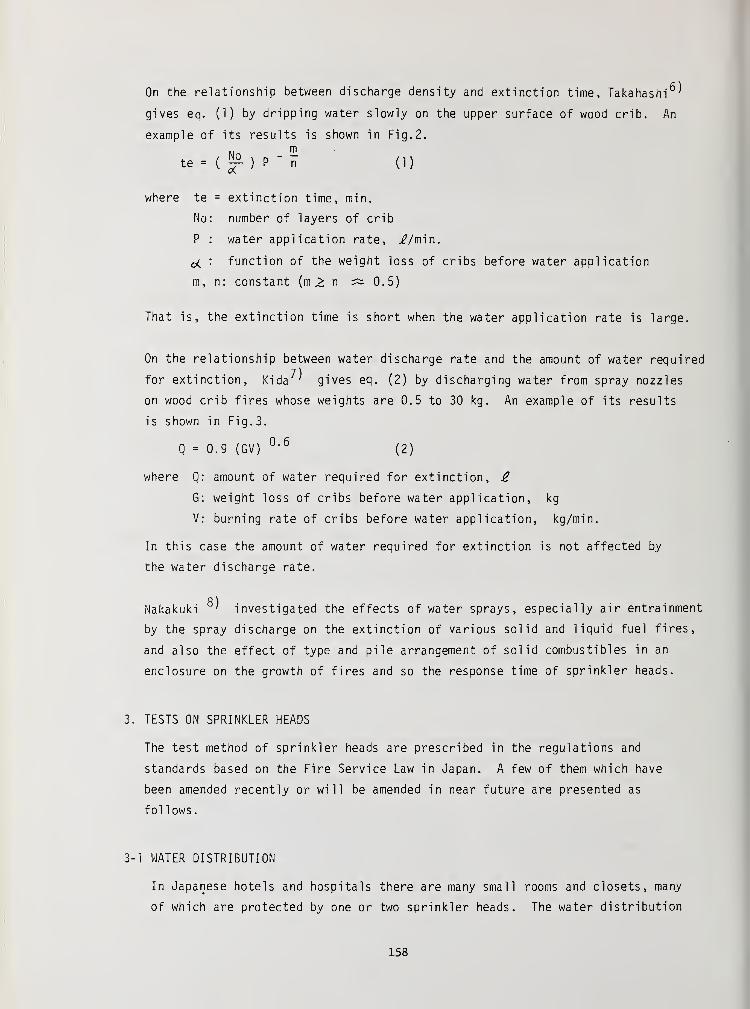
On the relationship between discharge density and extinction time, Takahashi6 ^
gives eq. (1) by dripping water slowly on the upper surface of wood crib. An
example of its results is shown in Fig. 2.
te =( ) P
" i ' (1)
where te = extinction time, min.
No: number of layers of crib
P : water application rate, //min.
c< : function of the weight loss of cribs before water application
m, n: constant (m > n ~ 0.5)
That is, the extinction time is short when the water application rate is large.
On the relationship between water discharge rate and the amount of water required
for extinction, Kida^ gives eq. (2) by discharging water from spray nozzles
on wood crib fires whose weights are 0.5 to 30 kg. An example of its results
is shown in Fig. 3.
Q = 0.9 (GV)°' 6
(2)
where Q: amount of water required for extinction, £
G: weight loss of cribs before water application, kg
V: burning rate of cribs before water application, kg/min.
In this case the amount of water required for extinction is not affected by
the water discharge rate.
Nakakuki8
^ investigated the effects of water sprays, especially air entrainment
by the spray discharge on the extinction of various solid and liquid fuel fires,
and also the effect of type and pile arrangement of solid combustibles in an
enclosure on the growth of fires and so the response time of sprinkler heads.
3. TESTS ON SPRINKLER HEADS
The test method of sprinkler heads are prescribed in the regulations and
standards based on the Fire Service Law in Japan. A few of them which have
been amended recently or will be amended in near future are presented as
follows.
3-1 WATER DISTRIBUTION
In Japanese hotels and hospitals there are many small rooms and closets, many
of which are protected by one or two sprinkler heads. The water distribution
158
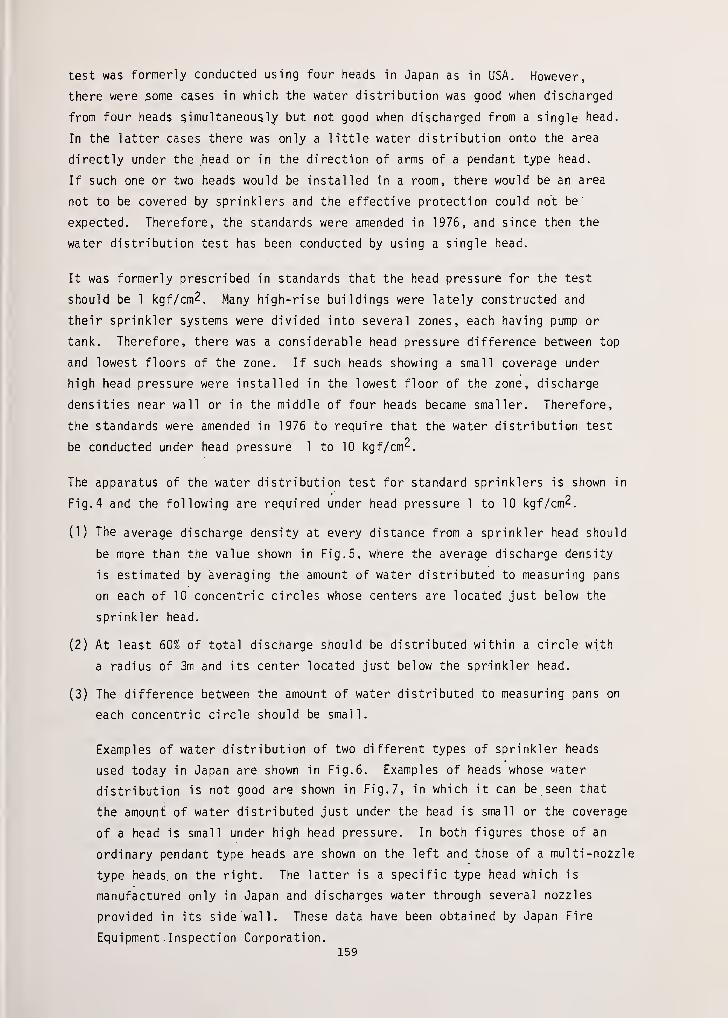
test was formerly conducted using four heads in Japan as in USA. However,
there were some cases in which the water distribution was good when discharged
from four heads simultaneously but not good when discharged from a single head.
In the latter cases there was only a little water distribution onto the area
directly under the head or in the direction of arms of a pendant type head.
If such one or two heads would be installed in a room, there would be an area
not to be covered by sprinklers and the effective protection could not be
expected. Therefore, the standards were amended in 1976, and since then the
water distribution test has been conducted by using a single head.
It was formerly prescribed in standards that the head pressure for the test
should be 1 kgf/cm2. Many high-rise buildings were lately constructed and
their sprinkler systems were divided into several zones, each having pump or
tank. Therefore, there was a considerable head pressure difference between top
and lowest floors of the zone. If such heads showing a small coverage under
high head pressure were installed in the lowest floor of the zone, discharge
densities near wall or in the middle of four heads became smaller. Therefore,
the standards were amended in 1976 to require that the water distribution test
be conducted under head pressure 1 to 10 kgf/cm^.
The apparatus of the water distribution test for standard sprinklers is shown in
Fig. 4 and the following are required under head pressure 1 to 10 kgf/cm2.
(1) The average discharge density at every distance from a sprinkler head should
be more than the value shown in Fig. 5, where the average discharge density
is estimated by averaging the amount of water distributed to measuring pans
on each of 10 concentric circles whose centers are located just below the
sprinkler head.
(2) At least 60% of total discharge should be distributed within a circle with
a radius of 3m and its center located just below the sprinkler head.
(3) The difference between the amount of water distributed to measuring pans on
each concentric circle should be small.
Examples of water distribution of two different types of sprinkler heads
used today in Japan are shown in Fig. 6. Examples of heads whose water
distribution is not good are shown in Fig. 7, in which it can be seen that
the amount of water distributed just under the head is small or the coverage
of a head is small under high head pressure. In both figures those of an
ordinary pendant type heads are shown on the left and those of a multi-nozzle
type heads, on the right. The latter is a specific type head which is
manufactured only in Japan and discharges water through several nozzles
provided in its side wall. These data have been obtained by Japan Fire
Equipment Inspection Corporation.159
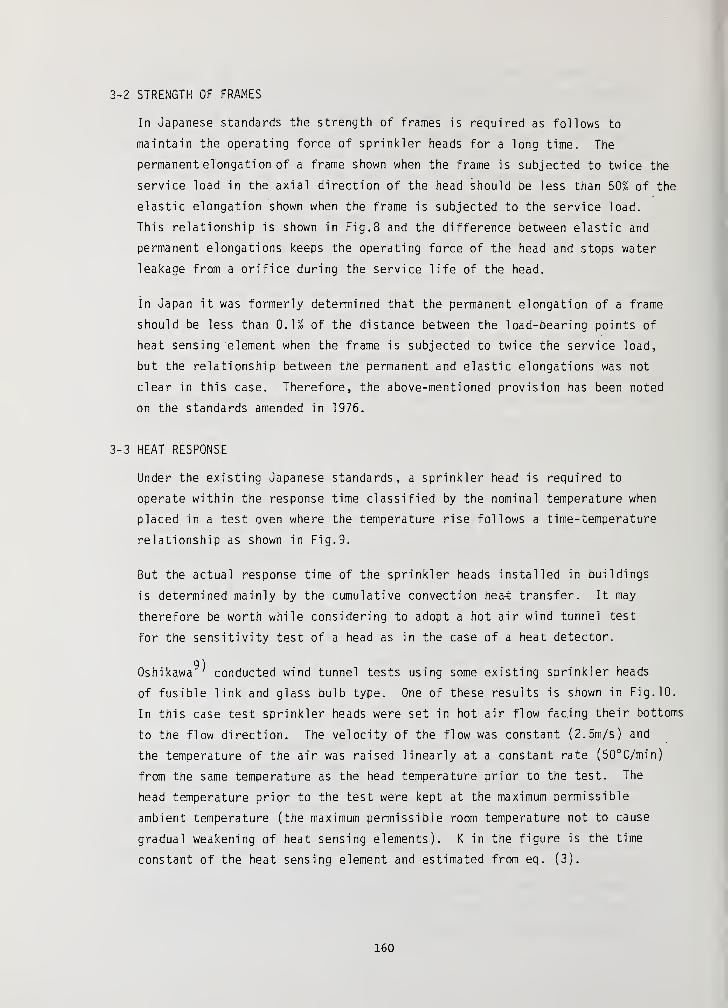
3-2 STRENGTH OF FRAMES
In Japanese standards the strength of frames is required as follows to
maintain the operating force of sprinkler heads for a long time. The
permanent el ongati on of a frame shown when the frame is subjected to twice the
service load in the axial direction of the head should be less than 50% of the
elastic elongation shown when the frame is subjected to the service load.
This relationship is shown in Fig. 8 and the difference between elastic and
permanent elongations keeps the operating force of the head and stops water
leakage from a orifice during the service life of the head.
In Japan it was formerly determined that the permanent elongation of a frame
should be less than 0.1% of the distance between the load-bearing points of
heat sensing element when the frame is subjected to twice the service load,
but the relationship between the permanent and elastic elongations was not
clear in this case. Therefore, the above-mentioned provision has been noted
on the standards amended in 1976.
3-3 HEAT RESPONSE
Under the existing Japanese standards, a sprinkler head is required to
operate within the response time classified by the nominal temperature when
placed in a test oven where the temperature rise follows a time-temperature
relationship as shown in Fig. 9.
But the actual response time of the sprinkler heads installed in buildings
is determined mainly by the cumulative convection hea4 transfer. It may
therefore be worth while considering to adopt a hot air wind tunnel test
for the sensitivity test of a head as in the case of a heat detector.
9
)
Oshikawa ' conducted wind tunnel tests using some existing sprinkler heads
of fusible link and glass bulb type. One of these results is shown in Fig. 10.
In this case test sprinkler heads were set in hot air flow facing their bottoms
to the flow direction. The velocity of the flow was constant (2.5m/s) and
the temperature of the air was raised linearly at a constant rate (50°C/min)
from the same temperature as the head temperature prior to the test. The
head temperature prior to the test were kept at the maximum permissible
ambient temperature (the maximum permissible room temperature not to cause
gradual weakening of heat sensing elements). K in the figure is the time
constant of the heat sensing element and estimated from eq. (3).
160
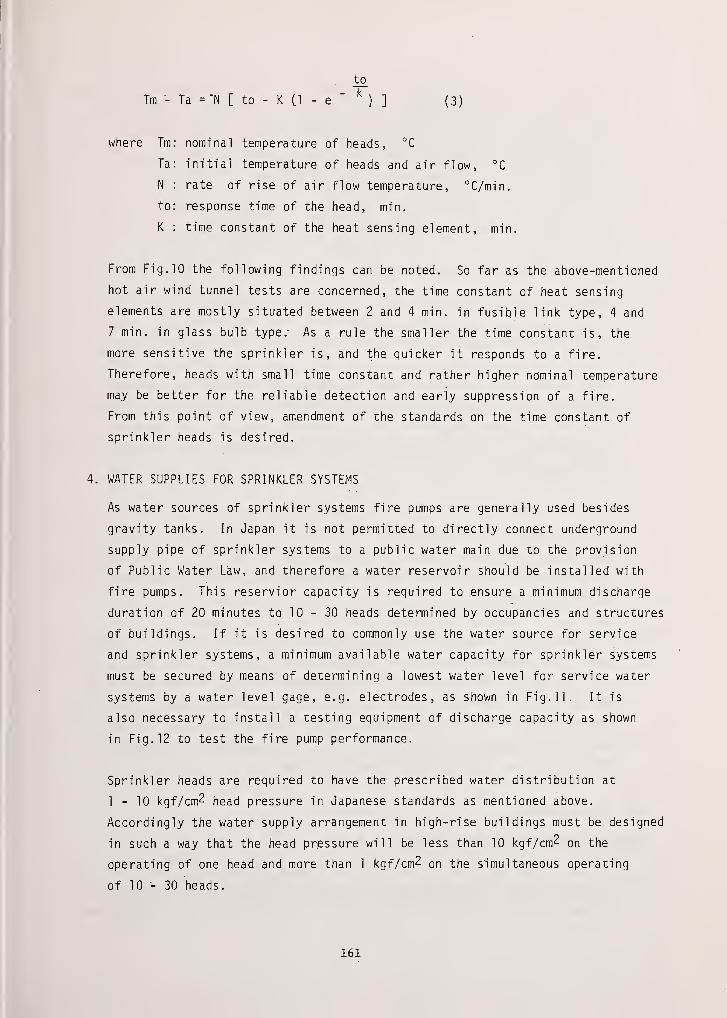
to
Tm - Ta = ~H [ to - K (1 - e" k
) J (3)
where Tm: nominal temperature of heads, °C
Ta: initial temperature of heads and air flow, °C
N : rate of rise of air flow temperature, °C/min.
to: response time of the head, min.
K : time constant of the heat sensing element, min.
From Fig. 10 the following findings can be noted. So far as the above-mentioned
hot air wind tunnel tests are concerned, the time constant of heat sensing
elements are mostly situated between 2 and 4 min. in fusible link type, 4 and
7 min. in glass bulb type: As a rule the smaller the time constant is, the
more sensitive the sprinkler is, and the quicker it responds to a fire.
Therefore, heads with small time constant and rather higher nominal temperature
may be better for the reliable detection and early suppression of a fire.
From this point of view, amendment of the standards on the time constant of
sprinkler heads is desired.
WATER SUPPLIES FOR SPRINKLER SYSTEMS
As water sources of sprinkler systems fire pumps are generally used besides
gravity tanks. In Japan it is not permitted to directly connect underground
supply pipe of sprinkler systems to a public water main due to the provision
of Public Water Law, and therefore a water reservoir should be installed with
fire pumps. This reservior capacity is required to ensure a minimum discharge
duration of 20 minutes to 10 - 30 heads determined by occupancies and structures
of buildings. If it is desired to commonly use the water source for service
and sprinkler systems, a minimum available water capacity for sprinkler systems
must be secured by means of determining a lowest water level for service water
systems by a water level gage, e.g. electrodes, as shown in Fig. 11. It is
also necessary to install a testing equipment of discharge capacity as shown
in Fig. 12 to test the fire pump performance.
Sprinkler heads are required to have the prescribed water distribution at
1 - 10 kgf/cm^ head pressure in Japanese standards as mentioned above.
Accordingly the water supply arrangement in high-rise buildings must be designed
in such a way that the head pressure will be less than 10 kgf/cm^ on the
operating of one head and more than 1 kgf/cm2 on the simultaneous operating
of 10 - 30 heads.
161
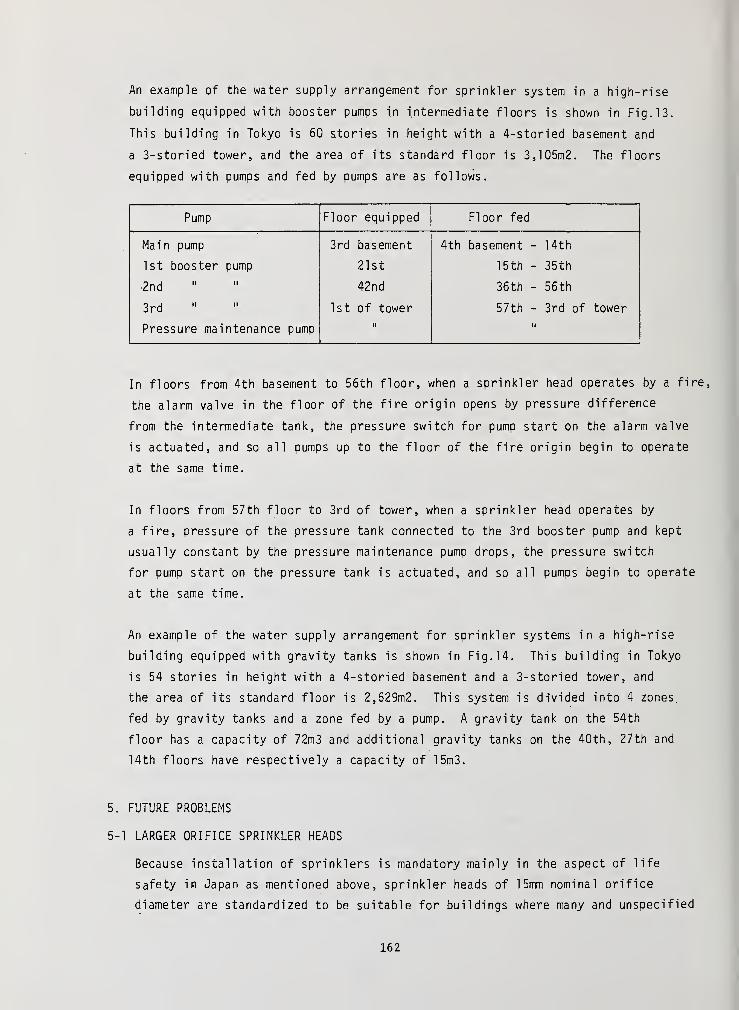
An example of the water supply arrangement for sprinkler system in a high-rise
building equipped with booster pumps in intermediate floors is shown in Fig. 13.
This building in Tokyo is 60 stories in height with a 4-storied basement and
a 3-storied tower, and the area of its standard floor is 3,105m2. The floors
equippeo w i tn pumps ana Tea uy pumps are as TO 1 1 OWS
.
Pump Floor equipped Floor fed
Main pump 3rd basement 4th basement - 14th
1st booster pump 21st 15th - 35th
•2nd 42nd 36th - 56th
3rd 1st of tower 57th - 3rd of tower
Pressure maintenance pumpii ii
In floors from 4th basement to 56th floor, when a sprinkler head operates by a fire,
the alarm valve in the floor of the fire origin opens by pressure difference
from the intermediate tank, the pressure switch for pump start on the alarm valve
is actuated, and so all pumps up to the floor of the fire origin begin to operate
at the same time.
In floors from 57th floor to 3rd of tower, when a sprinkler head operates by
a fire, pressure of the pressure tank connected to the 3rd booster pump and kept
usually constant by the pressure maintenance pump drops, the pressure switch
for pump start on the pressure tank is actuated, and so all pumps begin to operate
at the same time.
An example of the water supply arrangement for sprinkler systems in a high-rise
building equipped with gravity tanks is shown in Fig. 14. This building in Tokyo
is 54 stories in height with a 4-storied basement and a 3-storied tower, and
the area of its standard floor is 2,629m2. This system is divided into 4 zones
fed by gravity tanks and a zone fed by a pump. A gravity tank on the 54th
floor has a capacity of 72m3 and additional gravity tanks on the 40th, 27th and
14th floors have respectively a capacity of 15m3.
FUTURE PROBLEMS
1 LARGER ORIFICE SPRINKLER HEADS
Because installation of sprinklers is mandatory mainly in the aspect of life
safety in Japan as mentioned above, sprinkler heads of 15mm nominal orifice
diameter are standardized to be suitable for buildings where many and unspecified
162

persons are accommodated. These standard sprinkler heads are used for
protection of dangerous or hazardous material storages, etc., as well,
in which case satisfactory protection can only be achieved by reducing
the area allocated to one head or increasing the duration of discharge
with these heads. In view of the increase of storage size and commodity
variety, however, studies are being made with respect to use of larger
orifice sprinkler heads, e.g., 20mm nominal size head, which is capable
of discharging large drops penetrating through severe fire plume.
5-2 BEHAVIOR OF SMOKE AND WATER VAPOR SUPPRESSION WITH SPRINKLERS
When the fire has been suppressed by sprinklers, the burning rate decreases
and so the smoke generating rate surely decreases, too. But simultaneously
a large amount of water vapor generates, the ceiling smoke layer falls
near floor, the visibility in the room reduces, and so those may have a bad
effect on the escape of occupants. Regarding vapor generation resulting
from water application, Takahashi reported that when wood crib fire were
suppressed by water spray, the density of generating vapor increased to
a maximum value and afterward decreased again, with the increase of the
water application rate. On the other hand the density of smoke and vapor
in actual-scale fire tests was measured by light path maters, but any
conclusion has not yet been reached.
5-3 PREVENTION OF WATER DAMAGE
Sprinklers are very effective on the suppression of a fire in its early
stage, but it is strongly required especially by department stores, etc.
that water damages be limited to a minimum extent. However this requirement
is not always satisfied as they must manually close the stop valve near the
alarm valve to stop the water discharge after the extinction. In Japan
automatic fire alarm systems are mostly installed in buildings where
installation of sprinklers is mandatory. And so it may be rather easy to
install preaction systems or cycling systems in these buildings by the
interconnection of above-mentioned two systems. The future study including
the amendment of regulations is desired.
ACKNOWLEDGMENT
The author would like to thank Messrs. Y. Yahazuno, A. Watanabe, N. Jiromaru
- Fire Defence Agency, T. Nakajima-Formerly Fire Defence Agency, A. Nakakuki
- Association For Safety Technics of Petroleum and Y. Yaji-Japan Fire Equipment
Inspection Corporation, for their kind suggestions and advices to make this
. report.
163
REFERENCES
1) Fire Defence Agency, White Paper on Fire Defence, November 1979
2) Tadayoshi NAKAJIMA, Situations on Installation of Fire Protection Systems
and Future Problems, Kindai Shohboh (Modern Fire Defence), April 1980
3) Akio WATANABE, Effectiveness of Active Fire Protection Systems, Kenchiku
Bonsai (Disaster Protection in Building), April 1980
4) W. Robert POWERS, Automatic Sprinkler Experience in High-rise Buildings,
Fire Journal, November 1972
5) P. NASH and R.A. YOUNG, Sprinklers in High-rise Buildings, Building Research
Establishment Current Paper 29/78, February 1978
6) Satoshi TAKAHASHI, Quantative Treatment of Extinction Phenomena of Crib
Model Fire, Bulletin of Japanese Association of Fire Science and Engineering,
Vol 29, No.l, 1979
7^ Hajime KIDA, Extinction of Fires of Small Wood Crib with Sprays of Water and
Some Solutions, Report of Fire Research Institute of Japan, No. 36, March 1973
8) Atsushi NAKAKUKI and Masai chi TAKAHASHI, Extinction of Fires with Water Sprays
in Compressed and Oxygen-enriched Atmosphers, Report of Fire Research
Institute of Japan, No. 35, March 1972
9) Sataro OSHIKAWA, Sensitivity Tests of Automatic Sprinkler Heads, Technical
Report of Japan Fire Equipment Inspection Corporation, No.l, 1977
10) Satoshi TAKAHASHI, Steam generated by Fire and Extinguishing-I , Report of
Fire Research Institute of Japan, No. 43, March 1977
164
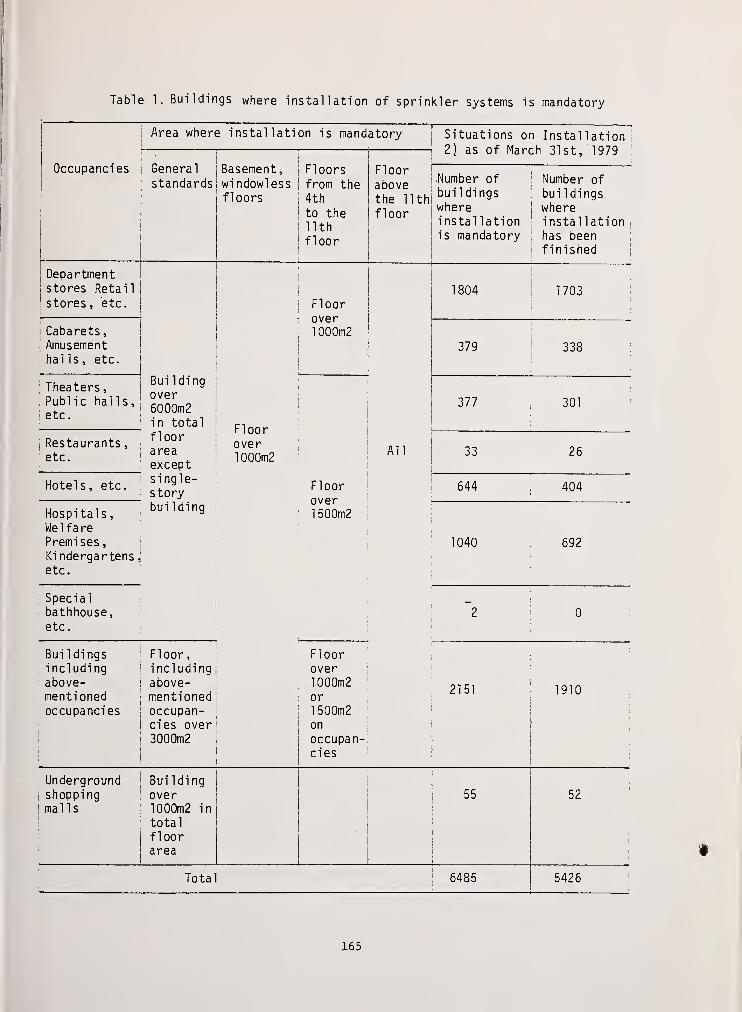
Table 1. Buildings where installation of sprinkler systems is mandatory
Area where installation is mandatory Situations on Installation,2) as of March 31st, 1979
Occupancies
i
Ocl It. I u 1
standards
!
Basement,jFloors
windowless!from the
floors; 4th
! to the
i
M tn
|
floor
Floor
abovethe 11th
floor
•Number ofbuildingswhereinstallationis mandatory
Number of
bui 1 dings
whereinstallation
1
has beenfinished
r
Department
j
stores Retail
! stores , etc.I
\Floor
- over
;1000m2
i
i
1804 1703
jCabarets
,
Amusementhalls , etc.
Buildingover6000m2in total
379 338
: Theaters
,
I
Public halls,1 etc.
i
Floorover1000m2
377!
301
j
Restaurants
,
etc.
f 1 oorareaexcept
All 33 26
Hotels, etc.single-story
Floorover
:
1500m2
644 404
Hospitals
,
WelfarePremi ses
,
Kindergartens
,
etc.
building
1040 692
Specialbathhouse,etc.
~20
Buildingsincludingabove-menti onedoccupancies
Floor,incl uding
above-mentionedoccupan-cies over3000m2
Floorover1000m2
: or
;
1500m2! on
j
occupan-
j
cies
2151 1910
Underground
I
shopping!malls
Buildingover1000m2 in
total
f 1 oorarea
Total
55 52
6485 5426
165

In addition to above-mentioned occupancies, they should install sprinkler
systems in the following areas.
1) All floors above the 11th floor
2) Rack storages, over 10m in ceiling height and over 700m2 in total floor
area.
3) Stages, having area over 300m2 in basement, floor without windows or
floor above the 4th, and over 500m2 in other floors.
4) Buildings where larger amount of dangerous materials, hazardous materials
etc. are stored or handled in excess of the predetermined amount.
166
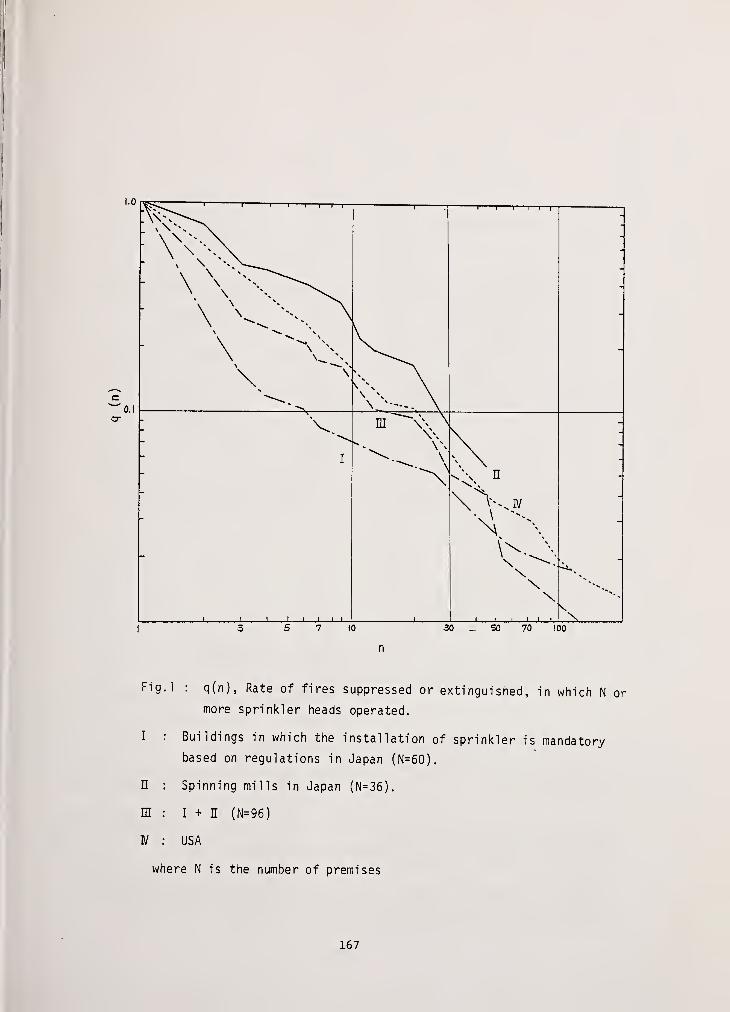
1.0 T?^T i1—
1 1 1—I—r—i—
• \ \ \\\ Vx A\ X\
1^,
i
^ \\ \ \
——i1 1—i—i—i—
-
: "v.
i
i i ] i i i 1
1
TTT > \
. l
0\ n
\N\\
i i i i i i
) 3 5 7 10 30 _ SO 70 100
n
Fig.l: q(n), Rate of fires suppressed or extinguished, in which N or
more sprinkler heads operated.
I : Buildings in which the installation of sprinkler is mandatory
based on regulations in Japan (N=60).
II : Spinning mills in Japan (N=36).
m : I + H (N=96)
IV : USA
where N is the number of premises
167
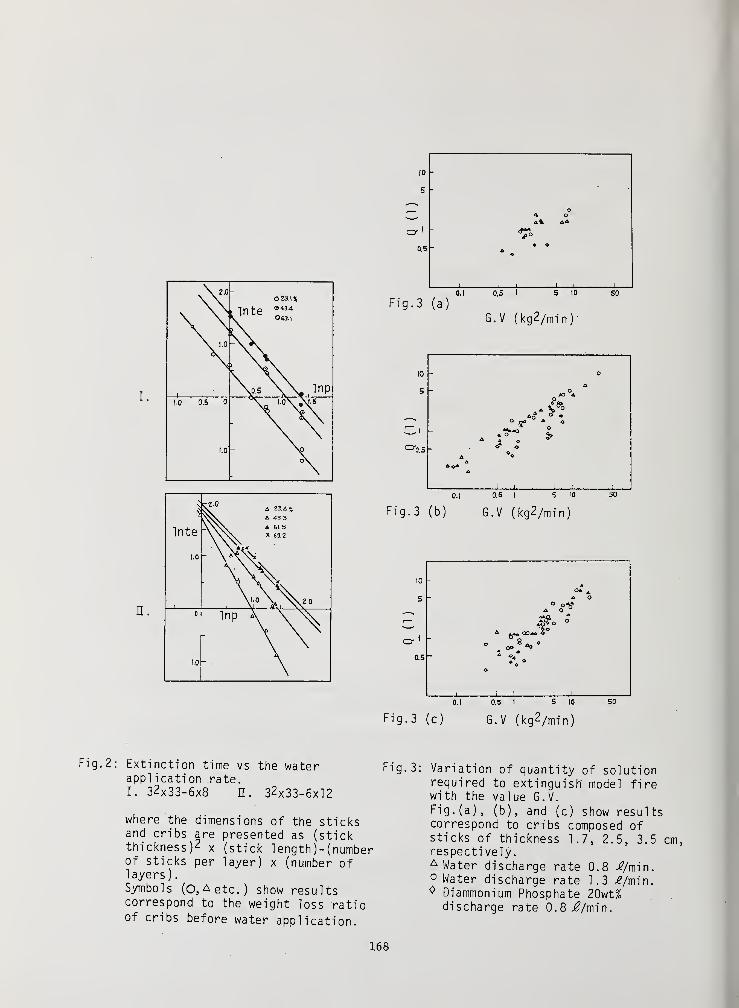
Fig. 2: Extinction time vs the waterappl ication rate.I. 32x33-6x8 H. 32 x 33-6xl2
where the dimensions of the sticksand cribs are presented as (stickthickness) 2 x (stick length)-(numberof sticks per layer) x (number oflayers).Symbols (O, A etc. ) show resultscorrespond to the weight loss ratioof cribs before water application.
Fig. 3: Variation of quantity of solutionrequired to extinguish model firewith the value G.V.Fig-(a)
5 (b), and (c) show resultscorrespond to cribs composed ofsticks of thickness 1.7, 2.5, 3.5 cm,respectively.A Water discharge rate 0.8 iymin.0 Water discharge rate 1.3 ^/min.0 Diammonium Phosphate 20wt%
discharge rate 0.8^/min.
168

I
7777^ //////
Fig. 4: The apparatus of water distribution test for
standard sprinkler
169

Symbol A B
Nominal orificediameter (mm)
20 15
A
B
_i u ' ii I i
50 100 150 200 230 250
Distance from the center of a sprinkler head (cm)
.5: Minimum discharge density curve
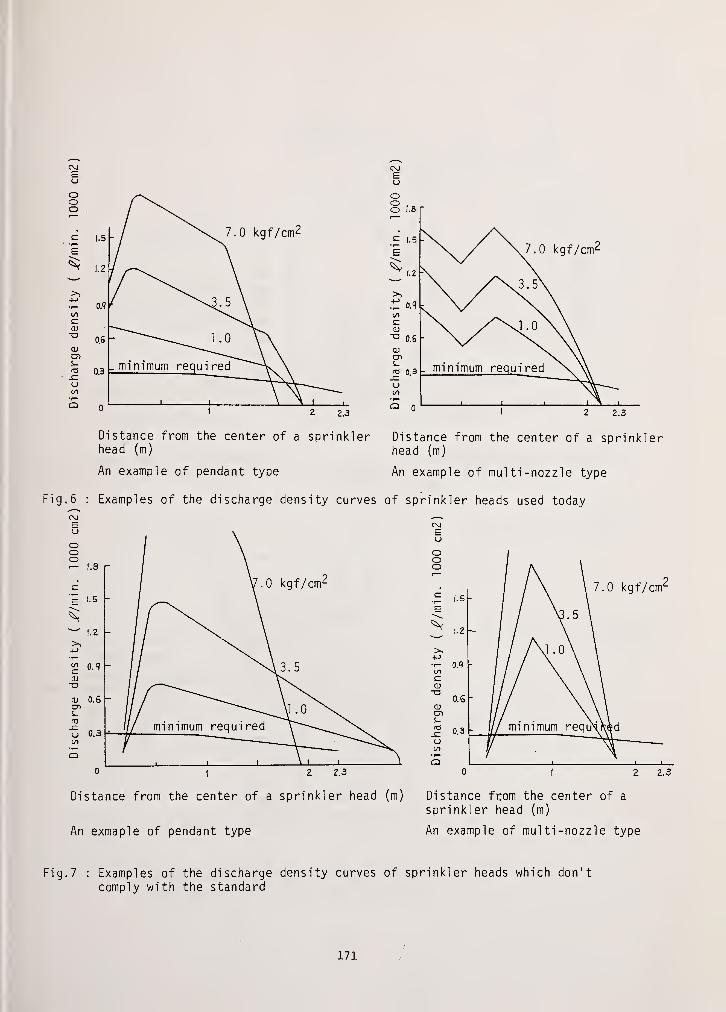
Distance from the center of a sprinkler Distance from the center of a sprinklerhead (m) head (m)
An example of pendant type An example of multi-nozzle type
Fig. 6 : Examples of the discharge density curves of sprinkler heads used today
CM -—
-
E CM
Distance from the center of a sprinkler head (m) Distance from the center of a
sprinkler head (m)
An exmaple of pendant type An example of multi-nozzle type
Fig. 7 : Examples of the discharge density curves of sprinkler heads which don't
comply with the standard
171
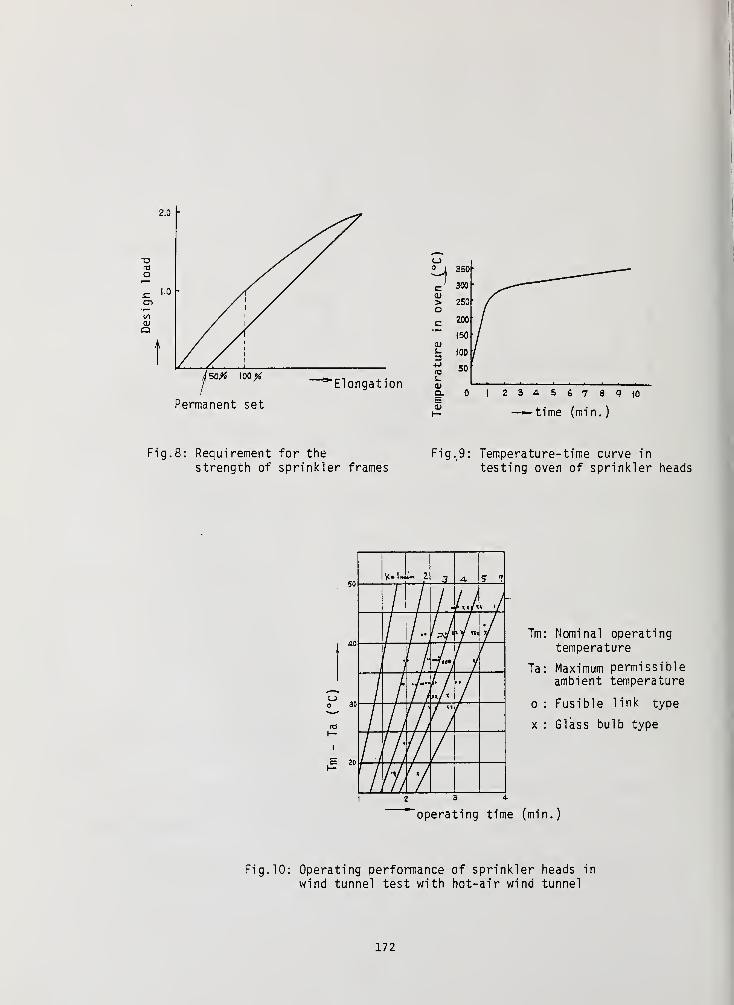
Permanent set
'Elongation
% sos-0)Ql 0EO)
2 3 .. 4 5 . 6 7 8 P 10— time (min.)
Fig. 8: Requirement for the
strength of sprinkler framesFig.9: Temperature-time curve in
testing oven of sprinkler heads
so
20
3 <5 1
huF
I f
7 /
«/
«
/ ** f
/
Tm: Nominal operatingtemperature
Ta: Maximum permissibleambient temperature
o : Fusible link type
x : Glass bulb type
'operating time (min.)
Fig. 10: Operating performance of sprinkler heads in
wind tunnel test with hot-air wind tunnel
172
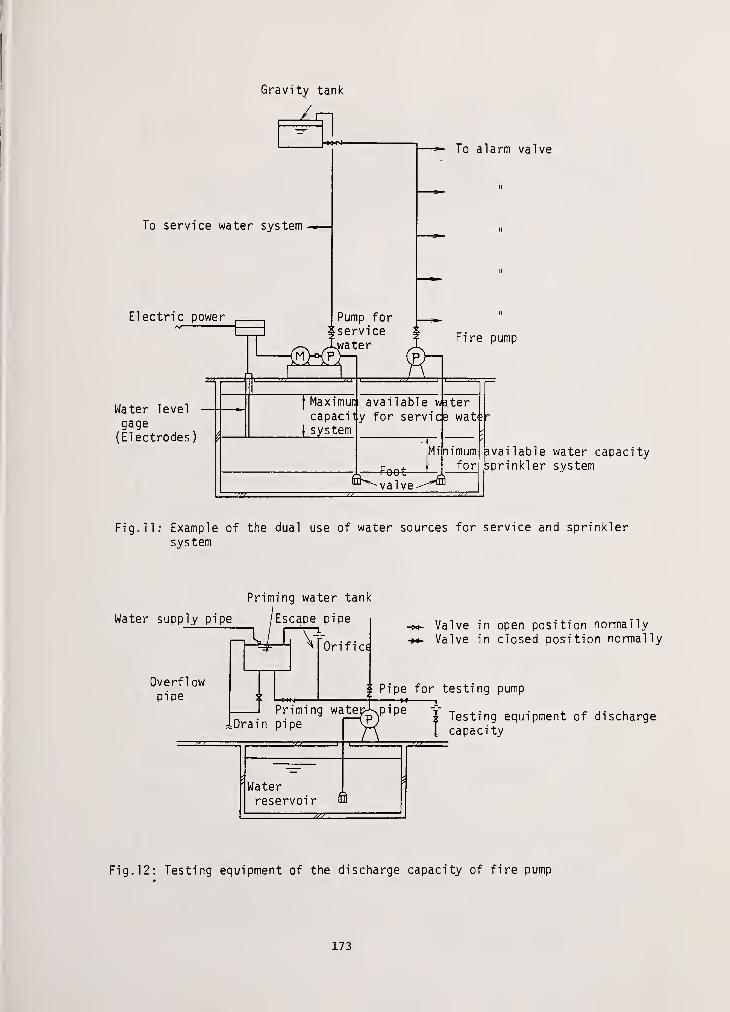
Gravity tank
^1
To service water system-.
—
Electric power
Water level
gage(Electrodes)
To alarm valve
Pump forservice.water
MhHP>-i (p
Maximum
capacitysystem
Fire pump
avai lable
for servicle
Mi
feet—*-
wterwat£|"
mmumfor
™"^valve^™
available water capacitysprinkler system
Fig. 11: Example of the dual use of water sources for service and sprinklersystem
Priming water tank
Water supp ly pipe /Escape pipe
Overf 1 ow
Orifice
-cxi- Valve in open position normally
Valve in closed position normally
1 Priming wa
iDrain pipetep-kpipe t
Waterreservoir ft i
Testing equipment of dischargecapacity
Fig. 12: Testing equipment of the discharge capacity of fire pump
173
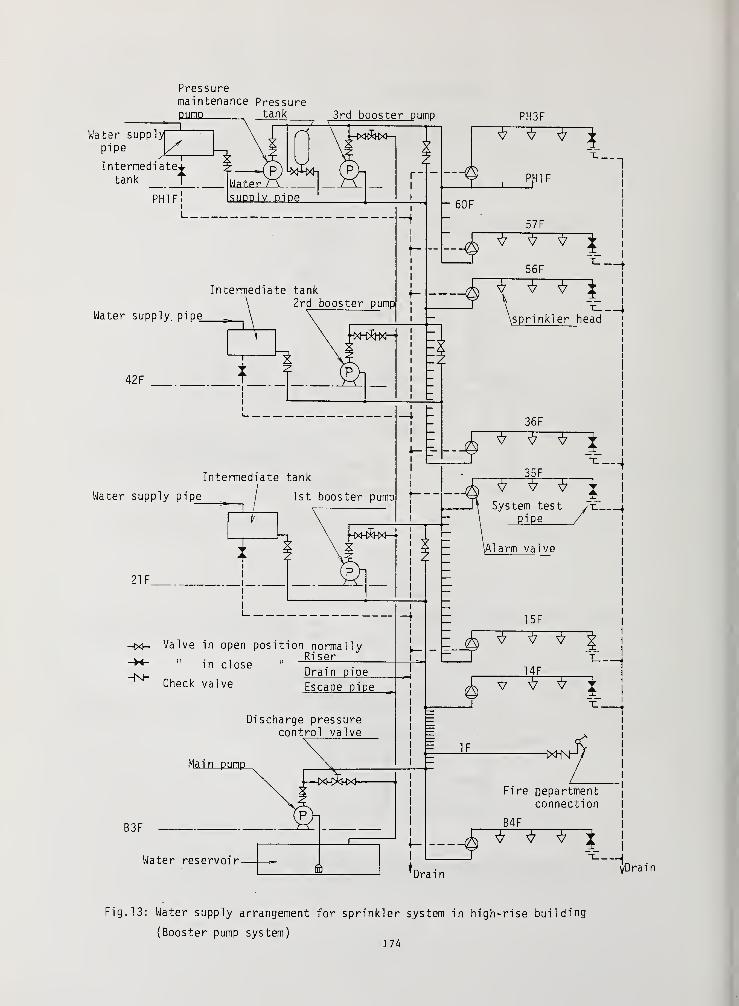
Pressuremaintenance Pressure
tank 3rd booster p ump
Water supply'
pipe
Intermediatetank
Water supply, pipe
Water supply pipe
Water reservoirDrain
yDrai n
Fig. 13: Water supply arrangement for sprinkler system in high-rise building
(Booster pump system)174
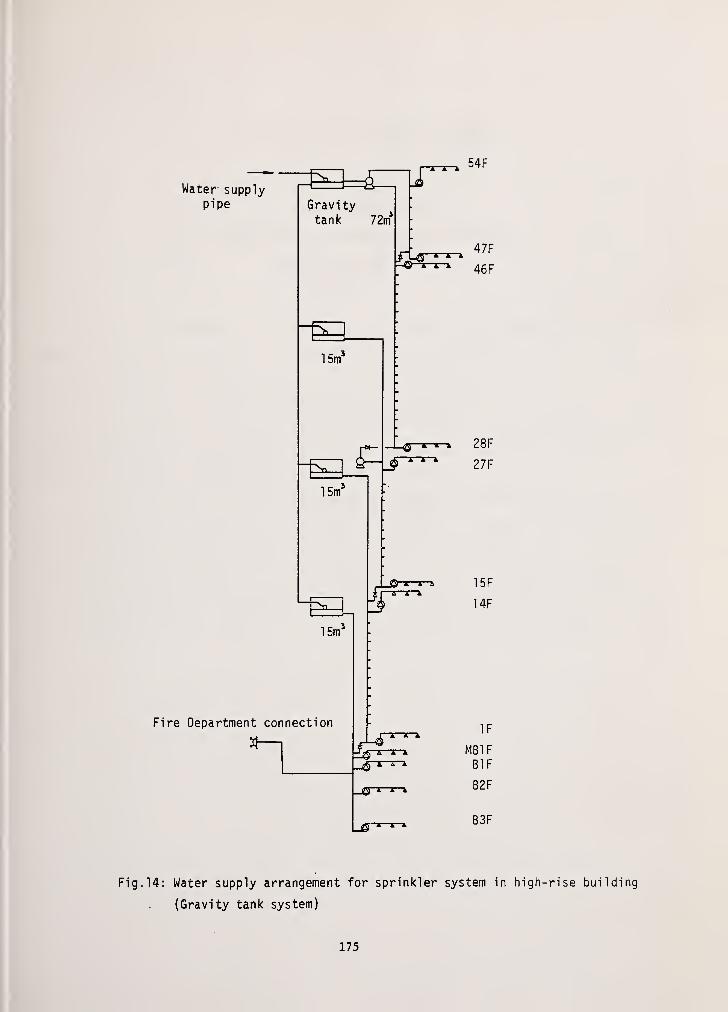
Water supplypipe Gravity
tank 72m
» * »A A
54F
47F
46F
15m3
15m5
15m3
Fire Department connection
_^ * A A
28F
27F
t—r—
a
AAA 15F
14F
AAAA A A
_Q AAA
IF
MB1FB1F
B2F
B3F
Fig. 14: Water supply arrangement for sprinkler system in high-rise building
(Gravity tank system)
175
ADVANCES IN RESIDENTIAL SPRINKLERS
by
Hsiang-Cheng Kung
Factory Mutual Research Corporation
Norwood, Massachusetts
October 15-17, 1980
176
ABSTRACT
Sprinkler performance as affected by sprinkler link sensitivity, link
temperature rating, and water distribution has been investigated in several
typical flame- initiated residential fire scenarios.
Commercially available sprinkler links representative of the most sensitive
on the market were employed for sprinkler activation. It was demonstrated that
links considerably more sensitive than the commercial link are essential in
providing adequate protection in residential fires.
In the ventilated living room fire tests with combustible walls and ceiling,
the fire was fast developing and highly challenging. Adequate water application
to the corner of the room, where the fire source was located, and to the walls
was found to be critical in controlling such a fire. The required sprinkler
operation conditions have been determined in terms of sprinkler water distribu-
tion associated with a link five times more sensitive than the commercial link.
177
ACKNOWLEDGEMENTS
The work was supported by the United States Fire Administration (USFA)
under Grants No. NFPCA 76054 and USFA 79019 and monitored by Mr. Harry Shaw
USFA.
178
I INTRODUCTION
The statistics on 1978 fires published by the U.S. Fire Administration show
that residential fires account for 77 percent of civilian fire fatalities,
46 percent of dollar loss, and over 50 percent of fire-fighter injuries^. It
is evident that residential fires are our nation's number one fire problem.
For over 100 years, attempts have been made to reduce fire losses. Loss
experience has provided evidence that sprinkler systems have significantly con-
tributed to reduction of fire losses. In the 1860's, before automatic sprink-
ler systems appeared, annual fire losses at Factory Mutual insured properties
averaged over 30 cents per $100 of insured value. Later, as sprinklers became
installed in industrial and commercial properties, the figure dropped steadily(2)
to a level of 2 to 3 cents per $100 in recent years .
Since the introduction of sprinklers, fire tests have been conducted ex-
tensively to determine required sprinkler operation conditions for industrial
fire protection in terms of water discharge density (water discharge rate in gpm2
in ratio to the designed coverage area in ft ), sprinkler spacing, and sprinkler
link temperature rating (link fusing temperature) . The emphasis has always
remained on industrial applications.
A National Fire Protection Association (NFPA) Standard on residential(3)sprinkler systems (NFPA 13-D-1975) has been available since 1975 . However,
NFPA 13-D, resulting from relaxation of the industry-oriented sprinkler standard,
produces a system too costly to be. widely installed. Furthermore, the adequacy
of protection provided by commercial sprinklers in accordance with the NFPA
13-D Standard has not been evaluated sufficiently in realistic residential fire
tests. Thus, sprinklers, the most effective means yet devised for fire suppres-
sion, are still limited almost exclusively to the protection of industrial and
commercial properties.
Due to the low ceiling height and compartmentation in residental buildings,
the hot ceiling gases generated by a fire tend to descend quickly below eye
level. It is vital that the sprinkler link be sufficiently sensitive to respond
to the fire at a sufficiently early stage to maintain a survivable environment
in the room of fire origin throughout the fire.
Standard commercial sprinklers are designed for achieving fire control with
several sprinklers operating at approximately 10-ft by 10-ft spacing. The voids
179

in the water distribution pattern of a spray usually presented behind the arms
of the sprinkler frame may be filled up by adjacent sprinkler sprays. However,
in residential fires, the effective control of fire by sprinklers often depends
on a single sprinkler operation in the room of fire origin. It is essential
that sprinkler water distribution tend toward uniformity in angular distribu-
tion, so that, even if a fire starts behind the arms of the sprinkler frame,
adequate amounts of water can still be delivered to the fire source. In addi-
tion, combustible items such as sofa, chair, bureau, and drapes are often placed
close to or against the walls. A residential sprinkler is required to protect
the furniture at the periphery of the room and even the combustible walls. The
NFPA 13-D Standard permits the use of standard sprinklers in residences to cover
a 16-ft x 16-ft floor area at approximately 25 gpm water discharge rate. Most
standard sprinklers throw little water to the upper portion of a wall which is
more than 6 ft from the sprinkler. New sprinklers with water distribution
sufficient to protect the walls must be developed.
In 1976, the U.S. Fire Administration began to sponsor several programs in
the area of residential fire suppression systems. In one of these programs,
Factory Mutual Research Corporation (FMRC) has been engaged in evaluating
sprinkler performance in residential fire tests. In the first phase of this
(4)program , a common residential fire scenario was simulated, a cigarette
dropped into the crevice of a couch in the living room, with subsequent initi-
ation of smoldering and eventual transition to flaming fire. There were no
combustibles in the test room other than the couch; windows and doors were
closed. Up to the time of flaming, the major burning areas were on the cushion
and the bolster of the couch and the fires had developed rather slowly. The
fire was exposed and could be reached by the sprinkler spray. The required
discharge rate to control such a fire is quite small.
The second phase of FMRC's program is concerned with flaming-started
fires . In these tests, several typical fire scenarios were selected. The
second phase of the program was designed to investigate sprinkler performance
as affected by sprinkler link sensitivity, link temperature rating, and water
distribution. In this paper, only some of the important results from the
second phase are presented.
The information gained in this program has served as a guide for the
sprinkler industry in developing residential sprinklers. The research results
180
of this program will provide a basis for new installation standards for resi-
dential sprinkler systems and will also lead to new evaluation standards for
residential sprinklers for approval and listing by recognized laboratories.
II TEST VARIABLES
The fire tests were designed to investigate sprinkler performance as affected
by sprinkler response time, water discharge rate, and water distribution in vari-
ous typical flame-started residential fires.
The response time of a sprinkler in a fire depends on 1) the gas velocity
and gas temperature histories (fire development) adjacent to the sprinkler, and
2) the sprinkler link sensitivity and its temperature rating. The link sensi-
tivity is expressed by its time constant, defined as the rime required for the
link to reach an excess temperature (temperature above initial temperature of
the link) which is a fraction, 0.632, of the excess gas temperature in a con-
stant-velocity, constant-temperature gas stream. The time constant depends
predictably upon gas velocity and is independent of gas temperature^. The
time constants of the sprinkler links and the simulated sprinkler links used in
(6)this program were measured in a hot air wind tunnel at 7.4 ft/s air vel-
ocity and 367°F temperature. All the time constants cited hereafter are refer-
enced to a velocity of 7.4 ft/s.
Results of six fire tests are presented to illustrate the effects of sprin-
kler link sensitivity, link temperature rating, and water distribution on sprin-
kler performance. The six tests consist of a nonventilated small bedroom fire,
two ventilated living room fires with noncombustible walls and ceiling, and
three ventilated living room fires with combustible walls and ceiling.
In the small bedroom fire test, a commercial 5/16-in. orifice diameter
sprinkler was used, discharging 4.3 gpm covering 12.3 ft x 8.8 ft floor area.
The sprinkler was activated by a commercially avaiable sprinkler link repre-
sentative of the most sensitive on the market. The time constant of the commer-
cial link used was 73.9 sec.
In the two ventilated living room fire tests with noncombustible walls and
ceiling, the same commercial 5/16-in. orifice sprinklers were used. In one of
the two tests, commercial links were used for sprinkler activation; in the other
test, simulated sprinkler links with much higher sensitivity (time constant =
16.9 sec) were employed for sprinkler activation.
181

I
60 "H 03
U >-i Ca oCO T-l
JJ
o3
re
u
JJ 4J Ure re a)
3 p.
re El-J CL0) 60a^o
CO
JE5<
P-
HCOtuH
<u 1
14J
CO CC C re1-1 PS •H uO iJ 0) /—
-
dJ o. a E60 CO o a
a) |j 6Dj-> re a) >-i
re x c 0)
u c i—
i
i-H
re cl•H c EJJ H 0) 0H -J H
• 60
c e -w fah ai w oj H re ^
P-
•H JJCO 4J iHc re cc oa> ^ o ^co >. -u ih u
jj in qj aj^ -H > CC
C > sr w•H -H • CO
J u it
60
0) 0i ,
r-H O l-l
Jj^ "H Oc xj -u•H -H * Ou u ccCO M-<
CO
cre
ucu1-1
c•H
c-CO
60 re
C -HT-l 1-1
—I QJ
i—I QJ
re u3
c
>
co o0) ZH
re
u
O-a
re
ai
u e ci h0) I -H Cg VD 144 -HE H rl 1jon i< acj m o co
CO
3
EOCJ
T3 T>C 0)
re co
oCO f-H
3 CJo•O l-i
c oH O3 O
eo
<-l o<-H 1-1
re t>E 0)
CO CO
+
On
On
OCM
O NCJ U1
CU
e xiO "HCJ JJ
C CO
O 3Z X
T3cre e
o>co a3 ooT3 1J
c o•H O3 O
60C•H £> OH O.J CS-
sD
+
ONSO
O
On
OCM
1-1
0)
iH
c•Hl-l
P-CO
cre c
a>
03 Cl3 OOT> l-i
C O•H O3 O
60C•H E
cl > O*H Op-J P2
ON
+On
vjO
On
JJ P-
I
Ure
UJ3Cre
2
co
3XEoCJ
-acre c
CD
co c-3 OoT> l-i
C O•H O3 a
60
a e<r > oH O
cy
o.>,jjojjo1-4
03
3XEou
T3cre c
co a
•O l-i
c oi-l o3 O
60cH Em > o•H OhJ Pi
SO
OO
QJ
I Cu co >,re - jj
u c
OO
I
CJ CO
re -IM l-l
3 0)
C I-
re 3S 4J
01
03
3XEou
T3cre c
0)
co c-3 OoO l-i
c oH O3 G
01
c.
60c
' EooJ p-
182
In the three ventilated living room fire tests with combustible walls and
ceiling, two different types of manufacturer's prototype sprinklers were used.
Both manufacturer's prototypes were activated by links with a 15.1-s time con-
stant. The sprinkler variables of these six tests are summarized in Table I.
Figure 1 is a photograph of the three sprinklers used.
Ill TEST SETUP
3.1 TEST FACILITY
The fire tests were conducted in one of FMRC's test buildings in Norwood,2 2
Massachusetts. The building contains a 741 ft apartment area and a 139 ft
instrument room.
The ceiling height in the apartment area and instrument room is uniformly
8 ft. With the exception of the north half of the living room, the ceiling was
constructed with 2-ft x 4-ft Armstrong "Fire Guard" ceiling panels suspended
from the beams of the building structure. Figure 2 shows the layout of the test
apartment. Wall partitions are 5/8-in. gypsym boards framed in "Unistrut"
channels (Unistrut Corporation) . All the living room fire tests were conducted
in the living room area of the test apartment. During all tests, the doors to
the instrumentation room (close fitting) , the observation room (11/16-in.
undercut) , and the bathroom were closed. During the ventilated living room fire
tests, two windows in the north wall and the entry door were fully open. For
the small bedroom fire test, a wall partition was erected 8.8 ft from the north
wall in the living room to convert the northern area of the living room into a
simulated small bedroom. During the bedroom fire test, the windows at the north
wall and the door in the partition wall were closed.
3.2 FURNISHINGS
Scale layouts of the furnishings with location coordinates for the small-
bedroom fire, and living room fire tests are shown in Figures 3 and 4 respec-
tively. Full descriptions of the small bedroom and living room furnishings are
included in Tables II and III. In the living room fire tests, the window cur-
tains were pulled aside as shown in Figure 4. The dimensions and positions of
the window openings are also shown in Figure 4.
For the small-bedroom fire test, a suspended ceiling was made of 2-ft x
4-ft combustible ceiling panels (297C Grenoble Temlock, Armstrong Cork Corpora-
tion) , 1/2-in. thick, consisting of loblolly pine, oak and cornstarch. Plywood
183

1 2 3
(1) commercial 5/16- in. -orifice sprinkler
(2) manufacturer's prototype #1
(3) manufacturer's prototype #2
FIGURE 1 PHOTOGRAPHIC VIEW OF TEST SPRINKLERS
184
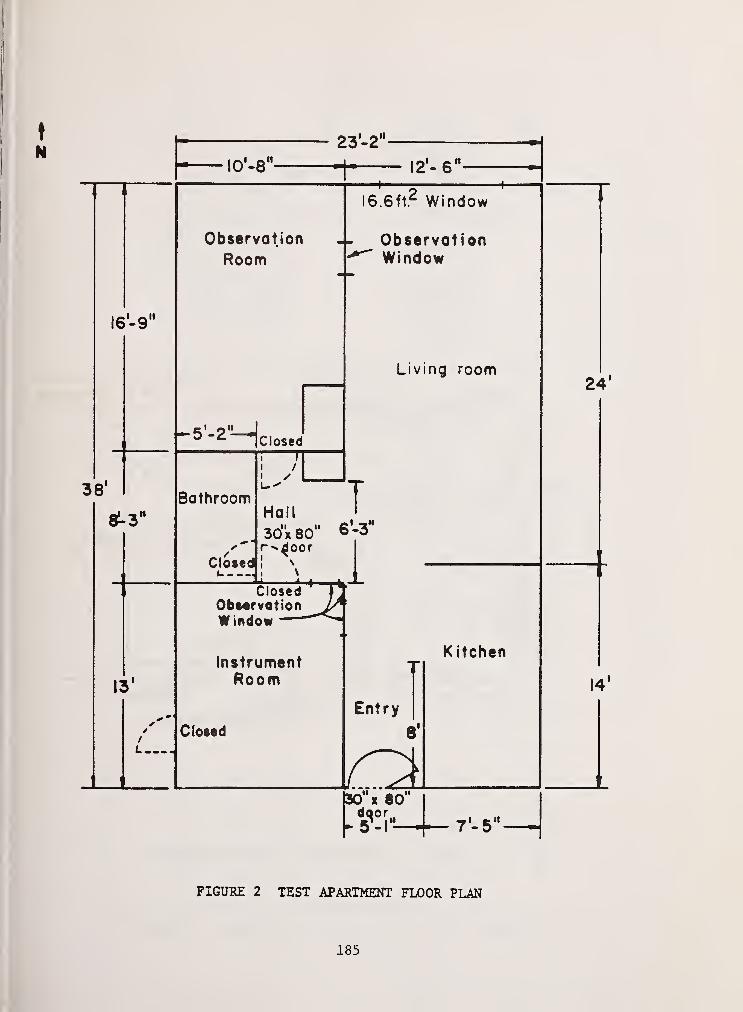
23'-2"
lO'-B"-> <~ II12-6
Observation
Room
6.6ft2 Window
Observation" Window
!6'-9"
38'
Living room
Bathroom
*-3 M
Closed !
Closed
i /
Hall
30x80^oor
6'-3"
13'
ClosedObservationWindow
instrumentRoom
Li
Closed
Kitchen
Entry
8'
Px 60
I m H7-5
FIGURE 2 TEST APARTMENT FLOOR PLAN
185

147
T2d'
31" -
.^Plywoodif Paneling
IT-
Sprinkler 73"
CP
42"i2 r-^
It« *
*NJT— C^Dummy Sprinkler 105 '/."
o
|Door(Clo>tdf. 1 1
B
M6,L+-30"H
|lqnition>
r>20
Plywood Paneling
FIGURE 3 FURNISHINGS IN SMALL BEDROOM
186

NORTH WALL
zzzzzzvAAAAAj
^-Curtains
Sprinkler" *\
DummySprinkler
FLOOR PLAN
FIGURE 4 FURNISHINGS IN THE VENTILATED LIVING ROOM
187
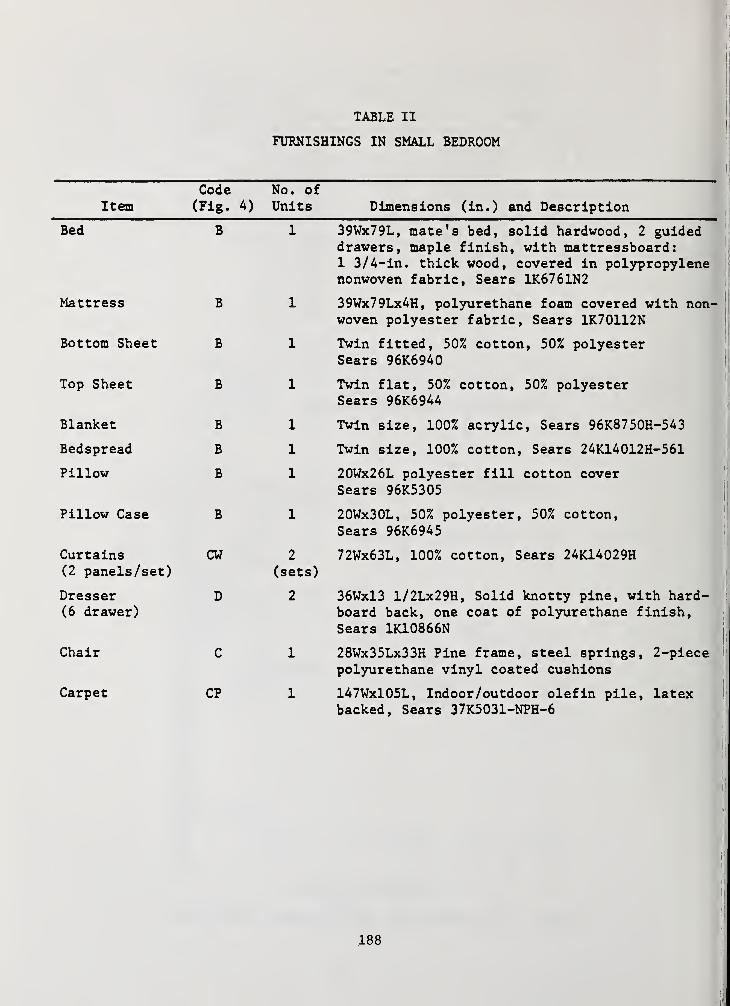
TABLE II
FURNISHINGS IN SMALL BEDROOM
ItemCode No. of(Fig. 4) Units Dimensions (in.) and Description
Bed B
Mattress B
Bottom Sheet B
Top Sheet B
Blanket B
Bedspread B
Pillow B
Pillow Case B
Curtains CW(2 panels/set)
Dresser D(6 drawer)
Chair C
Carpet CP
2
(sets)
2
39Wx79L, mate's bed, solid hardwood, 2 guideddrawers, maple finish, with mattressboard:1 3/4-in. thick wood, covered in polypropylenenonwoven fabric, Sears 1K6761N2
39Wx79Lx4H, polyurethane foam covered with non-
woven polyester fabric, Sears LK70112N
Twin fitted, 50% cotton, 50% polyesterSears 96K6940
Twin flat, 50% cotton, 50% polyesterSears 96K6944
Twin size, 100% acrylic, Sears 96K8750H-543
Twin size, 100% cotton, Sears 24K14012H-561
20Wx26L polyester fill cotton coverSears 96K5305
20Wx30L, 50% polyester, 50% cotton,Sears 96K6945
72Wx63L, 100% cotton, Sears 24K14029H
36Wxl3 l/2Lx29H, Solid knotty pine, with hard-board back, one coat of polyurethane finish,Sears 1K10866N
28Wx35Lx33H Pine frame, steel springs, 2-piecepolyurethane vinyl coated cushions
147Wxl05L, Indoor /outdoor olefin pile, latexbacked, Sears 37K5031-NPH-6
188
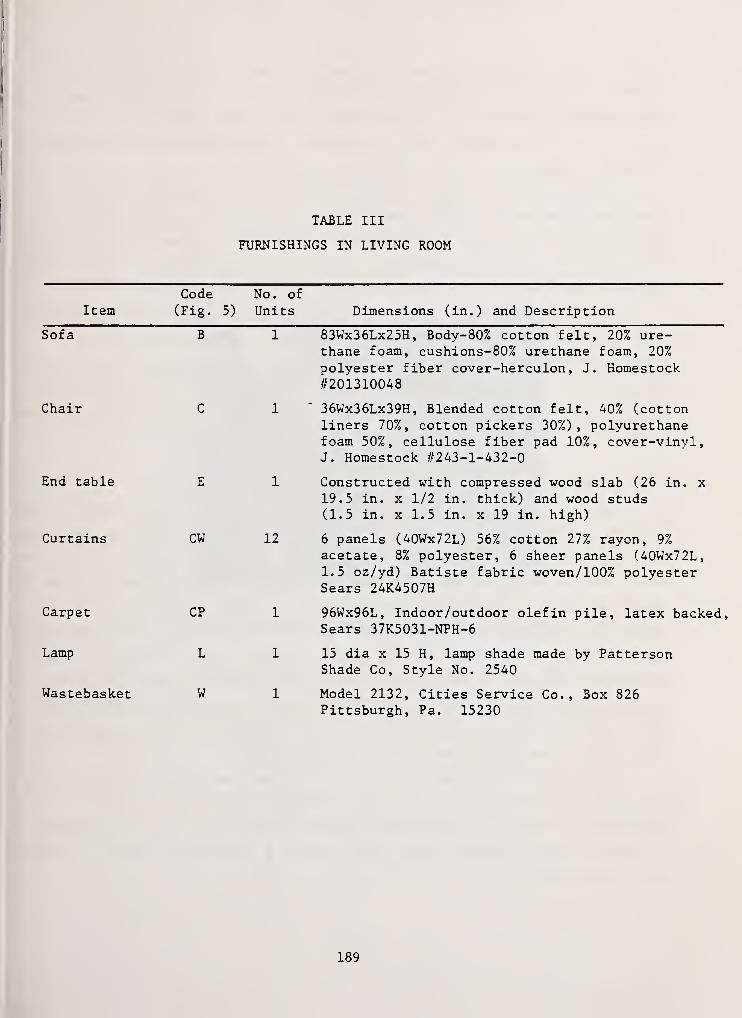
TABLE III
FURNISHINGS IN LIVING ROOM
ItemCode No. of
(Fig. 5) Units Dimensions (in.) and Description
Sofa
Chair
End table
Curtains
Carpet
Lamp
Wastebasket
B
CW
CP
L
W
12
1
1
1
83Wx36Lx25H, Body-80% cotton felt, 20% ure-thane foam, cushions-80% urethane foam, 20%
polyester fiber cover-herculon , J. Homestock#201310048
36Wx36Lx39H, Blended cotton felt, 40% (cottonliners 70%, cotton pickers 30%), polyurethanefoam 50%, cellulose fiber pad 10%, cover-vinvl,J. Homestock #243-1-432-0
Constructed with compressed wood slab (26 in. x
19.5 in. x 1/2 in. thick) and wood studs(1.5 in. x 1.5 in. x 19 in. high)
6 panels (40Wx72L) 56% cotton 27% rayon, 9%
acetate, 8% polyester, 6 sheer panels (40Wx72L,1.5 oz/yd) Batiste fabric woven/100% polyesterSears 24K4507H
96Wx96L, Indoor /outdoor olefin pile, latex backed,Sears 37K5031-NPH-6
15 dia x 15 H, lamp shade made by PattersonShade Co, Style No. 2540
Model 2132, Cities Service Co., Box 826Pittsburgh, Pa. 15230
189

panels (3/16-in.) thick were nailed to spruce studs (1 1/2 in. x 3 5/16 in.)
mounted directly to the existing north and east walls. The partition was con-
structed with plywood panels nailed directly over spruce studs (1 1/2 in. x
3 5/16 in.). Photographic view of the pretest appearance of the small bedroom
is shown in Figure 5.
For the living room fire tests with noncombustible walls and ceiling,
Armstrong "Fire Guard" ceiling panels (2 ft x 4 ft x 1/3 in. thick, Model 915,
Armstrong Cork Corporation) were fastened to the 5/8-in. gypsum board ceiling mthe northern half of the living room. Instead of plywood panels, 5/8-in. thick
gypsum boards were nailed to the wood studs on the north and east walls.
For the living room fire tests with combustible walls and ceiling, combus-
tible ceiling panels (2 ft x 4 ft x 1/2 in. thick, 297C Grenoble Temlock.
Armstrong Cork Corporation) were fastened to 5/8-in. gypsum board ceiling in the
northern half of the living room. Plywood panels (3/16-in. thick) were nailed
to the studs on the north and east walls. A photographic view of the ventilated
living room with furnishings is shown in Figure 6.
3 . 3 INSTRUMENTATION
The room of fire origin was instrumented to measure: 1) gas concentrations
of carbon monoxide, carbon dioxide, and oxygen at "eye level" (63 in. above the
floor); 2) gas temperatures at five elevations (93, 84, 63, 36, and 6 in. above
the floor) in one location; 3) ceiling surface temperature immediately above the
ignition point; 4) optical density (a measure of smoke obscuration) at "eye
level" (63 in. above the floor) ; and 5) gas velocities and gas temperatures near
the sprinklers (3 in. below ceiling level) . Figures 7 and 11 show the instru-
mentation plans for the small bedroom and living room fire tests. All data
signals, except optical density, were monitored by a data acquisition system
with a Hewlett-Packard 2100 S computer. Every second, the system scanned the
data channels and logged the data on a computer disk.
Carbon monoxide, carbon dioxide and oxygen were measured at a single loca-
tion near the center of the room using Beckman CO, CO^, and 0^ analyzers. The
gas sample was drawn to the analyzers through 3/8-in. ID (1/2-in. OD) aluminum
tubes and Tygon tubing and then cleaned through a glass wool filter, a condenser,
and a desiccant.
190
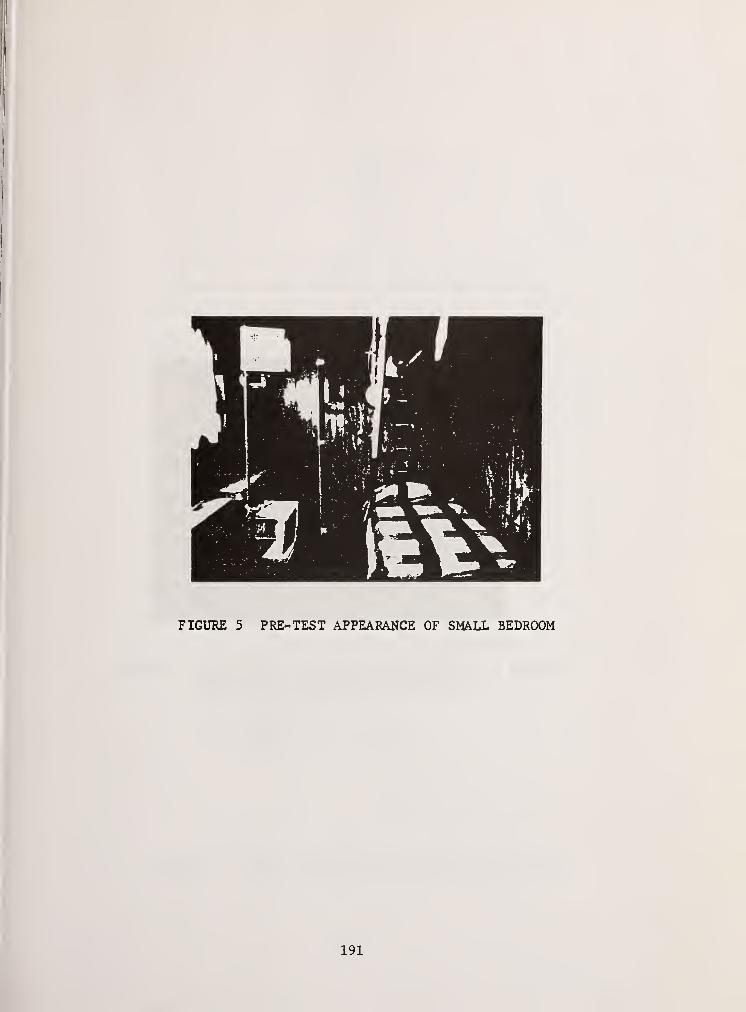
191
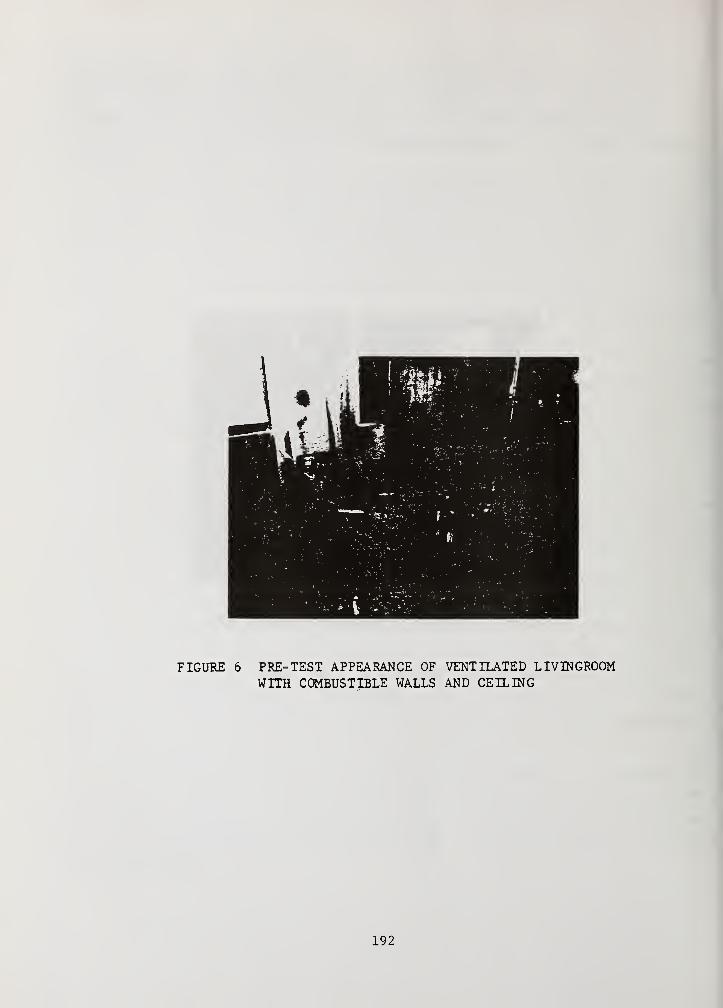
FIGURE 6 PRE- TEST APPEARANCE OF VENTILATED LIVINGROOMWITH COMBUSTIBLE WALLS AND CEILING
192

i
N
I47 :
CO.COg, O2
75—»57 '/a—-45
Gl-G5-^
56'/g
44 ,
/i"4l
9N
11
SK (-20-
105V
X Gas Thermocouple+ Ceiling Surface ThermocoupleD Bidirectional Flow Probe
O Gas Sampling= Optical Density
0 Sprinkler
^ "Dummy" Sprinkler
FIGURE 7 SMALL BEDROOM INSTRUMENTATION LOCATIONS
193
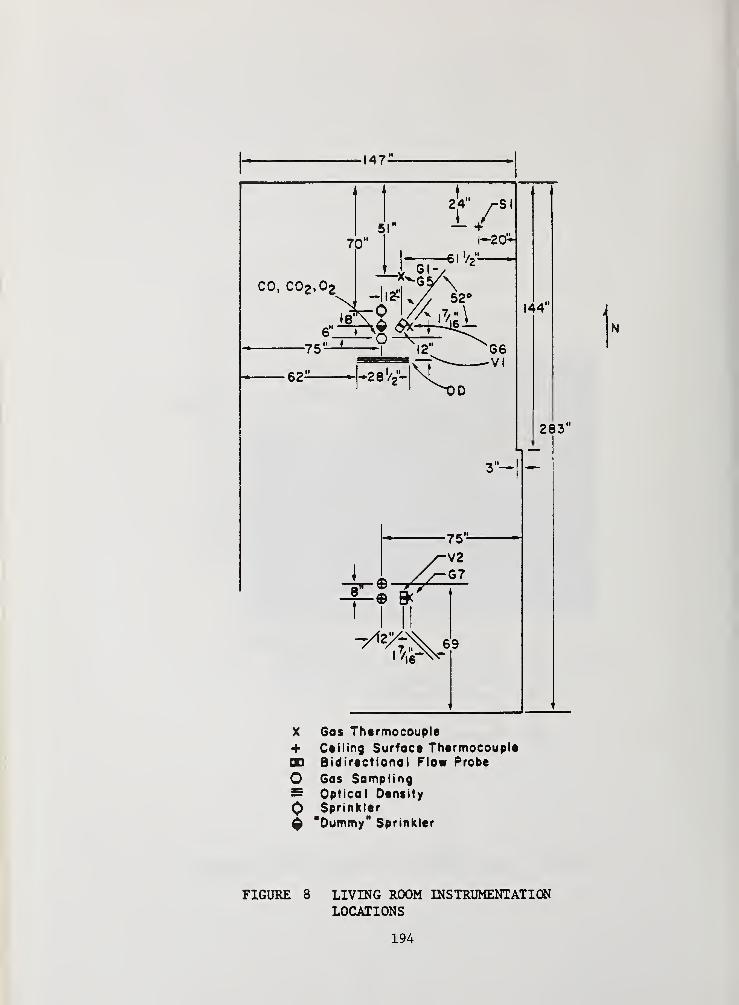
147^
X Gas Thermocouple
+ Ceiling Surface ThermocoupleCD Bidirectional Flow Probe
O Gas Samplings Optical Density
Q Sprinkler
$ "Dummy" Sprinkler
FIGURE 8 LIVING ROOM INSTRUMENTATIONLOCATIONS
194
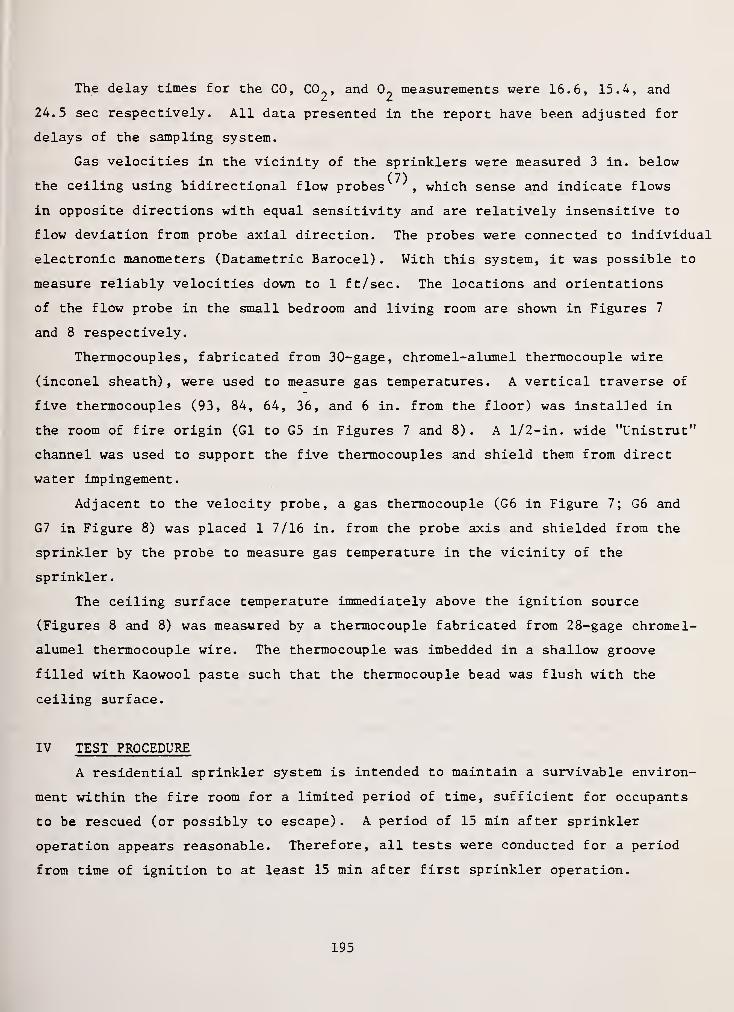
The delay times for the CO, C02
, and 0^ measurements were 16.6, 15.4, and
24.5 sec respectively. All data presented in the report have been adjusted for
delays of the sampling system.
Gas velocities in the vicinity of the sprinklers were measured 3 in. below
the ceiling using bidirectional flow probes , which sense and indicate flows
in opposite directions with equal sensitivity and are relatively insensitive to
flow deviation from probe axial direction. The probes were connected to individual
electronic manometers (Datametric Barocel) . With this system, it was possible to
measure reliably velocities down to 1 ft/sec. The locations and orientations
of the flow probe in the small bedroom and living room are shown in Figures 7
and 8 respectively.
Thermocouples, fabricated from 30-gage, chromel-alumel thermocouple wire
(inconel sheath), were used to measure gas temperatures. A vertical traverse of
five thermocouples (93, 84, 64, 36, and 6 in. from the floor) was instal]ed in
the room of fire origin (Gl to G5 in Figures 7 and 8). A 1/2-in. wide "Unistrut"
channel was used to support the five thermocouples and shield them from direct
water impingement.
Adjacent to the velocity probe, a gas thermocouple (G6 in Figure 7; G6 and
G7 in Figure 8) was placed 1 7/16 in. from the probe axis and shielded from the
sprinkler by the probe to measure gas temperature in the vicinity of the
sprinkler.
The ceiling surface temperature immediately above the ignition source
(Figures 8 and 8) was measured by a thermocouple fabricated from 28-gage chromel-
alumel thermocouple wire. The thermocouple was imbedded in a shallow groove
filled with Kaowool paste such that the thermocouple bead was flush with the
ceiling surface.
IV TEST PROCEDURE
A residential sprinkler system is intended to maintain a survivable environ-
ment within the fire room for a limited period of time, sufficient for occupants
to be rescued (or possibly to escape) . A period of 15 min after sprinkler
operation appears reasonable. Therefore, all tests were conducted for a period
from time of ignition to at least 15 min after first sprinkler operation.
195
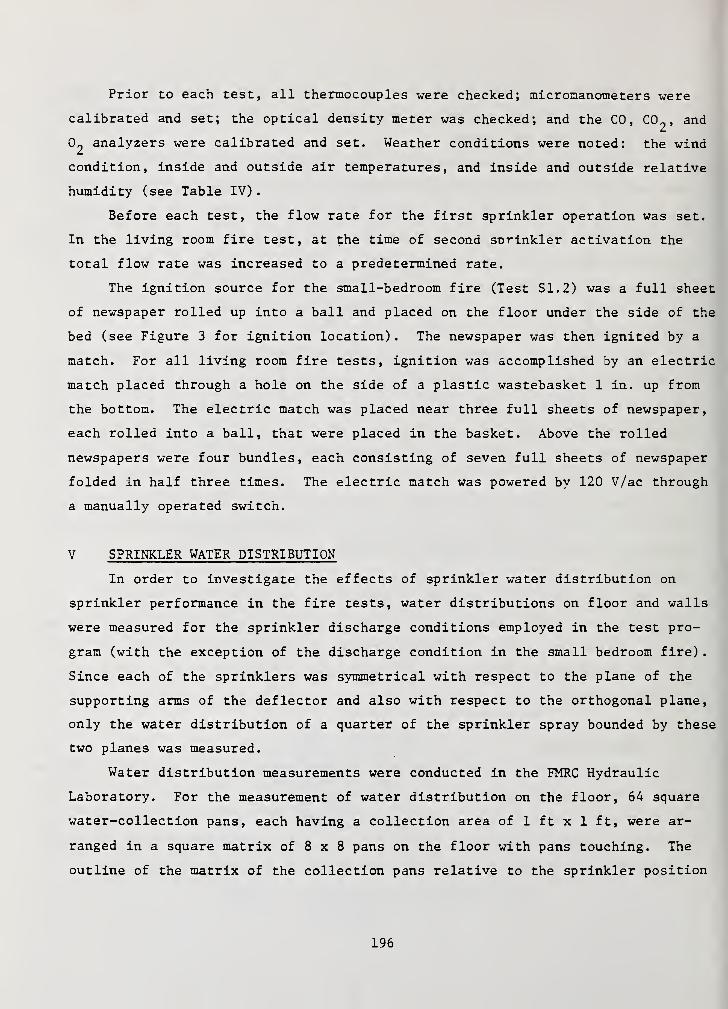
Prior to each test, all thermocouples were checked; micromanometers were
calibrated and set; the optical density meter was checked; and the CO, CC^, and
analyzers were calibrated and set. Weather conditions were noted: the wind
condition, inside and outside air temperatures, and inside and outside relative
humidity (see Table IV)
.
Before each test, the flow rate for the first sprinkler operation was set.
In the living room fire test, at the time of second sprinkler activation the
total flow rate was increased to a predetermined rate.
The ignition source for the small-bedroom fire (Test SI. 2) was a full sheet
of newspaper rolled up into a ball and placed on the floor under the side of the
bed (see Figure 3 for ignition location) . The newspaper was then ignited by a
match. For all living room fire tests, ignition was accomplished by an electric
match placed through a hole on the side of a plastic wastebasket 1 in. up from
the bottom. The electric match was placed near three full sheets of newspaper,
each rolled into a ball, that were placed in the basket. Above the rolled
newspapers were four bundles, each consisting of seven full sheets of newspaper
folded in half three times. The electric match was powered by 120 V/ac through
a manually operated switch.
V SPRINKLER WATER DISTRIBUTION
In order to investigate the effects of sprinkler water distribution on
sprinkler performance in the fire tests, water distributions on floor and walls
were measured for the sprinkler discharge conditions employed in the test pro-
gram (with the exception of the discharge condition in the small bedroom fire)
.
Since each of the sprinklers was symmetrical with respect to the plane of the
supporting arms of the deflector and also with respect to the orthogonal plane,
only the water distribution of a quarter of the sprinkler spray bounded by these
two planes was measured.
Water distribution measurements were conducted in the FMRC Hydraulic
Laboratory. For the measurement of water distribution on the floor, 64 square
water-collection pans, each having a collection area of 1 ft x 1 ft, were ar-
ranged in a square matrix of 8 x 8 pans on the floor with pans touching. The
outline of the matrix of the collection pans relative to the sprinkler position
196
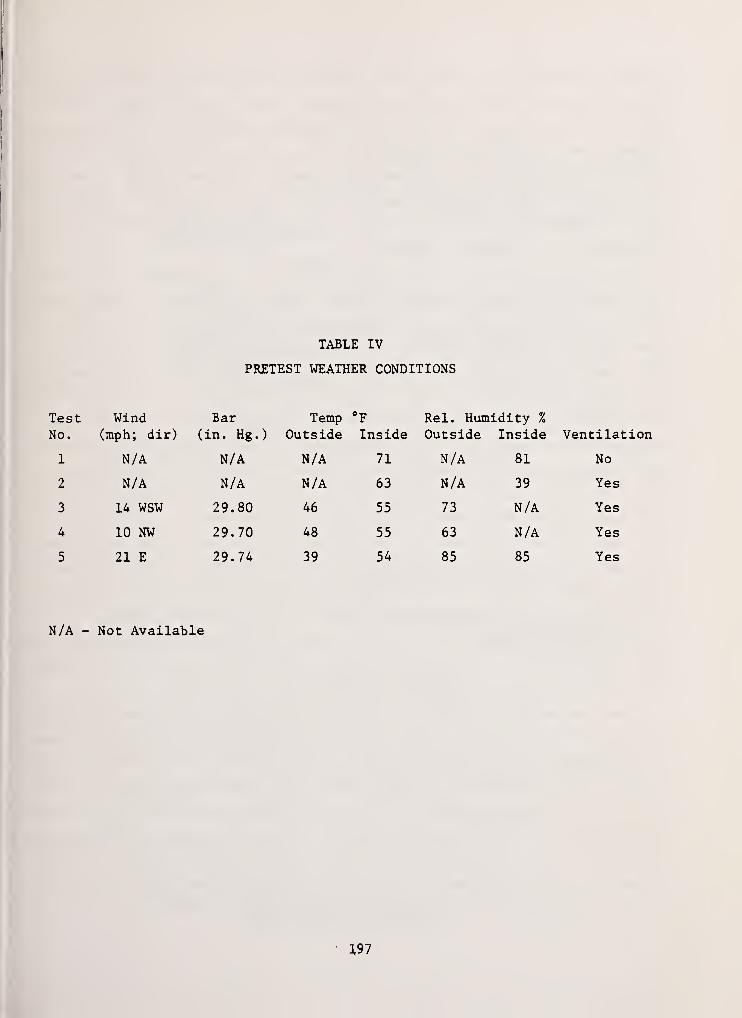
TABLE IV
PRETEST WEATHER CONDITIONS
Test Wind Bar Temp °F Rel. Humidity %
No. (mph; dir) (in. Hg.) Outside Inside Outside Inside Ventilation
1 N/A N/A N/A 71 N/A 81 No
2 N/A N/A N/A 63 N/A 39 Yes
3 14 WSW 29.80 46 55 73 N/A Yes
4 10 NW 29.70 48 55 63 N/A Yes
5 21 E 29.74 39 54 85 85 Yes
N/A - Not Available
197
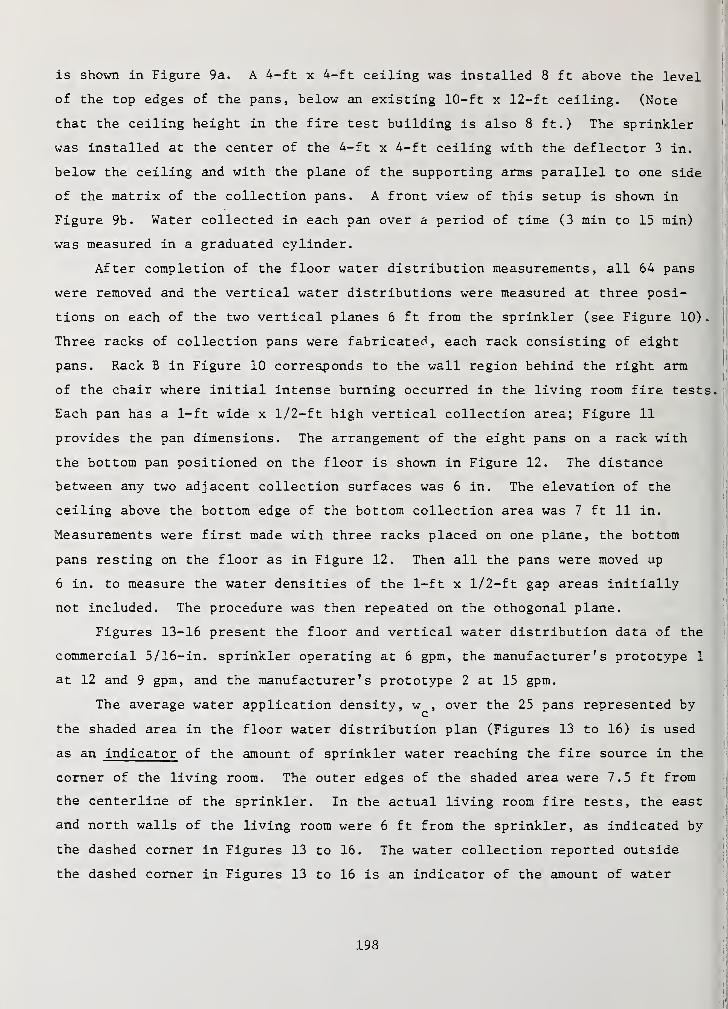
is shown in Figure 9a. A 4-ft x 4-ft ceiling was installed 8 ft above the level
of the top edges of the pans, below an existing 10-ft x 12-ft ceiling. (Note
that the ceiling height in the fire test building is also 8 ft.) The sprinkler
was installed at the center of the 4-ft x 4-ft ceiling with the deflector 3 in.
below the ceiling and with the plane of the supporting arms parallel to one side
of the matrix of the collection pans. A front view of this setup is shown in
Figure 9b. Water collected in each pan over a period of time (3 min to 15 min)
was measured in a graduated cylinder.
After completion of the floor water distribution measurements, all 64 pans
were removed and the vertical water distributions were measured at three posi-
tions on each of the two vertical planes 6 ft from the sprinkler (see Figure 10)
Three racks of collection pans were fabricated, each rack consisting of eight
pans. Rack B in Figure 10 corresponds to the wall region behind the right arm
of the chair where initial intense burning occurred in the living room fire test
Each pan has a 1-ft wide x 1/2-ft high vertical collection area; Figure 11
provides the pan dimensions. The arrangement of the eight pans on a rack with
the bottom pan positioned on the floor is shown in Figure 12. The distance
between any two adjacent collection surfaces was 6 in. The elevation of the
ceiling above the bottom edge of the bottom collection area was 7 ft 11 in.
Measurements were first made with three racks placed on one plane, the bottom
pans resting on the floor as in Figure 12. Then all the pans were moved up
6 in. to measure the water densities of the 1-ft x 1/2-ft gap areas initially
not included. The procedure was then repeated on the othogonal plane.
Figures 13-16 present the floor and vertical water distribution data of the
commercial 5/16-in. sprinkler operating at 6 gpm, the manufacturer's prototype 1
at 12 and 9 gpm, and the manufacturer's prototype 2 at 15 gpm.
The average water application density, w^, over the 25 pans represented by
the shaded area in the floor water distribution plan (Figures 13 to 16) is used
as an indicator of the amount of sprinkler water reaching the fire source in the
corner of the living room. The outer edges of the shaded area were 7.5 ft from
the centerline of the sprinkler. In the actual living room fire tests, the east
and north walls of the living room were 6 ft from the sprinkler, as indicated by
the dashed corner in Figures 13 to 16. The water collection reported outside
the dashed corner in Figures 13 to 16 is an indicator of the amount of water
198
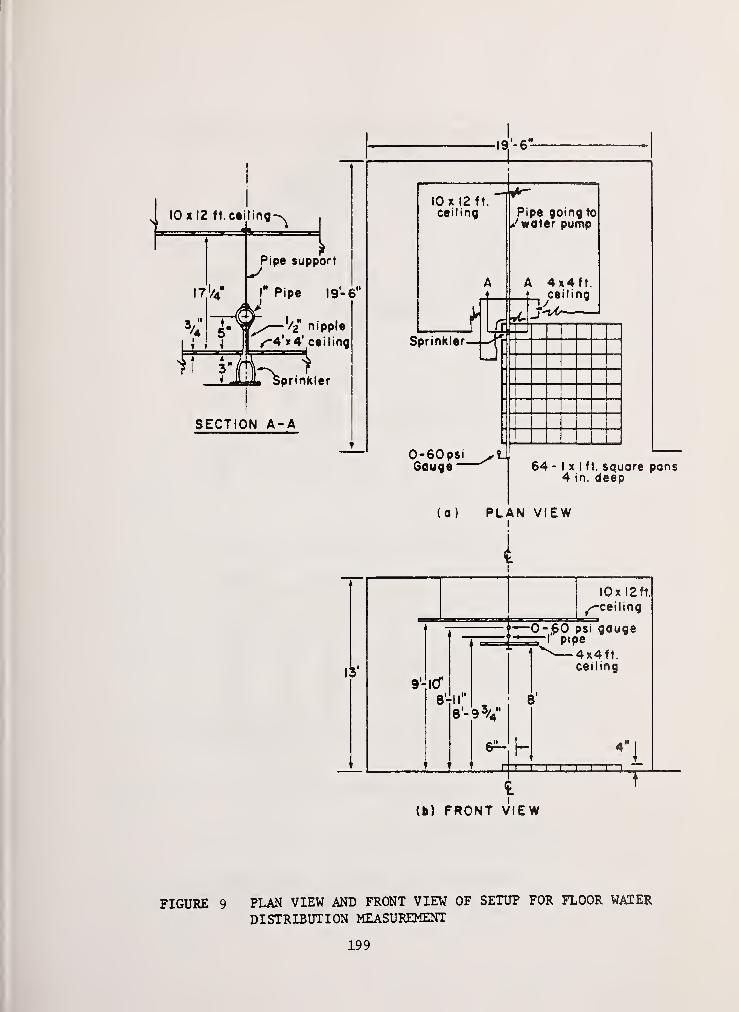
v 10 x 12 ft. ceiling-^
13"
•19-6!
10 x 12 ft.
ceiling
Sprinkler-t
0-60psi .\XGauge
Pipe going to/water pump
A 4x4ft.ceiling
64 -I x I ft. square pans4 in. deep
(a) PLAN VIEWi
i
9'- 10"
8'
lOx 12ft.
^-ceiling
-—0-60 psi gaugeP'Pe
4x4ft.ceiling
9 5/4"
e1
i i i i i i
(b) FRONT VIEW
FIGURE 9 PLAN VIEW AND FRONT VIEW OF SETUP FOR FLOOR WATER
DISTRIBUTION MEASUREMENT
199
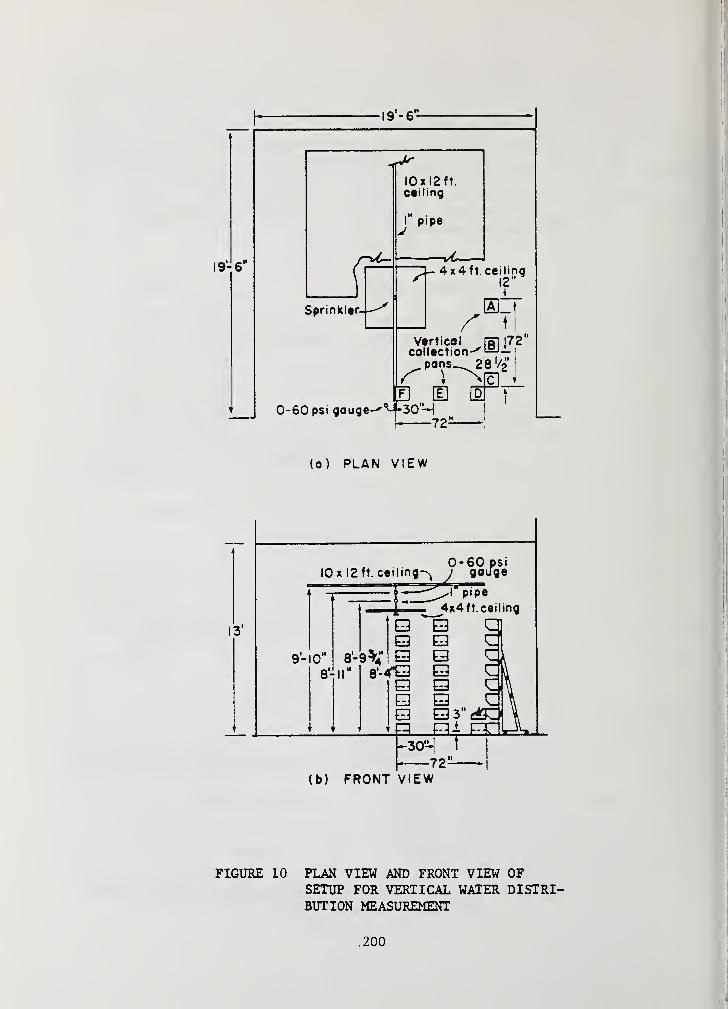
•I9'-6H-
19-6"
0-60 psi gauge
(o) PLAN VIEW
10 x 12 ft. ceiling-^0-60 psi
gauge
9-10"
8-
4 QE3
8-4"QBE3Q
I pipe
4x4 ft. ceiling
E3E3E3QE3
Hi EI
(b) FRONT VIEW
FIGURE 10 PLAN VIEW AND FRONT VIEW OFSETUP FOR VERTICAL WATER DISTRI-BUTION MEASUREMENT
.200
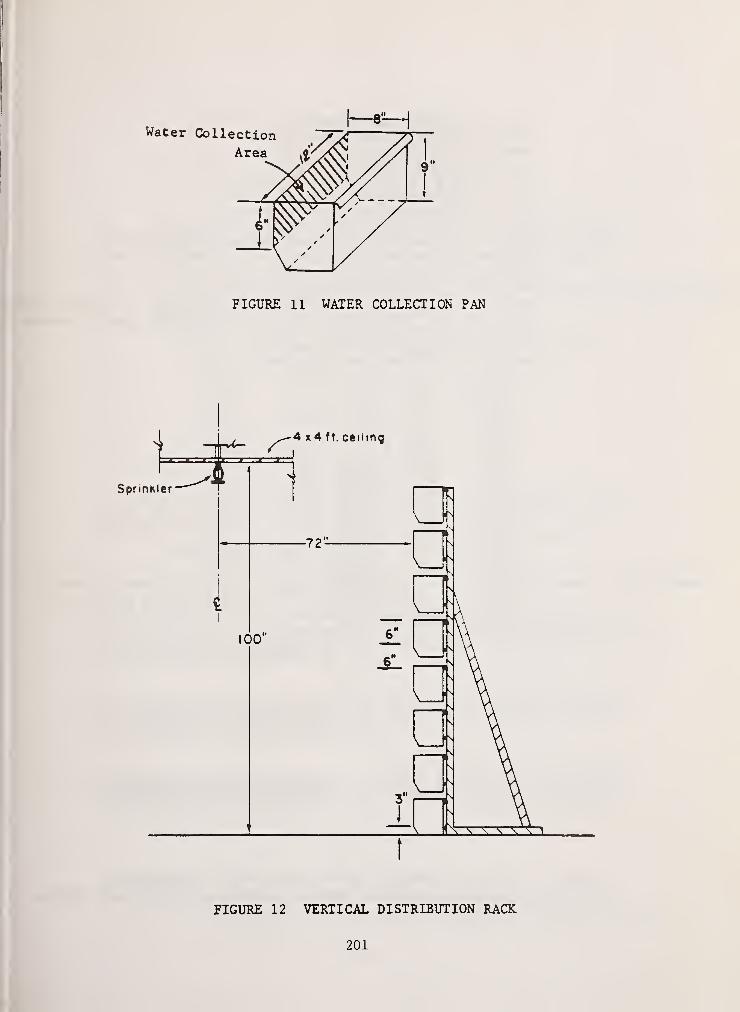
FIGURE 11 WATER COLLECTION PAN
FIGURE 12 VERTICAL DISTRIBUTION RACK
201

Sprinkler—
.023 .027 .025 .013 .012 .010 .012 12"
t
6
.020 .023 .025 •01 3« Ol0« tOIO1
.010
9
.022 .022 .025 !o22 .015 .010
—t
—
.0104
.010
.020 .022 .027 b27&i
.012 .012 .013t
.015
.018 .023 .027t"
y,.
0»5 .018
j
.022»
.020
.015 .017 .017 .018 .022 .022 020 .015
.012 .013 .015 .018 .018 .018 .017 .015
.010.010 .013 .015 .018 .022 .022 .022
-6" hi2~A 8 " C
Sprinkler-
.003
*007
.009'.016"
022023.020"61 o"
_009"004
.005'56~3
.003"002
95
72"
w
(0)
FLOOR WATERDISTRIBUTION
0.015 gpm/ftZ
Average application density
over 25 pans in shaded are^
0"6~0~4"
3>13~
ToiT
iOI4
lobs
,007*004|
_00_5
"6b"
.002*002
003002
J. 6
L5'
0
003.006*009
008*00~5'
004"oo¥
.002~0~02
0iooi
(b)
VERTICAL WATERDISTRIBUTION
20.011 gpm/ft
w Average application density
over 5 pans in shaded area95* A
-28 '/^H
—
36
12"
Ho oloOiOro iu
bibolo
b!b0|0
OiOO ON Ul
oi°1
1
OjO o|o1
Tr-OtO0,0
TOiOOiO•frig)
~r.OiOOiOg> I
->l
OiOOiO
O'OOIO-^1 -~i
O Oo oAO/
T8|o_j
OjOI
72'- O o o o b b o o bjb bib o oIko o o o o o OjOi
- 1~o o
2 g 001
FIGURE 13 FLOOR AND VERTICAL WATER DISTRIBUTION MEASUREMENTS
:
Commercial 5/16-in. Orifice Sprinkler, K-2.Q1, 6gpm, 9psig,
For Tests 2 and 3
202
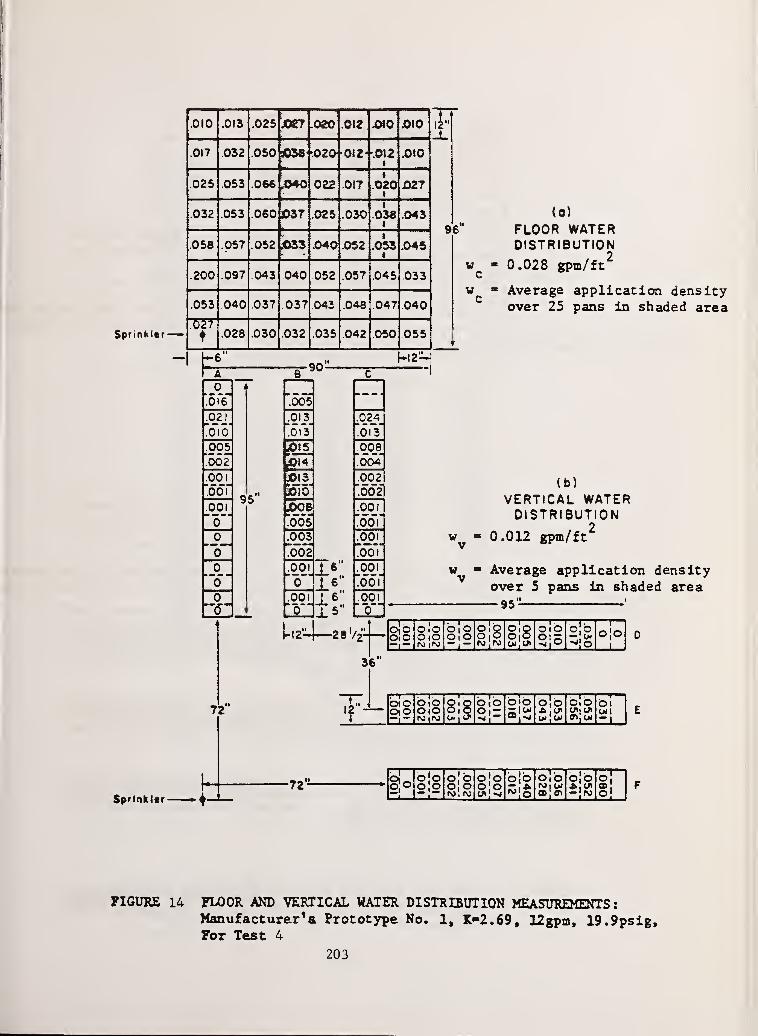
Sprinkler—
ft I ft.UI V All.OH JUc7 -CSoj -OI2 -CMC JO«0 12"
1
6
.VI 1fix? U3U IwO >ft?A. . ft! 9 4Wit
I
9
.035 022 017 .020t
.027
.032 .053 .060 037 .025 .030i
.0381
.043
.058 .057 .052 ,"033 .040 .052i
.053t
.045
.200 .097 043 .040 052 .057 .045 .033
.053 .040 .037 .037 .043 .048 .047 .040
.627
t .028 .030 032 .035 .042 .050 055
Sprinkltr
-6
0_
,0_2J"61 o'
005002
001
oof001
"o"
0
if0
95'
72"
•go-
to)
FLOOR WATERDISTRIBUTION
0.028 gpm/ft2
Average application densityover 25 pans in shaded area
M2-
J013
aolo
.005
,qi_3
013*
JjOOBj
005
PSA~00~2
.ooijj_ 6li001
00.001 16 .001
15 L0
.024.
"oi~3
qp_8
004
.002"062
.001"001'
001
00T
(b)
VERTICAL WATERDISTRIBUTION
0.012 gpm/ft2
Average application densityover 5 pans In shaded area-95- 1
I- 12-1 28 ,/2-— ojo
OiO0 !oOiO
o!oOi O
o!oOiO
OiQOiO
OiO015
00-is
1
1
o|oL—
J
rvj im1
36'
010 OiO QiOOiO bib O'O2 0 o!b OI
OiO O lO""1 w 05, W
•72'8i-
0 08 8
O O b|b 0! O O0 0 O O W I in •
is} 01 * —
1
FIGURE 14 FLOOR AND VERTICAL WATER DISTRIBUTION MEASUREMENTS:Manufacturer's Prototype No. 1, K-2.69, 12gpm, 19.9psig,For Test 4
203
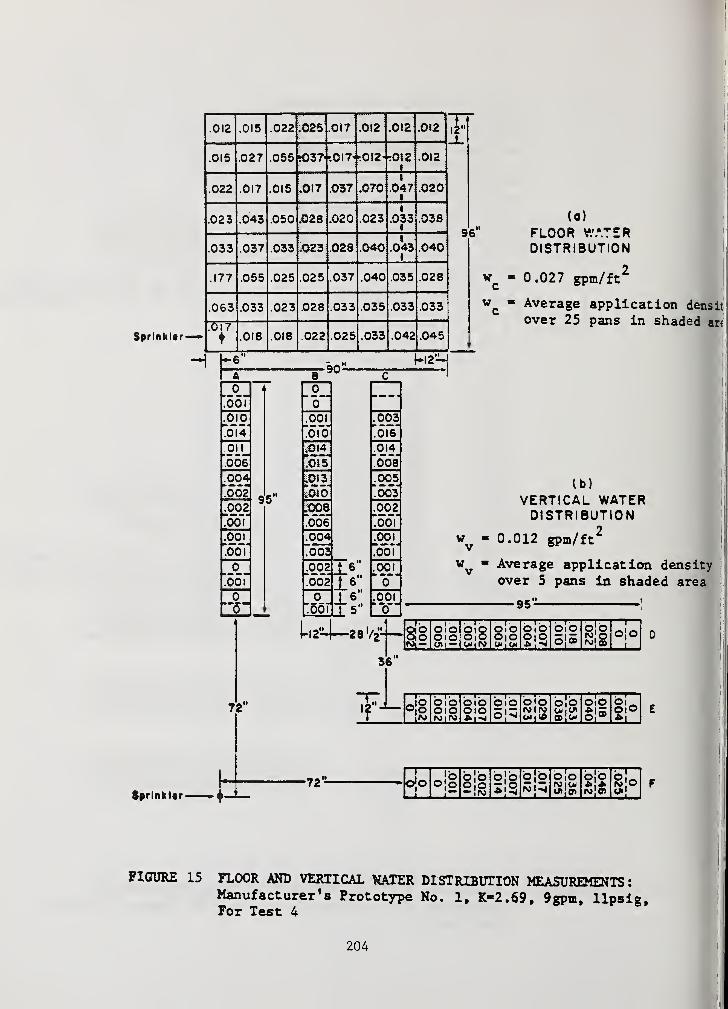
Sprinkler—*
.012 .015 .022 :025 .017 .012 .0)2 .012 12"'
i.
6
.015 .027 .055 s037< -.017' •012- i012t
.012
9
.022 .017 .015 .017 .037 .070l
.047I
.020
.023 .043 .050 ,028 .020 .023l
.0331
038
.033 .037 .033 .023 .028 .0401
.0431
.040
.177 .055 .025 .025 .037 .040 .035 .028
.063 .033 .023 .028 .033 .035 .033 .033
.017.018 .018 .022 .025 .033 .042 .045
-6'-90'
W
(0)
FLOOR WATERDISTRIBUTION
0.027 gpm/ft2
Average application dens it
over 25 pans in shaded an
hiiq
0OOi
010
61
4
on.006
0041
O02.002
obV.001
obi
OOI
.014
.015
95'
.001
ofo"
,OJ3
iOio
(.008
006.00476~03
.001
1-12=.—
;
.002 J_6 .001
.0021 J^6"|0"
0 J_ 6 .001_„_)__ u-0-
003OlV.014
ode.005
'ooi
.002
"oof
.001
obi
lb)
VERTICAL WATERDISTRIBUTION
wv
- 0.012 gpm/ft2
wv
Average application densityover 5 pans in shaded area
•95'
-2 8 72-
36*
72"
Sprlnkltr-
OiO OlOOlO OiOtni — Ichiro
O.OOlO1*1 w
OiO0|0* ^
OIOo oNO
1
1
ojo__L_
0
oSto
OiOOlOrs>ir\j
OiOOiO*• i
OlOo|^
O 'Orolro
o!o OiOo! 5
E
•72' ojo>b 6 b!b bjb o.o o o
o;S £ § roiw * * Sjo
PIGURE 15 FLOOR AND VERTICAL WATER DISTRIBUTION MEASUREMENTS
:
Manufacturer's Prototype No. 1, K-2.69, 9gpm, llpsig,For Test 4
204
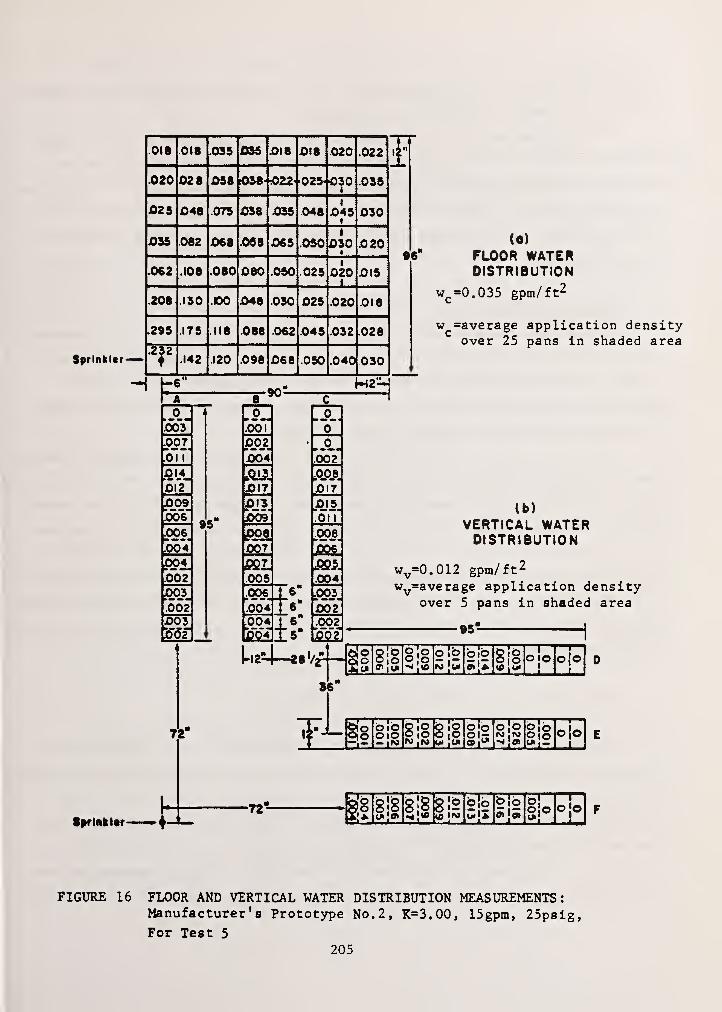
Sprinkler—
1-007
oil
0.003
A'AoiY
|p09obY
P91bbV[004.
0021003
002-003
toof
95"
72*
tfrlnkltr
WW w Baa oia Am u<cu ij"
6
0)20 02 8 osa UOwI
nit
9
AIC 9 J046 075 *J38AMMS 048
1
045i
030
AftJO3d .082 068 a^ n
.058 065 .050t
0304
.020
.0*2 .108 .080 080 .050 025 020 JUI?
.206 .130 DO 048 .030 025 .020 .018
.295 .175 .118 .088 062 .045 .032 .028
.142 .120 .098 068 .050 .040 030
h2-1A 8 C
(0)
FLOOR WATERDISTRIBUTION
w =0.035 gpm/ft2
w =average application densityover 25 pans in shaded area
(b)
VERTICAL WATERDISTRIBUTION
wv=0.012 gpm/ft 2
wy=average application densityover 5 pans in shaded area
95"-
L
o o oSb bib 60O
too OlO o{o
loio |o !o"JO|0 joio
fc'2N ,N
Ol-• l"
o!b bibO io ojo_1_
•T2!8i| 8 jfi
<a inbjb b|o
5>|3»
b| o|o
FIGURE 16 FLOOR AND VERTICAL WATER DISTRIBUTION MEASUREMENTS:Manufacturer's Prototype No. 2, K=3.00, 15gpm, 25psig,
For Test 5
205
which would have hit the lower portion of the walls if walls had been present
during these water distribution measurements.
If walls had been present, water collected over the 1-ft x 2.5-ft shaded
area of Rack B in the vertical water distribution plan of Figures 13 to 16
would have dripped along the plywood panel behind the chair, affecting ignition
of the walls in the living room fires. The vertical application density, w^,
over the 1-ft x 2.5-ft shaded area indicates the amount of water delivered to
protect the wall.
VI RESULTS AND DISCUSSION
To evaluate the adequacy of life-safety protection provided by sprinklers,
measurements were made of CO, CO2 and 0^ gas concentrations and gas tempera-
ture at eye level in the room of fire origin. The ability of residential
sprinklers to provide property protection was assessed by measurement of the
ceiling surface temperature over the fire source.
Sprinkler response time with known link sensitivity and temperature rating
can be predicted theoretically by means of gas temperature and velocity histories
at the sprinkler. Measurements of gas temperature and velocity in the vicinity
of the sprinkler closest to the fire source were used to aid in the selection
of a sprinkler link with a sensitivity such that, at the time of sprinkler
activation, the fire would stil be in the early stage of its rapid development.
The sprinkler water distribution required to control residential fires has
been determined from the fire test results, together with sprinkler water distri-
bution measurements.
6.1 LIFE SAFETY AND PROPERTY PROTECTION CRITERIA
6.1.1 Life Safety Criteria
Measurements of CO and gas temperature at eye level in the room of fire
origin were employed to evaluate the adequacy of life safety protection provided
by sprinklers.
Carbon monoxide has been identified as the major toxic gas in the fire(8)
environment causing fatality . The primary toxic effect exerted by CO is
to reduce the oxygen-carrying capacity of the blood. Once CO enters the body,
it combines reversibly with the chief oxygen-carrying protein of the red blood
206
cells, hemoglobin. This complex of CO and hemoglobin is termed "carboxyhemo-
globin" (CO Hb) ; a 16-20 percent CO Hb saturation in venous blood will cause(9)
headache and an "abnormal visual evoked response.' The amount of CO Hb
formation in the blood depends on the concentration and exposure duration. It
(9)is estimated that a 43-min exposure at 1000 ppm, a 100-min exposure at 500 ppm,
or a 400-min exposure at 200 ppm will result in a 20-percent CO Hb saturation in
blood. Estimates of "hazardous levels" reported by Yuill^^ are 1,600 ppm for
1/2 hr, 800 ppm for 12 hr and 120 ppm for 8 hr. Kimmerle^11
^ reported that CO
concentration at 1500 ppm will cause death after one hour of inhalation. A con-
servative criterion was selected for evaluating the CO hazard in the test pro-
gram; the maximum CO concentration at eye level in the room of fire origin was
required to be less than 1500 ppm throughout the entire test period, i.e., from
the time of ignition to 15 min after sprinkler activation.
Inhalation of carbon dioxide rapidly leads to abnormal breathing. As
little as 2 percent of CO2 by volume in the inspired air effectively stimulates
respiration and 3 percent doubles the lung ventilation. Inhalation of 7 to 10
(12)percent CO2 may be fatal within a short period.
The normal oxygen content of air is 21 percent. Diminishing the supply of
oxygen to 12 to 15 percent will result in shortness of breath, headache, dizzi-
ness and rapid fatigue. An oxygen supply of 6 to 8 percent will cause collapse,
with the possibility of death.(11 ' 12)
On the subject of human tolerance to heat, Kimmerle^^ reported that gas
temperatures of more than 212°F in a fire environment were capable of causing
loss of consciousness and death within several minutes. The criterion adopted
for evaluating the heat hazard in the program was that the gas temperature at
eye level should be less than 200°F throughout the test period.
6.1.2 Property Protection Criteria
Measurements of ceiling surface temperature over the fire source were used
to assess the ability of residential sprinklers to provide property protection.
Cellulosic and plastic material usually begin to pyrolyze vigorously at a tem-
perature of about 500°F. The limit for the ceiling surface temperature
directly above the ignition point is selected to be 500°F in order for sprinkler
protection of property to be considered adequate.
207
6.2 TEST RESULTS
6.2.1 Small Bedroom Fire Test
Gas concentrations of CO, CC^ and 0^ at the 63-in. level near the center of
the room are shown in Figure 17. The maximum CO and CO2 concentrations are
1107 ppm and 1.8 percent respectively, and the minimum 0^ concentration is
16.5 percent. The CO and C0£ concentrations and 0^ deficiency were smaller than
the critical values.
Gas temperatures at three elevations, 93 in., CO in., and 36 in. from the
floor, are shown in Figure 18. The gas temperatures measured at the three
elevations reached maximum values at about the time of sprinkler activation
(2 min, 5 sec). After sprinkler operation, the voltage readings from the thermo
couples measuring these temperatures seemed to indicate that the thermocouple
beads were wetted by the sprinkler spray. The eye-level gas temperature reached
241°F at the time of sprinkler activation. In such a small room, a more sensi-
tive sprinkler link would have been required in order to activate the sprinkler
before the eye- level gas temperature reached 200°F.
The maximum ceiling surface temperature over the ignition point was main-
tained below 165°F. In this test, combustible walls and ceiling were used but
were not involved in the fires.
6.2.2 Ventilated Living-Room Fire Tests with Noncombustible Walls and Ceiling
In Test 2, commercially available sprinkler links with a time constant of
73.9 sec and a temperature rating of 165°F were employed. At the time of the
first sprinkler operation, the fire was already in the very rapidly accelerating
stage, and the gas temperature adjacent to sprinkler No. 1 already reached 465 °F
The fire had spread to the full length of the curtains. The side of the chair
was burning intensely and flames were sweeping across the ceiling. Fire jumped
to the side of the sofa 1 sec before sprinkler activation.
In Test 3, simulated links with much higher sensitivity (time constant =
16.9 s) were used for sprinkler activations. Links were selected to have a
sensitivity such that, as the link reached the rated temperature, 140°F, the
curtains behind the chair would have just ignited and the major burning item
would be still limited to the chair. The determination of the time constant of
such a link was based on the histories of gas temperature and velocity adjacent
to sprinkler No. 1, Test 2.
208
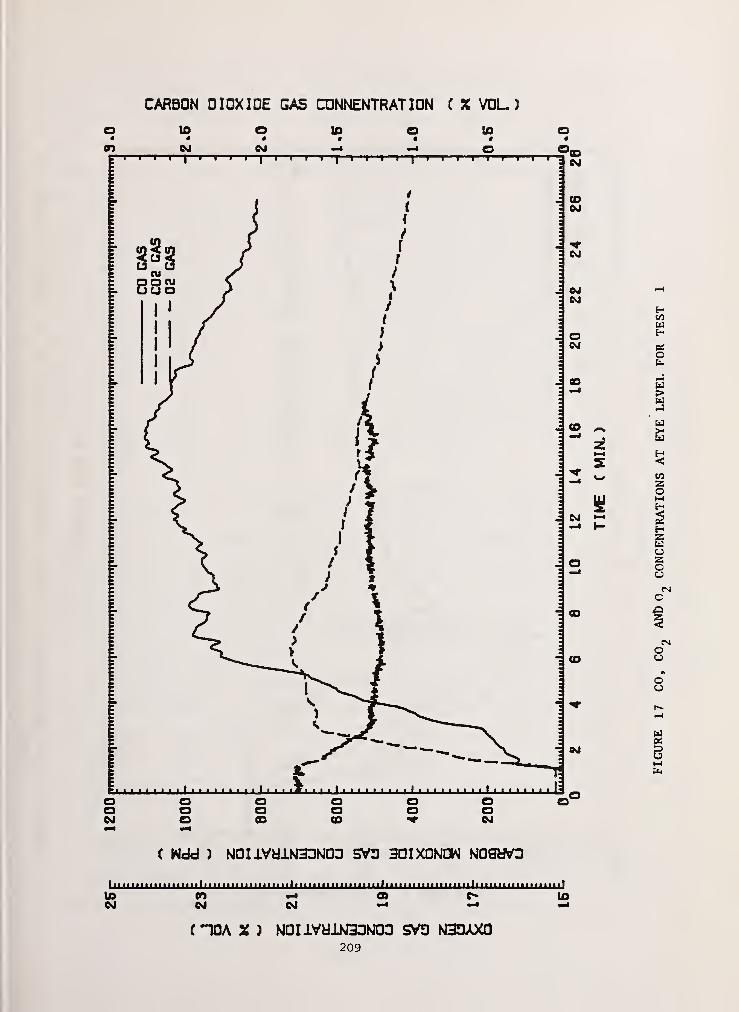
CARBON DIOXIDE GAS CONNENTRATION C X VOL.)
O ID O 10 O 10 O• «•••««
( Wdd ) NO I lVaiKQDNOD SV3 30IXONOW NOQWD
ii i ii min Lulu unuuuij mu »* '
10 xn m idCM Csl m -*
C IDA X ) N0UVU1N33N00 SVD N33AX0209
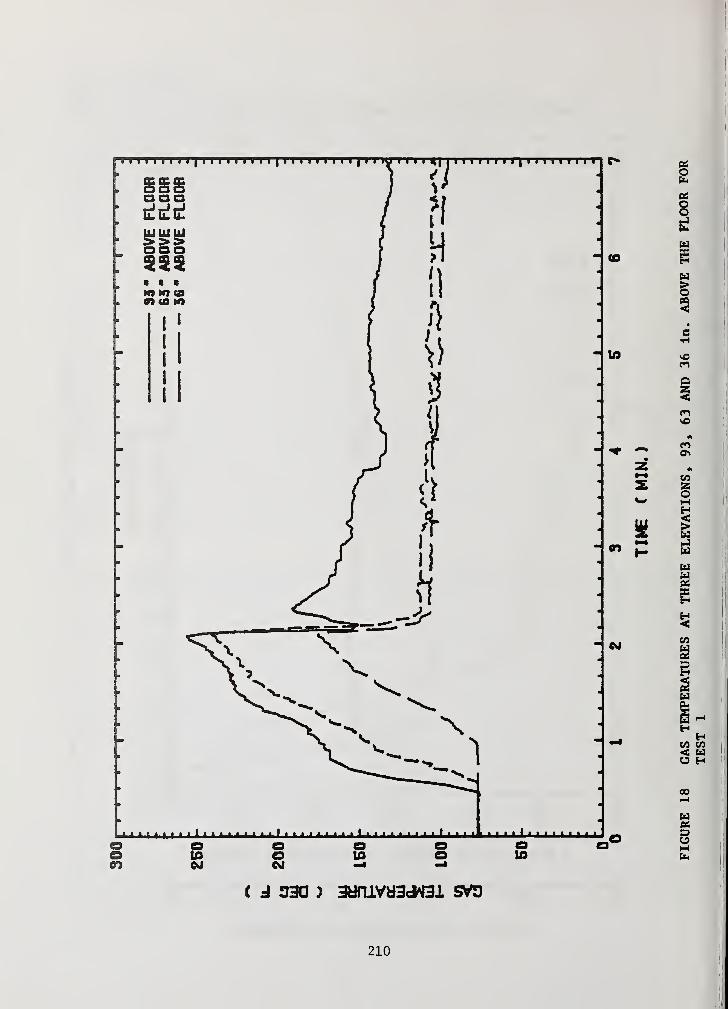
The effect of sprinkler response time is investigated by comparing the
results of Tests S2.1 and S2.3 which had the same water discharge rate but dif-
ferent link sensitivities. CO gas concentrations, gas temperatures at eye
level, and ceiling surface temperatures are plotted in Figures 19, 20 and 21
respectively. For Test 3 the reference point of the time abscissa is the activa-
tion time of sprinkler No. 1 (at which time the simulated link temperature
increased 71°F from its initial temperature), whereas for Test 2, the reference
point of the time abscissa is the time, t^, at which the temperature of a
16.9 sec time-constant simulated link would increase by 71°F. In Test 2, the
maximum CO concentration was over 10,000 ppm, beyond the range of the CO
analyzer. The maxmimum values of CO concentration, gas temperature at eye
level, and ceiling surface temperature for Test 2 exceeded the critical values
adopted for evaluation of sprinkler performance. The results of Test 3 demon-
strate that the commercial 5/16-in. orifice sprinkler activated by a simulated
link with a 16. 9-sec time constant, rated at 140°F, discharging 6 gpm is capable
of providing adequate life-safety and property protection in such a fast-growing
fire.
In Test 3, at the time of sprinkler activation, the gas temperature adjacent
to sprinkler No. 1 was only 202°F. Fire then gradually spread to the backside
of the chair and was completely shielded from the sprinkler spray. The sprinkler
spray tested was not capable of suppressing the fire and cooling the gases suffi-
ciently, and the gas temperature reached a maximum value of 637°F, 129 sec after
sprinkler activation. It is expected that sprinklers with the same links (rated
at 140° F) in the hallway and the kitchen would also have operated.
The average water application, wc
, over the 25 pans represented by the shaded
area in the floor water distribution plan in Figure 13 to 16 is used as an indi-
cator for the amount of sprinkler water reaching over the fire source in the
corner of the living room. For Tests 2 and 3, the value, w , was only2
c
0.015 gpm/ft (Figure 13). The fire test results indicate that, in order to
suppress the fire and cool the gases sufficiently, more water is required to be
delivered to the corner of the room.
6.2.3 Ventilated Living Room Fire Tests with Combustible Walls and Ceiling
The presence of the combustible walls and ceiling added a greater fire
challenge to the sprinklers. With a low-sensitivity link, at the time of
211
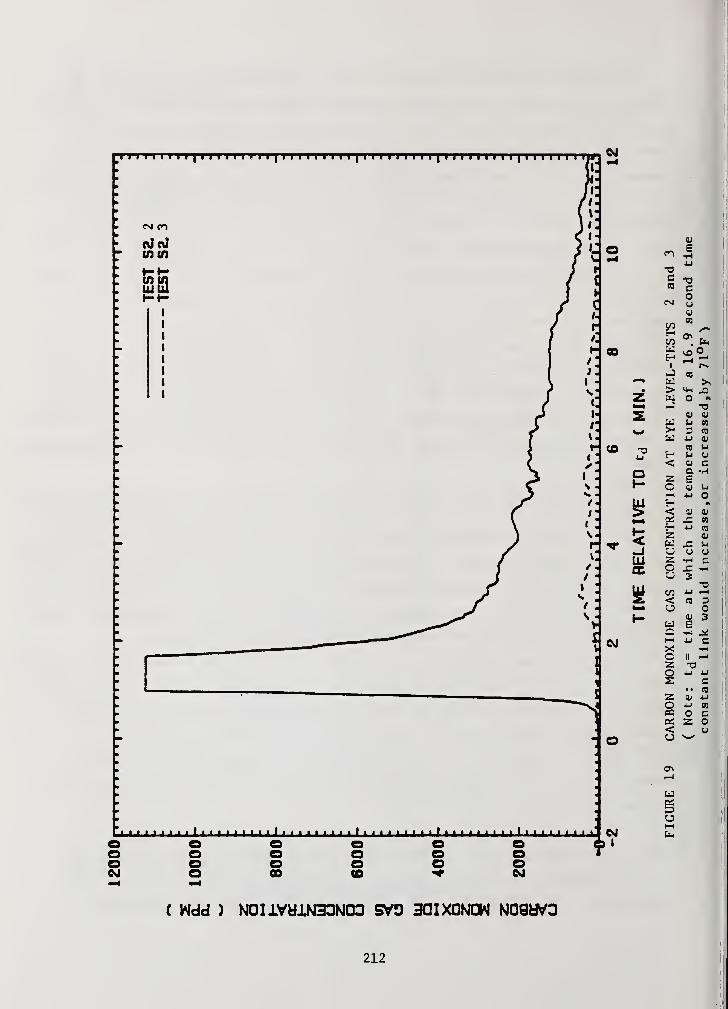
1 I I I I 1 I I II
I M M I I I II
I I I I II 1 1 1 I ; I I I I I I M II
I
cntn
Z5
t- (O -a
oI—
J 1 1 ' ' ' 1I ' 1
I1 1
J
1
1
1 1 1I ' I
1 1 1I I ' 1 ' ' 1 ' ' I
1
1
1 1 11 1
1
' 1 ' 1 ' ' 1I
1 '
ooCvl
©oo
eooeo
o©CD
©CM
©J
•JLUK
ha*
0)
Ecn
4Joc "O03
on
CMec
STS
• u.uj
i—
I
oHt
1—1
1
—
nJ Q
> Xo nJ -a
au=1
as
w jj 0)
03 u1j u
< <u ca «H
Z EC IV
h-
1
jj oH1 V <u
X 03
E- j-i fS2 <uK X uU u <J
z 1-1 co •Co 3TJ
CO jj i—l
< CO 3a O0) 3Ei-i
JJ cX 1^c II
1—1
z T3JJ JJ
§ cCOz <u Jj
o JJ 03
H5 0 cz o
< o
ON1-J.
W
o1—1
( Wdd ) NOIiVHihQDNOa SV3 30IXQNOW
212
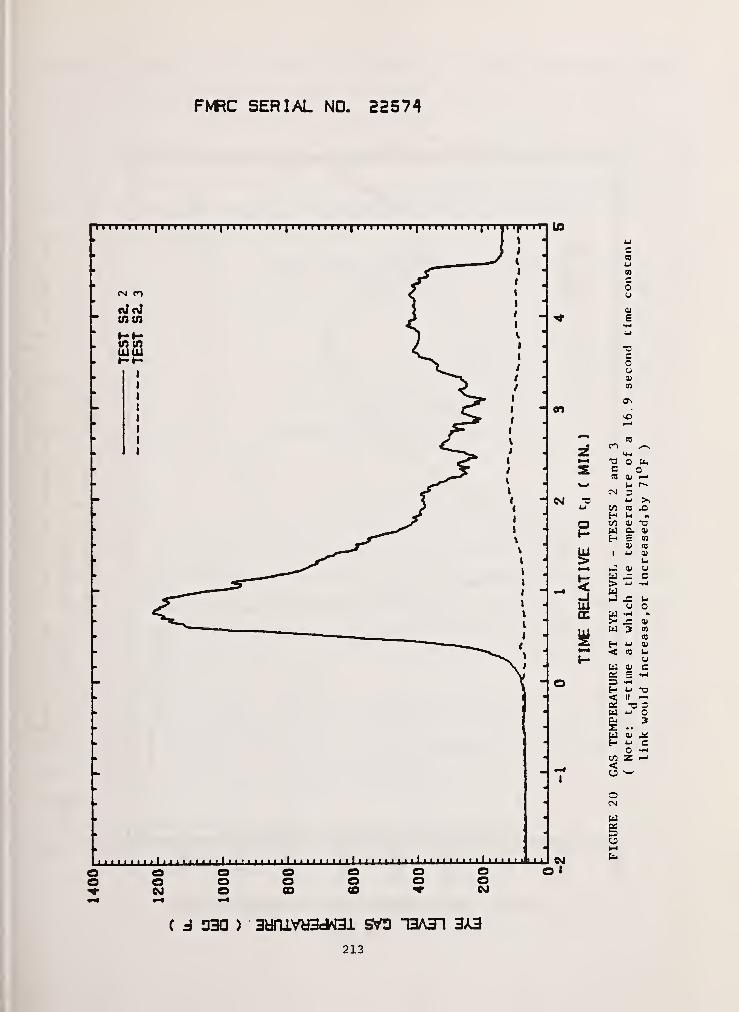
FMRC SERIAL NO. 22574
1 1 1 1 11
1
1
1
1 1 1 1
1
1 11
1 1 1 1
1
1 1
1
1
1
1
1
1 1 1 1 n 1 1 1 1
1
1 1
1
1
1
11
1 1 n if 1 11'
[U3
CM CO
cdoltntn
tn tnLUUi»-»-
'»» 1 i . . 1 1 1 1 i II II i1
ii 1 1 1 1 1 1 1 1 1 1 1 1 1 Ji 1 1 1 eg
en
•zsw
CM -c
-3
cou0»
tn
c
cm -
o u»o
U r-~
wHCO<
oCM
Ui
oM
CO X)Ui «0> T3Q. 01
E »01 COJ_l 11
u01 u— c
0 o1-t «.fi Ol
3 mco
u oi
CO uu
01 cE -h
II—
C 3u O3
01
j-> co2
OoCsl
ooooto
coCO
C d 33d ) 3cJTllVd3cW31 SV3 13A31 3A3
213
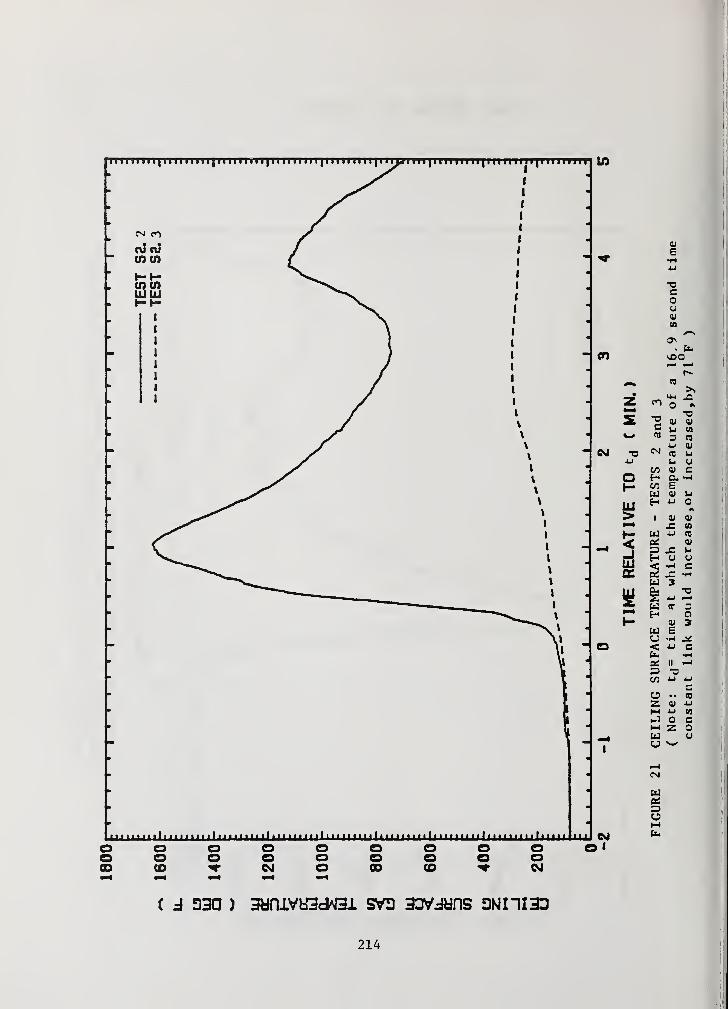
iih iii ih ii h i h ii|
i iii ii ii i|i h iiiii i| iii ii ii|
i i iiii iii|
i i i i h iii|Iii i i ii i«
cm cn
t i. . I. .1 1 11 1 J 1 1 1. 1 ii 1 1 11 1 in ii 1 1 1 ii ii ii ii I. ultAJJ 1-LUi.LLU.J LiJ
in
cn
CM
CM
ill>
<-JUJ
©o oo oo o o oO O Q ocs
o oo oCO CD CM O CO CO CM
( d 30 ) 3aniVH3d^31 SVD DNIH33
CO
co(4-1
o
CDed
C U 81co 3 CO
4-1 CDCM
CO hi
u uCO cd eH C. i-l
CO Ew CD i-l
H 4-1 o
I CD CD
X CO
w iJ co
Q£ CD
X l-i
H U uc
"5w1 4-1
w cr
H oCD 3W E
o •f! J*< 4J cfa
II I—
1
"3CO 4-1 4-1
o CO
z CD JJ
M CQ
1-1 o CM z ow uu
214
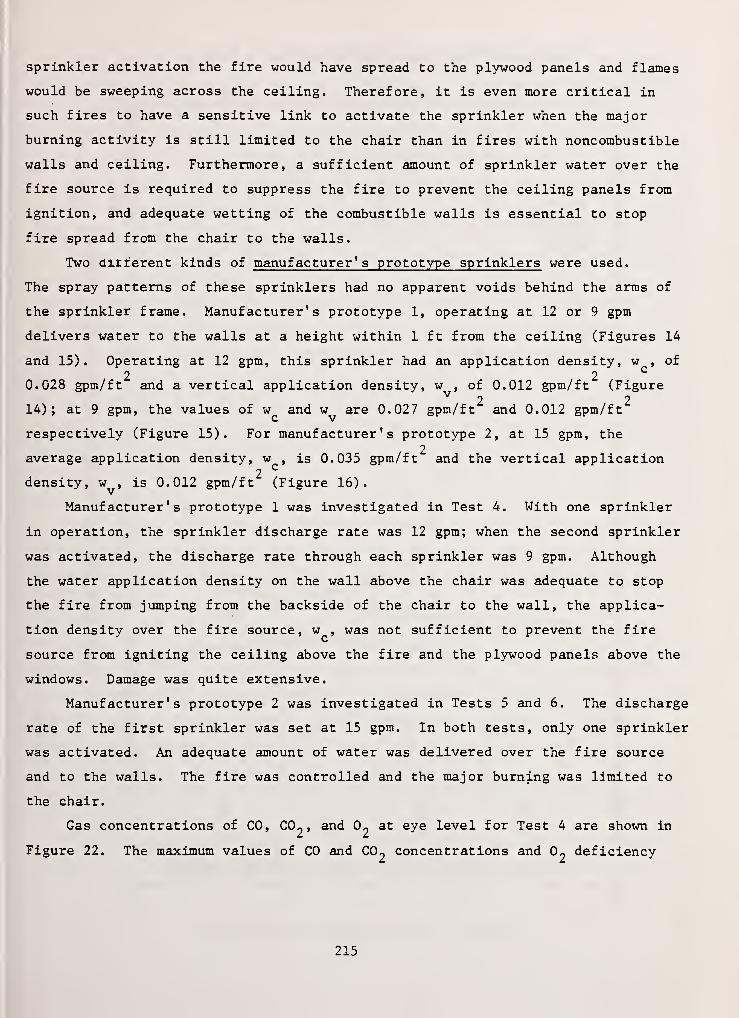
sprinkler activation the fire would have spread to the plywood panels and flames
would be sweeping across the ceiling. Therefore, it is even more critical in
such fires to have a sensitive link to activate the sprinkler when the major
burning activity is still limited to the chair than in fires with noncombustible
walls and ceiling. Furthermore, a sufficient amount of sprinkler water over the
fire source is required to suppress the fire to prevent the ceiling panels from
ignition, and adequate wetting of the combustible walls is essential to stop
fire spread from the chair to the walls.
Two dirt'erent kinds of manufacturer's prototype sprinklers were used.
The spray patterns of these sprinklers had no apparent voids behind the arms of
the sprinkler frame. Manufacturer's prototype 1, operating at 12 or 9 gpm
delivers water to the walls at a height within 1 ft from the ceiling (Figures 14
and 15). Operating at 12 gpm, this sprinkler had an application density, w , of
2 2C
0.028 gpm/ft and a vertical application density, w , of 0.012 gpm/ft (FigureV
2 214); at 9 gpm, the values of w
cand w
vare 0.027 gpm/ft and 0.012 gpm/ft
respectively (Figure 15). For manufacturer's prototype 2, at 15 gpm, the2
average application density, w , is 0.035 gpm/ft and the vertical application2
c
density, w^, is 0.012 gpm/ft (Figure 16).
Manufacturer's prototype 1 was investigated in Test 4. With one sprinkler
in operation, the sprinkler discharge rate was 12 gpm; when the second sprinkler
was activated, the discharge rate through each sprinkler was 9 gpm. Although
the water application density on the wall above the chair was adequate to stop
the fire from jumping from the backside of the chair to the wall, the applica-
tion density over the fire source, wc>
was not sufficient to prevent the fire
source from igniting the ceiling above the fire and the plywood panels above the
windows. Damage was quite extensive.
Manufacturer's prototype 2 was investigated in Tests 5 and 6. The discharge
rate of the first sprinkler was set at 15 gpm. In both tests, only one sprinkler
was activated. An adequate amount of water was delivered over the fire source
and to the walls. The fire was controlled and the major burning was limited to
the chair.
Gas concentrations of CO, C^, and O2 at eye level for Test 4 are shown in
Figure 22. The maximum values of CO and C0~ concentrations and 07deficiency
215
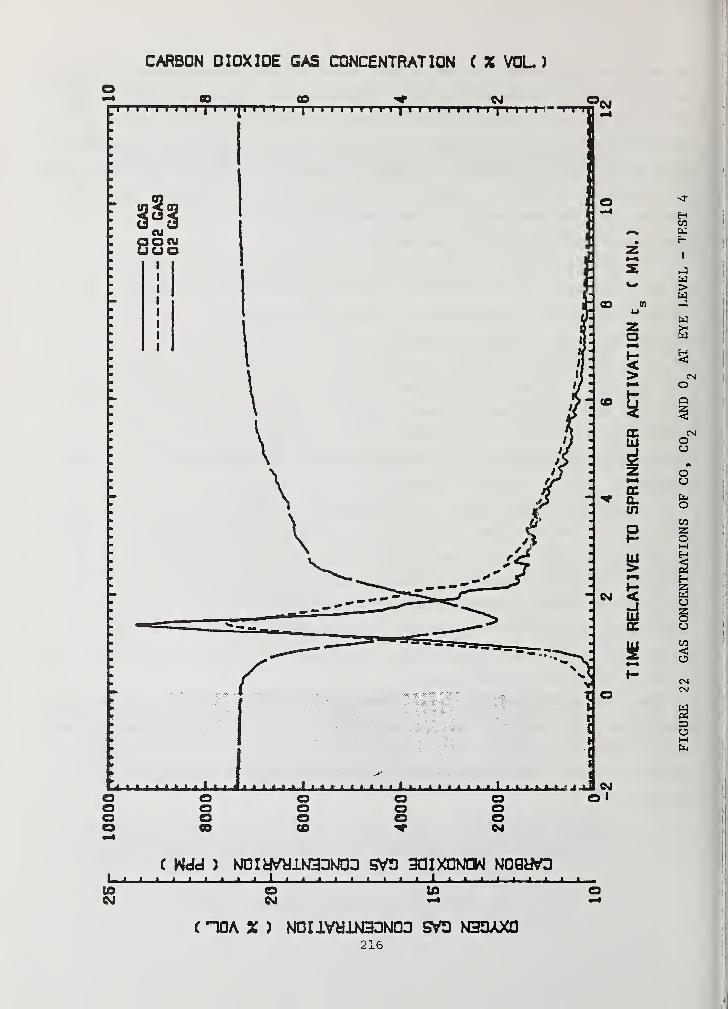
CARBON DIOXIDE GAS CONCENTRATION ( X VOL.)

were 9400 ppm, 8.0 percent, and 8.9 percent respectively. Based on measurements
of CO, CO2 and 0^ concentrations, the environment in the room of fire origin is
deemed nonsurvivable.
Figure 23 shows the CO gas concentrations at eye level for Tests 5 and
6. In both tests, the CO concentration had not exceeded 280 ppm.
For Tests 4, 5, and 6, eye-level gas temperature and ceiling surface tem-
perature above ignition are shown in Figures 24 and 25 respectively. The maxi-
mum ceiling surface temperature for Test 4 exceeded the adopted critical value
for evaluation of property protection. For both Tests 5 and 6, all the maximum
values of CO concentration, • eye-level gas temperature, and ceiling surface
temperature were considerably smaller than the critical values. Therefore, a
manufacturer's prototype sprinkler, activated by a 15.1-sec time-constant link2
rated at 136°F, delivering 0.035 gpm/ft of w over the fire source in the
2C
corner of the room and 0.012 gpm/ft of to the wall above the chair has been
demonstrated to be effective in controlling such a high-challenge, fast deve-
loping fire and capable of providing adequate life-safety and property protec-
tion in the room of fire origin.
VII CONCLUSIONS
Performance of pendent sprinklers as affected by sprinkler response time
and sprinkler water distribution has been investigated in several typical,
residential fire scenarios involving flaming fire starts. A commercially
available sprinkler link, representative of the most sensitive on the market,
was employed for sprinkler activation in a nonventilated small-bedroom fire.
Due to the small room size (12.3 ft x 8.8 ft), hot ceiling gases descended
quickly to eye level. At the time of sprinkler activation, the eye-level gas
temperature near the center of the room had already reached 241°F, exceeding the
adopted critical value for eye-level gas temperature. In order to maintain a
survivable environment in the room of fire origin throughout this fire, it was
concluded that the sprinkler should respond at an earlier stage of the fire; in
other words, the sprinkler link must be even more sensitive than the commer-
cially available link.
In the living room fire tests, combustibles were located in the northeast
corner of the room; fire first spread to the left side of a reclining chair, and
217
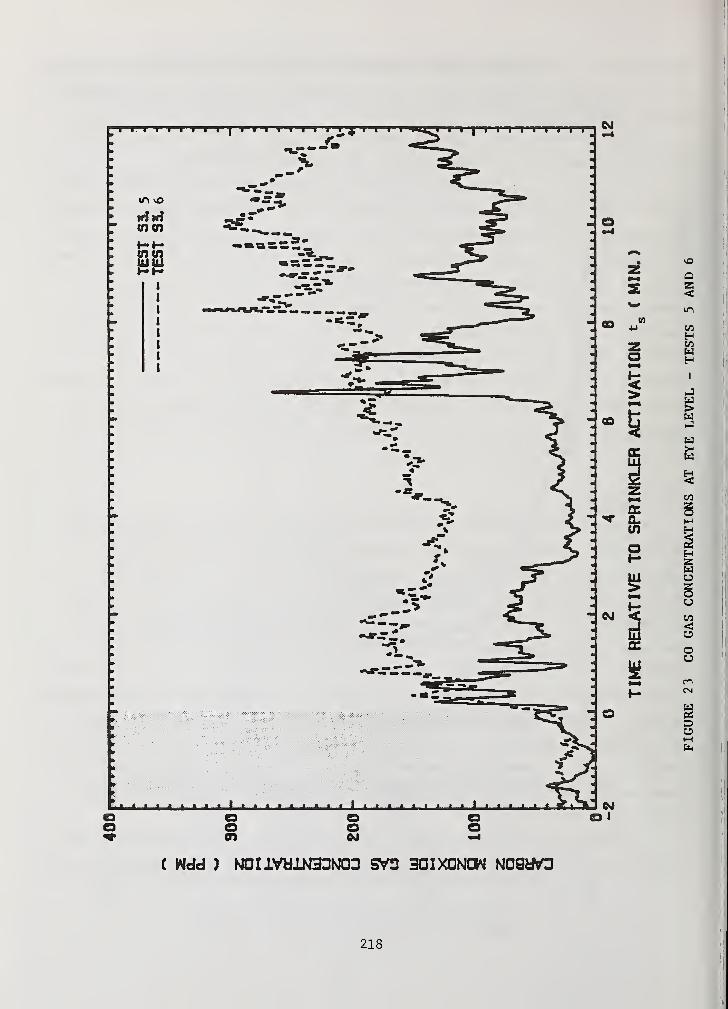
218

219
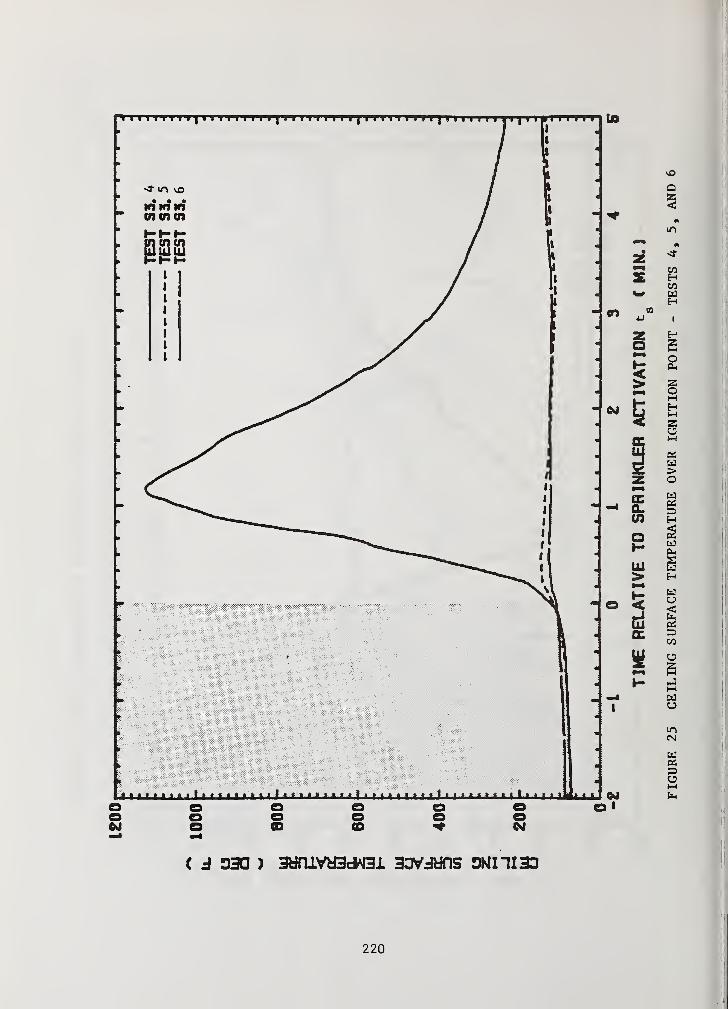
then to the curtains behind the chair. Fire on the left side and backside of
the chair was shielded from direct sprinkler water impingement. In order to
suppress such a challenging fire and cool the fire gases, considerably more
water was required over the fire source than in the small-bedroom fire. An
average water application density, w^, over a 5-ft x 5-ft floor area in the
corner of a 15-ft x 15-ft coverage area without walls was used to indicate the
amount of sprinkler water delivered to the corner of the living room. The
vertical application density, w^, over the 1-ft wide x 2. 5-ft high area on the
wall above the chair indicates the amount of water delivered to protect the wall
from igniting by the source fire.
In the ventilated living room fire tests with noncombustible walls and
ceiling, it was demonstrated that a sprinkler activated by a 16.9-sec time
constant link rated at 140°F, delivering an application density, w , of
2°
0.015 gpm/ft , was capable of providing adequate life-safety and property pro-2
tection in the room of fire origin. However, a value of wc
of 0.015 gpm/ft was
not sufficient to suppress the fire and cool the fire gases to prevent excessive
sprinkler openings in the hallway and the kitchen outside the living room.
In the ventilated living room fire tests with combustible walls and ceiling,
manufacturer's prototypes with a link of 15.1-sec time constant rated at 136°F
were investigated. The critical value of the application density, w , was found2
C
to be 0.035 gpm/ft in order to suppress the fire source in the corner and
prevent plywood panels and the combustible ceiling above the fire source from
igniting. In addition, sufficient wetting of the combustible walls was also
essential in preventing fire spread from the fire source to the walls. A ver-2
tical application density, w^, of 0.012 gpm/ft on the wall from 3.5 ft to 6 ft
from the floor was demonstrated to be adequate to prevent fire jump from the
backside of the chair to the wall.
In the tests in which the manufacturer's prototype 2 sprinkler was demon-
strated to be successful in controlling such a challenging ventilated fire, only
one sprinkler was activated and the sprinkler discharge rate was 15 gpm covering
a 12-ft x 12-ft area. Further, the prototype discharges a rather uniform pattern
in the angular distribution so that, even if a fire starts behind the arms of
the sprinkler frame, an adequate amount of water can be expected to be delivered
to the fire source.
221
In conclusion, significantly more sensitive links than the commercial link
representative of the most sensitive on the market are essential in providing
adequate life-safety and property protection in residential fires. The required
sprinkler operation conditions for control of such a typical high-challenge,
fast-developing residential fire have been determined in terms of water distri-
bution associated with a link (rated at 136°F) five times as sensitive as the
commercial link.
The results obtained in the program will 1) serve as a guide for the
development of residential sprinklers, 2) establish a foundation for new in-
stallation standards of residential sprinkler systems, and 3) lead to new evalua
tion standards for approval and listing by recognized laboratories.
222
REFERENCES
1. "Highlights of Fire in the United States," Second Edition, Federal
Emergency Management Agency, United States Fire Administration,
Washington, D.C., 1980.
2. "Automatic Sprinklers: Protection in New Setting," Record , vol 55,
No. 1, p 3, Factory Mutual System, Norwood, Mass., January-February, 1978.
3. "Standard for Installation of Sprinkler Systems in One- and Two-Family
Dwellings and Mobile Homes NFPA No. 13D-1975," National Fire Protection
Association, Boston, Mass., 1975.
4. Kung, H.C., Haines, D.M. and Greene, R.E., "Development of Low-cost
Residential Sprinkler Protection," Technical Report RC78-T-3, Serial
No. 22574, Factory Mutual Research Corporation, Norwood, Mass.,
February 1978.
5. Kung, H.C., Spaulding, R.D. , and Hill, E.E., "Sprinkler Performance in
Residential Fire Tests," Technical Report RC80-T-16, Serial No. 22574,
Factory Mutual Research Corporation, Norwood, Mass., July 1980.
6. Heskestad, G. and Smith, H.F. , "Investigation of a New Sprinkler Sensi-
tivity Approval Test: The Plunge Test," Technical Report RC76-T-50,
Serial No. 22485, Factory Mutual Research Corporation, Norwood, Mass.,
December 1976
7. Heskestad, G. , "Bidirectional Flow Tube for Fire-Induced Vent Flows,"
Appendix K of Technical Report RC74-T-31, Serial No. 21011.4,
Factory Mutual Research Corporation, Norwood, Mass., July 1974.
8. Halpin, B. , Fisher, R.S., and Caplan, Y.H., "Fire Fatality Study,"
Presented at International Symposium on Toxicity and Physiology of
Combustion Products, University of Utah, Salt Lake City, Utah, March 1976.
9. Steward, R.O., "The Effect of Carbon Monoxide on Man," JFF /Combustion
Toxicology , vol 1, p 167, August 1974.
10. Yuill, C.H., "Physiological Effects of Products of Combustion,"
ASSE Journal , p 36, February 1974.
11. Kimmerle, G., "Aspect and Methodology for the Evaluation of Toxicological
Parameters During Fire Exposure," JFF /Combustion Toxicology , vol 1, p 4,
1974.
223
B ! 1
12. Biekerdorf, F.W. and Yuill , C.H. , "An Investigation of the Hazards of
Combustion Products in Building Fires," Final Report SwRI Project
No. 3-1237-3, Southwest Research Institute, San Antonio, Texas, October 1963,
13. Banford, C.H. , Crank, J., and Malan, D.S., "The Combustion of Wood, Part I,"
Proceedings of Cambridge Philosophic Society, vol 42, p 166, 1945.
14. Madorsky, S.L., "Thermal Degradation of Organic Polymers," Interscience
Publishers (John Wiley and Sons), New York, 1964.
224

Discussion of Presentations on Sprinkler Technology
O'Neill Presentation
Handa: I understand the use of fast response sprinklers which hasa large amount of water sprinkling, but I do not understand the useof the slow response sprinkler.
O'Neill: In this paper we looked at standard U.L. listed sprinklerswhich are currently available. For the mattress and bedding fires,they were relatively slow in responding for the conditions that wewere looking at and given the gas temperatures that occurred in thevicinity of the sprinklers.
Handa: I think we are primarily talking about residential sprinklers.In my opinion, in this case, more numbers of sprinkler heads and morewater will be more useful. I do not understand for what case the slowresponse sprinkler would be used.
O'Neill: We specifically addressed the patient room arrangement of
a hospital. Dr. Kung will talk about the fast response for residentialfires later in the program.
Handa: What do you mean by slow response?
O'Neill: In terms of the thermal inertia, it is the length of time
difference from the time that the gas temperature near the sprinklerreaches its actuation point, (the nominal actuation rating) compared
to the actual time of response. To explain further, for example in
this case with this fire the gas temperature near the sprinkler has
reached 200°C before the sprinkler actuated although the sprinkler
was rated at 74°C.
Handa: What is the relationship of the sprinklers to detectors?
Did you use detectors in the test series?
O'Neill: Yes we did. However because of the limited time on the
agenda today, I have not discussed the response or results of the
detector phase. They are contained in another report which we can
make available to Prof. Handa.
225
Unoki Presentation
Quintiere: How important is the problem of disturbance of the smokelayer by the sprinkler.
Unoki: Any obscuration by smoke would be detrimental for the escapeof the occupants. As I mentioned in my presentation, in Japan thebuildings where sprinkler systems are mandatory in order to save humanlives, they must install automatic fire alarms as well. So, up to nowthe thinking has been for escape of the occupants, they would have todepend on the automatic fire alarm system. When you have to examinethe usefulness of the sprinklers installed above the escalators, or
staircases, we still have to find out if sprinklers are really helpfulor detrimental for people to escape.
Emmons: A few remarks in connection with the last question byDr. Quintiere may be worth noting. The effects of the sprinklerinvolve two things. The water spray coming down from the sprinklerdrives the gases down with it. This tends to mix the obscuringparticles into a larger volume, a little less density perhaps, butit increases the obscuration for a short time at least. It putsthe he fire out, but it does spread the obscuring particles. How-ever, it also cools the gas, and when you cool the gas it contractsand more fresh air coming in from outside. These two effects havecontradictory effects: outside it becomes a little less obscure;inside it becomes a little worse. This makes it very complicatedto know for certain whether you are better or worse with the sprinklers.It will also complicate the matter of fire modeling, as I believeDr. Quintiere was concerned with, in attempting to predict whether
sprinklers are better or worse.
Clarke: When was the date of the regulation requiring installation
of sprinklers in the buildings. Referring to you paper it was 1976,
but I may have missed it, if it was actually written down. I am
impressed with the remarkable rate at which sprinklers are being
installed in buildings, in which I guess previously did not have
sprinklers
.
Unoki: The regulation date was roughly twenty years ago. Of course
in those twenty years this problem of installation has expanded greatly.
Before the regulations went into effect, there was some sprinklers
installed but very few. One exception, the very famous Mitsukashi
department store in Tokyo installed its sprinkler system even before War
World II.
226

Clarke: Are metal, iron piping required in all sprinklers inJapan. Especially in retrofitting, in installing sprinklers after thebuilding is constructed, are lighter weight piping materials permissiblein any cases?
Unoki: A building that is mandated to install a system must use ironpiping. Neither plastic nor copper piping has been used as yet.
Benjamin: I would like to congratulate Dr. Unoki for his very fine
presentation. I now know far more about sprinklers in Japan than I
did before. Two features that are used in this country are what wecall water flow alarms which actually sound a gong alarm when the
water in the sprinkler is activated; and also sprinklers are requiredto be tied into the alarm system so that when a sprinkler headactivates the alarm system is also activated. I wonder if the Japanesepractice also has these features?
Unoki: The building which has an automatic alarm system will soundthe alarm when the sprinkler is activated. In other buildings werecommend installation of an alarm system in the middle of the building.There was an example, of an accident in a large storage building. In
the middle of the night a sprinkler system went off without any fire byfalse alarm. The local bell sounded but it did not reach the controlcenter and the accident was recognized after the consumption of 30
minutes of water storage.
O'Neill: Was the need for a change in the previous sprinkler spraydistribution test, the single head distribution test, enhanced or
necessitated by poor fire experience or was it justwas perceived to
be the problem with the void coverage?
Unoki: I do not believe that it was because of past fire experiences.
It was because Japanese rooms are small and each room seems to have one
or two heads. The reason the change occurred was to avoid any space
where water does not cover.
227
Kung Presentation
Handa: I am interested in how you developed the highly sensitivelink. I think you might lower the heat capacity. Is this a corporatesecret?
Kung: By reducing the mass and increasing the surface area to correctthe heating, you increase the sensitivity.
Handa: I assume the air content has very little heat. On the otherhand, the sensor is metal.
Kung: It takes much less heat to heat that element up than thestandard sprinkler link.
Emmons: What fraction of the heat actuation of the link comes fromthe gas directly by convective heat transfer as opposed to radiationfrom the flame? Does radiation contribute significantly?
Kung: We have not done an exercise to determine what fractioncomes from convection or what fraction comes from radiation. However,we assume that transport is by convection. Then we use the heattransport equation to predict that link thermal response and comparethe prediction with the measured value of the link temperature. The
predictions are very close. I imagine before the sprinkler activates,
the fire is not of such a big size. The fire was about five or six
feet tall.
Unoki: I remember you said only one sprinkler head activated, but
do you have two sprinklers that you installed for the test?
Kung: In the test we installed four sprinklers.
Unoki: Are there any figures describing where these sprinklers are
installed?
Kung: Yes, it is in the report.
Unoki: For your test described today, was there only one head
installed?
Kung: This was a condensed version.
Unoki: One thing I noticed in your presentation was that no
measurements of smoke obscuration were mentioned. Why?
Kung: The obscuration measurments were included in the report.
Unoki: I remember in Mr. O'Neill's report the obscuration was bad.
Were similar conditions reached in your experiment?
Kung: Yes.
228

Chaiken: The prototype link that you developed had a one second or
two second response; you also had a 135°F burn height capability.What would you expect the false alarm rate to be in a house with the
heating system or out west where you have some high solar energy.Do you have any ideas?
Kung: I think this concern has been taken care of in the new proposedstandard which requires that the fusing temperature at the link be at
least 35°F above the maximum temperatures in that locality. So, I
don't really know when they would have to use 165°F temperature rating.
Quintiere: What was the nature of the distribution of the spray? Doyou feel that that has been optimized with regard to the residentialenvironment of a relatively small room compared to industrial sprinklerapplications?
Kung: I do not feel that the spray pattern from the phototypesprinklers are necessarily optimized. Next week at the Annual Con-ference, I will shed some light on the pattern of spray distributionsfound in more extensive studies.
Miyama: I assume the residential sprinkler will become popular and
the standard test for these sprinklers may become important. One
suggestion is to standarize the dimension of the test room and the
type of burning fuel material and its quantity.
Kung: I think the new approved standards, specifically for
residential sprinklers, are being developed by Factory Mutual and
Underwriters Laboratories. The sprinklers used in residences will beonly the residential sprinklers and would not be standard sprinklers.In the approved test standards we will try to formulate some standardfire tests to evaluate the performance of sprinklers.
Saito: From what point of view did you decide the permissible levelsof CO concentration of 1500 ppm and temperature of 200°F?
Kung: We did not mean them as permissible levels. We just chosethese values. As experts you probably could provide better valuesfor these.
Saito: I am glad to hear this. If these values are approved, our
work in toxicity has been completed. In relation to those two factors,
CO concentration and the temperature, I believe the use of the sprinklerusually raises the amount of humidity. The humidity is another
factor affecting human conditions. I suggest that humidity should be
taken into consideration.
Kung: I hope NBS would take this into consideration.
229
5. FIRE MODELING
230

Reprinted from JOURNAL OF HEAT TRANSFER. Vol. 102. So. 1. February 1980
C. M. Kinoshita
P. J. Pagni
Department ol Mechanical Engineering,
University of California.
Berkeley. CA 94720
Laminar Wake Flame Heights
One important measure of material fire hazard is the flame height a given polymer pro-
duces upon burning in a specified ambience. Six systems are considered here—two fuel
geometries: wall-mounted and free standing; and three flow fields: forced, free and mixed-
mode. In each case, the extent of the combusting gas downstream of a pyrolyzing slab is
obtained as a function of the fuel's thermochemical properties. The flow is modeled as a
steady, laminar, two-dimensional, nonradiative boundary layer. The combustion is de-
scribed by a single Shvab-Zeldovich energy-species equation assuming unit Lewis numberand a fast one-step overall gas phase reaction. Sumerical methods are employed due to
the abrupt change in boundary conditions at the end of the pyrolyzing slab. However, an
approximate similarity solution is found for forced flow which yields explicit flame
heights. Based on these results, explicit functional fits to numerical flame heights are ob-
tained for free and mixed-mode flows. Comparisons between theory and experiment indi-
cate quantitative agreement.
Introduction
The development of laminar, forced, free, and mixed-mode con-
vection flames above both wall- mounted and free-standing vertical
burning surfaces is examined. This study is a natural extension of
previous investigations of laminar combusting boundary layers [1-7).
The limits of pure forced and pure free flow combustion downstream
of vertical pyrolyzing surfaces have been examined by Pagni and Shih
(4) and by Faeth and co-workers [5, 6). while mixed-mode diffusion
flames adjacent to a burning fuel slab have been analyzed by Shih and
Pagni [7], The present investigation extends the analysis of mixed-
mode combustion into the region above the fuel source and provides
accurate explicit expressions for flame heights in all six cases con-
sidered. Good agreement is obtained with experiments.
The six systems analyzed are illustrated schematically in Fig. 1. Thetwo geometries given in Figs. l(a ) and 1(6) are: I la ) combustion ad-
jacent to an inert, adiabatic, vertical extension above the fuel slab,
referred to as "wall-wake" or "wall-plume" combustion, and (16)
combustion above a free-standing fuel slab referred to as "wake" or
"plume" combustion. Three flow regimes are considered for each
geometry: (1) forced flow: £x « 1, (2) free flow: £x > 1, and (3) forced
and free mixed-mode flow: £, =0(1). In each case a uniform stream
of oxidizer approaches the vertical fuel plate and reacts with pyrolyzed
fuel in a thin diffusion flame.
All systems have two regions: a pyrolysis zone where energy transfer
to the fuel produces mass transfer into the flow and partial fuel con-
sumption occurs, and an extended flame zone where pyrolysis ceases
and the combustion process is completed. The abrupt change in
boundary conditions between these regions disallows similarity; hence,
numerical techniques are employed. For pure forced flow combustion,
however, an approximate similarity model is developed which yields
flame heights in terms of known combustion parameters. The analyses
are presented in order of increasing complexity, viz., pure forced, pure
free, and then mixed-mode combusting flow.
Forced Flow CombustionAnalyses. The boundary-layer equations which govern two-
dimensional, laminar flows with fast kinetics are well known, hence
the mathematical treatment is abbreviated. Making the usual
Shvab-Zeldovich and boundary-layer assumptions, the continuity,
momentum, and coupled energy-species equations for forced flow
combustion, neglecting dissipation and radiation, are. in turn,
d d— (pu) + — \pv) = 0dx dy
du du d I dupu h pv— = — \u—
dx dy dv \ dy.(1)
dj dJpu— + pv—
dx dy dy \ dyj
in which J is the normalized energy-species variable. The stoichi-
omecry is given by an assumed single-step overall chemical reac-
tion.
uf fuel + i>„, oxidizer — vp products + Q i.2)
where Q denotes the energy released by Vf moles of fuel in the reac-
tion.
At the pyrolyzing surface, the streamwise velocity vanishes, the
enthalpy is specified and energy and fuel balances yield the transverse
velocitv and the wall fuel concentration:
and
X dh
cpL dy
pD dYf
x < L 1 3)Yfw - Yft dy
The boundary conditions downstream of the pyrolyzing surface, x >
L depend on the specific system under consideration. For wall-wake
combustion, the velocity vanishes at the adiabatic. inert wall along
with the enthalpy and fuel gradients, whereas, for wake combustion,
the transverse gradients of streamwise velocity, enthalpy, and fuel
are zero along the axis of symmetry as is the transverse velocity. In
FLAMESHEET
Contributed by the Heat Transfer Division tor publication in the JOURNALOF HEAT TRANSFER. .Manuscript received by the Heat Transfer Division
October 17. 1979.
Fig. 1 System schematic of steady, laminar, mixed-mode combustion abovea burning vertical fuel slab: (a) wall-wake combustion; (b) wake combus-tion
104 / VOL. 102, FEBRUARY 1980 231 Transactions of the ASME
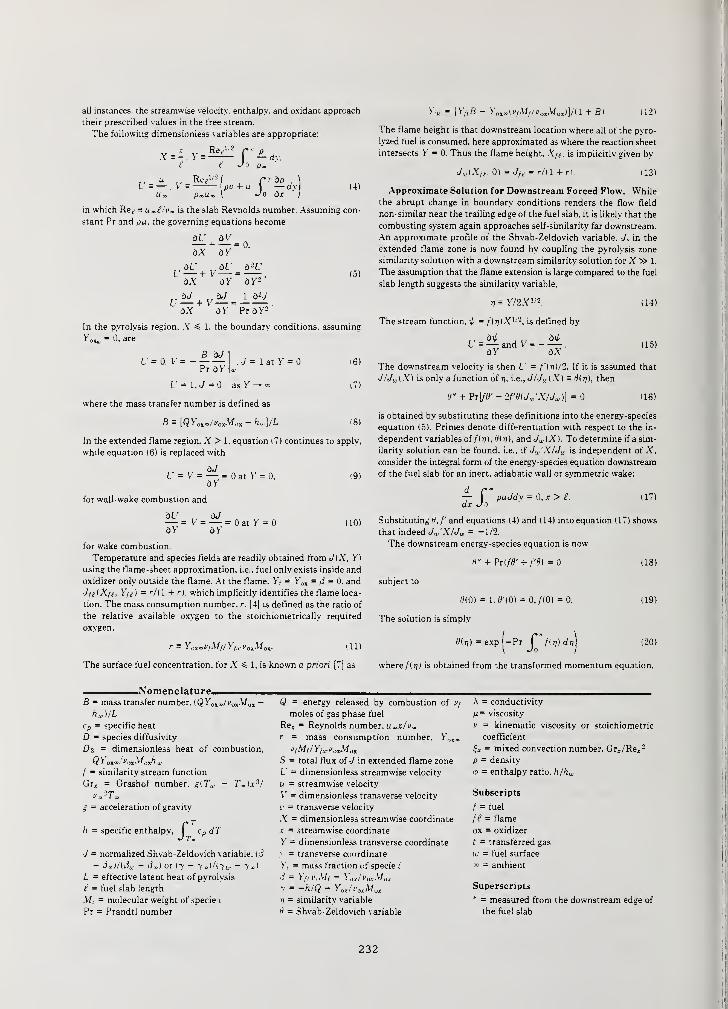
all instances, the streamwise velocity, enthalpy, and oxidant approach
their prescribed values in the tree stream.
The following dimensionless variables are appropriate:
X = -, Y =
V =Re,pv +
JO Pa,
Jo
dp14)
\ -'o a.t
in which Re^ = u.^/k. is the slab Reynolds number. Assuming con-
stant Pr and pp., the governing equations become
ar av;_
OX dV'"
r— + v— =
ax ay
o.
a-L':
ar2'
dX dY PrdV"2'
In the pyrolysis region, X $ 1. the boundary conditions, assuming
YaXu,= 0. are
U- o v'- -——\Pr ay
, =/ = 1 at V = 0 16)
(7)U = 1,J = 0 as V — =
where the mass transfer number is defined as
B^{QYoxJvoxMax -hw \/L iS)
In the extended flame region, X > 1, equation (7) continues to apply,
while equation (6) is replaced with
dV
for wall-wake combustion and
dU
dY•= V
dY
0 at Y = 0.
0 at y = 0
(9)
(10)
for wake combustion.
Temperature and species fields are readily obtained from J(X, Y)
using the flame-sheet approximation, i.e., fuel only exists inside and
oxidizer only outside the flame. At the flame. Y> = yox = 3 = 0. and
Jfe{Xfg, Yt e ) = r/(l + r), which implicitly identifies the flame loca-
tion. The mass consumption number, r. [4] is defined as the ratio of
the relative available oxygen to the stoichiometrically required
oxvgen.
r = Yo^vtMf/Yfui/oxMo*.
The surface fuel concentration, for X ^ 1, is known a prion
til)
Yfu = [Yf,B - Y0Xm u>fMf/v 0X\iax)}/U + B) (12)
The flame height is that downstream location where all of the pyro-
lyzed fuel is consumed, here approximated as where the reaction sheet
intersects Y = 0. Thus the flame height. Xfe . is implicitlv given by
J,AXf(, 0) = Jfe
= r/(l + rl 113)
Approximate Solution for Downstream Forced Flow. While
the abrupt change in boundary conditions renders the flow field
non-similar near the trailing edge of the fuel slab, it is likely that the
combusting system again approaches self-similarity far downstream.
An approximate profile of the Shvab-Zeldovich variable. J. in the
extended flame zone is now found by coupling the pyrolysis zone
similarity solution with a downstream similarity solution for X » 1.
The assumption that the flame extension is large compared to the fuel
slab length suggests the similarity variable,
n=Y/2X r' n: 114)
The stream function, \j. = /(rjlX 1 -. is defined by
=— and V= (15)ay ax
The downstream velocity is then L' = f'(r\)/2. If it is assumed that
J/JudX) is only a function of r\, i.e., J/JU.{X) = 0(7?), then
S" + Pr[/0' - -IfHUvXIJu,)] = 0 (16)
is obtained by substituting these definitions into the energy-species
equation 15). Primes denote differentiation with respect to the in-
dependent variables of firj), tf(rj), and JW [X). To determine if a sim-
ilarity solution can be found, i.e., if JW'XIJW is independent of X,
consider the integral form of the energy-species equation downstream
of the fuel slab for an inert, adiabatic wall or symmetric wake:
d r~— 1 puJdw = 0, x > e.
dx Jo(17)
Substituting ti, f and equations i4) and (14) into equation (17) shows
that indeed JW'XIJU,= -1/2.
The downstream energy-species equation is now
H" + Pr(/0' + f'9) = 0 (18)
subject to
tiiQ) = l.tf'(O) = 0,/(0) = 0.
The solution is simply
0(t/) = exp j-Pr fJfW dv
where /'(rj) is obtained from the transformed momentum equation
(19)
(20)
NomenclatureB = mass transfer number. lQY0X„/voxM0X
_
h w )/L
cp = specific heat
D = species diffusivity
D3 = dimensionless heat of combustion,
QYox~;voxMoxh a .
f = similarity stream function
Gr z = Grashof number. g{Tw — T*)x 3/
g = acceleration of gravity
h = specific enthalpy, ^ cp dT
J = normalized Shvab-Zeldovich variable. (,J
- 3„)/(3w - d.) or 17 - 7.)/('7n, - 7.)
L = effective latent heat of pyrolysis
f = fuel slab length
Mi = molecular weight of specie 1
Pr = Prandtl number
Q = energy released by combustion of Vf
moles of gas phase fuel
Rex = Reynolds number, u^x/v*r = mass consumption number, Y„x„
vfMf/Yfw v0XM0X
S = total flux of J in extended flame zone
U = dimensionless streamwise velocity
u = streamwise velocity
V = dimensionless transverse velocity
v = transverse velocity
X = dimensionless streamwise coordinate
x = streamwise coordinate
V = dimensionless transverse coordinate
= transverse coordinate
V, = mass fraction of specie ('
3 = V'.yiy.V// - Y,„/v„xMtey = -hlQ - Yox /i'0XMox
17 = similarity variable
0 = Shvab-Zeldovich variable
X = conductivity
M= viscosity
v = kinematic viscosity or stoichiometric
coefficient
5x = mixed convection number. Grr/Re, 2
p = density
o = enthalpy ratio. h/h,M
Subscripts
/ = fuel
ft = flame
ox = oxidizer
t = transferred gas
w = fuel surface
= = ambient
Superscripts
* = measured from the downstream edge of
the fuel slab
232
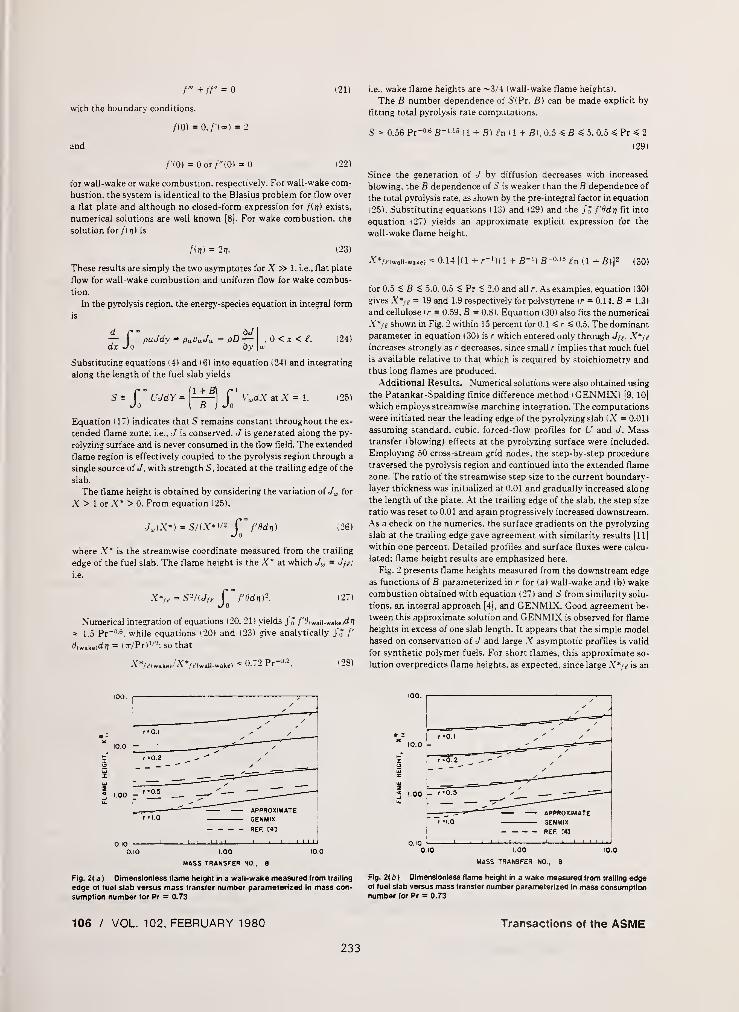
f" + ff" = 0
with the boundary conditions.
/(0) = 0, /'(«•) = 2
and
f'10) = 0or/"(0> = 0
(21)
1 22)
tor wall-wake or wake combustion, respectively. For wall-wake com-
bustion, the system is identical to the Blasius problem for flow over
a flat plate and although no closed-form expression for firj) exists,
numerical solutions are well known [8]. For wake combustion, the
solution for f(t]) is
flv) = 2i». (23)
These results are simply the two asymptotes for X » 1. i.e., flat plate
flow for wall-wake combustion and uniform flow for wake combus-
tion.
In the pyrolysis region, the energy-species equation in integral form
is
— I puJdy = pwuwJw - pD—dx Jo dv
0 < x < L (24)
JdY = V,MdX at X = 1. (25)
Substituting equations (4) and (6) into equation (24) and integrating
along the length of the fuel slab yields
[
1 + fi\
1 B I
Equation < 17) indicates that S remains constant throughout the ex-
tended flame zone; i.e., J is conserved. J is generated along the py-
rolyzing surface and is never consumed in the flow field. The extended
flame region is effectively coupled to the pyrolysis region through a
single source of J, with strength S, located at the trailing edge of the
slab.
The flame height is obtained by considering the variation of Jw for
X > 1 or X* > 0. From equation (25),
JW (X*) = SAX* 1/2 f~ f'ddriJo
(26)
where X* is the streamwise coordinate measured from the trailing
edge of the fuel slab. The flame height is the X* at which Jw = Jft;i.e.
XV = SVUrt C° f'ddiiY-.Jo
(27)
Numerical integration of equations (20, 21) yields J" /'tfiwaii-wakeidi?
* 1.5 Pr"'16 . while equations (20) and (23) give analytically J"J/'
t'lwakeic''? = (flVPr) 1 ' 2: so that
X*/Vlwake|/X*/clwall-wake) = 0.72 Pr~ (23)
i.e.. wake flame heights are ~3/4 (wall-wake flame heights).
The B number dependence of S(Pr. B) can be made explicit by
fitting total pyrolysis rate computations,
S = 0.56 Pr"0 -6 B-' 15(1 + B) (n ( 1 + B), 0.5 $ B « 5.0.5 =S Pr « 2
(29)
Since the generation of J by diffusion decreases with increased
blowing, the B dependence of S is weaker than the B dependence of
the total pyrolysis rate, as shown by the pre-integral factor in equation
1 25). Substituting equations 1 13) and (29) and the J J f'tidrj fit into
equation i27) yields an approximate explicit expression for the
wall-wake flame height.
X*/,< wall-wake) * 0.14 ((1 + /-Mil + B" 1) B~015 ^n ( 1 + B)} 2 (30)
for 0.5 S B S 5.0, 0.5 S Pr < 2.0 and all r. As examples, equation (30)
gives X*/e = 19 and 1.9 respectively for polystyrene tr = 0.14, B = 1.3)
and cellulose (r = 0.59, B = 0.8). Equation (30) also fits the numerical
X*f£ shown in Fig. 2 within 15 percent for 0.U r « 0.5. The dominant
parameter in equation (30) is r which entered only through Jfe- X*feincreases strongly as r decreases, since small r implies that much fuel
is available relative to that which is required by stoichiometry and
thus long flames are produced.
Additional Results. Numerical solutions were also obtained using
the Patankar-Spalding finite difference method iGENMIX) [9, 10]
which employs streamwise marching integration. The computations
were initiated near the leading edge of the pyrolyzing slab (X = 0.01)
assuming standard, cubic, forced-flow profiles for U and J. Masstransfer (blowing) effects at the pyrolyzing surface were included.
Employing 50 cross-stream grid nodes, the step-by-step procedure
traversed the pyrolysis region and continued into the extended flame
zone. The ratio of the streamwise step size to the current boundary-
layer thickness was initialized at 0.01 and gradually increased along
the length of the plate. At the trailing edge of the slab, the step size
ratio was reset to 0.01 and again progressively increased downstream.
As a check on the numerics, the surface gradients on the pyrolyzing
slab at the trailing edge gave agreement with similarity results [11)
within one percent. Detailed profiles and surface fluxes were calcu-
lated; flame height results are emphasized here.
Fig. 2 presents flame heights measured from the downstream edge
as functions of B parameterized in r for (a) wall-wake and (b) wake
combustion obtained with equation (27) and S from similarity solu-
tions, an integral approach [4|, and GENMIX. Good agreement be-
tween this approximate solution and GENMIX is observed for flame
heights in excess of one slab length. It appears that the simple model
based on conservation of J and large X asymptotic profiles is valid
for synthetic polymer fuels. For short flames, this approximate so-
lution overpredicts flame heights, as expected, since large X*<e is an
1.00
MASS TRANSFER NO., 3
1.00
MASS TRANSFER NO., 8
Fig. 2( a ) Oimensionless flame height in a wall-wake measured from trailing Fig. 2( b ) Dimenslonless tlame height in a wake measured from trailing edgeedge ol fuel slab versus mass transfer number parameterized in mass con-
sumption number for Pr = 0.73
of fuel slab versus mass transfer number parameterized In mass consumptionnumber for Pr = 0.73
106 / VOL. 102, FEBRUARY 1980 Transactions of the ASME
233
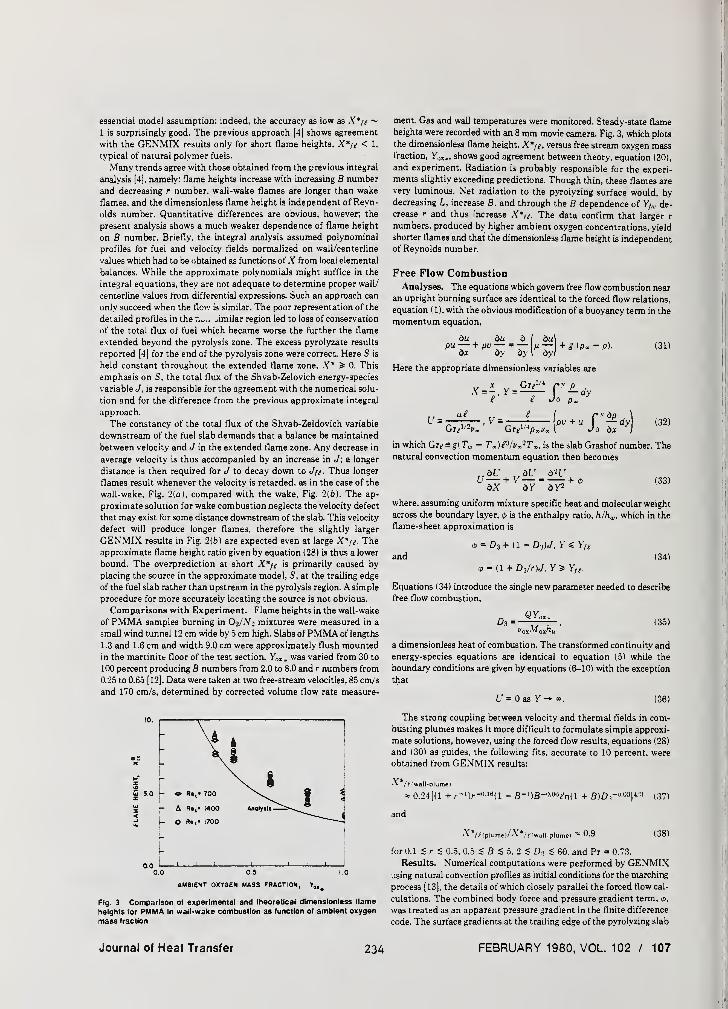
essential model assumption: indeed, the accuracy as low as X*ft ~1 is surprisingly good. The previous approach [4] shows agreement
with the GENMIX results only for short flame heights, X*/e < 1,
typical of natural polymer fuels.
Many trends agree with those obtained from the previous integral
analysis [4], namely: flame heights increase with increasing B number
and decreasing r number, wall-wake flames are longer than wake
flames, and the dimensionless flame height is independent of Reyn-
olds number. Quantitative differences are obvious, however; the
present analysis shows a much weaker dependence of flame height
on B number. Briefly, the integral analysis assumed polynominal
profiles for fuel and velocity fields normalized on wall/centerline
values which had to be obtained as functions of X from local elemental
balances. While the approximate polynomials might suffice in the
integral equations, they are not adequate to determine proper wall/
centerline values from differential expressions. Such an approach can
only succeed when the flew is similar. The poor representation of the
detailed profiles in the similar region led to loss of conservation
of the total flux of fuel which became worse the further the flame
extended beyond the pyrolysis zone. The excess pyrolyzate results
reported [4] for the end of the pyrolysis zone were correct. Here S is
held constant throughout the extended flame zone, X* > 0. This
emphasis on S, the total flux of the Shvab-Zelovich energy-species
variable J, is responsible for the agreement with the numerical solu-
tion and for the difference from the previous approximate integral
approach.
The constancy of the total flux of the Shvab-Zeldovich variable
downstream of the fuel slab demands that a balance be maintained
between velocity and J in the extended flame zone. Any decrease in
average velocity is thus accompanied by an increase in J; a longer
distance is then required for J to decay down to J/e. Thus longer
flames result whenever the velocity is retarded, as in the case of the
wall-wake. Fig. 2(a), compared with the wake, Fig. 2(6). The ap-
proximate solution for wake combustion neglects the velocity defect
that may exist for some distance downstream of the slab. This velocity
defect will produce longer flames, therefore the slightly larger
GENMIX results in Fig. 2(b) are expected even at large X*/e. Theapproximate flame height ratio given by equation (28) is thus a lower
bound. The overprediction at short X*/e is primarily caused by
placing the source in the approximate model, S, at the trailing edge
of the fuel slab rather than upstream in the pyrolysis region. A simple
procedure for more accurately locating the source is not obvious.
Comparisons with Experiment. Flame heights in the wall-wake
of PMMA samples burning in O2//V2 mixtures were measured in a
small wind tunnel 12 cm wide by 5 cm high. Slabs ofPMMA of lengths
1.3 and 1.6 cm and width 9.0 cm were approximately flush mounted
in the martinitt floor of the test section. Yox . was varied from 30 to
100 percent producing B numbers from 2.0 to 8.0 and r numbers from
0.25 to 0.65 [12]. Data were taken at two free-stream velocities, 85 cm/s
and 170 cm/s, determined by corrected volume flow rate measure-
u S.O (- O 700x
i
$ p A Rt,- 1400
5 t- O 1700
!-
AMBIENT OXYGEN MASS FRACTION, YM<
Fig. 3 Comparison of experimental and theoretical dimensionless flame
heights lor PMMA In wall-wake combustion as (unction of ambient oxygen
mass traction
ment. Gas and wall temperatures were monitored. Steady-state flame
heights were recorded with an 8 mm movie camera. Fig. 3, which plots
the dimensionless flame height. X*fg, versus free stream oxygen massfraction, YMm , shows good agreement between theory, equation (30),
and experiment. Radiation is probably responsible for the experi-
ments slightly exceeding predictions. Though thin, these flames arevery luminous. Net radiation to the pyrolyzing surface would, bydecreasing L, increase B. and through the B dependence of Yfw de-
crease r and thus increase .¥*,<• The data confirm that larger r
numbers, produced by higher ambient oxygen concentrations, yield
shorter flames and that the dimensionless flame height is independentof Reynolds number.
Free Flow CombustionAnalyses. The equations which govern free flow combustion near
an upright burning surface are identical to the forced flow relations,
equation (1), with the obvious modification of a buoyancy term in the
momentum equation.
du du 0 I du]pu— ¥ pv— = hi— + g (p. - p.).
ox oy ay \ d\l(31)
Here the appropriate dimensionless variables are
Grf_p
llP PIUs
X = -,Y = -
JO Dm
at e 1 r>zp,\pV
Jo ~ '(32)
Gremv* Gii h'*pm vm V Jo ox
in which Gr, a g{
T
w - T„)e3/i>JT„ is the slab Grashof number. Thenatural convection momentum equation then becomes
, roL'
, roU o 2U
U— + V— = + -
dX dY dY2(33)
where, assuming uniform mixture specific heat and molecular weight
across the boundary layer, <i> is the enthalpy ratio, h/hw , which in the
flame-sheet approximation is
and
ifl = D3 + ( 1 — D 3 )J, V'« Y,
<p = (1 + D 3/r)J. Y> Yt(
134)
Equations (34) introduce the single new parameter needed to describe
free flow combustion,
QY.y(35)
a dimensionless heat of combustion. The transformed continuity and
energy-species equations are identical to equation (5) while the
boundary conditions are given by equations (6-10) with the exception
that
L'=0asy — «. (36)
The strong coupling between velocity and thermal fields in com-
busting plumes makes it more difficult to formulate simple approxi-
mate solutions, however, using the forced flow results, equations (28)
and (30) as guides, the following fits, accurate to 10 percent, were
obtained from GENMIX results:
X*/nwall-plumel
* 0.24 {(1 + r- | )r-,,16 (l + fl- 1 )fi-|)06 i'n(l + S)D:r"-
0:,l
4 '' :!
and
X*, 0.9
(37)
(38)
for 0.1 < r < 0.5. 0.5 < B < 5, 2 < D;,< 60. and Pr = 0.73.
Results. Numerical computations were performed by GENMIXusing natural convection profiles as initial conditions for the marching
process [13|, the details of which closely parallel the forced flow cal-
culations. The combined body force and pressure gradient term, 0,
was treated as an apparent pressure gradient in the finite difference
code. The surface gradients at the trailing edge of the pyrolyzing slab
Journal of Heat Transfer 234 FEBRUARY 1980, VOL. 102 / 107

Conclusions
In summary, from the detailed steady, laminar, two-dimensional,
nonradiating, combusting boundary layer analyses of six systems
l wall-wake, wake, wall-plume, plume, mixed-mode wall-wake and
mixed-mode wake), emphasizing the constancy of the flux of the
Shvab-Zeldovich energy-species variable •/ in the extended flame
region, the following conclusions are drawn:
1 For forced flow, X*fe(r, B. Pr) and is independent of Re? . Ex-
plicit expressions are presented which quantify the strong increase
in X*fe as r decreases and the moderate increase in X*ft as B in-
creases. The Pr dependence is very weak. Good agreement with ex-
periment is obtained.
2 For free flow, X*/e(r, B, Pr, D3) and is independent of Gie-
Explicit fits to numerical results are given which quantify the r and
B dependence as in forced flow. The dependence on D3 and Pr is weak.
Free flow flames are generally shorter than forced flow flpmes for the
same fuel and ambience. Reasonable agreement with r—- rriment is
obtained.
3 For mixed-mode flow, X*ie (r, B. Pr, D% $e ) with the forced and
free limits approached at £^ S 10-2 and ^ 5 1 respectively. The
mixed-mode case appears to be a simple superposition of forced and
free flow.
4 Wall-mounted flames are longer than free-standing flames for
the same fuel and ambience. This difference depends on flow type and
Pr. i.e.. wall-wake flames are ~30 percent longer than wake flames,
wall-plume flames are ~10 percent longer than plume flames.
Future effort will be directed at extending these analyses to include
radiation and turbulence. More experimental results for comparison
would be valuable. It is hoped that flame height measurement under
controlled conditions will become one of the standard procedures for
assessing material fire hazard.
AcknowledgmentsMr. R. Beier obtained the experimental data reported in Fig. 3. The
authors appreciate support from the Products Research Committeeand from the National Bureau of Standards—Fire Research Center.
The conclusions are those of the authors and not of the Products
Research Committee nor the National Bureau of Standards.
References
1 Emmons. H. W., "The Film Combustion of Liquid Fuel." Zritnthrift fuer
Aneewandte Mathematik und Mechanik. Vol. 36. 1956. pp. 60-71.
2 Kosdon. F. -I.. Williams. F. A., and Buman. C, "Combustion of Vertical
Cellulosic Cylinders in Air." Twelfth Symposium {International) on Com-bustion, The Combustion Institute. 1969, pp. 253-264.
3 Kim. J. S.. de Ris. •(.. and Kroesser. F. W . "Laminar Free-Convective
Burning of Fuel Surfaces." Thirteenth Symposium {International) on Com-bustion. The Combustion Institute, 1971, pp. 949-961.
4 Pagni, P. J., and Shih. T. M.. "Excess Pyrolyzate." Sixteenth Symposium{International) on Combustion. The Combustion Institute. 1976. pp. 1329-
1342.
5 Ahmad. T., and Faeth. G. M.. "An Investigation of the Laminar Overfire
Region Along Upright Surfaces." ASME JOURNAL OF HEAT TRANSFER. Vol.
100. 1978, pp. 112-119.
6 Groff. E. G., and Faeth. G. M.. "Laminar Combustion of Vertical Free-
Standing Fuel Surfaces," Combustion and Flame. Vol. 32, 1978. pp. 139-
150.
7 Shih, T. M., and Pagni. P. J.. "Laminar Mixed-Mode. Forced and Free,
Diffusion Flames," ASME JOURNAL OF HEAT TRANSFER, Vol. 100. 1978. pp.
253-259.
8 Schlichting. H., Roundar\-La\er Theory. 6th ed.. McGraw-Hill. 1968.
p. 193.
9 Patankar. S. V.. and Spalding. D. B., Heat and Mass Transfer in
Boundary Layers. Morgan-Grampian. West Wickham. 1967.
10 Spalding. D. B.. "A General Computer Program for Two-DimensionalBoundary Layer Problems." Report No. HTS/73/48. Department of Mechanical
Engineering, Imperial College of Science and Technology. 1973.
11 Shih, T. M.. "Excess Pyrolyzate from Diffusion Flames." Ph.D. Thesis,
Mech. Engr. Dept., University of California, Berkeley, 1977.
12 de Ris, J.. "Fire Radiation—A Review." Seuenteenth Symposium {In-
ternational) on Combustion. The Combustion Institute. 1979. pp. 1003-
1016.
13 Sparrow, E. M.. Patankar. S. V.. and Abdel- Wahed. R. M., "Developmentof Wall and Free Plumes Above a Heated Vertical Plate." ASME JOURNAL OFHeat Transfer. Vol, 100. 1978. pp. 184-190.
Journal of Heat Transfer235
FEBRUARY 1980, VOL. 102 / 109
Howard W. Emmons1
1
:
The Computer Fire Code
The calculation of the growth of a fire in a building via computer has
!l
progressed slowly since the last meeting of this committee. The updated
version, Computer Fire Code IV, has itself been replaced by Computer Fire
Code V. This latest version in Fortran is available on tape, and is accom-
panied by a "Users' Guide."
The most important aspect of such a code—beyond its ability to calculateI
a fire correctly—is the ease with which it can be used. Thus, Computer Fire
Code V has a completely revised input system. The program is able to handle
a fire in a room of any size containing up to five objects, one of which is
initially ignited. The others will be heated as the fire progresses, and
will ignite at a user-specified ignition temperature (default 740°K)
.
After they ignite, their gases rise in a plume into the hot layer, and
their fires radiate to each other to provide the expected energy feedback.
The room can have one to five rectangular vents anywhere in the vertical walls.
To supply the required room and object dimensions, and the thermal and
fire properties of the walls and objects in the room, an interactive input
program has been developed. This program asks questions on the console, and
the user supplies the requested information.
The program itself contains a standard room with two objects—one ignited,
the other a target. The first question asked by the computer is: (underlined
items are printed by the computer)
STANDARD GEOMETRIC AND PHYSICAL PARAMETERS (NO - 0. YES = 1)?
On the console there then appears:
236
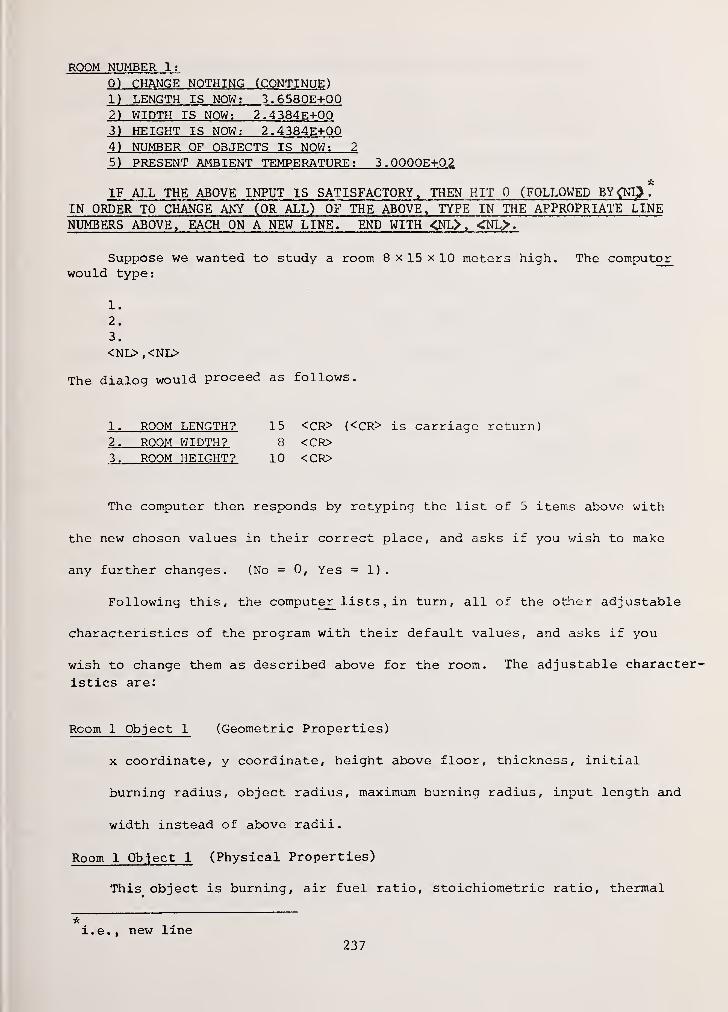
ROOM NUMBER 1:
0) CHANGE NOTHING (CONTINUE)
1) LENGTH IS NOW: 3.6580E+002) WIDTH IS NOW: 2.4384E+003) HEIGHT IS NOW: 2.4384E+004) NUMBER OF OBJECTS IS NOW: 2
5) PRESENT AMBIENT TEMPERATURE: 3.0000E+02
IF ALL THE ABOVE INPUT IS SATISFACTORY, THEN HIT 0 (FOLLOWED BY<NL} f
IN ORDER TO CHANGE ANY (OR ALL) OF THE ABOVE, TYPE IN THE APPROPRIATE LINENUMBERS ABOVE, EACH ON A NEW LINE. END WITH <NL> , <NL>.
Suppose we wanted to study a room 8 x 15 x 10 meters high. The computorwould type:
1.
,2.
3.
<NL> ,<NL>
The dialog would proceed as follows.
1. ROOM LENGTH? 15 <CR> (<CR> is carriage return)2. ROOM WIDTH? 8 <CR>3. ROOM HEIGHT? 10 <CR>
The computer then responds by retyping the list of 5 items above with
the new chosen values in their correct place, and asks if you wish to make
any further changes. (No = 0, Yes = 1)
.
Following this, the computer lists, in turn, all of the other adjustable
characteristics of the program with their default values, and asks if you
wish to change them as described above for the room. The adjustable character-
istics are:
Room 1 Object 1 (Geometric Properties)
x coordinate, y coordinate, height above floor, thickness, initial
burning radius, object radius, maximum burning radius, input length and
width instead of above radii.
Room 1 Object 1 (Physical Properties)
This object is burning, air fuel ratio, stoichiometric ratio, thermal
i.e. , new line237
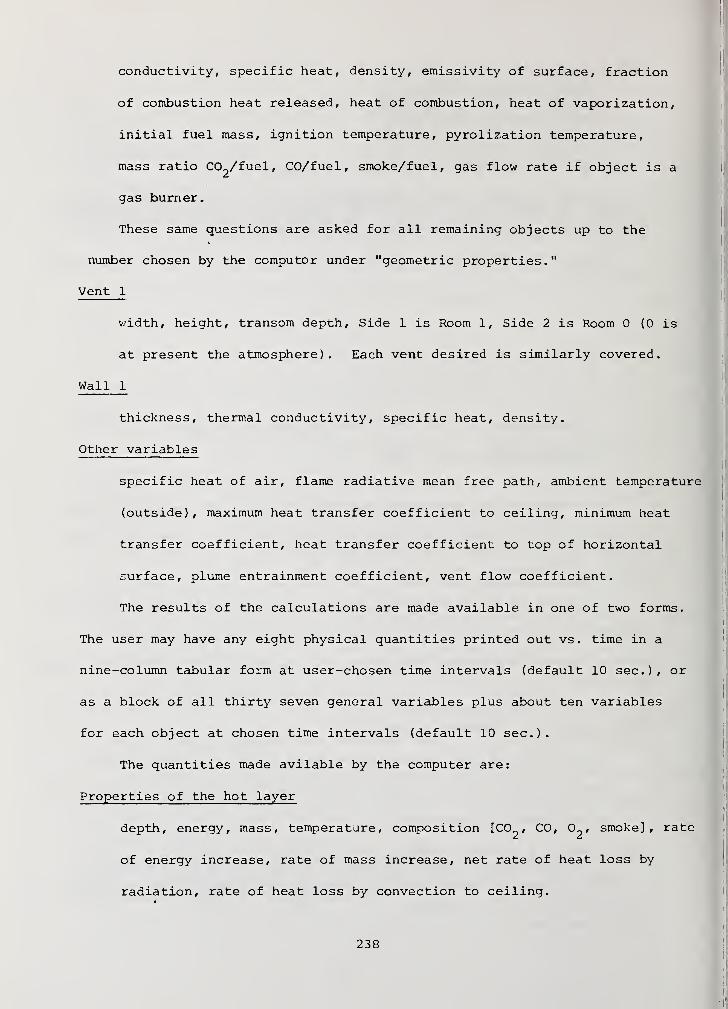
conductivity, specific heat, density, emissivity of surface, fraction
of combustion heat released, heat of combustion, heat of vaporization,
initial fuel mass, ignition temperature, pyrolization temperature,
mass ratio C02/fuel, CO/fuel f smoke/fuel, gas flow rate if object is a
gas burner.
These same questions are asked for all remaining objects up to the
number chosen by the computor under "geometric properties."
Vent 1
v/idth, height, transom depth, Side 1 is Room 1, Side 2 is Room 0 (0 is
at present the atmosphere). Each vent desired is similarly covered.
Wall 1
thickness, thermal conductivity, specific heat, density.
Other variables
specific heat of air, flame radiative mean free path, ambient temperature
(outside) , maximum heat transfer coefficient to ceiling, minimum heat
transfer coefficient, heat transfer coefficient to top of horizontal
surface, plume entrainment coefficient, vent flow coefficient.
The results of the calculations are made available in one of two forms.
The user may have any eight physical quantities printed out vs. time in a
nine-column tabular form at user-chosen time intervals (default 10 sec), or
as a block of all thirty seven general variables plus about ten variables
for each object at chosen time intervals (default 10 sec).
The quantities made avilable by the computer are:
Properties of the hot layer
depth, energy, mass, temperature, composition [CO^/ CO, , smoke], rate
of energy increase, rate of mass increase, net rate of heat loss by
radiation, rate of heat loss by convection to ceiling.
238
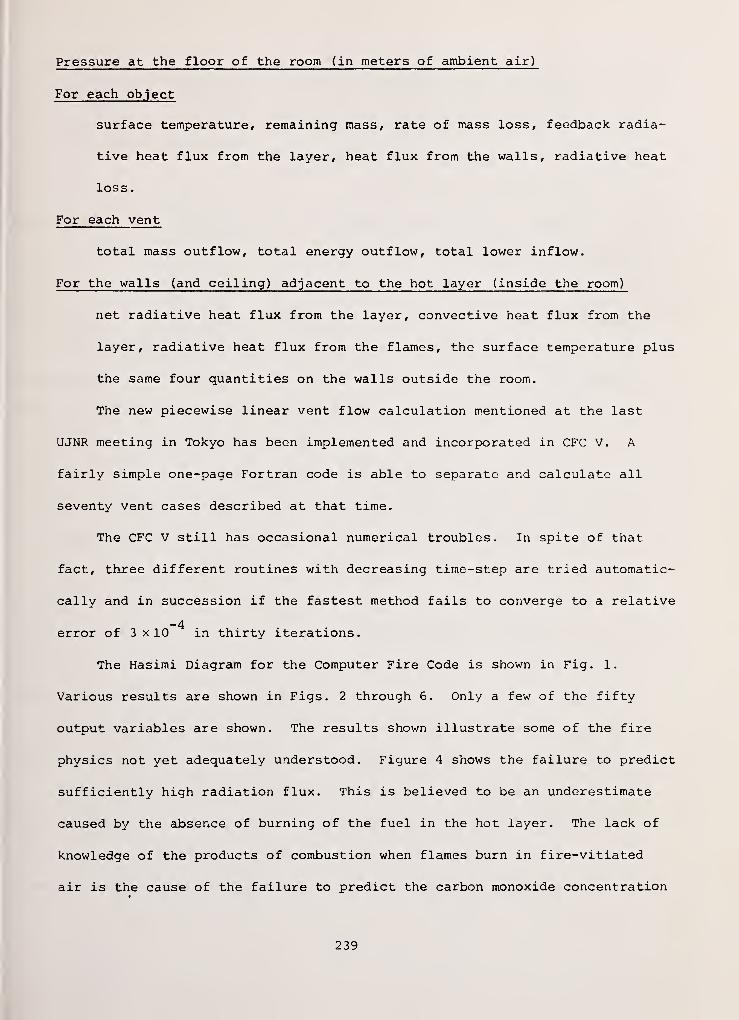
Pressure at the floor of the room (in meters of ambient air)
For each object
surface temperature, remaining mass, rate of mass loss, feedback radia-
tive heat flux from the layer, heat flux from the walls, radiative heat
loss
.
For each vent
total mass outflow, total energy outflow, total lower inflow.
For the walls (and ceiling) adjacent to the hot layer (inside the room)
net radiative heat flux from the layer, convective heat flux from the
layer, radiative heat flux from the flames, the surface temperature plus
the same four quantities on the walls outside the room.
The new piecewise linear vent flow calculation mentioned at the last
UJNR meeting in Tokyo has been implemented and incorporated in CFC V. A
fairly simple one-page Fortran code is able to separate and calculate all
seventy vent cases described at that time.
The CFC V still has occasional numerical troubles. In spite of that
fact, three different routines with decreasing time-step are tried automati-
cally and in succession if the fastest method fails to converge to a relative
-4error of 3 x 10 in thirty iterations.
The Hasimi Diagram for the Computer Fire Code is shown in Fig. 1.
Various results are shown in Figs. 2 through 6. Only a few of the fifty
output variables are shown. The results shown illustrate some of the fire
physics not yet adequately understood. Figure 4 shows the failure to predict
sufficiently high radiation flux. This is believed to be an underestimate
caused by the absence of burning of the fuel in the hot layer. The lack of
knowledge of the products of combustion when flames burn in fire-vitiated
air is the cause of the failure to predict the carbon monoxide concentration
239
by an order of magnitude as shown in Fig. 5.
However, the flexibility of the program in predicting a range of condi-
tions is shown by the predicted effect of lowering the top of the door all
the way from the ceiling to 25 cm from the floor.
Where do we go from here?
Although not sufficiently developed to be included in CFC V, two develop-
ments are well advanced.
I. The new piecewise linear solution of flow through a vent is being
used on various multi-room cases. It appears to give results which we believe
to be correct, but which seem to differ somewhat from the results obtained
previously by Tanaka . We hope to clarify the differences during this meeting.
II. Most fire codes have written the physical equations, simplified them
by algebraic manipulation, and then computer-coded the result. This tech-
nique results in relatively few (less than a dozen for one room) equations
to be solved. It has, however, a serious disadvantage, since it requires
that the equations must be rederived and recoded each time any change is
made in our knowledge of fire physics.
We have avoided this algebraic manipulation in the Computer Fire Code
so as to maintain greater flexibility, but at the cost of a large number of
equations and unknowns. Mr. John Ramsdell has examined this problem by use
of graph theory. He has developed a method by which the number of essential
independent variables can be reduced to a minimum, and a program by which
the computer can determine the numerical minimum and put the subroutines in
the correct order to use this minimum. We expect this will offer some
improvement in computing time for a single room, and will be extremely impor-
tant when a one-hundred-room building is being considered.
In separate experimental studies, the detailed composition of a flame
240
at various levels and the burning of a flame in a ceiling layer are being
measured, so as to supply this vital information for incorporation into
the Computer Fire Code.
The Harvard Home Fire Project is supported under a Grant from the National
Bureau of Standards, Washington, D.C.
241
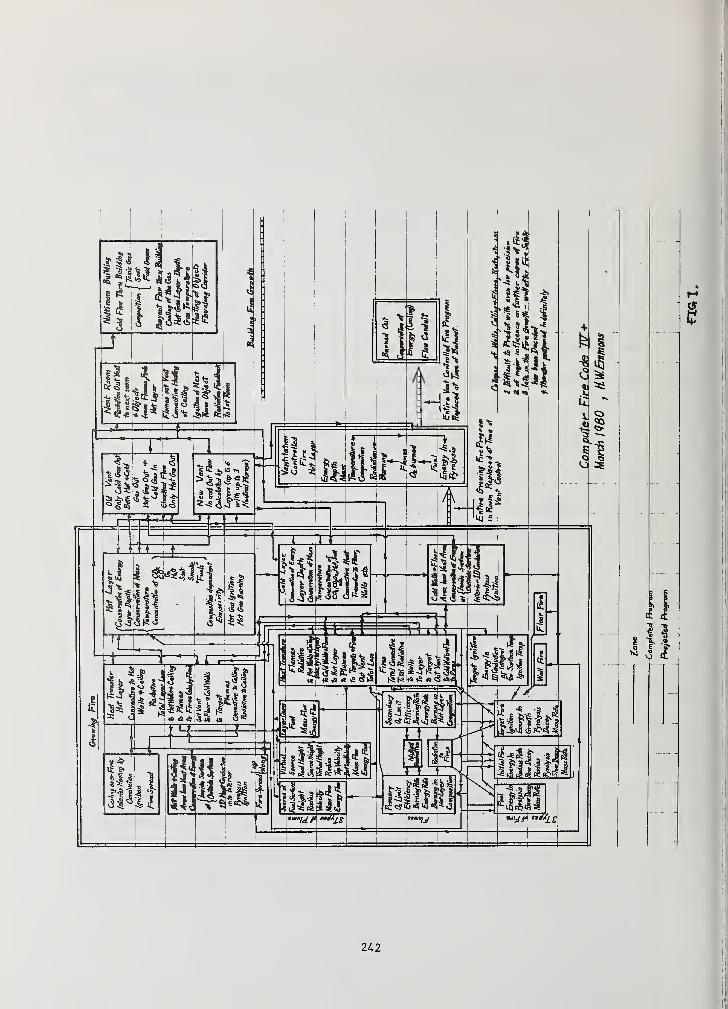
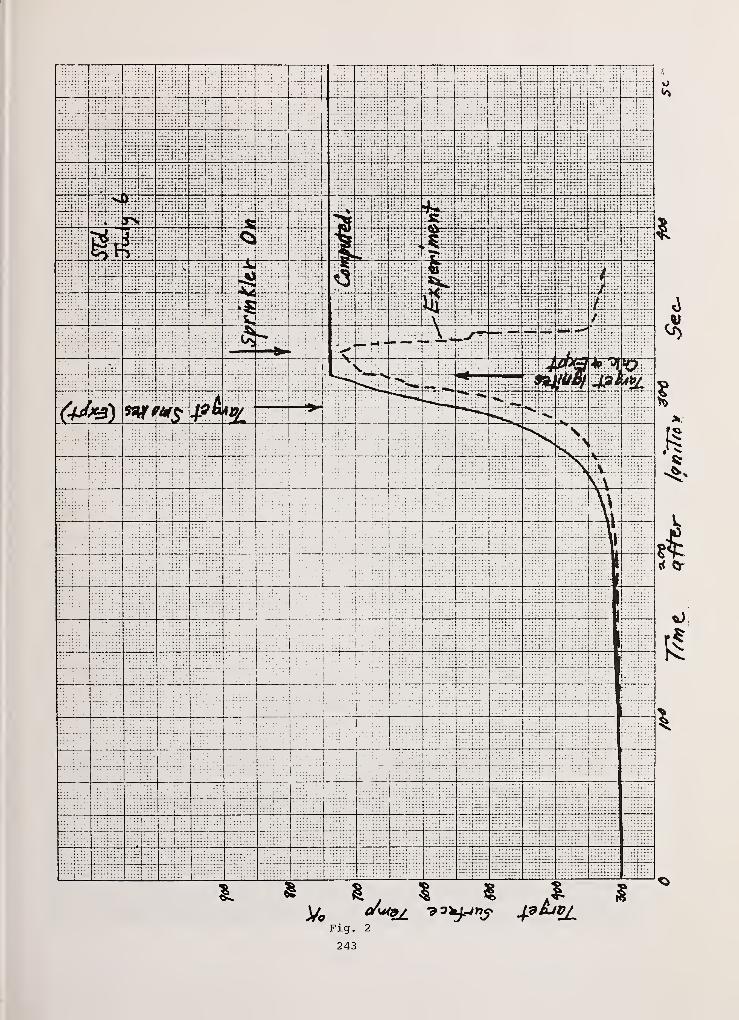
Fig. 2
243
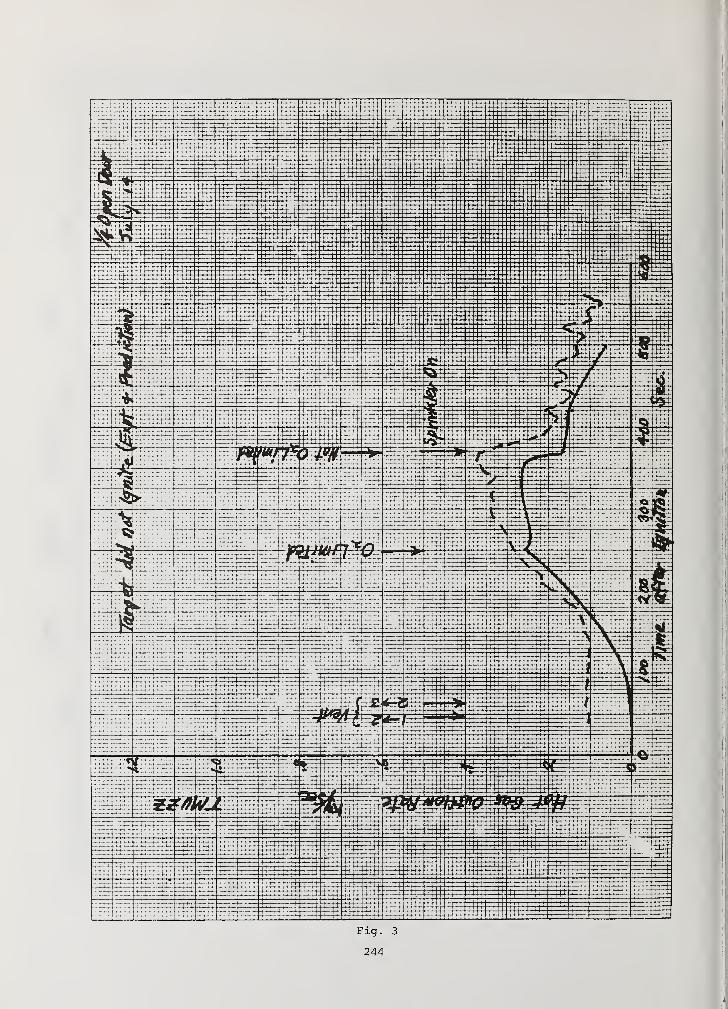
Fig. 3
244
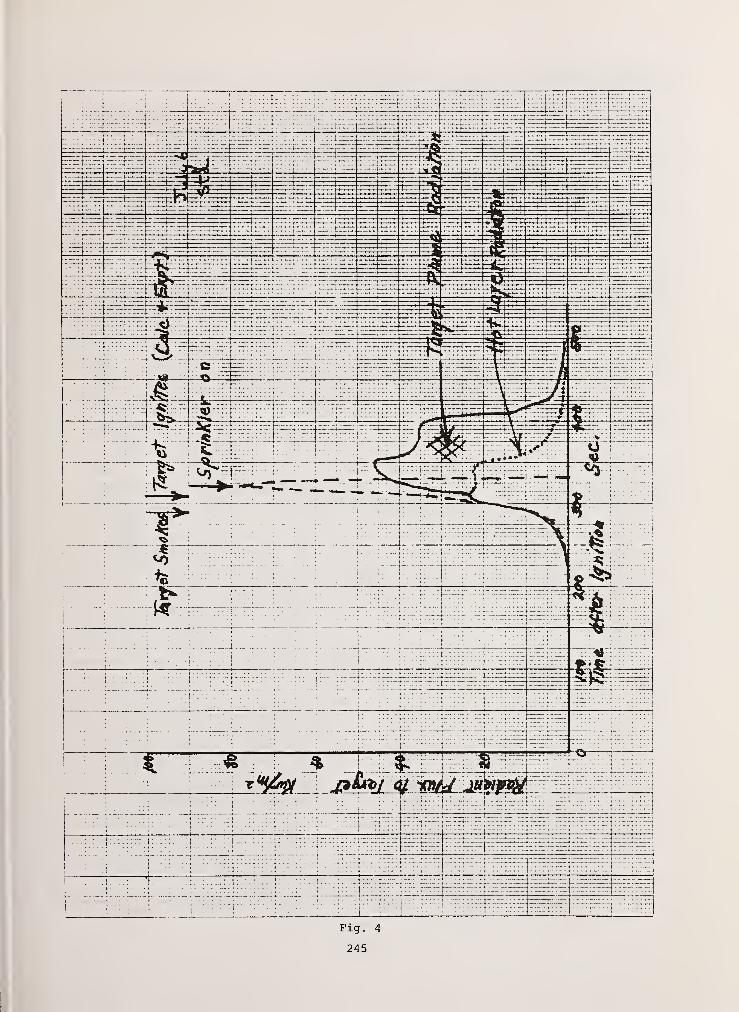
Fig. 4
245
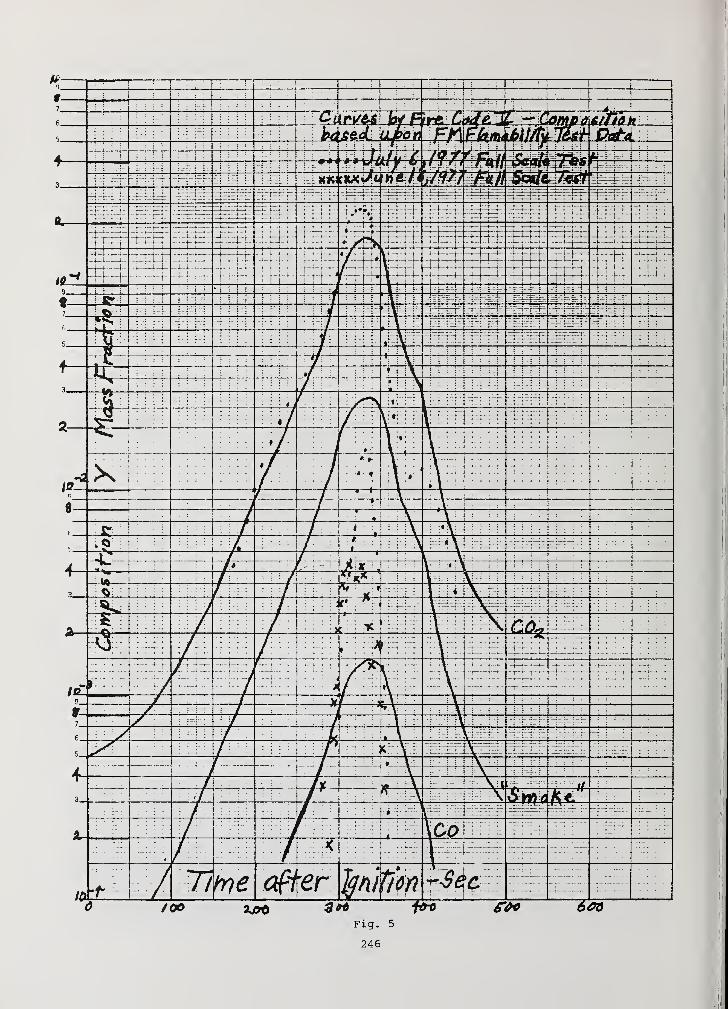
Fig. 5
246

Fig. 6
247

RECENT U. S. PROGRESS IN MATHEMATICAL MODELING
OF FIRE ENCLOSURES
Raymond Friedman
Factory Mutual Research Corporation
Norwood, Massachusetts 02062
September 1980
Abstract ; Current modeling progress at Notre Dame, the University of Dayton
Research Institute, the National Bureau of Standards, and IITRI is described.
The Harvard Computer Fire Code is discussed in a companion paper. In addition,
certain experimental studies useful for testing enclosure fire models which
were done at Notre Dame, at NBS, and at NASA/ JSC are summarized. Some investi-
gations at Factory Mutual of key model elements, especially radiation, turbu-
lent plume structure, and effect of oxygen deficiency, are referenced.
Introduction ; Since the last UJNR Joint Conference in February 1979, develop-
ment of models to describe fires in compartments has continued in the U. S.
The progress made with the Harvard Computer Fire Code by H. W. Emmons,
H. Mitler, and colleagues is reported in a companion paper. In this paper,
short summaries will be provided of other relevant U. S. work.
I wish to point out that the overall program is being conducted at a relatively
modest level of effort, considering the complexity of the problem, and progress
is relatively slow. However, definite advances are occurring.
University of Notre Dame - The key personnel are J. R. Lloyd, K. T. Yang,
K. Satoh, and N. P. Lynch. They have developed a finite-difference computer
code designated UNDSAFE-II which is based on a field model. There are three
recent publications (1, 2, 3).
248
The calculations were originally limited to two dimensions, but recently (3)
they have extended the model to three dimensions, using 12 x 12 x 12 cells in a
finite-difference grid. This model can take into account transients, strong
buoyancy, turbulence, compressibility and smoke diffusion. They currently feel
that adequate quantitative overall flow behavior except immediately above the
heat source may be obtained by using a turbulence viscosity which is 20 times
the laminar viscosity.
In a recent study of ventilation and smoke-layer depth (3), they have assumed a
cubic room with a central heat source and a door-like opening of variable size
in one wall. For a doorway of given height but progressively increasing width,
and a given heat source, they find that the steady-state ventilation flow at
first increases proportionally to door width. However, for widths greater than
a critical value, which appears to decrease with increasing door height, the
ventilation decreases to less than half of the maximum value corresponding to
the critical width. Simultaneously the smoke neutral plume rises very
substantially. Figures 1 and 2 show this behavior. The results are compared
with earlier predictions of Thomas et al., (4). A physical explanation of the
phenomenon is provided which is in agreement with the numerical results.
In another computer study, a two-dimensional compartment is analyzed with an
opening in the floor and another (offset) opening in the ceiling. The fire is
represented by a constant heat and smoke source. The computational grid was 16
cells high and 48 cells wide. The heat source strength and the locations of the
heat source and the ceiling vent were varied.
The results were presented in a plot of a dimensionless ventilation parameter
vs. a modified Grashof number. The modification of the buoyancy-driven flow by
the flowresistance of the compartment can be discerned by examining the trends
in the data. The steady-state smoke distributions are also plotted for the 6
cases studied. In two of the cases the long-time behaviors were oscillatory in
nature and the authors say that they can be explained by the developing flow
patterns in the compartment.
249
The other recent study by the Notre Dame group (1) is an experimental program to
obtain data with a growing methane fire in a room adjacent to a corridor.
Temperatures and velocities were measured and flow visualization techniques were
used. The data for the first minute after ignition were found adequate to
characterize conditions when adiabatic walls were assumed. The data were
specifically selected to be useful for evolution and development of transient
fire models.
National Bureau of Standards - The center for Fire Research has recently
organized a section of its Fire Safety Engineering Division entitled "Fire
Modeling", under the leadership of J. G. Quintiere. Other members are H. Baum,
M. Harkleroad, D. Corley and K. Steckler. In addition, J. Rockett, Senior
Scientist at the Center, has a major interest in computer models of fire.
Furthermore, their Exploratory Fire Research section, headed by R. Gann, is
concerned with refining the physical knowledge of various processes which must
be considered in an accurate fire model.
Quintiere (5) has recently outlined a framework for modeling vertical wall fire
spread in a room, using a two-layer zone methodology. He discusses the inputs
but apparently has not yet obtained numerical results. He suggests functional
expressions for the dependences of burning rate and of spread on incident
radiant heat flux and local oxygen concentration. He considers the primary
transient process to be the fire growth and spread, and suggests that some
fluid-mechanical transients, such as the time to fill the upper room with
combustion products may be ignored. However transient conduction into the wall
should be included. He concludes that the calculating scheme is far from
complete for the wall fire problem, primarily because of uncertainties in fire
growth equations and inconsistencies between actual non-uniformities in wall
temperature near the fire vs. assumed uniform wall temperature in each zone of a
zone model.
250
Quintiere and McCaffrey (6) have carried out a series of tests with cribs
burning in a room with an open doorway. The door was either 1/4 open, 1/2 open,
or fully open. The number of cribs in the room was varied from one to four.
Two types of cribs were used: sugar pine and polyurethane foam of nearly the
same density. Mass loss, temperatures, velocities, CO2, O2, and CO were
measured. The data were correlated; for example it was found that the mass loss
rate varied with the 5/4 power of the number of cribs in the room, suggesting
radiative interactions. The crib burning rates in the room were either smaller
(0.8 times) or larger (1.3 times) than the free burning rates depending on
whether the door was 1/4 open or fully open, demonstrating both ventilation
effects and radiant feedback effects. Results were compared with a mathematical
model which ignored transients. The equations (seven non-linear algebraic
equations) were solved numerically; in some ranges complete convergence was not
achieved. When the model output was compared with the data, "the agreement may
be considered fair to good," according to the authors.
In another N.B.S. study related to modeling, K. D. Steckler has accurately
measured flow coefficients for room openings with fire-induced flows, and will
shortly issue a report.
Factory Mutual Research - FMRC has a long-range goal to develop a mathematical
model of a sprinklered fire in a building. As a preliminary step, Alpert and
Mathews (7) have developed a computer program which computes the axisymmetric
flow field induced by entrainment of air into a sprinkler discharge. The model
includes a ceiling and a floor but no walls. Droplet drag and evaporation are
included. Calculated profiles of induced air velocity agree reasonably well
with measurements. The work is currently being extended to include the
interaction of a buoyant, upward-moving fire plume with the downward-moving flow
caused by sprinkler entrainment, including cooling of the fire gases.
In other programs, FMRC scientists have been developing quantitative
descriptions of fire properties as inputs for fire models, de Ris (8) has
251

reviewed the state of knowledge of fire radiation. He concludes that, for fires
of moderate scale, the radiation can be adequately approximated by representing
the flame as a homogeneous volume with an effective flame temperature and gray
emission-absorption coefficient. For large-scale fires, he is concerned that
there is significant blockage of radiation by pyrolysis vapors rising from a
horizontal combustible surface. There is as yet no way to treat this effect
quantitatively. He provides 42 references.
Work done at Factory Mutual, including that of Markstein (9, 10), Orloff (11),
Santo and Tamanini (12), Modak and Mathews (13) and Grosshandler and Modak (14)
have provided theoretical approaches and experimental data for calculating the
radiant flux emitted by a fire. The experimental work involves measurements of
polymethyl methacrylate , polystyrene, polypropylene, and polyoxymethylene
turbulent pool fires. Consideration is given to flame size and shape,
variations of radiative properties from point to point within a flame, and means
of finding equivalent overall radiative properties for use in a model. In one
of these studies (13) a mathematical model is presented for calculating the
radiation from non-isothermal regions containing variable concentrations of
soot, water vapor, and CO2.
In addition, Santo and Tamanini (12) specifically explored for the first time
the quantitative effect of reduced oxygen on diffusion flame radiation, using
nitrogen dilution. Tewarson et al., (15) measured the effect of reduced or
increased oxygen on pool fires of various plastics and methanol, observing
changes of burning rate and combustion efficiency. Perhaps the reader will be
surprised to learn that luminosity always increases with increasing oxygen.
Tamanini (16) has developed a relatively simple one-dimensional integral model
of a turbulent fire plume which assumes top-hat profiles and gives flame-shape
results close to those of more elaborate two-dimensional k-e-g treatments. He
has also (17) developed a model for turbulent wall fires which predicts
structure and burning rate. Heskestad (18) has found a new means of correlating
flame height and structure of buoyancy-controlled turbulent fire plumes.
252

University of Dayton Research Institute - C. D. MacArthur and co-workers for
some years have been developing a computer model of a growing fire in an
aircraft cabin, called DACFIR. No reports have been issued since the last UJNR
Conference. However interim progress is summarized below.
(1) The concept of the recirculation zone and the zone of uncontaminated air
(see Fig. 3) have been merged into a single idealized region now given the name
"recirculation zone". The mathematical formulation of the governing equations
for this region include, in addition to the usual continuity and energy
equations, a momentum equation for the purpose of computing the vertical
component of velocity. The effects of horizontal gas motion, due to entrainraent
by the flames and plume and flow through vents (doors) to the exterior, is
modeled by including artificial mass source or sink terms to the recirculation
zone equations. The size of these terms are determined by the entrainment rate
and the buoyant and/or pressure driven flow through the vents.
(2) A flame and plume model has been developed as an extension of the integral
models of Steward (19) and Fang (20) which admits variable external conditions
and uses a variable entrainment coefficient. To incorporate variable external
conditions, that is, changes in the ambient gas temperature or composition with
height, the equations are integrated numerically rather than in the approximate
analytical manner of Steward and Fang. An expression for the entrainment
coefficient as a function of fuel mass fraction was taken from work by Tamanini
(21) on the k-e-g modeling of turbulent diffusion flames.
The flame and plume model shows some improvement over the earlier integral
methods in predicting the vertical development of temperature and the flame
length but its main usefulness is in its compatibility with the recirculation
zone model, according to MacArthur. Work is still needed to obtain better flame
length predictions and to include flame radiation in a more fundamental fashion.
253
(3) A ceiling jet model has been formulated which is compatible with the
flame/plume and recirculation zone models and takes into account, albeit very
approximately, the effect of the end walls. In this model the horizontal flow
is specified by prescribing its value on a grid of points running along the
cabin length just below the ceiling. Physical constraints determine the
velocities at the outflow of the plume impact region and at the end walls;
between these limits interpolation is used to set the values. The conservation
equations are then used at each grid point to compute the amount of downward
flow into the recirculation zone. Convective losses to the ceiling and walls
are included and radiation from the jet will be added next.
(4) The full-scale cabin mock-up fire test program at NASA/JSC has been
completed and the data are now being analyzed and prepared for comparison to the
updated version of the model, DACFIR.3. NASA will publish a report on just
these tests probably near the end of the year or in early 1981. The report on
the comparison of DACFIR.3 to these tests should be ready at about the same
time.
MacArthur also plans to modify the model further to include the possibility of a
spill fire outside the cabin entering through a door or other vent and to add
the capability of compartmenting the cabin.
IITRI . R. Pape and T. Waterman have been developing a computer model of a fire
in a room, called RFIRES, which was described at the last UJNR conference in
some detail. The program has not been active since that time. However a
computer program documentation and users manual was issued (22). The authors,
with T. Eichler, are now preparing a final report on their modeling of burning
furniture items, with emphasis on a plume model.
254
REFERENCES
1. Lynch, N. P. and Lloyd, J. R. "An Experimental Investigation of the
Transient Build-Up of Fire in a Room-Corridor Geometry". To be published
in Eighteenth Symposium (International) on Combustion, The Combustion
Institute, Pittsburgh, Pa. 1981.
2. Satoh, K., Lloyd, J. R. and Yang, K. T. "Turbulent Buoyant Flow and Smoke
Layers in a 2-D Rectangular Compartment with Vertical Vents". To be
presented at Eastern Section Meeting of Combustion Institute, November 1980
at Princeton University.
3. Satoh, K.,Yang, K. T. and Lloyd, J. R. "Ventilation and Smoke Layer
Thickness Through a Doorway of a Cubic Enclosure with a Central Volumetric
Heat Source". To be presented at Eastern Section Meeting of Combustion
Institute, November 1980 at Princeton University.
4. Thomas, P. H., Heselden, J. M. and Law, M. "Fully Developed Compartment
Fires - Two Kinds of Behavior". Fire Research Tech. Paper No. 18, Fire
Research Station, Borehamwood, England, 1967.
5. Quintiere, J. G. "An Approach to Modeling Wall Fire Spread in a Room", Fire
Safety Journal, to appear in late 1980 or 1981.
6. Quintiere, J. G. and McCaffrey, B. J. "The Burning of Wood and Plastic
Cribs in an Enclosure: Volume I." NBSIR #80-2054, to be released in late
1980.
7. Alpert, R. L. and Mathews, M. K. "Calculation of Large-Scale Flow Fields
Induced by Droplet Sprays". FMRC Tech. Report 0E0J4.BU, December 1979,
presented at ASME Symposium on Polyphase Flow, San Francisco, California,
August 1980.
255
8. de Ris, J. "Fire Radiation - A Review". Seventeenth Symposium
(International) on Combustion, Combustion Institute, Pittsburgh, 1979, pp.
1003-1016.
9. Markstein, G. H. "Radiative Properties of Plastics Fires". Seventeenth
Symposium (International) on Combustion, Combustion Institute, Pittsburgh,
1979, pp. 1053-1062.
10. Markstein, G. H. "Scanning-Radiometer Measurements of the Radiance
Distribution in PMMA Pool Fires". Eighteenth Symposium (International) on
Combustion, The Combustion Institute, Pittsburgh, Pa., 1981, in press.
11. Orloff, L. "Simplified Radiation Modeling of Pool Fires", Eighteenth
Symposium (International) on Combustion, The Combustion Institute,
Pittsburgh, Pa., 1981, in press.
12. Santo, G. and Tamanini, F. "Influence of Oxygen Depletion on the Radiative
Properties of PMMA Flames", Eighteenth Symposium (International) on
Combustion, The Combustion Institute, Pittsburgh, Pa., 1981, in press.
13. Modak, A. T. and Mathews, M. K. "Nonhomogeneous Pool Fires" Fire Safety
Journal, in press.
14. Grosshandler , W. L. and Modak, A. T. "Radiation from Nonhomogeneous
Combustion Products" Eighteenth Symposium (International) on Combustion,
The Combustion Institute, Pittsburgh, Pa., 1981, in press.
15. Tewarson, A., Lee, J. L., and Pion, R. F. "The Influence of Oxygen
Concentration on Fuel Parmeters for Fire Modeling." Eighteenth Symposium
(International) on Combustion, The Combustion Institute, Pittsburgh, Pa,
1981, in press.
256

16. Tamanini, F. "An Integral Model of Turbulent Fire Plumes," Eighteenth
Symposium (International) on Combustion, The Combustion Institute,
Pittsburgh, Pa. 1981., in press.
17. Tamanini, F. "A Numerical Model for the Prediction of Radiation-Controlled
Turbulent Wall Fires." Seventeenth Symposium (International) on
Combustion, Combustion Institute, Pittsburgh, 1979, pp. 1075-1085.
18. Heskestad, G. "Peak Gas Velocities and Flame Heights of Buoyancy -
Controlled Turbulent Diffusion Flames". Eighteenth Symposium
(International) on Combustion, The Combustion Institute, Pittsburgh, Pa.,
in press.
19. Steward, F. R. , Prediction of the Height of Turbulent Diffusion Buoyant
Flames." Combustion Science and Technology , Vol. 2, (1970), pp. 203-212.
20. Fang, J. B., "Analysis of the Behavior of a Freely Burning Fire," NBSIR
73-115, Feb. 1973, U. S. National Bureau of Standards, Washington, D.C.
21. Tamanini, F. , "Reaction Rates, Air Entrainment and Radiation in Turbulent
Fire Plumes," Combustion and Flame , Vol. 30, pp. 85-101, (1977).
22. Pape, R. and Waterman, T. E. "Computer Program Documentation and User's
Manual. Development of Fire in a Room, from Ignition to Full Room
Involvement-RFIRES." IITRI Project J6A85, 1980.
257
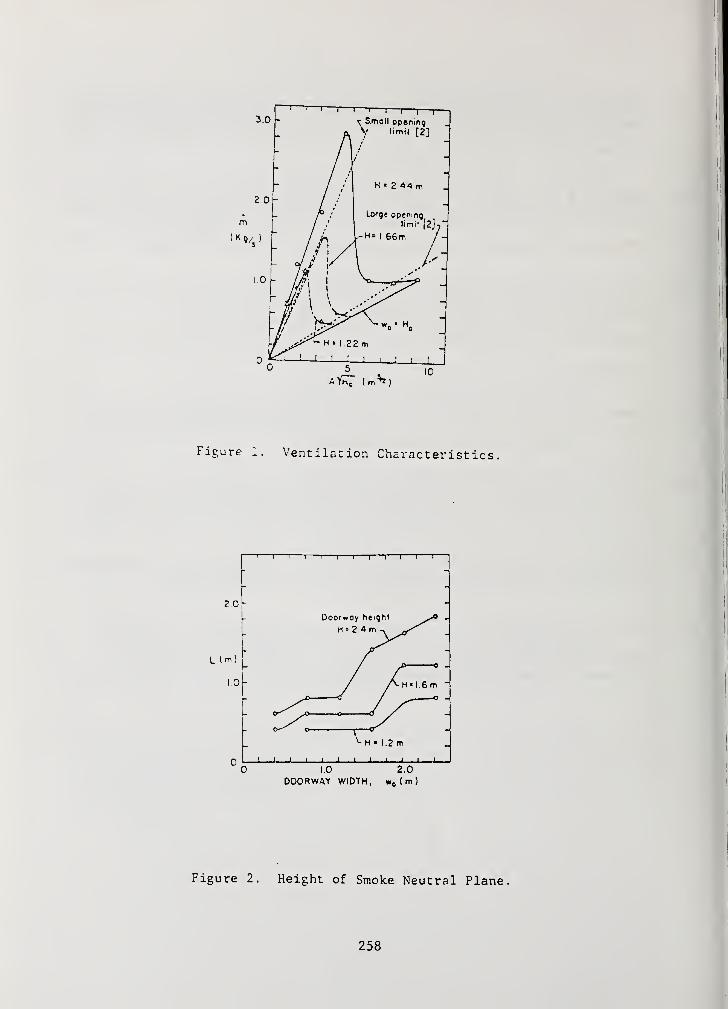
Figure 1. Ventilation Characteristics.
t—i—i—i—r—i1—i—i—i—i—
r
n I i i i i1 1
i i i ' l
0 1.0 2.0
DOORWAY WIDTH, w e ( m )
Figure 2. Height of Smoke Neutral Plane.
258

OSM
< 4J
w 13U 0)
•h 6£ 3tfl wc cn
>i td
QW -H(tJ
U 0)
rH
(1) tM
c o•H H
OS+j
HUo
C QJH >
w c<l) td
C -Ho wtS3 en +j
C tr>
•h cw E -H
O W -H
•H
259

Discussion of Presentations on ModelingPagni Presentation
Chaiken: Could you comment on the affects of charring solid,particularly one with wood which achieves sizable surface temperatureduring combustion.
Pagni: I would like to respond with two comments. One primaryeffect of char is to reduce the ability of the heat to get to thevirgin material. This has the effect of increasing the latent heatof the material causing more energy to be provided to produce a
gram of fuel into the gas phase. We would expect charring materialsto behave in a more acceptable way than non-charring materials.However, it makes it difficult for the analyzer of the model. Asthe char layer grows these properties become time dependent. I couldonly hope that quasisteady approximations would be valid and if theproperty at each instant of time is known, I could apply this analysesto the system. But this is much more information than one needs abouta material whose property doesn't change with time.
Quintiere: We have a potential apparatus that could measure equivalentproperties, such as heat of combustion or heat of vaporization. Whatis your opinion as to the viability of such an approach for measuringequivalent like properties in applying models to evaluate thosematerials
.
Pagni: . . . One has to be careful to have, in the apparatus in whichthe property is measured, the condition in which the material willexist in full scale and that is a major difficulty. There are threetechniques that I think are valuable in getting the laboratory scaleequipment to appear to the material like a full scale fire. Thosetechniques are: first, external radiant panels which would simulatethe effect of radiation from other materials to this sample; second,is the technique of pressuring modeling which was first described byProf. Williams theoretically and tested by the group at FactoryMutual by Dr. Alpert; and the third possibility would be to change the
oxygen concentration in these pressure modeling tests— the difficultyappears to be that the radiation isn't scaled in the same way as the
production. But the radiation is due to soot and as we change the
oxygen concentration, we might be able to change the soot concentration
in the appropriate way. But this addresses the major long range to the
modeler, which is to provide the transition from small scale tests to
large scale experiments. We could only hope for eventual success.
260
Hasemi Presentation
Pagni: That was quite an amount of material covered in a shorttime. Going back to your own work in modeling and flashover, is
there any simple way of distinguishing cases where flashover occurs.
Hasemi: We are still studying. One problem is in calculating the
model for practical purposes since our mathematical model is becomingmore and more complex.
Emmons: This is a comment rather than a question. I was interestedin the solution of Mr. Matsushima which you showed. I believe thatis the same problem that was studied both experimentally and analyticallyhere at the National Bureau of Standards by the Research Associates fromthe Factory Mutual Corporation in 1965 or 1966. Mr. Torrence workedout the solution to what I think is the same problem. It would be
interesting for Mr. Matsushima to make the comparison.
261
Emmons Presentation
Hasemi: What kind of input information is needed for this model?
Emmons: The program is in Fortran 4 and will operate on a considerablerange of different computers. But each different computer has its ownspecial properties and sometimes our program doesn't run because ofsome difference between our computer and another one.
Hasemi: Who are the users: firefighters, fire researchers, buildingarchitects?
Emmons: The use is rather limited at present because of the limitednumbers of fires that one can calculate. As an illustration, I amcurrently using this program in fire soot. The question of importanceis when did the detector detect the fire. By supposing that thedetector is one of the objects, (the detector will not burn, it willjust heat) I can predict the time after the begining of the firewhen the detector responded.
Hasemi: How do you calculate the burning rate? Do you actuallycalculate burning rate from heat feedback, or use as specified input?
Emmons: The burning rate was one that was ignited and spread. Thespread rate and the per unit of the area burning rate, pyrolysis rate,were taken in the following way from an experiment performed in the
open. The measured radius rate and the measured pyrolysis rate wereinterpreted as related to the radiant energy input from the open flame.
This means that when the object was burned inside of a room and hada different radiation rate, it would spread and vaporize differently.
Chaiken: How long does this computation take?
Emmons: The computation takes of the order of the actual fire time,
actually slightly faster than the real fire.
Friedman: Your last slide, does that refer to the second object of
target materials?
Emmons: In examining the effect of the heat of vaporization, I did
not have a target.
Quintiere: Was that for a spreading fire?
Emmons: Yes.
262
Friedman Presentation
Hasemi: Is there any cooperation or coordination among your researchstudies?
Friedman: There is a mathematical modeling committee of which Dr. R.
Levine is the Chairman. Perhaps he would care to comment.
Levine: I will give a short report of our last committee meeting.We used the Hasemi diagram of the interactions in a computer programon fire in order to try to start a discussion on which algorhythmsshould be used for each of these interactions. There were perhapsfifty people at our meeting and we were not successful. We havedecided for next year, to hold four workshops—each one on a differentphenomenon. In each case we will have a few people selecting the
workshops, almost all of them are people who are doing active researchon that particular phenomenon. In addition, Prof. Emmons, Dr. DeRiswho works with Dr. Friedman, and Dr. Quintiere will be present. Wehope we can arrive at the best algorithm and best input/outputstatements for the computer in each case. We will then hold anotherlarge meeting of the overall committees and discuss where we go fromthere.
263
DISCUSSION ON MATHEMATICAL MODELING SESSION
General Comments
Friedman: In my presentation earlier, I neglected to mention the workthat Dr. Baum is doing here at the National Bureau of Standards onmathematical modeling.
Baum: I will confine my remarks to advertising a talk that Dr. Rehmand I will give during the informal session later in the program.We are calculating field equation models of bouyant flow enclosuresand the transport and coagulation of smoke. We are now in the processof trying to integrate these two phenomena into a single computerprogram.
Emmons: I would like to make a few remarks that I feel are importantwith respect for fire modeling.
A number of people have observed questions with respect to
steady burning in the various models. Dr. Quintiere, NBS, Dr. Thomasof England and Dr. Hasemi have looked at various phases of this
question. These are important mathematical studies of the nature of
the steady burning in enclosures. It appears to me, however, that a
very important nonsteady question must still be answered. At anyinstant of time the nonsteady development of fire will be developingtowards the steady state. It has been interpreted by the authors that
the discontinuity is evidence of flashover. Flashover is not a well-defined term. There are a number of physical phenomena that atvarious times has been called flashover. It is not clear to me thatthe new work called flashover is the same as one of those alreadydefined, or is the new definition. Perhaps more important towardsimmediate modeling studies, is the question of whether or not the
occurrence of such discontinuities in equilibrum states have an affecton the nonsteady development of the fire. Nonsteady developmenttending first towards one equilibrium then towards the other, as thepoint exists in my program, has never showed itself. I have seen no
evidence of such a change. In any complex development of this kind,
the computer program behaves beautifully sometimes and other times for
no reason it behaves badly. It is very important to further studythese discontinuities as related to the numerical model, as well as
their relationship to possible physics.
264

6. SMOLDERING
265
Modeling of Smoldering Combustion Propagation
T. J. Ohlemiller
Center for Fire Research
National Bureau of Standards
Introduction
This paper is concerned with self-sustaining, heterogeneous oxidation
processes in organic materials. When such a process occurs in a fire
safety context, it is called smoldering combustion. Such processes do
occur in other contexts such as underground coal gasification and we
will mention results from that field when they are pertinent.
Nature of smoldering combustion phenomena . Smoldering, like flaming,
is a combustion process which spreads through a fuel when heat released
by oxidation is transferred to adjacent elements of the fuel. The
central role of heterogeneous oxidation (i.e. direct attack of oxygen on
the fuel surface) as the principal heat source in the smoldering of
polymeric materials has only recently been closely examined (1,2); it
appears analogous to, but more complex than, pure carbon oxidation (3)
.
Since oxygen attack on the fuel surface is paramount, access of the
surface to this attack plays a major role. It will be seen, furthermore,
that the relative directions of movement of oxygen and reaction zone can
have a major impact on the smoldering process.
Dominance of heterogeneous oxidation does not preclude some heat
release via gas phase oxidation. However, this dominance does generally
lead to a combustion process considerably different in quantitative
terms from the more familiar gas phase dominated flaming process. While
spread of smoldering and flaming both occur through coupled heat release
and heat transfer mechanisms, smoldering typically yields less c'omplete
oxidation of the fuel, lower temperatures and much slower propagation
rates. All of these smolder characteristics can vary widely with oxygen
supply. Stable smoldering is possible in some circumstances at equivalence
ratios only a few percent of stoichiometric. At the opposite extreme, a
strong oxygen supply can raise the intensity and temperature of smolder
to such a degree that gas phase reactions become dominant and flaming
propagation takes over.
266

Fire safety hazards involving smoldering . Only rather recently has
smoldering been recognized as a major fire safety hazard in the United
States. Clarke and Ottoson (4) found cigarette ignition of bedding and
upholstery materials to be the single largest cause of residential fire
deaths. The cigarette, itself a smoldering cellulosic fuel, is nearly
ideal as a smolder initiator in susceptible fabric and filling materials.
In such materials, a self-sustaining smolder process can often be established
well before the cigarette is consumed. This particular problem is
coupled to both fabric and filling response to heating. Once established
in this manner, smoldering becomes a steadily growing generator of
carbon monoxide and other toxic gases as the size of the reacting region
enlarges. This smoldering process may spread stably for an hour or so
then abruptly transition to flaming combustion. The hazard is thus two-
fold—toxic gases during smoldering and rapid destruction following
flaming transition. Which of these is most responsible for the observed
death toll is unclear; both undoubtedly contribute.
The increasing interest in residential energy conservation has
resulted in a strong demand for effective insulating materials, particularly
for attics where heat losses are greatest. Cellulosic loose-fill insulation
is quite effective and comparatively inexpensive. It is essentially
ground wood, being made mainly from recycled newsprint, reground to a
fibrous, fluffy form that is blown into place. The oxidation chemistry
of wood clearly renders this material combustible. A variety of additives,
typically in fine powder form, are included in an effort to control this
combustibility. They are rather effective in suppressing flaming but
are much less so for smoldering. When the insulation is improperly
installed, heat sources such as recessed light fixtures can cause smolder
initiation. Once started, this smolder becomes self-sustaining, spreading
through an attic space and posing the same toxicity and flaming-potential
hazards as in the above case.
The two problem areas above, upholstery/bedding and cellulosic
insulation smoldering, probably comprise the two most widespread and
common hazards from this form of combustion in the United States today.
They are also the most extensively studied in some respects. There are
numerous other problems, however. For example, wood and certain other
267
low permeability building materials (particleboard sheathing and some
types of rigid foam insulation) can be induced to smolder in configura-
tions where surface heat losses are suppressed. Spontaneous heating and
ignition, usually to smoldering combustion, have long been a problem with
a variety of natural products, usually cellulosic in nature. In industries
which process oxidizable materials in finely divided form there is
danger not only from dust explosions (a flaming problem) but also from
smoldering ignition of dust layers accumulating within or on top of hot
processing equipment. These industrial problems have been extensively
reviewed in a book by K. N. Palmer (46) and will not be examined here in
any depth.
Some experimental characteristics of smolder propagation . Table I
is a brief summary of the smolder behavior observed for a variety of
fuels in several configurations. The list of results is by no means
complete but it gives a representative picture for smolder in organic
materials. The study by Palmer (5) presents the most complete parametric
examination of smolder behavior for configurations that are rather
complex but realistic. The study by Lucca (12) is the first systematic
comparison of configurations simple enough to be modeled in detail.
(The forward/reverse terminology is explained below.)
Cellulosic materials show up most frequently in Table I because
they are so common and nearly all of them smolder. (It is interesting
to note that pure cellulose does not smolder, at least in small masses;
it requires alkali metal contamination to sustain smolder (6,7).) There
are, of course, numerous other materials with the potential to smolder
but both the material and the way it is used must be favorable to
smoldering in order for it to emerge as a fire safety hazard.
The various results in Table I generally justify the description of
smoldering as a slow, low temperature combustion phenomenon that responds
with increased vigor when the oxygen supply is enchanced. The slowness
268

is apparent in the magnitude of the smolder velocities. It is interesting
to note that these do not vary greatly (except for a cigarette during a
draw) in spite of wide variations in fuel type and configuration. This
probably reflects the oxygen-supply-limited character of the process; a
kinetically-limited process would be expected to vary more with various
materials. The low temperatures generally reflect the fact that smoldering
causes quite incomplete oxidation of the carbon and hydrogen in the
fuel. Part of this incompleteness is probably a consequence of the
detailed nature of the surface reactions but part is also a result of
how various configurations minimize or preclude gas phase oxidation of
surface-derived molecules (pyrolytic or oxidative) . One feature of
smoldering that is not evident in Table I is the variability of the air
to fuel-consumed ratio as air supply is changed. Smoldering, at least
in some configurations, achieves an extra degree of tenacity because it
can adapt to very weak air supplies by varying its effective equivalence
ratio (11).
General factors favoring smoldering combustion . All of the fire
safety problem areas noted previously do not have a unique set of common
factors but certain chemical and physical factors can be discerned to be
conducive to smoldering. First, access of the fuel surface to oxygen
attack clearly enhances heat generation by heterogeneous reactions. The
low diffusivity of oxygen in liquid or solid fuels effectively limits
oxidation reactions to the interfacial region between fuel and gas
phase. The reaction rate of unit volume of fuel can be increased many
orders of magnitude if that fuel is permeated with pores or is in a
finely divided form. Second, this access of oxygen to the surface must
be retained as the fuel increases in temperature due to self-heating or
external heating. The reaction will be effectively suppressed if the
fuel melts or forms a liquid product whose surface tension causes
contraction and loss of the extended interfacial area. Formation of a
solid product or the presence of an extended area support material thus
can favor smoldering; this preserves reactable surface and/or provides
an insulation for the reaction zone.
269
Third, the fuel clearly must be amenable to exothermic attack by
oxygen but the rate of that attack can vary widely. What counts is the
reaction rate under the thermophysical conditions at which the material
is used. Smolder initiation depends on a competition between heat
generation rate and heat loss rate. This also implicates a fourth
factor—conditions which retard heat losses from the reaction zone
thereby lessening the requisite reaction rate for smoldering. In the
case of smolder initiation, at least, heat losses can be influenced not
only by the conductivity and thickness of the fuel but also by the
initiating heat source. If that source is sustained in duration for a
time sufficient to thoroughly pre-heat all adjacent fuel, the losses
from the reaction zone are further diminished. Sustained sources of
intensity insufficient to cause fuel ablation or flaming are thus conducive
to smoldering.
Note that char formation per se was not listed as a prerequisite
factor in smoldering. A char is an ill-defined material and one has to
be cautious about the meaning of the word. The blackened solid product
formed by heating many organic materials is rarely pure carbon; its
chemical make-up and its physical properties are usually dependent on
the total history of its formation. It is deceptive to say that "char"
is the true fuel for smoldering combustion. The tendency to form a
solid product (by oxidative or inert pyrolysis) frequently means the
extended surface area of the condensed phase is preserved or even enlarged;
as noted above, this is a smolder enhancing factor. If there is a
persistent solid organic phase, there can be a continuum of exothermic
surface reactions available to drive smolder and some of these may start
while the fuel is only slightly discolored. While the term "char" is
useful (and is used here) , one should be careful about what it is meant
to imply.
There is, of course, an interplay among these factors that ultimately
determines the smolder hazards of a particular usage of a particular
material. Note that the hazard of a material is very much dependent on
the context of usage. Some situations bring together a particularly
undesirable set of factors. In the upholstery smolder problem, two
smolder-susceptible materials (cellulosic fabric and polyurethane foam
or cotton batting) are juxtaposed and then exposed to an already smoldering
source (a cigarette). In cellulosic loose-fill insulation, a thick,
heat-preserving layer of a high surface area wood product sits atop a
270

a prolonged heat source like a recessed light fixture. The great potential
for trouble in such circumstances should be more widely recognized.
This recognition would come more easily if the smolder hazard could be
more readily quantified. Unfortunately this quantification depends on
the specifics of all the above factors and only very limited studies
have as yet been made.
In the present overview of modeling efforts, we will first examine
a general classification scheme for smolder propagation problems.
Following this, we will survey the modeling efforts currently in the
literature and try to decide where further work is most needed.
Smolder Configurations
Conditions favorable to smolder may be encountered in a wide variety
of fuel configurations; the resulting propagation process will vary
quantitatively and, to a lesser extent, qualitatively with such configurations
(so also will the likelihood of smolder initiation). By configuration
we mean here the macroscopic and microscopic details of fuel geometry
and air supply that dictate how oxygen and fuel come together to react.
Characteristic Lengths . In examining the question of smolder configuration,
it is useful to keep several characteristic lengths in mind. There are,
first of all, certain physical dimensions that are relevant:
il^p - characteristic dimension of fuel particle
£„_ - characteristic dimension of effective fuel element
Note that in most problems £_„ equals either I or I . There are also
certain lengths characterizing the smolder process or component parts of
it:
£ OTT- characteristic thickness of propagating smolder wave
FE
'FBcharacteristic dimension of array or bed of fuel elements
I.REAC
- reaction zone length - t.REAC
- convective heat transfer length
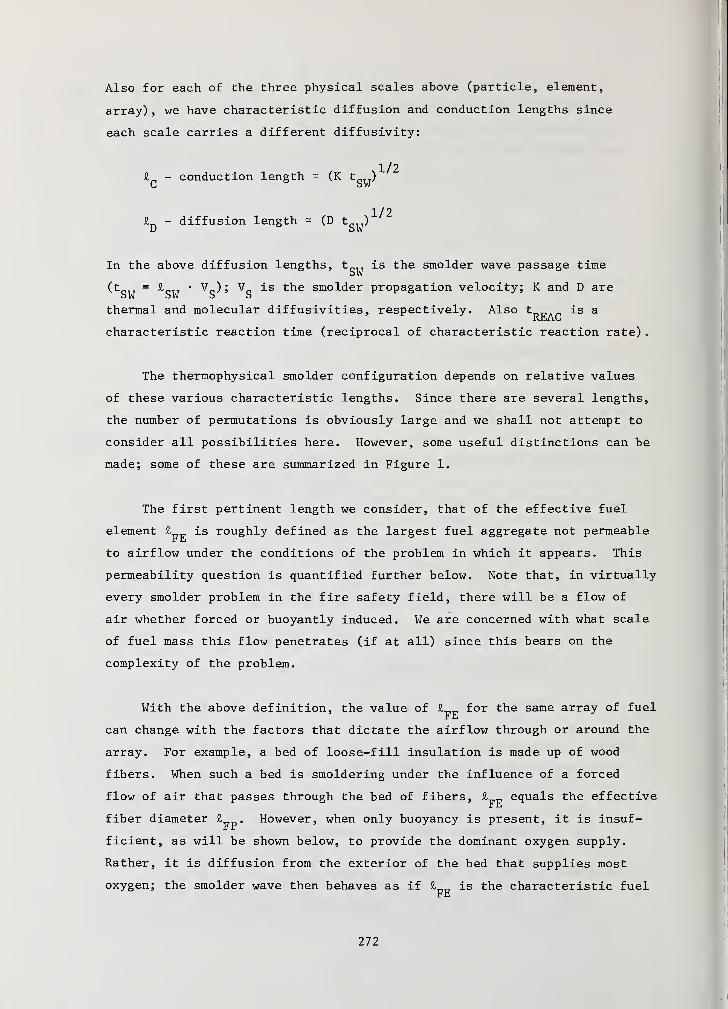
Also for each of the three physical scales above (particle, element,
array), we have characteristic diffusion and conduction lengths since
each scale carries a different diffusivity:
1/2£„ - conduction length - (K t,_TT)c SW
1/2J> - diffusion length = (D t OI7)D SW
In the above diffusion lengths, t is the smolder wave passage timeoW
(t = £ • V ); V is the smolder propagation velocity; K and D are
thermal and molecular diffusivities, respectively. Also t is a
characteristic reaction time (reciprocal of characteristic reaction rate)
The thermophysical smolder configuration depends on relative values
of these various characteristic lengths. Since there are several lengths,
the number of permutations is obviously large and we shall not attempt to
consider all possibilities here. However, some useful distinctions can be
made; some of these are summarized in Figure 1.
The first pertinent length we consider, that of the effective fuel
element £ is roughly defined as the largest fuel aggregate not permeabler li
to airflow under the conditions of the problem in which it appears. This
permeability question is quantified further below. Note that, in virtually
every smolder problem in the fire safety field, there will be a flow of
air whether forced or buoyantly induced. We are concerned with what scale
of fuel mass this flow penetrates (if at all) since this bears on the
complexity of the problem.
With the above definition, the value of £ for the same array of fuelFE
can change with the factors that dictate the airflow through or around the
array. For example, a bed of loose-fill insulation is made up of wood
fibers. When such a bed is smoldering under the influence of a forced
flow of air that passes through the bed of fibers, £ equals the effective
fiber diameter £„_. However, when only buoyancy is present, it is insuf-Fr
ficient, as will be shown below, to provide the dominant oxygen supply.
Rather, it is diffusion from the exterior of the bed that supplies most
oxygen; the smolder wave then behaves as if £ is the characteristic fuel
272
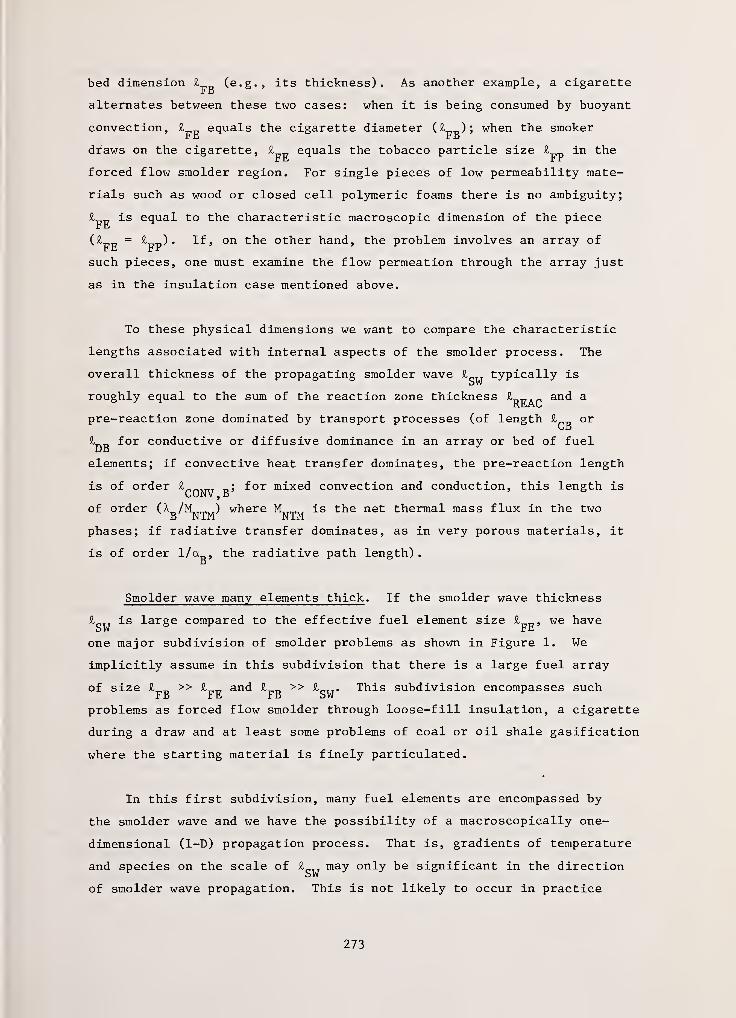
bed dimension £ (e.g., its thickness). As another example, a cigarette
alternates between these two cases: when it is being consumed by buoyant
convection, i equals the cigarette diameter (£ ); when the smokerFE FB
draws on the cigarette, I equals the tobacco particle size £ in theFE FP
forced flow smolder region. For single pieces of low permeability mate-
rials such as wood or closed cell polymeric foams there is no ambiguity;
£ is equal to the characteristic macroscopic dimension of the piece
(£ „ = ) . If, on the other hand, the problem involves an array ofr E r r
such pieces, one must examine the flow permeation through the array just
as in the insulation case mentioned above.
To these physical dimensions we want to compare the characteristic
lengths associated with internal aspects of the smolder process. The
overall thickness of the propagating smolder wave £ typically is
roughly equal to the sum of the reaction zone thickness ^j^q and a
pre-reaction zone dominated by transport processes (of length £ orHi
£ for conductive or diffusive dominance in an array or bed of fuel
elements; if convective heat transfer dominates, the pre-reaction length
is of order £„„_. „; for mixed convection and conduction, this length isCONV ,
B
of order^g/^j^M^
w^ere^ntm
^ S ^e net thermal mass flux in the two
phases; if radiative transfer dominates, as in very porous materials, it
is of order 1/a , the radiative path length).B
Smolder wave many elements thick . If the smolder wave thickness
£ is large compared to the effective fuel element size £„„, we have
one major subdivision of smolder problems as shown in Figure 1. We
implicitly assume in this subdivision that there is a large fuel array
of size £ >> £ and £ >> £ CTT . This subdivision encompasses suchFB r E r B oW
problems as forced flow smolder through loose-fill insulation, a cigarette
during a draw and at least some problems of coal or oil shale gasification
where the starting material is finely particulated
.
In this first subdivision, many fuel elements are encompassed by
the smolder wave and we have the possibility of a macroscopically one-
dimensional (1-D) propagation process. That is, gradients of temperature
and species on the scale of £ may only be significant in the direction
of smolder wave propagation. This is not likely to occur in practice
273

without some intentional efforts but it is a welcome simplification useful
in qualitatively simulating the smolder problems just mentioned.
Tractable detailed models of such smolder propagation require a
further simplication as well, that of microscopic one-dimensionality.
This requires
(W " 1; (W ~ 1 (1)
These conditions imply that there are no gradients of temperature or
species within each effective fuel element. The second of these two con-
ditions is usually the hardest to satisfy because of low species mobility
in micropores of the fuel element, especially if £ = I and the fuelr ii r r
element is a low porosity solid like coal or a char. If the conditions
in Equation (1) are satisfied, the smolder propagation process can be
simulated by a fully 1-D model that only considers gradients on the scale
of £ OTT . The simulation will only be qualitative, of course, if the real
smolder problem of interest is 2-D on the scale of £ CTT . If the conditions
in Equation (1) are not satisfied, modeling is still possible but it
becomes much more expensive; this problem is being confronted in the
underground coal gasification field.
Simpler limiting cases . As noted in the upper part of Figure 1,
there are two limiting cases that are macroscopically (and possibly micro-
scopically) 1-D, depending on the relative directions of air and smolder
wave movement. Forward smolder is the term applied to the case where
both air and smolder zone move in the same direction. (This is also called
counter-current smolder; an observer moving with the reaction zone sees
fuel and air enter it from opposite sides.) Reverse smolder (co-current
smolder) applies when the smolder zone moves toward the incoming air.
These distinctions are important because they can have considerable effect
on the character of the smolder process. Forward smolder tends to move
more slowly and to completely consume the fuel. The fuel heat up zone
ahead of the wave is devoid of oxygen; this can strongly affect the amount
of char formed as well as affecting the composition of the smoke. Reverse
smolder is faster for the same air flow and less complete (to a varying
degree), proceeding at a rate greatly dependent on heat transfer (like a
274
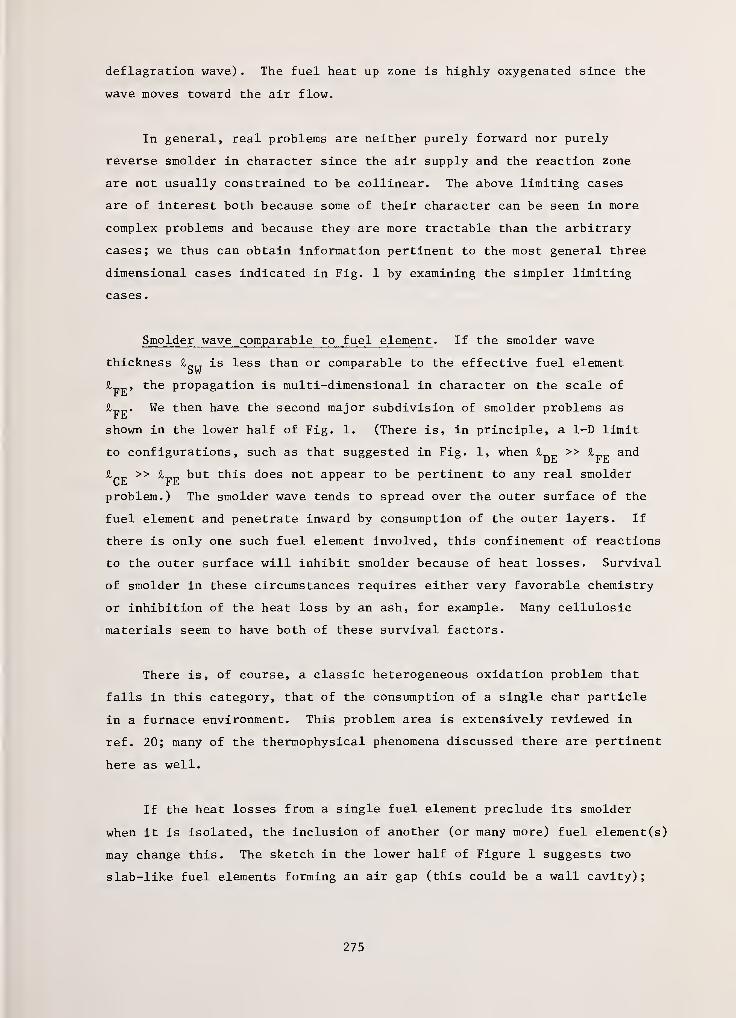
deflagration wave) . The fuel heat up zone is highly oxygenated since the
wave moves toward the air flow.
In general, real problems are neither purely forward nor purely
reverse smolder in character since the air supply and the reaction zone
are not usually constrained to be collinear. The above limiting cases
are of interest both because some of their character can be seen in more
complex problems and because they are more tractable than the arbitrary
cases; we thus can obtain information pertinent to the most general three
dimensional cases indicated in Fig. 1 by examining the simpler limiting
cases
.
Smolder wave comparable to fuel element . If the smolder wave
thickness I is less than or comparable to the effective fuel elemento W
the propagation is multi-dimensional in character on the scale ofrt
We then have the second major subdivision of smolder problems as
shown in the lower half of Fig. 1. (There is, in principle, a 1-D limit
to configurations, such as that suggested in Fig. 1, when S, >> I and
I >> I but this does not appear to be pertinent to any real smolderChi Ft,
problem.) The smolder wave tends to spread over the outer surface of the
fuel element and penetrate inward by consumption of the outer layers. If
there is only one such fuel element involved, this confinement of reactions
to the outer surface will inhibit smolder because of heat losses. Survival
of smolder in these circumstances requires either very favorable chemistry
or inhibition of the heat loss by an ash, for example. Many cellulosic
materials seem to have both of these survival factors.
There is, of course, a classic heterogeneous oxidation problem that
falls in this category, that of the consumption of a single char particle
in a furnace environment. This problem area is extensively reviewed in
ref. 20; many of the thermophysical phenomena discussed there are pertinent
here as well.
If the heat losses from a single fuel element preclude its smolder
when it is isolated, the inclusion of another (or many more) fuel element (s)
may change this. The sketch in the lower half of Figure 1 suggests two
slab-like fuel elements forming an air gap (this could be a wall cavity)
;
275
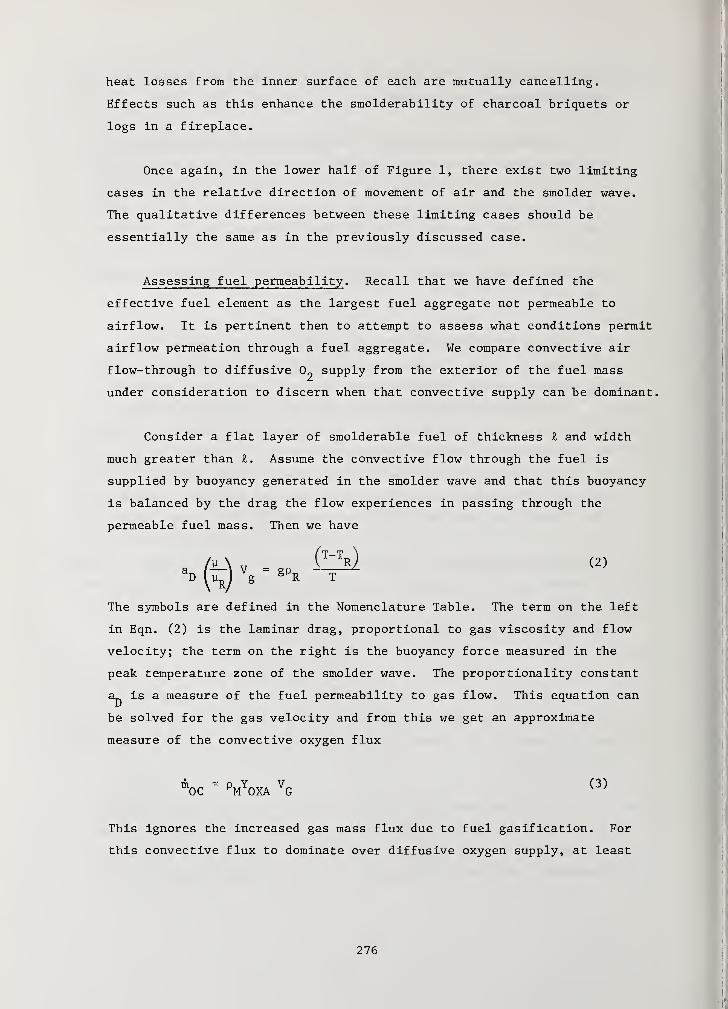
heat losses from the inner surface of each are mutually cancelling.
Effects such as this enhance the smolderability of charcoal briquets or
logs in a fireplace.
Once again, in the lower half of Figure 1, there exist two limiting
cases in the relative direction of movement of air and the smolder wave.
The qualitative differences between these limiting cases should be
essentially the same as in the previously discussed case.
Assessing fuel permeability . Recall that we have defined the
effective fuel element as the largest fuel aggregate not permeable to
airflow. It is pertinent then to attempt to assess what conditions permit
airflow permeation through a fuel aggregate. We compare convective air
flow-through to diffusive supply from the exterior of the fuel mass
under consideration to discern when that convective supply can be dominant.
Consider a flat layer of smolderable fuel of thickness I and width
much greater than £. Assume the convective flow through the fuel is
supplied by buoyancy generated in the smolder wave and that this buoyancy
is balanced by the drag the flow experiences in passing through the
permeable fuel mass. Then we have
The symbols are defined in the Nomenclature Table. The term on the left
in Eqn. (2) is the laminar drag, proportional to gas viscosity and flow
velocity; the term on the right is the buoyancy force measured in the
peak temperature zone of the smolder wave. The proportionality constant
a^ is a measure of the fuel permeability to gas flow. This equation can
be solved for the gas velocity and from this we get an approximate
measure of the convective oxygen flux
"oC=
PMYOXA
VG
(3)
This ignores the increased gas mass flux due to fuel gasification. For
this convective flux to dominate over diffusive oxygen supply, at least
276

when the reaction zone is a mid-depth in the fuel mass, we require that
it be, say, ten time larger than the diffusive flux at that point. The
diffusive flux at mid-depth may come from both bounding surfaces of the
where we have assumed that Y goes to zero in the reaction zone. Thisux
expression ignores the effect of convective counter-flow on the diffusive
flux from one bounding surface. Both Eqn. (3) and Eqn. (4) tend to
overestimate their respective fluxes.
From the requirement that rh be at least 10 m , we can solve for\J\j vJD
the upper limit on the gas permeability constant that satisfies our
criterion for dominance of convective oxygen supply.
This is an approximate guideline for the range of fuel mass permeabilities
that will permit dominant convective supply to the fuel mass interior. If
fuel mass in question satisfies Eqn. (5), we look at the next lower scale of
fuel mass to discern if it dictates as defined above since the scaleFE
just examined does not. For highly porous fuels such as flexible polyurethane3
cushioning materials, a^ can vary widely from about 1.0 to 100 g/cm sec (13);
for a typical cellulosic, loose-fill insulation, a is approximately3
10 g/cm sec. For typical smolder conditions, Eqn. (5) reduces to a-2
<_ 10 I; since £ for these fuels is 10-30 cm, typically, they will not
meet the criterion for high permeability. An exception might be cellulosic
insulation in a vertical wall cavity where £ could be much greater.
This conclusion only holds when natural convection provides the
oxygen supply. Forced convection may be pertinent to realistic smolder
hazard problems. For example external winds penetrating vent holes or
internal home ventilation could result in forced air flow through loose-
fill insulation. Then the right side of Eqn. (2) is replaced by the
pressure gradient AP/£ and Eqn. (5) is replaced by a calculation of the
minimum imposed pressure force for convective dominance. Thus a given
fuel mass scale may dictate the effective fuel element size I in one
fuel
(4)
(5)
277

set of conditions but in another, £ may be less (i.e. I = I or £rE FE FB FE
= V •
Other considerations . It is worth noting that the varying configurations
in Fig. 1 will affect not only smolder propagation but also the ease
with which smolder can transition into flaming combustion. For example,
smolder within a porous fuel mass is not likely to transition unless
there are large air gaps (presumably larger than a flame quench distance)
,
The available data on the transition process are meager (5,17,27,28).
The distinctions in Fig. 1 are not as important for smolder initiation,
however. Since a moving front does not yet exist during ignition, the
forward and reverse distinction does not apply. Fuel permeability is
pertinent primarily because it affects the extent of oxygen depletion
during ignition. Smolder initiation in high permeability fuels can be
treated as a problem in thermal ignition theory (14,15,16); smolder
initiation in low permeability fuels has received only limited study
(17).
It appears that virtually every established smolder process quickly
becomes oxygen-limited (i.e. oxygen concentration goes to zero in the
reaction zone) . If so we can make the following qualitative inferences
about smolder spread. Once smoldering is fully initiated on some part
of the outer boundary of a fuel, it will undergo a transient spreading
process and the smolder wave may arrive at a steady or quasi-steady
shape that then consumes the remaining fuel. (Since this evolution
takes time, the steady state may never be reached with small fuel masses.)
The transient evolution of the smolder wave is due to heat transfer but
278
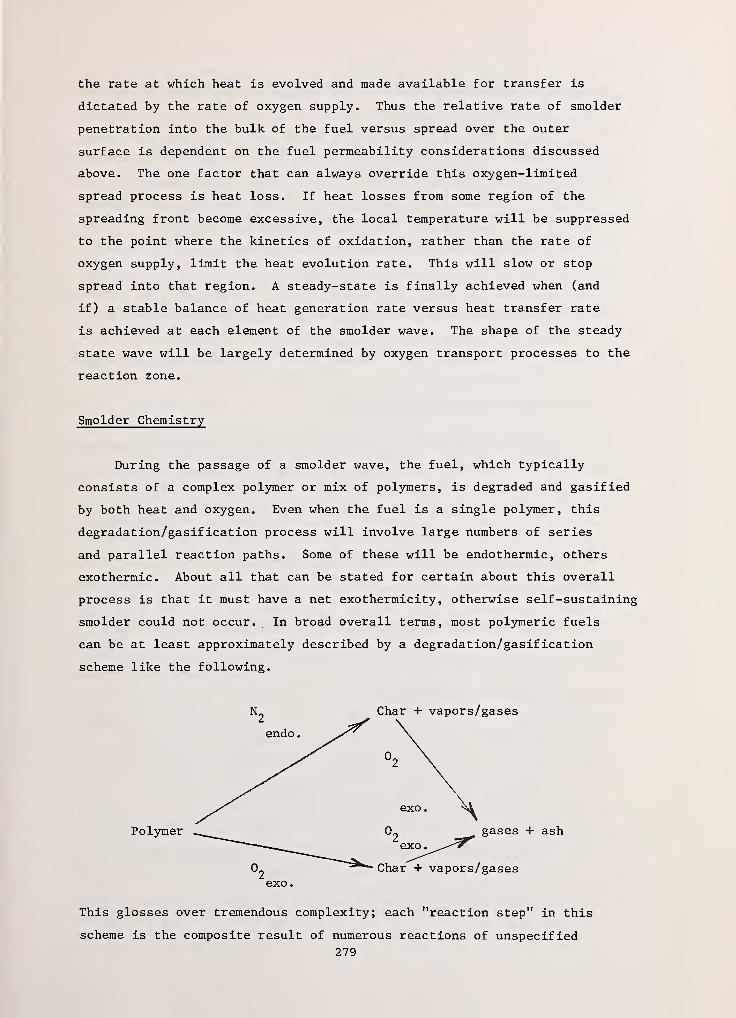
the rate at which heat is evolved and made available for transfer is
dictated by the rate of oxygen supply. Thus the relative rate of smolder
penetration into the bulk of the fuel versus spread over the outer
surface is dependent on the fuel permeability considerations discussed
above. The one factor that can always override this oxygen-limited
spread process is heat loss. If heat losses from some region of the
spreading front become excessive, the local temperature will be suppressed
to the point where the kinetics of oxidation, rather than the rate of
oxygen supply, limit the heat evolution rate. This will slow or stop
spread into that region. A steady-state is finally achieved when (and
if) a stable balance of heat generation rate versus heat transfer rate
is achieved at each element of the smolder wave. The shape of the steady
state wave will be largely determined by oxygen transport processes to the
reaction zone.
Smolder Chemistry
During the passage of a smolder wave, the fuel, which typically
consists of a complex polymer or mix of polymers, is degraded and gasified
by both heat and oxygen. Even when the fuel is a single polymer, this
degradation/gasification process will involve large numbers of series
and parallel reaction paths. Some of these will be endothermic, others
exothermic. About all that can be stated for certain about this overall
process is that it must have a net exothermicity , otherwise self-sustaining
smolder could not occur. In broad overall terms, most polymeric fuels
can be at least approximately described by a degradation/gasification
scheme like the following.
scheme is the composite result of numerous reactions of unspecified
279
nature. For example, for cellulose, the pyrolytic pathway (^) has been
under investigation for years but it is not fully clarified. Again for
cellulose, the initial oxidative reaction paths have examined to some
extent (18) and the char oxidation is also just beginning to be investigated
(1,2). For other smolderable fuels the underlying chemistry is even less
clear. What is termed "char" in the above scheme has to be operationally
defined since it has no definite composition (and probably differs
whether formed in the presence or absence of oxygen)
.
Much of what happens to the polymeric fuel during smolder is qualitatively
analogous to the fate of coal during devolatilization and oxidative
gasification. There is an extensive literature in the coal field
(19,20,21) which can provide insights into the smolder problem, especially
physical processes bearing on the above degradation scheme, but the
results cannot be directly applied here.
Even though the above type of scheme is only a crude representation
of reality, it can be quite useful if it can be quantified properly. A
tractable smolder model could handle four overall reactions; from the
model one can then learn what factors affect which of these overall
stages. This can in turn help pinpoint what aspects of the underlying
chemistry might best be further examined in efforts to retard or suppress
smolder
.
Since each step in the above scheme is a composite of several
reactions having, in general, different activation energies, quantification
of the scheme should ideally be done in the same conditions of atmosphere
and heating rate as occur in smolder. Otherwise, the apparent kinetics
of any given composite reaction step can change. In practice this can
only be approached at present, especially because heating rates in
smolder (1/2 °C/sec and up) frequently exceed present instrumental
capabilities. Thermal analysis (thermogravimetry and differential
scanning calorimetry) are the best techniques presently available for
quantifying the overall rate laws for each step in the above scheme.
Typically this requires sample runs at two or more heating rates and
several oxygen levels (21% to 0%) . Techniques are available for fitting
rate equations to the data (22,23).
280

A further important consideration pertains to matching the above
scheme to actual overall smolder chemistry. Physical factors affect the
degradation process as well as chemical factors. Oxidation occurs on
the available surface of the fuel, pyrolysis in the bulk of the fuel.
The available surface of the fuel may involve micropores either initially
or after some extent of reaction. The oxidative/pyrolytic competition
depends on the surface to volume ratio, among other factors, and that
ratio may change as degradation/gasif ication progresses. The physical
form of the sample should be the same as that occurring in real smolder
so that the physical interactions with the chemistry are the same. One
should recognize that the "kinetic rate law" derived for any overall
reaction step may be describing physical as well as chemical changes;
thus it is dangerous to assign any mechanistic significance to the
apparent activation energy.
Smolder chemistry is in a rather primitive state; there is much to
be learned that could have a large impact on the smolder hazard problem.
Until the situation improves, schemes such as that above can be applied
to carefully limited sets of conditions.
Smolder Propagation Models
The number of smolder models in the literature is rather small,
reflecting the underdeveloped state of this field. They can conveniently
be broken into two categories which will be called simple and complex.
The simple models typically are applied to rather complex configurations
where a detailed description quickly becomes intractable from the solution
standpoint. The main value of the simple models is in providing a
qualitative prediction of the effect of pertinent parameters on smolder
propagation characteristics. Potentially they can draw together a set
of experimental measurements, rationalize their main features and provide
an approximate extrapolation of behavior to other sets of conditions.
The more complex models begin, at least, with simple configurations,
impose fewer assumptions about controlling factors, and let the model
solution tell the story of what factors(s), in what conditions, govern(s)
the output of interest. The complex model is, in effect, another experimental
tool for examining the parameters that influence smolder characteristics;
it is a tool more easily manipulated and probed than the laboratory
smolder system. Of course, no model is better than the physics and
chemistry that go into it.
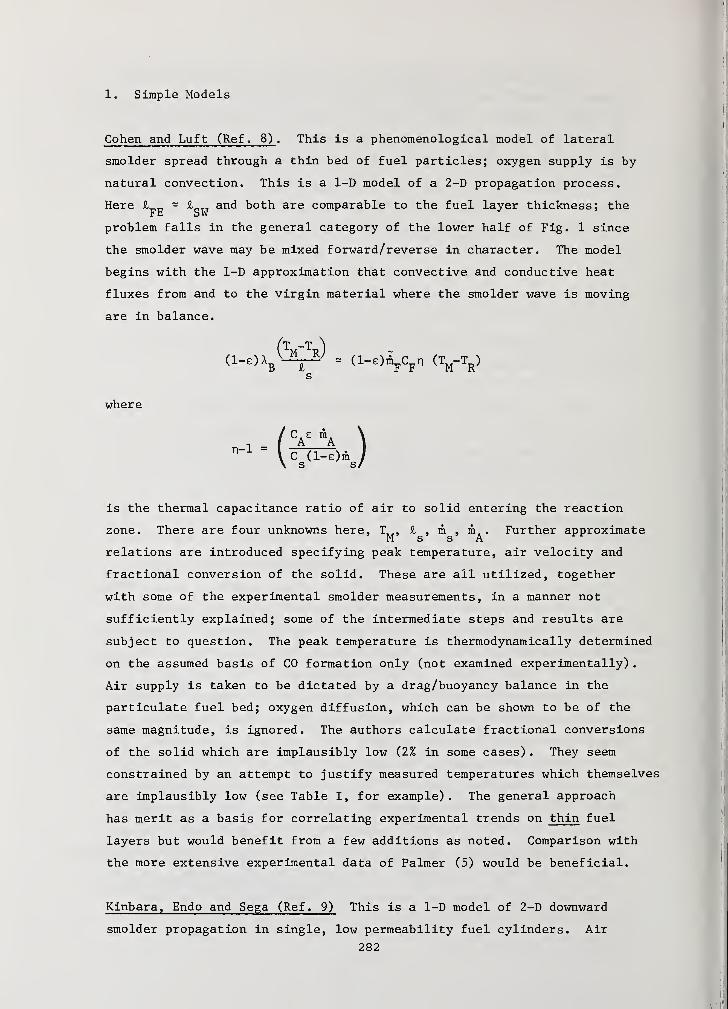
1. Simple Models
Cohen and Luft (Ref. 8) . This is a phenomenological model of lateral
smolder spread through a thin bed of fuel particles; oxygen supply is by
natural convection. This is a 1-D model of a 2-D propagation process.
Here £ - I and both are comparable to the fuel layer thickness; the
problem falls in the general category of the lower half of Fig. 1 since
the smolder wave may be mixed forward/reverse in character. The model
begins with the 1-D approximation that convective and conductive heat
fluxes from and to the virgin material where the smolder wave is moving
are in balance.
is the thermal capacitance ratio of air to solid entering the reaction
zone. There are four unknowns here, Tw , I , m , m, . Further approximateM s s A
relations are introduced specifying peak temperature, air velocity and
fractional conversion of the solid. These are all utilized, together
with some of the experimental smolder measurements, in a manner not
sufficiently explained; some of the intermediate steps and results are
subject to question. The peak temperature is thermodynamically determined
on the assumed basis of CO formation only (not examined experimentally)
.
Air supply is taken to be dictated by a drag/buoyancy balance in the
particulate fuel bed; oxygen diffusion, which can be shown to be of the
same magnitude, is ignored. The authors calculate fractional conversions
of the solid which are implausibly low (2% in some cases) . They seem
constrained by an attempt to justify measured temperatures which themselves
are implausibly low (see Table I, for example). The general approach
has merit as a basis for correlating experimental trends on thin fuel
layers but would benefit from a few additions as noted. Comparison with
the more extensive experimental data of Palmer (5) would be beneficial.
Kinbara, Endo and Sega (Ref. 9) This is a 1-D model of 2-D downward
smolder propagation in single, low permeability fuel cylinders. Air
282
s
where

flow is due to natural convection. Again £ - H and the problem
falls in the lower subdivision of Fig. 1. (Also £ _ = JL_ = cylinderFE FP
diameter.) Downward propagation against upward buoyant air flow around
the cylinder gives the problem a 2-D reverse smolder character. The
model is based on the 1-D heat conduction equation for the solid fuel;
estimates are made of heat production and heat loss terms in this equation.
The development seems somewhat forced in an attempt to match experimental
trends for the effect of ambient temperature and fuel cylinder radius.
Heat production rate on the fuel surface is taken to be oxygen-supply
limited; the rate of supply is assumed proportional to the temperature
difference between the surface and ambient (assumes mass and heat transfer
numbers are equal) . The heat production rate is also proportional to
the reacting surface area but here the actual conical shape is ignored
and a "correction" for effective surface area is applied. Finally, heat
production rate is assumed inversely proportional to the difference
between ambient temperature and a measured instantaneous ignition temperature.
Heat loss from the surface is Newtonian; the effective heat transfer
coefficient and the surface area "correction" are obtained from separate
experiments. The resulting steady-state energy conservation equation is
the following.
\J-~ + iUcJr +2(7 + r 2) ( T.-T - h) (t-T ) = 0Fdx
2 F Fdx \c c/\io / \ 0/
This equation has solutions of exponential form that involve a parameter
grouping called 8. The authors offer a rather obscure argument that
6=0; this leads directly to
..•-(as) (*.*yw*>-i)
This is the same form as that in which their experimental data on the
effects of r and T. are correlated. The unknowns q and A are inferredc 1 n
from this match and appear plausible. The same development is applied
to rectangular cross-section materials and leads to a very similar
expression which again correlates their experimental data. Here there
is some apparent conflict with the data of Palmer (5) on fiberboard2
strips; he found a linear relation (rather than Vg
) between smolder
velocity and sample dimensions (perimeter/area). The range in dimensions
for both studies is too narrow to settle this definitively.
283
Sega (24,25) has extended both the experimental and theoretical
work on downward smolder propagation in low permeability fuels to other
geometries including a hollow cylinder. The results are correlated
similarly. The model is developed in a somewhat different fashion that
accounts for the non 1-D geometry of the reacting surface. The final
correlating equations for smolder velocity in terms of sample dimensions
and temperature are similar to that above. This work has not been
translated to English so detailed comments cannot be made at present.
Williams (Ref. 26) . This development is couched in very broad terms in
the midst of a general discussion of fire spread mechanisms; it is
intended only as a phenomenological description of smolder spread
mechanisms. The author notes that oxygen-limited smolder is more probable
because kinetically-limited propagation is often unstable. This leads
to the interesting rough criterion for a smolder extinction limit:
Yn
A exp (E/RT ) < p D /lox c M ox ox G
This says that extinction can be expected when the kinetic oxidation
rate of the fuel drops below the diffusive oxygen supply rate (£ is a
characteristic length for oxygen diffusion) . Applying this in practice,
of course, calls for more detailed analysis of a specific configuration.
For a permeable fuel in a forward smolder mode (eg, a cigarette
smoldering upward with a buoyant/diffusive 0^ supply), Williams equates
an oxygen-limited heat generation rate to the fuel heat-up enthalpy to
get a rough expression for smolder velocity:
V = Q p D /£ p C (T —T )s
xox ox ox G F F M o
If the fuel is not permeable, the reaction is confined to the surface
and a configuration-dependent heat loss must be subtracted from the heat
generation rate. (In fact, heat losses must also be included in the
permeable forward smolder case, otherwise regenerative reactant heating
precludes the assumed steady state.) If £ is assumed proportional to aG
lateral dimension of the fuel, the resulting expression will look roughly
like that of Kinbara, et al, above but it is linear in V , not quadratic.
The expected dependencies here are qualitative only since no realistic
conf igurational details are included.
284
Moussa, Toong and Garris (Ref. 27) . This is a 1-D model of a 2-D lateral
smolder spread along a horizontal cellulosic roving (in effect a porous
cylinder made up of fibers); air is supplied by natural convection/dif fusion.
The problem is also qualitatively quite similar to a horizontal cigarette
smoldering under natural convection conditions; the model has also been
applied to horizontal smolder spread along blocks of polyurethane foam
wrapped with a cellulosic fabric (28) . For all these cases we have again
l„„ - £ OT7 with both approximately equal to the lateral dimension of the
fuel mass (a general case in the lower half of Fig. 1). This theory is
substantially more complete than any of the preceding models since it
includes fuel pyrolysis as well as oxidation and attempts, also, to
predict extinction limits for smoldering.
The cellulose is assumed to undergo two simultaneous degradation
reactions, one forming a char and the other forming volatiles that
disappear from the system; the oxidation of the char drives this system.
This is analogous to the overall reaction scheme given above but it
assumes no char is formed by the pyrolytic route (N^) ; this is an
approximation. Note that the amount of char available for oxidation
will depend on the balance between competing reactions.
A planar interface is assumed to divide the cellulose heat-up and
degradation zone from the char oxidation zone; heat from the latter
zone, less heat losses to ambient, must balance the heat requirements of
the former zone in order for a steady smolder solution to exist. If
not, the particular set of conditions falls in an extinguishment region
(transient smolder might exist but is not considered)
.
With the problem thus split into two parts, the parts are analyzed
separately. The heat-up/degradation zone is treated rather more accurately
than the char oxidation zone. For the former, a 1-D model (neglecting
surface heat losses and radiative transfer) for temperature and species
is solved numerically with various imposed heat fluxes at the artifical
interface. The reaction heats are found to have only a 20-30% effect on
these results so that an analytical solution for zero heat effect is
ultimately used instead. The output is interface temperature and char
285
fraction versus imposed flux. To match this and select a unique smolder
velocity, one needs the available feedback flux from the char oxidation
zone versus interface temperature. Here it is assumed that the char
oxidation zone is isothermal at the interface temperature in spite of
the experimental observation that temperature here varies over a 100-
200° C range. This is the roughest approximation in the model. Heat
generation in this isothermal region can be limited by 0^ supply, oxidation
kinetics or both. The oxidation rate is deduced from the carbon literature
Oxygen arrives at the char surface by diffusion through a natural convection
boundary layer
where 6 is the boundary layer thickness, taken from the literature. The
char is treated as though it is non-porous (on macroscopic & microscopic
scales) and the total heat generation rate is deduced by multiplying the
above reaction rate by an imposed char surface area (estimated from
experiment) . The partial pressure of oxygen at the char outer surface
is obtained from the steady state assumption that the above two expressions
specify equal oxygen fluxes. The char reaction rate specifies oxygen via a
stoichiometric coefficient, taken as that for carbon oxidation to CO^;
the reaction heat is also that of this reaction. Finally, the net heat
flux available for feedback is the chemical heat minus radiative and
convective losses as well as a loss through the ash end, rather crudely
estimated. As indicated, this is matched to the pyrolysis zone to get
smolder velocity and peak temperature.
This is a quite reasonable qualitative model of smolder propagation
for this type of over-oxidized configuration (i.e, where there is an
infinite reservior of oxygen available to the smolder zone) . It has
1/2r = FP
ox, s
02,
s
286
more real physics in it than any preceding model though it still has
some major approximations. One might expect that its prediction of
trends would carry over to the cigarette problem mentioned above or to a
smoldering fabric or, in fact, to the system studied by Kinbara, et al.
The authors give predictions of the variation of smolder velocity
and peak temperature with oxygen mole fraction and oxygen partial pressure.
They also predict minimum values of these two external parameters which
will yield smolder extinction. The prediction of experimental trends is
good in all cases. In certain cases the quantitative agreement between
model and experiment is quite good; in view of the numerous approximations,
this must be viewed as fortuitous.
Another interesting prediction of the model is that for essentially
all conditions not near an extinction limit the smolder process is oxygen
supply limited. Oxidation kinetics limit only in a narrow zone before
extinction; this is in qualitative agreement with Williams suggested
limit criterion above.
General Comments. From the fire safety viewpoint, the ultimate
goal and justification for modeling of a smolder process is to learn
how to eliminate it; short of reaching this ambitious goal, one at least
wants to know how to lessen the impact of smolder as a cause of fire
deaths and injuries. The above models are only a tentative first step
in this direction. They correlate experimental results, providing an
approximate but plausible rationale for the observed behavior. Only
in the last model, however, is there enough detail for one to begin to
discern a route to a lesser smolder tendency. The amount of char formed
is a variable calculated by the model; lessening the amount of char
should shift the extinction limit so that a lesser domain of conditions
permits smolder. Qualitatively, this is an old idea, of course; the
model, however, can quantify the relation between extinction and char
formation. This gives the chemist a quantitative guideline for how
much the char versus volatiles competition must be altered. This is
an example of how smolder propagation, which all models show to be oxygen
supply limited rather than chemically limited, is really a chemical
problem. Most solutions to smolder problems will ultimately be chemical
in nature. Another example is in the chemistry of the char oxidation.
287

The model of Moussa, et al. essentially says it affects only the position
of the extinction limit but this is an important relation to quantify;
to close the loop, the chemist must learn how to alter the chemistry of
char oxidation (as well as its formation)
.
With regard to the char oxidation process, the model of Moussa,
et al. is really rather rough, though less so than the preceding models.
The problem in all of the above cases, however, is that this part of
the problem is non 1-D in character because of the conditions of oxygen
supply. Detailed treatment of a 2-D problem would be premature, at
present; the 1-D cases have not been fully exploited or analyzed.
The 1-D configurations are those limiting cases of forward and
reverse smolder indicated in Fig. 1. Fuel bed permeability is high (due
to a very porous structure or an imposed forced flow) so that air and
product gases flow through the fuel. These cases are thus not "overoxidized"
in the sense used above; oxygen reaches the reaction zone from one side at
a rate dictated by buoyancy or by an imposed pressure differential. The
1-D nature of the reaction/propagation process makes a more detailed
treatment feasible though certainly not trivial.
2. Complex Models
The forward and reverse 1-D configurations are at uneven states
of development. That the models exist at all is mainly a consequence
of specific smolder problem areas demanding study. The forward smolder
models, in particular are thus very specialized.
Specialization is also a difficulty in applying to smolder the
literature results from other fields. There are a variety of related
problems, some of which have received very extensive treatment but the
differences from smolder in specific physical and chemical details
typically preclude anything more than some qualitative transferral of
trends. Johnson, et al. (29) present an analytical solution to the
1-D problem of carbon burn-off from a bed of catalyst particles. This
is essentially a forward smolder problem with a very low fuel loading
and a high "ash" content. However, the analytical solution is made
288

possible by de-coupling the reaction rate from the temperature; species
and heat diffusion are also neglected. The model is qualitatively-
instructive in that it shows succinctly how forward smolder, in the
absence of heat losses, is inherently unsteady, with a monotonically
increasing peak temperature. Physically this is a consequence of
regenerative heating of the reactants: gas and solid pass over each
other in opposite directions when leaving and entering the reaction
zone. Heat transfer between them is always such as to feed heat from
both sides back into the reaction zone where it accumulates. This is
one of the factors making forward smolder quite different from reverse
smolder
.
The underground coal and oil shale gasification field is currently
undergoing intensive development. Typically the fuel seam is permeable,
or is made permeable by drilling or explosives, and an exothermic reaction
zone is driven through the fuel, gasifying a substantial fraction of it.
Forward and reverse propagation schemes are used and the heat to drive
the wave comes from partial oxidation of the fuel. The analogy with
smolder propagation is apparent; only the names and the fuels are different.
The logical starting point for models of these processes has been 1-D
descriptions in which the conditions of Equation (1) are assumed to
apply (not necessarily a good assumption in this problem) . The modeling
goals are generally quite different than they are with smolder. The
rate of propagation versus air supply is of some interest but the major
concern is with the composition and energy content of the product gases.
This leads to models which contain rather extensive descriptions of
coal-related chemistry, having as much as a dozen chemical reactions.
Because of specific conditions in such problems, species diffusion is
typically neglected and radiative transfer is included only as a minor
correction to solid-solid conduction; these approximations are not
necessarily good in smolder problems. Typical reports of model development
and results can be found in references 30 to 36. This field continues
to proliferate and bears close watching for qualitative results that may
shed light on the smoldering problem. The models most likely to provide
insights of a useful nature are those less specialized such as ref. 31
or the general performance analyses such as those of wavefront stability
(ref. 33). There has been much less activity directly applied to the
question of smoldering combustion as will be seen.
289

Egerton, Gugan and Weinberg (Ref. 10); Forward Smolder . This model
was posed as a first step in the description of smolder propagation in
cigarettes. We have noted previously that the cigarette problem oscillates
in character, falling in the upper half of Fig. 1 during the smoker's
draw and in the lower half between draws. The model proposed is not
complete and it was never solved; nevertheless, the paper in which it
was presented was a pioneering effort and had a strong impact on this
field. Arguing from their partial model and from their experimental
results, the authors independently discovered the regenerative heating
effect in forward smolder, qualitatively demonstrated the impact of
switching from forward to reverse smolder, noted the rate-limiting
effects of oxygen supply on smolder and showed that this has powerful
effects on the shape and behavior of this smoldering system, leading
ultimately to an instability in its behavior that precludes uniform
propagation. This was a substantial contribution to the understanding
of smolder propagation.
Summerfield, Ohlemiller and Sandusky (Ref. 37); Forward Smolder .
This is a specialized 1-D model of 2-D forced forward smolder in a
cigarette; as noted above it falls in the upper half of Fig. 1 since £
equals the tobacco particle size and I » £ (marginally in someb w r hi
conditions). The peripheral paper behavior makes it 2-D. The model is
transient, encompassing ignition but the air flow is constant. Air flow
values are 5-60 cm/sec so that convection is the dominant heat and mass
transport mode; diffusion and conduction are neglected. The model is
further specialized by the fact that it includes a moving step decrease
in side wall flow resistance coupled to the moving thermal wave. This
is a simulation of burn-back of the peripheral cigarette paper, a process
which lets some of the incoming air bypass the oxidation zone. It also
lets essentially all air enter the sides of the cigarette, not the end,
decreasing the regenerative heat transfer effect. This sidewall entry
of air causes strongly 2-D behavior at the base of a real cigarette
coal; this model simulates it qualitatively in a 1-D fashion.
This is the first model to attempt a description of the complete
smolder wave structure, albeit for specialized circumstances. The fuel
chemistry, derived from thermal analysis experiments (heating rates 100X
less than cigarette), includes one step pyrolysis followed by one step
char oxidation (essentially the lower pathway in the above reaction
scheme) . 290
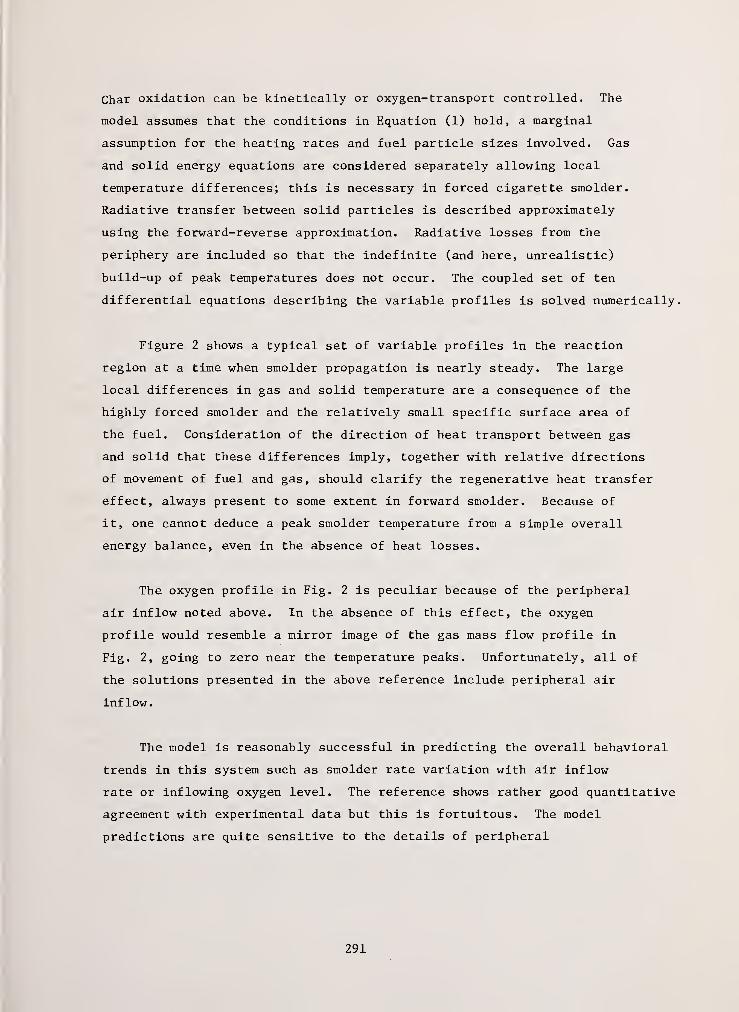
Char oxidation can be kinetically or oxygen- transport controlled. The
model assumes that the conditions in Equation (1) hold, a marginal
assumption for the heating rates and fuel particle sizes involved. Gas
and solid energy equations are considered separately allowing local
temperature differences; this is necessary in forced cigarette smolder.
Radiative transfer between solid particles is described approximately
using the forward-reverse approximation. Radiative losses from the
periphery are included so that the indefinite (and here, unrealistic)
build-up of peak temperatures does not occur. The coupled set of ten
differential equations describing the variable profiles is solved numerically.
Figure 2 shows a typical set of variable profiles in the reaction
region at a time when smolder propagation is nearly steady. The large
local differences in gas and solid temperature are a consequence of the
highly forced smolder and the relatively small specific surface area of
the fuel. Consideration of the direction of heat transport between gas
and solid that these differences imply, together with relative directions
of movement of fuel and gas, should clarify the regenerative heat transfer
effect, always present to some extent in forward smolder. Because of
it, one cannot deduce a peak smolder temperature from a simple overall
energy balance, even in the absence of heat losses.
The oxygen profile in Fig. 2 is peculiar because of the peripheral
air inflow noted above. In the absence of this effect, the oxygen
profile would resemble a mirror image of the gas mass flow profile in
Fig. 2, going to zero near the temperature peaks. Unfortunately, all of
the solutions presented in the above reference include peripheral air
inflow.
The model is reasonably successful in predicting the overall behavioral
trends in this system such as smolder rate variation with air inflow
rate or inflowing oxygen level. The reference shows rather g,ood quantitative
agreement with experimental data but this is fortuitous. The model
predictions are quite sensitive to the details of peripheral
291
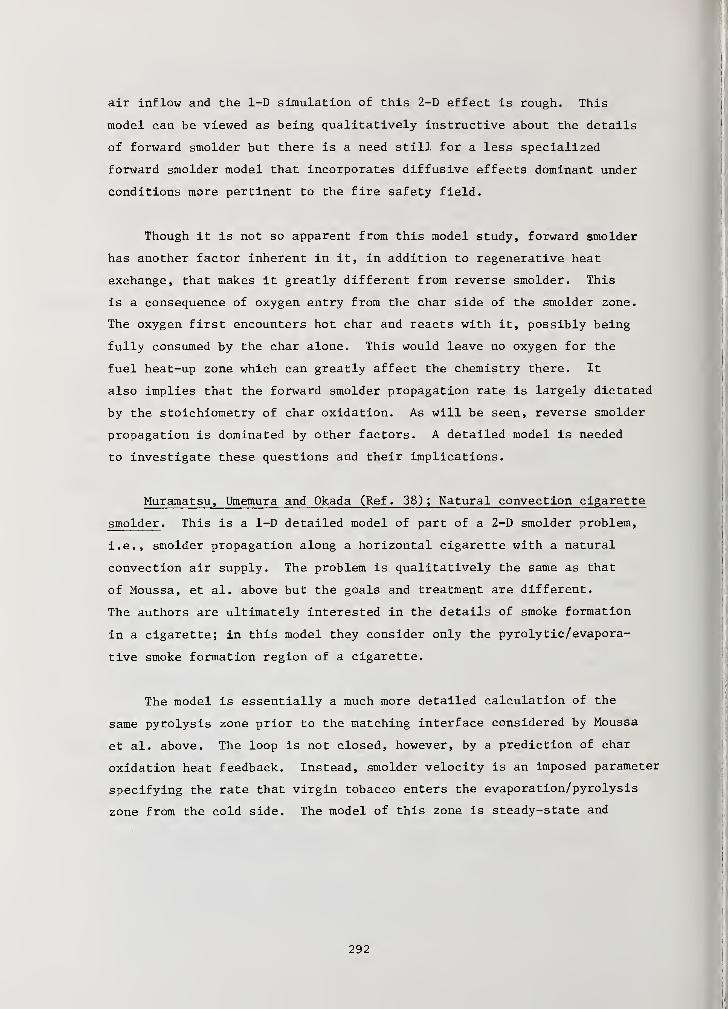
air inflow and the 1-D simulation of this 2-D effect is rough. This
model can be viewed as being qualitatively instructive about the details
of forward smolder but there is a need still for a less specialized
forward smolder model that incorporates diffusive effects dominant under
conditions more pertinent to the fire safety field.
Though it is not so apparent from this model study, forward smolder
has another factor inherent in it, in addition to regenerative heat
exchange, that makes it greatly different from reverse smolder. This
is a consequence of oxygen entry from the char side of the smolder zone.
The oxygen first encounters hot char and reacts with it, possibly being
fully consumed by the char alone. This would leave no oxygen for the
fuel heat-up zone which can greatly affect the chemistry there. It
also implies that the forward smolder propagation rate is largely dictated
by the stoichiometry of char oxidation. As will be seen, reverse smolder
propagation is dominated by other factors. A detailed model is needed
to investigate these questions and their implications.
Muramatsu, Umemura and Okada (Ref. 38); Natural convection cigarette
smolder . This is a 1-D detailed model of part of a 2-D smolder problem,
i.e., smolder propagation along a horizontal cigarette with a natural
convection air supply. The problem is qualitatively the same as that
of Moussa, et al. above but the goals and treatment are different.
The authors are ultimately interested in the details of smoke formation
in a cigarette; in this model they consider only the pyrolytic/evapora-
tive smoke formation region of a cigarette.
The model is essentially a much more detailed calculation of the
same pyrolysis zone prior to the matching interface considered by Moussa
et al. above. The loop is not closed, however, by a prediction of char
oxidation heat feedback. Instead, smolder velocity is an imposed parameter
specifying the rate that virgin tobacco enters the evaporation/pyrolysis
zone from the cold side. The model of this zone is steady-state and
292
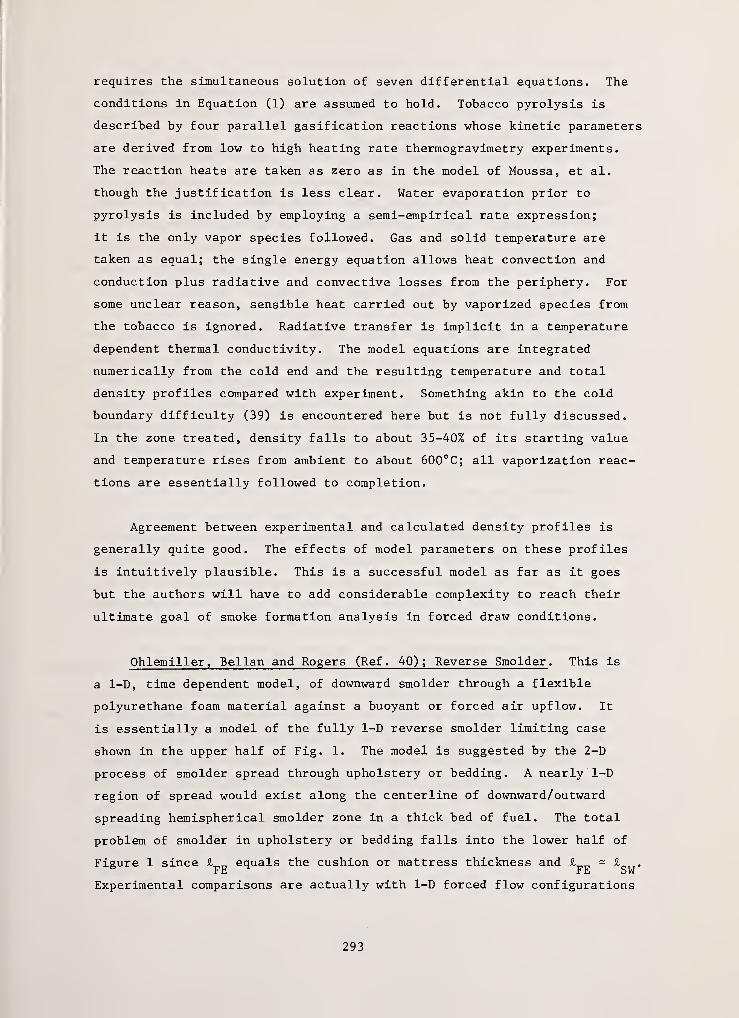
requires the simultaneous solution of seven differential equations. The
conditions in Equation (1) are assumed to hold. Tobacco pyrolysis is
described by four parallel gasification reactions whose kinetic parameters
are derived from low to high heating rate thermogravimetry experiments.
The reaction heats are taken as zero as in the model of Moussa, et al.
though the justification is less clear. Water evaporation prior to
pyrolysis is included by employing a semi-empirical rate expression;
it is the only vapor species followed. Gas and solid temperature are
taken as equal; the single energy equation allows heat convection and
conduction plus radiative and convective losses from the periphery. For
some unclear reason, sensible heat carried out by vaporized species from
the tobacco is ignored. Radiative transfer is implicit in a temperature
dependent thermal conductivity. The model equations are integrated
numerically from the cold end and the resulting temperature and total
density profiles compared with experiment. Something akin to the cold
boundary difficulty (39) is encountered here but is not fully discussed.
In the zone treated, density falls to about 35-40% of its starting value
and temperature rises from ambient to about 600°C; all vaporization reac-
tions are essentially followed to completion.
Agreement between experimental and calculated density profiles is
generally quite good. The effects of model parameters on these profiles
is intuitively plausible. This is a successful model as far as it goes
but the authors will have to add considerable complexity to reach their
ultimate goal of smoke formation analysis in forced draw conditions.
Ohlemiller, Bellan and Rogers (Ref . 40); Reverse Smolder . This is
a 1-D, time dependent model, of downward smolder through a flexible
polyurethane foam material against a buoyant or forced air upflow. It
is essentially a model of the fully 1-D reverse smolder limiting case
shown in the upper half of Fig. 1. The model is suggested by the 2-D
process of smolder spread through upholstery or bedding. A nearly 1-D
region of spread would exist along the centerline of downward/outward
spreading hemispherical smolder zone in a thick bed of fuel. The total
problem of smolder in upholstery or bedding falls into the lower half of
Figure 1 since I equals the cushion or mattress thickness and £ - ft CTT .
FE FE Sw
Experimental comparisons are actually with 1-D forced flow configurations
293

(11) ; in this case £_„ is of the order of the cell size in the poly-FE
urethane and the problem clearly falls in the upper half of Fig. 1.
The behavior of the polyurethane fuel is rather problematical.
Both conditions in Equation (1) are assumed to hold in the model but
there are indications that the second (pertaining to diffusion) fails
at certain stages. Char formation in this material requires oxygen but
this gas has very limited penetration into the original polyurethane
"particles" which have no pores. Thus, char forms on the exterior while
the interior pyrolyzes and vaporizes; the final porous char is open
enough to satisfy both conditions in Equation (2) when it oxidizes. No
attempt was made to account for the complex details of the initial char
formation/ pyrolysis process since this would have required a 2-D treatment
of the condensed phase. An approximate kinetic description in terms of
two overall steps (char formation, char oxidation) was obtained on the
same physical foam structure using thermogravimetry; it fits a limited
set of conditions that do not fully match the smolder situation. The
most likely consequence is an incorrect calculation of the amount of
char formed (overestimated)
.
Another difficulty with the chemistry is treated heuristically
.
Thermal analysis gives no information on the oxygen stoichiometry of the
overall reaction stages. Moussa, as well as Sandusky, essentially
solved this by treating the char as carbon; no other reactions consumed
oxygen. Here both overall reactions are exothermic as measured by
differential scanning calorimetry and both consume oxygen. In the
absence of better information, the char oxidation stoichiometric coefficient
was taken as (Q^/Q-^) times the char formation stoichiometric coefficient,
where Q is the reaction heat. The char formation stoichiometric coefficient
was adjusted until the overall equivalence ratio from the model solution
at one condition was in the right domain. This assumes constant heat
output per gram of oxygen which is an approximation, at best, for smolder.
294

Physically the model is fairly complete. Air flows up toward the
descending reaction zone as a result of buoyancy or forced convection.
Oxygen convects and diffuses toward the reaction zone. The gas phase is
taken to be quasi-steady because its characteristic time is much less
than the condensed phase; this approximation would distort rapid transients
only. The gas and solid temperatures are locally equal, a very good
approximation for reverse smolder in a high specific surface area fuel.
Heat from the reactions can accumulate, be convected, conducted or
transferred by radiation; this last is treated with the forward/reverse
approximation. The set of nine time and space dependent differential
equations is solved numerically.
The model is semi-quantitatively successful in predicting observed
reverse smolder trends and parameter values. Smolder velocity is of the
right magnitude; it and peak temperature increase with air flow or 0^
level at approximately the correct rate. Another correct prediction by
the model is that the oxygen/fuel equivalence ratio of the smolder zone
increases with supply; this is a distinctive feature of reverse
smolder that allows it to adapt to very low supply rates. The model
has definite deficiencies; it substantially underestimates total fuel
gasification and peak temperatures are some 75°C below experimental
values. Part of this is due to the inadequate description of the polyurethane
chemistry; the model will be tested further by the author on a cellulosic
system with fewer complications in the chemistry.
Figure 3 shows some of the variable profiles at a particular time
when the system is fully ignited and is propagating under the diminishing
influence of the igniting heat flux at x = 0. In comparing this reverse
smolder wave structure with the specialized forward smolder case in Fig.
2, one should recall the differing relative directions of movement of
smolder zone and gas flow inherent in the two configurations. Quantitative
comparisons of peak temperature or smolder velocity are deceptive because
of drastically differing air supply rates, about 150X greater in the
forward smolder case. Comparative experiments for the same fuel and air
supply (12) show that forward and reverse smolder temperatures are
comparable but that forward smolder propagation is an order of magnitude
slower
.
295
Note in Fig. 3 that the oxygen is now present on the fuel heat-up
side of the wave, affecting the chemistry there. Its presence there has
another consequence. As soon as an element of fuel reaches a reactable
temperature, it will do so. This cuts off some oxygen to the remainder
of the reaction zone and, in effect, moves the zone toward the oxygen
supply. In other words, this reverse smolder wave propagates at a rate
determined by heat transfer to the virgin fuel and it can leave behind a
varying amount of unburned material. The rate at which heat is generated
and made available for transfer is dictated by the oxygen supply so,
ultimately, this smolder process is also oxygen controlled.
An important consequence of the tendency for reverse smolder to
leave fuel behind is that it provides insulation to the reaction zone. When
one looks for a domain of non-self-sustaining smolder, the bounds of the
domain depend on the duration of the igniting heat flux. If the flux is
sustained long enough, the reaction zone manages to propagate inward and
insulate itself more and more, finally becoming self-sustaining. This
kind of realistic complication to the question of extinction limits
cannot be handled by simpler steady-state smolder models.
Conclusions
Smoldering combustion is not a well-characterized process. Certain
salient features, such as its oxygen limited character, are widely
recognized and reasonably described though almost always in highly
specialized models. While such models are always of value if they
correlate a set of observations, in general there has been too much
attention devoted to devising a model describing some very limited set
of parameter studies and very little attention devoted to ascertaining
what aspects of the process might be exploited in efforts to control
it. As with flaming combustion, the most practical means of control
will very likely be chemical in nature. This implies two things.
First, much more will have to be learned about the chemistry of smolder
—
what governs char formation and reactivity, what is the nature of low
temperature exothermic reactions in polymeric fuels, what are the key
296

details of char oxidation. Second, models incorporating tractable
descriptions of these chemical processes need to be developed and studied
in an effort to clarify the context in which this chemistry occurs and
to quantify the sensitivity of the overall smolder process to changes in
individual chemical "steps". It may well be that inhibition of one
"step" in the process, e.g., char formation, is more effective than
inhibiting another such as char oxidation. That is, modeling can help
focus chemical efforts on the most productive approaches to smolder
suppression.
As the various models above imply, the context in which the chemistry
is expressed (i.e., the temperature range, heating rate, oxygen level)
varies with the problem at hand; this, of course, affects the chemistry.
Models inclusive enough to help clarify some of these overall chemical
effects must inevitably be physically simplified. The two fully 1-D
limiting cases of Fig. 1, i.e., 1-D forward and reverse smolder, are the
logical starting points. While they do not necessarily bracket the full
range of behavior that might be exhibited in realistic multi-dimensional
smolder problems (especially those that fall in the lower half of Fig.
1) , they do represent opposing poles of a sort which can be identified
to varying degrees in real world problems. A comparative study of
forward and reverse smolder for the same fuel under the same conditions
would provide an excellent qualitative base from which to assess the
interaction of chemical and physical aspects of smolder in realistic
configurations. A preliminary experimental study along these lines of
overall smolder characteristics will soon be available (12) . The 1-D
reverse smolder model discussed above is available, although possibly in
need of some refinements; a forward smolder model adapted from it is
being developed (41)
.
There is a need for more information on the physical, thermal and
chemical structure of propagating smolder waves in realistic problem
configurations. Since the early work of Palmer (5) and Egerton et al.
(10) there has not been a great deal of work in this area. A notable
exception is the work of Baker (43,44) which has had great impact on the
cigarette smolder field.
297

Figure 4 is an example of some recent results obtained by the
author on the thermal structure of a 2-D smolder wave propagating hori-
zontally through an IS cm layer of cellulosic insulation (wood fibers)
.
This is the problem of Cohen and Luft on a larger scale.) This system
is still under study but it appears to be driven by the combined
exothermicities of char formation and char oxidation and is largely
forward smolder in character; this last is due to predominant, but not
exclusive, supply by diffusion from above. The point to note here is
that real 2-D or 3-D problems do introduce considerable additional
complexity and ambiguity of interpretation. The concepts to be quantified
by the 1-D models discussed above do indeed seem qualitatively applicable
here but this is an underdeveloped area and one must move with caution.
The caution is increasingly needed as diffusive transport processes
in the fuel element become more difficult. Little is known in the area
of smolder propagation in fuels where the conditions in Eqn (1) fail
completely; available data (9,17,24) are suggestive only. The only
complex model the author is aware of which resembles this case assumes
zero fuel permeability (45) and a single reaction at the gas/solid
interface. It is idealized in other ways as well but could provide some
insights for such problems as wood smolder. Any further modeling efforts
here should be preceded by experiment.
Another key aspect of the smolder problem is largely unexplored,
i.e., transition from smolder to flaming. It is a frequent end result
of the increasing intensity of smolder with increasing air supply as was
noted by several investigators (5,13,17,27,28). Exactly what conditions
are necessary for a switch from the dominance of heterogeneous oxidation
to the dominance of gas phase oxidation is essentially unknown at this
point. Since the transition can lead to a sudden loss of life and
property, it requires close study.
298
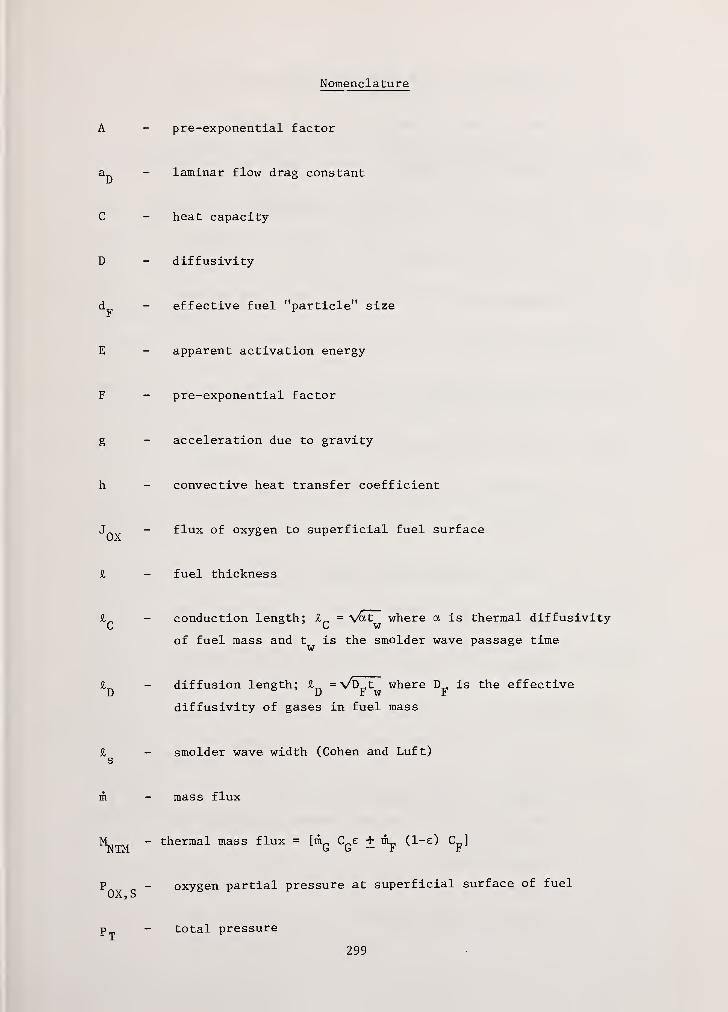
Nomenclature
pre-exponential factor
laminar flow drag constant
heat capacity
dif fusivity
effective fuel "particle" size
apparent activation energy
pre-exponential factor
acceleration due to gravity
convective heat transfer coefficient
flux of oxygen to superficial fuel surface
fuel thickness
conduction length; l n = V&it where a is thermal dif fusivityL w
of fuel mass and t^ is the smolder wave passage time
diffusion length; £_ = VD_t where D_ is the effectiveD r W r
diffusivity of gases in fuel mass
smolder wave width (Cohen and Luft)
mass flux
thermal mass flux = [m^ C^z + m^, (1-e) Cp
]
oxygen partial pressure at superficial surface of fuel
total pressure
299
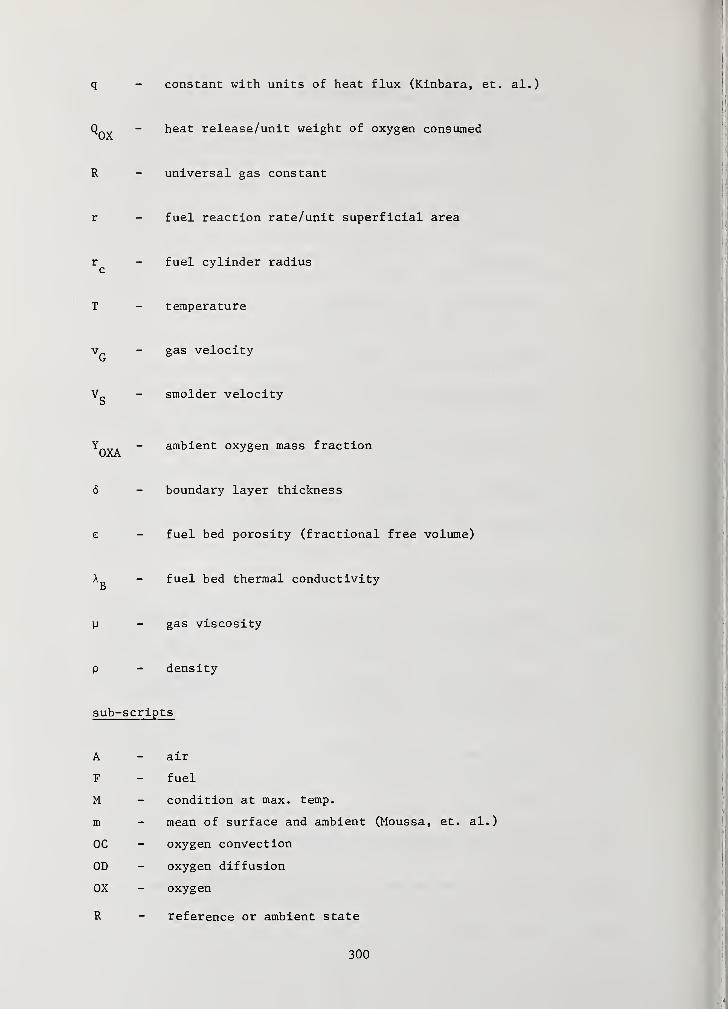
q - constant with units of heat flux (Kinbara, et. al.)
Qn - heat release/unit weight of oxygen consumed
R - universal gas constant
r - fuel reaction rate/unit superficial area
rc
- fuel cylinder radius
T - temperature
v - gas velocity
Vg - smolder velocity
Y - ambient oxygen mass fraction
6 - boundary layer thickness
e - fuel bed porosity (fractional free volume)
A - fuel bed thermal conductivitya
u - gas viscosity
p - density
sub-scripts
A - air
F - fuel
M - condition at max. temp.
m - mean of surface and ambient (Moussa, et. al.)
OC - oxygen convection
OD - oxygen diffusion
OX - oxygen
R - reference or ambient state
300

References
1. Bradbury, A. and Shafizadeh, F. , "Role of Oxygen Chemisorption in
Low-Temperature Ignition of Cellulose," Combustion and Flame 37 , p. 85 (1980).
2. Bradbury, A. and Shafizadeh, F., "Chemisorption of Oxygen on CelluloseChar," Carbon 18, p. 109 (1980).
3. Glassman, I., Combustion , Academic Press, New York (1977), Chapter 9.
4. Clarke, F. and Ottoson, J., Fire J. , p20, May 1976.
5. Palmer, K. , "Smoldering Combustion in Dusts and Fibrous Materials,"Combustion and Flame I, p. 129 (1957).
6. McCarter, R. , "Smoldering Combustion of Cotton and Rayon," J. ConsumerProd. Flamm. , 4, p. 346 (1977).
7. Gann, R. ,Earl, W. , Manka, M. and Miles, L. , "Mechanism of Cellulose
Smoldering Retardancy by Sulfur," paper presented at Eighteenth Symposium(International) on Combustion, Waterloo, Canada, August 1980.
8. Cohen, L. and Luft, N. , "Combustion of Dust Layers in Still Air,"Fuel 34, p. 154 (1955).
9. Kinbara, T. , Endo, H. and Sega, S., "Downward Propagation of SmolderingCombustion Through Solid Materials," Proceedings of the EleventhSymposium (International) on Combustion, The Combustion Institute,
Pittsburgh, 1967, p. 525.
10. Egerton, A. Gugan, K. and Weinberg, F. , "The Mechanism of Smoldering
in Cigarettes," Combustion and Flame , 7_, p. 63 (1963).
11. Rogers, F. and Ohlemiller, T. , "Smolder Characteristics of a PolyurethaneFoam," J. Fire Flamm. , 11, p. 32 (1980).
12. Lucca, D. , "A Comparative Experimental Study of Forward and Reverse SmolderPropagation in a Cellulosic Material," MSE Thesis, Mechanical and AerospaceEngineering Dept. , Princeton University, in preparation.
13. McCarter, R. , National Bureau of Standards, private communication.
14. Bowes, P. and Townshend, S. ,"Ignition of Combustible Dusts on Hot Surfaces,"
Brit. J. Appl. Phys . 1_3, p. 105 (1962).
15. Ohlemiller, T. and Rogers, F. , "Cellulosic Insulation Material II. Effectsof Additives on Some Smolder Characteristics," to be published in CombustionScience and Technology.
301
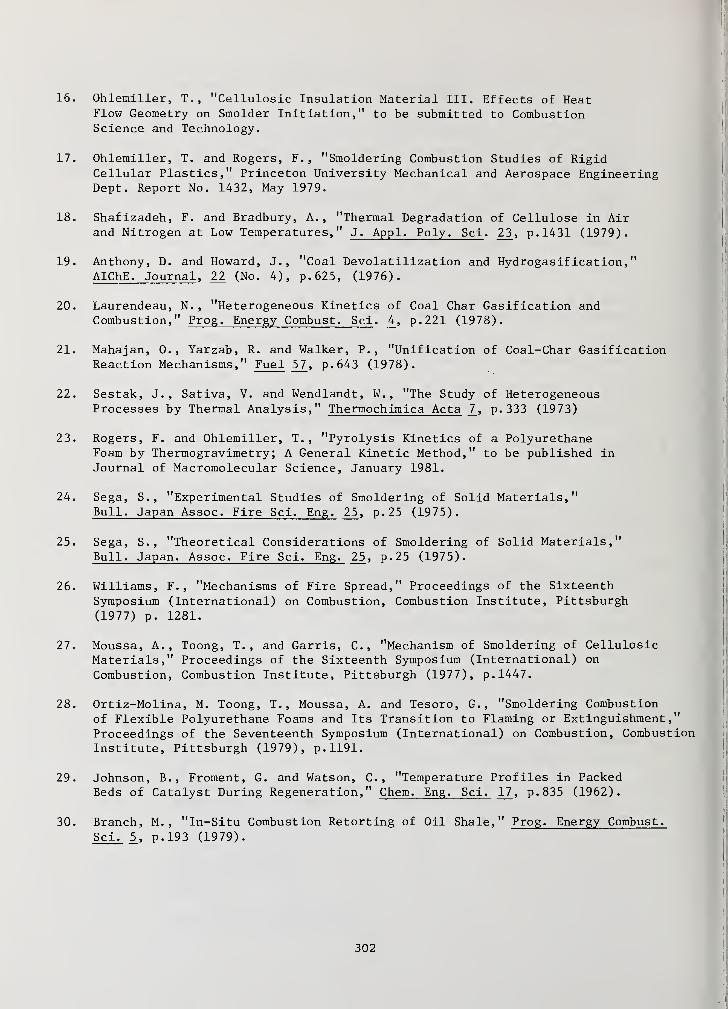
16. Ohlemiller, T., "Cellulosic Insulation Material III. Effects of HeatFlow Geometry on Smolder Initiation," to be submitted to CombustionScience and Technology.
17. Ohlemiller, T. and Rogers, F. , "Smoldering Combustion Studies of RigidCellular Plastics," Princeton University Mechanical and Aerospace EngineeringDept. Report No. 1432, May 1979.
18. Shafizadeh, F. and Bradbury, A., "Thermal Degradation of Cellulose in Airand Nitrogen at Low Temperatures," J. Appl. Poly. Sci . 23 , p. 1431 (1979).
19. Anthony, D. and Howard, J., "Coal Devolatilization and Hydrogasif ication,
"
AIChE. Journal , 22 (No. 4), p. 625, (1976).
20. Laurendeau, N. , "Heterogeneous Kinetics of Coal Char Gasification andCombustion," Prog. Energy Combust. Sci . 4, p. 221 (1978).
21. Mahajan, 0., Yarzab, R. and Walker, P., "Unification of Coal-Char GasificationReaction Mechanisms," Fuel 57 , p. 643 (1978).
22. Sestak, J., Sativa, V. and Wendlandt, W. , "The Study of HeterogeneousProcesses by Thermal Analysis," Thermochimica Acta 7, p. 333 (1973)
23. Rogers, F. and Ohlemiller, T. ,"Pyrolysis Kinetics of a Polyurethane
Foam by Thermogravimetry ; A General Kinetic Method," to be published in
Journal of Macromolecular Science, January 1981.
24. Sega, S. , "Experimental Studies of Smoldering of Solid Materials,"Bull. Japan Assoc. Fire Sci. Eng. 25, p. 25 (1975).
25. Sega, S. , "Theoretical Considerations of Smoldering of Solid Materials,"Bull. Japan. Assoc. Fire Sci. Eng. 25 , p. 25 (1975).
26. Williams, F. , "Mechanisms of Fire Spread," Proceedings of the SixteenthSymposium (International) on Combustion, Combustion Institute, Pittsburgh
(1977) p. 1281.
27. Moussa, A., Toong, T. , and Garris, C, "Mechanism of Smoldering of CellulosicMaterials," Proceedings of the Sixteenth Symposium (International) on
Combustion, Combustion Institute, Pittsburgh (1977), p. 1447.
28. Ortiz-Molina, M. Toong, T. , Moussa, A. and Tesoro, G. ,"Smoldering Combustion
of Flexible Polyurethane Foams and Its Transition to Flaming or Extinguishment,"Proceedings of the Seventeenth Symposium (International) on Combustion, CombustionInstitute, Pittsburgh (1979), p. 1191.
29. Johnson, B. , Froment, G. and Watson, C, "Temperature Profiles in PackedBeds of Catalyst During Regeneration," Chem. Eng. Sci. 17
, p. 835 (1962).
30. Branch, M. , "In-Situ Combustion Retorting of Oil Shale," Prog. Energy Combust.
Sci. 5, p. 193 (1979).
302

31. Kotowski, M. and Gunn, R. , "Theoretical Aspects of Reverse Combustionin the Underground Gasification of Coal," US ERDA Laramie Energy ResearchCenter Report LERC/RI-76/4, Laramie, Wyoming, March 1976.
32. Winslow, A., "Numerical Model of Coal Gasification in a Packed Bed,"Proceedings of Sixteenth Symposium (International) on Combustion, CombustionInstitute, Pittsburgh (1977) p. 503.
33. Krantz, W. , Keyashian, M. , Zollars, R. and Gunn, R., "Stability of
Forward and Reverse Wet Combustion Fronts in Porous Media," paper presentedat Society of Petroleum Engineers 53rd Fall Technical Conference, Houston,October 1978, SPE Paper No. 7523.
34. Thorsness, C. , Grens, E. and Sherwood, A., "A One-Dimensional Model forIn-Situ Coal Gasification," Univ. of California Lawrence LivermoreLaboratory Report UCRL-52523, August 1978.
35. Dockter, L. and Harris, A., "A Mathematical Model of Forward CombustionRetorting of Oil Shale," US DOE Laramie Energy Technology Center ReportLETC/TPR-78/1, July 1978.
36. Gunn, R. and Whitman, D. , "An In-Situ Coal Gasification Model (Forward Mode)for Feasibility Studies and Design," US ERDA Laramie Energy ResearchCenter Report LERC/RI-76/2, Laramie, Wyoming, February 1976.
37. Summerfield, M. , Ohlemiller, T. and Sandusky, H. , "A ThermophysicalMathematical Model of Steady-Draw Smoking and Predictions of OverallCigarette Behavior," Combustion and Flame 33 , p. 263 (1978).
38. Muramatsu, M. , Umemura, S., and Okada, T., "A Mathematical Model of
Evaporation-Pyrolysis Processes Inside a Naturally Smoldering Cigarette"Combustion and Flame 36, p. 245 (1979).
39. Williams, F. , Combustion Theory , Addison-Wesley , Reading Mass. (1965), p. 21.
40. Ohlemiller, T. , Bellan, J. and Rogers, F., "A Model of Smoldering CombustionApplied to Flexible Polyurethane Foams," Combustion and Flame 36 , p. 197 (1979).
41. Ohlemiller, T. and Padmanabhan, M. ,unpublished results.
42. Baker, R. and Kilburn, K. , "The Distribution of Gases Within the CombustionCoal of a Cigarette," Beitrage Zur Tabakforschung 7, p. 79 (1973).
43. Baker, R. ,"Temperature Distribution Inside a Burning Cigarette," Nature 247 ,
p. 405 (1974).
44. Baker, R. , "Combustion and Thermal Decompositon Regions Inside a Burning
Cigarette," Combustion and Flame 30 , p. 21 (1977).
45. Sirignano, W. ,"Theory of Flame Spread Above Solids," in Lectures on
Combustion Theory, New York University Courant Institute Report COO-3077-153
,
Spetember 1978.
46. Palmer, K. , Dust Explosions and Fires , Chapman and Hall, London (1973).
303
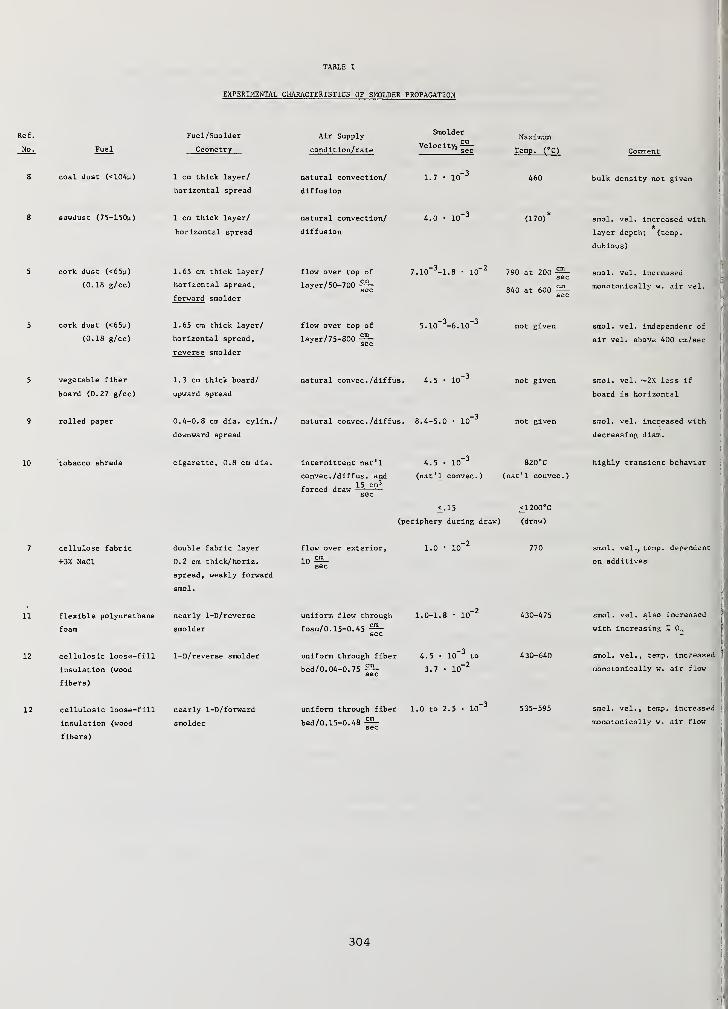
TABLE I
EXPERIMENTAL CHARACTERISTICS OF SMOLDER PROPAGATION
Ref.
No. Fuel
Fuel/Smolder
Geometry
Air Supply
condition/rate
Maximum
Temp. (°C) Comment
coal dust (<104u) 1 cm thick layer/
horizontal spread
natural convection/
diffusion
1.7-10 460 bulk density not given
sawdust (75-150u) 1 cm thick layer/
horizontal spread
natural convection/
diffusion
(170) stool, vel. increased with
layer depth; (temp,
dubious)
cork dust (<65u)
(0.18 g/cc)
1.65 cm thick layer/
horizontal spread
,
forward smolder
flow over top of
layer/50-700 —7.10 -1.8 • 10 790 at 200
840 at 600
smol . vel . increased
monotonically w. air vel.
cork dust (<65u)
(0.18 g/cc)
1.65 cm thick layer/
horizontal spread
,
reverse smolder
flow over top of not given smol. vel. independent of
air vel. above 400 cm/sec
vegetable fiber
board (0.27 g/cc)
1.3 cm thick board/
upward spread
natural convec./diffus. 4.5 10 not given smol. vel. ~2X less if
board is horizontal
rolled paper 0.4-0.8 cm dia. cylin./
downward spread
natural convec./diffus. 8.4-5.0 • 10 not given smol. vel. increased with
decreasing diam.
10 tobacco shreds cigarette, 0.8 cm dia. intermittent nat'l 820°C
convec./diffus. and (nat'l convec.) (nat'l convec.)
c j j 15 cm 3
forced draw
<.15 <1200°C
(periphery during draw) (draw)
highly transient behavior
cellulose fabric
+3% NaCl
double fabric layer
0.2 cm thick/horiz.
spread, weakly forward
smol.
flow over exterior,
10-25-
770 smol. vel ., te:np. dependent
on additives
11 flexible polyurethane
foam
nearly 1-D/reverse
smolder
uniform flow through
foam/0.15-0.45 —1.0-1.8 • 10 smol . vel . al so increased
with increasing Z 0^
12 celluloslc loose-fill
insulation (wood
fibers)
1-D/reverse smolder uniform through fiber
bed/0.04-0.75 —4.5 • 10 to
3.7 • 10"2
430-640 smol. vel., temp, increased
monotonically w. air flow
cellulosic loose-fill
insulation (wood
fibers)
nearly 1-D/forward
smolder
uniform through fiber 1.0 to 2.5 • 10
bed/0.15-0.48 —535-595 smol. vel., temp. Increased
monotonically w. air flow
304
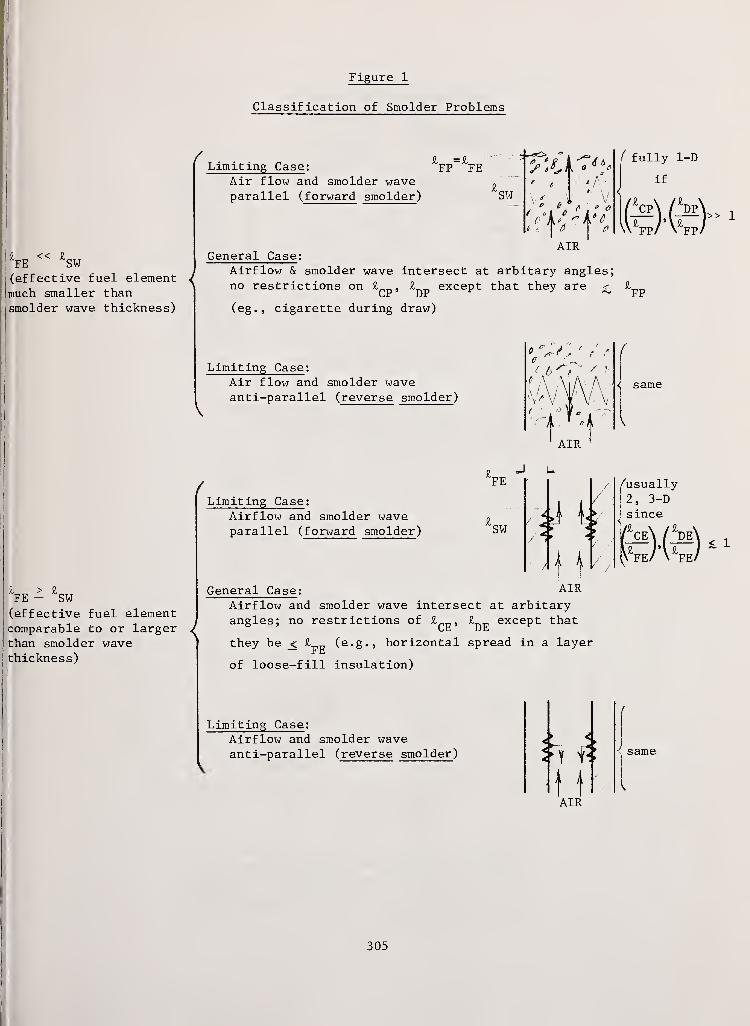
Figure 1
Classification of Smolder Problems
i, « I,FE '"SW
(effective fuel element J
much smaller thansmolder wave thickness)
Limiting Case ;
Air flow and smolder waveparallel (forward smolder)
General Case:
Vp £fe
SW
0„ ' ?
V0 0 » 1
AIR
FE - SW(effective fuel elementcomparable to or largerthan smolder wavethickness)
Airflow & smolder wave intersect at arbitary angles;no restrictions on SL,
'CP'Jl^p except that they are
"FP
V
(eg., cigarette during draw)
Limiting Case :
Air flow and smolder waveanti-parallel (reverse smolder )
same
AIR
-J
Limiting Case :
Airflow and smolder waveparallel (forward smolder)
General Case:
FE
'SW
/ '
/ /
/usually
2, 3-Dsince
< 1
AIR
{
Airflow and smolder wave intersect at arbitaryangles; no restrictions of £
CE :I except that
they be < I (e.g., horizontal spread in a layerFh
of loose-fill insulation)
Limiting Case :
Airflow and smolder waveanti-parallel (reverse smolder )
t 1AIR
same
305
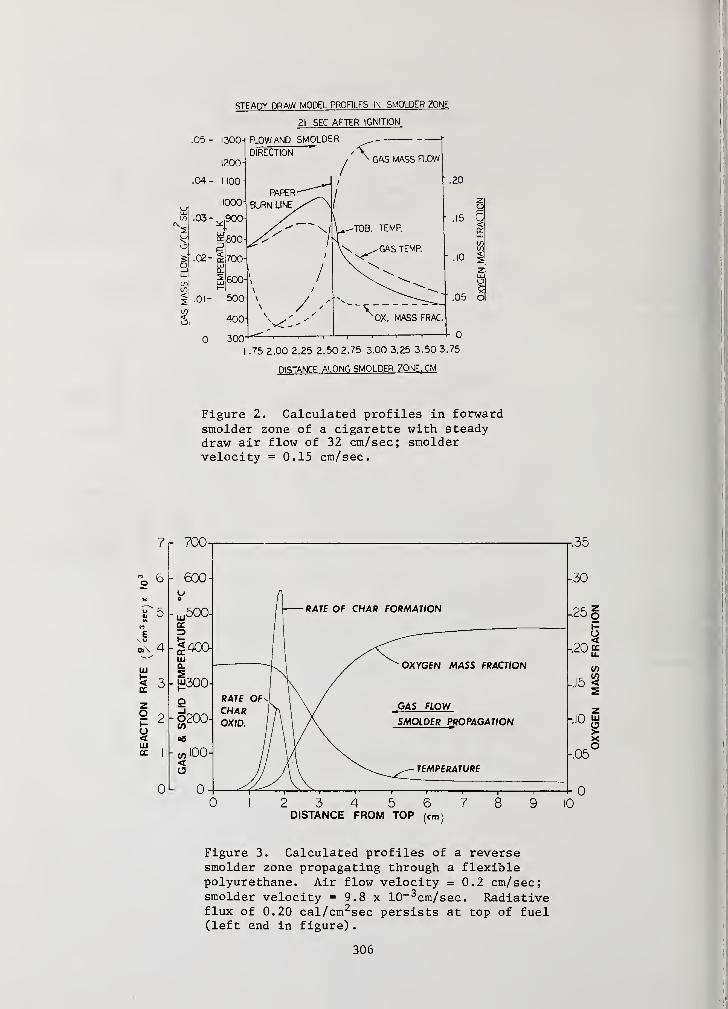
.03-
.02-
STEADY DRAW MODEL PROFILES IN SMOLDER ZONE
21 SEC AFTER IGNITION
.05
.04-
.01-
.75 2.00 2.25 2.50 2.75 3.00 3.25 3.50 3.75
DISTANCE ALONG SMOLDER ZONE. CM
Figure 2. Calculated profiles in forwardsmolder zone of a cigarette with steadydraw air flow of 32 cm/sec; smoldervelocity = 0.15 cm/sec.
DISTANCE FROM TOP (cm)
Figure 3. Calculated profiles of a reversesmolder zone propagating through a flexiblepolyurethane. Air flow velocity = 0.2 cm/sec;smolder velocity = 9.8 x 10~ 3cm/sec. Radiativeflux of 0.20 cal/cm2sec persists at top of fuel(left end in figure)
.
306
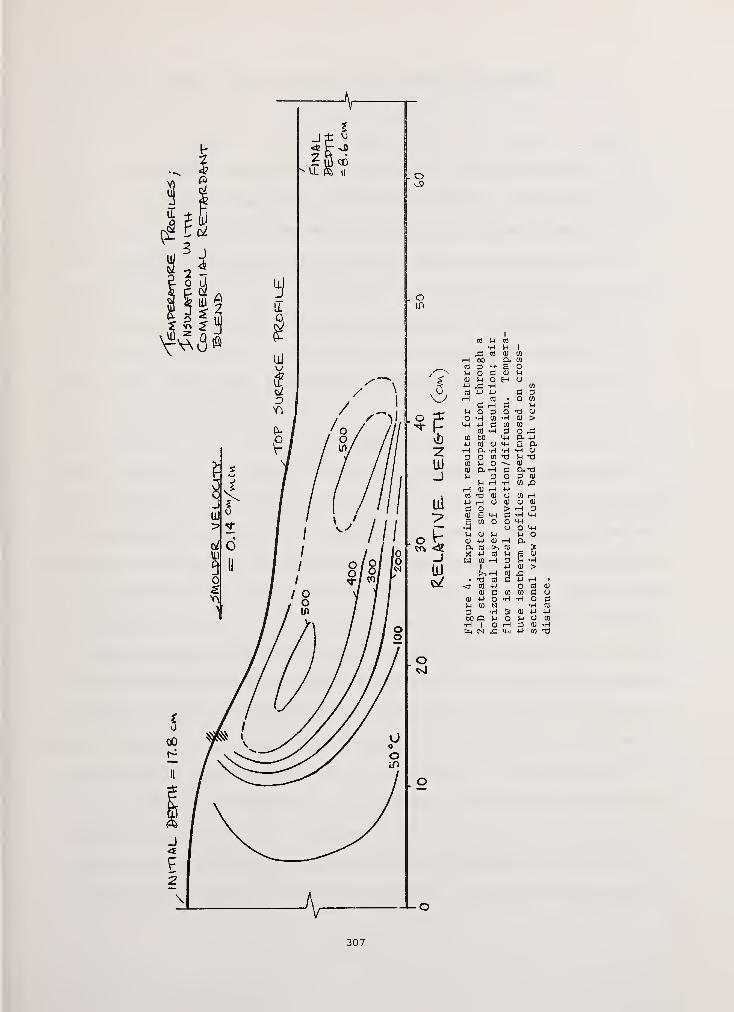
cd
&iH 60
u o4) t-l
n) 4-i
I
ca oi
- eC 41
O H•H
cn so4-1 tfl
i—I a, •
3 ow uai a t
uu .
.-i tu i
n) -a4->
(0 ^3oH Cd o
4) 4-J
a n)
X 4->
I
• 13
01
01 4->
u tn
360 P•H I
a) ao 01
0 ou
1-1
01 tH
s-i
.h 34-1
a) C4-1
C to
O -HN•H &V4 OO .H
U-i
O &CL 4J
e &.•H 0)
!J -O41
&, T33 01
W i-H
41 4)
.H 3•H M-l
4-1
O «-t
n op.
&S 41
•H>
cfl 01
C 0
307
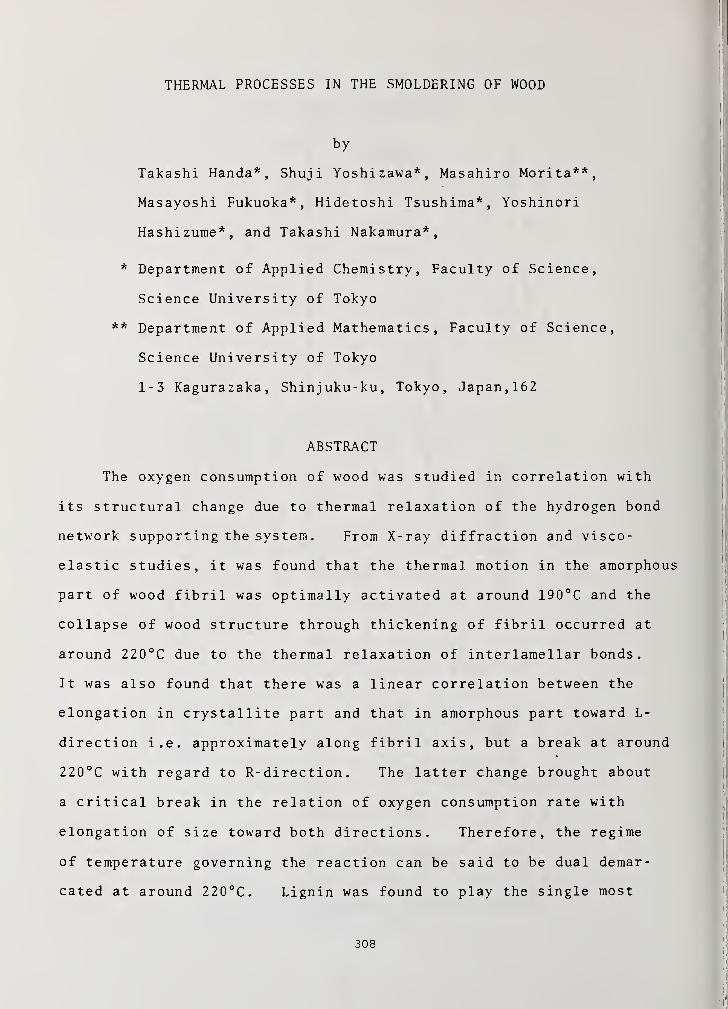
THERMAL PROCESSES IN THE SMOLDERING OF WOOD
by
Takashi Handa*, Shuj i Yoshizawa*, Masahiro Morita**,
Masayoshi Fukuoka* , Hidetoshi Tsushima*, Yoshinori
Hashi zume* , and Takashi Nakamura*
,
* Department of Applied Chemistry, Faculty of Science,
Science University of Tokyo
** Department of Applied Mathematics, Faculty of Science,
Science University of Tokyo
1-3 Kagurazaka, Shinjuku-ku, Tokyo, Japan, 162
ABSTRACT
The oxygen consumption of wood was studied in correlation with
its structural change due to thermal relaxation of the hydrogen bond
network supporting the system. From X-ray diffraction and visco-
elastic studies, it was found that the thermal motion in the amorphous
part of wood fibril was optimally activated at around 190°C and the
collapse of wood structure through thickening of fibril occurred at
around 220°C due to the thermal relaxation of interlamellar bonds.
It was also found that there was a linear correlation between the
elongation in crystallite part and that in amorphous part toward L-
direction i.e. approximately along fibril axis, but a break at around
220°C with regard to R-direction. The latter change brought about
a critical break in the relation of oxygen consumption rate with
elongation of size toward both directions. Therefore, the regime
of temperature governing the reaction can be said to be dual demar-
cated at around 220°C. Lignin was found to play the single most
308

significant role for the oxygen consumption in the first regime.
There was also an indication of an approximate coincidence in the
values of the apparent activation energies between oxygen consump-
tion rate and disclosure of hided sites with a correspondence to the
weight loss rate. The disclosure of hided sites in the second regime
above 220°C must be governed by a delay in the amorphitization of
crystallite part with temperature resulting in an indication of a
quasi first order or first order rate in the kinetics of weight loss
reactions. Therein, both values of apparent activation energies
in the first regime may be sustained with a correspondence to the
weight loss rate in the temperature range 130-280°C provided that
oxygen consumption occurred only by the disclosure of hided sites
in the amorphous part which was extented by a collapse of crystallite
part. Secondly, the effect of moisture in reducing the hazard for
the spontaneous ignition of wood during its thermal aging was discussed
with regard to the role of lignin and the state of arts of moisture
in wood. Finally, the calculations were made on-the basis of the
first order reaction rate utilizing the revised equation . Thereby, it
was assumed that the weight loss proceeded in a complex way through
the formation of char(l) which was made from cellulose by a transfer
of nascent oxygen from the thermal decomposition of the oxygen adducts
of active ingredients in lignin at higher temperature.
309
INTRODUCTION
We have studied so far on the thermal change in the physical
properties of wood-polymer alloys in correlation with those
pertinent to wood itself^ ^ . The objective of these studies
was originally from different prospect for the confrontation with
the deformation and rupture of the irradiated products by thermal
strain due to internal heat evolution in the graft-copolymerization
of synthetic monomers with lumber or a heap of fluffy cotton by
y-ray processing. A critical change occurred in the tangential
direction of wood dimension at around 220°C associated with an
indication of a significant break in its dynamic modulus which
was originated from the initiation of molecular motion in the
amorphous region at around 180°C leading to the scission of cellu-
lose chains in cellulosic fibrils at a high temperature. Abe
and Hirata have pursued the performance of fire retardants in
wood system^-' , As a related study, Hirata reported on the
thermal scission of molecular chains of -genuine cellulose in vacuo
elucidating the mechanism in the possibility for the scission of
molecular chains even at a temperature lower than 220°C ^ .
Hence, we may allow to propose that the thermal relaxation of
the tight hydrogen bond network supporting the wood system must
incur the penetration of oxygen into the cellular system and
as a consequence, will accelerate the chain scission besides the
genuine thermal process producing levoglucosan . Kosik et al.
reported that the oxygen consumption revealed at around 150°C^^^"^
We also probed the situation in the oxygen consumption in connection
with the thermal deformation of wood and cellulose structure covering
the range of temperature from 100°C to 220°C with regard to the
preparation of thermoresis tive wood and base panel of printed circuit
310
This is firstly because of the doubt as to whether the genuine
thermal process had really dominated the phase of thermal deterio-
ration of wooden and cellulosic materials in this range of tempera-
ture or the specific oxygen- affinity attributed to the chemical char-
acter of some ingredient governed the phase by making a cause for the
preferential break of the tight hydrogen bond network and secondly,
as to whether the latter character can really be one of the important
causes for the incidence of the spontaneous smoldering burn at around
the center of a pile of wood tips and saw dusts, and even in wood
cores far below their nominal ignition temperature after exposure
to hot environments with a long lapse of time.
The present paper deals first with the correlation between the
thermal processes and the oxygen consumption revealing in wood and
secondly, with the spontaneous smoldering ignition of thermally aged
wood core
.
EXPERIMENTALS
(1) Materials
Veneers used in the study were of rotary-cut beech 0.65mm
thick which were carefully selected from factory products of similar
quality. Filter paper (Toyo Filter Paper No. 2), cellulose film
(Cellulose Tubing by Visking Company), avicel SF, xylan, and lignin
were used as the reference materials of wood. All samples were
oven-dried in vacuo at 80°C for 30 hr, and then maintained in the
desiccator with phosphorus pentoxide in vacuo..
(2) Delignification of wood
Delignified wood was prepared by the sodium chlorite method.
The detailed procedures were as follows: ca. 30ml of distilled water
311
ca. 0.1ml of acetic acid, and ca. 0.3g sodium chlorite per lg of
wood were added to the specimens. Then, the system was heated at
70-80°C for 1 hr. After then, another ca. 0.1ml of acetic acid
and ca. 0 . 3g of sodium chlorite were added to the system per lg of
wood. The heating was continued at 70-80°C for another 1 hr.
After 6 times of chloriting processes at maximum in total, the treat-
ment was washed with cold water and then dried in vacuo.
(3) Measurements
The dynamic modulus E' and the loss modulus E" of the specimens
were measured by Vibron DDV-n. The measuring temperature was
raised from room temperature to 300°C at the rate of l°C/min.
Although E' and E" of specimens were measured in air, the contri-
bution of a slight amount of moisture to E' and E" was not recognized
during measurement at the higher temperature range over 100°C.
X-ray diffraction patterns of the pulverized specimens were
measured at room temperature for the range from 5° to 35° values
of 29 using Ni-filtered Cu-Ka radiation at 35kV and 20mA.
The moisture content (M.C.) of the specimens was controlled in
desiccators over two weeks at room temperature under different
standardized relative humidity (R.H.) using several kinds of solution
of inorganic salts. The M.C. of the system was adjusted to be kept
almost constant during measuring excluding the effect from the envir-
onmental humidity. Thereby, those data within the allowable
deviation of M.C. below 0.21 between before and after the measurement
were only adopted, particularly for those samples with an extremely
low and high M.C. For the samples within the allowable deviation
of moisture, the averages of M.C. before and after the measurement
were taken in specifying the M.C. samples. The instrument for the
312
measurement of the dielectric properties was equipped with a bridge
type transformer TRS-10C (An do Electric Co., Ltd.) and an electrode
which was capable to cover the measuring temperature range from -196°C
0°C. The dielectric constant e' and the loss factor e" were measured
along the radial direction of the specimens at each measuring fre-
quency from 30Hz to 1MHz.
Oxygen consumption of samples was determined according to the
procedure of W.L.Hawkins et al/ 14^ 15^ in which the amount of oxygen
reacting with the samples was measured volumetrically . The pressure
of oxygen inside the line was controlled at 760 mmHg by meas of a
manometer. Samples weighting 0.5g were placed in glass tubes along
with lOg of Molecular Sieve, Type 5A.
RESULTS AND DISCUSSION
(A) Oxygen Consumption and Thermal Deformation of Wood Structure
(a) Oxygen Consumption Below the Nominal Ignition Temperature
The situation in the oxygen consumption of wood and its ingre-
dients were studied covering the range of temperature from 100°C
to 220°C in connection with the thermal deformation of wood structure.
The test specimens were beech veneers (Fagus crenate Blume) which
we used in the measurements of the dynamic and the dielectric prop-
erties of wood. Thereby, L- , T- , and R-samples meant those veneers
which were cut out with size of 50 x 5 x 0.65mm and 34 x 34 x 0.65mm
by taking the longest perimeter toward the corresponding direction
of wood respectively. It should be noted hereby that the beech
wood is consisted of cellulose, hemicellulose , and lignin approxi-
mately in a weight ratio of 2:1:1. Fig.l shows the time - dependent
variation in the oxygen consumption of wood, delignified wood, and
313
some of those ingredients comprising the wood system at 200°C in
the genuine oxygen atmosphere. It is obvious that lignin possesses
the highest affinity with oxygen being subjected to the high reac-
tivity of its unstable components. Handa et al . elucidated that
those unstable components of lignin on the inner surface of vessels
had extensively terminated the propagating radicals of growing polymer
chains from irradiated radicals in the interior of wood cell through
recombination process in the manifacturing of wood-polymer alloys
under the electron beam irradiation . The next are mannan and
xylan in hemicellulose comprising the amorphous regions of wood
fibrils in combination with cellulose whereas the cellulosic system
either highly crystalline (Avicel) or lowly crystalline (Visking
tube) only exhibited a poor reactivity with oxygen in this range of
temperature. There was an indication of a fair coincidence of the
observed amount of oxygen consumption in wood with the calculated
one on the basis of those in lignin, delignified wood, mannan and
xylan taking the weight ratio of cellulose, hemicellulose, and
lignin as 2:1:1. Therefore, it can be said that about 751 of
oxygen consumption in wood was occupied by lignin leaving about 80%
of the rest 25% for hemicellulose. Therefore, it is suggested that
although there must be another kind of scission endorsed by oxygen,
almost of all scission of cellulose chain below this temperature
must be initiated by a genuine thermal process producing levoglucosan
.
Fig. 2 shows the situation in the oxygen consumption of wood with hot
bath temperature. The Arrehnius plot of the initial rate of oxygen
consumption vs 1/T gave approximately a straight line. Its slope
value of ca. 24kcal/mol was given as the apparent activation energy
of oxygen adsorption in the genuine oxygen atmosphere. A- similar
314

value of ca. 27kcal/mol was also given for that in air with a
decrease in frequency factor. Those values laid close to the value
of 26 . lkcal/mol given by Kinbara as the activation energy of the
f 1 7
1
weight loss rate of saw dusts in its spontaneous smoldering burn^ .
However, being evaluated with the same value of frequency factor,
the latter value in air converted to ca. 30kcal/mol. Fig. 3(a)
shows the effect of intermixed nitrogen in oxygen consumption at
200°C. There was an indication of an approximately linear relation
between oxygen consumption rate and oxygen partial pressure. Fig.
3(b) shows the correlation between the oxygen consumption and
the weight loss of the samples at 200°C in the genuine oxygen atmos-
phere. There was an indication of a linear correlation between
the weight loss and the amount of initial consumpt ion . Accounting
for the atomic ratios of C and H to 0 in the gasified fraction on the
basis of the lost weight of H, C and 0 as a sum of the weight of
each atom in the lost - fraction and adsorbed oxygen , it was found that
the atomic composition ratio in the gasified fraction were uniquely
of H-^Cj-Og irrespective of reaction time. Thereby, the contents of
H, C and 0 in wt% were 5.4%, 47.81, and 46.81 for the untreated
samples, 5.0%, 49.2%, 45.9% and 4.4%, 50.2%, 45.4% for the samples
exposed to oxygen for 4 and 12 hr, respectively. The content of
carbon in the exposed sample increased scarcely with time whereas
the contents of hydrogen and oxygen decreased. As a result, it
can be said that in a sense, the oxidative degradation proceeded
uniformly irrespective of an indication of the breaking in the
variation of the oxygen consumption with time. Hence, we may allow
to infer that only lignin reacted with oxygen and there must be a
delay of time between the adsorption of oxygen and its release in
315
the gasified fraction. That delay seems to be enhanced in the
oxygen consumption at a temperature lower than 180°C with an indica-
tion of a scarce recovery in the oxygen contents of the systems and
the increase of carbonyl groups in the infrared spectra.
Fig. 4 shows the pronounced pattern of such delay as reflected
in the differential weight loss which was promoted in the higher
range of temperature under oxygen- rich environment. Thereby, a fair
faster elevation rate of hot bath temperature of 2.5°C/min was taken.
As a result from the decomposition of the AW-Temperature diagram by
curve resolution, five phases appeared in the change of AW vs temp-
erature of the thermal decomposition of wood in the nitrogen atmos-
phere containing scarce oxygen. Therein, AVL.. was a difference
between the sample weight at a temperature T^ and W.. at T.. namely
AW^jEW^-W.. and AW-T diagram was prepared by taking always AT^j=4°C.
The first phase must be concerned with the thermal decomposition of
hemicellulose , the second and third ones with cellulose, the
fourth one with lignin, respectively and the fifth one is presumed
to be from the charred residues. Similarly, five phases appeared
in the oxidative thermal decomposition in air. Particularly, the
second and third phases are suggested to come from the decomposition
of cellulose in the scheme as Dr. Roger and Prof. Dr .Ohlemiller pro-
posed^ 18\ It seems likely that as the oxygen partial pressure
increased, the oxidative decomposition was promoted and the diagram
revealed apparently to be consisted of two major peaks by the shift
of third, fourth and fifth peaks to the lower temperature side due
to the accelerated charring of the oxidized products of lignin -to
oromote the scission of cellulose chain by the supply of nascent oxy-
gen from the decomposition .of' the former under the oxygen-rich atmosphere.
316
(b) Thermal Change in Wood Structure
It is generally accepted that the thermal change in wood
structure can be attributed first to the local relaxation of the
tight hydrogen bond network consisted of interlamellar , inter and
intra fibrilar hydrogen bonds to thermal relaxation and secondly,
to the scission of cellulosic chains due to strain coming from
thermal deformation of structure. As the complex pattern in the
thermal changes of wood structure is well reflected on the changes
in various physical properties of wood, it is not too far saying
that we can know the extent to which a certain change occurs by
detecting the change in the corresponding physical properties.
Fig. 5 shows the dilatometric change of wood dimension with
temperature along the longer direction of test specimens which
were cut out by taking the longest perimeter toward L- , and T-
direction of rotary-cut beech lace veneers, respectively. There
was an indication of the system for the inflexion of the thermal
expansion toward R-direction at around 220°C and also the compensated
inflexion to promote the elongation toward L-direction at around
230°C respectively being in overall resulted in a serious contraction
of volume above 220°C.
Fig. 6 shows the thermal changes in (002) spacing of the cellulose
crystallite and the half width angle of (002) with hot bath tempera-
ture by X-ray diffraction^. Thereby, the latter represents
changes in the fibril orientation suggesting that the thickening of
fibrils occurs at around 220°C in a way to take the maximum fibril
angle due to the thermal relaxation of interlamellar hydrogen bond
system. Comparing the macroscopic dilatometric change in Fig. 4 with
the microscopic one in Fig. 5, it was found that there was an :..
317
excellent linear correlation between the dimensional change in the
crystalline part as represented by the elongation of (002) spacing
and that in amorphous part as represented by the elongation of sample
toward L-direction. However, there was a revelation of break at
around 210°C in the linear correlation with regard to T-direction.
Further, the elongation of the (002) spacing was particularly
promoted above 230°C being corresponded with the enhanced elongation
toward L-direction. The promoted elongation must be caused by the
random scission of cellulosic chains revealing eminiently above 230°C
even in vacuo with an indication of levelling off degree of polymer-
ization (DP^) of ca. 600 after 3 hr at around that temperature and
DPro
of ca. 200 after 2 hr at around 260°C. Thereby, it should be
noted that the split fractions must be recrystallized into micro-
crystallites by cooling because of an indication of the elevation
in the crystallinity index of the test specimens after the exposure
(19)to repeated cycles of heat cure below 220°C^ 3J
. Above 250°C, the
enhanced stretching occurs toward L-direction in a way so as to
reduce the fibril angle by the dislocation leading to the rupture
of crystallite due to the thermal strain from the peeling motions
of the defolded tails which are entangled with the chains in the
amorphous part. The thermal motions of those molecules consisting
f amorphous part of wood ate activated optimally at around 190°C
as will be referred to in the succeeding discussion.
Fig. 7 shows the correlation between the oxygen consumption
and the dilatometric change in wood dimension. Remembering that
the initial rate of oxygen consumption illustrated a linear
plot vs 1/T and the cellulosic material either highly or lowly cry-
stalline exhibited a poor oxygen consumption at 200°C, the revelation
318

of anomalous break at around 210°C in the increase of oxygen consump-
tion with the elongation of size either toward both L- and Indirec-
tions suggests that the corresponding increase in the specific
internal area occurred by the disclosure of hided sites of lignin
and hemicellulose due to an extensive relaxation of interlamel lar
hydrogen bonds sustaining cellulosic fibrils in the temperature
range 210-230°C.
The predicted rupture of hydrohen bond network of cellulosic
fibrils in that temperature range can be said to be substantially
reflected in the break of the dynamic modulus of wood in the tempera-
ture range 210-250°C with revelation of the loss modulus peak at
around 220°C for T-samples and the at around 240°C for L-samples
respectively. The thermal behaviors of the dynamic modulus E'
and the loss modulus E" for T-samples at the measuring frequency
of 110Hz, 35Hz, and 11Hz are shown in Fig. 8. Approximately the
same pattern was also observed with regard to the measurement in
terms of the vibrating method. Similar patterns were observed in
the thermal dispersion of the dynamic shear G' and the loss modulus
G" which were measured by torsion pendulum in vacuo at a measuring
frequency of ca. 0.3Hz for L- and T-samples of oven-dried beech
veneers. Fig. 9 shows the variation in the temperature dispersion
of E' and E" with grain angle. The peculiar shift of the indicated
temperature of E" peak is based on the anisotropic character of the
thermal relaxation conforming to the spatial angle between grain and
fibril. Fig. 10 shows the temperature dispersion of E f of delignified
T-samples. The delignified samples indicate a higher crystal linity
index than that of the ordinary ones by X-ray diffraction. The
temperature dispersion of E' and E" looks like that of the ordinary
319
T-sample. This indicates that although the oxidation of lignin
proceeded considerably in the range of temperature lower than 220°C,
lignin itself was not authentically involved in this phase of struc-
tural change. Fig. 11 shows the overall change of dynamic modulus
and the loss modulus of wood (L-sample) at a measuring frequency of
110Hz and in ^ containing scarce oxygen covering the range of temp-
erature from 30°C up to 320°C which is nominated as decomposition
temperature of cellulose by DTA study. An intense decrease in E£
and the corresponding rise of E^ revealed suggesting the collapse
of fibril system.
As a result, togather the results so far^ 5^ 8^, eight E" bands
revealed in overall as pertinent to wood (M.C.=1%). They are
summarized in Fig. 12 and are assigned as follows: Band(a) at around
300°C comes supposedly from the defolded and zig-zag bridged short
chains of dehydrated cellulose due to the thermo-oxidative scission
of chain and cross-linking. Band(b) at around 250°C comes from the
decrystall i zing structural change to stretch fibrils being accompanied
by the shrinkage along the T-direction. Band(c) at around 220°C
comes from the degradative structural change to thicken fibrils due
to the thermal relaxation of the interlamellar hydrogen bonds.
Band(d) at around 190°C comes from the transition in the molecular
motion of amorphous cellulose and hemicellulose . The magnified
revelation of this loss band was confirmed by the lower temperature
shift of band(b) and band(c) in the decrystallized samples'^.
Band(e) at around 135°C comes from the deformation in the fibril
orientation by the disorder in its conformation close to the surface
of the cell wall. It was confirmed that a magnified activation of
this loss band revealed due to the thermal perturbation by polymer
320
produced outside the cell wall in polymer-wood alloys .
Band(f) at ca. 100°C comes from the dehydration of movable water
associated with the hydrogen bond in wood. Band(g) at ca. -50°C
for ordinary sample (M.C.2%) consists of dual bands. BandCg^) comes
from the relaxation of hydrogen bond involved in the local mode
motion of wood system due to moisture and Band(g2) comes from the
intrisic mode of cellulosic segments etc. Band(h) at ca. -120°C
must come from the rotational motion of the methylol (C^OH) groups
in wood. Therefore, it is allowable to conclude that eight step-
wise transitions occur in structural change and transition of wood.
The apparent activation energy for the thermal relaxations of hydro-
gen bond system attributed to bonds (a), (b) , (c),
(d) , (e), (g)
,
and (h) are estimated to be °°, 440 , 160 , 80 ,25- 30, 16 , and ca. 9
kcal/mol, respectively. Those for the thermal relaxations perti-
nent to bonds (a), (b) and (c) are anomally high. Hence, it is
suggested that the thermal scission of the glucosidic linkage must
occur involving the chemical reaction (dehydration cross- linking
and oxidation) before the system decomposes into single cellulosic
chains. Fig. 13(a), (b) shows the similar changes in the temperatur
dispersion of dielectric constant (e') and the loss factor (e") for
the oven-dried R-sample. It may be allowable to presume the low
measuring frequency (110Hz) represents the rotational motion of
C^OH groups with an indication of the loss peak for the rotational
motion of Ch^OH groups at a temperature close to -110°C (oven-dried)
and the high frequency (1MHz) rather responds with the motion of
OH groups. The former motion begins to be activated thermally at
around 135°C whereas the latter motion begins to be activated at
around a temperature higher than 200°C. The revelation of another
321
e" peak was confirmed at around -40°C due to hydration for R-samples
with M.C. of 1.2%^ 20 ^ (21)^ p^g > ^4 reveals the higher temperature
shift of the e" peak coming from the rotational motion of Ch^OH
groups for the heat cured samples at 240°C for 1 hr. The increase
in the value of the activation from 9.4kcal/mol to 12 . 8kcal/mol
associated with the higher temperature shift of that e" peak suggests
the possibility for the formation of cross - linking among cellulosic
chains in fibrils which promotes the restriction on the rotational
motion of CF^OH groups exposed to the channel among the folded
chains in the lamella. Fig. 15 shows the corresponding changes in
DTA thermogram. Curve (a), curve (b) , and curve (c) represent the
thermogram of beech veneers in air, ^ with a trace of oxygen and
the well known endothermic ones in genuine Ar environment, respect-
ively. The dotted line associated with curve (a) means the change
in the ratio of CO to CC^ in weight i.e. WC0/WCO2 with temperature.
It was assigned by many authors that the exothermic peak which
revealed at around 400°C in curve (a) came from the combusion of
oxidized lignin whereas the shoulder and peak at around 280°C and
310°C came from the hemicellulose and cellulose. From the change
in WC0/WCO2 with temperature and our foregoing results in the
oxygen consumption of each gradient at 200°C, it is evident that
lignin was oxidized in the lower range temperature and the oxidized
products must be decomposed vigorously at a high temperature around
400°C. As shown by curve(c), the thermal decomposition of wood
in Ar is authentically endothermic throughout the process. Curve (b)
suggestes the initiation of oxidation due to the scarce present of
oxygen at around 150°C corresponding to the relaxation of hydrogen
bond in the amorphous parts. The exothermic peak at around 150°C
322
in the dotted curve associated with curve (b) in rigid line represents
the estimated heat possibly issumed by the oxygen consumption of
lignin which was located close to the surface of cell wall. The
cross-over from endothermic to exothermic of curve (b) revealed at
around 225°C by the penetration of oxygen due to the aforementioned
thermal relaxation of hydrogen bond network in fibrils corresponding
to the E" band(b) and .(c) in the thermal change of E" in Fig. 14.
The higher temperature exothermic peaks at around 300°C in the
dotted curve must come from the oxidation of hemicellulose and
cellulose. It is evident that the oxidation accompanied by an
evolution of heat occurred even at a temperature lower than 150°C
with an indication of a scarce loss in weight. On the basis of
the analytical values of oxygen content in the heat cured product,
it is suggested that some chemical changes, say, oxygen bridge
involving the formation of peroxide with unstable components in
lignin must be occurred at a lower temperature besides the oxidation
during the slow elevation of the environmental temperature.
(B) Spontaneous Smoldering Ignition of Wooden Materials
It is evident that only lignin and some igredients comprising
hemicellulose can adsorb oxygen and react with it at a temperature
lower than 180°C. This lower temperature oxidation must be a cause
for the incidence of smoldering burn of wood materials after exposure
to hot environments for a long time in a shape of a bulky matter
or being placed in a state of thermal insulation. Since long time
ago, the spontaneous smolderings of a pile of fiberous materials,
coals, saw dusts and tips have been matters of a well known
discussion, the theoretical elucidation of which was given by Frank-
Kamenetzkii. Also, I should like to remember that Dr. Robertson in
323
National Bureau of Standards had made an extensive contribution to
this area of research. The point taken up in this paper is the
effect of moisture on the spontaneous smoldering burn. Moisture
can participate in the hydrogen bond network and confront with the
oxidative degradation of wood system by shielding the penetration
of oxygen into the cell system. As reported previously, even a
small amount of M.C. in an order of 1-3% can reform the authentically
deformed wood fibrils and gave a closest packing structure with an
indication of the maximum value of E 1 vs moisture^^. Fig. 16 shows
the state of moisture contained in wood from the dielectric aspect
of study on the temperature dispersion of loss factor for samples
equilibrated to various R.H. below moisture content (M.C.) 10%, the
moisture participates in the cooperative local motion of hydrogen
bonds and above M.C. of 10%, some part of moisture is free from the
f 211system with an indication of the presence of ice at -40°C l J.
Moreover, it consumes heat in the vaporization. The samples used
in the experiment were spherical cores of Japanese cedar wood with
diameters of 5, 10, 15 and 20cm, respectively. The hot bath (100cm
x 100cm x 150cm) was equipped witlr electric heaters in quartz-glass
tubes on every wall, ceiling and floor being shielded by asbesto
plates so as to reject the direct exposure to radiation from heaters.
The temperature of hot bath was adjusted multiply by a controller
system of the heater voltage. The temperature defference between
ceiling and bottom remained within 0.5°C.
The calculation on the temperature in wood was made on the basis
of the following equations and boundary values:
(i) equation of energy
324
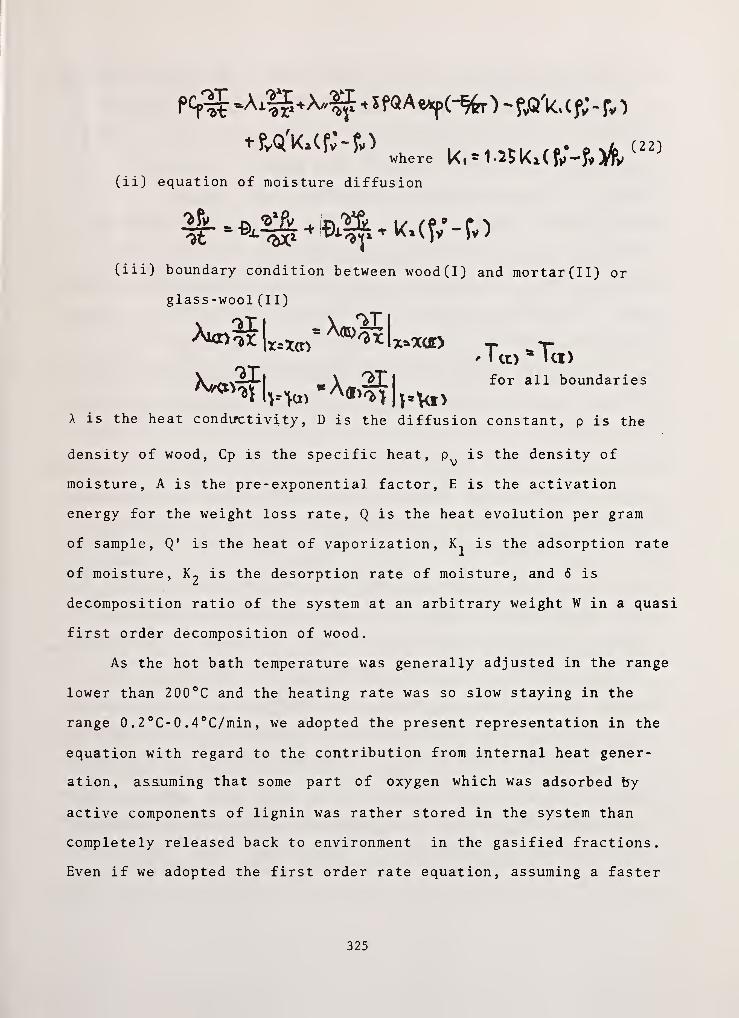
tfvQ'K,(f;-Pwhere kiSl .J5Mf;_j,^(")
(ii) equation of moisture diffusion
(iii) boundary condition between wood (I) and mortar (II) or
glass-wool (II)
.\ 'vri
' i ct> - Ui)_ \
r$T l for all boundaries
A is the heat conductivity, D is the diffusion constant, p is the
density of wood, Cp is the specific heat, p vis the density of
moisture, A is the pre - exponential factor, E is the activation
energy for the weight loss rate, Q is the heat evolution per gram
of sample, Q* is the heat of vaporization, is the adsorption rate
of moisture, is the desorption rate of moisture, and 6 is
decomposition ratio of the system at an arbitrary weight W in a quasi
first order decomposition of wood.
As the hot bath temperature was generally adjusted in the range
lower than 200°C and the heating rate was so slow staying in the
range 0 .
2 °C- 0 . 4°C/min , we adopted the present representation in the
equation with regard to the contribution from internal heat gener-
ation, assuming that some part of oxygen which was adsorbed by
active components of lignin was rather stored in the system than
completely released back to environment in the gasified fractions.
Even if we adopted the first order rate equation, assuming a faster
325
rate (2-3°C/min), there was no an indication of any obvious difference
in the behavior of the center temperature except some changes in
the values of activation energy and pre - exponential factors being
located close to those value which many authors estimated
covering the higher range of temperature under a faster
heating rate. The experiments revealed two distinctive results,
smoldering- ignition and non- ignition, depending on the balance
between the size of spherical wood core and the environmental temper-
ature. There were indications of stationary values being extended
from 80°C to 110°C in the elevation of the center temperature.
Fig. 17 shows the example for the non-ignition result with regard to
the wood sphere of 10cm in diam. being placed in the hot bath with
a slow heating rate and the levelling off of the elevation in hot
bath temperature at around 150°C. The curves (I) and (II) with rigid
lines are the observed values of the surface and center temerpature
respectively, while the curve with dotted line is the calculated
one. There was an indication of a symptom for some stationary
values in the range from 80°C to 90°C with the elevation of the
center temperature. However, it should be noted that the same
system ignited under a more slower heating rate with a higher levelled-
off temperature and a less moisture content. Fig. 18 shows the
example for the spontaneous smoldering ignition at an environmental
temperature far lower than the nominal ignition temperature of wood.
The wood sphere of 10cm in diam. enwrapped by glass wool was used.
Curve(I), curve(II) and curve(III) with rigid lines represent the
temperature in the hot bath, boundary between glass-wool and wood
sphere, and the center of sphere, respectively. The curve (II')
curve (III') with dotted lines represent the calculated values, respe-
326

ctively. There was also an indication of some stationary values
for the elevation in the center temperature due to the effect of
moisture. Fig. 19 shows the relation between the critical environ-
mental temperature to induce the spontaneous ignition of wood
sphere and the diameter of wood sphere with regart to the calculation
on the basis of the observed values of surface temperature taking
the activation energy as 35.5kcal/mol for the thermal decomposition
of wood issuing the heat ganeration. Therein, the rigid circles
are the observed values and open circles are the calculated values.
Fig. 20 shows the shift of ignition site in the spherical wood core
of 10cm in diam. with the elevation in the surface temperature.
The ignition site moves from the center to,'the surface with a route
as shown in the figure because of the anisotropy in the heat conduct-
ivity and diffusion coefficient of moisture in wood. Fig. 21 and
Fig. 22 shows the examples for the revelation of obvious stationing
of the temperature rise due to moisture with regard to the spherical
wood core of 10cm in diam. enwrapped by a layer of mortar with 2.5cm
width and the spherical saw dust blocks of 40cm in diam. The
3 3latter samples contained moisture 0.2099kg/m and 0.4000kg/m,
respectively. There was indication of obvious stationary values
extended from 80 to 100°C in the elevation of center temperature
for wood sphere enwrapped by mortar because of the moisture hydrated
in mortar and no indication of any symptom for the spontaneous smol-
dering ignition being prevented by a greater heat conductivity of
mortar. After 15 hr, every temperature at the center inner boundary
and surface levelled off and converged to the hot bath temperature
of ca. 150°C. The time - dependent variation in the observed values
327
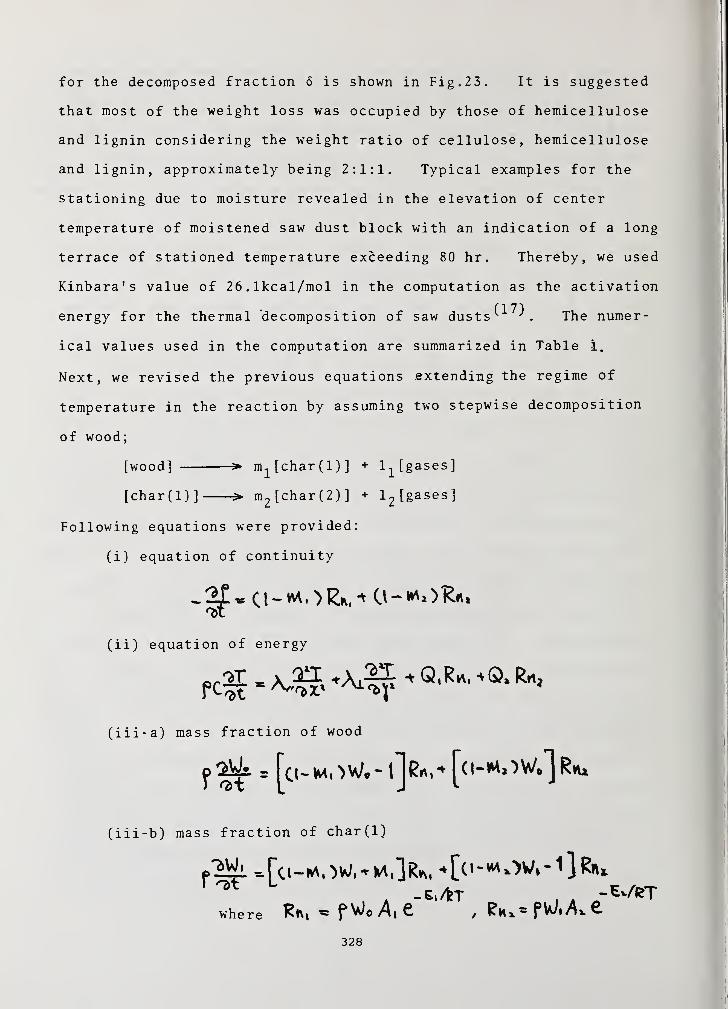
for the decomposed fraction 6 is shown in Fig. 23. It is suggested
that most of the weight loss was occupied by those of hemicellulose
and lignin considering the weight ratio of cellulose, hemicellulose
and lignin, approximately being 2:1:1. Typical examples for the
stationing due to moisture revealed in the elevation of center
temperature of moistened saw dust block with an indication of a long
terrace of stationed temperature exceeding 80 hr . Thereby, we used
Kinbara's value of 26.1kcal/mol in the computation as the activation
energy for the thermal decomposition of saw dusts v. The numer-
ical values used in the computation are summarized in Table 1.
Next, we revised the previous equations extending the regime of
temperature in the reaction by assuming two stepwise decomposition
of wood;
[wood] > m1[char(l)] + ljjgases]
[char(l)] > m2[char(2)] + l
2[gases]
Following equations were provided:
(i) equation of continuity
(ii) equation of energy
(iii-a) mass fraction of wood
(iii- b) mass fraction of char(l)
where
328

It should be noted hereby that we excluded the effect of moisture
utilizing the oven-dried wood sphere of 20cm in diam. Fig. 24(a)
shows the coincidence of the calculated result with the observed one
with regard to the time - dependent variation of temperature at the
center of sphere. Fig. 24(b) shows the time - dependent variation
of the calculated values for the density of wood, mass fraction of
char(l) and wood at the center. Fig. 25(a) and Fig. 25(b) show
calculated results on the time - dependent variations in the distribu-
tion profiles of temperature and density along the radial direction
of sphere. The numerical values of parameters used in the calcula-
tion are summarized in Table 2. We feel, it is really our great
honor and privilege that we could borrow the numerical values
estimated by Dr. Roger and Prof .Dr .Ohlemiller for the thermal decom-
position of cellulose in air. Thereby, we assumed; the thermal
decomposition proceeded in a complex way in that the thermal
decomposition of cellulose to char (1) occur due to the transfer of
nascent oxygen by the thermal decomposition of oxygen adducts
coming from the reaction of oxygen with the active ingredients in
lignin and hemicellulose in the range of 200-240°C. It should be
noted that the calculated value on the ultimate value of density
after thermal aging coincidenced approximately with the observed one.
CONCLUSION
Smoldering combusion of wood can be characterized to be promoted
by thermal processes in the relaxation of hydrogen bond system lead-
329
ing to the collapse of its fibril structure with genuine .or oxidative
scission of cellulosic chains. The function of temperature govern-
ing the reaction is distinctively divided into two regime demarcated
at around 220°C. The oxygen consumption of lignin plays the most
significant role in the first regime below 220°C being subsidiarily
endorsed by that of hemicellulose . It is suggested that those oxy-
gen consumption are promoted above 150°C depending on the extent to
which the hided sites of lignin and hemicellulose in the amorphous
part are disclosed on the inner surface of cell walls along the
vessel of wood. There was an indication of an approximate coinci-
dence in the value of the activation energy of the oxygen consumption
with that of the activation of the thermal motion of fibril tails
on the surface of vessels with a correspondence to weight loss.
It is suggested that the long time accumulation of heat issued from
those oxygen consumptions must be the most significant cause for
the spontaneous smoldering ignition of bulky wood materials far
below the nominal ignition temperature of wood under a faster heat-
ing rate. The role of moisture contained in wood in reducing the
possibility for that type of spontaneous ignition due to oxidation
of the components in lignin must be the rejection of the oxygen
adsorption being hydrated in the hydrogen bonds in those site as
well as taking off heat due to evaporation. The smoldering process
in the second regime above 220°C must be proceeded mostly through
the disclosure of hided sites in the amorphous part of wood depend-
ing on the extent to which the crystallite part binding the fibril
structure is descrystallized due to the genuine scission of folded
chains. Thereby, the weight loss must occur through disclosure of
hided sites with a correspondence in activation energy and a delay
330
in the amorphitization of crystallites. Comparing the results
of the simulation, it is likely that the decomposition reaction
proceeds in a first order rate under the faster heating rather than
in a quasi-first order rate.
331
REFERENCES
1) T.Handa, I.Seo, H.Akimoto, M.Saito, Y.Ikeda: Proc. 15th Jpn
.
Congr. Mat. Res., 1972, pl58.
2) T.Handa, S.Yoshizawa, H.Kaido, I.Seo, N.Otsuka, M.Saito, Y.
Ikeda: Proc. 18th. Jpn. Congr. Mat. Res., 1975, pl26.
3) T.Handa, S.Yoshizawa, Y.Ikeda, M.Saito: Kobunshi Ronbunshu,
33, 147(1976).
4) T.Handa, S.Yoshizawa, Y.Ikeda, M.Saito: Kobunshi Ronbunshu,
34, 195(1977).
5) T.Handa, S.Yoshizawa, M.Suzuki, T.Kanamoto: Kobunshi
Ronbunshu, 35, 117(1978).
6) T.Handa, S.Yoshizawa, M.Suzuki, M.Fukuoka, Y . Hashi zume , I.Seo
Proc. 21st Jpn. Congr. Mat. Res., 1978 p304.
7) T.Handa, S.Yoshizawa, T.Nagashima, H.Tsushima, H.Yamamoto,
N.Ebihara: Proc. 23rd. Jpn. Congr. Mat. Res., 1980, p333.
8) T.Handa, S.Yoshizawa, M.Fukuoka, M.Suzuki: Polym. Sci. and
Technol., voll. 11 "Polymer Alloys II", D.Klempner and
K.C.Frisch (Eds), Plenum Pub. Corp., 1980, p263.
9) T.Hirata, H.Abe: Mokuzai Gakkaishi, 19, 451(1973).
10) T.Hirata, H.Abe: Mokuzai Gakkaishi, 19, 483(1973).
11) T.Hirata: Mokuzai Gakkaishi, 22, 238(1976).
12) M.Kosik, M.Micko, R.Domansky: Wood Science, 1, 167(1969).
13) M.Kosik, V.Luzakova, V. Reiser, A.Blazej: Fire and Materials,
1, 19(1976).
14) W.L.Hawkins, R.H.Hansen, W.Matreyek, F.H.Winslow:
J. Appl. Polym. Sci., 1, 37 (1959)
332

15) W.L.Hawkins, W.Matreyek, F.H.Winslow: J. Polym. Sci., 41, 1
(1959)
16) T.Handa, S.Yoshizawa, K. Hatakeyama : J. Appl. Polym. Sci.,
23, 1527 (1979)
17) J.Kinbara: Bull. Fire Prevention Soc . Jpn, 16, 9 (1967)
18) F.E.Roger, T.J. Ohlemiller : Pretext of 5th UJNR Conference on
Fire Research, 1980
19) T.Handa, S.Yoshizawa, M.Suzuki, M.Fukuoka: Proc . 22nd Jpn.
Congr. Mat. Res., p. 223 (1979)
20) T.Handa, M.Fukuoka, S.Yoshizawa: Kobunshi Ronbunshu, 36, 703
(1979)
21) T.Handa, M.Fukuoka, S.Yoshizawa: J. Polym. Sci., Polym.
Phys. , submitted
22) C.O.Seborg: Ind. Eng. Chem. , 29, 169 (1937)
333
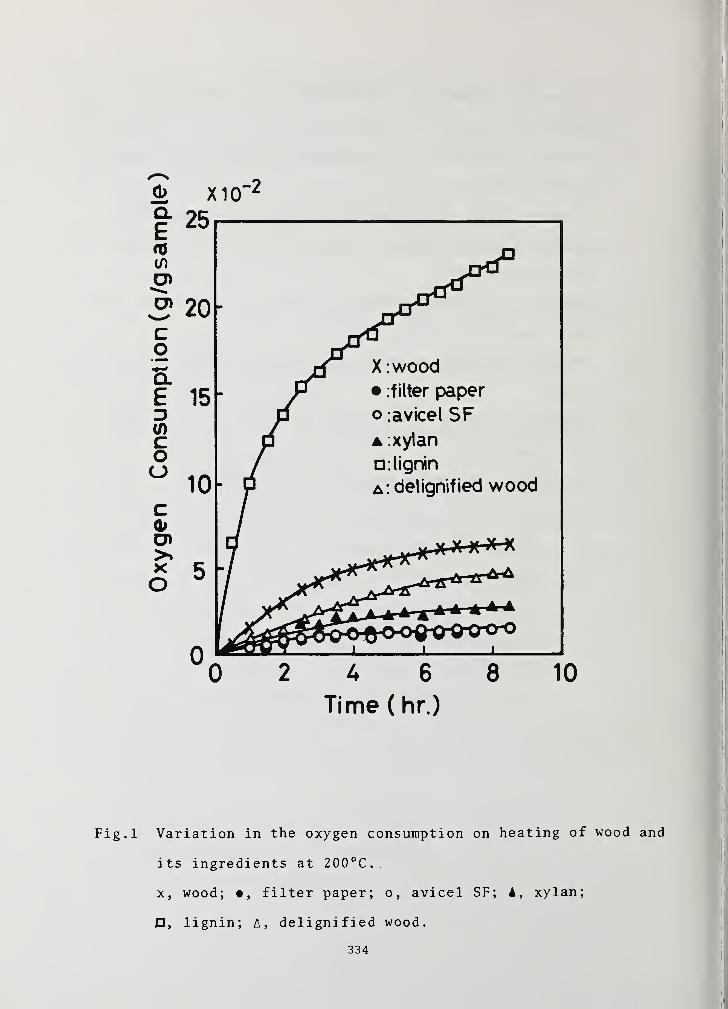
& X1CT
Time ( hr.)
Fig.l Variation in the oxygen consumption on heating of wood and
its ingredients at 200°C.
x, wood; •, filter paper; o, avicel SF; xylan;
D, lignin; A, delignified wood.
334
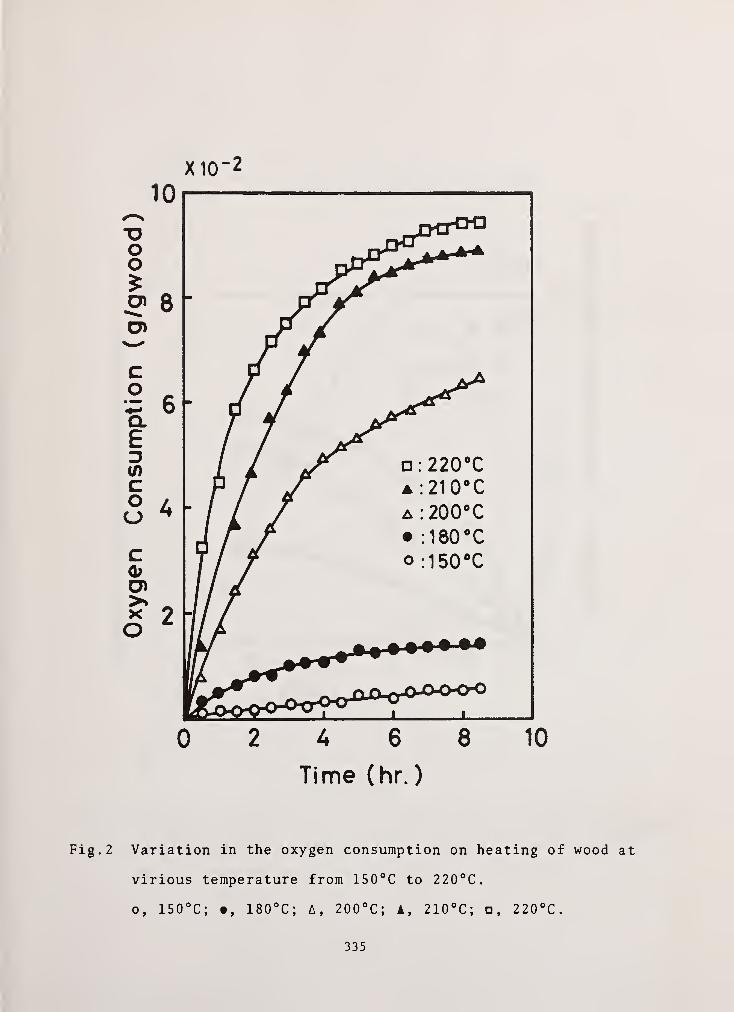
X10" 2
10 1
0 2 U 6 8 10
Time (hr.
)
Fig. 2 Variation in the oxygen consumption on heating of wood at
virious temperature from 150°C to 220°C.
o, 150°C; •, 180°C; A, 200°C; A, 210°C; 220°C.
335
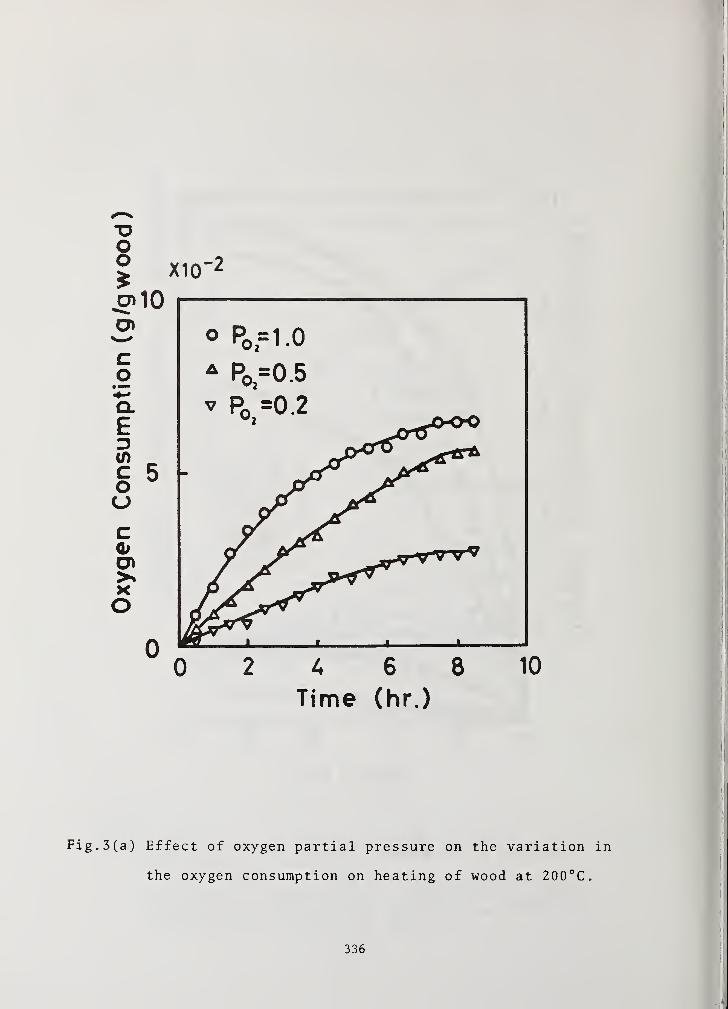
Time (hr.)
Fig. 3(a) Effect of oxygen partial pressure on the variation
the oxygen consumption on heating of wood at 200°C.
336
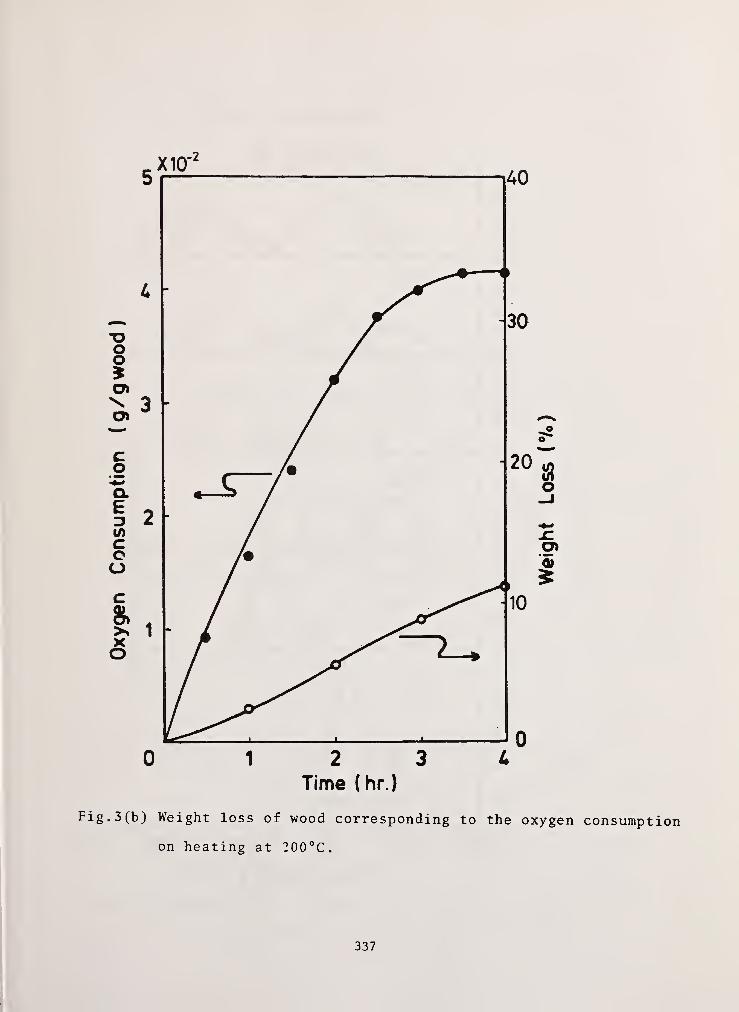
X10*40
Time (hr.)
Fig. 3(b) Weight loss of wood corresponding to the oxygen consumption
on heating at 200°C.
337
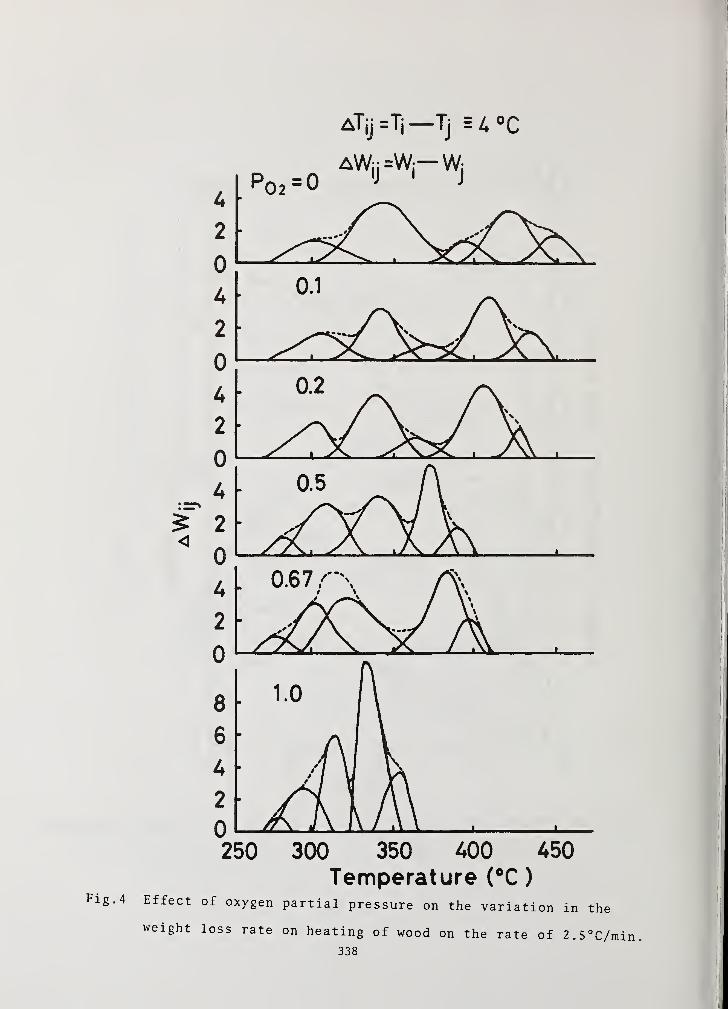
ATjj=Ti—Tj =4°C
Temperature (°C
)
Fig.4 Effect of oxygen partial pressure on the variation in the
weight loss rate on heating of wood on the rate of 2.5°C/mi
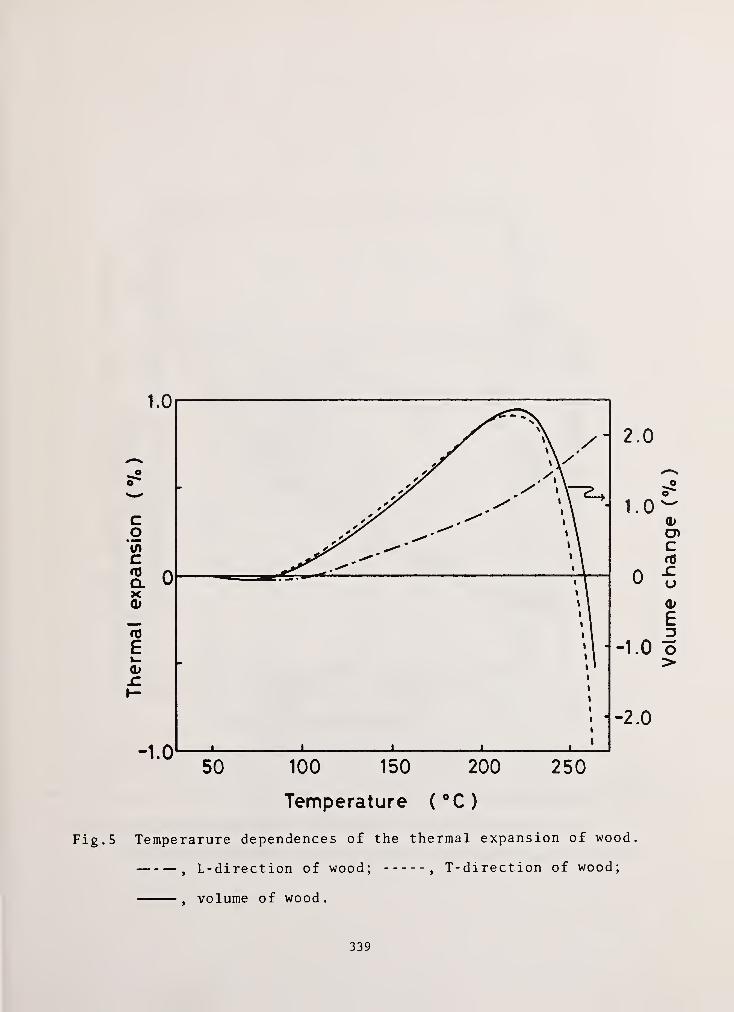
- 2.0
o
1.0o
<b
cnc
0 ch
ED
1.0 O>
--2.0
100 150 200
Temperature (°C)
Fig. 5 Temperarure dependences of the thermal expansion of wood
, L-direction of wood; , T-direction of wood;
, volume of wood.
339
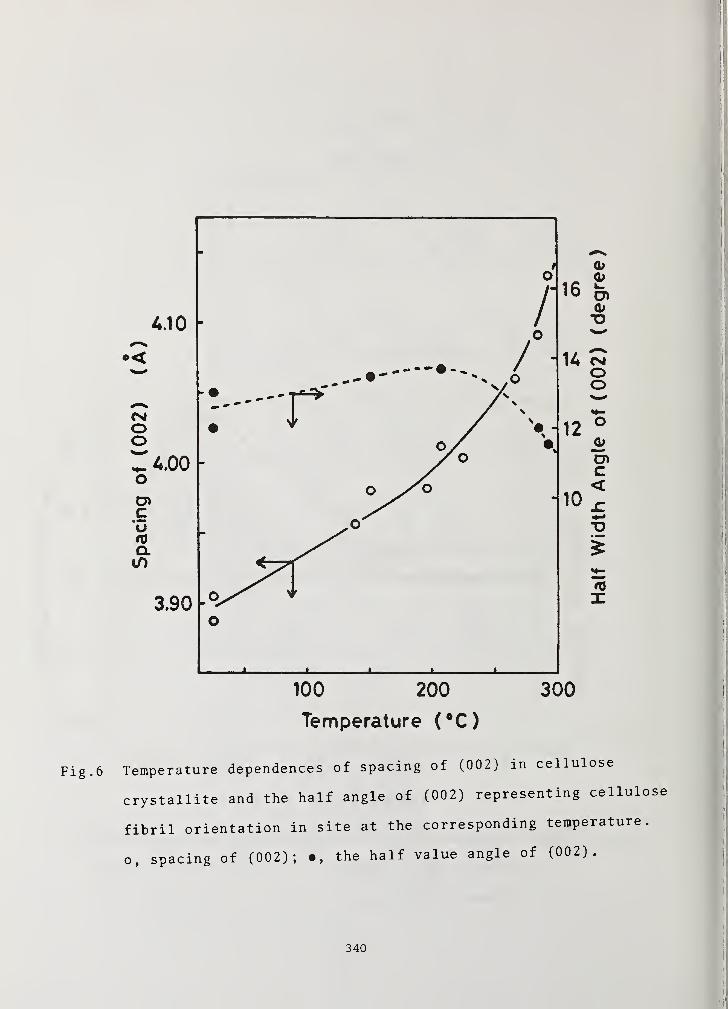
100 200
Temperature (°C)
300
Fig. 6 Temperature dependences of spacing of (002) in cellulose
crystallite and the half angle of (002) representing cellulose
fibril orientation in site at the corresponding temperature,
o, spacing of (002); •, the half value angle of (002).
340
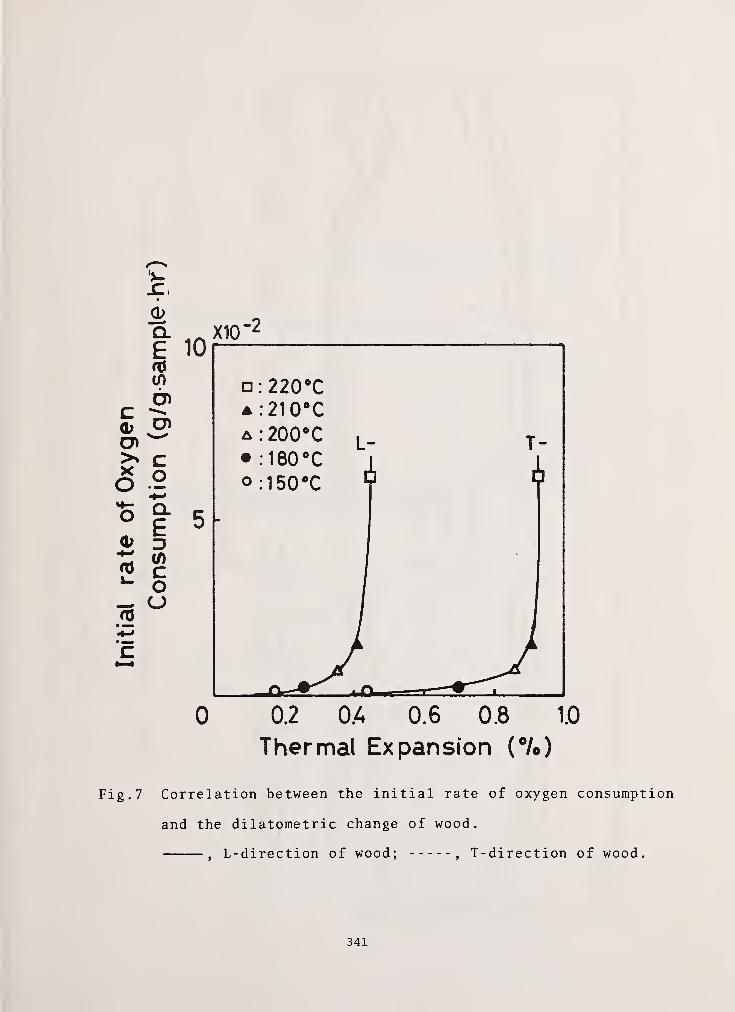
0.2 OA 0.6 0.8 1.0
Thermal Expansion (•/«.)
Fig. 7 Correlation between the initial rate of oxygen consumption
and the dilatometric change of wood.
, L-direction of wood; , T-direction of wood.
341
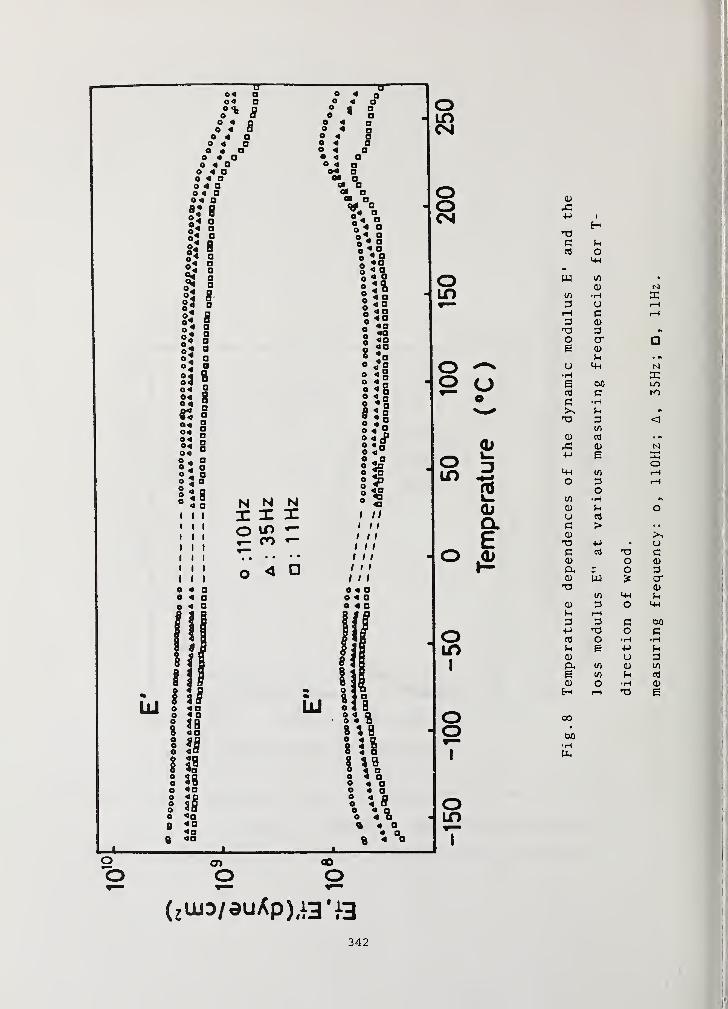
oO
OinCM
ooCM
oin
oo ue
O ^in ~2o.
o .0>
oin
i
ooI
oin
i
cd
HCCO o-
mw i/> •
CD ts)
t/> •Hu rH
iH c rHCD
T3 3O a*e CD
rH
u <+H N•H6 MlCO C f)c •H
rH 9s
Tb 3 <tt> CO * r>
CD N+J 6 o
rHo rH
ot/) H #v
CD OU CO
>CD >>-a +-> u
CO da> O CD
o PCD W ;* a*TJ CD
t/) r-<
CD P O mrH rH
C bo+-> 13 O cCO O •H •H(h e •M0) UP. </> CO in
B Sh co
CU o •H CD
rH T3 e
oo
•HPh
(jUJD/auApJ.iB'fa
342

1010
Ea
Ofc>*o
Li
"•""'•^^^
• : o*0° 0°;
°°."::
0:11.3°
a:22.5°o 00 «>o
a :45°
67 5°
50 100 150 200
Temperature ( °C
)
250
Fig. 9 Temperature dependence of the dynamic modulus E' and the
loss modulus E" at 110Hz as a function of grain angle of
wood
.
grain angle: •, G°(L); o, 11.3°; A, 22.5°; A, 45°;
,67.5° ; x , 90° (T)
.
343
I
I
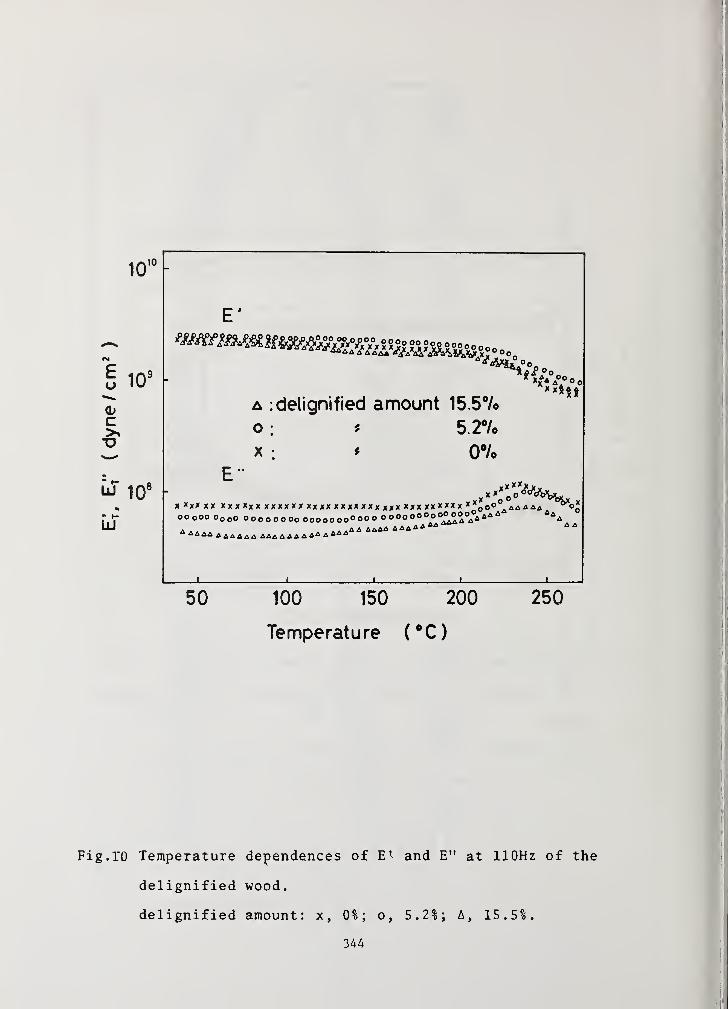
10,0
r
Eu
c
10!
E'
oo
a ; delignified amount 15.5%
o; * 5.2°/e
x:
* 0%
x-a°°°o
LU 108
h*XXXXXXXXX X XXXXXXXXXXXXXXXXXXXXXXXXXXXXXX x "
0 oc ^HJli
ocooo o oo0 oooooooo ooooooooooo oooo ooooooooo^
A A A A A A AAA AAA AAA A AAA'A AAAA A AA A A '
Aa,
50 100 150 200
Temperature (°C)
250
Fig.ro Temperature dependences of E'^ and E" at 110Hz of the
delignified wood.
delignified amount: x, 0%; o, 5.2%; A, 15.5%.
344

oe
to
•*->
aE
( 3aiD/9uAp) M 3 ',3
Fig. 11 Temperature dependences of E ' and E" at 110Hz of the L
direction of wood.
345

CT) 00O O i
( ?ujd/9uAp)„3 ..3
346

.3
Fig. 13(a) Dielectric constant e' for Redirection of oven-dried wood
as a function of temperature at respective frequency.
347
I
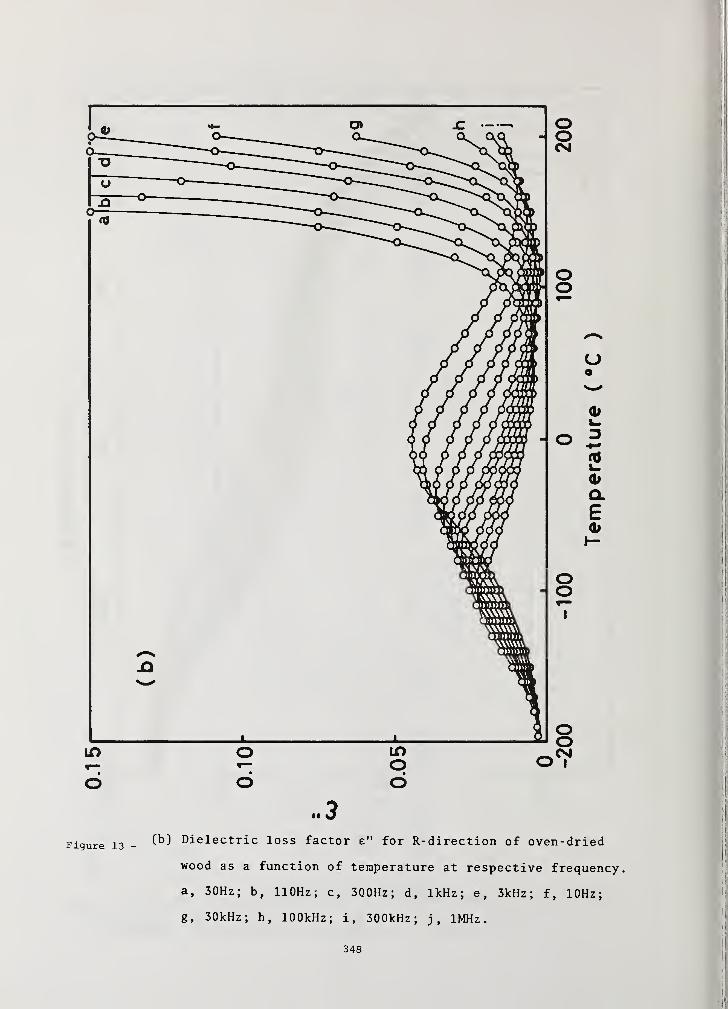
..3
(b) Dielectric loss factor e" for R-direction of oven-dried
wood as a function of temperature at respective frequency,
a, 30Hz; b, 110Hz; c, 3Q0Hz; d, 1kHz;
e, 3kHz; f, 10Hz;
g, 30kHz; h, 100kHz; i, 300kHz; j, 1MHz.
348

I 1 I I—CD in >t 00 CN
o o o o o o oo o o o o o o
..3
Fig. 14 Temperature dependence of the dielectric loss factor e"
R-direction of oven-dried heat-treated at 240°C.
a, 30Hz; b, 110Hz; c, 300Hz; d, 1kH z,
3kHz; f, 10kHz;
g, 30kHz; h, 100kHz; i, 300kHz; j, 1MHz
.
349
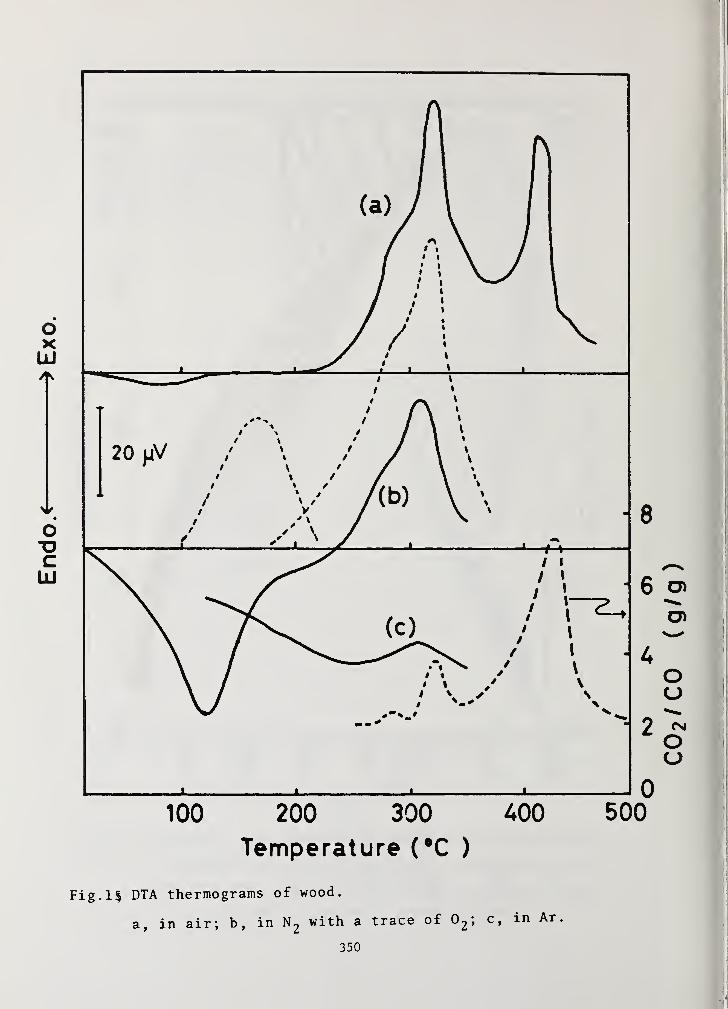
u__i i . i I 0100 200 300 400 500
Temperature (°C )
Fig.l§ DTA thermograms of wood.
a, in air; b, in N2with a trace of 0
2; c, i
350

-200 -150 -100 -50 0
Temperature (°C )
Fig. 1-6 Temperature dependence of log e" at 30Hz for R-direction of
wood containing various amounts of moisture,
x, oven-dried; ©, 0.7%; o, 4.2%; •, 8.7%; ©, 13.5%;
A, 18.5%; D, 24.7%.35l
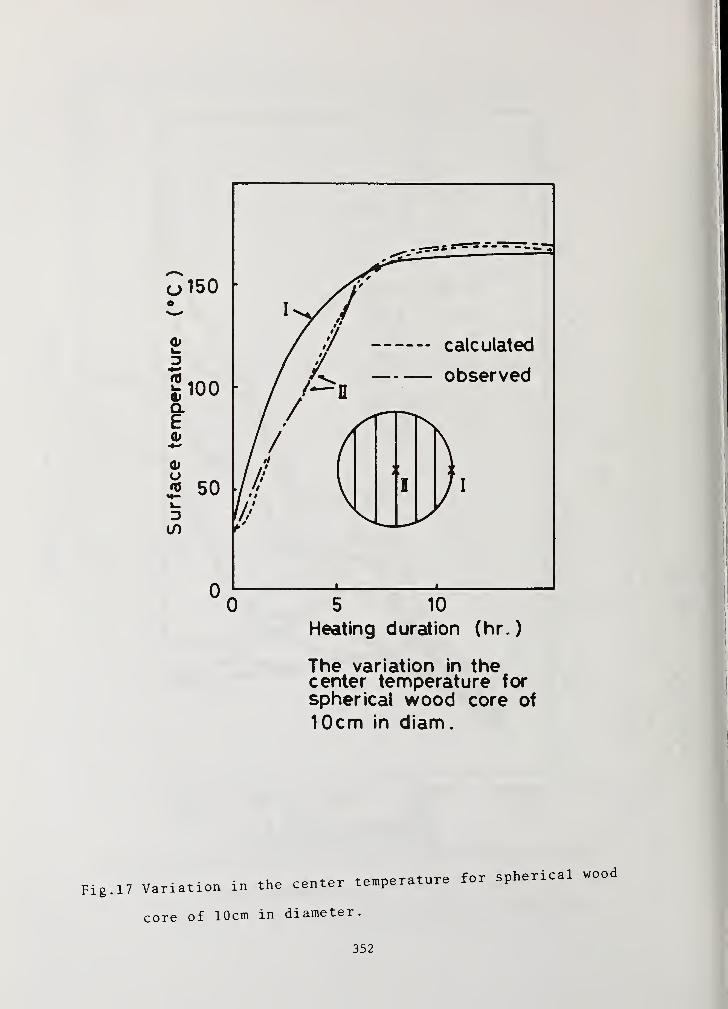
IS * - - •
calculated
observed
5 10
Heating duration (nr.)
The variation in thecenter temperature forspherical wood core of
10cm in diam.
Fig. 17 Variation in the center temperature for spherical .ood
core of 10cm in diameter.
352
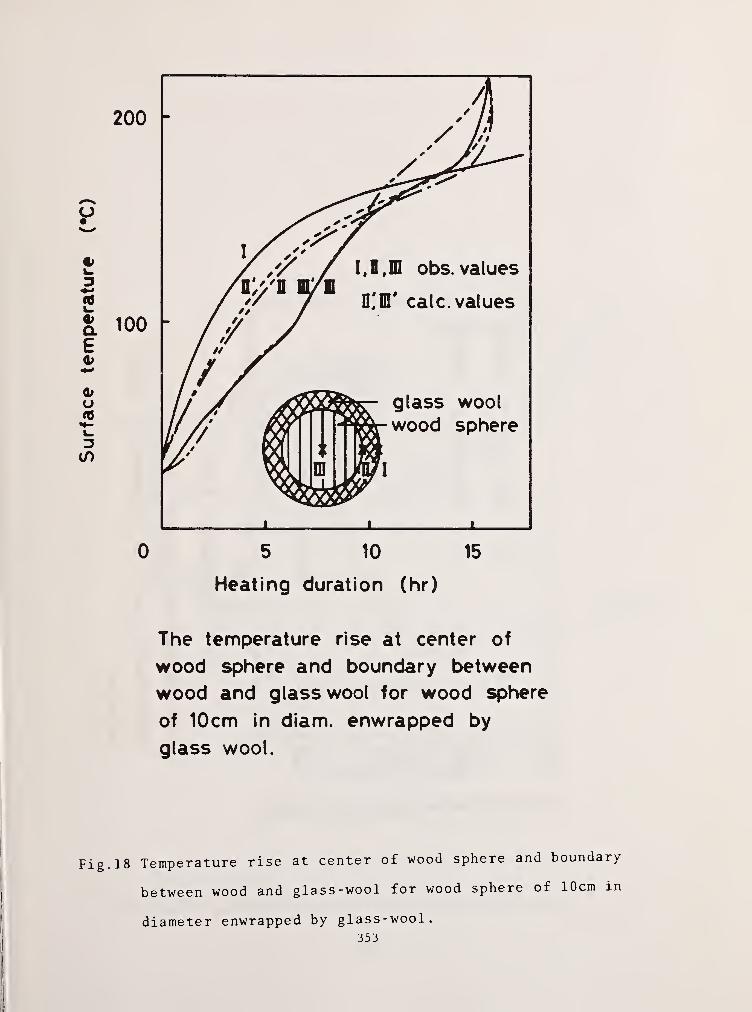
J I L
0 5 10 15
Heating duration (hr)
The temperature rise at center of
wood sphere and boundary between
wood and glass wool for wood sphere
of 10cm in diam. enwrapped by
glass wool.
Fig. 18 Temperature rise at center of wood sphere and boundary
between wood and glass-wool for wood sphere of 10cm in
diameter enwrapped by glass-wool353

OO
— o
"5
E
tj
Of
£
C<TJ
Of
a a>
i t
CD
4->
13CCO
0!h
3+-»
cd
eCD+J
43POXI
+J
o
u
o
F3
<I>
CD
MCD
X>
CO
CD
>-<
ou
•HPL,
CD
CD
(Xtfl
t3OO
CD!
+-»
CD
ecd
•HT3
354
I
1

center surface
0 12 3 4
Radial distance (cm)
Shift of ignition site withsurface temperature
Fig. 20 Shift of ignition site with surface temperature.
355
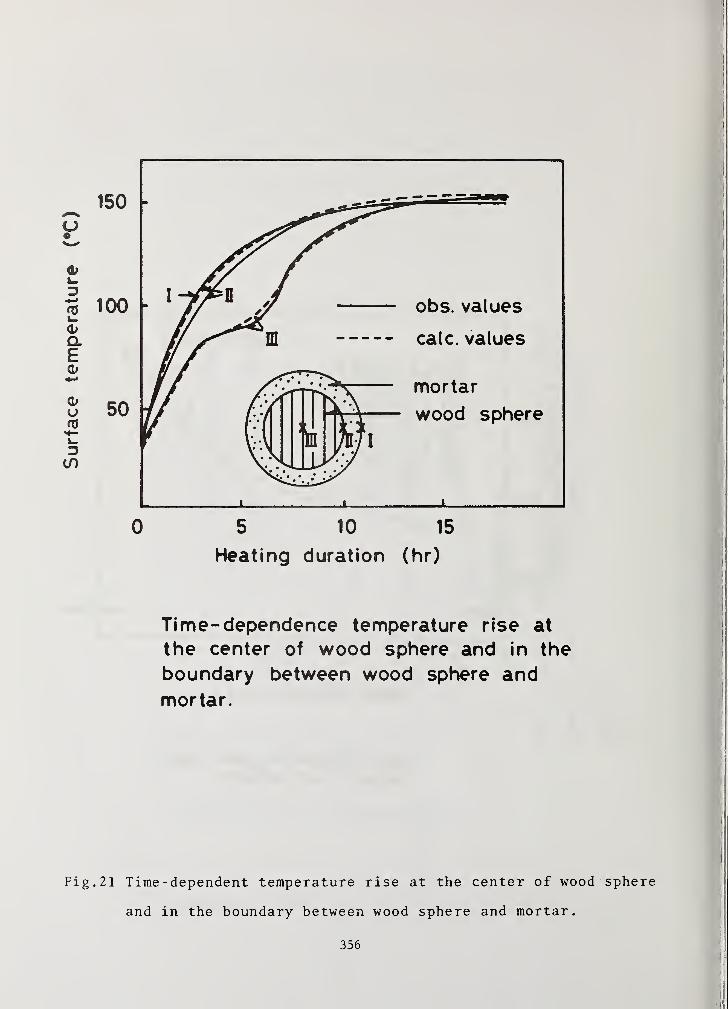
0 5 10 15
Heating duration (hr)
Time- dependence temperature rise at|
the center of wood sphere and in the
boundary between wood sphere andmortar.
Fig. 21 Time - dependent temperature rise at the center of wood sphere
and in the boundary between wood sphere and mortar.
356

0 20 AO 60 80
Time( hr)
Fig. 22 Thermal diagram of the wood sphere for the case of the
arbitrary size as illustrated in figure.
357

Fig. 23 Variation in decomposition rate of wood with heating duration.
358

I-—^fc I
o o oo oCM *-
(Do) ejn^pjadujai
.24(a) Time -dependent variation of temperature at the center
of sphere. 359
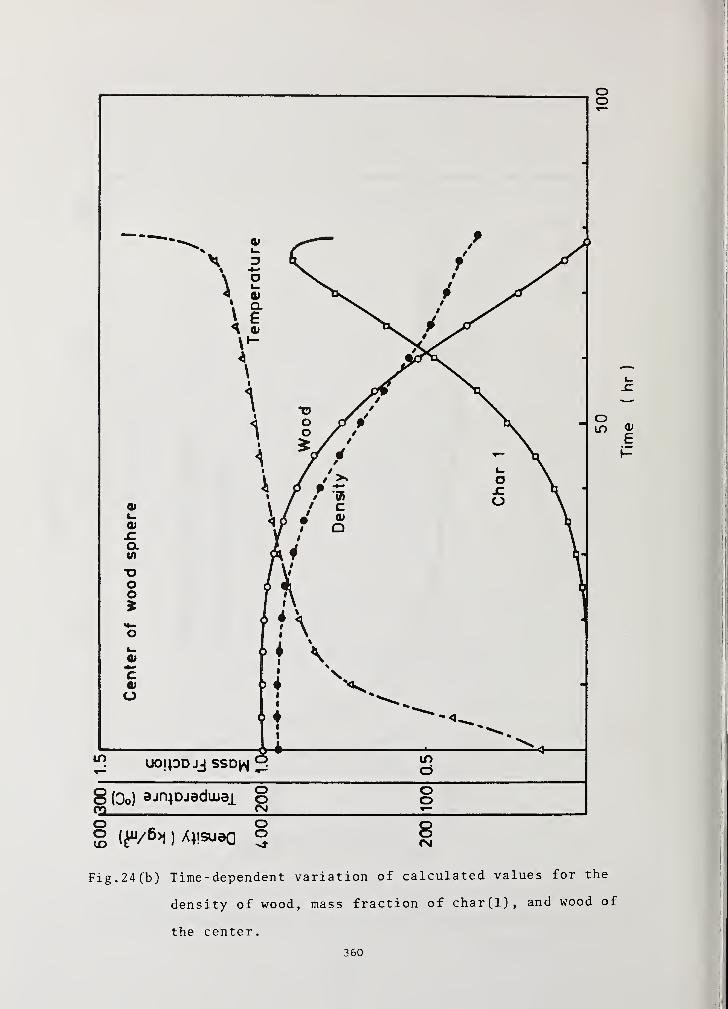
oo
\ 1< 01
Ott_01
-CCI
"OOO
o
o>
cat
u
a*i—
\i^ at
\*~
\•
•
•
o cr
V*i
i•
\ i
v
Density
L UIT)
CD
^8 (Oo) ejnpjadujei 8 OO
§ (^/6>j )Ajisuea 2 8
CM
Fig. 24(b) Time- dependent variation of calculated values for the
density of wood, mass fraction of char(l), and wood of
the center.
360
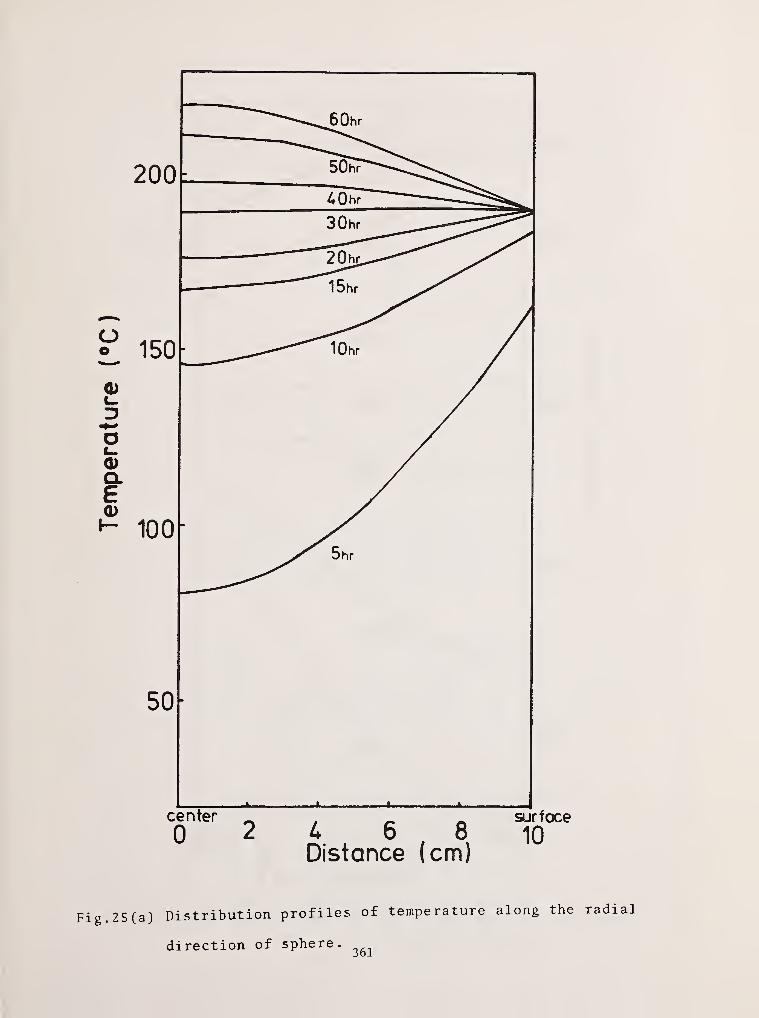
Fig. 25(a) Distribution profiles of temperature along the radial
direction of sphere.
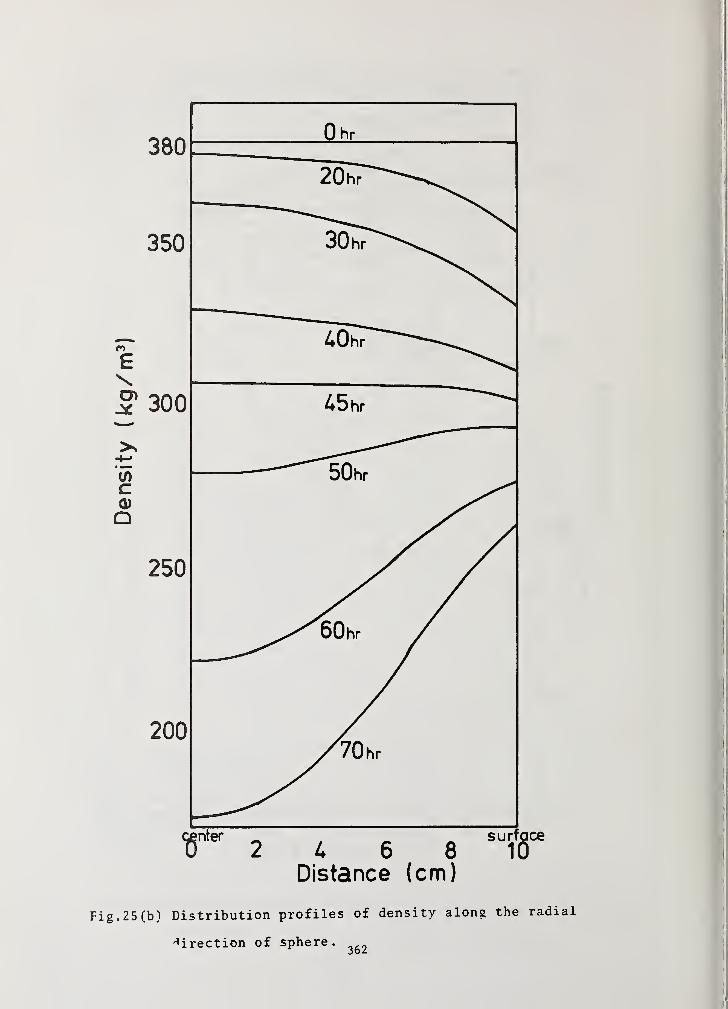
Distance (cm)
Fig. 25(b) Distribution profiles of density along the radial
direction of sphere.
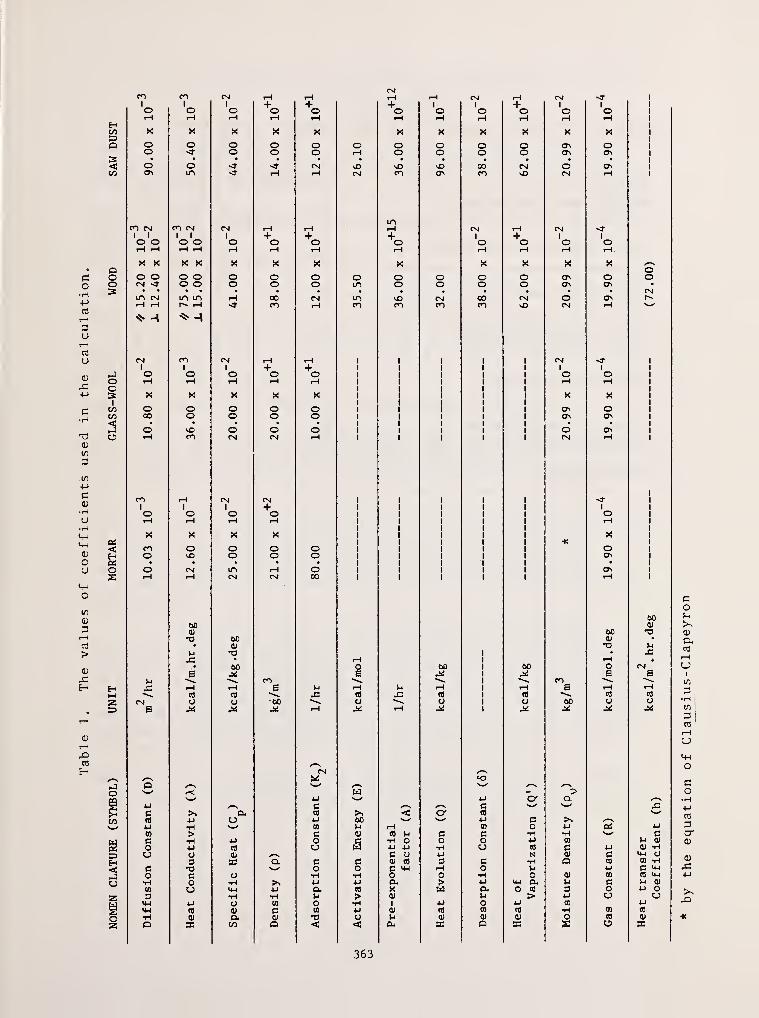

Table 2. Thermal parameter for the computer simulation
Specific Heat (kcal/kg.deg) c 0.41
Thermal Conductivity (kcal/m.hr .deg) *//
A J.
1.5 x 10~*
7.5 x 10
Stoichometric Coefficientml
m2
0.400.20
Heat of Evolution (kcal/kg)k
48.0375.0
Frequency Factor (1/hr)3.6 x loj*1.8 x 10
Activation Energy (kcal/mol)39.537.5
3Density (kg/m ) Po
380.0
364

Discussion of Presentations on Smoldering
Handa Presentation
Earl: Were studies on crystallinity index used? Did you seeany changes in the crystal form? In other words, did you see a changefrom cellulose 1 to cellulose 2?
Handa: Yes. However, without figures it is very distorted and hardto understand.
Earl: But you see no cellulose 2.
Handa: We tried to get some but we failed.
Emmons: In Table 2, you had two values of various quantities. Whatdoes 1 and 2 signify? Ml and M2, Ql and Q2 — what is 1 and 2?
Handa: Char 1 and Char 2.
Emmons: What is the difference between Char 1 and Char 2?
Ohlemiller: This is the thermal decomposition of cellulosic insulationand it falls more or less into two stages of degradation. The firstone is oxidative pyrolysis, and the second one is the char oxidationprocess
.
Chaiken: Just a comment. Much faster heating and degradation of woodis found using a laser. We are of the opinion now that the water thatis in the wood, as well as the water that is formed during the
composition, actually proceeds ahead of the thermal wave. At leastthe charring wave plays a very important role in the progress of the
degradation.
We haven't looked in detail in terms of the precursoroxidation reactions which might be subject to water. But from the
viewpoint of simply altering the thermal gradiants within the sample
as water is formed in the thermal wave, a water front is actuallymoving ahead of the thermal wave, this supplies a good heat conduction
mechanism for heating wood entering the reaction zone. This would be
interesting from the viewpoint of your results which say that water
can possibly react in terms of some precursor reaction.
Emmons: You indicated that the oxygen uptake by various compounds
is related to the thermal expansion in various directions.
365

Handa: I mean oxygen uptake might be by lignin; it absorbs mostoxygen around 200°C when fission of the chain occurs thermally. Above230°C, other processes suggested by Dr. Ohlemiller may occur.
Emmons: Does this imply that if the expansion is due to stress, thereis also an increase oxygen uptake.
Handa: Yes.
Friedman: I have a question on experimental detail. You state that
you measure the oxygen uptake by a decrease of pressure of the oxygen,
but if the wood is liberating gases at the same time, how does that
work?
Handa: We use several kinds of molecular sieve to analyze the gases.
366
FINAL SESSION REPORTS
367
REPORT OF TECHNICAL SESSIONON PROGRESS REPORTS
F. Clarke, Chairman
The first technical session was devoted to progress reports on: fireretardance, building design and smoke control, human behavior in fires,and fire protection.
Dr. Saito reported on the use of fire retardant chemicals in Japan,giving approximate amounts of use and numbers of manufacturers of
various kinds of fire retardants . A large amount of data was pre-sented on smoke generation of urethane and polyvinylchloride , treatedwith various additives and fire retardants. The relationship betweenflashover and heat content of cellulosic materials was discussed, as
was the flame profile as a function of location and size of pool fire.
For the American side, Dr. Clarke reported on several promising techniquesfor the elucidation of molecular process in the pre-combustion and earlycombustion phases. These include solid phase nuclear magnetic resonancespectroscopy; a laser reduced particle ionization technique which is
effectively a time-of-flight mass spectrometer for incipient soot particlesand the opposed flow diffusion burner, useful for a variety of flamephenomena
.
Dr. Morishita presented the Japanese progress report on Building Systemsand Smoke Control for himself and Dr. Wakamatsu. He reported briefly onseveral papers on building design, including advances in the field of
state transition modeling and network systems previously reported. Otheroptimization techniques, and the contribution the components of fire
environment to the overall fire hazards, were reviewed as well. In the
smoke control field, Dr. Morishita described the new experimental testfacility in Tsukuba, which has been used for over 80 experiments so far
this year. He also reported on "cold smoke" studies in two large office
buildings in Tokyo. For one of the two buildings, the Shinjuku CenterBuilding, the smoke control system was found to perform effectively.
Measurement difficulties made performance of the other building systemsdifficult to evaluate.
The American work on smoke control was presented at the "Annual Conference"
during the second week of the program. Dr. Klote of NBS reported on smoke
control modeling techniques for analysis of pressurized stairwells and on
refinements of the ISI smoke movement model. The progress for developing
a smoke control manual was also reviewed. Smoke movement studies at
California Institute of Technology were reported by Dr. Zukowski.
Emphasis in this work is on room-to-room flow of smoke and hot gases in
the early stages of a fire. Other American work on building design is
closely related to human behavior, and was covered in the session on
human behavior at the Annual Conference.
368
Dr. Jin reported on Human Behavior in Fires for the Japanese side.He presented a proposed new exit symbol now under study in Japan. Thesymbol may offer more legibility and clarity than a proposed ISO symbol.Work on human vision through smoke was also extended over that reportedin earlier conferences.
Prof. Vreeland of the University of North Carolina reported at theAnnual Conference on the actions of occupants caught in a simulatedresidential fire. Dr. Levin of the NBS discussed fire safety for thehandicapped and some of the implications which that carries for buildingdesign.
Dr. Stahl of NBS and Prof. Francis of University of Florida, both discussedthe modeling of human behavior in fire situations. Dr. Stahl concentratedon modeling the decision process which potential fire victims undertake,while Francis concentrated on the description of people movement in
building evacuation.
Mr. Benjamin from the U.S. side discussed smoke detection status in the
United States. He estimated that as many as 50% of U.S. homes are nowcovered by smoke detectors. Studies on the audibility of smoke alarmswere reported by Prof. Nober of the University of Massachusetts. Hereported that the 55db alarm level seems adequate as long as air con-ditioning and other interf erring noises are not present.
Prof. Miyama reported on Japanese work on smoke detection. He discusseddevelopments of criteria for performance of beam-type smoke detectors.He also presented findings that visible light, when used in photo-electric smoke detectors, is attenuated substantially less than infraredlight under the same experimental conditions.
369
REPORT OF TECHNICAL SESSION ON
ARSON AND FIRE INVESTIGATION
I. Benjamin, Chairman
Mr. Karchmer presented a paper discussing some of the possiblereasons for an increase in arson in the United States. He thenwent into detail on several of the early warning systems whichhad been set-up to attempt to predict where arson will occur.
Mr. Kawamura gave some statistics on arson in Japan indicatingthat it is not as serious a problem as in the United States, anddoes not appear to be substantially growing. He also presentedsome data from a supplemental report by Mr. Murakami which analyzedin detail psychological and sociological aspects of arson that had
occurred in Japan.
A brief discussion was held on what might be the reason for
differences between growth of arson in the United States and
Japan. Several plausible explanations were suggested but no
definite conclusions were reached.
370

REPORT OF TECHNICAL SESSION
TOXICITY OF COMBUSTION PRODUCTS
J. Bryan, Chairman
The session on Toxicity consisted of three segments with presentationsin the UJNR meeting on October 16, 1980. In addition, an informalsession was held on October 20. The final session relating to Toxicitywas presented at the Annual Conference on Fire Research on October 23.
Dr. F. Saito, Building Research Institute, presented the paper entitled"Basic Concepts on Toxic Hazards in Building Fire," written byKishitani and Saito. He emphasized that the burning condition of thesample controlled the level of toxicity of combustion products.Therefore, the detailed measurements of temperature and amount of airsupply to the sample in full size experiments are needed to define theburning condition for the toxicity measurement. Also, he recommendedthat the question of rapid acting toxicants should be included for theevaluation of toxicity of combustion products.
Prof. Y. Nishimaru, Yokohama City University, reported on the studyof the toxic gas generated by the combustion of artifical turf. Thespecimen samples were ignited in chamber test situations with eightmice exposed in each test situation. The use of occupancies such as
ball parks and golf courses for areas of refuge during earthquakesmotivated the concern for this study. The relationship betweenamounts of COHb and C02~Hb in blood and incapacitation time of micewas also reported.
Dr. M. Birky, Center for Fire Research, reported on the developmentof the proposed modeling procedure for the determination of toxiccombustion products which was introduced to the Panel at the 1978meeting. He reported on the seven laboratory evaluation projects,involving twelve materials. Dr. Birky also presented the resultsof the project to correlate the small test chamber results to a full
scale room situation for both a polyurethane and a cotton material.The analytical comparison of the two situations was most significantwhile the toxicological comparison indicated areas for further study.
The session on Toxicology during the Annual Conference on Fire Research
was chaired by Dr. Birky. Dr. Barbara Levin, CFR, presented the data
on the seven laboratory evaluation study presented by Dr. Birky to the
Panel. Ms. Maya Paabo, CFR, presented the results of the small scale
to large scale test comparisons also previously presented by Dr. Birky.
371
Dr. S. Packham, a consultant, presented a review of the publishedtenability time limits for CO and HCN from the Harvard School ofPublic Health, National Academy of Sciences and National Bureau ofStandards. He emphasized that tenability limits vary with time andthe total time concentration curve must be considered in the evaluationof materials.
Professor Y. Alarie, University of Pittsburgh, reported on theirstudies to determine the time-concentration effects of toxic productswhich involved large scale comparisons with the products of combustionfrom the wall panels exposed in a room corner test. The study exposedfour groups of rats of four animals each, with varying smoke concen-trations. Alarie agreed with Packham rather intently that the entiretime concentration curve must be utilized, and these curves are wellestablished.
Dr. Z. Annau, Johns Hopkins University, reported on the effects on ratsrelative to the learned shock-avoidance responses when exposed to aninjection of ethanol, ten minutes prior to a thirty minute exposureto 1500 ppm of CO, with a thirty minute observed recovery period. Hisdata indicated significant changes in the responses produced and shocksendured. He indicated his study did not evaluate the additional in-fluence of thermal exposure which should be considered.
Dr. R. Meyers, Maryland Institute for Emergency Medical Services,University of Maryland Hospital, Baltimore, reported on developmentof a cognitive-perceptive clinical test procedure to evaluate the needfor the treatment of patients with suspect COHb levels, in the hospitalhyperbaric oxygen chamber. The results of the test use were presentedwith the plans for improvement. Nurse Jones presented a Minico CO
analyzer which is being field tested as a diagnostic procedure to enableEMT, CMT, and Paramedics to determine if a patient requires hyperbaricoxygen chamber treatment. It was reported that FM radio transmissionsand alcohol breath both affect the instrument. The instrument is
currently being field tested on fire department personnel in the
Baltimore area.
Dr. G. Hartzell, Southwest Research Institute, reported on the study
supported by the U.S. Fire Administration, to determine the combustion
atmosphere in buildings encountered by fire department personnel. Ten
sampling boxes are being utilized by San Antonio, Texas, fire fighters
to collect samples for determination of levels of HCN, HCL, CO CO2, O2,
Benzine, Acrolein and Acetyaldehyde. The collection area consists
primarily of single family, frame dwellings. This is a followup study
from the Harvard University - Boston Fire Department study.
The discussions at all of these sessions appeared to be enlighteningand informative.
372

REPORT OF TECHNICAL SESSION
ADVANCES IN SPRINKLER TECHNOLOGY
T. Jin, Chairman
Presenting a paper, "Life Safety Factors Involved in the Use of
Sprinklers," Mr. O'Neill has reported on full-scale fire tests ina patient room and mentioned as follows: "A dynamic heatingmeasurement of the sprinkler, in addition to the temperature ratingof the sprinkler, may be a primary design variable in future sprinklercriteria. For life safety, a more rapidly responding sprinkler thanconventional sprinklers is necessary, but the benefit of it may not beso significant for very rapid developing, shielded fires, such as firesinside combustible clothing wardrobes."
Presenting a paper, "Sprinkler Technology and Design in Japan,"Mr. Unoki reported on mandatory installation of sprinklers in Japan andmentioned as follows: "The heads used in these systems are designedto meet the standards which are characterized by the following: thewater distribution test is to be conducted using a single head, and
the relationship between the permanent and the elastic elongation of
the frame is to be defined. The proposal on time constant as therequirement of heat response of heads is also being discussed."
Presenting a paper, "Advances in Residential Sprinklers," Dr. Kung
has reported on full-scale fire tests in a living room and mentionedas follows: "Links considerably more sensitive than the commercial
link are essential in providing adequate protection in residentialfires. The required sprinkler operation conditions have been deter-
mined in terms of sprinkler water distribution associated with a link
five times more sensitive than the commercial link."
Through these reports, the sensitivity of link, the water distribution,
the smoke obscuration problem, etc. , have been discussed.
373
REPORT OF TECHNICAL SESSION
FIRE MODELING
T. Handa, Chairman
Prof. P. Pagni presented a report entitled, "Diffusion Flame Analyseswith Fire Safety Application." This was a clear review using classicdiffusion flow studies to assess the potential fire hazard of syntheticpolymers in fire. Flame heights produced by various materials wereshown to depend primarily on the mass consumption number, r, andsecondarily on the mass transfer number, B, when using an approximatequasi-steady model for laminar diffusion flames. This emphasis onthe mass consumption number is new.
Mr. Y. Hasemi presented an excellent condensed review of the manuscriptsregarding recent advances in Japanese fire research including themathematical modeling of fire (Tanaka, Matsushima) , flashover ascritical instatiblity (Takeda, Hasemi) , the extinction of infraredradiation by smoke (Jin), the remote imaging of flames (Kawagoe)
,
statistical view on flashover occurrence (Morishita) , and criteriaon simulated model experiments (Saito)
.
Prof. Emmons presented a report entitled, "Computer Fire Codes," anoverview of the current status of the Harvard Fire Code, which emphasizedthe significance of numerical mathematical modeling in the practical
prediction of fire.
The presentation of a report entitled, "Recent United States Progress
in Mathematical Modeling of Fire Enclosure," was postponed to the
afternoon session. Dr. R. Friedman gave a comprehensive review of
the many computer programs in the United States which address components
of the compartment fire problem.
374

REPORT ON TECHNICAL SESSION
SMOLDERING
R. Friedman, Chairman
Dr. T. Ohlemiller of the National Bureau of Standards, Center for FireResearch presented a survey paper entitled, "Modeling of SmolderingCombustion Propagation." He divided smoldering into various regimes,depending on low vs high permeability, and forward smoldering vsreverse smoldering (oxygen approaching from the burned vs the unburnedside of the reaction zone). He discussed the significance of ratios ofvarious characteristic lengths. He concluded that there is need formore study of the smoldering problem, and especially on transitionto flaming combustion.
Prof. T. Handa of the Science University of Tokyo described work byhimself and his colleagues (S. Yoshizawa, M. Moria, M. Fukuoka, H.
Tsuhima, Y. Hashizume, and T. Nakamura), entitled, "Thermal Processesin the Smoldering of Wood." Wood samples were heated in variousoxygen-containing environments. Measurements were made of weight loss,
oxygen consumption, X-ray diffraction, viscoelastic properties, thermalanalysis. In another series of tests, spheres of wood of variousdiameters were exposed to heat over long periods, and conditions for
runaway thermal behavior were found. A collapse of the structure near220°C was related to the kinetics of oxidations in the amorphous partof the wood. The tendency to thermal runaway was shown to be dependenton moisture content.
Following these papers, some general comments on modeling were made.Prof. Emmons of Harvard University made a point with regard to studiesof flashover by making stability analyses of equations derived byassuming that the fire may be represented by a series of steady statesat successive times. Quintiere, Thomas, and Hasemi have made suchanalyses. Emmons commented that his numerical solutions of the full
set of time-dependent equations had not yet revealed any suddentransitions as suggested by the stability analyses, and recommendedthat an attempt be made to study more closely the relationship betweenthe two modes of analysis.
After the modeling discussion, Prof. Handa described some work on
"Current-Voltage Characteristics of Pt Dispersed Sn02 Wafer," which
is relevant to detection of various fire gases, including carbon
monoxide, by a device which functions at room temperature.
375

RESOLUTIONS
376

RESOLUTIONS
The members of the UJNR Panel on Fire Research and Safety are veryhappy with the results of the Fifth Joint Panel Meeting held inWashington, D.C., October 15-24, 1980. The progress reports on themany topics of concern to fire safety were very instructive. Theworkshops on special topics held on Monday and Tuesday proved to beespecially valuable for all participants. The limited topics ineach of the simultaneous sessions together with the more informalatmosphere lead to more intimate and detailed exchange of informationon the special topics.
The Panel Members herewith resolve:
1. That the next (6th) meeting of the UJNR Panel on FireResearch and Safety be held in Tokyo, Japan, for fiveworking days in May 1982.
2. That the format of the meeting be as follows:
a) The first two days be devoted to progress reports on
anaphases of fire safety: human behavior, fire modeling,toxicity, sprinklers, detectors, fire and smoke retardants,fire investigation techniques and building systems andsmoke control.
b) The next two and one-half days be devoted to workshopson building systems and smoke control, human behavior, firemodeling and toxicity with simultaneous sessions as
appropriate.
c) The last one-half day of closing session contain sessionreports, and adoption of resolutions.
3. That the meeting be held in several different laboratorieson different days, but that all sessions on any one day be
held all at one place.
4. That some cooperative fire research programs be started.
These will be especially valuable where the facilities are
somewhat different in our two countries.
5. That the working personnel exchange be pursued more vigorously.One NBS employee, Dr. Mulholland, spent a valuable month in
Japan. The U.S. is looking forward to the visit of Dr. Tanaka
for a year beginning in the near future. It is hoped that
someone from the U.S. can be sent to Japan for an extended
period of research in the not so distant future.
377
6. That the toxicity tests by mice (Japan) and rats (U.S.) becorrelated by the testing by each country by their respectivemethods of common samples. This would perhaps be best doneby each country submitting to the other for tests, samplesof materials already tested in the home country.
7. That Panel Members be encouraged to exchange information ofinterest through the respective Chairmen between meetings.A few such exchanges occured during the past year, butthere should have been many more. Reports should be submittedin the original language with an abstract in the otherlanguage.
8. That to improve communication during meetings, especiallythe first two days of formal progress reports, copies of allthe relevant reports be sent in time to be received in the
other country by one month ahead of the meeting.
378
Bibliography Of Support Papers*Fifth UJNR Panel on Fire Research
ARSON & FIRE INVESTIGATION
Murakami, Y. , Uehara, K. and Takahashi, T. Incendiary Fires in Tokyo;Tokyo Fire Department.
Yamoka, K. Features of Patterns in Arson - 1. A Comparison Betweenthe Single Offense Group and the Serial Offenses Group; Nat'l ResearchInstitute of Police Science.
White Book on Fire Service in Japan; Fire Defense Agency, Japan, 1976.
TOXICITY OF COMBUSTION PRODUCTS
Kishitani, K. , Saito, F and Yusa, S. Basic Concept of Toxic Hazardsin Building Fires.
DETECTION
Handa, T. , Fukaya, H. , Muruyama, T. , Hoshino, K. , Endo, K. andOkayama, Y. Pt and Sb Profiles in the Sintered Sn02-Pt-Sb203 Systemand Their Effect on I-V Characteristics; Proceedings of 22 JapanCongress on Materials Research, The Society of Materials Science,Japan, 1979, pp. 326-330.
Handa, T. , Fukaya, H.,Muruyama, T. , Hoshino, K. , Endo, K. and
Okayama, Y. The Current-Voltage Characteristics of Pt-Sn02 Point-Contact; Proceedings of 22 Japan Congress on Materials Research, TheSociety of Materials in Science, Japan, 1979, pp. 220-224.
Handa, T. , Fukaya, H. , Sugawa, 0., Kaneko , K.,Hameda, T. , Furukawa, Y.
and Endo, K. Performance Characteristics of Detector to Fire Productsthrough Corridor and Compartment; Bulletin of Japanese Assoc. of FireScience and Engineering, Vol. 28, No. 2, 1978, pp. 11-18.
FIRE MODELING
Handa, T. , Hamada, T. , Sugawa, 0., Fukaya, H. and Endo, K. ExperimentalStudy on the Branching of Flow through T- Shaped Corridor; Bulletin of
Japanese Assoc. of Fire Science and Engineering, Vol. 27, No. 1, 1977.
Handa, T. and Sugawa, 0. Flow Behavior of Plume from Growing FireSource in High Ceiling Enclosure; Science Univ. of Tokyo.
* Unpublished papers, prepared for 5th UJNR Conference, are availablethrough the Fire Research Information Services, Center for Fire Research,National Bureau of Standards, Washington, D.C. 20234 (USA).
379
Handa, T. , Sugawa, 0. and Watanabe, A. Motion of Fire Products in HighCeiling Enclosure; CIB Symposium, 1979, pp 111-29 - 43.
Hasemi, Y. Mathematical Study of Flashover, BRI, Japan.
Jin, T. and Kumano, Y. On Extinction of Thermal Radiation ThroughFire Smoke; Fire Research Institute, Tokyo, Bulletin of Japanese Assoc.of Fire Science and Engineering, Vol. 28, No. 1, 1978.
Kawagoe, K. , Mizuno, T. , Maruyasu, T., Uchiyama, H. and Hasemi, Y.
A New Method to Measure the Geometrical Aspects of Flame, Japan.
Matsushima, 0. A Numerical Study of the Smoke Layer Forming Processin a Compartment Fire, NTT, Japan.
Saito, K. and Emori, I. Theoretical Prediction for the ApplicableRange of Scaling Laws on Tank Fire Model Experiments.
Tanaka, T. A Model on Fire Spread in Small Scale Buildings; 2ndReport, BRI Research Paper No. 84, March 1980.
Yumoto, T. , Takahashi, A. and Handa, T. Combustion Behavior of LiquidFuel in a Small Vessel: Effect of Convective Motion in the Liquidon Burning Rate of Hexane in the Early Stage of Combustion; Combustionand Flame, The Combustion Institute, 1977, 30, 33-43.
SMOLDERING
Handa, T., Yoshizawa, S., Suzuki, M. and Fukuoka, M. MechanicalPerformance of Lignin and Cellulose in the Dynamic Viscoelasticityof Wood at High Temperature Region; Proceedings of 22nd Japan Congress
on Materials Research, The Society of Materials Science, Kyoto, 1979
pp. 223-228.
Handa, T., Yoshizawa, S., Fukuoka, M. and Suzuki, M. Dynamic Visco-
elasticity of Wood-Polymer Composites Prepared by an Electron Beam
Acceleator, Science Univ. of Tokyo, Plenum Pub. Corp. 1980, pp. 263-276.
SMOKE CHARACTERIZATION
Handa, T. , Suda, K., Kato, Y., Yamamura, T. , Ishii, T. and Shintani, A.
An Improved (0.06-10.0 ym) Optical Counter and Monitoring Particulates
from Combustions; J. Disperson Science and Tech., 1(2), 1980, pp. 209-231.
Suda, K. and Handa, T. Portable Optical Particle (0.06 umm) Counter,
Rev. Sci. Instrum., American Inst, of Physics, Vol 50, No. 7, Jul. 1979,
p. 831.
380
FLAME RETARDANCE
Handa, T. , Nagashima, T. and Ebihara, N. Synergistic Action of
SD2O3 with Bromine-containing Flame Retardant in Polyolefins, 1-TheVariance in their Performance Versus Sb/Br Ratio; Fire and Materials,Vol. 3, No. 2, 1979, pp. 61-67.
Handa, T. ,Nagashima, T., Takahashi, Y., Suda, K. , Ebihara, N. and
Saito, F. Characterization of Smokes from Flame-Retarded Plastics onthe Basis of the Size Distribution of Particles, Fire Research, 1,
Japan, 1977/78, pp. 265-272.
Handa, T. , Nagashima, T. , Takahashi, Y., Tsushima, H., Yamamoto, H.
and Ebihara, N. Synergistic Effect of THPC and M^Br on the Flameand Smoke Retardancy of Phenol-WPC; Vol. 25, 1979, pp 600-609.
Handa, T., Nagashima, T. , Yamamoto, H. , Tsushima, H., Miyanishi, S.
and Ebihara, N. Effect of Oxygen Partial Pressure on the Combustionof Organic Materials in the Hot Wire Ignition Test; Proceedings of 23Japan Congress on Mat'l Research, Society of Materials Science, Kyoto,1980, pp. 327-332.
Handa, T. 1
, Yoshizawa, S., Nagashima, T., Tsushima, H., Yamamoto, H.
and Ebihara, N. Effect of the Mechanical Structure on the CombustionBehavior in the Phenol-Fire Retardants-WPC; ibid. pp. 333-337.
Handa, T. , Nagashima, T. , Takeda, H. , Ebihara, N. and Takahashi, A.
Oxygen Index and Other Parameters for the Evaluation on the Effect of
Fire-Retardants ; Proceedings of 76 Int'l. Symposium on Flammabilityand Fire Retardants, Fire Retardants: 1976, pp. 45-54.
Handa, T., Nagashima, T., Takahashi, Y. and Ebihara, N. AugmentedCooperativity Between Halogen and Phosphorus in the Fire-Retardant-Phenol-Wood, Proceedings of 22 Japan Conference on Materials Research,
Society of Materials Science, Kyoto, 1978, pp 306-312.
Handa, T., Nagashima, T. and Ebihara, N. The Synergistic Behaviorof Antimony Trioxide in Endorsing the Performance of the HalogenContaining Fire-Retardants in Polyolefins, Proceedings of 21 JapanConf . on Mat' Is Research, Society of Materials Science, Kyoto, 1978,
pp. 326-331.
SMOKE CONTROL
Kaneko, K. , Handa, T., Suda, K. and Suzuki, H. Change of Smoke
Particles Size and Elimination of Smoke by Corona; CIB Symposium, 1979,pp. 111-45 - 57.
Smoke Control Design for Shinjuku Normura Bldg. ; Yasui Architects,CIB W14/80/43(J) Japan.
381
HUMAN BEHAVIOR
Kasaigakkai, N. Evaluation of Fire Safety in Buildings; OccasionalReport of Japanese Association of Fire Sdxence and Engineering, No. 3
1979.
Takeda, H. , Kawaguchi, T. and Akita, K. Critical Phenomenon andUnstable Behaviour in Compartment Fires; Univ. of Tokyo.
382
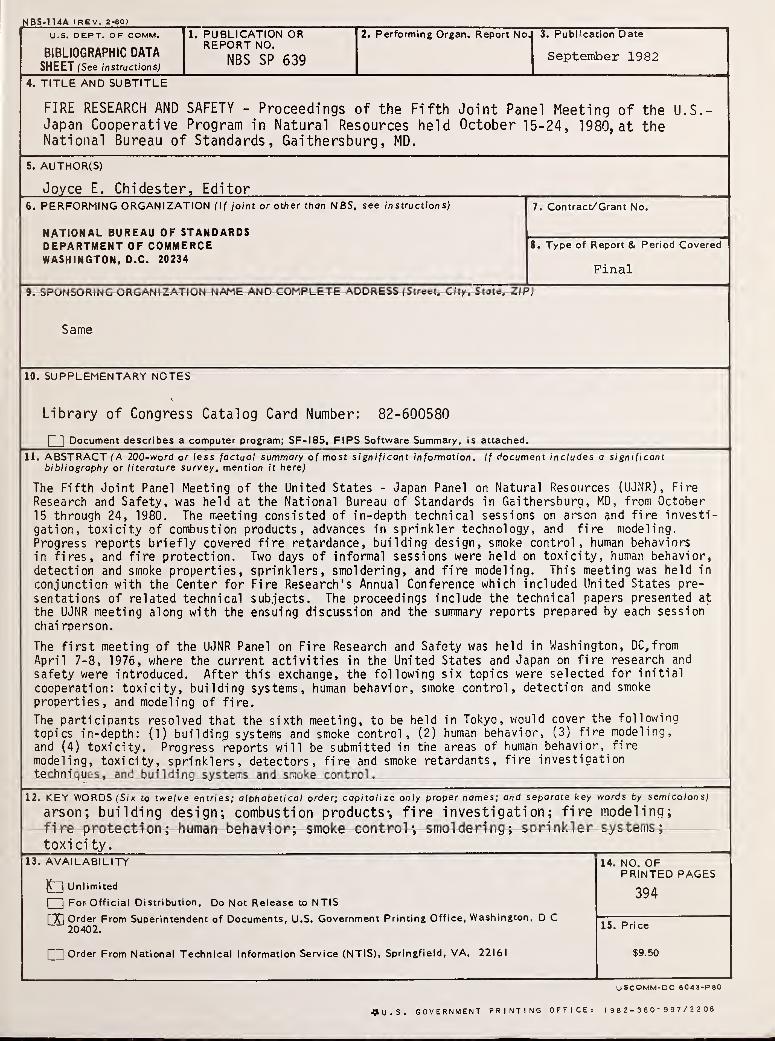
NBS-114A (rev. 2-eo)
U.S. DEPT. OF COMM.
BIBLIOGRAPHIC DATASHEET (See instructions)
1. PUBLICATION ORREPORT NO.
NBS SP 639
2. Performing Organ. Report No. 3. Publication Date
September 1982
4. TITLE AND SUBTITLE
FIRE RESEARCH AND SAFETY - Proceedings of the Fifth Joint Panel Meeting of the U.S.-Japan Cooperative Program in Natural Resources held October 15-24, 1980, at theNational Bureau of Standards, Gaithersburg, MD.
5. AUTHOR(S)
Joyce E. Chidester, Editor6. PERFORMING ORGANIZATION (If joint or other than NBS, see instructions)
NATIONAL BUREAU OF STANDARDSDEPARTMENT OF COMMERCEWASHINGTON, D.C 20234
7. Contract/Grant No.
8. Type of Report & Period Covered
Final
9. SPONSORING ORGANIZATION NAME AND COMPLETE ADDRESS (Street. City. State. ZIP)
Same
10. SUPPLEMENTARY NOTES
Library of Congress Catalog Card Number: 82-600580
I |
Document describes a computer program; SF-185, FlPS Software Summary, is attached.
11. ABSTRACT (A 200-word or less factual summary of most significant information. If document includes a significantbibliography or literature survey, mention it here)
The Fifth Joint Panel Meeting of the United States - Japan Panel on Natural Resources (UJNR), Fire
Research and Safety, was held at the National Bureau of Standards in Gaithersburg, MD, from October
15 through 24, 1980. The meeting consisted of in-depth technical sessions on arson and fire investi-
gation, toxicity of combustion products, advances in sprinkler technology, and fire modeling.
Progress reports briefly covered fire retardance, building design, smoke control, human behaviorsin fires, and fire protection. Two days of informal sessions were held on toxicity, human behavior,
detection and smoke properties, sprinklers, smoldering, and fire modeling. This meeting was held in
conjunction with the Center for Fire Research's Annual Conference which included United States pre-
sentations of related technical subjects. The proceedings include the technical papers presented at
the UJNR meeting along with the ensuing discussion and the summary reports prepared by each session
chai rperson.
The first meeting of the UJNR Panel on Fire Research and Safety was held in Washington, DC,from
April 7-8, 1976, where the current activities in the United States and Japan on fire research and
safety were introduced. After this exchange, the following six topics were selected for initial
cooperation: toxicity, building systems, human behavior, smoke control, detection and smoke
properties, and modeling of fire.
The participants resolved that the sixth meeting, to be held in Tokyo, would cover the following
topics in-depth: (1) building systems and smoke control, (2) human behavior, (3) fire modeling,
and (4) toxicity. Progress reports will be submitted in the areas of human behavior, fire
modeling, toxicity, sprinklers, detectors, fire and smoke retardants, fire investigation
techniques, and building systems and smoke control.
12. KEY WORDS (Six to twelve entries; alphabetical order; capitalize only proper names; and separate key words by semicolons)
arson; building design; combustion products-, fire investigation; fire modeling;fire protection; human behavior; smoke control; smoldering; sprinkler systems;
toxici ty .
13. AVAILABILITY
Unlimited
| |
For Official Distribution. Do Not Release to NTIS
[X] Order From Superintendent of Documents, U.S. Government Printing Office, Washington, D C20402.
Order From National Technical Information Service (NTIS), Springfield, VA. 22161
14. NO. OFPRINTED PAGES
394
15. Price
$9.50
USCOMM-DC 6043-P80
^U.S. GOVERNMENT PRINTING OFFICE! 1 9 8 2 - 3 6 O " 9 9 7 / 2 2 0
8


I


NBS TECHNICAL PUBLICATIONS
PERIODICALS
JOURNAL OF RESEARCH—The Journal of Research of the
National Bureau of Standards reports NBS research and develop-
ment in those disciplines of the physical and engineering sciences in
which the Bureau is active. These include physics, chemistry,
engineering, mathematics, and computer sciences. Papers cover a
broad range of subjects, with major emphasis on measurement
methodology and the basic technology underlying standardization.
Also included from time to lime are survey articles on topics
closely related to the Bureau's technical and scientific programs.
As a special service to subscribers each issue contains complete
citations to all recent Bureau publications in both NBS and non-
NBS media. Issued six times a year. Annual subscription: domestic
$18; foreign $22.50. Single copy, $4.25 domestic; $5.35 foreign.
NONPERIODICALS
Monographs—Major contributions to the technical literature onvarious subjects related to the Bureau's scientific and technical ac-
tivities.
Handbooks—Recommended codes of engineering and industrial
practice (including safety codes) developed in cooperation with in-
terested industries, professional organizations, and regulatory
bodies.
Special Publications—Include proceedings of conferences spon-
sored by NBS, NBS annual reports, and other special publications
appropriate to this grouping such as wall charts, pocket cards, andbibliographies.
Applied Mathematics Series— Mathematical tables, manuals, andstudies of special interest to physicists, engineers, chemists,
biologists, mathematicians, computer programmers, and others
engaged in scientific and technical work.
National Standard Reference Data Series—Provides quantitative
data on the physical and chemical properties of materials, com-piled from the world's literature and critically evaluated.
Developed under a worldwide program coordinated by NBS under
the authority of the National Standard Data Act (Public Law90-396).
NOTE: The principal publication outlet for the foregoing data is
the Journal of Physical and Chemical Reference Data (JPCRD)published quarterly for NBS by the American Chemical Society
(ACS) and the American Institute of Physics (AIP). Subscriptions,
reprints, and supplements available from ACS, 1 155 Sixteenth St.,
NW, Washington, DC 20056.
Building Science Series— Disseminates technical information
developed at the Bureau on building materials, components,
systems, and whole structures. The series presents research results,
test methods, and performance criteria related to the structural andenvironmental functions and the durability and safety charac-
teristics of building elements and systems.
Technical Notes—Studies or reports which are complete in them-
selves but restrictive in their treatment of a subject. Analogous to
monographs but not so comprehensive in scope or definitive in
treatment of the subject area. Often serve as a vehicle for final
reports of work performed at NBS under the sponsorship of other
government agencies.
Voluntary Product Standards—Developed under procedures
published by the Department of Commerce in Part 10, Title 15, of
the Code of Federal Regulations. The standards establish
nationally recognized requirements for products, and provide all
concerned interests with a basis for common understanding of the
characteristics of the products. NBS administers this program as a
supplement to the activities of the private sector standardizing
organizations.
Consumer Information Series— Practical information, based onNBS research and experience, covering areas of interest to the con-
sumer. Easily understandable language and illustrations provide
useful background knowledge for shopping in today's tech-
nological marketplace.
Order the above NBS publications from: Superintendent of Docu-
ments, Government Printing Office, Washington, DC 20402.
Order the following NBS publications—FlPS and NBSIR's—fromthe National Technical Information Services, Springfield, VA 22161
.
Federal Information Processing Standards Publications (FIPS
PUB)— Publications in this series collectively constitute the
Federal Information Processing Standards Register. The Register
serves as the official source of information in the Federal Govern-
ment regarding standards issued by NBS pursuant to the Federal
Property and Administrative Services Act of 1949 as amended,
Public Law 89-306 (79 Stat. 1127), and as implemented by Ex-
ecutive Order 11717 (38 FR 12315, dated May I I, 1973) and Part 6
of Title 15 CFR (Code of Federal Regulations).
NBS Interagency Reports (NBSIR)—A special series of interim or
final reports on work performed by NBS for outside sponsors
(both government and non-government). In general, initial dis-
tribution is handled by the sponsor; public distribution is by the
National Technical Information Services, Springfield, VA 22161,
in paper copy or microfiche form.

U.S. Department of CommerceNational Bureau of Standards
Washington, D.C. 20234Official Business
Penalty for Private Use $300
11111
f*lPOSTAGE AND FEES PAID
U S DEPARTMENT OF COMMERCECOM-215
SPECIAL FOURTH-CLASS RATEBOOK