Fire history and ecology of Garry oak and associated ecosystems in British Columbia
76
Fire History and Ecology of Garry Oak and Associated Ecosystems in British Columbia: Final Report for the Interdepartmental Recovery Fund Project 733 Dr. Marlow G. Pellatt Dr. Ze’ev Gedolof Marian McCoy, MSc Karin Bodtker, MRM Alex Cannon, MSc Shyanne Smith Dr. Brenda Beckwith Dr. Rolf Mathewes Dr. Dan Smith prepared by the Western and Northern Service Centre
Transcript of Fire history and ecology of Garry oak and associated ecosystems in British Columbia
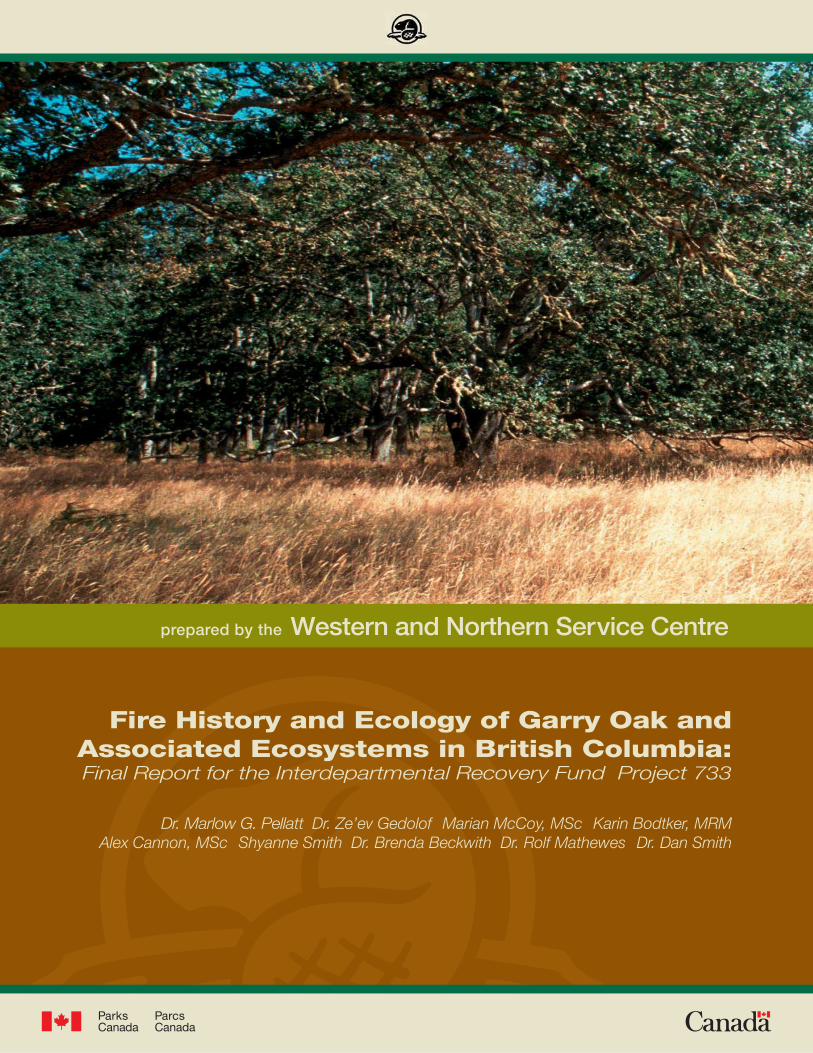
Fire History and Ecology of Garry Oak and
Associated Ecosystems in British Columbia:Final Report for the Interdepartmental Recovery Fund Project 733
Dr. Marlow G. Pellatt Dr. Ze’ev Gedolof Marian McCoy, MSc Karin Bodtker, MRM
Alex Cannon, MSc Shyanne Smith Dr. Brenda Beckwith Dr. Rolf Mathewes Dr. Dan Smith
prepared by the Western and Northern Service Centre
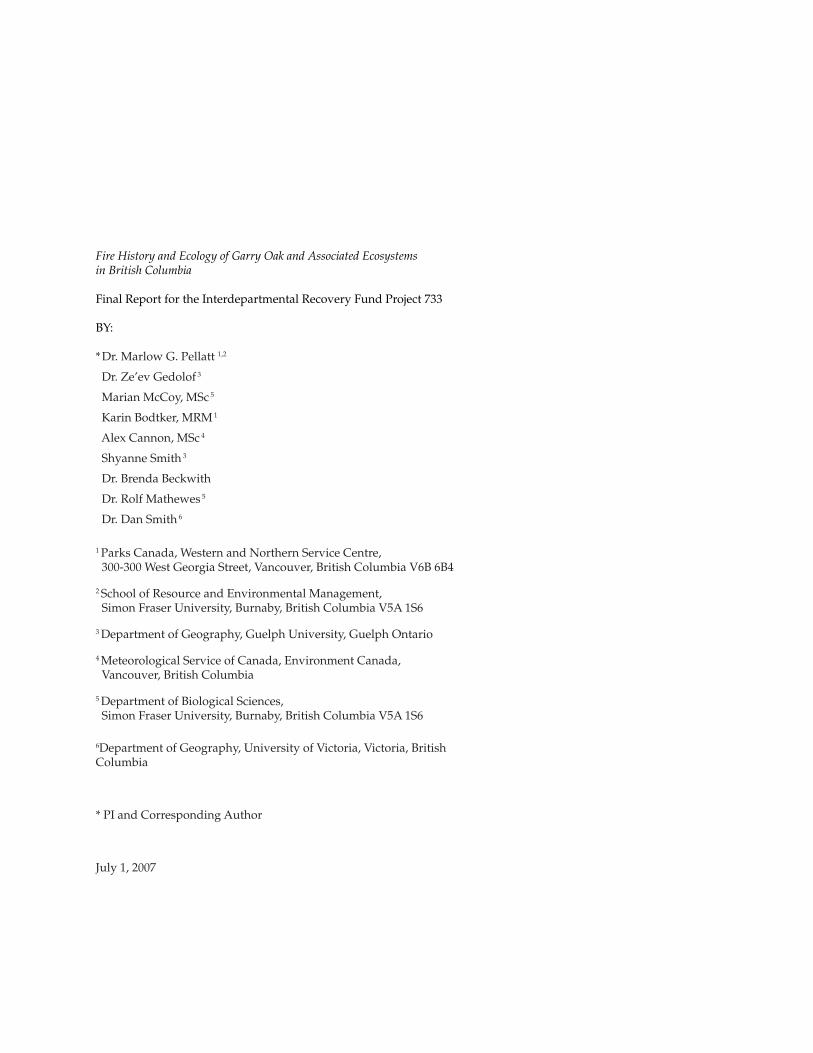
Fire History and Ecology of Garry Oak and Associated Ecosystems in British Columbia
Final Report for the Interdepartmental Recovery Fund Project 733
BY:
* Dr. Marlow G. Pellatt 1,2
Dr. Ze’ev Gedolof 3
Marian McCoy, MSc 5
Karin Bodtker, MRM 1
Alex Cannon, MSc 4
Shyanne Smith 3
Dr. Brenda Beckwith
Dr. Rolf Mathewes 5
Dr. Dan Smith 6
1 Parks Canada, Western and Northern Service Centre, 300-300 West Georgia Street, Vancouver, British Columbia V6B 6B4
2 School of Resource and Environmental Management, Simon Fraser University, Burnaby, British Columbia V5A 1S6
3 Department of Geography, Guelph University, Guelph Ontario
4 Meteorological Service of Canada, Environment Canada, Vancouver, British Columbia
5 Department of Biological Sciences, Simon Fraser University, Burnaby, British Columbia V5A 1S6
6Department of Geography, University of Victoria, Victoria, British Columbia
* PI and Corresponding Author
July 1, 2007
TABLE OF CONTENTS
1.0 INTRODUCTION ..........................................................................................................................1
1.1 Ecology ..............................................................................................................................21.2 Fire and humans in Garry oak ecosystems ...................................................................41.3 Paleoecology ......................................................................................................................61.4 Cultural History ................................................................................................................7
2.0 PALYNOLOGY AND CHARCOAL ANALYSIS OF THE RECENT PAST ............................................ 9
2.1 Research objectives ............................................................................................................92.2 Study sites and methods ...................................................................................................92.3 Results and Conclusions .................................................................................................10
2.3.1 Pre-1750 ...................................................................................................................122.3.2 1750 – 1850 ..............................................................................................................122.3.3 1850 – 1940 ..............................................................................................................132.3.4 1940 – present .........................................................................................................132.3.5 Mean Fire Return Intervals ...................................................................................13
3.0 DENDROECOLOGY .....................................................................................................................15
3.1 Research Objectives .........................................................................................................153.2 Study Sites .........................................................................................................................15
3.2.1 Rocky Point (DND) ................................................................................................153.2.2 Beaumont Marine Park (GINPR) .........................................................................183.2.3 Tumbo Island (GINPR) .........................................................................................20
3.3. Methods .............................................................................................................................223.3.1 Field Methods .........................................................................................................223.3.1 Sample preparation ...............................................................................................223.3.2 Ring-width measurement .....................................................................................223.3.3 Cross-dating ............................................................................................................233.3.4 Calculating the site chronology ...........................................................................233.3.5 Growth-climate relations ......................................................................................243.3.6 Ecosystem dynamics .............................................................................................25
3.4 Results and Discussion ....................................................................................................253.4.1 Cross-dating ............................................................................................................253.4.2 Growth-climate relationships ...............................................................................263.4.3 Fire histories ...........................................................................................................273.4.4 Ecosystem dynamics .............................................................................................30
3.5 Conclusions .......................................................................................................................333.5.1 Management Recommendations .........................................................................333.5.2 Future Work ............................................................................................................333.5.3 Closing Remarks ....................................................................................................33
ABSTRACT .......................................................................................................................................... vEXECUTIVE SUMMARY ....................................................................................................................... vACKNOWLEDGEMENTS .................................................................................................................... vii
i Fire History and Ecology of Garry Oak and Associated Ecosystems in British Columbia
4.0 REGIONAL ANALYSIS OF OVERSTORY AND UNDERSTORY DYNAMICS OF GARRY OAK ......35
4.1 Study Overview ................................................................................................................354.2 Orthophoto and Site Comparison .................................................................................35
4.2.1 Stand structure .......................................................................................................354.2.2 Understory composition ....................................................................................... 374.2.3 Regeneration ...........................................................................................................384.2.4 Tree-ring widths .....................................................................................................40
4.3 Conclusions .......................................................................................................................42
5.0 BIOCLIMATIC ENVELOPE MODELS ..........................................................................................43
5.1 Climate Modelling Methods ...........................................................................................435.1.1 Daily climate series ................................................................................................435.1.2 Gridded climate normals ......................................................................................45
5.2 Bioclimatic Modelling Methods .....................................................................................455.2.1 Data used .................................................................................................................475.2.2 Modelling techniques ............................................................................................485.2.3 Model building and performance measures .....................................................485.2.4 ROC score ................................................................................................................485.2.5 Kappa score ............................................................................................................. 495.2.6 Choosing the best threshold ................................................................................. 51
5.3 Results ................................................................................................................................ 515.4 Orthophoto and Site Comparison ..................................................................................54
6.0 CONCLUSION ............................................................................................................................55
7.0 RECOMMENDATIONS ...............................................................................................................59
8.0 REFERENCES ............................................................................................................................61
FIGURES
1.0 INTRODUCTION1-1. Present North American Distribution of Garry Oak (Quercus garryana) ..................21-2. Lightning Caused Fires for Gulf Island National Park Reserve between 1950 and 2002 ....................................................................................................51-3. Saanich Inlet Pollen Accumulation Diagram ...............................................................7
2.0 PALYNOLOGY AND CHARCOAL ANALYSIS OF THE RECENT PAST2-1. Location of Study Sites for Pollen and Charcoal Analyses ...........................................92-2. Comparison of pollen zones and re-sampled charcoal accumulation rate (rsCHAR) fire history for Roe Lake and Quamichan Lake, and upper (1745- 2003) fire history for Florence Lake ................................................................... 11
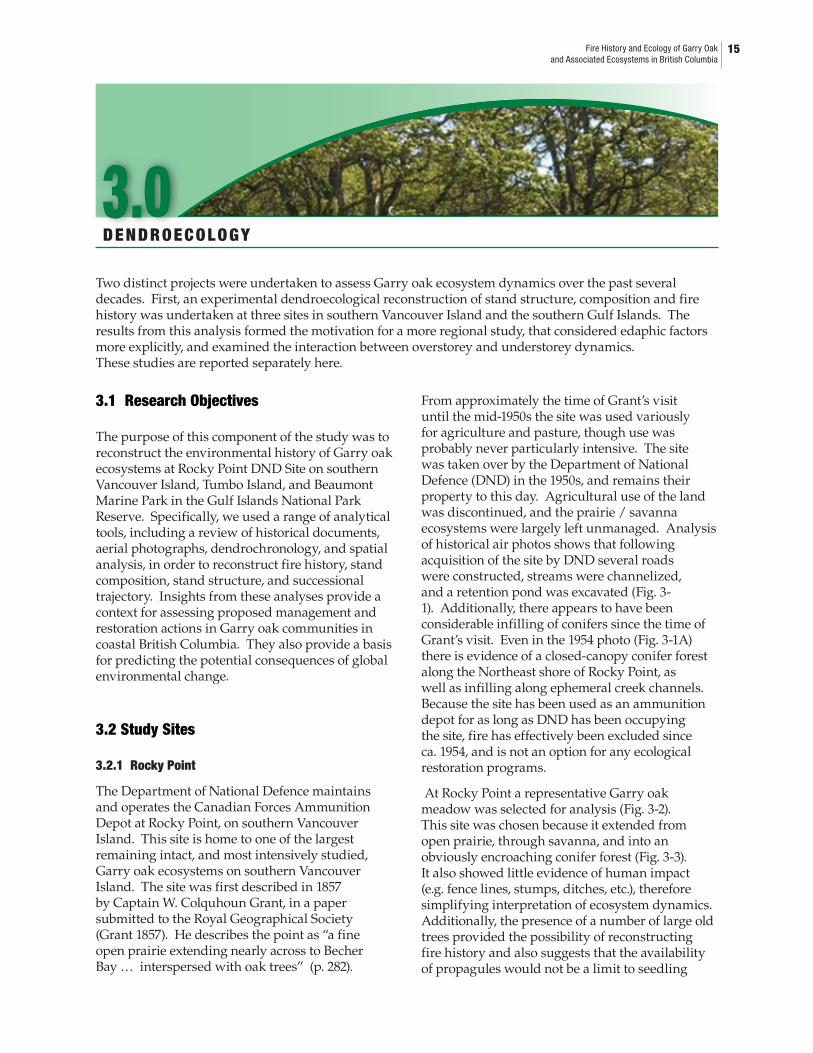
3.0 DENDROECOLOGY3-1. Study site Rocky Point (RPA) in (A) 1954, (B) 1964, and (C) 1975 ............................. 163-2. Study site Rocky Point (RPA) ........................................................................................ 173-3. Detail from study site RPA ............................................................................................ 173-4. The sampling grid used at site RPA............................................................................. 173-5. Part of study site Beaumont Marine Park ................................................................... 18
ii
3-6. The sampling grid used at site Beaumont Marine Park ......................................... 183-7. Detail from study site Beaumont Marine Park ......................................................... 193-8. Detail from study site Tumbo Island .........................................................................203-9. The sampling grid used at site Tumbo Island ..........................................................203-10. Detail from study site Tumbo Island .........................................................................213-11. Leader architecture of a typical deer-browsed tree ..................................................213-12. The response function for the Garry oak chronology collected at site RPA .........263-13. The response function for the Douglas-fir chronology collected at site RPA ......263-14. Recruitment of Garry oak and Douglas-fir to site RPA by decade ........................273-15. Recruitment of Garry oak and Douglas-fir to site Beaumont Marine Park by decade .................................................................283-16. Recruitment of Garry oak and Douglas-fir to site Tumbo Island by decade .......293-17. Number of trees per quadrat, and relative species proportions at site RPA for (A) seedlings, (B) saplings, and (C) trees sampled at site RPA ....303-18. Number of trees per quadrat, and relative species proportions at site BMP for (A) seedlings, (B) saplings, and (C) trees sampled at site RPA ....313-19. Number of trees per quadrat, and relative species proportions at site Tumbo Island for (A) seedlings, (B) saplings, and (C) trees sampled at site RPA ..............................................................................32
4.0 REGIONAL ANALYSIS OF OVERSTORY AND UNDERSTORY DYNAMICS IN GARRY OAK ECOSYSTEMS4-1. Comparison of forest cover in the vicinity of Site Beaumont Marine Park on South Pender Island .....................................................36
5.0 BIOCLIMATIC ENVELOPE MODELLING5-1. Geographic extents of climatic suitability model for Garry oak ecosystems .......445-2. Observed Garry oak sites in the study area ..............................................................475-3. Current Garry oak habitat modeled by a) Random Forest (RF), b) Logistic Regression (LR), c) Maximum Likelihood (ML), d) Minimum Distance (MD) models .........................................................................505-4. Model fit of Random Forests (RF) model. Garry oak modeled habitat compared to observed Garry oak sites for BC, Washington and Oregon ............525-5. Forecasted regions of reduced, retained, and improved climate suitability for Garry oak ecosystems for a) 2010-2039, b) 2040-2060, and c) 2070-2099 all relative to modeled Garry oak habitat for current day .......535-6. Probability that currently observed Garry oak sites retain a climate suited for Garry oak in the next few decades, according to the Random Forests model run with climate forecasts from the Canadian Coupled Global Climate Model v2 (CGCM2) with forcing scenario A2 ......................................................................................................54
6.0 CONCLUSIONS6-1. Solar insolation curves for 50oN latitude. Changes in solar insolation are expressed relative to current conditions ............................................................556-2. Garry oaks submerged in riparian zone of a creek near Olympia Washington ..566-3. Large Garry oak trees on Tumbo Island, Gulf Island National Parks Reserve ....56
iii Fire History and Ecology of Garry Oak and Associated Ecosystems in British Columbia

iv
TABLES
2.0 PALYNOLOGY AND CHARCOAL ANALYSIS OF THE RECENT PAST2-1. Years of fire events identified from re-sampled charcoal accumulation rate for 1745 to present at RL, QL, and FL, and differences in years of fire events among sites that are interpreted as coeval ................................................ 11
3.0 DENDROECOLOGY3-1. Chronology statistics for Dendroecological sites sampled in this analysis ...........25
5.0 BIOCLIMATIC ENVELOPE MODELLING5-1. Mean and standard deviation values (summarizing areas of Garry oak presence) for each of the independent variables used to model the geographic distribution of areas climatically suited to Garry oak ecosystemss ...................................................................................................465-2. Comparison of four models used to predict current range suitable for Garry oak ecosystems .............................................................................................. 495-3. Independent variables most important in building the random Forests model (in order of importance) ....................................................................... 515-4. Areas (km2) occupied and modelled as suitable for Garry oak (GO) currently and in the future ............................................................................................ 515-5. Climate variables with greatest magnitude of change in areas that are forecasted to lose suitability for Garry oak .................................................................53
v Fire History and Ecology of Garry Oak and Associated Ecosystems in British Columbia
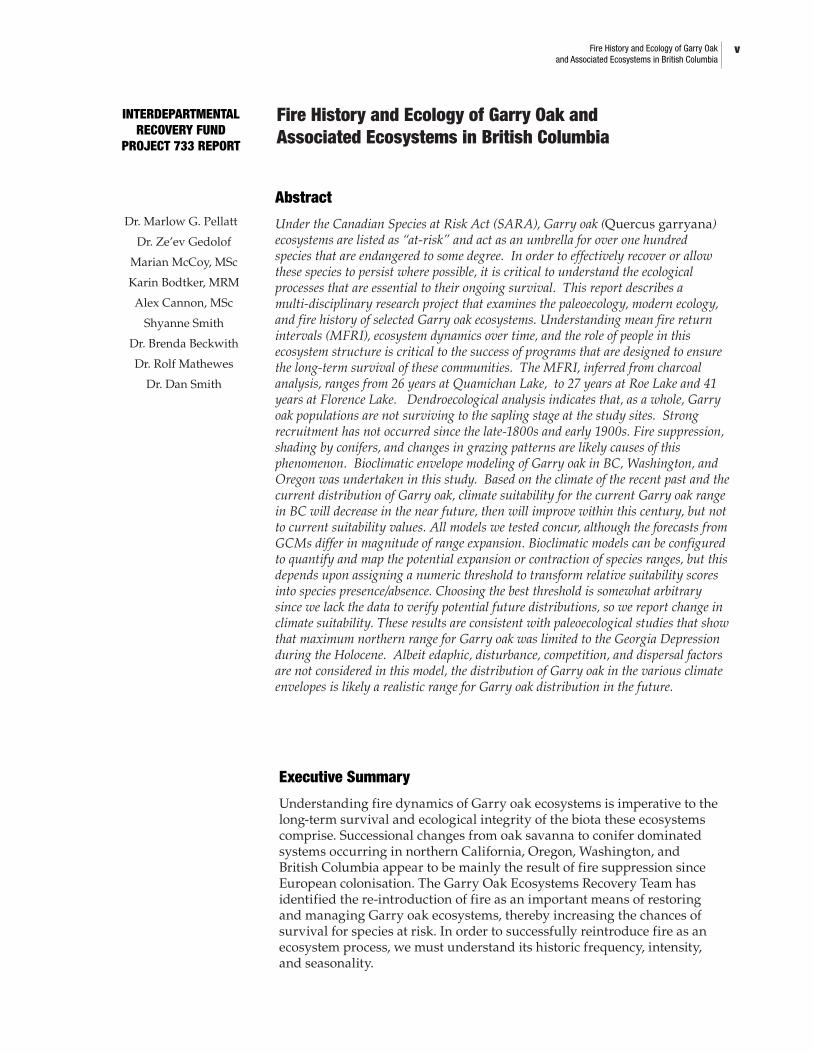
Abstract
Under the Canadian Species at Risk Act (SARA), Garry oak (Quercus garryana) ecosystems are listed as “at-risk” and act as an umbrella for over one hundred species that are endangered to some degree. In order to effectively recover or allow these species to persist where possible, it is critical to understand the ecological processes that are essential to their ongoing survival. This report describes a multi-disciplinary research project that examines the paleoecology, modern ecology, and fire history of selected Garry oak ecosystems. Understanding mean fire return intervals (MFRI), ecosystem dynamics over time, and the role of people in this ecosystem structure is critical to the success of programs that are designed to ensure the long-term survival of these communities. The MFRI, inferred from charcoal analysis, ranges from 26 years at Quamichan Lake, to 27 years at Roe Lake and 41 years at Florence Lake. Dendroecological analysis indicates that, as a whole, Garry oak populations are not surviving to the sapling stage at the study sites. Strong recruitment has not occurred since the late-1800s and early 1900s. Fire suppression, shading by conifers, and changes in grazing patterns are likely causes of this phenomenon. Bioclimatic envelope modeling of Garry oak in BC, Washington, and Oregon was undertaken in this study. Based on the climate of the recent past and the current distribution of Garry oak, climate suitability for the current Garry oak range in BC will decrease in the near future, then will improve within this century, but not to current suitability values. All models we tested concur, although the forecasts from GCMs differ in magnitude of range expansion. Bioclimatic models can be configured to quantify and map the potential expansion or contraction of species ranges, but this depends upon assigning a numeric threshold to transform relative suitability scores into species presence/absence. Choosing the best threshold is somewhat arbitrary since we lack the data to verify potential future distributions, so we report change in climate suitability. These results are consistent with paleoecological studies that show that maximum northern range for Garry oak was limited to the Georgia Depression during the Holocene. Albeit edaphic, disturbance, competition, and dispersal factors are not considered in this model, the distribution of Garry oak in the various climate envelopes is likely a realistic range for Garry oak distribution in the future.
Executive Summary
Understanding fire dynamics of Garry oak ecosystems is imperative to the long-term survival and ecological integrity of the biota these ecosystems comprise. Successional changes from oak savanna to conifer dominated systems occurring in northern California, Oregon, Washington, and British Columbia appear to be mainly the result of fire suppression since European colonisation. The Garry Oak Ecosystems Recovery Team has identified the re-introduction of fire as an important means of restoring and managing Garry oak ecosystems, thereby increasing the chances of survival for species at risk. In order to successfully reintroduce fire as an ecosystem process, we must understand its historic frequency, intensity, and seasonality.
Dr. Marlow G. Pellatt
Dr. Ze’ev Gedolof
Marian McCoy, MSc
Karin Bodtker, MRM
Alex Cannon, MSc
Shyanne Smith
Dr. Brenda Beckwith
Dr. Rolf Mathewes
Dr. Dan Smith
Fire History and Ecology of Garry Oak and Associated Ecosystems in British Columbia
INTERDEPARTMENTAL RECOVERY FUND
PROJECT 733 REPORT
vi
This report presents the results of a multi-disciplinary project that examined the fire history and paleoecology of Garry oak and associated ecosystems in British Columbia. The research was funded by the Interdepartmental Recovery Fund (projects 130, 438, 733), Climate Change Action Fund (A718), NSERC (MP & MM), and the Parks Canada Agency- Western and Northern Service Centre (MP).
The main results of the study are;
Pollen analysis shows that Garry oak was at its maximum abundance and had expanded to its range maximum between 8300 and 6500 BP. There is no paleoecological evidence that, in Canada, Garry oak expanded north or east of the Georgia Basin during the Holocene.
Modern autecology of Garry oak indicates that this species can grow on a wide variety of sites, but on good-qulaity sites it is often crowded out by species that grow faster and taller, such as Douglas-fir (Pseudotsuga menziesii). Garry oak is shade intolerant and cannot successfully compete against many other coastal species, hence is limited to marginal habitats or areas with suitable disturbance regimes. Prairie/meadow environments are also limited in a similar manner. On southern Vancouver Island, Garry oak is relatively common on sites that are too exposed or droughty for other tree species during at least part of the year. Overall it can withstand both lengthy flooding and drought. It is generally a seral species but it can be a climax species where yearly or seasonal precipitation is sparse, soils are shallow or droughty, or where fire is a repeated natural occurrence.
Fire is an important disturbance mechanism for Garry oak. In addition, aboriginal modification of the landscape through local burning and digging to enhance production of camas and other food resources likely played a significant role in perpetuating more suitable habitat, over millennia. Evidence indicates that, in order to maintain Garry oak ecosystems and the species at risk they support, there is a need to maintain disturbance regimes.
Charcoal analysis was used to determine a mean fire return interval (MFRI) for the study sites. The MFRI ranges from 26 years at Quamichan Lake, to 27 years at Roe Lake and 41 years at Florence Lake. The results indicate that these MFRIs are a reflection of lightning-induced fires and are tied directly to climate variability.
As a whole, Garry oak populations are not surviving to the sapling stage at the study sites. Strong recruitment has not occurred since the late-1800s and early 1900s. Fire suppression, shading by conifers, and changes in ungulate grazing patterns are likely causes of this phenomenon.
There is a general assumption that global climate change will cause northward and elevational migration of ecosystems. As paleoclimate research has indicated, northward expansion of Garry oak was limited to the Georgia Depression during the early Holocene. This
�
�
�
�
�
�
vii Fire History and Ecology of Garry Oakand Associated Ecosystems in British Columbia
is likely due to dispersal and climatic limitations presented by the surrounding Insular and Coastal mountain ranges. Climate and corresponding ecological change has been rapid and significant in the region throughout the Holocene, indicating that further work is needed to understand ecosystem thresholds. There is no doubt that climate change is occurring and is deleteriously affecting Garry oak ecosystems. Rapid change in ecosystem structure due to climate change, invasive species, species migration, suppression of natural disturbance regimes, and habitat fragmentation should be expected to effect Garry oak and associated ecosystems.
Bioclimatic envelope modeling of Garry oak in BC, Washington, and Oregon was undertaken in this study. Based on the climate of the recent past and the current distribution of Garry oak, climate suitability for the current Garry oak range in BC will decrease in the near future, then will improve within this century, but not back to current values. All models we tested concur, although the forecasts for range expansion from GCMs differ in magnitude. Bioclimatic models can be configured to quantify and map the potential expansion or contraction of species ranges, but this depends upon assigning a numeric threshold to transform relative suitability scores into species presence/absence. Choosing the best threshold is somewhat arbitrary since we lack the data to verify potential future distributions, so we report change in climate suitability. These results are consistent with paleoecological studies that show that maximum northern range for Garry oak was limited to the Georgia Depression during the Holocene. While edaphic, disturbance, competition, and dispersal factors are not considered in this model, the distribution of Garry oak in the various climate envelopes is likely a realistic range for Garry oak distribution in the future.
Acknowledgements
We are grateful to the Department of National Defence and to Parks Canada for granting permission to access study sites. Financial support for the project was provided to Marlow Pellatt (Principal Investigator) by the Interdepartmental Recovery Fund, Climate Change Action Fund, Parks Canada – Western and Northern Service Centre, and NSERC. Ze’ev Gedalof is supported by a Canadian Foundation for Climate and Atmospheric Sciences grant awarded to Dan J. Smith and Brian H. Luckman. Marian McCoy was supported by an NSERC graduate student scholarship. Thanks go to Brad Hawkes (CFS) for project support. Sarah Laxton, Darren Bos, Marian McCoy, and Dave Lewis endured inclement weather, and the backbreaking work of extracting cores from oak trees, in order to provide field assistance. Dan Smith and the University of Victoria Tree-Ring Laboratory and Rolf Mathewes (Simon Fraser University) provided laboratory facilities. Thanks is extended to Alice Gavin for formatting and graphical assistance in preparation of the WNSC report.
�

viii
1.0
1 Fire History and Ecology of Garry Oakand Associated Ecosystems in British Columbia
INTRODUCTION
Anthropogenic stresses on ecosystems and the species they sustain have at no time been as severe as during the late 20th and early 21st centuries. Rates of species decline have been compared to major extinction events that have occurred in the past (May et al, 1995). Anthropogenic changes to the landscape due to habitation, agriculture, resource extraction, and modification of natural processes can be compared to ecosystem change that occurred during the late-Pleistocene extinction and after the last great ice age.
Most Canadians live within 160 km of the Canada – U.S. border (CIA web page - Canada). A multitude of historical reasons have lead to this phenomenon, but it can be put forward that climate, hence productive agricultural lands, has been an important factor in this settlement pattern. This phenomenon is also reflected in the generally higher levels of biodiversity that occurs in the more temperate regions of our country. In many cases, the richest and most diverse ecosystems are also the most desirable for human settlement and agriculture.
The retreat of the Wisconsin glaciers from British Columbia over the last 12,000 years allowed for the biotic re-colinisation of the landscape and waterways. Some species may have persisted in glacial refugia, but the bulk of the species moving into BC migrated from the north (e.g., Beringia) or south. Glacial refugia tend to be higher in endemic species than other areas in the province, whereas in the south many species appear to be at the northern limit of their ecological ranges. This range limit is an important factor that we must consider when assessing the feasibility of species recovery in a specific area. If these northern populations are relicts from a broader range in the past, it may be that recovery will be challenged by changing environmental conditions. We must also discriminate between relict populations and populations that have been fragmented and isolated due to land
development and other land use practices. Changing land use practices present challenges if particular disturbance factors are necessary for the persistence of a species or community. All of these factors are likely playing a role in the reduction of Garry oak ecosystems in BC as well as the northwest coast of the U.S.
British Columbia’s Garry oak ecosystems are located in the drier portion of the Coastal Douglas-Fir biogeoclimatic zone (CDF) (Figure 1.1). These ecosystems are of limited extent and have come to public attention due to extreme development pressure, resource extraction, habitat fragmentation, and loss of ecosystem processes leading to ecosystem change and the decline of locally adapted species. The Canadian Species at Risk Act (SARA) highlights the need to protect at-risk species associated with Garry oak communities by an ecosystem approach instead of pursuing recovery by single species approaches. Although most SAR recovery plans have been geared toward single-species, the Garry Oak Ecosystems Recovery Team (GOERT) is cognisant of the need to protect habitat at the ecosystem level in order to sustain the long-term viability of endangered species.
This project was designed to understand the ecological processes that maintain Garry oak ecosystems. We have taken a multi-disciplinary approach that includes paleoecology (pollen analysis, charcoal analysis, and dendroecology), neo-ecology, downscaled climate modelling, and environmental envelope modelling in order to understand the dynamics of the Garry oak ecosystems. The paleoecological research concentrates on tree species and the pollen of species that are preserved in lake sediments. We examine the natural range of variability in these ecosystems, develop a mean fire return interval, and attempt to understand the natural and anthropogenically driven disturbance regimes that have lead to the development and persistence of Garry oak ecosystems. We couple Garry oak
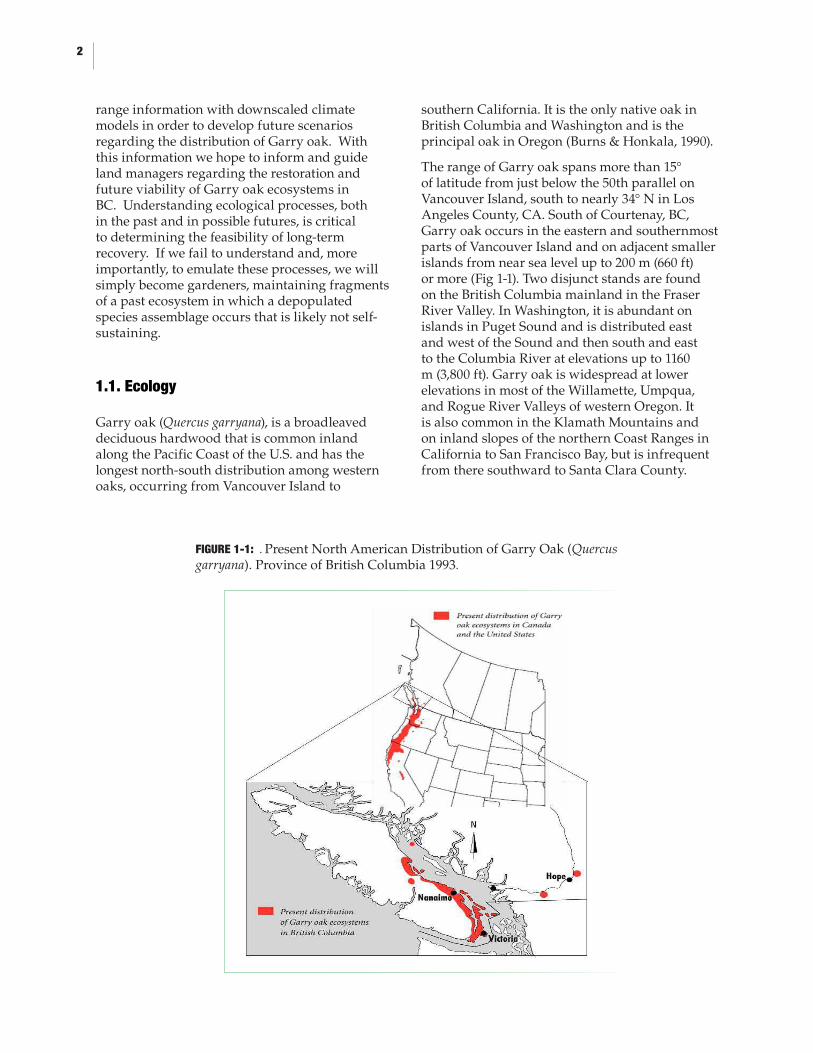
FIGURE 1-1: . Present North American Distribution of Garry Oak (Quercus garryana). Province of British Columbia 1993.
2
range information with downscaled climate models in order to develop future scenarios regarding the distribution of Garry oak. With this information we hope to inform and guide land managers regarding the restoration and future viability of Garry oak ecosystems in BC. Understanding ecological processes, both in the past and in possible futures, is critical to determining the feasibility of long-term recovery. If we fail to understand and, more importantly, to emulate these processes, we will simply become gardeners, maintaining fragments of a past ecosystem in which a depopulated species assemblage occurs that is likely not self-sustaining.
1.1. Ecology
Garry oak (Quercus garryana), is a broadleaved deciduous hardwood that is common inland along the Pacific Coast of the U.S. and has the longest north-south distribution among western oaks, occurring from Vancouver Island to
southern California. It is the only native oak in British Columbia and Washington and is the principal oak in Oregon (Burns & Honkala, 1990).
The range of Garry oak spans more than 15° of latitude from just below the 50th parallel on Vancouver Island, south to nearly 34° N in Los Angeles County, CA. South of Courtenay, BC, Garry oak occurs in the eastern and southernmost parts of Vancouver Island and on adjacent smaller islands from near sea level up to 200 m (660 ft) or more (Fig 1-1). Two disjunct stands are found on the British Columbia mainland in the Fraser River Valley. In Washington, it is abundant on islands in Puget Sound and is distributed east and west of the Sound and then south and east to the Columbia River at elevations up to 1160 m (3,800 ft). Garry oak is widespread at lower elevations in most of the Willamette, Umpqua, and Rogue River Valleys of western Oregon. It is also common in the Klamath Mountains and on inland slopes of the northern Coast Ranges in California to San Francisco Bay, but is infrequent from there southward to Santa Clara County.
3 Fire History and Ecology of Garry Oakand Associated Ecosystems in British Columbia
In Canada, Garry oak ecosystems have been categorized conventionally as a suite of related ecosystems within the dry Coastal Douglas-fir Biogeoclimatic Zone (CDF). This zone occurs on southeastern Vancouver Island, the adjacent Gulf Islands, and portions of the Lower Mainland (Fig 1-1). It is restricted to lower elevations and communities characterized as warm/dry, such as slopes with southern exposure, hilltops, rocky outcrop, and coastal bluff. Many plant communities within the historic range of Garry oak ecosystems were dependent on periodic disturbance for continued persistence across a dynamic landscape. These sites, usually with deeper soils, were maintained by natural means, such as annual periods of flood inundation or wildfire, or possibly by cultural management practices, including plant resource harvesting and controlled burning. Several major threats, including – habitat loss and fragmentation, introduced invasive species, and suppression of historic disturbance regimes – are affecting the ecological integrity of Garry oak ecosystems.
Most Garry oak ecosystems are nationally endangered in Canada with over 100 species at risk (provincial and federal). It has been estimated that less than five percent of these ecosystems exist in a near-natural condition today, and less than one percent of these ecosystems can be classified as deep-soil oak communities. Many sites with deeper soils were lost to agricultural expansion in the mid-late 1800s, and then to urban and suburban development throughout the twentieth century. Most of the remaining oak communities are shallow-soil sites that have withstood these pressures of development, although in some municipalities even shallow-soil sites are now being developed. All Garry oak ecosystems in British Columbia are degraded to some extent and many more communities will be lost to ecological succession if restoration and management initiatives are not undertaken.
After a century of fire exclusion and intensive land development, the landscape of Garry oak ecosystems in British Columbia today is a mosaic of fragmented stands or scattered relics (Erickson 2000). Depending on percent cover and tree density, this ecosystem type ranges from open savanna to woodland (Agee 1993) with remnants of the latter being predominant in its British Columbia range. In the presence of fire, oak woodlands can be climax forests; without fire they become seral to conifer forests
(Stein 1990) — characteristic of importance in restoration. Although considered a xeric species, Garry oak itself exhibits broad ecological amplitude (Fuchs 2001): it can be common on sites that are physiologically marginal for establishment and growth of other trees, typically due to moisture limitation caused by coarse-textured or thin soils or low rainfall (Erickson 2000; Sugihara & Reed 1987). Garry oak ecosystems often occur in very moist locations where standing water or a shallow water table are present during the wet season and on gravelly or heavy clay surface soils that may be droughty during the extended dry season (Stein 1990). Garry oak can grow on a wide variety of sites, but on good-quality sites it is often crowded out by species that grow faster and taller. It is shade intolerant and cannot successfully compete against many other coastal species, hence is limited to marginal habitats or areas with suitable disturbance regimes. Prairie/meadow environments are also limited in a similar manner. On southern Vancouver Island, Garry oak is relatively common on sites that are too exposed or droughty for other tree species during at least part of the year. Overall it can withstand both lengthy flooding and drought. It is generally a seral species but it can be a climax species where yearly or seasonal precipitation is sparse, soils are shallow or droughty, or where fire is a repeated natural occurrence. Fire is an important disturbance mechanism for the persistence of Garry oak. In addition, aboriginal modification of the landscape likely played a significant role in maintaining suitable habitat due over millennia. It appears that Garry oak ecosystems require disturbance in order to persist.
Climate is a critical determinant of the range and characteristics of Garry oak ecosystems. In British Columbia, they occur mainly within the Coastal Douglas-fir (Pseudotsuga menziesii) moist maritime (CDFmm) biogeoclimatic sub-zone of southeastern Vancouver Island and the southern Gulf Islands. Two remnant patches also occur in the Coastal Western Hemlock biogeoclimatic zone on Sumas Mountain in the Fraser Valley, and near Yale in the Fraser Canyon. Possibly due to milder winter temperatures, Garry oak ecosystems are more widespread in the U.S., extending south through the Puget Trough of Washington, the Willamette Valley of Oregon, and into northern and central California (Figure 1-1).
4
The CDFmm occurs at elevations below 150 metres asl, with a climate dictated by the rainshadow cast by Vancouver Island’s insular mountains. This rainshadow produces warm, dry summers characterized by drought, and mild, wet winters. Less than 5% of the 690 mm of average annual precipitation in the CDF (measured at Gonzales station) falls during July and August; the annual moisture deficit exceeds 350 mm (Meidinger & Pojar 1991). Mean annual temperature ranges between 9.2 - 10.5 oC and mean annual precipitation between 647 - 1263 mm, falling mostly as rain, from November through to April (Meidinger & Pojar 1991). Douglas-fir predominates in forests of the CDFmm, with western redcedar (Thuja plicata Donn ex D. Don), grand fir (Abies grandis Dougl.), red alder (Alnus rubra Bong.), arbutus (Arbutus menziesii Pursh), bigleaf maple (Acer macrophyllum Pursh), and Garry oak (Quercus garryana Dougl.) also being common, depending on site moisture and nutrient regime. Less common conifers include lodgepole pine (Pinus contorta Dougl. ex Loud. var. contorta), western hemlock (Tsuga heterophylla Raf. Sarg.), and Sitka spruce (Picea sitchensis Bong. Carr.) (Roemer 1993). Garry oak and grassland are xeric site associations that are present within the CDFmm, with the herb-dominated grassland often present as a mosaic within the Garry oak association (Allen et al. 1999; Erickson 2002).
In general, two broad communities are described within the Garry oak association: those occurring on thin rocky soils that are often excessively drained and usually found on rocky bluffs, outcroppings or shorelines; and Garry oak woodland communities, that occur on deeper soils, usually covering a larger area than their scrub oak counterparts, and that support a distinct array of understorey vegetation (Roemer 1993). In the absence of disturbance, Garry oak woodland becomes seral to conifer forest, replaced by Douglas-fir (Franklin & Dyrness 1988). Grand fir, which has thin bark and is very fire sensitive, is present as an understorey layer and co-dominant with Douglas-fir, and has increased in abundance with fire exclusion (Pojar & MacKinnon 1994). Garry oak ecosystems are typically ecotonal, representing a transition between open prairie and Douglas-fir forest, and are therefore subject to different fire regimes than surrounding ecotypes.
1.2 Fire and Humans in Garry Oak Ecosystems
Fire is an important factor in determining the structure of many forests throughout western North America (Agee 1993) and plays an important role in the development of vegetation assemblages by redirecting succession, altering community composition, and maintaining fire adapted ecosystems (Clark & Robinson 1993; Innes et al. 2004; Koslowski & Ahlgren 1974). In savanna and woodland plant communities, fire frequency is an especially important influence on structure and stand dynamics (Agee 1993; Peterson & Reich 2001). These fire adapted communities are believed to have been maintained by frequent, low severity ground fires that exclude fire-avoiding species (Agee 1993; Tveten & Fonda 1999) and species that are sensitive to fire until mature, such as young Douglas-fir.
Fire, along with climate, helps define the natural structure, function, and composition of Garry oak ecosystems. The fire regime of this ecosystem type is poorly understood, with the primary source of information from historical studies at sites in the United States, mainly in California (Sugihara & Reed 1987), Oregon (Boyd 1986; Johannessen et al. 1971; Thilenius 1986), and Washington (Tveten & Fonda 1999). Studies of Garry oak ecosystems in British Columbia have focused mainly on enthnoecology and ecosystem descriptions (Beckwith 2004; Erickson 2000; Roemer 1972, 1993; Turner 1999). In all cases these studies suggest nearly ubiquitous and annual use of fire by First Nations people. Such fires were thought to be frequent, extensive and of low intensity, being carried mainly in understorey layer of forbs and grasses (Agee 1993). Fire helped maintain the inverse relation between overstorey and understorey cover as well as the open vegetation structure that is typical of Garry oak ecosystems, particularly further south in their range (Agee 1993). Exotic species now typically dominate after heavy grazing or fire (Agee 1993; Fuchs 2001; Sugihara & Reed 1987). In the absence of fire, although oak density increases, conifers also establish, and oak stands are eventually shaded out and converted to conifer forests, with a corresponding loss of Garry oak ecosystem understorey species. In BC, Douglas-fir readily invades Garry oak ecosystems, particularly during
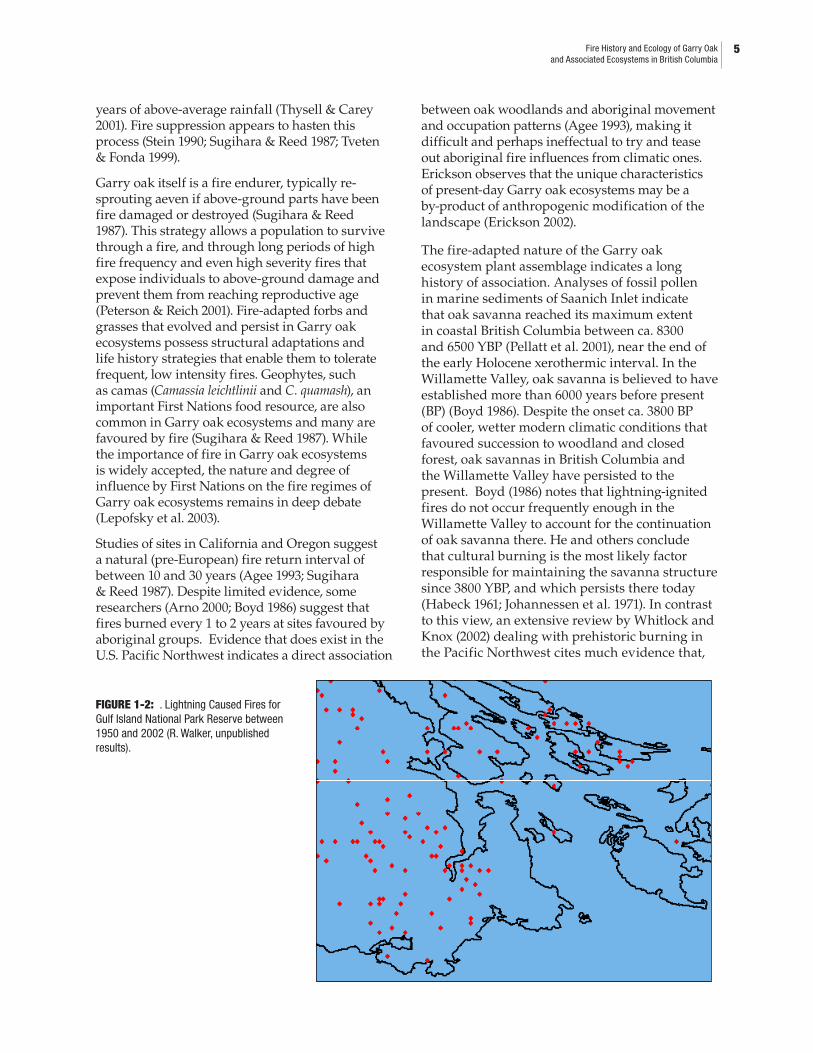
FIGURE 1-2: . Lightning Caused Fires for Gulf Island National Park Reserve between 1950 and 2002 (R. Walker, unpublished results).
5 Fire History and Ecology of Garry Oakand Associated Ecosystems in British Columbia
years of above-average rainfall (Thysell & Carey 2001). Fire suppression appears to hasten this process (Stein 1990; Sugihara & Reed 1987; Tveten & Fonda 1999).
Garry oak itself is a fire endurer, typically re-sprouting aeven if above-ground parts have been fire damaged or destroyed (Sugihara & Reed 1987). This strategy allows a population to survive through a fire, and through long periods of high fire frequency and even high severity fires that expose individuals to above-ground damage and prevent them from reaching reproductive age (Peterson & Reich 2001). Fire-adapted forbs and grasses that evolved and persist in Garry oak ecosystems possess structural adaptations and life history strategies that enable them to tolerate frequent, low intensity fires. Geophytes, such as camas (Camassia leichtlinii and C. quamash), an important First Nations food resource, are also common in Garry oak ecosystems and many are favoured by fire (Sugihara & Reed 1987). While the importance of fire in Garry oak ecosystems is widely accepted, the nature and degree of influence by First Nations on the fire regimes of Garry oak ecosystems remains in deep debate (Lepofsky et al. 2003).
Studies of sites in California and Oregon suggest a natural (pre-European) fire return interval of between 10 and 30 years (Agee 1993; Sugihara & Reed 1987). Despite limited evidence, some researchers (Arno 2000; Boyd 1986) suggest that fires burned every 1 to 2 years at sites favoured by aboriginal groups. Evidence that does exist in the U.S. Pacific Northwest indicates a direct association
between oak woodlands and aboriginal movement and occupation patterns (Agee 1993), making it difficult and perhaps ineffectual to try and tease out aboriginal fire influences from climatic ones. Erickson observes that the unique characteristics of present-day Garry oak ecosystems may be a by-product of anthropogenic modification of the landscape (Erickson 2002).
The fire-adapted nature of the Garry oak ecosystem plant assemblage indicates a long history of association. Analyses of fossil pollen in marine sediments of Saanich Inlet indicate that oak savanna reached its maximum extent in coastal British Columbia between ca. 8300 and 6500 YBP (Pellatt et al. 2001), near the end of the early Holocene xerothermic interval. In the Willamette Valley, oak savanna is believed to have established more than 6000 years before present (BP) (Boyd 1986). Despite the onset ca. 3800 BP of cooler, wetter modern climatic conditions that favoured succession to woodland and closed forest, oak savannas in British Columbia and the Willamette Valley have persisted to the present. Boyd (1986) notes that lightning-ignited fires do not occur frequently enough in the Willamette Valley to account for the continuation of oak savanna there. He and others conclude that cultural burning is the most likely factor responsible for maintaining the savanna structure since 3800 YBP, and which persists there today (Habeck 1961; Johannessen et al. 1971). In contrast to this view, an extensive review by Whitlock and Knox (2002) dealing with prehistoric burning in the Pacific Northwest cites much evidence that,
6
at least during the early- to mid-1800s, lightning and burns were common in the early autumn in the Willamette Valley oak savanna. Lightning caused fires were examined for the Gulf Island National Park Reserve for the period between 1950 and 2002 (Fig 1-2). These data indicate that lightning-climate related fires are not all that rare in the study region.
Yet evidence from Vancouver Island also suggests that humans rather than lightning may have been responsible for burning the landscape. From 2000 YBP until the 20th C, cool, moist climate conditions prevailed and fire activity on southern Vancouver Island was generally low (Brown & Hebda 2002a; Gavin et al. 2003b). Sites at southeastern Vancouver island, however, record an increase in fire activity (Allen 1995; Brown & Hebda 2002a, 2002b; Gavin et al. 2003b; Pellatt et al. 2001). There is no indication that climate conditions at southeastern Vancouver Island were different from the surrounding region. The difference in fire regime may therefore be attributable to cultural burning (Allen 1995; Brown 1998; Brown & Hebda 2002a; Pellatt 2002; Pellatt et al. 2001).
Many researchers (Boyd 1986; Thilenius 1968; Tveten & Fonda 1999), and accounts in historical journal materials (Dougan 1973; Duffus 2003; The Pioneer 1986) have concluded that First Nations people used fire to manage food resources, most notably to increase yields of root vegetables, berries, seeds (Beckwith 2004; Turner 1999), and forage species (Agee 1993; Turner 1999; Williams 2000). Empirical evidence suggests that, on southeastern Vancouver Island and Gulf Islands, this has been the case for millennia (MacDougall et al. 2004). The First Nations population for southern Vancouver Island before the arrival of Europeans is estimated to have been in the thousands. By the late Holocene, when climate favoured succession of oak savanna to forest, many generations of people over thousands of years would have observed the role and importance of fire in maintaining open woodland structure, and would likely have perfected fire management techniques.
Historical accounts indicate that Garry oak ecosystems were ignited in late summer and fall (Beckwith 2004; Boyd 1986; Fuchs 2001; Turner 1999). This supports the claim that fires in oak savannas were of low intensity (Turner 1999) and severity due to limited fuel availability (Boyd 1986; Gedalof et al. 2006; Johannessen
et al. 1971; Thilenius 1968). By the mid-1800s, however, as Europeans began clearing portions of southeastern Vancouver Island for agriculture, large fires were commonly observed (Grant 1857; Maslovat 2002). It is unclear whether the constant veil of summer smoke reported during this time originated from lightning strikes, or fires lit by First Nations people, or from the settlers themselves who burned for cultivation, to remove re-invading trees and shrubs from cleared fields, and to aid in logging. The fires of the mid-1800s often escaped to many hundreds of acres (Eis et al. 1976). Due to their origin, location, and fuel availability, such fires would likely have been higher in intensity and severity, and of different spatial distribution than those having burned prior to European settlement. Europeans legally restricted First Nations burning in southwestern BC through the Bush Fire Act of 1874. After the turn of the century, active fire suppression followed throughout southwestern British Columbia—in fact throughout North America—facilitated by the use of World War II aircraft. In less than 100 years, European settlement and fire exclusion disrupted the fire regime in virtually all western North America oak ecosystems that have been studied (Fuchs 2001). The implications of burning on the sustainability and ecological integrity of Garry oak ecosystems cannot be underestimated and should be examined during the development of any restoration project.
1.3 Paleoecology
The Holocene climate along coastal British Columbia has varied considerably over the last 12,000 years. After deglaciation, warm/dry conditions occurred on south eastern Vancouver Island (11,450 to 8,300 BP) supporting Douglas-fir parkland with abundant grasses (Poaceae) and bracken (Pterdium) (Pellatt et al, 2001; Figure 1-3). These, and other species present in the pollen record, are indicative of a relatively warm/dry climate with frequent disturbance, likely fire. Warm/dry climate was typical throughout the coast of BC at the time (Walker and Pellatt, 2003), with frequent fires also occurring in the Fraser Valley (Mathewes, 1973). Garry oak arrived curiously late along the south BC coast (~8300 BP), but quickly increases in abundance after its arrival (Allen, 1995; Heusser, 1983; Pellatt et al., 2001). Although maximum Holocene summer temperature has been inferred for

FIGURE 1-3: Saanich Inlet Pollen Accumulation Diagram (Pellatt et al., 2001).
7 Fire History and Ecology of Garry Oakand Associated Ecosystems in British Columbia
the interval 10,000 to ca. 8000 BP on the basis of midge fossils (Rosenberg et al., 2004), and from 11,000 to 9000 BP based on pollen records (Mathewes and Heusser, 1981), Quercus pollen was rare prior to 8300 BP and peaked at 8000 BP or later on southern Vancouver Island (Allen, 1995; Heusser, 1983; Pellatt et al., 2001). A slow northward migration across the southern Gulf Islands to Vancouver Island, and thus, a long time lag following climatic change, offers a possible explanation for the oak’s late arrival; however, unlike the other pollen indicators of coastal British Columbia, this species might be sensitive to winter temperature minima. Its absence may, therefore, indicate that Garry oak could not grow on the island during the early Holocene, despite higher summer temperatures, because winter temperatures were too cold. Greater seasonality may have been an important feature of early Holocene climate. Pellatt et al. (2001) also note that Garry oak persists into the late Holocene, when summer temperatures are thought to have cooled significantly from their early Holocene maximum thus facilitating dominance by Douglas-fir. They speculate that aboriginal burning practices might have played an important role in maintaining the oak savanna on southernmost Vancouver Island, despite less favourable climatic conditions.
1.4 Cultural History
First Nations have been utilizing the landscape of southern Vancouver Island and the Gulf Islands for millennia. About 5000 years ago, Indigenous peoples were more nomadic – “hunter-gatherers” – and had lower population numbers (Suttles and Ames 1997). Changes in cultural complexity, increased sedentism, and resource specialisation all coincided with changes in climate beginning around 3700 BP (Hebda and Mathewes 1984; Matson and Coupland 1995). By 2000 years ago, patterns of inter-community conflicts emerged which likely resulted from increased population numbers, social stress, and resource use intensification (Matson and Coupland 1995, Moss and Erlandson 1995).
The study region is often characterised by resource abundance and productivity. Salmon is commonly seen as the staple food, yet a wide variety of animals and plants was harvested to maintain a diverse and nutritious diet. On land, deer and elk were hunted, as well as waterfowl and gamebirds. Plants were used for foods, medicines, and in technology. The prime vegetable in the diet of Central Coast Salish peoples was camas (Camassia spp.) bulbs.
8
This root vegetable was gathered annually from extensive harvesting grounds that were often privately-owned and inherited, and carefully managed over time by numerous methods (e.g., selective harvesting, tilling and weeding, burning) to maintain adequate quantities of bulbs of harvestable quality. These bulbs figured prominently in feasts, ceremonies, and patterns of exchange and redistribution. The management for this culturally integral resource may have largely affected the structure and function of Garry oak ecosystems (Boyd, 1999; Beckwith 2004). For approximately 70 years before European colonization on southern Vancouver Island in 1843, coastal First Nations, including Straits Salish and Hul’q’umi’num peoples, felt the impacts of European presence in western North America. Four epidemics (smallpox, 1775, 1801; measles or smallpox, 1824; malaria, 1830) occurred along the British Columbia coast prior to the establishment of Fort Victoria (Boyd, 1999; Duff 1964). Although it is difficult to determine the direct effects of these outbreaks, devastating diseases no doubt severely affected Indigenous population densities, social networks, and patterned land management activities (c.f. Duff 1964). As early as 1792, George Vancouver documented signs of smallpox – pockmarks on the skin of Indigenous peoples and abandoned villages – in the Puget Sound area (in Lutz in press). Moreover, from his collection of letters of 1876, George Dawson (in Cole and Lockner 1989:171) often described “Indian burial Mounds or Cairns” in the Victoria vicinity, both along the shoreline and at inland locations. The devastation of First Nations populations would have had an impact on the utilization of selected areas of the landscape.
The use of fire to meet a number of land and resource management goals is documented for Indigenous peoples in the Pacific Northwest of the U.S.A. (Boyd 1999). Fires were recorded in the Victoria area (e.g., “…fires which have… passed through these forests…” [Verney 1862 in Shaw 1996:63]); regular in use (e.g., “Savages have [a]… custom of burning the woods” {Grant 1851 in Hendrickson 1975:11]); and producing extensive smoke (e.g., “On one occasion the smoke from burning woods cleared away enough to show [Mt. Baker],…” [Cole and Lockner 1989:13]). Even though First Nations people are often implicated in the setting of landscape-scale fires during the colonial period, the historical accounts should be
assessed with caution. For example, given the social and environmental context of the time:
These accounts are not likely representative of the former land management practices of Straits Salish peoples,
The landscape fires reported are probably a disproportional and biased selection that drew the attention and perhaps the fear of colonists and early settlers,
Some of the landscape fires represent fires that escaped, wildfire, or fires set by non-Indigenous residents for land clearing and agricultural purposes.
The use of fire by colonists and settlers should not be underestimated. Matthew MacFie (1865:202), in his extensive 1865 report on the colonies of Vancouver Island and British Columbia, recommended fire as an eradication tool used to rid settlers’ lands of pesky native plants. For example:
If fern [bracken] prevail in the land, it should be ploughed up in the heat of summer, in order, by exposure of the roots to the rays of the sun, to destroy them. These with all bulbous weeds, such as crocuses [other lilies?], kamass [camas], should be collected and burned.
Land covered with pine [Douglas-fir] is not difficult to clear. That tree, being of a resinous description, burns freely, and its roots creep close to the surface.
Throughout southern British Columbia, Euro-Canadian settlers set “prescribed” fires “to kill timber and create a fuel-wood supply, clear the land, improve domestic forage and drive game” (Parminter 1991:3). Excessive fire use in the late 1800s resulted in massive forest fires across North America and a growing anti-fire sentiment. The Bush Fire Act (1874) was the first fire prevention legislation passed in the new province of British Columbia. Although this act made it illegal to set a fire or allow a fire to escape resulting in damage to private property or Crown land between the months of June and September, there was no organisation to enforce it (in Parminter 1991). The Bush Fire Act was eventually incorporated into the Forest Act of 1912, and by 1914, fire suppression became more regularly enforced (DCDP 2005).
�
�
�
PALYNOLOGY AND CHARCOAL ANALYS IS OF THE RECENT PAST
2.02.0
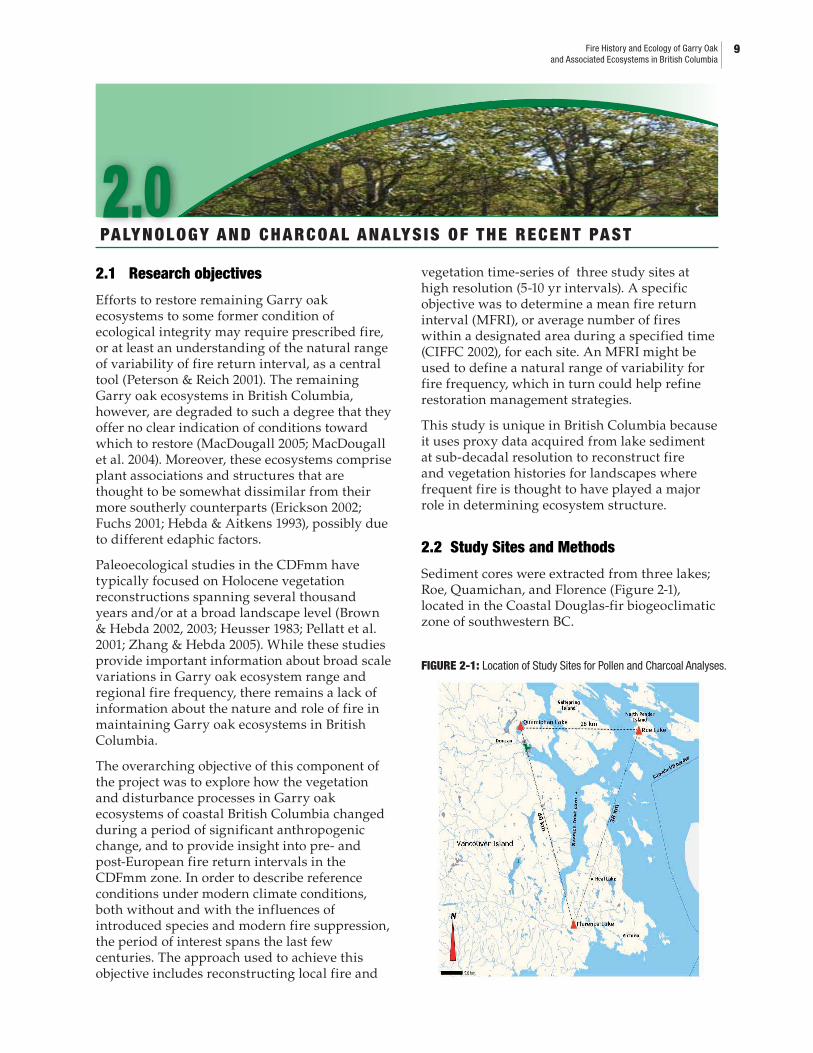
FIGURE 2-1: Location of Study Sites for Pollen and Charcoal Analyses.
9 Fire History and Ecology of Garry Oakand Associated Ecosystems in British Columbia
2.1 Research objectives
Efforts to restore remaining Garry oak ecosystems to some former condition of ecological integrity may require prescribed fire, or at least an understanding of the natural range of variability of fire return interval, as a central tool (Peterson & Reich 2001). The remaining Garry oak ecosystems in British Columbia, however, are degraded to such a degree that they offer no clear indication of conditions toward which to restore (MacDougall 2005; MacDougall et al. 2004). Moreover, these ecosystems comprise plant associations and structures that are thought to be somewhat dissimilar from their more southerly counterparts (Erickson 2002; Fuchs 2001; Hebda & Aitkens 1993), possibly due to different edaphic factors.
Paleoecological studies in the CDFmm have typically focused on Holocene vegetation reconstructions spanning several thousand years and/or at a broad landscape level (Brown & Hebda 2002, 2003; Heusser 1983; Pellatt et al. 2001; Zhang & Hebda 2005). While these studies provide important information about broad scale variations in Garry oak ecosystem range and regional fire frequency, there remains a lack of information about the nature and role of fire in maintaining Garry oak ecosystems in British Columbia.
The overarching objective of this component of the project was to explore how the vegetation and disturbance processes in Garry oak ecosystems of coastal British Columbia changed during a period of significant anthropogenic change, and to provide insight into pre- and post-European fire return intervals in the CDFmm zone. In order to describe reference conditions under modern climate conditions, both without and with the influences of introduced species and modern fire suppression, the period of interest spans the last few centuries. The approach used to achieve this objective includes reconstructing local fire and
vegetation time-series of three study sites at high resolution (5-10 yr intervals). A specific objective was to determine a mean fire return interval (MFRI), or average number of fires within a designated area during a specified time (CIFFC 2002), for each site. An MFRI might be used to define a natural range of variability for fire frequency, which in turn could help refine restoration management strategies.
This study is unique in British Columbia because it uses proxy data acquired from lake sediment at sub-decadal resolution to reconstruct fire and vegetation histories for landscapes where frequent fire is thought to have played a major role in determining ecosystem structure.
2.2 Study Sites and Methods
Sediment cores were extracted from three lakes; Roe, Quamichan, and Florence (Figure 2-1), located in the Coastal Douglas-fir biogeoclimatic zone of southwestern BC.
10
Roe Lake is located 100 m asl, on North Pender Island at 48o46’56”N 123o15’30”W, within the Gulf Islands National Park Reserve (GINPR). It is surrounded by second-growth coastal Douglas-fir forest. Although Garry oak and associated species are scattered in small numbers on the steep, rocky slopes above the east side of the lake, Roe Lake catchment does not contain a well-defined Garry oak ecosystem.
Quamichan Lake is 33 m asl, within the Cowichan Valley on southeastern Vancouver Island, at N48o48’00” W123o39’41”. Quamichan Lake is situated ecotonally between the CDF and Coastal Western Hemlock (CWH) zones. Perhaps the best remaining fragment of Garry oak ecosystem in Canada occurs near the southeast shore of Quamichan Lake, at the Nature Conservancy of Canada’s Cowichan Garry Oak Preserve. The surrounding landscape is characterized by a mosaic of pasture, other agricultural lands, suburban housing, with patches of mature second- and third-growth Douglas-fir forest, and scattered Garry oak woodlands.
Florence Lake is 81 m asl, about 9 km west of Victoria, at N48o27’32” W123o30’46”. A patch of Garry oak woodland, adjacent to the wetland on the south edge of the lake, remains from a much larger complex of woodland and prairie that extended 4 km to the southeast of Florence Lake, on glacial outwash, before the land was developed.
One core from each lake was selected and sectioned at closely spaced intervals. Pollen and charcoal particles were identified and abundance quantified to infer fire and vegetation histories of each site. A charcoal time series based on charcoal accumulation rate (CHAR; charcoal concentration x sediment accumulation rate) was calculated for each site. It was possible to identify fire events by first estimating a threshold, or background, CHAR that could be used to discriminate charcoal peaks from the other components contributing to charcoal influx.
Chronology for each core was estimated using Lead-210 isotope analysis. This provided estimated ages only for the upper sections in each core. Based on extrapolation from the Lead-210 results, ages for the bottom of Roe and Quamichan cores were estimated as 1750 and
1745 respectively. Results indicated that Florence Lake core was much older than the other two cores, so a basal date was acquired using Carbon-14 analysis estimated basal date of 1440 AD. For the purpose of this study we highlight the charcoal analysis and refer to the pollen analysis in McCoy 2006.
To assist in identifying charcoal peaks, Z-scores of charcoal concentration counts were calculated. Z-score is a statistic that measures the magnitude of differences in a set of values. The Z-score was used in this study to reveal fluctuations in the charcoal time series that are non-random. Z-scores greater than 2 are considered significant and were interpreted to indicate a sudden influx of charcoal following a fire event.
Fire events that were interpreted from tree ring, forest stand structure, and charcoal studies in other regions in the Pacific Northwest (Agee 1990; Allen 1995; Brown 1998; Brown and Hebda 2002; Clark 1993; Cwynar 1987; Daniels et al. 1995; Gavin et al.. 2003; Hallett et al. 2003; Heusser 1993; Heyerdahl et al. 2002; MacDougall et al. 2004; Parminter 2004; Pellatt et al. 2001; Schmidt 1970; Zhang & Hebda 2005) were compared against the results of this study to see if any trends were evident. Fire scar and trauma ring data from Roe Lake (Gedalof 2005, unpublished data) were also used to help validate charcoal peaks that were interpreted as fire events.
2.3 Results and Conclusions
The data provide strong evidence of regional synchroneity of fire histories among the three sites, and possibly with sites elsewhere in the Pacific Northwest. This suggests that climate has been the primary driver of fire frequency up until Europeans settled on the landscape. Table 2-1 and Figure 2-1 provides approximate years of fire events at each site and differences in years of fire events among sites.
The following sections provide a chronological synthesis of the results, as well as information regarding possible human influences on the fire histories of the sites. The implications of these results with respect to Garry oak ecosystems in the study region are also discussed.

TABLE 2-2: Years of fire events identified from re-sampled charcoal accumulation rate for 1745 to present at RL, QL, and FL, and differences in years of fire events among sites that are interpreted as coeval.
Sites and years of fire events Differences in years of coeval fire events among sites
RL QL FL RL-QL RL-Fl QL-FL
1984
1959 1969 1955 10 4 14
1924 1919 1925 5 1 4
1914
1894
1870 1879 1880 9 10 1
1859 1849 10
1820 1824 4
1815
1800 1798 2
1789 1779 1785 10 4 6
1759 1754 5
FIGURE 2-2: Comparison of pollen zones and re-sampled charcoal accumulation rate (rsCHAR) fire history for Roe Lake and Quamichan Lake, and upper (1745- 2003) fire history for Florence Lake. Grey bars span ca. 10 years and highlight fire events that appear coeval ± 10 years.
11 Fire History and Ecology of Garry Oakand Associated Ecosystems in British Columbia

12
2.3.1 Pre-1750
Only the Florence Lake charcoal record provides data prior to 1750. There are two broad modes of high background CHAR at 1520 to 1580 and 1620 to 1700. Both correspond with two episodes—1491 to 1591 and 1641 to 1691, respectively—of fire activity recorded in the stand structure of forests in other areas of the Pacific Northwest (Daniels et al. 1995). The earlier CHAR mode is followed by brief period of lower CHAR which coincides with a regionally cool period detected from tree ring data in central Washington and western Oregon (Weisberg & Swanson 2003). After the second fire episode, regional temperatures were again very cool, from about 1690 to 1760 (Graumlich & Brubaker 1986). This cool period corresponds to low CHAR at Florence Lake. These results suggest that the fire history at Florence Lake prior to 1750 was driven by climate fluctuations rather than some other factor, such as burning by First Nations.
The persistence of oak pollen in the Florence Lake record confirms that Garry oak ecosystems were present within the catchment. One study based on historical and soil data estimates that Garry oak ecosystem cover near Florence Lake at 1800 was much more extensive than it is today (Lea 2006). Furthermore, prior to the late 1700s, the study region is thought to have carried one of the most dense concentrations of aboriginal populations in North America (Harris 1997). It is possible that First Nations people were using fire to maintain Garry oak woodlands within Florence Lake catchment during this time, but that these fires are not discernible in the charcoal record because their inputs are swamped by broader trends and larger events. The methods used in this research, however, did not yield any results that indicate a significant control on Florence Lake fire history during this time period by anything other than climate.
It should be noted that, during the Little Ice Age period of glacial advance (ca. 1550 to 1850), the charcoal peak amplitude and charcoal influx at Florence Lake were higher than during those periods preceding and following. These results help define the Little Ice Age as a period of climatic instability.
2.3.2 1750 - 1850
This was a dynamic period that included regional climate variability, disruption and
decimation of First Nations populations due to warfare and disease, and the first direct effects of Europeans on the landscape. The results indicate that climate and cultural influences on the region’s fire history coalesced at this interface.
From about 1745 to 1780, background CHAR at Florence Lake is at its lowest of the record, and at Roe Lake it is near its lowest. This suggests a period of regionally low fire activity and possibly cooler/wetter conditions. Tree ring data from central Washington and western Oregon indicate very cool temperatures until about 1760, when there was a gradual shift to warmer conditions (Weisberg & Swanson 2003). At Quamichan Lake, however, background CHAR is only slightly lower than later in the record, and there is little variability between background and peak values. It is possible that frequent, low intensity fires were contributing to Quamichan Lake charcoal influx during this time. Even at sub-decadal sampling resolution, annual or near-annual burning might not resolve as individual events. Of the three sites, Quamichan Lake is the one known to have supported First Nations populations for at least the past 4000 years (Brown 2000).
From ca. 1780, CHAR values increase at all three sites (although less so at FL). This mode varies in length and amplitude among sites, but its synchroneity again suggests a climate response. The correlation with the period of widespread fire in the Pacific Northwest from 1791 to 1841 supports this interpretation. At Roe Lake and Quamichan Lake, a high CHAR peak ca. 1800 corresponds to fire scars dated to 1805 found in tree ring data from the much wetter Clayoquot Valley in southwestern Vancouver Island (Gavin et al. 2003a), and other fire events occurring in southwestern BC (Parminter 2004; Schmidt 1970), and throughout Washington and Oregon (Weisberg & Swanson 2003). The 1820 fire event recorded at Roe Lake and Quamichan Lake also left a record of widespread stand-replacing fires throughout southeastern Vancouver Island and the Coast mountains of southwestern BC (Hallett 2001; Parminter 2004; Schmidt 1970).
Some have postulated that this increase in fire activity was the result of First Nations people setting fires for warfare (B. Beckwith, pers. comm., 2005). Between 1790 and 1850, confrontations between the southern Kwakiutl and Cowichan people took place on a large
13 Fire History and Ecology of Garry Oakand Associated Ecosystems in British Columbia
enough scale to warrant summer abandonment of more exposed Gulf Island villages in favour of inland refuges (Brown 2000). It is possible that fire would have been used more frequently as a warfare tactic during these times and might often have been uncontrolled. At the same time, due to population decimation by disease, there would also be significant loss of ecological knowledge. Those few who remained may have lacked sufficient skills to ensure proper fire management (B. Beckwith, pers. comm., 2005). In the absence of regular burning, ecosystem succession could advance, with encroachment by shrubs and conifers into Garry oak savannas and woodlands. This would soon lead to biomass build-up in Garry oak ecosystems and adjacent forest ecosystems, resulting in larger and more intense fires, especially if burning occurred in late summer and early fall. The large decrease in oak pollen at ca. 1830 at Quamichan Lake might be evidence of larger than usual fire burning within the Garry oak ecosystems there.
2.3.3 1850 to 1940
At about 1850, pollen abundance in all taxa at Roe Lake and Quamichan Lake decrease. This could indicate a small-scale climate regime shift that marks the end of the Little Ice Age. Based on the presence of nearly uniform tree layers and dendrochonological data in study stands, Eis et al. (1962) identified 1868 as a year of significant major fires that burned through much of western Oregon, western Washington, parts of the Fraser Valley and Coast mountains of BC, and through the Gulf Islands. Fires also burned that year up into northern BC and Alaska. The charcoal data for the study sites record a fire episode up to about 10 years later.
While climate appears to be the causal factor of fire variability at that time, the arrival of Europeans to the region likely had a compounding effect. Land clearing and slash-burning for agriculture and logging were becoming dominant factors on the landscape, and the rate of landscape change was rapid. By the late 1840s, around Victoria, hundreds of acres were turned to crops, and thousands of livestock introduced, along with exotic grasses and other forage species (MacDougall 2002). This process followed settlers as they migrated and settled to the west, north, and east. They arrived to the Langford area (Florence Lake) by 1854; to the
Cowichan Valley (Quamichan Lake) in the 1860s; and Pender Island (Roe Lake) by the 1870s.
Between 1843 and 1865, fires were commonly observed on southeastern Vancouver Island. These were mostly attributed (by European settlers) to First Nations people (MacDougall 2002), although the settlers themselves were also burning the land. A sediment core extracted from Saanich Inlet revealed that charcoal abundance doubled at the time of European settlement (Heusser 1983). An increase in alder following settlement and logging has been shown to form a stratigraphic marker horizon in pollen diagrams from the Pacific Northwest (Mathewes 1973) and this is also seen at the study sites.
During the mid- to late-1800s, it appears that ecosystem response to disturbance begins to shift from climate-driven factors to modern human influences.
2.3.4 1940 - present
By 1940, CHAR values at Roe Lake and Quamichan Lake have diminished to their lowest values in the record, and they remain low to the present. This decrease in charcoal influx is apparent at other sites throughout North America beginning in the early 1900s (Clark 1990; Weisberg & Swanson 2003), and is interpreted as the result of active fire exclusion programs. In marked contrast with Roe Lake and Quamichan Lake, CHAR values at Florence Lake increase significantly from 1900 to present. The intensity of logging activity within that catchment could explain this trend, but the integrity of the sediment core at this point is also suspect. By 1940, ecosystem responses at the study sites and throughout the region have become primarily driven by modern human disturbances.
2.3.5 Mean Fire Return Intervals
It was possible to calculate mean fire return intervals, i.e., the arithmetic average of all fire intervals in a given space over a given time (Agee 1993), for the catchment area of each site using the fire event data. Because an objective of this study was to identify an MFRI prior to direct European influence, fire events that occurred after ca. 1880 were excluded from the
14
MFRI calculations. Roe Lake MFRI is estimated at 27 years, Quamichan Lake is 26 years, and Florence Lake at 41 years.
It is possible that smaller, low intensity fires of the kind thought to have been ignited by First Nations people are embedded in the data but are not revealed due to the methods used in the analysis. The MFRI estimates should therefore be considered in the context of how they were calculated and the limitations of the data. In other words, these estimates should not be interpreted to indicate frequency of all fires that burned at each site. Also, a fire return interval measured over only 250 years does not necessarily identify a fire frequency needed to restore the ecological integrity of communities that have developed over millennia. In the absence of any other data, however, these results provide a valuable starting point, and are similar to MFRIs estimated for Garry oak ecosystems in Oregon and California of 10 to 30 years (Agee 1993, 1998; Sugihara & Reed 1987).
DENDROECOLOGY
2.03.0
15 Fire History and Ecology of Garry Oakand Associated Ecosystems in British Columbia
From approximately the time of Grant’s visit until the mid-1950s the site was used variously for agriculture and pasture, though use was probably never particularly intensive. The site was taken over by the Department of National Defence (DND) in the 1950s, and remains their property to this day. Agricultural use of the land was discontinued, and the prairie / savanna ecosystems were largely left unmanaged. Analysis of historical air photos shows that following acquisition of the site by DND several roads were constructed, streams were channelized, and a retention pond was excavated (Fig. 3-1). Additionally, there appears to have been considerable infilling of conifers since the time of Grant’s visit. Even in the 1954 photo (Fig. 3-1A) there is evidence of a closed-canopy conifer forest along the Northeast shore of Rocky Point, as well as infilling along ephemeral creek channels. Because the site has been used as an ammunition depot for as long as DND has been occupying the site, fire has effectively been excluded since ca. 1954, and is not an option for any ecological restoration programs.
At Rocky Point a representative Garry oak meadow was selected for analysis (Fig. 3-2). This site was chosen because it extended from open prairie, through savanna, and into an obviously encroaching conifer forest (Fig. 3-3). It also showed little evidence of human impact (e.g. fence lines, stumps, ditches, etc.), therefore simplifying interpretation of ecosystem dynamics. Additionally, the presence of a number of large old trees provided the possibility of reconstructing fire history and also suggests that the availability of propagules would not be a limit to seedling
Two distinct projects were undertaken to assess Garry oak ecosystem dynamics over the past several decades. First, an experimental dendroecological reconstruction of stand structure, composition and fire history was undertaken at three sites in southern Vancouver Island and the southern Gulf Islands. The results from this analysis formed the motivation for a more regional study, that considered edaphic factors more explicitly, and examined the interaction between overstorey and understorey dynamics. These studies are reported separately here.
3.1 Research Objectives
The purpose of this component of the study was to reconstruct the environmental history of Garry oak ecosystems at Rocky Point DND Site on southern Vancouver Island, Tumbo Island, and Beaumont Marine Park in the Gulf Islands National Park Reserve. Specifically, we used a range of analytical tools, including a review of historical documents, aerial photographs, dendrochronology, and spatial analysis, in order to reconstruct fire history, stand composition, stand structure, and successional trajectory. Insights from these analyses provide a context for assessing proposed management and restoration actions in Garry oak communities in coastal British Columbia. They also provide a basis for predicting the potential consequences of global environmental change.
3.2 Study Sites
3.2.1 Rocky Point
The Department of National Defence maintains and operates the Canadian Forces Ammunition Depot at Rocky Point, on southern Vancouver Island. This site is home to one of the largest remaining intact, and most intensively studied, Garry oak ecosystems on southern Vancouver Island. The site was first described in 1857 by Captain W. Colquhoun Grant, in a paper submitted to the Royal Geographical Society (Grant 1857). He describes the point as “a fine open prairie extending nearly across to Becher Bay … interspersed with oak trees” (p. 282).
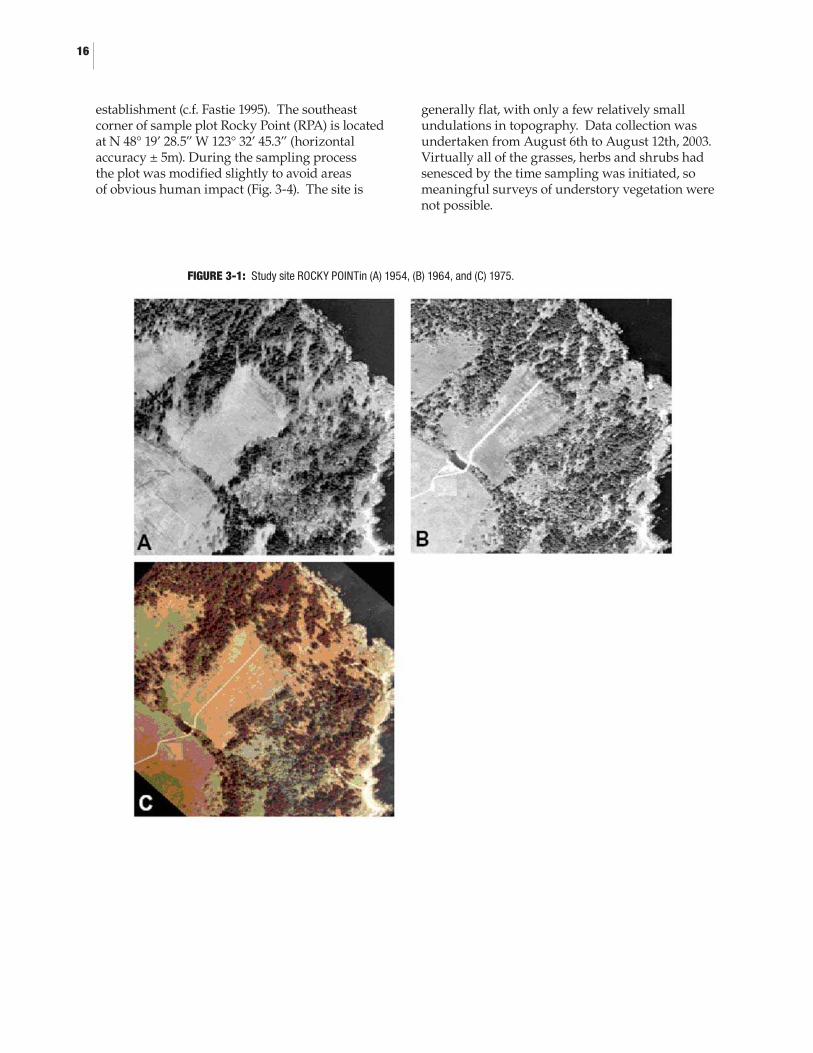
FIGURE 3-1: Study site ROCKY POINTin (A) 1954, (B) 1964, and (C) 1975.
16
establishment (c.f. Fastie 1995). The southeast corner of sample plot Rocky Point (RPA) is located at N 48° 19’ 28.5” W 123° 32’ 45.3” (horizontal accuracy ± 5m). During the sampling process the plot was modified slightly to avoid areas of obvious human impact (Fig. 3-4). The site is
generally flat, with only a few relatively small undulations in topography. Data collection was undertaken from August 6th to August 12th, 2003. Virtually all of the grasses, herbs and shrubs had senesced by the time sampling was initiated, so meaningful surveys of understory vegetation were not possible.
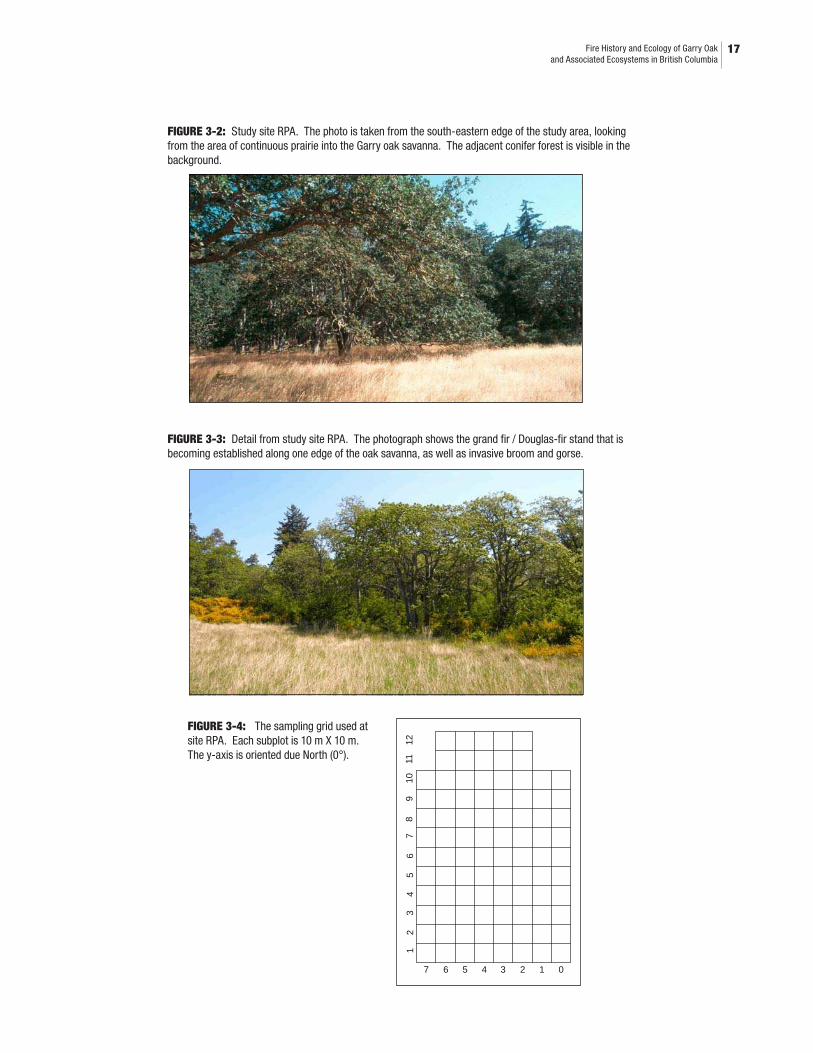
FIGURE 3-2: Study site RPA. The photo is taken from the south-eastern edge of the study area, looking from the area of continuous prairie into the Garry oak savanna. The adjacent conifer forest is visible in the background.
FIGURE 3-3: Detail from study site RPA. The photograph shows the grand fir / Douglas-fir stand that is becoming established along one edge of the oak savanna, as well as invasive broom and gorse.
FIGURE 3-4: The sampling grid used at site RPA. Each subplot is 10 m X 10 m. The y-axis is oriented due North (0°).
17 Fire History and Ecology of Garry Oakand Associated Ecosystems in British Columbia
01234567
81
92
103
114
125
67
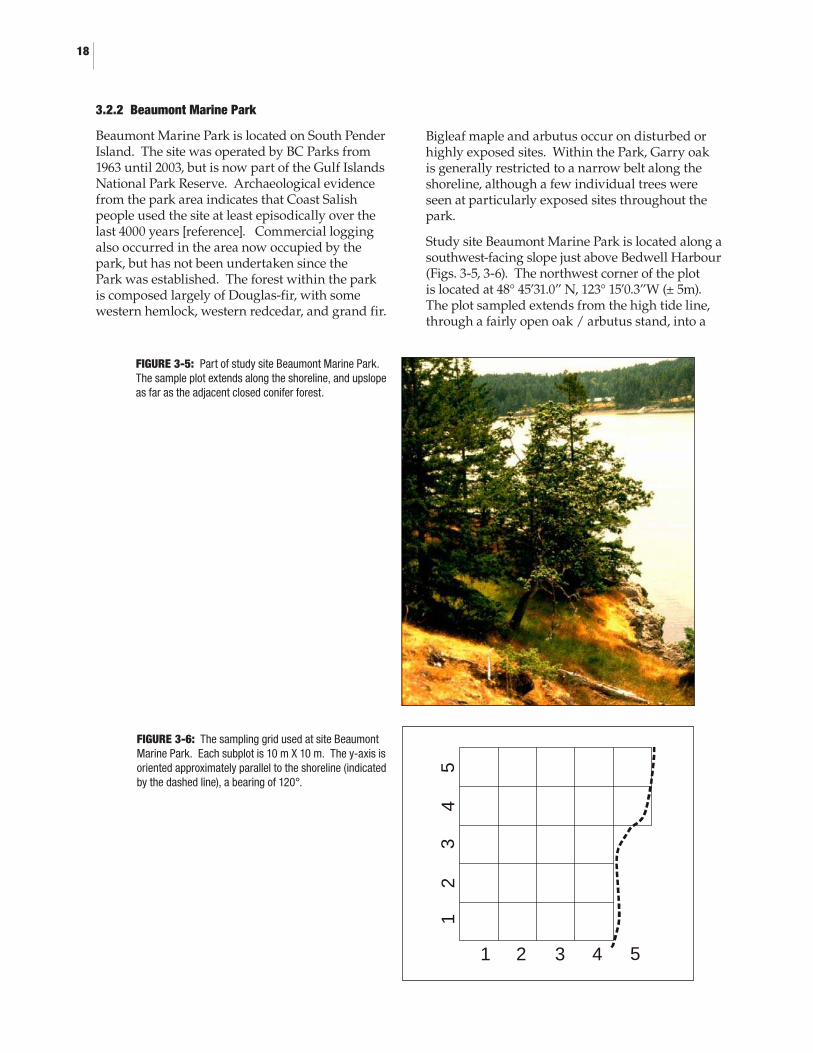
FIGURE 3-5: Part of study site Beaumont Marine Park. The sample plot extends along the shoreline, and upslope as far as the adjacent closed conifer forest.
FIGURE 3-6: The sampling grid used at site Beaumont Marine Park. Each subplot is 10 m X 10 m. The y-axis is oriented approximately parallel to the shoreline (indicated by the dashed line), a bearing of 120°.
18
12
34
5
1 2 3 4 5
3.2.2 Beaumont Marine Park
Beaumont Marine Park is located on South Pender Island. The site was operated by BC Parks from 1963 until 2003, but is now part of the Gulf Islands National Park Reserve. Archaeological evidence from the park area indicates that Coast Salish people used the site at least episodically over the last 4000 years [reference]. Commercial logging also occurred in the area now occupied by the park, but has not been undertaken since the Park was established. The forest within the park is composed largely of Douglas-fir, with some western hemlock, western redcedar, and grand fir.
Bigleaf maple and arbutus occur on disturbed or highly exposed sites. Within the Park, Garry oak is generally restricted to a narrow belt along the shoreline, although a few individual trees were seen at particularly exposed sites throughout the park.
Study site Beaumont Marine Park is located along a southwest-facing slope just above Bedwell Harbour (Figs. 3-5, 3-6). The northwest corner of the plot is located at 48° 45’31.0” N, 123° 15’0.3”W (± 5m). The plot sampled extends from the high tide line, through a fairly open oak / arbutus stand, into a
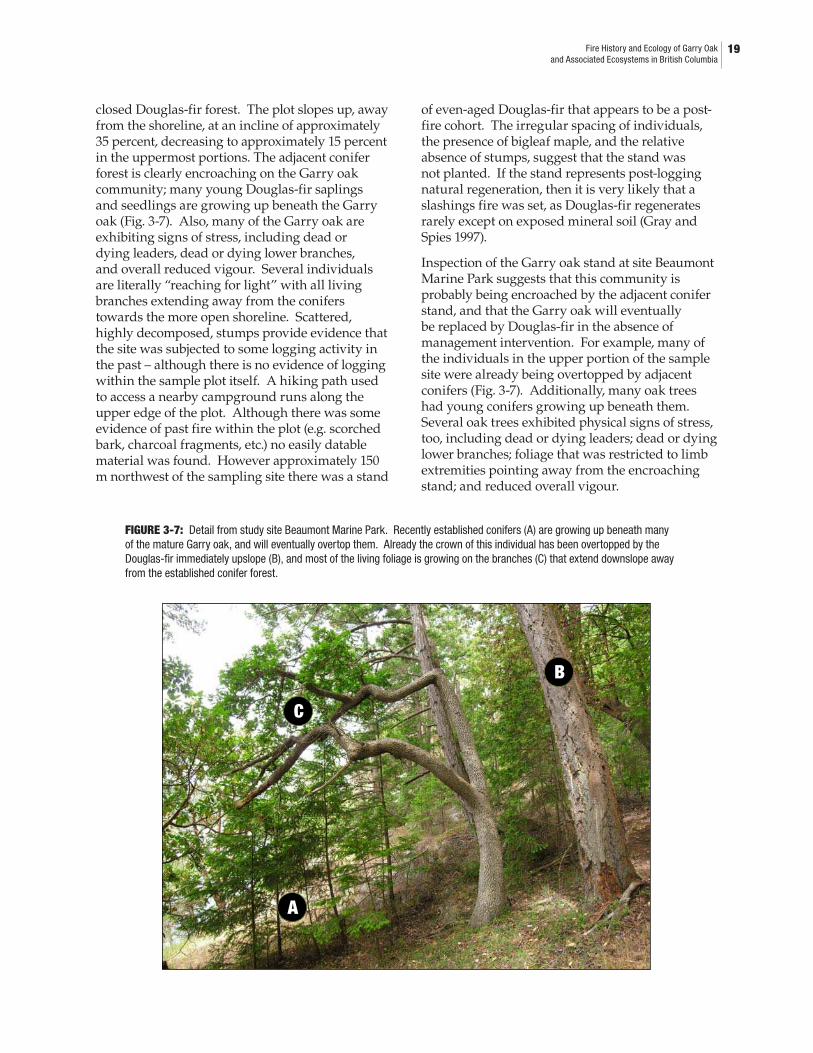
FIGURE 3-7: Detail from study site Beaumont Marine Park. Recently established conifers (A) are growing up beneath many of the mature Garry oak, and will eventually overtop them. Already the crown of this individual has been overtopped by the Douglas-fir immediately upslope (B), and most of the living foliage is growing on the branches (C) that extend downslope away from the established conifer forest.
19 Fire History and Ecology of Garry Oakand Associated Ecosystems in British Columbia
A
B
C
closed Douglas-fir forest. The plot slopes up, away from the shoreline, at an incline of approximately 35 percent, decreasing to approximately 15 percent in the uppermost portions. The adjacent conifer forest is clearly encroaching on the Garry oak community; many young Douglas-fir saplings and seedlings are growing up beneath the Garry oak (Fig. 3-7). Also, many of the Garry oak are exhibiting signs of stress, including dead or dying leaders, dead or dying lower branches, and overall reduced vigour. Several individuals are literally “reaching for light” with all living branches extending away from the conifers towards the more open shoreline. Scattered, highly decomposed, stumps provide evidence that the site was subjected to some logging activity in the past – although there is no evidence of logging within the sample plot itself. A hiking path used to access a nearby campground runs along the upper edge of the plot. Although there was some evidence of past fire within the plot (e.g. scorched bark, charcoal fragments, etc.) no easily datable material was found. However approximately 150 m northwest of the sampling site there was a stand
of even-aged Douglas-fir that appears to be a post-fire cohort. The irregular spacing of individuals, the presence of bigleaf maple, and the relative absence of stumps, suggest that the stand was not planted. If the stand represents post-logging natural regeneration, then it is very likely that a slashings fire was set, as Douglas-fir regenerates rarely except on exposed mineral soil (Gray and Spies 1997).
Inspection of the Garry oak stand at site Beaumont Marine Park suggests that this community is probably being encroached by the adjacent conifer stand, and that the Garry oak will eventually be replaced by Douglas-fir in the absence of management intervention. For example, many of the individuals in the upper portion of the sample site were already being overtopped by adjacent conifers (Fig. 3-7). Additionally, many oak trees had young conifers growing up beneath them. Several oak trees exhibited physical signs of stress, too, including dead or dying leaders; dead or dying lower branches; foliage that was restricted to limb extremities pointing away from the encroaching stand; and reduced overall vigour.
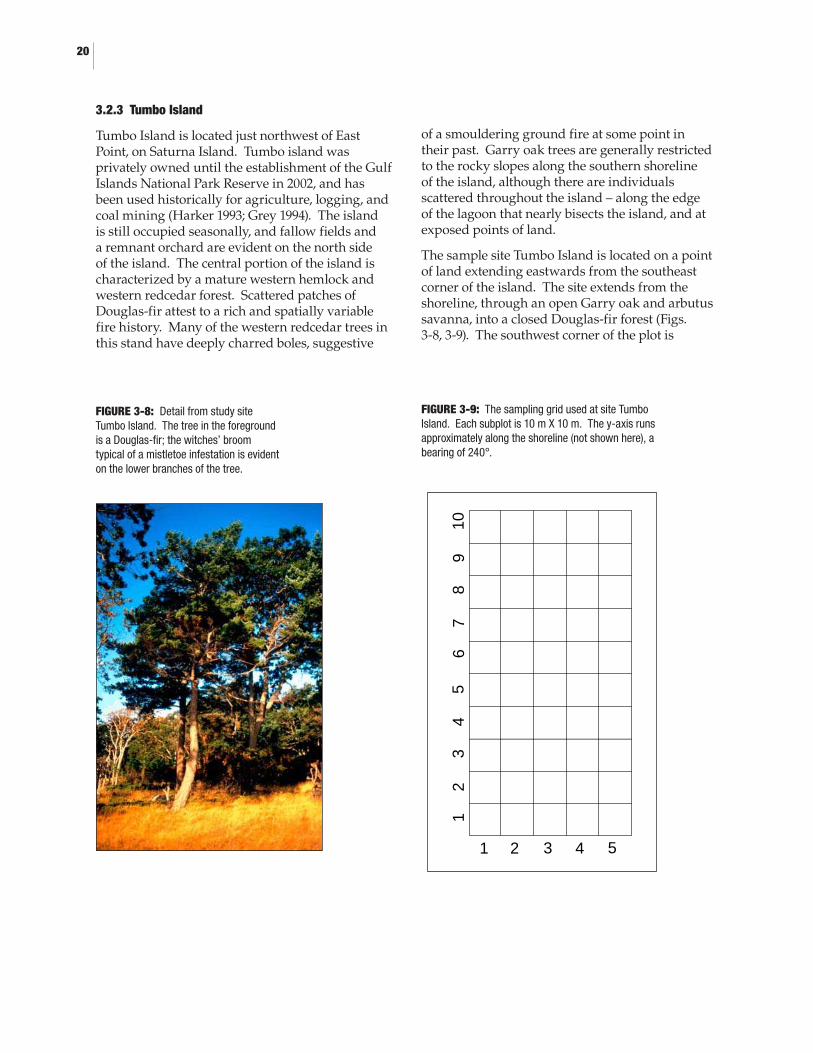
FIGURE 3-8: Detail from study site Tumbo Island. The tree in the foreground is a Douglas-fir; the witches’ broom typical of a mistletoe infestation is evident on the lower branches of the tree.
FIGURE 3-9: The sampling grid used at site Tumbo Island. Each subplot is 10 m X 10 m. The y-axis runs approximately along the shoreline (not shown here), a bearing of 240°.
20
12
34
56
78
910
1 2 3 4 5
3.2.3 Tumbo Island
Tumbo Island is located just northwest of East Point, on Saturna Island. Tumbo island was privately owned until the establishment of the Gulf Islands National Park Reserve in 2002, and has been used historically for agriculture, logging, and coal mining (Harker 1993; Grey 1994). The island is still occupied seasonally, and fallow fields and a remnant orchard are evident on the north side of the island. The central portion of the island is characterized by a mature western hemlock and western redcedar forest. Scattered patches of Douglas-fir attest to a rich and spatially variable fire history. Many of the western redcedar trees in this stand have deeply charred boles, suggestive
of a smouldering ground fire at some point in their past. Garry oak trees are generally restricted to the rocky slopes along the southern shoreline of the island, although there are individuals scattered throughout the island – along the edge of the lagoon that nearly bisects the island, and at exposed points of land.
The sample site Tumbo Island is located on a point of land extending eastwards from the southeast corner of the island. The site extends from the shoreline, through an open Garry oak and arbutus savanna, into a closed Douglas-fir forest (Figs. 3-8, 3-9). The southwest corner of the plot is
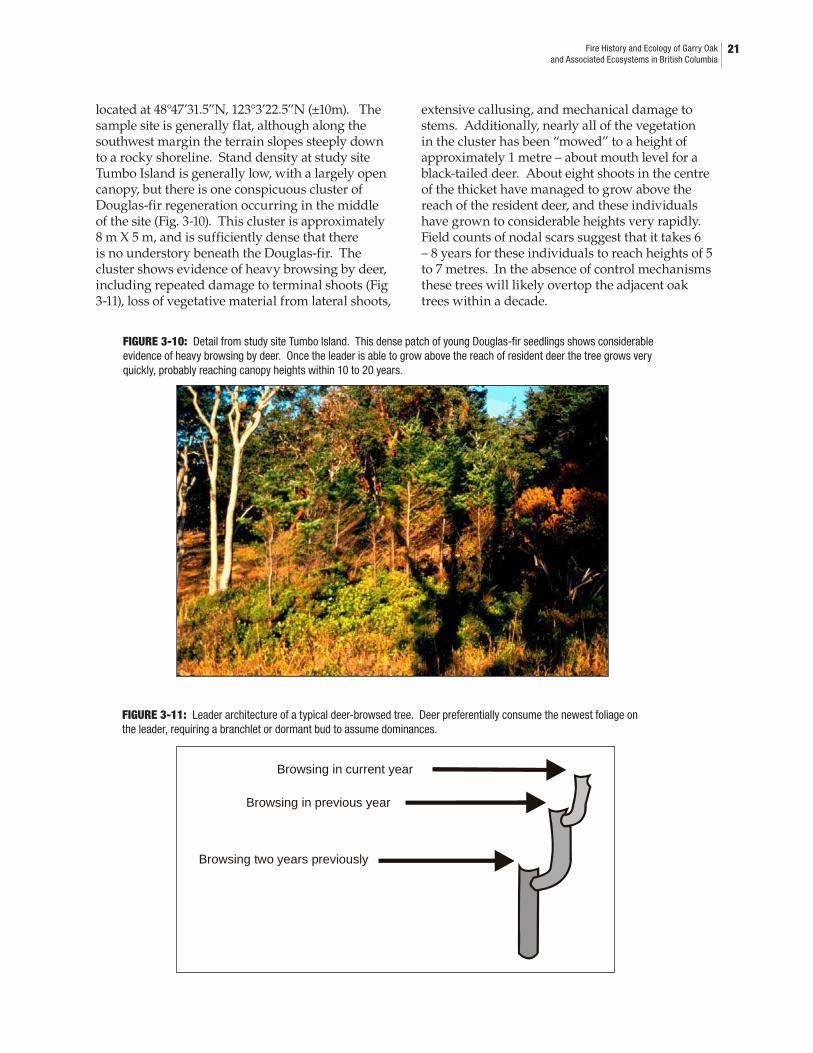
FIGURE 3-10: Detail from study site Tumbo Island. This dense patch of young Douglas-fir seedlings shows considerable evidence of heavy browsing by deer. Once the leader is able to grow above the reach of resident deer the tree grows very quickly, probably reaching canopy heights within 10 to 20 years.
FIGURE 3-11: Leader architecture of a typical deer-browsed tree. Deer preferentially consume the newest foliage onthe leader, requiring a branchlet or dormant bud to assume dominances.
21 Fire History and Ecology of Garry Oakand Associated Ecosystems in British Columbia
Browsing two years previously
Browsing in previous year
Browsing in current year
located at 48°47’31.5”N, 123°3’22.5”N (±10m). The sample site is generally flat, although along the southwest margin the terrain slopes steeply down to a rocky shoreline. Stand density at study site Tumbo Island is generally low, with a largely open canopy, but there is one conspicuous cluster of Douglas-fir regeneration occurring in the middle of the site (Fig. 3-10). This cluster is approximately 8 m X 5 m, and is sufficiently dense that there is no understory beneath the Douglas-fir. The cluster shows evidence of heavy browsing by deer, including repeated damage to terminal shoots (Fig 3-11), loss of vegetative material from lateral shoots,
extensive callusing, and mechanical damage to stems. Additionally, nearly all of the vegetation in the cluster has been “mowed” to a height of approximately 1 metre – about mouth level for a black-tailed deer. About eight shoots in the centre of the thicket have managed to grow above the reach of the resident deer, and these individuals have grown to considerable heights very rapidly. Field counts of nodal scars suggest that it takes 6 – 8 years for these individuals to reach heights of 5 to 7 metres. In the absence of control mechanisms these trees will likely overtop the adjacent oak trees within a decade.
22
3.3 Methods
3.3.1 Field Methods
At each study site a region extending from the treeless prairie or shoreline, through the Garry oak stand, and into the adjacent coniferous forest, was identified. This region was divided into a series of 10m X 10m plots for sampling purposes. Within each plot, increment cores were collected from all trees greater than 10 cm diameter at breast height. Cores were taken as close as practical to ground level to enable accurate estimates of establishment date to be determined. Diameter measurements were taken for all trees less than 10 cm in diameter, and all seedlings (individuals less than 1.5 m tall) were counted. Large snags and downed woody debris were also measured. When these structures were sufficiently solid enough, a core was extracted in order to determine the year of death.
The morphology of each overstory tree was also noted, with three categories recognized: (1) savanna-grown individuals included those trees that exhibited large lower branches, a wide crown, and a deep canopy; (2) woodland-grown individuals exhibited few lower branches, a narrow, tall crown, and a generally erect posture; (3) transitional individuals included those that either exhibited transitional features, or were in the process of transforming from one morphology to the other – usually through senescence of lower limbs, though in a very few cases individuals exhibiting woodland characteristics were developing savanna features through the development of bottom branches (oak) or epicormic shoots (Douglas-fir).
Site specific fire histories were determined using three main methods: first, whenever they could be identified, fire-scarred individuals were intensively sampled using the back-boring method (Agee 1993). Of the methods applied in this study, this method is the preferred approach for determining fire history, as it is based on direct evidence, and potentially provides sub-seasonal temporal resolution. Second, when obvious even-aged Douglas-fir stands were located adjacent to the sampling site these were cored opportunistically to determine establishment dates. This method is problematic as it only provides evidence for the most recent fire, and there is no certainty that the fire identified affected the adjacent oak stand. It is also possible that the stand represents a post-logging population, although Douglas-fir germinates best on exposed mineral soil (Gray and Spies 1997) so this scenario is unlikely. Cores
collected within the plot were also examined for evidence of cohorts, but the discontinuous canopy that is characteristic of Gary oak meadows typically reduces the severity of wildfires so it is less likely that a cohort will be detectable in these environments (Agee 1993). Third, cores collected within the plots were inspected visually for the presence of trauma rings. These rings are characterized by callous tissue that is much darker in colour than preceding rings, they are typically quite resinous, and may be associated with an abrupt change in growth rates. The traumatic response often persists for 3-7 years following a damaging event. Although they can be caused by a variety of factors, including insect attack, frost, lightning, and hail, fire is by far the most likely cause in coastal British Columbia.
3.3.2 Sample Preparation
Increment cores were mounted in slotted boards, and sanded with progressively finer sand paper to reveal individual cells. For most of the conifer samples, a 400-grit paper was sufficient. However for nearly all of the Garry oak samples a finer finish was required. For these samples, a 600-grit paper followed by a polishing cloth was required to make the ring boundaries sufficiently clear to distinguish during analysis.
3.3.3 Ring-Width Measurement
Ring width was measured using the WinDendro image analysis system (Régent Instruments, version 2002). This system makes use of high-resolution optical scanning technology to measure the width of growth rings. All cores were scanned at a minimum resolution of 800 dpi, which provides a minimum measurement error of ±0.05 mm. Earlywood and latewood width were measured based on optical properties of individual rings (Frank 1998). The mid-range pixel value in each ring (i.e. the reflectance value half-way between the minimum and maximum values seen in a given ring) was used as a threshold to distinguish these components. Although arbutus trees were cored, the species does not appear to produce an annual growth ring, so measurement was not undertaken of these samples.
Many of the core samples collected do not contain the pith, or innermost growth ring. There are several reasons for this situation: many savanna-grown trees have assymetrical morphologies, and the pith may be located well off-centre, making it difficult to sample (Schweingruber 1996); the
23 Fire History and Ecology of Garry Oakand Associated Ecosystems in British Columbia
tree may be too large to reach the pith with the increment borer; the tree may have heart-rot or butt-rot, causing the wood to disintegrate during sampling; or the operator may simply aim the borer in the wrong direction. In order to accurately determine the date of tree establishment it is important to estimate the number of rings missing from the sample. The number of missing rings was determined by measuring the curvature of the innermost ring using a transparent template and dividing the radius of the missing growth portion by the average growth rate for the tree during its period of early development.
3.3.4 Cross-Dating
Cross-dating is the process of assigning calendar years to all measured rings in a ring-width series (Fritts 1976). Cross-dating is typically accomplished by identifying particularly narrow rings that occur in many or all samples at a given site. These “marker rings” are assumed to correspond to the same year, and facilitate the identification of missing and false rings. Ring-width series often contain missing, locally absent, or partial rings, as well as false rings, due to particularly severe years, damaging events, or anomalous weather events (Fritts 1976; Yamaguchi 1991). Some species such as larch (larix spp.) are particularly prone to missing rings, with individuals exhibiting up to 5 percent missing rings, and many stands exhibiting 1-2 percent missing rings overall (Colenutt and Luckman 1995). In contrast, some species can have a very high percentage of false rings if conditions are variable and severe (Gedalof 1999). The absolute dating error typically introduced by these problems is typically small – usually no more than one or two years per century – but can be greater in some circumstances.
Cross-dating is essential in applications where variability in ring-width is relevant to the analysis. Examples include: quantifying the relationship between environmental variability and radial growth (Fritts et al. 1990); identifying the natural fire regime (Agee 1993); or assigning dates to undated chronologies (Stokes and Smiley 1868).
3.3.5 Calculating the Site Chronology
The annual growth increment in a tree is a function of many parametres, including environmental conditions, disturbance events, physiological processes within the tree, stand dynamics, nutrient regimes and climatic forcing.
For many applications it is desirable to isolate one or more of these factors and combine them into a single, representative site chronology. Cook (1987; 1990) provides a conceptual model for tree growth:
Rt = A
t + C
t + �D1
t + �D2
t + E
t [1]
where Rt is the observed ring width at time t; At is the age / size dependent trend in ringwidth; C
t
is the climate dependent signal; D1t and D2
t are
endogenous and exogenous disturbance signals; and Et is unexplained variability not related to the other signals. Endogenous disturbances are those classes of disturbance which arise from processes within the tree stand itself, such as gap-phase dynamics, whereas exogenous disturbances are those which occur independently of the stand, such as fire, insect infestation, frost damage or changes in the hydrologic or nutrient regime. The � is a dummy variable, indicating the occurrence or non-occurrence of the specified disturbance. A number of empirical and statistical models exist to partition variance into these components.
At is a non-stationary process which reflects the tendency for younger, smaller trees to exhibit greater annual radial growth than older, larger trees. Under conditions where the effects of competition and disturbance are minimised, trees will exhibit a tendency for growth to decay exponentially over time. This type of growth trend is most commonly removed by calculating a negative exponential curve which best fits the series, and then dividing the observed ring width by this expected ring width to produce a dimensionless index. The transformation of ring-width series to ring-width index values has added advantages for tree-ring analysis: by using this expected growth curve to standardise the ring-widths, the series are converted to dimensionless indices with unit mean and a relatively constant variance. Consequently, it is possible to compare directly the growth indices for trees which are different ages, or are developing at different rates.
There is a common practice in dendrochronology of double-detrending tree-ring data. Following the initial detrending with a negative exponential curve, the residual series is fit with a spline curve of a specified rigidity (Cook et al. 1990). This curve removes low-frequency trends in growth attributable to disturbance and competition. A consequence of this detrending method, though, is that trends in the end of the time-series are

24
removed. Because one of the goals of this analysis was to determine the magnitude of the increase in growth attributable to ecosystem changes the application of this type of detrending method would obscure exactly this sort of relationship. Consequently, only the negative exponential curve detrending method was applied to the ring-width series.
Following detrending, each tree-ring index series is pre-whitened using autoregressive and moving average (ARMA) models to remove the effects of autocorrelation on the series (Guiot 1986; Biondi and Swetnam 1987). Autocorrelation refers to the tendency for observations in time-series data to be dependent on previous observations. In tree-ring data, this dependence is a reflection of nutrient storage within the tree and plant hormone levels. Consequently, there is a tendency for years of good growth to be followed by another year of relatively enhanced growth, regardless of climate or disturbance factors. Similarly, there is a tendency for years of poor growth to be followed by another year of relatively reduced growth. This structure can obscure the degree of commonality in tree-ring series if the causes of variability are out of phase between trees (e.g. Riiters 1990), or can lead to spurious correlations if they are in phase (see Katz 1988).
Following detrending and pre-whitening the individual series were combined into a single, representative, site chronology. The simplest method of calculating the site chronology is to calculate the arithmetic mean ring width for each year in the series. This produces a time-series that concentrates the common signal, and averages out non-homogeneous noise. This procedure has the advantage of developing a site chronology based on all the trees in a given series. However, if the series being combined are noisy, the arithmetic mean may result in a flattened series. Similarly, a few outliers may significantly influence a given years’ index value. A more appropriate method of estimating the mean chronology in highly variable series is to use a robust mean (Cook 1987). Robust means discount the influence of outliers and consequently result in stronger estimations of the chronology. By ignoring outliers in the calculation of the site chronology, the robust mean reduces the influence of series which are acting individually; in particular, those trees which are reacting to endogenous disturbance agents. The most commonly applied robust mean, and the method used here, is the biweight mean (Mosteller and Tukey 1977).
3.3.6 Growth-Climate Relations
There are two main motivations for determining the relationship between radial growth and climate. The first is that trees are often much older than the available instrumental records of climate. In locations where growth is strongly limited by climate the tree-ring chronology can be used to derive a proxy record of climatic variability that is substantially longer than the available instrumental record (e.g. Cook et al. 1999; Laroque and Smith 1999; Gedalof and Smith 2001b). The second reason is that by assessing the climatic factors limiting growth it is possible to anticipate the likely consequences of global climate change on forest distributions (e.g. Brubaker 1986; Swetnam 1993; Luckman 1994; Gedalof and Smith 2001a).
The most commonly used technique for identifying the growth-climate relationship is response function analysis (Fritts et al. 1971). This technique undertakes a multiple stepwise regression on orthogonalised mean monthly climate variables in order to identify significant relationships. The application of eigenvector techniques serves several purposes here: (1) it reduces the number of variables input into the regression, thus increasing the number of degrees of freedom; (2) the new variables are uncorrelated with each other, which eliminates multicollinearity; and (3) the principal components can be ranked on the basis of variability explained, allowing the less important variables to be immediately discarded. Following extraction of the eigenvectors, stepwise multiple regression can be undertaken.
Significance testing of the observed associations is undertaken using the bootstrap method. Bootstrapping is a method of estimating the standard errors of statistical estimators and related parametres in cases where the data set is small, or where no theory exists for its underlying distribution (Efron and Tibshirani 1997). The method proceeds by developing many subsets of the data (termed pseudo-data sets) using random sampling with replacement. Each pseudo-data set is used to estimate a set of regression coefficients. This set of estimates can then be used to derive the frequency distribution of the actual regression parameters. Bootstrapped statistics have been shown to be robust even when residuals are non-normal, autocorrelated, or when the data set is too short for normal statistical estimators (Fritts et al. 1990).
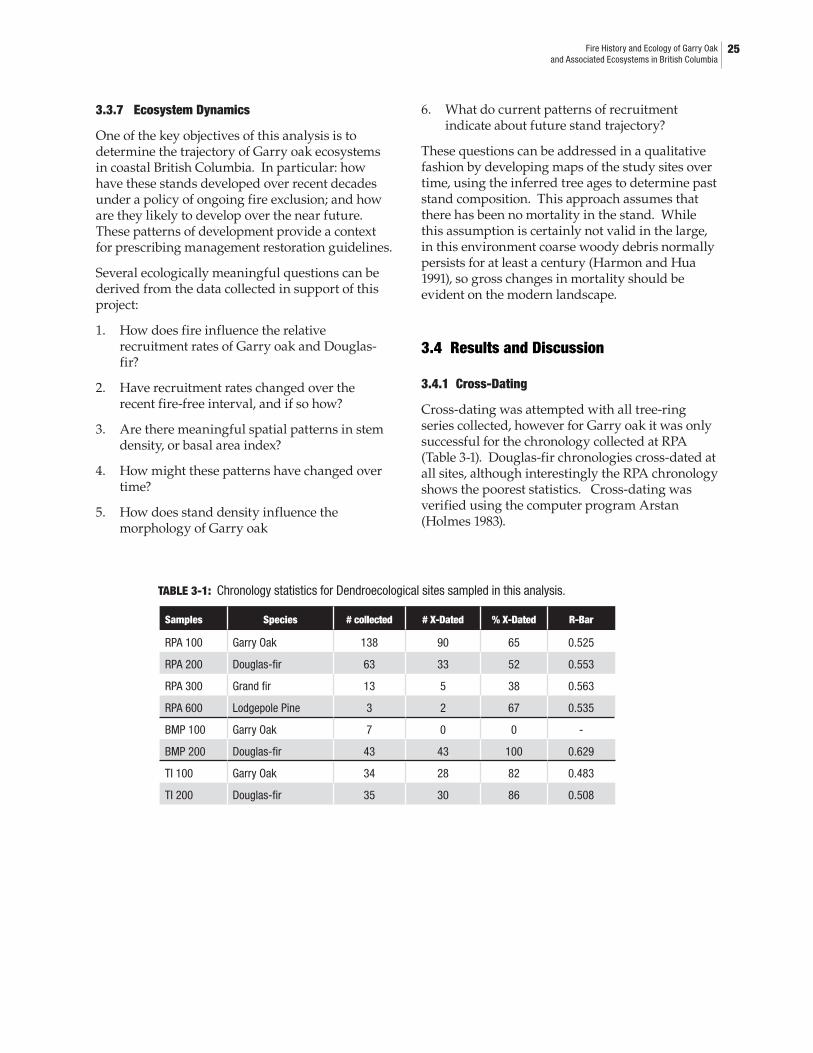
TABLE 3-1: Chronology statistics for Dendroecological sites sampled in this analysis.
Samples Species # collected # X-Dated % X-Dated R-Bar
RPA 100 Garry Oak 138 90 65 0.525
RPA 200 Douglas-fir 63 33 52 0.553
RPA 300 Grand fir 13 5 38 0.563
RPA 600 Lodgepole Pine 3 2 67 0.535
BMP 100 Garry Oak 7 0 0 -
BMP 200 Douglas-fir 43 43 100 0.629
TI 100 Garry Oak 34 28 82 0.483
TI 200 Douglas-fir 35 30 86 0.508
25 Fire History and Ecology of Garry Oakand Associated Ecosystems in British Columbia
3.3.7 Ecosystem Dynamics
One of the key objectives of this analysis is to determine the trajectory of Garry oak ecosystems in coastal British Columbia. In particular: how have these stands developed over recent decades under a policy of ongoing fire exclusion; and how are they likely to develop over the near future. These patterns of development provide a context for prescribing management restoration guidelines.
Several ecologically meaningful questions can be derived from the data collected in support of this project:
How does fire influence the relative recruitment rates of Garry oak and Douglas-fir?
Have recruitment rates changed over the recent fire-free interval, and if so how?
Are there meaningful spatial patterns in stem density, or basal area index?
How might these patterns have changed over time?
How does stand density influence the morphology of Garry oak
1.
2.
3.
4.
5.
What do current patterns of recruitment indicate about future stand trajectory?
These questions can be addressed in a qualitative fashion by developing maps of the study sites over time, using the inferred tree ages to determine past stand composition. This approach assumes that there has been no mortality in the stand. While this assumption is certainly not valid in the large, in this environment coarse woody debris normally persists for at least a century (Harmon and Hua 1991), so gross changes in mortality should be evident on the modern landscape.
3.4 Results and Discussion
3.4.1 Cross-Dating
Cross-dating was attempted with all tree-ring series collected, however for Garry oak it was only successful for the chronology collected at RPA (Table 3-1). Douglas-fir chronologies cross-dated at all sites, although interestingly the RPA chronology shows the poorest statistics. Cross-dating was verified using the computer program Arstan (Holmes 1983).
6.

FIGURE 3-12: The response function for the Garry oak chronology collected at site RPA. The y-axis indicates standardized regression
coefficients, in units of standard deviations. The plot indicates that 58 percent of growth can be explained by February precipitation.
FIGURE 3-13: The response function for the Douglas-fir chronology collected at site RPA. The y-axis indicates standardized regression coefficients, in units of standard deviations. The plot indicates that 56 percent of growth can be explained by a combination of July temperature during the year prior to growth, and to June precipitation during the year of growth.
26
J(-1) A S O N D J(0) F M A M J J AMonth
-0.3
-0.2
-0.1
0.0
0.1
0.2
0.3TempPrecipSig.
Rocky Point A - QUGA. 58% Var. exp. [Total Precip, Max T]
J(-1) A S O N D J(0) F M A M J J AMonth
-0.4
-0.3
-0.2
-0.1
0.0
0.1
0.2
0.3TempPrecipSig.
Rocky Point A - PSME. 56% Var. exp. [Total Precip, Max T]
3.4.2 Growth climate relationships
The relationship between annual radial growth increment and climate was calculated only for the RPA chronologies (Figs. 3-12, 3-13). The results of the response function analysis indicate considerable dendroclimatic potential for Garry oak, with over half of the variability in growth explained by winter precipitation variables. Although Douglas-fir exhibits a similarly strong response to climate, the relationship is divided between two growing seasons, and between temperature and precipitation – complicating interpretation of the results considerably.
Growth of Garry oak at RPA is limited primarily by winter precipitation – presumably through its importance in recharging subsurface soil moisture. This sensitivity suggests that a network of Garry oak chronologies could be used to reconstruct the history of drought in southern Vancouver Island – a record which would be useful for critical period analyses in regional watersheds. Additionally, the result may help explain why forecasts of the future distribution of Garry oak differ so dramatically (contrast, for example the Royal BC Museum forecasts (http://www.pacificclimate.org/impacts/rbcmuseum/index.cgi?oak) with those in Shafer et al. (2001)). Precipitation is poorly modelled by most climate models, and forecasts differ substantially between models and scenarios.
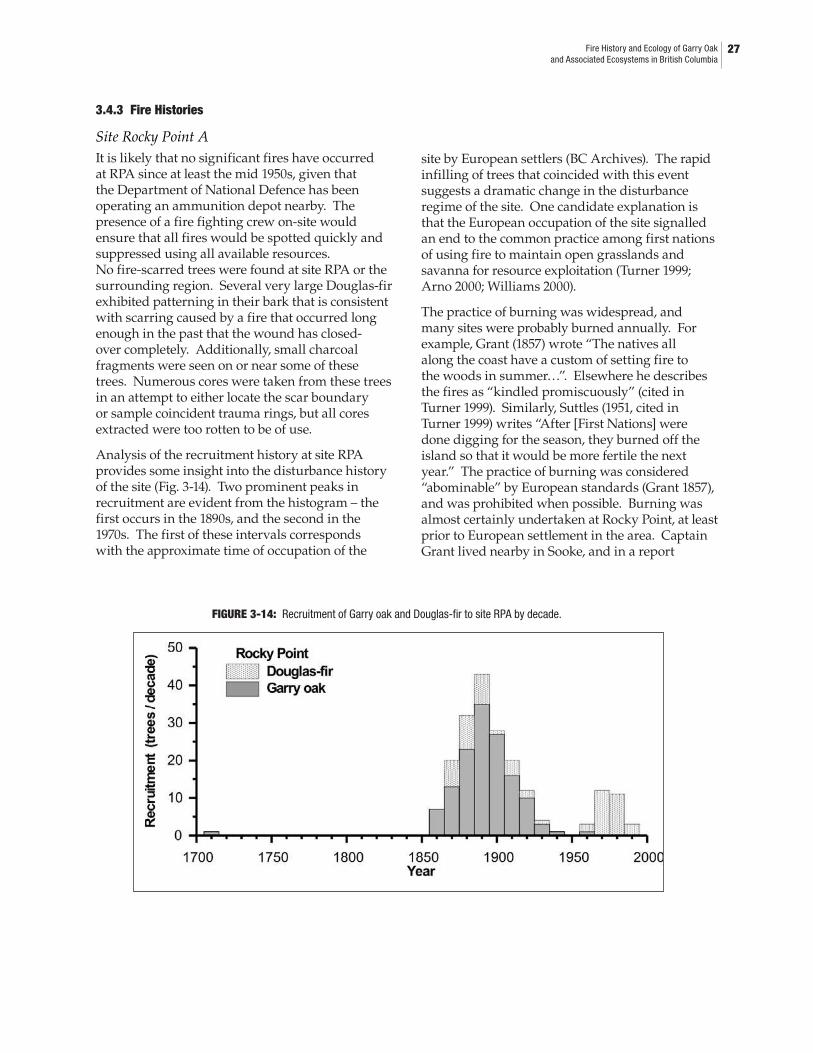
FIGURE 3-14: Recruitment of Garry oak and Douglas-fir to site RPA by decade.
27 Fire History and Ecology of Garry Oakand Associated Ecosystems in British Columbia
3.4.3 Fire Histories
Site Rocky Point A
It is likely that no significant fires have occurred at RPA since at least the mid 1950s, given that the Department of National Defence has been operating an ammunition depot nearby. The presence of a fire fighting crew on-site would ensure that all fires would be spotted quickly and suppressed using all available resources.No fire-scarred trees were found at site RPA or the surrounding region. Several very large Douglas-fir exhibited patterning in their bark that is consistent with scarring caused by a fire that occurred long enough in the past that the wound has closed-over completely. Additionally, small charcoal fragments were seen on or near some of these trees. Numerous cores were taken from these trees in an attempt to either locate the scar boundary or sample coincident trauma rings, but all cores extracted were too rotten to be of use.
Analysis of the recruitment history at site RPA provides some insight into the disturbance history of the site (Fig. 3-14). Two prominent peaks in recruitment are evident from the histogram – the first occurs in the 1890s, and the second in the 1970s. The first of these intervals corresponds with the approximate time of occupation of the
site by European settlers (BC Archives). The rapid infilling of trees that coincided with this event suggests a dramatic change in the disturbance regime of the site. One candidate explanation is that the European occupation of the site signalled an end to the common practice among first nations of using fire to maintain open grasslands and savanna for resource exploitation (Turner 1999; Arno 2000; Williams 2000).
The practice of burning was widespread, and many sites were probably burned annually. For example, Grant (1857) wrote “The natives all along the coast have a custom of setting fire to the woods in summer…”. Elsewhere he describes the fires as “kindled promiscuously” (cited in Turner 1999). Similarly, Suttles (1951, cited in Turner 1999) writes “After [First Nations] were done digging for the season, they burned off the island so that it would be more fertile the next year.” The practice of burning was considered “abominable” by European standards (Grant 1857), and was prohibited when possible. Burning was almost certainly undertaken at Rocky Point, at least prior to European settlement in the area. Captain Grant lived nearby in Sooke, and in a report
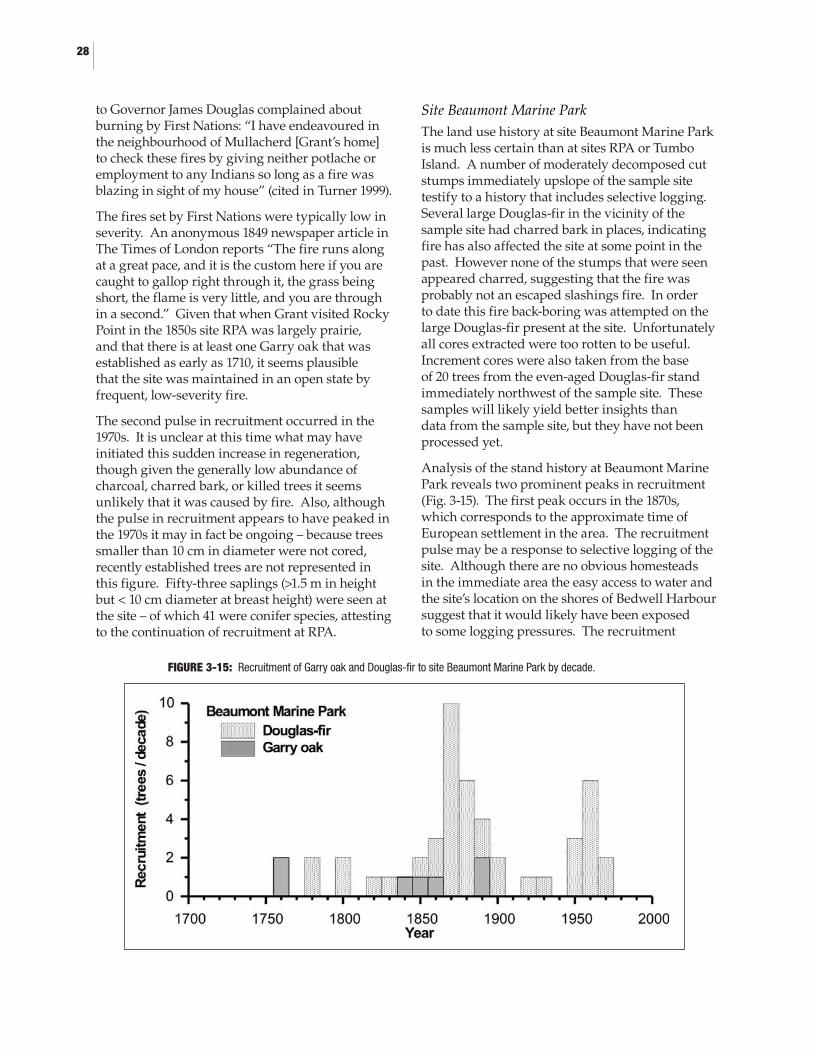
FIGURE 3-15: Recruitment of Garry oak and Douglas-fir to site Beaumont Marine Park by decade.
28
to Governor James Douglas complained about burning by First Nations: “I have endeavoured in the neighbourhood of Mullacherd [Grant’s home] to check these fires by giving neither potlache or employment to any Indians so long as a fire was blazing in sight of my house” (cited in Turner 1999).
The fires set by First Nations were typically low in severity. An anonymous 1849 newspaper article in The Times of London reports “The fire runs along at a great pace, and it is the custom here if you are caught to gallop right through it, the grass being short, the flame is very little, and you are through in a second.” Given that when Grant visited Rocky Point in the 1850s site RPA was largely prairie, and that there is at least one Garry oak that was established as early as 1710, it seems plausible that the site was maintained in an open state by frequent, low-severity fire.
The second pulse in recruitment occurred in the 1970s. It is unclear at this time what may have initiated this sudden increase in regeneration, though given the generally low abundance of charcoal, charred bark, or killed trees it seems unlikely that it was caused by fire. Also, although the pulse in recruitment appears to have peaked in the 1970s it may in fact be ongoing – because trees smaller than 10 cm in diameter were not cored, recently established trees are not represented in this figure. Fifty-three saplings (>1.5 m in height but < 10 cm diameter at breast height) were seen at the site – of which 41 were conifer species, attesting to the continuation of recruitment at RPA.
Site Beaumont Marine Park
The land use history at site Beaumont Marine Park is much less certain than at sites RPA or Tumbo Island. A number of moderately decomposed cut stumps immediately upslope of the sample site testify to a history that includes selective logging. Several large Douglas-fir in the vicinity of the sample site had charred bark in places, indicating fire has also affected the site at some point in the past. However none of the stumps that were seen appeared charred, suggesting that the fire was probably not an escaped slashings fire. In order to date this fire back-boring was attempted on the large Douglas-fir present at the site. Unfortunately all cores extracted were too rotten to be useful. Increment cores were also taken from the base of 20 trees from the even-aged Douglas-fir stand immediately northwest of the sample site. These samples will likely yield better insights than data from the sample site, but they have not been processed yet.
Analysis of the stand history at Beaumont Marine Park reveals two prominent peaks in recruitment (Fig. 3-15). The first peak occurs in the 1870s, which corresponds to the approximate time of European settlement in the area. The recruitment pulse may be a response to selective logging of the site. Although there are no obvious homesteads in the immediate area the easy access to water and the site’s location on the shores of Bedwell Harbour suggest that it would likely have been exposed to some logging pressures. The recruitment
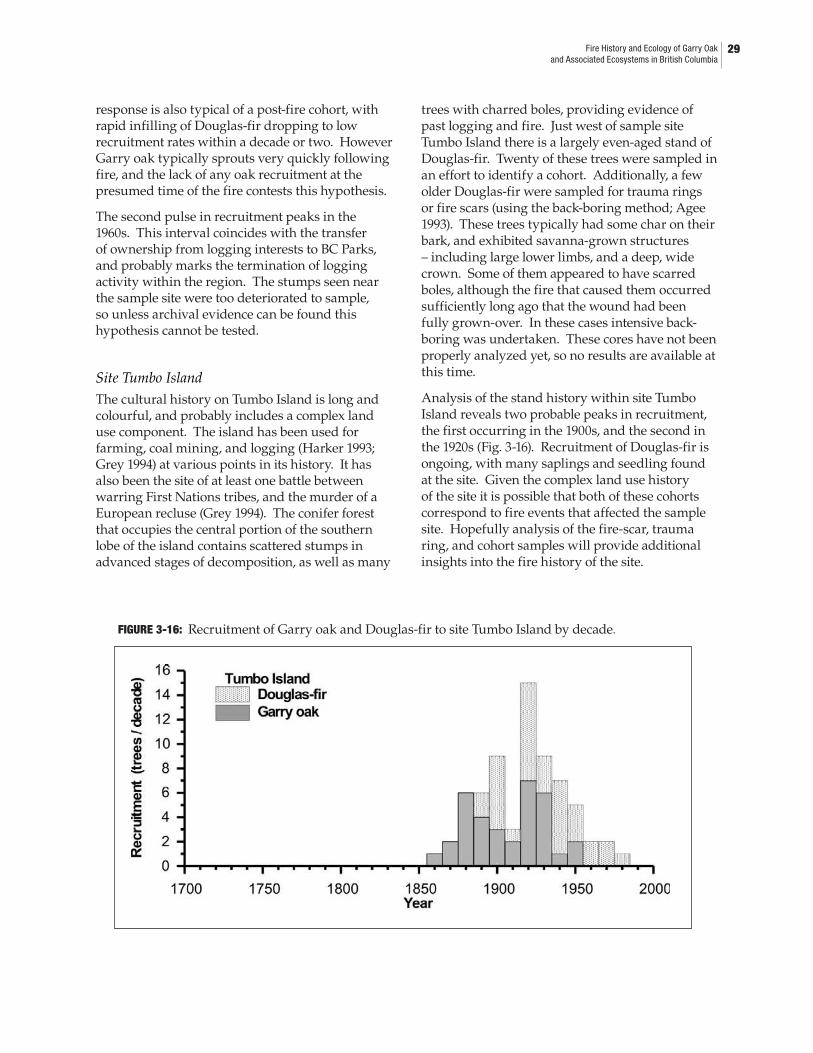
FIGURE 3-16: Recruitment of Garry oak and Douglas-fir to site Tumbo Island by decade.
29 Fire History and Ecology of Garry Oakand Associated Ecosystems in British Columbia
response is also typical of a post-fire cohort, with rapid infilling of Douglas-fir dropping to low recruitment rates within a decade or two. However Garry oak typically sprouts very quickly following fire, and the lack of any oak recruitment at the presumed time of the fire contests this hypothesis.
The second pulse in recruitment peaks in the 1960s. This interval coincides with the transfer of ownership from logging interests to BC Parks, and probably marks the termination of logging activity within the region. The stumps seen near the sample site were too deteriorated to sample, so unless archival evidence can be found this hypothesis cannot be tested.
Site Tumbo Island
The cultural history on Tumbo Island is long and colourful, and probably includes a complex land use component. The island has been used for farming, coal mining, and logging (Harker 1993; Grey 1994) at various points in its history. It has also been the site of at least one battle between warring First Nations tribes, and the murder of a European recluse (Grey 1994). The conifer forest that occupies the central portion of the southern lobe of the island contains scattered stumps in advanced stages of decomposition, as well as many
trees with charred boles, providing evidence of past logging and fire. Just west of sample site Tumbo Island there is a largely even-aged stand of Douglas-fir. Twenty of these trees were sampled in an effort to identify a cohort. Additionally, a few older Douglas-fir were sampled for trauma rings or fire scars (using the back-boring method; Agee 1993). These trees typically had some char on their bark, and exhibited savanna-grown structures – including large lower limbs, and a deep, wide crown. Some of them appeared to have scarred boles, although the fire that caused them occurred sufficiently long ago that the wound had been fully grown-over. In these cases intensive back-boring was undertaken. These cores have not been properly analyzed yet, so no results are available at this time.
Analysis of the stand history within site Tumbo Island reveals two probable peaks in recruitment, the first occurring in the 1900s, and the second in the 1920s (Fig. 3-16). Recruitment of Douglas-fir is ongoing, with many saplings and seedling found at the site. Given the complex land use history of the site it is possible that both of these cohorts correspond to fire events that affected the sample site. Hopefully analysis of the fire-scar, trauma ring, and cohort samples will provide additional insights into the fire history of the site.
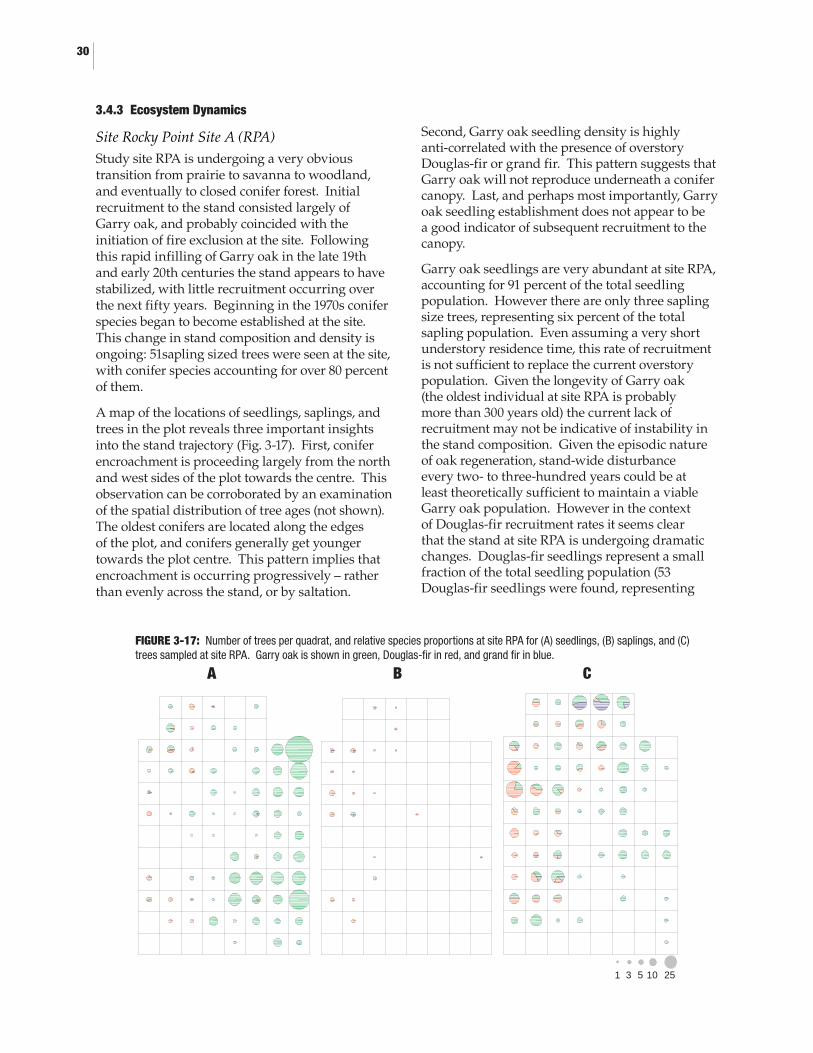
FIGURE 3-17: Number of trees per quadrat, and relative species proportions at site RPA for (A) seedlings, (B) saplings, and (C) trees sampled at site RPA. Garry oak is shown in green, Douglas-fir in red, and grand fir in blue.
A B C
30
1 253 5 10
3.4.3 Ecosystem Dynamics
Site Rocky Point Site A (RPA)
Study site RPA is undergoing a very obvious transition from prairie to savanna to woodland, and eventually to closed conifer forest. Initial recruitment to the stand consisted largely of Garry oak, and probably coincided with the initiation of fire exclusion at the site. Following this rapid infilling of Garry oak in the late 19th and early 20th centuries the stand appears to have stabilized, with little recruitment occurring over the next fifty years. Beginning in the 1970s conifer species began to become established at the site. This change in stand composition and density is ongoing: 51sapling sized trees were seen at the site, with conifer species accounting for over 80 percent of them.
A map of the locations of seedlings, saplings, and trees in the plot reveals three important insights into the stand trajectory (Fig. 3-17). First, conifer encroachment is proceeding largely from the north and west sides of the plot towards the centre. This observation can be corroborated by an examination of the spatial distribution of tree ages (not shown). The oldest conifers are located along the edges of the plot, and conifers generally get younger towards the plot centre. This pattern implies that encroachment is occurring progressively – rather than evenly across the stand, or by saltation.
Second, Garry oak seedling density is highly anti-correlated with the presence of overstory Douglas-fir or grand fir. This pattern suggests that Garry oak will not reproduce underneath a conifer canopy. Last, and perhaps most importantly, Garry oak seedling establishment does not appear to be a good indicator of subsequent recruitment to the canopy.
Garry oak seedlings are very abundant at site RPA, accounting for 91 percent of the total seedling population. However there are only three sapling size trees, representing six percent of the total sapling population. Even assuming a very short understory residence time, this rate of recruitment is not sufficient to replace the current overstory population. Given the longevity of Garry oak (the oldest individual at site RPA is probably more than 300 years old) the current lack of recruitment may not be indicative of instability in the stand composition. Given the episodic nature of oak regeneration, stand-wide disturbance every two- to three-hundred years could be at least theoretically sufficient to maintain a viable Garry oak population. However in the context of Douglas-fir recruitment rates it seems clear that the stand at site RPA is undergoing dramatic changes. Douglas-fir seedlings represent a small fraction of the total seedling population (53 Douglas-fir seedlings were found, representing

FIGURE 3-18: Number of trees per quadrat, and relative species proportions at site BMP for (A) seedlings, (B) saplings, and (C) trees sampled at site RPA. Garry oak is shown in green, Douglas-fir in red, and arbutus in blue.
A B C
31 Fire History and Ecology of Garry Oakand Associated Ecosystems in British Columbia
1 3 5 10
7 percent of the seedling population), but appear to survive to sapling sizes much more often than Garry oak. Of the 53 saplings identified, 41 were Douglas-fir. Also, Douglas-fir at site RPA are growing very quickly – counting branch nodes suggests that seedlings typically reach heights of 2 to 3 metres in less than a decade. This high rate of Douglas-fir recruitment is a continuation of a pattern that began in the 1960s, and suggests that the composition of the stand is undergoing a considerable shift in composition and structure relative to recent centuries.
Site Beaumont Marine Park
Like Rocky Point, site Beaumont Marine Park (BMP) appears to be undergoing a transition in stand character. Whereas no overstory oak trees have become established in the past 100 years, Douglas-fir have increased in abundance on three separate occasions. The first two pulses in recruitment occurred in the 1870s and the 1960s (discussed above). The most recent pulse in recruitment probably occurred in the last decade or so: although only 5 Douglas-fir seedlings were found at the site, 23 saplings were found. Assuming that trees remain in the seedling class for approximately the same length of time as in
the sapling class, this distribution implies that the current pulse is probably not ongoing. This assumption is also supported by the fact that some seedlings will inevitably die before reaching sapling status.
An examination of the spatial distribution of seedlings, saplings and trees (Fig. 3-18) reveals three additional insights into the stand trajectory. First, like at site RPA there is an anti-correlation between overstory density and seedling / sapling density. The overall tree density is generally lower at BMP than RPA, providing a possible explanation for the generally weaker association seen here. Second, the pattern of recent recruitment seems to be controlled at least in part by topographic conditions. Douglas-fir seedlings and saplings are generally restricted to locations with deeper soils and more level conditions. In contrast, the Garry oak seedlings present occur principally on exposed, rocky slopes. Because of the southerly exposure, these locations also probably receive more sunlight than they might otherwise, given the proximity of these seedlings to overstory Douglas-fir. Lastly, in spite of the relative abundance of seedlings, there are no sapling-sized Garry oaks at the site – suggesting that the cohort will not survive to reach canopy sizes.
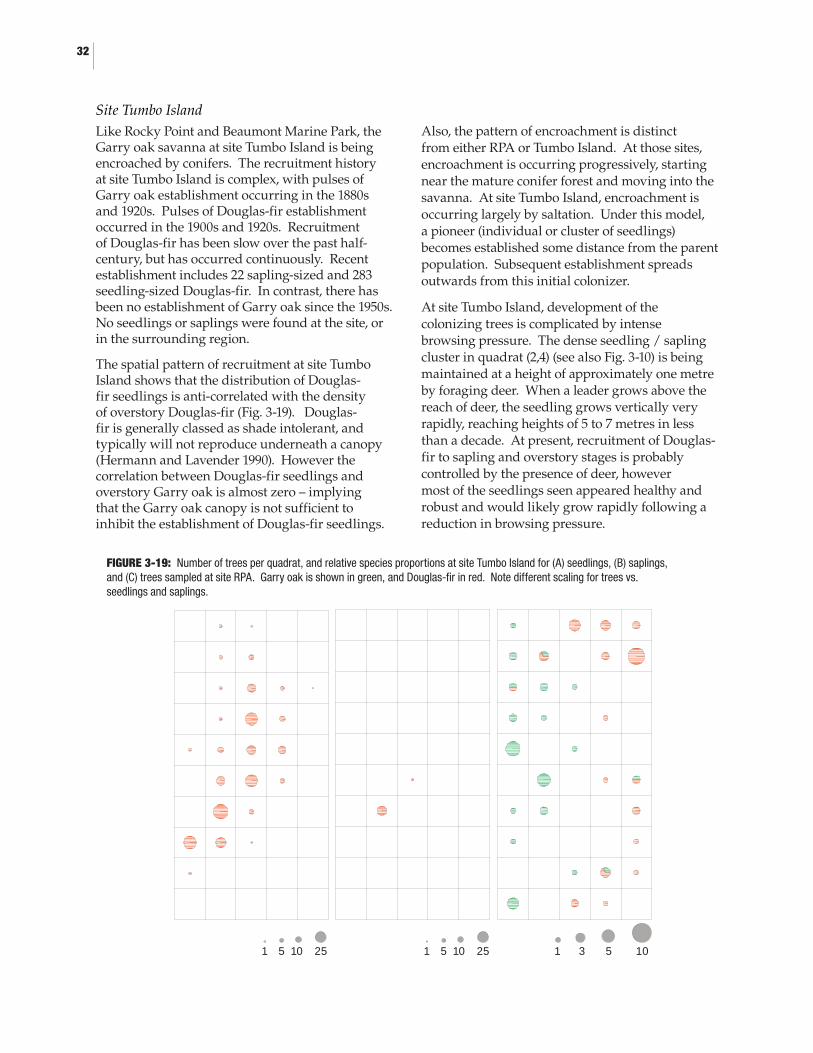
FIGURE 3-19: Number of trees per quadrat, and relative species proportions at site Tumbo Island for (A) seedlings, (B) saplings, and (C) trees sampled at site RPA. Garry oak is shown in green, and Douglas-fir in red. Note different scaling for trees vs. seedlings and saplings.
32
1 3 5 101 5 10 25 1 5 10 25
Site Tumbo Island
Like Rocky Point and Beaumont Marine Park, the Garry oak savanna at site Tumbo Island is being encroached by conifers. The recruitment history at site Tumbo Island is complex, with pulses of Garry oak establishment occurring in the 1880s and 1920s. Pulses of Douglas-fir establishment occurred in the 1900s and 1920s. Recruitment of Douglas-fir has been slow over the past half-century, but has occurred continuously. Recent establishment includes 22 sapling-sized and 283 seedling-sized Douglas-fir. In contrast, there has been no establishment of Garry oak since the 1950s. No seedlings or saplings were found at the site, or in the surrounding region.
The spatial pattern of recruitment at site Tumbo Island shows that the distribution of Douglas-fir seedlings is anti-correlated with the density of overstory Douglas-fir (Fig. 3-19). Douglas-fir is generally classed as shade intolerant, and typically will not reproduce underneath a canopy (Hermann and Lavender 1990). However the correlation between Douglas-fir seedlings and overstory Garry oak is almost zero – implying that the Garry oak canopy is not sufficient to inhibit the establishment of Douglas-fir seedlings.
Also, the pattern of encroachment is distinct from either RPA or Tumbo Island. At those sites, encroachment is occurring progressively, starting near the mature conifer forest and moving into the savanna. At site Tumbo Island, encroachment is occurring largely by saltation. Under this model, a pioneer (individual or cluster of seedlings) becomes established some distance from the parent population. Subsequent establishment spreads outwards from this initial colonizer.
At site Tumbo Island, development of the colonizing trees is complicated by intense browsing pressure. The dense seedling / sapling cluster in quadrat (2,4) (see also Fig. 3-10) is being maintained at a height of approximately one metre by foraging deer. When a leader grows above the reach of deer, the seedling grows vertically very rapidly, reaching heights of 5 to 7 metres in less than a decade. At present, recruitment of Douglas-fir to sapling and overstory stages is probably controlled by the presence of deer, however most of the seedlings seen appeared healthy and robust and would likely grow rapidly following a reduction in browsing pressure.
33 Fire History and Ecology of Garry Oakand Associated Ecosystems in British Columbia
3.5 Conclusions
3.5.1 Management Recommendations
All of the sites sampled in this analysis require active management if healthy Garry oak communities are to be maintained or restored. Mechanical removal of young conifers would probably be sufficient as an interim measure at all three sites to protect existing overstory individuals. However, given that Garry oak recruitment is virtually non-existent at all three sites, ultimately it will be necessary to restore some level of ecosystem processes if Garry oak is to survive at these locations. The process most likely to make a difference in this respect is fire, although used carelessly it can also provide a vector for invasion by exotic weeds(Agee 1996).
3.5.2 Future Work
Site-specific knowledge of fire history would dramatically enhance the ecosystem process inferences possible from the analyses presented here. These data were collected at sites BMP and Tumbo Island, but have not been analyzed yet. This analysis is a top research priority, and results should be forthcoming shortly. Additionally, there is a rich oral history among First Nations that could provide considerable insight into historical land use patterns and the cultural fire regime. Intensively used areas such as Rocky Point were typically burned frequently, but with
very low severity. This type of fire regime is often not well captured by the tree-ring record, but can have important ecological consequences. Lastly, this work needs to be tied in to much longer environmental reconstructions – that are only possible through the analysis of sedimentary pollen or macrofossil records.
3.5.3 Closing Remarks
The preliminary results presented here suggest that there are two relatively distinct processes that contribute to the development of Garry oak communities. Fire is clearly an important factor at all sites, but edaphic controls seem to be especially important in shoreline environments. Browsing pressure from ungulates may also be especially important in areas where the natural fire regime is too infrequent to maintain an open canopy, and cultural use of the site is either not practical (e.g. where the stand is too small) or not advisable (e.g. where large stores of explosives are nearby). Additionally, there are at least two mechanisms by which conifers can invade Garry oak communities. These systems may require different management practices to restore ecosystem functionality. Lastly, the long exclusion of fire from these sites means that it cannot be expected to perform the same function that it would have. In particular, the fire will almost certainly burn more severely, and the potential for weedy exotics to invade is considerable.

34
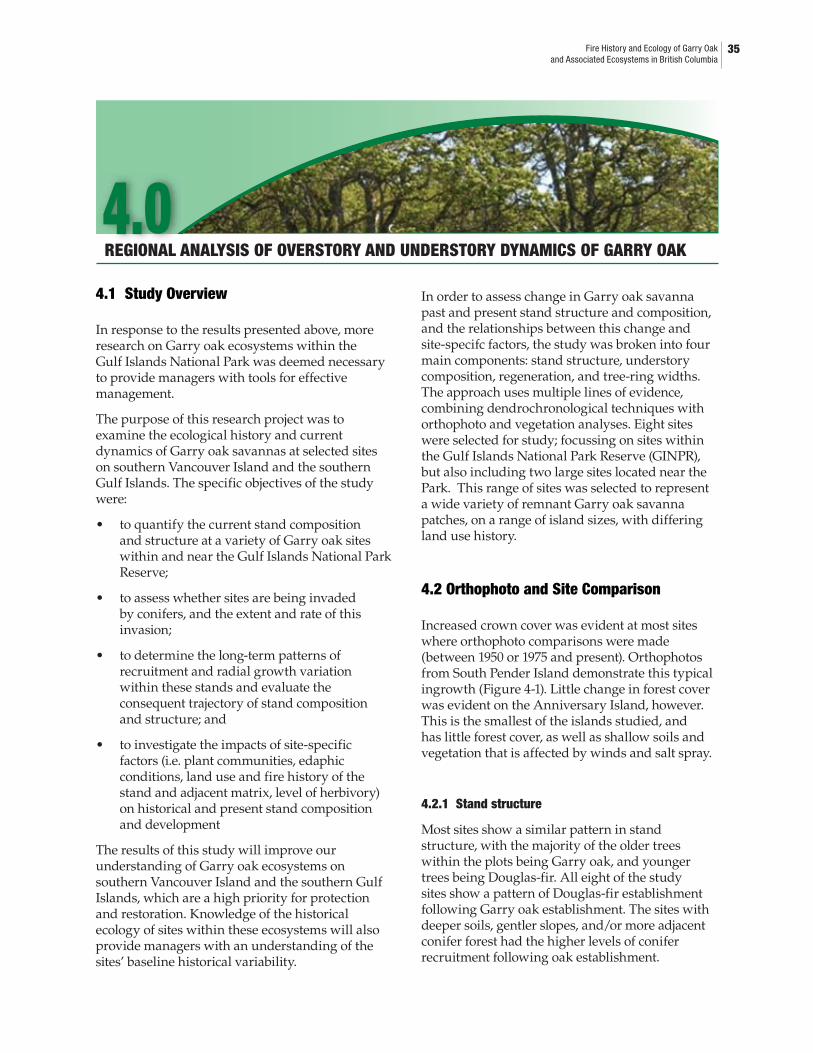
REGIONAL ANALYSIS OF OVERSTORY AND UNDERSTORY DYNAMICS OF GARRY OAK
2.04.0
35 Fire History and Ecology of Garry Oakand Associated Ecosystems in British Columbia
4.1 Study Overview
In response to the results presented above, more research on Garry oak ecosystems within the Gulf Islands National Park was deemed necessary to provide managers with tools for effective management.
The purpose of this research project was to examine the ecological history and current dynamics of Garry oak savannas at selected sites on southern Vancouver Island and the southern Gulf Islands. The specific objectives of the study were:
to quantify the current stand composition and structure at a variety of Garry oak sites within and near the Gulf Islands National Park Reserve;
to assess whether sites are being invaded by conifers, and the extent and rate of this invasion;
to determine the long-term patterns of recruitment and radial growth variation within these stands and evaluate the consequent trajectory of stand composition and structure; and
to investigate the impacts of site-specific factors (i.e. plant communities, edaphic conditions, land use and fire history of the stand and adjacent matrix, level of herbivory) on historical and present stand composition and development
The results of this study will improve our understanding of Garry oak ecosystems on southern Vancouver Island and the southern Gulf Islands, which are a high priority for protection and restoration. Knowledge of the historical ecology of sites within these ecosystems will also provide managers with an understanding of the sites’ baseline historical variability.
�
�
�
�
In order to assess change in Garry oak savanna past and present stand structure and composition, and the relationships between this change and site-specifc factors, the study was broken into four main components: stand structure, understory composition, regeneration, and tree-ring widths. The approach uses multiple lines of evidence, combining dendrochronological techniques with orthophoto and vegetation analyses. Eight sites were selected for study; focussing on sites within the Gulf Islands National Park Reserve (GINPR), but also including two large sites located near the Park. This range of sites was selected to represent a wide variety of remnant Garry oak savanna patches, on a range of island sizes, with differing land use history.
4.2 Orthophoto and Site Comparison
Increased crown cover was evident at most sites where orthophoto comparisons were made (between 1950 or 1975 and present). Orthophotos from South Pender Island demonstrate this typical ingrowth (Figure 4-1). Little change in forest cover was evident on the Anniversary Island, however. This is the smallest of the islands studied, and has little forest cover, as well as shallow soils and vegetation that is affected by winds and salt spray.
4.2.1 Stand structure
Most sites show a similar pattern in stand structure, with the majority of the older trees within the plots being Garry oak, and younger trees being Douglas-fir. All eight of the study sites show a pattern of Douglas-fir establishment following Garry oak establishment. The sites with deeper soils, gentler slopes, and/or more adjacent conifer forest had the higher levels of conifer recruitment following oak establishment.
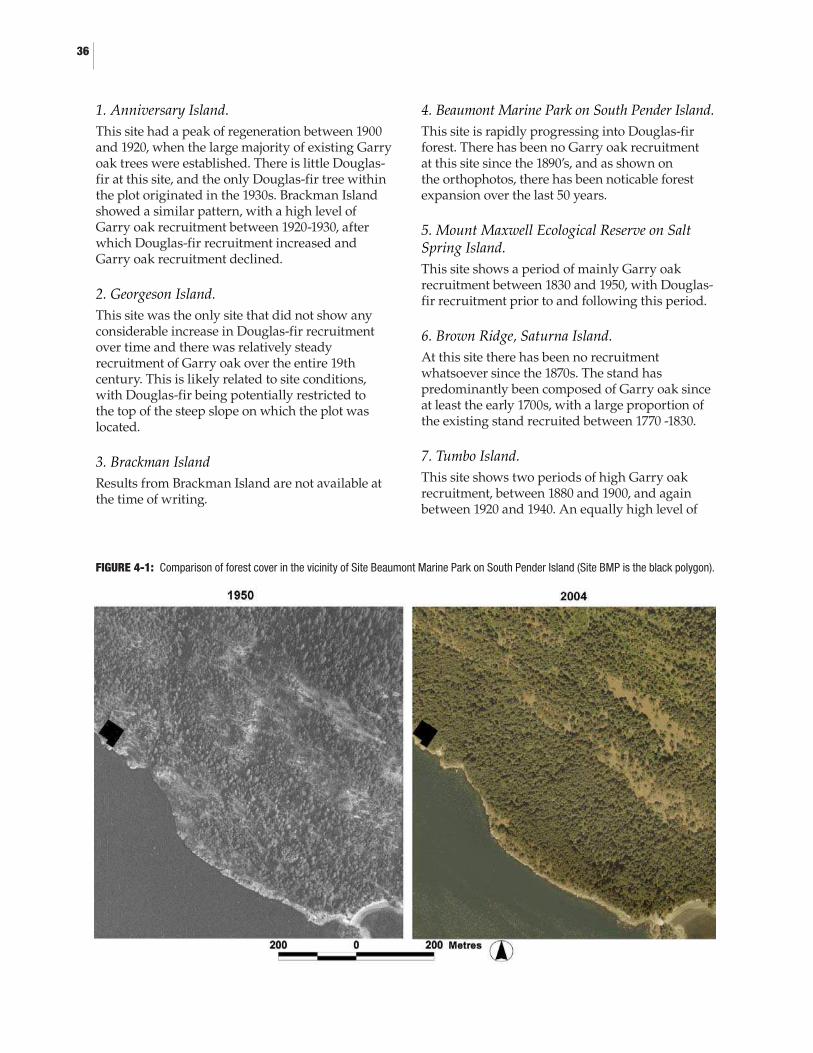
FIGURE 4-1: Comparison of forest cover in the vicinity of Site Beaumont Marine Park on South Pender Island (Site BMP is the black polygon).
36
1. Anniversary Island.
This site had a peak of regeneration between 1900 and 1920, when the large majority of existing Garry oak trees were established. There is little Douglas-fir at this site, and the only Douglas-fir tree within the plot originated in the 1930s. Brackman Island showed a similar pattern, with a high level of Garry oak recruitment between 1920-1930, after which Douglas-fir recruitment increased and Garry oak recruitment declined.
2. Georgeson Island.
This site was the only site that did not show any considerable increase in Douglas-fir recruitment over time and there was relatively steady recruitment of Garry oak over the entire 19th century. This is likely related to site conditions, with Douglas-fir being potentially restricted to the top of the steep slope on which the plot was located.
3. Brackman Island
Results from Brackman Island are not available at the time of writing.
4. Beaumont Marine Park on South Pender Island.
This site is rapidly progressing into Douglas-fir forest. There has been no Garry oak recruitment at this site since the 1890’s, and as shown on the orthophotos, there has been noticable forest expansion over the last 50 years.
5. Mount Maxwell Ecological Reserve on Salt Spring Island.
This site shows a period of mainly Garry oak recruitment between 1830 and 1950, with Douglas-fir recruitment prior to and following this period.
6. Brown Ridge, Saturna Island.
At this site there has been no recruitment whatsoever since the 1870s. The stand has predominantly been composed of Garry oak since at least the early 1700s, with a large proportion of the existing stand recruited between 1770 -1830.
7. Tumbo Island.
This site shows two periods of high Garry oak recruitment, between 1880 and 1900, and again between 1920 and 1940. An equally high level of
37 Fire History and Ecology of Garry Oakand Associated Ecosystems in British Columbia
Douglas-fir recruitment follows the first peak (between 1900 and 1910). A Douglas-fir peak also coincides with the second Garry oak recruitment peak (1920 to 1950). From 1940 onward, Garry oak recruitment drops off and Douglas-fir recruitment continues: there were only 3 Garry oak trees established thereon but 14 Douglas-fir were established.
8. Cowichan Garry Oak Preserve on Vancouver Island.
At this site there was a gradual increase in Garry oak recruitment around 1860, which peaked between 1880 and 1900. Garry oak recruitment abruptly declined after this, and was followed by continuing low levels of Douglas-fir recruitment.
4.2.2 Understory composition
1. Anniversary Island.
The predominant understory species on Anniversary Island was: Rubus discolour (14.03%), low-growing Garry oak (shrub-form) (13.06%), Rosa nutkana (12.72%), and Symphoricarpos albus (11.86%). Based on tree cover and understory importance values, the community is classified as Quercus garryana / Rubus discolour / Dactylis glomerata. Using values for native species only, the community is classified as a Quercus garryana / Rosa nutkana / Elymus glaucus community. Although this island is small and relatively remote, a number of exotic species are present. It still is relatively intact; however, with a cover of approximately 70% native and 30% exotic species – the highest ratio of native to exotic species of the eight sites. Shrubs dominate the community, with Rubus discolor, Rosa nutkana, Symphoricarpos albus, and Holodiscus discolor being the most common. At the time of the survey (late June), exotic grasses (Dactylis glomerata, Bromus spp., and Holcus lanatus) dominated the herbaceous layer, however, native herbs dominated open areas within the plot during a site visit in early April.
2. Georgeson Island
The slope sampled on Georgeson Island had a sparse shrub cover, with grasses being the predominant understory vegetation (nearly 70% of the relative cover). The community is classified as Quercus garryana / Lonicera hispidula / Bromus spp. – Cynosurus echinatus.
3. Brackman Island
Brackman Island also had a high shrub cover, with the most important species being Symphoricarpos albus (importance value of 24.26%). The community within the plot is classified as Quercus garryana / Symphoricarpos albus / Holcus lanatus – Vicia americana. This island has just a slightly lower cover of natives, and higher cover of exotics than Anniversary Island, with just under 70% and just over 30% respectively.
4. Beaumont Marine Park
A full vegetation survey was not done at Beaumont Marine Park on South Pender Island. However, a brief site visit at Beaumont found that the primary understory cover was Bromus spp., with smaller amounts of bryophytes and Madia sativa.
5. Mt. Maxwell Ecological Reserve
The plot selected in Mt. Maxwell Ecological Reserve on Salt Spring Island had a high level of exotic species, with just over 65% exotics. Grasses were the predominant understory vegetation at the site, however, there was also more herbaceous vegetation (20% relative cover) at this site than at the other sites. Much of this is due to the high relative cover (9.31%) of the exotic Lychnis coronaria. The site is classified as a Quercus garryana / Lonicera hispidula / Cynosurus echinatus / bryophyte community.
6. Brown Ridge
The understory cover on Brown Ridge, Saturna Island, was predominantly exotic species, with Bromus spp. (including Bromus rigidus, Bromus hordeaceus, and Bromus sterilis) at 52.13% relative cover and Cynosurus echinatus at 32.74% relative cover. The rest of the understory consisted mainly of other grasses. The little other herbaceous vegetation at the site mostly consisted of weedy species, such as Achillea millefolium, Torilis japonica, Hypochaeris radicata, Rumex acetosella, and Taraxacum officinale. There was no shrub layer at this site, and therefore no dominating exotic shrubs like Rubus discolour or Cytisus scoparius, as there are on many of the other southern Gulf Islands. Other common exotic herbaceous species are also not found at this site, including Cirsium spp., Digitalis purpurea, or Lychnis coronaria. The community within the plot is classified as Garry oak / Bromus spp.
38
7. Tumbo Island
A full vegetation survey was not done on Tumbo Island; however, a brief site visit at Tumbo Island was undertaken. The primary understory vegetation observed within the study area was Anthoxanthum odoratum, with small amounts of Gaultheria shallon and heavily grazed thickets of Douglas-fir.
8. Cowichan Garry Oak Preserve
At the Cowichan Garry Oak Preserve on Vancouver Island, the plot community is classified as Quercus garryana / Symphoricarpos albus / Dactylis glomerata. Both S. albus and D. glomerata had high importance values (22.02% and 15.38%) compared to the rest of the understory vegetation (7.29% and under). This plot also had the greatest number of species identified, with a total of 39 categories used in the calculation of importance values. The ratio of native to exotic species within this plot was 50:50. Although the percentage of herbaceous vegetative cover was relatively high (surpassed only by Georgeson and Salt Spring Island sites), the understory was predominantly shrubs and grasses, with the grass cover being slightly greater.
4.2.3 Regeneration
1. Anniversary Island
Oak regeneration on Anniversary Island appears to mainly result from sprouting. There were no seedlings of any species found within the plot; however there does not seem to be a problem with Garry oak regeneration. Some of the saplings and trees were found in clusters indicative of sprouting from the base of older trees. Much of the oaks at this site were krummholz or shrub-form, affected by wind and seaspray. In sheltered pockets, some tree-form oaks emerge from the dense Garry oak thicket. It was not possible to record the ages and numbers of these shrub-form oak individuals without destructive sampling; area was recorded instead.
Area measurements for the shrub oaks are included in the analysis of understory vegetation. On Anniversary Island, the Garry oak shrub layer formed a large percentage of the understory (19.15% of the understory vegetation) and was the second most important understory species within the plot. Garry oak trees, saplings and snags formed 86.36% of the tree layer in the plot, with a
total of 21 trees, 16 saplings and 1 snag. There were only two Douglas-fir trees, and no Douglas-fir saplings or snags. Rocky Mountain juniper formed a minor component of the tree layer, with 3 trees and 1 snag.
2. Georgeson Island
Regeneration of Garry oak on Georgeson Island appears to mainly be in the form of sprouting. Numerous patches of sprouts formed continuous ground cover in some areas (2.79% of total understory vegetation), and a total of 372 individuals were counted. The only other seedling within the plot was a 1 metre tall Rocky Mountain juniper.
There were 19 Garry oak saplings, 38 trees, and 3 snags. For Douglas-fir, there were 1 sapling, 11 trees and 5 snags (incl. one that had fallen). In addition, there were 2 juniper saplings, 6 juniper trees, 6 arbutus trees (one of which was dying) and 2 arbutus snags.
Regeneration on Georgeson appears to be continuing on a similar trajectory as that indicated by historical establishment dates, and the site is dominated by Garry oak. The steepness of the rocky slope, southern exposure and poor soils are all potentially limiting factors for recruitment.
3. Brackman Island
On Brackman Island, there were 4 Garry oak seedlings, 2 Douglas-fir seedlings, 1 arbutus seedling, 3 Rocky Mountain juniper seedlings, and one Prunus emarginata (bitter cherry) seedling. In addition, there were numerous Garry oak sprouts from existing trees (approx. 100 individuals). There was also Garry oak shrub at this site, covering approximately 60 m2, and forming approximately 2% of the plot’s understory cover.
There were 61 Garry oak saplings, 36 Garry oak trees, and 12 Garry oak snags within the plot. For Douglas-fir, there were 4 saplings, 35 trees, and one snag. In addition, there were also 16 arbutus saplings and 10 arbutus trees, 5 juniper saplings and 3 juniper trees, and 3 Salix spp. (willow) saplings.
Examination of tree establishment dates alone indicates that there was a sharp decline in Garry oak establishment and an increase in Douglas-fir establishment at this site starting around 1960. However, many of the larger Garry oak saplings were also likely established during the 1960-1980
39 Fire History and Ecology of Garry Oakand Associated Ecosystems in British Columbia
period, and are simply slower growing than the Douglas-fir of similar age. Regeneration of both Douglas-fir and Garry oak seem to be continuing and expanding. Comparison of historical and current airphotos also confirms this trend, and shows infilling of a previously open area in the southern half of the plot.
4. Beaumont Marine Park
At Beaumont Marine Park on South Pender Island, the lack of Garry oak recruitment evident throughout the 1900s appears to be continuing. Although there are 20 Garry oak seedlings, there are no Garry oak saplings and only 7 Garry oak trees (all of which were established prior to 1900). There were only 5 Douglas-fir seedlings, but there were 23 saplings and 41 trees (as well as one stump). Arbutus is also a minor component, with 1 sapling and 9 trees within the plot.
Based on the two major periods of establishment identified in the stand history (1870-1900 and 1950-1980), it is likely that there were two disturbance events associated with these periods that resulted in waves of tree establishment. The large number of Douglas-fir trees established in these periods is now making it difficult for Garry oak seedlings or saplings to survive. It is likely that there will be little to no future Garry oak recruitment under these current conditions at this site.
5. Mt. Maxwell Ecological Reserve
On the lower slope of Mt. Maxwell, on Salt Spring Island, there were twice as many Garry oak seedlings (79), as there were Douglas-fir (40). Garry oak sprouts at the bases of existing trees were also common (approximately 140). Almost all of the Douglas-fir seedlings and saplings were found on a nurselog and adjacent stump within the plot. There were also 17 Acer macrophylum (bigleaf maple) seedlings, though there were no bigleaf maple saplings or trees.
It appears that most of the oak seedlings are not making it into the sapling or tree layers, since there was only one Garry oak sapling observed within the plot (although there were 2 sapling-sized snags). However, Garry oak dominates the tree layer, with 68 trees (all of which were established between 1830 and 1950, but mostly in the 1920s). There were also 6 tree-sized Garry oak snags.
Aside from 3 old (approx 200 years) Douglas-fir, the majority (12) of the Douglas-fir in the plot were quite young (under 100 years). There were
also 4 Douglas-fir saplings approximately 8-10 years old (based on nodes). Though there were no Douglas-fir snags within the plot, a number of the nearby Douglas-firs have been killed by recurring Lambdina fiscellaria somniaria (western oak looper) infestations since 1978.
6. Brown Ridge
The plot on Brown Ridge, Saturna Island, is heavily grazed by goats, which have been on the site for more than 100 years. There were virtually no seedlings, saplings or shrubs within the plot. The only seedlings found were two first-year seedlings growing in the seasonal creekbed: one Douglas-fir and one Garry oak.
There were a total of 30 Garry oak trees recorded and 8 Douglas-firs, as well as 6 Garry oak snags (2 of which had fallen) and 1 Douglas-fir snag. All of these were established between 1690 and 1880; therefore, there has been no recruitment since 1880, which is possibly when goats began grazing on the site.
7. Tumbo Island
On Tumbo Island, there was no Garry oak seedlings found within the plot; however there were 106 Douglas-fir, 3 juniper and 2 Abies grandis (grand fir) seedlings recorded. There appears to be no Garry oak regeneration within the plot, and has not been since the 1950s. In addition to no Garry oak seedlings, there are also no Garry oak saplings.
Despite the high number of Douglas-fir seedlings, intense grazing by deer appears to be preventing most Douglas-fir seedlings from growing into saplings: there were only 2 Douglas-fir saplings recorded within the plot. There were no other species of saplings present.
In the tree layer, there were 35 Garry oak, 34 Douglas-fir (including 1 snag), 11 arbutus, and 2 Pinus contorta (shore pine) trees. Douglas-fir seedlings appear to be able to establish, whereas Garry oak seedlings are not, but the heavy grazing by deer that is evident at the site is restricting their development into saplings and eventually into the tree layer.
8. Cowichan Garry Oak Preserve
At the Cowichan Garry Oak Preserve on Vancouver Island, there were 61 Garry oak seedlings (as well as some sprouting from the bases of trees) and 9 Douglas-fir seedlings.
40
Despite the large number of Garry oak seedlings, there were no Garry oak saplings, and the youngest Garry oak trees were established in between 1900 and 1910.
There were 11 Douglas-fir saplings and 11 trees. Douglas-fir has been heavily logged in this area, and there was 1 snag and 29 stumps (some of which have been cut recently in a management effort by the Nature Conservancy of Canada, which owns the property). There were 55 Garry oak trees within the plot, along with 4 snags and 8 stumps. As with other sites, there has been no Garry oak recruitment since 1900-1910.
4.2.4 Tree-ring widths
1. Anniversary Island
On Anniversary Island, detrended ring-widths from Garry oak indicate ring-widths were most variable between 1870 and 1905, and least variable from 1965 to present. There appears to be a disturbance event at 1945, which caused a sharp decline in width, and a stand-wide resurgence in growth over the next 5 years. Ring-widths become uniformly narrow around 1960, with little variation except for narrow rings around 1987 and 2003.
Ring-width patterns in Douglas-fir are similar to Garry oak, with a decrease in width around 1947 and 1951, followed by increased ring width over the next 10 years. Another disturbance event is evident between 1973 and 1975, and again around 1990.
Ring widths for juniper on Anniversary Island vary widely from year to year, and one juniper is at least 200 years old. Sharp decreases in ring-width are common, and are typically followed by increased width for several years. There is; however, a noticeable suppression of ring widths between 1920 and 1930. Due to the presence of old juniper, it is unlikely that fire has been a significant disturbance event on Anniversary Island; therefore disturbance on this island is likely the result of storms and other weather extremes. There is no evidence of human occupation or logging, though the presence of a large amount of the exotic grasses Holcus lanatus and Dactylis glomerata (outside of the plot) suggests that the island may have historically been used for sheep or goat grazing.
2. Georgeson Island
Garry oak on Georgeson Island shows a similar pattern of ring-widths from 1850-2004, although the growth of the two oldest trees between 1830 and 1850 is greater than any other trees since. Periods of release following suppression occur at 1860, 1888, 1900, 1930, and 1980. The 1920s show particularly narrow rings, as do the 1960s and 1970s.
The Douglas-fir series on Georgeson appear to be responding to common factors, and are similar. Narrow rings are found at 1850, 1873, 1900-1920, 1965-75, 1988, and 1999. Wide rings occur at 1855-65, 1885, 1930-1960, 1976 and 1980. The suppression at 1900-1920 may have resulted or contributed to the growth release between 1930 and 1960, where several Douglas-fir were also established.
3. Brackman Island
On Brackman Island, there are narrow Garry oak ring-widths at approximately 1866, 1894, 1906, 1925, 1954, and 1976, all followed by 5-10 year periods of increased ring-width. The distinct period of high oak establishment between 1906 and 1937 could be related to disturbance events at 1906 and 1925, or could be related to a lack of disturbance or other factor that had previously limited tree establishment.
Douglas-fir ring-widths are more variable in the 1800s than they are in the 1900s. There are five periods where disturbance is indicated: at 1784, 1854, 1870, 1895, and 1950. In each instance, a narrow ring is followed by a 10+ year period of increased ring-width.
The steady tree establishment that occurs from 1906 onward, the lack of many older veterans or snags, and the increased canopy cover evident in the airphoto comparison indicate that there does not seem to be an environmental limitation to forest development on this island, and tree establishment may have been prevented by other factors during the 1800s.
Rocky Mountain juniper tree rings on Brackman are quite wide, with variation between years also being common. The oldest tree (159 years old) shows an extremely wide ring at 1878 and very narrow ring at 1950. Potential disturbances are indicated at 1881, 1900, 1924, 1950, 1970, and 1985.

41 Fire History and Ecology of Garry Oakand Associated Ecosystems in British Columbia
4. Beaumont Marine Park
The two older Garry oaks at Beaumont Marine Park appear to be relatively stable in their growth between 1745 and 1870. Both show very narrow rings at 1803, and one shows an increase in growth at 1810-15 and 1822, while the other shows decreased growth at these times. The trees that established between 1840 and 1870 grew slowly until a release between 1874 and 1890. There was a sharp drop in width at 1890, followed by a slight increase over the next 10 years. Tree-rings have been quite narrow since 1900, and show very little variation compared to the previous century.
Douglas-fir within the plot at Beaumont Marine Park appears to have grown slowly through much of the 1800s, except for peaks at 1842 and 1845 which follow very narrow years at 1839 and 1841. There is a noticeable drop in growth at 1870, followed by a very large increase in both growth rates and recruitment which continued until approximately 1900. Growth was very slow until the 1930s (only 2 trees were established in the period between 1910 and 1950 as well). After a period of extremely slow growth at 1925-30, and again at 1935, growth of Douglas-fir has increased and a number of trees were established between 1950 and 1980. Growth rings appear to be decreasing in width over the last 20 years, likely as a result of increased competition and canopy closure.
5. Mt. Maxwell Ecological Reserve
On Salt Spring Island, ring widths for trees between 1715 and 1800 are highly variable. After initial rapid growth, the oldest tree also showed rapid growth in 1757, 1770, 1780, and 1790. Growth was slow between 1800 and 1820, after which ring-widths began to increase, and additional trees were established. The general pattern indicated by comparison of all series within the plot is that of increased growth between 1880 and 1930. There is then a drop in growth over the 1940’s, after which it increases again over 1956-84. Growth seems to have slowed once again between 1995 and 2003.
Douglas-fir on within the plot on Mt. Maxwell shows rapid growth between 1880 and 1920, except for narrow rings around 1890 and 1912. Growth continued to be relatively steady throughout the rest of the 1900s, with the most noticeable variation being a narrowing at approximately 1952.
6. Brown Ridge
Garry oak on Brown Ridge, Saturna Island, grew rapidly in the late 1700s and into the 1800s (1770-1815), but ring-widths were uniformly narrow between 1820 and 1830. A narrow ring occurs between 1870 and 1875, followed by an increase in ring-width between 1875 and 1905. From 1910 to 2004, there is little growth and rings are uniformly narrow except for increases in width at 1914, 1928, 1984 and 1991.
Douglas-fir on Brown Ridge shows rapid growth until 1830, when ring-widths drop until approximately 1860. There are increases in width at 1875-1880, 1895-1920, 1930-35, 1940-1950. Between 1955 and 1985 growth is relatively uniform. There are sharp declines in ring-widths at 1925-1930, 1937, 1954, 1960, 1990, 1995 and 2003-04.
7. Tumbo Island
Garry oak on Tumbo Island have large growth rings. Ring-widths were particularly wide in the early years of the trees that established in the 1920s. Ring-widths were uniformly low at 1930, 1952, 1960-65, 1975, 1988, and 1995. Peaks in growth occurred in the early 1920s, around 1955, 1970, 1980, 1990, and 1996.
Douglas-fir established and grew rapidly, especially between 1880 and 1940. Growth slowed down between 1950 and 1970, although some recruitment continued. Growth rates picked up somewhat again between 1975 and 1990, but appear to have slowed over the last 15 years.
8. Cowichan Garry Oak Preserve
Growth of Garry oak at the Cowichan Garry Oak Preserve appears to be relatively consistent between 1775 and 1880. From 1the 1880’s through to 1910, there is recruitment of a large number of trees; however, almost all of which grew rapidly over the first approximately 20 years. There is a noticeable narrowing in widths around 1950, and throughout the 1960s. Since 1970, there appears to be a general increase in ring-width, except for narrow rings at 1982 and 1995.
Ring-widths from the one Douglas-fir established in the 1830s indicate that growth was rapid until approximately 1850, indicating an open canopy. Between 1840 and 1880, there was no Douglas-fir established, and growth is consistently minimal
42
through this period. After a drop in ring width at 1889, and again at 1895, recruitment of Douglas-fir begins and ring widths increase, particularly between 1900 and 1920. The year 1947 shows a decline in ring-width for all Douglas-fir. From this point on, growth is steady, with wide ring-widths, particularly between 1995 and 2004.
4.3 Conclusions
Overall the results of this analysis present two contrasting insights into the dynamics of Garry oak ecosystems on Southern Vancouver – all of the sites are undergoing a transition from oak-dominated ecosystems to closed forest ecosystems, however the role of fire and fire exclusion in driving this process seems complex and is likely modulated by local factors and site history. Several key messages emerge from these analyses that are relevant to ecologists and managers alike:
The relationship between wildfire and oak establishment is complex. Seasonality, site conditions, and antecedent and subsequent climatic conditions.
The historical oak savannahs and woodlands are as much artefacts of fire exclusion as the current conifer encroachment.
The oak ecosystems that have captured the attention of conservation groups are probably a non-equilibrium ecosystem and cannot be maintained in their current state. What is needed are efforts to maintain the processes that have given rise to these ecosystems – including fire, grazing, tilling, tree removal – as well as representative stands at various stages of development.
Active management is needed. But – there is no one-size-fits-all solution. Different sites will require distinct approaches to restoration. In particular, fire is probably appropriate at some sites but would be detrimental at others.
Interim solutions are needed. Encroachment is occurring rapidly, and ecological integrity is being lost at most sites. Our understanding of the ecosystem processes that maintain Garry oak associated ecosystems is imperfect, but these ecosystems will be lost if we wait for ecologists to answer all the needed questions. Managers need to take action with imperfect knowledge of management outcomes.
1.
2.
3.
4.
5.
The more “charismatic” exotics, such as gorse and broom may be less detrimental to Garry oak associates than other invasive species such as orchardgrass, sweet vernal grass, brome, and other agronomic grasses.
Several challenges to ecologists also emerge from the results discussed here:
There are probably more than two basic types of oak ecosystems. The conventional dichotomy between deep- and shallow-soiled sites is probably overly simplistic and does not capture the full range of ecosystem processes that give rise to Garry oak associated ecosystems.
We need to understand the ecology of invasions better. Species invasions associated with accidental introductions, fire exclusion, and herbivory are probably the single greatest threat to Garry oak associated ecosystems. A better theoretical understanding of how these invasions affect ecosystems, the mechanisms by which they displace native species, and the processes that allow them to gain dominance will provide essential insights into how native species can be restored or maintained.
We need to understand fire ecology better. Fire has highly variable effects depending on seasonality, weather at the time of burn, the composition of the soil seed bank, and other physical properties of the burned area. A better theoretical understanding of the processes and mechanisms by which fire influences post-burn structure and composition would provide essential insights into how fire can be used as an effective restoration tool in Garry oak associated ecosystems.
6.
1.
2.
3.
BIOCLIMATIC ENVELOPE MODELS
2.05.0
43 Fire History and Ecology of Garry Oakand Associated Ecosystems in British Columbia
Global climate models warn us of a generally warmer future and since Garry oak ecosystems exist in a near Mediterranean climate, we might assume climate change will assist Garry oak conservation efforts. However, recent bioclimatic modelling efforts predict that geographic ranges for many ecosystems will shift over time coupled with their zones of climatic suitability. To assess whether the climate in currently protected locations of Garry oak ecosystems will remain suitable for Garry oak into the future, we developed a spatial model of climatic suitability for Garry oak ecosystems in the Pacific Northwest and forecasted the distribution of suitable climate regions into the future based on predictions from four Global Climate Models (GCM). To build the model we used location data for current Garry oak sites and environmental predictors including 33 climate variables (baseline conditions from 1961-1990) and four geographic variables derived from a digital elevation model (DEM). We tested the performance of four types of statistical models (classification tree, multivariate regression, Bayesian classification, and minimum-distance classification) and chose the best model (classification tree) to forecast future distributions. In general, results suggest that the climate in the British Columbia portion of the current Garry oak range will be less suitable for Garry oak in the future. These results are subject to many caveats from both modelling and ecological perspectives. Therefore, interpreting these research findings in a broader ecological context is both challenging and mandatory to inform protected areas management.
Modelling efforts commenced along two fronts; development of an environmental envelope model to characterize current Garry oak habitat and assess potential impacts of climate change on the distribution of these ecosystems, and downscaling of climate data to support ecological modelling of Garry oak ecosystems. Two sets of climate data appropriate for this project were developed and one has been incorporated into an environmental envelope model.
5.1 Climate Modelling Methods
5.1.1 Daily climate series
Daily climate data were developed using two statistical downscaling techniques for the Gulf Islands, British Columbia: (1) a hybrid analog/artificial neural network (ANN) model (Cannon, 2007) and (2) the TreeGen model, which combines synoptic map-typing with a stochastic weather generator (Stahl et al., 2007; Cannon et al., 2002). These fine-scale data were produced to support future calculation of daily fire weather indices, which are required to consider the role of fire in Garry oak ecosystems in predictive ecological models.
Statistical downscaling models are used to develop empirical relationships between synoptic-scale atmospheric variables, which are typically well represented by coarse-resolution GCMs, and local-scale surface weather variables, which are typically poorly represented. Once relationships have been identified from historical observations, synoptic-scale climate data from GCMs are entered into the downscaling models to estimate surface weather conditions under simulated future climate conditions.
Historical surface climate data were taken from a dataset developed by Danard and Galbraith
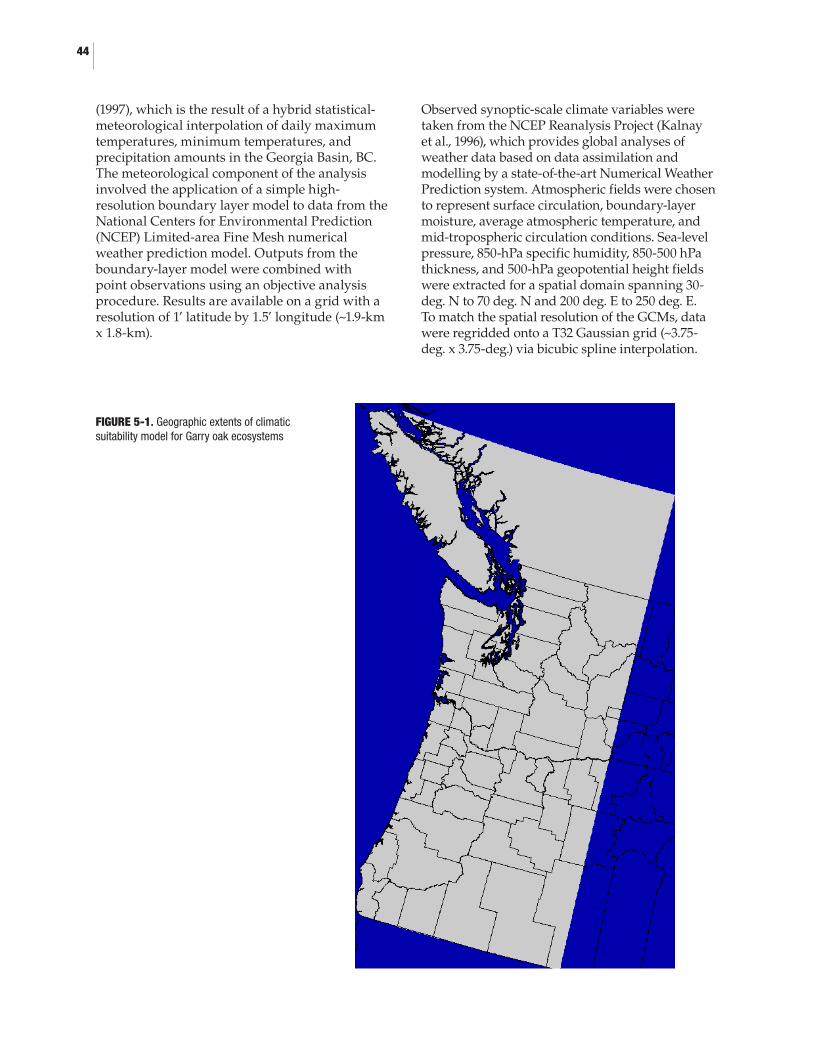
FIGURE 5-1. Geographic extents of climatic suitability model for Garry oak ecosystems
44
(1997), which is the result of a hybrid statistical-meteorological interpolation of daily maximum temperatures, minimum temperatures, and precipitation amounts in the Georgia Basin, BC. The meteorological component of the analysis involved the application of a simple high-resolution boundary layer model to data from the National Centers for Environmental Prediction (NCEP) Limited-area Fine Mesh numerical weather prediction model. Outputs from the boundary-layer model were combined with point observations using an objective analysis procedure. Results are available on a grid with a resolution of 1’ latitude by 1.5’ longitude (~1.9-km x 1.8-km).
Observed synoptic-scale climate variables were taken from the NCEP Reanalysis Project (Kalnay et al., 1996), which provides global analyses of weather data based on data assimilation and modelling by a state-of-the-art Numerical Weather Prediction system. Atmospheric fields were chosen to represent surface circulation, boundary-layer moisture, average atmospheric temperature, and mid-tropospheric circulation conditions. Sea-level pressure, 850-hPa specific humidity, 850-500 hPa thickness, and 500-hPa geopotential height fields were extracted for a spatial domain spanning 30-deg. N to 70 deg. N and 200 deg. E to 250 deg. E. To match the spatial resolution of the GCMs, data were regridded onto a T32 Gaussian grid (~3.75-deg. x 3.75-deg.) via bicubic spline interpolation.
45 Fire History and Ecology of Garry Oakand Associated Ecosystems in British Columbia
Synoptic-scale climate variables simulated by GCMs for 1961-2100 were taken from the Meteorological Service of Canada’s Canadian Coupled Global Climate Model v2 (CGCM2), the UK Met Office’s Hadley Centre Coupled Model v3 (HadCM3), and the US Department of Energy sponsored Parallel Climate Model (PCM). (Note: PCM data were only available for SLP and 500-hPa geopotential height.)
Results for the GCM simulations are based on statistical models developed using all historical data. Simulated GCM data are from two transient greenhouse gas plus aerosol forcing scenarios, IPCC SRES A2 and B2, which assume different rates of increase in greenhouse gas concentrations in the 21st century.
5.1.2 Gridded climate normals
A second set of climate fields was generated to support climate change studies in general and an environmental envelope model for Garry oak ecosystems in particular. These data were created for larger geographic extents (i.e., 42° - 51°N, 119° - 129°W), which include southwestern BC and western Washington and Oregon (Figure 5-1). Monthly, seasonal, and annual climate data (33 different variables) were upsampled to a 1-km by 1-km resolution using proven interpolation and rescaling techniques that take topography into account.. Temporally, the variables were calculated for baseline climate conditions (1961-1990) and forecasted for the 2020s (2010-2039), 2050s (2040-69) and 2080s (2070-2099).
Monthly temperature normals on a 1-km grid were generated following the ClimateBC algorithms (Hamann and Wang 2005; Wang et al 2005). ClimateBC upsamples monthly normals interpolated by the Parameter-elevation Regressions on Independent Slopes Model (PRISM) (Daly et al., 2000) on a 2.5 x 2.5 arc-minute grid to higher resolutions by (1) bilinear interpolation followed by (2) linear adjustment based on differences between the PRISM grid point elevations and elevations from a DEM. Elevations were taken from the Hydro1k DEM, which is derived from the USGS 30 arc-second DEM of the world.
Monthly precipitation normals at 1-km resolution were obtained by rescaling the 2.5 arc-minute PRISM data. Log-transformed scaling factors between the 2.5 arc-minute resolution PRISM dataset and a smoothed PRISM dataset, both
bilinearly interpolated to the 1-km Hydro1k coordinates, were modelled via linear regression. Elevation and slope differences between the two PRISM datasets were combined with latitude and longitude coordinates as interactions and entered as predictors in the regression model. Elevation and slope differences between the 2.5 arc-minute PRISM DEM and the 1-km Hydro1k DEM were then used in the model to predict scaling factors for upsampling the 2.5 arc-minute PRISM precipitation normals.
Differences/ratios with respect to baseline climate conditions simulated by various GCMS for the 2020s (2010-2039), 2050s (2040-69) and 2080s (2070-2099) were used with the topographically-adjusted surfaces to generate climate fields suitable for climate change studies. GCM data were taken from the IPCC SRES A2 and B2 scenarios for CGCM2, HadCM3, the Australian Commonwealth Scientific and Industrial Research Organization’s CSIRO Coupled GCM, and Japan’s Center for Climate System Research/National Institute for Environmental Studies CCSR/NIES Coupled GCM.
5.2 Bioclimatic Modelling Methods
The framework for an environmental envelope model of Garry oak ecosystems was developed and modelling is underway. Generally for such models, Geographical Information System (GIS) software is used to collate species presence (and absence) data with environmental parameters such that an empirical relationship between species and environment can be specified. Forecasted climate data is then fed into this statistical relationship to develop maps of potential future species’ distributions. To date, data has been obtained, much of it has been collated in a GIS, four types of models have been tested for modelling accuracy, and some preliminary forecasting with the best model has been completed.
In addition to the 33 appropriately-scaled climate fields, environmental variables including a digital elevation model (DEM, which provides elevation, slope, aspect, and a compound topographic index or wetness index), soil type, and georeferenced locations of Garry oak from eight different sources were obtained. All these data, except soil type, have been imported into the GIS (IDRISI- Andes, Clark Labs, Clark University, Worcester MA, USA) and Garry oak habitat has been statistically summarized for each of the variables (Table 5-1).
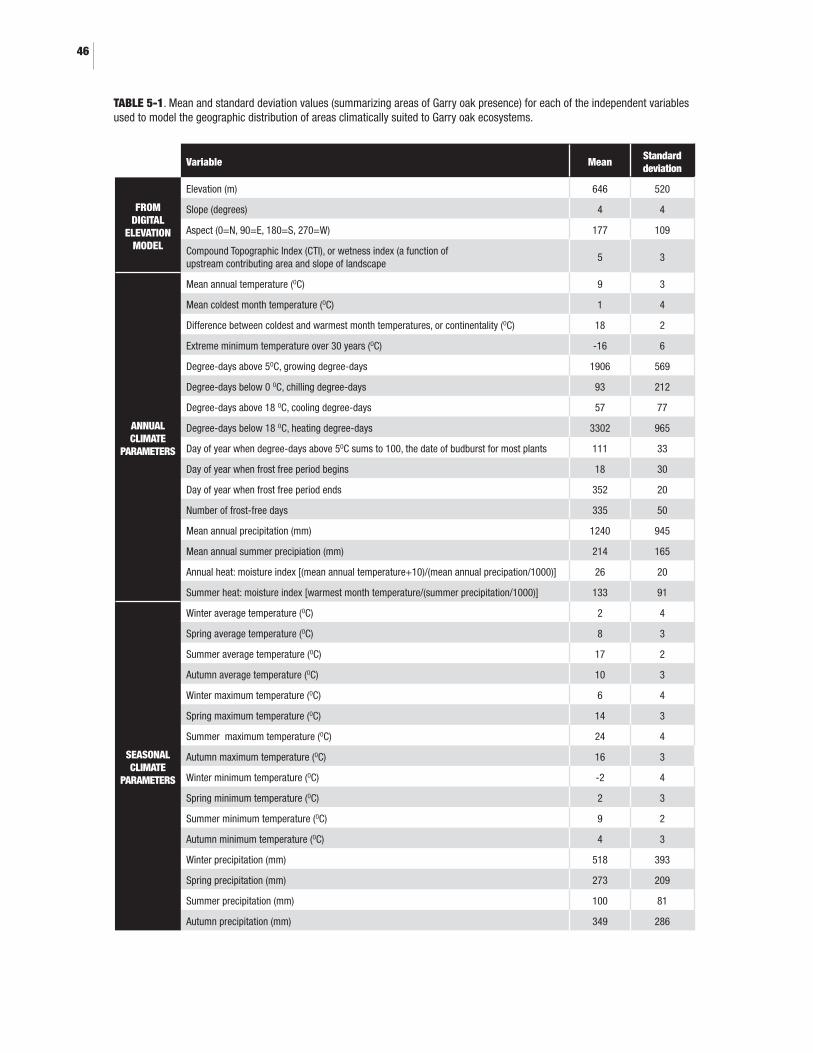
Variable MeanStandard deviation
FROM DIGITAL
ELEVATION MODEL
Elevation (m) 646 520
Slope (degrees) 4 4
Aspect (0=N, 90=E, 180=S, 270=W) 177 109
Compound Topographic Index (CTI), or wetness index (a function of upstream contributing area and slope of landscape
5 3
ANNUAL CLIMATE
PARAMETERS
Mean annual temperature (OC) 9 3
Mean coldest month temperature (OC) 1 4
Difference between coldest and warmest month temperatures, or continentality (OC) 18 2
Extreme minimum temperature over 30 years (OC) -16 6
Degree-days above 5OC, growing degree-days 1906 569
Degree-days below 0 OC, chilling degree-days 93 212
Degree-days above 18 OC, cooling degree-days 57 77
Degree-days below 18 OC, heating degree-days 3302 965
Day of year when degree-days above 5OC sums to 100, the date of budburst for most plants 111 33
Day of year when frost free period begins 18 30
Day of year when frost free period ends 352 20
Number of frost-free days 335 50
Mean annual precipitation (mm) 1240 945
Mean annual summer precipiation (mm) 214 165
Annual heat: moisture index [(mean annual temperature+10)/(mean annual precipation/1000)] 26 20
Summer heat: moisture index [warmest month temperature/(summer precipitation/1000)] 133 91
SEASONAL CLIMATE
PARAMETERS
Winter average temperature (OC) 2 4
Spring average temperature (OC) 8 3
Summer average temperature (OC) 17 2
Autumn average temperature (OC) 10 3
Winter maximum temperature (OC) 6 4
Spring maximum temperature (OC) 14 3
Summer maximum temperature (OC) 24 4
Autumn maximum temperature (OC) 16 3
Winter minimum temperature (OC) -2 4
Spring minimum temperature (OC) 2 3
Summer minimum temperature (OC) 9 2
Autumn minimum temperature (OC) 4 3
Winter precipitation (mm) 518 393
Spring precipitation (mm) 273 209
Summer precipitation (mm) 100 81
Autumn precipitation (mm) 349 286
TABLE 5-1. Mean and standard deviation values (summarizing areas of Garry oak presence) for each of the independent variables used to model the geographic distribution of areas climatically suited to Garry oak ecosystems.
46

Figure 5-2. Observed Garry oak sites in the study area (8 data sources.
47 Fire History and Ecology of Garry Oakand Associated Ecosystems in British Columbia
5.2.1 Data Used
For the bioclimatic model, all the data is geospatial and was mapped on a 1km x 1km grid. Garry oak ecosystem presence data was collected from eight different sources (Fig 5-2):
Oak and Grasslands GIS Data set from Washington State Dept. of Natural Resources, Natural Heritage Program. (http://www.dnr.wa.gov/nhp/refdesk/gis/oakgrsld.html)
GIS data of Oak-Madrone forest cover type from: Harrington, Constance A., comp. 2003. The 1930’s survey of forest resources in Washington and Oregon. Gen. Tech. Rep. PNW-GTR-584. Portland, OR: U.S. Department of Agriculture, Forest Service, Pacific Northwest Research Station. 123 p. [plus CD-ROM].
Locations of 1300+ oak trees from the PNW oak acorn survey (pers. comm., Dave Peter, USDA Forest Service) (http://www.fs.fed.us/pnw/olympia/silv/oak-studies/acorn_survey/survey-background.shtml).
GIS data of observed Garry oak sites for Comox, Cowichan, and Nanaimo areas on Vancouver Island (pers. comm., Ted Lea, Vegetation Ecologist, Ecosystems Branch, BC Ministry of Environment)
Garry oak ecosystem sites for Greater Victoria and Saanich Peninsula (pers. comm., Ted Lea, Vegetation Ecologist, Ecosystems Branch, BC Ministry of Environment)
Sensitive Ecosystems Inventory (SEI) data (2004) for East Vancouver Island and Gulf Islands; chose polygons where Quercus garryana was listed in ‘dominant species’ column. (http://www.env.gov.bc.ca/sei/van_gulf/index.html)
Locations for 39 plots of plant communities containing Quercus garryana in Washington, Oregon and BC, Vegbank, NatureServe (http://vegbank.org/vegbank/index.jsp)
Locations for 12 Garry oak sites in BC, data from herbariums at UBC and RBCM, retrieved from E-flora website (http://www.eflora.bc.ca/)
1.
2.
3.
4.
5.
6.
7.
8.
The climate data was generated from current climate normals (based on 1961 – 1990) for 33 variables. Digital elevation model (DEM) was from USGS Hydro1k (http://edc.usgs.gov/products/elevation/gtopo30/hydro/) and included elevation, slope, aspect, and compound topographic index (CTI).
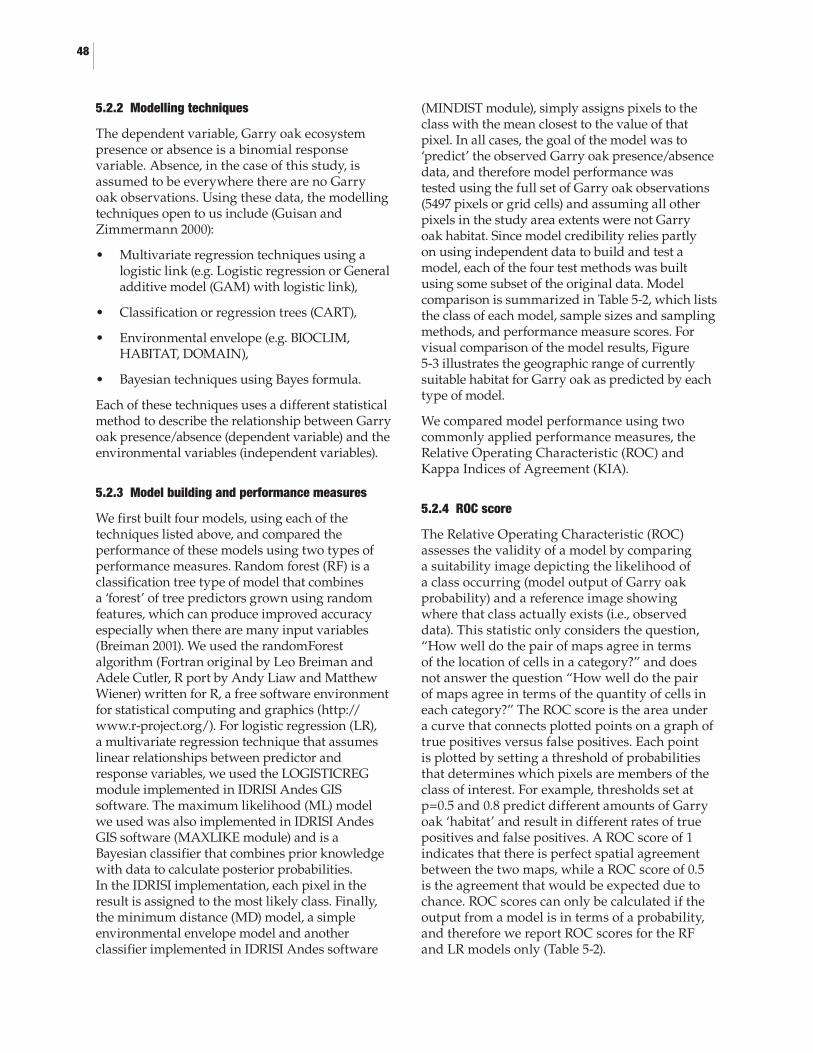
48
5.2.2 Modelling techniques
The dependent variable, Garry oak ecosystem presence or absence is a binomial response variable. Absence, in the case of this study, is assumed to be everywhere there are no Garry oak observations. Using these data, the modelling techniques open to us include (Guisan and Zimmermann 2000):
Multivariate regression techniques using a logistic link (e.g. Logistic regression or General additive model (GAM) with logistic link),
Classification or regression trees (CART),
Environmental envelope (e.g. BIOCLIM, HABITAT, DOMAIN),
Bayesian techniques using Bayes formula.
Each of these techniques uses a different statistical method to describe the relationship between Garry oak presence/absence (dependent variable) and the environmental variables (independent variables).
5.2.3 Model building and performance measures
We first built four models, using each of the techniques listed above, and compared the performance of these models using two types of performance measures. Random forest (RF) is a classification tree type of model that combines a ‘forest’ of tree predictors grown using random features, which can produce improved accuracy especially when there are many input variables (Breiman 2001). We used the randomForest algorithm (Fortran original by Leo Breiman and Adele Cutler, R port by Andy Liaw and Matthew Wiener) written for R, a free software environment for statistical computing and graphics (http://www.r-project.org/). For logistic regression (LR), a multivariate regression technique that assumes linear relationships between predictor and response variables, we used the LOGISTICREG module implemented in IDRISI Andes GIS software. The maximum likelihood (ML) model we used was also implemented in IDRISI Andes GIS software (MAXLIKE module) and is a Bayesian classifier that combines prior knowledge with data to calculate posterior probabilities. In the IDRISI implementation, each pixel in the result is assigned to the most likely class. Finally, the minimum distance (MD) model, a simple environmental envelope model and another classifier implemented in IDRISI Andes software
�
�
�
�
(MINDIST module), simply assigns pixels to the class with the mean closest to the value of that pixel. In all cases, the goal of the model was to ‘predict’ the observed Garry oak presence/absence data, and therefore model performance was tested using the full set of Garry oak observations (5497 pixels or grid cells) and assuming all other pixels in the study area extents were not Garry oak habitat. Since model credibility relies partly on using independent data to build and test a model, each of the four test methods was built using some subset of the original data. Model comparison is summarized in Table 5-2, which lists the class of each model, sample sizes and sampling methods, and performance measure scores. For visual comparison of the model results, Figure 5-3 illustrates the geographic range of currently suitable habitat for Garry oak as predicted by each type of model.
We compared model performance using two commonly applied performance measures, the Relative Operating Characteristic (ROC) and Kappa Indices of Agreement (KIA).
5.2.4 ROC score
The Relative Operating Characteristic (ROC) assesses the validity of a model by comparing a suitability image depicting the likelihood of a class occurring (model output of Garry oak probability) and a reference image showing where that class actually exists (i.e., observed data). This statistic only considers the question, “How well do the pair of maps agree in terms of the location of cells in a category?” and does not answer the question “How well do the pair of maps agree in terms of the quantity of cells in each category?” The ROC score is the area under a curve that connects plotted points on a graph of true positives versus false positives. Each point is plotted by setting a threshold of probabilities that determines which pixels are members of the class of interest. For example, thresholds set at p=0.5 and 0.8 predict different amounts of Garry oak ‘habitat’ and result in different rates of true positives and false positives. A ROC score of 1 indicates that there is perfect spatial agreement between the two maps, while a ROC score of 0.5 is the agreement that would be expected due to chance. ROC scores can only be calculated if the output from a model is in terms of a probability, and therefore we report ROC scores for the RF and LR models only (Table 5-2).
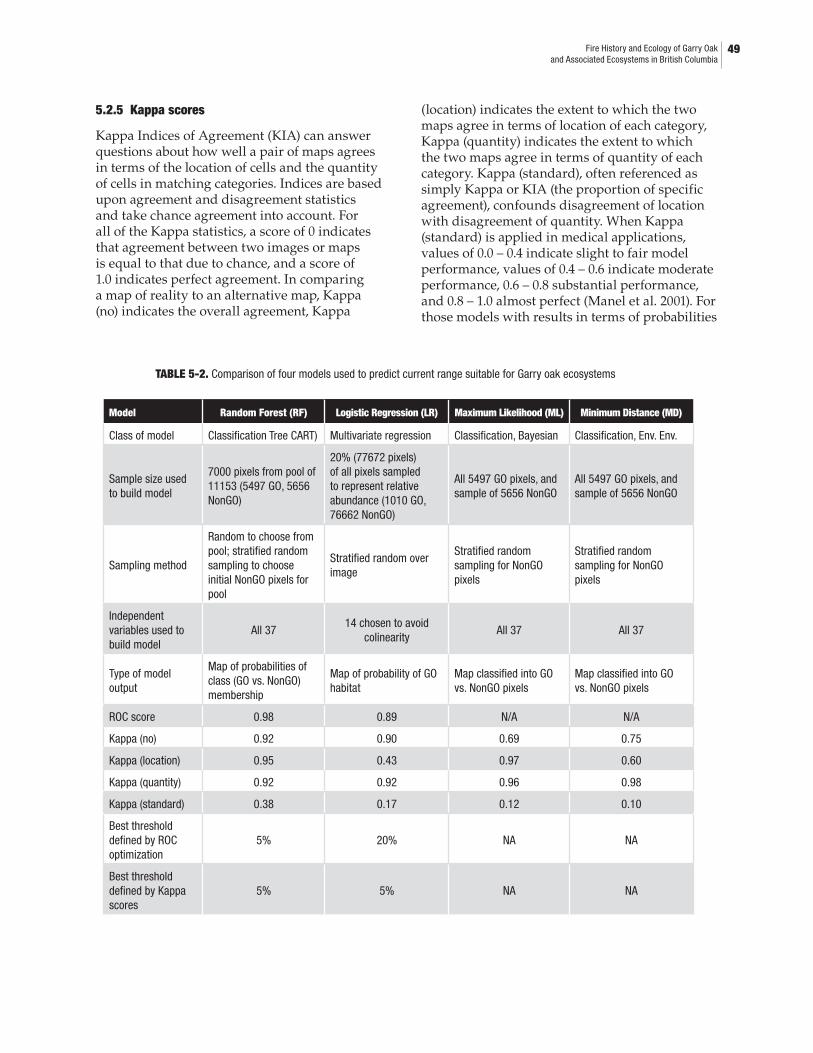
TABLE 5-2. Comparison of four models used to predict current range suitable for Garry oak ecosystems
Model Random Forest (RF) Logistic Regression (LR) Maximum Likelihood (ML) Minimum Distance (MD)
Class of model Classification Tree CART) Multivariate regression Classification, Bayesian Classification, Env. Env.
Sample size used to build model
7000 pixels from pool of 11153 (5497 GO, 5656 NonGO)
20% (77672 pixels) of all pixels sampled to represent relative abundance (1010 GO, 76662 NonGO)
All 5497 GO pixels, and sample of 5656 NonGO
All 5497 GO pixels, and sample of 5656 NonGO
Sampling method
Random to choose from pool; stratified random sampling to choose initial NonGO pixels for pool
Stratified random over image
Stratified random sampling for NonGO pixels
Stratified random sampling for NonGO pixels
Independent variables used to build model
All 3714 chosen to avoid
colinearityAll 37 All 37
Type of model output
Map of probabilities of class (GO vs. NonGO) membership
Map of probability of GO habitat
Map classified into GO vs. NonGO pixels
Map classified into GO vs. NonGO pixels
ROC score 0.98 0.89 N/A N/A
Kappa (no) 0.92 0.90 0.69 0.75
Kappa (location) 0.95 0.43 0.97 0.60
Kappa (quantity) 0.92 0.92 0.96 0.98
Kappa (standard) 0.38 0.17 0.12 0.10
Best threshold defined by ROC optimization
5% 20% NA NA
Best threshold defined by Kappa scores
5% 5% NA NA
49 Fire History and Ecology of Garry Oakand Associated Ecosystems in British Columbia
5.2.5 Kappa scores
Kappa Indices of Agreement (KIA) can answer questions about how well a pair of maps agrees in terms of the location of cells and the quantity of cells in matching categories. Indices are based upon agreement and disagreement statistics and take chance agreement into account. For all of the Kappa statistics, a score of 0 indicates that agreement between two images or maps is equal to that due to chance, and a score of 1.0 indicates perfect agreement. In comparing a map of reality to an alternative map, Kappa (no) indicates the overall agreement, Kappa
(location) indicates the extent to which the two maps agree in terms of location of each category, Kappa (quantity) indicates the extent to which the two maps agree in terms of quantity of each category. Kappa (standard), often referenced as simply Kappa or KIA (the proportion of specific agreement), confounds disagreement of location with disagreement of quantity. When Kappa (standard) is applied in medical applications, values of 0.0 – 0.4 indicate slight to fair model performance, values of 0.4 – 0.6 indicate moderate performance, 0.6 – 0.8 substantial performance, and 0.8 – 1.0 almost perfect (Manel et al. 2001). For those models with results in terms of probabilities
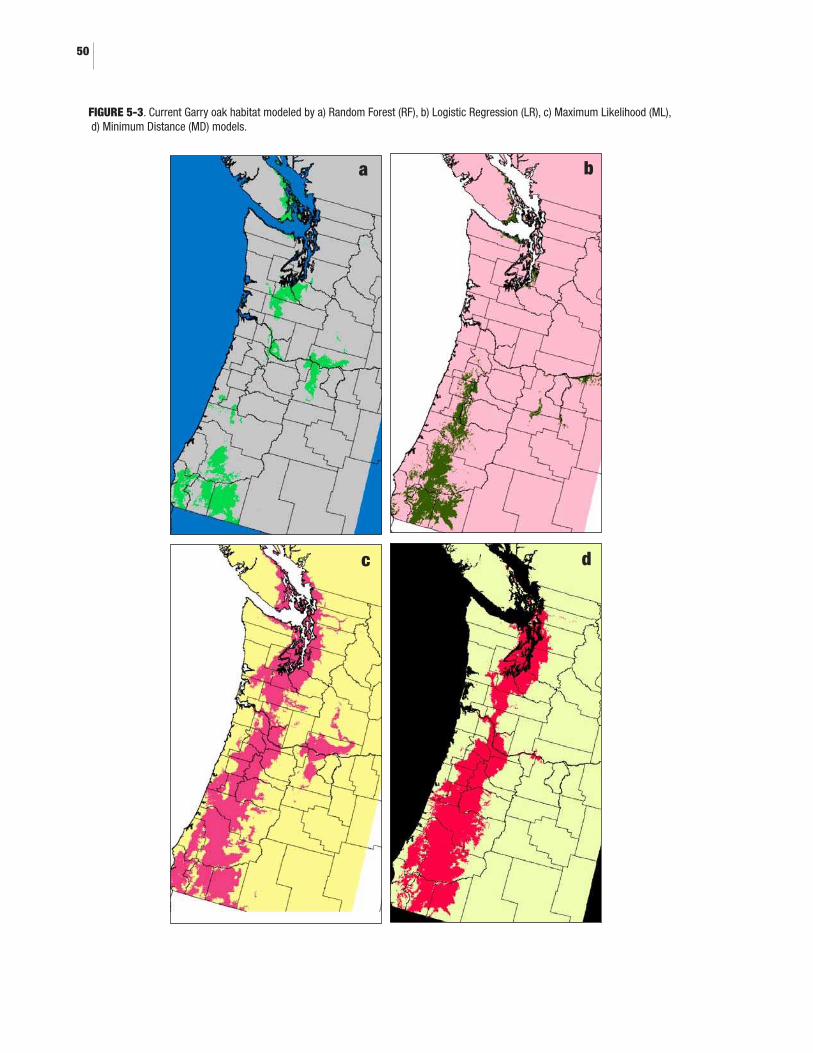
FIGURE 5-3. Current Garry oak habitat modeled by a) Random Forest (RF), b) Logistic Regression (LR), c) Maximum Likelihood (ML), d) Minimum Distance (MD) models.
50
a b
c d
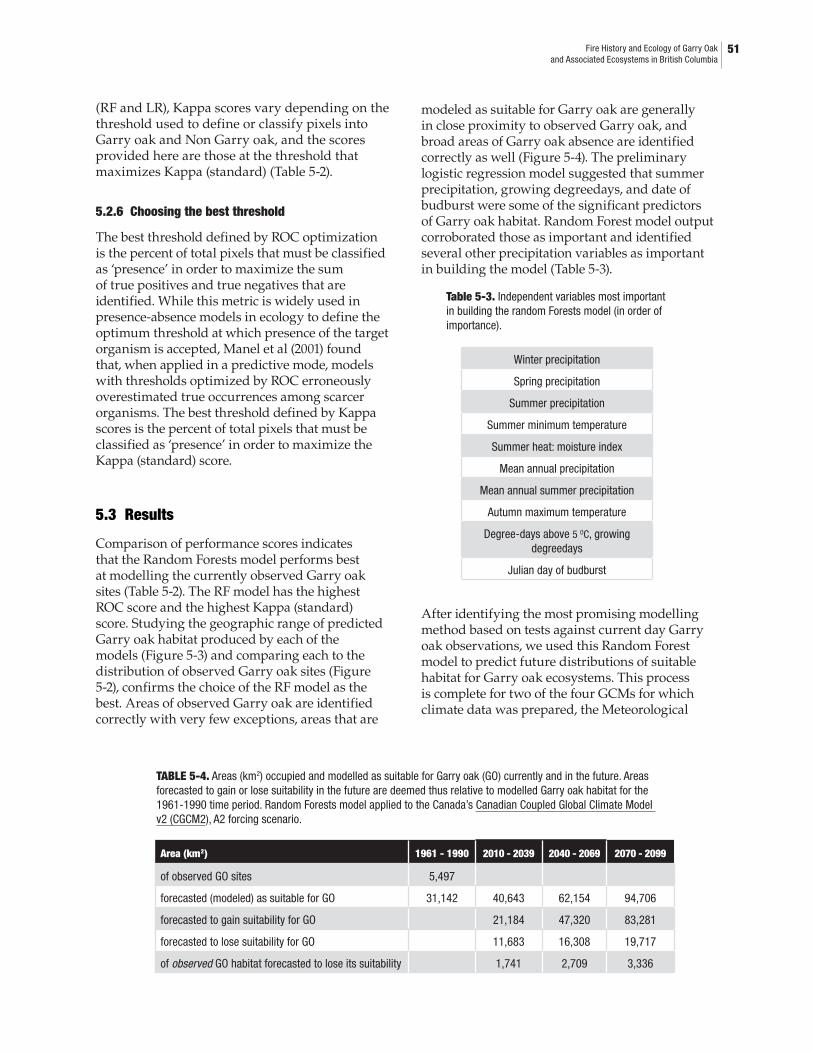
Table 5-3. Independent variables most important in building the random Forests model (in order of importance).
Winter precipitation
Spring precipitation
Summer precipitation
Summer minimum temperature
Summer heat: moisture index
Mean annual precipitation
Mean annual summer precipitation
Autumn maximum temperature
Degree-days above 5 OC, growing degreedays
Julian day of budburst
Area (km 2 ) 1961 - 1990 2010 - 2039 2040 - 2069 2070 - 2099
of observed GO sites 5,497
forecasted (modeled) as suitable for GO 31,142 40,643 62,154 94,706
forecasted to gain suitability for GO 21,184 47,320 83,281
forecasted to lose suitability for GO 11,683 16,308 19,717
of observed GO habitat forecasted to lose its suitability 1,741 2,709 3,336
TABLE 5-4. Areas (km2) occupied and modelled as suitable for Garry oak (GO) currently and in the future. Areas forecasted to gain or lose suitability in the future are deemed thus relative to modelled Garry oak habitat for the 1961-1990 time period. Random Forests model applied to the Canada’s Canadian Coupled Global Climate Model v2 (CGCM2), A2 forcing scenario.
51 Fire History and Ecology of Garry Oakand Associated Ecosystems in British Columbia
(RF and LR), Kappa scores vary depending on the threshold used to define or classify pixels into Garry oak and Non Garry oak, and the scores provided here are those at the threshold that maximizes Kappa (standard) (Table 5-2).
5.2.6 Choosing the best threshold
The best threshold defined by ROC optimization is the percent of total pixels that must be classified as ‘presence’ in order to maximize the sum of true positives and true negatives that are identified. While this metric is widely used in presence-absence models in ecology to define the optimum threshold at which presence of the target organism is accepted, Manel et al (2001) found that, when applied in a predictive mode, models with thresholds optimized by ROC erroneously overestimated true occurrences among scarcer organisms. The best threshold defined by Kappa scores is the percent of total pixels that must be classified as ‘presence’ in order to maximize the Kappa (standard) score.
5.3 Results
Comparison of performance scores indicates that the Random Forests model performs best at modelling the currently observed Garry oak sites (Table 5-2). The RF model has the highest ROC score and the highest Kappa (standard) score. Studying the geographic range of predicted Garry oak habitat produced by each of the models (Figure 5-3) and comparing each to the distribution of observed Garry oak sites (Figure 5-2), confirms the choice of the RF model as the best. Areas of observed Garry oak are identified correctly with very few exceptions, areas that are
modeled as suitable for Garry oak are generally in close proximity to observed Garry oak, and broad areas of Garry oak absence are identified correctly as well (Figure 5-4). The preliminary logistic regression model suggested that summer precipitation, growing degreedays, and date of budburst were some of the significant predictors of Garry oak habitat. Random Forest model output corroborated those as important and identified several other precipitation variables as important in building the model (Table 5-3).
After identifying the most promising modelling method based on tests against current day Garry oak observations, we used this Random Forest model to predict future distributions of suitable habitat for Garry oak ecosystems. This process is complete for two of the four GCMs for which climate data was prepared, the Meteorological
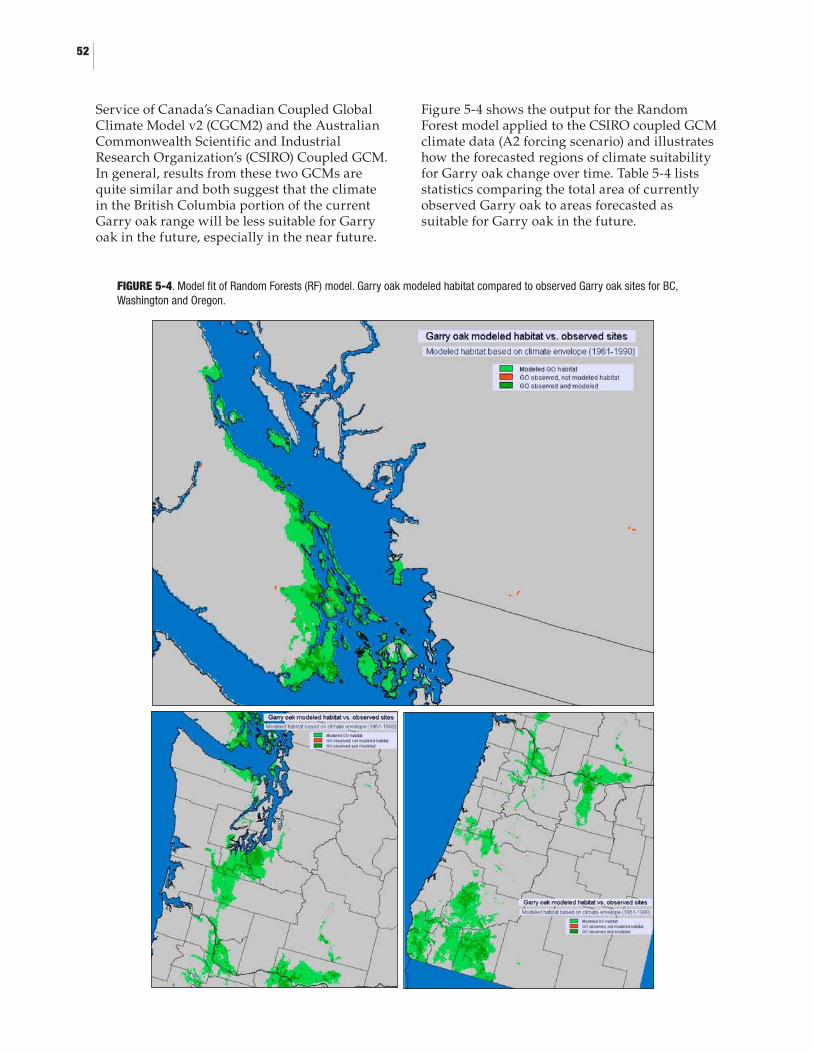
FIGURE 5-4. Model fit of Random Forests (RF) model. Garry oak modeled habitat compared to observed Garry oak sites for BC, Washington and Oregon.
52
Service of Canada’s Canadian Coupled Global Climate Model v2 (CGCM2) and the Australian Commonwealth Scientific and Industrial Research Organization’s (CSIRO) Coupled GCM. In general, results from these two GCMs are quite similar and both suggest that the climate in the British Columbia portion of the current Garry oak range will be less suitable for Garry oak in the future, especially in the near future.
Figure 5-4 shows the output for the Random Forest model applied to the CSIRO coupled GCM climate data (A2 forcing scenario) and illustrates how the forecasted regions of climate suitability for Garry oak change over time. Table 5-4 lists statistics comparing the total area of currently observed Garry oak to areas forecasted as suitable for Garry oak in the future.
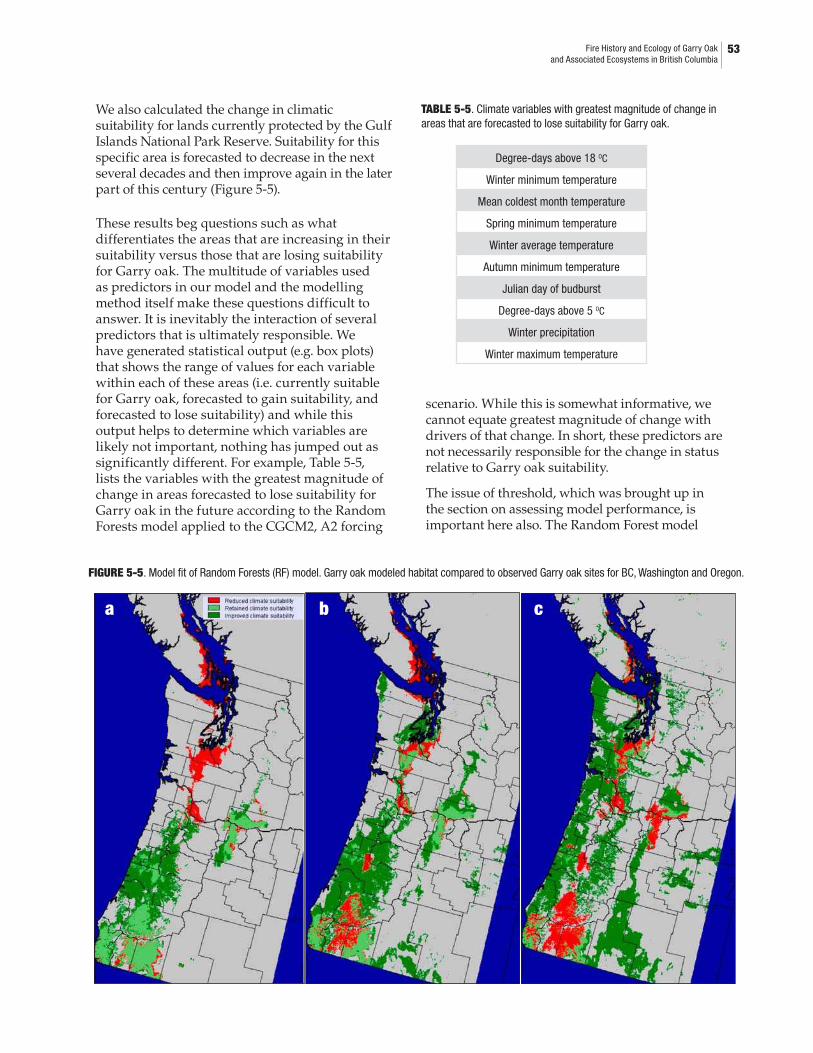
FIGURE 5-5. Model fit of Random Forests (RF) model. Garry oak modeled habitat compared to observed Garry oak sites for BC, Washington and Oregon.
TABLE 5-5. Climate variables with greatest magnitude of change in areas that are forecasted to lose suitability for Garry oak.
Degree-days above 18 OC
Winter minimum temperature
Mean coldest month temperature
Spring minimum temperature
Winter average temperature
Autumn minimum temperature
Julian day of budburst
Degree-days above 5 OC
Winter precipitation
Winter maximum temperature
53 Fire History and Ecology of Garry Oakand Associated Ecosystems in British Columbia
a b c
We also calculated the change in climatic suitability for lands currently protected by the Gulf Islands National Park Reserve. Suitability for this specific area is forecasted to decrease in the next several decades and then improve again in the later part of this century (Figure 5-5).
These results beg questions such as what differentiates the areas that are increasing in their suitability versus those that are losing suitability for Garry oak. The multitude of variables used as predictors in our model and the modelling method itself make these questions difficult to answer. It is inevitably the interaction of several predictors that is ultimately responsible. We have generated statistical output (e.g. box plots) that shows the range of values for each variable within each of these areas (i.e. currently suitable for Garry oak, forecasted to gain suitability, and forecasted to lose suitability) and while this output helps to determine which variables are likely not important, nothing has jumped out as significantly different. For example, Table 5-5, lists the variables with the greatest magnitude of change in areas forecasted to lose suitability for Garry oak in the future according to the Random Forests model applied to the CGCM2, A2 forcing
scenario. While this is somewhat informative, we cannot equate greatest magnitude of change with drivers of that change. In short, these predictors are not necessarily responsible for the change in status relative to Garry oak suitability.
The issue of threshold, which was brought up in the section on assessing model performance, is important here also. The Random Forest model
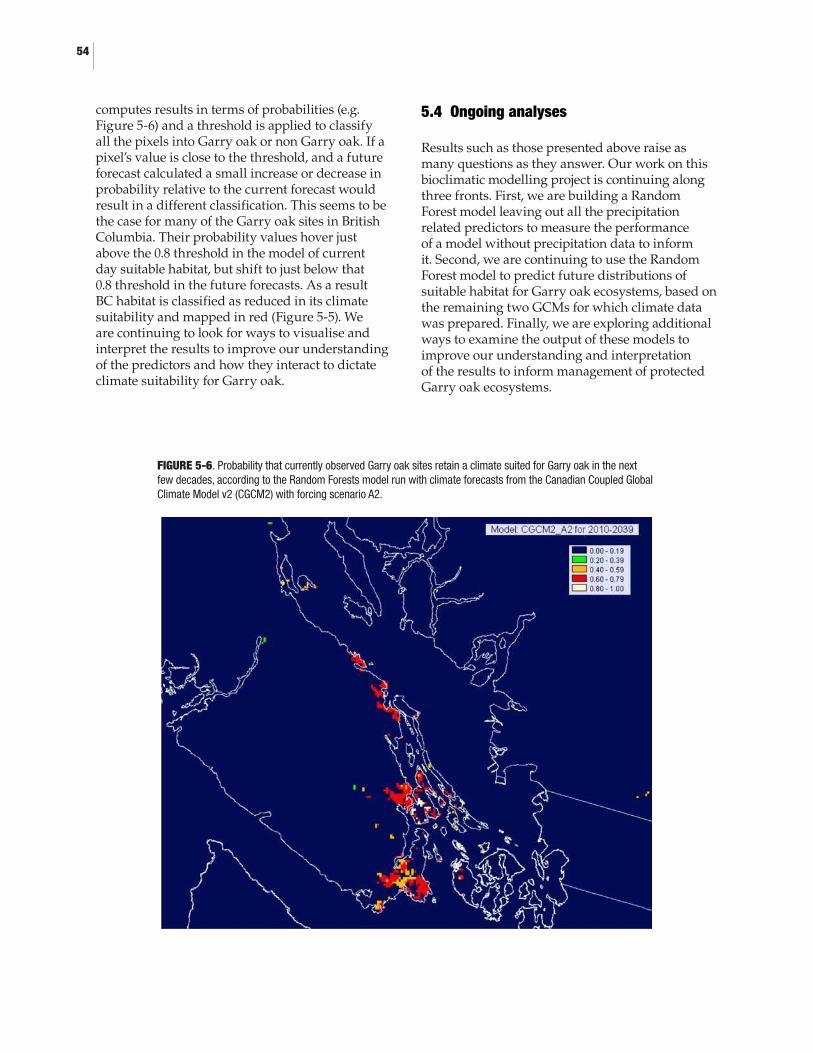
FIGURE 5-6. Probability that currently observed Garry oak sites retain a climate suited for Garry oak in the next few decades, according to the Random Forests model run with climate forecasts from the Canadian Coupled Global Climate Model v2 (CGCM2) with forcing scenario A2.
54
5.4 Ongoing analyses
Results such as those presented above raise as many questions as they answer. Our work on this bioclimatic modelling project is continuing along three fronts. First, we are building a Random Forest model leaving out all the precipitation related predictors to measure the performance of a model without precipitation data to inform it. Second, we are continuing to use the Random Forest model to predict future distributions of suitable habitat for Garry oak ecosystems, based on the remaining two GCMs for which climate data was prepared. Finally, we are exploring additional ways to examine the output of these models to improve our understanding and interpretation of the results to inform management of protected Garry oak ecosystems.
computes results in terms of probabilities (e.g. Figure 5-6) and a threshold is applied to classify all the pixels into Garry oak or non Garry oak. If a pixel’s value is close to the threshold, and a future forecast calculated a small increase or decrease in probability relative to the current forecast would result in a different classification. This seems to be the case for many of the Garry oak sites in British Columbia. Their probability values hover just above the 0.8 threshold in the model of current day suitable habitat, but shift to just below that 0.8 threshold in the future forecasts. As a result BC habitat is classified as reduced in its climate suitability and mapped in red (Figure 5-5). We are continuing to look for ways to visualise and interpret the results to improve our understanding of the predictors and how they interact to dictate climate suitability for Garry oak.
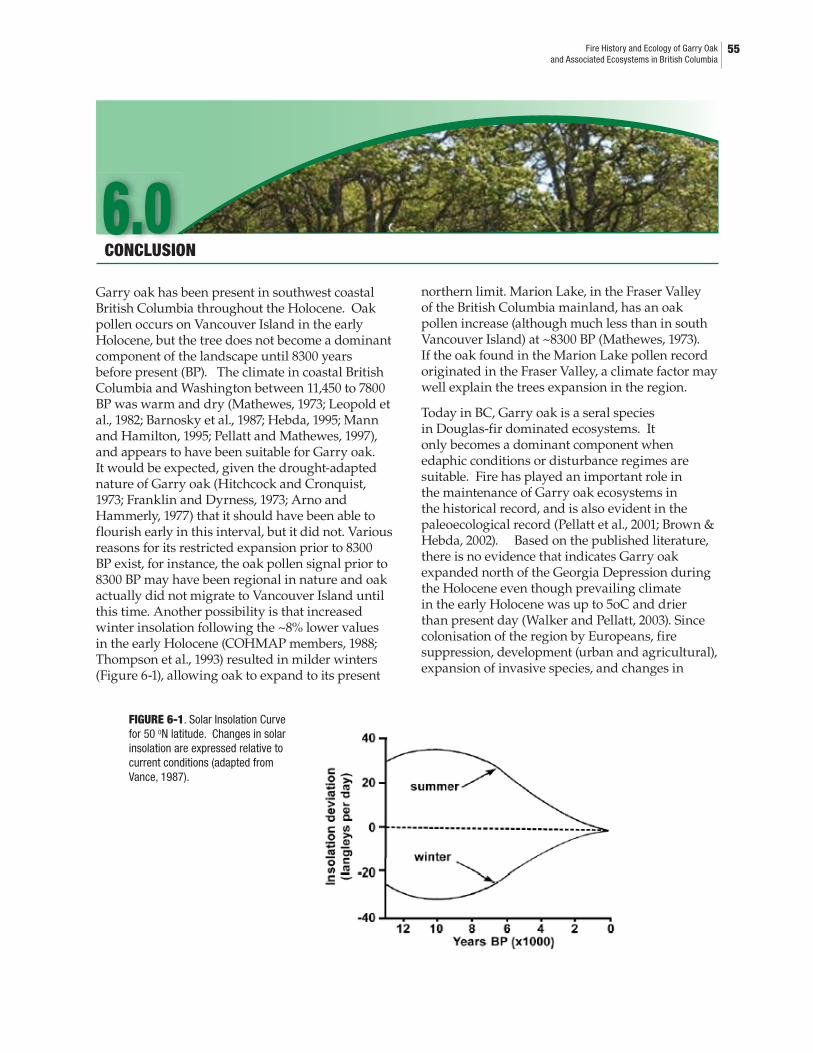
CONCLUSION
2.06.0
FIGURE 6-1. Solar Insolation Curve for 50 ON latitude. Changes in solar insolation are expressed relative to current conditions (adapted from Vance, 1987).
55 Fire History and Ecology of Garry Oakand Associated Ecosystems in British Columbia
Garry oak has been present in southwest coastal British Columbia throughout the Holocene. Oak pollen occurs on Vancouver Island in the early Holocene, but the tree does not become a dominant component of the landscape until 8300 years before present (BP). The climate in coastal British Columbia and Washington between 11,450 to 7800 BP was warm and dry (Mathewes, 1973; Leopold et al., 1982; Barnosky et al., 1987; Hebda, 1995; Mann and Hamilton, 1995; Pellatt and Mathewes, 1997), and appears to have been suitable for Garry oak. It would be expected, given the drought-adapted nature of Garry oak (Hitchcock and Cronquist, 1973; Franklin and Dyrness, 1973; Arno and Hammerly, 1977) that it should have been able to flourish early in this interval, but it did not. Various reasons for its restricted expansion prior to 8300 BP exist, for instance, the oak pollen signal prior to 8300 BP may have been regional in nature and oak actually did not migrate to Vancouver Island until this time. Another possibility is that increased winter insolation following the ~8% lower values in the early Holocene (COHMAP members, 1988; Thompson et al., 1993) resulted in milder winters (Figure 6-1), allowing oak to expand to its present
northern limit. Marion Lake, in the Fraser Valley of the British Columbia mainland, has an oak pollen increase (although much less than in south Vancouver Island) at ~8300 BP (Mathewes, 1973). If the oak found in the Marion Lake pollen record originated in the Fraser Valley, a climate factor may well explain the trees expansion in the region.
Today in BC, Garry oak is a seral species in Douglas-fir dominated ecosystems. It only becomes a dominant component when edaphic conditions or disturbance regimes are suitable. Fire has played an important role in the maintenance of Garry oak ecosystems in the historical record, and is also evident in the paleoecological record (Pellatt et al., 2001; Brown & Hebda, 2002). Based on the published literature, there is no evidence that indicates Garry oak expanded north of the Georgia Depression during the Holocene even though prevailing climate in the early Holocene was up to 5oC and drier than present day (Walker and Pellatt, 2003). Since colonisation of the region by Europeans, fire suppression, development (urban and agricultural), expansion of invasive species, and changes in
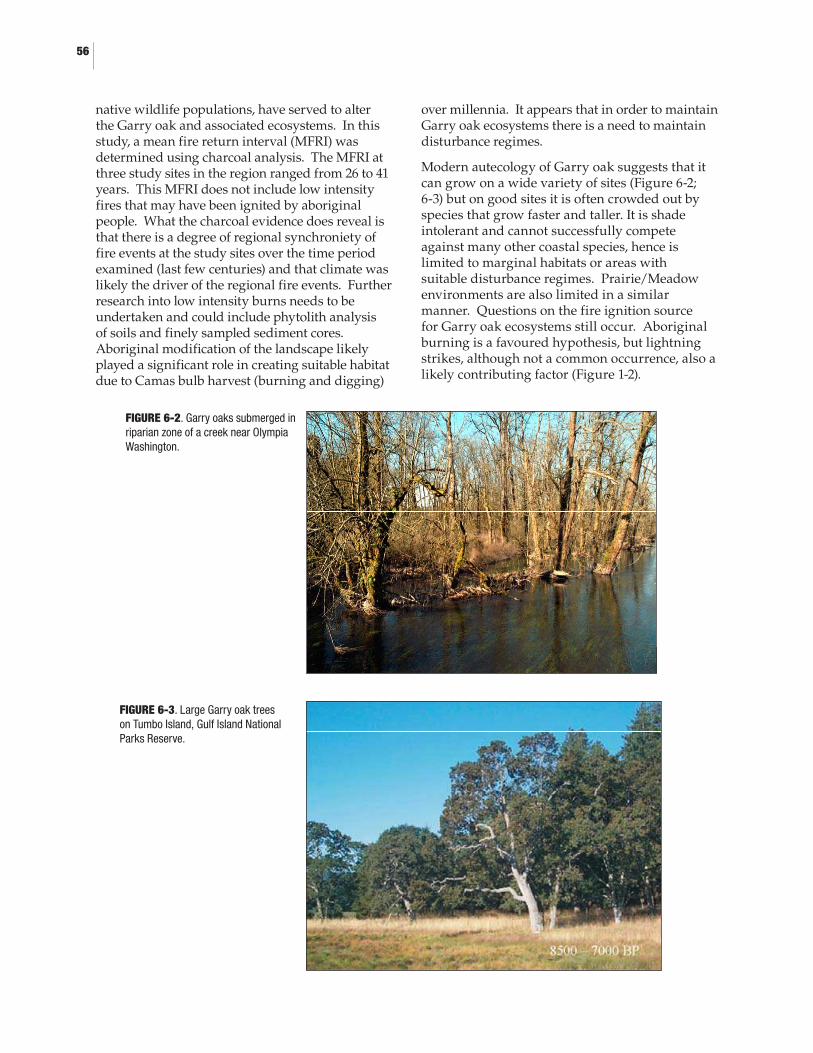
FIGURE 6-2. Garry oaks submerged in riparian zone of a creek near Olympia Washington.
FIGURE 6-3. Large Garry oak trees on Tumbo Island, Gulf Island National Parks Reserve.
56
native wildlife populations, have served to alter the Garry oak and associated ecosystems. In this study, a mean fire return interval (MFRI) was determined using charcoal analysis. The MFRI at three study sites in the region ranged from 26 to 41 years. This MFRI does not include low intensity fires that may have been ignited by aboriginal people. What the charcoal evidence does reveal is that there is a degree of regional synchroniety of fire events at the study sites over the time period examined (last few centuries) and that climate was likely the driver of the regional fire events. Further research into low intensity burns needs to be undertaken and could include phytolith analysis of soils and finely sampled sediment cores. Aboriginal modification of the landscape likely played a significant role in creating suitable habitat due to Camas bulb harvest (burning and digging)
over millennia. It appears that in order to maintain Garry oak ecosystems there is a need to maintain disturbance regimes.
Modern autecology of Garry oak suggests that it can grow on a wide variety of sites (Figure 6-2; 6-3) but on good sites it is often crowded out by species that grow faster and taller. It is shade intolerant and cannot successfully compete against many other coastal species, hence is limited to marginal habitats or areas with suitable disturbance regimes. Prairie/Meadow environments are also limited in a similar manner. Questions on the fire ignition source for Garry oak ecosystems still occur. Aboriginal burning is a favoured hypothesis, but lightning strikes, although not a common occurrence, also a likely contributing factor (Figure 1-2).

57 Fire History and Ecology of Garry Oakand Associated Ecosystems in British Columbia
On southern Vancouver Island, Garry oak is relatively common on sites that are too exposed or droughty for other tree species during at least part of the year. Overall it can withstand both lengthy flooding and drought. It is generally a seral species but it can be a climax species where yearly or seasonal precipitation is sparse, soils are shallow or droughty, or where fire is a repeated natural occurrence.
Conifer encroachment on the remaining Garry oak ecosystems is of considerable concern to conservation groups. Dendroecological research indicates that Garry oak recruitment spiked after fire cessation in the mid 1800s and has been greatly reduced in recent years. It appears at most sites conifer encroachment, primarily by Douglas-fir, is more common due to the shade-intolerant nature of Garry oak. In particular, Rocky Point has undergone a striking transformation from open prairie to savanna / woodland since the arrival of Europeans ca. 150 years ago. Prior to 1850, the site was probably largely treeless, with only a few scattered oak and Douglas- fir trees. Initial recruitment to the stand consisted largely of Garry oak, and was probably a response to fire exclusion at the site. Following this rapid infilling of Garry oak in the late 19th and early 20th centuries the stand appears to have stabilized, with little recruitment occurring from the 1930s to 1950s. Beginning in the 1950s conifer species began to become established in high numbers. This change in stand composition and density is ongoing. Garry oak does not appear to be establishing at the site in sufficient numbers to maintain dominance, and conifer species are establishing at rates and densities that are sufficient to eventually eliminate Garry oak and many important associates from Rocky Point. Although Garry oak often appears to occur after fire suppression, therefore over longer periods of time fire suppression will allow conifer encroachment of Garry oak ecosystems to be the dominant process unless other edaphic controlling factors occur.
Determining climate change scenarios for the future is a complex task. Downscaling of GCMs so that they are relevant to land managers is necessary for decisions relating to impacts, adaptation, restoration, and mitigation. Climate change scenarios for the future are critical to successful species at risk recovery programs if they are to be sustainable. Although it is recognized
that immediate species recovery actions are imperative, understanding possible habitat alteration due to climate change is prudent when choosing suitable recovery sites that are expected to persist over the next century.
With this information in mind we have started developing ecological models that consider climate and vegetation distribution. The model presented in this report is a bioclimatic envelope model for Garry oak in coastal British Columbia, Washington, and Oregon. Using different downscaled climate models and occurrences of Garry oak in the study region, scenarios for Garry oak where run using differing analytical models. Based on the climate of the recent past and the current distribution of Garry oak, climate suitability for Garry oak in BC will decrease in the near future then will improve again within this century. All models tested concur, although the forecasts from GCMs differ in magnitude. These results are consistent with paleoecological studies that show that maximum northern range for Garry oak was limited to the Georgia Depression during the Holocene. Albeit edaphic, disturbance, competition, and dispersal factors are not considered in this model, the distribution of Garry oak in the various climate envelopes is likely a realistic range for possible Garry oak distribution in the future.
Paleoclimate research has indicated climate and corresponding ecological change has been rapid and significant in the region throughout the Holocene. There is no doubt that climate change is occurring and will/is impact Garry oak and associated ecosystems. Some important questions arise when examining the ecology of Garry oak ecosystems. If these ecosystems are seral in nature and are composed of species at the northern limit of their native range then are the at-risk species in Garry oak ecosystems adapted to their environment? Also, if the bioclimatic envelope models suggest areas other than or in addition to existing Garry oak ecosystems are more climatically suitable in the future for Garry oak ecosystems should we select them for restoration or translocation? What is the frequency and intensity of disturbance (e.g., fire and bulb harvest) necessary to restore/maintain the structure of these ecosystems? Experimental studies will be needed to address these questions and should be undertaken to help to maintain the ecological integrity of these at-risk ecosystems.

58
RECOMMENDATIONS
2.07.0
59 Fire History and Ecology of Garry Oakand Associated Ecosystems in British Columbia
We were able to establish a preliminary mean fire return interval for larger climate driven fires but further work should be undertaken to determine the characteristics of low-intensity fires that may have been used by First Nations people. Phytolith (microscopic, inorganic mineral particles produced by grasses ) analysis of soils and finely sampled sediment cores.
There is a need for a connected network of protected areas in the Georgia basin as well as restoration or translocation projects to maintain Garry oak ecosystems in the future.
Experiments that re-establish disturbance processes such as fire, and soil tilling similar to that caused by First Nations Camas bulb harvesting should be undertaken.
Many Garry oak ecosystems of interest to conservation groups are probably a non-equilibrium (seral successional) ecosystem and cannot be maintained in their current state. What is needed are efforts to maintain the processes that have given rise to these ecosystems – including fire, grazing, tilling, tree removal – as well as representative stands at various stages of development.
Active management is needed. But – there is no one-size-fits-all solution. Different sites will require distinct approaches to restoration.
�
�
�
�
�
In particular, fire is probably appropriate at some sites but depending on particular species at risk or exotic species concerns may be detrimental at others.
Interim solutions are needed. Encroachment is occurring rapidly, and ecological integrity is being lost at most sites. Our understanding of the ecosystem processes that maintain Garry oak associated ecosystems is imperfect, but these ecosystems will be lost if we wait for ecologists to answer all the needed questions. Managers need to take action with imperfect knowledge of management outcomes.
The more “charismatic” exotics, such as gorse and broom may be less detrimental to Garry oak associates than other invasive species such as orchard grass, sweet vernal grass, brome, and other agronomic grasses.
We need to further refine the Bioclimatic Envelope models as better GCMs and regionally downscaled climate models are developed. With additional information on Garry oak associated species ranges – better models will be developed.
We need to incorporate disturbance and succession into ecological models to refine our confidence in developing future ecosystem scenarios due to climate change.
�
�
�
�

60

REFERENCES
2.08.0
61 Fire History and Ecology of Garry Oakand Associated Ecosystems in British Columbia
Agee, J. K. 1990. Fire history of Douglas-fir forests in the Pacific Northwest. Pages 25-33. Wildlife and Vegetation of Unmanaged Douglas-fir forests. USDA For. Serv. Gen. Tech. Rep. USDA Forest Service.
Agee, J. K. 1993. Fire ecology of Pacific Northwest forests. Island Press, Washington, DC.
Agee, J.K. 1996. Achieving conservation biology objectives with fire in the Pacific Northwest. Weed Technology. 10: 417-421.
Agee, J. K. 1998. The landscape ecology of western forest fire regimes. Northwest Science 72:24-34.
Allen, G. B. 1995. Vegetation and climate history of southeast Vancouver Island, British Columbia. University of Victoria, Victoria.
Allen, G. B., K. B. Brown, and R. J. Hebda. 1999. Surface pollen spectra from southern Vancouver Island, British Columbia, Canada. Canadian Journal of Botany 77:786-799.
Arno, S.F. 2000. Chapter 5: Fire in western forest ecosystems. Wildland fire in ecosystems. Gen. Tech. Rep. RMRS-GTR-42. J.K. Smith and J.K. Brown, Eds. Ogden, UT, U.S. Department of Agriculture, Forest Service, Rocky Mountain Research Station. 2: 97-120.
Barnhart, S. J., J. R. McBride and P. Warner. 1996. Invasion of northern oak woodlands by Pseudotsuga menziesii (Mirb.) Franco in the Sonoma Mountains of California. Madroño. 43:28-45.
Barnosky, C.W., P.M. Anderson and P.J. Bartlein. 1987. “The Northwestern U.S. During Deglaciation; Vegetational History and Paleoclimatic Implications.” In W.F. Ruddiman and H.E. Wright, Jr. (eds), North America and Adjacent Oceans During the last Deglaciation. The Geology of North America, v. K–3. Geological Society of America, Boulder, Colorado: 289–321.
Beckwith, B. R. 2004. “The Queen Root of This Clime”: ethnoecological investigations of blue camas (Camassia leichtlinii (Baker) Wats., C. quamash (Pursh) Greene; Liliaceae) and its landscapes on southern Vancouver Island, British Columbia. Page 263. Biology. University of Victoria, Victoria.
Biondi, F. and T.W. Swetnam 1987. Box-Jenkins models of forest interior tree-ring chronologies. Tree-Ring Bulletin. 47: 71 - 96.
Boyd, R. 1986. Strategies of Indian burning in the Willamette Valley. Canadian Journal of Anthropology, 5: 65-86.
Boyd, R., editor. 1999. Indians, Fire and the Land in the Pacific Northwest. Oregon State University Press, Corvallis.
Breiman, L. 2001. Random Forests. Machine Learning. 45: 5-32.
Brown, D. 2000. Archaeological investigations at the Somenos Creek site (DeRw 18). Page 120. University of British Columbia, Vancouver, BC.
Brown, K. B. 1998. Long-term fire incidence in coastal forests of British Columbia. Northwest Science 72:64-66.
Brown, K. B., and R. J. Hebda. 2003. Coastal rainforest connections disclosed through a late Quaternary vegetation, climate, and fire history investigation from the Mountain Hemlock Zone, on southern Vancouver Island, British Columbia, Canada. Review of Palaeobotany and Palynology. 123: 247-269.
Brown, K. B., and R. J. Hebda. 2002. Ancient Fires on Southern Vancouver Island, British Columbia, Canada: A Change in Causal Mechanisms at about 2,000 ybp. Environmental Archaeology 7:1-12.
Brubaker, L.B. 1986. Responses of tree populations to climatic change. Vegetatio. 67: 119 - 130.
62
Burns, Russell M., and Barbara H. Honkala, tech. coords. 1990. Silvics of North America: 1. Conifers; 2. Hardwoods. Agriculture Handbook 654. U.S. Department of Agriculture, Forest Service, Washington, DC. vol.2, 877 p.
Cannon, A.J., 2007. Nonlinear analog predictor analysis: A coupled neural network/analog model for climate downscaling. Neural Networks. doi:10.1016/j.neunet.2007.04.002
Cannon,A.J., P.H.Whitfield,and E.R.Lord, 2002.Synoptic map-pattern classification using recursive partitioning and principal component analysis. Monthly Weather Review. 130(5): 1187-1206.
CIA Web Page – Canada: https://www.cia.gov/cia/publications/factbook/geos/ca.html
CIFFC, C. I. F. F. C. 2002. Glossary of forest fire management terms, Winnipeg, Manitoba.
Clark, J. S. 1990. Fire and climate change during the last 750 yrs in northwestern Minnesota. Ecological Monographs 60:135-159.
Clark, J. S., and J. Robinson. 1993. Palaeoecology of fire. Pages 193-214 in P. J. Crutzen, and J. G. Goldammer, editors. Fire in the Environment: The Ecological, Atmospheric and Climatic Importance of Vegetation Fires. Wiley, Chichester.
COHMAP (1988) Climatic changes of the last 18,000 years: observations and model simulations. Science 241: 1043-1052.
Cole, D. and B. Lockner (Eds.). 1989. Journals of George M. Dawson. Volume 1, British Columbia 1875-1876. UBC Press, Vancouver.
Colenutt, M.E. and B.H. Luckman. 1995. The dendrochronological characteristics of alpine larch. Canadian Journal of Forest Research. 25: 777 - 789.
Cook, E.R. 1987. The decomposition of tree-ring series for environmental studies. Tree-Ring Bulletin. 47: 37 - 59.
Cook, E.R. 1990. A conceptual linear aggregate model for tree rings. Methods of Dendrochronology: Applications in the Environmental Sciences. E.R. Cook and L.A. Kairiukstis, Eds. Dordrecht, Netherlands, Kluwer Academic Publishers: 98 - 104.
Cook, E.R., K. Briffa, S. Shiyatov and V. Mazepa. 1990. Tree-ring standardization and growth-trend estimation. Methods of Dendrochronology: Applications in the Environmental Sciences.
E.R. Cook and L.A. Kairiukstis, Eds. Dordrecht, Netherlands, Kluwer Academic Publishers: 104 - 123.
Cook, E.R., D.M. Meko, D.W. Stahle and M.K. Cleaveland. 1999. Drought reconstructions for the continental United States. Journal of Climate. 12: 1145 - 1162.
Cwynar, L. C. 1987. Fire and the forest history of the North Cascade Range. Ecology 68:791-802.
Daly, C., G.H. Taylor, W. P. Gibson, T.W. Parzybok, G. L. Johnson, P. Pasteris. 2001. High-quality spatial climate data sets for the United States and beyond. Transactions of the American Society of Agricultural Engineers. 43: 1957-1962.
Danard, M. and J. Galbraith. 1997. High Resolution Analyses of Daily Precipitation Amounts and Temperatures in Southwestern British Columbia 31 Oct 1971 to 29 June 1995. Report prepared for B.C. Hydro by Atmospheric Dynamics Corporation. Victoria, BC
Daniels, L. D., P. L. Marshall, R. E. Carter, and K. Klinka. 1995. Age structure of Thuja plicata in the tree layer of old-growth stands near Vancouver, British Columbia. Northwest Science. 69:175-183.
DCDP. 2005. Settlement and Land Use History: Gulf Islands National Park Reserve. Various drafts and final reports submitted to Parks Canada, by Denise Cook Design + Planning, Dunster & Associates Environmental Consultants Ltd, North Vancouver.
Dougan, R. I. 1973. Cowichan My Valley, Cobble Hill, BC.
Duff, W. 1964. The Indian history of British Columbia. Volume 1, the impact of the white man. Anthropology in British Columbia, Memoir No. 5. Provincial Museum of British Columbia, Victoria.
Duff, Wilson. 1969. The Fort Victoria Treaties. BC Studies 3: 3-57.
Duffus, M. 2003. Old Langford: An Illustrated History 1850 - 1950. Town and Gown Press, Victoria.
Efron, B. and R.J. Tibshirani. 1997. An Introduction to the Bootstrap. London, Chapman and Hall.
Eis, S. 1962. Statistical analysis of several methods for estimation of forest habitats and tree growth near Vancouver, B.C. Page 76. Faculty of Forestry Bulletin. University of British Columbia, Vancouver, B.C.

63 Fire History and Ecology of Garry Oakand Associated Ecosystems in British Columbia
Eis, S., D. Craigdallie, and E. Oswald. 1976. Western Communities: a landscape analysis for urban development. Page 47. Pacific Forestry Service, Canadian Forest Service, Department of Fisheries and Environment Canada, Victoria.
Erickson, W. R. 2000. Garry oak communities in Canada: classification, characterization and conservation. International Oaks 10:40-54.
Erickson, W. 2002. Environmental relationship of Garry oak (Quercus garryana) communities at their northern margin. Page 12. USDA Forest Service Gen. Tech. Rep. USDA Forest Service.
Fastie, C.L. 1995. Causes and ecosystem consequences of multiple pathways of primary succession at Glacier Bay, Alaska. Ecology. 76: 1899 - 1916.
Frank, D.C. 1998. Dendroclimatic investigation of Tsuga mertensiana using reflected-light analysis, Yakutat, Alaska. Buffalo, State University of New York: 118.
Franklin, J. F., and C. T. Dyrness 1988. Natural vegetation of Oregon and Washington. OSU Press, Corvallis, Oregon.
Fritts, H.C. 1976. Tree Rings and Climate. London, Adademic.
Fritts, H.C., T.J. Blasing, B.P. Hayden and J.E. Kutzbach. 1971. Multivariate techniques for specifying tree-growth and climate relationships and for reconstructing anomolies in paleoclimate. Journal of Applied Meteorology. 10: 845 - 864.
Fritts, H.C., J. Guiot, G.A. Gordon and F. Schweingruber. 1990. Methods of calibration, verification, and reconstruction. Methods of Dendrochronology: Applications in the Environmental Sciences. E.R. Cook and L.A. Kairiukstis, Eds. Dordrecht, Netherlands, Kluwer Academic Publishers: 163 - 217.
Fuchs, M. A. 2001. Towards a recovery strategy for Garry oak and associated ecosystems in Canada: ecological assessment and literature review. Page 92. Environment Canada, Canadian Wildlife Service, Pacific and Yukon.
Gavin, D., L. B. Brubaker, and K. P. Lertzman. 2003. Holocene fire history of a coastal temperate rain forest based on soil charcoal radiocarbon dates. Ecology. 84:186-201.
Gedalof, Z. 1999. Burns Bog and adjacent areas: dendroecology. Prepared for Delta Fraser
Properties Partnership and the Environmental Assessment Office In support of the Burns Bog Ecosystem Review. UVTRL Report 99-06.
Gedalof, Z. and D.J. Smith. 2001a. Interdecadal climate variability and regime-scale shifts in Pacific North America. Geophysical Research Letters. 28: 1515 - 1518.
Gedalof, Z. and D.J. Smith. 2001b. Interdecadal climate variability and regime-scale shifts in Pacific North America. Geophysical Research Letters. 28: 1515 – 1518.
Grant, W.C. 1857. Description of Vancouver Island. Journal of the Royal Geographical Society of London. 27: 268 - 320.
Gray, A.N. and T.A. Spies. 1997. Microsite controls on tree seedling establishment in conifer forest canopy gaps. Ecology. 78: 2458 - 2473.
Grey, W. 1994. A gentlewoman’s remembrances of life in England and the Gulf Islands of British Columbia, 1871-1910. Victoria, BC, Gulf Islands Press.
Guiot, J. 1986. ARMA techniques for modelling tree-ring response to climate and for reconstructing variations of paleoclimates. Ecological Modelling. 33: 149 - 171.
Graumlich, L. J., and L. B. Brubaker. 1986. Reconstruction of annual temperature (1590-199) for Longmire, Washington, derived from tree rings. Quaternary Research. 25: 223-234.
Guisan, A. and N. E. Zimmermann. 2000. Predictive habitat distribution models in ecology. Ecological Modelling. 135: 147-186.
Habeck, J. R. 1961. The original vegetation of the mid-Willamette Valley, Oregon. Northwest Science 35:65-77.
Hallett, D. J. 2001. Holocene fire history and climate change in southern British Columbia, based on high-resolution analyses of sedimentary charcoal. Unpublished PhD Thesis. Department of Biological Sciences. Simon Fraser University, Burnaby.
Hamann, A. and Wang, T. 2005. Models of climatic normals for genecology and climate change studies in British Columbia. Agricultural and Forest Meteorology. 128: 211-221.
Harker, D. (Ed). 1993. A Gulf Islands Patchwork. Pender Island, BC, British Columbia Historical Federation.
64
Harmon, M. and C. Hua. 1991. Coarse woody debris dynamics in two old-growth ecosystems. Bioscience. 41: 604 - 610.
Harris, C. 1997. The Resettlement of British Columbia: essays on colonialism and geographical change. UBC Press, Vancouver.
Hebda, R. 1995. British Columbia Vegetation and Climate History with Focus on 6 KA BP. Geographie Physique et Quatemaire 49(1):55-79.
Hebda, R. J., and F. Aitkens. 1993. Forward, Garry Oak Meadow Colloquium Proceedings. Pages v - vii In R. J. Hebda, and F. Aitkens, editors. Garry Oak Meadow Colloquium Proceedings. Garry Oak Meadow Preservation Society, Victoria, British Columbia.
Hebda, R.J., and R.W. Mathewes. 1995. Holocene history of cedar and Native Indian cultures of the North American Pacific Coast. Science. 225: 771-713.
Hendrickson, J.E. 1975. Two letters from Walter Colquhoun Grant. BC Studies. 26:3-15.
Hermann, R.K. and D.P. Lavender. 1990. Pseudotsuga menziesii (Mirb.) Franco. Douglas-fir. Silvics of North America. R.M. Burns and B.H. Honkala, Eds. Washington, U.S. Dept. of Agriculture, Forest Service: 527 - 540.
Heusser, L. E. 1983. Palynology and paleoecology of post-glacial sediments in an anoxic basin, Sannich Inlet, British Columbia. Canadian Journal of Earth Science. 20:873-885.
Holmes, R.L. 1983. Computer-assisted quality control in tree-ring dating and measurement. Tree Ring Bulletin. 43: 69 - 78.
Innes, J. B., J. J. Blackford, and I. G. Simmons. 2004. Testing the integrity of fine spatial resolution palaeoecological records: micro-charcoal data from near-duplicate peat profiles from the North York Moors, UK. Palaeogeography, Palaeoclimatology, Palaeoecology 214:295-307.
Johannessen, C. L., W. A. Davenport, A. Millet, and S. McWilliams. 1971. The vegetation of the Willamette Valley. Annals of the Association of American Geographers 61:286-302.
Kalnay, E., M. Kanamitsu, R. Kistler, W. Collins, D. Deaven, L. Gandin, M. Iredell, S. Saha, G. White, J. Woolen, Y. Zhu, M. Chelliah, W. Ebisuzaki, W. Higgins, J. Janowiak, K. C. Mo, C. Ropelewski, J. Wang, A. Leetma, R. Reynolds, R. Jenne, and D. Joseph. 1996: The NCEP/NCAR 40-year reanalysis
project. Bullet. Amer. Meteorol. Soc. 77, 437-471.
Katz, R.W. 1988. Use of cross correlations in the search for teleconnections. Journal of Climatology. 8: 241 - 253.
Koslowski, S. K., and C. E. Ahlgren 1974. Fire and Ecosystems. Academic Press, London.
Laroque, C.P. and D.J. Smith. 1999. Tree-ring analysis of yellow cedar (Chamaecyparis nootkatensis) on Vancouver Island, British Columbia. Canadian Journal of Forest Research. 21: 115 - 123.
Lea, T. D. 2006. Historical Garry oak ecosystems of Vancouver Island: a summary 1800 - 2005. GOERT Research Colloquium 2006. Terrestrial Information Branch, B.C. Ministry of Sustainable Resource Management., Victoria.
Leopold, E., Nickmann, R., Hedges, J.I. and J.R. Ertel. 1982. Pollen and lignin records of late Quaternary vegetation, Lake Washington. Science, 218: 1305-1307.
Lepofsky, D., E. K. Heyerdahl, K. Lertzman, D. Schaepe and B. Mierendorf. 2003. Historical meadow dynamics in southwest British Columbia: a multidisciplinary Analysis. Conservation Ecology. 7: 5 [online] URL: http://www.consecol.org/vol7/iss3/art5.
Luckman, B.H. 1994. Dendrochronology and global change. Tree Rings, Environment, and Humanity: Proceedings of the International Conference, Tucson, Arizona, Radiocarbon. University of Arizona Press.
MacDougall, A. 2005. Responses of diversity and invasibility to burning in a northern oak savanna. Ecology. 86: 3354-3363.
MacDougall, A. S. 2002. Invasive perennial grasses in Quercus garryana meadows of southwestern British Columbia: prospects for restoration. Pages 1-10. USDA Forest Service Gen. Tech. Rep. PSW-GTR-184. USDA.
MacDougall, A. S., B. R. Beckwith, and C. Maslovat. 2004. Defining conservation strategies with historical perspectives: a case study from a degraded oak grassland ecosystem. Conservation Biology. 18: 155-165.
MacFie, M. 1865. Vancouver Island and British Columbia: their history, resources, and prospects-1865. Longman, Green, Longman, Roberts, & Green, London. (Reprinted: 1972: Coles Publishing Company, Toronto).
Manel, S., H. Ceri Williams, and S.J. Ormerod. 2001.
65 Fire History and Ecology of Garry Oakand Associated Ecosystems in British Columbia
Pellatt, M.G. and R.W. Mathewes. 1997. “Holocene Tree Line and Climate Change on the Queen Charlotte Islands, Canada.” Quaternary Research, 48: 88–99.
Pellatt, M. G., R. J. Hebda, and R. W. Mathewes. 2001. High-resolution Holocene vegetation history and climate from Hole 1034B, ODP leg 169S, Saanich Inlet, Canada. Marine Geology 174: 211-226.
Pojar, J., and A. MacKinnon 1994. Plants of Coastal British Columbia. Lone Pine, Vancouver.
Riiters, K.H. 1990. A comparison of chronologies from tree rings. Canadian Journal of Forest Research. 20: 76 - 83.
Roemer, H.L. 1972. Forest Vegetation and Environments of the Saanich Peninsula, Vancouver Island. Ph.D. Dissertation, University of Victoria.
Roemer, H. L. 1993. Vegetation and ecology of Garry oak woodlands. Pages 19-24 in R. J. Hebda, and F. Aitkens, editors. Garry Oak-meadow colloquium proceedings. Garry Oak Meadow Preservation Society, Victoria.
Rosenberg, S.M., Walker, I.R., Mathewes, R.W., and Hallett, D.J. 2004. Midge-inferred Holocene climate history of two subalpine lakes in southern British Columbia, Canada. Holocene 14: 258-271.
Schmidt, R. L. 1970. A history of pre-settlement fires on Vancouver Island as determined from Douglas-fir ages. Pages 107-108 In J. H. G. Smith, and J. Worrall, editors. Tree-ring analysis with special reference to North America. UBC Faculty of Forestry, Vancouver.
Schweingruber, F.H. 1996. Tree Rings and Environment: Dendroecology. Berne, Stuttgart, Vienna, Haupt.
Shafer, S.L., P.J. Bartlein and R.S. Thompson. 2001. Potential changes in the distributions of western North America tree and shrub taxa under future climate scenarios. Ecosystems. 4: 200 – 215.
Shaw, Norton (Ed.). 1961. Remarks on Vancouver Island, principally concerning townsites and native population, by Captain W.C. Grant. The Journal of the Royal Geographical Society 21, London.
Stahl,K., R.D. Moore, J.M. Shea, D. Hutchinson, and A.J. Cannon. 2007. Coupled modelling of glacier and streamflow response to future climate scenarios. Submitted to Water Resources Research.
Evaluating presence-absence models in ecology: the need to account for prevalence. Journal of Applied Ecology. 38: 921-931.
Mann D.H. and T.D. Hamilton. 1995. Late Pleistocene and Holocene paleoenvironments of the North Pacific Coast. Quaternary Science Reviews, 14: 449-471.
Maslovat, C. 2002. Historical jigsaw puzzles: piecing together the understory of Garry oak (Quercus garryana) ecosystems and the implications for restoration. USDA Forest Service General Technical Reports PSW-GTR-184:141-149.
Mathewes, R. W. 1973. A palynological study of postglacial vegetation changes in the University Research Forest, southwestern British Columbia. Canadian Journal of Botany. 51: 2085-2103.
Matson, R.G., and G. Coupland. 1995. The Prehistory of the Northwest Coast. Academic Press, San Diego.
May, R. M., Lawton, J. H. & Stork, N. E. 1995. Assessing extinction rates. In (Eds.) J.H. Lawton & R.M. May, Extinction Rates. Oxford University Press. pp.1-24.
McCoy, M. M. 2006. High resolution fire and vegetation history of Garry oak ecosystems in British Columbia. Unpublished MSc Thesis. Department of Biological Sciences, Simon Fraser University. Burnaby.
Meidinger, D., and J. Pojar 1991. Ecosystems of British Columbia. Research Branch, Ministry of Forests, Province of British Columbia, Victoria.
Moss, M.L., and J.M. Erlandson. 1995. Reflections on North American Pacific Coast prehistory. Journal of World Prehistory. 9: 1-45.
Mosteller, F. and J.W. Tukey. 1977. Data Analysis and Regression. New York, Addison Wesley.
Parminter, J. 2004. Fire history: CDF and CWH zones. Page 9. Research Branch, B. C. Ministry of Forests, Victoria.
Parminter, J. 1991. Burning alternatives panel: a review of fire ecology, fire history and prescribed burning in southern British Columbia. Unpublished paper presented at the Sixth Annual Fire Management Symposium, Southern Interior Fire Management Committee, May 29-30, Kelowna, BC. Accessed online (April 5, 2006) at: www.for.gov.bc.ca/hre/pubs/docs/sifmc.pdf.
66
Stein, W. I. 1990. Quercus garryana Dougl. ex. Hook. Pages 650-660 in R. M. Burns, and B. H. Honkala, editors. Silvics of North America - Hardwoods. U.S. Department of Agriculture, Forest Service, Washington, DC.
Stokes, M.A. and T.L. Smiley. 1868. An Introduction to Tree-Ring Dating. Chicago, University of Chicago Press.
Sugihara, N. and L. Reed. 1987. Vegetation ecology of the Bald Hills oak woodlands of Redwoods National Park. USDA National Park Service, Redwood National Park R&D Technical Report 21. Orick, California.
Suttles, W., and K. Ames. 1997. Pre-European history. Pages 255-274 In P.K. Schoonmaker, B. von Hagan, and E.C. Wolf, editors. The Rain Forests of Home: Profile of a North American Bioregion. Ecotrust and Island Press, Washington, DC.
Swetnam, T.W. 1993. Fire history and climate change in giant sequoia groves. Science. 262: 885 - 889.
The Pioneer, R. 1986. Memories Never Lost: stories of the pioneer women of the Cowichan Valley and a brief history of the valley 1850-1920. The Pioneer Researchers.
Thilenius, J. F. 1968. The Quercus garryana forests of the Willamette Valley, Oregon. Ecology 49:1124-1133.
Thompson, R.S., Bartlein, P.J., Whitlock, C., Harrison S.P. and W.G. Spaulding. 1993. Climatic changes in the western United States since 18,000 yr B.P. In: H.E. Wright, Jr., J.E. Kutzbach, T. Webb III, W.F. Ruddiman, F.A. Street-Perrot & P.J. Bartlein (editors), Global Climates Since the Last Glacial Maximum. University of Minnesota Press: Minneapolis.
Thysell, D. and A. Carey. 2001. Quercus garryana communities in the Puget Trough, Washington. Northwest Science 75: 219-235.
Turner, N.J. 1999. “Time to burn:” Traditional use of fire to enhance resource production by aboriginal peoples in British Columbia. In Indians, fire and the land in the Pacific Northwest. R. Boyd, Ed. Corvallis, OR, Oregon State University Press: 185-218.
Tveten, R. K., and R. W. Fonda. 1999. Fire effects on prairies and oak woodlands on Fort Lewis, Washington. Northwest Science 73:145-158.
Vance, R. E. 1987. Meteorological records of historic droughts as climatic analogues for the Holocene. In N. A. McKinnon & G. S. L. Stuart (eds), Man and the Mid-Holocene Climatic Optimum - Proceedings of the seventeenth annual conference of the Archaeological Association of the University of Calgary. The University of Calgary Archaeological Association, Calgary: 17-32.
Walker, I. R., and M. G. Pellatt. 2003. Climate change and impacts in southern British Columbia - a palaeoenvironmental perspective. Canadian Water Resources Journal 28: 531-566.
Wang, T., Hamann, A., Spittlehouse, D. L., and Aitken, S. N. 2006. Development of scale-free climate data for western Canada for use in resource management. International Journal of Climatology. 26: 383-397.
Weisberg, P. J., and F. J. Swanson. 2003. Regional synchroneity in fire regimes of western Oregon and Washington, USA. Forest Ecology and Management. 172:17-28.
Whitlock, C., and M. A. Knox. 2002. Prehistoric Burning in the Pacific Northwest: human versus climatic influences. Pages 195-231 in T. R. Vale, editor. Fire, Native Peoples, and the Natural Landscape. Island Press, Washington.
Williams, G.W. 2000. Early fire use in Oregon. Fire Management Today. 60: 13-20.
Yamaguchi, D.K. (1991). A simple method for cross-dating increment cores from living trees. Canadian Journal of Forest Research. 21: 414-416.
Zhang, Q. B., and D. R. J. Hebda. 2005. Abrupt climate change and variability in the past four millennia of the southern Vancouver Island, Canada. Geophysical Research Letters. 32: 1-4.