
FINITE ELEMENT STUDY OF RC SLAB IN PUNCHING SHEAR
397
FINITE ELEMENT STUDY OF RC SLAB IN PUNCHING SHEAR A. K. M. Jahangir Alam DEPARTMENT OF CIVIL ENGINEERING BANGLADESH UNIVERSITY OF ENGINEERING & TECHNOLOGY DHAKA, BANGLADESH
-
Upload
khangminh22 -
Category
Documents
-
view
4 -
download
0
Transcript of FINITE ELEMENT STUDY OF RC SLAB IN PUNCHING SHEAR

FINITE ELEMENT STUDY OF RC SLAB
IN PUNCHING SHEAR
A. K. M. Jahangir Alam
DEPARTMENT OF CIVIL ENGINEERING BANGLADESH UNIVERSITY OF ENGINEERING
& TECHNOLOGY DHAKA, BANGLADESH

FINITE ELEMENT STUDY OF RC SLAB
IN PUNCHING SHEAR
by
A. K. M. Jahangir Alam
A thesis submitted to the Department of Civil Engineering,
Bangladesh University of Engineering & Technology, Dhaka, for fulfillment
of
DOCTOR OF PHILOSOPHY IN CIVIL ENGINEERING
OCTOBER 2014
FINITE ELEMENT STUDY OF RC SLAB IN PUNCHING SHEAR
Approve as to style and contents on the dated October 14, 2014 by: Professor Dr. Khan Mahmud Amanat Department of Civil Engineering, BUET
Supervisor Chairman
Professor Dr. A. M. M. Taufiqul Anwar Head, Department of Civil Engineering, BUET
Ex-Officio Member
Professor Dr. Sk. Sekender Ali Department of Civil Engineering, BUET
Member
Professor Dr. Ahsanul Kabir Department of Civil Engineering, BUET
Member
Professor Dr. Tahsin Reza Hossain Department of Civil Engineering, BUET
Member
Professor Dr. Jamilur Reza Choudhury Vice Chancellor University of Asia Pacific House # 53/1, Road 4/A, Dhanmondi Dhaka, Bangladesh
Member (External)
Professor Dr. Iftekhar Anam Department of Civil Engineering University of Asia Pacific House # 53/1, Road 4/A, Dhanmondi Dhaka, Bangladesh
Member (External)

To
My parents and wife Dr. Nasrin Sultana

( iv )
DECLARATION
Declared that except where specific references are made to other investigators, the
work embodied in this thesis is the result of the investigation carried out by the author
under the supervision of Dr. Khan Mahmud Amanat, Professor, Department of Civil
Engineering, Bangladesh University of Engineering & Technology, Dhaka,
Bangladesh. Neither this thesis nor any part of it has been submitted or is being
concurrently submitted elsewhere for any other purpose (except for publication).
____________________ October, 2014 A. K. M. Jahangir Alam

( v )
ACKNOWLEDGMENT
The author wishes to express his deepest gratitude to Almighty Allah who is the
executive of everything and then his supervisor Dr. Khan Mahmud Amanat,
Professor, Department of Civil Engineering, Bangladesh University of Engineering &
Technology (BUET), for his constant guidance, continued encouragement, generous
help and unfailing enthusiasm at all the stages of this research work. His active
interest in this topic and valuable advice were the source of the author’s inspiration.
Sincere appreciation and gratitude are also expressed to Dr. A. M. M. Taufiqul
Anwar, Professor and Head, Department of Civil Engineering, BUET, for his
encouragement and cooperation. Thanks are also due to Dr. Sk. Sekender Ali,
Professor, Department of Civil Engineering, for his co-operation during his tenure as
Head, Department of Civil Engineering, BUET.
The author owes his thanks to the members of the Board of Post Graduate Studies of
the Department of Civil Engineering, BUET, and also to the members of the
Committee of Advanced Studies and Research for kindly approving the research
proposal and financing the experimental work reported in this thesis.
The author is grateful to Engr. Mohammad Mahfuzur Rahman, Sub-Divisional
Engineer (Civil), BUET, to support for software during analytical works. The author
is also grateful to Engr. M. M. Abdul Alim, Chief Engineer, BUET and other
colleagues for inspiration and support during the present study.
The author wishes to thank his family and friends who helped him with necessary
advice and information during the course of the study. Specially, author’s younger son
Md. Jarif Alam for his supports to produce sketch up model and elder son Md. Jahin
Alam for his help during preparation of this thesis.
Finally, the author likes to deliver his special thanks to his parents and beloved wife
Dr. Nasrin Sultana for their moral support to complete this work.
( vi )
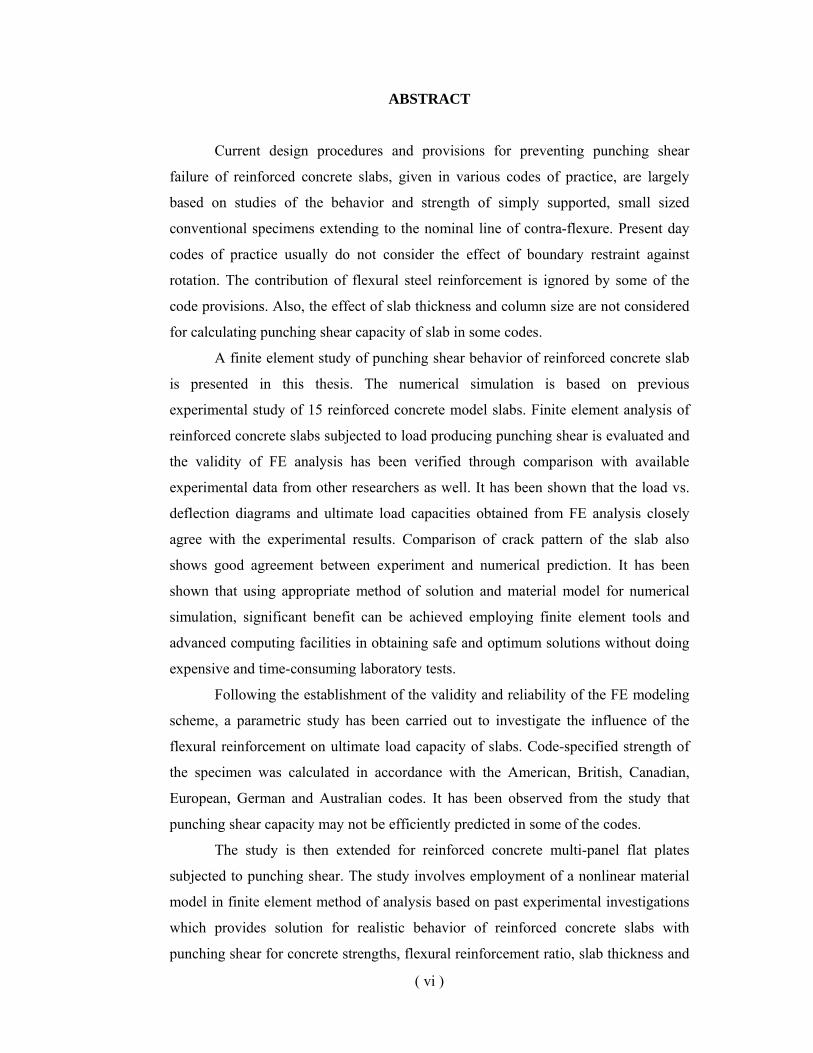
ABSTRACT
Current design procedures and provisions for preventing punching shear
failure of reinforced concrete slabs, given in various codes of practice, are largely
based on studies of the behavior and strength of simply supported, small sized
conventional specimens extending to the nominal line of contra-flexure. Present day
codes of practice usually do not consider the effect of boundary restraint against
rotation. The contribution of flexural steel reinforcement is ignored by some of the
code provisions. Also, the effect of slab thickness and column size are not considered
for calculating punching shear capacity of slab in some codes.
A finite element study of punching shear behavior of reinforced concrete slab
is presented in this thesis. The numerical simulation is based on previous
experimental study of 15 reinforced concrete model slabs. Finite element analysis of
reinforced concrete slabs subjected to load producing punching shear is evaluated and
the validity of FE analysis has been verified through comparison with available
experimental data from other researchers as well. It has been shown that the load vs.
deflection diagrams and ultimate load capacities obtained from FE analysis closely
agree with the experimental results. Comparison of crack pattern of the slab also
shows good agreement between experiment and numerical prediction. It has been
shown that using appropriate method of solution and material model for numerical
simulation, significant benefit can be achieved employing finite element tools and
advanced computing facilities in obtaining safe and optimum solutions without doing
expensive and time-consuming laboratory tests.
Following the establishment of the validity and reliability of the FE modeling
scheme, a parametric study has been carried out to investigate the influence of the
flexural reinforcement on ultimate load capacity of slabs. Code-specified strength of
the specimen was calculated in accordance with the American, British, Canadian,
European, German and Australian codes. It has been observed from the study that
punching shear capacity may not be efficiently predicted in some of the codes.
The study is then extended for reinforced concrete multi-panel flat plates
subjected to punching shear. The study involves employment of a nonlinear material
model in finite element method of analysis based on past experimental investigations
which provides solution for realistic behavior of reinforced concrete slabs with
punching shear for concrete strengths, flexural reinforcement ratio, slab thickness and
( vii )
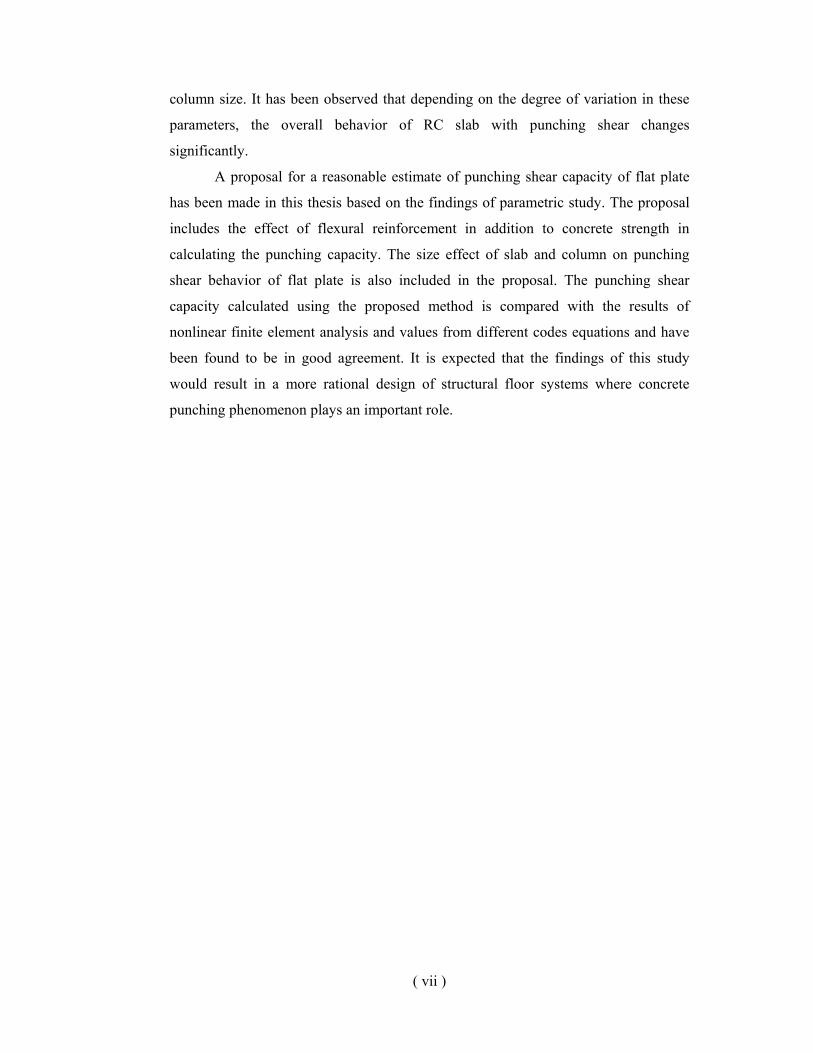
column size. It has been observed that depending on the degree of variation in these
parameters, the overall behavior of RC slab with punching shear changes
significantly.
A proposal for a reasonable estimate of punching shear capacity of flat plate
has been made in this thesis based on the findings of parametric study. The proposal
includes the effect of flexural reinforcement in addition to concrete strength in
calculating the punching capacity. The size effect of slab and column on punching
shear behavior of flat plate is also included in the proposal. The punching shear
capacity calculated using the proposed method is compared with the results of
nonlinear finite element analysis and values from different codes equations and have
been found to be in good agreement. It is expected that the findings of this study
would result in a more rational design of structural floor systems where concrete
punching phenomenon plays an important role.
( viii )
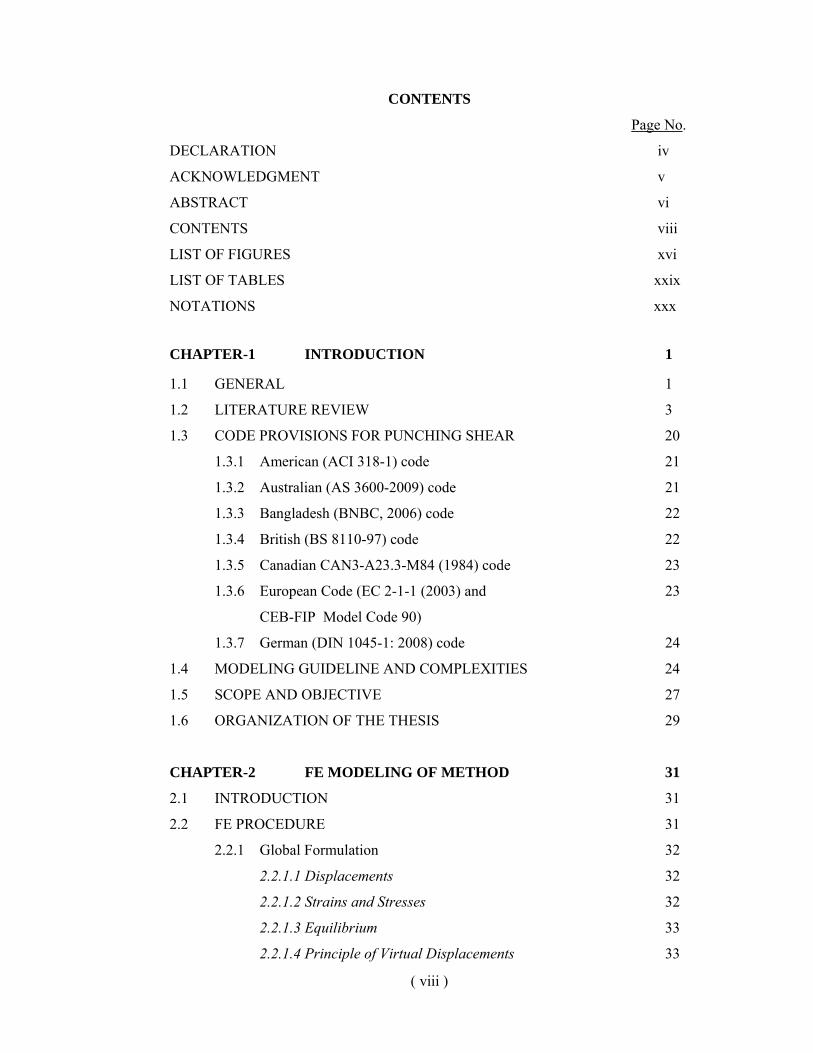
CONTENTS
Page No.
DECLARATION iv
ACKNOWLEDGMENT v
ABSTRACT vi
CONTENTS viii
LIST OF FIGURES xvi
LIST OF TABLES xxix
NOTATIONS xxx
CHAPTER-1 INTRODUCTION 1
1.1 GENERAL 1
1.2 LITERATURE REVIEW 3
1.3 CODE PROVISIONS FOR PUNCHING SHEAR 20
1.3.1 American (ACI 318-1) code 21
1.3.2 Australian (AS 3600-2009) code 21
1.3.3 Bangladesh (BNBC, 2006) code 22
1.3.4 British (BS 8110-97) code 22
1.3.5 Canadian CAN3-A23.3-M84 (1984) code 23
1.3.6 European Code (EC 2-1-1 (2003) and 23
CEB-FIP Model Code 90)
1.3.7 German (DIN 1045-1: 2008) code 24
1.4 MODELING GUIDELINE AND COMPLEXITIES 24
1.5 SCOPE AND OBJECTIVE 27
1.6 ORGANIZATION OF THE THESIS 29
CHAPTER-2 FE MODELING OF METHOD 31
2.1 INTRODUCTION 31
2.2 FE PROCEDURE 31
2.2.1 Global Formulation 32
2.2.1.1 Displacements 32
2.2.1.2 Strains and Stresses 32
2.2.1.3 Equilibrium 33
2.2.1.4 Principle of Virtual Displacements 33
( ix )
2.2.2 Discretization to Elements 34
2.2.2.1 Displacements 35
2.2.2.2 Strains and Stresses 35
2.2.2.3 Element Assembly 36
2.2.2.4 Virtual Strain Energy 36
2.2.2.5 Stiffness Matrix 38
2.2.3 Assembling the Load Vector 39
2.2.4 Equilibrium 39
2.3 SUITABLE ELEMENTS 40
2.3.1 Selection of Element 40
2.3.2 CHX60 Element 42
2.3.3 Displacements 43
2.3.4 Strains 43
2.3.5 Stresses 44
2.3.6 Shape functions 45
2.3.7 Element Stiffness Matrix 47
2.3.4 Numerical Solution of Element Integrals 48
2.4 INTEGRATION SCHEMES 49
2.5 STRAIN DISPLACEMENT RELATION 51
2.5.1 Equivalent Von Mises Strain 51
2.5.2 Principal Strains 51
2.5.3 Volumetric Strain 52
2.6 STRAIN MATRIX 52
2.7 STRESS-STRAIN RELATIONSHIP 54
2.8 REINFORCEMENT IN SOLID ELEMENT 54
CHAPTER-3 MATERIAL MODELLING 58
3.1 INTRODUCTION 58
3.2 BEHAVIOR OF CONCRETE IN COMPRESSION 59
3.2.1 Uniaxial Behavior 59
3.2.2 Biaxial Behavior 61
3.2.3 Triaxial Behavior 65
3.3 YIELD CRITEIA 68
3.3.1 The Tresca Yield Criterion 69
( x )
3.3.2 The Von Mises yield criterion 70
3.3.3 The Mohr-Coulomb yield criterion 70
3.3.4 The Ducker-Prager yield criterion 72
3.4 CRACKING OF CONCRETE AND MODELLING 73
3.4.1 Smeared Cracking Model 73
3.4.1.1 Crack Initiation 75
3.4.1.2 Crack Stress-Strain Relation 76
3.4.2 Total Strain Cracking Model 77
3.4.2.1 Coaxial and Fixed Stress–Strain Concept 77
3.4.2.2 Lateral Expansion Effects due to Poisson’s Ratio 79
3.4.3 Tensile Behavior 81
3.4.3.1 Tension Softening Relations 81
3.4.3.2 Linear Tension Softening 83
3.4.3.3 Multi-linear Tension Softening 84
3.4.3.4 Nonlinear Tension Softening by Hordijk et al. 84
3.4.3.5 Brittle Cracking 85
3.4.3.6 Exponential Tension Softening 86
3.4.3.7 Constant Tension Softening 86
3.4.4 Shear Retention Relations 87
3.4.4.1 Full Shear Retention 87
3.4.4.2 Constant Shear Retention 87
3.4.5 Compressive Behavior 87
3.5 REINFORCEMENT 89
3.5.1 Bar Reinforcement 90
3.5.2 Reinforcement Modeling 91
3.5.2.1 Linear Elasticity 91
3.5.2.2 Von Mises Plasticity 91
3.5.2.3 Monti–Nuti Plasticity 91
3.5.2.4 Reinforcement Specials 92
CHAPTER-4 NONLINEAR SOLUTION TECHNIQUES 93
4.1 INTRODUCTION 93
4.2 BASIC NUMERICAL PROCESS FOR NONLINEAR PROBLEM 93
4.2.1 Method of Direct Iteration 94

( xi )
4.2.2 The Newton-Rapson Method 95
4.2.2.1 Regular Newton-Raphson. 95
4.2.2.2 Modified Newton-Raphson. 96
4.2.3 Linear Stiffness Iteration 98
4.2.4 Constant Stiffness Iteration 98
4.3 CONVERGENCE CRITERIA 98
4.3.1 Force Norm 100
4.3.2 Displacement Norm 100
4.3.3 Energy Norm 100
4.4 INCREAMENTAL PROCEDURE 101
4.4.1 Load and Displacement Control 101
4.4.2 Arc-Length Control 102
4.4.2.1 Spherical Path ARC length method 104
4.4.2.2 Updated Normal Plane Arc length method 105
4.4.2.3 Indirect Displacement Control 105
4.5 ITERATIVE SOLUTION METHODS 106
4.5.1 Conjugate Gradient 107
4.5.2 Generalized Minimal Residual 107
4.6 SOLUTION TERMINATION CRITERIA 107
4.6.1 Loading Based Termination 107
4.6.2 Result Based Termination 108
CHAPTER-5 EXPERIMENTAL DATA 110
5.1 INTRODUCTION 110
5.2 PREVIOUS EXPERIMENTAL PROGRAM BY ALAM (1997) 110
5.2.1 Specimen Details 110
5.2.2 Test Results 112
5.2.3 Comparison of Test Results with different code of predictions 116
5.3 TEST RESULTS OF OTHER RESEARCHERS 119
5.3.1 Bresler and Scordelis Beam 119
5.3.2 Toronto Beam 120
5.3.3 Kotsovos Beam 121
5.3.4 Slab Tested by Kuang and Morley 121
( xii )
CHAPTER-6 NUMERICAL EXAMPLES AND VALIDATION 123
6.1 INTRODUCTION 123
6.2 MODELING OF TESTED SPECIMEN 123
6.3 ELEMENT SELECTION 124
6.4 MATERIAL MODEL OF CONCRETE 124
6.4.1 Compressive Behavior 124
6.4.2 Tensile Behavior 125
6.4.3 Shear Behavior 125
6.5 MODELING OF SLAB GEOMETRY 125
6.6 REINFORCEMENT MODEL 125
6.7 BOUNDARY CONDITION 126
6.8 LOADING 126
6.9 SOLUTION STRATEGY 126
6.10 RESULTS OF FE ANALYSIS 126
6.11 DISCUSSIONS ON FE ANALYSIS 132
6.11.1 Load-Deflection Behavior 132
6.11.2 Cracking 135
6.12 UPDATED FE MODEL 138
6.13 LOAD-DEFLECTION BEHAVIOR OF TESTED SLAB 138 USING UPDATED MODEL 6.14 COMPARISON OF TEST RESULTS AND ANALYSIS 141 WITH DIFFERENT CODE OF PREDICTIONS 6.15 PARAMETRIC STUDY 143
6.16 COMPARISON OF FE MODEL WITH TEST RESULTS 146 OF OTHER RESEARCHERS
6.16.1 Bresler and Scordelis Beam 146
6.16.2 Toronto Beam 147
6.16.3 Kotsovos Beam 148
6.16.4 Slab Tested by Kuang and Morley 149
6.17 SENSITIVITY OF MESH SIZE 151
6.18 VALIDATION OF FE ANALYSIS 153
( xiii )
CHAPTER-7 FE MODELING AND STUDY ON 154
MULTIPANEL FLAT PLATES
7.1 INTRODUCTION 154
7.2 BEHAVIORAL DIFFERENCE 154
7.3 FE MODELING OF MULTI PANEL FLAT PLATE 158
7.3.1 Flat Plate Building system 158
7.3.2 Boundary Condition and Loading 159
7.3.3 Material Model of Concrete in Slab 161
7.3.3.1 Compressive Behavior 161
7.3.3.2 Tensile Behavior 161
7.3.3.3 Shear Behavior 161
7.3.4 Reinforcement Modeling 161
7.4 FE MESHING OF MODEL 162
7.5 ANALYSIS PROCEDURE 164
7.6 PUNCHING TYPE OF FAILURE 164
CHAPTER-8 NUMERICAL EXAMPLES OF MULTI-PANEL 169 FLAT PLATES
8.1 INTRODUCTION 169
8.2 DIFFERENT SLABS COSIDERED 169
8.3 RESULTS OBTAINED FROM ANALYSIS OF MODEL SLAB 171
8.3.1 Load-deflection behavior 171
8.3.2 Sensitivity of Tension Softening to Multi Panel Model Slab 176
8.3.3 Ultimate Failure Load of Multi Panel Flat Plate 181
8.3.4 Sensitivity of Flexural Steel into the Flat Plate 190
8.4 DISCUSSION ON RESULTS AND COMPARISON WITH CODES 193
8.4.1 Punching Shear Stress of Multi Panel Flat Plate 193
8.4.2 Non-Dimensional Punching Shear of Multi Panel Flat Plate 198
8.4.3 Effect of Concrete Strength 203
8.4.3.1 On 400mm x 400mm column 203
8.4.3.2 On 600mm x 600mm column 206
8.4.3.3 On 800mm x 800mm column 209
8.4.3.4 On Average thickness of Slab 211
( xiv )
8.4.4 Effect of Flexural Reinforcement 214
8.4.4.1 On 400mm x 400mm column 214
8.4.4.2 On 600mm x 600mm column 217
8.4.4.3 On 800mm x 800mm column 219
8.4.4.4 On Average Thickness of Slab 221
8.4.5 Effect of Slab Thickness 226
8.4.5.1 On 400mm x 400mm column 226
8.4.5.2 On 600mm x 600mm column 229
8.4.5.3 On 800mm x 800mm column 231
8.4.5.4 On Average Column Size 234
8.4.6 Effect of Column Size 239
8.4.6.1 On 200mm thick slab 239
8.4.6.2 On 250mm thick slab 242
8.4.6.3 On 300mm thick slab 244
8.4.6.4 On Average Thickness of Slab 247
8.5 SUMMARY OF PRECEDING DISCUSSIONS 249
CHAPTER-9 SIMPLE PUNCHING SHEAR STRESS FORMULA 251 FOR MULTI PANEL FLAT PLATE 9.1 INTRODUCTION 251
9.2 BASIS OF PROPOSAL 251
9.2.1 Punching Shear Capacity of Slab 251
9.2.3 Relationship of Normalized Punching Shear with 253 Concrete Strength and Flexural Reinforcement 9.3 THE PROPOSED FORMULA 254
9.4 EFFECTIVENESS AND COMPARISON WITH CODE 255
9.4.1 Comparison with variable Concrete Strength 255
9.4.2 Application of Proposed Formula with variable Flexural 259 Reinforcement 9.4.3 Comparison with various codes of prediction 259
9.4.4 Comparison with test results 272
9.4.4.1 Comparison with Author’s Past Test Results. 272
9.4.4.2 Comparison with other’s Test Results. 272
9.5 CONCLUDING REMARKS 274
( xv )
CHAPTER-10 CONCLUSIONS AND RECOMMENDATIONS 275
10.1 CONCLUSIONS 275
10.2 RECOMMENDATIONS 278
REFFERENCE 279
APPENDIX-A DETAILS OF MODEL SLAB AN ANALYTICAL 294 RESULTS APPENDIX-B FAILURE LOAD AND PUNCHING SHEAR 298
STRESSES APPENDIX-C COMPARISON OF NORMALIZED PUNCHING 307 SHEAR OF MODEL SLAB
APPENDIX-D APPLICATION OF PROPOSED FORMULA FOR 314 PUNCHING SHEAR CAPACITY CALCULATION APPENDIX-E COMPARISON OF PROPOSED LOAD CARRYING 326 CAPACITY OF MODEL SLAB WITH VARIOUS
CODES APPENDIX-F COMPARISON OF PROPOSED FORMULA WITH 335 TEST RESULTS OF OTHER RESEARCHERS
APPENDIX- G LOAD DEFLECTION CURVE USING IDEAL 342 TENSION SOFTENING
( xvi )
LIST OF FIGURES
Page No. Figure 2.1 Stress resultants for plate/shell 41
Figure 2.2 Assumption Regarding deformation of a plate/shell 41
Figure 2.3 Solid Isoparametric Elements 42
Figure 2.4 Displacements of solid element 43
Figure 2.5 Deformation of solid element 44
Figure 2.6 Cauchy stresses of solid element 45
Figure 2.7 Integration schemes in ζ direction for bricks 50
Figure 2.8 Example integration schemes ηξ x ηη x ηζ for brick 50
Figure 2.9 Embedded reinforcement in 3D solid concrete element 55
Figure 3.1 Uniaxial Stress-strain relationship of ordinary concrete 60
Figure 3.2 Complete stress-strain curve including post-peak response 61
Figure 3.3 Biaxial strength envelope of concrete 62
Figure 3.4 Biaxial Compressive Yield Surface for Concrete with 64 Low Confining Pressure
Figure 3.5 Triaxial stress-strain curve of concrete for different confining 66 pressures Figure 3.6 Axial stress-strain relationship for 51.8 MPa concrete 68
Figure 3.7 Axial stress-strain relationship for 77.46 MPa concrete 68
Figure 3.8 Tresca and Von Mises yield condition (in π-and rendulic plane) 69
Figure 3.9 Mohr-Coulomb and Drucker-Prager yield condition 71 (in π-and rendulic plane)
Figure 3.10 Multi-directional fixed crack model 74
Figure 3.11 Secant crack stiffness 76
Figure 3.12 Linear tension softening 81
Figure 3.13 Multi-linear tension softening 84
Figure 3.14 Hordijk tension softening 85
Figure 3.15 Brittle tension softening 85
Figure 3.16 Exponential tension softening 86
Figure 3.17 Ideal tension softening 86
Figure 3.18 Predefined compression behavior for Total Strain model 88
Figure 3.19 Reinforcement bar 90
( xvii )
Figure 4.1 Regular Newton-Raphson iteration 96
Figure 4.2 Modified Newton-Raphson iteration 97
Figure 4.3 Linear Stiffness iteration 98
Figure 4.4 Convergence Norm 99
Figure 4.5 Load and displacement control 101
Figure 4.6 Arc-length control 103
Figure 4.7 Result based termination criteria 109
Figure 5.1 Details of a typical model slab with reinforcement. 111
Figure 5.2 Typical cracking pattern on the top surface of a model slab 113
Figure 5.3 Typical cracking pattern on the bottom surface of a model slab 113
Figure 5.4 Deflection at slab center of all slabs under different loading. 115
Figure 5.5 Comparison of test results with different code of prediction at 117 h=80mm and b=245mm.
Figure 5.6 Comparison of test results with different code of prediction 117
at h=60mm and b=245mm.
Figure 5.7 Comparison of test results with different codes at same slab 118 thickness of h=80mm.
Figure 5.8 Comparison of test results with different codes at same slab 118 thickness of h=60mm.
Figure 5.9 Details of Bresler and Scordelis Beam. 120
Figure 5.10 Details of Toronto Beam. 120
Figure 5.11 Details of Kotsovos Beam. 121
Figure 5.12 Details of Kuang and Morley model slab. 122
Figure 6.1 Meshed model of a typical slab showing 127 ( a ) top surface, ( b ) bottom surface.
Figure 6.2 Embedded reinforcement in a typical slab model. 128
Figure 6.3 Deflected shape and stress contour shown on 129 ( a ) top surface ( b ) bottom surface of typical slab model.
Figure 6.4 Compressive stress-strain on top surfaces of typical slab. 130
Figure 6.5 Tensile stress-strain on bottom surfaces of typical slab. 131
Figure 6.6 Tensile stress-strain diagram of typical reinforcement. 131
Figure 6.7 Deflection contour of bottom surface of a typical slab. 132
Figure 6.8 Load-deflection curves of analyzed and tested model having 133 slab thickness = 80mm and width of edge beam = 245mm.
( xviii )
Figure 6.9 Load-deflection curves of analyzed and tested model having 133 slab thickness = 60mm and width of edge beam = 245mm.
Figure 6.10 Load-deflection curves of analyzed and tested model having 134 width of edge beam = 175mm.
Figure 6.11 Load-deflection curves of analyzed and tested model having 134 width of edge beam = 105mm.
Figure 6.12 Load-deflection curves of analyzed and tested model having 135 no edge beam.
Figure 6.13 Cracking pattern of a typical slab at bottom surface. 136
Figure 6.14 Cracking at bottom surface of SLAB6 showing 136 (a) experimental cracking pattern, (b) analytical cracking pattern.
Figure 6.15 Cracking at bottom surface of SLAB9 showing 137
(a) experimental cracking pattern, (b) analytical cracking pattern.
Figure 6.16 Cracking at bottom surface of SLAB10 showing 137
(a) experimental cracking pattern, (b) analytical cracking pattern.
Figure 6.17 Cracking at bottom surface of SLAB15 showing 137
(a) experimental cracking pattern, (b) analytical cracking pattern.
Figure 6.18 Load-deflection curves of analyzed and tested model having 139
slab thickness = 80mm and width of edge beam = 245mm.
Figure 6.19 Load-deflection curves of analyzed and tested model having 139 slab thickness = 60mm and width of edge beam = 245mm
Figure 6.20 Load-deflection curves of analyzed and tested model having 140 width of edge beam = 175mm.
Figure 6.21 Load-deflection curves of analyzed and tested model having 140 width of edge beam = 105mm .
Figure 6.22 Load-deflection curves of analyzed and tested model having 141 no edge beam.
Figure 6.23 Comparison of test results with different codes at same 142 slab thickness of h=80mm.
Figure 6.24 Comparison of test results with different codes at same 143 slab thickness of h=60mm.
( xix )
Figure 6.25 Normalized Punching Shear of Slab model having 144 slab thickness = 80mm and width of edge beam = 245mm (similar to SLAB-2).
Figure 6.26 Normalized Punching Shear of Slab model having 144
slab thickness = 60mm and width of edge beam = 245mm (similar to SLAB-6).
Figure 6.27 Normalized Punching Shear of Slab model having 145
slab thickness = 60mm and width of edge beam = 175mm (similar to SLAB-9).
Figure 6.28 Normalized Punching Shear of Slab model having 145
slab thickness = 60mm and width of edge beam = 105mm (similar to SLAB-12).
Figure 6.29 ( a ) Meshed Model (b) Deformed Shape of Bresler and 147 Scordelis Beam. Figure 6.30 Load-Deflection curve of Bresler and Scordelis Beam. 147
Figure 6.31 ( a ) Meshed Model (b) Deformed Shape of Toronto Beam. 148
Figure 6.32 Load-Deflection curve of Toronto Beam. 148
Figure 6.33 ( a ) Meshed Model (b) Deformed Shape of Kotsovos Beam. 149
Figure 6.34 Load-deflection curve of Kotsovos Beam. 149
Figure 6.35 Meshed model of Kuang and Morley model slab (top surface). 150
Figure 6.36 Meshed model of Kuang and Morley model slab (top surface). 150
Figure 6.37 Load-deflection curves of analyzed and tested model by 151 Kuang and Morley.
Figure 6.38 Meshed model of a slab having smaller size of mesh 152
(same model as shown in Figure 6.1). Figure 6.39 Load-deflection behaviors for various size of mesh 153
Figure 7.1 Perspective view of a typical building with flat Plate. 159
Figure 7.2 Typical geometry of multi panel model slab 160
Figure 7.3 Typical embedded reinforcement in the multi panel 162 model at central column.
Figure 7.4 Model slab after meshing. 163
Figure 7.5 Enlarged corner of meshed model. 163
Figure 7.6 Location of nodes points from central column along 165 center line of model MSLAB11-7.
Figure 7.7 Load-deflection curves of various nodes of model slab 165
MSLAB11-7 for 'cf =30 MPa and 0.50% flexural reinforcement.
( xx )
Figure 7.8 Deformed shape of a typical slab MSLAB11-7 before 166
failure load. Figure 7.9 Typical crack pattern at the bottom surface of slab 166
MSLAB11-7 before failure. Figure 7.10 Location of elements from central column along center 167
line of model MSLAB11-7. Figure 7.11 Stress-Strain curves for various element adjacent to central 168
column of model slab MSLAB11-7.
Figure 8.1 Load-deflection of slab MSLAB11 for 'cf =24 MPa 171
at a distance 320mm from the edge of the central column. Figure 8.2 Load-deflection of slab MSLAB12 for '
cf =40 MPa 172 at a distance 320mm from the edge of the central column.
Figure 8.3 Load-deflection of slab MSLAB13 for 'cf = 50 MPa 172
at a distance 288mm from the edge of the central column.
Figure 8.4 Load-deflection of slab MSLAB21 for 'cf = 30 MPa 173
at a distance 150mm from the edge of the central column. Figure 8.5 Load-deflection of slab MSLAB22 for '
cf = 24 MPa 173 at a distance 300mm from the edge of the central column.
Figure 8.6 Load-deflection of slab MSLAB23 for '
cf = 50 MPa 174 at a distance 225mm from the edge of the central column.
Figure 8.7 Load-deflection of slab MSLAB31 for '
cf = 30 MPa 174 at a distance 315mm from the edge of the central column.
Figure 8.8 Load-deflection of slab MSLAB32 for '
cf = 60 MPa 175 at a distance 315mm from the edge of the central column.
Figure 8.9 Load-deflection of slab MSLAB33 for '
cf = 24 MPa 175 at a distance 158mm from the edge of the central column.
Figure 8.10 Load-deflection behaviors for ideal tension softening and 176
linear tension softening of model slab MSLAB11. Figure 8.11 Load-deflection behaviors for ideal tension softening 177
and linear tension softening of model slab MSLAB11, MSLAB12 and MSLAB13.
( xxi )
Figure 8.12 Load-deflection behaviors for ideal tension softening 178 and linear tension softening of model slab MSLAB21, MSLAB22 and MSLAB23.
Figure 8.13 Load-deflection behaviors for ideal tension softening 179
and linear tension softening of model slab MSLAB31, MSLAB32 and MSLAB33.
Figure 8.14 Ultimate punching failure loads of MSLAB11 for different '
cf . 181
Figure 8.15 Ultimate punching failure loads of MSLAB11 for 182 different flexural reinforcement ratio.
Figure 8.16 Ultimate punching failure loads of MSLAB12 for different '
cf . 182 Figure 8.17 Ultimate punching failure loads of MSLAB12 for 183
different flexural reinforcement ratio. Figure 8.18 Ultimate punching failure loads of MSLAB13 for different '
cf . 183 Figure 8.19 Ultimate punching failure loads of MSLAB13 for 184
different flexural reinforcement ratio. Figure 8.20 Ultimate punching failure loads of MSLAB21 for different '
cf . 184 Figure 8.21 Ultimate punching failure loads of MSLAB21 for 185
different flexural reinforcement ratio. Figure 8.22 Ultimate punching failure loads of MSLAB22 for different '
cf . 185 Figure 8.23 Ultimate punching failure loads of MSLAB22 for 186
different flexural reinforcement ratio. Figure 8.24 Ultimate punching failure loads of MSLAB23 for different '
cf . 186 Figure 8.25 Ultimate punching failure loads of MSLAB23 for 187
different flexural reinforcement ratio. Figure 8.26 Ultimate punching failure loads of MSLAB31 for different '
cf . 187 Figure 8.27 Ultimate punching failure loads of MSLAB31 for 188
different flexural reinforcement ratio. Figure 8.28 Ultimate punching failure loads of MSLAB32 for different '
cf . 188 Figure 8.29 Ultimate punching failure loads of MSLAB32 for 189
different flexural reinforcement ratio.
( xxii )
Figure 8.30 Ultimate punching failure loads of MSLAB33 for different 'cf . 189
Figure 8.31 Ultimate punching failure loads of MSLAB33 for 190
different flexural reinforcement ratio. Figure 8.32 Location of integration point for steel. 191 Figure 8.33 Stress-strain of Point-1 and Point-3 for steel. 192 Figure 8.34 Stress-strain of Point-2 for steel. 192 Figure 8.35 Punching shear stresses of MSLAB11 at various 193
compressive strength of concrete. Figure 8.36 Punching shear stresses of MSLAB12 at various 194
compressive strength of concrete. Figure 8.37 Punching shear stresses of MSLAB13 at various 194
compressive strength of concrete. Figure 8.38 Punching shear stresses of MSLAB21 at various 195
compressive strength of concrete. Figure 8.39 Punching shear stresses of MSLAB22 at various 195
compressive strength of concrete. Figure 8.40 Punching shear stresses of MSLAB23 at various 196
compressive strength of concrete. Figure 8.41 Punching shear stresses of MSLAB31 at various 196
compressive strength of concrete. Figure 8.42 Punching shear stresses of MSLAB32 at various 197
compressive strength of concrete. Figure 8.43 Punching shear stresses of MSLAB33 at various 197
compressive strength of concrete. Figure 8.44 Non-dimensional stresses due to punching force 198
of MSLAB11 for various compressive strength of concrete. Figure 8.45 Non-dimensional stresses due to punching force 199
of MSLAB12 for various compressive strength of concrete. Figure 8.46 Non-dimensional stresses due to punching force 199
of MSLAB13 for various compressive strength of concrete. Figure 8.47 Non-dimensional stresses due to punching force 200
of MSLAB21 for various compressive strength of concrete.
( xxiii )
Figure 8.48 Non-dimensional stresses due to punching force 200 of MSLAB22 for various compressive strength of concrete.
Figure 8.49 Non-dimensional stresses due to punching force 201
of MSLAB23 for various compressive strength of concrete. Figure 8.50 Non-dimensional stresses due to punching force 201
of MSLAB31 for various compressive strength of concrete. Figure 8.51 Non-dimensional stresses due to punching force 202
of MSLAB32 for various compressive strength of concrete. Figure 8.52 Non-dimensional stresses due to punching force 202
of MSLAB33 for various compressive strength of concrete. Figure 8.53 Normalized punching shear strength at various compressive 204
strength of concrete of 200mm thick slab (400mm x 400mm column).
Figure 8.54 Normalized punching shear strength at various compressive 205
strength of concrete of 250mm thick slab (400mm x 400mm column).
Figure 8.55 Normalized punching shear strength at various compressive 205
strength of concrete of 300mm thick slab (400mm x 400mm column).
Figure 8.56 Normalized punching shear strength at various compressive 207
strength of concrete of 200mm thick slab (600mm x 600mm column).
Figure 8.57 Normalized punching shear strength at various compressive 208
strength of concrete of 250mm thick slab (600mm x 600mm column).
Figure 8.58 Normalized punching shear strength at various compressive 208
strength of concrete of 300mm thick slab (600mm x 600mm column).
Figure 8.59 Normalized punching shear strength at various compressive 210
strength of concrete of 200mm thick slab (800mm x 800mm column).
Figure 8.60 Normalized punching shear strength at various compressive 210
strength of concrete of 250mm thick slab (800mm x 800mm column).
Figure 8.61 Normalized punching shear strength at various compressive 211
strength of concrete of 300mm thick slab (800mm x 800mm column).
( xxiv )
Figure 8.62 Normalized punching shear strength at various compressive 212
strength of concrete considering 400mm x 400mm column. Figure 8.63 Normalized punching shear strength at various compressive 213
strength of concrete considering 600mm x 600mm column. Figure 8.64 Normalized punching shear strength at various compressive 213
strength of concrete considering 800mm x 800mm column. Figure 8.65 Normalized punching shear of 200mm thick at various 215
reinforcement ratio (400mm x 400mm column). Figure 8.66 Normalized punching shear of 250mm thick at various 216
reinforcement ratio (400mm x 400mm column). Figure 8.67 Normalized punching shear of 300mm thick at various 216
reinforcement ratio (400mm x 400mm column). Figure 8.68 Normalized punching shear of 200mm thick at various 217
reinforcement ratio (600mm x 600mm column). Figure 8.69 Normalized punching shear of 250mm thick at various 218
reinforcement ratio (600mm x 600mm column). Figure 8.70 Normalized punching shear of 300mm thick at various 218
reinforcement ratio (600mm x 600mm column). Figure 8.71 Normalized punching shear of 200mm thick slab at various 220
reinforcement ratio (800mm x 800mm column). Figure 8.72 Normalized punching shear of 250mm thick slab at various 220
reinforcement ratio (800mm x 800mm column). Figure 8.73 Normalized punching shear of 300mm thick slab at various 221
reinforcement ratio (800mm x 800mm column). Figure 8.74 Average normalized punching shear strength at various 222
flexural reinforcement ratio for 'cf =24 MPa.
Figure 8.75 Average normalized punching shear strength at various 222
flexural reinforcement ratio for 'cf =30 MPa.
Figure 8.76 Average normalized punching shear strength at various 223
flexural reinforcement ratio for 'cf =40 MPa.
Figure 8.77 Average normalized punching shear strength at various 223
flexural reinforcement ratio for 'cf =50 MPa.
( xxv )
Figure 8.78 Average normalized punching shear strength at various 224
flexural reinforcement ratio for 'cf =60 MPa.
Figure 8.79 Normalized punching shear of model slabs having 0.5% flexural 227
reinforcement ratio (400mm x 400mm column). Figure 8.80 Normalized punching shear of model slabs having 1% flexural 227
reinforcement ratio (400mm x 400mm column). Figure 8.81 Normalized punching shear of model slabs having 1.5% flexural 228
reinforcement ratio (400mm x 400mm column). Figure 8.82 Normalized punching shear of model slabs having 2% flexural 228
reinforcement ratio (400mm x 400mm column). Figure 8.83 Normalized punching shear of model slabs having 0.5% flexural 229
reinforcement ratio (600mm x 600mm column). Figure 8.84 Normalized punching shear of model slabs having 1% flexural 230
reinforcement ratio (600mm x 600mm column). Figure 8.85 Normalized punching shear of model slabs having 1.5% flexural 230
reinforcement ratio (600mm x 600mm column). Figure 8.86 Normalized punching shear of model slabs having 2% flexural 231
reinforcement ratio (600mm x 600mm column). Figure 8.87 Normalized punching shear of model slabs having 0.25% flexural 232
reinforcement ratio (800mm x 800mm column). Figure 8.88 Normalized punching shear of model slabs having 0.5% flexural 232
reinforcement ratio (800mm x 800mm column). Figure 8.89 Normalized punching shear of model slabs having 1% flexural 233
reinforcement ratio (800mm x 800mm column). Figure 8.90 Normalized punching shear of model slabs having 1.5% flexural 233
reinforcement ratio (800mm x 800mm column). Figure 8.91 Normalized punching shear of model slabs having 2% flexural 234
reinforcement ratio (800mm x 800mm column). Figure 8.92 Average normalized punching shear of model slabs having 235
0.25% flexural reinforcement ratio. Figure 8.93 Average normalized punching shear of model slabs having 236
0.5% flexural reinforcement ratio.
( xxvi )
Figure 8.94 Average normalized punching shear of model slabs having 236 1% flexural reinforcement ratio.
Figure 8.95 Average normalized punching shear of model slabs having 237
1.5% flexural reinforcement ratio. Figure 8.96 Average normalized punching shear of model slabs having 237
2% flexural reinforcement ratio.
Figure 8.97 Normalized punching shear of model slabs having 0.5% flexural 240 reinforcement ratio (200mm thick slab).
Figure 8.98 Normalized punching shear of model slabs having 1% flexural 240
reinforcement ratio (200mm thick slab). Figure 8.99 Normalized punching shear of model slabs having 1.5% flexural 241
reinforcement ratio(200mm thick slab).
Figure 8.100 Normalized punching shear of model slabs having 2% flexural 241 reinforcement ratio (200mm thick slab).
Figure 8.101 Normalized punching shear of model slabs having 0.5% flexural 242 reinforcement ratio (250mm thick slab).
Figure 8.102 Normalized punching shear of model slabs having 1% flexural 243
reinforcement ratio (250mm thick slab). Figure 8.103 Normalized punching shear of model slabs having 1.5% flexural 243
reinforcement ratio (250mm thick slab). Figure 8.104 Normalized punching shear of model slabs having 2% flexural 244
reinforcement ratio (250mm thick slab). Figure 8.105 Normalized punching shear of model slabs having 0.5% flexural 245
reinforcement ratio (300mm thick slab). Figure 8.106 Normalized punching shear of model slabs having 1% flexural 245
reinforcement ratio (300mm thick slab). Figure 8.107 Normalized punching shear of model slabs having 1.5% flexural 246
reinforcement ratio (300mm thick slab). Figure 8.108 Normalized punching shear of model slabs having 2% flexural 246
reinforcement ratio (300mm thick slab). Figure 8.109 Average normalized punching shear of model slabs having 247
0.5% flexural reinforcement ratio.
( xxvii )
Figure 8.110 Average normalized punching shear of model slabs having 248 1% flexural reinforcement ratio.
Figure 8.111 Average normalized punching shear of model slabs having 248
1.5% flexural reinforcement ratio. Figure 8.112 Average normalized punching shear of model slabs having 249
2% flexural reinforcement ratio. Figure 9.1 Average normalized punching shear of all model slab for 253
variable compressive strength of concrete.
Figure 9.2 Average normalized punching shear of all model slab for variable 254 flexural reinforcement.
Figure 9.3 Application of proposed formula for variable strength of 256
concrete of ( a ) 0.25% , ( b ) 0.5% , ( c ) 1%, ( d ) 1.5% and ( e ) 2% flexural steel (400mm x 400mm column and 200mm thick slab).
Figure 9.4 Application of proposed formula for variable strength of 257
concrete of ( a ) 0.25% , ( b ) 0.5% , ( c ) 1%, ( d ) 1.5% and ( e ) 2% flexural steel (600mm x 600mm column and 250mm thick slab).
Figure 9.5 Application of proposed formula for variable strength of 258
concrete of ( a ) 0.25% , ( b ) 0.5% , ( c ) 1%, ( d ) 1.5% and ( e ) 2% flexural steel (800mm x 800mm column and 300mm thick slab).
Figure 9.6 Application of proposed formula for variable flexural 260
reinforcement of ( a ) 24 MPa, ( b ) 30 MPa, ( c ) 40 MPa, ( d ) 50 MPa and ( e ) 60 MPa (400mm x 400mm column and 200mm thick slab).
Figure 9.7 Application of proposed formula for variable flexural 261
reinforcement of ( a ) 24 MPa, ( b ) 30 MPa, ( c ) 40 MPa, ( d ) 50 MPa and ( e ) 60 MPa (600mm x 600mm column and 250mm thick slab).
Figure 9.8 Application of proposed formula for variable flexural 262
reinforcement of ( a ) 24 MPa, ( b ) 30 MPa, ( c ) 40 MPa, ( d ) 50 MPa and ( e ) 60 MPa (800mm x 800mm column and 300mm thick slab).
Figure 9.9 Punching shear load of obtained from FE analysis, calculated 263
by the proposed formula and various code of 200mm thick model slab having 400mm x 400mm column for ( a ) f’c = 24 MPa, ( b ) f’c = 30 MPa
( xxviii )
Figure 9.10 Punching shear load of obtained from FE analysis, calculated 264 by the proposed formula and various code of 250mm thick model slab having 400mm x 400mm column for
( a ) f’c = 24 MPa, ( b ) f’c = 30 MPa Figure 9.11 Punching shear load of obtained from FE analysis, calculated 265 by the proposed formula and various code of 300mm
thick model slab having 400mm x 400mm column for ( a ) f’c = 24 MPa, ( b ) f’c = 30 MPa Figure 9.12 Punching shear load of obtained from FE analysis, calculated 266
by the proposed formula and various code of 200mm thick model slab having 600mm x 600mm column for ( a ) f’c = 24 MPa, ( b ) f’c = 30 MPa
Figure 9.13 Punching shear load of obtained from FE analysis, calculated 267 by the proposed formula and various code of 250mm thick model slab having 600mm x 600mm column for ( a ) f’c = 24 MPa, ( b ) f’c = 30 MPa Figure 9.14 Punching shear load of obtained from FE analysis, calculated 268
by the proposed formula and various code of 300mm thick model slab having 600mm x 600mm column for
( a ) f’c = 24 MPa, ( b ) f’c = 30 MPa Figure 9.15 Punching shear load of obtained from FE analysis, calculated 269
by the proposed formula and various code of 200mm thick model slab having 800mm x 800mm column for ( a ) f’c = 24 MPa, ( b ) f’c = 30 MPa Figure 9.16 Punching shear load of obtained from FE analysis, calculated 270
by the proposed formula and various code of 250mm thick model slab having 800mm x 800mm column for ( a ) f’c = 24 MPa, ( b ) f’c = 30 MPa Figure 9.17 Punching shear load of obtained from FE analysis, calculated 271
by the proposed formula and various code of 300mm thick model slab having 800mm x 800mm column for
( a ) f’c = 24 MPa, ( b ) f’c = 30 MPa
( xxix )
LIST OF TABLES
Page No.
Table 5.1 Details of Reinforced Concrete Slab Specimens 111
Table 5.2 Test results, Non-dimensional and Normalized Punching 114 Shear Strength of Reinforced Concrete Slabs Table 8.1 Geometry of model slab 170
Table 8.2 Details of model slab MSLAB11 170
Table 8.3 Comparison of failure load using ideal and linear tension 180 softening.
Table 9.1 Average normalized punching shear capacity of all slabs 252
Table 9.2 Comparison of proposed formula with experimental result 273 of Alam (1997)
Table 9.3 Comparison of proposed formula with experimental result 273 of Kuang and Morley (1992)
( xxx )
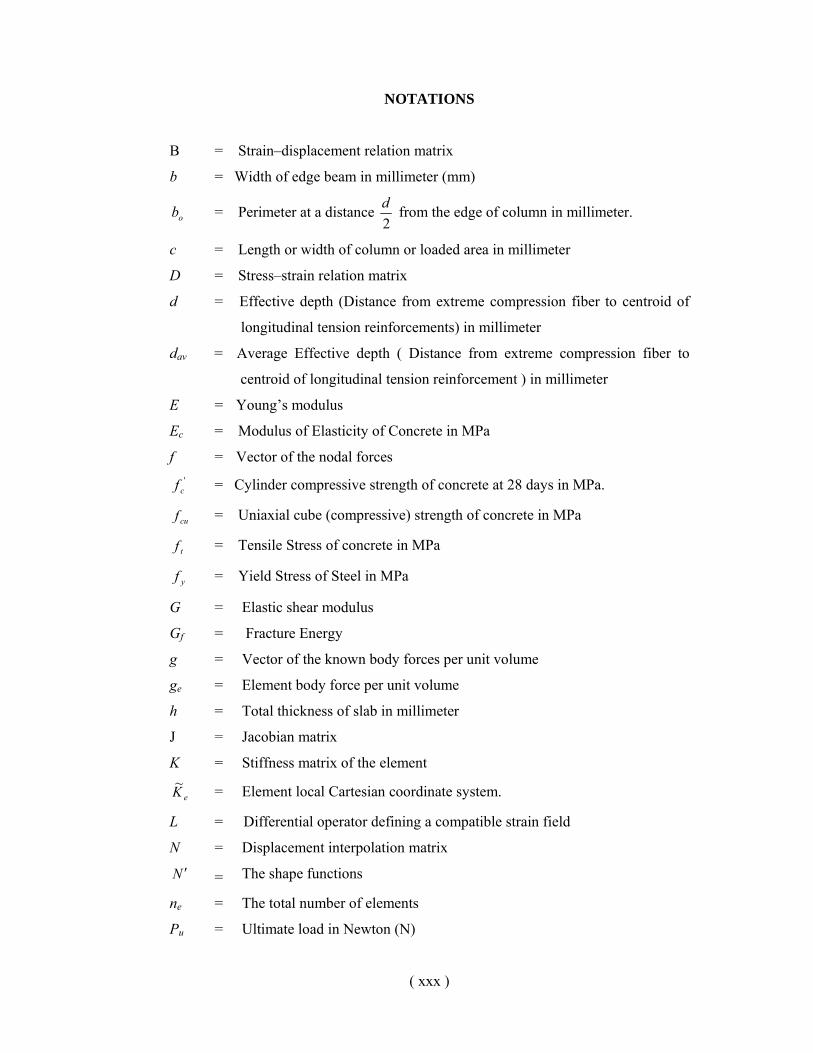
NOTATIONS
B = Strain–displacement relation matrix
b = Width of edge beam in millimeter (mm)
ob = Perimeter at a distance 2d from the edge of column in millimeter.
c = Length or width of column or loaded area in millimeter
D = Stress–strain relation matrix
d = Effective depth (Distance from extreme compression fiber to centroid of
longitudinal tension reinforcements) in millimeter
dav = Average Effective depth ( Distance from extreme compression fiber to
centroid of longitudinal tension reinforcement ) in millimeter
E = Young’s modulus
Ec = Modulus of Elasticity of Concrete in MPa f = Vector of the nodal forces
'cf = Cylinder compressive strength of concrete at 28 days in MPa.
cuf = Uniaxial cube (compressive) strength of concrete in MPa
tf = Tensile Stress of concrete in MPa
yf = Yield Stress of Steel in MPa
G = Elastic shear modulus
Gf = Fracture Energy
g = Vector of the known body forces per unit volume
ge = Element body force per unit volume
h = Total thickness of slab in millimeter
J = Jacobian matrix
K = Stiffness matrix of the element
eK~ = Element local Cartesian coordinate system.
L = Differential operator defining a compatible strain field
N = Displacement interpolation matrix
N ′ = The shape functions
ne = The total number of elements
Pu = Ultimate load in Newton (N)

( xxxi )
r = Vector of the internal forces
St = Element surface, edge
T = Slab thickness in millimeter
Te = Element transformation matrix
TԐ = Strain transformation matrix
t = Traction forces vector on the boundary
te = Element tractions per unit area
u = Vector of the unknown nodal degrees of freedom
ue = Element nodal displacement vector
V = Total volume or domain of the model.
Vc = Punching shear strength provided by concrete in Newton (N)
Vn = Nominal Punching Shear Capacity in Newton (N)
Vp = Punching shear strength provided by concrete in Newton (N)
x = The approximation of any x
αs = 40 for interior column, 30 for edge column, 20 for corner column
β = Shear retention factor
βc = Ratio of long side to short side of concentrated load or reaction area
ρ = Flexural reinforcement ratio.
ρav = Average Reinforcement ratio in percentage
ε = Total Strain (mm/mm)
εcr = Crack Strain (mm/mm)
εe = Elastic Strain (mm/mm)
εcr,nn = Ultimate Crack Strain (mm/mm)
εp = Plastic Strain (mm/mm)
Ԑ0 = Initial strains vector
Ԑl = Local strain vector
σ = Total Stress in MPa
σ1, σ2, σ3 = Principal Stress in MPa
σ0 = Initial residual stresses vector
κ = hardening parameter
τ = Shearing stress in millimeter

( xxxii )
φ = Angle of internal friction
ϕ0 = The initial angle of internal friction
ρψ
776.7
3 '
+= cf
, for 'cf = 21 MPa to 48 MPa
)3.71(47.0 ρψ −= , for 'cf = above 48 MPa
υ = Poisson’s ratio
ξ, η and ζ = The intrinsic co-ordinates of any point within the element.
1
CHAPTER-1
INTRODUCTION
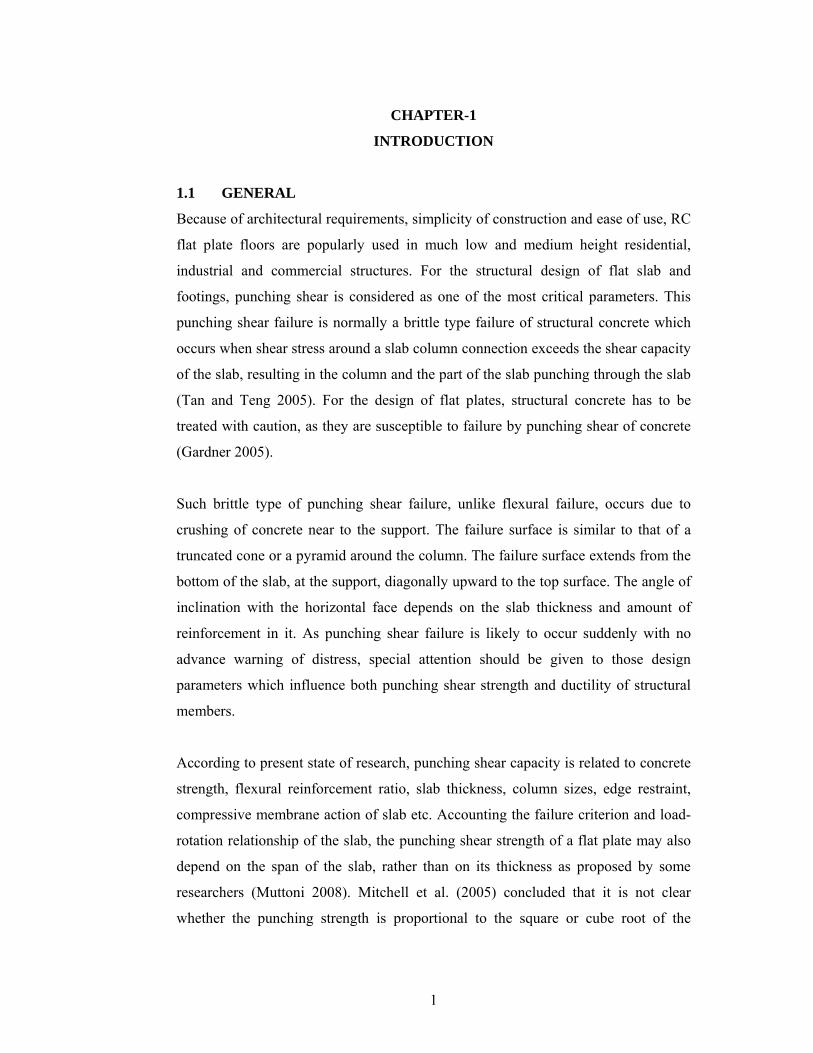
1.1 GENERAL
Because of architectural requirements, simplicity of construction and ease of use, RC
flat plate floors are popularly used in much low and medium height residential,
industrial and commercial structures. For the structural design of flat slab and
footings, punching shear is considered as one of the most critical parameters. This
punching shear failure is normally a brittle type failure of structural concrete which
occurs when shear stress around a slab column connection exceeds the shear capacity
of the slab, resulting in the column and the part of the slab punching through the slab
(Tan and Teng 2005). For the design of flat plates, structural concrete has to be
treated with caution, as they are susceptible to failure by punching shear of concrete
(Gardner 2005).
Such brittle type of punching shear failure, unlike flexural failure, occurs due to
crushing of concrete near to the support. The failure surface is similar to that of a
truncated cone or a pyramid around the column. The failure surface extends from the
bottom of the slab, at the support, diagonally upward to the top surface. The angle of
inclination with the horizontal face depends on the slab thickness and amount of
reinforcement in it. As punching shear failure is likely to occur suddenly with no
advance warning of distress, special attention should be given to those design
parameters which influence both punching shear strength and ductility of structural
members.
According to present state of research, punching shear capacity is related to concrete
strength, flexural reinforcement ratio, slab thickness, column sizes, edge restraint,
compressive membrane action of slab etc. Accounting the failure criterion and load-
rotation relationship of the slab, the punching shear strength of a flat plate may also
depend on the span of the slab, rather than on its thickness as proposed by some
researchers (Muttoni 2008). Mitchell et al. (2005) concluded that it is not clear
whether the punching strength is proportional to the square or cube root of the
2
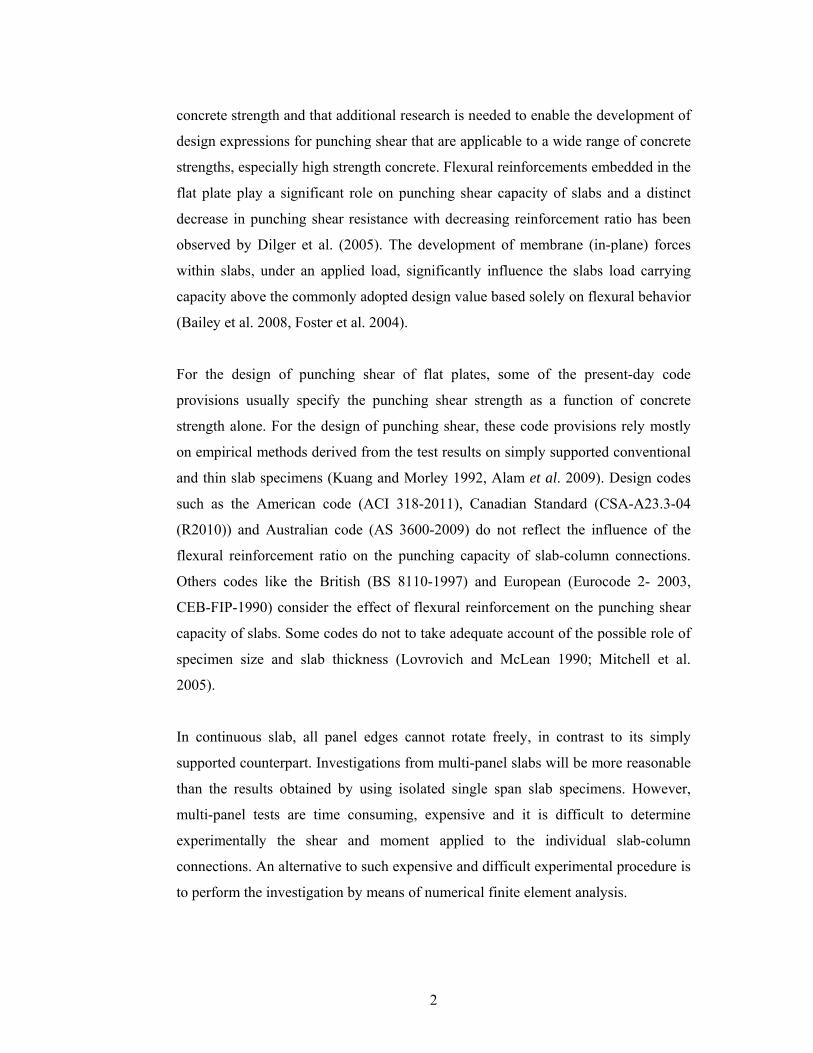
concrete strength and that additional research is needed to enable the development of
design expressions for punching shear that are applicable to a wide range of concrete
strengths, especially high strength concrete. Flexural reinforcements embedded in the
flat plate play a significant role on punching shear capacity of slabs and a distinct
decrease in punching shear resistance with decreasing reinforcement ratio has been
observed by Dilger et al. (2005). The development of membrane (in-plane) forces
within slabs, under an applied load, significantly influence the slabs load carrying
capacity above the commonly adopted design value based solely on flexural behavior
(Bailey et al. 2008, Foster et al. 2004).
For the design of punching shear of flat plates, some of the present-day code
provisions usually specify the punching shear strength as a function of concrete
strength alone. For the design of punching shear, these code provisions rely mostly
on empirical methods derived from the test results on simply supported conventional
and thin slab specimens (Kuang and Morley 1992, Alam et al. 2009). Design codes
such as the American code (ACI 318-2011), Canadian Standard (CSA-A23.3-04
(R2010)) and Australian code (AS 3600-2009) do not reflect the influence of the
flexural reinforcement ratio on the punching capacity of slab-column connections.
Others codes like the British (BS 8110-1997) and European (Eurocode 2- 2003,
CEB-FIP-1990) consider the effect of flexural reinforcement on the punching shear
capacity of slabs. Some codes do not to take adequate account of the possible role of
specimen size and slab thickness (Lovrovich and McLean 1990; Mitchell et al.
2005).
In continuous slab, all panel edges cannot rotate freely, in contrast to its simply
supported counterpart. Investigations from multi-panel slabs will be more reasonable
than the results obtained by using isolated single span slab specimens. However,
multi-panel tests are time consuming, expensive and it is difficult to determine
experimentally the shear and moment applied to the individual slab-column
connections. An alternative to such expensive and difficult experimental procedure is
to perform the investigation by means of numerical finite element analysis.
3
Nonlinear finite analysis procedures are reliable and popular in recent years as
engineers attempt to more realistically model the behavior of structures subjected to
all types of loading. Computer simulation makes the accuracy for describing actual
behavior of structures, compare the behavior with laboratory experimenting methods,
prospects in the process of scientific research, and relation with experiment and
analysis methods. It is very important that before practical application finite element
analysis methods should be verified and validated comparing the analysis results
with reliable experiment data.
In this study, an advanced nonlinear finite element investigation of multi-panel flat
plate considering full scale with practical geometry has been carried out on the
behavior of punching shear characteristics of concrete slab in presence of flexural
reinforcement. At first stage, FE model has been used to simulate relevant
experiments carried out earlier (Alam et al. 2009). Good agreement has been
observed between numerical FE simulation and experiment, which establish the
validity of FE model. Later on, the same FE procedure has been used to analyze
multi-panel slab models and the results are presented in this study in an effort to
understand the actual punching shear behavior of slab systems.
1.2 LITERATURE REVIEW
A large number of investigators, on the basis of their experimental and analytical
studies on the punching shear behavior of slabs, have expressed their opinion against
the present punching shear provisions. They have shown that the code does not
usually provide an accurate prediction of the punching shear strength of reinforced
concrete slab for various end conditions, reinforcement ratio, span-to-depth ratio, etc.
Rankin and Long (1987) from their experiment recognized the importance of the
flexure and shear modes of punching failure to produce more consistent and
economic design procedure. They have drawn out that the punching strength of full
panel specimen is significantly greater than that of equivalent conventional slab, for
the effect of compressive membrane action in the full panel specimen gives
4
significantly better correlation with test result than present code method and other
procedures.
Punching shear tests of geometrically similar reinforced concrete slabs of different
sizes have been carried out by Bazant and Coa (1987). They have summarized that
the punching shear failure of slab without stirrup is not plastic but brittle. They have
found that larger the slab thickness, steeper the post-peak decline of the load
deflection diagram, thus the punching shear behavior of thin slab is closer to
plasticity and that of thick slab is closer to linear elastic fracture mechanics.
Regan and Jorabi (1988) have shown that analysis using current code provisions and
making separate calculations of full width shear strength and punching shear are
inappropriate. They proposed that design checks should be based on nominal shear
stresses obtained as the sum of stresses arising from two components of load bearing
action. The first is a symmetrical spreading of concentrated load and the second is
the spanning of the slab carrying the spread load between supports.
Gardner (1990) presents the result of an investigation relating punching shear to
concrete strength and steel ratio. He concluded that the shear capacity is proportional
to the cube root of concrete strength and steel ratio and that the ACI 318 (1983) and
CSA A23.3-M84 (1984) provision should be reviewed. He also opined that the shear
perimeter should be increased by using large columns and column capitals, if the
punching shear capacity is in doubt.
Results of an experimental investigation on the punching shear strength of reinforced
concrete slabs with varying span-to-depth ratio have been summarized by Lovrovich
and McLean (1990). They have reported that the ACI Building code does not
recognize span-to-depth ratio effects or the effects of restraining action at the support
when treating punching shear in reinforced concrete slabs. They observed that
punching shear strength were much greater than the values permitted by the ACI
Building code. This was especially true for those specimens with smaller span-to-
depth ratios. The higher strengths were a result of smaller span-to-depth ratios, in-
5
plane compressive forces caused by restraining action at the support and excellent
anchorage provided for the shear reinforcement.
McLean et al. (1990) concluded from their experimental work that punching shear
strengths are much higher than those predicted by ACI 318 (1983). They cited some
reasons for such higher strengths. The authors stated that the ACI Building code
allows only half of concrete contribution to the punching shear strength in a slab with
shear reinforcement than it allows in a slab without shear reinforcement. From the
test results, they have shown that the strength provided by the concrete is the same in
the specimens with and without shear reinforcement. The researchers stated that the
code recognizes only the shear reinforcement activated by the assumed 450 degree
failure surfaces. In the test specimens, the cracks were generally much flatter than
450 degree, thus activating substantially more shear reinforcement than is recognized
by the code. The study revealed that the relatively small span-to-thickness ratios of
the specimens resulted in different internal cracking patterns than those of thinner
slabs. This cracking was indicative of development of internal compression struts
similar to those observed in deep beams. They also argued with the code specified
upper limits on the punching shear strength in a slab, regardless of the amount of
shear reinforcement provided.
Kuang and Morley (1992) tested 12 restrained reinforced concrete slabs with
varying span-to-depth ratio, percentage of reinforcement, degree of edge restraint
and reported that the punching shear strengths are much higher than those predicted
by ACI 318 (1989) and BS 8110 (1985). They opined that no code specified method
predicts an enhancement in punching shear strength of restrained concrete slabs with
an increase in the degree edge restraint. In reality, they have suggested that there is a
definite enhancement in punching shear strength as the degree of edge restraint
increases. The codes do not give accurate predictions of the punching shear capacity
of restraint slab, and in view of the magnitude of the strength enhancement, the
authors have opined that it would evidently be beneficial if the effect of compressive
membrane action could be allowed for in the design codes.
6
Yamada et al. (1992) performed a research program for the determination of the
effect of shear reinforcement type and ratios on punching shear strength of
monolithic slab to column connections. Their experimental study showed that ACI
318-89 (1989) provisions for the computation of shear strength considering the
reinforcement contribution are justifiably conservative at low reinforcement ratios
(upto approximately 0.6 percent).They have also shown that the hat-shaped
reinforcement (this type of reinforcement did not conform to the requirements of
ACI 318-89) was not effective because of lack of proper anchorage and large
spacing. Double hooked reinforcement showed high effectiveness, which resulted in
a considerable increment of the punching shear resistance of the connections.
Loo and Guan (1997) presented in their research paper that nonlinear-layered finite
element method is capable of analyzing cracking and punching shear failure of
reinforced concrete flat plates with spandrel beams or torsion strips. Incorporating
the layered approach with transverse shear capacities, the procedure takes into
account the full interaction between the spandrel beam and adjoining slab. They
observed good correlation for punching shear strength, the collapse loads, load
deflection responses and crack patterns.
A model for predicting punching shear failures at interior slab-column connections
was developed by Hueste and Wight (1999) based on experimental results.
Experimental studies performed by researchers at various universities provided the
data used as the bases for the punching shear failure prediction model. Much of this
data was summarized by Pan and Moehle (1989), Megally and Ghali (1994), and Luo
and Durrani (1995). Their model had been incorporated into a new RC slab element
for the nonlinear analysis program, DRAIN-2DM, along with the desired unloading
behavior when a punch occurs. A four-story RC frame office building that
experienced punching shear failures during the Northridge earthquake was evaluated
using this new model and the occurrence of punching shear failures was successfully
post calculated for the ground motion recorded nearest the structure. The study
building was evaluated for three ground motions scaled to the same peak ground
acceleration. The building response varied for each record, but in general, it was
7
found that the inclusion of punching shear failures can modify the overall building
response in terms of drift, fundamental period, inelastic activity, and base shear
distribution. In the case of the study building, the presence of the stiffer moment-
resisting perimeter frames helped limit the magnitude of the effect that the punching
shear failures had on the overall structural response.
Mansur et al. (2000) represented an experimental study on a total of 14 restrained
ferrocement slabs. Test results revealed that the provision of end restraint leads to a
substantial enhancement in strength and stiffness of slabs, but the shape and location
of the critical punching shear perimeter remained unchanged. Both cracking and
punching shear loads increased with an individual increase in any of the test
parameters considered the thickness of the edge beam.
Xiao and Flaherty (2000) presented both experimental behavior and finite-element
analyses of reinforced concrete slab-column connections and concluded that the
numerical investigations provided good agreement between the predicted and the
measured test results of the ultimate load and associated deflection. They opined that
the single layered slab model provides the closest results compared with the
experimental tests.
Menetrey (2002) produced a synthesis of punching failure in reinforced concrete.
First, some recent experimental results are presented allowing one to show the
difference between flexural and punching failure. Second, the punching failure
mechanism is discussed based on results obtained with numerical simulations
demonstrating among others the influence of the concrete tensile strength. Then,
using these results, an analytical model is derived for punching load prediction. The
model allows a unified treatment of slabs with various types of reinforcement. He
concluded that the predicted failure load is successfully compared with the
experimental results available in database and also some special punching
experiments.
8
Hailgren and Bjerke (2002) investigated punching tests on two circular column
footings of reinforced concrete were simulated numerically. Their results show how
the failure mechanism differs from that of more slender slabs. A parametric study
also confirms that the punching shear strength of the analyzed slabs strongly depends
on the compressive strength of concrete. The results from their investigation could
preferably be used for the development of new design methods, or further
development of current design methods, in order to make them valid for slabs with
low shear-span to depth ratios also. Hereby, the new or further developed design
methods should be based on mechanical models rather than on empirically derived
formulas.
Hallgren (2002) concluded that current design methods and code formulas for the
assessment of the punching shear strength are normally based on tests on slabs with
relatively high slenderness, i.e., with high shear-span to depth ratios. Column
footings normally have low shear-span to depth ratios. Previous punching tests on
column footings indicate that the failure mechanism for punching of slabs with low
shear-span to depth ratios differs from that of slabs with high shear-span to depth
ratios. In this investigation, punching tests on two circular column footings of
reinforced concrete were simulated numerically. The results show how the failure
mechanism differs from that of more slender slabs. A parametric study also confirms
that the punching shear strength of the analyzed slabs strongly depends on the
compressive strength of concrete.
Salim and Sebastian (2003) presented the test results of an experimental study of the
ultimate punching load capacity of reinforced concrete slabs that are restrained by
means of incorporating hoop reinforcement. An upper bound-plastic solution for
predicting shear of laterally restrained slabs has been presented in which concrete is
assumed to be rigid plastic, with yielding controlled by a parabolic Mohr failure
criterion. They proposed a method that allows for the effect of compressive
membrane action and a membrane modified flexural theory of elasto-plasticity
developed by others is used to calculate the compressive membrane forces.
9
Islam (2004) found from his study that both span-to-depth ratio effects and the type
of support condition have significant influence on punching shear in concrete slab.
The author proposed to include the effect of steel percentage, support condition,
concrete strength and slab dimension in ACI-318 code.
Dilger et al. (2005) compared more than one thousand experiments on isolated
interior slab-column connections. The authors show a distinct decrease in punching
shear resistance with decreasing reinforcement ratio. It is therefore recommended
that the influence of the flexural reinforcement ratio should be added to the codes
based on ACI 318. The yield strength of the flexural reinforcement does not have to
be included in this formulation. The reinforcement ratio should be calculated in the
region where the punching cone occurs. A definition of the extent of this region
needs to be developed. They also delivered their comments that the influence of slab
thickness on the punching capacity is significant, but research on slabs with varying
thickness is very limited. There is no widely accepted formula to account for the slab
thickness in the punching load calculations.
Mitchell et al. (2005) concluded from comparison of test results and code
expressions that, as the effective depth increases the shear stress at punching failure
decreases. This size effect is significant and is an important feature to include in the
code design expressions. They commented that rectangularity of a column increases
the shear stress at punching failure. This geometric feature, expressed as the aspect
ratio of the long side to short side of a column, is an important feature to include in
all code design expressions.
Bailey et al. (2008), in their paper presented a comparison between a simple
analytical approach, based on rigid-plastic behavior with change of geometry, an
advanced finite element model (FEM), and fourteen tests on horizontally
unrestrained concrete slabs, which reached vertical displacements up to 10 times the
effective depth of the slab. Both analytical approaches predicted the membrane
behavior of the slabs, comprising compressive membrane action around the slab’s
perimeter and tensile membrane action in the central span region of the slab. The
10
simple approach produced good predictions of the load-displacement response
towards the end of the test, whereas the FEM produced reasonable predictions over
the full history of the test. They opined, the comparison of the simple approach
against the FEM and test results shows that it can safely be used in design for
predicting the load carrying capacity, due to membrane action, of concrete slabs
under large displacements.
Muttani (2008) presented a mechanical explanation of the phenomenon of punching
shear in slabs without transverse reinforcement on the basis of the opening of a
critical shear crack. It leads to the formulation of a new failure criterion for punching
shear based on the rotation of a slab. This criterion correctly describes punching
shear failures observed in experimental testing, even in slabs with low reinforcement
ratios. Its application requires the knowledge of the load-rotation relationship of the
slab, for which a simple mechanical model is proposed. The resulting approach is
shown to give better results than current design codes, with a very low coefficient of
variation (COV). Parametric studies demonstrate that it correctly predicts several
aspects of punching shear previously observed in testing as size effect (decreasing
nominal shear strength with increasing size of the member). Accounting for the
proposed failure criterion and load-rotation relationship of the slab, the punching
shear strength of a flat slab is shown to depend on the span of the slab, rather than on
its thickness as often proposed.
Guandalini et al. (2009) presented results of a test series on the punching behavior of
slabs with varying flexural reinforcement ratios and without transverse reinforcement
are presented. The aim of the tests was to investigate the behavior of slabs failing in
punching shear with low reinforcement ratios. The size of the specimens and of the
aggregate was also varied to investigate its effect on punching shear. Measurements
at the concrete surface as well as through the thickness of the specimens allowed the
observation of phenomena related to the development of the internal critical shear
crack prior to punching. The results are compared with design codes and to the
critical shear crack theory. From that comparison, it is shown that the formulation of
ACI 318-08 (2008) can lead to less conservative estimates of the punching strength
for thick slabs and for lower reinforcement ratios than in the test results. Satisfactory
11
results are, on the other hand, obtained using Eurocode 2 and the critical shear crack
theory.
A total of 17 reinforced concrete footings were tested to investigate the punching
shear behavior of footings by Hegger et al. (2009). The test parameters investigated
are the shear span-depth ratio (a/d), concrete strength, and punching shear
reinforcement. The (a/d) ranged between 1.25 and 2.0, whereas the concrete strength
ranged between 20 and 40 MPa (2.9 and 5.8 ksi). To study the effect of soil-structure
interaction, five footings were realistically supported on sand. The remaining
specimens were supported on a column stub and a uniform surface load was applied.
The present experimental investigations indicated that the angle of the failure shear
crack is steeper in punching tests on compact footings than observed in tests on more
slender slabs. Furthermore, the (a/d) significantly affects the punching shear
capacity. Based on the test results, the ACI and Eurocode 2 provisions are critically
reviewed and improvements are proposed.
Ruiz et al. (2009) commented in their research paper that the traditional approach of
codes of practice for estimating the punching strength of shear-reinforced flat slabs is
based on the assumption that concrete carries a fraction of the applied load at
ultimate while the rest of the load is carried by the shear reinforcement. Concrete
contribution is usually estimated as a fraction of the punching strength of members
without shear reinforcement. The ratio between the concrete contribution for
members with and without shear reinforcement is usually assumed constant,
independent of the amount of shear reinforcement, flexural reinforcement ratio, and
bond conditions of the shear reinforcement. The limitations of such an approach are
discussed in this paper and a new theoretical model, based on the critical shear crack
theory, is presented to investigate the strength and ductility of shear-reinforced slabs.
The proposed approach is based on a physical model and overcomes most limitations
of current codes of practice
Yang et al. (2010) studied the punching shear behavior of slabs reinforced with high-
strength steel reinforcement and compared with that of slabs reinforced with
conventional steel reinforcement. The high-strength steel selected for this research
12
conforms to ASTM A1035-07. The influences of the flexural reinforcement ratio,
concentrating the reinforcement in the immediate column region, and using steel
fiber-reinforced concrete (SFRC) in the slab on the punching shear resistance, post-
cracking stiffness, strain distribution, and crack control were investigated. In
addition, the test results were compared with the predictions using various design
codes. The use of high-strength steel reinforcement and SFRC increased the
punching shear strength of slabs, and concentrating the top mat of flexural
reinforcement showed beneficial effects on post-cracking stiffness, strain
distribution, and crack control.
Gardner (2011) compared the punching shear provisions of ACI 318-08 (ACI
Committee 318 2008), BS 8110-97 (1997), DIN 1045-1 (2001), CEB-FIP MC90
(1993), EN1992-1-1 (2004), and Gardner (1996) for interior column slab connections
with and without moment transfer and edge and corner column slab connections with
published experimental data. The code equations cannot be directly compared due to
the different philosophies used in their derivations. Comparisons with experimental
data indicate that the equations of ACI 318-08 and Gardner (1996) for concentric
punching shear used the 5% probability value to determine the equation coefficients,
whereas CEB-FIP MC90, EN 1992-1-1, and DIN 1045-1 used the mean value
coefficients. ACI 318-08 and Gardner (1996) have satisfactory equation safety
indexes (3.40 and 3.14, respectively), whereas DIN 1045-1 and EN 1992-1-1 are
marginally less satisfactory at 2.8 and 3.0, respectively. Expected equation
coefficients derived using mean measured concrete strength—not code equation
coefficients—should be used to compare a prediction equation to a single result or
group of experimental results. The ACI 318-08 elastic eccentric shear interaction
method and the CEB-FIP MC90/EN 1992-1-1 plastic eccentric shear interaction
method are equally effective for interior column slab connections with moment
transfer and edge and corner column slab connections with the eccentricity towards
the slab. The BS 8110-97 equation is effective for interior column slab connections
with moment transfer.
Higashiyama et al. (2011) presented a design equation for the punching shear
capacity of steel fiber reinforced concrete (SFRC) slabs. The proposal is base on the
13
Japan Society of Civil Engineers (JSCE) standard specifications. Addition of steel
fibers into concrete improves mechanical behavior, ductility, and fatigue strength of
concrete. Previous studies have demonstrated the effectiveness of fiber reinforcement
in improving the shear behavior of reinforced concrete slabs. In this study, twelve
SFRC slabs using hooked-ends type steel fibers are tested with varying fiber dosage,
slab thickness, steel reinforcement ratio, and compressive strength. Furthermore, test
data conducted by earlier researchers are involved to verify the proposed design
equation. The proposed design equation addresses the fiber pull-out strength and the
critical shear perimeter changed by the fiber factor. Consequently, it is confirmed
that the proposed design equation can predict the punching shear capacity of SFRC
slabs with an applicable accuracy.
Mostafaei et al. (2011) have shown the use of externally post-tensioned fiber-
reinforced concrete decks in highway bridge structures is seen as available option in
the move toward the design and construction of high-performance structures.
However, with the thin unreinforced deck slabs that may result, punching shear is a
potential concern. An experimental program is described in which the punching
shear behavior of externally prestressed slabs is investigated, both with plain and
fiber-reinforced concrete specimens. Results indicate that significant improvements
in strength, ductility, energy absorption and non-brittleness of failure can be achieved
with fiber reinforcement. Nonlinear finite-element analysis procedures are used to
model the specimens, and reasonably accurate simulations of behavior are obtained.
Design code procedures are found to be unconservative in estimating the punching
shear strength of these elements, whereas a commonly used analytical model is found
to be overly conservative.
Rizk et al. (2011) commented that thick concrete plates are currently used for
offshore and nuclear containment concrete walls. In their research, five thick
concrete slabs with a total thickness of 300 to 400 mm (12 to 16 in.) were tested
under concentric punching loading. Four specimens had no shear reinforcement,
whereas the remaining one included T-headed shear reinforcement consisting of
vertical bars mechanically anchored at the top and bottom by welded anchor plates.
The main focus of this research was to investigate the influence of the size effect on
14
the punching shear strength of thick high-strength concrete plates. All tests without
shear reinforcement exhibited brittle shear failures. The addition of T-headed shear
reinforcement with a shear reinforcement ratio of approximately 0.68% by volume
changed the failure mode to ductile flexural failure. The test results revealed that
increasing the total thickness from 350 to 400 mm (14 to 16 in.) resulted in increased
punching capacity and at the same time resulted in a small increase in ductility
characteristics. An equation based on fracture mechanics principles is recommended
to account for the size effect factor. The proposed equation is verified using the test
results and is compared with the predictions of different design codes.
Trautwein et al. (2011) analyzed the punching strength of concrete flat slabs with
shear reinforcement that does not embrace flexural reinforcement. This paper also
reports the results of tests of slabs without shear reinforcement. Finally, they show
some comparisons of tests of similar slabs without shear reinforcement and slabs
with different types of shear reinforcement. The obtained results show that the use of
shear reinforcement elements without embracement in the flexural reinforcement
improves the punching strength of reinforced concrete flat slabs.
Choi and Kim (2012) tested three slab-column connections to investigate the moment
redistribution and punching shear resistance of flat plates under realistic loading and
boundary conditions. The test specimens were essentially identical except that they
had different reinforcement layouts within a span to impose different ratios of the
end span and mid span design moments to total static moment. The test results
showed that the different reinforcement layouts significantly and minutely influenced
the moment redistribution and the punching shear resistance, respectively. The
moment redistribution and punching shear resistance provisions in ACI 318 and EC2
were used to analyze the test results. New code recommendations for moment
redistribution limit and punching shear strength are proposed based on the novel
findings of this study.
The results of punching tests carried out at the Swiss Federal Institute of Technology
(ETH) in Zurich, Switzerland, on three full-scale reinforced concrete slab specimens
are presented and discussed by Heinzmann et al. (2012). Main focus is on the
15
punching failure modes obtained with different shear reinforcement arrangements
and their corresponding failure loads. One of the 350 mm (13.8 in.) thick specimens
had no shear reinforcement (Specimen SP1), whereas the other two were reinforced
with double-headed shear studs, which were placed locally around the column
(Specimen SP2) or over the entire slab (Specimen SP3). The three failure modes—
punching without shear reinforcement, punching outside the shear-reinforced zone,
and punching within the shear-reinforced zone due to concrete crushing were
observed. The experimental failure loads ranged from 43 to 85% of the computed
ultimate flexural load of the specimens. All three failure modes were correctly
predicted by the pertinent ACI 318-08 and EC2 Code provisions, as well as by the
critical shear crack theory (CSCT). Further, it is shown that the load-deflection
behavior of the slabs can be computed with a bending approach.
Lips et al. (2012) presented results of an extensive experimental campaign on 16 flat-
slab specimens with and without punching shear reinforcement. The tests aimed to
investigate the influence of a set of mechanical and geometrical parameters on the
punching shear strength and deformation capacity of flat slabs supported by interior
columns. All specimens had the same plan dimensions of 3.0 x 3.0 m (9.84 x 9.84 ft).
The investigated parameters were the column size (ranging between 130 and 520 mm
[approximately 5 and 20 in.]), the slab thickness (ranging between 250 and 400 mm
[approximately 10 and 16 in.]), the shear reinforcement system (studs and stirrups),
and the amount of punching shear reinforcement. Systematic measurements (such as
the load, the rotations of the slab, the vertical displacements, the change in slab
thickness, concrete strains, and strains in the shear reinforcement) allow for an
understanding of the behavior of the slab specimens, the activation of the shear
reinforcement, and the strains developed in the shear-critical region at failure.
Finally, the test results were investigated and compared with reference to design
codes (ACI 318-08 and EC2) and the mechanical model of the critical shear crack
theory (CSCT), obtaining a number of conclusions on their suitability.
Lontsoght et al. (2012) opined that current code provisions are based on shear tests
on heavily reinforced slender beams under point loads. The question remains if these
procedures are valid for wide beams and slabs under point loads close to the support.
16
To evaluate the shear capacity of reinforced concrete slabs and the associated
effective width, they executed a series of experiments is carried out on eight
continuous one-way slabs and twelve continuous slab strips loaded close to the
simple and continuous supports. Test results are compared to current code provisions
and methods to calculate the shear capacity from the literature. The influence of the
shear span to depth ratio, the size of the loading plate and the overall width of the
specimen are discussed. From these results follow that the behavior in shear of slabs
and beams is not identical. The effective slab width, used for calculating the beam
shear capacity, is recommended to be based on load spreading under 45° from the far
side of the loading plate towards the support.
Maya et al. (2012) concluded that the ultimate strength of reinforced concrete slabs is
frequently governed by the punching shear capacity, which may be increased with
addition of traditional fitments such as reinforcing steel, headed studs or shear heads.
In addition to these traditional methods of strengthening against punching, steel fibre
reinforcement has proved to be an effective and viable alternative. The addition of
fibres into the concrete improves not only the shear behavior but also the
deformation capacity of reinforced concrete slabs. This paper presents a mechanical
model for predicting the punching strength and behavior of concrete slabs reinforced
with steel fibres as well as conventional reinforcement. The proposed model is
validated against a wide number of available experimental data and its accuracy is
verified. On this basis, a simple design equation for the punching shear capacity of
steel fibre reinforced concrete (SFRC) slabs is proposed.
Hundreds of laboratory experiments have been conducted by Ospina et al. (2012) to
investigate the punching shear behavior of two-way reinforced concrete (RC) slabs at
interior supports. These experiments provide a mandatory frame of reference for the
development, calibration and evaluation of punching shear design provisions.
Unfortunately, because of the lack of dissemination and unavailability of some of the
references together with some level of arbitrariness by researchers and code
developers in selecting reference data, code provisions have been developed based
on a rather limited subset of the available test results. To overcome these limitations,
a task group was formed within ACI Committee 445 to gather, compile and post-
17
process the results from laboratory tests studying the concentric punching shear
behavior of two-way RC slabs without shear reinforcement at interior supports. The
development of the databank involved two stages: first, the creation of a "collected"
databank, where the characteristics of test specimens and test results were compiled
as faithfully as possible to what was reported by researchers. Secondly, the
development of a "selected" databank based on a series of Data Acceptance Criteria
(DAC), with the goal of endorsing a test result into an evaluation-level databank.
This paper describes the creation process and main features of the collected databank
and discusses several important aspects in databank development including the
selected platform being used to disseminate the information to users.
Peiris and Ghali (2012) presented a research paper on punching shear strength of
concrete. They concluded that ductility and the strength of flat plate connections with
their supporting columns are influenced by the concrete strength, the thickness of the
slab and the shear and the flexural reinforcements. The present paper concentrates on
the important effect of flexural reinforcement in the presence or the absence of shear
reinforcement.
Said et al. (2012) studied punching shear, both experimentally and analytically.
However, due to the number of parameters involved and the complexities in
modeling, current approaches used to estimate the punching shear capacity of
reinforced concrete (RC) slabs include mechanical models and design code
equations. Mechanical models are complex, while design code equations are
empirical. This study investigates the ability of artificial neural networks (ANN) to
predict the punching shear strength of concrete slabs. The parameters considered to
be the most significant in punching shear resistance of RC slabs were: concrete
strength, slab depth, shear span to depth ratio, column size to slab effective depth
ratio and flexure reinforcement ratio. Using a large and homogenous database from
existing experimental data reported in the literature, the ANN model is able to
predict the punching shear capacity of slabs more accurately than were the code
design equations.
18
Punching shear tests were conducted by Borges et al. (2013) on 13 reinforced
concrete flat plates with and without openings or/and shear reinforcement. The
openings (one or two) were adjacent to the shorter sides of rectangular supports and
had widths equal to those of the supports. The methods of calculating punching shear
strengths given in ACI 318-11 (2011) and MC90/EC2 (2003) are reviewed along
with some proposed formulations, and their predictions are compared with the test
results. Conclusions are drawn on the influence of plate depth on the unit shear
resistance from the concrete; the possibility of using straight projections of openings
onto control perimeters, rather than radial ones, to evaluate the effect of openings;
and the case for considering eccentricity in a pattern of openings as an influencing
factor and the detailing of shear reinforcement. It is shown that for the relatively
small openings considered, the provision of continuous bars adjacent to openings to
replace the areas of reinforcement seems to be an adequate approach to flexural
design. It is suggested that the shear stress used for the concrete in ACI 318-11
(2011) could be increased for the assessment of strengths at the edges of zones with
shear reinforcement (outer control perimeter).
Results from an experimental study aimed at investigating the behavior of full-scale
two-way flat slabs reinforced with glass fiber-reinforced polymer (GFRP) bars and
subjected to monotonically increase concentrated load is carried out by Dulude et al.
(2013). A total of 10 interior slab-column prototypes measuring 2.5 x 2.5 m (98 x 98
in.) were constructed and tested up to failure. The test parameters were: 1)
reinforcement type (GFRP and steel) and ratio (0.34 to 1.66%); 2) slab thickness
(200 and 350 mm [7.9 and 13.8 in.]); and 3) column dimensions (300 x 300 mm
[11.8 x 11.8 in.] and 450 x 450 mm [17.7 x 17.7 in.]). All test prototypes showed
punching shear failure and the crack patterns at failure were almost the same
regardless of reinforcement type or ratio. Besides, the GFRP-reinforced prototypes
showed lower punching capacity compared to that of the steel-reinforced ones when
the same reinforcement ratio was employed due to the lower modulus of GFRP bars
compared to steel. Predictions using different design guidelines were compared to
the experimental results obtained herein. The comparisons showed that the ACI
440.1R equation yielded very conservative predictions with an average Vtest/Vpred
equal to 2.10 ± 0.30.
19
Hawileh et al. (2013) developed a 3D nonlinear finite element (FE) model to predict
the punching shear of two-way reinforced concrete (RC) slabs. Six slabs casted with
regular and steel fiber reinforced concrete (SFRC) and reinforced with normal and
high strength steel reinforcement were modeled using ANSYS. The results were
validated with published experimental data. The computational model accounts for
the different nonlinear constitutive material laws by utilizing state-of-the-art
modeling methodologies. Concrete cracking and softening, effects of the embedded
steel fibers, steel yielding, and the bond-slip mechanism of the embedded steel
reinforcement were all taken into account. A good correlation was obtained between
the predicted and measured results at all stages of loading including failure of the
specimens. It is concluded that correlating models could be used as a reliable tool to
conduct parametric studies to evaluate the punching shear behavior of two-way slabs
cast with normal and SFRC concrete, reinforced with ordinary and high-strength
steel reinforcement.
Ruiz (2013) presented an extensive experimental campaign performed at the Ecole
Polytechnique Fédérale de Lausanne (EPFL) on the role of integrity reinforcement
by means of 20 slabs with dimensions of 1500 x 1500 x 125 mm (≈5 ft x 5 ft x 5 in.)
and various integrity reinforcement layouts. The performance and robustness of the
various solutions is investigated to obtain physical explanations and a consistent
design model for the load-carrying mechanisms and strength after punching failures.
Coronelli and Corti (2014) modeled for the nonlinear response of a flat slab
subjected to gravity and lateral cyclic loading. The model requires the definition of
the grid geometry and properties of point hinges in beam finite elements, and
modeling the nonlinear response in bending, torsion, and shear. The simulation is
carried out for experimental tests on a floor under gravity and lateral biaxial cyclic
loading of increasing amplitude. Pushover analyses have been performed under
gravity and horizontal loads in the two principal directions. Predictions are shown of
the global response and the connections of different column shapes and slab
reinforcement with the strength, drift capacity, and failure modes. The accuracy is
different in the two directions of loading due to the damage of the test slab for biaxial
20
cyclic loading. The results show the potential of the model for design and analysis of
existing flat slab structures.
Islam (2014) carried out a research program regarding to numerical modeling of
beam slab joint of flat plate. He obtained that the increase in ultimate load is more
prominent with lower slab thickness compared to higher slab thickness and it
decreases with increase of slab thickness. He also found that the increase in ultimate
load is more prominent with smaller size square column compared to larger size
square column. He opined that the support condition has a significant influence on
the punching shear strength of reinforced concrete flat plate.
The brief literature reviews shows that punching shear tests of the most researchers
are mainly based on simply supported and isolated slab specimens. The parameters
considered to be the most significant in punching shear resistance of reinforced
concrete slabs are concrete strength, slab depth, shear span to depth ratio, column
size to slab effective depth ratio and flexure reinforcement ratio etc. No code
specified method predicts an enhancement in punching shear strength of restrained
concrete slabs with an increase in the degree edge restraint. In reality, some
researchers have suggested that there is a definite enhancement in punching shear
strength as the degree of edge restraint increases. Ductility and the strength of flat
plate connections with their supporting columns are influenced by the concrete
strength, the thickness of the slab, the shear and the flexural reinforcements. The use
of high-strength steel reinforcement increases the punching shear strength of slabs,
and concentrating the top mat of flexural reinforcement showed beneficial effects on
post-cracking stiffness, strain distribution, and crack control. Some investigators
used three dimensional analyses as the aim was to understand flexural behavior on
punching shear behavior of RC flat slab.
1.3 CODE PROVISIONS FOR PUNCHING SHEAR
For the design of flat plates, flat slabs, bridge decks and column footings punching
shear strength of concrete in the vicinity of columns, concentrated loads or reactions
is one of the design criteria which governs the design. Thus, the critical shear section
for this type of shear should be located so as the perimeter of critical section is a
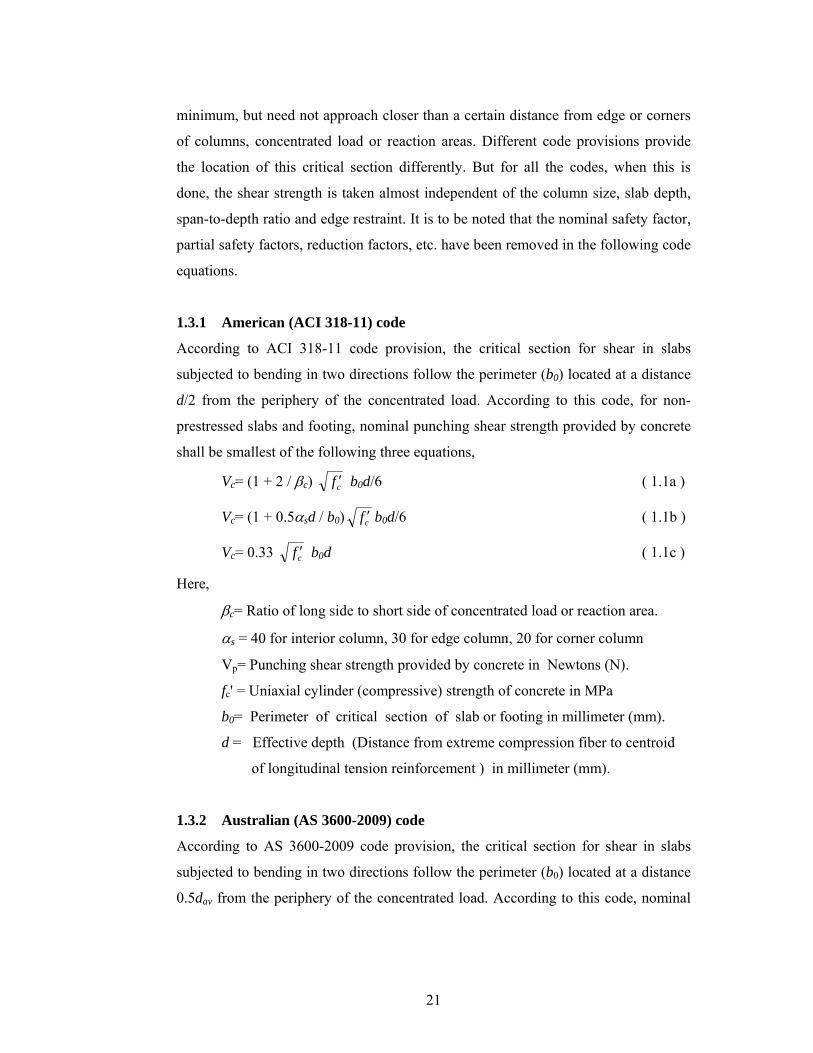
21
minimum, but need not approach closer than a certain distance from edge or corners
of columns, concentrated load or reaction areas. Different code provisions provide
the location of this critical section differently. But for all the codes, when this is
done, the shear strength is taken almost independent of the column size, slab depth,
span-to-depth ratio and edge restraint. It is to be noted that the nominal safety factor,
partial safety factors, reduction factors, etc. have been removed in the following code
equations.
1.3.1 American (ACI 318-11) code
According to ACI 318-11 code provision, the critical section for shear in slabs
subjected to bending in two directions follow the perimeter (b0) located at a distance
d/2 from the periphery of the concentrated load. According to this code, for non-
prestressed slabs and footing, nominal punching shear strength provided by concrete
shall be smallest of the following three equations,
Vc= (1 + 2 / βc) cf ′ b0d/6 ( 1.1a )
Vc= (1 + 0.5αsd / b0) cf ′ b0d/6 ( 1.1b )
Vc= 0.33 cf ′ b0d ( 1.1c )
Here,
βc= Ratio of long side to short side of concentrated load or reaction area.
αs = 40 for interior column, 30 for edge column, 20 for corner column
Vp= Punching shear strength provided by concrete in Newtons (N).
fc' = Uniaxial cylinder (compressive) strength of concrete in MPa
b0= Perimeter of critical section of slab or footing in millimeter (mm).
d = Effective depth (Distance from extreme compression fiber to centroid
of longitudinal tension reinforcement ) in millimeter (mm).
1.3.2 Australian (AS 3600-2009) code
According to AS 3600-2009 code provision, the critical section for shear in slabs
subjected to bending in two directions follow the perimeter (b0) located at a distance
0.5dav from the periphery of the concentrated load. According to this code, nominal
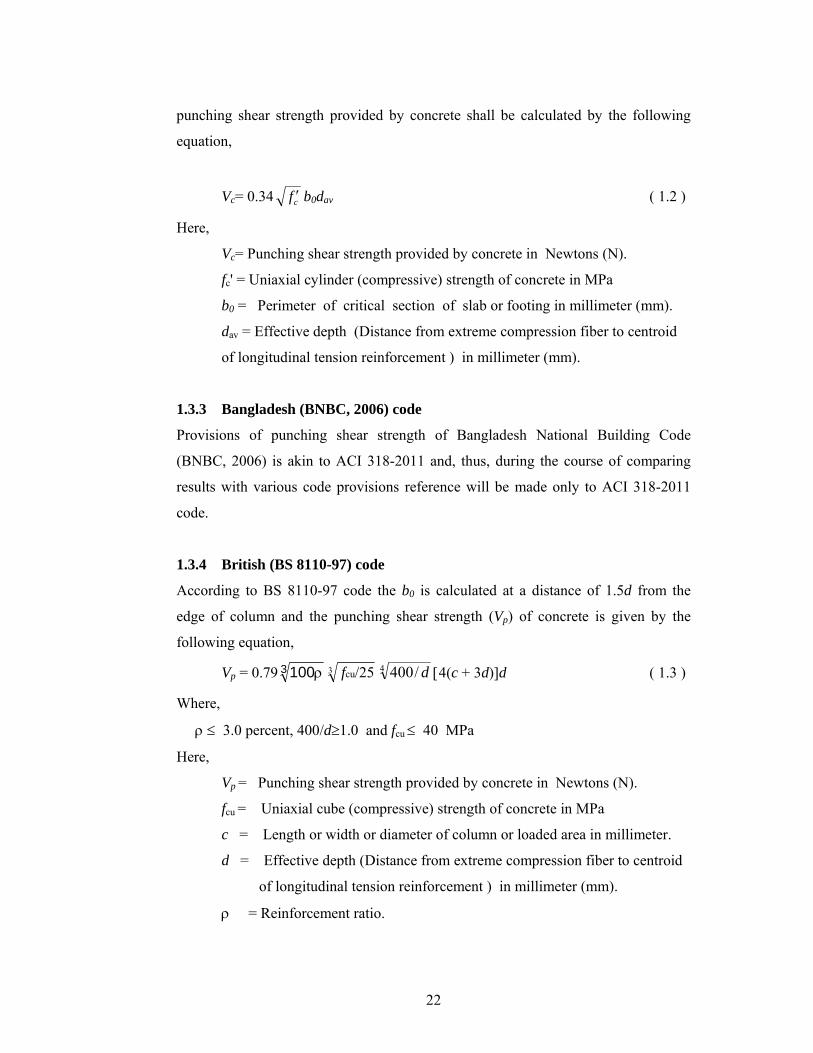
22
punching shear strength provided by concrete shall be calculated by the following
equation,
Vc= 0.34 cf ′ b0dav ( 1.2 )
Here,
Vc= Punching shear strength provided by concrete in Newtons (N).
fc' = Uniaxial cylinder (compressive) strength of concrete in MPa
b0 = Perimeter of critical section of slab or footing in millimeter (mm).
dav = Effective depth (Distance from extreme compression fiber to centroid
of longitudinal tension reinforcement ) in millimeter (mm).
1.3.3 Bangladesh (BNBC, 2006) code
Provisions of punching shear strength of Bangladesh National Building Code
(BNBC, 2006) is akin to ACI 318-2011 and, thus, during the course of comparing
results with various code provisions reference will be made only to ACI 318-2011
code.
1.3.4 British (BS 8110-97) code
According to BS 8110-97 code the b0 is calculated at a distance of 1.5d from the
edge of column and the punching shear strength (Vp) of concrete is given by the
following equation,
Vp = 0.79 1003 ρ 3 /25cuf 4 /400 d [4(c + 3d)]d ( 1.3 )
Where,
ρ ≤ 3.0 percent, 400/d≥1.0 and fcu ≤ 40 MPa
Here,
Vp = Punching shear strength provided by concrete in Newtons (N).
fcu = Uniaxial cube (compressive) strength of concrete in MPa
c = Length or width or diameter of column or loaded area in millimeter.
d = Effective depth (Distance from extreme compression fiber to centroid
of longitudinal tension reinforcement ) in millimeter (mm).
ρ = Reinforcement ratio.
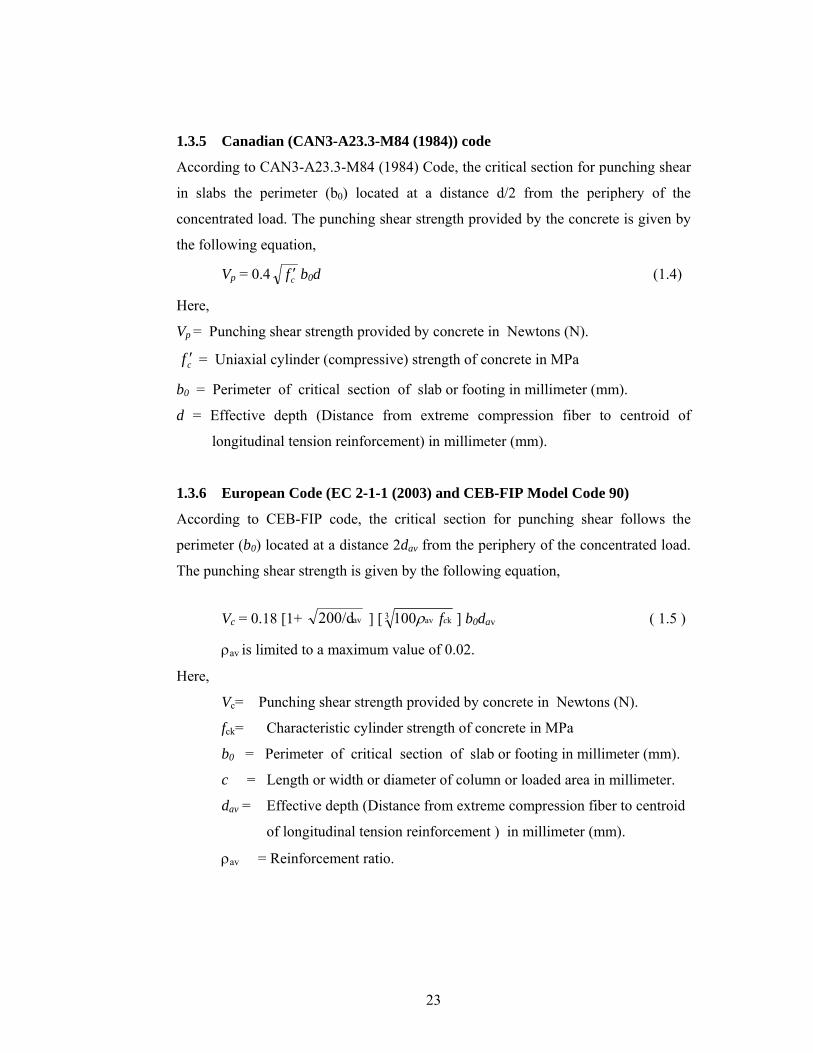
23
1.3.5 Canadian (CAN3-A23.3-M84 (1984)) code
According to CAN3-A23.3-M84 (1984) Code, the critical section for punching shear
in slabs the perimeter (b0) located at a distance d/2 from the periphery of the
concentrated load. The punching shear strength provided by the concrete is given by
the following equation,
Vp = 0.4 cf ′ b0d (1.4)
Here,
Vp = Punching shear strength provided by concrete in Newtons (N).
cf ′ = Uniaxial cylinder (compressive) strength of concrete in MPa
b0 = Perimeter of critical section of slab or footing in millimeter (mm).
d = Effective depth (Distance from extreme compression fiber to centroid of
longitudinal tension reinforcement) in millimeter (mm).
1.3.6 European Code (EC 2-1-1 (2003) and CEB-FIP Model Code 90)
According to CEB-FIP code, the critical section for punching shear follows the
perimeter (b0) located at a distance 2dav from the periphery of the concentrated load.
The punching shear strength is given by the following equation,
Vc = 0.18 [1+ av200/d ] [ 3 kav 100 cfρ ] b0dav ( 1.5 )
ρav is limited to a maximum value of 0.02.
Here,
Vc= Punching shear strength provided by concrete in Newtons (N).
fck= Characteristic cylinder strength of concrete in MPa
b0 = Perimeter of critical section of slab or footing in millimeter (mm).
c = Length or width or diameter of column or loaded area in millimeter.
dav = Effective depth (Distance from extreme compression fiber to centroid
of longitudinal tension reinforcement ) in millimeter (mm).
ρav = Reinforcement ratio.
24
1.3.7 German (DIN 1045-1: 2008) code
According to DIN 1045-1:2008 code the b0 is calculated at a distance of 1.5dav from
the edge of column and the punching shear strength of concrete is given by the
following equation,
Vc = 0.14 [1+ av200/d ] [ 3 kav 100 cfρ ] b0dav ( 1.6 )
Where b0 is the perimeter of the critical section located at a distance of 1.5dav from
the face of the column. The maximum value if ρav is the similar of 0.02 and 0.4 times
the ratio between the design concrete strength and the design steel strength.
Here,
Vc= Punching shear strength provided by concrete in Newtons (N).
fck= Characteristic cylinder strength of concrete in MPa
b0 = Perimeter of critical section of slab or footing in millimeter (mm).
c = Length or width or diameter of column or loaded area in millimeter.
dav = Effective depth (Distance from extreme compression fiber to centroid
of longitudinal tension reinforcement ) in millimeter (mm).
ρav = Reinforcement ratio.
1.4 MODELING GUIDELINE AND COMPLEXITIES
The response of a reinforced concrete structure is determined in part by the material
response of the plain concrete of which it is composed. Thus, analysis and prediction
of structural response to static or dynamic loading requires prediction of concrete
response to variable load histories. The fundamental characteristics of concrete
behavior are established through experimental testing of plain concrete specimens
subjected to specific, relatively simple load histories. Continuum mechanics provides
a framework for developing an analytical model that describes these fundamental
characteristics. Experimental data provide additional information for refinement and
calibration of the analytical model.
Concrete is a non-homogeneous composite and that the primary mechanism of
response is the development and propagation of discrete cracks, it is necessary to
consider the general framework of the model in establishing the experimental data
25
set. The response of plain concrete can be modeled at the scale of the coarse
aggregate with the model explicitly accounting for the response of the aggregate,
hydrated cement paste, the transition zone material as independent elements or as
components of a composite. However, while there may be available experimental
data that defines the response of aggregate and hydrated cement paste to general
loading, characterization of the transition zone must be accomplished indirectly.
Further, the random nature of the component material properties and distribution
adds complexity to models that are developed at this scale. In modeling the response
of a reinforced concrete structural element, it is reasonable to incorporate both the
microscopic response as well as the random nature of the concrete into a macro
model. The macro model describes the response of a body of concrete that is many
times the size of individual pieces of aggregate or of continuous zones of hydrated
cement paste. It is assumed that initially the concrete within the body is homogenous
and that the material response of the components is represented in the global
response of the concrete composite. For this investigation, plain concrete is idealized
as an initially homogenous material.
The idealization of concrete as a homogeneous body requires additional
consideration for the case of concrete subjected to moderate through severe loading.
At these load levels, the response of concrete is determined by the formation of
continuous crack systems. Some researchers have proposed models in which the
idealization of concrete as a continuum is abandoned in the vicinity of the crack, and
crack systems are modeled discretely. Development and calibration of such a model
requires experimental data defining the rate of crack propagation under variable
stress states and load histories. Currently, there are few data available characterizing
the concrete fracture process under multi-dimensional stress states. Additionally,
such a model requires special consideration within the framework of a finite element
program.
Other researchers have shown that it is possible to maintain the idealization of
concrete as a continuum in the presence of discrete cracks. In these models, the
material damage (evident in reduced material strength and stiffness) associated with
26
discrete cracking is distributed over a continuous volume of the material. Such
models include the fictitious-crack model, smeared-crack models and the crack-band
model. Modeling of concrete as a continuum results in a model that is compatible
with many existing computer codes as well as provides a basis for application of
existing continuum constitutive theory in developing models. For these reasons, in
this investigation concrete is considered to be a continuum.
Modeling concrete as an initially homogeneous material and assuming that the
discrete cracking is incorporated into a continuum model of concrete, it is necessary
that the experimental data set on which the analytical model will be developed and
calibrated be compiled from investigations that meet several criteria. The concrete
specimens must have critical zones that are sufficiently large that the concrete
composite in the vicinity is approximately a homogenous mixture. For load cases in
which the material response is determined by a global mechanism (e.g., micro
cracking) experimental measurement must define the deformation of the entire
concrete body to ensure that the deformation is representative of the composite. For
load cases in which the material response is determined by a local mechanism (e.g.,
formation of a continuous crack surface), it is necessary that experimental
measurement define the global deformation of the concrete body as well as the
deformation associated with the localized mechanism. This allows for appropriate
calibration of the continuum model.
The connections between the floor slab and column in a flat slab structure are
generally the most critical part as far as the strength is concerned because it is a
region where large moments and shear forces are concentrated. Despite an extensive
amount of experimental research work on shear strength of reinforced concrete slab,
there is still no single theory that can accurately predict the shear strength of a
reinforced concrete flat slab which consider the effect of concrete, flexural
reinforcement, column size and slab thickness simultaneously. With the advancement
in computing technology and numerical modeling of constitutive relationship of
reinforced concrete, many features have been implemented into the finite element
model to describe the behavior of reinforced concrete rationally.
27
Punching shear behavior is a 3-dimensional complex problem, in which tension,
compression, shear force, confinement action of concrete etc. are considerable factor
for numerical finite element analysis. Therefore, efficient use of the finite element
method for studying the behavior of reinforced concrete flat slabs and find out how
well it can predict the actual behavior is necessary to implement.
1.5 SCOPE AND OBJECTIVE
From the literature review and code provisions as stated earlier section, it is found
that present design rules for punching shear failure of reinforced concrete slabs,
given in various codes of practice, are largely based on studies of the behavior and
strength of simply-supported, conventional specimens extending to the nominal line
of contra-flexure. The code provisions rely mostly on empirical methods derived
from the test results on conventional and thin slab specimens. Test results from
simply supported slab specimens do not usually provide an accurate prediction of the
ultimate load capacity of a slab having lateral restraint. When the slab is restrained
against lateral deformation, this induces large restraining force within the slab and
between the supports, thus membrane forces are developed. The enhancement of
punching shear capacity can be attributed due to the presence of compressive
membrane action in the slab. The importance of compressive membrane stresses due
to edge restraint was not incorporated into the code formulations, which results in
conservative prediction.
Some of the present-day code provisions usually specify the punching shear strength
as a function of compressive strength of concrete alone. The parameters considered
to be the most significant in punching shear resistance of reinforced concrete slabs
are concrete strength, slab depth, shear span to depth ratio, column size to slab
effective depth ratio and flexure reinforcement ratio etc. are not properly
incorporated in some code provisions. Some codes do not acknowledge the possible
effect of flexural reinforcement on the punching shear behavior of reinforced
concrete slabs. Some codes do not take adequate account of the possible role of
specimen size and slab thickness.
28
From above discussion, there are scopes of work to investigate punching shear
provision of Flat Plate more accurately. Punching shear related parameters on multi-
panel Flat Plates will be more reasonable than the results obtained by using isolated
single span slab specimens in this regard. Continuity of slab and edge restraint will
be adjusted in multi-panel Flat Plate. Several parameters such as concrete strength,
flexural reinforcement, slab thickness, column size, span to depth ratio may be
applied to multi-panel Flat Plate.
However, multi-panel tests are time consuming, expensive and it is difficult to
determine experimentally the shears and moments applied to the individual slab-
column connections. An alternative to such expensive and difficult experimental
procedure is to perform the investigation by means of numerical finite element
analysis. Advanced nonlinear finite element investigation of multi-panel Flat Plate
considering full scale with practical geometry may be carried out on the behavior of
punching shear characteristics of concrete slab in presence of flexural reinforcement.
Thus, the objective of this study is to attempt to find out the punching shear features
of a multi-panel finite element model slab which is able to predict, with reasonable
accuracy, the ultimate punching load capacity and the correct mode of failure for a
large number of slabs which cover all factors affecting the behavior of reinforced
concrete slabs. The study may use three dimensional elements to study the behavior
of Flat Plates with different types of multi-panel Flat Plate model.
The objectives of this research work may be summarized as follows:
i) To develop a numerical finite element model including concrete nonlinearity
to compare the results of numerical analysis with test results.
ii) To simulate the actual punching shear capacity of slabs.
iii) To study the multi-panel flat plate on the punching shear strength of concrete.
iv) To find out the effect of concrete strength and flexural reinforcement ratio on
the punching shear strength of concrete.
v) To study the effect of slab thicknesses and column sizes on the punching
shear strength.
29
vi) To study the crack patterns for punching load.
vii) Parametric study on punching shear behavior.
viii) To formulate a guide line for more rational estimate of punching shear
capacity of slabs.
1.6 ORGANIZATION OF THE THESIS
The thesis covers mainly four parts, namely the background theory of finite element
analysis, the simulation of experimental investigations to validate finite element
model, the numerical analysis of multi-panel flat plate and the proposal for punching
shear capacity of RC slab.
After the introduction of punching shear and code provision in Chapter-1, Chapter-2
presents the theoretical background of FE modeling such as FE procedure, suitable
elements, integration scheme, stress-strain relationship and reinforcement in FE solid
elements. In Chapter-3, behavior of materials such as concrete and reinforcement in
FE are discussed. Nonlinear solution techniques including process of iteration,
convergence criteria, solution termination criteria are elaborated in Chapter-4.
Afterwards, Chapter-5 presents an overview of the test campaign that was used for
validation of FE model. Based on experimental investigation and numerical analysis,
an analytical model was developed. FE analysis of experimented works to validate
the analysis and parametric study based on experimental results presents in the
Chapter-6.
After the validation of the FE modeling technique in simulating the punching shear
behavior of flat plates and thus such modeling can be further applied to numerically
study the behavior of multi panel flat plate systems as an alternative to experiments
and presented in Chapter-7 and Chapter-8. In Chapter-7, various data for modeling
multi-panel flat plate and other input data are included. Results and discussions of FE
analysis of multi-panel flat plate are elaborated in Chapter-8.

30
According to the relationship of normalized punching shear with concrete strength,
flexural reinforcement and size effect of slab and column, an empirical equation for
calculating punching shear capacity is proposed in Chapter-9. The proposed equation
is verified by analyzed data and test results and comparison with various code of
prediction is also discussed in this chapter.
Finally, the thesis is finished with conclusions, followed by recommendation for
future research in Chapter-10.
31
CHAPTER-2
FINITE ELEMENT METHOD
2.1 INTRODUCTION
The finite element method is now firmly accepted as a most powerful general
technique for the numerical solution of variety of problems encountered in
engineering. For linear analysis, at least, the technique is widely employed as a
design tools. Similar acceptance for nonlinear situations is dependent on two major
factors. Firstly, in view of the increased numerical operations associated with
numerical problems, considerable computing power is required. Secondly, before the
finite element method can be used in design, the accuracy of any proposed solution
technique must be proven.
The development of improved element characteristics and more efficient nonlinear
solution algorithms and the experience gained in their application in engineering
problems have ensured that nonlinear finite element analysis can now be performed
with some confidence and the process is already economically acceptable for
selected industrial applications. Nonlinear analysis is necessary when,
o Designing high performance components.
o Establishing the causes of failure.
o Simulating true material behavior.
o Trying to gain a better understanding of physical phenomena.
Details of numerical analysis and procedure in accordance with TNO DIANA BV
(2010) have discussed in this chapter.
2.2 FE PROCEDURE
For linear elastic problems the system of equations to be solved is
Ku = f ( 2.1 )
Where, K is the system stiffness matrix, u is a vector of the unknown nodal degrees
of freedom such as displacements and rotations and f is the vector of the nodal
forces corresponding with the degrees of freedom u.
32
2.2.1 Global Formulation
When considering a general three-dimensional body, denoted by V, the problem is
identified by unknown displacements u and known body forces per unit volume g.
External forces in the form of concentrated forces and known tractions t are applied
to the part St of the boundary and are called the natural boundary conditions. The
displacements u are specified as known values u on the part Su of the boundary and
are called the essential boundary conditions. In the finite element method the body V
will be approximated as an assemblage of finite elements, which are connected by
nodal points on the element boundaries.
2.2.1.1 Displacements
In order to solve the problem the displacements u has to satisfy a continuity and
differentiability to the necessary degree. On the boundary Su the displacements must
satisfy the essential boundary condition,
( 2.2 )
The displacements of a particular point (x, y, z) are assumed to be continuous
functions expressed in terms of discretized variables at the nodal points and are
approximated as
( 2.3 )
where N is the displacement interpolation matrix and u is a vector of nodal point
variables such as components of displacements and rotations, and is denoted as the
vector of degrees of freedom. The interpolation matrix N comprises interpolation or
shape functions described in terms of independent variables, such as coordinates and
are locally defined for the individual elements.
2.2.1.2 Strains and Stresses
The strains at any point in the structure can be determined by,
( 2.4 )
where L is a differential operator defining a compatible strain field. Now the strain
field can be written as the derivative of the vector u as,
( 2.5 )
33
where the matrix B defines the strain–displacement relation for a particular point and
is called the differential matrix. Assuming linear elastic behavior, the relationship
between stresses and strains in a particular point can be written in the form,
( 2.6 )
where the matrix D is the stress–strain relation and is a function of material
properties like Young’s modulus E and Poisson’s ratio υ. The vector Ԑ0 denotes the
initial strains changes etc. and the vector σ0 contains the initial residual stresses.
2.2.1.3 Equilibrium
In a structural problem the governing equilibrium equations can be written as
( 2.7 )
where g is the vector of the known body forces per unit volume, with V as the total
volume or domain of the model. Vector t represents the known traction forces on the
boundary St such as surface, edge and point loads. For the derivation of the
equilibrium equations the stationarity condition of the total potential energy can be
used.
2.2.1.4 Principle of Virtual Displacements
A simpler way of introducing the equilibrium relationships of equation 2.7 can be
done by invoking the principle of virtual displacements. This principle states that an
elastic structure is in equilibrium under a given loading system if, for any virtual
displacement from a compatible state of deformation, the virtual work is equal to the
virtual strain energy. The virtual work equation can be written as
( 2.8 )
Where δԐ are the virtual strains which correspond to the virtual displacements δu,
Substituting (equation 2.3) and (equation 2.5) into (equation 2.8) gives,
( 2.9 )
34
where r is the vector of the internal forces corresponding to the vector of the nodal
degrees of freedom u. The principle of the virtual work states that (equation 2.9)
should be satisfied for any u so that,
( 2.10 )
These equations do not ensure that the equilibrium is satisfied at any point, but only
guarantee that the stresses satisfy equilibrium in a weighted average sense.
Substituting (equation 2.6) and (equation 2.5), the left hand side of (equation 2.10)
can be written as,
( 2.11 )
Combining the expression for r, in (equation 2.9) and (equation 2.11) we obtain
( 2.12 )
Where
( 2.13 )
is the system stiffness matrix, and f is the right hand side vector defined by
( 2.14 )
This provides a set of linear simultaneous equations which can be solved in a direct
or indirect way:
( 2.15 )
2.2.2 Discretization to Elements
In the Finite Element Method the solution domain V is divided into a finite number
of elements Ve, which are connected by nodal points at the inter-element boundaries.
In this way the solution domain is discretized and represented as a patch of elements.
35
The unknown displacements in each element are now approximated by continuous
functions expressed in terms of nodal variables. The functions over each finite
element are called interpolation or shape functions.
2.2.2.1 Displacements
In each element the displacements of an arbitrary point (x, y, z) can be measured in a
convenient local Cartesian coordinate system and are approximated by shape
functions and nodal variables
( 2.16 )
where N is the interpolation matrix with shape functions N(x, y, z) and ue the element
nodal displacement vector, expressed in local xyz axes. This element vector can be
composed from the nodal variables of the system degrees of freedom vector u by,
( 2.17 )
where Te is the element transformation matrix which transforms the corresponding
system degrees of freedom to the local element degrees of freedom, oriented in the
xyz coordinate system.
The rest is identical to global formulation as stated in the earlier section.
2.2.2.2 Strains and Stresses
Using the strain–displacement law for compatibility and assuming that the shape
functions N are known, the discrete form of the strain–displacement relation can be
written as
( 2.18 )
Likewise equation 2.6, for the entire domain, the relation between strains and
stresses, including initial strains and initial stresses, can be written for an element as
( 2.19 )
where D is the rigidity matrix representing the stress–strain law, usually derived from
Hooke’s law, varying from element to element. Often the matrix D is only defined in
a local element Cartesian (xl, yl, zl) coordinate system. In order to obtain the strains in
this system, it is necessary to apply a strain transformation
( 2.20 )
36
where TԐ is the strain transformation matrix. With equation 2.18 the local strain
vector Ԑl can now be related directly to the local element degrees of freedom vector
ue by
( 2.21 )
2.2.2.3 Element Assembly
During this process, also the constraints and the linear constraints (tyings) are
handled. The general tying equation for eccentric connection of three translations and
three rotations is
( 2.22 )
Where uxi denotes the x translation of the slave node, φyj the y rotation of the master
node, ∆x the eccentricity in x direction, etc.
2.2.2.4 Virtual Strain Energy
Now the structure has been idealized as an assemblage of elements, the integral form
of the virtual work equation 2.8 can be rewritten as a summation of the virtual work
done by the individual elements having volumes Ve and boundary surfaces Se like
( 2.23 )
where ne is the total number of elements, ge is the element body force per unit
volume and te are the element tractions per unit area acting along the element
boundary Se. For each element, its surface boundary Se can be separated in an
exterior part and an interior part having imaginary interfaces with adjacent elements.
The equation 2.23 is of fundamental importance for the displacement based Finite
Element Method and imposes some restrictions on the displacement functions. In the
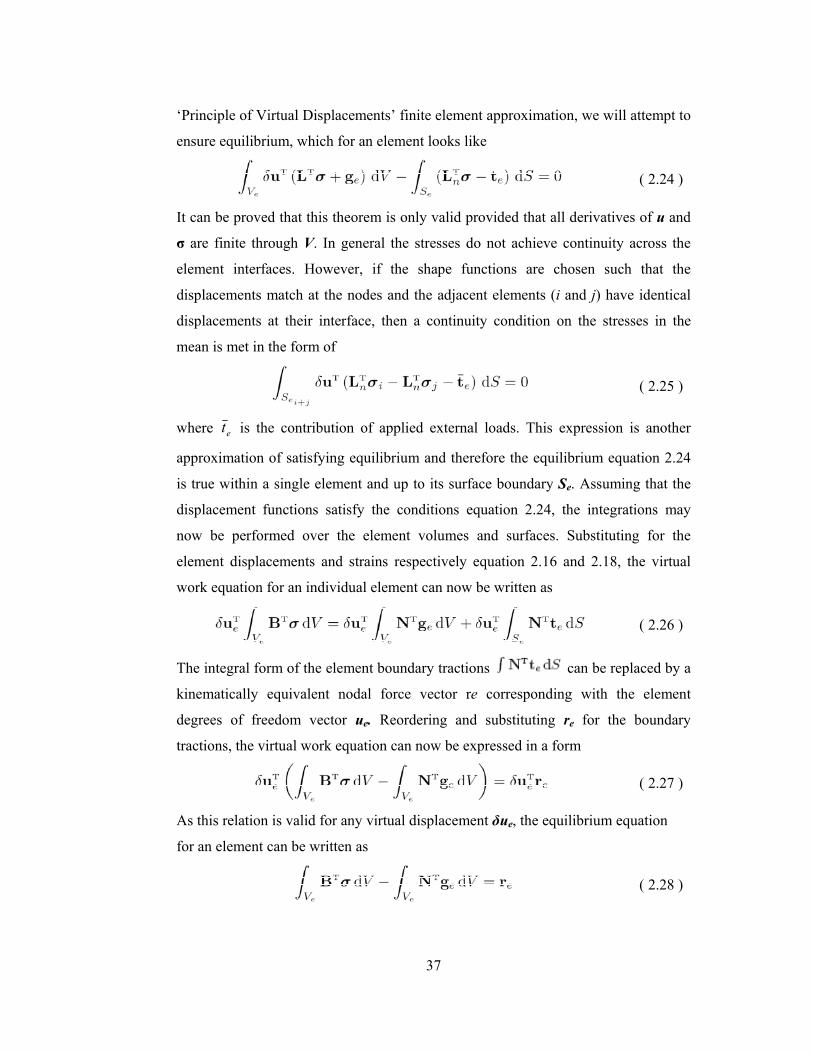
37
‘Principle of Virtual Displacements’ finite element approximation, we will attempt to
ensure equilibrium, which for an element looks like
( 2.24 )
It can be proved that this theorem is only valid provided that all derivatives of u and
σ are finite through V. In general the stresses do not achieve continuity across the
element interfaces. However, if the shape functions are chosen such that the
displacements match at the nodes and the adjacent elements (i and j) have identical
displacements at their interface, then a continuity condition on the stresses in the
mean is met in the form of
( 2.25 )
where et is the contribution of applied external loads. This expression is another
approximation of satisfying equilibrium and therefore the equilibrium equation 2.24
is true within a single element and up to its surface boundary Se. Assuming that the
displacement functions satisfy the conditions equation 2.24, the integrations may
now be performed over the element volumes and surfaces. Substituting for the
element displacements and strains respectively equation 2.16 and 2.18, the virtual
work equation for an individual element can now be written as
( 2.26 )
The integral form of the element boundary tractions can be replaced by a
kinematically equivalent nodal force vector re corresponding with the element
degrees of freedom vector ue. Reordering and substituting re for the boundary
tractions, the virtual work equation can now be expressed in a form
( 2.27 )
As this relation is valid for any virtual displacement δue, the equilibrium equation
for an element can be written as
( 2.28 )
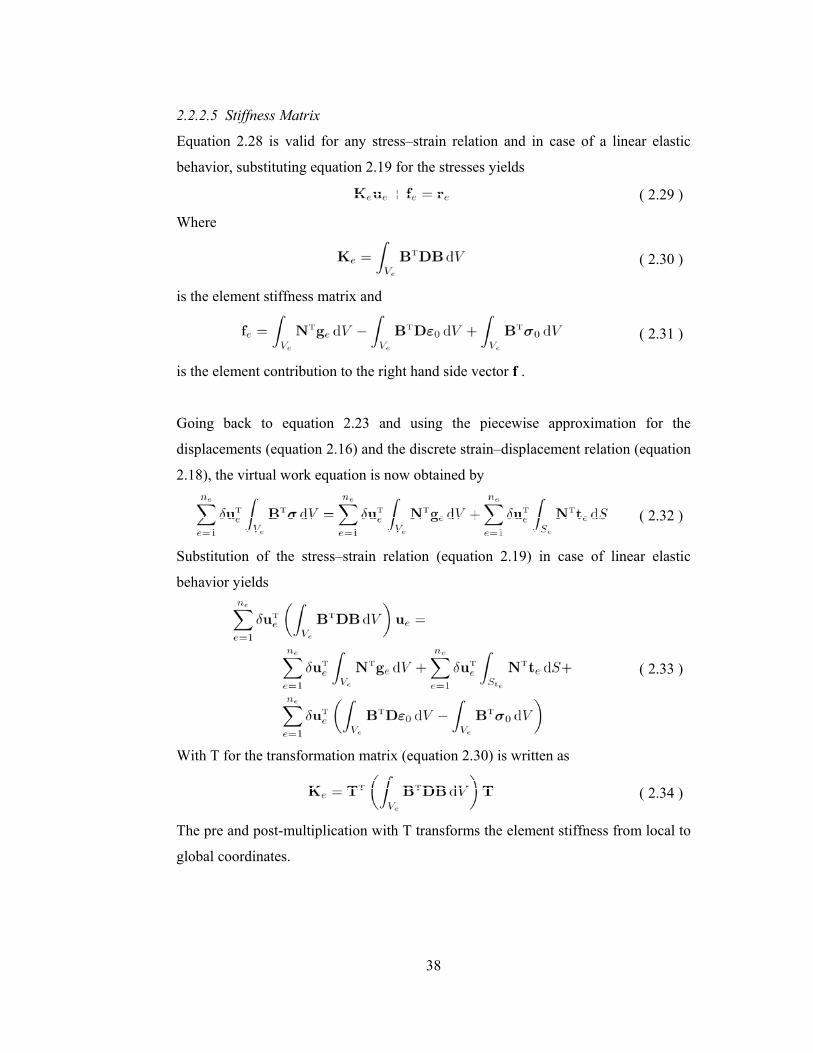
38
2.2.2.5 Stiffness Matrix
Equation 2.28 is valid for any stress–strain relation and in case of a linear elastic
behavior, substituting equation 2.19 for the stresses yields
( 2.29 )
Where
( 2.30 )
is the element stiffness matrix and
( 2.31 )
is the element contribution to the right hand side vector f .
Going back to equation 2.23 and using the piecewise approximation for the
displacements (equation 2.16) and the discrete strain–displacement relation (equation
2.18), the virtual work equation is now obtained by
( 2.32 )
Substitution of the stress–strain relation (equation 2.19) in case of linear elastic
behavior yields
( 2.33 )
With T for the transformation matrix (equation 2.30) is written as
( 2.34 )
The pre and post-multiplication with T transforms the element stiffness from local to
global coordinates.
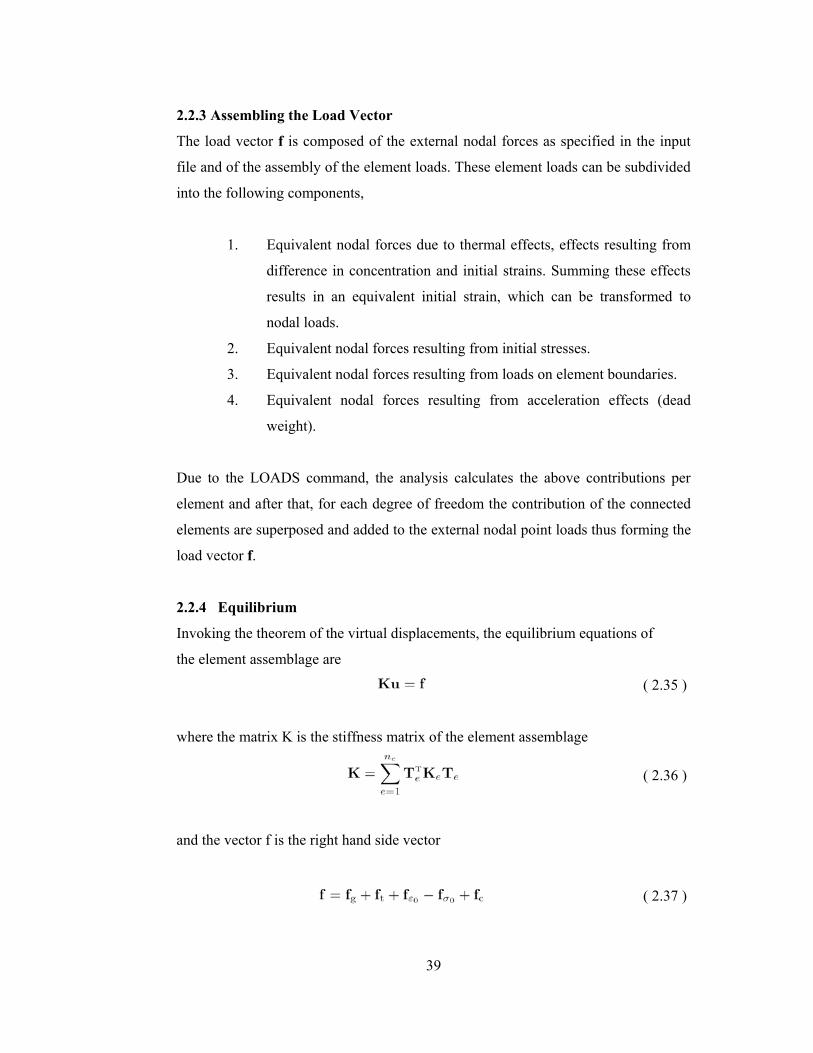
39
2.2.3 Assembling the Load Vector
The load vector f is composed of the external nodal forces as specified in the input
file and of the assembly of the element loads. These element loads can be subdivided
into the following components,
1. Equivalent nodal forces due to thermal effects, effects resulting from
difference in concentration and initial strains. Summing these effects
results in an equivalent initial strain, which can be transformed to
nodal loads.
2. Equivalent nodal forces resulting from initial stresses.
3. Equivalent nodal forces resulting from loads on element boundaries.
4. Equivalent nodal forces resulting from acceleration effects (dead
weight).
Due to the LOADS command, the analysis calculates the above contributions per
element and after that, for each degree of freedom the contribution of the connected
elements are superposed and added to the external nodal point loads thus forming the
load vector f.
2.2.4 Equilibrium
Invoking the theorem of the virtual displacements, the equilibrium equations of
the element assemblage are
( 2.35 )
where the matrix K is the stiffness matrix of the element assemblage
( 2.36 )
and the vector f is the right hand side vector
( 2.37 )
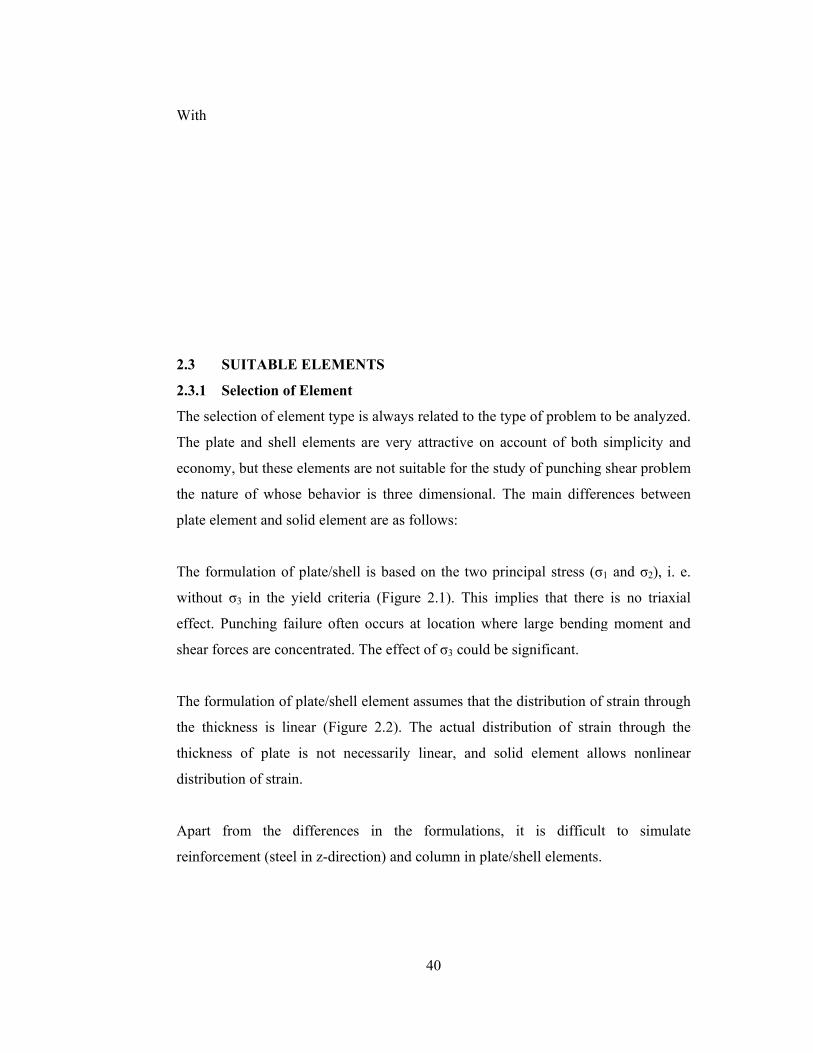
W
2
2
T
T
e
t
p
T
w
e
s
T
t
t
d
A
r
With
2.3 SUIT
2.3.1 Selec
The selectio
The plate an
economy, bu
the nature o
plate elemen
The formula
without σ3 i
effect. Punc
shear forces
The formula
the thicknes
thickness of
distribution
Apart from
reinforcemen
TABLE EL
ction of Elem
n of element
nd shell elem
ut these elem
of whose be
nt and solid e
ation of plat
in the yield
ching failure
are concent
ation of plate
ss is linear
f plate is n
of strain.
m the diffe
nt (steel in z
EMENTS
ment
t type is alw
ments are v
ments are not
ehavior is th
element are
te/shell is ba
d criteria (Fi
e often occu
trated. The e
e/shell eleme
(Figure 2.2
not necessar
rences in
z-direction) a
40
ways related t
very attractiv
t suitable for
hree dimensi
as follows:
ased on the
igure 2.1). T
urs at locatio
ffect of σ3 c
ent assumes
2). The actu
rily linear,
the formul
and column
to the type o
ve on accoun
r the study o
ional. The m
two princip
This implies
on where lar
ould be sign
that the dist
ual distributi
and solid e
lations, it
in plate/shel
of problem to
nt of both s
of punching s
main differe
al stress (σ1
s that there
rge bending
nificant.
tribution of
ion of strain
element allo
is difficult
ll elements.
o be analyze
simplicity an
shear proble
ences betwee
and σ2), i.
is no triaxi
g moment an
strain throug
n through th
ows nonline
to simula
ed.
nd
em
en
e.
ial
nd
gh
he
ear
ate
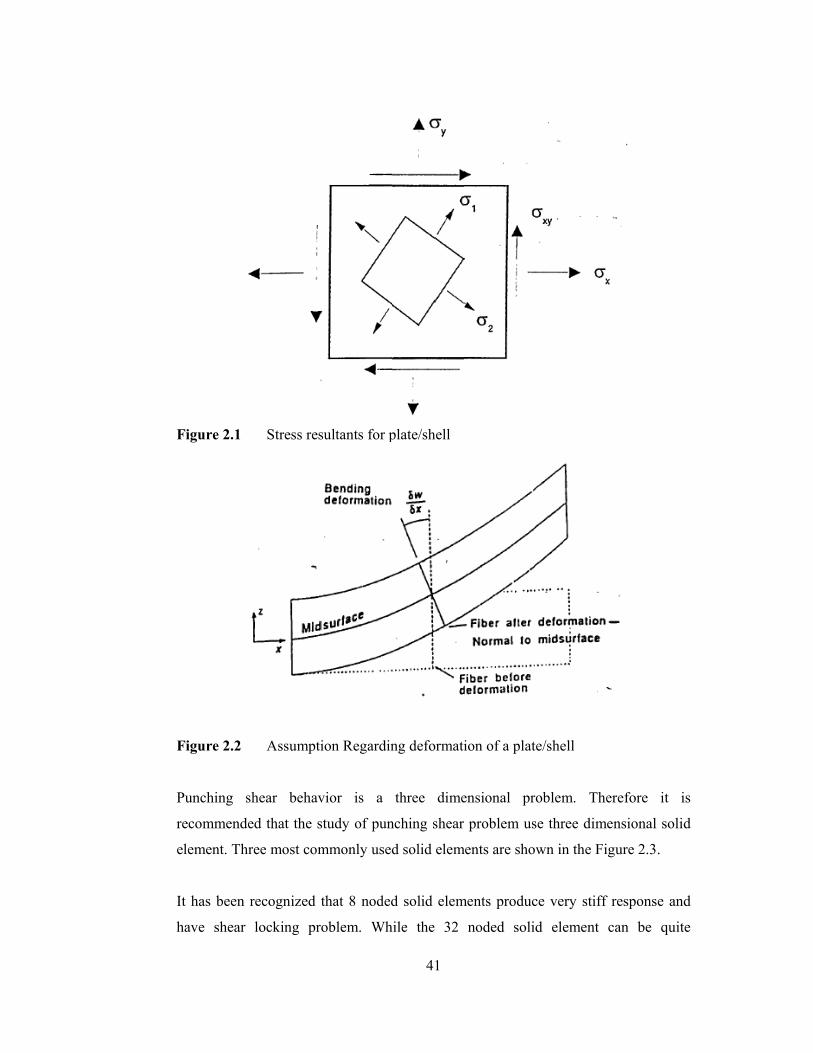
F
F
P
r
e
I
h
Figure 2.1
Figure 2.2
Punching s
recommende
element. Thr
It has been
have shear
Stress res
Assumpti
shear behav
ed that the s
ree most com
recognized
locking pr
sultants for p
ion Regardin
vior is a
study of pun
mmonly used
that 8 noded
roblem. Wh
41
plate/shell
ng deformati
three dime
nching shear
d solid elem
d solid elem
hile the 32
ion of a plat
ensional pr
r problem us
ments are sho
ments produc
noded soli
te/shell
oblem. The
se three dim
wn in the Fi
ce very stiff
d element
erefore it
ensional sol
igure 2.3.
f response an
can be qui
is
lid
nd
ite
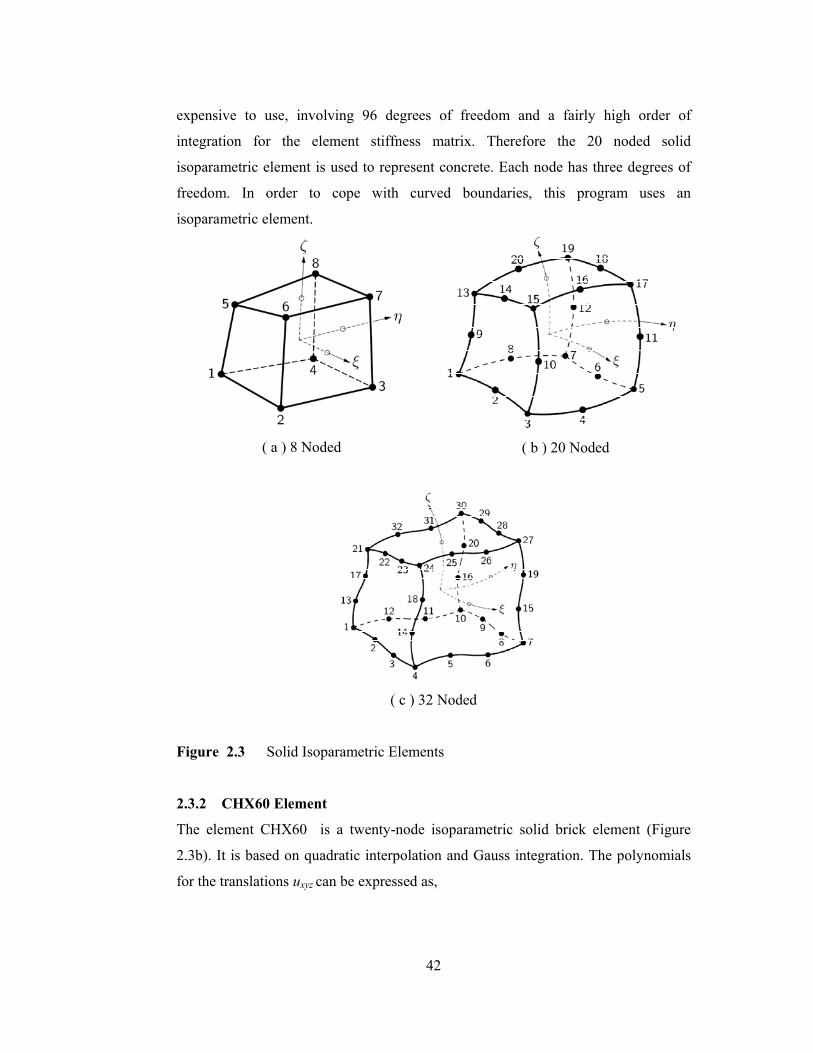
42
expensive to use, involving 96 degrees of freedom and a fairly high order of
integration for the element stiffness matrix. Therefore the 20 noded solid
isoparametric element is used to represent concrete. Each node has three degrees of
freedom. In order to cope with curved boundaries, this program uses an
isoparametric element.
( a ) 8 Noded
( b ) 20 Noded
( c ) 32 Noded
Figure 2.3 Solid Isoparametric Elements
2.3.2 CHX60 Element
The element CHX60 is a twenty-node isoparametric solid brick element (Figure
2.3b). It is based on quadratic interpolation and Gauss integration. The polynomials
for the translations uxyz can be expressed as,
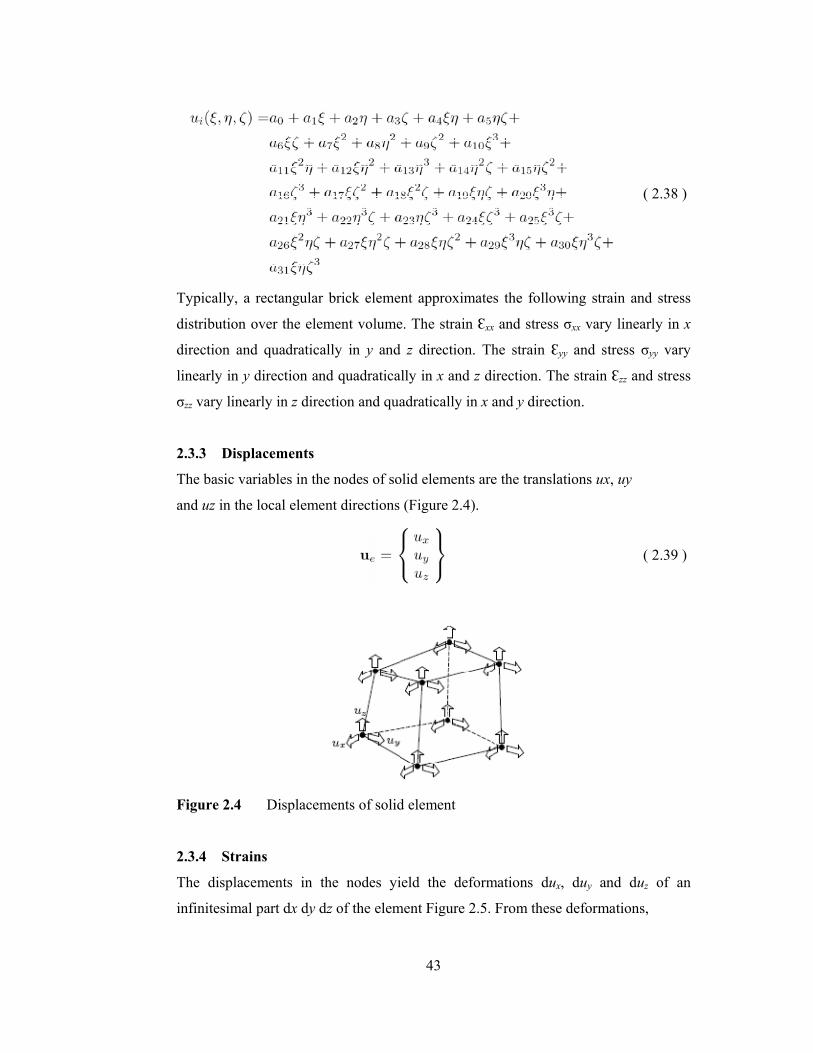
43
( 2.38 )
Typically, a rectangular brick element approximates the following strain and stress
distribution over the element volume. The strain Ԑxx and stress σxx vary linearly in x
direction and quadratically in y and z direction. The strain Ԑyy and stress σyy vary
linearly in y direction and quadratically in x and z direction. The strain Ԑzz and stress
σzz vary linearly in z direction and quadratically in x and y direction.
2.3.3 Displacements
The basic variables in the nodes of solid elements are the translations ux, uy
and uz in the local element directions (Figure 2.4).
( 2.39 )
Figure 2.4 Displacements of solid element
2.3.4 Strains
The displacements in the nodes yield the deformations dux, duy and duz of an
infinitesimal part dx dy dz of the element Figure 2.5. From these deformations,
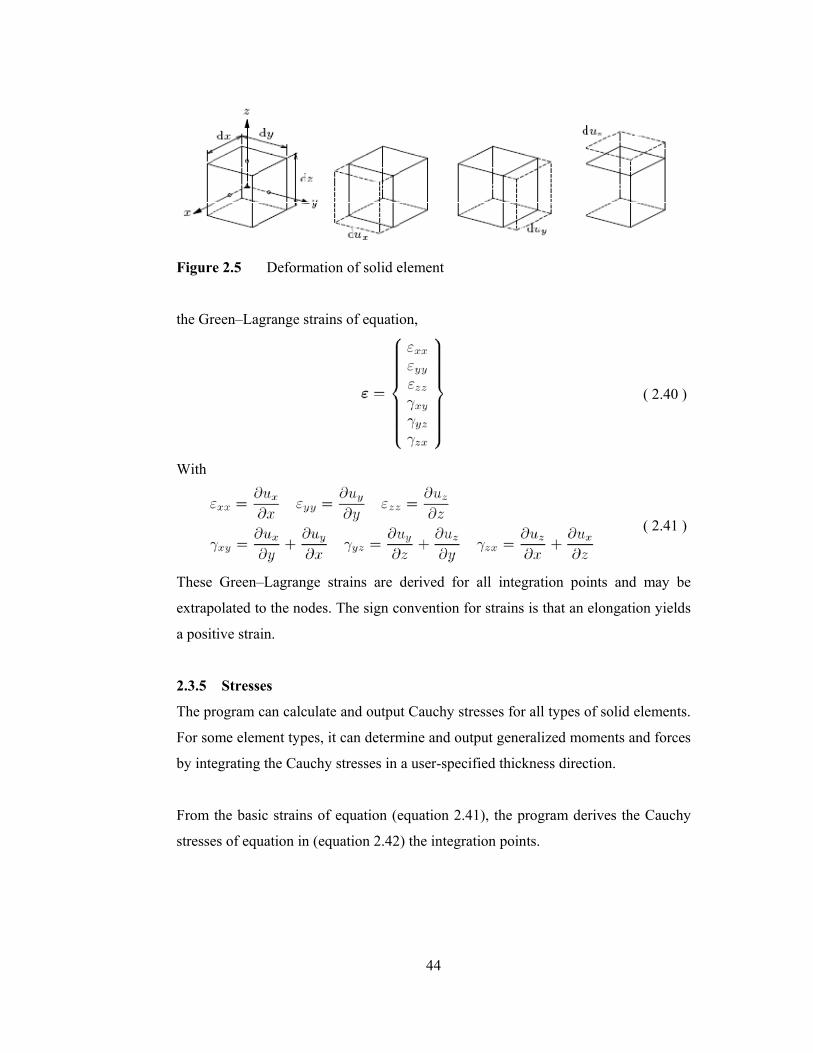
44
Figure 2.5 Deformation of solid element
the Green–Lagrange strains of equation,
( 2.40 )
With
( 2.41 )
These Green–Lagrange strains are derived for all integration points and may be
extrapolated to the nodes. The sign convention for strains is that an elongation yields
a positive strain.
2.3.5 Stresses
The program can calculate and output Cauchy stresses for all types of solid elements.
For some element types, it can determine and output generalized moments and forces
by integrating the Cauchy stresses in a user-specified thickness direction.
From the basic strains of equation (equation 2.41), the program derives the Cauchy
stresses of equation in (equation 2.42) the integration points.
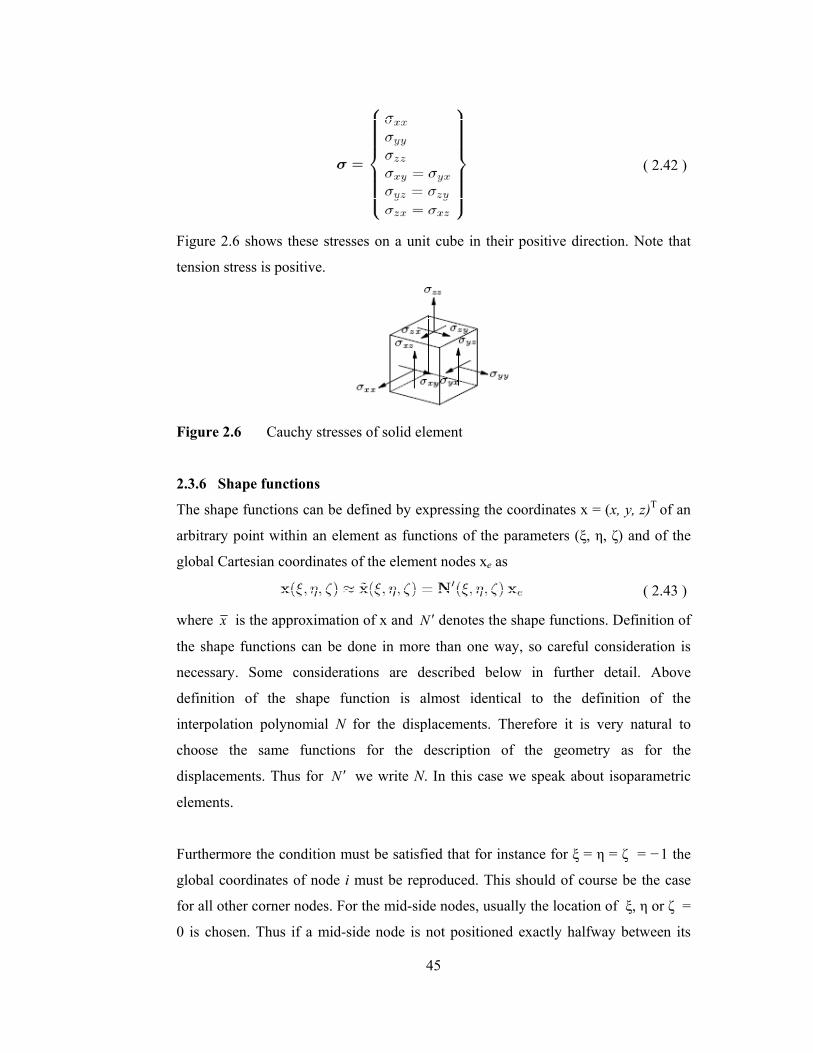
45
( 2.42 )
Figure 2.6 shows these stresses on a unit cube in their positive direction. Note that
tension stress is positive.
Figure 2.6 Cauchy stresses of solid element
2.3.6 Shape functions
The shape functions can be defined by expressing the coordinates x = (x, y, z)T of an
arbitrary point within an element as functions of the parameters (ξ, η, ζ) and of the
global Cartesian coordinates of the element nodes xe as
( 2.43 )
where x is the approximation of x and N ′ denotes the shape functions. Definition of
the shape functions can be done in more than one way, so careful consideration is
necessary. Some considerations are described below in further detail. Above
definition of the shape function is almost identical to the definition of the
interpolation polynomial N for the displacements. Therefore it is very natural to
choose the same functions for the description of the geometry as for the
displacements. Thus for N ′ we write N. In this case we speak about isoparametric
elements.
Furthermore the condition must be satisfied that for instance for ξ = η = ζ = −1 the
global coordinates of node i must be reproduced. This should of course be the case
for all other corner nodes. For the mid-side nodes, usually the location of ξ, η or ζ =
0 is chosen. Thus if a mid-side node is not positioned exactly halfway between its
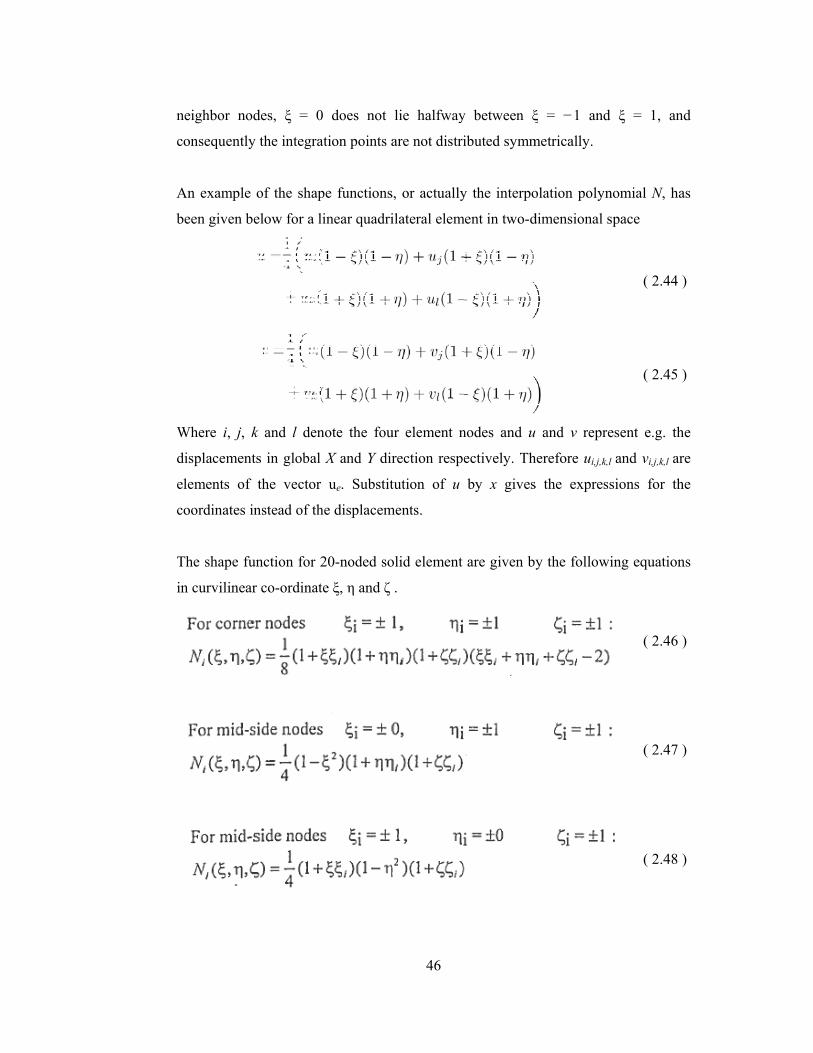
n
c
A
b
W
d
e
c
T
i
neighbor no
consequently
An example
been given b
Where i, j,
displacemen
elements of
coordinates
The shape fu
in curvilinea
odes, ξ = 0
y the integra
e of the shap
below for a l
k and l den
nts in global
f the vector
instead of th
function for 2
ar co-ordinat
0 does not
ation points a
pe functions
linear quadri
note the fou
X and Y dir
r ue. Substit
he displacem
20-noded so
te ξ, η and ζ
46
lie halfway
are not distri
s, or actually
ilateral elem
ur element n
rection respe
tution of u
ments.
olid element
.
y between ξ
ibuted symm
y the interpo
ment in two-d
nodes and u
ectively. Th
by x gives
are given by
ξ = −1 and
metrically.
olation polyn
dimensional
and v repr
herefore ui,j,k,
s the expres
y the follow
d ξ = 1, an
nomial N, h
space
( 2.44
( 2.45
resent e.g. th
,l and vi,j,k,l a
ssions for th
wing equation
( 2.46
( 2.47
( 2.48
nd
as
)
)
he
are
he
ns
)
)
)
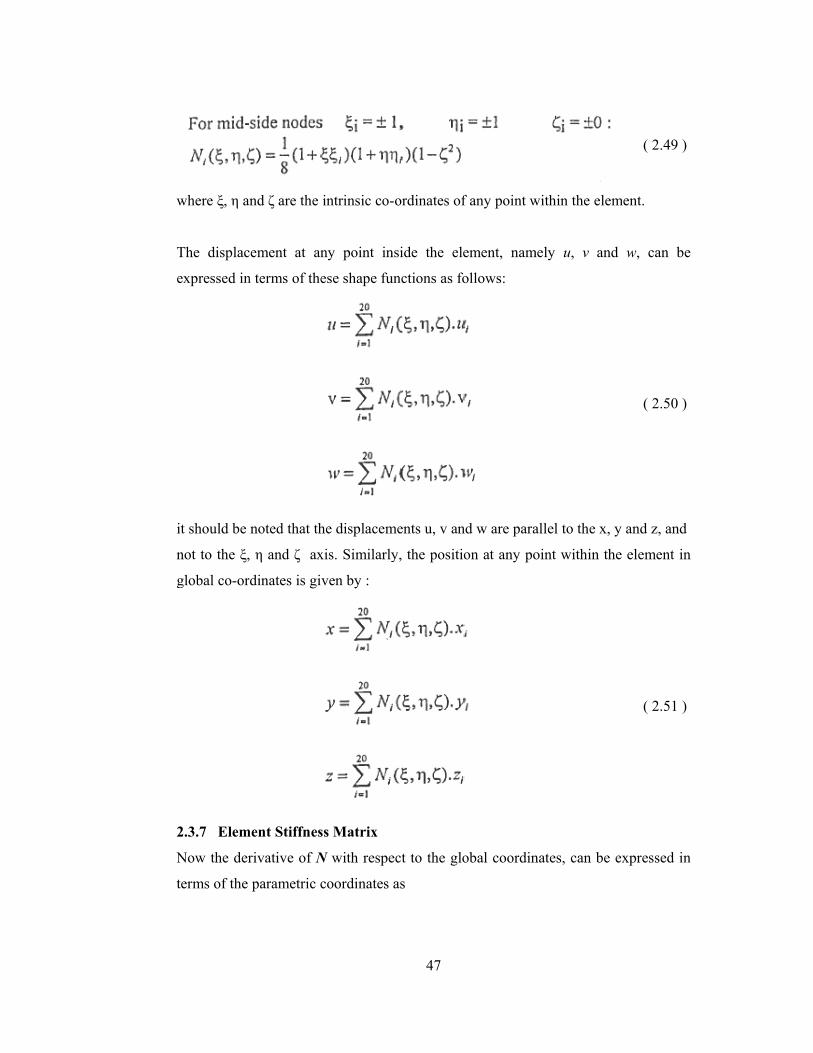
w
T
e
i
n
g
2
N
t
where ξ, η a
The displac
expressed in
it should be
not to the ξ,
global co-or
2.3.7 Elem
Now the der
terms of the
and ζ are the
cement at an
n terms of the
noted that th
, η and ζ ax
rdinates is gi
ment Stiffnes
rivative of N
parametric c
intrinsic co-
ny point in
ese shape fu
he displacem
xis. Similarly
ven by :
ss Matrix
N with respe
coordinates
47
-ordinates of
nside the ele
unctions as fo
ments u, v an
y, the positio
ect to the glo
as
f any point w
ement, nam
ollows:
nd w are para
on at any po
obal coordin
within the ele
mely u, v an
allel to the x
oint within t
nates, can be
( 2.49
ement.
nd w, can b
( 2.50
, y and z, an
the element
( 2.51
e expressed
)
be
)
nd
in
)
in
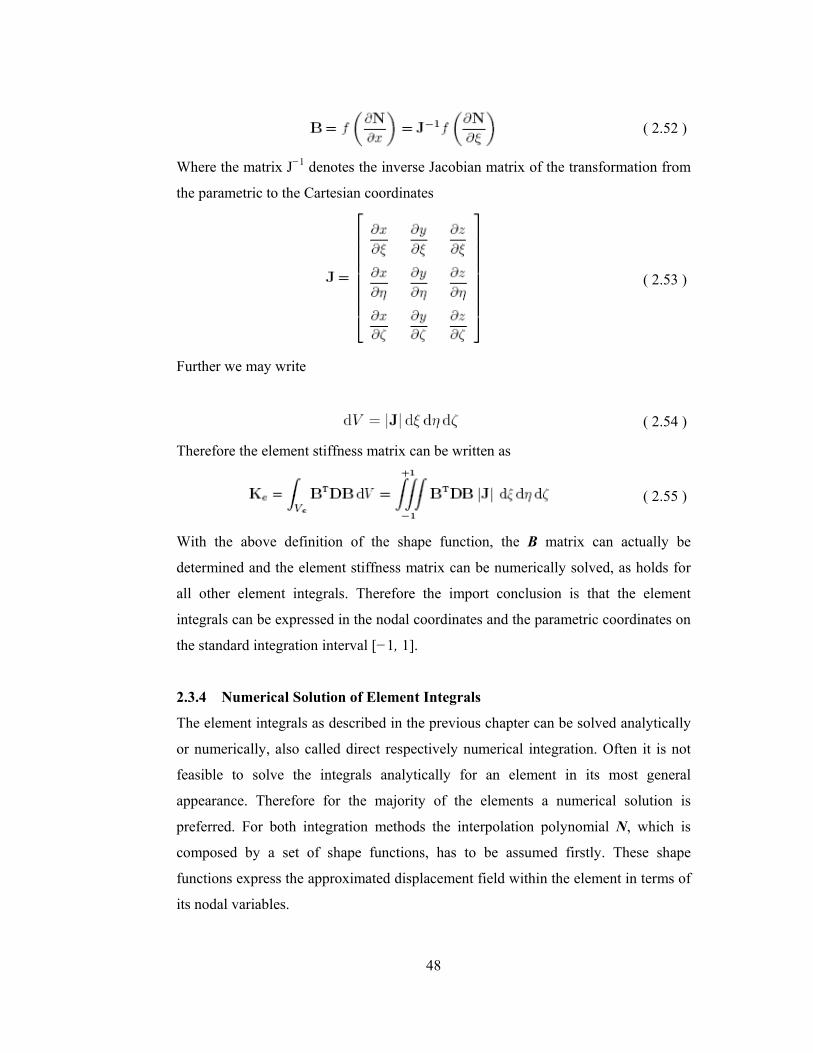
48
( 2.52 )
Where the matrix J−1 denotes the inverse Jacobian matrix of the transformation from
the parametric to the Cartesian coordinates
( 2.53 )
Further we may write
( 2.54 )
Therefore the element stiffness matrix can be written as
( 2.55 )
With the above definition of the shape function, the B matrix can actually be
determined and the element stiffness matrix can be numerically solved, as holds for
all other element integrals. Therefore the import conclusion is that the element
integrals can be expressed in the nodal coordinates and the parametric coordinates on
the standard integration interval [−1, 1].
2.3.4 Numerical Solution of Element Integrals
The element integrals as described in the previous chapter can be solved analytically
or numerically, also called direct respectively numerical integration. Often it is not
feasible to solve the integrals analytically for an element in its most general
appearance. Therefore for the majority of the elements a numerical solution is
preferred. For both integration methods the interpolation polynomial N, which is
composed by a set of shape functions, has to be assumed firstly. These shape
functions express the approximated displacement field within the element in terms of
its nodal variables.
49
Principle of numerical integration: Numerical integration is based upon the
evaluation of the function to be integrated in a number of specific points, the so
called integration points. These function values in the integration points are then
weighted and summed to obtain the value of the integral. The weight function
depends on the method of integration. For finite element integration usually the
Gauss integration scheme is applied, as this method requires the least number of
integration points. Now the integration of a function f(x) can be rewritten numerically
as
( 2.56 )
Where ω ξi describes the weight function of the applied method for the specific
integration interval n, the number of integration points and xi the coordinate of the
integration point. In the case of the element stiffness matrix we rewrite equation
( 2.57 )
in which ωξ ωη and ωζ are the weight functions for each integration direction and
based on the standard interval and eK~ is expressed in the element local Cartesian
coordinate system. Above, the solution of the integral provides a simple algorithm to
determine the stiffness matrix.
2.4 INTEGRATION SCHEMES
As mentioned, the numerical integration is based upon the addition of weighted
function values as determined in the integration points. A minimum number of
integration points is required by the numerical integration method and depends on
the order of the interpolation polynomial. In order to integrate all of the terms in the
integrand a full integration scheme is necessary. Often however, especially in linear
elastic problems, some higher order cross terms of the polynomial can be ignored
safely, which reduces the required number of integration points and therefore is
called the reduced integration scheme.
It showed that the position of the Gauss integration points of the reduced scheme,
coincide with the optimal stress points, the so called Barlow stress points. It can be
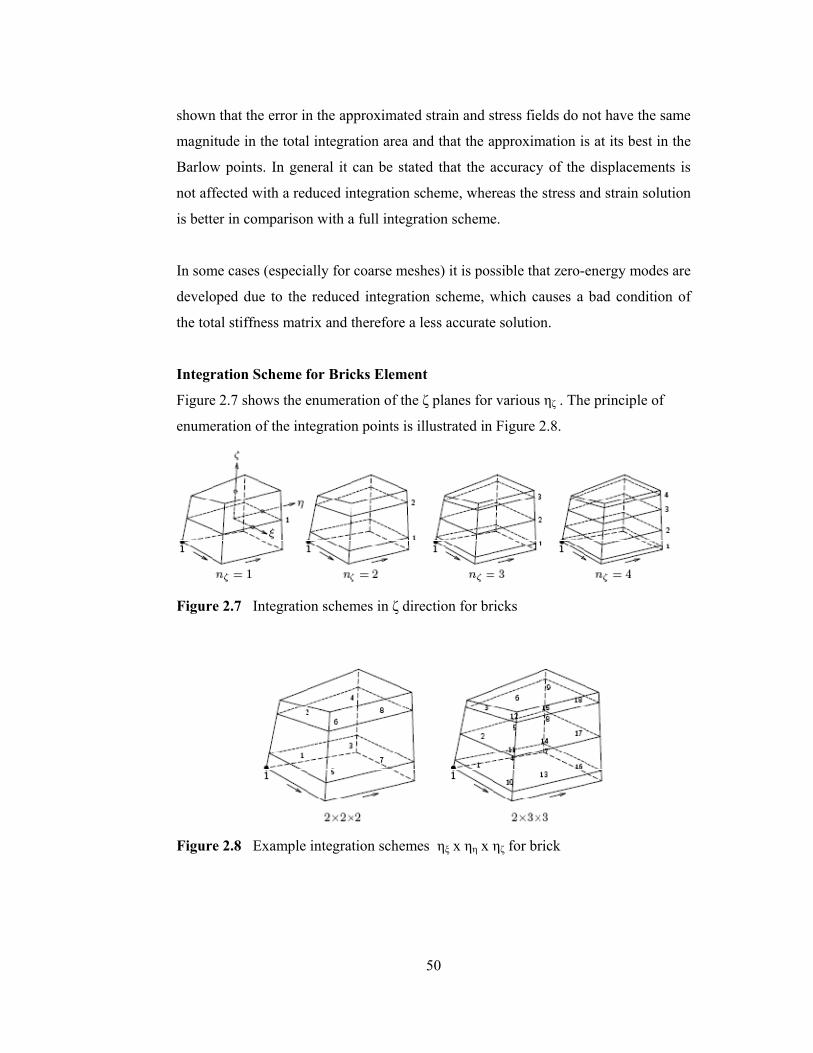
50
shown that the error in the approximated strain and stress fields do not have the same
magnitude in the total integration area and that the approximation is at its best in the
Barlow points. In general it can be stated that the accuracy of the displacements is
not affected with a reduced integration scheme, whereas the stress and strain solution
is better in comparison with a full integration scheme.
In some cases (especially for coarse meshes) it is possible that zero-energy modes are
developed due to the reduced integration scheme, which causes a bad condition of
the total stiffness matrix and therefore a less accurate solution.
Integration Scheme for Bricks Element
Figure 2.7 shows the enumeration of the ζ planes for various ηζ . The principle of
enumeration of the integration points is illustrated in Figure 2.8.
Figure 2.7 Integration schemes in ζ direction for bricks
Figure 2.8 Example integration schemes ηξ x ηη x ηζ for brick
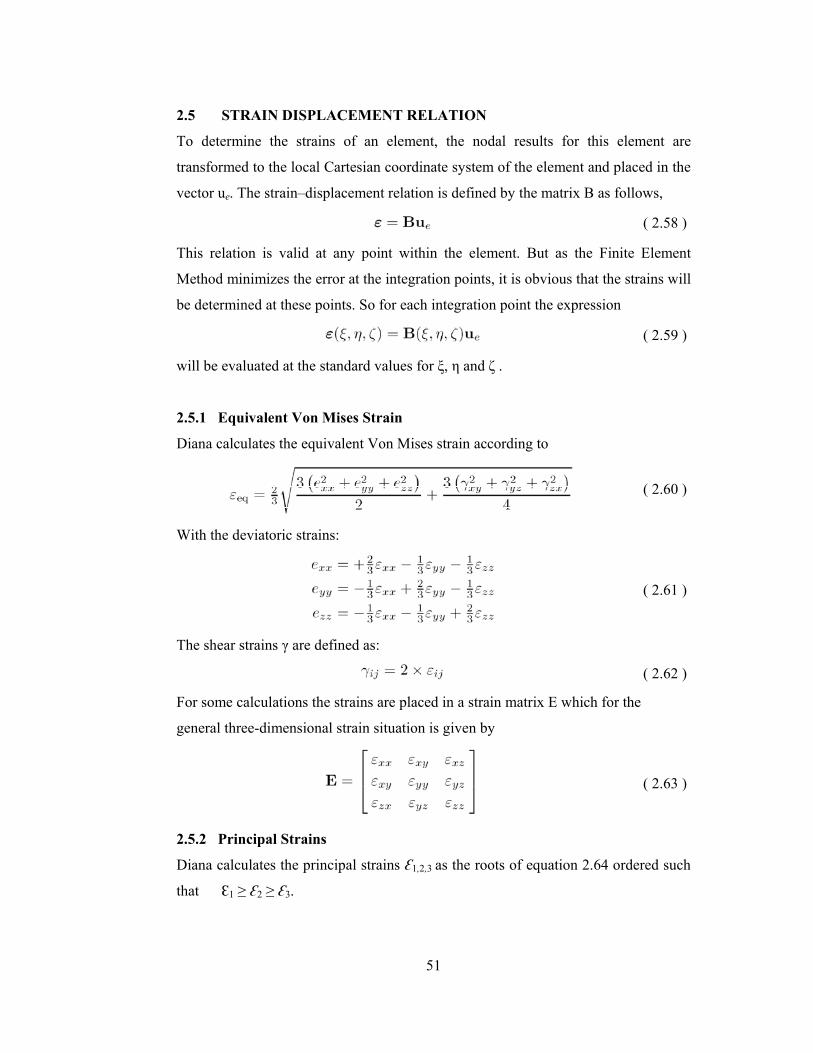
51
2.5 STRAIN DISPLACEMENT RELATION
To determine the strains of an element, the nodal results for this element are
transformed to the local Cartesian coordinate system of the element and placed in the
vector ue. The strain–displacement relation is defined by the matrix B as follows,
( 2.58 )
This relation is valid at any point within the element. But as the Finite Element
Method minimizes the error at the integration points, it is obvious that the strains will
be determined at these points. So for each integration point the expression
( 2.59 )
will be evaluated at the standard values for ξ, η and ζ .
2.5.1 Equivalent Von Mises Strain
Diana calculates the equivalent Von Mises strain according to
( 2.60 )
With the deviatoric strains:
( 2.61 )
The shear strains γ are defined as:
( 2.62 )
For some calculations the strains are placed in a strain matrix E which for the
general three-dimensional strain situation is given by
( 2.63 )
2.5.2 Principal Strains
Diana calculates the principal strains Ԑ1,2,3 as the roots of equation 2.64 ordered such
that Ԑ1 ≥ Ԑ2 ≥ Ԑ3.
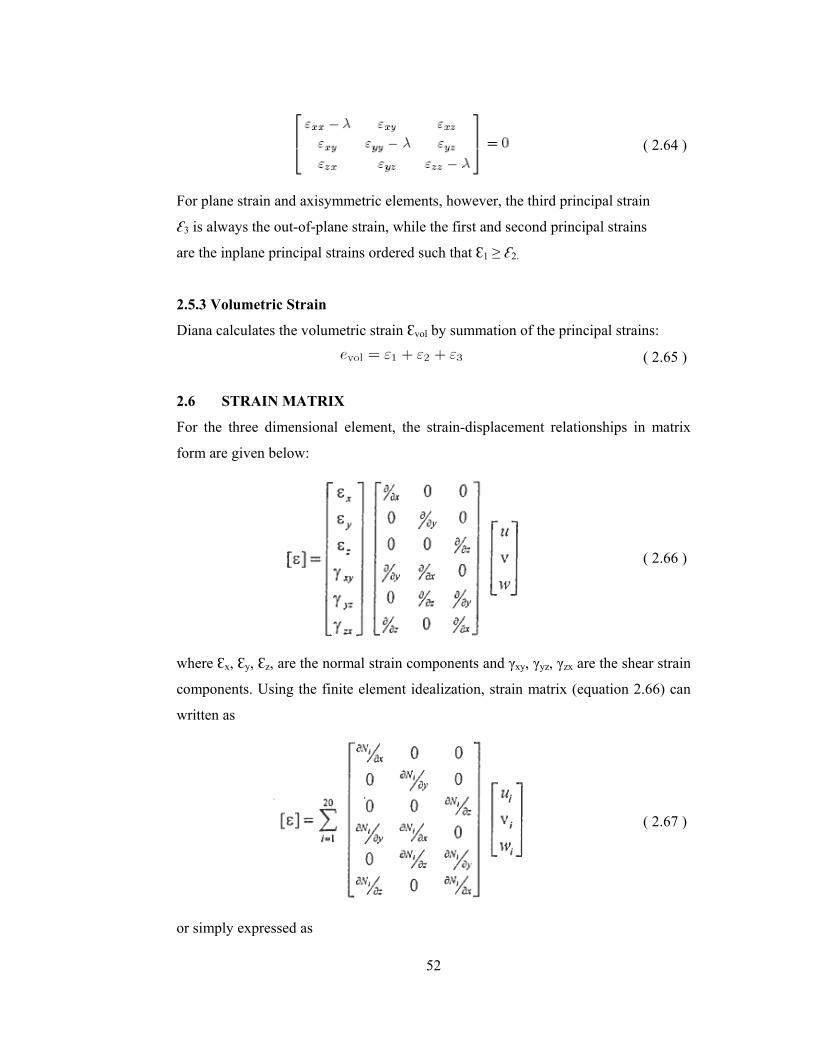
F
Ԑ
a
2
D
2
F
f
w
c
w
o
For plane str
Ԑ3 is always
are the inpla
2.5.3 Volum
Diana calcul
2.6 STR
For the thre
form are giv
where Ԑx, Ԑy
components
written as
or simply ex
rain and axis
the out-of-p
ane principal
metric Strain
lates the volu
RAIN MATR
ee dimension
ven below:
y, Ԑz, are the
. Using the
xpressed as
symmetric e
plane strain,
l strains orde
n
umetric strai
RIX
nal element
normal strai
finite eleme
52
lements, how
while the fir
ered such tha
in Ԑvol by sum
, the strain-
in componen
ent idealizati
wever, the th
rst and secon
at Ԑ1 ≥ Ԑ2.
mmation of
-displacemen
nts and γxy, γ
ion, strain m
hird principa
nd principal
the principa
nt relationsh
γyz, γzx are th
matrix (equat
( 2.64
al strain
strains
al strains:
( 2.65
hips in matr
( 2.66
he shear stra
tion 2.66) ca
( 2.67
)
)
rix
)
ain
an
)
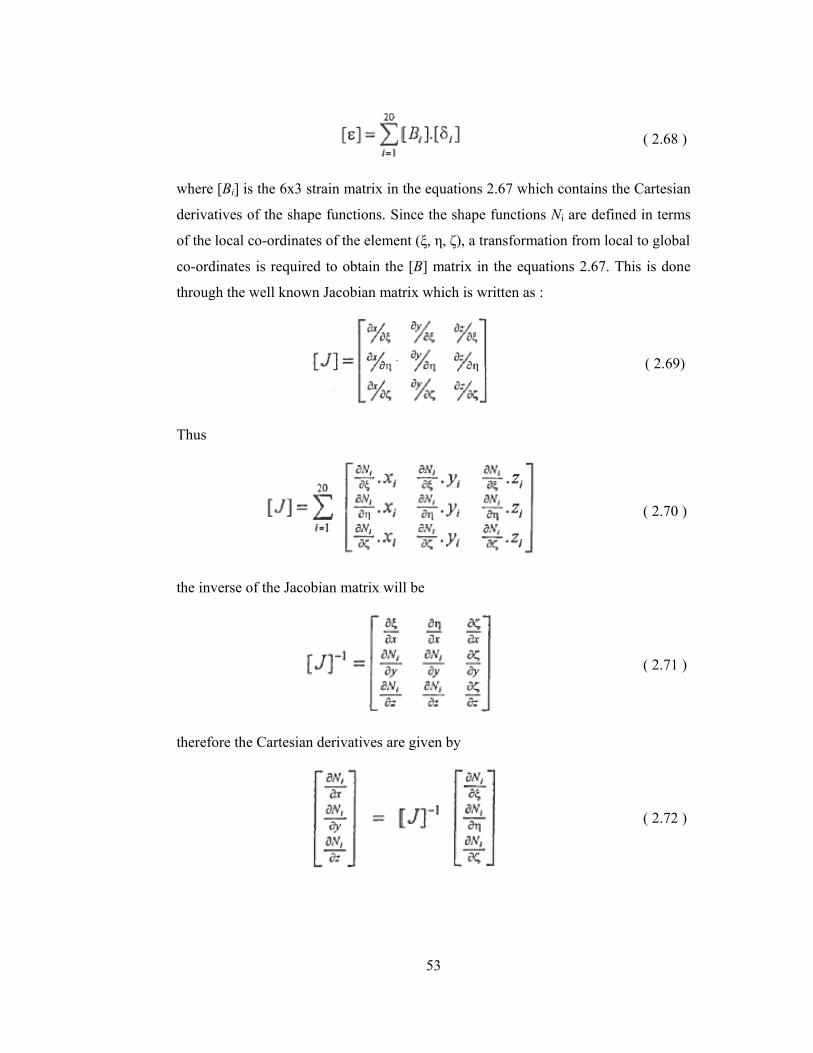
w
d
o
c
t
T
t
t
where [Bi] is
derivatives o
of the local c
co-ordinates
through the w
Thus
the inverse o
therefore the
s the 6x3 str
of the shape
co-ordinates
s is required
well known
of the Jacobi
e Cartesian d
rain matrix in
e functions. S
s of the elem
to obtain th
Jacobian ma
ian matrix w
derivatives a
53
n the equatio
Since the sh
ment (ξ, η, ζ),
he [B] matri
atrix which i
will be
are given by
ons 2.67 wh
hape function
, a transform
ix in the equ
is written as
ich contains
ns Ni are def
mation from l
uations 2.67.
:
( 2.68
s the Cartesia
fined in term
local to glob
. This is don
( 2.69
( 2.70
( 2.71
( 2.72
)
an
ms
bal
ne
9)
)
)
)
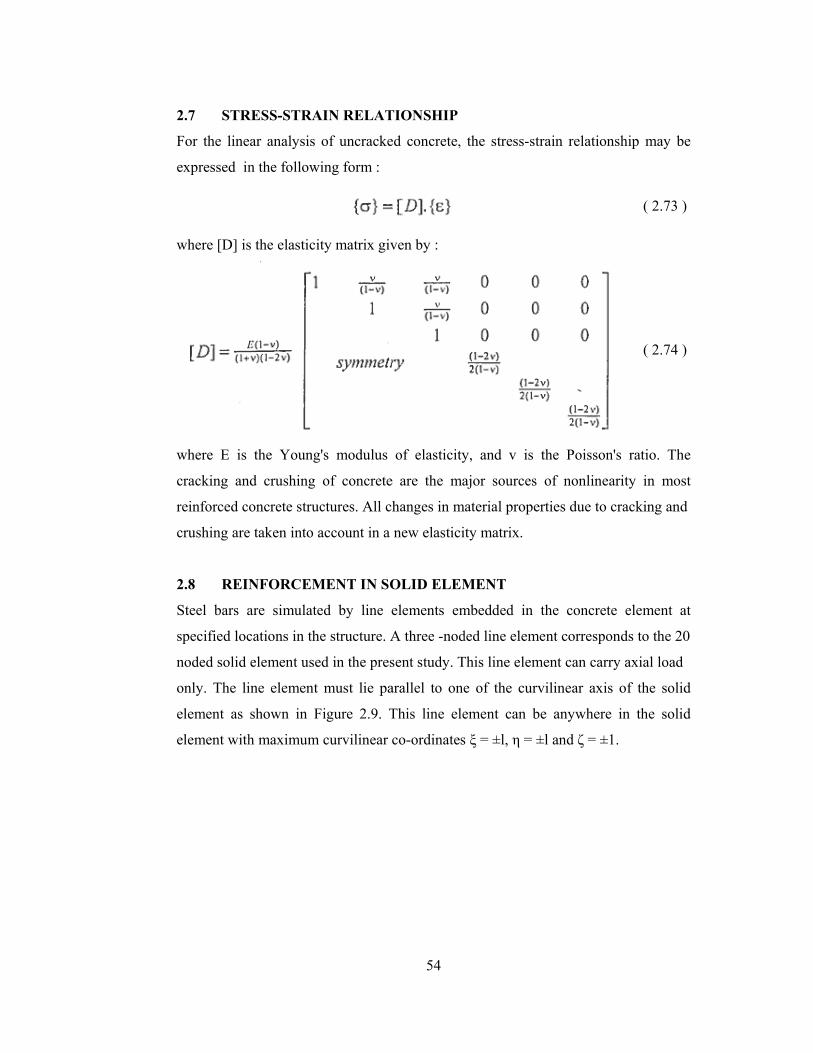
2
F
e
w
w
c
r
c
2
S
s
n
o
e
e
2.7 STR
For the line
expressed in
where [D] is
where E is
cracking an
reinforced co
crushing are
2.8 REIN
Steel bars a
specified loc
noded solid
only. The li
element as
element with
RESS-STRA
ar analysis
n the followi
s the elasticit
the Young
d crushing
oncrete struc
e taken into a
NFORCEM
are simulate
cations in the
element use
ine element
shown in F
h maximum
AIN RELAT
of uncracke
ing form :
ty matrix giv
's modulus
of concrete
ctures. All ch
account in a
MENT IN SO
ed by line e
e structure. A
ed in the pres
must lie pa
Figure 2.9. T
curvilinear c
54
TIONSHIP
ed concrete,
ven by :
of elasticity
e are the ma
hanges in m
new elastici
OLID ELEM
elements em
A three -nod
sent study. T
arallel to one
This line ele
co-ordinates
the stress-st
y, and v is
ajor sources
material prope
ity matrix.
MENT
mbedded in
ded line elem
This line elem
e of the cur
ement can b
s ξ = ±l, η =
train relation
the Poisson
s of nonline
erties due to
the concret
ment correspo
ment can car
rvilinear axi
be anywhere
±l and ζ = ±
nship may b
( 2.73
( 2.74
n's ratio. Th
earity in mo
cracking an
te element
onds to the 2
rry axial load
is of the sol
e in the sol
±1.
be
)
)
he
ost
nd
at
20
d
lid
lid
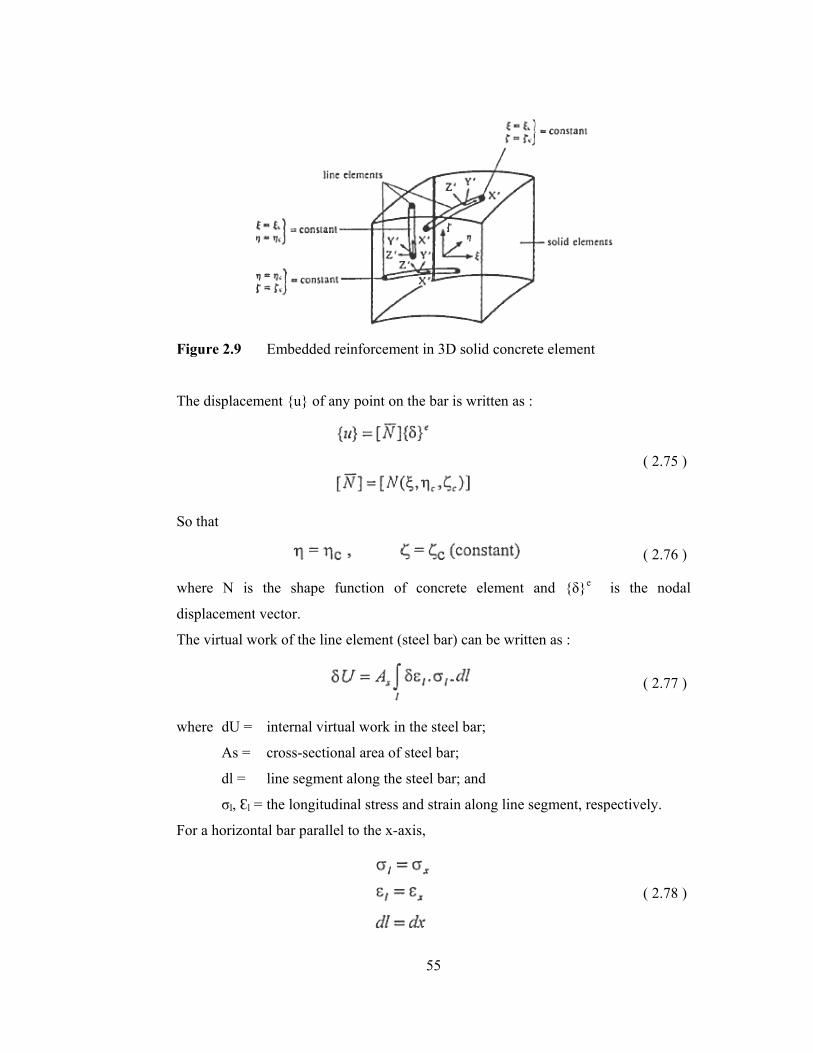
F
T
S
w
d
T
w
F
Figure 2.9
The displace
So that
where N is
displacemen
The virtual w
where dU =
As =
dl =
σl, Ԑl
For a horizo
Embedde
ement {u} of
s the shape
nt vector.
work of the l
= internal v
= cross-sec
line segm
l = the longit
ontal bar para
ed reinforcem
f any point o
e function
line element
virtual work
ctional area o
ment along th
tudinal stres
allel to the x
55
ment in 3D s
on the bar is
of concrete
t (steel bar) c
in the steel b
of steel bar;
he steel bar;
s and strain
x-axis,
solid concret
written as :
e element a
can be writte
bar;
and
along line se
te element
and {δ}e
en as :
egment, resp
( 2.75
( 2.76
is the nod
( 2.77
pectively.
( 2.78
)
)
dal
)
)
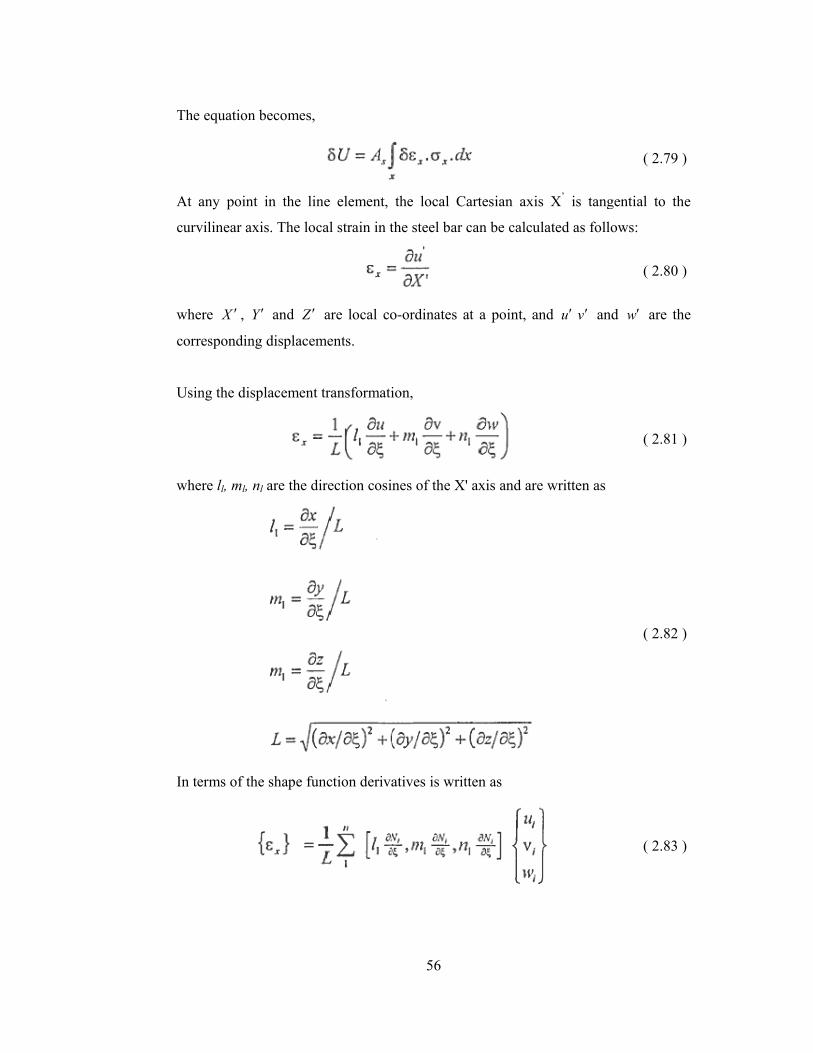
T
A
c
w
c
U
w
I
The equation
At any poin
curvilinear a
where X ′ ,
correspondin
Using the di
where ll, ml,
In terms of t
n becomes,
nt in the lin
axis. The loc
Y ′ and Z ′
ng displacem
isplacement
nl are the di
the shape fun
ne element,
cal strain in t
are local co
ments.
transformati
irection cosin
nction deriva
56
the local C
the steel bar
o-ordinates a
ion,
nes of the X
atives is writ
Cartesian axi
can be calcu
at a point, a
X' axis and ar
tten as
is X’ is tang
ulated as foll
and u ′ v ′ an
re written as
( 2.79
gential to th
lows:
( 2.80
nd w′ are th
( 2.81
( 2.82
( 2.83
)
he
)
he
)
)
)
T
w
s
A
w
T
T
a
The strain in
where B is t
strain in the
And the stiff
where Es is
The same ste
The final ex
adding the st
n steel can be
the nodal dis
steel bar is :
fness of the
the Young's
eps can be re
xpression fo
tiffness matr
e written as
splacement-s
:
embedded b
s modulus of
epeated for b
or the comp
rices for con
57
strain matrix
bar can be ex
f steel bar an
bars parallel
posite eleme
ncrete and ste
x. The relatio
xpressed as,
nd Js is the J
to y and z a
ent stiffness
eel together,
on between
acobian for
axis.
s is simply
, as follows:
( 2.84
the stress an
( 2.85
( 2.86
steel elemen
evaluated b
( 2.87
)
nd
5)
)
nt.
by
)
58
CHAPTER-3
MATERIAL MODELLING
3.1 INTRODUCTION
With the advancement of finite element technique and availability of high speed
computer, there has been a demand for refined and sophisticated model in order to
trace the response of RC structure in the nonlinear post-cracking and post-yield
range. The limitation of linear elastic, plastic and ultimate load theories necessitate
the nonlinear plastic analysis by a computational model such as finite element
method. Linear elastic theory can never predict the failure surface the true factor of
safety can never determine. To overcome this problem, plastic methods and ultimate
load theories have been developed. Since determination of the actual failure stress
distribution and collapse mechanism is not straightforward due to complex geometry
of structures and loading, this method can not be relied for important structures.
Moreover there is no consideration in these methods for several other factors such as,
inplane behavior, failure mechanism, of localized failure, effect of load history etc.
Although the use of finite element technique for RC structures is highly promising,
yet the task of modeling the material behavior was and remains a great challenge.
Ever since this method was applied to RC structure, concrete material modeling has
become a very active area of research. Although a great deal of progress has been
made by the researchers as seen in the state of art report of American Society of Civil
Engineers, ASCE (1982) and Christian and Hajime (1986), continuing research work
is still attempting to resolve some of the difficult issue. These include nonlinear
behavior, tension cracking, biaxial stiffening, strain softening, modeling of post
fracture behavior, interaction between the concrete and reinforcing bars etc. For the
development of a mathematical model, the typical experimental data is used for
concrete under uniaxial, biaxial and triaxial state of stress in order to simulate the
material behavior and to determine the various material constants in the
mathematical model.
3
I
f
s
i
b
s
W
b
t
c
o
i
c
m
c
p
3
A
s
s
s
T
d
m
A
p
t
s
o
3.2 BEH
It is a comm
for several
structures. I
index of its b
bond streng
strength of c
With the ev
behavior of
the effect o
conditions. T
of a biaxial
investigation
conditions,
modeling. H
concrete und
practice.
3.2.1 Unia
A common
section, is su
system is in
section of th
Therefore th
described by
may be calle
A typical re
presented in
the ultimate
small increm
of micro cra
HAVIOR OF
mon practice
requiremen
In fact the u
behavior in g
gth or even
concrete rule
ver increasi
concrete in
of fatigue on
The loading
or triaxial i
n regarding
no constitu
Hence, there
der biaxial a
axial Behavi
situation wi
ubjected to s
n equilibrium
he bar the to
he stress th
y = F/A, w
ed normal str
elationship
n Figure 3.1.
load, the cu
ments of stre
acks at the p
F CONCRE
e to determin
nts relating
uniaxial com
general. Be i
cyclic loadi
es.
ng awarene
the prototy
n concrete,
conditions
in nature, pa
g the behav
utive laws a
are need to
and triaxial c
ior
ith a simple
stress by opp
m and not ch
op part must
hroughout th
where A is t
ress or uniax
between str
After an ini
urve becomes
ss. The nonl
aste-aggrega
59
ETE IN COM
ne the uniax
to the desi
mpressive st
it the durabi
ing leading
ess amongst
ype structure
but once a
in real life s
articularly in
vior of con
are readily
have such f
conditions a
stress patter
posite forces
hanging with
t pull on the
he bar, acr
the area of
xial stress.
ress and str
tial linear po
s nonlinear,
linearity is p
ate interface
MPRESSIO
xial compres
ign and qua
trength of c
ility or tensil
to fatigue,
t the design
es, attempts
again mostly
structures are
n bridges an
ncrete has
available fo
facilities and
nd incorpora
rn is with un
s of magnitu
h time then
e bottom pa
ross any ho
the cross-se
rain for nor
ortion lasting
with large s
rimarily a fu
e. The ultima
ON
ssive strengt
ality contro
concrete is c
le strength, s
the uniaxial
ners regardin
have been m
y under uni
e seldom un
nd dams. Sin
been done
or analysis
d to study th
ate the resul
niform mate
ude F along
through eac
art with the s
orizontal sur
ection. This
rmal strengt
g up to abou
trains being
unction of th
ate stress is
th of concre
l of concre
considered a
shear strengt
l compressiv
ng the actu
made to stud
iaxial loadin
niaxial and a
nce not muc
e under suc
or numeric
he behavior
lts into desig
erial and cro
its axis. If th
ch transvers
same force F
rface, can b
type of stre
th concrete
ut 30 – 40%
registered f
he coalescenc
reached whe
ete
ete
an
th,
ve
ual
dy
ng
are
ch
ch
cal
of
gn
ss
he
sal
F.
be
ess
is
of
for
ce
en
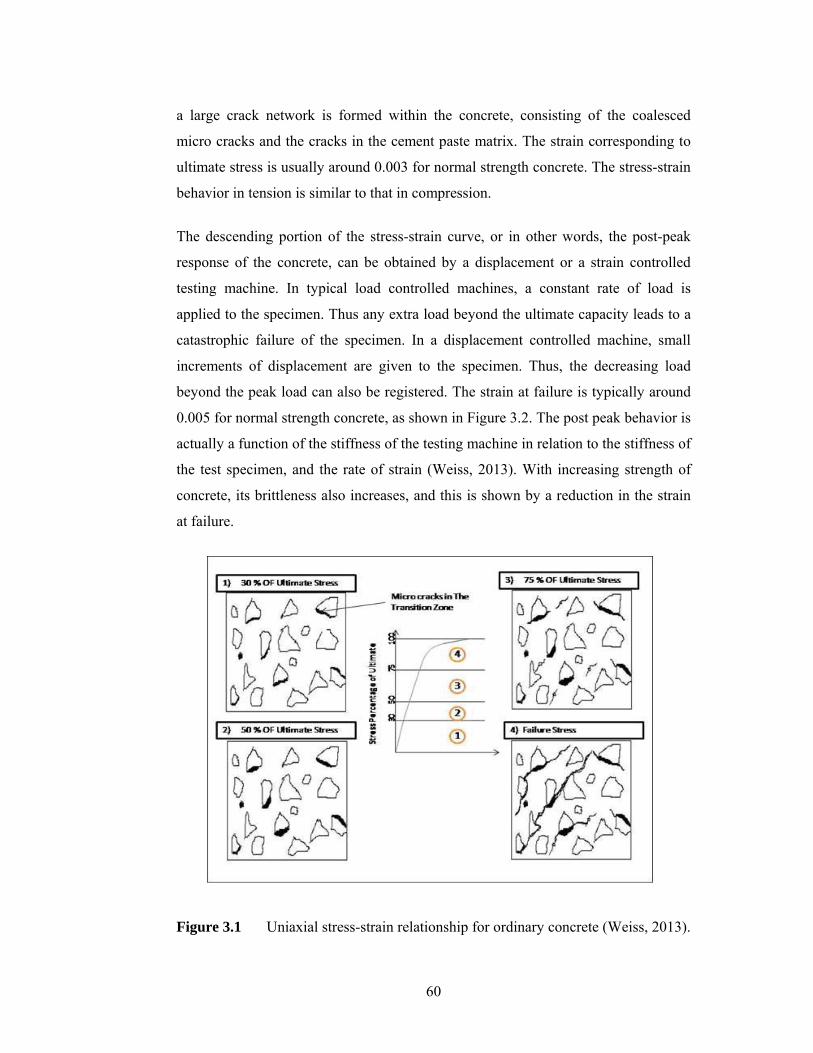
60
a large crack network is formed within the concrete, consisting of the coalesced
micro cracks and the cracks in the cement paste matrix. The strain corresponding to
ultimate stress is usually around 0.003 for normal strength concrete. The stress-strain
behavior in tension is similar to that in compression.
The descending portion of the stress-strain curve, or in other words, the post-peak
response of the concrete, can be obtained by a displacement or a strain controlled
testing machine. In typical load controlled machines, a constant rate of load is
applied to the specimen. Thus any extra load beyond the ultimate capacity leads to a
catastrophic failure of the specimen. In a displacement controlled machine, small
increments of displacement are given to the specimen. Thus, the decreasing load
beyond the peak load can also be registered. The strain at failure is typically around
0.005 for normal strength concrete, as shown in Figure 3.2. The post peak behavior is
actually a function of the stiffness of the testing machine in relation to the stiffness of
the test specimen, and the rate of strain (Weiss, 2013). With increasing strength of
concrete, its brittleness also increases, and this is shown by a reduction in the strain
at failure.
Figure 3.1 Uniaxial stress-strain relationship for ordinary concrete (Weiss, 2013).
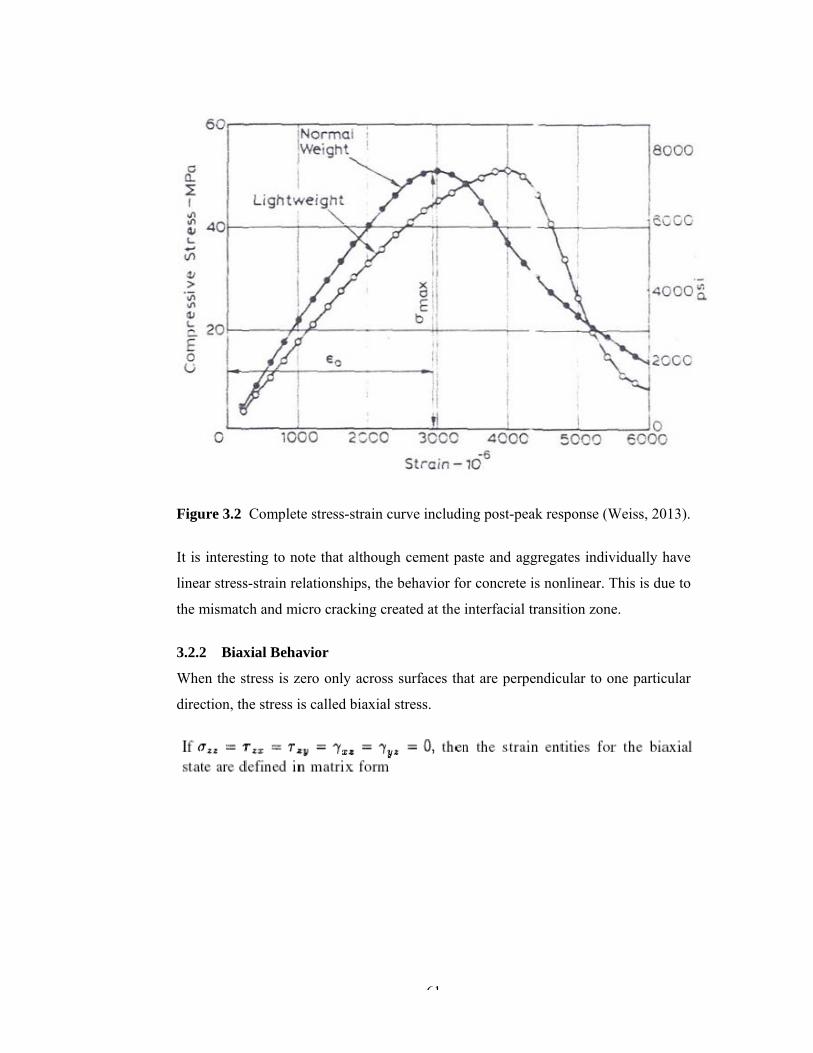
F
I
l
t
3
W
d
Figure 3.2
It is interest
linear stress-
the mismatc
3.2.2 Biax
When the st
direction, th
Complete st
ting to note
-strain relati
h and micro
xial Behavio
tress is zero
e stress is ca
tress-strain c
that althoug
ionships, the
cracking cr
or
only across
alled biaxial
61
curve includi
gh cement pa
e behavior fo
eated at the
s surfaces th
stress.
ing post-peak
aste and agg
or concrete is
interfacial tr
at are perpe
k response (
gregates indi
s nonlinear.
ransition zon
endicular to
(Weiss, 2013
ividually hav
This is due
ne.
one particul
3).
ve
to
lar
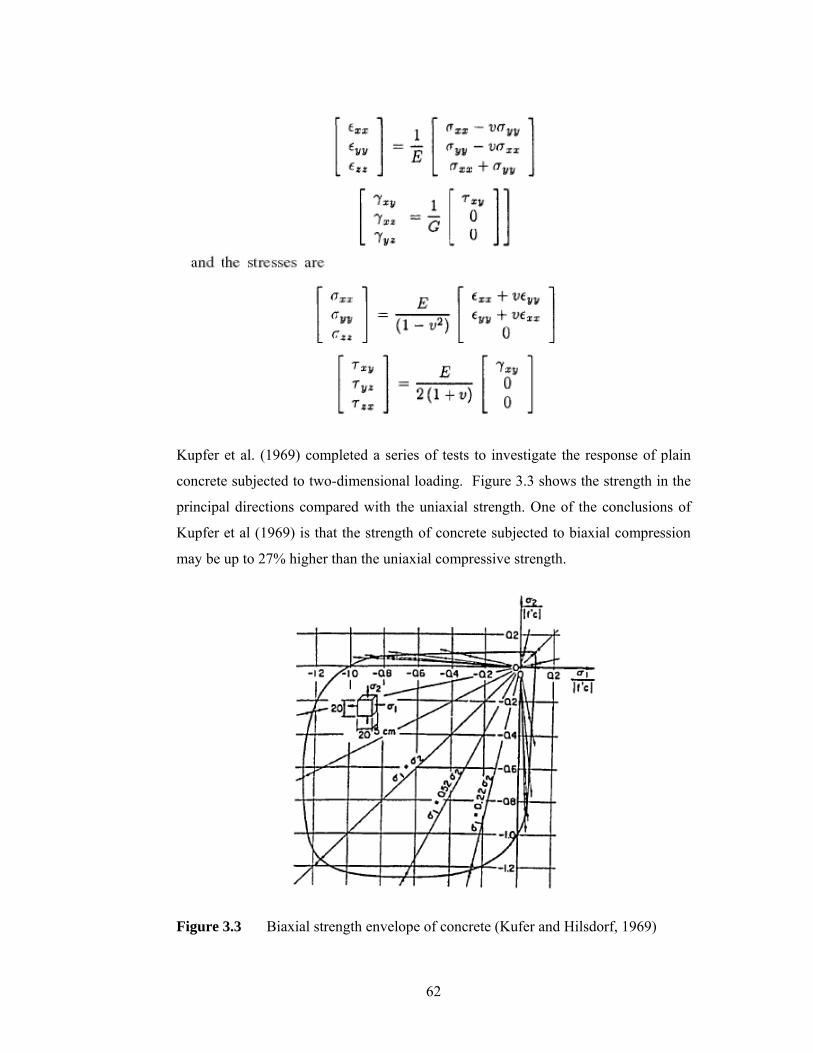
62
Kupfer et al. (1969) completed a series of tests to investigate the response of plain
concrete subjected to two-dimensional loading. Figure 3.3 shows the strength in the
principal directions compared with the uniaxial strength. One of the conclusions of
Kupfer et al (1969) is that the strength of concrete subjected to biaxial compression
may be up to 27% higher than the uniaxial compressive strength.
Figure 3.3 Biaxial strength envelope of concrete (Kufer and Hilsdorf, 1969)
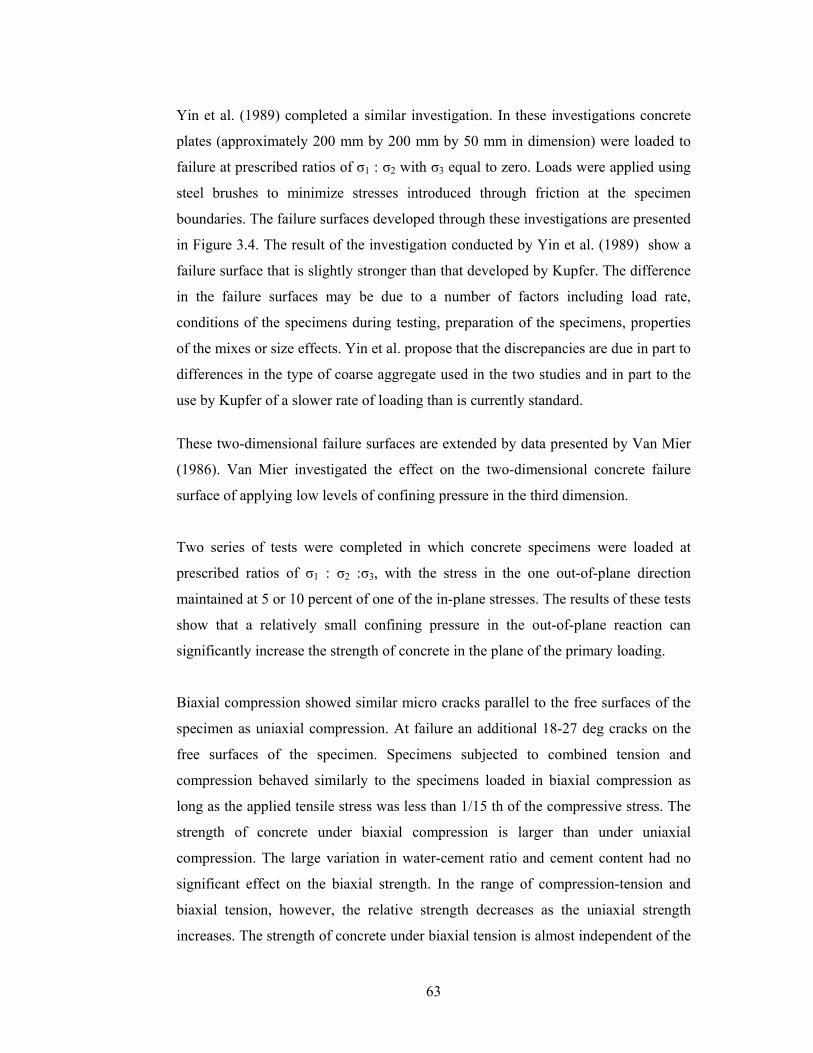
63
Yin et al. (1989) completed a similar investigation. In these investigations concrete
plates (approximately 200 mm by 200 mm by 50 mm in dimension) were loaded to
failure at prescribed ratios of σ1 : σ2 with σ3 equal to zero. Loads were applied using
steel brushes to minimize stresses introduced through friction at the specimen
boundaries. The failure surfaces developed through these investigations are presented
in Figure 3.4. The result of the investigation conducted by Yin et al. (1989) show a
failure surface that is slightly stronger than that developed by Kupfer. The difference
in the failure surfaces may be due to a number of factors including load rate,
conditions of the specimens during testing, preparation of the specimens, properties
of the mixes or size effects. Yin et al. propose that the discrepancies are due in part to
differences in the type of coarse aggregate used in the two studies and in part to the
use by Kupfer of a slower rate of loading than is currently standard.
These two-dimensional failure surfaces are extended by data presented by Van Mier
(1986). Van Mier investigated the effect on the two-dimensional concrete failure
surface of applying low levels of confining pressure in the third dimension.
Two series of tests were completed in which concrete specimens were loaded at
prescribed ratios of σ1 : σ2 :σ3, with the stress in the one out-of-plane direction
maintained at 5 or 10 percent of one of the in-plane stresses. The results of these tests
show that a relatively small confining pressure in the out-of-plane reaction can
significantly increase the strength of concrete in the plane of the primary loading.
Biaxial compression showed similar micro cracks parallel to the free surfaces of the
specimen as uniaxial compression. At failure an additional 18-27 deg cracks on the
free surfaces of the specimen. Specimens subjected to combined tension and
compression behaved similarly to the specimens loaded in biaxial compression as
long as the applied tensile stress was less than 1/15 th of the compressive stress. The
strength of concrete under biaxial compression is larger than under uniaxial
compression. The large variation in water-cement ratio and cement content had no
significant effect on the biaxial strength. In the range of compression-tension and
biaxial tension, however, the relative strength decreases as the uniaxial strength
increases. The strength of concrete under biaxial tension is almost independent of the
64
stress ratiosigma1/sigma2 and equal to the uniaxial tensile strength. In the region of
biaxial compression the strains in the direction of the larger principal stress increase
in magnitude as the stress at failure increases in magnitude. For biaxial compression
Figure 3.4 Biaxial Compressive Yield Surface for Concrete with Low Confining Pressure [Data from Kupfer et al. (1969), Yin et al. (1989) and Van Mier (1986)]
and tension, the failure strains in the compressive stress decrease in magnitude as the
the simultaneously acting tensile stress increases. If the stresses increase beyond this
value the rate of volume reduction increases until at 80 to 90 percent of the ultimate a
point of inflection is reached. Further strain results in an increase in volume, it is
generally agreed that the inflection point coincides with the stress at which major
micro cracking of the concrete is initiated. Poisson’s ratio is constant beyond the
elastic limit and increases only at stresses beyond the point of inflection of the
volumetric strain relationship.
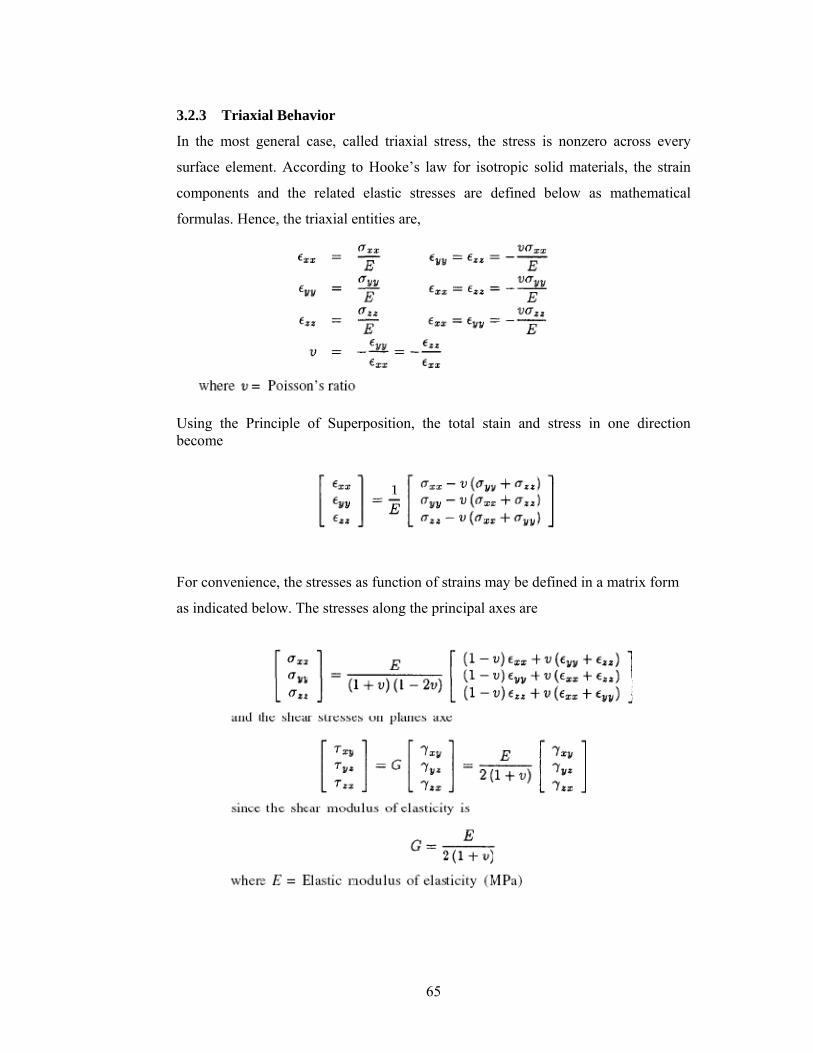
65
3.2.3 Triaxial Behavior
In the most general case, called triaxial stress, the stress is nonzero across every
surface element. According to Hooke’s law for isotropic solid materials, the strain
components and the related elastic stresses are defined below as mathematical
formulas. Hence, the triaxial entities are,
Using the Principle of Superposition, the total stain and stress in one direction become
For convenience, the stresses as function of strains may be defined in a matrix form
as indicated below. The stresses along the principal axes are
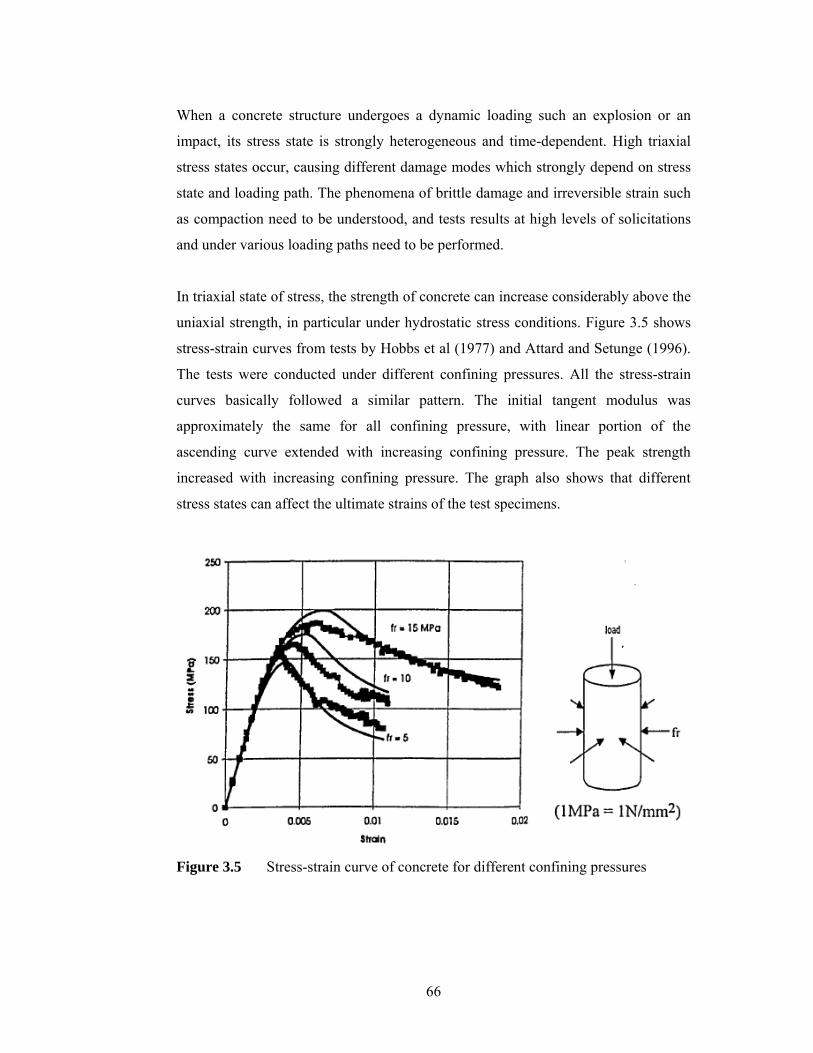
66
When a concrete structure undergoes a dynamic loading such an explosion or an
impact, its stress state is strongly heterogeneous and time-dependent. High triaxial
stress states occur, causing different damage modes which strongly depend on stress
state and loading path. The phenomena of brittle damage and irreversible strain such
as compaction need to be understood, and tests results at high levels of solicitations
and under various loading paths need to be performed.
In triaxial state of stress, the strength of concrete can increase considerably above the
uniaxial strength, in particular under hydrostatic stress conditions. Figure 3.5 shows
stress-strain curves from tests by Hobbs et al (1977) and Attard and Setunge (1996).
The tests were conducted under different confining pressures. All the stress-strain
curves basically followed a similar pattern. The initial tangent modulus was
approximately the same for all confining pressure, with linear portion of the
ascending curve extended with increasing confining pressure. The peak strength
increased with increasing confining pressure. The graph also shows that different
stress states can affect the ultimate strains of the test specimens.
Figure 3.5 Stress-strain curve of concrete for different confining pressures
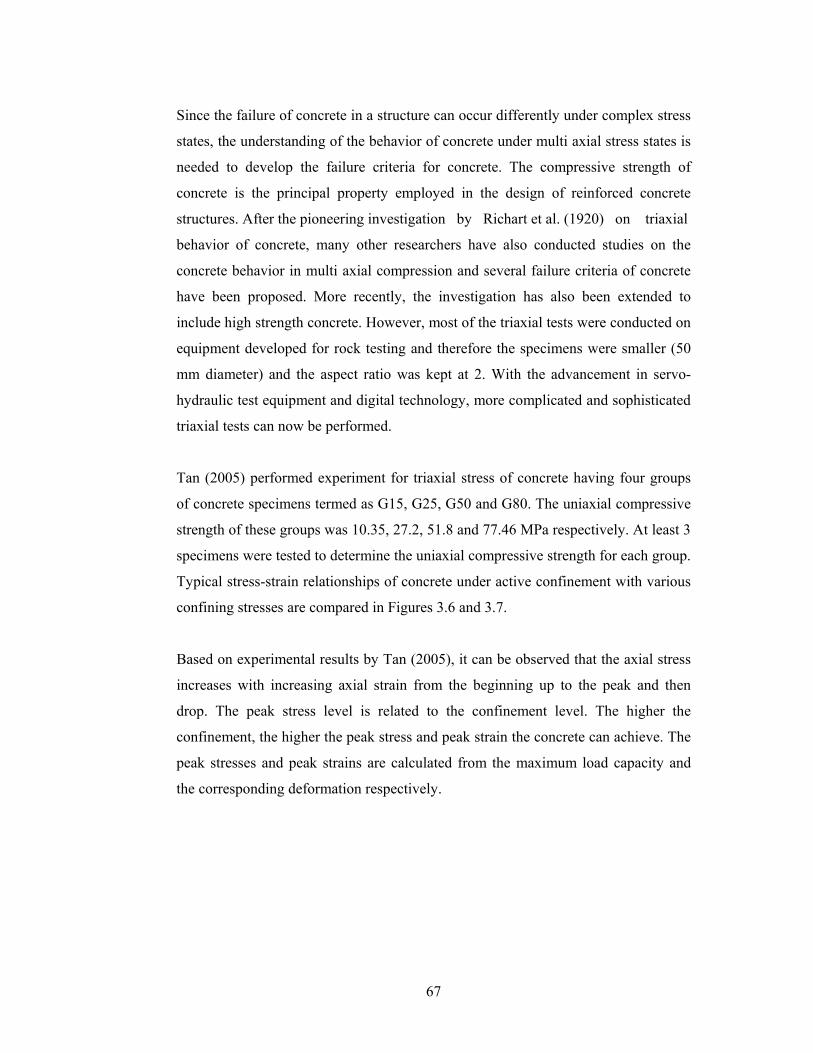
67
Since the failure of concrete in a structure can occur differently under complex stress
states, the understanding of the behavior of concrete under multi axial stress states is
needed to develop the failure criteria for concrete. The compressive strength of
concrete is the principal property employed in the design of reinforced concrete
structures. After the pioneering investigation by Richart et al. (1920) on triaxial
behavior of concrete, many other researchers have also conducted studies on the
concrete behavior in multi axial compression and several failure criteria of concrete
have been proposed. More recently, the investigation has also been extended to
include high strength concrete. However, most of the triaxial tests were conducted on
equipment developed for rock testing and therefore the specimens were smaller (50
mm diameter) and the aspect ratio was kept at 2. With the advancement in servo-
hydraulic test equipment and digital technology, more complicated and sophisticated
triaxial tests can now be performed.
Tan (2005) performed experiment for triaxial stress of concrete having four groups
of concrete specimens termed as G15, G25, G50 and G80. The uniaxial compressive
strength of these groups was 10.35, 27.2, 51.8 and 77.46 MPa respectively. At least 3
specimens were tested to determine the uniaxial compressive strength for each group.
Typical stress-strain relationships of concrete under active confinement with various
confining stresses are compared in Figures 3.6 and 3.7.
Based on experimental results by Tan (2005), it can be observed that the axial stress
increases with increasing axial strain from the beginning up to the peak and then
drop. The peak stress level is related to the confinement level. The higher the
confinement, the higher the peak stress and peak strain the concrete can achieve. The
peak stresses and peak strains are calculated from the maximum load capacity and
the corresponding deformation respectively.
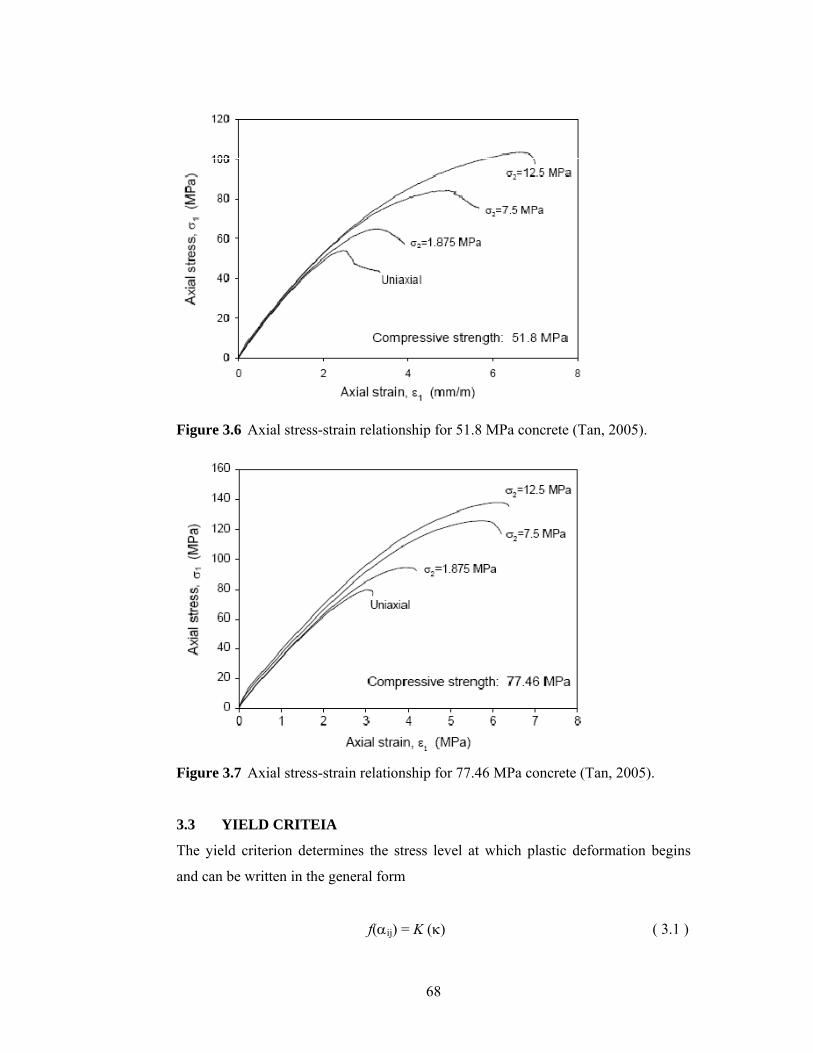
68
Figure 3.6 Axial stress-strain relationship for 51.8 MPa concrete (Tan, 2005).
Figure 3.7 Axial stress-strain relationship for 77.46 MPa concrete (Tan, 2005). 3.3 YIELD CRITEIA
The yield criterion determines the stress level at which plastic deformation begins
and can be written in the general form
f(αij) = K (κ) ( 3.1 )
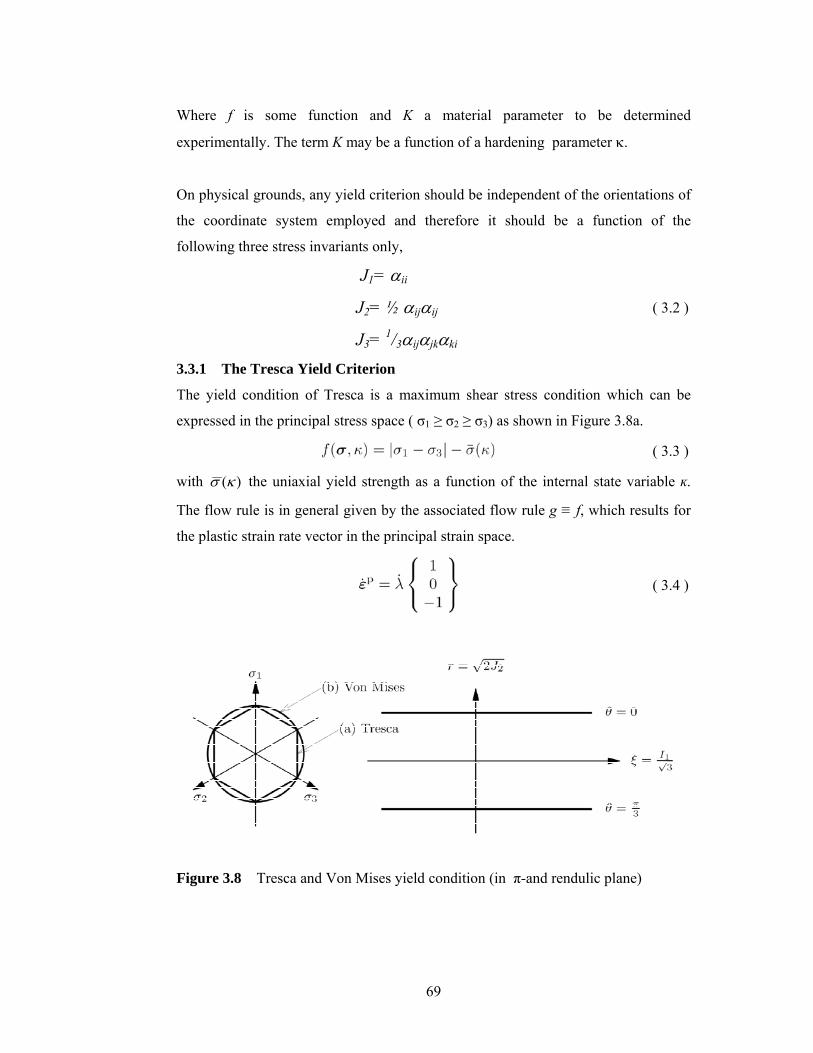
69
Where f is some function and K a material parameter to be determined
experimentally. The term K may be a function of a hardening parameter κ.
On physical grounds, any yield criterion should be independent of the orientations of
the coordinate system employed and therefore it should be a function of the
following three stress invariants only,
J1= αii
J2= ½ αijαij
J3= 1/3αijαjkαki
( 3.2 )
3.3.1 The Tresca Yield Criterion
The yield condition of Tresca is a maximum shear stress condition which can be
expressed in the principal stress space ( σ1 ≥ σ2 ≥ σ3) as shown in Figure 3.8a.
( 3.3 )
with )(κσ the uniaxial yield strength as a function of the internal state variable ĸ.
The flow rule is in general given by the associated flow rule g ≡ f, which results for
the plastic strain rate vector in the principal strain space.
( 3.4 )
Figure 3.8 Tresca and Von Mises yield condition (in π-and rendulic plane)
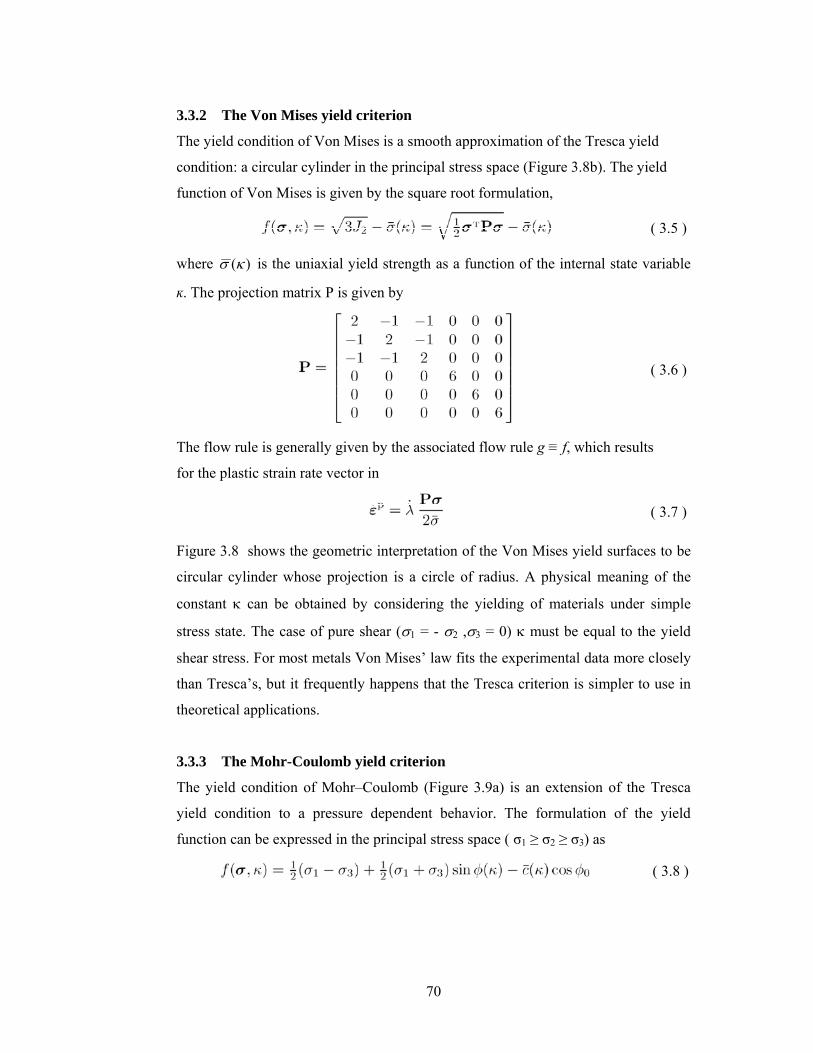
70
3.3.2 The Von Mises yield criterion
The yield condition of Von Mises is a smooth approximation of the Tresca yield
condition: a circular cylinder in the principal stress space (Figure 3.8b). The yield
function of Von Mises is given by the square root formulation,
( 3.5 )
where )(κσ is the uniaxial yield strength as a function of the internal state variable
ĸ. The projection matrix P is given by
( 3.6 )
The flow rule is generally given by the associated flow rule g ≡ f, which results
for the plastic strain rate vector in
( 3.7 )
Figure 3.8 shows the geometric interpretation of the Von Mises yield surfaces to be
circular cylinder whose projection is a circle of radius. A physical meaning of the
constant κ can be obtained by considering the yielding of materials under simple
stress state. The case of pure shear (σ1 = - σ2 ,σ3 = 0) κ must be equal to the yield
shear stress. For most metals Von Mises’ law fits the experimental data more closely
than Tresca’s, but it frequently happens that the Tresca criterion is simpler to use in
theoretical applications.
3.3.3 The Mohr-Coulomb yield criterion
The yield condition of Mohr–Coulomb (Figure 3.9a) is an extension of the Tresca
yield condition to a pressure dependent behavior. The formulation of the yield
function can be expressed in the principal stress space ( σ1 ≥ σ2 ≥ σ3) as
( 3.8 )
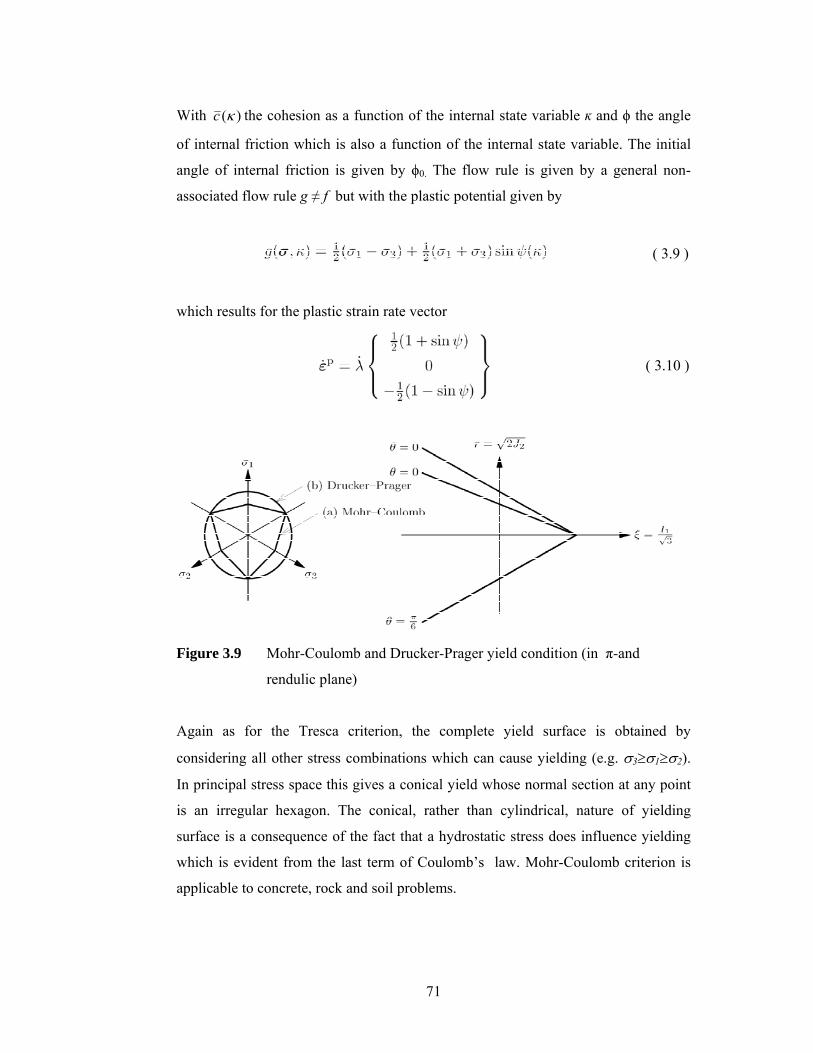
71
With )(κc the cohesion as a function of the internal state variable ĸ and ϕ the angle
of internal friction which is also a function of the internal state variable. The initial
angle of internal friction is given by ϕ0. The flow rule is given by a general non-
associated flow rule g ≠ f but with the plastic potential given by
( 3.9 )
which results for the plastic strain rate vector
( 3.10 )
Figure 3.9 Mohr-Coulomb and Drucker-Prager yield condition (in π-and
rendulic plane)
Again as for the Tresca criterion, the complete yield surface is obtained by
considering all other stress combinations which can cause yielding (e.g. σ3≥σ1≥σ2).
In principal stress space this gives a conical yield whose normal section at any point
is an irregular hexagon. The conical, rather than cylindrical, nature of yielding
surface is a consequence of the fact that a hydrostatic stress does influence yielding
which is evident from the last term of Coulomb’s law. Mohr-Coulomb criterion is
applicable to concrete, rock and soil problems.
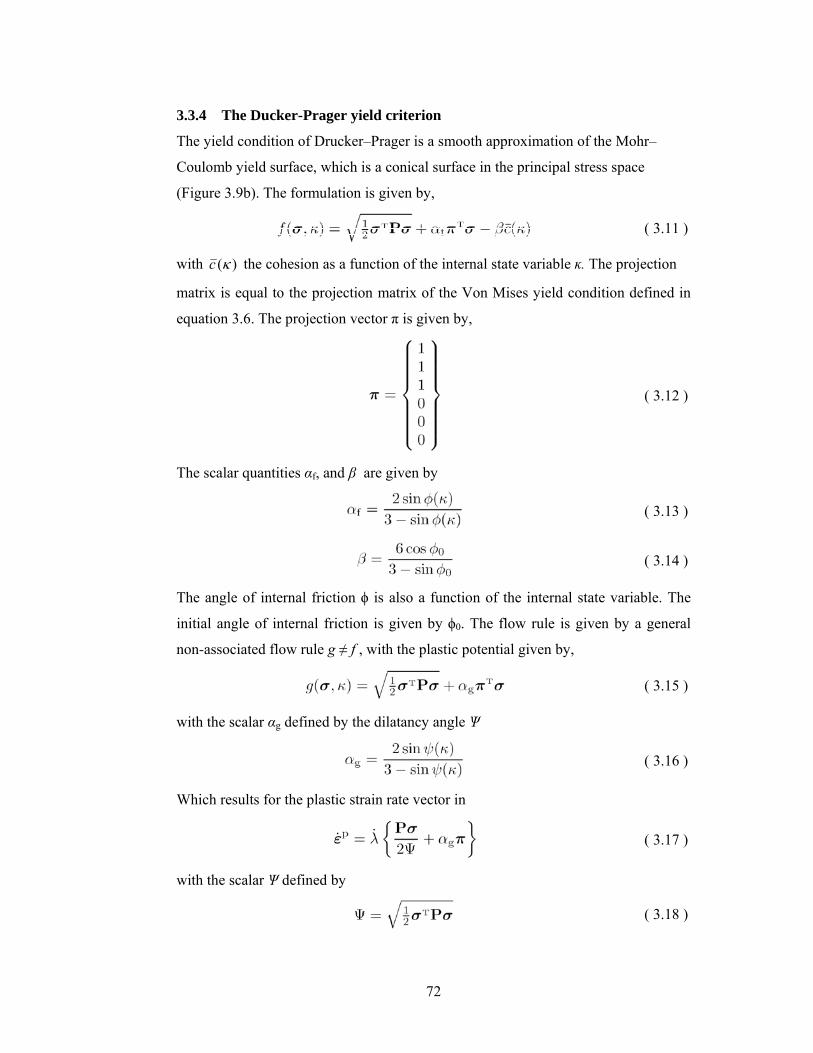
72
3.3.4 The Ducker-Prager yield criterion
The yield condition of Drucker–Prager is a smooth approximation of the Mohr–
Coulomb yield surface, which is a conical surface in the principal stress space
(Figure 3.9b). The formulation is given by,
( 3.11 )
with )(κc the cohesion as a function of the internal state variable ĸ. The projection
matrix is equal to the projection matrix of the Von Mises yield condition defined in
equation 3.6. The projection vector π is given by,
( 3.12 )
The scalar quantities αf, and β are given by
( 3.13 )
( 3.14 )
The angle of internal friction ϕ is also a function of the internal state variable. The
initial angle of internal friction is given by ϕ0. The flow rule is given by a general
non-associated flow rule g ≠ f , with the plastic potential given by,
( 3.15 )
with the scalar αg defined by the dilatancy angle Ѱ
( 3.16 )
Which results for the plastic strain rate vector in
( 3.17 )
with the scalar Ѱ defined by
( 3.18 )
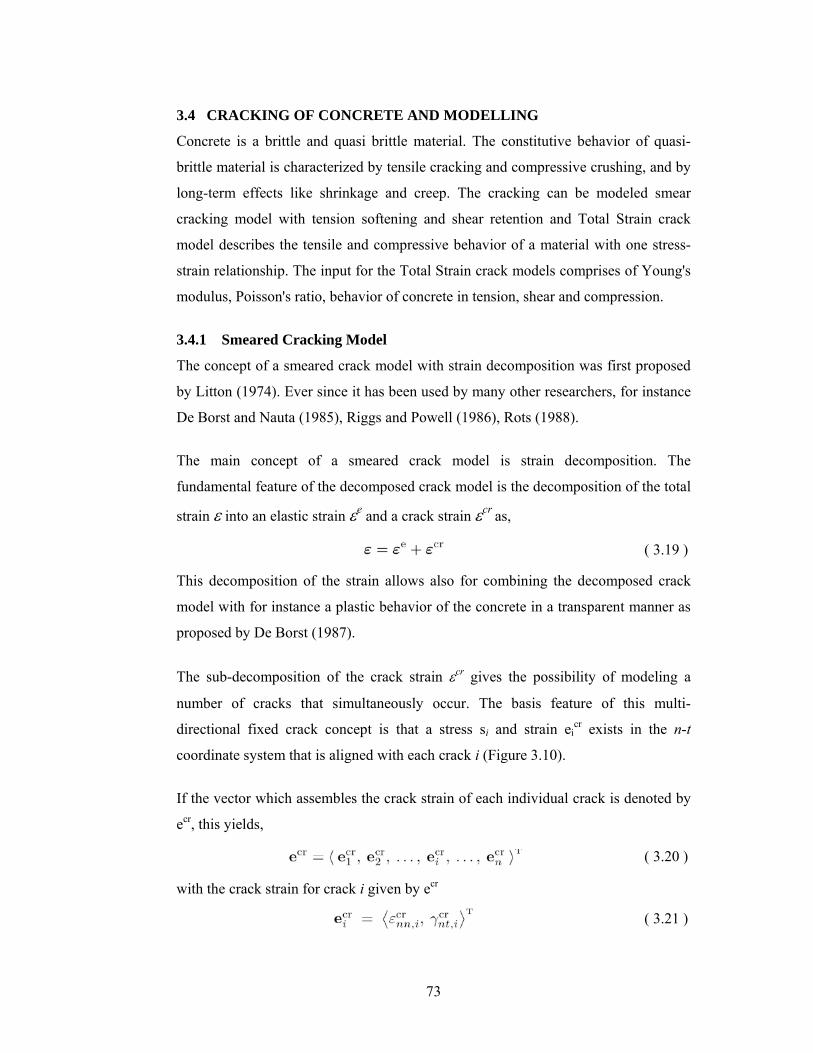
73
3.4 CRACKING OF CONCRETE AND MODELLING
Concrete is a brittle and quasi brittle material. The constitutive behavior of quasi-
brittle material is characterized by tensile cracking and compressive crushing, and by
long-term effects like shrinkage and creep. The cracking can be modeled smear
cracking model with tension softening and shear retention and Total Strain crack
model describes the tensile and compressive behavior of a material with one stress-
strain relationship. The input for the Total Strain crack models comprises of Young's
modulus, Poisson's ratio, behavior of concrete in tension, shear and compression.
3.4.1 Smeared Cracking Model
The concept of a smeared crack model with strain decomposition was first proposed
by Litton (1974). Ever since it has been used by many other researchers, for instance
De Borst and Nauta (1985), Riggs and Powell (1986), Rots (1988).
The main concept of a smeared crack model is strain decomposition. The
fundamental feature of the decomposed crack model is the decomposition of the total
strain ε into an elastic strain εe and a crack strain εcr as,
( 3.19 )
This decomposition of the strain allows also for combining the decomposed crack
model with for instance a plastic behavior of the concrete in a transparent manner as
proposed by De Borst (1987).
The sub-decomposition of the crack strain εcr gives the possibility of modeling a
number of cracks that simultaneously occur. The basis feature of this multi-
directional fixed crack concept is that a stress si and strain eicr exists in the n-t
coordinate system that is aligned with each crack i (Figure 3.10).
If the vector which assembles the crack strain of each individual crack is denoted by
ecr, this yields,
( 3.20 )
with the crack strain for crack i given by ecr
( 3.21 )
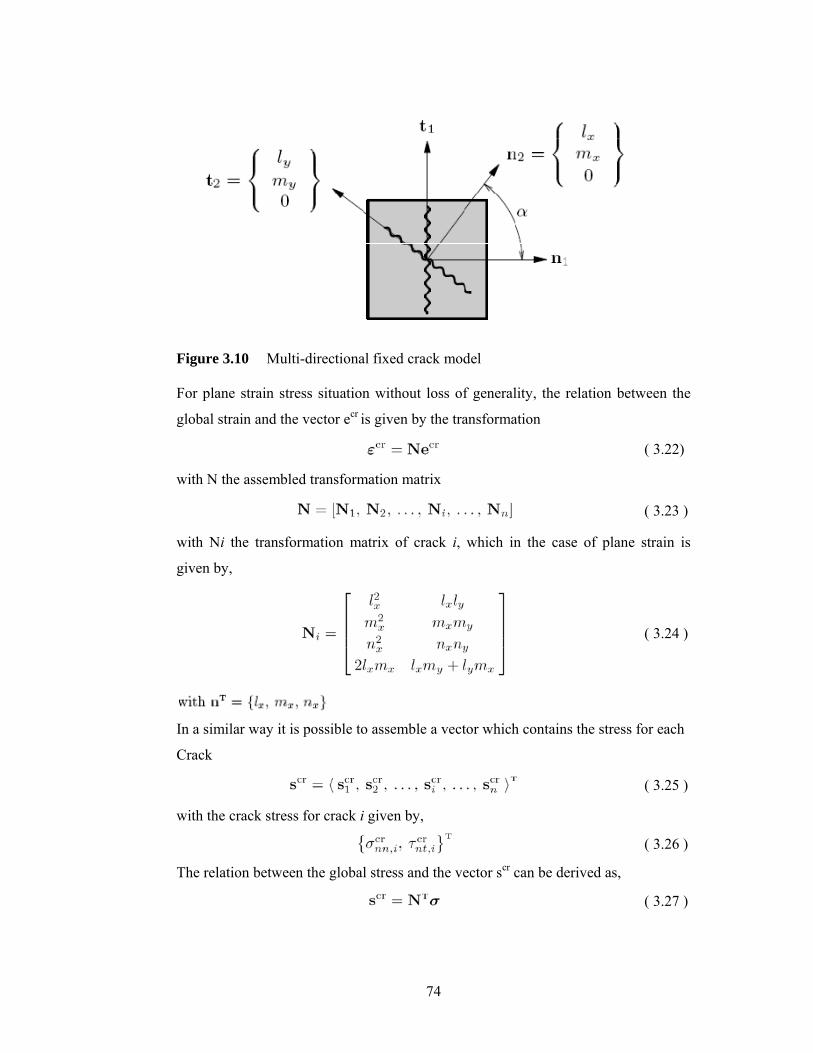
74
Figure 3.10 Multi-directional fixed crack model For plane strain stress situation without loss of generality, the relation between the
global strain and the vector ecr is given by the transformation
( 3.22)
with N the assembled transformation matrix
( 3.23 )
with Ni the transformation matrix of crack i, which in the case of plane strain is
given by,
( 3.24 )
In a similar way it is possible to assemble a vector which contains the stress for each
Crack
( 3.25 )
with the crack stress for crack i given by,
( 3.26 )
The relation between the global stress and the vector scr can be derived as,
( 3.27 )
75
with the transformation matrix N given by equation 3.23. A basic assumption is that
the crack stresses are given as a function of the crack strains which results in the
general formulation,
( 3.28 )
Modeling of coupling effects between the different cracks is possible within this
general formulation but taking coupling into account would lead to an increasing and
unnecessary level of sophistication. For this reason, the crack stresses are solely
governed by the corresponding crack strains,
( 3.29 )
3.4.1.1 Crack Initiation
The constitutive model is complete if the criterion for crack initiation and the relation
between the crack stresses and the crack strains defined. The initiation of cracks is
governed by a tension cut-off criterion and a threshold angle between two
consecutive cracks. For successive initiation of the cracks the program for analysis
applies the following two criteria which must be satisfied simultaneously:
o The principal tensile stress violates the maximum stress condition.
o The angle between the existing crack and the principal tensile stress exceeds
the value of a threshold angle.
However, with these criteria it is possible that the tensile stress temporarily becomes
greater than three times the tensile strength while the threshold angle condition was
still not violated.
The principal tensile stress violates the maximum stress condition. The angle
between the existing crack and the principal tensile stress exceeds the value of a
threshold angle.
76
3.4.1.2 Crack Stress-Strain Relation
As defined in equation 3.29, the crack stresses in the n-t coordinate system of the
crack are determined by the corresponding crack strains,
( 3.30 )
A further simplification is made by ignoring the coupling between the normal stress crnnσ and the shear stress cr
nnτ . This results in the constitutive relation for crack i,
( 3.31 )
where the subscript i has been dropped for convenience. The Mode-I secant modulus
DI secant (Figure 3.11), is determined by use of the softening relation )( crnnnn
crnn f τσ =
according to:
( 3.32 )
In case of crack unloading, the secant stiffness remains constant. This means that
upon crack closing both the crack normal strain and the crack normal stress vanish.
Figure 3.11 Secant crack stiffness
The relation between the stress vector and the strain vector in the global coordinate
system can be derived starting from the strain decomposition equation 3.19, which
yields the relation for the global stress vector
( 3.33 )
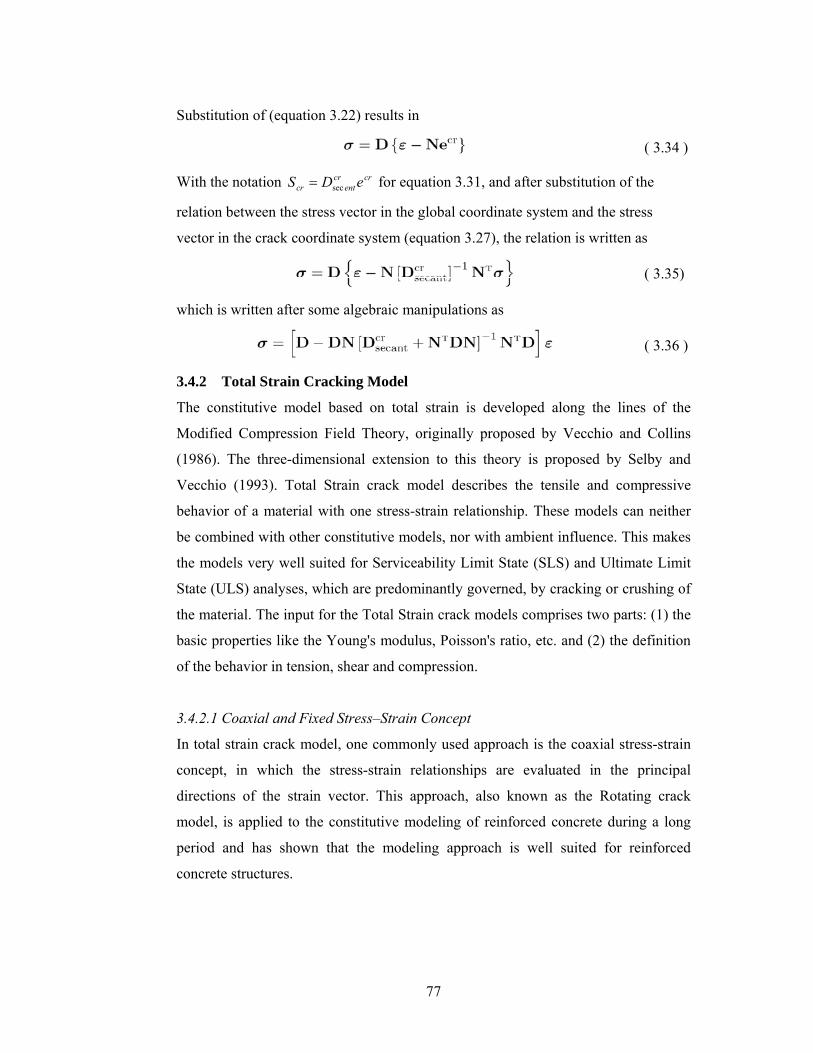
77
Substitution of (equation 3.22) results in
( 3.34 )
With the notation crcrentcr eDS sec= for equation 3.31, and after substitution of the
relation between the stress vector in the global coordinate system and the stress
vector in the crack coordinate system (equation 3.27), the relation is written as
( 3.35)
which is written after some algebraic manipulations as
( 3.36 )
3.4.2 Total Strain Cracking Model
The constitutive model based on total strain is developed along the lines of the
Modified Compression Field Theory, originally proposed by Vecchio and Collins
(1986). The three-dimensional extension to this theory is proposed by Selby and
Vecchio (1993). Total Strain crack model describes the tensile and compressive
behavior of a material with one stress-strain relationship. These models can neither
be combined with other constitutive models, nor with ambient influence. This makes
the models very well suited for Serviceability Limit State (SLS) and Ultimate Limit
State (ULS) analyses, which are predominantly governed, by cracking or crushing of
the material. The input for the Total Strain crack models comprises two parts: (1) the
basic properties like the Young's modulus, Poisson's ratio, etc. and (2) the definition
of the behavior in tension, shear and compression.
3.4.2.1 Coaxial and Fixed Stress–Strain Concept
In total strain crack model, one commonly used approach is the coaxial stress-strain
concept, in which the stress-strain relationships are evaluated in the principal
directions of the strain vector. This approach, also known as the Rotating crack
model, is applied to the constitutive modeling of reinforced concrete during a long
period and has shown that the modeling approach is well suited for reinforced
concrete structures.
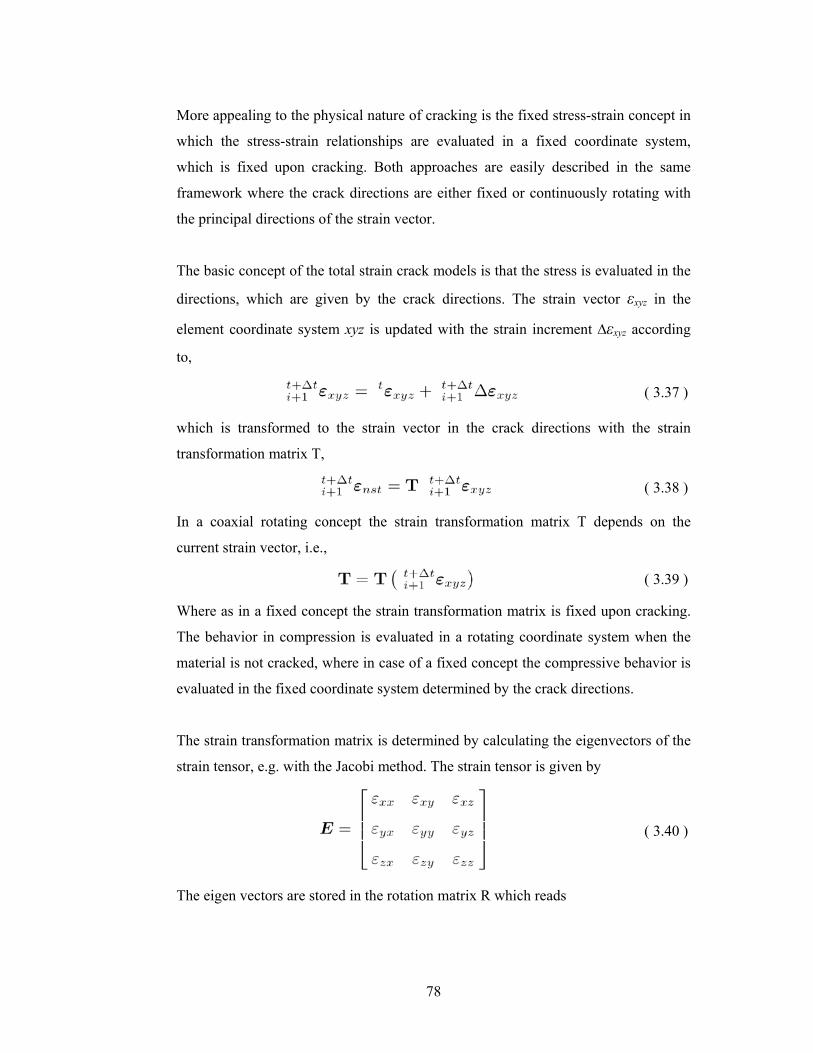
78
More appealing to the physical nature of cracking is the fixed stress-strain concept in
which the stress-strain relationships are evaluated in a fixed coordinate system,
which is fixed upon cracking. Both approaches are easily described in the same
framework where the crack directions are either fixed or continuously rotating with
the principal directions of the strain vector.
The basic concept of the total strain crack models is that the stress is evaluated in the
directions, which are given by the crack directions. The strain vector εxyz in the
element coordinate system xyz is updated with the strain increment ∆εxyz according
to,
( 3.37 )
which is transformed to the strain vector in the crack directions with the strain
transformation matrix T,
( 3.38 )
In a coaxial rotating concept the strain transformation matrix T depends on the
current strain vector, i.e.,
( 3.39 )
Where as in a fixed concept the strain transformation matrix is fixed upon cracking.
The behavior in compression is evaluated in a rotating coordinate system when the
material is not cracked, where in case of a fixed concept the compressive behavior is
evaluated in the fixed coordinate system determined by the crack directions.
The strain transformation matrix is determined by calculating the eigenvectors of the
strain tensor, e.g. with the Jacobi method. The strain tensor is given by
( 3.40 )
The eigen vectors are stored in the rotation matrix R which reads
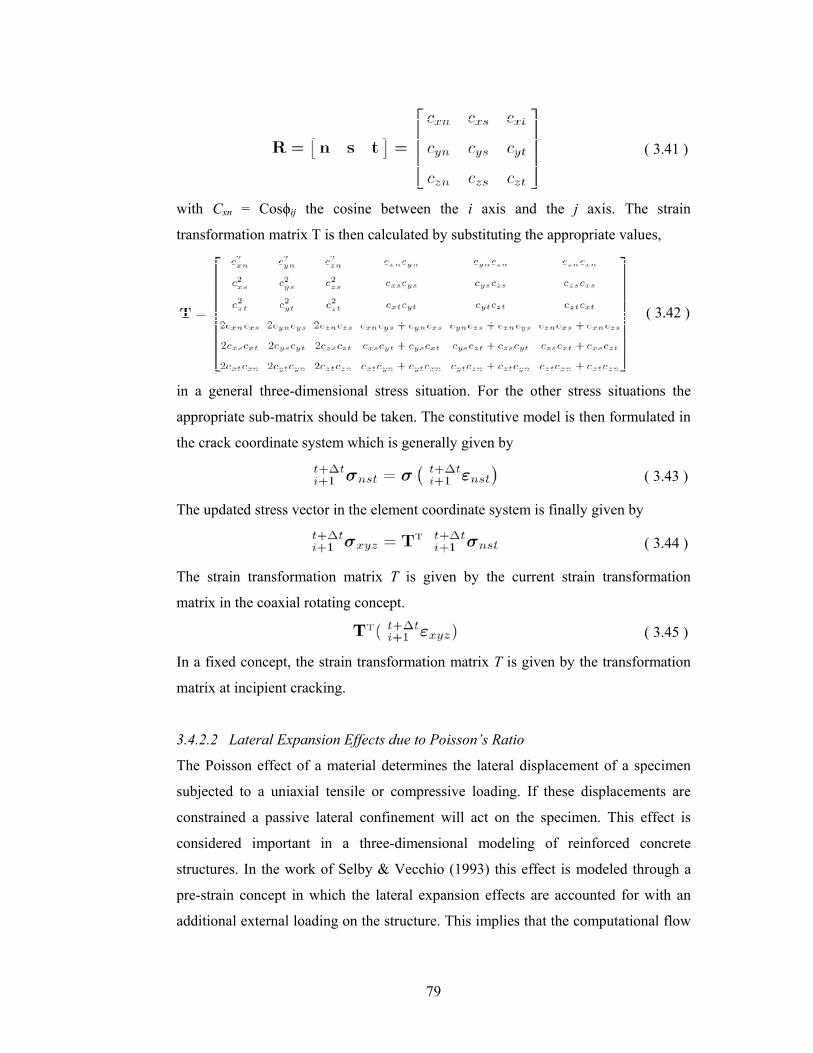
79
( 3.41 )
with Cxn = Cosϕij the cosine between the i axis and the j axis. The strain
transformation matrix T is then calculated by substituting the appropriate values,
( 3.42 )
in a general three-dimensional stress situation. For the other stress situations the
appropriate sub-matrix should be taken. The constitutive model is then formulated in
the crack coordinate system which is generally given by
( 3.43 )
The updated stress vector in the element coordinate system is finally given by
( 3.44 )
The strain transformation matrix T is given by the current strain transformation
matrix in the coaxial rotating concept.
( 3.45 )
In a fixed concept, the strain transformation matrix T is given by the transformation
matrix at incipient cracking.
3.4.2.2 Lateral Expansion Effects due to Poisson’s Ratio
The Poisson effect of a material determines the lateral displacement of a specimen
subjected to a uniaxial tensile or compressive loading. If these displacements are
constrained a passive lateral confinement will act on the specimen. This effect is
considered important in a three-dimensional modeling of reinforced concrete
structures. In the work of Selby & Vecchio (1993) this effect is modeled through a
pre-strain concept in which the lateral expansion effects are accounted for with an
additional external loading on the structure. This implies that the computational flow
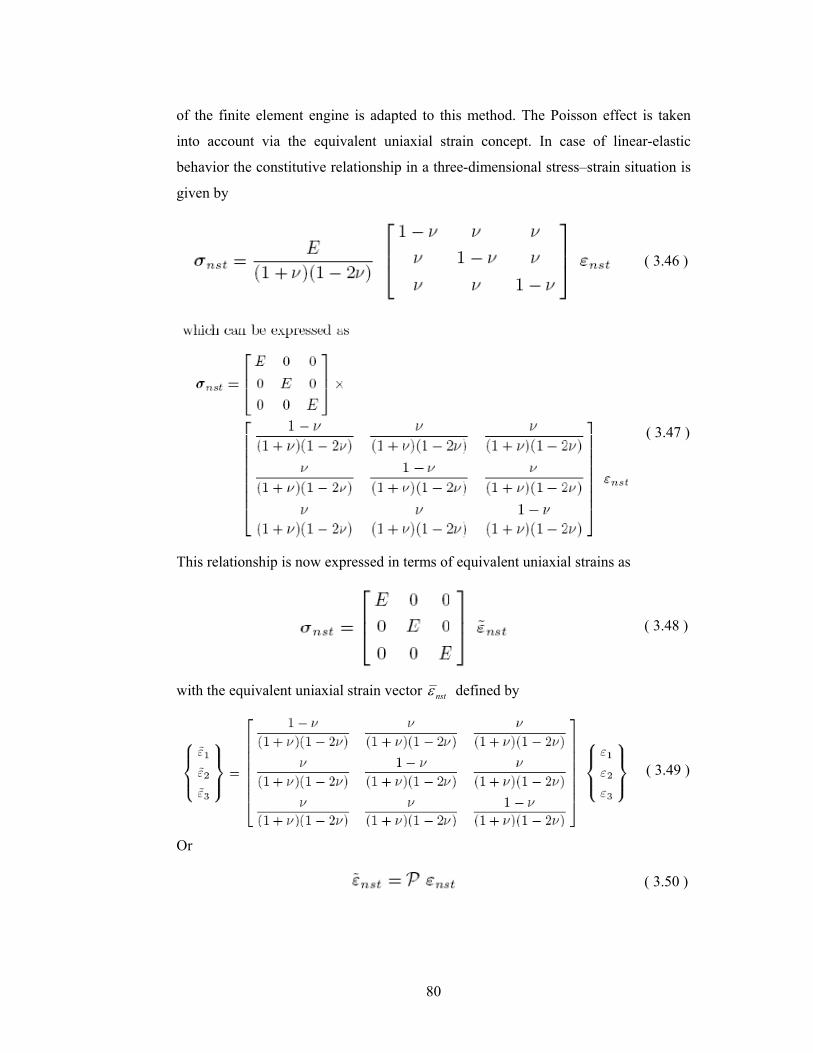
80
of the finite element engine is adapted to this method. The Poisson effect is taken
into account via the equivalent uniaxial strain concept. In case of linear-elastic
behavior the constitutive relationship in a three-dimensional stress–strain situation is
given by
( 3.46 )
( 3.47 )
This relationship is now expressed in terms of equivalent uniaxial strains as
( 3.48 )
with the equivalent uniaxial strain vector nstε defined by
( 3.49 )
Or
( 3.50 )
81
This concept is also applied to the nonlinear material model implemented in
numerical analysis. The stress vector in the principal coordinate system, is evaluated
in terms of the equivalent uniaxial strain vector, 123ε and not in terms of the principal
strain vector, nstε . The equivalent uniaxial strain vector is simply determined when
the principal strain vector and the (constant) Poisson’s ratio are known.
The tangent stiffness sub-matrix Dnst is slightly modified due to the equivalent
uniaxial strain concept. The matrix is given by
( 3.51 )
3.4.3 Tensile Behavior
The tensile behavior of reinforced concrete can be modeled using different
approaches, one resulting in a more complex description than the other. For the Total
Strain crack model, four softening functions based on fracture energy are
implemented, a linear softening curve, an exponential softening curve, the nonlinear
softening curve according to Reinhardt et al., and the nonlinear softening curve
according to Hordijk (1991), all related to a crack bandwidth as is usual in Smeared
crack models. Tensile behavior which is not directly related to the fracture energy
can also be modeled within the Total Strain concept. A constant tensile behavior, a
multi-linear behavior, and a brittle behavior are also implemented.
3.4.3.1 Tension Softening Relations
The relation between the crack stress crnnσ and the crack strain cr
nnε in the normal
direction can be written as a multiplicative relation,
( 3.52 )
in which ft is the tensile strength and crultnn.ε the ultimate crack strain. The general
function y (. . . ) represents the actual softening diagram. In numerical analysis both
the tensile strength and ultimate strain may be a function of temperature, (moisture)
concentration or maturity. Therefore the development of tensile strength and fracture
82
energy in time can be simulated. If the softening behavior on the constitutive level is
related to the Mode-I fracture energy IfG through an equivalent length or crack
bandwidth denoted as h , the following relation can be derived,
( 3.53 )
Thus the results become,
( 3.54 )
with the assumption that ft is a constant. Change from the variable crnnε to
( 3.55 )
and consequently d crnnε = cr
ultnn.ε dx results in the relation
( 3.56 )
where it is tacitly assumed that the ultimate crack strain crultnn.ε is finite. The final
expression for the ultimate crack strain is now given by,
( 3.57 )
with the factor α determined by the integral,
( 3.58 )
The factor crultnn.ε is assumed to be constant during the analysis and is considered to
be an element-related material property, which can be calculated from the material
properties, the tensile strength ft, the fracture energy IfG and the element area
represented by the equivalent length h.
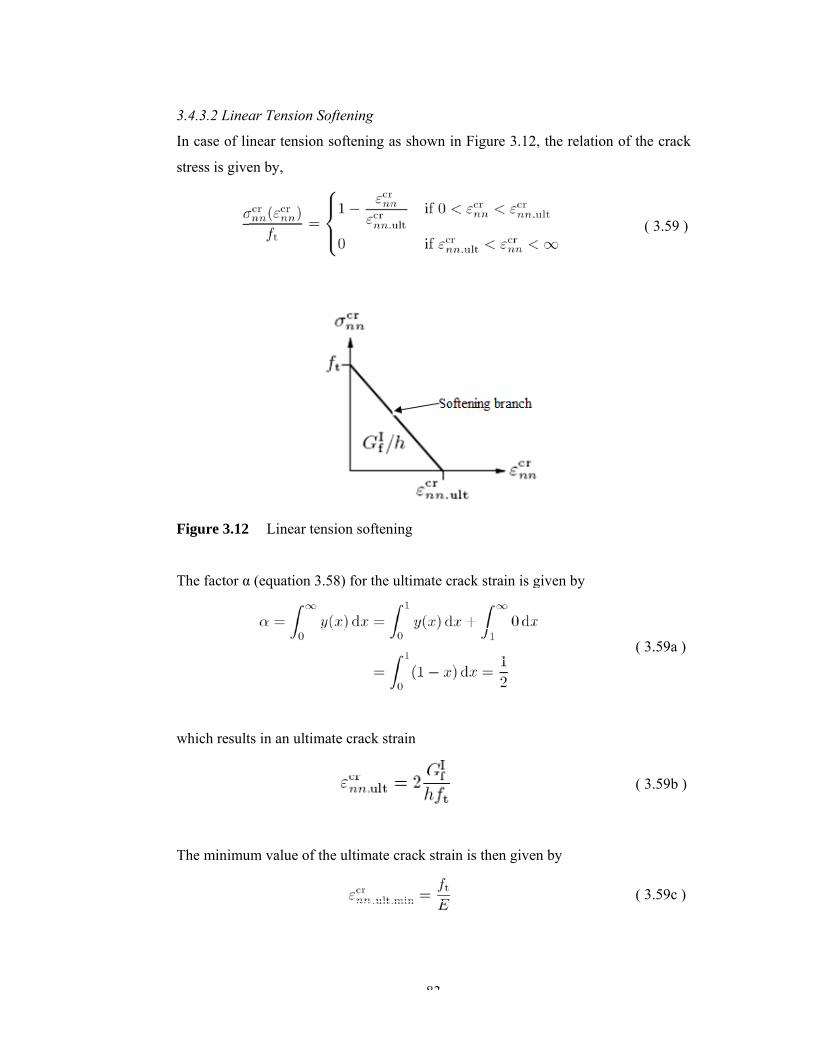
3
I
s
F
T
w
T
3.4.3.2 Linea
In case of li
stress is give
Figure 3.12
The factor α
which result
The minimu
ar Tension S
inear tension
en by,
Linear ten
α (equation 3
ts in an ultim
um value of t
Softening
n softening a
nsion soften
.58) for the
mate crack st
the ultimate
83
as shown in
ning
ultimate cra
train
crack strain
Figure 3.12
ack strain is g
is then give
2, the relation
given by
en by
n of the crac
( 3.59
( 3.59a
( 3.59b
( 3.59c
ck
9 )
)
)
)
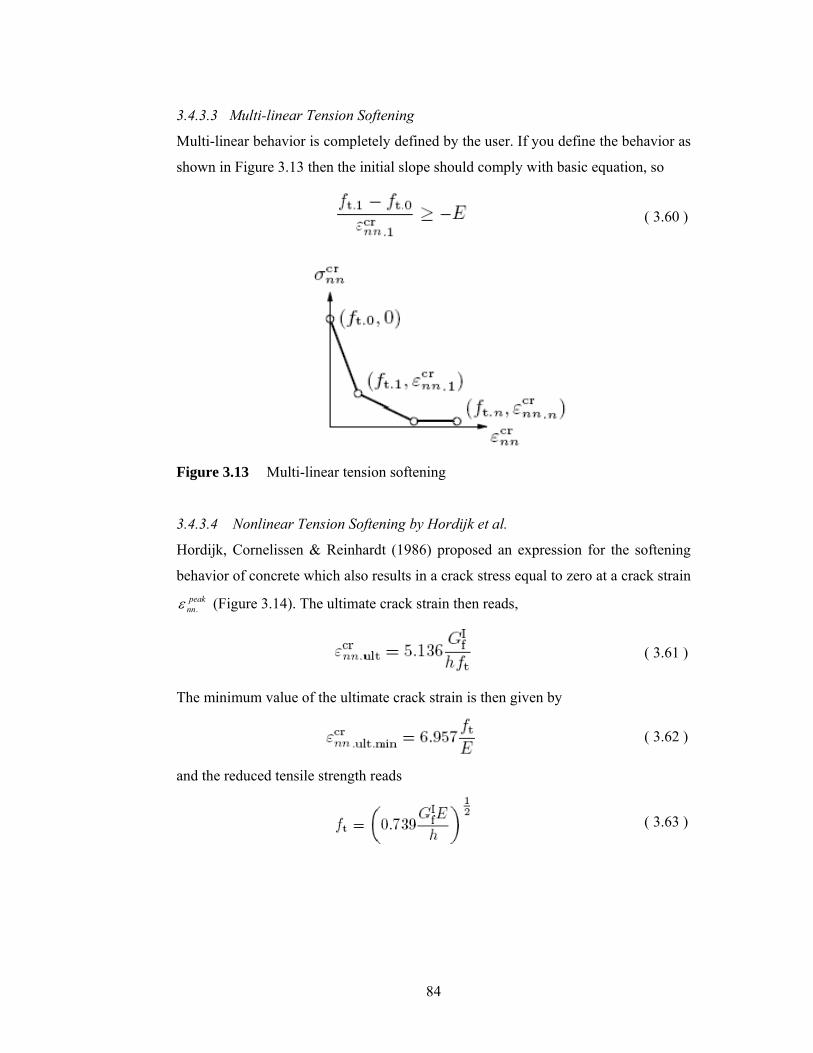
84
3.4.3.3 Multi-linear Tension Softening
Multi-linear behavior is completely defined by the user. If you define the behavior as
shown in Figure 3.13 then the initial slope should comply with basic equation, so
( 3.60 )
Figure 3.13 Multi-linear tension softening
3.4.3.4 Nonlinear Tension Softening by Hordijk et al.
Hordijk, Cornelissen & Reinhardt (1986) proposed an expression for the softening
behavior of concrete which also results in a crack stress equal to zero at a crack strain peak
nn.ε (Figure 3.14). The ultimate crack strain then reads,
( 3.61 )
The minimum value of the ultimate crack strain is then given by
( 3.62 )
and the reduced tensile strength reads
( 3.63 )
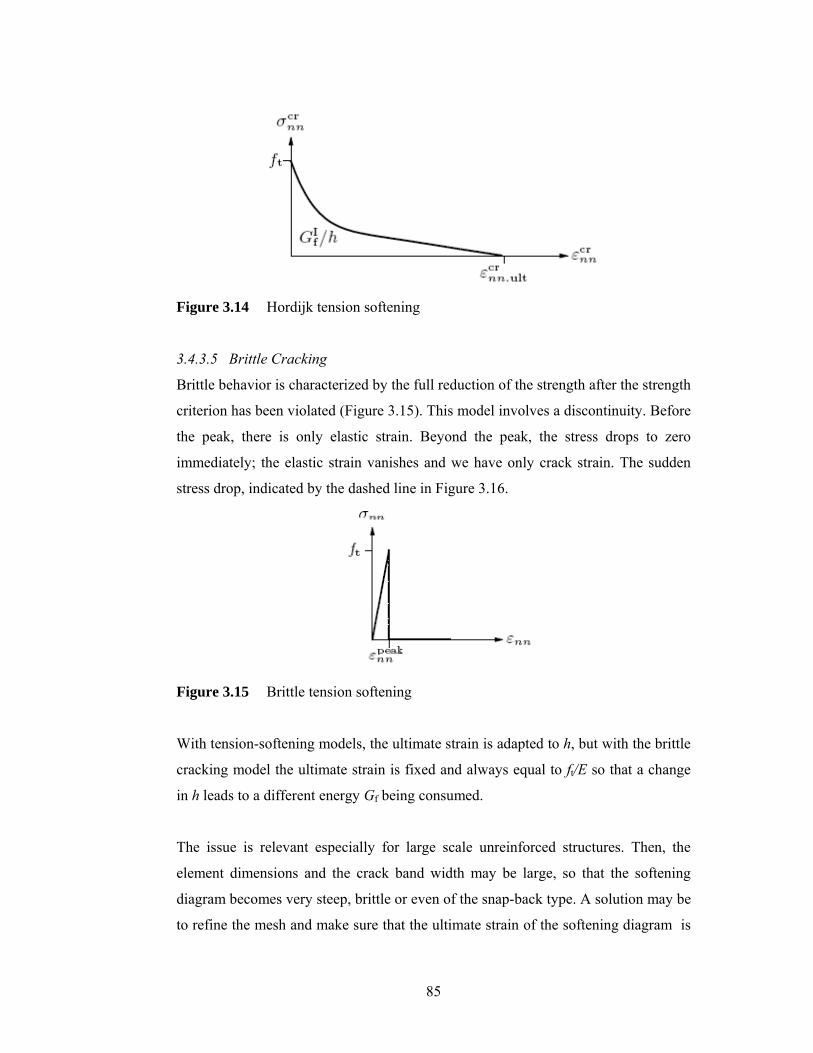
85
Figure 3.14 Hordijk tension softening
3.4.3.5 Brittle Cracking
Brittle behavior is characterized by the full reduction of the strength after the strength
criterion has been violated (Figure 3.15). This model involves a discontinuity. Before
the peak, there is only elastic strain. Beyond the peak, the stress drops to zero
immediately; the elastic strain vanishes and we have only crack strain. The sudden
stress drop, indicated by the dashed line in Figure 3.16.
Figure 3.15 Brittle tension softening
With tension-softening models, the ultimate strain is adapted to h, but with the brittle
cracking model the ultimate strain is fixed and always equal to ft/E so that a change
in h leads to a different energy Gf being consumed.
The issue is relevant especially for large scale unreinforced structures. Then, the
element dimensions and the crack band width may be large, so that the softening
diagram becomes very steep, brittle or even of the snap-back type. A solution may be
to refine the mesh and make sure that the ultimate strain of the softening diagram is
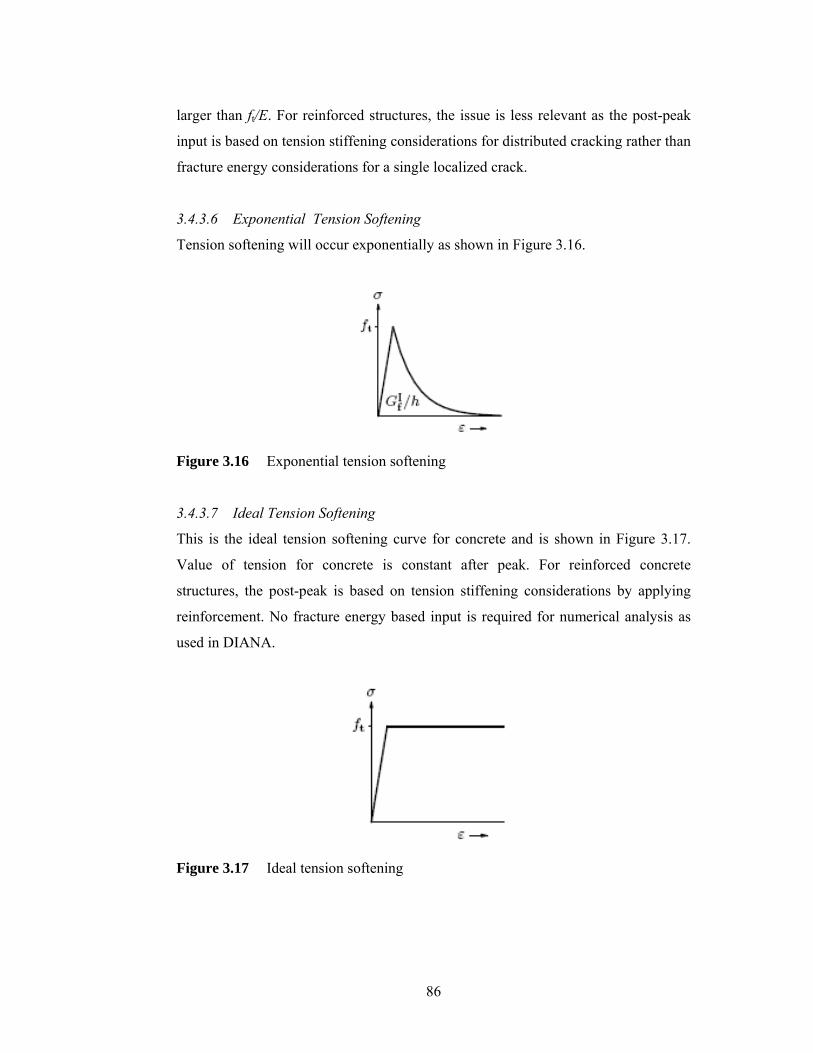
86
larger than ft/E. For reinforced structures, the issue is less relevant as the post-peak
input is based on tension stiffening considerations for distributed cracking rather than
fracture energy considerations for a single localized crack.
3.4.3.6 Exponential Tension Softening
Tension softening will occur exponentially as shown in Figure 3.16.
Figure 3.16 Exponential tension softening
3.4.3.7 Ideal Tension Softening
This is the ideal tension softening curve for concrete and is shown in Figure 3.17.
Value of tension for concrete is constant after peak. For reinforced concrete
structures, the post-peak is based on tension stiffening considerations by applying
reinforcement. No fracture energy based input is required for numerical analysis as
used in DIANA.
Figure 3.17 Ideal tension softening
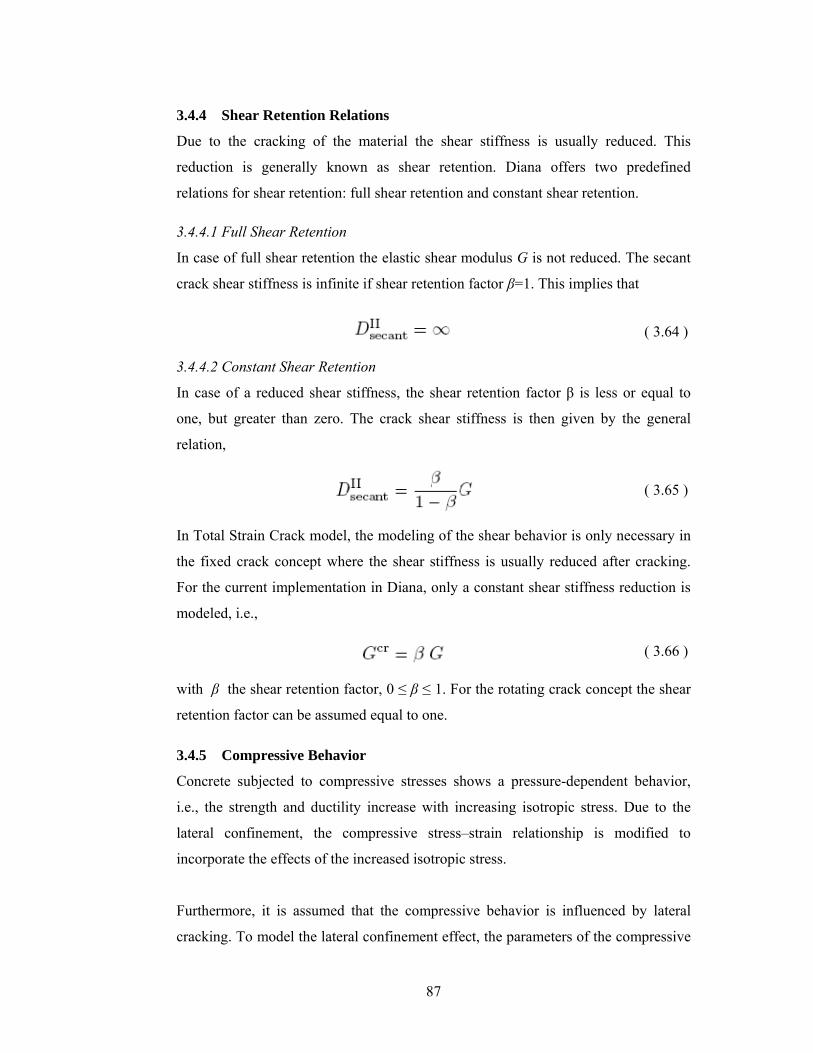
87
3.4.4 Shear Retention Relations
Due to the cracking of the material the shear stiffness is usually reduced. This
reduction is generally known as shear retention. Diana offers two predefined
relations for shear retention: full shear retention and constant shear retention.
3.4.4.1 Full Shear Retention
In case of full shear retention the elastic shear modulus G is not reduced. The secant
crack shear stiffness is infinite if shear retention factor β=1. This implies that
( 3.64 )
3.4.4.2 Constant Shear Retention
In case of a reduced shear stiffness, the shear retention factor β is less or equal to
one, but greater than zero. The crack shear stiffness is then given by the general
relation,
( 3.65 )
In Total Strain Crack model, the modeling of the shear behavior is only necessary in
the fixed crack concept where the shear stiffness is usually reduced after cracking.
For the current implementation in Diana, only a constant shear stiffness reduction is
modeled, i.e.,
( 3.66 )
with β the shear retention factor, 0 ≤ β ≤ 1. For the rotating crack concept the shear
retention factor can be assumed equal to one. 3.4.5 Compressive Behavior
Concrete subjected to compressive stresses shows a pressure-dependent behavior,
i.e., the strength and ductility increase with increasing isotropic stress. Due to the
lateral confinement, the compressive stress–strain relationship is modified to
incorporate the effects of the increased isotropic stress.
Furthermore, it is assumed that the compressive behavior is influenced by lateral
cracking. To model the lateral confinement effect, the parameters of the compressive
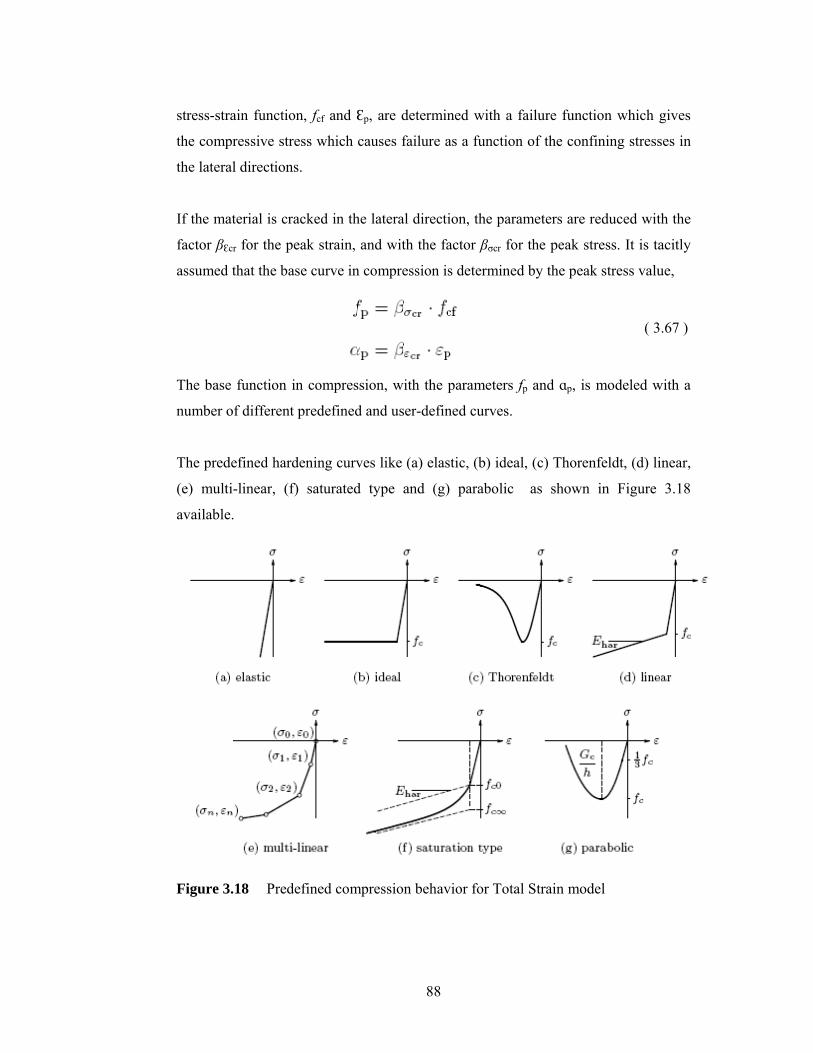
88
stress-strain function, fcf and Ԑp, are determined with a failure function which gives
the compressive stress which causes failure as a function of the confining stresses in
the lateral directions.
If the material is cracked in the lateral direction, the parameters are reduced with the
factor βԐcr for the peak strain, and with the factor βσcr for the peak stress. It is tacitly
assumed that the base curve in compression is determined by the peak stress value,
( 3.67 )
The base function in compression, with the parameters fp and ɑp, is modeled with a
number of different predefined and user-defined curves.
The predefined hardening curves like (a) elastic, (b) ideal, (c) Thorenfeldt, (d) linear,
(e) multi-linear, (f) saturated type and (g) parabolic as shown in Figure 3.18
available.
Figure 3.18 Predefined compression behavior for Total Strain model
89
3.5 REINFORCEMENT
Embedded reinforcements add stiffness to the finite element model. Next to the
standard embedded reinforcements. The main characteristics of embedded
reinforcements are:
• Reinforcements are embedded in structural elements, the so-called mother
elements. Diana ignores the space occupied by an embedded reinforcement.
The mother element neither diminishes in stiffness, nor in weight. The
reinforcement does not contribute to the weight (mass) of the element.
• Standard reinforcements do not have degrees of freedom of their own. . In
standard reinforcements the strains in the reinforcements are computed from
the displacement field of the mother elements. This implies perfect bond
between the reinforcement and the surrounding material. However, with the
NOBOND input option can specify that the reinforcement is not bonded to
the embedding elements.
• Bond–slip reinforcements are only available as embedded lines in solid
elements. In this case the reinforcement bar is internally modeled as a truss or
beam elements, which are connected to the mother elements by line–solid
interface elements.
• In bond–slip reinforcements elastic or nonlinear bond–slip material behavior
may be defined for the line–solid interfaces in the bond–slip reinforcements.
• Bond–slip reinforcements may be applied for modeling slip of steel
reinforcement in concrete or for modeling interaction of pile foundations in
soil and rock.
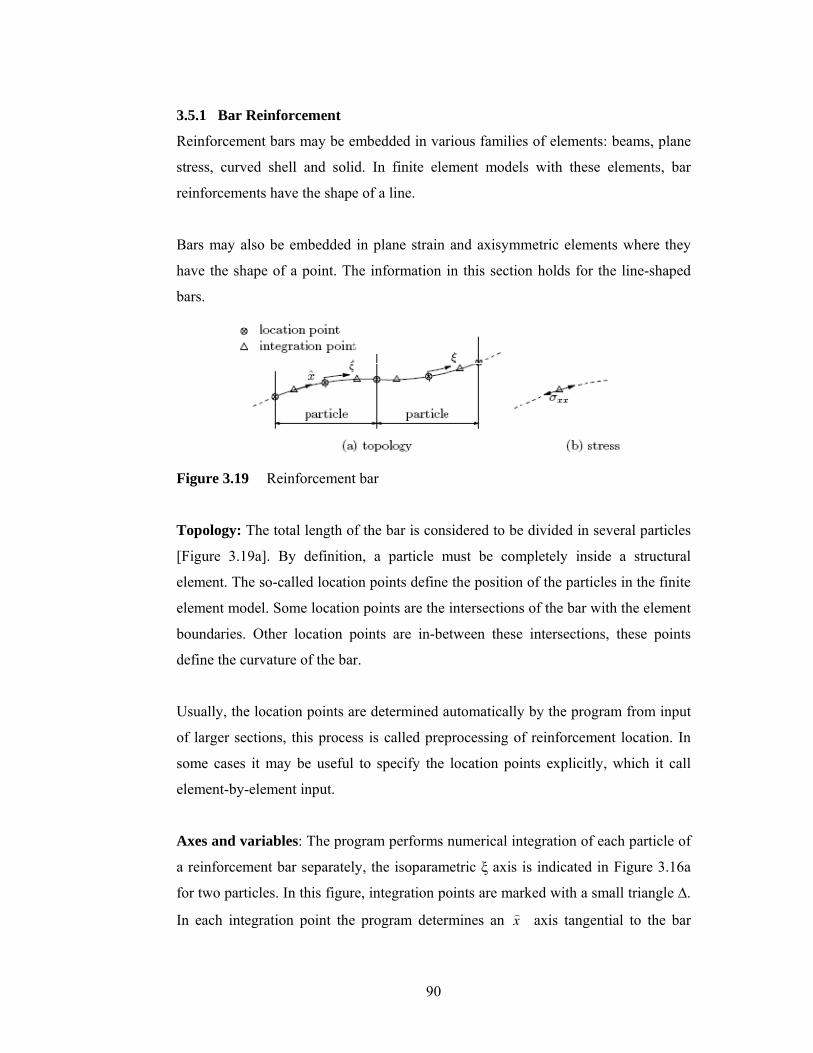
90
3.5.1 Bar Reinforcement
Reinforcement bars may be embedded in various families of elements: beams, plane
stress, curved shell and solid. In finite element models with these elements, bar
reinforcements have the shape of a line.
Bars may also be embedded in plane strain and axisymmetric elements where they
have the shape of a point. The information in this section holds for the line-shaped
bars.
Figure 3.19 Reinforcement bar
Topology: The total length of the bar is considered to be divided in several particles
[Figure 3.19a]. By definition, a particle must be completely inside a structural
element. The so-called location points define the position of the particles in the finite
element model. Some location points are the intersections of the bar with the element
boundaries. Other location points are in-between these intersections, these points
define the curvature of the bar.
Usually, the location points are determined automatically by the program from input
of larger sections, this process is called preprocessing of reinforcement location. In
some cases it may be useful to specify the location points explicitly, which it call
element-by-element input.
Axes and variables: The program performs numerical integration of each particle of
a reinforcement bar separately, the isoparametric ξ axis is indicated in Figure 3.16a
for two particles. In this figure, integration points are marked with a small triangle ∆.
In each integration point the program determines an x) axis tangential to the bar
91
axis. The variables for a bar reinforcement are the strains Ԑxx and the stresses σxx
oriented in this x) axis (Figure 3.19b). The strains and stresses are coupled to the
degrees of freedom of the surrounding element.
Input data: The input data for bar reinforcements comprises the general material and
geometrical properties, the loading if appropriate and the specification of the location
of the bar.
3.5.2 Reinforcement Modeling
The reinforcement in a concrete structure can be modeled with the embedded
reinforcement types which are available in numerical FE analysis. The constitutive
behavior of the reinforcement can be modeled by an elasto-plastic material model
with hardening.
Furthermore, temperature influence on the Young’s modulus and thermal expansion
coefficient can be taken into account. Embedded reinforcements can be modeled as
bar or grid type. Four material models such as linear elasticity, two plasticity models
to model yielding of the reinforcement and special type material model are available.
3.5.2.1 Linear Elasticity
Embedded reinforcements in structural analysis require the input of Young’s
modulus E. Input of the thermal expansion coefficient α is only necessary in case of
temperature load.
3.5.2.2 Von Mises Plasticity
Von Mises plasticity and hardening models are available for embedded
reinforcements. Temperature influence on the plasticity is also possible.
3.5.2.3 Monti–Nuti Plasticity
The Monti–Nuti model is a special plasticity model for the cyclic behavior of steel. It
is available for embedded reinforcements. The model can be combined with different
hardening types.
92
3.5.2.4 Reinforcement Specials
Two special features can be applied for embedded reinforcements such as bonding
and corrosion influence.
Bonding Influence: For linear elasticity and plasticity it may require that the bar
reinforcement is not bonded to its mother elements. This option only applies for the
nonlinear calculation of the effects of post–tensioning.
Corrosion Influence: For embedded reinforcement it may specify corrosion
influence. It will require specifying corrosion influence time and corresponding
reduction factor of cross section data will require for this purpose.
93
CHAPTER-4
NONLINEAR SOLUTION TECHNIQUES
4.1 INTRODUCTION
In nonlinear Finite Element Analysis the relation between a force vector and
displacement vector is no longer linear. For several reasons, the relation becomes
nonlinear and the displacements often depend on the displacements at earlier stages,
e.g. in case of plastic material behavior. Just as with a linear analysis, it is required to
calculate a displacement vector that equilibrates the internal and external forces. In
the linear case, the solution vector could be calculated right away but in the nonlinear
case it cannot. To determine the state of equilibrium we not only make the problems
discrete in space (with finite elements) but also in time (with increments). To achieve
equilibrium at the end of the increment, it can use an iterative solution algorithm.
The combination of both is called an incremental-iterative solution procedure.
In this chapter we will consider a vector of displacement increments that must yield
an equilibrium between internal and external forces, and a stiffness matrix relating
internal forces to incremental displacements. In reality the physical meaning of items
in the ‘displacement’ vector can also be e.g. a velocity or a Lagrange multiplier. In
this chapter the physical meaning of what we call the displacement and force vector
and the stiffness matrix is irrelevant. Most often it represents a continuous system
that is approximated using the Principle of Virtual Work, Galerkin discretization or
another method.
4.2 BASIC NUMERICAL PROCESS FOR NONLINEAR PROBLEM
The use of finite element descretisation in a large class of nonlinear problems results
in a system of simultaneous equation of the form,
Hϕ + f = 0 ( 4.1 )
In which ϕ is the vector of the basic unknowns, f is the vector of applied `loads` and
H is the assembled `stiffness` matrix . For structural applications, the terms `load`
and `stiffness` are directly applicable, but for other situations the interpretation of
these quantities varies according to the physical problem under consideration.
94
If the coefficients of the matrix H depend on the unknowns ϕ or their derivatives, the
problem clearly becomes nonlinear. In this case, direct solution of equation system is
generally impossible and an iterative scheme must be adopted. Many options remain
open for iterative sequence to be employed. Some of the most generally applicable
materials available will now be outlined.
4.2.1 Method of Direct Iteration
In nonlinear Finite Element Analysis the relation between a force vector and
displacement vector is no longer linear. For several reasons, the relation becomes
nonlinear and the displacements often depend on the displacements at earlier stages,
e.g. in case of plastic material behavior. Just as with a linear analysis, we want to
calculate a displacement vector that equilibrates the internal and external forces. In
the linear case, the solution vector could be calculated right away but in the nonlinear
case it can not. To determine the state of equilibrium we not only make the problems
discrete in space (with finite elements) but also in time (with increments). To achieve
equilibrium at the end of the increment, we can use an iterative solution algorithm.
The combination of both is called an incremental-iterative solution procedure.
A vector of displacement increments that must yield an equilibrium between internal
and external forces, and a stiffness matrix relating internal forces to incremental
displacements. In reality the physical meaning of items in the `displacement' vector
can also be e.g. a velocity or a Lagrange multiplier. The physical meaning of what
we call the displacement and force vector and the stiffness matrix is irrelevant. Most
often it represents a continuous system that is approximated using the Principle of
Virtual Work, Galerkin discretization or another method.
In this approach successive solutions are performed, in each of the previous solution
for the unknowns ϕ is used to predict the current values of the coefficient matrix
H(ϕ) as,
ϕ = - [H(ϕ)]-1 f ( 4.2 )
95
then the iteration process yields the (r+1)th approximation to be,
ϕ(r+1) = - [H( ϕr )]-1 f ( 4.3 )
If the process is convergent then in the limit as r tends to infinity ϕr tend to the true
solution.
4.2.2 The Newton-Rapson Method
In numerical analysis, Newton's method (also known as the Newton–Raphson
method), named after Isaac Newton and Joseph Raphson, is perhaps the best known
method for finding successively better approximations to the zero. Newton's method
can often converge remarkably quickly, especially if the iteration begins "sufficiently
near" the desired value. Just how near "sufficiently near" needs to be, and just how
quickly "remarkably quickly" can be, depends on the problem.
Within the class of Newton-Raphson methods, generally two subclasses are
distinguished: the Regular and the Modified Newton-Raphson method. Both methods
use to determine the iterative increment of the displacement vector.
In a Newton-Raphson method, if u is the displacement, the stiffness matrix Ki
represents the tangential stiffness of the structure,
( 4.4 )
4.2.2.1 Regular Newton-Raphson.
In the Regular Newton-Raphson iteration the stiffness relation is evaluated every
iteration (Figure 4.1). This means that the prediction of is based on the last known or
predicted situation, even if this is not an equilibrium state.
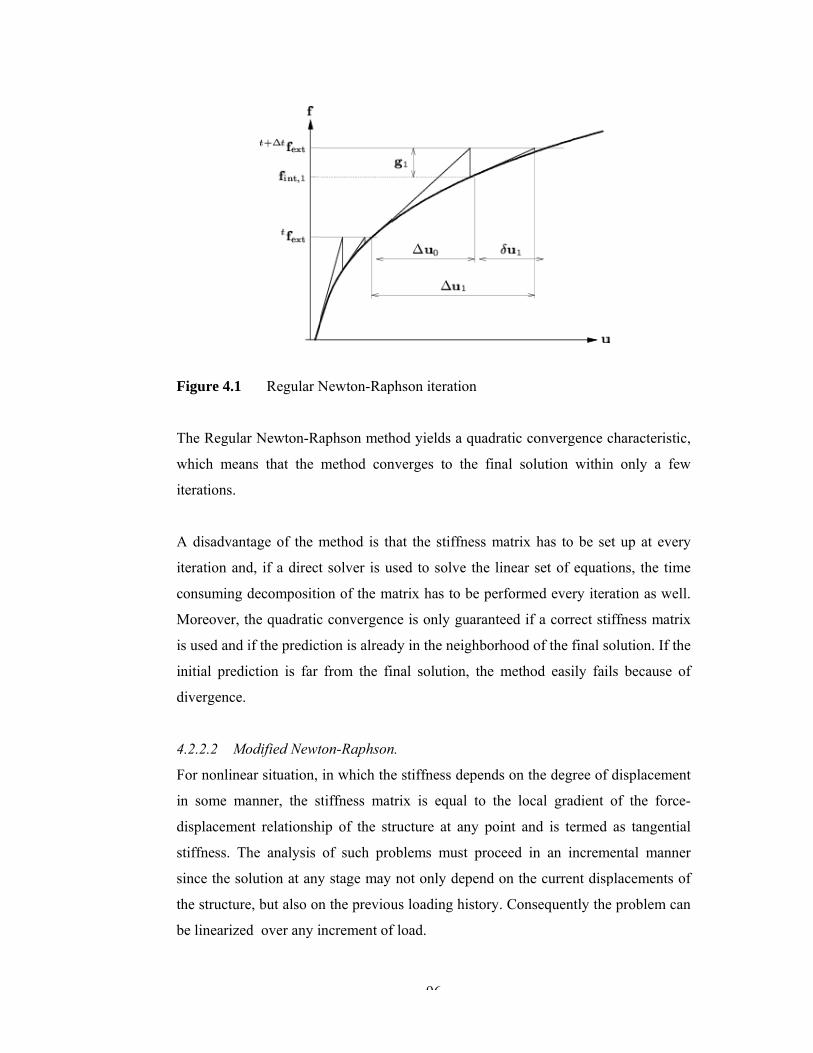
F
T
w
i
A
i
c
M
i
i
d
4
F
i
d
s
s
t
b
Figure 4.1
The Regular
which mean
iterations.
A disadvant
iteration and
consuming d
Moreover, th
is used and i
initial predic
divergence.
4.2.2.2 Mo
For nonlinea
in some ma
displacemen
stiffness. Th
since the sol
the structure
be linearized
Regular N
r Newton-Ra
ns that the
tage of the m
d, if a direct
decompositi
he quadratic
if the predict
ction is far
odified Newt
ar situation,
anner, the st
nt relationsh
he analysis
lution at any
e, but also on
d over any i
Newton-Rap
aphson meth
method con
method is th
t solver is u
on of the m
c convergenc
tion is alread
from the fi
ton-Raphson
in which the
tiffness mat
hip of the str
of such pro
y stage may
n the previou
increment of
96
phson iteratio
hod yields a
nverges to th
hat the stiffn
used to solve
atrix has to
ce is only gu
dy in the nei
inal solution
n.
e stiffness de
trix is equal
ructure at an
oblems must
not only de
us loading h
f load.
on
quadratic co
he final sol
ness matrix
e the linear s
be performe
uaranteed if
ighborhood o
n, the metho
epends on th
l to the loc
ny point an
t proceed in
epend on the
history. Cons
onvergence
lution within
has to be se
set of equati
ed every iter
f a correct st
of the final s
od easily fai
he degree of
cal gradient
nd is termed
n an increm
e current disp
sequently the
characteristi
n only a fe
et up at ever
ions, the tim
ration as we
iffness matr
solution. If th
ils because
f displaceme
of the forc
d as tangenti
mental mann
placements
e problem ca
ic,
ew
ry
me
ll.
rix
he
of
ent
ce-
ial
ner
of
an
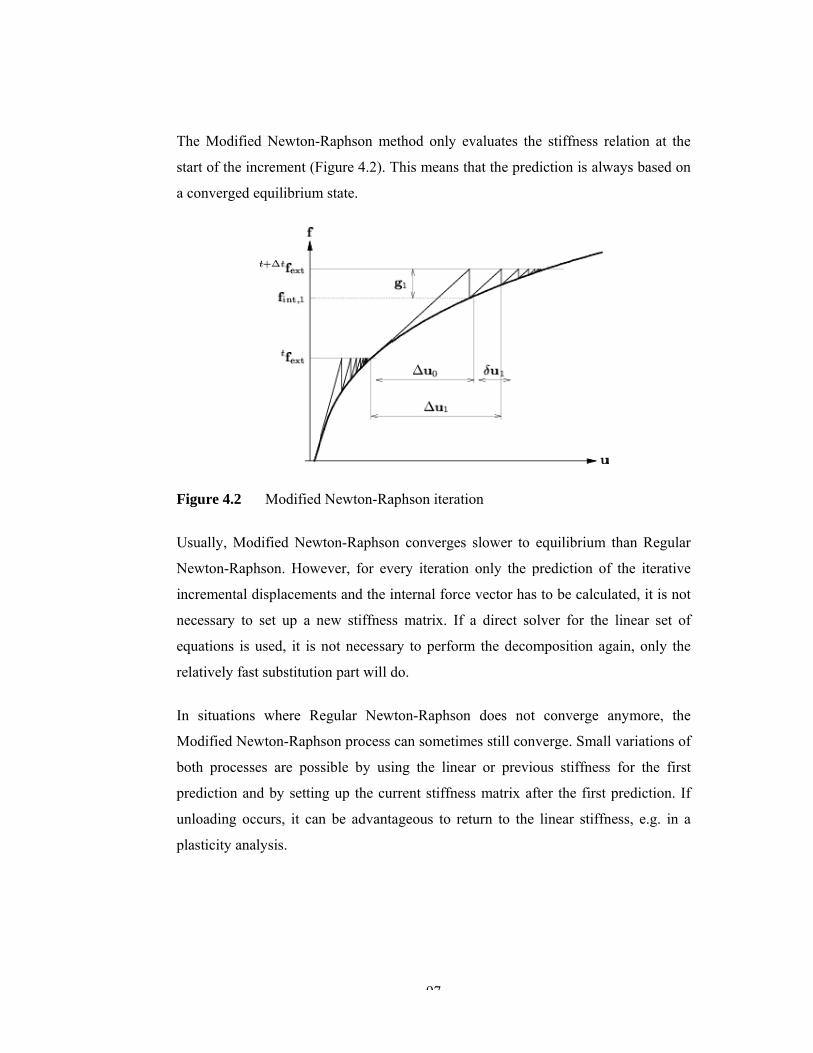
T
s
a
F
U
N
i
n
e
r
I
M
b
p
u
p
The Modifie
start of the i
a converged
Figure 4.2
Usually, Mo
Newton-Rap
incremental
necessary to
equations is
relatively fa
In situation
Modified Ne
both proces
prediction a
unloading o
plasticity an
ed Newton-R
increment (F
d equilibrium
Modified
odified New
phson. How
displacemen
o set up a n
used, it is
st substitutio
ns where Re
ewton-Raph
ses are pos
nd by settin
ccurs, it can
nalysis.
Raphson me
Figure 4.2). T
m state.
d Newton-Ra
wton-Raphson
ever, for ev
nts and the i
new stiffnes
not necessar
on part will d
egular New
son process
sible by usi
ng up the cu
n be advanta
97
ethod only e
This means t
aphson iterat
n converges
very iteration
internal forc
s matrix. If
ry to perform
do.
wton-Raphson
can sometim
ing the line
urrent stiffne
ageous to re
evaluates th
that the pred
tion
s slower to
n only the p
e vector has
f a direct so
m the decom
n does not
mes still conv
ar or previo
ss matrix af
eturn to the
e stiffness r
diction is alw
equilibrium
prediction of
s to be calcu
olver for the
mposition ag
converge
verge. Smal
ous stiffness
fter the first
linear stiffn
relation at th
ways based o
than Regul
f the iterativ
ulated, it is n
e linear set
gain, only th
anymore, th
l variations
s for the fir
prediction.
ness, e.g. in
he
on
lar
ve
not
of
he
he
of
rst
If
a
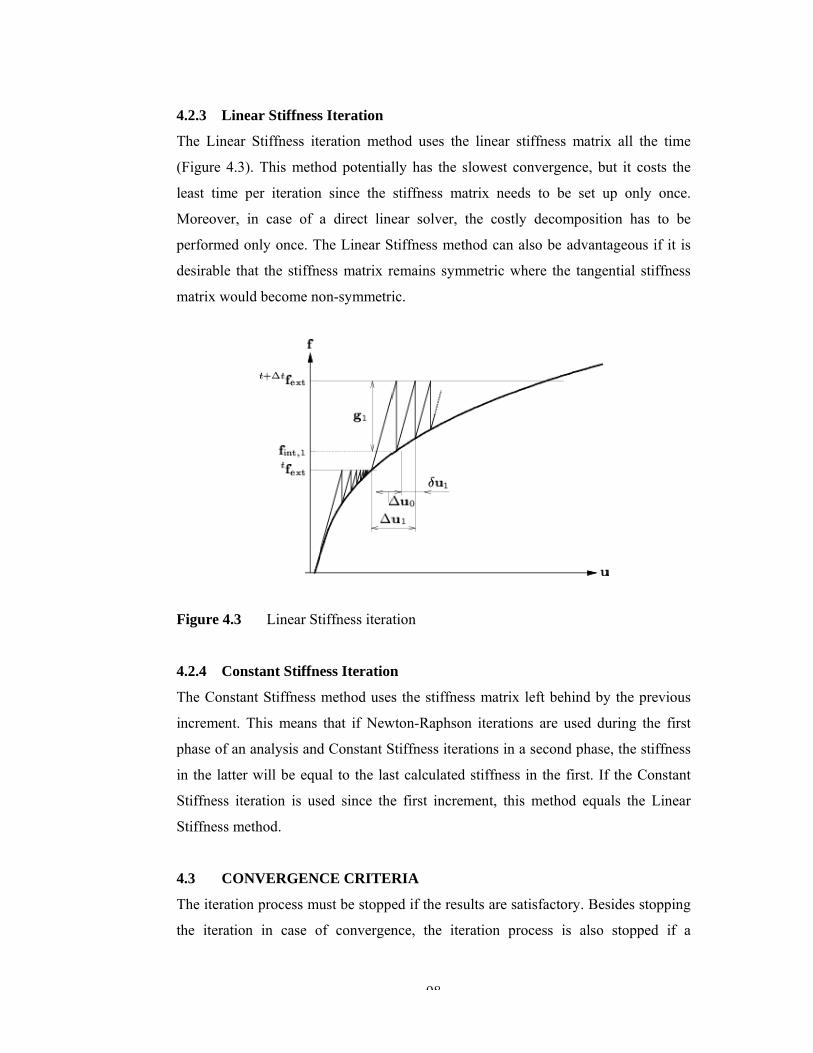
4
T
(
l
M
p
d
m
F
4
T
i
p
i
S
S
4
T
t
4.2.3 Line
The Linear
(Figure 4.3)
least time p
Moreover, i
performed o
desirable tha
matrix woul
Figure 4.3
4.2.4 Cons
The Constan
increment. T
phase of an
in the latter
Stiffness ite
Stiffness me
4.3 CON
The iteration
the iteration
ear Stiffness
Stiffness ite
). This meth
per iteration
in case of a
only once. T
at the stiffne
d become no
Linear St
stant Stiffne
nt Stiffness
This means
analysis and
will be equ
eration is us
ethod.
NVERGENC
n process mu
n in case o
s Iteration
eration meth
hod potential
n since the
a direct line
The Linear S
ess matrix r
on-symmetri
tiffness itera
ess Iteration
method uses
that if New
d Constant S
ual to the las
ed since the
CE CRITER
ust be stoppe
of convergen
98
hod uses the
lly has the s
stiffness ma
ear solver,
Stiffness met
remains sym
ic.
ation
n
s the stiffne
wton-Raphso
Stiffness itera
st calculated
e first increm
RIA
ed if the resu
nce, the ite
e linear stif
slowest conv
atrix needs
the costly d
thod can als
mmetric wher
ss matrix le
n iterations
ations in a s
d stiffness in
ment, this m
ults are satis
eration proce
ffness matrix
vergence, bu
to be set u
decompositi
o be advant
re the tange
ft behind by
are used du
econd phase
n the first. If
method equa
sfactory. Bes
ess is also
x all the tim
ut it costs th
up only onc
ion has to b
ageous if it
ential stiffne
y the previou
uring the fir
e, the stiffne
f the Consta
als the Line
sides stoppin
stopped if
me
he
ce.
be
is
ess
us
rst
ess
ant
ear
ng
a
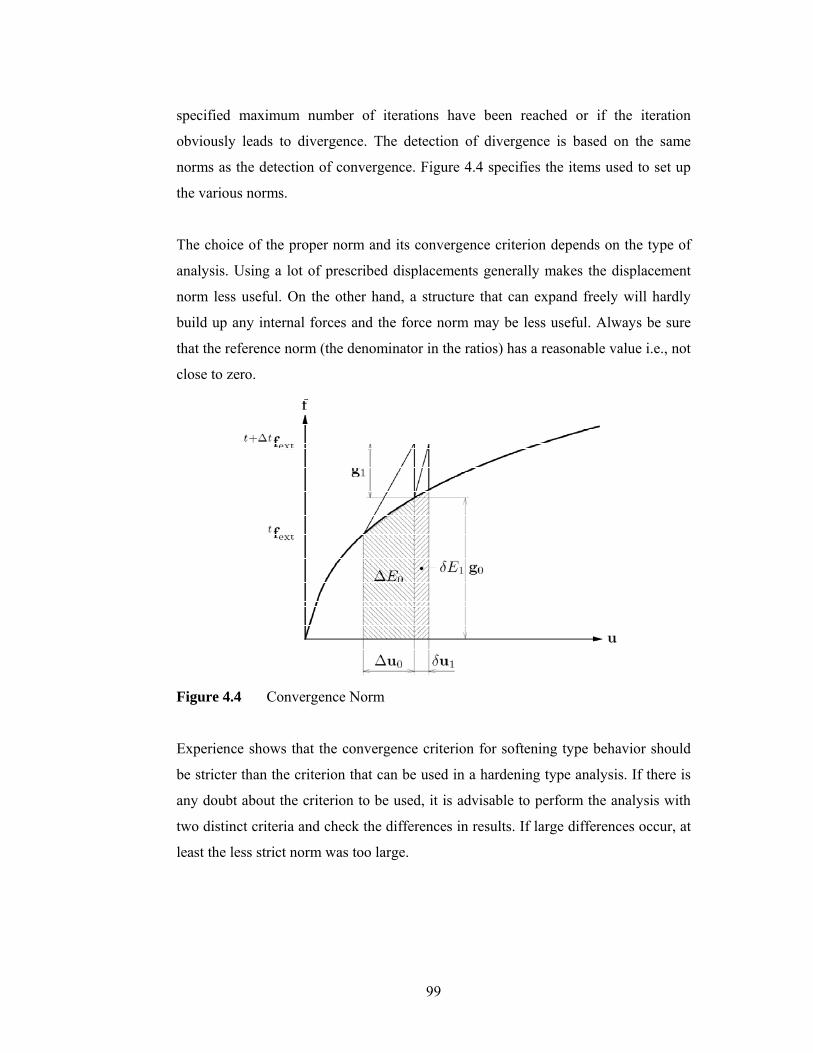
99
specified maximum number of iterations have been reached or if the iteration
obviously leads to divergence. The detection of divergence is based on the same
norms as the detection of convergence. Figure 4.4 specifies the items used to set up
the various norms.
The choice of the proper norm and its convergence criterion depends on the type of
analysis. Using a lot of prescribed displacements generally makes the displacement
norm less useful. On the other hand, a structure that can expand freely will hardly
build up any internal forces and the force norm may be less useful. Always be sure
that the reference norm (the denominator in the ratios) has a reasonable value i.e., not
close to zero.
Figure 4.4 Convergence Norm
Experience shows that the convergence criterion for softening type behavior should
be stricter than the criterion that can be used in a hardening type analysis. If there is
any doubt about the criterion to be used, it is advisable to perform the analysis with
two distinct criteria and check the differences in results. If large differences occur, at
least the less strict norm was too large.
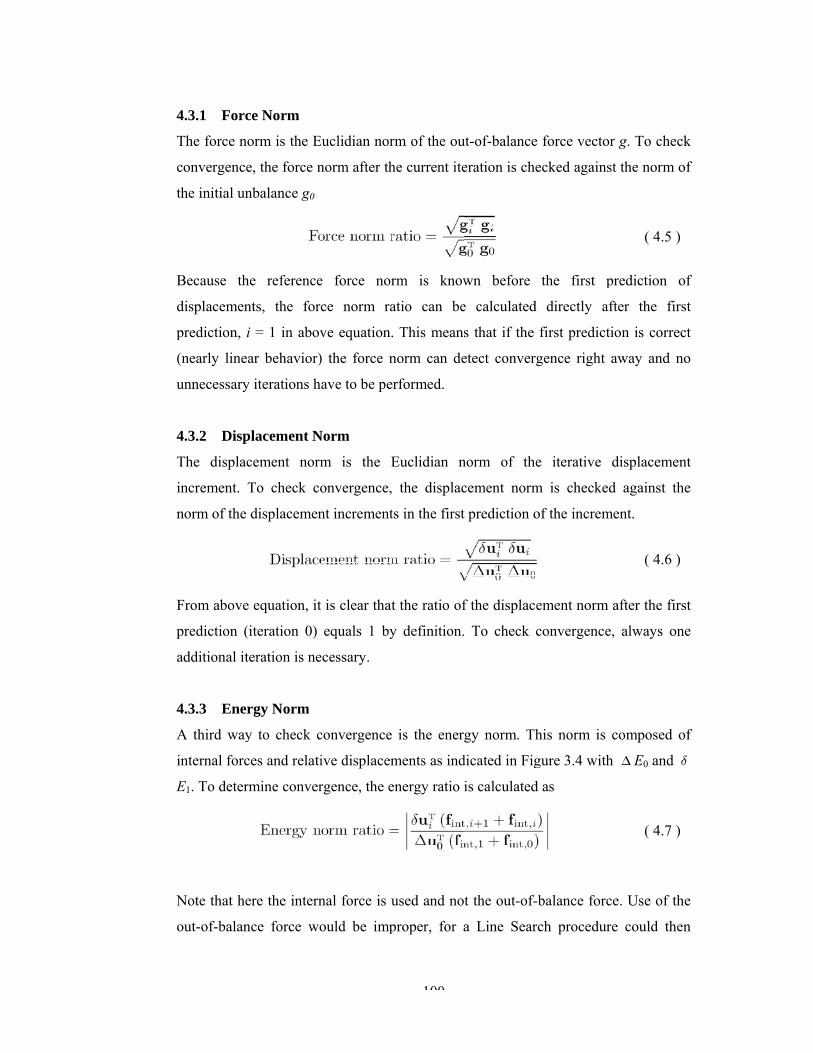
4
T
c
t
B
d
p
(
u
4
T
i
n
F
p
a
4
A
i
E
N
o
4.3.1 Forc
The force no
convergence
the initial un
Because th
displacemen
prediction, i
(nearly linea
unnecessary
4.3.2 Disp
The displac
increment. T
norm of the
From above
prediction (i
additional ite
4.3.3 Ener
A third way
internal forc
E1. To determ
Note that he
out-of-balan
ce Norm
orm is the E
e, the force n
nbalance g0
e reference
nts, the for
i = 1 in abov
ar behavior)
y iterations h
placement N
cement norm
To check co
displacemen
equation, it
iteration 0)
eration is ne
rgy Norm
y to check c
ces and relati
mine conver
ere the intern
nce force wo
Euclidian nor
norm after th
e force nor
ce norm ra
ve equation.
) the force n
ave to be pe
Norm
m is the E
onvergence,
nt increment
t is clear that
equals 1 by
ecessary.
convergence
ive displacem
rgence, the e
nal force is u
ould be imp
100
rm of the ou
he current ite
rm is know
atio can be
. This mean
norm can de
erformed.
Euclidian n
the displac
ts in the first
t the ratio of
y definition.
is the ener
ments as ind
energy ratio
used and no
proper, for a
ut-of-balance
eration is che
wn before
e calculated
s that if the
etect conver
norm of th
cement norm
t prediction o
f the displac
. To check
gy norm. Th
dicated in Fig
is calculated
t the out-of-
a Line Sear
e force vecto
ecked again
the first p
d directly a
first predict
rgence right
e iterative
m is checke
of the increm
ement norm
convergence
his norm is
gure 3.4 with
d as
-balance forc
rch procedur
or g. To chec
st the norm
( 4.5 )
prediction
after the fir
tion is corre
away and n
displaceme
ed against th
ment.
( 4.6 )
m after the fir
e, always on
composed
h E0 and
( 4.7 )
ce. Use of th
re could the
ck
of
)
of
rst
ect
no
ent
he
)
rst
ne
of
)
he
en
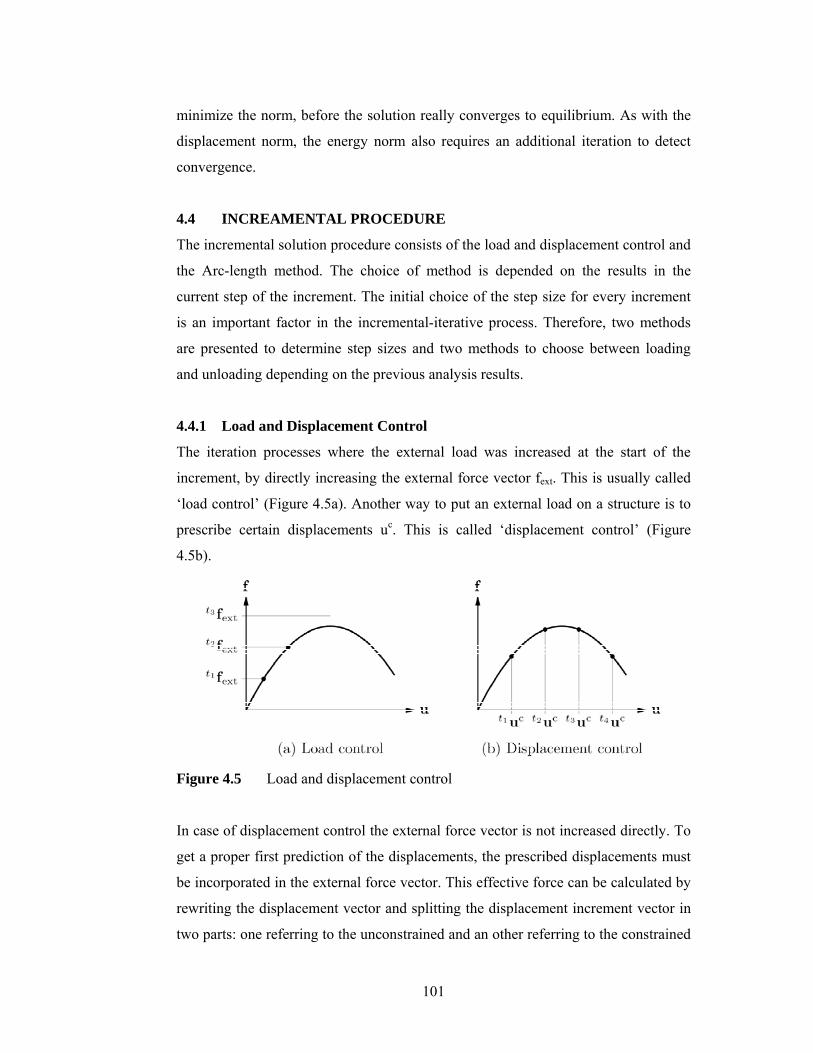
101
minimize the norm, before the solution really converges to equilibrium. As with the
displacement norm, the energy norm also requires an additional iteration to detect
convergence.
4.4 INCREAMENTAL PROCEDURE
The incremental solution procedure consists of the load and displacement control and
the Arc-length method. The choice of method is depended on the results in the
current step of the increment. The initial choice of the step size for every increment
is an important factor in the incremental-iterative process. Therefore, two methods
are presented to determine step sizes and two methods to choose between loading
and unloading depending on the previous analysis results.
4.4.1 Load and Displacement Control
The iteration processes where the external load was increased at the start of the
increment, by directly increasing the external force vector fext. This is usually called
‘load control’ (Figure 4.5a). Another way to put an external load on a structure is to
prescribe certain displacements uc. This is called ‘displacement control’ (Figure
4.5b).
Figure 4.5 Load and displacement control
In case of displacement control the external force vector is not increased directly. To
get a proper first prediction of the displacements, the prescribed displacements must
be incorporated in the external force vector. This effective force can be calculated by
rewriting the displacement vector and splitting the displacement increment vector in
two parts: one referring to the unconstrained and an other referring to the constrained
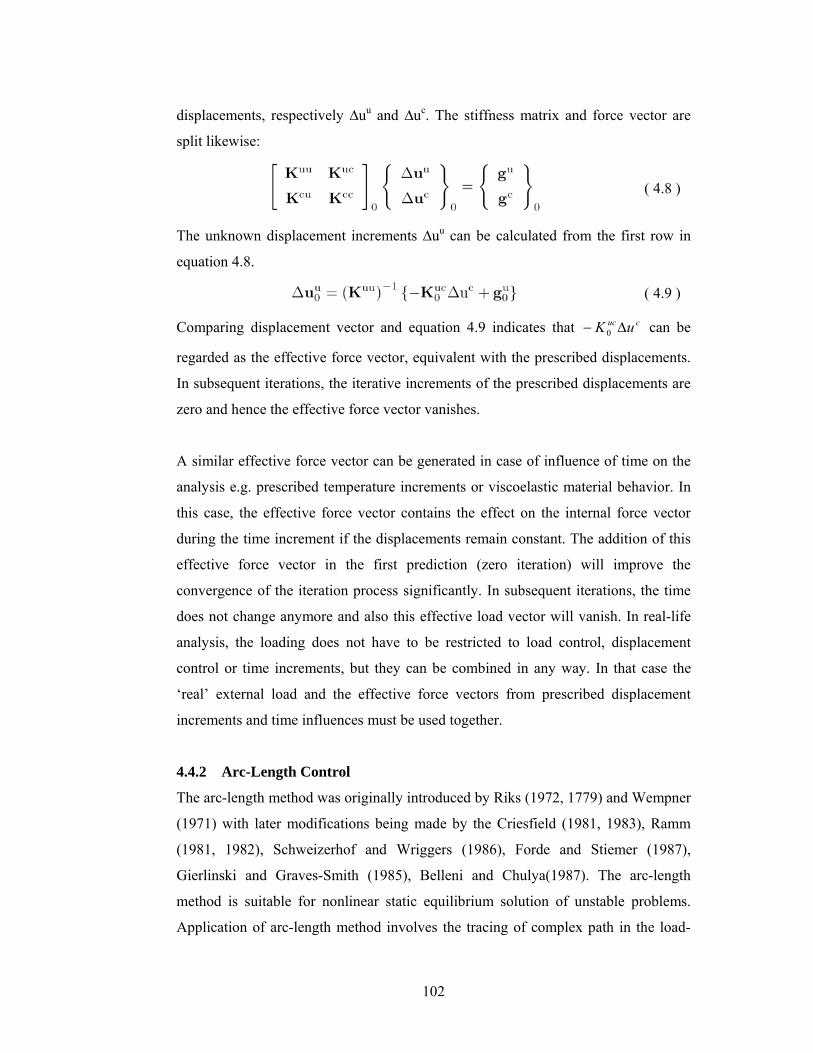
102
displacements, respectively ∆uu and ∆uc. The stiffness matrix and force vector are
split likewise:
( 4.8 )
The unknown displacement increments ∆uu can be calculated from the first row in
equation 4.8.
( 4.9 )
Comparing displacement vector and equation 4.9 indicates that cuc uK Δ− 0 can be
regarded as the effective force vector, equivalent with the prescribed displacements.
In subsequent iterations, the iterative increments of the prescribed displacements are
zero and hence the effective force vector vanishes.
A similar effective force vector can be generated in case of influence of time on the
analysis e.g. prescribed temperature increments or viscoelastic material behavior. In
this case, the effective force vector contains the effect on the internal force vector
during the time increment if the displacements remain constant. The addition of this
effective force vector in the first prediction (zero iteration) will improve the
convergence of the iteration process significantly. In subsequent iterations, the time
does not change anymore and also this effective load vector will vanish. In real-life
analysis, the loading does not have to be restricted to load control, displacement
control or time increments, but they can be combined in any way. In that case the
‘real’ external load and the effective force vectors from prescribed displacement
increments and time influences must be used together.
4.4.2 Arc-Length Control
The arc-length method was originally introduced by Riks (1972, 1779) and Wempner
(1971) with later modifications being made by the Criesfield (1981, 1983), Ramm
(1981, 1982), Schweizerhof and Wriggers (1986), Forde and Stiemer (1987),
Gierlinski and Graves-Smith (1985), Belleni and Chulya(1987). The arc-length
method is suitable for nonlinear static equilibrium solution of unstable problems.
Application of arc-length method involves the tracing of complex path in the load-
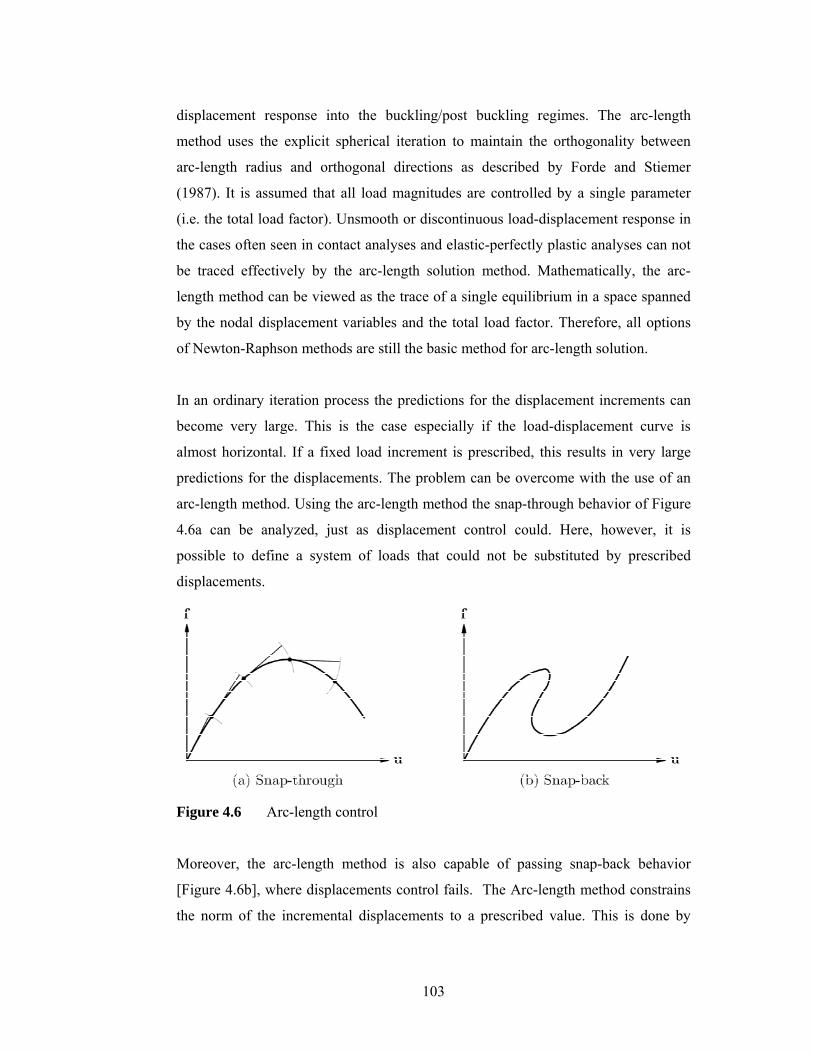
103
displacement response into the buckling/post buckling regimes. The arc-length
method uses the explicit spherical iteration to maintain the orthogonality between
arc-length radius and orthogonal directions as described by Forde and Stiemer
(1987). It is assumed that all load magnitudes are controlled by a single parameter
(i.e. the total load factor). Unsmooth or discontinuous load-displacement response in
the cases often seen in contact analyses and elastic-perfectly plastic analyses can not
be traced effectively by the arc-length solution method. Mathematically, the arc-
length method can be viewed as the trace of a single equilibrium in a space spanned
by the nodal displacement variables and the total load factor. Therefore, all options
of Newton-Raphson methods are still the basic method for arc-length solution.
In an ordinary iteration process the predictions for the displacement increments can
become very large. This is the case especially if the load-displacement curve is
almost horizontal. If a fixed load increment is prescribed, this results in very large
predictions for the displacements. The problem can be overcome with the use of an
arc-length method. Using the arc-length method the snap-through behavior of Figure
4.6a can be analyzed, just as displacement control could. Here, however, it is
possible to define a system of loads that could not be substituted by prescribed
displacements.
Figure 4.6 Arc-length control
Moreover, the arc-length method is also capable of passing snap-back behavior
[Figure 4.6b], where displacements control fails. The Arc-length method constrains
the norm of the incremental displacements to a prescribed value. This is done by
104
simultaneously adapting the size of the increment. Note that the size is adapted
within the iteration process and is not fixed at the moment the increment starts.
Arc-length methods may only be used in combination with nodal or element loads,
not with prescribed non-zero displacements or with time steps. Arc-length methods
fail if the loading is dominantly nonconservative. Arc-length methods adapt the
loading during iterations in one load step. For adaptive loading in consecutive load
steps use the adaptive loading options.
In Arc length control the external force vector multiplies a unit load and can change
every iteration. Thus the results,
( 4.10 )
The solution δui is now split in two parts;
( 4.11 )
and
( 4.12)
The total iterative increment is then derived from,
( 4.13 )
FE analysis offers a quadratic and a linearized constraint, leading to the Spherical
Path Arc-length method and the Updated Normal Plane method.
4.4.2.1 Spherical Path ARC length method
In the spherical constraint, the constraint equation is,
( 4.14 )
Where ∆l is the required arc length. Thus,
( 4.15 )
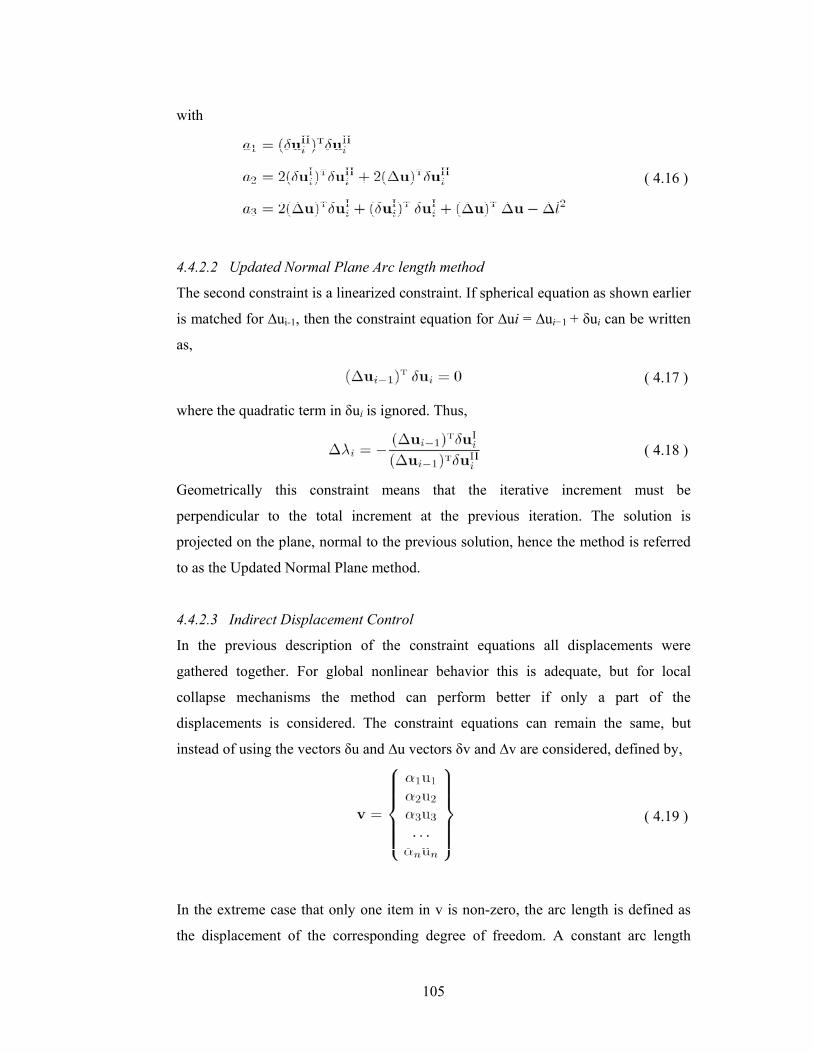
105
with
( 4.16 )
4.4.2.2 Updated Normal Plane Arc length method
The second constraint is a linearized constraint. If spherical equation as shown earlier
is matched for ∆ui-1, then the constraint equation for ∆ui = ∆ui−1 + δui can be written
as,
( 4.17 )
where the quadratic term in δui is ignored. Thus,
( 4.18 )
Geometrically this constraint means that the iterative increment must be
perpendicular to the total increment at the previous iteration. The solution is
projected on the plane, normal to the previous solution, hence the method is referred
to as the Updated Normal Plane method.
4.4.2.3 Indirect Displacement Control
In the previous description of the constraint equations all displacements were
gathered together. For global nonlinear behavior this is adequate, but for local
collapse mechanisms the method can perform better if only a part of the
displacements is considered. The constraint equations can remain the same, but
instead of using the vectors δu and ∆u vectors δv and ∆v are considered, defined by,
( 4.19 )
In the extreme case that only one item in v is non-zero, the arc length is defined as
the displacement of the corresponding degree of freedom. A constant arc length
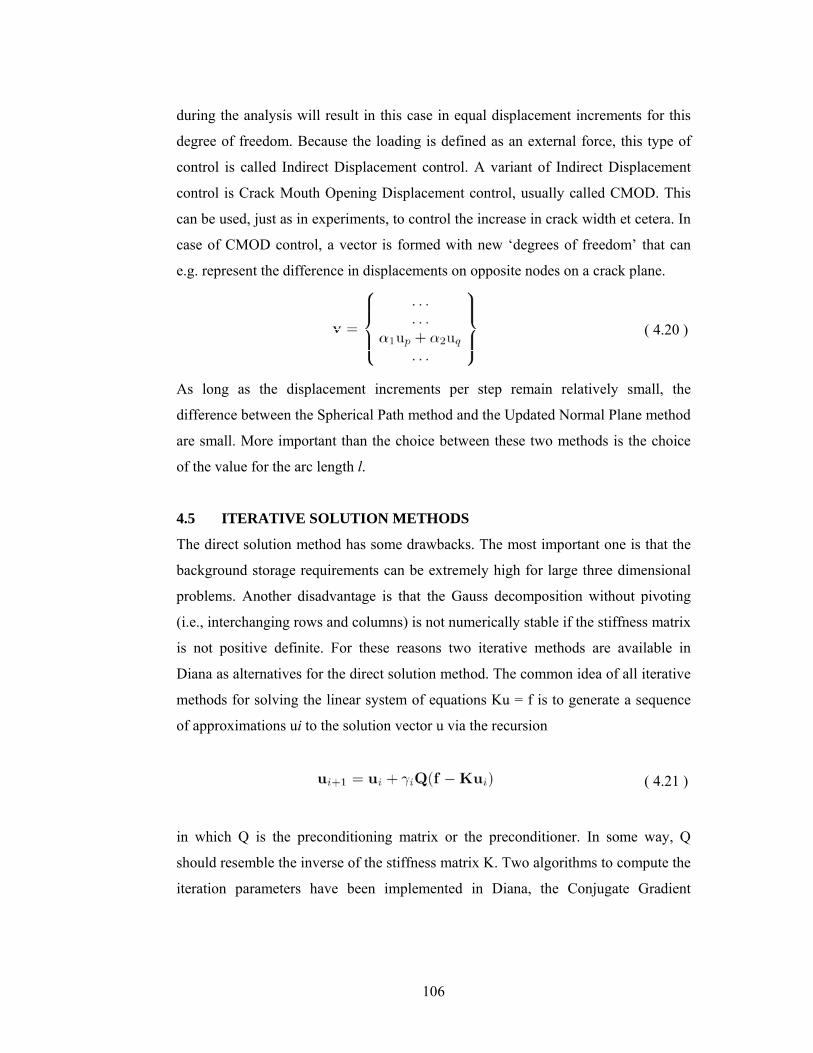
106
during the analysis will result in this case in equal displacement increments for this
degree of freedom. Because the loading is defined as an external force, this type of
control is called Indirect Displacement control. A variant of Indirect Displacement
control is Crack Mouth Opening Displacement control, usually called CMOD. This
can be used, just as in experiments, to control the increase in crack width et cetera. In
case of CMOD control, a vector is formed with new ‘degrees of freedom’ that can
e.g. represent the difference in displacements on opposite nodes on a crack plane.
( 4.20 )
As long as the displacement increments per step remain relatively small, the
difference between the Spherical Path method and the Updated Normal Plane method
are small. More important than the choice between these two methods is the choice
of the value for the arc length l.
4.5 ITERATIVE SOLUTION METHODS
The direct solution method has some drawbacks. The most important one is that the
background storage requirements can be extremely high for large three dimensional
problems. Another disadvantage is that the Gauss decomposition without pivoting
(i.e., interchanging rows and columns) is not numerically stable if the stiffness matrix
is not positive definite. For these reasons two iterative methods are available in
Diana as alternatives for the direct solution method. The common idea of all iterative
methods for solving the linear system of equations Ku = f is to generate a sequence
of approximations ui to the solution vector u via the recursion
( 4.21 )
in which Q is the preconditioning matrix or the preconditioner. In some way, Q
should resemble the inverse of the stiffness matrix K. Two algorithms to compute the
iteration parameters have been implemented in Diana, the Conjugate Gradient
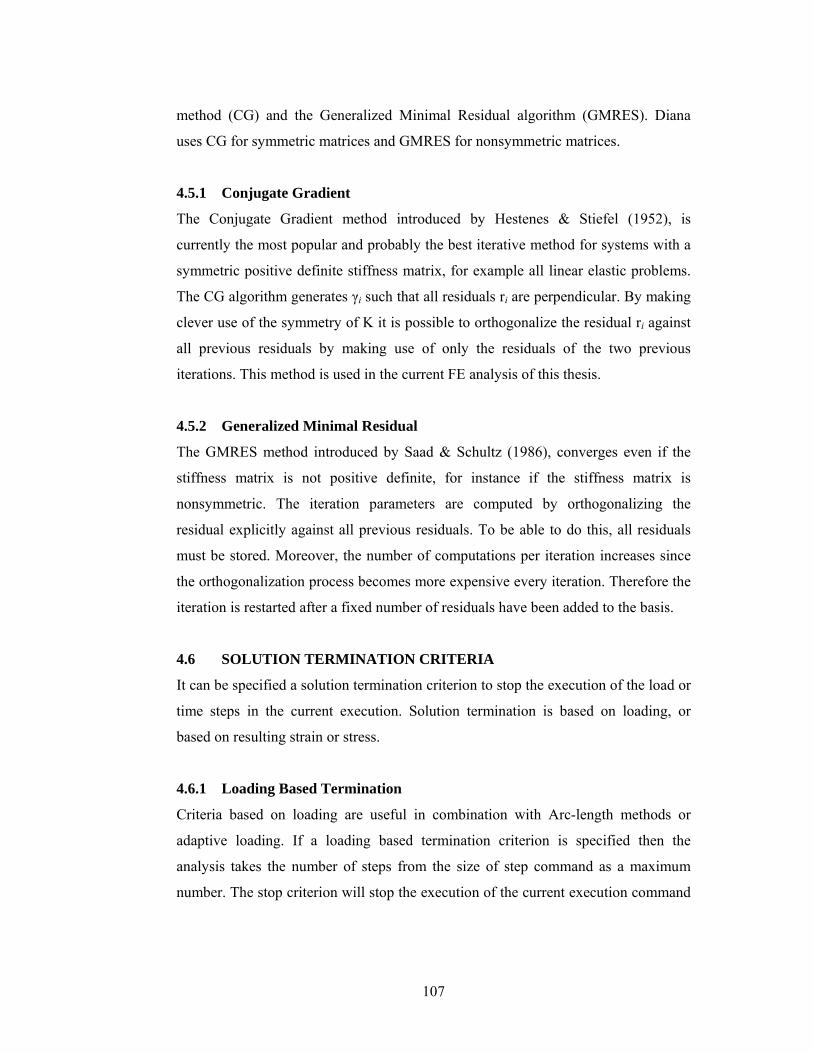
107
method (CG) and the Generalized Minimal Residual algorithm (GMRES). Diana
uses CG for symmetric matrices and GMRES for nonsymmetric matrices.
4.5.1 Conjugate Gradient
The Conjugate Gradient method introduced by Hestenes & Stiefel (1952), is
currently the most popular and probably the best iterative method for systems with a
symmetric positive definite stiffness matrix, for example all linear elastic problems.
The CG algorithm generates γi such that all residuals ri are perpendicular. By making
clever use of the symmetry of K it is possible to orthogonalize the residual ri against
all previous residuals by making use of only the residuals of the two previous
iterations. This method is used in the current FE analysis of this thesis.
4.5.2 Generalized Minimal Residual
The GMRES method introduced by Saad & Schultz (1986), converges even if the
stiffness matrix is not positive definite, for instance if the stiffness matrix is
nonsymmetric. The iteration parameters are computed by orthogonalizing the
residual explicitly against all previous residuals. To be able to do this, all residuals
must be stored. Moreover, the number of computations per iteration increases since
the orthogonalization process becomes more expensive every iteration. Therefore the
iteration is restarted after a fixed number of residuals have been added to the basis.
4.6 SOLUTION TERMINATION CRITERIA
It can be specified a solution termination criterion to stop the execution of the load or
time steps in the current execution. Solution termination is based on loading, or
based on resulting strain or stress.
4.6.1 Loading Based Termination
Criteria based on loading are useful in combination with Arc-length methods or
adaptive loading. If a loading based termination criterion is specified then the
analysis takes the number of steps from the size of step command as a maximum
number. The stop criterion will stop the execution of the current execution command
108
block. The analysis will continue with the next block (if any). The following types of
load based termination criteria may be assigned;
( i ) Total load based termination : Solution will be terminated if total load is
reached.
( ii ) Increment load based termination : Execution will stop when the incremental
load is less than assigned incremental load. This type termination criteria is
used in the present analysis.
( iii ) Sign change based termination : Solution will stop when the sign of the load
vector changes. This criterion is for use in combination with automatic
loading–unloading or loading–unloading based on negative pivots. Sign for
automatic loading–unloading for the incremental step sizes similar to
spherical path arc-length control. This method may only be used in
combination with arc-length control.
4.6.2 Result Based Termination
With a termination criterion based on analysis results, Diana will stop the execution
of the steps in the current execution block if the value of certain strains or stresses
exceeds a specified extreme. The following types of results based termination criteria
may be assigned;
( i ) Selection of based termination : Selection of certain parts of the model for
which the criterion for resulting strain or stress must be applied. Otherwise the
analysis applies the specified results criterion on all elements of the model.
( ii ) Strain based termination : Execution will stop based on the total Green–
Lagrange strain as shown in Figure 4.7a.
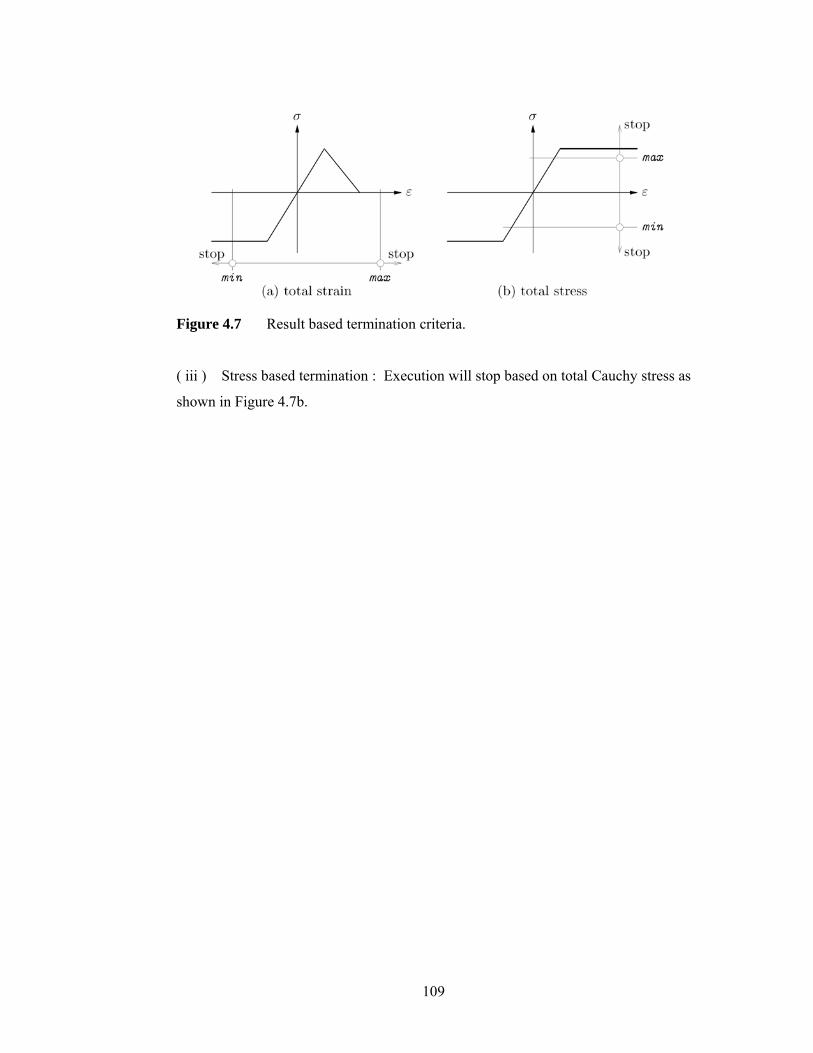
109
Figure 4.7 Result based termination criteria.
( iii ) Stress based termination : Execution will stop based on total Cauchy stress as
shown in Figure 4.7b.
110
CHAPTER-5
EXPERIMENTAL DATA
5.1 INTRODUCTION
An experimental program was carried out on the author’s post graduate study which
was comprised of a planned series of tests on restrained as well as unrestrained slabs,
variation of flexural reinforcement and slab thickness (Alam, 1997). The
experimental study describes punching shear tests conducted on reinforced concrete
slabs with their edges restrained as well as unrestrained. Edge restraint was provided,
by means of edge beams of various dimensions, to mimic the behavior of continuous
slabs. A total of 15 model slabs were tested in an effort to ascertain the influence of
the degree of boundary restraint, percentage of steel reinforcement, and slab
thickness of the slab models on their structural behavior and punching load-carrying
capacity. The cracking pattern and load-deflection behavior of the slabs tested was
also monitored closely. The test program was carried out to provide basic
information on the real punching behavior of restrained slabs subjected to
concentrated loading and may also be usefully applied in the assessment of existing
structures with laterally restrained slab construction.
Experimental data of other researchers are briefly discussed in this chapter. Some
analysis, discussion of test result, comparison of test result are also added.
5.2 PREVIOUS EXPERIMENTAL PROGRAM BY ALAM (1997)
5.2.1 Specimen Details
A total of 15 square reinforced concrete slab specimens was constructed and tested
by Alam (1997). Twelve of these slabs had edge restraints in the form of edge beam,
whereas the other three samples were plain normal slabs having no edge beams.
Width of edge beam, slab thickness and reinforcement ratio were test variable
elements for different samples having one or more than one variability. Details of the
slab samples are given in Table 5.1 and typical plan and sectional details of slabs
with edge beam are shown on the Figure 5.1.
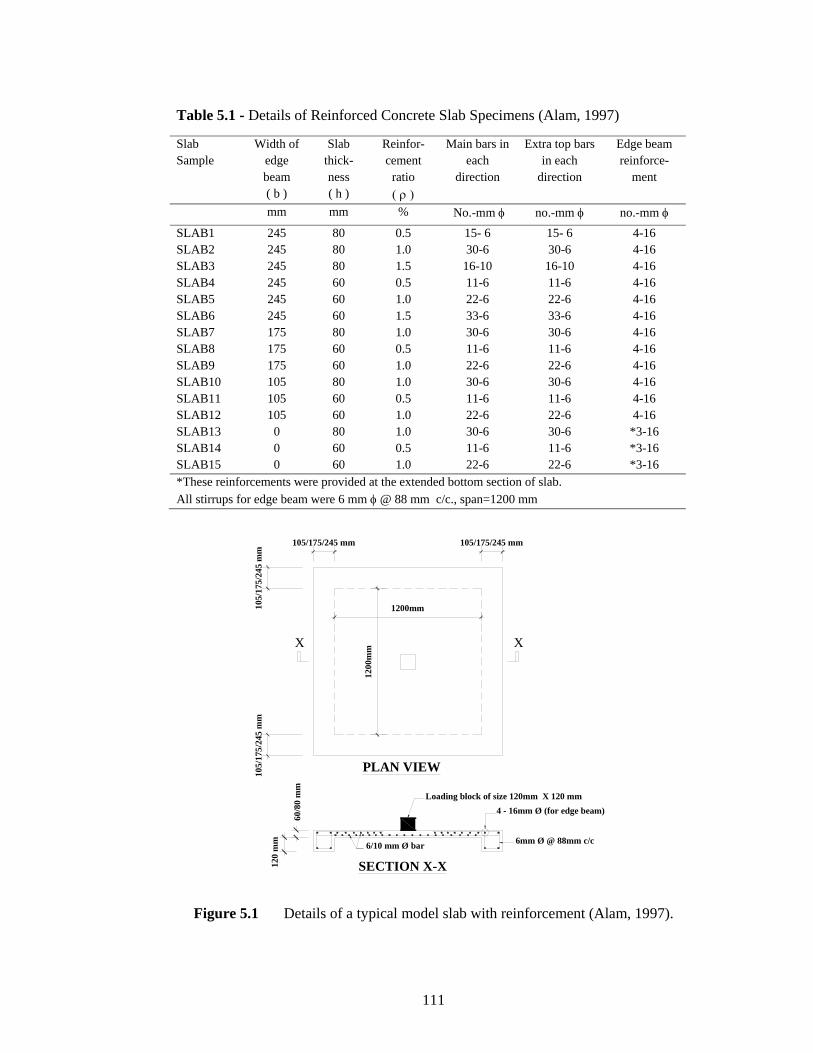
111
Table 5.1 - Details of Reinforced Concrete Slab Specimens (Alam, 1997)
Slab Sample
Width of edge beam ( b )
Slab thick-ness ( h )
Reinfor-cement
ratio ( ρ )
Main bars in each
direction
Extra top bars in each
direction
Edge beam reinforce-
ment
mm mm % No.-mm φ no.-mm φ no.-mm φ SLAB1 245 80 0.5 15- 6 15- 6 4-16 SLAB2 245 80 1.0 30-6 30-6 4-16 SLAB3 245 80 1.5 16-10 16-10 4-16 SLAB4 245 60 0.5 11-6 11-6 4-16 SLAB5 245 60 1.0 22-6 22-6 4-16 SLAB6 245 60 1.5 33-6 33-6 4-16 SLAB7 175 80 1.0 30-6 30-6 4-16 SLAB8 175 60 0.5 11-6 11-6 4-16 SLAB9 175 60 1.0 22-6 22-6 4-16 SLAB10 105 80 1.0 30-6 30-6 4-16 SLAB11 105 60 0.5 11-6 11-6 4-16 SLAB12 105 60 1.0 22-6 22-6 4-16 SLAB13 0 80 1.0 30-6 30-6 *3-16 SLAB14 0 60 0.5 11-6 11-6 *3-16 SLAB15 0 60 1.0 22-6 22-6 *3-16 *These reinforcements were provided at the extended bottom section of slab. All stirrups for edge beam were 6 mm φ @ 88 mm c/c., span=1200 mm
1200
mm
105/
175/
245
mm
60/8
0 m
m
120
mm
Loading block of size 120mm X 120 mm
6mm Ø @ 88mm c/c
4 - 16mm Ø (for edge beam)
6/10 mm Ø bar
SECTION X-X
PLAN VIEW
105/175/245 mm
1200mm105/
175/
245
mm
X
105/175/245 mm
X
Figure 5.1 Details of a typical model slab with reinforcement (Alam, 1997).
112
The concrete used in the specimens consisted of ordinary Portland cement, natural
sand and crushed stone aggregate with maximum size 10 mm. The water cement
ratio for concrete was 0.45. Both 6 mm and 10 mm diameter steel bars having
average yield strength of 421 MPa were used in the slab panels and stirrup of edge
beams. Flexural reinforcement in the edge beams were provided by 16 mm diameter
steel bars with average yield strength 414 MPa.
5.2.2 Test Results
All the models underwent punching type of failure with their inherent brittle
characteristics and failed in a punching shear mode. Most of the slab samples failed
at a load much higher than those predicted by the codes. The cracking pattern of the
top surface of all the slabs were very much localized and approximately had a size of
average 120mm x 120mm as shown in Figure 5.2. The cracking patterns at the
bottom surface of slabs having low percentage of reinforcement were more severe
than those having higher percentages of steel. It has been noticed that the surface
area of cracked zone for the slabs having wider edge beams were more than those
slabs having smaller edge beams. It has also been observed for all the samples that
the deflection at support was negligible, pointing out to the fact that support fixity
was ensured, albeit approximately, during the testing of the models. A typical crack
pattern after failure on the bottom surface of slab model is shown on Figure 5.3.
Test results obtained from this study have been analyzed and shown in the Table 5.2.
It has been found that ultimate punching shear capacity and behavior of slab samples
are dependent on restraining action of slab edges, flexural reinforcement ratio, slab
thickness and span-to-depth ratio of the slab.
Analysis of test result as shown in Table 5.2, where non-dimensional punching shear
strength Vu / fc'b0d, [where, d=effective depth of slab, b0= 4 x (120+d)] and
normalized punching shear strength Vu / f 'c b0d of each specimen have been given.
There is a general trend to increase the load carrying capacity of slabs with the
increase of width of edge beam as well as flexural reinforcement of slab.
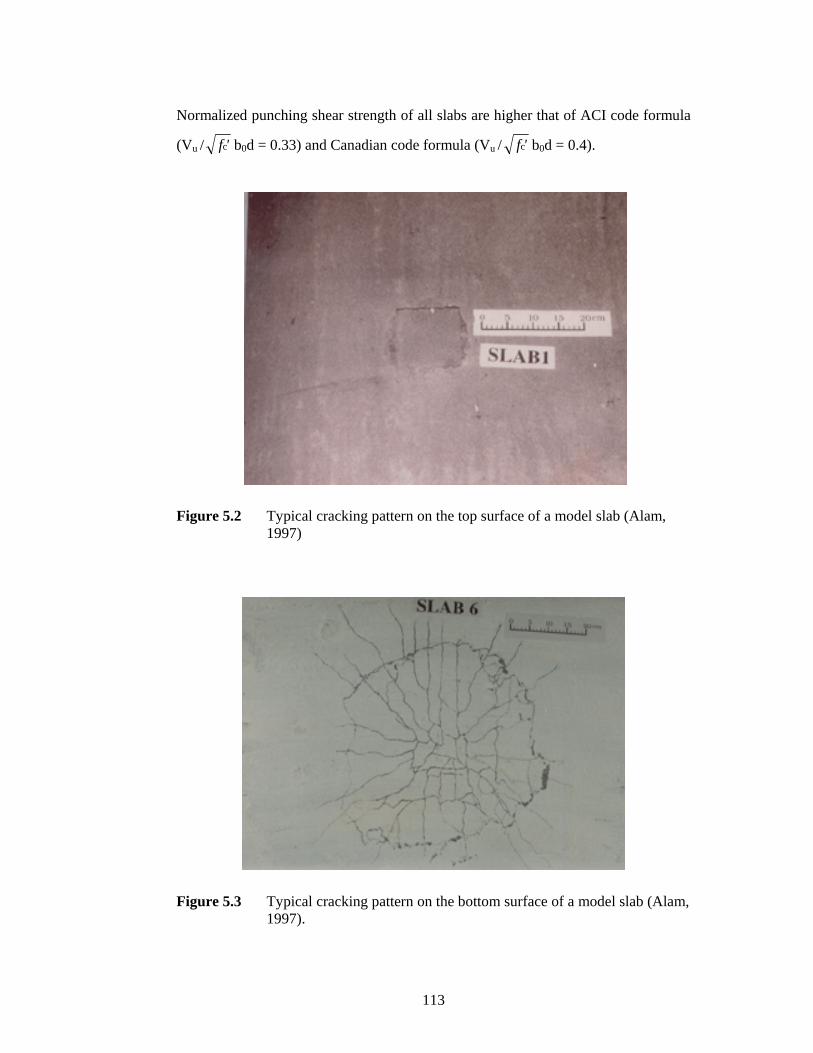
113
Normalized punching shear strength of all slabs are higher that of ACI code formula
(Vu / f 'c b0d = 0.33) and Canadian code formula (Vu / f 'c b0d = 0.4).
Figure 5.2 Typical cracking pattern on the top surface of a model slab (Alam, 1997)
Figure 5.3 Typical cracking pattern on the bottom surface of a model slab (Alam, 1997).
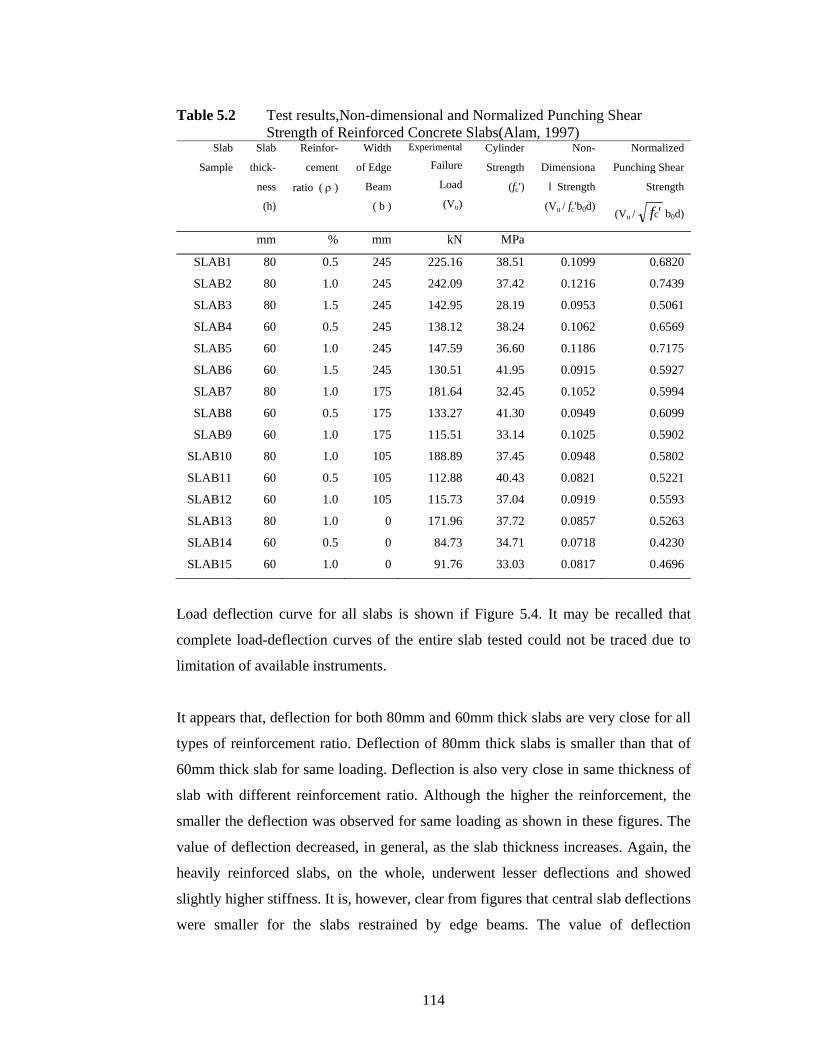
114
Table 5.2 Test results,Non-dimensional and Normalized Punching Shear Strength of Reinforced Concrete Slabs(Alam, 1997)
Slab
Sample
Slab
thick-
ness
(h)
Reinfor-
cement
ratio ( ρ )
Width
of Edge
Beam
( b )
Experimental
Failure
Load
(Vu)
Cylinder
Strength
(fc')
Non-
Dimensiona
l Strength
(Vu / fc'b0d)
Normalized
Punching Shear
Strength
(Vu / f 'c b0d)
mm % mm kN MPa
SLAB1 80 0.5 245 225.16 38.51 0.1099 0.6820
SLAB2 80 1.0 245 242.09 37.42 0.1216 0.7439
SLAB3 80 1.5 245 142.95 28.19 0.0953 0.5061
SLAB4 60 0.5 245 138.12 38.24 0.1062 0.6569
SLAB5 60 1.0 245 147.59 36.60 0.1186 0.7175
SLAB6 60 1.5 245 130.51 41.95 0.0915 0.5927
SLAB7 80 1.0 175 181.64 32.45 0.1052 0.5994
SLAB8 60 0.5 175 133.27 41.30 0.0949 0.6099
SLAB9 60 1.0 175 115.51 33.14 0.1025 0.5902
SLAB10 80 1.0 105 188.89 37.45 0.0948 0.5802
SLAB11 60 0.5 105 112.88 40.43 0.0821 0.5221
SLAB12 60 1.0 105 115.73 37.04 0.0919 0.5593
SLAB13 80 1.0 0 171.96 37.72 0.0857 0.5263
SLAB14 60 0.5 0 84.73 34.71 0.0718 0.4230
SLAB15 60 1.0 0 91.76 33.03 0.0817 0.4696
Load deflection curve for all slabs is shown if Figure 5.4. It may be recalled that
complete load-deflection curves of the entire slab tested could not be traced due to
limitation of available instruments.
It appears that, deflection for both 80mm and 60mm thick slabs are very close for all
types of reinforcement ratio. Deflection of 80mm thick slabs is smaller than that of
60mm thick slab for same loading. Deflection is also very close in same thickness of
slab with different reinforcement ratio. Although the higher the reinforcement, the
smaller the deflection was observed for same loading as shown in these figures. The
value of deflection decreased, in general, as the slab thickness increases. Again, the
heavily reinforced slabs, on the whole, underwent lesser deflections and showed
slightly higher stiffness. It is, however, clear from figures that central slab deflections
were smaller for the slabs restrained by edge beams. The value of deflection
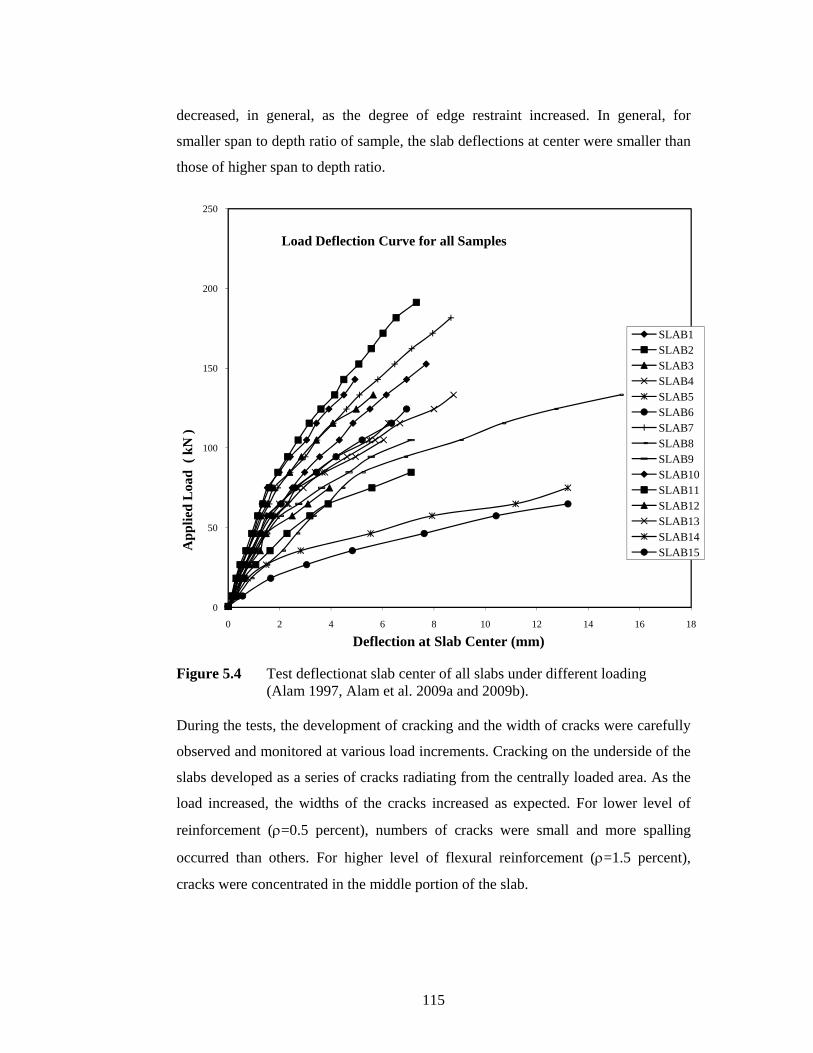
115
decreased, in general, as the degree of edge restraint increased. In general, for
smaller span to depth ratio of sample, the slab deflections at center were smaller than
those of higher span to depth ratio.
Figure 5.4 Test deflectionat slab center of all slabs under different loading
(Alam 1997, Alam et al. 2009a and 2009b). During the tests, the development of cracking and the width of cracks were carefully
observed and monitored at various load increments. Cracking on the underside of the
slabs developed as a series of cracks radiating from the centrally loaded area. As the
load increased, the widths of the cracks increased as expected. For lower level of
reinforcement (ρ=0.5 percent), numbers of cracks were small and more spalling
occurred than others. For higher level of flexural reinforcement (ρ=1.5 percent),
cracks were concentrated in the middle portion of the slab.
0
50
100
150
200
250
0 2 4 6 8 10 12 14 16 18
App
lied
Loa
d (
kN )
Deflection at Slab Center (mm)
Load Deflection Curve for all Samples
SLAB1SLAB2SLAB3SLAB4SLAB5SLAB6SLAB7SLAB8SLAB9SLAB10SLAB11SLAB12SLAB13SLAB14SLAB15
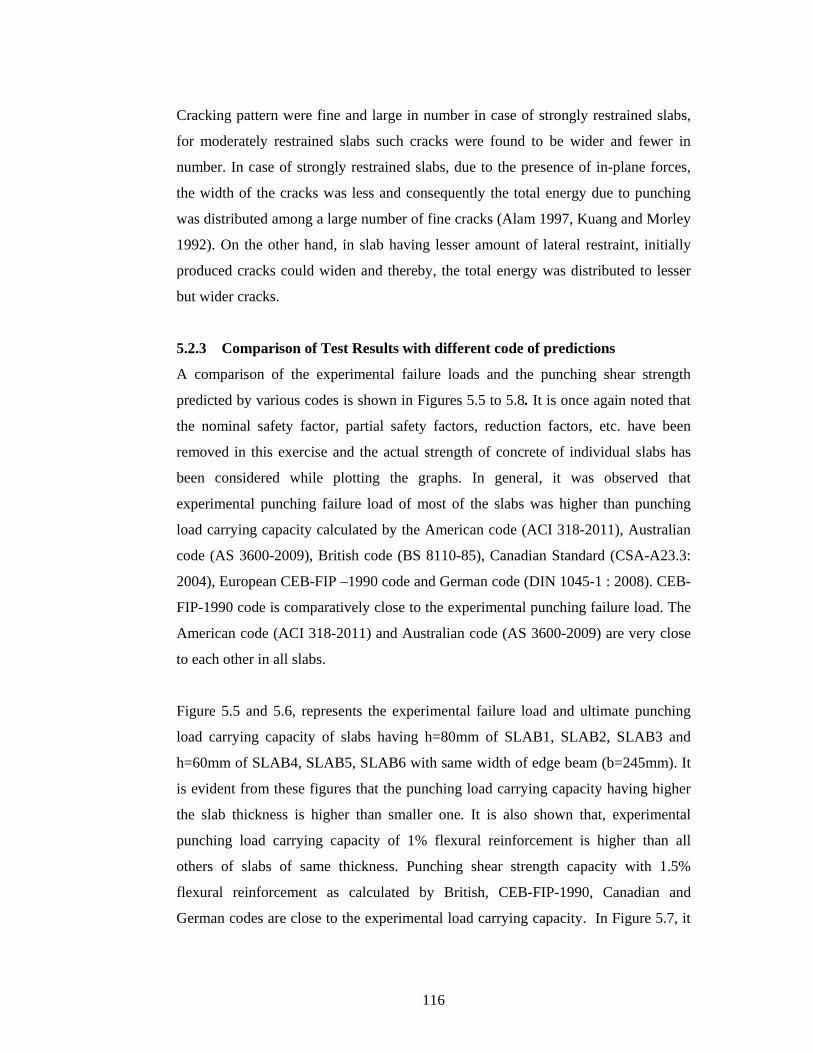
116
Cracking pattern were fine and large in number in case of strongly restrained slabs,
for moderately restrained slabs such cracks were found to be wider and fewer in
number. In case of strongly restrained slabs, due to the presence of in-plane forces,
the width of the cracks was less and consequently the total energy due to punching
was distributed among a large number of fine cracks (Alam 1997, Kuang and Morley
1992). On the other hand, in slab having lesser amount of lateral restraint, initially
produced cracks could widen and thereby, the total energy was distributed to lesser
but wider cracks.
5.2.3 Comparison of Test Results with different code of predictions A comparison of the experimental failure loads and the punching shear strength
predicted by various codes is shown in Figures 5.5 to 5.8. It is once again noted that
the nominal safety factor, partial safety factors, reduction factors, etc. have been
removed in this exercise and the actual strength of concrete of individual slabs has
been considered while plotting the graphs. In general, it was observed that
experimental punching failure load of most of the slabs was higher than punching
load carrying capacity calculated by the American code (ACI 318-2011), Australian
code (AS 3600-2009), British code (BS 8110-85), Canadian Standard (CSA-A23.3:
2004), European CEB-FIP –1990 code and German code (DIN 1045-1 : 2008). CEB-
FIP-1990 code is comparatively close to the experimental punching failure load. The
American code (ACI 318-2011) and Australian code (AS 3600-2009) are very close
to each other in all slabs.
Figure 5.5 and 5.6, represents the experimental failure load and ultimate punching
load carrying capacity of slabs having h=80mm of SLAB1, SLAB2, SLAB3 and
h=60mm of SLAB4, SLAB5, SLAB6 with same width of edge beam (b=245mm). It
is evident from these figures that the punching load carrying capacity having higher
the slab thickness is higher than smaller one. It is also shown that, experimental
punching load carrying capacity of 1% flexural reinforcement is higher than all
others of slabs of same thickness. Punching shear strength capacity with 1.5%
flexural reinforcement as calculated by British, CEB-FIP-1990, Canadian and
German codes are close to the experimental load carrying capacity. In Figure 5.7, it
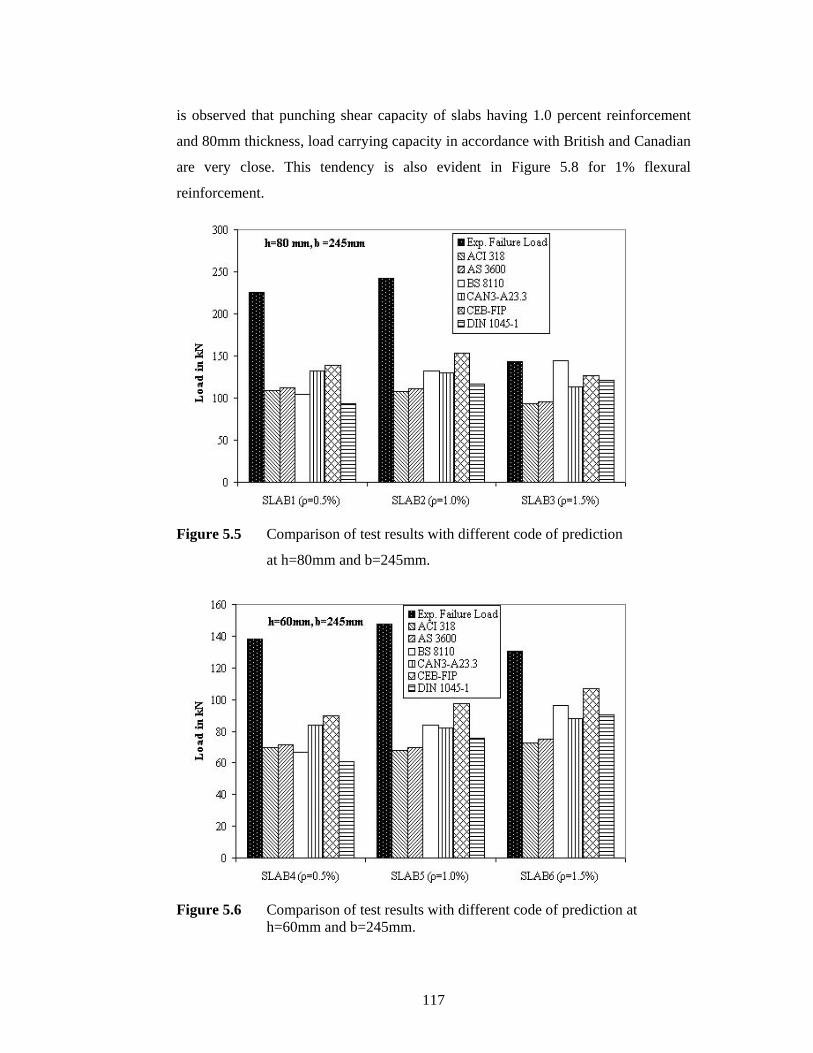
117
is observed that punching shear capacity of slabs having 1.0 percent reinforcement
and 80mm thickness, load carrying capacity in accordance with British and Canadian
are very close. This tendency is also evident in Figure 5.8 for 1% flexural
reinforcement.
Figure 5.5 Comparison of test results with different code of prediction
at h=80mm and b=245mm.
Figure 5.6 Comparison of test results with different code of prediction at h=60mm and b=245mm.
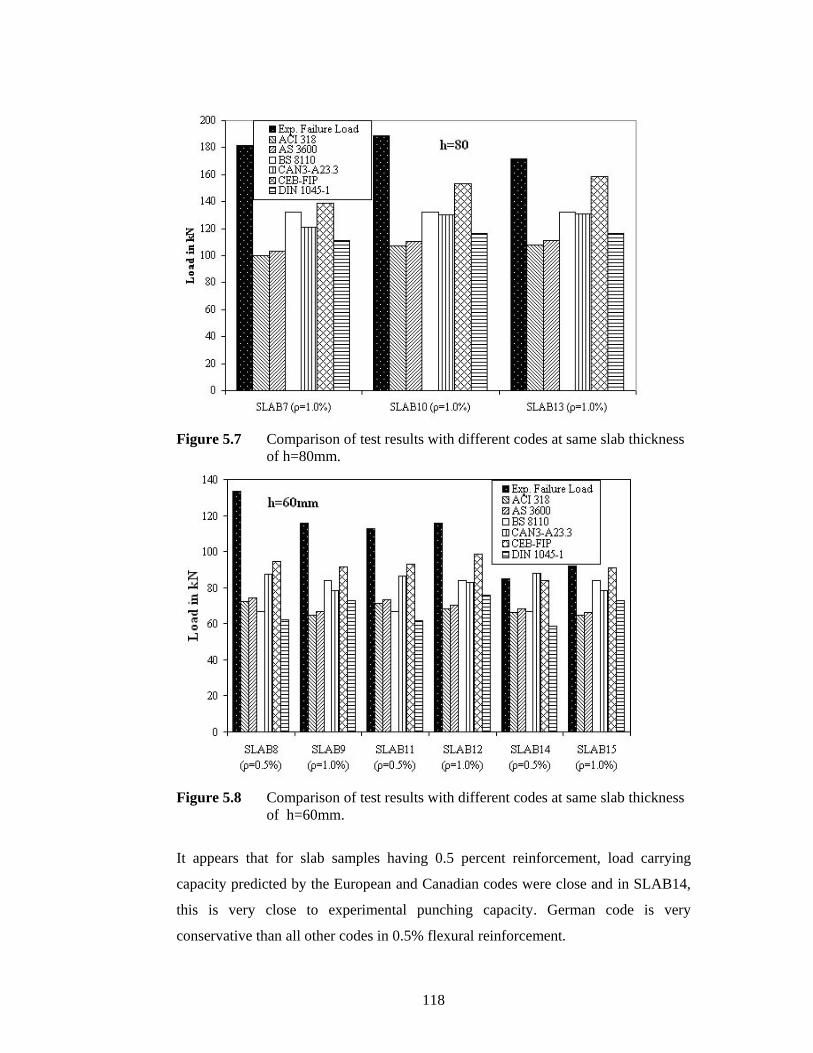
118
Figure 5.7 Comparison of test results with different codes at same slab thickness
of h=80mm.
Figure 5.8 Comparison of test results with different codes at same slab thickness
of h=60mm.
It appears that for slab samples having 0.5 percent reinforcement, load carrying
capacity predicted by the European and Canadian codes were close and in SLAB14,
this is very close to experimental punching capacity. German code is very
conservative than all other codes in 0.5% flexural reinforcement.
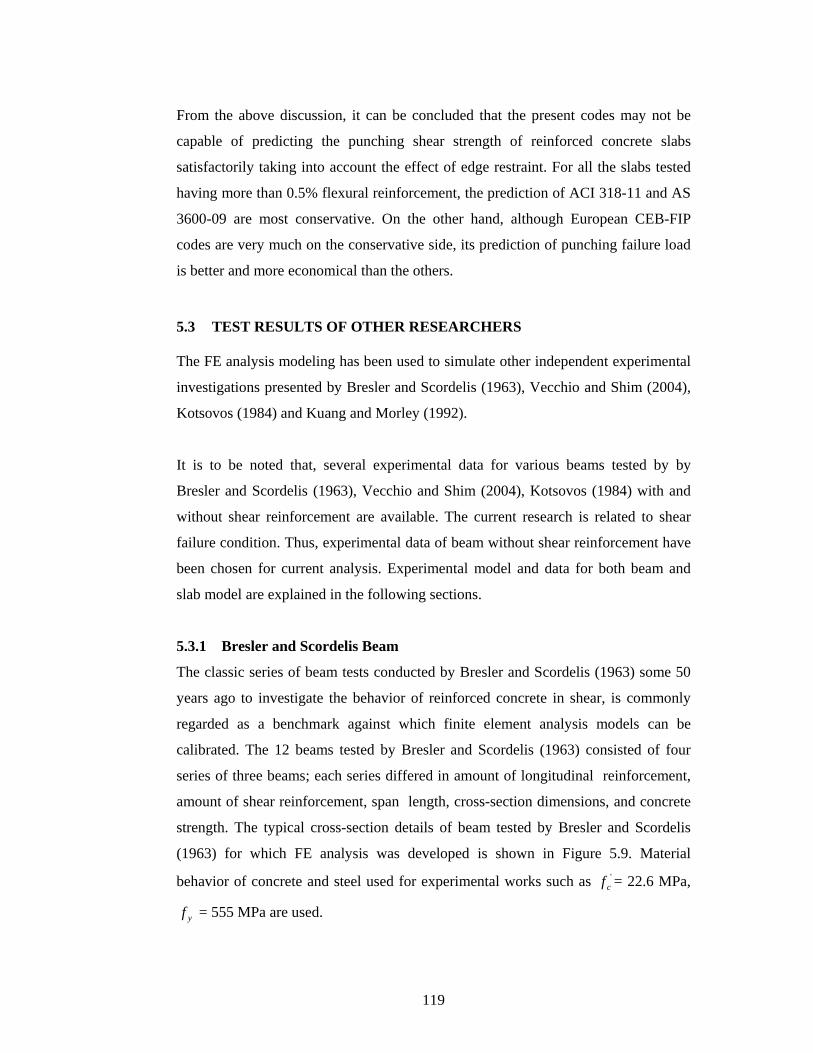
119
From the above discussion, it can be concluded that the present codes may not be
capable of predicting the punching shear strength of reinforced concrete slabs
satisfactorily taking into account the effect of edge restraint. For all the slabs tested
having more than 0.5% flexural reinforcement, the prediction of ACI 318-11 and AS
3600-09 are most conservative. On the other hand, although European CEB-FIP
codes are very much on the conservative side, its prediction of punching failure load
is better and more economical than the others.
5.3 TEST RESULTS OF OTHER RESEARCHERS
The FE analysis modeling has been used to simulate other independent experimental
investigations presented by Bresler and Scordelis (1963), Vecchio and Shim (2004),
Kotsovos (1984) and Kuang and Morley (1992).
It is to be noted that, several experimental data for various beams tested by by
Bresler and Scordelis (1963), Vecchio and Shim (2004), Kotsovos (1984) with and
without shear reinforcement are available. The current research is related to shear
failure condition. Thus, experimental data of beam without shear reinforcement have
been chosen for current analysis. Experimental model and data for both beam and
slab model are explained in the following sections.
5.3.1 Bresler and Scordelis Beam
The classic series of beam tests conducted by Bresler and Scordelis (1963) some 50
years ago to investigate the behavior of reinforced concrete in shear, is commonly
regarded as a benchmark against which finite element analysis models can be
calibrated. The 12 beams tested by Bresler and Scordelis (1963) consisted of four
series of three beams; each series differed in amount of longitudinal reinforcement,
amount of shear reinforcement, span length, cross-section dimensions, and concrete
strength. The typical cross-section details of beam tested by Bresler and Scordelis
(1963) for which FE analysis was developed is shown in Figure 5.9. Material
behavior of concrete and steel used for experimental works such as 'cf = 22.6 MPa,
yf = 555 MPa are used.
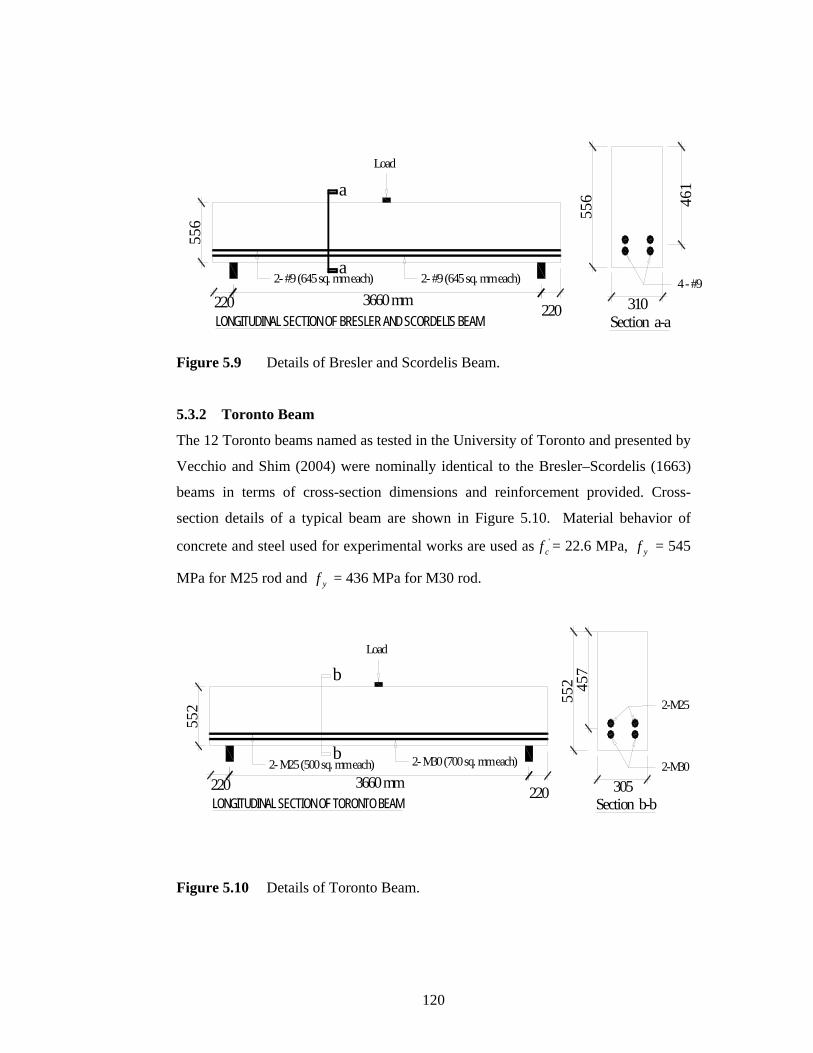
120
2- #9 (645 sq. mm each)
LONGITUDINAL SECTION OF BRESLER AND SCORDELIS BEAM
a
a
3660 mm 220220
556
2- #9 (645 sq. mm each)
556
Section a-a310
4 - #9
461
Load
Figure 5.9 Details of Bresler and Scordelis Beam.
5.3.2 Toronto Beam
The 12 Toronto beams named as tested in the University of Toronto and presented by
Vecchio and Shim (2004) were nominally identical to the Bresler–Scordelis (1663)
beams in terms of cross-section dimensions and reinforcement provided. Cross-
section details of a typical beam are shown in Figure 5.10. Material behavior of
concrete and steel used for experimental works are used as 'cf = 22.6 MPa, yf = 545
MPa for M25 rod and yf = 436 MPa for M30 rod.
2- M30 (700 sq. mm each)
LONGITUDINAL SECTION OF TORONTO BEAM
b
b3660 mm 220220
552
2- M25 (500 sq. mm each)
552
Section b-b305
2-M30
457
Load
2-M25
Figure 5.10 Details of Toronto Beam.
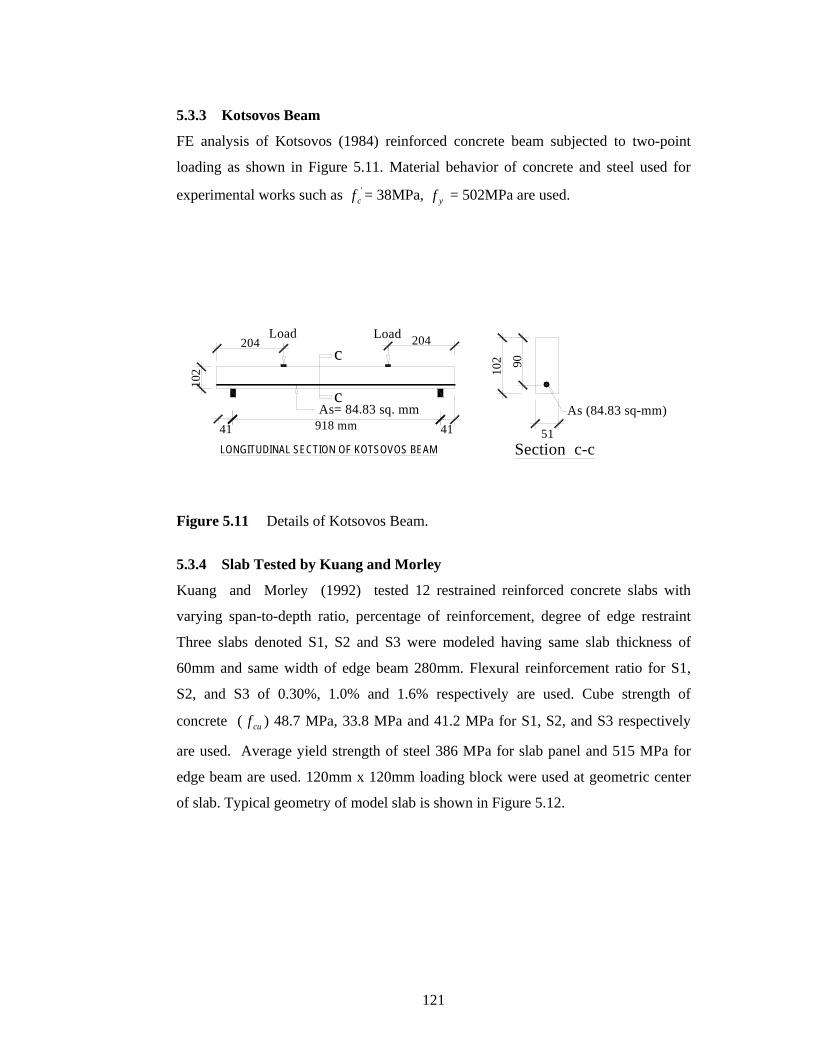
121
5.3.3 Kotsovos Beam
FE analysis of Kotsovos (1984) reinforced concrete beam subjected to two-point
loading as shown in Figure 5.11. Material behavior of concrete and steel used for
experimental works such as 'cf = 38MPa, yf = 502MPa are used.
As= 84.83 sq. mm
LONGITUDINAL SECTION OF KOTSOVOS BEAM
c
c918 mm 4141
102 10
2
Section c-c51
As (84.83 sq-mm)
90
Load Load204 204
Figure 5.11 Details of Kotsovos Beam.
5.3.4 Slab Tested by Kuang and Morley
Kuang and Morley (1992) tested 12 restrained reinforced concrete slabs with
varying span-to-depth ratio, percentage of reinforcement, degree of edge restraint
Three slabs denoted S1, S2 and S3 were modeled having same slab thickness of
60mm and same width of edge beam 280mm. Flexural reinforcement ratio for S1,
S2, and S3 of 0.30%, 1.0% and 1.6% respectively are used. Cube strength of
concrete ( cuf ) 48.7 MPa, 33.8 MPa and 41.2 MPa for S1, S2, and S3 respectively
are used. Average yield strength of steel 386 MPa for slab panel and 515 MPa for
edge beam are used. 120mm x 120mm loading block were used at geometric center
of slab. Typical geometry of model slab is shown in Figure 5.12.
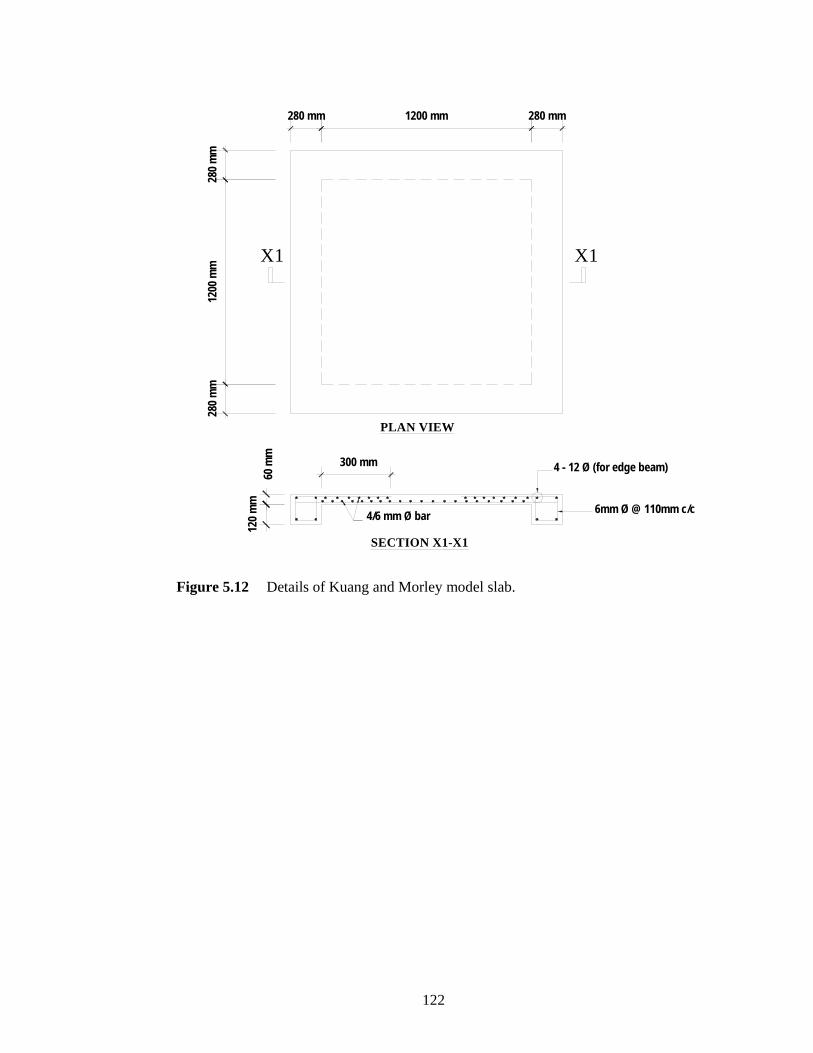
122
4 - 12 Ø (for edge beam)
4/6 mm Ø bar 6mm Ø @ 110mm c/c
120 m
mX1 X1
PLAN VIEW
SECTION X1-X1
280 m
m12
00 m
m
1200 mm280 mm
60 m
m
280 mm
280 m
m
300 mm
Figure 5.12 Details of Kuang and Morley model slab.
123
CHAPTER-6
NUMERICAL EXAMPLES AND VALIDATION
6.1 INTRODUCTION
A numerical simulation for experimental punching shear behaviors of reinforced
concrete slabs has been developed based on author’s previous experimental studies
(Alam 1997) in this chapter. The numerical simulations using for reinforced concrete
slabs were based on the total strain crack model approach (Vecchio and
Collins 1986, Selby and Vecchio 1993). This study involves the development of a
nonlinear strategy which implements solution for a realistic description of the
deflection and crack process related to punching shear of RC slabs for several type of
slab thickness, edge restraints and reinforcement ratio. The simulation would
investigate experimental behavior of structural concrete slabs under different
loadings and it is thought that the findings would form the basis of further numerical
investigation on the punching shear behavior of RC slabs.
The FE analysis modeling is simulated with test result of other researchers. In this
case also, very good agreement has been obtained between the FE analysis and the
experimental data. A parametric study has also conducted by using exactly similar
geometry and material properties of each slab except flexural reinforcement of all
model slabs also presented in this chapter.
6.2 MODELING OF TESTED SPECIMEN
The modeling of a concrete structure, which has to be analyzed, can be divided into
three major parts: (i) the modeling of the geometry of structure, selection of
appropriate element and proper finite element meshing. (ii) the modeling of the
physical behavior of the materials which are applied in the structure, for instance
concrete and reinforcing steel, (iii) the modeling of the structural effects which
influence the behavior of the structure, for instance large displacements.
The finite element software DIANA 8.1 developed by TNO DIANA BV (2003) was
used to develop finite element model of concrete slabs at the preliminary stage of this
124
thesis work. In this thesis, it was decided to focus on modeling both the load
deflection characteristics of the slabs and cracking. Stress-strain behavior of a typical
slab model, which was not included in the experiment, is also discussed. After
availability of DIANA 9.4 developed by TNO DIANA BV (2010), FE model is
slightly revised to obtain better results as discussed in Section 6.12 and this FE
model is used next analytical works.
6.3 ELEMENT SELECTION
The elements adopted were twenty-node isoparametric solid brick element (elements
CHX60). The element CHX60 is based on quadratic interpolation and Gauss
integration. The basic variables in the nodes of this element are the translations in the
local element directions. In this rectangular brick element approximates the strain εxx
and stress σxx vary linearly in x direction and quadratically in y and z direction over
the element volume. Distribution of strain εyy and εzz, stress σyy and σzz follow
similar approximation.
Gaussian integration scheme 3×3×3 was used which yields optimal stress points. The
Green-Lagrange strains are derived for all integration points and may be extrapolated
to the nodes. The most important feature of this element is that it can represent both
linear and nonlinear behavior of the concrete. For the linear stage, the concrete is
assumed to be an isotropic material up to cracking. For the nonlinear part, the
concrete may undergo plasticity and/or creep.
6.4 MATERIAL MODEL OF CONCRETE
The input for the total strain crack models comprises two parts: (1) the basic
properties like the Young's modulus, Poisson's ratio, tensile and compressive
strength, etc and (2) the definition of the behavior in tension, shear, and compression.
6.4.1 Compressive Behavior
The pre-defined curves are the ideal curve and the brittle curve, and the linear and
exponential softening curves based on the compressive fracture energy. Other
available hardening-softening curves in compression are the parabolic, parabolic-
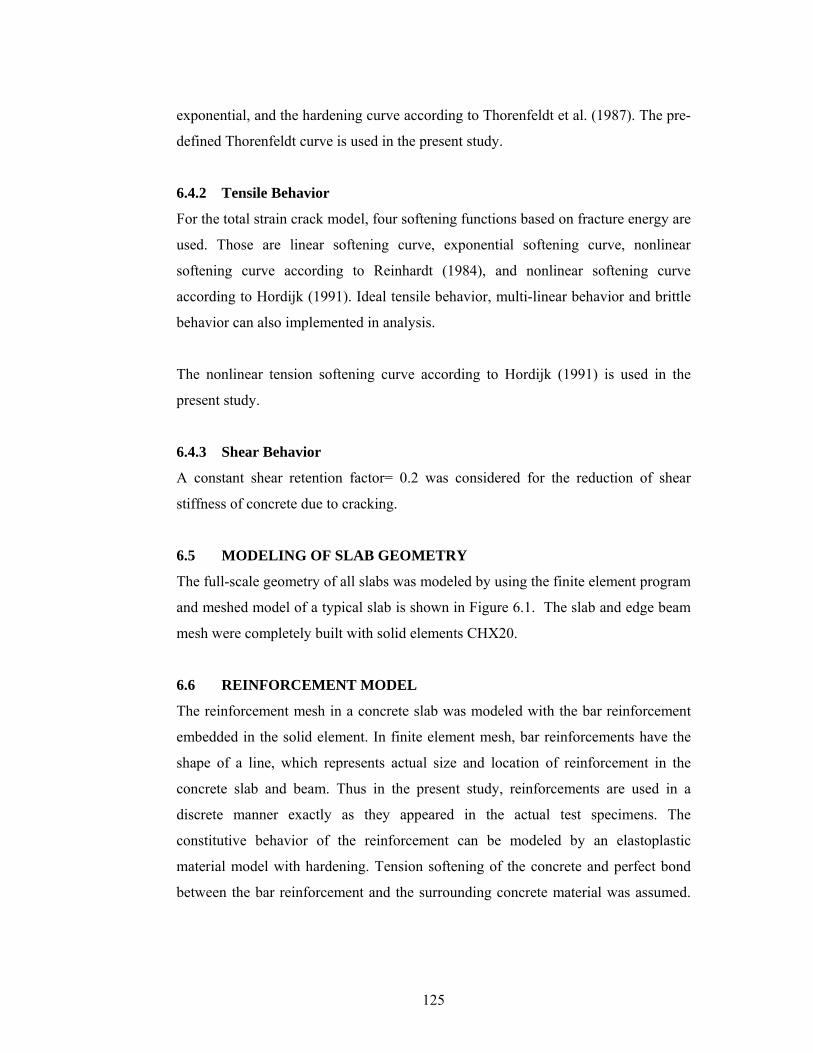
125
exponential, and the hardening curve according to Thorenfeldt et al. (1987). The pre-
defined Thorenfeldt curve is used in the present study.
6.4.2 Tensile Behavior
For the total strain crack model, four softening functions based on fracture energy are
used. Those are linear softening curve, exponential softening curve, nonlinear
softening curve according to Reinhardt (1984), and nonlinear softening curve
according to Hordijk (1991). Ideal tensile behavior, multi-linear behavior and brittle
behavior can also implemented in analysis.
The nonlinear tension softening curve according to Hordijk (1991) is used in the
present study.
6.4.3 Shear Behavior
A constant shear retention factor= 0.2 was considered for the reduction of shear
stiffness of concrete due to cracking.
6.5 MODELING OF SLAB GEOMETRY
The full-scale geometry of all slabs was modeled by using the finite element program
and meshed model of a typical slab is shown in Figure 6.1. The slab and edge beam
mesh were completely built with solid elements CHX20.
6.6 REINFORCEMENT MODEL
The reinforcement mesh in a concrete slab was modeled with the bar reinforcement
embedded in the solid element. In finite element mesh, bar reinforcements have the
shape of a line, which represents actual size and location of reinforcement in the
concrete slab and beam. Thus in the present study, reinforcements are used in a
discrete manner exactly as they appeared in the actual test specimens. The
constitutive behavior of the reinforcement can be modeled by an elastoplastic
material model with hardening. Tension softening of the concrete and perfect bond
between the bar reinforcement and the surrounding concrete material was assumed.
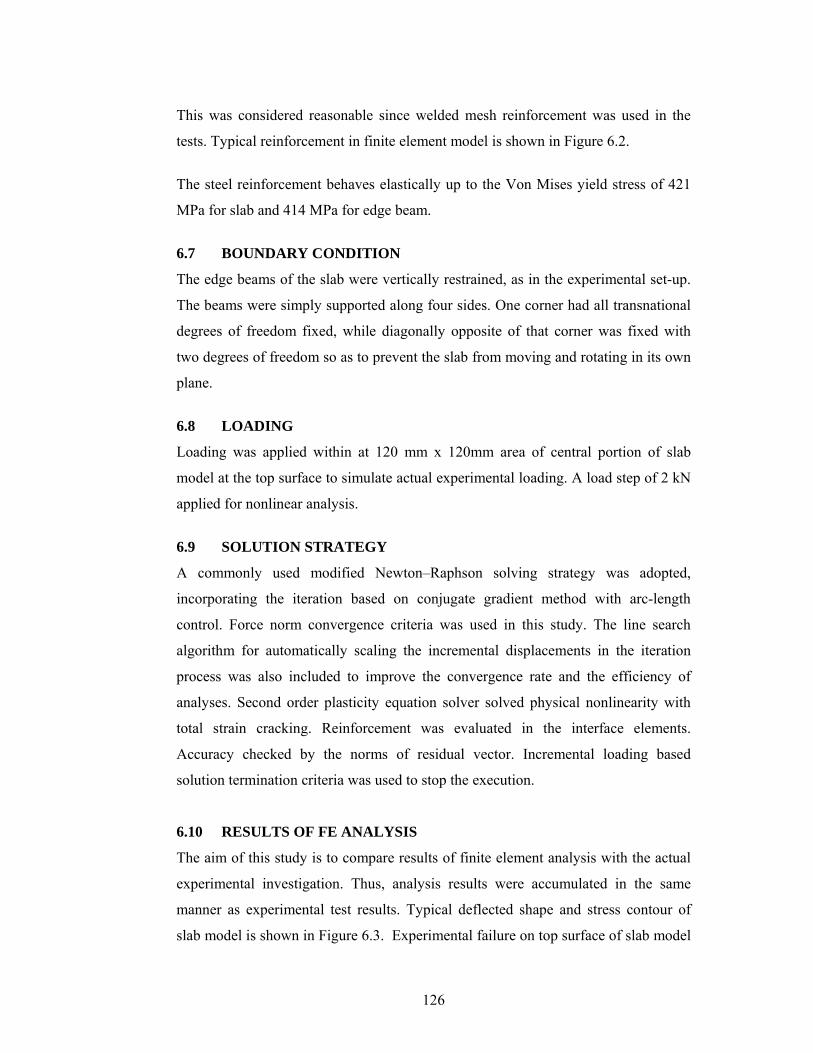
126
This was considered reasonable since welded mesh reinforcement was used in the
tests. Typical reinforcement in finite element model is shown in Figure 6.2.
The steel reinforcement behaves elastically up to the Von Mises yield stress of 421
MPa for slab and 414 MPa for edge beam.
6.7 BOUNDARY CONDITION
The edge beams of the slab were vertically restrained, as in the experimental set-up.
The beams were simply supported along four sides. One corner had all transnational
degrees of freedom fixed, while diagonally opposite of that corner was fixed with
two degrees of freedom so as to prevent the slab from moving and rotating in its own
plane.
6.8 LOADING
Loading was applied within at 120 mm x 120mm area of central portion of slab
model at the top surface to simulate actual experimental loading. A load step of 2 kN
applied for nonlinear analysis.
6.9 SOLUTION STRATEGY
A commonly used modified Newton–Raphson solving strategy was adopted,
incorporating the iteration based on conjugate gradient method with arc-length
control. Force norm convergence criteria was used in this study. The line search
algorithm for automatically scaling the incremental displacements in the iteration
process was also included to improve the convergence rate and the efficiency of
analyses. Second order plasticity equation solver solved physical nonlinearity with
total strain cracking. Reinforcement was evaluated in the interface elements.
Accuracy checked by the norms of residual vector. Incremental loading based
solution termination criteria was used to stop the execution.
6.10 RESULTS OF FE ANALYSIS
The aim of this study is to compare results of finite element analysis with the actual
experimental investigation. Thus, analysis results were accumulated in the same
manner as experimental test results. Typical deflected shape and stress contour of
slab model is shown in Figure 6.3. Experimental failure on top surface of slab model
127
was very localized which is represented analytically by stress contour on top surface
as shown in Figure 6.3 (a).
( a )
( b )
Figure 6.1 Meshed model of a typical slab showing ( a ) top surface, ( b ) bottom surface (Alam and Amanat 2012a).
128
Figure 6.2 Embedded reinforcement in a typical slab model (Alam and Amanat
2012a). Compressive stress developed on top surface and tensile stress developed on bottom
surface at the central region of slab as shown in Figure 6.3. Maximum compressive
stresses produced on top surface, which are concentrated around and within loading
block. But higher value of tensile stress developed outside of the loading block as
shown in Figure 6.3(b) and indicative to failure surface at that portion. This
analytical stress concentration at bottom surface as shown in Figures 6.3 is analogous
to experimental failure surface as well as cracking pattern of slabs.
Stress-strain curve of concrete is shown in Figure 6.4 and 6.5. In Figure 6.4, related
stress and strain are calculated at the integration point positioned on the top face of
slab. In Figure 6.4, element ET1 is located at the central top surface of slab model,
where as element ET2 and ET3 are 90mm and 150mm apart from slab center
respectively (Figure 6.1a). Concrete failed by compression at central region on top
surfaces earlier than apart from center as shown in Figure 6.4. In Figure 6.5, related
stress and strain are calculated at the integration point positioned on the bottom face
of slab. In this figure, element EB1 is located at the central bottom surface of slab
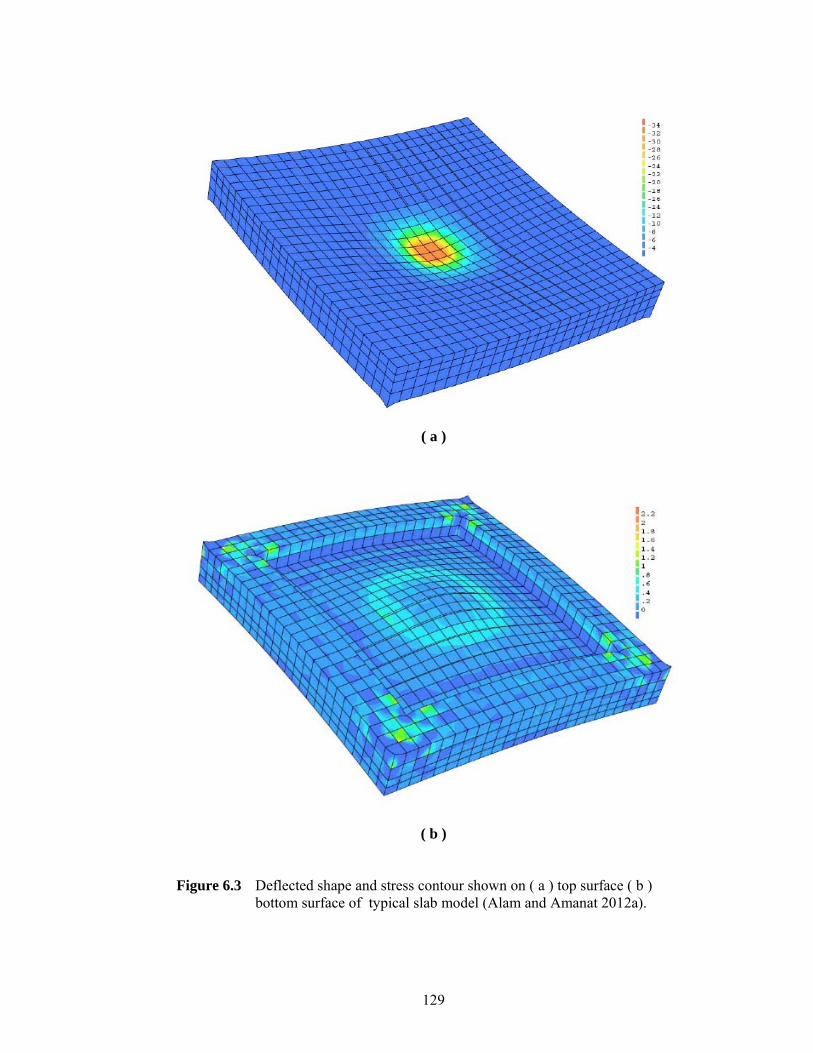
129
( a )
( b )
Figure 6.3 Deflected shape and stress contour shown on ( a ) top surface ( b ) bottom surface of typical slab model (Alam and Amanat 2012a).
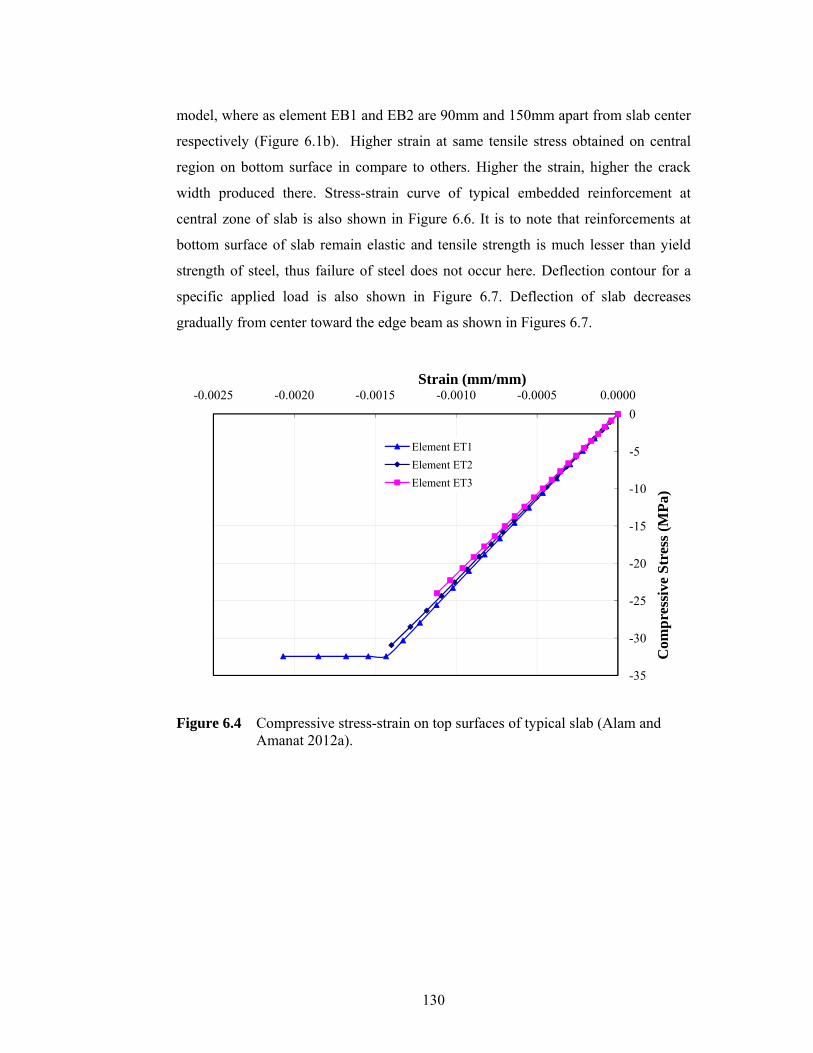
130
model, where as element EB1 and EB2 are 90mm and 150mm apart from slab center
respectively (Figure 6.1b). Higher strain at same tensile stress obtained on central
region on bottom surface in compare to others. Higher the strain, higher the crack
width produced there. Stress-strain curve of typical embedded reinforcement at
central zone of slab is also shown in Figure 6.6. It is to note that reinforcements at
bottom surface of slab remain elastic and tensile strength is much lesser than yield
strength of steel, thus failure of steel does not occur here. Deflection contour for a
specific applied load is also shown in Figure 6.7. Deflection of slab decreases
gradually from center toward the edge beam as shown in Figures 6.7.
Figure 6.4 Compressive stress-strain on top surfaces of typical slab (Alam and
Amanat 2012a).
-35
-30
-25
-20
-15
-10
-5
0-0.0025 -0.0020 -0.0015 -0.0010 -0.0005 0.0000
Com
pres
sive
Str
ess (
MPa
)
Strain (mm/mm)
Element ET1Element ET2Element ET3
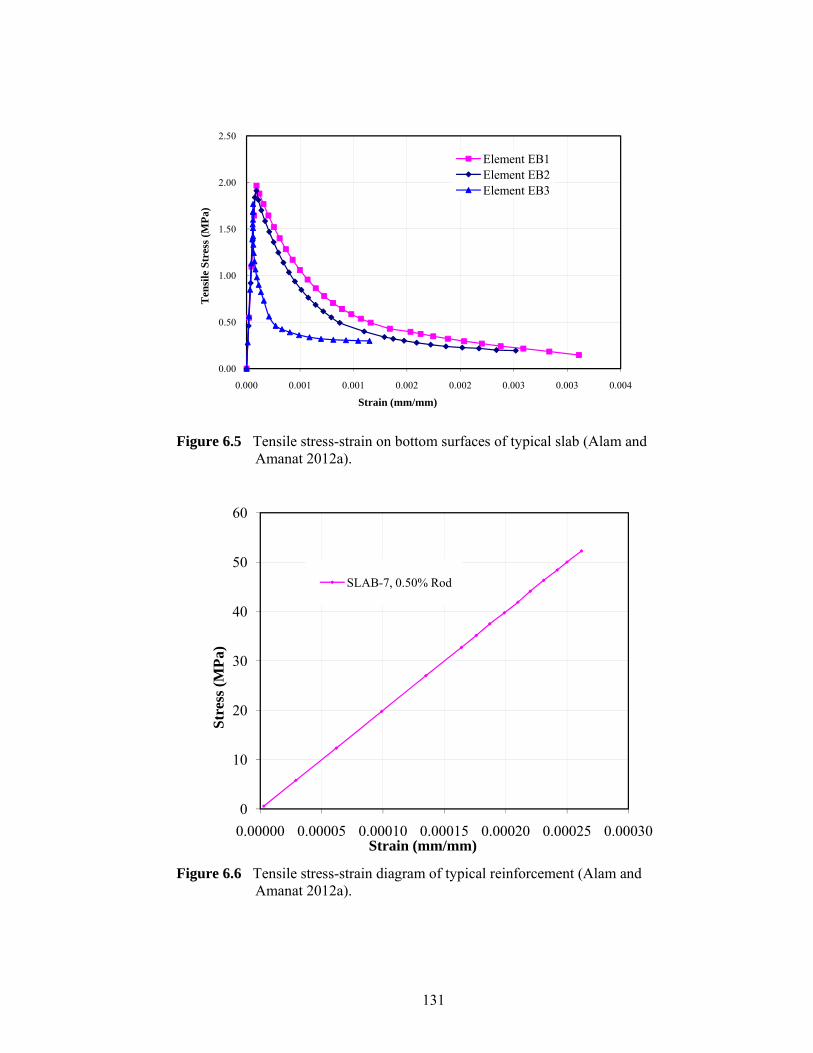
131
Figure 6.5 Tensile stress-strain on bottom surfaces of typical slab (Alam and
Amanat 2012a).
Figure 6.6 Tensile stress-strain diagram of typical reinforcement (Alam and
Amanat 2012a).
0.00
0.50
1.00
1.50
2.00
2.50
0.000 0.001 0.001 0.002 0.002 0.003 0.003 0.004
Ten
sile
Str
ess (
MPa
)
Strain (mm/mm)
Element EB1Element EB2Element EB3
0
10
20
30
40
50
60
0.00000 0.00005 0.00010 0.00015 0.00020 0.00025 0.00030
Stre
ss (M
Pa)
Strain (mm/mm)
SLAB-7, 0.50% Rod
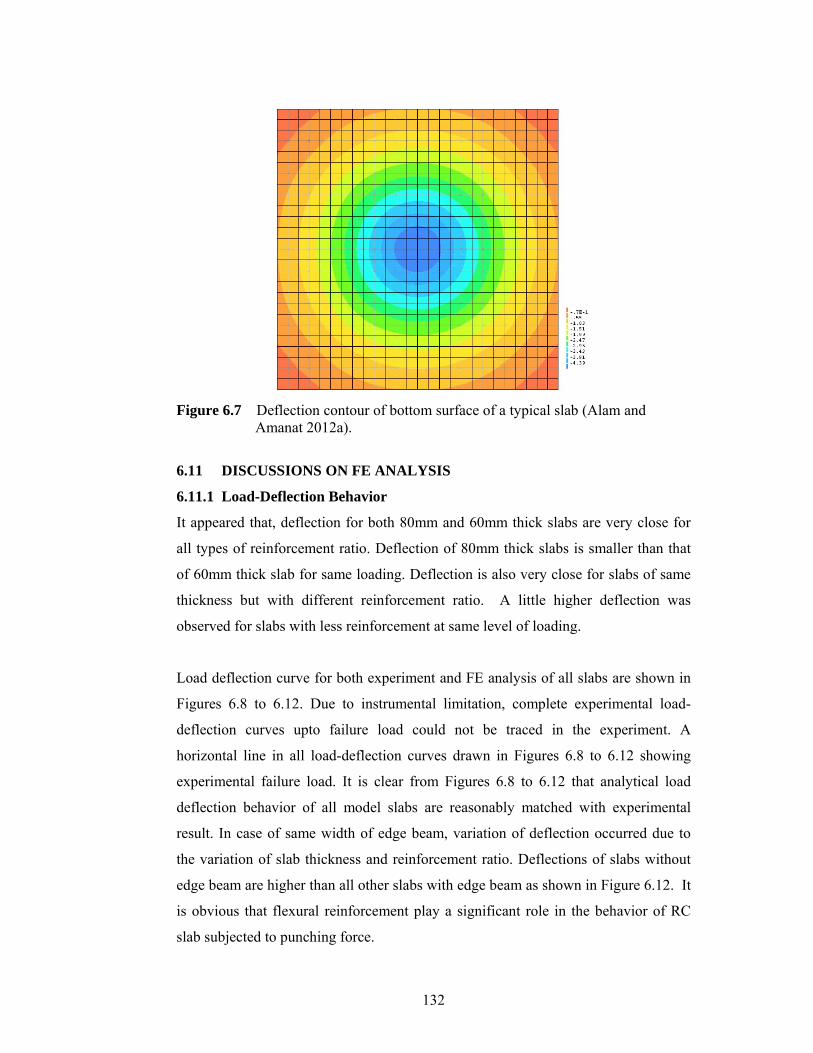
132
Figure 6.7 Deflection contour of bottom surface of a typical slab (Alam and
Amanat 2012a).
6.11 DISCUSSIONS ON FE ANALYSIS
6.11.1 Load-Deflection Behavior
It appeared that, deflection for both 80mm and 60mm thick slabs are very close for
all types of reinforcement ratio. Deflection of 80mm thick slabs is smaller than that
of 60mm thick slab for same loading. Deflection is also very close for slabs of same
thickness but with different reinforcement ratio. A little higher deflection was
observed for slabs with less reinforcement at same level of loading.
Load deflection curve for both experiment and FE analysis of all slabs are shown in
Figures 6.8 to 6.12. Due to instrumental limitation, complete experimental load-
deflection curves upto failure load could not be traced in the experiment. A
horizontal line in all load-deflection curves drawn in Figures 6.8 to 6.12 showing
experimental failure load. It is clear from Figures 6.8 to 6.12 that analytical load
deflection behavior of all model slabs are reasonably matched with experimental
result. In case of same width of edge beam, variation of deflection occurred due to
the variation of slab thickness and reinforcement ratio. Deflections of slabs without
edge beam are higher than all other slabs with edge beam as shown in Figure 6.12. It
is obvious that flexural reinforcement play a significant role in the behavior of RC
slab subjected to punching force.
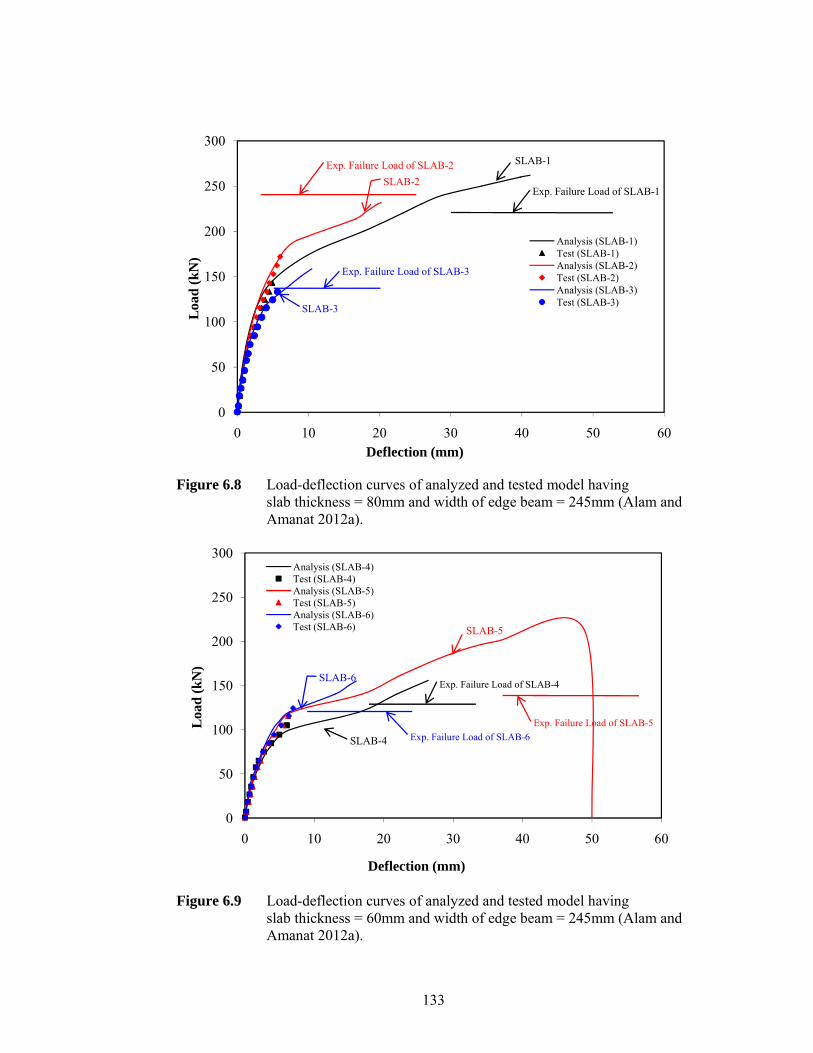
133
Figure 6.8 Load-deflection curves of analyzed and tested model having slab thickness = 80mm and width of edge beam = 245mm (Alam and Amanat 2012a).
Figure 6.9 Load-deflection curves of analyzed and tested model having
slab thickness = 60mm and width of edge beam = 245mm (Alam and Amanat 2012a).
0
50
100
150
200
250
300
0 10 20 30 40 50 60
Loa
d (k
N)
Deflection (mm)
Analysis (SLAB-1)Test (SLAB-1)Analysis (SLAB-2)Test (SLAB-2)Analysis (SLAB-3)Test (SLAB-3)
SLAB-1
SLAB-2
SLAB-3
Exp. Failure Load of SLAB-1
Exp. Failure Load of SLAB-2
Exp. Failure Load of SLAB-3
0
50
100
150
200
250
300
0 10 20 30 40 50 60
Loa
d (k
N)
Deflection (mm)
Analysis (SLAB-4)Test (SLAB-4)Analysis (SLAB-5)Test (SLAB-5)Analysis (SLAB-6)Test (SLAB-6) SLAB-5
SLAB-6
SLAB-4
Exp. Failure Load of SLAB-4
Exp. Failure Load of SLAB-5Exp. Failure Load of SLAB-6
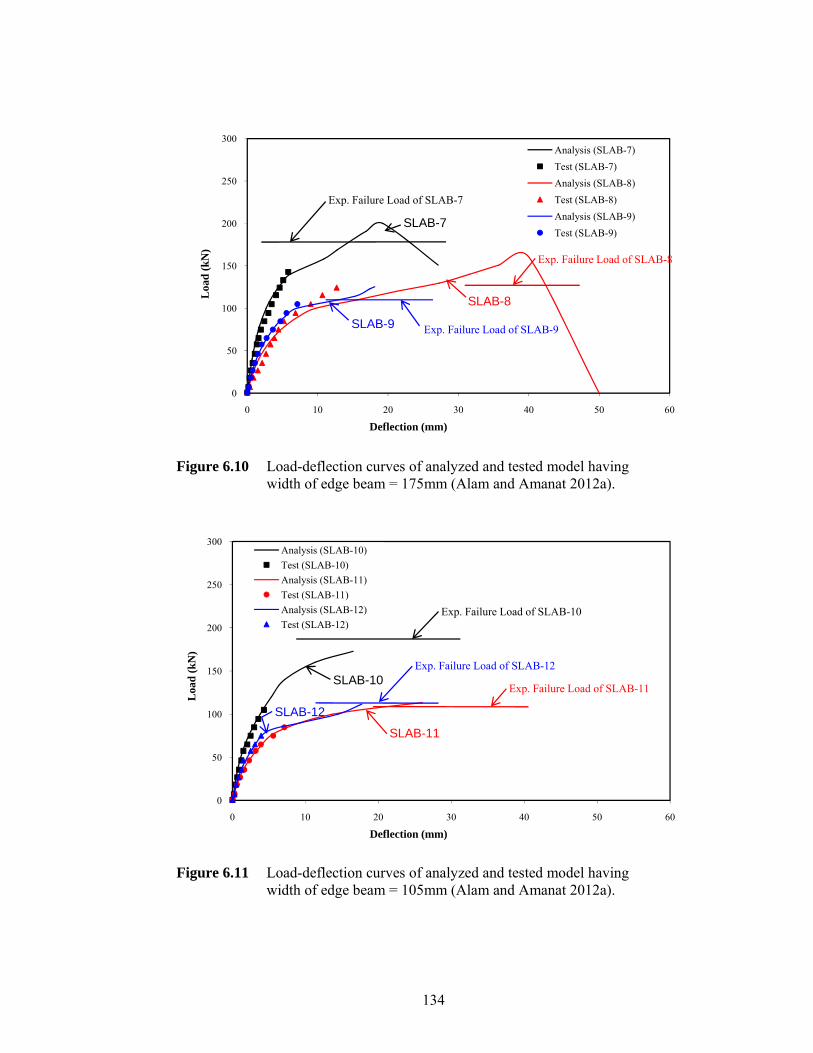
134
Figure 6.10 Load-deflection curves of analyzed and tested model having
width of edge beam = 175mm (Alam and Amanat 2012a).
Figure 6.11 Load-deflection curves of analyzed and tested model having
width of edge beam = 105mm (Alam and Amanat 2012a).
0
50
100
150
200
250
300
0 10 20 30 40 50 60
Loa
d (k
N)
Deflection (mm)
Analysis (SLAB-7)Test (SLAB-7)Analysis (SLAB-8)Test (SLAB-8)Analysis (SLAB-9)Test (SLAB-9)
SLAB-7
SLAB-8
SLAB-9
Exp. Failure Load of SLAB-8
Exp. Failure Load of SLAB-7
Exp. Failure Load of SLAB-9
0
50
100
150
200
250
300
0 10 20 30 40 50 60
Loa
d (k
N)
Deflection (mm)
Analysis (SLAB-10)Test (SLAB-10)Analysis (SLAB-11)Test (SLAB-11)Analysis (SLAB-12)Test (SLAB-12)
SLAB-10
SLAB-11
SLAB-12
Exp. Failure Load of SLAB-11
Exp. Failure Load of SLAB-10
Exp. Failure Load of SLAB-12
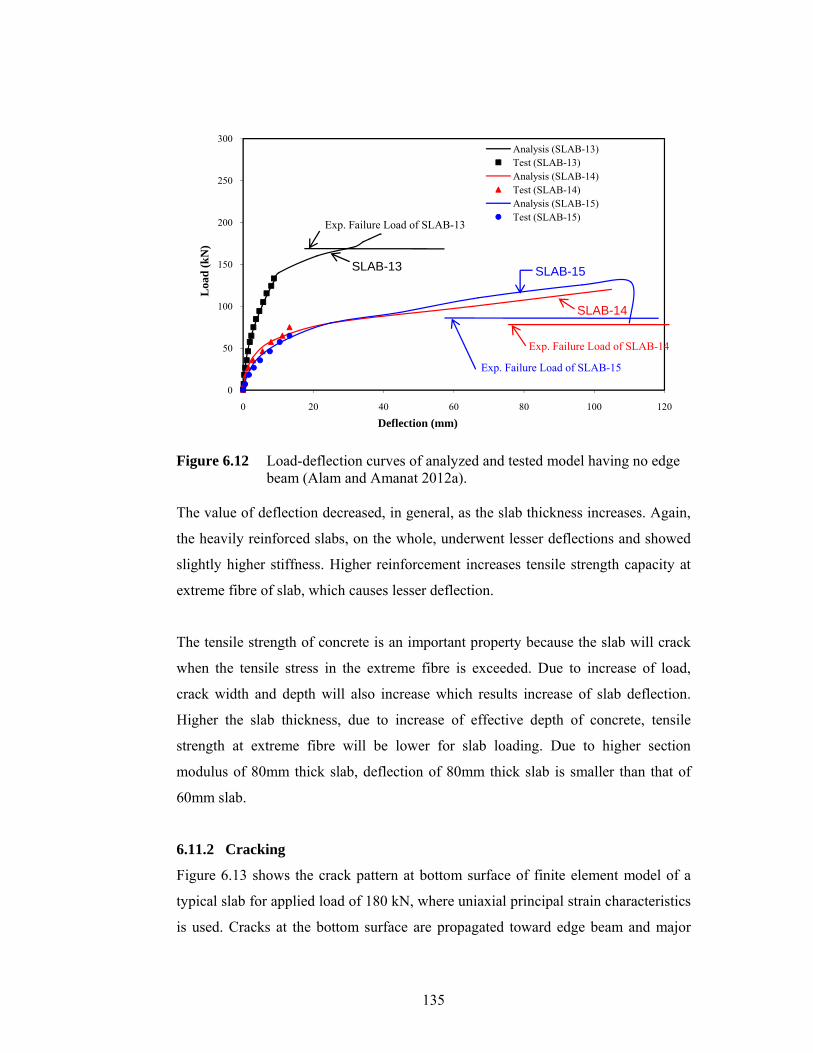
135
Figure 6.12 Load-deflection curves of analyzed and tested model having no edge
beam (Alam and Amanat 2012a). The value of deflection decreased, in general, as the slab thickness increases. Again,
the heavily reinforced slabs, on the whole, underwent lesser deflections and showed
slightly higher stiffness. Higher reinforcement increases tensile strength capacity at
extreme fibre of slab, which causes lesser deflection.
The tensile strength of concrete is an important property because the slab will crack
when the tensile stress in the extreme fibre is exceeded. Due to increase of load,
crack width and depth will also increase which results increase of slab deflection.
Higher the slab thickness, due to increase of effective depth of concrete, tensile
strength at extreme fibre will be lower for slab loading. Due to higher section
modulus of 80mm thick slab, deflection of 80mm thick slab is smaller than that of
60mm slab.
6.11.2 Cracking
Figure 6.13 shows the crack pattern at bottom surface of finite element model of a
typical slab for applied load of 180 kN, where uniaxial principal strain characteristics
is used. Cracks at the bottom surface are propagated toward edge beam and major
0
50
100
150
200
250
300
0 20 40 60 80 100 120
Loa
d (k
N)
Deflection (mm)
Analysis (SLAB-13)Test (SLAB-13)Analysis (SLAB-14)Test (SLAB-14)Analysis (SLAB-15)Test (SLAB-15)
SLAB-13
SLAB-14
SLAB-15
Exp. Failure Load of SLAB-13
Exp. Failure Load of SLAB-14
Exp. Failure Load of SLAB-15
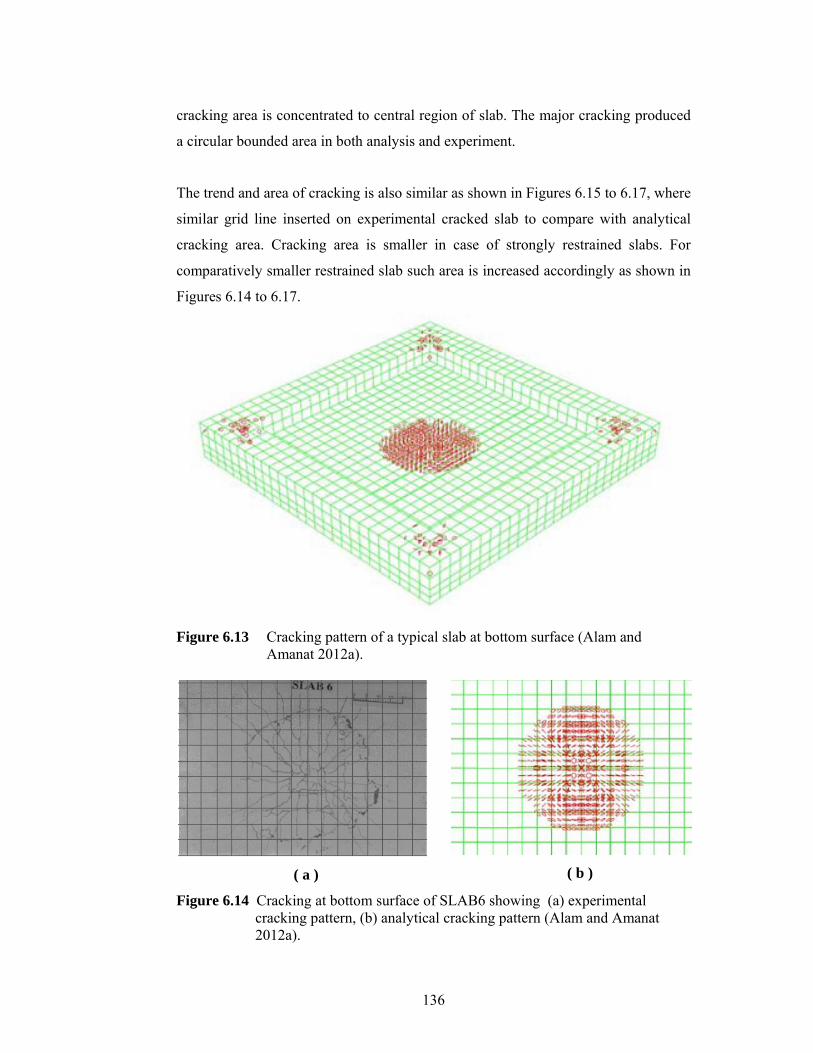
136
cracking area is concentrated to central region of slab. The major cracking produced
a circular bounded area in both analysis and experiment.
The trend and area of cracking is also similar as shown in Figures 6.15 to 6.17, where
similar grid line inserted on experimental cracked slab to compare with analytical
cracking area. Cracking area is smaller in case of strongly restrained slabs. For
comparatively smaller restrained slab such area is increased accordingly as shown in
Figures 6.14 to 6.17.
Figure 6.13 Cracking pattern of a typical slab at bottom surface (Alam and
Amanat 2012a).
( a )
( b )
Figure 6.14 Cracking at bottom surface of SLAB6 showing (a) experimental cracking pattern, (b) analytical cracking pattern (Alam and Amanat 2012a).
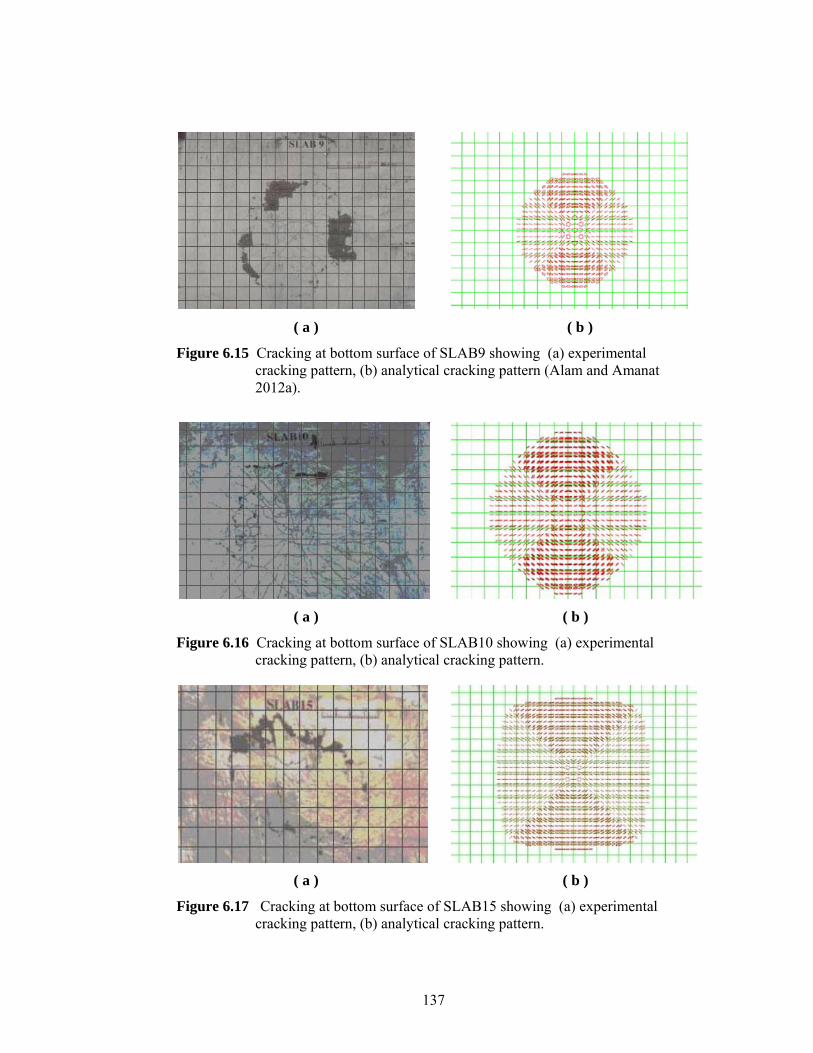
137
( a )
( b )
Figure 6.15 Cracking at bottom surface of SLAB9 showing (a) experimental cracking pattern, (b) analytical cracking pattern (Alam and Amanat 2012a).
( a )
( b )
Figure 6.16 Cracking at bottom surface of SLAB10 showing (a) experimental cracking pattern, (b) analytical cracking pattern.
( a )
( b )
Figure 6.17 Cracking at bottom surface of SLAB15 showing (a) experimental cracking pattern, (b) analytical cracking pattern.
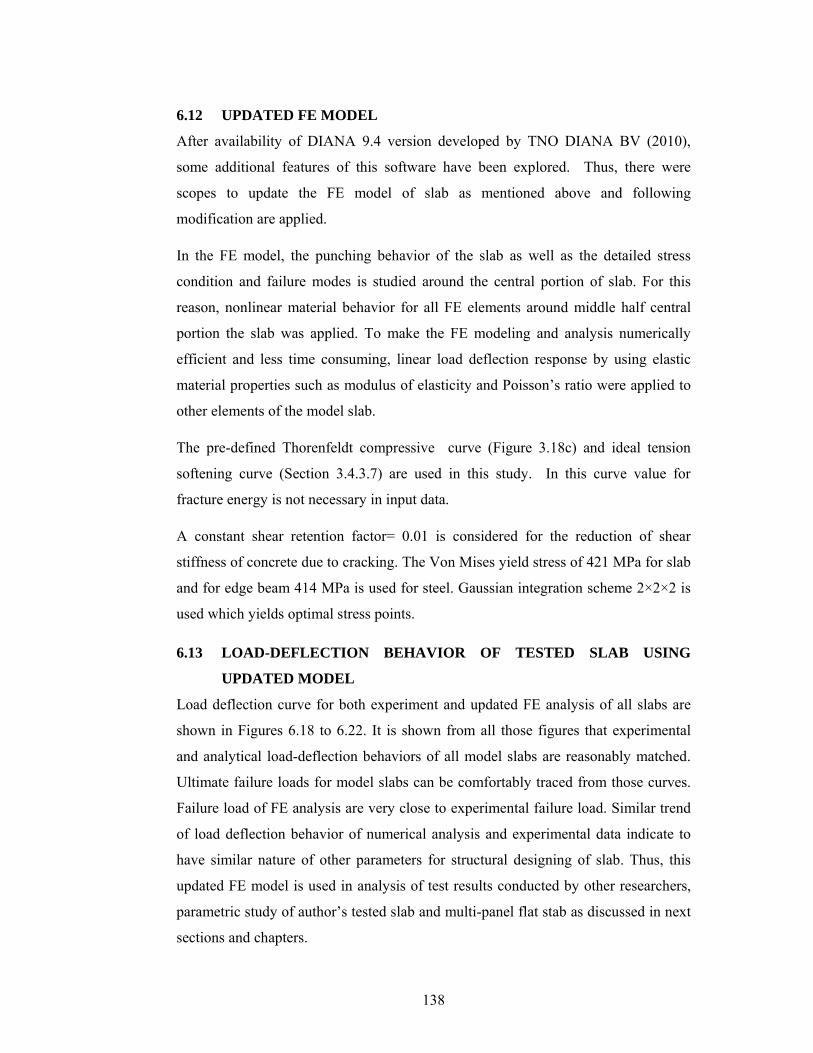
138
6.12 UPDATED FE MODEL
After availability of DIANA 9.4 version developed by TNO DIANA BV (2010),
some additional features of this software have been explored. Thus, there were
scopes to update the FE model of slab as mentioned above and following
modification are applied.
In the FE model, the punching behavior of the slab as well as the detailed stress
condition and failure modes is studied around the central portion of slab. For this
reason, nonlinear material behavior for all FE elements around middle half central
portion the slab was applied. To make the FE modeling and analysis numerically
efficient and less time consuming, linear load deflection response by using elastic
material properties such as modulus of elasticity and Poisson’s ratio were applied to
other elements of the model slab.
The pre-defined Thorenfeldt compressive curve (Figure 3.18c) and ideal tension
softening curve (Section 3.4.3.7) are used in this study. In this curve value for
fracture energy is not necessary in input data.
A constant shear retention factor= 0.01 is considered for the reduction of shear
stiffness of concrete due to cracking. The Von Mises yield stress of 421 MPa for slab
and for edge beam 414 MPa is used for steel. Gaussian integration scheme 2×2×2 is
used which yields optimal stress points.
6.13 LOAD-DEFLECTION BEHAVIOR OF TESTED SLAB USING
UPDATED MODEL
Load deflection curve for both experiment and updated FE analysis of all slabs are
shown in Figures 6.18 to 6.22. It is shown from all those figures that experimental
and analytical load-deflection behaviors of all model slabs are reasonably matched.
Ultimate failure loads for model slabs can be comfortably traced from those curves.
Failure load of FE analysis are very close to experimental failure load. Similar trend
of load deflection behavior of numerical analysis and experimental data indicate to
have similar nature of other parameters for structural designing of slab. Thus, this
updated FE model is used in analysis of test results conducted by other researchers,
parametric study of author’s tested slab and multi-panel flat stab as discussed in next
sections and chapters.
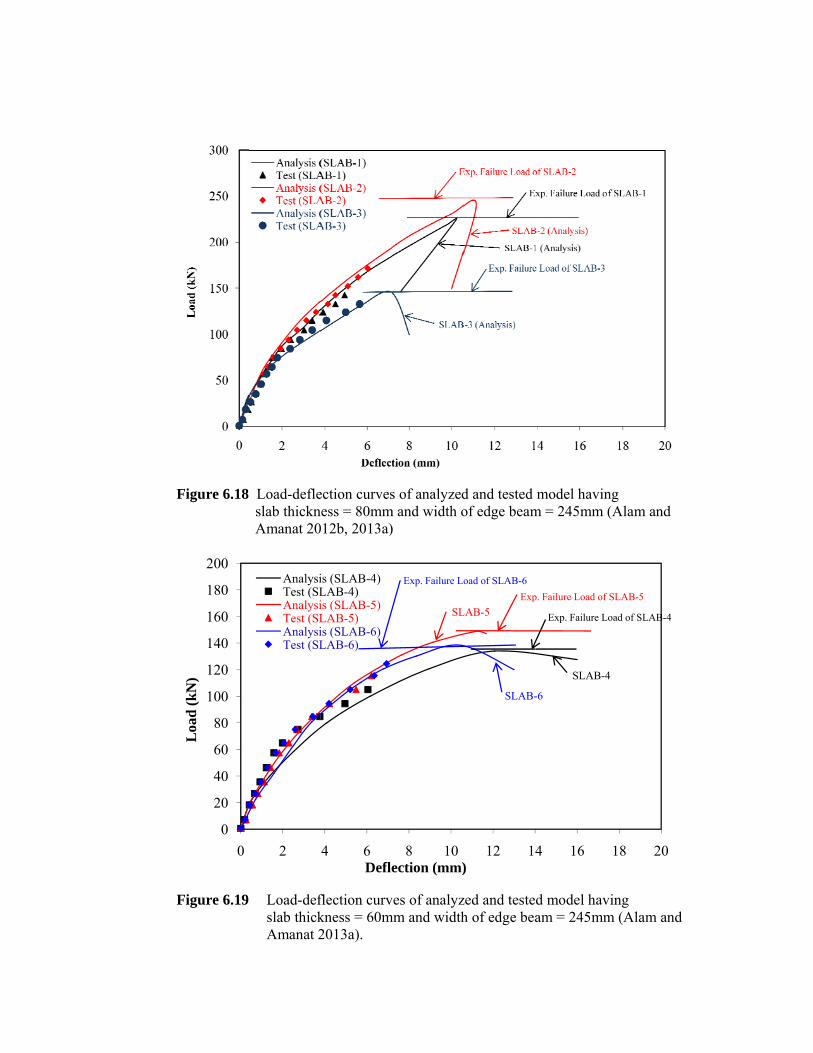
F
F
Figure 6.18
Figure 6.19
0
20
40
60
80
100
120
140
160
180
200
0
Loa
d (k
N)
Load-defleslab thicknAmanat 20
Load-defslab thickAmanat 2
2
AnalysiTest (SLAnalysiTest (SLAnalysiTest (SL
ection curvesess = 80mm
012b, 2013a)
flection curvkness = 60m2013a).
4 6Defle
is (SLAB-4)LAB-4)is (SLAB-5)LAB-5)is (SLAB-6)LAB-6)
s of analyzedm and width o)
ves of analyzmm and width
8 10ection (mm)
SL
Exp. Failure Lo
d and tested of edge beam
zed and testeh of edge bea
12 14)
LAB-5
SLAB-
Expoad of SLAB-6
model havinm = 245mm
d model havam = 245mm
4 16
-6
SLAB-4
Exp. Failure L
p. Failure Load of
ng (Alam and
ving m (Alam and
18 20
4
Load of SLAB-4
f SLAB-5
d
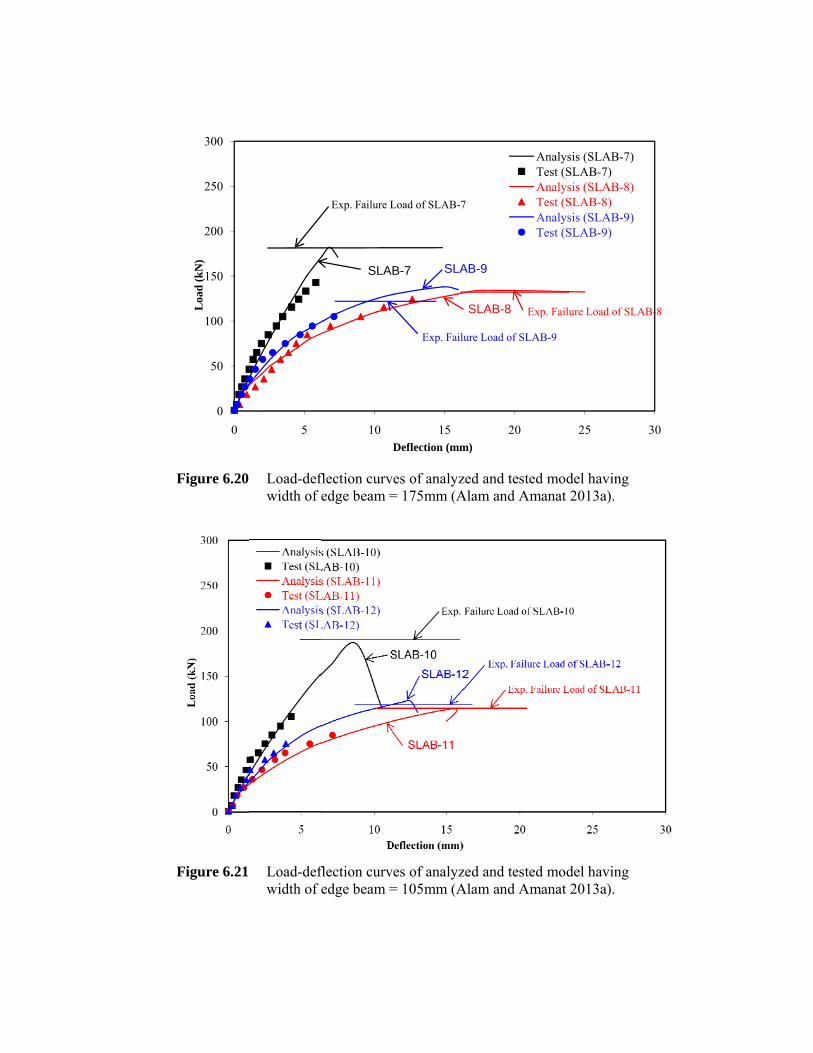
F
F
Figure 6.20
Figure 6.21
0
50
100
150
200
250
300
0
Loa
d (k
N)
Load-defwidth of
Load-defwidth of
5
flection curvedge beam =
flection curvedge beam =
10
SLA
Exp. Failure L
ves of analyz= 175mm (A
ves of analyz= 105mm (A
15Deflection (mm
B-7 SLA
Load of SLAB-7
Exp. Failu
zed and testeAlam and Am
zed and testeAlam and Am
20m)
SLAB-8
AB-9
Ex
7
ure Load of SLA
d model havmanat 2013a)
d model havmanat 2013a)
25
Analysis (SLATest (SLAB-7Analysis (SLATest (SLAB-8Analysis (SLATest (SLAB-9
xp. Failure Load
AB-9
ving ).
ving ).
30
AB-7)7)AB-8))
AB-9)9)
d of SLAB-8
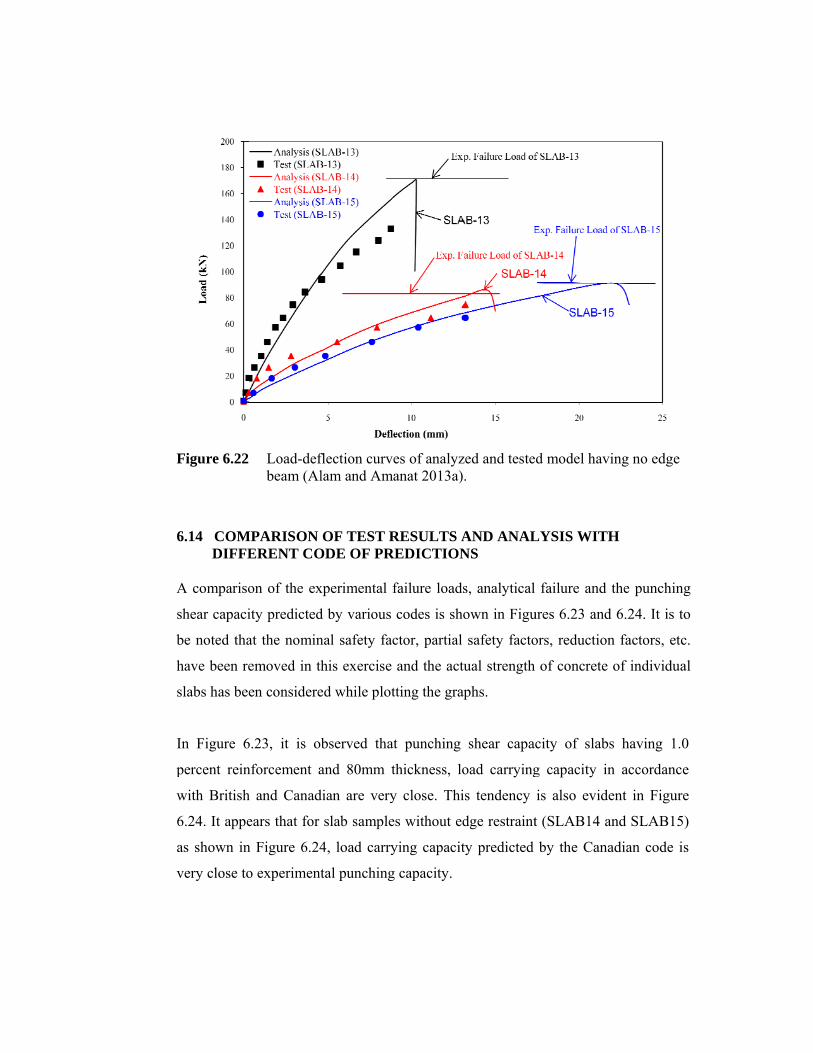
F
6
A
s
b
h
s
I
p
w
6
a
v
Figure 6.22
6.14 COMDIFFE
A compariso
shear capaci
be noted tha
have been re
slabs has bee
In Figure 6
percent rein
with British
6.24. It appe
as shown in
very close to
Load-defbeam (Al
MPARISON ERENT CO
on of the ex
ity predicted
at the nomin
emoved in th
en considere
6.23, it is o
nforcement a
h and Canad
ears that for
n Figure 6.24
o experiment
flection curvlam and Am
OF TEST RODE OF PR
xperimental
d by various
nal safety fa
his exercise
ed while plot
bserved tha
and 80mm t
dian are very
slab sample
4, load carry
tal punching
ves of analyzmanat 2013a)
RESULTS AREDICTION
failure loads
codes is sho
ctor, partial
and the actu
tting the grap
at punching
thickness, lo
y close. Thi
es without ed
ying capacit
g capacity.
zed and teste.
AND ANALNS
s, analytical
own in Figu
safety facto
ual strength
phs.
shear capac
oad carrying
is tendency
dge restraint
ty predicted
d model hav
LYSIS WIT
failure and
ures 6.23 and
ors, reductio
of concrete
city of slab
g capacity i
is also evid
t (SLAB14 a
by the Can
ving no edge
TH
the punchin
d 6.24. It is
n factors, et
e of individu
bs having 1
in accordanc
dent in Figur
and SLAB15
nadian code
e
ng
to
tc.
ual
.0
ce
re
5)
is
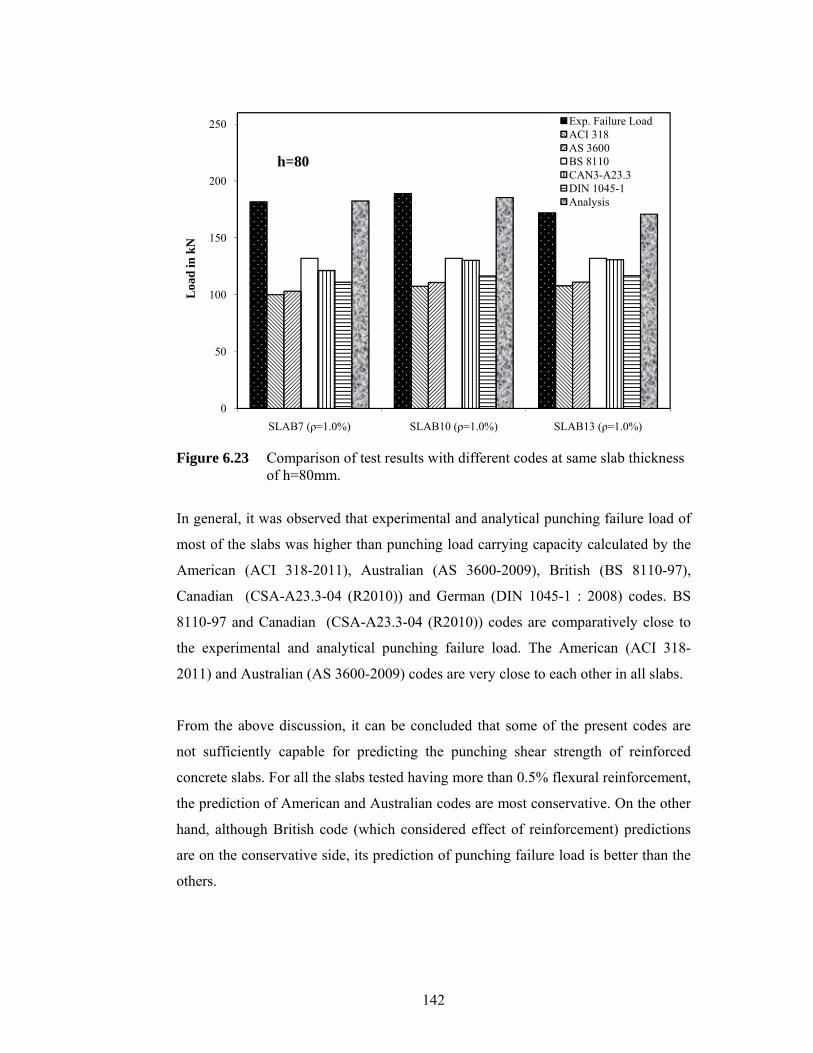
142
Figure 6.23 Comparison of test results with different codes at same slab thickness
of h=80mm.
In general, it was observed that experimental and analytical punching failure load of
most of the slabs was higher than punching load carrying capacity calculated by the
American (ACI 318-2011), Australian (AS 3600-2009), British (BS 8110-97),
Canadian (CSA-A23.3-04 (R2010)) and German (DIN 1045-1 : 2008) codes. BS
8110-97 and Canadian (CSA-A23.3-04 (R2010)) codes are comparatively close to
the experimental and analytical punching failure load. The American (ACI 318-
2011) and Australian (AS 3600-2009) codes are very close to each other in all slabs.
From the above discussion, it can be concluded that some of the present codes are
not sufficiently capable for predicting the punching shear strength of reinforced
concrete slabs. For all the slabs tested having more than 0.5% flexural reinforcement,
the prediction of American and Australian codes are most conservative. On the other
hand, although British code (which considered effect of reinforcement) predictions
are on the conservative side, its prediction of punching failure load is better than the
others.
0
50
100
150
200
250
SLAB7 (ρ=1.0%) SLAB10 (ρ=1.0%) SLAB13 (ρ=1.0%)
Loa
d in
kN
h=80
Exp. Failure LoadACI 318AS 3600BS 8110CAN3-A23.3DIN 1045-1Analysis
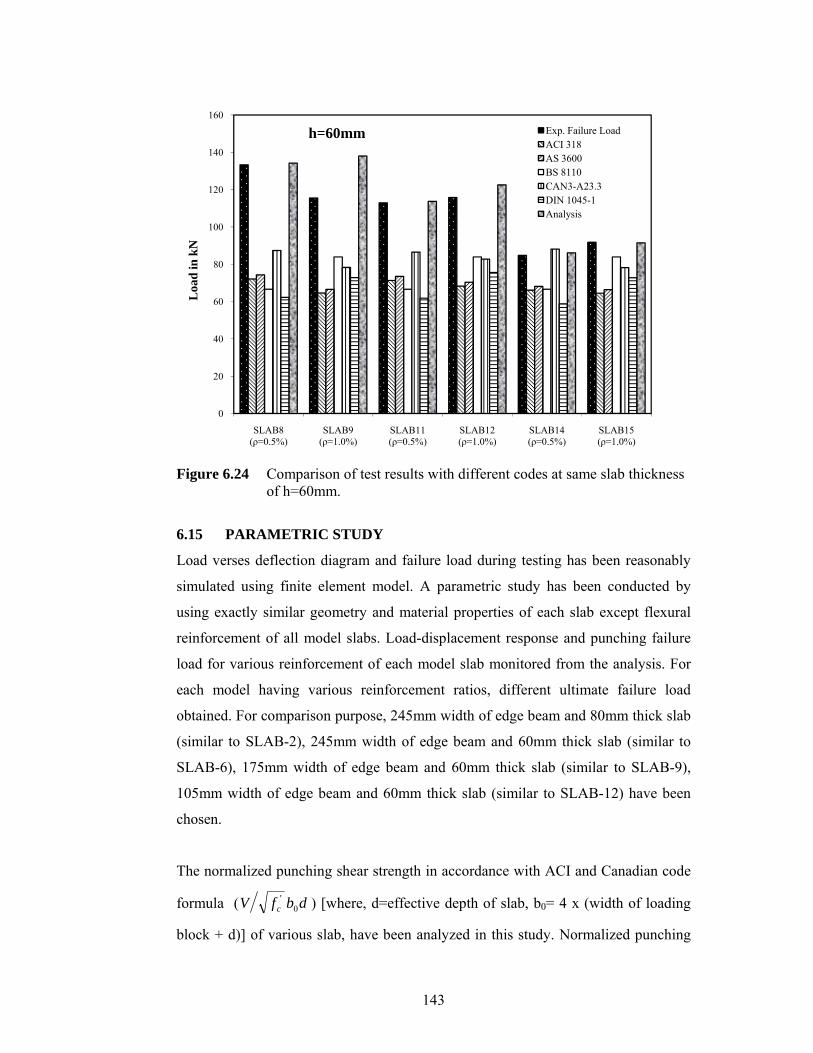
143
Figure 6.24 Comparison of test results with different codes at same slab thickness
of h=60mm.
6.15 PARAMETRIC STUDY
Load verses deflection diagram and failure load during testing has been reasonably
simulated using finite element model. A parametric study has been conducted by
using exactly similar geometry and material properties of each slab except flexural
reinforcement of all model slabs. Load-displacement response and punching failure
load for various reinforcement of each model slab monitored from the analysis. For
each model having various reinforcement ratios, different ultimate failure load
obtained. For comparison purpose, 245mm width of edge beam and 80mm thick slab
(similar to SLAB-2), 245mm width of edge beam and 60mm thick slab (similar to
SLAB-6), 175mm width of edge beam and 60mm thick slab (similar to SLAB-9),
105mm width of edge beam and 60mm thick slab (similar to SLAB-12) have been
chosen.
The normalized punching shear strength in accordance with ACI and Canadian code
formula ( dbfV c 0' ) [where, d=effective depth of slab, b0= 4 x (width of loading
block + d)] of various slab, have been analyzed in this study. Normalized punching
0
20
40
60
80
100
120
140
160
SLAB8 (ρ=0.5%)
SLAB9 (ρ=1.0%)
SLAB11 (ρ=0.5%)
SLAB12 (ρ=1.0%)
SLAB14 (ρ=0.5%)
SLAB15 (ρ=1.0%)
Loa
d in
kN
h=60mm Exp. Failure LoadACI 318AS 3600BS 8110CAN3-A23.3DIN 1045-1Analysis
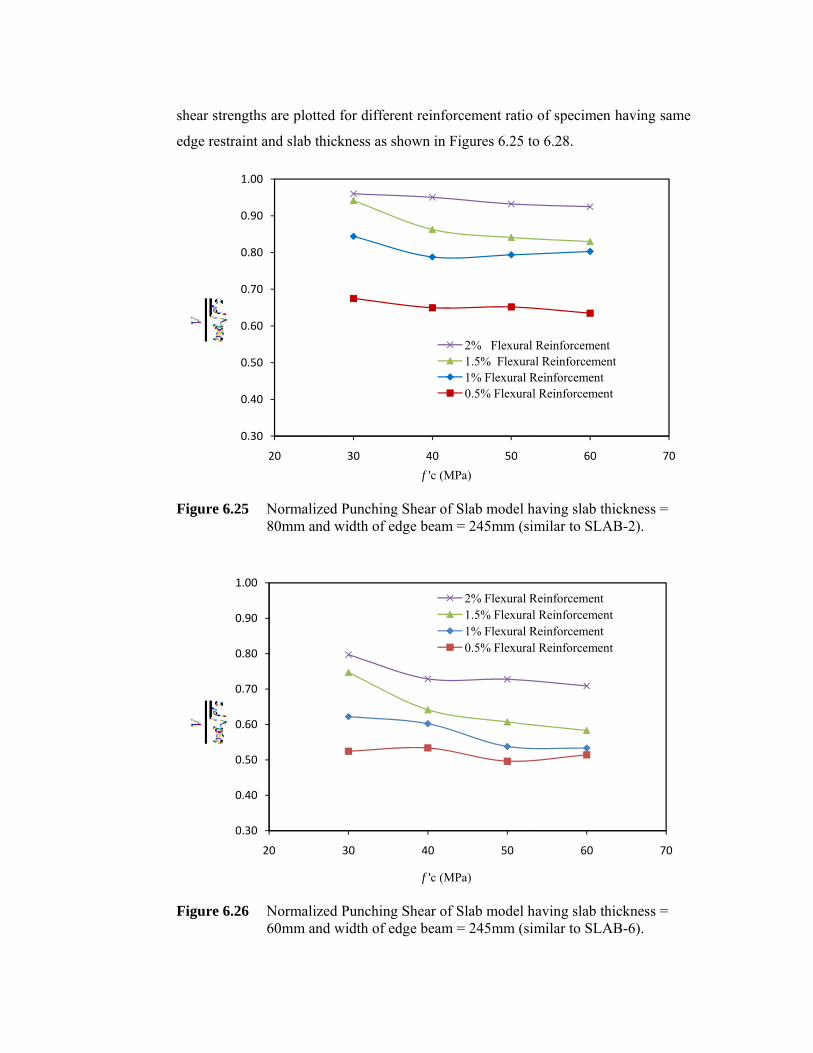
s
e
F
F
shear strengt
edge restrain
Figure 6.25
Figure 6.26
0.
0.
0.
0.
0.
0.
0.
1.
0.3
0.4
0.5
0.6
0.7
0.8
0.9
1.0
ths are plott
nt and slab th
Normaliz80mm an
Normaliz60mm an
.30
.40
.50
.60
.70
.80
.90
.00
20
30
40
50
60
70
80
90
00
20
ted for differ
hickness as s
zed Punchingnd width of e
zed Punchingnd width of e
30
30
rent reinforc
shown in Fig
g Shear of Sedge beam =
g Shear of Sedge beam =
40f 'c (MPa
40
f 'c (MPa
cement ratio
gures 6.25 to
lab model h= 245mm (sim
lab model h= 245mm (sim
50a)
2% Flexural 1.5% Flexura1% Flexural R0.5% Flexural
50
a)
2% Flexural R1.5% Flexural1% Flexural R0.5% Flexural
of specimen
o 6.28.
aving slab thmilar to SLA
aving slab thmilar to SLA
60
Reinforcementl Reinforcemen
Reinforcementl Reinforcemen
60
Reinforcement Reinforcemen
Reinforcement Reinforcemen
n having sam
hickness = AB-2).
hickness = AB-6).
70
tnt
nt
70
nt
nt
me
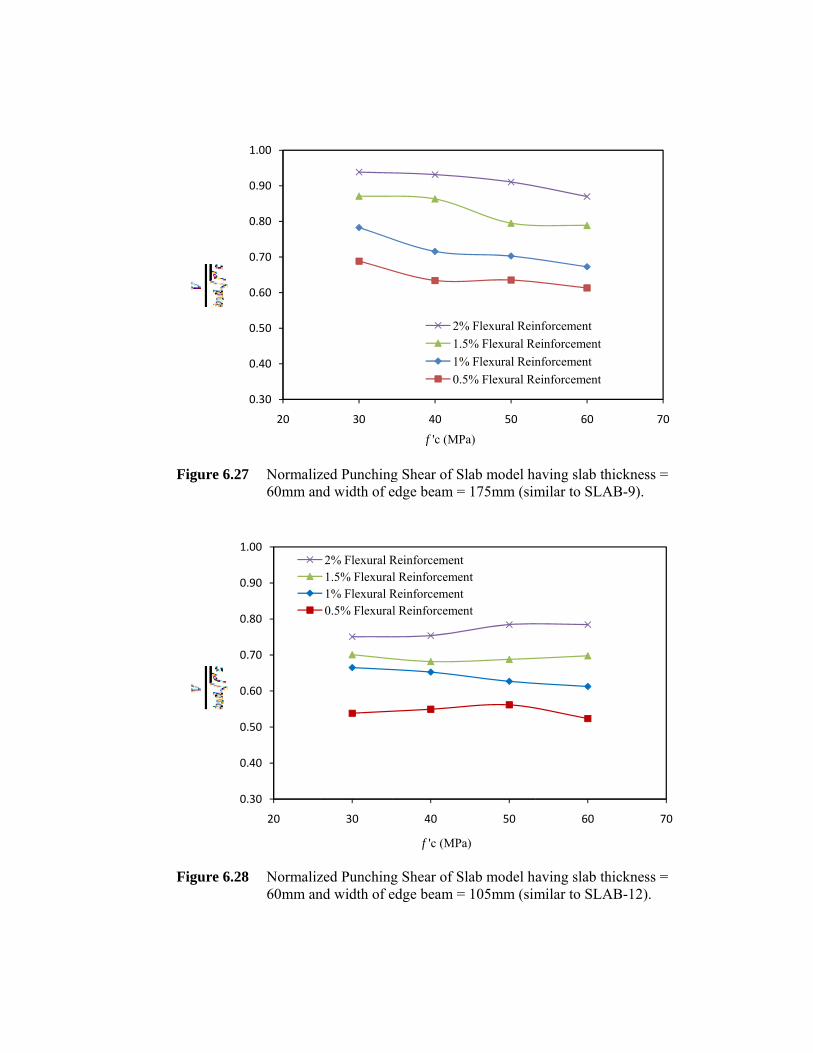
F
F
Figure 6.27
Figure 6.28
0.
0.
0.
0.
0.
0.
0.
1.
Normaliz60mm an
Normaliz60mm an
0.30
0.40
0.50
0.60
0.70
0.80
0.90
1.00
20
30
40
50
60
70
80
90
00
20
zed Punchingnd width of e
zed Punchingnd width of e
30
30
2% Flexural R1.5% Flexura1% Flexural R0.5% Flexura
g Shear of Sedge beam =
g Shear of Sedge beam =
40
f 'c (MP
2%1.51%0.5
40
f 'c (MPa
Reinforcementl ReinforcemenReinforcementl Reinforcemen
lab model h= 175mm (sim
lab model h= 105mm (sim
50
Pa)
% Flexural Rein5% Flexural Re% Flexural Rein5% Flexural Re
50
a)
nt
nt
aving slab thmilar to SLA
aving slab thmilar to SLA
60
nforcementeinforcementnforcementeinforcement
60
hickness = AB-9).
hickness = AB-12).
70
70
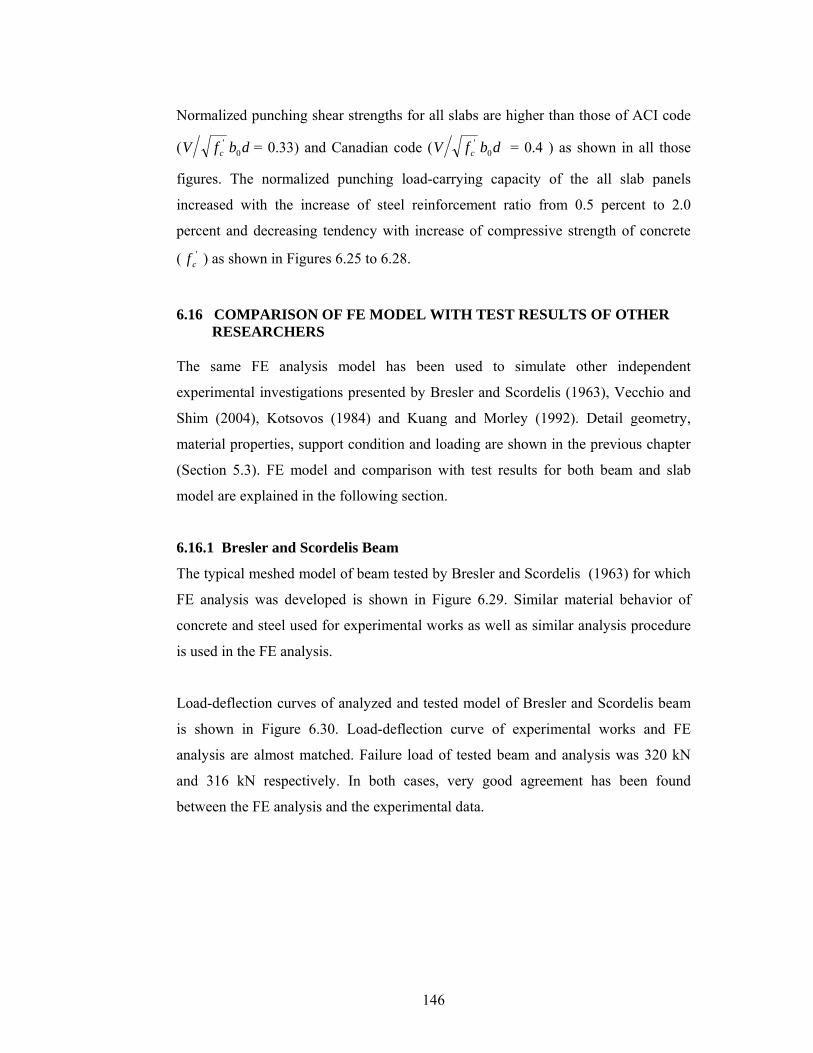
146
Normalized punching shear strengths for all slabs are higher than those of ACI code
( dbfV c 0' = 0.33) and Canadian code ( dbfV c 0
' = 0.4 ) as shown in all those
figures. The normalized punching load-carrying capacity of the all slab panels
increased with the increase of steel reinforcement ratio from 0.5 percent to 2.0
percent and decreasing tendency with increase of compressive strength of concrete
( 'cf ) as shown in Figures 6.25 to 6.28.
6.16 COMPARISON OF FE MODEL WITH TEST RESULTS OF OTHER RESEARCHERS
The same FE analysis model has been used to simulate other independent
experimental investigations presented by Bresler and Scordelis (1963), Vecchio and
Shim (2004), Kotsovos (1984) and Kuang and Morley (1992). Detail geometry,
material properties, support condition and loading are shown in the previous chapter
(Section 5.3). FE model and comparison with test results for both beam and slab
model are explained in the following section.
6.16.1 Bresler and Scordelis Beam
The typical meshed model of beam tested by Bresler and Scordelis (1963) for which
FE analysis was developed is shown in Figure 6.29. Similar material behavior of
concrete and steel used for experimental works as well as similar analysis procedure
is used in the FE analysis.
Load-deflection curves of analyzed and tested model of Bresler and Scordelis beam
is shown in Figure 6.30. Load-deflection curve of experimental works and FE
analysis are almost matched. Failure load of tested beam and analysis was 320 kN
and 316 kN respectively. In both cases, very good agreement has been found
between the FE analysis and the experimental data.
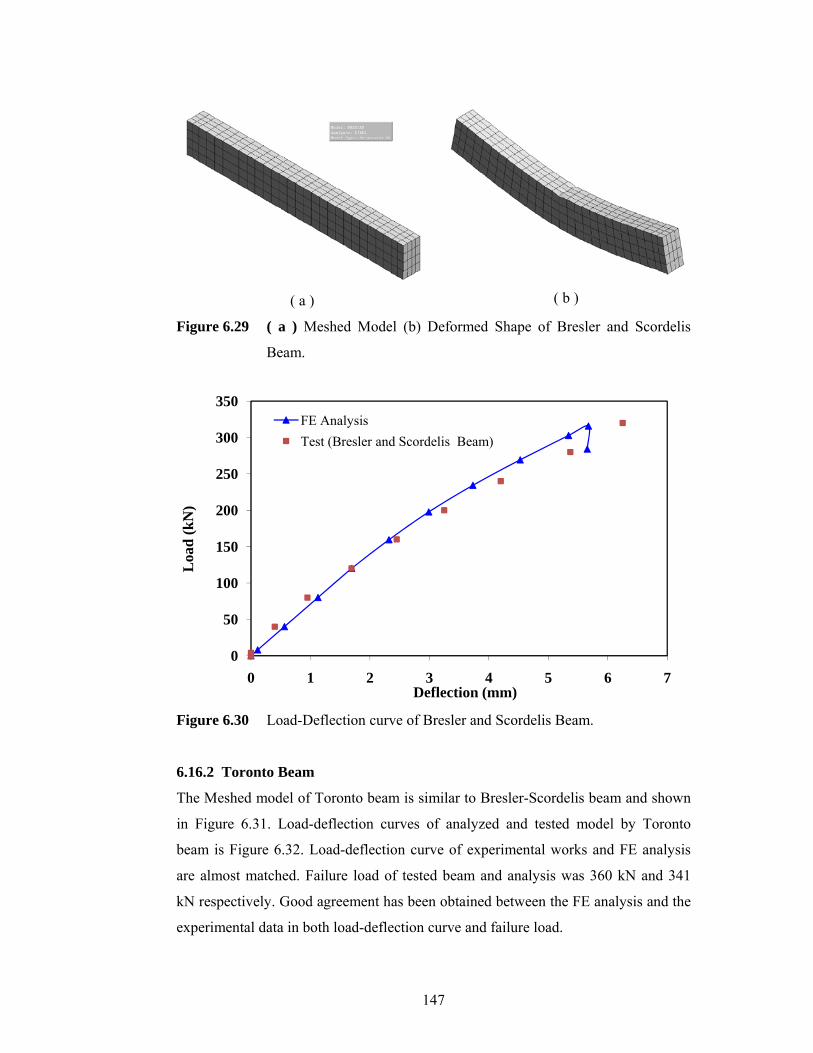
147
( a )
( b )
Figure 6.29 ( a ) Meshed Model (b) Deformed Shape of Bresler and Scordelis
Beam.
Figure 6.30 Load-Deflection curve of Bresler and Scordelis Beam.
6.16.2 Toronto Beam
The Meshed model of Toronto beam is similar to Bresler-Scordelis beam and shown
in Figure 6.31. Load-deflection curves of analyzed and tested model by Toronto
beam is Figure 6.32. Load-deflection curve of experimental works and FE analysis
are almost matched. Failure load of tested beam and analysis was 360 kN and 341
kN respectively. Good agreement has been obtained between the FE analysis and the
experimental data in both load-deflection curve and failure load.
0
50
100
150
200
250
300
350
0 1 2 3 4 5 6 7
Loa
d (k
N)
Deflection (mm)
FE AnalysisTest (Bresler and Scordelis Beam)
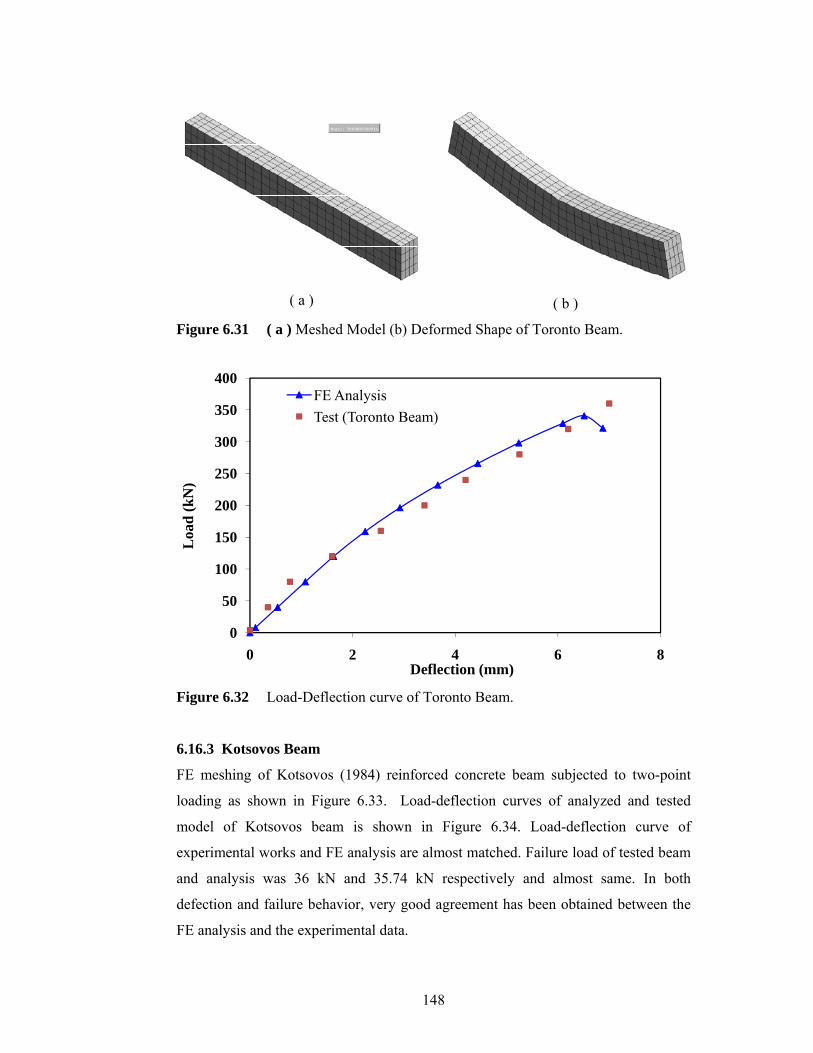
148
( a )
( b )
Figure 6.31 ( a ) Meshed Model (b) Deformed Shape of Toronto Beam.
Figure 6.32 Load-Deflection curve of Toronto Beam.
6.16.3 Kotsovos Beam
FE meshing of Kotsovos (1984) reinforced concrete beam subjected to two-point
loading as shown in Figure 6.33. Load-deflection curves of analyzed and tested
model of Kotsovos beam is shown in Figure 6.34. Load-deflection curve of
experimental works and FE analysis are almost matched. Failure load of tested beam
and analysis was 36 kN and 35.74 kN respectively and almost same. In both
defection and failure behavior, very good agreement has been obtained between the
FE analysis and the experimental data.
0
50
100
150
200
250
300
350
400
0 2 4 6 8
Loa
d (k
N)
Deflection (mm)
FE AnalysisTest (Toronto Beam)
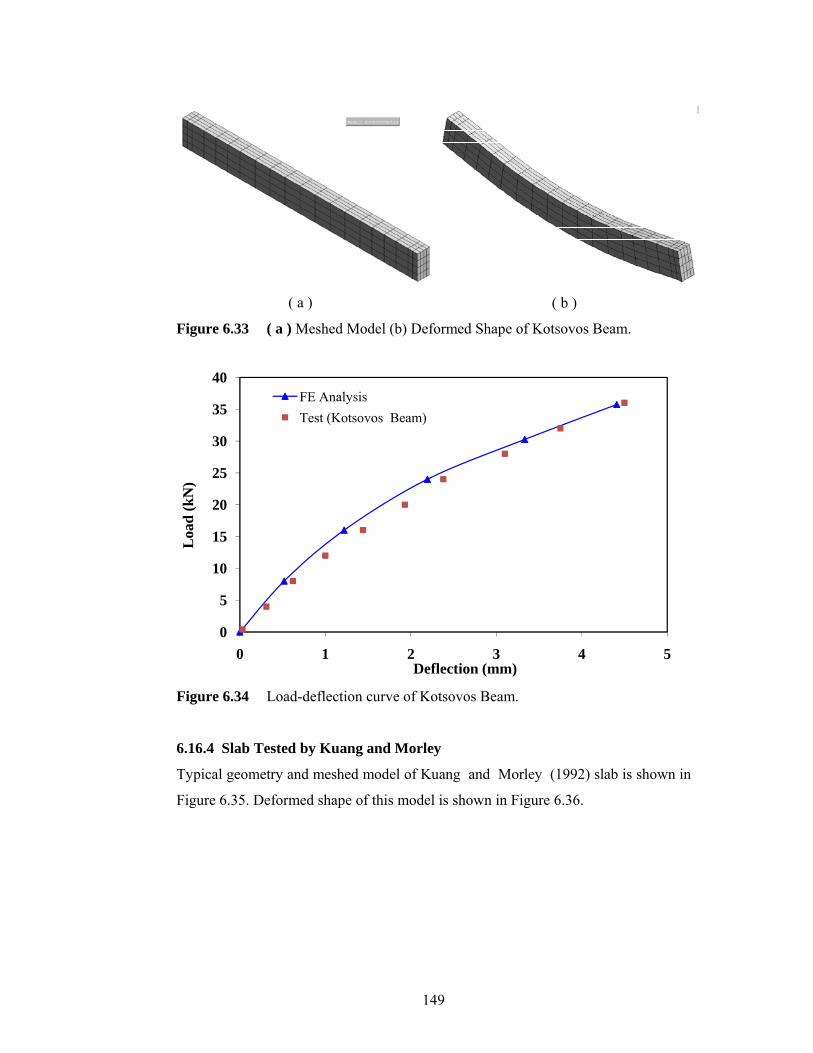
149
( a ) ( b )
Figure 6.33 ( a ) Meshed Model (b) Deformed Shape of Kotsovos Beam.
Figure 6.34 Load-deflection curve of Kotsovos Beam.
6.16.4 Slab Tested by Kuang and Morley
Typical geometry and meshed model of Kuang and Morley (1992) slab is shown in
Figure 6.35. Deformed shape of this model is shown in Figure 6.36.
0
5
10
15
20
25
30
35
40
0 1 2 3 4 5
Loa
d (k
N)
Deflection (mm)
FE AnalysisTest (Kotsovos Beam)
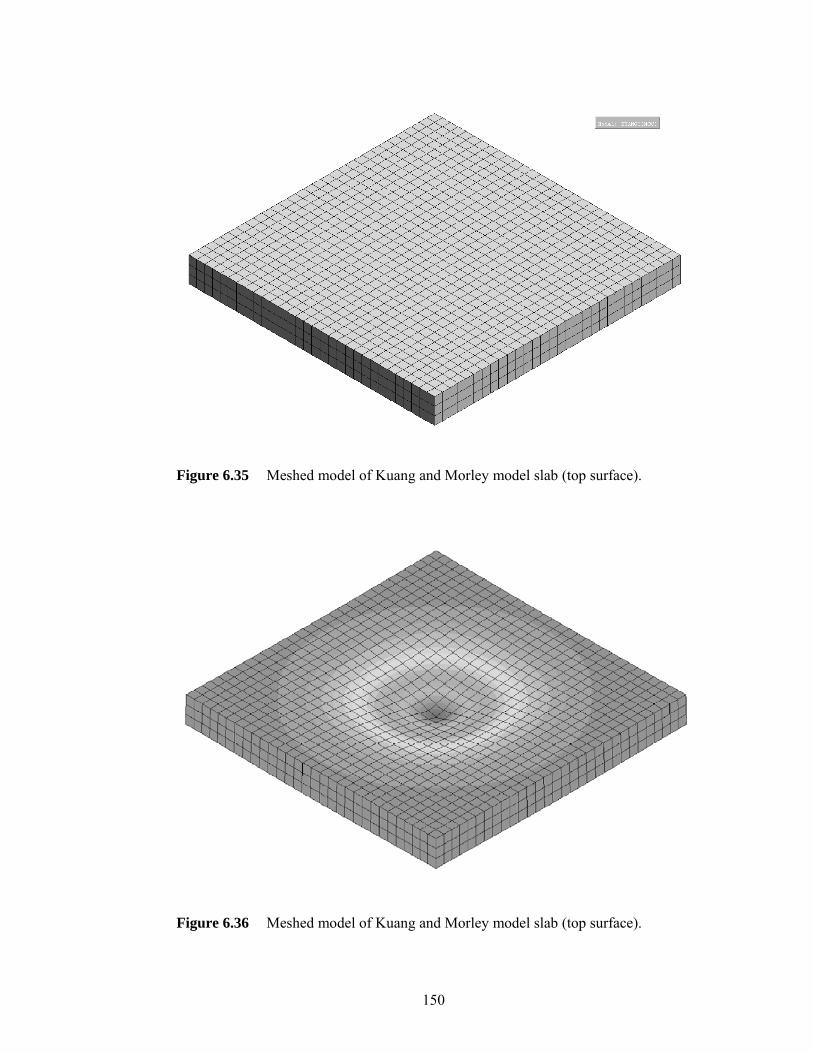
150
Figure 6.35 Meshed model of Kuang and Morley model slab (top surface).
Figure 6.36 Meshed model of Kuang and Morley model slab (top surface).
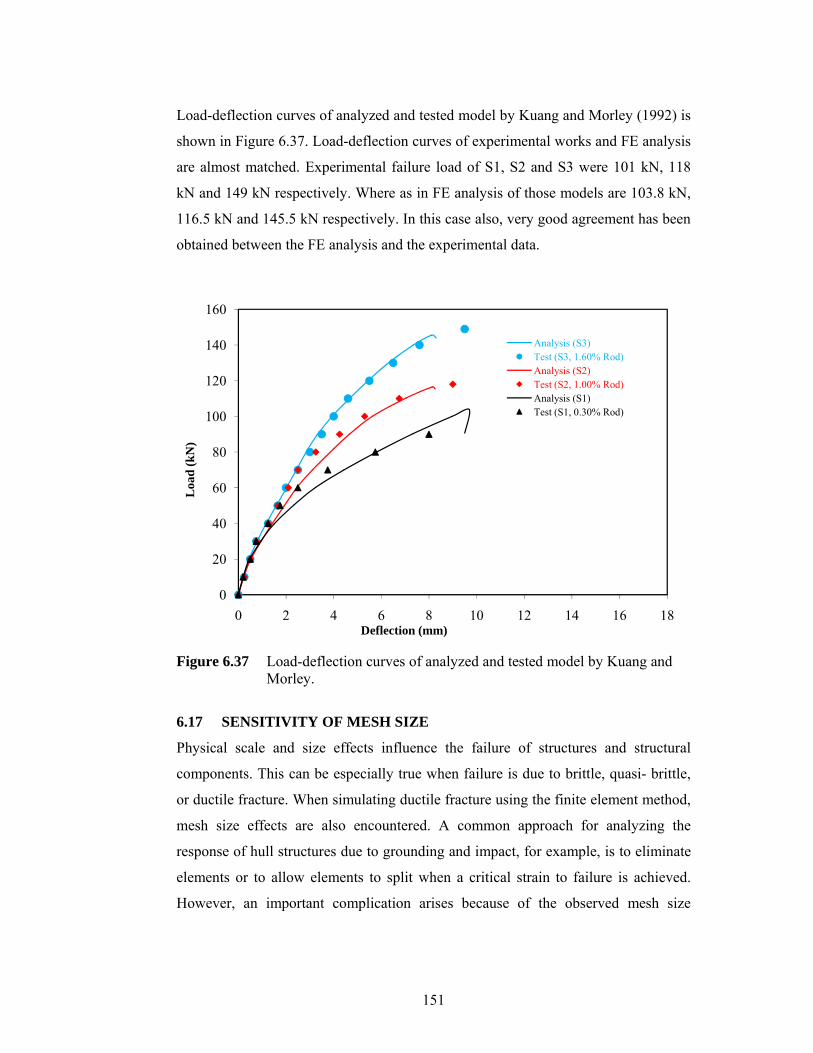
151
Load-deflection curves of analyzed and tested model by Kuang and Morley (1992) is
shown in Figure 6.37. Load-deflection curves of experimental works and FE analysis
are almost matched. Experimental failure load of S1, S2 and S3 were 101 kN, 118
kN and 149 kN respectively. Where as in FE analysis of those models are 103.8 kN,
116.5 kN and 145.5 kN respectively. In this case also, very good agreement has been
obtained between the FE analysis and the experimental data.
Figure 6.37 Load-deflection curves of analyzed and tested model by Kuang and
Morley.
6.17 SENSITIVITY OF MESH SIZE
Physical scale and size effects influence the failure of structures and structural
components. This can be especially true when failure is due to brittle, quasi- brittle,
or ductile fracture. When simulating ductile fracture using the finite element method,
mesh size effects are also encountered. A common approach for analyzing the
response of hull structures due to grounding and impact, for example, is to eliminate
elements or to allow elements to split when a critical strain to failure is achieved.
However, an important complication arises because of the observed mesh size
0
20
40
60
80
100
120
140
160
0 2 4 6 8 10 12 14 16 18
Loa
d (k
N)
Deflection (mm)
Analysis (S3)Test (S3, 1.60% Rod)Analysis (S2)Test (S2, 1.00% Rod)Analysis (S1)Test (S1, 0.30% Rod)
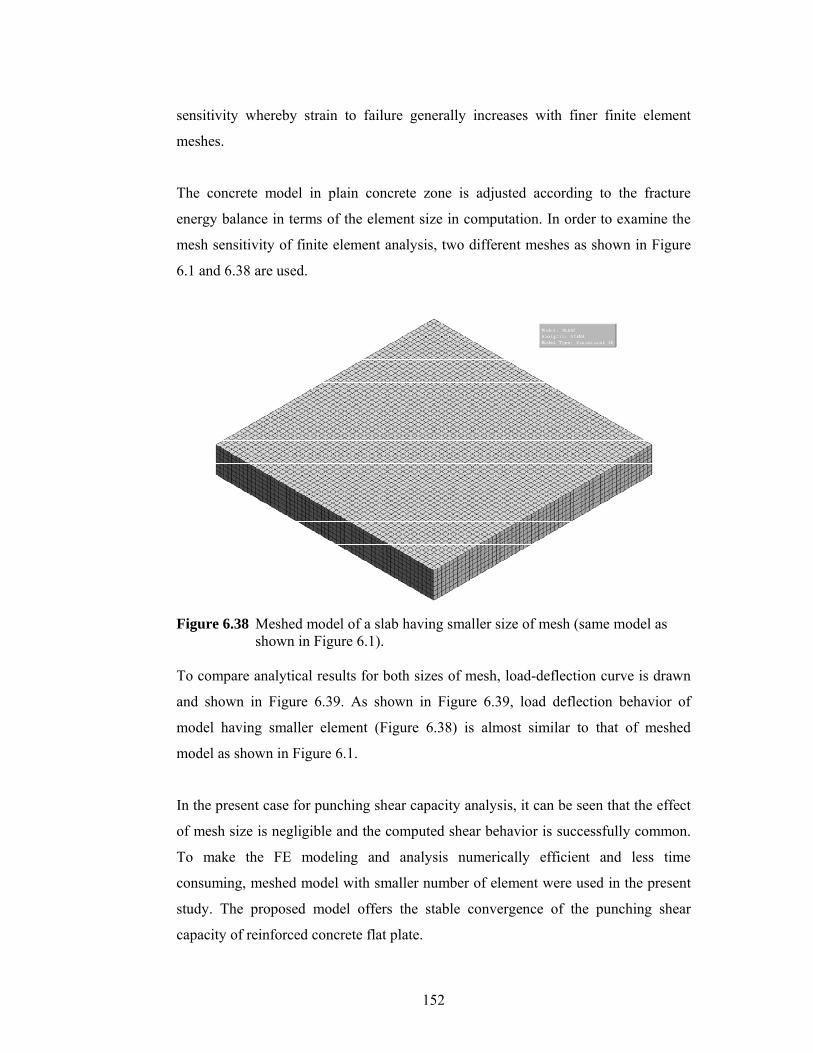
152
sensitivity whereby strain to failure generally increases with finer finite element
meshes.
The concrete model in plain concrete zone is adjusted according to the fracture
energy balance in terms of the element size in computation. In order to examine the
mesh sensitivity of finite element analysis, two different meshes as shown in Figure
6.1 and 6.38 are used.
Figure 6.38 Meshed model of a slab having smaller size of mesh (same model as
shown in Figure 6.1). To compare analytical results for both sizes of mesh, load-deflection curve is drawn
and shown in Figure 6.39. As shown in Figure 6.39, load deflection behavior of
model having smaller element (Figure 6.38) is almost similar to that of meshed
model as shown in Figure 6.1.
In the present case for punching shear capacity analysis, it can be seen that the effect
of mesh size is negligible and the computed shear behavior is successfully common.
To make the FE modeling and analysis numerically efficient and less time
consuming, meshed model with smaller number of element were used in the present
study. The proposed model offers the stable convergence of the punching shear
capacity of reinforced concrete flat plate.
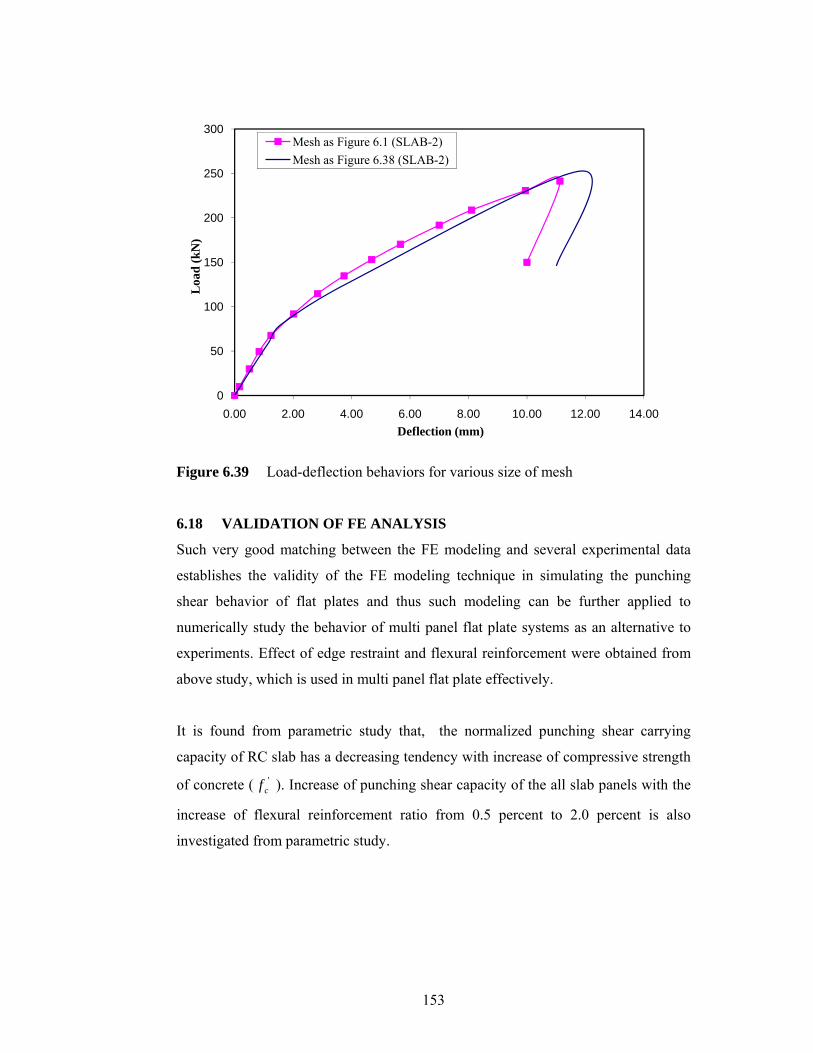
153
Figure 6.39 Load-deflection behaviors for various size of mesh
6.18 VALIDATION OF FE ANALYSIS
Such very good matching between the FE modeling and several experimental data
establishes the validity of the FE modeling technique in simulating the punching
shear behavior of flat plates and thus such modeling can be further applied to
numerically study the behavior of multi panel flat plate systems as an alternative to
experiments. Effect of edge restraint and flexural reinforcement were obtained from
above study, which is used in multi panel flat plate effectively.
It is found from parametric study that, the normalized punching shear carrying
capacity of RC slab has a decreasing tendency with increase of compressive strength
of concrete ( 'cf ). Increase of punching shear capacity of the all slab panels with the
increase of flexural reinforcement ratio from 0.5 percent to 2.0 percent is also
investigated from parametric study.
0
50
100
150
200
250
300
0.00 2.00 4.00 6.00 8.00 10.00 12.00 14.00
Loa
d (k
N)
Deflection (mm)
Mesh as Figure 6.1 (SLAB-2)Mesh as Figure 6.38 (SLAB-2)
154
CHAPTER-7
FE MODELING AND STUDY ON MULTIPANEL FLAT PLATES
7.1 INTRODUCTION
According to present state of research, punching shear capacity is related to concrete
strength, punching perimeter of slab, slab thickness, reinforcement ratio, edge
restraint etc. Continuity of flat plate or effect of edge restraint on punching shear
behavior of slab is investigated. Application of continuity of flat plate to multi-panel
flat plates will be more reasonable than the results obtained by using isolated single
span slab specimens. However, multi-panel tests are time consuming, expensive and
it is difficult to determine experimentally the shears and moments applied to the
individual slab-column connections. An alternative to such expensive and difficult
experimental procedure is to perform the investigation by means of numerical finite
element analysis.
In this study, an advanced nonlinear finite element investigation of multi-panel flat
plate considering full scale with practical geometry has been carried out on the
behavior of punching shear characteristics of concrete slab in presence of flexural
reinforcement. FE model has been developed to simulate relevant experiments
carried out in the previous chapter. Good agreement has been observed between
numerical FE simulation and experiment, which establish the validity of FE model.
Same FE procedure has been used to analyze multi-panel slab models and the results
are presented in this study in an effort to understand the actual punching shear
behavior of slab systems.
7.2 BEHAVIORAL DIFFERENCE
Test results from simply supported slab specimens do not usually provide an accurate
prediction of the ultimate load capacity of a slab having lateral restraint (Kaung and
Morley 1992). When the slab is restrained against lateral deformation, this induces
large restraining force within the slab and between the supports, thus membrane
forces are developed (Selim and Sebastian 2003). The enhancement of punching
shear capacity can be attributed due to the presence of in-plane compressive
155
membrane action in the slab (Kaung and Morley 1992; McLean et al. 1990; Selim
and Sebastian 2003). The importance of compressive membrane stresses due to edge
restraint was not incorporated into the code formulations, which results in
conservative prediction.
The present exercise reveals that the edge restraint has a significant effect on the
ultimate punching load of reinforced concrete slabs, resulting in a significant
increase of punching shear resistance in the slabs and effectively enhancing the load-
carrying capacity of the member subjected to punching load. The enhancement in the
punching load carrying capacity of slabs due to edge continuity may be attributed to
the possible influence of in-plane restraint. This may be due to the lateral slab
expansion and possible restraint against outward movement by the edge beams.
Continuous slabs deflect less than similar simply supported slabs under the action of
load. This helps the slabs having edge continuity to sustain more punching load.
Enhancement of punching shear capacity due to restraint action was also advocated
by other researchers like Salim and Sebastian (2003), Kuang and Morley (1992),
Lovrovich and McLean (1990), McLean, et al. (1990) and Rankin and Long (1987).
Similar to the findings of other researchers, compressive membrane forces were, in
fact, developed in the slabs due to edge restraints.
Kuang and Morley (1992) tested a total twelve slabs which were supported and
restrained on all four sides by edge beams. Different degrees of edge restraint were
provided by different sizes of edge beam. They observed that a restrained slab with
low percentage of steel failed in punching shear mode when subjected to
concentrated loading. This indicated lateral restraint may also change the mode of
failure because the membrane forces developed enhances the shear and flexural
capacity of the slab and at the same time reduces the ductility of the slab. It is
apparent that from the above test results that the restraint can considerably enhance
the load carrying capacity of slab, but reduce the ductility of the slab. However, the
degree of the enhancement in strength due to the membrane action is difficult to
quantify since it depends on the in-plane restraint provided by the surrounding
156
structure. Others (Aoki and Seki 1971, Tong and Batchelor 1971) observed that
restraint will enhance punching shear strength of slab in all cases.
The enhancement of load carrying capacity can also be attributed to the presence of
in-plane compressive membrane action in the slab (Fenwick and Dickson 1989).
Membrane action generally occurs after cracking of the concrete or yielding of the
reinforcement, and has been found to result in substantial enhancement in the load
carrying capacity of restrained concrete slabs (Kuang and Morley 1992). These arise
from the coupling of in-plane and bending deformations in flexural cracked
reinforced concrete members and the restraint in the in-plane deformation provided
by the surrounding structure and the boundaries (Fenwick and Dickson 1989).
The restraining effects of the slab produces a higher load carrying capacity for the
spandrel beam in flat plate slab when compared with an isolated beam. This increase
in capacity is a result of the slab restraints on both the elongation and the rotation of
the edge beam (Loo and Falamaki 1992). Apart from this, the rotation of spandrel
beam also produces a vertical displacement at the beam slab interface. The vertical
displacement will be restrained by the vertical stiffness of slab. The restraining
effects of the slab on the rotation of beam also increases the strength of beam (Loo
and Falamaki 1992), thereby reducing the moment of the column-slab junction and
indirectly increasing the punching shear capacity.
In a normal simply supported reinforced concrete design, the neutral axis is located
closer to the compression face of the member, and so strain of the middle depth of
the slab is tensile over the full length, indicating expansion. Conventionally, this
length change is ignored. In practice, this expansion results in a compressive force
that enhances the performance of the member by reducing the magnitude of the
tensile force required in the reinforcement for a given load (Fenwick and Dickson
1989). Thus, slab deflection at column junction in the presence of edge beam also
affects the punching shear capacity.
157
Taylor and Hayes (1965) carried out a series of tests on the effect of edge restraint.
The slabs were divided into three groups depending on the amount of tension
reinforcement which was zero, 1.57% and 3.14%. The restraint was imposed by a
heavy welded steel frame which surrounded the slabs, i.e. the edges of slab were
restrained against lateral movement. All slabs without reinforcement were tested in
the restrained condition. For pairs of slab with reinforcement, one of each pair was
tested in the simply supported condition and the other in the restrained condition.
The test results indicated that for slab with low percentage of reinforcement, the
restraint significantly increased the ultimate load up to 60%. This group of slabs
exhibited high ductility and were more likely to fail in flexural mode. Tile ductile
behavior allowed compressive membrane forces to fully develop. The flexural
capacity was thus significantly increased as observed by other researchers (Roberts
1969). However, for slabs with high reinforcement ratio, the enhancement by
restraint was less significant and in some cases there was virtually no increase in
strength. Punching shear failure is critical for this group of slabs and the slabs
suddenly rupture. It is possible that the slab fails before the membrane action has
developed.
Hewitt and Batchelor (1975) stated that restraining forces at the slab boundaries can
result from compressive membrane (arch) action as well as from “fixed boundary
action”. The compressive membrane action gives a net in-plane force at the slab
boundaries, while fixed boundary action is due to moment restraint with no net in-
plane force at the slab boundary. Compressive membrane forces can be induced in a
cracked concrete slab but, unlike fixed boundary moments, cannot occur in a slab
that is uncracked or made from a material having the same stress-strain relationships
in compression and tension. Thus, compressive membrane action can occur in a
cracked unreinforced concrete slab, whereas fixed boundary action in a cracked slab
requires the provision of tension reinforcement at the boundary. A restrained
reinforced slab loaded to its punching load goes through the following stages: fixed
boundary action, cracking, compressive membrane action superimposed on fixed
boundary action, and finally punching shear failure.
158
The area of the slab beyond the line of contra flexure and external frames enhances
the capacity of slabs due to the action of in-plane compression forces. The portion of
the slab beyond the line of contraflexure acts as a tension ring which reacts against
compressive forces induced in the inner portion of the slab. Hewitt and Batchelor
(1975) wrote that the first model which took fixed boundary action into account, was
the model developed by Kinnunen and Nylander (1960).
Tests carried out by Csagoly (1979) for the Ontaria Ministry of Transportation and
Communications also indicated the increase in punching resistance due to membrane
action. Very high factors of safety against punching of slabs designed by
conventional methods were found. While Hewitt and Batchelor (1975) made a clear
distinction between the compressive membrane action and the fixed boundary action,
Bakker (2008) and Wei (2008) name the existence of any restraining force
“compressive membrane action”.
Effect of continuity can be effectively used in multi panel flat. In multi panel flat
plate, lateral deformation is resisted by the continuity of slab which induces large
restraining force within the flat plate, thus membrane forces are developed. The
enhancement of punching shear capacity in multi panel is occurred due to the
presence of membrane action in compare to simply supported slab.
7.3 FE MODELING OF MULTI PANEL FLAT PLATE
7.3.1 Flat plate Building system
Finite element model of the multi-panel full-scaled reinforced concrete is obtained
from a typical building structure with flat plate floor system as shown in Figure 7.1.
Multi panel flat plate is ideal for short span floors which are subjected to uniformly
distributed loads, and is used extensively in residential buildings as well as in certain
areas of commercial buildings. Flat plate can also be used for cantilever balconies as
permanent formwork. The design of multi panel flat plate concrete buildings
composed of flat plates and columns is considered. The analysis to calculate the
displacements and the internal forces, due to gravity load on flat plate buildings, has
to be preceded by defining the structural idealization model. FE analysis of the multi-
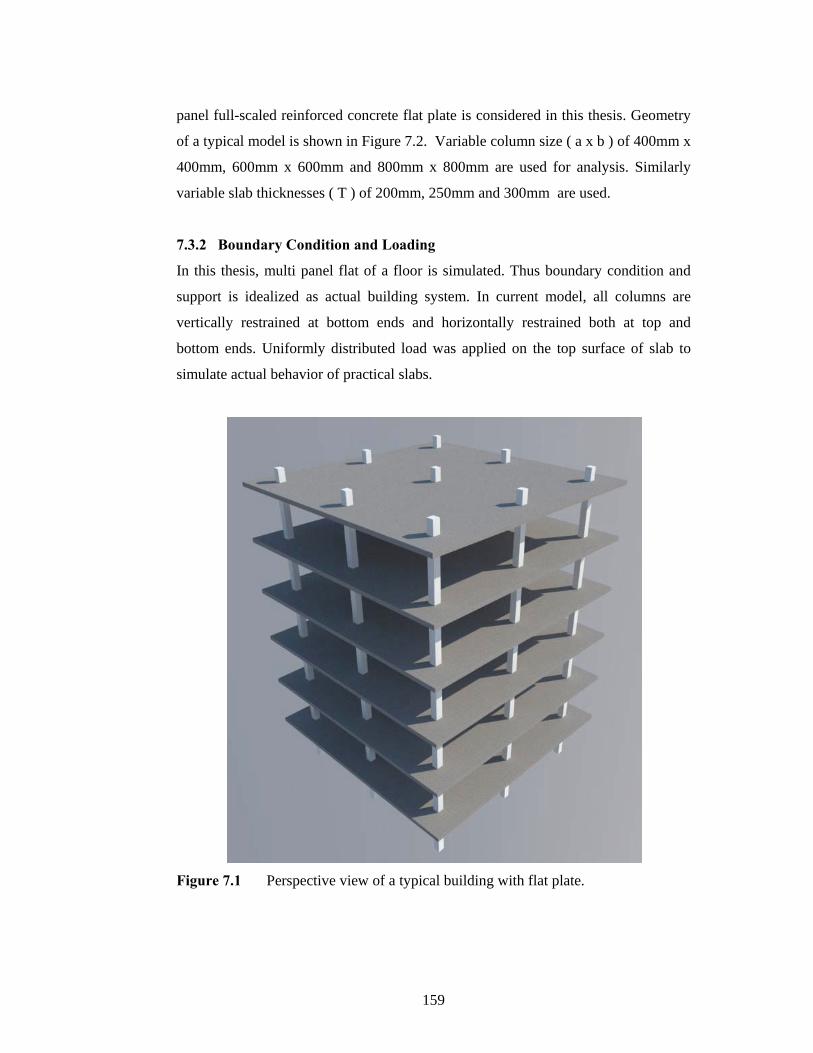
159
panel full-scaled reinforced concrete flat plate is considered in this thesis. Geometry
of a typical model is shown in Figure 7.2. Variable column size ( a x b ) of 400mm x
400mm, 600mm x 600mm and 800mm x 800mm are used for analysis. Similarly
variable slab thicknesses ( T ) of 200mm, 250mm and 300mm are used.
7.3.2 Boundary Condition and Loading
In this thesis, multi panel flat of a floor is simulated. Thus boundary condition and
support is idealized as actual building system. In current model, all columns are
vertically restrained at bottom ends and horizontally restrained both at top and
bottom ends. Uniformly distributed load was applied on the top surface of slab to
simulate actual behavior of practical slabs.
Figure 7.1 Perspective view of a typical building with flat plate.
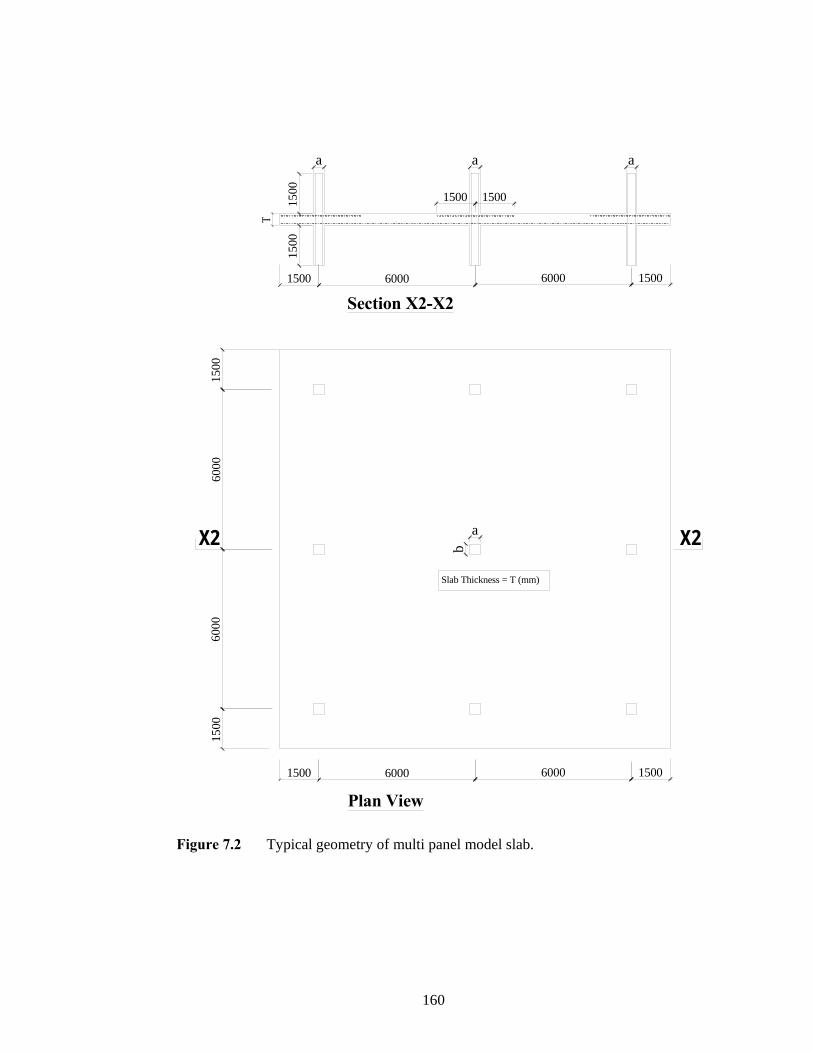
160
6000 6000
6000
6000
1500
1500
1500
Slab Thickness = T (mm)
1500
X2
1500
1500
Section X2-X26000 60001500 1500
1500 1500
Plan View
X2a
b
aa a
Figure 7.2 Typical geometry of multi panel model slab.
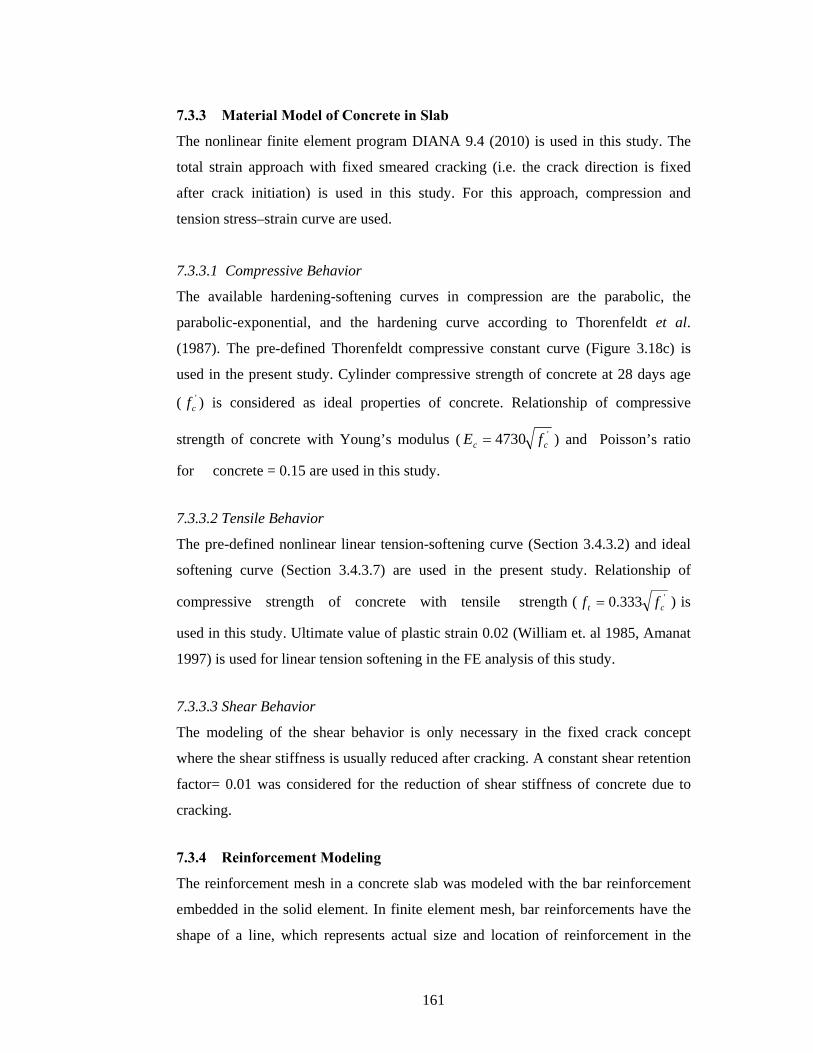
161
7.3.3 Material Model of Concrete in Slab
The nonlinear finite element program DIANA 9.4 (2010) is used in this study. The
total strain approach with fixed smeared cracking (i.e. the crack direction is fixed
after crack initiation) is used in this study. For this approach, compression and
tension stress–strain curve are used.
7.3.3.1 Compressive Behavior
The available hardening-softening curves in compression are the parabolic, the
parabolic-exponential, and the hardening curve according to Thorenfeldt et al.
(1987). The pre-defined Thorenfeldt compressive constant curve (Figure 3.18c) is
used in the present study. Cylinder compressive strength of concrete at 28 days age
( 'cf ) is considered as ideal properties of concrete. Relationship of compressive
strength of concrete with Young’s modulus ( '4730 cc fE = ) and Poisson’s ratio
for concrete = 0.15 are used in this study.
7.3.3.2 Tensile Behavior
The pre-defined nonlinear linear tension-softening curve (Section 3.4.3.2) and ideal
softening curve (Section 3.4.3.7) are used in the present study. Relationship of
compressive strength of concrete with tensile strength ( '333.0 ct ff = ) is
used in this study. Ultimate value of plastic strain 0.02 (William et. al 1985, Amanat
1997) is used for linear tension softening in the FE analysis of this study.
7.3.3.3 Shear Behavior
The modeling of the shear behavior is only necessary in the fixed crack concept
where the shear stiffness is usually reduced after cracking. A constant shear retention
factor= 0.01 was considered for the reduction of shear stiffness of concrete due to
cracking.
7.3.4 Reinforcement Modeling
The reinforcement mesh in a concrete slab was modeled with the bar reinforcement
embedded in the solid element. In finite element mesh, bar reinforcements have the
shape of a line, which represents actual size and location of reinforcement in the
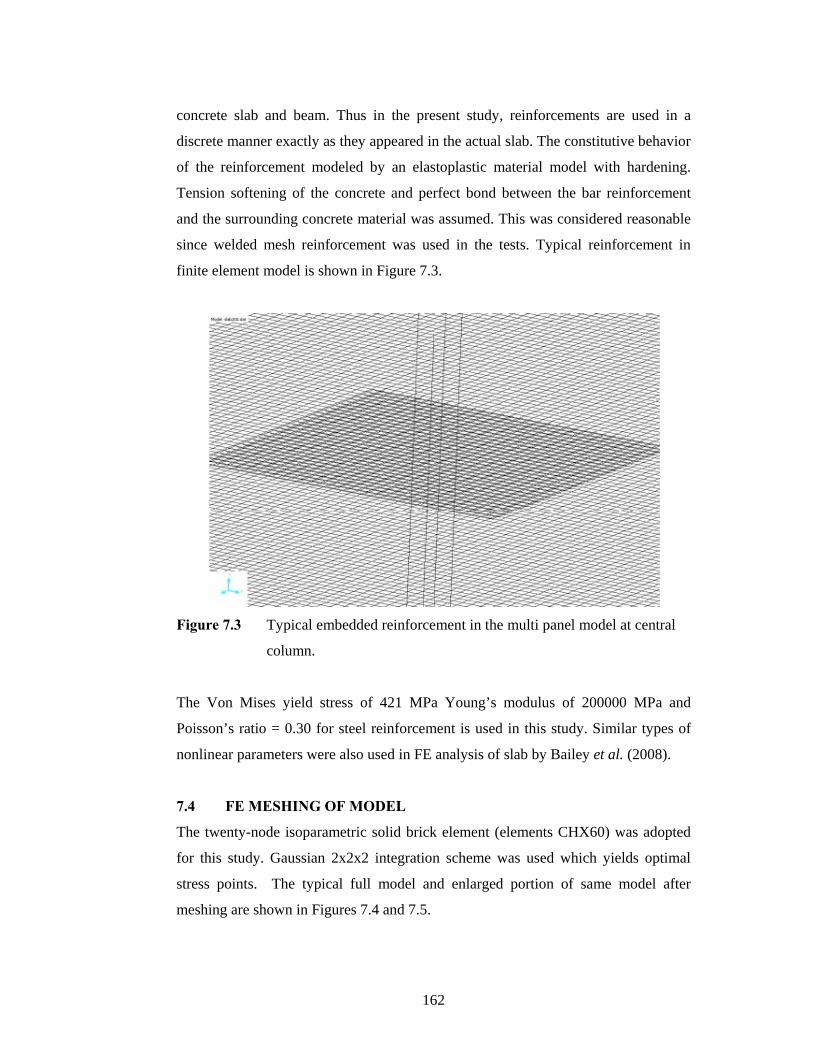
162
concrete slab and beam. Thus in the present study, reinforcements are used in a
discrete manner exactly as they appeared in the actual slab. The constitutive behavior
of the reinforcement modeled by an elastoplastic material model with hardening.
Tension softening of the concrete and perfect bond between the bar reinforcement
and the surrounding concrete material was assumed. This was considered reasonable
since welded mesh reinforcement was used in the tests. Typical reinforcement in
finite element model is shown in Figure 7.3.
Figure 7.3 Typical embedded reinforcement in the multi panel model at central
column.
The Von Mises yield stress of 421 MPa Young’s modulus of 200000 MPa and
Poisson’s ratio = 0.30 for steel reinforcement is used in this study. Similar types of
nonlinear parameters were also used in FE analysis of slab by Bailey et al. (2008).
7.4 FE MESHING OF MODEL
The twenty-node isoparametric solid brick element (elements CHX60) was adopted
for this study. Gaussian 2x2x2 integration scheme was used which yields optimal
stress points. The typical full model and enlarged portion of same model after
meshing are shown in Figures 7.4 and 7.5.
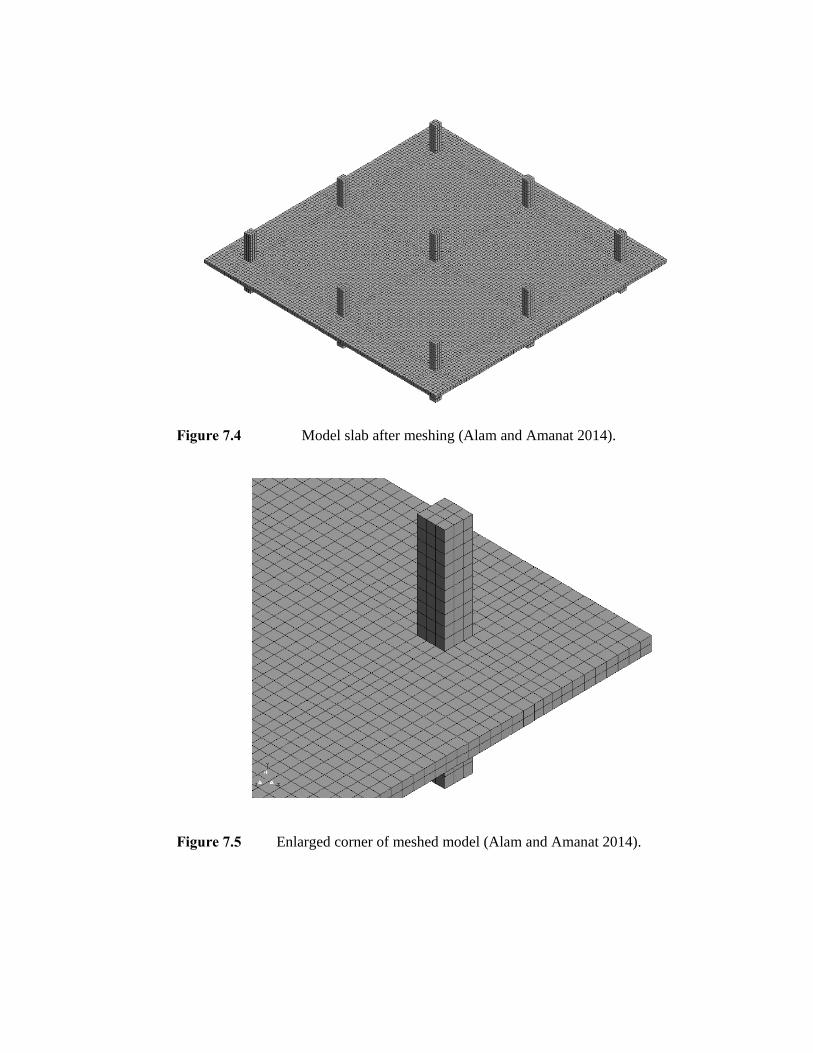
F
F
Figure 7.4
Figure 7.5
Mo
Enlarge
odel slab afte
ed corner of
er meshing (A
meshed mod
Alam and A
del (Alam an
Amanat 2014
nd Amanat 2
).
2014).
164
7.5 ANALYSIS PROCEDURE
A commonly used modified Newton–Raphson solving strategy was adopted,
incorporating the iteration based on conjugate gradient method with arc-length
control. Force norm convergence criteria was used in this study. The line search
algorithm for automatically scaling the incremental displacements in the iteration
process was also included to improve the convergence rate and the efficiency of
analyses. Second order plasticity equation solver solved physical nonlinearity with
total strain cracking. Reinforcement was evaluated in the interface elements.
Accuracy checked by the norms of residual vector. Incremental loading based
solution termination criteria was used to stop the execution.
7.6 PUNCHING TYPE OF FAILURE
All the models underwent punching type of failure with their inherent brittle
characteristics and failed in a punching shear mode. Most of the slab samples failed
at a load much higher than those predicted by the codes. The cracking patterns of the
top surface of all the slabs were very much localized. Punching type of failure is
confirmed by load-defection analysis and cracking pattern of a typical model slab
MSLAB11-7 ( 'cf =30 MPa and 0.50% flexural reinforcement) as discussed below.
To compare load deflection behavior of model MSLAB11-7 for various nodes
adjacent to central column is shown in Figure 7.6. In this figure node B00, B80,
B160, B320, B480 and B640 are located at bottom surface of slab at a distance 0mm,
80mm, 160mm, 320mm, 480mm and 640mm respectively from edge of middle
column toward the edge column along center line. Similarly nodes T00, T80, T160,
T320, T480 and T640 are located at top surface of slab. Load-deflection curve of
those nodes are shown in Figure 7.7. Deflections of node located same section of
slab such as B00 and T00, B80 and T80, B160 and T160, B320 and T320, B480 and
T480, B640 and T640 are almost matched. Similar deflect of top and bottom fiber at
any load is indicating no differential horizontal movement in same section of slab.
No differential horizontal movement of top and bottom chords at same section of
slab during failure load indicates that failure due to bending moment is not occurred
for model slab in this study.
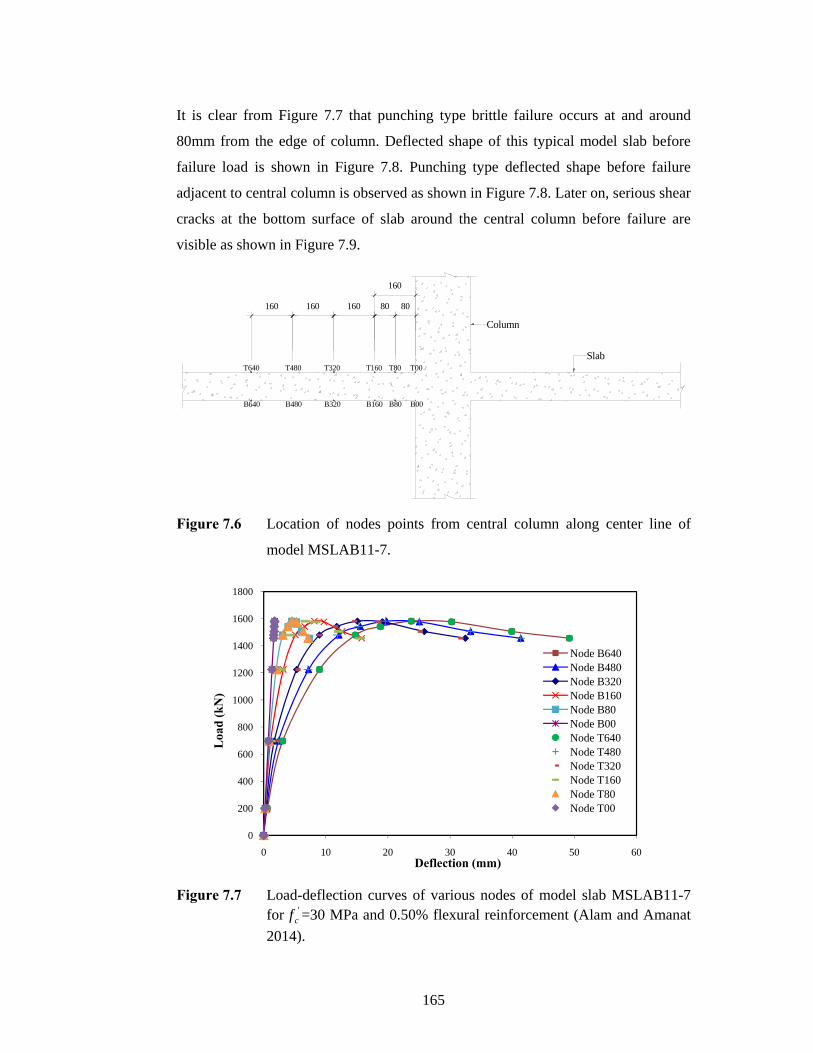
165
It is clear from Figure 7.7 that punching type brittle failure occurs at and around
80mm from the edge of column. Deflected shape of this typical model slab before
failure load is shown in Figure 7.8. Punching type deflected shape before failure
adjacent to central column is observed as shown in Figure 7.8. Later on, serious shear
cracks at the bottom surface of slab around the central column before failure are
visible as shown in Figure 7.9.
8080160
B00B80B160B320B640
160
T00T80T160T320T640
Column
Slab
160160
B480
T480
Figure 7.6 Location of nodes points from central column along center line of
model MSLAB11-7.
Figure 7.7 Load-deflection curves of various nodes of model slab MSLAB11-7
for 'cf =30 MPa and 0.50% flexural reinforcement (Alam and Amanat
2014).
0
200
400
600
800
1000
1200
1400
1600
1800
0 10 20 30 40 50 60
Loa
d (k
N)
Deflection (mm)
Node B640Node B480Node B320Node B160Node B80Node B00Node T640Node T480Node T320Node T160Node T80Node T00
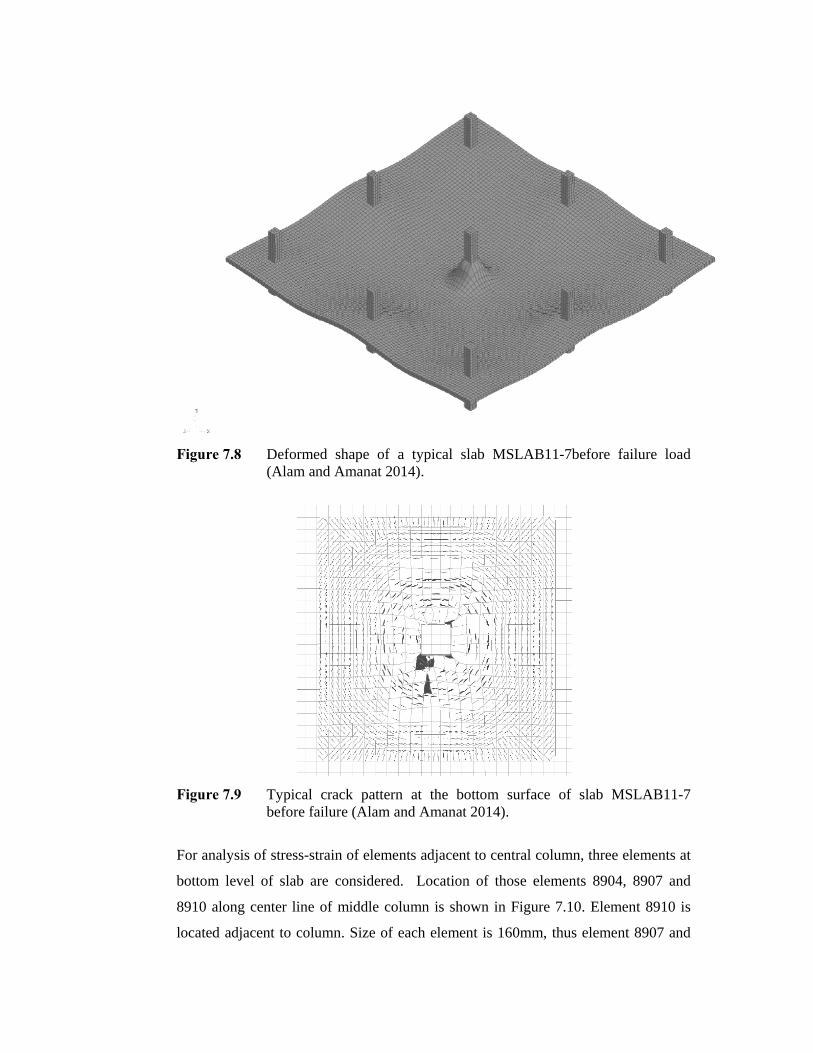
F
F
F
b
8
l
Figure 7.8
Figure 7.9
For analysis
bottom leve
8910 along
located adja
Deformed(Alam an
Typical before fai
s of stress-str
el of slab ar
center line o
acent to colu
d shape of nd Amanat 2
crack patterilure (Alam
rain of elem
re considere
of middle co
umn. Size of
a typical s014).
rn at the band Amanat
ents adjacen
d. Location
olumn is sho
f each eleme
slab MSLAB
ottom surfat 2014).
nt to central
n of those e
own in Figu
ent is 160mm
B11-7before
ace of slab
column, thre
elements 89
ure 7.10. Ele
m, thus elem
e failure loa
MSLAB11
ee elements
04, 8907 an
ement 8910
ment 8907 an
ad
-7
at
nd
is
nd
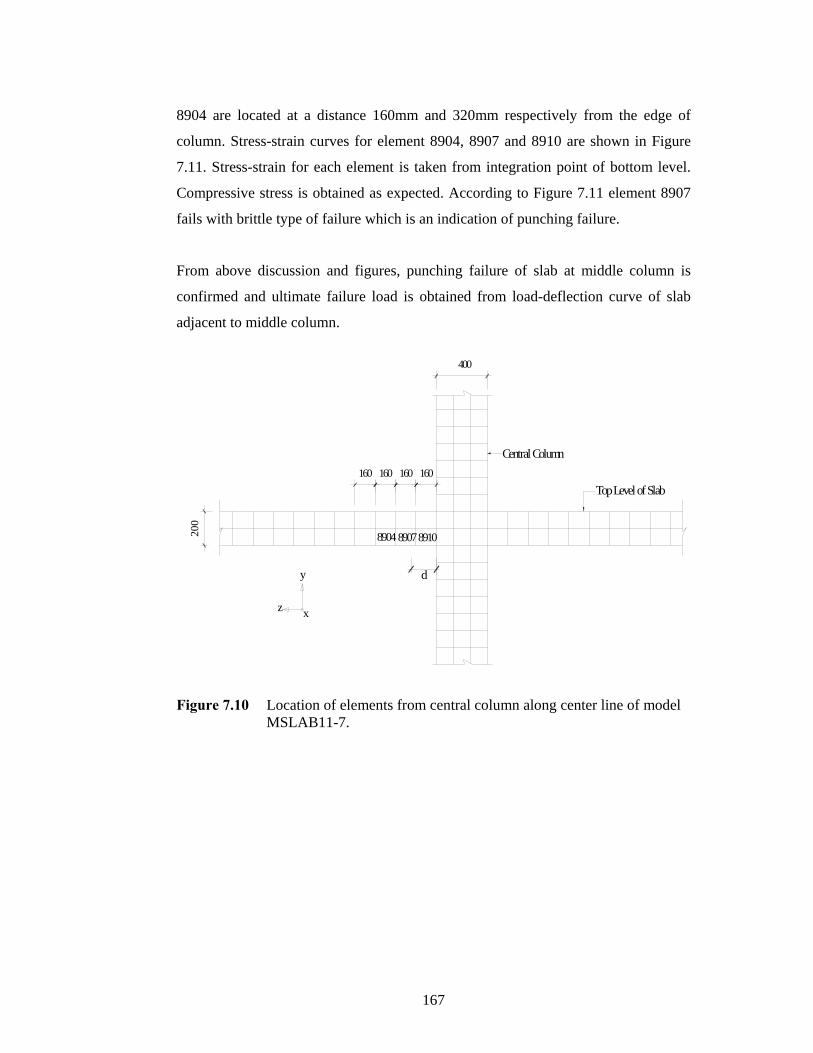
167
8904 are located at a distance 160mm and 320mm respectively from the edge of
column. Stress-strain curves for element 8904, 8907 and 8910 are shown in Figure
7.11. Stress-strain for each element is taken from integration point of bottom level.
Compressive stress is obtained as expected. According to Figure 7.11 element 8907
fails with brittle type of failure which is an indication of punching failure.
From above discussion and figures, punching failure of slab at middle column is
confirmed and ultimate failure load is obtained from load-deflection curve of slab
adjacent to middle column.
160
Central Column
Top Level of Slab
200
400
160160160
891089078904
y
xz
d
Figure 7.10 Location of elements from central column along center line of model MSLAB11-7.
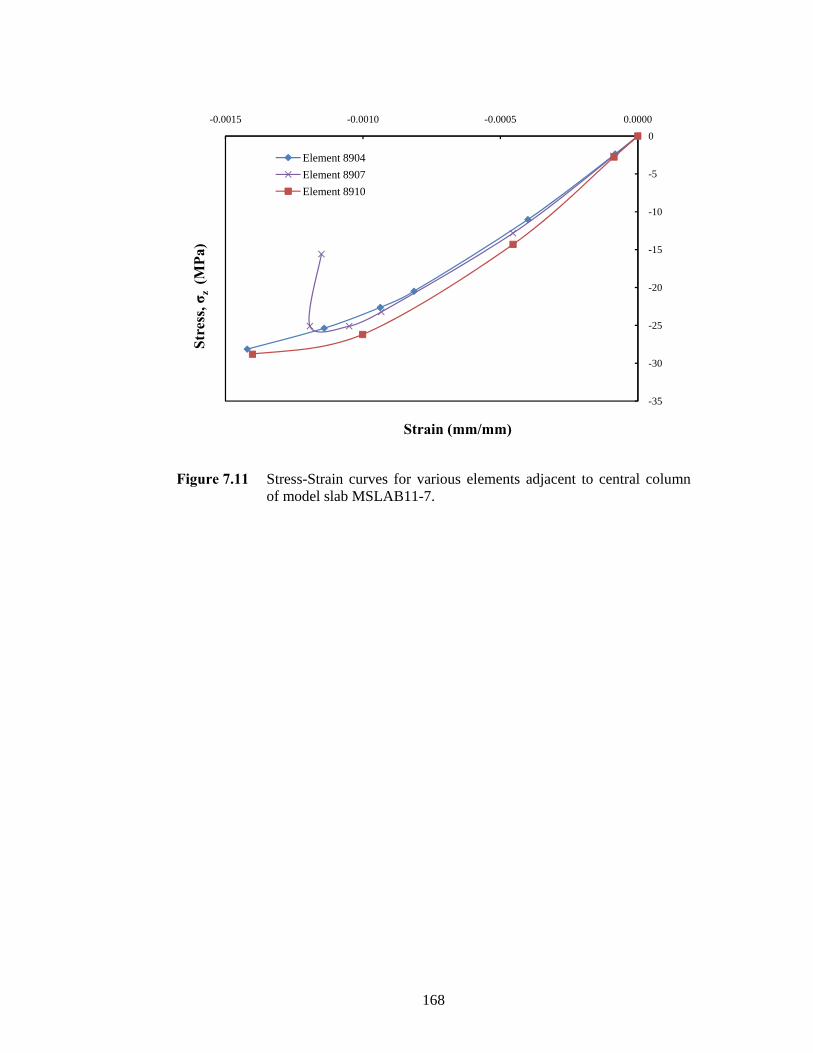
168
Figure 7.11 Stress-Strain curves for various elements adjacent to central column
of model slab MSLAB11-7.
-35
-30
-25
-20
-15
-10
-5
0-0.0015 -0.0010 -0.0005 0.0000
Stre
ss, σ
z (M
Pa)
Strain (mm/mm)
Element 8904Element 8907Element 8910
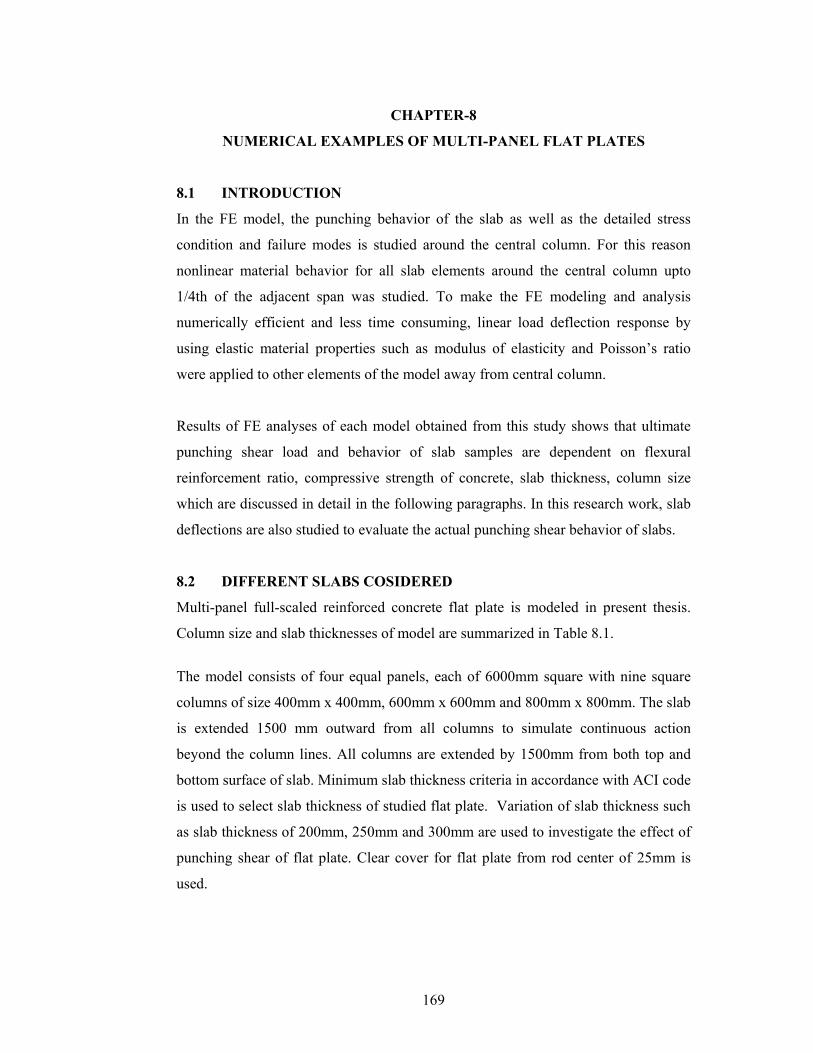
169
CHAPTER-8
NUMERICAL EXAMPLES OF MULTI-PANEL FLAT PLATES
8.1 INTRODUCTION
In the FE model, the punching behavior of the slab as well as the detailed stress
condition and failure modes is studied around the central column. For this reason
nonlinear material behavior for all slab elements around the central column upto
1/4th of the adjacent span was studied. To make the FE modeling and analysis
numerically efficient and less time consuming, linear load deflection response by
using elastic material properties such as modulus of elasticity and Poisson’s ratio
were applied to other elements of the model away from central column.
Results of FE analyses of each model obtained from this study shows that ultimate
punching shear load and behavior of slab samples are dependent on flexural
reinforcement ratio, compressive strength of concrete, slab thickness, column size
which are discussed in detail in the following paragraphs. In this research work, slab
deflections are also studied to evaluate the actual punching shear behavior of slabs.
8.2 DIFFERENT SLABS COSIDERED
Multi-panel full-scaled reinforced concrete flat plate is modeled in present thesis.
Column size and slab thicknesses of model are summarized in Table 8.1.
The model consists of four equal panels, each of 6000mm square with nine square
columns of size 400mm x 400mm, 600mm x 600mm and 800mm x 800mm. The slab
is extended 1500 mm outward from all columns to simulate continuous action
beyond the column lines. All columns are extended by 1500mm from both top and
bottom surface of slab. Minimum slab thickness criteria in accordance with ACI code
is used to select slab thickness of studied flat plate. Variation of slab thickness such
as slab thickness of 200mm, 250mm and 300mm are used to investigate the effect of
punching shear of flat plate. Clear cover for flat plate from rod center of 25mm is
used.
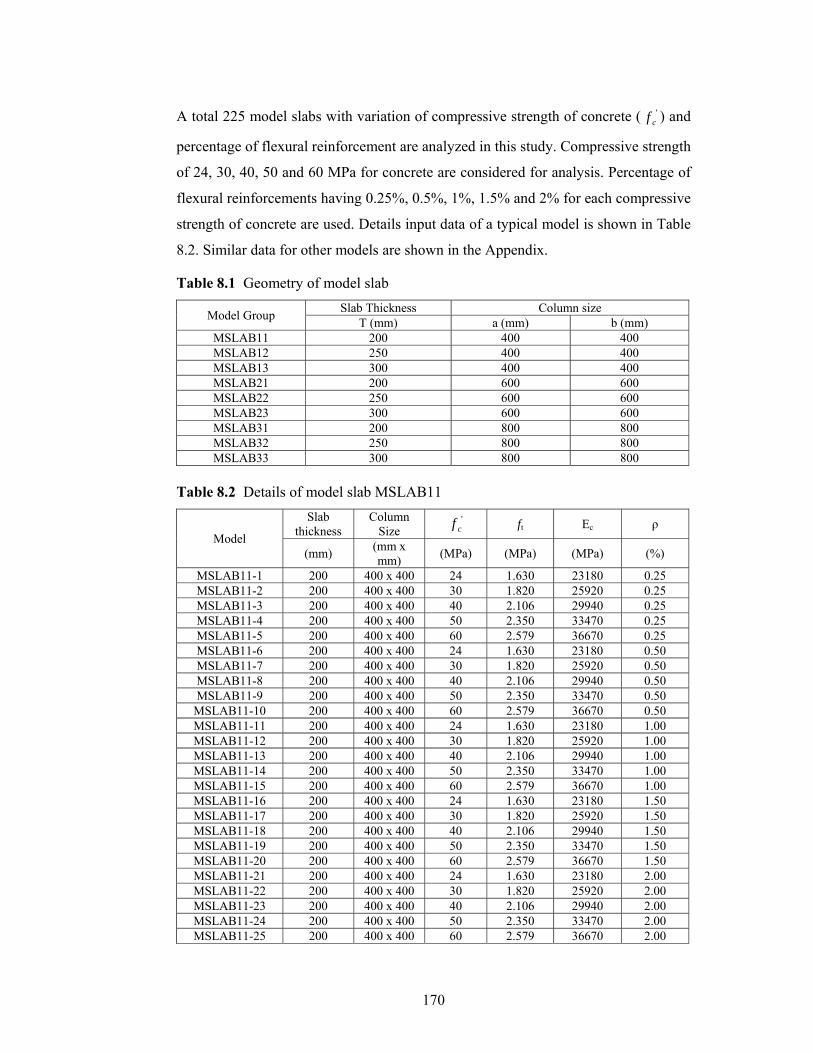
170
A total 225 model slabs with variation of compressive strength of concrete ( 'cf ) and
percentage of flexural reinforcement are analyzed in this study. Compressive strength
of 24, 30, 40, 50 and 60 MPa for concrete are considered for analysis. Percentage of
flexural reinforcements having 0.25%, 0.5%, 1%, 1.5% and 2% for each compressive
strength of concrete are used. Details input data of a typical model is shown in Table
8.2. Similar data for other models are shown in the Appendix.
Table 8.1 Geometry of model slab
Model Group Slab Thickness Column size T (mm) a (mm) b (mm)
MSLAB11 200 400 400 MSLAB12 250 400 400 MSLAB13 300 400 400 MSLAB21 200 600 600 MSLAB22 250 600 600 MSLAB23 300 600 600 MSLAB31 200 800 800 MSLAB32 250 800 800 MSLAB33 300 800 800
Table 8.2 Details of model slab MSLAB11
Model
Slab thickness
Column Size
'cf ft Ec
ρ
(mm) (mm x mm) (MPa) (MPa) (MPa) (%)
MSLAB11-1 200 400 x 400 24 1.630 23180 0.25 MSLAB11-2 200 400 x 400 30 1.820 25920 0.25 MSLAB11-3 200 400 x 400 40 2.106 29940 0.25 MSLAB11-4 200 400 x 400 50 2.350 33470 0.25 MSLAB11-5 200 400 x 400 60 2.579 36670 0.25MSLAB11-6 200 400 x 400 24 1.630 23180 0.50MSLAB11-7 200 400 x 400 30 1.820 25920 0.50 MSLAB11-8 200 400 x 400 40 2.106 29940 0.50 MSLAB11-9 200 400 x 400 50 2.350 33470 0.50 MSLAB11-10 200 400 x 400 60 2.579 36670 0.50 MSLAB11-11 200 400 x 400 24 1.630 23180 1.00MSLAB11-12 200 400 x 400 30 1.820 25920 1.00MSLAB11-13 200 400 x 400 40 2.106 29940 1.00 MSLAB11-14 200 400 x 400 50 2.350 33470 1.00 MSLAB11-15 200 400 x 400 60 2.579 36670 1.00 MSLAB11-16 200 400 x 400 24 1.630 23180 1.50 MSLAB11-17 200 400 x 400 30 1.820 25920 1.50 MSLAB11-18 200 400 x 400 40 2.106 29940 1.50 MSLAB11-19 200 400 x 400 50 2.350 33470 1.50 MSLAB11-20 200 400 x 400 60 2.579 36670 1.50 MSLAB11-21 200 400 x 400 24 1.630 23180 2.00 MSLAB11-22 200 400 x 400 30 1.820 25920 2.00 MSLAB11-23 200 400 x 400 40 2.106 29940 2.00 MSLAB11-24 200 400 x 400 50 2.350 33470 2.00 MSLAB11-25 200 400 x 400 60 2.579 36670 2.00
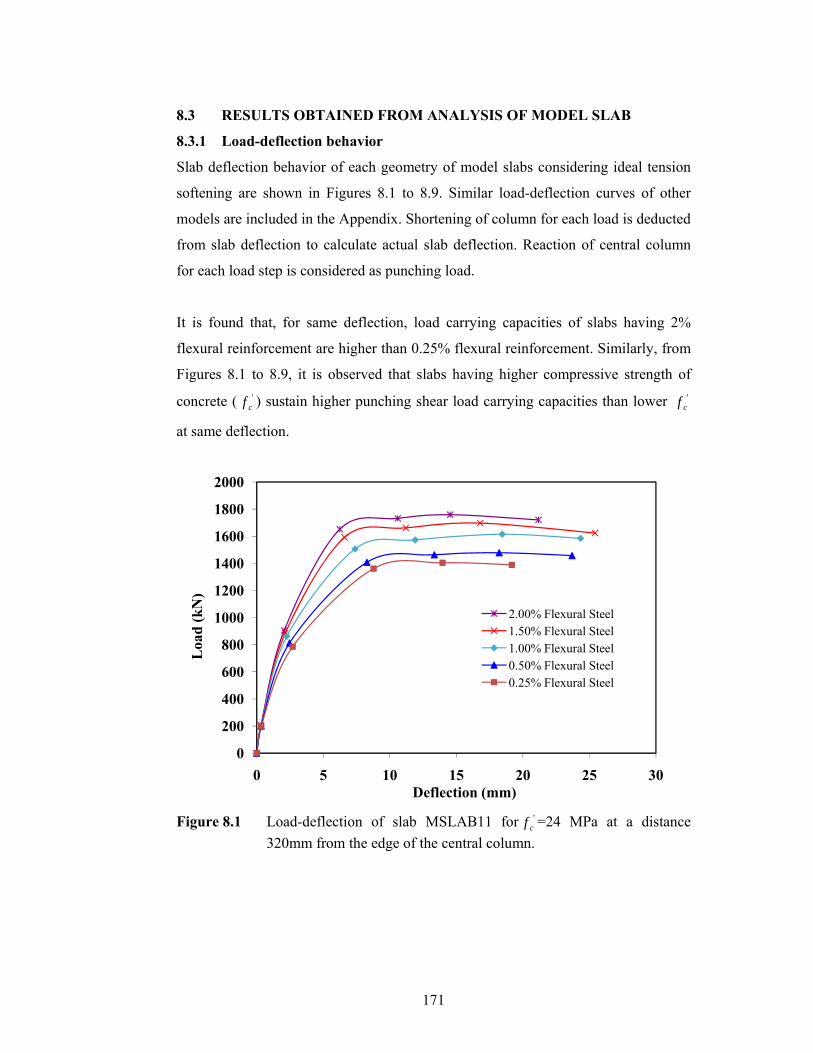
171
8.3 RESULTS OBTAINED FROM ANALYSIS OF MODEL SLAB
8.3.1 Load-deflection behavior
Slab deflection behavior of each geometry of model slabs considering ideal tension
softening are shown in Figures 8.1 to 8.9. Similar load-deflection curves of other
models are included in the Appendix. Shortening of column for each load is deducted
from slab deflection to calculate actual slab deflection. Reaction of central column
for each load step is considered as punching load.
It is found that, for same deflection, load carrying capacities of slabs having 2%
flexural reinforcement are higher than 0.25% flexural reinforcement. Similarly, from
Figures 8.1 to 8.9, it is observed that slabs having higher compressive strength of
concrete ( 'cf ) sustain higher punching shear load carrying capacities than lower '
cf
at same deflection.
Figure 8.1 Load-deflection of slab MSLAB11 for '
cf =24 MPa at a distance 320mm from the edge of the central column.
0
200
400
600
800
1000
1200
1400
1600
1800
2000
0 5 10 15 20 25 30
Loa
d (k
N)
Deflection (mm)
2.00% Flexural Steel1.50% Flexural Steel1.00% Flexural Steel0.50% Flexural Steel0.25% Flexural Steel
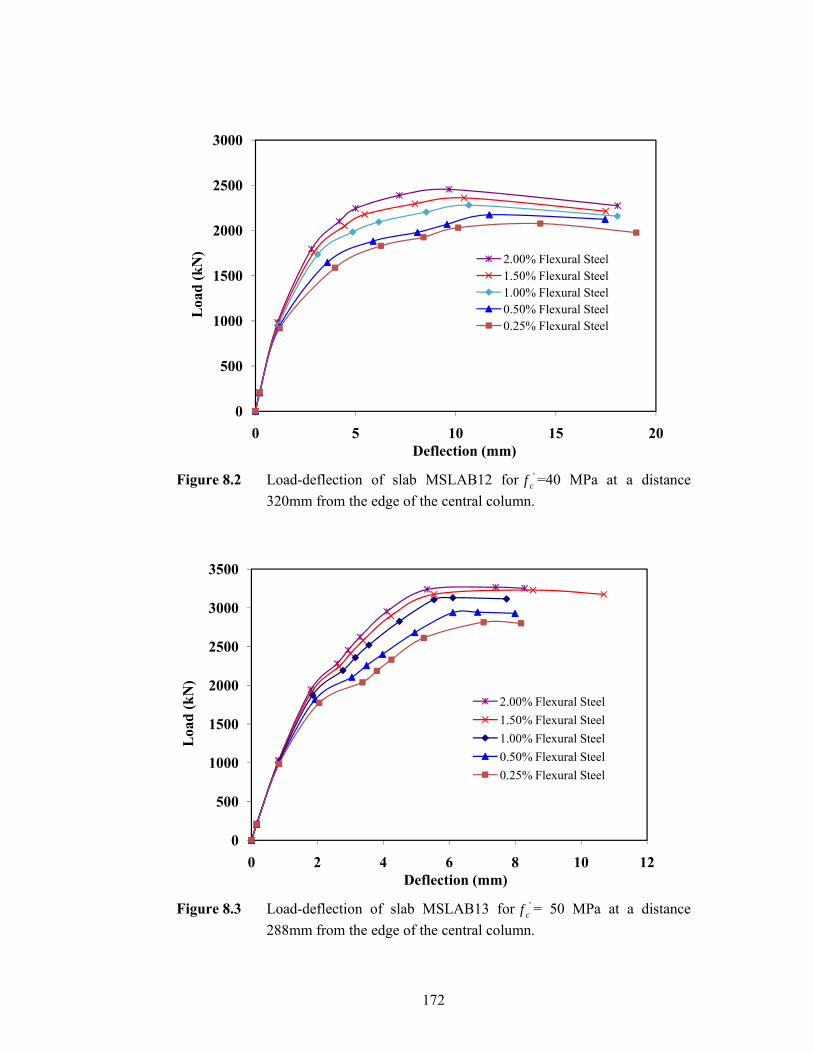
172
Figure 8.2 Load-deflection of slab MSLAB12 for '
cf =40 MPa at a distance 320mm from the edge of the central column.
Figure 8.3 Load-deflection of slab MSLAB13 for '
cf = 50 MPa at a distance 288mm from the edge of the central column.
0
500
1000
1500
2000
2500
3000
0 5 10 15 20
Loa
d (k
N)
Deflection (mm)
2.00% Flexural Steel1.50% Flexural Steel1.00% Flexural Steel0.50% Flexural Steel0.25% Flexural Steel
0
500
1000
1500
2000
2500
3000
3500
0 2 4 6 8 10 12
Loa
d (k
N)
Deflection (mm)
2.00% Flexural Steel1.50% Flexural Steel1.00% Flexural Steel0.50% Flexural Steel0.25% Flexural Steel
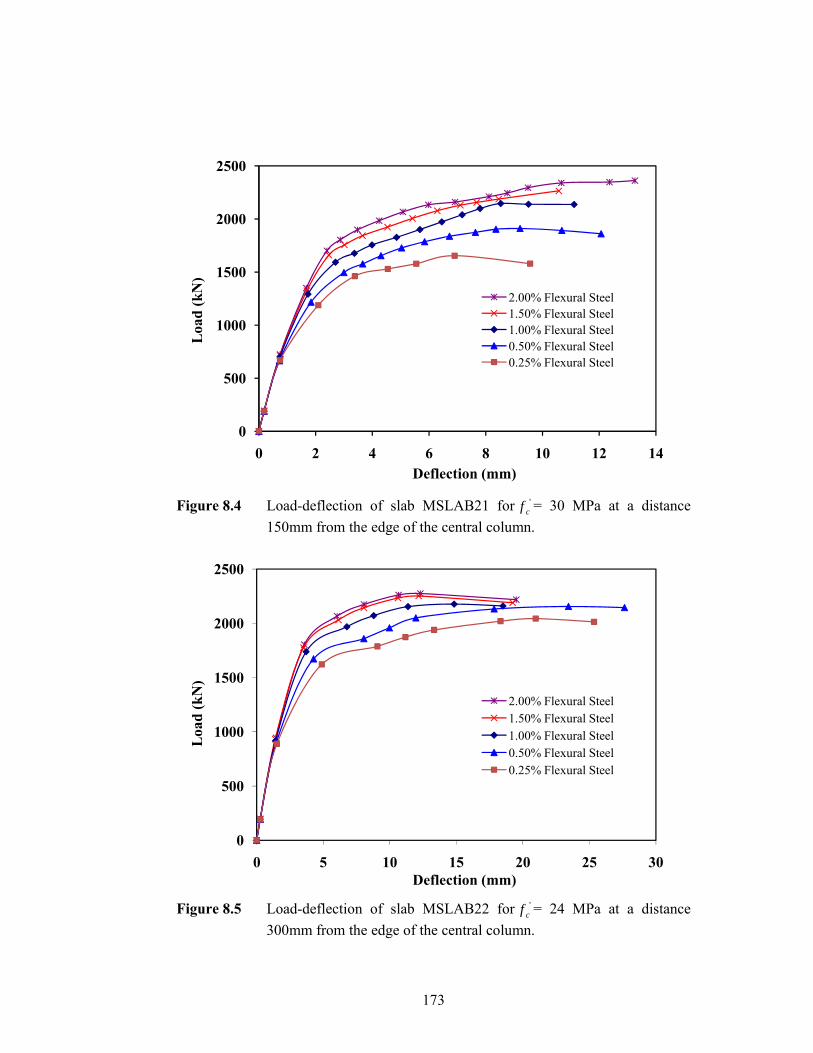
173
Figure 8.4 Load-deflection of slab MSLAB21 for '
cf = 30 MPa at a distance 150mm from the edge of the central column.
Figure 8.5 Load-deflection of slab MSLAB22 for '
cf = 24 MPa at a distance 300mm from the edge of the central column.
0
500
1000
1500
2000
2500
0 2 4 6 8 10 12 14
Loa
d (k
N)
Deflection (mm)
2.00% Flexural Steel1.50% Flexural Steel1.00% Flexural Steel0.50% Flexural Steel0.25% Flexural Steel
0
500
1000
1500
2000
2500
0 5 10 15 20 25 30
Loa
d (k
N)
Deflection (mm)
2.00% Flexural Steel1.50% Flexural Steel1.00% Flexural Steel0.50% Flexural Steel0.25% Flexural Steel
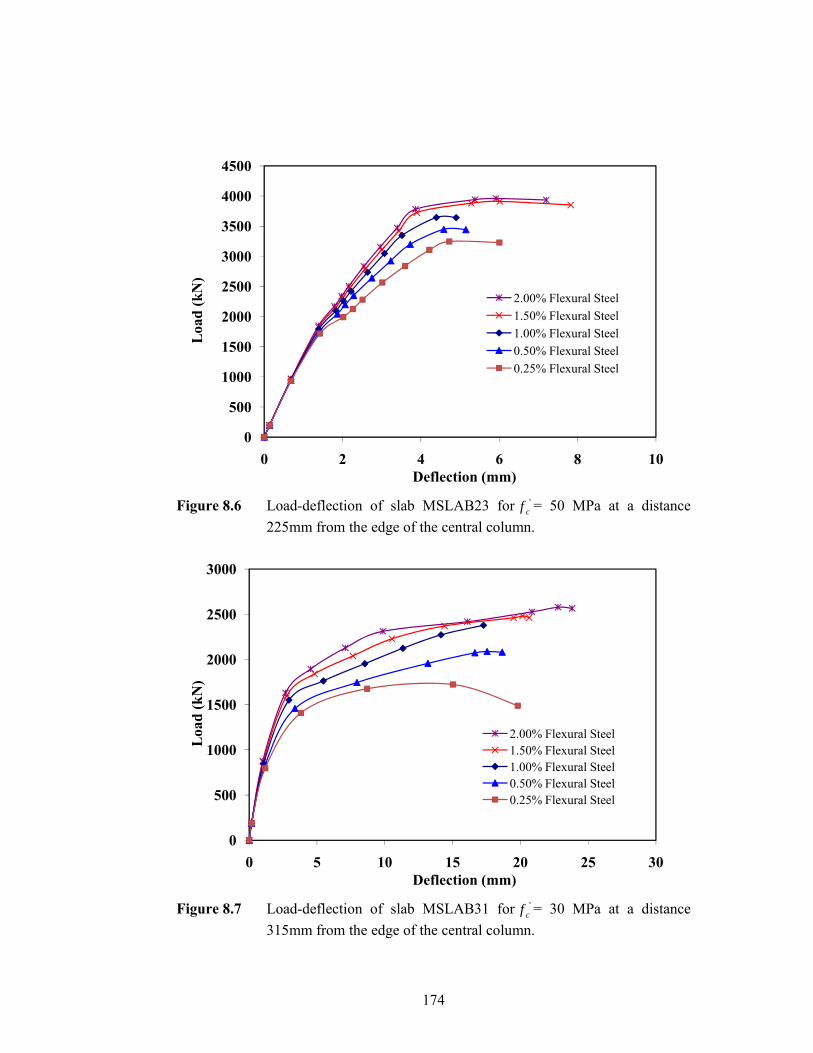
174
Figure 8.6 Load-deflection of slab MSLAB23 for '
cf = 50 MPa at a distance 225mm from the edge of the central column.
Figure 8.7 Load-deflection of slab MSLAB31 for '
cf = 30 MPa at a distance 315mm from the edge of the central column.
0
500
1000
1500
2000
2500
3000
3500
4000
4500
0 2 4 6 8 10
Loa
d (k
N)
Deflection (mm)
2.00% Flexural Steel1.50% Flexural Steel1.00% Flexural Steel0.50% Flexural Steel0.25% Flexural Steel
0
500
1000
1500
2000
2500
3000
0 5 10 15 20 25 30
Loa
d (k
N)
Deflection (mm)
2.00% Flexural Steel1.50% Flexural Steel1.00% Flexural Steel0.50% Flexural Steel0.25% Flexural Steel
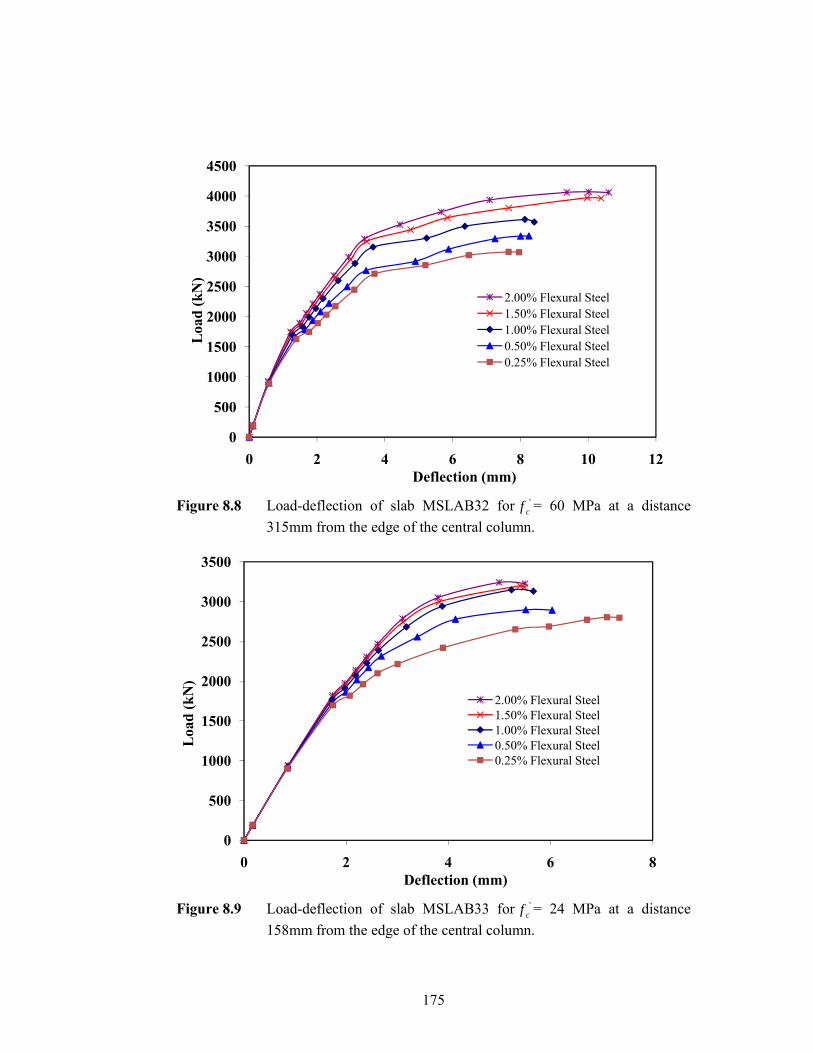
175
Figure 8.8 Load-deflection of slab MSLAB32 for '
cf = 60 MPa at a distance 315mm from the edge of the central column.
Figure 8.9 Load-deflection of slab MSLAB33 for '
cf = 24 MPa at a distance 158mm from the edge of the central column.
0
500
1000
1500
2000
2500
3000
3500
4000
4500
0 2 4 6 8 10 12
Loa
d (k
N)
Deflection (mm)
2.00% Flexural Steel1.50% Flexural Steel1.00% Flexural Steel0.50% Flexural Steel0.25% Flexural Steel
0
500
1000
1500
2000
2500
3000
3500
0 2 4 6 8
Loa
d (k
N)
Deflection (mm)
2.00% Flexural Steel1.50% Flexural Steel1.00% Flexural Steel0.50% Flexural Steel0.25% Flexural Steel
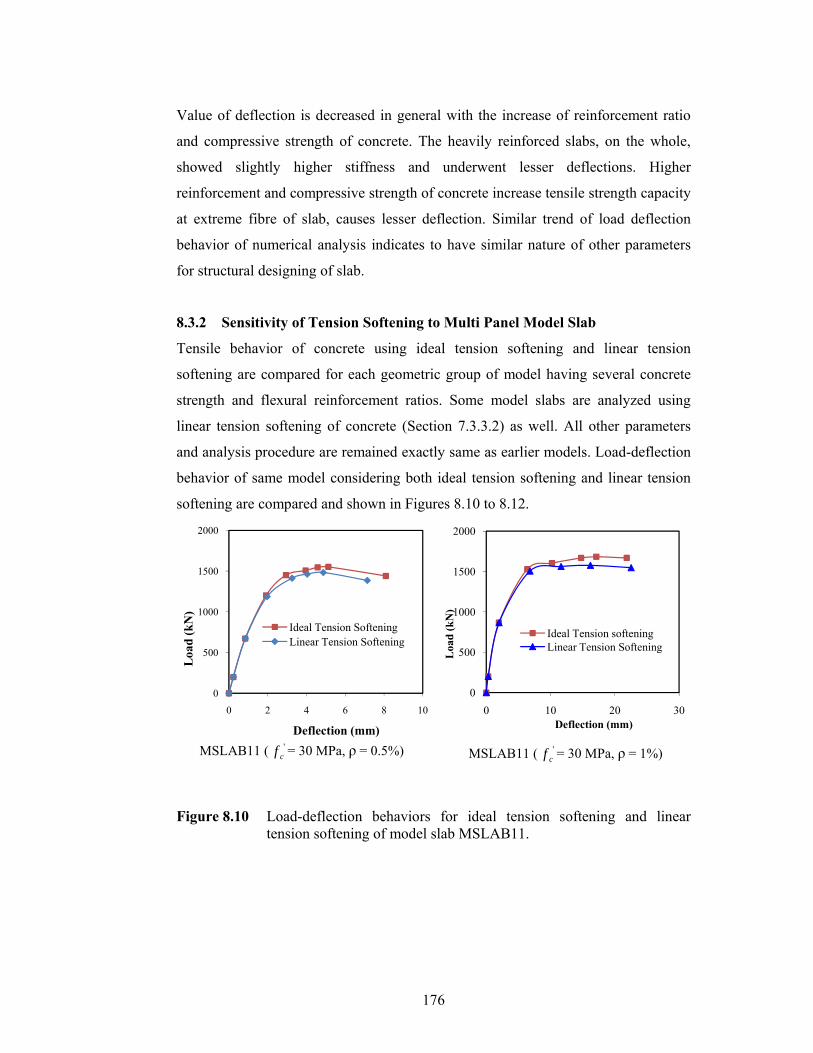
176
Value of deflection is decreased in general with the increase of reinforcement ratio
and compressive strength of concrete. The heavily reinforced slabs, on the whole,
showed slightly higher stiffness and underwent lesser deflections. Higher
reinforcement and compressive strength of concrete increase tensile strength capacity
at extreme fibre of slab, causes lesser deflection. Similar trend of load deflection
behavior of numerical analysis indicates to have similar nature of other parameters
for structural designing of slab.
8.3.2 Sensitivity of Tension Softening to Multi Panel Model Slab
Tensile behavior of concrete using ideal tension softening and linear tension
softening are compared for each geometric group of model having several concrete
strength and flexural reinforcement ratios. Some model slabs are analyzed using
linear tension softening of concrete (Section 7.3.3.2) as well. All other parameters
and analysis procedure are remained exactly same as earlier models. Load-deflection
behavior of same model considering both ideal tension softening and linear tension
softening are compared and shown in Figures 8.10 to 8.12.
MSLAB11 ( 'cf = 30 MPa, ρ = 0.5%)
MSLAB11 ( '
cf = 30 MPa, ρ = 1%)
Figure 8.10 Load-deflection behaviors for ideal tension softening and linear tension softening of model slab MSLAB11.
0
500
1000
1500
2000
0 2 4 6 8 10
Loa
d (k
N)
Deflection (mm)
Ideal Tension SofteningLinear Tension Softening
0
500
1000
1500
2000
0 10 20 30
Loa
d (k
N)
Deflection (mm)
Ideal Tension softeningLinear Tension Softening
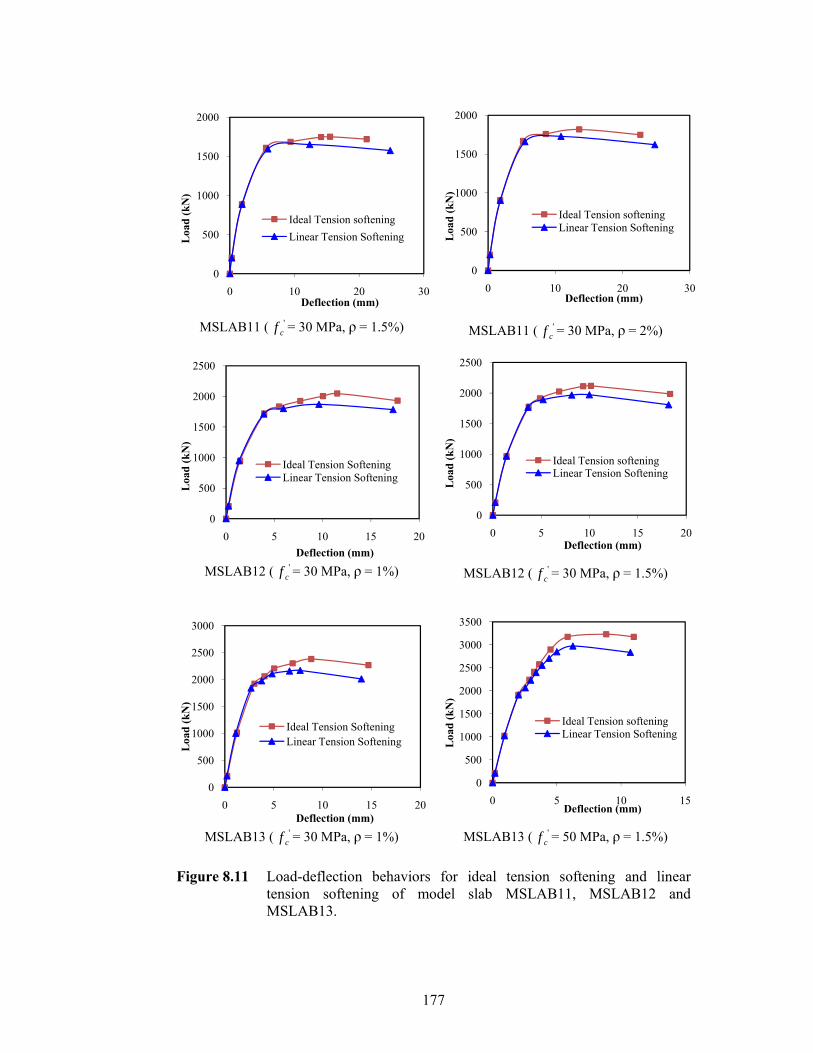
177
MSLAB11 ( 'cf = 30 MPa, ρ = 1.5%)
MSLAB11 ( '
cf = 30 MPa, ρ = 2%)
MSLAB12 ( 'cf = 30 MPa, ρ = 1%)
MSLAB12 ( '
cf = 30 MPa, ρ = 1.5%)
MSLAB13 ( 'cf = 30 MPa, ρ = 1%)
MSLAB13 ( '
cf = 50 MPa, ρ = 1.5%)
Figure 8.11 Load-deflection behaviors for ideal tension softening and linear
tension softening of model slab MSLAB11, MSLAB12 and MSLAB13.
0
500
1000
1500
2000
0 10 20 30
Loa
d (k
N)
Deflection (mm)
Ideal Tension softeningLinear Tension Softening
0
500
1000
1500
2000
0 10 20 30
Loa
d (k
N)
Deflection (mm)
Ideal Tension softeningLinear Tension Softening
0
500
1000
1500
2000
2500
0 5 10 15 20
Loa
d (k
N)
Deflection (mm)
Ideal Tension SofteningLinear Tension Softening
0
500
1000
1500
2000
2500
0 5 10 15 20
Loa
d (k
N)
Deflection (mm)
Ideal Tension softeningLinear Tension Softening
0
500
1000
1500
2000
2500
3000
0 5 10 15 20
Loa
d (k
N)
Deflection (mm)
Ideal Tension SofteningLinear Tension Softening
0
500
1000
1500
2000
2500
3000
3500
0 5 10 15
Loa
d (k
N)
Deflection (mm)
Ideal Tension softeningLinear Tension Softening
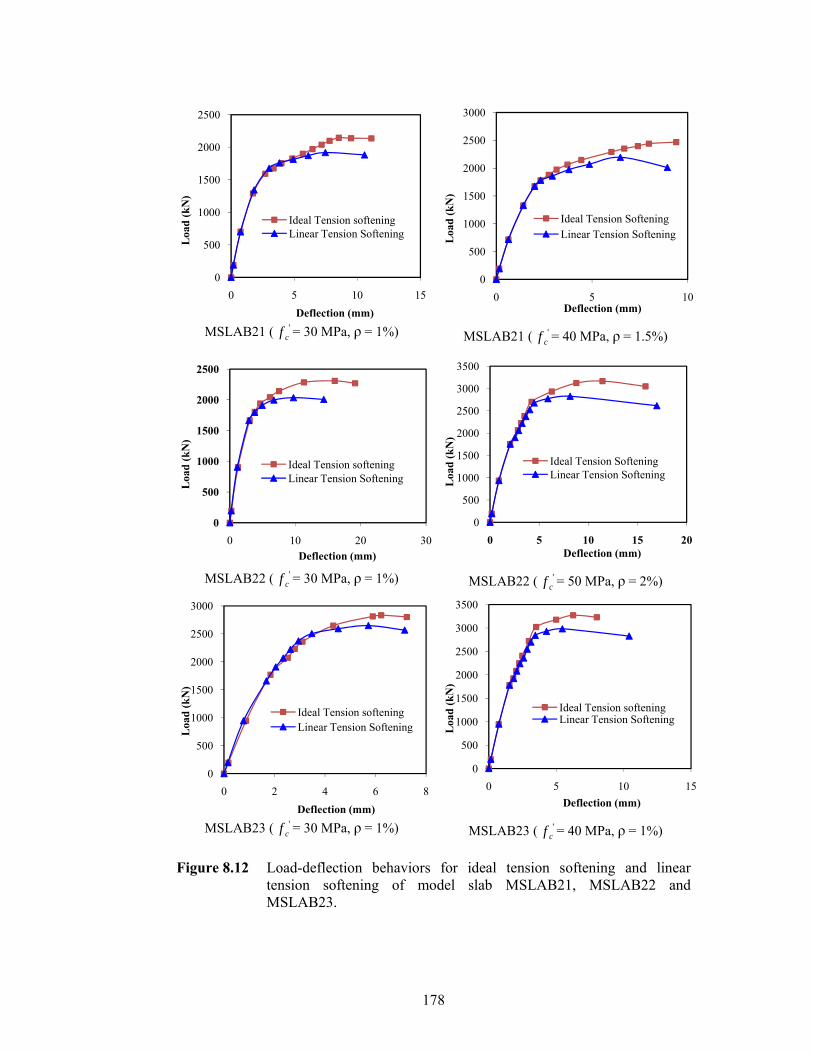
178
MSLAB21 ( 'cf = 30 MPa, ρ = 1%) MSLAB21 ( '
cf = 40 MPa, ρ = 1.5%)
MSLAB22 ( 'cf = 30 MPa, ρ = 1%) MSLAB22 ( '
cf = 50 MPa, ρ = 2%)
MSLAB23 ( 'cf = 30 MPa, ρ = 1%)
MSLAB23 ( '
cf = 40 MPa, ρ = 1%)
Figure 8.12 Load-deflection behaviors for ideal tension softening and linear tension softening of model slab MSLAB21, MSLAB22 and MSLAB23.
0
500
1000
1500
2000
2500
0 5 10 15
Loa
d (k
N)
Deflection (mm)
Ideal Tension softeningLinear Tension Softening
0
500
1000
1500
2000
2500
3000
0 5 10
Loa
d (k
N)
Deflection (mm)
Ideal Tension SofteningLinear Tension Softening
0
500
1000
1500
2000
2500
0 10 20 30
Loa
d (k
N)
Deflection (mm)
Ideal Tension softeningLinear Tension Softening
0
500
1000
1500
2000
2500
3000
3500
0 5 10 15 20
Loa
d (k
N)
Deflection (mm)
Ideal Tension SofteningLinear Tension Softening
0
500
1000
1500
2000
2500
3000
0 2 4 6 8
Loa
d (k
N)
Deflection (mm)
Ideal Tension softeningLinear Tension Softening
0
500
1000
1500
2000
2500
3000
3500
0 5 10 15
Loa
d (k
N)
Deflection (mm)
Ideal Tension softeningLinear Tension Softening
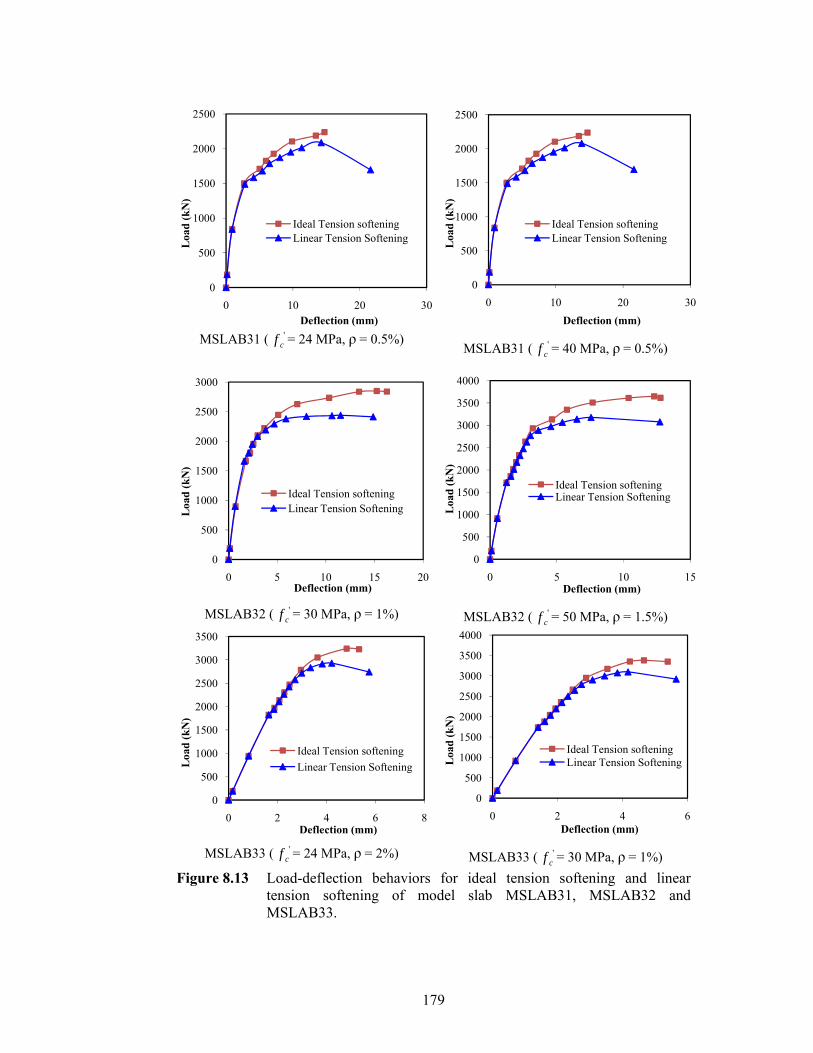
179
MSLAB31 ( 'cf = 24 MPa, ρ = 0.5%)
MSLAB31 ( '
cf = 40 MPa, ρ = 0.5%)
MSLAB32 ( 'cf = 30 MPa, ρ = 1%) MSLAB32 ( '
cf = 50 MPa, ρ = 1.5%)
MSLAB33 ( 'cf = 24 MPa, ρ = 2%) MSLAB33 ( '
cf = 30 MPa, ρ = 1%) Figure 8.13 Load-deflection behaviors for ideal tension softening and linear
tension softening of model slab MSLAB31, MSLAB32 and MSLAB33.
0
500
1000
1500
2000
2500
0 10 20 30
Loa
d (k
N)
Deflection (mm)
Ideal Tension softeningLinear Tension Softening
0
500
1000
1500
2000
2500
0 10 20 30
Loa
d (k
N)
Deflection (mm)
Ideal Tension softeningLinear Tension Softening
0
500
1000
1500
2000
2500
3000
0 5 10 15 20
Loa
d (k
N)
Deflection (mm)
Ideal Tension softeningLinear Tension Softening
0
500
1000
1500
2000
2500
3000
3500
4000
0 5 10 15
Loa
d (k
N)
Deflection (mm)
Ideal Tension softeningLinear Tension Softening
0
500
1000
1500
2000
2500
3000
3500
0 2 4 6 8
Loa
d (k
N)
Deflection (mm)
Ideal Tension softeningLinear Tension Softening
0
500
1000
1500
2000
2500
3000
3500
4000
0 2 4 6
Loa
d (k
N)
Deflection (mm)
Ideal Tension softeningLinear Tension Softening
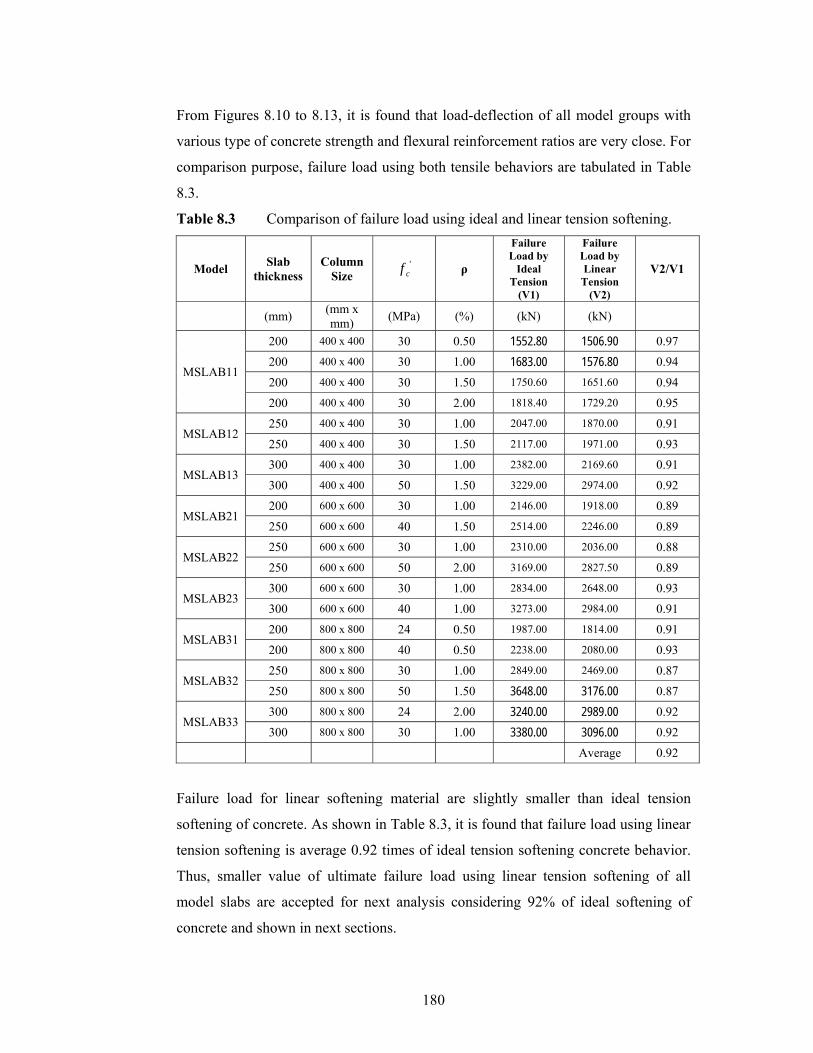
180
From Figures 8.10 to 8.13, it is found that load-deflection of all model groups with
various type of concrete strength and flexural reinforcement ratios are very close. For
comparison purpose, failure load using both tensile behaviors are tabulated in Table
8.3.
Table 8.3 Comparison of failure load using ideal and linear tension softening.
Model Slab thickness
Column Size
'cf ρ
Failure Load by
Ideal Tension
(V1)
Failure Load by Linear Tension
(V2)
V2/V1
(mm) (mm x mm) (MPa) (%) (kN) (kN)
MSLAB11
200 400 x 400 30 0.50 1552.80 1506.90 0.97 200 400 x 400 30 1.00 1683.00 1576.80 0.94
200 400 x 400 30 1.50 1750.60 1651.60 0.94
200 400 x 400 30 2.00 1818.40 1729.20 0.95
MSLAB12 250 400 x 400 30 1.00 2047.00 1870.00 0.91
250 400 x 400 30 1.50 2117.00 1971.00 0.93
MSLAB13 300 400 x 400 30 1.00 2382.00 2169.60 0.91
300 400 x 400 50 1.50 3229.00 2974.00 0.92
MSLAB21 200 600 x 600 30 1.00 2146.00 1918.00 0.89
250 600 x 600 40 1.50 2514.00 2246.00 0.89
MSLAB22 250 600 x 600 30 1.00 2310.00 2036.00 0.88
250 600 x 600 50 2.00 3169.00 2827.50 0.89
MSLAB23 300 600 x 600 30 1.00 2834.00 2648.00 0.93
300 600 x 600 40 1.00 3273.00 2984.00 0.91
MSLAB31 200 800 x 800 24 0.50 1987.00 1814.00 0.91
200 800 x 800 40 0.50 2238.00 2080.00 0.93
MSLAB32 250 800 x 800 30 1.00 2849.00 2469.00 0.87
250 800 x 800 50 1.50 3648.00 3176.00 0.87
MSLAB33 300 800 x 800 24 2.00 3240.00 2989.00 0.92 300 800 x 800 30 1.00 3380.00 3096.00 0.92
Average 0.92
Failure load for linear softening material are slightly smaller than ideal tension
softening of concrete. As shown in Table 8.3, it is found that failure load using linear
tension softening is average 0.92 times of ideal tension softening concrete behavior.
Thus, smaller value of ultimate failure load using linear tension softening of all
model slabs are accepted for next analysis considering 92% of ideal softening of
concrete and shown in next sections.
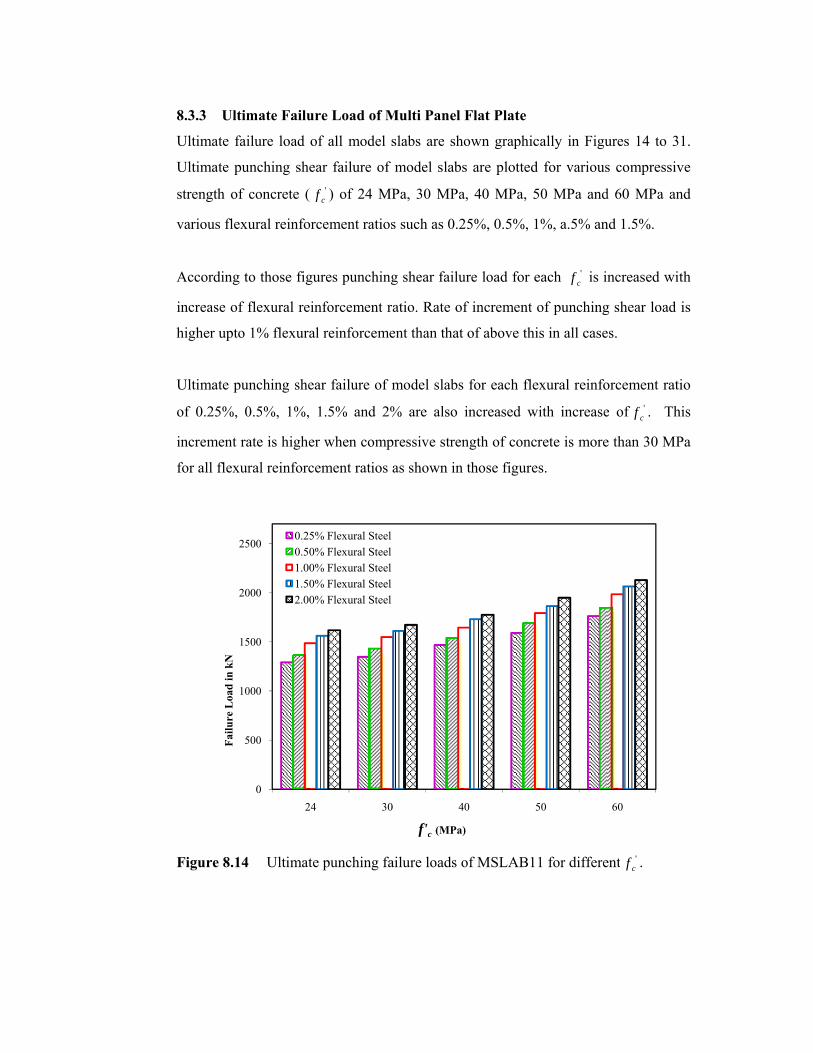
8
U
U
s
v
A
i
h
U
o
i
f
F
8.3.3 Ultim
Ultimate fai
Ultimate pu
strength of c
various flexu
According to
increase of f
higher upto
Ultimate pun
of 0.25%, 0
increment ra
for all flexur
Figure 8.14
5
10
15
20
25
Failu
re L
oad
in k
N
mate Failur
ilure load of
nching shea
concrete ( f
ural reinforc
o those figur
flexural rein
1% flexural
nching shea
0.5%, 1%, 1
ate is higher
ral reinforce
Ultimate
0
500
000
500
000
500
24
0.25%0.50%1.00%1.50%2.00%
re Load of M
f all model s
ar failure of '
cf ) of 24 MP
cement ratios
res punching
nforcement r
reinforceme
ar failure of m
1.5% and 2%
when comp
ment ratios
punching fa
30
% Flexural Steel% Flexural Steel% Flexural Steel% Flexural Steel% Flexural Steel
Multi Panel
slabs are sho
model slabs
Pa, 30 MPa
s such as 0.2
g shear failu
atio. Rate of
ent than that
model slabs
% are also
pressive stren
as shown in
ailure loads o
0 4
f'c (MPa)
Flat Plate
own graphic
s are plotted
a, 40 MPa, 5
25%, 0.5%, 1
ure load for e
f increment
of above thi
for each fle
increased w
ngth of conc
those figure
of MSLAB1
0
)
cally in Figu
d for various
50 MPa and
1%, a.5% an
each 'cf is i
of punching
is in all case
exural reinfo
with increase
crete is more
es.
1 for differe
50
ures 14 to 3
s compressiv
d 60 MPa an
nd 1.5%.
ncreased wi
g shear load
es.
orcement rat
e of 'cf . Th
e than 30 MP
ent '
cf .
60
1.
ve
nd
ith
is
tio
his
Pa
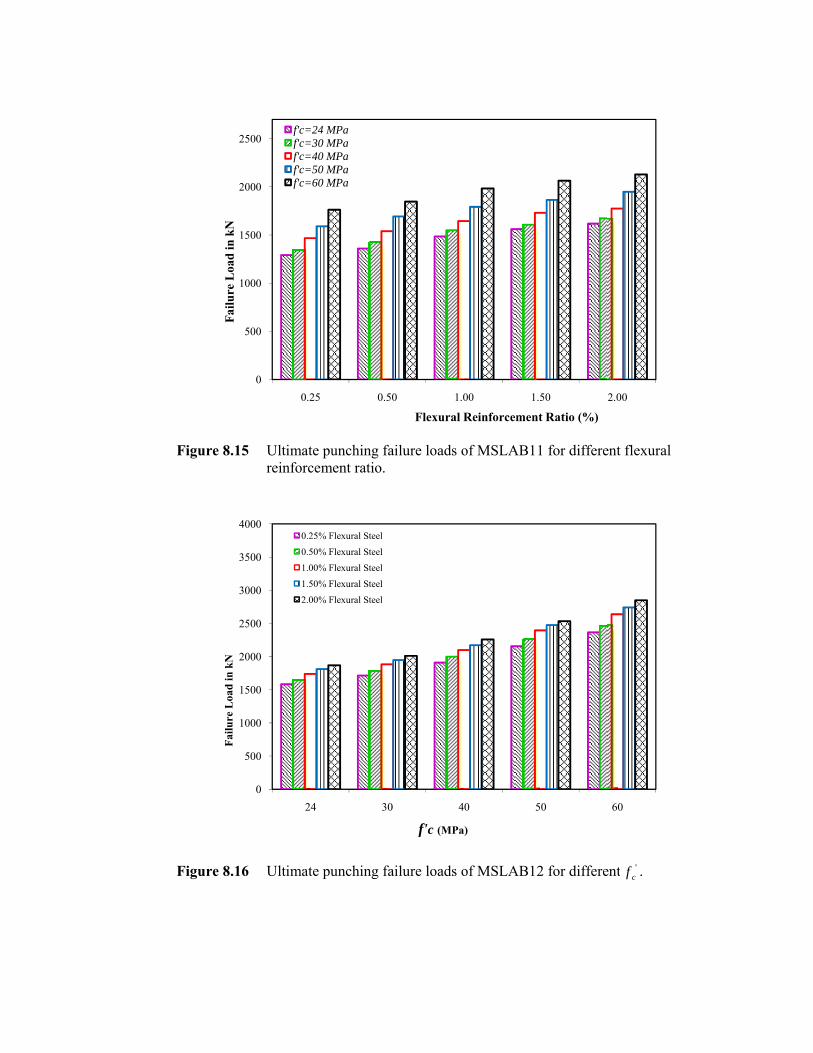
F
F
Figure 8.15
Figure 8.16
5
10
15
20
25
Failu
re L
oad
in k
N
5
10
15
20
25
30
35
40
Failu
re L
oad
in k
N
Ultimate reinforce
Ultimate
0
500
000
500
000
500
0.25
f'c=24f'c=30f'c=40f'c=50f'c=60
0
500
000
500
000
500
000
500
000
24
0.25%
0.50%
1.00%
1.50%
2.00%
punching fament ratio.
punching fa
0.50
4 MPa0 MPa0 MPa0 MPa0 MPa
30
% Flexural Steel
% Flexural Steel
% Flexural Steel
% Flexural Steel
% Flexural Steel
ailure loads o
ailure loads o
0 1.0
Flexural R
0 4
f'c (MPa
of MSLAB1
of MSLAB1
00 1
Reinforcemen
0
a)
1 for differe
2 for differe
.50
nt Ratio (%)
50
ent flexural
ent 'cf .
2.00
60
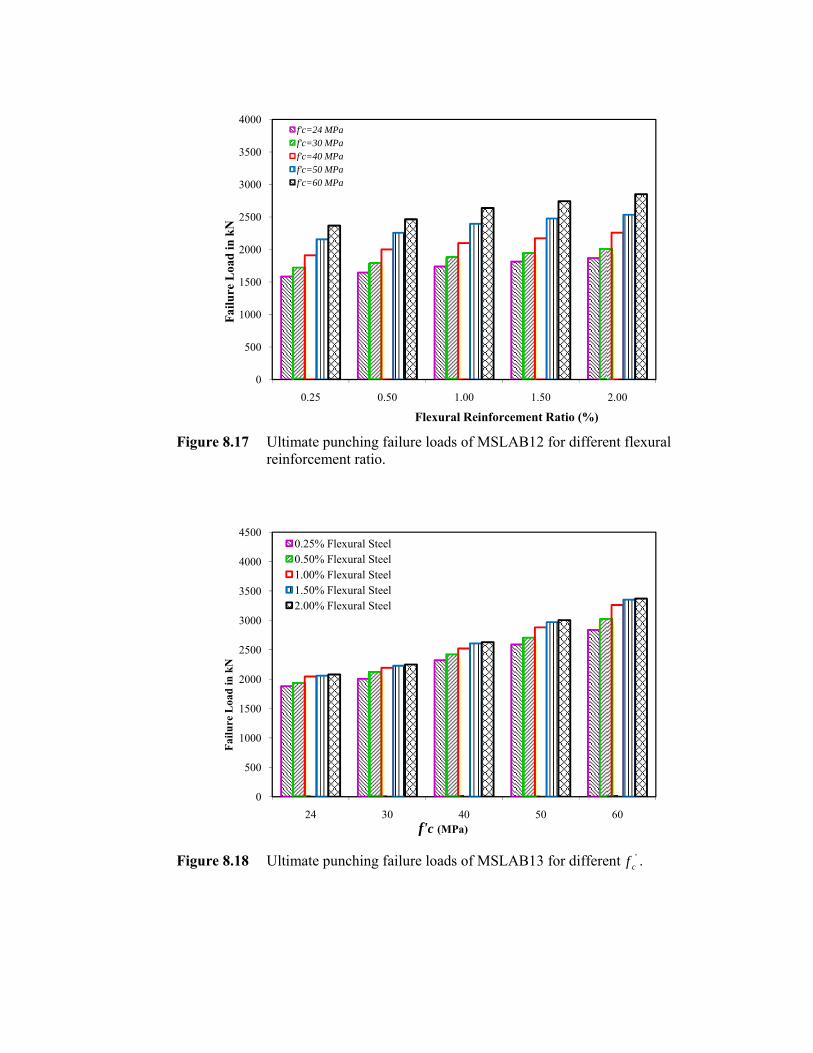
F
F
Figure 8.17
Figure 8.18
5
10
15
20
25
30
35
40
Failu
re L
oad
in k
N
5
10
15
20
25
30
35
40
45
Failu
re L
oad
in k
N
Ultimate reinforce
Ultimate
0
500
000
500
000
500
000
500
000
0.25
f'c=24f'c=30f'c=40f'c=50f'c=60
0
500
000
500
000
500
000
500
000
500
24
0.25%0.50%1.00%1.50%2.00%
punching fament ratio.
punching fa
0.50
4 MPa0 MPa0 MPa0 MPa0 MPa
30
% Flexural Steel% Flexural Steel% Flexural Steel% Flexural Steel% Flexural Steel
ailure loads o
ailure loads o
0 1.0
Flexural R
0 4f'c (MPa
of MSLAB1
of MSLAB1
00 1
Reinforcemen
0a)
2 for differe
3 for differe
.50
nt Ratio (%)
50
ent flexural
ent '
cf .
2.00
60
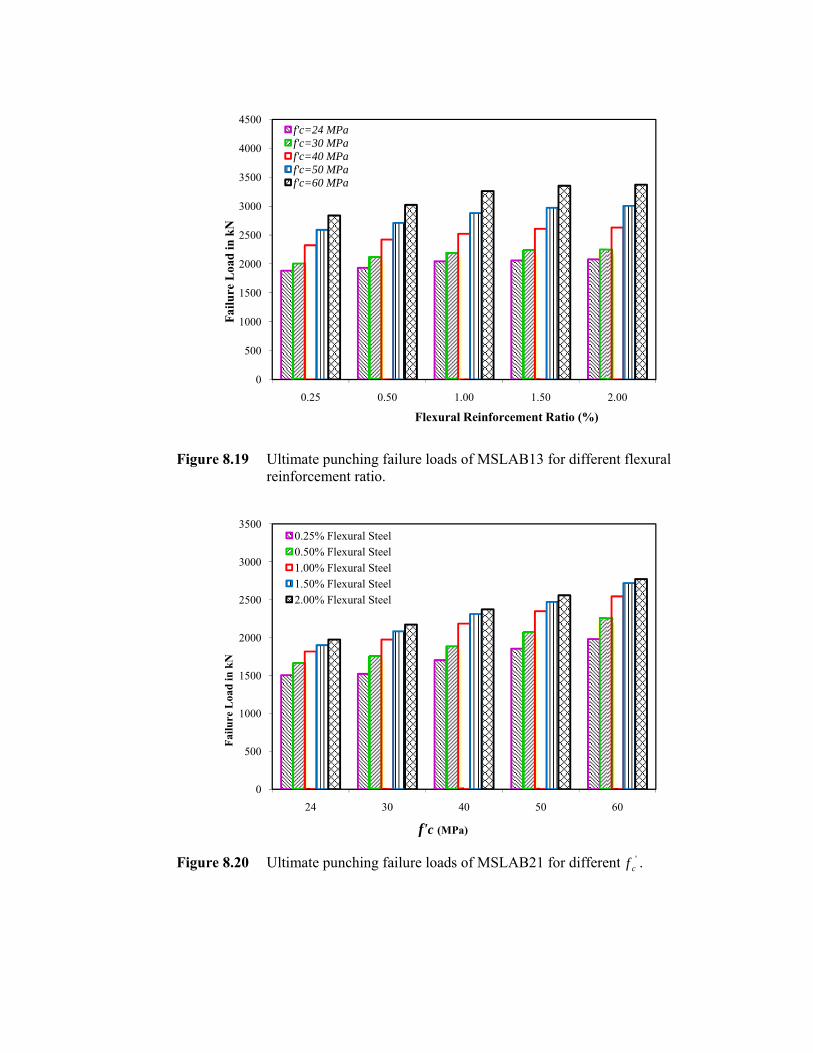
F
F
Figure 8.19
Figure 8.20
5
10
15
20
25
30
35
40
45
Failu
re L
oad
in k
N
5
10
15
20
25
30
35
Failu
re L
oad
in k
N
Ultimate reinforce
Ultimate
0
500
000
500
000
500
000
500
000
500
0.25
f'c=24f'c=30f'c=40f'c=50f'c=60
0
500
000
500
000
500
000
500
24
0.25%0.50%1.00%1.50%2.00%
punching fament ratio.
punching fa
0.50
4 MPa0 MPa0 MPa0 MPa0 MPa
30
% Flexural Steel% Flexural Steel% Flexural Steel% Flexural Steel% Flexural Steel
ailure loads o
ailure loads o
0 1.0
Flexural R
0 4
f'c (MPa
of MSLAB1
of MSLAB2
00 1
Reinforcemen
0
a)
3 for differe
21 for differe
.50
nt Ratio (%)
50
ent flexural
ent '
cf .
2.00
60
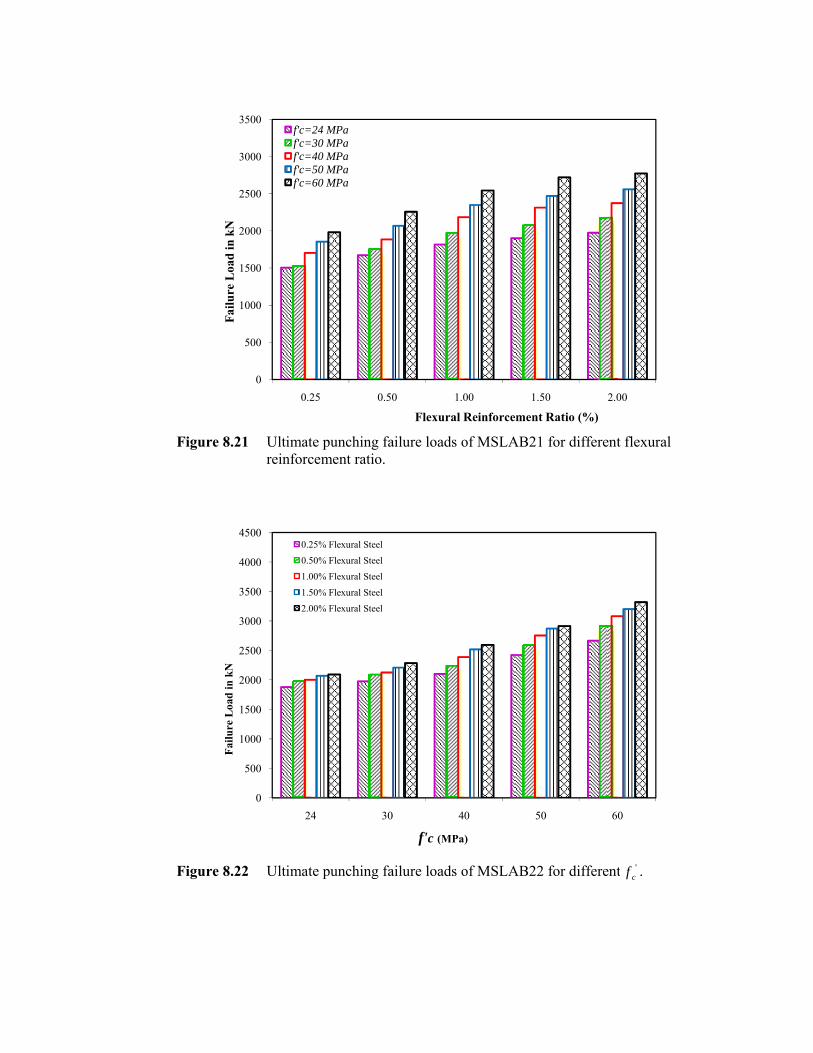
F
F
Figure 8.21
Figure 8.22
5
10
15
20
25
30
35
Failu
re L
oad
in k
N
5
10
15
20
25
30
35
40
45
Failu
re L
oad
in k
N
Ultimate reinforce
Ultimate
0
500
000
500
000
500
000
500
0.25
f'c=24f'c=30f'c=40f'c=50f'c=60
0
500
000
500
000
500
000
500
000
500
24
0.25%
0.50%
1.00%
1.50%
2.00%
punching fament ratio.
punching fa
0.50
4 MPa0 MPa0 MPa0 MPa0 MPa
30
% Flexural Steel
% Flexural Steel
% Flexural Steel
% Flexural Steel
% Flexural Steel
ailure loads o
ailure loads o
0 1.0
Flexural R
0 4
f'c (MPa
of MSLAB2
of MSLAB2
00 1
Reinforcemen
0
a)
21 for differe
22 for differe
.50
nt Ratio (%)
50
ent flexural
ent '
cf .
2.00
60
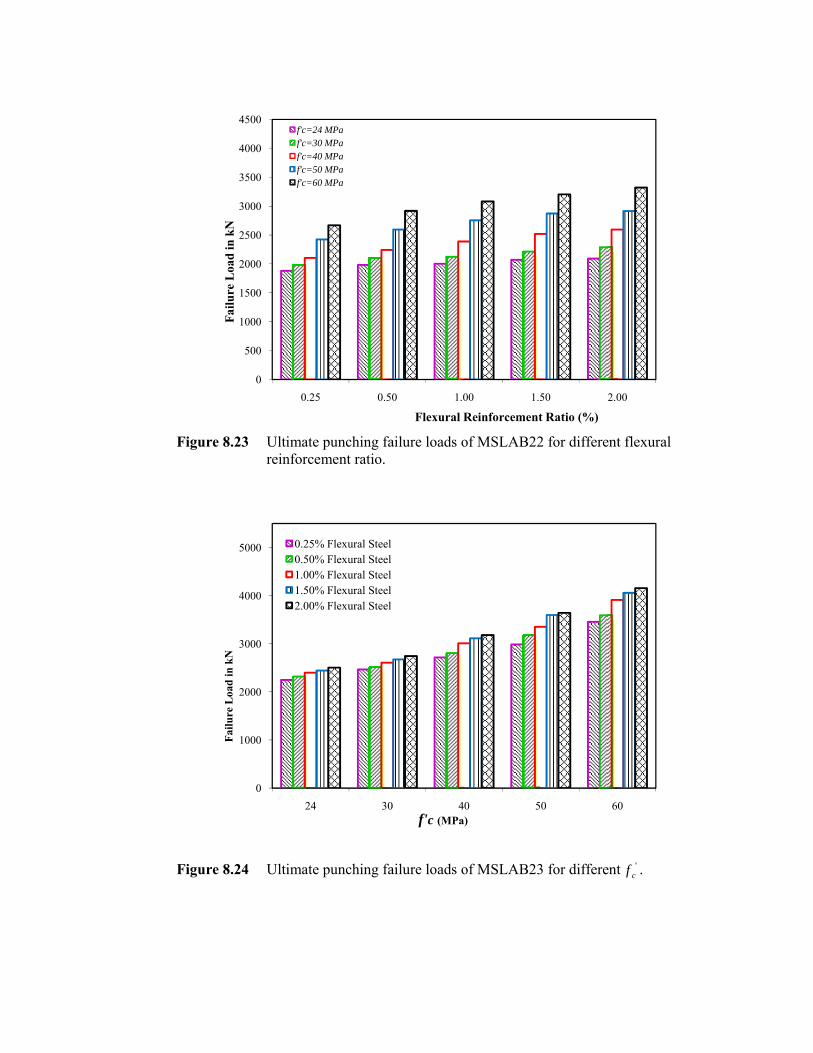
F
F
Figure 8.23
Figure 8.24
5
10
15
20
25
30
35
40
45
Failu
re L
oad
in k
N
10
20
30
40
50
Failu
re L
oad
in k
N
Ultimate reinforce
Ultimate
0
500
000
500
000
500
000
500
000
500
0.25
f'c=24f'c=30f'c=40f'c=50f'c=60
0
000
000
000
000
000
24
0.25%0.50%1.00%1.50%2.00%
punching fament ratio.
punching fa
0.50
4 MPa0 MPa0 MPa0 MPa0 MPa
30
% Flexural Steel% Flexural Steel% Flexural Steel% Flexural Steel% Flexural Steel
ailure loads o
ailure loads o
0 1.0
Flexural R
0 4f'c (MPa
of MSLAB2
of MSLAB2
00 1
Reinforcemen
0a)
22 for differe
23 for differe
.50
nt Ratio (%)
50
ent flexural
ent 'cf .
2.00
60
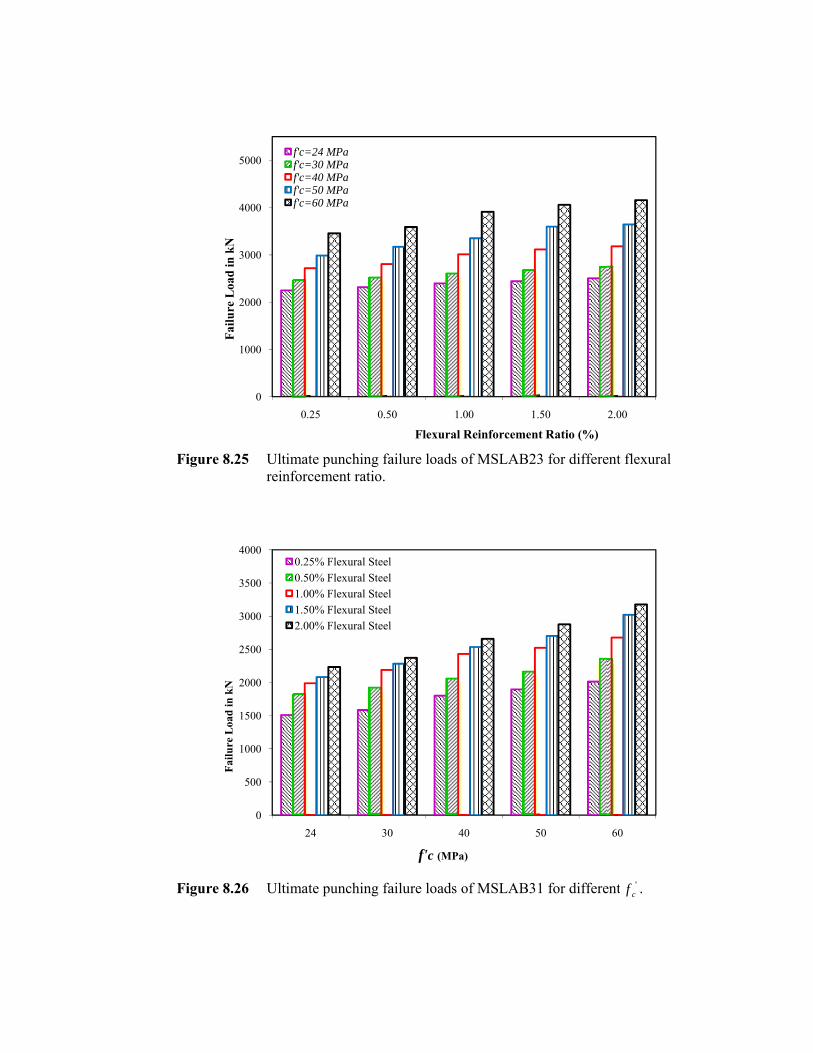
F
F
Figure 8.25
Figure 8.26
10
20
30
40
50
Failu
re L
oad
in k
N
5
10
15
20
25
30
35
40
Failu
re L
oad
in k
N
Ultimate reinforce
Ultimate
0
000
000
000
000
000
0.25
f'c=24f'c=30f'c=40f'c=50f'c=60
0
500
000
500
000
500
000
500
000
24
0.25%0.50%1.00%1.50%2.00%
punching fament ratio.
punching fa
0.50
4 MPa0 MPa0 MPa0 MPa0 MPa
30
% Flexural Steel% Flexural Steel% Flexural Steel% Flexural Steel% Flexural Steel
ailure loads o
ailure loads o
0 1.0
Flexural R
0 4
f'c (MPa
of MSLAB2
of MSLAB3
00 1
Reinforcemen
0
a)
23 for differe
1 for differe
.50
nt Ratio (%)
50
ent flexural
ent '
cf .
2.00
60
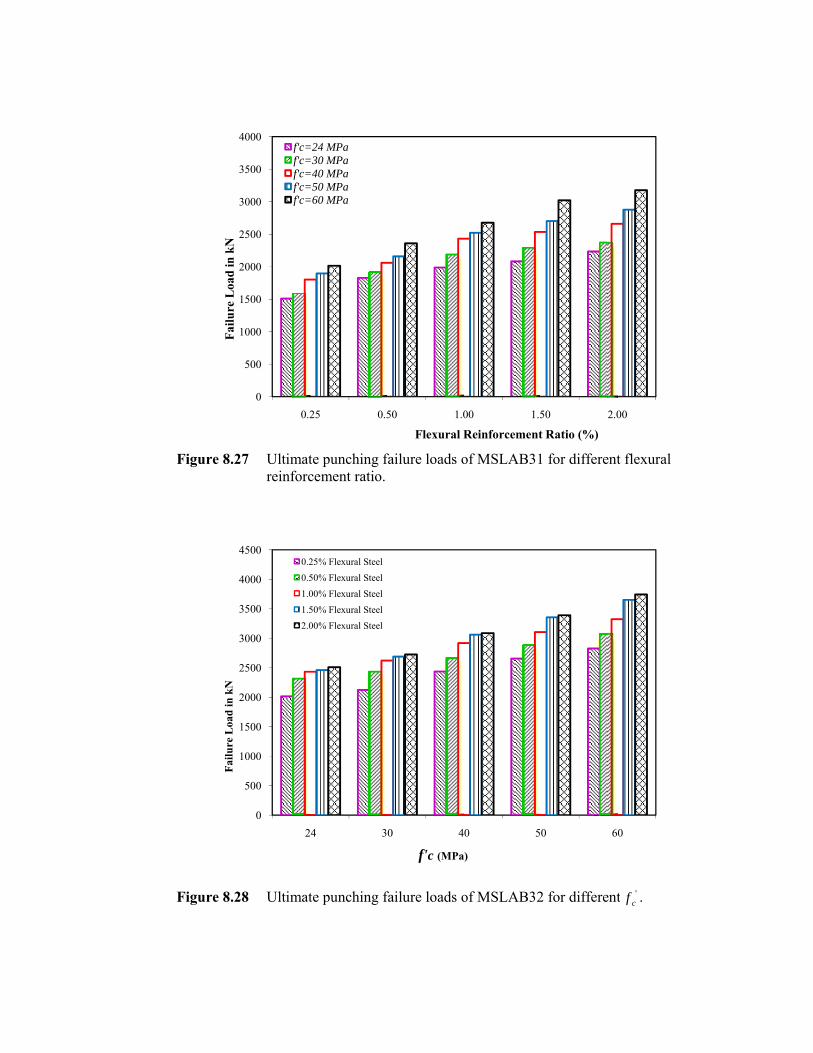
F
F
Figure 8.27
Figure 8.28
5
10
15
20
25
30
35
40
Failu
re L
oad
in k
N
5
10
15
20
25
30
35
40
45
Failu
re L
oad
in k
N
Ultimate reinforce
Ultimate
0
500
000
500
000
500
000
500
000
0.25
f'c=24f'c=30f'c=40f'c=50f'c=60
0
500
000
500
000
500
000
500
000
500
24
0.25%
0.50%
1.00%
1.50%
2.00%
punching fament ratio.
punching fa
0.50
4 MPa0 MPa0 MPa0 MPa0 MPa
30
% Flexural Steel
% Flexural Steel
% Flexural Steel
% Flexural Steel
% Flexural Steel
ailure loads o
ailure loads o
0 1.0
Flexural R
0 4
f'c (MPa
of MSLAB3
of MSLAB3
00 1
Reinforcemen
0
a)
1 for differe
2 for differe
.50
nt Ratio (%)
50
ent flexural
ent 'cf .
2.00
60
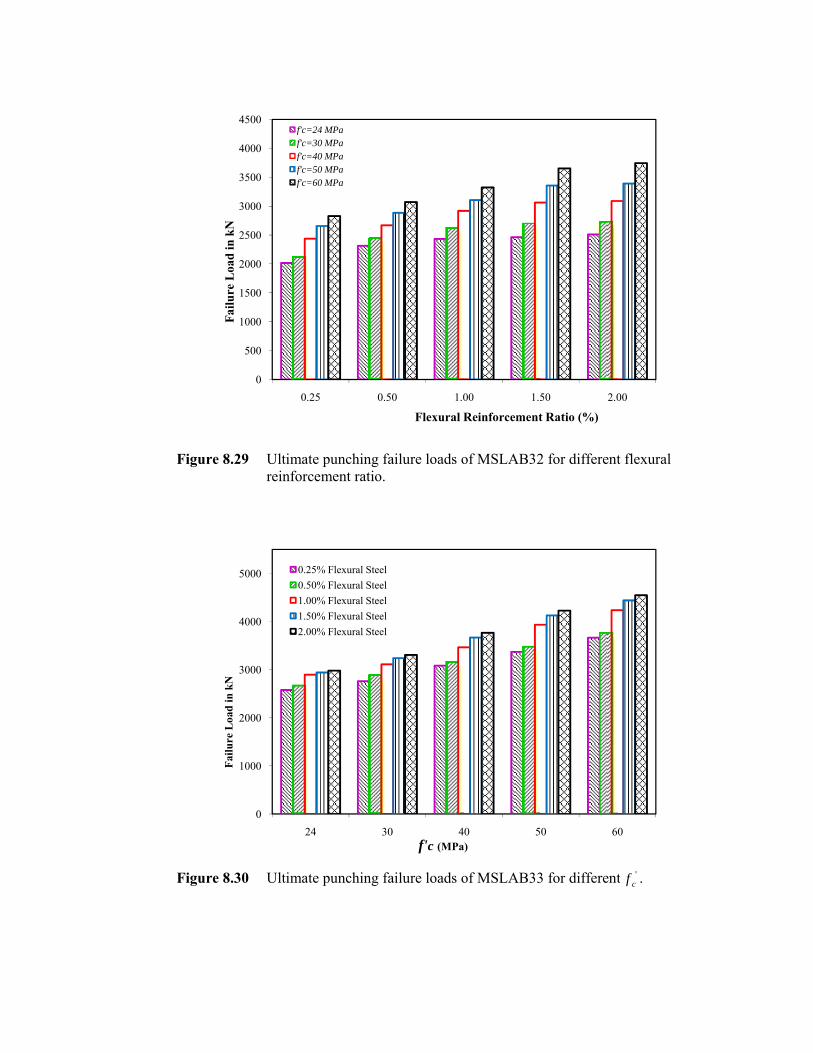
F
F
Figure 8.29
Figure 8.30
5
10
15
20
25
30
35
40
45
Failu
re L
oad
in k
N
10
20
30
40
50
Failu
re L
oad
in k
N
Ultimate reinforce
Ultimate
0
500
000
500
000
500
000
500
000
500
0.25
f'c=24f'c=30f'c=40f'c=50f'c=60
0
000
000
000
000
000
24
0.25%0.50%1.00%1.50%2.00%
punching fament ratio.
punching fa
0.50
4 MPa0 MPa0 MPa0 MPa0 MPa
30
% Flexural Steel% Flexural Steel% Flexural Steel% Flexural Steel% Flexural Steel
ailure loads o
ailure loads o
0 1.0
Flexural R
0 4f'c (MPa
of MSLAB3
of MSLAB3
00 1
Reinforcemen
0a)
2 for differe
3 for differe
.50
nt Ratio (%)
50
ent flexural
ent '
cf .
2.00
60
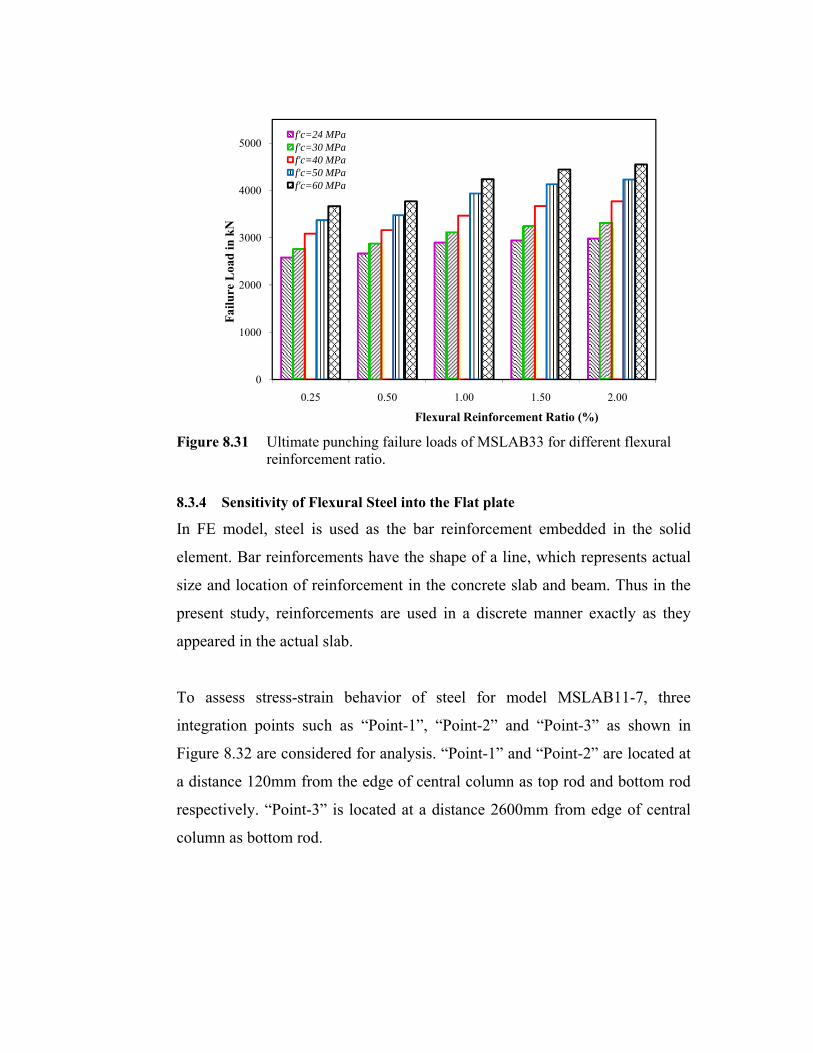
F
8
I
e
s
p
a
T
i
F
a
r
c
Figure 8.31
8.3.4 Sens
In FE mod
element. Ba
size and loc
present stu
appeared in
To assess
integration
Figure 8.32
a distance 1
respectively
column as b
10
20
30
40
50
Failu
re L
oad
in k
N
Ultimate reinforce
sitivity of Fl
del, steel is
ar reinforce
cation of re
dy, reinfor
n the actual
stress-stra
points suc
2 are consid
120mm from
y. “Point-3”
bottom rod.
0
000
000
000
000
000
0.25
f'c=24f'c=30f'c=40f'c=50f'c=60
punching fament ratio.
lexural Stee
s used as th
ements hav
einforcemen
cements ar
slab.
in behavio
ch as “Poin
dered for an
m the edge
” is located
.
0.50
4 MPa0 MPa0 MPa0 MPa0 MPa
ailure loads o
el into the Fl
he bar rein
e the shape
nt in the co
re used in a
or of steel
nt-1”, “Poi
nalysis. “Po
e of central
d at a distan
0 1.0
Flexural R
of MSLAB3
lat plate
nforcement
e of a line,
oncrete slab
a discrete m
l for mod
nt-2” and
oint-1” and
column as
nce 2600m
00 1
Reinforcemen
3 for differe
embedded
which repr
b and beam
manner exa
el MSLAB
“Point-3”
“Point-2” a
top rod and
mm from ed
.50
nt Ratio (%)
ent flexural
in the sol
resents actu
. Thus in th
actly as the
B11-7, thre
as shown
are located
d bottom ro
ge of centr
2.00
id
ual
he
ey
ee
in
at
od
ral
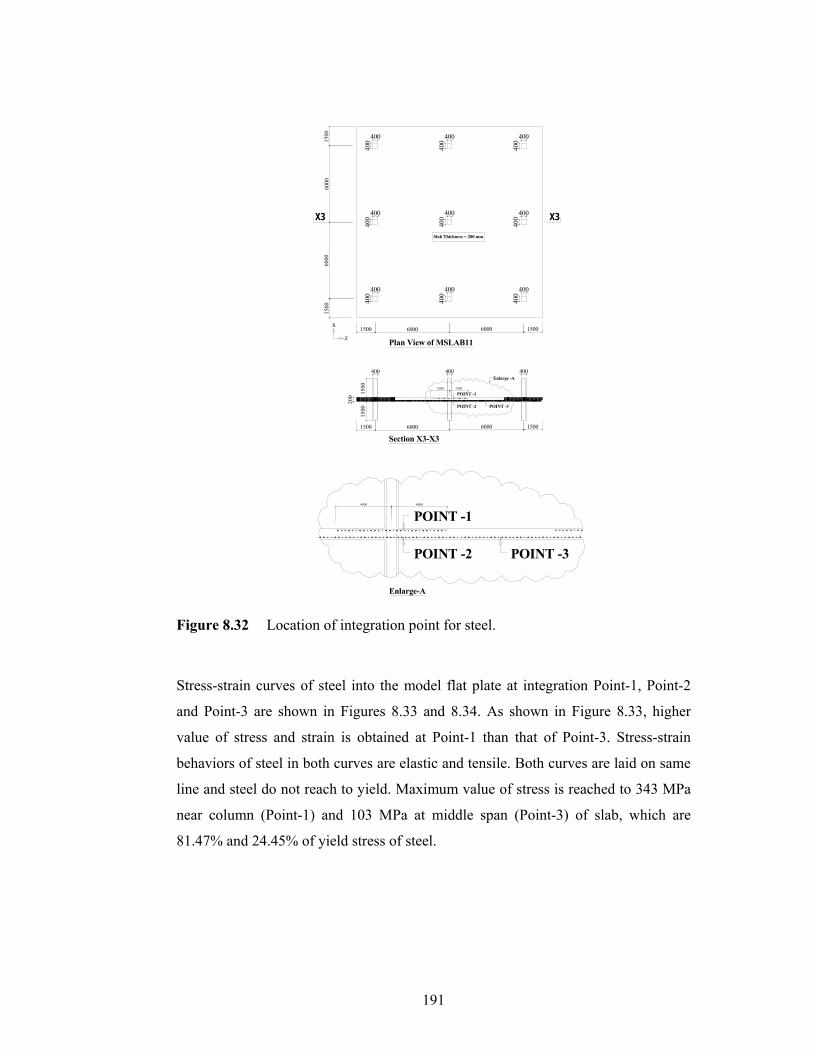
191
6000 600060
0060
001500
1500
1500
Slab Thickness = 200 mm
1500
X3
200
1500
1500
Section X3-X3
400
6000 60001500 1500
400 400
1500 1500
Plan View of MSLAB11
X3
400
400
400
400
400
400
400
400
400
400
400
400
400
400
400
400
400
400
x
z
POINT -3POINT -2
POINT -1
Enlarge -A
Enlarge-A
4500 4500
POINT -3POINT -2
POINT -1
Figure 8.32 Location of integration point for steel.
Stress-strain curves of steel into the model flat plate at integration Point-1, Point-2
and Point-3 are shown in Figures 8.33 and 8.34. As shown in Figure 8.33, higher
value of stress and strain is obtained at Point-1 than that of Point-3. Stress-strain
behaviors of steel in both curves are elastic and tensile. Both curves are laid on same
line and steel do not reach to yield. Maximum value of stress is reached to 343 MPa
near column (Point-1) and 103 MPa at middle span (Point-3) of slab, which are
81.47% and 24.45% of yield stress of steel.
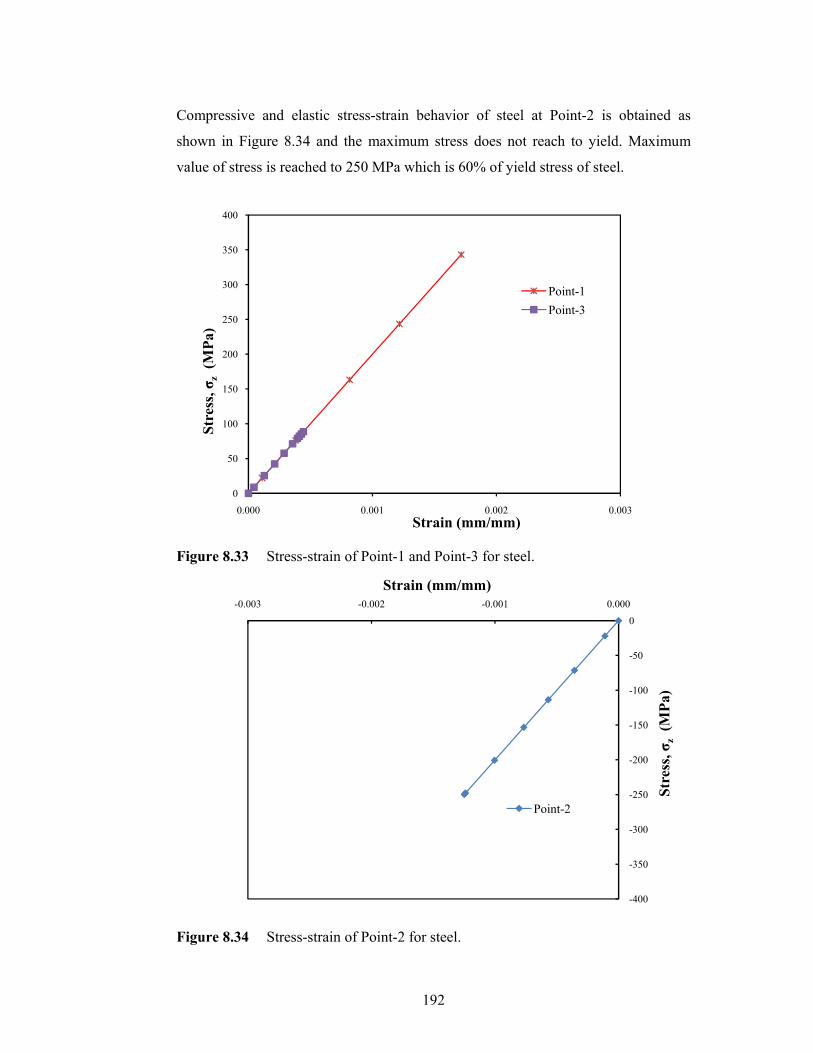
192
Compressive and elastic stress-strain behavior of steel at Point-2 is obtained as
shown in Figure 8.34 and the maximum stress does not reach to yield. Maximum
value of stress is reached to 250 MPa which is 60% of yield stress of steel.
Figure 8.33 Stress-strain of Point-1 and Point-3 for steel.
Figure 8.34 Stress-strain of Point-2 for steel.
0
50
100
150
200
250
300
350
400
0.000 0.001 0.002 0.003
Stre
ss, σ
z(M
Pa)
Strain (mm/mm)
Point-1Point-3
-400
-350
-300
-250
-200
-150
-100
-50
0-0.003 -0.002 -0.001 0.000
Stre
ss, σ
z(M
Pa)
Strain (mm/mm)
Point-2
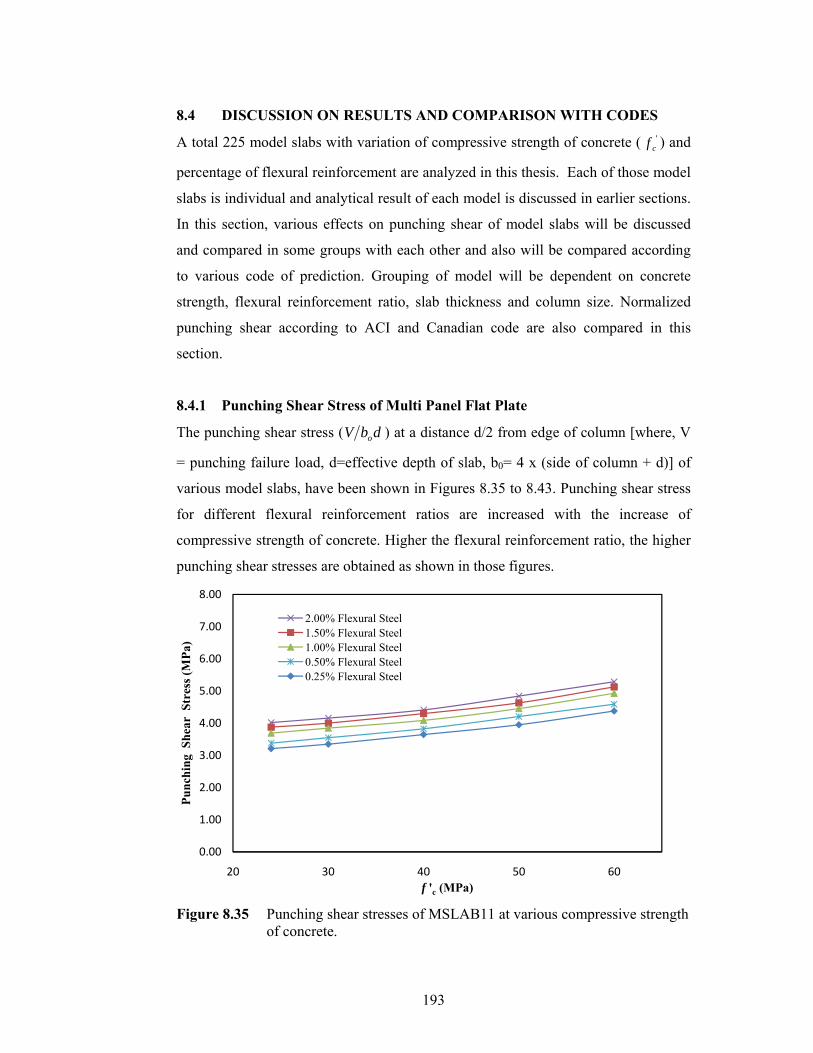
193
8.4 DISCUSSION ON RESULTS AND COMPARISON WITH CODES
A total 225 model slabs with variation of compressive strength of concrete ( 'cf ) and
percentage of flexural reinforcement are analyzed in this thesis. Each of those model
slabs is individual and analytical result of each model is discussed in earlier sections.
In this section, various effects on punching shear of model slabs will be discussed
and compared in some groups with each other and also will be compared according
to various code of prediction. Grouping of model will be dependent on concrete
strength, flexural reinforcement ratio, slab thickness and column size. Normalized
punching shear according to ACI and Canadian code are also compared in this
section.
8.4.1 Punching Shear Stress of Multi Panel Flat Plate
The punching shear stress ( dbV o ) at a distance d/2 from edge of column [where, V
= punching failure load, d=effective depth of slab, b0= 4 x (side of column + d)] of
various model slabs, have been shown in Figures 8.35 to 8.43. Punching shear stress
for different flexural reinforcement ratios are increased with the increase of
compressive strength of concrete. Higher the flexural reinforcement ratio, the higher
punching shear stresses are obtained as shown in those figures.
Figure 8.35 Punching shear stresses of MSLAB11 at various compressive strength
of concrete.
0.00
1.00
2.00
3.00
4.00
5.00
6.00
7.00
8.00
20 30 40 50 60
Punc
hing
She
ar S
tres
s (M
Pa)
f 'c (MPa)
2.00% Flexural Steel1.50% Flexural Steel1.00% Flexural Steel0.50% Flexural Steel0.25% Flexural Steel
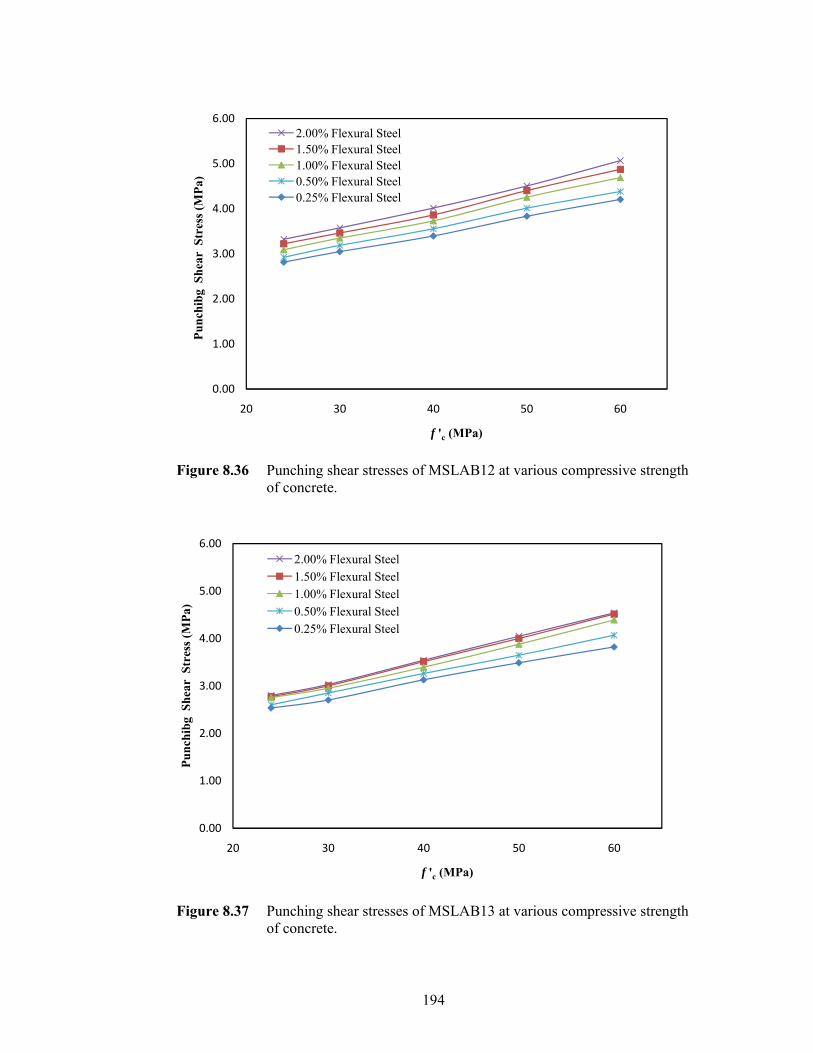
194
Figure 8.36 Punching shear stresses of MSLAB12 at various compressive strength
of concrete.
Figure 8.37 Punching shear stresses of MSLAB13 at various compressive strength
of concrete.
0.00
1.00
2.00
3.00
4.00
5.00
6.00
20 30 40 50 60
Punc
hibg
She
ar S
tres
s (M
Pa)
f 'c (MPa)
2.00% Flexural Steel1.50% Flexural Steel1.00% Flexural Steel0.50% Flexural Steel0.25% Flexural Steel
0.00
1.00
2.00
3.00
4.00
5.00
6.00
20 30 40 50 60
Punc
hibg
She
ar S
tres
s (M
Pa)
f 'c (MPa)
2.00% Flexural Steel1.50% Flexural Steel1.00% Flexural Steel0.50% Flexural Steel0.25% Flexural Steel
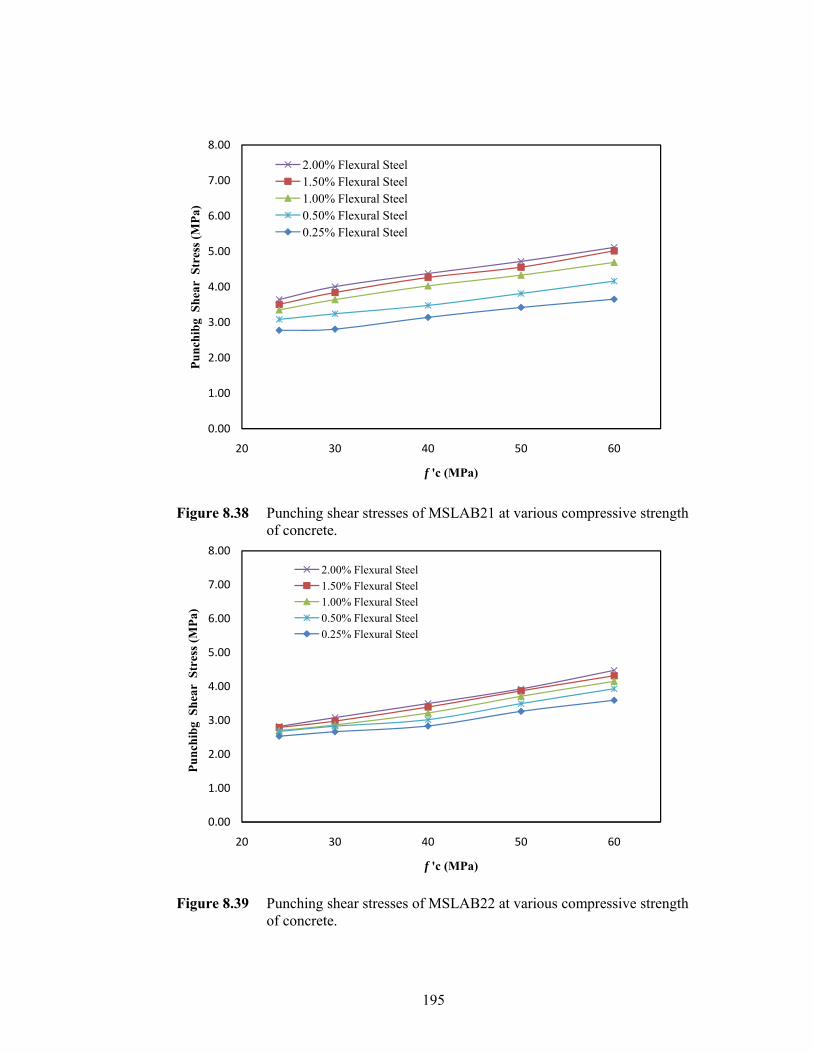
195
Figure 8.38 Punching shear stresses of MSLAB21 at various compressive strength
of concrete.
Figure 8.39 Punching shear stresses of MSLAB22 at various compressive strength
of concrete.
0.00
1.00
2.00
3.00
4.00
5.00
6.00
7.00
8.00
20 30 40 50 60
Punc
hibg
She
ar S
tres
s (M
Pa)
f 'c (MPa)
2.00% Flexural Steel1.50% Flexural Steel1.00% Flexural Steel0.50% Flexural Steel0.25% Flexural Steel
0.00
1.00
2.00
3.00
4.00
5.00
6.00
7.00
8.00
20 30 40 50 60
Punc
hibg
She
ar S
tres
s (M
Pa)
f 'c (MPa)
2.00% Flexural Steel1.50% Flexural Steel1.00% Flexural Steel0.50% Flexural Steel0.25% Flexural Steel
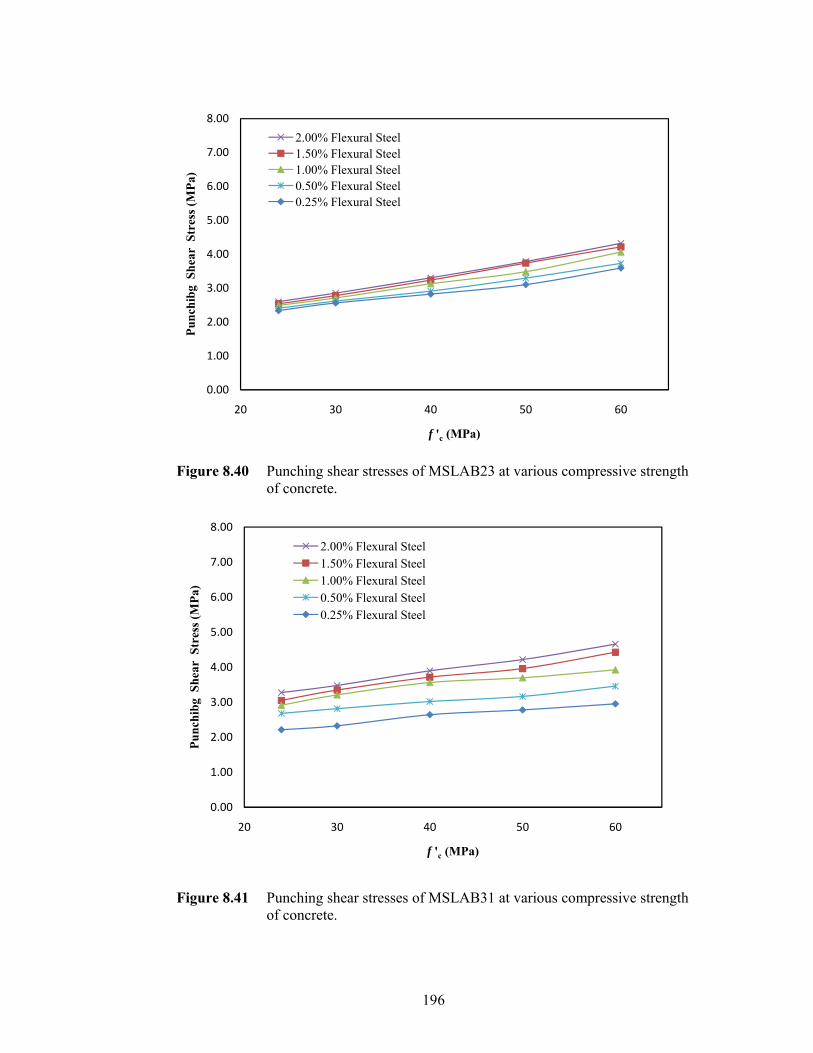
196
Figure 8.40 Punching shear stresses of MSLAB23 at various compressive strength
of concrete.
Figure 8.41 Punching shear stresses of MSLAB31 at various compressive strength
of concrete.
0.00
1.00
2.00
3.00
4.00
5.00
6.00
7.00
8.00
20 30 40 50 60
Punc
hibg
She
ar S
tres
s (M
Pa)
f 'c (MPa)
2.00% Flexural Steel1.50% Flexural Steel1.00% Flexural Steel0.50% Flexural Steel0.25% Flexural Steel
0.00
1.00
2.00
3.00
4.00
5.00
6.00
7.00
8.00
20 30 40 50 60
Punc
hibg
She
ar S
tres
s (M
Pa)
f 'c (MPa)
2.00% Flexural Steel1.50% Flexural Steel1.00% Flexural Steel0.50% Flexural Steel0.25% Flexural Steel
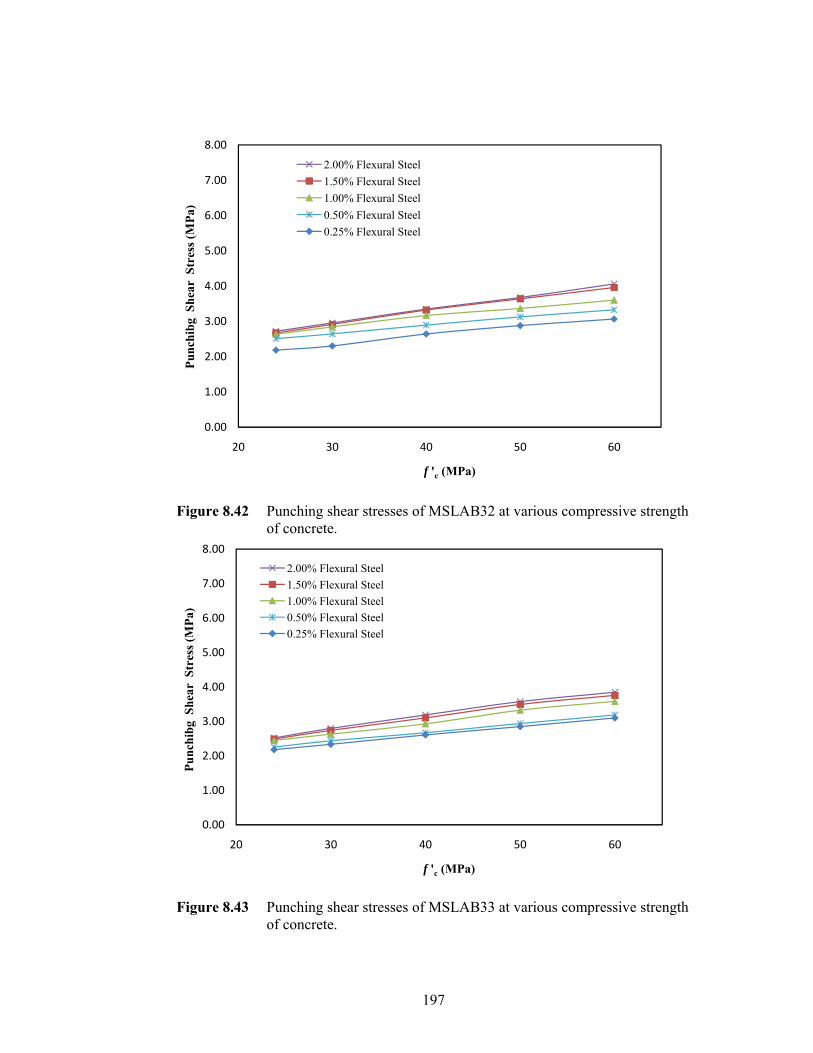
197
Figure 8.42 Punching shear stresses of MSLAB32 at various compressive strength
of concrete.
Figure 8.43 Punching shear stresses of MSLAB33 at various compressive strength
of concrete.
0.00
1.00
2.00
3.00
4.00
5.00
6.00
7.00
8.00
20 30 40 50 60
Punc
hibg
She
ar S
tres
s (M
Pa)
f 'c (MPa)
2.00% Flexural Steel1.50% Flexural Steel1.00% Flexural Steel0.50% Flexural Steel0.25% Flexural Steel
0.00
1.00
2.00
3.00
4.00
5.00
6.00
7.00
8.00
20 30 40 50 60
Punc
hibg
She
ar S
tres
s (M
Pa)
f 'c (MPa)
2.00% Flexural Steel1.50% Flexural Steel1.00% Flexural Steel0.50% Flexural Steel0.25% Flexural Steel
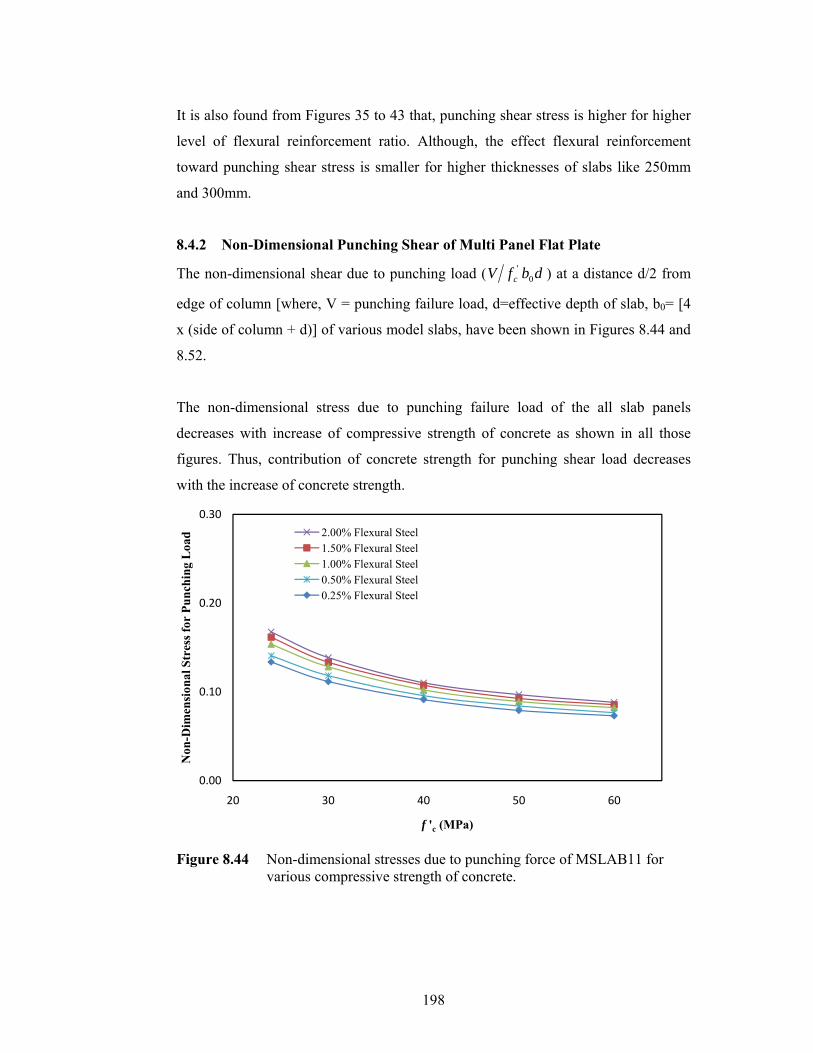
198
It is also found from Figures 35 to 43 that, punching shear stress is higher for higher
level of flexural reinforcement ratio. Although, the effect flexural reinforcement
toward punching shear stress is smaller for higher thicknesses of slabs like 250mm
and 300mm.
8.4.2 Non-Dimensional Punching Shear of Multi Panel Flat Plate
The non-dimensional shear due to punching load ( dbfV c 0' ) at a distance d/2 from
edge of column [where, V = punching failure load, d=effective depth of slab, b0= [4
x (side of column + d)] of various model slabs, have been shown in Figures 8.44 and
8.52.
The non-dimensional stress due to punching failure load of the all slab panels
decreases with increase of compressive strength of concrete as shown in all those
figures. Thus, contribution of concrete strength for punching shear load decreases
with the increase of concrete strength.
Figure 8.44 Non-dimensional stresses due to punching force of MSLAB11 for
various compressive strength of concrete.
0.00
0.10
0.20
0.30
20 30 40 50 60
Non
-Dim
ensi
onal
Str
ess f
or P
unch
ing
Loa
d
f 'c (MPa)
2.00% Flexural Steel1.50% Flexural Steel1.00% Flexural Steel0.50% Flexural Steel0.25% Flexural Steel
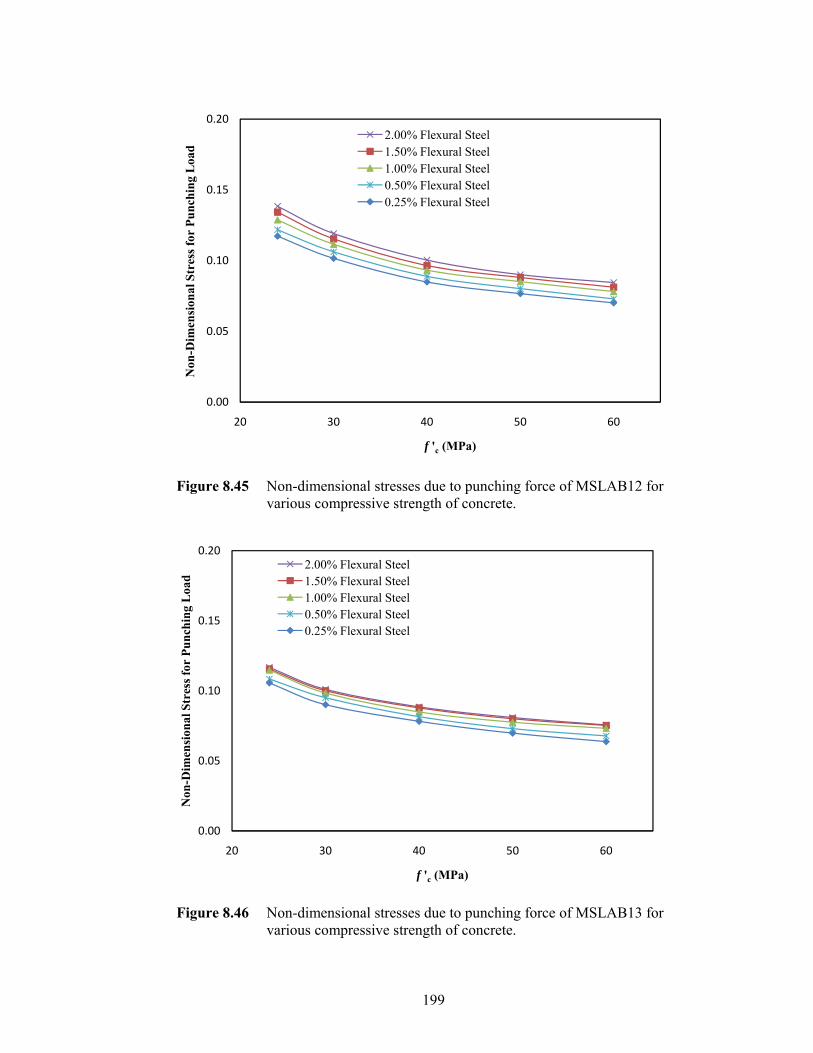
199
Figure 8.45 Non-dimensional stresses due to punching force of MSLAB12 for
various compressive strength of concrete.
Figure 8.46 Non-dimensional stresses due to punching force of MSLAB13 for
various compressive strength of concrete.
0.00
0.05
0.10
0.15
0.20
20 30 40 50 60
Non
-Dim
ensi
onal
Str
ess f
or P
unch
ing
Loa
d
f 'c (MPa)
2.00% Flexural Steel1.50% Flexural Steel1.00% Flexural Steel0.50% Flexural Steel0.25% Flexural Steel
0.00
0.05
0.10
0.15
0.20
20 30 40 50 60
Non
-Dim
ensi
onal
Str
ess f
or P
unch
ing
Loa
d
f 'c (MPa)
2.00% Flexural Steel1.50% Flexural Steel1.00% Flexural Steel0.50% Flexural Steel0.25% Flexural Steel
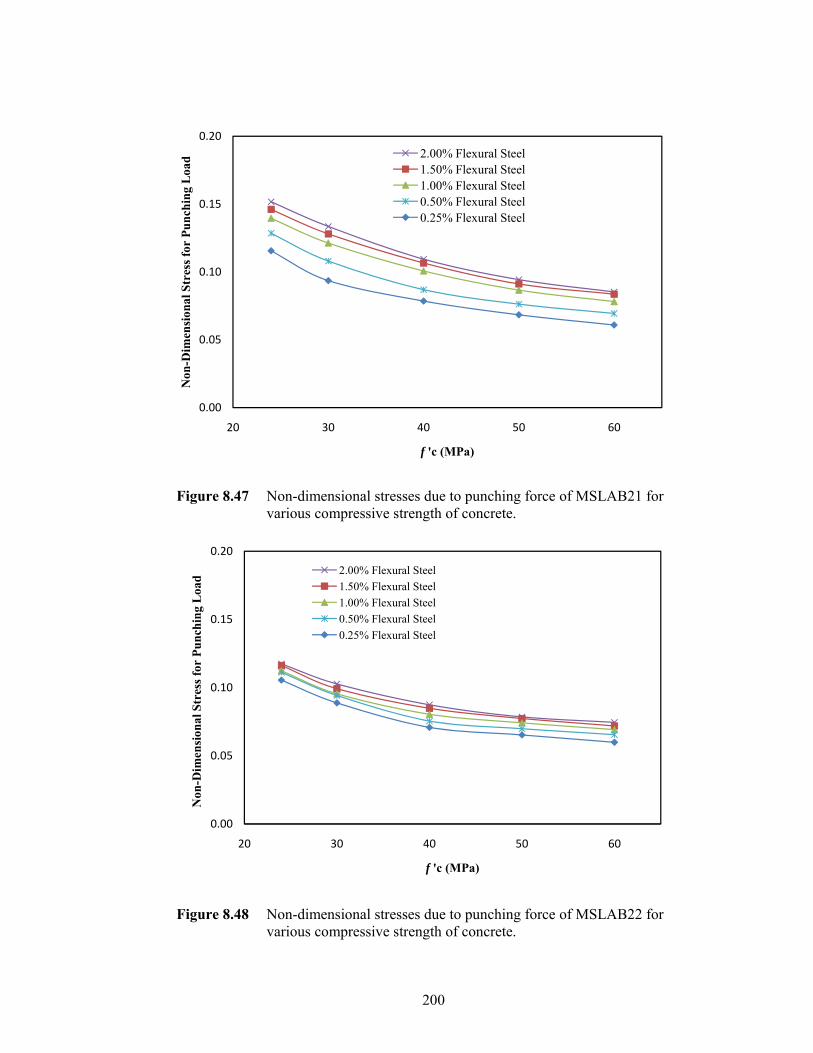
200
Figure 8.47 Non-dimensional stresses due to punching force of MSLAB21 for
various compressive strength of concrete.
Figure 8.48 Non-dimensional stresses due to punching force of MSLAB22 for
various compressive strength of concrete.
0.00
0.05
0.10
0.15
0.20
20 30 40 50 60
Non
-Dim
ensi
onal
Str
ess f
or P
unch
ing
Loa
d
f 'c (MPa)
2.00% Flexural Steel1.50% Flexural Steel1.00% Flexural Steel0.50% Flexural Steel0.25% Flexural Steel
0.00
0.05
0.10
0.15
0.20
20 30 40 50 60
Non
-Dim
ensi
onal
Str
ess f
or P
unch
ing
Loa
d
f 'c (MPa)
2.00% Flexural Steel1.50% Flexural Steel1.00% Flexural Steel0.50% Flexural Steel0.25% Flexural Steel
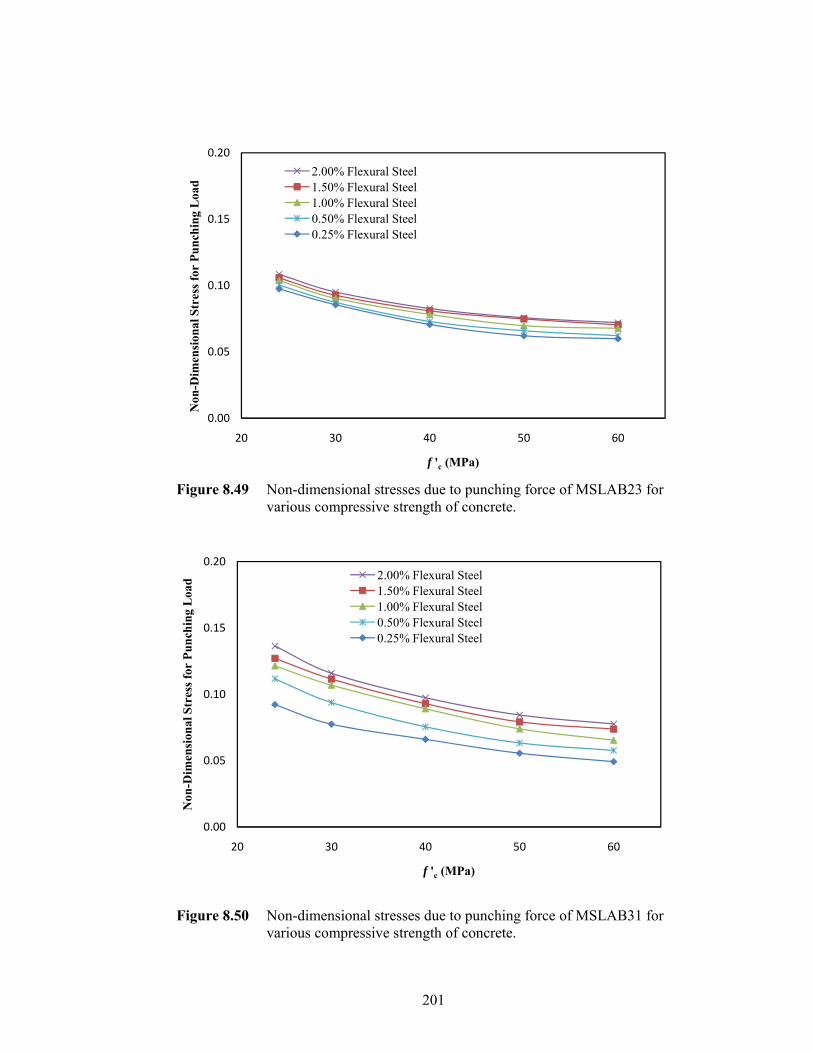
201
Figure 8.49 Non-dimensional stresses due to punching force of MSLAB23 for
various compressive strength of concrete.
Figure 8.50 Non-dimensional stresses due to punching force of MSLAB31 for
various compressive strength of concrete.
0.00
0.05
0.10
0.15
0.20
20 30 40 50 60
Non
-Dim
ensi
onal
Str
ess f
or P
unch
ing
Loa
d
f 'c (MPa)
2.00% Flexural Steel1.50% Flexural Steel1.00% Flexural Steel0.50% Flexural Steel0.25% Flexural Steel
0.00
0.05
0.10
0.15
0.20
20 30 40 50 60
Non
-Dim
ensi
onal
Str
ess f
or P
unch
ing
Loa
d
f 'c (MPa)
2.00% Flexural Steel1.50% Flexural Steel1.00% Flexural Steel0.50% Flexural Steel0.25% Flexural Steel
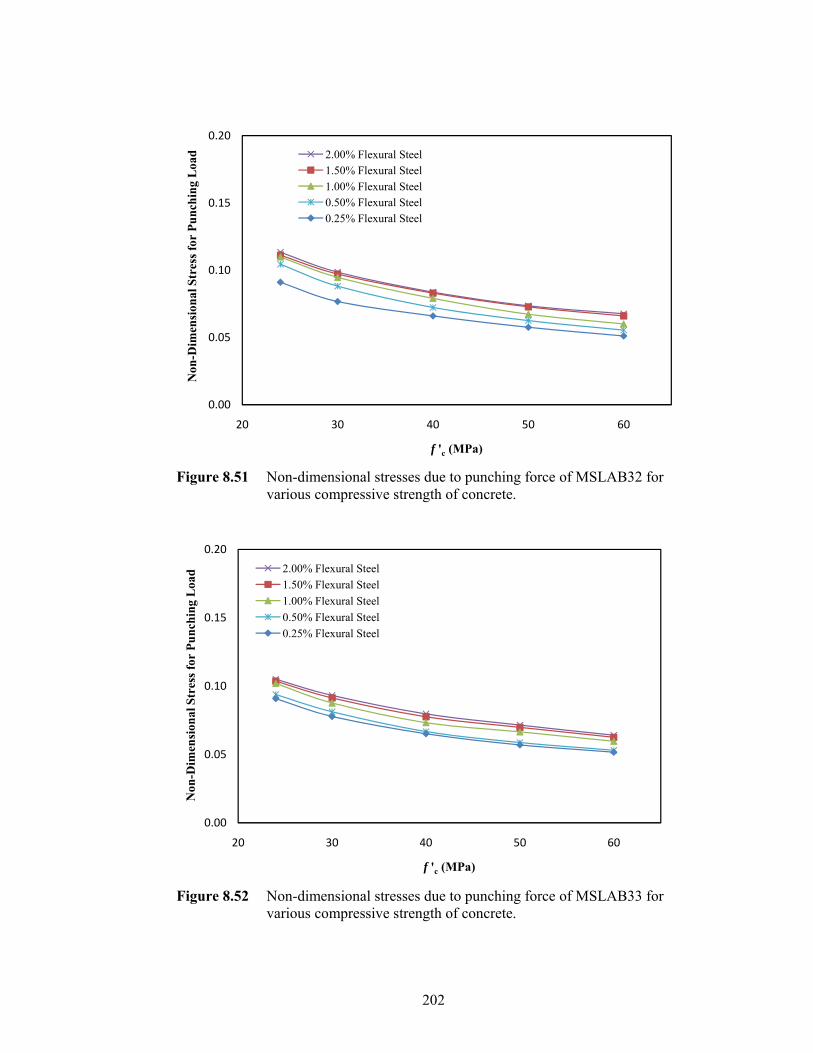
202
Figure 8.51 Non-dimensional stresses due to punching force of MSLAB32 for
various compressive strength of concrete.
Figure 8.52 Non-dimensional stresses due to punching force of MSLAB33 for
various compressive strength of concrete.
0.00
0.05
0.10
0.15
0.20
20 30 40 50 60
Non
-Dim
ensi
onal
Str
ess f
or P
unch
ing
Loa
d
f 'c (MPa)
2.00% Flexural Steel1.50% Flexural Steel1.00% Flexural Steel0.50% Flexural Steel0.25% Flexural Steel
0.00
0.05
0.10
0.15
0.20
20 30 40 50 60
Non
-Dim
ensi
onal
Str
ess f
or P
unch
ing
Loa
d
f 'c (MPa)
2.00% Flexural Steel1.50% Flexural Steel1.00% Flexural Steel0.50% Flexural Steel0.25% Flexural Steel
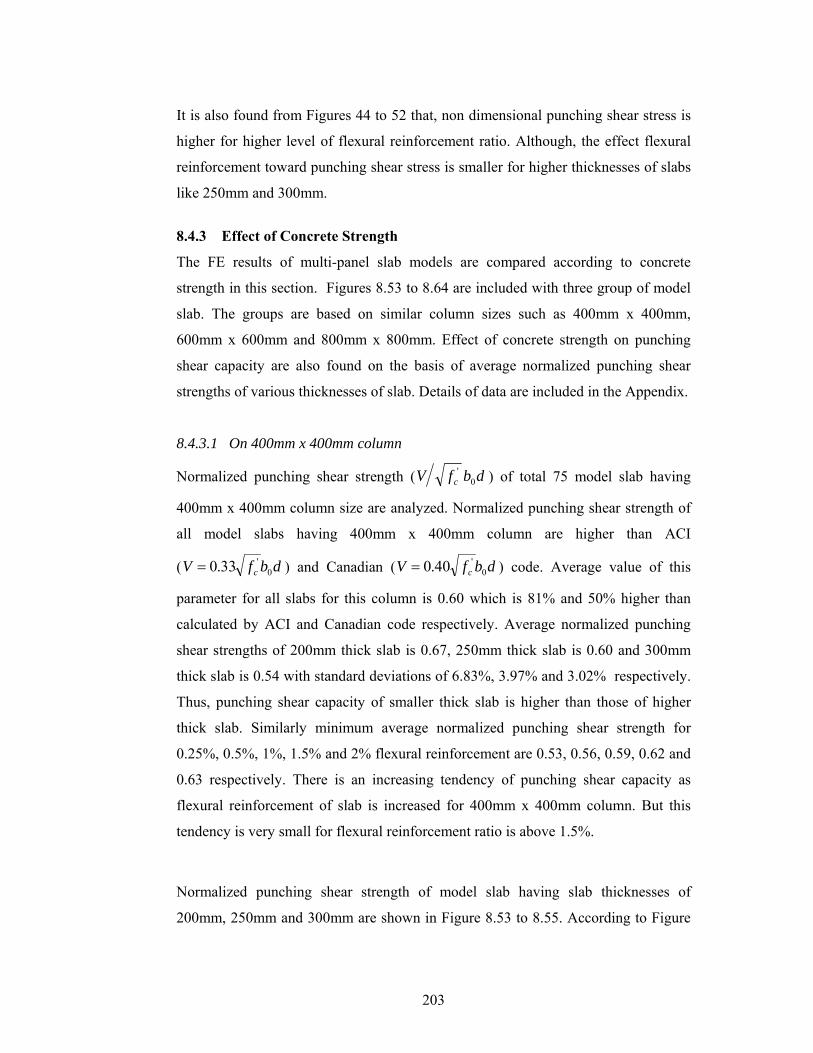
203
It is also found from Figures 44 to 52 that, non dimensional punching shear stress is
higher for higher level of flexural reinforcement ratio. Although, the effect flexural
reinforcement toward punching shear stress is smaller for higher thicknesses of slabs
like 250mm and 300mm.
8.4.3 Effect of Concrete Strength
The FE results of multi-panel slab models are compared according to concrete
strength in this section. Figures 8.53 to 8.64 are included with three group of model
slab. The groups are based on similar column sizes such as 400mm x 400mm,
600mm x 600mm and 800mm x 800mm. Effect of concrete strength on punching
shear capacity are also found on the basis of average normalized punching shear
strengths of various thicknesses of slab. Details of data are included in the Appendix.
8.4.3.1 On 400mm x 400mm column
Normalized punching shear strength ( dbfV c 0' ) of total 75 model slab having
400mm x 400mm column size are analyzed. Normalized punching shear strength of
all model slabs having 400mm x 400mm column are higher than ACI
( dbfV c 0'33.0= ) and Canadian ( dbfV c 0
'40.0= ) code. Average value of this
parameter for all slabs for this column is 0.60 which is 81% and 50% higher than
calculated by ACI and Canadian code respectively. Average normalized punching
shear strengths of 200mm thick slab is 0.67, 250mm thick slab is 0.60 and 300mm
thick slab is 0.54 with standard deviations of 6.83%, 3.97% and 3.02% respectively.
Thus, punching shear capacity of smaller thick slab is higher than those of higher
thick slab. Similarly minimum average normalized punching shear strength for
0.25%, 0.5%, 1%, 1.5% and 2% flexural reinforcement are 0.53, 0.56, 0.59, 0.62 and
0.63 respectively. There is an increasing tendency of punching shear capacity as
flexural reinforcement of slab is increased for 400mm x 400mm column. But this
tendency is very small for flexural reinforcement ratio is above 1.5%.
Normalized punching shear strength of model slab having slab thicknesses of
200mm, 250mm and 300mm are shown in Figure 8.53 to 8.55. According to Figure
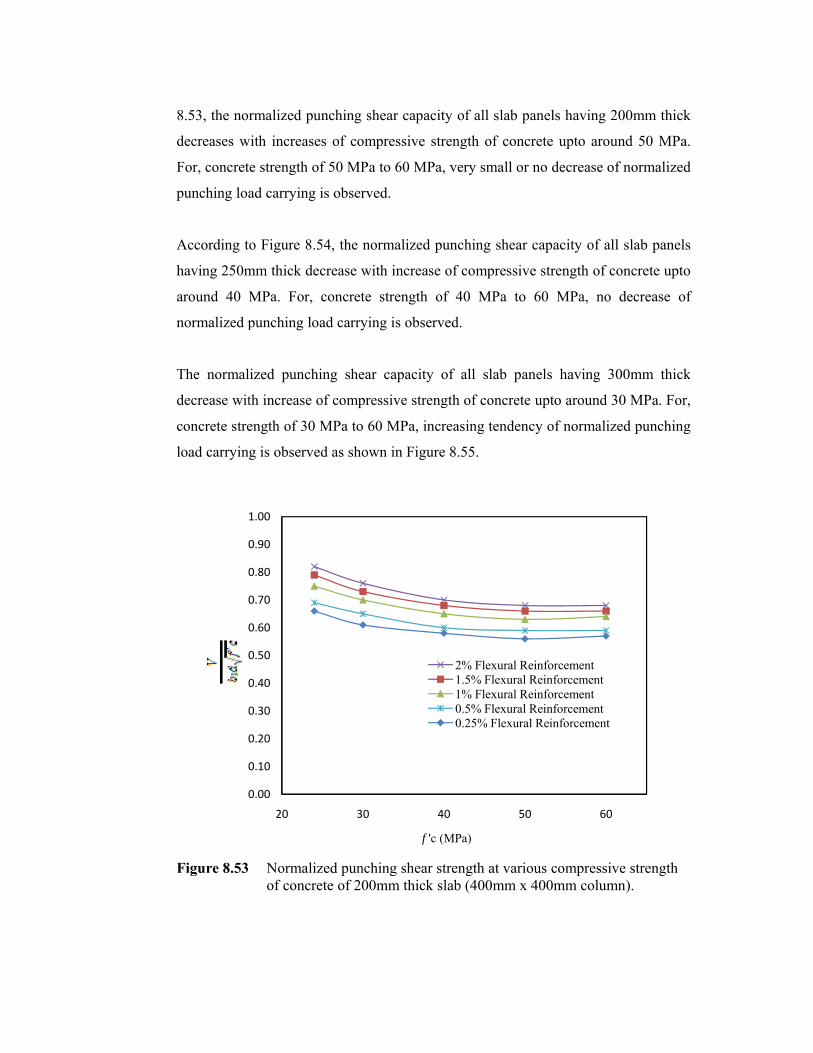
8
d
F
p
A
h
a
n
T
d
c
l
F
8.53, the nor
decreases w
For, concret
punching loa
According t
having 250m
around 40 M
normalized p
The normal
decrease wit
concrete stre
load carrying
Figure 8.53
0
0
0
0
0
0
0
0
0
0
1
rmalized pu
with increase
e strength of
ad carrying i
o Figure 8.5
mm thick dec
MPa. For,
punching loa
ized punchi
th increase o
ength of 30 M
g is observe
Normalizof concre
0.00
0.10
0.20
0.30
0.40
0.50
0.60
0.70
0.80
0.90
1.00
20
unching shea
s of compre
f 50 MPa to
is observed.
54, the norm
crease with i
concrete str
ad carrying i
ing shear ca
of compressi
MPa to 60 M
d as shown i
zed punchingete of 200mm
30
ar capacity o
essive streng
60 MPa, ver
malized punc
increase of c
rength of 40
is observed.
apacity of a
ive strength
MPa, increas
in Figure 8.5
g shear strenm thick slab
40
f 'c (MPa
2%1.1%0.0.
of all slab pa
gth of concr
ry small or n
hing shear c
compressive
0 MPa to 6
all slab pan
of concrete u
sing tendency
55.
ngth at variou(400mm x 4
50
a)
% Flexural Rei5% Flexural R
% Flexural Rei5% Flexural R25% Flexural
anels having
rete upto aro
no decrease
capacity of a
e strength of
60 MPa, no
nels having
upto around
y of normali
us compress400mm colum
60
inforcementReinforcementinforcement
ReinforcementReinforcement
200mm thic
ound 50 MP
of normalize
all slab pane
concrete up
o decrease
300mm thic
d 30 MPa. Fo
ized punchin
sive strength mn).
0
t
ck
Pa.
ed
els
to
of
ck
or,
ng
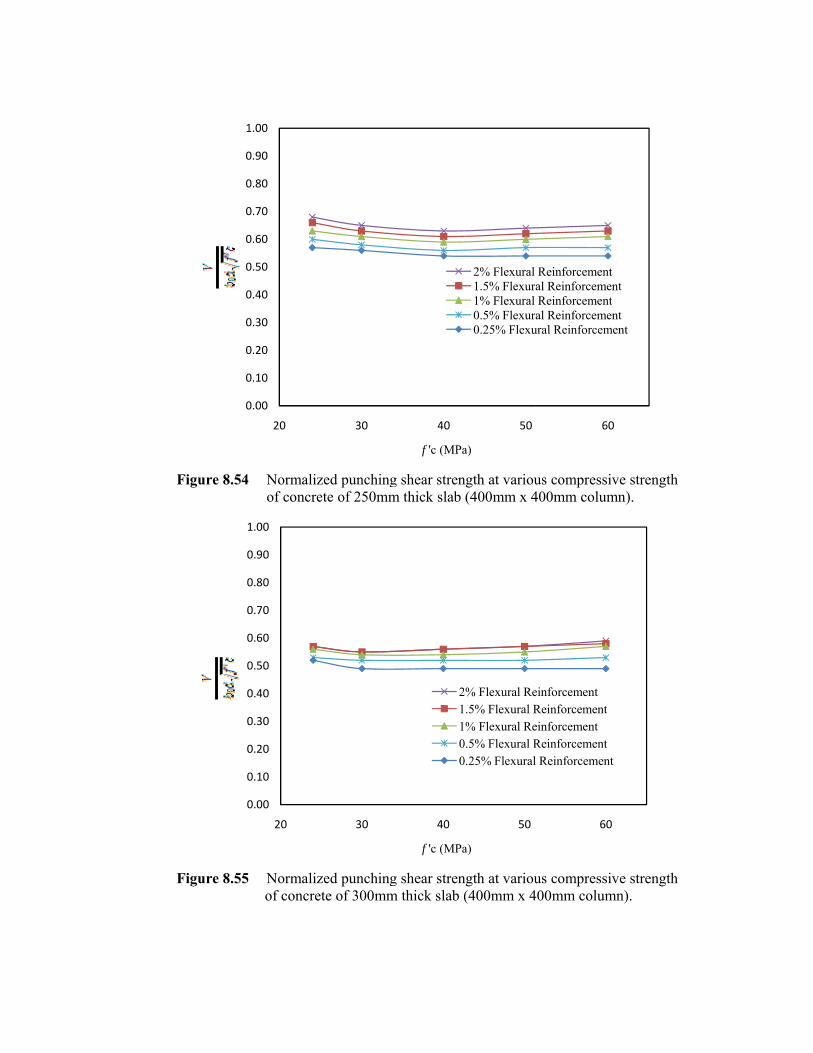
F
F
Figure 8.54
Figure 8.55
0
0
0
0
0
0
0
0
0
0
1
0
0
0
0
0
0
0
0
0
0
1
Normalizof concre
Normaliz of concre
0.00
0.10
0.20
0.30
0.40
0.50
0.60
0.70
0.80
0.90
1.00
20
0.00
0.10
0.20
0.30
0.40
0.50
0.60
0.70
0.80
0.90
1.00
20
zed punchingete of 250mm
zed punchingte of 300mm
30
30
g shear strenm thick slab
g shear strenm thick slab
40
f 'c (MPa
40
f 'c (MPa
21100
ngth at variou(400mm x 4
ngth at variou(400mm x 4
50
a)
2% Flexural 1.5% Flexur1% Flexural 0.5% Flexur0.25% Flexu
50
a)
2% Flexural Re.5% Flexural R% Flexural Re
0.5% Flexural R0.25% Flexural
us compress400mm colum
us compress400mm colum
6
Reinforcemenal ReinforcemeReinforcemenal Reinforceme
ural Reinforcem
60
einforcementReinforcementeinforcementReinforcementl Reinforcemen
sive strength mn).
sive strength mn).
60
ntent
ntent
ment
0
t
tnt
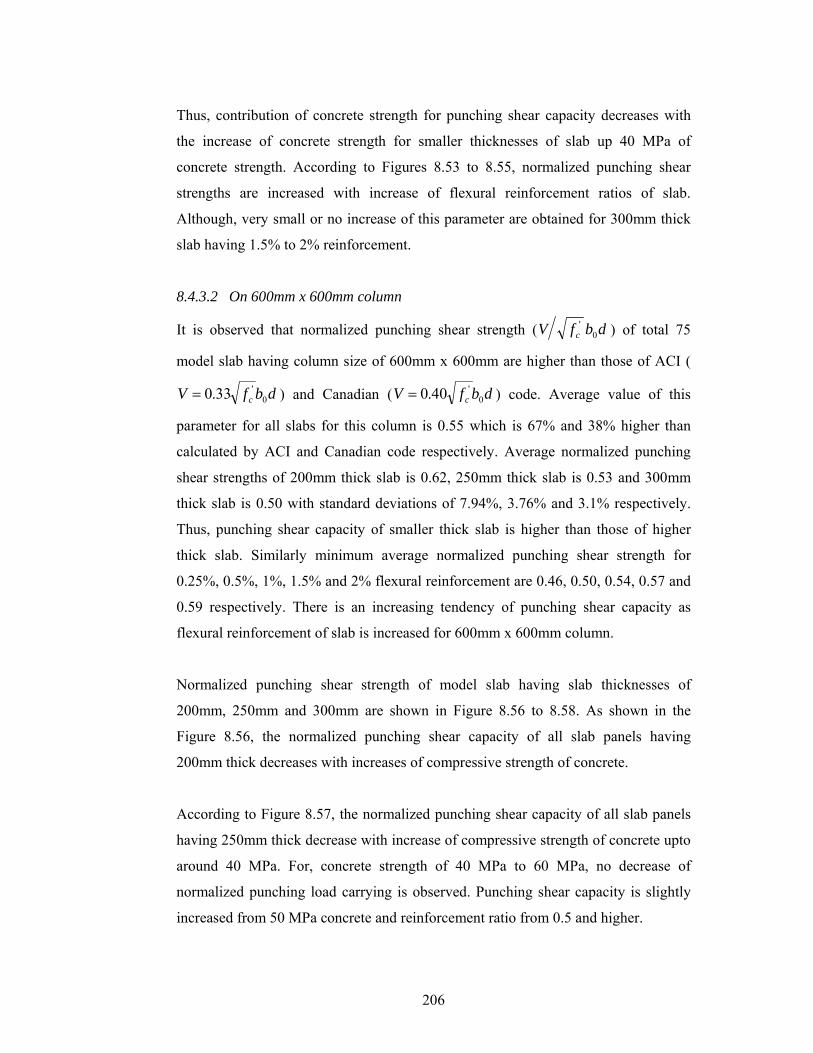
206
Thus, contribution of concrete strength for punching shear capacity decreases with
the increase of concrete strength for smaller thicknesses of slab up 40 MPa of
concrete strength. According to Figures 8.53 to 8.55, normalized punching shear
strengths are increased with increase of flexural reinforcement ratios of slab.
Although, very small or no increase of this parameter are obtained for 300mm thick
slab having 1.5% to 2% reinforcement.
8.4.3.2 On 600mm x 600mm column
It is observed that normalized punching shear strength ( dbfV c 0' ) of total 75
model slab having column size of 600mm x 600mm are higher than those of ACI (
dbfV c 0'33.0= ) and Canadian ( dbfV c 0
'40.0= ) code. Average value of this
parameter for all slabs for this column is 0.55 which is 67% and 38% higher than
calculated by ACI and Canadian code respectively. Average normalized punching
shear strengths of 200mm thick slab is 0.62, 250mm thick slab is 0.53 and 300mm
thick slab is 0.50 with standard deviations of 7.94%, 3.76% and 3.1% respectively.
Thus, punching shear capacity of smaller thick slab is higher than those of higher
thick slab. Similarly minimum average normalized punching shear strength for
0.25%, 0.5%, 1%, 1.5% and 2% flexural reinforcement are 0.46, 0.50, 0.54, 0.57 and
0.59 respectively. There is an increasing tendency of punching shear capacity as
flexural reinforcement of slab is increased for 600mm x 600mm column.
Normalized punching shear strength of model slab having slab thicknesses of
200mm, 250mm and 300mm are shown in Figure 8.56 to 8.58. As shown in the
Figure 8.56, the normalized punching shear capacity of all slab panels having
200mm thick decreases with increases of compressive strength of concrete.
According to Figure 8.57, the normalized punching shear capacity of all slab panels
having 250mm thick decrease with increase of compressive strength of concrete upto
around 40 MPa. For, concrete strength of 40 MPa to 60 MPa, no decrease of
normalized punching load carrying is observed. Punching shear capacity is slightly
increased from 50 MPa concrete and reinforcement ratio from 0.5 and higher.
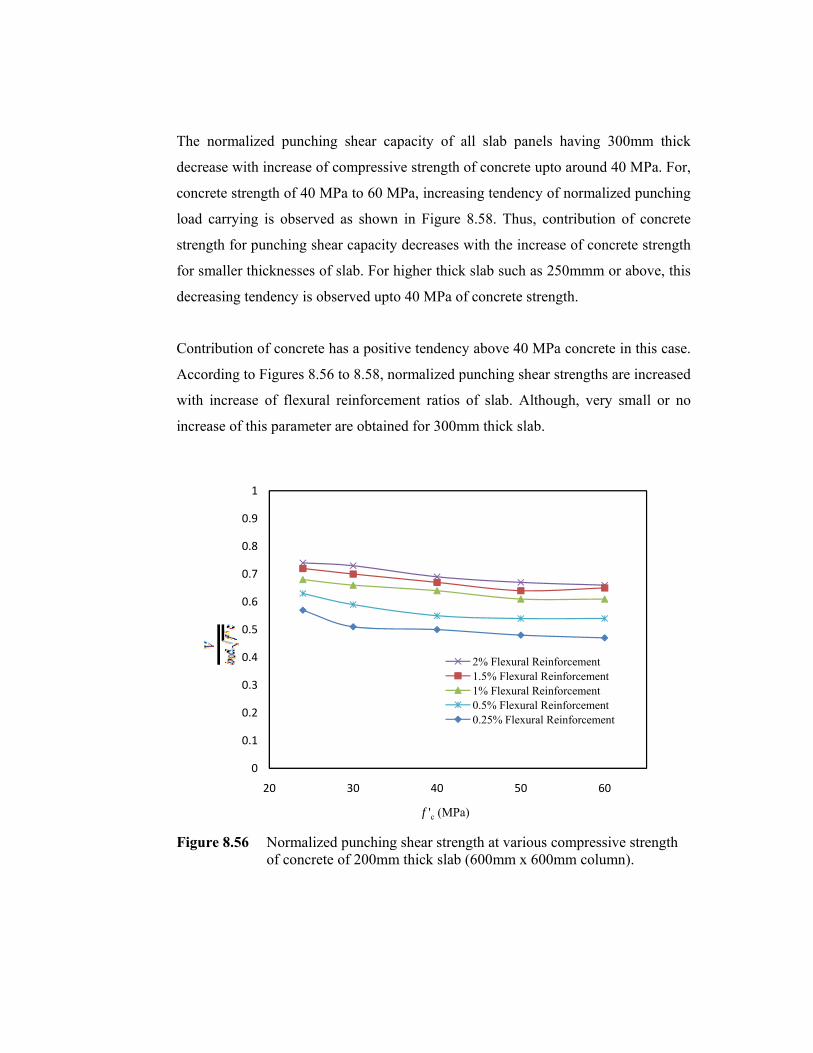
T
d
c
l
s
f
d
C
A
w
i
F
The normal
decrease wit
concrete stre
load carryin
strength for
for smaller t
decreasing te
Contribution
According to
with increas
increase of t
Figure 8.56
0.
0.
0.
0.
0.
0.
0.
0.
0.
ized punchi
th increase o
ength of 40 M
ng is observe
punching sh
thicknesses o
endency is o
n of concrete
o Figures 8.5
se of flexura
this paramete
Normalizof concre
0
.1
.2
.3
.4
.5
.6
.7
.8
.9
1
20
ing shear ca
of compressi
MPa to 60 M
ed as shown
hear capacity
of slab. For
observed upt
e has a posit
56 to 8.58, n
al reinforcem
er are obtain
zed punchingete of 200mm
30
apacity of a
ive strength
MPa, increas
n in Figure
y decreases w
higher thick
to 40 MPa of
tive tendency
normalized p
ment ratios
ned for 300m
g shear strenm thick slab
40
f 'c (MPa
all slab pan
of concrete u
sing tendency
8.58. Thus,
with the incr
k slab such a
f concrete st
y above 40 M
punching she
of slab. Alt
mm thick slab
ngth at variou(600mm x 6
50
a)
2% Flexural R1.5% Flexural1% Flexural R0.5% Flexural0.25% Flexur
nels having
upto around
y of normali
, contributio
rease of con
as 250mmm
trength.
MPa concret
ear strengths
though, very
b.
us compress600mm colum
60
Reinforcementl ReinforcementReinforcementl Reinforcemental Reinforcemen
300mm thic
d 40 MPa. Fo
ized punchin
on of concre
ncrete streng
or above, th
te in this cas
s are increase
y small or n
sive strength mn).
0
t
tnt
ck
or,
ng
ete
gth
his
se.
ed
no
F
F
Figure 8.57
Figure 8.58
0
0
0
0
0
0
0
0
0
0
0
0
0
0
0
0
0
0
Normalizof concre
Normalizof concre
0
.1
.2
.3
.4
.5
.6
.7
.8
.9
1
20
0
0.1
0.2
0.3
0.4
0.5
0.6
0.7
0.8
0.9
1
20
zed punchingete of 250mm
zed punchingete of 300mm
30
30
g shear strenm thick slab
g shear strenm thick slab
40
f 'c (MPa
21100
40
f 'c (MPa
ngth at variou(600mm x 6
ngth at variou(600mm x 6
50
a)
2% Flexural Rei1.5% Flexural R1% Flexural Rei0.5% Flexural R0.25% Flexural R
50
a)
2% Flexural Re1.5% Flexural R1% Flexural Re0.5% Flexural R0.25% Flexural
us compress600mm colum
us compress600mm colum
6
inforcementReinforcementinforcement
ReinforcementReinforcement
60
einforcementReinforcementeinforcementReinforcementl Reinforcement
sive strength mn).
sive strength mn).
0
0
t
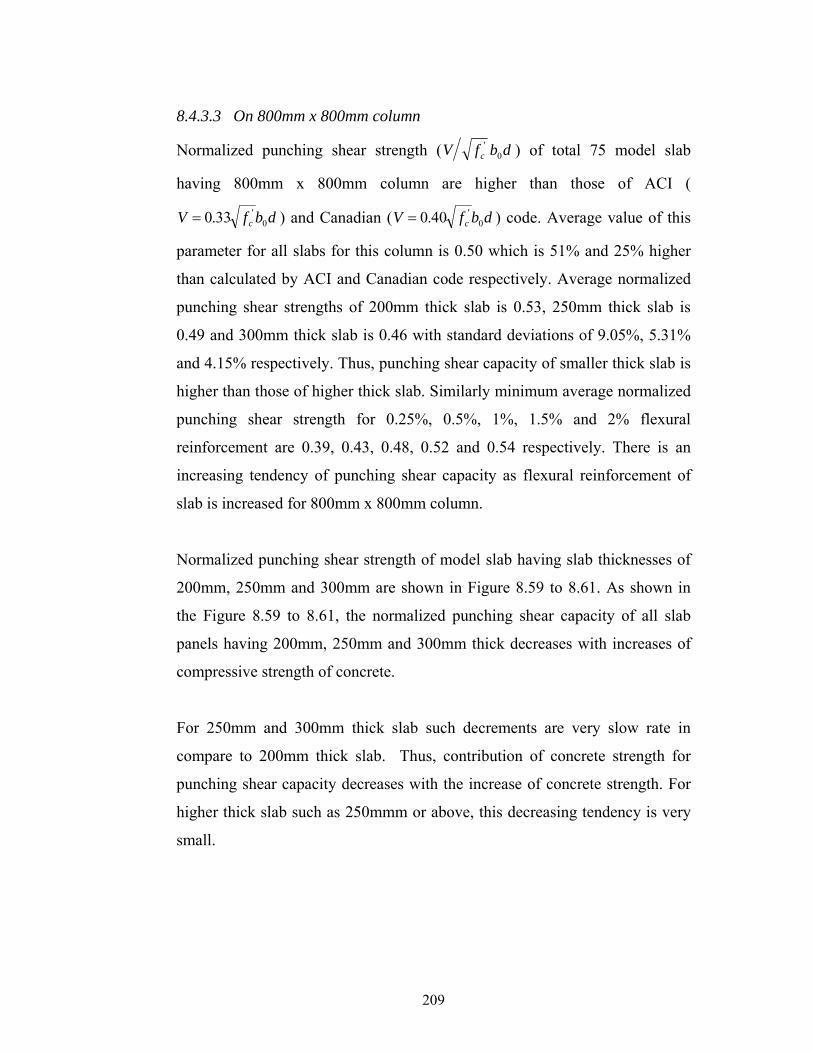
209
8.4.3.3 On 800mm x 800mm column
Normalized punching shear strength ( dbfV c 0' ) of total 75 model slab
having 800mm x 800mm column are higher than those of ACI (
dbfV c 0'33.0= ) and Canadian ( dbfV c 0
'40.0= ) code. Average value of this
parameter for all slabs for this column is 0.50 which is 51% and 25% higher
than calculated by ACI and Canadian code respectively. Average normalized
punching shear strengths of 200mm thick slab is 0.53, 250mm thick slab is
0.49 and 300mm thick slab is 0.46 with standard deviations of 9.05%, 5.31%
and 4.15% respectively. Thus, punching shear capacity of smaller thick slab is
higher than those of higher thick slab. Similarly minimum average normalized
punching shear strength for 0.25%, 0.5%, 1%, 1.5% and 2% flexural
reinforcement are 0.39, 0.43, 0.48, 0.52 and 0.54 respectively. There is an
increasing tendency of punching shear capacity as flexural reinforcement of
slab is increased for 800mm x 800mm column.
Normalized punching shear strength of model slab having slab thicknesses of
200mm, 250mm and 300mm are shown in Figure 8.59 to 8.61. As shown in
the Figure 8.59 to 8.61, the normalized punching shear capacity of all slab
panels having 200mm, 250mm and 300mm thick decreases with increases of
compressive strength of concrete.
For 250mm and 300mm thick slab such decrements are very slow rate in
compare to 200mm thick slab. Thus, contribution of concrete strength for
punching shear capacity decreases with the increase of concrete strength. For
higher thick slab such as 250mmm or above, this decreasing tendency is very
small.
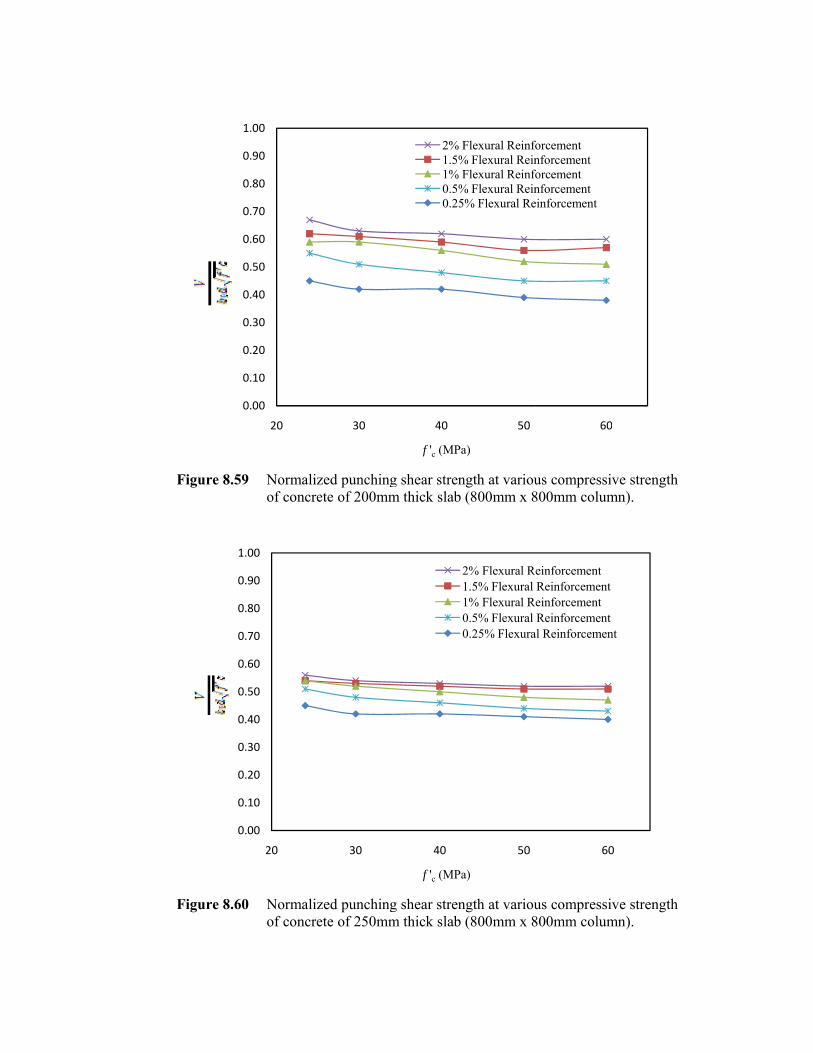
F
F
Figure 8.59
Figure 8.60
0
0
0
0
0
0
0
0
0
0
1
0.0
0.1
0.2
0.3
0.4
0.5
0.6
0.7
0.8
0.9
1.0
Normalizof concre
Normalizof concre
.00
.10
.20
.30
.40
.50
.60
.70
.80
.90
.00
20
00
10
20
30
40
50
60
70
80
90
00
20
zed punchingete of 200mm
zed punchingete of 250mm
30
30
g shear strenm thick slab
g shear strenm thick slab
40
f 'c (MPa
2% F1.5%1% F0.5%0.25
40
f 'c (MPa
21100
ngth at variou(800mm x 8
ngth at variou(800mm x 8
50
a)
Flexural Reinfo% Flexural ReinFlexural Reinfo
% Flexural Rein% Flexural Re
50
a)
2% Flexural R1.5% Flexural 1% Flexural R0.5% Flexural 0.25% Flexura
us compress800mm colum
us compress800mm colum
60
forcementnforcementforcementnforcementeinforcement
6
einforcementReinforcemeneinforcementReinforcemen
al Reinforceme
sive strength mn).
sive strength mn).
0
60
nt
ntnt
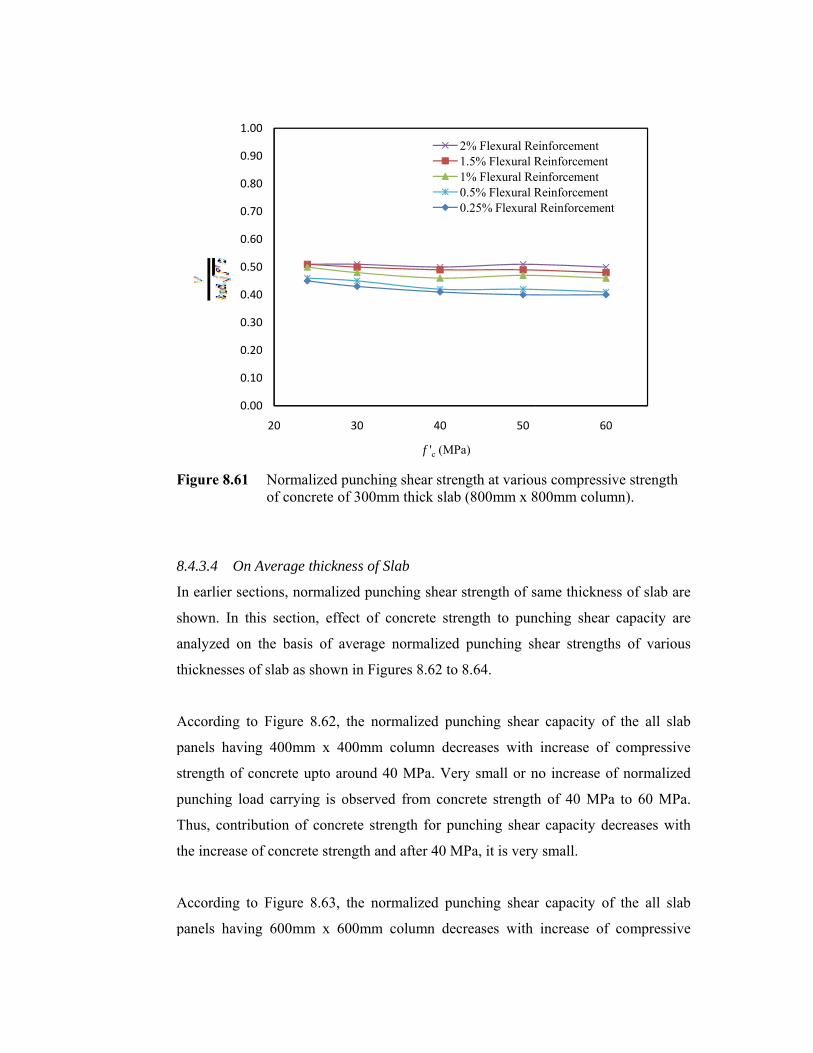
F
8
I
s
a
t
A
p
s
p
T
t
A
p
Figure 8.61
8.4.3.4 On
In earlier se
shown. In th
analyzed on
thicknesses o
According t
panels havin
strength of c
punching lo
Thus, contri
the increase
According t
panels havin
0.
0.
0.
0.
0.
0.
0.
0.
0.
0.
1.
Normalizof concre
n Average th
ctions, norm
his section,
n the basis o
of slab as sh
to Figure 8.
ng 400mm
concrete upt
ad carrying
ibution of co
of concrete
to Figure 8.
ng 600mm
00
10
20
30
40
50
60
70
80
90
00
20
zed punchingete of 300mm
ickness of Sl
malized punc
effect of c
of average n
hown in Figu
62, the norm
x 400mm c
to around 40
is observed
oncrete stren
strength and
63, the norm
x 600mm c
30
g shear strenm thick slab
lab
ching shear s
oncrete stre
normalized
ures 8.62 to 8
malized pun
column decr
0 MPa. Very
d from conc
ngth for pun
d after 40 MP
malized pun
column decr
40
f 'c (MPa
21100
ngth at variou(800mm x 8
strength of s
ngth to pun
punching sh
8.64.
nching shear
reases with
y small or n
crete strength
nching shear
Pa, it is very
nching shear
reases with
50
a)
2% Flexural Re1.5% Flexural R1% Flexural Re0.5% Flexural R0.25% Flexural
us compress800mm colum
same thickne
nching shear
hear strengt
r capacity o
increase of
no increase o
h of 40 MP
r capacity d
y small.
r capacity o
increase of
60
einforcementReinforcementeinforcementReinforcementl Reinforcemen
sive strength mn).
ess of slab a
r capacity a
ths of variou
of the all sla
f compressiv
of normalize
Pa to 60 MP
decreases wi
of the all sla
f compressiv
0
t
tnt
are
are
us
ab
ve
ed
Pa.
ith
ab
ve
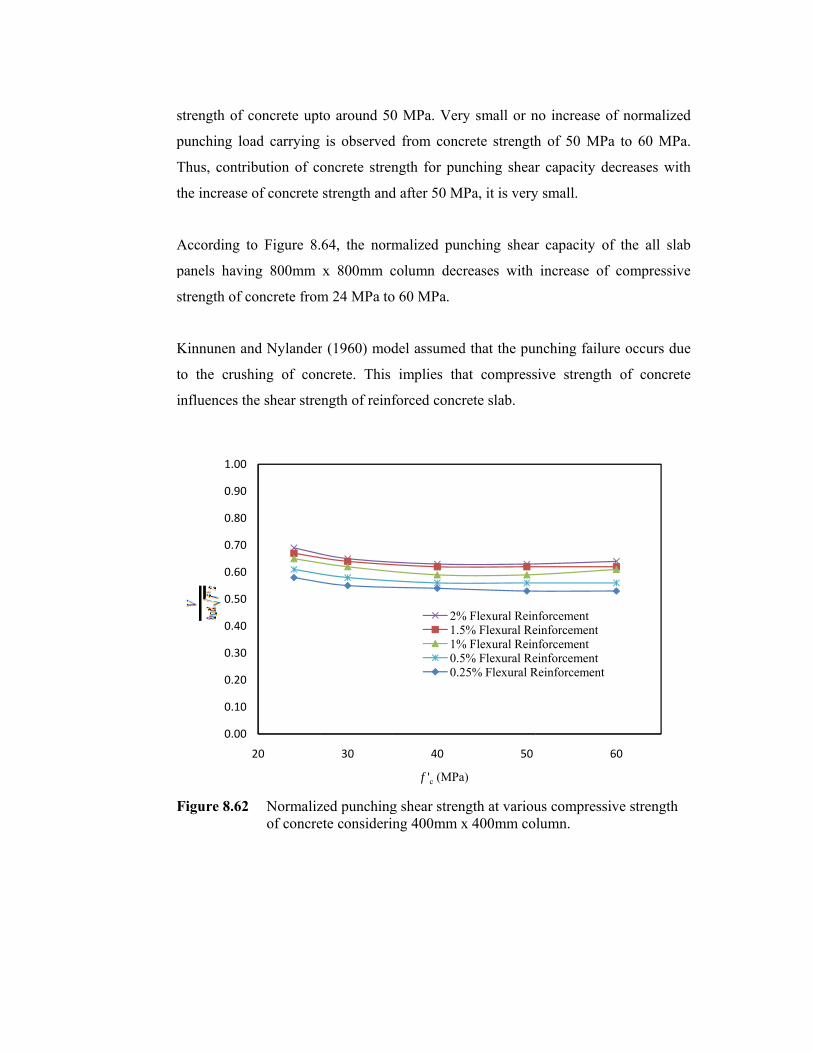
s
p
T
t
A
p
s
K
t
i
F
strength of c
punching lo
Thus, contri
the increase
According t
panels havin
strength of c
Kinnunen an
to the crush
influences th
Figure 8.62
0.00
0.10
0.20
0.30
0.40
0.50
0.60
0.70
0.80
0.90
1.00
concrete upt
ad carrying
ibution of co
of concrete
to Figure 8.
ng 800mm
concrete from
nd Nylander
hing of con
he shear stre
Normalizof concre
20
to around 50
is observed
oncrete stren
strength and
64, the norm
x 800mm c
m 24 MPa to
r (1960) mod
ncrete. This
ngth of reinf
zed punchingete consideri
30
0 MPa. Very
d from conc
ngth for pun
d after 50 MP
malized pun
column decr
o 60 MPa.
del assumed
implies tha
forced concr
g shear strenng 400mm x
40
f 'c (MPa
2%1.51%0.50.2
y small or n
crete strength
nching shear
Pa, it is very
nching shear
reases with
d that the pu
at compress
rete slab.
ngth at varioux 400mm co
50
a)
% Flexural Rein5% Flexural Re% Flexural Rein5% Flexural Re25% Flexural R
no increase o
h of 50 MP
r capacity d
y small.
r capacity o
increase of
unching failu
sive strength
us compresslumn.
nforcementeinforcementnforcementeinforcementReinforcement
of normalize
Pa to 60 MP
decreases wi
of the all sla
f compressiv
ure occurs du
h of concre
sive strength
60
ed
Pa.
ith
ab
ve
ue
ete
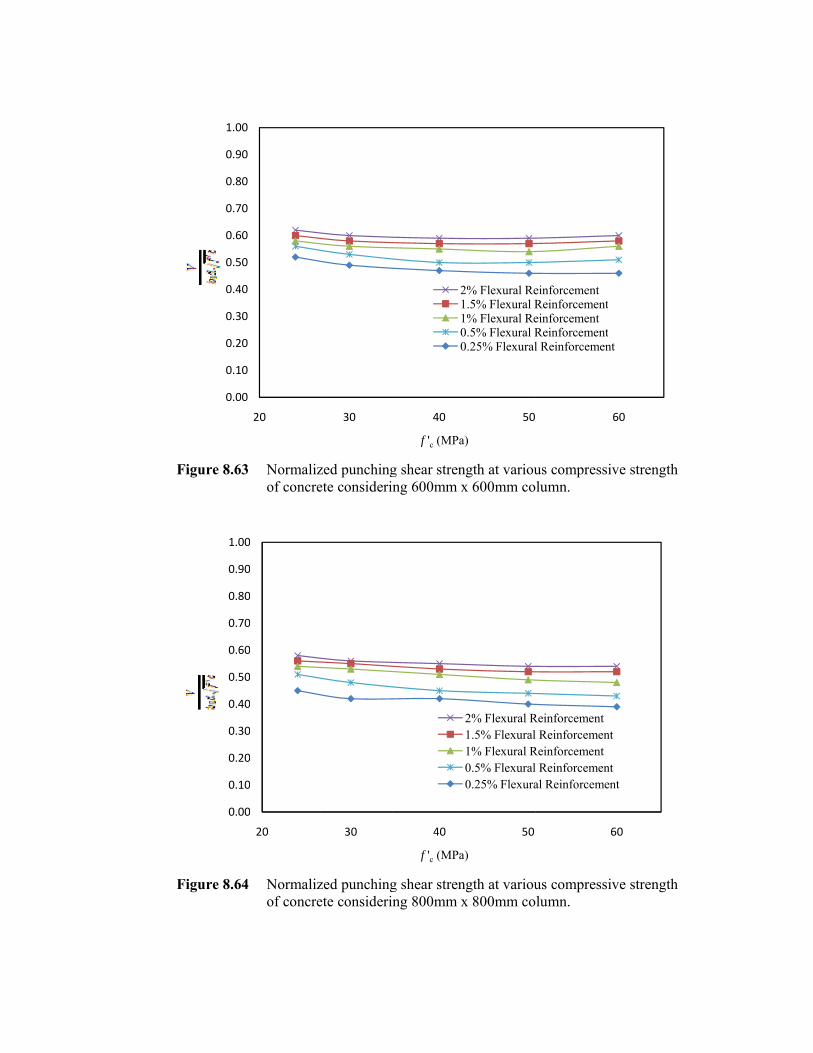
F
F
Figure 8.63
Figure 8.64
0.00
0.10
0.20
0.30
0.40
0.50
0.60
0.70
0.80
0.90
1.00
0.00
0.10
0.20
0.30
0.40
0.50
0.60
0.70
0.80
0.90
1.00
Normalizof concre
Normalizof concre
20
0
0
0
0
0
0
0
0
0
0
0
20
zed punchingete consideri
zed punchingete consideri
30
30
g shear strenng 600mm x
g shear strenng 800mm x
40
f 'c (MPa
21100
40
f 'c (MPa
ngth at varioux 600mm co
ngth at varioux 800mm co
50
a)
2% Flexural Re1.5% Flexural R1% Flexural Re0.5% Flexural R0.25% Flexural
50
a)
2% Flexural R1.5% Flexural1% Flexural R0.5% Flexural0.25% Flexura
us compresslumn.
us compresslumn.
einforcementReinforcementeinforcementReinforcementl Reinforcemen
Reinforcementl ReinforcemenReinforcementl Reinforcemenal Reinforceme
sive strength
sive strength
60
t
tnt
60
nt
ntent
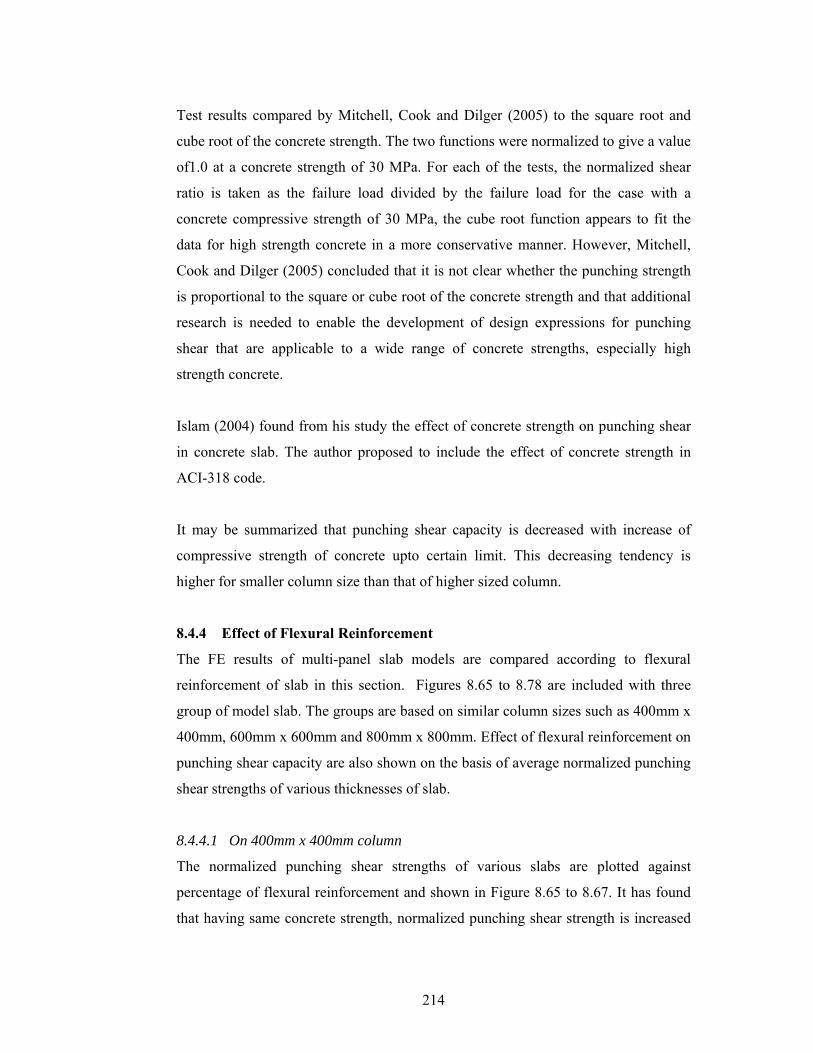
214
Test results compared by Mitchell, Cook and Dilger (2005) to the square root and
cube root of the concrete strength. The two functions were normalized to give a value
of1.0 at a concrete strength of 30 MPa. For each of the tests, the normalized shear
ratio is taken as the failure load divided by the failure load for the case with a
concrete compressive strength of 30 MPa, the cube root function appears to fit the
data for high strength concrete in a more conservative manner. However, Mitchell,
Cook and Dilger (2005) concluded that it is not clear whether the punching strength
is proportional to the square or cube root of the concrete strength and that additional
research is needed to enable the development of design expressions for punching
shear that are applicable to a wide range of concrete strengths, especially high
strength concrete.
Islam (2004) found from his study the effect of concrete strength on punching shear
in concrete slab. The author proposed to include the effect of concrete strength in
ACI-318 code.
It may be summarized that punching shear capacity is decreased with increase of
compressive strength of concrete upto certain limit. This decreasing tendency is
higher for smaller column size than that of higher sized column.
8.4.4 Effect of Flexural Reinforcement
The FE results of multi-panel slab models are compared according to flexural
reinforcement of slab in this section. Figures 8.65 to 8.78 are included with three
group of model slab. The groups are based on similar column sizes such as 400mm x
400mm, 600mm x 600mm and 800mm x 800mm. Effect of flexural reinforcement on
punching shear capacity are also shown on the basis of average normalized punching
shear strengths of various thicknesses of slab.
8.4.4.1 On 400mm x 400mm column
The normalized punching shear strengths of various slabs are plotted against
percentage of flexural reinforcement and shown in Figure 8.65 to 8.67. It has found
that having same concrete strength, normalized punching shear strength is increased
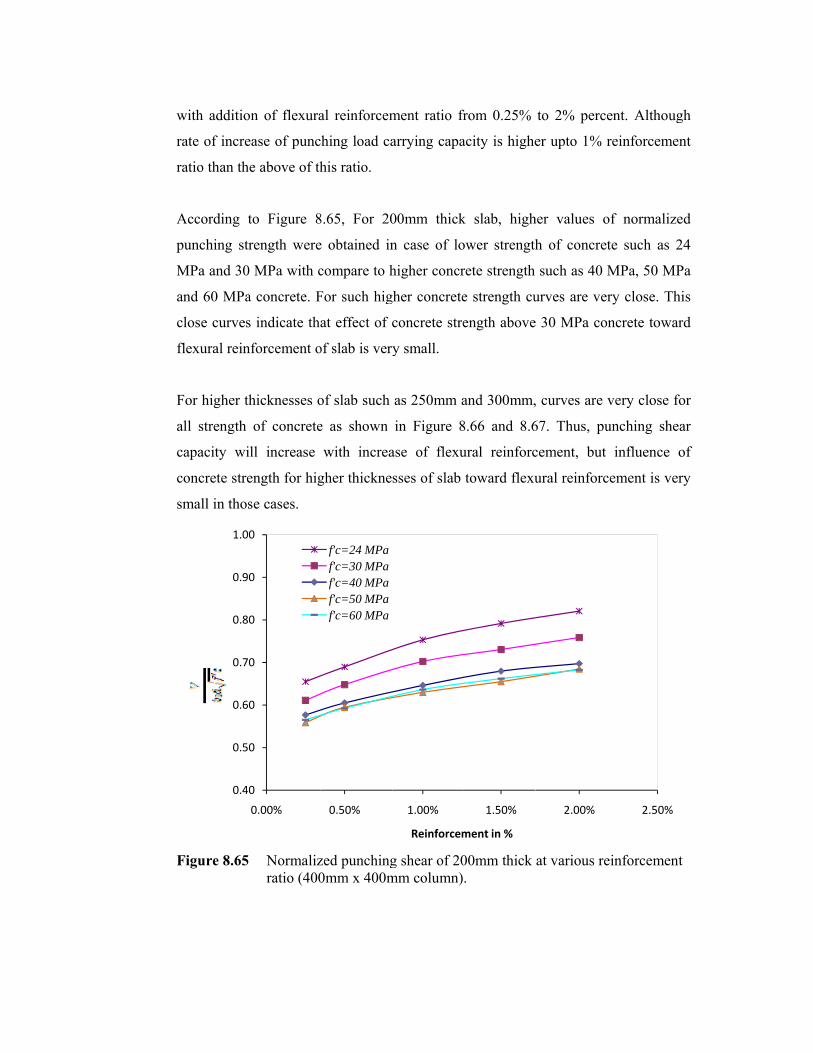
w
r
r
A
p
M
a
c
f
F
a
c
c
s
F
with additio
rate of incre
ratio than th
According t
punching str
MPa and 30
and 60 MPa
close curves
flexural rein
For higher th
all strength
capacity wi
concrete stre
small in thos
Figure 8.65
0.40
0.50
0.60
0.70
0.80
0.90
1.00
on of flexura
ease of punc
e above of th
to Figure 8
rength were
0 MPa with c
a concrete. F
s indicate tha
nforcement o
hicknesses o
of concrete
ill increase
ength for hig
se cases.
Normalizratio (400
0
0
0
0
0
0
0
0.00%
al reinforcem
hing load ca
his ratio.
8.65, For 20
e obtained in
compare to h
For such hig
at effect of c
of slab is very
of slab such
e as shown
with increa
gher thickne
zed punching0mm x 400m
0.50%
f'c=24 MPaf'c=30 MPaf'c=40 MPaf'c=50 MPaf'c=60 MPa
ment ratio fr
arrying capa
00mm thick
n case of lo
higher concr
gher concrete
concrete stre
y small.
as 250mm a
in Figure 8
ase of flexu
sses of slab
g shear of 20mm column)
1.00%
Reinforcem
from 0.25%
acity is highe
k slab, high
ower strength
rete strength
e strength cu
ength above
and 300mm,
8.66 and 8.6
ural reinforc
toward flexu
00mm thick .
1.50%
ment in %
to 2% perce
er upto 1% r
her values o
h of concret
such as 40
urves are ve
e 30 MPa co
, curves are
67. Thus, pu
cement, but
ural reinforc
at various re
2.00%
ent. Althoug
reinforceme
of normalize
te such as 2
MPa, 50 MP
ry close. Th
oncrete towar
very close f
unching she
influence
cement is ver
einforcement
2.50%
gh
ent
ed
24
Pa
his
rd
for
ear
of
ry
t
F
F
Figure 8.66
Figure 8.67
0.40
0.50
0.60
0.70
0.80
0.90
1.00
0.30
0.40
0.50
0.60
0.70
0.80
0.90
1.00
Normalizratio (400
Normalizratio (400
0
0
0
0
0
0
0
0.00%
0
0
0
0
0
0
0
0
0.00%
zed punching0mm x 400m
zed punching0mm x 400m
0.50%
f'c=24 MPaf'c=30 MPaf'c=40 MPaf'c=50 MPaf'c=60 MPa
0.50%
f'c=24 MPaf'c=30 MPaf'c=40 MPaf'c=50 MPaf'c=60 MPa
g shear of 25mm column)
g shear of 30mm column)
1.00%
Reinforcem
1.00%
Reinforcem
50mm thick .
00mm thick .
1.50%
ment in %
1.50%
ment in %
at various re
at various re
2.00%
2.00%
einforcement
einforcement
2.50%
2.50%
t
t
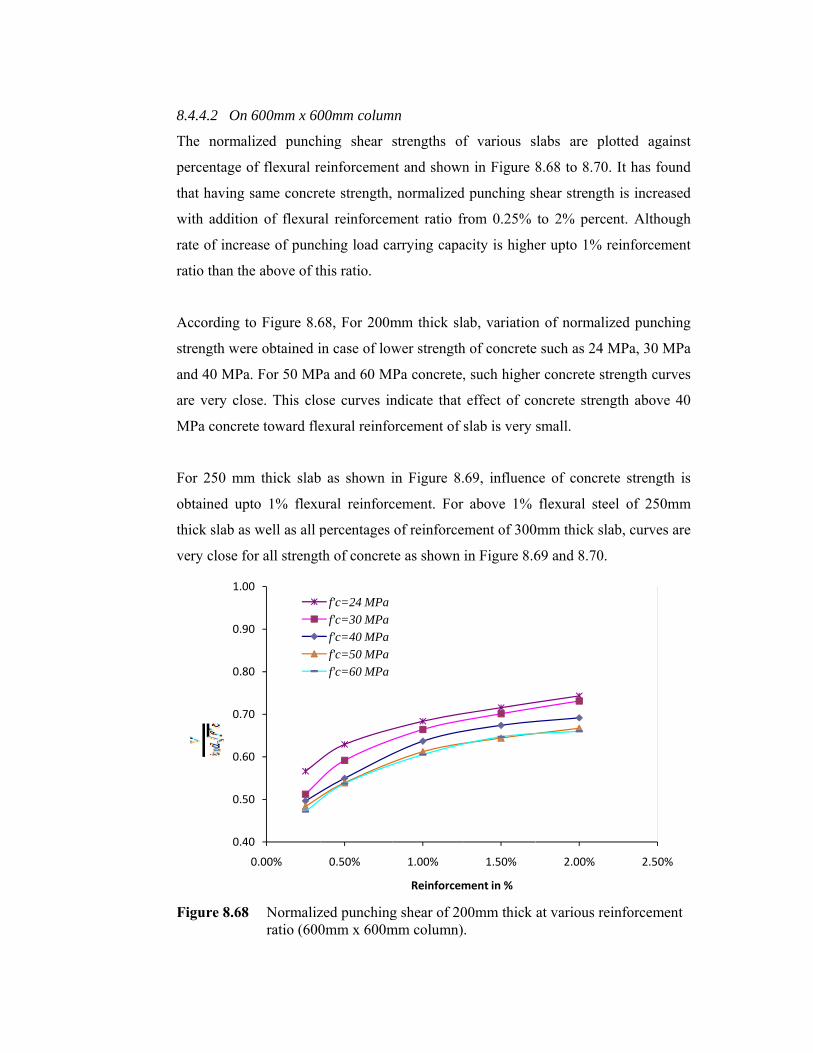
8
T
p
t
w
r
r
A
s
a
a
M
F
o
t
v
F
8.4.4.2 On
The normal
percentage o
that having
with additio
rate of incre
ratio than th
According t
strength wer
and 40 MPa
are very clo
MPa concret
For 250 mm
obtained up
thick slab as
very close fo
Figure 8.68
0.40
0.50
0.60
0.70
0.80
0.90
1.00
600mm x 60
lized punch
of flexural re
same concre
on of flexura
ease of punc
e above of th
o Figure 8.6
re obtained i
a. For 50 MP
ose. This clo
te toward fle
m thick slab
to 1% flexu
s well as all p
or all strengt
Normalizratio (600
0
0
0
0
0
0
0
0.00%
00mm colum
hing shear
einforcemen
ete strength,
al reinforcem
hing load ca
his ratio.
68, For 200m
in case of low
Pa and 60 M
ose curves in
exural reinfo
as shown i
ural reinforc
percentages
th of concret
zed punching0mm x 600m
0.50%
f'c=24 MPaf'c=30 MPaf'c=40 MPaf'c=50 MPaf'c=60 MPa
mn
strengths of
nt and shown
normalized
ment ratio fr
arrying capa
mm thick sla
wer strength
Pa concrete,
ndicate that
orcement of
in Figure 8.
cement. For
of reinforce
te as shown
g shear of 20mm column)
1.00%
Reinforcem
f various s
n in Figure
d punching s
from 0.25%
acity is highe
ab, variation
h of concrete
, such higher
effect of co
slab is very
69, influenc
above 1%
ment of 300
in Figure 8.6
00mm thick .
1.50%
ment in %
slabs are pl
8.68 to 8.70
hear strengt
to 2% perce
er upto 1% r
n of normali
e such as 24
r concrete st
oncrete stren
small.
ce of concre
flexural ste
0mm thick sl
69 and 8.70.
at various re
2.00%
lotted again
0. It has foun
th is increase
ent. Althoug
reinforceme
ized punchin
MPa, 30 MP
trength curv
ngth above 4
ete strength
eel of 250m
lab, curves a
einforcement
2.50%
nst
nd
ed
gh
ent
ng
Pa
es
40
is
mm
are
t
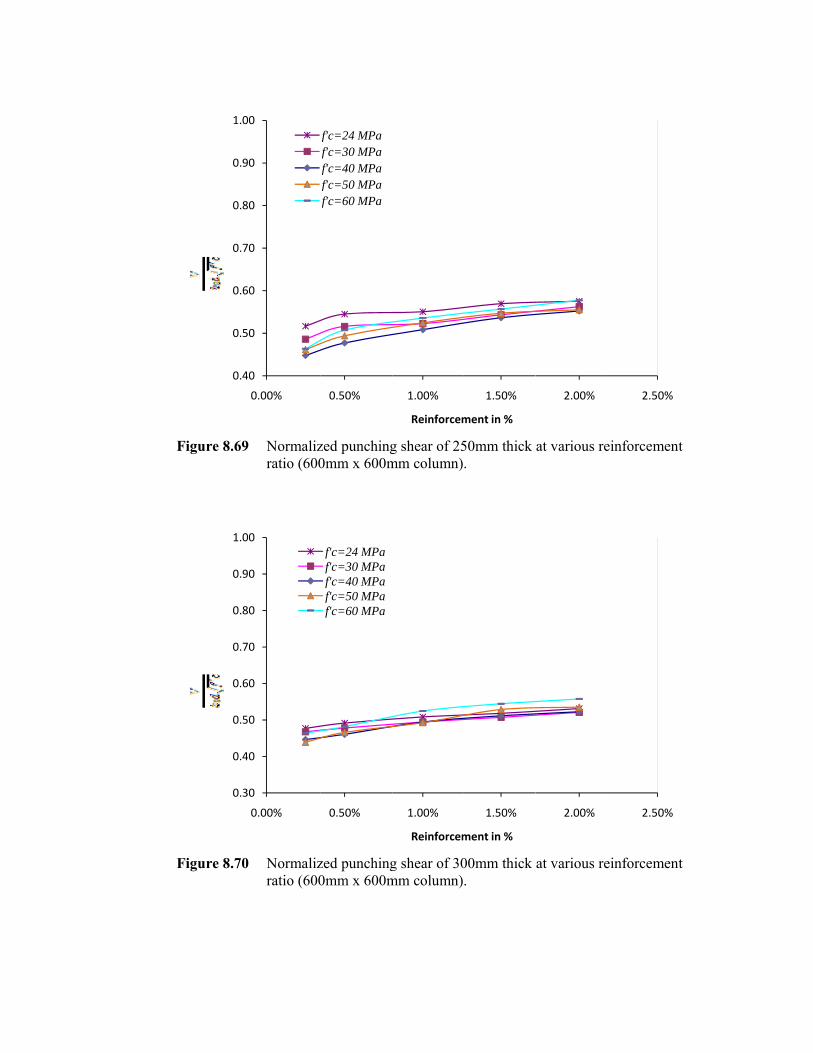
F
F
Figure 8.69
Figure 8.70
0.40
0.50
0.60
0.70
0.80
0.90
1.00
0.30
0.40
0.50
0.60
0.70
0.80
0.90
1.00
Normalizratio (600
Normalizratio (600
0
0
0
0
0
0
0
0.00%
fffff
0
0
0
0
0
0
0
0
0.00%
zed punching0mm x 600m
zed punching0mm x 600m
0.50%
f'c=24 MPaf'c=30 MPaf'c=40 MPaf'c=50 MPaf'c=60 MPa
0.50%
f'c=24 MPaf'c=30 MPaf'c=40 MPaf'c=50 MPaf'c=60 MPa
g shear of 25mm column)
g shear of 30mm column)
1.00%
Reinforcem
1.00%
Reinforcem
50mm thick .
00mm thick .
1.50%
ment in %
1.50%
ment in %
at various re
at various re
2.00%
2.00%
einforcement
einforcement
2.50%
2.50%
t
t
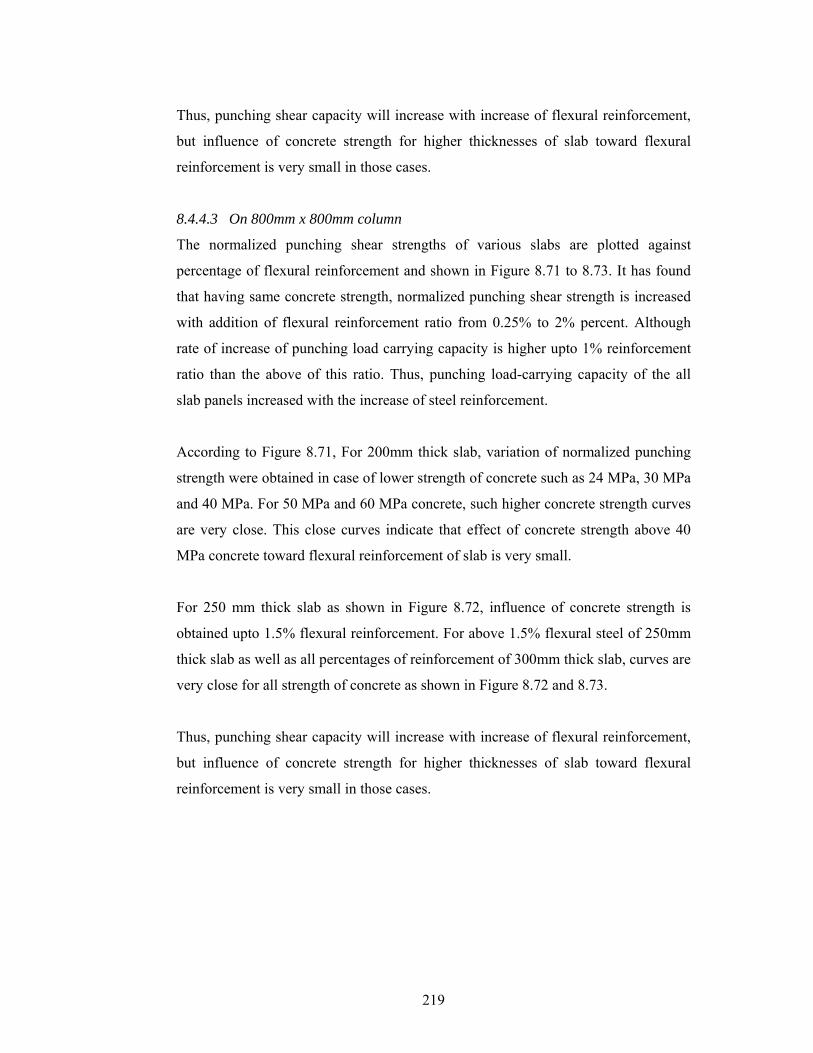
219
Thus, punching shear capacity will increase with increase of flexural reinforcement,
but influence of concrete strength for higher thicknesses of slab toward flexural
reinforcement is very small in those cases.
8.4.4.3 On 800mm x 800mm column
The normalized punching shear strengths of various slabs are plotted against
percentage of flexural reinforcement and shown in Figure 8.71 to 8.73. It has found
that having same concrete strength, normalized punching shear strength is increased
with addition of flexural reinforcement ratio from 0.25% to 2% percent. Although
rate of increase of punching load carrying capacity is higher upto 1% reinforcement
ratio than the above of this ratio. Thus, punching load-carrying capacity of the all
slab panels increased with the increase of steel reinforcement.
According to Figure 8.71, For 200mm thick slab, variation of normalized punching
strength were obtained in case of lower strength of concrete such as 24 MPa, 30 MPa
and 40 MPa. For 50 MPa and 60 MPa concrete, such higher concrete strength curves
are very close. This close curves indicate that effect of concrete strength above 40
MPa concrete toward flexural reinforcement of slab is very small.
For 250 mm thick slab as shown in Figure 8.72, influence of concrete strength is
obtained upto 1.5% flexural reinforcement. For above 1.5% flexural steel of 250mm
thick slab as well as all percentages of reinforcement of 300mm thick slab, curves are
very close for all strength of concrete as shown in Figure 8.72 and 8.73.
Thus, punching shear capacity will increase with increase of flexural reinforcement,
but influence of concrete strength for higher thicknesses of slab toward flexural
reinforcement is very small in those cases.
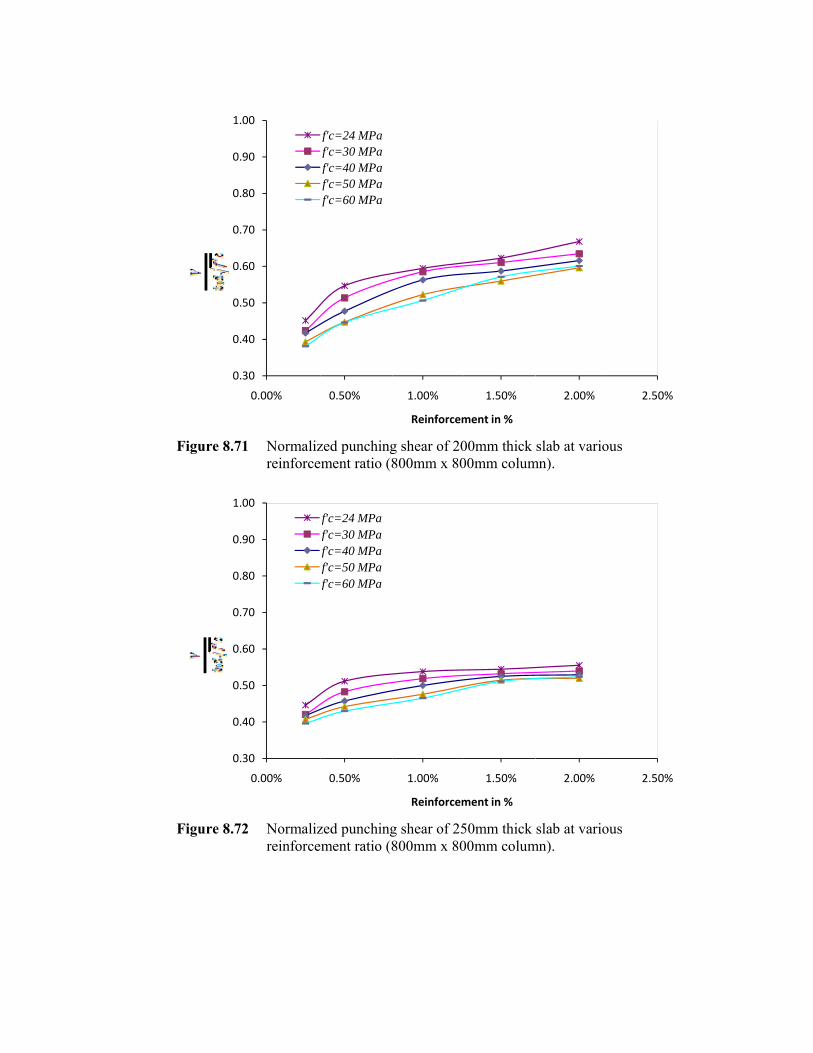
F
F
Figure 8.71
Figure 8.72
0.30
0.40
0.50
0.60
0.70
0.80
0.90
1.00
0.30
0.40
0.50
0.60
0.70
0.80
0.90
1.00
Normalizreinforce
Normalizreinforce
0
0
0
0
0
0
0
0
0.00%
fffff
0
0
0
0
0
0
0
0
0.00%
fffff
zed punchingment ratio (8
zed punchingment ratio (8
0.50%
f'c=24 MPaf'c=30 MPaf'c=40 MPaf'c=50 MPaf'c=60 MPa
0.50%
f'c=24 MPaf'c=30 MPaf'c=40 MPaf'c=50 MPaf'c=60 MPa
g shear of 20800mm x 80
g shear of 25800mm x 80
1.00%
Reinforcem
1.00%
Reinforcem
00mm thick 00mm colum
50mm thick 00mm colum
1.50%
ment in %
1.50%
ment in %
slab at variomn).
slab at variomn).
2.00%
2.00%
ous
ous
2.50%
2.50%
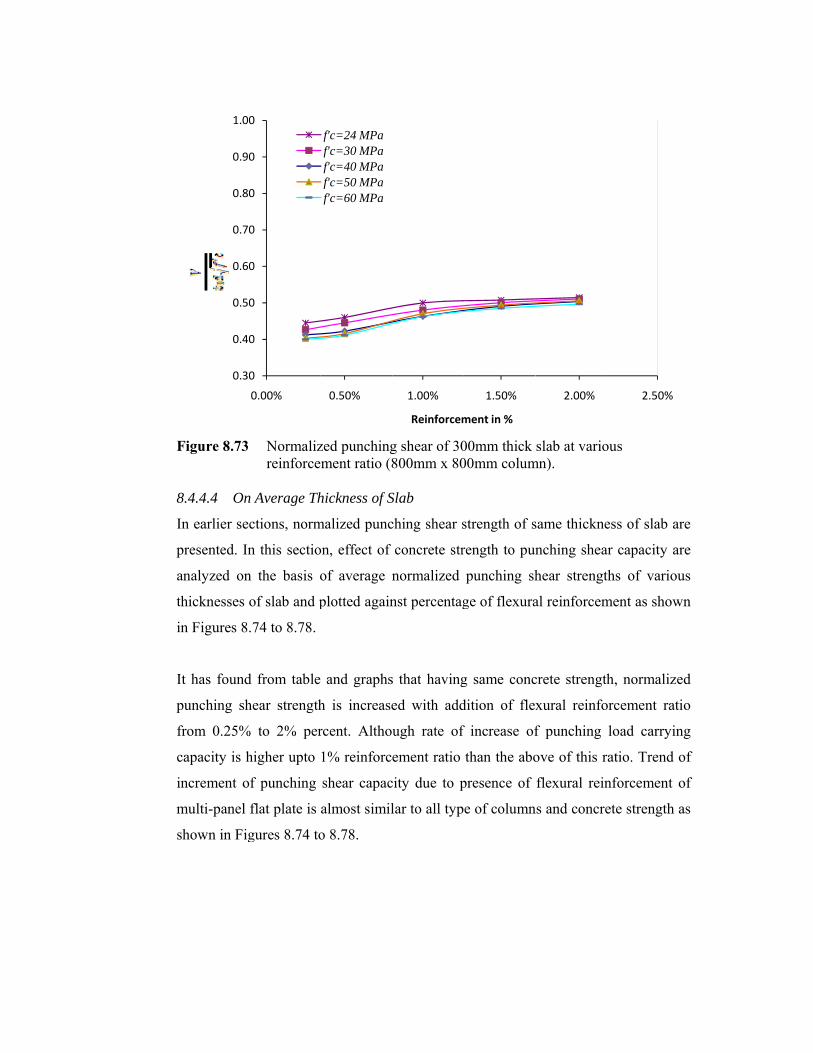
F
8
I
p
a
t
i
I
p
f
c
i
m
s
Figure 8.73
8.4.4.4 On
In earlier se
presented. In
analyzed on
thicknesses
in Figures 8
It has found
punching sh
from 0.25%
capacity is h
increment o
multi-panel
shown in Fig
0.30
0.40
0.50
0.60
0.70
0.80
0.90
1.00
Normalizreinforce
n Average Th
ctions, norm
n this sectio
n the basis o
of slab and p
.74 to 8.78.
d from table
hear strength
% to 2% per
higher upto
f punching
flat plate is
gures 8.74 to
0
0
0
0
0
0
0
0
0.00%
zed punchingment ratio (8
hickness of S
malized punc
on, effect of
of average n
plotted again
and graphs
h is increase
rcent. Althou
1% reinforc
shear capac
almost simil
o 8.78.
0.50%
f'c=24 MPaf'c=30 MPaf'c=40 MPaf'c=50 MPaf'c=60 MPa
g shear of 30800mm x 80
Slab
ching shear s
concrete str
normalized
nst percentag
s that having
ed with add
ugh rate of
ement ratio
city due to p
lar to all typ
1.00%
Reinforcem
00mm thick 00mm colum
strength of s
rength to pun
punching sh
ge of flexura
g same conc
dition of flex
f increase of
than the abo
presence of
e of column
1.50%
ment in %
slab at variomn).
same thickne
nching shea
hear strengt
al reinforcem
crete strength
xural reinfo
f punching
ove of this r
flexural rein
ns and concre
2.00%
ous
ess of slab a
ar capacity a
ths of variou
ment as show
h, normalize
orcement rat
load carryin
ratio. Trend
nforcement
ete strength
2.50%
are
are
us
wn
ed
tio
ng
of
of
as
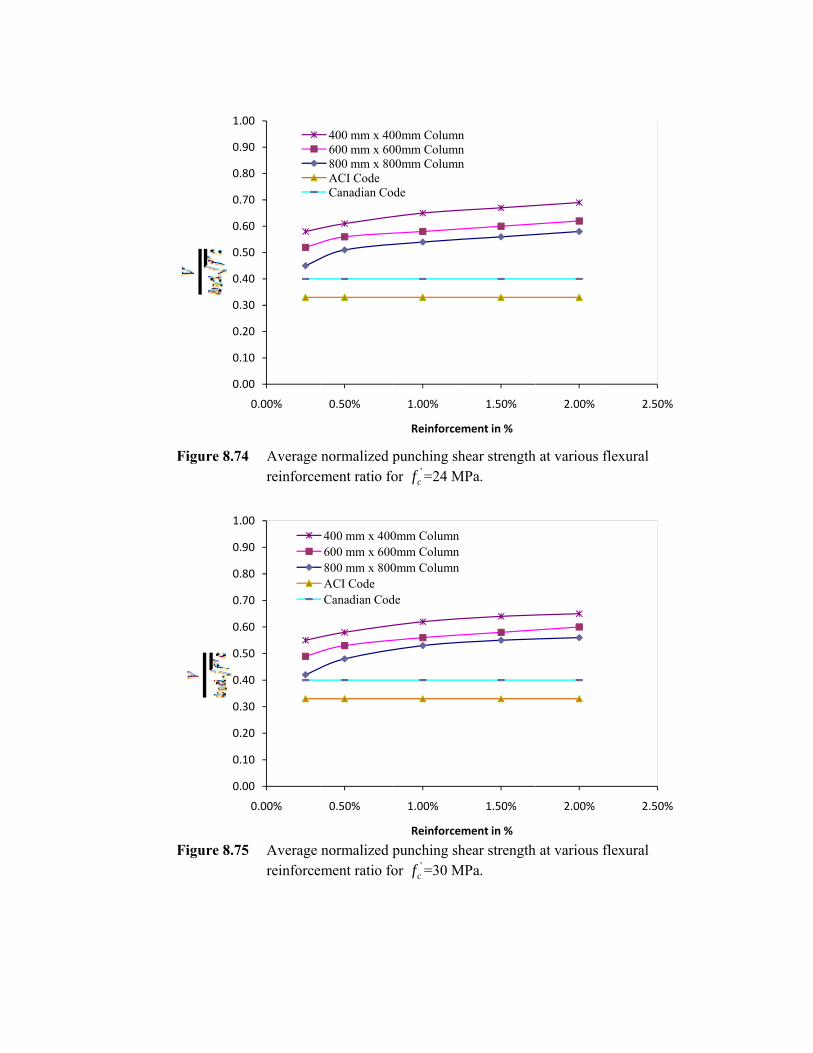
F
F
Figure 8.74
Figure 8.75
0.00
0.10
0.20
0.30
0.40
0.50
0.60
0.70
0.80
0.90
1.00
0.00
0.10
0.20
0.30
0.40
0.50
0.60
0.70
0.80
0.90
1.00
Average reinforce
Average reinforce
0
0
0
0
0
0
0
0
0
0
0
0.00%
0
0
0
0
0
0
0
0
0
0
0
0.00%
normalized ment ratio fo
normalized ment ratio fo
0.50%
400 mm x 40600 mm x 60800 mm x 80ACI CodeCanadian Co
0.50%
400 mm x 400600 mm x 600800 mm x 800ACI CodeCanadian Cod
punching shor '
cf =24 M
punching shor '
cf =30 M
1.00%
Reinforcem
00mm Column00mm Column00mm Column
ode
1.00%
Reinforcem
0mm Column0mm Column0mm Column
de
hear strengthMPa.
hear strengthMPa.
1.50%
ment in %
nnn
1.50%
ment in %
h at various f
h at various f
2.00%
2.00%
flexural
flexural
2.50%
2.50%
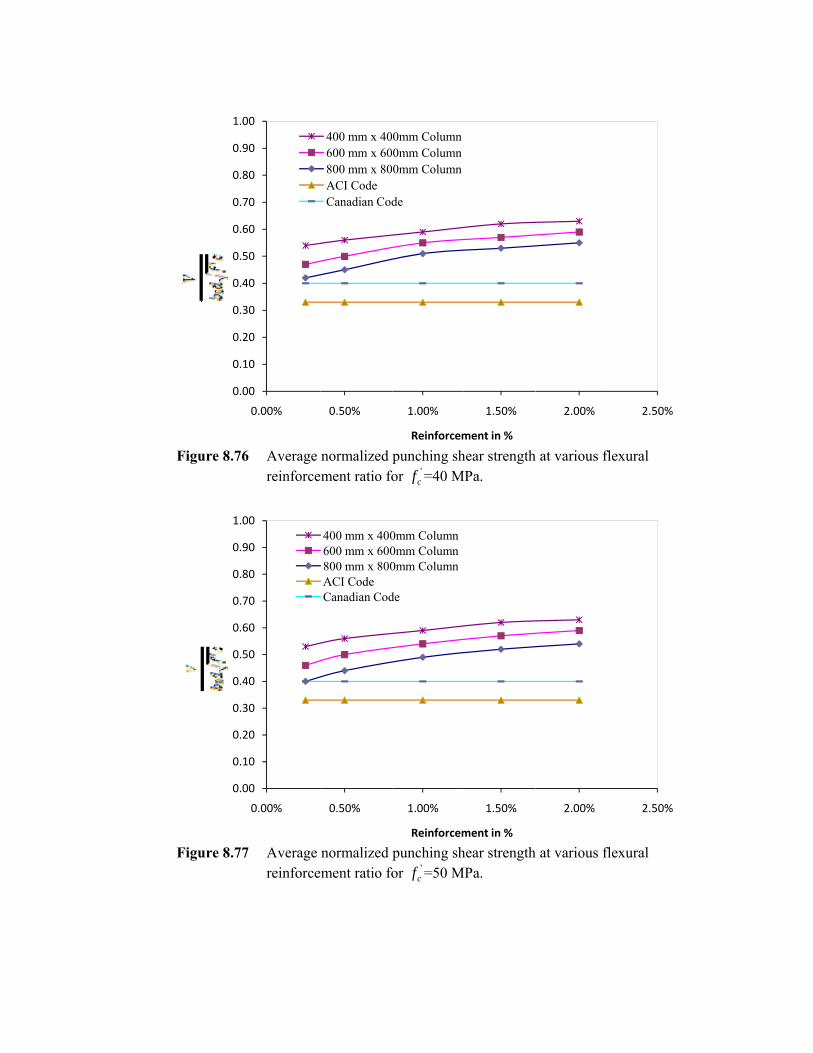
F
F
Figure 8.76
Figure 8.77
0.00
0.10
0.20
0.30
0.40
0.50
0.60
0.70
0.80
0.90
1.00
0.00
0.10
0.20
0.30
0.40
0.50
0.60
0.70
0.80
0.90
1.00
Average reinforce
Average reinforce
0
0
0
0
0
0
0
0
0
0
0
0.00%
0
0
0
0
0
0
0
0
0
0
0
0.00%
normalized ment ratio fo
normalized ment ratio fo
0.50%
400 mm x 40600 mm x 60800 mm x 80ACI CodeCanadian Cod
0.50%
400 mm x 400600 mm x 600800 mm x 800ACI CodeCanadian Cod
punching shor '
cf =40 M
punching shor '
cf =50 M
1.00%
Reinforcem
0mm Column0mm Column0mm Column
de
1.00%
Reinforcem
0mm Column0mm Column0mm Column
de
hear strengthMPa.
hear strengthMPa.
1.50%
ment in %
1.50%
ment in %
h at various f
h at various f
2.00%
2.00%
flexural
flexural
2.50%
2.50%
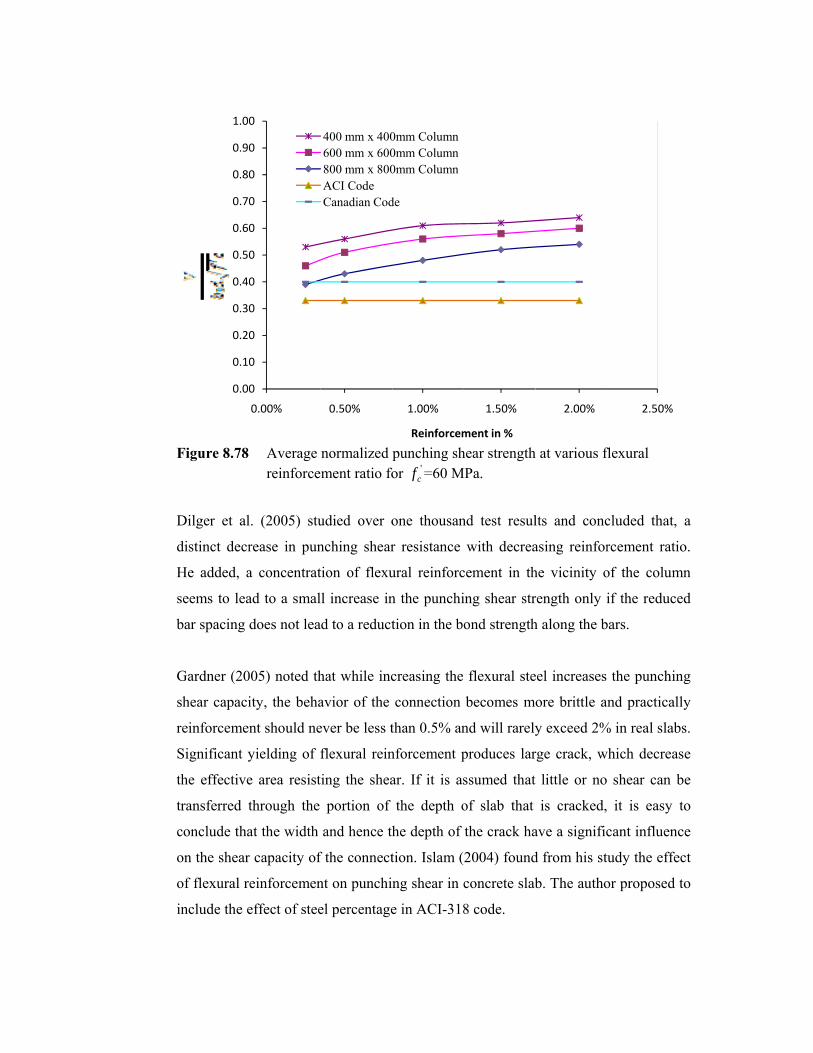
F
D
d
H
s
b
G
s
r
S
t
t
c
o
o
i
Figure 8.78
Dilger et al
distinct decr
He added, a
seems to lea
bar spacing
Gardner (20
shear capaci
reinforcemen
Significant y
the effective
transferred t
conclude tha
on the shear
of flexural r
include the e
0.00
0.10
0.20
0.30
0.40
0.50
0.60
0.70
0.80
0.90
1.00
Average reinforce
l. (2005) stu
rease in pun
a concentrat
ad to a smal
does not lea
005) noted th
ity, the beha
nt should ne
yielding of f
e area resist
through the
at the width
r capacity of
einforcemen
effect of stee
0
0
0
0
0
0
0
0
0
0
0
0.00%
normalized ment ratio fo
udied over o
nching shear
tion of flexu
l increase in
d to a reduct
hat while inc
avior of the
ever be less t
flexural rein
ing the shea
portion of
and hence th
f the connect
nt on punchin
el percentage
0.50%
400 mm x 400600 mm x 600800 mm x 800ACI CodeCanadian Cod
punching shor '
cf =60 M
one thousan
r resistance
ural reinforc
n the punchi
tion in the bo
creasing the
connection
than 0.5% an
nforcement p
ar. If it is as
the depth o
he depth of
tion. Islam (
ng shear in c
e in ACI-318
1.00%
Reinforcem
0mm Column0mm Column0mm Column
de
hear strengthMPa.
nd test resul
with decrea
cement in th
ing shear str
ond strength
flexural ste
becomes m
nd will rarely
produces lar
ssumed that
of slab that
the crack ha
2004) found
concrete slab
8 code.
1.50%
ment in %
h at various f
lts and conc
asing reinfor
he vicinity o
rength only i
h along the b
eel increases
ore brittle a
y exceed 2%
rge crack, w
t little or no
is cracked,
ave a signific
d from his st
b. The autho
2.00%
flexural
cluded that,
rcement rati
of the colum
if the reduce
bars.
the punchin
and practical
% in real slab
which decrea
shear can b
it is easy
cant influenc
tudy the effe
or proposed
2.50%
a
io.
mn
ed
ng
lly
bs.
se
be
to
ce
ect
to
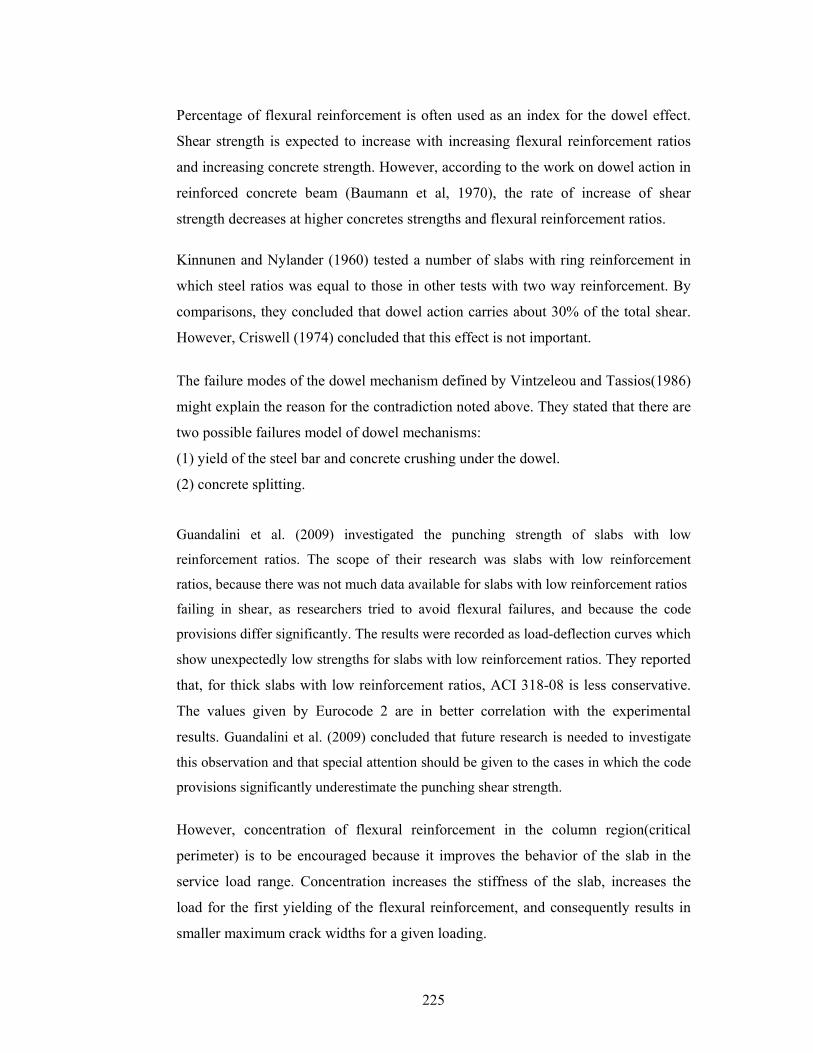
225
Percentage of flexural reinforcement is often used as an index for the dowel effect.
Shear strength is expected to increase with increasing flexural reinforcement ratios
and increasing concrete strength. However, according to the work on dowel action in
reinforced concrete beam (Baumann et al, 1970), the rate of increase of shear
strength decreases at higher concretes strengths and flexural reinforcement ratios.
Kinnunen and Nylander (1960) tested a number of slabs with ring reinforcement in
which steel ratios was equal to those in other tests with two way reinforcement. By
comparisons, they concluded that dowel action carries about 30% of the total shear.
However, Criswell (1974) concluded that this effect is not important.
The failure modes of the dowel mechanism defined by Vintzeleou and Tassios(1986)
might explain the reason for the contradiction noted above. They stated that there are
two possible failures model of dowel mechanisms:
(1) yield of the steel bar and concrete crushing under the dowel.
(2) concrete splitting.
Guandalini et al. (2009) investigated the punching strength of slabs with low
reinforcement ratios. The scope of their research was slabs with low reinforcement
ratios, because there was not much data available for slabs with low reinforcement ratios
failing in shear, as researchers tried to avoid flexural failures, and because the code
provisions differ significantly. The results were recorded as load-deflection curves which
show unexpectedly low strengths for slabs with low reinforcement ratios. They reported
that, for thick slabs with low reinforcement ratios, ACI 318-08 is less conservative.
The values given by Eurocode 2 are in better correlation with the experimental
results. Guandalini et al. (2009) concluded that future research is needed to investigate
this observation and that special attention should be given to the cases in which the code
provisions significantly underestimate the punching shear strength.
However, concentration of flexural reinforcement in the column region(critical
perimeter) is to be encouraged because it improves the behavior of the slab in the
service load range. Concentration increases the stiffness of the slab, increases the
load for the first yielding of the flexural reinforcement, and consequently results in
smaller maximum crack widths for a given loading.
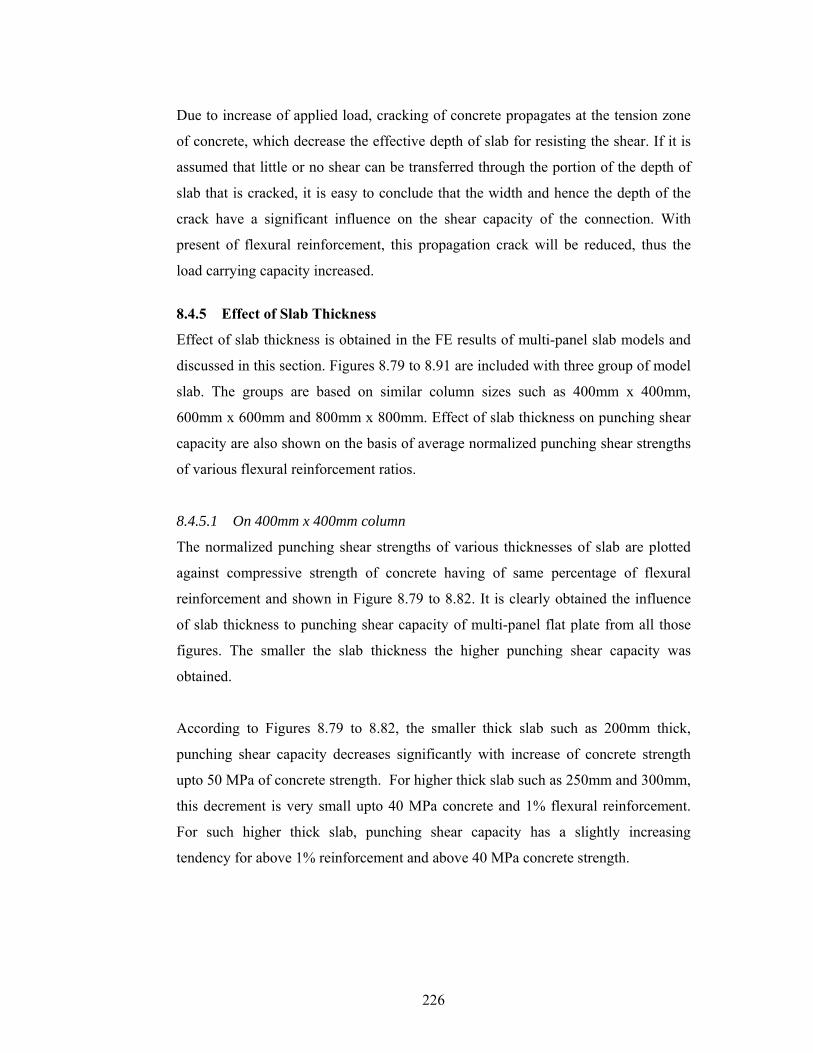
226
Due to increase of applied load, cracking of concrete propagates at the tension zone
of concrete, which decrease the effective depth of slab for resisting the shear. If it is
assumed that little or no shear can be transferred through the portion of the depth of
slab that is cracked, it is easy to conclude that the width and hence the depth of the
crack have a significant influence on the shear capacity of the connection. With
present of flexural reinforcement, this propagation crack will be reduced, thus the
load carrying capacity increased.
8.4.5 Effect of Slab Thickness
Effect of slab thickness is obtained in the FE results of multi-panel slab models and
discussed in this section. Figures 8.79 to 8.91 are included with three group of model
slab. The groups are based on similar column sizes such as 400mm x 400mm,
600mm x 600mm and 800mm x 800mm. Effect of slab thickness on punching shear
capacity are also shown on the basis of average normalized punching shear strengths
of various flexural reinforcement ratios.
8.4.5.1 On 400mm x 400mm column
The normalized punching shear strengths of various thicknesses of slab are plotted
against compressive strength of concrete having of same percentage of flexural
reinforcement and shown in Figure 8.79 to 8.82. It is clearly obtained the influence
of slab thickness to punching shear capacity of multi-panel flat plate from all those
figures. The smaller the slab thickness the higher punching shear capacity was
obtained.
According to Figures 8.79 to 8.82, the smaller thick slab such as 200mm thick,
punching shear capacity decreases significantly with increase of concrete strength
upto 50 MPa of concrete strength. For higher thick slab such as 250mm and 300mm,
this decrement is very small upto 40 MPa concrete and 1% flexural reinforcement.
For such higher thick slab, punching shear capacity has a slightly increasing
tendency for above 1% reinforcement and above 40 MPa concrete strength.
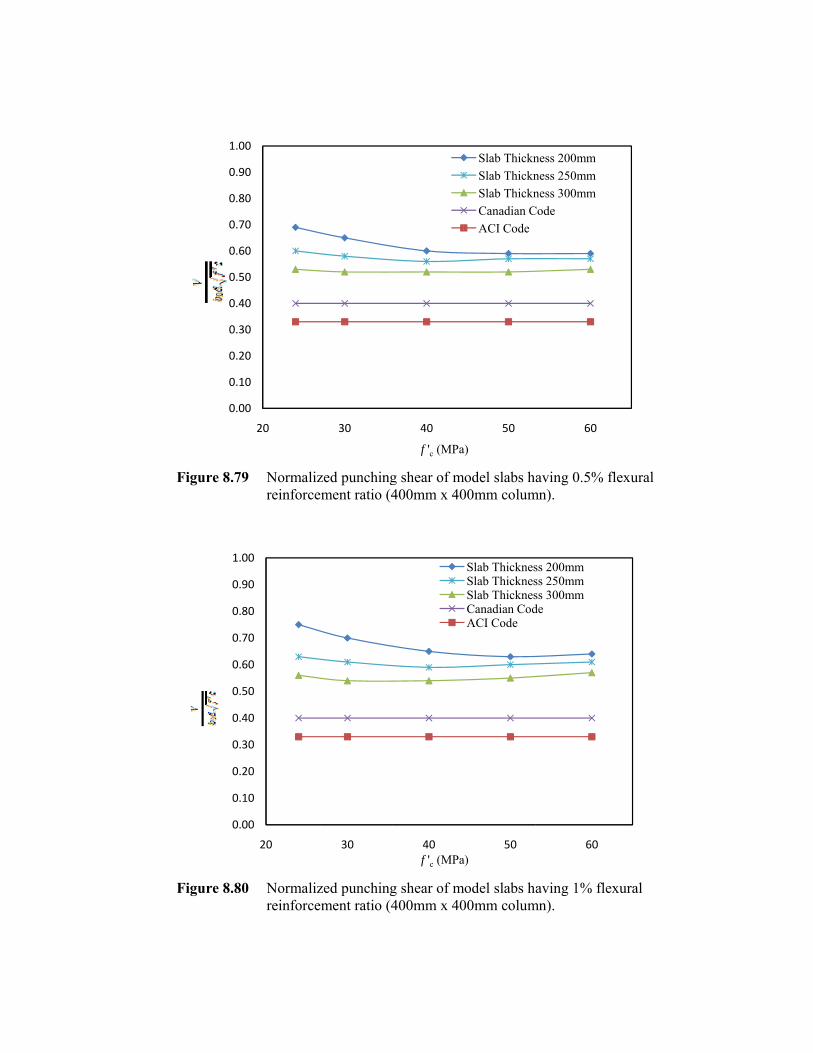
F
F
Figure 8.79
Figure 8.80
0.00
0.10
0.20
0.30
0.40
0.50
0.60
0.70
0.80
0.90
1.00
0.00
0.10
0.20
0.30
0.40
0.50
0.60
0.70
0.80
0.90
1.00
Normalizreinforce
Normalizreinforce
0
0
0
0
0
0
0
0
0
0
0
20
0
0
0
0
0
0
0
0
0
0
0
20
zed punchingment ratio (4
zed punchingment ratio (4
30
30
g shear of m400mm x 40
g shear of m400mm x 40
40
f 'c (MPa
40f 'c (MPa
model slabs h00mm colum
model slabs h00mm colum
50
a)
Slab ThicknSlab ThicknSlab ThicknCanadian CACI Code
50a)
Slab ThicknesSlab ThicknesSlab ThicknesCanadian CodACI Code
aving 0.5% mn).
aving 1% flemn).
60
ness 200mm ness 250mmness 300mm
Code
60
ss 200mm ss 250mmss 300mmde
flexural
exural
F
F
Figure 8.81
Figure 8.82
0.0
0.1
0.2
0.3
0.4
0.5
0.6
0.7
0.8
0.9
1.0
0.0
0.1
0.2
0.3
0.4
0.5
0.6
0.7
0.8
0.9
1.0
Normalizreinforce
Normalizreinforce
0
0
0
0
0
0
0
0
0
0
0
20
00
10
20
30
40
50
60
70
80
90
00
20
zed punchingment ratio (4
zed punchingment ratio (4
30
30
g shear of m400mm x 40
g shear of m400mm x 40
40f 'c (MPa
40f 'c (MPa
model slabs h00mm colum
model slabs h00mm colum
50a)
Slab ThicknesSlab ThicknesSlab ThicknesCanadian CodACI Code
50a)
Slab ThiSlab ThiSlab ThiCanadiaACI Cod
aving 1.5% mn).
aving 2% flemn).
60
ss 200mm ss 250mmss 300mmde
60
ickness 200mmickness 250mmickness 300mm
an Codede
flexural
exural
m mm
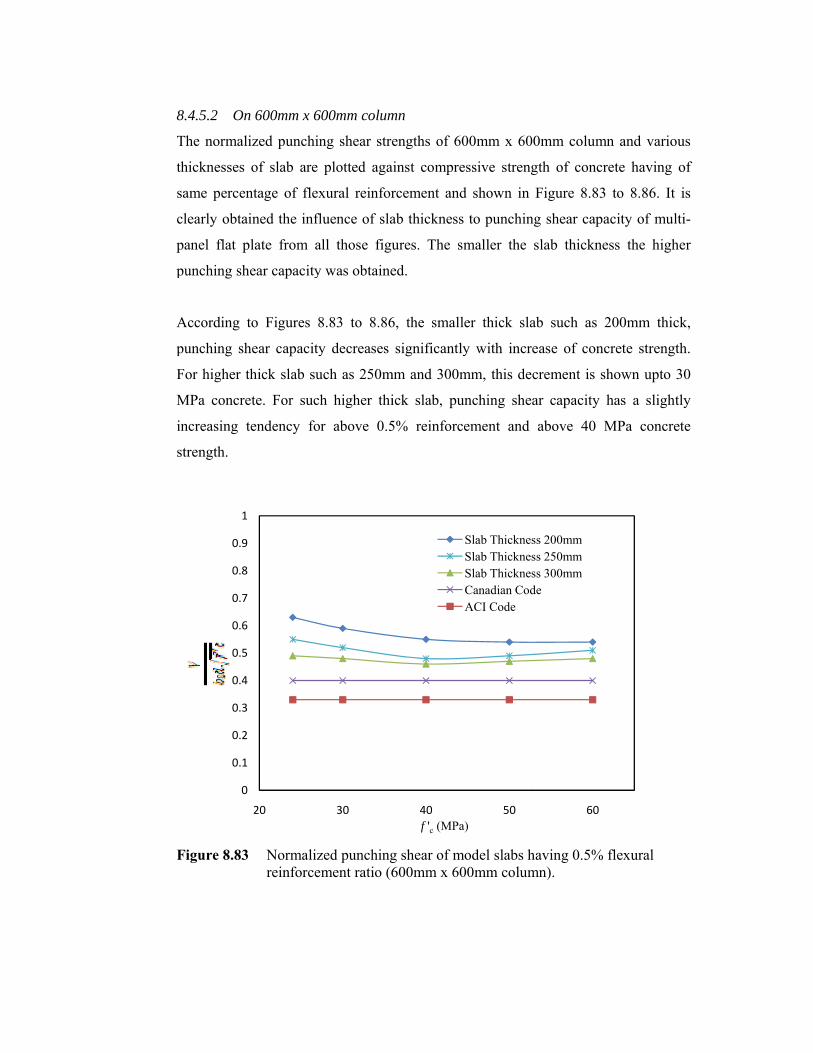
8
T
t
s
c
p
p
A
p
F
M
i
s
F
8.4.5.2 On
The normali
thicknesses
same percen
clearly obtai
panel flat p
punching sh
According t
punching sh
For higher t
MPa concre
increasing t
strength.
Figure 8.83
0
0.1
0.2
0.3
0.4
0.5
0.6
0.7
0.8
0.9
1
n 600mm x 6
ized punchin
of slab are
ntage of flex
ined the infl
plate from a
ear capacity
to Figures 8
hear capacity
thick slab su
ete. For such
tendency for
Normalizreinforce
20
600mm colum
ng shear stre
plotted aga
xural reinfor
luence of sla
all those figu
y was obtaine
8.83 to 8.86
y decreases
uch as 250m
h higher thi
r above 0.5
zed punchingment ratio (6
30
mn
engths of 60
ainst compre
rcement and
ab thickness
ures. The sm
ed.
6, the small
significantly
mm and 300m
ick slab, pu
5% reinforc
g shear of m600mm x 60
40f 'c (MPa
00mm x 600
essive streng
d shown in F
to punching
maller the s
er thick sla
y with incre
mm, this dec
unching shea
ement and
model slabs h00mm colum
50a)
Slab ThicknesSlab ThicknesSlab ThicknesCanadian CodACI Code
0mm column
gth of concr
Figure 8.83
g shear capa
slab thickne
ab such as 2
ease of conc
crement is sh
ar capacity h
above 40 M
aving 0.5% mn).
60
ss 200mm ss 250mmss 300mmde
n and variou
rete having
to 8.86. It
acity of mult
ess the high
200mm thic
crete strengt
hown upto 3
has a slight
MPa concre
flexural
us
of
is
ti-
her
ck,
th.
30
tly
ete
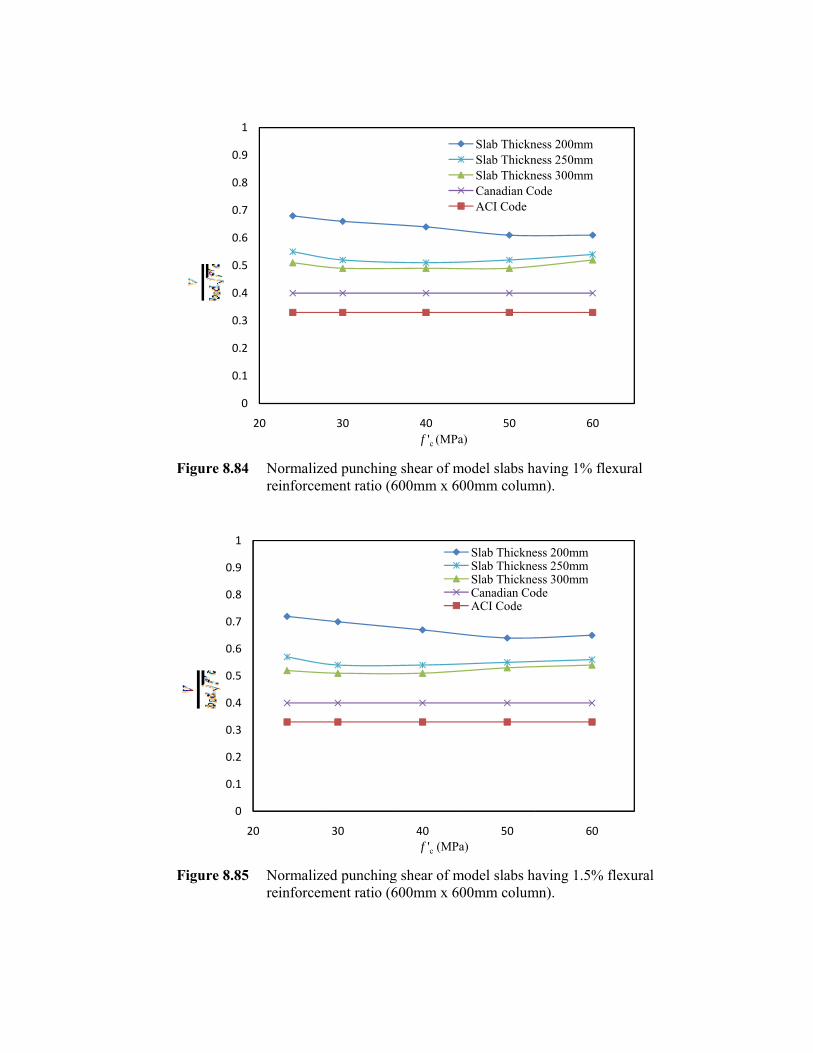
F
F
Figure 8.84
Figure 8.85
0
0.1
0.2
0.3
0.4
0.5
0.6
0.7
0.8
0.9
1
0
0.1
0.2
0.3
0.4
0.5
0.6
0.7
0.8
0.9
1
2
Normalizreinforce
Normalizreinforce
20
20
zed punchingment ratio (6
zed punchingment ratio (6
30
30
g shear of m600mm x 60
g shear of m600mm x 60
40f 'c (MPa)
40f 'c (MPa
model slabs h00mm colum
model slabs h00mm colum
50)
Slab ThicknSlab ThicknSlab ThicknCanadian CoACI Code
50a)
Slab ThickneSlab ThickneSlab ThickneCanadian CoACI Code
aving 1% flemn).
aving 1.5% mn).
60
ness 200mm ness 250mmness 300mmode
60
ess 200mm ess 250mmess 300mmode
exural
flexural
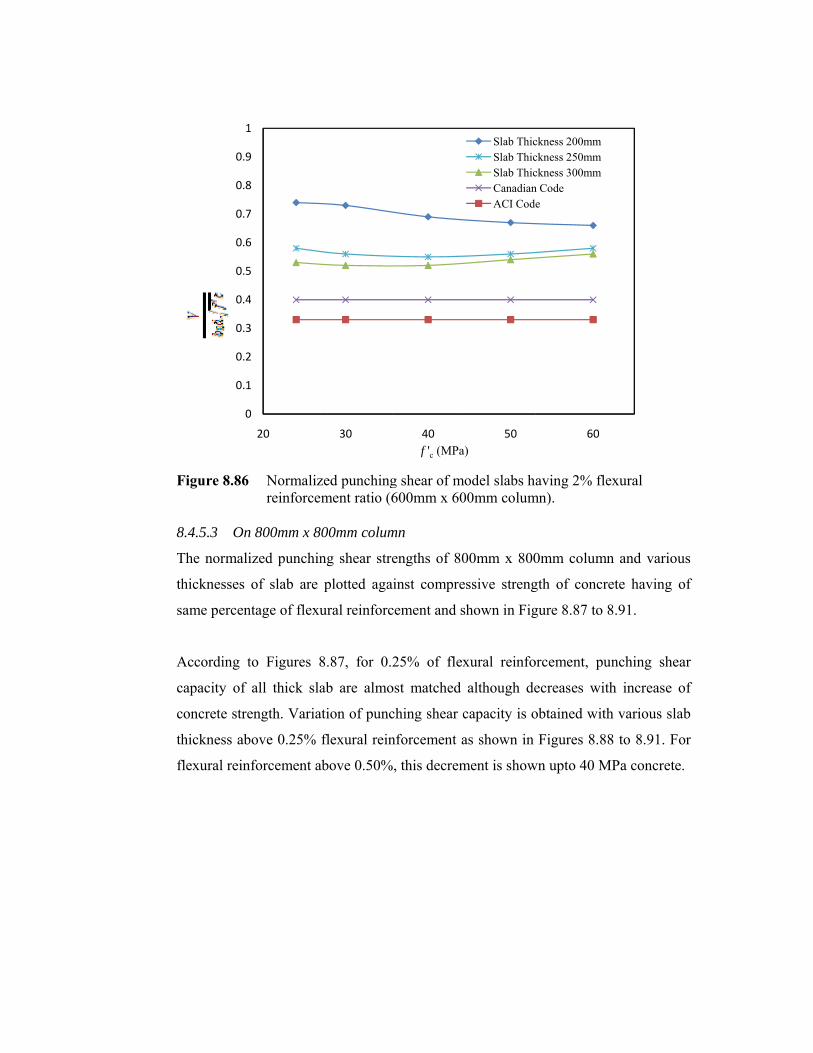
F
8
T
t
s
A
c
c
t
f
Figure 8.86
8.4.5.3 On
The normali
thicknesses
same percen
According t
capacity of
concrete stre
thickness ab
flexural rein
0
0.1
0.2
0.3
0.4
0.5
0.6
0.7
0.8
0.9
1
Normalizreinforce
n 800mm x 8
ized punchin
of slab are
ntage of flexu
to Figures 8
all thick sla
ength. Varia
bove 0.25%
nforcement a
0
1
2
3
4
5
6
7
8
9
1
20
zed punchingment ratio (6
00mm colum
ng shear stre
plotted aga
ural reinforc
8.87, for 0.2
ab are almo
ation of punc
flexural rein
above 0.50%
30
g shear of m600mm x 60
mn
engths of 80
ainst compre
cement and s
25% of flex
ost matched
ching shear c
nforcement a
%, this decrem
40f 'c (MPa
model slabs h00mm colum
00mm x 800
essive streng
shown in Fig
xural reinfo
although de
capacity is o
as shown in
ment is show
50a)
Slab ThicSlab ThicSlab ThicCanadianACI Cod
aving 2% flemn).
0mm column
gth of concr
gure 8.87 to
orcement, pu
ecreases wit
obtained with
Figures 8.8
wn upto 40 M
60
ckness 200mm ckness 250mmckness 300mmn Codee
exural
n and variou
rete having
8.91.
unching she
th increase
h various sla
8 to 8.91. F
MPa concrete
us
of
ear
of
ab
or
e.
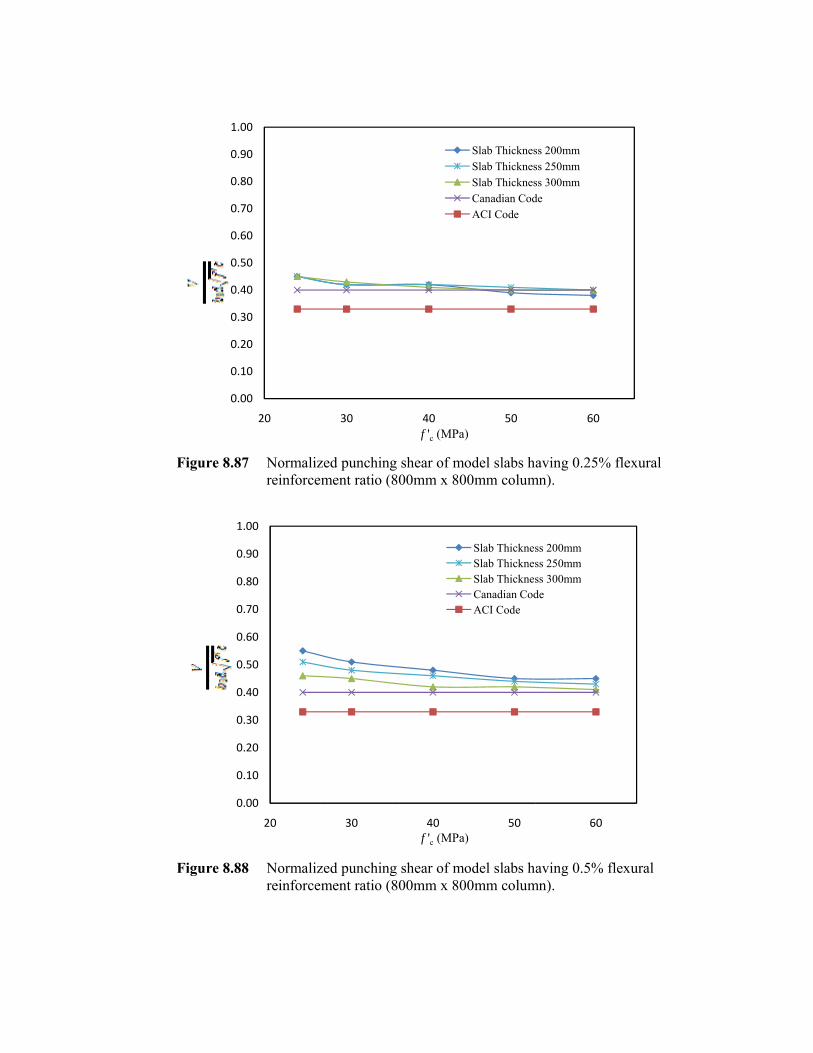
F
F
Figure 8.87
Figure 8.88
0.00
0.10
0.20
0.30
0.40
0.50
0.60
0.70
0.80
0.90
1.00
0.0
0.1
0.2
0.3
0.4
0.5
0.6
0.7
0.8
0.9
1.0
Normalizreinforce
Normalizreinforce
0
0
0
0
0
0
0
0
0
0
0
20
00
10
20
30
40
50
60
70
80
90
00
20
zed punchingment ratio (8
zed punchingment ratio (8
30
30
g shear of m800mm x 80
g shear of m800mm x 80
40f 'c (MPa
40f 'c (MPa
model slabs h00mm colum
model slabs h00mm colum
50a)
Slab ThicknesSlab ThicknesSlab ThicknesCanadian CodACI Code
50a)
Slab ThicknesSlab ThicknesSlab ThicknesCanadian CodACI Code
aving 0.25%mn).
aving 0.5% mn).
60
ss 200mm ss 250mmss 300mmde
60
ss 200mm ss 250mmss 300mmde
% flexural
flexural
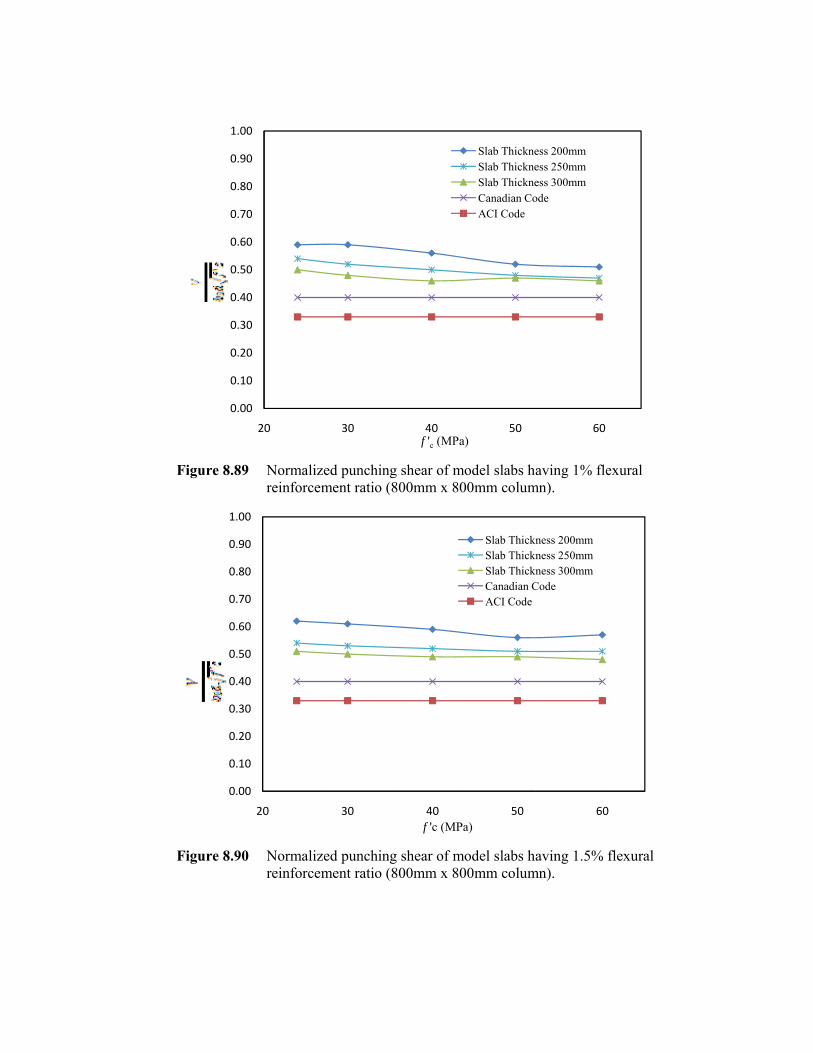
F
F
Figure 8.89
Figure 8.90
0.00
0.10
0.20
0.30
0.40
0.50
0.60
0.70
0.80
0.90
1.00
0.00
0.10
0.20
0.30
0.40
0.50
0.60
0.70
0.80
0.90
1.00
Normalizreinforce
Normalizreinforce
0
0
0
0
0
0
0
0
0
0
0
20
0
0
0
0
0
0
0
0
0
0
0
20
zed punchingment ratio (8
zed punchingment ratio (8
30
30
g shear of m800mm x 80
g shear of m800mm x 80
40f 'c (MPa
40f 'c (MPa
model slabs h00mm colum
model slabs h00mm colum
50a)
Slab ThickneSlab ThickneSlab ThickneCanadian CoACI Code
50a)
Slab ThicknSlab ThicknSlab ThicknCanadian CACI Code
aving 1% flemn).
aving 1.5% mn).
60
ess 200mm ess 250mmess 300mmode
60
ness 200mm ness 250mmness 300mm
Code
exural
flexural
0
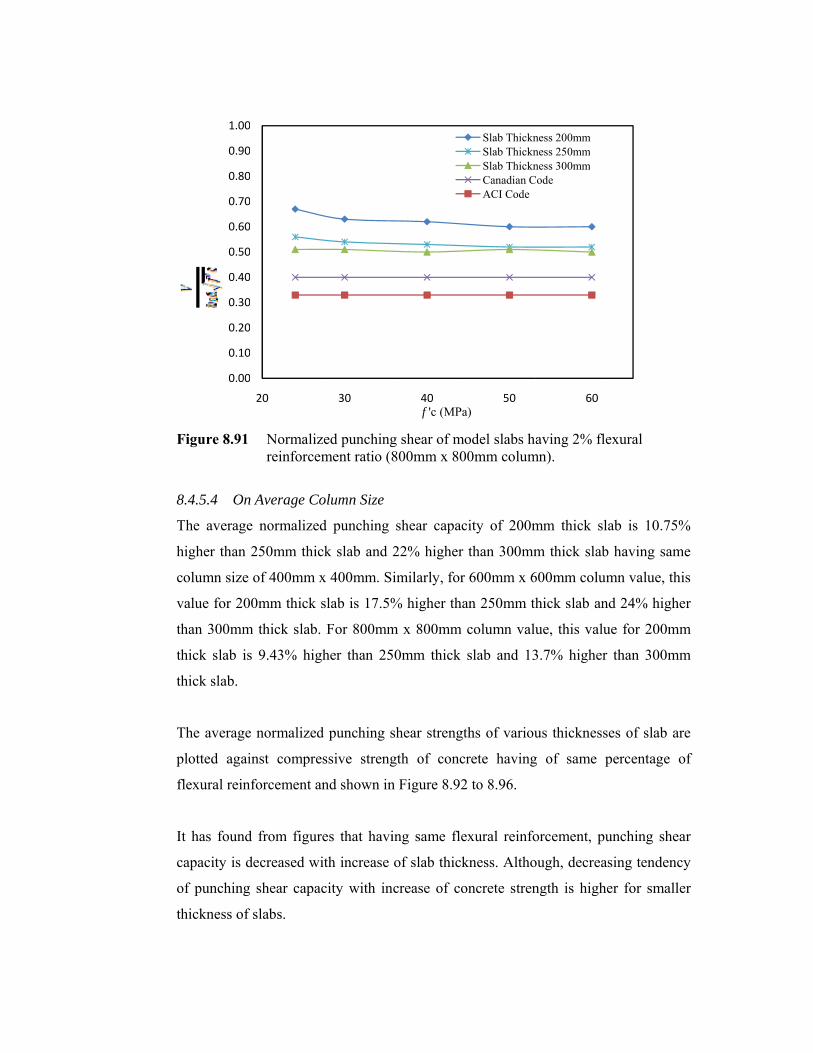
F
8
T
h
c
v
t
t
t
T
p
f
I
c
o
t
Figure 8.91
8.4.5.4 On
The average
higher than
column size
value for 20
than 300mm
thick slab is
thick slab.
The average
plotted agai
flexural rein
It has found
capacity is d
of punching
thickness of
0.00
0.10
0.20
0.30
0.40
0.50
0.60
0.70
0.80
0.90
1.00
Normalizreinforce
n Average Co
e normalized
250mm thic
of 400mm x
00mm thick
m thick slab.
s 9.43% hig
e normalized
inst compre
nforcement a
d from figur
decreased wi
g shear capa
f slabs.
0
0
0
0
0
0
0
0
0
0
0
20
zed punchingment ratio (8
olumn Size
d punching
ck slab and
x 400mm. S
slab is 17.5%
For 800mm
gher than 25
d punching s
essive streng
and shown in
res that havi
ith increase
city with in
30
g shear of m800mm x 80
shear capac
22% higher
imilarly, for
% higher tha
m x 800mm
50mm thick
shear strengt
gth of conc
n Figure 8.92
ing same fle
of slab thick
ncrease of co
40f 'c (MPa
model slabs h00mm colum
city of 200m
than 300mm
r 600mm x 6
an 250mm th
column valu
slab and 13
ths of variou
crete having
2 to 8.96.
exural reinfo
kness. Altho
oncrete stren
50a)
Slab ThicknSlab ThicknSlab ThicknCanadian CACI Code
aving 2% flemn).
mm thick sl
m thick slab
600mm colum
hick slab an
ue, this valu
3.7% higher
us thickness
g of same p
orcement, pu
ough, decrea
ngth is highe
60
ness 200mm ness 250mmness 300mm
Code
exural
lab is 10.75
b having sam
mn value, th
nd 24% high
ue for 200m
r than 300m
ses of slab a
percentage
unching she
asing tendenc
er for small
%
me
his
her
mm
mm
are
of
ear
cy
ler
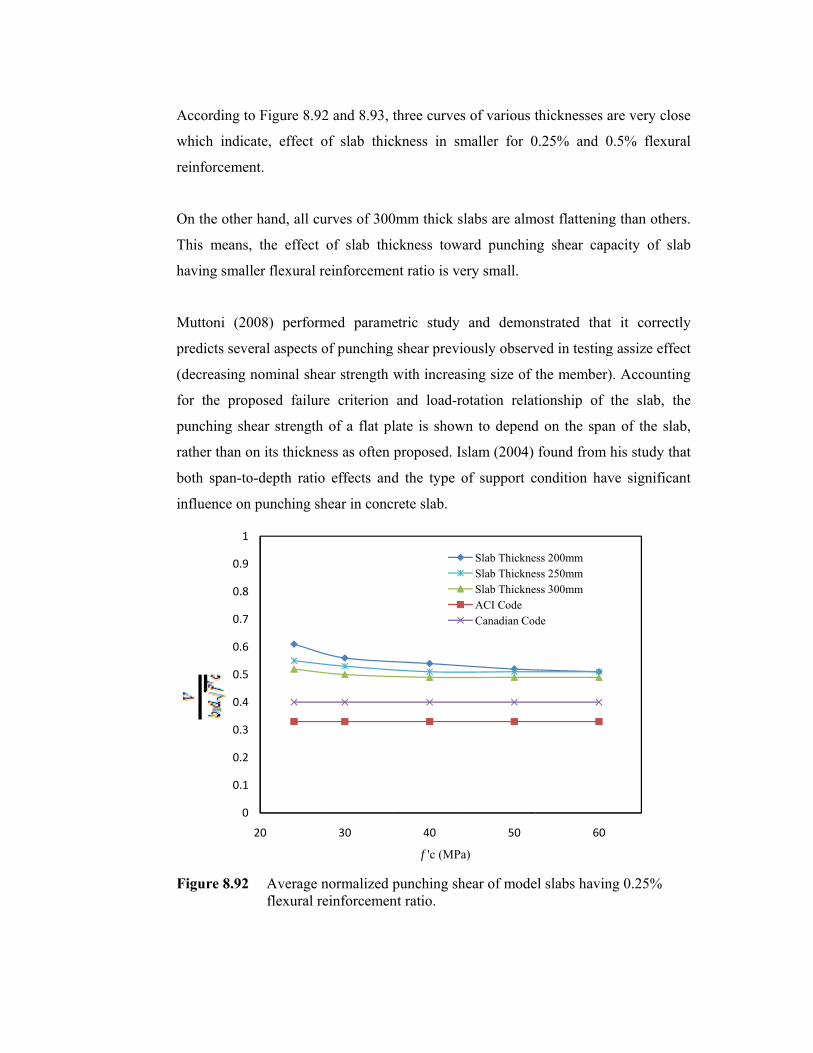
A
w
r
O
T
h
M
p
(
f
p
r
b
i
F
According to
which indic
reinforcemen
On the other
This means
having smal
Muttoni (20
predicts seve
(decreasing
for the prop
punching sh
rather than o
both span-to
influence on
Figure 8.92
0
0.1
0.2
0.3
0.4
0.5
0.6
0.7
0.8
0.9
1
o Figure 8.9
cate, effect
nt.
r hand, all cu
, the effect
ler flexural r
008) perform
eral aspects
nominal she
posed failur
hear strength
on its thickne
o-depth ratio
n punching sh
Average flexural r
20
2 and 8.93,
of slab thic
urves of 300
of slab thi
reinforcemen
med parame
of punching
ear strength
re criterion
h of a flat pl
ess as often
o effects and
hear in conc
normalized reinforcemen
30
three curves
ckness in sm
0mm thick sl
ckness towa
nt ratio is ve
etric study
g shear previ
with increas
and load-ro
late is show
proposed. Is
d the type o
crete slab.
punching shnt ratio.
40
f 'c (MPa
s of various t
maller for 0
labs are alm
ard punchin
ery small.
and demon
ously observ
sing size of t
otation relat
wn to depend
slam (2004)
of support c
hear of mode
50
a)
Slab ThickneSlab ThickneSlab ThickneACI CodeCanadian Cod
thicknesses
0.25% and 0
most flattenin
ng shear cap
nstrated tha
ved in testing
the member
tionship of
d on the spa
found from
condition ha
el slabs havin
60
ess 200mm ess 250mmess 300mm
de
are very clo
0.5% flexur
ng than other
pacity of sla
at it correct
g assize effe
r). Accountin
the slab, th
an of the sla
his study th
ave significa
ng 0.25%
se
ral
rs.
ab
tly
ect
ng
he
ab,
hat
ant
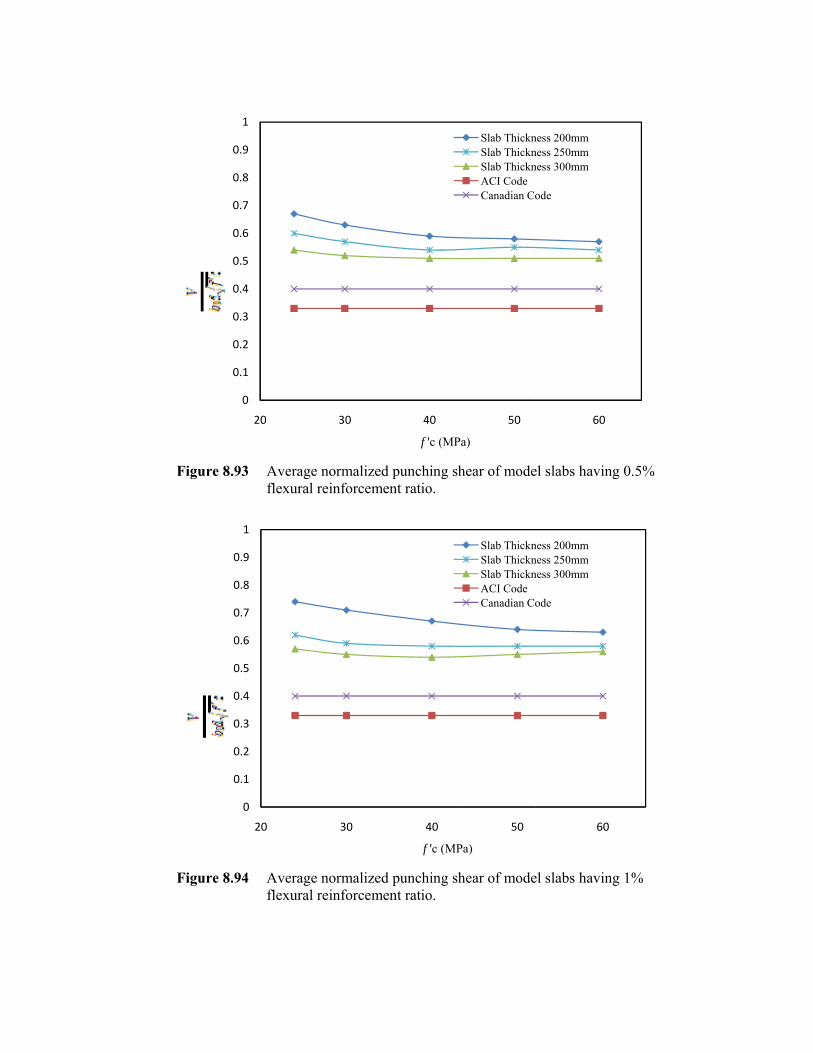
F
F
Figure 8.93
Figure 8.94
0
0.1
0.2
0.3
0.4
0.5
0.6
0.7
0.8
0.9
1
0
0.1
0.2
0.3
0.4
0.5
0.6
0.7
0.8
0.9
1
Average flexural r
Average flexural r
20
20
normalized reinforcemen
normalized reinforcemen
30
30
punching shnt ratio.
punching shnt ratio.
40
f 'c (MPa
40
f 'c (MPa
hear of mode
hear of mode
50
a)
Slab ThicknSlab ThicknSlab ThicknACI CodeCanadian Co
50
a)
Slab ThicknSlab ThicknSlab ThicknACI CodeCanadian Co
el slabs havin
el slabs havin
60
ness 200mm ness 250mmness 300mm
ode
60
ness 200mm ness 250mmness 300mm
ode
ng 0.5%
ng 1%
0
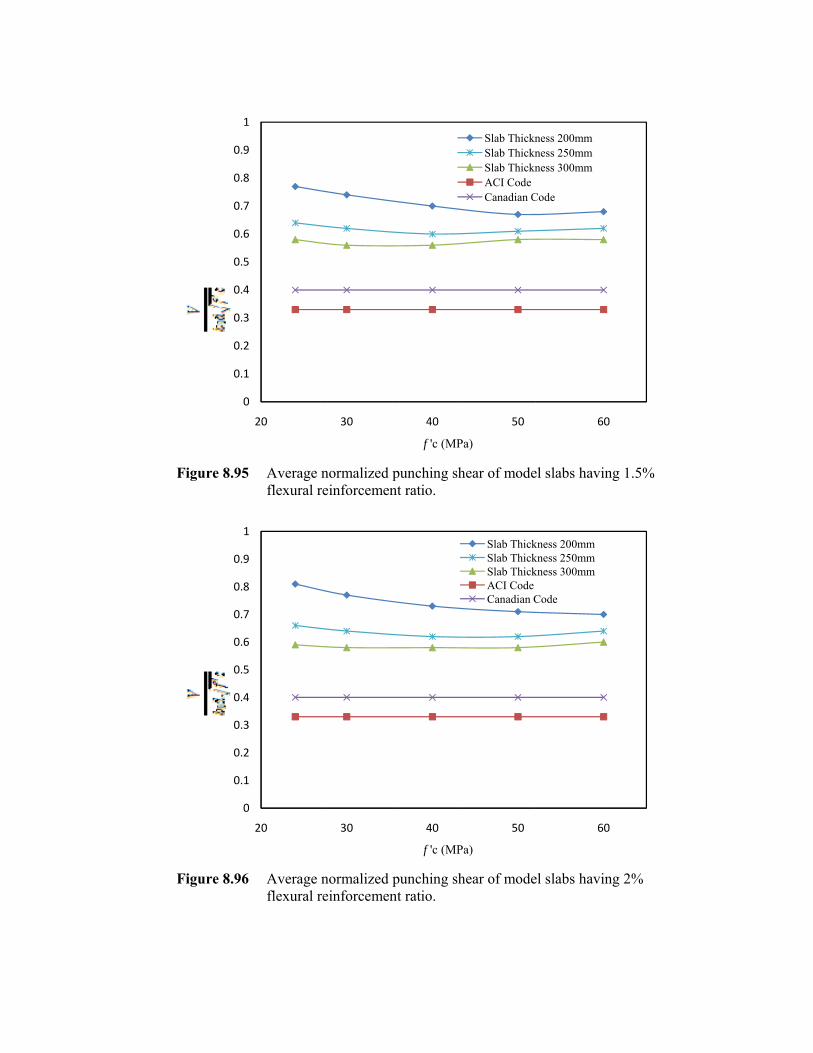
F
F
Figure 8.95
Figure 8.96
0
0.1
0.2
0.3
0.4
0.5
0.6
0.7
0.8
0.9
1
0
0.1
0.2
0.3
0.4
0.5
0.6
0.7
0.8
0.9
1
Average flexural r
Average flexural r
20
20
normalized reinforcemen
normalized reinforcemen
30
30
punching shnt ratio.
punching shnt ratio.
40
f 'c (MPa
40
f 'c (MPa
hear of mode
hear of mode
50
a)
Slab ThicknSlab ThicknSlab ThicknACI CodeCanadian C
50
a)
Slab ThickSlab ThickSlab ThickACI CodeCanadian C
el slabs havin
el slabs havin
60
ness 200mm ness 250mmness 300mm
Code
60
kness 200mm kness 250mmkness 300mm
Code
ng 1.5%
ng 2%
0
0
238
According to Bazant and Cao (1987), the larger the slab thickness, the steeper the
post peak decline of the load-deflection diagram. Thus, the punching shear behavior
of thin slabs is closer to plasticity and that of thick slabs is close to linear elastic
fracture mechanics. This independently confirms the applicability of the size-effect
law, since this law predicts exactly such kind of behavior.
Elstner and Hognestad (1956) questioned the extrapolation of observations on thick
footing slabs to flat plate floors from a theoretical point of view, since lower thickness-to
span ratios and higher moment-to-shear ratios are more associated with floor slabs than
with footings.
Collins and Kuchma (1999) investigated the importance of the size effect on beams,
slabs and footings and concluded that the size effect has to be taken into account and that
high-strength concrete members display a more significant size effect. They pointed out
that the shear stress at failure decreases, both as the member depth increases and as the
maximum aggregate size decreases. According to Collins and Kuchma (1999), the size
effect had to be studied especially in slabs and footings, as these members can be both
very thick and very lightly reinforced.
Mitchell, Cook and Dilger (2005) stated that it is difficult to gather experimental data
solely on the size effect, as many reported experiments varied other parameters together
with the thickness. For example, the reinforcement ratio was changed together with the
slab thickness to keep the ratio of flexural capacity to shear capacity constant.
Mitchell, Cook and Dilger (2005) gathered information of tests where only the size was
varied. It is clear from the data that there is a size effect for slabs thicker than about 200
mm (8 in). The data also show a size effect, even for slabs with a thickness smaller than
200 mm (8 in). Tests with varying maximum aggregate size are not included. As can be
seen, the shear stress at punching failure decreases as the effective depth increases.
According to Mitchell, Cook and Dilger (2005) the size effect is significant, but the
available data are scarce.

239
According to Sundquist (2005), no good analysis method has been presented to date that
can really explain the size effect. A model developed by Hallgren (1996) was cited,
based on fracture mechanics that incorporated the aggregate size.
Guandalini et al. (2009) performed series of 11 punching tests on flat plates. The
tests are useful to complement available punching test series performed in the past,
as the tests presented in this paper systematically explore the domain of slabs with
low flexural reinforcement ratios. The tests have confirmed that, due to size effect,
the punching strength decreases with increasing slab thickness. At the same time, the
deformation at failure decreases.
Borges et al. (2013) concluded that there is some indication of a size effect on
punching resistance, which can be related to the slab effective depth, even though
some differences could have been expected due to the different arrangements of the
supports.
It can be concluded that having same flexural reinforcement, punching shear capacity
is decreased with increase of slab thickness. Decreasing tendency of punching shear
capacity due to slab thickness with smaller strength of concrete is higher. For higher
slab thickness, decreasing tendency of punching shear capacity is very small. The
contribution of slab thickness may be included in the presently recognized codes.
8.4.6 Effect of Column Size
The FE results of multi-panel slab models are compared according to column size as
shown in Figures 8.97 to 8.108. The models are grouped on the basis of similar slab
thicknesses of 200mm, 250mm and 300mm.
8.4.6.1 On 200mm thick slab
The normalized punching shear strengths of various size of columns of all model
slabs having 200mm thick are plotted against compressive strength of concrete and
shown in Figure 8.97 to 8.100. It is clearly obtained the influence of column size to
punching shear capacity of multi-panel flat plate from all those figures. The smaller
the column size the higher punching shear capacity was obtained.
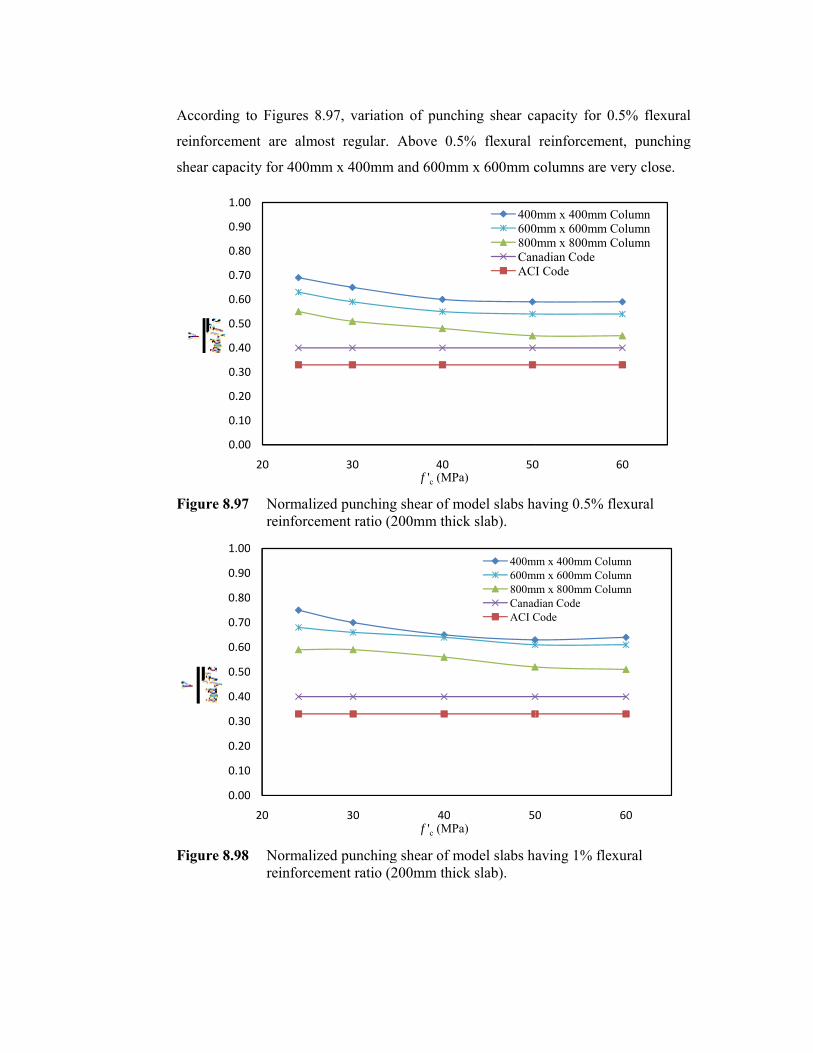
A
r
s
F
F
According t
reinforcemen
shear capaci
Figure 8.97
Figure 8.98
0.00
0.10
0.20
0.30
0.40
0.50
0.60
0.70
0.80
0.90
1.00
0.00
0.10
0.20
0.30
0.40
0.50
0.60
0.70
0.80
0.90
1.00
to Figures 8
nt are almo
ity for 400m
Normalizreinforce
Normalizreinforce
0
0
0
0
0
0
0
0
0
0
0
20
0
0
0
0
0
0
0
0
0
0
0
20
8.97, variatio
ost regular.
mm x 400mm
zed punchingment ratio (2
zed punchingment ratio (2
30
30
on of punch
Above 0.5
m and 600mm
g shear of m200mm thick
g shear of m200mm thick
40f 'c (MPa
40f 'c (MPa
hing shear ca
% flexural
m x 600mm c
model slabs hk slab).
model slabs hk slab).
50a)
400600800CanAC
5a)
400m600m800mCanadACI C
apacity for
reinforceme
columns are
aving 0.5%
aving 1% fle
0
0mm x 400mm 0mm x 600mm 0mm x 800mm nadian CodeI Code
0
mm x 400mm Comm x 600mm Comm x 800mm Co
dian CodeCode
0.5% flexur
ent, punchin
very close.
flexural
exural
60
ColumnColumnColumn
60
olumnolumnolumn
ral
ng
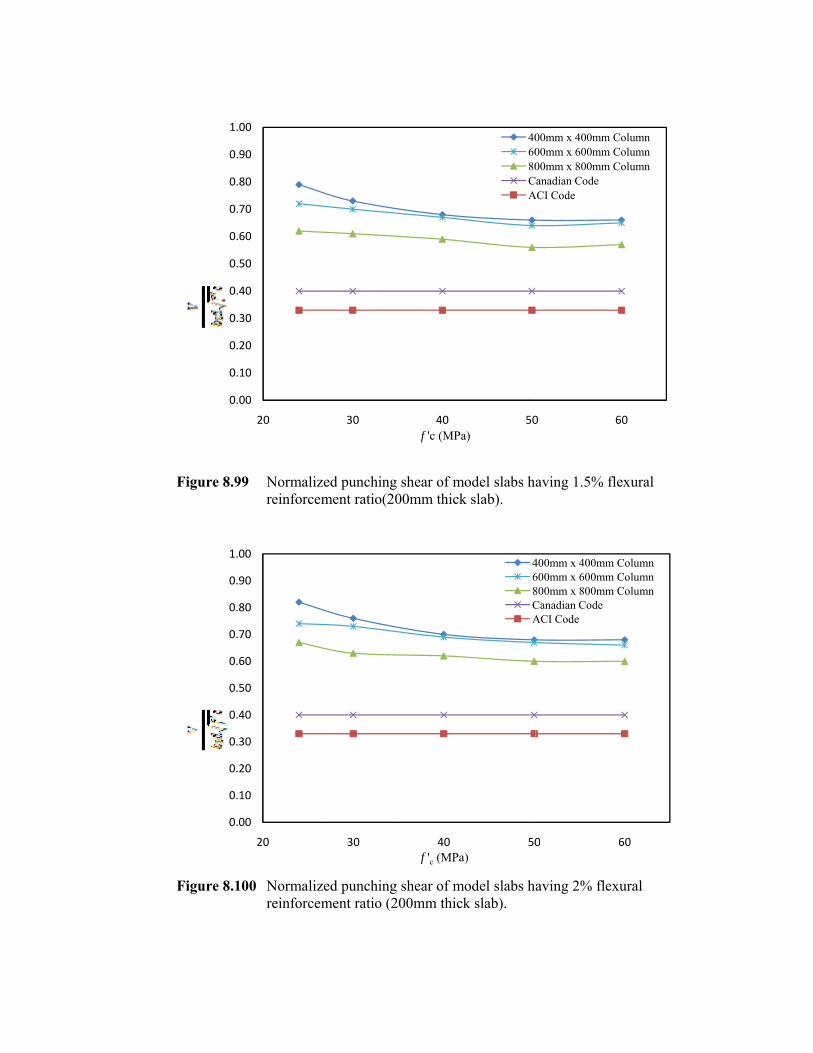
F
F
Figure 8.99
Figure 8.10
0.00
0.10
0.20
0.30
0.40
0.50
0.60
0.70
0.80
0.90
1.00
0.00
0.10
0.20
0.30
0.40
0.50
0.60
0.70
0.80
0.90
1.00
Normalizreinforce
0 Normalizreinforce
0
0
0
0
0
0
0
0
0
0
0
20
0
0
0
0
0
0
0
0
0
0
0
20
zed punchingment ratio(2
zed punchingment ratio (2
30
30
g shear of m200mm thick
g shear of m200mm thick
40f 'c (MPa
40f 'c (MPa
model slabs hk slab).
model slabs hk slab).
50a)
406080CA
50a)
468CA
aving 1.5%
aving 2% fle
0
00mm x 400mm00mm x 600mm00mm x 800mm
Canadian CodeACI Code
0
400mm x 400mm600mm x 600mm800mm x 800mmCanadian CodeACI Code
flexural
exural
60
m Columnm Columnm Column
60
m Columnm Columnm Column
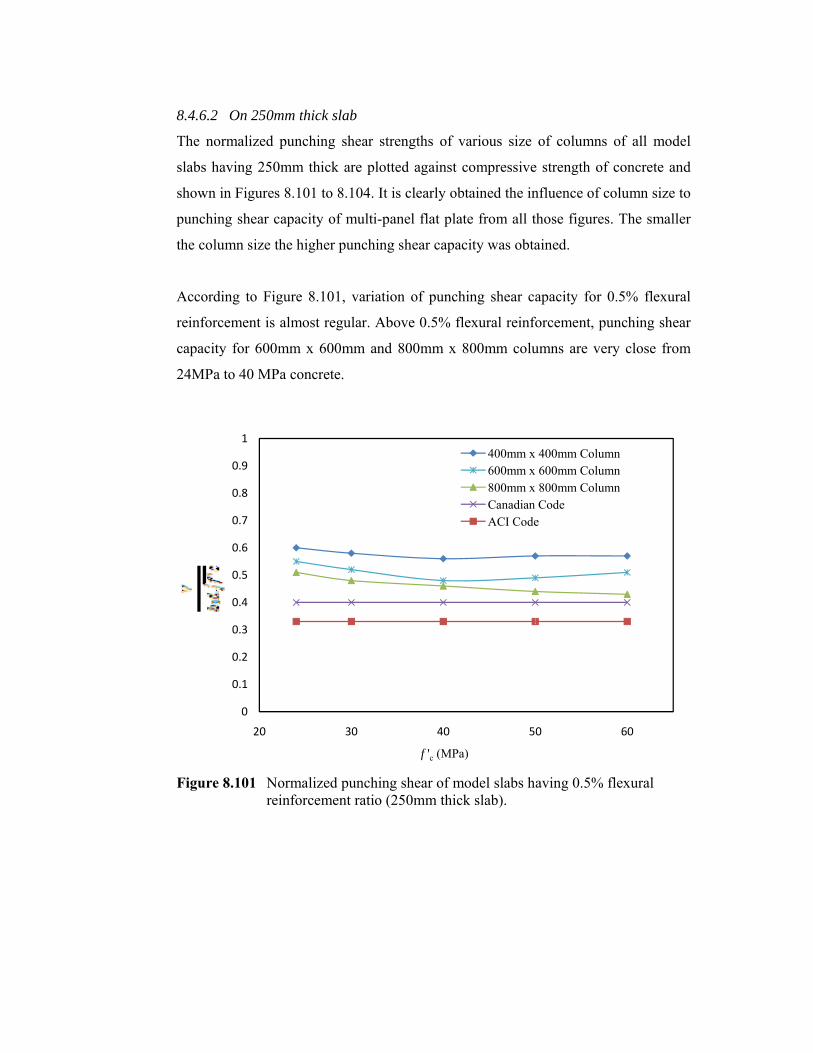
8
T
s
s
p
t
A
r
c
2
F
8.4.6.2 On
The normali
slabs having
shown in Fig
punching sh
the column s
According t
reinforcemen
capacity for
24MPa to 40
Figure 8.10
0
0.1
0.2
0.3
0.4
0.5
0.6
0.7
0.8
0.9
1
250mm thic
ized punchin
g 250mm thi
gures 8.101
hear capacity
size the high
to Figure 8.
nt is almost
r 600mm x 6
0 MPa concr
1 Normalizreinforce
20
ck slab
ng shear str
ick are plott
to 8.104. It i
y of multi-pa
her punching
101, variatio
regular. Ab
600mm and
rete.
zed punchingment ratio (2
30
rengths of v
ted against c
is clearly ob
anel flat plat
g shear capac
on of punch
bove 0.5% fl
800mm x 8
g shear of m250mm thick
40
f 'c (MPa
various size
compressive
btained the in
te from all t
city was obta
hing shear ca
lexural reinfo
800mm colu
model slabs hk slab).
5
a)
400mm x 600mm x 800mm x Canadian ACI Code
of columns
e strength of
nfluence of c
those figures
ained.
apacity for
forcement, pu
umns are ve
aving 0.5%
0
400mm Colum600mm Colum800mm ColumCode
e
of all mod
f concrete an
column size
s. The small
0.5% flexur
unching she
ry close fro
flexural
60
mnmnmn
del
nd
to
ler
ral
ear
om
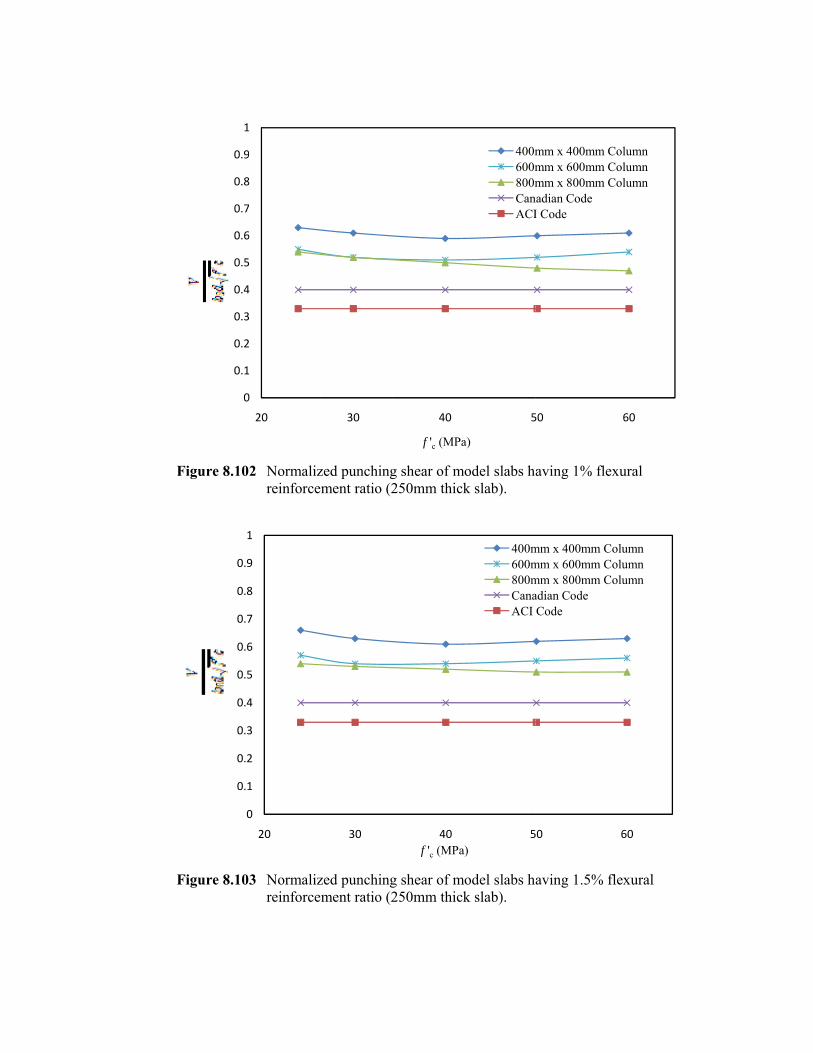
F
F
Figure 8.10
Figure 8.10
0
0.1
0.2
0.3
0.4
0.5
0.6
0.7
0.8
0.9
1
0
0.1
0.2
0.3
0.4
0.5
0.6
0.7
0.8
0.9
1
2 Normalizreinforce
3 Normalizreinforce
0
4
6
8
20
0
1
2
3
4
5
6
7
8
9
1
20
zed punchingment ratio (2
zed punchingment ratio (2
30
30
g shear of m250mm thick
g shear of m250mm thick
40
f 'c (MPa
40f 'c (MPa
model slabs hk slab).
model slabs hk slab).
5
a)
400m600m800mCanACI
5a)
400m600m800mCanaACI
aving 1% fle
aving 1.5%
50
mm x 400mm mm x 600mm mm x 800mm
nadian CodeI Code
50
mm x 400mm Cmm x 600mm Cmm x 800mm Cadian CodeCode
exural
flexural
60
ColumnColumnColumn
60
ColumnColumnColumn
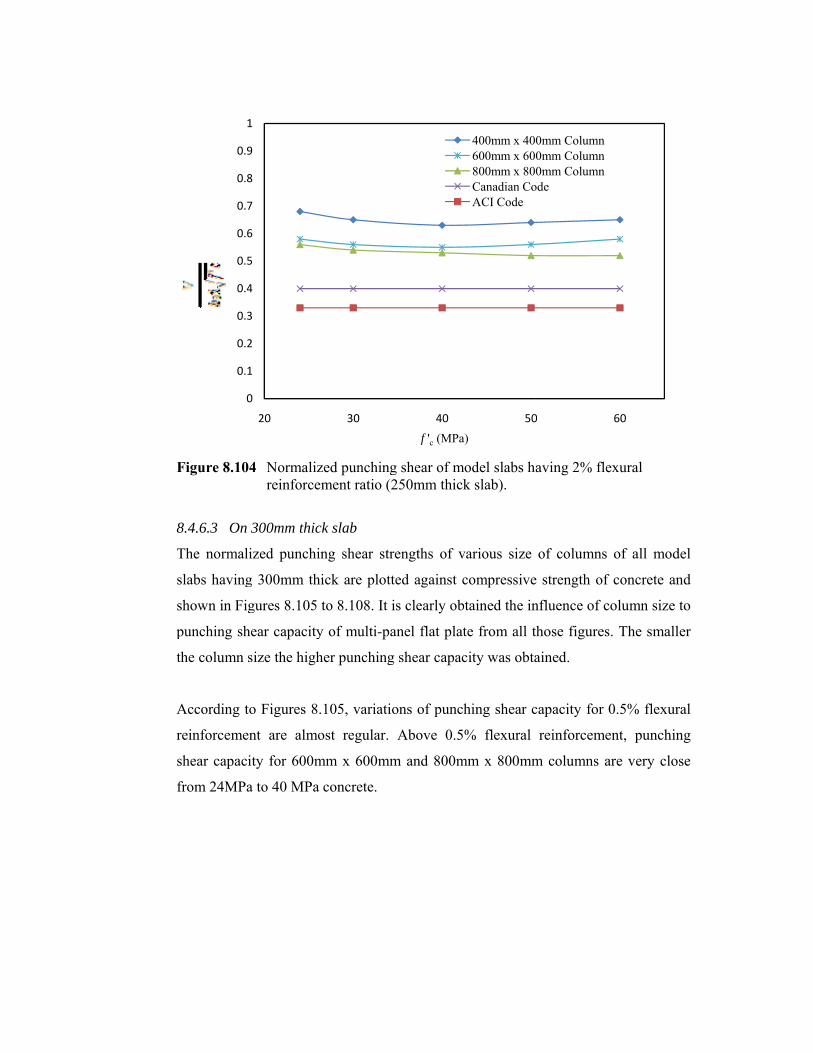
F
8
T
s
s
p
t
A
r
s
f
Figure 8.10
8.4.6.3 On
The normali
slabs having
shown in Fig
punching sh
the column s
According t
reinforcemen
shear capaci
from 24MPa
0
0.1
0.2
0.3
0.4
0.5
0.6
0.7
0.8
0.9
1
4 Normalizreinforce
300mm thic
ized punchin
g 300mm thi
gures 8.105
hear capacity
size the high
o Figures 8.
nt are almo
ity for 600m
a to 40 MPa
0
1
2
3
4
5
6
7
8
9
1
20
zed punchingment ratio (2
ck slab
ng shear str
ick are plott
to 8.108. It i
y of multi-pa
her punching
.105, variatio
ost regular.
mm x 600mm
concrete.
30
g shear of m250mm thick
rengths of v
ted against c
is clearly ob
anel flat plat
g shear capac
ons of punch
Above 0.5
m and 800m
40
f 'c (MPa
model slabs hk slab).
various size
compressive
btained the in
te from all t
city was obta
hing shear c
% flexural
mm x 800mm
50
a)
400mm x 40600mm x 60800mm x 80Canadian CoACI Code
aving 2% fle
of columns
e strength of
nfluence of c
those figures
ained.
capacity for
reinforceme
m columns a
0
0mm Column0mm Column0mm Column
ode
exural
of all mod
f concrete an
column size
s. The small
0.5% flexur
ent, punchin
are very clo
60
del
nd
to
ler
ral
ng
se
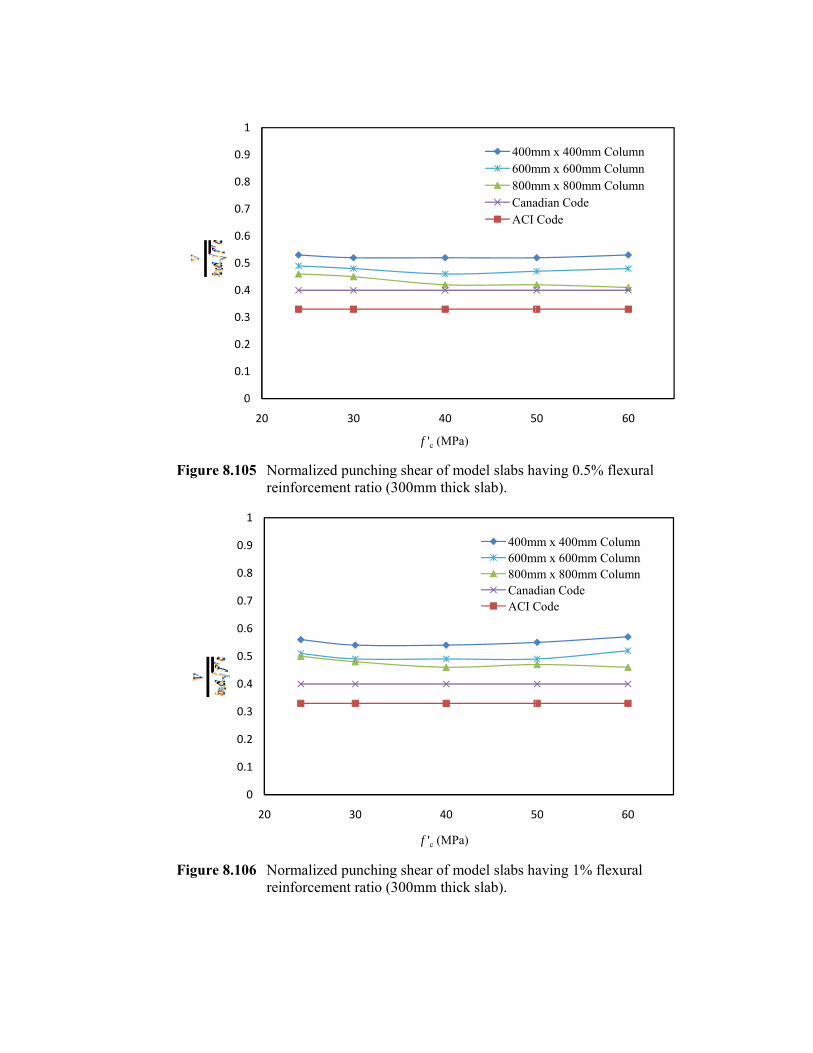
F
F
Figure 8.10
Figure 8.10
0
0.1
0.2
0.3
0.4
0.5
0.6
0.7
0.8
0.9
1
0
0.1
0.2
0.3
0.4
0.5
0.6
0.7
0.8
0.9
1
5 Normalizreinforce
6 Normalizreinforce
0
1
2
3
4
5
6
7
8
9
1
20
0
1
2
3
4
5
6
7
8
9
1
20
zed punchingment ratio (3
zed punchingment ratio (3
30
30
g shear of m300mm thick
g shear of m300mm thick
40
f 'c (MPa
40
f 'c (MPa
model slabs hk slab).
model slabs hk slab).
5
a)
400m600m800mCanaACI
5
a)
400m600m800mCanadACI C
aving 0.5%
aving 1% fle
50
mm x 400mm Cmm x 600mm Cmm x 800mm Cadian CodeCode
50
mm x 400mm Cmm x 600mm Cmm x 800mm C
dian CodeCode
flexural
exural
60
ColumnColumnColumn
60
ColumnColumnColumn
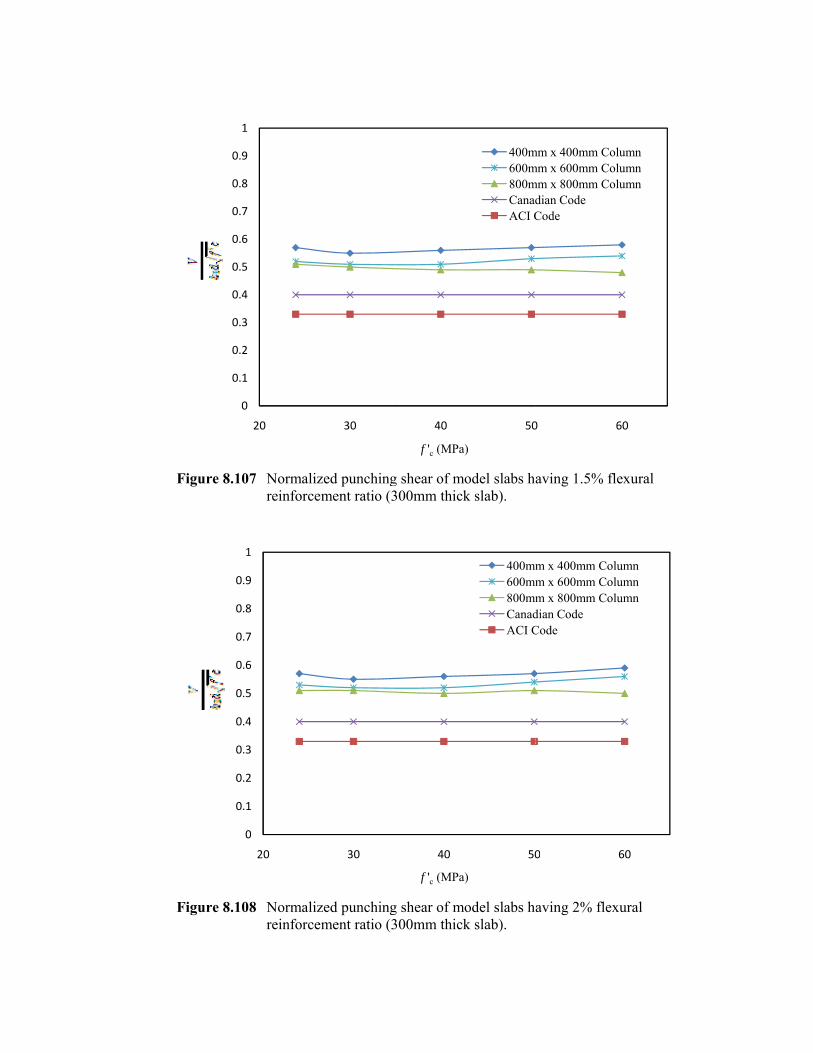
F
F
Figure 8.10
Figure 8.10
0
0.1
0.2
0.3
0.4
0.5
0.6
0.7
0.8
0.9
1
0
0.1
0.2
0.3
0.4
0.5
0.6
0.7
0.8
0.9
1
7 Normalizreinforce
8 Normalizreinforce
20
0
1
2
3
4
5
6
7
8
9
1
20
zed punchingment ratio (3
zed punchingment ratio (3
30
30
g shear of m300mm thick
g shear of m300mm thick
40
f 'c (MPa
40
f 'c (MPa
model slabs hk slab).
model slabs hk slab).
50
a)
400m600m800mCanadACI C
50
a)
400mm600mm800mmCanadACI C
aving 1.5%
aving 2% fle
0
mm x 400mm Cmm x 600mm Cmm x 800mm C
dian CodeCode
0
m x 400mm Cm x 600mm Cm x 800mm Cdian CodeCode
flexural
exural
60
ColumnColumnColumn
60
olumnolumnolumn
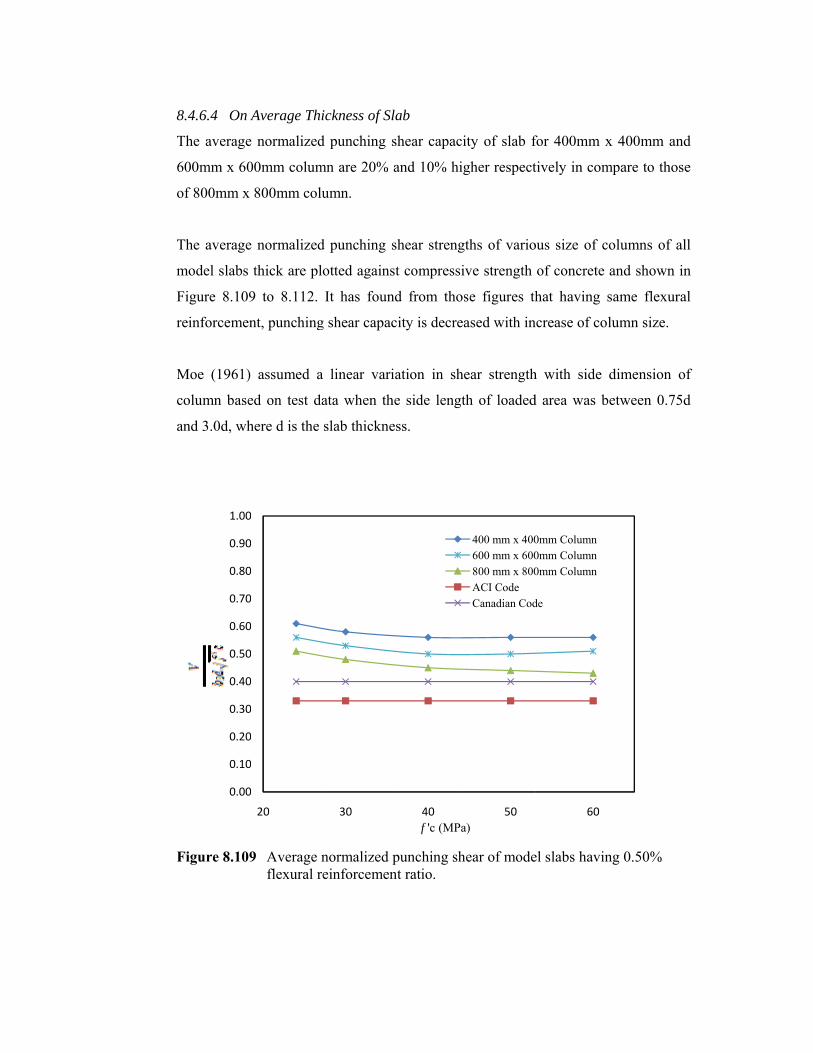
8
T
6
o
T
m
F
r
M
c
a
F
8.4.6.4 On
The average
600mm x 60
of 800mm x
The average
model slabs
Figure 8.109
reinforcemen
Moe (1961)
column base
and 3.0d, wh
Figure 8.10
0.00
0.10
0.20
0.30
0.40
0.50
0.60
0.70
0.80
0.90
1.00
Average Th
e normalized
00mm colum
x 800mm col
e normalized
thick are pl
9 to 8.112.
nt, punching
) assumed a
ed on test d
here d is the
9 Average flexural r
0
0
0
0
0
0
0
0
0
0
0
20
ickness of Sl
d punching s
mn are 20%
lumn.
d punching s
lotted agains
It has foun
g shear capac
a linear vari
data when th
slab thickne
normalized reinforcemen
30
lab
shear capaci
and 10% hig
shear streng
st compressi
nd from tho
city is decrea
iation in sh
he side lengt
ess.
punching shnt ratio.
40f 'c (MPa
ity of slab f
gher respect
gths of vario
ive strength
se figures th
ased with in
ear strength
th of loaded
hear of mode
50a)
400 mm x 400600 mm x 600800 mm x 800ACI CodeCanadian Cod
for 400mm x
tively in com
ous size of c
of concrete
hat having
ncrease of co
h with side
d area was b
el slabs havin
60
0mm Column0mm Column0mm Column
de
x 400mm an
mpare to tho
columns of a
and shown
same flexur
lumn size.
dimension
between 0.75
ng 0.50%
nd
se
all
in
ral
of
5d
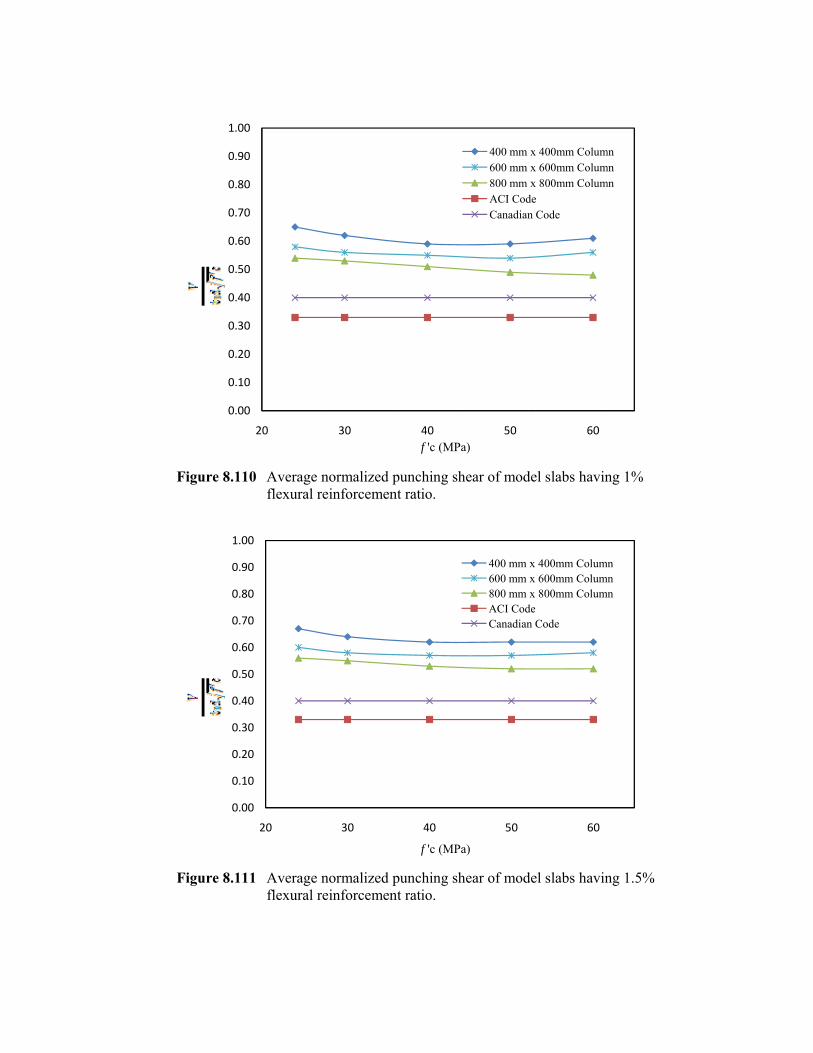
F
F
Figure 8.11
Figure 8.11
0.00
0.10
0.20
0.30
0.40
0.50
0.60
0.70
0.80
0.90
1.00
0.00
0.10
0.20
0.30
0.40
0.50
0.60
0.70
0.80
0.90
1.00
0 Average flexural r
1 Average flexural r
0
0
0
0
0
0
0
0
0
0
0
20
0
0
0
0
0
0
0
0
0
0
0
20
normalized reinforcemen
normalized reinforcemen
30
30
punching shnt ratio.
punching shnt ratio.
40f 'c (MPa
40
f 'c (MPa
hear of mode
hear of mode
50a)
400 mm x600 mm x800 mm xACI CodeCanadian
50
a)
400 mm x 600 mm x 800 mm x ACI CodeCanadian C
el slabs havin
el slabs havin
60
x 400mm Columx 600mm Columx 800mm ColumeCode
60
400mm Colum600mm Colum800mm Colum
Code
ng 1%
ng 1.5%
mnmnmn
mnmnmn
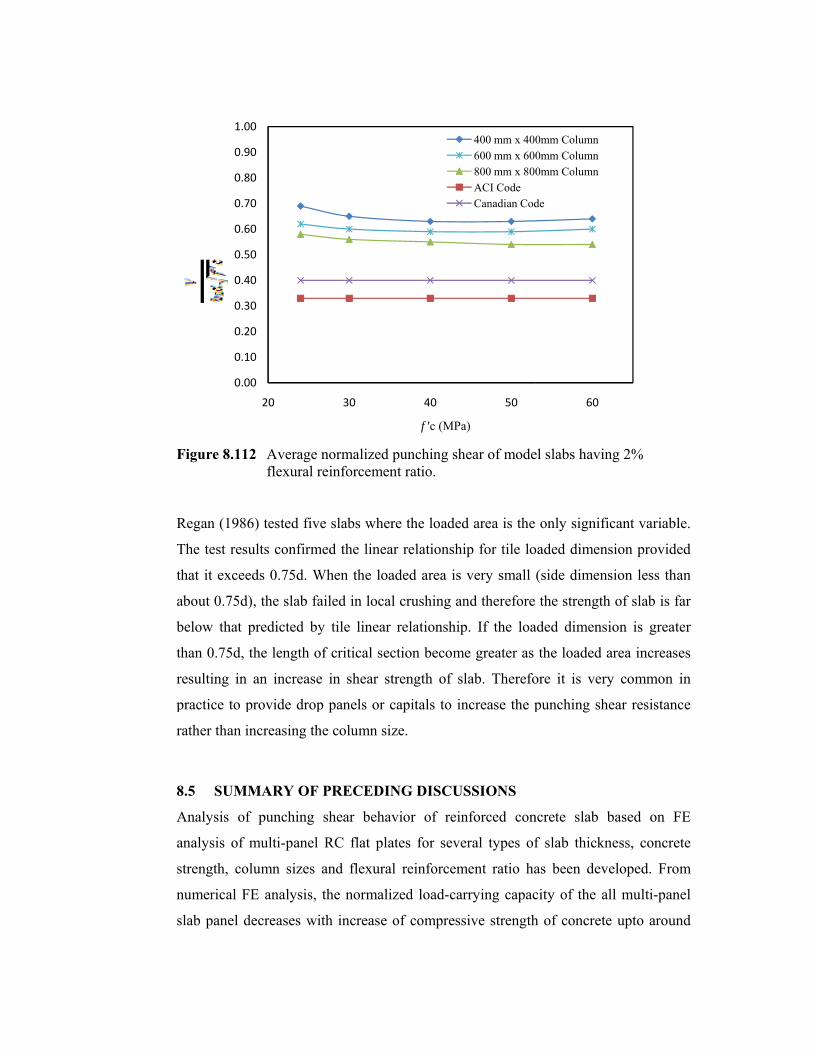
F
R
T
t
a
b
t
r
p
r
8
A
a
s
n
s
Figure 8.11
Regan (1986
The test resu
that it excee
about 0.75d)
below that p
than 0.75d, t
resulting in
practice to p
rather than in
8.5 SUMM
Analysis of
analysis of m
strength, co
numerical F
slab panel d
0.0
0.1
0.2
0.3
0.4
0.5
0.6
0.7
0.8
0.9
1.0
2 Average flexural r
6) tested five
ults confirm
eds 0.75d. W
), the slab fa
predicted by
the length o
an increase
provide drop
ncreasing th
MARY OF
f punching
multi-panel
lumn sizes
FE analysis,
decreases wi
00
10
20
30
40
50
60
70
80
90
00
20
normalized reinforcemen
e slabs wher
med the linea
When the loa
ailed in local
y tile linear
of critical sec
e in shear st
p panels or c
he column siz
PRECEDIN
shear behav
RC flat pla
and flexural
the normali
th increase
30
punching shnt ratio.
re the loaded
ar relationshi
aded area is
l crushing an
relationship
ction becom
trength of sl
capitals to in
ze.
NG DISCUS
vior of rein
ates for seve
l reinforcem
zed load-car
of compress
40
f 'c (MPa
hear of mode
d area is the
ip for tile lo
very small
nd therefore
p. If the loa
me greater as
lab. Therefo
ncrease the p
SSIONS
nforced con
eral types of
ment ratio ha
rrying capac
sive strength
50
a)
400 mm x 400600 mm x 600800 mm x 800ACI CodeCanadian Cod
el slabs havin
only signifi
oaded dimen
(side dimen
the strength
aded dimens
the loaded a
ore it is very
punching sh
ncrete slab b
f slab thickn
as been dev
city of the a
h of concrete
60
0mm Column0mm Column0mm Column
de
ng 2%
icant variabl
nsion provide
nsion less tha
h of slab is f
sion is great
area increas
y common
hear resistanc
based on F
ness, concre
veloped. Fro
all multi-pan
e upto aroun
le.
ed
an
far
ter
es
in
ce
FE
ete
om
nel
nd
250
48 MPa. Very small or no increase of normalized punching load carrying is observed
above the concrete strength of 48 MPa. It has found that punching shear capacity is
increased with addition of flexural reinforcement ratio. Although rate of increase of
punching load carrying capacity is higher upto 1% reinforcement ratio than the above
of this ratio. Size of column for flat plate is important for determining punching shear
load carrying capacity. It has been found that for slabs having same size and
reinforcement, the punching shear capacity decreases with a corresponding increase
in the column size. It has found that having same flexural reinforcement, punching
shear capacity is decreased with increase of slab thickness.
251
CHAPTER-9
SIMPLE PUNCHING SHEAR STRESS FORMULA FOR
MULTI PANEL FLAT PLATE
9.1 INTRODUCTION
From the analysis of all 225 model slabs, it is established that punching shear
capacity of multi-panel flat plate is dependent on compressive strength of concrete,
flexural reinforcement, column size and slab thickness. From analysis and
discussion, it is established that punching shear capacity is decreased with increase of
compressive strength of concrete upto certain limit and increase with increase of
flexural reinforcement. Decreasing tendency of punching shear capacity with
increase of slab thickness and column size has also investigated from earlier
chapters. According to the relationship of normalized punching shear with concrete
strength, flexural reinforcement and size effect of slab and column, an empirical
equation for calculating punching shear capacity is proposed in this chapter. The
proposed equation is verified by analyzed data and test results and comparison with
various code of prediction is also discussed in this chapter.
9.2 BASIS OF PROPOSAL
9.2.1 Punching Shear Capacity of Slab
Summary of analysis of 225 model slab are tabulated in Table 9.1 as average value
of normalized punching shear. In this table average normalized punching shear of
200mm, 250mm and 300mm thick slab are used. According to this table, average
normalized punching shear strength of 400x400 mm2 is 0.66 with 4.78% standard
deviation, 600x 600 mm2 is 0.60 with 5.12% standard deviation and 800x 800 mm2 is
0.54 with 6.10% standard deviation. For all model slabs irrespective of column size,
slab thickness, flexural reinforcement and concrete strength, the average normalized
punching shear strength is 0.60.
According to table 9.1, normalized punching shear strength of all model slabs is
higher than ACI and Canadian building code requirements. According to American,
Australian, Bangladesh and Canadian, punching shear capacity is function of square
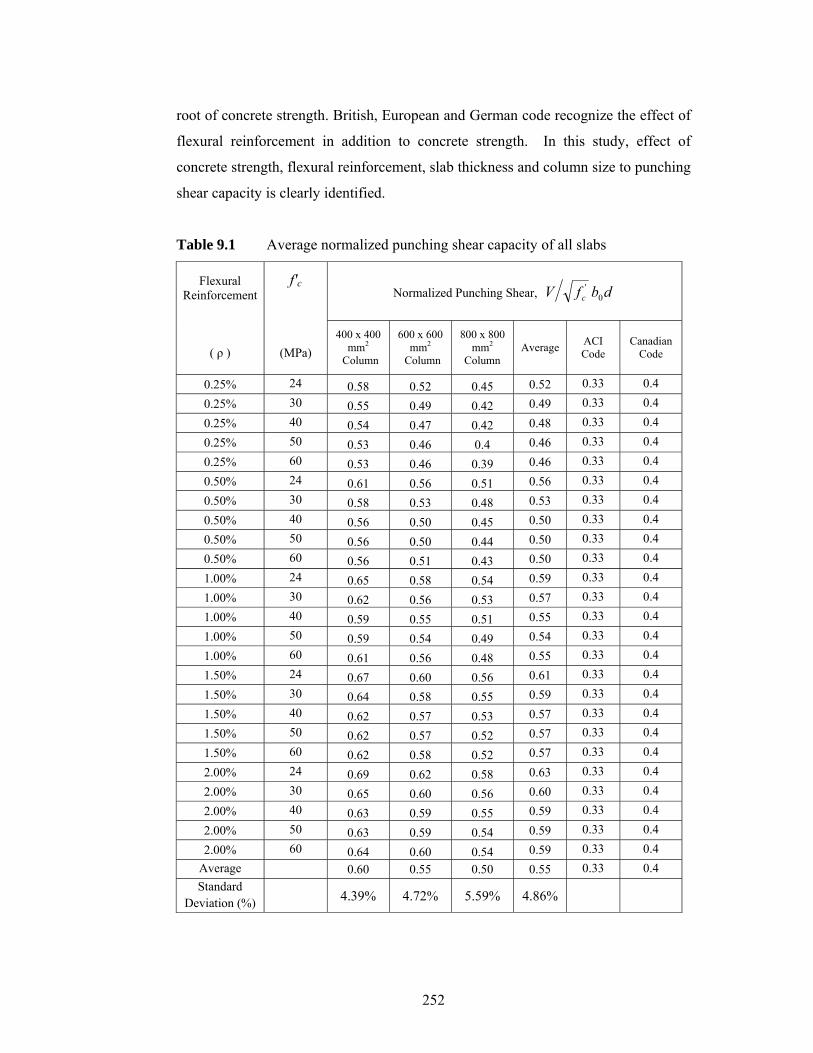
252
root of concrete strength. British, European and German code recognize the effect of
flexural reinforcement in addition to concrete strength. In this study, effect of
concrete strength, flexural reinforcement, slab thickness and column size to punching
shear capacity is clearly identified.
Table 9.1 Average normalized punching shear capacity of all slabs
Flexural Reinforcement
( ρ )
f'c
(MPa)
Normalized Punching Shear, dbfV c 0'
400 x 400 mm2
Column
600 x 600 mm2
Column
800 x 800 mm2
Column Average ACI
Code Canadian
Code
0.25% 24 0.58 0.52 0.45 0.52 0.33 0.4 0.25% 30 0.55 0.49 0.42 0.49 0.33 0.4 0.25% 40 0.54 0.47 0.42 0.48 0.33 0.4 0.25% 50 0.53 0.46 0.4 0.46 0.33 0.4 0.25% 60 0.53 0.46 0.39 0.46 0.33 0.4 0.50% 24 0.61 0.56 0.51 0.56 0.33 0.4 0.50% 30 0.58 0.53 0.48 0.53 0.33 0.4
0.50% 40 0.56 0.50 0.45 0.50 0.33 0.4 0.50% 50 0.56 0.50 0.44 0.50 0.33 0.4 0.50% 60 0.56 0.51 0.43 0.50 0.33 0.4
1.00% 24 0.65 0.58 0.54 0.59 0.33 0.4 1.00% 30 0.62 0.56 0.53 0.57 0.33 0.4 1.00% 40 0.59 0.55 0.51 0.55 0.33 0.4
1.00% 50 0.59 0.54 0.49 0.54 0.33 0.4 1.00% 60 0.61 0.56 0.48 0.55 0.33 0.4 1.50% 24 0.67 0.60 0.56 0.61 0.33 0.4
1.50% 30 0.64 0.58 0.55 0.59 0.33 0.4 1.50% 40 0.62 0.57 0.53 0.57 0.33 0.4 1.50% 50 0.62 0.57 0.52 0.57 0.33 0.4
1.50% 60 0.62 0.58 0.52 0.57 0.33 0.4 2.00% 24 0.69 0.62 0.58 0.63 0.33 0.4 2.00% 30 0.65 0.60 0.56 0.60 0.33 0.4 2.00% 40 0.63 0.59 0.55 0.59 0.33 0.4 2.00% 50 0.63 0.59 0.54 0.59 0.33 0.4 2.00% 60 0.64 0.60 0.54 0.59 0.33 0.4
Average 0.60 0.55 0.50 0.55 0.33 0.4 Standard
Deviation (%) 4.39% 4.72% 5.59% 4.86%
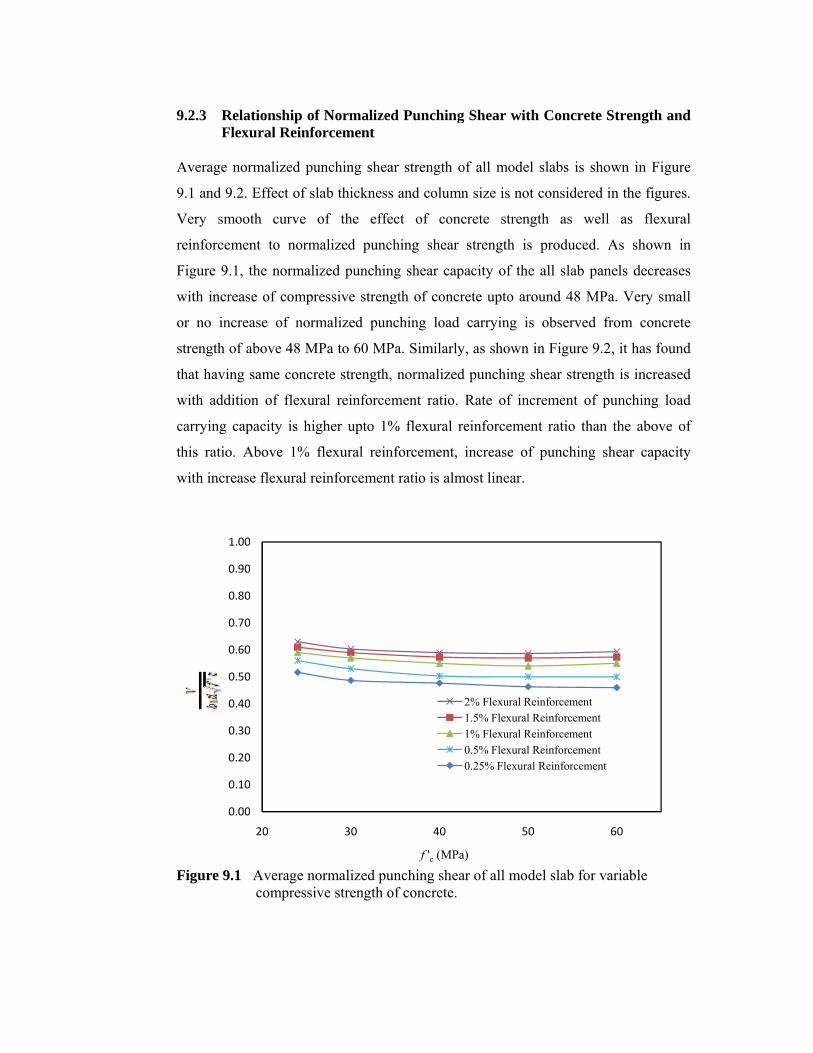
9
A
9
V
r
F
w
o
s
t
w
c
t
w
F
9.2.3 RelaFlex
Average nor
9.1 and 9.2.
Very smoo
reinforcemen
Figure 9.1, t
with increas
or no incre
strength of a
that having
with additio
carrying cap
this ratio. A
with increas
Figure 9.1
0.00
0.10
0.20
0.30
0.40
0.50
0.60
0.70
0.80
0.90
1.00
ationship of ural Reinfo
rmalized pun
Effect of sla
oth curve o
nt to norma
the normaliz
se of compre
ase of norm
above 48 MP
same concre
on of flexura
pacity is hig
Above 1% f
e flexural re
Average nocompressiv
0
0
0
0
0
0
0
0
0
0
0
20
Normalizedorcement
nching shea
ab thickness
of the effe
alized punc
zed punchin
essive streng
malized pun
Pa to 60 MP
ete strength,
al reinforcem
gher upto 1%
flexural rein
einforcement
ormalized puve strength o
30
d Punching
ar strength o
s and column
ect of conc
hing shear
ng shear cap
gth of concr
nching load
Pa. Similarly
normalized
ment ratio.
% flexural re
nforcement,
t ratio is alm
unching sheaof concrete.
40
f 'c (MPa
g Shear with
of all model
n size is not
crete streng
strength is
acity of the
rete upto aro
carrying is
y, as shown i
d punching s
Rate of inc
einforcemen
increase of
most linear.
ar of all mod
50
a)
2% Flexural Re1.5% Flexural R1% Flexural Re0.5% Flexural R0.25% Flexural
h Concrete
slabs is sho
considered
gth as well
produced.
all slab pan
ound 48 MP
observed f
in Figure 9.2
hear strengt
rement of p
nt ratio than
punching s
el slab for v
einforcementReinforcementeinforcementReinforcement
Reinforcement
Strength an
own in Figu
in the figure
l as flexur
As shown
nels decreas
Pa. Very sma
from concre
2, it has foun
th is increase
punching loa
the above
shear capaci
ariable
60
nd
ure
es.
ral
in
es
all
ete
nd
ed
ad
of
ity
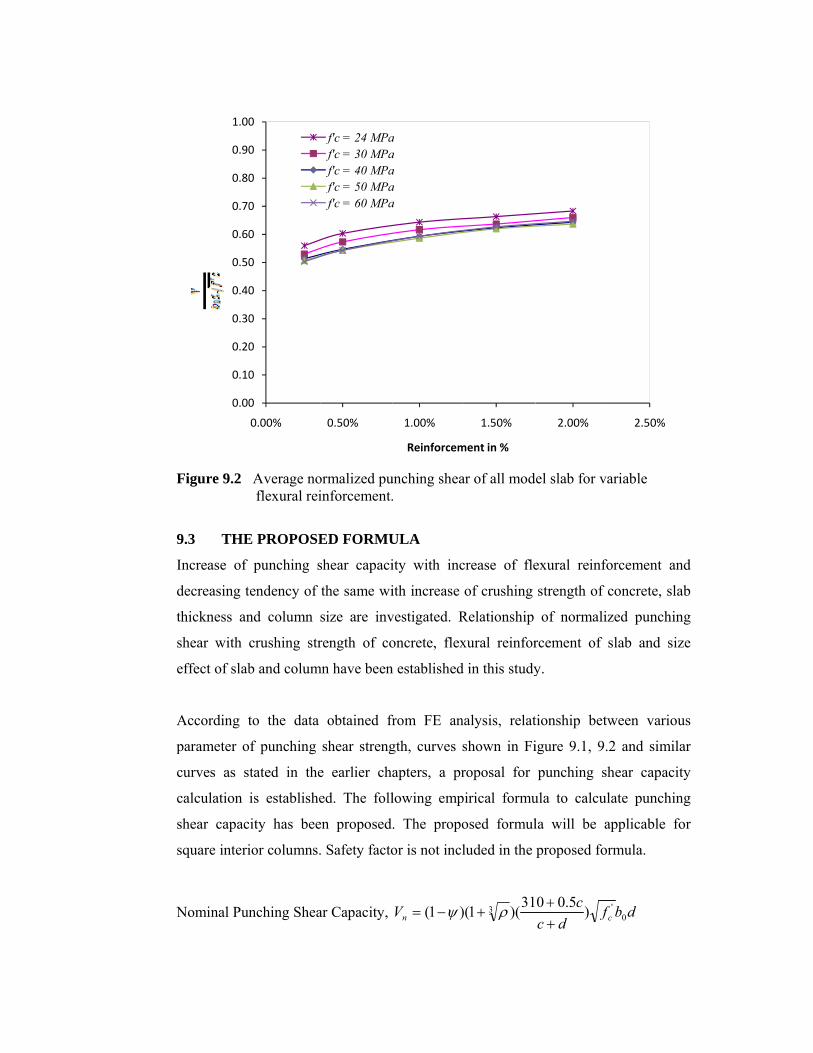
F
9
I
d
t
s
e
A
p
c
c
s
s
N
Figure 9.2
9.3 THE
Increase of
decreasing t
thickness an
shear with
effect of slab
According t
parameter o
curves as s
calculation
shear capac
square interi
Nominal Pun
0.00
0.10
0.20
0.30
0.40
0.50
0.60
0.70
0.80
0.90
1.00
Average noflexural rei
E PROPOSE
punching s
tendency of
nd column s
crushing str
b and colum
to the data
f punching
tated in the
is establishe
city has bee
ior columns.
nching Shea
0
0
0
0
0
0
0
0
0
0
0
0.00%
ormalized puinforcement.
ED FORMU
shear capaci
the same wi
size are inv
rength of co
mn have been
obtained fr
shear streng
e earlier cha
ed. The foll
en proposed
. Safety facto
ar Capacity,
0.50%
f'c = 24 MPaf'c = 30 MPaf'c = 40 MPaf'c = 50 MPaf'c = 60 MPa
unching shea.
ULA
ity with inc
ith increase
vestigated. R
oncrete, flex
n established
from FE an
gth, curves s
apters, a pr
lowing emp
. The propo
or is not incl
Vn )1( −= ψ
1.00%
Reinforcem
aaaaa
ar of all mod
crease of fle
of crushing
Relationship
xural reinfor
in this study
alysis, relat
shown in Fi
roposal for
irical formu
osed formul
luded in the
3 31)(1( + ρ
1.50%
ment in %
el slab for v
exural reinfo
strength of
of normali
rcement of
y.
tionship bet
igure 9.1, 9.
punching s
ula to calcul
la will be a
proposed fo
fdc
c)5.00++
2.00%
ariable
forcement an
concrete, sla
zed punchin
slab and siz
ween variou
.2 and simil
hear capaci
late punchin
applicable f
ormula.
dbfc 0'
2.50%
nd
ab
ng
ze
us
lar
ity
ng
for
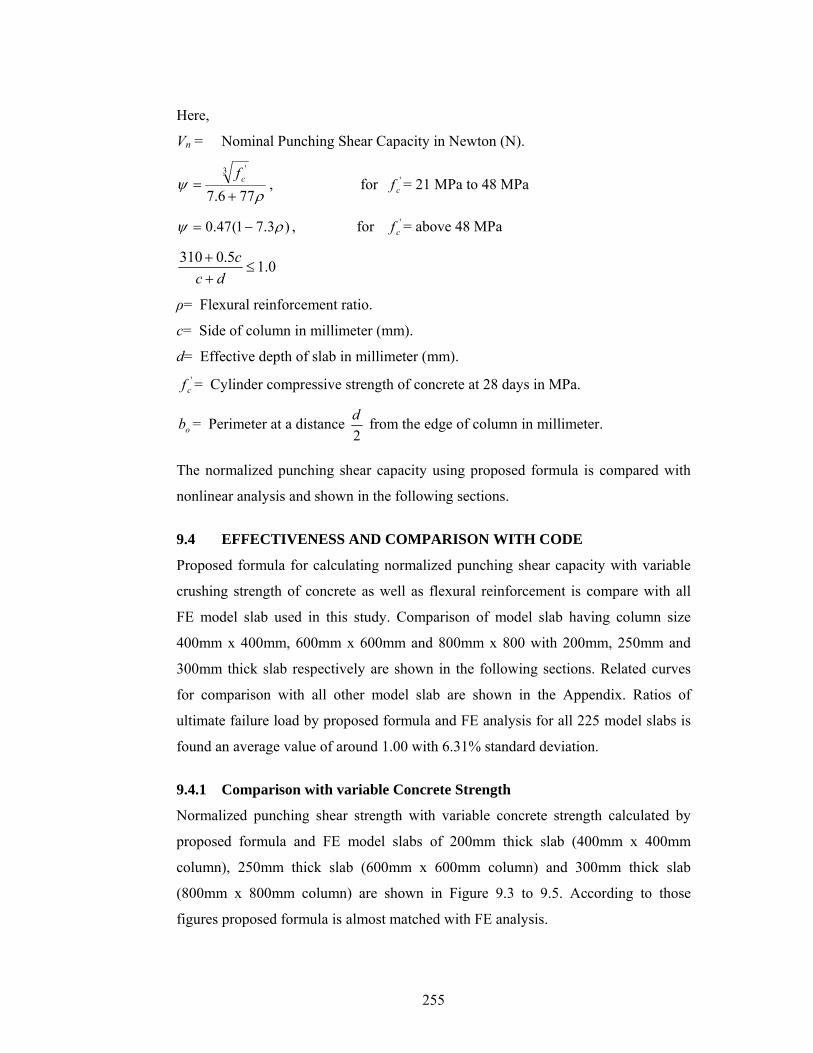
255
Here,
Vn = Nominal Punching Shear Capacity in Newton (N).
ρψ
776.7
3 '
+= cf
, for 'cf = 21 MPa to 48 MPa
)3.71(47.0 ρψ −= , for 'cf = above 48 MPa
0.15.0310≤
++
dcc
ρ= Flexural reinforcement ratio. c= Side of column in millimeter (mm).
d= Effective depth of slab in millimeter (mm). '
cf = Cylinder compressive strength of concrete at 28 days in MPa.
ob = Perimeter at a distance 2d from the edge of column in millimeter.
The normalized punching shear capacity using proposed formula is compared with
nonlinear analysis and shown in the following sections.
9.4 EFFECTIVENESS AND COMPARISON WITH CODE
Proposed formula for calculating normalized punching shear capacity with variable
crushing strength of concrete as well as flexural reinforcement is compare with all
FE model slab used in this study. Comparison of model slab having column size
400mm x 400mm, 600mm x 600mm and 800mm x 800 with 200mm, 250mm and
300mm thick slab respectively are shown in the following sections. Related curves
for comparison with all other model slab are shown in the Appendix. Ratios of
ultimate failure load by proposed formula and FE analysis for all 225 model slabs is
found an average value of around 1.00 with 6.31% standard deviation.
9.4.1 Comparison with variable Concrete Strength
Normalized punching shear strength with variable concrete strength calculated by
proposed formula and FE model slabs of 200mm thick slab (400mm x 400mm
column), 250mm thick slab (600mm x 600mm column) and 300mm thick slab
(800mm x 800mm column) are shown in Figure 9.3 to 9.5. According to those
figures proposed formula is almost matched with FE analysis.
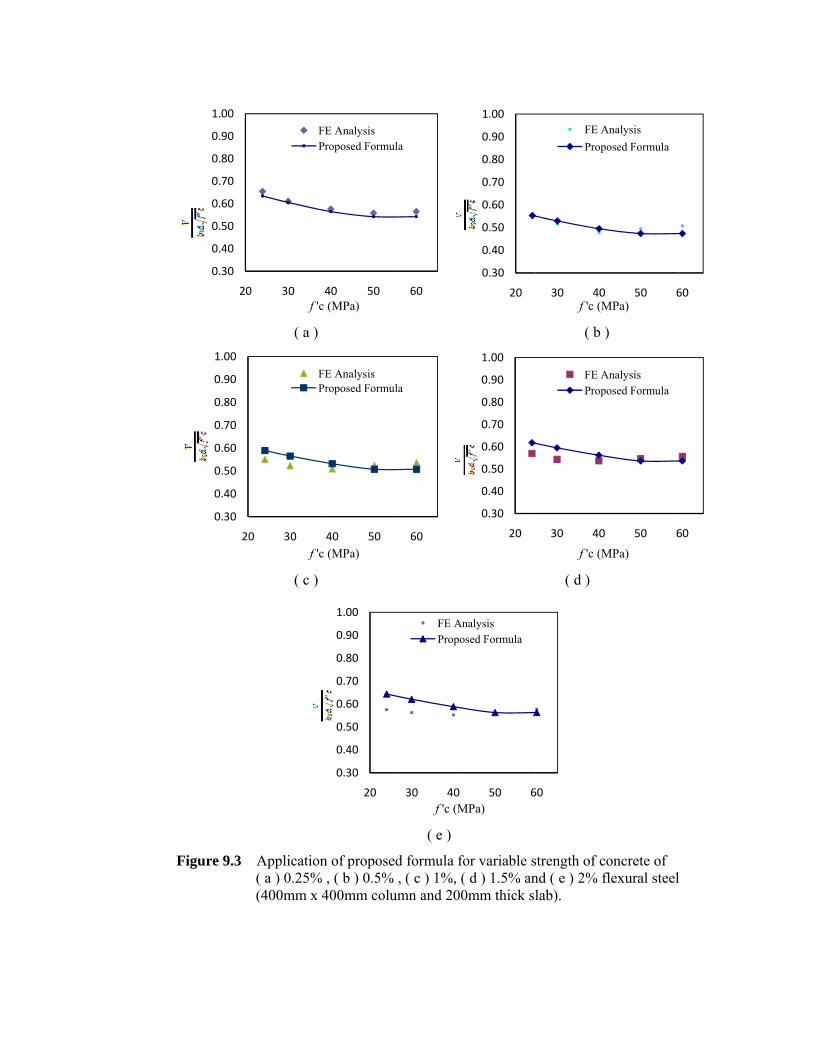
FFigure 9.3
0.30
0.40
0.50
0.60
0.70
0.80
0.90
1.00
20
0.30
0.40
0.50
0.60
0.70
0.80
0.90
1.00
20
( a )
( c )
Application( a ) 0.25%(400mm x
0 30f 'c
FP
0 30f 'c
FP
n of propose% , ( b ) 0.5%
400mm colu
40 50c (MPa)
FE AnalysisProposed Formu
40 50c (MPa)
FE AnalysisProposed Formu
0.30
0.40
0.50
0.60
0.70
0.80
0.90
1.00
20
( e ) ed formula fo
% , ( c ) 1%, (umn and 200
60
ula
60
ula
30 40f 'c (M
FE AnPropo
for variable s( d ) 1.5% an0mm thick sl
0.30
0.40
0.50
0.60
0.70
0.80
0.90
1.00
20
0.30
0.40
0.50
0.60
0.70
0.80
0.90
1.00
20
50 6MPa)
nalysisosed Formula
( b )
( d )
strength of cond ( e ) 2% flab).
30 40f 'c (M
FE APropo
30 40
f 'c (M
FE APropo
60
)
oncrete of flexural steel
50 6MPa)
Analysisosed Formula
50 6
MPa)
Analysisosed Formula
l
60
60
F
Figure 9.4
0.30
0.40
0.50
0.60
0.70
0.80
0.90
1.00
20
0.30
0.40
0.50
0.60
0.70
0.80
0.90
1.00
2
( a )
( c )
Application( a ) 0.25%(600mm x
0 30f 'c
FP
20 30
f
n of propose% , ( b ) 0.5%
600mm colu
40 50c (MPa)
FE AnalysisProposed Formu
40 50
f 'c (MPa)
FE AnalysisProposed Form
0.30
0.40
0.50
0.60
0.70
0.80
0.90
1.00
20
( e ) ed formula fo
% , ( c ) 1%, (umn and 250
60
ula
60
mula
30 40f 'c (M
FE AnPropos
for variable s( d ) 1.5% an0mm thick sl
0.30
0.40
0.50
0.60
0.70
0.80
0.90
1.00
20
0.30
0.40
0.50
0.60
0.70
0.80
0.90
1.00
20
50 6MPa)
nalysissed Formula
( b )
( d )
strength of cond ( e ) 2% flab).
30 40
f 'c (M
FP
30 40f 'c (M
FEPr
60
oncrete of flexural steel
50 6
MPa)
FE AnalysisProposed Formula
50 6MPa)
E Analysisroposed Formul
l
60
a
60
la
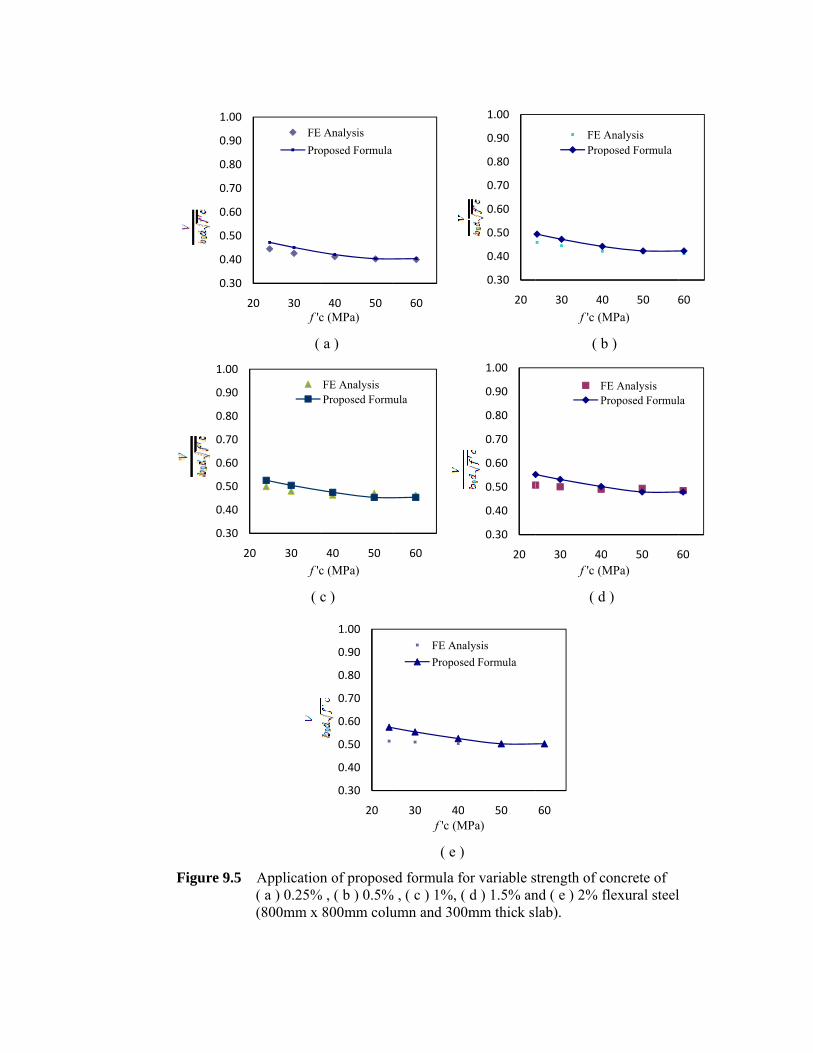
F
Figure 9.5
0.30
0.40
0.50
0.60
0.70
0.80
0.90
1.00
2
0.30
0.40
0.50
0.60
0.70
0.80
0.90
1.00
2
(
( c
Application( a ) 0.25%(800mm x
20 30f 'c
FE Pro
0 30f 'c
a )
c )
n of propose% , ( b ) 0.5%
800mm colu
40 50c (MPa)
Analysisoposed Formula
40 50c (MPa)
FE AnalysisProposed Form
0.30
0.40
0.50
0.60
0.70
0.80
0.90
1.00
20
( e )
ed formula fo% , ( c ) 1%, (
umn and 300
60
60
mula
30 40f 'c (M
FE AnaPropos
for variable s( d ) 1.5% an0mm thick sl
0.30
0.40
0.50
0.60
0.70
0.80
0.90
1.00
20
0.30
0.40
0.50
0.60
0.70
0.80
0.90
1.00
20
0 50MPa)
alysised Formula
( b
( d
strength of cond ( e ) 2% flab).
30 40f 'c (M
FE AProp
30 40f 'c (M
FEPr
60
b )
)
oncrete of flexural steel
0 50 6MPa)
Analysisposed Formula
0 50 6MPa)
E Analysisroposed Formul
l
60
60
la
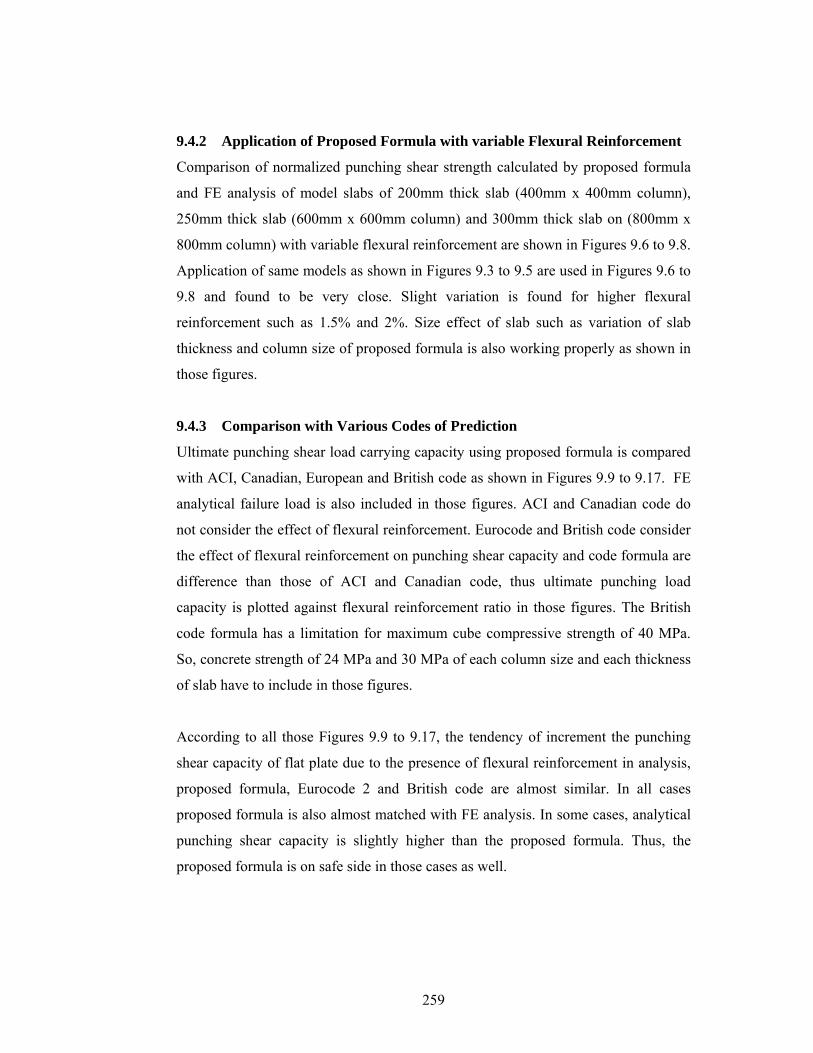
259
9.4.2 Application of Proposed Formula with variable Flexural Reinforcement
Comparison of normalized punching shear strength calculated by proposed formula
and FE analysis of model slabs of 200mm thick slab (400mm x 400mm column),
250mm thick slab (600mm x 600mm column) and 300mm thick slab on (800mm x
800mm column) with variable flexural reinforcement are shown in Figures 9.6 to 9.8.
Application of same models as shown in Figures 9.3 to 9.5 are used in Figures 9.6 to
9.8 and found to be very close. Slight variation is found for higher flexural
reinforcement such as 1.5% and 2%. Size effect of slab such as variation of slab
thickness and column size of proposed formula is also working properly as shown in
those figures.
9.4.3 Comparison with Various Codes of Prediction
Ultimate punching shear load carrying capacity using proposed formula is compared
with ACI, Canadian, European and British code as shown in Figures 9.9 to 9.17. FE
analytical failure load is also included in those figures. ACI and Canadian code do
not consider the effect of flexural reinforcement. Eurocode and British code consider
the effect of flexural reinforcement on punching shear capacity and code formula are
difference than those of ACI and Canadian code, thus ultimate punching load
capacity is plotted against flexural reinforcement ratio in those figures. The British
code formula has a limitation for maximum cube compressive strength of 40 MPa.
So, concrete strength of 24 MPa and 30 MPa of each column size and each thickness
of slab have to include in those figures.
According to all those Figures 9.9 to 9.17, the tendency of increment the punching
shear capacity of flat plate due to the presence of flexural reinforcement in analysis,
proposed formula, Eurocode 2 and British code are almost similar. In all cases
proposed formula is also almost matched with FE analysis. In some cases, analytical
punching shear capacity is slightly higher than the proposed formula. Thus, the
proposed formula is on safe side in those cases as well.
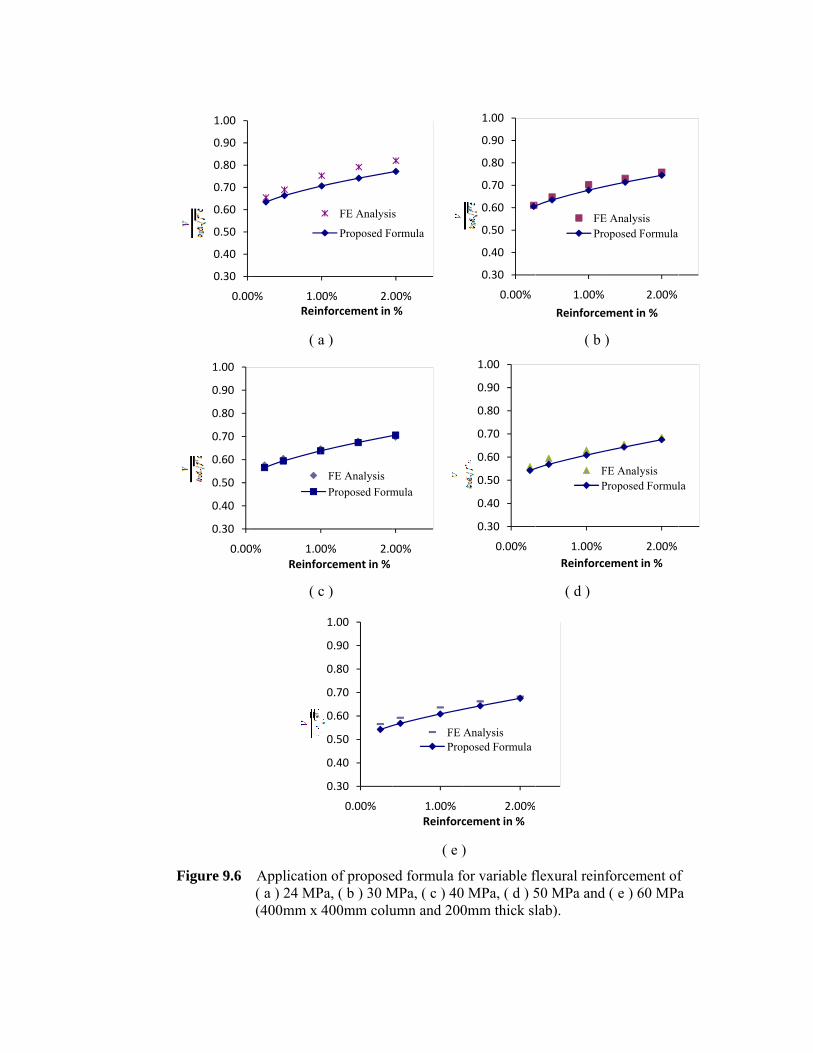
F
Figure 9.6
0.30
0.40
0.50
0.60
0.70
0.80
0.90
1.00
0.00
0.30
0.40
0.50
0.60
0.70
0.80
0.90
1.00
0.00
( a
( c
Application( a ) 24 MP(400mm x
0% 1.0Rein
0% 1.0Reinfo
a )
c )
n of proposePa, ( b ) 30 M400mm colu
00% 2.0nforcement in
FE Analysis
Proposed Fo
0% 2.0orcement in %
FE AnalysisProposed Form
0.30
0.40
0.50
0.60
0.70
0.80
0.90
1.00
0.00%
( e )
ed formula foMPa, ( c ) 40umn and 200
00%%
s
ormula
00%
mula
1.00%Reinforc
FE AProp
) for variable f MPa, ( d ) 5
0mm thick sl
0.30
0.40
0.50
0.60
0.70
0.80
0.90
1.00
0.00%
0.30
0.40
0.50
0.60
0.70
0.80
0.90
1.00
0.00%
2.00%cement in %
Analysisposed Formula
( b )
( d )
flexural reinf50 MPa and lab).
1.00%Reinforcem
FE Pro
1.00%Reinforce
FP
)
forcement of( e ) 60 MPa
2.00%ment in %
Analysisoposed Formula
2.00%ement in %
FE AnalysisProposed Formul
f a
la
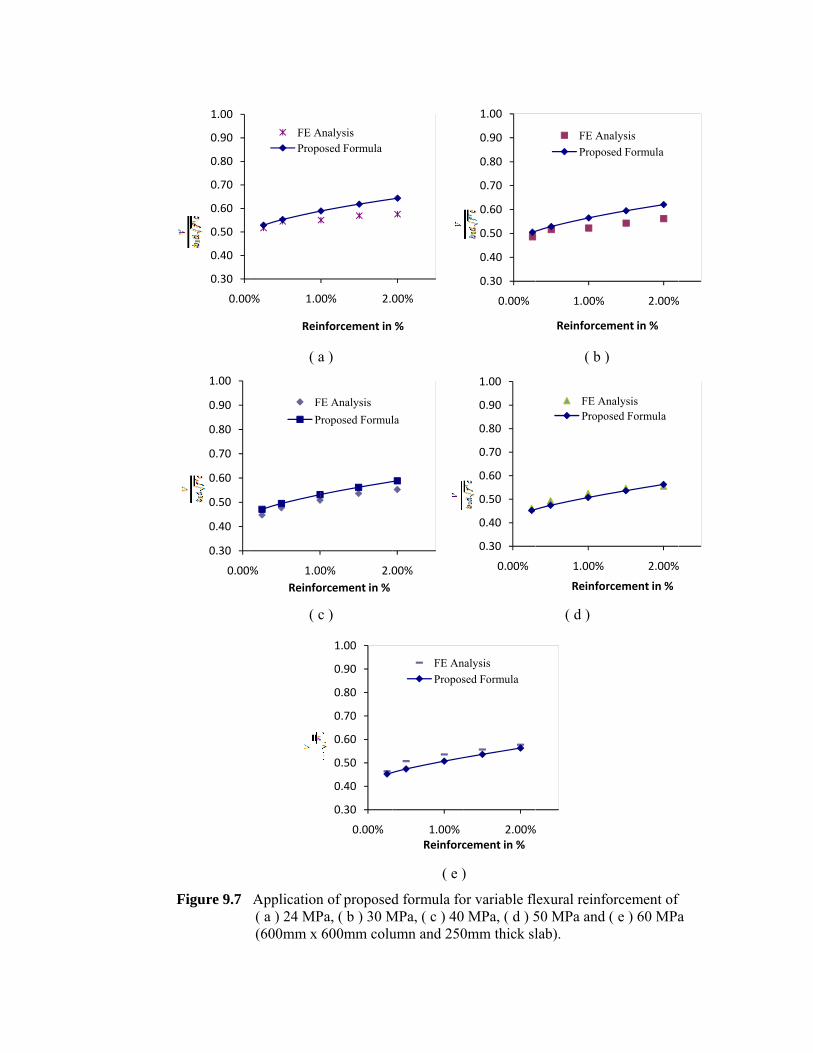
FFigure 9.7
0.30
0.40
0.50
0.60
0.70
0.80
0.90
1.00
0.00
0.30
0.40
0.50
0.60
0.70
0.80
0.90
1.00
0.00
( a
( c
Application( a ) 24 MP(600mm x
0% 1.0
Rein
FE APropo
% 1.0Reinfo
FP
a )
c )
n of proposedPa, ( b ) 30 M600mm colu
00% 2.0
nforcement in
Analysisosed Formula
0% 2.0orcement in %
E Analysisroposed Formul
0.30
0.40
0.50
0.60
0.70
0.80
0.90
1.00
0.00%
( e )
d formula foMPa, ( c ) 40umn and 250
00%
%
00%
la
1.00%Reinforc
FE AnPropos
) or variable fl MPa, ( d ) 5
0mm thick sl
0.30
0.40
0.50
0.60
0.70
0.80
0.90
1.00
0.00%
0.30
0.40
0.50
0.60
0.70
0.80
0.90
1.00
0.00%
2.00%cement in %
nalysissed Formula
( b )
( d )
lexural reinfo50 MPa and lab).
1.00%
Reinforce
FE AnPropo
1.00%
Reinfor
FE AnPropo
%
)
forcement of ( e ) 60 MPa
2.00%
ment in %
nalysissed Formula
2.00%
rcement in %
nalysisosed Formula
f a
%
%
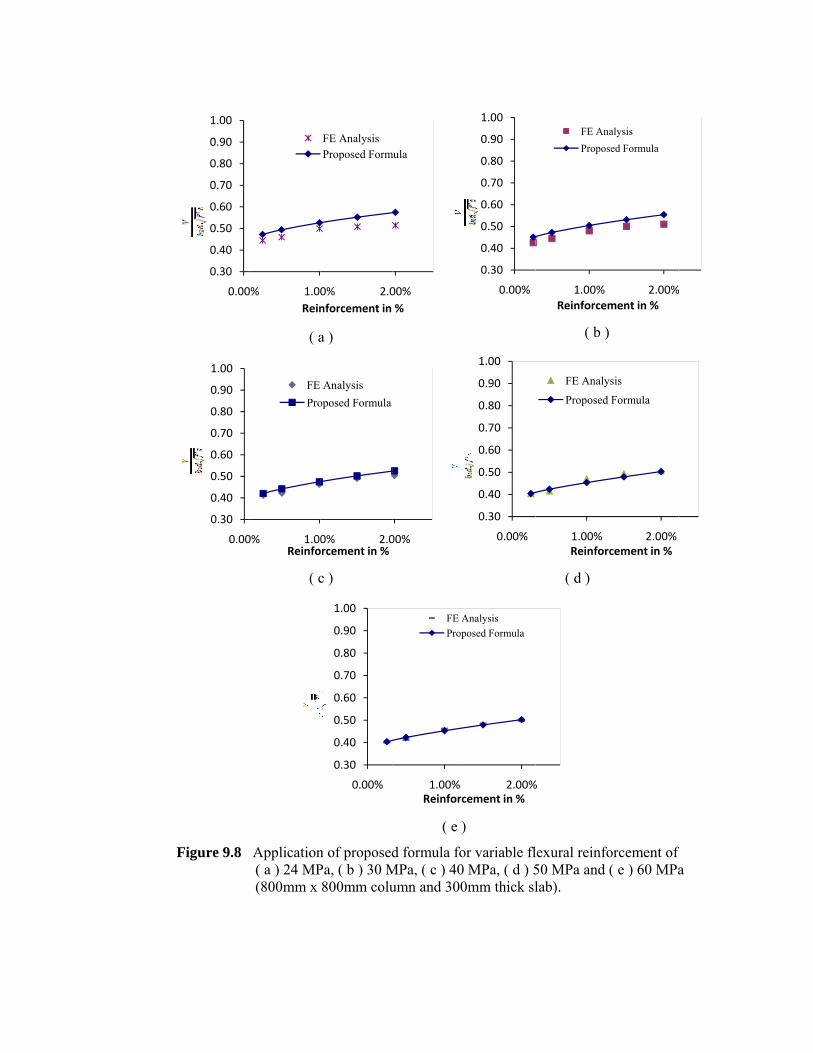
F
Figure 9.8
0.30
0.40
0.50
0.60
0.70
0.80
0.90
1.00
0.00
0.30
0.40
0.50
0.60
0.70
0.80
0.90
1.00
0.00
( a
( c
Application( a ) 24 MP(800mm x
0% 1.00Rein
0% 1.00Reinfo
FE Pro
a )
c )
n of proposedPa, ( b ) 30 M800mm colu
0% 2.0nforcement in
FE AnalysisProposed Form
0% 2.0rcement in %
Analysisoposed Formula
0.30
0.40
0.50
0.60
0.70
0.80
0.90
1.00
0.00%
( e )
d formula foMPa, ( c ) 40umn and 300
00%%
mula
00%
1.00%Reinforc
FE AProp
) or variable fl MPa, ( d ) 5
0mm thick sl
0.30
0.40
0.50
0.60
0.70
0.80
0.90
1.00
0.00%
0.30
0.40
0.50
0.60
0.70
0.80
0.90
1.00
0.00%
2.00%cement in %
Analysisposed Formula
( b )
( d )
lexural reinfo50 MPa and lab).
1.00%Reinforce
FE AnPropos
1.00%Reinfor
FE Analy
Proposed
%
)
forcement of( e ) 60 MPa
2.00%ment in %
nalysissed Formula
2.00%rcement in %
ysis
d Formula
f a
%
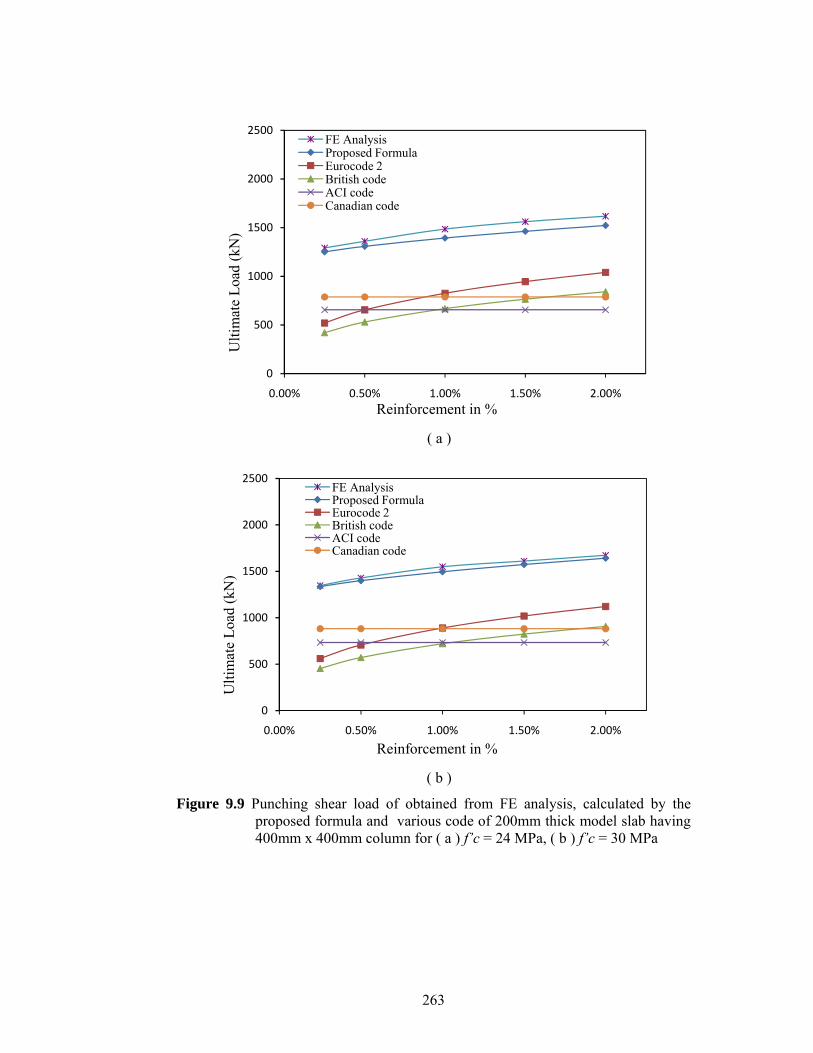
263
( a )
( b )
Figure 9.9 Punching shear load of obtained from FE analysis, calculated by the proposed formula and various code of 200mm thick model slab having 400mm x 400mm column for ( a ) f’c = 24 MPa, ( b ) f’c = 30 MPa
0
500
1000
1500
2000
2500
0.00% 0.50% 1.00% 1.50% 2.00%Reinforcement in %
FE AnalysisProposed Formula Eurocode 2 British code ACI code Canadian code
Ulti
mat
e Lo
ad (k
N)
0
500
1000
1500
2000
2500
0.00% 0.50% 1.00% 1.50% 2.00%Reinforcement in %
FE AnalysisProposed Formula Eurocode 2 British code ACI code Canadian code
Ulti
mat
e Lo
ad (k
N)
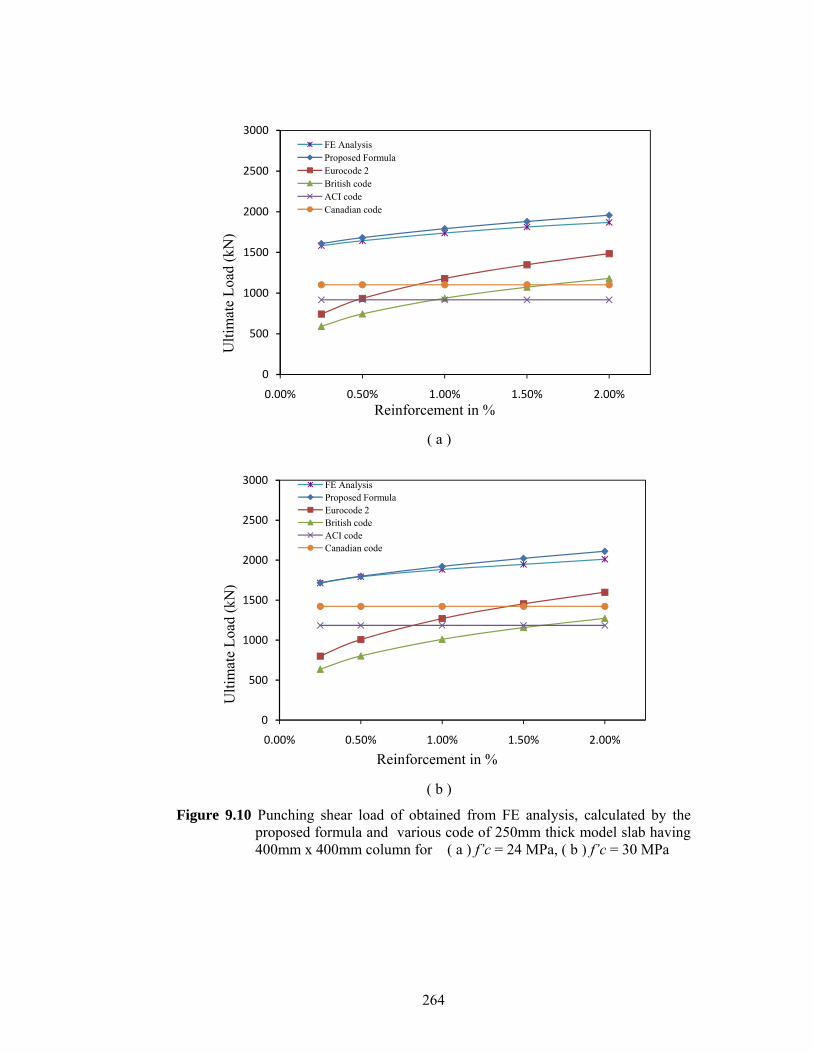
264
( a )
( b )
Figure 9.10 Punching shear load of obtained from FE analysis, calculated by the proposed formula and various code of 250mm thick model slab having 400mm x 400mm column for ( a ) f’c = 24 MPa, ( b ) f’c = 30 MPa
0
500
1000
1500
2000
2500
3000
0.00% 0.50% 1.00% 1.50% 2.00%Reinforcement in %
FE AnalysisProposed Formula Eurocode 2 British code ACI code Canadian code
Ulti
mat
e Lo
ad (k
N)
0
500
1000
1500
2000
2500
3000
0.00% 0.50% 1.00% 1.50% 2.00%
Reinforcement in %
FE AnalysisProposed Formula Eurocode 2 British code ACI code Canadian code
Ulti
mat
e Lo
ad (k
N)
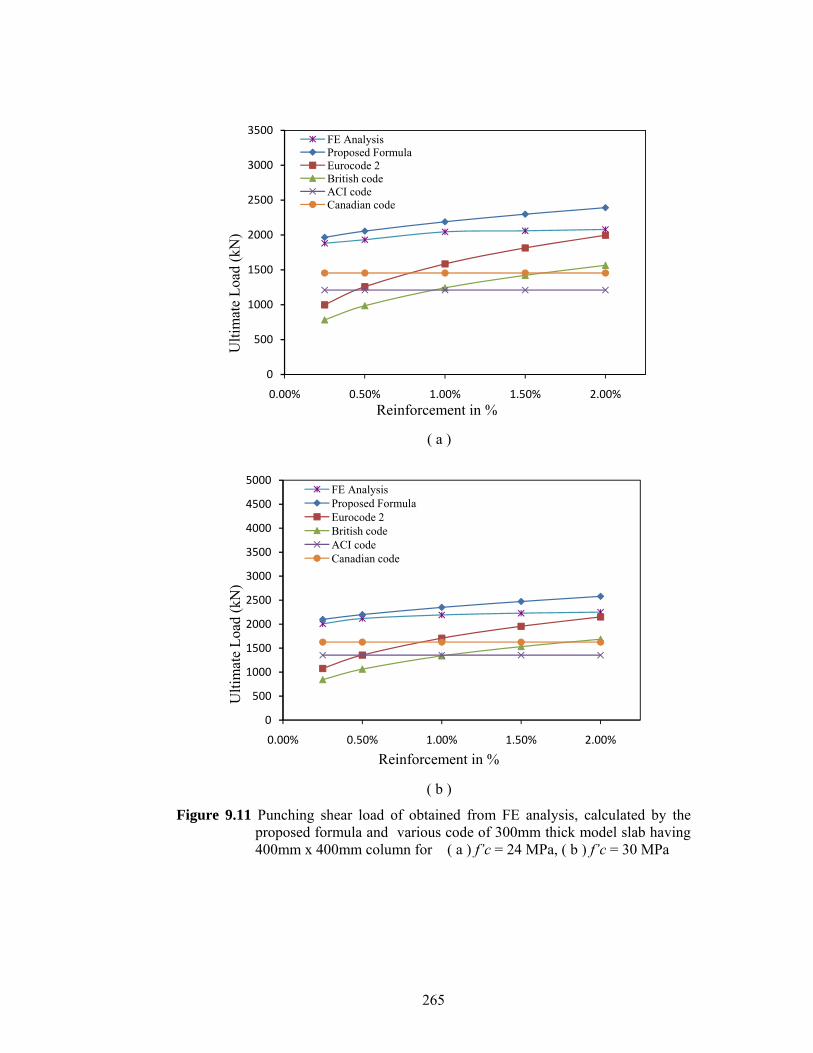
265
( a )
( b )
Figure 9.11 Punching shear load of obtained from FE analysis, calculated by the proposed formula and various code of 300mm thick model slab having 400mm x 400mm column for ( a ) f’c = 24 MPa, ( b ) f’c = 30 MPa
0
500
1000
1500
2000
2500
3000
3500
0.00% 0.50% 1.00% 1.50% 2.00%Reinforcement in %
FE AnalysisProposed Formula Eurocode 2 British code ACI code Canadian code
Ulti
mat
e Lo
ad (k
N)
0
500
1000
1500
2000
2500
3000
3500
4000
4500
5000
0.00% 0.50% 1.00% 1.50% 2.00%
Reinforcement in %
FE AnalysisProposed Formula Eurocode 2 British code ACI code Canadian code
Ulti
mat
e Lo
ad (k
N)
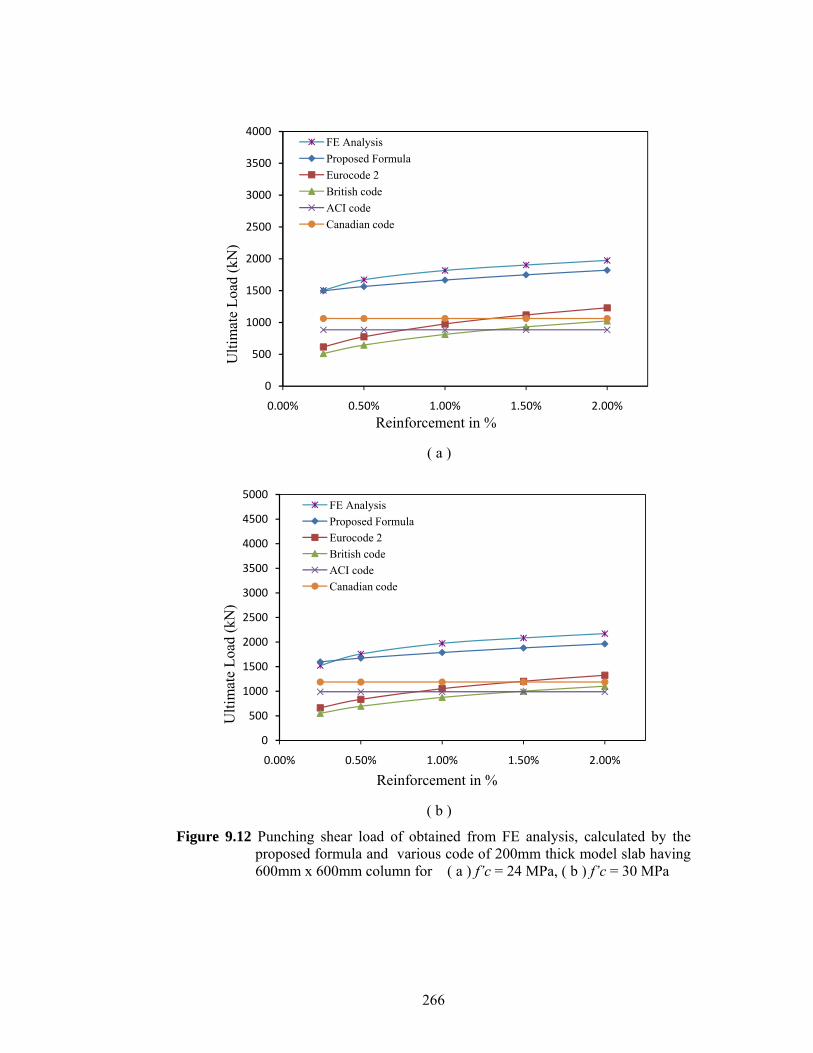
266
( a )
( b )
Figure 9.12 Punching shear load of obtained from FE analysis, calculated by the proposed formula and various code of 200mm thick model slab having 600mm x 600mm column for ( a ) f’c = 24 MPa, ( b ) f’c = 30 MPa
0
500
1000
1500
2000
2500
3000
3500
4000
0.00% 0.50% 1.00% 1.50% 2.00%Reinforcement in %
FE AnalysisProposed Formula Eurocode 2 British code ACI code Canadian code
Ulti
mat
e Lo
ad (k
N)
0
500
1000
1500
2000
2500
3000
3500
4000
4500
5000
0.00% 0.50% 1.00% 1.50% 2.00%
Reinforcement in %
FE AnalysisProposed Formula Eurocode 2 British code ACI code Canadian code
Ulti
mat
e Lo
ad (k
N)
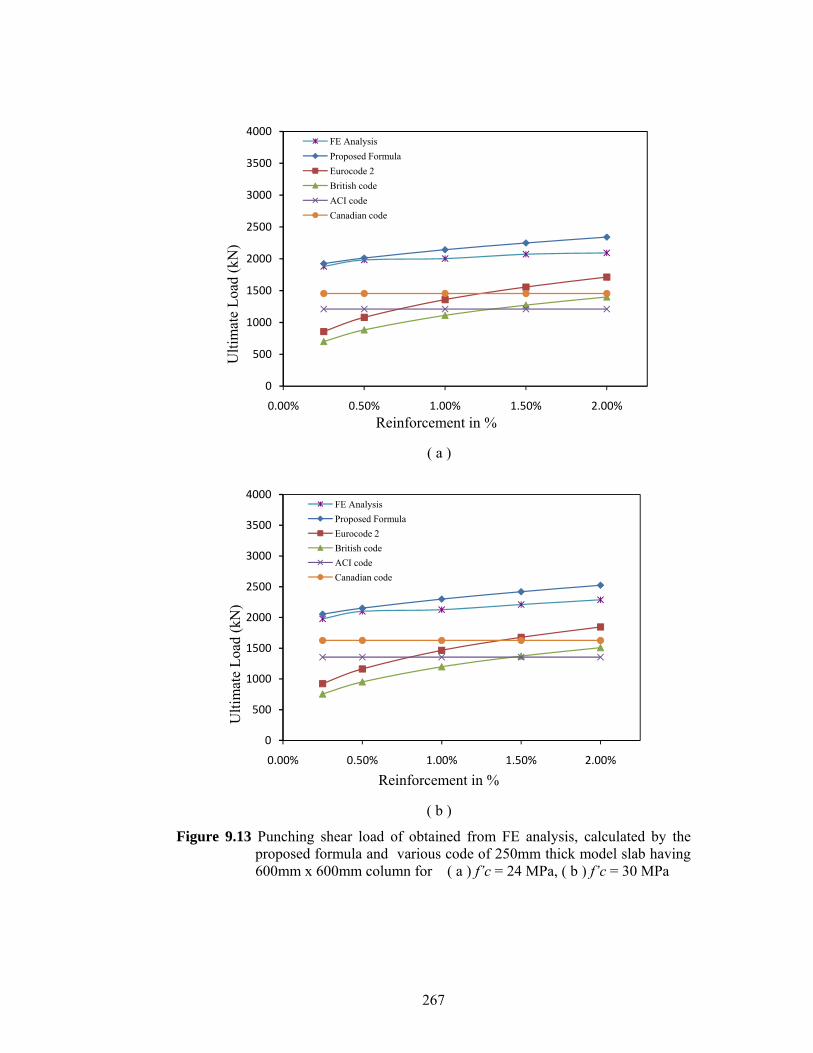
267
( a )
( b )
Figure 9.13 Punching shear load of obtained from FE analysis, calculated by the proposed formula and various code of 250mm thick model slab having 600mm x 600mm column for ( a ) f’c = 24 MPa, ( b ) f’c = 30 MPa
0
500
1000
1500
2000
2500
3000
3500
4000
0.00% 0.50% 1.00% 1.50% 2.00%Reinforcement in %
FE AnalysisProposed Formula Eurocode 2 British code ACI code Canadian code
Ulti
mat
e Lo
ad (k
N)
0
500
1000
1500
2000
2500
3000
3500
4000
0.00% 0.50% 1.00% 1.50% 2.00%
Reinforcement in %
FE AnalysisProposed Formula Eurocode 2 British code ACI code Canadian code
Ulti
mat
e Lo
ad (k
N)
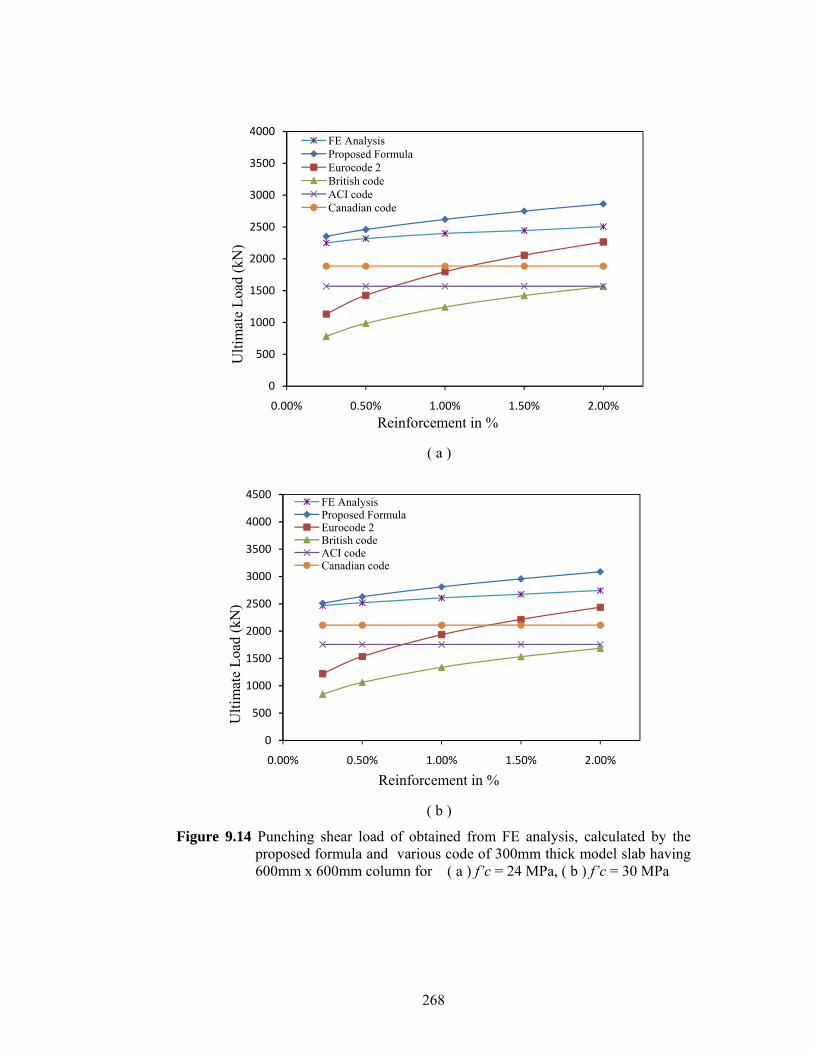
268
( a )
( b )
Figure 9.14 Punching shear load of obtained from FE analysis, calculated by the proposed formula and various code of 300mm thick model slab having 600mm x 600mm column for ( a ) f’c = 24 MPa, ( b ) f’c = 30 MPa
0
500
1000
1500
2000
2500
3000
3500
4000
0.00% 0.50% 1.00% 1.50% 2.00%Reinforcement in %
FE AnalysisProposed Formula Eurocode 2 British code ACI code Canadian code
Ulti
mat
e Lo
ad (k
N)
0
500
1000
1500
2000
2500
3000
3500
4000
4500
0.00% 0.50% 1.00% 1.50% 2.00%
Reinforcement in %
FE AnalysisProposed Formula Eurocode 2 British code ACI code Canadian code
Ulti
mat
e Lo
ad (k
N)
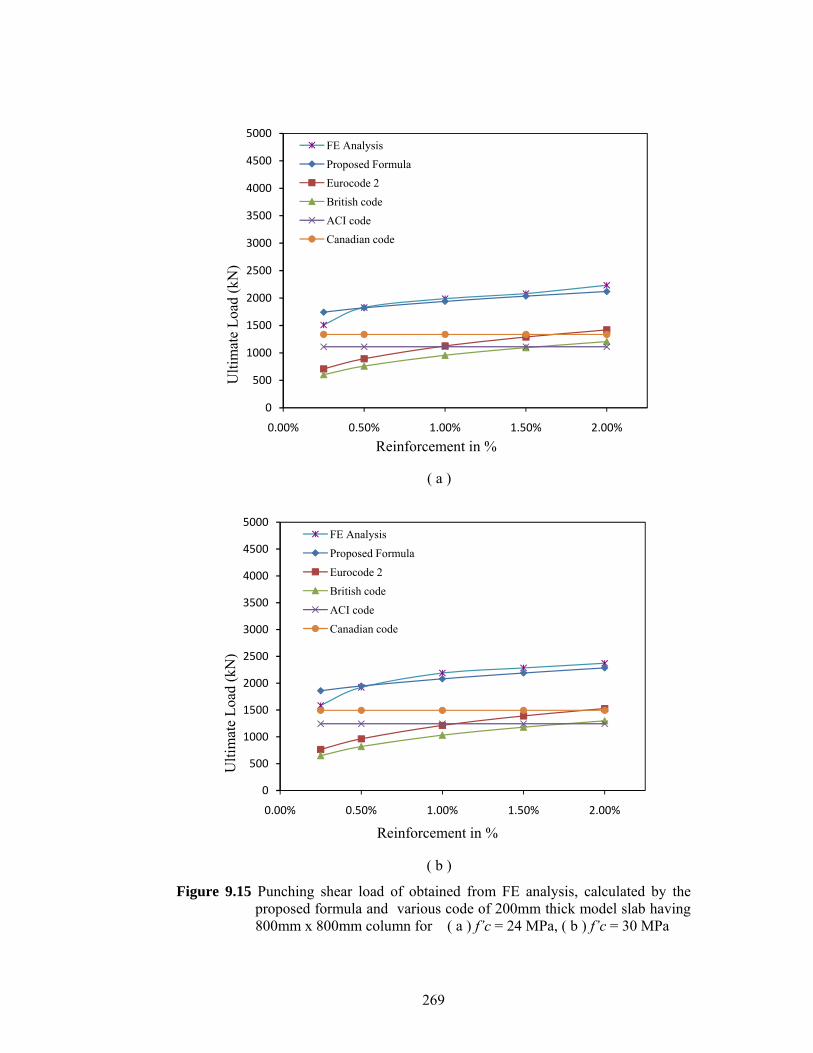
269
( a )
( b )
Figure 9.15 Punching shear load of obtained from FE analysis, calculated by the proposed formula and various code of 200mm thick model slab having 800mm x 800mm column for ( a ) f’c = 24 MPa, ( b ) f’c = 30 MPa
0
500
1000
1500
2000
2500
3000
3500
4000
4500
5000
0.00% 0.50% 1.00% 1.50% 2.00%
Reinforcement in %
FE AnalysisProposed Formula Eurocode 2 British code ACI code Canadian code
Ulti
mat
e Lo
ad (k
N)
0
500
1000
1500
2000
2500
3000
3500
4000
4500
5000
0.00% 0.50% 1.00% 1.50% 2.00%
Reinforcement in %
FE Analysis
Proposed Formula
Eurocode 2 British code
ACI code
Canadian code
Ulti
mat
e Lo
ad (k
N)
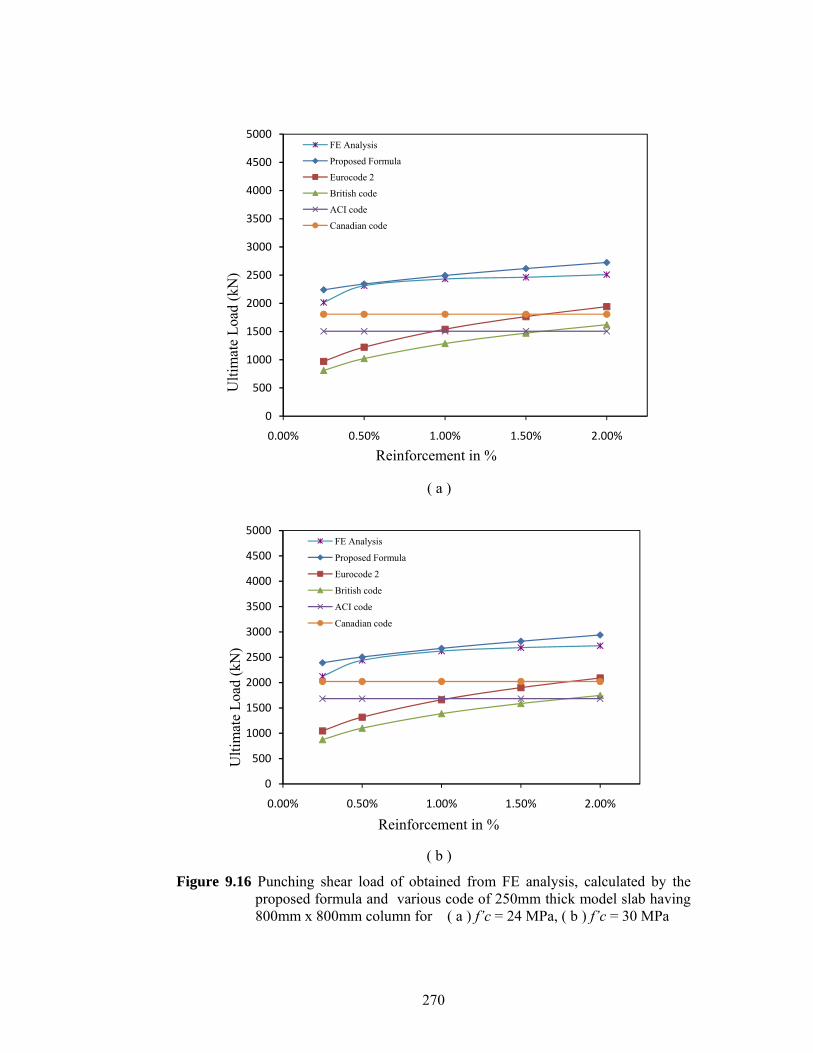
270
( a )
( b )
Figure 9.16 Punching shear load of obtained from FE analysis, calculated by the proposed formula and various code of 250mm thick model slab having 800mm x 800mm column for ( a ) f’c = 24 MPa, ( b ) f’c = 30 MPa
0
500
1000
1500
2000
2500
3000
3500
4000
4500
5000
0.00% 0.50% 1.00% 1.50% 2.00%
Reinforcement in %
FE Analysis
Proposed Formula
Eurocode 2
British code
ACI code
Canadian code U
ltim
ate
Load
(kN
)
0
500
1000
1500
2000
2500
3000
3500
4000
4500
5000
0.00% 0.50% 1.00% 1.50% 2.00%
Reinforcement in %
FE Analysis
Proposed Formula
Eurocode 2
British code
ACI code
Canadian code
Ulti
mat
e Lo
ad (k
N)
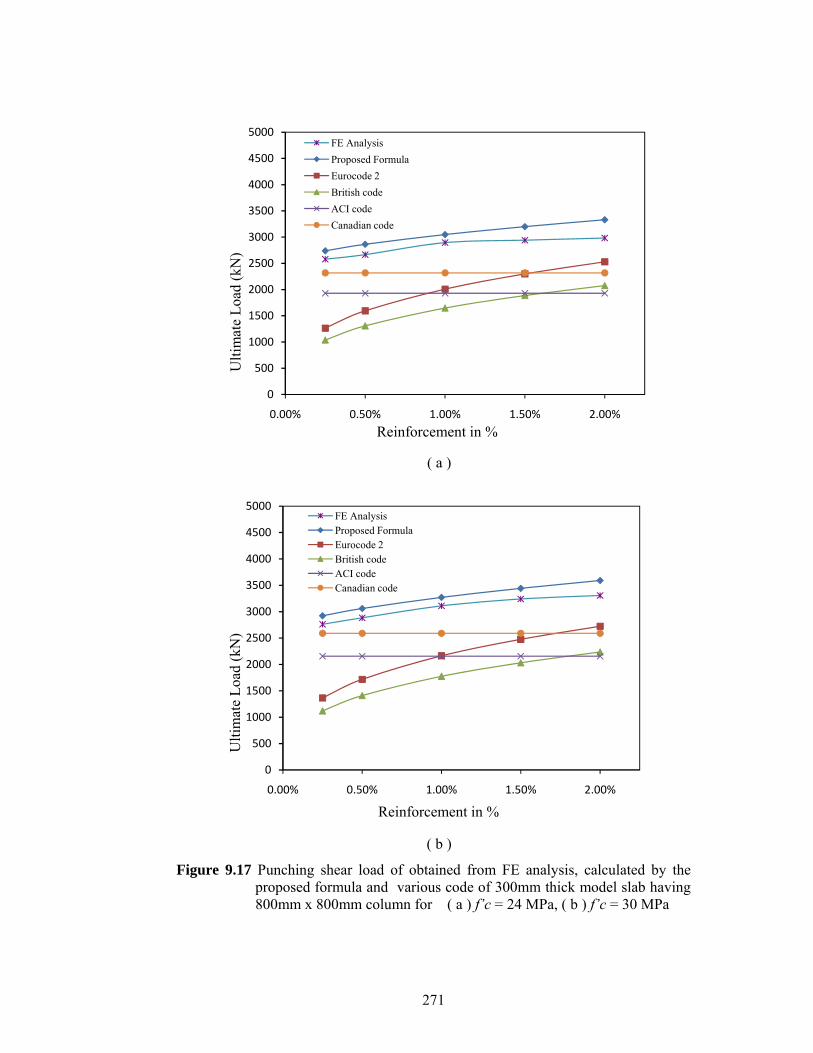
271
( a )
( b )
Figure 9.17 Punching shear load of obtained from FE analysis, calculated by the proposed formula and various code of 300mm thick model slab having 800mm x 800mm column for ( a ) f’c = 24 MPa, ( b ) f’c = 30 MPa
0
500
1000
1500
2000
2500
3000
3500
4000
4500
5000
0.00% 0.50% 1.00% 1.50% 2.00%Reinforcement in %
FE AnalysisProposed Formula Eurocode 2 British code ACI code Canadian code
Ulti
mat
e Lo
ad (k
N)
0
500
1000
1500
2000
2500
3000
3500
4000
4500
5000
0.00% 0.50% 1.00% 1.50% 2.00%
Reinforcement in %
FE AnalysisProposed Formula Eurocode 2 British code ACI code Canadian code
Ulti
mat
e Lo
ad (k
N)
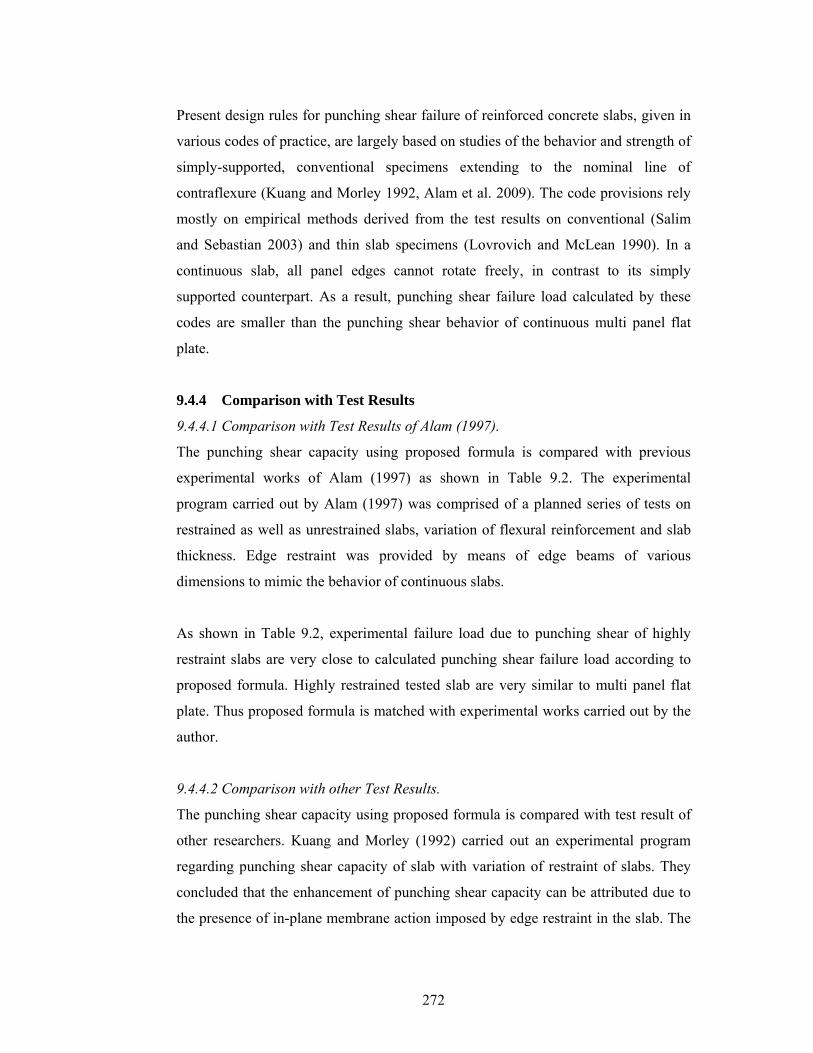
272
Present design rules for punching shear failure of reinforced concrete slabs, given in
various codes of practice, are largely based on studies of the behavior and strength of
simply-supported, conventional specimens extending to the nominal line of
contraflexure (Kuang and Morley 1992, Alam et al. 2009). The code provisions rely
mostly on empirical methods derived from the test results on conventional (Salim
and Sebastian 2003) and thin slab specimens (Lovrovich and McLean 1990). In a
continuous slab, all panel edges cannot rotate freely, in contrast to its simply
supported counterpart. As a result, punching shear failure load calculated by these
codes are smaller than the punching shear behavior of continuous multi panel flat
plate.
9.4.4 Comparison with Test Results
9.4.4.1 Comparison with Test Results of Alam (1997).
The punching shear capacity using proposed formula is compared with previous
experimental works of Alam (1997) as shown in Table 9.2. The experimental
program carried out by Alam (1997) was comprised of a planned series of tests on
restrained as well as unrestrained slabs, variation of flexural reinforcement and slab
thickness. Edge restraint was provided by means of edge beams of various
dimensions to mimic the behavior of continuous slabs.
As shown in Table 9.2, experimental failure load due to punching shear of highly
restraint slabs are very close to calculated punching shear failure load according to
proposed formula. Highly restrained tested slab are very similar to multi panel flat
plate. Thus proposed formula is matched with experimental works carried out by the
author.
9.4.4.2 Comparison with other Test Results.
The punching shear capacity using proposed formula is compared with test result of
other researchers. Kuang and Morley (1992) carried out an experimental program
regarding punching shear capacity of slab with variation of restraint of slabs. They
concluded that the enhancement of punching shear capacity can be attributed due to
the presence of in-plane membrane action imposed by edge restraint in the slab. The
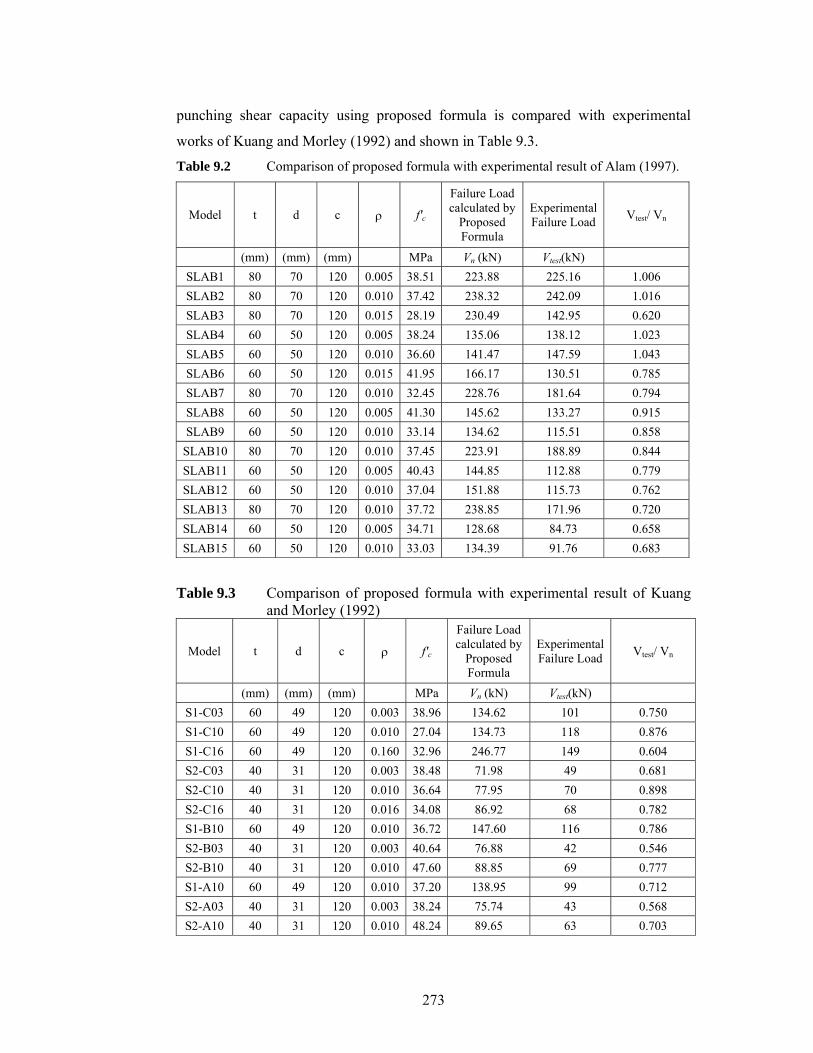
273
punching shear capacity using proposed formula is compared with experimental
works of Kuang and Morley (1992) and shown in Table 9.3.
Table 9.2 Comparison of proposed formula with experimental result of Alam (1997).
Model t d c ρ f'c
Failure Load calculated by
Proposed Formula
Experimental Failure Load Vtest/ Vn
(mm) (mm) (mm) MPa Vn (kN) Vtest(kN) SLAB1 80 70 120 0.005 38.51 223.88 225.16 1.006 SLAB2 80 70 120 0.010 37.42 238.32 242.09 1.016 SLAB3 80 70 120 0.015 28.19 230.49 142.95 0.620 SLAB4 60 50 120 0.005 38.24 135.06 138.12 1.023 SLAB5 60 50 120 0.010 36.60 141.47 147.59 1.043 SLAB6 60 50 120 0.015 41.95 166.17 130.51 0.785 SLAB7 80 70 120 0.010 32.45 228.76 181.64 0.794 SLAB8 60 50 120 0.005 41.30 145.62 133.27 0.915 SLAB9 60 50 120 0.010 33.14 134.62 115.51 0.858
SLAB10 80 70 120 0.010 37.45 223.91 188.89 0.844 SLAB11 60 50 120 0.005 40.43 144.85 112.88 0.779 SLAB12 60 50 120 0.010 37.04 151.88 115.73 0.762 SLAB13 80 70 120 0.010 37.72 238.85 171.96 0.720 SLAB14 60 50 120 0.005 34.71 128.68 84.73 0.658 SLAB15 60 50 120 0.010 33.03 134.39 91.76 0.683
Table 9.3 Comparison of proposed formula with experimental result of Kuang and Morley (1992)
Model t d c ρ f'c
Failure Load calculated by
Proposed Formula
Experimental Failure Load Vtest/ Vn
(mm) (mm) (mm) MPa Vn (kN) Vtest(kN) S1-C03 60 49 120 0.003 38.96 134.62 101 0.750 S1-C10 60 49 120 0.010 27.04 134.73 118 0.876 S1-C16 60 49 120 0.160 32.96 246.77 149 0.604 S2-C03 40 31 120 0.003 38.48 71.98 49 0.681 S2-C10 40 31 120 0.010 36.64 77.95 70 0.898 S2-C16 40 31 120 0.016 34.08 86.92 68 0.782 S1-B10 60 49 120 0.010 36.72 147.60 116 0.786 S2-B03 40 31 120 0.003 40.64 76.88 42 0.546 S2-B10 40 31 120 0.010 47.60 88.85 69 0.777 S1-A10 60 49 120 0.010 37.20 138.95 99 0.712 S2-A03 40 31 120 0.003 38.24 75.74 43 0.568 S2-A10 40 31 120 0.010 48.24 89.65 63 0.703
274
As shown in Table 9.3, experimental punching shear failure load carried out by
Kuang and Morley (1992) of highly restraint slabs are also very close to calculated
punching shear failure load according to proposed formula. Thus proposed formula is
also matched with experimental works in this case.
Comparison of the punching shear capacity using proposed formula with test result
of other researchers like Elstner and Hognestad (1956), Moe (1961), Mowrer and
Vanderbilt (1967), Kinnunen et al. (1978), Regan and Zakaria (1979), Rankin and
Long (1987), Gardner (1990), Marzouk and Hussein (1991), Tomaszewicz (1993),
Hallgren (1996), Ramdane (1996), Kevin (2000), Sundquist and Kinnunen (2004),
Birkle and Dilger (2008), Marzouk and Hussein (2007) and Marzouk and Rizk
(2009) are included in the Appendix. The average ratio of experimental failure load
obtained by those researchers to predicted failure load calculated by the proposed
formula is within the range of 0.45 to 0.71 with 4.63% to 13.92% standard deviation.
All these experimental works to obtain punching shear capacity of flat plate were
carried out of simply supported slabs. Test results of simply supported slab
specimens will not be similar to the load capacity of slabs having lateral restraint.
Thus, punching shear failure load obtained by these researchers are smaller than that
calculated by multi panel flat plate proposed formula. It may be mentioned that past
experimental results of Alam (1997) for specimens having simple supports and no
edge restraints also have shown similar response.
9.5 CONCLUDING REMARKS
From the above discussion, it may be concluded that the proposal for estimating
punching shear capacity made in this study predicts the capacity more reasonably
taking into account the effect of flexural steel and effect of column size and slab
thickness which some well practiced codes do not account for. Thus, the proposed
equation may be accepted by codes after applying some appropriate factor of safety
on it.
275
CHAPTER-10
CONCLUSIONS AND RECOMMENDATIONS
10.1 CONCLUSIONS
Analysis of punching shear behavior of reinforced concrete slab based on
experimental works and nonlinear finite element investigation of same experimental
works has been carried out. Finite element analysis of previous experimental works
along with comprehensive parametric study has been performed. After this study on
previous experimental works, the validation of material model and FE procedure has
been established. The same FE procedure has been used to analyze multi-panel flat
plate considering full-scale with practical geometry is carried out on the behavior of
punching shear characteristics of concrete slab. A nonlinear solution technique for a
realistic modeling of the punching shear behavior of multi-panel RC flat plates for
different slab thickness, concrete strength, column sizes and flexural reinforcement
ratio has been used. Finally an empirical equation for calculating punching shear
capacity of flat plate is proposed. The following conclusions may be derived from
this study;
( i ) Nonlinear finite element analysis for punching shear behavior of reinforced
concrete slabs can effectively be used to simulate the actual behavior of
reinforced concrete slab under punching load and provide a virtual testing
scheme of structures to explore their behavior under different loadings and
other effects under different conditions.
( ii ) Using appropriate simulation technique and material model for numerical
simulation, it can be demonstrated that significant benefits can be achieved
using finite element tools and advanced computing facilities to obtain safe
and optimum solutions without the need for expensive and time-consuming
laboratory testing.
( iii ) Punching shear strength observed from punching tests conducted on the
restrained reinforced concrete slabs has been found to be higher than the
276
predictions of present-day design provisions. Present code provision
underestimates the punching shear capacity of slabs as the code expressions
are based on tests conducted on simply-supported slabs with their edges
unrestrained. The strength enhancement in such case increases with the
degree of edge restraint.
( iv ) The level of flexural reinforcement has a positive effect on the ultimate
punching shear capacity of the reinforced concrete slabs. Although British,
European CEB-FIP and German codes recognize the influence of percentages
of steel, American, Australian and Canadian codes completely ignore the
possible influence of the amount of flexural reinforcement in formulating the
equations of punching shear capacity of slabs. The provision of all these
codes may thus be reviewed to accommodate the influence of flexural steel
more rationally.
( v ) Load deflection behavior of experimental works and FE analysis has been
reasonably predicted using finite element model. In finite element simulation,
the load-displacement response can be predicted over the full load range of
the analysis. Punching failure load can also be predicted by FE analysis.
( vi ) Cracking is an important phenomenon on punching shear behavior of
reinforcement concrete slab. Such cracking areas and pattern of cracking can
be effectively simulated by finite element analysis.
( vii ) For lower level of reinforcement ratios (ρ = 0.50% and 1.0%), some cracking of
the slab is predicted in the immediate vicinity of the column, but punching occurs
before yielding of the entire slab reinforcement. For higher reinforcement ratios
( ρ = 1.5%), punching occurs before any yielding of the reinforcement takes place
and hence a brittle failure is experienced.
( viii ) The magnitude of punching load carrying capacity of slabs increases with the
increase of compressive strength of concrete and the normalized load-
carrying capacity of the all multi-panel slab panel decreases with increase of

277
compressive strength of concrete upto around 48 MPa. Very small or no
increase of normalized punching load carrying is observed above the concrete
strength of 48 MPa.
( ix ) Decreasing tendency of normalized punching shear capacity due to increasing
strength of concrete is higher for smaller column size than that of higher sized
column.
( x ) From the analysis of multi-panel flat plate, it has been found that punching
shear capacity increases with the addition of flexural top reinforcement ratio
from 0.25% to 2.00% percent. However, the rate of increase of load carrying
capacity in punching shear continues to be higher upto 1% reinforcement
ratio after which the effect becomes insignificant.
( xi ) Size of column for flat plate is important for determining punching shear load
carrying capacity. It has been found that for slabs with same size and
reinforcement, the normalized punching shear capacity decreases with the
increase of column size.
( xii ) It has found that for same flexural reinforcement, normalized punching shear
capacity decreases with increase of slab thickness. However, the effect of slab
thickness on normalized punching shear capacity of slab with smaller flexural
reinforcement ratio is very small. Decreasing tendency of punching shear
capacity due to slab thickness with smaller strength of concrete is higher.
( xiii ) The contribution of slab thickness and column dimension may be included in
the presently recognized codes.
The punching shear capacity using proposed formula has been found to agree well
with the results of nonlinear finite element analysis. The load carrying capacities
predicted by the codes are much smaller and over-conservative due to exclusion of
the effect of concrete strength and flexural steel efficiently. The inclusion of size
effect such as slab thickness and column size is also incorporated in the proposed
formula. The proposed empirical equation can be used for estimating the punching
278
capacity of slabs more reasonably and after applying appropriate safety factor, the
proposal may be incorporated in codes so that designer may use the proposed
formula for calculating punching shear capacity of slab for optimum design of
building structure.
10.2 RECOMMENDATIONS
The proposal for calculating punching shear capacity of flat plate with interior square
column is recommended in this study. This formula can predict the punching shear
capacity more reasonably, taking into account the effect of flexural steel and size
effect which some well practiced codes do not consider. The proposed equation may
be verified by nonlinear finite element analysis and experimental works with the
variation of concrete strengths, flexural reinforcement ratios, column shape and size,
slab thickness etc. Additional research work may be carried out to calculate punching
shear capacity for multi-panel flat plate with rectangular column, combined effect of
punching shear and unbalanced moment to verify the proposed equation.
279
REFFERENCE ACI committee 318 (1983), "Building Code Requirements for Reinforced Concrete (ACI 318-83)", American Concrete Institute, Detroit. ACI committee 318 (1989), "Building Code Requirements for Reinforced Concrete (ACI 318-83)", American Concrete Institute, Detroit. ACI committee 318 (1995), "Building Code Requirements for Reinforced Concrete (ACI 318-83)", American Concrete Institute, Detroit. ACI Committee 318 (2005), "Building Code Requirements for Reinforced Concrete (ACI 318-83)", American Concrete Institute, Detroit. ACI Committee 318 (2008), "Building Code Requirements for Reinforced Concrete (ACI 318-83)", American Concrete Institute, Detroit. ACI Committee 318 (2011). “ACI 318-08: Building Code Requirements for Structural Concrete and Commentary”, American Concrete Institute. ISBN 0-87031-264-2. Aktan, A.E. and Peeknold, D.A. (1974), “Response of a Reinforced Concrete Section to Two-Dimensional Curvature Histories.” ACI Structural Journal, Vol. 71, No. 5, pp 246-250. Alam, A.K.M. Jahangir (1997) “Punching Shear Behavior of Reinforcement Concrete Slabs”, M.Sc. Engineering Thesis, Department of Civil Engineering, Bangladesh University of Engineering & Technology, Dhaka, Bangladesh. Alam, A.K.M. Jahangir, Amanat, Khan Mahmud and Seraj, Salek M.(2009a) “Experimental investigation of edge restraint on punching shear behaviour of RC slabs”, The IES Journal Part A: Civil & Structural Engineering, 2:1, Page 35 - 46. Alam, A.K.M. Jahangir, Amanat, Khan Mahmud and Seraj, Salek M.(2009b) “An Experimental Study on Punching Shear Behavior of Concrete Slabs”, Advances in Structural Engineering. Vol. 12 No. 2, Page 257- 265. Alam, A.K.M. Jahangir and Amanat, Khan Mahmud (2012a), “Finite Element Simulation on Punching Shear Behavior of Reinforced Concrete Slabs”, International Scholarly Research Network ISRN Civil Engineering, Volume 2012, Article ID 501816, doi:10.5402/2012/501816, Page 1-9. Alam, A.K.M. Jahangir and Amanat, Khan Mahmud (2012b), “Effect of Flexural Reinforcement on Punching Shear Behavior of RC Slabs”, Proceedings of the First International Conference on Performance-based and Life-cycle Structural Engineering (PLSE 2012), 5-7 December 2012, Hong Kong, China. Page 1851-1859.
280
Alam, A.K.M. Jahangir and Amanat, Khan Mahmud (2013a), “FE Analysis On The Effect of Flexural Steel On Punching Shear Of Slabs”, International Journal of Engineering Research & Technology (IJERT), ISSN: 2278-0181, Vol. 2 Issue 6, Page 2878-2901. Alam, A.K.M. Jahangir and Amanat, K. M. (2013b), “Effect of reinforcement on punching shear of multipanel flat slab”, Journal of Civil Engineering, (IEB), Vol. 41 Issue 2, Page 123-137. Alam, A.K.M. Jahangir and Amanat, K. M. (2014), “Investigation on punching shear behaviour of multi-panel flat slab”, International Journal of Structural Engineering, Vol. 5, No. 3, pp 189-206. Alexander, S. D. B. and Simmonds, S. H. (1992), “Tests of column flat plate connections”, ACI Structural Journal, Vol. 89, No. 5, pp 495-502. Al-Mahaidi, R.S.H.(1979), “Non-Linear Finite Element Analysis of Reinforced Concrete Deep Members”, Thesis presented to Cornell University, Ithaca, N.Y. 1979, in partial fulfillment of the requirements of Doctor of Philosophy. Amanat, K.M. (1997), “Gradient Plasticity Modeling For The Fracture and Strain Localization of Early Age Concrete”, PhD Thesis, Department of Civil Engineering, Nagoya University, Japan, January 1997. American Concrete Institute 318-95/318R-95. “Building code requirements for structural concrete”, ACI manual of concrete practice. Part 3: use of concrete in buildings––design, specifications, and related topics. Detroit, Michigan, 345 pp. American Concrete Institute 363R-92. “State-of-the-art report on high strength concrete”, ACI manual of concrete practice. Part 1: materials and general properties of concrete. Detroit, Michigan, 55 pp. Aoki. Y. and Seki. H. (1971), “Shearing strength and cracking in two-way slab Subjected to concentrated load”, ACI Publication SP-30, pp 104-127. AS 3600-1994, “Australian Standard: Concrete Structures”, Standards Association of Australia, Homebush, NSW 2140. AS 3600-2009, “Australian Standard: Concrete Structures”, Standards Association of Australia, Homebush, NSW 2140. Bailey Colin G., Toh Wee S., and Chan Bok M. (2008), “Simplified and Advanced Analysis of Membrane Action of Concrete Slabs”, ACI Structural Journal, V.105, No.1, Page 30-40. Baumann, T. and Rusch, H. (1970), “Tests studying the dowel action of flexural tensile reinforcement in reinforced concrete beam”, Berlin, Deutscher Ausschuss, Fur Stahlbeton, Heft 210.
281
Bazant, Z. P. and Cao, Zhiping (1987), “Size Effect in Punching Shear Failure of Slabs”, ACI Structural Journal, January·February 1987, pp 44-53. Bazant, Z.P. and Shieh, C.I. (1980), “Hysteretic Fracturing Endochronic Theory for Concrete”, Journal of Engg. Mech. Div., ASCE, Vol. 106, No. 6, pp. 929-950. Bazant, Z.P. and Kim, S.S. (1979), “Plastic-Fracturing Theory for Concrete”, Journal of Engg. Mech. Div., ASCE, Vol. 105, No. 3, pp. 407-428 with Errata in Vol. 106. Bazant, Z.P. (1978), “Endochronic Inelasticity and Incremental Plasticity”, International Jounral of Solid and Structures. Vol. 14, pp. 619-714. Bazant, Z.P. and Shieh, C.I. (1978), “Endochronic Model for Nonlinear Triaxial Behavior of Concrete”, Nuclear Engg. And Design. Vol. 47, pp. 305-315. Bazant, Z.P. and Bhat, P.D. (1976), “Endochronic Theory of Inelasticity and Failure of Concrete”, Journal of Engg. Mech. Div., ASCE, Vol. 102, No. 4, pp. 701-722. Belleni, P. X. and Chulya, A. (1987), “An improved automatic incremental algoithm for the efficient solution of nonlinear finite element equations”, Computers & Structures, 26, pp 99-110. Bentz, D. P., Garboczi, E. J., and Lagergren, E. S. (1998). Multi-scale microstructural modelling of concrete diffusivity: identification of significant variables. ASTM Journal of Cement, Concrete, and Aggregates, 20:129–139. Birkle G, Dilger W. (2008), “Influence of slab thickness on punching shear strength”. ACI Struct J ;105(2):180–8. BNBC (1993), “Bangladesh National Building Code”, Prepared for Housing and Building Research Institute, Dhaka, Bangladesh.
Borges, L. L. J., Melo, G.S. and Gomes, R. B.(2013), ”Punching Shear of Reinforced Concrete Flat Plates with Openings”, ACI Structural Journal, Volume: 110, Issue: 4, pp 547-556. DOI: 10.14359/51685740.
Bresler, B., and Scordelis, A. C. (1963), “Shear strength of reinforced concrete beams”, J. Am. Concr. Inst., 60(1), 51–72. BS 8110 (1997), "Structural use of Concrete: Part 1: Code of Practice for Design and Construction", British Standard Institution, London. Buyukozturk, O. “Nonlinear Analysis of Reinforced Concrete Structures”, Computers and Structures, Vol. 7, pp 149-156. CAN3-A23.3-M04 (2004), "Design of Concrete for Buildings", Canadian Standards Association, Rexdale.
282
Carrasquillo, R. L., Nilson, A. H., and Slate, F. O. (1981). "Properties of high-strength concrete subject to short-term loads." Journal of the American Concrete Institute, 78(3), 171-178. CEB-FIP (1990), "Model Code for Concrete Structures", Comite Euro-International du Beton, Cement and Concrete Association, London, 1990. Cedilin, L. Crutzen, Y.R.J. and Poli, S.D., “Triaxial Stress Strain Relationship for Concrete”. Journal of Engg. Mech. Div., ASCE, Vol. 103, No. 3, pp 423-439. Chaimoon, K. and Attard, M. M. (2005). “Shear fracture in masonry joints”, Proceedings of CMEM 2005, Malta. Chen, A.C.T. and Chen, W.F. (1975), “Constitutive Relations for Concrete”, Journal of Engg. Mech. Div., ASCE, Vol. 101, No. 4, pp. 465-481. Chen, A.C.T. and Chen, W.F. (1975), “Constitutive Equation and Punch-Indentation of Concrete”, Journal of Engg. Mech. Div., ASCE, Vol. 101, No. 6, pp. 889-906. Choi, J. W and Kim, J.H.J (2012), “Experimental Investigations on Moment Redistribution and Punching Shear of Flat Plates”, ACI Structural Journal, Volume: 109, Issue: 3, pp 329-338. DOI: 10.14359/51683746. Christian M. and Hajime, O. (1986), “Finite Element Analysis of Reinforced Concrete Structures, Proceedings of Seminar”, Sponsored by Japan Society for Promotion of Science and U.S. National Science Foundation. Tokyo, Japan. Coon, M. D. and Evans, R. S. “Incremental Constitutive Laws and Their Associated Failure Criteria with Application to Plain Concrete”, Int’l Journal of Solids and Struct., Vol. 8. pp. 1169-1183. Cornelissen, H. A. W., Hordijk, D. A., and Reinhardt, H. W. (1986), “ Experimental determination of crack softening characteristics of normal weight and lightweight concrete”. Heron 31, 2.
Coronelli, Dario and Corti, Guglielmo (2014), “Nonlinear Static Analysis of Flat Slab Floors with Grid Model (with Appendix)”, ACI Structural Journal, Volume: 111, Issue: 2, pp 343-352. DOI: 10.14359/51686526,
Crisfield, M. A. (1981), “A fast incremental/iterative solution procedure that handles snapthrough”, Computers & Structures, 13, 55-62.
Crisfield, M.A. (1982), “Local Instabilities in the Non-Linear Analysis of Reinforced Concrete Beams and Slabs, Proc. of the Institutions of Civil Engineers”, Part 2, Vol. 73, pp 135-145. Crisfield, M. A. (1983), “An arc-length method including line searches and accelerations”, Int. J . Num. Meth. Engny., 19, 1269- 1289.
283
Criswell, M. E., (1974), “Shear strength of slabs: Basic principle and their relation to current method of analysis”, Publication SP-42, Vol 2, ACI, pp, 641-676. CSA-A23.3:-04 (R2010), "Design of Concrete for Buildings", Canadian Standards Association, Mississauga, Ontario, Canada, 2010. Csagoly, P. F. (1979), “Design of Thin Concrete Deck Slabs by the Ontario Highway Bridge Design Code”, Ministry of Transportation and Communications, Ontario, 50. De Borst, R., and Nauta, P. (1985), “Non-orthogonal cracks in a smeared finite element model”. Engineering Computations 2, pp 35–46. De Borst, R. (1987), “Smeared cracking, plasticity, creep and thermal loading – a unified approach”. Comp. Meth. Appl. Mech. Eng. 62, pp 89–110. Dilger, W., Birkle, G. and Mitchell, D. (2005), “Effect of Flexural Reinforcement on Punching Shear Resistance,” Punching Shear in Reinforced Concrete Slabs, SP-232-4, American Concrete Institute, pp. 57-74. DIN 1045-1 (2001), “Tragwerke aus Beton, Stahlbeton und Spannbeton; Teil 1: Bemessung und Konstruktion”, DIN-Deutsches Institut fur Normung, Berlin. DIN 1045-1 : 2008, “Tragwerke aus Beton, Stahlbeton und Spannbeton; Teil 1: Bemessung und Konstruktion”, DIN-Deutsches Institut fur Normung, Berlin.
Dulude, C., Hassan, M., Ahmed, E.A. and Benmokrane, B. (2013), “Punching Shear Behavior of Flat Slabs Reinforced with Glass Fiber-Reinforced Polymer Bars”, ACI Structural Journal, Volume: 110, Issue: 5, pp 723-734. DOI: 10.14359/51685826.
EN 1992-1-1 (2004), “Eurocode 2: Design of concrete structures - Part 1-1: General rules and rules for buildings”, Author: European Committee for Standardization. EC 2-1-1 (2003), “Eurocode 2: design of concrete structure – Part-1 General rules and rules for building. prEN 1992-1-1”, Final draft December 2003. Elstner, R. C. and Hognestad, E. (1956), “Shearing strength of Reinforced concrete slabs”, ACI Journal Proceedings, Vol. 53, No. 1, pp 29-58. Elwi, A.A. and Murray, D. W. (1979), “A 3D Hypoclassic Concrete Constitutive Relationship”, Journal of Engg. Mech. Div., ASCE, Vol. 105, No. 4, pp 623-641. Fenwick R. C. and Dickson A.R. (1989), "Slabs Subjected to Concentrated Loading", ACI Structural Journal, American Concrete Institute, 86(6), pp. 672-678. Forde, W.R.B and Stiemer , S.F. (1987), “Improved Arc Length Orthogonality Methods for Nonlinear Finite Element Analysis”, Computers & Structures, Vol. 27, No. 5, pp 625-630.
284
Foster, S.J., Bailey, C.G., Burgess, I.W., and Plank, R.J. (2004), "Experimental behaviour of concrete floor slabs at large displacements", Engineering Structures, Elsevier, Netherlands, Vol. 26, Issue 9, pp. 1231-1247. Gardner, N. J. (1990), "Relationship of the Punching Shear Capacity of Reinforced Concrete Slabs with Concrete Strength," ACI Structural Journal, V.87, No.1, pp 66-71. Gardner N. J. and Shao X.(1996),”Punching Shear of Continuous Flat Reinforced Concrete Slabs”, ACI Structural Journal, No. 93, pp. 218-228, Detroit, USA. Gardner, N.J. (2005), “ACI 318-05, CS A23.3-04, Eurocode 2 (2003), DIN 1045-1 (2001), BS 8110-97 and CEB-FIP MC 90 Provisions for Punching Shear of Reinforced Concrete Flat Slabs”, Punching Shear in Reinforced Concrete Slabs, SP-232-1, American Concrete Institute, pp. 1-22.
Gardner, N. J. (2011), “Verification of Punching Shear Provisions for Reinforced Concrete Flat Slabs”, ACI Structural Journal, Volume: 108, Issue: 5, pp 572-580, DOI: 10.14359/51683214.
Gierlinski, J. T. & Graves-Smith, T. R. (1985), A variable load iteration procedure for thin-walled structures, Computer & Structures, 21, 1085- 1094. Gilbert, R. I. and Warner, R.F. (1978), “Tension Stiffening in Reinforced Concrete Slabs”, Journal of Struct. Div. ASCE, Vol. 104, No. 12, pp. 1885-1900. Greunen, J.V. (1979), “Non-Linear Geometry, Material and Time Dependent Analysis of Reinforced and Pre-stressed Concrete Slabs and Panels”, Thesis presented to California, Berkeley, California, in partial fulfillment of the requirements of Doctor of Philosophy. Guandalini S, Muttoni A. (2004), “Symmetrical punching tests on slabs without transverse reinforcement”, Test Report. École Polytechnique Fédérale de Lausanne. Lausanne. Switzerland; 85 pp.
Guandalini, S., Burdet, O. L. and Muttoni, A., (2009), “Punching Tests of Slabs with Low Reinforcement Ratios”, ACI Structural Journal, Volume: 106, Issue: 1, pp 87-95, DOI: 10.14359/56287.
Hallgren, M. and Bjerke, M. (2002), “ Non-linear finite element analyses of punching shear failure of column footings”, Cement and Concrete Composites, Volume 24, pp 491-496. DOI:10.1016/S0958-9465(01)00065-8.
Hallgren, M. (1996), “Punching Shear Capacity of Reinforced High Strength Concrete Slabs", PhD Thesis, KTH Stockholm, TRITA-BKN. Bull. No. 23, 150p.
285
Han, D.J. and Chen, W.F. (1972), “Strain-Space Plasticity Formulation for Hardening-Softening Materials with Elasto-plastic Coupling”, International Journal of Solids and Structures, Vol. 8, pp. 1169-1183. Harsh S, Shen Z, Darwin D. (1987), “Strain-rate sensitive behavior of cement paste and mortar in compression”, ACI Material Journal, 84(4):278–85. Hassanzadeh, M. (1992). “Behaviour Of Fracture Process Zones In Concrete Influenced By Simultaneously Applied Normal And Shear Displacements”. PhD thesis, Lund Institute of Technology. Hassanzadeh, M. (1995). “Fracture mechanical properties of rocks and mortar/rock interfaces”, Microstrcture of Cement-based Systems/Bonding and Interfaces in Cementitious Materials, Volume 370: Materials Research Society Symposium, 377–386. Hawileh, R., Naser, M., and Malhas, F. (2013), “Finite Element Modeling of Punching Shear in Two-Way Slabs Reinforced with High-Strength Steel”, Structures Congress 2013, ASCE, doi: 10.1061/9780784412848.144, pp. 1650-1661. Hawkins, N. M. (1971), “Shear and moment transfer between concrete flat plates and columns”, Progress Report on NSF Grant No. Gk-16375, Department of Civil Engineering, University of Washington. Hawkins, N. M., Criswell, M. E. and Roll, F. (1974), “Shear strength of slabs without shear reinforcement”, Publication SP-42 Vol. 2, ACI, pp 677-720.
Hegger, J., Ricker, M. and Sherif , A. G. (2009), “Punching Strength of Reinforced Concrete Footings”, ACI Structural Journal, Volume: 106, Issue: 5, pp 706-716. DOI: 10.14359/51663111.
Heinzmann, D, Etter, S., Villiger, S. and Jaeger, T. (2012), “ Punching Tests on Reinforced Concrete Slabs with and without Shear Reinforcement”, ACI Structural Journal, Volume: 109, Issue: 6, pp 787-794, DOI: 10.14359/51684122.
Hestenes, M. R., and Stiefel, E. (1952), “ Methods of conjugate gradients for solving linear systems”. J. Res. Nat. Bur. Standards 49, 6, 409–436.
Hewitt, B. and Batchelor, B. (1975), “Punching Shear Strength of Restrained Slabs,” Journal of the Structural Division, V. 101, No. 9, pp. 1837-1853. Higashiyama, H., Ota, A. and Mizukoshi, M. (2011), “Design Equation for Punching Shear Capacity of SFRC Slabs”, International Journal of Concrete Structures and Materials, Volume: 5, Issue: 1, pp 35-42. DOI 10.4334/IJCSM.2011.5.1.035. Hofmeyer H. and Bos A. A. Van Den (2008), “Total Strain FE Model for Reinforcement Concrete Floors on Piles”, Struct. Design Tall Spec. Build. 17, 809–822, PP 809-822.
286
Hordijk, D. A. (1991), “Local approach to fatigue of concrete”, PhD thesis, Delft University of Technology. Hueste, M. B. D. and Wight, J. K. (1999), ”Nonlinear Punching Shear Failure Model for Interior Slab-Column Connections”, Journal of Structural Engineering, Vol. 125, No. 9, ASCE, ISSN 0733-9445/99/0009-0997–1008, pp 997-1008. Iravani, S. (1996). "Mechanical properties of high-performance concrete." ACI Materials Journal, 93(5), 416-426. Islam, Md. Dewan Shaikh (2004), “Nonlinear Finite Element Analysis of Reinforced Concrete Plates in Punching Shear”, M.Sc Thesis, Department of Civil Engineering, Bangladesh University of Engineering and Technology, Dhaka, Bangladesh. Islam, Mohammad Rafiqul (2014), “Numerical Modeling of Slab-Column Joints of RC Flat Plates”, M.Sc Thesis, Department of Civil Engineering, Bangladesh University of Engineering and Technology, Dhaka, Bangladesh. Jimenz, R., Gergely, P. and White, R.N., “Bond and Dowel Capacities of Reinforced Concrete”, ACI Structural Journal, Vol. 76, No. 1, pp. 73-92. Sideris, K.K., P. Manita, K. Sideris (2004), “Estimation of ultimate modulus of elasticity and Poisson ratio of normal concrete”, Cement & Concrete Composites 26 , 623–631. Kevin K. (2000), “Influence of size on punching shear strength of concrete slabs”, Master’s thesis. McGill University. Montreal; 92 pp. Kinnunen. S. and Nylander. H. (1960), “Punching of concrete slabs without shear reinforcement”, Meddelande Nr 38, Institutionen for Byggnadsstatik, KTH, Stockholm. Kinnunen S, Nylander H, Tolf P. (1978), “ Investigations on punching at the division of building statics and structural engineering. Nordisk Betong. Stockholm; 3:25–7.
Kotsovos, M. D. (1984), “Behavior of Reinforced Concrete Beam with a Shear Span to Depth ratio between 1.0 and 2.5”, ACI Journal, No. 3, Vol. 81, pp 279-286. DOI: 10.14359/10684
Kuang, J. S. and Morley, C. T. (1992), "Punching Shear Behavior of Restrained Reinforced Concrete Slabs", ACI Structural Journal, 89(1), pp 13-19. Kupfer H., Hilsdorf H. K. and Rusch H. (1969), “Behaviour of concrete under Biaxial stresses”, ACI Journal, August, Vol. 66, No. 8, pp 656-666
287
Liana L. J. Borges, Guilherme S. Melo, and Ronaldo B. Gomes (2013), “Punching Shear of Reinforced Concrete Flat Plates with Openings”, ACI Structural Journal, V. 110, No. 4, pp 1-10.
Lantsoght, E. O. L, Veen, C. V. D. and Walraven, J. C. (2012), “Shear Capacity of Slabs and Slab Strips Loaded Close to the Support”, ACI Special Publication, Volume: 287, pp 1-18. DOI: 10.14359/51683859.
Leite, J. P. B., Slowik, V., and Mihashi, H. (2004). Computer simulation of fracture processes of concrete using mesolevel models of lattice structures. Cement and Concrete Research, 34:1025–1033. Lim, Boon Tiong (1997), “ Punching shear capacity of flat slab-column junctions (a study by 3-D non-linear finite element analysis)”. PhD thesis. Department of Civil Engineering, University-of Glasgow. Lin, C.S., and Scordelis, A.C.(1975), “Nonlinear Analysis of RC Shell of General Form”, Journal of Struct. Div. ASCE, Vol. 101, No. 3, pp. 523-538. Lips. S., Ruiz, M.F, and Muttoni, A. (2012), “Experimental Investigation on Punching Strength and Deformation Capacity of Shear-Reinforced Slabs”, ACI Structural Journal, Volume: 109, Issue: 6, November 2012, pp 889-900. DOI: 10.14359/51684132. Loo Y. C and Falamaki M. (1992), "Punching Shear Strength Analysis of Reinforced Concrete Flat Plates with Spandrel Beams", ACI Structural Journal, 89(4), pp. 375-383. Loo, Yew-Chaye and Guan, Hong (1997), "Cracking and Punching Shear Failure Analysis of RC Flat Plate", Journal of Structural Journal, ASCE, Volume 123, No.10, Page 1321-1330. Litton, R. W. “A Contribution to the Analysis of Concrete Structures Under Cyclic Loading”. PhD thesis, University of California, Berkeley, 1974. Lovrovich, J. S. and McLean, D. I. (1990), "Punching Shear Behavior of Slabs with varying Span-Depth Ratios," ACI Structural Journal, 87(5), pp 507-511. Luo, Y., and Durrani, A. J. (1995). ‘‘Evaluation, modeling, and seismic retrofit of flab-slab buildings.’’ Struct. Res. at Rice, Rep. 44, Dept. of Civ. Engrg., Rice University, Houston, Tex. Marzouk, H., and Hussein, A., (1991), "Experimental Investigation on the Behavior of High Strength Concrete Slabs," ACI Structural Journal, V.88, No.6, pp 701-713. Marzouk H, Hossin M. (2007), “Crack analysis of reinforced concrete two-way slabs”. Research Report RCS01, Faculty of Engineering and Applied Science, Memorial University of Newfoundland, St. John’s, Newfoundland; 159 pp.
288
Marzouk, Rizk. (2009), “Punching analysis of reinforced concrete two-way slabs”, Research Report RCS01, Faculty of Engineering and Applied Science, Memorial University of Newfoundland, St. John’s, Newfoundland, Canada; 2009. 159 pp. Maya, D. L. F., Fernández, R. M., Muttoni A., Foster S. J. (2012), “Punching shear strength of steel fibre reinforced concrete slabs”, Engineering Structures, Vol. 40, UK, pp. 83-94. doi:10.1016/j.engstruct.2012.02.009. McLean, D. I., Phan, L. T., Lew, H. S. and White, R. N. (1990), "Punching Shear Behavior of Lightweight Concrete Slabs and Shells," ACI Structural Journal, 87(4), pp 386-392. Megally, S., and Ghali, A. (1994). ‘‘Design considerations for slab-column connections in seismic zones.’’ ACI Struct. J., 91(3), 303–314. Mitchell D., Cook, W.D., and Dilger, W. (2005), “Effect of Size, Geometry and Material Properties on Punching Shear Resistance,” Punching Shear in Reinforced Concrete Slabs, SP-232-3, American Concrete Institute, pp. 39-56. Moe J. (1961), “Shearing strength of reinforced concrete slabs and footings under concentrated load”, Bulletin D47, Portland Cement Association, Research and Development Laboratories, Skokie, Illinois. Mowrer R, Vanderbilt M. (1967), “Shear strength of lightweight aggregate reinforced concrete flat plates”. ACI J Proc; 64(11):722–9. Mostafaei, H.; Vecchio, F. J.; Gauvreau, P. and Semelawy, M. (2011), “Punching Shear Behavior of Externally Prestressed Concrete Slabs”, Journal of Structural Engineering, Vol. 137, No. 1, ©ASCE, ISSN 0733-9445/2011/1, pp 100–108. Murray, D.W., Chitnuyanondh, I., Rijub, A.K.Y. and Wong, C. “Concrete Plasticity Theory for Biaxial Stress Analysis”, Journal of Engg. Mech. Div., ASCE, Vol. 105, No. 6, pp. 989-1006.
Muttoni, A. (2008), “Punching Shear Strength of Reinforced Concrete Slabs without Transverse Reinforcement”, Volume: 105, Issue: 4, ACI Structural Journal, pp 440-450, DOI: 10.14359/19858
Neville, A. M. (1996). Properties of Concrete. John Wiley and Sons, New York, fourth edition. Ngo, D. and Scordelis, A.C. “Finite Element Analysis of Reinforced Concrete Beam”, ACI Structural Journal, Vol. 64. No. 3. Nilson, A.H., Darwin, D., and Dolan, C.W., (2004), “Design of Concrete Structure”, The McGraw-Hill Companies.
289
Ospina, C., Birkle, G., and Widianto (2012), “Databank of Concentric Punching Shear Tests of Two-Way Concrete Slabs without Shear Reinforcement at Interior Supports”. Structures Congress 2012, ASCE, doi: 10.1061/9780784412367.160, pp. 1814-1832. Ottosen, N.S., “Constitutive Model for Short-Time Loading of Concrete”, Journal of Engg. Mech. Div., ASCE, Vol. 105, No. 1, pp 127-141. Palaniswamy, R., and Shah, S.P. “Fracture and Stress-Strain Relationship of Concrete Under Triaxial Compression”, Journal of Struct. Div., ASCE, Vol. 100, No. 5, pp 901-916. Pan, A., and Moehle, J. P. (1989). ‘‘Lateral displacement ductility of reinforced concrete flat plates.’’ ACI Struct. J., 86(3), pp 250–258.
Peiris, C. and Ghali, A. (2012), “Flexural Reinforcement Essential for Punching Shear Resistance of Slabs”, ACI Special Publication, Volume: 287, pp 1-16. DOI: 10.14359/51683860.
Ramdane K. (1996), “Punching shear of high performance concrete slabs”. In: Proceedings of the 4th international symposium on utilization of high strength high performance concrete. Paris; p. 1015–26. Ramm, E. (1981), “Strategies for tracing the non-linear response near limit-points”, Non-linear Finite element Analysis in structural Mechanics, ed. W. Wunderlich, Springer-Verlag, Berlin, pp. 63-89. Ramm, E. (1982), “The Riks/Wempner approach-an extension of the displacement control method in non-linear analysis”, Non-linear Computational Mechanics, ed. E. Hinton et al., Pineridge, Swansea, pp. 63-86. Rankin, G.I.B. and Long, A.E. (1987), "Predicting the Enhanced Punching Strength of Interior Slab-Column Connections", Proceedings of the Institution of Civil Engineers (London), Part 1, 82, pp. 1165-1186. Rankin G, Long A. (1987), “Predicting the punching strength of conventional slab–column specimens”, Proc Instit Civ Eng, Part 1; 82:327–46. Regan P, Walker P, Zakaria K. (1979), “Tests of reinforced concrete flat slabs”, CIRIA Project No. RP 220. Polytechnic of Central London. Regan. P. E. (1986), “Symmetric punching of reinforced concrete slabs”, Magazine of Concrete Research, Volume 38, No. 136 , pp. 115-128. Regan, P. E., Jorabi, H. R. (1988), "Shear Resistance of One Way Slabs Under Concentrated Load," ACI Structural Journal, V.85, No.2, pp 150-157.
290
Reinhardt, H. W. (1984), “Fracture mechanics of an elastic softening material like concrete”, Heron 29, 2 (1984). Riggs, H. R., and Powell, G. H. (1986), “Rough crack model for analysis of concrete”. J. Eng. Mech. Div., ASCE 112, 5, 448–464. Riks, E. (1972), “ The application of Newton’s method to the problem of elastic stability”, J. A p p l . Mech., 39, 1060-6. Riks, E. (1979), “An incremental approach to the solution of snapping and buckling problems”, Int. J . Solids & S t r u m . 15, 529-551.
Rizk, E., Marzouk, H. and Hussein, A. (2011), “Punching Shear of Thick Plates with and without Shear Reinforcement”, ACI Structural Journal, Volume: 108, Issue: 5, pp 581-591. DOI: 10.14359/51683215.
Roberts. E. H. (1969), “Load-carrying capacity of slab-strips restrained against longitudinal expansion”, Concrete, Vol. 3(9), 1969, pp. 369-378. Rots, J. G. (1988) “Computational Modeling of Concrete Fracture”. PhD thesis, Delft University of Technology.
Ruiz, M. F. and Muttoni, A. (2009), “Applications of Critical Shear Crack Theory to Punching of Reinforced Concrete Slabs with Transverse Reinforcement”, ACI Structural Journal, Volume: 106, Issue: 4, pp 485-494, DOI: 10.14359/56614.
Ruiz, M. F., Mirzaei, Y, and Muttoni, A. (2013), “Post-Punching Behavior of Flat Slabs”, ACI Structural Journal, Volume: 110, Issue: 5, pp 801-812. DOI: 10.14359/51685833.
Saad, Y., and Schultz, M. H. GMRES (1986), “A Generalized Minimal Residual algorithm for solving nonsymmetric linear systems”. SIAM J. Sci. Stat. Comput. 7, 3, 856–869. Sadouki, H. and Wittmann, F. H. (2000). Modelling of micro cracking induced by drying and endogenuos shrinkage in cement composites. In Proceedings of International Conference on Advanced Materials, Their Processes and Applications, Munich, Germany. Werkstoffwoche-Partnerschaft GbR, Frankfurt, Germany.
Said, A.M., Tian, Y. and Hussain, A. (2012), “Evaluating Punching Shear Strength of Slabs without Shear Reinforcement Using Artificial Neural Networks”, ACI Special Publication, Volume: 287, pp 1-18, DOI: 10.14359/51683862.
Salim, W. and Sebastian, W.M. (2003), "Punching Shear Failure in Reinforced Concrete Slabs with Compressive Membrane Action," ACI Structural Journal, 100(4), pp 471-479.
291
Saouma, V. E., ˇCervenka, J., Slowik, V., and Chandra Kishen, J. M. (1994). Mixed mode fracture of rock-concrete interfaces. In Baˇzant, Z. P., editor, US-Europe Workshop on Fracture and Damage of Quasi-Brittle Materials: Experiment, Modeling and Computer Analysis, Prague, Czech Republic. Schweizerhof, K. & W riggers, P. (1986), “Consistent linearization for path following methodsin nonlinear f.e. analysis”, Comp. Meth. A p p l . Mech. & Engg., 59, 261-279. Selby, R. G., and Vecchio, F. J. (1993), “Three-dimensional Constitutive Relations for Reinforced Concrete”, Tech. Rep. 93-02, Univ. Toronto, dept. Civil Eng., Toronta, Canada. Seraj, S. M., Kotsovos, M. D. and Pavlovic, M. N. (1995), "Behavior of High-Strength Mix Reinforced Concrete Beams", Journal of Archives of Civil Engineers, Proceedings Polish Academy of Sciences, 41(1), pp. 31-67. Setunge, S. D. (1993). Structural Properties of Very High Strength Concrete. PhD thesis, Monash University, Victoria, Australia. Shah, S., and Ahmad, S. (1994). "High performance concrete : properties and applications." New York, McGraw-Hill. Shing, P., Manzouri, T., Atkinson, R., Schuller, M., and Amadei, B. (1994). Evaluation of grout injection techniques for unreinforced masonry structures. In Proceedings of the Fifth U.S. National Conference on Earthquake Engineering, Volume III, 851–860, Chicago. State-of-the-Art Report on Finite Element Analysis of Reinforced Concrete, Task Committee on Concrete and Masonry Structures, ASCE, April 1982. Sundquist H., Kinnunen S. (2004), “The effect of column head and drop panels on the punching capacity of flat slabs”. Bulletin No. 82. Department of Civil and Architectural Engineering. Royal Institute of Technology. Stockholm, 24 pp. (in Swedish with summary and Figure captions in English). Tan Y., and Teng S. (2005), “Interior Slab-Rectangular Column Connections Under Biaxial Lateral Loading,” Punching Shear in Reinforced Concrete Slabs, SP-232-9, American Concrete Institute, pp. 147-174. Taylor, R. and Hayes. B. (1965), “Some tests on the effect of edge restraint on punching shear in reinforced concrete slabs”, Magazine of Concrete Research, Vol. 17, No. 50, pp 39-44. Thorenfeldt, E., Tomaszewicz, A., and Jensen, J. J. (1987), “Mechanical properties of high-strength concrete and applications in design”, Proc. Symp. Utilization of High-Strength Concrete (Stavanger, Norway) (Trondheim, 1987), Tapir.
292
TNO DIANA BV (2003), DIANA Finite Element Analysis User's Manual Release 8.1, 2nd Edition,19 Delft, Netherlands, 2003. TNO DIANA BV (2010), DIANA Finite Element Analysis User's Manual Release 9.4, Schoemakerstraat 97, 2628 VK Delft, The Netherlands. 2010. Tan, T. H. (2005), “EFFECTS OF TRIAXIAL STRESS ON CONCRETE”, 30th Conference on OUR WORLD IN CONCRETE & STRUCTURES: 23 - 24 August 2005, Singapore Article Online Id: 100030007, The online version of this article can be found at: http://cipremier.com/100030007. Tomaszewicz A. (1993), “Punching shear capacity of reinforced concrete slabs. High Strength Concrete SP2-Plates and Shells”. Report 2.3. Report No. STF70A93082. SINTEF. Trondheim; 1993. 36 pp. Tong, P. Y. and Batchelor, D. D. (1971), “Compressive membrane enhancement in two-way bridge slabs”, ACI Publication SP-30, pp 271-286.
Trautwein, L. M., Bittencourt, T. N. Gomes, R. B. and Bella, J. C. D. , “Punching Strength of Flat Slabs with Unbraced Shear Reinforcement”, ACI Structural Journal, Volume: 108, Issue: 2, pp 197-205. DOI: 10.14359/51664255.
Valanis, K.C., “Theory of Viscoplasticity without a Yield Surface”, Afehiwum Mechanik Stossowancj, Vol. 23, pp 517-551. Vanderbilt, M.D., (1972), “Shear Strength of Continuous Plates,” Journal of Structural Division, Proc., ASCE, V.98, No. ST5, pp. 961-973. Van der Pluijm, R. (1992). Material properties of masonry and its components under tension and shear. Proc. of the 6th Canadian Masonry Symposium, 675–686. Van der Pluijm, R. (1993). Shear behaviour of bed joints. Proceeding of the 6th North American Masonry Conference, 125–136. Van Mier, J. G. M. (1997). “Fracture Processes of Concrete”, CRC Press, Boca Raton, Florida. Van Mier, J. G. M., Schlangen, E., and Vervuurt, A. (1996). “Tensile cracking in concrete and sandstone: Part 2. Effect of boundary rotations”, Material Constructions, 29:87–96. Vecchio, F. J., and Collins, M. P. (1986), “The modified compression field theory for reinforced concrete elements subjected to shear”, ACI Journal 83, 22 (1986), 219-231. Vecchio, F. J. and Shim, W. (2004), Experimental and Analytical Reexamination of Classic Concrete Beam Tests”, Journal of Structural Engineering, Vol. 130, No. 3, pp 460-469.
293
Vintzeleou, E. N. and Tassios T. P. (1986), “Mathematical models for dowel action under monotonic and cyclic conditions”, Magazine of Concrete Research, Vol. 38, No. 134, pp. 13-22. Vonk, R. (1992). “Softening of Concrete Loaded in Compression”, PhD thesis, Delft University of Technology, The Netherlands. Wempner, G. A. (1971), “Discrete approximations related to nonlinear theories of solids”, Int.J . Solids & Structs., 7, 1581 – 1599. William K.J., Hurlbut, B. and Sture, S. (1985), “Experimental, Constitutive and Computational Aspects of Concrete Failure”, Proc. of Seminar on F.E.M. Analysis of Concrete Structures, Japan Concrete Institute (JCI), Tokeyo, May 1985. Wang Wenyuan and Teng Susanto (2008), “Finite-Element Analysis of Reinforced Concrete Flat Plate Structures by Layered Shell Element”, Journal of Structural Engineering, ASCE. Vol. 134, No. 12, PP 1862-1872. Weiss, Jason (2013), “The Concrete Portal”, School of Civil Engineering, Purdue University. http://www.theconcreteportal.com/cons_rel.html. Yamada, T., Nanni, A. and Endo, K. (1992), "Punching Shear Resistance of Flat Slabs : Influence of Reinforcement Type and Ratio," ACI Structural Journal, V.88, No. 4, pp 555-563.
Yang, J.M, Yoon,Y.S., Cook, W. D. and Mitchell, D. (2010), “Punching Shear Behavior of Two-Way Slabs Reinforced with High-Strength Steel”, ACI Structural Journal, Volume: 107, Issue: 4, pp 468-475.
Zaitsev, Y. B. and Wittmann, F. H. (1981). Simulation of crack propagation and failure of concrete. Materials Constructions, 14:357–365. Zak, A. and Williams, M. (1963). Crack point stress singularities at a bi-material interface. ASME Journal of Applied Mechanics, 30:142–143.
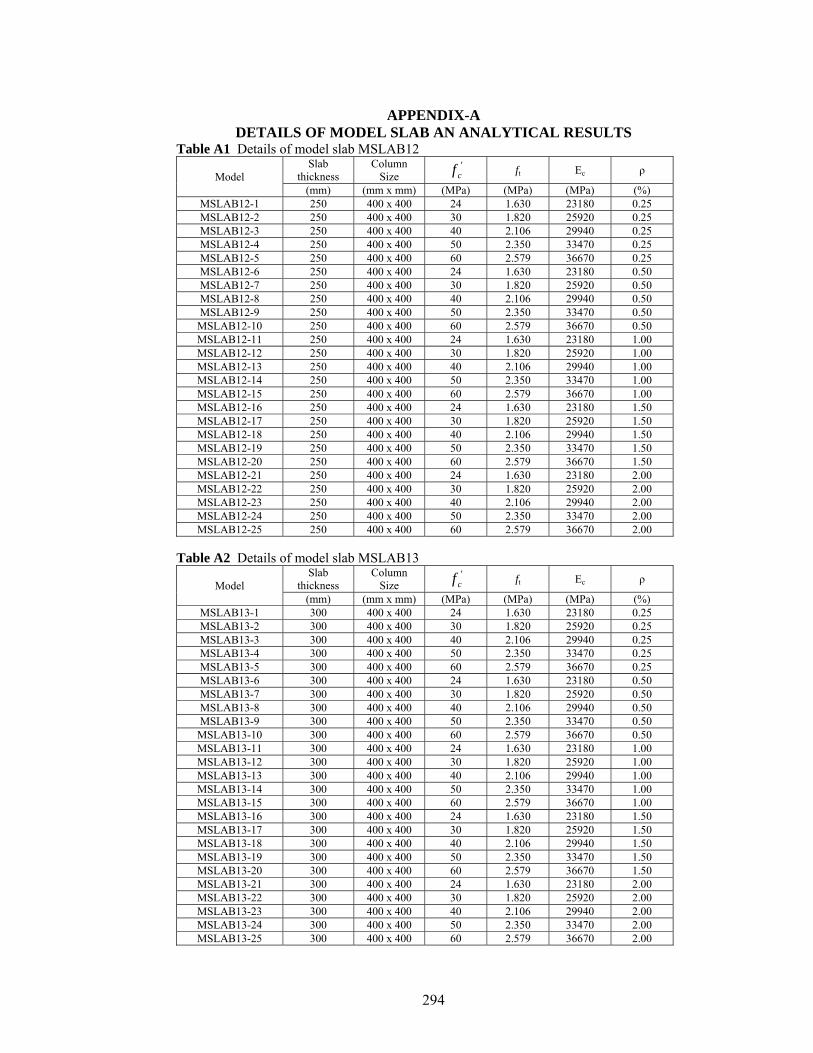
294
APPENDIX-A DETAILS OF MODEL SLAB AN ANALYTICAL RESULTS
Table A1 Details of model slab MSLAB12
Model Slab
thickness Column
Size '
cf ft Ec
ρ
(mm) (mm x mm) (MPa) (MPa) (MPa) (%) MSLAB12-1 250 400 x 400 24 1.630 23180 0.25 MSLAB12-2 250 400 x 400 30 1.820 25920 0.25 MSLAB12-3 250 400 x 400 40 2.106 29940 0.25 MSLAB12-4 250 400 x 400 50 2.350 33470 0.25 MSLAB12-5 250 400 x 400 60 2.579 36670 0.25 MSLAB12-6 250 400 x 400 24 1.630 23180 0.50 MSLAB12-7 250 400 x 400 30 1.820 25920 0.50 MSLAB12-8 250 400 x 400 40 2.106 29940 0.50 MSLAB12-9 250 400 x 400 50 2.350 33470 0.50
MSLAB12-10 250 400 x 400 60 2.579 36670 0.50 MSLAB12-11 250 400 x 400 24 1.630 23180 1.00 MSLAB12-12 250 400 x 400 30 1.820 25920 1.00 MSLAB12-13 250 400 x 400 40 2.106 29940 1.00 MSLAB12-14 250 400 x 400 50 2.350 33470 1.00 MSLAB12-15 250 400 x 400 60 2.579 36670 1.00 MSLAB12-16 250 400 x 400 24 1.630 23180 1.50 MSLAB12-17 250 400 x 400 30 1.820 25920 1.50 MSLAB12-18 250 400 x 400 40 2.106 29940 1.50 MSLAB12-19 250 400 x 400 50 2.350 33470 1.50 MSLAB12-20 250 400 x 400 60 2.579 36670 1.50 MSLAB12-21 250 400 x 400 24 1.630 23180 2.00 MSLAB12-22 250 400 x 400 30 1.820 25920 2.00 MSLAB12-23 250 400 x 400 40 2.106 29940 2.00 MSLAB12-24 250 400 x 400 50 2.350 33470 2.00 MSLAB12-25 250 400 x 400 60 2.579 36670 2.00
Table A2 Details of model slab MSLAB13
Model Slab
thickness Column
Size '
cf ft Ec
ρ
(mm) (mm x mm) (MPa) (MPa) (MPa) (%) MSLAB13-1 300 400 x 400 24 1.630 23180 0.25 MSLAB13-2 300 400 x 400 30 1.820 25920 0.25 MSLAB13-3 300 400 x 400 40 2.106 29940 0.25 MSLAB13-4 300 400 x 400 50 2.350 33470 0.25 MSLAB13-5 300 400 x 400 60 2.579 36670 0.25 MSLAB13-6 300 400 x 400 24 1.630 23180 0.50 MSLAB13-7 300 400 x 400 30 1.820 25920 0.50 MSLAB13-8 300 400 x 400 40 2.106 29940 0.50 MSLAB13-9 300 400 x 400 50 2.350 33470 0.50
MSLAB13-10 300 400 x 400 60 2.579 36670 0.50 MSLAB13-11 300 400 x 400 24 1.630 23180 1.00 MSLAB13-12 300 400 x 400 30 1.820 25920 1.00 MSLAB13-13 300 400 x 400 40 2.106 29940 1.00 MSLAB13-14 300 400 x 400 50 2.350 33470 1.00 MSLAB13-15 300 400 x 400 60 2.579 36670 1.00 MSLAB13-16 300 400 x 400 24 1.630 23180 1.50 MSLAB13-17 300 400 x 400 30 1.820 25920 1.50 MSLAB13-18 300 400 x 400 40 2.106 29940 1.50 MSLAB13-19 300 400 x 400 50 2.350 33470 1.50 MSLAB13-20 300 400 x 400 60 2.579 36670 1.50 MSLAB13-21 300 400 x 400 24 1.630 23180 2.00 MSLAB13-22 300 400 x 400 30 1.820 25920 2.00 MSLAB13-23 300 400 x 400 40 2.106 29940 2.00 MSLAB13-24 300 400 x 400 50 2.350 33470 2.00 MSLAB13-25 300 400 x 400 60 2.579 36670 2.00
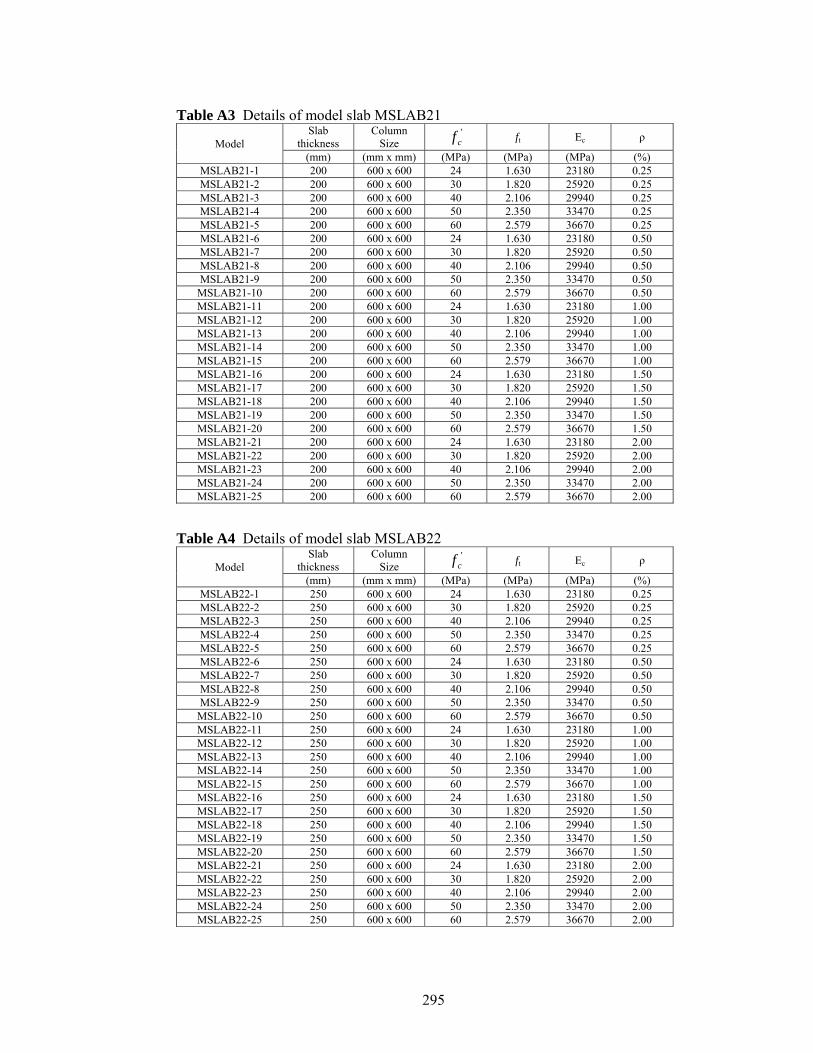
295
Table A3 Details of model slab MSLAB21
Model Slab
thickness Column
Size '
cf ft Ec
ρ
(mm) (mm x mm) (MPa) (MPa) (MPa) (%) MSLAB21-1 200 600 x 600 24 1.630 23180 0.25 MSLAB21-2 200 600 x 600 30 1.820 25920 0.25 MSLAB21-3 200 600 x 600 40 2.106 29940 0.25 MSLAB21-4 200 600 x 600 50 2.350 33470 0.25 MSLAB21-5 200 600 x 600 60 2.579 36670 0.25 MSLAB21-6 200 600 x 600 24 1.630 23180 0.50 MSLAB21-7 200 600 x 600 30 1.820 25920 0.50 MSLAB21-8 200 600 x 600 40 2.106 29940 0.50 MSLAB21-9 200 600 x 600 50 2.350 33470 0.50
MSLAB21-10 200 600 x 600 60 2.579 36670 0.50 MSLAB21-11 200 600 x 600 24 1.630 23180 1.00 MSLAB21-12 200 600 x 600 30 1.820 25920 1.00 MSLAB21-13 200 600 x 600 40 2.106 29940 1.00 MSLAB21-14 200 600 x 600 50 2.350 33470 1.00 MSLAB21-15 200 600 x 600 60 2.579 36670 1.00 MSLAB21-16 200 600 x 600 24 1.630 23180 1.50 MSLAB21-17 200 600 x 600 30 1.820 25920 1.50 MSLAB21-18 200 600 x 600 40 2.106 29940 1.50 MSLAB21-19 200 600 x 600 50 2.350 33470 1.50 MSLAB21-20 200 600 x 600 60 2.579 36670 1.50 MSLAB21-21 200 600 x 600 24 1.630 23180 2.00 MSLAB21-22 200 600 x 600 30 1.820 25920 2.00 MSLAB21-23 200 600 x 600 40 2.106 29940 2.00 MSLAB21-24 200 600 x 600 50 2.350 33470 2.00 MSLAB21-25 200 600 x 600 60 2.579 36670 2.00
Table A4 Details of model slab MSLAB22
Model Slab
thickness Column
Size '
cf ft Ec
ρ
(mm) (mm x mm) (MPa) (MPa) (MPa) (%) MSLAB22-1 250 600 x 600 24 1.630 23180 0.25 MSLAB22-2 250 600 x 600 30 1.820 25920 0.25 MSLAB22-3 250 600 x 600 40 2.106 29940 0.25 MSLAB22-4 250 600 x 600 50 2.350 33470 0.25 MSLAB22-5 250 600 x 600 60 2.579 36670 0.25 MSLAB22-6 250 600 x 600 24 1.630 23180 0.50 MSLAB22-7 250 600 x 600 30 1.820 25920 0.50 MSLAB22-8 250 600 x 600 40 2.106 29940 0.50 MSLAB22-9 250 600 x 600 50 2.350 33470 0.50
MSLAB22-10 250 600 x 600 60 2.579 36670 0.50 MSLAB22-11 250 600 x 600 24 1.630 23180 1.00 MSLAB22-12 250 600 x 600 30 1.820 25920 1.00 MSLAB22-13 250 600 x 600 40 2.106 29940 1.00 MSLAB22-14 250 600 x 600 50 2.350 33470 1.00 MSLAB22-15 250 600 x 600 60 2.579 36670 1.00 MSLAB22-16 250 600 x 600 24 1.630 23180 1.50 MSLAB22-17 250 600 x 600 30 1.820 25920 1.50 MSLAB22-18 250 600 x 600 40 2.106 29940 1.50 MSLAB22-19 250 600 x 600 50 2.350 33470 1.50 MSLAB22-20 250 600 x 600 60 2.579 36670 1.50 MSLAB22-21 250 600 x 600 24 1.630 23180 2.00 MSLAB22-22 250 600 x 600 30 1.820 25920 2.00 MSLAB22-23 250 600 x 600 40 2.106 29940 2.00 MSLAB22-24 250 600 x 600 50 2.350 33470 2.00 MSLAB22-25 250 600 x 600 60 2.579 36670 2.00
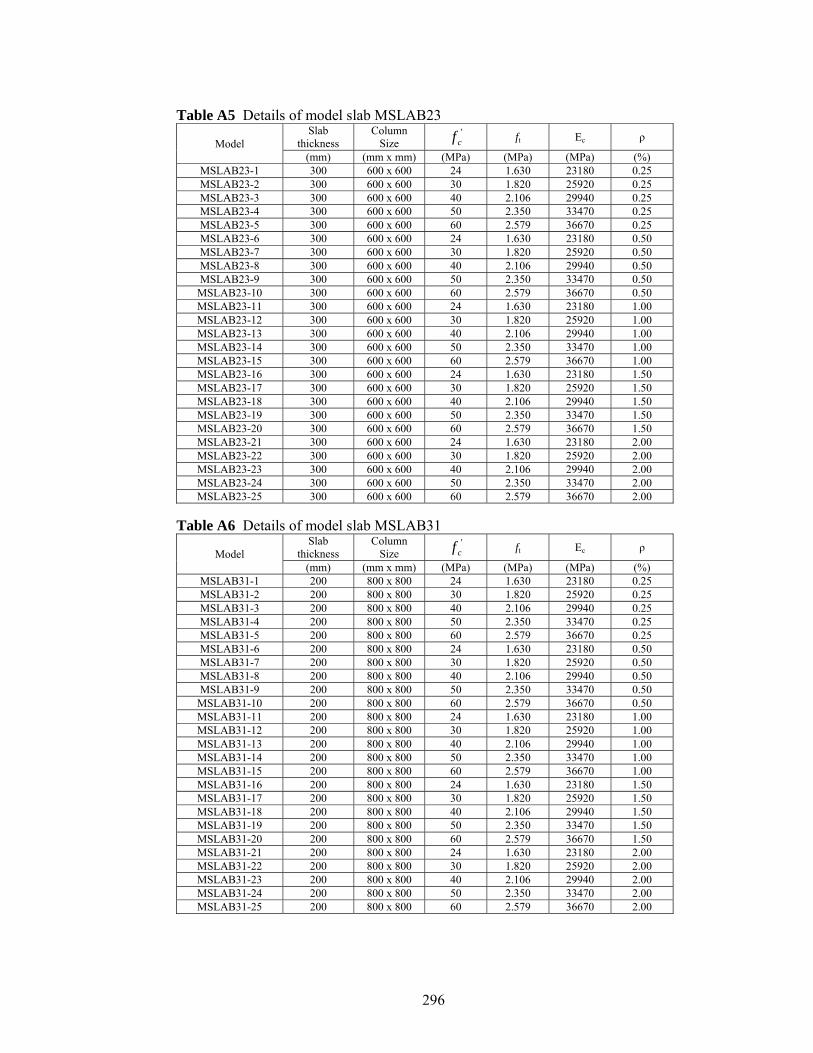
296
Table A5 Details of model slab MSLAB23
Model Slab
thickness Column
Size '
cf ft Ec
ρ
(mm) (mm x mm) (MPa) (MPa) (MPa) (%) MSLAB23-1 300 600 x 600 24 1.630 23180 0.25 MSLAB23-2 300 600 x 600 30 1.820 25920 0.25 MSLAB23-3 300 600 x 600 40 2.106 29940 0.25 MSLAB23-4 300 600 x 600 50 2.350 33470 0.25 MSLAB23-5 300 600 x 600 60 2.579 36670 0.25 MSLAB23-6 300 600 x 600 24 1.630 23180 0.50 MSLAB23-7 300 600 x 600 30 1.820 25920 0.50 MSLAB23-8 300 600 x 600 40 2.106 29940 0.50 MSLAB23-9 300 600 x 600 50 2.350 33470 0.50
MSLAB23-10 300 600 x 600 60 2.579 36670 0.50 MSLAB23-11 300 600 x 600 24 1.630 23180 1.00 MSLAB23-12 300 600 x 600 30 1.820 25920 1.00 MSLAB23-13 300 600 x 600 40 2.106 29940 1.00 MSLAB23-14 300 600 x 600 50 2.350 33470 1.00 MSLAB23-15 300 600 x 600 60 2.579 36670 1.00 MSLAB23-16 300 600 x 600 24 1.630 23180 1.50 MSLAB23-17 300 600 x 600 30 1.820 25920 1.50 MSLAB23-18 300 600 x 600 40 2.106 29940 1.50 MSLAB23-19 300 600 x 600 50 2.350 33470 1.50 MSLAB23-20 300 600 x 600 60 2.579 36670 1.50 MSLAB23-21 300 600 x 600 24 1.630 23180 2.00 MSLAB23-22 300 600 x 600 30 1.820 25920 2.00 MSLAB23-23 300 600 x 600 40 2.106 29940 2.00 MSLAB23-24 300 600 x 600 50 2.350 33470 2.00 MSLAB23-25 300 600 x 600 60 2.579 36670 2.00
Table A6 Details of model slab MSLAB31
Model Slab
thickness Column
Size '
cf ft Ec
ρ
(mm) (mm x mm) (MPa) (MPa) (MPa) (%) MSLAB31-1 200 800 x 800 24 1.630 23180 0.25 MSLAB31-2 200 800 x 800 30 1.820 25920 0.25 MSLAB31-3 200 800 x 800 40 2.106 29940 0.25 MSLAB31-4 200 800 x 800 50 2.350 33470 0.25 MSLAB31-5 200 800 x 800 60 2.579 36670 0.25 MSLAB31-6 200 800 x 800 24 1.630 23180 0.50 MSLAB31-7 200 800 x 800 30 1.820 25920 0.50 MSLAB31-8 200 800 x 800 40 2.106 29940 0.50 MSLAB31-9 200 800 x 800 50 2.350 33470 0.50
MSLAB31-10 200 800 x 800 60 2.579 36670 0.50 MSLAB31-11 200 800 x 800 24 1.630 23180 1.00 MSLAB31-12 200 800 x 800 30 1.820 25920 1.00 MSLAB31-13 200 800 x 800 40 2.106 29940 1.00 MSLAB31-14 200 800 x 800 50 2.350 33470 1.00 MSLAB31-15 200 800 x 800 60 2.579 36670 1.00 MSLAB31-16 200 800 x 800 24 1.630 23180 1.50 MSLAB31-17 200 800 x 800 30 1.820 25920 1.50 MSLAB31-18 200 800 x 800 40 2.106 29940 1.50 MSLAB31-19 200 800 x 800 50 2.350 33470 1.50 MSLAB31-20 200 800 x 800 60 2.579 36670 1.50 MSLAB31-21 200 800 x 800 24 1.630 23180 2.00 MSLAB31-22 200 800 x 800 30 1.820 25920 2.00 MSLAB31-23 200 800 x 800 40 2.106 29940 2.00 MSLAB31-24 200 800 x 800 50 2.350 33470 2.00 MSLAB31-25 200 800 x 800 60 2.579 36670 2.00
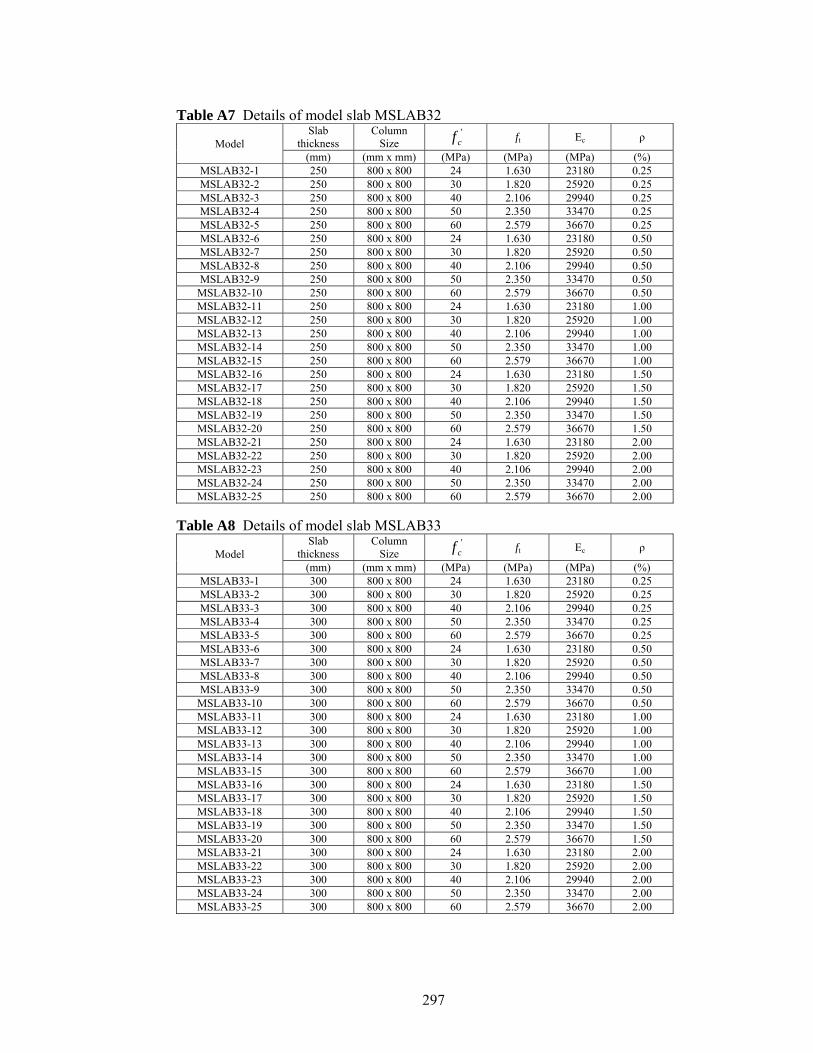
297
Table A7 Details of model slab MSLAB32
Model Slab
thickness Column
Size '
cf ft Ec
ρ
(mm) (mm x mm) (MPa) (MPa) (MPa) (%) MSLAB32-1 250 800 x 800 24 1.630 23180 0.25 MSLAB32-2 250 800 x 800 30 1.820 25920 0.25 MSLAB32-3 250 800 x 800 40 2.106 29940 0.25 MSLAB32-4 250 800 x 800 50 2.350 33470 0.25 MSLAB32-5 250 800 x 800 60 2.579 36670 0.25 MSLAB32-6 250 800 x 800 24 1.630 23180 0.50 MSLAB32-7 250 800 x 800 30 1.820 25920 0.50 MSLAB32-8 250 800 x 800 40 2.106 29940 0.50 MSLAB32-9 250 800 x 800 50 2.350 33470 0.50
MSLAB32-10 250 800 x 800 60 2.579 36670 0.50 MSLAB32-11 250 800 x 800 24 1.630 23180 1.00 MSLAB32-12 250 800 x 800 30 1.820 25920 1.00 MSLAB32-13 250 800 x 800 40 2.106 29940 1.00 MSLAB32-14 250 800 x 800 50 2.350 33470 1.00 MSLAB32-15 250 800 x 800 60 2.579 36670 1.00 MSLAB32-16 250 800 x 800 24 1.630 23180 1.50 MSLAB32-17 250 800 x 800 30 1.820 25920 1.50 MSLAB32-18 250 800 x 800 40 2.106 29940 1.50 MSLAB32-19 250 800 x 800 50 2.350 33470 1.50 MSLAB32-20 250 800 x 800 60 2.579 36670 1.50 MSLAB32-21 250 800 x 800 24 1.630 23180 2.00 MSLAB32-22 250 800 x 800 30 1.820 25920 2.00 MSLAB32-23 250 800 x 800 40 2.106 29940 2.00 MSLAB32-24 250 800 x 800 50 2.350 33470 2.00 MSLAB32-25 250 800 x 800 60 2.579 36670 2.00
Table A8 Details of model slab MSLAB33
Model Slab
thickness Column
Size '
cf ft Ec
ρ
(mm) (mm x mm) (MPa) (MPa) (MPa) (%) MSLAB33-1 300 800 x 800 24 1.630 23180 0.25 MSLAB33-2 300 800 x 800 30 1.820 25920 0.25 MSLAB33-3 300 800 x 800 40 2.106 29940 0.25 MSLAB33-4 300 800 x 800 50 2.350 33470 0.25 MSLAB33-5 300 800 x 800 60 2.579 36670 0.25 MSLAB33-6 300 800 x 800 24 1.630 23180 0.50 MSLAB33-7 300 800 x 800 30 1.820 25920 0.50 MSLAB33-8 300 800 x 800 40 2.106 29940 0.50 MSLAB33-9 300 800 x 800 50 2.350 33470 0.50
MSLAB33-10 300 800 x 800 60 2.579 36670 0.50 MSLAB33-11 300 800 x 800 24 1.630 23180 1.00 MSLAB33-12 300 800 x 800 30 1.820 25920 1.00 MSLAB33-13 300 800 x 800 40 2.106 29940 1.00 MSLAB33-14 300 800 x 800 50 2.350 33470 1.00 MSLAB33-15 300 800 x 800 60 2.579 36670 1.00 MSLAB33-16 300 800 x 800 24 1.630 23180 1.50 MSLAB33-17 300 800 x 800 30 1.820 25920 1.50 MSLAB33-18 300 800 x 800 40 2.106 29940 1.50 MSLAB33-19 300 800 x 800 50 2.350 33470 1.50 MSLAB33-20 300 800 x 800 60 2.579 36670 1.50 MSLAB33-21 300 800 x 800 24 1.630 23180 2.00 MSLAB33-22 300 800 x 800 30 1.820 25920 2.00 MSLAB33-23 300 800 x 800 40 2.106 29940 2.00 MSLAB33-24 300 800 x 800 50 2.350 33470 2.00 MSLAB33-25 300 800 x 800 60 2.579 36670 2.00
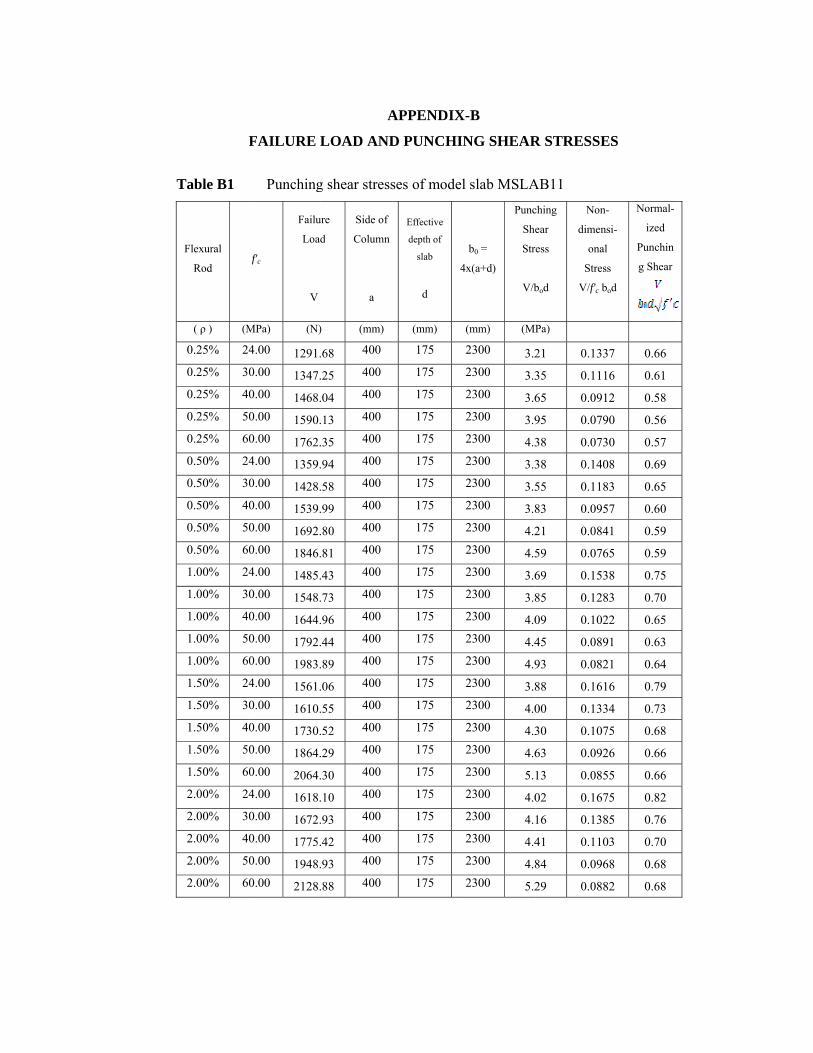
T
F
Table B1
Flexural
Rod
( ρ ) (M
0.25% 24
0.25% 30
0.25% 40
0.25% 50
0.25% 60
0.50% 24
0.50% 30
0.50% 40
0.50% 50
0.50% 60
1.00% 24
1.00% 30
1.00% 40
1.00% 50
1.00% 60
1.50% 24
1.50% 30
1.50% 40
1.50% 50
1.50% 60
2.00% 24
2.00% 30
2.00% 40
2.00% 50
2.00% 60
FAILURE L
Punching
f'c
Failu
Load
V
MPa) (N)
4.00 1291.0.00 1347.0.00 1468.0.00 1590.0.00 1762.4.00 1359.0.00 1428.0.00 1539.0.00 1692.0.00 1846.4.00 1485.0.00 1548.0.00 1644.0.00 1792.0.00 1983.4.00 1561.0.00 1610.0.00 1730.0.00 1864.0.00 2064.4.00 1618.0.00 1672.0.00 1775.0.00 1948.0.00 2128.
A
LOAD AND
g shear stress
ure
d
Side of
Column
a
) (mm)
.68 400
.25 400
.04 400
.13 400
.35 400
.94 400
.58 400
.99 400
.80 400
.81 400
.43 400
.73 400
.96 400
.44 400
.89 400
.06 400
.55 400
.52 400
.29 400
.30 400
.10 400
.93 400
.42 400
.93 400
.88 400
APPENDIX
D PUNCHIN
ses of model
Effective
depth of
slab
d
4
(mm)
175
175
175
175
175
175
175
175
175
175
175
175
175
175
175
175
175
175
175
175
175
175
175
175
175
X-B
NG SHEAR
l slab MSLA
b0 =
4x(a+d)
Punc
She
Str
V/b
(mm) (MP
2300 3.22300 3.32300 3.62300 3.92300 4.32300 3.32300 3.52300 3.82300 4.22300 4.52300 3.62300 3.82300 4.02300 4.42300 4.92300 3.82300 4.02300 4.32300 4.62300 5.2300 4.02300 4.2300 4.42300 4.82300 5.2
R STRESSE
AB11 ching
ear
ess
bod
Non-
dimens
onal
Stres
V/f'c b
Pa)
21 0.133
35 0.111
65 0.091
95 0.079
38 0.073
38 0.140
55 0.118
83 0.095
21 0.084
59 0.076
69 0.153
85 0.128
09 0.102
45 0.089
93 0.082
88 0.161
00 0.133
30 0.107
63 0.092
13 0.085
02 0.167
16 0.138
41 0.110
84 0.096
29 0.088
ES
-
si-
l
s
od
Normal-
ized
Punchin
g Shear
37 0.66
16 0.61
12 0.58
90 0.56
30 0.57
08 0.69
83 0.65
57 0.60
41 0.59
65 0.59
38 0.75
83 0.70
22 0.65
91 0.63
21 0.64
16 0.79
34 0.73
75 0.68
26 0.66
55 0.66
75 0.82
85 0.76
03 0.70
68 0.68
82 0.68

T
Table B2
Flexural
Rod
( ρ ) (M
0.25% 240.25% 300.25% 400.25% 500.25% 600.50% 240.50% 300.50% 400.50% 500.50% 601.00% 241.00% 301.00% 401.00% 501.00% 601.50% 241.50% 301.50% 401.50% 501.50% 602.00% 242.00% 302.00% 402.00% 502.00% 60
Punching
f'c
Failu
Load
V
MPa) (N)
4.00 158350.00 171480.00 190990.00 215640.00 236664.00 164430.00 179280.00 200000.00 225650.00 246464.00 173840.00 188340.00 209850.00 239450.00 263804.00 181310.00 194780.00 217210.00 247660.00 274234.00 186900.00 201110.00 225860.00 253400.00 28501
g shear stress
ure
d
Side of
Column
a
) (mm)
504 400 880 400 920 400 480 400 608 400 316 400 896 400 080 400 576 400 680 400 432 400 424 400 520 400 576 400 008 400 136 400 824 400 120 400 640 400 336 400 072 400 120 400 600 400 048 400 160 400
ses of model
Effective
depth of
slab
d
4
(mm)
225 225 225 225 225 225 225 225 225 225 225 225 225 225 225 225 225 225 225 225 225 225 225 225 225
l slab MSLA
b0 =
4x(a+d)
Punc
She
Str
V/b
(mm) (MP
2500 2.82500 3.02500 3.42500 3.82500 4.22500 2.92500 3.2500 3.52500 4.02500 4.32500 3.02500 3.32500 3.72500 4.22500 4.62500 3.22500 3.42500 3.82500 4.42500 4.82500 3.32500 3.52500 4.02500 4.52500 5.0
AB12 ching
ear
ess
bod
Non-
dimens
onal
Stres
V/f'c b
Pa)
82 0.11705 0.10140 0.08483 0.07621 0.07092 0.12119 0.10656 0.08801 0.08038 0.07309 0.12835 0.11173 0.09326 0.08569 0.07822 0.13446 0.11586 0.09640 0.08888 0.08132 0.13858 0.11902 0.10050 0.09007 0.084
-
si-
l
s
od
Normal-
ized
Punching
Shear
73 0.57 16 0.56 49 0.54 67 0.54 01 0.54 18 0.60 62 0.58 89 0.56 02 0.57 30 0.57 88 0.63 16 0.61 33 0.59 51 0.60 82 0.61 43 0.66 54 0.63 65 0.61 81 0.62 13 0.63 84 0.68 92 0.65 04 0.63 01 0.64 44 0.65

T
Table B3
Flexural
Rod
( ρ ) (M
0.25% 240.25% 300.25% 400.25% 500.25% 600.50% 240.50% 300.50% 400.50% 500.50% 601.00% 241.00% 301.00% 401.00% 501.00% 601.50% 241.50% 301.50% 401.50% 501.50% 602.00% 242.00% 302.00% 402.00% 502.00% 60
Punching
f'c
Failu
Load
V
MPa) (N)
4.00 188210.00 200680.00 232270.00 258960.00 283804.00 193230.00 211740.00 242140.00 270880.00 302124.00 204530.00 219140.00 252080.00 288020.00 326114.00 206000.00 222910.00 260760.00 297090.00 335264.00 207950.00 224990.00 262930.00 300430.00 33708
g shear stress
ure
d
Side of
Column
a
) (mm)
136 400 888 400 724 400 616 400 016 400 368 400 472 400 440 400 848 400 280 400 344 400 440 400 892 400 244 400 124 400 064 400 160 400 648 400 956 400 664 400 568 400 952 400 360 400 352 400 880 400
ses of model
Effective
depth of
slab
d
4
(mm)
275 275 275 275 275 275 275 275 275 275 275 275 275 275 275 275 275 275 275 275 275 275 275 275 275
l slab MSLA
b0 =
4x(a+d)
Punc
She
Str
V/b
(mm) (MP
2700 2.52700 2.72700 3.2700 3.42700 3.82700 2.62700 2.82700 3.22700 3.62700 4.02700 2.72700 2.92700 3.42700 3.82700 4.32700 2.72700 3.02700 3.52700 4.02700 4.52700 2.82700 3.02700 3.52700 4.02700 4.5
AB13 ching
ear
ess
bod
Non-
dimens
onal
Stres
V/f'c b
Pa)
53 0.10570 0.09013 0.07849 0.06982 0.06360 0.10885 0.09526 0.08165 0.07307 0.06775 0.11495 0.09840 0.08488 0.07739 0.07377 0.11500 0.10051 0.08700 0.08052 0.07580 0.11603 0.10154 0.08805 0.08054 0.075
-
si-
l
s
od
Normal-
ized
Punching
Shear
56 0.52 01 0.49 82 0.49 98 0.49 37 0.49 84 0.53 51 0.52 15 0.52 30 0.52 78 0.53 48 0.56 84 0.54 49 0.54 76 0.55 32 0.57 56 0.57 01 0.55 78 0.56 00 0.57 53 0.58 67 0.57 10 0.55 85 0.56 09 0.57 57 0.59

T
Table B4
Flexural
Rod
( ρ ) (M
0.25% 240.25% 300.25% 400.25% 500.25% 600.50% 240.50% 300.50% 400.50% 500.50% 601.00% 241.00% 301.00% 401.00% 501.00% 601.50% 241.50% 301.50% 401.50% 501.50% 602.00% 242.00% 302.00% 402.00% 502.00% 60
Punching
f'c
Failu
Load
V
MPa) (N)
4.00 150510.00 152260.00 170380.00 185470.00 198164.00 167250.00 175810.00 188600.00 206810.00 225764.00 181700.00 197430.00 218500.00 234870.00 254384.00 190160.00 208380.00 231280.00 247110.00 272044.00 197520.00 217300.00 237360.00 255940.00 27738
g shear stress
ure
d
Side of
Column
a
) (mm)
120 600 600 600 840 600 720 600 680 600 560 600 120 600 000 600 160 600 680 600 000 600 320 600 000 600 760 600 800 600 640 600 800 600 880 600 120 600 440 600 240 600 040 600 600 600 440 600 800 600
ses of model
Effective
depth of
slab
d
4
(mm)
175 175 175 175 175 175 175 175 175 175 175 175 175 175 175 175 175 175 175 175 175 175 175 175 175
l slab MSLA
b0 =
4x(a+d)
Punc
She
Str
V/b
(mm) (MP
3100 2.73100 2.83100 3.3100 3.43100 3.63100 3.03100 3.23100 3.43100 3.83100 4.3100 3.33100 3.63100 4.03100 4.33100 4.63100 3.53100 3.83100 4.23100 4.53100 5.03100 3.63100 4.03100 4.33100 4.73100 5.
AB21 ching
ear
ess
bod
Non-
dimens
onal
Stres
V/f'c b
Pa)
77 0.11581 0.09314 0.07842 0.06865 0.06008 0.12824 0.10848 0.08681 0.07616 0.06935 0.13964 0.12103 0.10033 0.08669 0.07851 0.14684 0.12826 0.10656 0.09101 0.08364 0.15101 0.13338 0.10972 0.09411 0.085
-
si-
l
s
od
Normal-
ized
Punching
Shear
56 0.57 36 0.51 85 0.50 84 0.48 09 0.47 85 0.63 80 0.59 69 0.55 62 0.54 94 0.54 96 0.68 13 0.66 07 0.64 66 0.61 82 0.61 61 0.72 80 0.70 66 0.67 11 0.64 36 0.65 17 0.74 35 0.73 94 0.69 44 0.67 52 0.66
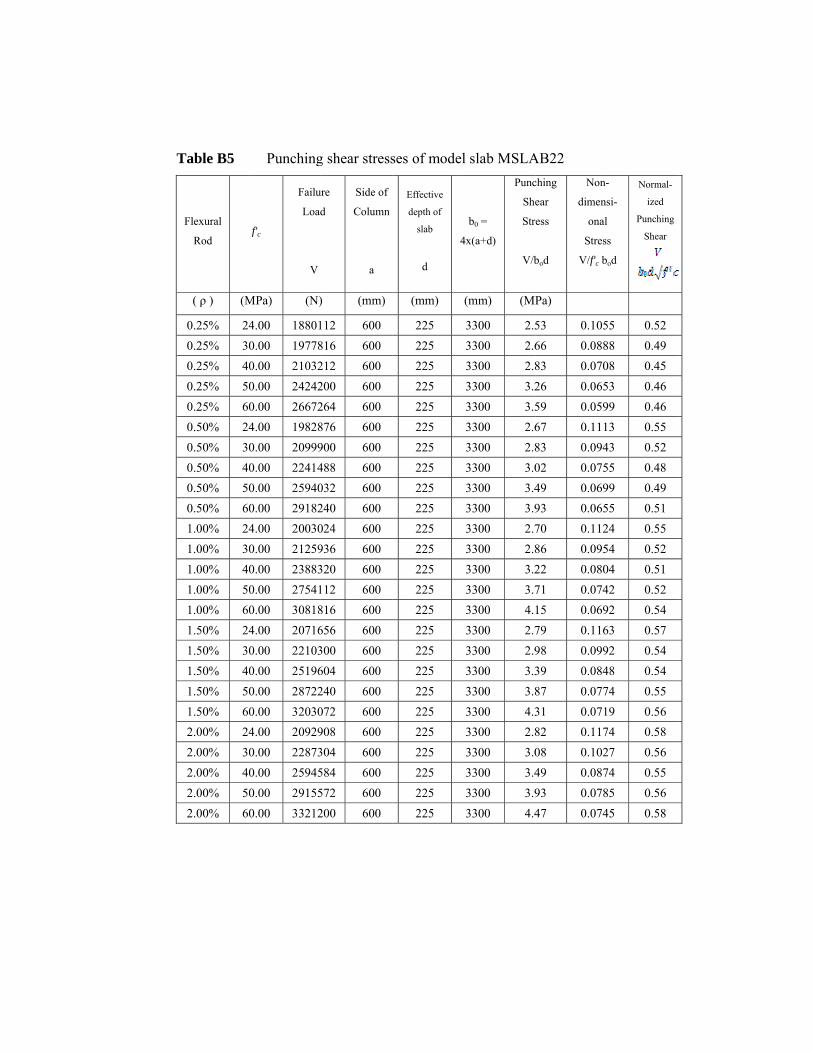
T
Table B5
Flexural
Rod
( ρ ) (M
0.25% 240.25% 300.25% 400.25% 500.25% 600.50% 240.50% 300.50% 400.50% 500.50% 601.00% 241.00% 301.00% 401.00% 501.00% 601.50% 241.50% 301.50% 401.50% 501.50% 602.00% 242.00% 302.00% 402.00% 502.00% 60
Punching
f'c
Failu
Load
V
MPa) (N)
4.00 188010.00 197780.00 210320.00 242420.00 266724.00 198280.00 209990.00 224140.00 259400.00 291824.00 200300.00 212590.00 238830.00 275410.00 308184.00 207160.00 221030.00 251960.00 287220.00 320304.00 209290.00 228730.00 259450.00 291550.00 33212
g shear stress
ure
d
Side of
Column
a
) (mm)
112 600 816 600 212 600 200 600 264 600 876 600 900 600 488 600 032 600 240 600 024 600 936 600 320 600 112 600 816 600 656 600 300 600 604 600 240 600 072 600 908 600 304 600 584 600 572 600 200 600
ses of model
Effective
depth of
slab
d
4
(mm)
225 225 225 225 225 225 225 225 225 225 225 225 225 225 225 225 225 225 225 225 225 225 225 225 225
l slab MSLA
b0 =
4x(a+d)
Punc
She
Str
V/b
(mm) (MP
3300 2.53300 2.63300 2.83300 3.23300 3.53300 2.63300 2.83300 3.03300 3.43300 3.93300 2.73300 2.83300 3.23300 3.73300 4.3300 2.73300 2.93300 3.33300 3.83300 4.33300 2.83300 3.03300 3.43300 3.93300 4.4
AB22 ching
ear
ess
bod
Non-
dimens
onal
Stres
V/f'c b
Pa)
53 0.10566 0.08883 0.07026 0.06559 0.05967 0.11183 0.09402 0.07549 0.06993 0.06570 0.11286 0.09522 0.08071 0.07415 0.06979 0.11698 0.09939 0.08487 0.07731 0.07182 0.11708 0.10249 0.08793 0.07847 0.074
-
si-
l
s
od
Normal-
ized
Punching
Shear
55 0.52 88 0.49 08 0.45 53 0.46 99 0.46 13 0.55 43 0.52 55 0.48 99 0.49 55 0.51 24 0.55 54 0.52 04 0.51 42 0.52 92 0.54 63 0.57 92 0.54 48 0.54 74 0.55 19 0.56 74 0.58 27 0.56 74 0.55 85 0.56 45 0.58

T
Table B6
Flexural
Rod
( ρ ) (M
0.25% 240.25% 300.25% 400.25% 500.25% 600.50% 240.50% 300.50% 400.50% 500.50% 601.00% 241.00% 301.00% 401.00% 501.00% 601.50% 241.50% 301.50% 401.50% 501.50% 602.00% 242.00% 302.00% 402.00% 502.00% 60
Punching
f'c
Failu
Load
V
MPa) (N)
4.00 224990.00 246740.00 271760.00 298680.00 345694.00 231760.00 251980.00 280430.00 317180.00 359084.00 239800.00 260720.00 301020.00 335280.00 391184.00 244410.00 267510.00 311420.00 359860.00 405904.00 250570.00 274590.00 318130.00 364340.00 41584
g shear stress
ure
d
Side of
Column
a
) (mm)
952 600 440 600 680 600 872 600 992 600 664 600 880 600 344 600 884 600 852 600 072 600 280 600 240 600 848 600 840 600 164 600 176 600 200 600 672 600 040 600 712 600 924 600 360 600 476 600 400 600
ses of model
Effective
depth of
slab
d
4
(mm)
275 275 275 275 275 275 275 275 275 275 275 275 275 275 275 275 275 275 275 275 275 275 275 275 275
l slab MSLA
b0 =
4x(a+d)
Punc
She
Str
V/b
(mm) (MP
3500 2.33500 2.53500 2.83500 3.3500 3.53500 2.43500 2.63500 2.93500 3.33500 3.73500 2.43500 2.73500 3.3500 3.43500 4.03500 2.53500 2.73500 3.23500 3.73500 4.23500 2.63500 2.83500 3.33500 3.73500 4.3
AB23 ching
ear
ess
bod
Non-
dimens
onal
Stres
V/f'c b
Pa)
34 0.09756 0.08582 0.07010 0.06259 0.05941 0.10062 0.08791 0.07230 0.06573 0.06249 0.10371 0.09013 0.07848 0.06906 0.06754 0.10578 0.09224 0.08074 0.07422 0.07060 0.10885 0.09531 0.08279 0.07532 0.072
-
si-
l
s
od
Normal-
ized
Punching
Shear
74 0.48 55 0.47 06 0.45 21 0.44 99 0.46 03 0.49 73 0.48 28 0.46 59 0.47 22 0.48 38 0.51 03 0.49 82 0.49 97 0.49 77 0.52 58 0.52 26 0.51 09 0.51 48 0.53 03 0.54 85 0.53 51 0.52 26 0.52 57 0.54 20 0.56
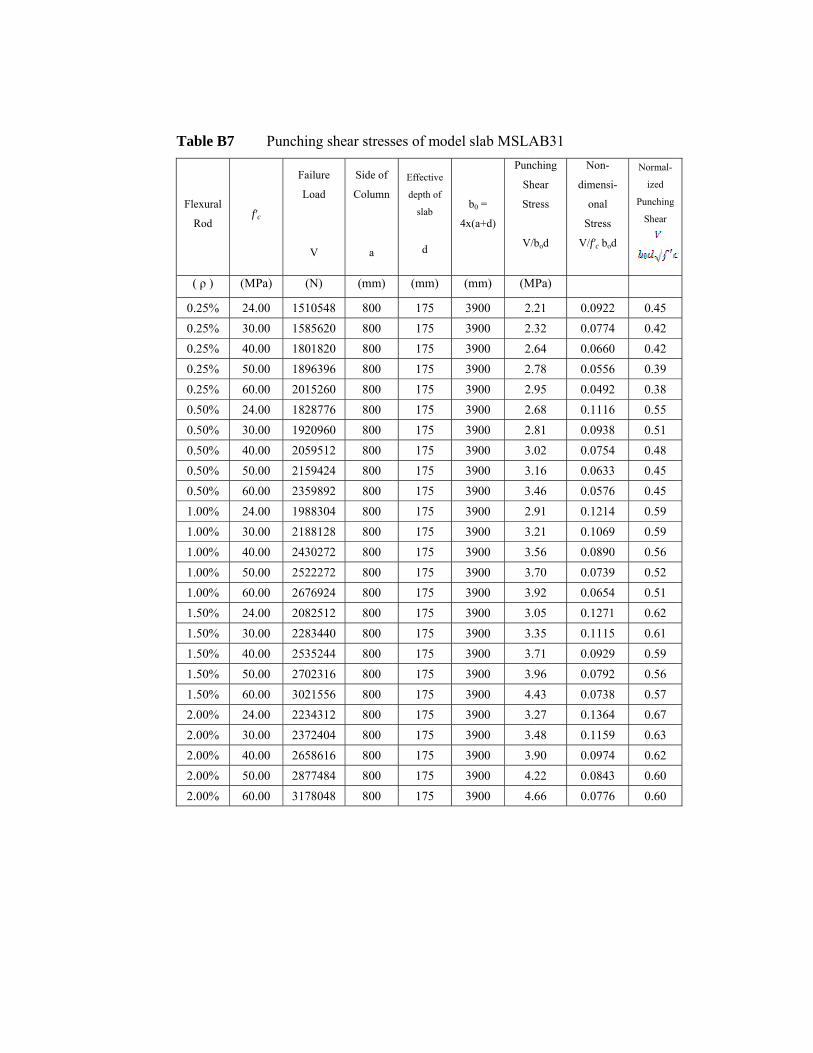
T
Table B7
Flexural
Rod
( ρ ) (M
0.25% 240.25% 300.25% 400.25% 500.25% 600.50% 240.50% 300.50% 400.50% 500.50% 601.00% 241.00% 301.00% 401.00% 501.00% 601.50% 241.50% 301.50% 401.50% 501.50% 602.00% 242.00% 302.00% 402.00% 502.00% 60
Punching
f'c
Failu
Load
V
MPa) (N)
4.00 151050.00 158560.00 180180.00 189630.00 201524.00 182870.00 192090.00 205950.00 215940.00 235984.00 198830.00 218810.00 243020.00 252220.00 267694.00 208250.00 228340.00 253520.00 270230.00 302154.00 223430.00 237240.00 265860.00 287740.00 31780
g shear stress
ure
d
Side of
Column
a
) (mm)
548 800 620 800 820 800 396 800 260 800 776 800 960 800 512 800 424 800 892 800 304 800 128 800 272 800 272 800 924 800 512 800 440 800 244 800 316 800 556 800 312 800 404 800 616 800 484 800 048 800
ses of model
Effective
depth of
slab
d
4
(mm)
175 175 175 175 175 175 175 175 175 175 175 175 175 175 175 175 175 175 175 175 175 175 175 175 175
l slab MSLA
b0 =
4x(a+d)
Punc
She
Str
V/b
(mm) (MP
3900 2.23900 2.33900 2.63900 2.73900 2.93900 2.63900 2.83900 3.03900 3.3900 3.43900 2.93900 3.23900 3.53900 3.73900 3.93900 3.03900 3.33900 3.73900 3.93900 4.43900 3.23900 3.43900 3.93900 4.23900 4.6
AB31 ching
ear
ess
bod
Non-
dimens
onal
Stres
V/f'c b
Pa)
21 0.09232 0.07764 0.06678 0.05595 0.04968 0.11181 0.09302 0.07516 0.06346 0.05791 0.12121 0.10656 0.08970 0.07392 0.06505 0.12735 0.11171 0.09296 0.07943 0.07327 0.13648 0.11590 0.09722 0.08466 0.077
-
si-
l
s
od
Normal-
ized
Punching
Shear
22 0.45 74 0.42 60 0.42 56 0.39 92 0.38 16 0.55 38 0.51 54 0.48 33 0.45 76 0.45 14 0.59 69 0.59 90 0.56 39 0.52 54 0.51 71 0.62 15 0.61 29 0.59 92 0.56 38 0.57 64 0.67 59 0.63 74 0.62 43 0.60 76 0.60

T
Table B8
Flexural
Rod
( ρ ) (M
0.25% 240.25% 300.25% 400.25% 500.25% 600.50% 240.50% 300.50% 400.50% 500.50% 601.00% 241.00% 301.00% 401.00% 501.00% 601.50% 241.50% 301.50% 401.50% 501.50% 602.00% 242.00% 302.00% 402.00% 502.00% 60
Punching
f'c
Failu
Load
V
MPa) (N)
4.00 201600.00 212400.00 243650.00 265600.00 282804.00 231280.00 243930.00 266840.00 288400.00 307054.00 243210.00 262130.00 291780.00 310410.00 332304.00 246210.00 268910.00 306230.00 335620.00 365274.00 251040.00 272660.00 308770.00 339130.00 37444
g shear stress
ure
d
Side of
Column
a
) (mm)
088 800 096 800 528 800 040 800 080 800 880 800 380 800 460 800 016 800 592 800 112 800 356 800 872 800 172 800 040 800 104 800 160 800 312 800 252 800 768 800 404 800 696 800 704 800 304 800 400 800
ses of model
Effective
depth of
slab
d
4
(mm)
225 225 225 225 225 225 225 225 225 225 225 225 225 225 225 225 225 225 225 225 225 225 225 225 225
l slab MSLA
b0 =
4x(a+d)
Punc
She
Str
V/b
(mm) (MP
4100 2.4100 2.34100 2.64100 2.84100 3.04100 2.54100 2.64100 2.84100 3.4100 3.34100 2.64100 2.84100 3.4100 3.34100 3.64100 2.64100 2.94100 3.34100 3.64100 3.94100 2.74100 2.94100 3.34100 3.64100 4.0
AB32 ching
ear
ess
bod
Non-
dimens
onal
Stres
V/f'c b
Pa)
19 0.09130 0.07664 0.06688 0.05707 0.05151 0.10464 0.08889 0.07213 0.06233 0.05564 0.10984 0.09416 0.07936 0.06760 0.06067 0.11192 0.09732 0.08364 0.07296 0.06672 0.11396 0.09835 0.08368 0.07306 0.067
-
si-
l
s
od
Normal-
ized
Punching
Shear
11 0.45 68 0.42 60 0.42 76 0.41 11 0.40 45 0.51 81 0.48 23 0.46 25 0.44 55 0.43 99 0.54 47 0.52 91 0.50 73 0.48 00 0.47 12 0.54 72 0.53 30 0.52 28 0.51 60 0.51 34 0.56 85 0.54 37 0.53 35 0.52 76 0.52

T
Table B9
Flexural
Rod
( ρ ) (M
0.25% 240.25% 300.25% 400.25% 500.25% 600.50% 240.50% 300.50% 400.50% 500.50% 601.00% 241.00% 301.00% 401.00% 501.00% 601.50% 241.50% 301.50% 401.50% 501.50% 602.00% 242.00% 302.00% 402.00% 502.00% 60
Punching
f'c
Failu
Load
V
MPa) (N)
4.00 257910.00 276110.00 308440.00 337070.00 366604.00 266500.00 288360.00 315900.00 347520.00 376834.00 289520.00 311020.00 346470.00 393390.00 423564.00 294190.00 324140.00 366890.00 412890.00 444174.00 298110.00 330790.00 376830.00 422830.00 45484
g shear stress
ure
d
Side of
Column
a
) (mm)
128 800 196 800 484 800 788 800 016 800 056 800 648 800 004 800 208 800 320 800 240 800 244 800 720 800 920 800 680 800 976 800 436 800 960 800 960 800 760 800 168 800 952 800 320 800 320 800 480 800
ses of model
Effective
depth of
slab
d
4
(mm)
275 275 275 275 275 275 275 275 275 275 275 275 275 275 275 275 275 275 275 275 275 275 275 275 275
l slab MSLA
b0 =
4x(a+d)
Punc
She
Str
V/b
(mm) (MP
4300 2.4300 2.34300 2.64300 2.84300 3.4300 2.24300 2.44300 2.64300 2.94300 3.4300 2.44300 2.64300 2.94300 3.34300 3.54300 2.44300 2.74300 3.4300 3.44300 3.74300 2.54300 2.84300 3.4300 3.54300 3.8
AB33 ching
ear
ess
bod
Non-
dimens
onal
Stres
V/f'c b
Pa)
18 0.09034 0.07761 0.06585 0.05710 0.05125 0.09344 0.08167 0.06694 0.05819 0.05345 0.10263 0.08793 0.07333 0.06658 0.05949 0.10374 0.09110 0.07749 0.06976 0.06252 0.10580 0.09319 0.07958 0.07185 0.064
-
si-
l
s
od
Normal-
ized
Punching
Shear
09 0.45 78 0.43 52 0.41 70 0.40 17 0.40 39 0.46 13 0.45 68 0.42 88 0.42 31 0.41 20 0.50 77 0.48 32 0.46 65 0.47 97 0.46 37 0.51 14 0.50 76 0.49 98 0.49 26 0.48 50 0.51 32 0.51 97 0.50 15 0.51 41 0.50
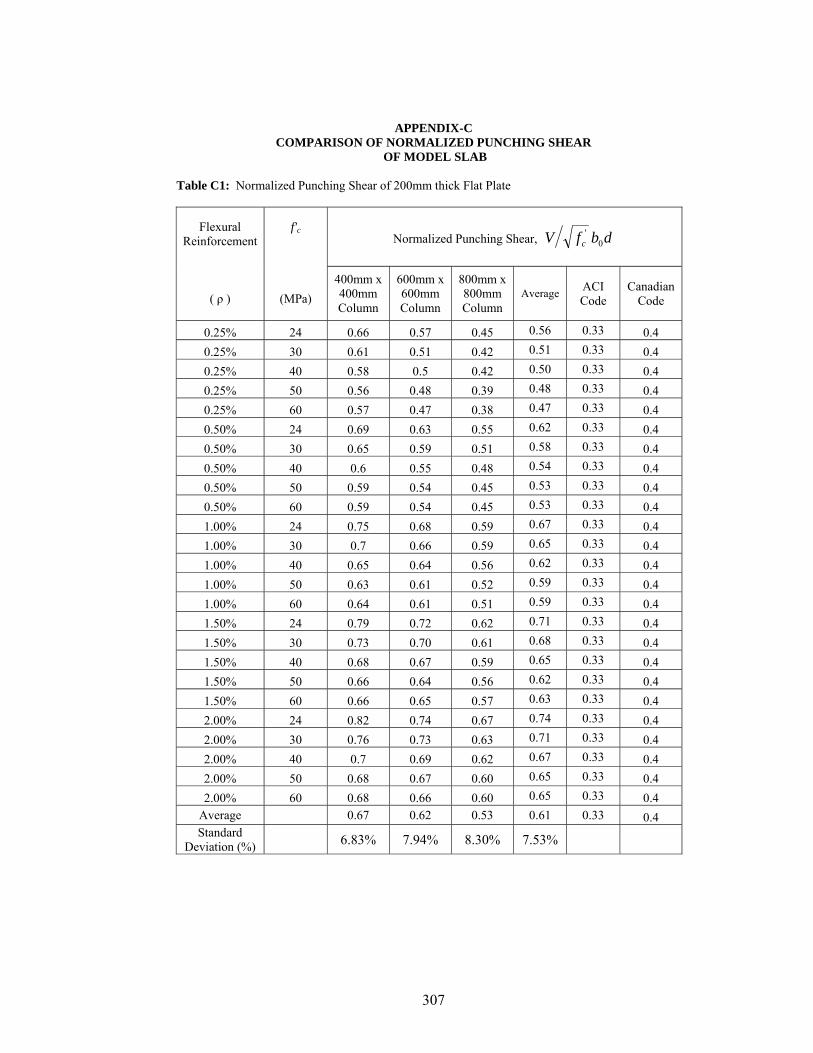
307
APPENDIX-C
COMPARISON OF NORMALIZED PUNCHING SHEAR OF MODEL SLAB
Table C1: Normalized Punching Shear of 200mm thick Flat Plate
Flexural Reinforcement
( ρ )
f'c
(MPa)
Normalized Punching Shear, dbfV c 0'
400mm x 400mm Column
600mm x 600mm Column
800mm x 800mm Column
Average ACI Code
Canadian Code
0.25% 24 0.66 0.57 0.45 0.56 0.33 0.4 0.25% 30 0.61 0.51 0.42 0.51 0.33 0.4 0.25% 40 0.58 0.5 0.42 0.50 0.33 0.4 0.25% 50 0.56 0.48 0.39 0.48 0.33 0.4 0.25% 60 0.57 0.47 0.38 0.47 0.33 0.4 0.50% 24 0.69 0.63 0.55 0.62 0.33 0.4 0.50% 30 0.65 0.59 0.51 0.58 0.33 0.4 0.50% 40 0.6 0.55 0.48 0.54 0.33 0.40.50% 50 0.59 0.54 0.45 0.53 0.33 0.4 0.50% 60 0.59 0.54 0.45 0.53 0.33 0.4 1.00% 24 0.75 0.68 0.59 0.67 0.33 0.41.00% 30 0.7 0.66 0.59 0.65 0.33 0.4 1.00% 40 0.65 0.64 0.56 0.62 0.33 0.4 1.00% 50 0.63 0.61 0.52 0.59 0.33 0.4 1.00% 60 0.64 0.61 0.51 0.59 0.33 0.4 1.50% 24 0.79 0.72 0.62 0.71 0.33 0.4 1.50% 30 0.73 0.70 0.61 0.68 0.33 0.4 1.50% 40 0.68 0.67 0.59 0.65 0.33 0.4 1.50% 50 0.66 0.64 0.56 0.62 0.33 0.4 1.50% 60 0.66 0.65 0.57 0.63 0.33 0.4 2.00% 24 0.82 0.74 0.67 0.74 0.33 0.4 2.00% 30 0.76 0.73 0.63 0.71 0.33 0.4 2.00% 40 0.7 0.69 0.62 0.67 0.33 0.4 2.00% 50 0.68 0.67 0.60 0.65 0.33 0.4 2.00% 60 0.68 0.66 0.60 0.65 0.33 0.4
Average 0.67 0.62 0.53 0.61 0.33 0.4 Standard
Deviation (%) 6.83% 7.94% 8.30% 7.53%

308
Table C2: Normalized Punching Shear of 250mm thick Flat Plate
Flexural Reinforcement
( ρ )
f'c
(MPa)
Normalized Punching Shear, dbfV c 0'
400mm x 400mm Column
600mm x 600mm Column
800mm x 800mm Column
Average ACI Code
Canadian Code
0.25% 24 0.57 0.52 0.45 0.51 0.33 0.4 0.25% 30 0.56 0.49 0.42 0.49 0.33 0.4 0.25% 40 0.54 0.45 0.42 0.47 0.33 0.40.25% 50 0.54 0.46 0.41 0.47 0.33 0.4 0.25% 60 0.54 0.46 0.4 0.47 0.33 0.4 0.50% 24 0.6 0.55 0.51 0.55 0.33 0.4 0.50% 30 0.58 0.52 0.48 0.53 0.33 0.4 0.50% 40 0.56 0.48 0.46 0.50 0.33 0.4 0.50% 50 0.57 0.49 0.44 0.50 0.33 0.4 0.50% 60 0.57 0.51 0.43 0.50 0.33 0.4 1.00% 24 0.63 0.55 0.54 0.57 0.33 0.4 1.00% 30 0.61 0.52 0.52 0.55 0.33 0.4 1.00% 40 0.59 0.51 0.5 0.53 0.33 0.4 1.00% 50 0.6 0.52 0.48 0.53 0.33 0.4 1.00% 60 0.61 0.54 0.47 0.54 0.33 0.4 1.50% 24 0.66 0.57 0.54 0.59 0.33 0.4 1.50% 30 0.63 0.54 0.53 0.57 0.33 0.4 1.50% 40 0.61 0.54 0.52 0.56 0.33 0.4 1.50% 50 0.62 0.55 0.51 0.56 0.33 0.4 1.50% 60 0.63 0.56 0.51 0.57 0.33 0.4 2.00% 24 0.68 0.58 0.56 0.61 0.33 0.42.00% 30 0.65 0.56 0.54 0.58 0.33 0.4 2.00% 40 0.63 0.55 0.53 0.57 0.33 0.4 2.00% 50 0.64 0.56 0.52 0.57 0.33 0.42.00% 60 0.65 0.58 0.52 0.58 0.33 0.4
Average 0.60 0.53 0.49 0.54 0.33 0.4 Standard
Deviation (%) 3.97% 3.76% 4.74% 4.05%
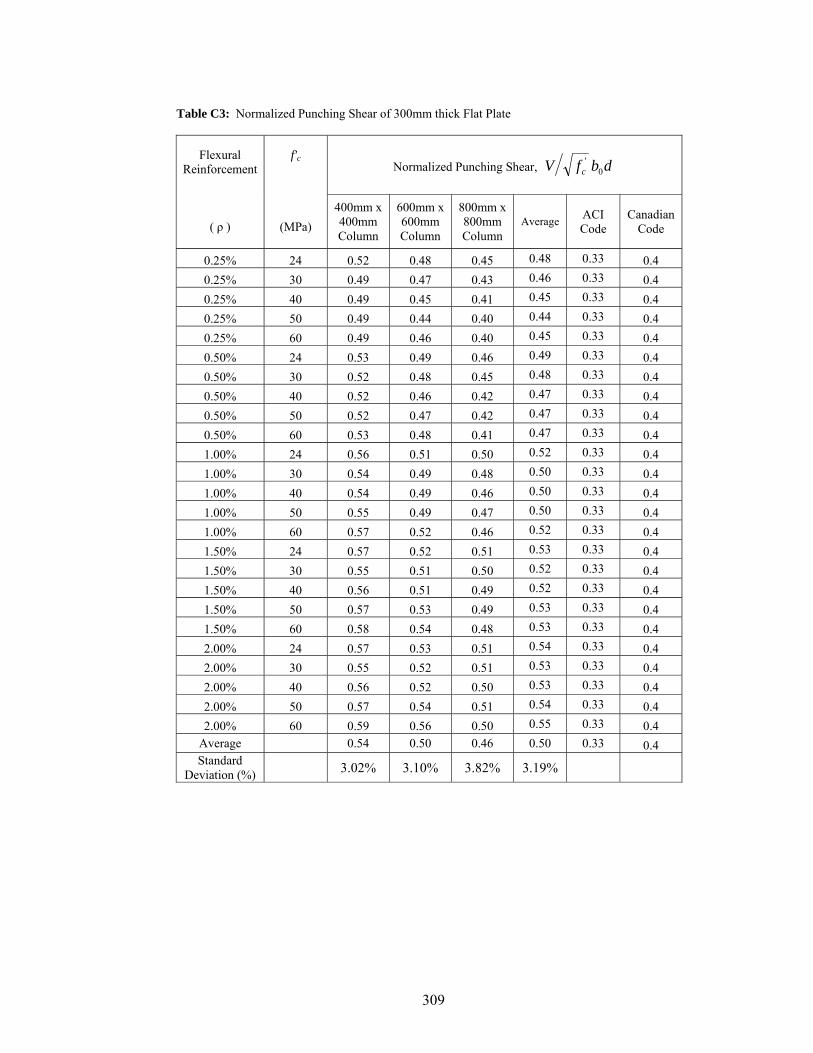
309
Table C3: Normalized Punching Shear of 300mm thick Flat Plate
Flexural Reinforcement
( ρ )
f'c
(MPa)
Normalized Punching Shear, dbfV c 0'
400mm x 400mm Column
600mm x 600mm Column
800mm x 800mm Column
Average ACI Code
Canadian Code
0.25% 24 0.52 0.48 0.45 0.48 0.33 0.4 0.25% 30 0.49 0.47 0.43 0.46 0.33 0.4 0.25% 40 0.49 0.45 0.41 0.45 0.33 0.40.25% 50 0.49 0.44 0.40 0.44 0.33 0.4 0.25% 60 0.49 0.46 0.40 0.45 0.33 0.4 0.50% 24 0.53 0.49 0.46 0.49 0.33 0.4 0.50% 30 0.52 0.48 0.45 0.48 0.33 0.4 0.50% 40 0.52 0.46 0.42 0.47 0.33 0.4 0.50% 50 0.52 0.47 0.42 0.47 0.33 0.4 0.50% 60 0.53 0.48 0.41 0.47 0.33 0.4 1.00% 24 0.56 0.51 0.50 0.52 0.33 0.4 1.00% 30 0.54 0.49 0.48 0.50 0.33 0.4 1.00% 40 0.54 0.49 0.46 0.50 0.33 0.4 1.00% 50 0.55 0.49 0.47 0.50 0.33 0.4 1.00% 60 0.57 0.52 0.46 0.52 0.33 0.4 1.50% 24 0.57 0.52 0.51 0.53 0.33 0.4 1.50% 30 0.55 0.51 0.50 0.52 0.33 0.4 1.50% 40 0.56 0.51 0.49 0.52 0.33 0.4 1.50% 50 0.57 0.53 0.49 0.53 0.33 0.4 1.50% 60 0.58 0.54 0.48 0.53 0.33 0.4 2.00% 24 0.57 0.53 0.51 0.54 0.33 0.42.00% 30 0.55 0.52 0.51 0.53 0.33 0.4 2.00% 40 0.56 0.52 0.50 0.53 0.33 0.4 2.00% 50 0.57 0.54 0.51 0.54 0.33 0.42.00% 60 0.59 0.56 0.50 0.55 0.33 0.4
Average 0.54 0.50 0.46 0.50 0.33 0.4 Standard
Deviation (%) 3.02% 3.10% 3.82% 3.19%
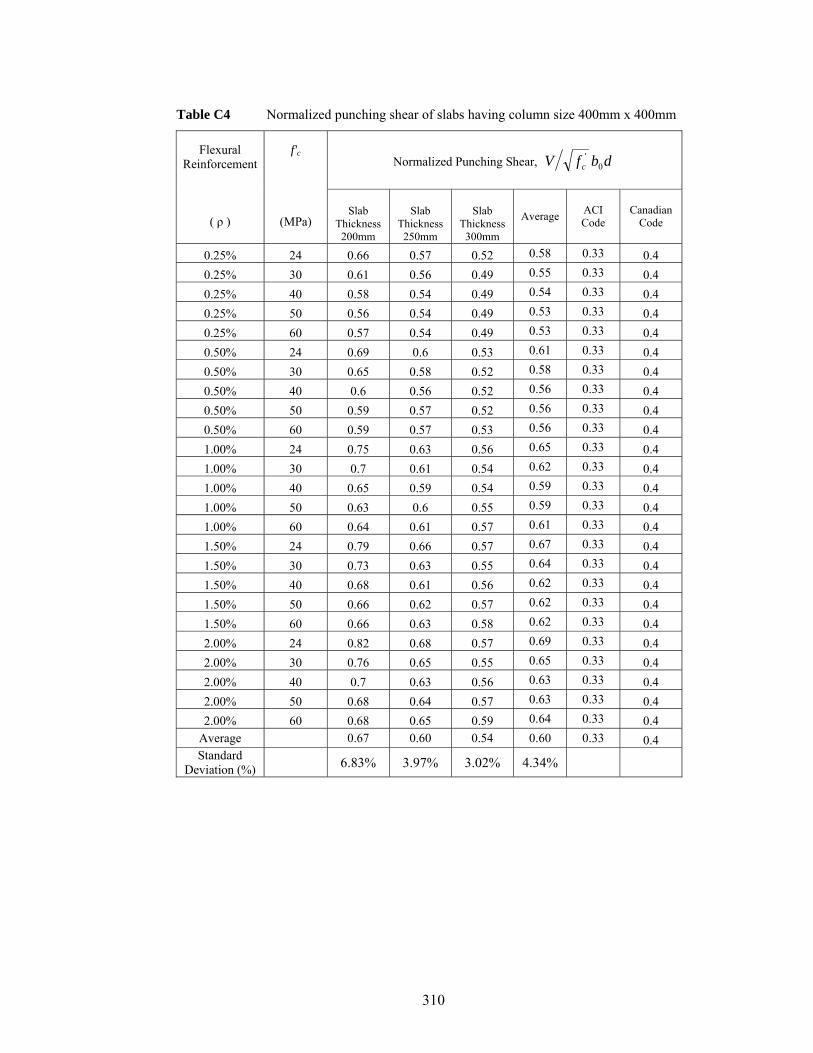
310
Table C4 Normalized punching shear of slabs having column size 400mm x 400mm
Flexural Reinforcement
( ρ )
f'c
(MPa)
Normalized Punching Shear, dbfV c 0'
Slab Thickness
200mm
Slab Thickness
250mm
Slab Thickness
300mm
Average ACI Code
Canadian Code
0.25% 24 0.66 0.57 0.52 0.58 0.33 0.4 0.25% 30 0.61 0.56 0.49 0.55 0.33 0.4 0.25% 40 0.58 0.54 0.49 0.54 0.33 0.4 0.25% 50 0.56 0.54 0.49 0.53 0.33 0.4 0.25% 60 0.57 0.54 0.49 0.53 0.33 0.4 0.50% 24 0.69 0.6 0.53 0.61 0.33 0.4 0.50% 30 0.65 0.58 0.52 0.58 0.33 0.4 0.50% 40 0.6 0.56 0.52 0.56 0.33 0.4 0.50% 50 0.59 0.57 0.52 0.56 0.33 0.4 0.50% 60 0.59 0.57 0.53 0.56 0.33 0.4 1.00% 24 0.75 0.63 0.56 0.65 0.33 0.4 1.00% 30 0.7 0.61 0.54 0.62 0.33 0.4 1.00% 40 0.65 0.59 0.54 0.59 0.33 0.4 1.00% 50 0.63 0.6 0.55 0.59 0.33 0.41.00% 60 0.64 0.61 0.57 0.61 0.33 0.4 1.50% 24 0.79 0.66 0.57 0.67 0.33 0.4 1.50% 30 0.73 0.63 0.55 0.64 0.33 0.41.50% 40 0.68 0.61 0.56 0.62 0.33 0.4 1.50% 50 0.66 0.62 0.57 0.62 0.33 0.4 1.50% 60 0.66 0.63 0.58 0.62 0.33 0.4 2.00% 24 0.82 0.68 0.57 0.69 0.33 0.4 2.00% 30 0.76 0.65 0.55 0.65 0.33 0.4 2.00% 40 0.7 0.63 0.56 0.63 0.33 0.4 2.00% 50 0.68 0.64 0.57 0.63 0.33 0.4 2.00% 60 0.68 0.65 0.59 0.64 0.33 0.4
Average 0.67 0.60 0.54 0.60 0.33 0.4 Standard
Deviation (%) 6.83% 3.97% 3.02% 4.34%
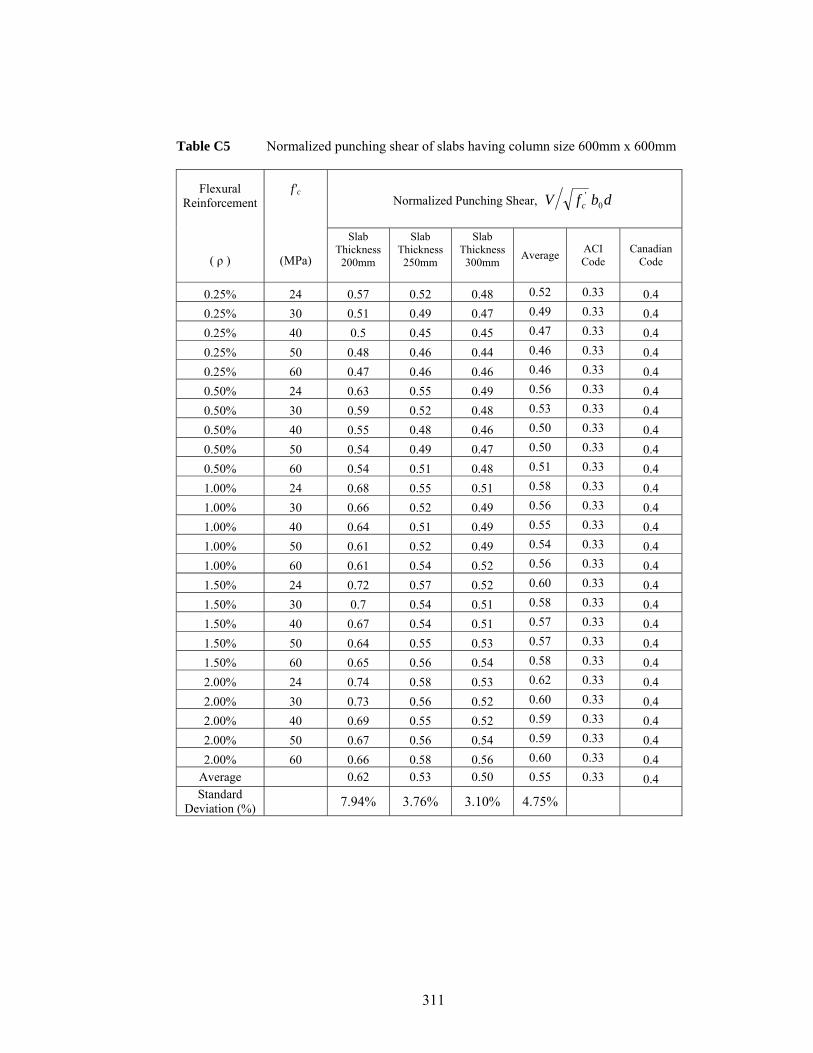
311
Table C5 Normalized punching shear of slabs having column size 600mm x 600mm
Flexural Reinforcement
( ρ )
f'c
(MPa)
Normalized Punching Shear, dbfV c 0'
Slab Thickness
200mm
Slab Thickness
250mm
Slab Thickness
300mm
Average ACI Code
Canadian Code
0.25% 24 0.57 0.52 0.48 0.52 0.33 0.40.25% 30 0.51 0.49 0.47 0.49 0.33 0.4 0.25% 40 0.5 0.45 0.45 0.47 0.33 0.4 0.25% 50 0.48 0.46 0.44 0.46 0.33 0.4 0.25% 60 0.47 0.46 0.46 0.46 0.33 0.4 0.50% 24 0.63 0.55 0.49 0.56 0.33 0.4 0.50% 30 0.59 0.52 0.48 0.53 0.33 0.4 0.50% 40 0.55 0.48 0.46 0.50 0.33 0.4 0.50% 50 0.54 0.49 0.47 0.50 0.33 0.4 0.50% 60 0.54 0.51 0.48 0.51 0.33 0.4 1.00% 24 0.68 0.55 0.51 0.58 0.33 0.4 1.00% 30 0.66 0.52 0.49 0.56 0.33 0.4 1.00% 40 0.64 0.51 0.49 0.55 0.33 0.4 1.00% 50 0.61 0.52 0.49 0.54 0.33 0.4 1.00% 60 0.61 0.54 0.52 0.56 0.33 0.4 1.50% 24 0.72 0.57 0.52 0.60 0.33 0.4 1.50% 30 0.7 0.54 0.51 0.58 0.33 0.4 1.50% 40 0.67 0.54 0.51 0.57 0.33 0.4 1.50% 50 0.64 0.55 0.53 0.57 0.33 0.41.50% 60 0.65 0.56 0.54 0.58 0.33 0.4 2.00% 24 0.74 0.58 0.53 0.62 0.33 0.4 2.00% 30 0.73 0.56 0.52 0.60 0.33 0.42.00% 40 0.69 0.55 0.52 0.59 0.33 0.4 2.00% 50 0.67 0.56 0.54 0.59 0.33 0.4 2.00% 60 0.66 0.58 0.56 0.60 0.33 0.4
Average 0.62 0.53 0.50 0.55 0.33 0.4 Standard
Deviation (%) 7.94% 3.76% 3.10% 4.75%
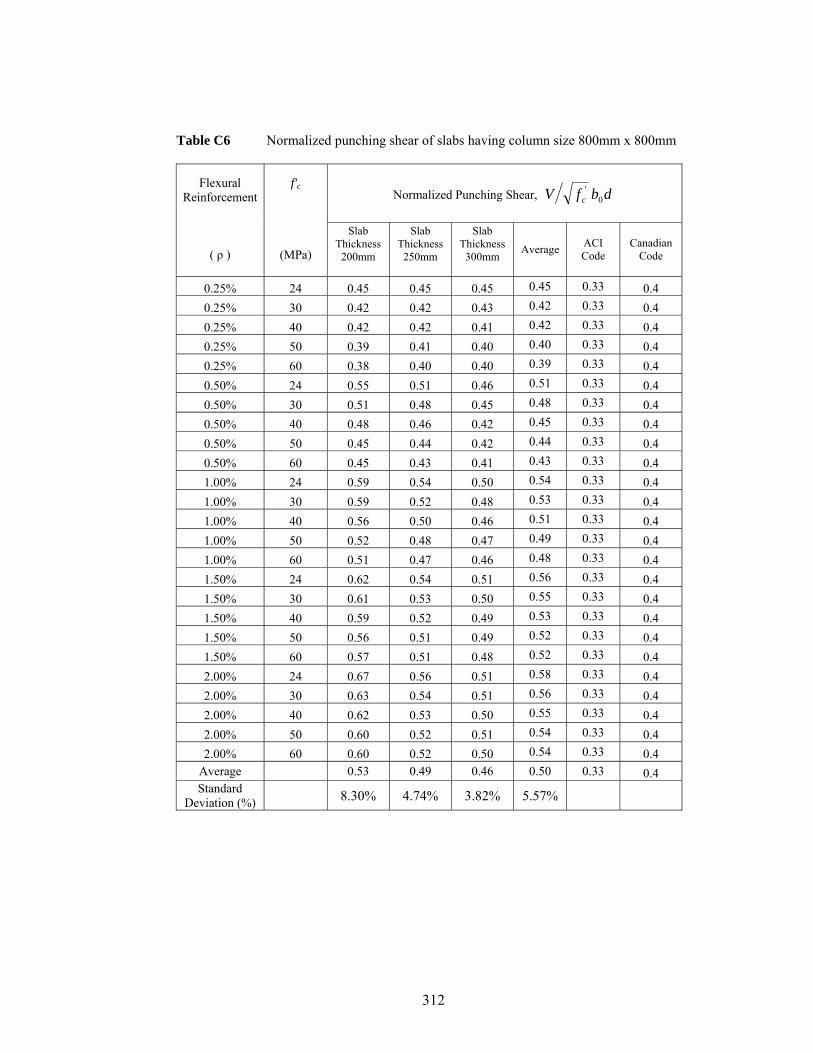
312
Table C6 Normalized punching shear of slabs having column size 800mm x 800mm
Flexural Reinforcement
( ρ )
f'c
(MPa)
Normalized Punching Shear, dbfV c 0'
Slab Thickness
200mm
Slab Thickness
250mm
Slab Thickness
300mm
Average ACI Code
Canadian Code
0.25% 24 0.45 0.45 0.45 0.45 0.33 0.4 0.25% 30 0.42 0.42 0.43 0.42 0.33 0.4 0.25% 40 0.42 0.42 0.41 0.42 0.33 0.40.25% 50 0.39 0.41 0.40 0.40 0.33 0.4 0.25% 60 0.38 0.40 0.40 0.39 0.33 0.4 0.50% 24 0.55 0.51 0.46 0.51 0.33 0.40.50% 30 0.51 0.48 0.45 0.48 0.33 0.4 0.50% 40 0.48 0.46 0.42 0.45 0.33 0.4 0.50% 50 0.45 0.44 0.42 0.44 0.33 0.4 0.50% 60 0.45 0.43 0.41 0.43 0.33 0.4 1.00% 24 0.59 0.54 0.50 0.54 0.33 0.4 1.00% 30 0.59 0.52 0.48 0.53 0.33 0.4 1.00% 40 0.56 0.50 0.46 0.51 0.33 0.4 1.00% 50 0.52 0.48 0.47 0.49 0.33 0.4 1.00% 60 0.51 0.47 0.46 0.48 0.33 0.4 1.50% 24 0.62 0.54 0.51 0.56 0.33 0.4 1.50% 30 0.61 0.53 0.50 0.55 0.33 0.4 1.50% 40 0.59 0.52 0.49 0.53 0.33 0.4 1.50% 50 0.56 0.51 0.49 0.52 0.33 0.4 1.50% 60 0.57 0.51 0.48 0.52 0.33 0.4 2.00% 24 0.67 0.56 0.51 0.58 0.33 0.42.00% 30 0.63 0.54 0.51 0.56 0.33 0.4 2.00% 40 0.62 0.53 0.50 0.55 0.33 0.4 2.00% 50 0.60 0.52 0.51 0.54 0.33 0.42.00% 60 0.60 0.52 0.50 0.54 0.33 0.4
Average 0.53 0.49 0.46 0.50 0.33 0.4 Standard
Deviation (%) 8.30% 4.74% 3.82% 5.57%
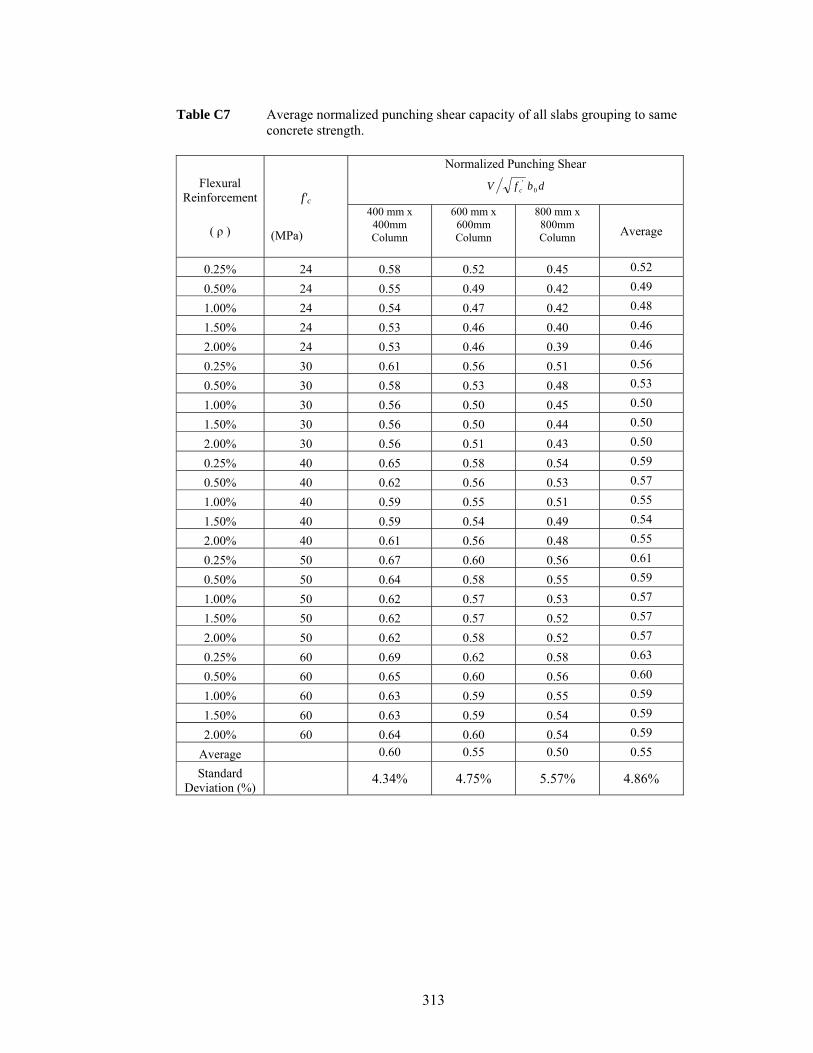
313
Table C7 Average normalized punching shear capacity of all slabs grouping to same concrete strength.
Flexural Reinforcement f'c
Normalized Punching Shear
( ρ ) (MPa)
400 mm x 400mm Column
600 mm x 600mm Column
800 mm x 800mm Column
Average
0.25% 24 0.58 0.52 0.45 0.52
0.50% 24 0.55 0.49 0.42 0.49
1.00% 24 0.54 0.47 0.42 0.48
1.50% 24 0.53 0.46 0.40 0.46
2.00% 24 0.53 0.46 0.39 0.46
0.25% 30 0.61 0.56 0.51 0.56
0.50% 30 0.58 0.53 0.48 0.53
1.00% 30 0.56 0.50 0.45 0.50
1.50% 30 0.56 0.50 0.44 0.50
2.00% 30 0.56 0.51 0.43 0.50
0.25% 40 0.65 0.58 0.54 0.59
0.50% 40 0.62 0.56 0.53 0.57
1.00% 40 0.59 0.55 0.51 0.55
1.50% 40 0.59 0.54 0.49 0.54
2.00% 40 0.61 0.56 0.48 0.55
0.25% 50 0.67 0.60 0.56 0.61
0.50% 50 0.64 0.58 0.55 0.59
1.00% 50 0.62 0.57 0.53 0.57
1.50% 50 0.62 0.57 0.52 0.57
2.00% 50 0.62 0.58 0.52 0.57
0.25% 60 0.69 0.62 0.58 0.63
0.50% 60 0.65 0.60 0.56 0.60
1.00% 60 0.63 0.59 0.55 0.59
1.50% 60 0.63 0.59 0.54 0.59
2.00% 60 0.64 0.60 0.54 0.59
Average 0.60 0.55 0.50 0.55
Standard Deviation (%)
4.34% 4.75% 5.57% 4.86%
dbfV c 0'
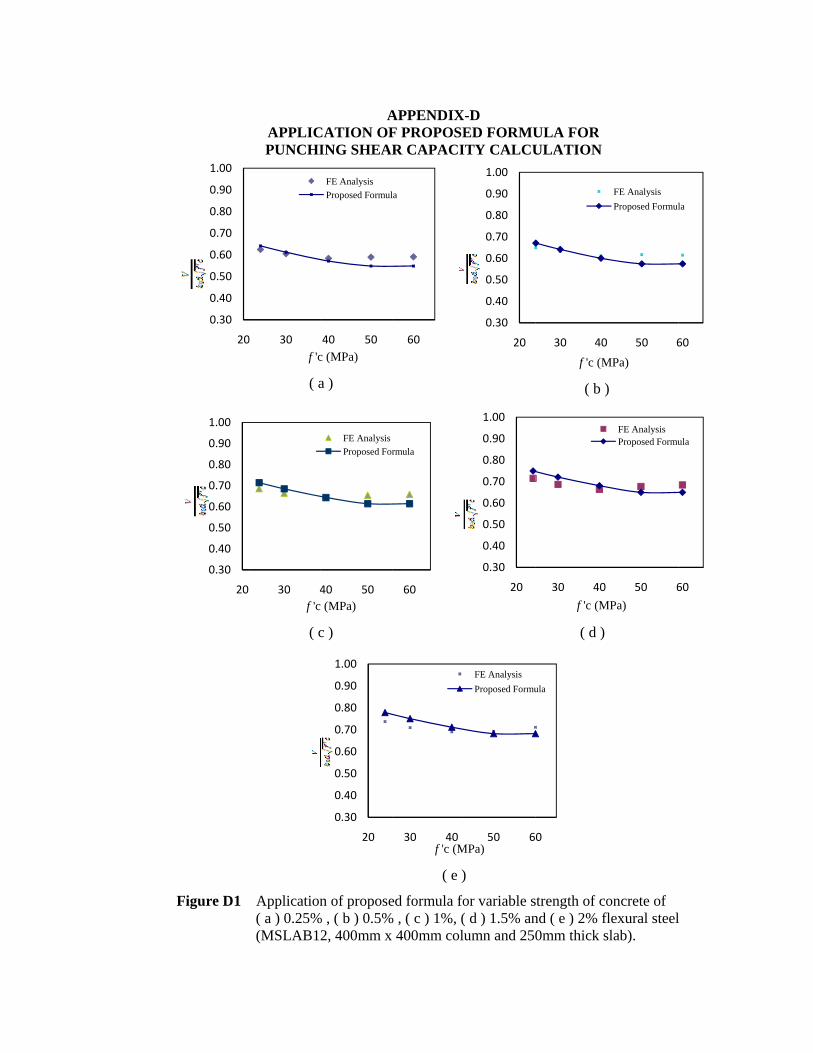
FFigure D1
0.30
0.40
0.50
0.60
0.70
0.80
0.90
1.00
20
0.30
0.40
0.50
0.60
0.70
0.80
0.90
1.00
20
APPLICPUNCHI
( a
( c
Application( a ) 0.25%(MSLAB12
0 30f 'c
30 4f 'c
ACATION OFING SHEAR
a )
c )
n of propose% , ( b ) 0.5%
2, 400mm x
40 50c (MPa)
FE AnalysisProposed Formul
40 50(MPa)
FE AnalysisProposed For
0.30
0.40
0.50
0.60
0.70
0.80
0.90
1.00
20
APPENDIXF PROPOSER CAPACI
( e )
ed formula fo% , ( c ) 1%, (
400mm colu
60
la
60
rmula
30 40f 'c (M
X-D ED FORMUITY CALCU
) or variable s( d ) 1.5% anumn and 250
0.30
0.40
0.50
0.60
0.70
0.80
0.90
1.00
20
0.30
0.40
0.50
0.60
0.70
0.80
0.90
1.00
20
50 6MPa)
FE AnalysisProposed Formu
ULA FOR ULATION
( b )
( d )
strength of cond ( e ) 2% f0mm thick s
30 40
f 'c (M
30 40f 'c (M
0
ula
)
oncrete of flexural steelslab).
0 50 6
MPa)
FE AnalysisProposed Formul
50 6MPa)
FE AnalysisProposed Formu
l
60
la
60
ula
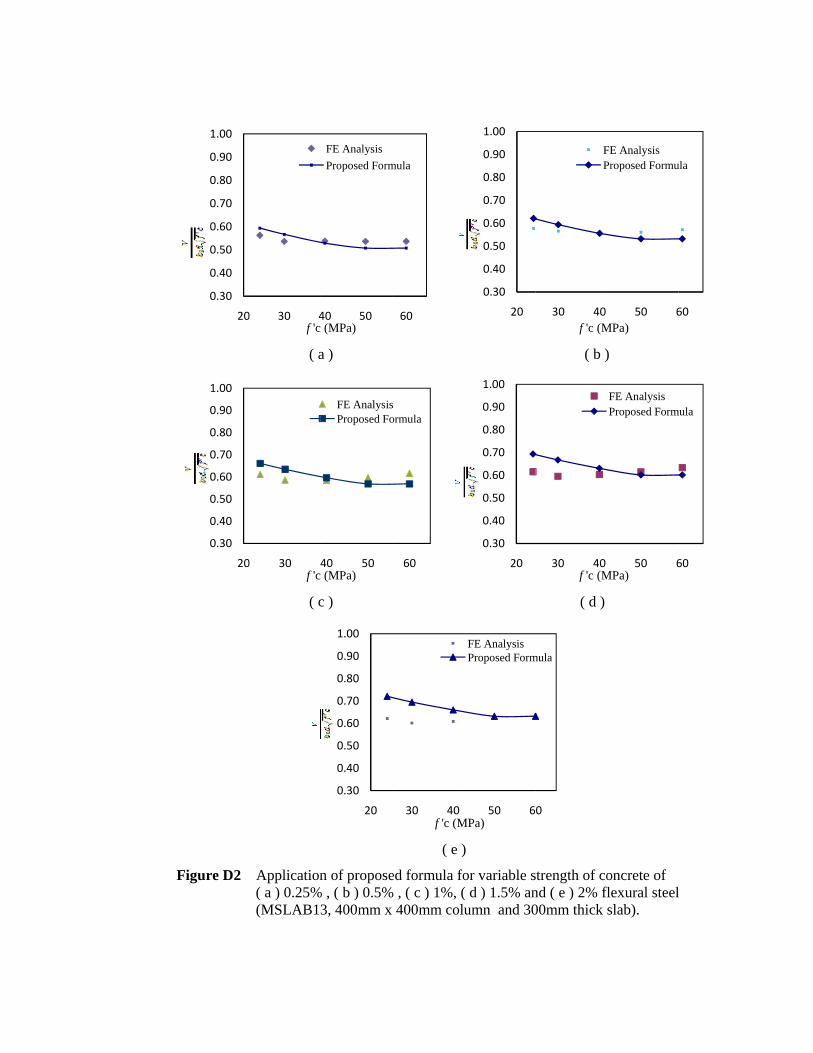
F
Figure D2
0.30
0.40
0.50
0.60
0.70
0.80
0.90
1.00
20
0.30
0.40
0.50
0.60
0.70
0.80
0.90
1.00
20
( a
( c
Application( a ) 0.25%(MSLAB13
0 30 4f 'c
0 30 4f 'c
a )
c )
n of propose% , ( b ) 0.5%
3, 400mm x
40 50(MPa)
FE AnalysisProposed Form
40 50(MPa)
FE AnalysisProposed Fo
0.30
0.40
0.50
0.60
0.70
0.80
0.90
1.00
20
( e )
ed formula fo% , ( c ) 1%, (
400mm colu
60
mula
60
sormula
30 40f 'c (M
) or variable s( d ) 1.5% anumn and 30
0.30
0.40
0.50
0.60
0.70
0.80
0.90
1.00
20
0.30
0.40
0.50
0.60
0.70
0.80
0.90
1.00
20
50 6MPa)
FE AnalysisProposed Form
( b )
( d )
strength of cond ( e ) 2% f00mm thick
30 40f 'c (M
FP
30 40f 'c (M
0
mula
)
oncrete of flexural steelslab).
50 6MPa)
FE AnalysisProposed Formu
50 6MPa)
FE AnalysisProposed Form
l
60
ula
60
mula
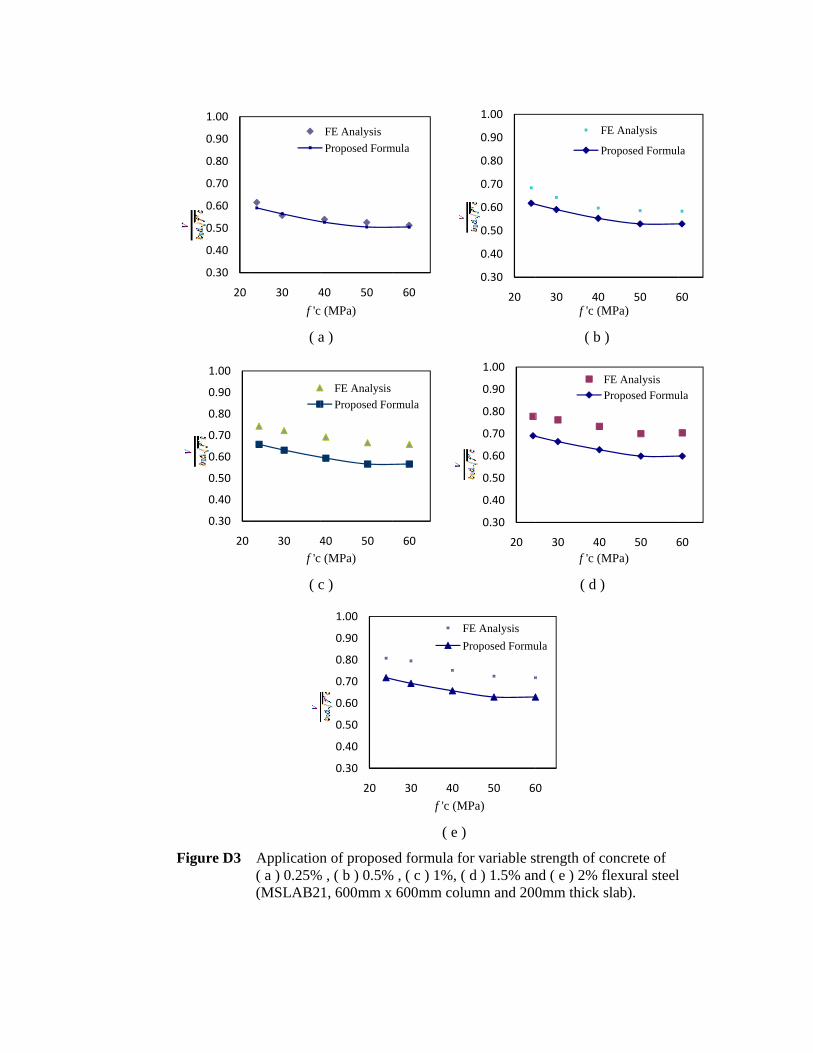
F
Figure D3
0.30
0.40
0.50
0.60
0.70
0.80
0.90
1.00
20
0.30
0.40
0.50
0.60
0.70
0.80
0.90
1.00
20
( a
( c
Application( a ) 0.25%(MSLAB2
30 4f 'c
30 4f 'c
a )
c )
n of propose% , ( b ) 0.5%
1, 600mm x
40 50(MPa)
FE AnalysisProposed Form
40 50(MPa)
FE AnalysisProposed For
0.30
0.40
0.50
0.60
0.70
0.80
0.90
1.00
20
( e )
ed formula fo% , ( c ) 1%, (
600mm colu
60
mula
60
rmula
30 40f 'c (M
FP
) or variable s( d ) 1.5% anumn and 200
0.30
0.40
0.50
0.60
0.70
0.80
0.90
1.00
20
0.30
0.40
0.50
0.60
0.70
0.80
0.90
1.00
20
50 6MPa)
FE AnalysisProposed Formu
( b )
( d )
strength of cond ( e ) 2% f0mm thick s
30 40f 'c (M
F
P
30 40f 'c (M
FP
0
ula
)
oncrete of flexural steelslab).
50 6MPa)
E Analysis
roposed Formul
50 6MPa)
FE AnalysisProposed Formu
l
60
la
60
ula
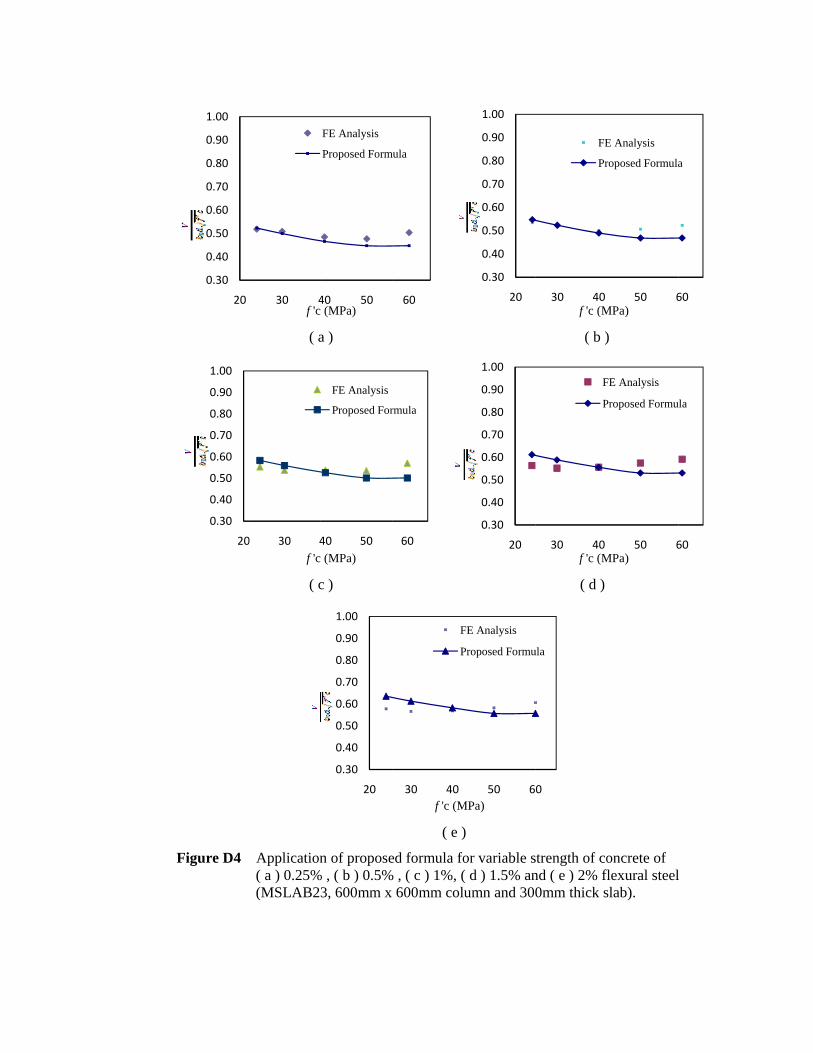
F
Figure D4
0.30
0.40
0.50
0.60
0.70
0.80
0.90
1.00
20
0.30
0.40
0.50
0.60
0.70
0.80
0.90
1.00
20
( a
( c
Application( a ) 0.25%(MSLAB23
30 4f 'c
0 30 4f 'c
a )
c )
n of propose% , ( b ) 0.5%
3, 600mm x
40 50(MPa)
FE Analysis
Proposed Form
40 50(MPa)
FE Analysis
Proposed For
0.30
0.40
0.50
0.60
0.70
0.80
0.90
1.00
20
( e )
ed formula fo% , ( c ) 1%, (
600mm colu
60
mula
60
rmula
30 40f 'c (M
F
P
) or variable s( d ) 1.5% anumn and 300
0.30
0.40
0.50
0.60
0.70
0.80
0.90
1.00
20
0.30
0.40
0.50
0.60
0.70
0.80
0.90
1.00
20
50 6MPa)
FE Analysis
Proposed Formu
( b )
( d )
strength of cond ( e ) 2% f0mm thick s
30 40f 'c (M
FE
Pr
30 40f 'c (M
F
P
0
ula
)
oncrete of flexural steelslab).
50 6MPa)
E Analysis
roposed Formula
50 6MPa)
FE Analysis
Proposed Formu
l
60
a
60
ula
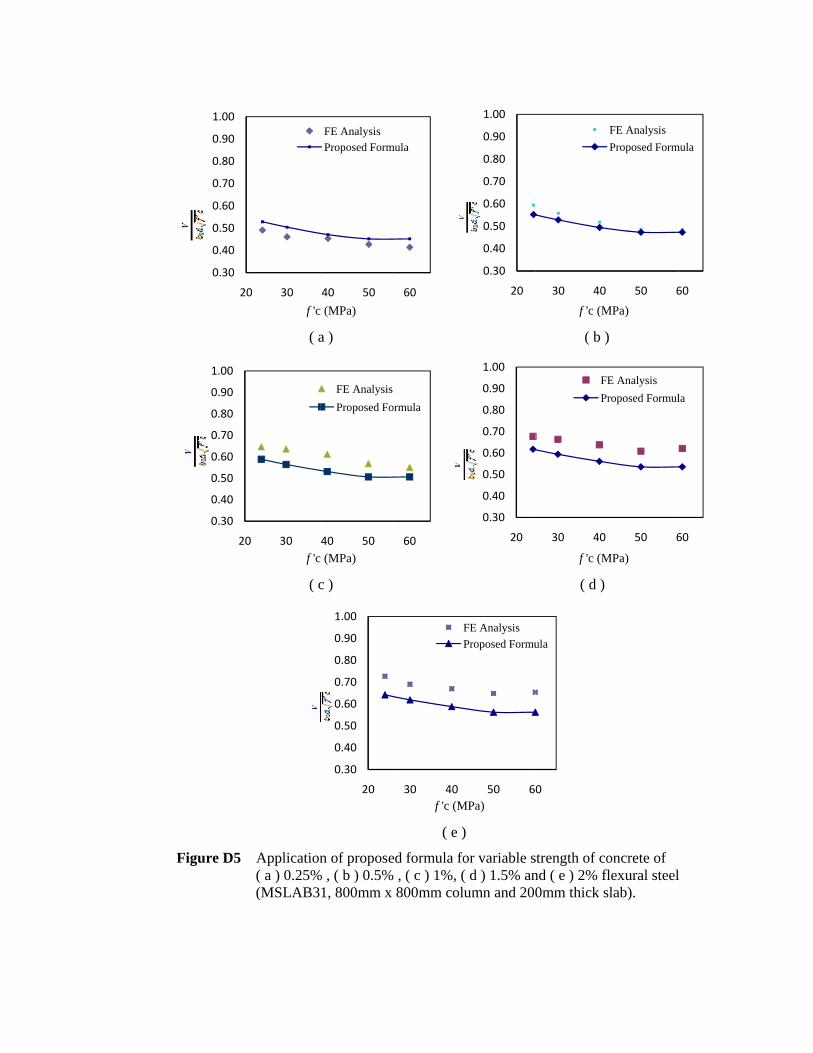
F
Figure D5
0.30
0.40
0.50
0.60
0.70
0.80
0.90
1.00
20
0.30
0.40
0.50
0.60
0.70
0.80
0.90
1.00
20
( a
( c
Application( a ) 0.25%(MSLAB3
0 30f 'c
0 30f 'c
a )
c )
n of propose% , ( b ) 0.5%
1, 800mm x
40 50(MPa)
FE AnalysisProposed Form
40 50(MPa)
FE AnalysisProposed Fo
0.30
0.40
0.50
0.60
0.70
0.80
0.90
1.00
20
( e )
ed formula fo% , ( c ) 1%, (
800mm colu
60
mula
60
sormula
30 40f 'c (M
FP
) or variable s( d ) 1.5% anumn and 200
0.30
0.40
0.50
0.60
0.70
0.80
0.90
1.00
20
0.30
0.40
0.50
0.60
0.70
0.80
0.90
1.00
20
50 6MPa)
FE AnalysisProposed Formu
( b )
( d )
strength of cond ( e ) 2% f0mm thick s
30 40
f 'c (M
30 40
f 'c (M
FP
0
ula
)
oncrete of flexural steelslab).
50 6
MPa)
FE AnalysisProposed Form
50 6
MPa)
E Analysisroposed Formul
l
60
mula
60
la
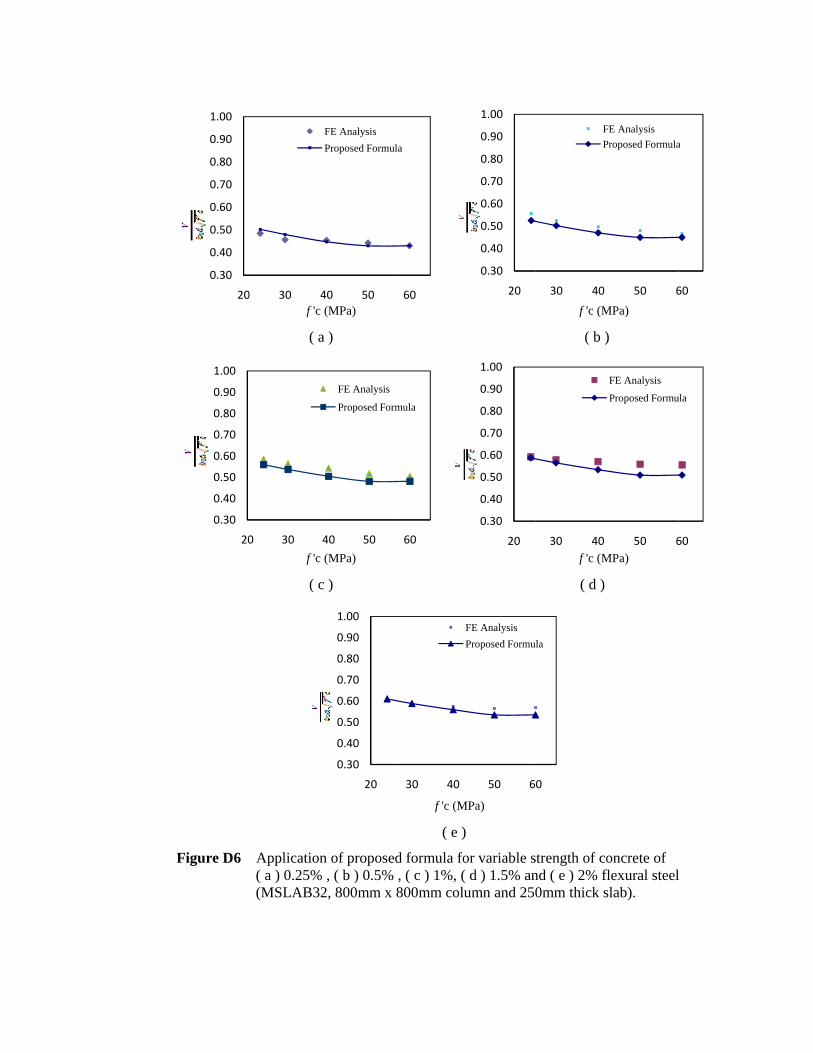
F
Figure D6
0.30
0.40
0.50
0.60
0.70
0.80
0.90
1.00
20
0.30
0.40
0.50
0.60
0.70
0.80
0.90
1.00
20
( a
( c
Application( a ) 0.25%(MSLAB32
0 30 4f 'c
0 30f 'c
a )
c )
n of propose% , ( b ) 0.5%
2, 800mm x
40 50(MPa)
FE AnalysisProposed Formu
40 50(MPa)
FE Analysis
Proposed For
0.30
0.40
0.50
0.60
0.70
0.80
0.90
1.00
20
( e )
ed formula fo% , ( c ) 1%, (
800mm colu
60
ula
60
rmula
30 40
f 'c (M
) or variable s( d ) 1.5% anumn and 250
0.30
0.40
0.50
0.60
0.70
0.80
0.90
1.00
20
0.30
0.40
0.50
0.60
0.70
0.80
0.90
1.00
20
50 6
MPa)
FE AnalysisProposed Formu
( b )
( d )
strength of cond ( e ) 2% f0mm thick s
30 40
f 'c (M
FP
30 40f 'c (M
0
ula
)
oncrete of flexural steelslab).
50 6
MPa)
FE AnalysisProposed Formula
50 6MPa)
FE Analysis
Proposed Formu
l
60
a
60
ula
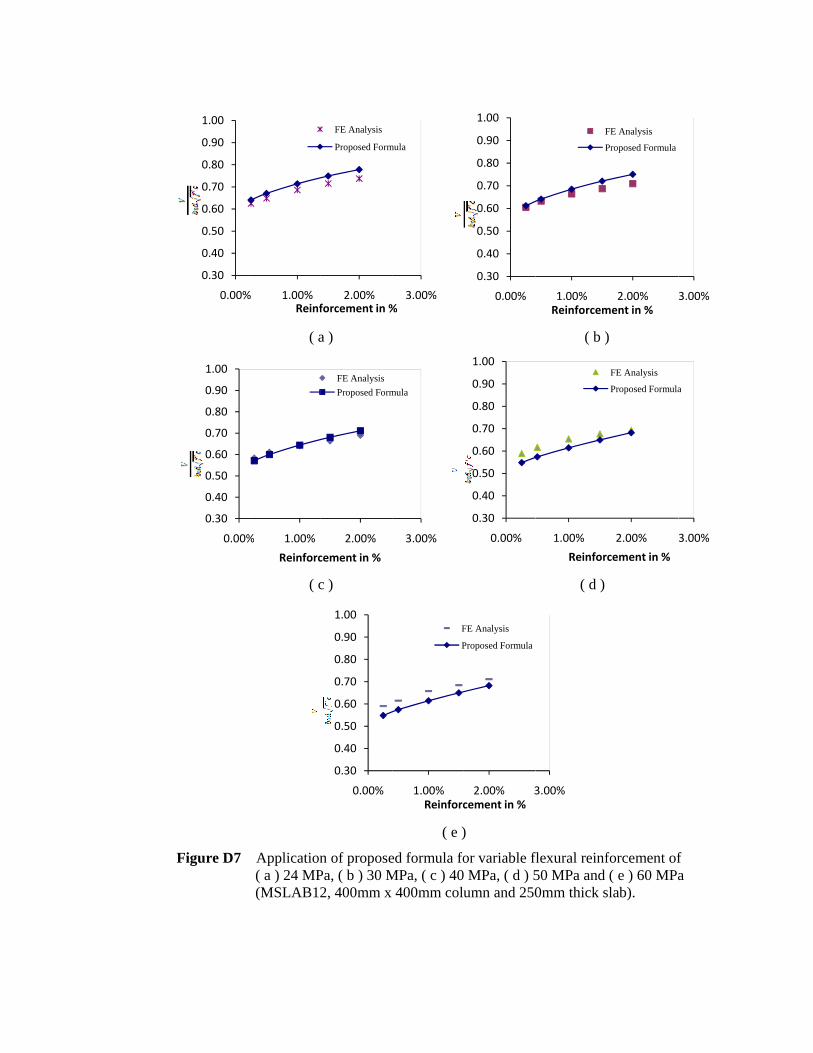
F
Figure D7
0.30
0.40
0.50
0.60
0.70
0.80
0.90
1.00
0.00%
0.30
0.40
0.50
0.60
0.70
0.80
0.90
1.00
0.00%
( a
( c
Application( a ) 24 MP(MSLAB12
% 1.00%Reinf
% 1.00%Reinforc
a )
c )
n of proposePa, ( b ) 30 M2, 400mm x
2.00%forcement in %
FE Analysis
Proposed Form
2.00%cement in %
FE AnalysisProposed Form
0.30
0.40
0.50
0.60
0.70
0.80
0.90
1.00
0.00%
( e )
ed formula foMPa, ( c ) 40
400mm colu
3.00%%
mula
3.00%
mula
1.00%Reinforc
F
P
) or variable f MPa, ( d ) 5umn and 250
0.30
0.40
0.50
0.60
0.70
0.80
0.90
1.00
0.00%
0.30
0.40
0.50
0.60
0.70
0.80
0.90
1.00
0.00%
2.00% 3cement in %
FE Analysis
Proposed Formula
( b )
( d )
flexural reinf50 MPa and 0mm thick s
1.00%Reinforcem
F
P
1.00%Reinfor
3.00%
)
forcement of( e ) 60 MPa
slab).
2.00%ment in %
FE Analysis
Proposed Formula
2.00%cement in %
FE Analysis
Proposed Formula
f a
3.00%
3.00%
a
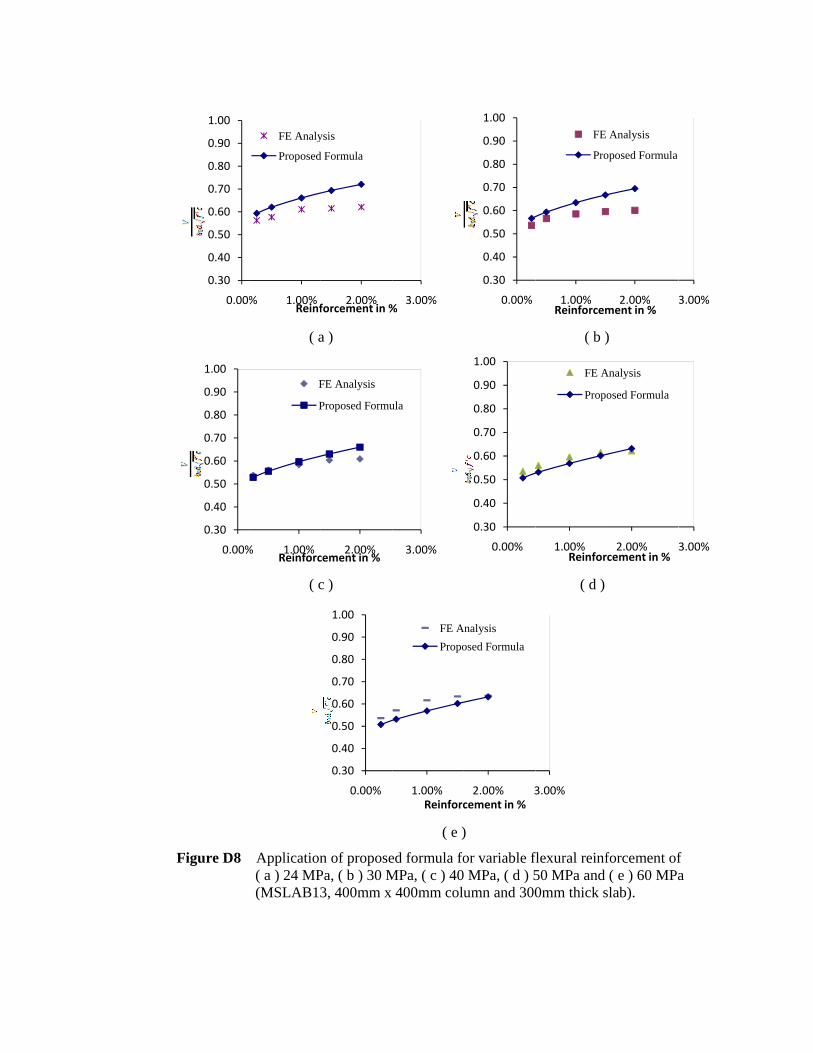
F
Figure D8
0.30
0.40
0.50
0.60
0.70
0.80
0.90
1.00
0.00%
0.30
0.40
0.50
0.60
0.70
0.80
0.90
1.00
0.00%
( a
( c
Application( a ) 24 MP(MSLAB13
% 1.00%Reinf
FE Analy
Proposed
% 1.00%Reinforc
F
P
a )
c )
n of proposePa, ( b ) 30 M3, 400mm x
2.00%forcement in %
ysis
d Formula
2.00%cement in %
FE Analysis
Proposed Formu
0.30
0.40
0.50
0.60
0.70
0.80
0.90
1.00
0.00%
( e )
ed formula foMPa, ( c ) 40
400mm colu
3.00%%
3.00%
ula
1.00%Reinforc
FE APropo
) or variable f MPa, ( d ) 5umn and 300
0.30
0.40
0.50
0.60
0.70
0.80
0.90
1.00
0.00%
0.30
0.40
0.50
0.60
0.70
0.80
0.90
1.00
0.00%
2.00% 3cement in %
Analysisosed Formula
( b )
( d )
flexural reinf50 MPa and 0mm thick s
1.00%Reinforcem
FE
Pro
1.00%Reinfor
FE A
Propo
3.00%
)
forcement of( e ) 60 MPa
slab).
2.00%ment in %
Analysis
oposed Formula
2.00%cement in %
Analysis
osed Formula
f a
3.00%
3.00%
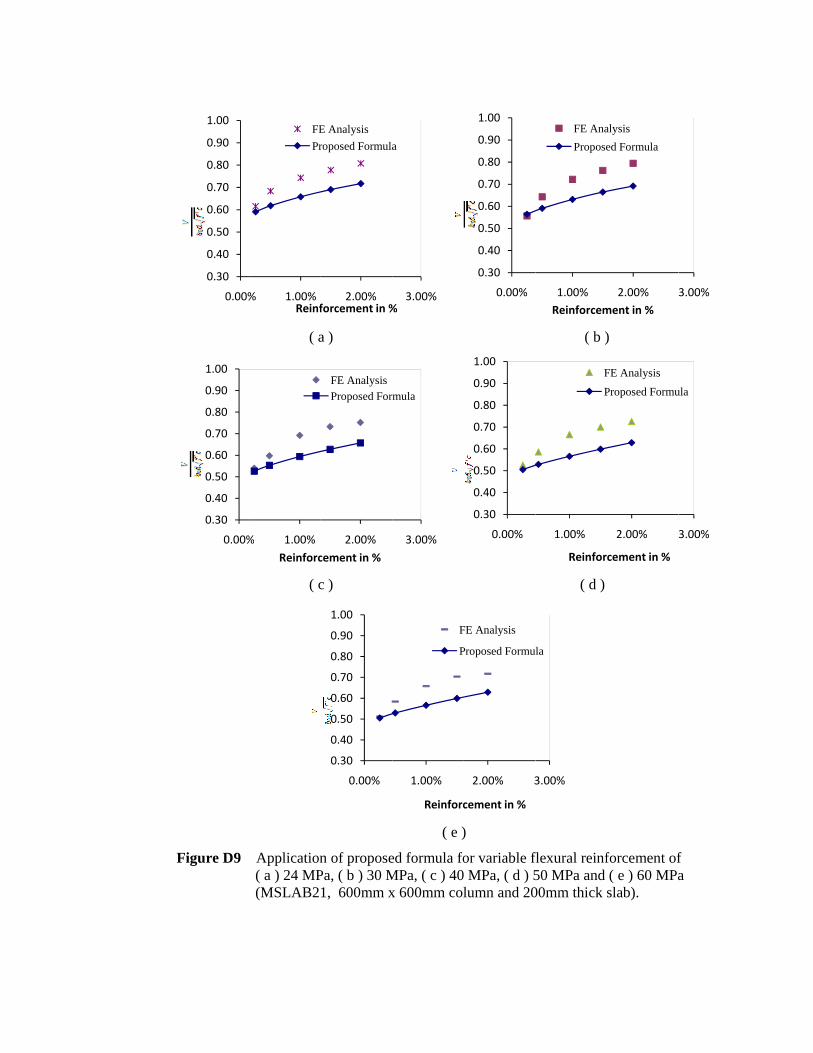
F
Figure D9
0.30
0.40
0.50
0.60
0.70
0.80
0.90
1.00
0.00%
0.30
0.40
0.50
0.60
0.70
0.80
0.90
1.00
0.00%
( a
( c
Application( a ) 24 MP(MSLAB2
% 1.00%Reinf
FEPr
% 1.00%Reinforc
a )
c )
n of proposePa, ( b ) 30 M1, 600mm x
2.00%forcement in %
E Analysisroposed Formula
2.00%cement in %
FE AnalysisProposed For
0.30
0.40
0.50
0.60
0.70
0.80
0.90
1.00
0.00%
( e )
ed formula foMPa, ( c ) 40x 600mm col
3.00%%
a
3.00%
rmula
1.00%
Reinforc
F
P
) or variable f MPa, ( d ) 5lumn and 20
0.30
0.40
0.50
0.60
0.70
0.80
0.90
1.00
0.00%
0.30
0.40
0.50
0.60
0.70
0.80
0.90
1.00
0.00%
2.00% 3
cement in %
FE Analysis
Proposed Formu
( b )
( d )
flexural reinf50 MPa and 00mm thick
1.00%Reinforcem
FE AnaPropose
1.00%
Reinfor
F
P
3.00%
la
)
forcement of( e ) 60 MPaslab).
2.00%ment in %
alysised Formula
2.00%
cement in %
FE Analysis
Proposed Formu
f a
3.00%
3.00%
ula
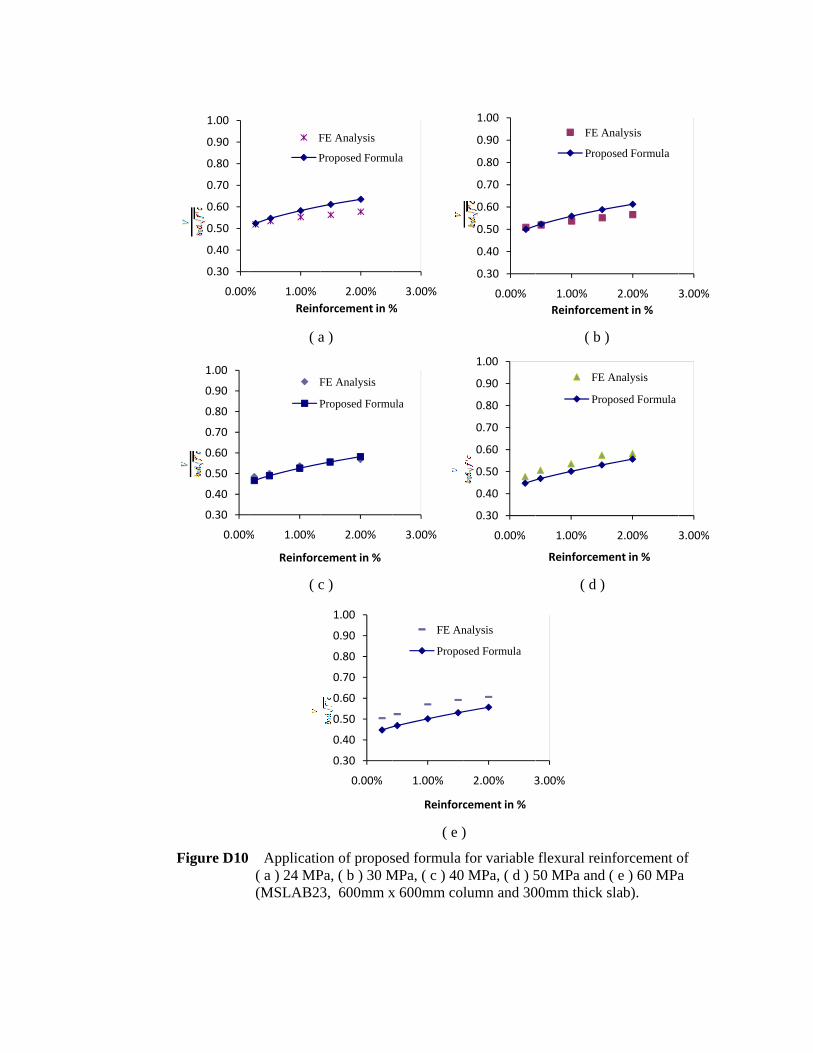
F
Figure D10
0.30
0.40
0.50
0.60
0.70
0.80
0.90
1.00
0.00%
0.30
0.40
0.50
0.60
0.70
0.80
0.90
1.00
0.00%
( a
( c
Applicatio( a ) 24 MP(MSLAB23
% 1.00%Reinf
F
P
% 1.00%
Reinforc
F
P
a )
c )
on of proposPa, ( b ) 30 M3, 600mm x
2.00%forcement in %
FE Analysis
Proposed Formu
2.00%
cement in %
FE Analysis
Proposed Formu
0.30
0.40
0.50
0.60
0.70
0.80
0.90
1.00
0.00%
( e )
sed formula MPa, ( c ) 40x 600mm col
3.00%%
ula
3.00%
ula
1.00%
Reinforc
FE An
Propo
) for variable MPa, ( d ) 5lumn and 30
0.30
0.40
0.50
0.60
0.70
0.80
0.90
1.00
0.00%
0.30
0.40
0.50
0.60
0.70
0.80
0.90
1.00
0.00%
2.00% 3
cement in %
nalysis
sed Formula
( b )
( d )
flexural rein50 MPa and 00mm thick
1.00%Reinforcem
FE A
Prop
1.00%
Reinforcem
FE
Pro
3.00%
)
nforcement o( e ) 60 MPaslab).
2.00%ment in %
Analysis
osed Formula
2.00%
ment in %
Analysis
posed Formula
of a
3.00%
3.00%
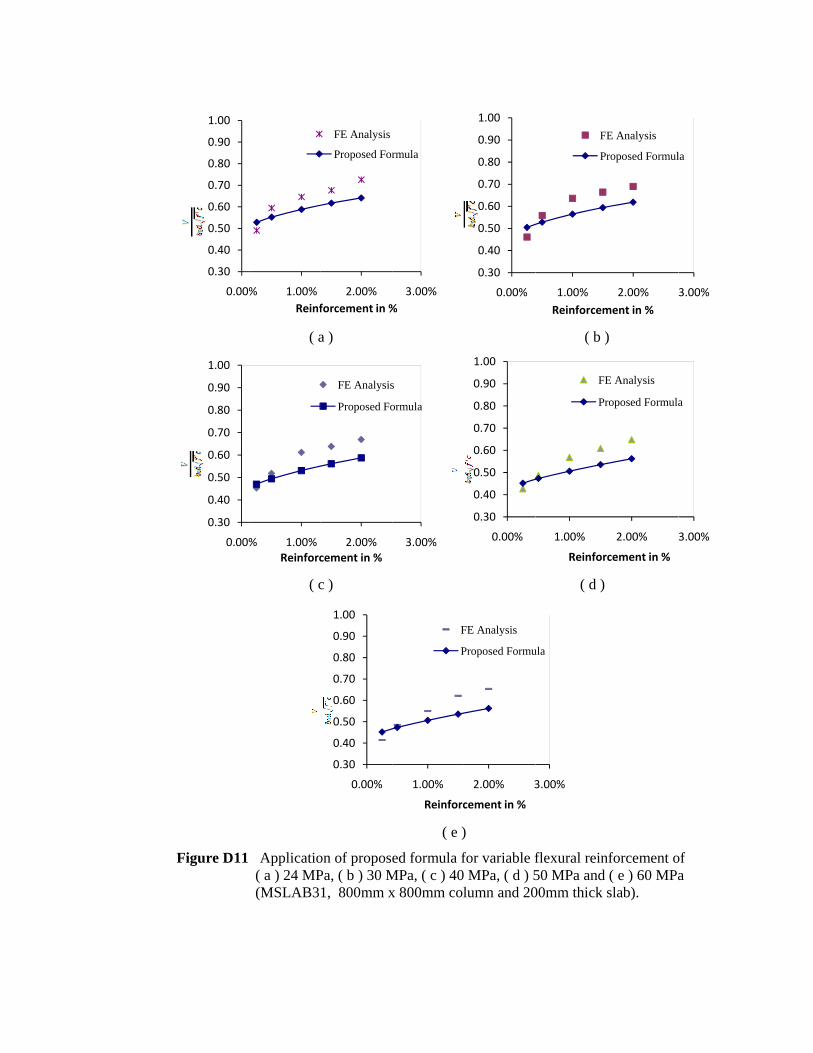
F
Figure D11
0.30
0.40
0.50
0.60
0.70
0.80
0.90
1.00
0.00%
0.30
0.40
0.50
0.60
0.70
0.80
0.90
1.00
0.00%
( a
( c
Applicatio( a ) 24 MP(MSLAB3
% 1.00%Reinf
% 1.00%Reinforc
a )
c )
on of proposePa, ( b ) 30 M1, 800mm x
2.00%forcement in %
FE Analysis
Proposed For
2.00%cement in %
FE Analysis
Proposed Fo
0.30
0.40
0.50
0.60
0.70
0.80
0.90
1.00
0.00%
( e )
ed formula fMPa, ( c ) 40x 800mm col
3.00%%
rmula
3.00%
s
ormula
1.00%
Reinforc
F
P
) for variable f MPa, ( d ) 5lumn and 20
0.30
0.40
0.50
0.60
0.70
0.80
0.90
1.00
0.00%
0.30
0.40
0.50
0.60
0.70
0.80
0.90
1.00
0.00%
2.00% 3
cement in %
FE Analysis
Proposed Formu
( b )
( d )
flexural rein50 MPa and 00mm thick
1.00%Reinforcem
FE
Pr
1.00%
Reinfor
FE
Pr
3.00%
ula
)
nforcement o( e ) 60 MPaslab).
2.00%ment in %
E Analysis
roposed Formul
2.00%
cement in %
E Analysis
roposed Formula
of a
3.00%
la
3.00%
a

F
Figure D12
0.30
0.40
0.50
0.60
0.70
0.80
0.90
1.00
0.00%
0.30
0.40
0.50
0.60
0.70
0.80
0.90
1.00
0.00%
( a
( c
Applicatio( a ) 24 MP(MSLAB32
% 1.00%Reinf
% 1.00%
Reinforc
a )
c )
on of proposePa, ( b ) 30 M2, 800mm x
2.00%forcement in %
FE Analysis
Proposed Form
2.00%
cement in %
FE Analysis
Proposed For
0.30
0.40
0.50
0.60
0.70
0.80
0.90
1.00
0.00%
( e )
ed formula fMPa, ( c ) 40x 800mm col
3.00%%
mula
3.00%
rmula
1.00%
Reinforcemen
FE
Pro
) for variable f MPa, ( d ) 5lumn and 25
0.30
0.40
0.50
0.60
0.70
0.80
0.90
1.00
0.00%
0.30
0.40
0.50
0.60
0.70
0.80
0.90
1.00
0.00%
2.00% 3
nt in %
E Analysis
oposed Formula
( b )
( d )
flexural rein50 MPa and 50mm thick
1.00%Reinforcem
F
P
1.00%Reinfor
F
P
3.00%
)
nforcement o( e ) 60 MPaslab).
2.00%ment in %
FE Analysis
Proposed Formula
2.00%cement in %
FE Analysis
Proposed Formul
of a
3.00%
a
3.00%
la
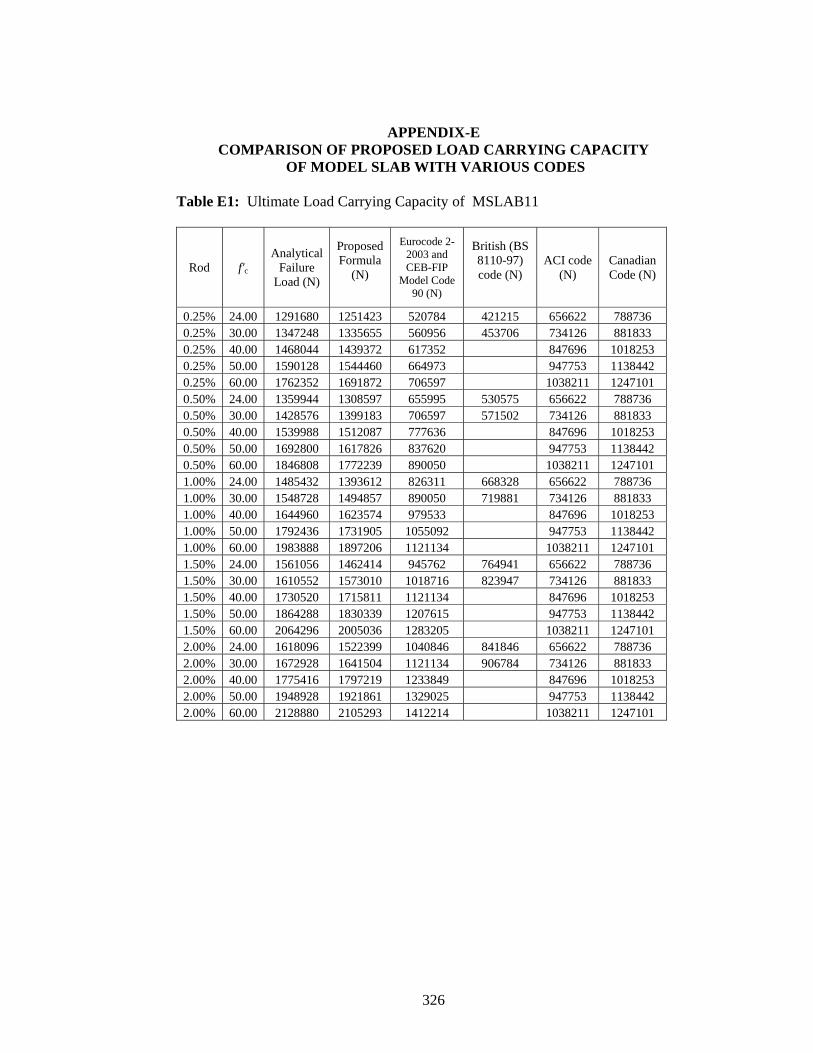
326
APPENDIX-E
COMPARISON OF PROPOSED LOAD CARRYING CAPACITY OF MODEL SLAB WITH VARIOUS CODES
Table E1: Ultimate Load Carrying Capacity of MSLAB11
Rod f'c Analytical
Failure Load (N)
Proposed Formula
(N)
Eurocode 2-2003 and CEB-FIP
Model Code 90 (N)
British (BS 8110-97) code (N)
ACI code (N)
Canadian Code (N)
0.25% 24.00 1291680 1251423 520784 421215 656622 788736 0.25% 30.00 1347248 1335655 560956 453706 734126 881833 0.25% 40.00 1468044 1439372 617352 847696 1018253 0.25% 50.00 1590128 1544460 664973 947753 1138442 0.25% 60.00 1762352 1691872 706597 1038211 1247101 0.50% 24.00 1359944 1308597 655995 530575 656622 788736 0.50% 30.00 1428576 1399183 706597 571502 734126 881833 0.50% 40.00 1539988 1512087 777636 847696 1018253 0.50% 50.00 1692800 1617826 837620 947753 1138442 0.50% 60.00 1846808 1772239 890050 1038211 1247101 1.00% 24.00 1485432 1393612 826311 668328 656622 788736 1.00% 30.00 1548728 1494857 890050 719881 734126 881833 1.00% 40.00 1644960 1623574 979533 847696 1018253 1.00% 50.00 1792436 1731905 1055092 947753 1138442 1.00% 60.00 1983888 1897206 1121134 1038211 1247101 1.50% 24.00 1561056 1462414 945762 764941 656622 788736 1.50% 30.00 1610552 1573010 1018716 823947 734126 881833 1.50% 40.00 1730520 1715811 1121134 847696 1018253 1.50% 50.00 1864288 1830339 1207615 947753 1138442 1.50% 60.00 2064296 2005036 1283205 1038211 1247101 2.00% 24.00 1618096 1522399 1040846 841846 656622 788736 2.00% 30.00 1672928 1641504 1121134 906784 734126 881833 2.00% 40.00 1775416 1797219 1233849 847696 1018253 2.00% 50.00 1948928 1921861 1329025 947753 11384422.00% 60.00 2128880 2105293 1412214 1038211 1247101

327
Table E2: Ultimate Load Carrying Capacity of MSLAB12
Rod f'c Analytical
Failure Load (N)
Proposed Formula
(N)
Eurocode 2-2003 and CEB-FIP
Model Code 90 (N)
British (BS 8110-97) code (N)
ACI code (N)
Canadian Code (N)
0.25% 24.00 1583504 1608972 743041 591056 917640 1102270 0.25% 30.00 1714880 1717271 800357 636649 1025953 1232376 0.25% 40.00 1909920 1850621 880823 1184668 1423025 0.25% 50.00 2156480 1985735 948767 1324499 1590990 0.25% 60.00 2366608 2175263 1008154 1450916 1742843 0.50% 24.00 1644316 1682482 935957 744512 917640 1102270 0.50% 30.00 1792896 1798949 1008154 801942 1025953 1232376 0.50% 40.00 2000080 1944112 1109511 1184668 1423025 0.50% 50.00 2256576 2080061 1195095 1324499 1590990 0.50% 60.00 2464680 2278593 1269901 1450916 1742843 1.00% 24.00 1738432 1791787 1178959 937810 917640 1102270 1.00% 30.00 1883424 1921959 1269901 1010150 1025953 1232376 1.00% 40.00 2098520 2087452 1397573 1184668 1423025 1.00% 50.00 2394576 2226735 1505378 1324499 1590990 1.00% 60.00 2638008 2439265 1599605 1450916 1742843 1.50% 24.00 1813136 1880246 1349389 1073379 917640 1102270 1.50% 30.00 1947824 2022441 1453477 1156177 1025953 1232376 1.50% 40.00 2172120 2206043 1599605 1184668 1423025 1.50% 50.00 2476640 2353294 1722994 1324499 1590990 1.50% 60.00 2742336 2577904 1830844 1450916 1742843 2.00% 24.00 1869072 1957370 1485053 1181293 917640 1102270 2.00% 30.00 2011120 2110506 1599605 1272415 1025953 1232376 2.00% 40.00 2258600 2310710 1760425 1184668 1423025 2.00% 50.00 2534048 2470964 1896219 1324499 1590990 2.00% 60.00 2850160 2706805 2014911 1450916 1742843
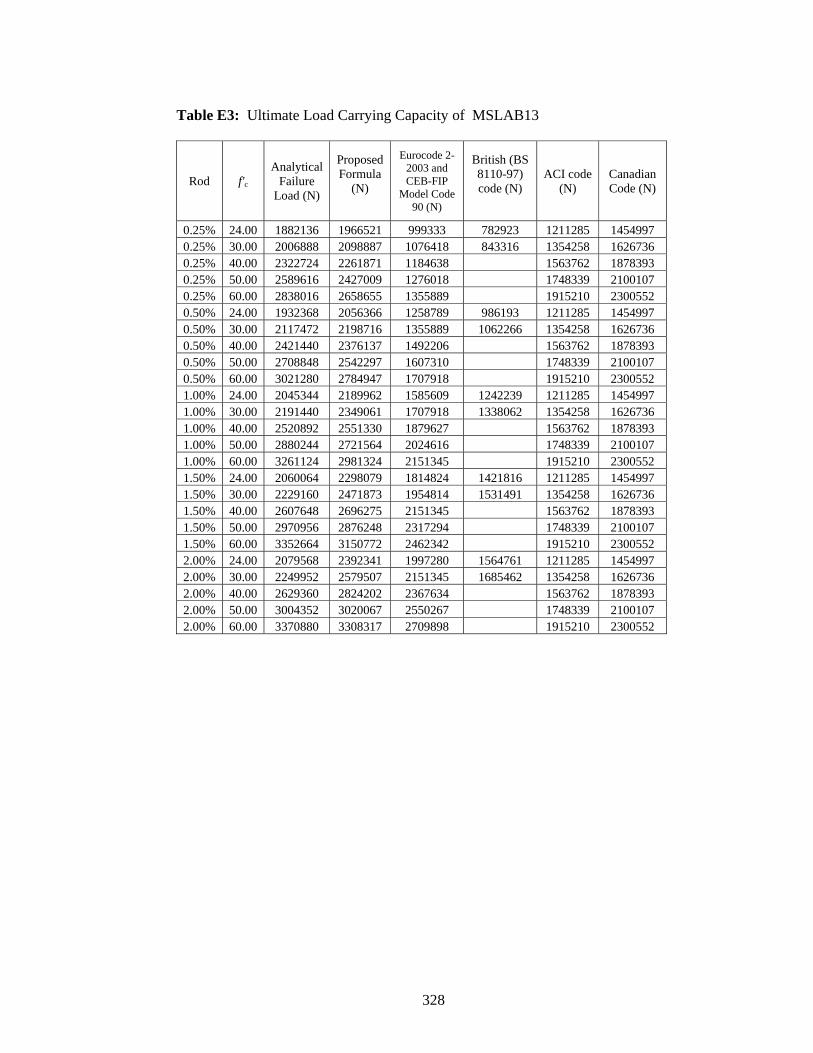
328
Table E3: Ultimate Load Carrying Capacity of MSLAB13
Rod f'c Analytical
Failure Load (N)
Proposed Formula
(N)
Eurocode 2-2003 and CEB-FIP
Model Code 90 (N)
British (BS 8110-97) code (N)
ACI code (N)
Canadian Code (N)
0.25% 24.00 1882136 1966521 999333 782923 1211285 1454997 0.25% 30.00 2006888 2098887 1076418 843316 1354258 1626736 0.25% 40.00 2322724 2261871 1184638 1563762 1878393 0.25% 50.00 2589616 2427009 1276018 1748339 2100107 0.25% 60.00 2838016 2658655 1355889 1915210 2300552 0.50% 24.00 1932368 2056366 1258789 986193 1211285 1454997 0.50% 30.00 2117472 2198716 1355889 1062266 1354258 1626736 0.50% 40.00 2421440 2376137 1492206 1563762 1878393 0.50% 50.00 2708848 2542297 1607310 1748339 2100107 0.50% 60.00 3021280 2784947 1707918 1915210 2300552 1.00% 24.00 2045344 2189962 1585609 1242239 1211285 1454997 1.00% 30.00 2191440 2349061 1707918 1338062 1354258 1626736 1.00% 40.00 2520892 2551330 1879627 1563762 1878393 1.00% 50.00 2880244 2721564 2024616 1748339 2100107 1.00% 60.00 3261124 2981324 2151345 1915210 2300552 1.50% 24.00 2060064 2298079 1814824 1421816 1211285 1454997 1.50% 30.00 2229160 2471873 1954814 1531491 1354258 1626736 1.50% 40.00 2607648 2696275 2151345 1563762 1878393 1.50% 50.00 2970956 2876248 2317294 1748339 2100107 1.50% 60.00 3352664 3150772 2462342 1915210 2300552 2.00% 24.00 2079568 2392341 1997280 1564761 1211285 1454997 2.00% 30.00 2249952 2579507 2151345 1685462 1354258 1626736 2.00% 40.00 2629360 2824202 2367634 1563762 1878393 2.00% 50.00 3004352 3020067 2550267 1748339 2100107 2.00% 60.00 3370880 3308317 2709898 1915210 2300552

329
Table E4: Ultimate Load Carrying Capacity of MSLAB21
Rod f'c Analytical
Failure Load (N)
Proposed Formula
(N)
Eurocode 2-2003 and CEB-FIP
Model Code 90 (N)
British (BS 8110-97) code (N)
ACI code (N)
Canadian Code (N)
0.25% 24.00 1505120 1496800 615472 512288 885013 1063079 0.25% 30.00 1522600 1597549 662948 551805 989474 1188558 0.25% 40.00 1703840 1721602 729598 1142547 1372429 0.25% 50.00 1854720 1847296 785878 1277406 1534422 0.25% 60.00 1981680 2023611 835069 1399328 1680875 0.50% 24.00 1672560 1565184 775267 645294 885013 1063079 0.50% 30.00 1758120 1673532 835069 695070 989474 1188558 0.50% 40.00 1886000 1808574 919024 1142547 1372429 0.50% 50.00 2068160 1935046 989915 1277406 1534422 0.50% 60.00 2257680 2119737 1051878 1399328 1680875 1.00% 24.00 1817000 1666869 976549 812831 885013 1063079 1.00% 30.00 1974320 1787966 1051878 875531 989474 1188558 1.00% 40.00 2185000 1941922 1157630 1142547 1372429 1.00% 50.00 2348760 2071494 1246926 1277406 1534422 1.00% 60.00 2543800 2269208 1324977 1399328 1680875 1.50% 24.00 1901640 1749162 1117719 930334 885013 1063079 1.50% 30.00 2083800 1881443 1203937 1002097 989474 1188558 1.50% 40.00 2312880 2052245 1324977 1142547 1372429 1.50% 50.00 2471120 2189230 1427182 1277406 1534422 1.50% 60.00 2720440 2398181 1516515 1399328 1680875 2.00% 24.00 1975240 1820908 1230091 1023867 885013 1063079 2.00% 30.00 2173040 1963368 1324977 1102845 989474 1188558 2.00% 40.00 2373600 2149615 1458186 1142547 1372429 2.00% 50.00 2559440 2298696 1570666 1277406 1534422 2.00% 60.00 2773800 2518095 1668980 1399328 1680875

330
Table E5: Ultimate Load Carrying Capacity of MSLAB22
Rod f'c Analytical
Failure Load (N)
Proposed Formula
(N)
Eurocode 2-2003 and CEB-FIP
Model Code 90 (N)
British (BS 8110-97) code (N)
ACI code (N)
Canadian Code (N)
0.25% 24.00 1880112 1924457 857355 701020 1211285 1454997 0.25% 30.00 1977816 2053991 923489 755095 1354258 1626736 0.25% 40.00 2103212 2213488 1016334 1563762 1878393 0.25% 50.00 2424200 2375095 1094731 1748339 2100107 0.25% 60.00 2667264 2601786 1163255 1915210 2300552 0.50% 24.00 1982876 2012380 1079950 883026 1211285 1454997 0.50% 30.00 2099900 2151685 1163255 951140 1354258 1626736 0.50% 40.00 2241488 2325310 1280205 1563762 1878393 0.50% 50.00 2594032 2487917 1378956 1748339 2100107 0.50% 60.00 2918240 2725376 1465270 1915210 2300552 1.00% 24.00 2003024 2143118 1360338 1112286 1211285 1454997 1.00% 30.00 2125936 2298814 1465270 1198085 1354258 1626736 1.00% 40.00 2388320 2496757 1612584 1563762 1878393 1.00% 50.00 2754112 2663349 1736974 1748339 2100107 1.00% 60.00 3081816 2917553 1845698 1915210 2300552 1.50% 24.00 2071656 2248922 1556987 1273078 1211285 1454997 1.50% 30.00 2210300 2418998 1677089 1371279 1354258 1626736 1.50% 40.00 2519604 2638600 1845698 1563762 1878393 1.50% 50.00 2872240 2814724 1988071 1748339 2100107 1.50% 60.00 3203072 3083375 2112512 1915210 2300552 2.00% 24.00 2092908 2341168 1713522 1401069 1211285 1454997 2.00% 30.00 2287304 2524330 1845698 1509143 1354258 1626736 2.00% 40.00 2594584 2763791 2031259 1563762 1878393 2.00% 50.00 2915572 2955466 2187945 1748339 2100107 2.00% 60.00 3321200 3237551 2324897 1915210 2300552

331
Table E6: Ultimate Load Carrying Capacity of MSLAB23
Rod f'c Analytical
Failure Load (N)
Proposed Formula
(N)
Eurocode 2-2003 and CEB-FIP
Model Code 90 (N)
British (BS 8110-97) code (N)
ACI code (N)
Canadian Code (N)
0.25% 24.00 2249952 2352114 1132577 782923 1570184 1886107 0.25% 30.00 2467440 2510434 1219941 843316 1755519 2108732 0.25% 40.00 2717680 2705375 1342590 2027099 2434954 0.25% 50.00 2986872 2902893 1446153 2266366 2722361 0.25% 60.00 3456992 3179960 1536674 2482679 2982197 0.50% 24.00 2317664 2459575 1426628 986193 1570184 1886107 0.50% 30.00 2519880 2629837 1536674 1062266 1755519 2108732 0.50% 40.00 2804344 2842046 1691166 2027099 2434954 0.50% 50.00 3171884 3040787 1821618 2266366 2722361 0.50% 60.00 3590852 3331015 1935641 2482679 2982197 1.00% 24.00 2398072 2619366 1797023 1242239 1570184 1886107 1.00% 30.00 2607280 2809661 1935641 1338062 1755519 2108732 1.00% 40.00 3010240 3051591 2130244 2027099 2434954 1.00% 50.00 3352848 3255205 2294565 2266366 2722361 1.00% 60.00 3911840 3565898 2438191 2482679 2982197 1.50% 24.00 2444164 2748683 2056800 1421816 1570184 1886107 1.50% 30.00 2675176 2956554 2215456 1531491 1755519 2108732 1.50% 40.00 3114200 3224956 2438191 2027099 2434954 1.50% 50.00 3598672 3440218 2626266 2266366 2722361 1.50% 60.00 4059040 3768570 2790655 2482679 2982197 2.00% 24.00 2505712 2861427 2263584 1564761 1570184 1886107 2.00% 30.00 2745924 3085292 2438191 1685462 1755519 2108732 2.00% 40.00 3181360 3377967 2683319 2027099 2434954 2.00% 50.00 3643476 3612237 2890303 2266366 2722361 2.00% 60.00 4158400 3957007 3071218 2482679 2982197
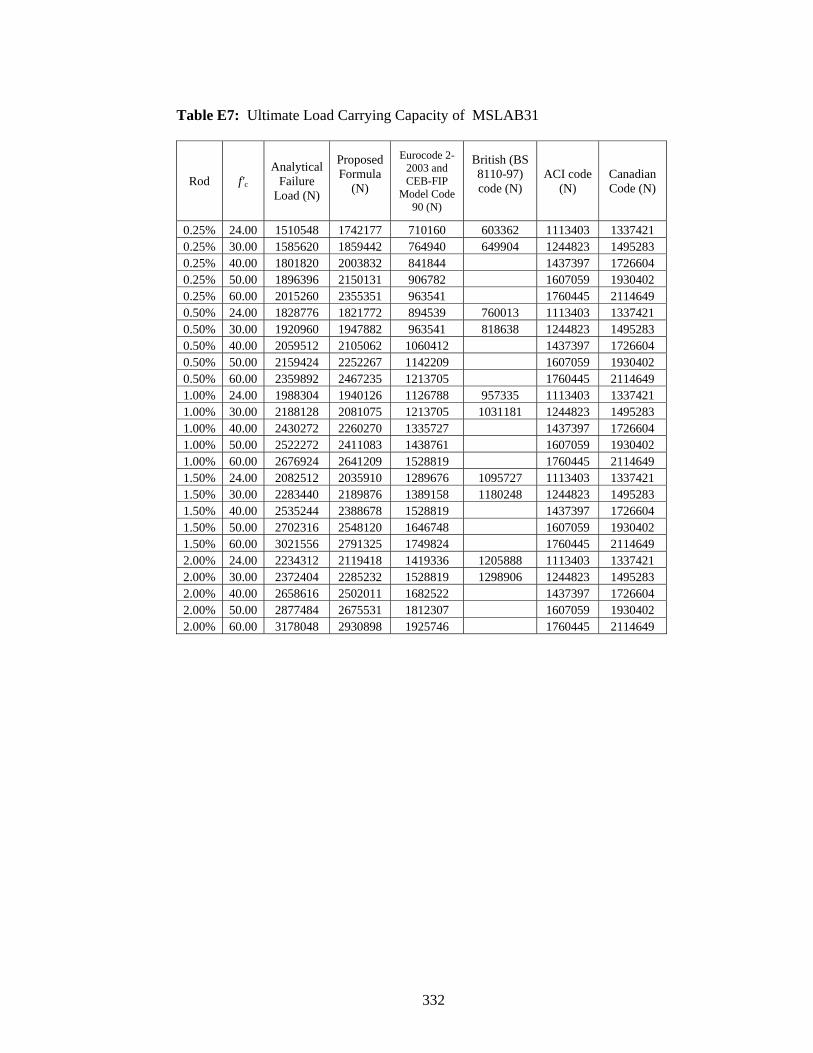
332
Table E7: Ultimate Load Carrying Capacity of MSLAB31
Rod f'c Analytical
Failure Load (N)
Proposed Formula
(N)
Eurocode 2-2003 and CEB-FIP
Model Code 90 (N)
British (BS 8110-97) code (N)
ACI code (N)
Canadian Code (N)
0.25% 24.00 1510548 1742177 710160 603362 1113403 1337421 0.25% 30.00 1585620 1859442 764940 649904 1244823 1495283 0.25% 40.00 1801820 2003832 841844 1437397 1726604 0.25% 50.00 1896396 2150131 906782 1607059 1930402 0.25% 60.00 2015260 2355351 963541 1760445 2114649 0.50% 24.00 1828776 1821772 894539 760013 1113403 1337421 0.50% 30.00 1920960 1947882 963541 818638 1244823 1495283 0.50% 40.00 2059512 2105062 1060412 1437397 1726604 0.50% 50.00 2159424 2252267 1142209 1607059 1930402 0.50% 60.00 2359892 2467235 1213705 1760445 2114649 1.00% 24.00 1988304 1940126 1126788 957335 1113403 1337421 1.00% 30.00 2188128 2081075 1213705 1031181 1244823 1495283 1.00% 40.00 2430272 2260270 1335727 1437397 1726604 1.00% 50.00 2522272 2411083 1438761 1607059 1930402 1.00% 60.00 2676924 2641209 1528819 1760445 2114649 1.50% 24.00 2082512 2035910 1289676 1095727 1113403 1337421 1.50% 30.00 2283440 2189876 1389158 1180248 1244823 1495283 1.50% 40.00 2535244 2388678 1528819 1437397 1726604 1.50% 50.00 2702316 2548120 1646748 1607059 1930402 1.50% 60.00 3021556 2791325 1749824 1760445 2114649 2.00% 24.00 2234312 2119418 1419336 1205888 1113403 1337421 2.00% 30.00 2372404 2285232 1528819 1298906 1244823 1495283 2.00% 40.00 2658616 2502011 1682522 1437397 1726604 2.00% 50.00 2877484 2675531 1812307 1607059 1930402 2.00% 60.00 3178048 2930898 1925746 1760445 2114649
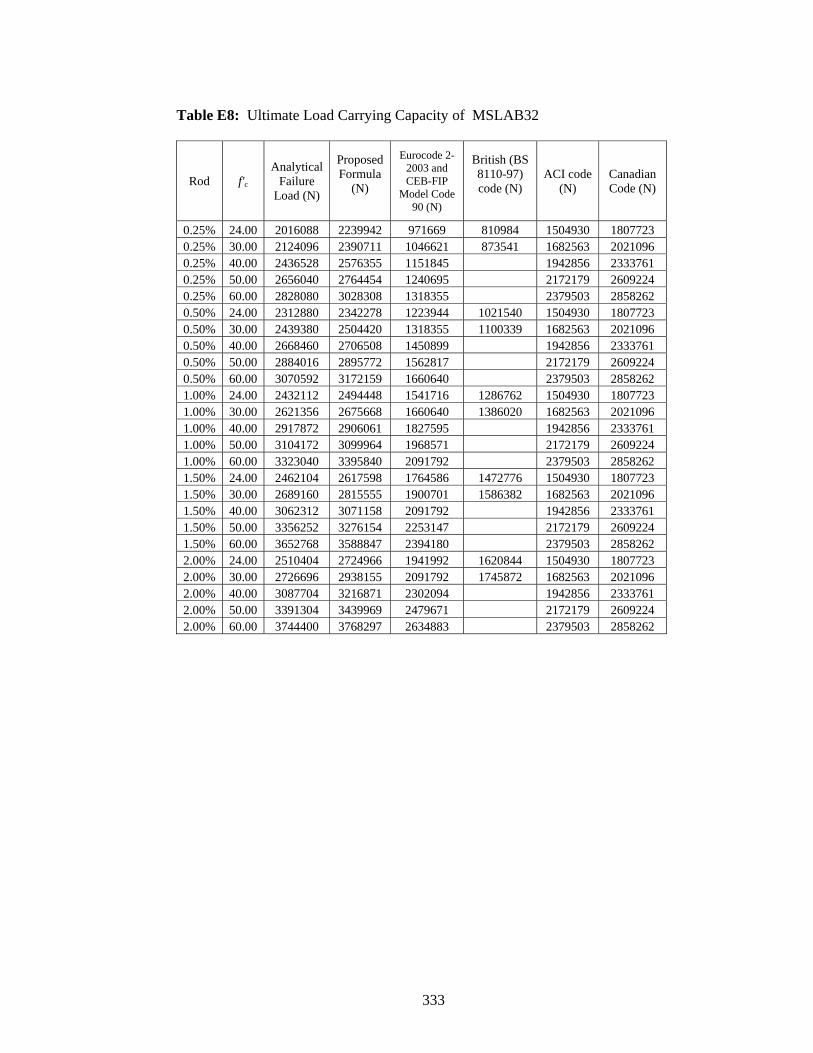
333
Table E8: Ultimate Load Carrying Capacity of MSLAB32
Rod f'c Analytical
Failure Load (N)
Proposed Formula
(N)
Eurocode 2-2003 and CEB-FIP
Model Code 90 (N)
British (BS 8110-97) code (N)
ACI code (N)
Canadian Code (N)
0.25% 24.00 2016088 2239942 971669 810984 1504930 1807723 0.25% 30.00 2124096 2390711 1046621 873541 1682563 2021096 0.25% 40.00 2436528 2576355 1151845 1942856 2333761 0.25% 50.00 2656040 2764454 1240695 2172179 2609224 0.25% 60.00 2828080 3028308 1318355 2379503 2858262 0.50% 24.00 2312880 2342278 1223944 1021540 1504930 1807723 0.50% 30.00 2439380 2504420 1318355 1100339 1682563 2021096 0.50% 40.00 2668460 2706508 1450899 1942856 2333761 0.50% 50.00 2884016 2895772 1562817 2172179 2609224 0.50% 60.00 3070592 3172159 1660640 2379503 2858262 1.00% 24.00 2432112 2494448 1541716 1286762 1504930 1807723 1.00% 30.00 2621356 2675668 1660640 1386020 1682563 2021096 1.00% 40.00 2917872 2906061 1827595 1942856 2333761 1.00% 50.00 3104172 3099964 1968571 2172179 2609224 1.00% 60.00 3323040 3395840 2091792 2379503 2858262 1.50% 24.00 2462104 2617598 1764586 1472776 1504930 1807723 1.50% 30.00 2689160 2815555 1900701 1586382 1682563 2021096 1.50% 40.00 3062312 3071158 2091792 1942856 2333761 1.50% 50.00 3356252 3276154 2253147 2172179 2609224 1.50% 60.00 3652768 3588847 2394180 2379503 2858262 2.00% 24.00 2510404 2724966 1941992 1620844 1504930 1807723 2.00% 30.00 2726696 2938155 2091792 1745872 1682563 2021096 2.00% 40.00 3087704 3216871 2302094 1942856 2333761 2.00% 50.00 3391304 3439969 2479671 2172179 2609224 2.00% 60.00 3744400 3768297 2634883 2379503 2858262

334
Table E9: Ultimate Load Carrying Capacity of MSLAB33
Rod f'c Analytical
Failure Load (N)
Proposed Formula
(N)
Eurocode 2-2003 and CEB-FIP
Model Code 90 (N)
British (BS 8110-97) code (N)
ACI code (N)
Canadian Code (N)
0.25% 24.00 2579128 2737706 1265821 1038571 1929083 2317217 0.25% 30.00 2761196 2921980 1363463 1118684 2156781 2590728 0.25% 40.00 3084484 3148879 1500541 2490436 2991515 0.25% 50.00 3370788 3378778 1616289 2784392 3344615 0.25% 60.00 3666016 3701265 1717459 3050149 3663842 0.50% 24.00 2665056 2862785 1594466 1308216 1929083 2317217 0.50% 30.00 2883648 3060957 1717459 1409128 2156781 2590728 0.50% 40.00 3159004 3307955 1890127 2490436 2991515 0.50% 50.00 3475208 3539277 2035926 2784392 3344615 0.50% 60.00 3768320 3877083 2163363 3050149 3663842 1.00% 24.00 2895240 3048770 2008438 1647868 1929083 2317217 1.00% 30.00 3110244 3270261 2163363 1774980 2156781 2590728 1.00% 40.00 3464720 3551852 2380861 2490436 2991515 1.00% 50.00 3933920 3788845 2564514 2784392 3344615 1.00% 60.00 4235680 4150471 2725037 3050149 3663842 1.50% 24.00 2941976 3199286 2298776 1886083 1929083 2317217 1.50% 30.00 3241436 3441234 2476098 2031570 2156781 2590728 1.50% 40.00 3668960 3753637 2725037 2490436 2991515 1.50% 50.00 4128960 4004188 2935239 2784392 3344615 1.50% 60.00 4441760 4386368 3118967 3050149 3663842 2.00% 24.00 2981168 3330514 2529888 2075703 1929083 2317217 2.00% 30.00 3307952 3591078 2725037 2235817 2156781 2590728 2.00% 40.00 3768320 3931732 2999003 2490436 2991515 2.00% 50.00 4228320 4204406 3230338 2784392 3344615 2.00% 60.00 4548480 4605697 3432538 3050149 3663842
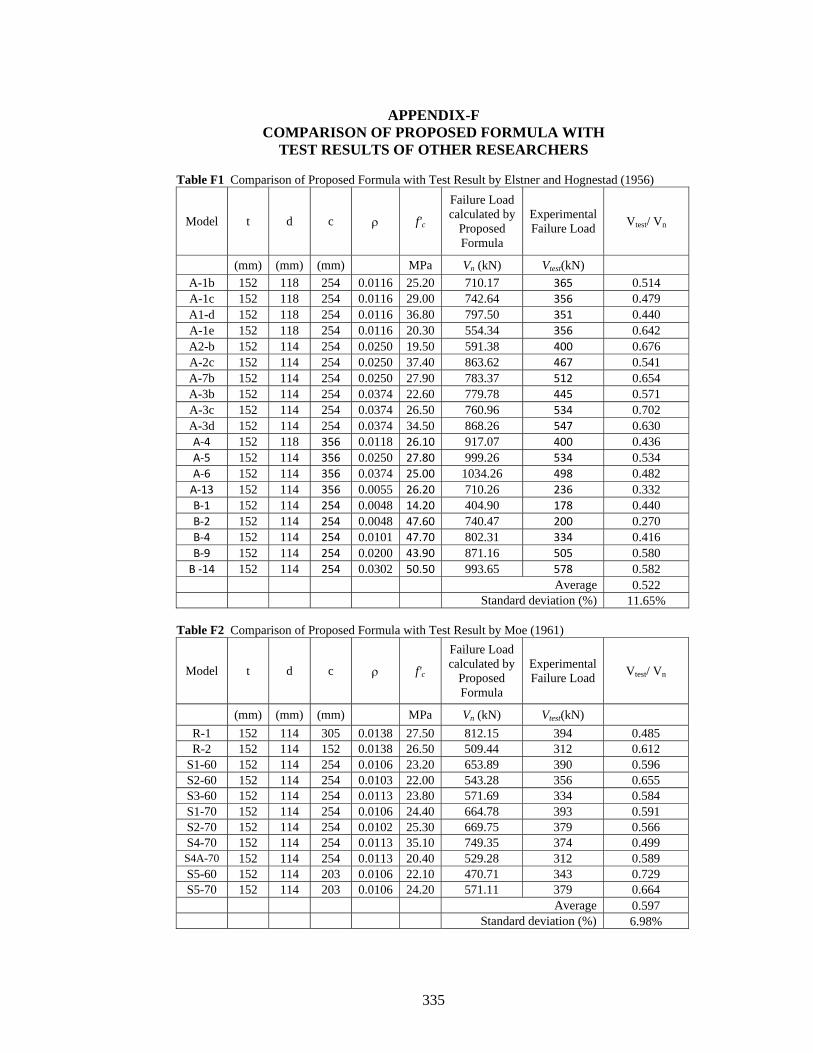
335
APPENDIX-F COMPARISON OF PROPOSED FORMULA WITH
TEST RESULTS OF OTHER RESEARCHERS Table F1 Comparison of Proposed Formula with Test Result by Elstner and Hognestad (1956)
Model t d c ρ f'c
Failure Load calculated by
Proposed Formula
Experimental Failure Load Vtest/ Vn
(mm) (mm) (mm) MPa Vn (kN) Vtest(kN) A-1b 152 118 254 0.0116 25.20 710.17 365 0.514 A-1c 152 118 254 0.0116 29.00 742.64 356 0.479 A1-d 152 118 254 0.0116 36.80 797.50 351 0.440 A-1e 152 118 254 0.0116 20.30 554.34 356 0.642 A2-b 152 114 254 0.0250 19.50 591.38 400 0.676 A-2c 152 114 254 0.0250 37.40 863.62 467 0.541 A-7b 152 114 254 0.0250 27.90 783.37 512 0.654 A-3b 152 114 254 0.0374 22.60 779.78 445 0.571 A-3c 152 114 254 0.0374 26.50 760.96 534 0.702 A-3d 152 114 254 0.0374 34.50 868.26 547 0.630 A‐4 152 118 356 0.0118 26.10 917.07 400 0.436 A‐5 152 114 356 0.0250 27.80 999.26 534 0.534 A‐6 152 114 356 0.0374 25.00 1034.26 498 0.482 A‐13 152 114 356 0.0055 26.20 710.26 236 0.332 B‐1 152 114 254 0.0048 14.20 404.90 178 0.440 B‐2 152 114 254 0.0048 47.60 740.47 200 0.270 B‐4 152 114 254 0.0101 47.70 802.31 334 0.416 B‐9 152 114 254 0.0200 43.90 871.16 505 0.580 B ‐14 152 114 254 0.0302 50.50 993.65 578 0.582
Average 0.522 Standard deviation (%) 11.65%
Table F2 Comparison of Proposed Formula with Test Result by Moe (1961)
Model t d c ρ f'c
Failure Load calculated by
Proposed Formula
Experimental Failure Load Vtest/ Vn
(mm) (mm) (mm) MPa Vn (kN) Vtest(kN) R-1 152 114 305 0.0138 27.50 812.15 394 0.485 R-2 152 114 152 0.0138 26.50 509.44 312 0.612
S1-60 152 114 254 0.0106 23.20 653.89 390 0.596 S2-60 152 114 254 0.0103 22.00 543.28 356 0.655 S3-60 152 114 254 0.0113 23.80 571.69 334 0.584 S1-70 152 114 254 0.0106 24.40 664.78 393 0.591 S2-70 152 114 254 0.0102 25.30 669.75 379 0.566 S4-70 152 114 254 0.0113 35.10 749.35 374 0.499 S4A-70 152 114 254 0.0113 20.40 529.28 312 0.589 S5-60 152 114 203 0.0106 22.10 470.71 343 0.729 S5-70 152 114 203 0.0106 24.20 571.11 379 0.664
Average 0.597 Standard deviation (%) 6.98%
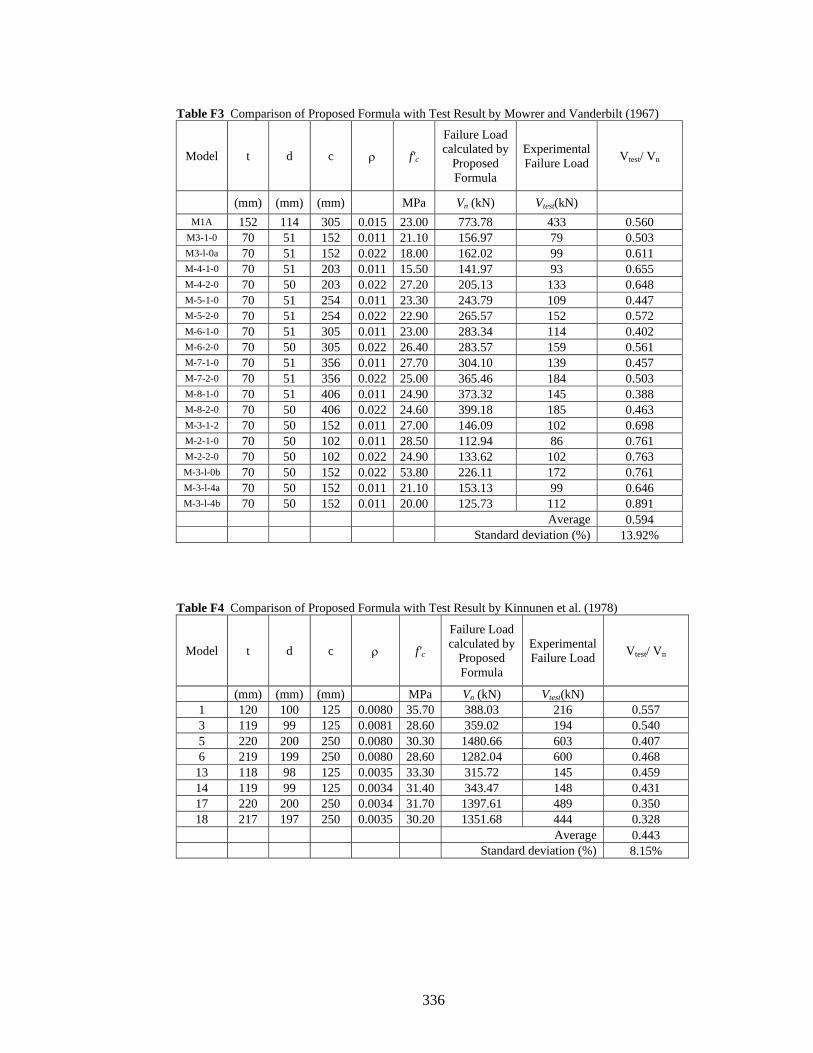
336
Table F3 Comparison of Proposed Formula with Test Result by Mowrer and Vanderbilt (1967)
Model t d c ρ f'c
Failure Load calculated by
Proposed Formula
Experimental Failure Load Vtest/ Vn
(mm) (mm) (mm) MPa Vn (kN) Vtest(kN) M1A 152 114 305 0.015 23.00 773.78 433 0.560
M3-1-0 70 51 152 0.011 21.10 156.97 79 0.503 M3-l-0a 70 51 152 0.022 18.00 162.02 99 0.611 M-4-1-0 70 51 203 0.011 15.50 141.97 93 0.655 M-4-2-0 70 50 203 0.022 27.20 205.13 133 0.648 M-5-1-0 70 51 254 0.011 23.30 243.79 109 0.447 M-5-2-0 70 51 254 0.022 22.90 265.57 152 0.572 M-6-1-0 70 51 305 0.011 23.00 283.34 114 0.402 M-6-2-0 70 50 305 0.022 26.40 283.57 159 0.561 M-7-1-0 70 51 356 0.011 27.70 304.10 139 0.457 M-7-2-0 70 51 356 0.022 25.00 365.46 184 0.503 M-8-1-0 70 51 406 0.011 24.90 373.32 145 0.388 M-8-2-0 70 50 406 0.022 24.60 399.18 185 0.463 M-3-1-2 70 50 152 0.011 27.00 146.09 102 0.698 M-2-1-0 70 50 102 0.011 28.50 112.94 86 0.761 M-2-2-0 70 50 102 0.022 24.90 133.62 102 0.763 M-3-l-0b 70 50 152 0.022 53.80 226.11 172 0.761 M-3-l-4a 70 50 152 0.011 21.10 153.13 99 0.646 M-3-l-4b 70 50 152 0.011 20.00 125.73 112 0.891
Average 0.594 Standard deviation (%) 13.92%
Table F4 Comparison of Proposed Formula with Test Result by Kinnunen et al. (1978)
Model t d c ρ f'c
Failure Load calculated by
Proposed Formula
Experimental Failure Load Vtest/ Vn
(mm) (mm) (mm) MPa Vn (kN) Vtest(kN) 1 120 100 125 0.0080 35.70 388.03 216 0.557 3 119 99 125 0.0081 28.60 359.02 194 0.540 5 220 200 250 0.0080 30.30 1480.66 603 0.407 6 219 199 250 0.0080 28.60 1282.04 600 0.468
13 118 98 125 0.0035 33.30 315.72 145 0.459 14 119 99 125 0.0034 31.40 343.47 148 0.431 17 220 200 250 0.0034 31.70 1397.61 489 0.350 18 217 197 250 0.0035 30.20 1351.68 444 0.328
Average 0.443 Standard deviation (%) 8.15%
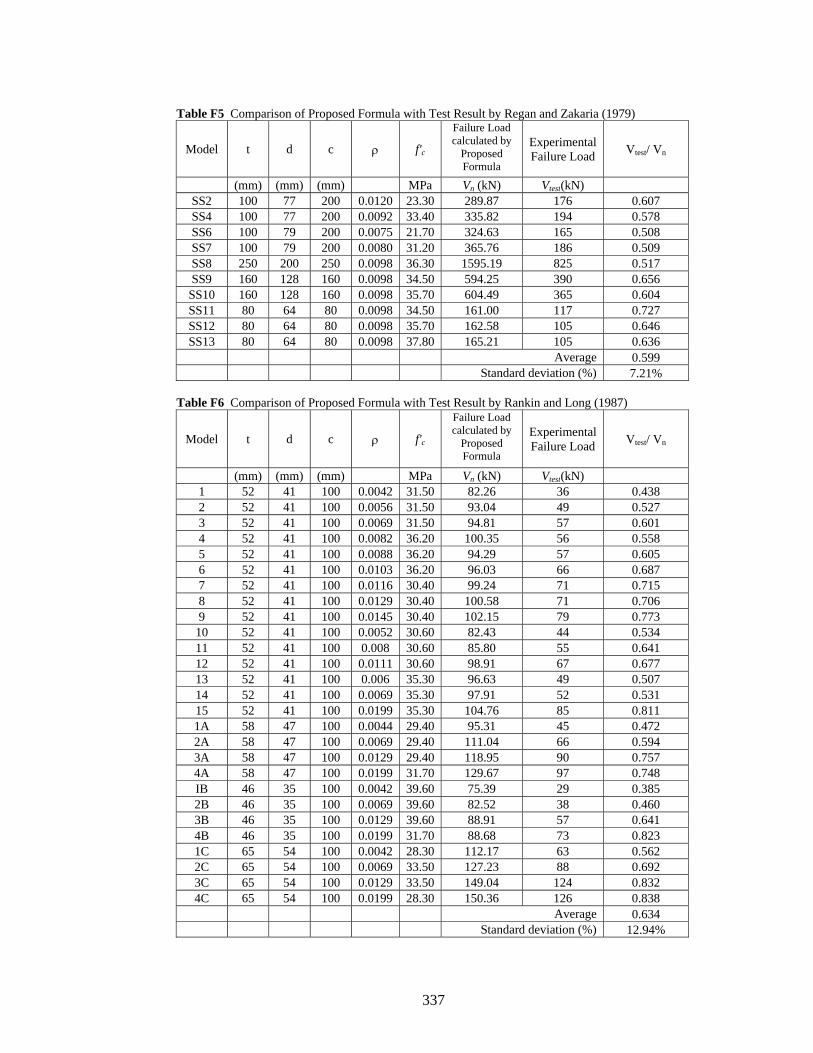
337
Table F5 Comparison of Proposed Formula with Test Result by Regan and Zakaria (1979)
Model t d c ρ f'c
Failure Load calculated by
Proposed Formula
Experimental Failure Load Vtest/ Vn
(mm) (mm) (mm) MPa Vn (kN) Vtest(kN) SS2 100 77 200 0.0120 23.30 289.87 176 0.607 SS4 100 77 200 0.0092 33.40 335.82 194 0.578 SS6 100 79 200 0.0075 21.70 324.63 165 0.508 SS7 100 79 200 0.0080 31.20 365.76 186 0.509 SS8 250 200 250 0.0098 36.30 1595.19 825 0.517 SS9 160 128 160 0.0098 34.50 594.25 390 0.656 SS10 160 128 160 0.0098 35.70 604.49 365 0.604 SS11 80 64 80 0.0098 34.50 161.00 117 0.727 SS12 80 64 80 0.0098 35.70 162.58 105 0.646 SS13 80 64 80 0.0098 37.80 165.21 105 0.636
Average 0.599 Standard deviation (%) 7.21%
Table F6 Comparison of Proposed Formula with Test Result by Rankin and Long (1987)
Model t d c ρ f'c
Failure Load calculated by
Proposed Formula
Experimental Failure Load Vtest/ Vn
(mm) (mm) (mm) MPa Vn (kN) Vtest(kN) 1 52 41 100 0.0042 31.50 82.26 36 0.438 2 52 41 100 0.0056 31.50 93.04 49 0.527 3 52 41 100 0.0069 31.50 94.81 57 0.601 4 52 41 100 0.0082 36.20 100.35 56 0.558 5 52 41 100 0.0088 36.20 94.29 57 0.605 6 52 41 100 0.0103 36.20 96.03 66 0.687 7 52 41 100 0.0116 30.40 99.24 71 0.715 8 52 41 100 0.0129 30.40 100.58 71 0.706 9 52 41 100 0.0145 30.40 102.15 79 0.773
10 52 41 100 0.0052 30.60 82.43 44 0.534 11 52 41 100 0.008 30.60 85.80 55 0.641 12 52 41 100 0.0111 30.60 98.91 67 0.677 13 52 41 100 0.006 35.30 96.63 49 0.507 14 52 41 100 0.0069 35.30 97.91 52 0.531 15 52 41 100 0.0199 35.30 104.76 85 0.811 1A 58 47 100 0.0044 29.40 95.31 45 0.472 2A 58 47 100 0.0069 29.40 111.04 66 0.594 3A 58 47 100 0.0129 29.40 118.95 90 0.757 4A 58 47 100 0.0199 31.70 129.67 97 0.748 IB 46 35 100 0.0042 39.60 75.39 29 0.385 2B 46 35 100 0.0069 39.60 82.52 38 0.460 3B 46 35 100 0.0129 39.60 88.91 57 0.641 4B 46 35 100 0.0199 31.70 88.68 73 0.823 1C 65 54 100 0.0042 28.30 112.17 63 0.562 2C 65 54 100 0.0069 33.50 127.23 88 0.692 3C 65 54 100 0.0129 33.50 149.04 124 0.832 4C 65 54 100 0.0199 28.30 150.36 126 0.838
Average 0.634 Standard deviation (%) 12.94%
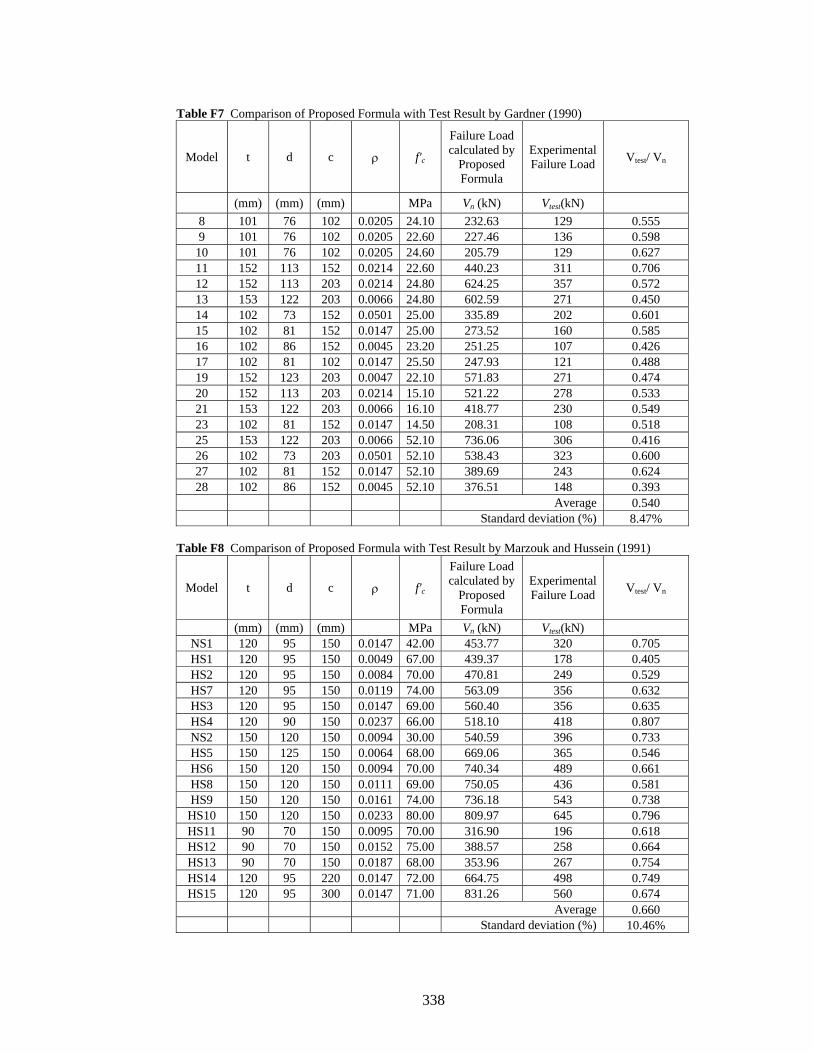
338
Table F7 Comparison of Proposed Formula with Test Result by Gardner (1990)
Model t d c ρ f'c
Failure Load calculated by
Proposed Formula
Experimental Failure Load Vtest/ Vn
(mm) (mm) (mm) MPa Vn (kN) Vtest(kN) 8 101 76 102 0.0205 24.10 232.63 129 0.555 9 101 76 102 0.0205 22.60 227.46 136 0.598
10 101 76 102 0.0205 24.60 205.79 129 0.627 11 152 113 152 0.0214 22.60 440.23 311 0.706 12 152 113 203 0.0214 24.80 624.25 357 0.572 13 153 122 203 0.0066 24.80 602.59 271 0.450 14 102 73 152 0.0501 25.00 335.89 202 0.601 15 102 81 152 0.0147 25.00 273.52 160 0.585 16 102 86 152 0.0045 23.20 251.25 107 0.426 17 102 81 102 0.0147 25.50 247.93 121 0.488 19 152 123 203 0.0047 22.10 571.83 271 0.474 20 152 113 203 0.0214 15.10 521.22 278 0.533 21 153 122 203 0.0066 16.10 418.77 230 0.549 23 102 81 152 0.0147 14.50 208.31 108 0.518 25 153 122 203 0.0066 52.10 736.06 306 0.416 26 102 73 203 0.0501 52.10 538.43 323 0.600 27 102 81 152 0.0147 52.10 389.69 243 0.624 28 102 86 152 0.0045 52.10 376.51 148 0.393
Average 0.540 Standard deviation (%) 8.47%
Table F8 Comparison of Proposed Formula with Test Result by Marzouk and Hussein (1991)
Model t d c ρ f'c
Failure Load calculated by
Proposed Formula
Experimental Failure Load Vtest/ Vn
(mm) (mm) (mm) MPa Vn (kN) Vtest(kN) NS1 120 95 150 0.0147 42.00 453.77 320 0.705 HS1 120 95 150 0.0049 67.00 439.37 178 0.405 HS2 120 95 150 0.0084 70.00 470.81 249 0.529 HS7 120 95 150 0.0119 74.00 563.09 356 0.632 HS3 120 95 150 0.0147 69.00 560.40 356 0.635 HS4 120 90 150 0.0237 66.00 518.10 418 0.807 NS2 150 120 150 0.0094 30.00 540.59 396 0.733 HS5 150 125 150 0.0064 68.00 669.06 365 0.546 HS6 150 120 150 0.0094 70.00 740.34 489 0.661 HS8 150 120 150 0.0111 69.00 750.05 436 0.581 HS9 150 120 150 0.0161 74.00 736.18 543 0.738 HS10 150 120 150 0.0233 80.00 809.97 645 0.796 HS11 90 70 150 0.0095 70.00 316.90 196 0.618 HS12 90 70 150 0.0152 75.00 388.57 258 0.664 HS13 90 70 150 0.0187 68.00 353.96 267 0.754 HS14 120 95 220 0.0147 72.00 664.75 498 0.749 HS15 120 95 300 0.0147 71.00 831.26 560 0.674
Average 0.660Standard deviation (%) 10.46%
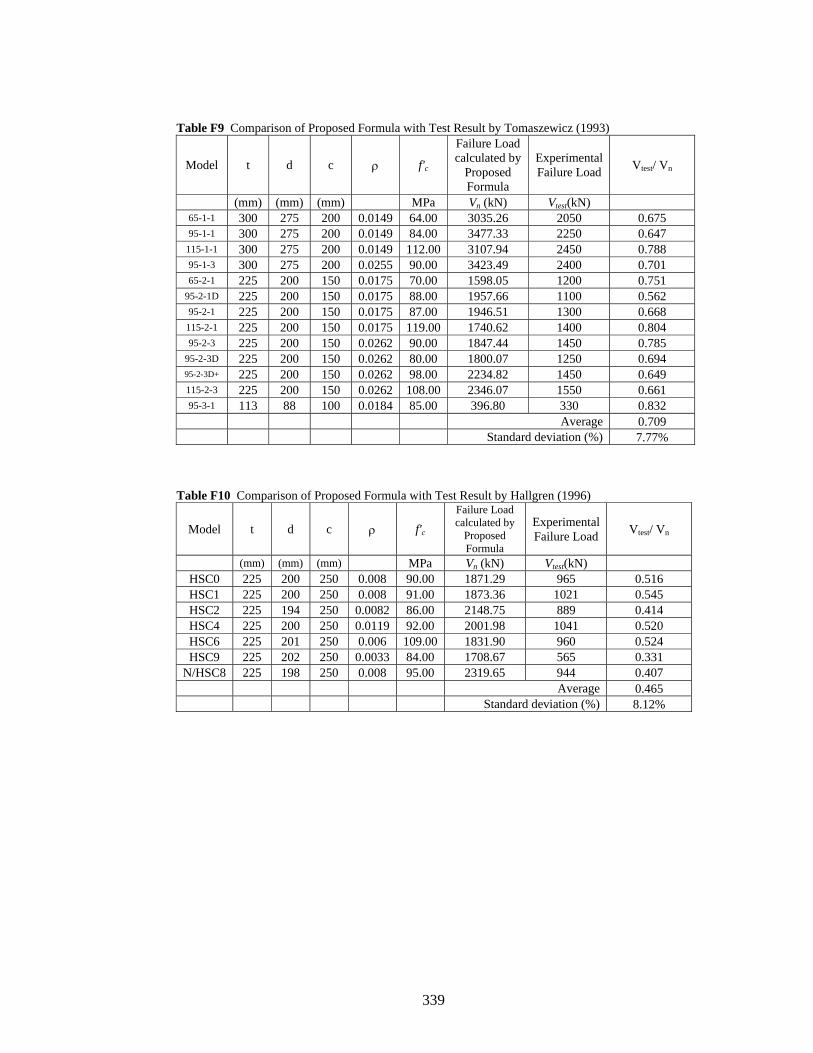
339
Table F9 Comparison of Proposed Formula with Test Result by Tomaszewicz (1993)
Model t d c ρ f'c
Failure Load calculated by
Proposed Formula
Experimental Failure Load Vtest/ Vn
(mm) (mm) (mm) MPa Vn (kN) Vtest(kN) 65-1-1 300 275 200 0.0149 64.00 3035.26 2050 0.675 95-1-1 300 275 200 0.0149 84.00 3477.33 2250 0.647
115-1-1 300 275 200 0.0149 112.00 3107.94 2450 0.788 95-1-3 300 275 200 0.0255 90.00 3423.49 2400 0.701 65-2-1 225 200 150 0.0175 70.00 1598.05 1200 0.751
95-2-1D 225 200 150 0.0175 88.00 1957.66 1100 0.562 95-2-1 225 200 150 0.0175 87.00 1946.51 1300 0.668
115-2-1 225 200 150 0.0175 119.00 1740.62 1400 0.804 95-2-3 225 200 150 0.0262 90.00 1847.44 1450 0.785
95-2-3D 225 200 150 0.0262 80.00 1800.07 1250 0.694 95-2-3D+ 225 200 150 0.0262 98.00 2234.82 1450 0.649 115-2-3 225 200 150 0.0262 108.00 2346.07 1550 0.661 95-3-1 113 88 100 0.0184 85.00 396.80 330 0.832
Average 0.709 Standard deviation (%) 7.77%
Table F10 Comparison of Proposed Formula with Test Result by Hallgren (1996)
Model t d c ρ f'c Failure Load calculated by
Proposed Formula
Experimental Failure Load Vtest/ Vn
(mm) (mm) (mm) MPa Vn (kN) Vtest(kN) HSC0 225 200 250 0.008 90.00 1871.29 965 0.516 HSC1 225 200 250 0.008 91.00 1873.36 1021 0.545 HSC2 225 194 250 0.0082 86.00 2148.75 889 0.414 HSC4 225 200 250 0.0119 92.00 2001.98 1041 0.520 HSC6 225 201 250 0.006 109.00 1831.90 960 0.524 HSC9 225 202 250 0.0033 84.00 1708.67 565 0.331
N/HSC8 225 198 250 0.008 95.00 2319.65 944 0.407 Average 0.465
Standard deviation (%) 8.12%
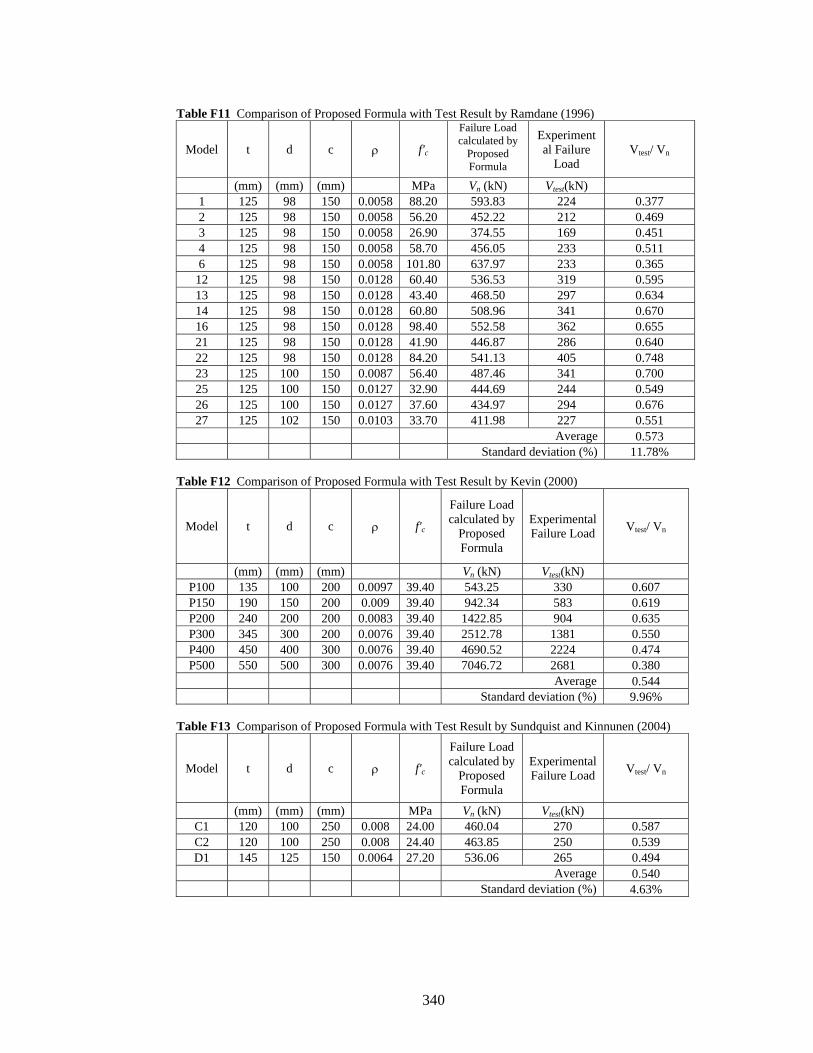
340
Table F11 Comparison of Proposed Formula with Test Result by Ramdane (1996)
Model t d c ρ f'c
Failure Load calculated by
Proposed Formula
Experimental Failure
Load Vtest/ Vn
(mm) (mm) (mm) MPa Vn (kN) Vtest(kN) 1 125 98 150 0.0058 88.20 593.83 224 0.377 2 125 98 150 0.0058 56.20 452.22 212 0.469 3 125 98 150 0.0058 26.90 374.55 169 0.451 4 125 98 150 0.0058 58.70 456.05 233 0.511 6 125 98 150 0.0058 101.80 637.97 233 0.365
12 125 98 150 0.0128 60.40 536.53 319 0.595 13 125 98 150 0.0128 43.40 468.50 297 0.634 14 125 98 150 0.0128 60.80 508.96 341 0.670 16 125 98 150 0.0128 98.40 552.58 362 0.655 21 125 98 150 0.0128 41.90 446.87 286 0.640 22 125 98 150 0.0128 84.20 541.13 405 0.748 23 125 100 150 0.0087 56.40 487.46 341 0.700 25 125 100 150 0.0127 32.90 444.69 244 0.549 26 125 100 150 0.0127 37.60 434.97 294 0.676 27 125 102 150 0.0103 33.70 411.98 227 0.551
Average 0.573Standard deviation (%) 11.78%
Table F12 Comparison of Proposed Formula with Test Result by Kevin (2000)
Model t d c ρ f'c
Failure Load calculated by
Proposed Formula
Experimental Failure Load Vtest/ Vn
(mm) (mm) (mm) Vn (kN) Vtest(kN) P100 135 100 200 0.0097 39.40 543.25 330 0.607 P150 190 150 200 0.009 39.40 942.34 583 0.619 P200 240 200 200 0.0083 39.40 1422.85 904 0.635 P300 345 300 200 0.0076 39.40 2512.78 1381 0.550 P400 450 400 300 0.0076 39.40 4690.52 2224 0.474 P500 550 500 300 0.0076 39.40 7046.72 2681 0.380
Average 0.544 Standard deviation (%) 9.96%
Table F13 Comparison of Proposed Formula with Test Result by Sundquist and Kinnunen (2004)
Model t d c ρ f'c
Failure Load calculated by
Proposed Formula
Experimental Failure Load Vtest/ Vn
(mm) (mm) (mm) MPa Vn (kN) Vtest(kN) C1 120 100 250 0.008 24.00 460.04 270 0.587 C2 120 100 250 0.008 24.40 463.85 250 0.539 D1 145 125 150 0.0064 27.20 536.06 265 0.494
Average 0.540 Standard deviation (%) 4.63%
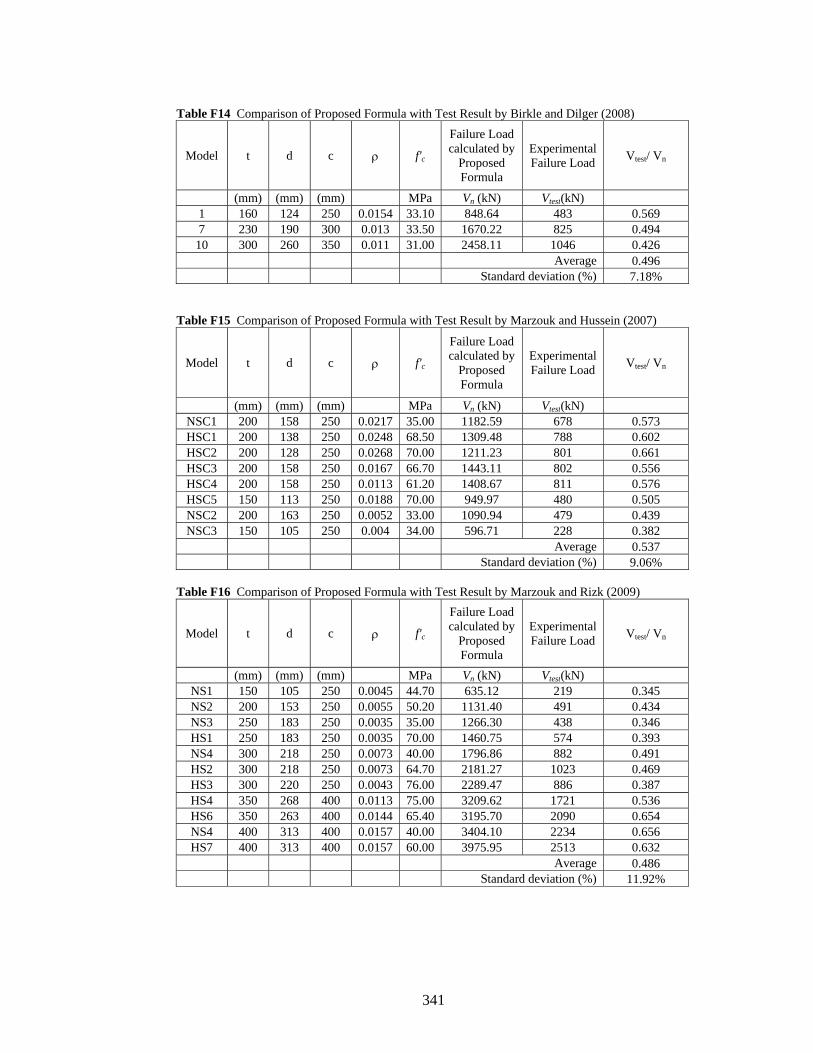
341
Table F14 Comparison of Proposed Formula with Test Result by Birkle and Dilger (2008)
Model t d c ρ f'c
Failure Load calculated by
Proposed Formula
Experimental Failure Load Vtest/ Vn
(mm) (mm) (mm) MPa Vn (kN) Vtest(kN) 1 160 124 250 0.0154 33.10 848.64 483 0.569 7 230 190 300 0.013 33.50 1670.22 825 0.494
10 300 260 350 0.011 31.00 2458.11 1046 0.426 Average 0.496
Standard deviation (%) 7.18% Table F15 Comparison of Proposed Formula with Test Result by Marzouk and Hussein (2007)
Model t d c ρ f'c
Failure Load calculated by
Proposed Formula
Experimental Failure Load Vtest/ Vn
(mm) (mm) (mm) MPa Vn (kN) Vtest(kN) NSC1 200 158 250 0.0217 35.00 1182.59 678 0.573 HSC1 200 138 250 0.0248 68.50 1309.48 788 0.602 HSC2 200 128 250 0.0268 70.00 1211.23 801 0.661 HSC3 200 158 250 0.0167 66.70 1443.11 802 0.556 HSC4 200 158 250 0.0113 61.20 1408.67 811 0.576 HSC5 150 113 250 0.0188 70.00 949.97 480 0.505 NSC2 200 163 250 0.0052 33.00 1090.94 479 0.439 NSC3 150 105 250 0.004 34.00 596.71 228 0.382
Average 0.537 Standard deviation (%) 9.06%
Table F16 Comparison of Proposed Formula with Test Result by Marzouk and Rizk (2009)
Model t d c ρ f'c
Failure Load calculated by
Proposed Formula
Experimental Failure Load Vtest/ Vn
(mm) (mm) (mm) MPa Vn (kN) Vtest(kN) NS1 150 105 250 0.0045 44.70 635.12 219 0.345 NS2 200 153 250 0.0055 50.20 1131.40 491 0.434 NS3 250 183 250 0.0035 35.00 1266.30 438 0.346 HS1 250 183 250 0.0035 70.00 1460.75 574 0.393 NS4 300 218 250 0.0073 40.00 1796.86 882 0.491 HS2 300 218 250 0.0073 64.70 2181.27 1023 0.469 HS3 300 220 250 0.0043 76.00 2289.47 886 0.387 HS4 350 268 400 0.0113 75.00 3209.62 1721 0.536 HS6 350 263 400 0.0144 65.40 3195.70 2090 0.654 NS4 400 313 400 0.0157 40.00 3404.10 2234 0.656 HS7 400 313 400 0.0157 60.00 3975.95 2513 0.632
Average 0.486 Standard deviation (%) 11.92%
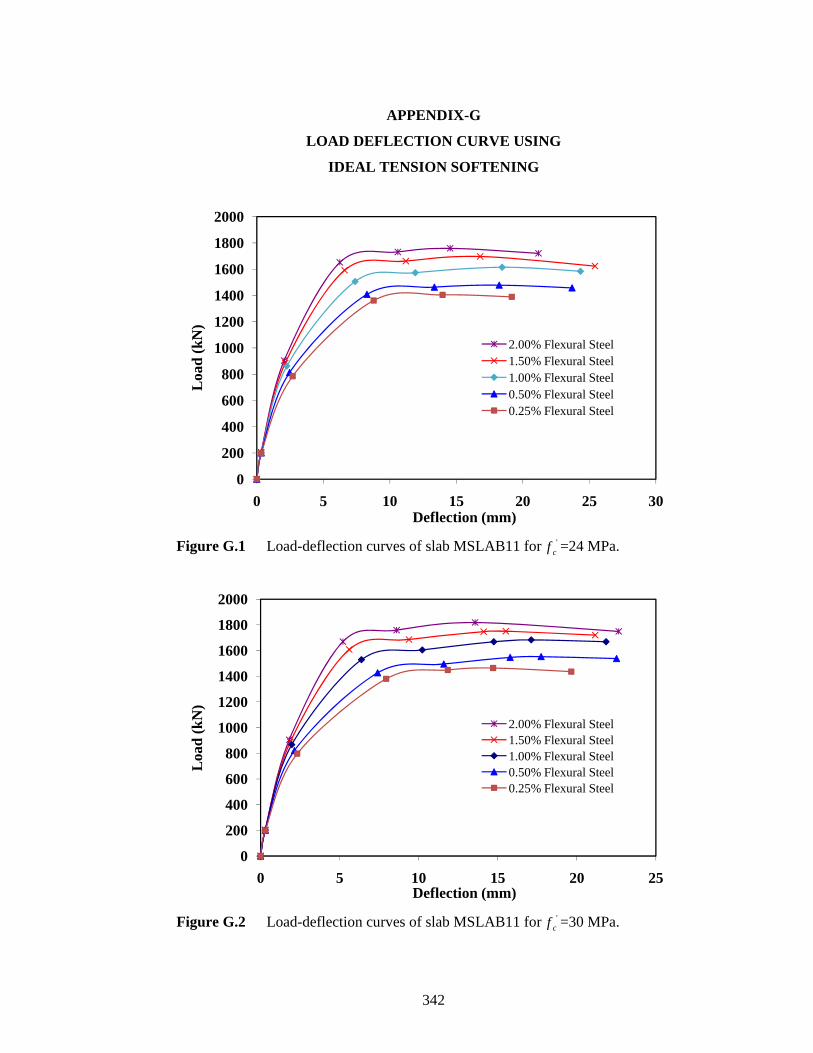
342
APPENDIX-G
LOAD DEFLECTION CURVE USING
IDEAL TENSION SOFTENING
Figure G.1 Load-deflection curves of slab MSLAB11 for '
cf =24 MPa.
Figure G.2 Load-deflection curves of slab MSLAB11 for '
cf =30 MPa.
0
200
400
600
800
1000
1200
1400
1600
1800
2000
0 5 10 15 20 25 30
Loa
d (k
N)
Deflection (mm)
2.00% Flexural Steel1.50% Flexural Steel1.00% Flexural Steel0.50% Flexural Steel0.25% Flexural Steel
0
200
400
600
800
1000
1200
1400
1600
1800
2000
0 5 10 15 20 25
Loa
d (k
N)
Deflection (mm)
2.00% Flexural Steel1.50% Flexural Steel1.00% Flexural Steel0.50% Flexural Steel0.25% Flexural Steel
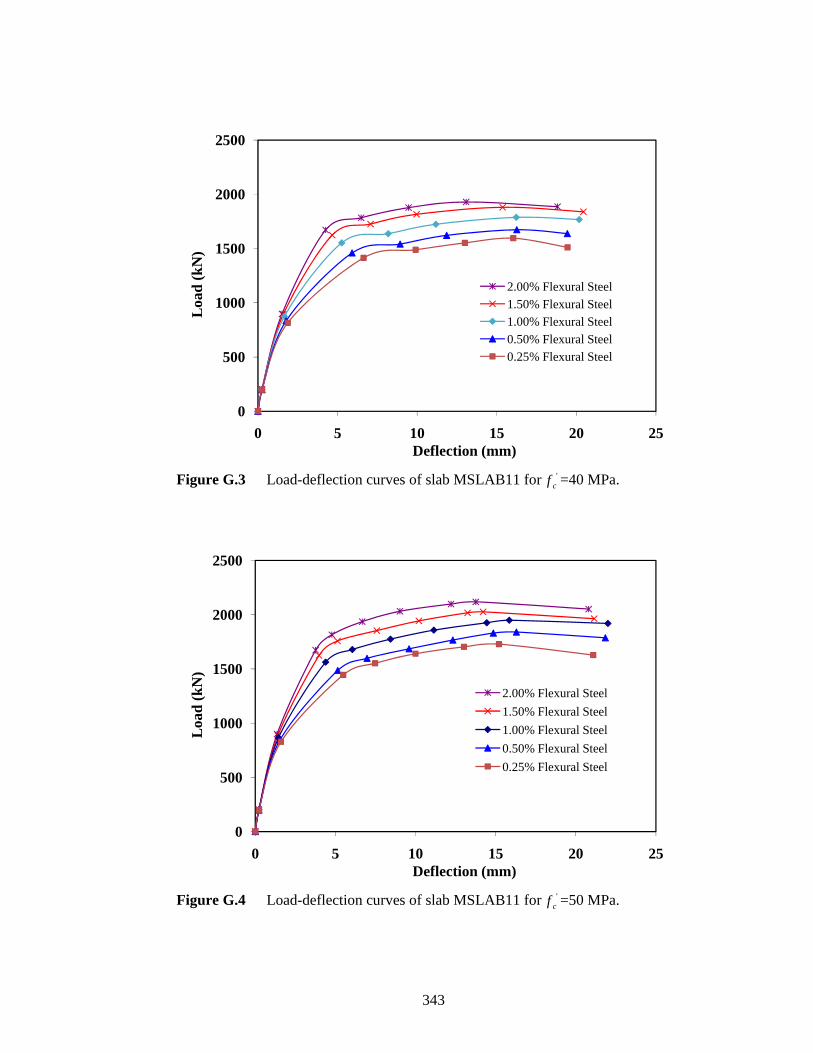
343
Figure G.3 Load-deflection curves of slab MSLAB11 for '
cf =40 MPa.
Figure G.4 Load-deflection curves of slab MSLAB11 for '
cf =50 MPa.
0
500
1000
1500
2000
2500
0 5 10 15 20 25
Loa
d (k
N)
Deflection (mm)
2.00% Flexural Steel1.50% Flexural Steel1.00% Flexural Steel0.50% Flexural Steel0.25% Flexural Steel
0
500
1000
1500
2000
2500
0 5 10 15 20 25
Loa
d (k
N)
Deflection (mm)
2.00% Flexural Steel1.50% Flexural Steel1.00% Flexural Steel0.50% Flexural Steel0.25% Flexural Steel
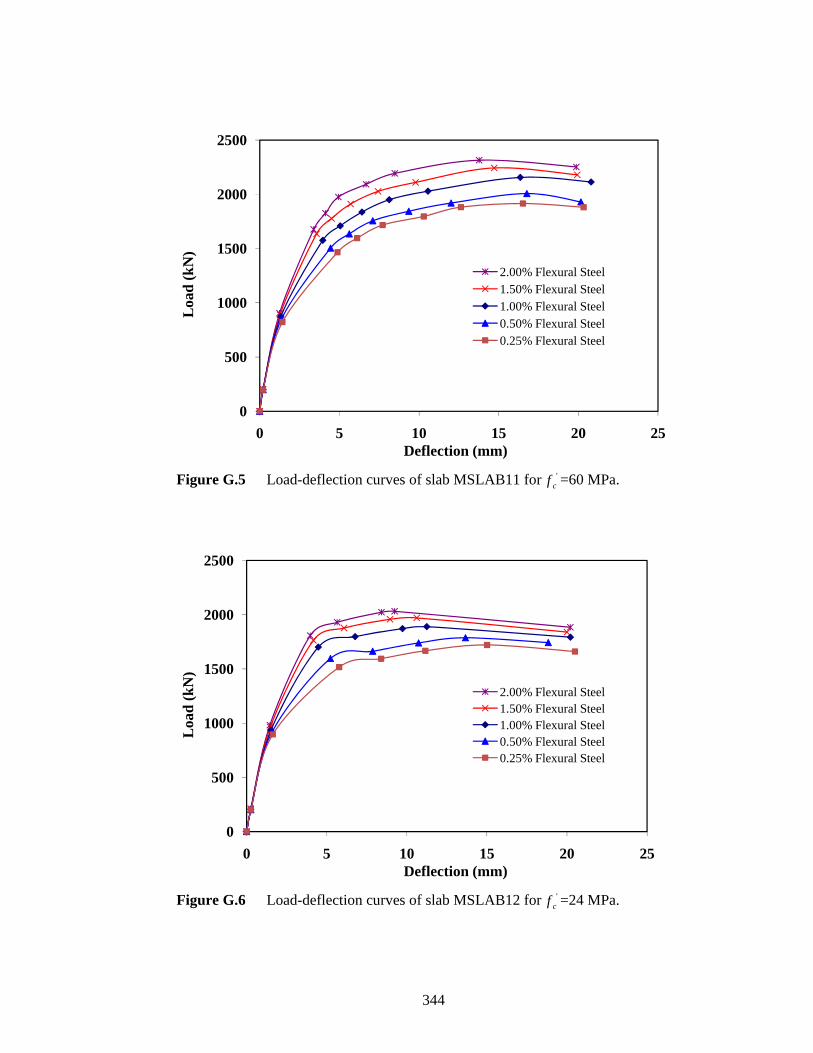
344
Figure G.5 Load-deflection curves of slab MSLAB11 for '
cf =60 MPa.
Figure G.6 Load-deflection curves of slab MSLAB12 for '
cf =24 MPa.
0
500
1000
1500
2000
2500
0 5 10 15 20 25
Loa
d (k
N)
Deflection (mm)
2.00% Flexural Steel1.50% Flexural Steel1.00% Flexural Steel0.50% Flexural Steel0.25% Flexural Steel
0
500
1000
1500
2000
2500
0 5 10 15 20 25
Loa
d (k
N)
Deflection (mm)
2.00% Flexural Steel1.50% Flexural Steel1.00% Flexural Steel0.50% Flexural Steel0.25% Flexural Steel
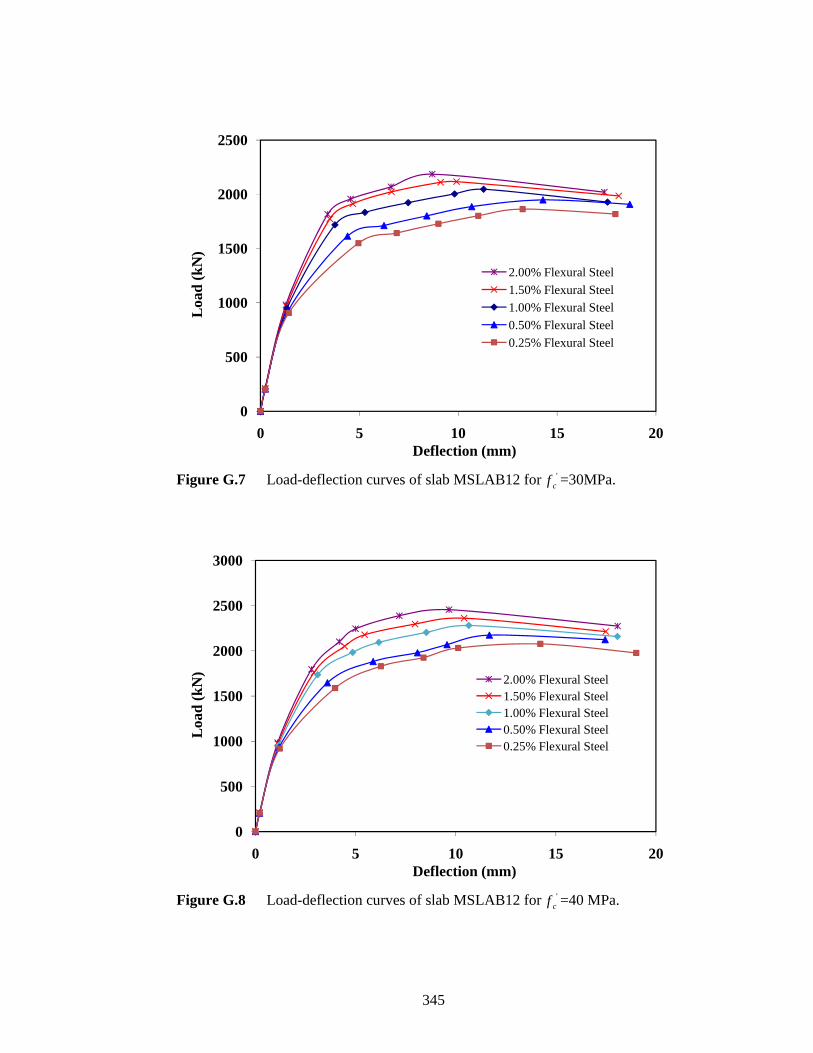
345
Figure G.7 Load-deflection curves of slab MSLAB12 for '
cf =30MPa.
Figure G.8 Load-deflection curves of slab MSLAB12 for '
cf =40 MPa.
0
500
1000
1500
2000
2500
0 5 10 15 20
Loa
d (k
N)
Deflection (mm)
2.00% Flexural Steel1.50% Flexural Steel1.00% Flexural Steel0.50% Flexural Steel0.25% Flexural Steel
0
500
1000
1500
2000
2500
3000
0 5 10 15 20
Loa
d (k
N)
Deflection (mm)
2.00% Flexural Steel1.50% Flexural Steel1.00% Flexural Steel0.50% Flexural Steel0.25% Flexural Steel
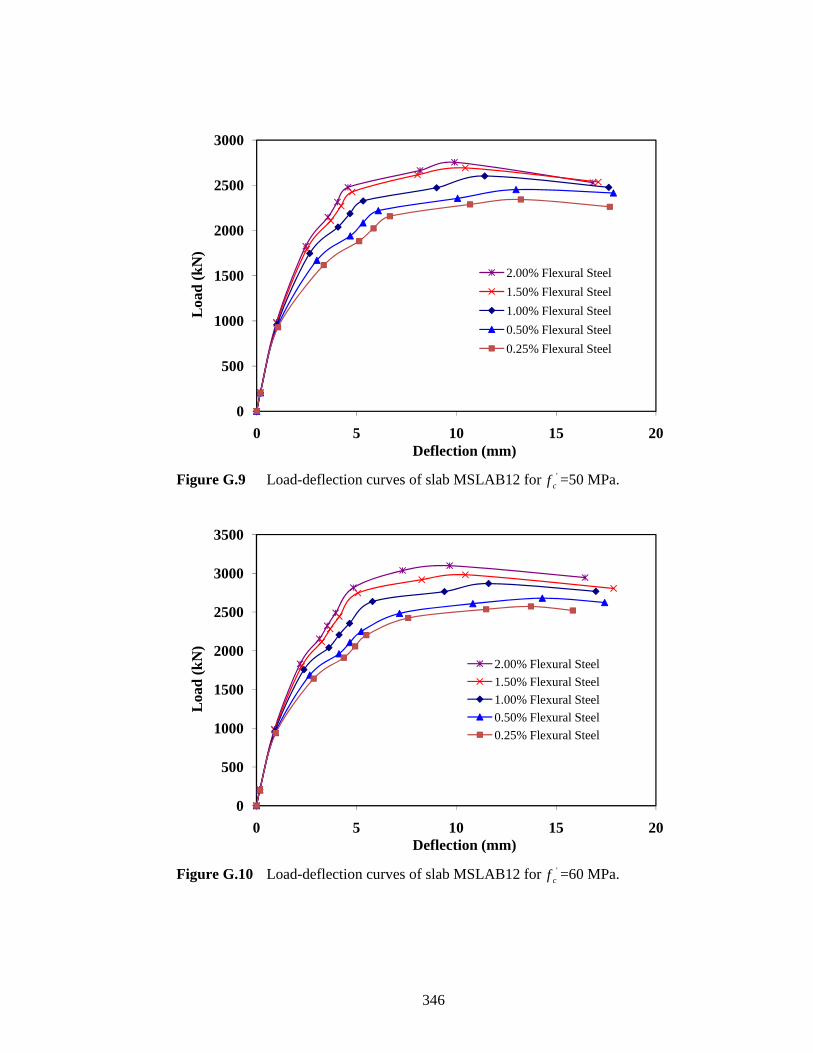
346
Figure G.9 Load-deflection curves of slab MSLAB12 for '
cf =50 MPa.
Figure G.10 Load-deflection curves of slab MSLAB12 for '
cf =60 MPa.
0
500
1000
1500
2000
2500
3000
0 5 10 15 20
Loa
d (k
N)
Deflection (mm)
2.00% Flexural Steel1.50% Flexural Steel1.00% Flexural Steel0.50% Flexural Steel0.25% Flexural Steel
0
500
1000
1500
2000
2500
3000
3500
0 5 10 15 20
Loa
d (k
N)
Deflection (mm)
2.00% Flexural Steel1.50% Flexural Steel1.00% Flexural Steel0.50% Flexural Steel0.25% Flexural Steel
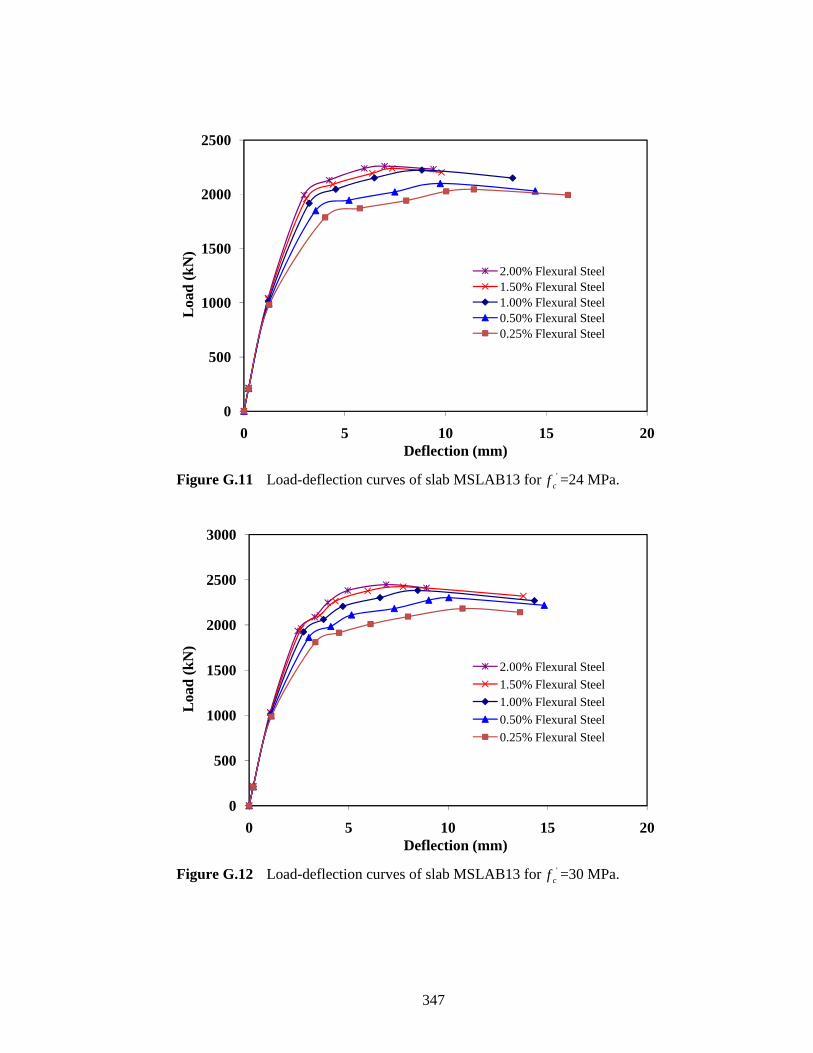
347
Figure G.11 Load-deflection curves of slab MSLAB13 for '
cf =24 MPa.
Figure G.12 Load-deflection curves of slab MSLAB13 for '
cf =30 MPa.
0
500
1000
1500
2000
2500
0 5 10 15 20
Loa
d (k
N)
Deflection (mm)
2.00% Flexural Steel1.50% Flexural Steel1.00% Flexural Steel0.50% Flexural Steel0.25% Flexural Steel
0
500
1000
1500
2000
2500
3000
0 5 10 15 20
Loa
d (k
N)
Deflection (mm)
2.00% Flexural Steel1.50% Flexural Steel1.00% Flexural Steel0.50% Flexural Steel0.25% Flexural Steel
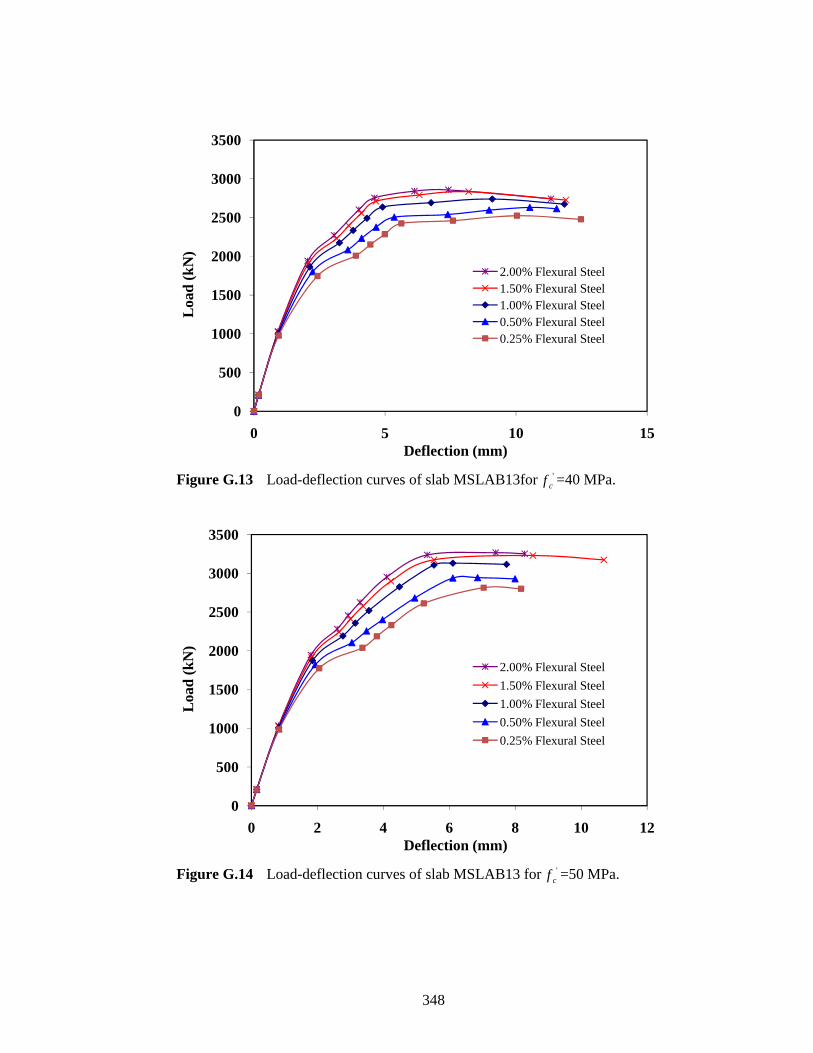
348
Figure G.13 Load-deflection curves of slab MSLAB13for '
cf =40 MPa.
Figure G.14 Load-deflection curves of slab MSLAB13 for '
cf =50 MPa.
0
500
1000
1500
2000
2500
3000
3500
0 5 10 15
Loa
d (k
N)
Deflection (mm)
2.00% Flexural Steel1.50% Flexural Steel1.00% Flexural Steel0.50% Flexural Steel0.25% Flexural Steel
0
500
1000
1500
2000
2500
3000
3500
0 2 4 6 8 10 12
Loa
d (k
N)
Deflection (mm)
2.00% Flexural Steel1.50% Flexural Steel1.00% Flexural Steel0.50% Flexural Steel0.25% Flexural Steel
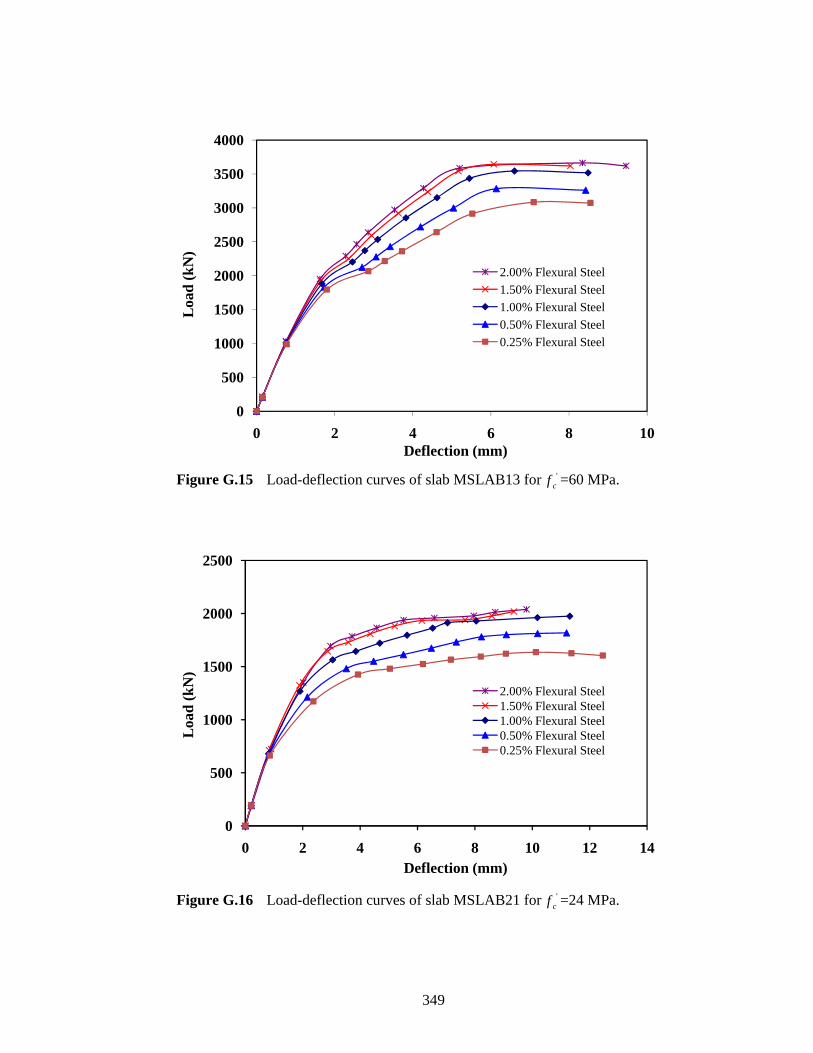
349
Figure G.15 Load-deflection curves of slab MSLAB13 for '
cf =60 MPa.
Figure G.16 Load-deflection curves of slab MSLAB21 for '
cf =24 MPa.
0
500
1000
1500
2000
2500
3000
3500
4000
0 2 4 6 8 10
Loa
d (k
N)
Deflection (mm)
2.00% Flexural Steel1.50% Flexural Steel1.00% Flexural Steel0.50% Flexural Steel0.25% Flexural Steel
0
500
1000
1500
2000
2500
0 2 4 6 8 10 12 14
Loa
d (k
N)
Deflection (mm)
2.00% Flexural Steel1.50% Flexural Steel1.00% Flexural Steel0.50% Flexural Steel0.25% Flexural Steel
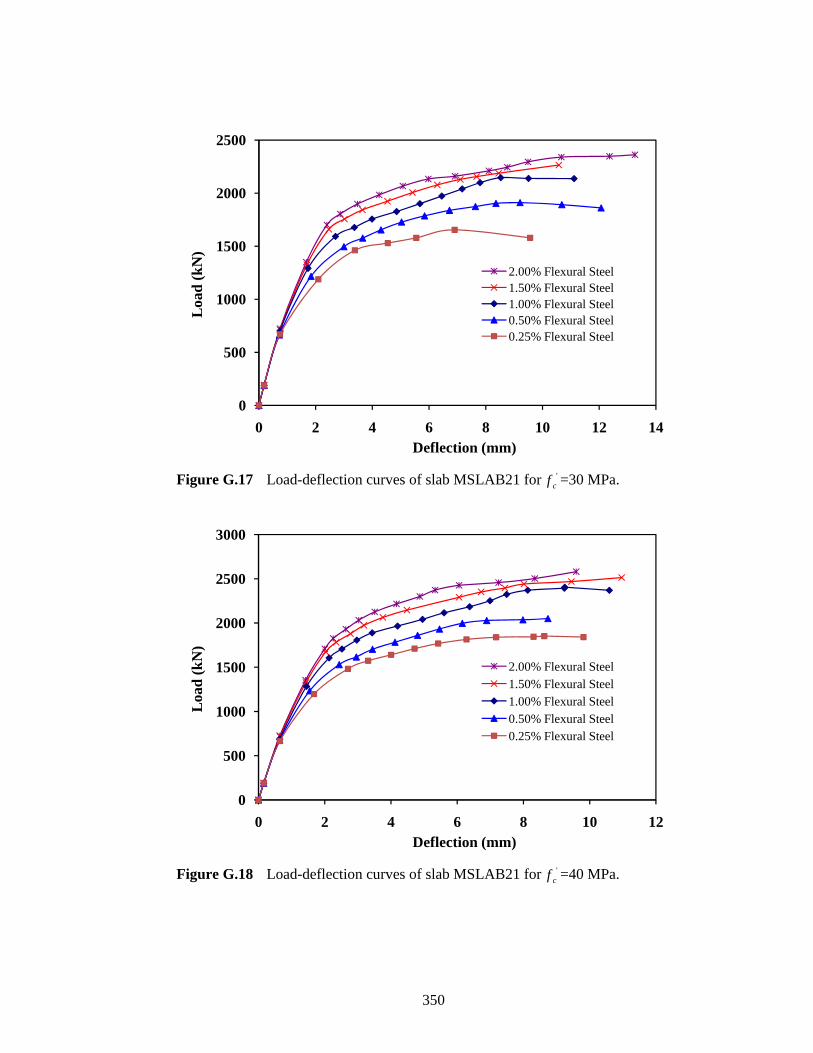
350
Figure G.17 Load-deflection curves of slab MSLAB21 for '
cf =30 MPa.
Figure G.18 Load-deflection curves of slab MSLAB21 for '
cf =40 MPa.
0
500
1000
1500
2000
2500
0 2 4 6 8 10 12 14
Loa
d (k
N)
Deflection (mm)
2.00% Flexural Steel1.50% Flexural Steel1.00% Flexural Steel0.50% Flexural Steel0.25% Flexural Steel
0
500
1000
1500
2000
2500
3000
0 2 4 6 8 10 12
Loa
d (k
N)
Deflection (mm)
2.00% Flexural Steel1.50% Flexural Steel1.00% Flexural Steel0.50% Flexural Steel0.25% Flexural Steel
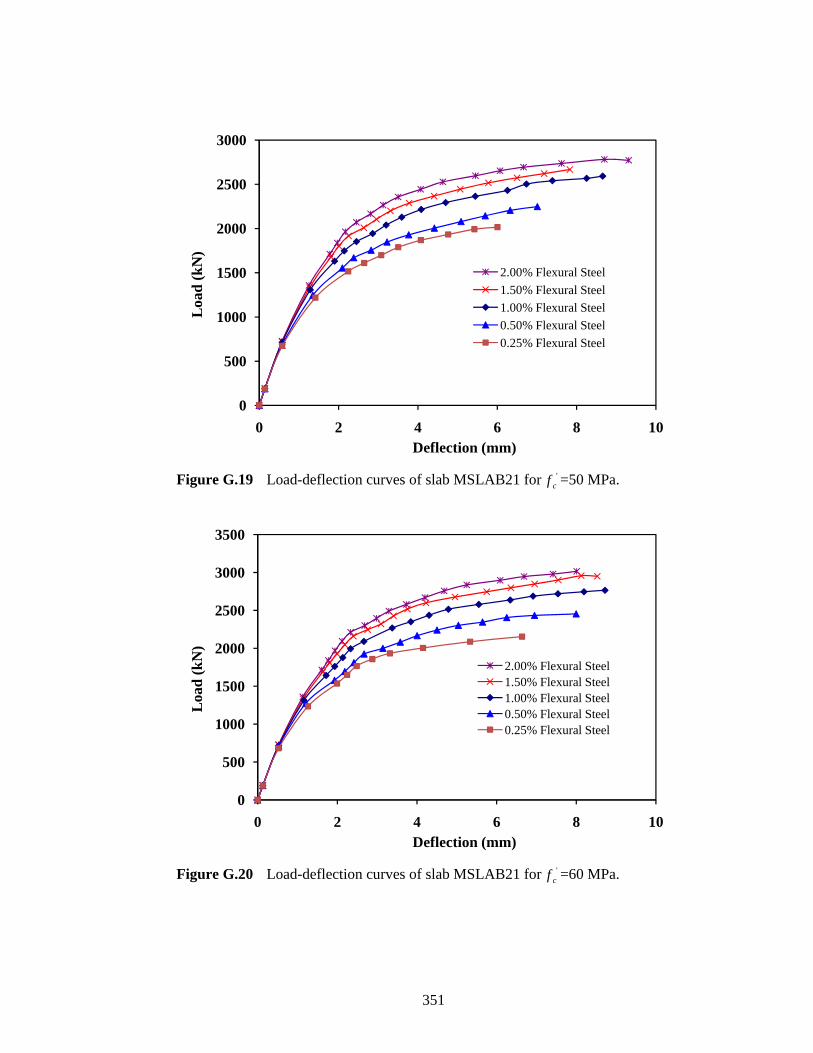
351
Figure G.19 Load-deflection curves of slab MSLAB21 for '
cf =50 MPa.
Figure G.20 Load-deflection curves of slab MSLAB21 for '
cf =60 MPa.
0
500
1000
1500
2000
2500
3000
0 2 4 6 8 10
Loa
d (k
N)
Deflection (mm)
2.00% Flexural Steel1.50% Flexural Steel1.00% Flexural Steel0.50% Flexural Steel0.25% Flexural Steel
0
500
1000
1500
2000
2500
3000
3500
0 2 4 6 8 10
Loa
d (k
N)
Deflection (mm)
2.00% Flexural Steel1.50% Flexural Steel1.00% Flexural Steel0.50% Flexural Steel0.25% Flexural Steel
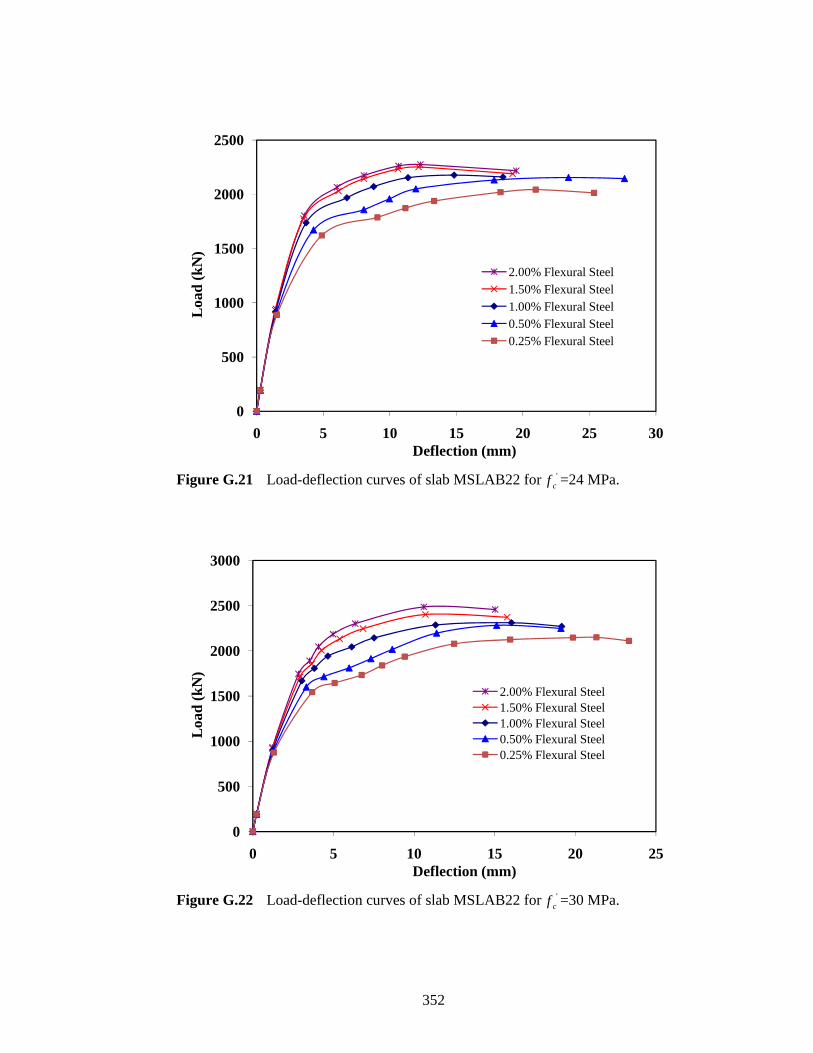
352
Figure G.21 Load-deflection curves of slab MSLAB22 for '
cf =24 MPa.
Figure G.22 Load-deflection curves of slab MSLAB22 for '
cf =30 MPa.
0
500
1000
1500
2000
2500
0 5 10 15 20 25 30
Loa
d (k
N)
Deflection (mm)
2.00% Flexural Steel1.50% Flexural Steel1.00% Flexural Steel0.50% Flexural Steel0.25% Flexural Steel
0
500
1000
1500
2000
2500
3000
0 5 10 15 20 25
Loa
d (k
N)
Deflection (mm)
2.00% Flexural Steel1.50% Flexural Steel1.00% Flexural Steel0.50% Flexural Steel0.25% Flexural Steel
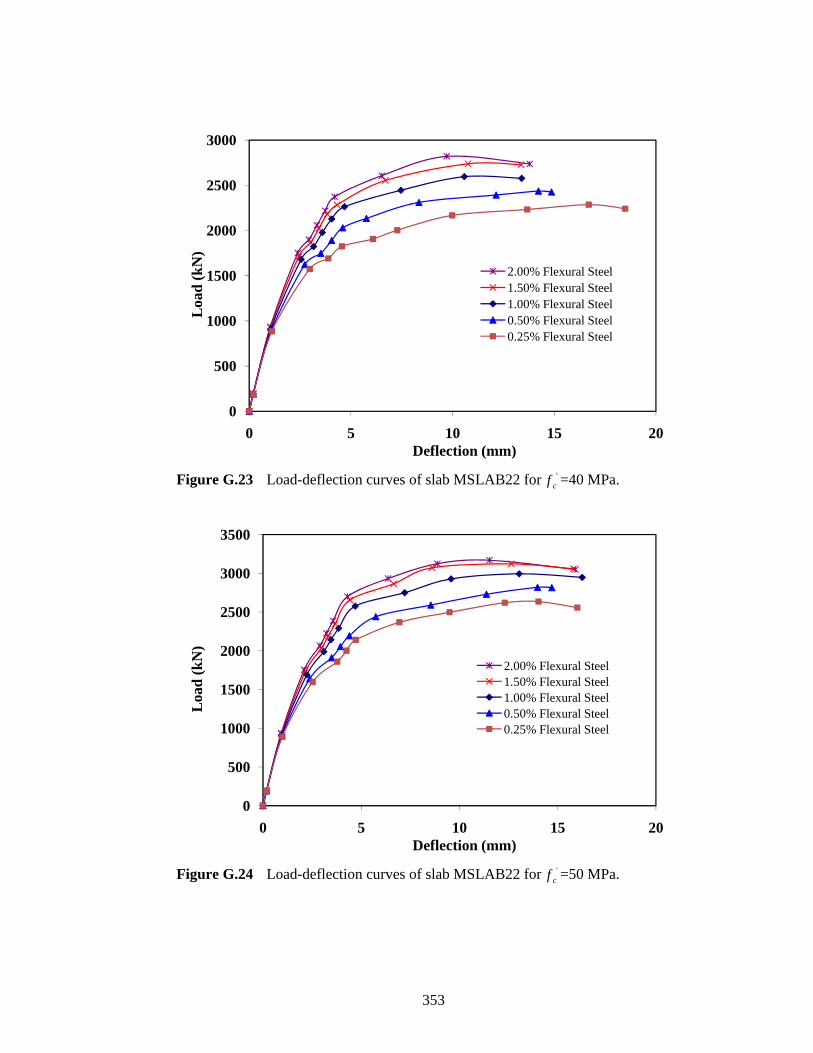
353
Figure G.23 Load-deflection curves of slab MSLAB22 for '
cf =40 MPa.
Figure G.24 Load-deflection curves of slab MSLAB22 for '
cf =50 MPa.
0
500
1000
1500
2000
2500
3000
0 5 10 15 20
Loa
d (k
N)
Deflection (mm)
2.00% Flexural Steel1.50% Flexural Steel1.00% Flexural Steel0.50% Flexural Steel0.25% Flexural Steel
0
500
1000
1500
2000
2500
3000
3500
0 5 10 15 20
Loa
d (k
N)
Deflection (mm)
2.00% Flexural Steel1.50% Flexural Steel1.00% Flexural Steel0.50% Flexural Steel0.25% Flexural Steel
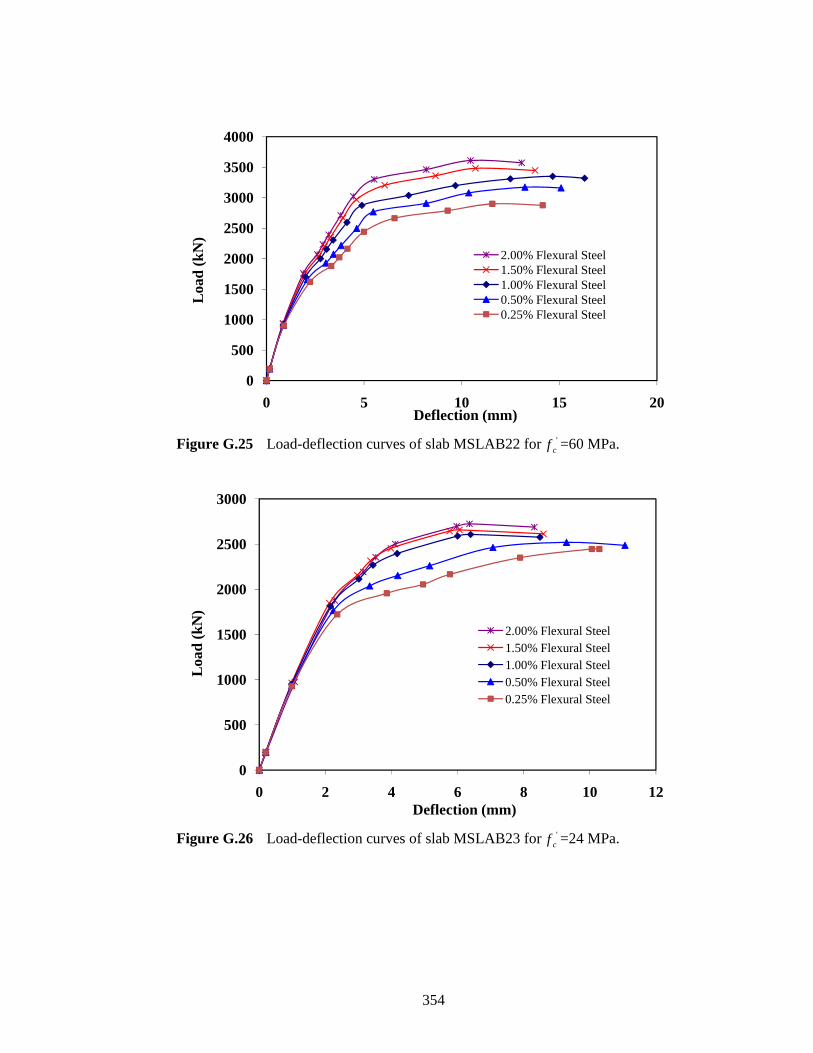
354
Figure G.25 Load-deflection curves of slab MSLAB22 for '
cf =60 MPa.
Figure G.26 Load-deflection curves of slab MSLAB23 for '
cf =24 MPa.
0
500
1000
1500
2000
2500
3000
3500
4000
0 5 10 15 20
Loa
d (k
N)
Deflection (mm)
2.00% Flexural Steel1.50% Flexural Steel1.00% Flexural Steel0.50% Flexural Steel0.25% Flexural Steel
0
500
1000
1500
2000
2500
3000
0 2 4 6 8 10 12
Loa
d (k
N)
Deflection (mm)
2.00% Flexural Steel1.50% Flexural Steel1.00% Flexural Steel0.50% Flexural Steel0.25% Flexural Steel
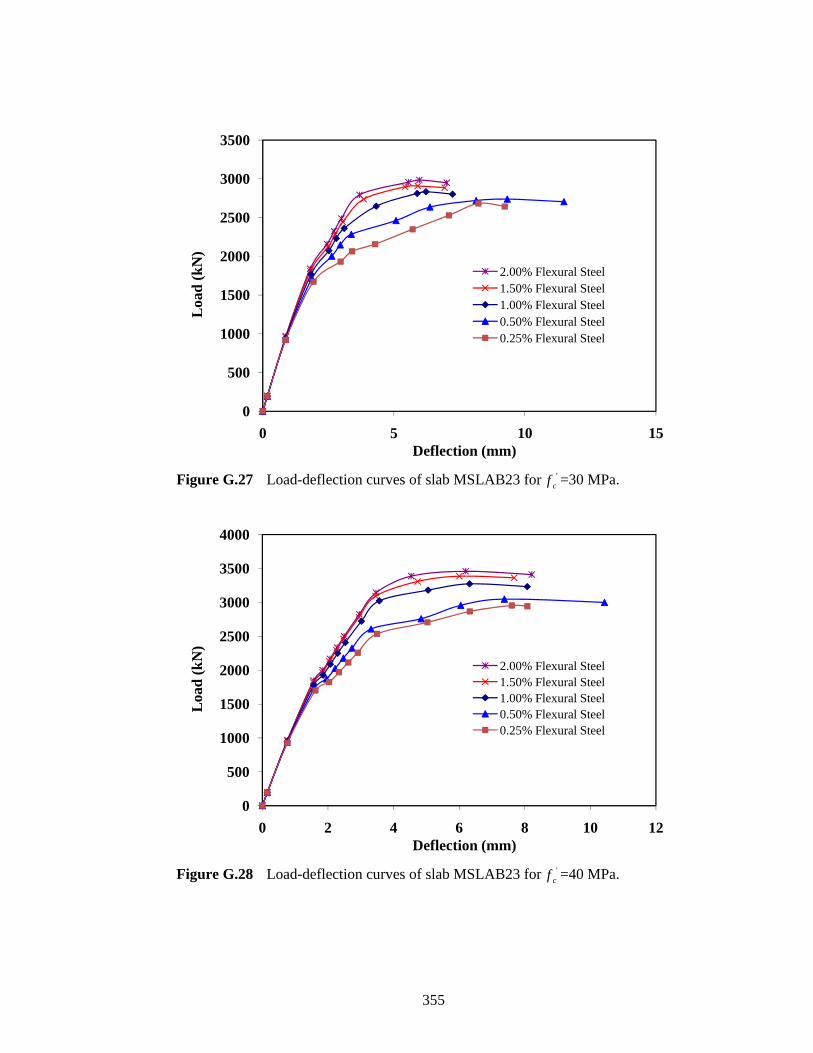
355
Figure G.27 Load-deflection curves of slab MSLAB23 for '
cf =30 MPa.
Figure G.28 Load-deflection curves of slab MSLAB23 for '
cf =40 MPa.
0
500
1000
1500
2000
2500
3000
3500
0 5 10 15
Loa
d (k
N)
Deflection (mm)
2.00% Flexural Steel1.50% Flexural Steel1.00% Flexural Steel0.50% Flexural Steel0.25% Flexural Steel
0
500
1000
1500
2000
2500
3000
3500
4000
0 2 4 6 8 10 12
Loa
d (k
N)
Deflection (mm)
2.00% Flexural Steel1.50% Flexural Steel1.00% Flexural Steel0.50% Flexural Steel0.25% Flexural Steel
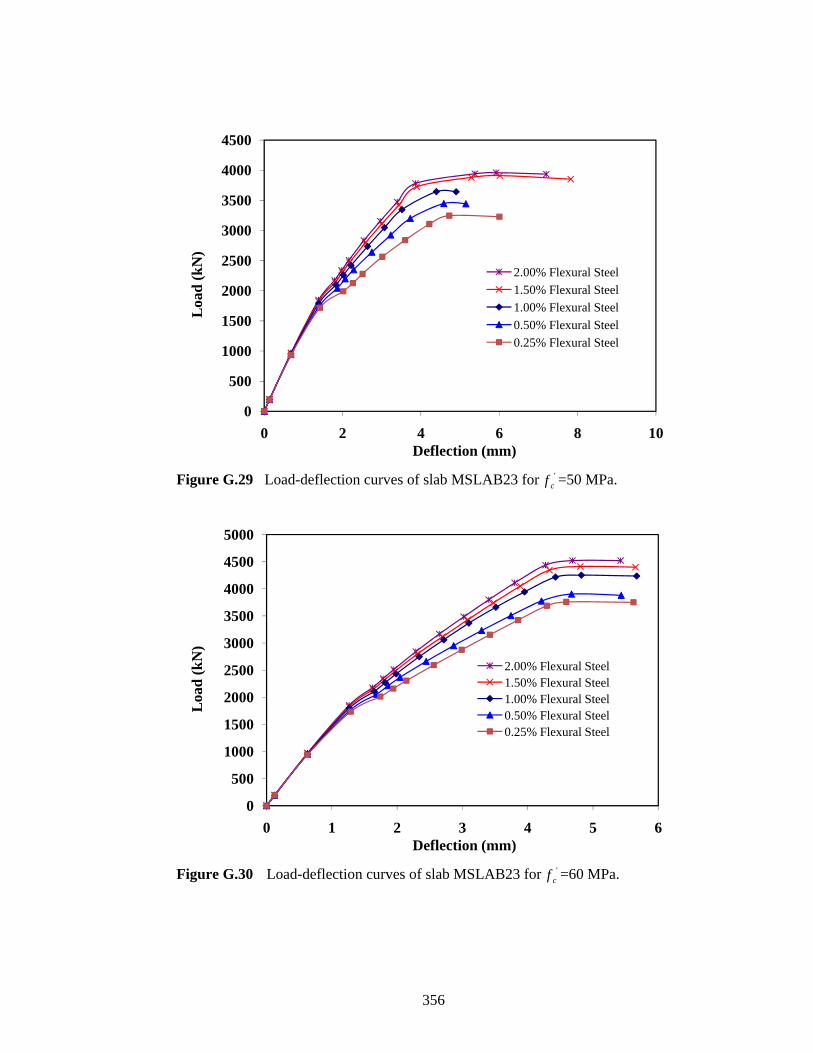
356
Figure G.29 Load-deflection curves of slab MSLAB23 for '
cf =50 MPa.
Figure G.30 Load-deflection curves of slab MSLAB23 for '
cf =60 MPa.
0
500
1000
1500
2000
2500
3000
3500
4000
4500
0 2 4 6 8 10
Loa
d (k
N)
Deflection (mm)
2.00% Flexural Steel1.50% Flexural Steel1.00% Flexural Steel0.50% Flexural Steel0.25% Flexural Steel
0
500
1000
1500
2000
2500
3000
3500
4000
4500
5000
0 1 2 3 4 5 6
Loa
d (k
N)
Deflection (mm)
2.00% Flexural Steel1.50% Flexural Steel1.00% Flexural Steel0.50% Flexural Steel0.25% Flexural Steel
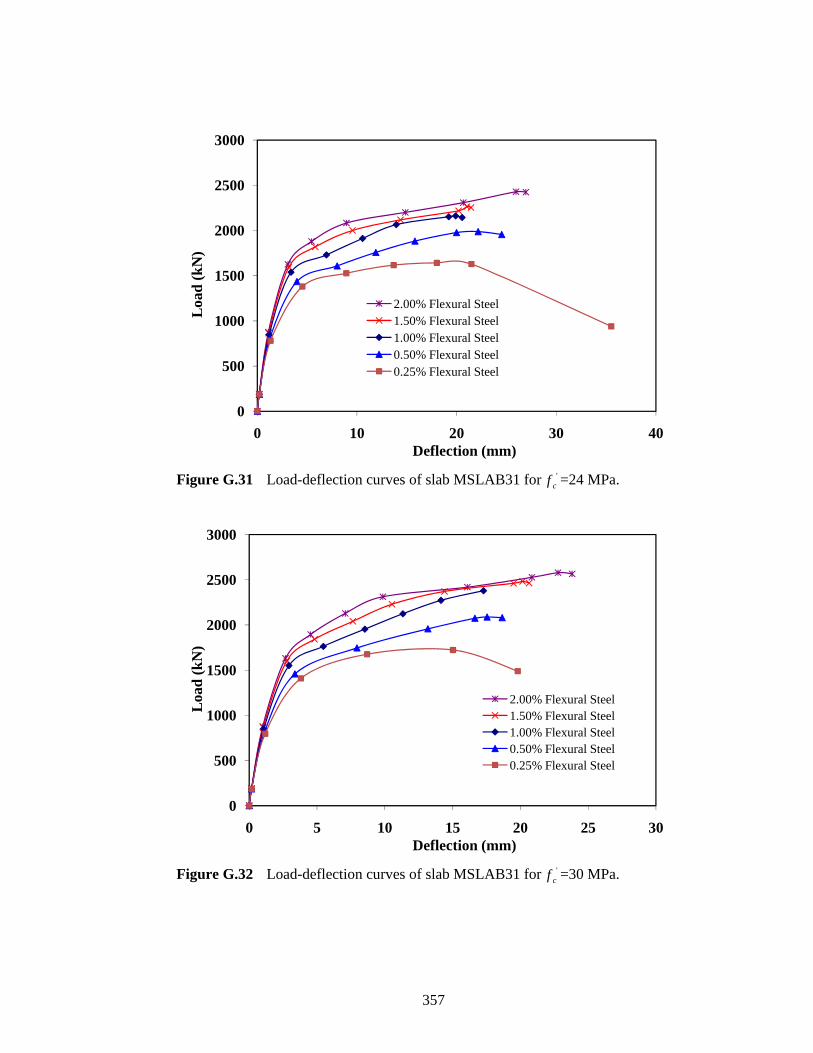
357
Figure G.31 Load-deflection curves of slab MSLAB31 for '
cf =24 MPa.
Figure G.32 Load-deflection curves of slab MSLAB31 for '
cf =30 MPa.
0
500
1000
1500
2000
2500
3000
0 10 20 30 40
Loa
d (k
N)
Deflection (mm)
2.00% Flexural Steel1.50% Flexural Steel1.00% Flexural Steel0.50% Flexural Steel0.25% Flexural Steel
0
500
1000
1500
2000
2500
3000
0 5 10 15 20 25 30
Loa
d (k
N)
Deflection (mm)
2.00% Flexural Steel1.50% Flexural Steel1.00% Flexural Steel0.50% Flexural Steel0.25% Flexural Steel
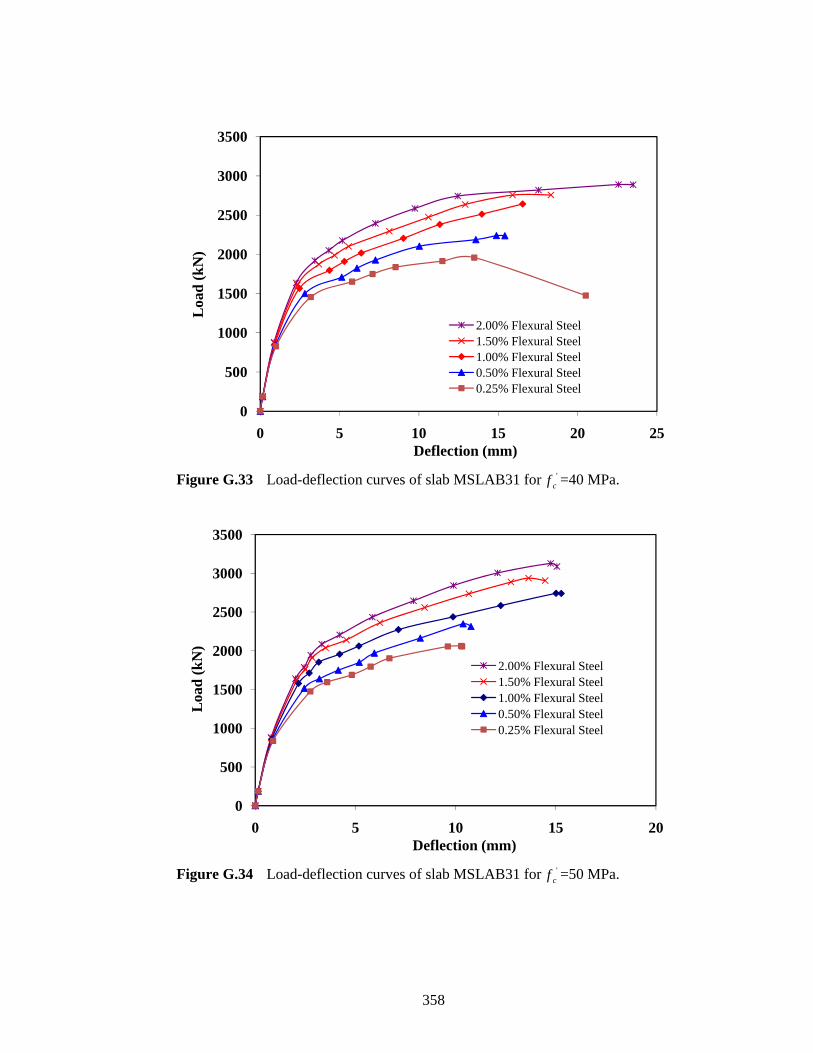
358
Figure G.33 Load-deflection curves of slab MSLAB31 for '
cf =40 MPa.
Figure G.34 Load-deflection curves of slab MSLAB31 for '
cf =50 MPa.
0
500
1000
1500
2000
2500
3000
3500
0 5 10 15 20 25
Loa
d (k
N)
Deflection (mm)
2.00% Flexural Steel1.50% Flexural Steel1.00% Flexural Steel0.50% Flexural Steel0.25% Flexural Steel
0
500
1000
1500
2000
2500
3000
3500
0 5 10 15 20
Loa
d (k
N)
Deflection (mm)
2.00% Flexural Steel1.50% Flexural Steel1.00% Flexural Steel0.50% Flexural Steel0.25% Flexural Steel
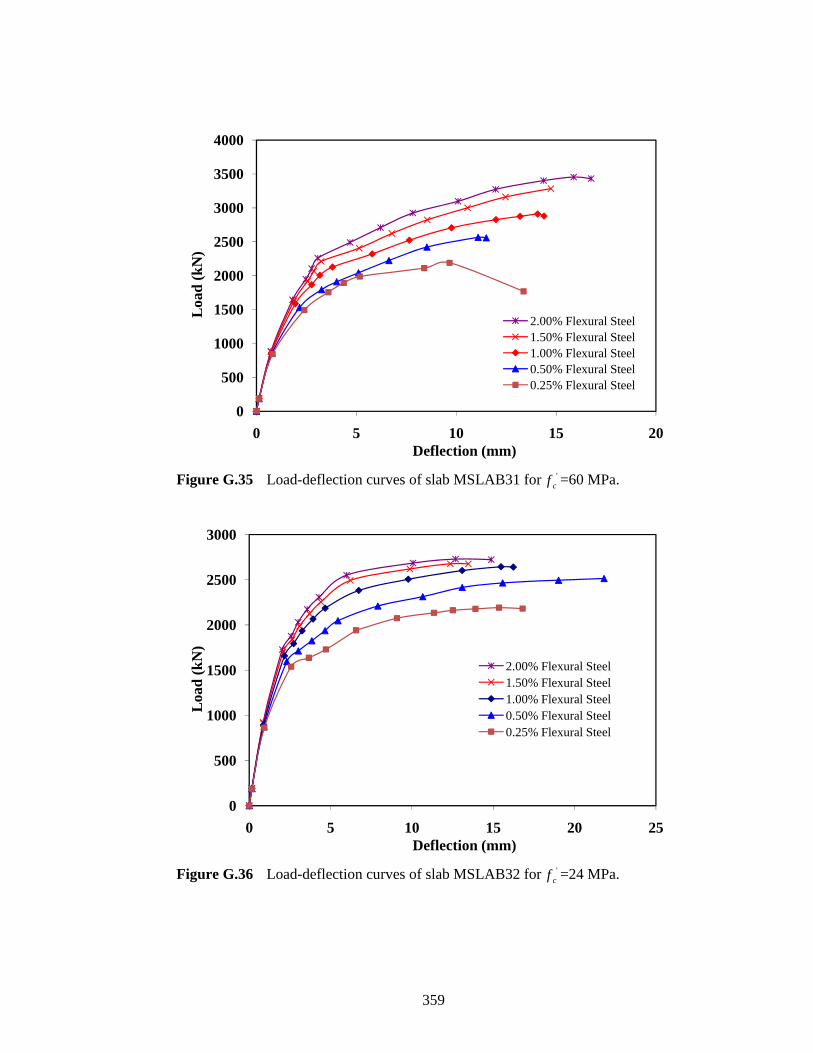
359
Figure G.35 Load-deflection curves of slab MSLAB31 for '
cf =60 MPa.
Figure G.36 Load-deflection curves of slab MSLAB32 for '
cf =24 MPa.
0
500
1000
1500
2000
2500
3000
3500
4000
0 5 10 15 20
Loa
d (k
N)
Deflection (mm)
2.00% Flexural Steel1.50% Flexural Steel1.00% Flexural Steel0.50% Flexural Steel0.25% Flexural Steel
0
500
1000
1500
2000
2500
3000
0 5 10 15 20 25
Loa
d (k
N)
Deflection (mm)
2.00% Flexural Steel1.50% Flexural Steel1.00% Flexural Steel0.50% Flexural Steel0.25% Flexural Steel
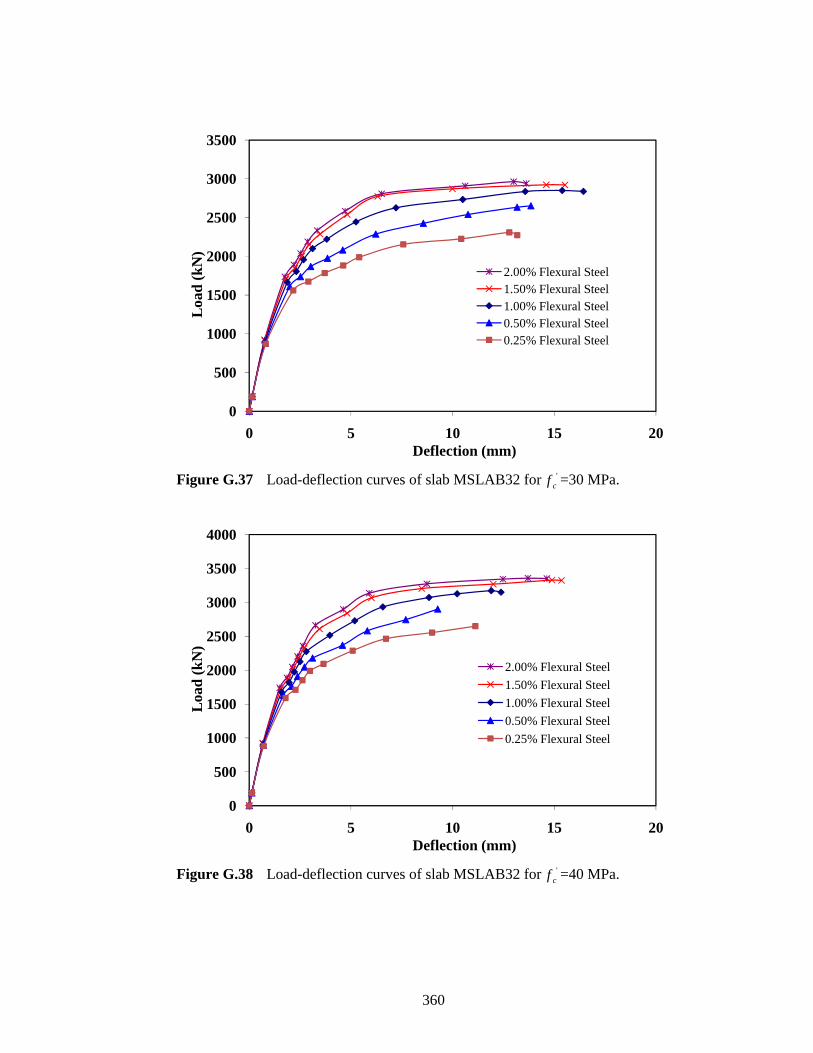
360
Figure G.37 Load-deflection curves of slab MSLAB32 for '
cf =30 MPa.
Figure G.38 Load-deflection curves of slab MSLAB32 for '
cf =40 MPa.
0
500
1000
1500
2000
2500
3000
3500
0 5 10 15 20
Loa
d (k
N)
Deflection (mm)
2.00% Flexural Steel1.50% Flexural Steel1.00% Flexural Steel0.50% Flexural Steel0.25% Flexural Steel
0
500
1000
1500
2000
2500
3000
3500
4000
0 5 10 15 20
Loa
d (k
N)
Deflection (mm)
2.00% Flexural Steel1.50% Flexural Steel1.00% Flexural Steel0.50% Flexural Steel0.25% Flexural Steel
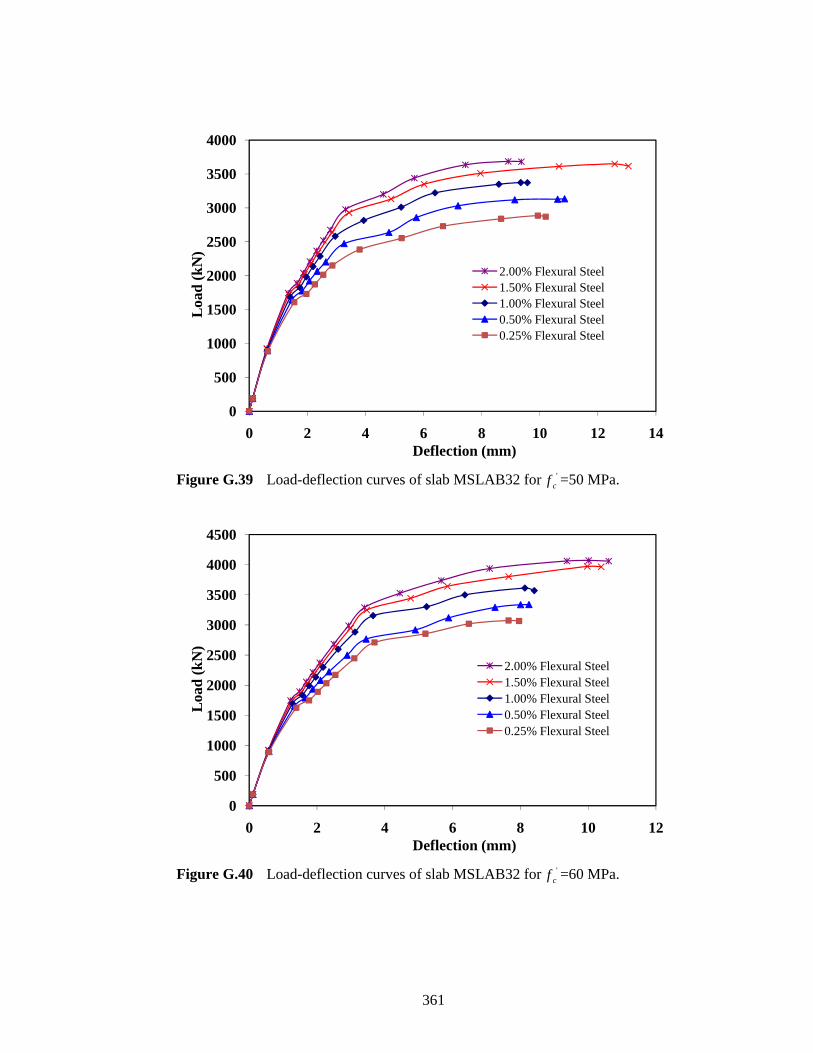
361
Figure G.39 Load-deflection curves of slab MSLAB32 for '
cf =50 MPa.
Figure G.40 Load-deflection curves of slab MSLAB32 for '
cf =60 MPa.
0
500
1000
1500
2000
2500
3000
3500
4000
0 2 4 6 8 10 12 14
Loa
d (k
N)
Deflection (mm)
2.00% Flexural Steel1.50% Flexural Steel1.00% Flexural Steel0.50% Flexural Steel0.25% Flexural Steel
0
500
1000
1500
2000
2500
3000
3500
4000
4500
0 2 4 6 8 10 12
Loa
d (k
N)
Deflection (mm)
2.00% Flexural Steel1.50% Flexural Steel1.00% Flexural Steel0.50% Flexural Steel0.25% Flexural Steel
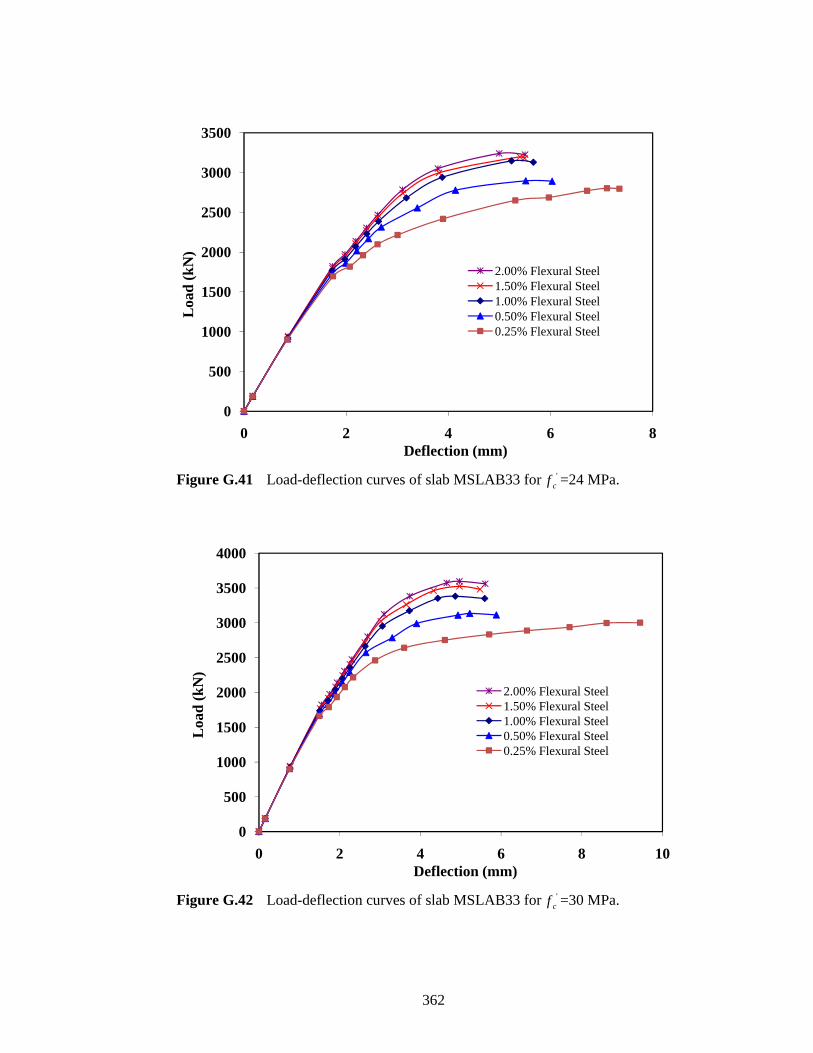
362
Figure G.41 Load-deflection curves of slab MSLAB33 for '
cf =24 MPa.
Figure G.42 Load-deflection curves of slab MSLAB33 for '
cf =30 MPa.
0
500
1000
1500
2000
2500
3000
3500
0 2 4 6 8
Loa
d (k
N)
Deflection (mm)
2.00% Flexural Steel1.50% Flexural Steel1.00% Flexural Steel0.50% Flexural Steel0.25% Flexural Steel
0
500
1000
1500
2000
2500
3000
3500
4000
0 2 4 6 8 10
Loa
d (k
N)
Deflection (mm)
2.00% Flexural Steel1.50% Flexural Steel1.00% Flexural Steel0.50% Flexural Steel0.25% Flexural Steel
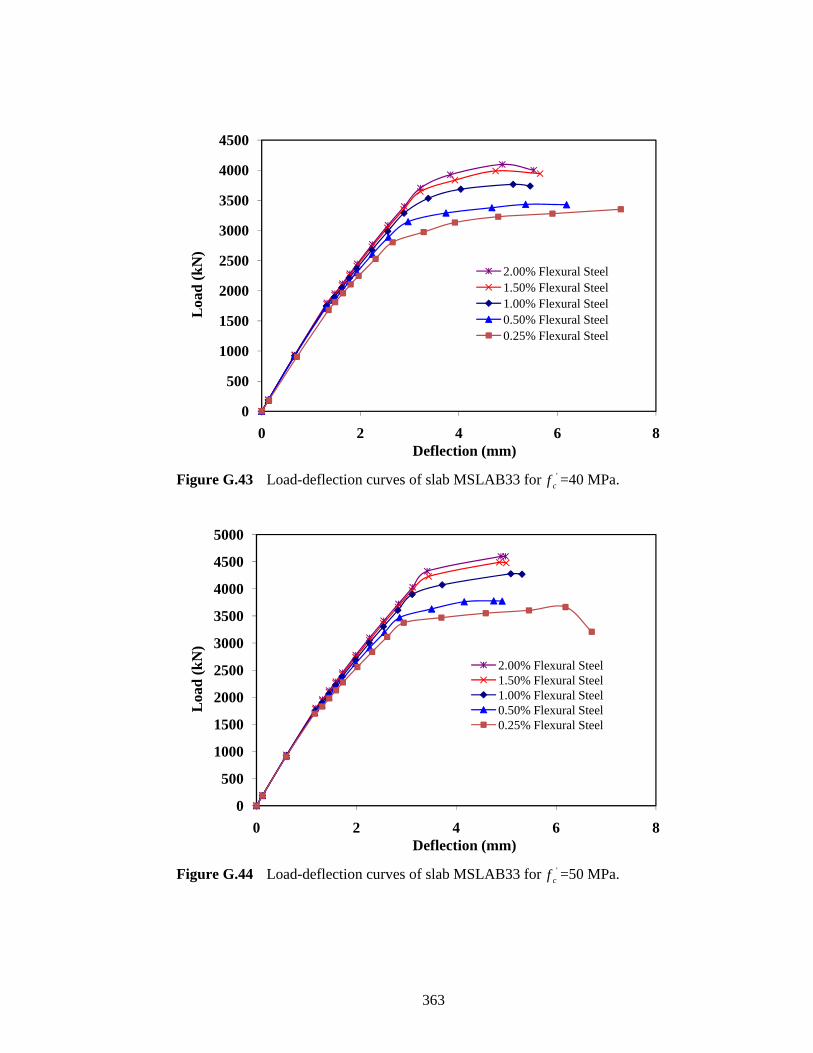
363
Figure G.43 Load-deflection curves of slab MSLAB33 for '
cf =40 MPa.
Figure G.44 Load-deflection curves of slab MSLAB33 for '
cf =50 MPa.
0
500
1000
1500
2000
2500
3000
3500
4000
4500
0 2 4 6 8
Loa
d (k
N)
Deflection (mm)
2.00% Flexural Steel1.50% Flexural Steel1.00% Flexural Steel0.50% Flexural Steel0.25% Flexural Steel
0
500
1000
1500
2000
2500
3000
3500
4000
4500
5000
0 2 4 6 8
Loa
d (k
N)
Deflection (mm)
2.00% Flexural Steel1.50% Flexural Steel1.00% Flexural Steel0.50% Flexural Steel0.25% Flexural Steel
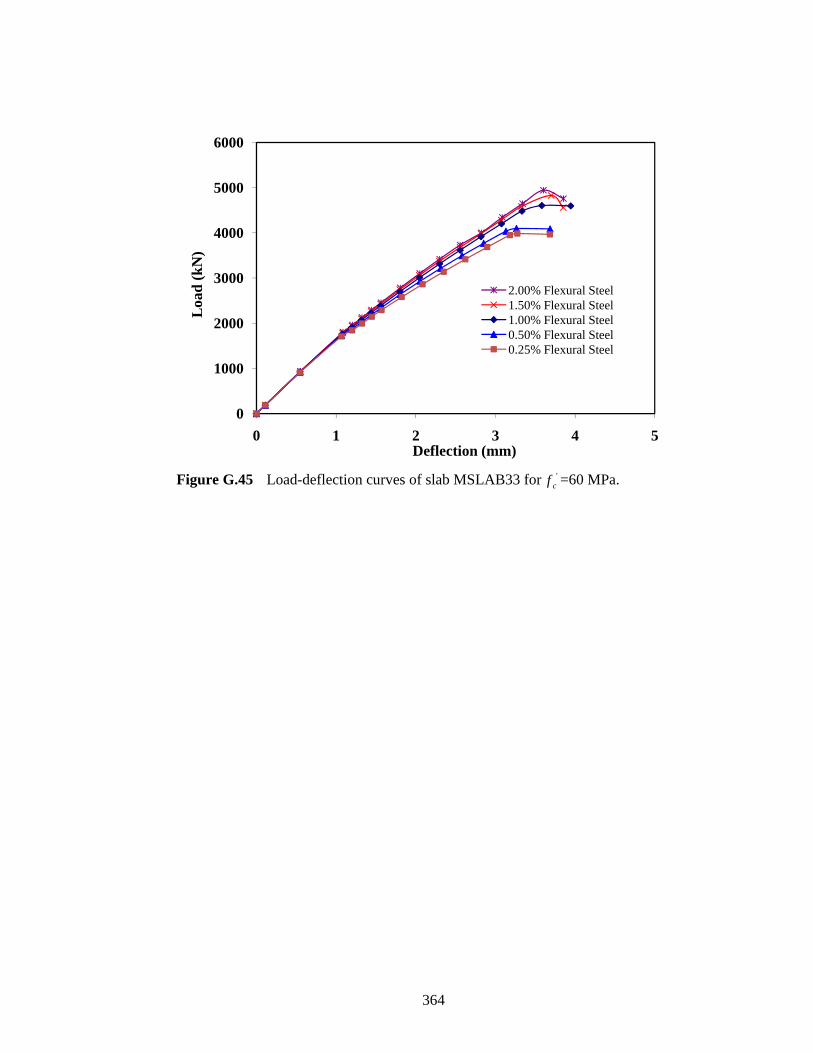
364
Figure G.45 Load-deflection curves of slab MSLAB33 for '
cf =60 MPa.
0
1000
2000
3000
4000
5000
6000
0 1 2 3 4 5
Loa
d (k
N)
Deflection (mm)
2.00% Flexural Steel1.50% Flexural Steel1.00% Flexural Steel0.50% Flexural Steel0.25% Flexural Steel