
Fine-tuning Gold Questions in Crowdsourcing Tasks using ...
14
Example Journal, XXXX, XX: 1–14 Fine-tuning Gold Questions in Crowdsourcing Tasks using Probabilistic and Siamese Neural Network Models José María González Pinto 1 , Kinda El-Maary 1 and Wolf-Tilo Balke 1 1 Institute for Information Systems Technische Universität Braunschweig Braunschweig, Germany, pinto,elmaarry,balke@ifis.cs.tu-bs.de ABSTRACT The economic benefits of crowdsourcing have furthered its widespread use over the past decade. However, increas- ing numbers of fraudulent workers threaten to undermine the emerging crowdsourcing economy: requestors face the choice of either risking low-quality results or having to pay extra money for quality safeguards such as gold questions or majority voting. The more safeguards injected into the workload, the lower are the risks imposed by fraudulent workers, yet the higher are the costs. So, how many of them are actually needed? Is there a generally applicable number or percentage? This paper uses deep learning techniques to identify custom-tailored numbers of gold questions per worker for individually managing the cost/quality balance. Our new method follows real-life experiences: the more we know about workers before assigning a task, the clearer our belief or disbelief in this worker’s reliability gets. Employing probabilistic models, namely Bayesian belief networks and certainty factor models, our method creates worker profiles reflecting different a-priori belief values, and we prove that the actual number of gold questions per worker can indeed be assessed. Our evaluation on real-world crowdsourcing datasets demonstrates our method’s efficiency in saving money while maintaining high-quality results. Keywords: Quality Control, Crowdsourcing, Gold Questions, Probabilistic models, Deep Learning ISSN 2332-4031; DOI 10.1561/106.XXXXXXXX © 2018 JMGP, KEM, WTB 1 Introduction In recent years, several hybrid solutions for augmenting and extending traditional database capabilities with intelligent hu- man steering have been developed. For example 1) processing queries that cannot be adequately answered by database sys- tems (Franklin et al., 2011), such as skyline queries (Lofi et al., 2013), top-k and group-by queries (Davidson et al., 2013; Zheng et al., 2015), and 2) dealing with missing information (Nieke et al., 2014). The benefits for data science come as no sur- prise, since crowdsourcing is relatively cheap, agile, and offers an intelligent and global 24/7 online labor pool. However, the anonymity of workers on the platforms and the short-term na- ture of the work contracts also invite fraudulent misuse threat- ening to cancel the benefits. In contrast to traditional work- places, crowdsourcing requestors do not know much about the workers they are hiring: there is no interview process, no CVs, no personal impressions. In the best case for crowdsourcing, platforms offer reputation scores from previous work. Unfor- tunately, it has been shown that reputation systems only work for long-standing relationships. As an analogy, remember peer- to-peer networks: also here reputation systems have been pro- posed to combat malicious peer behavior, see, e.g., (Aberer and Despotovic, 2001; Kamvar et al., 2003). However, meaning- ful scores were difficult to construct since reputations suffered from the cold start problem (Daltayanni et al., 2015) and were easy to fake (Yu and Singh, 2003). These problems become even more pronounced in crowdsourcing due to the high at- trition rates of workers (Ross et al., 2010) reports about 70%, i.e., relationships tend to be even more short-termed than in peer-to-peer systems. Hence, crowdsourcing requestors usually favor on-the-run methods to instantly judge workers leverag- ing the limited amount of information provided. For the rest of this paper and without loss of generality we will focus only on gold questions as a quality mechanism, i.e., questions whose correct answers are known to the requestor and where fail- ing to answer a preset number of them indicates fraud. Until now the problem of “how many gold questions to use?” has no definitive answer (Liu et al., 2013). Obviously, there is a cost/quality trade-off: the more gold questions are used, the better the output’s quality will be, yet the higher the costs are. If too many gold questions are posed after a certain number of questions, the returned benefit becomes minimal, and the costs become unjustifiably high. On the other hand, if too little gold questions are posed, the returned result remains inconclusive in determining the worker’s reliability or fraudulence. In this paper, we develop a worker-aware ad hoc method that exploits the limited information known about the short- term hired workers. We transform this information into a dig- ital personal impression indicating whether a worker matches the profiles of fraudulent or reliable workers. Profiles of fraud- ulent workers come at a higher risk, and should thus be tested more rigorously, whereas profiles of reliable workers come at a lower risk and need only be loosely tested. Our goal with our proposed approach is not to discriminate workers but rather to adjust the number of gold questions to assess more realistically the quality of the work that he or she is delivering. In other words, our method does not attempt to exclude workers, but
-
Upload
khangminh22 -
Category
Documents
-
view
17 -
download
0
Transcript of Fine-tuning Gold Questions in Crowdsourcing Tasks using ...

Example Journal, XXXX, XX: 1–14
Fine-tuning Gold Questions in Crowdsourcing Tasks usingProbabilistic and Siamese Neural Network Models
José María González Pinto1, Kinda El-Maary1 and Wolf-Tilo Balke1
1Institute for Information Systems Technische Universität Braunschweig Braunschweig, Germany,pinto,elmaarry,[email protected]
ABSTRACT
The economic benefits of crowdsourcing have furthered its widespread use over the past decade. However, increas-ing numbers of fraudulent workers threaten to undermine the emerging crowdsourcing economy: requestors facethe choice of either risking low-quality results or having to pay extra money for quality safeguards such as goldquestions or majority voting. The more safeguards injected into the workload, the lower are the risks imposed byfraudulent workers, yet the higher are the costs. So, how many of them are actually needed? Is there a generallyapplicable number or percentage? This paper uses deep learning techniques to identify custom-tailored numbersof gold questions per worker for individually managing the cost/quality balance. Our new method follows real-lifeexperiences: the more we know about workers before assigning a task, the clearer our belief or disbelief in thisworker’s reliability gets. Employing probabilistic models, namely Bayesian belief networks and certainty factormodels, our method creates worker profiles reflecting different a-priori belief values, and we prove that the actualnumber of gold questions per worker can indeed be assessed. Our evaluation on real-world crowdsourcing datasetsdemonstrates our method’s efficiency in saving money while maintaining high-quality results.
Keywords: Quality Control, Crowdsourcing, Gold Questions, Probabilistic models, Deep Learning
ISSN 2332-4031; DOI 10.1561/106.XXXXXXXX© 2018 JMGP, KEM, WTB
1 Introduction
In recent years, several hybrid solutions for augmenting andextending traditional database capabilities with intelligent hu-man steering have been developed. For example 1) processingqueries that cannot be adequately answered by database sys-tems (Franklin et al., 2011), such as skyline queries (Lofi et al.,2013), top-k and group-by queries (Davidson et al., 2013; Zhenget al., 2015), and 2) dealing with missing information (Niekeet al., 2014). The benefits for data science come as no sur-prise, since crowdsourcing is relatively cheap, agile, and offersan intelligent and global 24/7 online labor pool. However, theanonymity of workers on the platforms and the short-term na-ture of the work contracts also invite fraudulent misuse threat-ening to cancel the benefits. In contrast to traditional work-places, crowdsourcing requestors do not know much about theworkers they are hiring: there is no interview process, no CVs,no personal impressions. In the best case for crowdsourcing,platforms offer reputation scores from previous work. Unfor-tunately, it has been shown that reputation systems only workfor long-standing relationships. As an analogy, remember peer-to-peer networks: also here reputation systems have been pro-posed to combat malicious peer behavior, see, e.g., (Aberer andDespotovic, 2001; Kamvar et al., 2003). However, meaning-ful scores were difficult to construct since reputations sufferedfrom the cold start problem (Daltayanni et al., 2015) and wereeasy to fake (Yu and Singh, 2003). These problems becomeeven more pronounced in crowdsourcing due to the high at-trition rates of workers (Ross et al., 2010) reports about 70%,
i.e., relationships tend to be even more short-termed than inpeer-to-peer systems. Hence, crowdsourcing requestors usuallyfavor on-the-run methods to instantly judge workers leverag-ing the limited amount of information provided. For the restof this paper and without loss of generality we will focus onlyon gold questions as a quality mechanism, i.e., questions whosecorrect answers are known to the requestor and where fail-ing to answer a preset number of them indicates fraud. Untilnow the problem of “how many gold questions to use?” hasno definitive answer (Liu et al., 2013). Obviously, there is acost/quality trade-off: the more gold questions are used, thebetter the output’s quality will be, yet the higher the costs are.If too many gold questions are posed after a certain number ofquestions, the returned benefit becomes minimal, and the costsbecome unjustifiably high. On the other hand, if too little goldquestions are posed, the returned result remains inconclusivein determining the worker’s reliability or fraudulence.
In this paper, we develop a worker-aware ad hoc methodthat exploits the limited information known about the short-term hired workers. We transform this information into a dig-ital personal impression indicating whether a worker matchesthe profiles of fraudulent or reliable workers. Profiles of fraud-ulent workers come at a higher risk, and should thus be testedmore rigorously, whereas profiles of reliable workers come at alower risk and need only be loosely tested. Our goal with ourproposed approach is not to discriminate workers but rather toadjust the number of gold questions to assess more realisticallythe quality of the work that he or she is delivering. In otherwords, our method does not attempt to exclude workers, but
2 González Pinto et al.
rather to instantiate more quality controls in case of fraudulentbehavior. However, in the case of false positives task providerswill have to decide on the acceptance rate on the gold ques-tions to minimize the impact of exclusions. Accordingly, for ourmethod’s technical implementation we turn to well-establishedapproaches for uncertainty management. Namely, we investi-gate the usage of both: 1) probabilistic certainty factor models(Stadler, 2004) pioneered for uncertain deduction of diagnosesby medical expert systems.
The model reflects the relative change of belief and/or dis-belief in some hypothesis given new observations, i.e., in ourcase the relative change in the high/low risk associated witha worker. 2) Bayesian Belief Networks, which express uncer-tainty through probabilities. Using either of these models al-lows building a system of decision rules, which create digitalimpressions of each worker and what we refer to as enhancedworker profiles. These worker profiles do not only encode whatis known about a worker but also assess the risks involved witha worker by either 1) relative apriori belief or disbelief mea-sures as given by the certainty factor model or 2) probabilitiesas given by the Bayesian belief network. Our underlying as-sumption is that the higher the belief value or the probabilityin a worker’s reliability, the lower the risk, and the less goldquestions may be used. The higher the disbelief value or, thelower the probability in a worker’s reliability, the higher therisk, and the more gold questions should be used. By per-sonalizing the number of questions to be asked based on theseenhanced profiles, we can then save some money, while main-taining a high level of result quality. To realize this underlyingidea, we identify the exact number of gold questions to be asked(the gold par), by fitting an exponential distribution of numberof questions to be asked on top of the values of belief/disbeliefand probabilities.
In this paper, we extend our work presented in (Maarryand Balke, 2018) to explore the potential and limitations oflatent representations based on neural networks in our questto distinguish between fraudulent and reliable workers. In-deed, distinguishing between reliable and fraudulent workers isa fundamental component of our proposed approach to adjustthe number of gold questions dynamically. Thus, given thesuccess of Deep Learning models in fields such as computer vi-sion and natural language processing, we test in this work theirapplicability to our particular setting. In particular, given thelimited amount of both data and attributes, we restricted ourinvestigation to a particular neural network architecture called‘Siamese Networks’ (Section 4.3) that we hypothesized couldbe a good fit for our problem. We demonstrate the applicabil-ity of our method on real-world crowdsourcing test data of 200workers and compare how well it performs regarding overall re-sult quality, the effectiveness of the algorithm, fraud detection’sfailure rates, and discrimination rates against reliable workers.
However, further work could be done, if data is available, toaccount for a different type of spammers: colluding spammers.As introduced in (Checco et al., 2018), colluding spammerscan undermine the use of gold questions. In particular, as theauthors demonstrated in their paper, it is feasible to build anddeploy a system that can detect which parts of a crowdsourcingjob are more likely to be gold questions (Checco et al., 2018).Given that it is unlikely to get more attributes for building our
profiles, such an attack in gold questions will be for us relevantto investigate if we can get access to training data with such“colluding spammers”. Otherwise, our main assumption high-performance on gold questions leads to low-risk workers willnot work as expected.
2 Safeguards in Practice
Many safeguards for quality issues in crowdsourcing systemshave been investigated. We identify four families of safeguards:
Pessimistic safeguards ensure high quality by directly iden-tifying fraudulent workers and excluding them. The most com-mon approach in this family are gold questions randomly in-jected into the workload. Failing to answer a preset num-ber of these questions (whose correct answers are known bythe system), declares the corresponding worker as fraudulent,in turn leading to exclusion. These safeguards are typicallyworker-oblivious, i.e., no distinction in the underlying testingmechanism is made for different workers. A notable exceptionis skill-adapted gold questions (Maarry and Balke, 2015) andadaptive gold questions (Maarry et al., 2015), which aim atadapting gold questions to the underlying skills of workers fora fairer judgment of workers in alignment with the vision ofimpact sourcing.
Optimistic safeguards ensure high quality by aggregatingthe results of multiple workers on a given task. The best-known aggregation method here is majority voting. Otherweighted aggregation methods in the literature include the ex-pectation maximization (EM) algorithm (Dawid and Skene,1979), a Bayesian version of the EM algorithm (Pearl, 1985),and a probabilistic approach in (Whitehill et al., 2009). Thisfamily is more worker-aware, as it tries to identify the workers’reliability and may distinguish different levels of skills, whichcan then be incorporated as weights in the final step of aggre-gation.
Feedback-based safeguards ensure high quality by monitor-ing the history of workers and their outputs’ feedback Ignja-tovic et al., 2008, thus making it also a worker-aware familyof safeguards. A typical example of this family is reputation-based systems, whether based on a reputation model (Krieg,2001; Lofi et al., 2013) or deterministic approaches (Noorianand Ulieru, 2010).
Incentive-based safeguards ensure high quality by motivat-ing the workers either intrinsically or extrinsically (Hossain,2012). Intrinsic refers to motivations inherent to the task it-self, e.g., Zooniverse1. Extrinsic refers to external motivationsthat offer some reward, e.g., monetary rewards (Kazai, 2011).
Our proposed method falls under the pessimistic safeguardfamily but is a worker-aware method. Moreover, in contrast tothe pessimistic safeguards, our method is designed to adapt toeach new worker, by re-computing the sufficient number of goldquestions needed to distinguish between reliable and fraudulentworkers.
The most relevant work on adaptive quality control is (Liuet al., 2013) who investigated the universal number of goldquestions needed. Although they concluded that the problem
1https://www.zooniverse.org/
Fine-tuning Gold Questions in Crowdsourcing Tasks using Probabilistic and Siamese Neural Network Models 3
is unlikely to reach a definitive answer, their work provides arule of thumb for the optimal number of gold questions to beused: either linearly with or following the order of the squareroot of the total size of the task given to a worker. The choiceof either rule of thumb depends on the corresponding level ofaggregation used: two-stage or joint inference. Since this isclosest to our work, we designated it as a baseline and com-pared our results against the order of the square root scalingrule for the optimal number of questions to be used. We com-pare among others the overall number of gold questions needed,the overall accuracy rate of the gold questions as a safeguardfor distinguishing between reliable and fraudulent workers (seeSection 5).
3 Creating Worker Profiles
We can formally concisely define the problem as follows
Problem Definition. Given a crowdsourcing task T compris-ing n questions, we want to find the minimal number of goldquestions m, such that 0<m<n needed to determine the reli-ability of a given worker w. A reliable worker is defined as aworker, whose accuracy rate on a crowdsourcing task >0.75
Our method can be divided into three necessary steps:1. Creating a system of decision rules: the enhanced work-
er profiles. For building these profiles and their corre-sponding encoding of associated risks, we experimentwith two approaches: a) Bayesian belief networks, whichencode risks with probabilities and b) certainty factormodels, which encode risks with relative apriori mea-sures of belief and disbelief. We turned to both of thesemodels, as they are well-established approaches for un-certainty management. The uncertainty in our problemmaterializes in our attempt to reason whether a newincoming worker is reliable or not based on uncertainknowledge.
2. Identifying the minimum required number of gold ques-tions for each enhanced worker profile, the gold par.
3. Mapping the workers to their corresponding enhancedprofile.
In this section, we focus on the first step of creating en-hanced worker profiles; Section 4 covers the second and thirdstep. Starting with certainty factor models and Bayesian beliefnetworks, we map and redefine both models’ parameters to ourcrowdsourcing setup.
3.1 The Certainty Factor Model (CF)
The probabilistic certainty factor model (CFM) was first devel-oped by (Shortliffe and Buchanan, 1975) for MYCIN, a medi-cal expert system employing certainty factors (CF) for uncer-tain deduction within heuristic systems. In essence, CFs donot correspond to probabilities, but rather depict the relativechange of belief and/or disbelief in some hypothesis H given acertain observation E. The combinations of these Measures ofBeliefMB(H|E) andDisbeliefMD(H|E) constitutes the CFs.These measures are relatives and are not to be confused with
probabilities. Nevertheless, their values are normalized to spanbetween [0, 1], with 1 representing the highest belief or disbeliefwith respect to a certain hypothesis H , and 0 representing thelowest belief or disbelief, again with respect to a certain hypoth-esis H. Moreover, these measures are individually observed, i.e.for MB(H|E) = x and MD(H|E) = y 6=⇒ x+ y = 1
Definition 1 MB, MD and CF. Given an observation E anda Hypothesis H, we can compute the MB(H|E),MD(H|E),and the CF (H|E)
MB(H|E) =
{max[P (H|E),P (H)]−P (H)
1−P (H) if P (H) is 6= 1
1 otherwise
MD(H|E) =
{P (H)−min[P (H|E),P (H)]
P (H) if P (H) is 6= 0
1 otherwise
CF (H|E) =MB(H|E)−MD(H|E)
In other words, CF (H|E) can also be formulated as follows:
CF (H|E) =
{P (H|E)−P (H)
1−P (H) if P (H|E) ≥ P (H), P (H) is 6= 1P (H|E)−P (H)
P (H) if P (H) ≥ P (H|E), P (H) is 6= 0
The CF rules’ value span between [−1.0, 1.0]. Subsequently,we distinguish two types of rules:
1. Confirming CF rules: are those having a high measureof belief, i.e., positive certainty factor value CF (H|E) ≥0.
2. Disconfirming CF rules: are those having a high mea-sure of disbelief, i.e., negative certainty factor valueCF (H|E) < 0.
Given a set of CF rules, new rules/deductions can be auto-matically drawn: 1) chaining and 2) parallel combination. Thelatter is of particular interest: it consolidates different observa-tions leading to the same hypothesis. This allows us to createmore complex CF rules, which combine several independentobservations. Parallel combination can be efficiently computedfrom the rules directly; that is, there is no need to go back tothe data for computations.
Definition 2 Deduction by Parallel Combination. Giventwo CF rules: CFE1
(H) and CFE2(H) where two observations
E1 and E2 lead to the same Hypothesis H. A new CFE1E2(H)can be deduced by parallel combination as follows:
CFE1E2(H) =
x+ y − x ∗ y for x ≥ 0, y ≥ 0
x+ y + x ∗ y for x ≤ 0, y ≤ 0x+y
1−min(|x|,|y|) for − 1 < x ∗ y < 0
where x = CFE1(H) and y = CFE2
(H)
In case of combining more than two CF rules with differentobservations, the above definition applies by taking the resultof the first two combined CF rules and designating it as x whencombining it with the next CF rule and so on (Mellouli, 2014).
4 González Pinto et al.
3.2 Bayesian Belief Network (BN)
Bayes nets belong to the family of probabilistic graphical mod-els and are used to represent/infer knowledge about an uncer-tain domain (Pearl, 1985; Pearl, 1988). Somewhat similar toour crowdsourcing problem, Bayes nets have been applied tothe target recognition problems, where transponders should beidentified as Friend or Foe (Krieg, 2001).
Bayes nets encode a directed acyclic graph G. The di-rected property of the graph complies with our problem, sinceour underlying idea is that observing certain attributes of theworkers lead to a certain belief value in the reliability of aworker. Accordingly, this directed relationship from the ob-servations to the hypothesis can be represented in Bayes Netswith a directed graph. Formally, Bayes nets B is given by thepair B =< G, θ >. The graph G is made up of a set of randomVariables V , depicted by n nodes x1, x2, ..., xn, and directededges
−→E : xi → xj . The underlying semantics of Bayes nets,
namely, the local markov property defines an ordering of thenodes such that only the nodes indexed lower than i can havea directed path to xi. The nodes are the worker’s observa-tions and the hypothesis to be inferred, i.e., the reliability ofthe worker. There are different types of nodes: Root, Par-ent and Child nodes. The edges E represent the probabilisticdependency between the nodes. For discrete variables, the re-lationship between them is given by the conditional probabilitydistribution. The second parameter θ depicts the full joint dis-tribution as follows:
Definition 3 Full Joint distribution of BN. The full jointdistribution for a Bayes net B having n nodes x1, x2, ..., xn, canbe defined by the product of the local conditional distributions
P (x1, x2, ..., xn) =∏
1≤i≤nP (xi|Parents(xi))
There are two types of reasoning: Predictive support anddiagnostic support. Predictive support is top-down reasoningstarting from the parents’ node to the child node, while di-agnostic reasoning is bottom-up reasoning starting from thechild node. Since we aim to infer whether a worker is reliable,i.e., inferring the child node/hypothesis, we follow the predic-tive support inference (see Definition 4). In our crowdsourcingsetup, the random variables V are the workers’ observationsand are depicted by the parent nodes. The parent nodes inour case also happen to be the root nodes, since they have nopredecessor nodes, while the hypothesis is the child node. Eachroot node has a prior probability distribution.
Definition 4 Inferencing in BN. We can infer the strengthof our hypothesis H having seen a worker’s observation E usingthe Bayes nets conditional probability formula:
P (child|parent) = P (child, parent)
P (parent)
i.e.
P (H|E) =P (H,E)
P (E)
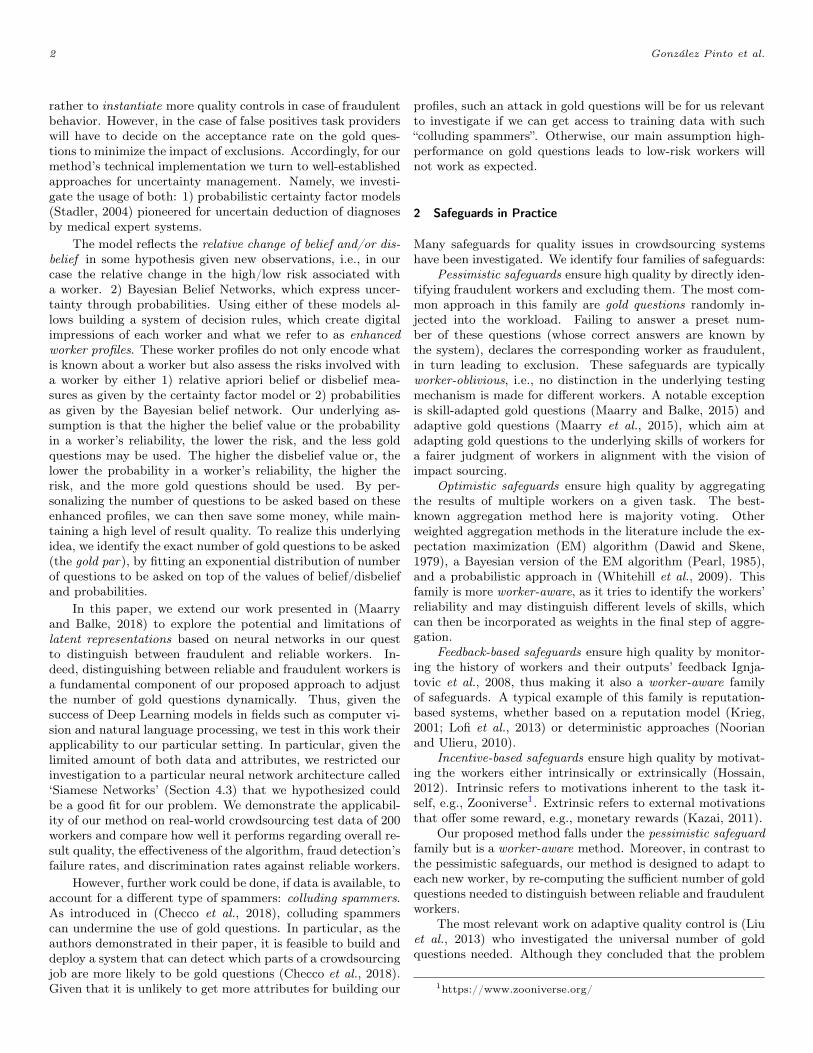
Figure 1: Correlation between workers’ gold question’s accuracyand overall accuracy rate
3.3 Formulating the Hypothesis: H
For our crowdsourcing setup, the hypothesis is always the same.Namely, given a pool of workers W , a worker w ∈ W is a reli-able worker. It follows then that workers fitting low risk pro-files (i.e., profiles with a positive CF value, whereMB(H|E) >MD(H|E) or profiles with P (H|E) ≥ 0.5 come at lower risk,while those fitting high risk profiles (i.e. profiles with a nega-tive CF value, where MB(H|E) < MD(H|E) or profiles withP (H|E) < 0.5 come at higher risk (more on how to map aworker to a worker profile is explained in Section 4.2). Butthe question of how to define such a reliable worker instantlyarises. The difficulty of this question lies within the scarcityof the data the requestor has on a particular worker, who ismore often than not, a new worker. Currently, the only ad hocquantitative metric available to the requestors is the accuracyrate of a worker on the gold questions.
In general, we seek workers whose overall accuracy rate ishigher than 75%. An initial correlation investigation betweenthe accuracy rate on the gold questions and the overall accu-racy rate on the whole task shows, as expected, a high positivecorrelation of 0.7 (see Figure 1). Outliers can also be observed,which is attributed to 1) strategic spammer schemes, wherethey always submit the frequent answer label, 2) inherentlysmall crowdsourcing tasks, e.g., five tasks and one gold ques-tion. We ran this experiment on real crowdsourcing datasetscomprised of 1006 workers, with 40% gold questions (see Sec-tion 5.1).
Accordingly, we generally define the hypothesis that a workeris reliable if he/she attains at least 75% accuracy rate on thegold questions. Eventually, however, workers fitting low-riskprofiles are assigned less gold questions, while workers fittinghigh-risk profiles are assigned more gold questions. Conse-quently, we vary the expected quality thresholds such thatworkers fitting the disconfirming profile with the lowest value,i.e., CF (H|E) → −1.0 or P (H|E) = 0, should attain at least75% quality rate, while workers fitting profiles with higher val-ues should attain higher quality rates. The idea is to decreasethe discrimination rate against workers fitting high risk pro-files, while still maintaining the threshold quality. On the otherhand, workers fitting low risk profiles should prove their relia-bility even more so by scoring higher quality thresholds. Thus,we uniformly fit the quality thresholds to be attained on thebelief/disbelief values and probabilities, such that the thresh-olds range between 75% - 100%, where the high risk worker
Fine-tuning Gold Questions in Crowdsourcing Tasks using Probabilistic and Siamese Neural Network Models 5
profile: CF (H|E) → −1.0 or P (H|E) = 0 should attain atleast 75% accuracy rate on gold questions to be considered re-liable, while the low risk worker profile: CF (H|E) → 1.0 orP (H|E) = 1 should attain a perfect 100% accuracy rate to beconsidered reliable. In practice, such a perfect profile does notexist.
3.4 Formulating the Observations: E
Observations capture the limited information we know aboutworkers. Of course, all attributes available in crowdsourcingplatforms can and should be exploited for best discrimina-tion accuracy. As all crowdsourcing tasks were run on theCrowdFlower2 platform (see Section 5.2), below we list thepublicly available attributes offered by CrowdFlower. For eachattribute, we also investigated its domain to find out which ofits instances should be considered as an observation. An at-tribute’s instance is a valid observation if it is frequent sinceboth CF rules and Bayesian conditional probabilities becomeunreliable if based on sparse observations.
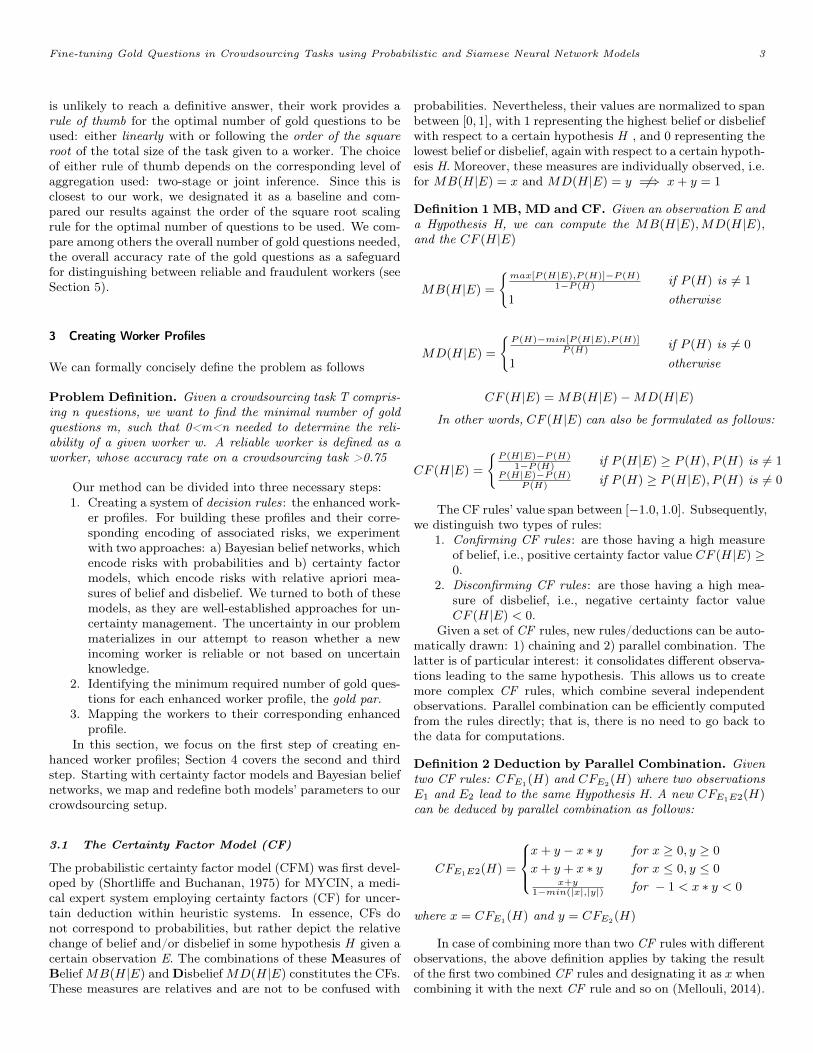
1. Channel : There are 30 different crowdsourcing channels,from which workers are hired. Only eight channels, how-ever, are dominating our labor quota, leaving 22 chan-nels providing only around 4.3% of the total workforce(see Figure 2). Accordingly, we only use the top 8 chan-nels as observations, which constitute 95.6% of the data.
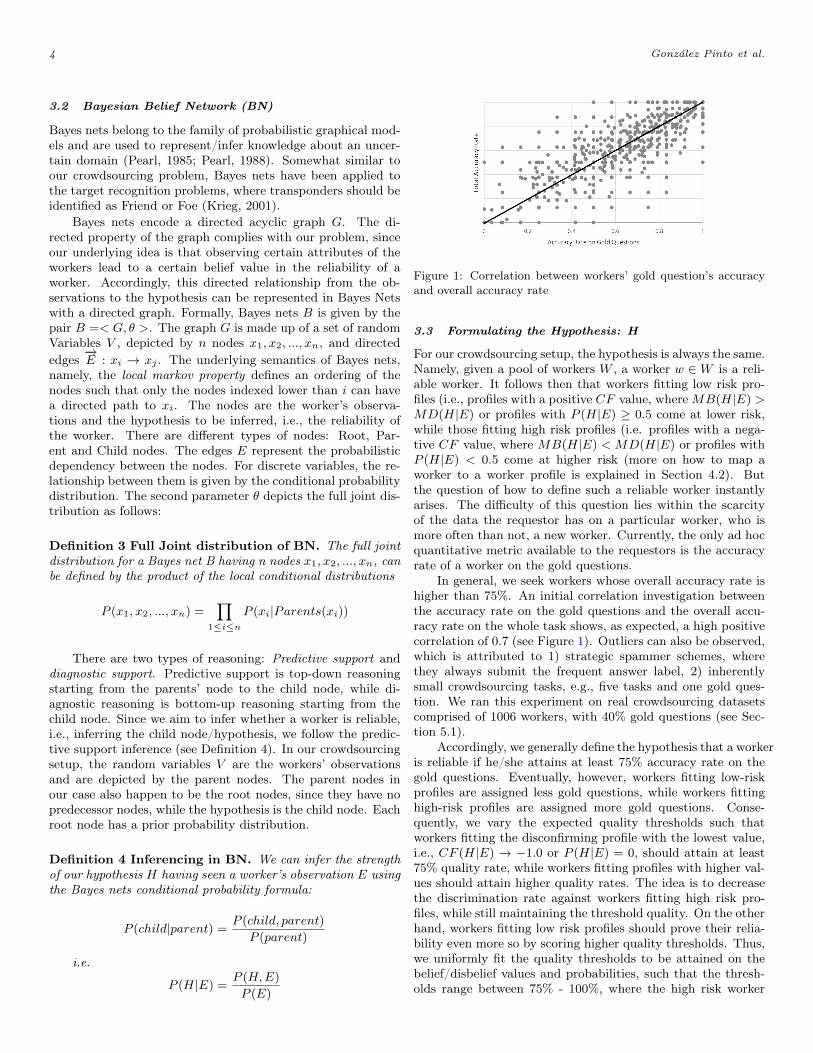
2. Country : In total, we have workers from 75 differentcountries. Figure 3 shows a clear Zipfian distribution,with 85% of workers coming from only 24 countries. Welimit our observation to these 24 countries ignoring thedistribution’s tail.
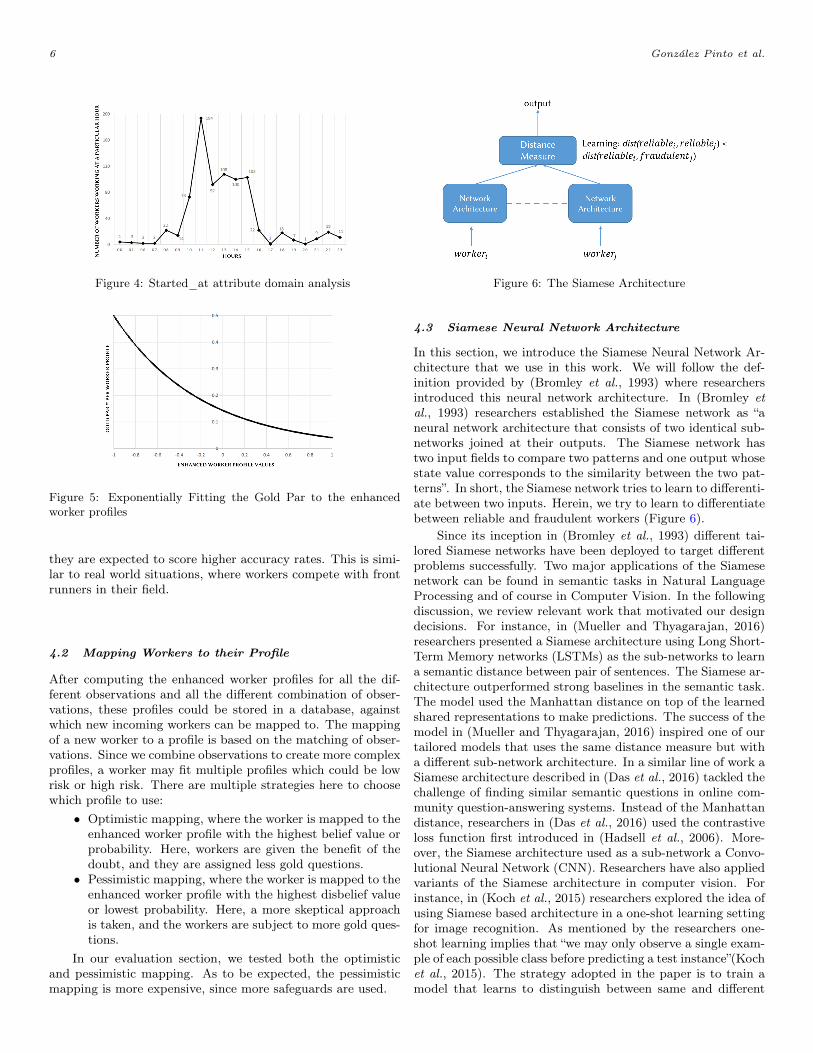
3. Started_at : this attribute marks the time (GMT) atwhich a worker started working. On its own, this at-tribute would not make much sense, but rather in combi-nation with the country, since it would indicate whetherworking in the morning, evening or night is more reli-able. As seen in Figure 4, about 88.7% of the workersworked between 08 am - 6 pm. We used these hours forour observations.
4. City : the city attribute proved too sparse, as it is onlyavailable for 71% of the workers (i.e., 716 workers). More-over, it exhibited an extremely long-tailed distributionof 462 cities. The head of the distribution, on the otherhand, had two cities: Caracas and Belgrade, comprising7% of the workers. Accordingly, we chose to disregardthe city attribute all together as a discriminating obser-vation.
5. Trust : the trust attribute ranges between 0.0 and 1.0and is computed by the platform based on the last taska worker performed. For this attribute, all values provedsensible to be taken as observations. We aggregatedthe values by grouping them into intervals of 0.1, thusyielding ten values of trust.
Overall, our models’ observations comprise eight channels,eight different hours to work within, 24 countries and ten levelsof trust.
2https://www.crowdflower.com/
Figure 2: Channel attribute domain analysis
Figure 3: Country attribute domain analysis
4 Towards the Gold Par
After computing the enhanced worker profiles, the next step isto determine how many gold questions are sufficient per profile,depending on the profiles’ encoded risk.
4.1 Mapping Profiles to the Gold Par
Following our notion that low-risk workers should be asked lessgold questions than high-risk workers, both the uniform and theexponential distribution could mimic this notion when fitted ontop of the enhanced worker profiles, such that at the worst casescenario, e.g., CF (H|E)→ −1.0, 50% gold questions should beasked, and at the best case scenario, e.g. CF (H|E)→ 1.0, only1 gold question needs to be asked. Note that such a perfectprofile does not exist in practice.
The exponential distribution, however, has a lower discrim-ination rate than the uniform distribution, since low-risk work-ers are given more gold questions, thus more chances, to breakaway from their high-risk profile. Moreover, the exponentialdistribution also takes into account, that gold questions couldbe imbalanced and that some of them might be more difficulti.e. honest workers fitting high-risk profiles might end up get-ting the short end of the stick. Whereas, workers fitting low-risk profiles get exponentially less number of questions, whichalso decreases the overall costs of utilizing safeguards.
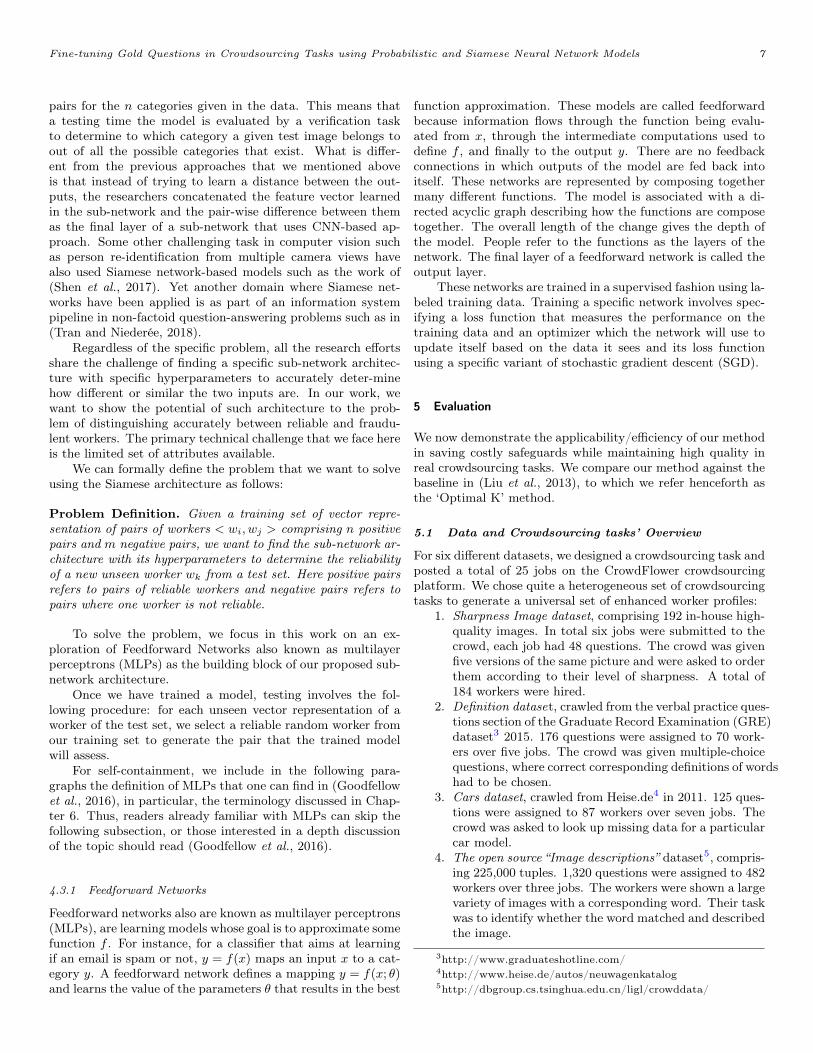
Experimenting with various exponential distributions hav-ing different rate parameters yielded the best results with theexponential distribution f(x, λ) = λe−xλ, where λ = 2 (seeFigure 5). As discussed in Section in 3.3, although workersfitting low risk profiles get a less number of gold questions,
6 González Pinto et al.
Figure 4: Started_at attribute domain analysis
Figure 5: Exponentially Fitting the Gold Par to the enhancedworker profiles
they are expected to score higher accuracy rates. This is simi-lar to real world situations, where workers compete with frontrunners in their field.
4.2 Mapping Workers to their Profile
After computing the enhanced worker profiles for all the dif-ferent observations and all the different combination of obser-vations, these profiles could be stored in a database, againstwhich new incoming workers can be mapped to. The mappingof a new worker to a profile is based on the matching of obser-vations. Since we combine observations to create more complexprofiles, a worker may fit multiple profiles which could be lowrisk or high risk. There are multiple strategies here to choosewhich profile to use:
• Optimistic mapping, where the worker is mapped to theenhanced worker profile with the highest belief value orprobability. Here, workers are given the benefit of thedoubt, and they are assigned less gold questions.
• Pessimistic mapping, where the worker is mapped to theenhanced worker profile with the highest disbelief valueor lowest probability. Here, a more skeptical approachis taken, and the workers are subject to more gold ques-tions.
In our evaluation section, we tested both the optimisticand pessimistic mapping. As to be expected, the pessimisticmapping is more expensive, since more safeguards are used.
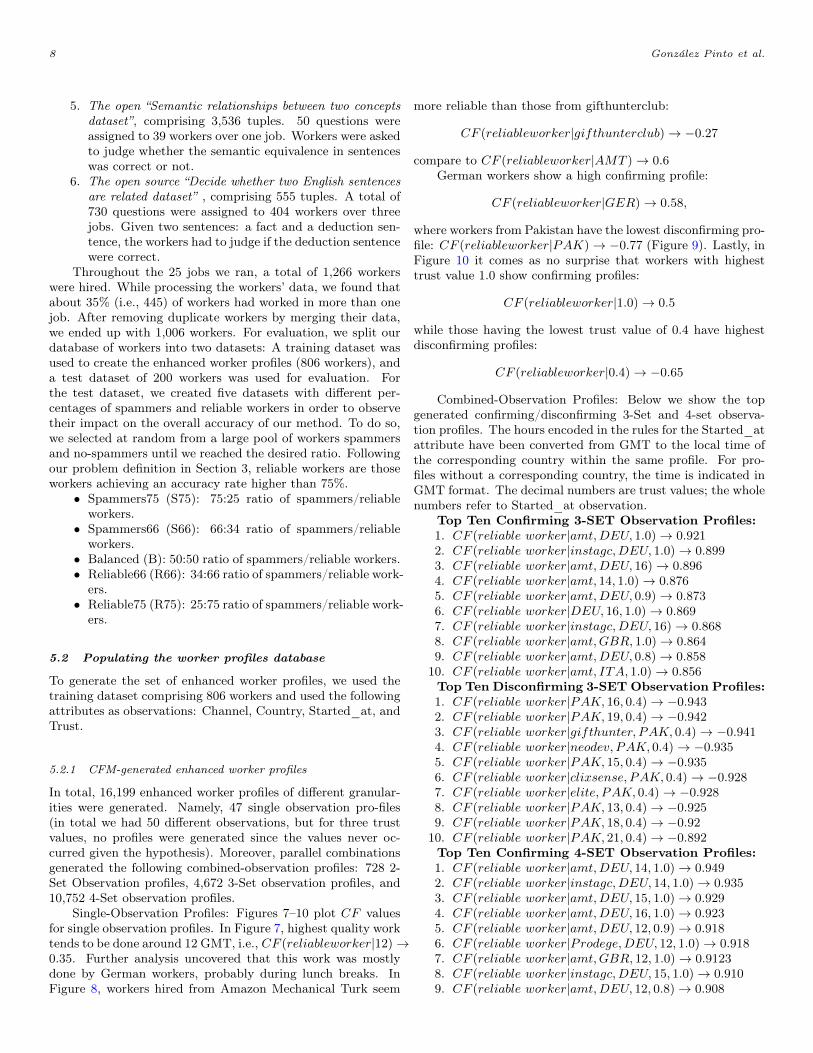
Figure 6: The Siamese Architecture
4.3 Siamese Neural Network Architecture
In this section, we introduce the Siamese Neural Network Ar-chitecture that we use in this work. We will follow the def-inition provided by (Bromley et al., 1993) where researchersintroduced this neural network architecture. In (Bromley etal., 1993) researchers established the Siamese network as “aneural network architecture that consists of two identical sub-networks joined at their outputs. The Siamese network hastwo input fields to compare two patterns and one output whosestate value corresponds to the similarity between the two pat-terns”. In short, the Siamese network tries to learn to differenti-ate between two inputs. Herein, we try to learn to differentiatebetween reliable and fraudulent workers (Figure 6).
Since its inception in (Bromley et al., 1993) different tai-lored Siamese networks have been deployed to target differentproblems successfully. Two major applications of the Siamesenetwork can be found in semantic tasks in Natural LanguageProcessing and of course in Computer Vision. In the followingdiscussion, we review relevant work that motivated our designdecisions. For instance, in (Mueller and Thyagarajan, 2016)researchers presented a Siamese architecture using Long Short-Term Memory networks (LSTMs) as the sub-networks to learna semantic distance between pair of sentences. The Siamese ar-chitecture outperformed strong baselines in the semantic task.The model used the Manhattan distance on top of the learnedshared representations to make predictions. The success of themodel in (Mueller and Thyagarajan, 2016) inspired one of ourtailored models that uses the same distance measure but witha different sub-network architecture. In a similar line of work aSiamese architecture described in (Das et al., 2016) tackled thechallenge of finding similar semantic questions in online com-munity question-answering systems. Instead of the Manhattandistance, researchers in (Das et al., 2016) used the contrastiveloss function first introduced in (Hadsell et al., 2006). More-over, the Siamese architecture used as a sub-network a Convo-lutional Neural Network (CNN). Researchers have also appliedvariants of the Siamese architecture in computer vision. Forinstance, in (Koch et al., 2015) researchers explored the idea ofusing Siamese based architecture in a one-shot learning settingfor image recognition. As mentioned by the researchers one-shot learning implies that “we may only observe a single exam-ple of each possible class before predicting a test instance”(Kochet al., 2015). The strategy adopted in the paper is to train amodel that learns to distinguish between same and different
Fine-tuning Gold Questions in Crowdsourcing Tasks using Probabilistic and Siamese Neural Network Models 7
pairs for the n categories given in the data. This means thata testing time the model is evaluated by a verification taskto determine to which category a given test image belongs toout of all the possible categories that exist. What is differ-ent from the previous approaches that we mentioned aboveis that instead of trying to learn a distance between the out-puts, the researchers concatenated the feature vector learnedin the sub-network and the pair-wise difference between themas the final layer of a sub-network that uses CNN-based ap-proach. Some other challenging task in computer vision suchas person re-identification from multiple camera views havealso used Siamese network-based models such as the work of(Shen et al., 2017). Yet another domain where Siamese net-works have been applied is as part of an information systempipeline in non-factoid question-answering problems such as in(Tran and Niederée, 2018).
Regardless of the specific problem, all the research effortsshare the challenge of finding a specific sub-network architec-ture with specific hyperparameters to accurately deter-minehow different or similar the two inputs are. In our work, wewant to show the potential of such architecture to the prob-lem of distinguishing accurately between reliable and fraudu-lent workers. The primary technical challenge that we face hereis the limited set of attributes available.
We can formally define the problem that we want to solveusing the Siamese architecture as follows:
Problem Definition. Given a training set of vector repre-sentation of pairs of workers < wi, wj > comprising n positivepairs and m negative pairs, we want to find the sub-network ar-chitecture with its hyperparameters to determine the reliabilityof a new unseen worker wk from a test set. Here positive pairsrefers to pairs of reliable workers and negative pairs refers topairs where one worker is not reliable.
To solve the problem, we focus in this work on an ex-ploration of Feedforward Networks also known as multilayerperceptrons (MLPs) as the building block of our proposed sub-network architecture.
Once we have trained a model, testing involves the fol-lowing procedure: for each unseen vector representation of aworker of the test set, we select a reliable random worker fromour training set to generate the pair that the trained modelwill assess.
For self-containment, we include in the following para-graphs the definition of MLPs that one can find in (Goodfellowet al., 2016), in particular, the terminology discussed in Chap-ter 6. Thus, readers already familiar with MLPs can skip thefollowing subsection, or those interested in a depth discussionof the topic should read (Goodfellow et al., 2016).
4.3.1 Feedforward Networks
Feedforward networks also are known as multilayer perceptrons(MLPs), are learning models whose goal is to approximate somefunction f . For instance, for a classifier that aims at learningif an email is spam or not, y = f(x) maps an input x to a cat-egory y. A feedforward network defines a mapping y = f(x; θ)and learns the value of the parameters θ that results in the best
function approximation. These models are called feedforwardbecause information flows through the function being evalu-ated from x, through the intermediate computations used todefine f , and finally to the output y. There are no feedbackconnections in which outputs of the model are fed back intoitself. These networks are represented by composing togethermany different functions. The model is associated with a di-rected acyclic graph describing how the functions are composetogether. The overall length of the change gives the depth ofthe model. People refer to the functions as the layers of thenetwork. The final layer of a feedforward network is called theoutput layer.
These networks are trained in a supervised fashion using la-beled training data. Training a specific network involves spec-ifying a loss function that measures the performance on thetraining data and an optimizer which the network will use toupdate itself based on the data it sees and its loss functionusing a specific variant of stochastic gradient descent (SGD).
5 Evaluation
We now demonstrate the applicability/efficiency of our methodin saving costly safeguards while maintaining high quality inreal crowdsourcing tasks. We compare our method against thebaseline in (Liu et al., 2013), to which we refer henceforth asthe ‘Optimal K’ method.
5.1 Data and Crowdsourcing tasks’ Overview
For six different datasets, we designed a crowdsourcing task andposted a total of 25 jobs on the CrowdFlower crowdsourcingplatform. We chose quite a heterogeneous set of crowdsourcingtasks to generate a universal set of enhanced worker profiles:
1. Sharpness Image dataset, comprising 192 in-house high-quality images. In total six jobs were submitted to thecrowd, each job had 48 questions. The crowd was givenfive versions of the same picture and were asked to orderthem according to their level of sharpness. A total of184 workers were hired.
2. Definition dataset, crawled from the verbal practice ques-tions section of the Graduate Record Examination (GRE)dataset3 2015. 176 questions were assigned to 70 work-ers over five jobs. The crowd was given multiple-choicequestions, where correct corresponding definitions of wordshad to be chosen.
3. Cars dataset, crawled from Heise.de4 in 2011. 125 ques-tions were assigned to 87 workers over seven jobs. Thecrowd was asked to look up missing data for a particularcar model.
4. The open source “Image descriptions” dataset5, compris-ing 225,000 tuples. 1,320 questions were assigned to 482workers over three jobs. The workers were shown a largevariety of images with a corresponding word. Their taskwas to identify whether the word matched and describedthe image.
3http://www.graduateshotline.com/4http://www.heise.de/autos/neuwagenkatalog5http://dbgroup.cs.tsinghua.edu.cn/ligl/crowddata/
8 González Pinto et al.
5. The open “Semantic relationships between two conceptsdataset”, comprising 3,536 tuples. 50 questions wereassigned to 39 workers over one job. Workers were askedto judge whether the semantic equivalence in sentenceswas correct or not.
6. The open source “Decide whether two English sentencesare related dataset” , comprising 555 tuples. A total of730 questions were assigned to 404 workers over threejobs. Given two sentences: a fact and a deduction sen-tence, the workers had to judge if the deduction sentencewere correct.
Throughout the 25 jobs we ran, a total of 1,266 workerswere hired. While processing the workers’ data, we found thatabout 35% (i.e., 445) of workers had worked in more than onejob. After removing duplicate workers by merging their data,we ended up with 1,006 workers. For evaluation, we split ourdatabase of workers into two datasets: A training dataset wasused to create the enhanced worker profiles (806 workers), anda test dataset of 200 workers was used for evaluation. Forthe test dataset, we created five datasets with different per-centages of spammers and reliable workers in order to observetheir impact on the overall accuracy of our method. To do so,we selected at random from a large pool of workers spammersand no-spammers until we reached the desired ratio. Followingour problem definition in Section 3, reliable workers are thoseworkers achieving an accuracy rate higher than 75%.
• Spammers75 (S75): 75:25 ratio of spammers/reliableworkers.
• Spammers66 (S66): 66:34 ratio of spammers/reliableworkers.
• Balanced (B): 50:50 ratio of spammers/reliable workers.• Reliable66 (R66): 34:66 ratio of spammers/reliable work-
ers.• Reliable75 (R75): 25:75 ratio of spammers/reliable work-
ers.
5.2 Populating the worker profiles database
To generate the set of enhanced worker profiles, we used thetraining dataset comprising 806 workers and used the followingattributes as observations: Channel, Country, Started_at, andTrust.
5.2.1 CFM-generated enhanced worker profiles
In total, 16,199 enhanced worker profiles of different granular-ities were generated. Namely, 47 single observation pro-files(in total we had 50 different observations, but for three trustvalues, no profiles were generated since the values never oc-curred given the hypothesis). Moreover, parallel combinationsgenerated the following combined-observation profiles: 728 2-Set Observation profiles, 4,672 3-Set observation profiles, and10,752 4-Set observation profiles.
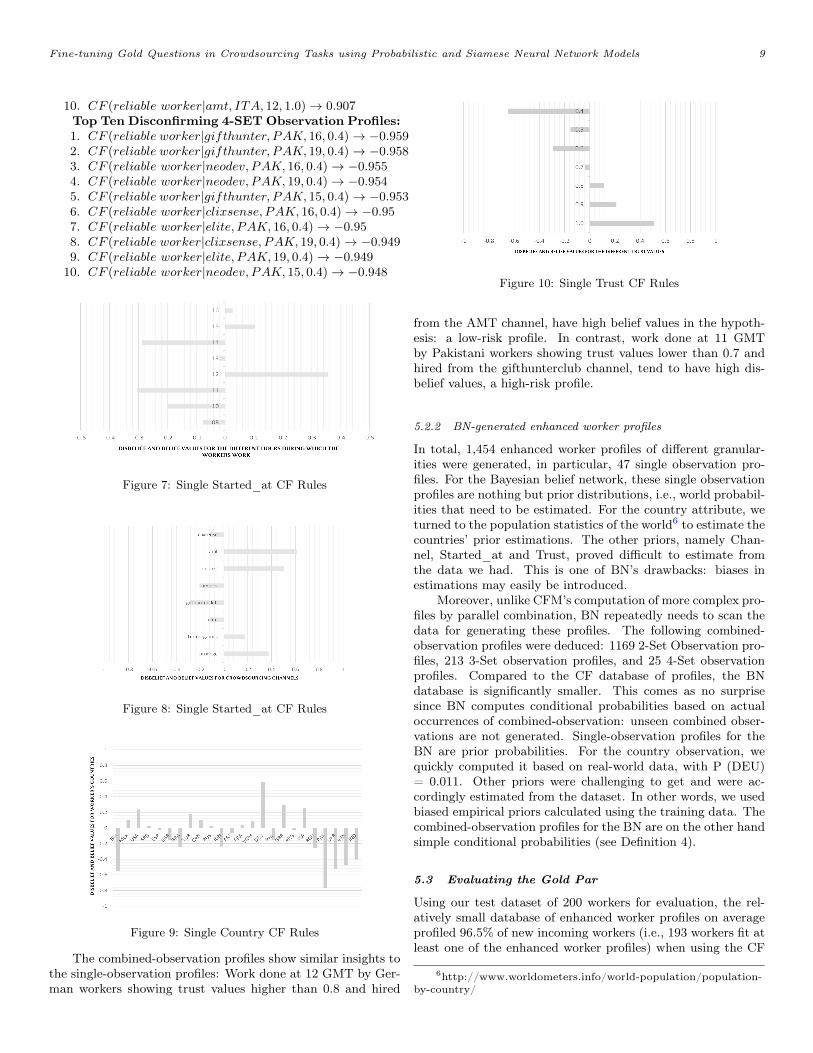
Single-Observation Profiles: Figures 7–10 plot CF valuesfor single observation profiles. In Figure 7, highest quality worktends to be done around 12 GMT, i.e., CF (reliableworker|12)→0.35. Further analysis uncovered that this work was mostlydone by German workers, probably during lunch breaks. InFigure 8, workers hired from Amazon Mechanical Turk seem
more reliable than those from gifthunterclub:
CF (reliableworker|gifthunterclub)→ −0.27
compare to CF (reliableworker|AMT )→ 0.6German workers show a high confirming profile:
CF (reliableworker|GER)→ 0.58,
where workers from Pakistan have the lowest disconfirming pro-file: CF (reliableworker|PAK)→ −0.77 (Figure 9). Lastly, inFigure 10 it comes as no surprise that workers with highesttrust value 1.0 show confirming profiles:
CF (reliableworker|1.0)→ 0.5
while those having the lowest trust value of 0.4 have highestdisconfirming profiles:
CF (reliableworker|0.4)→ −0.65
Combined-Observation Profiles: Below we show the topgenerated confirming/disconfirming 3-Set and 4-set observa-tion profiles. The hours encoded in the rules for the Started_atattribute have been converted from GMT to the local time ofthe corresponding country within the same profile. For pro-files without a corresponding country, the time is indicated inGMT format. The decimal numbers are trust values; the wholenumbers refer to Started_at observation.
Top Ten Confirming 3-SET Observation Profiles:1. CF (reliable worker|amt,DEU, 1.0)→ 0.9212. CF (reliable worker|instagc,DEU, 1.0)→ 0.8993. CF (reliable worker|amt,DEU, 16)→ 0.8964. CF (reliable worker|amt, 14, 1.0)→ 0.8765. CF (reliable worker|amt,DEU, 0.9)→ 0.8736. CF (reliable worker|DEU, 16, 1.0)→ 0.8697. CF (reliable worker|instagc,DEU, 16)→ 0.8688. CF (reliable worker|amt,GBR, 1.0)→ 0.8649. CF (reliable worker|amt,DEU, 0.8)→ 0.85810. CF (reliable worker|amt, ITA, 1.0)→ 0.856Top Ten Disconfirming 3-SET Observation Profiles:1. CF (reliable worker|PAK, 16, 0.4)→ −0.9432. CF (reliable worker|PAK, 19, 0.4)→ −0.9423. CF (reliable worker|gifthunter, PAK, 0.4)→ −0.9414. CF (reliable worker|neodev, PAK, 0.4)→ −0.9355. CF (reliable worker|PAK, 15, 0.4)→ −0.9356. CF (reliable worker|clixsense, PAK, 0.4)→ −0.9287. CF (reliable worker|elite, PAK, 0.4)→ −0.9288. CF (reliable worker|PAK, 13, 0.4)→ −0.9259. CF (reliable worker|PAK, 18, 0.4)→ −0.9210. CF (reliable worker|PAK, 21, 0.4)→ −0.892Top Ten Confirming 4-SET Observation Profiles:1. CF (reliable worker|amt,DEU, 14, 1.0)→ 0.9492. CF (reliable worker|instagc,DEU, 14, 1.0)→ 0.9353. CF (reliable worker|amt,DEU, 15, 1.0)→ 0.9294. CF (reliable worker|amt,DEU, 16, 1.0)→ 0.9235. CF (reliable worker|amt,DEU, 12, 0.9)→ 0.9186. CF (reliable worker|Prodege,DEU, 12, 1.0)→ 0.9187. CF (reliable worker|amt,GBR, 12, 1.0)→ 0.91238. CF (reliable worker|instagc,DEU, 15, 1.0)→ 0.9109. CF (reliable worker|amt,DEU, 12, 0.8)→ 0.908
Fine-tuning Gold Questions in Crowdsourcing Tasks using Probabilistic and Siamese Neural Network Models 9
10. CF (reliable worker|amt, ITA, 12, 1.0)→ 0.907Top Ten Disconfirming 4-SET Observation Profiles:1. CF (reliable worker|gifthunter, PAK, 16, 0.4)→ −0.9592. CF (reliable worker|gifthunter, PAK, 19, 0.4)→ −0.9583. CF (reliable worker|neodev, PAK, 16, 0.4)→ −0.9554. CF (reliable worker|neodev, PAK, 19, 0.4)→ −0.9545. CF (reliable worker|gifthunter, PAK, 15, 0.4)→ −0.9536. CF (reliable worker|clixsense, PAK, 16, 0.4)→ −0.957. CF (reliable worker|elite, PAK, 16, 0.4)→ −0.958. CF (reliable worker|clixsense, PAK, 19, 0.4)→ −0.9499. CF (reliable worker|elite, PAK, 19, 0.4)→ −0.94910. CF (reliable worker|neodev, PAK, 15, 0.4)→ −0.948
Figure 7: Single Started_at CF Rules
Figure 8: Single Started_at CF Rules
Figure 9: Single Country CF Rules
The combined-observation profiles show similar insights tothe single-observation profiles: Work done at 12 GMT by Ger-man workers showing trust values higher than 0.8 and hired
Figure 10: Single Trust CF Rules
from the AMT channel, have high belief values in the hypoth-esis: a low-risk profile. In contrast, work done at 11 GMTby Pakistani workers showing trust values lower than 0.7 andhired from the gifthunterclub channel, tend to have high dis-belief values, a high-risk profile.
5.2.2 BN-generated enhanced worker profiles
In total, 1,454 enhanced worker profiles of different granular-ities were generated, in particular, 47 single observation pro-files. For the Bayesian belief network, these single observationprofiles are nothing but prior distributions, i.e., world probabil-ities that need to be estimated. For the country attribute, weturned to the population statistics of the world6 to estimate thecountries’ prior estimations. The other priors, namely Chan-nel, Started_at and Trust, proved difficult to estimate fromthe data we had. This is one of BN’s drawbacks: biases inestimations may easily be introduced.
Moreover, unlike CFM’s computation of more complex pro-files by parallel combination, BN repeatedly needs to scan thedata for generating these profiles. The following combined-observation profiles were deduced: 1169 2-Set Observation pro-files, 213 3-Set observation profiles, and 25 4-Set observationprofiles. Compared to the CF database of profiles, the BNdatabase is significantly smaller. This comes as no surprisesince BN computes conditional probabilities based on actualoccurrences of combined-observation: unseen combined obser-vations are not generated. Single-observation profiles for theBN are prior probabilities. For the country observation, wequickly computed it based on real-world data, with P (DEU)= 0.011. Other priors were challenging to get and were ac-cordingly estimated from the dataset. In other words, we usedbiased empirical priors calculated using the training data. Thecombined-observation profiles for the BN are on the other handsimple conditional probabilities (see Definition 4).
5.3 Evaluating the Gold Par
Using our test dataset of 200 workers for evaluation, the rel-atively small database of enhanced worker profiles on averageprofiled 96.5% of new incoming workers (i.e., 193 workers fit atleast one of the enhanced worker profiles) when using the CF
6http://www.worldometers.info/world-population/population-by-country/
10 González Pinto et al.
database, and 94% of new incoming workers (i.e. 188 workers)when using BN.
Next, we evaluate our method with both types of profilemapping (optimistic and pessimistic) and compare it againstoptimal k (see Section 2), in terms of overall quality, effec-tiveness of the algorithm, number of gold questions used, i.e.incurred costs, fraud detection failure rates, and discriminationagainst reliable workers.
5.3.1 Method’s Effectiveness and the Gold Par
We evaluate two trading-off parameters: 1) the method’s ef-fectiveness, that is, how effective the method is in includingreliable workers, while simultaneously removing spammers. 2)The gold par percentage that is the overall percentage of goldquestions posed in the crowdsourcing task. The more questionsare posed, the more information the method gets, which directsit to the correct decision. Nevertheless, more gold questions,incur higher costs, e.g., BN-pessimistic method is overall themost effective (90.04%), yet comes at the highest cost of goldquestions usage (19.31%).
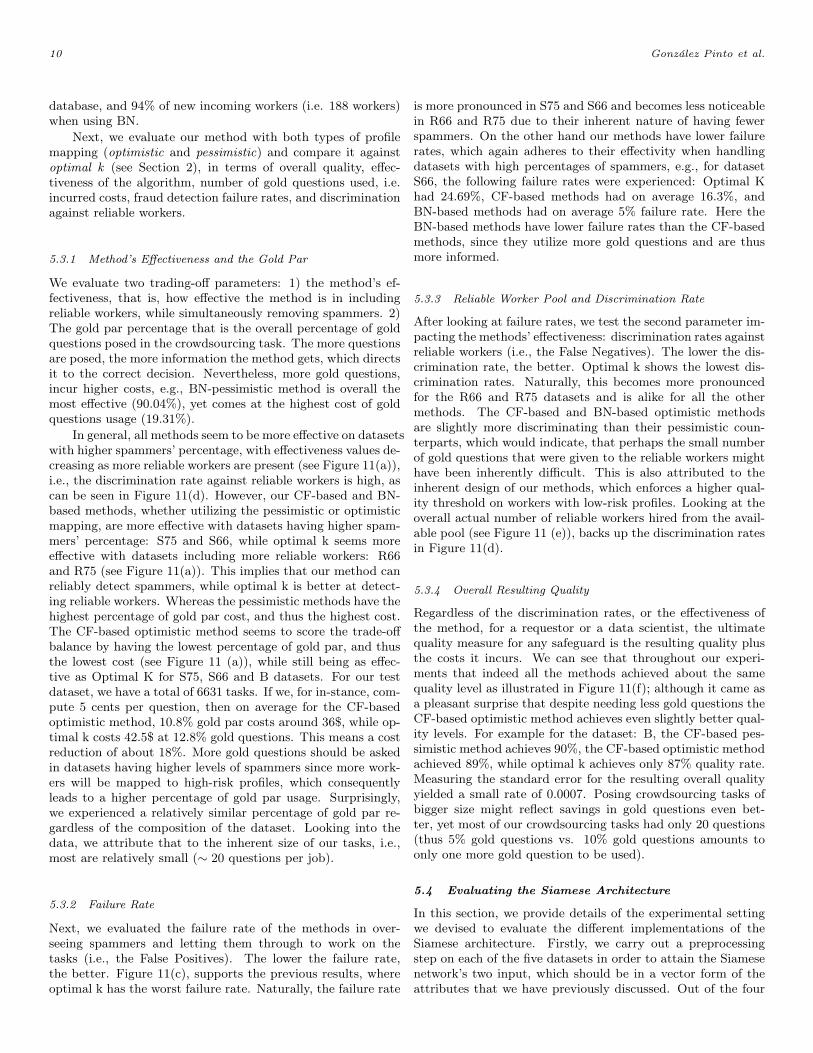
In general, all methods seem to be more effective on datasetswith higher spammers’ percentage, with effectiveness values de-creasing as more reliable workers are present (see Figure 11(a)),i.e., the discrimination rate against reliable workers is high, ascan be seen in Figure 11(d). However, our CF-based and BN-based methods, whether utilizing the pessimistic or optimisticmapping, are more effective with datasets having higher spam-mers’ percentage: S75 and S66, while optimal k seems moreeffective with datasets including more reliable workers: R66and R75 (see Figure 11(a)). This implies that our method canreliably detect spammers, while optimal k is better at detect-ing reliable workers. Whereas the pessimistic methods have thehighest percentage of gold par cost, and thus the highest cost.The CF-based optimistic method seems to score the trade-offbalance by having the lowest percentage of gold par, and thusthe lowest cost (see Figure 11 (a)), while still being as effec-tive as Optimal K for S75, S66 and B datasets. For our testdataset, we have a total of 6631 tasks. If we, for in-stance, com-pute 5 cents per question, then on average for the CF-basedoptimistic method, 10.8% gold par costs around 36$, while op-timal k costs 42.5$ at 12.8% gold questions. This means a costreduction of about 18%. More gold questions should be askedin datasets having higher levels of spammers since more work-ers will be mapped to high-risk profiles, which consequentlyleads to a higher percentage of gold par usage. Surprisingly,we experienced a relatively similar percentage of gold par re-gardless of the composition of the dataset. Looking into thedata, we attribute that to the inherent size of our tasks, i.e.,most are relatively small (∼ 20 questions per job).
5.3.2 Failure Rate
Next, we evaluated the failure rate of the methods in over-seeing spammers and letting them through to work on thetasks (i.e., the False Positives). The lower the failure rate,the better. Figure 11(c), supports the previous results, whereoptimal k has the worst failure rate. Naturally, the failure rate
is more pronounced in S75 and S66 and becomes less noticeablein R66 and R75 due to their inherent nature of having fewerspammers. On the other hand our methods have lower failurerates, which again adheres to their effectivity when handlingdatasets with high percentages of spammers, e.g., for datasetS66, the following failure rates were experienced: Optimal Khad 24.69%, CF-based methods had on average 16.3%, andBN-based methods had on average 5% failure rate. Here theBN-based methods have lower failure rates than the CF-basedmethods, since they utilize more gold questions and are thusmore informed.
5.3.3 Reliable Worker Pool and Discrimination Rate
After looking at failure rates, we test the second parameter im-pacting the methods’ effectiveness: discrimination rates againstreliable workers (i.e., the False Negatives). The lower the dis-crimination rate, the better. Optimal k shows the lowest dis-crimination rates. Naturally, this becomes more pronouncedfor the R66 and R75 datasets and is alike for all the othermethods. The CF-based and BN-based optimistic methodsare slightly more discriminating than their pessimistic coun-terparts, which would indicate, that perhaps the small numberof gold questions that were given to the reliable workers mighthave been inherently difficult. This is also attributed to theinherent design of our methods, which enforces a higher qual-ity threshold on workers with low-risk profiles. Looking at theoverall actual number of reliable workers hired from the avail-able pool (see Figure 11 (e)), backs up the discrimination ratesin Figure 11(d).
5.3.4 Overall Resulting Quality
Regardless of the discrimination rates, or the effectiveness ofthe method, for a requestor or a data scientist, the ultimatequality measure for any safeguard is the resulting quality plusthe costs it incurs. We can see that throughout our experi-ments that indeed all the methods achieved about the samequality level as illustrated in Figure 11(f); although it came asa pleasant surprise that despite needing less gold questions theCF-based optimistic method achieves even slightly better qual-ity levels. For example for the dataset: B, the CF-based pes-simistic method achieves 90%, the CF-based optimistic methodachieved 89%, while optimal k achieves only 87% quality rate.Measuring the standard error for the resulting overall qualityyielded a small rate of 0.0007. Posing crowdsourcing tasks ofbigger size might reflect savings in gold questions even bet-ter, yet most of our crowdsourcing tasks had only 20 questions(thus 5% gold questions vs. 10% gold questions amounts toonly one more gold question to be used).
5.4 Evaluating the Siamese Architecture
In this section, we provide details of the experimental settingwe devised to evaluate the different implementations of theSiamese architecture. Firstly, we carry out a preprocessingstep on each of the five datasets in order to attain the Siamesenetwork’s two input, which should be in a vector form of theattributes that we have previously discussed. Out of the four
Fine-tuning Gold Questions in Crowdsourcing Tasks using Probabilistic and Siamese Neural Network Models 11
Figure 11: Evaluating Optimal k vs. CF-based/BN-based (Pessimistic and Optimistic) methods on S75, S66, B, R66, and R75
available attributes, three of them is categorical, and one is nu-merical. Accordingly, for each of the categorical variables thatcan take on K different values, we represent each data pointwith aK-dimensional vector x in which one element of x equals1 and all the remaining elements equal zero. Secondly, in orderto derive the hyperparameters, e.g., number of layers, num-ber of neurons in each layer, regularization to avoid overfittingfor the different models, we reserve part of the training datafor validation purposes. For all the datasets, we reserved 20%of the original training data as validation data. The modelsevaluated here used hyperas7 to search for the optimal hyper-parameters mentioned above.
Next, with the remaining training data, we generated thepairs which are to be used as inputs for the Siamese networksthat we test. Thus, we proceeded as follows: for each reliableworker, we generate positive pairs and negative pairs. A posi-tive pair comprises of two reliable workers and, a negative paircomprises of a reliable worker and a non-reliable worker. Fol-lowing one of the empirical findings, which states that havingmany examples, e.g., above 5000 (Goodfellow et al., 2016) canlead to robust deep learning models, we generated all possiblepositive pairs and all possible negative pairs for each dataset.In Table 1, we can indeed see that the number of generatedsamples seems to be enough for our particular setting. Ourlater experiments, however, would prove otherwise (see Section5.4.1).
7https://github.com/maxpumperla/hyperas
Table 1: Statistics of the Training Data
Dataset Positive pairs Negative pairs
Spammers75 (S75) 87,912 103,059Spammers66 (S66) 78,680 102,003Balanced (B) 75,350 101,475Reliable66 (R66) 68,382 100,084Reliable75 (R75) 56,882 96,795
5.4.1 Results of the Siamese Experiments
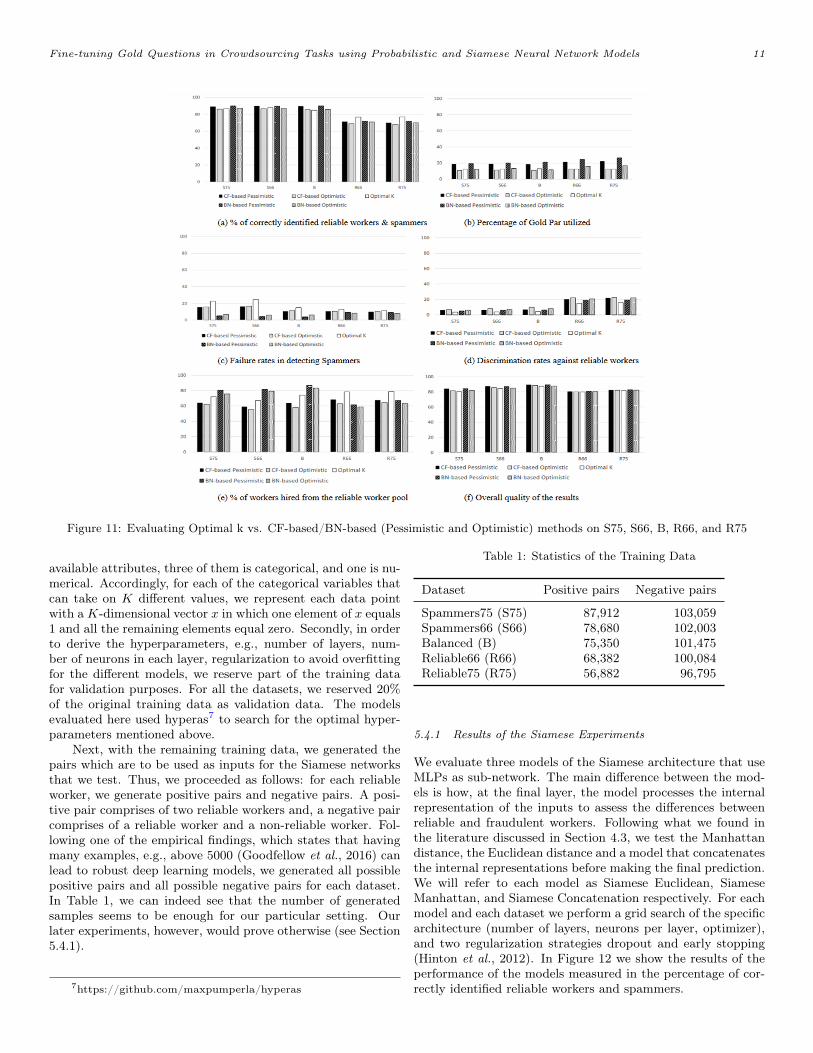
We evaluate three models of the Siamese architecture that useMLPs as sub-network. The main difference between the mod-els is how, at the final layer, the model processes the internalrepresentation of the inputs to assess the differences betweenreliable and fraudulent workers. Following what we found inthe literature discussed in Section 4.3, we test the Manhattandistance, the Euclidean distance and a model that concatenatesthe internal representations before making the final prediction.We will refer to each model as Siamese Euclidean, SiameseManhattan, and Siamese Concatenation respectively. For eachmodel and each dataset we perform a grid search of the specificarchitecture (number of layers, neurons per layer, optimizer),and two regularization strategies dropout and early stopping(Hinton et al., 2012). In Figure 12 we show the results of theperformance of the models measured in the percentage of cor-rectly identified reliable workers and spammers.
12 González Pinto et al.
Figure 12: Percentage of correctly identified reliable workers andspammers
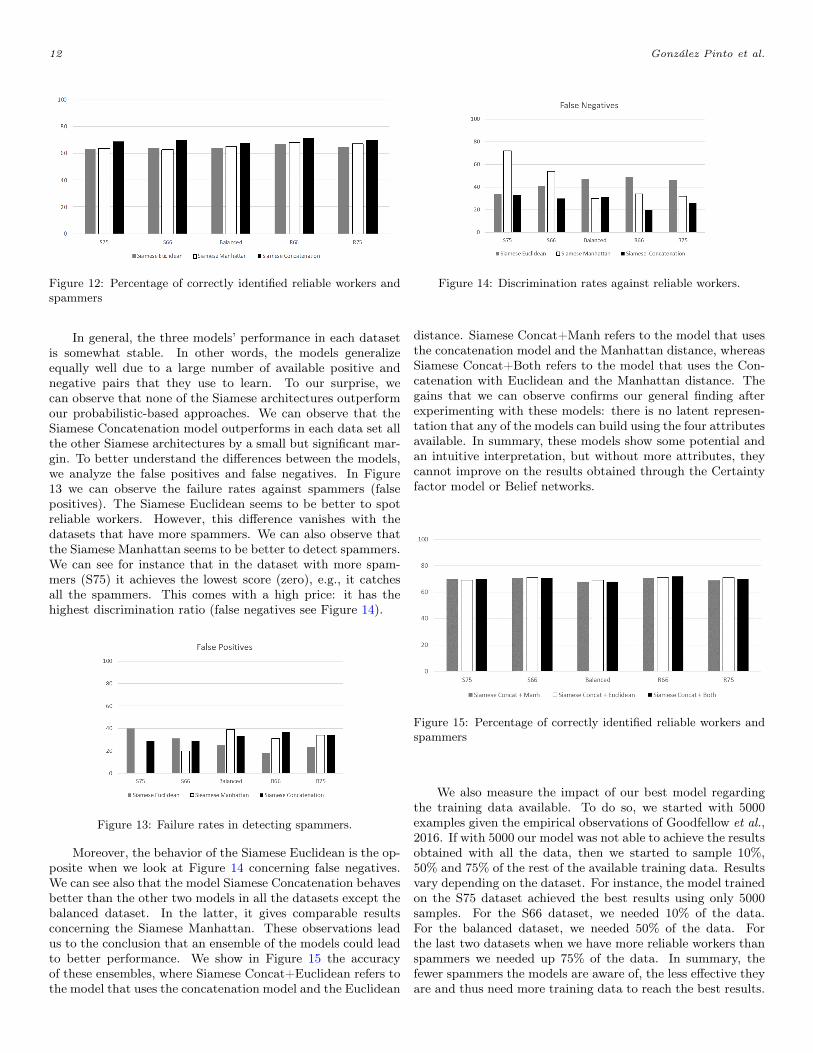
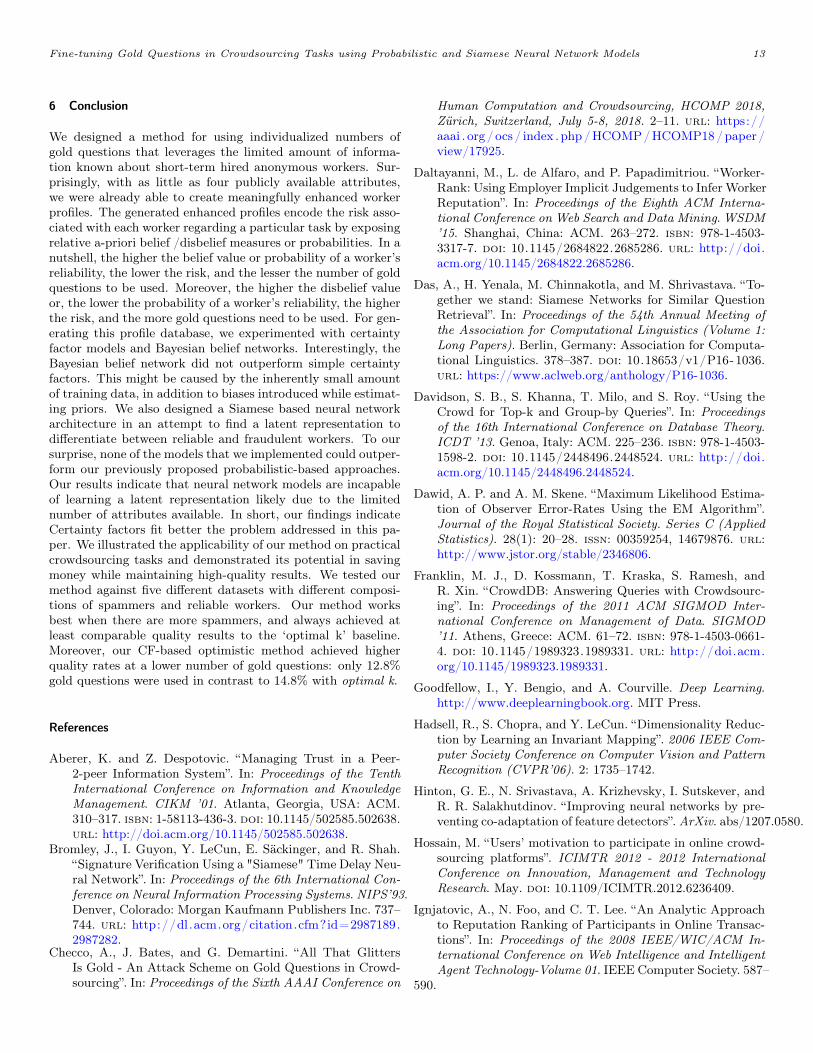
In general, the three models’ performance in each datasetis somewhat stable. In other words, the models generalizeequally well due to a large number of available positive andnegative pairs that they use to learn. To our surprise, wecan observe that none of the Siamese architectures outperformour probabilistic-based approaches. We can observe that theSiamese Concatenation model outperforms in each data set allthe other Siamese architectures by a small but significant mar-gin. To better understand the differences between the models,we analyze the false positives and false negatives. In Figure13 we can observe the failure rates against spammers (falsepositives). The Siamese Euclidean seems to be better to spotreliable workers. However, this difference vanishes with thedatasets that have more spammers. We can also observe thatthe Siamese Manhattan seems to be better to detect spammers.We can see for instance that in the dataset with more spam-mers (S75) it achieves the lowest score (zero), e.g., it catchesall the spammers. This comes with a high price: it has thehighest discrimination ratio (false negatives see Figure 14).
Figure 13: Failure rates in detecting spammers.
Moreover, the behavior of the Siamese Euclidean is the op-posite when we look at Figure 14 concerning false negatives.We can see also that the model Siamese Concatenation behavesbetter than the other two models in all the datasets except thebalanced dataset. In the latter, it gives comparable resultsconcerning the Siamese Manhattan. These observations leadus to the conclusion that an ensemble of the models could leadto better performance. We show in Figure 15 the accuracyof these ensembles, where Siamese Concat+Euclidean refers tothe model that uses the concatenation model and the Euclidean
Figure 14: Discrimination rates against reliable workers.
distance. Siamese Concat+Manh refers to the model that usesthe concatenation model and the Manhattan distance, whereasSiamese Concat+Both refers to the model that uses the Con-catenation with Euclidean and the Manhattan distance. Thegains that we can observe confirms our general finding afterexperimenting with these models: there is no latent represen-tation that any of the models can build using the four attributesavailable. In summary, these models show some potential andan intuitive interpretation, but without more attributes, theycannot improve on the results obtained through the Certaintyfactor model or Belief networks.
Figure 15: Percentage of correctly identified reliable workers andspammers
We also measure the impact of our best model regardingthe training data available. To do so, we started with 5000examples given the empirical observations of Goodfellow et al.,2016. If with 5000 our model was not able to achieve the resultsobtained with all the data, then we started to sample 10%,50% and 75% of the rest of the available training data. Resultsvary depending on the dataset. For instance, the model trainedon the S75 dataset achieved the best results using only 5000samples. For the S66 dataset, we needed 10% of the data.For the balanced dataset, we needed 50% of the data. Forthe last two datasets when we have more reliable workers thanspammers we needed up 75% of the data. In summary, thefewer spammers the models are aware of, the less effective theyare and thus need more training data to reach the best results.
Fine-tuning Gold Questions in Crowdsourcing Tasks using Probabilistic and Siamese Neural Network Models 13
6 Conclusion
We designed a method for using individualized numbers ofgold questions that leverages the limited amount of informa-tion known about short-term hired anonymous workers. Sur-prisingly, with as little as four publicly available attributes,we were already able to create meaningfully enhanced workerprofiles. The generated enhanced profiles encode the risk asso-ciated with each worker regarding a particular task by exposingrelative a-priori belief /disbelief measures or probabilities. In anutshell, the higher the belief value or probability of a worker’sreliability, the lower the risk, and the lesser the number of goldquestions to be used. Moreover, the higher the disbelief valueor, the lower the probability of a worker’s reliability, the higherthe risk, and the more gold questions need to be used. For gen-erating this profile database, we experimented with certaintyfactor models and Bayesian belief networks. Interestingly, theBayesian belief network did not outperform simple certaintyfactors. This might be caused by the inherently small amountof training data, in addition to biases introduced while estimat-ing priors. We also designed a Siamese based neural networkarchitecture in an attempt to find a latent representation todifferentiate between reliable and fraudulent workers. To oursurprise, none of the models that we implemented could outper-form our previously proposed probabilistic-based approaches.Our results indicate that neural network models are incapableof learning a latent representation likely due to the limitednumber of attributes available. In short, our findings indicateCertainty factors fit better the problem addressed in this pa-per. We illustrated the applicability of our method on practicalcrowdsourcing tasks and demonstrated its potential in savingmoney while maintaining high-quality results. We tested ourmethod against five different datasets with different composi-tions of spammers and reliable workers. Our method worksbest when there are more spammers, and always achieved atleast comparable quality results to the ‘optimal k’ baseline.Moreover, our CF-based optimistic method achieved higherquality rates at a lower number of gold questions: only 12.8%gold questions were used in contrast to 14.8% with optimal k.
References
Aberer, K. and Z. Despotovic. “Managing Trust in a Peer-2-peer Information System”. In: Proceedings of the TenthInternational Conference on Information and KnowledgeManagement. CIKM ’01. Atlanta, Georgia, USA: ACM.310–317. isbn: 1-58113-436-3. doi: 10.1145/502585.502638.url: http://doi.acm.org/10.1145/502585.502638.
Bromley, J., I. Guyon, Y. LeCun, E. Säckinger, and R. Shah.“Signature Verification Using a "Siamese" Time Delay Neu-ral Network”. In: Proceedings of the 6th International Con-ference on Neural Information Processing Systems. NIPS’93.Denver, Colorado: Morgan Kaufmann Publishers Inc. 737–744. url: http://dl.acm.org/citation.cfm?id=2987189.2987282.
Checco, A., J. Bates, and G. Demartini. “All That GlittersIs Gold - An Attack Scheme on Gold Questions in Crowd-sourcing”. In: Proceedings of the Sixth AAAI Conference on
Human Computation and Crowdsourcing, HCOMP 2018,Zürich, Switzerland, July 5-8, 2018. 2–11. url: https://aaai . org/ocs/ index .php/HCOMP/HCOMP18/paper/view/17925.
Daltayanni, M., L. de Alfaro, and P. Papadimitriou. “Worker-Rank: Using Employer Implicit Judgements to Infer WorkerReputation”. In: Proceedings of the Eighth ACM Interna-tional Conference on Web Search and Data Mining.WSDM’15. Shanghai, China: ACM. 263–272. isbn: 978-1-4503-3317-7. doi: 10.1145/2684822.2685286. url: http://doi.acm.org/10.1145/2684822.2685286.
Das, A., H. Yenala, M. Chinnakotla, and M. Shrivastava. “To-gether we stand: Siamese Networks for Similar QuestionRetrieval”. In: Proceedings of the 54th Annual Meeting ofthe Association for Computational Linguistics (Volume 1:Long Papers). Berlin, Germany: Association for Computa-tional Linguistics. 378–387. doi: 10.18653/v1/P16-1036.url: https://www.aclweb.org/anthology/P16-1036.
Davidson, S. B., S. Khanna, T. Milo, and S. Roy. “Using theCrowd for Top-k and Group-by Queries”. In: Proceedingsof the 16th International Conference on Database Theory.ICDT ’13. Genoa, Italy: ACM. 225–236. isbn: 978-1-4503-1598-2. doi: 10.1145/2448496.2448524. url: http://doi.acm.org/10.1145/2448496.2448524.
Dawid, A. P. and A. M. Skene. “Maximum Likelihood Estima-tion of Observer Error-Rates Using the EM Algorithm”.Journal of the Royal Statistical Society. Series C (AppliedStatistics). 28(1): 20–28. issn: 00359254, 14679876. url:http://www.jstor.org/stable/2346806.
Franklin, M. J., D. Kossmann, T. Kraska, S. Ramesh, andR. Xin. “CrowdDB: Answering Queries with Crowdsourc-ing”. In: Proceedings of the 2011 ACM SIGMOD Inter-national Conference on Management of Data. SIGMOD’11. Athens, Greece: ACM. 61–72. isbn: 978-1-4503-0661-4. doi: 10.1145/1989323.1989331. url: http://doi.acm.org/10.1145/1989323.1989331.
Goodfellow, I., Y. Bengio, and A. Courville. Deep Learning.http://www.deeplearningbook.org. MIT Press.
Hadsell, R., S. Chopra, and Y. LeCun. “Dimensionality Reduc-tion by Learning an Invariant Mapping”. 2006 IEEE Com-puter Society Conference on Computer Vision and PatternRecognition (CVPR’06). 2: 1735–1742.
Hinton, G. E., N. Srivastava, A. Krizhevsky, I. Sutskever, andR. R. Salakhutdinov. “Improving neural networks by pre-venting co-adaptation of feature detectors”. ArXiv. abs/1207.0580.
Hossain, M. “Users’ motivation to participate in online crowd-sourcing platforms”. ICIMTR 2012 - 2012 InternationalConference on Innovation, Management and TechnologyResearch. May. doi: 10.1109/ICIMTR.2012.6236409.
Ignjatovic, A., N. Foo, and C. T. Lee. “An Analytic Approachto Reputation Ranking of Participants in Online Transac-tions”. In: Proceedings of the 2008 IEEE/WIC/ACM In-ternational Conference on Web Intelligence and IntelligentAgent Technology-Volume 01. IEEE Computer Society. 587–
590.
14 González Pinto et al.
Kamvar, S. D., M. T. Schlosser, and H. Garcia-Molina. “TheEigentrust Algorithm for Reputation Management in P2PNetworks”. In: Proceedings of the 12th International Con-ference on World Wide Web. WWW ’03. Budapest, Hun-gary: ACM. 640–651. isbn: 1-58113-680-3. doi: 10.1145/775152.775242. url: http://doi.acm.org/10.1145/775152.775242.
Kazai, G. “In Search of Quality in Crowdsourcing for SearchEngine Evaluation”. In: Advances in Information Retrieval.Ed. by P. Clough, C. Foley, C. Gurrin, G. J. F. Jones,W. Kraaij, H. Lee, and V. Mudoch. Berlin, Heidelberg:Springer Berlin Heidelberg. 165–176. isbn: 978-3-642-20161-5.
Koch, G., R. Zemel, and R. Salakhutdinov. “Siamese neuralnetworks for one-shot image recognition”. In: InternationalConference on Machine Learning (ICML). Vol. 2.
Krieg, M. L. “A tutorial on Bayesian belief networks”. Tech. rep.Defence Science and Technology Organisation Salisbury.Australia.
Liu, Q., M. Steyvers, and A. Ihler. “Scoring Workers in Crowd-sourcing: How Many Control Questions Are Enough?” In:Proceedings of the 26th International Conference on Neu-ral Information Processing Systems - Volume 2. NIPS’13.Lake Tahoe, Nevada: Curran Associates Inc. 1914–1922.url: http://dl.acm.org/citation.cfm?id=2999792.2999826.
Lofi, C., K. El Maarry, and W.-T. Balke. “Skyline Queries inCrowd-enabled Databases”. In: Proceedings of the 16th In-ternational Conference on Extending Database Technology.EDBT ’13. Genoa, Italy: ACM. 465–476. isbn: 978-1-4503-1597-5. doi: 10.1145/2452376.2452431. url: http://doi.acm.org/10.1145/2452376.2452431.
Maarry, K. E. and W.-T. Balke. “Retaining Rough Diamonds:Towards a Fairer Elimination of Low-Skilled Workers”. In:Database Systems for Advanced Applications. Ed. by M.Renz, C. Shahabi, X. Zhou, and M. A. Cheema. Cham:Springer International Publishing. 169–185.
Maarry, K. E. and W.-T. Balke. “Quest for the Gold Par: Min-imizing the Number of Gold Questions to distinguish be-tween the Good and the Bad”. In: 10th ACM Conference onWeb Science. ACM. Amsterdam, The Netherlands: ACM.
Maarry, K. E., U. Güntzer, and W.-T. Balke. “Realizing ImpactSourcing by Adaptive Gold Questions: A Socially Respon-sible Measure for Workers’ Trustworthiness”. In: Web-AgeInformation Management. Ed. by X. L. Dong, X. Yu, J.Li, and Y. Sun. Cham: Springer International Publishing.17–29. isbn: 978-3-319-21042-1.
Mellouli, T. “Complex certainty factors for rule based systems -Detecting inconsistent argumentations”. CEUR WorkshopProceedings. 1335(Jan.): 81–102.
Mueller, J. and A. Thyagarajan. “Siamese Recurrent Archi-tectures for Learning Sentence Similarity”. In: Proceedingsof the 30th Conference on Artificial Intelligence (AAAI2016).
Nieke, C., U. Güntzer, and W.-T. Balke. “TopCrowd EfficientCrowd-enabled Top-k Retrieval on Incomplete Data”. In:Conceptual Modeling. Ed. by E. Yu, G. Dobbie, M. Jarke,and S. Purao. Cham: Springer International Publishing.122–135. isbn: 978-3-319-12206-9.
Noorian, Z. and M. Ulieru. “The State of the Art in Trustand Reputation Systems: A Framework for Comparison”.J. Theor. Appl. Electron. Commer. Res. 5(2): 97–117. issn:0718-1876. doi: 10.4067/S0718-18762010000200007. url:http://dx.doi.org/10.4067/S0718-18762010000200007.
Pearl, J. “Bayesian Networks: A Model of Self-Activated Mem-ory for Evidential Reasoning”. In: Proc. of Cognitive Sci-ence Society (CSS-7).
Pearl, J. Probabilistic Reasoning in Intelligent Systems: Net-works of Plausible Inference. San Francisco, CA, USA: Mor-gan Kaufmann Publishers Inc. isbn: 0-934613-73-7.
Ross, J., L. Irani, M. S. Silberman, A. Zaldivar, and B. Tomlin-son. “Who Are the Crowdworkers?: Shifting Demographicsin Mechanical Turk”. In: CHI ’10 Extended Abstracts onHuman Factors in Computing Systems. CHI EA ’10. At-lanta, Georgia, USA: ACM. 2863–2872. isbn: 978-1-60558-930-5. doi: 10.1145/1753846.1753873. url: http://doi .acm.org/10.1145/1753846.1753873.
Shen, C., Z. Jin, Y. Zhao, Z. Fu, R. Jiang, Y. Chen, andX.-S. Hua. “Deep Siamese Network with Multi-level Simi-larity Perception for Person Re-identification”. In: Proceed-ings of the 25th ACM International Conference on Multi-media. MM ’17. Mountain View, California, USA: ACM.1942–1950. isbn: 978-1-4503-4906-2. doi: 10.1145/3123266.3123452. url: http : / / doi . acm . org / 10 . 1145 / 3123266 .3123452.
Shortliffe, E. and B. Buchanan. “A Model of Inexact Reason-ing in Medicine”.Mathematical Biosciences. 23(Apr.): 351–379. doi: 10.1016/0025-5564(75)90047-4.
Stadler, F. Induction and Deduction in the Sciences. Springer.Tran, N. K. and C. Niederée. “A Neural Network-based Frame-
work for Non-factoid Question Answering”. In: CompanionProceedings of the The Web Conference 2018. WWW ’18.Lyon, France: International World Wide Web ConferencesSteering Committee. 1979–1983. isbn: 978-1-4503-5640-4.doi: 10.1145/3184558.3191830. url: https://doi.org/10.1145/3184558.3191830.
Whitehill, J., T.-f. Wu, J. Bergsma, J. R. Movellan, and P. L.Ruvolo. “Whose Vote Should Count More: Optimal Inte-gration of Labels from Labelers of Unknown Expertise”.In: Advances in Neural Information Processing Systems 22.Ed. by Y. Bengio, D. Schuurmans, J. D. Lafferty, C. K. I.Williams, and A. Culotta. Curran Associates, Inc. 2035–2043. url: http://papers.nips.cc/paper/3644-whose-vote-should- count-more- optimal- integration- of- labels- from-labelers-of-unknown-expertise.pdf.
Yu, B. and M. P. Singh. “Detecting Deception in ReputationManagement”. In: Proceedings of the Second InternationalJoint Conference on Autonomous Agents and MultiagentSystems. AAMAS ’03. Melbourne, Australia: ACM. 73–80. isbn: 1-58113-683-8. doi: 10.1145/860575.860588. url:http://doi.acm.org/10.1145/860575.860588.
Zheng, Y., J. Wang, G. Li, R. Cheng, and J. Feng. “QASCA:A Quality-Aware Task Assignment System for Crowdsourc-ing Applications”. In: Proceedings of the 2015 ACM SIG-MOD International Conference on Management of Data.SIGMOD ’15. Melbourne, Victoria, Australia: ACM. 1031–1046. isbn: 978-1-4503-2758-9. doi: 10.1145/2723372.2749430.url: http://doi.acm.org/10.1145/2723372.2749430.