Findings from the 2017–18 California Student Tobacco Survey
56
Tobacco Use among High School Students in Los Angeles County: Findings from the 2017–18 California Student Tobacco Survey Shu-Hong Zhu, Ph.D. Yue-Lin Zhuang, Ph.D. Joan Lee, B.S. Adam Cole, Ph.D. Katherine Braden, M.P.H. Tanya Wolfson, M.A. Anthony Gamst, Ph.D.
-
Upload
khangminh22 -
Category
Documents
-
view
1 -
download
0
Transcript of Findings from the 2017–18 California Student Tobacco Survey

Tobacco Use among High School Students in Los Angeles County: Findings from the 2017–18 California Student Tobacco Survey
Shu-Hong Zhu, Ph.D. Yue-Lin Zhuang, Ph.D.
Joan Lee, B.S. Adam Cole, Ph.D.
Katherine Braden, M.P.H. Tanya Wolfson, M.A.
Anthony Gamst, Ph.D.

i
Principal Investigator: Shu-Hong Zhu, Ph.D. Institution: Regents of the University of California, San Diego
Address: 9500 Gilman Drive #0905 La Jolla, CA 92093-0905 Phone: (858) 300-1056
Fax: (858) 300-1099 E-mail: [email protected]
Contract #: PH-18324207-1 Contract Period: 06/12/2018 – 6/30/2019
Suggested citation: Zhu S-H, Zhuang YL, Lee J, Cole A, Braden K, Wolfson T, Gamst A (2019). Tobacco use among high school students in Los Angeles County: Findings from the 2017-18 California Student Tobacco Survey. San Diego, California: Center for Research and Intervention in Tobacco Control (CRITC), University of California, San Diego Made possible by funds received from the California Department of Public Health-California Tobacco Control Program, contract #CDPH-16-10109, and funds from the Los Angeles Tobacco Control and Prevention Program

ii
TABLE OF CONTENTS INTRODUCTION ............................................................................................................................................ 1 EXECUTIVE SUMMARY ................................................................................................................................... 2
Key Findings .............................................................................................................................................. 2 DEFINITIONS USED IN THIS REPORT ............................................................................................................ 4
Tobacco Products ...................................................................................................................................... 4 Definitions of Product Use ........................................................................................................................ 4 Other Terms .............................................................................................................................................. 4
CHAPTER 1 – Tobacco Use Behavior ............................................................................................................ 7 Highlights .................................................................................................................................................. 7 Tobacco Product Use among High School Students ................................................................................. 7 Demographic Categories ........................................................................................................................... 8 Overall Prevalence of Tobacco Use by Demographics .............................................................................. 8 Use of Specific Tobacco Products by Demographics ................................................................................ 9 Use of Specific Tobacco Products by LGBTQ Community Affiliation ...................................................... 12 Frequency of Current Tobacco Product Use ........................................................................................... 13 Multiple Tobacco Product Use ................................................................................................................ 14
CHAPTER 2 – Use of Flavored Tobacco Products....................................................................................... 15 Highlights ................................................................................................................................................ 15 Flavored Tobacco Product Use among High School Students ................................................................ 15 Flavored Tobacco Use by Demographics ................................................................................................ 16 Use of Specific Flavor Types .................................................................................................................... 16
CHAPTER 3 – Susceptibility to Future Tobacco Use .................................................................................. 18 Highlights ................................................................................................................................................ 18 Susceptibility and Tobacco Use Behavior ............................................................................................... 18 Susceptibility to Tobacco Product Use among High School Students .................................................... 18 Susceptibility to Tobacco Use by Demographics .................................................................................... 19 Susceptibility to Tobacco Use by Personal Characteristics ..................................................................... 20 Susceptibility to Tobacco Use by Environmental Influences .................................................................. 21
CHAPTER 4 – Environmental Influences .................................................................................................... 22 Highlights ................................................................................................................................................ 22 Home Bans for Vaping and Smoking among High School Students ....................................................... 22 Home Type .............................................................................................................................................. 24 Exposure to Secondhand Vapor and Smoke in the Last 30 Days among High School Students ............ 25
CHAPTER 5 – Access to Tobacco Products ................................................................................................. 28 Highlights ................................................................................................................................................ 28 Access to and Offers of Tobacco Products .............................................................................................. 28 Acquisition of E-Cigarettes and Cigarettes among High School Students .............................................. 28 Offers of Tobacco Products in the Last 30 Days among High School Students ...................................... 30 Offers of Tobacco Products by Demographics ........................................................................................ 30 Perceived Ease of Acquiring E-Cigarettes and Cigarettes among High School Students ........................ 31
iii
CHAPTER 6 – Tobacco Use Behavior: Comparisons from 2015–16 to 2017–18 ....................................... 33 Highlights ................................................................................................................................................ 33 Tobacco Product Use among High School Students ............................................................................... 33
CONCLUSION .............................................................................................................................................. 35 RESOURCES ................................................................................................................................................. 36 APPENDIX A – 8th Grade Tobacco Use ....................................................................................................... 37
Highlights ................................................................................................................................................ 37 Tobacco Product Use among 8th Grade Students ................................................................................... 37 Susceptibility to Tobacco Product Use among 8th Grade Students ........................................................ 37 Secondhand Exposure to Vapor and Smoke among 8th Grade Students ................................................ 38
APPENDIX B – Marijuana ........................................................................................................................... 39 Highlights ................................................................................................................................................ 39 Marijuana Use among High School Students .......................................................................................... 39
APPENDIX C – Survey Methodology .......................................................................................................... 40 Survey Administration ............................................................................................................................ 40 Survey Content ........................................................................................................................................ 40 Participation ............................................................................................................................................ 40 Survey Sample 2017–18 CSTS ................................................................................................................. 41 Sampling Strategy ................................................................................................................................... 41 Analysis ................................................................................................................................................... 41 Race/Ethnicity ......................................................................................................................................... 42
APPENDIX D – County-specific Questions ................................................................................................. 44 Participation ............................................................................................................................................ 44 Los Angeles County-specific Questions................................................................................................... 44
APPENDIX E – Supplementary Tables ........................................................................................................ 46 REFERENCES ................................................................................................................................................ 49

iv
LIST OF TABLES Table 1. Prevalence of tobacco use by gender, race/ethnicity, and grade................................................... 9 Table 2. Prevalence of current tobacco product use by gender ................................................................. 10 Table 3. Prevalence of current tobacco product use by ethnicity .............................................................. 11 Table 4. Prevalence of current tobacco product use by grade ................................................................... 12 Table 5. Prevalence of current tobacco product use by LGBTQ Community affiliation ............................. 12 Table 6. Frequency of use among current users of a given tobacco product............................................. 13 Table 7. Prevalence of current use of at least one product and of multiple tobacco products ................. 14 Table 8. Proportion using flavored tobacco among current tobacco users by gender, race/ethnicity, and grade ........................................................................................................................................................... 16 Table 9. Proportion using flavored tobacco products among current users by flavor type ....................... 17 Table 10. Proportion of never users who are susceptible to future tobacco use by gender, race/ethnicity, and grade .................................................................................................................................................... 20 Table 11. Proportion of never users who are susceptible to future tobacco use by loneliness and depressive symptoms ................................................................................................................................. 20 Table 12. Proportion of never users who are susceptible to future tobacco use by the number of tobacco-using friends .................................................................................................................................. 21 Table 13. Prevalence of complete home bans on e-cigarette vaping and tobacco* smoking by race/ethnicity .............................................................................................................................................. 23 Table 14. Proportion of current tobacco product use by home type among current users ...................... 25 Table 15. Proportion of e-cigarette or cigarette use inside home, by home type, among current users .. 25 Table 16. Prevalence of exposure in the last 30 days to e-cigarette vapor and tobacco* smoke in a room by home type .............................................................................................................................................. 26 Table 17. Prevalence of reported tobacco smoke drifting into home within the last 7 days..................... 27 Table 18. Acquisition of e-cigarettes (or e-liquid) among current e-cigarette users by social source ....... 28 Table 19. Acquisition of e-cigarettes (or e-liquid) among current e-cigarette users by purchase source . 29 Table 20. Acquisition of cigarettes among current cigarette users by social source ................................. 29 Table 21. Acquisition of cigarettes among current cigarette users by purchase source ............................ 29 Table 22. Acquisition of e-cigarettes and cigarettes among current users who buy e-cigarettes or cigarettes from a store by store type ......................................................................................................... 30 Table 23. Prevalence of offers of tobacco products in the last 30 days by use status ............................... 30 Table 24. Prevalence of offers of tobacco products* in the last 30 days by gender, race/ethnicity, and grade ........................................................................................................................................................... 31 Table 25. Prevalence of current tobacco product use among 8th grade students...................................... 37 Table 26. Prevalence of susceptibility to future product use among never using 8th grade students ....... 38 Table 27. Prevalence of exposure in the last 30 days to e-cigarette vapor or tobacco* smoke by location among 8th grade students ........................................................................................................................... 38 Table 28. Prevalence of exposure in the last 30 days to e-cigarette vapor and tobacco* smoke in a room by home type among 8th grade students .................................................................................................... 38 Table 29. Prevalence of marijuana use among by gender, race/ethnicity, and grade ............................... 39

v
Table 30. Numbers of schools and students participating, Los Angeles County middle schools vs. high schools ........................................................................................................................................................ 41 Table 31. Prevalence of race/ethnicity categories in the CSTS and CDE enrollment data ......................... 42 Table 32. Prevalence of labeled and endorsed race/ethnicity ................................................................... 43 Table 33. Numbers of schools and students that received county-specific questions, Los Angeles County middle schools vs. high schools .................................................................................................................. 44 Table A. Prevalence of ever and current use of tobacco products ............................................................. 46 Table B. Proportion using flavored tobacco products among current users of a given tobacco product .. 46 Table C. Susceptibility to future tobacco use among never users .............................................................. 46 Table D. Prevalence of complete home bans on e-cigarette vaping or tobacco* smoking by use status . 47 Table E. Prevalence of housing types in Los Angeles County ..................................................................... 47 Table F. Prevalence of exposure in the last 30 days to e-cigarette vapor and tobacco* smoke in a room and car ........................................................................................................................................................ 47 Table G. Perceived ease of acquiring e-cigarettes and cigarettes by use status ........................................ 48

vi
LIST OF FIGURES Figure 1. Prevalence of ever and current use of tobacco products .............................................................. 7 Figure 2. Proportion using flavored products among current users of a given tobacco product .............. 15 Figure 3. Susceptibility to future tobacco use among never users ............................................................. 19 Figure 4. Prevalence of complete home bans on e-cigarette vaping and tobacco* smoking by use status .................................................................................................................................................................... 23 Figure 5. Prevalence of housing types in Los Angeles County .................................................................... 24 Figure 6. Prevalence of exposure in the last 30 days to e-cigarette vapor and tobacco* smoke in a room and car ........................................................................................................................................................ 26 Figure 7. Perceived ease of acquiring e-cigarettes and cigarettes by use status ....................................... 32 Figure 8. Prevalence of current tobacco use by survey cycle ..................................................................... 34

1
INTRODUCTION Los Angeles County is the most populous county in California. With approximately 10 million residents, it consists of about 27% of the state’s population.1 The county has a rich culture with diverse ethnic groups. The four largest racial/ethnic groups are Hispanic or Latino (48.6%), White (26.2%), Asian (15.3%), and African American (9.0%).1
A little over 20% of Los Angeles County’s population is under the age of 18. In the 2017–2018 school year, more than one million middle and high school students were attending 1,360 public schools from 88 districts.2 The ethnic composition of these middle and high school student populations is also diverse. Again, the four largest ethnic groups are: Hispanic (64.4%), White (14.0%), Asian (8.0%), and African American (7.5%).2
This report presents the main results from a school-based survey: the 2017–2018 California Student Tobacco Survey (CSTS). It reports findings from the 2017–18 CSTS that are specific to Los Angeles County, including results based on the statewide survey questionnaire as well as the additional questions specifically requested by the Los Angeles Tobacco Control and Prevention Program. The report is intended to serve a broad spectrum of the tobacco-control community. It aims to facilitate the understanding of adolescent tobacco use behavior in the current, rapidly changing tobacco landscape—and to assist the development of tobacco-control interventions to reduce tobacco use among youth in Los Angeles County.
2
EXECUTIVE SUMMARY This report summarizes the main findings from the 2017–18 California Student Tobacco Survey (CSTS) for Los Angeles County. The survey was administered to 8th, 10th, and 12th grade students from September 2017 to June 2018. Schools were randomly selected within Los Angeles County. The project was conducted by the University of California, San Diego. Throughout the 2017–18 academic year, 28,071 students from 75 schools in Los Angeles County participated in the survey. The survey was designed to assess use of, knowledge of, and attitudes towards cigarettes and other tobacco products, including e-cigarettes, big cigars, little cigars or cigarillos (LCC), hookah, and smokeless tobacco. The survey included questions that assessed use of each tobacco product, susceptibility to future use, social and environmental exposure to products, and known covariates of use. The survey also included a few questions on marijuana use. This report focuses on high school students (10th and 12th graders; 25,068 students). The results for 8th graders, who were sampled separately from 10th and 12th graders, are presented in Appendix A, and basic results for marijuana use among high school students are presented in Appendix B. The following key findings are presented in this report:
Key Findings
Tobacco Use Behavior
• The smoking prevalence for high school students in Los Angeles has reached a historical low. In 2017–18, only 1.7% of high school students in Los Angeles County reported currently using cigarettes. Use of other combustible tobacco products, like little cigars or cigarillos (LCC) and hookah, was also very low (2.0% and 1.7%, respectively).
• E-cigarettes were the most commonly used tobacco product among high school students in Los Angeles County (10.0%).
• Overall tobacco use was still relatively high among students in Los Angeles County (11.6%), which was driven mainly by the high rate of e-cigarette use.
• From 2015–16 to 2017–18, the overall tobacco use among high school students in Los Angeles increased from 10.6% to 11.6%. This increase in overall tobacco use is not statistically significant. However, the increase in the use of e-cigarettes, from 6.4% to 10.0%, is statistically significant. The use of all other tobacco products combined has decreased significantly, from 7.6% to 4.5%.
• Use of multiple tobacco products was common. Approximately one-quarter of tobacco product users reported using two or more products.
• The majority of current tobacco users reported using a flavored tobacco product (83.0%). Flavored tobacco product use was high across all genders, races/ethnicities, and grades. Fruit or sweet was the most popular reported flavor for most tobacco products.
Risk Factors for Tobacco Use
• Among high school students in Los Angeles County who had never used a tobacco product, two in five were susceptible to future use if offered by a best friend (40.4%). Susceptibility was even
3
higher among those who reported greater loneliness and/or depressive symptoms, and who had friends who used tobacco products.
• One-quarter of high school students in Los Angeles County reported being offered e-cigarettes, cigarettes, LCC, or hookah in the last 30 days. Over one in eight (13.3%) students who had never used these products reported being offered one in the last 30 days.
• Less than half of high school students in Los Angeles County who used tobacco products reported paying for their own e-cigarettes (38.6%) and cigarettes (45.4%). Social sources were more common. Many high school students perceived that it would be easy to get e-cigarettes (57.3%) or cigarettes (48.4%) if they wanted them.
Exposure to Tobacco Use
• The vast majority of high school students in Los Angeles County reported having a complete home ban on vaping (79.4%) and smoking (85.9%).
• Despite home bans on smoking and vaping, the rate of exposure to secondhand vapor and smoke was still high: almost one-third of high school students were exposed to secondhand vapor (29.5%) and smoke (30.9%) in a room in the last 30 days.
• Exposure to secondhand vapor and smoke did not differ by home type. However, more students who lived in multi-unit housing reported smelling tobacco smoke drifting into their home in the last week (55.5%) relative to those who lived in detached houses (39.2%).

4
DEFINITIONS USED IN THIS REPORT
Tobacco Products
E-cigarettes (vapes, e-hookah, hookah pen): Also called e-cigs, vape pens, tanks, or mods. Some come with liquid inside and others you fill yourself. Popular names are Blu, NJOY, MarkTen, Juul, Suorin*, Imperial, and Fantasia.
Cigarettes: Sold in packs and cartons. Popular brands include Marlboro, Newport, Pall Mall, Camel, and Winston.
Little cigars or cigarillos: Wrapped in tobacco leaf or brown paper containing tobacco. May be flavored. Popular brands are Swisher Sweets, White Owl, and Black & Mild. Little cigars or cigarillos is abbreviated to LCC throughout this report.
Big cigars: Tobacco wrapped in a tobacco leaf. Popular brands are Romeo Y Julieta, Cohiba, Davidoff, and Ashton.
Hookah: Water pipe used to smoke flavored tobacco (shisha). Popular brands are Starbuzz, Al-Fakher, Samba, and Social Smoke.
Smokeless tobacco (chew, dip, snuff, or snus): Loose leaf or ground tobacco leaves. It comes in a large pouch (bag) or in tins. Popular brands are Red Man, Copenhagen, Grizzly, Skoal, Swedish Match, and Klondike. Snus comes in a small pouch (like a tea bag). Popular brands are General, Marlboro, and Camel. Smokeless tobacco is abbreviated to smokeless throughout this report.
Definitions of Product Use
Ever use: Having used within a lifetime
Current use: Use within the last 30 days
Poly use: Use of two or more tobacco products in the last 30 days
Flavored tobacco product use: Use of a flavored tobacco product within the last 30 days
Never user: A student that reports having never used the tobacco product(s)
Former user: A student that reports having used the tobacco product(s), but not within the last 30 days
Current user: A student that reports using the tobacco product(s) within the last 30 days
*Suorin was added to the e-cigarette description in February 2018. It was not originally listed because the 2017–18 CSTS was developed before Suorin use became widespread.

5
Other Terms*
LGBTQ Community Affiliation: Responded yes to the question: “Do you identify yourself as LGBTQ?”
Loneliness: Indicated agreement (strongly agree or agree) with the statement: “A lot of times I feel lonely.”
Depressive symptoms: Responded yes to the question: “In the last 12 months did you ever feel sad and hopeless EVERY DAY for 2 weeks or more?”
Susceptible to future tobacco product use: Responded definitely yes, probably yes, or probably not to the question: “If one of your BEST FRIENDS offered you [tobacco product†], would you use it?”
Not susceptible to future tobacco product use: Responded definitely not to the question: “If one of your BEST FRIENDS offered you [tobacco product†], would you use it?”
Complete home ban on vaping: Indicated that vaping e-cigarettes is not allowed inside my home when asked about the rules about vaping e-cigarettes inside the home.
Complete home ban on smoking: Indicated that smoking is not allowed inside my home when asked about the rules about smoking cigarettes or other tobacco products inside the home.
Exposure to secondhand vapor in a room: Indicated being in a room when someone was using e-cigarettes (including e-hookah and hookah pens) in the last 30 days.
Exposure to secondhand vapor in a car: Indicated being in a car when someone was using e-cigarettes (including e-hookah and hookah pens) in the last 30 days.
Exposure to secondhand smoke in a room: Indicated being in a room when someone was smoking a cigarette, little cigar, or cigarillo in the last 30 days.
Exposure to secondhand smoke in a car: Indicated being in a car when someone was smoking a cigarette, little cigar, or cigarillo in the last 30 days.
Offers of tobacco products: Responded yes to the question: “In the last 30 days, has ANYONE offered you [tobacco product‡]?”
*These terms are based on student responses to the questions in the 2017–18 CSTS. I prefer not to answer was included as a response option for all survey questions. †Tobacco products the respondent had never used. ‡Tobacco products included e-cigarettes, cigarettes, little cigars or cigarillos (LCC), and hookah only.

6
A Word of Caution on Interpreting Rates and Proportions
All estimates of rates and proportions should be interpreted in reference to their 95% confidence intervals. Although estimates are roughly the median of this interval, the range of the confidence interval is the best descriptive measure for statistical accuracy. Therefore, estimates with wide confidence intervals should be interpreted with caution. Data that are statistically unreliable because the coefficient of variation (also known as relative variance) is greater than 30% are marked with a dagger symbol (†) in the tables. Please pay special attention when estimates are based on small sample sizes.
7
CHAPTER 1 – Tobacco Use Behavior
Highlights
• 11.6% of high school students in Los Angeles County reported using any tobacco product. • E-cigarettes were the most popular tobacco product, with one in ten high school students
currently using them. • Only 1.7% of high school students in Los Angeles County reported smoking cigarettes. • Current use of all combustible tobacco products was very low. This was true across gender,
race/ethnicity, and grade. • Most of the students used tobacco products infrequently. • About one-quarter of current users reported using more than one tobacco product.
Tobacco Product Use among High School Students
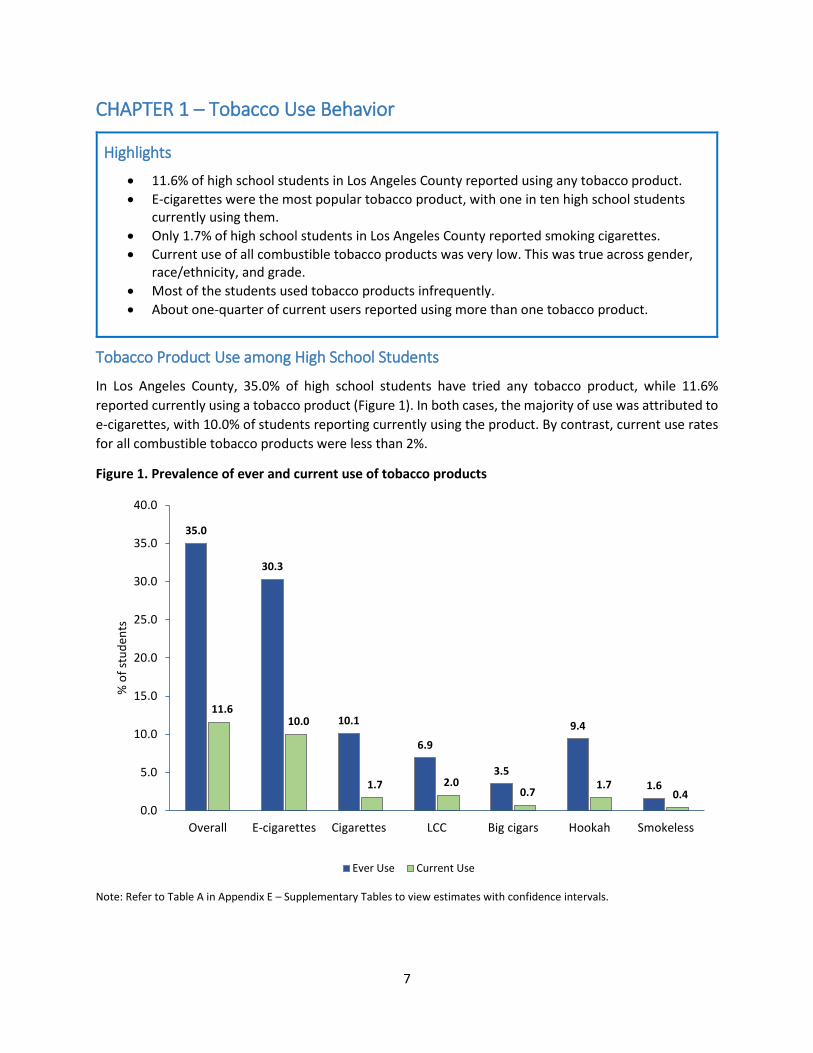
In Los Angeles County, 35.0% of high school students have tried any tobacco product, while 11.6% reported currently using a tobacco product (Figure 1). In both cases, the majority of use was attributed to e-cigarettes, with 10.0% of students reporting currently using the product. By contrast, current use rates for all combustible tobacco products were less than 2%.
Figure 1. Prevalence of ever and current use of tobacco products
Note: Refer to Table A in Appendix E – Supplementary Tables to view estimates with confidence intervals.
35.0
30.3
10.1
6.9
3.5
9.4
1.6
11.610.0
1.7 2.00.7
1.70.4
0.0
5.0
10.0
15.0
20.0
25.0
30.0
35.0
40.0
Overall E-cigarettes Cigarettes LCC Big cigars Hookah Smokeless
% o
f stu
dent
s
Ever Use Current Use
8
Demographic Categories
For race/ethnicity, survey participants were first grouped by whether they were of Hispanic (Latino) origin (ethnicity). For those who classified as non-Hispanic, they were further divided into specific races that they identified with. If respondents selected more than one race, they were classified as Multiple race. There was also an option for Other race. Due to the small sample sizes for some of the racial/ethnic groups in the survey, Native Hawaiian and other Pacific Islander, American Indian or Alaska Native, and non-standard entries were all combined into the Other category in this report. Approximately 8.8% of students declined to answer either race/ethnicity question.
For the question on gender, there is a response option I identify my gender in another way in addition to Male and Female. Approximately 2.3% of participating students in Los Angeles County indicated that they identified their gender another way, and 8.1% declined to answer the gender-identity question. Rates of declining to answer this type of question are comparable to those in other surveys of California’s middle and high school population (e.g., the California Student Survey and the California Healthy Kids Survey).3
Throughout the survey, students were given the option of I prefer not to answer. Results from this group are presented when endorsement of this response option was considered meaningful and most likely non-random (e.g., gender/ethnicity) and/or where the group was deemed sizeable. When the proportion for the declined-to-answer group was small, they were treated as missing and excluded from analysis in order to keep the tables readable.
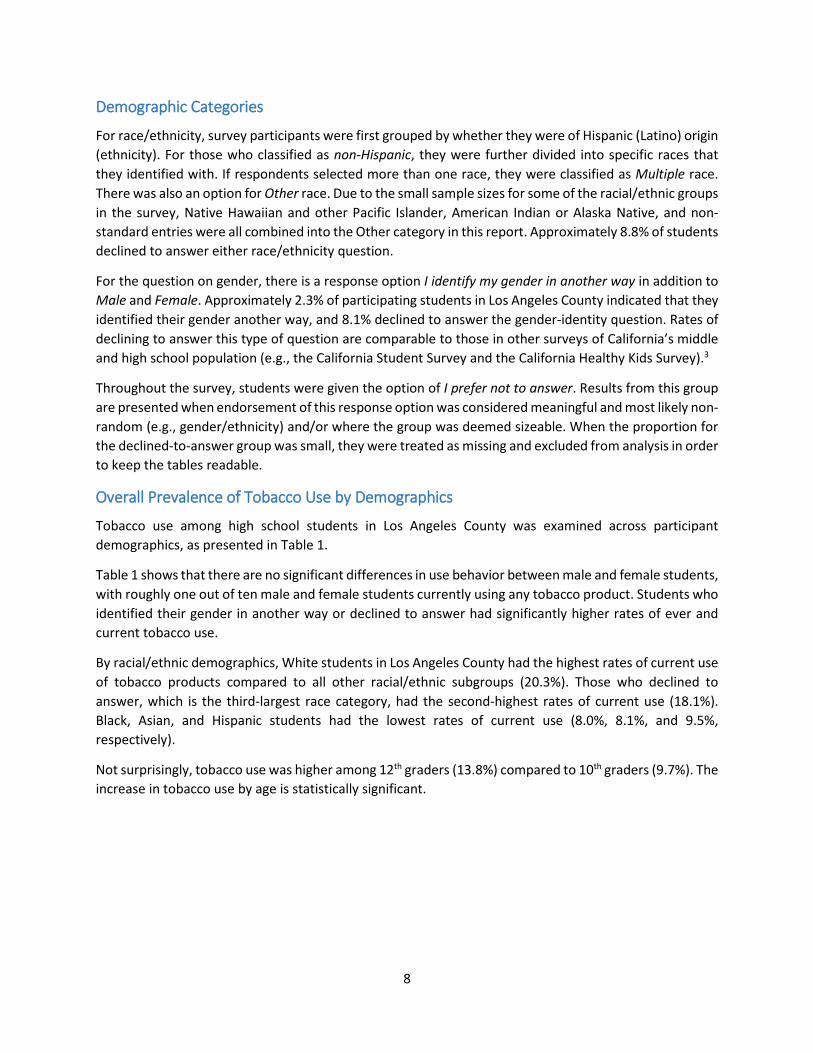
Overall Prevalence of Tobacco Use by Demographics
Tobacco use among high school students in Los Angeles County was examined across participant demographics, as presented in Table 1.
Table 1 shows that there are no significant differences in use behavior between male and female students, with roughly one out of ten male and female students currently using any tobacco product. Students who identified their gender in another way or declined to answer had significantly higher rates of ever and current tobacco use.
By racial/ethnic demographics, White students in Los Angeles County had the highest rates of current use of tobacco products compared to all other racial/ethnic subgroups (20.3%). Those who declined to answer, which is the third-largest race category, had the second-highest rates of current use (18.1%). Black, Asian, and Hispanic students had the lowest rates of current use (8.0%, 8.1%, and 9.5%, respectively).
Not surprisingly, tobacco use was higher among 12th graders (13.8%) compared to 10th graders (9.7%). The increase in tobacco use by age is statistically significant.

9
Table 1. Prevalence of tobacco use by gender, race/ethnicity, and grade Ever use Current use N % (95% CI) % (95% CI) Overall 24903 35.0 (32.5-37.6) 11.6 (10.1-13.1) Gender Male 10651 33.9 (30.4-37.3) 10.5 (8.9-12.1) Female 11164 33.6 (30.8-36.4) 10.4 (8.6-12.2) Identified in Another Way 663 48.5 (44.6-52.4) 21.6 (17.7-25.5) Declined to Answer 2180 44.1 (40.8-47.3) 19.5 (16.6-22.4)
Race/Ethnicity White 2283 39.4 (36.7-42.0) 20.3 (17.5-23.1) Black 791 32.8 (29.3-36.3) 8.0 (6.0-10.1) Hispanic 15092 35.0 (31.5-38.4) 9.5 (8.2-10.9) Asian 2098 19.3 (15.5-23.1) 8.1 (6.4-9.7) Other 584 37.9 (31.7-44.2) 15.8 (11.6-20.1) Multiple 1298 38.5 (34.0-43.1) 14.7 (12.1-17.3) Declined to Answer 2250 41.4 (38.7-44.1) 18.1 (15.2-20.9)
Grade Grade 10 13474 31.3 (27.7-35.0) 9.7 (8.5-11.0) Grade 12 11429 39.5 (37.2-41.8) 13.8 (11.6-16.1)
Note: Race/Ethnicity category Other includes Native Hawaiian and Other Pacific Islander, American Indian or Alaska Native, and other non-standard entries.
Use of Specific Tobacco Products by Demographics
Table 2 shows the use of specific tobacco products, in addition to the rate of overall tobacco use. Among high school students, males and females had no difference in current use for overall tobacco use (10.5% and 10.4%, respectively). However, gender differences are evident between specific tobacco products. For example, male students had higher rates of big cigar (0.9%), LCC (2.2%), and smokeless tobacco use (0.5%) compared to female students (0.1%, 1.2%, and 0.0%, respectively). Those who declined to answer or identified their gender in another way reported using all tobacco products at significantly higher rates compared to male or female students.

10
Table 2. Prevalence of current tobacco product use by gender
Male Female Identified in
Another Way Declined to
Answer N=10649 N=11163 N=662 N=2173 % (95% CI) % (95% CI) % (95% CI) % (95% CI)
Overall 10.5 (8.9-12.1) 10.4 (8.6-12.2) 21.6 (17.7-25.5) 19.5 (16.6-22.4) E-cigarettes 8.9 (7.2-10.6) 9.3 (7.5-11.2) 17.5 (13.4-21.6) 17.3 (14.2-20.3) Cigarettes 1.7 (1.3-2.1) 1.0 (0.7-1.4) 7.2 (4.6-9.8) 3.0 (2.2-3.9) LCC 2.2 (1.8-2.6) 1.2 (0.9-1.4) 5.7 (3.9-7.6) 4.3 (3.4-5.3) Big cigars 0.9 (0.4-1.3) 0.1 (0.1-0.2) 3.5 (2.0-5.0) 1.9 (1.1-2.6) Hookah 1.5 (1.2-1.8) 1.5 (0.9-2.1) 5.3 (3.4-7.2) 3.7 (2.6-4.8) Smokeless 0.5 (0.2-0.8) 0.0 (0.0-0.1) 3.9 (1.4-6.5)† 1.4 (0.8-2.1)
†Data are statistically unreliable because relative variance is greater than 30%. Interpret with caution. Table 3 presents current use of tobacco products by race/ethnicity. Differences in the use of specific tobacco products replicate differences in the overall rates of use, with some notable exceptions. For example, although Black students had the lowest current use rates across all subgroups, they reported having one of the highest use rates of LCC (2.4%). Another notable difference is shown in current hookah use, where students reporting other races had the highest rates of use (6.1%).

11
Table 3. Prevalence of current tobacco product use by race/ethnicity White Black Hispanic Asian Other Multiple Declined to
Answer N=2282 N=790 N=15090 N=2098 N=584 N=1298 N=2243 % (95% CI) % (95% CI) % (95% CI) % (95% CI) % (95% CI) % (95% CI) % (95% CI) Overall 20.3 (17.5-23.1) 8.0 (6.0-10.1) 9.5 (8.2-10.9) 8.1 (6.4-9.7) 15.8 (11.6-20.1) 14.7 (12.1-17.3) 18.1 (15.2-20.9) E-cigarettes 18.9 (15.7-22.2) 5.8 (3.8-7.8) 8.2 (6.9-9.5) 7.6 (5.9-9.3) 11.8 (7.0-16.6) 13.3 (10.5-16.1) 14.7 (12.4-17.0) Cigarettes 3.5 (2.6-4.4) 0.7 (0.0-1.6)† 1.2 (0.9-1.5) 1.1 (0.6-1.6) 2.9 (1.7-4.1) 2.5 (1.3-3.8) 3.8 (2.2-5.3) LCC 1.8 (1.4-2.2) 2.4 (1.5-3.4) 1.8 (1.4-2.2) 0.9 (0.5-1.2) 2.8 (1.5-4.1) 2.2 (0.9-3.4) 4.8 (3.3-6.3) Big cigars 1.1 (0.7-1.5) 0.6 (0.0-1.2)† 0.5 (0.2-0.8) 0.2 (0.0-0.3)† 1.8 (0.8-2.7) 0.9 (0.3-1.4)† 2.3 (0.8-3.8)† Hookah 3.2 (1.9-4.6) 1.5 (0.4-2.6)† 1.3 (0.9-1.7) 0.6 (0.3-0.9) 6.1 (3.6-8.5) 2.0 (1.0-3.0) 3.4 (2.5-4.4) Smokeless 0.9 (0.2-1.7)† 0.0 0.2 (0.1-0.3) 0.0 (0.0-0.1)† 0.8 (0.1-1.6)† 1.7 (0.4-2.9)† 1.2 (0.5-1.8)
Note: Race/Ethnicity category Other includes Native Hawaiian and Other Pacific Islander, American Indian or Alaska Native, and other non-standard entries. †Data are statistically unreliable because relative variance is greater than 30%. Interpret with caution.

12
Table 4 presents tobacco product use by grade among high school students. As expected, current use of all tobacco products increased with grade. E-cigarettes were consistently the most popular product used by both 10th grade and 12th grade students, and the prevalence of use of other tobacco products was low.
Table 4. Prevalence of current tobacco product use by grade Grade 10 Grade 12 N=13466 N=11425 % (95% CI) % (95% CI)
Overall 9.7 (8.5-11.0) 13.8 (11.6-16.1) E-cigarettes 8.6 (7.3-9.9) 11.7 (9.3-14.0) Cigarettes 1.3 (1.1-1.6) 2.2 (1.6-2.7) LCC 1.8 (1.4-2.3) 2.3 (1.9-2.7) Big cigars 0.7 (0.4-1.1) 0.7 (0.4-1.0) Hookah 1.3 (1.0-1.6) 2.3 (1.8-2.9) Smokeless 0.4 (0.2-0.5) 0.5 (0.2-0.8)
Use of Specific Tobacco Products by LGBTQ Community Affiliation
Table 5 presents tobacco product use by reported LGBTQ Community affiliation. Students who identified as LGBTQ had higher rates of overall tobacco use (14.4%) than those who did not identify with this group (10.6%) and the same rate as those who declined to answer (14.4%). Consistent with previous results, e-cigarettes were the most commonly used product across all respondents.
Table 5. Prevalence of current tobacco product use by LGBTQ Community affiliation
Identified as
LGBTQ Did not Identify
as LGBTQ Declined to
Answer N=2205 N=18806 N=3622 % (95% CI) % (95% CI) % (95% CI)
Overall 14.4 (12.1-16.7) 10.6 (9.0-12.3) 14.4 (12.3-16.5) E-cigarettes 12.7 (10.5-14.9) 9.3 (7.5-11.2) 11.6 (9.7-13.5) Cigarettes 2.8 (1.9-3.7) 1.4 (1.1-1.7) 2.7 (1.8-3.5) LCC 2.8 (1.7-4.0) 1.7 (1.5-1.9) 3.4 (2.5-4.2) Big cigars 0.9 (0.5-1.3) 0.6 (0.3-0.8) 1.5 (0.7-2.4) Hookah 2.1 (1.4-2.8) 1.5 (1.1-2.0) 2.6 (1.9-3.4) Smokeless 0.7 (0.3-1.1) 0.3 (0.1-0.5)† 0.8 (0.4-1.2)
†Data are statistically unreliable because relative variance is greater than 30%. Interpret with caution.

13
Frequency of Current Tobacco Product Use
Overall, more than half of students reported infrequent usage: 57.6% of current users reported using a product on either 1–2 days or 3–5 days (38.4% + 19.2% = 57.6%). Approximately one in five (19.4%) students used a product on 20 or more days of the past 30 days.
Table 6. Frequency of use among current users of a given tobacco product 1 or 2 days 3-5 days 6-19 days 20-30 days
N* % (95% CI) % (95% CI) % (95% CI) % (95% CI) Overall 2740 38.4 (34.1-42.6) 19.2 (17.0-21.3) 23.1 (19.7-26.5) 19.4 (16.1-22.7) E-cigarettes 2274 38.9 (34.3-43.5) 19.4 (16.9-21.9) 23.1 (20.2-25.9) 18.6 (14.7-22.5) Cigarettes 408 48.5 (42.8-54.2) 11.9 (8.5-15.3) 14.0 (8.8-19.1) 25.6 (20.1-31.2) LCC 421 35.6 (24.9-46.3) 24.8 (16.7-33.0) 20.5 (16.6-24.3) 19.1 (15.3-23.0) Big cigars 138 36.5 (29.5-43.5) 18.6 (8.8-28.3) 20.5 (11.9-29.0) 24.5 (9.2-39.7)† Hookah 416 49.9 (43.3-56.6) 19.4 (14.2-24.7) 19.5 (14.3-24.7) 11.2 (6.9-15.5) Smokeless 93 37.7 (21.6-53.7) 5.9 (1.9-9.8)† 26.8 (8.5-45.0)† 29.7 (14.6-44.9)
*As some participants used more than one tobacco product, the sum of sample sizes for each product is greater than the overall sample size. †Data are statistically unreliable because relative variance is greater than 30%. Interpret with caution.

14
Multiple Tobacco Product Use
Table 7 presents current use of multiple products, referred to as poly use, by participant demographics. Overall, 3.0% of students reported using two or more tobacco products, representing about one-quarter of current users. Differences in poly use by demographic characteristics varied in ways one would expect based on tobacco use behavior (i.e., those who had higher rates of using specific products were also the ones who had higher rates of poly use). For example, those who identified their gender another way or declined to answer had higher rates of poly use than males or females.
Table 7. Prevalence of current use of at least one product and of multiple tobacco products
Used at least one
product Used two or more
products N % (95% CI) % (95% CI) Overall 24891 11.6 (10.1-13.1) 3.0 (2.5-3.6) Gender Male 10649 10.5 (8.9-12.1) 3.2 (2.3-4.0) Female 11163 10.4 (8.6-12.2) 2.0 (1.4-2.5) Identified in Another Way 662 21.6 (17.7-25.5) 8.2 (5.6-10.9) Declined to Answer 2173 19.5 (16.6-22.4) 5.8 (4.7-7.0)
Race/Ethnicity White 2282 20.3 (17.5-23.1) 5.8 (4.6-7.1) Black 790 8.0 (6.0-10.1) 1.6 (0.5-2.8)† Hispanic 15090 9.5 (8.2-10.9) 2.4 (1.7-3.0) Asian 2098 8.1 (6.4-9.7) 1.2 (0.8-1.7) Other 584 15.8 (11.6-20.1) 5.2 (3.4-6.9) Multiple 1298 14.7 (12.1-17.3) 4.8 (3.3-6.3) Declined to Answer 2243 18.1 (15.2-20.9) 5.7 (4.2-7.2)
Grade Grade 10 13466 9.7 (8.5-11.0) 2.5 (1.9-3.1) Grade 12 11425 13.8 (11.6-16.1) 3.7 (2.9-4.5)
Note: Race/ethnicity category Other includes Native Hawaiian and Other Pacific Islander, American Indian or Alaska Native, and other non-standard entries. †Data are statistically unreliable because relative variance is greater than 30%. Interpret with caution.

15
CHAPTER 2 – Use of Flavored Tobacco Products
Highlights
• The vast majority (83.0%) of high school students in Los Angeles County who were current tobacco users reported using a flavored tobacco product.
• The highest use of flavored products was among current hookah users (87.5%), LCC users (87.4%), and e-cigarette users (80.7%).
• Over half of current cigarette smokers (57.9%) reported using menthol/mint cigarettes in the last 30 days.
• Fruit or sweet flavors were reported most frequently for all tobacco products except cigarettes and smokeless tobacco.
Flavored Tobacco Product Use among High School Students
Overall, 83.0% of students in Los Angeles County who were current tobacco users reported using flavored tobacco products in the last 30 days (data not shown). Use of flavored products was widespread across all tobacco products, even cigarettes, for which only menthol/mint flavor is available (Figure 2). The most prevalent flavored tobacco products were hookah (87.5%), LCC (87.4%), and e-cigarettes (80.7%). Of note, more than half of cigarette smokers (57.9%) reported using flavored cigarettes in the last 30 days.
Figure 2. Proportion using flavored products among current users of a given tobacco product
Note: Refer to Table B in Appendix E – Supplementary Tables to view estimates with confidence intervals.
80.7
57.9
87.4
69.5
87.5
75.2
E-Cigarettes Cigarettes LCC Big Cigars Hookah Smokeless0
10
20
30
40
50
60
70
80
90
100
% o
f stu
dent
s

16
Flavored Tobacco Use by Demographics
Table 8 presents current use of any flavored tobacco product by participant demographics. Across gender, race/ethnicity, and grade, the majority of students reported using flavored tobacco products in the last 30 days.
Table 8. Proportion using flavored tobacco among current tobacco users by gender, race/ethnicity, and grade
Current use N % (95% CI) Overall 2806 83.0 (80.3-85.7) Gender Male 1095 83.6 (80.7-86.5) Female 1114 83.0 (79.0-87.0) Identified in Another Way 129 78.6 (67.9-89.4) Declined to Answer 405 81.8 (77.3-86.3)
Race/Ethnicity White 443 87.0 (80.5-93.5) Black 65 72.8 (60.5-85.1) Hispanic 1392 81.1 (76.2-86.1) Asian 160 85.5 (77.5-93.4) Other 79 89.7 (81.3-98.2)† Multiple 190 88.4 (81.2-95.5)† Declined to Answer 380 81.9 (77.2-86.5)
Grade Grade 10 1305 83.2 (78.7-87.7) Grade 12 1501 82.8 (80.6-85.1)
Note: Race/Ethnicity category Other includes Native Hawaiian and Other Pacific Islander, American Indian or Alaska Native, and other non-standard entries. †Data are statistically unreliable because relative variance is greater than 30%. Interpret with caution.
Use of Specific Flavor Types
Students who used a flavored tobacco product in the last 30 days were asked to indicate the flavor type they used most often. Possible flavor types included fruit or sweet, mint, liquor, tobacco (for e-cigarettes only), and other. Due to the small sample size, liquor and other flavors were combined. As shown in Table 9, with the exception of cigarettes (where mint is the only flavor) and smokeless tobacco, fruit or sweet flavors were by far the most popular. In fact, 81.7% of e-cigarette users in Los Angeles County indicated preferring to use fruit or sweet flavored e-liquid over other flavors. Furthermore, the majority of students who used LCC and hookah reported using fruit or sweet flavors (84.4% and 76.2%, respectively). Mint was the most popular flavor among current smokeless tobacco users (43.3%). Furthermore, all current smokers used mint/menthol flavored cigarettes (100%). Few students reported using tobacco flavored e-cigarettes (2.1%).

17
Table 9. Proportion using flavored tobacco products among current users by flavor type Fruit or sweet Mint Tobacco* Other
N % (95% CI) % (95% CI) % (95% CI) % (95% CI) E-cigarettes 1802 81.7 (78.4-84.9) 10.2 (7.9-12.4) 2.1 (1.2-2.9) 6.1 (4.3-8.0) Cigarettes 230 -- 100.0 -- -- LCC 364 84.8 (79.6-90.1) 4.3 (2.1-6.5) -- 10.8 (6.6-15.1) Big cigars 91 67.7 (48.8-86.7) 11.4 (0.4-22.4)† -- 20.9 (8.1-33.6)† Hookah 374 76.2 (70.3-82.0) 15.2 (10.2-20.3) -- 8.6 (5.0-12.2) Smokeless 73 34.2 (17.6-50.8) 43.3 (22.3-64.4) -- 22.5 (9.0-35.9)†
*Tobacco was included as a flavor option for e-cigarettes only. †Data are statistically unreliable because relative variance is greater than 30%. Interpret with caution.

18
CHAPTER 3 – Susceptibility to Future Tobacco Use
Highlights
• Two in five high school students (40.4%) in Los Angeles County who had never used a tobacco product were susceptible to using at least one tobacco product in the future.
• Rates of susceptibility to different tobacco products varied across demographic variables, but more than one-third of never users in all subgroups were susceptible to using a tobacco product.
• Overall, a higher proportion of never users were susceptible to future tobacco use when they had more friends who used a tobacco product.
Susceptibility and Tobacco Use Behavior
Intention is a strong predictor of performing a behavior.4 Research has shown that it is possible to identify students who are at risk of using tobacco products in the future based on their level of intention to use a tobacco product in the future.5 In the 2017–18 CSTS, Los Angeles County students who had never used a particular tobacco product were asked whether they would use it if one of their best friends offered it to them (see Definitions Used in this Report). Those who answered anything other than definitely not and I don’t know were considered susceptible to future tobacco use. This chapter presents Los Angeles County high school students’ susceptibility to future use of any tobacco product, as well as to specific tobacco products.
Susceptibility to Tobacco Product Use among High School Students
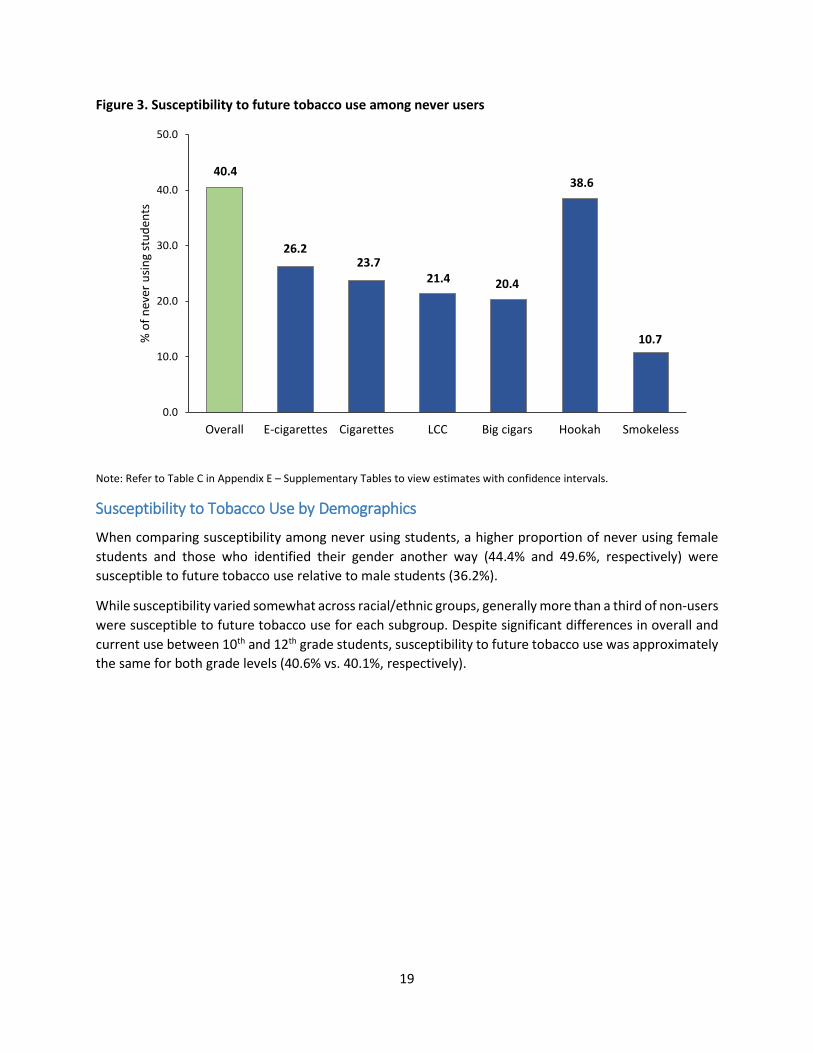
Figure 3 shows the proportion of never using high school students’ susceptibility to future tobacco use. Overall, 40.4% of never users of any tobacco product were susceptible to at least one product. Susceptibility to specific tobacco products generally varied according to product popularity, although hookah (used at lower rates than e-cigarettes) represents an anomaly. Never users of the product in Los Angeles County were most susceptible to using hookah (38.6%), followed by e-cigarettes (26.2%) and cigarettes (23.7%), and least susceptible to using big cigars (20.4%) or smokeless tobacco (10.7%).
19
Figure 3. Susceptibility to future tobacco use among never users
Note: Refer to Table C in Appendix E – Supplementary Tables to view estimates with confidence intervals.
Susceptibility to Tobacco Use by Demographics
When comparing susceptibility among never using students, a higher proportion of never using female students and those who identified their gender another way (44.4% and 49.6%, respectively) were susceptible to future tobacco use relative to male students (36.2%).
While susceptibility varied somewhat across racial/ethnic groups, generally more than a third of non-users were susceptible to future tobacco use for each subgroup. Despite significant differences in overall and current use between 10th and 12th grade students, susceptibility to future tobacco use was approximately the same for both grade levels (40.6% vs. 40.1%, respectively).
40.4
26.223.7
21.4 20.4
38.6
10.7
0.0
10.0
20.0
30.0
40.0
50.0
Overall E-cigarettes Cigarettes LCC Big cigars Hookah Smokeless
% o
f nev
er u
sing
stud
ents

20
Table 10. Proportion of never users who are susceptible to future tobacco use by gender, race/ethnicity, and grade
Never users of any tobacco product
N % (95% CI) Overall 16299 40.4 (39.3-41.5) Gender Male 7206 36.2 (34.3-38.1) Female 7501 44.4 (42.2-46.5) Identified in Another Way 345 49.6 (42.7-56.6) Declined to Answer 1132 41.1 (37.1-45.1)
Race/Ethnicity White 1399 35.6 (32.3-38.9) Black 543 36.0 (30.6-41.4) Hispanic 9949 42.3 (41.1-43.5) Asian 1688 36.2 (34.0-38.5) Other 376 34.7 (28.5-40.9) Multiple 823 38.9 (33.6-44.1) Declined to Answer 1239 40.5 (36.6-44.4)
Grade Grade 10 9417 40.6 (39.4-41.8) Grade 12 6882 40.1 (38.5-41.7)
Note: Race/Ethnicity category Other includes Native Hawaiian and Other Pacific Islander, American Indian or Alaska Native, and other non-standard entries.
Susceptibility to Tobacco Use by Personal Characteristics
Table 11 shows that a higher proportion of never using students who reported feelings of loneliness were susceptible to future tobacco use (45.0%) relative to those who declined to answer (39.2%) or disagreed (37.9%). Similarly, a higher proportion of never using students who reported depressive symptoms were susceptible to future tobacco use (46.8%) relative to those who declined to answer (40.4%) or did not report depressive symptoms (38.1%).
Table 11. Proportion of never users who are susceptible to future tobacco use by loneliness and depressive symptoms
Never users of any tobacco product
N % (95% CI) Overall 16299 40.4 (39.3-41.5) Often feel lonely Agree 5505 45.0 (43.3-46.6) Disagree 8416 37.9 (36.5-39.2) Declined to Answer 2232 39.2 (35.9-42.5)
Depressive symptoms Yes 3904 46.8 (44.8-48.8) No 9891 38.1 (36.6-39.5) Declined to Answer 2346 40.4 (37.5-43.4)

21
Susceptibility to Tobacco Use by Environmental Influences
Students indicated the proportion of their friends that used specific tobacco products. Table 12 presents never users’ susceptibility to future tobacco use by the proportion of their friends that use the tobacco product. Overall, a higher proportion of never users were susceptible to future tobacco use when they had more friends who used a tobacco product.
The proportion of never users susceptible to future hookah use was highest across all tobacco products and categories of friend use. As mentioned earlier in this chapter, students’ high rates of susceptibility to hookah represents an anomaly given its relatively low use. This anomaly may reflect the way hookah is typically used (i.e., in a hookah lounge or similar social setting), which may increase its allure as both a social and perhaps an exotic activity to try.
Table 12. Proportion of never users who are susceptible to future tobacco use by the number of tobacco-using friends
None Some Most All
N=17661 % (95% CI)
N=5548 % (95% CI)
N=1020 % (95%)
N=204 % (95% CI)
E-cigarettes 18.5 (17.1-19.9) 37.6 (35.4-39.7) 40.0 (35.9-44.1) 57.1 (39.5-74.8) Cigarettes 20.7 (19.7-21.7) 32.7 (31.0-34.4) 29.8 (24.1-35.5) 34.2 (25.0-43.4) LCC 19.6 (18.8-20.3) 31.4 (29.4-33.5) 28.1 (21.6-34.6) 30.6 (22.6-38.6) Hookah 30.1 (28.8-31.3) 54.1 (52.2-55.9) 58.0 (54.1-61.9) 60.5 (51.6-69.3)

22
CHAPTER 4 – Environmental Influences
Highlights
• Most high school students reported living in a home that had complete bans on smoking (85.1%) and vaping (79.8%).
• The prevalence of tobacco use and the proportion of current users who vaped and smoked inside their homes did not significantly differ between students who lived in detached houses and those in multi-unit housing.
• Some Los Angeles County students reported being exposed to secondhand vapor (18.5%) or smoke (14.9%) in a car in the last 30 days.
• More students reported being exposed to secondhand vapor (29.5%) or smoke (30.9%) in a room than in a car. The proportion of students exposed did not significantly differ according to home type.
• Almost half of students (45.7%) in Los Angeles County reported smelling tobacco smoke drifting in from the neighborhood. Those who lived in multi-unit housing had the highest rate of exposure (55.5%).
Home Bans for Vaping and Smoking among High School Students
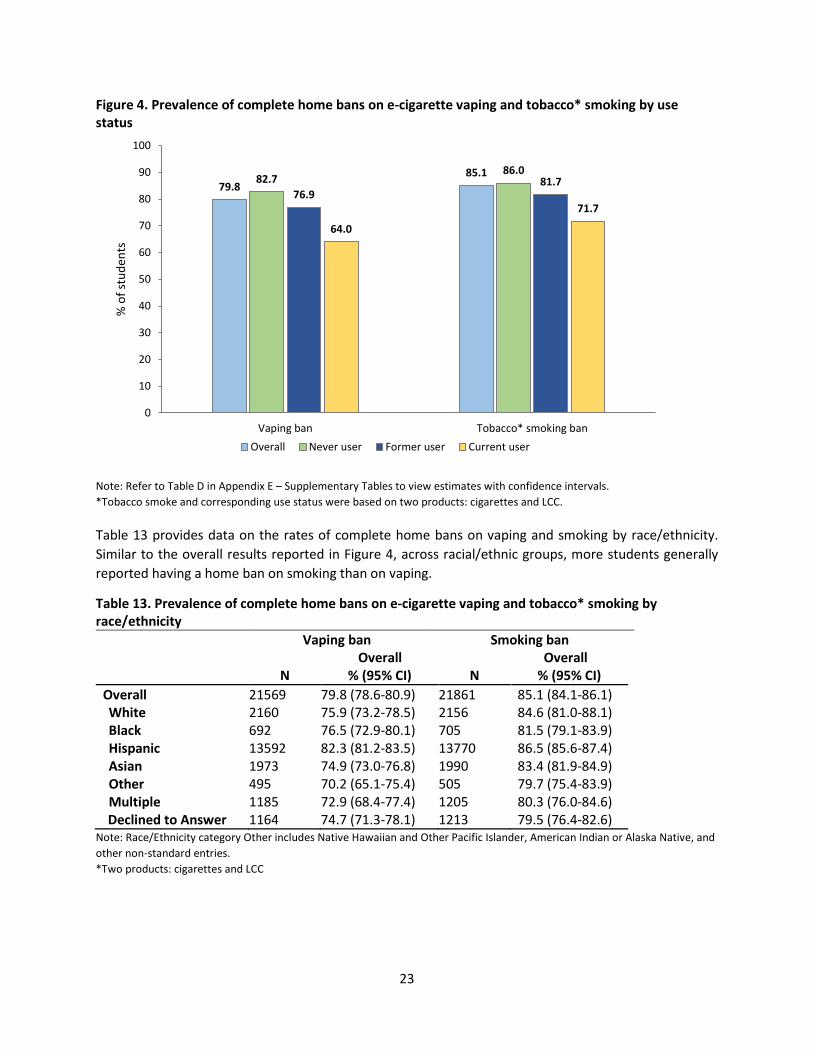
Home bans indicate whether the student’s home environment explicitly discourages smoking tobacco (cigarettes and LCC) and vaping e-cigarettes. Using two separate questions, students were asked to indicate which statement best described the rules about vaping e-cigarettes or smoking tobacco products in their home (see Definitions Used in this Report). Overall, the vast majority of students had a complete home ban on vaping and on smoking (79.8% and 85.1%, respectively).
Figure 4 presents the prevalence of complete home bans on vaping and smoking by vaping and smoking status. Vaping status (never, former, or current vaper) was determined by students’ use of e-cigarettes, while smoking status was determined by students’ use of cigarettes and LCC. Smoking status was limited to cigarettes and LCC to remain consistent with information presented on secondhand smoke exposure. Figure 4 shows that more never vapers and never smokers reported having a complete home ban relative to current vapers and smokers. Rates of home bans among former vapers and smokers fell between those for never and current users. Fewer vapers reported having a home ban compared to smokers. However, rates of home bans on vaping were relatively high given e-cigarettes’ recent introduction to the marketplace.
23
Figure 4. Prevalence of complete home bans on e-cigarette vaping and tobacco* smoking by use status
Note: Refer to Table D in Appendix E – Supplementary Tables to view estimates with confidence intervals. *Tobacco smoke and corresponding use status were based on two products: cigarettes and LCC. Table 13 provides data on the rates of complete home bans on vaping and smoking by race/ethnicity. Similar to the overall results reported in Figure 4, across racial/ethnic groups, more students generally reported having a home ban on smoking than on vaping.
Table 13. Prevalence of complete home bans on e-cigarette vaping and tobacco* smoking by race/ethnicity
Vaping ban Smoking ban Overall Overall N % (95% CI) N % (95% CI)
Overall 21569 79.8 (78.6-80.9) 21861 85.1 (84.1-86.1) White 2160 75.9 (73.2-78.5) 2156 84.6 (81.0-88.1) Black 692 76.5 (72.9-80.1) 705 81.5 (79.1-83.9) Hispanic 13592 82.3 (81.2-83.5) 13770 86.5 (85.6-87.4) Asian 1973 74.9 (73.0-76.8) 1990 83.4 (81.9-84.9) Other 495 70.2 (65.1-75.4) 505 79.7 (75.4-83.9) Multiple 1185 72.9 (68.4-77.4) 1205 80.3 (76.0-84.6) Declined to Answer 1164 74.7 (71.3-78.1) 1213 79.5 (76.4-82.6)
Note: Race/Ethnicity category Other includes Native Hawaiian and Other Pacific Islander, American Indian or Alaska Native, and other non-standard entries. *Two products: cigarettes and LCC
79.885.182.7
86.0
76.981.7
64.0
71.7
0
10
20
30
40
50
60
70
80
90
100
Vaping ban Tobacco* smoking ban
% o
f stu
dent
s
Overall Never user Former user Current user

24
Home Type
Students are predisposed to environmental influences that may affect tobacco use behavior and vulnerability to secondhand exposure to smoke and vapor. Research shows that secondhand smoke exposure can vary according to home type, which Los Angeles County was interested in exploring.6 Therefore, students were asked what type of home they currently live in. There were five answer categories: a house that is not attached to another house; an apartment, condominium, or townhouse that shares a wall with another unit; some other type of housing; I don’t know; and I prefer not to answer. For reporting purposes, we abbreviated the five response choices as “House” (a house that is not attached to another house), “Multi-unit housing” (an apartment, condominium, or townhouse that shares a wall with another unit), and “Other” (some other type of housing). The options I don’t know and I prefer not to answer were combined under “Not specified.”
Figure 5 presents the prevalence of students who reported each home type. Overall, the majority of students lived in a house or in multi-unit housing (48.9% and 31.4%, respectively).
Figure 5. Prevalence of housing types in Los Angeles County
Notes: Not specified = “I prefer not to answer” and “I don’t know” answer choices. Refer to Table E in Appendix E – Supplementary Tables to view estimates with confidence intervals
Table 14 presents the prevalence of current use of a given tobacco product based on the type of home students reported they lived in. Consistent with the main findings, across home type, e-cigarettes were the most prevalent product used by students, while combustible tobacco product use was low. Generally, the prevalence of tobacco use did not significantly differ across home type, except for those who did not identify their home type (which tend to have higher use rates).
48.9%
31.4%
5.4%
14.4%
House Multi-unit Housing Other Not Specified

25
Table 14. Proportion of current tobacco product use by home type
House Multi-unit housing
Other Not specified
N=11505 N=7536 N=1149 N=3574 % (95% CI) % (95% CI) % (95% CI) % (95% CI)
Overall 11.8 (9.8-13.9) 9.5 (7.9-11.1) 10.3 (7.6-13.1) 15.6 (12.9-18.4) E-cigarettes 10.6 (8.4-12.7) 8.3 (6.8-9.8) 8.7 (6.0-11.5) 12.0 (9.7-14.3) Cigarettes 1.4 (1.0-1.9) 1.3 (0.9-1.8) 3.7 (1.5-5.8) 2.9 (1.9-3.9) LCC 1.7 (1.3-2.2) 1.3 (1.0-1.7) 3.0 (1.6-4.3) 4.5 (2.8-6.2) Big cigars 0.6 (0.3-0.9) 0.5 (0.2-0.9)† 0.9 (0.3-1.5)† 1.7 (0.8-2.6) Hookah 1.7 (1.2-2.3) 1.2 (0.8-1.6) 0.8 (0.2-1.4)† 3.4 (2.3-4.6) Smokeless 0.5 (0.2-0.7) 0.2 (0.1-0.3) 0.4 (0.1-0.7)† 0.9 (0.5-1.3)
Note: Not specified = “I prefer not to answer” and “I don’t know” answer choices. †Data are statistically unreliable because relative variance is greater than 30%. Interpret with caution.
Table 15 provides data on whether current users vape e-cigarettes or smoke cigarettes inside their home based on their home type. Overall, there were no significant differences in the proportion of current e-cigarette users who vaped inside their home across home types. Similarly, there were no significant differences in the proportion of current cigarette users who smoked inside their home across home types. Table 15. Proportion of e-cigarette or cigarette use inside home, by home type
Vapes inside home Smokes inside home N % (95% CI) N % (95% CI)
Overall 1830 35.2 (30.3-40.1) 308 30.5 (22.2-38.7) House 1078 35.0 (28.3-41.7) 148 25.1 (15.2-35.1) Multi-unit housing 577 32.1 (26.1-38.2) 112 25.1 (16.8-33.4) Other 82 49.4 (31.7-67.1) 28 62.3 (30.7-94.0)† Not specified 89 42.6 (32.6-52.6) 20 32.1 (10.2-54.0)†
Note: Not specified = “I prefer not to answer” and “I don’t know” answer choices. †Data are statistically unreliable because relative variance is greater than 30%. Interpret with caution.
Exposure to Secondhand Vapor and Smoke in the Last 30 Days among High School Students
Secondhand exposure to tobacco products is a priority issue in Los Angeles County, especially as smoke and vapor have been shown to contain chemicals that are identified by the State as carcinogens and can affect developing youth.6 Los Angeles County has taken precautionary steps to restrict tobacco sales and tobacco smoking behavior in areas that may increase youth risk to secondhand smoke exposure. However, 45.9% of students had still been exposed to secondhand e-cigarette vapor or tobacco smoke, in a room or in a car, within the last 30 days (data not shown).
The 2017–18 CSTS asked students about secondhand exposure to vapor in a room: “In the last 30 days, how many days were you in a room when someone was using an e-cigarette (including e-hookah and hookah pens)?” Another question asked about secondhand exposure to tobacco smoke in a room: “In the last 30 days, how many days were you in a room when someone was smoking a cigarette, little cigar or cigarillo?” Students were asked whether they have been exposed in a car in the same way.
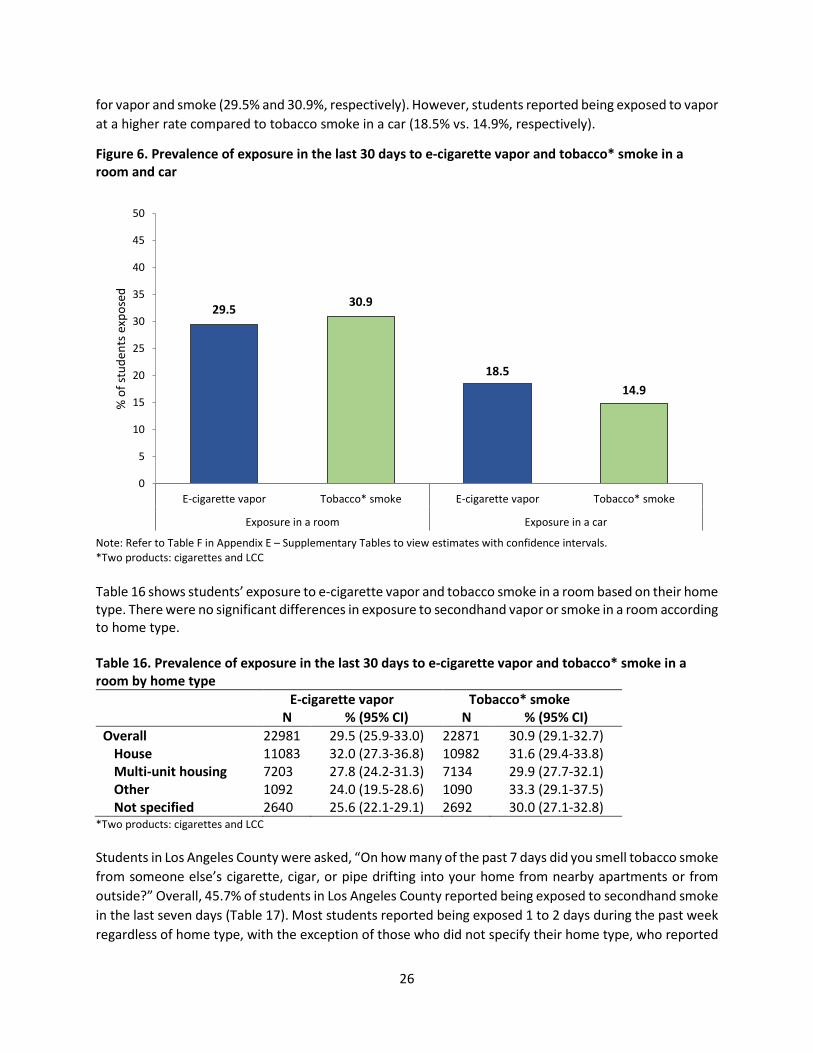
As shown in Figure 6, students reported being exposed to e-cigarette vapor and tobacco smoke in a room at higher rates compared to in a car. Secondhand exposure in a room within the last 30 days was similar
26
for vapor and smoke (29.5% and 30.9%, respectively). However, students reported being exposed to vapor at a higher rate compared to tobacco smoke in a car (18.5% vs. 14.9%, respectively).
Figure 6. Prevalence of exposure in the last 30 days to e-cigarette vapor and tobacco* smoke in a room and car
Note: Refer to Table F in Appendix E – Supplementary Tables to view estimates with confidence intervals. *Two products: cigarettes and LCC Table 16 shows students’ exposure to e-cigarette vapor and tobacco smoke in a room based on their home type. There were no significant differences in exposure to secondhand vapor or smoke in a room according to home type. Table 16. Prevalence of exposure in the last 30 days to e-cigarette vapor and tobacco* smoke in a room by home type
E-cigarette vapor Tobacco* smoke N % (95% CI) N % (95% CI)
Overall 22981 29.5 (25.9-33.0) 22871 30.9 (29.1-32.7) House 11083 32.0 (27.3-36.8) 10982 31.6 (29.4-33.8) Multi-unit housing 7203 27.8 (24.2-31.3) 7134 29.9 (27.7-32.1) Other 1092 24.0 (19.5-28.6) 1090 33.3 (29.1-37.5) Not specified 2640 25.6 (22.1-29.1) 2692 30.0 (27.1-32.8)
*Two products: cigarettes and LCC Students in Los Angeles County were asked, “On how many of the past 7 days did you smell tobacco smoke from someone else’s cigarette, cigar, or pipe drifting into your home from nearby apartments or from outside?” Overall, 45.7% of students in Los Angeles County reported being exposed to secondhand smoke in the last seven days (Table 17). Most students reported being exposed 1 to 2 days during the past week regardless of home type, with the exception of those who did not specify their home type, who reported
29.5 30.9
18.514.9
0
5
10
15
20
25
30
35
40
45
50
E-cigarette vapor Tobacco* smoke E-cigarette vapor Tobacco* smoke
Exposure in a room Exposure in a car
% o
f stu
dent
s exp
osed

27
being exposed 3 to 5 days during the past week. Most notably, students who lived in multi-unit housing had the highest rate of exposure in the last seven days (55.5%).
Table 17. Prevalence of reported tobacco smoke drifting into home within the last 7 days
Any in the last 7 days
1-2 days 3-5 days 6-7 days
N % (95% CI) % (95% CI) % (95% CI) % (95% CI) Overall 20176 45.7 (43.7-47.6) 21.6 (20.6-22.5) 15.0 (14.0-16.0) 9.1 (8.1-10.0)
House 10858 39.2 (37.0-41.4) 19.8 (18.8-20.8) 12.2 (10.9-13.6) 7.1 (5.9-8.4) Multi-unit housing 7015 55.5 (53.3-57.6) 25.0 (23.7-26.3) 18.4 (17.2-19.6) 12.1 (10.8-13.4) Other 1068 50.6 (46.8-54.5) 26.5 (20.8-32.2) 16.5 (12.9-20.0) 7.7 (5.6-9.8) Not specified 1198 42.5 (36.2-48.8) 12.5 (10.1-14.9) 19.2 (15.2-23.1) 10.9 (8.0-13.8)
Note: Not specified = “I prefer not to answer” and “I don’t know” answer choices.
Secondhand exposure may change due to Los Angeles County’s recent strengthening of its Smoke-free Ordinance. Data from future waves of the CSTS will help to monitor changes in exposure. However, it is concerning that students have been exposed to secondhand e-cigarette vapor and tobacco smoke in their own homes, inside rooms and in cars, and from outside tobacco smoke drifting into their homes.

28
CHAPTER 5 – Access to Tobacco Products
Highlights
• More students obtain e-cigarettes and cigarettes through social sources than purchase them through retail sources.
• Many students believed that it would be easy to get e-cigarettes (57.3%) or cigarettes (48.4%) if they wanted them.
• One in eight (13.3%) high school students who had never used any tobacco product had nevertheless been offered a tobacco product in the last 30 days.
Access to and Offers of Tobacco Products
Age restrictions are intended to make it difficult for students to access tobacco products. The legal age to purchase tobacco products in California is 21 years old. Because of this, it is important to monitor how underage students obtain tobacco products, particularly through social sources. This chapter presents data on how students access e-cigarettes and cigarettes and on student offers of tobacco products. Students who were current users of e-cigarettes or cigarettes were asked whether they pay for their own e-cigarettes (or e-liquid) or cigarettes. They were then asked subsequent questions on how they obtained the product. Offers were measured by use status (e.g., never, former, and current users) and across demographics based on tobacco product.
Acquisition of E-Cigarettes and Cigarettes among High School Students
Table 18 presents how students usually get e-cigarettes (or e-liquid) from social sources. Of current e-cigarette users, 61.4% reported not paying for their own e-cigarettes; approximately half of these students reported being offered e-cigarettes.
Table 18. Acquisition of e-cigarettes (or e-liquid) among current e-cigarette users by social source
Did not pay for own e-cigarettes (or e-liquid)
Current e-cigarette users
N=1301 % (95% CI)
Someone else offers them to me 49.1 (43.1-55.1) I ask someone for them 17.9 (14.7-21.1) I get them some other way 18.5 (13.9-23.2) Declined to Answer 14.5 (11.0-17.9)
Note: Data are based on a subset of current e-cigarette users who reported that they do not usually pay for their own e-cigarettes (61.4%; n=2172).
Table 19 shows how students usually buy e-cigarettes (or e-liquid). Overall, only 38.6% of current vapers reported paying for their own e-cigarettes. Three-fifths of those students reported buying e-cigarettes from the store themselves or from someone else. Few students (3.3%) reported buying e-cigarettes from the Internet (including apps). Of note, a high percentage of students did not report how they bought or obtained e-cigarettes (10.1% and 8.9%, respectively).

29
Table 19. Acquisition of e-cigarettes (or e-liquid) among current e-cigarette users by purchase source
Paid for own e-cigarettes (or e-liquid)
Current e-cigarette users
N=867 % (95% CI)
I buy them from the store myself 27.3 (22.8-31.7) I buy them from someone else 34.3 (29.4-39.2) Internet (including apps) 8.6 (6.0-11.2) Other 3.8 (1.7-5.9) Declined to Answer 26.1 (22.4-29.8)
Note: Data are based on a subset of current e-cigarette users who reported that they do usually pay for their own e-cigarettes (38.6%; n=2172).
Table 20 shows how students usually get their cigarettes from social sources. Of current cigarette smokers, 54.6% reported not paying for their own cigarettes, with approximately one-third of these students reporting being offered cigarettes and nearly one-fifth reporting asking someone for cigarettes.
Table 20. Acquisition of cigarettes among current cigarette users by social source
Did not pay for own cigarettes
Current cigarette users
N=205 % (95% CI)
Someone else offers them to me 33.9 (25.9-41.9) I ask someone for them 21.8 (16.3-27.3) I get them some other way 30.4 (19.0-41.8) Declined to Answer 13.9 (8.4-19.5)
Note: Data are based on a subset of current cigarette users who reported that they do not usually pay for their own cigarettes (54.6%; n=383).
Table 21 presents how students usually purchase their cigarettes. Overall, almost half of current smokers (45.4%) reported paying for their own cigarettes. Approximately 80% of those students reported buying cigarettes from the store themselves or from someone else. Very few students (0.5%) reported buying cigarettes from the Internet (including apps). Of note, just as with e-cigarette users, a high percentage of students did not report how they bought or got cigarettes (7.8% and 7.6%, respectively).
Table 21. Acquisition of cigarettes among current cigarette users by purchase source
Paid for own cigarettes
Current cigarette users
N=178 % (95% CI)
I buy them from the store myself 38.9 (29.2-48.5) I buy them from someone else 40.9 (27.5-54.4) Internet (including apps) 1.0 (0.0-2.5)† Other 2.1 (0.2-3.9)† Declined to Answer 17.1 (9.7-24.5)
Note: Data are based on a subset of current cigarette users who reported that they do usually pay for their own cigarettes (45.4%; n=383). †Data are statistically unreliable because relative variance is greater than 30%. Interpret with caution.

30
Students who reported buying e-cigarettes or cigarettes from the store were asked the specific store type where they bought the tobacco product. As shown in Table 22, among current e-cigarette users, vape shops (60.5 %) and tobacco shops (16.8%) were the most popular store types for purchasing e-cigarettes. By contrast, among current cigarette smokers, gas stations or convenience stores (31.3%) and tobacco shops (27.5%) were the most popular store types for purchasing cigarettes.
Table 22. Acquisition of e-cigarettes and cigarettes among current users who buy e-cigarettes or cigarettes from a store by store type
Bought e-cigarettes from a store
Bought cigarettes from a store
N=252 N=74 % (95% CI) % (95% CI) Gas station or convenience store 8.4 (4.4-12.5) 31.3 (17.0-45.7) Grocery store 2.5 (0.4-4.7)† 9.3 (3.4-15.2)† Drugstore or pharmacy 2.0 (0.3-3.6)† 3.8 (0.0-8.2)† Restaurant, deli, or donut shop 0.8 (0.0-1.9)† 0.9 (0.0-2.7)† Tobacco shop 16.8 (9.1-24.5) 27.5 (14.7-40.3) Vape shop 60.5 (47.4-73.6) 8.0 (1.2-14.7)† Other 1.8 (0.1-3.5)† 10.8 (0.0-26.0)† Declined to Answer 7.2 (3.6-10.8) 8.3 (2.7-14.0)†
†Data are statistically unreliable because relative variance is greater than 30%. Interpret with caution.
Offers of Tobacco Products in the Last 30 Days among High School Students
The 2017–18 CSTS assessed whether high school students were offered various tobacco products in the last 30 days by asking, “In the last 30 days, has anyone offered you… ?” followed by a list of tobacco products. Overall, one-quarter of students (25.1%) in Los Angeles County were offered a tobacco product in the last month (Table 23). Significantly more current users (77.7%) reported tobacco product offers relative to never (13.3%) or former users (33.1%). The overall prevalence of offers of specific tobacco products reflects the overall prevalence of use of each tobacco product: more students reported being offered e-cigarettes (the most prevalent product used by high school students) relative to cigarettes, LCC, or hookah.
Table 23. Prevalence of offers of tobacco products in the last 30 days by use status
Overall Never user of the product
Former user of the product
Current user of the product
N=23847 N= 22030 N=5155 N=2638 % (95% CI) % (95% CI) % (95% CI) % (95% CI) Any of the below 25.1 (22.9-27.4) 13.3 (12.1-14.6) 33.1 (30.5-35.7) 77.7 (74.2-81.3) E-cigarettes 20.5 (17.9-23.1) 10.1 (8.8-11.4) 29.5 (26.5-32.6) 76.1 (71.4-80.8) Cigarettes 6.6 (5.8-7.4) 3.9 (3.5-4.2) 19.5 (17.5-21.6) 78.5 (72.8-84.2) LCC 4.1 (3.6-4.5) 2.5 (2.1-2.8) 13.5 (9.7-17.4) 50.4 (44.5-56.4) Hookah 8.9 (7.8-10.0) 6.2 (5.5-7.0) 25.0 (22.0-27.9) 66.6 (57.7-75.6)
Offers of Tobacco Products by Demographics
Table 24 shows the prevalence of offers of tobacco products by demographics. Overall, offers of tobacco products according to demographic characteristics reflect the prevalence of tobacco use by gender, race/ethnicity, and grade. Offers of tobacco products were generally similar across gender. There were

31
some differences in the prevalence of offers across race/ethnicity, with White students (37.2%) generally indicating the highest prevalence of offers and Asian students (17.1%) generally indicating the lowest prevalence of offers. There were no significant differences in offers across grade levels.
Table 24. Prevalence of offers of tobacco products* in the last 30 days by gender, race/ethnicity, and grade
Overall
N % (95% CI) Overall 23847 25.1 (22.9-27.4) Gender Male 10383 23.6 (21.3-26.0) Female 10937 25.5 (22.6-28.3) Identified in Another Way 598 32.2 (27.9-36.5) Declined to Answer 1740 29.2 (26.3-32.1)
Race/Ethnicity White 2247 37.2 (32.5-42.0) Black 774 19.8 (16.5-23.1) Hispanic 14692 23.6 (21.4-25.7) Asian 2068 17.1 (14.4-19.7) Other 560 30.4 (24.9-35.8) Multiple 1268 32.5 (28.6-36.4) Declined to Answer 1807 27.8 (24.8-30.8)
Grade Grade 10 12928 24.7 (22.5-26.9) Grade 12 10919 25.6 (22.8-28.4)
Note: Race/Ethnicity category Other includes Native Hawaiian and Other Pacific Islander, American Indian or Alaska Native, and other non-standard entries. *Four products: e-cigarettes, cigarettes, LCC, and hookah.
Perceived Ease of Acquiring E-Cigarettes and Cigarettes among High School Students
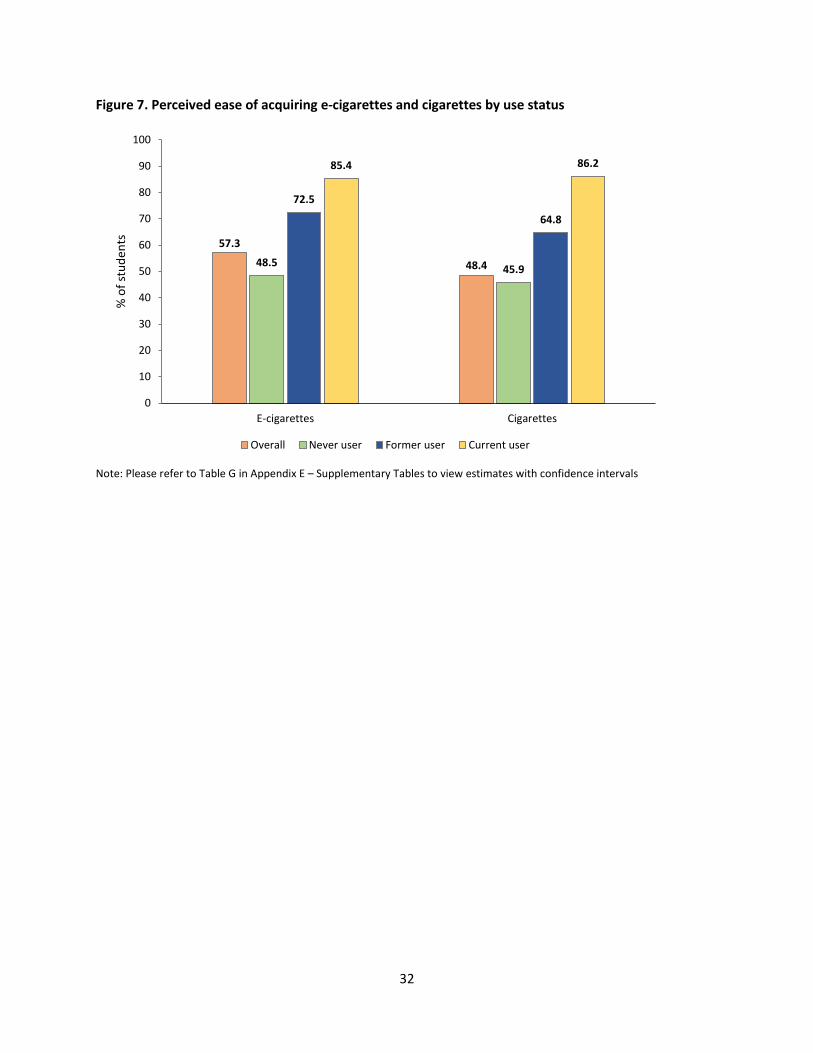
Figure 7 presents the perceived ease of acquiring e-cigarettes and cigarettes among high school students. Overall, 57.3% of students believed that it would be very easy or somewhat easy to get e-cigarettes, which is significantly more than those who believed it would be very easy or somewhat to get cigarettes (48.4%).
Perceived ease of access differed significantly according to product use status, with the highest percentage of current users perceiving that is would be very easy or somewhat easy to get e-cigarettes or cigarettes relative to never or former users of those products.
32
Figure 7. Perceived ease of acquiring e-cigarettes and cigarettes by use status
Note: Please refer to Table G in Appendix E – Supplementary Tables to view estimates with confidence intervals
57.3
48.448.5 45.9
72.5
64.8
85.4 86.2
0
10
20
30
40
50
60
70
80
90
100
E-cigarettes Cigarettes
% o
f stu
dent
s
Overall Never user Former user Current user

33
CHAPTER 6 – Tobacco Use Behavior: Comparisons from 2015–16 to 2017–18
Highlights
• From 2015–16 to 2017–18, the use of e-cigarettes among high school students in Los Angeles has increased significantly, from 6.4% to 10.0%.
• The use of all other tobacco products, not including e-cigarettes, decreased significantly from 7.6% in 2015–16 to 4.5% in 2017–18.
• Overall tobacco use, including e-cigarettes, did not change significantly (10.6% to 11.6%).
There was a sufficiently large number of Los Angeles County schools that participated in the CSTS in 2015–16 and more so in 2017–18 that a comparison of results from 2015–16 with those from 2017–18 is feasible. For this comparison, we assume that the demographic composition of students between the two surveys has not changed significantly; thus, no adjustment was made with regard to demographics.
Tobacco Product Use among High School Students
Figure 8 shows that the use of e-cigarettes increased significantly from 2015–16 to 2017–18 (6.4% to 10.0%, p<0.002). By contrast, cigarette smoking significantly decreased, 3.5% to 1.7% (p<0.001). In fact, the use of all other forms of tobacco decreased during this period: 1.2% to 0.7% for big cigars, 3.2% to 2.0% for LCC, 3.9% to 1.7% for hookah, and 1.0% to 0.4% for smokeless tobacco.
Despite the fact that the use of all tobacco products other than e-cigarettes significantly decreased, overall tobacco use in Los Angeles County from 2015–16 to 2017–18 did not reduce due to the dramatic increase in e-cigarette use. If cigarettes, big cigars, LCC, hookah, and smokeless are combined into one category, then the prevalence for using these products significantly decreased from 7.6% to 4.5% (p<0.001). However, the overall tobacco use (including e-cigarettes) in Los Angeles County did not decrease. Rather, it increased from 10.6% to 11.6% during this period, although the change is not statistically significant (p=0.44).

34
Figure 8. Prevalence of current tobacco use by survey cycle
The decline in tobacco product use, with the exception of e-cigarettes, is notable in two aspects. First, it continues the trend that has been observed previously on the statewide level. The 2015–16 CSTS found that the use of all forms of tobacco other than e-cigarettes declined dramatically in California from 2011–12 to 2015–16.7 The rate of decline shown in Figure 8 is very substantial and similar to what has been observed in earlier trends. Second, the absolute prevalence for each of those products in 2017–18 is very low. In fact, none were greater than 2%. This makes it obvious that the next phase of tobacco control should focus on e-cigarettes, the only product that has attracted more students to use in 2017–18 than in 2015–16.
6.4
3.53.2
1.2
3.9
1.0
10.610.0
1.72.0
0.71.7
0.4
11.6
0.0
2.0
4.0
6.0
8.0
10.0
12.0
14.0
E-cigarettes Cigarettes LCC Big cigars Hookah Smokeless Any TobaccoProduct
% o
f stu
dent
s
2015-16 2017-18
35
CONCLUSION The smoking prevalence for Los Angeles youth, like the rest of California, has reached a historical low. Only 1.7% of high school students in Los Angeles smoked cigarettes in 2017–18. Few would have imagined such a low prevalence only a few years ago. In fact, the rate of using any one of the combustible tobacco products was very low (none is higher than 2%). As far as the numerical goal for tobacco control is concerned, the prevalence for each of the combustible tobacco products among high school students in Los Angeles had dropped to the level accepted by many as an end-game number.8 There is cause for celebration.
The low prevalence suggests that the social norm for cigarette smoking among teens has collapsed. Smoking is simply no longer a cool thing to do. The anti-smoking campaign in California, both at the statewide level and at the Los Angeles County level, has been very successful in this regard.
We still have to be vigilant in that many students who have not used tobacco remain susceptible to future use. Many adults in California are still smokers, which contributes to the fact that almost a third of high school students reported being exposed to secondhand smoke. Many of the students were offered tobacco products even though they were not users themselves. A majority of students considered it easy to acquire tobacco products, if they wanted them.
The biggest concern, of course, is the rising popularity of e-cigarettes among adolescents. Current e-cigarette use among high school students in Los Angeles in 2017–18 was 10%, which accounts for the majority of all tobacco use (11.6%). Moreover, a significant proportion of high school students, most of whom were not current users, reported that someone had offered e-cigarettes to them in the last 30 days. Being offered these products through a youth’s social framework could increase the rate of experimentation or the rate of transition from experimentation to regular use. The social norm for vaping is clearly different from that of cigarette smoking. Vaping is popular. The novel devices and plethora of flavors that come with these new products are attractive to teens. Many have experimented with these devices, and many who have not are susceptible to trying them in the future.
The campaign against the use of tobacco products, therefore, should focus on vaping. New interventions must be developed to counter the influence that comes from students’ immediate environment as well as the influences from the tobacco and vaping industry. The social-norm approach, which has been so successfully employed in anti-smoking campaigns, may be useful in reducing vaping among teens as well. New strategies may also be necessary given that the products and the industry itself continues to evolve.
Of special concern is the intersection of vaping nicotine and vaping marijuana. The marijuana use prevalence is currently even higher than that for e-cigarettes for high school students in Los Angeles. Even though most of the teens who currently use marijuana are smoking it, this rate can change quickly given the appeal of new vaping devices for youth. The public health community has to be particularly vigilant in monitoring the impact of new vaping devices on the use of both nicotine and marijuana among school children.
In summary, findings from the 2017–18 CSTS offer much reason for celebration, while also raising new questions about the next phase of the public health campaign. The very low prevalence for all combustible tobacco products shows that it is possible to reduce tobacco use closer to nearly zero, even though it took

36
many years. Vaping does present a new challenge, and the public health community will have to be creative in developing new strategies in order to succeed in the next phase of tobacco control.
RESOURCES • Find the California Student Tobacco Survey Biennial Report 2017-2018 on the California
Department of Public Health, California Tobacco Control Branch’s website: https://www.cdph.ca.gov/Programs/CCDPHP/DCDIC/CTCB/Pages/Reports.aspx.
• Contact Los Angeles County’s Tobacco Use Prevention Education (TUPE) Coordinator for local resources: www.cde.ca.gov/ls/he/at/countycoordinators.asp.
• View anti-tobacco commercials at www.tobaccofreeca.com/resources. • Connect students to the California Smokers’ Helpline (1-800-NO-BUTTS) for free, evidence-
based telephone counseling. Help is available for tobacco users and the people who care about them. Visit www.nobutts.org for more information.
• Download free, print-ready tobacco education materials through the Tobacco Education Clearinghouse of California at: www.tecc.org.

37
APPENDIX A – 8th Grade Tobacco Use
Highlights
• Few 8th grade students (5.1%) reported using a tobacco product in the last 30 days. • E-cigarettes were the most prevalent product used (4.5%). The use of all other tobacco
products was very low (<1%). • Over one-third (37.0%) of never using 8th grade students were susceptible to using a tobacco
product in the future. • Eighth grade students reported higher rates of exposure to tobacco smoke in a car compared
to exposure to e-cigarette vapor.
The following section summarizes key tobacco use data for 8th grade students in Los Angeles County. Due to different sampling approaches between middle and high school students, where fewer 8th grade students were sampled, data for 8th grade students have been separated from that of high school students.
Tobacco Product Use among 8th Grade Students
Current tobacco use rates are significantly lower than those of high school students; overall, 5.1% of 8th grade students in Los Angeles County reported currently using a tobacco product (compared with 11.6% of high school students). Similar to high school students, e-cigarettes were the most commonly used product (4.5%) among 8th graders, followed by cigarettes, LCC, and hookah (each 0.8%).
Table 25. Prevalence of current tobacco product use among 8th grade students Current use N=3042 % (95% CI)
Overall 5.1 (3.4-6.7) E-cigarettes 4.5 (2.9-6.1) Cigarettes 0.8 (0.1-1.5)† LCC 0.8 (0.3-1.3)† Big cigars 0.4 (0.0-0.7)† Hookah 0.8 (0.4-1.2) Smokeless 0.1 (0.0-0.2)†
†Data are statistically unreliable because relative variance is greater than 30%. Interpret with caution.
Susceptibility to Tobacco Product Use among 8th Grade Students
Table 26 shows that over one-third (37.0%) of 8th grade students who have not tried a tobacco product were susceptible to trying one in the future (see Definitions Used in this Report). Similar to high school students, a higher percentage of 8th graders were most susceptible to hookah (27.7%), e-cigarettes (25.9%), and cigarettes (22.0%).

38
Table 26. Prevalence of susceptibility to future product use among never using 8th grade students Never users of the product N % (95% CI)
Overall 2420 37.0 (34.8-39.3) E-cigarettes 2224 25.9 (23.6-28.3) Cigarettes 2614 22.0 (19.9-24.0) LCC 2656 19.9 (17.4-22.3) Big cigars 2760 15.6 (12.6-18.6) Hookah 2605 27.7 (23.5-32.0) Smokeless 2797 9.9 (8.4-11.4)
Secondhand Exposure to Vapor and Smoke among 8th Grade Students
Table 27 reports 8th grade students’ exposure to secondhand vapor or smoke in a room (see Definitions Used in this Report). Similar to high school students, 8th grade students reported greater exposure to cigarette and LCC smoke compared to e-cigarette vapor (30.9% vs. 20.4%, respectively). However, middle school students were significantly less likely to be exposed to overall e-cigarette vapor, compared to high school students (20.4% vs. 31.5%, respectively). Eighth grade students were more likely to be exposed in a room than in a car.
Table 27. Prevalence of exposure in the last 30 days to e-cigarette vapor or tobacco* smoke by location among 8th grade students
Any in the last 30 days Exposure to e-cigarette vapor N % (95% CI) Overall 2903 20.4 (16.2-24.6)
Room 2875 19.2 (15.0-23.3) Car 2875 10.3 (8.4-12.3)
Exposure to tobacco* smoke Overall 2924 30.9 (27.7-34.2)
Room 2853 27.9 (24.7-31.1) Car 2874 13.0 (10.4-15.5)
*Two products: cigarettes and LCC Table 28 presents students’ exposure to e-cigarette vapor or tobacco smoke in a room based on their home type. There were no significant differences in exposure to secondhand vapor or smoke in a room according to home type. Table 28. Prevalence of exposure in the last 30 days to e-cigarette vapor and tobacco* smoke in a room by home type among 8th grade students
E-cigarette vapor Tobacco* smoke N % (95% CI) N % (95% CI)
Overall 2875 19.2 (15.0-23.3) 2853 27.9 (24.7-31.1) House 1353 22.0 (16.6-27.4) 1342 29.4 (25.0-33.9) Multi-unit housing 941 18.1 (13.8-22.4) 930 28.4 (25.3-31.5) Other 158 18.3 (11.9-24.6) 151 26.6 (18.7-34.5) Not specified 274 13.5 (6.6-20.5) 279 23.0 (16.3-29.6)
*Two products: cigarettes and LCC

39
APPENDIX B – Marijuana
Highlights
• One-third (33.6%) of high school students in Los Angeles County reported having tried marijuana, while 15.0% reported using it in the last 30 days.
Marijuana Use among High School Students
Marijuana is described in the 2017-18 CSTS as “Marijuana (including blunts and edibles): Commonly known as cannabis, weed, pot, hash, grass, THC, or CBD. It can be smoked (joint, blunt, bong), vaped, or eaten (baked goods, candies).” Table 25 presents the prevalence of ever and current marijuana use among high school students by demographic characteristics.
In Los Angeles County, the rate of currently using marijuana (15.0%) is higher than the current use rates for all tobacco products. There is no difference when comparing current use rates of marijuana between females and males. Notably, students who identified their gender in another way or declined to report their gender had significantly higher marijuana use rates (23.3% and 25.4%, respectively). Asian students had the lowest rates of marijuana use (6.2%) of all racial/ethnic groups. The prevalence of marijuana use was higher among 12th grade students relative to 10th grade students (18.5% vs. 12.1%, respectively).
Table 29. Prevalence of marijuana use by gender, race/ethnicity, and grade Ever use Current use N % (95% CI) % (95% CI) Overall 23890 33.6 (31.0-36.2) 15.0 (13.8-16.2) Gender Male 10319 30.6 (27.0-34.2) 13.8 (12.3-15.3) Female 10756 33.8 (30.9-36.6) 13.9 (12.4-15.4) Identified in Another Way 629 44.7 (39.9-49.5) 23.3 (19.3-27.2) Declined to Answer 1963 45.4 (42.5-48.3) 25.4 (21.7-29.0)
Race/Ethnicity White 2228 32.5 (28.8-36.3) 19.8 (15.9-23.7) Black 768 40.7 (35.5-46.0) 19.3 (14.7-23.9) Hispanic 14497 34.6 (31.3-37.9) 13.8 (12.6-14.9) Asian 2058 13.7 (11.8-15.5) 6.2 (4.9-7.5) Other 569 28.5 (22.2-34.9) 15.3 (10.0-20.7) Multiple 1257 34.9 (31.5-38.3) 17.6 (14.3-20.8) Declined to Answer 2043 42.2 (39.0-45.4) 23.5 (19.8-27.2)
Grade Grade 10 12857 29.3 (25.8-32.9) 12.1 (11.0-13.2) Grade 12 11033 38.7 (36.3-41.1) 18.5 (16.8-20.2)
Note: Race/Ethnicity category Other includes Native Hawaiian and Other Pacific Islander, American Indian or Alaska Native, and other non-standard entries.

40
APPENDIX C – Survey Methodology
Survey Administration
The California Student Tobacco Survey (CSTS) is funded by the California Department of Public Health (CDPH) and has been conducted biennially since 2001–02. The 2015–16 CSTS was the first to be administered by the University of California, San Diego (UCSD). For this 2017–18 CSTS, Local Lead Agencies (LLA) of the California Tobacco Control Program (CTCP) were given the opportunity to subcontract with UCSD to analyze survey data within the LLA’s health jurisdiction.
This appendix provides a brief overview of survey methodology for the 2017–18 CSTS specific to Los Angeles County. Additional details of the statewide report can be found in the 2017–18 California Student Tobacco Survey Report by SH. Zhu, et al.9 Statewide survey methods can be found in the Technical Report on Analytical Methods and Approaches Used in the California Student Tobacco Survey 2017–18 by SH. Zhu, et al.10
Survey Content
The survey questionnaire was designed to assess use of, knowledge of, and attitudes toward cigarettes and emerging tobacco products (e.g., e-cigarettes, hookah, cigarillos). It also included questions about use of and attitudes toward marijuana and alcohol. The survey contained 134 questions, including topics such as: awareness of and use of different tobacco products; history and patterns of tobacco use; tobacco purchasing patterns; knowledge of and participation in school tobacco prevention or cessation programs; perceptions of tobacco use (i.e., social norms); awareness of advertising; and susceptibility to future tobacco use. Los Angeles County augmented the survey with additional county-specific questions (see Appendix E).
Participation
To increase participation in the CSTS, schools were provided a $500 Amazon gift card for administering the survey. Participating schools also received a brief report highlighting their school’s results. Teachers primarily acted as proctors for the survey, and, in some cases, other school staff proctored. UCSD provided proctors for schools that required additional support. Teachers and proctors were provided with directions for administering the survey. UCSD staff were available to answer questions from teachers and proctors.
The 2017–18 CSTS was administered online and took between 15 and 25 minutes to complete. The online survey included programmed skip logic to reduce participant burden. In other words, students were only asked survey questions based on their previous answers, allowing them to skip questions not relevant to their experiences. Answers were not mandatory, although an error message of “Oops, you didn’t answer” appeared if the question was unanswered. The student was allowed to move forward and skip the question if desired. The 2017–18 CSTS also included the response option I prefer not to answer for all questions.
Student participation was voluntary and anonymous. Consent procedures were consistent with school district guidelines. In a passive consent protocol, parents can opt their children out of the survey if they do not want them to participate. In an active consent protocol, only students who return a consent form signed by the parent can participate in the survey. All participating districts accepted passive consent.

41
Consent forms were distributed to parents via the students one week before the survey. Spanish forms were available as needed. In addition to obtaining consent from parents, students were also asked to give their assent to participate in the survey.
Survey Sample 2017–18 CSTS
Table 30 provides information about the number of schools and students that participated in the 2017–18 survey for each of the three grades. The total sample included 28,071 students from 75 schools. Grades 10 and 12 are considered high school, and grade 8 is considered middle school.
Table 30. Numbers of schools and students participating, Los Angeles County middle schools vs. high schools
Middle schools (8th) High schools (10th & 12th) Total Number of schools 13 62 75 Number of students 3003 25068 28071
Sampling Strategy
Los Angeles County deferred to the statewide CSTS sample for this report. The statewide sampling strategy used a two-stage sampling design, in which stage 1 was the random sampling of schools within regions and stage 2 was the sampling of classrooms within schools. Los Angeles County was considered its own region (Region 15) in the 2017–18 CSTS. Sampling used the probability proportional to size (PPS) method and stratified by region with oversampling of less densely populated regions, African American students, and schools that received Tobacco-Use Prevention Education program funding.
Participating middle schools were encouraged to survey all 8th graders, while high schools were encouraged to survey all 10th and 12th graders. For the minority of schools that chose not to survey all students in the selected grades (10.7% of schools), classrooms within a grade were randomly sampled for participation.
Analysis
Los Angeles County surveyed an adequate sample size to allow for county-level data. All estimates include 95% confidence intervals. The 2017–18 CSTS provided the option I prefer not to answer for all questions. Rates of endorsement varied considerably. It is important to note that it appears as though selection of this response option was not random; questions that were difficult to understand or more personal in nature tended to have higher endorsement of this response option. Respondents that declined to answer also tended to have high rates of tobacco use.
The CSTS design utilized stratified random sampling and proper weighting to provide stable statewide prevalence rates. Data are weighted to account for the study’s sampling design, and the weighting procedure is described elsewhere.10 Los Angeles County’s Tobacco Control and Prevention Program deferred to the statewide sampling strategy. In addition, as more than 5% of California’s students participated in the survey, a finite population correction was applied in the analyses. This correction will reduce the variance, resulting in narrower confidence intervals for all estimates.

42
Race/Ethnicity
The racial/ethnic background of students was determined using two primary questions. The first asked about Spanish or Hispanic (Latino) origin (i.e., ethnicity), and the second asked participants to indicate how they describe themselves (i.e., race) by marking all that apply: American Indian or Alaska Native, Asian, Black or African American, Native Hawaiian or Other Pacific Islander, White, or Other. The Other ethnic category included non-standard entries (such as Middle Eastern or Italian). Due to the small sample size of Native Hawaiian or Other Pacific Islander, American Indian or Alaska Native, and Other groups, they were combined to form the Other category. The response option I prefer not to answer was also provided for both questions. In line with other surveys, students identifying as Hispanic are labeled as such regardless of the other races selected. Students selecting multiple races were grouped as Multiple in tables that include racial/ethnic categories.
With the exception of the I prefer not to answer response option, race/ethnicity categories of the CSTS are similar to those used by the California Department of Education (CDE), allowing us to compare the prevalence of each race/ethnicity (Table 31). In many cases, the prevalence of each race/ethnicity is similar between the CSTS and CDE enrollment data. Of note, the prevalence of Multiple race is far higher in the CSTS than reported by CDE (5.7% vs. 1.9%, respectively). One possible reason for the difference is that CSTS is based on student self-reporting, whereas the CDE is based on parent reporting of the child’s race/ethnicity. Students and parents may not have the same perspective regarding multi-racial identification. Because of the differences in how race/ethnicity was identified between the CSTS and CDE, student responses were not weighted by race/ethnicity. Given the ethnic diversity of Los Angeles County, and the increasing number of people who identify themselves as two or more races,11 the issue of how to analyze race/ethnicity data will continue to be relevant for the CSTS.
Table 31. Prevalence of race/ethnicity categories in the CSTS and CDE enrollment data CSTS Sample CDE Enrollment N=27513 (%) (%) NH-White 2591 9.4 14.1 NH-Black 876 3.2 7.6 Hispanic 16873 61.3 64.1 NH-Asian 2356 8.6 10.8 NH-AI/AN 48 0.2 0.3 NH-NHOPI 119 0.4 0.4 NH-Other 557 2.0 0.9 NH-Multiple 1573 5.7 1.9 Declined to Answer 2520 9.2 --
Note: Race/ethnicity data above are unweighted and should not be compared with weighted estimates throughout the report. Abbreviations: NH = Non-Hispanic; AI/AN = American Indian or Alaska Native; NHOPI = Native Hawaiian or Other Pacific Islander. There are limitations with this method of classifying race/ethnicity. To provide a greater understanding of the impact of this classification of race/ethnicity, Table 32 compares how individuals are labeled using usual methods as to whether they endorse a given race at all. It is clear that students tend to endorse multiple responses, and in particular, underrepresented races. For example, under the usual classification of labeling, the number of Black students is 876 (i.e., non-Hispanic Black who did not endorse any other racial identity). However, there were more than three times as many students who indicated their race was Black (including those who also indicated they were Hispanic or who selected at least one other racial

43
category). This phenomenon is even more striking for Native Hawaiian or Other Pacific Islanders (n=119 vs. 982, depending on the categorization strategy) and for American Indian or Alaska Natives (n=48 vs. 1,424). Table 32. Prevalence of labeled and endorsed race/ethnicity
Labeled Endorsed N=27513 (%) N=27513 (%) White 2591 9.4 6861 25.1 Black 876 3.2 2442 8.9 Hispanic 16873 61.3 16873 61.4 Asian 2356 8.6 3845 14.1 AI/AN 48 0.2 1424 5.2 NHOPI 119 0.4 982 3.6 Other 557 2.0 11785 43.2 Multiple 1573 5.7 0 -- Declined to Answer 2520 9.2 5487 20.2
Note: The percent in endorsed does not add up to 100% because students could select more than one response. Race/ethnicity data above are unweighted and should not be compared with weighted estimates throughout the report. Abbreviations: NH = Non-Hispanic; AI/AN = American Indian or Alaska Native; NHOPI = Native Hawaiian or Other Pacific Islander.

44
APPENDIX D – County-specific Questions
Participation
Los Angeles County was given the opportunity to augment the 2017–18 CSTS with additional questions at the end of the survey (see Los Angeles County–specific Questions below). Five questions on environmental influences and tobacco use behavior specifically for the county’s students were included. Respondents were asked about their home type and, if they had used in the past 30 days, whether they had used inside their home. All students were asked whether they were exposed to outside smoke drifting into their homes. Surveys were available in English and Spanish, administered online, and used programmed skip logic to reduce participant burden.
Out of the 75 Los Angeles County schools that participated, 73 schools (61 high schools and 12 middle schools) provided students with the county-specific questions; two schools (one high and one middle) had surveyed before the additional questions were programmed. This was due to the delay of receiving the county-specific questions. Only students from those schools who were asked the county-specific questions were included in the analysis, and the sample size was still large enough to provide county-specific estimates for those questions.
Table 33. Numbers of schools and students that received county-specific questions, Los Angeles County middle schools vs. high schools
Middle schools (8th) High schools (10th & 12th) Total Number of schools 12 61 73 Number of students 2858 24307 27165
Los Angeles County-specific Questions
Students from Los Angeles County schools received the following additional questions after the last question in the CSTS survey: LAC1. Do you currently live in...
A. A house that is not attached to another house B. An apartment, condominium, or townhouse that shares a wall with another unit C. Some other type of housing D. I don’t know E. I prefer not to answer
LAC2. On how many of the past 7 days did you smell tobacco smoke from someone else’s cigarette, cigar, or pipe drifting into your home from nearby apartments or from outside?
A. 0 days B. 1 days C. 2 days D. 3 days E. 4 days F. 5 days G. 6 days H. All 7 days I. I prefer not to answer
45
LAC3. You mentioned earlier that you smoke cigarettes. In the last 30 days, have you smoked in your home?
A. Yes B. No C. I prefer not to answer
LAC4. You mentioned earlier that you vape e-cigarettes (vapes, e-hookah, hookah pen). In the last 30 days, have you vaped e-cigarettes in your home?
A. Yes B. No C. I prefer not to answer
LAC5. You mentioned earlier that you use marijuana. In the last 30 days, have you smoked or vaped marijuana in your home?
A. Yes B. No C. I prefer not to answer

46
APPENDIX E – Supplementary Tables Table A. Prevalence of ever and current use of tobacco products
Ever use Current use N=24903 N=24891 % (95% CI) % (95% CI)
Overall 35.0 (32.5-37.6) 11.6 (10.1-13.1) E-cigarettes 30.3 (27.5-33.1) 10.0 (8.4-11.6) Cigarettes 10.1 (8.6-11.6) 1.7 (1.4-2.0) LCC 6.9 (6.1-7.8) 2.0 (1.7-2.4) Big cigars 3.5 (2.6-4.4) 0.7 (0.4-1.0) Hookah 9.4 (8.3-10.5) 1.7 (1.4-2.1) Smokeless 1.6 (1.2-2.0) 0.4 (0.3-0.6)
Table B. Proportion using flavored tobacco products among current users of a given tobacco product
N*
Flavored product use
% (95% CI) E-cigarettes 2318 80.7 (77.3-84.1) Cigarettes 412 57.9 (50.1-65.7) LCC 435 87.4 (82.4-92.4) Big cigars 143 69.5 (64.0-75.1) Hookah 431 87.5 (81.3-93.8) Smokeless 93 75.2 (66.3-84.0)
*As some participants used more than one tobacco product, the sum of sample sizes for each product is greater than the overall sample size.
Table C. Susceptibility to future tobacco use among never users Never users of the product N % (95% CI)
Overall 16299 40.4 (39.3-41.5) E-cigarettes 16081 26.2 (25.1-27.4) Cigarettes 20887 23.7 (22.8-24.7) LCC 21531 21.4 (20.6-22.2) Big cigars 22565 20.4 (19.4-21.4) Hookah 20118 38.6 (37.2-39.9) Smokeless 23292 10.7 (10.1-11.3)

47
Table D. Prevalence of complete home bans on e-cigarette vaping or tobacco* smoking by use status Complete home ban Vaping Ban N % (95% CI) Overall 21569 79.8 (78.6-80.9)
Never vapers 15362 82.7 (81.5-84.0) Former vapers 3640 76.9 (73.6-80.2) Current vapers 1938 64.0 (61.5-66.4)
Smoking Ban N % (95% CI) Overall 21861 85.1 (84.1-86.1)
Never smokers 19277 86.0 (85.2-86.8) Former smokers 1914 81.7 (79.4-83.9) Current smokers 569 71.7 (65.1-78.3)
*Tobacco smoke and corresponding use status were based on two products: cigarettes and LCC.
Table E. Prevalence of housing types in Los Angeles County
House Multi-unit housing
Other Not specified
N % (95% CI) % (95% CI) % (95% CI) % (95% CI) Overall 23878 48.9 (44.4-53.3) 31.4 (27.2-35.6) 5.4 (4.7-6.0) 14.4 (12.6-16.2)
Abbreviations: Not specified = “I prefer not to answer” and “I don’t know” answer choices.
Table F. Prevalence of exposure in the last 30 days to e-cigarette vapor and tobacco* smoke in a room and car
E-cigarette vapor Tobacco* smoke N % (95% CI) N % (95% CI) Exposure in a room 22981 29.5 (25.9-33.0) 22871 30.9 (29.1-32.7) Exposure in a car 22958 18.5 (16.3-20.8) 23026 14.9 (14.0-15.8)
*Tobacco smoke and corresponding use status were based on two products: cigarettes and LCC.

48
Table G. Perceived ease of acquiring e-cigarettes and cigarettes by use status
Overall Never user of the product
Former user of the product
Current user of the product
N % (95% CI) N % (95% CI) N % (95% CI) N % (95% CI) Any of the below 22795 64.2 (62.1-66.3) 15784 56.8 (54.7-58.9) 4547 75.9 (73.6-78.1) 2352 88.5 (86.6-90.5) E-cigarettes 22596 57.3 (54.8-59.8) 15715 48.5 (46.1-50.9) 3928 72.5 (70.3-74.8) 2209 85.4 (82.5-88.4) Cigarettes 22557 48.4 (46.8-50.1) 20162 45.9 (44.4-47.5) 1670 64.8 (61.5-68.1) 375 86.2 (81.6-90.8)

49
REFERENCES 1. U.S. Census Bureau QuickFacts: Los Angeles County, California.
https://www.census.gov/quickfacts/fact/table/losangelescountycalifornia/PST045218. Accessed June 17, 2019.
2. California Department of Education. Enrollment by School�Student & School Data Files (Downloadable). http://www.cde.ca.gov/ds/sd/sd/filesenr.asp. Published May 17, 2016. Accessed October 17, 2016.
3. Choi SK, Baams L, Wilson BDM. LGBTQ Youth in California’s Public Schools: Differences Across the State. Los Angeles, CA: The Williams Institute; 2017.
4. Ajzen I. The theory of planned behavior. Organ Behav Hum Decis Process. 1991;50(2):179-211. doi:10.1016/0749-5978(91)90020-T
5. Pierce JP, Choi WS, Gilpin EA, Farkas AJ, Merritt RK. Validation of susceptibility as a predictor of which adolescents take up smoking in the United States. Health Psychol. 1996;15(5):355-361.
6. Health Effects of Outdoor SHS. Los. http://publichealth.lacounty.gov/tob/pdf/SHS%20Flyer.pdf. Accessed May 10, 2019.
7. Zhu S-H, Cummins S, Zhuang Y, et. al. California Student Tobacco Survey 2015-2016: Results of the Statewide Student Survey, Grades 8, 10, and 12. San Diego, CA: Center for Research and Intervention in Tobacco Control (CRITIC), University of California, San Diego; 2017.
8. McDaniel PA, Smith EA, Malone RE. The tobacco endgame: A qualitative review and synthesis. Tob Control. August 2015:tobaccocontrol-2015-052356. doi:10.1136/tobaccocontrol-2015-052356
9. Zhu S-H, Cummins S, Zhuang Y, et. al. California Student Tobacco Survey 2017-2018: Results of the Statewide Student Survey, Grades 8, 10, and 12. San Diego, CA: Center for Research and Intervention in Tobacco Control (CRITIC), University of California, San Diego; 2019.
10. Zhu S-H, Gamst A, Zhuang Y-L, et al. Technical Report on Analytic Methods and Approaches Used in the California Student Tobacco Survey 2017-2018. San Diego, CA: Center for Research and Intervention in Tobacco Control (CRITIC)
11. Jones N, Bullock J. The Two or More Races Population: 2010. Washington, DC: U.S. Department of Commerce, Economics and Statistics, Administration, U.S. Census Bureau; 2012. https://www.census.gov/prod/cen2010/briefs/c2010br-13.pdf. Accessed May 10, 2019.