Finding citations for PubMed: A large-scale comparison ... - arXiv
23
-1- Finding citations for PubMed: A large-scale comparison between five freely available bibliographic data sources Zhentao Liang 1,2 , Jin Mao 1,2,* , Kun Lu 3 , Gang Li 1,2 Abstract As an important biomedical database, PubMed provides users with free access to abstracts of its documents. However, citations between these documents need to be collected from external data sources. Although previous studies have investigated the coverage of various data sources, the quality of citations is underexplored. In response, this study compares the coverage and citation quality of five freely available data sources on 30 million PubMed documents, including OpenCitations Index of CrossRef open DOI-to-DOI citations (COCI), Dimensions, Microsoft Academic Graph (MAG), National Institutes of Health’s Open Citation Collection (NIH-OCC), and Semantic Scholar Open Research Corpus (S2ORC). Three gold standards and five metrics are introduced to evaluate the correctness and completeness of citations. Our results indicate that Dimensions is the most comprehensive data source that provides references for 62.4% of PubMed documents, outperforming the official NIH-OCC dataset (56.7%). Over 90% of citation links in other data sources can also be found in Dimensions. The coverage of MAG, COCI, and S2ORC is 59.6%, 34.7%, and 23.5%, respectively. Regarding the citation quality, Dimensions and NIH-OCC achieve the best overall results. Almost all data sources have a precision higher than 90%, but their recall is much lower. All databases have better performances on recent publications than earlier ones. Meanwhile, the gaps between different data sources have diminished for the documents published in recent years. This study provides evidence for researchers to choose suitable PubMed citation sources, which is also helpful for evaluating the citation quality of free bibliographic databases. Keywords open citation, PubMed, COCI, Dimensions, Microsoft Academic Graph, NIH-OCC, Semantic Scholar Introduction As an indispensable component of scientific publications, citation allows the author to include relevant studies in his/her own work for various motivations, including acknowledgment, criticism, persuasion, and background reading (Tahamtan and Bornmann 2018). With backward citations (also known as references), one can trace the intellectual bases of academic work (Hammarfelt 2011). On the other hand, the scientific impact and derived studies of this work can also be investigated through its forward citations (Hu et al. 2011). The importance of citation is even more prominent when it comes to the field of bibliometrics. By recording the citation relationship between publications, 1 Center for Studies of Information Resources, Wuhan University, Bayi Road #299, Wuchang District, Wuhan, 430072, Hubei, China 2 School of Information Management, Wuhan University, Bayi Road #299, Wuchang District, Wuhan, 430072, Hubei, China 3 School of Library and Information Studies, University of Oklahoma, Norman, OK 73019, USA * Corresponding author: Jin Mao ([email protected])
-
Upload
khangminh22 -
Category
Documents
-
view
1 -
download
0
Transcript of Finding citations for PubMed: A large-scale comparison ... - arXiv

-1-
Finding citations for PubMed: A large-scale comparison between five freely available bibliographic data sources
Zhentao Liang1,2, Jin Mao1,2,*, Kun Lu3, Gang Li1,2
Abstract
As an important biomedical database, PubMed provides users with free access to abstracts of its
documents. However, citations between these documents need to be collected from external data
sources. Although previous studies have investigated the coverage of various data sources, the
quality of citations is underexplored. In response, this study compares the coverage and citation
quality of five freely available data sources on 30 million PubMed documents, including
OpenCitations Index of CrossRef open DOI-to-DOI citations (COCI), Dimensions, Microsoft
Academic Graph (MAG), National Institutes of Health’s Open Citation Collection (NIH-OCC), and
Semantic Scholar Open Research Corpus (S2ORC). Three gold standards and five metrics are
introduced to evaluate the correctness and completeness of citations. Our results indicate that
Dimensions is the most comprehensive data source that provides references for 62.4% of PubMed
documents, outperforming the official NIH-OCC dataset (56.7%). Over 90% of citation links in
other data sources can also be found in Dimensions. The coverage of MAG, COCI, and S2ORC is
59.6%, 34.7%, and 23.5%, respectively. Regarding the citation quality, Dimensions and NIH-OCC
achieve the best overall results. Almost all data sources have a precision higher than 90%, but their
recall is much lower. All databases have better performances on recent publications than earlier ones.
Meanwhile, the gaps between different data sources have diminished for the documents published
in recent years. This study provides evidence for researchers to choose suitable PubMed citation
sources, which is also helpful for evaluating the citation quality of free bibliographic databases.
Keywords open citation, PubMed, COCI, Dimensions, Microsoft Academic Graph, NIH-OCC,
Semantic Scholar
Introduction
As an indispensable component of scientific publications, citation allows the author to include
relevant studies in his/her own work for various motivations, including acknowledgment, criticism,
persuasion, and background reading (Tahamtan and Bornmann 2018). With backward citations (also
known as references), one can trace the intellectual bases of academic work (Hammarfelt 2011). On
the other hand, the scientific impact and derived studies of this work can also be investigated through
its forward citations (Hu et al. 2011). The importance of citation is even more prominent when it
comes to the field of bibliometrics. By recording the citation relationship between publications,
1 Center for Studies of Information Resources, Wuhan University, Bayi Road #299, Wuchang District,
Wuhan, 430072, Hubei, China 2 School of Information Management, Wuhan University, Bayi Road #299, Wuchang District, Wuhan,
430072, Hubei, China 3 School of Library and Information Studies, University of Oklahoma, Norman, OK 73019, USA
* Corresponding author: Jin Mao ([email protected])

-2-
citation indices (e.g., Science Citation Index and Social Sciences Citation Index) have been
developed and used for document retrieval and analytical purposes. Subsequently, numerous
bibliometric applications have emerged, including research evaluation (Abdul-Majeed et al. 2021;
Hirsch 2005), identification of research front (Small et al. 2014; Wang 2018), and topic evolution
analysis (Chen et al. 2017; Han 2020). These applications serve as valuable tools for researchers
and decision-makers, but they also heavily rely on citation data.
Clarivate’s Web of Science (WoS) and Elsevier’s Scopus are the two most comprehensive
bibliographic databases that provide users with the metadata of hundreds of millions of scientific
publications and citations between these documents. In fact, WoS and Scopus have been the
preferred choices for many bibliometrics studies as they are recognized as authoritative and accurate
data sources (Zhu and Liu 2020). However, both databases are commercial, charging a substantial
cost for the access to their data. Such a paywall impedes researchers without institutional access to
perform analyses on the two platforms. To alleviate this problem, the open access (OA) movement
has been proposed and enacted by organizations and scientists from various disciplines. For instance,
the establishment of PubMed and arXiv enables access to the abstracts and full texts of research
papers free of charge. This results in accelerated scholarly communication as well as increased
exposure of publications (Wang et al. 2015). It is also found that open access may promote the
impact of scientific documents (Koler-Povh et al. 2014).
As one of the most comprehensive life science and biomedical databases, PubMed provides
researchers with free access to the abstracts of its documents. It is an important database for
literature-based discovery and other bibliometric research. During the COVID-19 pandemic,
PubMed plays a critical role in grasping the latest scientific findings and supporting decision making.
A number of studies have been conducted on it to help the fight against COVID-19, including drug
repurposing/discovery (Mohamed et al. 2021), evolutionary path analysis (Ho and Liu 2021), and
topic analysis (Zhang et al. 2021). While the PubMed documents are open to researchers, the citation
relationships are not shipped with them. In other words, citation links between these documents are
still “protected” behind the paywall. This poses a significant challenge to bibliometricians, who
have to augment PubMed with external data sources to continue their citation-based studies (Boyack
et al. 2020; Xu et al. 2020).
To rectify this, scholars urge that citation data should be recognized as a part of the commons that
are freely and legally available for sharing (Shotton 2013). New academic products that involve
citation data have also been developed and open to the public, including Dimensions, Microsoft
Academic Graph (MAG), Semantic Scholar, and PubMed Central (PMC). National Institutes of
Health (NIH) has also launched its official project to construct an open citation collection for
PubMed documents (Ian Hutchins et al. 2019). With such a wide range of free bibliographic data
sources, a critical research problem has emerged: Which is the most suitable free data source for
providing PubMed with citation relationships?
Related studies have been conducted to analyze the differences between academic databases,
primarily focusing on the coverage of documents (Harzing 2016), journals (Singh et al. 2021),
scholars (Harzing and Alakangas 2017), and institutions (Hug and Brändle 2017). However, besides
the coverage, it is also essential to evaluate the correctness and other aspects of the quality of the
databases. Missing and false citations may cause problems in bibliometric practices, especially for
the studies that are sensitive to citation relationships, e.g., main path analysis and link prediction. In

-3-
addition, most previous studies compared databases based on relatively small or biased samples.
They did not take PubMed as a research object, either.
To fill these gaps, we study the quality of citation relationships provided by five freely available
data sources based on the 2020 version of PubMed Baseline4 , which contains over 30 million
publications but most of the citations are not given. The free bibliographic data sources are
compared pairwise and against gold standards (PubMed, Scopus, and WoS) in terms of various
evaluation metrics. Different from previous studies, we avoid selection bias by adopting a complete
set of documents and retrieving their backward citations from each database. In addition to coverage,
we define other metrics to investigate the data quality, including accuracy, precision, and recall.
Through diachronic analyses, our research also shows how citation quality changes over time. Our
study is beneficial to researchers to select the proper free citation sources, especially those without
institutional access. Moreover, this study is primarily based on open datasets, which increases the
reproducibility and validity of our results. The extracted PMID-to-PMID citations in this study are
available on Zenodo5.
This paper is organized as follows. In Related work, we briefly review related work on academic
databases comparison. The data collection, processing, and evaluation methods are described in the
Methodology section, following which, we present the results. In Discussion, we elaborate the
implications, limitations, and future work of this study. Finally, we conclude our research in the
Conclusions.
Related work
To investigate the differences between academic databases, scholars first performed bibliometric
analyses based on small samples of documents. Harzing (2016) compared the publication and
citation coverage of Microsoft Academic Graph, Google Scholar, WoS, and Scopus. The comparison
was based on her 124 publications and forward citations, showing that Google Scholar and
Microsoft Academic Graph had a larger coverage than WoS and Scopus. Later, Harzing and
Alakangas (2017) expanded the sample to the publications authored by 145 scholars from the same
university. The result also confirmed that the two databases not only covered more publications but
also had higher citation counts of these documents. In a similar vein, research of this type starts with
a controlled set of documents, which usually consists of article lists maintained by academics or
institutions, and iteratively searches for these documents as well as their citations in candidate
databases (Bar-Ilan 2010; de Winter et al. 2014; Harzing 2019; Hug et al. 2017; Hug and Brändle
2017). Although these studies have provided insight into the coverage of different data sources, their
analyses were based on small and different sets of documents. Therefore, results may vary when
using other samples, undermining the generality and comparability of the research.
Recently, more studies have focused on larger and more comprehensive sets of articles. Thelwall
(2017) sampled 172,752 articles from 29 large journals for analysis. As he paid special attention to
the disciplinary differences of citation counts, the selected journals covered 26 Scopus broad fields.
Martín-Martín et al. (2018) used 2,515 highly-cited articles displayed in Google Scholar’s Classic
Papers as seed documents. A total of 2,448,055 forward citations of these documents were extracted
from three databases, covering almost all subject areas. In addition to disciplinary differences in
4 ftp://ftp.ncbi.nlm.nih.gov/pubmed/baseline
5 https://doi.org/10.5281/zenodo.5184461

-4-
citation coverage, they also revealed characteristics of unique citations in each database. According
to their results, Google Scholar had a significant advantage in indexing non-journal and non-English
citations. In the follow-up research, they included three more data sources and performed a pairwise
comparison (Martín-Martín et al. 2020). Google Scholar still ranked first in terms of the coverage
of citations, followed by Microsoft Academic Graph. While a larger and systematic sample increases
the validity of these studies, three limitations remain as follows: (1) Samples used in previous
research were biased toward highly-cited, classical articles and those published in large journals. (2)
Most studies focused only on the coverage of databases. Given that citations provided by the
databases may contain errors (Van Eck and Waltman 2017), additional quality measurements are
needed when comparing different data sources. (3) Previous studies mainly collected forward
citations of the seed documents to construct their experimental dataset. This is an effective approach
to enlarge the sample, but the dynamic nature of forward citations also makes it difficult to
investigate the correctness and completeness of data.
Some researchers have realized these limitations and attempted to perform the comparison more
systematically. In particular, the complete lists of documents covered by the databases have been
used to eliminate the selection bias (Mongeon and Paul-Hus 2016; Visser et al. 2021). Special
attention has also been paid to the correctness of citation relationships (Haunschild et al. 2018; Van
Eck and Waltman 2017). The most relevant study of our research is Visser et al.’s work (Visser et
al. 2021) on the large-scale comparison between five databases. They obtained the metadata of all
documents from each dataset and analyzed the coverage in terms of various breakdown criteria,
including publication year, document type, and language. In addition, they studied the overlap of
citations between Scopus and other data sources, from which the reason for incomplete/incorrect
citations was also investigated manually, such as citations towards unpublished documents and the
“secondary version” of documents (preprints or proceedings). However, the main focus was still on
the publication coverage of databases, and limited attention was paid to citations and corresponding
evaluation metrics.
In this study, we investigate the quality of PubMed-to-PubMed citations provided by five free
bibliographic data sources based on the complete set of PubMed documents. We define various
quality measurements, including coverage, accuracy, precision, as well as recall, and compare data
sources against three gold standards. Temporal changes of these quality metrics are also investigated.
Our research provides practical references for selecting the suitable free database to augment the
PubMed dataset. In addition, this study is helpful to the scientists who are interested in performing
bibliometric analyses based on open/freely available data sources, by providing the knowledge of
how accurate the citation links are and how the quality changes through time.
Methodology
Fig. 1 shows the overall framework of our research, which consists of four stages. The first step
is to collect the PubMed Baseline and extract the identifier and metadata of each document. This
results in a baseline dataset, whose citations are retrieved from external databases later. Next,
PubMed-to-PubMed citations are collected from five freely available data sources and matched with
the documents in our baseline. In the third step, a subset of documents is sampled from the baseline
dataset. Their backward citations are retrieved from three authoritative databases, composing the
gold standards used to evaluate the data sources. Finally, we analyze the overlap and correlation
between these databases based on the complete PubMed dataset. Evaluation metrics are also

-5-
developed to measure the data quality against gold standards. In addition, we perform diachronic
analyses to study the temporal changes in the citation quality. It should be noticed that we intend to
investigate the differences in citation quality for documents published in different years, rather than
the longitudinal differences for versions of data sources released at different times. Details of these
stages are described in the following subsections.
Fig. 1. Research framework of citation sources comparison.
Baseline preparation
As we focus on the citation links provided by different data sources, a set of documents without
citation relationships should be defined beforehand. PubMed Baseline is an annual snapshot of
PubMed that offers a complete list and metadata of documents, while the citation relationships of
most of the documents are absent. We downloaded the PubMed 2020 Baseline dataset in October
2020, which contains 30 million PubMed documents published by 2019. The dataset was delivered
in XML format and we extracted the metadata of all documents through Python scripts. The digital
object identifier (DOI) and PubMed ID (PMID) of each document were parsed to match with other
data sources. The major function of the PubMed Baseline is to provide a common platform to
compare different citation sources.
-6-
Collecting and matching citations
In the second step, we collected the backward citations (i.e., the references) of documents in the
baseline from five free bibliographic databases: OpenCitations Index of CrossRef open DOI-to-DOI
citations (COCI), Dimensions, Microsoft Academic Graph (MAG), National Institutes of Health’s
Open Citation Collection (NIH-OCC), and Semantic Scholar’s Open Research Corpus (S2ORC).
We collected references instead of forward citations because the reference list of an article is fixed
after publishment, which makes it easier to examine the correctness and completeness. In addition,
by collecting the references of these documents, their forward citations can also be found within the
dataset. The collecting and matching procedures of each data source are described below.
COCI. COCI contains all the citations that are specified by the open references to DOI-identified
works present in Crossref (Heibi et al. 2019). We downloaded the September 2020 Dump of COCI
from OpenCitations’ official website. It contained 733 million DOI-to-DOI citation links between
59 million publications (OpenCitations, 2020). By matching the DOIs with those in our baseline,
we obtained 258 million referencing relationships of 11 million PubMed documents. During the
peer-review process of this paper, COCI has integrated references from Elsevier in an important
release (OpenCitations, 2021). We measured its performance separately (denoted as COCI.Updated)
to compare it with the previous release.
Dimensions. Dimensions is a database with over 105 million publications and offers no-cost
access to researchers (Herzog et al. 2020). Through the applications programming interface (API),
we retrieved the references of all PubMed documents by their DOIs or PMIDs in November 2020.
The DOIs and PMIDs of the references were provided if available. By matching the DOIs and
PMIDs with those in our baseline, we obtained 509 million referencing relationships of 19 million
PubMed documents.
MAG. As one of the largest academic databases, MAG contains over 240 million publications of
various types (Sinha et al. 2015). We acquired the October 2020 version of MAG and extracted
DOI-to-DOI citation links from it. Although PMIDs were also provided as the second-class attribute
of MAG articles, we found a substantial number of articles were assigned with wrong PMIDs. For
papers without DOIs, we matched them to the PubMed database jointly by the last name of the first
author, International Standard Serial Number (ISSN) of the venue, publication year, volume number,
and the begin page number. A MAG document was matched to a PubMed document only if they
had the same values of all five fields. As a result, we obtained 480 million referencing relationships
of 18 million PubMed documents.
NIH-OCC. To solve the problem that a large number of citations are not open, NIH started to
build its own open citation collection in 2019 (Ian Hutchins et al. 2019). NIH-OCC provides native
PMID-to-PMID citations between PubMed articles. We downloaded the September 2020 version of
NIH-OCC (iCite et al. 2020). By matching the PMIDs with those in our baseline, we obtained 468
million referencing relationships of 17 million PubMed documents.
S2ORC. S2ORC is a general-purpose corpus freely available for researchers. It contains over 136
million publications and 467 million citation relationships between them (Lo et al. 2020). PMIDs
and DOIs are provided if available. We downloaded the July 2020 version of S2ORC and matched
the PMIDs and DOIs with those in our baseline. Finally, we obtained 183 million referencing
relationships of 7 million PubMed documents from S2ORC.

-7-
Gold standard establishment
To evaluate the quality of citation provided by the five data sources, the actual reference lists of
PubMed documents should be obtained as gold standards. We established three gold standards in
this study. The first gold standard consists of citation relationships included in the PubMed Baseline,
which are provided by the publishers or have full-text articles archived in PMC. It contains 174
million references of 5.5 million PubMed publications (~19%). As we focused on finding citations
within the PubMed Baseline, references without PMIDs were dropped. We treated citation
relationships of the first gold standard as the most authentic since they were shipped with the
PubMed Baseline. On the other hand, we also expected that all data sources would achieve better
results on this gold standard as the data may be directly integrated into these data sources.
In addition to the first gold standard, we also collected citation relationships from Scopus and
WoS as our second and third gold standards. We chose Scopus and WoS since they are the most
established bibliographic databases, which allow us to compare freely available data sources against
the commercial veterans. Although the problems of missing and incorrect citations have also been
found in both Scopus and WoS, it is still beneficial to investigate to what extent free data sources
resemble them. We expected that the performance of free data sources would be lower on the second
and third gold standards. However, the performances on the second and third gold standards are
more helpful to judge the overall citation quality of free data sources as they represent a more
general population.
Because we do not have access to the full Scopus and WoS databases, a representative set of
documents was sampled from the PubMed Baseline and their references were collected from the
two databases. This sample consists of 50,000 documents randomly sampled over the last 50 years
(1970-2019), from which 1,000 documents were selected each year. The publication types were
restricted to journal article and review to ensure the existence of references. Publications whose
references are available in the PubMed Baseline are not selected. To collect data from Scopus, we
queried the PMID and DOI of each document in our sample and exported the metadata of their
references in CSV format. The Scopus API was not used because we found that the metadata of
many references was missing, while they were properly supplied through the export function on the
Scopus website. A similar procedure was applied to the WoS Core Collection. WoS allows exporting
all metadata of the documents as well as their references in batches of up to 500.
After collecting data from Scopus and WoS, the references need to be matched with the
documents in the PubMed Baseline. A reference that meets any of the following criteria were
considered a match to the PubMed publication.
(1) Sharing the same PMID or DOI with a document in the PubMed Baseline.
(2) Sharing the same venue, volume, publication year, and start page with a document in the
PubMed Baseline.
(3) Sharing the same title and publication year with only one document in the PubMed Baseline.
Finally, we collected 42,803 (85.6%) documents from Scopus and 977,813 references were
matched in the PubMed Baseline. The figures for WoS were 37,897 (75.8%) documents and 851,521
PubMed references. Documents that were not found in the databases or had no PubMed references
were not included in the two gold standards.

-8-
Citation quality evaluation
As reported by previous research, the problems of missing and incorrect citations exist in various
bibliographical databases (Van Eck and Waltman 2017; Visser et al. 2021). For instance, in the NIH-
OCC dataset, we found document PMID-23487520 published in 2013 was incorrectly reported as
the reference of document PMID-15224180 published in 2004. Similar errors were also found in
the reference lists of the documents PMID-8702918, PMID-12917354, and PMID-15818467.
Therefore, it is necessary to understand the quality of data sources before using them in bibliometric
research. While most of the comparative studies focused only on the coverage, this study also pays
attention to other aspects of the citation quality. We evaluate the correctness and completeness of
citation data provided by different data sources with the metrics below.
Coverage. It measures the proportion of PubMed documents whose references can be found in
the free data source, regardless of the correctness and completeness of references. The coverage
does not count the situation that the metadata of a document can be found but not its references. The
coverage of a data source is calculated as follows:
( )
( )
DB PubMed
DB
PubMed
count doc docCoverage
count doc
= (1)
Precision. It measures the extent to which the references provided by the free data source are
correct, compared with the gold standard. We first calculated the precision of the references on every
single document:
doc
TPPrecision
TP FP=
+ (2)
where TP denotes the references of a document provided by the data source, which are also reported
as true references in the gold standard (i.e., true positive). FP denotes the references provided by
the data source but does not exist in the gold standard (i.e., false positive). The precision of the data
source is calculated as the average of document-level reference precision:
1
1 n
DB doc
doc
Precision Precisionn =
= (3)
It should be noted that only documents covered by the specific data source were included in the
calculation process of precision. Therefore, n equals to the number of covered documents.
Recall. It measures the extent to which the references provided by the free data source are
complete, compared with the gold standard. The recall of the references was first calculated for
every document:
doc
TPRecall
TP FN=
+ (4)
where TP has the same meaning as formula (2). FN denotes the references that are reported as true
references of a document by the gold standard, but the relationships are not found in the free data
source (i.e., false negatives). The recall of the data source is calculated as the average of document-
level reference recall:
1
1 n
DB doc
doc
Recall Recalln =
= (5)
Similarly, only documents covered by the specific data source were included in the calculation
process of recall.

-9-
F1-score. It is a measure of data quality combining both precision and recall. We adopted the
macro version of F1-score of a data source in this study, which is the average document-level F1-
score:
1 2 doc doc
doc
doc doc
Precision RecallF
Precision Recall
=
+ (6)
1
11 1
n
DB doc
doc
F Fn =
= (7)
Accuracy. It measures the proportion of PubMed documents whose references are correctly
provided by the free data source, without the problems of incorrect and missing references (formula
8). Only the documents covered by the specific data source were included in the calculation process
of precision.
( )
( )
correct
DB
DB PubMed
count docAccuracy
count doc doc=
(8)
where doccorrect denotes documents whose reference lists are correctly and completely provided by
the data source. In other words, the F1-scores of these documents equal to 1.
Results
Descriptive statistics
We first present the descriptive statistics of the coverage of five data sources. As Table 1 shows,
Dimensions has the highest coverage that 62.4% of documents in the PubMed 2020 Baseline can
find at least one reference in this data source. NIH-OCC has a lower coverage but the most
references per document, while MAG has a similar coverage but fewer references on average. On
the other hand, the coverage of COCI and S2ORC are substantially lower, so as the average
references. The integration of Elsevier’s references significantly increased the coverage of
COCI.Updated by 50% with the average number of references almost unchanged. By combining
the data from all five databases, 66.9% of PubMed documents can find their references and the
average number of references per document is 27.3. It is worth noting that the coverage presented
in Table 1 is relatively conservative since not all types of PubMed documents should have references.
There are 28,374,243 articles and reviews in the PubMed 2020 Baseline. By taking this number as
the denominator, we obtained the adjusted coverage for each data source (column 4, Table 1).
Table 1 The coverage of five bibliographic data sources on the PubMed Baseline.
Database Publications Coverage Adjusted coverage Referencing relationships*
Avg. references
COCI 10,563,315 34.7% 37.2% 257,638,206 24.4
COCI.Updated 15,349,346 50.5% 54.1% 374,332,023 24.4
Dimensions 18,995,173 62.4% 66.9% 508,742,050 26.8
MAG 18,136,034 59.6% 63.9% 479,947,694 26.5
NIH-OCC 17,248,884 56.7% 60.8% 467,922,262 27.1
S2ORC 7,145,784 23.5% 25.2% 182,653,647 25.6
Combined result** 20,339,956 66.9% 71.7% 555,460,052 27.3
* A distinct referencing relationship is identified between one citing publication and one cited publication.
** Duplicate citing publications and referencing relationships are merged.

-10-
In terms of the change of coverage over time, Dimensions remains the most comprehensive data
source from 1900 to 2019, followed by NIH-OCC (Fig. 2). The coverage of MAG is higher than
NIH-OCC for documents published in 1997-2011 and 2018-2019, while it ranks third in other time
periods. COCI and S2ORC have the lowest coverage during the whole period. The updated version
of COCI has a larger coverage than the September 2020 release since 1945. It even surpasses MAG
after 2018. In addition, an abnormal decrease is observed in the coverage of NIH-OCC and S2ORC
in 2017. As shown in the inset plot, an increasing proportion of PubMed documents can find
references in free data sources. The sudden drop in 1945 is caused by the sharp increase of indexed
PubMed documents.
Fig. 2. The temporal change of coverage of each data source. The black line in the major graph represents
the annual distribution of PubMed documents. The inset plot shows the percentage of PubMed documents
whose references can be found in any one of the five data sources. PubMed documents published before
1900 are not included as their references cannot be found in all data sources.
Overlap analysis
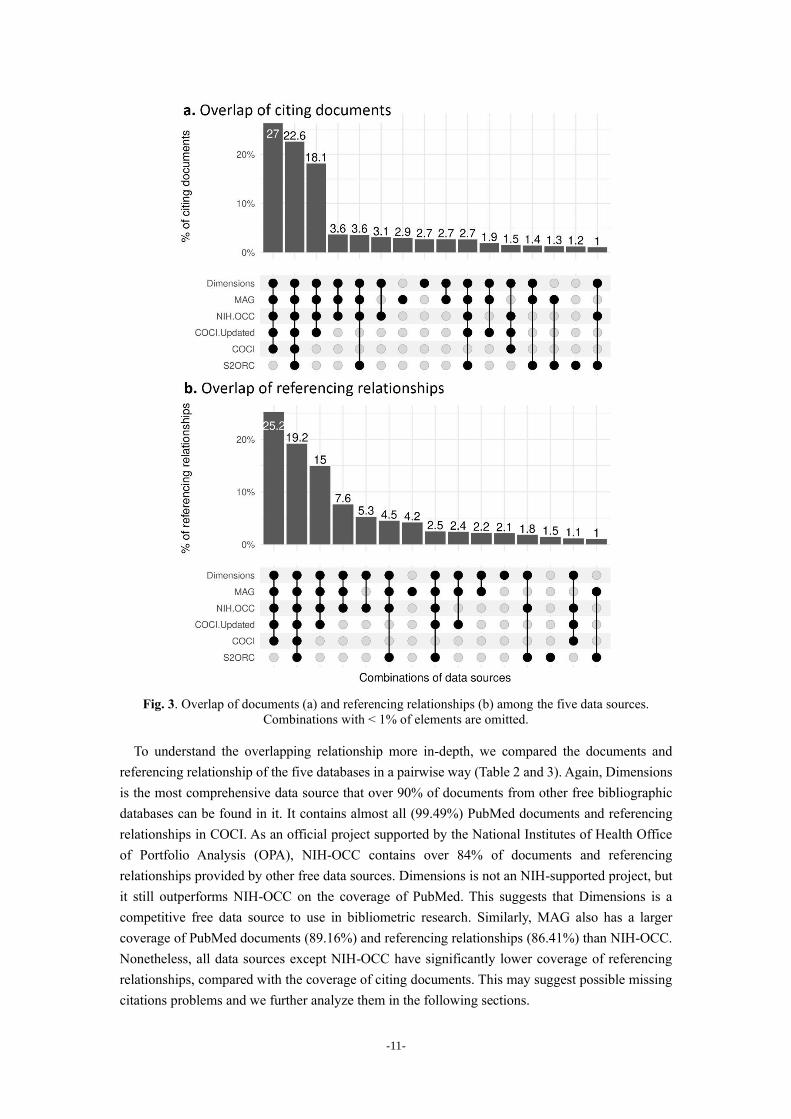
Moreover, we investigated the document-level and referencing-relationship-level overlap among
the five databases (Fig. 3). We used UpSet plots (Lex et al. 2014) to visualize the results, in which
the lower area shows the exclusive combinations of data sources with their sizes in percentage above.
It is shown that 22.6% of the documents and 19.2% of the referencing relationships are shared by
all data sources. MAG possesses the largest number of exclusive documents (2.9%), followed by
Dimensions (2.7%), whereas most of the documents in COCI can also be found in other data sources.
Surprisingly, while S2ORC ranks last in terms of document coverage, it has the third-largest number
of exclusive documents (1.2%). By contrast, though NIH-OCC has the second-largest document
coverage, it has relatively fewer exclusive documents (< 1.0%). Regarding referencing relationships,
the number of exclusive relationships is the largest in MAG (4.2%), followed by Dimensions (2.1%),
S2ORC (1.5%), NIH-OCC (0.5%), and COCI (~0.0%). Documents that can be found in all
databases except S2ORC constitute the largest proportion in Fig 3.a (27.0%). Similar characteristic
exists in the overlap of referencing relationships (Fig 3.b).
-11-
Fig. 3. Overlap of documents (a) and referencing relationships (b) among the five data sources.
Combinations with < 1% of elements are omitted.
To understand the overlapping relationship more in-depth, we compared the documents and
referencing relationship of the five databases in a pairwise way (Table 2 and 3). Again, Dimensions
is the most comprehensive data source that over 90% of documents from other free bibliographic
databases can be found in it. It contains almost all (99.49%) PubMed documents and referencing
relationships in COCI. As an official project supported by the National Institutes of Health Office
of Portfolio Analysis (OPA), NIH-OCC contains over 84% of documents and referencing
relationships provided by other free data sources. Dimensions is not an NIH-supported project, but
it still outperforms NIH-OCC on the coverage of PubMed. This suggests that Dimensions is a
competitive free data source to use in bibliometric research. Similarly, MAG also has a larger
coverage of PubMed documents (89.16%) and referencing relationships (86.41%) than NIH-OCC.
Nonetheless, all data sources except NIH-OCC have significantly lower coverage of referencing
relationships, compared with the coverage of citing documents. This may suggest possible missing
citations problems and we further analyze them in the following sections.

-12-
Table 2 Pairwise document overlap of five data sources. COCI COCI.Updated Dimensions MAG NIH-OCC S2ORC
Overall 51.93% 75.46% 93.39% 89.16% 84.80% 35.13%
COCI 100.00% 99.49% 96.34% 99.46% 44.44%
COCI.Updated 68.82% 99.37% 96.95% 96.35% 34.52%
Dimensions 55.33% 80.30% 90.00% 89.78% 34.64%
MAG 56.11% 82.05% 94.27% 87.82% 36.02%
NIH-OCC 60.91% 85.74% 98.87% 92.34% 36.04%
S2ORC 65.70% 74.16% 92.09% 91.42% 87.00%
Table 3 Pairwise referencing relationships overlap of five data sources. COCI COCI.Updated Dimensions MAG NIH-OCC S2ORC
Overall 46.38% 67.39% 91.59% 86.41% 84.24% 32.88%
COCI 100.00% 99.49% 96.69% 99.30% 42.32%
COCI.Upadted 68.83% 99.08% 96.94% 94.82% 33.37%
Dimensions 50.38% 72.91% 87.48% 90.53% 32.81%
MAG 51.91% 75.61% 92.73% 86.45% 33.34%
NIH-OCC 54.68% 75.85% 98.43% 88.67% 34.09%
S2ORC 59.69% 68.38% 91.37% 87.60% 87.33%
Correlation analysis
We also investigated how similar were citation counts of the cited documents shared by all data
sources. The citation counts were obtained based on the referencing relationships within the same
database. As the citation counts of documents are not normally distributed (Thelwall 2016), the
Spearman correlation was calculated for each pair of data sources (Table 4). The highest correlation
coefficient (0.99) is observed between Dimensions and MAG, as well as between Dimensions and
NIH-OCC. With the lowest coverage, S2ORC presents a relatively low but similar correlation (0.84)
with other databases. All correlation coefficients are above 0.8, suggesting the citation ranks of
publications have high consistency across data sources.
Table 4 Spearman correlation between the five data sources. COCI COCI.Updated Dimensions MAG NIH-OCC S2ORC
COCI 1.00
COCI.Updated 0.96 1.00
Dimensions 0.93 0.97 1.00
MAG 0.92 0.97 0.99 1.00
NIH-OCC 0.94 0.97 0.99 0.98 1.00
S2ORC 0.84 0.82 0.84 0.84 0.84 1.00
Note: 13,390,210 cited documents shared by all data sources were included in the calculation. All correlations are
significant at the 0.01 level (2-tailed).
Quality of the citations
In addition to coverage, overlap, and correlation of citation counts, more evidence is needed to
evaluate the citations provided by the free data sources. One of the most important questions is how
accurate and complete these citation relationships are. The quality of the citations from free data
sources is defined as the extent to which they resemble citations in the gold standards. To this end,
-13-
we established three gold standards and five measurements for evaluation purposes (see the
Methodology section). References provided by free data sources were compared against the true
references in the gold standards. Table 5 presents descriptive statistics of the three gold standards.
The PubMed Baseline gold standard is the largest and has the greatest number of average references
per document. The Scopus and WoS gold standards are smaller and have a similar number of average
references.
Table 5 Descriptive statistics of the gold standards.
Gold standard Publications Referencing relationships* Avg. references
PubMed Baseline 5,512,064 175,958,177 31.9
Scopus 42,803 977,813 22.8
Web of Science 37,897 851,521 22.5
* A distinct referencing relationship is identified by one citing publication and one cited publication.
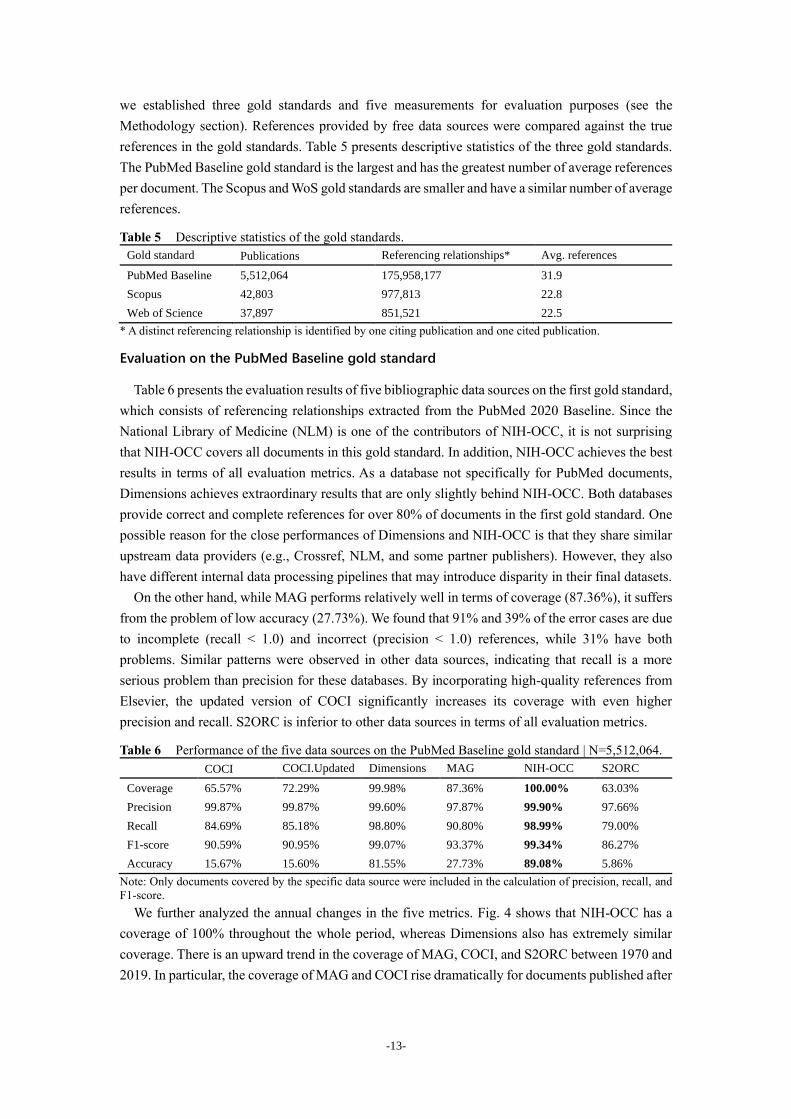
Evaluation on the PubMed Baseline gold standard
Table 6 presents the evaluation results of five bibliographic data sources on the first gold standard,
which consists of referencing relationships extracted from the PubMed 2020 Baseline. Since the
National Library of Medicine (NLM) is one of the contributors of NIH-OCC, it is not surprising
that NIH-OCC covers all documents in this gold standard. In addition, NIH-OCC achieves the best
results in terms of all evaluation metrics. As a database not specifically for PubMed documents,
Dimensions achieves extraordinary results that are only slightly behind NIH-OCC. Both databases
provide correct and complete references for over 80% of documents in the first gold standard. One
possible reason for the close performances of Dimensions and NIH-OCC is that they share similar
upstream data providers (e.g., Crossref, NLM, and some partner publishers). However, they also
have different internal data processing pipelines that may introduce disparity in their final datasets.
On the other hand, while MAG performs relatively well in terms of coverage (87.36%), it suffers
from the problem of low accuracy (27.73%). We found that 91% and 39% of the error cases are due
to incomplete (recall < 1.0) and incorrect (precision < 1.0) references, while 31% have both
problems. Similar patterns were observed in other data sources, indicating that recall is a more
serious problem than precision for these databases. By incorporating high-quality references from
Elsevier, the updated version of COCI significantly increases its coverage with even higher
precision and recall. S2ORC is inferior to other data sources in terms of all evaluation metrics.
Table 6 Performance of the five data sources on the PubMed Baseline gold standard | N=5,512,064. COCI COCI.Updated Dimensions MAG NIH-OCC S2ORC
Coverage 65.57% 72.29% 99.98% 87.36% 100.00% 63.03%
Precision 99.87% 99.87% 99.60% 97.87% 99.90% 97.66%
Recall 84.69% 85.18% 98.80% 90.80% 98.99% 79.00%
F1-score 90.59% 90.95% 99.07% 93.37% 99.34% 86.27%
Accuracy 15.67% 15.60% 81.55% 27.73% 89.08% 5.86%
Note: Only documents covered by the specific data source were included in the calculation of precision, recall, and
F1-score.
We further analyzed the annual changes in the five metrics. Fig. 4 shows that NIH-OCC has a
coverage of 100% throughout the whole period, whereas Dimensions also has extremely similar
coverage. There is an upward trend in the coverage of MAG, COCI, and S2ORC between 1970 and
2019. In particular, the coverage of MAG and COCI rise dramatically for documents published after

-14-
1995 and 2005, respectively. Also, the difference between the updated and previous version of COCI
is most prominent after 2005.
Fig. 5 presents the other four metrics of each data source. It is evident that the performance of
each database increases on recent publications. Among them, NIH-OCC and Dimensions make the
greatest progress in terms of accuracy (Fig. 5a), while the precision of MAG and S2ORC increases
most significantly (Fig. 5c). The performances of two versions of COCI on these metrics are close.
In addition, NIH-OCC and Dimensions have a similar and extraordinary performance during the
whole period, compared with other data sources. The gaps between different data sources diminish
for documents published in recent years.
Fig. 4. Temporal changes in the coverage of different data sources on the PubMed Baseline gold
standard.
Fig. 5. Temporal changes in the accuracy, precision, recall, and F1-score of different data sources on
the PubMed Baseline gold standard.

-15-
Evaluation on the Scopus gold standard
Regarding the Scopus gold standard, all data sources experience a drop in performance, compared
with those on the first gold standard (Table 7). It is reasonable because the references of documents
in this gold standard cannot be exported directly from PubMed. By representing a more general
population of documents, the Scopus gold standard can yield more informative results than the first
gold standard. Intriguingly, Dimensions outperforms NIH-OCC in terms of coverage (90.53% vs.
84.10%), recall (93.85% vs. 93.44%), and accuracy (52.49% vs. 44.70%). The precision (97.70%)
and F1-score (94.78%) of Dimensions are only slightly behind those of NIH-OCC (97.73% and
94.92%). This confirms that Dimensions is a competitive data source for providing citations of
PubMed documents. The updated version of COCI achieves the highest precision performance. In
addition, it is obvious that all data sources have a precision of over 95% but a much lower recall.
MAG has the second largest coverage but lower accuracy due to serious incomplete reference
problem.
Table 7 Performance of the five data sources on the Scopus gold standard | N=42,803. COCI COCI.Updated Dimensions MAG NIH-OCC S2ORC
Coverage 50.59% 80.47% 90.53% 86.87% 84.10% 20.30%
Precision 97.72% 98.05% 97.70% 96.00% 97.73% 95.99%
Recall 80.11% 78.86% 93.85% 86.40% 93.44% 72.56%
F1-score 86.36% 85.88% 94.78% 89.82% 94.92% 80.85%
Accuracy 22.38% 18.87% 52.49% 23.18% 44.70% 6.41%
Note: Only documents covered by the specific data source were included in the calculation of precision, recall, F1-
score.
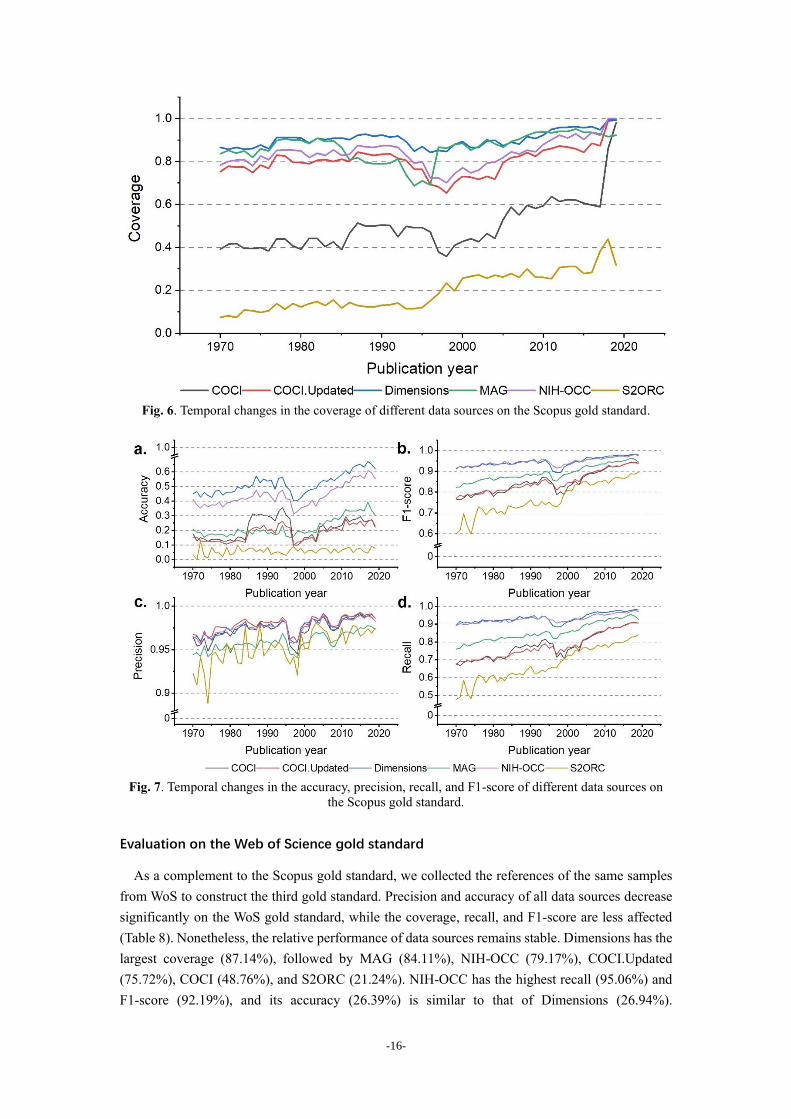
Fig. 6 and 7 demonstrate the temporal performance changes of the free bibliographic databases
on the Scopus gold standard. Dimensions has the largest coverage during the whole period, followed
by MAG and NIH-OCC. The coverage of COCI and S2ORC is much lower. It is worth noting that
the updated version of COCI has a much larger coverage than the previous version throughout this
period, but their gap diminishes significantly after 2018. In general, all data sources cover more
PubMed documents over time, while COCI experienced a sudden rise in 2018. In addition,
Dimensions always provides the most accurate references on the Scopus gold standard, followed by
NIH-OCC (Fig. 7a). It is interesting that COCI provided more accurate references for documents
published between 1985 and 1996, then its accuracy dropped to 10% for those in 1997 and gradually
increased afterward. The precision, recall, and F1-score of all data sources increase on more recent
publications. Dimensions and NIH-OCC achieve similar recall rate and F1-score, so do MAG and
COCI (Fig. 7b and 7d).
-16-
Fig. 6. Temporal changes in the coverage of different data sources on the Scopus gold standard.
Fig. 7. Temporal changes in the accuracy, precision, recall, and F1-score of different data sources on
the Scopus gold standard.
Evaluation on the Web of Science gold standard
As a complement to the Scopus gold standard, we collected the references of the same samples
from WoS to construct the third gold standard. Precision and accuracy of all data sources decrease
significantly on the WoS gold standard, while the coverage, recall, and F1-score are less affected
(Table 8). Nonetheless, the relative performance of data sources remains stable. Dimensions has the
largest coverage (87.14%), followed by MAG (84.11%), NIH-OCC (79.17%), COCI.Updated
(75.72%), COCI (48.76%), and S2ORC (21.24%). NIH-OCC has the highest recall (95.06%) and
F1-score (92.19%), and its accuracy (26.39%) is similar to that of Dimensions (26.94%).

-17-
COCI.Updated provides the most precise (93.44%) references on this gold standard but its coverage
is smaller. S2ORC is still inferior to other data sources in terms of all evaluation metrics.
Table 8 Performance of the five data sources on the WoS gold standard | N=37,897. COCI COCI.Updated Dimensions MAG NIH-OCC S2ORC
Coverage 48.76% 75.72% 87.14% 84.11% 79.17% 21.24%
Precision 92.61% 93.44% 90.87% 90.76% 91.26% 88.96%
Recall 84.04% 82.99% 93.88% 89.42% 95.06% 73.87%
F1-score 86.33% 86.35% 90.78% 88.91% 92.19% 78.97%
Accuracy 18.26% 16.17% 26.94% 17.46% 26.39% 4.81%
Note: Only documents covered by the specific data source were included in the calculation of precision, recall, F1-
score.
With respect to the diachronic changes, the patterns on the WoS gold standard are similar to those
on the Scopus gold standards. The coverage, recall, and F1-score of all data sources increase on
recent publications, and the gaps between data sources become narrower (Fig.8 and 9). Two versions
of COCI outperform other data sources in terms of precision (Fig. 9c). Different from the Scopus
gold standards, the accuracy and precision fluctuate on the WoS gold standard. They even witness
decreases for publications in recent years (Fig. 9a and 9c). By manually analyzing the raw data, we
found that the metadata of unpublished references (in press) is absent from WoS’s export results.
They were merely labeled as “in press” and would not be updated after publishment. This situation
became more common in later years. Moreover, as suggested by a previous study (van Eck &
Waltman, 2017), we also found the problem of incorrect references. WoS might provide incorrect
metadata for references or even totally irrelevant references. Therefore, the experiment on the WoS
gold standard may underestimate the precision of all data sources, which also significantly affects
the accuracy. Nonetheless, the relative performances of databases are still informative. While
Dimension still has the largest coverage during the whole period, NIH-OCC consistently excels
other data sources in terms of recall and F1-score.
Fig. 8. Temporal changes in the coverage of different data sources on the WoS gold standard.

-18-
Fig. 9. Temporal changes in the accuracy, precision, recall, and F1-score of different data sources on
the WoS gold standard.
Discussion
Accessibility of the data sources
The accessibility is yet another major factor to be considered for researchers who decide to
perform large-scale citation analyses based on bibliographic data sources. Data sources that support
bulk download and API access can significantly reduce the burden of data collection. Table 9 lists
some characteristics of the data sources analyzed in this study. Among them, NIH-OCC is the only
data source that does not require an application form and supports bulk download and API (bulk)
access. Access to COCI is also convenient, one can download the latest release of its entire dataset
within an hour. On the other hand, users must submit an application form or even a research proposal
to request access to Dimensions, MAG (the latest version), and S2ORC. This procedure may take
weeks to complete.
It is worth noting that Microsoft delivers the latest version of MAG through the Microsoft Azure
platform and provides computational functions through Azure Databricks, a commercial big data
computing platform. Though applying for MAG is free, it still costs money to store, compute, and
download the dataset. Users may choose archived versions of MAG, which is available on
archive.org at no cost6 . Unfortunately, during the peer-review process of this paper, Microsoft
announced that MAG would be retired by December 31, 2021. At that time, OpenAlex may be a
promising replacement yet to be released7.
6 https://archive.org/search.php?query=creator%3A%22Microsoft+Academic%22 7 https://openalex.org/

-19-
Finally, collecting data from Dimensions is the most time-consuming as it only allows
downloading its data in batches up to 500. Nonetheless, such an effort is worthwhile because both
the coverage and quality of the Dimensions data are satisfying.
Table 9
Accessibility of the data sources. Require application Bulk download API access API bulk access License
COCI No Yes Yes No CC0
Dimensions Yes No Yes Yes, 500 at a time N/A
MAG Yes/No* Yes No No ODC-By
NIH-OCC No Yes Yes Yes, 1000 at a time CC0
S2ORC Yes Yes No No CC BY-NC 2.0
* Application is required to obtain the latest release of MAG, but archived versions are available on archive.org.
While all bibliographic data sources employed in this study are freely available, applying a
dichotomy of “open data” and “non-open data” is still valuable for researchers. According to the
definition of “open” given by Open Knowledge Foundation8, open data should allow “freely use,
modify, and share by anyone for any purpose”. COCI, NIH-OCC, and the archived versions of MAG
can be classified as open data sources as they meet all the above characteristics, indicated by their
data licenses. However, both Dimensions and S2ORC require users to submit applications
beforehand and forbid commercial purposes. Dimensions also restricts the distribution of its data to
any other person. Since not anyone can use the two datasets for any purpose, they cannot be
considered as open.
Comparison with previous studies
Previous studies on comparing databases primarily focus on the coverage. MAG is considered an
excellent alternative for citation analysis as it covers more documents than Scopus and WoS
(Harzing 2016; Harzing and Alakangas 2017; Martín-Martín et al. 2020). According to our results,
although 89.16% of documents in other data sources also exist in MAG, their references suffer from
data incomplete problem. This problem is even more serious in COCI, which is consistent with the
research of Visser et al. (2021). Therefore, caution should be taken when adopting MAG or COCI
alone as the data source. Visser et al. (2021) also pointed out that missing citation links is a
significant problem in Dimensions. However, Dimensions provides high-quality data with large
coverage in our study, both its precision and recall are satisfying. One possible reason is that
documents in PubMed are mostly from biomedical and life science, while Visser et al. (2021)
perform their comparisons based on the entire Scopus and Dimensions database. In addition,
Dimensions is a fast-growing database that continuously expands its coverage (Herzog et al. 2020).
The data incomplete issue may have been greatly alleviated.
Implications
The implications of this research are mostly practical. With an increasing number of freely
available bibliographic databases, researchers may have both interest in and concerns about
8 https://opendefinition.org/

-20-
substituting the expensive commercial databases with the free ones. However, to what extent these
data sources resemble the commercial databases they used to employ should be investigated
beforehand. Our results on the PubMed Baseline show that Dimensions and NIH-OCC are the ideal
data sources to retrieve PubMed-to-PubMed citations at no cost, with high coverage and accuracy.
Researchers can also combine multiple data sources to generate a more comprehensive dataset,
depending on the sensitivity of their studies. For instance, integrating data sources with high
precision but low recall is an effective way to enhance the overall recall without undermining the
precision.
Although we mainly focused on the citations within PubMed, the comparison between different
data sources was performed on a large scale. We also established gold standards based on authentic
data sources and constructed representative samples to investigate the completeness and correctness
of citations. The relative performances of databases are stable across different gold standards.
Therefore, our results can provide valid references for researchers to choose the appropriate free
bibliographic databases for their studies, especially for those based on PubMed documents.
Limitations
This study has several limitations. First, without access to the full data of Scopus and WoS (i.e.,
an in-house version), the referencing relationships in the second and third gold standards were
obtained from the websites of Scopus and WoS. Due to the rate limit, we constructed the Scopus
and WoS gold standards based on random samples of 50,000 documents. The samples are
representative, but the generality can be further improved by using all citation data from Scopus and
WoS. Second, gold standards are not perfect. False positives (incorrect references) and false
negatives (incomplete references) may occur due to the errors in commercial databases and our
conservative matching criteria, respectively. This may lead to underestimation of the data sources’
performance. However, the errors in gold standards are rare and the relative performances of
databases are stable. The results in the current work are still valid.
Conclusions
To conclude, this study aims to help researchers to select appropriate free bibliographic data
sources for citation-based studies on PubMed. We compare five freely available data sources in
terms of their ability to provide high-quality citation data for PubMed documents. Dimensions turns
out to be the most comprehensive data source that provides references for 62.4% of PubMed
documents, outperforming the official NIH-OCC dataset. In addition, over 90% of citation links
provided by other data sources can be found in Dimensions. The correlation between citation counts
of documents in different data sources is strong, suggesting high consistency on citation ranks across
data sources.
The results also show that while the coverage is an important factor in choosing data sources, it
is still necessary to evaluate the correctness and completeness of the citation data. On the one hand,
large coverage does not guarantee high accuracy, e.g., MAG. On the other hand, a data source with
smaller coverage may also have competitive performance, e.g., COCI. Overall, NIH-OCC and
Dimensions achieve the best results. While NIH-OCC performs better on the PubMed documents
preserved by NLM (the first gold standard), Dimensions is still competitive and even outperforms
NIH-OCC on a more general population of PubMed documents. Almost all data sources have a
-21-
precision higher than 90%, but their recall is much lower. All databases have better performances
on recent publications than earlier ones. Meanwhile, the differences in performance of data sources
have diminished for documents published in recent years.
Taking accessibility into consideration, one can obtain a large volume of high-quality citation
data from NIH-OCC with ease and use it for any purpose, while it takes more effort to collect data
from Dimensions. Our results show that both databases provide high-quality referencing
relationships and have a large coverage, which makes them suitable data sources for augmenting
PubMed. It is also beneficial for researchers to combine citations from multiple data sources to build
a more comprehensive dataset.
Acknowledgments This study was partially funded by the National Natural Science Foundation of China
(NSFC) Grant Nos. 71921002 and 71804135. We sincerely thank Dr. Silvio Peroni and anonymous
reviewers for their valuable comments. Zhentao Liang would also like to give special thanks to his
fiancée Lishan Mai and family for their supports throughout the hard times.
References
Abdul-Majeed, G., Mahmood, W., & Namer, N. S. M. (2021). Measuring research performance of
Iraqi universities using Scopus data. Scientometrics, 126(3), 2349–2363.
https://doi.org/10.1007/s11192-021-03866-6
Bar-Ilan, J. (2010). Citations to the “Introduction to informetrics” indexed by WOS, Scopus and
Google Scholar. Scientometrics, 82(3), 495–506. https://doi.org/10.1007/s11192-010-0185-9
Boyack, K. W., Smith, C., & Klavans, R. (2020). A detailed open access model of the PubMed
literature. Scientific Data, 1–16. https://doi.org/10.1038/s41597-020-00749-y
Chen, B., Tsutsui, S., Ding, Y., & Ma, F. (2017). Understanding the topic evolution in a scientific
domain: An exploratory study for the field of information retrieval. Journal of Informetrics,
11(4), 1175–1189. https://doi.org/10.1016/j.joi.2017.10.003
de Winter, J. C. F., Zadpoor, A. A., & Dodou, D. (2014). The expansion of Google Scholar versus Web
of Science: a longitudinal study. Scientometrics, 98(2), 1547–1565.
https://doi.org/10.1007/s11192-013-1089-2
Hammarfelt, B. (2011). Interdisciplinarity and the intellectual base of literature studies: Citation
analysis of highly cited monographs. Scientometrics, 86(3), 705–725.
https://doi.org/10.1007/s11192-010-0314-5
Han, X. (2020). Evolution of research topics in LIS between 1996 and 2019: an analysis based on
latent Dirichlet allocation topic model. Scientometrics, 125(3), 2561–2595.
https://doi.org/10.1007/s11192-020-03721-0
Harzing, A. W. (2016). Microsoft Academic (Search): a Phoenix arisen from the ashes? Scientometrics,
108(3), 1637–1647. https://doi.org/10.1007/s11192-016-2026-y
Harzing, A. W. (2019). Two new kids on the block: How do Crossref and Dimensions compare with
Google Scholar, Microsoft Academic, Scopus and the Web of Science? Scientometrics, 120(1),
341–349. https://doi.org/10.1007/s11192-019-03114-y
Harzing, A. W., & Alakangas, S. (2017). Microsoft Academic: is the phoenix getting wings?
Scientometrics, 110(1), 371–383. https://doi.org/10.1007/s11192-016-2185-x
Haunschild, R., Hug, S. E., Brändle, M. P., & Bornmann, L. (2018). The number of linked references

-22-
of publications in Microsoft Academic in comparison with the Web of Science. Scientometrics,
114(1), 367–370. https://doi.org/10.1007/s11192-017-2567-8
Heibi, I., Peroni, S., & Shotton, D. (2019). Software review: COCI, the OpenCitations Index of
Crossref open DOI-to-DOI citations. Scientometrics, 121(2), 1213–1228.
https://doi.org/10.1007/s11192-019-03217-6
Herzog, C., Hook, D., & Konkiel, S. (2020). Dimensions: Bringing down barriers between
scientometricians and data. Quantitative Science Studies, 1(1), 387–395.
https://doi.org/10.1162/qss_a_00020
Hirsch, J. E. (2005). An index to quantify an individual’s scientific research output. Proceedings of the
National Academy of Sciences of the United States of America, 102(46), 16569–16572.
https://doi.org/10.1073/pnas.0507655102
Ho, M. H. C., & Liu, J. S. (2021). The swift knowledge development path of COVID-19 research: the
first 150 days. Scientometrics, 126(3), 2391–2399. https://doi.org/10.1007/s11192-020-03835-5
Hu, X., Rousseau, R., & Chen, J. (2011). On the definition of forward and backward citation
generations. Journal of Informetrics, 5(1), 27–36. https://doi.org/10.1016/j.joi.2010.07.004
Hug, S. E., & Brändle, M. P. (2017). The coverage of Microsoft Academic: analyzing the publication
output of a university. Scientometrics, 113(3), 1551–1571. https://doi.org/10.1007/s11192-017-
2535-3
Hug, S. E., Ochsner, M., & Brändle, M. P. (2017). Citation analysis with microsoft academic.
Scientometrics, 111(1), 371–378. https://doi.org/10.1007/s11192-017-2247-8
Ian Hutchins, B., Baker, K. L., Davis, M. T., Diwersy, M. A., Haque, E., Harriman, R. M., et al.
(2019). The NIH open citation collection: A public access, broad coverage resource. PLoS
Biology, 17(10), 8–13. https://doi.org/10.1371/journal.pbio.3000385
iCite, Hutchins, B. I., & Santangelo, G.. (2020). iCite Database Snapshots (NIH Open Citation
Collection). https://doi.org/10.35092/yhjc.c.4586573.v10
Koler-Povh, T., Južnič, P., & Turk, G. (2014). Impact of open access on citation of scholarly
publications in the field of civil engineering. Scientometrics, 98(2), 1033–1045.
https://doi.org/10.1007/s11192-013-1101-x
Lex, A., Gehlenborg, N., Strobelt, H., Vuillemot, R., & Pfister, H. (2014). UpSet: Visualization of
intersecting sets. IEEE Transactions on Visualization and Computer Graphics, 20(12), 1983–
1992. https://doi.org/10.1109/TVCG.2014.2346248
Lo, K., Wang, L. L., Neumann, M., Kinney, R., & Weld, D. (2020). S2ORC: The Semantic Scholar
Open Research Corpus, 4969–4983. https://doi.org/10.18653/v1/2020.acl-main.447
Martín-Martín, A., Orduna-Malea, E., Thelwall, M., & Delgado López-Cózar, E. (2018). Google
Scholar, Web of Science, and Scopus: A systematic comparison of citations in 252 subject
categories. Journal of Informetrics, 12(4), 1160–1177. https://doi.org/10.1016/j.joi.2018.09.002
Martín-Martín, A., Thelwall, M., Orduna-Malea, E., & Delgado López-Cózar, E. (2020). Google
Scholar, Microsoft Academic, Scopus, Dimensions, Web of Science, and OpenCitations’ COCI: a
multidisciplinary comparison of coverage via citations. Scientometrics. Springer International
Publishing. https://doi.org/10.1007/s11192-020-03690-4
Mohamed, K., Yazdanpanah, N., Saghazadeh, A., & Rezaei, N. (2021). Computational drug discovery
and repurposing for the treatment of COVID-19: A systematic review. Bioorganic Chemistry,
106(November 2020), 104490. https://doi.org/10.1016/j.bioorg.2020.104490
Mongeon, P., & Paul-Hus, A. (2016). The journal coverage of Web of Science and Scopus: a

-23-
comparative analysis. Scientometrics, 106(1), 213–228. https://doi.org/10.1007/s11192-015-
1765-5
OpenCitations. (2020). COCI, the OpenCitations Index of Crossref open DOI-to-DOI references
(September 2020 Dump). https://doi.org/10.6084/m9.figshare.6741422.v8
OpenCitations. (2021). COCI, the OpenCitations Index of Crossref open DOI-to-DOI references (July
2021 Dump). https://doi.org/10.6084/m9.figshare.6741422.v10
Shotton, D. (2013). Open citations. Nature, 502(7471), 295–297. https://doi.org/10.1038/502295a
Singh, V. K., Singh, P., Karmakar, M., Leta, J., & Mayr, P. (2021). The journal coverage of Web of
Science, Scopus and Dimensions: A comparative analysis. Scientometrics.
https://doi.org/10.1007/s11192-021-03948-5
Sinha, A., Shen, Z., Song, Y., Ma, H., Eide, D., June Hsu, B., & Wang, K. (2015). An overview of
microsoft academic service (MAS) and applications. WWW 2015 Companion - Proceedings of
the 24th International Conference on World Wide Web, 243–246.
https://doi.org/10.1145/2740908.2742839
Small, H., Boyack, K. W., & Klavans, R. (2014). Identifying emerging topics in science and
technology. Research Policy, 43(8), 1450–1467. https://doi.org/10.1016/j.respol.2014.02.005
Tahamtan, I., & Bornmann, L. (2018). Core elements in the process of citing publications: Conceptual
overview of the literature. Journal of Informetrics, 12(1), 203–216.
https://doi.org/10.1016/j.joi.2018.01.002
Thelwall, M. (2016). Interpreting correlations between citation counts and other indicators.
Scientometrics, 108(1), 337–347. https://doi.org/10.1007/s11192-016-1973-7
Thelwall, M. (2017). Microsoft Academic: A multidisciplinary comparison of citation counts with
Scopus and Mendeley for 29 journals. Journal of Informetrics, 11(4), 1201–1212.
https://doi.org/10.1016/j.joi.2017.10.006
Van Eck, N. J., & Waltman, L. (2017). Accuracy of citation data in Web of Science and Scopus. ISSI
2017 - 16th International Conference on Scientometrics and Informetrics, Conference
Proceedings, 1087–1092.
Visser, M., Jan van Eck, N., & Waltman, L. (2021). Large-scale comparison of bibliographic data
sources: Scopus, Web of Science, Dimensions, Crossref, and Microsoft Academic. Quantitative
Science Studies, 2(1), 2641–3337.
Wang, Q. (2018). A bibliometric model for identifying emerging research topics. Journal of the
Association for Information Science and Technology, 69(2), 290–304.
https://doi.org/10.1002/asi.23930
Wang, X., Liu, C., Mao, W., & Fang, Z. (2015). The open access advantage considering citation, article
usage and social media attention. Scientometrics, 103(2), 555–564.
https://doi.org/10.1007/s11192-015-1547-0
Xu, J., Kim, S., Song, M., Jeong, M., Kim, D., Kang, J., et al. (2020). Building a PubMed knowledge
graph. Scientific Data, 7(1), 205. https://doi.org/10.1038/s41597-020-0543-2
Zhang, Y., Cai, X., Fry, C. V., Wu, M., & Wagner, C. S. (2021). Topic evolution, disruption and
resilience in early COVID-19 research. Scientometrics, (0123456789).
https://doi.org/10.1007/s11192-021-03946-7
Zhu, J., & Liu, W. (2020). A tale of two databases: the use of Web of Science and Scopus in academic
papers. Scientometrics, 123(1), 321–335. https://doi.org/10.1007/s11192-020-03387-8