Building Disease-Specific Drug-Protein Connectivity Maps from Molecular Interaction Networks and...
15
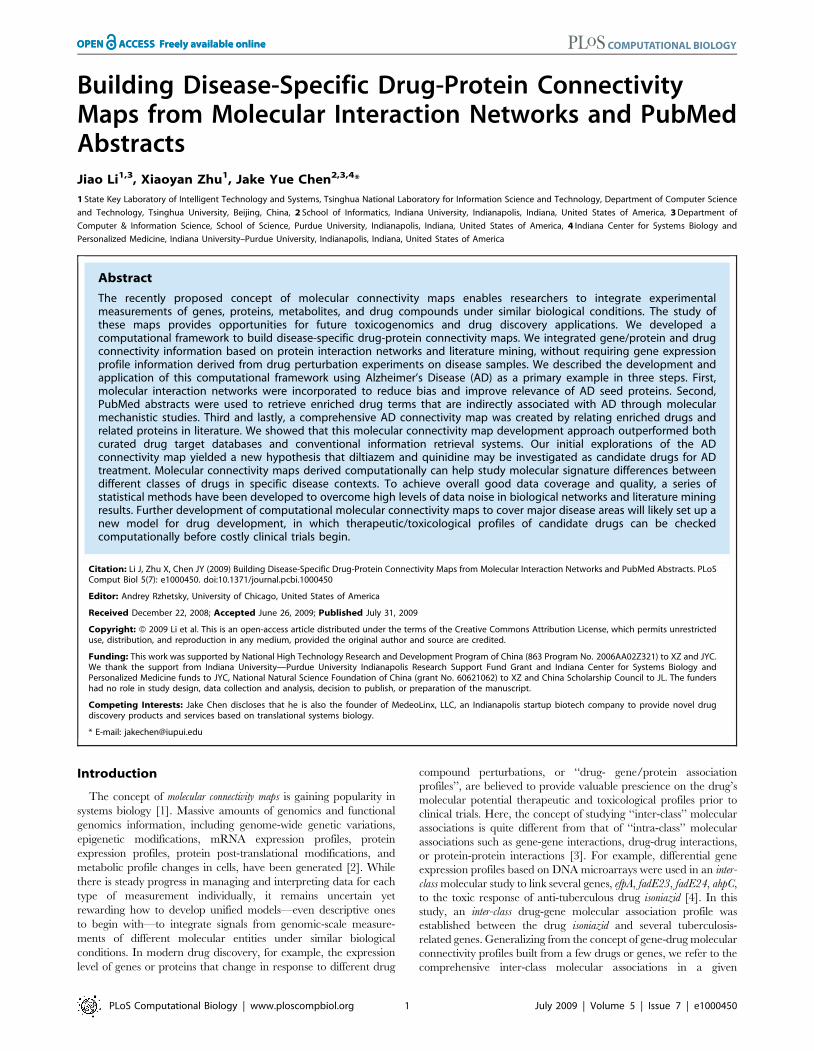
Building Disease-Specific Drug-Protein Connectivity Maps from Molecular Interaction Networks and PubMed Abstracts Jiao Li 1,3 , Xiaoyan Zhu 1 , Jake Yue Chen 2,3,4 * 1 State Key Laboratory of Intelligent Technology and Systems, Tsinghua National Laboratory for Information Science and Technology, Department of Computer Science and Technology, Tsinghua University, Beijing, China, 2 School of Informatics, Indiana University, Indianapolis, Indiana, United States of America, 3 Department of Computer & Information Science, School of Science, Purdue University, Indianapolis, Indiana, United States of America, 4 Indiana Center for Systems Biology and Personalized Medicine, Indiana University–Purdue University, Indianapolis, Indiana, United States of America Abstract The recently proposed concept of molecular connectivity maps enables researchers to integrate experimental measurements of genes, proteins, metabolites, and drug compounds under similar biological conditions. The study of these maps provides opportunities for future toxicogenomics and drug discovery applications. We developed a computational framework to build disease-specific drug-protein connectivity maps. We integrated gene/protein and drug connectivity information based on protein interaction networks and literature mining, without requiring gene expression profile information derived from drug perturbation experiments on disease samples. We described the development and application of this computational framework using Alzheimer’s Disease (AD) as a primary example in three steps. First, molecular interaction networks were incorporated to reduce bias and improve relevance of AD seed proteins. Second, PubMed abstracts were used to retrieve enriched drug terms that are indirectly associated with AD through molecular mechanistic studies. Third and lastly, a comprehensive AD connectivity map was created by relating enriched drugs and related proteins in literature. We showed that this molecular connectivity map development approach outperformed both curated drug target databases and conventional information retrieval systems. Our initial explorations of the AD connectivity map yielded a new hypothesis that diltiazem and quinidine may be investigated as candidate drugs for AD treatment. Molecular connectivity maps derived computationally can help study molecular signature differences between different classes of drugs in specific disease contexts. To achieve overall good data coverage and quality, a series of statistical methods have been developed to overcome high levels of data noise in biological networks and literature mining results. Further development of computational molecular connectivity maps to cover major disease areas will likely set up a new model for drug development, in which therapeutic/toxicological profiles of candidate drugs can be checked computationally before costly clinical trials begin. Citation: Li J, Zhu X, Chen JY (2009) Building Disease-Specific Drug-Protein Connectivity Maps from Molecular Interaction Networks and PubMed Abstracts. PLoS Comput Biol 5(7): e1000450. doi:10.1371/journal.pcbi.1000450 Editor: Andrey Rzhetsky, University of Chicago, United States of America Received December 22, 2008; Accepted June 26, 2009; Published July 31, 2009 Copyright: ß 2009 Li et al. This is an open-access article distributed under the terms of the Creative Commons Attribution License, which permits unrestricted use, distribution, and reproduction in any medium, provided the original author and source are credited. Funding: This work was supported by National High Technology Research and Development Program of China (863 Program No. 2006AA02Z321) to XZ and JYC. We thank the support from Indiana University—Purdue University Indianapolis Research Support Fund Grant and Indiana Center for Systems Biology and Personalized Medicine funds to JYC, National Natural Science Foundation of China (grant No. 60621062) to XZ and China Scholarship Council to JL. The funders had no role in study design, data collection and analysis, decision to publish, or preparation of the manuscript. Competing Interests: Jake Chen discloses that he is also the founder of MedeoLinx, LLC, an Indianapolis startup biotech company to provide novel drug discovery products and services based on translational systems biology. * E-mail: [email protected] Introduction The concept of molecular connectivity maps is gaining popularity in systems biology [1]. Massive amounts of genomics and functional genomics information, including genome-wide genetic variations, epigenetic modifications, mRNA expression profiles, protein expression profiles, protein post-translational modifications, and metabolic profile changes in cells, have been generated [2]. While there is steady progress in managing and interpreting data for each type of measurement individually, it remains uncertain yet rewarding how to develop unified models—even descriptive ones to begin with—to integrate signals from genomic-scale measure- ments of different molecular entities under similar biological conditions. In modern drug discovery, for example, the expression level of genes or proteins that change in response to different drug compound perturbations, or ‘‘drug- gene/protein association profiles’’, are believed to provide valuable prescience on the drug’s molecular potential therapeutic and toxicological profiles prior to clinical trials. Here, the concept of studying ‘‘inter-class’’ molecular associations is quite different from that of ‘‘intra-class’’ molecular associations such as gene-gene interactions, drug-drug interactions, or protein-protein interactions [3]. For example, differential gene expression profiles based on DNA microarrays were used in an inter- class molecular study to link several genes, efpA, fadE23, fadE24, ahpC, to the toxic response of anti-tuberculous drug isoniazid [4]. In this study, an inter-class drug-gene molecular association profile was established between the drug isoniazid and several tuberculosis- related genes. Generalizing from the concept of gene-drug molecular connectivity profiles built from a few drugs or genes, we refer to the comprehensive inter-class molecular associations in a given PLoS Computational Biology | www.ploscompbiol.org 1 July 2009 | Volume 5 | Issue 7 | e1000450
Transcript of Building Disease-Specific Drug-Protein Connectivity Maps from Molecular Interaction Networks and...
Building Disease-Specific Drug-Protein ConnectivityMaps from Molecular Interaction Networks and PubMedAbstractsJiao Li1,3, Xiaoyan Zhu1, Jake Yue Chen2,3,4*
1 State Key Laboratory of Intelligent Technology and Systems, Tsinghua National Laboratory for Information Science and Technology, Department of Computer Science
and Technology, Tsinghua University, Beijing, China, 2 School of Informatics, Indiana University, Indianapolis, Indiana, United States of America, 3 Department of
Computer & Information Science, School of Science, Purdue University, Indianapolis, Indiana, United States of America, 4 Indiana Center for Systems Biology and
Personalized Medicine, Indiana University–Purdue University, Indianapolis, Indiana, United States of America
Abstract
The recently proposed concept of molecular connectivity maps enables researchers to integrate experimentalmeasurements of genes, proteins, metabolites, and drug compounds under similar biological conditions. The study ofthese maps provides opportunities for future toxicogenomics and drug discovery applications. We developed acomputational framework to build disease-specific drug-protein connectivity maps. We integrated gene/protein and drugconnectivity information based on protein interaction networks and literature mining, without requiring gene expressionprofile information derived from drug perturbation experiments on disease samples. We described the development andapplication of this computational framework using Alzheimer’s Disease (AD) as a primary example in three steps. First,molecular interaction networks were incorporated to reduce bias and improve relevance of AD seed proteins. Second,PubMed abstracts were used to retrieve enriched drug terms that are indirectly associated with AD through molecularmechanistic studies. Third and lastly, a comprehensive AD connectivity map was created by relating enriched drugs andrelated proteins in literature. We showed that this molecular connectivity map development approach outperformed bothcurated drug target databases and conventional information retrieval systems. Our initial explorations of the ADconnectivity map yielded a new hypothesis that diltiazem and quinidine may be investigated as candidate drugs for ADtreatment. Molecular connectivity maps derived computationally can help study molecular signature differences betweendifferent classes of drugs in specific disease contexts. To achieve overall good data coverage and quality, a series ofstatistical methods have been developed to overcome high levels of data noise in biological networks and literature miningresults. Further development of computational molecular connectivity maps to cover major disease areas will likely set up anew model for drug development, in which therapeutic/toxicological profiles of candidate drugs can be checkedcomputationally before costly clinical trials begin.
Citation: Li J, Zhu X, Chen JY (2009) Building Disease-Specific Drug-Protein Connectivity Maps from Molecular Interaction Networks and PubMed Abstracts. PLoSComput Biol 5(7): e1000450. doi:10.1371/journal.pcbi.1000450
Editor: Andrey Rzhetsky, University of Chicago, United States of America
Received December 22, 2008; Accepted June 26, 2009; Published July 31, 2009
Copyright: � 2009 Li et al. This is an open-access article distributed under the terms of the Creative Commons Attribution License, which permits unrestricteduse, distribution, and reproduction in any medium, provided the original author and source are credited.
Funding: This work was supported by National High Technology Research and Development Program of China (863 Program No. 2006AA02Z321) to XZ and JYC.We thank the support from Indiana University—Purdue University Indianapolis Research Support Fund Grant and Indiana Center for Systems Biology andPersonalized Medicine funds to JYC, National Natural Science Foundation of China (grant No. 60621062) to XZ and China Scholarship Council to JL. The fundershad no role in study design, data collection and analysis, decision to publish, or preparation of the manuscript.
Competing Interests: Jake Chen discloses that he is also the founder of MedeoLinx, LLC, an Indianapolis startup biotech company to provide novel drugdiscovery products and services based on translational systems biology.
* E-mail: [email protected]
Introduction
The concept of molecular connectivity maps is gaining popularity in
systems biology [1]. Massive amounts of genomics and functional
genomics information, including genome-wide genetic variations,
epigenetic modifications, mRNA expression profiles, protein
expression profiles, protein post-translational modifications, and
metabolic profile changes in cells, have been generated [2]. While
there is steady progress in managing and interpreting data for each
type of measurement individually, it remains uncertain yet
rewarding how to develop unified models—even descriptive ones
to begin with—to integrate signals from genomic-scale measure-
ments of different molecular entities under similar biological
conditions. In modern drug discovery, for example, the expression
level of genes or proteins that change in response to different drug
compound perturbations, or ‘‘drug- gene/protein association
profiles’’, are believed to provide valuable prescience on the drug’s
molecular potential therapeutic and toxicological profiles prior to
clinical trials. Here, the concept of studying ‘‘inter-class’’ molecular
associations is quite different from that of ‘‘intra-class’’ molecular
associations such as gene-gene interactions, drug-drug interactions,
or protein-protein interactions [3]. For example, differential gene
expression profiles based on DNA microarrays were used in an inter-
class molecular study to link several genes, efpA, fadE23, fadE24, ahpC,
to the toxic response of anti-tuberculous drug isoniazid [4]. In this
study, an inter-class drug-gene molecular association profile was
established between the drug isoniazid and several tuberculosis-
related genes. Generalizing from the concept of gene-drug molecular
connectivity profiles built from a few drugs or genes, we refer to the
comprehensive inter-class molecular associations in a given
PLoS Computational Biology | www.ploscompbiol.org 1 July 2009 | Volume 5 | Issue 7 | e1000450
biological context as a molecular connectivity map. Molecular connec-
tivity maps may be developed between drugs and a wide range of
bio-molecular entities such as genes, microRNAs, proteins, and
metabolites for a variety of disease areas. A high-quality molecular
connectivity map can enable researchers to compare the molecular
therapeutic/toxicological profiles of many candidate drugs or drug
target genes/proteins, therefore improving the chance of developing
high-quality drugs and reducing drug development time.
Several large-scale molecular connectivity mapping projects are
currently under way. Lamb et al. recently established a systematic
approach to build connectivity maps using gene-expression profile
information as the common vocabulary that connects small
molecules, genes, and diseases [5]. These connectivity maps
consist of a reference collection of gene-expression profiles from
cultured human cells treated with bioactive small molecules. The
map data also come with pattern-matching software to help
researchers query these maps [1]. Butte et al. proposed a different
strategy, using the UMLS (Unified Medical Language System)
ontology and publically available gene expression data to associate
a broad spectrum of ‘‘vantage points’’—biologically significant
terms used in phenotypic, disease, environmental and experimen-
tal contexts—with genes [6]. While both approaches open up new
opportunities that make it possible to observe molecular
connectivity profiles in parallel, the coverage and quality of these
connectivity maps raise doubts. Lamb et al.’s approach relies on
systematic screening of each known chemical compound against
cell lines simulating each biological condition to derive gene
expression profile changes—a costly and time-consuming exper-
imental process that will take many years and a huge budget
before sufficient data coverage can be achieved for practical use.
The approach by Butte et al. relies heavily on integrating available
gene expression data from different laboratories running different
experimental platforms on different biological samples—some-
times producing incompatible results that require thorough in-
depth experimental validations or knowledge curation.
Is it possible to build high-quality low-cost molecular connec-
tivity maps? To answer this question, one must resort to the vast
amount of biomedical literature and emerging biomedical
literature mining techniques. Recent advances in biomedical
information retrieval [7], gene/protein entity identification [8],
information extraction [9], text clustering and classification [10],
and the integration of structured and textual data [11], have made
it practical to perform knowledge discovery in primary biomedical
literature [12]. There are quite a few successful examples. FACTA
is a biomedical literature search engine for identifying biomedical
concepts (e.g., disease, gene/protein, chemical compounds) from
PubMed abstracts [13]. G2D is a tool for inferring logical chains of
connections from disease names and ranked genes on the basis of a
score that represents their likelihood of being associated with the
query disease [14]. Tiffin et al. identified co-occurring disease
names and tissue names in PubMed abstracts, and linked the
tissues to candidate disease genes [15]. Srinivasan et al. developed a
method to explore implicit relationships between pharmacology
substances and diseases [16]. Given disease names and user-
specified terms, these biomedical literature-mining techniques
were capable of prioritizing terms (e.g., genes, tissues, and
substances etc.) with potential roles in the diseases. It is quite
tempting to conclude that molecular connectivity maps could be
built theoretically by searching, collecting, and ‘‘triangulating’’
disease-gene, disease-drug, and gene-drug term co-occurrences,
using existing literature mining methods. The real challenge,
however, is how to achieve satisfactory sensitivity and specificity
from diseases to drugs, while enabling the discovery of novel
therapeutic applications for known drugs. An approach that reports
only significant associations among protein, drug, and disease
terms co-cited in the same article would be undesirable, because
there would be no new knowledge connections between molecules
and diseases. An approach that either misses many drug entities
(low sensitivity performance) or assigns unrelated drug entities (low
positive predictive value performance) would also be depreciated,
because human experts, not computers, would have to bear a
heavy burden of performing manual knowledge validations.
In this study, we propose a novel computational framework to
develop high-coverage disease-specific drug-protein connectivity
maps, by applying integrated molecular interaction network
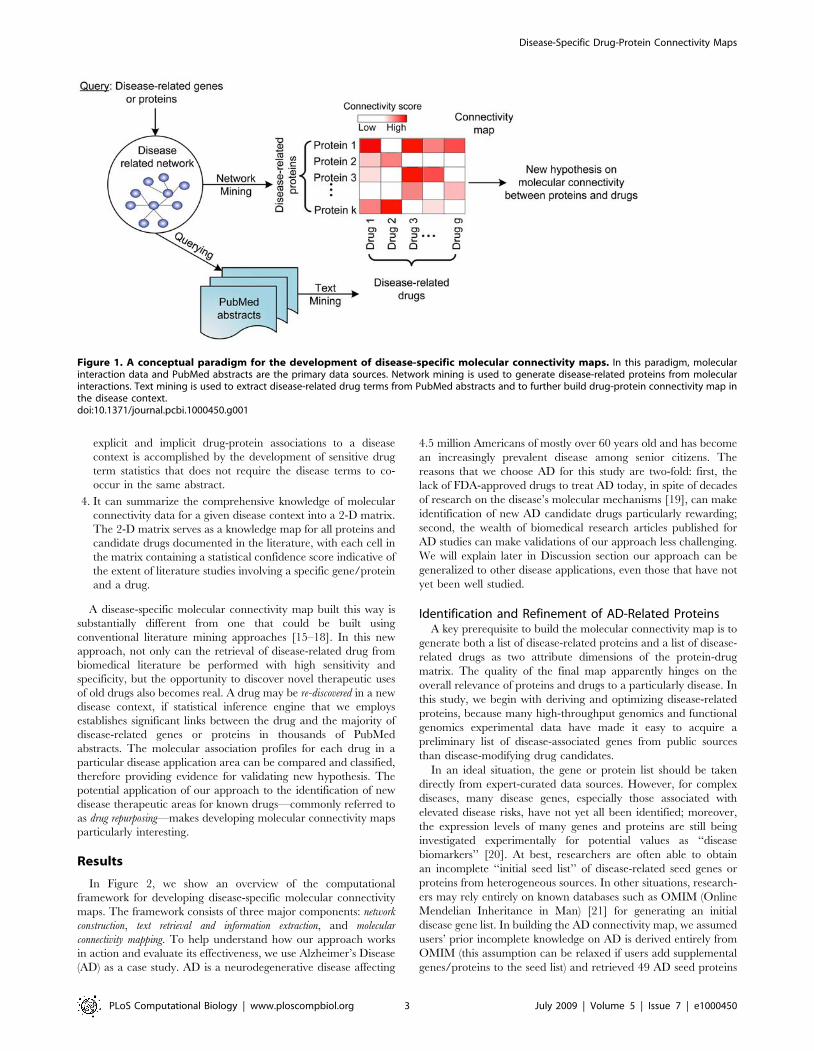
mining and text mining techniques (Figure 1). We aim to uncover
interesting and non-obvious patterns by relating research publi-
cations on genes/proteins, drugs, and disease contexts. The
computational paradigm has the following characteristics:
1. It can incorporate the user input of disease-specific seed genes/
proteins derived from prior knowledge. Each seed list may be
curated by in-house knowledge experts, extracted computa-
tionally from large Omics experimental results (e.g., differen-
tially expressed genes from microarray experiments comparing
genes between disease samples and normal samples), or
retrieved automatically from online curated gene/protein
databases for the given disease. While the quality of seeds
apparently affects the quality of downstream analysis, these
seeds can serve as a starting point and does not need to be
complete or optimized.
2. It can automatically improve the quality of initial seed genes/
proteins list by expanding and re-ranking them in the
functional context by reprioritizing them in disease-related
molecular interaction networks. Therefore, the final list of
genes/proteins used to build connectivity maps will have
heightened relevance to the specific disease context.
3. It can discover drugs implicitly studied across multiple research
papers spanning multiple disciplines. This identification of both
Author Summary
Molecular connectivity maps between drugs and a widerange of bio-molecular entities can help researchers tostudy and compare the molecular therapeutic/toxicolog-ical profiles of many candidate drugs. Recent studies in thisarea have focused on linking drug molecules and genes inspecific disease contexts using drug-perturbed geneexpression experiments, which can be costly and time-consuming to derive. In this paper, we developed acomputational framework to build disease-specific drug-protein connectivity maps, by mining molecular interac-tion networks and PubMed abstracts. Using Alzheimer’sDisease (AD) as a case study, we described how drug-protein molecular connectivity maps can be constructedto overcome data coverage and noise issues inherent inautomatically extracted results. We showed that this newapproach outperformed both curated drug target data-bases and conventional text mining systems in retrievingdisease-related drugs, with an overall balanced perfor-mance of sensitivity, specificity, and positive predictivevalues. The AD molecular connectivity map containednovel information on AD-related genes/proteins, ADcandidate drugs, and protein therapeutic/toxicologicalprofiles of all the AD candidate drugs. Bi-clustering ofthe molecular connectivity map revealed interestingpatterns of functionally similar proteins and drugs,therefore creating new opportunities for future drugdevelopment applications.
Disease-Specific Drug-Protein Connectivity Maps
PLoS Computational Biology | www.ploscompbiol.org 2 July 2009 | Volume 5 | Issue 7 | e1000450
explicit and implicit drug-protein associations to a disease
context is accomplished by the development of sensitive drug
term statistics that does not require the disease terms to co-
occur in the same abstract.
4. It can summarize the comprehensive knowledge of molecular
connectivity data for a given disease context into a 2-D matrix.
The 2-D matrix serves as a knowledge map for all proteins and
candidate drugs documented in the literature, with each cell in
the matrix containing a statistical confidence score indicative of
the extent of literature studies involving a specific gene/protein
and a drug.
A disease-specific molecular connectivity map built this way is
substantially different from one that could be built using
conventional literature mining approaches [15–18]. In this new
approach, not only can the retrieval of disease-related drug from
biomedical literature be performed with high sensitivity and
specificity, but the opportunity to discover novel therapeutic uses
of old drugs also becomes real. A drug may be re-discovered in a new
disease context, if statistical inference engine that we employs
establishes significant links between the drug and the majority of
disease-related genes or proteins in thousands of PubMed
abstracts. The molecular association profiles for each drug in a
particular disease application area can be compared and classified,
therefore providing evidence for validating new hypothesis. The
potential application of our approach to the identification of new
disease therapeutic areas for known drugs—commonly referred to
as drug repurposing—makes developing molecular connectivity maps
particularly interesting.
Results
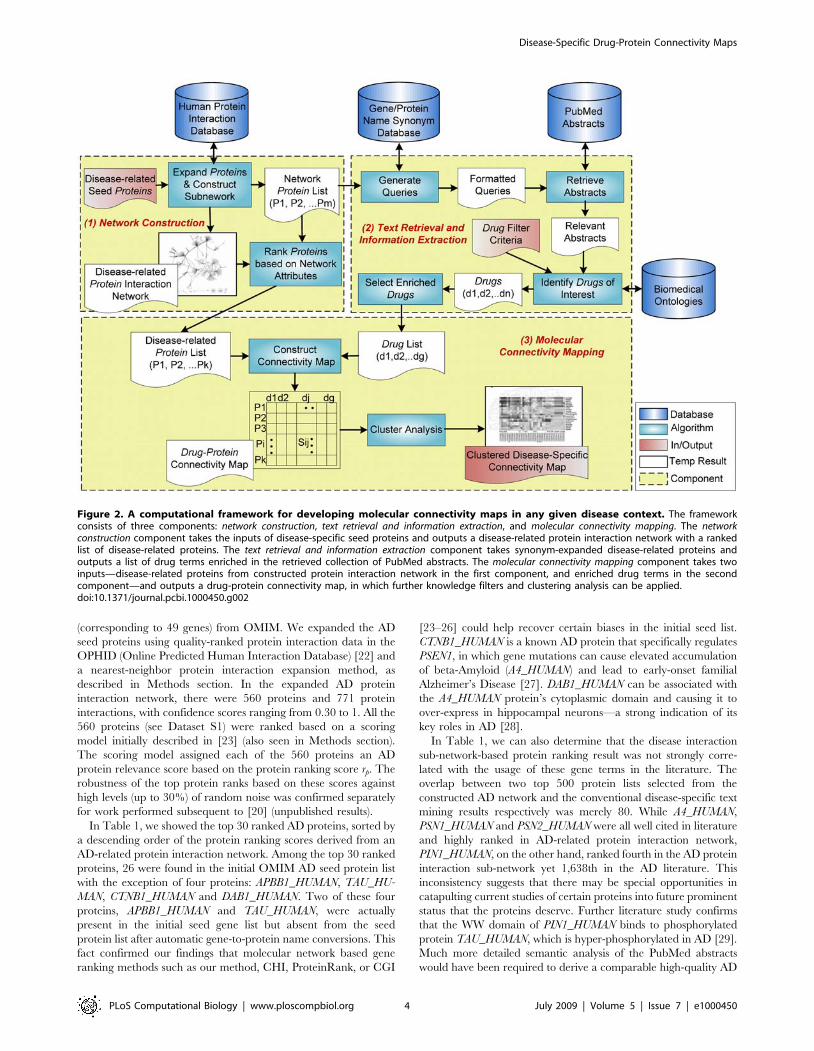
In Figure 2, we show an overview of the computational
framework for developing disease-specific molecular connectivity
maps. The framework consists of three major components: network
construction, text retrieval and information extraction, and molecular
connectivity mapping. To help understand how our approach works
in action and evaluate its effectiveness, we use Alzheimer’s Disease
(AD) as a case study. AD is a neurodegenerative disease affecting
4.5 million Americans of mostly over 60 years old and has become
an increasingly prevalent disease among senior citizens. The
reasons that we choose AD for this study are two-fold: first, the
lack of FDA-approved drugs to treat AD today, in spite of decades
of research on the disease’s molecular mechanisms [19], can make
identification of new AD candidate drugs particularly rewarding;
second, the wealth of biomedical research articles published for
AD studies can make validations of our approach less challenging.
We will explain later in Discussion section our approach can be
generalized to other disease applications, even those that have not
yet been well studied.
Identification and Refinement of AD-Related ProteinsA key prerequisite to build the molecular connectivity map is to
generate both a list of disease-related proteins and a list of disease-
related drugs as two attribute dimensions of the protein-drug
matrix. The quality of the final map apparently hinges on the
overall relevance of proteins and drugs to a particularly disease. In
this study, we begin with deriving and optimizing disease-related
proteins, because many high-throughput genomics and functional
genomics experimental data have made it easy to acquire a
preliminary list of disease-associated genes from public sources
than disease-modifying drug candidates.
In an ideal situation, the gene or protein list should be taken
directly from expert-curated data sources. However, for complex
diseases, many disease genes, especially those associated with
elevated disease risks, have not yet all been identified; moreover,
the expression levels of many genes and proteins are still being
investigated experimentally for potential values as ‘‘disease
biomarkers’’ [20]. At best, researchers are often able to obtain
an incomplete ‘‘initial seed list’’ of disease-related seed genes or
proteins from heterogeneous sources. In other situations, research-
ers may rely entirely on known databases such as OMIM (Online
Mendelian Inheritance in Man) [21] for generating an initial
disease gene list. In building the AD connectivity map, we assumed
users’ prior incomplete knowledge on AD is derived entirely from
OMIM (this assumption can be relaxed if users add supplemental
genes/proteins to the seed list) and retrieved 49 AD seed proteins
Figure 1. A conceptual paradigm for the development of disease-specific molecular connectivity maps. In this paradigm, molecularinteraction data and PubMed abstracts are the primary data sources. Network mining is used to generate disease-related proteins from molecularinteractions. Text mining is used to extract disease-related drug terms from PubMed abstracts and to further build drug-protein connectivity map inthe disease context.doi:10.1371/journal.pcbi.1000450.g001
Disease-Specific Drug-Protein Connectivity Maps
PLoS Computational Biology | www.ploscompbiol.org 3 July 2009 | Volume 5 | Issue 7 | e1000450
(corresponding to 49 genes) from OMIM. We expanded the AD
seed proteins using quality-ranked protein interaction data in the
OPHID (Online Predicted Human Interaction Database) [22] and
a nearest-neighbor protein interaction expansion method, as
described in Methods section. In the expanded AD protein
interaction network, there were 560 proteins and 771 protein
interactions, with confidence scores ranging from 0.30 to 1. All the
560 proteins (see Dataset S1) were ranked based on a scoring
model initially described in [23] (also seen in Methods section).
The scoring model assigned each of the 560 proteins an AD
protein relevance score based on the protein ranking score rp. The
robustness of the top protein ranks based on these scores against
high levels (up to 30%) of random noise was confirmed separately
for work performed subsequent to [20] (unpublished results).
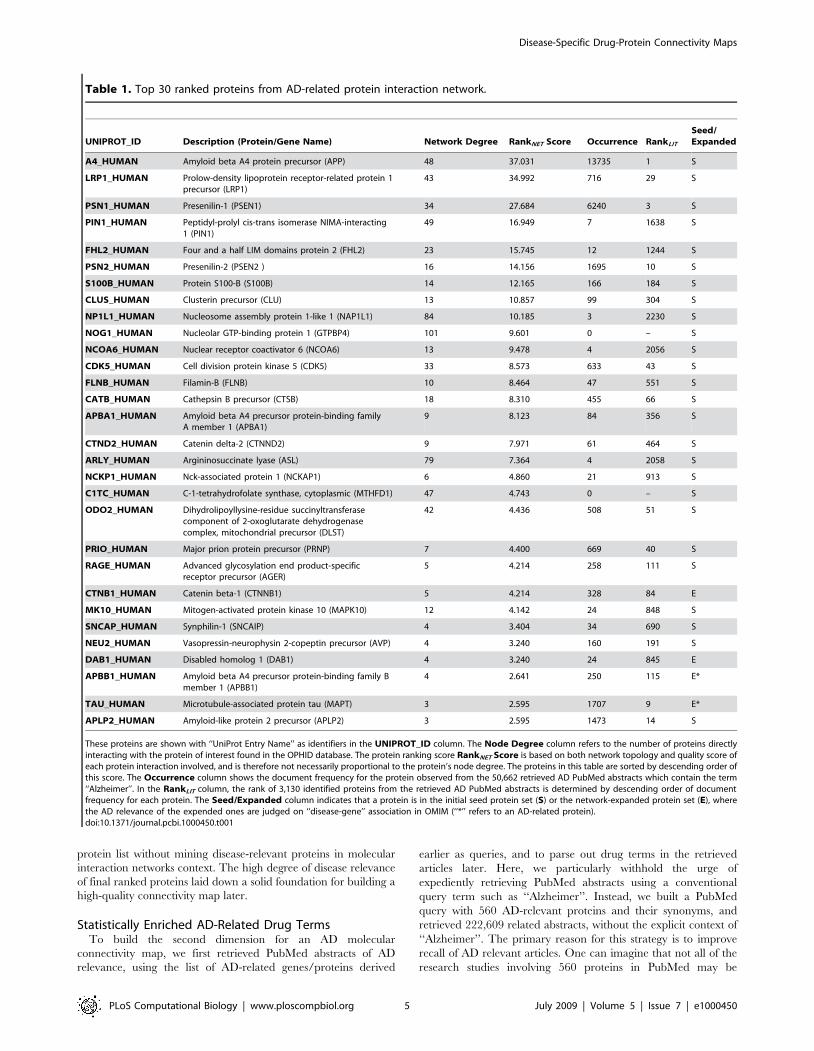
In Table 1, we showed the top 30 ranked AD proteins, sorted by
a descending order of the protein ranking scores derived from an
AD-related protein interaction network. Among the top 30 ranked
proteins, 26 were found in the initial OMIM AD seed protein list
with the exception of four proteins: APBB1_HUMAN, TAU_HU-
MAN, CTNB1_HUMAN and DAB1_HUMAN. Two of these four
proteins, APBB1_HUMAN and TAU_HUMAN, were actually
present in the initial seed gene list but absent from the seed
protein list after automatic gene-to-protein name conversions. This
fact confirmed our findings that molecular network based gene
ranking methods such as our method, CHI, ProteinRank, or CGI
[23–26] could help recover certain biases in the initial seed list.
CTNB1_HUMAN is a known AD protein that specifically regulates
PSEN1, in which gene mutations can cause elevated accumulation
of beta-Amyloid (A4_HUMAN) and lead to early-onset familial
Alzheimer’s Disease [27]. DAB1_HUMAN can be associated with
the A4_HUMAN protein’s cytoplasmic domain and causing it to
over-express in hippocampal neurons—a strong indication of its
key roles in AD [28].
In Table 1, we can also determine that the disease interaction
sub-network-based protein ranking result was not strongly corre-
lated with the usage of these gene terms in the literature. The
overlap between two top 500 protein lists selected from the
constructed AD network and the conventional disease-specific text
mining results respectively was merely 80. While A4_HUMAN,
PSN1_HUMAN and PSN2_HUMAN were all well cited in literature
and highly ranked in AD-related protein interaction network,
PIN1_HUMAN, on the other hand, ranked fourth in the AD protein
interaction sub-network yet 1,638th in the AD literature. This
inconsistency suggests that there may be special opportunities in
catapulting current studies of certain proteins into future prominent
status that the proteins deserve. Further literature study confirms
that the WW domain of PIN1_HUMAN binds to phosphorylated
protein TAU_HUMAN, which is hyper-phosphorylated in AD [29].
Much more detailed semantic analysis of the PubMed abstracts
would have been required to derive a comparable high-quality AD
Figure 2. A computational framework for developing molecular connectivity maps in any given disease context. The frameworkconsists of three components: network construction, text retrieval and information extraction, and molecular connectivity mapping. The networkconstruction component takes the inputs of disease-specific seed proteins and outputs a disease-related protein interaction network with a rankedlist of disease-related proteins. The text retrieval and information extraction component takes synonym-expanded disease-related proteins andoutputs a list of drug terms enriched in the retrieved collection of PubMed abstracts. The molecular connectivity mapping component takes twoinputs—disease-related proteins from constructed protein interaction network in the first component, and enriched drug terms in the secondcomponent—and outputs a drug-protein connectivity map, in which further knowledge filters and clustering analysis can be applied.doi:10.1371/journal.pcbi.1000450.g002
Disease-Specific Drug-Protein Connectivity Maps
PLoS Computational Biology | www.ploscompbiol.org 4 July 2009 | Volume 5 | Issue 7 | e1000450
protein list without mining disease-relevant proteins in molecular
interaction networks context. The high degree of disease relevance
of final ranked proteins laid down a solid foundation for building a
high-quality connectivity map later.
Statistically Enriched AD-Related Drug TermsTo build the second dimension for an AD molecular
connectivity map, we first retrieved PubMed abstracts of AD
relevance, using the list of AD-related genes/proteins derived
earlier as queries, and to parse out drug terms in the retrieved
articles later. Here, we particularly withhold the urge of
expediently retrieving PubMed abstracts using a conventional
query term such as ‘‘Alzheimer’’. Instead, we built a PubMed
query with 560 AD-relevant proteins and their synonyms, and
retrieved 222,609 related abstracts, without the explicit context of
‘‘Alzheimer’’. The primary reason for this strategy is to improve
recall of AD relevant articles. One can imagine that not all of the
research studies involving 560 proteins in PubMed may be
Table 1. Top 30 ranked proteins from AD-related protein interaction network.
UNIPROT_ID Description (Protein/Gene Name) Network Degree RankNET Score Occurrence RankLIT
Seed/Expanded
A4_HUMAN Amyloid beta A4 protein precursor (APP) 48 37.031 13735 1 S
LRP1_HUMAN Prolow-density lipoprotein receptor-related protein 1precursor (LRP1)
43 34.992 716 29 S
PSN1_HUMAN Presenilin-1 (PSEN1) 34 27.684 6240 3 S
PIN1_HUMAN Peptidyl-prolyl cis-trans isomerase NIMA-interacting1 (PIN1)
49 16.949 7 1638 S
FHL2_HUMAN Four and a half LIM domains protein 2 (FHL2) 23 15.745 12 1244 S
PSN2_HUMAN Presenilin-2 (PSEN2 ) 16 14.156 1695 10 S
S100B_HUMAN Protein S100-B (S100B) 14 12.165 166 184 S
CLUS_HUMAN Clusterin precursor (CLU) 13 10.857 99 304 S
NP1L1_HUMAN Nucleosome assembly protein 1-like 1 (NAP1L1) 84 10.185 3 2230 S
NOG1_HUMAN Nucleolar GTP-binding protein 1 (GTPBP4) 101 9.601 0 – S
NCOA6_HUMAN Nuclear receptor coactivator 6 (NCOA6) 13 9.478 4 2056 S
CDK5_HUMAN Cell division protein kinase 5 (CDK5) 33 8.573 633 43 S
FLNB_HUMAN Filamin-B (FLNB) 10 8.464 47 551 S
CATB_HUMAN Cathepsin B precursor (CTSB) 18 8.310 455 66 S
APBA1_HUMAN Amyloid beta A4 precursor protein-binding familyA member 1 (APBA1)
9 8.123 84 356 S
CTND2_HUMAN Catenin delta-2 (CTNND2) 9 7.971 61 464 S
ARLY_HUMAN Argininosuccinate lyase (ASL) 79 7.364 4 2058 S
NCKP1_HUMAN Nck-associated protein 1 (NCKAP1) 6 4.860 21 913 S
C1TC_HUMAN C-1-tetrahydrofolate synthase, cytoplasmic (MTHFD1) 47 4.743 0 – S
ODO2_HUMAN Dihydrolipoyllysine-residue succinyltransferasecomponent of 2-oxoglutarate dehydrogenasecomplex, mitochondrial precursor (DLST)
42 4.436 508 51 S
PRIO_HUMAN Major prion protein precursor (PRNP) 7 4.400 669 40 S
RAGE_HUMAN Advanced glycosylation end product-specificreceptor precursor (AGER)
5 4.214 258 111 S
CTNB1_HUMAN Catenin beta-1 (CTNNB1) 5 4.214 328 84 E
MK10_HUMAN Mitogen-activated protein kinase 10 (MAPK10) 12 4.142 24 848 S
SNCAP_HUMAN Synphilin-1 (SNCAIP) 4 3.404 34 690 S
NEU2_HUMAN Vasopressin-neurophysin 2-copeptin precursor (AVP) 4 3.240 160 191 S
DAB1_HUMAN Disabled homolog 1 (DAB1) 4 3.240 24 845 E
APBB1_HUMAN Amyloid beta A4 precursor protein-binding family Bmember 1 (APBB1)
4 2.641 250 115 E*
TAU_HUMAN Microtubule-associated protein tau (MAPT) 3 2.595 1707 9 E*
APLP2_HUMAN Amyloid-like protein 2 precursor (APLP2) 3 2.595 1473 14 S
These proteins are shown with ‘‘UniProt Entry Name’’ as identifiers in the UNIPROT_ID column. The Node Degree column refers to the number of proteins directlyinteracting with the protein of interest found in the OPHID database. The protein ranking score RankNET Score is based on both network topology and quality score ofeach protein interaction involved, and is therefore not necessarily proportional to the protein’s node degree. The proteins in this table are sorted by descending order ofthis score. The Occurrence column shows the document frequency for the protein observed from the 50,662 retrieved AD PubMed abstracts which contain the term‘‘Alzheimer’’. In the RankLIT column, the rank of 3,130 identified proteins from the retrieved AD PubMed abstracts is determined by descending order of documentfrequency for each protein. The Seed/Expanded column indicates that a protein is in the initial seed protein set (S) or the network-expanded protein set (E), wherethe AD relevance of the expended ones are judged on ‘‘disease-gene’’ association in OMIM (‘‘*’’ refers to an AD-related protein).doi:10.1371/journal.pcbi.1000450.t001
Disease-Specific Drug-Protein Connectivity Maps
PLoS Computational Biology | www.ploscompbiol.org 5 July 2009 | Volume 5 | Issue 7 | e1000450
performed in the AD disease context—or in any disease context at
all. For example, a biochemical study of a drug compound’s effect
on gene expressions would not involve any mention of AD,
particularly not so in PubMed abstracts. Retrieving abstracts in
any contexts based on these AD-related proteins to build an initial
corpus was demonstrated to be a preferred method in improving
recall of information retrieval. The recall performance was at
approximately 81% (refer to Text S1 for details).
While we could build a database of all current experimental
drugs and approved drugs for AD, this database would be of
marginal interest to researchers focusing on novel drug discovery.
Therefore, we concentrated on first identifying drug terms that are
significantly ‘‘enriched’’ in the AD-related literature collection, as
compared with the overall PubMed. In the 16,120,074 PubMed
abstracts, there are 6,543 ‘‘drug chemicals’’ organized in a
hierarchical structure, according to provided MeSH term
annotations. In the 222,609 AD related PubMed abstracts
retrieved from 560 AD-related proteins, 2,019 drugs remained
(see Dataset S2 for a list), 1,279 of which were determined to be
‘‘enriched’’—the outcome of passing a statistical term enrichment
test below the pre-set filter of false discovery rate (FDR) (refer to
Methods for details). Again, the associations of these significant
drug terms to the ‘‘Alzheimer’’ disease context were made without
the explicit term co-occurrence requirement for ‘‘Alzheimer’’ as a
query term, or for particular AD genes or proteins in the same
abstract. These 1,279 drugs, therefore, may constitute new
knowledge worth investigation and incorporation into the AD
connectivity map later.
Assessment of Novel AD Drug IdentifiedTo estimate how the first stage (the network construction
component) affected the second stage (the text retrieval and information
extraction component), we evaluated the performance of AD-related
drug identification by changing the input of AD seed proteins.
Given different sets of the initial seed proteins, we calculated
sensitivity and specificity at top N drugs determined by FDR (refer
to Methods section). In summary, we sub-sampled 49 AD seed
proteins into 8 data sets of varying sizes i.e., S5, S10, S15, S20,
S25, S30, S35, S40 (the number indicating size) and also generated
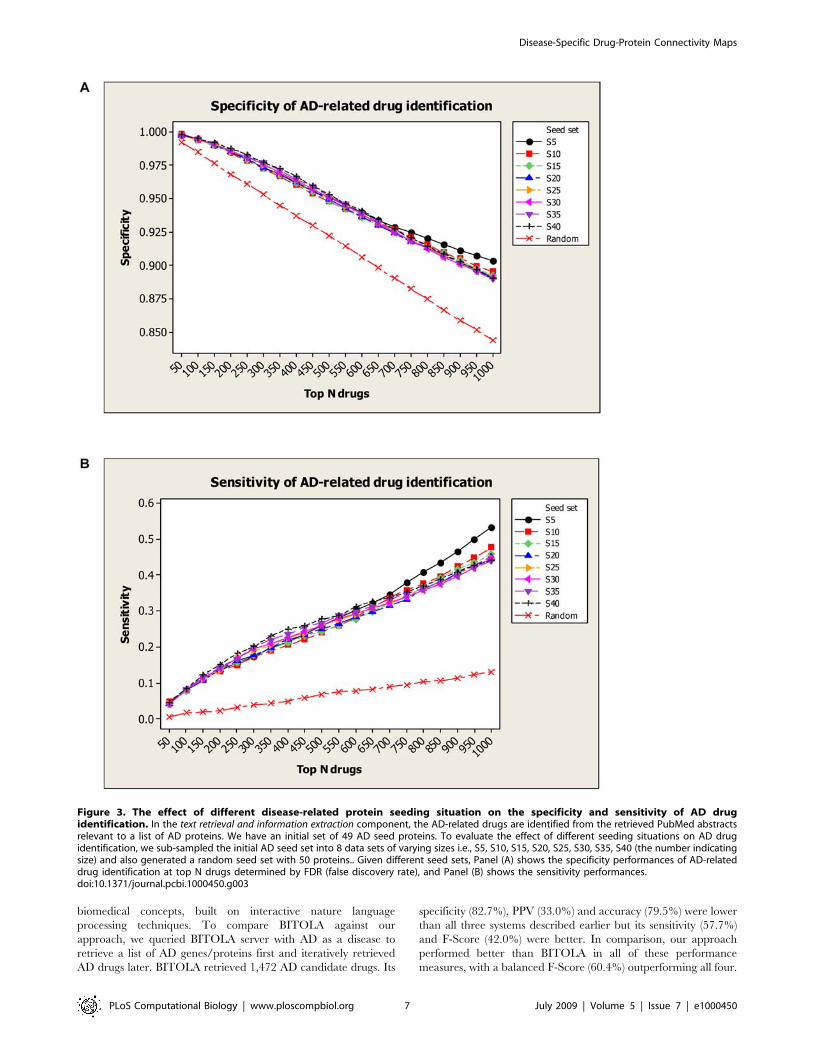
a random seed set with 50 proteins. As shown in Figure 3, the
overall specificity and sensitivity are robustly maintained while the
seed set changed from S5 to S40 (overall specificity vari-
ance,0.000021 and sensitivity variance,0.00098). The random
seed performance was distinctly lower than any seeding strategies
experimented. This shows that potential bias in selecting seed
proteins did not significantly affect drug identifications. We
attribute this success to the molecular interaction network
approach used.
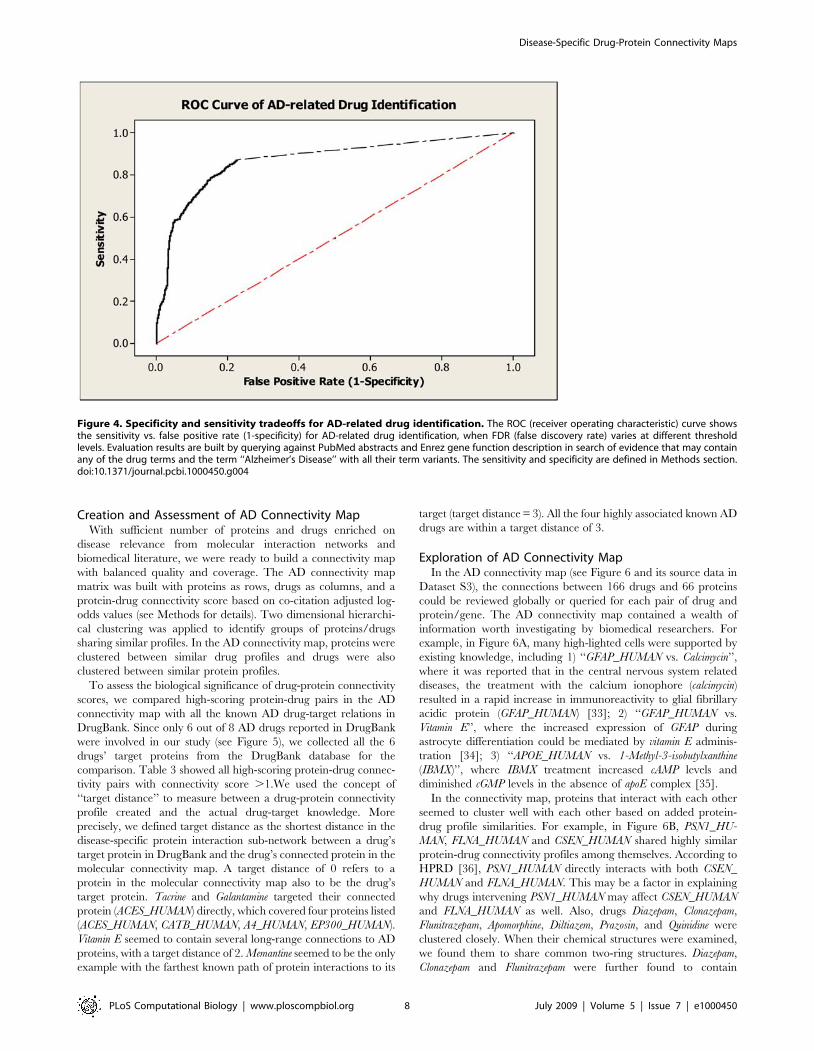
We evaluated the overall performance of our drug enrichment
method using a Receiver Operating Characteristic (ROC) curve
(Figure 4). We used the 49 AD seed proteins as the initial input,
and calculated sensitivity and specificity tradeoffs by varying
different FDR thresholds over the entire 2,019 identified drugs
against a ‘‘gold standard’’ of AD drugs (see Methods for details).
The best sensitivity was seen at 87.2% based on the result. When
we set FDR threshold at 0.05, the system achieved an overall
sensitivity of 76.0% and a specificity of 88.8%. This confirmed our
literature mining approach to be satisfactory for practical use.
Then, we investigated the 1,279 AD-related drugs in detail. At
FDR,0.05, 50.1% of 1,279 drugs can be found also in the 843
‘‘positive’’ AD drugs of the ‘‘gold standard’’; therefore, the positive
predictive value (PPV) of the drug enrichment test was 50.1%.
Compared to the general prevalence (843/6,543 = 12.8%) of AD
drugs, the AD drug enrichment method was able to enrich AD-
related drugs almost fourfold (50.1%/12.8% = 3.91). We believe
the 46 enrichment and 50.1% PPV were conservative estimates,
because the construction of ‘‘gold standard’’ AD drugs did not take
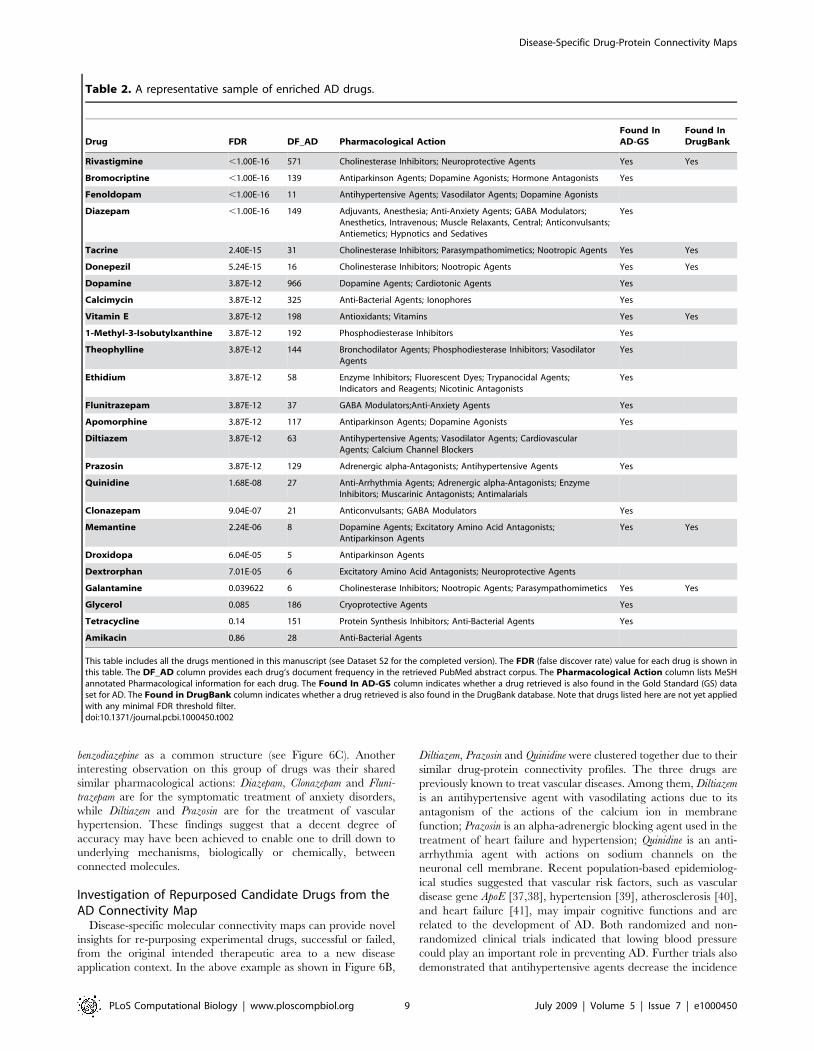
into account potentially novel AD drugs. In Table 2, we listed 25
representative drugs from the total collection of 2,019 drugs found
in 222,609 AD-related PubMed abstracts. Among the tabulated 22
drugs with FDR,0.05, 17 were confirmed to be AD-related
determined by us reading literature. Among the 17 drugs,
Rivastigmine, Tacrine, Donepezil, Vitamin E, Memantine, and Galantamine
are approved drugs for AD treatment in DrugBank [30]. Some
enriched drugs are predominantly known for other disease
treatments, such as Fenoldopam is a vasodilator that may reduce
blood pressure in hypertension and decrease both regional and
global cerebral blood flow; Droxidopa is a precursor of noradren-
aline, which is used in the treatment of Parkinson and Familial
Amyloidotic Polyneuropathy—both related to AD. About the
repurposed drug investigation, it was separately discussed in the
subsequent subsection. The last two examples showed that novel
AD drug candidates may be derived by our method by automated
implicit knowledge transfer from disorders with symptoms closely
related to AD. We also observed that drugs occurring more
frequently in the retrieved PubMed abstracts yet with high FDR
values are indeed not specific to AD, for example, Glycerol
(Cryoprotective Agents; DF_AD = 185) and Tetracycline (Protein
Synthesis Inhibitors; Anti-Bacterial Agents; DF_AD = 151). Al-
though both are highly mentioned in the AD-related articles as
common chemicals used to process biological samples, they are
filtered out of our enriched drug list for further AD connectivity
maps construction.
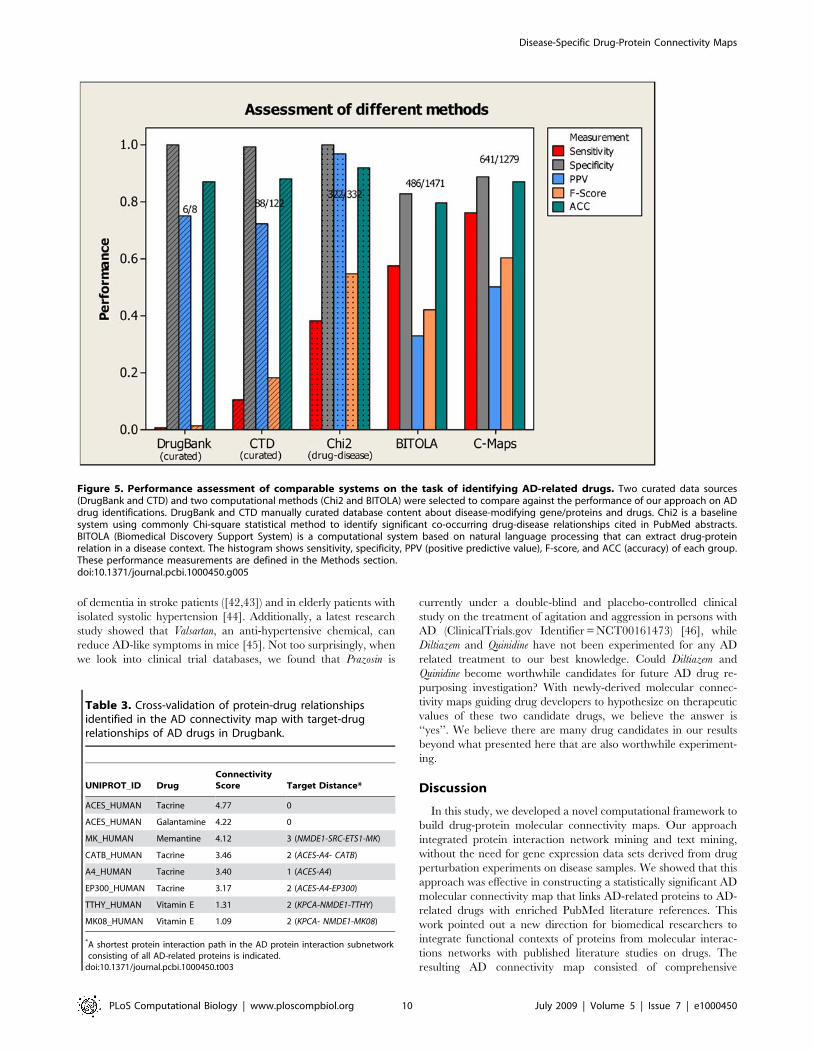
Lastly, we compared the performance of several related systems,
which also aims to provide information mapping diseases, drugs,
and genes/proteins, and showed this result in Figure 5. The four
systems that we compared includes: DrugBank [30], CTD (the
Comparative Toxicogenomics Database) [31], a baseline system
using the common Chi-square (x2) method [32], and BITOLA
(Biomedical Discovery Support System) [17]. DrugBank is a
manually annotated resource that combines detailed drug data
with drug target information such as protein sequence, structure
and pathway. It includes FDA approved small molecule, biotech
(peptide or protein), nutraceutical, withdrawn, illicit, and exper-
imental drugs. Only eight AD drugs were reported in the
DrugBank database. Since it only contains known drugs currently
approved or experimented for a disease, its specificity (,100%)
and PPV (75%) were understandably better than ours. However,
since Drugbank does not contain candidate drug information, its
sensitivity (0.7%) and F-Score (1.4%) were extremely low. Similar
to Drugbank, CTD is a manually curated data resource that
includes cross-species chemical-gene/protein interactions, chemi-
cal-to-disease relationships, and gene-to-disease relationships.
Since it also only contains known therapeutic drug information,
its high specificity (99%) and PPV (72%) were also accompanied
by low sensitivity (10.4%) and F-Score (18.2%). Commonly
designed baseline text mining systems using standard Chi-square
statistic can also offer a measure of significant drug-disease
association explicitly stated in PubMed abstracts. Applying a
threshold (p-value,0.05) in Chi-square test, we could derive 332
AD candidate drugs. Since these drugs are already co-cited with
AD, its specificity (,100%) and PPV (,100%) were understand-
ably high (and included as part of the gold standard), however,
many potentially novel drugs would also be missed as a result of
meeting the disease-drug co-currence requirement, causing such
systems to suffer badly in sensitivity as compared to our method
(38% Chi-square vs. 76% ours). BITOLA is an advanced system
that can automatically extract semantic relations between
Disease-Specific Drug-Protein Connectivity Maps
PLoS Computational Biology | www.ploscompbiol.org 6 July 2009 | Volume 5 | Issue 7 | e1000450
biomedical concepts, built on interactive nature language
processing techniques. To compare BITOLA against our
approach, we queried BITOLA server with AD as a disease to
retrieve a list of AD genes/proteins first and iteratively retrieved
AD drugs later. BITOLA retrieved 1,472 AD candidate drugs. Its
specificity (82.7%), PPV (33.0%) and accuracy (79.5%) were lower
than all three systems described earlier but its sensitivity (57.7%)
and F-Score (42.0%) were better. In comparison, our approach
performed better than BITOLA in all of these performance
measures, with a balanced F-Score (60.4%) outperforming all four.
Figure 3. The effect of different disease-related protein seeding situation on the specificity and sensitivity of AD drugidentification. In the text retrieval and information extraction component, the AD-related drugs are identified from the retrieved PubMed abstractsrelevant to a list of AD proteins. We have an initial set of 49 AD seed proteins. To evaluate the effect of different seeding situations on AD drugidentification, we sub-sampled the initial AD seed set into 8 data sets of varying sizes i.e., S5, S10, S15, S20, S25, S30, S35, S40 (the number indicatingsize) and also generated a random seed set with 50 proteins.. Given different seed sets, Panel (A) shows the specificity performances of AD-relateddrug identification at top N drugs determined by FDR (false discovery rate), and Panel (B) shows the sensitivity performances.doi:10.1371/journal.pcbi.1000450.g003
Disease-Specific Drug-Protein Connectivity Maps
PLoS Computational Biology | www.ploscompbiol.org 7 July 2009 | Volume 5 | Issue 7 | e1000450
Creation and Assessment of AD Connectivity MapWith sufficient number of proteins and drugs enriched on
disease relevance from molecular interaction networks and
biomedical literature, we were ready to build a connectivity map
with balanced quality and coverage. The AD connectivity map
matrix was built with proteins as rows, drugs as columns, and a
protein-drug connectivity score based on co-citation adjusted log-
odds values (see Methods for details). Two dimensional hierarchi-
cal clustering was applied to identify groups of proteins/drugs
sharing similar profiles. In the AD connectivity map, proteins were
clustered between similar drug profiles and drugs were also
clustered between similar protein profiles.
To assess the biological significance of drug-protein connectivity
scores, we compared high-scoring protein-drug pairs in the AD
connectivity map with all the known AD drug-target relations in
DrugBank. Since only 6 out of 8 AD drugs reported in DrugBank
were involved in our study (see Figure 5), we collected all the 6
drugs’ target proteins from the DrugBank database for the
comparison. Table 3 showed all high-scoring protein-drug connec-
tivity pairs with connectivity score .1.We used the concept of
‘‘target distance’’ to measure between a drug-protein connectivity
profile created and the actual drug-target knowledge. More
precisely, we defined target distance as the shortest distance in the
disease-specific protein interaction sub-network between a drug’s
target protein in DrugBank and the drug’s connected protein in the
molecular connectivity map. A target distance of 0 refers to a
protein in the molecular connectivity map also to be the drug’s
target protein. Tacrine and Galantamine targeted their connected
protein (ACES_HUMAN) directly, which covered four proteins listed
(ACES_HUMAN, CATB_HUMAN, A4_HUMAN, EP300_HUMAN).
Vitamin E seemed to contain several long-range connections to AD
proteins, with a target distance of 2. Memantine seemed to be the only
example with the farthest known path of protein interactions to its
target (target distance = 3). All the four highly associated known AD
drugs are within a target distance of 3.
Exploration of AD Connectivity MapIn the AD connectivity map (see Figure 6 and its source data in
Dataset S3), the connections between 166 drugs and 66 proteins
could be reviewed globally or queried for each pair of drug and
protein/gene. The AD connectivity map contained a wealth of
information worth investigating by biomedical researchers. For
example, in Figure 6A, many high-lighted cells were supported by
existing knowledge, including 1) ‘‘GFAP_HUMAN vs. Calcimycin’’,
where it was reported that in the central nervous system related
diseases, the treatment with the calcium ionophore (calcimycin)
resulted in a rapid increase in immunoreactivity to glial fibrillary
acidic protein (GFAP_HUMAN) [33]; 2) ‘‘GFAP_HUMAN vs.
Vitamin E’’, where the increased expression of GFAP during
astrocyte differentiation could be mediated by vitamin E adminis-
tration [34]; 3) ‘‘APOE_HUMAN vs. 1-Methyl-3-isobutylxanthine
(IBMX)’’, where IBMX treatment increased cAMP levels and
diminished cGMP levels in the absence of apoE complex [35].
In the connectivity map, proteins that interact with each other
seemed to cluster well with each other based on added protein-
drug profile similarities. For example, in Figure 6B, PSN1_HU-
MAN, FLNA_HUMAN and CSEN_HUMAN shared highly similar
protein-drug connectivity profiles among themselves. According to
HPRD [36], PSN1_HUMAN directly interacts with both CSEN_
HUMAN and FLNA_HUMAN. This may be a factor in explaining
why drugs intervening PSN1_HUMAN may affect CSEN_HUMAN
and FLNA_HUMAN as well. Also, drugs Diazepam, Clonazepam,
Flunitrazepam, Apomorphine, Diltiazem, Prazosin, and Quinidine were
clustered closely. When their chemical structures were examined,
we found them to share common two-ring structures. Diazepam,
Clonazepam and Flunitrazepam were further found to contain
Figure 4. Specificity and sensitivity tradeoffs for AD-related drug identification. The ROC (receiver operating characteristic) curve showsthe sensitivity vs. false positive rate (1-specificity) for AD-related drug identification, when FDR (false discovery rate) varies at different thresholdlevels. Evaluation results are built by querying against PubMed abstracts and Enrez gene function description in search of evidence that may containany of the drug terms and the term ‘‘Alzheimer’s Disease’’ with all their term variants. The sensitivity and specificity are defined in Methods section.doi:10.1371/journal.pcbi.1000450.g004
Disease-Specific Drug-Protein Connectivity Maps
PLoS Computational Biology | www.ploscompbiol.org 8 July 2009 | Volume 5 | Issue 7 | e1000450
benzodiazepine as a common structure (see Figure 6C). Another
interesting observation on this group of drugs was their shared
similar pharmacological actions: Diazepam, Clonazepam and Fluni-
trazepam are for the symptomatic treatment of anxiety disorders,
while Diltiazem and Prazosin are for the treatment of vascular
hypertension. These findings suggest that a decent degree of
accuracy may have been achieved to enable one to drill down to
underlying mechanisms, biologically or chemically, between
connected molecules.
Investigation of Repurposed Candidate Drugs from theAD Connectivity Map
Disease-specific molecular connectivity maps can provide novel
insights for re-purposing experimental drugs, successful or failed,
from the original intended therapeutic area to a new disease
application context. In the above example as shown in Figure 6B,
Diltiazem, Prazosin and Quinidine were clustered together due to their
similar drug-protein connectivity profiles. The three drugs are
previously known to treat vascular diseases. Among them, Diltiazem
is an antihypertensive agent with vasodilating actions due to its
antagonism of the actions of the calcium ion in membrane
function; Prazosin is an alpha-adrenergic blocking agent used in the
treatment of heart failure and hypertension; Quinidine is an anti-
arrhythmia agent with actions on sodium channels on the
neuronal cell membrane. Recent population-based epidemiolog-
ical studies suggested that vascular risk factors, such as vascular
disease gene ApoE [37,38], hypertension [39], atherosclerosis [40],
and heart failure [41], may impair cognitive functions and are
related to the development of AD. Both randomized and non-
randomized clinical trials indicated that lowing blood pressure
could play an important role in preventing AD. Further trials also
demonstrated that antihypertensive agents decrease the incidence
Table 2. A representative sample of enriched AD drugs.
Drug FDR DF_AD Pharmacological ActionFound InAD-GS
Found InDrugBank
Rivastigmine ,1.00E-16 571 Cholinesterase Inhibitors; Neuroprotective Agents Yes Yes
Bromocriptine ,1.00E-16 139 Antiparkinson Agents; Dopamine Agonists; Hormone Antagonists Yes
Fenoldopam ,1.00E-16 11 Antihypertensive Agents; Vasodilator Agents; Dopamine Agonists
Diazepam ,1.00E-16 149 Adjuvants, Anesthesia; Anti-Anxiety Agents; GABA Modulators;Anesthetics, Intravenous; Muscle Relaxants, Central; Anticonvulsants;Antiemetics; Hypnotics and Sedatives
Yes
Tacrine 2.40E-15 31 Cholinesterase Inhibitors; Parasympathomimetics; Nootropic Agents Yes Yes
Donepezil 5.24E-15 16 Cholinesterase Inhibitors; Nootropic Agents Yes Yes
Dopamine 3.87E-12 966 Dopamine Agents; Cardiotonic Agents Yes
Calcimycin 3.87E-12 325 Anti-Bacterial Agents; Ionophores Yes
Vitamin E 3.87E-12 198 Antioxidants; Vitamins Yes Yes
1-Methyl-3-Isobutylxanthine 3.87E-12 192 Phosphodiesterase Inhibitors Yes
Theophylline 3.87E-12 144 Bronchodilator Agents; Phosphodiesterase Inhibitors; VasodilatorAgents
Yes
Ethidium 3.87E-12 58 Enzyme Inhibitors; Fluorescent Dyes; Trypanocidal Agents;Indicators and Reagents; Nicotinic Antagonists
Yes
Flunitrazepam 3.87E-12 37 GABA Modulators;Anti-Anxiety Agents Yes
Apomorphine 3.87E-12 117 Antiparkinson Agents; Dopamine Agonists Yes
Diltiazem 3.87E-12 63 Antihypertensive Agents; Vasodilator Agents; CardiovascularAgents; Calcium Channel Blockers
Prazosin 3.87E-12 129 Adrenergic alpha-Antagonists; Antihypertensive Agents Yes
Quinidine 1.68E-08 27 Anti-Arrhythmia Agents; Adrenergic alpha-Antagonists; EnzymeInhibitors; Muscarinic Antagonists; Antimalarials
Clonazepam 9.04E-07 21 Anticonvulsants; GABA Modulators Yes
Memantine 2.24E-06 8 Dopamine Agents; Excitatory Amino Acid Antagonists;Antiparkinson Agents
Yes Yes
Droxidopa 6.04E-05 5 Antiparkinson Agents
Dextrorphan 7.01E-05 6 Excitatory Amino Acid Antagonists; Neuroprotective Agents
Galantamine 0.039622 6 Cholinesterase Inhibitors; Nootropic Agents; Parasympathomimetics Yes Yes
Glycerol 0.085 186 Cryoprotective Agents Yes
Tetracycline 0.14 151 Protein Synthesis Inhibitors; Anti-Bacterial Agents Yes
Amikacin 0.86 28 Anti-Bacterial Agents
This table includes all the drugs mentioned in this manuscript (see Dataset S2 for the completed version). The FDR (false discover rate) value for each drug is shown inthis table. The DF_AD column provides each drug’s document frequency in the retrieved PubMed abstract corpus. The Pharmacological Action column lists MeSHannotated Pharmacological information for each drug. The Found In AD-GS column indicates whether a drug retrieved is also found in the Gold Standard (GS) dataset for AD. The Found in DrugBank column indicates whether a drug retrieved is also found in the DrugBank database. Note that drugs listed here are not yet appliedwith any minimal FDR threshold filter.doi:10.1371/journal.pcbi.1000450.t002
Disease-Specific Drug-Protein Connectivity Maps
PLoS Computational Biology | www.ploscompbiol.org 9 July 2009 | Volume 5 | Issue 7 | e1000450
of dementia in stroke patients ([42,43]) and in elderly patients with
isolated systolic hypertension [44]. Additionally, a latest research
study showed that Valsartan, an anti-hypertensive chemical, can
reduce AD-like symptoms in mice [45]. Not too surprisingly, when
we look into clinical trial databases, we found that Prazosin is
currently under a double-blind and placebo-controlled clinical
study on the treatment of agitation and aggression in persons with
AD (ClinicalTrials.gov Identifier = NCT00161473) [46], while
Diltiazem and Quinidine have not been experimented for any AD
related treatment to our best knowledge. Could Diltiazem and
Quinidine become worthwhile candidates for future AD drug re-
purposing investigation? With newly-derived molecular connec-
tivity maps guiding drug developers to hypothesize on therapeutic
values of these two candidate drugs, we believe the answer is
‘‘yes’’. We believe there are many drug candidates in our results
beyond what presented here that are also worthwhile experiment-
ing.
Discussion
In this study, we developed a novel computational framework to
build drug-protein molecular connectivity maps. Our approach
integrated protein interaction network mining and text mining,
without the need for gene expression data sets derived from drug
perturbation experiments on disease samples. We showed that this
approach was effective in constructing a statistically significant AD
molecular connectivity map that links AD-related proteins to AD-
related drugs with enriched PubMed literature references. This
work pointed out a new direction for biomedical researchers to
integrate functional contexts of proteins from molecular interac-
tions networks with published literature studies on drugs. The
resulting AD connectivity map consisted of comprehensive
Figure 5. Performance assessment of comparable systems on the task of identifying AD-related drugs. Two curated data sources(DrugBank and CTD) and two computational methods (Chi2 and BITOLA) were selected to compare against the performance of our approach on ADdrug identifications. DrugBank and CTD manually curated database content about disease-modifying gene/proteins and drugs. Chi2 is a baselinesystem using commonly Chi-square statistical method to identify significant co-occurring drug-disease relationships cited in PubMed abstracts.BITOLA (Biomedical Discovery Support System) is a computational system based on natural language processing that can extract drug-proteinrelation in a disease context. The histogram shows sensitivity, specificity, PPV (positive predictive value), F-score, and ACC (accuracy) of each group.These performance measurements are defined in the Methods section.doi:10.1371/journal.pcbi.1000450.g005
Table 3. Cross-validation of protein-drug relationshipsidentified in the AD connectivity map with target-drugrelationships of AD drugs in Drugbank.
UNIPROT_ID DrugConnectivityScore Target Distance*
ACES_HUMAN Tacrine 4.77 0
ACES_HUMAN Galantamine 4.22 0
MK_HUMAN Memantine 4.12 3 (NMDE1-SRC-ETS1-MK)
CATB_HUMAN Tacrine 3.46 2 (ACES-A4- CATB)
A4_HUMAN Tacrine 3.40 1 (ACES-A4)
EP300_HUMAN Tacrine 3.17 2 (ACES-A4-EP300)
TTHY_HUMAN Vitamin E 1.31 2 (KPCA-NMDE1-TTHY)
MK08_HUMAN Vitamin E 1.09 2 (KPCA- NMDE1-MK08)
*A shortest protein interaction path in the AD protein interaction subnetworkconsisting of all AD-related proteins is indicated.
doi:10.1371/journal.pcbi.1000450.t003
Disease-Specific Drug-Protein Connectivity Maps
PLoS Computational Biology | www.ploscompbiol.org 10 July 2009 | Volume 5 | Issue 7 | e1000450
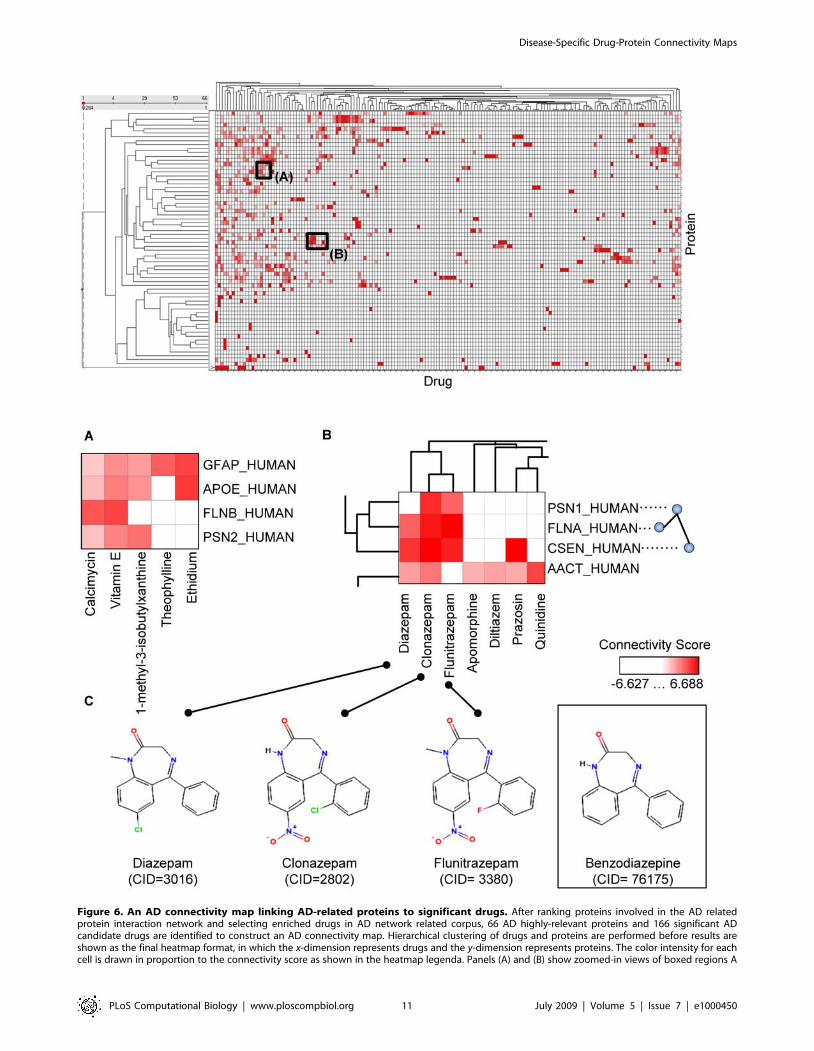
Figure 6. An AD connectivity map linking AD-related proteins to significant drugs. After ranking proteins involved in the AD relatedprotein interaction network and selecting enriched drugs in AD network related corpus, 66 AD highly-relevant proteins and 166 significant ADcandidate drugs are identified to construct an AD connectivity map. Hierarchical clustering of drugs and proteins are performed before results areshown as the final heatmap format, in which the x-dimension represents drugs and the y-dimension represents proteins. The color intensity for eachcell is drawn in proportion to the connectivity score as shown in the heatmap legenda. Panels (A) and (B) show zoomed-in views of boxed regions A
Disease-Specific Drug-Protein Connectivity Maps
PLoS Computational Biology | www.ploscompbiol.org 11 July 2009 | Volume 5 | Issue 7 | e1000450
collections of AD drug-protein connectivity profiles, which may
help guide hypothesis generations of AD drug development.
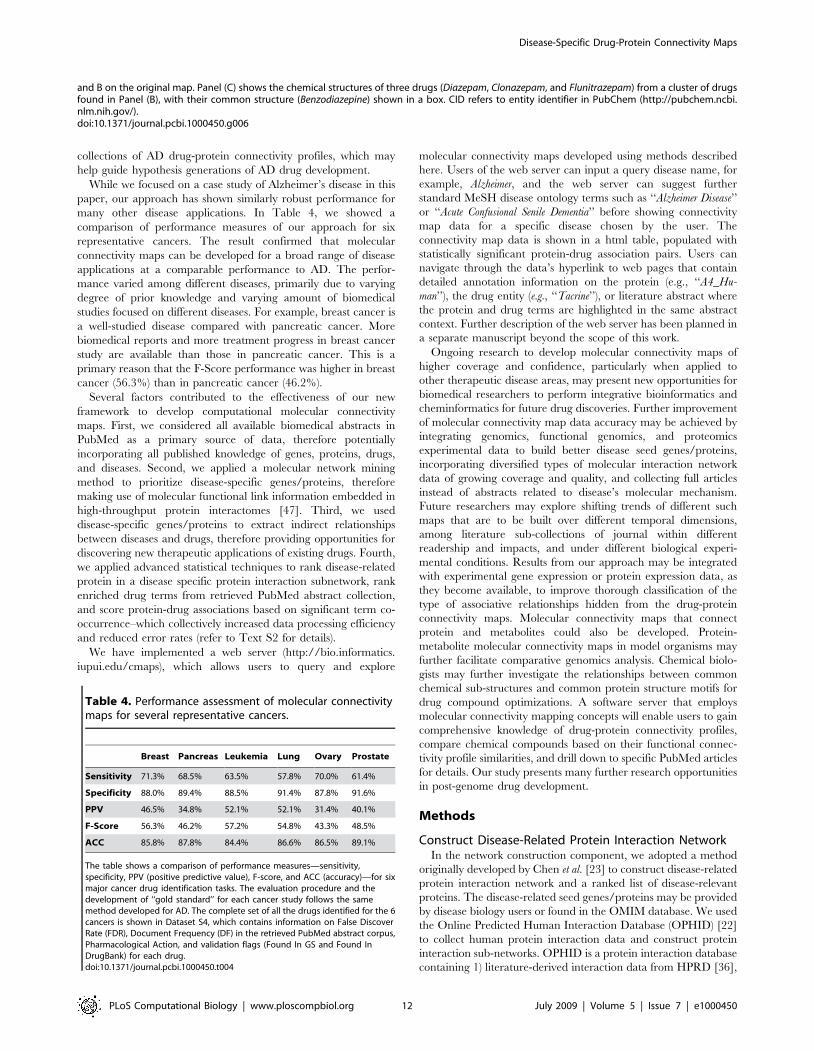
While we focused on a case study of Alzheimer’s disease in this
paper, our approach has shown similarly robust performance for
many other disease applications. In Table 4, we showed a
comparison of performance measures of our approach for six
representative cancers. The result confirmed that molecular
connectivity maps can be developed for a broad range of disease
applications at a comparable performance to AD. The perfor-
mance varied among different diseases, primarily due to varying
degree of prior knowledge and varying amount of biomedical
studies focused on different diseases. For example, breast cancer is
a well-studied disease compared with pancreatic cancer. More
biomedical reports and more treatment progress in breast cancer
study are available than those in pancreatic cancer. This is a
primary reason that the F-Score performance was higher in breast
cancer (56.3%) than in pancreatic cancer (46.2%).
Several factors contributed to the effectiveness of our new
framework to develop computational molecular connectivity
maps. First, we considered all available biomedical abstracts in
PubMed as a primary source of data, therefore potentially
incorporating all published knowledge of genes, proteins, drugs,
and diseases. Second, we applied a molecular network mining
method to prioritize disease-specific genes/proteins, therefore
making use of molecular functional link information embedded in
high-throughput protein interactomes [47]. Third, we used
disease-specific genes/proteins to extract indirect relationships
between diseases and drugs, therefore providing opportunities for
discovering new therapeutic applications of existing drugs. Fourth,
we applied advanced statistical techniques to rank disease-related
protein in a disease specific protein interaction subnetwork, rank
enriched drug terms from retrieved PubMed abstract collection,
and score protein-drug associations based on significant term co-
occurrence–which collectively increased data processing efficiency
and reduced error rates (refer to Text S2 for details).
We have implemented a web server (http://bio.informatics.
iupui.edu/cmaps), which allows users to query and explore
molecular connectivity maps developed using methods described
here. Users of the web server can input a query disease name, for
example, Alzheimer, and the web server can suggest further
standard MeSH disease ontology terms such as ‘‘Alzheimer Disease’’
or ‘‘Acute Confusional Senile Dementia’’ before showing connectivity
map data for a specific disease chosen by the user. The
connectivity map data is shown in a html table, populated with
statistically significant protein-drug association pairs. Users can
navigate through the data’s hyperlink to web pages that contain
detailed annotation information on the protein (e.g., ‘‘A4_Hu-
man’’), the drug entity (e.g., ‘‘Tacrine’’), or literature abstract where
the protein and drug terms are highlighted in the same abstract
context. Further description of the web server has been planned in
a separate manuscript beyond the scope of this work.
Ongoing research to develop molecular connectivity maps of
higher coverage and confidence, particularly when applied to
other therapeutic disease areas, may present new opportunities for
biomedical researchers to perform integrative bioinformatics and
cheminformatics for future drug discoveries. Further improvement
of molecular connectivity map data accuracy may be achieved by
integrating genomics, functional genomics, and proteomics
experimental data to build better disease seed genes/proteins,
incorporating diversified types of molecular interaction network
data of growing coverage and quality, and collecting full articles
instead of abstracts related to disease’s molecular mechanism.
Future researchers may explore shifting trends of different such
maps that are to be built over different temporal dimensions,
among literature sub-collections of journal within different
readership and impacts, and under different biological experi-
mental conditions. Results from our approach may be integrated
with experimental gene expression or protein expression data, as
they become available, to improve thorough classification of the
type of associative relationships hidden from the drug-protein
connectivity maps. Molecular connectivity maps that connect
protein and metabolites could also be developed. Protein-
metabolite molecular connectivity maps in model organisms may
further facilitate comparative genomics analysis. Chemical biolo-
gists may further investigate the relationships between common
chemical sub-structures and common protein structure motifs for
drug compound optimizations. A software server that employs
molecular connectivity mapping concepts will enable users to gain
comprehensive knowledge of drug-protein connectivity profiles,
compare chemical compounds based on their functional connec-
tivity profile similarities, and drill down to specific PubMed articles
for details. Our study presents many further research opportunities
in post-genome drug development.
Methods
Construct Disease-Related Protein Interaction NetworkIn the network construction component, we adopted a method
originally developed by Chen et al. [23] to construct disease-related
protein interaction network and a ranked list of disease-relevant
proteins. The disease-related seed genes/proteins may be provided
by disease biology users or found in the OMIM database. We used
the Online Predicted Human Interaction Database (OPHID) [22]
to collect human protein interaction data and construct protein
interaction sub-networks. OPHID is a protein interaction database
containing 1) literature-derived interaction data from HPRD [36],
Table 4. Performance assessment of molecular connectivitymaps for several representative cancers.
Breast Pancreas Leukemia Lung Ovary Prostate
Sensitivity 71.3% 68.5% 63.5% 57.8% 70.0% 61.4%
Specificity 88.0% 89.4% 88.5% 91.4% 87.8% 91.6%
PPV 46.5% 34.8% 52.1% 52.1% 31.4% 40.1%
F-Score 56.3% 46.2% 57.2% 54.8% 43.3% 48.5%
ACC 85.8% 87.8% 84.4% 86.6% 86.5% 89.1%
The table shows a comparison of performance measures—sensitivity,specificity, PPV (positive predictive value), F-score, and ACC (accuracy)—for sixmajor cancer drug identification tasks. The evaluation procedure and thedevelopment of ‘‘gold standard’’ for each cancer study follows the samemethod developed for AD. The complete set of all the drugs identified for the 6cancers is shown in Dataset S4, which contains information on False DiscoverRate (FDR), Document Frequency (DF) in the retrieved PubMed abstract corpus,Pharmacological Action, and validation flags (Found In GS and Found InDrugBank) for each drug.doi:10.1371/journal.pcbi.1000450.t004
and B on the original map. Panel (C) shows the chemical structures of three drugs (Diazepam, Clonazepam, and Flunitrazepam) from a cluster of drugsfound in Panel (B), with their common structure (Benzodiazepine) shown in a box. CID refers to entity identifier in PubChem (http://pubchem.ncbi.nlm.nih.gov/).doi:10.1371/journal.pcbi.1000450.g006
Disease-Specific Drug-Protein Connectivity Maps
PLoS Computational Biology | www.ploscompbiol.org 12 July 2009 | Volume 5 | Issue 7 | e1000450
BIND [48] and MINT [49]; 2) human interaction data from high-
throughput experiments; and 3) transferred interactions from
orthologous proteins in eukaryotic model organisms. While 23,889
of 39,923 interactions are predicted interactions, the quality of the
OPHID data set can be controlled for successful disease-specific
studies [23,50,51]. George, et al. examined the OPHID protein
interaction data set, and used it to predict candidate disease genes.
They assessed the usefulness of protein interactions from different
OPHID protein interaction data categories. They built a successful
case to show that the full OPHID dataset was applicable to
disease-related studies [51]. Chen, et al. also used OPHID full data
set, but by assigning them different confidence scores based on the
source of the data. Using the weighted protein interaction data,
they successfully constructed an AD related sub-network and
validated the disease relevance of the top-ranked proteins in the
sub-network [23]. Here, we adopted a similar weighted approach
when using OPHID data sets, and a similar ranking method when
calculating protein’s disease relevance score, rp, as the following:
rp~k�ln(X
q[NETconf (p,q)){ln(
Xq[NET
N(p,q)) ð1Þ
In the formula, p and q are indices for proteins in the disease-
related interaction network NET. k is an empirical constant (k = 2 in
this study). conf(p, q) is a confidence score assigned to each
interaction (p, q) between protein p and q. Consistent with [23],
conf(p, q) = 0.9 if (p, q)M{curated interactions}, conf(p, q) = 0.5 if (p,
q)M{predicted interactions from mammalian organisms}, and conf(p,
q) = 0.3 if (p, q)M{predicted interactions from non-mammalian
organisms}. N(p, q) holds the value of 1 if the protein p interacts with
q. The rp score is used to rank proteins and filter out protein-drug
associations that may arise due to noise in literature mining results.
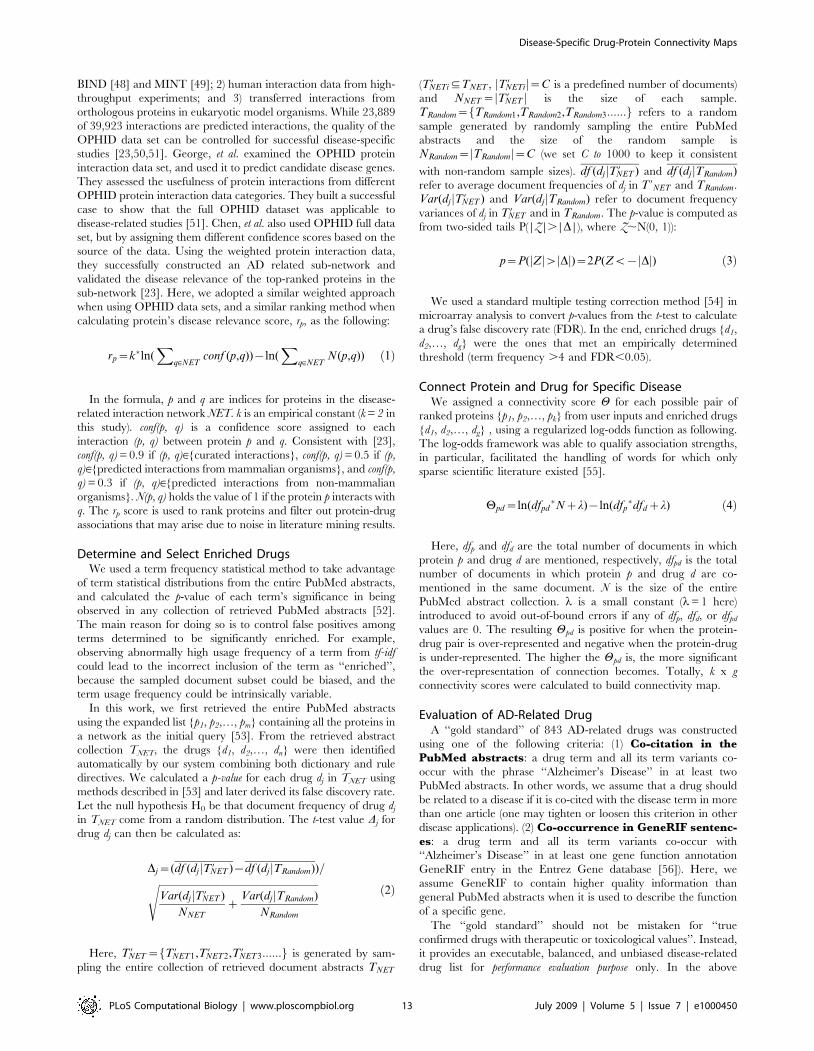
Determine and Select Enriched DrugsWe used a term frequency statistical method to take advantage
of term statistical distributions from the entire PubMed abstracts,
and calculated the p-value of each term’s significance in being
observed in any collection of retrieved PubMed abstracts [52].
The main reason for doing so is to control false positives among
terms determined to be significantly enriched. For example,
observing abnormally high usage frequency of a term from tf-idf
could lead to the incorrect inclusion of the term as ‘‘enriched’’,
because the sampled document subset could be biased, and the
term usage frequency could be intrinsically variable.
In this work, we first retrieved the entire PubMed abstracts
using the expanded list {p1, p2,…, pm} containing all the proteins in
a network as the initial query [53]. From the retrieved abstract
collection TNET, the drugs {d1, d2,…, dn} were then identified
automatically by our system combining both dictionary and rule
directives. We calculated a p-value for each drug dj in TNET using
methods described in [53] and later derived its false discovery rate.
Let the null hypothesis H0 be that document frequency of drug dj
in TNET come from a random distribution. The t-test value Dj for
drug dj can then be calculated as:
Dj~(df (dj jT ’NET ){df (dj jTRandom))=ffiffiffiffiffiffiffiffiffiffiffiffiffiffiffiffiffiffiffiffiffiffiffiffiffiffiffiffiffiffiffiffiffiffiffiffiffiffiffiffiffiffiffiffiffiffiffiffiffiffiffiffiffiffiffiffiffiffiffiffiffiffiffiffiVar(dj jT ’NET )
NNET
zVar(dj jTRandom)
NRandom
s ð2Þ
Here, T ’NET~fT ’NET1,T ’NET2,T ’NET3::::::g is generated by sam-
pling the entire collection of retrieved document abstracts TNET
(T ’NETi(TNET , jT ’NETij~C is a predefined number of documents)
and NNET~jT ’NET j is the size of each sample.
TRandom~fTRandom1,TRandom2,TRandom3::::::g refers to a random
sample generated by randomly sampling the entire PubMed
abstracts and the size of the random sample is
NRandom~jTRandomj~C (we set C to 1000 to keep it consistent
with non-random sample sizes). df (dj jT ’NET ) and df (dj jTRandom)refer to average document frequencies of dj in T ’NET and TRandom.
Var(dj jT ’NET ) and Var(dj jTRandom) refer to document frequency
variances of dj in T ’NET and in TRandom. The p-value is computed as
from two-sided tails P(|Z|.|D|), where Z,N(0, 1)):
p~P(jZjwjDj)~2P(Zv{jDj) ð3Þ
We used a standard multiple testing correction method [54] in
microarray analysis to convert p-values from the t-test to calculate
a drug’s false discovery rate (FDR). In the end, enriched drugs {d1,
d2,…, dg} were the ones that met an empirically determined
threshold (term frequency .4 and FDR,0.05).
Connect Protein and Drug for Specific DiseaseWe assigned a connectivity score H for each possible pair of
ranked proteins {p1, p2,…, pk} from user inputs and enriched drugs
{d1, d2,…, dg} , using a regularized log-odds function as following.
The log-odds framework was able to qualify association strengths,
in particular, facilitated the handling of words for which only
sparse scientific literature existed [55].
Hpd~ln(dfpd�Nzl){ln(dfp
�dfdzl) ð4Þ
Here, dfp and dfd are the total number of documents in which
protein p and drug d are mentioned, respectively, dfpd is the total
number of documents in which protein p and drug d are co-
mentioned in the same document. N is the size of the entire
PubMed abstract collection. l is a small constant (l= 1 here)
introduced to avoid out-of-bound errors if any of dfp, dfd, or dfpd
values are 0. The resulting Hpd is positive for when the protein-
drug pair is over-represented and negative when the protein-drug
is under-represented. The higher the Hpd is, the more significant
the over-representation of connection becomes. Totally, k x g
connectivity scores were calculated to build connectivity map.
Evaluation of AD-Related DrugA ‘‘gold standard’’ of 843 AD-related drugs was constructed
using one of the following criteria: (1) Co-citation in thePubMed abstracts: a drug term and all its term variants co-
occur with the phrase ‘‘Alzheimer’s Disease’’ in at least two
PubMed abstracts. In other words, we assume that a drug should
be related to a disease if it is co-cited with the disease term in more
than one article (one may tighten or loosen this criterion in other
disease applications). (2) Co-occurrence in GeneRIF sentenc-es: a drug term and all its term variants co-occur with
‘‘Alzheimer’s Disease’’ in at least one gene function annotation
GeneRIF entry in the Entrez Gene database [56]). Here, we
assume GeneRIF to contain higher quality information than
general PubMed abstracts when it is used to describe the function
of a specific gene.
The ‘‘gold standard’’ should not be mistaken for ‘‘true
confirmed drugs with therapeutic or toxicological values’’. Instead,
it provides an executable, balanced, and unbiased disease-related
drug list for performance evaluation purpose only. In the above
Disease-Specific Drug-Protein Connectivity Maps
PLoS Computational Biology | www.ploscompbiol.org 13 July 2009 | Volume 5 | Issue 7 | e1000450

automated method for AD ‘‘gold standard’’ construction, we used
coverage and disease-relevance as the most important criteria,
considering both peer-reviewed article abstracts and curated gene
function annotations from reputable databases.
The following measurements were involved in our evaluation
and comparison experiments. (1) Sensitivity is the percent of
correctly identified AD-related drugs; (2) Specificity is the
percent of correctly identified non AD-related drugs; (3) PPV(Positive Predictive Value) is the probability of correct positive
prediction; (4) F-score is the harmonic mean of Sensitivity and
PPV; (5) Accuracy is the proportion of correctly predicted drugs.
Sensitivity~TP
TPzFNð5:1Þ
Specificity~TN
TNzFPð5:2Þ
PPV (Positive Predictive Value)~TP
TPzFPð5:3Þ
F{Score~2�(PPV �Sensitivity)
PPVzSensitivityð5:4Þ
ACC~TPzTN
TPzTNzFPzFNð5:5Þ
Clustering of Proteins or Drugs in a Disease-SpecificMolecular Connectivity Map
In the integrated analysis component, two-dimensional hierar-
chical clustering of the drug-protein connectivity map was
performed using the weighted pair-group method and arithmetic
mean method, with Tanimoto as similarity measures. The
similarity between two drugs da and db was calculated as following:
sim(da,db)~ Pkj~1 (Hpj da
�Hpjdb)Pk
j~1 H2pjda
zPk
j~1 H2pjdb
{Pk
j~1 (Hpjda
�Hpj db)
ð6Þ
where, Hpjdaand Hpjdb
are cell values calculated by the function 4.
The similarity between proteins was also calculated by the function 6.
The final clustered attributes along the drug dimension
(horizontal axis) and protein dimension (vertical axis) were sorted
by averaged values, decreasing from left to right and from top to
bottom. The clustering was performed and visualized with the
Spotfire DecisionSite Browser 8.2 software. The tool has been
widely used in bioinformatics.
Supporting Information
Dataset S1 The table contains 560 proteins with their network
degrees and ranking scores in the AD-related protein interaction
network.
Found at: doi:10.1371/journal.pcbi.1000450.s001 (0.06 MB XLS)
Dataset S2 The table contains 2,019 drugs identified from
222,609 PubMed abstracts related to AD protein interaction
network. It also contains the False Discover Rate (FDR),
document frequency in the AD related corpus (DF_AD),
Pharmacological Action, and validation flag for each drug.
Found at: doi:10.1371/journal.pcbi.1000450.s002 (0.33 MB XLS)
Dataset S3 The file includes one source matrix data of Figure 6
(a connectivity map for Alzheimer’s Disease connecting 66
proteins with 166 drugs), and one table containing protein-drug
associations shown pairwise with their evidence PMIDs.
Found at: doi:10.1371/journal.pcbi.1000450.s003 (0.32 MB
DOC)
Dataset S4 The file includes the complete drug lists for breast
cancer, pancreatic cancer, leukemia, lung cancer, ovarian cancer
and prostate cancer. Like Dataset S2 for AD, it contains False
Discover Rate (FDR), Document Frequency (DF) in the retrieved
PubMed abstract corpus, Pharmacological Action, and validation
flags (Found In GS and Found In DrugBank) for each drug.
Found at: doi:10.1371/journal.pcbi.1000450.s004 (1.13 MB XLS)
Text S1 Information Retrieval Performance and Method
Found at: doi:10.1371/journal.pcbi.1000450.s005 (0.08 MB PDF)
Text S2 A Discussion of Statistical Components Used
Found at: doi:10.1371/journal.pcbi.1000450.s006 (0.09 MB PDF)
Acknowledgments
The authors would like to thank Dr. Scott H. Harrison for his critical
review and comments to the early versions of this manuscript, and thank
Michael Grobe of the Pervasive Technology Institute at Indiana University
for his comments and revision to help improve this manuscript.
Author Contributions
Conceived and designed the experiments: JL JYC. Performed the
experiments: JL. Analyzed the data: JL JYC. Contributed reagents/
materials/analysis tools: JL JYC. Wrote the paper: JL JYC. Provided
support throughout the research process: XZ.
References
1. Lamb J, Crawford ED, Peck D, Modell JW, Blat IC, et al. (2006) The
Connectivity Map: using gene-expression signatures to connect small molecules,genes, and disease. Science 313: 1929–1935.
2. Kitano H (2002) Systems biology: a brief overview. Science 295: 1662–1664.
3. Beyer A, Bandyopadhyay S, Ideker T (2007) Integrating physical and geneticmaps: from genomes to interaction networks. Nat Rev Genet 8: 699–710.
4. Wilson M, DeRisi J, Kristensen HH, Imboden P, Rane S, et al. (1999) Exploring
drug-induced alterations in gene expression in Mycobacterium tuberculosis bymicroarray hybridization. Proc Natl Acad Sci U S A 96: 12833–12838.
5. Lamb J (2007) The Connectivity Map: a new tool for biomedical research. NatRev Cancer 7: 54–60.
6. Butte AJ, Kohane IS (2006) Creation and implications of a phenome-genome
network. Nat Biotechnol 24: 55–62.
7. Schatz BR (1997) Information retrieval in digital libraries: bringing search to the
net. Science 275: 327–334.
8. Leser U, Hakenberg J (2005) What makes a gene name? Named entityrecognition in the biomedical literature. Brief Bioinform 6: 357–369.
9. Muller H-M, Kenny EE, Sternberg PW (2004) Textpresso: an ontology-basedinformation retrieval and extraction system for biological literature. PLoS Biol 2:
e309.
10. Cohen AM, Hersh WR (2005) A survey of current work in biomedical textmining. Brief Bioinform 6: 57–71.
11. Masys DR, Welsh JB, Lynn Fink J, Gribskov M, Klacansky I, et al. (2001) Use of
keyword hierarchies to interpret gene expression patterns. Bioinformatics 17:319–326.
12. Jensen LJ, Saric J, Bork P (2006) Literature mining for the biologist: from
information retrieval to biological discovery. Nat Rev Genet 7: 119–129.
13. Tsuruoka Y, Tsujii Ji, Ananiadou S (2008) FACTA: a text search engine
for finding associated biomedical concepts. Bioinformatics 24: 2559–
2560.
Disease-Specific Drug-Protein Connectivity Maps
PLoS Computational Biology | www.ploscompbiol.org 14 July 2009 | Volume 5 | Issue 7 | e1000450
14. Perez-Iratxeta C, Bork P, Andrade MA (2002) Association of genes to genetically
inherited diseases using data mining. Nat Genet 31: 316–319.15. Tiffin N, Kelso JF, Powell AR, Pan H, Bajic VB, et al. (2005) Integration of text-
and data-mining using ontologies successfully selects disease gene candidates.
Nucleic Acids Res 33: 1544–1552.16. Srinivasan P (2004) Text mining: generating hypotheses from MEDLINE.
Journal of the American Society for Information Science and Technology 55:396–413.
17. Hristovski D, Friedman C, Rindflesch TC, Peterlin B (2006) Exploiting semantic
relations for literature-based discovery. AMIA Annu Symp Proc. pp 349–353.18. Garten Y, Altman RB (2009) Pharmspresso: a text mining tool for extraction of
pharmacogenomic concepts and relationships from full text. BMC Bioinfor-matics 10 Suppl 2: S6.
19. Alzheimer’s Disease Fact Sheet. http://www.nia.nih.gov/Alzheimers/Publications/adfact.htm.
20. Rifai N, Gillette MA, Carr SA (2006) Protein biomarker discovery and
validation: the long and uncertain path to clinical utility. Nat Biotechnol 24:971–983.
21. Hamosh A, Scott AF, Amberger JS, Bocchini CA, McKusick VA (2005) OnlineMendelian Inheritance in Man (OMIM), a knowledgebase of human genes and
genetic disorders. Nucleic Acids Res 33: D514–517.
22. Brown KR, Jurisica I (2005) Online predicted human interaction database.Bioinformatics 21: 2076–2082.
23. Chen JY, Shen C, Sivachenko AY (2006) Mining Alzheimer disease relevantproteins from integrated protein interactome data. Pac Symp Biocomput. pp
367–378.24. Ma X, Lee H, Wang L, Sun F (2007) CGI: a new approach for prioritizing genes
by combining gene expression and protein-protein interaction data. Bioinfor-
matics 23: 215–221.25. Morrison JL, Breitling R, Higham DJ, Gilbert DR (2005) GeneRank: using
search engine technology for the analysis of microarray experiments. BMCBioinformatics 6: 233.
26. Estrada E, Rodriguez-Velazquez JA (2005) Subgraph centrality in complex
networks. Phys Rev E Stat Nonlin Soft Matter Phys 71: 056103.27. Ertekin-Taner N, Ronald J, Asahara H, Younkin L, Hella M, et al. (2003) Fine
mapping of the alpha-T catenin gene to a quantitative trait locus onchromosome 10 in late-onset Alzheimer’s disease pedigrees. Hum Mol Genet
12: 3133–3143.28. Howell BW, Lanier LM, Frank R, Gertler FB, Cooper JA (1999) The disabled 1
phosphotyrosine-binding domain binds to the internalization signals of
transmembrane glycoproteins and to phospholipids. Mol Cell Biol 19:5179–5188.
29. Lu PJ, Wulf G, Zhou XZ, Davies P, Lu KP (1999) The prolyl isomerase Pin1restores the function of Alzheimer-associated phosphorylated tau protein. Nature
399: 784–788.
30. Wishart DS, Knox C, Guo AC, Cheng D, Shrivastava S, et al. (2008) DrugBank:a knowledgebase for drugs, drug actions and drug targets. Nucleic Acids Res 36:
D901–906.31. Mattingly CJ, Rosenstein MC, Colby GT, Forrest JN, Boyer JL (2006) The
Comparative Toxicogenomics Database (CTD): a resource for comparativetoxicological studies. J Exp Zoolog A Comp Exp Biol 305: 689–692.
32. Chen ES, Hripcsak G, Xu H, Markatou M, Friedman C (2008) Automated
acquisition of disease drug knowledge from biomedical and clinical documents:an initial study. J Am Med Inform Assoc 15: 87–98.
33. Lee YB, Du S, Rhim H, Lee EB, Markelonis GJ, et al. (2000) Rapid increase inimmunoreactivity to GFAP in astrocytes in vitro induced by acidic pH is
mediated by calcium influx and calpain I. Brain Res 864: 220–229.
34. Baydas G, Nedzvetskii VS, Tuzcu M, Yasar A, Kirichenko SV (2003) Increase ofglial fibrillary acidic protein and S-100B in hippocampus and cortex of diabetic
rats: effects of vitamin E. Eur J Pharmacol 462: 67–71.35. Riddell DR, Graham A, Owen JS (1997) Apolipoprotein E inhibits platelet
aggregation through the L-arginine:nitric oxide pathway. Implications for
vascular disease. J Biol Chem 272: 89–95.
36. Prasad TS, Goel R, Kandasamy K, Keerthikumar S, Kumar S, et al. (2008)
Human Protein Reference Database–2009 update. Nucleic Acids Res 37:
D767–772.
37. Eichner JE, Dunn ST, Perveen G, Thompson DM, Stewart KE, et al. (2002)
Apolipoprotein E polymorphism and cardiovascular disease: a HuGE review.
Am J Epidemiol 155: 487–495.
38. Martins CAR, Oulhaj A, de Jager CA, Williams JH (2005) APOE alleles predict
the rate of cognitive decline in Alzheimer disease: a nonlinear model. Neurology
65: 1888–1893.
39. Hanon O, Latour F, Seux ML, Lenoir H, Forette F, et al. (2005) Evolution of
blood pressure in patients with Alzheimer’s disease: a one year survey of a
French Cohort (REAL.FR). J Nutr Health Aging 9: 106–111.
40. van Oijen M, de Jong FJ, Witteman JC, Hofman A, Koudstaal PJ, et al. (2007)
Atherosclerosis and risk for dementia. Ann Neurol 61: 403–410.
41. Qiu C, Winblad B, Marengoni A, Klarin I, Fastbom J, et al. (2006) Heart failure
and risk of dementia and Alzheimer disease: a population-based cohort study.
Arch Intern Med 166: 1003–1008.
42. Tzourio C, Anderson C, Chapman N, Woodward M, Neal B, et al. (2003)
Effects of blood pressure lowering with perindopril and indapamide therapy on
dementia and cognitive decline in patients with cerebrovascular disease. Arch
Intern Med 163: 1069–1075.
43. Bosch J, Yusuf S, Pogue J, Sleight P, Lonn E, et al. (2002) Use of ramipril in
preventing stroke: double blind randomised trial. BMJ 324: 699–702.
44. Forette F, Seux M-L, Staessen JA, Thijs L, Babarskiene M-R, et al. (2002) The
prevention of dementia with antihypertensive treatment: new evidence from the
Systolic Hypertension in Europe (Syst-Eur) study. Arch Intern Med 162:
2046–2052.
45. Wang J, Ho L, Chen L, Zhao Z, Zhao W, et al. (2007) Valsartan lowers brain
beta-amyloid protein levels and improves spatial learning in a mouse model of
Alzheimer disease. J Clin Invest 117: 3393–3402.
46. Prazosin in ClinicalTrials. http://clinicaltrials.gov/ct2/show/NCT00161473?
term=prazosin&rank=17.
47. Chen JY, Sivachenko AY (2005) Data mining in protein interactomics. Six
computational research challenges and opportunities. IEEE Eng Med Biol Mag
24: 95–102.
48. Bader GD, Betel D, Hogue CW (2003) BIND: the Biomolecular Interaction
Network Database. Nucleic Acids Res 31: 248–250.
49. Zanzoni A, Montecchi-Palazzi L, Quondam M, Ausiello G, Helmer-Citterich M,
et al. (2002) MINT: a Molecular INTeraction database. FEBS Lett 513:
135–140.
50. Wachi S, Yoneda K, Wu R (2005) Interactome-transcriptome analysis reveals
the high centrality of genes differentially expressed in lung cancer tissues.
Bioinformatics 21: 4205–4208.
51. George RA, Liu JY, Feng LL, Bryson-Richardson RJ, Fatkin D, et al. (2006)
Analysis of protein sequence and interaction data for candidate disease gene
prediction. Nucleic Acids Res 34: e130.
52. Li H, Chen JY (2009) Improved Biomedical Document Retrieval System with
PubMed Term Statistics an Expansions. Int J Comput Intelligence in
Bioinformatics and Systems Biology 1: 74–85.
53. Li J, Zhu X, Chen JY (2008) Mining disease-specific molecular association
profiles from biomedical literature: a case study. Fortaleza, Brazil. pp 1287–
1291.
54. Benjamini Y, Hochberg Y (1995) Controlling the False Discovery Rate: A
Practical and Powerful Approach to Multiple Testing. Journal of the Royal
Statistical Society 57: 289–300.
55. Korbel JO, Doerks T, Jensen LJ, Perez-Iratxeta C, Kaczanowski S, et al. (2005)
Systematic association of genes to phenotypes by genome and literature mining.
PLoS Biol 3: e134.
56. Maglott D, Ostell J, Pruitt KD, Tatusova T (2007) Entrez Gene: gene-centered
information at NCBI. Nucleic Acids Res 35: D26–31.
Disease-Specific Drug-Protein Connectivity Maps
PLoS Computational Biology | www.ploscompbiol.org 15 July 2009 | Volume 5 | Issue 7 | e1000450