Ringkasan Eksekutif STRATEGI AKSELERASI PENCAPAIAN TARGET MDGs 2015
Upload
peacebuildingportalCategory
view
0download
0
Financing Strategy for Achievement of the MDGs and Implementation of the Tenth Five Year Plan M. Govinda Rao, Anuradha Seth and Chewang Rinzin Working Paper No. 2009-59 March 2009
National Institute of Public Finance and Policy
New Delhi
http://www.nipfp.org.

2
Financing Strategy for Achievement of the MDGs and Implementation of the Tenth Five Year Plan
M. Govinda Rao∗ Anuradha Seth∗∗
Chewang Rinzin∗∗∗
∗ Director, National Institute of Public Finance and Policy, New Delhi. Email: [email protected]; [email protected] ∗∗ Senior Policy Advisor, UNDP ∗∗∗ Consultant, Bhutan
3
Fiscal Space for Achieving Millennium Development Goals in Bhutan
Introduction
Bhutan, a small Himalayan Kingdom with just about 640,000 people, is one of the less developed countries, but making rapid strides in economic progress and human development. The country has recorded impressive growth rates to average over 7 percent per annum during the last two decades and during the Ninth Plan period (2002-07), the growth rate was over 9 percent. This has transformed the economy from being one of the least developed to one with a per capita income of USD 1200. There has been a steady improvement in the human development indicators as well. The country transformed itself steadily from a low to a medium human development country and the HDI value increased steadily from 0.550 in 1998 to 0.6001 in 2006. Among the South Asian countries, only India and Sri Lanka have marginally higher values of HDI. Besides increases in incomes, significant improvement in social indicators has contributed to this gain.
In a small landlocked country with limited market penetration, economic growth
has mainly been based on exploitation of natural resources, more particularly, generation and export of hydropower. The narrow basis of growth has been capital intensive and has led to uneven distribution. However, the government has used the resources generated through these activities to make impressive progress in achieving Millennium Development Goals (MDGs). The government has made significant efforts to spread the education, reduce child and maternal mortality, ensure better access to water and sanitation facilities, connectivity, including roads. It is fully committed to achieving the MDGs by mainstreaming it with the Tenth Plan (2008-13). These achievements help to infuse confidence in the capacity of the country to achieve the MDGs.
Even as the achievements of the country in the recent past in economic and
social development have been impressive, Bhutan faces formidable challenges in allocating the required resources. The landlocked nature of the country makes it isolated and the inhospitable terrain and sparcity of population renders the cost of providing public services significantly higher than in the plains. At the same time, low level of market penetration and low capacity of the tax administration have posed constraints on the ability to mobilise domestic resources. Not surprisingly, even as the share of domestic resources has shown an increase, external finance has continued to be an important source of financing the plan.
The important step in aligning the MDGs with the Tenth Plan is to assess the
resource requirements. A detailed costing exercise was undertaken to quantify the resource requirements for achieving seven of the eight MDGs namely, reducing poverty and hunger, securing universal primary education, promoting gender equality and women’s empowerment, reducing child mortality, improving maternal health, combating the spread of communicable diseases and ensuring environmental sustainability.
4
This report presents an analysis of the strategy required to generate the required resources for investment in various services necessary to achieve the MDGs. The analysis attempts to quantify the fiscal space to finance the MDGs and identify the necessary fiscal reforms required to finance the MDGs in a sustainable manner. The next section outlines the analytical framework used to determine the potential for expanding fiscal space in an economy. Section 3 makes an assessment of overall financing requirements for achieving the MDGs and compares it with the Tenth Plan outlay. Section 4 explores the prospects of domestic revenue mobilisation. Section 5 analyses expenditure trends, its consistency with MDG costing requirements and explores the scope for creating fiscal space by improving efficiency and reprioritisation. Section 6 considers the role of ODA and examines the scope for borrowings (both external and domestic) and section 7 deals with the possibilities of enhancing fiscal space through private sources (FDI, households, public-private partnerships). The last section presents the concluding remarks.
II. Mobilising Resources for Financing MDGs: Analytical Framework It is very well recognised that acceleration in the growth rate of the economy by itself, may not bring about improvement in the living conditions of the poor. Inclusive growth requires building capabilities of the poor and disadvantaged sections to empower them to participate in the market in a productive manner. The MDGs essentially seek to build human development which will enhance capabilities and thereby, freedoms of the people. As argued by Amartya Sen, “….poverty must be seen as the deprivation of basic capabilities rather than merely as lowness of incomes” (Sen, 1999; p.86). Capabilities provide freedoms – freedom from hunger and poverty, freedom to work, freedom from increased choice of avocations. Bhutan has been marching forward to transform itself into a democratic society and ensure these freedoms make this transformation even more meaningful. Bhutan is fully committed to pursuing the MDGs and towards that end, has tried to align them to the national planning process. The record of the country in human development has been impressive and it is well on track to achieve most of the MDGs. Although in recent years the base of economic growth has been narrow, mainly on generation and export of hydroelectricity, the government has tried to broaden its developmental base through spendings on education, healthcare, and agriculture and rural development to spread the benefits of growth to the population as a whole. Nevertheless, progress in achieving MDGs crucially depends on the ability of the government to release resources for investment in sectors as worked out in the “Bhutan Millennium Development Goals: Needs Assessment and Costing Report (2006-2015)” RGoB (2007). Analytically, investments in various sectors contributing to the MDGs should come from both public and private sectors. In principle, these services are not strictly “public goods” in the sense of “non-excludability” and “non-rivalry” in consumption and therefore, households can be asked to pay for the services equivalent to the benefits they receive. However, these services, in addition to the private benefits they confer on the households have significant social benefits and therefore, optimal provision would require
5
significant public spending. Moreover, significant public spending on these services is necessary also to achieve redistribution. Appreciable reduction in poverty and hunger and improvement in capabilities of the poor and disadvantaged sections cannot be achieved unless the government spends large volumes of resources on social sectors, agriculture and rural development, and supporting infrastructure sectors with cross-cutting impact.
The financing strategy for achieving the MDGs, thus entails comprehensive mapping of potential sources of finance indicating that resources can be mobilised from both public and private sources. As mentioned above, public spending constitutes a predominant part of spending on sectors impacting on MDGs. The diagnostic tool for mapping the different fiscal instruments to secure more public fiscal space for scaling up MDG expenditures (Seth, 2007) is shown in the fiscal space diamond (see box) The four sides of the diamond represent (i) enhancing domestic revenues from tax and non-tax sources; (ii) Official Development Assistance (ODA) including grants, concessional loans and debt relief; (iii) reprioritisation of expenditures and enhancing their allocative and technical efficiency; and (iv) financing public expenditures by borrowing from domestic and international sources.
Although the private sector cannot be a predominant source to finance MDGs, it
is important to augment it both for efficiency and accountability reasons. Households, particularly economically affluent ones, can be a potential source of financing MDGs. Making such households to pay for services will help to reduce the gap between the need and capacity of the government to invest. Typically, households pay to access MDG goods and services such as water, health, and education services, which are produced in both the public and private sectors. Payments made by households to the public sector take two forms: households pay out of pocket directly to public sector agencies (such as water and waste management agencies); alternatively household payments go directly to the government budget as is the case with targeted or universal cash recovery programmes.

6
The Fiscal Space Diamond* The fiscal space diamond has four ‘pillars’ that collectively constitute the universe of avenues to secure fiscal space. The diamond is created by putting the four pillars together in Cartesian space, with the area of the diamond representing the aggregate fiscal space available in the country. The diamond does not include seignorage which is not commonly considered to be a desirable option. Governments can create fiscal space through the following types of fiscal instruments: 1) Official Development Assistance (ODA) through aid and debt relief 2) Domestic revenue mobilization through improved tax administration or tax policy reforms 3) Deficit financing through domestic and external borrowing 4) Reprioritization and raising efficiency of expenditures The diamond is constructed by (a) mapping the four pillars, one on each axis, with the total resources available under each head representing a point on the axis; (b) joining the points. It is of course possible to design different variations of this generic diamond. For example if one were to calculate the grant element of a concessional loan then that part of the loan could be put under the aid pillar with the balance under the loan pillar. The diamond can be constructed in incremental or absolute terms. * Development Committee 2006
When households finance a portion of publicly provided goods and services (not
through fees and charges going to central government revenue), but through public sector agencies providing goods and services, the financing gap will narrow. In order to identify which goods and services have been financed by the households and not reflected in government revenues, a thorough study at the country level is needed. Besides, households’ ability (affordability) to contribute to MDG goods and services needs to be examined to design an MDG consistent financing strategy.
1. Official Development Assistance (% of GDP)
3. Deficit Financing (% of GDP)
2. Domestic Revenues Mobilization (% of GDP)
4. Reprioritization & Efficiency of Expenditures (% of GDP)
7
To sum up, the fiscal diamond1 is a diagnostic tool that assesses the major sources of public finance available to countries. The diamond illustrates the scope for a government to (a) generate fiscal savings from improved allocative and technical efficiency of existing spending; and (b) to raise additional fiscal resources from new revenue measures, additional aid, or new borrowing. To the extent that a country already raises a significant amount in revenue, has a high initial stock of debt, or receives high aid inflows, the scope to raise additional revenue from any of these sources would be small. Conversely, the lower the allocative and technical efficiency of the existing expenditures and the larger the volume of such spending, the greater would be the scope for efficiency gains as a source of fiscal space. The scope for additional aid or borrowing could, in principle, be estimated with reference to donor commitments or debt sustainability analysis. III. Financing Requirements for MDGs and Proposed Investments in
the Tenth Plan
Bhutan’s Millennium Development Goals Needs Assessment Report (2007)
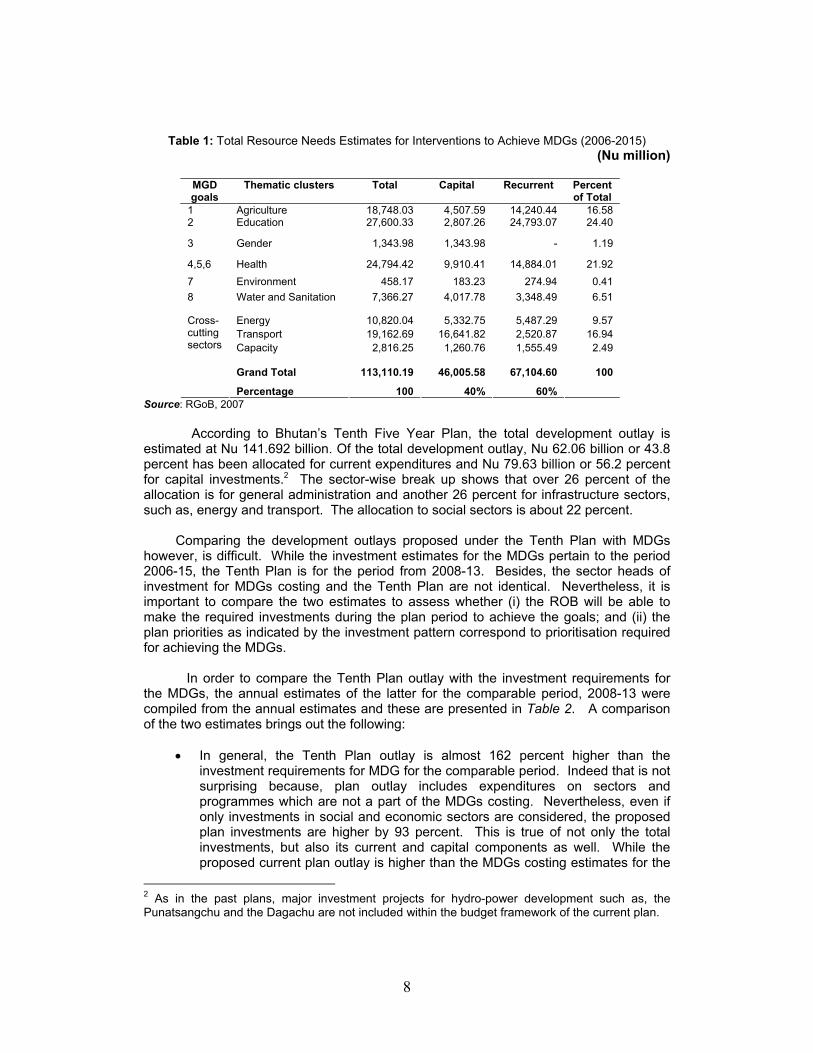
estimated that between 2006 and 2015, the country will need to invest approximately Nu. 113.110 billion (USD 2.5 billion) in 2005 prices to implement interventions identified for achieving the MDGs (Table 1). These estimates represent on average Nu 17,815 ($394) per capita annually or Nu 178,146 ($3,937) per capita for the next ten years from 2006-2015.
As identified by the Needs Assessment Report, investment needs are highest for
the social sectors. Investment requirements for the education sector constitute almost a quarter of total investment needs and requirement for health is 21.9 percent. Investment needs for infrastructure (transport & energy) comprise 26.5 percent of total investment needs followed by agriculture and rural development (16.6 percent). Collectively, these four sectors account for 89.4 percent of total MDG investment needs. The analysis also shows that about 60 percent of total investment requirements will be required for recurrent expenditures and capital investment requirements will be 40 percent.
As mentioned earlier, the Royal Government of Bhutan has fully subscribed to the MDGs and has made considerable attempts to reinforce the development process towards achieving the MDG goals. As the Tenth Plan period covers the period up to 2013 and leaves out only the last two years of the MDG period, the investment made during this plan is critical to achieving the MDG goals. It is therefore, important to examine the plan outlay juxtaposed to the investment requirements for achieving the MDGs.
1 See Report prepared for the Development Committee of the World Bank and IMF, “Fiscal policy for growth and development: further analysis and lessons learnt from country case studies”, 2007.
8
Table 1: Total Resource Needs Estimates for Interventions to Achieve MDGs (2006-2015) (Nu million)
MGD goals
Thematic clusters
Total Capital Recurrent Percent of Total
1 Agriculture 18,748.03 4,507.59 14,240.44 16.58 2 Education 27,600.33 2,807.26 24,793.07 24.40
3 Gender 1,343.98 1,343.98 - 1.19
4,5,6 Health 24,794.42 9,910.41 14,884.01 21.92 7 Environment 458.17 183.23 274.94 0.41 8 Water and Sanitation 7,366.27 4,017.78 3,348.49 6.51
Energy 10,820.04 5,332.75 5,487.29 9.57 Transport 19,162.69 16,641.82 2,520.87 16.94 Capacity
2,816.25 1,260.76
1,555.49
2.49
Grand Total 113,110.19 46,005.58 67,104.60 100
Cross- cutting sectors
Percentage 100 40% 60% Source: RGoB, 2007
According to Bhutan’s Tenth Five Year Plan, the total development outlay is
estimated at Nu 141.692 billion. Of the total development outlay, Nu 62.06 billion or 43.8 percent has been allocated for current expenditures and Nu 79.63 billion or 56.2 percent for capital investments.2 The sector-wise break up shows that over 26 percent of the allocation is for general administration and another 26 percent for infrastructure sectors, such as, energy and transport. The allocation to social sectors is about 22 percent.
Comparing the development outlays proposed under the Tenth Plan with MDGs
however, is difficult. While the investment estimates for the MDGs pertain to the period 2006-15, the Tenth Plan is for the period from 2008-13. Besides, the sector heads of investment for MDGs costing and the Tenth Plan are not identical. Nevertheless, it is important to compare the two estimates to assess whether (i) the ROB will be able to make the required investments during the plan period to achieve the goals; and (ii) the plan priorities as indicated by the investment pattern correspond to prioritisation required for achieving the MDGs.
In order to compare the Tenth Plan outlay with the investment requirements for
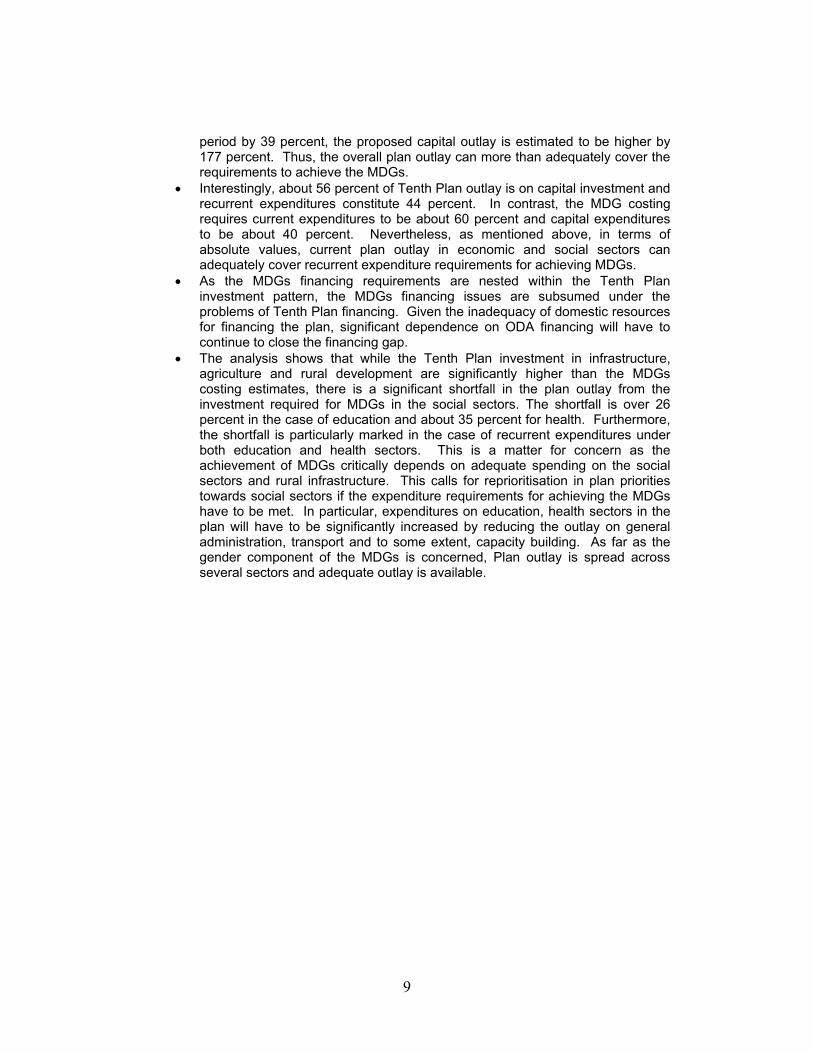
the MDGs, the annual estimates of the latter for the comparable period, 2008-13 were compiled from the annual estimates and these are presented in Table 2. A comparison of the two estimates brings out the following:
• In general, the Tenth Plan outlay is almost 162 percent higher than the
investment requirements for MDG for the comparable period. Indeed that is not surprising because, plan outlay includes expenditures on sectors and programmes which are not a part of the MDGs costing. Nevertheless, even if only investments in social and economic sectors are considered, the proposed plan investments are higher by 93 percent. This is true of not only the total investments, but also its current and capital components as well. While the proposed current plan outlay is higher than the MDGs costing estimates for the
2 As in the past plans, major investment projects for hydro-power development such as, the Punatsangchu and the Dagachu are not included within the budget framework of the current plan.
9
period by 39 percent, the proposed capital outlay is estimated to be higher by 177 percent. Thus, the overall plan outlay can more than adequately cover the requirements to achieve the MDGs.
• Interestingly, about 56 percent of Tenth Plan outlay is on capital investment and recurrent expenditures constitute 44 percent. In contrast, the MDG costing requires current expenditures to be about 60 percent and capital expenditures to be about 40 percent. Nevertheless, as mentioned above, in terms of absolute values, current plan outlay in economic and social sectors can adequately cover recurrent expenditure requirements for achieving MDGs.
• As the MDGs financing requirements are nested within the Tenth Plan investment pattern, the MDGs financing issues are subsumed under the problems of Tenth Plan financing. Given the inadequacy of domestic resources for financing the plan, significant dependence on ODA financing will have to continue to close the financing gap.
• The analysis shows that while the Tenth Plan investment in infrastructure, agriculture and rural development are significantly higher than the MDGs costing estimates, there is a significant shortfall in the plan outlay from the investment required for MDGs in the social sectors. The shortfall is over 26 percent in the case of education and about 35 percent for health. Furthermore, the shortfall is particularly marked in the case of recurrent expenditures under both education and health sectors. This is a matter for concern as the achievement of MDGs critically depends on adequate spending on the social sectors and rural infrastructure. This calls for reprioritisation in plan priorities towards social sectors if the expenditure requirements for achieving the MDGs have to be met. In particular, expenditures on education, health sectors in the plan will have to be significantly increased by reducing the outlay on general administration, transport and to some extent, capacity building. As far as the gender component of the MDGs is concerned, Plan outlay is spread across several sectors and adequate outlay is available.
10
Table 2: Cost of Financing MDGs Compared with Tenth Plan Outlay (Mn. Nu)
Thematic clusters
Expenditure requirements for MDGs Proposed Tenth Plan Outlay
Current Capital Total Current Capital Total
Excess of
Tenth Plan
Outlay over
MDGs costing
Agriculture 6533.6 2024.7 8558.4 6193.6 7947.3 14140.9 65.2 Education 11690.7 1102.2 12792.9 1945.8 7452.0 9397.7 -26.5 Gender 612.4 0.0 612.4 10.0 57.9 67.9 -88.9 Health 7113.4 5220.6 12334.0 3570.4 4469.7 8040.1 -34.8 Environment 254.8 175.0 429.8 * * * na Water and Sanitation
1978.2 1617.9 3596.2 * * * na
Energy 2634.1 2418.3 5052.5 3748.4 4809.8 8558.2 69.4 Transport 1193.7 7958.1 9151.8 12747.2 16356.4 29103.6 218.0 Capacity Building
794.1 734.2 1528.3 1210.3 5015.6 6225.8 307.4
Gen. Admini-stration
* * * 16203.9 20791.9 36995.8 na
Grand Total 32805.2 21251.1 54056.3 62060.2 79632.0 141692.2 162.1 Note: * denotes that the expenditures are included under other heads. Na – Not available. Source: 1.Tenth Five Year Plan (Draft) GNH Commission, February 2008.
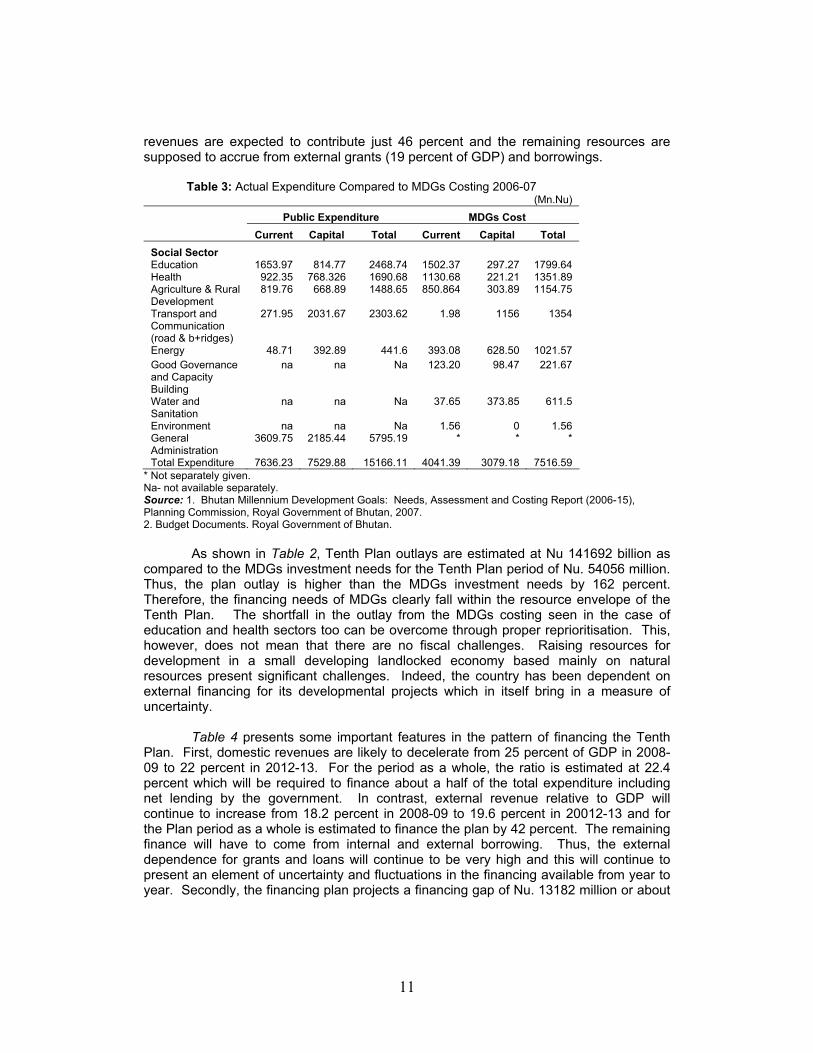
2.Bhutan Millennium Development Goals: Needs, Assessment and Costing Report (2006-15), November 2007. The feasibility of financing MDGs is reinforced by comparing the actual
expenditures incurred in 2006-07 with the MDG cost estimates. The comparison presented in Table 3 shows that total expenditure in 2006-07 was almost double of what was required to spend for MDGs. Both recurrent and capital expenditures exceeded the MDGs costing estimates by a significant margin. In terms of important individual sectors except in the case of recurrent expenditures in the health sector, actual expenditures exceeded the required level. Of course, in the case of energy, significant volume of investment is made by the corporation and therefore, actual expenditure is lower.
Thus, MDGs financing needs are nested in the Tenth Plan outlays, and therefore,
a study on financing the MDGs for Bhutan is effectively a study on financing for the Tenth Plan. That is, a study on identifying how the resource gap of the Tenth Plan can be closed. Clearly, securing investments for implementing the Tenth Plan will be a critical factor in ensuring that the country is able to achieve poverty targets that are reflected in the MDGs.
Indeed, the reliance on ODA to finance capital investment is explicitly stated in
the Tenth Plan: “Domestic revenues including other receipts are expected to be sufficient to fund only around 46.3 percent of the total plan outlay or around Nu 65.6 billion. While Bhutan has become increasingly more self reliant over successive plan periods in being able to meet a larger share of its development expenditures, the country will still require external assistance grants of around Nu 56 billion to help meet its capital expenditures in the Tenth Plan” (p. 63). The pattern of plan financing shown in Table 3 shows that total plan outlay during the Tenth Plan is estimated at over 28 percent of GDP and domestic
11
revenues are expected to contribute just 46 percent and the remaining resources are supposed to accrue from external grants (19 percent of GDP) and borrowings.
Table 3: Actual Expenditure Compared to MDGs Costing 2006-07 (Mn.Nu)
Public Expenditure MDGs Cost Current Capital Total Current Capital Total Social Sector Education 1653.97 814.77 2468.74 1502.37 297.27 1799.64 Health 922.35 768.326 1690.68 1130.68 221.21 1351.89 Agriculture & Rural Development
819.76 668.89 1488.65 850.864 303.89 1154.75
Transport and Communication (road & b+ridges)
271.95 2031.67 2303.62 1.98 1156 1354
Energy 48.71 392.89 441.6 393.08 628.50 1021.57 Good Governance and Capacity Building
na na Na 123.20 98.47 221.67
Water and Sanitation
na na Na 37.65 373.85 611.5
Environment na na Na 1.56 0 1.56 General Administration
3609.75 2185.44 5795.19 * * *
Total Expenditure 7636.23 7529.88 15166.11 4041.39 3079.18 7516.59 * Not separately given. Na- not available separately. Source: 1. Bhutan Millennium Development Goals: Needs, Assessment and Costing Report (2006-15), Planning Commission, Royal Government of Bhutan, 2007. 2. Budget Documents. Royal Government of Bhutan.
As shown in Table 2, Tenth Plan outlays are estimated at Nu 141692 billion as
compared to the MDGs investment needs for the Tenth Plan period of Nu. 54056 million. Thus, the plan outlay is higher than the MDGs investment needs by 162 percent. Therefore, the financing needs of MDGs clearly fall within the resource envelope of the Tenth Plan. The shortfall in the outlay from the MDGs costing seen in the case of education and health sectors too can be overcome through proper reprioritisation. This, however, does not mean that there are no fiscal challenges. Raising resources for development in a small developing landlocked economy based mainly on natural resources present significant challenges. Indeed, the country has been dependent on external financing for its developmental projects which in itself bring in a measure of uncertainty.
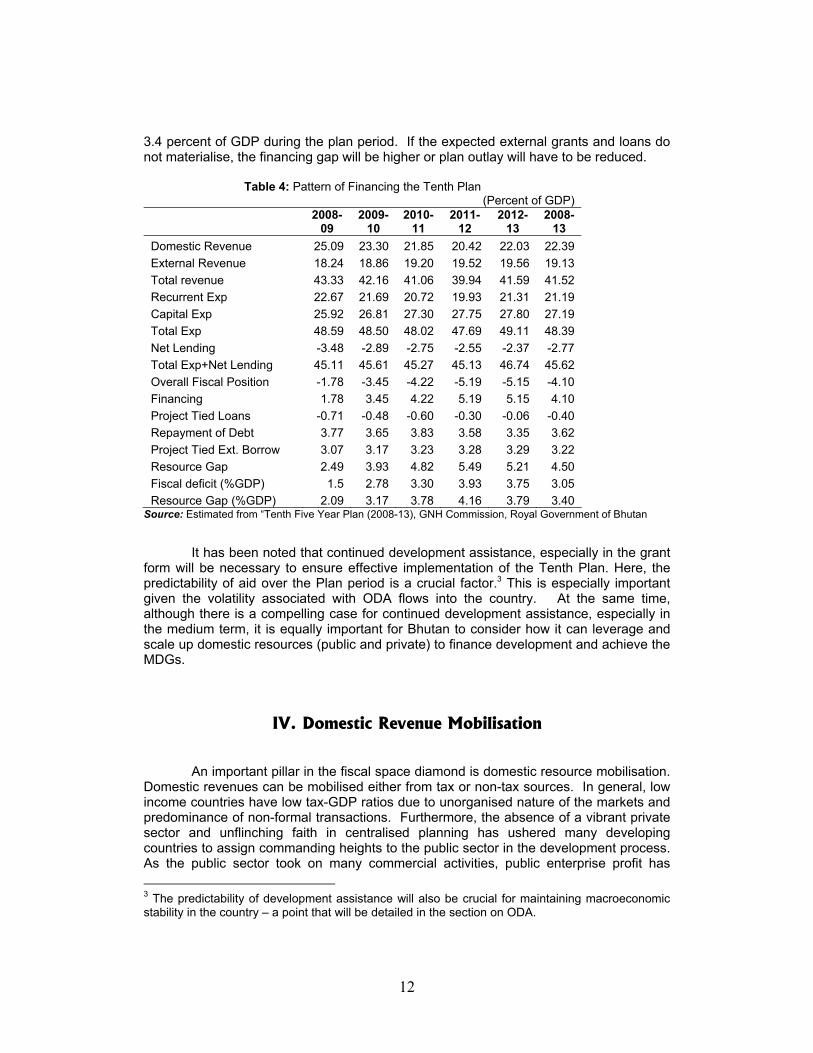
Table 4 presents some important features in the pattern of financing the Tenth
Plan. First, domestic revenues are likely to decelerate from 25 percent of GDP in 2008-09 to 22 percent in 2012-13. For the period as a whole, the ratio is estimated at 22.4 percent which will be required to finance about a half of the total expenditure including net lending by the government. In contrast, external revenue relative to GDP will continue to increase from 18.2 percent in 2008-09 to 19.6 percent in 20012-13 and for the Plan period as a whole is estimated to finance the plan by 42 percent. The remaining finance will have to come from internal and external borrowing. Thus, the external dependence for grants and loans will continue to be very high and this will continue to present an element of uncertainty and fluctuations in the financing available from year to year. Secondly, the financing plan projects a financing gap of Nu. 13182 million or about
12
3.4 percent of GDP during the plan period. If the expected external grants and loans do not materialise, the financing gap will be higher or plan outlay will have to be reduced.
Table 4: Pattern of Financing the Tenth Plan
(Percent of GDP)
2008-
09 2009-
10 2010-
11 2011-
12 2012-
13 2008-
13 Domestic Revenue 25.09 23.30 21.85 20.42 22.03 22.39 External Revenue 18.24 18.86 19.20 19.52 19.56 19.13 Total revenue 43.33 42.16 41.06 39.94 41.59 41.52 Recurrent Exp 22.67 21.69 20.72 19.93 21.31 21.19 Capital Exp 25.92 26.81 27.30 27.75 27.80 27.19 Total Exp 48.59 48.50 48.02 47.69 49.11 48.39 Net Lending -3.48 -2.89 -2.75 -2.55 -2.37 -2.77 Total Exp+Net Lending 45.11 45.61 45.27 45.13 46.74 45.62 Overall Fiscal Position -1.78 -3.45 -4.22 -5.19 -5.15 -4.10 Financing 1.78 3.45 4.22 5.19 5.15 4.10 Project Tied Loans -0.71 -0.48 -0.60 -0.30 -0.06 -0.40 Repayment of Debt 3.77 3.65 3.83 3.58 3.35 3.62 Project Tied Ext. Borrow 3.07 3.17 3.23 3.28 3.29 3.22 Resource Gap 2.49 3.93 4.82 5.49 5.21 4.50 Fiscal deficit (%GDP) 1.5 2.78 3.30 3.93 3.75 3.05 Resource Gap (%GDP) 2.09 3.17 3.78 4.16 3.79 3.40
Source: Estimated from “Tenth Five Year Plan (2008-13), GNH Commission, Royal Government of Bhutan
It has been noted that continued development assistance, especially in the grant form will be necessary to ensure effective implementation of the Tenth Plan. Here, the predictability of aid over the Plan period is a crucial factor.3 This is especially important given the volatility associated with ODA flows into the country. At the same time, although there is a compelling case for continued development assistance, especially in the medium term, it is equally important for Bhutan to consider how it can leverage and scale up domestic resources (public and private) to finance development and achieve the MDGs.
IV. Domestic Revenue Mobilisation
An important pillar in the fiscal space diamond is domestic resource mobilisation. Domestic revenues can be mobilised either from tax or non-tax sources. In general, low income countries have low tax-GDP ratios due to unorganised nature of the markets and predominance of non-formal transactions. Furthermore, the absence of a vibrant private sector and unflinching faith in centralised planning has ushered many developing countries to assign commanding heights to the public sector in the development process. As the public sector took on many commercial activities, public enterprise profit has 3 The predictability of development assistance will also be crucial for maintaining macroeconomic stability in the country – a point that will be detailed in the section on ODA.
13
became an important instrument of resource mobilisation. Despite market reforms, many of the prices continue to be determined through administrative fiat instead of markets and many of the enterprises continue to be public monopolies, thus blurring the distinction between tax and public enterprise profits. Thus, generation of fiscal space for MDGs entails understanding of revenue mobilisation from both tax and non-tax revenue sources.
A government can enhance fiscal space by reforming the tax system. Tax system
reforms include reforms in both structure of the tax and its administration. Reforms to enhance fiscal space for the MDGs would need to weigh the benefits of incremental financing for public services against the economic distortions of the tax. Generally, tax policies and systems vary largely from country to country, reflecting different socio-political histories, levels of development and size of the formal economy and tax-collection capacities. The heterogeneity of tax systems and performances among countries require detailed assessments at the country level since the level of development, the size of the formal economy, trade openness and other structural factors determine the tax base (i.e. the tax potential a government can expect to collect).4
The structure of the tax system also plays a role in determining the progressivity
of tax and transfer policies. Progressive taxation can foster inclusive growth through redistribution. It is important to collect tax revenues mainly from the better off sections of society. However, calibration of tax policy to reduce the income of the rich by itself may not increase the incomes of the poor. It has often been suggested that the expenditure side of the budget –not tax policy- should be a primary redistributive tool (Bird and Zolt, 2006; Tanzi, 1998). Some studies argue that taxation as tool to reduce inequalities has limitations due to adverse incentives and evasion possibilities from high tax rates. A review of existing studies on tax incidence in 36 countries (Chu et al., 2000) suggests that the redistributive effects of the taxes are not as large in developing countries as they are in industrialised countries. The ineffectiveness of tax policy to achieve better distribution outcomes has two policy implications: (1) tax policy does not represent a major instrument for fostering inclusive growth and this has to be achieved mainly through public expenditure policies; (2) nonetheless, financing of public expenditures will have to come from taxing relatively better off sections of society and therefore, detailed analysis of the incidence of taxation is important to improve the progressivity of the tax system over the long run and to minimise the burden of incremental taxation on the poor.
The efficiency of generating tax revenues depends on a number of factors, such
as the extent and structure of GDP growth, tax rates and the quality of tax administration including the technology employed and the information system. As income levels increase, tax revenues are also expected to increase. However, this relationship may not be very strong in many Asian Pacific countries because a sizable part of the growth in many of these economies comes from the informal sector which is outside of the formal tax net. 4.1. Sources of Domestic Revenues
In Bhutan, the government mobilises domestic revenues from tax and non-tax sources (Box 2). In 2006, of the total domestic revenues, 37 percent was collected from
4 The tax effort of a government can be assessed by looking at the difference between the expected and the actual ratio of tax to GDP (Chambas et al., 2006).

14
tax revenues and 63 percent from non-tax sources (Table 5). The direct taxes contributed 23 percent of total domestic revenues and the contribution of indirect taxes was 14.3 percent of domestic revenues. Over 67 percent of direct tax collections or more than 15 percent of domestic revenues accrued from corporation income tax and the contributions of other major taxes such as business income tax and personal income tax in domestic revenues were 3.65 percent and 1.73 percent respectively. As far as indirect taxes are concerned, sales tax and excise duty are the most important sources. In 2006, they respectively contributed 7.59 percent and 5.15 percent of the domestic revenues.
The tax system in Bhutan is of recent vintage. Prior to 1960, Bhutan did not have
a proper tax system and taxes were collected in kind mainly due to the predominance of informal economy and absence of a well orchestrated revenue mobilisation policy for development. With the launch of the Five Year Plan in 1961, taxes were levied on land, business income and consumption. The first major tax reform was in 1989 which was revisited in 1992. In 2000, sales tax, customs duty and excise duty acts were enacted. In 2001, in Income-tax Act was enacted
Box 2: Domestic Revenues in Bhutan Tax Revenue Non-Tax Revenue
Direct Tax • Corporate income tax • Business income tax • Personal income tax • Other tax revenue
Indirect Tax • Sales tax • Export tax • Excise duty • Import duty • Royalty • Other indirect tax revenue
• Administrative fees and charges • Capital revenue • Revenue from government
departments • Dividends • Transfer of profits • Interest on loan from corporations • Other non-tax revenue
Corporate income tax (CIT) is levied at 30 percent on the net profits of the
companies incorporated under the Companies’ Act, 2000 and registered with the Ministry of Trade and Industry (MTI). There are 65 units registered under the CIT and the most important of them are in the public sector. Business Income Tax (BIT) is levied on all unincorporated businesses registered with MTI with an investment exceeding Nu. 10000. Although there are 10088 such units registered under BIT the revenue collection is not very significant. Poor information system impacts adversely on the compliance of tax by these small businesses. In fact, only 10 percent of the BIT payers are assessed on the basis of their actual business incomes and the remaining 90 percent pay presumptive tax based on the tax paid during the past three years, import-export figures available with the department, tax paid by similar units in similar locations and third party information. Personal income tax is collected on income from various sources. The exemption limit for PIT is Nu. 10000 and the tax is levied at four rates ranging from 10 percent to 25 percent.
As mentioned above, customs duty, sales tax and excise duty are the three
important indirect taxes. Bhutan sources a bulk of its imports from India and under a bilateral treaty the imports from India are exempt from customs duty. Therefore, in 2006, it contributed just about 1.4 percent of the domestic revenue. Initially sales tax was levied mainly on imports from India which were exempted from customs duty. Later on,
15
this has been extended to imports from all countries. In addition, selected domestic goods and services are also subjected to the tax. The schedule of rates is given in Annexure I. It is seen from the schedule that the coverage of the tax remains narrow and the poor information system and administrative capacity have rendered the base narrower. Excise duty is levied on alcoholic beverages ranging from 20 percent to 60 percent.
Unlike many other developing countries, non-tax revenues in Bhutan are
predominant constituting almost two-thirds of domestic revenue. Major contribution to revenue comes from the transfer of profits and dividends from various government companies including CHPC. Almost 60 percent of the domestic revenues are generated by the dividends and profits of government companies and the Hydroelectric Corporation which generates and exports electricity to India, is a major contributor. In fact, sharp increases in non-tax revenues in certain years correspond to the commissioning of major hydroelectric projects.
4.2. Level, Growth and Composition of Revenues
Table 5 presents the growth rate of revenues from domestic – both tax and non-
tax and foreign sources in Bhutan over the period from 1995-96 to 2006-07. The analysis of revenues shows a sharp deceleration in the annual growth rate of aggregate revenues from 16 percent during 1995-2001 to 12 percent during 2001-07. This was mainly due to the deceleration in the domestic revenues from about 20 percent per annum during the first sub-period to less than 12 percent in the latter period. The revenue from foreign sources, by contrast grew steadily at about 12 percent. As the GDP growth rate was faster, particularly during the latter period, aggregate revenue relative to GDP declined from 43.9 percent in 1995-96 to 26.7 percent in 2002-03 before recovering to 38.8 percent in 2006-07 (Table 6). In fact, the average revenue – GDP ratio during 1995-2001 was significantly higher than the ratio during 2001-07.
Disaggregated analysis of the trend in various sources of revenue shows that the
growth of domestic revenues declined to 12 percent during 2001-07 from almost 20 percent during the previous sub-period. The acceleration in the growth of foreign revenues during the second sub-period was not sufficient to offset the deceleration in domestic revenues and consequently, aggregate revenues relative to GDP declined by four percentage points from 16 percent during 1995-2000 to 12 percent during 2000-06. The decline in the growth of domestic revenues was mainly due to the sharp deceleration in the tax revenues from 20.7 percent during 1995-2000 to 10.2 percent during 2000-07. However, non-tax revenues continued to register very high growth rate – almost 17.7 percent per annum, thanks to the revenue from hydroelectric generation. Consequently, the share of non-tax revenues in domestic revenues increased steadily and in 2006-07, it constituted almost two-thirds. Tax revenues constituted just one-third of the total domestic revenue.
The tax-GDP ratio during the last decade increased from 7.5 percent in 1996-97
to 10.8 percent in 1999-00, but thereafter it fluctuated between 8.3 percent in 2003-04 and 10.5 percent in 2001-02. In the last year of observation, it declined by three percentage points to 9.2 percent. Thus (i) the tax ratio instead of increasing with development has shown a decline; (ii) the tax ratio has shown very high degree of volatility from one year to another; and (iii) there is considerable untapped potential amounting to 3-4 percentage points. It is therefore important to undertake reforms to
16
enhance revenue productivity of the tax system and to make the tax system responsive to changes in incomes.
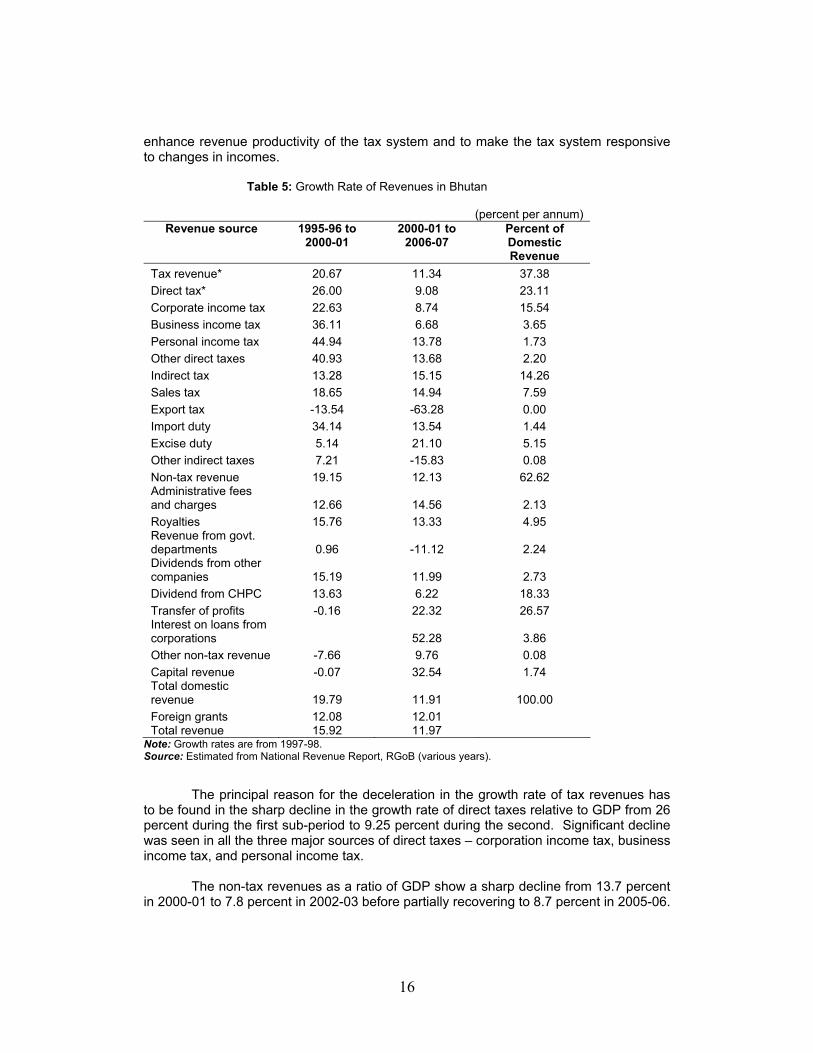
Table 5: Growth Rate of Revenues in Bhutan
(percent per annum)
Revenue source 1995-96 to 2000-01
2000-01 to 2006-07
Percent of Domestic Revenue
Tax revenue* 20.67 11.34 37.38 Direct tax* 26.00 9.08 23.11 Corporate income tax 22.63 8.74 15.54 Business income tax 36.11 6.68 3.65 Personal income tax 44.94 13.78 1.73 Other direct taxes 40.93 13.68 2.20 Indirect tax 13.28 15.15 14.26 Sales tax 18.65 14.94 7.59 Export tax -13.54 -63.28 0.00 Import duty 34.14 13.54 1.44 Excise duty 5.14 21.10 5.15 Other indirect taxes 7.21 -15.83 0.08 Non-tax revenue 19.15 12.13 62.62 Administrative fees and charges 12.66 14.56 2.13 Royalties 15.76 13.33 4.95 Revenue from govt. departments 0.96 -11.12 2.24 Dividends from other companies 15.19 11.99 2.73 Dividend from CHPC 13.63 6.22 18.33 Transfer of profits -0.16 22.32 26.57 Interest on loans from corporations 52.28 3.86 Other non-tax revenue -7.66 9.76 0.08 Capital revenue -0.07 32.54 1.74 Total domestic revenue 19.79 11.91 100.00 Foreign grants 12.08 12.01 Total revenue 15.92 11.97
Note: Growth rates are from 1997-98. Source: Estimated from National Revenue Report, RGoB (various years).
The principal reason for the deceleration in the growth rate of tax revenues has to be found in the sharp decline in the growth rate of direct taxes relative to GDP from 26 percent during the first sub-period to 9.25 percent during the second. Significant decline was seen in all the three major sources of direct taxes – corporation income tax, business income tax, and personal income tax.
The non-tax revenues as a ratio of GDP show a sharp decline from 13.7 percent
in 2000-01 to 7.8 percent in 2002-03 before partially recovering to 8.7 percent in 2005-06.
17
Thanks to the sharp increase in the revenues from the Tala hydroelectric project in 2006-07, the ratio increased by 6.5 percentage points in one year. Thus (i) the revenues from the various projects do not have built in flexibility; and decline over time; and (ii) the increases in revenues are in spurts depending on the commissioning of various projects.
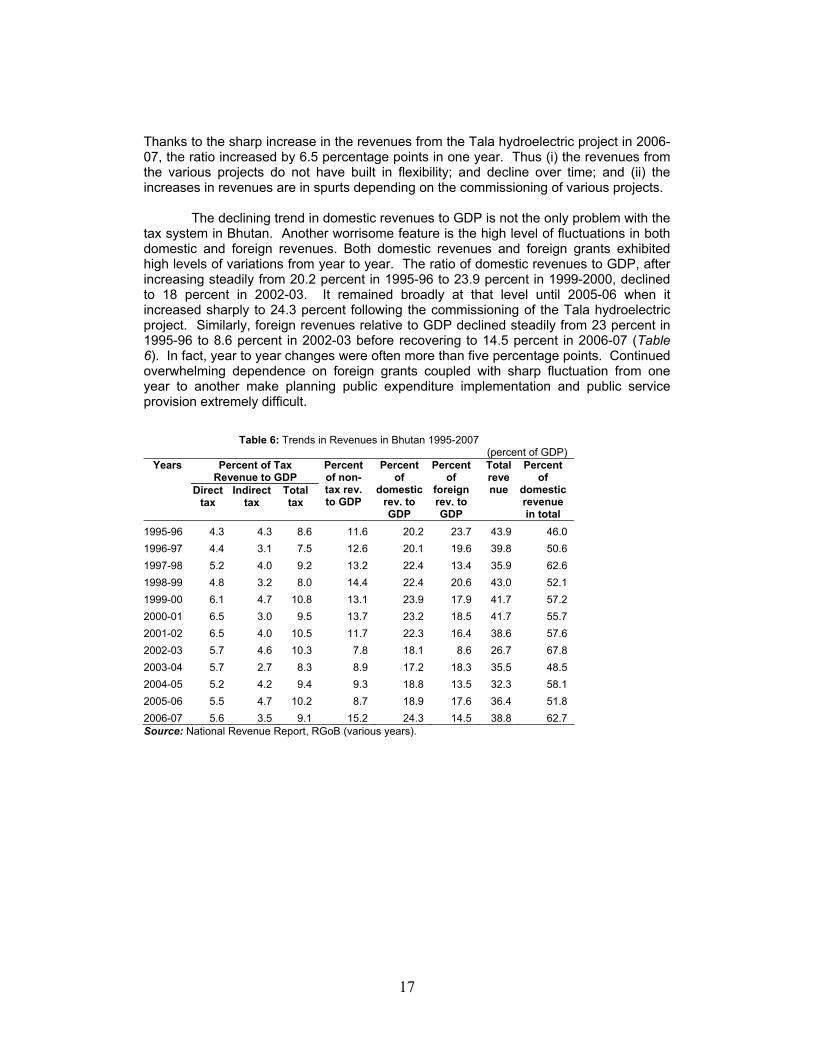
The declining trend in domestic revenues to GDP is not the only problem with the
tax system in Bhutan. Another worrisome feature is the high level of fluctuations in both domestic and foreign revenues. Both domestic revenues and foreign grants exhibited high levels of variations from year to year. The ratio of domestic revenues to GDP, after increasing steadily from 20.2 percent in 1995-96 to 23.9 percent in 1999-2000, declined to 18 percent in 2002-03. It remained broadly at that level until 2005-06 when it increased sharply to 24.3 percent following the commissioning of the Tala hydroelectric project. Similarly, foreign revenues relative to GDP declined steadily from 23 percent in 1995-96 to 8.6 percent in 2002-03 before recovering to 14.5 percent in 2006-07 (Table 6). In fact, year to year changes were often more than five percentage points. Continued overwhelming dependence on foreign grants coupled with sharp fluctuation from one year to another make planning public expenditure implementation and public service provision extremely difficult.
Table 6: Trends in Revenues in Bhutan 1995-2007 (percent of GDP)
Percent of Tax Revenue to GDP
Years
Direct tax
Indirect tax
Total tax
Percent of non-tax rev. to GDP
Percent of
domestic rev. to GDP
Percent of
foreign rev. to GDP
Total revenue
Percent of
domestic revenue in total
1995-96 4.3 4.3 8.6 11.6 20.2 23.7 43.9 46.0 1996-97 4.4 3.1 7.5 12.6 20.1 19.6 39.8 50.6 1997-98 5.2 4.0 9.2 13.2 22.4 13.4 35.9 62.6 1998-99 4.8 3.2 8.0 14.4 22.4 20.6 43.0 52.1 1999-00 6.1 4.7 10.8 13.1 23.9 17.9 41.7 57.2 2000-01 6.5 3.0 9.5 13.7 23.2 18.5 41.7 55.7 2001-02 6.5 4.0 10.5 11.7 22.3 16.4 38.6 57.6 2002-03 5.7 4.6 10.3 7.8 18.1 8.6 26.7 67.8 2003-04 5.7 2.7 8.3 8.9 17.2 18.3 35.5 48.5 2004-05 5.2 4.2 9.4 9.3 18.8 13.5 32.3 58.1 2005-06 5.5 4.7 10.2 8.7 18.9 17.6 36.4 51.8 2006-07 5.6 3.5 9.1 15.2 24.3 14.5 38.8 62.7 Source: National Revenue Report, RGoB (various years).
18
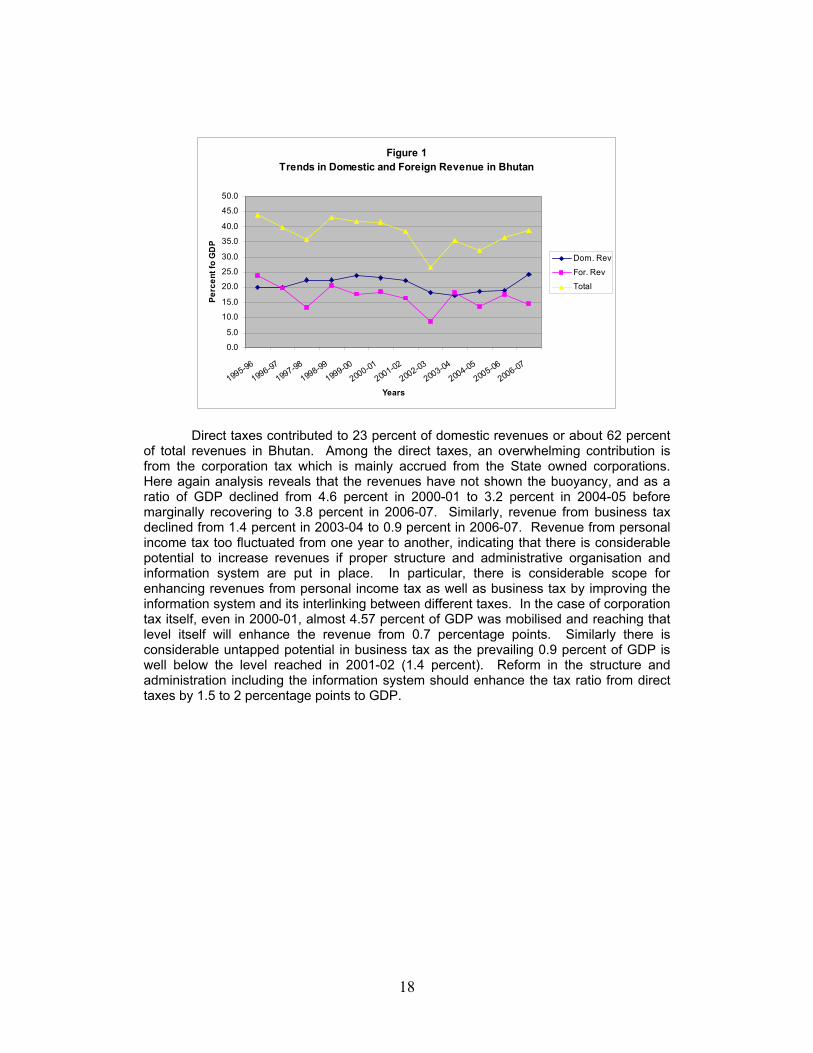
Figure 1Trends in Domestic and Foreign Revenue in Bhutan
0.0
5.0
10.0
15.0
20.0
25.0
30.0
35.0
40.0
45.0
50.0
1995-96
1996-97
1997-98
1998-99
1999-00
2000-01
2001-02
2002-03
2003-04
2004-05
2005-06
2006-07
Years
Perc
ent f
o G
DP
Dom. Rev
For. Rev
Total
Direct taxes contributed to 23 percent of domestic revenues or about 62 percent of total revenues in Bhutan. Among the direct taxes, an overwhelming contribution is from the corporation tax which is mainly accrued from the State owned corporations. Here again analysis reveals that the revenues have not shown the buoyancy, and as a ratio of GDP declined from 4.6 percent in 2000-01 to 3.2 percent in 2004-05 before marginally recovering to 3.8 percent in 2006-07. Similarly, revenue from business tax declined from 1.4 percent in 2003-04 to 0.9 percent in 2006-07. Revenue from personal income tax too fluctuated from one year to another, indicating that there is considerable potential to increase revenues if proper structure and administrative organisation and information system are put in place. In particular, there is considerable scope for enhancing revenues from personal income tax as well as business tax by improving the information system and its interlinking between different taxes. In the case of corporation tax itself, even in 2000-01, almost 4.57 percent of GDP was mobilised and reaching that level itself will enhance the revenue from 0.7 percentage points. Similarly there is considerable untapped potential in business tax as the prevailing 0.9 percent of GDP is well below the level reached in 2001-02 (1.4 percent). Reform in the structure and administration including the information system should enhance the tax ratio from direct taxes by 1.5 to 2 percentage points to GDP.
19
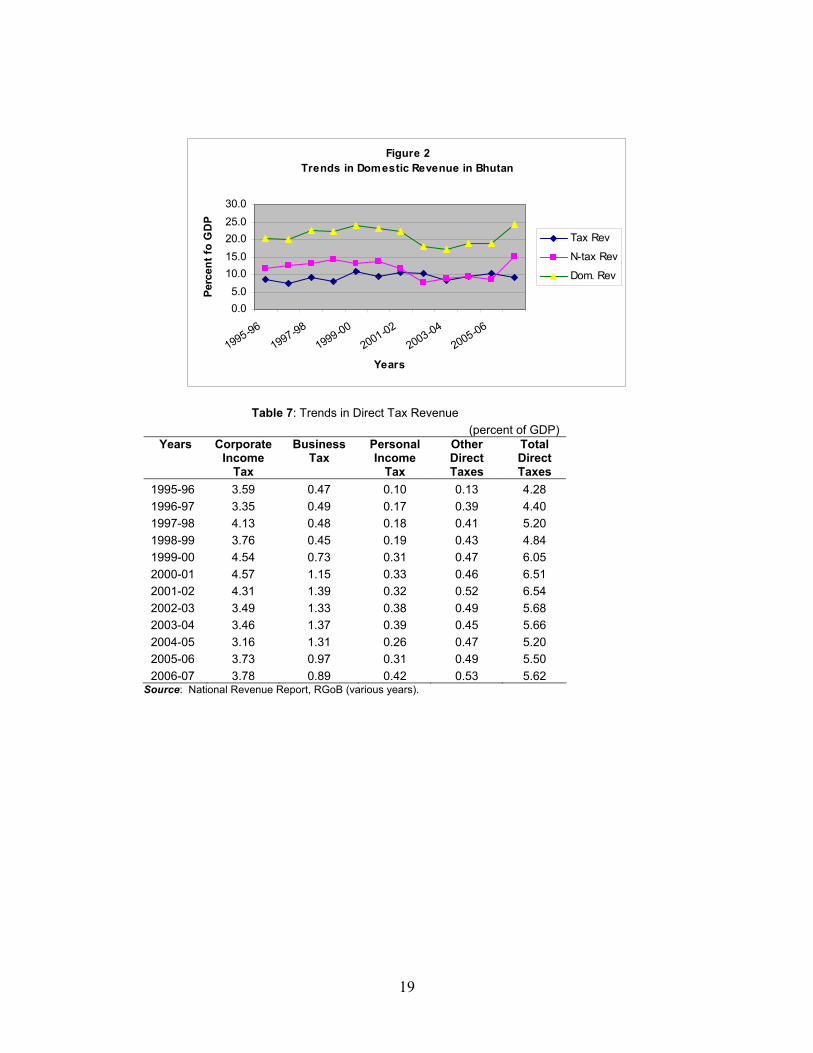
Figure 2Trends in Domestic Revenue in Bhutan
0.05.0
10.015.020.025.030.0
1995-96
1997-98
1999-00
2001-02
2003-04
2005-06
Years
Perc
ent f
o G
DP
Tax Rev
N-tax Rev
Dom. Rev
Table 7: Trends in Direct Tax Revenue (percent of GDP)
Years
Corporate Income
Tax
Business Tax
Personal Income
Tax
Other Direct Taxes
Total Direct Taxes
1995-96 3.59 0.47 0.10 0.13 4.28 1996-97 3.35 0.49 0.17 0.39 4.40 1997-98 4.13 0.48 0.18 0.41 5.20 1998-99 3.76 0.45 0.19 0.43 4.84 1999-00 4.54 0.73 0.31 0.47 6.05 2000-01 4.57 1.15 0.33 0.46 6.51 2001-02 4.31 1.39 0.32 0.52 6.54 2002-03 3.49 1.33 0.38 0.49 5.68 2003-04 3.46 1.37 0.39 0.45 5.66 2004-05 3.16 1.31 0.26 0.47 5.20 2005-06 3.73 0.97 0.31 0.49 5.50 2006-07 3.78 0.89 0.42 0.53 5.62
Source: National Revenue Report, RGoB (various years).
20
Figure 3Trends in Tax Revenue in Bhutan
0.0
2.0
4.0
6.0
8.0
10.0
12.0
1995-96
1997-98
1999-00
2001-02
2003-04
2005-06
Years
Perc
ent o
f GD
P
Total TaxDirect TaxIndirect Tax
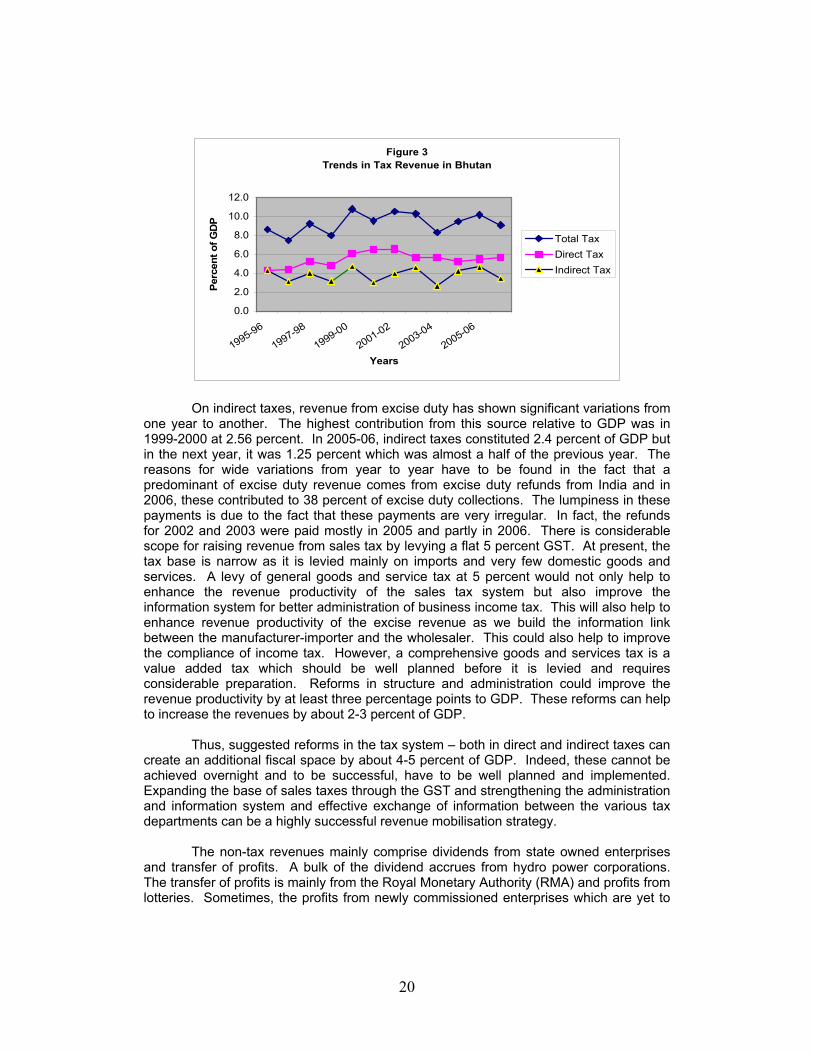
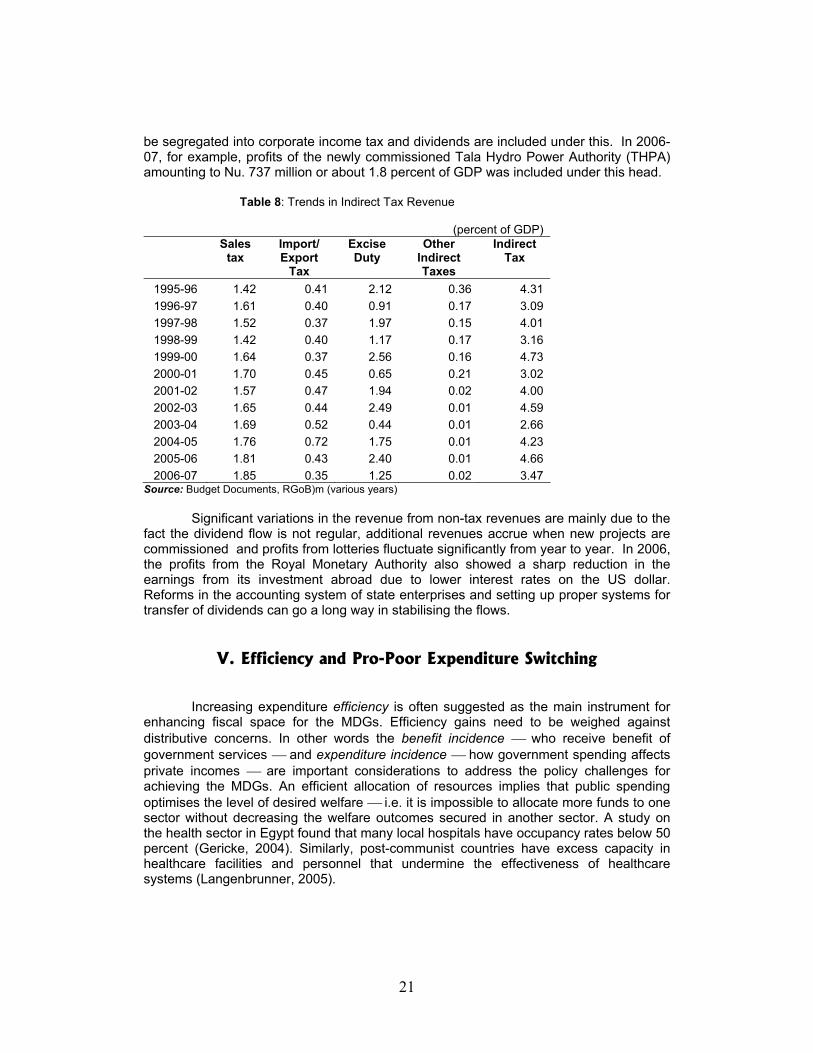
On indirect taxes, revenue from excise duty has shown significant variations from
one year to another. The highest contribution from this source relative to GDP was in 1999-2000 at 2.56 percent. In 2005-06, indirect taxes constituted 2.4 percent of GDP but in the next year, it was 1.25 percent which was almost a half of the previous year. The reasons for wide variations from year to year have to be found in the fact that a predominant of excise duty revenue comes from excise duty refunds from India and in 2006, these contributed to 38 percent of excise duty collections. The lumpiness in these payments is due to the fact that these payments are very irregular. In fact, the refunds for 2002 and 2003 were paid mostly in 2005 and partly in 2006. There is considerable scope for raising revenue from sales tax by levying a flat 5 percent GST. At present, the tax base is narrow as it is levied mainly on imports and very few domestic goods and services. A levy of general goods and service tax at 5 percent would not only help to enhance the revenue productivity of the sales tax system but also improve the information system for better administration of business income tax. This will also help to enhance revenue productivity of the excise revenue as we build the information link between the manufacturer-importer and the wholesaler. This could also help to improve the compliance of income tax. However, a comprehensive goods and services tax is a value added tax which should be well planned before it is levied and requires considerable preparation. Reforms in structure and administration could improve the revenue productivity by at least three percentage points to GDP. These reforms can help to increase the revenues by about 2-3 percent of GDP.
Thus, suggested reforms in the tax system – both in direct and indirect taxes can
create an additional fiscal space by about 4-5 percent of GDP. Indeed, these cannot be achieved overnight and to be successful, have to be well planned and implemented. Expanding the base of sales taxes through the GST and strengthening the administration and information system and effective exchange of information between the various tax departments can be a highly successful revenue mobilisation strategy.
The non-tax revenues mainly comprise dividends from state owned enterprises
and transfer of profits. A bulk of the dividend accrues from hydro power corporations. The transfer of profits is mainly from the Royal Monetary Authority (RMA) and profits from lotteries. Sometimes, the profits from newly commissioned enterprises which are yet to
21
be segregated into corporate income tax and dividends are included under this. In 2006-07, for example, profits of the newly commissioned Tala Hydro Power Authority (THPA) amounting to Nu. 737 million or about 1.8 percent of GDP was included under this head.
Table 8: Trends in Indirect Tax Revenue
(percent of GDP)
Sales tax
Import/ Export
Tax
Excise Duty
Other Indirect Taxes
Indirect Tax
1995-96 1.42 0.41 2.12 0.36 4.31 1996-97 1.61 0.40 0.91 0.17 3.09 1997-98 1.52 0.37 1.97 0.15 4.01 1998-99 1.42 0.40 1.17 0.17 3.16 1999-00 1.64 0.37 2.56 0.16 4.73 2000-01 1.70 0.45 0.65 0.21 3.02 2001-02 1.57 0.47 1.94 0.02 4.00 2002-03 1.65 0.44 2.49 0.01 4.59 2003-04 1.69 0.52 0.44 0.01 2.66 2004-05 1.76 0.72 1.75 0.01 4.23 2005-06 1.81 0.43 2.40 0.01 4.66 2006-07 1.85 0.35 1.25 0.02 3.47
Source: Budget Documents, RGoB)m (various years) Significant variations in the revenue from non-tax revenues are mainly due to the
fact the dividend flow is not regular, additional revenues accrue when new projects are commissioned and profits from lotteries fluctuate significantly from year to year. In 2006, the profits from the Royal Monetary Authority also showed a sharp reduction in the earnings from its investment abroad due to lower interest rates on the US dollar. Reforms in the accounting system of state enterprises and setting up proper systems for transfer of dividends can go a long way in stabilising the flows.
V. Efficiency and Pro-Poor Expenditure Switching
Increasing expenditure efficiency is often suggested as the main instrument for enhancing fiscal space for the MDGs. Efficiency gains need to be weighed against distributive concerns. In other words the benefit incidence who receive benefit of government services and expenditure incidence how government spending affects private incomes are important considerations to address the policy challenges for achieving the MDGs. An efficient allocation of resources implies that public spending optimises the level of desired welfare i.e. it is impossible to allocate more funds to one sector without decreasing the welfare outcomes secured in another sector. A study on the health sector in Egypt found that many local hospitals have occupancy rates below 50 percent (Gericke, 2004). Similarly, post-communist countries have excess capacity in healthcare facilities and personnel that undermine the effectiveness of healthcare systems (Langenbrunner, 2005).
22
The scope for enhancing fiscal space through pro-poor expenditure switching generally appears to be considerable. Yet, this is not to argue that governments should simplistically earmark some percentage of their budgets to basic social services. It is difficult to specify ex ante the size of the potential gains from expenditure reallocation and the sectors where efficiency can be improved. Gupta et. al. (1997) demonstrate that the marginal benefits of education and health spending decrease rapidly. This implies that governments should exercise caution before expanding government expenditure on education and health when the initial level of spending is already high.
Expenditure switching and efficiency-enhancing reforms can, therefore, create fiscal space through a reallocation of resources from lower priority to higher priority (sub) sectors or through productive efficiency gains. It is essential to carefully measure the incidence of public spending on desired development outcomes. This assessment is critical to guide the allocation of expenditures and the budget making process.
Expenditure switching policy and efficiency gains can be a powerful instrument to
enhance fiscal space. The potential for additional fiscal space, however, varies with development for three related reasons: (1) the scope for expenditure switching is determined by the size of the public sector; (2) productive inefficiency can be addressed through long-term capacity development programmes that limit low income countries’ abilities to secure fiscal space through active expenditure switching policy over the short-run; and (3) addressing political economy constraints to reforms is critical to improve distributive inefficiency that often represents a binding constraint to sustainable development (UNDP, 2007).
Improvement in the effectiveness of public expenditure calls for reforms in both
policies and institutions. Policy reforms help to direct expenditures according to the envisaged priorities. Reforms in institutions help to smoothen the processes and help in the implementation and monitoring of expenditure programmes. They are also necessary to ensure greater accountability.
5.1. Trends in Public Expenditures In keeping with the trends in revenues, there has been a sharp deceleration in the growth of expenditures. The annual growth rate of total expenditures decelerated from 20 percent during 1995-2000 to 10 percent during 2001-06 (Table 8). Although the growth of both current and capital expenditures decelerated, the decline was much sharper in the case of the latter, from almost 23 percent during the first sub-period to 8.3 percent in the second. The sharp decline in capital expenditures is a matter of concern though in part, this is due to the corporatisation of hydroelectric projects which are financed outside the budget.

23
Table 9: Public Expenditure Growth in Bhutan (percent)
Average Annual Growth
Rate 1995-2000 Average Annual Growth
Rate 2001-06
Current Capital Total Current Capital Total
I General Services 11.56 41.44 20.55 13.68 15.10 14.25
1 General Public Services 10.11 41.44 19.54 9.96 14.66 11.90
II Social Services 21.49 22.51 22.07 13.94 9.47 11.97 1 Education 28.72 25.48 27.42 12.05 13.59 12.43 2 Health 19.46 20.50 19.79 10.29 5.47 8.08
3 Housing & Public Amenities 4.49 20.46 17.06 59.19 9.42 21.08
4 Religion and Culture Services 19.83 -15.68 8.55 -34.54 0.00 -3.47
III Economic Services 18.77 17.27 17.67 4.80 3.69 3.99
1 Energy Services 13.10 40.30 32.80 -20.65 -26.17 -26.43 2 Agriculture 15.13 -13.50 -1.86 11.71 4.56 8.24
5 Mining & Manufacturing. 5.49 25.47 12.39 20.63 38.75 19.76
8 Transport and Communication 8.97 25.10 15.47 4.23 26.73 22.56
10 Other Economic Services 10.15 8.39 9.52
IV Total Expenditures 16.99 23.21 20.28 12.07 8.29 10.08
Source: Budget Documents, RGoB (various years)
Figure 4Trends in Public Expenditures in Bhutan: Economic Categories
0.010.020.030.040.050.060.0
1995-96
1997-98
1999-00
2001-02
2003-04
2005-06
Years
Perc
ent f
o G
DP
Current
Capital
Total
24
Figure 5Trends in Expenditures: Functional categories
0.0010.0020.0030.0040.0050.0060.00
1995
-96
1997
-98
1999
-00
2001
-02
2003
-04
2005
-06
Year
Perc
ent f
o G
DP
General ServicesSocial ServicesEconomic ServicesTotal
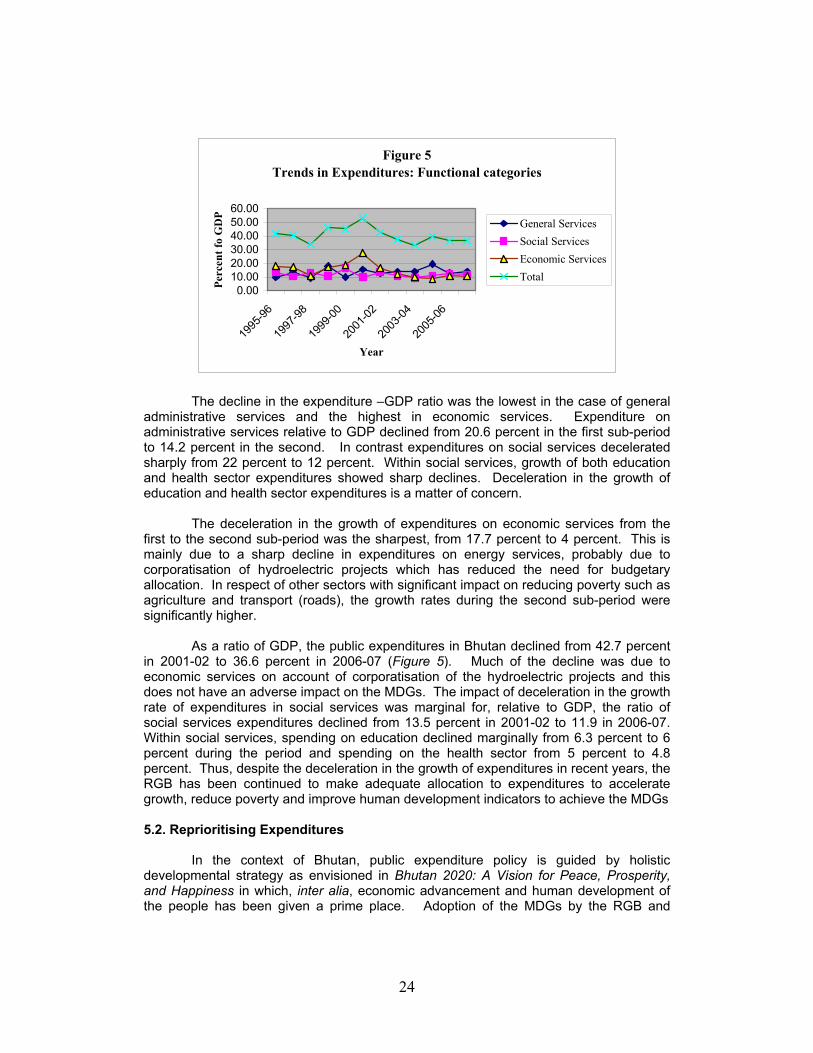
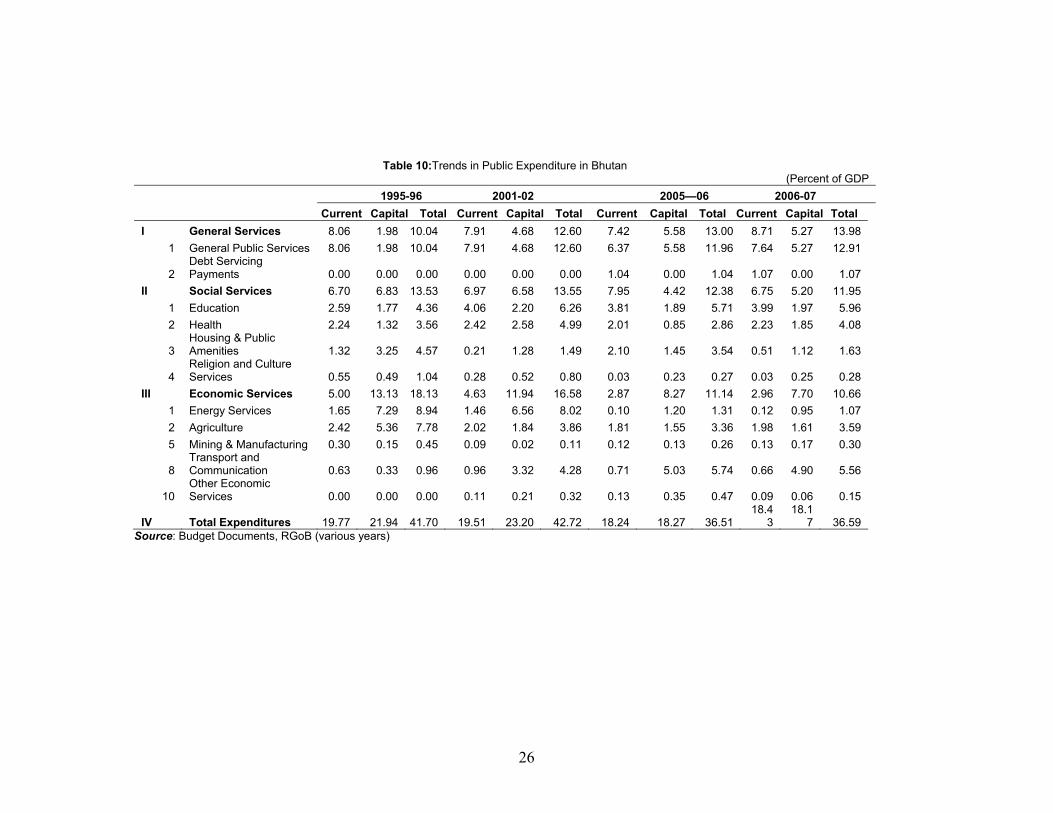
The decline in the expenditure –GDP ratio was the lowest in the case of general administrative services and the highest in economic services. Expenditure on administrative services relative to GDP declined from 20.6 percent in the first sub-period to 14.2 percent in the second. In contrast expenditures on social services decelerated sharply from 22 percent to 12 percent. Within social services, growth of both education and health sector expenditures showed sharp declines. Deceleration in the growth of education and health sector expenditures is a matter of concern. The deceleration in the growth of expenditures on economic services from the first to the second sub-period was the sharpest, from 17.7 percent to 4 percent. This is mainly due to a sharp decline in expenditures on energy services, probably due to corporatisation of hydroelectric projects which has reduced the need for budgetary allocation. In respect of other sectors with significant impact on reducing poverty such as agriculture and transport (roads), the growth rates during the second sub-period were significantly higher.
As a ratio of GDP, the public expenditures in Bhutan declined from 42.7 percent in 2001-02 to 36.6 percent in 2006-07 (Figure 5). Much of the decline was due to economic services on account of corporatisation of the hydroelectric projects and this does not have an adverse impact on the MDGs. The impact of deceleration in the growth rate of expenditures in social services was marginal for, relative to GDP, the ratio of social services expenditures declined from 13.5 percent in 2001-02 to 11.9 in 2006-07. Within social services, spending on education declined marginally from 6.3 percent to 6 percent during the period and spending on the health sector from 5 percent to 4.8 percent. Thus, despite the deceleration in the growth of expenditures in recent years, the RGB has been continued to make adequate allocation to expenditures to accelerate growth, reduce poverty and improve human development indicators to achieve the MDGs 5.2. Reprioritising Expenditures
In the context of Bhutan, public expenditure policy is guided by holistic
developmental strategy as envisioned in Bhutan 2020: A Vision for Peace, Prosperity, and Happiness in which, inter alia, economic advancement and human development of the people has been given a prime place. Adoption of the MDGs by the RGB and

25
alignment of development planning process with the MDGs, to a large extent, determines the public expenditure allocation.
26
Table 10:Trends in Public Expenditure in Bhutan
(Percent of GDP 1995-96 2001-02 2005—06 2006-07 Current Capital Total Current Capital Total Current Capital Total Current Capital TotalI General Services 8.06 1.98 10.04 7.91 4.68 12.60 7.42 5.58 13.00 8.71 5.27 13.98
1 General Public Services 8.06 1.98 10.04 7.91 4.68 12.60 6.37 5.58 11.96 7.64 5.27 12.91
2 Debt Servicing Payments 0.00 0.00 0.00 0.00 0.00 0.00 1.04 0.00 1.04 1.07 0.00 1.07
II Social Services 6.70 6.83 13.53 6.97 6.58 13.55 7.95 4.42 12.38 6.75 5.20 11.95 1 Education 2.59 1.77 4.36 4.06 2.20 6.26 3.81 1.89 5.71 3.99 1.97 5.96 2 Health 2.24 1.32 3.56 2.42 2.58 4.99 2.01 0.85 2.86 2.23 1.85 4.08
3 Housing & Public Amenities 1.32 3.25 4.57 0.21 1.28 1.49 2.10 1.45 3.54 0.51 1.12 1.63
4 Religion and Culture Services 0.55 0.49 1.04 0.28 0.52 0.80 0.03 0.23 0.27 0.03 0.25 0.28
III Economic Services 5.00 13.13 18.13 4.63 11.94 16.58 2.87 8.27 11.14 2.96 7.70 10.66 1 Energy Services 1.65 7.29 8.94 1.46 6.56 8.02 0.10 1.20 1.31 0.12 0.95 1.07 2 Agriculture 2.42 5.36 7.78 2.02 1.84 3.86 1.81 1.55 3.36 1.98 1.61 3.59 5 Mining & Manufacturing 0.30 0.15 0.45 0.09 0.02 0.11 0.12 0.13 0.26 0.13 0.17 0.30
8 Transport and Communication 0.63 0.33 0.96 0.96 3.32 4.28 0.71 5.03 5.74 0.66 4.90 5.56
10 Other Economic Services 0.00 0.00 0.00 0.11 0.21 0.32 0.13 0.35 0.47 0.09 0.06 0.15
IV Total Expenditures 19.77 21.94 41.70 19.51 23.20 42.72 18.24 18.27 36.51 18.4
3 18.1
7 36.59 Source: Budget Documents, RGoB (various years)

27
As shown in Section 3, although the actual allocation of expenditures to various sectors in 2006-07 was higher than the costing done in the MGD Needs Assessment Report, the former includes spending on sectors with no significant impact on the MDGs. More importantly, the estimated allocations in the Tenth Plan for various sectors, although in the aggregate are higher, they are significantly short of the needs in education and health sectors. It is also seen that while the Tenth Plan outlay on capital expenditures are significantly higher than the MDG Needs assessment for the comparable period, there is a significant shortfall in current expenditures. Thus, while there is sufficient provision made for public spending, reorientation of spending allocation is necessary towards social sectors to achieve the MDGs. The shortfall is more in current expenditures which will provide immediate returns in terms of improving education and health standards. Reprioritisation of expenditure allocation towards education and health sectors from the plan outlay is important and necessary to achieve the MDGs. This should be accompanied by measures to enhance allocative and technical efficiency of expenditures. Efficient transformation of expenditures into outputs and outcomes is important for reasons of efficiency and accountability. 5.3. Institutional Issues in Public Finance Management
Efficient public expenditure management has been the main concern of the Ministry of Finance. To this end, the Financial Manual of 1998 was revised and extended into separate manuals like budgeting, accounting, procurement, and revenue and property management, which together form the Financial Rules and Regulations 2001 (FRR-2001). The FRR-2001 attempts to improve the resource allocation in the public sector in an environment of macroeconomic stability.
In its efforts to strengthen the budgetary process and improve the efficiency of
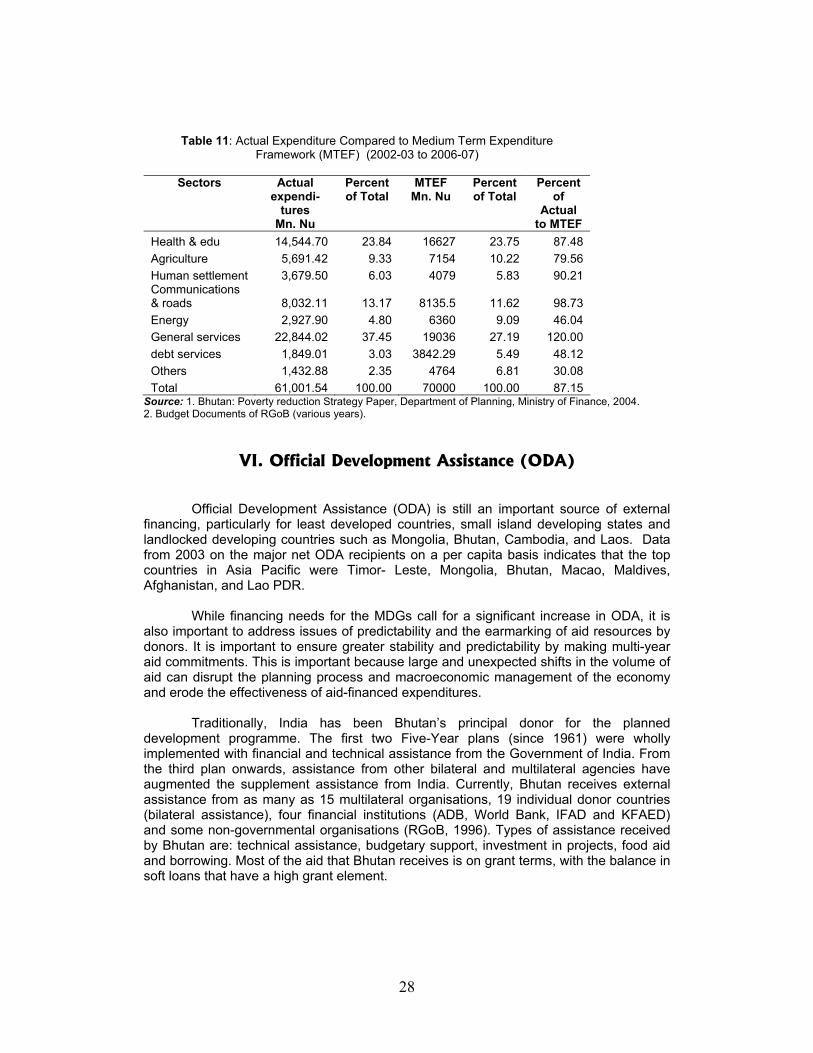
expenditure implementation, the RGoB initiated a two year rolling budget from 2003-04. This led to the first Medium Term Expenditure Framework (MTEF) for the period from 2002-03 to 2006-07. This has helped to improve both planning and implementation of expenditures. Despite this, shortfall in the actual realisation of revenue from the planned led to reduction in the actual expenditures from the MTEF by 13 percent. As actual expenditures on general services exceeded the MTEF by 20 percent, the shortfall in expenditures on agriculture was about 21 percent and on education and health 12.5 percent. As mentioned earlier, the shortfall in expenditure on energy was mainly due to the corporatisation of the sector. In spite of these shortfalls, it must be stated that the MTEF and the rolling plan introduced has helped to smoothen the expenditure implementation process.
The Public Finance Act (PFA) approved by the National Assembly in June 2007
attempts to improve the public finance management system in the country. The Act provides that the government is committed to various fiscal objectives of sustainable and transparent fiscal management and a sound budgeting and accounting system. This commitment is further enunciated in the draft constitution (to be adopted in 2008), which seeks to provide additional improvement in public finance management by furthering the fiscal decentralisation process by devolving fiscal powers from the central to district level administration.
28
Table 11: Actual Expenditure Compared to Medium Term Expenditure Framework (MTEF) (2002-03 to 2006-07)
Sectors Actual
expendi-tures
Mn. Nu
Percent of Total
MTEF Mn. Nu
Percent of Total
Percent of
Actual to MTEF
Health & edu 14,544.70 23.84 16627 23.75 87.48 Agriculture 5,691.42 9.33 7154 10.22 79.56 Human settlement 3,679.50 6.03 4079 5.83 90.21 Communications & roads 8,032.11 13.17 8135.5 11.62 98.73 Energy 2,927.90 4.80 6360 9.09 46.04 General services 22,844.02 37.45 19036 27.19 120.00 debt services 1,849.01 3.03 3842.29 5.49 48.12 Others 1,432.88 2.35 4764 6.81 30.08 Total 61,001.54 100.00 70000 100.00 87.15
Source: 1. Bhutan: Poverty reduction Strategy Paper, Department of Planning, Ministry of Finance, 2004. 2. Budget Documents of RGoB (various years).
VI. Official Development Assistance (ODA)
Official Development Assistance (ODA) is still an important source of external financing, particularly for least developed countries, small island developing states and landlocked developing countries such as Mongolia, Bhutan, Cambodia, and Laos. Data from 2003 on the major net ODA recipients on a per capita basis indicates that the top countries in Asia Pacific were Timor- Leste, Mongolia, Bhutan, Macao, Maldives, Afghanistan, and Lao PDR.
While financing needs for the MDGs call for a significant increase in ODA, it is
also important to address issues of predictability and the earmarking of aid resources by donors. It is important to ensure greater stability and predictability by making multi-year aid commitments. This is important because large and unexpected shifts in the volume of aid can disrupt the planning process and macroeconomic management of the economy and erode the effectiveness of aid-financed expenditures.
Traditionally, India has been Bhutan’s principal donor for the planned
development programme. The first two Five-Year plans (since 1961) were wholly implemented with financial and technical assistance from the Government of India. From the third plan onwards, assistance from other bilateral and multilateral agencies have augmented the supplement assistance from India. Currently, Bhutan receives external assistance from as many as 15 multilateral organisations, 19 individual donor countries (bilateral assistance), four financial institutions (ADB, World Bank, IFAD and KFAED) and some non-governmental organisations (RGoB, 1996). Types of assistance received by Bhutan are: technical assistance, budgetary support, investment in projects, food aid and borrowing. Most of the aid that Bhutan receives is on grant terms, with the balance in soft loans that have a high grant element.
29
The Department of Aid and Debt Management (DADM) was the main department within the Ministry of Finance responsible for managing external debts. During the recent reorganisation exercise the DADM has been placed under the Gross National Happiness Commission (GNHC), while a Debt Management Division operates under DPA, which is responsible for managing external debts (See Figure…). According to the Debt Portfolio Review and Debt Sustainability Analysis Report 2007 issued by DPA, the Government of India is by far the largest donor holding a major chunk of debt stock at 61 percent, while multilateral agencies hold 28 percent and other bilateral donors hold 11 percent (RGoB, 2007).
The RGoB receives international assistance (grants) (a) in cash, including program and project tied grants; and (b) in-kind. During the financial year 2006-07, the RGoB received a total grant amounting to Nu. 6,000 million and this constituted 33 percent to the total revenues or 14.5 percent of GDP. The grant in-cash accounted to 84 percent and in-kind 16 percent of the total receipts respectively. It is also seen that the level of foreign grants to Bhutan are much lower during the period from 2001-o2 to 2006-07 than during 1995-96 to 2000-01.
From the viewpoint of financing MDGs, it is important that the present level of foreign grants is enhanced to enable the government to make the required allocation while keeping the debt at a sustainable level. During the last five years, the average foreign grants worked out to be less than 16 percent of GDP, whereas, the pattern of plan financing envisaged for the Tenth Plan assumes 19.1 percent. The financing table assumes a financing gap of 4.5 percent of GDP on average which has to be covered through borrowing from domestic and foreign sources. Unless, the assumed level of foreign grants is not received, either the outlay will have to be compressed or domestic resources will have to be increased, or the borrowing limit will have to be enhanced. In other words, it may still be possible to meet the MDG financing needs at the level of deficit of 4-5 percent of GDP envisaged in the plan financing table if tax – GDP ratio increases by 4-56 percent as argued earlier.
VII. Borrowings from Domestic External Markets The outstanding debt of Bhutan at the end of June 2007 is estimated at USD 820.85 million in nominal terms which works out to be is more than 100 percent of GDP, The present market value of outstanding debt is estimated at USD 993 million. The domestic component of this is just 7.4 percent and the remaining 92.6 percent is external. Of the total loans, 66 percent is from India, other bilateral loans constitute 7 percent, and the remaining 20 percent is multilateral loans. In other words, almost 61 percent of debt is rupee denominated, SDR loans constitute 28 percent and Euro loans account for 11 percent of outstanding loans.
Detailed analysis of debt in Bhutan shows that overwhelming proportion of the loans – 66 percent of the present value of debt has been contracted for the energy sector borrowed from India. The servicing of these loans is matched by additional revenues generated from the sale of electricity to India. Therefore, there is no problem of debt distress. A detailed debt sustainability analysis was undertaken by the Ministry of Finance with technical assistance from the Asian Development Bank. This analysis shows that after excluding the enclave projects, Bhutan passes the sustainability test
30
comfortably and public debt ratios remain within the threshold throughout the next decade. Indeed, enclave projects generate their own incomes adequate to service the debt and repay the principal and therefore, there is no possibility of the country entering into a debt stressed situation.
The RGoB has adopted a conservative fiscal policy and has consistently
restricted the fiscal deficit at lower than 5 percent of GDP. The pattern of plan financing for the Tenth Plan also shows that the average financing gap is estimated at 4.5 percent and fiscal deficit at just about 3 percent. As mentioned earlier, the MDG costing falls well within the resource envelop for the Tenth Plan both in the aggregate, and for individual sectors and therefore, there is no need to resort to additional borrowing over what is assumed in the plan financing table.
VIII. Alternative Possibilities for Mobilising Finance
Foreign Direct Investment and Other Private Flows: So far, the discussion on enhancing fiscal space has focused on identifying the major sources of public finance. However, the role of the private sector and of FDI can be important for mobilising finance, especially in sectors such as infrastructure and energy.
Private capital flows include commercial flows (portfolio investment, bank lending and FDI) and non-commercial flows like migrant workers’ remittances. Indeed, the capital flows as a source of investment, technology, and economic growth in developing countries is well recognised. Without major and sustained efforts to promote more and better investments, both domestic and foreign, and other capital flows, meeting the MDGs will be even more difficult than expected.
Notwithstanding the importance of domestic investment, FDI has become one of
the most important sources of development financing, but it can also do much for productivity by providing access to new investment capital, new technologies, management expertise, and export markets.
Other private capital flows such as short and long term bank lending and portfolio
investment can be very volatile and their contribution to development is less recognised. For some countries’ workers remittances have been an important source of external capital over the past few years. In some countries, workers’ remittances are the second largest source of private financial flows behind FDI. In others, remittances are larger than all other flows combined. Household Financing: It was noted earlier that some types of user fees paid by households go directly to the government budget. However, there are some categories of user fees (water charges, electricity charges) that are not routed through the government budget – yet, these charges serve to finance some of the MDGs. These latter charges are to be considered in the discussion on household financing for the MDGs.
Estimating the contribution of households for financing the MDGs requires that cost-recovery programmes be designed in ways that do not impose user fees for poor households. In other words, the design of cost-recovery programmes should be based on the following two principles:
31
1. User fees do not contribute to the cost of primary school education, adult literacy
programmes, improving gender equality, basic healthcare, nutritional interventions, and transport infrastructure.
2. Richer households bear some of the cost for agricultural interventions (especially in food security, agro-processing, and live-stock), secondary school education, energy provision, and water supply and sanitation.
IX. Policy Recommendations The analysis of MDG financing and Financing of MDGs in the medium term essentially broils down to the analysis of the financing of the Tenth Plan. Though the time period of the former extends by a couple of years for the period 2008-2013, MDG financing needs should be nested in the Tenth Plan outlays and, therefore, realisation of the targets will depend upon fulfilling the financing of the Tenth Plan outlay. The acceptance of the MDG goals and its alignment with the Tenth Plan also helps to keep the sectoral priorities in harmony.
However, the pattern of financing the Tenth Plan shows that there is a resource gap of about 4.5 percent of GDP which has to be closed. Realising the revenue targets indicated in the plan financing table and keeping the uncovered resources gap at a sustainable level are the important challenges faced in MDG financing in the medium term.
RGoB has adopted the MDGs as a development strategy and has attempted to align the Five Year Plans to this effect. It has made considerable progress in economic conditions and in empowering people through human development and is well on track to achieving most of the MDGs. The outlay for the Tenth Plan is significantly higher than the required expenditures for MDGs as assessed in the costing estimates. Analysis shows that the costing estimates for the MDGs fall well within the plan outlay in the aggregate. Thus, financing needs of MDGs are nested in the Tenth Plan outlay and therefore, finding the fiscal space for MDGs is essentially an exercise in plan financing.
It must however, be noted that plan outlay is not merely concerned with MDGs financing and includes several additional sectors. However, the fact that the outlay exceeds the MDGs costing by over 160 percent, essentially implies considerable reprioritisation. Reprioritisation is necessary also because the plan outlay on education and health sectors fall considerably short of MDGs costing estimates. The shortfall is over 26 percent in the case of education and about 35 percent in the case of health. Furthermore, the shortfall is particularly marked in the case of recurrent expenditures under both education and health sectors. Therefore achievement of MDGs would call for reprioritisation in plan priorities towards social sectors. In particular, expenditures on education, health sectors in the plan will have to be significantly increased by reducing the outlay on general administration, transport and to some extent, capacity building. In regard to the gender component of MDGs, the Plan outlay is spread across several sectors, and adequate outlay is available.
32
One of the major shortcomings in the financing system of Bhutan is the high dependence on external revenues. Greater dependence on domestic revenues allows the government to plan the provision of public services better. However, in the medium term, continued sourcing of external revenue will be necessary to finance the MDGs needs. External donors will have to continue to support the Royal Government of Bhutan through grants and concessional assistance at the prevailing level. Here, pleading aid for a longer term would help the RGoB to plan its activities better and enhance expenditure efficiency. Additional resource mobilisation from the tax revenues will require significant reforms on both the structure and administration of the tax system. In the case of personal income tax, improvement in revenue collection will have to be achieved both by reforming the structure and by streamlining administration, particularly by instituting a reliable information system. Indeed the prevailing exemption limit for the tax is extremely low (Nu. 10,000). There is a case for increasing that limit to Nu. 100,000. This will leave out a large number of assessees, but will not much reduce the tax collection. Also it will reduce the administrative burden and avoid harassment to a large number of taxpayers. The best way to enhance revenue productivity is by streamlining the administration, including instituting an information system. Another tax that requires significant overhauling is the sales tax. At present, the tax is levied on the imports and a few domestic goods and services. The coverage of the tax is narrow and the scope for large scale evasion is high. The tax is levied at the point of import, and this can be evaded through under-invoicing. In addition, the fact that there is no follow-up on subsequent transactions, tax evasion is easy. The coverage of commodities on domestic production is extremely narrow and value added at subsequent stages is not included in the tax base. To simplify the tax system, it may be useful to exempt the basic food items and essential services, and levy the tax at a uniform rate on all goods and services, domestically produced as well as imported, at 5 percent. The sumptuary items can be subjected to a separate extra tax. The tax could cover both goods and services. Exemption limit for the payment of goods and services tax can be kept at turnover level of Nu. 500,000. The units having a turnover between Nu. 500,000 and Nu. 2.5 million can pay a simplified tax at 1 percent of their turnovers and may be asked to keep simplified accounts recording their total turnover, taxable turnover and tax payable. The businesses with a turnover above Nu 2.5 million can be subjected to regular value added tax with credit given to the tax paid at previous stages.
An important pre-condition for the success of GST is a well-trained administrative organisation and competent information system. Thorough preparation is necessary before the tax is levied. Once the decision is taken to replace the prevailing sales tax with a goods and service tax, preparatory steps will have to be initiated. It will take at least a year-and-a-half for proper preparation to be made. Once a computerised information system is put in place, it should be exchanged with other tax departments to significantly augment the revenues of both business income tax and the personal income tax by minimising evasion.
The information collected from GST should be usefully employed to administer
the BIT. At present, compliance in regard to BIT is extremely low and the information collected for GST can become a useful tool to increase voluntary compliance of BIT.
33
Analysis of expenditures shows that by and large, the actual expenditures
defrayed have been consistent with the MDGs costing estimates. It is also seen that the Tenth Plan expenditure estimates are much higher than the MDGs needs assessment expenditures. However, the Tenth Plan outlay on education and health sectors particularly, current expenditures fall well short of the MDGs needs estimates.
The attempts by the RGoB to introduce a two-year rolling budget and MTEF have
helped to enhance efficiency, but much remains to be done to operationalise the MTEF in different sectors. A comparison of the MTEF expenditures with actual expenditures for the period from 2002-03 to 2006-07 shows that there was a significant shortfall in actual expenditures from MTEF. This is true not only of aggregate expenditures but also in some important social and economic sectors with significant impact on poverty alleviation and human development. Nevertheless, the attempt has helped to plan and implement expenditure programmes in different sectors. It has assisted in avoiding seasonality and making the spending pattern smoother, thus helping departments complete spending programmes as planned.
Based on the total volume of debt, Bhutan may be considered to be a debt
stressed country. However, a detailed analysis of Bhutan shows that an overwhelming proportion of the loans – 66 percent of the present value of debt contracted for the energy sector has been borrowed from India. The servicing of these loans is matched by additional revenues generated from the sale of electricity to India. A detailed debt sustainability analysis undertaken by the Ministry of Finance shows that after excluding the enclave projects, Bhutan passes the sustainability test comfortably and public debt ratios remain within the threshold throughout the next decade.
The RGoB has been careful in adopting a conservative fiscal policy and has
consistently restricted the fiscal deficit at lower than 5 percent of GDP. The pattern of plan financing for the Tenth Plan also shows that the average financing gap is 4.5 percent. The MDG costing falls well within the resource envelop for the Tenth Plan both in aggregate terms and for individual sectors and therefore, there is no need to resort to additional borrowing over what is assumed in the plan financing table.
There is considerable scope for augmenting resources for financing MDGs
related expenditures by creating an enabling environment for private investments – particularly foreign investment in a strategic manner. It may also be necessary to augment resources by charging fees on the households for consuming some of the public services – particularly those that benefit relatively better off sections of society and those which are of non-merit good nature.
On the whole, the MDGs financing needs are nested within the Tenth Plan outlay
and its sustainable financing of MDGs is well within the realm of feasibility. Indeed, reforms are necessary in both policies and institutions both to mobilise larger volume of resources and to improve efficiency in public service delivery. Reform in the tax system indicated in this report could help to enhance the domestic revenues significantly. Much remains to be done to improve expenditure management and control systems. As mentioned above, there is considerable scope for the participation of private sector in supplementing government efforts to provide public service with significant impact on MDGs.
34
References Asian Development Bank, 2007. Kingdom of Bhutan: Strengthening Public Financial Management, ADB; 20. Royal Government of Bhutan, 1996. Eighth Five Year Plan (1997-2002). P. Commission. Thimphu, Keen Publishing Co. Ltd. Thailand. I; 211. ----------------, 2003. National Revenue Report 2002 - 2003. M. Department of Revenue and Customs, DRC, MoF; 32. ----------------, 2004. International Tourism Monitor, Kingdom of Bhutan. Department of Tourism. Thimphu, Ministry of Trade and Industries; 31. ----------------, 2004. Poverty Reduction Strategy Paper: A Cover Note to the Ninth Plan Main Document. Department of Planning, MoF; 57. ----------------, 2006. Annual Audit Report 2006. R. A. Authority, RAA. ---------------, 2007. Bhutan Millennium Development Goals: Needs Assessment and Costing Report (2006-2015). G. N. H. Commission, GNHC; 103. ----------------, 2007. Public Debt of Bhutan for the Year Ended June, 2007: Debt portfolio review and debt sustainability analysis. Debt Management Division, Department of Public Accounts, Ministry of Finance; 29. ----------------, 2008. Annual Financial Statements of the Royal Government of Bhutan for the Financial Year ended 30 June, 2007. Department of Budget and Accounts, Ministry of Finance. Seth, Anuradha 2007, "National Financing Strategies for Achieving Millennium Development Goals" Discussion Paper, Regional Centre for Asia and Pacific, UNDP.
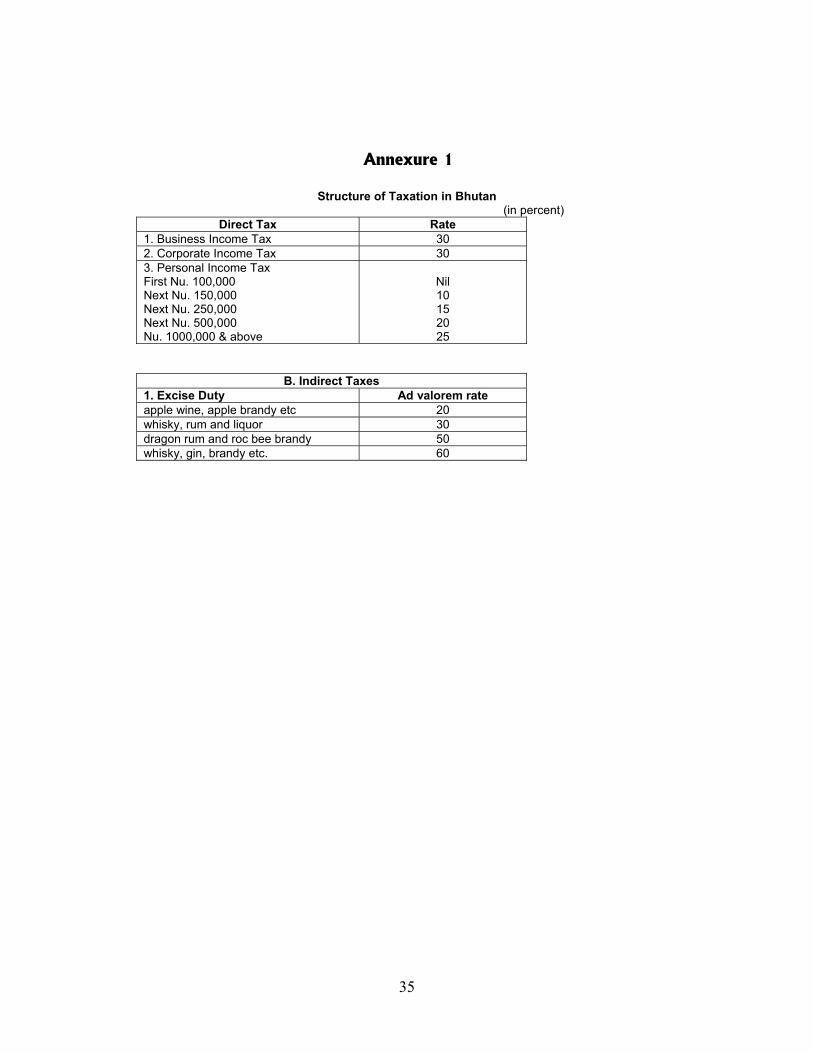
35
Annexure 1
Structure of Taxation in Bhutan
(in percent) Direct Tax Rate
1. Business Income Tax 30 2. Corporate Income Tax 30 3. Personal Income Tax First Nu. 100,000 Next Nu. 150,000 Next Nu. 250,000 Next Nu. 500,000 Nu. 1000,000 & above
Nil 10 15 20 25
B. Indirect Taxes 1. Excise Duty Ad valorem rate apple wine, apple brandy etc 20 whisky, rum and liquor 30 dragon rum and roc bee brandy 50 whisky, gin, brandy etc. 60
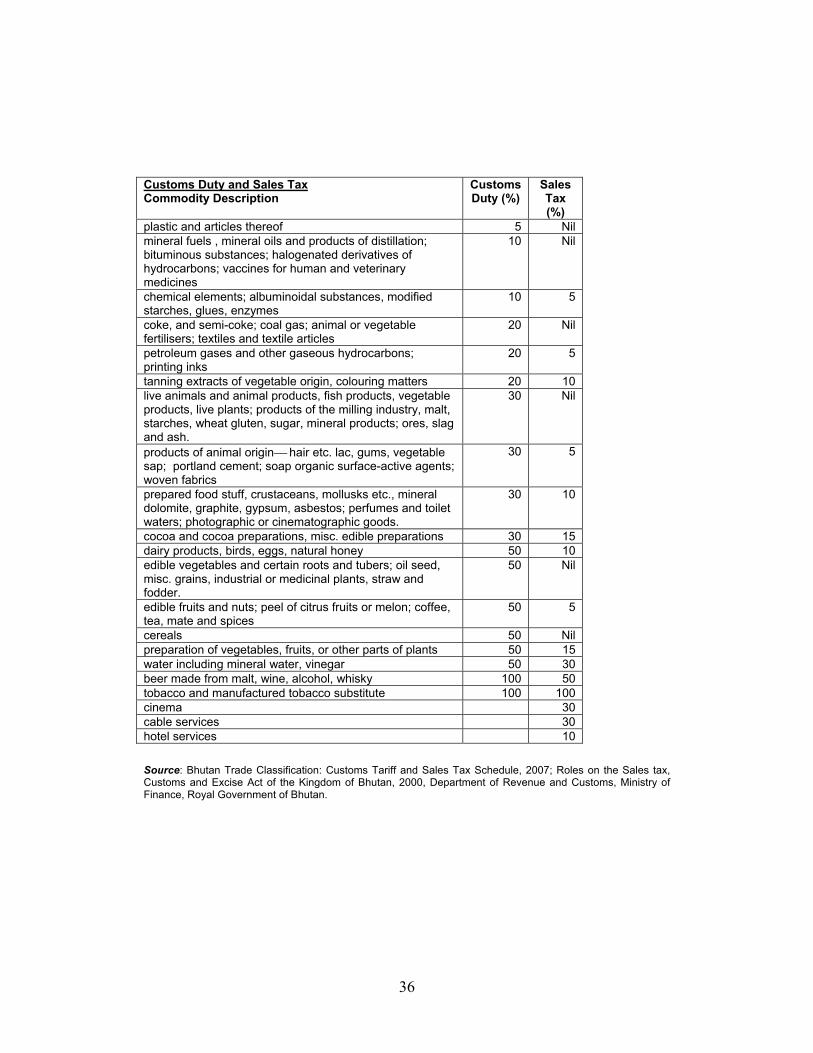
36
Source: Bhutan Trade Classification: Customs Tariff and Sales Tax Schedule, 2007; Roles on the Sales tax, Customs and Excise Act of the Kingdom of Bhutan, 2000, Department of Revenue and Customs, Ministry of Finance, Royal Government of Bhutan.
Customs Duty and Sales Tax Commodity Description
Customs Duty (%)
Sales Tax (%)
plastic and articles thereof 5 Nil mineral fuels , mineral oils and products of distillation; bituminous substances; halogenated derivatives of hydrocarbons; vaccines for human and veterinary medicines
10 Nil
chemical elements; albuminoidal substances, modified starches, glues, enzymes
10 5
coke, and semi-coke; coal gas; animal or vegetable fertilisers; textiles and textile articles
20 Nil
petroleum gases and other gaseous hydrocarbons; printing inks
20 5
tanning extracts of vegetable origin, colouring matters 20 10 live animals and animal products, fish products, vegetable products, live plants; products of the milling industry, malt, starches, wheat gluten, sugar, mineral products; ores, slag and ash.
30 Nil
products of animal origin hair etc. lac, gums, vegetable sap; portland cement; soap organic surface-active agents; woven fabrics
30 5
prepared food stuff, crustaceans, mollusks etc., mineral dolomite, graphite, gypsum, asbestos; perfumes and toilet waters; photographic or cinematographic goods.
30 10
cocoa and cocoa preparations, misc. edible preparations 30 15 dairy products, birds, eggs, natural honey 50 10 edible vegetables and certain roots and tubers; oil seed, misc. grains, industrial or medicinal plants, straw and fodder.
50 Nil
edible fruits and nuts; peel of citrus fruits or melon; coffee, tea, mate and spices
50 5
cereals 50 Nil preparation of vegetables, fruits, or other parts of plants 50 15 water including mineral water, vinegar 50 30 beer made from malt, wine, alcohol, whisky 100 50 tobacco and manufactured tobacco substitute 100 100 cinema 30 cable services 30 hotel services 10
Copyright © 2022 FDOKUMEN