Financing Human Capital Development by Increasing the Minimum Wage: Evidence from Canada
16
The Journal of Applied Business Research – July/August 2015 Volume 31, Number 4 Copyright by author(s); CC-BY 1605 The Clute Institute Financing Human Capital Development By Increasing The Minimum Wage: Evidence From Canada Mahmoud Yousef Askari, Al Ain University of Science and Technology, UAE ABSTRACT This study provides empirical evidence that using the minimum wage as a tool to generate extra taxes to establish a fully publically-funded higher education system is a harmless approach to boost funding for human capital development without changing governments’ spending priorities or raising current tax rates. The paper proposes a method to finance human capital development through higher education by generating more income taxes from a higher minimum wage and through an effective link of the minimum wage to the Consumer Price Index (CPI) in Canada. The paper also argues that indexed minimum wage adjustments will help in fighting poverty, maintain an acceptable living standard for minimum wage workers, reduce dependence on government subsidies, and make-work more attractive. The paper concludes that using minimum wage adjustments as a tool to generate tax revenues and fund higher education could be an effective fiscal tool and could be considered a ‘safe political instrument’. Keywords: Human Capital Development; Minimum Wage; Canada INTRODUCTION t could be argued that investing in human capital is a necessity for all nations. Regardless of a nation’s wealth of financial and natural resources, maintaining the intangible wealth of knowledge, skills, and capabilities of citizens could be inevitable. A major challenge in this process for many countries is the associated cost of education and training at all levels (K-12 & post-secondary education) and the increasing number of learners in a knowledge-based global economy (Woodhall, 2007). Also, while many developing and developed nations are striving to properly fund a public K-12 education system, many, including Canada, are reducing public funding for higher education and gradually pushing public academic institutions towards a market driven, managed, and financed higher education system (Askari, 2014; AUCC, 2008; Metcalfe, 2010). OVERVIEW OF THE PROBLEM Unlike the sensitivity and attractiveness of healthcare and K-12 funding in Canada, higher education funding lacks the appeal to become an election campaign issue for political parties. Many politicians argue that more spending (for higher education) would have to be financed by higher taxes that could scare voters away from political parties. Consequently, many Liberal and Conservative policy makers have adopted Milton Friedman’s approach to higher education funding who suggested that “it is eminently desirable that every young man and woman, regardless of his or her parents’ income, social position, residence or race, have the opportunity to get higher education – provided that he or she is willing to pay for it.” (Friedman & Friedman, 1980, p. 183). This ideology has led to the use of tuition fees and student loans as funding alternatives and has led to the adoption of many business tools by many publicly funded academic institutions. Also, this has led many public universities in Canada to operate in what might be called: ‘A Semi-Private Higher Education Industry’. Certainly, public academic institutions in Canada are still ‘public’ in terms of government influence and also due to the existing, but declining, government financial support for these institutions. At the same time, the private portion of the operating budgets of I
-
Upload
alainuniversity -
Category
Documents
-
view
3 -
download
0
Transcript of Financing Human Capital Development by Increasing the Minimum Wage: Evidence from Canada

The Journal of Applied Business Research – July/August 2015 Volume 31, Number 4
Copyright by author(s); CC-BY 1605 The Clute Institute
Financing Human Capital Development By Increasing The Minimum Wage:
Evidence From Canada Mahmoud Yousef Askari, Al Ain University of Science and Technology, UAE
ABSTRACT
This study provides empirical evidence that using the minimum wage as a tool to generate extra taxes to establish a fully publically-funded higher education system is a harmless approach to boost funding for human capital development without changing governments’ spending priorities or raising current tax rates. The paper proposes a method to finance human capital development through higher education by generating more income taxes from a higher minimum wage and through an effective link of the minimum wage to the Consumer Price Index (CPI) in Canada. The paper also argues that indexed minimum wage adjustments will help in fighting poverty, maintain an acceptable living standard for minimum wage workers, reduce dependence on government subsidies, and make-work more attractive. The paper concludes that using minimum wage adjustments as a tool to generate tax revenues and fund higher education could be an effective fiscal tool and could be considered a ‘safe political instrument’.
Keywords: Human Capital Development; Minimum Wage; Canada
INTRODUCTION
t could be argued that investing in human capital is a necessity for all nations. Regardless of a nation’s wealth of financial and natural resources, maintaining the intangible wealth of knowledge, skills, and capabilities of citizens could be inevitable. A major challenge in this process for many countries is the
associated cost of education and training at all levels (K-12 & post-secondary education) and the increasing number of learners in a knowledge-based global economy (Woodhall, 2007). Also, while many developing and developed nations are striving to properly fund a public K-12 education system, many, including Canada, are reducing public funding for higher education and gradually pushing public academic institutions towards a market driven, managed, and financed higher education system (Askari, 2014; AUCC, 2008; Metcalfe, 2010).
OVERVIEW OF THE PROBLEM
Unlike the sensitivity and attractiveness of healthcare and K-12 funding in Canada, higher education funding lacks the appeal to become an election campaign issue for political parties. Many politicians argue that more spending (for higher education) would have to be financed by higher taxes that could scare voters away from political parties. Consequently, many Liberal and Conservative policy makers have adopted Milton Friedman’s approach to higher education funding who suggested that “it is eminently desirable that every young man and woman, regardless of his or her parents’ income, social position, residence or race, have the opportunity to get higher education – provided that he or she is willing to pay for it.” (Friedman & Friedman, 1980, p. 183). This ideology has led to the use of tuition fees and student loans as funding alternatives and has led to the adoption of many business tools by many publicly funded academic institutions. Also, this has led many public universities in Canada to operate in what might be called: ‘A Semi-Private Higher Education Industry’. Certainly, public academic institutions in Canada are still ‘public’ in terms of government influence and also due to the existing, but declining, government financial support for these institutions. At the same time, the private portion of the operating budgets of
I
The Journal of Applied Business Research – July/August 2015 Volume 31, Number 4
Copyright by author(s); CC-BY 1606 The Clute Institute
these institutions is growing, and tuition fees from both domestic and international students are becoming major sources of revenue (Hauptman & Nolan, 2011; Sun & Barrientos, 2009).
This paper proposes a sustainable solution to the problem of public funding for human capital development through higher education in Canada. The paper provides empirical evidence that provincial governments in Canada have other options to pay for higher education without the need to increase taxes, redesign their spending priorities, and, arguably, without suffering from heavy political consequences. The paper is an examination of Askari’s (2014) suggested idea that adjusting the minimum wage could be a tool to generate enough tax revenues to fully fund public academic institutions. Using the minimum wage as a tool to pay for higher education is a harmless mechanism of funding that could give a ‘win win’ result for governments, learners, and minimum wage workers. In fact, “the political appeal for minimum wages as an anti-poverty device is obvious. Raising the wages of the working poor should enhance their earned income and reduce their likelihood of being in poverty” (Campolieti, Gunderson, & Lee, 2012, p. 288). Dickson and Mayatt (2002) also stated that in Canada, minimum wage adjustments are used to enhance support for politicians to win them votes. Thus, using the minimum wage as a tool could be considered a ‘safe political instrument’.
This study has analyzed a one-dollar difference in minimum wage and its effect on the generated life-long income tax revenues in the 13 Canadian provinces and territories. Unlike the United States that has federal, state, and, in some cases, local minimum wage legislations, Canada’s minimum wage is under provincial jurisdiction and is legislated by provincial governments only. At the same time, each province has its own income tax rates to accompany the federal income tax rates (Appendix B & C). This makes it easier for provincial governments to re-evaluate their own minimum wage and income tax legislations and craft their own appropriate policies.
THE MINIMUM WAGE ARGUMENT
This paper assumes that firms have enough power to prevent the invisible hands of the market to determine a fair price (wage) in the labour market and assumes that firms are able to set prices below a ‘just’ market price for labour. In other words, the labour market is assumed to be in a ‘Monopsony state’, where buyers of labour services have a high degree of bargaining power and could easily control wages. Based on this logic, governments are obligated to interfere in setting wage rates that could be closer to a true market rate in a competitive labour market. According to Edward and Gilman (1999), some researchers (Manning, 1996) stated that Monopsony is a fact of life in all labour markets, and one need not to have the classical case of a company town to declare the existence of Monopsony. Governments’ interference in mandating a minimum wage in the Monopsony case is similar to the interference of governments to protect consumers in Monopoly markets from higher Monopolist-determined prices.
This paper also assumes that indexed minimum wage adjustments will help in fighting poverty, maintain an
acceptable living standard for minimum wage workers, reduce dependence on government subsidies, and make-work more attractive. In fact, supporters of minimum wage legislations, according to Even and Macpherson (1996) highlight the “equalizing effect on income distribution and argue that increasing the minimum wage reduces poverty” (p. 67). Evan and Macpherson also added that those who are against minimum wage usually use the excuse of higher unemployment due to higher minimum wage. A study by Partridge and Partridge (1999) concluded that higher minimum wage would reduce employment and negatively affect poverty. Also, Campolieti, Fung, and Gunderson (2005) have concluded, “minimum wage increases led to large and statistically significant reductions in the employment of teenagers” (p. 533). Another Canadian study by Campolieti, Gunderson, and Lee (2012) also argued that a minimum wage increase in Canada would not reduce poverty because many working teenagers are coming from rich families.
Indeed, the argument that increasing the minimum wage will negatively affect youth employment might not have enough support in literature. According to Card and Krueger (1995), time series studies have shown an average of one percent decrease in youth employment due to a 10 percent increase in minimum wage, but recent studies “have estimated negligible or even marginally positive employment effect of the minimum wage” (p. 238). Card and Krueger further added that both researchers and academic journals might be guided by predetermined assumptions that higher minimum wage would decrease employment and they usually choose certain variables and samples to generate statistically significant results. Higher minimum wage, according to Card and Krueger, has the

The Journal of Applied Business Research – July/August 2015 Volume 31, Number 4
Copyright by author(s); CC-BY 1607 The Clute Institute
potential to increase employment because it could draw more workers to the labour market. They also concluded that there is a publication bias in the minimum wage published literature and stated “studies in the literature have been affected by specification-searching and publication biases, induced by editors’ and authors’ tendencies to look for negative and statistically significant estimates of the employment effect of the minimum wage” (p. 242). Indexing the minimum wage to CPI is based on the logical argument that the minimum wage is assumed to be a living wage. But due to inflation, the real value of the wage will decrease, thus justifying an adjustment guided by an inflation index to maintain living standard. According to Even and Macpherson (1996), in the US, “the decline in the minimum’s real value accounted for 20 to 30% of the rise in wage inequality during the 1980s … [and that indexing could be based on] consumer price index (CPI) and the average wage of non-supervisory private workers.” (p. 68). Even and Macpherson added that using CPI as an index will help in maintaining the same living standard for minimum wage workers.
RESEARCH METHODOLOGY
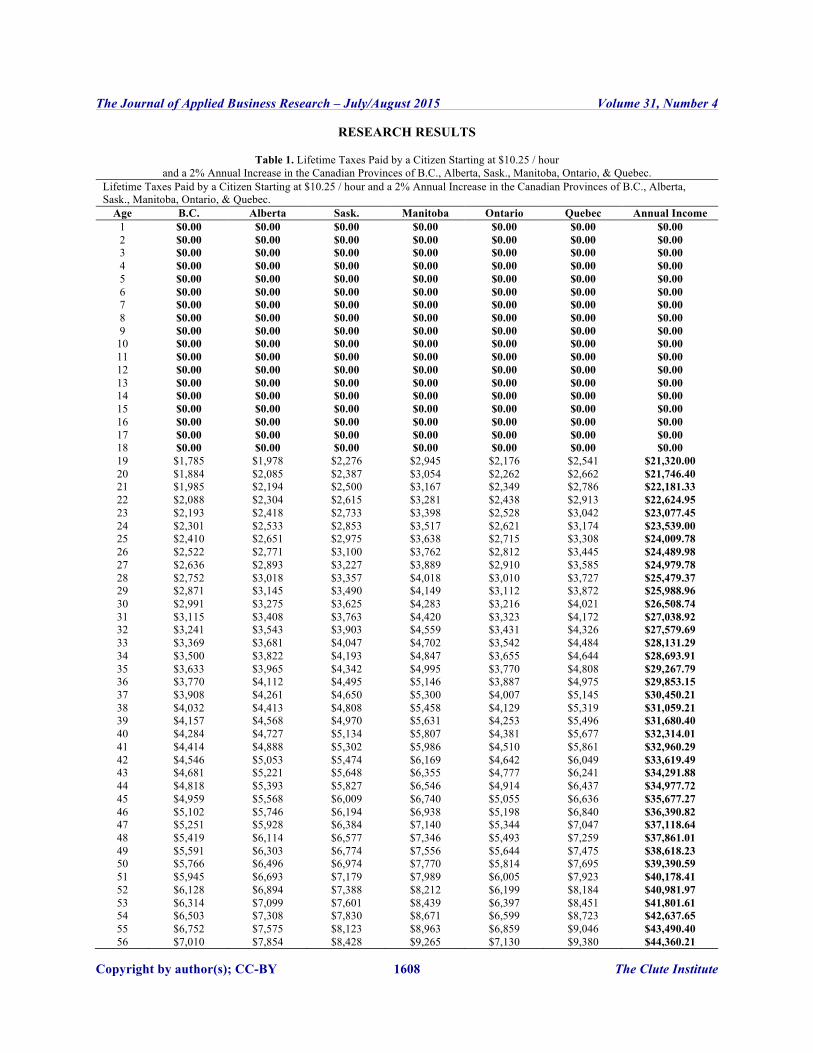
To see the effect of a slight increase in personal earnings on the lifetime contributions of income taxes, two hypothetical citizens with a one dollar per hour difference in earnings (one makes $10.25 / hour and one makes $11.25 / hour) were compared in every province and territory in Canada. Using the average tax rates in 2012 and Ernst and Young LLP public personal income tax calculator, lifetime annual income tax payments were calculated and compared with government transfer payment per person for 2012 ($6,122) that was calculated in Askari (2014). Lifetime income tax payments to government for a citizen starting at minimum wage of $10.25 / hour with a two percent annual wage increase, and lifetime income tax payments for a citizen with one dollar above the minimum wage ($11.25 / hour) were compared to see how a one dollar increase in hourly earnings might affect the lifetime payment of income taxes and the breakeven point for the hypothetical citizen. The breakeven point for the citizen is the point where government transfer payments for the citizen are equal to the taxes paid by the citizen. Consequently, the breakeven age is the age when the citizen contributes taxes equivalent to government transfer payments. The analysis was based on the assumptions that work was not interruption due to illness, job loss, or other reasons for the two hypothetical citizens during their working life, and that the two citizens are at the same age.
The Journal of Applied Business Research – July/August 2015 Volume 31, Number 4
Copyright by author(s); CC-BY 1608 The Clute Institute
RESEARCH RESULTS
Table 1. Lifetime Taxes Paid by a Citizen Starting at $10.25 / hour and a 2% Annual Increase in the Canadian Provinces of B.C., Alberta, Sask., Manitoba, Ontario, & Quebec.
Lifetime Taxes Paid by a Citizen Starting at $10.25 / hour and a 2% Annual Increase in the Canadian Provinces of B.C., Alberta, Sask., Manitoba, Ontario, & Quebec.
Age B.C. Alberta Sask. Manitoba Ontario Quebec Annual Income 1 $0.00 $0.00 $0.00 $0.00 $0.00 $0.00 $0.00 2 $0.00 $0.00 $0.00 $0.00 $0.00 $0.00 $0.00 3 $0.00 $0.00 $0.00 $0.00 $0.00 $0.00 $0.00 4 $0.00 $0.00 $0.00 $0.00 $0.00 $0.00 $0.00 5 $0.00 $0.00 $0.00 $0.00 $0.00 $0.00 $0.00 6 $0.00 $0.00 $0.00 $0.00 $0.00 $0.00 $0.00 7 $0.00 $0.00 $0.00 $0.00 $0.00 $0.00 $0.00 8 $0.00 $0.00 $0.00 $0.00 $0.00 $0.00 $0.00 9 $0.00 $0.00 $0.00 $0.00 $0.00 $0.00 $0.00
10 $0.00 $0.00 $0.00 $0.00 $0.00 $0.00 $0.00 11 $0.00 $0.00 $0.00 $0.00 $0.00 $0.00 $0.00 12 $0.00 $0.00 $0.00 $0.00 $0.00 $0.00 $0.00 13 $0.00 $0.00 $0.00 $0.00 $0.00 $0.00 $0.00 14 $0.00 $0.00 $0.00 $0.00 $0.00 $0.00 $0.00 15 $0.00 $0.00 $0.00 $0.00 $0.00 $0.00 $0.00 16 $0.00 $0.00 $0.00 $0.00 $0.00 $0.00 $0.00 17 $0.00 $0.00 $0.00 $0.00 $0.00 $0.00 $0.00 18 $0.00 $0.00 $0.00 $0.00 $0.00 $0.00 $0.00 19 $1,785 $1,978 $2,276 $2,945 $2,176 $2,541 $21,320.00 20 $1,884 $2,085 $2,387 $3,054 $2,262 $2,662 $21,746.40 21 $1,985 $2,194 $2,500 $3,167 $2,349 $2,786 $22,181.33 22 $2,088 $2,304 $2,615 $3,281 $2,438 $2,913 $22,624.95 23 $2,193 $2,418 $2,733 $3,398 $2,528 $3,042 $23,077.45 24 $2,301 $2,533 $2,853 $3,517 $2,621 $3,174 $23,539.00 25 $2,410 $2,651 $2,975 $3,638 $2,715 $3,308 $24,009.78 26 $2,522 $2,771 $3,100 $3,762 $2,812 $3,445 $24,489.98 27 $2,636 $2,893 $3,227 $3,889 $2,910 $3,585 $24,979.78 28 $2,752 $3,018 $3,357 $4,018 $3,010 $3,727 $25,479.37 29 $2,871 $3,145 $3,490 $4,149 $3,112 $3,872 $25,988.96 30 $2,991 $3,275 $3,625 $4,283 $3,216 $4,021 $26,508.74 31 $3,115 $3,408 $3,763 $4,420 $3,323 $4,172 $27,038.92 32 $3,241 $3,543 $3,903 $4,559 $3,431 $4,326 $27,579.69 33 $3,369 $3,681 $4,047 $4,702 $3,542 $4,484 $28,131.29 34 $3,500 $3,822 $4,193 $4,847 $3,655 $4,644 $28,693.91 35 $3,633 $3,965 $4,342 $4,995 $3,770 $4,808 $29,267.79 36 $3,770 $4,112 $4,495 $5,146 $3,887 $4,975 $29,853.15 37 $3,908 $4,261 $4,650 $5,300 $4,007 $5,145 $30,450.21 38 $4,032 $4,413 $4,808 $5,458 $4,129 $5,319 $31,059.21 39 $4,157 $4,568 $4,970 $5,631 $4,253 $5,496 $31,680.40 40 $4,284 $4,727 $5,134 $5,807 $4,381 $5,677 $32,314.01 41 $4,414 $4,888 $5,302 $5,986 $4,510 $5,861 $32,960.29 42 $4,546 $5,053 $5,474 $6,169 $4,642 $6,049 $33,619.49 43 $4,681 $5,221 $5,648 $6,355 $4,777 $6,241 $34,291.88 44 $4,818 $5,393 $5,827 $6,546 $4,914 $6,437 $34,977.72 45 $4,959 $5,568 $6,009 $6,740 $5,055 $6,636 $35,677.27 46 $5,102 $5,746 $6,194 $6,938 $5,198 $6,840 $36,390.82 47 $5,251 $5,928 $6,384 $7,140 $5,344 $7,047 $37,118.64 48 $5,419 $6,114 $6,577 $7,346 $5,493 $7,259 $37,861.01 49 $5,591 $6,303 $6,774 $7,556 $5,644 $7,475 $38,618.23 50 $5,766 $6,496 $6,974 $7,770 $5,814 $7,695 $39,390.59 51 $5,945 $6,693 $7,179 $7,989 $6,005 $7,923 $40,178.41 52 $6,128 $6,894 $7,388 $8,212 $6,199 $8,184 $40,981.97 53 $6,314 $7,099 $7,601 $8,439 $6,397 $8,451 $41,801.61 54 $6,503 $7,308 $7,830 $8,671 $6,599 $8,723 $42,637.65 55 $6,752 $7,575 $8,123 $8,963 $6,859 $9,046 $43,490.40 56 $7,010 $7,854 $8,428 $9,265 $7,130 $9,380 $44,360.21

The Journal of Applied Business Research – July/August 2015 Volume 31, Number 4
Copyright by author(s); CC-BY 1609 The Clute Institute
(Table 1 continued) Age B.C. Alberta Sask. Manitoba Ontario Quebec Annual Income 57 $7,274 $8,138 $8,738 $9,573 $7,407 $9,720 $45,247.41 58 $7,542 $8,427 $9,055 $9,888 $7,688 $10,067 $46,152.36 59 $7,817 $8,723 $9,378 $10,208 $7,976 $10,422 $47,075.41 60 $8,096 $9,024 $9,708 $10,535 $8,269 $10,783 $48,016.91 61 $8,381 $9,331 $10,044 $10,869 $8,568 $11,151 $48,977.25 62 $8,672 $9,645 $10,387 $11,210 $8,873 $11,527 $49,956.80 63 $8,969 $9,964 $10,736 $11,557 $9,185 $11,910 $50,955.93 64 $9,272 $10,291 $11,093 $11,911 $9,502 $12,302 $51,975.05 65 $9,580 $10,623 $11,457 $12,272 $9,826 $12,700 $53,014.55 66 $9,895 $10,962 $11,828 $12,641 $10,156 $13,107 $54,074.84 67 $10,217 $11,309 $12,207 $13,017 $10,493 $13,522 $55,156.34 68 $0.00 $0.00 $0.00 $0.00 $0.00 $0.00 $0.00 69 $0.00 $0.00 $0.00 $0.00 $0.00 $0.00 $0.00 70 $0.00 $0.00 $0.00 $0.00 $0.00 $0.00 $0.00 71 $0.00 $0.00 $0.00 $0.00 $0.00 $0.00 $0.00 72 $0.00 $0.00 $0.00 $0.00 $0.00 $0.00 $0.00 73 $0.00 $0.00 $0.00 $0.00 $0.00 $0.00 $0.00 74 $0.00 $0.00 $0.00 $0.00 $0.00 $0.00 $0.00 75 $0.00 $0.00 $0.00 $0.00 $0.00 $0.00 $0.00 76 $0.00 $0.00 $0.00 $0.00 $0.00 $0.00 $0.00 77 $0.00 $0.00 $0.00 $0.00 $0.00 $0.00 $0.00 78 $0.00 $0.00 $0.00 $0.00 $0.00 $0.00 $0.00 79 $0.00 $0.00 $0.00 $0.00 $0.00 $0.00 $0.00 80 $0.00 $0.00 $0.00 $0.00 $0.00 $0.00 $0.00
Total $250,341 $278,335 $301,786 $337,732 $259,050 $334,580 $1,746,973 Note. Tax calculations are based on average tax rates of 2012 using Ernst & Young personal income tax calculator.
Table 2. Lifetime Taxes Paid by a Citizen Starting at $10.25 / hour
and a 2% Annual Increase in the Canadian Provinces of N.B, N.S., P.E.I., Nfld., N.W.T., Yukon, & Nunavut. Lifetime Taxes Paid by a Citizen Starting at $10.25 / hour and a 2% Annual Increase in the Canadian Provinces of N.B, N.S., P.E.I., Nfld., N.W.T., Yukon, & Nunavut
Age N.B. N.S. P.E.I. Nfld. N.W.T. Yukon Nunavut Annual Income 1 $0.00 $0.00 $0.00 $0.00 $0.00 $0.00 $0.00 $0.00 2 $0.00 $0.00 $0.00 $0.00 $0.00 $0.00 $0.00 $0.00 3 $0.00 $0.00 $0.00 $0.00 $0.00 $0.00 $0.00 $0.00 4 $0.00 $0.00 $0.00 $0.00 $0.00 $0.00 $0.00 $0.00 5 $0.00 $0.00 $0.00 $0.00 $0.00 $0.00 $0.00 $0.00 6 $0.00 $0.00 $0.00 $0.00 $0.00 $0.00 $0.00 $0.00 7 $0.00 $0.00 $0.00 $0.00 $0.00 $0.00 $0.00 $0.00 8 $0.00 $0.00 $0.00 $0.00 $0.00 $0.00 $0.00 $0.00 9 $0.00 $0.00 $0.00 $0.00 $0.00 $0.00 $0.00 $0.00
10 $0.00 $0.00 $0.00 $0.00 $0.00 $0.00 $0.00 $0.00 11 $0.00 $0.00 $0.00 $0.00 $0.00 $0.00 $0.00 $0.00 12 $0.00 $0.00 $0.00 $0.00 $0.00 $0.00 $0.00 $0.00 13 $0.00 $0.00 $0.00 $0.00 $0.00 $0.00 $0.00 $0.00 14 $0.00 $0.00 $0.00 $0.00 $0.00 $0.00 $0.00 $0.00 15 $0.00 $0.00 $0.00 $0.00 $0.00 $0.00 $0.00 $0.00 16 $0.00 $0.00 $0.00 $0.00 $0.00 $0.00 $0.00 $0.00 17 $0.00 $0.00 $0.00 $0.00 $0.00 $0.00 $0.00 $0.00 18 $0.00 $0.00 $0.00 $0.00 $0.00 $0.00 $0.00 $0.00 19 $2,296 $2,703 $2,908 $2,508 $2,049 $2,314 $1,939 $21,320.00 20 $2,411 $2,804 $3,014 $2,604 $2,138 $2,407 $2,020 $21,746.40 21 $2,529 $2,908 $3,122 $2,703 $2,229 $2,503 $2,102 $22,181.33 22 $2,649 $3,013 $3,232 $2,804 $2,321 $2,601 $2,187 $22,624.95 23 $2,772 $3,121 $3,344 $2,907 $2,416 $2,701 $2,273 $23,077.45 24 $2,897 $3,231 $3,459 $3,012 $2,513 $2,803 $2,360 $23,539.00 25 $3,024 $3,343 $3,575 $3,118 $2,611 $2,906 $2,450 $24,009.78 26 $3,155 $3,457 $3,694 $3,227 $2,711 $3,012 $2,541 $24,489.98 27 $3,287 $3,573 $3,816 $3,338 $2,814 $3,120 $2,634 $24,979.78 28 $3,423 $3,692 $3,940 $3,452 $2,918 $3,230 $2,729 $25,479.37 29 $3,561 $3,814 $4,066 $3,567 $3,024 $3,342 $2,826 $25,988.96

The Journal of Applied Business Research – July/August 2015 Volume 31, Number 4
Copyright by author(s); CC-BY 1610 The Clute Institute
(Table 2 continued) Age N.B. N.S. P.E.I. Nfld. N.W.T. Yukon Nunavut Annual Income 30 $3,702 $3,937 $4,195 $3,685 $3,133 $3,457 $2,925 $26,508.74 31 $3,845 $4,063 $4,326 $3,806 $3,244 $3,574 $3,025 $27,038.92 32 $3,992 $4,192 $4,461 $3,929 $3,357 $3,693 $3,128 $27,579.69 33 $4,141 $4,323 $4,598 $4,054 $3,472 $3,815 $3,233 $28,131.29 34 $4,294 $4,457 $4,737 $4,181 $3,590 $3,939 $3,340 $28,693.91 35 $4,449 $4,594 $4,879 $4,312 $3,710 $4,065 $3,449 $29,267.79 36 $4,608 $4,749 $5,025 $4,445 $3,832 $4,194 $3,560 $29,853.15 37 $4,770 $4,928 $5,173 $4,580 $3,957 $4,326 $3,674 $30,450.21 38 $4,935 $5,110 $5,324 $4,719 $4,084 $4,460 $3,789 $31,059.21 39 $5,103 $5,296 $5,478 $4,860 $4,214 $4,597 $3,907 $31,680.40 40 $5,275 $5,486 $5,648 $5,003 $4,347 $4,737 $4,028 $32,314.01 41 $5,450 $5,680 $5,834 $5,153 $4,482 $4,879 $4,150 $32,960.29 42 $5,629 $5,877 $6,024 $5,334 $4,619 $5,024 $4,276 $33,619.49 43 $5,803 $6,078 $6,217 $5,519 $4,760 $5,172 $4,403 $34,291.88 44 $5,968 $6,284 $6,415 $5,708 $4,903 $5,324 $4,534 $34,977.72 45 $6,137 $6,493 $6,617 $5,900 $5,049 $5,478 $4,667 $35,677.27 46 $6,309 $6,707 $6,822 $6,096 $5,198 $5,635 $4,802 $36,390.82 47 $6,484 $6,925 $7,032 $6,297 $5,351 $5,795 $4,940 $37,118.64 48 $6,664 $7,148 $7,246 $6,501 $5,506 $5,959 $5,082 $37,861.01 49 $6,859 $7,374 $7,464 $6,709 $5,664 $6,126 $5,225 $38,618.23 50 $7,068 $7,605 $7,686 $6,921 $5,845 $6,296 $5,372 $39,390.59 51 $7,281 $7,841 $7,913 $7,138 $6,031 $6,470 $5,522 $40,178.41 52 $7,499 $8,082 $8,144 $7,359 $6,220 $6,647 $5,682 $40,981.97 53 $7,721 $8,328 $8,380 $7,584 $6,414 $6,828 $5,863 $41,801.61 54 $7,948 $8,578 $8,621 $7,814 $6,611 $7,012 $6,047 $42,637.65 55 $8,234 $8,888 $8,922 $8,104 $6,867 $7,275 $6,289 $43,490.40 56 $8,530 $9,210 $9,233 $8,404 $7,133 $7,551 $6,541 $44,360.21 57 $8,833 $9,537 $9,551 $8,710 $7,405 $7,832 $6,798 $45,247.41 58 $9,142 $9,872 $9,875 $9,022 $7,682 $8,119 $7,061 $46,152.36 59 $9,456 $10,213 $10,205 $9,341 $7,964 $8,411 $7,329 $47,075.41 60 $9,777 $10,561 $10,542 $9,665 $8,252 $8,709 $7,601 $48,016.91 61 $10,105 $10,916 $10,886 $9,997 $8,546 $9,013 $7,880 $48,977.25 62 $10,439 $11,277 $11,236 $10,334 $8,846 $9,324 $8,164 $49,956.80 63 $10,779 $11,646 $11,594 $10,679 $9,151 $9,640 $8,454 $50,955.93 64 $11,127 $12,023 $11,959 $11,031 $9,463 $9,963 $8,750 $51,975.05 65 $11,481 $12,407 $12,331 $11,389 $9,781 $10,292 $9,051 $53,014.55 66 $11,843 $12,799 $12,711 $11,755 $10,106 $10,628 $9,358 $54,074.84 67 $12,212 $13,199 $13,098 $12,128 $10,437 $10,971 $9,672 $55,156.34 68 $0.00 $0.00 $0.00 $0.00 $0.00 $0.00 $0.00 $0.00 69 $0.00 $0.00 $0.00 $0.00 $0.00 $0.00 $0.00 $0.00 70 $0.00 $0.00 $0.00 $0.00 $0.00 $0.00 $0.00 $0.00 71 $0.00 $0.00 $0.00 $0.00 $0.00 $0.00 $0.00 $0.00 72 $0.00 $0.00 $0.00 $0.00 $0.00 $0.00 $0.00 $0.00 73 $0.00 $0.00 $0.00 $0.00 $0.00 $0.00 $0.00 $0.00 74 $0.00 $0.00 $0.00 $0.00 $0.00 $0.00 $0.00 $0.00 75 $0.00 $0.00 $0.00 $0.00 $0.00 $0.00 $0.00 $0.00 76 $0.00 $0.00 $0.00 $0.00 $0.00 $0.00 $0.00 $0.00 77 $0.00 $0.00 $0.00 $0.00 $0.00 $0.00 $0.00 $0.00 78 $0.00 $0.00 $0.00 $0.00 $0.00 $0.00 $0.00 $0.00 79 $0.00 $0.00 $0.00 $0.00 $0.00 $0.00 $0.00 $0.00 80 $0.00 $0.00 $0.00 $0.00 $0.00 $0.00 $0.00 $0.00
Total $305,896 $328,342 $334,572 $301,406 $256,970 $276,169 $237,632 $1,746,973 Note. Tax calculations are based on average tax rates of 2012 using Ernst & Young personal income tax calculator.

The Journal of Applied Business Research – July/August 2015 Volume 31, Number 4
Copyright by author(s); CC-BY 1611 The Clute Institute
Table 3. Lifetime Taxes Paid by a Citizen Starting at $11.25 / hour and a 2% Annual Increase in the Canadian Provinces of B.C., Alberta, Sask., Manitoba, Ontario, & Quebec.
Lifetime Taxes Paid by a Citizen Starting at $11.25 / hour and a 2% Annual Increase in the Canadian Provinces of B.C., Alberta, Sask., Manitoba, Ontario, & Quebec.
Age B.C. Alberta Sask. Manitoba Ontario Quebec Annual Income 1 $0.00 $0.00 $0.00 $0.00 $0.00 $0.00 $0.00 2 $0.00 $0.00 $0.00 $0.00 $0.00 $0.00 $0.00 3 $0.00 $0.00 $0.00 $0.00 $0.00 $0.00 $0.00 4 $0.00 $0.00 $0.00 $0.00 $0.00 $0.00 $0.00 5 $0.00 $0.00 $0.00 $0.00 $0.00 $0.00 $0.00 6 $0.00 $0.00 $0.00 $0.00 $0.00 $0.00 $0.00 7 $0.00 $0.00 $0.00 $0.00 $0.00 $0.00 $0.00 8 $0.00 $0.00 $0.00 $0.00 $0.00 $0.00 $0.00 9 $0.00 $0.00 $0.00 $0.00 $0.00 $0.00 $0.00
10 $0.00 $0.00 $0.00 $0.00 $0.00 $0.00 $0.00 11 $0.00 $0.00 $0.00 $0.00 $0.00 $0.00 $0.00 12 $0.00 $0.00 $0.00 $0.00 $0.00 $0.00 $0.00 13 $0.00 $0.00 $0.00 $0.00 $0.00 $0.00 $0.00 14 $0.00 $0.00 $0.00 $0.00 $0.00 $0.00 $0.00 15 $0.00 $0.00 $0.00 $0.00 $0.00 $0.00 $0.00 16 $0.00 $0.00 $0.00 $0.00 $0.00 $0.00 $0.00 17 $0.00 $0.00 $0.00 $0.00 $0.00 $0.00 $0.00 18 $0.00 $0.00 $0.00 $0.00 $0.00 $0.00 $0.00 19 $2,269 $2,498 $2,817 $3,481 $2,593 $3,134 $23,400.00 20 $2,377 $2,615 $2,939 $3,602 $2,687 $3,268 $23,868.00 21 $2,488 $2,735 $3,063 $3,725 $2,783 $3,404 $24,345.36 22 $2,602 $2,856 $3,189 $3,851 $2,880 $3,543 $24,832.27 23 $2,717 $2,980 $3,318 $3,979 $2,980 $3,684 $25,328.91 24 $2,835 $3,107 $3,450 $4,109 $3,081 $3,829 $25,835.49 25 $2,955 $3,236 $3,584 $4,243 $3,185 $3,976 $26,352.20 26 $3,078 $3,368 $3,721 $4,379 $3,291 $4,127 $26,879.24 27 $3,203 $3,502 $3,861 $4,517 $3,398 $4,280 $27,416.83 28 $3,330 $3,640 $4,004 $4,659 $3,509 $4,436 $27,965.17 29 $3,460 $3,779 $4,149 $4,803 $3,621 $4,596 $28,524.47 30 $3,593 $3,922 $4,297 $4,950 $3,735 $4,758 $29,094.96 31 $3,728 $4,067 $4,449 $5,100 $3,852 $4,924 $29,676.86 32 $3,867 $4,216 $4,603 $5,254 $3,971 $5,094 $30,270.40 33 $3,996 $4,367 $4,760 $5,410 $4,092 $5,266 $30,875.80 34 $4,119 $4,522 $4,921 $5,579 $4,216 $5,443 $31,493.32 35 $4,246 $4,679 $5,085 $5,754 $4,342 $5,622 $32,123.19 36 $4,375 $4,840 $5,252 $5,932 $4,471 $5,806 $32,765.65 37 $4,506 $5,003 $5,422 $6,114 $4,602 $5,992 $33,420.96 38 $4,640 $5,171 $5,596 $6,299 $4,736 $6,183 $34,089.38 39 $4,777 $5,341 $5,773 $6,488 $4,873 $6,378 $34,771.17 40 $4,916 $5,515 $5,954 $6,681 $5,012 $6,576 $35,466.59 41 $5,059 $5,692 $6,138 $6,878 $5,155 $6,778 $36,175.92 42 $5,204 $5,873 $6,327 $7,079 $5,300 $6,985 $36,899.44 43 $5,368 $6,058 $6,518 $7,284 $5,448 $7,195 $37,637.43 44 $5,539 $6,246 $6,714 $7,493 $5,599 $7,410 $38,390.18 45 $5,713 $6,438 $6,914 $7,706 $5,758 $7,629 $39,157.98 46 $5,891 $6,634 $7,117 $7,923 $5,947 $7,853 $39,941.14 47 $6,073 $6,833 $7,325 $8,145 $6,140 $8,106 $40,739.97 48 $6,258 $7,037 $7,537 $8,371 $6,337 $8,371 $41,554.77 49 $6,446 $7,245 $7,759 $8,601 $6,538 $8,641 $42,385.86 50 $6,675 $7,493 $8,033 $8,873 $6,779 $8,947 $43,233.58 51 $6,932 $7,770 $8,336 $9,174 $7,049 $9,279 $44,098.25 52 $7,194 $8,052 $8,645 $9,480 $7,323 $9,618 $44,980.21 53 $7,461 $8,340 $8,960 $9,793 $7,603 $9,963 $45,879.82 54 $7,734 $8,634 $9,281 $10,112 $7,889 $10,315 $46,797.42 55 $8,012 $8,933 $9,608 $10,437 $8,181 $10,674 $47,733.36

The Journal of Applied Business Research – July/August 2015 Volume 31, Number 4
Copyright by author(s); CC-BY 1612 The Clute Institute
(Table 3 continued) Age B.C. Alberta Sask. Manitoba Ontario Quebec Annual Income 56 $8,296 $9,239 $9,943 $10,769 $8,478 $11,041 $48,688.03 57 $8,585 $9,550 $10,283 $11,107 $8,782 $11,414 $49,661.79 58 $8,880 $9,868 $10,631 $11,453 $9,091 $11,795 $50,655.03 59 $9,181 $10,192 $10,986 $11,805 $9,407 $12,184 $51,668.13 60 $9,487 $10,523 $11,347 $12,163 $9,728 $12,580 $52,701.49 61 $9,801 $10,860 $11,716 $12,530 $10,057 $12,985 $53,755.52 62 $10,120 $11,204 $12,092 $12,903 $10,392 $13,397 $54,830.63 63 $10,446 $11,555 $12,476 $13,285 $10,733 $13,818 $55,927.24 64 $10,778 $11,913 $12,868 $13,673 $11,082 $14,247 $57,045.79 65 $11,117 $12,278 $13,267 $14,070 $11,437 $14,685 $58,186.70 66 $11,462 $12,651 $13,674 $14,474 $11,800 $15,132 $59,350.44 67 $11,815 $13,031 $14,090 $14,886 $12,169 $15,587 $60,537.45 68 $0.00 $0.00 $0.00 $0.00 $0.00 $0.00 $0.00 69 $0.00 $0.00 $0.00 $0.00 $0.00 $0.00 $0.00 70 $0.00 $0.00 $0.00 $0.00 $0.00 $0.00 $0.00 71 $0.00 $0.00 $0.00 $0.00 $0.00 $0.00 $0.00 72 $0.00 $0.00 $0.00 $0.00 $0.00 $0.00 $0.00 73 $0.00 $0.00 $0.00 $0.00 $0.00 $0.00 $0.00 74 $0.00 $0.00 $0.00 $0.00 $0.00 $0.00 $0.00 75 $0.00 $0.00 $0.00 $0.00 $0.00 $0.00 $0.00 76 $0.00 $0.00 $0.00 $0.00 $0.00 $0.00 $0.00 77 $0.00 $0.00 $0.00 $0.00 $0.00 $0.00 $0.00 78 $0.00 $0.00 $0.00 $0.00 $0.00 $0.00 $0.00 79 $0.00 $0.00 $0.00 $0.00 $0.00 $0.00 $0.00 80 $0.00 $0.00 $0.00 $0.00 $0.00 $0.00 $0.00
Total $293,604 $326,101 $352,792 $389,376 $302,112 $390,948 $1,917,409 Note. Tax calculations are based on average tax rates of 2012 using Ernst & Young personal income tax calculator.
Table 4. Lifetime Taxes Paid by a Citizen Starting at $11.25 / hour
and a 2% Annual Increase in the Canadian Provinces of N.B, N.S., P.E.I., Nfld., N.W.T., Yukon, & Nunavut Lifetime Taxes Paid by a Citizen Starting at $11.25 / hour and a 2% Annual Increase in the Canadian Provinces of N.B, N.S., P.E.I., Nfld., N.W.T., Yukon, & Nunavut.
Age N.B. N.S. P.E.I. Nfld. N.W.T. Yukon Nunavut Annual Income 1 $0.00 $0.00 $0.00 $0.00 $0.00 $0.00 $0.00 $0.00 2 $0.00 $0.00 $0.00 $0.00 $0.00 $0.00 $0.00 $0.00 3 $0.00 $0.00 $0.00 $0.00 $0.00 $0.00 $0.00 $0.00 4 $0.00 $0.00 $0.00 $0.00 $0.00 $0.00 $0.00 $0.00 5 $0.00 $0.00 $0.00 $0.00 $0.00 $0.00 $0.00 $0.00 6 $0.00 $0.00 $0.00 $0.00 $0.00 $0.00 $0.00 $0.00 7 $0.00 $0.00 $0.00 $0.00 $0.00 $0.00 $0.00 $0.00 8 $0.00 $0.00 $0.00 $0.00 $0.00 $0.00 $0.00 $0.00 9 $0.00 $0.00 $0.00 $0.00 $0.00 $0.00 $0.00 $0.00
10 $0.00 $0.00 $0.00 $0.00 $0.00 $0.00 $0.00 $0.00 11 $0.00 $0.00 $0.00 $0.00 $0.00 $0.00 $0.00 $0.00 12 $0.00 $0.00 $0.00 $0.00 $0.00 $0.00 $0.00 $0.00 13 $0.00 $0.00 $0.00 $0.00 $0.00 $0.00 $0.00 $0.00 14 $0.00 $0.00 $0.00 $0.00 $0.00 $0.00 $0.00 $0.00 15 $0.00 $0.00 $0.00 $0.00 $0.00 $0.00 $0.00 $0.00 16 $0.00 $0.00 $0.00 $0.00 $0.00 $0.00 $0.00 $0.00 17 $0.00 $0.00 $0.00 $0.00 $0.00 $0.00 $0.00 $0.00 18 $0.00 $0.00 $0.00 $0.00 $0.00 $0.00 $0.00 $0.00 19 $2,859 $3,198 $3,424 $2,980 $2,484 $2,772 $2,334 $23,400.00 20 $2,986 $3,309 $3,540 $3,086 $2,581 $2,875 $2,423 $23,868.00 21 $3,115 $3,423 $3,659 $3,194 $2,681 $2,980 $2,514 $24,345.36 22 $3,247 $3,539 $3,779 $3,305 $2,783 $3,088 $2,606 $24,832.27

The Journal of Applied Business Research – July/August 2015 Volume 31, Number 4
Copyright by author(s); CC-BY 1613 The Clute Institute
(Table 4 continued) Age N.B. N.S. P.E.I. Nfld. N.W.T. Yukon Nunavut Annual Income 23 $3,382 $3,657 $3,902 $3,418 $2,887 $3,197 $2,700 $25,328.91 24 $3,519 $3,777 $4,028 $3,533 $2,992 $3,309 $2,797 $25,835.49 25 $3,659 $3,900 $4,156 $3,650 $3,101 $3,423 $2,895 $26,352.20 26 $3,802 $4,025 $4,287 $3,770 $3,211 $3,539 $2,995 $26,879.24 27 $3,948 $4,153 $4,420 $3,892 $3,323 $3,657 $3,097 $27,416.83 28 $4,097 $4,284 $4,556 $4,016 $3,438 $3,778 $3,201 $27,965.17 29 $4,248 $4,417 $4,695 $4,143 $3,554 $3,901 $3,308 $28,524.47 30 $4,402 $4,552 $4,836 $4,272 $3,674 $4,027 $3,416 $29,094.96 31 $4,560 $4,696 $4,981 $4,405 $3,795 $4,155 $3,527 $29,676.86 32 $4,721 $4,874 $5,128 $4,539 $3,919 $4,286 $3,639 $30,270.40 33 $4,885 $5,055 $5,278 $4,677 $4,046 $4,419 $3,754 $30,875.80 34 $5,053 $5,240 $5,431 $4,817 $4,175 $4,556 $3,872 $31,493.32 35 $5,223 $5,429 $5,593 $4,960 $4,307 $4,695 $3,991 $32,123.19 36 $5,397 $5,621 $5,778 $5,106 $4,441 $4,836 $4,113 $32,765.65 37 $5,575 $5,817 $5,967 $5,280 $4,578 $4,980 $4,238 $33,420.96 38 $5,754 $6,018 $6,159 $5,464 $4,718 $5,128 $4,365 $34,089.38 39 $5,919 $6,222 $6,356 $5,651 $4,860 $5,278 $4,495 $34,771.17 40 $6,086 $6,430 $6,556 $5,842 $5,005 $5,431 $4,627 $35,466.59 41 $6,257 $6,643 $6,760 $6,037 $5,154 $5,588 $4,761 $36,175.92 42 $6,432 $6,859 $6,969 $6,236 $5,305 $5,747 $4,899 $36,899.44 43 $6,610 $7,080 $7,181 $6,439 $5,459 $5,910 $5,039 $37,637.43 44 $6,797 $7,306 $7,398 $6,646 $5,616 $6,076 $5,182 $38,390.18 45 $7,005 $7,536 $7,619 $6,857 $5,790 $6,245 $5,328 $39,157.98 46 $7,217 $7,771 $7,845 $7,073 $5,975 $6,418 $5,477 $39,941.14 47 $7,434 $8,010 $8,075 $7,292 $6,163 $6,593 $5,629 $40,739.97 48 $7,654 $8,254 $8,309 $7,517 $6,355 $6,773 $5,808 $41,554.77 49 $7,880 $8,502 $8,549 $7,745 $6,551 $6,956 $5,991 $42,385.86 50 $8,146 $8,793 $8,830 $8,015 $6,788 $7,194 $6,214 $43,233.58 51 $8,441 $9,113 $9,139 $8,313 $7,053 $7,468 $6,465 $44,098.25 52 $8,742 $9,439 $9,455 $8,618 $7,323 $7,747 $6,721 $44,980.21 53 $9,048 $9,771 $9,777 $8,928 $7,598 $8,032 $6,982 $45,879.82 54 $9,361 $10,110 $10,105 $9,245 $7,879 $8,323 $7,248 $46,797.42 55 $9,681 $10,456 $10,441 $9,568 $8,165 $8,619 $7,519 $47,733.36 56 $10,006 $10,809 $10,782 $9,897 $8,458 $8,922 $7,796 $48,688.03 57 $10,338 $11,168 $11,131 $10,233 $8,755 $9,230 $8,079 $49,661.79 58 $10,677 $11,536 $11,487 $10,576 $9,059 $9,545 $8,367 $50,655.03 59 $11,022 $11,910 $11,849 $10,925 $9,369 $9,866 $8,661 $51,668.13 60 $11,375 $12,292 $12,219 $11,281 $9,686 $10,193 $8,960 $52,701.49 61 $11,734 $12,681 $12,596 $11,645 $10,008 $10,527 $9,266 $53,755.52 62 $12,101 $13,078 $12,981 $12,016 $10,337 $10,868 $9,578 $54,830.63 63 $12,475 $13,484 $13,374 $12,394 $10,673 $11,215 $9,896 $55,927.24 64 $12,856 $13,897 $13,774 $12,780 $11,015 $11,569 $10,220 $57,045.79 65 $13,245 $14,318 $14,183 $13,174 $11,364 $11,931 $10,551 $58,186.70 66 $13,642 $14,751 $14,599 $13,575 $11,720 $12,300 $10,888 $59,350.44 67 $14,047 $15,210 $15,024 $13,985 $12,083 $12,676 $11,233 $60,537.45 68 $0.00 $0.00 $0.00 $0.00 $0.00 $0.00 $0.00 $0.00 69 $0.00 $0.00 $0.00 $0.00 $0.00 $0.00 $0.00 $0.00 70 $0.00 $0.00 $0.00 $0.00 $0.00 $0.00 $0.00 $0.00 71 $0.00 $0.00 $0.00 $0.00 $0.00 $0.00 $0.00 $0.00 72 $0.00 $0.00 $0.00 $0.00 $0.00 $0.00 $0.00 $0.00 73 $0.00 $0.00 $0.00 $0.00 $0.00 $0.00 $0.00 $0.00 74 $0.00 $0.00 $0.00 $0.00 $0.00 $0.00 $0.00 $0.00 75 $0.00 $0.00 $0.00 $0.00 $0.00 $0.00 $0.00 $0.00 76 $0.00 $0.00 $0.00 $0.00 $0.00 $0.00 $0.00 $0.00 77 $0.00 $0.00 $0.00 $0.00 $0.00 $0.00 $0.00 $0.00 78 $0.00 $0.00 $0.00 $0.00 $0.00 $0.00 $0.00 $0.00 79 $0.00 $0.00 $0.00 $0.00 $0.00 $0.00 $0.00 $0.00 80 $0.00 $0.00 $0.00 $0.00 $0.00 $0.00 $0.00 $0.00
Total $356,660 $382,413 $386,960 $351,010 $300,254 $320,841 $277,665 $1,917,409 Note. Tax calculations are based on average tax rates of 2012 using Ernst & Young personal income tax calculator.

The Journal of Applied Business Research – July/August 2015 Volume 31, Number 4
Copyright by author(s); CC-BY 1614 The Clute Institute
Table 5 (below) is a summary of the information provided for all Canadian provinces and territories’ lifetime income tax comparison of two hypothetical citizens who have a one-dollar per hour difference in their earnings. The table also contains the mean and the standard deviation of the compared variables and also the lifetime variance of income tax contributions for these two hypothetical citizens. The national average of extra taxes (variance) paid by the higher earning hypothetical citizen is $48,301 and the province of Quebec has the highest variance for the difference between the earnings of these two citizens ($56,368) and Nunavut has the lowest variance in earnings ($40,033). Figure 1 shows the same results in a chart format.
Table 5. Comparing Lifetime Taxes Paid by Two Hypothetical Citizens,
One Starting at $11.25/hr. and One at $10.25/hr. (all Canadian provinces and territories). Comparing Lifetime Taxes Paid by Two Citizen, One Staring at $11.25 and One at $10.25
Province / Territory Lifetime Taxes Paid by a
Citizen Starting at $11.25 / hour and 2% annual increase
Lifetime Taxes Paid by a Citizen Starting at $10.25 / hour and 2%
annual increase
Extra Taxes Received by a Provincial Gov. Due to a Higher
Minimum Wage B.C. $293,604.00 $250,341.00 $43,263.00
Alberta $326,101.00 $278,335.00 $47,766.00 Sask. $352,792.00 $301,786.00 $51,006.00
Manitoba $389,376.00 $337,732.00 $51,644.00 Ontario $302,112.00 $259,050.00 $43,062.00 Quebec $390,948.00 $334,580.00 $56,368.00
N.B. $356,660.00 $305,896.00 $50,764.00 N.S. $382,413.00 $328,342.00 $54,071.00 P.E.I. $386,960.00 $334,572.00 $52,388.00 Nfld. $351,010.00 $301,406.00 $49,604.00
N.W.T. $300,254.00 $256,970.00 $43,284.00 Yukon $320,841.00 $276,169.00 $44,672.00
Nunavut $277,665.00 $237,632.00 $40,033.00 Mean $340,825.85 $292,523.92 $48,301.92
SD $40,005.28 $35,181.51 $5,009.53
Figure 1. Comparing Lifetime taxes paid by two hypothetical citizens, one starting at $11.25 / hour and one starting at $10.25 / hour

The Journal of Applied Business Research – July/August 2015 Volume 31, Number 4
Copyright by author(s); CC-BY 1615 The Clute Institute
DISCUSSION OF THE RESULTS
It was surprising to discover the effect of this unexpected method to pay for human capital development through higher education and to see the large increase in lifetime income tax revenues due to a one-dollar increase in the minimum wage. When the two hypothetical citizens with a one dollar difference in their hourly wages ($10.25 & $11.25 / hour) were compared, the citizen with the higher wage ($11.25) was found to contribute a lifelong amount of $48,301 more in income taxes due to the one dollar increase in the citizen’s wage (Table 5). This means that the government income tax opportunity cost (the forgone taxes) of keeping the minimum wage at $10.25 (or lower in some provinces) is equal to $48,301 for every minimum wage working citizen in Canada.
Figure 2 (below) shows a chart of the tax payments of the two hypothetical citizens and their interaction with government transfer payments. The two hypothetical citizens have both entered the working stage at age 19 and worked untill they reached the Canadian retirement age of 67. The chart shows that a one dollar more in wages per hour increase in Canada can translate into an increased contribution of $48,301 in income taxes over the lifetime of these two hypothetical citizens and a reduction of the breakeven age of 4.6 years.
Figure 2. Government-citizen funding cycle for two hypothetical citizens in Canada, one with a starting wage of $10.25 / hour and one with a starting wage of $11.25 / hour
The aim of comparing these two hypothetical citizens in Figure 2 (above) is to see whether a one dollar per hour difference in a citizen’s income due to extra training could generate enough tax revenue to justify, financially, the public investment in human capital development through post-secondary education. Another way to interprit the results of this comparison is to conclude that any training beyond the high school level that could facilitate any higher income (even one dollar above the minimum wage) could, in fact, justify public investment in human capital development. In other words, comparing two citizens with only one dollar difference in their earnings is used to show the financial consequences and the ‘worst case scenario’ for a government budget as a result of public investment in higher education.
Table 6 (below) summarizes the data from all Canadian provinces and territories of the comparison of the number of years it would take to break even for the two hypothetical citizens with a one-dollar difference in their hourly wages. Results (Table 6 below) show that the average age to break even at the national level, in the case of the $11.25/hour citizen is 42.8 years, and in the case of the $10.25/hr. citizen is 47.5 years, a gap of 4.6 years between the two compared hypothetical citizens. This means that a one-dollar increase in hourly earnings due to

The Journal of Applied Business Research – July/August 2015 Volume 31, Number 4
Copyright by author(s); CC-BY 1616 The Clute Institute
any kind of training has the potential to save 4.6 years of subsidization by the government. Figure 3 shows the same results in a chart format.
Table 6. Comparing Years to Breakeven for Two Hypothetical Citizens, One Starting at $11.25/hr. vs. one starting at $10.25/hr Comparing Years to Breakeven for Two Citizen, One Staring at $11.25 vs. $10.25
Province / Territory Years to Breakeven for a
Citizen Starting at $11.25 / hour and 2% annual increase
Years to Breakeven for a Citizen Starting at $10.25 / hour
and 2% annual increase Variance in Years to Breakeven
Province / Territory $11.25 $10.25 Variance B.C. 48 52 -4
Alberta 44 48 -4 Sask. 41 46 -5
Manitoba 37 42 -5 Ontario 47 52 -5 Quebec 38 43 -5
N.B. 41 45 -4 N.S. 39 44 -5 P.E.I. 38 43 -5 Nfld. 42 46 -4
N.W.T. 47 52 -5 Yukon 45 49 -4
Nunavut 50 55 -5 Mean 42.8 47.5 -4.6
SD 4.3 4.2 0.5 Figure 3. Years to Breakeven for hypothetical citizens starting at $11.25 / hour and hypothetical citizens starting at $10.25 / hour
Also, while this experiment demonstrated the effect of a one-dollar increase in the minimum wage on income taxes, it could be argued that other taxes (e. g., sales taxes) are also expected to increase due to a higher minimum wage. The higher minimum wage hypothetical citizen had extra lifetime income of $170,436 when compared with the lower minimum wage hypothetical citizen. Assuming that this extra amount will become disposable income, and using a Harmonized Sales Tax (HST) rate of 13 percent, the government is expected to receive an extra $22,156 in sales taxes per citizen due to a one-dollar increase in minimum wage. This difference in taxes could lead one to conclude that adjusting the minimum wage is a potential way to generate revenues to

The Journal of Applied Business Research – July/August 2015 Volume 31, Number 4
Copyright by author(s); CC-BY 1617 The Clute Institute
facilitate the full funding of higher education by using the extra generated taxes. Indexing the minimum wage and linking the increase in minimum wage to the CPI could undertake this policy.
RECOMMENDATIONS AND CONCLUSION
This study suggests that the following goals could be achieved by adopting a minimum wage indexing
policy:
1. Higher income tax revenues will be generated by the government to fund public programs like higher education.
2. Higher income for the most vulnerable workers (those who depend on minimum wage). 3. A reduction in the breakeven gap for government with respect to its minimum wage citizens. 4. A reduced dependence on the welfare system by making work more attractive due to higher wages. 5. Increased economic activity due to the expected higher disposable income of minimum wage workers.
A one-dollar difference in the minimum wage could be powerful enough to pay for the full cost of human capital development through higher education. A slight adjustment to the hourly wage due to a slightly higher level of training would translate into a lifetime national average of $48,301 more in income taxes per person. These extra lifetime taxes can positively affect governments’ budgets by increasing revenues in one side of the budget, and by reducing expenditures on government subsidies in the other side due to the reduction in the breakeven age of the two compared hypothetical citizens by 4.6 years.
AUTHOR INFORMATION Mahmoud Yousef Askari is an assistant professor of management in the Department of Management & MIS, College of Business Administration, Al Ain University of Science and Technology, P O Box 64141, Al Ain, UAE. Email: [email protected]
REFERENCES Askari, M. (2014). A partnership approach to public finance for higher education funding in Canada (Doctoral
Dissertation). Retrieved from Dissertations and Theses database, University of Calgary http://hdl.handle.net/11023/1383.
AUCC (2008). Trends in higher education, volume 3: Finance. Ottawa: AUCC http://www.aucc.ca/wp-content/uploads/2011/06/trends_2008_vol3_e.pdf. Campolieti, M., Fang, T., & Gunderson, M. (2005). How minimum wages affect schooling-employment outcomes
in canada, 1993-1999. Journal of Labor Research, 26(3), 533-545. Retrieved from doi:http://dx.doi.org/10.1007/s12122-005-1019-z
Campolieti, M., Gunderson, M., & Lee, B. (2012). The (non) impact of minimum wages on poverty: Regression and simulation evidence for canada. Journal of Labor Research, 33(3), 287-302. Retrieved from doi:http://dx.doi.org/10.1007/s12122-012-9139-8
Card, D., & Krueger, A. B. (1995). Time-series minimum-wage studies: A meta-analysis. The American Economic Review, 85(2), 238. Retrieved from http://search.proquest.com/docview/233026818?accountid=130846
Dickson, V., & Myatt, T. (2002). The determinants of provincial minimum wages in canada. Journal of Labor Research, 23(1), 57-67. Retrieved from http://search.proquest.com/docview/214017974?accountid=130846
Edwards, P., & Gilman, M. (1999). Pay equity and the national minimum wage: What can theories tell us? Human Resource Management Journal, 9(1), 20-38. Retrieved from http://search.proquest.com/docview/199448047?accountid=130846
Even, W. E., & Macpherson, D. A. (1996). Consequences of minimum wage indexing. Contemporary Economic Policy, 14(4), 67-77. Retrieved from http://search.proquest.com/docview/274335929?accountid=130846
Friedman, M. and Friedman R. (1980). Free to Choose: A Personal Statement. London: Secker and Warburg.

The Journal of Applied Business Research – July/August 2015 Volume 31, Number 4
Copyright by author(s); CC-BY 1618 The Clute Institute
Hauptman, A. M., & Nolan, P. (2011). Assessing the effects of four budget-balancing strategies in higher education. Higher Education Management And Policy, 23(1).
Metcalfe, A. (2010). Revisiting academic capitalism in Canada: No longer the exception. Journal Of Higher Education, 81(4), 489-514.
Partridge, M. D., & Partridge, J. S. (1999). Do minimum wage hikes raise US long term unemployment? evidence using state minimum wage rates. Regional Studies, 33(8), 713-726. Retrieved from http://search.proquest.com/docview/208878912?accountid=130846
Sun, F., & Barrientos, A. (2009). The equity challenge in China's higher education finance policy. Higher Education Policy, 22(2), 191-207.
Woodhall, M. (2007). Funding higher education: The contribution of economic thinking to debate and policy development. Working Paper No. 8. Washington: The World Bank: http://siteresources.worldbank.org/EDUCATION/Resources/278200-1099079877269/547664-1099079956815/Funding_HigherEd_wps8.pdf.

The Journal of Applied Business Research – July/August 2015 Volume 31, Number 4
Copyright by author(s); CC-BY 1619 The Clute Institute
APPENDIX A
Government Transfer Payments by Category Annual government transfer payments to persons (dollars x 1,000,00) Geography Government transfer payments to persons 2005 2006 2007 2008 2009
Canada Total government transfer payments 136247 145754 154609 165101 176630 Canada Total federal 67903 70547 76578 81119 88051 Canada Family and youth allowances 165 187 205 210 211 Canada Child tax benefit or credit 9174 9470 9495 9468 6716 Canada Universal child care benefit 1175 2451 2518 2590 Canada Pensions, World Wars I and II 1584 1693 1694 1696 1686 Canada War veterans’’ allowances 289 331 464 588 639 Canada Grants to aboriginal persons and organizations 5752 5823 6179 7534 6532 Canada Goods and Services Tax credit 3472 3566 3599 3692 3742 Canada Employment insurance benefits 12937 12498 12561 13275 18755 Canada Old age security payments 29085 30468 31929 33538 34973 Canada Scholarships and research grants 789 858 883 922 880 Canada Miscellaneous and other transfers 4656 4478 7118 7678 8127 Canada Total provincial 33297 38570 39446 42922 45030 Canada Social Insurance benefits, workers’ compensation 5229 5316 5500 5797 5970 Canada Social insurance benefits, other 830 1452 1561 1649 Canada Grants to benevolent associations 9581 10593 11280 12153 12877 Canada Social assistance, income maintenance 6918 7123 7480 7784 8232 Canada Social assistance, other 3445 3791 3989 4354 4986 Canada Miscellaneous transfers 8124 10917 9745 11273 11316 Canada Total local 3026 2976 3305 3827 7268 Canada Canada Pension Plan (CPP) 24225 25417 26624 28089 29611 Canada Quebec Pension Plan (QPP) 7796 8244 8656 9144 9670 Source: Statistics Canada. Table 384-0009 – Government transfer payments to person, provincial economic accounts, annual (dollars) (accessed: May 21, 2013).
APPENDIX B Federal Income Tax Rates in Canada (2012)
Use this column if your
taxable income is $42,707 or less
Use this column if your taxable income is more than $42,707, but not
more than $85,414
Use this column is your taxable income is more than $85,414, but not
more than 132,406
Use this column if your taxable income is more
than $132,406
Enter your taxable income from line 206 of your return Base amount
- 0
- 42,707
- 85,414
- 132,406
1 2
Line 1 minus line 2 (this amount cannot be negative) Federal tax rate
= x 15%
= x 22%
= x 26%
= x 29%
3 4
Multiply the amount on line by the tax rate on line 4
= = = = 5
Tax on the amount from line 2 Add lines 5 and 6
+ 0 =
+ 6,406 =
+ 15,802 =
+ 28,020 =
6 7
Note: under the current tax on income method, tax for all provinces (except Quebec) and territories is calculated the same way as federal tax. Form 728 is used to calculate this provincial or territorial tax. Provincial or territorial specific non-refundable tax credits are also calculate on Form 428. For complete details, see the provincial or territorial information and dorms in your 2012 tax package. Source: Canada Revenue Service Date modified: 1/03/13

The Journal of Applied Business Research – July/August 2015 Volume 31, Number 4
Copyright by author(s); CC-BY 1620 The Clute Institute
APPENDIX C
Provincial Income Tax Rates (2012) Provincial/territorial tax rates (combined chart) Provinces/Territories Rates(s) Newfoundland and Labrador 7.7% on the first $32,893 of taxable income, + 12.5% on the next $ 32,892, + 13.3% on the amount over $ 65,785 Nova Scotia 8.79% on the first $29,590 of taxable income, + 14.95% on the next $29,590, + 16.67% on the next $33,820, + 17.5% on the next $57,000, + 21% on the amount over %150,00 New Brunswick 9.1% on the first $38,190 of taxable income, + 12.1% on the next $38,190, + 12.4% on the next $47,798, + 14.3% on the amount over $ 124,178 Qubec See income tax rates (Revenue Quebec Web site) Ontario 5.05% on the first $39,020 of taxable income, + 11.16% on the next $421,957, + 12.4% on the next $47,798, + 12.16% on the amount over $ 500,000 Manitoba 10.8% on the first $31,000 of taxable income, + 12.75% on the next $36,000, + 17.4% on the amount over $ 67,000 Sakatchewan 11% on the first $42,065 of taxable income, + 13% on the next $78,120, + 15% on the next $120,185, + Alberta 10% of taxable income British Columbia 5.06% on the first $37,013 of taxable income, + 7.7% on the next $37,015, + 10.5% on the next $10,965, + 12.29% on the next $18,212, + 14.7% on the amount over $ 103,205 Yukon 7.04% on the first $42,707 of taxable income, + 9.68% on the next $72,707, + 11.44% on the next $46,992, + 12.76% on the amount over $ 132,406 Northwest Territores 5.9% on the first $38,679 of taxable income, + 8.6% on the next $38,681, + 12.2% on the next $48,411, + 14.05% on the amount over $ 125,771 Nunavut 4% on the first $40,721 of taxable income, + 7% on the next $40,721, + 9% on the amount over $ 50,964 Source: Canada Revenue Agency Date modified: 0/03/13