FINANCIAL TRENDS PAST, PRESENT AND FUTURE
28
Town of Carrboro Adopted Annual Budget Fiscal Year 2020 141 FINANCIAL TRENDS PAST, PRESENT AND FUTURE The Town monitors its financial condition in various ways, from forecasting future revenue and expenditure trends to aggregating financial information into ratios that provide meaningful data about the Town’s fiscal health. The Town is considered to be on solid economic footing. The Town currently holds a credit rating of AAA with Standard and Poor’s and Moody’s Aa1. These are considered very favorable ratings, particularly for municipalities similar to Carrboro. The Town’s financial condition through the last audited year is evaluated using methodology recommended by the International City/County Management Association (ICMA). This analysis, formally known as FTMS (Financial Trends Monitoring System), offers governments a systematic way to monitor changes and to anticipate future problems. The town also projects future financial activity based on the most current budget. In forecasting the future, the five-year plan is designed to show the tax rate impact of Town services over the long-term if growth continues at the current rates assumed in the model. The five-year plan provides information about underlying trends in the Town’s fiscal position and budgetary trends monitoring key revenue and expenditures, debt and debt ratios, and the impact of capital investments and improvements on the Town’s budget. It is used as a tool for reflecting trends rather than actual revenues, expenditures, and tax rates. Historical Financial Trends Incorporated in the FTMS analysis are indicators used by credit rating firms that analyze major components of governmental operations (revenue, expenditures, operating position, and debt) to quantify changes or trends in financial condition. Minimum standards are not declared for most indicators. Instead, potential “warning trends” are identified and suggestions for analysis are offered. In a few cases, however, relevant credit industry benchmarks are noted by the FTMS. These benchmarks are identified for each indicator, where relevant, within the report. When analyzing financial conditions, we are attempting to: Maintain existing service levels, Withstand local and regional economic disruption, Meet demands of natural growth, decline, and change, Maintain facilities to protect investment and keep in usable condition, Meet future obligations (debt, leases, etc.), and Take advantage of cost-effective opportunities that may arise. Included with every indicator is a description of the indicator, a table and graphical representation of the trend over the fiscal years for which we have audited budget reports, and an explanation of the implications of that trend for the government and residents of the Town. All the financial figures in the report are taken from the approved annual Town audit reports and other official Town records.
-
Upload
khangminh22 -
Category
Documents
-
view
1 -
download
0
Transcript of FINANCIAL TRENDS PAST, PRESENT AND FUTURE

Town of Carrboro Adopted Annual Budget Fiscal Year 2020
141
FINANCIAL TRENDS
PAST, PRESENT AND FUTURE
The Town monitors its financial condition in various ways, from forecasting future revenue and expenditure trends to aggregating financial information into ratios that provide meaningful data about the Town’s fiscal health. The Town is considered to be on solid economic footing. The Town currently holds a credit rating of AAA with Standard and Poor’s and Moody’s Aa1. These are considered very favorable ratings, particularly for municipalities similar to Carrboro. The Town’s financial condition through the last audited year is evaluated using methodology recommended by the International City/County Management Association (ICMA). This analysis, formally known as FTMS (Financial Trends Monitoring System), offers governments a systematic way to monitor changes and to anticipate future problems. The town also projects future financial activity based on the most current budget. In forecasting the future, the five-year plan is designed to show the tax rate impact of Town services over the long-term if growth continues at the current rates assumed in the model. The five-year plan provides information about underlying trends in the Town’s fiscal position and budgetary trends monitoring key revenue and expenditures, debt and debt ratios, and the impact of capital investments and improvements on the Town’s budget. It is used as a tool for reflecting trends rather than actual revenues, expenditures, and tax rates.
Historical Financial Trends Incorporated in the FTMS analysis are indicators used by credit rating firms that analyze major components of governmental operations (revenue, expenditures, operating position, and debt) to quantify changes or trends in financial condition. Minimum standards are not declared for most indicators. Instead, potential “warning trends” are identified and suggestions for analysis are offered. In a few cases, however, relevant credit industry benchmarks are noted by the FTMS. These benchmarks are identified for each indicator, where relevant, within the report. When analyzing financial conditions, we are attempting to:
Maintain existing service levels, Withstand local and regional economic disruption, Meet demands of natural growth, decline, and change, Maintain facilities to protect investment and keep in usable condition, Meet future obligations (debt, leases, etc.), and Take advantage of cost-effective opportunities that may arise.
Included with every indicator is a description of the indicator, a table and graphical representation of the trend over the fiscal years for which we have audited budget reports, and an explanation of the implications of that trend for the government and residents of the Town. All the financial figures in the report are taken from the approved annual Town audit reports and other official Town records.
Town of Carrboro Adopted Annual Budget Fiscal Year 2020
142
Several indicators used throughout the report present dollar figures that have been adjusted for inflation using the Consumer Price Index (CPI) provided by the Bureau of Labor Statistics. By illustrating figures in constant dollars the effects of inflation are removed. The analyses illustrate historical trends for the General Fund and Special Revenue Funds (Grant Funds and Revolving Loan Fund). All per capita figures were calculated using population figures used by the North Carolina Department of Revenue to distribute sales tax revenue. They, in turn, rely on Census and state demographics information.
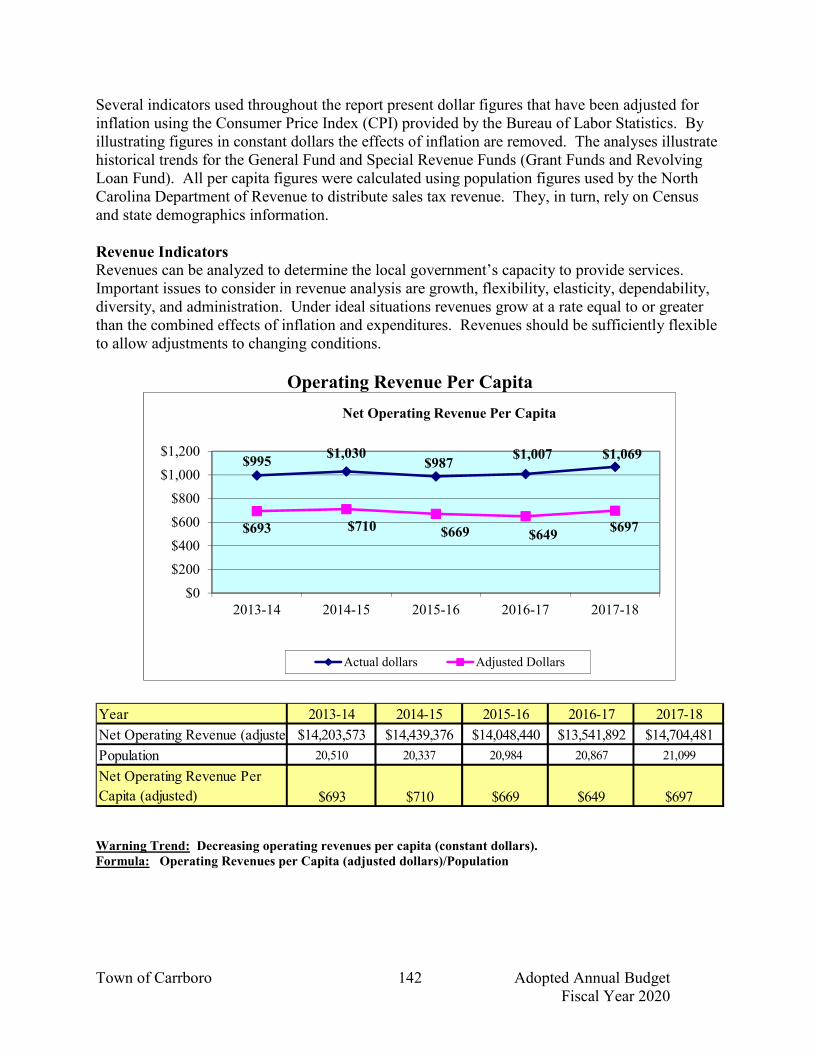
Revenue Indicators Revenues can be analyzed to determine the local government’s capacity to provide services. Important issues to consider in revenue analysis are growth, flexibility, elasticity, dependability, diversity, and administration. Under ideal situations revenues grow at a rate equal to or greater than the combined effects of inflation and expenditures. Revenues should be sufficiently flexible to allow adjustments to changing conditions.
Operating Revenue Per Capita
Warning Trend: Decreasing operating revenues per capita (constant dollars). Formula: Operating Revenues per Capita (adjusted dollars)/Population
$995$1,030
$987$1,007 $1,069
$693 $710 $669 $649$697
$0
$200
$400
$600
$800
$1,000
$1,200
2013-14 2014-15 2015-16 2016-17 2017-18
Net Operating Revenue Per Capita
Actual dollars Adjusted Dollars
Year 2013-14 2014-15 2015-16 2016-17 2017-18
Net Operating Revenue (adjusted)$14,203,573 $14,439,376 $14,048,440 $13,541,892 $14,704,481
Population 20,510 20,337 20,984 20,867 21,099
$693 $710 $669 $649 $697
Net Operating Revenue Per
Capita (adjusted)

Town of Carrboro Adopted Annual Budget Fiscal Year 2020
143
Description Examining per capita revenues shows changes in revenues relative to changes in population size. As population increases, it might be expected that revenues and the need for services would increase proportionally, and therefore the level of per capita revenues would remain at least constant in real terms. If per capita revenues are decreasing, the government may be unable to maintain existing service levels unless it finds new revenue sources or ways to provide existing services more efficiently. The reasoning in both cases assumes that the cost of services is directly related to population size. Operating revenues, as defined in this chart, are that portion of gross revenues collected by the Town that is available for general municipal operations. Thus, revenues legally restricted to capital improvements or other special purposes are excluded. The only legally restricted revenue deducted to calculate operating revenue is Powell Bill revenue that is used for street resurfacing. Discussion In real terms (adjusted for inflation), revenues per capita in Carrboro have remained constant since FY2014. In actual dollars collected (adjusted for inflation), revenue increased by 3.5% percent. Ad valorem tax, local option sales tax, other taxes and licenses, permits and fees, and investment earnings have increased in the past 5 years. The following chart shows distinct revenue trends as reflected in the Town’s audit reports.
Having a significant impact on the revenue stream is the property tax and sales taxes revenue per capita, representing 77% of the total revenue per capita in 2018. The significant impact of property taxes as a source of revenue is largely a reflection of the state restrictions on the ability of local government to use other types of revenues to support community needs. Intergovernmental Revenues had the most significant decrease.
Revenue Source
2018 Revenue
Adjusted for
Inflation
2014 Revenue
Adjusted for
Inflation
% Change in
Revenue Since
2014
2018 per capita 2014 per capita
% Change Since
2014 (per
capita)
Ad valorem taxes 8,423,144.51$ 8,206,147.53$ 2.6% 399$ 400$ -0.3%
Local option sales taxes 2,971,079.46$ 2,482,340.29$ 19.7% 141$ 121$ 16.5%
Other taxes and licenses 1,043,844.60$ 916,406.40$ 13.9% 49$ 45$ 8.9%
Intergovernmental revenues 1,008,822.76$ 1,379,222.69$ -26.9% 48$ 67$ -28.4%
Permits and fees 897,976.66$ 869,393.88$ 3.3% 43$ 42$ 2.4%
Sales and services 159,741.22$ 197,363.26$ -19.1% 8$ 10$ -20.0%
Investment earnings 88,318.88$ 8,181.63$ 979.5% 4$ -$ #DIV/0!
Other 111,553.35$ 144,517.05$ -22.8% 5$ 7$ -28.6%Total revenues by source $14,704,481.45 $14,203,572.72 3.5% 697$ 692$ 0.7%

Town of Carrboro Adopted Annual Budget Fiscal Year 2020
144
Major Revenue Sources
Description This graph reflects the Town’s revenue base composition by property tax, elastic (economically responsive) revenue, and intergovernmental revenue. An increasing reliance on federal and state revenues may signal a warning trend. A balance between property tax and more elastic revenue sources such as sales tax is desirable and considered healthy. Discussion As a percentage of total gross operating revenue, all revenues have remained fairly stable. Property tax increased by .9%, elastic revenues increased by .6%, and intergovernmental revenues decreased by .7%. Intergovernmental revenue, as a share of the revenue stream in FY17-18 decreased from FY16-17 mainly due to decreases in the beer and wine tax and Powell Bill funding. Elastic revenue had an increase in all revenue categories, including sales tax, all permit fees, and interest earnings.
61.0% 60.1% 61.3% 61.1% 62.0%
18.6% 19.8% 21.1% 21.7% 22.3%
8.4% 10.0% 9.9% 9.5% 8.8%0.0%
10.0%
20.0%
30.0%
40.0%
50.0%
60.0%
70.0%
2013-2014 2014-2015 2015-16 2016-17 2017-18
Carrboro Revenue Trends Intergovernmental, Elastic and Property Tax Revenues as a % of Total Gross Operating Revenue (Audited)
Property Tax Revenues Elastic Revenue Intergovernmental Revenue
Revenues 2013-14 2014-15 2015-16 2016-17 2017-18
Property Tax 12,741,993$ 12,887,757$ $12,989,241 $13,143,645 $14,276,093
Elastic Revenue 3,894,719$ 4,251,370$ $4,467,684 $4,654,349 $5,127,457
Intergovernmental Revenue 1,757,458$ 2,148,129$ $2,103,432 $2,042,392 $2,030,130
Total Revenue $ 18,394,170 $ 19,287,256 $19,560,357 $19,840,386 $21,433,680

Town of Carrboro Adopted Annual Budget Fiscal Year 2020
145
Property Tax Collection Rate
Warning Trend: Decreasing amount of collected property taxes as a percentage of net property tax levy. Formula: Collected property taxes/Net property tax levy
Description If the percentage of property tax collected decreases over time, it may indicate overall decline in the local government’s economic health. Additionally, as uncollected property taxes rise, liquidity is decreased, and there is less cash on hand to pay bills or to invest. Credit-rating firms assume that a local government normally will be unable to collect from 2 to 3 percent of its property taxes within the year that taxes are due. If uncollected property taxes rise to more than 5 to 8 percent, rating firms consider this a negative factor because it signals potential instability in the property tax base. An increase in the rate of delinquency for two consecutive years is also considered a negative factor. Discussion The graph above shows that Orange County, which provides continuous assessment services, annual tax collections, and in-house revaluations every four years to both Carrboro and Chapel Hill, has a positive collection rate for the Town’s property tax base. Collections decreased slightly to 99.30% in FY2017-18.
Tax Collection Rates in Carrboro and Neighboring Cities
2013-14 2014-15 2015-16 2016-17 2017-18
Carrboro 99.01% 99.36% 99.28% 99.42% 99.30%
Chapel Hill 99.36% 99.59% 99.62% 99.60% 99.66%
City of Durham 99.00% 99.57% 99.69% 99.80% 99.84%
Hillsborough 98.00% 98.11% 98.72% 99.18% 99.13%
99.01%99.36% 99.28%
99.42% 99.30%
96.0%
96.5%
97.0%
97.5%
98.0%
98.5%
99.0%
99.5%
2013-14 2014-15 2015-16 2016-17 2017-18
Percentage of Carrboro Property Taxes Collected

Town of Carrboro Adopted Annual Budget Fiscal Year 2020
146
Comparison of Actual Revenues to Budgeted Revenues
Warning Trend: Increase in revenue shortfalls or surpluses as a percentage of budgeted revenues. Formula: Revenue Variance/Budgeted Operating Revenues
Description This indicator examines the differences between revenue estimates and revenues actually received during the fiscal year. Major discrepancies that continue year after year can indicate a declining economy, inefficient collection procedures; changes in the law, or inaccurate estimating techniques. One of the criteria reviewed by Standard and Poor’s for the quality of financial management in a local government is financial results compared against original expectations. Variances between budget and actual results are indicative of management’s financial planning capabilities over time. The Town aims to have variances exceeding budgeted estimates no larger than 3-5 percent and seeks to avoid shortfalls to maintain the Town’s fiscal health as surplus is one critical component of maintaining or improving fund balance levels. Discussion The variances in the graph indicate the Town’s conservative approach to estimating revenues. In FY13-14, the main increases were with local option sales taxes ($241,307), other taxes and licenses ($780,830) and restricted intergovernmental revenues ($134, 509). Fiscal year 14-15 had increases in local option sales taxes ($525,663), other taxes and licenses ($829,973) and restricted intergovernmental revenues ($581,077). Major increases in FY 15-16 include unrestricted
10.2%
11.4%
5.0%
0.3%
5.8%
-1.0%
1.0%
3.0%
5.0%
7.0%
9.0%
11.0%
13.0%
15.0%
2013-14 2014-15 2015-16 2016-17 2017-18
Comparison of Actual Revenues to Budgeted Revenues
General Fund
2013-14 2014-15 2015-16 2016-17 2017-18
Budgeted Operating Revenue $18,970,318 $19,236,874 $20,189,109 $21,430,027 $21,774,331
Actual Operating Revenue $20,898,471 $21,432,760 $21,200,253 $21,495,739 $23,040,640
Revenue Variance $1,928,153 $2,195,886 $1,011,144 $65,712 $1,266,309
Revenue
Budgeted Operating Revenues 10.2% 11.4% 5.0% 0.3% 5.8%

Town of Carrboro Adopted Annual Budget Fiscal Year 2020
147
intergovernmental revenues ($576,627), other taxes and licenses ($501,715) and local option sales taxes ($279,597). In FY 16-17, the main increases were property taxes ($154,404), sales tax ($240,329), and other taxes and licenses ($220,033). In FY 17-18, the main increases were property taxes ($192,304), sales tax ($539,434), unrestricted intergovernmental revenues ($186,557), permits and fees ($197,457), and investment earnings ($108,401). Expenditure Indicators Expenditures are a rough measure of a local government’s service output. Generally, the more a government spends in constant dollars (adjusted for inflation), the more services it is providing. This formula does not take into account how effective the services are or how efficiently they are delivered.
Net Operating Expenditures per Capita
Warning Trend: Increasing net operating expenditures per capita (constant dollars). Formula: Net Operating Expenditures/Population
Description Changes in per capita expenditures reflect changes in expenditures relative to changes in population. Increasing per capita expenditures can indicate the provision of new services, rising costs of providing services (or supporting the personnel who provide them), or changes in accounting practices (see next section). If expenditures are greater than can be accounted for by inflation or the addition of new services, it may indicate declining productivity – that is, the government is spending more real dollars to support the same level of services.
$959 $996 $989 $1,018$1,091
$668 $687 $671 $682 $711
$0
$200
$400
$600
$800
$1,000
$1,200
2013-14 2014-15 2015-16 2016-17 2017-18
Net Operating Expenditures Per CapitaGeneral Fund & Special Revenue Funds
Actual Dollars Adjusted Dollars
2013-14 2014-15 2015-16 2016-17 2017-18
Net Operating Expenditures (Adjusted) $13,694,031 $13,968,450 $14,074,303 $14,221,815 $15,010,066
Population 20,510 20,337 20,984 20,867 21,099

Town of Carrboro Adopted Annual Budget Fiscal Year 2020
148
Discussion Net operating expenditures, adjusted for inflation, show an increase in expenditures made by the Town since FY13-14, from $13,694,031 to $15,010,066 in FY17-18. When adjusted for the combined impact of inflation and population, per capita spending increased from $668 in FY13-14 to $711 in FY 17-18, or 6.4%. Over the past five years, expenditures per capita have fluctuated. The following highlights variations in fiscal years presented in the graph: FY 2013-14 – Per capita expenditures decreased $76 due to reduction in capital expenditures. FY 2014-15 – Per capita expenditures changed slightly ($19) from the previous year. FY 2015-16 – Per capita expenditures decreased $16 from the previous year due to reduction in Public Works expenditures. FY 2016-17 - Per capita expenditures increased $11 from the previous year due to change in population. FY 2017-18 - Per capita expenditures increased $29 from the previous year primarily due to transfers to the capital fund for capital projects. Changes in net operating per capita expenditures can be explained by highlighting events that have contributed to changes in expenditure levels. The following section looks at the various components of expenditures and service levels. Public Works Expenditures per Capita
In inflation-adjusted dollars, Carrboro’s per capita expenditures on public works have varied. The variability of public works spending is related to ongoing capital and maintenance needs
$160
$216
$167 $165 $169
$111
$149
$113$106 $109
$90
$110
$130
$150
$170
$190
$210
$230
2013-14 2014-15 2015-16 2016-17 2017-18
Public Works Expenditures Per Capita
Actual Dollars Adjusted Dollars

Town of Carrboro Adopted Annual Budget Fiscal Year 2020
149
including street maintenance, stormwater system repairs, and responding to major natural disasters. The increase in FY 14-15 is due to the purchase of new Town signs, contract services for the mulch pile relocation and the purchase of an automated leaf truck. The decrease in FY 15-16 is due to the one-time cost of equipment and contract services from the previous year and personnel changes. The decrease in FY 16-17 is due to vacant personnel positions. The uptick in FY 17-18 is due to an increase in street resurfacing costs. Debt Service Expenditures Per Capita
Debt costs include debt paid on general obligation bonds, installment financing for property and town infrastructure as well as equipment and vehicles. The Town has been able to take advantage of retiring debt and low interest rates to borrow for major infrastructure needs and maintain debt service at a relatively constant level. The decrease in costs for FY 14-15 is due to a decrease in equipment and vehicle financing. There was very little change in per capita costs during the next few years.
$63$56 $55 $54 $54
$44
$39 $38$36
$35$30
$40
$50
$60
$70
$80
$90
$100
2013-14 2014-15 2015-16 2016-17 2017-18
Debt Service Expenditures Per Capita
Actual Dollars Adjusted Dollars
Town of Carrboro Adopted Annual Budget Fiscal Year 2020
150
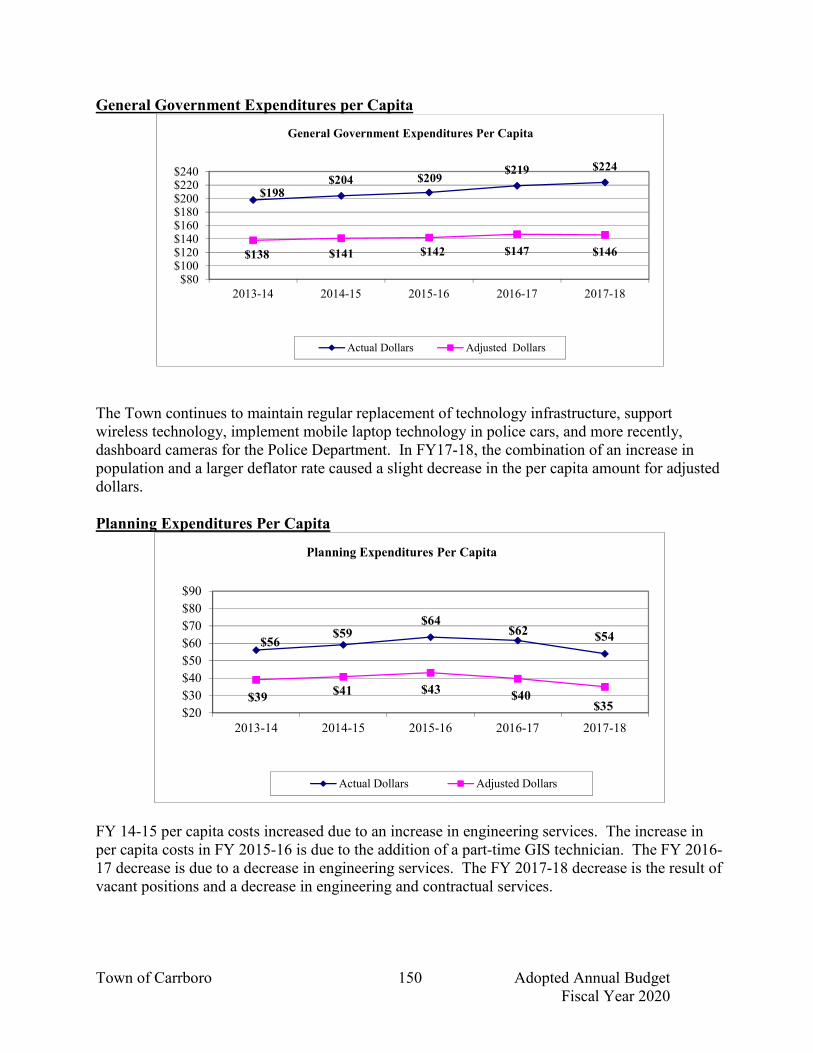
General Government Expenditures per Capita
The Town continues to maintain regular replacement of technology infrastructure, support wireless technology, implement mobile laptop technology in police cars, and more recently, dashboard cameras for the Police Department. In FY17-18, the combination of an increase in population and a larger deflator rate caused a slight decrease in the per capita amount for adjusted dollars. Planning Expenditures Per Capita
FY 14-15 per capita costs increased due to an increase in engineering services. The increase in per capita costs in FY 2015-16 is due to the addition of a part-time GIS technician. The FY 2016-17 decrease is due to a decrease in engineering services. The FY 2017-18 decrease is the result of vacant positions and a decrease in engineering and contractual services.
$198$204 $209
$219 $224
$138 $141 $142 $147 $146
$80$100$120$140$160$180$200$220$240
2013-14 2014-15 2015-16 2016-17 2017-18
General Government Expenditures Per Capita
Actual Dollars Adjusted Dollars
$56$59
$64$62 $54
$39$41 $43 $40
$35$20
$30
$40
$50
$60
$70
$80
$90
2013-14 2014-15 2015-16 2016-17 2017-18
Planning Expenditures Per Capita
Actual Dollars Adjusted Dollars

Town of Carrboro Adopted Annual Budget Fiscal Year 2020
151
Recreation and Parks Expenditures per Capita
Per capita expenditures adjusted for inflation, have fluctuated over the past 5 years due to the completion of several capital projects and addition of special programs and events. The increase in per capita expenditures in FY 2014-15 included the resurfacing of the tennis court and basketball court at Anderson Park and the basketball court renovation and expansion at Baldwin Park. FY 2015-16 per capita costs remained fairly constant. FY 2016-17 per capita decrease is due to the completion of Anderson Park projects. FY 2017-18 remained constant. Transportation Expenditures Per Capita
The Town and UNC-Chapel Hill are partners in the transit system administered by the Town of Chapel Hill. The contract increased in FY 14-15 due to the necessity for bus replacements. Costs for FY 2015-16 have remained constant. The decrease in per capita costs in FY 2016-17 is due to revised calculation of the bus replacements. FY 2017-18 remained at previous year levels because a new contract has not yet been negotiated. The increases are primarily due to decreased
$68
$74$73 $71
$71
$48 $51 $50$46
$46
$30
$40
$50
$60
$70
$80
$90
2013-14 2014-15 2015-16 2016-17 2017-18
Recreation and Parks Expenditures Per Capita
Actual Dollars Adjusted Dollars
$68$72 $73
$70 $69
$47 $50 $50$45 $44
$10
$20
$30
$40
$50
$60
$70
$80
2013-14 2014-15 2015-16 2016-17 2017-18
Transportation Expenditures Per Capita
Actual Dollars Adjusted Dollars

Town of Carrboro Adopted Annual Budget Fiscal Year 2020
152
state and federal pass-through funds that supported the transit, which affected the local match. With a grant and local funds, Shared Ride Feeder services were enabled in areas of Carrboro that do not have regular bus service. Trips are provided between designated bus stops in the “feeder” zones and the nearest bus routes or to another “feeder” service. This service extends largely to the northern areas of town. Public Safety Expenditures per Capita
The increase in per capita expenditures in FY 2014-15 included the purchase of defibrillators for Century Center and Town Hall and increased cost for replacement vehicles. The decrease in FY 2015-16 is due to a decrease in fuel, uniform and training costs. FY 2016-17 per capita costs increased due to personnel costs. FY 2017-18 figures decreased primarily due to an increase in population.
$304$315 $308
$324$322
$212 $217 $209 $217$210
$160
$210
$260
$310
$360
2013-14 2014-15 2015-16 2016-17 2017-18
Public Safety Expenditures Per Capita
Actual dollars Adjusted Dollars

Town of Carrboro Adopted Annual Budget Fiscal Year 2020
153
Net Operating Expenditures by Function
The chart above represents the allocation of funding for the various services provided by the Town. Approximately 45 percent of the Town’s spending is dedicated to public safety (fire protection and law enforcement services) and public works (street and sidewalk maintenance; solid waste collections; building, grounds, and parks maintenance; and fleet maintenance). General government, which largely represents Board functions (Town Clerk, Mayor and Board of Aldermen, nonprofit and advisory boards) and support services (Finance, Technology, Human Resources, and Town Manager), represents approximately 21 percent of total spending. The remainder of the programs (debt service, transportation, planning and recreation programs) combined represent approximately 34 percent of the net operating expenses.
0.0%5.0%
10.0%15.0%20.0%25.0%30.0%35.0%
All Government Functions as % of Net Operating Expenditures
Public Safety
Public Works
Recreation andParks
Planning andZoning
GeneralGovernment
Transportation
Debt Service

Town of Carrboro Adopted Annual Budget Fiscal Year 2020
154
Fringe Benefits
Warning Trend: Unexplained, uncontrolled, or unanticipated increases in fringe benefit costs may signal a warning trend to credit rating industries. Formula: Expenditures for Fringe Benefits/Salaries &Wages
Description Fringe benefits represent the costs, in addition to salaries and wages, incurred by a jurisdiction to support the personnel it employs. The calculation in this indicator includes FICA payments, health insurance payments, retiree insurance payments, separation allowance payments for retired police officers, retirement payments, and supplemental retirement insurance payments. FICA, retirement, and supplemental retirement benefits are fixed as a certain percentage of salaries and will rise accordingly. Vacation pay and sick leave programs are not considered fringe benefits since both are usually paid out of regular salary expense line items. Discussion Fringe benefits, as a percentage of the overall wages and salaries paid in Carrboro, have risen from FY13-14 to FY 17-18. The increase in fringe benefits is largely due to double-digit increases in health insurance costs for employees and retirees. Other factors include an increase in the number of retirees benefiting from the Town’s insurance coverage subsidy, therefore increasing retiree insurance costs; an increase in retiring police officers who are eligible for a separation allowance benefit; additional positions in departments, and an increase in the Town’s contribution to the State Retirement Fund.
40.7% 39.8%41.0% 41.6% 43.3%
20.0%
25.0%
30.0%
35.0%
40.0%
45.0%
50.0%
2013-14 2014-15 2015-16 2016-17 2017-18
Fringe Benefits as % of Wage and Salary Expenditures
2013-14 2014-15 2015-16 2016-17 2017-18
Expenditures for fringe benefits $3,201,670 $3,215,876 $3,307,824 $3,379,677 $3,550,472
Salaries/Wages (FT,PT,OT, Temp) $7,858,124 $8,088,265 $8,068,980 $8,115,182 $8,205,705
Fringe benefits as % of overall wage
and salary expenditures 40.7% 39.8% 41.0% 41.6% 43.3%

Town of Carrboro Adopted Annual Budget Fiscal Year 2020
155
Municipal Employees per 1,000 Residents
Warning Trend: Increasing number of full-time municipal employees per (1,000) capita. Formula: Number of Municipal Employees (approved)/Population/1000
Description Because personnel costs are a major portion of a local government's operating budget, plotting changes in the number of employees per capita (or per thousand residents) is a good way to measure changes in expenditures. An increase in employees per capita might indicate that expenditures are rising faster than revenues that the government is becoming more labor intensive, or that personnel productivity is declining.
Discussion The number of municipal employees per capita has remained relatively stable over the past five years. The changes in FY 13-14 are based on changes in population. The changes in FY 14-15 through FY 17-18 are based on the combination of population and personnel changes.
2013-14 2014-15 2015-16 2016-17 2017-18
Population 20,510 20,337 20,984 20,867 21,099Number of municipal employees
approved 156 158 158.5 159.5 160.5

Town of Carrboro Adopted Annual Budget Fiscal Year 2020
156
Work Force Totals
Permanent Full-time Equivalent
Description of Position Changes FY 12-13 – Eliminate 4 frozen positions – Maintenance/Construction Worker, Groundskeeper, Police Officer I in Community Services, Police Officer I in Criminal Investigations. Add an Information Technology Support II position and unfreeze Planning/Zoning Specialist position. FY13-14 – Part-time position moved from Mayor and Board of Aldermen to Town Clerk, eliminated the Animal Control Officer position and added a Solid Waste Operator in Public Works. FY14-15 – Convert one part-time position in Police Department and one part-time position Fire Department to full-time. Add Assistant to Town Manager position. Move Information Technology from a division within the Manager’s office to a department. FY15-16 - Two part-time administrative positions (one in Finance; and one in Recreation and Parks) will be converted to full-time. A full-time position in Planning has been converted to a part-time GIS position. FY16-17 – Program Support Assistant II position transferred from Finance to Human Resources as Human Resources Representative. A Capital Projects Manager position was added to Public Works. FY17-18 – Capital Projects Manager position added to Public Works in the previous year is being combined with the Engineering Tech position. Added a new Stormwater Utility Manager to Public Works. Planning Department will add an additional Planner position. FY18-19 – Added a Communications Manager to Town Manager; an Accounting Tech/Receptionist and Management Specialist to Finance, and a Stormwater Specialist to the Stormwater Utility Fund. Deleted Human Resources Representative in Human Resources. FY19-20 – Add an Associate Planner in Planning; add a Groundskeeper I and an Engineering Technician in Public Works; and change a permanent part-time Program Support Assistant I to a full-time Program Support Assistant II in Recreation and Parks.
FY Mayor & Board
Manager Economic Development
Clerk Management Services
Information Technology
Human Resource
Police Fire Planning Public Works
Recreation & Parks
TOTAL
2012-13 .5 5 1.5 1 6.5 2 42 36.5 14 34 12.5 155.5
2013-14 0 5 1.5 1.5 6.5 2 41.5 36.5 14 35 12.5 156
2014-15 0 3 1.5 1.5 6.5 3 2 42 37 14 35 12.5 158
2015-16 0 3 1.5 1.5 7 3 2 42 37 13.5 35 13 158.5
2016-17 0 3 1.5 1.5 6 3 3 42 37 13.5 36 13 159.5
2017-18 0 3 1.5 1.5 6 3 3 42 37 14.5 36 13 160.5
2018-19 0 4 1.5 1.5 8 3 2 42 37 14.5 37 13 163.5
2019-20 0 4 1.5 1.5 8 3 2 42 37 15.5 39 13.5 167.0
Note: Through FY17, all positions are budgeted within the General Fund. Starting in FY18, one of the Public Works positions was budgeted in the Stormwater Utility Enterprise Fund, and another position was added in FY19.

Town of Carrboro Adopted Annual Budget Fiscal Year 2020
157
Operating Position Indicators Revenues and Expenditures have a direct impact on a town’s operating position. The term “operating position” refers to a local government’s ability to: (1) balance its budget on a current basis, (2) maintain reserves for emergencies, and (3) have sufficient liquidity to pay its bills on time. The primary indicator that is tracked by the Town is fund balance. Fund Balance As an accounting calculation, fund balance is the difference between current assets and current liabilities. Unreserved fund balance, also called “fund balance available for appropriation,” is the maximum amount that can be used to finance expenditures in next year’s budget. Available fund balance is also considered a non-recurring financial resource that provides a local government with flexibility. Once used, it is difficult to replace. As a result, it should be protected and maintained at a reasonable level to provide for emergencies, unforeseen shortfalls in revenue, or to take advantage of unforeseen opportunities. The Local Government Commission (LGC) considers the amount of unreserved fund balance to be one of the key indicators of the financial condition of a town. LGC, as part of the process of reviewing audited financial statements each year, calculates the amount of fund balance available for appropriation in the general fund and the amount of reserves in other funds. The LGC has an 8 percent minimum as a guideline for fund balance but this is not applicable to all governments, especially smaller governments like the Town of Carrboro. The 8 percent ratio is intended to represent 1/12th of a government’s operating expenditures. However, 1/12th of a small government’s budget is not considered an adequate reserve level due to the sheer small dollar amount that it reflects. The LGC uses, as its guideline for Carrboro, the average unreserved fund balance (commonly referred to as “fund balance available for appropriation (FBAA)” for units with similar populations. If a jurisdiction’s unreserved fund balance falls to half of the group average, the LGC will write a letter to alert the Board of Aldermen and Town administration and to advise them that the municipality review the current level of fund balance and determine what fund balance level the municipality should have. Using the latest year available from LGC (year ending June 30, 2017), unreserved fund balance that includes designated and undesignated reserves is at 65.81% in Carrboro.

Town of Carrboro Adopted Annual Budget Fiscal Year 2020
158
The graph above illustrates the five-year undesignated fund balance trends. The Town policy is to maintain undesignated reserves within a range of 22.5% to 35% as in its financial policy on fund balance.
Debt / Liability Indicators
Another large expenditure that credit rating industries monitor is the debt load. Debt is an obligation resulting from the borrowing of money. Under favorable conditions, debt:
Is proportionate in size and growth to the government’s tax base, Does not extend past the facilities useful life which it finances, Is not used to balance the operating budget, Does not put excessive burdens on operating expenditures, and Is not so high as to jeopardize the credit rating.
The Board has approved a debt policy that addresses guidelines and restrictions affecting the amount, issuance, process, and type of debt issued by a governmental entity. The policy also requires Town staff to monitor various debt ratios that are used to evaluate ability to repay as well as the government’s capacity to incur debt (see Town’s fiscal policies within the Community and Organizational Profile section). The Town’s debt structure primarily consists of installment financing and GO bond debt to support its capital improvements and equipment and vehicle replacements. Debt load is a large expenditure that credit rating industries monitor. Debt ratios are considered by the LGC and credit rating agencies to ascertain the fiscal health of a municipality. High debt ratios may adversely affect the ability of the Town to obtain the lowest possible interest rate when borrowing funds. One measure of a unit’s debt capacity is debt expressed in terms of assessed or market valuation. It is important to note, however, the Town’s debt is far below the legal limit in the NC General Statutes (GS 159-55) that limits net debt to eight percent (8%) or less of a local government’s total property valuation. Outstanding debt in most governmental units falls well below this limit, and typically ranges from about 1% to 4% for most governments. The legal margin or the maximum amount of outstanding debt allowable by law, based on the June 30, 2018 audited valuation is $183,348,468. Debt service, annual interest and principal payments, can be a major part of a government’s fixed costs, and its increase may indicate excessive debt and fiscal strain; credit firms consider debt exceeding 20% of operating revenues as a potential problem. Ten percent is considered
Town of Carrboro, North Carolina Computation of Legal Debt Margin
June 30 ,2018 Total assessed valuation at June 30, 2017 $2,360,764,978 Debt limit – eight percent (8%) of assessed value $ 188,861,198 Amount of debt applicable to debt limit Net Bonded Debt
$ 5,512,730
Legal Debt Margin $ 183,348,468

Town of Carrboro Adopted Annual Budget Fiscal Year 2020
159
acceptable (footnote1). The North Carolina Local Government Commission (LGC) advises that a heavy debt burden may be evidenced by a ratio of General Fund Debt Service to General Fund Expenditures exceeding 15%. The Town will maintain this ratio at or below 12%, considering this to be a moderate level of debt. In the last audited year, the Town shows that debt expenditures are approximately 5.0% of the total expenditures for the year ending June 30, 2018. The Five-Year Plan shows the percentage of debt service expenditures remaining at or below this level.
Long-Term Debt
2013-2014 2014-2015 2015-2016 2016-2017 2017-2018
Long-Term Debt $7,477,109 $7,248,164 $6,971,705 $6,274,461 $5,512,730
Property Valuation $2,088,514,087 $2,113,902,961 $2,135,604,701 $2,163,259,569 $2,360,764,978
Warning Trend: Increasing ratio of long-term debt to total property valuation. Formula: Long-term Debt/Total Property Valuation.
Description The definition of debt considered by rating agencies is generally limited to bonded debt because of the fact that this debt is backed by the full faith and credit of the town which is represented by the Town’s property valuation. However, given that all debt by the Town is considered a fixed cost and property taxes are the primary revenue source for the Town, the analysis of debt above includes long-term installment financing for infrastructure and land as well as equipment and vehicle debt. An increase in total long-term debt as a percentage of taxable assessed valuation can mean that the government's ability to repay debt is diminishing - assuming that the government depends on the property tax to repay its debts.
1 “Evaluating Financial Condition, A Handbook for Local Government,” ICMA, Sanford M. Groves and Maureen Godsey Valente, pp 83

Town of Carrboro Adopted Annual Budget Fiscal Year 2020
160
Standard and Poor’s (S&P) reviews the level of long-term debt, recognizing that accelerated debt issuance can overburden a municipality. However, S&P also recognizes that a low debt profile may not be a positive credit factor since it may indicate underinvestment in capital facilities. Investment in public infrastructure is believed to enhance the growth prospects of the private sector. Discussion For municipalities comparable to Carrboro (populations ranging from 10,000 to 24,999), the average debt-to-assessed valuation ratio (computed by the Local Government Commission) in FY17-18 was .415 percent; a high level is considered 1.804 percent. The debt-to-assessed valuation ratio for Carrboro in the last audited year was .234 percent, which is below the average valuation for jurisdictions of similar size. The LGC includes authorized but unissued debt in its debt ratio formula. The graph above reflects the historical perspective that credit-rating agencies and audit reports consider; only issued debt is calculated in the debt ratio and thus Town debt ratios in the presented graphs are slightly different. Debt per Capita
Debt can also be monitored on a per capita basis. It is especially useful for communities that do not rely heavily on property taxes and that cannot easily compute a substitute revenue base for comparison (footnote2). This is an indicator that is monitored by the LGC and is useful for comparison with other similar jurisdictions. The average for comparable jurisdictions in FY17-18 was $303 per capita; $1,534 per capita is considered a high ratio. According to the LGC, the Town’s ratio of outstanding general obligation bond debt which includes authorized and unissued general obligation bond debt and installment purchase debt is $170 per capita. The graph above shows a lower per capita figure that is based on different assumptions than LGC. This figure is adjusted for inflation, relies on actual audited valuation, and does not include authorized but unissued debt. The decreases in FY14-15 through FY17-18 are due to lease-purchase of fewer vehicles and equipment and continued principal payments on bonded debt.
2 Evaluating Financial Condition, A Handbook for Local Government,” ICMA, Sanford M. Groves and Maureen Godsey Valente, pp 81
$254 $246$225
$194$170
$100
$150
$200
$250
$300
$350
2013-2014 2014-2015 2015-16 2016-17 2017-18
Long-Term Debt Per Capita (Adjusted Dollars)

Town of Carrboro Adopted Annual Budget Fiscal Year 2020
161
Debt Service
Warning Trend: Increasing debt service as a percentage of operating revenue. Formula: Debt Service/Operating Revenue
Description Debt service is defined here as the amount of principal and interest that a local government must pay each year on its long-term debt plus the interest it must pay on short-term debt. Increasing debt service reduces expenditure flexibility by adding to the government's obligations. According to the ICMA, debt service under 10 percent of net operating revenue is considered acceptable while anything approaching 20 percent is considered excessive. Debt service can be a major part of a government's fixed costs, and increases may indicate excessive debt and fiscal strain. Discussion The graph shows that debt expenditures are approximately 5.1 percent of net operating revenues in FY17-18. This ratio, while different in focus than the Town’s debt policy which monitors debt service as a percentage of expenditures, tells a similar story of relatively stable debt service that is below the stated ceiling of 12%. In January 2013 the Town issued $4.6 million of general obligation bonds which required principal and interest payment beginning in FY 2013-14.
6.3%5.5% 5.6% 5.4% 5.1%
0.0%1.0%2.0%3.0%4.0%5.0%6.0%7.0%
2013-2014 2014-15 2015-16 2016-17 2017-18
Debt Service as% of Net Operating Revenues
2013-2014 2014-2015 2015-2016 2016-2017 2017-2018
Debt Service $1,292,484 $1,148,954 $1,164,298 $1,136,832 $1,140,714
Net Operating Revenue $20,410,534 $20,938,539 $20,705,996 $21,008,891 $22,558,145

Town of Carrboro Adopted Annual Budget Fiscal Year 2020
162
Overlapping Debt
Warning Trend: Increasing overlapping debt as a percentage of total assessed property valuation. Formula: Carrboro Long-Term Debt Plus Orange County Long-Term Debt/Carrboro Assessed Property Valuation
Description Overlapping debt is the net direct bonded debt of another jurisdiction that is issued against a tax base within part or all of the boundaries of the community. The level of overlapping debt is only that debt which is applicable to the property shared by the two jurisdictions. The overlapping debt indicator measures the ability of the community’s tax base to repay the debt obligations issued by all of its governmental and quasi-governmental jurisdictions. Discussion The overlapping debt ratio does not present any warning signs. From FY13-14 to FY16-17, the overlapping debt rate for Orange County has decreased. FY17-18 trended slightly higher due to an increase in the Orange County total debt.
2013-14 2014-15 2015-16 2016-17 2017-18
Carrboro Debt $4,350,000 $4,100,000 $3,850,000 $3,600,000 $3,350,000
O range County Debt $26,912,280 $26,617,234 $24,286,596 $22,637,920 $25,505,518
Total O verlapping Debt $31,262,280 $30,717,234 $28,136,596 $26,237,920 $28,855,518

Town of Carrboro Adopted Annual Budget Fiscal Year 2020
163
Current Town Financial Condition The Town’s current financial condition is very strong. The Town has consistently maintained a fund balance exceeding 35% of total expenditures. At June 30, 2018 the Town’s unassigned fund balance as a percentage of total expenditures was 52%. For the last nine years through FY 2018-19, the Town has been able to maintain service levels without a property tax increase.
Future Trends The Town makes projections about future costs based on the most recent adopted budget and the Capital Improvements Plan (CIP). This is a tool for reflecting trends rather than actual revenues, expenditures, and tax rates. The five-year plan is designed to show the tax rate impact of town services over the long-term if growth continues at the current rates assumed in the model. The projections contained in the plan are best estimates based upon current information, past trends, and the assumptions outlined within this section. The model is built with the objective of maintaining undesignated fund balance levels at a minimum of twenty-two and one-half percent (22.5%) of budgeted expenditures. The Town Manager’s goal is to keep tax rates at the lowest possible level while continuing to provide a high quality level of services. The assumptions built into this model are very conservative, projecting slow growth in the revenue base while continuing to fund expenditures at historical levels or higher, creating a budgetary gap that in the model, is filled by anticipated revenue increases. Revenues Over the last five years total revenue has grown by roughly 2%. The Town has four sources of recurring revenue: Property Taxes, Local Sales Tax, Other Taxes and Licenses, and Intergovernmental. Property and sales tax revenues are 72% of total revenues. Based on the past five-year trend, we expect property taxes to grow at a modest 2%. On the other hand, sales tax revenues have rebounded over the last five years. Sales tax revenues are expected to increase 3-5% in the coming year. Because of the Town’s close proximity to Research Triangle Park, UNC-Chapel Hill, and UNC Hospitals, the Town has maintained a steady flow of economic activities. In addition to property and sales tax revenues, the Town includes projections for certain intergovernmental revenues collected by the state that are distributed to local governments based upon a formula. These intergovernmental revenues include sales tax on electricity, natural piped gas, telecommunications sales tax, and beer and wine sales. The Town occasionally receives grant funding for specific projects or programs. In FY 2015-16 the Town received grant awards totaling $928,096 from FEMA and NC Hazard Mitigation Program to address storm water management and flooding in the Town. Fund balance is used to balance the budget and to minimize tax increases. Budgets are balanced with the goal of maintaining the undesignated fund balance within the range of 22.5% to 35% of total expenditures. Unassigned fund balance on June 30, 2018 was 52% of total FY18 expenditures. This reflects a healthy fund balance level above the established policy that may provide options to offset some of the capital costs in future years.

Town of Carrboro Adopted Annual Budget Fiscal Year 2020
164
Below is a summary of projected property tax rates and general fund revenues through fiscal year ending June 30, 2024.
Note: The above property tax rate does not include the amount devoted to Affordable Housing Fund…see related chart on the following pages. Property tax valuation assumes growth of 2% per year.
Assumptions used in revenue projections are as follows:
Ad Valorem Tax Base 2% per year thereafter Local Sales Tax 3% per year Other Taxes and Licenses 2% per year Unrestricted Intergovernmental 1% per year Restricted Intergovernmental 1% per year Fees and Permits 2% per year Sales and Services 2% per year Interest Earnings/Other Revenue 1% per year Fund Balance Appropriation Per balanced budget financial policy.
2018-19 2019-20 2020-21 2021-22 2022-23 2023-24
General Fund Adopted Recommended
Property Tax Revenues Budget Budget
Property Valuation 2,265,330,304 2,269,860,965 2,315,258,184 2,361,563,348 2,408,794,615 2,456,970,507
Tax Collection Rate 98.0% 98.0% 98.0% 98.0% 98.0% 98.0%
Collectible Tax Base 2,220,023,698 2,224,463,746 2,268,953,020 2,314,332,081 2,360,618,723 2,407,831,097
Tax Base per $100 Levy 22,200,237 22,244,637 22,689,530 23,143,321 23,606,187 24,078,311
Ad Valorem Revenue 13,084,820 13,110,989 13,373,209 13,640,673 13,913,487 14,191,757
Tax Levy per Penny 222,002 222,446 226,895 231,433 236,062 240,783
Tax Rate 0.5894 0.5894 0.5894 0.5894 0.5894 0.5894
Current Levy - Ad Valorem 11,805,069 12,950,000 13,373,209 13,640,673 13,913,487 14,191,757
Prior Year Ad Valorem Tax - - - - - -
Penalty/Interest Revenue 28,086 28,367 28,934 29,513 30,103 30,705
Total Ad Valorem Revenues 11,833,155 12,978,367 13,402,143 13,670,186 13,943,590 14,222,462
Projected
2018-19 2019-20 2020-21 2021-22 2022-23 2023-24
General Fund Adopted Recommended
Revenues Budget Budget
Ad Valorem Tax 11,833,155 12,978,367 13,237,934 13,502,693 13,772,747 14,048,202
Local Sales Tax 4,475,980 4,649,090 4,788,563 4,932,220 5,080,187 5,232,593
Other Taxes/Licenses 1,604,757 1,610,441 1,642,650 1,675,503 1,709,013 1,743,193
Unrestricted Intergovernmental 1,422,090 1,400,700 1,414,707 1,428,854 1,443,143 1,457,574
Restricted Intergovernmental 633,991 645,198 651,650 658,167 664,749 671,396
Fees and Permits 1,193,085 1,227,219 1,251,763 1,276,798 1,302,334 1,328,381
Sales and Services 285,521 273,050 278,511 284,081 289,763 295,558
Investment Earnings 51,812 150,000 151,500 153,015 154,545 156,090
Other Revenues 161,441 142,190 143,612 145,048 146,498 147,963
Other Financing Sources - - - - - -
Fund Balance Appropriated 1,088,391 1,500,753 886,677 1,362,010 1,891,301 2,479,868
General Fund Total Revenues 22,750,223 24,577,008 24,447,567 25,418,389 26,454,280 27,560,818
Projected

Town of Carrboro Adopted Annual Budget Fiscal Year 2020
165
General Fund Operating Expenditures Personnel costs represent over half of the budget, which underscores the nature of government as a service industry and the primary asset is the people who work for it. Consequently, the five-year plan is impacted by assumptions regarding employee salaries and related expenses. For FY 2018-19 the Town has 163.5 full-time equivalent positions with an additional 1.5 full-time equivalent positions projected for next year. The assumptions within the plan assume an average 2% increase in salaries and a 10% increase in fringe benefits. The five-year plan generally shows operating expenditures at rates that mirror historical trends and commitments of the Town for specific policy or capital initiatives.
The expenditure assumptions are:
Salary and Wages 2% per year and maintain current 167 FTEs after FY20 Fringe Benefits 10% increase per year General Operating Costs 3% per year Human Services 0% per year Other Governance Support 2% per year Landfill Fees 3% per year Transportation Costs 5% per year Debt Service Based on Debt Service projections-see following pages Transfer to Affordable Hsg Amount needed to balance the AH Fund Transfers To Other Funds
Level funding transfer to Capital Reserve for street re-surfacing and future debt service of facilities
2018-19 2019-20 2020-21 2021-22 2022-23 2023-24
General Fund Adopted Recommended
Expenditures Budget Budget
Salary and Wages 9,729,183 9,939,112 10,137,894 10,340,652 10,547,465 10,758,414
Fringe Benefits 3,820,098 4,691,362 5,160,498 5,676,548 6,244,203 6,868,623
Total Personnel Costs 13,549,281 14,630,474 15,298,392 16,017,200 16,791,668 17,627,037
Operating Costs:
General Operating Costs 4,939,117 4,938,838 5,087,003 5,239,613 5,396,801 5,558,705
Human Services Grant 270,000 249,000 249,000 249,000 249,000 249,000
Other Governance Support 373,067 408,052 416,213 424,537 433,028 441,689
Landfill Fees 311,000 360,000 370,800 381,924 393,382 405,183
Transportation Costs 1,811,000 2,002,600 2,102,730 2,207,867 2,318,260 2,434,173
Debt Service 1,094,285 1,245,244 1,211,346 1,550,612 1,550,765 1,601,654
Transfer to Affordable Housing - 52,000 18,242 14,986 11,629 8,169
Transfers to Other Funds 250,000 405,200 405,200 405,200 405,200 405,200
Total Operating Costs 9,048,469 9,660,934 9,860,534 10,473,739 10,758,065 11,103,773
Capital Outlay 215,779 285,600 250,000 250,000 250,000 250,000
Total Expenditures 22,813,529 24,577,008 25,408,926 26,740,939 27,799,733 28,980,810
Projected

Town of Carrboro Adopted Annual Budget Fiscal Year 2020
166
Affordable Housing Fund Below is a summary of projected property tax rates, revenue sources and expenditures through fiscal year ending June 30, 2024.
The above chart uses the below assumptions:
Ad Valorem Tax Base 2% per year thereafter Transfer fr General Fund Amount needed to balance the AH Fund
Operating Costs 1% per year
Capital Investments The Board adopts a 5-year Capital Improvements Plan (CIP) annually. The table below is a summary of capital projects, current and new requests with estimated cash needs per year.
Summary of Capital Improvements Plan FY 2019-20 through FY 2023-24
2018-19 2019-20 2020-21 2021-22 2022-23 2023-24
Affordable Housing Fund Adopted Recommended
Property Tax Revenues Budget Budget
Property Valuation 2,265,330,304 2,269,860,965 2,315,258,184 2,361,563,348 2,408,794,615 2,456,970,507
Tax Collection Rate 98.0% 98.0% 98.0% 98.0% 98.0% 98.0%
Collectible Tax Base 2,220,023,698 2,224,463,746 2,268,953,020 2,314,332,081 2,360,618,723 2,407,831,097
Tax Base per $100 Levy 22,200,237 22,244,637 22,689,530 23,143,321 23,606,187 24,078,311
Ad Valorem Revenue 111,001 222,446 340,343 347,150 354,093 361,175
Tax Levy per Penny 222,002 222,446 226,895 231,433 236,062 240,783
Tax Rate 0.0050 0.0100 0.0150 0.0150 0.0150 0.0150
Current Levy - Ad Valorem 112,500 225,000 340,343 347,150 354,093 361,175
Prior Year Ad Valorem Tax - - 3,000 3,060 3,121 3,183
Penalty/Interest Revenue - - 500 510 520 530
Total Ad Valorem Revenues 112,500 225,000 343,843 350,720 357,734 364,888
Transfer from General Fund - 52,000 18,242 14,986 11,629 8,169
Total Operating Costs 337,500 358,500 362,085 365,706 369,363 373,057
Projected
Previous FY20-FY24 Project
Appropriations FY 2020 FY 2021 FY 2022 FY 2023 FY 2024 Total Total
Expenses
Planning/Design 2,400,124 460,406 55,000 1,154,897 447,000 6,110,000 8,227,303 10,627,427
Construction 19,684,645 1,993,516 1,495,000 1,592,500 3,445,000 4,368,907 12,894,923 32,579,568
Land/ROW 696,480 125,000 46,000 - 43,196 - 214,196 910,676
Equipment/Furnishings - 1,144,800 771,003 476,560 639,377 428,904 3,460,644 3,460,644
Total Expenditures 22,781,249$ 3,723,722$ 2,367,003$ 3,223,957$ 4,574,573$ 10,907,811$ 24,797,066$ 47,578,315$
Appropriations
Intergovernmental Funds 8,231,100 969,472 477,000 1,312,718 164,557 6,635,125 9,558,872 17,789,972
General Fund 4,218,591 300,000 300,000 300,000 300,000 300,000 1,500,000 5,718,591
Capital Project Fund 248,823 1,058,974 225,000 251,179 8,639 133,782 1,677,574 1,926,397
Storm Water Fund - 235,400 375,000 381,000 462,000 510,000 1,963,400 1,963,400
GO Bonds 882,898 - - - - - - 882,898
Installment Financing 9,000,000 651,876 771,003 576,560 3,539,377 3,328,904 8,867,720 17,867,720
Other 199,837 508,000 219,000 402,500 100,000 - 1,229,500 1,429,337
Total Funding 22,781,249$ 3,723,722$ 2,367,003$ 3,223,957$ 4,574,573$ 10,907,811$ 24,797,066$ 47,578,315$

Town of Carrboro Adopted Annual Budget Fiscal Year 2020
167
The Capital Improvements Plan (CIP) for FY 2019-20 through FY 2023-24 includes a number of new projects related to facility improvements and stormwater retrofits. The Town currently has 9 capital projects underway totaling $22.7 million. The largest project is the 203 S. Greensboro Street project at $15.7 million, a joint endeavor between the Town and Orange County, to develop a facility to house the Orange County Southern Branch Library, administrative offices for the Town, and other possible uses. The County is expected to contribute $6.0 million and the Town anticipates debt financing of $9.0 million. Over the next five years, the Town will need funds to undertake the following projects;
Street Re-surfacing: $1.5 million; Vehicles and Equipment: $2.8 million; Town Facility Improvements: $12.4 million; Stormwater improvements: $2.2 million; Infrastructure Projects (e.g., sidewalks, bike ways, etc.): $3.6 million.
The Facilities Assessment and Space Needs Study in 2016 identified a need to renovate several Town building. However, these projects will required further definition to allow for better evaluation of funding options as well as impact analysis on the General Fund. Past CIPs anticipated increased pressure on the tax rate when the Town issued the $4.6 million general obligation bonds for construction of sidewalks and greenways in 2013. However, after evaluating its debt portfolio, the Town elected to pay off some old debt before maturity that had interest rates higher than the current market. This allowed the Town to maintain a level rate of debt service. The only major debt over the next three to five years is expected to be financing for the 203 S. Greensboro Project and the facility improvement projects. The Town historically has not carried a significant amount of debt. Below is a summary of the Town’s current and future debt service projected through FY 2023-24.
2018-19 2019-20 2020-21 2021-22 2022-23 2023-24
Adopted Recommended
Budget Budget
Sidewalk & Greenways GO Bonds 327,500 322,136 317,500 312,500 307,500 302,500
Fire Substation 251,740 251,740 240,517 234,905 229,293 223,682
Vehicle and Equipment 515,045 671,368 125,732 50,735
Current Debt Service 1,094,285 1,245,244 683,749 598,140 536,793 526,182
Future Vehicle & Equipment Debt 167,597 242,597 317,597 392,597
Future Long-Term Debt Service:
203 S Greensboro Development 360,000 709,875 696,375 682,875
Total Current & Future Debt 1,094,285 1,245,244 1,211,346 1,550,612 1,550,765 1,601,654
ProjectedDebt Service

Town of Carrboro Adopted Annual Budget Fiscal Year 2020
168
This page intentionally left blank